991022289508603411.pdf - PolyU Electronic Theses
391
Copyright Undertaking This thesis is protected by copyright, with all rights reserved. By reading and using the thesis, the reader understands and agrees to the following terms: 1. The reader will abide by the rules and legal ordinances governing copyright regarding the use of the thesis. 2. The reader will use the thesis for the purpose of research or private study only and not for distribution or further reproduction or any other purpose. 3. The reader agrees to indemnify and hold the University harmless from and against any loss, damage, cost, liability or expenses arising from copyright infringement or unauthorized usage. IMPORTANT If you have reasons to believe that any materials in this thesis are deemed not suitable to be distributed in this form, or a copyright owner having difficulty with the material being included in our database, please contact [email protected] providing details. The Library will look into your claim and consider taking remedial action upon receipt of the written requests. Pao Yue-kong Library, The Hong Kong Polytechnic University, Hung Hom, Kowloon, Hong Kong http://www.lib.polyu.edu.hk
-
Upload
khangminh22 -
Category
Documents
-
view
1 -
download
0
Transcript of 991022289508603411.pdf - PolyU Electronic Theses
Copyright Undertaking
This thesis is protected by copyright, with all rights reserved.
By reading and using the thesis, the reader understands and agrees to the following terms:
1. The reader will abide by the rules and legal ordinances governing copyright regarding the use of the thesis.
2. The reader will use the thesis for the purpose of research or private study only and not for distribution or further reproduction or any other purpose.
3. The reader agrees to indemnify and hold the University harmless from and against any loss, damage, cost, liability or expenses arising from copyright infringement or unauthorized usage.
IMPORTANT
If you have reasons to believe that any materials in this thesis are deemed not suitable to be distributed in this form, or a copyright owner having difficulty with the material being included in our database, please contact [email protected] providing details. The Library will look into your claim and consider taking remedial action upon receipt of the written requests.
Pao Yue-kong Library, The Hong Kong Polytechnic University, Hung Hom, Kowloon, Hong Kong
http://www.lib.polyu.edu.hk
CUSTOMER EXPERIENCE WITH THE APPLICATION OF SELF-
SERVICE TECHNOLOGY IN HOTELS IN CHINA:
A HIGH-TECH OR HIGH-TOUCH DEBATE
CHUN LIU
PhD
The Hong Kong Polytechnic University
2019

The Hong Kong Polytechnic University
School of Hotel & Tourism Management
Customer Experience with the Application of Self-service
Technology in Hotels in China:
A High-tech or High-touch Debate
Chun LIU
A thesis submitted in partial fulfilment of the requirements for the degree of
Doctor of Philosophy
June 2019

CERTIFICATE OF ORIGINALITY
I hereby declare that this thesis is my own work and that, to the best of my knowledge and
belief, it reproduces no material previously published or written, nor material that has been
accepted for the award of any other degree or diploma, except where due acknowledgement
has been made in the text.
___________________________________(Signed)
CHUN LIU

I
ABSTRACT
With ever-increasing advances in technology, self-service technologies (SSTs) that enable
customers to have independent experiences with minimal service employees’ involvement
have shown potential to supplement or replace personal services. Hotels are no exception to
the investment in various SST applications. Accompanying these rapid technological
developments is a debate on high technology versus high touch, which has yet to be solved.
Although scholars have begun to examine customers’ adoption of SST and its outcomes,
relevant research streams have overlooked the multi-channel nature of service delivery and
organizational opinions, particularly in a hotel context. Therefore, this research adopted a
sequential mixed method (60 in-depth interviews followed by two rounds of surveys) to
develop a framework to elucidate how customers and hoteliers construct preferences for SSTs
compared with human services during hotel service delivery, from an experiential perspective.
Specifically, this study examined whether the customer experience is enhanced by SSTs
compared to conventional human services.
Findings revealed that customers and hoteliers often take service employees into consideration
when making decisions on SST adoption. Customers’ and hoteliers’ preferences between SSTs
and service employees are rather sequences of channel choices during the hotel service delivery
process than binary choices. The quantitative study also indicated that overall, customers
expressed a greater preference for smartphone-based SSTs, whereas hoteliers tended to favor
self-service kiosks for customer check-in/-out.
Based on the qualitative results, this study developed a hierarchical framework which unveils
the mechanism of preference construction. The external environment, middle organizational
context, and core customer experience with service encounters interplayed and influenced
customers’ and hoteliers’ preference construction. Findings from the quantitative study
facilitated the development of a commensurate measurement scale (5 dimensions covering 22
items) for customer experience with SSTs and human services. The study further revealed
discrepancies between customer experience with SSTs and human services and identified those
experience discrepancies explained the most variances in customers’ and hoteliers’ preferences
for SSTs to human services. Overall, fresh experience contributed least compared with the
other four experience dimensions (i.e., affective, cognitive, actional, and social experiences).

II
Moreover, three clusters of customers were identified based on customers’ preferences at
different service delivery stages, namely “innovative users of SSTs”, “actional non-users of
robots”, and “neurotic non-users of SSTs”. The three customer segments were distinct across
demographics (e.g., age, type of employment, and education level), times of travel and used
hotel SSTs within the past 12 months, personal innovativeness in technology, personality,
customer experiences with SSTs, and experience discrepancies.
Considering the crucial roles of customer responses and practitioners’ opinions on successful
application and promotion of new technology, this study enriched the knowledge of SSTs,
enhanced understanding of experience economy, and promoted expertise around the influences
of human services. This research also revealed constructive practical implications for real-
world application of SSTs, including rational decisions about high-tech investment and
effective service channel management strategies.
Keywords: self-service technology, service employee, customer experience, experience
discrepancy, high-tech, high-touch, debate

III
ACKNOWLEDGEMENTS
Time flies. It seems untrue that my Ph.D. is drawing to a close. I could never have gone through
the tough times without support from numerous people.
My deepest thanks and gratitude go to my supervisor, Dr. Kam Hung. No words exist to express
my appreciation. You were always ready to help me whenever I encountered challenges or was
confused. Thank you so much for the frequent discussions and guidance, and thus, I finally
found an interesting and valuable topic. Many thanks for introducing me to industry
practitioners; otherwise I would never have been able to finish the quantitative data collection
in a couple of days. Aside from the great support for my academic research, I would like to
thank you for your suggestions on communicating with people and your concerns for my
emotions. You always rooted for me at the end of our discussions. Moreover, your student-
oriented philosophy benefitted my growth and future career.
I would also like to thank the members of the supervisory committee meeting and the members
of the confirmation panel: Dr. Norman Au, Dr. Dan Wang, and Dr. Vincent Tung. Your
professional expertise and insightful views equipped me with the ability to design the study
properly and thus to improve my research. Furthermore, many thanks for your assistance with
the content validity check of my questionnaire. I am also appreciative of Professor Rob Law,
Dr. Daniel Leung, Mr. Qiang Zhou, Mr. Changzhong Li, and Mr. Haiwei Jin, who gave
valuable comments on my questionnaire design.
My appreciation also goes to the faculty members of the School of Hotel and Tourism
Management at Hong Kong Polytechnic University. Thank you, Dr. Lorenzo Masiero, for
teaching me statistics and SPSS. Thank you, Dr. Jinsoo Lee, for the SEM course. Thank you,
Dr. Markus Schuckert, for the encouragement and course on qualitative methods. Without
knowledge of research methods, I could never have finished my thesis. I am also grateful to
Dean Kaye Chon for leading this excellent school and taking care of all the students. My
gratitude also to Professor Haiyan Song, Professor Sam Kim, Dr. Mimi Li, and Dr. Honggen
Xiao, who give me warmth with their kindness.
Special thanks to my friends, Shirley Zhang, Lorraine Zhang, Richard Hrankai, Taurus Sun,
Vicky Chen, Fuad Mehraliyev, Dagnachew Senbeto, Vasilis Papavasiliou, Irene Chan, and to
all my other friends who studied with me to pursue a doctoral degree. Thank you very much
IV
for your companionship and encouragement. Many thanks also to my friends from the industry
and outside the domain. Thank you for your help with recruiting the qualified participants for
the in-depth interviews and the quantitative data collection.
I also greatly appreciate my boyfriend, Junot Liang. Thank you for the companionship, support,
and encouragement that I needed. Countless thanks to my parents who gave me their best. I
could never have accomplished my academic goals without your great support and
encouragement.
Additionally, I would like to thank the administrative staff of our school, Yuki Lui and Karen
Ng. Thanks for your contributions to administrative affairs such as leave applications, subject
registrations, and the use of associated and conference funds.
Last but not least, great thanks to the Hong Kong Polytechnic University. Thank you very much
for the research sources and studentships, which allowed me to concentrate on my studies fully.
In short, the accomplishment of this thesis would never have been possible without those who
stood behind me. Thank you all!

V
TABLE OF CONTENTS
ABSTRACT .............................................................................................................................. I
ACKNOWLEDGEMENTS ................................................................................................. III
TABLE OF CONTENTS ....................................................................................................... V
LIST OF FIGURES .............................................................................................................. XI
LIST OF TABLES ................................................................................................................... I
CHAPTER 1: INTRODUCTION ........................................................................................... 1
1.1 Research Background ..................................................................................................... 1
1.1.1 Technology is Becoming a Trend ............................................................................ 1
1.1.2 Hotels Increasingly Introduce SSTs ......................................................................... 3
1.1.3 Self-service Technology Incurs Negative Influences .............................................. 4
1.1.4 A Debate over High-tech versus High-touch ........................................................... 6
1.2 Research Gaps, Questions, and Objectives................................................................... 9
1.3 Significance of the Study .............................................................................................. 12
1.4 Organization of the Thesis ........................................................................................... 14
1.5 Chapter Summary ........................................................................................................ 14
CHAPTER 2: LITERATURE REVIEW ............................................................................ 16
2.1 Different Service Delivery Channels in Hotel ............................................................ 16
2.1.1 Service Delivery Channels ..................................................................................... 16
2.1.2 Service Employees in High-touch Service ............................................................ 22
2.1.3 High Technology in Hotel ..................................................................................... 27
2.1.4 Service Delivery Process in Hotel ......................................................................... 37
2.2 Customer Experience with Different Service Delivery Channels............................. 39
2.2.1 Defining Customer Experience .............................................................................. 39
2.2.2 Measurement of Hotel Customer Experience ........................................................ 41
2.2.3 Customer Experience in a Service Encounter with Service Employees ................ 45
2.3.4 Customer Experience in a Service Encounter with SSTs ...................................... 45

VI
2.2.5 Customer Experience and Innovation .................................................................... 47
2.2.6 Service Employee vs. SST Concerning Customer Experience .............................. 49
2.3 A Debate on High Touch versus High Tech ............................................................... 52
2.3.1 The Increasing High-tech Service .......................................................................... 52
2.3.2 The Synchronous Growth of High Touch .............................................................. 55
2.3.3 A Debate on SST versus Service Employee in a Hotel Context............................ 57
2.4 Current Theories and Factors Influencing Technology Adoption ........................... 61
2.4.1 Theories/Concepts for Technology Adoption ........................................................ 61
2.4.2 Factors Influencing the Adoption of Technology .................................................. 67
2.4.3 Factors Influencing Preferences between SSTs and Service Employees .............. 77
2.5 Chapter Summary and Critique.................................................................................. 78
CHAPTER 3: METHODOLOGY ....................................................................................... 82
3.1 Study Setting: China ..................................................................................................... 83
3.1.1 Background and Context of SST Application in China ......................................... 83
3.1.2 Self-service Technology in Hotels in Mainland China .......................................... 87
3.1.3 Why China? ........................................................................................................... 90
3.2 Research Design ............................................................................................................ 92
3.2.1 Mixed Methods Research ...................................................................................... 92
3.2.2 Sequential Exploratory Design .............................................................................. 93
3.2.3 Visual Diagram ...................................................................................................... 95
3.3 Research Paradigm: Constructivism .......................................................................... 96
3.3.1 Ontological Assumption ........................................................................................ 97
3.3.2 Epistemological Assumption ................................................................................. 98
3.3.3 Methodological Assumption .................................................................................. 98
3.4 Stage One: Qualitative Research ................................................................................. 99
3.4.1 Data Collection: In-depth Interview ...................................................................... 99
3.4.2 Data Analysis: Content Analysis ......................................................................... 105
3.5 Stage Two: Quantitative Study .................................................................................. 108
3.5.1 Questionnaire Design: Item Pool Generation ...................................................... 108
VII
3.5.2 First Round of Data Collection: Measurement Item Purification ........................ 117
3.5.3 Second Round of Data Collection: Measurement Finalization and Hypotheses Test........................................................................................................................................ 121
3.6 Chapter Summary ...................................................................................................... 130
CHAPTER 4: QUALITATIVE FINDINGS ...................................................................... 132
4.1 Self-service Technologies at Different Hotel Service Delivery Stages .................... 132
4.1.1 Available SSTs at Different Hotel Service Delivery Stages ................................ 132
4.1.2 Preferences at Different Service Delivery Stages ................................................ 135
4.2 Environmental Inhibitors and Enablers ................................................................... 136
4.2.1 Public Readiness .................................................................................................. 137
4.2.2 Social Values ....................................................................................................... 138
4.2.3 Government Regulation ....................................................................................... 138
4.2.4 Industry Development .......................................................................................... 139
4.2.5 Technology Development .................................................................................... 140
4.2.6 Labor Issues ......................................................................................................... 140
4.3 Organizational Inhibitors and Enablers ................................................................... 141
4.3.1 Hotel Profile ......................................................................................................... 141
4.3.2 Incompatibility ..................................................................................................... 143
4.3.3 Top Management ................................................................................................. 144
4.3.4 Perceived Benefits for Hotels .............................................................................. 145
4.3.5 Technology Company Contributions ................................................................... 147
4.4 Attributes of SSTs and Human Services ................................................................... 147
4.4.1 Attributes of SSTs ................................................................................................ 147
4.3.2 Attributes of Human Services .............................................................................. 151
4.5 Service Task Attributes and Customer Needs ......................................................... 153
4.5.1 Service Task Attributes ........................................................................................ 153
4.5.2 Customer Needs ................................................................................................... 155
4.6 Customer Sociodemographic ..................................................................................... 156
4.6.1 Demographics ...................................................................................................... 156
VIII
4.6.2 Personality............................................................................................................ 157
4.6.3 Trip Profile ........................................................................................................... 158
4.6.4 Prior Experience................................................................................................... 160
4.7 Customer Experience: Appropriation Criteria and Reinforcers ........................... 160
4.7.1 Customer Experience with SSTs ......................................................................... 161
4.7.2 Customer Experience with Human Services........................................................ 169
4.8 Chapter Summary ...................................................................................................... 172
CHAPTER 5: DISCUSSION AND CONCLUSION OF QUALITATIVE STUDY ...... 174
5.1 Distinct Preferences at Different Hotel Service Stages ............................................ 174
5.2 External Environmental Context .............................................................................. 176
5.3 Organizational Context .............................................................................................. 180
5.4 Channel Attributes...................................................................................................... 183
5.5 Service Task Features ................................................................................................. 186
5.6 Customer Difference ................................................................................................... 187
5.7 Customer Experience.................................................................................................. 191
5.8 Development of Conceptual Framework .................................................................. 195
5.9 Chapter Summary ...................................................................................................... 199
CHAPTER 6: RESULTS OF QUANTITATIVE STUDY ............................................... 202
6.1 Purification of Experience Measures ........................................................................ 202
6.1.1 EFA Results of Customer Experience with SSTs ................................................ 202
6.1.2 EFA Results of Customer Experience with Human Services .............................. 204
6.2 Evaluation of Reliability and Validity of Experience Measures ............................. 204
6.2.1 CFA Results of Customer Experience with SSTs................................................ 205
6.2.2 CFA Results of Measurement of Customer Experience with Human Services ... 208
6.3 External Validity of Measurement Scale for Customer Experience ...................... 209
6.3.1 External Validity of Measurement Scale for Customer Experience with SSTs .. 209
6.3.2 External Validity of Measurement Scale for Customer Experience with Human Services .......................................................................................................................... 212
IX
6.4 Preferences at Different Service Delivery Stages ..................................................... 213
6.5 Customer Experience Discrepancies and Their Influences on Preferences .......... 217
6.5.1 Customer Experience Discrepancies.................................................................... 217
6.5.2 Influences of Customer Experience on Preferences ............................................ 220
6.6 Classifying Customers Based on Behavioral Preferences ....................................... 226
6.7 Chapter Summary ...................................................................................................... 231
CHAPTER 7: DISCUSSION AND CONCLUSION OF QUANTITATIVE STUDY ... 233
7.1 Development of Measurement Scale of Customer Experience ............................... 233
7.2 Preference Differences by Hotel Service Stage ........................................................ 235
7.3 Customer Segments Based on Behavioral Preferences ........................................... 236
7.4 Chapter Summary ...................................................................................................... 238
CHAPTER 8: FINAL REMARKS AND IMPLICATIONS ............................................ 240
8.1 Revisiting Research Gaps and Responses in the Present Study ............................. 240
8.2 Major Findings ............................................................................................................ 243
8.2.1 Research Question 1: What SST do customers and hoteliers prefer at different hotel service delivery stages?.................................................................................................. 243
8.2.2 Research Question 2: How do customers and hoteliers develop preferences during hotel service delivery? ................................................................................................... 244
8.2.3 Research Question 3: To what extent do customers’ preferences correspond to hoteliers’ preferences for specific SSTs in associated service delivery stages? ............ 245
8.3 Contributions of the Study ......................................................................................... 246
8.3.1 Theoretical Implications ...................................................................................... 246
8.3.2 Practical Implications........................................................................................... 249
8.4 Limitations and Future Research .............................................................................. 252
REFERENCES ..................................................................................................................... 254
APPENDICES ...................................................................................................................... 297
Appendix 1 In-depth Interview Questions ...................................................................... 297
Appendix 1.1 In-depth Interview Questions to Hoteliers ............................................. 297
X
Appendix 1.2 In-depth Interview Questions to Customers ........................................... 301
Appendix 2 Interviewees’ Preferences by Hotel Service Stage ..................................... 305
Appendix 2.1 Customer Interviewees’ Preferences by Hotel Service Stage (N = 30) . 305
Appendix 2.2 Hotelier Interviewees’ Preferences by Hotel Service Stage (N = 30) .... 308
Appendix 3 Task for Expert Panel .................................................................................. 310
Appendix 4 Questionnaires .............................................................................................. 316
Appendix 4.1 Questionnaire for First-Round Data Collection ..................................... 316
Appendix 4.2 Questionnaires for Second-Round Data Collection ............................... 336
XI
LIST OF FIGURES
Figure 1.1The Evolution of the Interaction between Customers and Service Employees ....... 13
Figure 2.1 The History of Technology Development in Hotel ................................................ 28
Figure 2.2 Factors Influencing the Acceptance of SSTs from Four Dimensions ................... 70
Figure 3.1 Study Framework of the Present Research ............................................................. 82
Figure 3.2 Estimated Worldwide Annual Supply of Industrial Robots in 15 Largest Markets
2017.......................................................................................................................................... 85
Figure 3.3 The History of Technology Development in Hotels in Mainland China ............... 88
Figure 3.4 Visual Diagram of the Procedures for the Sequential Exploratory Design of this
Study ........................................................................................................................................ 96
Figure 3.5 Overview of Experience Scale Development ....................................................... 110
Figure 3.6 Second-order Customer Experience Model.......................................................... 127
Figure 4.1 Examples of SSTs During Check-in/-out Service Encounters ............................. 134
Figure 4.2 Examples of SSTs During Room Service Encounters ......................................... 134
Figure 4.3 Example of QR Code for Invoicing...................................................................... 134
Figure 4.4 Proportions of Customers’ Preferences for SSTs Compared with Service Employees
(N = 30) .................................................................................................................................. 135
Figure 4.5 Influencing Process of Service Task Complexity ................................................ 154
Figure 4.6 A Child Interrupted Robot Food Delivery in a Hot Pot Restaurant in Mainland China
................................................................................................................................................ 165
Figure 4. 7 Friends of the Author Shared Their Experiences with Robots on WeChat Friend
Circle ...................................................................................................................................... 167
Figure 5.1 Service-Channel-Fit Conceptual Framework ....................................................... 175
Figure 5.2 Overview of Influences of External Environmental Context ............................... 179
Figure 5.3 Organizational Context Influencing Hotels’ Preferences for SSTs ...................... 180
Figure 5.4 Overview of Influences of Organizational Context.............................................. 183

XII
Figure 5.5 Influencing Process of Consistent Standardization on Customers’ Preferences .. 184
Figure 5.6 Overview of Influences of Channel Attributes ..................................................... 185
Figure 5.7 Overview of Influences of Service Task Features ................................................ 186
Figure 5.8 Overview of Influences of Customer Differences ................................................ 190
Figure 5.9 Overview of Influences of Customer Experience ................................................ 194
Figure 5.10 Hierarchical Framework for Preference Construction from an Experiential
Perspective ............................................................................................................................. 195
Figure 5.11 Extended and Integrated Framework of TOE and TTF from an Experiential
Perspective ............................................................................................................................. 197
Figure 5.12 Major Qualitative Findings and Corresponding Hypotheses ............................. 201
Figure 6.1 Model for Nomological Validity Assessment of Measurement Scale of Customer
Experience with SSTs ............................................................................................................ 211
Figure 6.2 Model for Nomological Validity Assessment of Measurement Scale of Customer
Experience with Human Services .......................................................................................... 211
Figure 6.3 Percentages of Respondents Using Different SSTs.............................................. 213
Figure 6.4 Percentages of Preferences for SSTs by Hotel Service Stage .............................. 214
Figure 6.5 Percentage of Preferences for Specific Service Channel by Hotel Service Stage 216
Figure 6.6 Means of Customer Experience Dimensions ....................................................... 218
Figure 6.7 Model for the Influences of Experience with SSTs on Customers’ Preferences for
SSTs ....................................................................................................................................... 220
Figure 6.8 Model for the Influences of Experience with Human Services on Customers’
Preferences for SSTs .............................................................................................................. 221
Figure 6.9 Model for Influences of Experience Discrepancies on Customers’ Preferences for
SSTs ....................................................................................................................................... 222
Figure 6.10 Model for the Influences of Experience with SSTs on Hotelier’s Preferences for
SSTs ....................................................................................................................................... 223
XIII
Figure 6.11 Model for Influences of Experience Discrepancies on Hoteliers’ Preferences for
SSTs ....................................................................................................................................... 225
Figure 6.12 Cluster Quality.................................................................................................... 226
Figure 6.13 Customer Segments Based on Behavioral Preferences ...................................... 227
I
LIST OF TABLES
Table 2.1 Previous Studies Regarding Service Delivery Channel ........................................... 20
Table 2.2 Categories and Examples of Innovative SSTs in Hotel ........................................... 32
Table 2.3 Previous Studies Regarding SST Performance in the Hotel Context ...................... 34
Table 2.4 Hotel Service Delivery Process ............................................................................... 37
Table 2.5 Classification Scheme for Service Encounter .......................................................... 38
Table 2.6 Definitions of Experience ........................................................................................ 39
Table 2.7 Dimensions of Customer Experience in a Hospitality Setting ................................ 43
Table 2.8 Previous Literature Exploring SST and Service Employee in a Single Study ........ 50
Table 2.9 Definitions and Influences of Technology Characteristics ...................................... 71
Table 2.10 Summary of Research Gaps and Responses of the Present Study ......................... 80
Table 3.1 Types of Designs by Implementation, Priority, Integration, and Theoretical
Perspective ............................................................................................................................... 93
Table 3.2 Demographics of the In-depth Interview Participants (Hoteliers) ......................... 103
Table 3.3 Demographics of the In-depth Interview Participants (Customers) ...................... 104
Table 3.4 Initial Measurement Experience Items .................................................................. 112
Table 3.5 Behavioral Intention Measurement Items Used in Second-Round Data Collection
Targeting Customers .............................................................................................................. 114
Table 3.6 Respondent Characteristics (Sample 1; N = 193) .................................................. 119
Table 3.7 Trip Profiles within the Past 12 Months (Sample 1; N = 193) .............................. 120
Table 3.8 Respondent Characteristics (Sample 2: N = 408) .................................................. 122
Table 3.9 Trip Profiles within the Past 12 Months (Sample 2: N = 408) .............................. 123
Table 3.10 Respondent characteristics (Sample3: N = 504) .................................................. 125
Table 3.11 Organization Profile of Respondents’ Workplace (Sample 3: N=504) ............... 125
Table 3.12 Hypotheses and Test Results ............................................................................... 129
Table 4.1 Innovative SSTs at Different Service Delivery Stages in Hotels .......................... 133

II
Table 4.2 Environmental Inhibitors and Enablers ................................................................. 136
Table 4.3 Organizational Inhibitors and Enablers ................................................................. 142
Table 4.4 Channel Attributes ................................................................................................. 148
Table 4.5 Service Task Features ............................................................................................ 153
Table 4.6 Customer Differences ............................................................................................ 157
Table 4.7 Customer Experience: Appropriation Criteria and Reinforcers ............................ 162
Table 6.1 Results of PCA on Customer Experience with SSTs (Human Services) .............. 203
Table 6.2 Fit Indices for CFA Models ................................................................................... 205
Table 6.3 Measurement Properties for Scale of Customer Experience with SSTs (Human
Services) ................................................................................................................................. 206
Table 6.4 Correlations of All Constructs for Customer Experience Scale with SSTs (Human
Services) ................................................................................................................................. 207
Table 6.5 Second-order Model of Customer Experience with SSTs (Human services) ........ 207
Table 6.6 Independent-samples t-tests: Customers’ and Hotels’ General Preferences ........ 214
Table 6.7 Results of Cross-tabulation Analysis: Customers’ and Hotels’ Preferences by Hotel
Service Stage .......................................................................................................................... 215
Table 6.8 Results of Paired-samples t-tests: Experience with SSTs vs Experience with Human
Services .................................................................................................................................. 218
Table 6.9 Independent-samples t-tests: Customers’ and Hotels’ Perceptions of Customer
Experiences ............................................................................................................................ 219
Table 6.10 Profile of Three Clusters According to Sociodemographic by Crosstabulation
Analysis.................................................................................................................................. 228
Table 6.11 Profile of Three Clusters According to Personality, Experience, and Task
Complexity by ANOVA ........................................................................................................ 229
Table 6.12 Summary of Influences of Experience on Customers’ and Hoteliers’ Intentions and
Preferences ............................................................................................................................. 232
Table 8.1 Revisiting Summary of Research Gaps and Responses of this Study ................... 241
1
CHAPTER 1: INTRODUCTION
1.1 Research Background
1.1.1 Technology is Becoming a Trend
With ever-increasing advances in technology and the continuous influences of these advances,
many technology-based services seemingly show the potential of supplementing or replacing
personal services (Bitner, Brown, & Meuter, 2000; Kaushik, Agrawal, & Rahman, 2015; Kim
& Qu, 2014; Rust & Espinoza, 2006; Scherer & von Wangenheim, 2016; Selnes & Hansen,
2001). In particular, self-service technology (SST) that enable customers to produce a service
independent of the direct involvement of human staff provide new service delivery
opportunities (Lema, 2009; Meuter, Ostrom, Roundtree, & Bitner, 2000). A wave of unmanned
products, such as self-driving cars, unmanned restaurants, and stores, have attracted the
attention of both industry and the populace.
The hotel industry is no exception to the revolution of such developments. For the sake of
efficiency, productivity, cost-saving and profits, labor-savings, service quality, customer
control, and customer satisfaction, hoteliers have constantly invested in technology, including
self-check-in/check-out systems, self-service ordering gadgets, and robots (Chen, Batchuluun,
& Batnasan, 2015; Karadag & Dumanoglu, 2009; Kim & Qu, 2014; Shin & Perdue, 2019).
Back to the history of technology development in the lodging industry, hotels, in the 1940s,
began to leverage the telephone for reservation services. Stepping into the 1990s, numerous
hotels started to build websites (e.g., Hilton.com and ChoiceHotels.com), while third-party
websites (e.g., Booking.com and Venere.com) that focused on online hotel reservations
emanated. In contemporary society, hotels staffed by robots and unmanned hotels are
beginning to appear. A response to this rapid service technology development is a
corresponding push for academic studies (Stoshikj, Kryvinska, & Strauss, 2016).
Previous studies concerning SSTs divide into two streams. The first stream is the research with
respect to factors influencing customers’ adoption of SSTs. Drawing on various
theories/concepts such as theory of reasoned action, theory of planned behavior and technology
acceptance model (TAM) or extended TAM, prior studies investigated how customers’
intentions to use SSTs are influenced by their attitudes toward SSTs. Factors influencing
customers’ adoption of SST in the past literature can be summarized and anatomized into four
2
groups, namely SST characteristics (e.g., perceived usefulness), individual differences (e.g.,
age), situational influences (e.g., perceived waiting time) and tasks characteristics (e.g.,
complexity). Among these diverse factors is prior experience, the influencing approach of
which is more complicated than SST characteristics and other individual differences (C. Wang,
Harris, & Patterson, 2012). Despite previous studies on the effects of product-norm experience,
service failure and recovery experience, and first-time experience (Bateson, 1985; Kasavana,
2008; Kim & Qu, 2014; Oh, Jeong, & Baloglu, 2013; C. Wang et al., 2012), the plausible
influences of other experiential aspects (e.g., feeling, fun and entertainment) are ignored and
call for further exploration.
Apart from that, this literature stream focuses primarily on customers’ adoption of SST, ignores
the standpoints of the supplier, and separates technology from service contact personnel. The
lack of consideration of the possible influences of manpower leads to plausible findings for the
role of SST in the context of service. More importantly, two service delivery channels (SST
and service contact personnel) seemingly coexist. Pieterson and Ebbers (2008) reported that
there was no autonomous decline in the utilization of traditional channels (e.g., telephone and
face-to-face), resonating with Cassab (2009) who argued that although waiting to turn to
personnel for help was frustrating, it did not motivate consumers to forgo a live customer
service representative. Sousa and Voss (2006) confirmed the multichannel nature of service
employing virtual delivery channels (e.g., Internet). Consequently, the simplistic nature of a
model based on exclusively one service delivery channel is questionable. It is necessary to take
another channel into account to explore the preference rather than the intention to use SST
(Gelderman, Ghijsen, & van Diemen, 2011), echoing that SSTs are supposed to be investigated
in the setting consisting of all channels rather than in isolation (Eriksson & Nilsson, 2007).
The second literature stream concentrates on the changes brought by SST into the service
domain, including its influences on customer commitment (Beatson, Coote, & Rudd, 2006;
Panda, Dash, & Rath, 2011; Wei, Torres, & Hua, 2016), customer satisfaction (Buell,
Campbell, & Frei, 2010; Dabholkar & Spaid, 2012; Meuter et al., 2000; Orel & Kara, 2014;
Weijters, Rangarajan, Falk, & Schillewaert, 2007), customer loyalty (Orel & Kara, 2014;
Selnes & Hansen, 2001), service quality (Sousa & Voss, 2006), and specific facets such as
waiting time (Kokkinou & Cranage, 2013; Weijters et al., 2007; Wittmer, 2011) and delight
(Collier & Barnes, 2015).
3
1.1.2 Hotels Increasingly Introduce SSTs
Given the benefits resulting from SST, introducing it to offer service can be a profitable
business, including cost saving (Considine & Cormican, 2016; Kasavana, 2008; Orel & Kara,
2014), effective cost (Rosenbaum & Wong, 2015), improved service quality (Kaushik et al.,
2015; Kim & Qu, 2014; Oh et al., 2013; Reid & Sandler, 1992), increased productivity (Selnes
& Hansen, 2001), decreased deviations of quality (Selnes & Hansen, 2001), creation of
competitiveness and differentiation (Griffy-Brown, Chun, & Machen, 2008; Meuter & Bitner,
1998; Oh et al., 2013), improved satisfaction (Kasavana, 2008; Ong, 2010), improved customer
experience (Considine & Cormican, 2016; Orel & Kara, 2014), enhanced customer loyalty
(Griffy-Brown et al., 2008; Kasavana, 2008), enhanced efficiencies (Griffy-Brown et al., 2008;
Oh et al., 2013; Ong, 2010), reallocated labor (Kasavana, 2008), more convenient service, more
control over operations (Wei et al., 2016), and increased revenues (Kasavana, 2008). Self-
service technologies are growingly widespread and taking place in marketing (Zhu, Nakata,
Sivakumar, & Grewal, 2007).
Hotel is one of the domains that increasingly invest in various SSTs (Kim, Christodoulidou, &
Brewer, 2012; Shin & Perdue, 2019), for the sake of better service quality, customer
experience, operation efficiency and reduced cost (Kaushik et al., 2015; Kim & Qu, 2014; Shin
& Perdue, 2019). At the same time, the number of customers who interact with technologies
rather than service contact personnel to generate service outcomes is increasing (Meuter et al.,
2000). Customers are beneficiaries of SSTs as well. Benefits gained by customers comprise
enhanced control and choice over service delivery channels (Curran & Meuter, 2005; Griffy-
Brown et al., 2008; Kim & Qu, 2014; Meuter, Ostrom, Bitner, & Roundtree, 2003), increased
flexibility (Kim & Qu, 2014), increased service quality (Meuter et al., 2003; Pan, Xiang, Law,
& Fesenmaier, 2011), enhanced customization (Meuter & Bitner, 1998), fun and entertainment
(Rosenbaum & Wong, 2015), time and money savings(Kim & Qu, 2014; Meuter et al., 2003;
Rosenbaum & Wong, 2015; Wittmer, 2011), reduced anxiety received from hotel employees
(Rosenbaum & Wong, 2015), 24/7 service (Meuter et al., 2003; Schumann, Wünderlich, &
Wangenheim, 2012), ease of use (Meuter et al., 2003), increased convenience (Griffy-Brown
et al., 2008; Kim & Qu, 2014; Meuter et al., 2003; Rosenbaum & Wong, 2015), and aligned
available services of self-service kiosks (Kim & Qu, 2014). The benefits resulting from
technology-based self-service is forecasted to surpass those incurred by interpersonal service,
4
in terms of convenience, self-control, consistency, cost, and time. Then comes the question: is
manual service being replaced by innovative technology in the service domain?
SSTs available in the lodging industry range from traditional SSTs (e.g., telephone reservation
systems and online booking and payment) to newer technological interfaces, for example,
mobile self-check-in/self-check-out technology (Kelly, Lawlor, & Mulvey, 2017a). Hotels are
usually equipped with various SSTs, the reason for which might reside in that a convergence
of multiple SSTs contributes to reducing costs and increasing profits (Kasavana, 2008). The
present study exclusively focuses on innovative SSTs that can be used by customers in an
offline hotel context, excluding traditional hotel SSTs. Telephone reservation is partially
outdated and is gradually and increasingly replaced by online reservation and mobile
reservation, while both the techniques and academic research of online reservation and online
payment are relatively mature (Kim & Kim, 2004; Law & Hsu, 2006; Law & Wong, 2010; Qi,
Law, & Buhalis, 2013; Sparks & Browning, 2011; Sudarno, 2012; Liang Wang, Law, Guillet,
Hung, & Fong, 2015). By contrast, there is still much to be learned about innovative SSTs
which have sparked a wave of nonacademic discussions among practitioners and the average
people. Moreover, the on-site experience is valued most by customers. Compared with ATM
in banking, self-service kiosks in airports, self-scanner in retailing, innovative SST is relatively
new in hotels and receives limited awareness (Kaushik et al., 2015; Kim & Qu, 2014;
Kucukusta, Heung, & Hui, 2014). The experience of other industries serves as a limited
reference for mangers without a lucid understanding of the sameness and distinctness among
services (Cunningham, Young, & Gerlach, 2009). Therefore, it necessitates an exclusive
academic study on SST in a hotel context.
1.1.3 Self-service Technology Incurs Negative Influences
In spite of those mentioned above, some researchers and practitioners queried the claimed
benefits of SST and noticed the negative effects incurred by this technology. The study of Ba
Ba, Stallaert, and Zhang (2010) alluded to that not all firms are beneficiaries of digital service
systems and suggested a considerable analysis of their competitive situations and the
competitive dynamic interactions with rivals. Hilton, Hughes, Little, and Marandi (2013)
conveyed the concerns about regarding SSTs as an effective approach to save money and
heighten efficiency. They argued that the elevated customer participation should at least equal
to the value that customer perceives of adopting SSTs. Practitioners in fields (e.g., art, science,

5
military, and theology) involved in technology acknowledged that technology enhances and
damages human life (Naisbitt, Naisbitt, & Philips, 1999). Virtually, aside from perceived
benefits brought by SSTs, perceived negative facets inhibit participators’ attitudes and
intentions to deploy SSTs. Because of the elimination of service providers, service recovery
efforts and customer loyalty might be restrained, and employee resentment of SSTs through
declined social bonds between customers and hotels might occur (Kim & Qu, 2014; Oh et al.,
2013; Selnes & Hansen, 2001). Furthermore, it is not rare that the investment and the
capabilities of SST is continuously growing, expanding and evolving, while its adoptions and
utilization remain relatively low (Voelker, 2010), particularly in the hotel domain. Previous
studies in banking indicated that not all customers adopted e-service, and some customers even
returned to manual services after trying SST (Ba et al., 2010; Kaushik et al., 2015). This
signifies a necessity to ascertain whether the application of SST enhanced customer experience
as suppliers expected.
Wünderlich, Wangenheim, and Bitner (2013) reported that one of the biggest challenges of the
application and proliferation of SST is to gain customers’ acceptance and to increase their usage
of innovative services. Hotels should have an exhaustive knowledge of customers’ overall state
of mind toward SSTs (Kim & Qu, 2014). A discussion regarding to what extent consumers are
willing to incorporate technology in their accommodation experience is unfolding (Donner &
Dudley, 1997). On the one hand, there are endless possibilities of SST (Meuter et al., 2000),
and SST is indeed becoming a trend (Pan et al., 2011) that has gained momentum. On the other
hand, customers sometimes are negatively influenced by SSTs. Terrible customer experience
might result from technology anxiety, frustration, perceived risk, reduced impact on service
production processes, lost customized service, all coupled with the lack of positive effects
brought by employee and customer needs for interpersonal communication (i.e.,
responsiveness, customized service, flexibility, and spontaneous delight) (Ba et al., 2010; Kim
& Qu, 2014; Parasuraman, 2000; Schumann et al., 2012). Despite the debate in the extant
literature regarding the positive and negative influences of SST, the review on customer
experience with SSTs demonstrates a deficiency of comprehensiveness.
Given the increasing popularity of SST in service encounters and the contradictory statements,
it is imperative to illuminate the role of SST (inhibitor or contributor) from an experiential view
(Giebelhausen, Robinson, Sirianni, & Brady, 2014). In response, this study attempts to address

6
these controversial results and clarify the role of SST by ascertaining the degree to which
consumers/hoteliers are willing to introduce technology into accommodation experience.
1.1.4 A Debate over High-tech versus High-touch
Studies in the past mentioned that there might be a relationship between technology and
humanized service (Anderson, 1995). Burghard (2001) indicated that as customer needs for
personalization are increasing, better methods of balancing technology and personal service
call for attention. Other scholars signified a plausible trend that technology-based services
supplement or replace people-delivered services (Bitner et al., 2000; Kaushik et al., 2015; Kim
& Qu, 2014; Rust & Espinoza, 2006; Scherer & von Wangenheim, 2016; Selnes & Hansen,
2001). According to consumer theory, both substitute goods and complementary goods have
great effects on the demand for the good they replace and complement. With respect to the
relationship between SSTs and human service, previous studies usually investigated the
application of SST via discussing high tech versus high touch (Apte & Vepsäläinen, 1993;
Giebelhausen et al., 2014). Before going to the limited studies on high tech versus high touch,
their definitions are firstly clarified.
Specifically, high tech is short for high technology which is delimited by future advancements,
innovations, and progress-control, whose purpose is to make life easier (Naisbitt et al., 1999).
In this sense, innovative SSTs designed to provide more convenience, thereby can be described
as high tech. In reality, prior studies adopted high-tech to describe self-service (Salomann,
Dous, Kolbe, & Brenner, 2007; Salomann, Kolbe, & Brenner, 2006), or tapping SST to explore
high tech in comparison with human touch (Ba et al., 2010; Voelker, 2010). For instance, Apte
and Vepsäläinen (1993) from a “high tech or high touch” perspective, explored efficient service
delivery channel strategies through discussing the structure of technology-centered channel
(i.e., automated teller machines) and human-centered channel in a setting of bank. Kaushik et
al. (2015) used the substitution of “high-tech and low-touch” manner for “high-tech and low-
touch” approach to depict the changes brought by the application of advanced SSTs in service
delivery process, in line with Kim and Qu (2014) who regarded SSTs as one of the most
common “high-tech and low-touch” technological interfaces that supplemented or substituted
“high-touch and low-tech” traditional interpersonal encounters. Hence, in this study, high tech
refers to new SSTs (e.g., self-check-in/out technology, service robot, smart speaker, and
intelligent control panel) designed to enhance self-service in a hotel context.
7
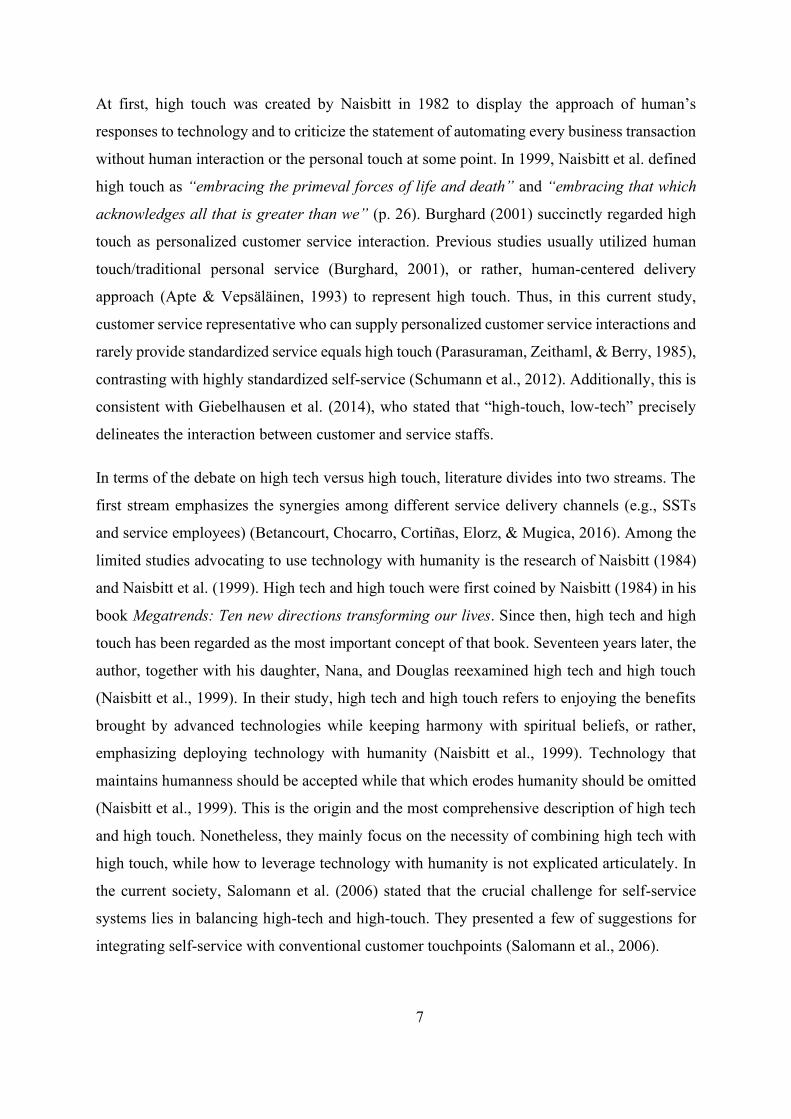
At first, high touch was created by Naisbitt in 1982 to display the approach of human’s
responses to technology and to criticize the statement of automating every business transaction
without human interaction or the personal touch at some point. In 1999, Naisbitt et al. defined
high touch as “embracing the primeval forces of life and death” and “embracing that which
acknowledges all that is greater than we” (p. 26). Burghard (2001) succinctly regarded high
touch as personalized customer service interaction. Previous studies usually utilized human
touch/traditional personal service (Burghard, 2001), or rather, human-centered delivery
approach (Apte & Vepsäläinen, 1993) to represent high touch. Thus, in this current study,
customer service representative who can supply personalized customer service interactions and
rarely provide standardized service equals high touch (Parasuraman, Zeithaml, & Berry, 1985),
contrasting with highly standardized self-service (Schumann et al., 2012). Additionally, this is
consistent with Giebelhausen et al. (2014), who stated that “high-touch, low-tech” precisely
delineates the interaction between customer and service staffs.
In terms of the debate on high tech versus high touch, literature divides into two streams. The
first stream emphasizes the synergies among different service delivery channels (e.g., SSTs
and service employees) (Betancourt, Chocarro, Cortiñas, Elorz, & Mugica, 2016). Among the
limited studies advocating to use technology with humanity is the research of Naisbitt (1984)
and Naisbitt et al. (1999). High tech and high touch were first coined by Naisbitt (1984) in his
book Megatrends: Ten new directions transforming our lives. Since then, high tech and high
touch has been regarded as the most important concept of that book. Seventeen years later, the
author, together with his daughter, Nana, and Douglas reexamined high tech and high touch
(Naisbitt et al., 1999). In their study, high tech and high touch refers to enjoying the benefits
brought by advanced technologies while keeping harmony with spiritual beliefs, or rather,
emphasizing deploying technology with humanity (Naisbitt et al., 1999). Technology that
maintains humanness should be accepted while that which erodes humanity should be omitted
(Naisbitt et al., 1999). This is the origin and the most comprehensive description of high tech
and high touch. Nonetheless, they mainly focus on the necessity of combining high tech with
high touch, while how to leverage technology with humanity is not explicated articulately. In
the current society, Salomann et al. (2006) stated that the crucial challenge for self-service
systems lies in balancing high-tech and high-touch. They presented a few of suggestions for
integrating self-service with conventional customer touchpoints (Salomann et al., 2006).

8
Conversely, instead of emphasizing harmonizing of high tech and high touch, some academics
argued that high tech contrasts with high touch. High tech featured by standardization and
automation is out of alignment with the personalization and customization emphasized by high
touch. Standardization highlights reduced time and cost, while customization aims to satisfy
individual needs at the cost of efficiency and money (Wang, Wang, Ma, & Qiu, 2010).
Furthermore, Kokkinou and Cranage (2013) alluded to the incompatibility between enhancing
customization and reducing waiting time through SST. Besides, the benefits brought by SSTs
conflicts with the significance of a service encounter with employees to a luxury hotel brand
(Kucukusta et al., 2014). For instance, people utilizing technology hold different needs for
face-to-face interaction compared with those who do not, albeit the results of problem solutions
are similar (Fortune, Shifflett, & Sibley, 2010). Hardly can the emotional values provided by
employees be achieved by technology.
Several existing studies showed differences between technology-mediated and classical
services (Schumann et al., 2012), in terms of cost structure, relationship with satisfaction, and
person sensitivity and attribution. In respect to cost structure, digital systems demand large
fixed cost but lower marginal costs than human-based service that require a high diversified
cost component (Ba et al., 2010). Regarding satisfaction, the work of Panda et al. (2011) did
not indicate a significant relationship between technology-based self-service performance and
overall satisfaction, but a relationship between personal-service performance and overall
satisfaction in the hotel context. The sources of dis/satisfaction with SST-based service
encounters are greatly distinct from those with interpersonal service encounters (Bitner,
Booms, & Tetreault, 1990; Meuter et al., 2000). Given person sensitivity, bias exists because
customers assess high-touch human service in a more extreme approach than high-tech self-
service (Scherer & von Wangenheim, 2016). Concerning attribution responsibility, customers
adopting personal services prefer to attribute commitment to service suppliers, while customers
employing high-tech are inclined to ascribe responsibility to external, situational factors and
themselves (Scherer & von Wangenheim, 2016). This is not consistent with previous research
which stated that although customers generate service themselves, few blame themselves when
things go wrong (Meuter et al., 2000). Ironically, those preceding studies do not match the
indication of Lin and Hsieh (2011) that there is a likelihood that service staff and impersonal
machines produce the same fundamental service. Given these conflicting views, questions arise

9
regarding the trade-off between high tech and high touch, or self-service and conventional
services. Are high tech and high touch harmonious coexistence or incompatible?
Another study completed is the research of Sousa and Voss (2006), who developed a
conceptual framework for service quality in multichannel services that employ virtual
channels. Their work explicitly recognized the multichannel nature of these services and linked
the marketing side of services with the operations side by explicating the quality of distinct
service delivery system components (virtual channel, physical channel, and integration
mechanisms). Nevertheless, their study primarily focuses on the outcomes of distinct service
delivery channels instead of the service delivery channels themselves. It is important to explore
service from the perspective of service delivery, as it is as important as service outcomes (Mohr
& Bitner, 1995a; Parasuraman et al., 1985; Parasuraman, Zeithaml, & Berry, 1988). The cause
of the equal importance of process and outcome might be that service encounters, of which a
series of consecutive phases compose service delivery, engages human interactions (Mohr &
Bitner, 1995a; Yang, 2008). Additionally, customers regularly expect and desire more from
these interactions than consequences derived from mechanical administration. As a result, the
investigation of the debate on different service delivery channels is conducive to the success of
new and innovative technology. However, extant studies have not presented a satisfactory way
to substantiate the dilemma among different service delivery channels. To fill the gap, this
study intends to explore the application of SSTs in hotels to help solve the debate over human-
touch versus tech-focus in a hospitality domain (Wei et al., 2016).
1.2 Research Gaps, Questions, and Objectives
Looking back on the research background and previous studies in this field, several limitations
of existing studies are summarized as follows. Also, the reasons why the gaps are supposed to
be tackled are justified. First of all, prior studies separate SST from workforce, neglecting their
possible interaction. According to prospect theory, or rather, reference-independent preference,
decision making is influenced by a reference point (Kahneman & Tversky, 1979). The
reference point is diversified, including status quo and expectation level (Kahneman &
Tversky, 1979). Among these various reference points is an alternative state (Kahneman &
Tversky, 1979). Therefore, it is necessary to take an alternative state (i.e., service contact
personnel) into account and explore how does it affect decision making, instead of exclusively
focusing on the “intention to use” SST (Gelderman et al., 2011). To achieve this, two questions
10
should be taken into account: the position of the reference point (the performance of employee)
and the extent of the discrepancy (positive or negative) between the objective and the reference
point (Kahneman & Tversky, 1979). For example, whether people think an SST is useful hinges
on the usefulness of employee. Therefore, much attention is urged to pay to the degree of the
changes brought by SSTs from customer service representatives.
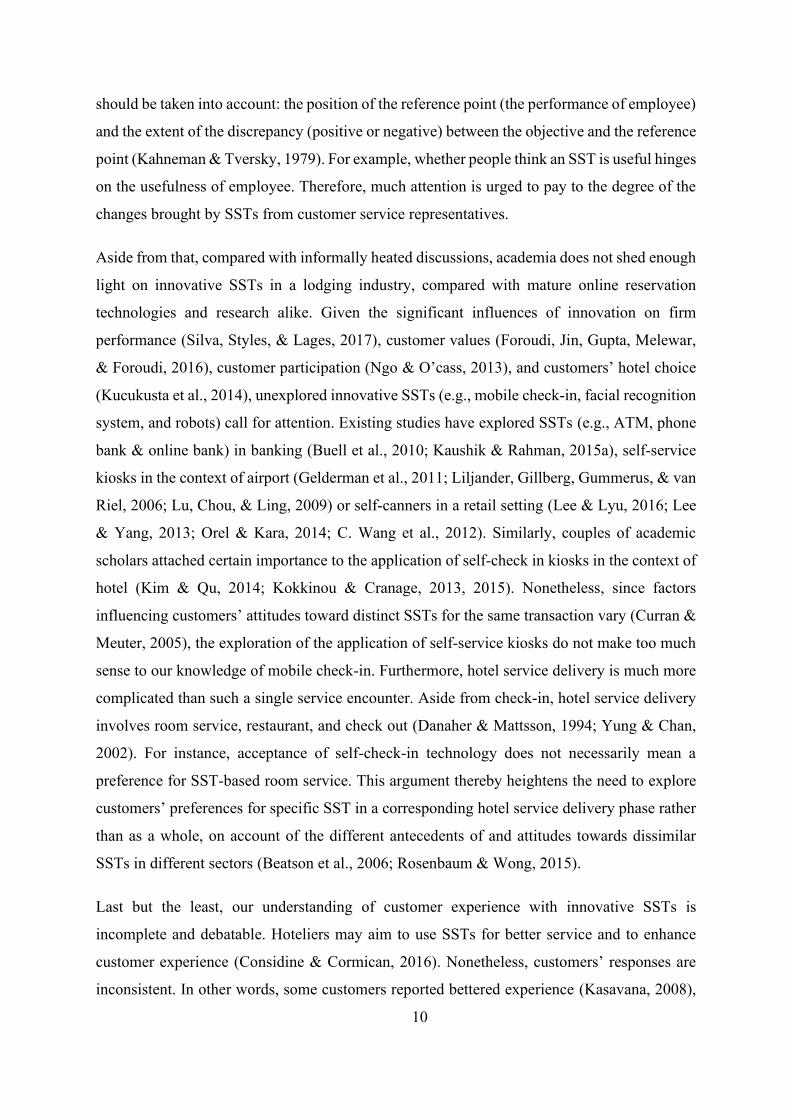
Aside from that, compared with informally heated discussions, academia does not shed enough
light on innovative SSTs in a lodging industry, compared with mature online reservation
technologies and research alike. Given the significant influences of innovation on firm
performance (Silva, Styles, & Lages, 2017), customer values (Foroudi, Jin, Gupta, Melewar,
& Foroudi, 2016), customer participation (Ngo & O’cass, 2013), and customers’ hotel choice
(Kucukusta et al., 2014), unexplored innovative SSTs (e.g., mobile check-in, facial recognition
system, and robots) call for attention. Existing studies have explored SSTs (e.g., ATM, phone
bank & online bank) in banking (Buell et al., 2010; Kaushik & Rahman, 2015a), self-service
kiosks in the context of airport (Gelderman et al., 2011; Liljander, Gillberg, Gummerus, & van
Riel, 2006; Lu, Chou, & Ling, 2009) or self-canners in a retail setting (Lee & Lyu, 2016; Lee
& Yang, 2013; Orel & Kara, 2014; C. Wang et al., 2012). Similarly, couples of academic
scholars attached certain importance to the application of self-check in kiosks in the context of
hotel (Kim & Qu, 2014; Kokkinou & Cranage, 2013, 2015). Nonetheless, since factors
influencing customers’ attitudes toward distinct SSTs for the same transaction vary (Curran &
Meuter, 2005), the exploration of the application of self-service kiosks do not make too much
sense to our knowledge of mobile check-in. Furthermore, hotel service delivery is much more
complicated than such a single service encounter. Aside from check-in, hotel service delivery
involves room service, restaurant, and check out (Danaher & Mattsson, 1994; Yung & Chan,
2002). For instance, acceptance of self-check-in technology does not necessarily mean a
preference for SST-based room service. This argument thereby heightens the need to explore
customers’ preferences for specific SST in a corresponding hotel service delivery phase rather
than as a whole, on account of the different antecedents of and attitudes towards dissimilar
SSTs in different sectors (Beatson et al., 2006; Rosenbaum & Wong, 2015).
Last but the least, our understanding of customer experience with innovative SSTs is
incomplete and debatable. Hoteliers may aim to use SSTs for better service and to enhance
customer experience (Considine & Cormican, 2016). Nonetheless, customers’ responses are
inconsistent. In other words, some customers reported bettered experience (Kasavana, 2008),

11
while others had negative experience (Meuter et al., 2003). The causes are unexplored.
Experience design and delivery process is the business of hoteliers and thus should be
investigated from a hotelier’s standpoint (Kingman-Brundage, 1989; Zhang, Cai, &
Kavanaugh, 2008). This is consistent with Hilton et al. (2013) who suggested scholars to extend
understanding of customer experience with SST from customers’ perspectives to
organizations’ and employees’ views on customer experience. According to cognitivist theory
of affordance, there are three types of affordance (Cardona-Rivera & Young, 2013; Norman,
1999). The first affordance refers to what is actually possible. The second affordance is
regarded as possibilities perceived by users. The last affordance usually is delimited as
information used by providers to evoke precise perception of affordance. By the same token, it
is necessary to ascertain whether or not there are discrepancies between the experience
customers expressed and the experience hoteliers perceived, echoing Kokkinou and Cranage
(2013) who conveyed a disconfirmation between industry’s estimation of self-service check-
in time and the actual check-in time in an airport.
To recap, these deficiencies suggest an urgent need to answer the key research question with
sub-questions:
From an experiential view, how do customers and hoteliers construct preferences for
innovative SSTs during hotel service delivery?
1) What SST do customers and hoteliers prefer at different hotel service delivery stages
(e.g., check in, room, restaurant, and check out)?
2) How do customers and hoteliers develop preferences during hotel service delivery?
3) To what extent do customers’ preferences correspond to hoteliers’ preferences for
specific SSTs in associated service delivery stages?
Therefore, from an experiential perspective, this research seeks to develop a framework to
explain how customers and hoteliers construct their preferences for innovative SSTs during the
delivery process of hotel service. The sub-objectives of the current study are as follows:
1) To unveil the extent to which customers and hoteliers prefer SSTs during hotel service
delivery;
12
2) To identify the experiential factors influencing customers’ and hoteliers’ preferences
for SSTs during hotel service delivery;
3) To provide insights into customer experience during hotel service delivery with
reference to SST preference;
4) To explore and explain the plausible discrepancies existing between customers’ and
hoteliers’ perceptions of customere xperience.
1.3 Significance of the Study
The present study is conducive to the field of technology and hotels from the following facets.
To begin with, a conceptual framework is developed to ascertain the construction of preference
for SSTs versus service employees, contributing to our understanding of individual and
organizational behaviors and in turn doing a favor to further handling the high-tech or high-
touch debate. The conveying of preference via choice and decision making functions as the
essence of intelligent and intentional behavior (Slovic, 1995). However, customers probably
are not clear about their own preferences (Piccoli, Lui, & Grün, 2017). As a consequence, the
clarification of the construction of preference for SST acts as an excellent complement and
perfection of previous academic research regarding customer adoption of SST and amends the
research gaps in organizational SST adoption. Furthermore, exploring the preference for
specific SST by means of anatomizing service delivery process into couples of service
encounters (e.g., check in, room, restaurant, and check out) is much more detailed and
comprehensive than existing studies that either exclusively focuses on the check-in encounter
or overlooking the distinctions among different service encounters.
Moreover, the knowledge of innovative SST is conducive to the understanding of the role of
technology in human life. Numerous technologies are utilized to help service employees to
enhance customer experience, while this study investigated the role of SST independent from
service employee to help customers handle tasks. In this respect, the present work encourages
academics and practitioners to rethink the experience economy. Although it is plausible that
SSTs provoke customers to engage actively in tackling tasks and thus enhance customer
experience, the automation of SSTs conflicts with the customization of experience economy.
Experience economy emphasizes that experiences are generated through a compatible
interaction between customers and service employees rather than service staff providing

13
experience without customer involvement (Pine & Gilmore, 1998; Xu, 2010). However, the
advanced SST directly removes the interaction between customers and employees as opposed
to enhancing the interaction (Figure 1.1). As a result, this study extends the knowledge of the
place and function of technology in human life and experience economy, through extending
beyond technologies that are designed to better communication and help customer service
representatives to meet customers’ needs to technologies which exclude direct interpersonal
interaction between customers and service employees (Curran & Meuter, 2005; Janowitz,
2007; Kucukusta et al., 2014).
Figure 1.1The Evolution of the Interaction between Customers and Service Employees
Last but not least, the findings derived from this research can help hoteliers decide the extent
of SST application in their setting, which is greatly related with operation financial
performance (Hung, Yen, & Ou, 2012). This research reviewed the history of technology
development and the range of SST in the hotel domain, which may serve as useful references
for hoteliers. Considering the crucial role of customer responses and practitioners’ opinions to
a success of the application and promotion of a new technology (Hansen, 1995; Ozturk &
Hancer, 2014; Sahadev & Islam, 2005; Zhang & Dhaliwal, 2009), the elucidation of the
customers’ and hoteliers’ preference provides valuable implications for practitioners who find
themselves with a dilemma: whether or not to implement SST and to what degree to deploy
SST. The exploration of customers’ and hoteliers’ preferences and the plausible
disconfirmations between the two groups’ preferences and experiences during the service
delivery process enable hoteliers to locate the discrepancies, make corresponding
enhancements, so as to tailor service offerings to satisfy customer needs and thus enhance
customer loyalty (Buell et al., 2010). Consequently, better strategies can be wielded to manage
appropriately and deploy multiple channels during the service delivery process rather than
simply making a decision regarding whether or not implement SSTs (C. Wang et al., 2012).
Effective management of service delivery channels heightens the likelihood of gaining
Service employees produce service without customer participation.
Experience economy highlights customer involvement and the interaction between
customers and service employees.
Customers generate service through SST without direct servic
employees' involvement.
14
profitability and success in a growing competitive marketplace (Meuter et al., 2000). In this
respect, not only money and time can be saved and used efficiently, but also customer
relationship and loyalty can be elevated, leading to future success.
1.4 Organization of the Thesis
The remainder of the thesis is organized as follows. The next chapter provided the study
background by reviewing, summarizing, and critiquing extant research concerning different
service delivery channels and customer experiences. In detail, the second chapter consisted of
five sections. The first section reviewed current studies concerning multiple service delivery
channels, the role of service employees and SSTs in hotels respectively, and delivery process
of hotel service. Subsequently, customer experience with different service encounters were
reviewed separately. A debate on different high tech versus high touch was then discussed.
Next, existing theories and factors concerning the SST adoption were summarized. Ultimately,
the aforementioned literature reviewed was summarized and critiqued. After reviewing existing
studies in this area, this study summarized the status quo of SST application in hotels in China,
the study setting of this research (Chapter 3). Subsequently, the research paradigm of mixed
methods and specific approaches of data collection and analysis were described. Chapter 4
described the findings of the qualitative research followed by Chapter 5 which associated the
qualitative findings with prior studies and summarized the qualitative research. Chapter 6
presented the quantitative results. Chapter 7 associated such quantitative results with the
literature and qualitative research and thereafter gave a summary. The last chapter revisited
research gaps outlined in Chapter 2, summarized major findings from the qualitative and
quantitative studies (Chapters 4 and 7) to answer research questions, associated such results
with previous research, and revealed the theoretical and practical implications of this study.
Ultimately, limitations and directions for future research were described.
1.5 Chapter Summary
This chapter offered a basic background of the research, pointed out the void in existing
research, introduced the study setting, proposed the research question, presented research
objectives, justified the significances of the study, and briefed the organization of the rest of
the study.

15
To be more specific, technology is becoming a trend, and SST exerts influences on every aspect
of society. Previous studies concerning SST can be anatomized into two dimensions:
customers’ adoption of SST and its outcomes. However, both streams overlook the multi-
channel nature of service delivery, and some findings are inconsistent. In the service domain,
SST is one of the most important types of technologies that facilitate and transform service.
For the sake of the merits of SSTs, hotel industry is no exception and gradually introduces
SSTs. Nevertheless, SST gives rise to negative influences. Aside from that, compared with
informally heated discussions, academia does not shed enough light on innovative SSTs in the
lodging industry. A gap concerning the dilemma between different service delivery channels
(i.e., SSTs and service employees) is identified. Existing statements concerning high tech and
high touch are inconsistent and inconclusive. For example, Naisbitt et al. (1999) promoted the
idea to employ high tech with humanity, while others highlighted the opposition between high
tech and high touch (Kokkinou & Cranage, 2013). Therefore, this study attempts to develop a
framework to articulate the mechanism of how customers and hoteliers construct their
preferences for SSTs compared with service employees during the hotel service delivery
process. This study also aims to ascertain whether customer experience is enhanced with the
application of SST. By doing so, this research not only deepens and extends our knowledge of
SST and experience economy, but also is practical for real-world application of SST in the
lodging industry.
16
CHAPTER 2: LITERATURE REVIEW
This present study aimed to ascertain hotels’ and customers’ preferences construction during
hotel service delivery process from an experiential perspective. To achieve the research
objectives, this study firstly reviewed existing studies on service delivery, customer experience,
high tech versus high tech debate, and current theories and factors regarding technology
adoption. The first section labeled as “different service delivery channels in hotel” articulated
what is high tech and high touch as well as their role in the hotel context. The hotel service
delivery process was also articulated in this section. Then the definition and measurement of
customer experience was described, followed by review of research on customer experience
with two distinct service encounters. This section was thus named after “customer experience
with different service delivery channels”. Subsequently, this chapter discussed the
transformation from manual service to high-tech service, and the commensurate growth of high
touch from the perspectives of hoteliers and customers, followed by a debate over SST versus
service contact personnel in the context of hotel. Lastly, the theories used by extant studies to
explore the adoption of technology, together with factors influencing adoption and preference
were summarized and complied. Based on the foregoing work, the voids in this field are
described in detail and respectively. Accordingly, research questions and objectives proposed
in the first chapter were reinforced.
2.1 Different Service Delivery Channels in Hotel
2.1.1 Service Delivery Channels
Service delivery is “the process of applying specialized competences through goods
(mechanisms)” (J.-S. Chen, Tsou, & Huang, 2009, p. 37). Channels refer to methods of
supplying what customers desire (Betancourt et al., 2016; Bucklin, 1966), or “mechanisms for
communication, service delivery, and transaction completion” (Berry et al., 2010, p. 155).
Sousa and Voss (2006) defined channel of service delivery as “the means of communication
through which a service is delivered to (or reaches) the customer” (p. 357). They further
introduced two types of service delivery channels, namely virtual channels featured by
automated delivery using various technologies, and physical channels highlighting human
intervention. In a similar manner, this study argues that service delivery channels refer to
approaches adopted by customers to complete task or receive service.

17
Customers probably adopt various channels to satisfy their needs (Berry et al., 2010; Pieterson
& Ebbers, 2008; Pieterson & Van Dijk, 2007). In this endeavor, service providers (e.g., retailers
and government) have growingly tapped diversified channels due to the advance and
multiplicity of technologies (Berry et al., 2010; Reddick & Turner, 2012; Sousa & Voss, 2006).
Some of these channels access different customers by means of physical facilities, vending
machines, service kiosks, phone, email, and websites. Technologies are supposed to contribute
to firms’ internal operations processes and external supply chains (Connolly, 1999; Zhang &
Dhaliwal, 2009). Some organizations have taken advantage of technologies (e.g., internet,
interactive TV, and mobile devices) to complement traditional channels (Sousa & Voss, 2006),
while other operations growingly execute substitute channels (Cassab, 2009). It seems that
various channels can function as not only complementary approaches but also substitute
methods (Berry et al., 2010). Complementary channels are regarded as mutually balancing and
can co-exist, while parallel (or substitute) channels, equal that if one is adopted to provide
service completely, the other will not be employed (Sousa & Voss, 2006).
Nevertheless, the multiplicity of channels has sparked a debate. On the one hand, the synergies
of diversified channels enable customers to utilize channels more efficiently (Betancourt et al.,
2016). On the other hand, inconsistency across channels probably leads to customer confusion
(Berry et al., 2010). Another difficulty lies in the management of service quality and service
levels, which is especially apparent concerning SSTs (Berry et al., 2010). Self-service
technology can greatly enhance efficiency while ruining customer-firm relationships and
customer loyalty due to a lack of interpersonal communication. Consequently, it is necessary
to articulate the trade-offs among multiple channels of service delivery.
Previous studies concerning delivery channels mainly focus on two facets: distribution
channels for products and service delivery channels. The former prevailingly speaks about the
antecedents (e.g., price, quality and delivery lead time) and outcomes (e.g., effects on product
quality, product variety decision, channel profits, and consumer welfare) of different
distribution channels including centralized (manufacturers selling directly to customers),
decentralized (selling through a retailer), and dual-channel supply chains (Bian, Guo, & Li,
2015; Chen, Liang, Yao, & Sun, 2017; Guo & Heese, 2017; Kolay, 2015; Li & Li, 2016; Wang,
Song, & Wang, 2017; Xu, Liu, & Zhang, 2012). Connolly (1999) stated that the numerous
global distribution channels overwhelm hoteliers selecting an appropriate platform.
18
The later consists of research on public service delivery and private service delivery (Table
2.1). Public service delivery channels refer to methods provided by the government to deliver
service to citizens and businesses. Literature in this field covers multi-channel management,
determinants of channel choice, theories of channel choice (e.g., media richness theory, social
influence model and channel expansion theory), and the comparison of e-government (e.g.,
website and email) with traditional service delivery (e.g., phone and visiting a government
office) (Pieterson & Ebbers, 2008; Pieterson & Van Dijk, 2007; Reddick & Turner, 2012;
Shareef, Dwivedi, Kumar, & Kumar, 2016; van den Boer, Arendsen, & Pieterson, 2016).
Since numerous citizens adopt different channels in service delivery (Pieterson & Van Dijk,
2007), governments seek to provide various service delivery channels according to residents’
task at hand (Pieterson & Ebbers, 2008; Reddick & Turner, 2012). Pieterson and Ebbers (2008)
signified that different channels have specific advantages in completing specific tasks. Reddick
and Turner (2012) indicated that citizens’ channel choice is a question of channel sequencing
instead of a binary preference. Reddick and Turner (2012) unveiled the influences of digital
divide (access to Internet or not), the nature of interaction between residents with bureaucracy,
public service values, and satisfaction with services, on residents’ choice of public service
delivery channels, while Pieterson and Van Dijk (2007) found that the populace’s choice of
service delivery channel is influenced by habit, channel characteristics, task characteristics
(e.g., complexity and ambiguity), situational constraints, experiences, and personal
characteristics. Shareef et al. (2016) showed that seamless connectivity, time and location
sensitive interactivity, informativeness of structured news, ease and attractive information
processing, and target-oriented relevant information exert influences on the competence of
service delivery channel and residents’ satisfaction. However, these factors are far from
enough. There are huge numbers of other factors influencing the preference of different
channels (Pieterson & Van Dijk, 2007).
In terms of private service delivery, J.-S. Chen et al. (2009) decoded the key role of innovation
orientation and information technology (IT) capability (i.e., IT infrastructure, human IT
resources, and IT-enable intangibles) in giving birth to service delivery innovation and in turn,
bettering firm performance both financially and non-financially. A similar study completed by
Cassab (2009) reported the influences of multi-channel service attributes (i.e., problem
handling, website usability, record accuracy, automated phone systems usability, and
scalability) on customers’ loyalty intentions according to whether they are above or below
19
average market levels. Moreover, couples of existing studies present several suggestions and
point out the direction for future research drawn from prior literature without confirmation and
substantiation (Berry et al., 2010; Betancourt et al., 2016; Sousa & Voss, 2006). Sousa and
Voss (2006) proposed a framework for multichannel service quality, differentiating virtual
(automated delivery), physical (people-delivered), and integration quality. In their framework,
dimensions of website quality, a type of virtual quality, include virtual fulfillment, efficiency
(i.e., ease of use and speed), system availability, and privacy. Interpersonal service (routine),
exception (customer support), and logistics fulfillment together represent physical quality.
Integration quality is comprised of channel-service configuration (i.e., breadth of channel
choice and transparency of channel-service configuration) and integrated interactions (content
consistency and process consistency). Berry et al. (2010) spawned future avenues concerning
the role of channel consistency for the delivery of interactive service. In a later contribution,
Betancourt et al. (2016) proposed that online and offline service delivery channels provide
different maximum levels of services according to space, assurance, time, information form,
and breadth and depth. The differences of distinct service delivery channels garnered certain
attention as well, in terms of the capability of providing distribution services (Betancourt et al.,
2016) and features of interactive retail services (i.e., the atmospherics and the social
environment) (Berry et al., 2010).
This current research concentrates on two polar service delivery channels, SST and customer
service representative, in a hotel context. For one thing, SST represents the approach
eliminating employee intervention, while employee underlines the whole course involvement
of humans instead of technology, enhancing the difficulty of managing service quality and
service levels (Berry et al., 2010). For another, previous studies concerning service delivery
channels mainly pay attention to websites or email in the domain of government service
(Pieterson & Ebbers, 2008; Pieterson & Van Dijk, 2007; Reddick & Turner, 2012; van den
Boer et al., 2016). There is a paucity of knowledge regarding innovative service delivery
channels, such as innovative SSTs, conveying the need for investigation (Sousa & Voss, 2006),
especially in the hotel domain.
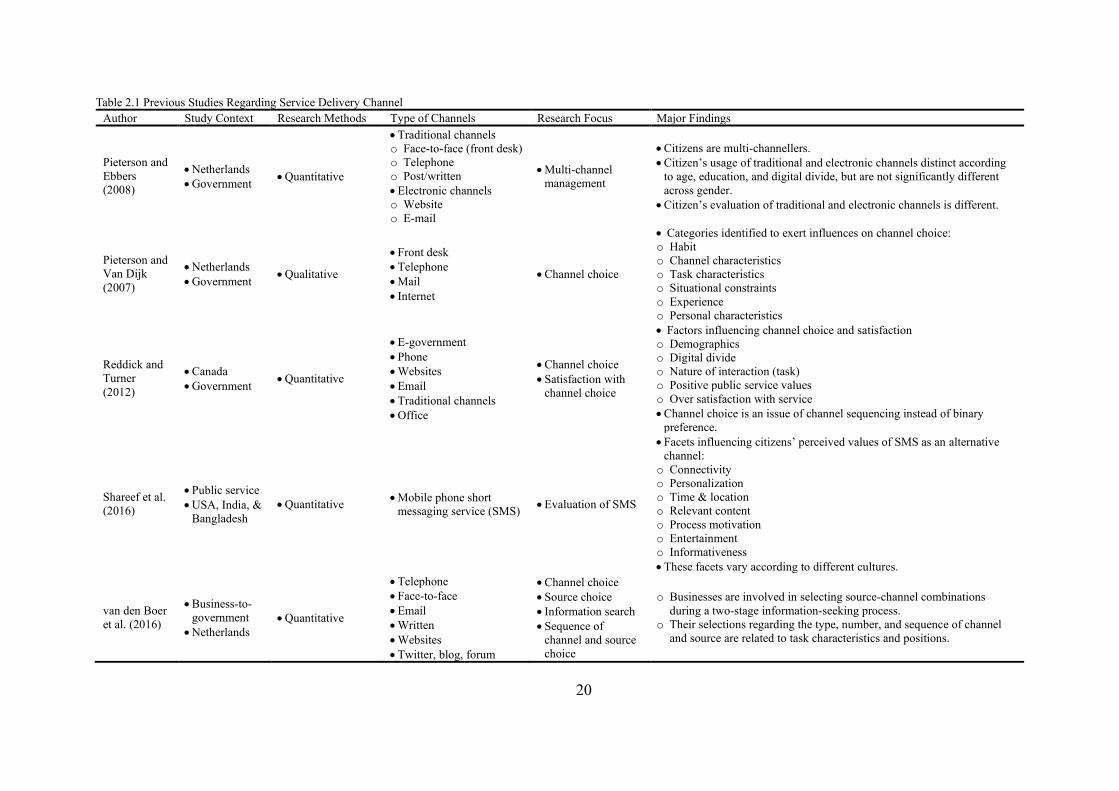
20
Table 2.1 Previous Studies Regarding Service Delivery Channel Author Study Context Research Methods Type of Channels Research Focus Major Findings
Pieterson and Ebbers (2008)
• Netherlands • Government • Quantitative
• Traditional channels o Face-to-face (front desk) o Telephone o Post/written • Electronic channels o Website o E-mail
• Multi-channel management
• Citizens are multi-channellers. • Citizen’s usage of traditional and electronic channels distinct according
to age, education, and digital divide, but are not significantly different across gender. • Citizen’s evaluation of traditional and electronic channels is different.
Pieterson and Van Dijk (2007)
• Netherlands • Government • Qualitative
• Front desk • Telephone • Mail • Internet
• Channel choice
• Categories identified to exert influences on channel choice: o Habit o Channel characteristics o Task characteristics o Situational constraints o Experience o Personal characteristics
Reddick and Turner (2012)
• Canada • Government • Quantitative
• E-government • Phone • Websites • Email • Traditional channels • Office
• Channel choice • Satisfaction with
channel choice
• Factors influencing channel choice and satisfaction o Demographics o Digital divide o Nature of interaction (task) o Positive public service values o Over satisfaction with service • Channel choice is an issue of channel sequencing instead of binary
preference.
Shareef et al. (2016)
• Public service • USA, India, &
Bangladesh • Quantitative • Mobile phone short
messaging service (SMS) • Evaluation of SMS
• Facets influencing citizens’ perceived values of SMS as an alternative channel:
o Connectivity o Personalization o Time & location o Relevant content o Process motivation o Entertainment o Informativeness • These facets vary according to different cultures.
van den Boer et al. (2016)
• Business-to-government • Netherlands
• Quantitative
• Telephone • Face-to-face • Email • Written • Websites • Twitter, blog, forum
• Channel choice • Source choice • Information search • Sequence of
channel and source choice
o Businesses are involved in selecting source-channel combinations during a two-stage information-seeking process.
o Their selections regarding the type, number, and sequence of channel and source are related to task characteristics and positions.
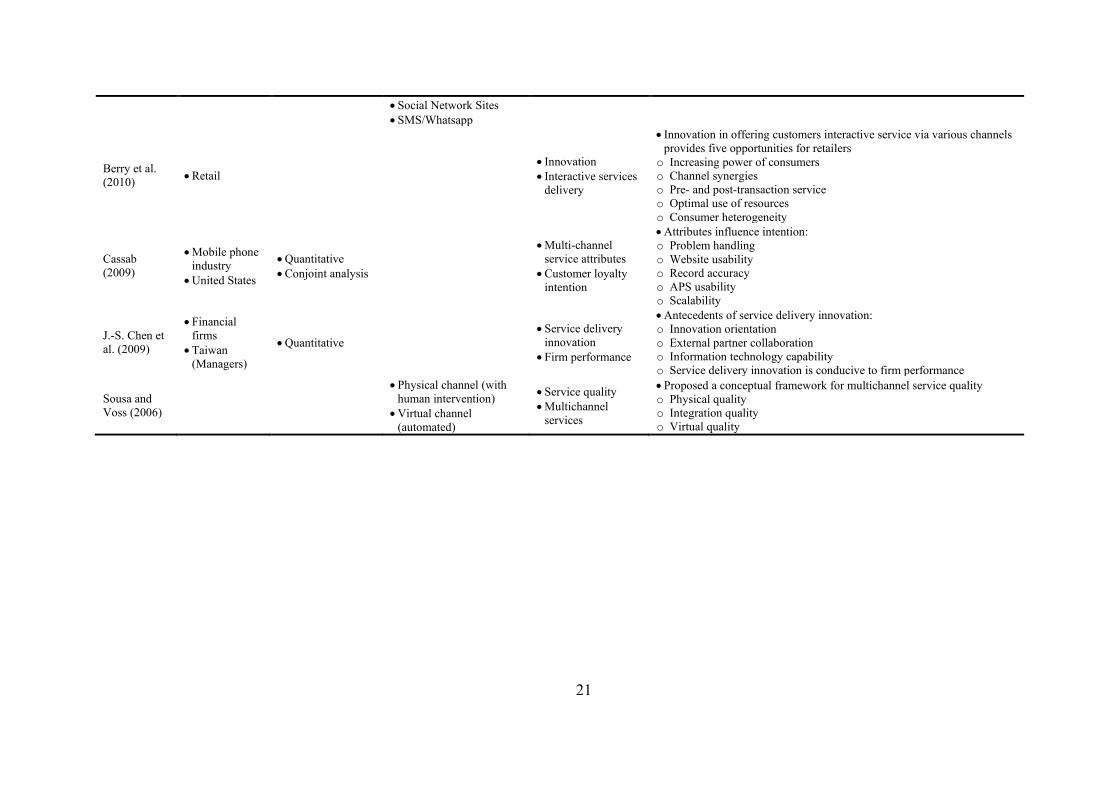
21
• Social Network Sites • SMS/Whatsapp
Berry et al. (2010) • Retail
• Innovation • Interactive services
delivery
• Innovation in offering customers interactive service via various channels provides five opportunities for retailers
o Increasing power of consumers o Channel synergies o Pre- and post-transaction service o Optimal use of resources o Consumer heterogeneity
Cassab (2009)
• Mobile phone industry • United States
• Quantitative • Conjoint analysis
• Multi-channel service attributes • Customer loyalty
intention
• Attributes influence intention: o Problem handling o Website usability o Record accuracy o APS usability o Scalability
J.-S. Chen et al. (2009)
• Financial firms • Taiwan
(Managers)
• Quantitative • Service delivery
innovation • Firm performance
• Antecedents of service delivery innovation: o Innovation orientation o External partner collaboration o Information technology capability o Service delivery innovation is conducive to firm performance
Sousa and Voss (2006)
• Physical channel (with human intervention) • Virtual channel
(automated)
• Service quality • Multichannel
services
• Proposed a conceptual framework for multichannel service quality o Physical quality o Integration quality o Virtual quality
22
2.1.2 Service Employees in High-touch Service
Service refers to a deed, act, or performance (Berry, 1980). Service marketing is defined as
“the marketing of activities and processes (health care, entertainment, air travel) rather than
objects (soap powder, cars)” (Solomon, Surprenant, Czepiel, & Gutman, 1985, p. 99).
However, it is not always apparent to describe service due to its ephemeral. Likewise, there
were numerous classifications regarding service (Bowen, 1990; Lovelock, 1983; Silvestro,
Fitzgerald, Johnston, & Voss, 1992). For example, Lovelock (1983), for the sake of strategy
marketing, categorized services according to the nature of service act, the relationship between
service organization and customers, the extent for customization and judgment, the nature of
the demand for the service relative to supply, and the approach of service delivery. Hotel is
taken as a classic example of the service with high extent customized service characteristics
and low discretion and judgment of service supplier in changing the service characteristics to
satisfy individual customer needs. Some researchers, nonetheless, queried this statement and
stated that contact personnel have the opportunity to tailor both the service and the approach in
which it is delivered in real-time (Zeithaml & Gilly, 1987). Gwinner, Bitner, Brown, and
Kumar (2005) argued that service employees are supposed to shoulder the responsibility of
customization, whose capability and motivation to provide customized service are imperative
antecedents of customization success, and quantitatively substantiate that service employees
have the capability of offering customized and personalized service through adjusting their
interpersonal adaptive behavior and service offering adaptive behavior. Customized service
cries out for employees’ involvement and contributions (Wang et al., 2010). The role of
employee in service customization involves interpersonal adaptive behavior and service
offering adaptation. To satisfy the specific needs of individual customers, the former is defined
as an employee altering multiple interpersonal communication ingredients, while the latter
equals tailoring or producing unique service attributes or benefits (Bettencourt & Gwinner,
1996). High touch is regarded as personalized customer service interaction (Burghard, 2001)
and it is difficult to provide standardized service through service staffs (Parasuraman et al.,
1985). By contrast, self-service is a highly standardized process (Schumann et al., 2012). In
other words, customers have an exact expectation for the interaction with SST and consistent
experience each time (Kim et al., 2012). This is in accordance with that inconsistency incurred
by service staffs is removed by self-service in service delivery (Mattila, 1999b). In this present
study, service employees who can offer personalized customer service interaction as opposed
23
to standardized service represent high touch (Fortune et al., 2010), conforming to the historical
statement that “high-touch, low-tech” accurately expresses the interaction between customer
and service staffs (Giebelhausen et al., 2014).
Although providing customized service are crucial in securing stable customer relationships
(Ahearne, Jones, Rapp, & Mathieu, 2008), employees may find themselves on the horns of a
dilemma: how to satisfy customers’ needs for personalization while working efficiently
(Bettencourt & Gwinner, 1996). Existing research concerning employees can be anatomized
into three groups, employee management, factors influencing employee performance and its
outcomes (e.g., influences on corporate image, customer involvement, customer satisfaction,
and service quality). For instance, Menguc, Auh, Fisher, and Haddad (2013) quantiatatively
demonstrated that supervisory feedback influences employee engagement, and in turn, affects
customers’ evaluations of employee performance. By the same token, Kim and Cha (2002)
quantitatively proved the positive effects of service providers’ relational orientation, customer
orientation, and attributes (i.e., expertise, experience, and appearance) on the relationship
quality between service suppliers and customers in the context of hotel.
Previous studies paid attention to handle issues concerning employee management (Hartline &
Ferrell, 1996), including employee scheduling (Ağralı, Taşkın, & Ünal, 2017), employee
responsibility and basic human values (Ariza-Montes, Arjona-Fuentes, Han, & Law, 2017),
employees’ service sabotage (Lee & Ok, 2014), employee training (Dhar, 2015; Salem &
Abdien, 2017), drivers (e.g., psychological contracts) of service-oriented behaviors of
employees (Lu, Capezio, Restubog, Garcia, & Wang, 2016), and knowledge management
among employees (Shamim, Cang, & Yu, 2017).
With respect to factors influencing the performance of service employee, the work of Price,
Arnould, & Tierney (1995) indicated that the role of service suppliers and customers’ service
satisfaction are associated with the constructs of service encounters, namely duration, affective
content, and proxemics. This is in line with the work of Solomon et al. (1985) who revealed
that, on the basis of role theory, social interaction is facilitated by congruent role expectations
between customers and service provider, whereas inhibited by discrepant role expectations.
They suggested that extended encounters probably cost significant emotional labor for
employees. Besides, they used overall performance, authentic understanding, and extras to
measure the performance of service staffs, and their study illustrated that authentic
24
understanding and extras highly are associated with customers’ perception of overall employee
performance. Prior studies also verified the managerial influences on employee responses
which significantly influence customers’ perceived service quality and service encounters
(Hartline & Ferrell, 1996), the effects of organizational politics on employee commitment (Lau,
Tong, Lien, Hsu, & Chong, 2017), and influences of firms’ decentralization on employee
involvement (Rangus & Slavec, 2017). King, So, and Grace (2013) showed the necessity of a
service brand orientation and employee customer orientation for corresponding positive
employee brand-oriented behaviors and customer-oriented behaviors, respectively. Gwinner et
al. (2005) attested the influences of customer knowledge, predispositions to adapt, and
motivation on employee adaptive behaviors. Moreover, the context the operation offers,
together with the latent and apparent signals it provides for service staffs, contribute to deciding
the content of the employee role that exerts influences on and, in turn, is affected by the
customer (Solomon et al., 1985). Barnes, Ponder, & Hopkins (2015) quantitively confirmed
the influences of employees perceptions of customer delight on their positive affect, which then
incurs behavioral changes from the employees (e.g., commitment). Furthermore, Schepers,
Nijssen, and van der Heijden (2016) unveiled that role conflicts influence employee
performance, which is impacted by employee’s learning orientation and administrator’s
encouragement for improvement. Jimmieson, Tucker, and Campbell (2017) reported that task
conflict has a positive indirect effect on employee pressure through relationship conflict with
a moderate effect of employees’ trait self-control.
Given that employee satisfaction, retention, and productivity connect with business
achievement within the service-profit chain (Heskett & Schlesinger, 1994), previous studies
identified the important role of service employees in corporate image, customer involvement,
satisfaction, service quality, service encounters, social relationship and customer experience
(Alexander, MacLaren, O’Gorman, & Taheri, 2012; Bettencourt & Gwinner, 1996; Bitner,
Booms, & Mohr, 1994; Bitner et al., 1990; Fischer, Gainer, & Bristor, 1997; Hartline & Ferrell,
1996; Kim & Cha, 2002; Luoh & Tsaur, 2011; Mohr & Henson, 1996; Price et al., 1995). For
instance, employee satisfaction and loyalty are significant determinants of firm performance,
exerting influences on service quality, customer satisfaction and firm profitability (Yee, Yeung,
& Cheng, 2008; Yee, Yeung, & Edwin Cheng, 2010).
More specifically, considering the corporate image, customer perceived employee role
ambiguity and role overload negatively influence brand associations, perceived quality, and
25
brand loyalty, while customer-employee rapport exerts positive influences (Biedenbach,
Bengtsson, & Wincent, 2011). Aside from that, employees’ happiness is found to positively
affect customers’ evaluation of employees, which in turn, positively influences receivers’
evaluation of firm’s offer overall (Söderlund & Sagfossen, 2017).
Service suppliers are supposed not only to perform effectively but also to motivate customers
to engage actively, which is important to creating positive experiences (Xu, 2010). The
perceived authenticity of staffs enhances consumers’ continuance intentions to adopt web-
based support service through improving customers’ perceptions of employee friendliness or
through increasing information and perceived usefulness of the service (Turel, Connelly, &
Fisk, 2013). Employee engagement, together with service climate, moderately impacts the
relationship of servicescape and customer behavioral intentions (Chang, 2016). The online
contents generated by hotel staffs regarding their work conditions influence guest satisfaction,
word of mouth, and revisit intentions (Melián-González & Bulchand-Gidumal, 2017).
With respect to satisfaction, the selection of best customer contact staffs plays a critical role in
customer satisfaction and finally, firm success (Mohr & Henson, 1996), probably because
regular personal interaction garners importance, especially in the service setting (Mohr &
Bitner, 1995b). Solomon et al. (1985) suggested that the dyadic interaction between service
suppliers and customers serves as an important determinant of customer satisfaction with
service. For example, customer satisfaction is negatively influenced by employee display of
burnout in service encounter (Söderlund, 2017). Subsequently, Price et al. (1995) confirmed
that service satisfaction highly relies on service provider performance. Generally speaking, the
more effort the service provider makes, the more positive evaluation the customer gives (Mohr
& Bitner, 1995b, 1995a). Both functional and personal facets of staff behavior contribute to
accounting for customer satisfaction (Alhelalat, Habiballah, & Twaissi, 2017). For instance,
the study of Mohr and Henson (1996) implied that employee gender and gender-job
congruency seem to exert influences on customers’ evaluations of employees and satisfaction
in the context of nursing an automobile repair, which is partially consistent with the study of
Rod, Ashill, and Gibbs (2016) who demonstrated that relational service delivery of bank staff
has significant influences on male customers’ satisfaction, while it is the core service delivery
of employee that matters from the standpoints of females. Notably, a relatively comprehensive
research conducted by Bitner et al. (1990) revealed three categories (i.e. employee response to
service delivery, customer needs and request, and unprompted and unsolicited employee

26
actions) of employee behaviors leading to dis/satisfying service encounters based on 700
incidents from customers of airlines, hotels, as well as restaurants. Four years later, Bitner et
al. (1994) explored the sources of dis/satisfaction in service encounters from contact personnel’
perspectives. Their results showed that employees and customers are consistent with the
sources of dis/satisfaction, except that contact employee added problematic customer behaviors
as a determinant.
Additionally, companies, customers, and academics value service quality alike (Dabholkar,
1996). Grönroos (1984) divided service quality into technical quality and functional quality
based on product performance (instrumental performance and expressive performance).
Parasuraman et al. (1985) identified ten determinants of service quality, namely access,
communication, competence, courtesy, credibility, reliability, responsiveness, security,
tangibles, and understanding or knowing the customer, labeled as SERVQUAL. Then,
Knutson, Stevens, Patton, and Thompson (1993) tailored SERVQUAL to LODGSERV to
measure lodging hotel service quality, including reliability, assurance, responsiveness,
tangibles, and empathy. Lehtinen and Lehtinen (1991) defined customers’ perceived service
quality from three dimensions: physical quality, interactive quality, and corporate quality.
According to Lehtinen and Lehtinen (1991), interactive quality is the quality of the interaction
between customer and interactive elements (interactive person and interaction equipment) of
the service company. Besides, service sometimes happens when customers interact and
communicate with service personnel (Parasuraman et al., 1985). Lin and Hsieh (2011) verified
the necessity of interaction in the connection of services. Therefore, communication, or rather,
interaction plays an important role in service quality (Lehtinen & Lehtinen, 1991; Parasuraman
et al., 1985). Employees’ influences on service quality have been recognized. Malhotra,
Mavondo, Mukherjee, and Hooley (2013) supported that staffs who acknowledge and value
operational goals and identity have a higher likelihood of performing better than those who do
not. Concretely speaking, service staffs’ attitudinal and behavioral responses have effects on
perceived service quality by customers. Enhanced service quality perceived by customers could
be achieved via enhancing employees’ self-efficacy and job satisfaction and decreasing their
role conflict and ambiguity (Hartline & Ferrell, 1996), while a negative impression can result
from an employee attitude (Solomon et al., 1985). Apart from that, demographic characteristics
(e.g., gender and age) proved their influences on perceived service quality (Fischer et al., 1997;
Luoh & Tsaur, 2011). Fischer et al. (1997) indicated that server gender stereotype has some

27
influences on the evaluations of perceived service quality across fast food restaurants, hair
cutting salons, and dental service. Luoh and Tsaur (2011) examined the influences of servers’
age stereotypes in customers’ perception of service quality in the context of dining restaurants
in Taiwan, and they found that customers perceived service quality concerning tangibles and
reliability can be affected by suppliers’ age.
Notably, customer experience created by means of interacting with customer service
representative were discussed in the section focusing on the customer experience created
through the interaction with different service delivery channels (i.e., customer experience
produced through the interaction with service employees and the customer experience
generated via the interaction with SST).
2.1.3 High Technology in Hotel
The History of Technology Development in Hotel
The emergence of technology has profoundly transformed service delivery. New service
delivery dependent on technology emanates. Before discussing innovate SST, the history of
technology development in the realm of hotel is reviewed, conducive to our understanding of
the appearance and function of SST.
After reviewing the histories of historic hotels, online travel agency (OTA) and existing
literature, with the assistance of search engine -- Google, the current study is the first to
summarize and to allocate the introduction of high tech into the hotel arena into three stages
(Figure 2.1), together with couples of examples of technologies. In 1946, Best Western Motels
was formed (Best Western, 2015), and they built a “referral system” via telephone used by desk
operators. Next year, the Roosevelt Hilton in New York City installed televisions in guest
rooms. It was the first time that televisions were deployed in guest rooms all around the world,
opening the initial stage of deploying technology in the lodging industry (Hilton, 2016). In
1948, Hilton initiated the modern-day reservation system via firstly introducing a multi-hotel
reservations system (Hilton, 2016). In 1965, the hotel industry launched the first computerized
reservation system, HOLIDEX, in the world (IHG, 2015). The initial stage, lasting from the
1940s to 1980s, is mainly based on the telephone to provide service, including reservation
service. Stepping into the 1990s, numerous hotels built their own websites while third-party
websites for booking hotel rooms were continuously and constantly formed. For example,
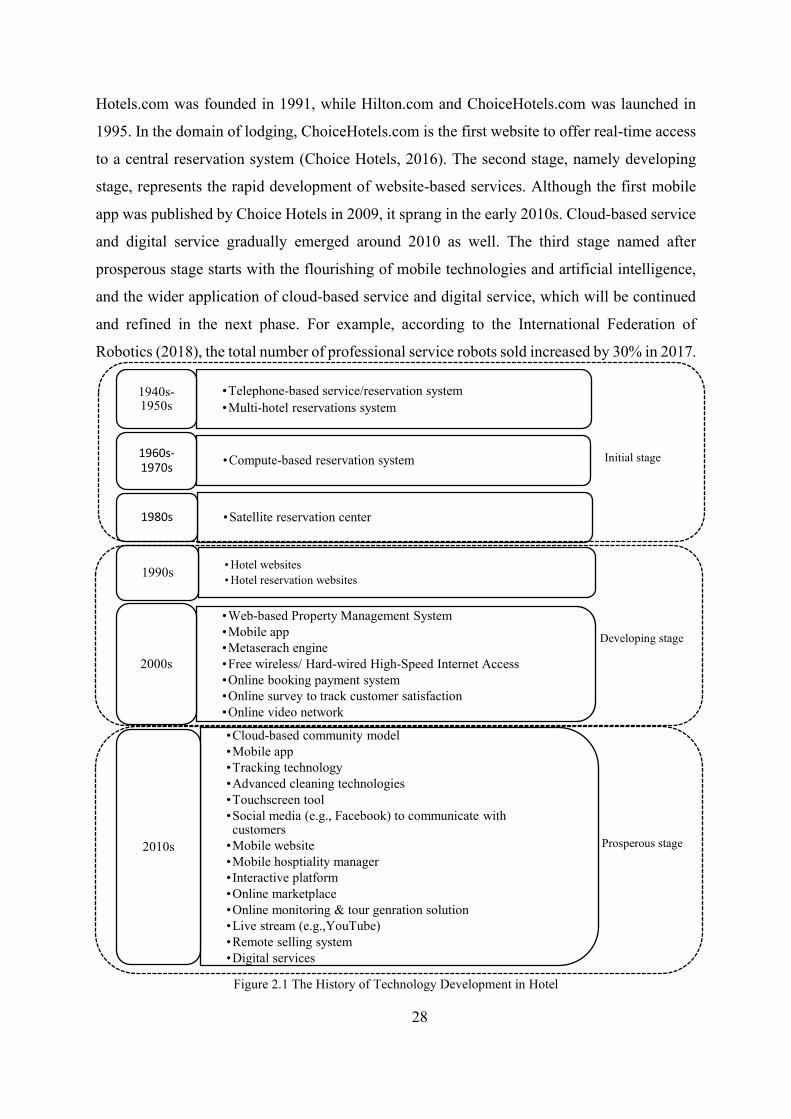
28
Developing stage
Prosperous stage
Hotels.com was founded in 1991, while Hilton.com and ChoiceHotels.com was launched in
1995. In the domain of lodging, ChoiceHotels.com is the first website to offer real-time access
to a central reservation system (Choice Hotels, 2016). The second stage, namely developing
stage, represents the rapid development of website-based services. Although the first mobile
app was published by Choice Hotels in 2009, it sprang in the early 2010s. Cloud-based service
and digital service gradually emerged around 2010 as well. The third stage named after
prosperous stage starts with the flourishing of mobile technologies and artificial intelligence,
and the wider application of cloud-based service and digital service, which will be continued
and refined in the next phase. For example, according to the International Federation of
Robotics (2018), the total number of professional service robots sold increased by 30% in 2017.
Figure 2.1 The History of Technology Development in Hotel
•Telephone-based service/reservation system•Multi-hotel reservations system
1940s-1950s
•Compute-based reservation system1960s-1970s
•Satellite reservation center1980s
• Hotel websites• Hotel reservation websites1990s
•Web-based Property Management System•Mobile app•Metaserach engine•Free wireless/ Hard-wired High-Speed Internet Access•Online booking payment system•Online survey to track customer satisfaction•Online video network
2000s
•Cloud-based community model•Mobile app•Tracking technology•Advanced cleaning technologies•Touchscreen tool•Social media (e.g., Facebook) to communicate with customers
•Mobile website •Mobile hosptiality manager• Interactive platform•Online marketplace•Online monitoring & tour genration solution•Live stream (e.g.,YouTube) •Remote selling system•Digital services
2010s
Initial stage
29
Definition of Self-service Technology
With the continuously and constantly advent of technology, the development and delivery of
service have changed greatly (Meuter, Bitner, Ostrom, & Brown, 2005). New types of
technology-based services continue to emerge. Academics noticed this transformation and
began to examine technology-based services (Dabholkar, 1994; Froehle & Roth, 2004; Kelley,
1989; Kim & Ham, 2006; Schumann et al., 2012; Warren, Abercrombie, & Berl, 1989).
Dabholkar (1994) presented a classification scheme for technology-based service delivery that
allocates service from three dimensions, namely who (i.e., person-to-person, and person-to-
technology), where (i.e., at customers’ home/ place of work, and at service site), and how (i.e.,
physical distance, and physical proximity). Hotel industry is used as an example to illustrate
this categorization. What is noteworthy is that the person-to-technology service is delimited by
that customers uses technology to perform service for self, and thereby, this can be regarded as
self-service technology service. Almost two decades later, Schumann et al. (2012) proposed a
new typology of technology-mediated services, that categorized technology-mediated service
into self-services and delivered services. Technology-mediated services are refined as
“services provided by a technological interface between provider and customers, which allows
for an immediate exchange of information over long distances” (Schumann et al., 2012, p.
133). Froehle and Roth (2004) anatomized technology-mediated customer contact into five
modes, namely, technology-free, technology-assisted, technology-facilitated, technology-
mediated, and technology-generated customer contact. Technology-generated customer
contact (i.e., self-service) refers to that service employees are totally substituted by technology.
These studies provide support for the commonplace existence and importance of SSTs.
Regarding the definition of SST, technology-based self-service options were first created by
Dabholkar (1996), albeit he did not clarify this concept. Wünderlich et al. (2013) delimited
self-service as high customer activity level with low provider activity level, indicating that the
production of self-service is utmost single-sided activities by the customer with technology
according to the activity level of customer and provider. Meuter et al. (2000) regarded SSTs as
“technological interfaces that enable customers to produce a service independent of direct
service employee involvement” (p.50). Since then, this definition serves as the mainstay in
conceptualizing SST. In other words, a majority of subsequent studies adopt this definition to
delimit SST (e.g., Considine & Cormican, 2016; Cunningham et al., 2009; Curran & Meuter,
2005; Meuter et al., 2005, 2003; Zhu et al., 2007).
30
The Available Self-service Technology in Hotel
When original formats of SSTs such as vending machines are updated, innovative, and
advanced SSTs are constantly and continuously generated (Meuter et al., 2000). Self-service
technologies are increasingly adopted and employed by firms (Zhu et al., 2007). The benefits
brought by these automated transactions, including convenience, self-control, reduced costs
and time, and consistency, have been recognized by customers and practitioners in bank and
airport settings. However, the future for the application SSTs in the hotel industry is still
underlying (Kasavana, 2008). For example, self-service kiosks (SSKs) in hotels are not as
common and successful as SSKs at airports. Hilton firstly introduced SSKs in 1997 and ended
in failure (Griffy-Brown et al., 2008). Besides, although hoteliers value the benefits resulting
from SSTs, customers seem not to be aware of the incentives of SSTs in the hotel context where
traditionally this industry is spoken highly of its personal hospitality. One reason conducive to
explaining this phenomenon is that customers might not know what types of SSTs are available
in the hotel context. Understanding the range of SSTs available to hotels is conducive to
hotelier and customer adoption alike.
Compared with academic attention on service classification (Bowen, 1990; Lovelock, 1983;
Silvestro et al., 1992), the attention to SST-based service is sparse. Except Kasavana (2008),
Meuter et al. (2000) and Ong (2010), none scholars tried to explicate the range of SSTs
available to customers systematically. Meuter et al. (2000) delimited SSTs according to four
interfaces (i.e., telephone/interactive voice response, online/internet, interactive kiosks, and
video/CD) and three purposes of SSTs from the perspectives of customers (i.e., customer
service, transactions, and self-help). Kasavana (2008) explicated three most prevalent SSTs,
namely vending, kiosk, and Web applications. Ong (2010) is the first researcher to categorize
SSTs in the hotel industry into three types, namely SSKs, internet-based self-service, and
mobile commerce. Based on the category developed by Meuter et al. (2000), this current study
classifies SSTs available in hotel according to five interfaces (i.e., interactive kiosks,
telephone/interactive voice response, website via smartphone/tablets/computer,
smartphone/tablets applications and artificial intelligence robots) and three stages of hotel
service delivery (check-in/check-out, room, and restaurant). These examples are derived from
extant literature, trade press, hotel websites, hotel mobile apps and App Store (Ba et al., 2010;
Bateson, 1985; Beatson et al., 2006; Curran & Meuter, 2005; Hanks, Line, & Mattila, 2016;
Kasavana, 2008; Kaushik & Rahman, 2016; Lu et al., 2009; Meuter et al., 2005; Oh et al.,

31
2013; Stockdale, 2007; Wei et al., 2016; Wünderlich et al., 2013). As shown in Table 2.2, the
columns represent the types of SSTs through which customers interact with service employees,
while the rows display the service delivery stages where a customer might leverage SST to
receive service. It is possible that a service spills over into two or more categories (Lovelock,
1983). In a similar manner, SST-based service might be classified into two or more categories
since the SST-based services are diversified (Zhu et al., 2007). Besides, a task can be achieved
via the collaboration of two or more SSTs. Hotels are equipped with diversified SSTs. It could
be explained that a convergence of various SSTs contributes to reducing costs and thus
increasing profits (Kasavana, 2008). In this sense, this study explores various SSTs during hotel
service delivery process instead of exclusively concentrate on a single SST (e.g., Fan, Wu, &
Mattila, 2016; Kokkinou & Cranage, 2015), in accord with Wei et al. (2016).
Contrary to the installation of the telephone in the 1940s, this study focuses on new SSTs
introduced in the 21st century and encompasses SSTs used in the whole delivery process of
hotel service (i.e., from check-in to check-out). To be more specific, this study focuses on
innovative SSTs such as mobile check-in/check-out, automated room service ordering systems,
and touch screen for food orders used in on-site hotel context (as shown in Table 2.2), excluding
telephone reservation system, online booking and online payment. This is a remedy for Kaushik
et al.’s (2015) criticism of the paucity of empirical research on SSTs in an offline hospitality
context.

32
Table 2.2 Categories and Examples of Innovative SSTs in Hotel Task Interface Check-in/Check out Room Restaurant
Interactive Kiosks • ATM • VR room selection • Self-check-in/out kiosks (e.g., facial recognition check-in)
• Smart speaker (e.g., Tmall Genie) • Digital signage
• Pay-at-the-pump terminals • Self-fill petrol pumps (e.g., Self-service food & drink dispenser, Charging kiosks) • Self-ordering kiosks • Self-service point-of-sale terminals (Debit/credit card scanning devices) • Touch screen tables for food and bar orders
Telephone/Interactive voice response • Automatic check-out (e.g., Television screen and online access to Hilton HHonors® loyalty programs)
• Automated message services • Automated message services
Website via smartphone/tablets/ computer
• Web-based check-in/checkout • Account information • Online payment
• Online purchasing • Online order system • Automatic house-keeping service
Smartphone/Tablets Application • Smartphone/Tablets check-in/check out • Mobile payment (e.g., Alipay, ApplePay, and WeChat Pay) • Online room selection
• Automated room service ordering systems • App-based order placement system • Mobile payment (e.g., Alipay, ApplePay, and WeChat Pay) • Touch-screen stations for ordering and paying
• Mobile payment (e.g., Alipay, ApplePay, and WeChat Pay) • App-based order placement system • Touch-screen stations for ordering and bill payment (e.g., tablet-based menus with touch-screen & tablet computers)
Artificial intelligence Robots • Smart robot concierge • Offering amenities via robots • Cleaning room via robots
• Delivering food/drinks via robots

33
The Role of Self-service Technology in Hotel
Accompanying the growingly available SSTs has been a number of studies exploring the
performance of SST in terms of customer commitment (Beatson et al., 2006; Panda et al., 2011;
Wei et al., 2016), customer experience (Kelly et al., 2017; Meuter et al., 2003; Wei, Torres, &
Hua, 2017), customer satisfaction (Beatson et al., 2006; Buell et al., 2010; Dabholkar & Spaid,
2012; Meuter et al., 2003, 2000; Orel & Kara, 2014; Weijters et al., 2007; Wittmer, 2011),
customer evaluation (Giebelhausen et al., 2014), customer relationship (Salomann et al., 2006),
customer loyalty (Orel & Kara, 2014; Selnes & Hansen, 2001), customers’ donation behavior
(Hanks et al., 2016), operations (Chang & Yang, 2008; Kincaid & Baloglu, 2006), service
quality (Considine & Cormican, 2016; Sousa & Voss, 2006), restoring justice (Mattila, Cho,
& Ro, 2011), reducing waiting time (Kokkinou & Cranage, 2013; Weijters et al., 2007;
Wittmer, 2011), performance (Hung et al., 2012; Melián-González & Bulchand-Gidumal,
2016), customer choice of luxury hotel brands (Kucukusta et al., 2014), word of mouth
intention (Meuter et al., 2003), re-intention (Buell et al., 2010), attribution (Dabholkar & Spaid,
2012; Meuter et al., 2003), and customer delight (Collier & Barnes, 2015). These influences
incurred by SST are examined in different fields such as retail (Collier & Barnes, 2015; Orel
& Kara, 2014; Weijters et al., 2007), banking (Buell et al., 2010; Selnes & Hansen, 2001) and
airline (Chang & Yang, 2008; Mattila et al., 2011; Wittmer, 2011). Only couples of studies are
conducted in the context of hotel (Table 2.3), indicating further exploration.
Specifically, with respect to customer commitment, Beatson et al. (2006) revealed a significant
relationship between SST performance and customer commitment. After a decade, Wei et al.
(2016) tested the effects of customers’ experience of utilizing SSTs on customer commitment
in the hospitality setting via adding transcendent consumer experience (TCE) as a mediator.
Transcendent consumer experience is drawn from the work of Schouten, McAlexander, and
Koenig (2007), which is featured by “feelings such as self-transformation or awakening,
separation from the mundane, and connectedness to larger phenomena outside the self”
(p.358) in a consumption sector. The results of the study of Wei et al. (2016) showed that TCE
fully mediated the influences of SSTs’ extrinsic and intrinsic constructs on customers’
instrumental commitment and partially on customers’ affective commitment, while the
influences of SSTs’ extrinsic and intrinsic attributes on customers’ temporal commitment were
partially and fully meditated by TCE respectively.

34
Table 2.3 Previous Studies Regarding SST Performance in the Hotel Context Author Study Context Type of SST Research Focus Major Findings Beatson et al. (2006)
• Australia • Hotel
• Various SSTs • Overall satisfaction • Commitment
• Overall satisfaction, and affective and temporal commitment are influenced by personal service attributes. • Overall satisfaction and commitment are influenced by SST attributes.
Kokkinou and Cranage (2013)
• USA • Hotel • Check-in process
• Self-service kiosk • Reduce waiting time
Waiting-times and service levels are influenced by: • Customer demand • Available service employees • Processing speed of SSK • Failure rate of SSK
Kucukusta et al. (2014)
• Hong Kong • Luxury hotel
• SSTs • Choice of luxury hotel brands with SSTs
• Diffusion of innovation factors of SST includes: o Relative advantage, Ease of use, Communicability, First trial, Psychological risks, Product
efficiency, Product veracity & Product risks • Business traveler’s choice of a luxury hotel brand is influenced by relative advantage and
ease of use. • Business travelers’ perceptions of these factors vary according to gender, age, education, and
country of origin. Melián-González and Bulchand-Gidumal (2016)
• Hotel • IT which includes SST
• Hotel performance
• A model connecting IT and hotel performance was proposed and presented. • It is proposed that SST usage can be used to reduce queues and avoid negative rapport.
Panda et al. (2011) • India • Hotel
• Technology-based self-service (TBSS)
• Overall satisfaction • Commitment
• Overall satisfaction is influenced by personal-service performance, while it is not significantly influenced by TBSS performance. • Affective and temporal commitment are positively influenced by overall satisfaction.
Wei et al. (2016) • Hotel • Restaurant
• Various SSTs • Commitment • Affective and temporal commitment are influenced by extrinsic attributes (EA) of customer experience, which are partially mediated by TCE. • Affective commitment is negatively influenced by intrinsic attributes (IA) of customer
experience, which is partially mediated by TCE. • The influences of EA on instrumental commitment and the influences of IA on instrumental
and temporal commitment are fully mediated by TCE. Giebelhausen et al. (2014)
• North American • Hotel • Restaurant
• Check-in/check-out kiosk • Debit/credit card
scanning devices
• Evaluation • SST use decreasing (increasing) customer’s evaluation of service encounters when employee rapport is present (absent). • This influence is governed by psychological discomfort.

35
Since satisfaction influences retention and profits, having the knowledge of the sources of
dis/satisfaction is conducive to customer-firm relationships in practice (Meuter et al., 2000). In
the technology-based context, it is proven that customers’ satisfaction was influenced by
interaction channels, and there was an ideal point where the combination of different
communication channels (e.g., mail, phone, email), could most satisfy customers rather than
overwhelming them (Flynn, Seiders, & Voss, 2012). Notably, it is suggested that SST usage
also plays an important role in the influences of IT on organizational performance and can
influence customer satisfaction through queue reduction and avoiding negative rapport
(Melián-González & Bulchand-Gidumal, 2016). With a high level of participation in service
and changes of interaction channels, it is interesting to explore self-service’s influences on
service quality and customer satisfaction given that consumer activity level is one of the main
drivers of service quality and customer satisfaction (Wünderlich et al., 2013). The study of
Meuter et al. (2000) expressed the first step in exploring how customers feel and use SSTs by
exploring customer experience across a broad range of SSTs available in the marketplace and
focusing on factors leading to customer dis/satisfaction underlying experiences with SSTs
based on 800 incidents from customers. Derived factors leading to satisfactory evaluation of
an SST experience include solved intensified need, better than interpersonal method of service
delivery, and did its job. Factors influencing dissatisfaction with SST-based service encounters
consist of technology failure, process failure, poor design, and customer-driven failure.
However, there are other unexplored factors desiring investment (Meuter et al., 2003), and the
prior research does not reveal the sources of dis/satisfaction underlying SST experiences form
employees’ perspectives.
In terms of the overall satisfaction, the findings of Beatson et al. (2006) and Panda et al. (2011)
are out of alignment. When Beatson et al. (2006) unveiled that overall satisfaction was
significantly influenced by SST performance, Panda et al. (2011) did not find a significant
relationship between SST attributes and overall satisfaction. This disconfirmation might be
explained by the distinct study settings (i.e., hotels in Australia versus hotels in India).
In terms of the role of SSTs in service quality, Dabholkar (1996) proposed and attested two
models of service quality for technology-based self-service options, namely the attribute model
and overall affect model. In a later contribution, Lin and Hsieh (2011) developed a new 7-
dimension measure (SSTQUAL) to assess SST service quality, including functionality,
enjoyment, security/privacy, assurance, design, convenience, and customization. Self-service
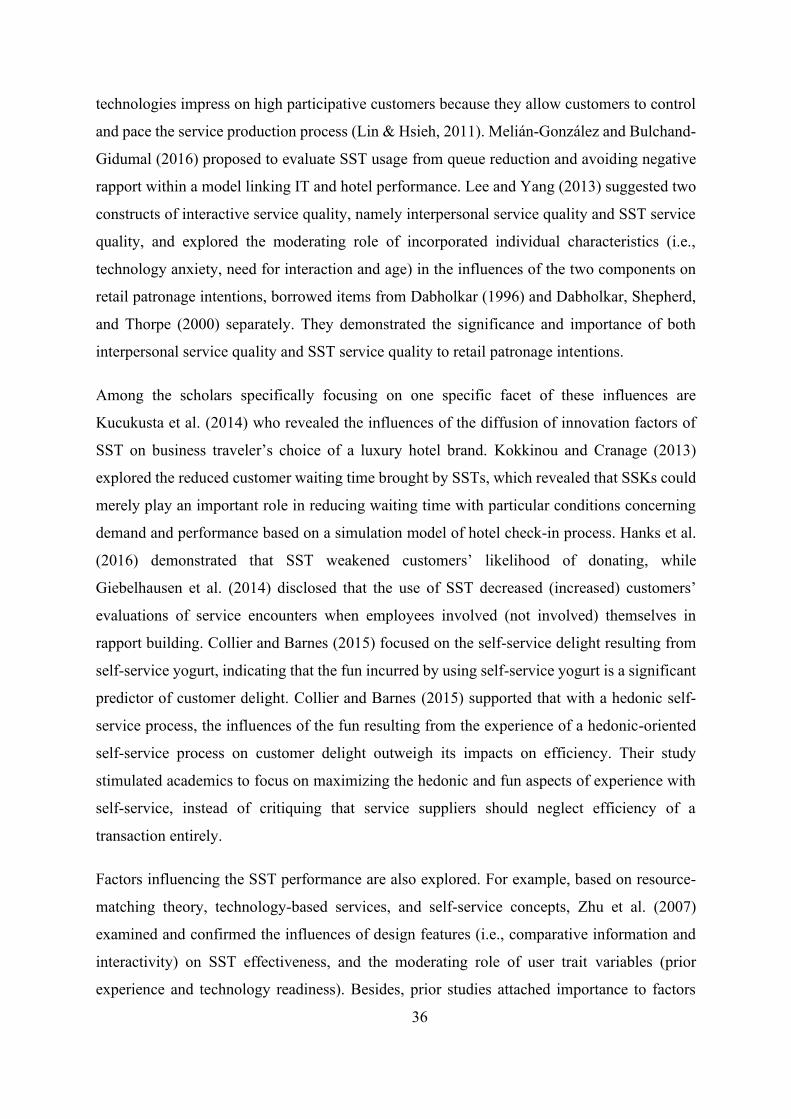
36
technologies impress on high participative customers because they allow customers to control
and pace the service production process (Lin & Hsieh, 2011). Melián-González and Bulchand-
Gidumal (2016) proposed to evaluate SST usage from queue reduction and avoiding negative
rapport within a model linking IT and hotel performance. Lee and Yang (2013) suggested two
constructs of interactive service quality, namely interpersonal service quality and SST service
quality, and explored the moderating role of incorporated individual characteristics (i.e.,
technology anxiety, need for interaction and age) in the influences of the two components on
retail patronage intentions, borrowed items from Dabholkar (1996) and Dabholkar, Shepherd,
and Thorpe (2000) separately. They demonstrated the significance and importance of both
interpersonal service quality and SST service quality to retail patronage intentions.
Among the scholars specifically focusing on one specific facet of these influences are
Kucukusta et al. (2014) who revealed the influences of the diffusion of innovation factors of
SST on business traveler’s choice of a luxury hotel brand. Kokkinou and Cranage (2013)
explored the reduced customer waiting time brought by SSTs, which revealed that SSKs could
merely play an important role in reducing waiting time with particular conditions concerning
demand and performance based on a simulation model of hotel check-in process. Hanks et al.
(2016) demonstrated that SST weakened customers’ likelihood of donating, while
Giebelhausen et al. (2014) disclosed that the use of SST decreased (increased) customers’
evaluations of service encounters when employees involved (not involved) themselves in
rapport building. Collier and Barnes (2015) focused on the self-service delight resulting from
self-service yogurt, indicating that the fun incurred by using self-service yogurt is a significant
predictor of customer delight. Collier and Barnes (2015) supported that with a hedonic self-
service process, the influences of the fun resulting from the experience of a hedonic-oriented
self-service process on customer delight outweigh its impacts on efficiency. Their study
stimulated academics to focus on maximizing the hedonic and fun aspects of experience with
self-service, instead of critiquing that service suppliers should neglect efficiency of a
transaction entirely.
Factors influencing the SST performance are also explored. For example, based on resource-
matching theory, technology-based services, and self-service concepts, Zhu et al. (2007)
examined and confirmed the influences of design features (i.e., comparative information and
interactivity) on SST effectiveness, and the moderating role of user trait variables (prior
experience and technology readiness). Besides, prior studies attached importance to factors
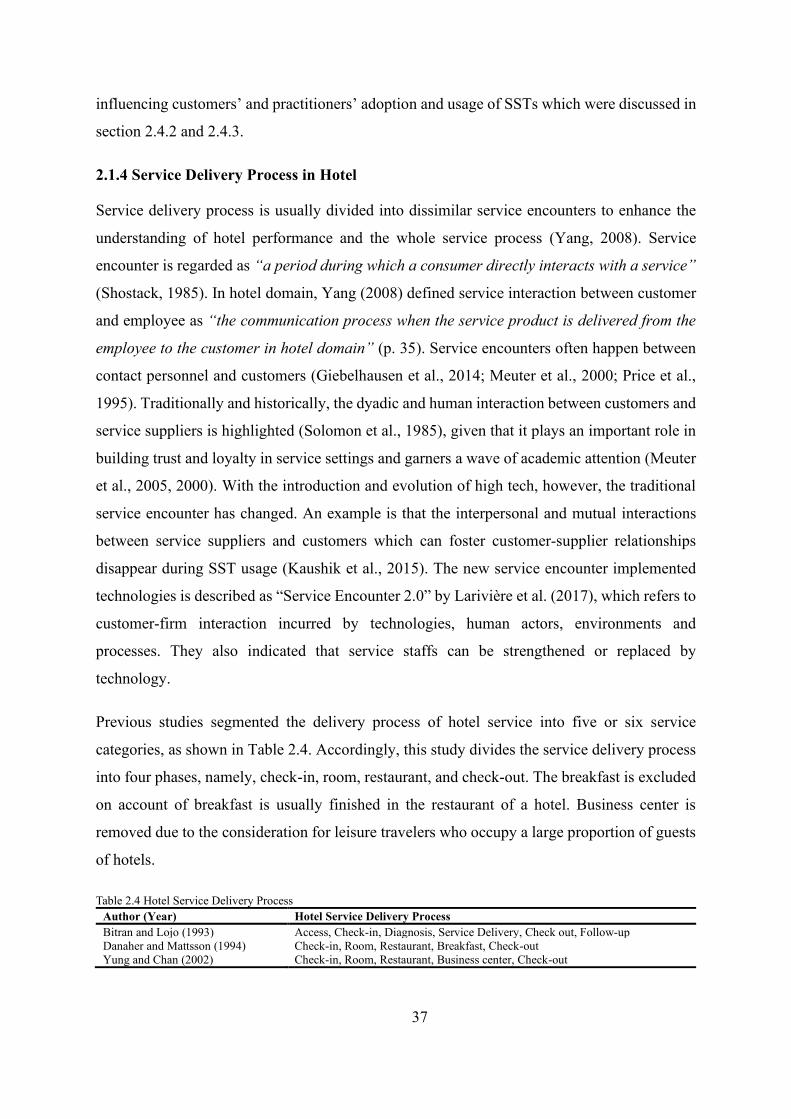
37
influencing customers’ and practitioners’ adoption and usage of SSTs which were discussed in
section 2.4.2 and 2.4.3.
2.1.4 Service Delivery Process in Hotel
Service delivery process is usually divided into dissimilar service encounters to enhance the
understanding of hotel performance and the whole service process (Yang, 2008). Service
encounter is regarded as “a period during which a consumer directly interacts with a service”
(Shostack, 1985). In hotel domain, Yang (2008) defined service interaction between customer
and employee as “the communication process when the service product is delivered from the
employee to the customer in hotel domain” (p. 35). Service encounters often happen between
contact personnel and customers (Giebelhausen et al., 2014; Meuter et al., 2000; Price et al.,
1995). Traditionally and historically, the dyadic and human interaction between customers and
service suppliers is highlighted (Solomon et al., 1985), given that it plays an important role in
building trust and loyalty in service settings and garners a wave of academic attention (Meuter
et al., 2005, 2000). With the introduction and evolution of high tech, however, the traditional
service encounter has changed. An example is that the interpersonal and mutual interactions
between service suppliers and customers which can foster customer-supplier relationships
disappear during SST usage (Kaushik et al., 2015). The new service encounter implemented
technologies is described as “Service Encounter 2.0” by Larivière et al. (2017), which refers to
customer-firm interaction incurred by technologies, human actors, environments and
processes. They also indicated that service staffs can be strengthened or replaced by
technology.
Previous studies segmented the delivery process of hotel service into five or six service
categories, as shown in Table 2.4. Accordingly, this study divides the service delivery process
into four phases, namely, check-in, room, restaurant, and check-out. The breakfast is excluded
on account of breakfast is usually finished in the restaurant of a hotel. Business center is
removed due to the consideration for leisure travelers who occupy a large proportion of guests
of hotels.
Table 2.4 Hotel Service Delivery Process Author (Year) Hotel Service Delivery Process Bitran and Lojo (1993) Access, Check-in, Diagnosis, Service Delivery, Check out, Follow-up Danaher and Mattsson (1994) Check-in, Room, Restaurant, Breakfast, Check-out Yung and Chan (2002) Check-in, Room, Restaurant, Business center, Check-out

38
Therefore, service encounter in this study is delimited in two dimensions (Table 2.5). The first
is in light of the service delivery channel (i.e., SST or service contact personnel). The second
dimension is according to the task.
Table 2.5 Classification Scheme for Service Encounter
Task
Channel
Check-in Room Restaurant Check-out
SST
Service employee
The quality of service encounter plays a necessary role in overall service quality (Lewis &
Entwistle, 1990). Bitran and Lojo (1993) conveyed that a drawback of either phase of service
delivery process probably led to low overall service quality of the entire process. Furthermore,
Danaher and Mattsson (1994) posited and revealed that these segmented service encounters
differently influenced overall satisfaction. They quantitatively proved that breakfast and room
have the largest influences on overall satisfaction.
This approach is also leveraged to study elements of service delivery process (Yang, 2008).
Although physical environment serves as an important ingredient in customers’ perceptions of
values (Mattila, 1999b), a service delivery channel plays an essential role in managing service
encounter (Lewis & Entwistle, 1990). In a customer-employee service encounter, service staffs
exert great impacts on customers in terms of efficiency, customer evaluation, satisfaction, and
attribution (Lewis & Entwistle, 1990; Yang, 2008). With the respect of the influences of IT on
service quality in lodging industry, Kim and Ham (2006) quantitatively proved that front office
applications, restaurant and banquet management systems, as well as guest–service interface
applications positively contribute to service quality of the lodging operations.
Service providers generally executed multiple channels to contact with customers (Lin &
Hsieh, 2011; Sousa & Voss, 2006; van den Boer et al., 2016). Moreover, customers are multi-
channellers, which means that they adopt more than two channels to interact with service
providers (Pieterson & Ebbers, 2008; Pieterson & Van Dijk, 2007). A similar statement is held
by Eriksson and Nilsson (2007) who contended that SST ought to be considered in a multi-
channel setting since customers do not isolate it from other channels. This indicates that the
usage of SST during a service delivery process is not a binary variable (Buell et al., 2010).
Besides, the attributes of service encounter (e.g., check-in) have influences on customers’

39
choices among service delivery channels (Lu, Choi, & Tseng, 2011). Buell et al. (2010) further
verified that customer satisfaction with different delivery channels varies, which plays an
important role in customer retention.
Thus, previous studies in the hotel context are accused of exploring SSTs without taking other
channels into consideration, taking the service delivery as a whole or exclusively focusing on
a single service encounter (e.g., check-in encounter). This study argues to explore customers’
and hoteliers’ preference construction during hotel service delivery process by considering all
service delivery channels.
2.2 Customer Experience with Different Service Delivery Channels
2.2.1 Defining Customer Experience
Table 2.6 lists several academic definitions of experience, a majority of which underline the
interaction between customers and suppliers. Experience is generally looked at from the
perspectives of customers or users and is generally labelled as customer experience. Experience
in the same domain might be defined from different perspectives, not to mention in different
industries. For example, in the context of tourism, Cohen (1979) proposed five modes of tourist
experience, namely the recreational, the diversionary, the experiential, the experimental, and
the existential modes. Wang, Xiang, and Fesenmaier (2014) comprehended tourist experience
from two dimensions, including activities and emotions. In service sector, customers’ primary
experiences with organizations are generally interactions with frontline employees, and thus,
the importance of these encounters is substantial (Bitner et al., 2000). Sousa and Voss (2006)
recognized that customer experience is generated across all moments of interaction with the
company via certain channels. Wei et al. (2016) described customer experience of utilizing
SSTs as extrinsic and intrinsic constructs in hospitality settings.
Table 2.6 Definitions of Experience Author (Year) Definition of Experience
Holbrook and Hirschman (1982) A primarily subjective state of consciousness with a variety of symbolic meanings, hedonic responses and aesthetic criteria (p. 132).
Carbone and Haeckel (1994) The "takeaway" impression formed by people's encounters with products, services, and businesses—a perception produced when humans consolidate sensory information (p.1).
Otto and Ritchie (1996) The subjective mental state felt by participants (p. 166).
Pine and Gilmore (1998) Economists have typically lumped experiences in with services, but experiences are a distinct economic offering, as different from services as services are from goods (p.97).
Schmitt (1999) A result of encountering, undergoing, or living through situation (p.25-26). Bigné and Andreu (2004) Events that engage individuals in a personal way (p. 692)

40
Experience is regarded as a basis of economy, competitive edge, service evaluation, customer
attitudes toward brand as well as customer satisfaction (Grace & O’Cass, 2004; Yang, 2008).
For instance, Joshi (2014) connoted that customer experience served as a predominant
ingredient influencing customers’ purchase decision process. As the word “experience
economy” was coined in 1998 by Pine and Gilmore, both academics and practitioners attached
great importance to experience. Difficult though it is for a firm to distinguish its products in
fierce market competition, managing different types of experiences (entertainment, escapist,
esthetic, and education) might do a favor to excelling offerings (Gilmore & Pine, 2002; Pine &
Gilmore, 1998). A firm should have a knowledge of what enables a special and meaningful
experience (Kucukusta et al., 2014). Thereafter, “experience marketing” emerges, which
differentiates from traditional marketing, through underlining customer experience, regarding
consumption as a holistic experience, acknowledging functional and emotional values, and
adopting eclectic methods (Schmitt, 1999). This is in accord with Berry, Carbone, and Haeckel
(2002) who pointed out that management of experience is far from simply offering
entertainment or involving creativity, but highlighting providing both functional and emotional
merits. Customer experience management becomes important (Xu, 2010). In this sense, this
study preferred Pine and Gilmore’s definition of experience. That is, experience is a specific
economic offering, or rather, a special product, as distinct from services as services are from
goods (Pine & Gilmore, 1998).
Hotel is no exception to this awareness. Not only the essential role of customer experience in
customer satisfaction but also the negative outcomes of employees’ indifference and deficiency
of personal touches, all motivate and push hotels to pay attention to customer experience
(McIntosh & Siggs, 2005; Meyer & Schwager, 2007). Different from previous statements that
customers’ hotel choice is influenced by the availability of a restaurant, parking, convenient
interior décor and exterior aesthetics (Saleh & Ryan, 1992), psychographic values excel
demographics and socioeconomics in contemporary society in predicting customer behavior
(Zins, 1998). In response, Zins (1998) developed a theme hotel choice model based on
psychographic concepts (i.e., values, lifestyle, vacation style, and benefits).
To make a success in experiential marketing, firms must have a knowledge of what creates
unique and meaningful experiences (Kucukusta et al., 2014). SST is regarded as a manner of
improving customer experience. However, the extent to which SST would influence consumer
experiences remains unclear (Hanks et al., 2016). The crucial question faced by hotels is how

41
to take advantage of SSTs best to produce better experiences rather than whether to employ
SSTs (Wei, Torres, et al., 2017). Given that customers might not fully understand the
usefulness and importance of each SST option (Kaushik & Rahman, 2017; Rosenbaum &
Wong, 2015), it is deemed necessary to explore the discrepancies of the real possibilities that
SSTs can provide for customers and customer perceived possibilities.
According to cognitivist theory of affordances (Cardona-Rivera & Young, 2013; Norman,
1999), there are three independent entities. The first entity is real affordance meaning the what
is actually possible. Second, perceived affordance means the possibilities perceived by users.
The last designated as feedback refers to the information used by providers to promote the real
affordance and thus evoke precise perceptions of affordance. Since the perceived affordance is
not necessarily consistent with real affordance (Cardona-Rivera & Young, 2013), the feedback
indicates a necessity to explore the plausible discrepancies between the real affordance and
perceived affordance. In this respect, the discrepancies existing between customers’ perception
of experiences and the experiences that hoteliers perceive were explored in this study.
Previous literature identified a wave of factors influencing customer experience as well,
including environmental atmospherics, physical facilities, social variables, hedonic or
ideological facets (e.g., fun), service encounter, individual and the situational characteristics,
core service, employee service, service employees’ language use, service delivery (e.g.,
process, and channels’ price transparency), ability to protect and conserve resources,
servicescapes, and customer involvement (Bonnin, 2006; Grace & O’Cass, 2004; Holbrook &
Hirschman, 1982; Kraak & Holmqvist, 2017; Liu, 2014; Mattila, 2001; Pizam, Uriely, &
Reichel, 2010; Puccinelli et al., 2009; Yang, 2008). Along this literature stream, the present
study investigated the customer experience in light of service delivery process and service
encounter. In other words, customer experience of service delivered by customer service
representative and SSTs during the hotel service delivery process were explored.
2.2.2 Measurement of Hotel Customer Experience
Although it is difficult to measure customer experience, academic scholars have worked on it.
Based on three dimensions (i.e., extrinsic/intrinsic value, self-oriented/other-oriented value,
and active/reactive value), Holbrook (1994) proposed a typology of value in service
consumption experience, namely, efficiency (output/input ratio or convenience), excellence
(quality), play (fun), esthetics (beauty), politics (success), morality (virtue or ethical acts),

42
esteem (reputation), and spirituality (faith or ecstasy). Schmitt (1999) presented an experiential
gird consisting of strategic experiential modules (SEMs; sense, feel, think, act and relative) and
experience providers (ExPros; communications, identities, products, co-branding,
environment, web sites and people). Besides, he used a slew of cases to show how managers
can leverage ExPros to instantiate SEMs to create holistic experiences. Based on SEMs, Su
(2011) investigated and verified that the mediating role of customer experience on the
relationship between service innovation and behavioral intention. Nevertheless, Su (2011) did
not clarify how he developed the items used to evaluate customer experience. Mathwick,
Malhotra, & Rigdon (2001) developed and tested an experiential value scale to delineate values
and forecast shopping preferences and intention in retail industry. The scale is comprised of
aesthetics (visual appeal, and entertainment value), playfulness (escapism, and intrinsic
enjoyment), customer return on investment (efficiency, and economic value), and service
excellence.
In a similar vein, hospitality researchers have also attached importance to customer experience,
which are summarized in Table 2.7. For example, Otto and Ritchie (1996) identified four
experience dimensions of hotel services, namely, hedonics, peace of mind, involvement, and
recognition. Mattila (1999b) identified four dimensions highly valued by business travelers in
terms of evaluating luxury-hotel service, namely sense of accomplishment, respect of others,
self-respect and sense of fulfillment. McIntosh and Siggs (2005) revealed five key experience
factors concerning the success of boutique accommodation, namely unique character,
personalized, homely, quality, and value added. Knutson, Beck, Kim, and Cha (2009) created
a hotel experience index via revealing four dimensions of the customer hotel experience
consisting of benefits, convenience, incentive, and environment from the customer side.

43
Table 2.7 Dimensions of Customer Experience in a Hospitality Setting
Author (Year) Study Context Respondents Research Focus Dimensions of Customer Experience Findings
Otto and Ritchie (1996)
• Hotels • Airlines • Tours & attractions
• English-speaking respondents in Canada
Satisfaction with service experience
• Hedonics • Peace of mind • Involvement • Recognition
• A measurement scale is developed and tested. • The constructs vary across tourism sectors.
Mattila (1999a) • Luxury hotel
• Cross-culture • Asian & Western
business travelers in Singapore
Attribute-consequence-value chains
• Attributes Concrete attributes (location, business center, messages, price); Abstract attributes (knowledgeable employees, speed of service, comfort, quietness, image) • Consequence
Functional consequences (communication, minimizing time, hassle-free); Psychological consequences (efficiency, relaxation, impress others) • Terminal values (accomplishment, self-esteem)
• Asian and western business travelers attach different importance to these attributes, consequences, and values.
Mattila (1999b) • Luxury hotel
• Business executives from Singapore
Trade-off between functional physical environments and personalized service
• List of values (LOV) (sense of accomplishment, respect of others, self-respect, sense of fulfillment, security, warm relationships with others, fun and enjoyment in life, sense of belonging, excitement)
• Pleasant and functional spaces excel enhanced personalized service. • Sense of accomplishment, respect of others,
self-respect, and sense of fulfillment are the most important values in business traveler’s daily life.
Zins (2002) • Tourism sector • Leisure travelers in Austria
Relationship among consumption emotions, experience quality, and satisfaction
• Product-elicited emotions In a good mood, Nervous, Happy, Sluggish, Active, Scared, Attentive, Ashamed, and Astonished • Cognitive evaluation for vacation travel experience
Destination atmosphere, Infrastructure, Tourism related infrastructure and Tourism service
• Negative and positive affectivity can be used to arrange experiential consumption emotions. • Satisfaction are related to emotions. • The influence of experience evaluation on
satisfaction is moderated by emotions.
McIntosh and Siggs (2005)
• Boutique accommodation
• Hosts and Guests in New Zealand Experiential Nature
• Unique character • Personalized • Homely • Quality • Value added
• Five experiential dimensions are revealed. • These dimensions play an important role in
the success of boutique accommodation.
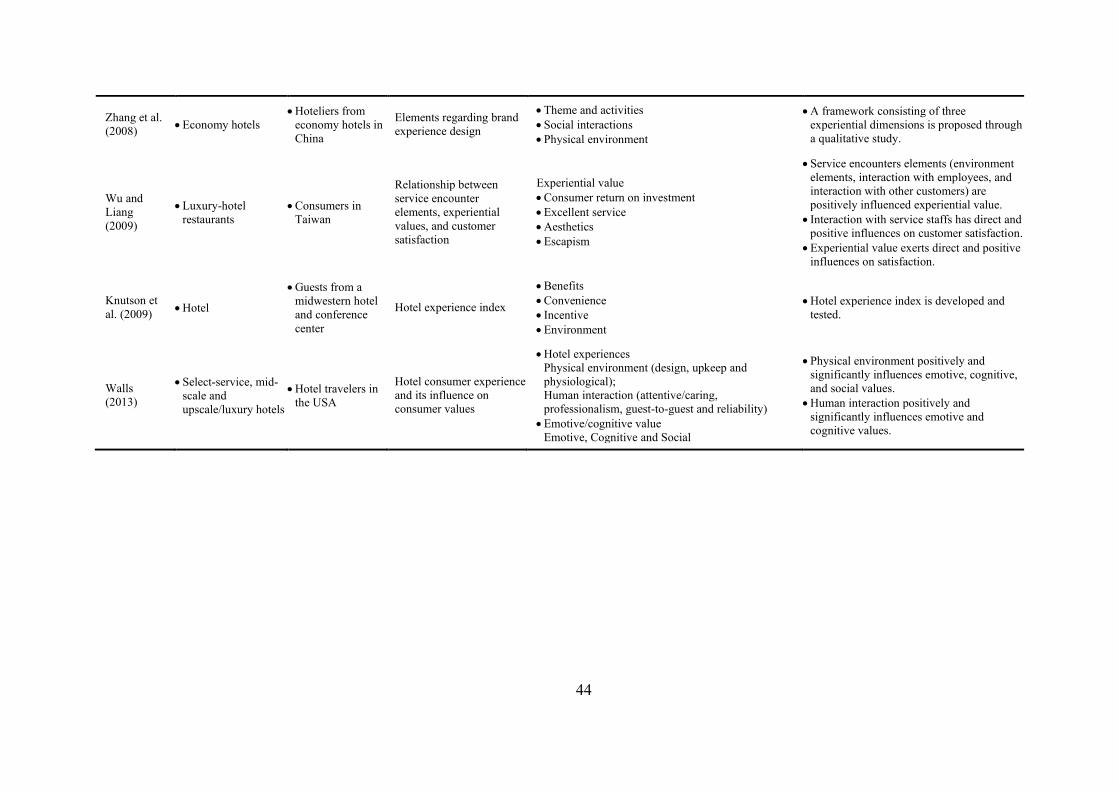
44
Zhang et al. (2008) • Economy hotels
• Hoteliers from economy hotels in China
Elements regarding brand experience design
• Theme and activities • Social interactions • Physical environment
• A framework consisting of three experiential dimensions is proposed through a qualitative study.
Wu and Liang (2009)
• Luxury-hotel restaurants
• Consumers in Taiwan
Relationship between service encounter elements, experiential values, and customer satisfaction
Experiential value • Consumer return on investment • Excellent service • Aesthetics • Escapism
• Service encounters elements (environment elements, interaction with employees, and interaction with other customers) are positively influenced experiential value. • Interaction with service staffs has direct and
positive influences on customer satisfaction. • Experiential value exerts direct and positive
influences on satisfaction.
Knutson et al. (2009) • Hotel
• Guests from a midwestern hotel and conference center
Hotel experience index
• Benefits • Convenience • Incentive • Environment
• Hotel experience index is developed and tested.
Walls (2013)
• Select-service, mid-scale and upscale/luxury hotels
• Hotel travelers in the USA
Hotel consumer experience and its influence on consumer values
• Hotel experiences Physical environment (design, upkeep and physiological); Human interaction (attentive/caring, professionalism, guest-to-guest and reliability) • Emotive/cognitive value
Emotive, Cognitive and Social
• Physical environment positively and significantly influences emotive, cognitive, and social values. • Human interaction positively and
significantly influences emotive and cognitive values.

45
2.2.3 Customer Experience in a Service Encounter with Service Employees
This current study explored customer experience in light of customer-employee interaction,
since service encounters often occur during the interaction between service employees and
customers (Bitner et al., 2000; Giebelhausen et al., 2014; Price et al., 1995), and the
introduction of SSTs mainly change the interactions between customer and customer service
representative. Price et al. (1995) displayed the central role of the performance of service
employees in service encounters. Similarly, Lewis and Entwistle (1990) pointed out that
seemly employee policies and practices function as the most vital ingredients in managing
service encounters aside from physical environment, procedures, and attention.
Wang et al. (2010) indicated that more customized service equals a greater experience.
Customization is hardly achieved without employee (Gwinner et al., 2005; Wang et al., 2010),
underpinning the importance of employee to customer experience. Xu (2010) suggested that
a compatible interaction between suppliers and customers serves as a key role in generating
experience. The outcomes and process of the interactions between customers and service
personnel play an important and crucial role in customers’ evaluations of service quality,
satisfaction, and commitment (Bitner et al., 1990; Grönroos, 1984; Ong, 2010). For example,
customer satisfaction is impacted frequently by the quality of interpersonal interactions
between customers and staffs (Bitner et al., 1994). This dovetails with Solomon et al. (1985)
who suggested that the dyadic interaction between service suppliers and customers serves as
a key determinant of customers’ satisfaction with service. Mattila (2001) pointed out that
committed customers highlight friendship and familiarity rather than physical facilities and
atmosphere in a restaurant. Additionally, Bitner (1990) explored and confirmed the influences
of employees’ responses on customers’ attributions in a service failure context. If customers
had a negative impression of a service employee, it is possible that other efforts (e.g., physical
facilities) would make no sense (Solomon et al., 1985). Therefore, carefully selecting the best
staffs for customer services plays a vital role in securing customer satisfaction and ultimately,
an organization’s success (Mohr & Henson, 1996), because service satisfaction highly relies
on the performance of the service supplier (Price et al., 1995).
2.3.4 Customer Experience in a Service Encounter with SSTs
With the ever-increasing development of high technology, traditional service encounter has
been revolutionized. The emergence of IT has transformed the determinant role of the
46
interpersonal interaction between service staffs and customers in customer perceived service.
Not only are communication technologies (e.g., smartphone) designed to facilitate
communication between customers and service providers, but also work as technologies
underlining customer self-help and removing employees’ direct involvement emanate to
improve efficiency (Cassab, 2009). Larivière et al. (2017) used “Service Encounter 2.0” to
describe a service encounter implemented technologies.
Nevertheless, extant research mainly paid attention to technologies designed for assisting in
interpersonal interaction. The SSTs that have revolutionized service encounter by means of
directly eliminating customer-employee interaction is relatively overlooked (Janowitz, 2007;
Kaushik & Rahman, 2015b; Kucukusta et al., 2014). In the sector of service, a raft of
organizations is willing to shift customer experience through integrating SSTs and citing them
as critical factors in controlling costs and bettering customer experience (Considine &
Cormican, 2016; Kasavana, 2008; Wei et al., 2016). More control over customer experience
is among the benefits derived from SSTs utilization (Kasavana, 2008).
Notably, there are critiques regarding the consequences of introduction of SSTs in service
settings. For instance, the convenience derived from SST usage discounts a transcendent and
memorable experience (Wei et al., 2016). With the lack of interpersonal interactions between
customers and service employees leading to lower interpersonal connections, it is likely for
customers to neglect the usefulness of SSTs and perceive overall service quality distinctly
(Kaushik et al., 2015). The advent of SSTs gets firms in e-tourism domain into a dilemma:
how to build and maintain close customer relationships, while providing cost-effective self-
service (Stockdale, 2007).
Furthermore, Meuter et al. (2003) verified that technology anxiety influences experience of
SST usage. In a satisfactory experience, with the increase of technology anxiety, customers’
satisfaction with SSTs decreases, and customers are less likely to reuse the same SST nor
positively promote it. Conversely, in a dissatisfactory experience, there is no significant
relationship between technology anxiety and customer experience, whereas growing
technology anxiety can discount the probability of spreading word-of-mouth (Meuter et al.,
2003).
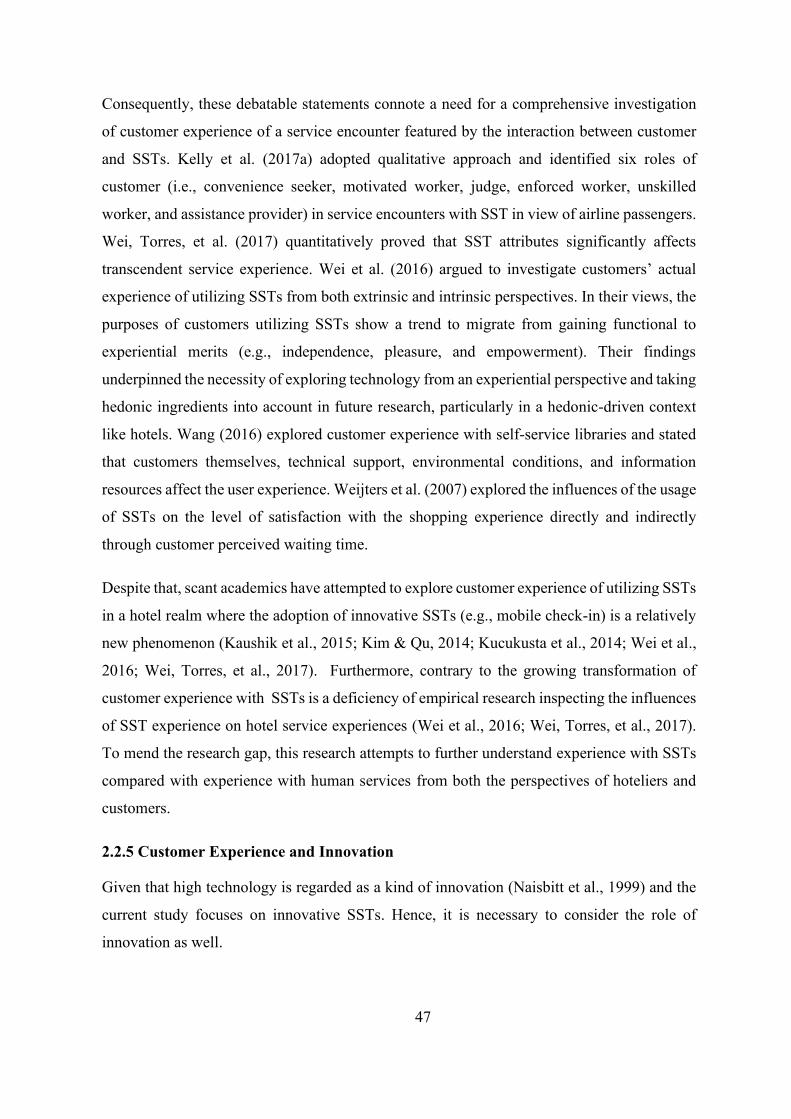
47
Consequently, these debatable statements connote a need for a comprehensive investigation
of customer experience of a service encounter featured by the interaction between customer
and SSTs. Kelly et al. (2017a) adopted qualitative approach and identified six roles of
customer (i.e., convenience seeker, motivated worker, judge, enforced worker, unskilled
worker, and assistance provider) in service encounters with SST in view of airline passengers.
Wei, Torres, et al. (2017) quantitatively proved that SST attributes significantly affects
transcendent service experience. Wei et al. (2016) argued to investigate customers’ actual
experience of utilizing SSTs from both extrinsic and intrinsic perspectives. In their views, the
purposes of customers utilizing SSTs show a trend to migrate from gaining functional to
experiential merits (e.g., independence, pleasure, and empowerment). Their findings
underpinned the necessity of exploring technology from an experiential perspective and taking
hedonic ingredients into account in future research, particularly in a hedonic-driven context
like hotels. Wang (2016) explored customer experience with self-service libraries and stated
that customers themselves, technical support, environmental conditions, and information
resources affect the user experience. Weijters et al. (2007) explored the influences of the usage
of SSTs on the level of satisfaction with the shopping experience directly and indirectly
through customer perceived waiting time.
Despite that, scant academics have attempted to explore customer experience of utilizing SSTs
in a hotel realm where the adoption of innovative SSTs (e.g., mobile check-in) is a relatively
new phenomenon (Kaushik et al., 2015; Kim & Qu, 2014; Kucukusta et al., 2014; Wei et al.,
2016; Wei, Torres, et al., 2017). Furthermore, contrary to the growing transformation of
customer experience with SSTs is a deficiency of empirical research inspecting the influences
of SST experience on hotel service experiences (Wei et al., 2016; Wei, Torres, et al., 2017).
To mend the research gap, this research attempts to further understand experience with SSTs
compared with experience with human services from both the perspectives of hoteliers and
customers.
2.2.5 Customer Experience and Innovation
Given that high technology is regarded as a kind of innovation (Naisbitt et al., 1999) and the
current study focuses on innovative SSTs. Hence, it is necessary to consider the role of
innovation as well.

48
Previous studies explore innovations according to several different dimensions. Anning-
Dorson (2017) probed innovation from two aspects, namely, process and product. Foroudi et
al. (2016), Ngo and O’cass (2013), and Silva et al. (2017) inspected innovation according to
technological innovation capability and non-technical innovation capability. Krolikowski and
Yuan (2017) assessed innovation from several attributes, including incentive, intensity,
importance and efficiency. Despite these different constructs, the consensus is that innovation
plays a significant role in organizational performance and can function as a competitive
advantage (Chen et al., 2015; Victorino, Verma, Plaschka, & Dev, 2005). Previous studies
signified the importance of innovation to customer values (Chen et al., 2015; Foroudi et al.,
2016; Yaşlıoğlu, Çalışkan, & Şap, 2013), customer participation (Ngo & O’cass, 2013),
transcend service experience (Wei, Torres, et al., 2017), customers’ hotel choice (Victorino et
al., 2005), company’s economic performance (Silva et al., 2017; Victorino et al., 2005), and
strategic export performance (Silva et al., 2017). For examples, Victorino et al. (2005)
provided support for the contributions of three types of service innovation to accounting for
customers’ hotel choice, namely, hotel type innovation, technology innovation, and
customization innovation. As a consequence, firms are suggested to devote more attention to
invest and development innovation (Chen et al., 2015).
Besides, Anning-Dorson (2017) elicited and identified the mediating effects of innovation on
the relationship between customer involvement capability and service organization
performance, while Chen et al. (2015) proved the moderating effects of self-check-in kiosks
in airports on the relationship between customer satisfaction and customer value. Foroudi et
al. (2016) indicated that the influences of customer demographics (age, gender, education, and
occupation) on loyalty and reputation could be modified by innovation and customer
experience. Nevertheless, few studies are devoted explicitly to exploring the relationship
between innovation and customer experience. The results of Su (2011) suggested that service
innovation significantly influences customers’ behavioral intention and customer experience,
which mediately influences service innovation and customers’ behavioral intention. In this
endeavor, Wei et al. (2016) and Wei, Torres, et al. (2017) suggested SST developers to
constantly create innovative technological interfaces to stipulate transcend customer
experience.

49
2.2.6 Service Employee vs. SST Concerning Customer Experience
Service delivery acts as a crucial role in providers’ interactions with customers (J.-S. Chen et
al., 2009). In the sector of service, Bitner et al. (1994, 1990) revealed the influences of
customers’ satisfaction/dissatisfaction with employees both from the standpoints of customers
and employees, while Meuter et al. (2000) identified factors influencing customers’
satisfaction/dissatisfaction with SSTs. Nevertheless, various service delivery channels
regularly coexist at the same time (Lin & Hsieh, 2011; Sousa & Voss, 2006; van den Boer et
al., 2016) and customers are multi-channellers (Pieterson & Ebbers, 2008), implying that they
usually adopt different channels to receive a service (Pieterson & Van Dijk, 2007). As such,
previous academics taking a single-channel perspective seemingly restrict the holistic view of
the influences of multiple channels on customer experience, in accordance with Giebelhausen
et al. (2014) who criticized previous studies on SST for focusing on technology itself and not
taking SST’s interaction with other ingredients of service delivery process into account.
There are couples of previous studies paid attention to SST and customer service
representative in single research which are summarized in Table 2.8. These studies focus on
antecedents of customers’ choices among different service delivery channels (Fan et al., 2016;
Gelderman et al., 2011; Kaushik & Rahman, 2017; Lu et al., 2011; Simon & Usunier, 2007;
C. Wang et al., 2012), different usage of multiple channels and satisfaction (Buell et al., 2010;
Wittmer, 2011), customer acceptance of SSTs when faced with a choice between SSTs and
service employees (Bateson, 1985), attributes and service qualities of SSTs and employees on
customer satisfaction, commitment, retail patronage, social bonds, customer loyalty (Beatson
et al., 2006; Lee & Yang, 2013; Panda et al., 2011; Selnes & Hansen, 2001) and their role in
failure recovery (Dabholkar & Spaid, 2012; Mattila et al., 2011; Zhu, Nakata, Sivakumar, &
Grewal, 2013). However, as shown in Table 2.8, limited attention has been paid to customer
experience and hotel setting.
To mend this gap, this study explores SST by taking service employees into account, as a
response to Wei et al.’s (2016) call for investigation in the interaction effects between service
contact personnel with SST.
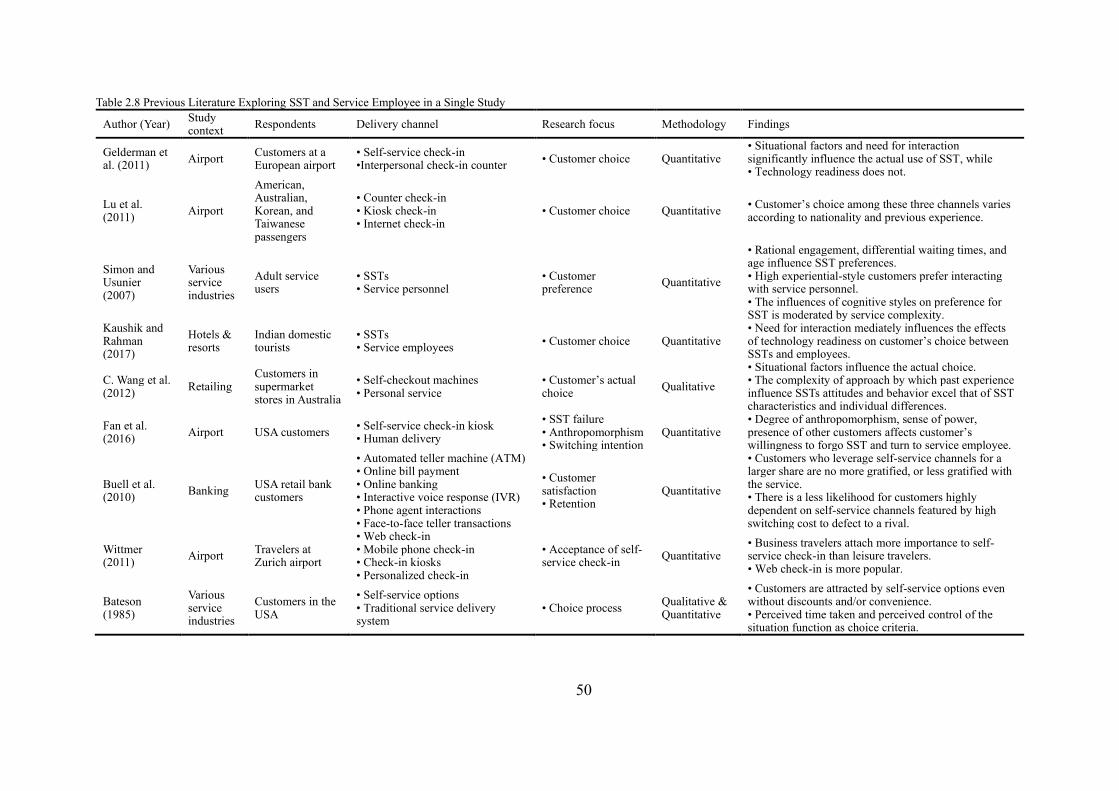
50
Table 2.8 Previous Literature Exploring SST and Service Employee in a Single Study
Author (Year) Study context Respondents Delivery channel Research focus Methodology Findings
Gelderman et al. (2011) Airport Customers at a
European airport • Self-service check-in •Interpersonal check-in counter • Customer choice Quantitative
• Situational factors and need for interaction significantly influence the actual use of SST, while • Technology readiness does not.
Lu et al. (2011) Airport
American, Australian, Korean, and Taiwanese passengers
• Counter check-in • Kiosk check-in • Internet check-in
• Customer choice Quantitative • Customer’s choice among these three channels varies according to nationality and previous experience.
Simon and Usunier (2007)
Various service industries
Adult service users
• SSTs • Service personnel
• Customer preference Quantitative
• Rational engagement, differential waiting times, and age influence SST preferences. • High experiential-style customers prefer interacting with service personnel. • The influences of cognitive styles on preference for SST is moderated by service complexity.
Kaushik and Rahman (2017)
Hotels & resorts
Indian domestic tourists
• SSTs • Service employees • Customer choice Quantitative
• Need for interaction mediately influences the effects of technology readiness on customer’s choice between SSTs and employees.
C. Wang et al. (2012) Retailing
Customers in supermarket stores in Australia
• Self-checkout machines • Personal service
• Customer’s actual choice Qualitative
• Situational factors influence the actual choice. • The complexity of approach by which past experience influence SSTs attitudes and behavior excel that of SST characteristics and individual differences.
Fan et al. (2016) Airport USA customers • Self-service check-in kiosk
• Human delivery • SST failure • Anthropomorphism • Switching intention
Quantitative • Degree of anthropomorphism, sense of power, presence of other customers affects customer’s willingness to forgo SST and turn to service employee.
Buell et al. (2010) Banking USA retail bank
customers
• Automated teller machine (ATM) • Online bill payment • Online banking • Interactive voice response (IVR) • Phone agent interactions • Face-to-face teller transactions
• Customer satisfaction • Retention
Quantitative
• Customers who leverage self-service channels for a larger share are no more gratified, or less gratified with the service. • There is a less likelihood for customers highly dependent on self-service channels featured by high switching cost to defect to a rival.
Wittmer (2011) Airport Travelers at
Zurich airport
• Web check-in • Mobile phone check-in • Check-in kiosks • Personalized check-in
• Acceptance of self-service check-in Quantitative
• Business travelers attach more importance to self-service check-in than leisure travelers. • Web check-in is more popular.
Bateson (1985)
Various service industries
Customers in the USA
• Self-service options • Traditional service delivery system
• Choice process Qualitative & Quantitative
• Customers are attracted by self-service options even without discounts and/or convenience. • Perceived time taken and perceived control of the situation function as choice criteria.
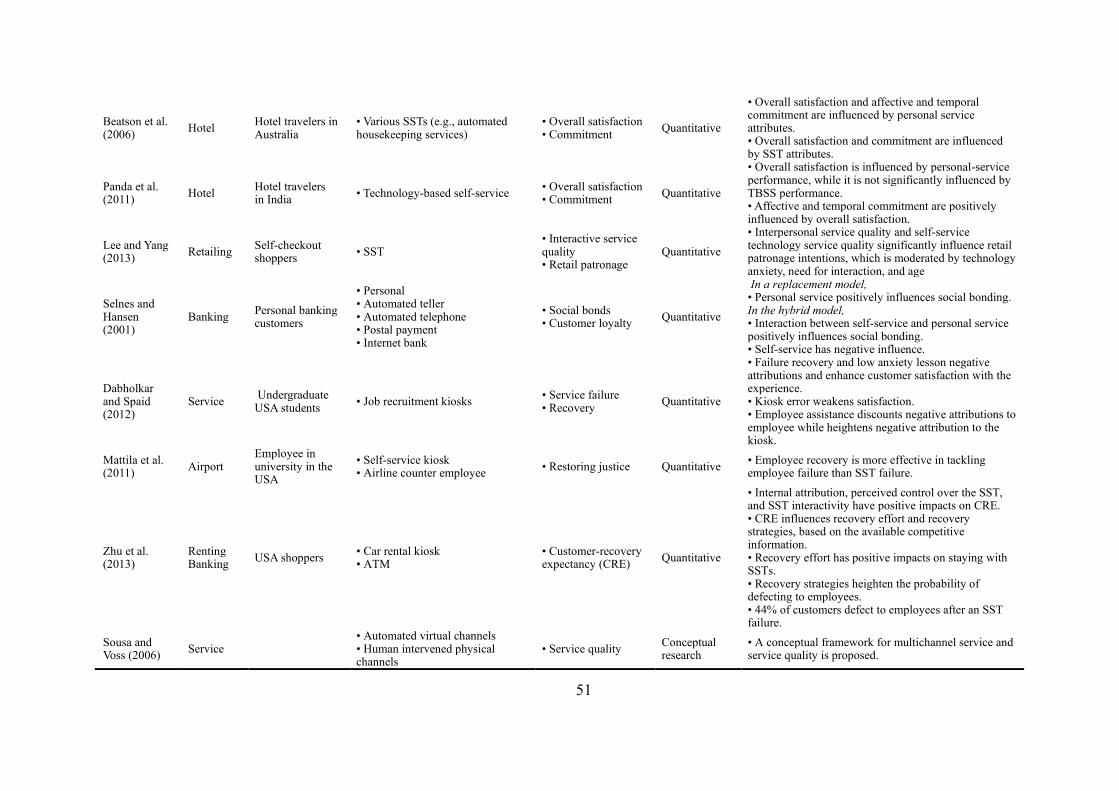
51
Beatson et al. (2006) Hotel Hotel travelers in
Australia • Various SSTs (e.g., automated housekeeping services)
• Overall satisfaction • Commitment Quantitative
• Overall satisfaction and affective and temporal commitment are influenced by personal service attributes. • Overall satisfaction and commitment are influenced by SST attributes.
Panda et al. (2011) Hotel Hotel travelers
in India • Technology-based self-service • Overall satisfaction • Commitment Quantitative
• Overall satisfaction is influenced by personal-service performance, while it is not significantly influenced by TBSS performance. • Affective and temporal commitment are positively influenced by overall satisfaction.
Lee and Yang (2013) Retailing Self-checkout
shoppers • SST • Interactive service quality • Retail patronage
Quantitative
• Interpersonal service quality and self-service technology service quality significantly influence retail patronage intentions, which is moderated by technology anxiety, need for interaction, and age
Selnes and Hansen (2001)
Banking Personal banking customers
• Personal • Automated teller • Automated telephone • Postal payment • Internet bank
• Social bonds • Customer loyalty Quantitative
In a replacement model, • Personal service positively influences social bonding. In the hybrid model, • Interaction between self-service and personal service positively influences social bonding. • Self-service has negative influence.
Dabholkar and Spaid (2012)
Service Undergraduate USA students • Job recruitment kiosks • Service failure
• Recovery Quantitative
• Failure recovery and low anxiety lesson negative attributions and enhance customer satisfaction with the experience. • Kiosk error weakens satisfaction. • Employee assistance discounts negative attributions to employee while heightens negative attribution to the kiosk.
Mattila et al. (2011) Airport
Employee in university in the USA
• Self-service kiosk • Airline counter employee • Restoring justice Quantitative • Employee recovery is more effective in tackling
employee failure than SST failure.
Zhu et al. (2013)
Renting Banking USA shoppers • Car rental kiosk
• ATM • Customer-recovery expectancy (CRE) Quantitative
• Internal attribution, perceived control over the SST, and SST interactivity have positive impacts on CRE. • CRE influences recovery effort and recovery strategies, based on the available competitive information. • Recovery effort has positive impacts on staying with SSTs. • Recovery strategies heighten the probability of defecting to employees. • 44% of customers defect to employees after an SST failure.
Sousa and Voss (2006) Service
• Automated virtual channels • Human intervened physical channels
• Service quality Conceptual research
• A conceptual framework for multichannel service and service quality is proposed.

52
2.3 A Debate on High Touch versus High Tech
Notwithstanding the growing invasion of high technology, the interpersonal service still plays
an essential role ( Lee & Yang, 2013; Wittmer, 2011), resonating with the study of Mäkinen
(2016), which reported that although most participants showed a propensity to use SST rather
than traditional personal interaction, the later was verified as the most important factor of
customer service. Managers are advised to leverage the advantages of both high-tech self-
service and high-touch personal service and their potential synergies (Oh et al., 2013; Salomann
et al., 2006). Before putting SSTs into practice, nevertheless, neither participators nor academic
scholars allocate attention to explore the dilemma of the two different service delivery
channels, a key to multiple service delivery channel strategies. Among the limited studies is
the work of Salomann et al. (2007) who suggested firms to regard self-service as a complement
of personal contact as opposed to a substitute. They presented an intimacy-driven and a
personality driven approach for service automation and to access to a balance between high
tech and high touch in customer relationships. This is consistent with work by Mäkinen (2016),
who implied that SST should serve as an additional choice instead of replacement of personal
service. However, their suggestion lacks sufficient support and conflicts with other studies who
argued that high technology contrasts with high touch due to their competition in money, space,
and capability. For instance, Lewis and Entwistle (1990) indicated that there is a likelihood of
enhancing efficiency and customer satisfaction through minimizing face-to-face interaction
between customers and service staff in certain situations. Overall, given the unique features of
SST-based service, the interaction with high-tech machines calls for further exploration.
2.3.1 The Increasing High-tech Service
High technology has been increasingly important with a purpose to simplify human life and
will be more significant in the following years (Ferrell & Ferrell, 2012). Some benefits of high
technology, such as efficiency and personalized service, are gained both on providers’ and
customers’ sides (Wünderlich et al., 2013). Virtualization, mobility, and social networking are
three kinds of technologies that have the potential to benefit both on the sides of customers and
companies (Violino, 2009). Concerning customers, they can provide customized services,
while for the sake of service providers, they are helpful in decreasing cost and increasing
flexibility. For example, server virtualization, a useful alternative to physical servers,
contributes to reducing cost and power consumption (Violino, 2009). With the advanced

53
development and evolution of technology, especially the automation technology and SSTs, the
transformation from high touch to high tech is commonly realized. Industry practitioners and
customers have increasingly adopted technology to better customer experience. The following
section explained the transformation of manual service to high-tech service from the
perspectives of hoteliers and customers, respectively.
From the Perspectives of Hoteliers
Practitioners from every walk of life struggle to implement technology but do so for the
perceived benefits. Computers enable firms to provide individualized employee arrangement
(Naisbitt, 1984). High tech releases farmers from simple but heavy manual work (Rosenberg,
1994). Pharmaceutical sales performances can be enhanced via IT through bettering customer
service and salespersons’ adaptability (Ahearne et al., 2008). The application of high
technology in education improves students’ perceptions of service quality regarding reliability
and responsiveness with a counterbalancing reduction in high-touch areas such as empathy on
the basis of SERVQUAL instrument (Anderson, 1995).
Service businesses have invested a plethora of money in high tech because firms’ choices on
the application of IT-based digital service could affect their competitiveness (Ba et al., 2010).
For example, the ubiquity of high technology generates growing opportunities for servicing
marketing, customization, and customer relationship management (CRM) (Ferrell & Ferrell,
2012; Rust & Espinoza, 2006). For example, social media (e.g., YouTube) can help with
discerning potential customers personalizing promotional information and improving trust and
organizational cultures due to its transparency (Ferrell & Ferrell, 2012). The likelihood of
customization, especially mass customization, has been verified in practice via collecting
customers’ preferences and prior behaviors through Internet-based SSTs (Meuter et al., 2000).
Supporters of high technology believe that it can help service suppliers provide more
customized service and enable them to better than staffs in personalization and customization.
With the help of technology, especially SST, saved labor can be allocated to render assistance
to customers faced with complicated issues that cannot be tackled by technology. Moreover,
they assert that technology can precisely memorize more than billions of customers, and
thereby, it is easier for technology to make customers feel valued through recognizing them
accurately and rapidly. Furthermore, technology can function as an excellent server and
promoter since it is capable of recording customer behaviors and thus providing personalized
54
service accordingly. That is, customized service can be offered by automatically extracting and
matching customer characteristics with personalized service (Voelker, 2010). Virtually, in light
of customers, customization/standardization, and separability /inseparability display SSTs,
while customization/ standardization and person/object represent traditional services
(Cunningham et al., 2009).
In this endeavor, the nature of service is greatly and profoundly transformed by technology
through extending customer service access, revamping service delivery, and supplying new
services (Kasavana, 2008). The boundary between technology and customer service gradually
and continuously fades, and service providers’ work is growingly replaced by technology in
some circumstances, due to the increasing introduction and reliance on high technology (Ba et
al., 2010; Romps, 2007). As a model and a market trend having gained momentum, IT-based
self-service flourishes, which is predicted to imitate and/or excel the positive facets of
interpersonal service encounters in the service sector (Kasavana, 2008; Meuter et al., 2000).
For example, efficiency is derived from benefits such as reduced cost and time, and increased
flexibility and access (Ba et al., 2010; Wünderlich et al., 2013). E-service could help service
providers with delivering satisfying and gratifying service in a more effective approach (Ba et
al., 2010). Hotel is no exception to these changes. For the sake of efficiency, productivity, cost
saving as well as customer satisfaction, hotel participators constantly invest in IT to better
service quality (Kaushik et al., 2015; Kim & Qu, 2014; Ong, 2010). Among these technologies
adopted to facilitate service is SST featured by standardization or automation (Scherer & von
Wangenheim, 2016) so as to avoid unreliable and variable employees (Wang et al., 2010). The
hospitality industry has attempted to transform from human service to self-service, and from
face-to-face encounters to face-to-monitor encounters (Kasavana, 2008). Given that the degree
of demand generally fluctuates widely over time and its peak desire usually exceeds capacity
(Lovelock, 1983), it is hard for hotels to always meet all customers’ needs due to the high labor
cost. However, if SST is introduced, this issue will presumably be tackled. Hardly should the
significant competitive advantages and possibilities of SSTs be neglected (Kasavana, 2008).
From the Perspectives of Customers
Meanwhile, the number of customers who prefer to communicate with technologies rather than
customer service representatives to assist in service and generate service outcomes is increasing
(Meuter et al., 2000). When those customers are frustrated by disappointing employees, long

55
waiting lines, and 24/7 access unavailable, these issues can be addressed by SST options
(Kasavana, 2008). For example, customers in uWink, a restaurant without human waiters or
waitresses, have fun, aesthetical, and entertaining experience due to flexible ambiance and
unconformable experience with human staffs, aside from fast food delivery and delicious food
(Janowitz, 2007). Besides, more customer control and 24/7 service are benefits resulting from
high technology (Ba et al., 2010). Efficiency is also one of these benefits of technology via
enhanced speed of delivery, along with reduced cost and time, and increased flexibility and
access (Ba et al., 2010; Wünderlich et al., 2013). It seems that with the application of advanced
technology, tasks could be handled more conveniently and in a more limited period of time
(Naisbitt et al., 1999). In terms of customization, customers could personalize their house
according to personal preferences with the application of intelligent home automation systems
(Ba et al., 2010; Naisbitt et al., 1999). To some extent, the more complex and higher technology
is, the simpler and the easier life becomes (Naisbitt et al., 1999).
2.3.2 The Synchronous Growth of High Touch
High touch grows in parallel with high tech (Naisbitt, 1984). As high tech increasingly replaces
high touch in some situations, technology gradually becomes high touch as well. Naisbitt et al.
(1999) argued, “high tech becomes high touch with longevity and cultural familiarity” (p.27).
A loom used to be regarded as high tech in ancient Egypt is a high-touch product in current
society since it induces nostalgic emotions (Naisbitt et al., 1999). The more quickly innovative
technology is created, the more rapidly older-fashioned technologies become high touch
(Naisbitt et al., 1999). Additionally, the parallel growth of high touch can be explained by
concerns about the negative effects incurred by high tech and the desire for communication
with people, which were discussed from the perspectives of hoteliers and customers as follows.
From the Perspectives of Hoteliers
For one thing, despite the frequently highlighted positive effects, SSTs incur negative effects.
For instance, high touch is one of the significant traditional manners to build and maintain a
relationship with customers. Human staffs could provide the responsiveness, customized
service, flexibility, and spontaneous delight valued by customers, which are probably lost
during the use of SST (Ba et al., 2010). Except general information online such as prices,
human staffs can provide specific messages to inspire, guide, and suggest customers to shop
and persuade them to purchase what they might have neglected through interpersonal

56
interaction in a knowledgeable and involving approach (Cook, 2014). Moreover, the lack of
interpersonal interaction might restrain employees’ service recovery efforts and incur
employees’ resentment of SSTs (Kim & Qu, 2014; Oh et al., 2013; Selnes & Hansen, 2001).
Thus, hoteliers remain hesitant and contemplate the implementation for the sake of a great
waste of resources if customers do not accept SSTs (Curran & Meuter, 2005; Oh et al., 2013).
For another thing, useful although high technology is, customers often desire for interaction
and communication with staffs (Voelker, 2010). With respect to excellent customer service,
first-rate interaction and socialization with customers to make them feel valued still serves as
an essential contributor to customer satisfaction, given that customer satisfaction is associated
with customers’ feelings of valued (Voelker, 2010). Thus, aside from solutions to problems,
emotional support is needed by customers as well. Paul, president of Great American
Brokerage and restaurant expert, affirmed the importance of human staffs in spite of their
deficiencies by stating that except efficiency of delivering food, customers’ feel does matter,
which can be bettered by a human waiter or waitress (Janowitz, 2007).
From the Perspectives of Customers
In the lens of customers, SSTs give rise to negative effects as well. The significant increasing
investment of technology has led to negative customer experience resulting from anxiety,
frustration, perceived risk, reduced impact on service production process, lost customized
service, reduced flexibility and spontaneous delight due to a lack of human staffs’
responsiveness (Ba et al., 2010; Parasuraman, 2000; Schumann et al., 2012). For instance,
given that self-services are standardized and automated, customers have extremely restricted
impacts on the process of service production and delivery (Schumann et al., 2012).
Additionally, analogous to the idea that highways supposed to ease traffic jams incur more
vehicles and thus lead to more serious traffic jams, the introduction of technology aiming
simple life might result in more complexity (Ferrell & Ferrell, 2012; Naisbitt, 1984). For
example, as the application of intelligent technologies in hotels increases, it is not rare for us
to hear complaints about automated curtains, which add to customers’ learning cost and
complicate a simple task. Considering these aforementioned negative consequences resulting
from high tech, some people gradually begin to eschew technology. It seems that the more
technology you are involved in, the more likely you are to escape. However, high touch can be

57
the antidote to the negative effects resulting from high tech. Therefore, some people begin to
refrain from high tech and pursue high touch.
The quest for people-oriented service has been widely acknowledged in the service domain as
well. The more technology invades into human society, the more people desire to be with
people (Naisbitt, 1984). Alone together seemingly contributed to accounting for the
counterbalancing desire, which was created by Turkle (2011) and originated from her
experience in a conference where attendees were physically together but preferred to be alone
with their own business, or rather, people were physically present in one place albeit mentally
and emotionally involved elsewhere. In her book, Alone together: Why we expect more from
technology and less from each other, Turkle (2011) explored how human life is changed as
technology provide substitutes for face-to-face communication via trapping people in a whole
world of machine-mediated relationships, and tried to ascertain the relationship between
solitude and intimacies. She pointed out that technology changes our understanding of
relationship, community, privacy, and intimacy, redraws the boundaries between intimacy and
solitude, and leads to ambiguity of personal connections. For one thing, with the company of
robots, people feel connected, albeit alone: in solitude with new intimacies (Turkle, 2011). For
another thing, the human is more alone, albeit he is closely connected with each other. Thanks
to the assistance of technologies: in intimacy, there are new solitudes (Turkle, 2011).
2.3.3 A Debate on SST versus Service Employee in a Hotel Context
Some benefits of high tech are gained on both providers and customers’ sides (Wünderlich et
al., 2013), such as time savings, improved service quality, increased convenience, and
enhanced control. Ironically, the outcomes incurred by SSTs are occasionally, inconsistent, and
conflicting.
The reduced flexibility due to a lack of human staff responsiveness, supported by the study of
Ba et al. (2010), is nevertheless conflicting with the research of Kim and Qu (2014) which
pointed out that the flexibility is one of the benefits resulting from SSTs. With respect to
customization, Meuter and Bitner (1998) regarded enhanced customization as a benefit of self-
service, while Ba et al. (2010) mentioned that IT-based customer service led to customized
service loss, which is partially consistent with the study of Selnes and Hansen (2001) displaying
SSTs’ contributions to decreased deviations of quality. Rosenbaum and Wong (2015)
demonstrated the fun and entertainment customers derived from SSTs usage, whereas Ba et al.
58
(2010) criticized the reduced spontaneous delight due to a lack of human staffs’ responsiveness
and Parasuraman (2000) showed the growing customer frustration in handling technology-
based systems. Prior studies also pointed out that SSTs restrain service recovery efforts while
hoteliers valued the spontaneous delight and responsiveness brought by personal service (Ba
et al., 2010; Kim & Qu, 2014; Oh et al., 2013; Selnes & Hansen, 2001). With respect to anxiety,
SSTs reduce the anxiety incurred by service employees but give birth to technology anxiety.
Regarding customer experience, Considine and Cormican (2016) stated that SST was valued
by organizations to enhance customer experience, while other scholars showed concerns about
the terrible experience resulting from SSTs (Kim & Qu, 2014) and emphasize the importance
of employees in the customized experience generation (Gwinner et al., 2005; Zeithaml & Gilly,
1987). When it comes to customer loyalty, although some hoteliers use SSTs to improve
customer loyalty (Kaushik et al., 2015; Kim & Qu, 2014; Oh et al., 2013), comprehensive
review of the effects on customer loyalty reveals that SSTs might retrain customer loyalty (Kim
& Qu, 2014; Oh et al., 2013; Selnes & Hansen, 2001). Service providers and suppliers gain
more control over operations and service delivery channels, respectively. In contrast, SST
critiques assert that customers have fewer influences on the process of service production, and
some hoteliers emphasize the role of service contact personnel in service delivery.
Understanding these contrary points from the perspectives of suppliers and customers plays a
vital role in the success of new and innovative technology.
From the Perspectives of Hoteliers
Existing literature reflected the necessity of high touch and the worries that high touch is being
gradually replaced by high tech in some circumstances (Dodrill, 1999). Without human
responses, technology would presumably fail (Naisbitt, 1984). Failure in balancing high tech
and high touch may give rise to dissatisfaction, and poor rewards for technology investments
(Burghard, 2001). A company without personalized service, added values, nor ongoing
interaction with customers in their high-tech products will lose customers to rivals who connect
high touch with high tech (Richter, 2000). Berry et al. (2010) indicated that ending onsite
services are probably unwise on account of their abilities of maintaining communication with
customers, bringing customers back to other service channels (e.g., website), and leading to
loyalty. Actually, the importance of high touch in the field of product design, especially in
consumer product design, has been identified and emphasized. Among business-driven product

59
development strategies is high touch, which plays a key role in product success (Lee, Yun, &
Lee, 1996). Meanwhile, scholars reported that high touch could be a distinct trend in both
contemporary and future products and service (Lee et al., 1996). However, those exclusively
concentrating on providing highest level of high touch (e.g., human-service) without
concerning digital service, would not necessarily be the most profitable ones, as if prior
research revealed that not all enterprises benefit from high tech (e.g., digital service systems)
(Ba et al., 2010). It suggests that profits rely on the cost allocation between high-tech digital
service and high-touch human service (Ba et al., 2010).
As such, some academics argue to combine high tech and high touch to provide customized
service efficiently to satisfy customers’ diversified needs. For example, Salomann et al. (2007)
stated that the key of successful application of SSTs mostly lies in the organization’s ability to
manage the trade-offs between high-tech self-service environment and customers’ request for
high touch. Anderson (1995) pointed out that the efficiency derived from high-tech service
delivery, for instance, automation, should not outweigh the significance of high-touch
ingredients in service delivery systems, such as human interaction. Industry participators are
supposed to have the capability of both deriving profits from high tech and retaining benefits
resulting from high-touch interactions (Ferrell & Ferrell, 2012). In reality, certain efforts have
been made, including merging high-tech predictive analytics and high-touch ongoing
communications (Triplett, 2013), collaborating mobile techniques with customer interaction
(Cook, 2014), combining high-touch messages with high-tech social media (Naisbitt et al.,
1999), and integrating of social media in direct selling (Ferrell & Ferrell, 2012). In terms of
patient care management, Burghard (2001) suggested that an appropriate approach of
combining high tech and high touch is to assess information sensitivity and consumers personal
preferences, by reporting that consumers prefer to receive general information online, but
personal and private data calls for human touch.
It seems that the future will be the collaboration of high tech and high touch (Donner & Dudley,
1997). Conversely, Wang et al. (2010) manifested that synchronous pursuit of high
standardization and customization discounts customer satisfaction, consistent with the work of
Kokkinou and Cranage (2013) who pointed out the incompatibility of bettering customization
with decreasing waiting time through SSTs. High tech and high touch are, thereby, both an
opportunity and a challenge for industry participators (Ferrell & Ferrell, 2012; Weber, 2002).
The high tech of hotel service is a highly complicated issue, which engages several threatening
60
and beneficial aspects of hoteliers, employees, and customers, the interaction between high
tech and high touch, as well as brand positioning. The biggest and most complicated difficulty
hoteliers encountered is how to turn the adoption of innovative technology (e.g., SST) into an
advantage (Mest, 2014). Consequently, comprehensive consideration of the role of innovation
(e.g., SST) in customer experience together with different ratings of hotels is critical as high
tech and high touch are plausibly conflicting topics but both imperative to the lodging industry.
From the Perspectives of Customers
Compared with other service sectors, such as the airline industry, self-service is relatively
innovative in the hotel domain (Kim & Qu, 2014). Although innovation can function as a
selling point and appeal to customers, not all customers accept IT-facilitated service (Ba et al.,
2010; Kaushik et al., 2015; Romps, 2007; Voelker, 2010). For example, older people, a typical
service sector, are less likely to accept SSTs in hotel, who hold the view that customer service
was individualized and delivered by staffs, even if they do not refuse high tech. In contrast, the
younger generation living in such a hectic and hustling life is more likely to value efficiency
and embrace SSTs (Romps, 2007). A research named The Hotel Industry in 2020 and carried
out by Peter O’Connor, revealed that “digital natives” described as sophisticated customers
looking for unique experience and with recognition expectation are mainly predicted to utilize
mobile devices to interact with hotels in spite of before, during and after their hotel stays; and
in terms of consumers’ buying behavior, human interaction take a smaller place in their
decision makings than flexibility, value, and control (Hertzfeld, 2017). Besides, would
customers garner unique experience if high tech became a dominant feature in place of service
staffs in the service context currently? The escalating prevalence of SSTs in routine life
weakens the uniqueness of SST utilization (Wei et al., 2016).
Additionally, customers do not want to make everything technology-based, although majority
of them in the realm of banking adopts technologies to tackle problems (Donner & Dudley,
1997). Customers are paradox themselves since they call for not only more customized and
personalized services, but also standardized and equal treatment (Demirkan & Spohrer, 2014).
A primary KPMG consumer research alludes to common worship and fear of technology
(Donner & Dudley, 1997). Subsequently, Naisbitt et al. (1999) pointed out that America has
stepped into a Technologically Intoxicated Zone, one of whose features is that Americans
61
worship and fear technology. Parasuraman (2000) confirmed that humans harbor positive
feelings while apprehending technology.
2.4 Current Theories and Factors Influencing Technology Adoption
2.4.1 Theories/Concepts for Technology Adoption
In the literature, the theories or concepts used by extant studies concerning SST adoption are
various, including theory of reasoned action, theory of planned behavior, TAM or extended
TAM, technology readiness, diffusion of innovation, resource-matching theory, self-efficacy,
task-technology fit theory, unified theory of acceptance and use of technology, technology
affordances and constraints theory, and technology-organization-environment framework.
These theories or concepts can be divided into two groups.
The first group consists of theory of reasoned action, theory of planned behavior, resource-
matching theory, and self-efficacy theory, which are developed to explain human behavior and
then used to assist in explaining customer adoption of technology.
Theory of reasoned action was created by Fishbein and Ajzen (1975) who showed that attitude
and subjective norm determine behavioral intention and subsequently actual behavior. Then it
was utilized in various fields to understand and forecast human behavior, including technology
adoption (Rehman et al., 2007). Its effectiveness and strong predictive utility were proven by
Sheppard, Hartwick, and Warshaw (1988). However, theory of reasoned action is a general
model that does not clarify the beliefs that are operative for a particular behavior (Davis,
Bagozzi, & Warshaw, 1989) and as such, appropriate modification of the original theory of
reasoned action are suggested and call for further exploration (Sheppard et al., 1988). Virtually,
new models for specific behavior are developed based on theory of reasoned action such as
theory of planned behavior and technology acceptance model.
Theory of planned behavior is an extension of technology of reasoned action, which adds
perceived behavioral control as a construct influencing intention, for the sake of control over
intended behavior (Ajzen, 1991; Ajzen & Madden, 1986). Two experiments conducted by
Ajzen and Madden (1986) proved that the addition of perceived behavioral control enhanced
the prediction of behavioral intentions and lent support to the theory of planned behavior. Ajzen
(1991) further showed the usefulness of theory of planned behavior for tackling complexities
and predicting and understanding specific human social behaviors in particular settings. For

62
example, Lynne, Casey, Hodges, and Rahmani (1995) lent credence to theory of planned
behavior via demonstrating that perceived control influenced the adoption of conservation
technology.
Resource-matching theory originated from describing message influence and designing
persuasive messages in the advertising sector (Anand & Sternthal, 1989). According to Anand
and Sternthal (1989), persuasion is determined by matching resources available for message
processing with cognitive resources required. If available resources are too few, persuasion
might be limited. If available resources exceed resources required, persuasion might be
lessened due to idiosyncratic associations. Conversely, persuasion can be enhanced by the
congruence between resources available and cognitive resources (Anand & Sternthal, 1989).
Zhu et al. (2007) drew on it to elucidate the interaction among multiple SST features and to
improve the comprehension of complicated customers’ response to SSTs. Specifically, based
on resource-matching theory, Zhu et al. (2007) verified the interactive influences on SST
effectiveness, and the moderators, namely, two individual traits (i.e., prior experience and
technology readiness).
Self-efficacy is a core construct of social cognitive theory (Locke, 1997), concerning the
function of personal cognitive factors in social cognitive theory (Maddux, 1995). Self-efficacy
is first presented and explored in detail by Bandura (1977, 1986) who at first, allocated a central
role to self-efficacy to analyze transforms achieved in fearful and avoidant behavior and found
it a reliable predictor of performance. Efficacy expectation referring to “the conviction that one
can successfully execute the behavior required to produce the outcomes” is used to
differentiate outcome expectations (Bandura, 1997, p. 193). Self-efficacy is defined as “a
generative capability in which multiple subskills must be continuously improvised to manage
ever-changing circumstances” (Bandura & Wood, 1989, p. 805). Dabholkar and Bagozzi
(2002) introduced it as constructs of consumer traits to examine their moderating effects on the
adoption of technology-based self-service.
The second group covers technology acceptance model, technology readiness, diffusion of
innovation, task-technology fit theory, unified theory of acceptance and use of technology,
technology affordance and constraints theory and technology-organization-environment (TOE)
framework, which are specially created to handle technology-related issues.
63
Among the most widely adopted models of examining peoples’ acceptance of technology is
technology acceptance model (TAM) (Wünderlich et al., 2013), which is adapted from theory
of reasoned action (Yeo, Goh, & Rezaei, 2017). Based on theory of reasoned action, Davis
(1985) coined TAM to examine the influences of system features and capabilities on user
motivation to use computer-based information systems and then their actual system use. At
first, TAM was comprised of perceived usefulness, perceived ease of use, attitudes, and
behavioral intentions (Davis, 1985). Subsequently, academic scholars constantly introduced
and ascertained new constructs into TAM. On the basis of TAM or extended TAM, a majority
of prior studies quantitatively investigated customers’ behavioral intentions to use SSTs (e.g.,
Curran & Meuter, 2005; Kaushik et al., 2015; Kim & Qu, 2014; Lu et al., 2009; Oh et al., 2013;
Yeo et al., 2017). Factors influencing customers’ adoption of SSTs cover four facets, namely
technology characteristics, individual differences, situational factors, and task characteristics,
which are clarified in the next section. These new factors growingly added into TAM originate
from diversified previous theories or concepts such as technology readiness, theory of reasoned
action (e.g., subjective norm) and self-efficacy. It is essential for participators to comprehend
these factors (both drivers and inhibitors) concerning customers’ acceptance of SSTs.
Technology readiness construct represents “people’s propensity to embrace and use new
technologies for accomplishing goals in home life and at work” (Parasuraman, 2000, p. 308),
which can be determined by the gestalt of mental enablers and inhibitors. Collaborating with
Rockbridge Associates, Parasuraman (2000) developed a 4-dimension and 36-item technology
readiness scale, namely drivers (optimism and innovativeness) and inhibitors (discomfort and
insecurity). Subsequently, Meuter et al. (2005) delimited technology readiness as “a
generalized individual difference concept that balances contributors (optimism and
innovativeness) and inhibitors (discomfort and insecurity)” (p.62), and defined consumer
readiness as “a condition or state in which a consumer is prepared and likely to use an
innovation for the first time” (p.64), which is conceptualized as role clarity, motivation, and
ability. Their studies focused on actual trial behavior instead of behavioral intention, and they
introduced and embed customer readiness within well-established innovation and adoption
models for the prediction of the trail of technology. Consumer readiness variables mediate the
effects of individual differences and innovation characteristics on trial, and they are the best
set of predictors, followed by innovation characteristics and individual difference variables
(Meuter et al., 2005). Rosenbaum and Wong (2015) categorized customers into two groups:

64
innovators and laggards, based on the technology readiness scales developed by Parasuraman
(2000) and they found that despite technology readiness, fun and technological pause could
influence SSTs adoption.
Rogers (1995) explicated diffusion of innovation. In his study, diffusion is “the process by
which an innovation is communicated through certain channels over time among the members
of a social system” (p.35). The innovation-decision process consists of a series of stages,
including knowledge, persuasion, decision, implementation, and confirmation (Rogers, 1995).
The characteristics of technological innovation determined its rate of adoption, including
relative advantage, compatibility, complexity, trialability, and observability (Rogers, 1995).
Different from technology readiness, Rogers (1995) categorized adopters into five groups,
namely, innovators, early adopters, early majority, late majority, and laggards. The diffusion
of innovation theory is tested and supported by the following scholars (e.g., Franceschinis et
al., 2017). Based on this theory, subsequent academics evaluate technology acceptance and
sustainability (Aizstrauta, Ginters, & Eroles, 2015), help to explain comparative uptake of
methodological innovations (Meade & Islam, 2006), assess influences of incentives on
innovation adoption (Simpson & Clifton, 2017), and relate the theory to other theories or
concepts, such as preference structure (Franceschinis et al., 2017) and Integrated Acceptance
and Sustainability Assessment Model (IASAM) (Aizstrauta et al., 2015). For example, Dibra
(2015), after reviewing previously different theoretical models, claimed that diffusion of
innovation theory function as an appropriate theoretical model in the research on factors
influencing the adoption of sustainable tourism practices in the tourism businesses. Diffusion
of innovation theory spreads into different sectors and innovation represents different
objectives including innovative technology.
Task-technology fit is defined as “the degree to which a technology assists an individual in
performing his or her portfolio of tasks” (Goodhue & Thompson, 1995, p. 216), or rather, “the
correspondence between task requirements, individual abilities, and the functionality of the
technology” (Goodhue & Thompson, 1995, p. 218). Task-technology fit serves as a vital
construct in technology-to-performance chain model that is in use to explore the linkage
between information technology and individual performance and asserts that individual
performance will be enhanced if technology matches well with the task (Goodhue &
Thompson, 1995). Aside from contributing to accounting for how technology leads to
individual influences, task-technology fit is integrated with TAM to explore the adoption of a
65
technology (Dishaw & Strong, 1999; Yen, Wu, Cheng, & Huang, 2010), and it is proven that
the addition of task-technology fit improves explanatory power. Task-technology fit functions
as a vital predictor of customer intention to employ technology. It is said that the likelihood of
the adoption of technology might be enhanced if its functionality fit the tasks that it supports.
Venkatesh, Morris, Davis, and Davis (2003) reviewed eight existing models to explore the
knowledge level of people’s adoption of IT via discussing and comparing their similarities and
differences. The eight models are the theory of reasoned action, the theory of planned behavior,
social cognitive theory, the motivational model, diffusion of innovation, the model of PC
utilization, TAM, and a model combining TAM and theory of planned behavior. On the basis
of the relatively comprehensive assessment, they developed a unified theory of acceptance and
use of technology (UTAUT). The UTAUT consists of four core and direct antecedents (i.e.,
performance expectancy, effort expectancy, social influence and facilitating conditions) of
behavioral intention and in turn use behavior, with moderating variables, such as gender, age,
experience, and voluntariness of use (Venkatesh et al., 2003). Thereafter, a huge bulk of
academic leveraged UTAUT to examine technology (e.g., robot system, automated feedback
system and mobile wallet) adoption and innovation diffusion (Williams, Rana, & Dwivedi,
2015). Williams et al. (2015) reviewed studies concerning UTAUT from 2004 to 2011, and
found that technologies studied cover communication systems (e.g., robot system and
automated feedback system), general purpose systems (e.g., web-based virtual M-Learning
system and e-government services), office systems (e.g., computer-assisted audit techniques
and computer graphics technology) and specialized business systems (e.g., tax software system
and electronic medical record system). They also pointed out that one of the widest
acknowledged limitations of the majority of these reviewed studies is concentrating on a single
subject or task.
Inspired by the ideas of the Gestalt, Gibson (1979) first coined the word affordance to serve
as an ingredient of his theory of direct perception (Gibson, 1979) in the field of ecological
psychology. Affordance refers to opportunities for action that the environment can afford to a
creature, emphasizing the relationships between the opportunities and the creature in Gibson’s
view. To perceive an affordance is to perceive how one can act when confronted with a
particular set of environmental conditions (Fajen, Riley, & Turvey, 2009). The term
“affordance” gain popularity with the publication of Norman’s book, The Psychology of
Everyday Things (Norman, 1988). Apart from ecological psychology, the theory of affordance

66
has been further developed and applied to a wide range of disciplines (Overhill, 2012),
including cognitive science (Barsalou, 1999; Glenberg, 1997), design (Dickey, 2003; Norman,
1988), education, sport (Fajen et al., 2009), human-computer interface studies (Gaver, 1991),
phenomenologists, social life (Osmond, 1957) and tourism (Liu & Hung, 2019). Leonardi
(2011) suggested that perceived affordance stimulates service contact personnel to change
routines rather than technologies. Then a framework, technology affordances and constraints
theory, was introduced by Majchrzak and Markus (2012) to explore the people’s and firms’
usage of information system. As they said, technology affordances and constraints theory
(TACT) contributes to explain both human and organizational technology-use behavior and
defining fit between human and technology.
Technology-organization-environment (TOE) framework was first developed by Tornatzky
and Fleischer in 1990. As an organization-level theory, TOE framework states that
technological factors, organizational factors, and environmental factors exert influences on
organizations’ adoption of innovative technology (Baker, 2011; Kurnia, Karnali, & Rahim,
2015). Technological factors related to technological contexts refer to the availability and
attributes of technology (e.g., complexity) (Kurnia et al., 2015). Organizational factors
associated with organizational context are regarded as the characteristics and resources of the
organization (e.g., managerial structure) (Baker, 2011; Teo, Lin, & Lai, 2009). Environmental
factors that are associated with environmental context include industry characteristics, market
structure, supporting infrastructure, and government regulation (Baker, 2011; Kurnia et al.,
2015). These factors are not always consistent, and scholars assumed that different technology
or context have different and specific factors (Baker, 2011; Teo et al., 2009). Extant studies
across industries and contexts have consistently proved its prevalence and usefulness in
investigating organizational adoption of innovative technology (Baker, 2011; Hameed,
Counsell, & Swift, 2012; Kurnia et al., 2015; Teo et al., 2009). No matter how specific
contextual factors vary, technological, organizational, and environmental contexts deliver
“both constraints and opportunities for technological innovation” (Tornatzky & Fleischer,
1990, p. 154). TOE framework is popular in studies on organizations’ adoption of innovative
technology, whereas it is rarely used to explain individual technology adoption.
To recap, current theories and concepts (e.g., TAM, diffusion of innovation, and task-
technology fit theory) are mainly designed to tackle technology adoption instead of the
preference among different service delivery channels. The simplistic nature of a model based
67
on a single service delivery channel is open to doubt, conveying a demanding need for thorough
research to take the interaction among different service delivery channels into consideration.
This is conducive to the comprehensiveness and deepness of the investigation on their
precursors and results.
2.4.2 Factors Influencing the Adoption of Technology
Academics contribute valuable insights into SST adoption (Curran & Meuter, 2005; Dabholkar
& Bagozzi, 2002; Kaushik et al., 2015; Kim & Qu, 2014; Lu et al., 2009; Oh et al., 2013;
Rosenbaum & Wong, 2015). The literature regarding the adoption of SSTs is summarized and
reviewed from the standpoints of hoteliers and customers, respectively.
From the Perspectives of Hoteliers
Customer acceptance lay the foundation for managers’ decisions on technology application
(Hansen, 1995; Sahadev & Islam, 2005; Wünderlich et al., 2013). In Hansen’s framework for
the implementation of mass information systems, one of the fundamental decisions was to
delimit the target customers whose adoption was influenced by their demographics and profiles
(Hansen, 1995; Sahadev & Islam, 2005). Anning-Dorson (2017) signified that customer
involvement capability served as a vital precursor of innovation to better organization
performance in service context, in accordance with Krolikowski and Yuan (2017) who
manifested that provider innovation (process and product) was positively influenced by
customer concentration and negatively influenced by customer bargaining power.
Employees are also of importance to firms’ adoption of technology (Hsieh, 2016; Lema, 2009;
Li & Hsu, 2016; Rangus & Slavec, 2017). A labor force that was adaptable to changes was
important to preparing hospitality firms to deploy effective SST delivery systems (Lema,
2009). This, hence, necessitates practitioners to take employee readiness into account when
implementing SST (Lema, 2009). Besides, the innovative behaviors of employee served as a
basic and fundamental role in firms’ innovation and success (Li & Hsu, 2016). Managers
valued the important role of employee involvement in innovation implementation (Rangus &
Slavec, 2017). In light of managers, the sentiment (i.e., motivation, commitment, and
satisfaction) of frontline employees were facilitated by the co-creation of frontline employees
for the implementation of innovative services (Hsieh, 2016). The training and empowerment

68
of employee significantly influence hotel success and development (Yadegaridehkordi,
Nilashi, Nasir, & Ibrahim, 2018).
Aside from that, the support from top management played an important role (Leung, Lo, Fong,
& Law, 2015; Racherla & Hu, 2008; Wang, Li, Li, & Zhang, 2016). The demographics (e.g.,
age, education level, and job tenure) and profiles (e.g., managerial IT knowledge) of decision
makers exert impacts on organizational acceptance and application of technologies (Ozturk &
Hancer, 2014; Zhang & Dhaliwal, 2009). For example, Zhang and Dhaliwal (2009) revealed
that managerial IT knowledge positively influences organizational technology adoption. If top
management has a shortage of expertise of technology, the hotel is inclined to reject SST
adoption or rely on third-party intermediaries to leverage technology to create profits (Song,
Kim, Tang, & Bosselman, 2015).
Firm-related ingredients (e.g., hotel age, hotel size, chain affiliation, operational capabilities,
hotel activities, lodging type, lodging segment, hotel class, and financial readiness) also
influence hotel adoption of technology (Leung et al., 2015; Ozturk & Hancer, 2014; Sahadev
& Islam, 2005; Siguaw, Enz, & Namasivayam, 2000; Victorino et al., 2005; Yadegaridehkordi
et al., 2018). Organizational characteristics were the most frequently examined attributes in
organizational technology adoption research (Hameed et al., 2012). For example, Ozturk and
Hancer (2014), Wang et al. (2016) and Teo et al. (2009) indicated that firm size positively
influence organizational adoption of RFID technology, mobile reservation system, and e-
procurement, respectively. Siguaw et al. (2000) further indicated that once the hotel size
reaches a special level, their reliance on technology will be reduced. There exist differences
concerning technology adoption among dissimilar lodging types (i.e., all suite, extended stay,
convention center, casino, conference center, condovilla, standard, motel, and bed-and-
breakfast) and lodging segment (i.e., budget, economy, midprice, upscale, and luxury) as well
(Siguaw et al., 2000). More specifically, higher grade hotels were more likely to adopt
innovative information and communications technology (ICT) than lower grade hotels
(Sahadev & Islam, 2005). Moreover, it is reported that the domain barrier for restaurateurs in
America to adopt SST is cost (Kasavana, 2008). This is partially consistent with the statement
that the trouble with counting return on investment (ROI) heavily inhibits the advance of
technology in the domain of hospitality (Connolly, 1999). Besides, operators regarded
collecting customer data, and the performance of SSTs (e.g. accuracy and speed) as key criteria
to ROI, increased revenue, improved productivity and competitive edge (Kasavana, 2008).
69
Additionally, other factors, including environmental factors (e.g., location and perceived
pressure from competitors, partners and customers) (Leung et al., 2015; Sahadev & Islam,
2005; Yadegaridehkordi et al., 2018), technologies characteristics (e.g., complexity and
expected benefits and risk) (Leung et al., 2015; Wang et al., 2016), service/product
characteristics (e.g., price) (Hansen, 1995), the time when to adopt technology (Hansen, 1995),
as well as the approaches to develop and execute technologies (Hansen, 1995) are identified to
exert influences on firms’ adoption of technology.
Albeit hotel’s application of SST is influenced by various factors, their investment in SST
application might incur negative consequences if they do not take customers’ preferences into
consideration (Wei et al., 2016). In this sense, the discrepancies between hotels’ preferences
and customers’ preferences for SSTs during hotel service delivery warrants exploration.
From the Perspectives of Customers
A majority of studies concerning SSTs focus on customers’ adoption and acceptance of SSTs
(Shin & Perdue, 2019). For instance, Dabholkar and Bagozzi (2002) concentrated on the
moderating effects of consumer traits and situational factors. Instead of merely exploring the
different influences of different consumer traits and situational factors, they divided these traits
and factors into two groups: high and low groups. However, their respondents are
undergraduate students majoring in business, and their generalization deserves further
exploration. Griffy-Brown et al. (2008) took Hilton Hotels Corporation as an example to
complement and extend human knowledge about SST implementation in a hotel context. They
included a previous failure experience to discuss the benefits of filling the gap between early
adopters and the subsequent majority adopters and found that customers’ perception and
usability are vital constraints to SSKs adoption. Another approach to examine customers’
attitudes toward SSTs was adopted by Rosenbaum and Wong (2015) who explored the reasons
why customers did not accept SSTs in Hotel X in Macau. Most of these previous studies focus
on behavioral intention and attitude (Curran & Meuter, 2005; Curran, Meuter, & Surprenant,
2003; Kaushik et al., 2015; Kim & Qu, 2014; Lu et al., 2009). Behavioral intention represents
the probability of adopting SSTs (Oh et al., 2013), and they are proven to positively associate
with actual behavior (Lee & Yang, 2013). Attitudes account for customers’ mental inclinations
or reactions to SSTs according to evaluations (Curran & Meuter, 2005; Kaushik et al., 2015;
Lu et al., 2009). The influences of attitudes on behavioral intention have been quantitatively

70
proven through prior studies (Kaushik et al., 2015; Kim & Qu, 2014; Lu et al., 2009). Based
on extant literature, antecedents of customers’ attitudes and in turn on their behavioral
intentions to adopt SSTs may be divided into technology characteristics, customer
characteristics, situational influences, and task characteristics (Figure 2.2), under the
instruction of aforementioned theories (e.g., TAM).
Figure 2.2 Factors Influencing the Acceptance of SSTs from Four Dimensions
Notes: PU=perceived usefulness; PEOU= perceived ease of use; TA = technology anxiety; PBC=perceived behavioral control; INS = inherent novelty seeking; NFI=need for interaction;
PR= perceived risk, PSQ=perceived service quality
Technology Characteristics
Technology characteristics include perceived usefulness and perceived ease of use, which are
the core facets of TAM, as well as technology anxiety, and control (Table 2.9). Technology is
wonderful when easily understood and useful (Naisbitt et al., 1999). Borrowed from computer
anxiety, technology anxiety can be defined as customers’ fear or apprehension resulting from
considering and actual utilizing technology (Lee & Yang, 2013). Although technology anxiety
is related to technology readiness, they are different. Technology anxiety focuses on the
Factors
Technology Characteristics
Control
Autonomy
Compatibility
PBCPU
PEOU
TA
Individual Differences
Customer Profile
Peceived evaluation
Satisfaction
Effectiveness
Fun
PSQSelf-efficacy
Motivation
INS
Pror experience
Product-norm experience
Service failure & recovery experience
First time experience
Self-consciousness
NFI
Privacy
Trust
PR
PrivacyDemographics Age
Region
Situational Influences
Macro-social context
Micro-social context
Companions
Perceived waiting time
External stimuli
Subjective normTask Characteristics Complexity
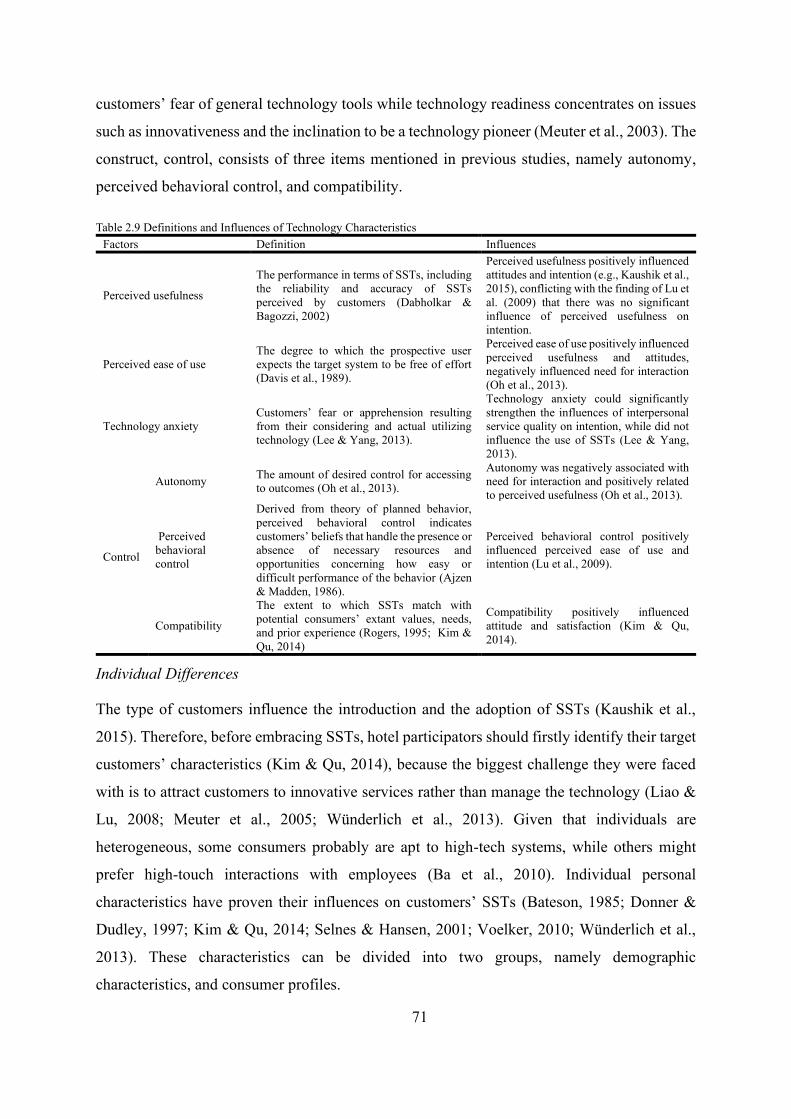
71
customers’ fear of general technology tools while technology readiness concentrates on issues
such as innovativeness and the inclination to be a technology pioneer (Meuter et al., 2003). The
construct, control, consists of three items mentioned in previous studies, namely autonomy,
perceived behavioral control, and compatibility.
Table 2.9 Definitions and Influences of Technology Characteristics Factors Definition Influences
Perceived usefulness
The performance in terms of SSTs, including the reliability and accuracy of SSTs perceived by customers (Dabholkar & Bagozzi, 2002)
Perceived usefulness positively influenced attitudes and intention (e.g., Kaushik et al., 2015), conflicting with the finding of Lu et al. (2009) that there was no significant influence of perceived usefulness on intention.
Perceived ease of use The degree to which the prospective user expects the target system to be free of effort (Davis et al., 1989).
Perceived ease of use positively influenced perceived usefulness and attitudes, negatively influenced need for interaction (Oh et al., 2013).
Technology anxiety Customers’ fear or apprehension resulting from their considering and actual utilizing technology (Lee & Yang, 2013).
Technology anxiety could significantly strengthen the influences of interpersonal service quality on intention, while did not influence the use of SSTs (Lee & Yang, 2013).
Control
Autonomy The amount of desired control for accessing to outcomes (Oh et al., 2013).
Autonomy was negatively associated with need for interaction and positively related to perceived usefulness (Oh et al., 2013).
Perceived behavioral control
Derived from theory of planned behavior, perceived behavioral control indicates customers’ beliefs that handle the presence or absence of necessary resources and opportunities concerning how easy or difficult performance of the behavior (Ajzen & Madden, 1986).
Perceived behavioral control positively influenced perceived ease of use and intention (Lu et al., 2009).
Compatibility
The extent to which SSTs match with potential consumers’ extant values, needs, and prior experience (Rogers, 1995; Kim & Qu, 2014)
Compatibility positively influenced attitude and satisfaction (Kim & Qu, 2014).
Individual Differences
The type of customers influence the introduction and the adoption of SSTs (Kaushik et al.,
2015). Therefore, before embracing SSTs, hotel participators should firstly identify their target
customers’ characteristics (Kim & Qu, 2014), because the biggest challenge they were faced
with is to attract customers to innovative services rather than manage the technology (Liao &
Lu, 2008; Meuter et al., 2005; Wünderlich et al., 2013). Given that individuals are
heterogeneous, some consumers probably are apt to high-tech systems, while others might
prefer high-touch interactions with employees (Ba et al., 2010). Individual personal
characteristics have proven their influences on customers’ SSTs (Bateson, 1985; Donner &
Dudley, 1997; Kim & Qu, 2014; Selnes & Hansen, 2001; Voelker, 2010; Wünderlich et al.,
2013). These characteristics can be divided into two groups, namely demographic
characteristics, and consumer profiles.
72
In terms of demographics, previous studies reported that age and region had influences on
technology adoption. In terms of age, it shows that young people are more likely to embrace
innovative technology and utilize SSTs than the older (Castillo-Manzano & López-Valpuesta,
2013; Donner & Dudley, 1997). Besides, rural residents prefer to regard technology as an easy
approach to connect themselves to their bankers (Donner & Dudley, 1997). Additionally, the
influences of consumer profiles have been revealed, including perceived evaluation, self-
efficacy, motivation, role clarity, inherent novelty seeking, previous experience, self-
consciousness, need for interaction and privacy (Curran et al., 2003; Dabholkar & Bagozzi,
2002; Kasavana, 2008; Selnes & Hansen, 2001; Voelker, 2010; D. Wang, Park, & Fesenmaier,
2012; Wünderlich et al., 2013).
Perceived evaluation is comprised of satisfaction, effectiveness, fun, and perceived service
quality. Satisfaction represents the extent of consumers’ positive feelings and beliefs towards
perceived values of SSTs (Kim & Qu, 2014). Effectiveness can be regarded as achieving
topnotch satisfaction via preventing the process from error and hassle, which is positively
associated with the desire for interaction (Oh et al., 2013). Fun refers to enjoyment. It is found
that customers will engage themselves in utilizing SSKs if they perceive hedonic pleasure, and
they prefer SSTs options that bring about monetary discounts for entertainment (Dabholkar &
Bagozzi, 2002). Perceived service quality reflects the performance of SSTs customers perceive,
in terms of reliability, accuracy, and wellness, positively affecting attitude (Lu et al., 2009).
In SST domain, self-efficacy is regarded as the ability to utilize SSTs to tackle issues, which is
evaluated by customers themselves (Dabholkar & Bagozzi, 2002). High self-efficacy has a
negative influence on the relationship between perceived ease of use and attitude, and a positive
influence on the relationship between fun and attitude (Dabholkar & Bagozzi, 2002).
On one hand, in a particular domain, the benefits consumers gained due to the utilization of
SSTs probably provide implications for their behaviors with other services (Bateson, 1985;
Kim & Qu, 2014). On the other hand, customers who expect to have a “technological pause”
vacation will keep themselves from utilizing technology (Rosenbaum & Wong, 2015).
However, this is to some degree out of alignment with the findings which showed that there
were no significant differences between SST innovators and laggards in terms of travel
purposes (i.e., business VS. leisure) (Rosenbaum & Wong, 2015). Thereby, different
motivations have different influences on SST adoption. Moreover, motivation can be divided
73
into intrinsic and extrinsic motivations. Inherent novelty seeking refers to the desire to find
new stimuli (Dabholkar & Bagozzi, 2002), thereby enhancing the relationship between ease of
use and attitude.
Previous experience consists of product-norm experience, service failure and recovery
experience, and first-time experience (C. Wang et al., 2012). Prior experience refers to
familiarity with SSTs. Customers embracing SSTs in other domains (e.g., airline self-service
check-in kiosks) might be inclined to use hotel SSKs and gain gratification (Bateson, 1985;
Kim & Qu, 2014; C. Wang et al., 2012). Besides, Liao and Lu (2008) signified that factors
influencing customer adoption are different between consumers who have used it before in
comparison with those who never use this type of technology. Specifically, the findings of C.
Wang et al. (2012) showed that a gratifying first-time experience would result in like and
improved self-efficacy and stimulate future use, while a dissatisfying first-time experience
might give rise to negative attitude and reduced self-efficacy and thus prevent customers from
future utilization. This is consistent with the findings of Kasavana (2008) who reported that
customers who did not have satisfactory experience, or rather, did have a negative experience
with personal service, preferred to involve themselves in innovative technologies such as SSTs.
On the contrary, Kim et al. (2012) did not find a significant relationship between previous
experience (ever used SST or not) on the possibility of utilizing SST. It is worthy to note that
the methods in which previous experience influence SST adoption is more complicated than
SST characteristics and other individual differences (C. Wang et al., 2012).
Self-consciousness can be delimited as how individuals regarded themselves as a social object
taking other peoples’ opinions of them into consideration, which can be verified by social risk
in adopting SSTs with the presence of other customers (Dabholkar & Bagozzi, 2002). High
self-consciousness can enhance the relationships between performance and attitude, fun and
attitude, and attitude and intention, while slightly reduced the relationship between perceived
ease of use and attitude (Dabholkar & Bagozzi, 2002).
Need for interaction represents the mutual contact and communication between employees and
customers, which can be labelled as need for human services and desire for interaction (Curran
& Meuter, 2005). Notably, according to Kaushik et al. (2015), and Curran and Meuter (2005),
there was no significant influences of need for interaction on attitudes towards SSTs adoption,
while the study of Oh et al. (2013) decoded that need for interaction negatively influenced
74
perceived usefulness and intention. Dabholkar and Bagozzi (2002) found that high need for
interaction did not exert significant influences on the relationship between perceived usefulness
and attitude, but positively contributed to the relationships between perceived ease of use and
attitude, fun and attitude, and attitude and intention. Instead of strengthening the influences of
attitudes on intention, Lu et al. (2009) supported negative effects of need for interaction on
intention. Due to the limited variances explained by need for interaction, Oh et al. (2013)
suggested exploring other underlying staff-oriented antecedents. Need for interaction did not
significantly strengthen the influences of interpersonal service quality on intention, but did
significantly weaken the influences of SST on intention (Lee & Yang, 2013).
The dimension, privacy, encompasses trust and perceived risk and itself. Privacy consists of
the amount of control for the presence of other individuals and their information, related to
trust and perceived risk, and which is found to be positively associated with perceived
usefulness (Oh et al., 2013). Trust represents the beliefs of customers resulting from their
perceived certain information and can be used to tackle security and privacy issues (Kaushik
et al., 2015), and its positive effects on attitude and intention have been manifested (Kaushik
et al., 2015). Perceived risks refer to customers’ subjective beliefs about the negative outcomes,
and the expected and potential loss when pursuing a desired result, negatively influencing
attitude, satisfaction and intention (Curran & Meuter, 2005; Kaushik et al., 2015; Kim & Qu,
2014; Lu et al., 2009).
Situational Influences
Situational influences take an important place in customers’ decision-making on SST usage
(Collier, Moore, Horky, & Moore, 2015). These factors can be allocated into two groups,
namely micro-social context and macro-social context.
Micro-social context focuses on the service situations in a hotel. Previous research has
identified the role of customers’ companions in customer adoption of SSTs (C. Wang et al.,
2012). The old with young children are more likely to adopt SSTs than alone, while young
people are inclined to be influenced by their companions as well (C. Wang et al., 2012).
Perceived waiting time is also included in this group (Dabholkar & Bagozzi, 2002; C. Wang et
al., 2012). It means that customers wish to choose the service delivery channel which can save
their time, depending on the queue length and the efficiency of the service delivery (C. Wang
et al., 2012). Oh, Jeong, Lee, and Warnick (2016) quantitively demonstrated waiting line before

75
service contact personnel positively influences customers’ intention to use SST. Kokkinou and
Cranage (2015) further illustrated that not only the number of customers waiting to use people-
delivered service exert positive influences on intention, but also the number of customers
waiting to use SST-delivered have negative influences. However, academic research in this
area is still limited and deserves more attention. Location convenience, employee presence,
tolerance to wait, and order size all influence effectiveness, while order size and employee
presence enhance customers’ perceived time pressure (Collier et al., 2015).
External stimuli are comprised of employees’ demonstrations, other customers’ adoption, and
service providers’ incentives for utilization, positively influencing perceived usefulness,
perceived ease of use, and perceived behavioral control (Lu et al., 2009). Drawn from rational
behavioral theory, subjective norm originating from theory of reasoned action reflects customer
perceived social pressures, or rather, the degree to which their families, friends, and others
expect them to or not to conduct a behavior (e.g., accept SSTs) and their motivation to comply
with their families, friends and others (Fishbein & Ajzen, 1975; Kaushik et al., 2015; Lu et al.,
2009). Kaushik et al. (2015) found that subjective norms contributed to behavioral intention.
These findings indicate the influences of the recommendations of others.
Task Characteristics
Tasks broadly refer to “actions carried out by individuals in turning inputs into outputs”
(Goodhue & Thompson, 1995, p. 216). The acceptance and customer experience are influenced
by the task itself and customer self-efficacy. Prior research revealed that customers’
perceptions of task complexity affected their adoption of SSTs. Faced with a small and simple
problem, customers with sophisticated experience and knowledge prefer SSTs for the sake of
efficiency (Selnes & Hansen, 2001; Voelker, 2010). Conversely, high-touch services are more
preferred for a complicated task. In this sense, self-service is supposed to negatively influence
social bonds in simple relationships, while exerting positive effects on social bonds in complex
relationships(Selnes & Hansen, 2001). This is because more high-touch employees gain release
from repetitive and simple work and thus can engage themselves in rendering assistances to
customers who encounter complicated problems (Selnes & Hansen, 2001). In short, the
adoption of SSTs can be influenced by the nature of the service to be delivered (Kaushik et al.,
2015).
76
Antecedents and Attitudes toward Different SSTs
Moreover, aside from service itself, service delivery channels vary from company to company
and thus different enterprises hold dissimilar attitudes to SSTs and take unique competitive
strategies concerning service delivery (Ba et al., 2010). Likewise, customers’ attitudes towards
different SSTs vary (Kaushik et al., 2015). To be more specific, the adoption of different
technology used in different fields has different antecedents, and even the same technology in
different settings and the distinct technology used in the same domain. Similar although some
of the antecedents are, there are special and specific antecedents for this innovation in a special
sector (Considine & Cormican, 2016). In other words, customers not only hold different
attitudes towards similar SSTs in different domains but also had diversified attitudes toward
distinct SSTs used to deliver the same service (Curran & Meuter, 2005; Kaushik et al., 2015;
Meuter et al., 2003). For example, customers hold more positive attitudes towards widely
adopted SSTs than those rarely adopted (Curran & Meuter, 2005; Kaushik et al., 2015). Curran
and Meuter (2005) further revealed that factors influencing customers’ adoption of different
SSTs (ATM, phone, and online banking) are not always consistent, and indicated a difference
among stages in the adoption process in the same field (i.e., banking). Additionally, in different
studies, the degree to which different factors affect attitudes towards behavioral intentions to
use SSKs are diverse (Curran & Meuter, 2005). For example, in the study of Kim and Qu
(2014), the compatibility played the most important role, while technology anxiety in the
research of Kaushik et al. (2015) stood out. The extent of the impact of consumer readiness in
the forecast of customers’ trail of SSTs surpassed the degree of the influences of innovation
characteristic or individual difference variables (Meuter et al., 2005).
To sum up, conducive although prior literature regarding the antecedents of SST adoption is to
understanding preference between SST and service contact personnel, it is far from adequate.
With the advances in technology, hotel service delivery is usually multichannel. Taking a sing-
channel perspective to explore customers’ adoption of SST is open to doubt. Dovetailing with
previous studies regarding service delivery channel (Table 2.1), this study argues to
acknowledge the multiple nature of service delivery channel and that customers are multi-
channellers (Berry et al., 2010; Pieterson & Ebbers, 2008). Adding that reference-independent
preference emphasizes that decision making is influenced by a reference point (e.g., alternative
service delivery channel), a necessity of taking service contact personnel into consideration
calls for attention (Kahneman & Tversky, 1979). In other words, it is necessary to explore
77
customers’ preferences for SSTs by taking service employee as a reference point. Expressing
preference through choice functions as the essence of behavior (Slovic, 1995).
What is worse, existing studies concerning the adoption of SST is rare (Shin & Perdue, 2019).
For example, a sheer dearth of academic work exists regarding the influences of customer
experience on technology adoption (Shin & Perdue, 2019). Despite that academics revealed
the effects of need for interaction, product-norm experience, service failure and recovery
experience, and first-time experience on technology adoption, scant studies have attempted to
ascertain whether other facets related to customer experience impact technology adoption.
2.4.3 Factors Influencing Preferences between SSTs and Service Employees
There are limited studies investigating customers’ preferences between SST and service contact
personnel. Cassab (2009) revealed that multi-channel service attributes (including problem
handling, usability, record accuracy, scalability, and service quality) influence customers’
loyalty intentions in the context of mobile phone service. Lu et al. (2011) revealed that at an
airport, customers’ choices among counter check-in, kiosk check-in, internet check-in vary
according to nationality and previous experience. Situational factors (perceived crowdedness,
perceived waiting time, role clarity, perceived task complexity, and companion influence)
proved significant influences on customers’ choices between SST and personal service
(Gelderman et al., 2011; C. Wang et al., 2012). Cognitive style, age, and need for interaction
also significantly exert influences on customers’ choices between SST and service contact
personnel (Gelderman et al., 2011; Simon & Usunier, 2007). Besides, Fan et al. (2016)
demonstrated customer traits (sense of power), SST characteristics (degree of
anthropomorphism), and situational factors (presence of other customers) influence customers’
willingness to forgo SST and turn to service employee.
However, these studies are quantitatively conducted in a retailing context or at an airport,
mainly focus on check-in/check-out SST, and being explored from western and customers’
perspectives (Table 2.8). Experience of other industries serves as limited references
(Cunningham et al., 2009). Fail to take context into account might lead to failure (Rosenbaum
& Wong, 2015). Thereby, hoteliers’ and customers’ preferences between SSTs and service
contact personnel in a realm of hotel warrant further research. In the domain of hotel, Kaushik
and Rahman (2017) illustrated the mediating effects of need for interaction on the relationship
between technology readiness and customers’ choice between SSTs and service staffs from the
78
view of Indian domestic tourists. Nonetheless, Kaushik and Rahman (2017) used intention to
adopt SSTs to refer to the choice between SSTs and service personnel. That is, their study is
rather a research on customers’ intentions to use SSTs than customers’ choices between the
two delivery channels. Another drawback of their research is that they regarded choice between
SSTs and staffs as a one-off event, thus neglecting that customers are repeatedly faced with a
choice during the hotel service delivery process.
Hotel service delivery is distinct from the delivery process of a check-out service at a
supermarket, or a check-in service at an airport. Hotel service process involving check-in, room
service, restaurant, and check out (Danaher & Mattsson, 1994; Yung & Chan, 2002) are much
more complicated than the exclusive and single check-in/check-out service encounter at a
supermarket or airport. Additionally, individuals’ attitudes towards different/similar SSTs in
different service encounters are influenced by dissimilar factors and varies. Last but not the
least, Lu et al (2011) only used one item (i.e., whether participants used SST before) to measure
previous experience, which is out of align with C. Wang et al. (2012) who found that the
complexity of approach by which past experience influence SSTs attitudes and behavior excel
that of SST characteristics and individual differences. Thus, qualitative research is required so
as to gain a comprehensive understanding of how customers and hoteliers construct their
preference during the hotel service delivery process from the standpoint of experience.
2.5 Chapter Summary and Critique
To recap, this chapter lays a foundation for the design and conduction of the present research.
To begin with, this chapter reviewed previous studies on service delivery, including service
delivery channel, the role of high-touch employees and high-tech SSTs in the hotel industry,
and hotel service delivery process. Then the second part delimited customer experience,
summarized measurements of hotel customer experiences utilized in prior studies, and
reviewed research on customer experience with two distinct service encounters. Next, this
chapter discussed the transformation from manual service to high-tech service, and the
commensurate growth of high touch from the perspectives of hoteliers and customers, followed
by a debate over SST versus service contact personnel in the context of hotel. Subsequently,
the theories used by extant studies to explore the adoption of technology, together with factors
influencing adoption and preference were summarized and complied.

79
Based on the foregoing work, the voids in this field are summarized as shown in Table 2.10.
Accordingly, research questions and objectives proposed in the first chapter were reinforced.
In one word, the present study aimed to ascertain hotels’ and customers’ preferences among
different service channels (i.e., SSTs and service contact personnel) and to delve experiential
factors influencing their preferences during the hotel service delivery process, as well as the
discrepancies between hoteliers and customers in terms of preferences and experiences. The
next chapter articulated the study setting and methods used to achieve research objectives and
handle research questions.

80
Table 2.10 Summary of Research Gaps and Responses of the Present Study Field Main gaps Why should gaps be handled What will be done
Service delivery channel
Mainly focuses on government service but overlooks hotel context
Private service is distinct from government/public service
Investigate SSTs in a setting consisting of all service agents and channels, rather than in an isolated context in hotels
Overlooks different usages of delivery channels in distinct hotel service delivery stages
Hotel service delivery process is better understood through distinct service encounters
Anatomize hotel service delivery process into service encounters (e.g., check in, room, restaurant, and check out)
Deficiency of research on service delivery process
Service delivery process is as important as service outcomes
Investigate customers’ and hotels’ preferences for SSTs compared with service employees during the service delivery process
Customer experience
Lack of uniform measurement of hotel customer experience
General measurement across different types of hotels is needed
Develop a uniform measurement scale for customer experiences with SSTs and human services; Explore discrepancies between customer experiences with SSTs and with human services
Enhanced customer experience versus negative customer experience with SSTs
Customer experience plays an important role
Lack of a commensurate measurement scale for customer experiences with SSTs and human services
The degree of changes brought by SSTs with reference to service employees matters
Lack of comprehensive measurement of previous experience with different service delivery channels
Previous experience is usually measured by whether customers ever used SSTs Conflicting findings regarding whether previous experience is significantly related to customers’ adoption of SSTs The means by which previous experience influences customers’ SST adoption is much more complicated than other factors
Lack of research on the experience hoteliers provided and perceived
Hoteliers design experience Explore the customer experiences with SSTs and human services that hoteliers provided and perceived; Examine differences between customers’ and hoteliers’ perceptions of customers experience
Hoteliers determine available delivery channels used to deliver services Practitioners’ understanding of customer perceptions of SSTs is important when deciding whether to further implement SSTs
Debate over SSTs versus service personnel
Mainly conducted in airports, banking, or retail instead of hotels
Hotel service delivery process is much more complicated than a single service encounter (e.g., check-in at an airport)
Conduct in a hotel domain
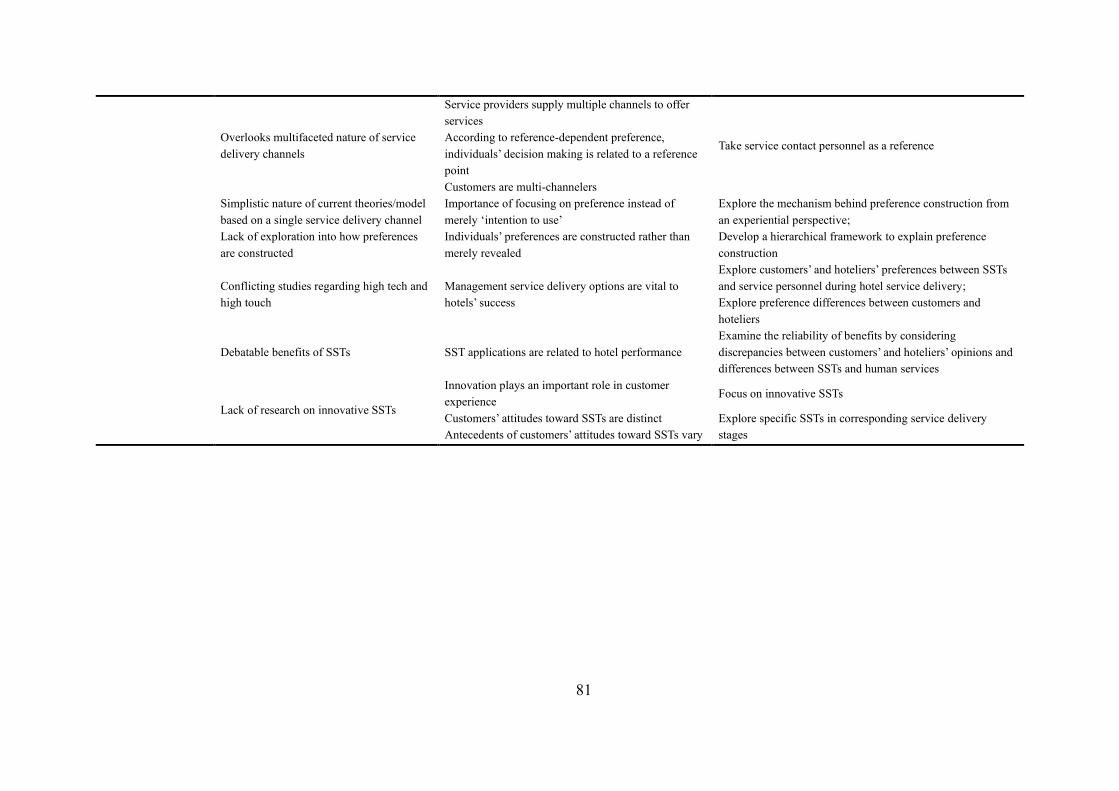
81
Overlooks multifaceted nature of service delivery channels
Service providers supply multiple channels to offer services
Take service contact personnel as a reference According to reference-dependent preference, individuals’ decision making is related to a reference point Customers are multi-channelers
Simplistic nature of current theories/model based on a single service delivery channel
Importance of focusing on preference instead of merely ‘intention to use’
Explore the mechanism behind preference construction from an experiential perspective; Develop a hierarchical framework to explain preference construction
Lack of exploration into how preferences are constructed
Individuals’ preferences are constructed rather than merely revealed
Conflicting studies regarding high tech and high touch
Management service delivery options are vital to hotels’ success
Explore customers’ and hoteliers’ preferences between SSTs and service personnel during hotel service delivery; Explore preference differences between customers and hoteliers
Debatable benefits of SSTs SST applications are related to hotel performance Examine the reliability of benefits by considering discrepancies between customers’ and hoteliers’ opinions and differences between SSTs and human services
Lack of research on innovative SSTs
Innovation plays an important role in customer experience
Focus on innovative SSTs
Customers’ attitudes toward SSTs are distinct Explore specific SSTs in corresponding service delivery stages Antecedents of customers’ attitudes toward SSTs vary

82
CHAPTER 3: METHODOLOGY
The first two chapters provided the background, reviewed previous academic work concerning
different service delivery channels (i.e., SSTs and service employees), and presented the
research objectives and questions of this study. As SSTs infiltrated tourism and hospitality
(Kaushik et al., 2015; Oh et al., 2013), customers’ adoption of SST has garnered some academic
attention (e.g., Kim & Qu, 2014). However, a drawback of these studies is that they did not
take service staffs into account. An alternative channel, as a reference point, significantly
influence preference according to reference-dependent preference (Kahneman & Tversky,
1979). Besides, organizational preference for SSTs still remains unexplored. Although
expressing of preference via choice functions as the essence of behavior (Slovic, 1995), there
is limited knowledge on customers’ and hotels’ preferences for innovative SSTs during hotel
service delivery process, particularly from a view of experience. Thus, as gleaned from Figure
3.1, from an experiential view, this current study explored hotels’ and customers’ preferences
for SSTs during hotel service delivery process by taking human services as a reference point.
The discrepancies between hoteliers’ and customers’ preferences and perceptions of
experiences were probed as well. Such a study was set in a context of China. As follows, after
introducing the study setting, the methodology and methods used to reach the objectives and
to address the research questions defined and defended above were explained in detail.
Figure 3.1 Study Framework of the Present Research

83
3.1 Study Setting: China
3.1.1 Background and Context of SST Application in China
Tourism + Internet
In 2015, with the State Council's No. 62 document enacted, “tourism + internet” is recognized
as a suggested approach to promote tourism investment and consumption. Subsequently, China
National Tourism Administration (CNTA) (2015) promulgated Notice on the Action Plan of
the Implement of “Tourism + Internet”, including advancing infrastructure construction of
regional internet, promoting interactive terminals, developing smart tourism destination,
innovating tourism network marketing models, promoting smart rural tourism development,
rapidly developing new operational types of tourism, supporting online tourism entrepreneurial
innovation, and promoting facility construction of tourism internet of things in the same year.
All these action plans are supported by corresponding strategies, consisting of constructing
open and inclusive “tourism + internet” environment, enhancing innovative capability of
“tourism + internet”, launching pilot demonstration and popularization and application of
innovative products of “tourism + internet”, supporting and guiding the innovation of
development policies of “tourism + internet”, and supporting internet tourism enterprises to
expand overseas collaborations. Meanwhile, Li (2015), director of CNTA, addressed a speech,
emphasizing to strongly promote the rapid and healthy development of “tourism + internet”.
In 2017, CNTA and University of Chinese Academy of Sciences collaboratively published
China’s first top ten science and technology tourism bases, in favor of promoting the support
of science and technology for tourism development, and tourism’ promotion for science and
technology (Chinanews, 2017). These government documents and strategies indicate that
China attaches importance to the role of technology, specifically the internet, in tourism. As an
important component in tourism, accommodation, or rather hotel, has paid attention to
technology (Sun, 1990). For example, “Internet + Smart Hotel Self-service Machines”
appeared on a digital economic conference (Huanqiu, 2017). With Tech breakthroughs
megatrend: how to prepare for its impact published by PricewaterhouseCoopers (PWC, 2016),
a fierce discussion was sparked off about the influences of innovative technologies, including
VR, Augmented Reality (AR), 3D printing, blockchain, Internet of Things (IoT), artificial
intelligence (AI), robots, and drones. All these technologies benefit both hotels and customers.
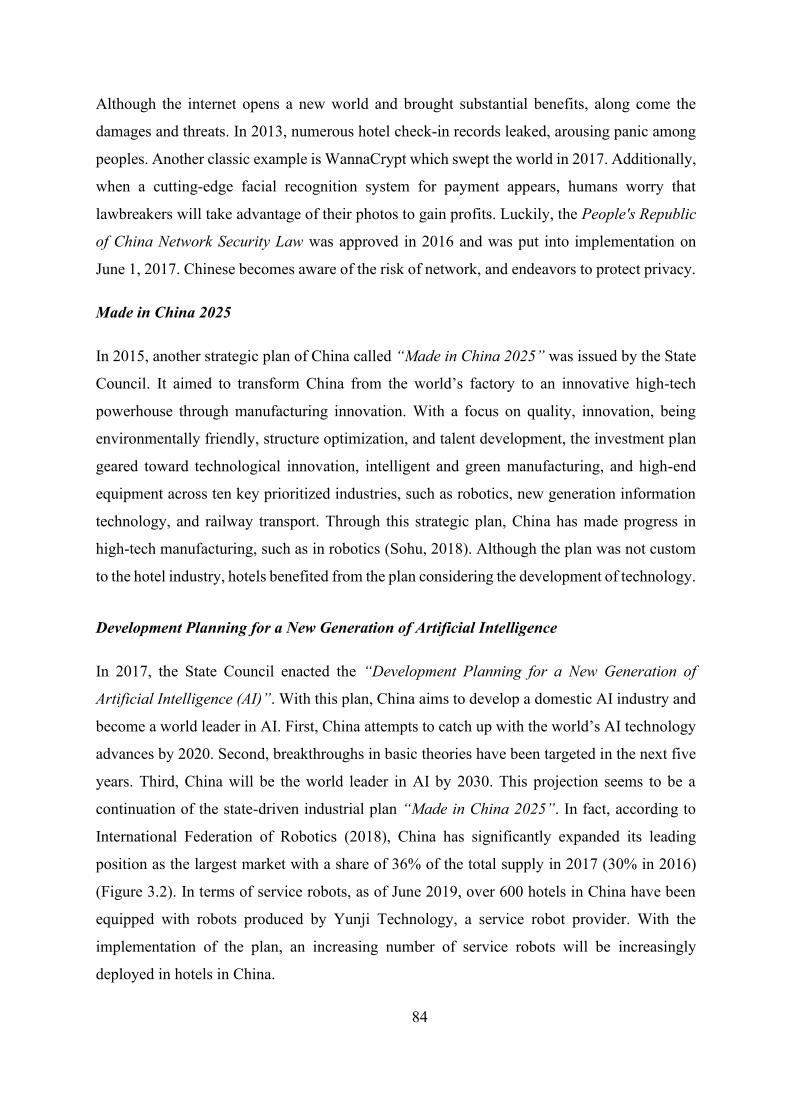
84
Although the internet opens a new world and brought substantial benefits, along come the
damages and threats. In 2013, numerous hotel check-in records leaked, arousing panic among
peoples. Another classic example is WannaCrypt which swept the world in 2017. Additionally,
when a cutting-edge facial recognition system for payment appears, humans worry that
lawbreakers will take advantage of their photos to gain profits. Luckily, the People's Republic
of China Network Security Law was approved in 2016 and was put into implementation on
June 1, 2017. Chinese becomes aware of the risk of network, and endeavors to protect privacy.
Made in China 2025
In 2015, another strategic plan of China called “Made in China 2025” was issued by the State
Council. It aimed to transform China from the world’s factory to an innovative high-tech
powerhouse through manufacturing innovation. With a focus on quality, innovation, being
environmentally friendly, structure optimization, and talent development, the investment plan
geared toward technological innovation, intelligent and green manufacturing, and high-end
equipment across ten key prioritized industries, such as robotics, new generation information
technology, and railway transport. Through this strategic plan, China has made progress in
high-tech manufacturing, such as in robotics (Sohu, 2018). Although the plan was not custom
to the hotel industry, hotels benefited from the plan considering the development of technology.
Development Planning for a New Generation of Artificial Intelligence
In 2017, the State Council enacted the “Development Planning for a New Generation of
Artificial Intelligence (AI)”. With this plan, China aims to develop a domestic AI industry and
become a world leader in AI. First, China attempts to catch up with the world’s AI technology
advances by 2020. Second, breakthroughs in basic theories have been targeted in the next five
years. Third, China will be the world leader in AI by 2030. This projection seems to be a
continuation of the state-driven industrial plan “Made in China 2025”. In fact, according to
International Federation of Robotics (2018), China has significantly expanded its leading
position as the largest market with a share of 36% of the total supply in 2017 (30% in 2016)
(Figure 3.2). In terms of service robots, as of June 2019, over 600 hotels in China have been
equipped with robots produced by Yunji Technology, a service robot provider. With the
implementation of the plan, an increasing number of service robots will be increasingly
deployed in hotels in China.

85
Figure 3.2 Estimated Worldwide Annual Supply of Industrial Robots in 15 Largest Markets 2017
(International Federation of Robotics, 2018)
Registration for Guests
One of China’s special national conditions is that according to the Ministry of Public Security
(MPS) of the People’s Republic of China, customers must register on the system of lodging
industry security management when checking in. Foreigners are no exception. In 2017, MPS
released a draft of the new regulations on the security administration of tourism, asking
hoteliers to install the system for lodging industry security management and upload customers’
information in real time, and demanding customers to provide valid identification documents.
This is not new in China. The State Council approved management measures of tourism
security in 1987. Among the measures is the one asking hotels to check customers’ identify
documents and registration information. If hoteliers violate these regulations or measures, they
will be punished according to the rules of The Law of the People’s Republic of China on
Administrative Penalties for Public Security (CPGPRC, 2005). This registration procedure to
some degree impedes the promotion and implementation of self-check-in.
3.4
3.4
4
4.2
4.5
4.9
6.3
7.7
8.3
10.9
21.4
33.2
39.7
45.6
137.9
0 20 40 60 80 100 120 140 160
India
Thailand
Canada
Spain
Singapore
France
Mexico
Italy
Vietnam
Taiwan
Germany
United States
Rep. of Korea
Japan
China
000 of units

86
Chinese Workforce
On the one hand, labor supply is dramatically decreasing in China. First, the number of Chinese
workforces is decreasing. From 2012 to 2018, approximate 30 million in the labor force
population diminished (Chinatimes, 2019), leading to increased labor cost, transfer of industry,
and the future trend of technology serving as a replacement of labor. According to Ministry of
Human Resources and Social Security,15-64 age population of China would decrease to 830
million in 2030 and 700 million in 2050 (Tse & Wu, 2018). Besides, the issues incurred by the
aging of the labor force population even surpass that aroused by the decreased number. A
supply and demand study on the skills shortages in the Chinese labor market conducted by
Tsinghua University and Fudan University in 2016, predicted that in the following 15 years,
the aging of the labor force population would accelerate. Virtually, the average age of Chinese
labor force has risen from 34 in 1978 to 38 in 2010, and this trend will continue deteriorating,
probably due to the one-child policy. Demographic dividend fades away. The lack of workforce
pushes the development of industrial automation (ChinaIRN, 2013).
On the other hand, the high rate of employee turnover has been a serious issue in China. Its
negative outcomes have been recognized by both practitioners and scholars. For example, Yang
and Yin (2012) pointed out that employee turnover gives rise to unstable service quality,
damages hotels’ intangible assets, and increases labor costs. Li (2005) stated that high staff
turnover rate seriously and negatively impact hotels’ operation, result in the leak of employee
skills and experience, lead to lower competition, cause lower customer and employee loyalty,
and subsequently inhibit the further development of the hotel industry. Previous studies
identified that the reasons for staff turnover include limited career development opportunities,
poor salary, ideological questions, low social status, bad working conditions, the deficiency of
communication among employees and between employees and managers, and industry
competition (Lv & Wang, 2009). Extant literature introduced some countermeasures,
comprised of carrying out reward mechanisms, sticking to people-oriented management
concepts, emphasizing employee’s career planning, and enhancing staff salary and welfare
(Yang & Yin, 2012). Recently, using technology, especially SST which can provide service
without employees’ participation and replace humans, is seen as an effective approach to the
lack of labor force (Wei et al., 2016).
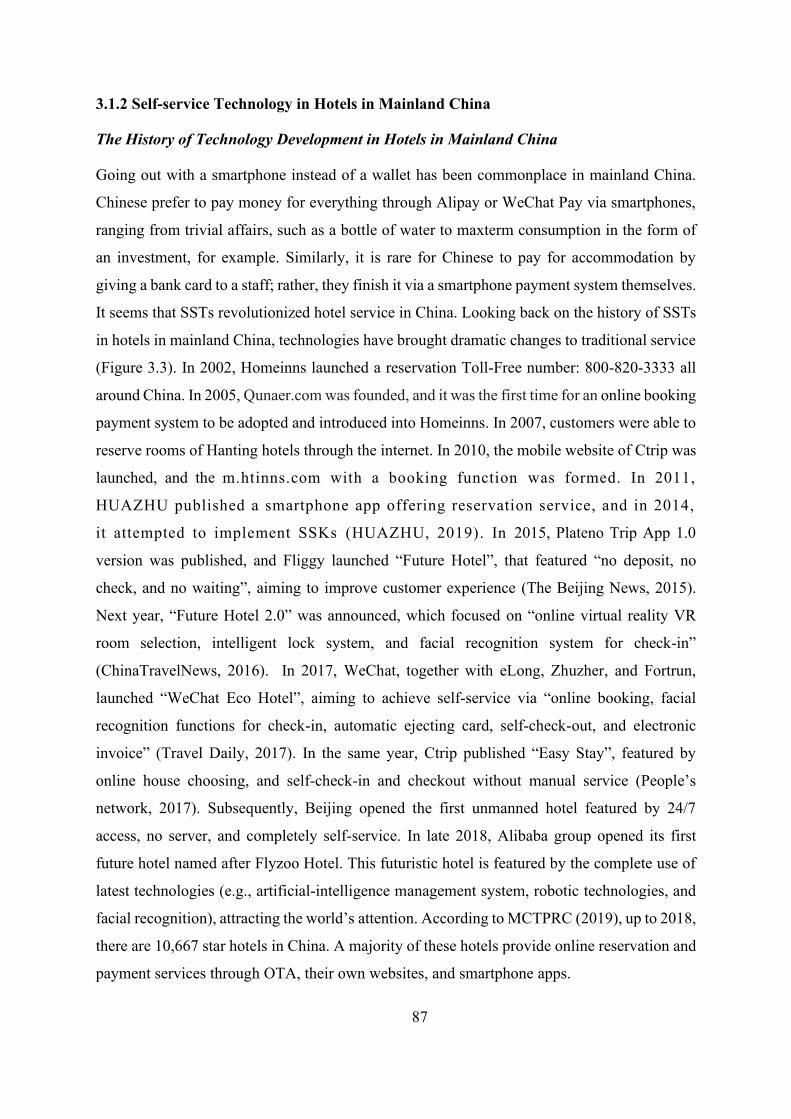
87
3.1.2 Self-service Technology in Hotels in Mainland China
The History of Technology Development in Hotels in Mainland China
Going out with a smartphone instead of a wallet has been commonplace in mainland China.
Chinese prefer to pay money for everything through Alipay or WeChat Pay via smartphones,
ranging from trivial affairs, such as a bottle of water to maxterm consumption in the form of
an investment, for example. Similarly, it is rare for Chinese to pay for accommodation by
giving a bank card to a staff; rather, they finish it via a smartphone payment system themselves.
It seems that SSTs revolutionized hotel service in China. Looking back on the history of SSTs
in hotels in mainland China, technologies have brought dramatic changes to traditional service
(Figure 3.3). In 2002, Homeinns launched a reservation Toll-Free number: 800-820-3333 all
around China. In 2005, Qunaer.com was founded, and it was the first time for an online booking
payment system to be adopted and introduced into Homeinns. In 2007, customers were able to
reserve rooms of Hanting hotels through the internet. In 2010, the mobile website of Ctrip was
launched, and the m.htinns.com with a booking function was formed. In 2011,
HUAZHU published a smartphone app offering reservation service, and in 2014,
it attempted to implement SSKs (HUAZHU, 2019). In 2015, Plateno Trip App 1.0
version was published, and Fliggy launched “Future Hotel”, that featured “no deposit, no
check, and no waiting”, aiming to improve customer experience (The Beijing News, 2015).
Next year, “Future Hotel 2.0” was announced, which focused on “online virtual reality VR
room selection, intelligent lock system, and facial recognition system for check-in”
(ChinaTravelNews, 2016). In 2017, WeChat, together with eLong, Zhuzher, and Fortrun,
launched “WeChat Eco Hotel”, aiming to achieve self-service via “online booking, facial
recognition functions for check-in, automatic ejecting card, self-check-out, and electronic
invoice” (Travel Daily, 2017). In the same year, Ctrip published “Easy Stay”, featured by
online house choosing, and self-check-in and checkout without manual service (People’s
network, 2017). Subsequently, Beijing opened the first unmanned hotel featured by 24/7
access, no server, and completely self-service. In late 2018, Alibaba group opened its first
future hotel named after Flyzoo Hotel. This futuristic hotel is featured by the complete use of
latest technologies (e.g., artificial-intelligence management system, robotic technologies, and
facial recognition), attracting the world’s attention. According to MCTPRC (2019), up to 2018,
there are 10,667 star hotels in China. A majority of these hotels provide online reservation and
payment services through OTA, their own websites, and smartphone apps.

88
Figure 3.3 The History of Technology Development in Hotels in Mainland China
The Status Quo of SST Application in Hotels in Mainland China
International hotel chains such as Hilton Worldwide and Hyatt pushed digital check-in or SSKs
around the world (Breaking Travel News, 2014; Hotel News Now, 2010). These strategies are
more successful in western countries than in China. One of the reasons might be that customers
in China must offer identification documents, and hotels must upload this information in real
time according to the rules of MPS. Albeit the SST application in hotels in China started late,
it catches up rapidly (Liu & Hung, 2019). Technologies have attached importance to tackle
labor issues in China, including the decreased labor force, the aging labor force, and the high
rate of employee staff turnover. In 2015, Xbed, an internet hotel platform, created in China,
aimed to provide accommodation service through an APP instead of clerks. There are no front
desk, receptionist, or guards. Customers are supposed to make a reservation, unlock their hotel
room doors, and check out all through the APP (Jiemian, 2016). Subsequently, a series of
projects targeting self-service and service automation based on high technologies were
2002 •Homeinns launched researvation Toll-Free number all aroud China.
2005•Qunaer. com was founded. • Homeinns firstly introduced online booking payment system.
2007 •Hanting provide online booking service.
2010 •HUAZHU opened mobile researvation website, m.htinns.com.
2011 •HUAZHU published smartphone app offerting researvation service.
2014 •HUAZHU attempted to implement SSKs.
2015•Plateno Trip APP 1.0 was published.•Fliggy launched " Future Hotel".
2016 •Fliggy launched " Future Hotel 2.0".
2017 •"WeChat Eco Hotel" was launched.
2017 •Ctrip published "Easy Stay".
2017 •The frist unmanned hotels were opened in Beijing.
2018•Flyzoon Hotel, the world’s first future hotel, was opened in Hangzhou.
89
published including “Future Hotel,” “WeChat Eco Hotel,” and “Easy Stay” in mainland China
(Liu & Hung, 2019). At the same time, domestic hotels such as Wanda, 99in, and Hanting
began to try SSTs. The East Hotel Hangzhou, The Yingsu Film Hotel Suzhou, and The Dragon
Hangzhou in mainland China attempted to adopt facial recognition check-in or SSKs. As
mentioned earlier, more than 600 hotels in mainland China have introduced robots. However,
compared with 10,667 star hotels in China (MCTPRC, 2019), the number of hotels that
attempted to implement SSTs to supply on-site services was relatively limited, albeit gradually
escalating. A recent hit in China was that the first unmanned hotel was opened in Beijing and
earned a plethora of public attention and discussion in 2017. However, it was closed due to a
lack of legal licenses several days after it became an online celebrity. The flash in the pan
exacerbates the need to ponder the SST application in hotels in China. Another hit is Flyzoon
Hotel, the world’s first future hotel. However, it is still in its trial with unknown future given
that some of the user generated comments were terrible.
Research Progress in SSTs in China
The opportunities and challenges faced by China’s self-service development garnered
attention. For example, Zhang (2013) took civil aviation industry as an example to elucidate
the opportunities and challenges that China’s self-service development confronts. According
to him, the opportunities comprised the technological opportunities incurred by the evolution
of the internet and the development of electronic commerce, and the market opportunities
resulting from customers’ demand for self-service. The challenges consisted of the lack of
institutional and policy support and the inadequate completely self-service system. Previous
Chinese studies also examined the factors influencing the use and outcomes of SSTs. Chen
(2014) explored the relationship between behavioral intention and customers’ self-efficiency
concerning SSTs. Influencing factors previously examined, include company image, self-
efficacy, customers’ sensing control, customer participation, perceived convenience,
technology anxiety, self-service preference, and subjective norm (Cen & Gan, 2011; Jiang,
2013; Liu, 2016; Lou, 2010). Gao and Dong (2011b) summarized and reviewed the antecedents
and models of the self-service technology adoption. They divided the antecedents into two
categories, namely cognitive antecedents and emotional antecedents, while categorizing the
adoption models into three groups: cognition-drive model, motivation-drive model, and
integration-drive model.
90
Academic research regarding outcomes can be divided into two streams. The first literature
stream focuses on the influences of SSTs on customers, including effects on customer values,
willingness of continued use, customer satisfaction, service trade, cultural dimension, channel
migration, and experience (Gong, 2014; Wang, 2015; Wang, 2012; Wang, 2016; Wang, 2013;
Zhang, 2012). For example, Wang (2013) took E-bank as a case study and explored the
influences of customer participation on customer values in the context of SSTs. The more
participation there is, the more likely it is to improve customer values. Wang (2016) explored
customer experience with self-service of libraries and stated that customers themselves affected
user experience, coupled with technical support, environmental conditions, and information
resources. The second stream concentrates on the influences of SSTs on firms, or rather, effects
on service firm performance (Wang, 2010).
Chinese academic scholars also paid attention to foreign studies regarding SSTs. For example,
Peng (2015) invested self-service remedies in other countries. Gao and Dong (2011a) reviewed
domestic and overseas studies with respect to SST. Self-service technologies themselves, or
rather SST design, received attention as well. For example, Liu and Jin (2009) introduced a
hotel self-service vending management system based on room key card. Zhang and Liu (2013)
explored the design methods of self-service terminal interface on the basis of consumers’
cognitive skills.
Yet, limited attention has been attached to the comparison between self-service and
conventional service. Xie (2014) explored the implicit attitude of consuming style according
to self-service and traditional service and revealed that females with high income and rich
experience of using internet preferred self-service, whereas men whose income was low and
did not use internet much preferred manual service.
3.1.3 Why China?
The current inquiry is situated in the Chinese context for three reasons. First, China is facing
serious labor issues, including the decreased number of labor force, the aging of labor force,
and the high rate of staff turnover. Technology might be conducive to handling these problems.
However, hotels in China is in the early stage of introducing SSTs. Hoteliers are faced with a
decision regarding whether or not deploy SSTs and to what extent implement SST (Oh et al.,
2013). Fortunately, China provides policy support for the collaboration between technology
and tourism, for example, the suggested “tourism + internet”. On the contrary, in China,
91
customers are supposed to provide identification documents and hotels are required to upload
these information pieces in real time according to the rules of MPS, to some degree derailing
the application of self-check-in in China.
Additionally, as an essential construct of tourism, accommodation attaches importance to
technology, and almost all hotels in China provided online booking and payment service.
However, there are a very limited number of hotels in China that deploy innovative SSTs in
comparison with the total number of hotels in the country. Contrary to the 10,667 star hotels in
China, only couples of hotels attempted to implement SSTs to supply on-site services.
Moreover, even though academia paid attention to SSTs in western countries such as USA (as
shown in Table 2.3 and Table 2.8), there is still a lack of knowledge about SSTs in mainland
China. Differences exist across different perspectives and contexts, in line with Mattila (1999a)
who conveyed that Asian customers and western customers hold different values of luxury
hotel stay. Lu et al. (2011) revealed that Taiwanese are inclined to use conventional personal
check-in, while Korean, Australian, and American prefer to come to SST to check in at an
airport. Concerning the application of SST in a hotel context, the failure in taking distinction
of national culture into account probably exerts negative impacts on customer service and hotel
performance (Fisher & Beatson, 2002). In fact, nationality significantly influences the SST
adoption and usage (Fisher & Beatson, 2002; Lu et al., 2011). For example, the Hotel X in
Macau did not test SSTs in Macau context before implementing SST kiosks resulted in low
utilization ratio (Rosenbaum & Wong, 2015).
Last but not least, although existing Chinese scholars paid attention to the opportunities and
challenges faced by China’s self-service development, the factors influencing the adoption of
SSTs, the outcomes of SSTs, and SSTs design, most of which are set in the field of finance and
libraries rather than hotels. Furthermore, research on the comparison between self-service and
traditional service is still in its fancy. Understanding the interaction between SST and employee
is conducive to the knowledge about the role of technology in human lives. An even more
neglected area of research concerns the debate of SSTs and employees in hotels in mainland
China considering customer experience. It is necessary to explore the trade-off between SST
and employee in different service domains such as a hotel setting for the sake of generalization
(Ahearne et al., 2008; Anderson, 1995). Thereby, the study of Chinese SST has both practical
significance and theoretical importance.
92
3.2 Research Design
3.2.1 Mixed Methods Research
Both quantitative research and qualitative research are useful approaches to handle academic
issues, despite their differences. Notwithstanding that quantitative research is no better than
qualitative research and vice versa, each approach has its own pros and cons (Waller,
Farquharson, & Dempsey, 2016). Firstly, qualitative research is engaged in the quality or the
nature of something via addressing what is going on, while quantitative research is involved in
trying to quantify something via asking how widespread the issue is in the situations. Knowing
what is going on is the prerequisite of answering the question of whether it is widespread or
not (Waller et al., 2016). Secondly, qualitative research stresses unexplored processes, for
example, how experience is created, while quantitative studies underline the measurement and
analysis of relationships between variables as opposed to processes (Denzin & Lincoln, 1994).
Thirdly, qualitative research is inductive, while quantitative research is deductive. That is, aside
from testing theories, qualitative research can generate new theories (Waller et al., 2016). The
values and beliefs of the goal of research decide the choice between the two research methods
(Waller et al., 2016). To combine these advantages and neutralize disadvantages, another
legitimate research emerged (Creswell, Clark, Gutmann, & Hanson, 2003). That is mixed
methods research, which is defined as a “collection or analysis of both quantitative and
qualitative data in a single study in which the data are collected concurrently or sequentially,
are given a priority, and involve integration of the data at one or more stages in the process of
research” (Creswell et al., 2003, p. 212).
In this study, mixed methods research is adopted due to the following two considerations. To
begin with, preference construction and customer experience are so complicated that calls for
different methods to enhance our understanding (Creswell et al., 2003). A qualitative
exploration of the process of preference is inadequate. A quantitative study is wanted to
discover what are true concerns to the preference (Creswell & Clark, 2007; Kutner, Steiner,
Corbett, Jahnigen, & Barton, 1999). Secondly, the mixed methods research makes access to
more thorough and comprehensive answers to the research questions (Creswell & Clark, 2007).
Specifically, the qualitative data can provide in-depth insights into the preference construction
and customer experience, while the quantitative research can measure the frequency and extent
of preference and experience during the service delivery process (Hilton et al., 2013).

93
3.2.2 Sequential Exploratory Design
There are different strategies to conduct mixed methods research. Creswell et al. (2003)
classified mixed methods designs into six types according to four factors, namely
implementation, priority, integration, and theoretical perspective (Table 3.1) (Creswell et al.,
2003). It is necessary to specify the strategy the research adopts together with the criteria they
rely on to select the strategy (Creswell, 2003). The researcher supposed to choose among the
types to satisfy the needs of reaching research objectives (Creswell et al., 2003). Here, a
sequential exploratory design (qualitative research emphasized) is selected on the basis of the
four criteria (Creswell et al., 2003).
Table 3.1 Types of MieDesigns by Implementation, Priority, Integration, and Theoretical Perspective (Creswell et al., 2003, p. 224)
Design Type Implementation Priority Stage of Integration Theoretical Perspective
Sequential explanatory
Quantitative followed by qualitative
Usually quantitative; can be qualitative or equal
Interpretation phase May be present
Sequential exploratory
Qualitative followed by quantitative
Usually qualitative; can be quantitative or equal
Interpretation phase May be present
Sequential transformative
Either quantitative followed by qualitative or qualitative followed by quantitative
Quantitative, qualitative, or equal
Interpretation phase
Definitely present (i.e., conceptual framework, advocacy, empowerment)
Concurrent triangulation
Concurrent collection or quantitative and qualitative data
Preferably equal; can be quantitative or qualitative
Interpretation phase or analysis phase
May be present
Concurrent nested
Concurrent collection or quantitative and qualitative data
Quantitative or qualitative
Analysis phase May be present
Concurrent transformative
Concurrent collection or quantitative and qualitative data
Quantitative, qualitative, or equal
Usually analysis phase; can be during interpretative phase
Definitely present (i.e., conceptual framework, advocacy, empowerment)
Implementation is regarded as the sequence of data collection (Creswell et al., 2003). In detail,
the qualitative data and quantitative data are collected at the same time (i.e., concurrent), or
one is collected before the other (i.e., sequential) (Creswell et al., 2003). This current study
employed sequential collection, or rather, the qualitative data was collected before the
quantitative data. The consideration lied in that the factors influencing the preference, or the
gaps mentioned in research objectives were first explored by the qualitative study and then
examined through quantitative research.

94
In mixed methods, priority was given to quantitative research or qualitative research. Besides,
the two research can receive the same importance. The priority can be decided based on the
preference of the researcher and the research questions (Creswell & Clark, 2007; Creswell et
al., 2003). This study underlined the exploration of the preference for SSTs compared with
human services from an experiential view. To the best of the author’s knowledge, there is no
existing theory or framework for customers’ and hoteliers’ preference construction for SSTs
and customer experience creation. A priority thus was allocated to qualitative research to firstly
unveil the mechanism of the construction of preference and experience creation. Then,
quantitative study was conducted to ascertain whether influences of customer experience on
preferences can be generalized to different samples and assistant the quantitative readers to
understand the qualitative findings (Creswell & Clark, 2007; Creswell et al., 2003).
Qualitative research and quantitative research are not separative in a single study. There should
be a point where they can combine. The integration can occur at the data collection, data
analysis, data interpretation, or during the whole research process (Creswell et al., 2003). This
research integrated the two studies at the interpretation stage because the quantitative data is
garnered to assist in the interpretation of qualitative results (Creswell et al., 2003). That is, the
following quantitative research contributed to confirming and generalizing the qualitative
findings and thus expanded our knowledge (Creswell, 2003). Therefore, the results of
qualitative research were heightened by quantitative data (Creswell & Clark, 2007). In other
words, in the end, the current study combined the findings of the qualitative and quantitative
studies to address the research gaps, answer research questions, and achieve research objectives
followed by theoretical and practical implications.
A theoretical perspective refers to the lens from which a researcher views his or her study. The
theoretical lens may be explicit or implicit (Creswell et al., 2003). In this study, an implicit
theoretical lens was tapped since the conceptual framework was built based on the results of
the qualitative research.
According to the good fit between the nature and characteristics of the objective and questions
of the study and the characteristics and aims of sequential exploration design, sequential
exploratory design was adopted. Sequential exploratory design was useful for in-depth
exploration of the preferences between SSTs and service employees and measuring prevalence
(Creswell & Clark, 2007). This design in the present study was carried out in two phases, which

95
was featured by starting with qualitative research followed by quantitative study, with a priority
given to the former research. The theoretical perspective was not prescribed but built on the
qualitative results and used to guide the subsequent quantitative study. Ultimately, the findings
of the two pieces of research were integrated.
Additionally, sequential exploratory design was deployed on account of its inherent
advantages. In detail, its two-phase approach allowed easy implementation and straightforward
description (Creswell & Clark, 2007; Creswell et al., 2003). Last but not least, this design
contributed to assisting quantitative-oriented readers in understanding the qualitative study
(Creswell & Clark, 2007; Creswell et al., 2003).
3.2.3 Visual Diagram
This study aimed to build a model that could explain customer preference between SSTs and
service employees from an experiential view. The purpose of this exploratory sequential design
was to develop and test the mechanism of the construction of preference. The first phase was
qualitative research focusing on the exploration of customer experience and hotelier’s
perceptions of customer experience, for which in-depth interviews with customers and hoteliers
were conducted to collect data. This inductive approach allowed for the flexible development
and presentation of multidimensional views from the field, or rather, for the meaning and
interpretation of preference from an experiential view, contributing to developing a relatively
comprehensive framework. Following the qualitative phase was the second phase, quantitative
research, whose purpose was to generalize and test the hypotheses which were developed based
on the results of qualitative research. In the quantitative phase, questionnaires with the
measures developed form qualitative study and literature review were sent to both customers
and hoteliers. The reason for collecting qualitative data initially was that there is no conceptual
framework or theory to clarify the construction of customer preference from an experiential
view (Creswell & Clark, 2007).
After identifying the strategy to conduct the research, a visual diagram was made for
elucidating the steps of carrying out the study (Figure 3.4) (Creswell et al., 2003). The
elaborated procedures and their corresponding products were explicated in Section 3.4 (Stage
One) and Section 3.5 (Stage Two). The following was the paradigm used to guide the mixed
methods research.

96
Figure 3.4 Visual Diagram of the Procedures for the Sequential Exploratory Design of this Study
3.3 Research Paradigm: Constructivism
A paradigm represents “a set of basic beliefs about how the world is and values about how the
world should be” (Waller et al., 2016, p. 7), or rather, “a combination of basic beliefs and
values that will guide how you do your research” (Waller et al., 2016, pp. 7–8), which are
based on and can be explained by three assumptions, namely ontological, epistemological and
methodological assumptions (Denzin & Lincoln, 1994). There are different typologies and
terminologies of paradigms, such as positivism, post-positivism, critical social theory,
pragmatism, phenomenology, and constructivism. Positivism and post-positivism are mainly
used to instruct quantitative research, highlighting the exclusive reality that is independent of
human consciousness (Waller et al., 2016). Critical theory stresses historical realism, which
means that the reality is formed based on the accumulation of social, economic, and cultural
facets over time (Denzin & Lincoln, 1994).
Similarly, mixed methods research calls for basic worldviews to guide the study (Creswell &
Clark, 2007). However, academia disputes the paradigm for mixed methods research. The
debates cover two major issues. The first focus of the discussion is whether there are
appropriate beliefs and values to guide mixed methods research. The second focus lies in the
selection of a suitable paradigm. Teddlie and Tashakkori (2003) summarized these debates and
anatomized them into six distinct groups. According to the first stance, there is no problem to
link epistemological methods since methods and paradigms are independent. In contrast, some
scholars argue the incompatibility of qualitative research and quantitative research. The third
group recognizes the legitimacy of mixed methods, while emphasizing the separateness of
97
paradigms to highlight complementary advantages. The fourth group advocates a single
paradigm to serve as the foundation for mixed methods research. Nevertheless, they are out of
align in terms of which paradigm should be the best paradigm. Some academic researchers
prefer pragmatism, whereas transformative-emancipatory paradigm is promoted by other
scholars. Instead of advocating that one paradigm excels others, “dialectic” stance conveys that
all paradigms are valuable but partial. The last group believes multiple paradigms and promotes
that the best paradigm relies on the type of mixed methods research. For example, in their
opinions, pragmatism stands out in terms of guiding a concurrent triangulation design. In a
sequential explanatory design (quantitative emphasized), the best paradigm is post-positivism
(Creswell et al., 2003). Constructivism likely functions a lot in a sequential exploratory design
(qualitative emphasized) (Creswell & Clark, 2007).
This current study backs up the standpoint of the last group which advocates that the best
paradigm depends on the type of the research and the matching with the purposes of the study
(Creswell & Clark, 2007). The first consideration resides in the fact that it is consistent with
the position in qualitative research, which means that there are couples of paradigms that can
instruct qualitative research and the best paradigm of qualitative research counts on the
characteristics of the research. The same situation applies to mixed methods research (Creswell
et al., 2003). Aside from that, given the qualitative emphasis, the sequential exploratory design
is supposed to be under the direction of constructivism, which is in accordance with Creswell
et al. (2003) who espouse to take account of the choice among the aforementioned six types.
Therefore, the paradigm of the present study is constructivism due to consistent beliefs and
values, especially in the emphasized qualitative phase. The selection of constructivism is
further explained by the three preceding assumptions as follows.
3.3.1 Ontological Assumption
The ontological question asks what the form and the nature of reality is and what is there that
can be known about it (Guba & Lincoln, 1994). Straightly speaking, what can be known
(Waller et al., 2016)? The breakaway assumption of constructivism is relativism (Guba &
Lincoln, 1994). That is, realities are local and specific constructed (Guba & Lincoln, 1994;
Waller et al., 2016). Contrary to ontological realism that an objective reality exists, proponents
of constructivism state that realities reside in the mind of individuals and are locally created,
leading to many realities (Guba & Lincoln, 1994; Waller et al., 2016). In a similar vein, the

98
preference among different service delivery channels depends on individual persons,
contrasting with the reality that there is exclusively one correct result of choices regardless of
individuals. Besides, these realities can be changed with the evolution of constructors. For
instance, consumers are more critical and informed than ever before due to the constantly
advanced technology. Consumers’ preferences are changing rapidly, and more complicated and
numerous consumer segments with different tastes, values, and consumption patterns emanate
(J.-S. Chen et al., 2009). In this sense, constructivism is suitable for the present study.
3.3.2 Epistemological Assumption
The epistemological question is what the nature of the relationship between the knower is or
would-be knower and what can be known (Guba & Lincoln, 1994). Researchers are linked
interactively to phenomena, the object being investigated, and exert influences on their
relationship with respondents and the interpretation of what is done and said (Guba & Lincoln,
1994; Waller et al., 2016). Researchers involved themselves in their research and, in this sense,
the knowledge is rather a set of results of researchers’ interactions with the world (Waller et
al., 2016). Knowledge is not discovered in the world but by unpacking individual experience
and built by researchers. For example, researchers give and make meaning. In the qualitative
study, researchers and the research informants interact with each other to construct knowledge.
For example, the voice of each interviewee informants is controlled and allocated by the
researcher. In this regard, constructivism fits well with this research.
3.3.3 Methodological Assumption
The methodological question is how investigators can seek whatever they believe to be known
(Guba & Lincoln, 1994), or rather, how are things found out (Waller et al., 2016). The
methodology of constructivism emphasizes individuals’ own understanding of their attitudes
and behaviors. Instead of emphasizing the utilization of classifications such as gender,
ethnicity, and age, supporters of constructivism are inclined to attach importance to the
meanings which they give to their lived experience (Waller et al., 2016). In line with this
methodology, this study aimed to find the meaning of different service channels and customer
experience to explore their preferences.

99
3.4 Stage One: Qualitative Research
3.4.1 Data Collection: In-depth Interview
This study adopted the primary data collection method of qualitative research, that is,
interviews with service providers and consumers, to obtain qualitative data. An in-depth
interview refers to a one-on-one conversation where an interviewer asks questions according
to the designed protocols and interviewees’ responses to maximize the gathering of information
(Veal, 2011). The conversation typically ought to last for over half an hour (Veal, 2011).
Whether in-depth interview is an appropriate method depends on the research questions. The
present study adopted in-depth interview given the subsequent reasons.
First, in-depth interview is usually leveraged to derive significantly different information and
complicated approaches (Veal, 2011). Given inconsistencies in individual preference between
high technology and high touch, in-depth interviews thus adopted.
Second, in-depth interview is typically adopted when research questions can be addressed by
respondents who discuss personal experiences (Morris, 2015). The research questions in the
present study can be answered by informants who speak about their preferences and
experiences with different service delivery channels and are therefore applicable to in-depth
interviews.
In addition, in-depth interview serves as a suitable approach to acquire individuals’
perspectives of their situations and their experiences concerning the research topic (Morris,
2015). Therefore, the present study adopted in-depth interview to obtain participants’ opinions
and experiences of two service delivery channels.
Finally, in-depth interview was utilized considering its inherent advantages. Interviews enable
researchers to delve deep into responses (Johnson & Turner, 2003; Morris, 2015). Rather than
acquiring simple answers by asking questions one by one, in-depth interview allows for follow-
up questions and encourages respondents to explain their answers (Veal, 2011) to obtain in-
depth information (Johnson & Turner, 2003). A semi-structured interview adopted in the
present study allows the researcher to adjust interview questions to enhance outcomes.
Therefore, in-depth interview was used to generate deep insights into SST application in the
hotel service delivery. This response answers the requirements of previous studies for in-depth
research in this field (Kelly et al., 2017a; Oh et al., 2016).
100
Sampling Methods
Sampling involves selecting informants, research sites, and sample size (Creswell & Clark,
2007; Waller et al., 2016). Sampling methods are closely associated with research objectives
(Waller et al., 2016). In particular, selected respondents, sampling sites, and sample size must
function optimally for data collection to address research questions (Creswell & Clark, 2007).
All the people related to the study cannot be included due to time and money. Thus, recruiting
appropriate informants who would carefully and accurately answer the research questions is
crucial (Waller et al., 2016). Rather than randomly selecting informants, researchers have
purposively and intentionally selected specific informants in qualitative studies to collect
imperative and adequate data for in-depth research (Creswell & Clark, 2007; Kemper,
Stringfield, & Teddie, 2003; Tashakkori & Teddlie, 2003). Thus, qualitative sampling is
typically delimited as purposeful or nonprobability sampling (Teddlie & Yu, 2007). Examples
of such sampling include criterion, typical case, maximum variation, theory-based, snowball,
and convenience (Palinkas et al., 2015; Teddlie & Yu, 2007). In addition to utilizing a single-
purpose sampling strategy, qualitative studies commonly combine two or more sampling
techniques to gather the required information; this strategy can be defined as a multistage
purposeful sampling (Palinkas et al., 2015; Teddlie & Yu, 2007). To maximize efficiency and
validity (Palinkas et al., 2015), this qualitative study adopted criterion sampling to delimit the
population of participants, applied maximum variation sampling to heighten heterogeneity, and
leveraged convenience and snowball sampling to access specific informants. This multistage
purposeful sampling technique was further clarified as follows.
Criterion sampling means selecting informants in accordance with a key criterion (Veal, 2011).
In the present study, hoteliers and customers (i.e., supplier versus demand side) function as key
informants. Hotel managers in China were invited to participate in the present study, given
their industry insights (Hilton et al., 2013; Knutson et al., 2009). Previous studies have
confirmed the usefulness of obtaining managers’ opinions in terms of identifying key
innovative SSTs in hotels (Oh et al., 2013) and values and concerns of SST for operations and
customers (Lu et al., 2009; Oh et al., 2013). In addition to general managers, hoteliers here
included managers or directors from different departments of a single hotel and a hotel group;
they were supposed to have a clear idea about SST. In this respect, managers from hotels with
the SST application or who have used innovative SSTs in the field of hospitality were selected
because of their certain level of knowledge of the hotel’s service practices and performance
101
(J.-S. Chen et al., 2009) and innovative SSTs. Thus, available innovative SSTs in the hotel
context were identified, and the customer experience that hotels perceived were investigated.
Also, customers were recruited because they utilize or experience the delivered hotel services
and have direct feelings toward its quality. Customers are at the nucleus of the success of a
hotel. Thus, those who have used hotel SSTs were invited. Moreover, a screening question
(i.e., Have you stayed in a hotel in mainland China within the past 12 months?) is asked to
underpin their knowledge of the hotel service delivery process (Kim et al., 2012; Wei, Torres,
et al., 2017).
Moreover, maximum variation sampling was adopted to select informants who hold different
opinions on key issues (Creswell & Clark, 2007). The factors used for differential informants
were gender, education level, and race. In the present study, the criteria for distinct participants
were the supplier versus demand side and different hotel types (i.e., luxury, upscale, midscale,
and economy).
Convenience and snowball sampling methods were adopted to access qualified informants.
Convenience sampling refers to recruiting informants who are easily accessible (Palinkas et
al., 2015; Teddlie & Yu, 2007), such as friends, family members, and colleagues (Veal, 2011).
In the present study, eligible acquaintances of the researcher were first contacted, and then
additional qualified participants were reached through the introduction of acquaintances. The
latter is snowball sampling that involves reaching additional eligible informants through
interviewees (Veal, 2011). More specifically, eligible respondents were accessed from
acquaintances. If they consent to attend the study, then the researcher asked for their
preferences and made an appointment for face-to-face, video, or telephone interviews. In
addition to the acquaintances of the researcher, other qualified informants were reached
through the suggestion of these acquaintances.
Pilot Study
Before conducting the formal interview, this study conducted pilot studies to examine the
validity, reliability, aptness, and articulation of interview questions and sampling methods. In
late December 2017 and early January 2018, four hotel managers were invited to attend the
pilot study through the introduction of an acquaintance. In the same period, four acquainted
customers who had experienced SSTs in a hotel-related restaurant-like setting were invited to
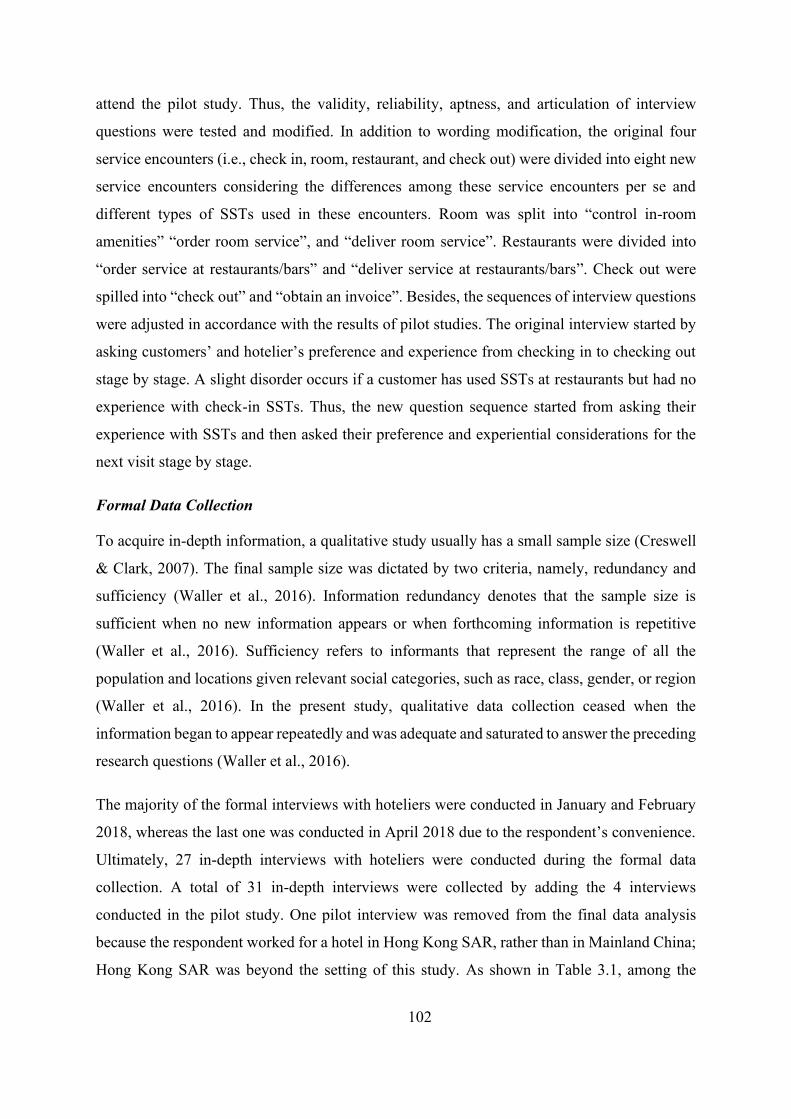
102
attend the pilot study. Thus, the validity, reliability, aptness, and articulation of interview
questions were tested and modified. In addition to wording modification, the original four
service encounters (i.e., check in, room, restaurant, and check out) were divided into eight new
service encounters considering the differences among these service encounters per se and
different types of SSTs used in these encounters. Room was split into “control in-room
amenities” “order room service”, and “deliver room service”. Restaurants were divided into
“order service at restaurants/bars” and “deliver service at restaurants/bars”. Check out were
spilled into “check out” and “obtain an invoice”. Besides, the sequences of interview questions
were adjusted in accordance with the results of pilot studies. The original interview started by
asking customers’ and hotelier’s preference and experience from checking in to checking out
stage by stage. A slight disorder occurs if a customer has used SSTs at restaurants but had no
experience with check-in SSTs. Thus, the new question sequence started from asking their
experience with SSTs and then asked their preference and experiential considerations for the
next visit stage by stage.
Formal Data Collection
To acquire in-depth information, a qualitative study usually has a small sample size (Creswell
& Clark, 2007). The final sample size was dictated by two criteria, namely, redundancy and
sufficiency (Waller et al., 2016). Information redundancy denotes that the sample size is
sufficient when no new information appears or when forthcoming information is repetitive
(Waller et al., 2016). Sufficiency refers to informants that represent the range of all the
population and locations given relevant social categories, such as race, class, gender, or region
(Waller et al., 2016). In the present study, qualitative data collection ceased when the
information began to appear repeatedly and was adequate and saturated to answer the preceding
research questions (Waller et al., 2016).
The majority of the formal interviews with hoteliers were conducted in January and February
2018, whereas the last one was conducted in April 2018 due to the respondent’s convenience.
Ultimately, 27 in-depth interviews with hoteliers were conducted during the formal data
collection. A total of 31 in-depth interviews were collected by adding the 4 interviews
conducted in the pilot study. One pilot interview was removed from the final data analysis
because the respondent worked for a hotel in Hong Kong SAR, rather than in Mainland China;
Hong Kong SAR was beyond the setting of this study. As shown in Table 3.1, among the
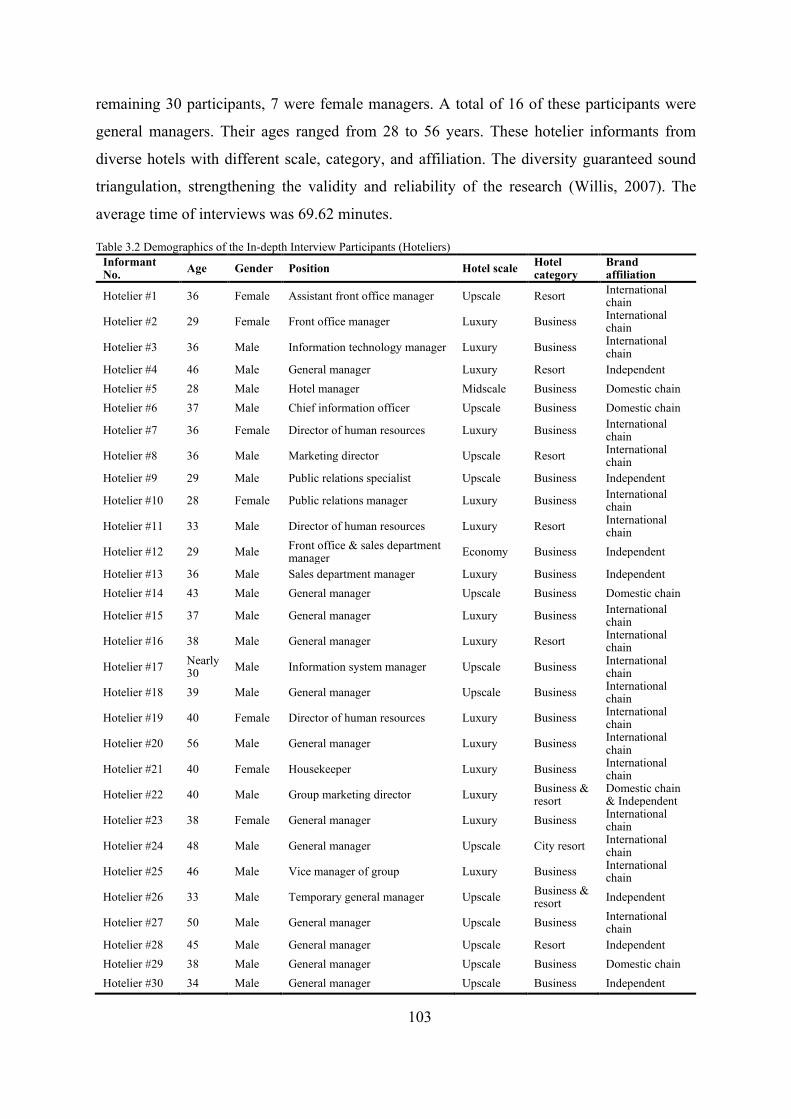
103
remaining 30 participants, 7 were female managers. A total of 16 of these participants were
general managers. Their ages ranged from 28 to 56 years. These hotelier informants from
diverse hotels with different scale, category, and affiliation. The diversity guaranteed sound
triangulation, strengthening the validity and reliability of the research (Willis, 2007). The
average time of interviews was 69.62 minutes.
Table 3.2 Demographics of the In-depth Interview Participants (Hoteliers) Informant No. Age Gender Position Hotel scale Hotel
category Brand affiliation
Hotelier #1 36 Female Assistant front office manager Upscale Resort International chain
Hotelier #2 29 Female Front office manager Luxury Business International chain
Hotelier #3 36 Male Information technology manager Luxury Business International chain
Hotelier #4 46 Male General manager Luxury Resort Independent Hotelier #5 28 Male Hotel manager Midscale Business Domestic chain Hotelier #6 37 Male Chief information officer Upscale Business Domestic chain
Hotelier #7 36 Female Director of human resources Luxury Business International chain
Hotelier #8 36 Male Marketing director Upscale Resort International chain
Hotelier #9 29 Male Public relations specialist Upscale Business Independent
Hotelier #10 28 Female Public relations manager Luxury Business International chain
Hotelier #11 33 Male Director of human resources Luxury Resort International chain
Hotelier #12 29 Male Front office & sales department manager Economy Business Independent
Hotelier #13 36 Male Sales department manager Luxury Business Independent Hotelier #14 43 Male General manager Upscale Business Domestic chain
Hotelier #15 37 Male General manager Luxury Business International chain
Hotelier #16 38 Male General manager Luxury Resort International chain
Hotelier #17 Nearly 30 Male Information system manager Upscale Business International
chain Hotelier #18 39 Male General manager Upscale Business International
chain Hotelier #19 40 Female Director of human resources Luxury Business International
chain Hotelier #20 56 Male General manager Luxury Business International
chain Hotelier #21 40 Female Housekeeper Luxury Business International
chain Hotelier #22 40 Male Group marketing director Luxury Business &
resort Domestic chain & Independent
Hotelier #23 38 Female General manager Luxury Business International chain
Hotelier #24 48 Male General manager Upscale City resort International chain
Hotelier #25 46 Male Vice manager of group Luxury Business International chain
Hotelier #26 33 Male Temporary general manager Upscale Business & resort Independent
Hotelier #27 50 Male General manager Upscale Business International chain
Hotelier #28 45 Male General manager Upscale Resort Independent Hotelier #29 38 Male General manager Upscale Business Domestic chain Hotelier #30 34 Male General manager Upscale Business Independent

104
The formal interviews with customers were conducted from February 2018 to April 2018. A
total of 26 customers were invited for in-depth interviews. Adding the 4 in-depth interviews in
the pilot study, a total of 30 in-depth interviews were used for the following data analysis. The
interviewees were from economy, midscale, upscale, and luxury hotels (Table 3.3). The age of
these customers ranged from 8 to 55 years, with an average of 30 years. 18 of them were female.
Again, this variation indicates that the triangulation was appropriate, thereby ensuring validity
and reliability (Willis, 2007). The average time of interviews was approximately 59 min. To
ensure data quality, all the interviews with hoteliers and customers were taped by a voice
recorder after obtaining the approval of the respondents (Kelly et al., 2017a).
Table 3.3 Demographics of the In-depth Interview Participants (Customers) Informant No. Age Gender Hotel scale Hotel category Travel purpose
Customer #1 25 Female Economy Business Business Customer #2 25 Female Upscale Business Business Customer #3 28 Male Economy Business Visit friends Customer #4 27 Female Economy Business Leisure Customer #5 29 Male Upscale Business Business Customer #6 27 Male Upscale Business Business Customer #7 24 Male Upscale Business Business Customer #8 27 Female Upscale Business Business Customer #9 28 Female Luxury Resort Leisure Customer #10 27 Female Upscale Business Visit family Customer #11 28 Female Luxury Business Business Customer #12 35 Female Upscale Business Business & Leisure Customer #13 35 Female Luxury Business Leisure Customer #14 29 Female Luxury Business Leisure Customer #15 26 Female Midscale Business Business Customer #16 28 Female Luxury Both Visit friends Customer #17 28 Female Upscale Business Leisure Customer #18 30 Female Midscale Business Business Customer #19 30 Female Luxury Business Business Customer #20 25 Female Midscale Business Leisure Customer #21 30 Male Upscale Business Business Customer #22 27 Male Midscale Business Leisure Customer #23 42 Male Economy Business Business Customer #24 52 Female Economy Resort Leisure Customer #25 30 Male Luxury Business Business Customer #26 27 Male Economy Business Business Customer #27 27 Male Luxury Resort Leisure Customer #28 55 Male Luxury Both Business Customer #29 31 Female Midscale Homestay Leisure Customer #30 8 Male Midscale Homestay Leisure

105
Interview Protocol
The present study adopted qualitative data as the first step of investigation (Fortune et al.,
2010). In accordance with Veal (2011) who stated that an in-depth interview could be regarded
as semi-structured. A semi-structured protocol was designed accordingly to stimulate
customers (hoteliers) to discuss customer experience (the experience that hoteliers perceive)
considering flexibility (Hilton et al., 2013). Informants’ responses may exceed the researchers’
assumptions. In this respect, a semi-structured interview protocol allows the researcher to
provide a reference for direct interviews and for flexibility to new possibilities (Morris, 2015).
For example, the interviewer encouraged interviewees to explain their answers and asked
follow-up questions (Veal, 2011). The semi-structured interview questions were designed on
the basis of previous studies (Eriksson & Nilsson, 2007; Knutson et al., 2009; Lin & Hsieh,
2011; Meuter et al., 2000; Schmitt, 1999).
Interview questions for hoteliers (Appendix 1.1) and customers (Appendix 1.2) were proposed.
The usage of SST/employee and experience at each service delivery phase were explored. In
particular, questions, such as “As a hotel manager, which do you prefer to help customers with
checking in: mobile check-in, self-service check-in kiosk, front desk, or other service
channels?” were asked to achieve Objective 1 (i.e., to unveil the extent to which customers and
hoteliers prefer SSTs during hotel service delivery). Furthermore, questions, such as “Why do
you prefer this channel in terms of checking in?” were presented to realize Objective 2 (i.e., to
identify the experiential factors influencing customers’ and hoteliers’ preferences for SSTs
during the delivery process of hotel service). In addition, questions on experiences, such as “In
terms of check-in, what experience do you think you can obtain by using this channel?” were
asked to achieve Objective 3 (i.e., provide insights into customer experience during the delivery
process of hotel service with reference to SST preference).
3.4.2 Data Analysis: Content Analysis
Content analysis is the most fundamental form of analysis; it refers to methods for inferring by
systematically and objectively spotting unique features of a message (Holsti, 1968). Content
analysis is a regular approach to pinpointing interview text characteristics (Jones, 1995) and
revealing the underlying meanings, biases, values, and opinions (Holsti, 1969). Holsti (1969)
mentioned that content analysis is useful for analyzing interviews given its usefulness in
interpreting conversation messages by categorizing and exploring themes. In particular, content

106
analysis refers to a systematic text examination, including analyzing the form, patterns, and
substance of materials (Holsti, 1969). Therefore, the present study adopted content analysis to
interpret data that were gathered from in-depth interviews to identify themes and reveal
underlying messages.
Although content analysis may be conducted in different ways (Jones, 1995), such as
leveraging the coding system of ground theory, calculating word, interpreting work means,
summation, explanation, structuration, and objective hermeneutics (Holsti, 1969), data analysis
generally involves five stages (Creswell & Clark, 2007). The first stage is to prepare the
collected data for analysis (Creswell & Clark, 2007). In the second stage, data are explored to
develop a general and overall comprehension of the information (Creswell & Clark, 2007). The
third stage is analyzing or coding the data in detail to identify and extract categories and units
(Creswell & Clark, 2007). In the fourth stage, the results of data analysis are displayed in
accordance with the identified categories and units (Creswell & Clark, 2007). The final stage
involves validating the data (Creswell & Clark, 2007). Moreover, three golden rules guide data
analysis despite the different methods. The first rule is to keep research questions in mind to
instruct data analysis. Second, the researcher must review the data repeatedly to familiarize
himself with the information. The third rule is to connect the data with previous literature
(Waller et al., 2016). Based on the abovementioned fundamental steps and rules, the present
study conducted content analysis in accordance with the following five steps.
First, the data collected through interviews were prepared by literally transcribing information
(Creswell & Clark, 2007). In the present study, a professional transcript company was
employed to transcribe the in-depth interview recordings. The researcher then examined the
transcript word-for-word. Prior to coding the data, the transcribed text was explored through
repeated reading and memos of the rich information (Creswell & Clark, 2007).
Second, data analysis started with coding the transcripts. Coding is the process of
systematically grouping and labeling raw data units accordingly (Creswell & Clark, 2007;
Holsti, 1969). Five recording units were characterized by being classified into a given category
and used by a majority of content analysis research, namely, single word or symbol, theme,
character, sentence or paragraph, and item (Holsti, 1969). The theme, “a single assertion about
a subject” (Holsti, 1969, p. 116) was leveraged by the present study to reduce the data given
its indispensability to exploring values and preferences (Holsti, 1969).

107
Third, the codes were grouped into categories with references to content units that characterize
the foregoing recording units (Holsti, 1969). Holsti (1969) devised five general principles to
guide category construction. First, the categories must reflect research objectives (Holsti, 1969;
Jones, 1995). The second guideline is exhaustiveness, which implies that all codes can be
anatomized into a category (Holsti, 1969). Third, all the categories are mutually exclusive. That
is, coded items can be allocated into only one category (Holsti, 1969; Jones, 1995). The fourth
guideline is the independence of categories. More specifically, there is no relationship between
the assignment of one item and the assignment of another (Holsti, 1969; Jones, 1995). Finally,
the categories must be derived from a single classification principle (Holsti, 1969). That is,
categories must be constructed on the basis of a uniform classification principle for the sake of
unity (Jones, 1995). Given the lack of standardized classification schemes, this study adopted
trial-and-error methods to construct proper categories (Holsti, 1969). In concrete terms,
category construction involves moving back and forth, checking the usefulness of provisional
categories, and adjusting them in accordance with the content (Holsti, 1969). Finally, six
categories were identified to influence customers’ and hoteliers’ preferences, namely,
environmental and organizational inhibitors and enables, attributes of SSTs and human services,
service task attributes, customer sociodemographic and customer experience.
Fourth, the outcomes of data analysis were presented. The results were presented as narratives,
figures, and frameworks (Creswell & Clark, 2007). Discussions of proofs for the units and
categories were drawn from comparisons with previous literature and quoting informant
opinions. Finally, validity and reliability were tested. The focus of triangulation is to seek
multiple sources (Willis, 2007), which can be acquired through diverse data collection methods
(e.g., a combination of interview, observation, and focus group), various sources of
information, diversified contexts, diverse theories, different researchers, and multiple studies
(Willis, 2007). To stipulate validity, the present study performed triangulation across sources
of information. In terms of sampling, although only in-depth interviews were conducted to
collect data, the informants cover hotel managers and customers. The different populations
contributed to the comprehensiveness and trustworthiness of the present study. Moreover,
multiple settings were considered to reach trustworthiness. Thereby, informants from different
types of hotels (i.e., luxury, upscale, mid-range, and economy) were included.
Reliability was verified through two techniques. The most common technique for guaranteeing
the reliability of analysis results is to ask two or more coders to perform independent coding
108
(Jones, 1995). However, this study cannot invite another coder due to copyright. Alternatively,
the other technique, consistency through time, was adopted (Prothro, 1956). In particular, the
researcher finished the first-round coding of interviews with customers from May to August
2018 and repeated data analysis in November 2018. Given the repetitions and for the sake of
easy interpretation, the repetitive themes under different stages and types of service channels
were categorized into the same group after the second-round data analysis. The first round of
data analysis of interviews with hoteliers was conducted from August to September 2018.
Then, the coding was repeated in November 2018 and early December 2018.
3.5 Stage Two: Quantitative Study
The quantitative study aimed to test the hypotheses proposed based on the findings of the
qualitative study. To test the hypotheses, a measurement scale to measure experience with SSTs
and experience with human services should be developed first. Experience with SSTs and
experience with human services were developed separately. Then the two independently
developed experience scales were compared to verify their sameness to form a commensurate
experience scale. Two rounds of surveys were conducted in the quantitative study to develop
the uniform experience scale and to achieve the research objectives according to the guidelines
suggested by Churchill (1979). Specifically, the scale development process involved three
sections: 1) item generation via literature review and in-depth interviews, 2) first round of data
collection and purification of measures, and 3) second round of data collection and
repurification of measures. Ultimately, two-round data collection with three samples were
derived. The first round of data collection targeting customers was aimed to determine the
underlying dimensions of the experience items via exploratory factor analysis (EFA). The
second round of data collection targeting customers was referred to as Sample 2. Along with
the second-round data collection targeting customers was the data collection targeting hoteliers,
which was named Sample 3. Sample 2 and Sample 3 were used to examine the reliability and
validity of the measures in order to finalize the measures via confirmatory factor analysis
(CFA) and structural equation model (SEM). The following section describes the questionnaire
design, the two rounds of data collection, and data analysis in detail.
3.5.1 Questionnaire Design: Item Pool Generation
The questionnaires (Appendix 4) used in the quantitative research were designed in this stage.
The variables and measure items were developed based on the literature, the qualitative
109
findings, and the assessment of the panel of experts. In addition to the basic questions
(screening questions), the first section of the questionnaire focused on the complexity of each
service task per se. The second section centered on customer experience with SSTs in general
based on their hotel experiences in Mainland China within the past 12 months. The third section
regarded customer experience with human services in general within the past 12 months, while
the fourth section aimed to evaluate the respondents’ preferences at different hotel service
delivery stages (e.g., check-in, room service order, and check-out). The fifth section focused
on customers’ personalities and attitudes toward technology, and the sixth section consisted of
demographic information. The last section pertained to the trip profiles of the respondents
within the past 12 months, which were revised and integrated into basic questions in the second-
round data collection. Notably, given the differences in screening questions, the questionnaires
delivered to the customers (Appendix 4.1 and Appendix 4.2.1) and the hoteliers (Appendix
4.2.2) were designed and revised separately.
Measurement of Task Complexity
Although previous research used a five-point Likert-type scale to measure task complexity
(Simon & Usunier, 2007), the present study adopted a seven-point Likert-type scale ranging
from 1 (very simple) to 7 (very complex) owing to three considerations. First, in terms of
discrimination, seven points were better than three or five points, and having more than seven
points may result in overwhelming response options. A seven-point Likert-type scale served as
a balance and thus was chosen to measure the variables. The second consideration was for the
sameness of the rating scale used in the questionnaire. The third consideration was that,
according to the pretest, the respondents preferred a seven-point scale.
Experience Items
Despite the prevalence of SSTs is increasing, academic research on this topic, particularly in
terms of customer experience is sparse (Shin & Perdue, 2019). The establishment of an
experience scale for SSTs timely contributes to the literature and acts as a stepping stone to
further investigation in this field. In the past literature, scholars have adopted different scales
to measure customer experience with technology or innovation. For instance, Kincaid and
Baloglu (2006) required respondents to rate technology according to a five-point Likert-type
scale ranging from 1 (poor) to 5 (excellent). Based on Schmitt (1999), Su (2011) measured
customer experience from five dimensions, namely sense, feel, think, act, and relative.

110
However, Su did not elucidate the items used to comprise the dimension. Other scholars
explored experience from the standpoints of satisfaction (Beatson et al., 2006; S.-C. Chen,
Chen, & Chen, 2009; Kim & Qu, 2014; Orel & Kara, 2014; Tseng, 2015; Zins, 2002), fun
(Kokkinou & Cranage, 2015), enjoyment (Orel & Kara, 2014), pleasure, happiness and
satisfaction (Dabholkar & Spaid, 2012), and customer value (Ho & Ko, 2008; Walls, 2013).
Items measuring previous experiences that were utilized by previous studies included the
following: 1) Whether the respondent had previously used service delivery channels (Kim et
al., 2012; Lu et al., 2011), 2) the number of times SST was utilized (Eastlick, Ratto, Lotz, &
Mishra, 2012; Meuter et al., 2005), and 3) SST failure/recovery (C. Wang et al., 2012).
Looking back to these prior studies, the measurement for the experience was inconsistent and
incomprehensive. Similarly, previous research adopted different measurement scales for
experience with human services (e.g., Walls, 2013). This review indicates a lack of uniform
measurement of customer experience across different types of service delivery channels. Yet,
the degree of changes brought by SSTs with reference to service employees played an
important role in explaining individual and organizational preferences (see qualitative
findings). To test possible discrepancies between experiences with SSTs and human services
and their influences on preference (H4 and H7), it is necessary to develop a commensurate and
comprehensive measurement scale that can simultaneously measure customer experience with
SSTs and human services. Therefore, the current study generated such an experience
measurement scale according to the guidelines suggested by Churchill (1979). Specifically, the
scale development process involved three sections: 1) item generation via literature review and
in-depth interviews, 2) first round of data collection and purification of measures, and 3) second
round of data collection and repurification of measures (Figure 3.5).
Figure 3.5 Overview of Experience Scale Development
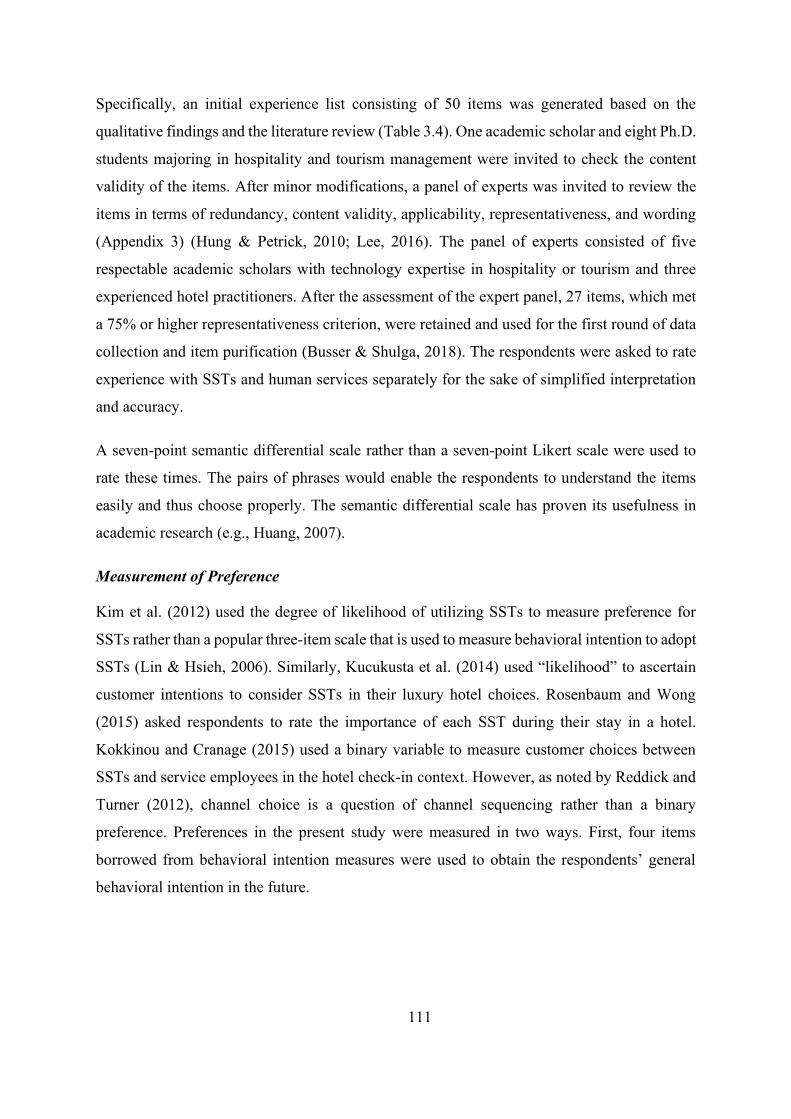
111
Specifically, an initial experience list consisting of 50 items was generated based on the
qualitative findings and the literature review (Table 3.4). One academic scholar and eight Ph.D.
students majoring in hospitality and tourism management were invited to check the content
validity of the items. After minor modifications, a panel of experts was invited to review the
items in terms of redundancy, content validity, applicability, representativeness, and wording
(Appendix 3) (Hung & Petrick, 2010; Lee, 2016). The panel of experts consisted of five
respectable academic scholars with technology expertise in hospitality or tourism and three
experienced hotel practitioners. After the assessment of the expert panel, 27 items, which met
a 75% or higher representativeness criterion, were retained and used for the first round of data
collection and item purification (Busser & Shulga, 2018). The respondents were asked to rate
experience with SSTs and human services separately for the sake of simplified interpretation
and accuracy.
A seven-point semantic differential scale rather than a seven-point Likert scale were used to
rate these times. The pairs of phrases would enable the respondents to understand the items
easily and thus choose properly. The semantic differential scale has proven its usefulness in
academic research (e.g., Huang, 2007).
Measurement of Preference
Kim et al. (2012) used the degree of likelihood of utilizing SSTs to measure preference for
SSTs rather than a popular three-item scale that is used to measure behavioral intention to adopt
SSTs (Lin & Hsieh, 2006). Similarly, Kucukusta et al. (2014) used “likelihood” to ascertain
customer intentions to consider SSTs in their luxury hotel choices. Rosenbaum and Wong
(2015) asked respondents to rate the importance of each SST during their stay in a hotel.
Kokkinou and Cranage (2015) used a binary variable to measure customer choices between
SSTs and service employees in the hotel check-in context. However, as noted by Reddick and
Turner (2012), channel choice is a question of channel sequencing rather than a binary
preference. Preferences in the present study were measured in two ways. First, four items
borrowed from behavioral intention measures were used to obtain the respondents’ general
behavioral intention in the future.
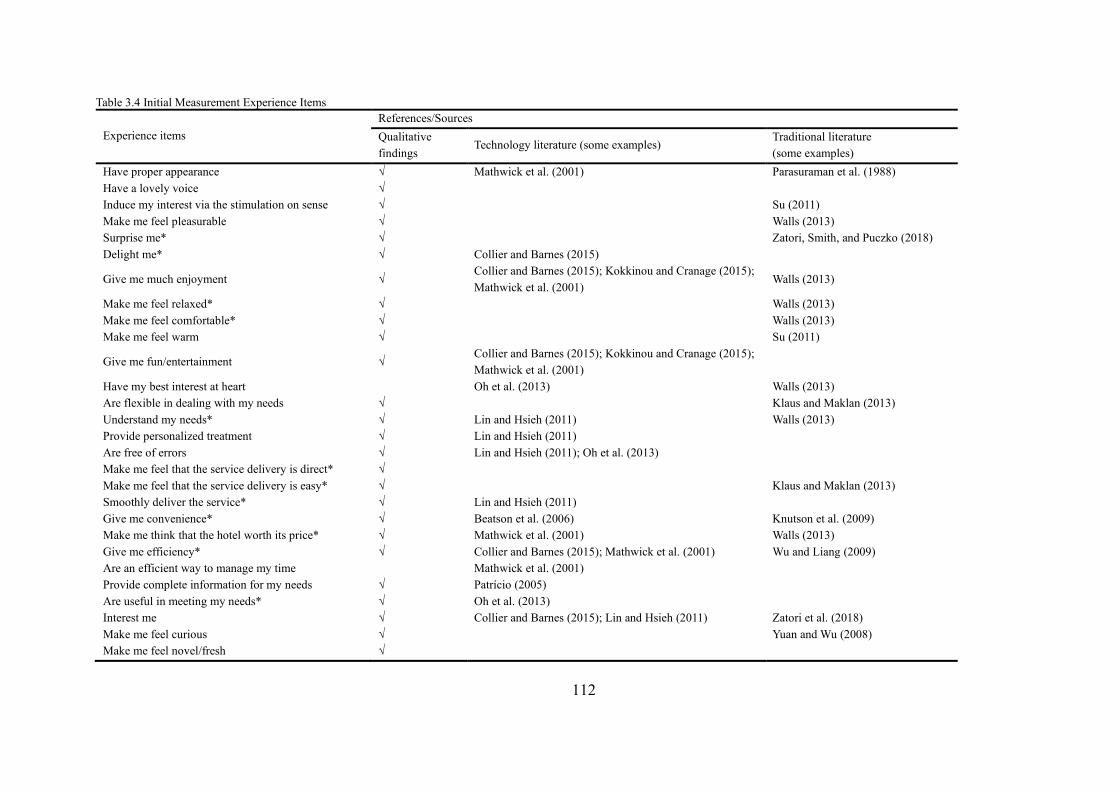
112
Table 3.4 Initial Measurement Experience Items
Experience items References/Sources Qualitative findings
Technology literature (some examples) Traditional literature (some examples)
Have proper appearance √ Mathwick et al. (2001) Parasuraman et al. (1988) Have a lovely voice √ Induce my interest via the stimulation on sense √ Su (2011) Make me feel pleasurable √ Walls (2013) Surprise me* √ Zatori, Smith, and Puczko (2018) Delight me* √ Collier and Barnes (2015)
Give me much enjoyment √ Collier and Barnes (2015); Kokkinou and Cranage (2015); Mathwick et al. (2001)
Walls (2013)
Make me feel relaxed* √ Walls (2013) Make me feel comfortable* √ Walls (2013) Make me feel warm √ Su (2011)
Give me fun/entertainment √ Collier and Barnes (2015); Kokkinou and Cranage (2015); Mathwick et al. (2001)
Have my best interest at heart Oh et al. (2013) Walls (2013) Are flexible in dealing with my needs √ Klaus and Maklan (2013) Understand my needs* √ Lin and Hsieh (2011) Walls (2013) Provide personalized treatment √ Lin and Hsieh (2011) Are free of errors √ Lin and Hsieh (2011); Oh et al. (2013) Make me feel that the service delivery is direct* √ Make me feel that the service delivery is easy* √ Klaus and Maklan (2013) Smoothly deliver the service* √ Lin and Hsieh (2011) Give me convenience* √ Beatson et al. (2006) Knutson et al. (2009) Make me think that the hotel worth its price* √ Mathwick et al. (2001) Walls (2013) Give me efficiency* √ Collier and Barnes (2015); Mathwick et al. (2001) Wu and Liang (2009) Are an efficient way to manage my time Mathwick et al. (2001) Provide complete information for my needs √ Patrício (2005) Are useful in meeting my needs* √ Oh et al. (2013) Interest me √ Collier and Barnes (2015); Lin and Hsieh (2011) Zatori et al. (2018) Make me feel curious √ Yuan and Wu (2008) Make me feel novel/fresh √

113
Make me learn something new* Su (2011) Stimulate my imagination Su (2011) Make me feel active √ Zatori et al. (2018) I usually blame myself when things go wrong √ Give me more freedom* √ Give me more control* √ Kokkinou and Cranage (2015); Collier and Barnes (2015) Allow me to do things my own way Kokkinou and Cranage (2015) Make my stay in hotel easier* √ Mathwick et al. (2001) Fit well with my lifestyle* Kim and Qu (2014) Fit well with the way I like to get things done* Kim and Qu (2014) Make me rethink the habits of my life* Su (2011) Are environment friendly √ Make me feel being trusted* √ Make me feel safe in the transaction* √ Kaushik et al. (2015) Parasuraman et al. (1988) Make me feel that my privacy is valued √ Kaushik et al. (2015) Walls (2013) Make me feel being respected √ Walls (2013) Make me feel being valued* √ Make me feel being served* √ Make me feel fashionable* √ Make me feel cool* √ Walls (2013) Make me feel unusual* √ Su (2011) Make me think that the society is progressing* √
*items were retained according to evaluations of the expert panel
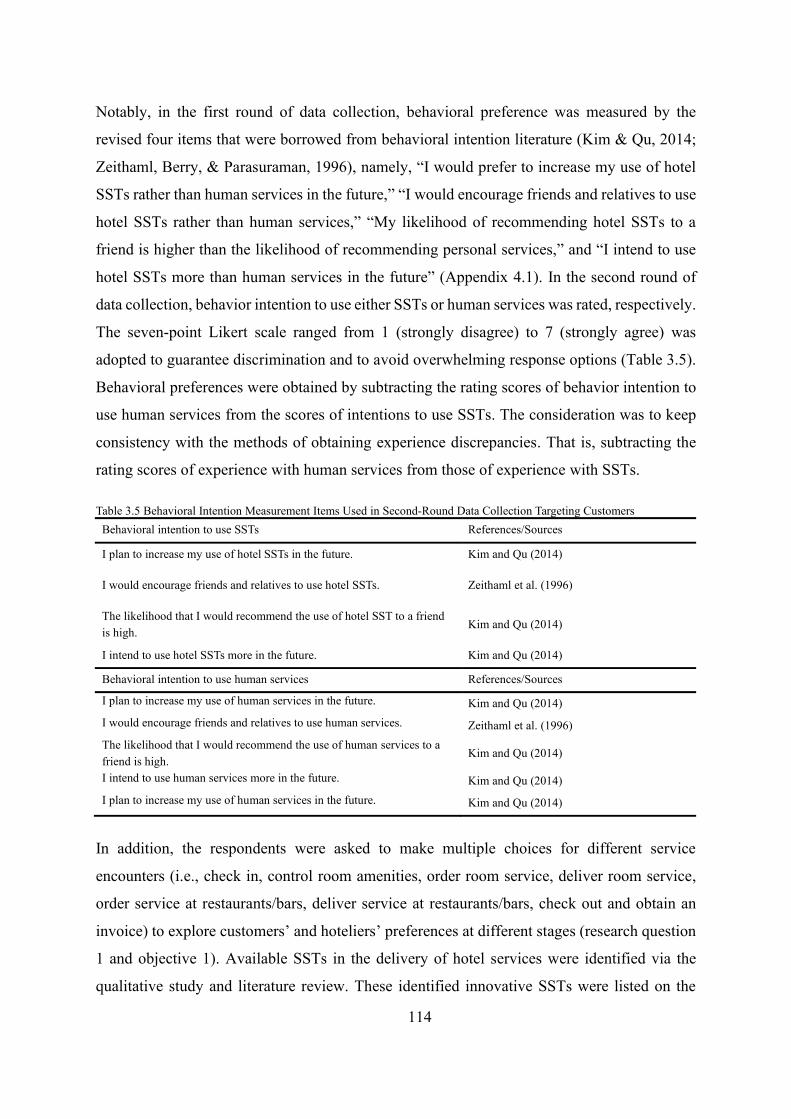
114
Notably, in the first round of data collection, behavioral preference was measured by the
revised four items that were borrowed from behavioral intention literature (Kim & Qu, 2014;
Zeithaml, Berry, & Parasuraman, 1996), namely, “I would prefer to increase my use of hotel
SSTs rather than human services in the future,” “I would encourage friends and relatives to use
hotel SSTs rather than human services,” “My likelihood of recommending hotel SSTs to a
friend is higher than the likelihood of recommending personal services,” and “I intend to use
hotel SSTs more than human services in the future” (Appendix 4.1). In the second round of
data collection, behavior intention to use either SSTs or human services was rated, respectively.
The seven-point Likert scale ranged from 1 (strongly disagree) to 7 (strongly agree) was
adopted to guarantee discrimination and to avoid overwhelming response options (Table 3.5).
Behavioral preferences were obtained by subtracting the rating scores of behavior intention to
use human services from the scores of intentions to use SSTs. The consideration was to keep
consistency with the methods of obtaining experience discrepancies. That is, subtracting the
rating scores of experience with human services from those of experience with SSTs.
Table 3.5 Behavioral Intention Measurement Items Used in Second-Round Data Collection Targeting Customers Behavioral intention to use SSTs References/Sources
I plan to increase my use of hotel SSTs in the future. Kim and Qu (2014)
I would encourage friends and relatives to use hotel SSTs. Zeithaml et al. (1996)
The likelihood that I would recommend the use of hotel SST to a friend is high.
Kim and Qu (2014)
I intend to use hotel SSTs more in the future. Kim and Qu (2014)
Behavioral intention to use human services References/Sources
I plan to increase my use of human services in the future. Kim and Qu (2014) I would encourage friends and relatives to use human services. Zeithaml et al. (1996) The likelihood that I would recommend the use of human services to a friend is high.
Kim and Qu (2014)
I intend to use human services more in the future. Kim and Qu (2014) I plan to increase my use of human services in the future. Kim and Qu (2014)
In addition, the respondents were asked to make multiple choices for different service
encounters (i.e., check in, control room amenities, order room service, deliver room service,
order service at restaurants/bars, deliver service at restaurants/bars, check out and obtain an
invoice) to explore customers’ and hoteliers’ preferences at different stages (research question
1 and objective 1). Available SSTs in the delivery of hotel services were identified via the
qualitative study and literature review. These identified innovative SSTs were listed on the
115
questionnaires and were allocated to the corresponding service delivery phases (e.g., check-in,
room service order, and check-out). Respondents were asked to express their preferences
between these innovative SSTs and conventional service employees at each service delivery
phase.
Sociodemographic Factors
Demographic factors were measured, including gender, age, education level, employment type,
marital status, annual household income, and daily use of SSTs. This step was consistent with
previous studies and the foregoing qualitative research that demographic characteristics can
influence customer adoption of SSTs (Castillo-Manzano & López-Valpuesta, 2013;
Dabholkar, Michelle Bobbitt, & Lee, 2003; Donner & Dudley, 1997; Kim et al., 2012; Lee &
Yang, 2013; Meuter et al., 2005). Education consisted of less than high school, high school, 2-
3 years of college, four-year college/university, postgraduate level or higher, according to
Chinese education level. Type of employment included student, full-time employment, part-
time employment, retired, self-employed, unemployed, and other. Marital status was
categorized into single, with partner, married without children, married with children,
separated/divorced and widowed. Annual household income was divided into six groups
according to the most popular and the latest standard of the division of the rich and poor strata
in mainland China. The daily use of SSTs was measured by one item, that is, “In the past 30
days, how many times have you used self-service technologies (e.g., self-check-in at airport,
self-check-out at a retailing store, self-ordering kiosks in McDonald’s)?”.
The qualitative results (Chapter 4) indicated that personality influenced customer preferences.
Thus, in addition to demographics, respondents’ personalities and innovativeness in technology
were measured. In the field of psychology, the Big Five Inventory (BFI) has proven its
usefulness and prevalence in measuring personality (Goldberg, 1992; John & Srivastava,
1999). Therefore, five self-descriptive sentence items for each factor were adapted from the
BFI and the International Personality Item Pool (Goldberg, 1992; IPIP, 2018; John &
Srivastava, 1999; Yoo & Gretzel, 2011). Three items were used to obtain the respondents’
personal innovativeness in technology on the basis of previous studies (Yi, Jackson, Park, &
Probst, 2006). All the items were measured on a seven-point Likert scale ranging from 1
(strongly disagree) to 7 (strongly agree).
116
Moreover, the qualitative findings revealed that trip purposes, hotel category, and hotel
segment influenced customer preference for SSTs. Thus, respondents were asked to recall their
trip profiles in the past 12 months in the first round of data collection. Trip purposes were
measured by asking respondents to recall, “How many business trips have you taken within the
past 12 months?” and “How many leisure trips have you taken within the past 12 months?”
Hotel category included business, resort, and convention hotel, which was drawn from the
study of Kim, Cho, and Brymer (2013). Specific questions were asked, namely, “How many
times have you stayed at a business hotel within the past 12 months?”, “How many times have
you stayed at a resort hotel within the past 12 months?”, and “How many times have you stayed
at a resort hotel within the past 12 months?” The questions for hotel grade included, “How
many times have you stayed at an upscale hotel within the past 12 months?”, “How many times
have you stayed at a midscale hotel within the past 12 months?”, and “How many times have
you stayed at an economy hotel within the past 12 months?”
However, classifying the respondents according to their trip profiles was difficult. For example,
the results of the cluster analysis based on trip purposes were dissatisfying. That is, the author
could not identify whether the respondent was a business visitor or a leisure traveler. Therefore,
the questions on the trip profiles were changed to multiple-choice questions in the second round
of data collection. For example, “What kind of purpose do you typically travel for?” (Appendix
4.2.1). The revised question was earnest and simple. In the second round of data collection,
hotel grade was measured via four groups according to Chinese hotel star ratings rather than
the aforementioned three items (e.g., economy, midscale, and upscale). The new four choices
comprised 1–2 stars (economy), 3 stars (midscale), 4 stars (upscale), and 5 stars (luxury).
Questionnaire for Hoteliers
Identical items/questions were used in the questionnaire for hoteliers to measure task
complexity, experience, and preference. In terms of demographics, aside from gender, age,
education level, marital status, annual household income, and daily use of SSTs, work
experience and work experience in a management position in the hotel industry were likewise
asked. Work experience was measured by five groups, namely, 1–5 years, 6–10 years, 11–15
years, 16–20 years, and more than 20 years. This classification was based on the research of
Ozturk and Hancer (2014).

117
The hotel profiles (e.g., opening date, location, number of rooms, hotel grade, hotel category,
and brand affiliation) of managers from single hotels were collected. Hotel category and hotel
segment were used in the same measures as in the questionnaire for the customers. Brand
affiliation was allocated to three measurement categories (i.e., international chain affiliated,
domestic chain affiliated, and independent), according to Karadag and Dumanoglu (2009).
Screening Questions, Attention Filter, Back Translation, and Online Design
In addition to the aforementioned sections, screening questions labeled as basic questions were
used at the beginning of the questionnaire to identify qualified customers who have used hotel
SSTs at least once in Mainland China in the past 12 months and qualified hoteliers. Attention
filters were used to secure data quality (Wei, Lu, Miao, Cai, & Wang, 2017). Specifically,
additional questions were included in the different sections to check the reliability of the
questionnaire.
The self-administered questionnaire was designed in English and edited by a native English
speaker. Then, the questionnaire was translated into Chinese based on the double-translation
method designed by Mcgorry (2000). First, the author translated the questionnaire. The
questionnaire was then back-translated from Chinese to English via two bilingual (Chinese and
English) experts and two professional translation software (Google Translate and Youdao
Translate). These steps were conducted to ensure the accuracy of the Chinese translation
(Behling & Law, 2000). Thus, discrepancies emerging from the back translation were handled.
Then, the online questionnaire was designed with Wenjuanxing (www.wjx.cn), which is the
largest online survey platform in China (Wang, Hung, & Li, 2018).
3.5.2 First Round of Data Collection: Measurement Item Purification
Pretest
The first round of data collection was aimed to determine the underlying dimensions of the
experience items. Only customers were targeted in this round to purify the measures due to the
following considerations. Looking back to existing studies on measurement scale development,
academic scholars usually use one sample to purify the measures. However, when it comes to
examining the external validity of measures, more than one sample is sometimes collected. For
example, Lu, Cai, and Gursoy (2019) recruited one more sample across four different industries

118
to further assess the replicability and generalization of the measure. Given that it is much more
difficult to approach hoteliers than customers, this study only recruited customers in the first
round data collection to purify the measures, whereas included hoteliers and customers data to
examine the external validity of measures. In doing so, time and money were saved.
A pretest was conducted before the formal study to enhance the validity and reliability of the
instruments drawn from the qualitative findings and prior literature. Specifically, eleven Ph.D.
students were invited to check the validity of the online questionnaire with different point-
rating scales (a five-point scale vs. a seven-point scale) and different screen configurations
(computer and mobile phone) to ensure consistent appearance of the survey (Dillman, 2007).
Modifications were made on the rating scale, the types of questions, wording, font size, and
spelling. In terms of the rating scale, the respondents indicated a preference for a seven-point
scale over a five-point scale. Therefore, a seven-point rating scale was used in this study. The
questions regarding trip profiles were changed from fill-in-the-blank questions to multiple-
choice questions. According to the respondents, multiple-choice questions saved time and were
easy to answer. One respondent also mentioned that, based on his previous experience, fill-in-
the-blank questions may result in awkward answers owing to wrong spelling. An academic
scholar was invited to evaluate the questionnaire after the minor adjustments according to the
pretest feedback. The questionnaire was ready to be administered after this final step.
Formal Data Collection: Sample 1
Formally, the first-round data were collected from February. 2 to 15, 2019 via convenience and
snowball sampling. The questionnaire was disseminated through WeChat, which is one of the
most popular social media platforms in Mainland China. Cash incentives ranging from 1 to 20
CNY were randomly given to qualified respondents. A total of 714 questionnaires were handed
out, and 256 respondents passed the screening process. A total of 193 valid questionnaires were
retained for further analysis according to attention filters, which had a validity rate of 75.39%.
The sample size of the present study was assumed to be similar to those of analogous studies
(Kaushik & Rahman, 2017). Given that most studies on customer adoption of SST obtained
approximately 200 to 300 responses (e.g., Beatson et al., 2006; Kaushik et al., 2015; Kim &
Qu, 2014; Kucukusta et al., 2014; Rosenbaum & Wong, 2015), 193 valid responses were
acceptable. The first-round data were labeled as Sample 1.

119
The demographic characteristics of the respondents are presented in Table 3.6. Nearly half of
the 193 respondents (47.7%) were male. Five categories were generated for age, and 70% of
the respondents were no older than 35 years old, while only 1% were between the ages of 55–
64 years. More than half of the respondents had postgraduate degrees or higher (63.2%),
followed by bachelor’s degrees (33.2%). In terms of annual household income, the majority of
the respondents earned between CNY100,000 and CNY 599,999 (71.6%). The respondents
who had worked or were currently working in the hotel industry comprised of 16.1% of the
sample. Over 10% of the respondents had used SSTs more than 5 times in hotels in Mainland
China in the past 12 months.
Table 3.6 Respondent Characteristics (Sample 1; N = 193) Variables N % Variables N %
Gender Male 92 47.7
Marital status
Single 65 33.7 Female 101 52.3 With partner 35 18.1
Age
18–24 21 10.9 Married without children 26 13.5
25–34 114 59.1 Married with children 66 34.2
35–44 40 20.7 Separated/divorced 1 0.5 45–54 16 8.3
Annual household income (CNY)
Less than 100,000 30 15.5 55–64 2 1 100,000–199,999 80 41.5
Education
Less than high school 1 0.5 200,000–599,999 58 30.1 High school 2 1 600,000–799,999 17 8.8 2–3 years of college 4 2.1 800,000–1,999,999 8 4.1 Four-year college/university 64 33.2
Times of used SSTs in daily life in the past 30 days
0 10 5.2
Postgraduate level or higher 122 63.2 Once 16 8.3
Type of employment
Student 43 22.3 2–3 times 56 29 Full-time employment 132 68.4 4–5 times 38 19.7 Part-time employment 3 1.6 6–12 times 41 21.2 Self-employed 7 3.6 More than 12 times 32 16.6 Retired 1 0.5 Times used SSTs
in hotels in mainland China within the past 12 months
Once 61 31.6 Unemployed 3 1.6 2–3 times 84 43.5 Other 4 2.1 4–5 times 28 14.5
Hotel industry work experience
Yes 31 16.1 more than 5 times 20 10.4 No 162 83.9
The respondents’ trip profiles in the past 12 months are presented in Table 3.7. Among the
respondents, 39.9% had gone on 2-3 domestic trips. The respondents who had gone on 2-3
business trips comprised approximately of 25.4% of the sample. A total of 35.2% of the
respondents had stayed at a midscale hotel 2-3 times, and 30.6% had stayed at an economy
hotel 2-3 times.

120
Table 3.7 Trip Profiles within the Past 12 Months (Sample 1; N = 193) Variables N % Variables N %
Total trips within the past 12 months
1 trip 11 5.7
Domestic trips within the past 12 months
1 trip 20 10.4 2–3 trips 60 31.1 2–3 trips 77 39.9 4–5 trips 55 28.5 4–5 trips 42 21.8 6–12 trips 39 20.2 6–12 trips 29 15.0 More than 12 trips 28 14.5 More than
12 trips 25 13.0
Business trips within the past 12 months
0 50 25.9
Leisure trips within the past 12 months
0 23 11.9 1 trip 29 15 1 trip 57 29.5 2–3 trips 49 25.4 2–3 trips 76 39.4 4–5 trips 27 14 4–5 trips 32 16.6 6–12 trips 14 7.3 6–12 trips 4 2.1 More than 12 trips 24 12.4 More than
12 trips 1 0.5
Times stayed at a business hotel within the past 12 months
0 21 10.9
Times stayed at an upscale hotel within the past 12 months
0 56 29 Once 26 13.5 Once 47 24.4 2–3 times 68 35.2 2–3 times 45 23.3 4–5 times 43 22.3 4–5 times 25 13 6–12 times 15 7.8 6–12 times 11 5.7 More than 12 times 20 10.4 More than
12 times 9 4.7
Times stayed at a resort hotel within the past 12 months
0 53 27.5
Times stayed at a midscale hotel within the past 12 months
0 33 17.1 Once 49 25.4 Once 49 25.4 2–3 times 67 34.7 2–3 times 68 35.2 4–5 times 15 7.8 4–5 times 26 13.5 6–12 times 8 4.1 6–12 times 5 2.6 More than 12 times 1 0.5 More than
12 times 12 6.2
Times stayed at a convention hotel within the past 12 months
0 92 47.7
Times stayed at an economy hotel within the past 12 months
0 53 27.5 Once 42 21.8 Once 46 23.8 2–3 times 41 21.2 2–3 times 59 30.6 4–5 times 12 6.2 4–5 times 15 7.8 6–12 times 2 1 6–12 times 11 5.7 More than 12 times 4 2.1 More than
12 times 9 4.7
Data Analysis: Exploratory Factor Analysis
Factor analysis is associated with normal distribution (Wang et al., 2018). The abnormal
distribution may result in inflated chi-square statistics, and key value bias and thus influence
coefficient significance (Hair et al., 2006). Therefore, normality was tested using SPSS 25
before the factor analysis. The majority of the skewness and kurtosis values of the experience
items were between -0.653 to 0.768. Only “Made me reconsider my daily habits” (experience
with SSTs) had a kurtosis value of 1.258, which was less than 1.5 (Hair et al., 2006). Therefore,
the data were regarded as a normal distribution.
Exploratory factor analysis, or rather, principal component analysis (PCA) with Varimax
rotation, was conducted to identify the underlying constructs. The Cronbach’s alpha reliability
of each component was tested via SPSS 25. The priori criterion, a simple but reasonable
criterion, was used to determine the number of factors (Hair et al., 2006) due to two
121
considerations. First, based on qualitative results and previous research in experimental
marketing, the researcher has already known the number of constructs to extract. Second, the
results of factor analysis using latent root criterion were dissatisfying. According to the results
of factor analysis using latent root criterion, one factor extracted for customer experience with
human services consisted of 13 items, which was a rather large group. Factor identification and
item elimination were conducted according to the following standards. (1) The Kaiser–Meyer–
Olkin measure of sampling adequacy is equal to or bigger than 0.7; (2) Bartlett’s test of
sphericity is significant at the 0.01 level; (3) communality is greater than 0.5; (4) factor loading
is equal to or greater than 0.5; (5) cross-loaded items, which means that one item is loaded on
more than one factor with both loadings higher than 0.5, are deleted; (6) eigenvalues are greater
than 1; (7) Cronbach’s alphas are no less than 0.7; (8) item-to-total correlations are greater than
0.5; and (9) interitem correlations exceed 0.3 (Hair et al., 2006). The first two criteria stipulated
a good fitness of the data for factor analysis (Sinclair-Maragh, Gursoy, & Vieregge, 2015).
Moreover, another popular extraction method, that is, principal axis factoring analysis (PAF)
with Promax rotation was conducted for a comparison between the PCA with Varimax rotation
method.
3.5.3 Second Round of Data Collection: Measurement Finalization and Hypotheses Test
Data Collection Targeting Customers: Sample 2
The following modifications were made based on the results of the first round of data
collection. First, the measurement items for experience were revised on the basis of the PCA
results. Second, the measurement of the trip profiles was revised to ask typical questions rather
than recall questions. For example, “How many business trips have you taken within the past
12 months?” and “How many leisure trips have you taken within the past 12 months?” were
combined and replaced by, “What kind of purpose do you typically travel for?” The questions
were revised because the results of cluster analyses based on recall questions were not
satisfactory. Another reason was that typical questions simplified the questionnaire, thereby
encouraging earnest answers.
The revised questionnaire was first reviewed by an academic scholar. Subsequently, four Ph.D.
students were invited for the pretest. Reverse or homogeneous attention questions concerning
experience and personality items were changed to attention items (i.e., This item is for attention
check, please choose “2”), based on the comments from the pretest. Wenjuanxing
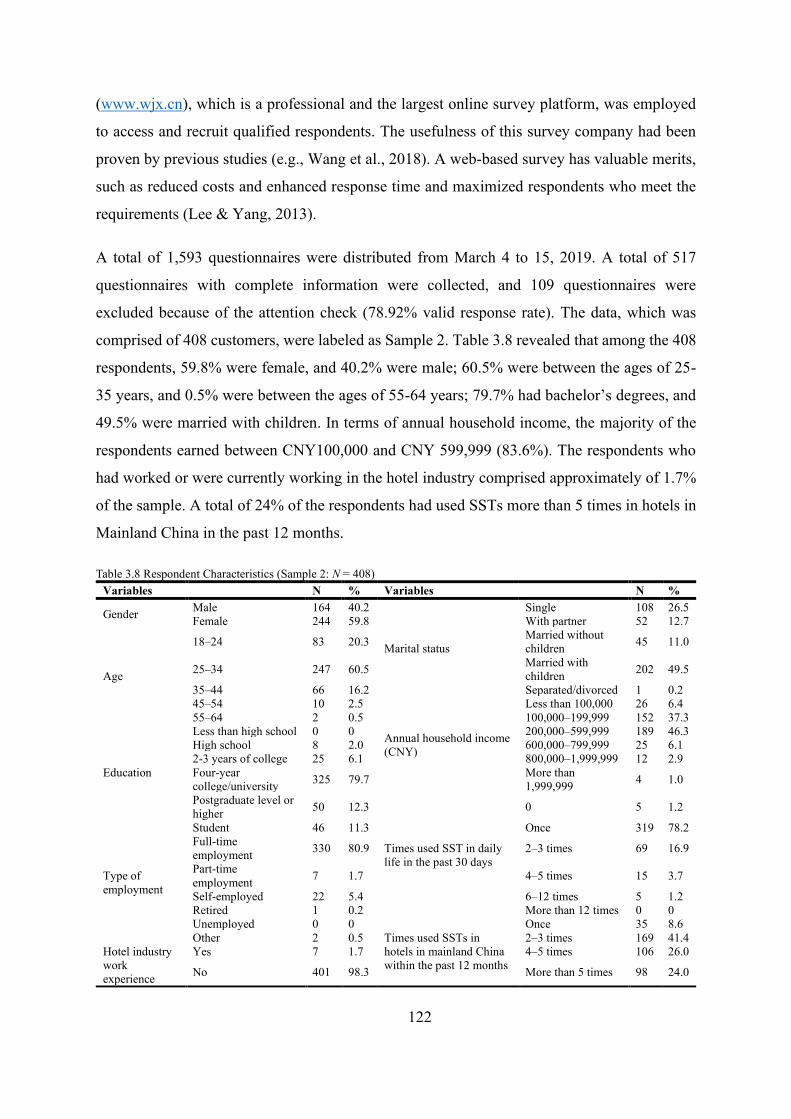
122
(www.wjx.cn), which is a professional and the largest online survey platform, was employed
to access and recruit qualified respondents. The usefulness of this survey company had been
proven by previous studies (e.g., Wang et al., 2018). A web-based survey has valuable merits,
such as reduced costs and enhanced response time and maximized respondents who meet the
requirements (Lee & Yang, 2013).
A total of 1,593 questionnaires were distributed from March 4 to 15, 2019. A total of 517
questionnaires with complete information were collected, and 109 questionnaires were
excluded because of the attention check (78.92% valid response rate). The data, which was
comprised of 408 customers, were labeled as Sample 2. Table 3.8 revealed that among the 408
respondents, 59.8% were female, and 40.2% were male; 60.5% were between the ages of 25-
35 years, and 0.5% were between the ages of 55-64 years; 79.7% had bachelor’s degrees, and
49.5% were married with children. In terms of annual household income, the majority of the
respondents earned between CNY100,000 and CNY 599,999 (83.6%). The respondents who
had worked or were currently working in the hotel industry comprised approximately of 1.7%
of the sample. A total of 24% of the respondents had used SSTs more than 5 times in hotels in
Mainland China in the past 12 months.
Table 3.8 Respondent Characteristics (Sample 2: N = 408) Variables N % Variables N %
Gender Male 164 40.2
Marital status
Single 108 26.5 Female 244 59.8 With partner 52 12.7
Age
18–24 83 20.3 Married without children 45 11.0
25–34 247 60.5 Married with children 202 49.5
35–44 66 16.2 Separated/divorced 1 0.2 45–54 10 2.5
Annual household income (CNY)
Less than 100,000 26 6.4 55–64 2 0.5 100,000–199,999 152 37.3
Education
Less than high school 0 0 200,000–599,999 189 46.3 High school 8 2.0 600,000–799,999 25 6.1 2-3 years of college 25 6.1 800,000–1,999,999 12 2.9 Four-year college/university 325 79.7 More than
1,999,999 4 1.0
Postgraduate level or higher 50 12.3
Times used SST in daily life in the past 30 days
0 5 1.2
Type of employment
Student 46 11.3 Once 319 78.2 Full-time employment 330 80.9 2–3 times 69 16.9
Part-time employment 7 1.7 4–5 times 15 3.7
Self-employed 22 5.4 6–12 times 5 1.2 Retired 1 0.2 More than 12 times 0 0 Unemployed 0 0
Times used SSTs in hotels in mainland China within the past 12 months
Once 35 8.6 Other 2 0.5 2–3 times 169 41.4
Hotel industry work experience
Yes 7 1.7 4–5 times 106 26.0
No 401 98.3 More than 5 times 98 24.0
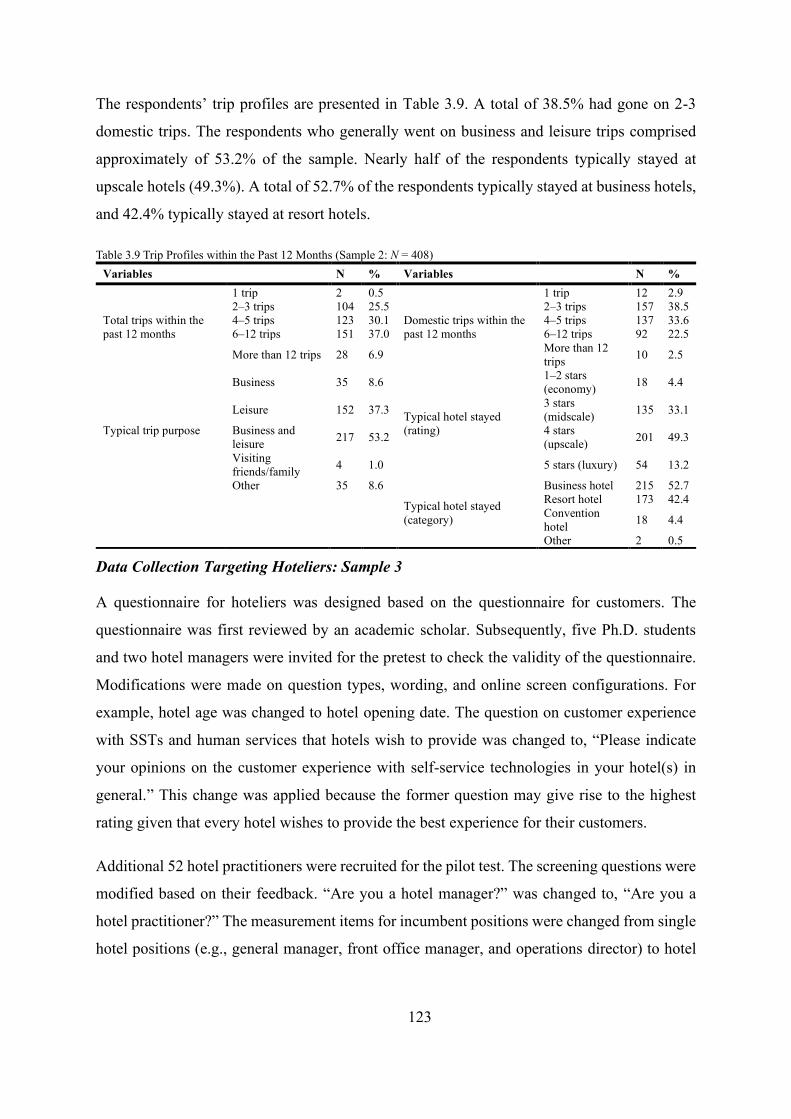
123
The respondents’ trip profiles are presented in Table 3.9. A total of 38.5% had gone on 2-3
domestic trips. The respondents who generally went on business and leisure trips comprised
approximately of 53.2% of the sample. Nearly half of the respondents typically stayed at
upscale hotels (49.3%). A total of 52.7% of the respondents typically stayed at business hotels,
and 42.4% typically stayed at resort hotels.
Table 3.9 Trip Profiles within the Past 12 Months (Sample 2: N = 408) Variables N % Variables N %
Total trips within the past 12 months
1 trip 2 0.5
Domestic trips within the past 12 months
1 trip 12 2.9 2–3 trips 104 25.5 2–3 trips 157 38.5 4–5 trips 123 30.1 4–5 trips 137 33.6 6–12 trips 151 37.0 6–12 trips 92 22.5
More than 12 trips 28 6.9 More than 12 trips 10 2.5
Typical trip purpose
Business 35 8.6
Typical hotel stayed (rating)
1–2 stars (economy) 18 4.4
Leisure 152 37.3 3 stars (midscale) 135 33.1
Business and leisure 217 53.2 4 stars
(upscale) 201 49.3
Visiting friends/family 4 1.0 5 stars (luxury) 54 13.2
Other 35 8.6
Typical hotel stayed (category)
Business hotel 215 52.7 Resort hotel 173 42.4
Convention hotel 18 4.4
Other 2 0.5
Data Collection Targeting Hoteliers: Sample 3
A questionnaire for hoteliers was designed based on the questionnaire for customers. The
questionnaire was first reviewed by an academic scholar. Subsequently, five Ph.D. students
and two hotel managers were invited for the pretest to check the validity of the questionnaire.
Modifications were made on question types, wording, and online screen configurations. For
example, hotel age was changed to hotel opening date. The question on customer experience
with SSTs and human services that hotels wish to provide was changed to, “Please indicate
your opinions on the customer experience with self-service technologies in your hotel(s) in
general.” This change was applied because the former question may give rise to the highest
rating given that every hotel wishes to provide the best experience for their customers.
Additional 52 hotel practitioners were recruited for the pilot test. The screening questions were
modified based on their feedback. “Are you a hotel manager?” was changed to, “Are you a
hotel practitioner?” The measurement items for incumbent positions were changed from single
hotel positions (e.g., general manager, front office manager, and operations director) to hotel

124
group manager, hotel manager, manager of owner company, owner representative, and other.
If the respondents chose hotel manager, then the original single hotel positions would appear.
Lastly, 2,102 questionnaires were distributed and returned from March 9 to 12, 2019. A total
of 2,020 respondents passed the screening process, and 481 valid questionnaires were retained
for further analysis based on attention filters with a validity rate of 23.81%. A total of 504
questionnaires were used for further analysis after the 23 valid questionnaires from the pilot
studies were added. The hotelier data were named Sample 3. Notably, some social scientists
argued that the data might be flawed as modifications have been made in the final study
according to the results of pilot test (ResearchGate, 2016). However, the data of pilot data will
be of value if the questions and process have been established and validated (ResearchGate,
2016). The pilot test was included in the final study is due to the following considerations.
First, before the pilot test, a pre-test has been conducted to simulate the formal study and
improve the wording of questions. After modifications according to pre-test, the pilot test was
conducted to further simulate and examine the feasibility of the questions and process. The
results of pilot test showed no big modifications. That is, the final interview
questions/questionnaires were similar to those used in pilot tests. Second, the respondents in
pilot study satisfy the requirements of target participants. Pilot study respondents and final
study participants were from the same population. Third, the inclusion of pilot test in final
study papers has been observed in top journal articles (e.g., Wang, Xiang, & Fesenmaier, 2014).
The demographic characteristics of the respondents were displayed in Table 3.10. The female
respondents (55.8%) outnumbered their male counterparts (44.2%). The majority age group
was 25-35 years, comprising approximately 57.3% of the respondents. The majority of the
hotel managers had a 2-3 year college degree (58.9%). The majority of the respondents were
married with children (61.5%). The most common total annual household income earned by
the respondents was between CNY100,000 and CNY199,999 (54.6%). Nearly all the
respondents had used SSTs at least once in the past 30 days (90.1%). The most common number
of years of experience at a management level position was 6-10 years (41.5%).
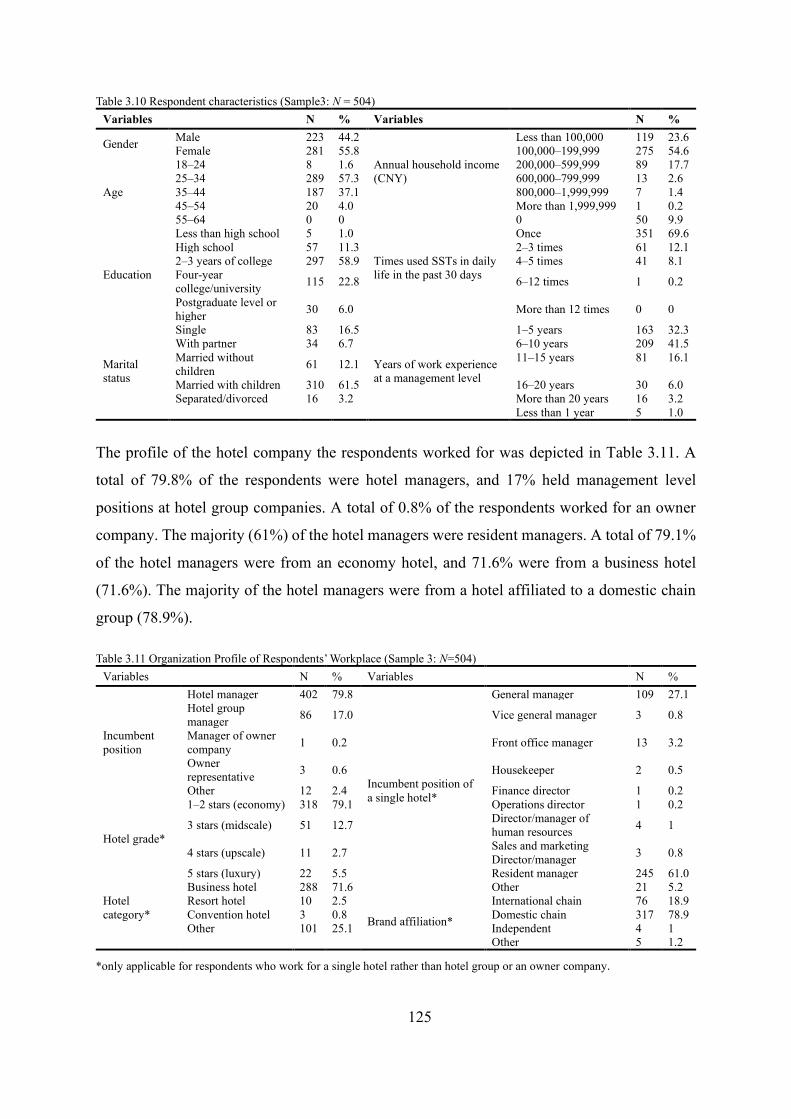
125
Table 3.10 Respondent characteristics (Sample3: N = 504) Variables N % Variables N %
Gender Male 223 44.2
Annual household income (CNY)
Less than 100,000 119 23.6 Female 281 55.8 100,000–199,999 275 54.6
Age
18–24 8 1.6 200,000–599,999 89 17.7 25–34 289 57.3 600,000–799,999 13 2.6 35–44 187 37.1 800,000–1,999,999 7 1.4 45–54 20 4.0 More than 1,999,999 1 0.2 55–64 0 0
Times used SSTs in daily life in the past 30 days
0 50 9.9
Education
Less than high school 5 1.0 Once 351 69.6 High school 57 11.3 2–3 times 61 12.1 2–3 years of college 297 58.9 4–5 times 41 8.1 Four-year college/university 115 22.8 6–12 times 1 0.2
Postgraduate level or higher 30 6.0 More than 12 times 0 0
Marital status
Single 83 16.5
Years of work experience at a management level
1–5 years 163 32.3 With partner 34 6.7 6–10 years 209 41.5 Married without children 61 12.1 11–15 years 81 16.1
Married with children 310 61.5 16–20 years 30 6.0 Separated/divorced 16 3.2 More than 20 years 16 3.2 Less than 1 year 5 1.0
The profile of the hotel company the respondents worked for was depicted in Table 3.11. A
total of 79.8% of the respondents were hotel managers, and 17% held management level
positions at hotel group companies. A total of 0.8% of the respondents worked for an owner
company. The majority (61%) of the hotel managers were resident managers. A total of 79.1%
of the hotel managers were from an economy hotel, and 71.6% were from a business hotel
(71.6%). The majority of the hotel managers were from a hotel affiliated to a domestic chain
group (78.9%).
Table 3.11 Organization Profile of Respondents’ Workplace (Sample 3: N=504) Variables N % Variables N %
Incumbent position
Hotel manager 402 79.8
Incumbent position of a single hotel*
General manager 109 27.1 Hotel group manager 86 17.0 Vice general manager 3 0.8
Manager of owner company 1 0.2 Front office manager 13 3.2
Owner representative 3 0.6 Housekeeper 2 0.5
Other 12 2.4 Finance director 1 0.2
Hotel grade*
1–2 stars (economy) 318 79.1 Operations director 1 0.2
3 stars (midscale) 51 12.7 Director/manager of human resources 4 1
4 stars (upscale) 11 2.7 Sales and marketing Director/manager 3 0.8
5 stars (luxury) 22 5.5 Resident manager 245 61.0
Hotel category*
Business hotel 288 71.6 Other 21 5.2 Resort hotel 10 2.5
Brand affiliation*
International chain 76 18.9 Convention hotel 3 0.8 Domestic chain 317 78.9 Other 101 25.1 Independent 4 1
Other 5 1.2
*only applicable for respondents who work for a single hotel rather than hotel group or an owner company.

126
Data Analysis: Confirmatory Factor Analysis (CFA) and Hypotheses Test
The data were analyzed according to the following steps via SPSS 25 and AMOS 25. First,
outliers that can detect potential issues in subsequent analysis were considered. Specifically,
stem-and-leaf and box plots were adopted to detect anomalous values. Subsequently, the
normality of all the continuous variables was tested. Nearly all the skewness and kurtosis values
fell between -1.5 and 1.5. The skewness value of one item (“made me think that society is
progressing”) on Sample 2 was 1.744, which was slightly higher than 1.5. Although a few of
the kurtosis values of items (e.g., “make customer feel as if he/she is being served” [customer
experience with human services] on Sample 3) were greater than 1.5, they were all smaller than
3. Given that no serious kurtosis occurs as long as the absolute value is smaller than 4.6 (Kline,
2016; Wei, Lu, et al., 2017), it can be safely concluded that the two groups of data were both
approximately normally distributed. These normality tests served as the basis for further
analysis via SPSS 25 and AMOS 25.
Subsequently, CFA was conducted in AMOS 25 to purify the measurement of experience. A
two-step approach suggested by Anderson and Gerbing (1988) was used to examine the
measurement model and subsequent structural equation model. The measurement model aimed
to test the relationships between the 22 experience items and 5 first-order constructs to assess
the fit between the relationships and the data. The focus of the structural model was on the
relationships between the 5 first-order latent constructs and 1 second-order latent factor labeled
as “customer experience” (Figure 3.6). The second-order confirmatory factor analysis was
adopted due to theoretical consideration (Hair et al., 2006). That is, in the past literature,
customer experience was usually regarded as one construct with couples of dimensions (Su,
2011; Wu & Liang, 2009; Yang, 2008).
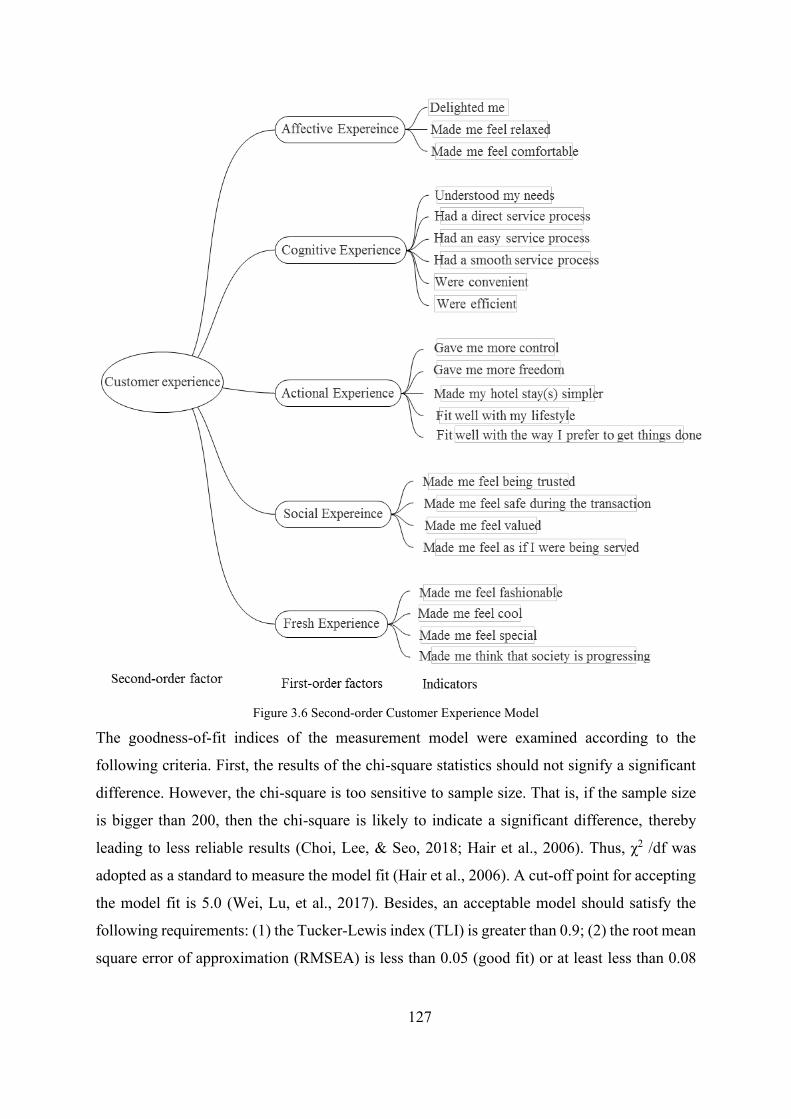
127
Figure 3.6 Second-order Customer Experience Model
The goodness-of-fit indices of the measurement model were examined according to the
following criteria. First, the results of the chi-square statistics should not signify a significant
difference. However, the chi-square is too sensitive to sample size. That is, if the sample size
is bigger than 200, then the chi-square is likely to indicate a significant difference, thereby
leading to less reliable results (Choi, Lee, & Seo, 2018; Hair et al., 2006). Thus, χ2 /df was
adopted as a standard to measure the model fit (Hair et al., 2006). A cut-off point for accepting
the model fit is 5.0 (Wei, Lu, et al., 2017). Besides, an acceptable model should satisfy the
following requirements: (1) the Tucker-Lewis index (TLI) is greater than 0.9; (2) the root mean
square error of approximation (RMSEA) is less than 0.05 (good fit) or at least less than 0.08
128
(acceptable fit); and (3) the comparative fit index (CFI) is equal to or exceeds 0.9 (Hair et al.,
2006; Kline, 2016).
Additionally, the construct and composite reliability and the convergent, discriminant, and
external validity of the measurement scale were inspected. Regarding construct reliability,
Cronbach’s alpha reliability test was conducted in SPSS 25 to verify the internal consistency
of the items with original constructs. The criteria were the same as the criteria used in the
reliability test conducted in the EFA stage (Section 3.5.2) and thus not explained here. The
values of the composite reliabilities should exceed 0.7 (Hair et al., 2006; Kline, 2016). For
convergent validity, factor loadings should exceed 0.5 and be significant at the 0.01 level (Hair
et al., 2006; Hung & Petrick, 2011; Wang et al., 2018). The average variance extracted (AVE)
should surpass 0.5 (Bagozzi, 2006). Regarding discriminant validity, the square root of AVE
should exceed the correlations among the constructs (Bagozzi, 2006), and these correlation
coefficients should not be greater than 0.85 (Kline, 2016). For external validity, the structural
models with paths from experience with SSTs to intention to use SSTs and from experience
with human services to intention to use human services were tested in AMOS 25.
After the experience measurement scale was developed, a series of descriptive analyses,
crosstabulation analyses, and t-tests were conducted to test the hypotheses presented in Chapter
5 (Discussion and Conclusion of Qualitative Study). Customers’ and hoteliers’ preferences for
different SSTs and traditional service delivery channels at different service delivery stages
were derived from the descriptive analysis and comparison (H1a, H1b). That descriptive
analysis was used to test hypotheses H1a and H1b is because there are no other proper data
analysis methods due to the question design. H1a and H1b were aimed to ascertain whether
customers’ or hoteliers’ preferences between SSTs and service employees differ by service
delivery stage (e.g., check in, room service order, and room service delivery). Distinct SSTs
were used in different service delivery stage. For instance, mobile check-in and facial
recognition self-service kiosk were used in check-in service encounter, while smartphone,
control panel, AI management system (e.g., Tmall Genie) can be used to control in-room
amenities (e.g., television, curtains, and lights). Given the differences existing both service
delivery stage and available SSTs in each stage, it is improper to conduct cross-tabulation
analysis, T-test, ANOVA or other hypotheses testing. Therefore, only descriptive analysis was
conducted to explore the percentages of preferences for SSTs by hotel service stage.

129
The preference differences between hoteliers and customers by hotel service delivery stage
were compared via crosstabulation analysis (H1d), as shown in Table 3.12. The different
behavioral intentions of customers and hoteliers were tested via independent-sample t-tests
(H1c). The differences between the perceptions of experience delivered by SSTs and service
staffs were examined by paired-sample t-test from the perspectives of the hoteliers (H7a) and
the customers (H4a), separately. The different perceptions of customer experience from the
perspectives of customers and hoteliers were examined by independent-samples t-tests (H8a
and H8b). A series of structural equation models (SEM) were tested to verify the influences of
experience with SSTs (H2 and H5), experience with human services (H3 and H6) and
experience discrepancies (H4b and H7b) on behavioral intentions and preferences respectively.
Table 3.12 Hypotheses and Test Results
Hypotheses Data analysis methods
Data sources Results
H1a: Customers’ preferences between SSTs and service employees differ by service delivery stage.
Descriptive analysis Sample 4 Supported
H1b: Hoteliers’ preferences between SSTs and service employees differ by service delivery stage.
Descriptive analysis Sample 3 Supported
H1c: Customers’ and hoteliers’ behavioral intentions to use SSTs or human services are different.
Independent-sample t-tests
Sample 4 vs. Sample 3 Supported
H1d: Customers’ and hoteliers’ preferences between SSTs and service employees differ by service delivery stage.
Crosstabulation analyses
Sample 4 vs. Sample 3
Partially supported
H2: Customer experience with SSTs influence customers’ preference for SSTs. SEM Sample 2 Supported
H3: Customer experience with human services influence customers’ preference for SSTs. SEM Sample 2 Supported
H4a: Discrepancies exist between customers’ experiences with SSTs and human services.
Paired-sample t-tests Sample4 Supported
H4b: Discrepancies existing between customers’ experiences with SSTs and human services influence customers’ preferences for SSTs.
SEM Sample 2 Supported
H5: Customer experience with SSTs influence hotelier’s preference for SSTs. SEM Sample 3 Supported
H6: Customer experience with human services influence hotelier’s preference for SSTs. SEM Sample 3 Not
supported H7a: Discrepancies exist between hoteliers’ perceptions of customer experience with SSTs and human services.
Paired-sample t-tests Sample 3 Partially
Supported H7b: Discrepancies existing between hoteliers’ perceptions of customer experience with SSTs and human services influence hoteliers’ preferences for SSTs.
SEM Sample 3 Supported
H8a: Discrepancies exist between hoteliers’ perceived customer experiences and customers’ expressed experiences with SSTs.
Independent-sample t-tests
Sample 4 vs. Sample 3 Supported
H8b: Discrepancies exist between hoteliers’ perceived customer experiences and customers’ expressed experiences with human services.
Independent-sample t-tests
Sample 4 vs. Sample 3
Partially Supported
Note: Sample 4 was obtained by combing Sample 1 with Sample2; N=601.
130
Lastly, customers were segmented on the basis of their preferences for SSTs at different service
delivery stages. First, behavior preferences at different service encounters were transformed
into binary variables. Then, a two-step cluster analysis was conducted (IBM Support, n.d.;
Satish & Bharadhwaj, 2010). Thereafter, a series of crosstabulation analyses and one-way
ANOVA tests with post hoc tests (Scheffe) were conducted to profile the clusters according to
customer demographics, personality, personal innovativeness in technology, experience, and
perceptions of task complexity. When it comes to ANOVA tests, homogeneity of variances test
(Levene’s Test) were leveraged to examine whether there exist big discrepancies in the
variances of the different sub-samples. Differences existing in variances and sample sizes give
rise to high risks of biased results under which condition the Welch test with post hoc tests
(Games-Howell test) was used instead of the usual F test.
3.6 Chapter Summary
This chapter described the methodology used to reach the research objectives. The beginning
of this chapter articulated the study setting followed by research design. To answer research
questions, mixed methods were adopted, and a visual diagram was presented (Figure 3.4).
Then, the research paradigm, which was adopted to guide the research, was explicated. The
beliefs and values of constructivism matched well with the beliefs and values of the current
study. Such beliefs and values were explained from ontological, epistemological, and
methodological perspectives. Next, qualitative and quantitative research approaches were
depicted in detail. A total of 60 in-depth interviews with customers and hoteliers were
conducted separately in qualitative research. Pilot studies were conducted to examine the
validity and reliability of the interview questions and sampling methods before the formal
study. Content analysis was adopted to analyze the text after the record information was
transcribed verbatim.
Subsequently, this chapter accounted for the measurement items and designed the initial
questionnaire for the quantitative research. A panel of experts was invited to review the initial
experience items. Then, two rounds of surveys were conducted to collect data to 1) develop a
valid and reliable measurement for customer experience with SSTs and customer experience
with human services, and 2) test hypotheses proposed according to qualitative findings.
Specifically, Paired-sample t-tests were done to compare experience discrepancies between
SSTs and human services from the perspectives of hoteliers and customers, respectively.
Independent-sample t-tests were conducted to compare the differences regarding experience

131
perceptions between hoteliers and customers. Structural models were conducted in Amos 25 to
examine the influences of experience with SSTs, experience with human services, and
experience discrepancies on customers’ and hoteliers’ behavioral preferences, respectively.
Moreover, a two-step cluster analysis was conducted to identify different types of customers
based on their preferences at different service stages. In the last stage, cross-tabulation analysis,
and ANOVA tests were conducted to profile the identified clusters by individual demographics,
personal innovativeness in technology, personality, experience, and perceived task complexity.

132
CHAPTER 4: QUALITATIVE FINDINGS
Content analysis of interview information allowed for identification of factors influencing
customers’ and hoteliers’ preferences for SSTs and encouraged them to integrate SSTs into
their accommodations. Six dimensions influencing individual and organizational preferences
for and use of SSTs were identified. Supporting examples from interviews were provided to
illustrate these factors. The SSTs that participants discussed and their preferences for different
types of SSTs, were described first to provide context for respondents’ underlying rationale.
4.1 Self-service Technologies at Different Hotel Service Delivery Stages
4.1.1 Available SSTs at Different Hotel Service Delivery Stages
The literature review presented a classification of innovative SSTs in hotels (Table 2.2) based
on the work of Meuter et al. (2000). According to the findings of interviews, the categorization
of hotel SSTs was revised (Table 4.1). The five original interfaces were condensed into four
interfaces, namely interactive kiosks, television, smartphone/mobile tablet, and artificial
intelligence. The original three stages of hotel service delivery (i.e., check-in/-out, room, and
restaurant) were expanded to five stages. Room was separated into three service encounters due
to distinctions among such encounters: “in-room facilities control” (e.g., controlling the
television, curtains, and lights); “room service orders” (e.g., ordering food); and “room service
delivery”. Restaurant was similarly divided into “service orders at restaurants/bars” (e.g.,
ordering food) and “service delivery at restaurants/bars” (e.g., served dishes). Considering the
similar SSTs used for room service orders and service orders at restaurants/bars, options were
merged into a new task labeled “room service order/service order at restaurants/bars”. In a
related vein, room service delivery and service delivery at restaurants/bars were combined and
labeled as “room service delivery/delivery at restaurants/bars”. Furthermore, in mainland
China, business travelers cannot request company reimbursement for expenses without an
invoice. China’s State Taxation Administration imposes strict regulations on invoicing. Aside
from a company name, address, telephone number, and bank account, beginning July 1, 2017,
customers must provide the taxpayer’s registration number or unified social credit code to
obtain a value-added tax invoice (State Taxation Administration, 2017). Self-financed
travelers do not require such an invoice, while every guest must complete the check-out
process. Given the specificity of invoicing in mainland China, invoicing was separated from
check-out and considered as a new task, “invoice obtained”.

133
Table 4.1 Innovative SSTs at Different Service Delivery Stages in Hotels
Task SSTs
Check-in/Check-out In-room facilities control Room service order/service order at restaurants & bars
Room service delivery/delivery at restaurants & bars
Invoice obtained
Interactive kiosks • Self-check in/-out kiosk • Face verification kiosk
• Control panel • Remote control
NA NA
• Self-service kiosk for invoice
Television • Television check-out system NA • Television ordering system NA NA
Smartphone/mobile tablet • Mobile check-in/-out • Mobile room keys • Online room selection
• Smartphone app for in-room facilities control • Mobile tablet for in-room facilities control
• Smartphone ordering system • Mobile tablet ordering system • Touchscreen table for ordering
NA • Scan QR code via smartphone
Artificial intelligence • Concierge robot
• Artificial intelligence (AI) management system (i.e., smart speaker) • Intelligent lights • Intelligent closestool
• Artificial intelligence management system (e.g., smart speaker)
• Robot NA
NA: Not applicable

134
The revised classification (Table 4.1) is clearer than that presented in the literature review
(Table 2.2) to more easily delineate hoteliers’ and customers’ knowledge of SSTs across
service delivery stages. Figure 4.1 to Figure 4.3 were some examples of these hotel SSTs
Figure 4.1 Examples of SSTs During Check-in/-out Service Encounters
(All photos were taken by the author except for the concierge robot taken by a friend of the author)
Figure 4.2 Examples of SSTs During Room Service Encounters
(All photos were taken by the author except for the mobile tablet taken by a friend of the author)
Figure 4.3 Example of QR Code for Invoicing
(All photos were taken by the author)

135
4.1.2 Preferences at Different Service Delivery Stages
Customers and hoteliers suggested that hotels should use SSTs selectively, based on service
stage rather than blindly replacing all humans with SSTs. Customers and hoteliers would not
prefer a hotel fully staffed by SSTs and their preferences for technology varied throughout the
hotel service delivery process.
Customers’ Preferences by Service Delivery Stage
Customers’ preferences between SSTs and service employees varied across service encounters
(Appendix 2.1). Customer #15 indicated that she preferred mobile check-in but tended to visit
the front desk to check out and obtain an invoice. In terms of in-room facilities control and
room service order, she preferred an AI management system; conversely, she would like a
service employee to help her place an order at a restaurant. Additionally, she preferred a service
employee to deliver room service but was comfortable with either robots or service employees
regarding service delivery at a restaurant. Customer #26 preferred visiting the front desk to
check in but favored mobile check-out, whereas he wanted a front desk employee to provide
an invoice for him. With respect to in-room facilities control and room service order, he showed
a preference for AI management system but would like service employees to deliver service
whether to his room or at a restaurant. These two examples suggest that customers’ preferences
for SSTs or service employees are not binary but rather involve channel sequencing. Customers
often adopted multiple channels to handle specific service tasks during a hotel stay. In general,
customer informants preferred SSTs to service employees, particularly for controlling in-room
facilities and checking out (Figure 4.4). However, in terms of service delivery, customers’
preferences for SSTs or service employees were nearly equal.
Figure 4.4 Proportions of Customers’ Preferences for SSTs Compared with Service Employees (N = 30)
00.10.20.30.40.50.60.70.80.9
1Check in
Control in-roomfacilities
Order roomservice
Deliver roomservice
Order service atrestaurant/bars
Deliver service atrestaurants/bars
Check out
Obtain an Invoice
SST
Service employee
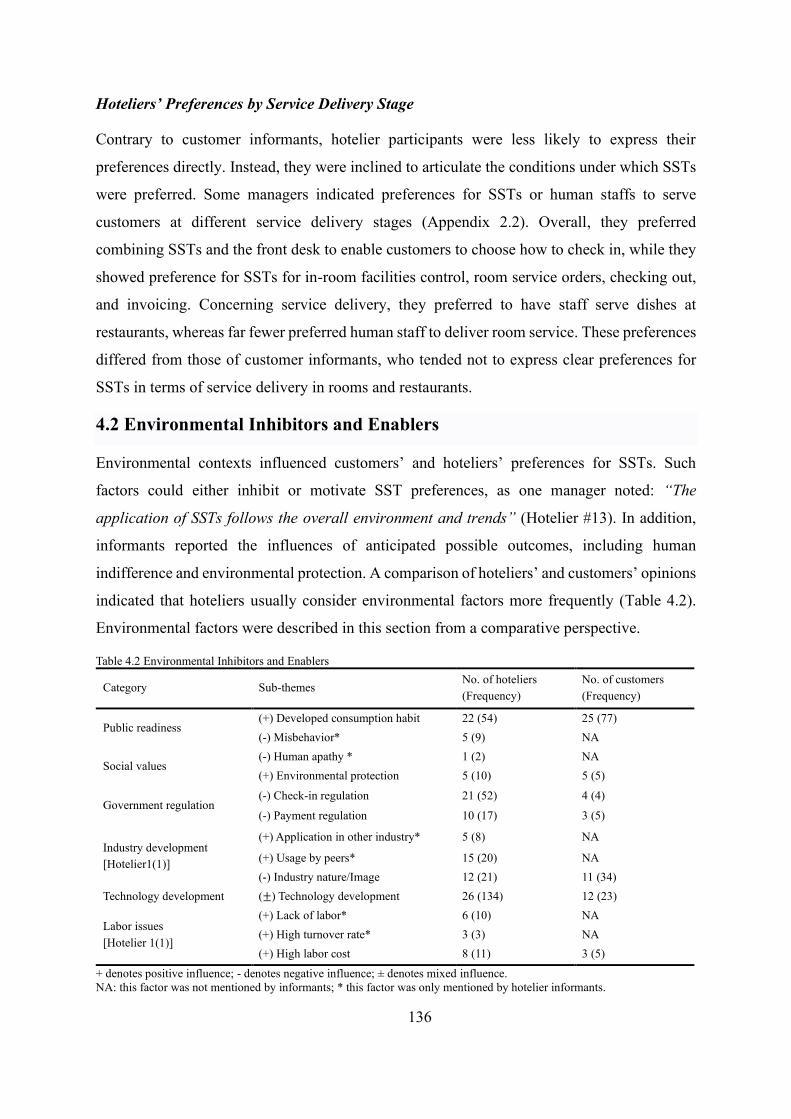
136
Hoteliers’ Preferences by Service Delivery Stage
Contrary to customer informants, hotelier participants were less likely to express their
preferences directly. Instead, they were inclined to articulate the conditions under which SSTs
were preferred. Some managers indicated preferences for SSTs or human staffs to serve
customers at different service delivery stages (Appendix 2.2). Overall, they preferred
combining SSTs and the front desk to enable customers to choose how to check in, while they
showed preference for SSTs for in-room facilities control, room service orders, checking out,
and invoicing. Concerning service delivery, they preferred to have staff serve dishes at
restaurants, whereas far fewer preferred human staff to deliver room service. These preferences
differed from those of customer informants, who tended not to express clear preferences for
SSTs in terms of service delivery in rooms and restaurants.
4.2 Environmental Inhibitors and Enablers
Environmental contexts influenced customers’ and hoteliers’ preferences for SSTs. Such
factors could either inhibit or motivate SST preferences, as one manager noted: “The
application of SSTs follows the overall environment and trends” (Hotelier #13). In addition,
informants reported the influences of anticipated possible outcomes, including human
indifference and environmental protection. A comparison of hoteliers’ and customers’ opinions
indicated that hoteliers usually consider environmental factors more frequently (Table 4.2).
Environmental factors were described in this section from a comparative perspective.
Table 4.2 Environmental Inhibitors and Enablers
Category Sub-themes No. of hoteliers (Frequency)
No. of customers (Frequency)
Public readiness (+) Developed consumption habit 22 (54) 25 (77) (-) Misbehavior* 5 (9) NA
Social values (-) Human apathy * 1 (2) NA (+) Environmental protection 5 (10) 5 (5)
Government regulation (-) Check-in regulation 21 (52) 4 (4) (-) Payment regulation 10 (17) 3 (5)
Industry development [Hotelier1(1)]
(+) Application in other industry* 5 (8) NA
(+) Usage by peers* 15 (20) NA (-) Industry nature/Image 12 (21) 11 (34)
Technology development (±) Technology development 26 (134) 12 (23)
Labor issues [Hotelier 1(1)]
(+) Lack of labor* 6 (10) NA (+) High turnover rate* 3 (3) NA (+) High labor cost 8 (11) 3 (5)
+ denotes positive influence; - denotes negative influence; ± denotes mixed influence. NA: this factor was not mentioned by informants; * this factor was only mentioned by hotelier informants.

137
4.2.1 Public Readiness
Public readiness refers to whether the public has developed a consumption habit of using SSTs,
and if their misbehaviors are corrected, it will help promote the popularity of self-service.
(+) Developed Consumption Habit
Hoteliers and customers mentioned that the popularity of SSTs within society and the public’s
habit of using SSTs positively contributed to their SST preferences. They expected their
preferences for SSTs should increase as SSTs become more common. Both groups also noted
the positive effects of customers’ use of SSTs in daily life. Among hoteliers, because customers
have already been in the habit of using SSTs, SST use in hotels “just brought their daily habits
to their hotel stays” (Hotelier #2). Some customer informants directly indicated that technology
use in hotels better suited their lifestyle (e.g., Customer #15).
On the contrary, the unpopularity of technology, customers’ tendencies to use human services,
and unfamiliarity with SSTs diminished individuals’ preferences. For example, Customer #8
stated she preferred to use a smartphone to order food at her room because she was accustomed
to using a smartphone to order takeout, whereas she did not prefer smart speakers during her
stay given that she was not familiar with such products. Even so, she mentioned that she
expected to use smart-speaker-based products in the future. Ten hoteliers mentioned that hotels
could cultivate customers’ tendencies to use SSTs via appropriate promotion, after which
people would become accustomed to using these devices. Hotelier #6 shared that “Customers
gradually began to use self-service kiosks to obtain invoices thanks to our training and
introduction.”
(+) Misbehavior
Customer misbehavior influenced hoteliers’ preferences for SSTs. The less customer
misbehavior, the more likely hoteliers would be to use SSTs. Unfortunately, customer
misbehavior remains problematic in mainland China, inhibiting hotels’ application of SSTs,
particularly portable devices. Hoteliers worried about the loss of portable SSTs because some
customers may steal these in-room amenities: “What worries me most is not whether SSTs are
suitable for us but whether [the iPads] will be stolen” (Hotelier #21). Hotelier #15 took the
supermarket as an example to explain the negative influences of the misbehavior. Due to some
customers’ misbehavior, hotels did not trust customers as if consumers were asked to deposit
138
their luggage before entering a supermarket (to prevent theft) when supermarkets began
opening in the country.
4.2.2 Social Values
Aside from societal developments, anticipated outcomes influenced participants’ preferences.
If they expected positive outcomes, they would prefer SSTs and vice versa. The results of data
analysis indicated that hoteliers and customers expected SSTs to exert positive influences on
the environment, thus contributing to their preferences for these devices. For instance, one of
the reasons Hotelier #8 preferred using iPads for food order was that they reduced
environmental damage, whereas paper menus wasted forest resources. In a similar vein,
customers preferred using a smartphone to open doors so as to limit the need for cards and
promote environmental protection.
Conversely, hotelier participants in the qualitative study mentioned that SST applications could
evoke apathy, diminishing their preferences for SSTs. In their opinion, people are emotional
animals. The use of emotionless technologies may result in indifference.
“If one day the whole world is using robots to serve, I think people will be more
apathetic. That is the problem. From an anthropological perspective, humans are
social and emotional animals rather than machines. I think this is certainly one of the
negative influences of technology development to the whole human civilization.”
(Hotelier #22)
4.2.3 Government Regulation
(-) Check-in Regulation
Although Hotelier #4 mentioned that the Chinese government promoted AI, hotel managers
most frequently mentioned the negative influences of government regulations on the check-in
process. The Chinese government mandated that hotels upload guests’ identifying information
in real time, which was not a compulsory requirement in other countries. If hotels in China did
not adhere to this policy, they would be fined. This regulation was considered the largest barrier
to the popularity of self-service check-in in mainland China. Each time the author asked
hoteliers’ opinions on self-service check-in, hoteliers’ initial reactions indicated the
disapproval of the Chinese government. In their opinion, self-check-in technology is well
developed. Once the Chinese government relaxes check-in regulations, the application of self-

139
check-in technology should proliferate. Fortunately, some hoteliers mentioned that local
governments (e.g., Hangzhou government) have sought to collaborate with technology
companies and hotels to test the feasibility of self-check-in technology in hotels.
Additionally, the Chinese government recently asked hotels to install a face verification kiosk
to substitute face checks by service employees. Customers and hotels expressed different
attitudes toward this machine. Although Hotelier #5 indicated he did not like the machine
because customers sometimes resisted it, Hotelier #28 and customers did not express strong
feelings given that the identity verification and registration is a government mandate. Customer
#25 indicated, “If the public security bureau has such a rule, then it does not bother me.”
(-) Payment Regulation
Chinese credit cards cannot be used without the card owner providing a signature and
password. That is, Chinese credit cards cannot be used via automatic purse. This presents a
problem for managers: “Without solving this issue, it seems to be impossible to use mobile
check-in in hotels” (Hotelier #8). However, thanks to the rapid development of online and
mobile payment in mainland China, automatic purses are becoming a reality. Many hotels
allow customers to pay for their room online and do not require deposits. Thus, the payment
issue may be tackled in the near future. As mentioned in the following statement:
“[Technology] supports prepayment. That is, the room rate can be prepaid. [Self-service
check-in] works as long as there is no business at the front desk” (Customer #12).
4.2.4 Industry Development
“[The use of robots] depends on the development of the whole industry” (Hotelier #6).
Hoteliers in this study indicated that SST applications in other industries motivated them to
apply SSTs. In their opinions, it was important to learn from other industries. Hotelier #2 shared
that if Meituan takeout, a popular online food platform in mainland China, allows people to lay
on the couch and order whatever they wanted, hotels can do the same. SST usage among peers
also exerts positive influences. Fifteen hoteliers mentioned that if their rivals or peers begin to
use SSTs, they will not fall behind. Apart from competitive pressure, peers’ successful
implementation and application of SSTs motivates hotels to adopt such technology. Some
hoteliers indicated that they did not have the energy to be the first hotel to debug and test new
140
SSTs, but if their peers verified the usefulness and benefits of using these devices, they would
consider introducing such options (e.g., Hotelier #29).
Also, the nature of service tempered customers’ and hoteliers’ preferences for SSTs. From
hoteliers’ perspectives, hotel service was a human business requiring human touch: “The
service industry is more about communication between people than a process or stylized work”
(Hotelier #3). Customers also viewed the hotel business as a people-oriented service and
expected to be served by people. In their views, hotels were supposed to arrange everything
rather than shifting the responsibility to consumers. Moreover, a sense of ceremony contributed
to customers’ preferences for traditional services. Customer #15 mentioned that returning the
key to the front desk marked the end of her stay, providing closure.
4.2.5 Technology Development
Informants indicated that their preferences depended on the direction and extent of technology
development. Trends in technology development have effectively forced some managers to
adopt SSTs.
“When technology develops, it is not [a question of] whether we will use it or not.
When technology develops, it touches everyone, it surrounds everyone. If you do not
use it, if you do not hug it, it will hug you. There is no way to run. … You cannot
escape the embrace of technology.” (Hotelier #14)
Nonetheless, most current SSTs are immature or not developed well. SST operation still
requires a human in the loop, which apparently diminished participants’ preferences for SSTs.
Hotelier #21 stated that robots relied on people to prepare the goods they were supposed to
deliver, in line with Customer #5 who criticized SSTs as providing “half self-service” rather
than pure self-service.
4.2.6 Labor Issues
In-depth interviews revealed that labor issues influenced hotels’ preferences for SSTs.
Although four managers expressed concerns about a potentially high unemployment rate in the
future, usage of SSTs could help mitigate a lack of labor, high turnover, and resignations.
Higher labor costs compared with technology costs also contributed to hotels’ preferences for
SSTs. Albeit some hoteliers were concerned about the investment and maintenance costs

141
associated with SSTs, others argued that the evolution of technology would decrease these
costs, especially when SSTs begin to scale. Interestingly, Customers #11 and #13 also
expressed concerns regarding the high cost of technology or investment from a hotel
perspective, likely because they worked in the hospitality industry.
By contrast, Customers #13 and #19 claimed labor is not a scarce resource and that current
labor costs are not as high as in other countries such as the USA; thus, it will be inappropriate
for hotels in China to replace service employees with SSTs. Even if labor costs are expensive,
Customer #13 hoped hotels to comprehensively train employees to reduce labor. Customer #19
further explained that she had paid money for human services in hotels, and therefore,
establishments should not use SSTs to save labor.
4.3 Organizational Inhibitors and Enablers
Organizational factors either inhibited or facilitated customers’ and hoteliers’ preferences for
SSTs. A comparison of hoteliers’ and customers’ opinions indicated that aside from a hotel’s
profile, hoteliers considered more organizational factors than customers, including
incompatibility, top management support, and technology company contributions (Table 4.3).
Similar to hoteliers, customers stated that expected benefits for hotels influenced their
preferences as described in the following sub-sections.
4.3.1 Hotel Profile
Hoteliers and customers believed that new, business, and non-luxury hotels with high
passenger volume were better suited to SSTs. New hotels were considered appropriate sites for
SSTs for two reasons. First, SSTs were not popular when already-built hotels opened, resulting
in a lack of SST integration. One manager explained, “This hotel has been open for about 3
years. At that time, there was no large-scale promotion of SST, so it was not involved in [digital
check-in]” (Hotelier #1). Another consideration is that reconstructing hotel hardware or
opening ports to meet SST operating requirements require substantial investments in money
and time.

142
Table 4.3 Organizational Inhibitors and Enablers
Category Sub-themes No. of Hoteliers (Frequency)
No. of Customers (Frequency)
Hotel profile
Open date: (+) New hotel 10 (16) 1 (1) (±) Hotel size 12 (16) 1 (1) Hotel position: (+) business & (+) non-luxury hotel
25 (107) 15 (33)
Incompatibility* (-) Space incompatibility 12 (18) NA (-) System incompatibility 12 (30) NA
Top management* [Hoteliers 3 (3)]
(-) Disagreement among management 7 (12) NA (-) Underemphasized IT department 2 (2) NA (+) Management openness to technology
14 (22) NA
(±) Hotel group standards 16 (34) NA (-) Owner restrictions on budget 10 (16) NA
Perceived benefits for hotels [Hoteliers 7 (10)]
(+) Economic profits 23 (88) 11 (16) (+) Benefits for employees 24 (47) 3 (3) (+) Convenience to operation & management
12 (21) 5 (9)
(+) Brand marketing 16 (36) 16 (26)
Technology company contributions*
(+) Active promotion 4 (5) NA (+) Collaboration with hotel 7 (10) NA
+ denotes positive influence; - denotes negative influence; ± denotes mixed influence. NA: this factor was not mentioned by informants; * this factor was only mentioned by hotelier informants.
The effects of hotel size depended on SST type. In terms of self-service check-in/-out kiosks,
the more rooms a hotel has, the more suitable the hotel is for SSTs (especially those with high
passenger volume). Such kiosks could reduce pressure on the front desk, as noted by Customer
#24. Yet, some managers were understandably concerned about the ability of SSTs to cope
with workloads in hotels with 600 rooms (e.g., Hotelier #22). Regarding in-room SSTs such as
television ordering systems, hoteliers believed that large hotels are not appropriate application
sites since it may be cost-prohibitive to install a television ordering system in every room of a
large hotel (Hotelier #13). Hoteliers #2 and #22 revealed that SSTs were often used in relatively
small-scale hotels with 100 or 150 rooms.
Furthermore, the results of data analysis revealed that hoteliers’ and customers’ preferences for
SSTs were associated with a hotel’s position. In their views, hotels should decide whether to
use SSTs based on their target customers. If their target customers are young, travel frequently,
and use SSTs in their daily life, then these consumers should have no problem using SSTs.
Participants further indicated that business and non-luxury hotels are less suitable for SSTs
compared with resort and luxury hotels. For instance, Hotelier #16 explained that more children
visit resort hotels, and they may be more likely to interfere with robots that deliver food. Also,
143
hotelier and customer participants recommended that luxury hotels not use too many SSTs.
They noted that luxury hotels should focus on human services and provide excellent human
services. Customers will be unhappy if they are faced with SSTs that are cold as ice.
Furthermore, customers pay expensive rates for high-quality human services in luxury hotels.
Even so, luxury hotels should still provide SST-based services as amenities offered at economy
hotels should never be absent from luxury hotels. Customer #16 explained, “Since economy
hotels have already used SSTs, as an upscale hotel, you are supposed to catch up with the era.”
4.3.2 Incompatibility
The incompatibility of existing systems and hardware further inhibited hoteliers’ preferences
for SSTs. Many participants, especially those from international chain hotels, indicated that
many hotels use Opera property management solutions. Since Opera monopolizes the market,
it becomes too challenging and expensive to ask the company to provide an interface to dock
with SSTs. The same situation arises with invoicing, as the invoice service has also been
monopolized by two companies in mainland China. Fortunately, Hotelier #3 mentioned that
Alibaba Group collaborates with Shiji Group, an agent of Opera in mainland China. In his
opinion, SSTs produced by the Alibaba Group (or in cooperation with them) may be able to
address this incompatibility. Another example involved integration between self-service check-
in with the Police Station Bureau. As noted earlier, hotels in mainland China must provide
customers’ identifying information to the Police Station Bureau in real time. Thus, self-service
check-in should dock well with the Police Station Bureau. The incompatibility with extant hotel
systems thus restricted hoteliers’ preferences for SSTs.
Another incompatibility issue was related to hotel space. In light of hotel practitioners, hotels
could not just buy SSTs and then use them directly as buying and consuming clothes and coffee.
The built hotels needed to consider reconstructing their hardware to meet the requirements of
SSTs application, as Hotelier #22 questioned that “How do robot walk since the current hotel
has stairs?” This also contributes to explaining why new hotels are more appropriate for SSTs
than already-built hotels.
144
4.3.3 Top Management
According to hoteliers in this study, hotels’ preferences relied heavily on top management,
including the department manager, general manager, hotel group, and hotel owner. Hoteliers
reported that managers’ openness to technology enhanced their preferences for SSTs. For
instance, hotel general managers #14, #15, #24, and #26 expressed that applying SSTs in their
hotels was associated with their openness to technology, and they wanted more innovative
SSTs in their establishments. As one manager noted, “First of all, I am curious. Given that I
manage the hotel, and I am curious about new technologies, I would like to try new technology
applications” (Hotelier #26). On the contrary, conservative management constrained hoteliers’
preferences for SSTs.
In addition to the openness to technology among top management, managers’ agreement played
an important role. If a member of top management holds negative attitudes toward SSTs, there
will be a limited possibility of introducing SSTs in associated hotels. A hotel group marketing
director reported it is hard for hotel management to come to a unanimous decision. “Every
department manager has different cognitive perspectives. Therefore, it is difficult for them to
reach a consensus” (Hotelier #22). For example, hotel managers from different departments
probably hold different opinions about whether to open the docking interface for innovative
SSTs. Marketing and service managers may think the interface should be opened, while finance
managers are concerned about safety. Hence, disagreement regarding SST applications appear.
Additionally, disagreement on who should lead the implementation of SSTs limited their
application. This form of disagreement could result from complex vertical management in hotel
companies. Hotelier #3 mentioned that applying SSTs fell under the purview of the financial
director and general manager. At this stage, the IT department’s role is not clear; those
managers simply carry out what the hotel group wants them to do rather than occupying a
position where they could actively request technologies to enhance hotel operations. What is
worse, current IT departments are not strong enough to support or maintain given technologies,
likely due to less investment. An IT manager could only inform his direct leader, the financial
director, about new technology. Then the general manager would likely discuss SST
implementation with the hotel owner.
However, hoteliers mentioned that reluctance to apply SSTs may stem from hotel owners.
Although one hotelier noted that ‘face’ (mianzi) contributed to owners’ preferences for SSTs,

145
many hoteliers in this study emphasized the influence of owners’ investment. As described by
Hotelier #28, “We decide to use [self-service kiosks]. However, the owner needs to invest.
Therefore, [SST use] ultimately depends on whether the owner can give enough funding to
invest.” If hoteliers have a limited budget or their proposal is rejected by the owner, SSTs will
not be applied in their hotels despite their desire for it.
Moreover, the results indicated disagreement on the role of hotel group in leading the
implementation of SSTs. Although Hotelier #15 said that it was he, the general manager of a
single hotel that decided to use QR code ordering, Hotelier #5 from a midscale hotel considered
such decisions to be the responsibility of a hotel group’s top management, for example, the
brand CEO. Hoteliers #8, #24, and #25 agreed that SST application depended on the hotel
group rather than a single hotel. Furthermore, hotelier informants indicated that SST
applications in a hotel may be extinguished before implementation if the hotel group does not
allow the hotel to use SSTs. By comparison, an independent hotel probably is able to introduce
SSTs quickly.
SST-related disapproval may arise from a hotel group’s position. For example, Hotelier #10
mentioned that their hotel group highlighted face-to-face service, and thus her hotel preferred
to use service employees rather than robots to serve food. Hotelier #15 indicated that the
diversity of hotel owners within a large hotel group complicated the introduction of new
technologies. Greater emphasis on safety and privacy among large hotel groups presented
another barrier. Yet, Hotelier #22 mentioned that international chain hotels were more willing
to promote SSTs. Hotelier #6 explained that strong technology support and resources rendered
SST applications in group hotels simpler than in small, standalone hotels.
4.3.4 Perceived Benefits for Hotels
Hoteliers and customers pointed out that SSTs benefited hotels, contributing to their
preferences for SSTs. First, both groups spoke highly of the economic benefits of SSTs. They
believed that costs could be conserved when using SSTs to reduce labor, while hotel revenues
increased. Also, service employees were beneficiaries of SSTs through improved convenience,
decreased workloads and pressure, and simplified work. Hotelier #6 explained, “The QR code
for invoices and self-service kiosks for invoicing greatly decrease the operation pressure and
complexity for front desk employees.” Hoteliers also expected technology to enhance work
efficiency. Some existing technologies did improve efficiency, such as electronic menus (e.g.,

146
iPad ordering). Albeit Hotelier #17 mentioned that electronic menus remained unused, other
hoteliers (e.g., Hoteliers #14, #15 and #23) praised the swiftness with which menu information
could be updated as well as the costs saved from printing hard copies of new menus. Customer
#1 further explained that using the iPad ordering system saved employees time because staffs
did not need to wait while customers made orders.
Additionally, the ease of management and convenience of operation contributed to hotels’
preferences for SSTs. Many managers found it simpler to manage machines than humans.
Hoteliers did not need to consider labor issues such as vacation, sick leave, or dismissal.
Hotelier #29, Customer #5, and Customer #24 cited benefits for management from an operation
perspective, taking AI management systems (e.g., Tmall Genie and Xiaomi MI AI speakers)
as an example. When customers ordered room service (e.g., requesting an extra bottle of water)
via a smart speaker, hotels could review data about the service delivery, identify problems, and
thus help management. Two customers mentioned that when water was not delivered on time,
order data could serve as evidence that hotels were responsible for the oversight because
customers had proof of the request.
Moreover, SSTs were conducive to brand marketing, which supported hoteliers’ and
customers’ preferences for SSTs. In hoteliers’ opinions, innovative SSTs such as robots
functioned as a selling point to attract customers. Customer informants confirmed that the
application of innovative SSTs enhanced consumers’ acceptance of and satisfaction with a
hotel. Customer #14 said, “[SSTs] enhanced my recognition for the hotel. I think the hotel is
advanced in technology adoption.”
Contrary to these benefits, Hotelier #6 expressed concerns over safety management. In his
opinion, mobile check-in could result in hotels not knowing whether customers had arrived at
their room. High system reliability was essential to addressing this issue. A director of human
resources (Hotelier #11) presented another concern: in the future, directors would likely need
to be capable of maintaining machines or programming. Consequently, he suggested that
managers actively familiarize themselves with innovative technologies to avoid falling behind
and to prepare themselves for the future.

147
4.3.5 Technology Company Contributions
According to hotel practitioners interviewed in the qualitative study, the promotion of
technology companies was important. Hotelier #17 explained, “If some suppliers recommend
the technology to me and if I think the technology is conducive to service quality, I would
recommend it to our hotel group.” Conversely, if a technology company did not promote its
products aggressively, a hotel may encounter difficulties in applying innovative technologies.
The existence of a hotel collaboration with a technology company (or lack thereof) and
collaboration methods also influenced hotels’ SST preferences. Hotelier #5 expressed that: “If
there is a third party to cooperate, I will consider [using robots to deliver services or lead the
way].” A popular cooperation mode in mainland China consists of technology suppliers
providing technologies for free but relying on hotels to promote the company’s technology
products. Profits from sales are then shared by technology suppliers and hotels. However, if
hotels must pay a large sum to rent or buy the technology, their preferences for such options
may decline, as evidenced by the following statement. “If there is a collaboration, I can use it.
… However, if you ask me to rent, to spend money, I do not want to pay the money because of
the cost” (Hotelier #5).
4.4 Attributes of SSTs and Human Services
The results of this research revealed the influences of SST characteristics on customers’ and
hoteliers’ preferences for SSTs relative to the characteristics of human services (Table 4.4).
4.4.1 Attributes of SSTs
Standardized
In terms of customization, hoteliers and customers both criticized SSTs for lacking
customization and personalization. They found SSTs to be inflexible when dealing with
customer needs, leading to informants’ preferences for human services. As illustrated in the
following assertion:
“I feel that people should be in charge. After all, a robot does not – I think no matter
how it develops, even if it develops for another hundred years – it cannot be as flexible
as a human being. People can deal with anything flexibly. A machine is designed by
people following a program. All robots are programmed. They do not have a brain to
deal with affairs flexibly.” (Hotelier #17)
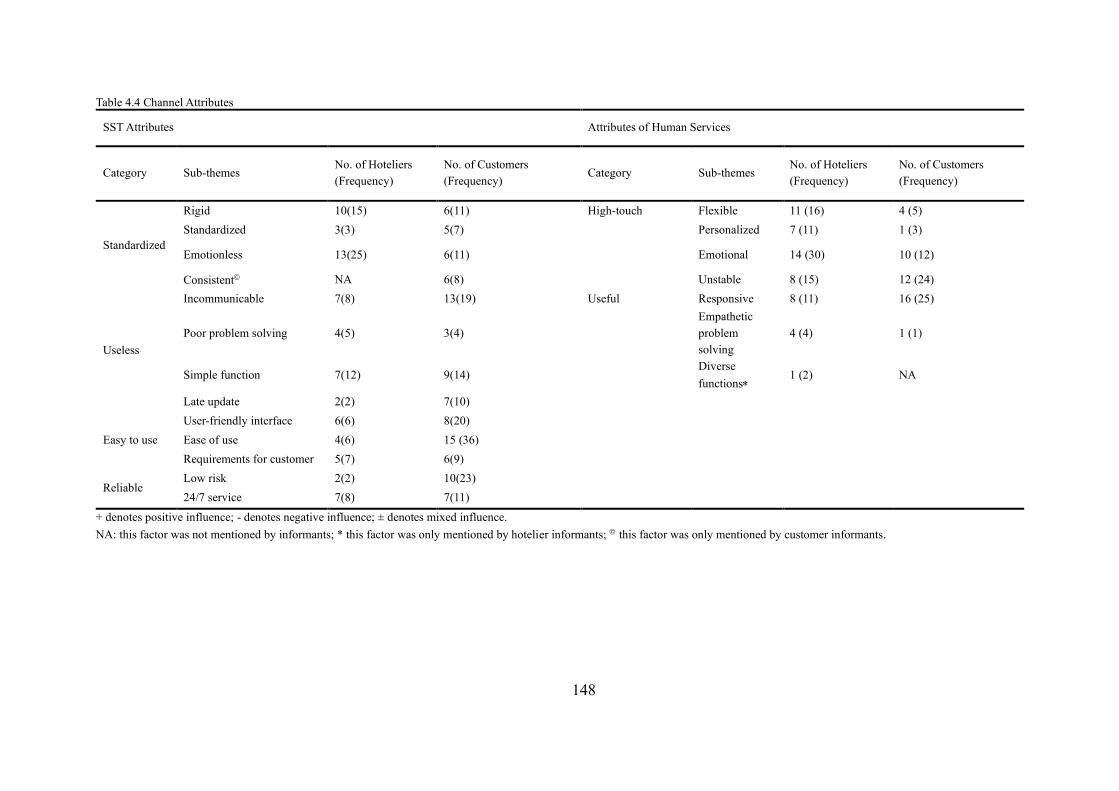
148
Table 4.4 Channel Attributes
SST Attributes Attributes of Human Services
Category Sub-themes No. of Hoteliers (Frequency)
No. of Customers (Frequency)
Category Sub-themes No. of Hoteliers (Frequency)
No. of Customers (Frequency)
Standardized
Rigid 10(15) 6(11) High-touch Flexible 11 (16) 4 (5) Standardized 3(3) 5(7) Personalized 7 (11) 1 (3)
Emotionless 13(25) 6(11) Emotional 14 (30) 10 (12)
Consistent© NA 6(8) Unstable 8 (15) 12 (24)
Useless
Incommunicable 7(8) 13(19) Useful Responsive 8 (11) 16 (25)
Poor problem solving 4(5) 3(4) Empathetic problem solving
4 (4) 1 (1)
Simple function 7(12) 9(14) Diverse functions
1 (2) NA
Late update 2(2) 7(10)
Easy to use User-friendly interface 6(6) 8(20) Ease of use 4(6) 15 (36) Requirements for customer 5(7) 6(9)
Reliable Low risk 2(2) 10(23) 24/7 service 7(8) 7(11)
+ denotes positive influence; - denotes negative influence; ± denotes mixed influence. NA: this factor was not mentioned by informants; * this factor was only mentioned by hotelier informants; © this factor was only mentioned by customer informants.
149
On the contrary, some customers indicated that as technology develops, many personalized
services may become a reality. For example, Customers #9 and #21 shared that online room
selection offered them personalization. Customers and hoteliers in this study further revealed
that SSTs are emotionless, which limited participants’ preferences. In their opinions, “If a
human is replaced by robots, there is no warmth but [rather] cold as ice” (Customer #19).
This lack of close interaction causes customers to feel disconnected. Customer #26 explained,
“A machine is certainly emotionless and does not react like a human.”
Although some customers experienced a lack of connection, others felt cared for thanks to
some SSTs. For example, Hotelier #16 mentioned that business guests would likely consider a
hotel as caring because mobile check-out saved them valuable time. Additionally, customers
praised the stability of SST-based services. In their opinions, “Services provided by machines
stay at the same level and are unlikely to fluctuate” (Customer #2). Such devices would
typically not provide good service today to be followed by poor service tomorrow. However,
Customer #6 contended there would be no differences among hotels if personnel was replaced
by SSTs. Therefore, he would not pay high fees to stay at a luxury hotel.
Useless
Customers in this qualitative study criticized the incommunicability of SSTs, which simply
completed tasks as programmed with no opportunity for two-way communication. As such,
customers could not provide instantaneous feedback or have other (e.g., previously
unrequested) needs to be met when receiving services. This limitation reduced communication
between customers and hotels. In a similar vein, hotels could not get in touch with customers
in a timely manner. As evident in the following excerpt: “It seems that [a robot] does not have
a tape recorder to record the guest's praises. Similarly, it cannot [receive] timely feedback or
criticism. It is unable to deal with this information” (Hotelier #14).
Customers and hoteliers also voiced concerns about SSTs’ ability to deal with service failures
and preferred to have employees address such problems. Hotelier #22 asked, “After substituting
all service employees with SSTs, how [will we] handle problems? This is a topic left
[unanswered] for us. Is it necessary to depend on humans to handle on-site issues?” Regarding
service failures, customers also indicated their preferences for service employees; otherwise,
customers may “complain about why no people are [available to help]” (Customer #22).
150
Moreover, customers and hoteliers criticized the simple functionality of current SSTs. In their
opinions, today’s robots can merely deliver goods but do not fulfill other functions. Robots
cannot swing or collect plates, causing such tasks to be consumers’ responsibilities. What is
worse, due to capacity limitations, there are inconsistencies among goods delivered. For
instance, robots could deliver slippers but not quilts. Accordingly, customers and hoteliers
hoped for more functional SSTs. Hotelier #26 noted, “If robots are more functional, more
people will likely use them.”
Moreover, SST applications involved system and information updates. Customers’ preferences
for SSTs were influenced by whether a system or information could be updated in time. In their
opinions, the information provided by SSTs was less immediate than that offered by staff. For
example, Customers #18 and #20 lamented that information about available rooms was not
updated online promptly. As a result, Customer #18 could not choose the room she wanted,
and Customer #20 had to wait 40 minutes before her room was ready. Customers and hoteliers
also mentioned problems of technology system updating. Customer #5 stated that changes in
technology may make customers feel uncomfortable and realize that technology is continually
evolving. Nonetheless, Customer #10 and Hotelier #14 anticipated positive prospects from
updates to SSTs. In their opinions, technology would be updated gradually and become more
refined.
Easy to Use
Customer and hotelier informants indicated that perceived ease of use, a user-friendly interface,
and customer requirements influenced their SST preferences. If an SST was simple to use with
an approachable interface, they would prefer it. Conversely, if an SST was complex to use or
the interface was complicated, their preferences for such technology would diminish and they
would continue using human services. As illustrated in the following statement: “This is where
the user interface of the app comes in. If the app is complicated, I will become sick of using it.
Hence, I will stick with the traditional one” (Customer #7).
Whether SSTs included requirements also influenced informants’ preferences. Customers
mentioned that some SSTs (e.g., self-check-out technologies) are only suitable for individuals
with certain skills. Hotelier informants concurred: “Not everyone can do [self-check-out]. If
you are a regular customer, then you can. This [can create] billing problems” (Hotelier #18).
Taking self-check-in kiosks at the airport as an example, Customer #13 added three more

151
requirements for customers to master SSTs: operation skills, willingness, and age. If customers
do not meet these criteria, their difficulties in using SSTs will waste time, reduce efficiency,
and eventually give rise to negative customer experiences, as Customer #23 illustrated: “If you
do not know how to operate [a self-service kiosk for an invoice], you have to wait there.
Somebody has to come and teach you how to operate it.”
Reliable
One hotelier and eleven customers in this qualitative study argued that SSTs are more reliable
than traditional services. SSTs are less likely than humans to make mistakes, and such devices
are punctual, effectively guaranteeing service quality. Furthermore, customers and hotel
managers mentioned that SSTs are available 24/7. Hoteliers stated that SSTs do not need rest,
do not fall ill, and do not resign; rather, they are always on call. Hotel guests could, therefore,
receive service at any time, which inspired customers’ and hoteliers’ preferences. One pointed
out that mobile check-in/-out enabled her to check in or out anytime and from anywhere:
“I definitely prefer [mobile check-in]. Why? Because no matter what kind of, like,
mobile payment, the public is becoming more and more dependent on mobile phones.
If I can handle [checking in] during my way to the hotel, then when I arrive at the
hotel, I can go to my room directly.” (Customer #20)
By contrast, Customers #19, #22, and #25 expressed concern about robots’ reliability in terms
of food delivery, while Customers #7 and #16 showed concerns about the accuracy of bills
during self-service check-out.
4.3.2 Attributes of Human Services
High-touch
Informants tended to emphasize service employees’ flexibility, who are adept in addressing
customer needs. One manager suggested, “People are different. Customers need different
services. Robots are not flexible enough. On the contrary, people can fully meet [customers’]
needs” (Hotelier #7). Similarly, hoteliers and customers both highlighted the personalization
of human services. Customer #15 shared that service employees “would satisfy [customers’]
personalized needs. That is, you can negotiate with employees when you have requirements.”

152
Human services were also perceived as more warm, friendly, and caring than SST-based
services. According to informants, preferences for service employees over SSTs arose because
“in addition to the things customers want to achieve, human beings bring more care and
warmth” (Hotelier #12). Customer #20 added, “For instance, service staff may ask customers
what else they need. Thus, the customer will feel very cared for.” By contrast,
“It is impossible for a robot to provide this kind of humanistic and caring service.
Additionally, nowadays, what motivates customers most is caring service. For
instance, if we handwrite a note, guests will feel happy.” (Hotelier #18)
However, both customers and hoteliers criticized the unstable nature of human services. They
found the quality of human services to be closely tied to employees’ emotions, professionalism,
and external factors. For example, human services could easily be satisfactory one day but
unsatisfactory the next if a service employee is in a foul mood. Poor human services contributed
to customers’ preferences for SSTs, whereas excellent human services drove their preferences
for service employees.
Useful
According to hoteliers, although waitstaff are specifically labeled ‘waiters’, their duties are
rather broad (Hotelier #7). For example, a front desk employee may be responsible for customer
check-in, check-out, responding to customers’ questions, and reconciling bills and invoices.
Waiters in restaurants must address customers’ diverse needs in addition to helping them order
food and serving and collecting dishes. Additionally, hoteliers cited the importance of service
employees’ empathy when addressing service failures.
Hotel managers in this qualitative study also highlighted service employees’ communication
abilities. Managers found that service employees could communicate with customers and
provide personalized service according to their judgments of customers’ occupation, emotions,
and clothing. Hotelier #24 stated that a professional front desk employee could change a
customer’s foul mood into a positive mood by speaking nicely, whereas SSTs could not do the
same. Besides, hoteliers indicated that service employees could satisfy customers’ needs for
interaction by listening to and conversing with customers. Service employees also proved their
direct communication abilities, as noted below:

153
“I think [ordering room service via calling the front desk] is more direct. That is,
people give you responses more directly. ‘I will send it to you in 10 minutes’ or ‘The
quilt has been lent out today. Do you feel cold? Could I give you a blanket?’ That is
it.” (Hotelier #29)
Albeit customers admitted that service staffs often offered simple and direct communication,
some customers mentioned that employees sometimes are difficult to reach. For example,
service employees may not answer a customer’s call.
4.5 Service Task Attributes and Customer Needs
Results of data analysis revealed that various service task features influenced hoteliers’ and
customers’ preferences for SSTs (Table 4.5). Customer #4 explained that her preference for
SSTs regarding room service differed from her preferences for food delivery at restaurants.
Essentially, different service environments give rise to different expectations and needs.
Hoteliers’ and customers’ preferences for SSTs varied by stage according to service task
attributes and customer needs.
Table 4.5 Service Task Features
Category Sub-themes No. of Hoteliers (Frequency)
No. of Customers (Frequency)
Task attributes [Hoteliers 2 (2); Customer 1 (1)]
(±) Complexity 18 (48) 10 (14) (±) Frequency 9 (11) 13 (23) (-) Standardization 4 (7) 3 (3)
Customer needs [Customer 1 (1)]
(-) Ill-defined needs© NA 4 (4) (-) Unique needs 18 (41) 25 (107)
+ denotes positive influence; - denotes negative influence; ± denotes mixed influence. NA: this factor was not mentioned by informants; © this factor was only mentioned by customer informants.
4.5.1 Service Task Attributes
Customers held distinct opinions about the influence of service complexity on their SST
preferences, generally based on whether the service was originally provided by service
employees (Figure 4.5).

154
Figure 4.5 Influencing Process of Service Task Complexity
In terms of in-room facilities, five customers preferred to use conventional methods if tasks
could be completed easily (e.g., using a room card to take the elevator and manually close
curtains) rather than trying innovative technologies (e.g., mobile room keys). For simple tasks,
they found that technology did not make a notable difference. Yet, for facilities that are
complex to use, two customers reported preferences for technologies. Customer #16 preferred
to close curtains manually but tended to use the AI management system to turn on the
television. She often found it complicated to turn on the television because she first needed to
find the remote control, and then press the correct button while aiming the remote control
toward another device near the television. Furthermore, turning on the television at different
hotels usually involve unfamiliar processes that are dissimilar to those guests used at home.
Thus, guests often could not determine how to turn on the television or find their preferred
channel. In this respect, customers preferred to use smartphones or an AI management system
(e.g., Tmall Genie) to help them find the channel they wanted by speaking a simple command
such as “Hi, Tmall Genie, open CCTV 5”.
Informants held opposite attitudes regarding tasks that would be originally completed by
service employees. The simpler a task, the more customers preferred SSTs. Customer #18
stated she was happy to use a robot to deliver basic items (e.g., towels) but preferred service
employees to deliver food, which had higher requirements for customers. Likewise, Hotelier
#8 mentioned he preferred to use robots to deliver simple products, whereas service employees
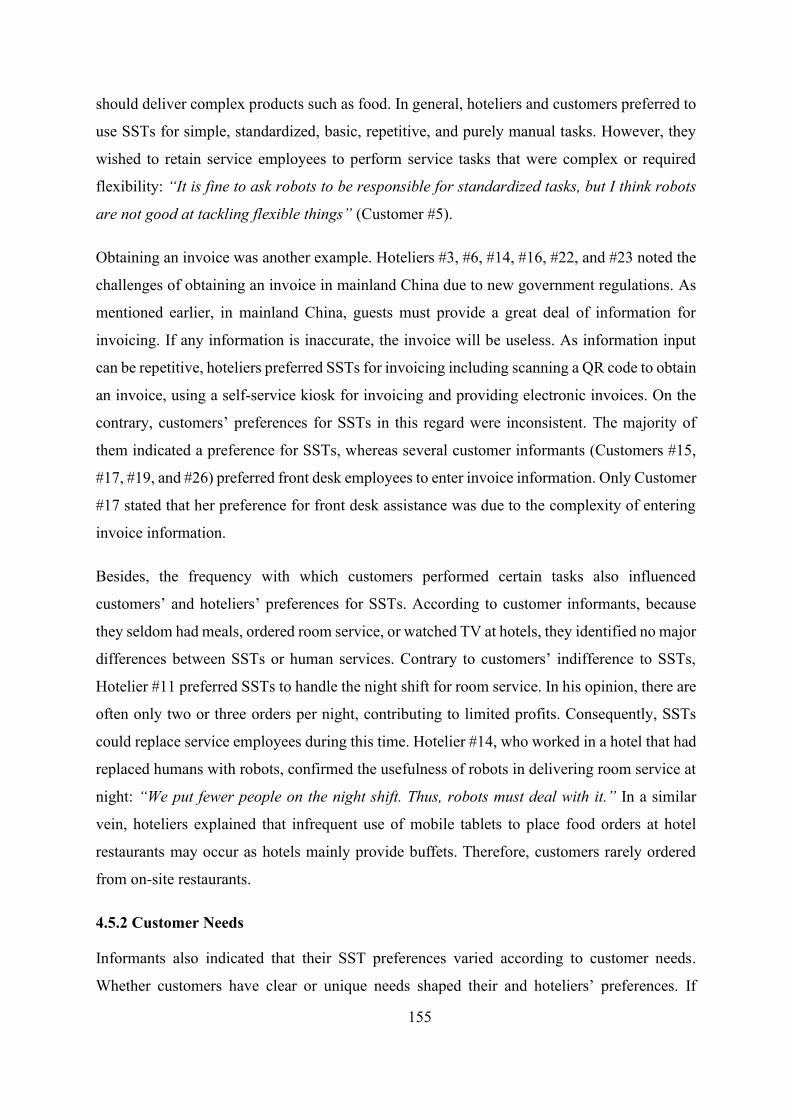
155
should deliver complex products such as food. In general, hoteliers and customers preferred to
use SSTs for simple, standardized, basic, repetitive, and purely manual tasks. However, they
wished to retain service employees to perform service tasks that were complex or required
flexibility: “It is fine to ask robots to be responsible for standardized tasks, but I think robots
are not good at tackling flexible things” (Customer #5).
Obtaining an invoice was another example. Hoteliers #3, #6, #14, #16, #22, and #23 noted the
challenges of obtaining an invoice in mainland China due to new government regulations. As
mentioned earlier, in mainland China, guests must provide a great deal of information for
invoicing. If any information is inaccurate, the invoice will be useless. As information input
can be repetitive, hoteliers preferred SSTs for invoicing including scanning a QR code to obtain
an invoice, using a self-service kiosk for invoicing and providing electronic invoices. On the
contrary, customers’ preferences for SSTs in this regard were inconsistent. The majority of
them indicated a preference for SSTs, whereas several customer informants (Customers #15,
#17, #19, and #26) preferred front desk employees to enter invoice information. Only Customer
#17 stated that her preference for front desk assistance was due to the complexity of entering
invoice information.
Besides, the frequency with which customers performed certain tasks also influenced
customers’ and hoteliers’ preferences for SSTs. According to customer informants, because
they seldom had meals, ordered room service, or watched TV at hotels, they identified no major
differences between SSTs or human services. Contrary to customers’ indifference to SSTs,
Hotelier #11 preferred SSTs to handle the night shift for room service. In his opinion, there are
often only two or three orders per night, contributing to limited profits. Consequently, SSTs
could replace service employees during this time. Hotelier #14, who worked in a hotel that had
replaced humans with robots, confirmed the usefulness of robots in delivering room service at
night: “We put fewer people on the night shift. Thus, robots must deal with it.” In a similar
vein, hoteliers explained that infrequent use of mobile tablets to place food orders at hotel
restaurants may occur as hotels mainly provide buffets. Therefore, customers rarely ordered
from on-site restaurants.
4.5.2 Customer Needs
Informants also indicated that their SST preferences varied according to customer needs.
Whether customers have clear or unique needs shaped their and hoteliers’ preferences. If
156
customers have a clear idea of what they wanted, they are more likely to prefer SSTs, as
Customer #10 indicated: “If my purpose is strong – for example, I want a towel. That is, I know
what I want. I prefer to order via [an AI management system].”
Likewise, if customers do not have special needs, they are inclined to use SSTs. Alternatively,
they do not care whether a service is provided via SST or a service employee as long as the
service is delivered. If customers have special needs, however, they and hoteliers both preferred
employees. Hotelier #11 stated he preferred robots to deliver room service but tended to rely
on service employees to serve dishes at restaurants. In his opinion, there was limited interaction
with customers during room service delivery because the room represents a private space;
service employees should leave as soon as the service is delivered, and robots could thus
replace service employees. By contrast, restaurant customers often have more needs, such as
requesting another dish. In this case, employees may be a better choice when serving dishes.
4.6 Customer Sociodemographic
According to respondents, aside from task characteristics, customers’ and hoteliers’
preferences for SSTs were related to customer demographics, personality, prior experience,
and trip profiles (Table 4.6). As Customer #5 said, “Every service has to be refined. That is,
whether this service can appropriately be substituted. Indeed, it should be refined to customers
who use this service.”
4.6.1 Demographics
Participants clarified that the elderly prefer SSTs less compared with youth. Young people have
been raised in an information era and are more accustomed to (and prefer) technology. By
contrast, elderly people are less familiar with SSTs. Degradation in their physical functioning
over time may also constrain older individuals’ preferences for technology. Customer #24, at
the age of 52, explained that her slower acceptance of technology was due to the natural law of
aging:
“There were no electronic devices when I was young. … So as I get older, I am slower
to accept new things, [including those] brought by technology. Meanwhile, it is a
natural law. That is, when people get older…it is a natural law, a natural law of
physiological changes. As you can imagine, [people can become] poor-sighted from
old age. It [can be] truly inconvenient to find the control panel.” (Customer #24)

157
Table 4.6 Customer Differences
Category Sub-themes No. of Hoteliers (Frequency)
No. of Customers (Frequency)
Demographics
Age: (+) Young 25 (62) 10 (24) Gender: (+) Male© NA 1 (2) Occupation: (+) Hospitality© NA 4 (6) (+) High education 3 (3) NA (+) First-tier cities 3 (3) NA (-) Social status 7 (15) NA
Personality
(-) Talkative 10 (14) 5 (7) (+) Open to technology 3 (3) 11 (17) (+) Efficient© NA 1 (1) (±) Lazy© NA 5 (7)
Prior experience© (+) First time NA 15 (27) (+) Good experience in other fields NA 5 (6)
Trip profile
(+) Frequent travel 4 (6) 5 (7) (+) Familiar with hotel© NA 4 (5) (+) Travel Companion 1 (1) 6 (13) Trip purpose: (+) Business trip 15 (28) 4 (6) Trip arrangement: (-) Package trip 1 (1) 2 (3)
+ denotes positive influence; - denotes negative influence; ± denotes mixed influence. NA: this factor was not mentioned by informants; * this factor was only mentioned by hotelier informants; © this factor was only mentioned by customer informants.
Additionally, customer informants mentioned that their preferences were affected by their
gender and occupation. Taking her and her husband’s experience as an example, Customer #11
indicated that “Males will love [using a smartphone to control in-room amenities like curtains
and lights].” Customer #12 explained that her preference for SSTs came from working in the
field of hotel design.
Hotelier informants emphasized the influences of customer education level, residence, and
social status. They suggested that customers with higher levels of education and who were from
first-tier cities were more likely to prefer SSTs, contributing to their SST preferences. Eight of
thirty hoteliers mentioned that they preferred to provide high-touch service to individuals with
high social status, such as celebrities, the rich, and politicians. In their opinions, these guests
were too important to help themselves.
4.6.2 Personality
In this study, customers explained that their preferences for SSTs were associated with
personality. Some of them did not like to converse with strangers, as Customer #14 explained:

158
“[A robot delivering room service] may be related to personality. Actually, I am a person who
is afraid of communicating with strangers.” This notion remained consistent among hoteliers:
some managers mentioned that certain customers did not want to interact with service
employees, whereas other customers preferred to chat with workers. In this respect, “If
customers expect to communicate with people, then it would be improper to replace humans
with machines” (Hotelier #3).
Several customers indicated they preferred employees to help them complete tasks because
they were lazy. Customer #11 said, “Yes, I am lazy. Therefore, I choose to go to the front desk
[when I need something].” In a similar vein, with respect to in-room facilities, Customer #22
explained that he preferred service automation because he was lazy, whereas Customer #25 did
not mind closing curtains by himself since he was diligent. Customer #28 indicated there was
no need for him to use SSTs or control in-room facilities manually as a butler did everything
for him. These findings signified that the lazier the customer is, the more likely he or she is to
prefer convenience; however, the convenience of a particular channel depended on the original
channel being replaced by an SST (i.e., a service employee or controlling in-room facilities
manually).
Moreover, customer informants who were open to technology and completed tasks efficiently
preferred SSTs over human services. Comparatively, if consumers are not tech savvy, they will
probably not try innovative SSTs. Hotel managers confirmed the influence of customer
openness on technology. Hotelier #26 cited his cousin as an example, noting that his cousin
would definitely prefer to use technology such as a self-service check-in kiosk.
4.6.3 Trip Profile
According to customers and hoteliers in this research, preferences for SSTs depended on a
customer’s trip profile including travel frequency, travel companion(s), trip purposes, and trip
arrangements. Customers and hoteliers agreed on the influence of travel frequency, considering
SSTs more suitable for those who travel frequently. First, such patrons tend to be busy and do
not want to waste time. Thus, they would likely prefer SSTs to enhance efficiency. Second,
frequent travelers are likely more familiar with new technologies. Hotelier #24 stated, “[A
guest’s] experience with frequent travel is a very important factor in deciding whether he will
accept or like [robot-based services].”

159
Customers also revealed that their preferences were influenced by their familiarity with a hotel
and destination. If they have visited the hotel many times and are familiar with it, they will tend
to prefer self-service. Otherwise, they would prefer to turn to service employees for help as
mentioned by Customer #12: “For example, I am familiar with this hotel. I know its general
situation. I have nothing to ask. Then I will certainly choose the fast methods of check-in [like
SSKs].” By contrast, if customers are in a hotel in a location where they have not visited prior,
they might request recommendations from service employees. Alternatively, they may want to
communicate with people in a strange city, as expressed by Customer #6: “If all [staff] are
machines, I will feel afraid. Sometimes, you feel like it is just you in a strange city. That is, the
city has nothing to do with you.”
Besides, the results of data analysis indicated that customers’ use of SSTs depended on their
travel companion(s). Customer participants mentioned that if they are traveling alone, they may
prefer to keep using human services. When traveling with friends or lovers, however, their
technology anxiety will be reduced, and they will prefer to try SSTs. In terms of the effects of
traveling with children, interviewees held different opinions. Customers #24 and #28
mentioned that patrons traveling with children are more likely to prefer SSTs. Hotelier #14
confirmed this assumption by saying, “The true users of the robots or those who communicate
with these robots are those who travel with family.” By contrast, Customer #13 shared that she
did not prefer to use mobile room keys when traveling with children. This distinct finding may
result from different types of technologies.
Moreover, customers and hoteliers concurred on the influences of trip purpose. According to
informants, customers who travel for business tend not to have many special needs and instead
pursue efficiency. Therefore, they often prefer SSTs. On the contrary, customers traveling for
leisure prefer high-touch human services. Interestingly, Hotelier #14 shared that business
travelers may avoid taking the same elevator with robots, presumably due to robots’ relatively
slow speed.
Additionally, two customers in this study pointed out differences between independent trips
and package tours regarding checking in and out. Customer #17 expressed doubt about how
front desk employees might deal with facial recognition when many identity cards are
presented at once (e.g., during a package tour check-in). Customer #27 mentioned there was
no need for him to go to the front desk to check out because the travel company handled the
160
booking and bill payment. Hotelier #39 indicated that independent travelers are more likely to
prefer SSTs than package tour travelers. He was also skeptical of SSKs’ ability to manage
room-share issues and customers’ payment methods in the event of different trip arrangements.
“I think if two people share one room, you must choose who will share with you. Is it
right? This is the issue. Actually, the check-in of packaged tours will encounter this
issue. Two people share a single room. Although people are from the same company,
they may not know each other. Is it right? They may be from different places or
different branches of the company. This situation is possible. Independent customers
may pay by themselves. It is relatively complex to use [SSKs] for the package tour
market.” (Hotelier #29)
4.6.4 Prior Experience
Customers in this study indicated that their prior experience with SSTs shaped their preferences.
Data analysis revealed that if customers do not use SSTs before, they would like to experience
the technology. For example, Customer #17 said, “Anyhow, I will experience [an AI
management system] for the first time.” Customer #10 concurred: “After [I try SSTs], I will
decide which channel to use [SSTs or service employees] based on my rational judgments.”
Despite this, some customers indicated a reluctance to use SSTs because of having never used
such technology or enjoyed related benefits (e.g., Customers #5, #13, and #19).
Additionally, customers mentioned that their prior experiences with SSTs in other fields (e.g.,
self-check-in at the airport) affected their preferences for SSTs in the hotel context. If their
experiences in other industries are negative, they may not prefer SSTs in hotels and vice versa.
For instance, Customer #19 shared her experience using a smartphone app to open her
apartment door and said the app was a nuisance. Customer #27 mentioned that he was unable
to open an app due to poor-quality WIFI and mobile traffic when trying to use a self-check-out
kiosk at the supermarket or print a ticket at a train station. Given these negative experiences,
he preferred to use a room card instead of a mobile room key to open the hotel room door.
4.7 Customer Experience: Appropriation Criteria and Reinforcers
Customers and hoteliers revealed that customer experience played a pivotal role in their SST
preferences. They signified that their preferences depended on whether the customer
experience was enhanced over the experience with traditional human services. Customer #15

161
explained, “It is a question of whether the customer experience is improved or decreased
compared with [the experience with human services].” Hotelier #22 agreed: “Therefore, in a
word, only if the change is better than the original state can I make a decision on whether to
use this technology.” The following section delineates how the five dimensions of customer
experience with SSTs may reinforce customers’ and hoteliers’ preferences based on customer
experience with service employees (Table 4.7).
4.7.1 Customer Experience with SSTs
Aesthetic Experience
The anthropomorphism of SSTs influenced customers’ preferences. The more
anthropomorphic SSTs were, the more strongly customers and hotels preferred them. Two
customers shared their experiences with robots and said they found robots’ voices to be
unappealing or unfriendly, reducing their SST preferences. In addition to voice, hoteliers and
customers indicated that the appearance of SSTs affected their preferences: the more
aesthetically appealing SSTs were, the more strongly customers and hoteliers preferred them.
For example, Customers #9, and #17 expressed preferences for robots, which they found cute.
On the contrary, Customer #19 thought robots were machines and cold as ice, which she did
not appreciate. Yet, she indicated that if the robots were better decorated, she would prefer
them. In short, an unattractive design reduced preference:
“Well, I think there is another consideration. I think this thing depends on the robot’s
design. If it is simple, like a machine, it will not attract people’s attention. I think you
may have to do some more novel [design], to attract people to try it or even take
photos with it. In these aspects, it is [a question of] how can you make it more
beautiful.” (Hotelier #27)
Affective Experience
SST use evoked different emotions, including entertainment, surprise, freshness, comfort,
pleasure, relaxation, and regret. Hoteliers used SSTs to entertain customers, and customers
used SSTs for fun. Both groups considered innovative SSTs to be entertaining rather than
useful. Hotelier #14 said, “Now I feel like robots play more of an entertainment role in the
hotel.” Customer #4 explained, “Yes, I will play with [Tmall Genie, a smart speaker] as I play
with Siri, but I will not use it for anything real.”
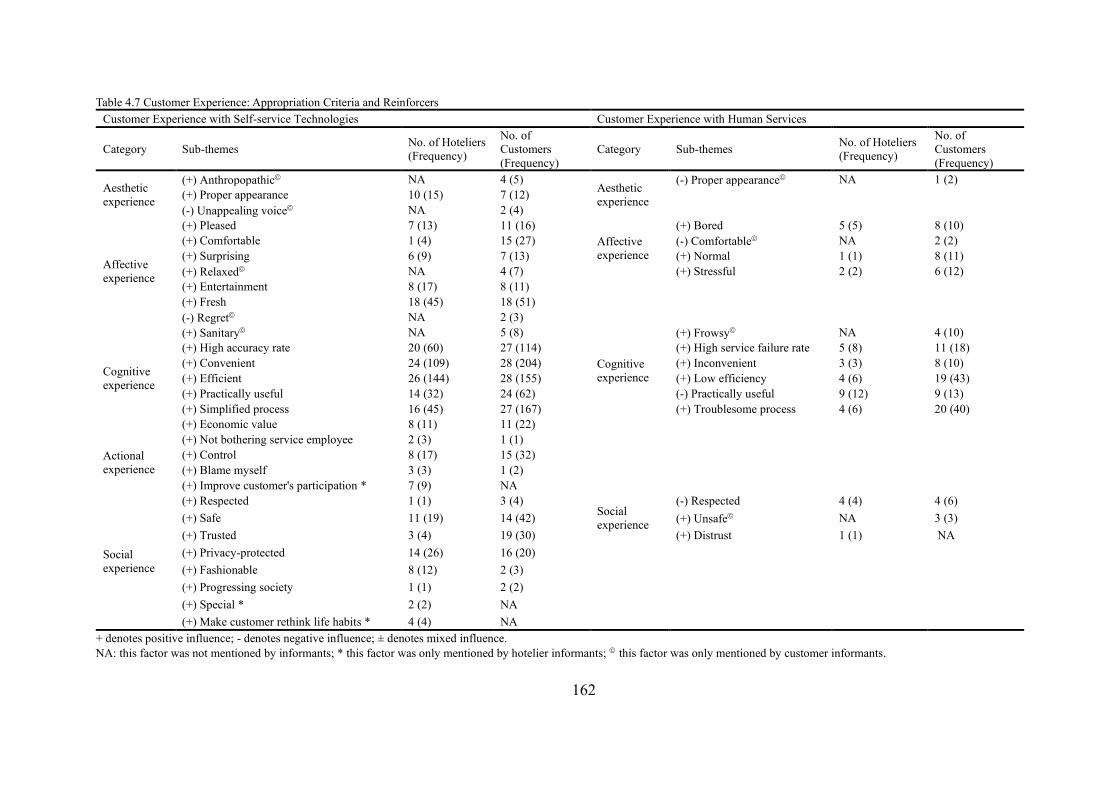
162
Table 4.7 Customer Experience: Appropriation Criteria and Reinforcers Customer Experience with Self-service Technologies Customer Experience with Human Services
Category Sub-themes No. of Hoteliers (Frequency)
No. of Customers (Frequency)
Category Sub-themes No. of Hoteliers (Frequency)
No. of Customers (Frequency)
Aesthetic experience
(+) Anthropopathic© NA 4 (5) Aesthetic experience
(-) Proper appearance© NA 1 (2) (+) Proper appearance 10 (15) 7 (12) (-) Unappealing voice© NA 2 (4)
Affective experience
(+) Pleased 7 (13) 11 (16) Affective experience
(+) Bored 5 (5) 8 (10) (+) Comfortable 1 (4) 15 (27) (-) Comfortable© NA 2 (2) (+) Surprising 6 (9) 7 (13) (+) Normal 1 (1) 8 (11) (+) Relaxed© NA 4 (7) (+) Stressful 2 (2) 6 (12) (+) Entertainment 8 (17) 8 (11) (+) Fresh 18 (45) 18 (51) (-) Regret© NA 2 (3)
Cognitive experience
(+) Sanitary© NA 5 (8)
Cognitive experience
(+) Frowsy© NA 4 (10) (+) High accuracy rate 20 (60) 27 (114) (+) High service failure rate 5 (8) 11 (18) (+) Convenient 24 (109) 28 (204) (+) Inconvenient 3 (3) 8 (10) (+) Efficient 26 (144) 28 (155) (+) Low efficiency 4 (6) 19 (43) (+) Practically useful 14 (32) 24 (62) (-) Practically useful 9 (12) 9 (13) (+) Simplified process 16 (45) 27 (167) (+) Troublesome process 4 (6) 20 (40) (+) Economic value 8 (11) 11 (22)
Actional experience
(+) Not bothering service employee 2 (3) 1 (1) (+) Control 8 (17) 15 (32) (+) Blame myself 3 (3) 1 (2) (+) Improve customer's participation * 7 (9) NA
Social experience
(+) Respected 1 (1) 3 (4) Social experience
(-) Respected 4 (4) 4 (6) (+) Safe 11 (19) 14 (42) (+) Unsafe© NA 3 (3) (+) Trusted 3 (4) 19 (30) (+) Distrust 1 (1) NA (+) Privacy-protected 14 (26) 16 (20)
(+) Fashionable 8 (12) 2 (3)
(+) Progressing society 1 (1) 2 (2)
(+) Special * 2 (2) NA
(+) Make customer rethink life habits * 4 (4) NA
+ denotes positive influence; - denotes negative influence; ± denotes mixed influence. NA: this factor was not mentioned by informants; * this factor was only mentioned by hotelier informants; © this factor was only mentioned by customer informants.
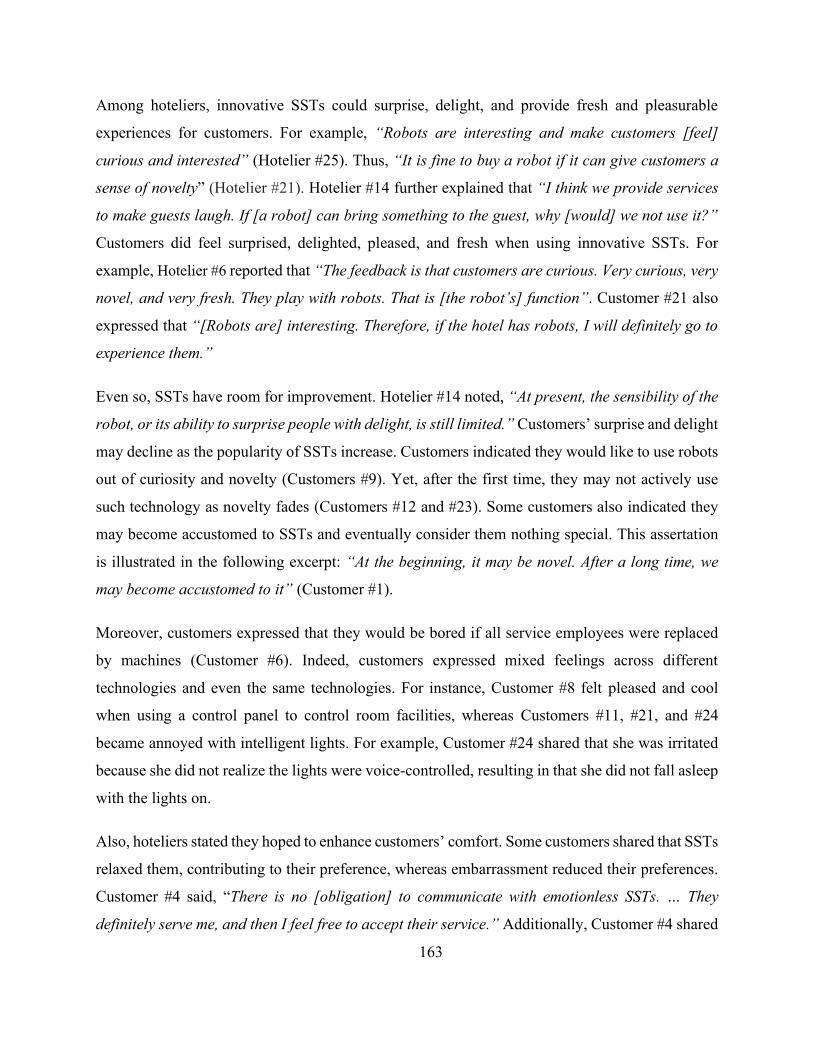
163
Among hoteliers, innovative SSTs could surprise, delight, and provide fresh and pleasurable
experiences for customers. For example, “Robots are interesting and make customers [feel]
curious and interested” (Hotelier #25). Thus, “It is fine to buy a robot if it can give customers a
sense of novelty” (Hotelier #21). Hotelier #14 further explained that “I think we provide services
to make guests laugh. If [a robot] can bring something to the guest, why [would] we not use it?”
Customers did feel surprised, delighted, pleased, and fresh when using innovative SSTs. For
example, Hotelier #6 reported that “The feedback is that customers are curious. Very curious, very
novel, and very fresh. They play with robots. That is [the robot’s] function”. Customer #21 also
expressed that “[Robots are] interesting. Therefore, if the hotel has robots, I will definitely go to
experience them.”
Even so, SSTs have room for improvement. Hotelier #14 noted, “At present, the sensibility of the
robot, or its ability to surprise people with delight, is still limited.” Customers’ surprise and delight
may decline as the popularity of SSTs increase. Customers indicated they would like to use robots
out of curiosity and novelty (Customers #9). Yet, after the first time, they may not actively use
such technology as novelty fades (Customers #12 and #23). Some customers also indicated they
may become accustomed to SSTs and eventually consider them nothing special. This assertation
is illustrated in the following excerpt: “At the beginning, it may be novel. After a long time, we
may become accustomed to it” (Customer #1).
Moreover, customers expressed that they would be bored if all service employees were replaced
by machines (Customer #6). Indeed, customers expressed mixed feelings across different
technologies and even the same technologies. For instance, Customer #8 felt pleased and cool
when using a control panel to control room facilities, whereas Customers #11, #21, and #24
became annoyed with intelligent lights. For example, Customer #24 shared that she was irritated
because she did not realize the lights were voice-controlled, resulting in that she did not fall asleep
with the lights on.
Also, hoteliers stated they hoped to enhance customers’ comfort. Some customers shared that SSTs
relaxed them, contributing to their preference, whereas embarrassment reduced their preferences.
Customer #4 said, “There is no [obligation] to communicate with emotionless SSTs. … They
definitely serve me, and then I feel free to accept their service.” Additionally, Customer #4 shared

164
that she felt relaxed when ordering food via SSTs at a restaurant; she did not need to ask a waiter
and then wait for a long time when ordering food. She could talk to her companions more casually
as she did not want their conversation to be listened to. Customer #1 also highlighted the relaxation
evoked by robots: “I am fine with a female service employee. A male service employee may make
me feel embarrassed in some situations. However, I will never feel embarrassed with a robot”.
Yet, not all customers felt the same. For some customers (e.g., Customers #6 and #15), self-check-
in/-out made them feel strange, albeit others (e.g., Customer #7) was comfortable with SSKs.
Customer #21 shared that he was upset when he could not obtain an invoice through an SSK.
Couples of customers (Customers #17 and #21) also expressed disappointment with SSTs when a
hotel advertised it was equipped with innovative SSTs that were in fact unavailable:
“I felt lost. Because I saw a guide that said [the hotel] had [SSTs], and this was one of
its selling points. However, I did not find them. I felt very disappointed because I did not
have the chance to [use the SST].” (Customer #21)
Cognitive Experience
Data analysis revealed that the cognitive value of using SSTs affected hoteliers’ and customers’
preferences. For example, customers and hoteliers preferred online room selection, control panels,
smart speakers, and mobile tablet ordering systems. These devices were useful and provided direct
and complete information. For instance, Customer #9 said the online room selection system
informed her of the hotel’s layout via an intuitive map. By contrast, Hotelier #25 indicated that
robots were incapable of tackling substantive questions, and there were no practical reports about
the usefulness of SSTs. The true value of hotel service came in handling diverse customer needs
(Hotelier #6). Thus, preferences for robots declined in this respect.
In addition, nearly all customers and hoteliers in this study mentioned the convenience and
efficiency of SSTs. Among hoteliers, SSTs were intended to provide customers with convenience
and efficiency. Thus, “It is worth it if convenience, speed, and efficiency are enhanced after using
SSTs” (Hotelier #6). Although Hotelier #14 indicated that robots were not especially fast (in fact,
they were as slow as the internet connection at first), Hotelier #3 reported that “already-
implemented applications are very convenient.” Customers provided further evidence of devices’

165
convenience, contending that SSTs were convenient because they were well-suited to given
circumstances. For instance, Customer #4 shared the following:
“If it is in a crowded place, when a guest is in line, he will be in a state of being very
anxious and irritable. He may hope a self-service kiosk that can allow him to enter the
room as soon as possible.” (Customer #4)
Hoteliers and customers also found SSTs less likely to make errors compared with humans.
“Unless something unusual happens, … [SSTs’] error rate is lower than that of humans” (Hotelier
#2). However, SSTs may make errors due to internal limitations and external elements. For
example, hoteliers and customers expressed worries about the accuracy of a smart speaker’s voice
recognition. They stated that a smart speaker may fail to recognize customers’ needs if it cannot
understand foreign languages (e.g., English), dialects, or accents. External elements included
network malfunctions, lack of power, and customer interfaces. For example, Customer #20
indicated that children might intervene in SST operations. Hotel general managers #14 and #16
concurred that when robots are delivering services, the devices may attract children’s attention.
Children may then touch the robots or inhibit them from moving. Customers who have ordered
service may therefore not receive it in a timely manner, resulting in complaints.
Figure 4.6 A Child Interrupted Robot Food Delivery in a Hot Pot Restaurant in Mainland China

166
Besides, according to hoteliers and customers, the SST service process was simplified and smooth.
SSTs involved fewer service delivery steps. For example, “[A smart speaker] probably reduces
the step of human service. [Service] is done as long as you speak service words” (Hotelier #10).
Smart speakers freed customers from looking for a phone to call the front desk (Customer #5).
“[Mobile check-in] saves me from going to the front desk. So it is appealing” (Customer #4). On
the contrary, some informants were concerned about mobile-app-based technologies. Customer #9
found it a nuisance to download apps if she would not be traveling frequently. A lack of clear
instructions or navigation could also be burdensome. Customer #8 shared that she had no idea how
to open her room curtains because she could not do so manually and did not realize they were
intelligent curtains because no instructions were provided. Interestingly, some customers indicated
preferences for mobile-based SSTs, smart speakers, control panels, and robots due to cleanliness
and sanitation.
Moreover, the obtained economic values positively influenced hoteliers’ and customers’
preferences. Hotelier #5 explained, “There is no pressure for customers to give tips.” Customer
#24 confirmed this: “Where are robots used? Probably a buffet or a service encounter that does
not require tips. Anyway, you cannot give robots tips, right?” Customers also thought a hotel was
worth the money if it was equipped with innovative technologies, although they were unwilling to
pay extra for such technologies. According to informants, patrons expected to be able to choose
between innovative SSTs and traditional services; otherwise, they would not consider the hotel
service worthwhile because they did not wish to pay 2000 RMB for a hotel staffed entirely by
robots (e.g., Customer #12). Nevertheless, if a hotel stated it was equipped with innovative
technologies that were, in fact, unavailable, customers would be unhappy:
“My first reaction is how come the room rate is so high, and they did not indicate that
these technologies are not available? In my opinion, it is unreal. The hotel should indicate
that these technologies are not ready in the trial period on its official website.” (Customer
#17)

167
Actional Experience
According to hotelier managers, SSTs enhanced customers’ sense of participation. Managers
believed SSTs were preferable to involving service employees in service delivery while leaving
customers to wait. SSTs removed service employees’ direct involvement and emphasized
customers’ reactions, improving customer participation, and contributing to hoteliers’ and
customers’ preferences. For instance, Hotelier #8 shared that children preferred to interact with
robots. Hotelier informants also mentioned that customers preferred to share their experiences on
social media: “In my opinion, most [customers] will share this. Many people took photos [in the
hotel] and said, ‘Look, a robot is serving me’” (Hotelier #14).
Figure 4. 7 Friends of the Author Shared Their Experiences with Robots on WeChat Friend Circle
Additionally, hoteliers and customers explained that they preferred SSTs thanks to the control and
freedom these devices offered. One manager noted, “People prefer to take matters into their own
hands” (Hotelier #27). For example, Hotelier #1 indicated that digital check-in enabled customers
to control all aspects of this situation, benefiting customers who expected to control the whole
process. Customer #18 shared that online room selection gave her more freedom to choose her
own room. Besides, hoteliers and customers both mentioned that customers occasionally did not
want to bother service employees. Hence, they preferred SSTs. For example, Customer #9 said she
did not want to bother service employees at night. Consequently, if robots could deliver room
service, she would prefer robots.

168
Managers and customers also concurred that it would be the customer’s fault if service failure
occurred when using SSTs. Hotelier #29 shared that if customers went to the front desk and a
service employee entered their invoice information incorrectly, the hotel would be responsible for
the error. However, if a customer used an SSK to create an invoice and input the wrong information,
he or she would be accountable. Customers also indicated they would be more willing to accept
service failure if they caused errors themselves.
Social Experience
Social values such as privilege, respect, trust, safety, and privacy were found to contribute to
hoteliers’ and customers’ preferences for SSTs, coupled with worries. Although Hotelier #6 was
concerned that self-check-out might make customers feel invisible, possibly leaving them in a blue
mood, other managers indicated that SST use made customers feel special, fashionable, cool, and
respected. As indicated in the following excerpts: “SSTs are novel, in line with the trend of the
times. … Young people would say SSTs are cool” (Hotelier #12). Customers themselves regarded
innovative SSTs as a privilege. For example, Customer #18 commented, “First of all, [SSTs] gave
me a sense that I have this kind of right [in this hotel], which other hotels do not have. Then I think
this is a kind of privilege. You feel that you are respected.”
Managers further indicated that the use of innovative SSTs in hotel compelled customers to
reconsider their daily habits. Customers were surprised that hotels were leading in certain aspects
of social life. As customer #9 shared, “It feels like society is progressing when using innovative
SSTs.” This experience with technologies in hotels could help customers develop a habit of using
technologies in their daily lives. For example, Hotelier #15 shared that using a smart speaker or
control panel in hotels encouraged customers to use these technologies at home, as he did in his
own life.
Customers also indicated that they felt trusted by hotels when using SSTs. Customer #9 said, “I
think the hotel trusts me. It was not worried that I would damage the in-room amenities.” However,
managers and customers both revealed that some customers distrusted SSTs. Despite that they
believed that as familiarity with technology increases, customers’ trust in technology would grow
in kind.
169
Customers demonstrated mixed perceptions of safety. In some cases, they felt relieved and safer
when tackling problems on their own rather than depending on others (i.e., service employees):
“Compared with having other people do it for you, you will feel more relieved by doing it yourself”
(Customer #7). Yet, customers worried about the safety of their life and information. For example,
Customer #27 expressed his concerns on the threats of SSTs on his life safety: “What do I do if
SSTs explode? What do I do if it becomes aggressive, and I cannot beat him?”
Likewise, opinions about privacy differed, although managers and customers indicated that SSTs
contributed to privacy protection. Hotelier #4 reported that customers might feel as though their
privacy was protected because self-check-in eliminates the need to show an identity card to
employees. Customer #25 preferred a robot to deliver private goods because he would feel
awkward if a service employee delivered such goods. Customers #2 and #21 indicated that they
preferred robot-based room service because they did not need to dress modestly or allow an
unknown employee to enter their room. Nevertheless, Customers #8, #9, and #13 mentioned
potential privacy leaks due to facial recognition technology.
4.7.2 Customer Experience with Human Services
Aesthetic Experience
Hotelier #2 stated that customers have requirements regarding service employees’ appearance,
which constitutes a customer’s first impression of a hotel. Proper dress was valued from aesthetic
and visual perspectives. When customers entered a hotel, they looked at the establishment
superficially: is the porter handsome? Is his hair nicely combed? Are his facial features and beard
cared for well? Customer informants also said that if a front desk employee was dressed
professionally, they would prefer to talk with the staff rather than a machine (e.g., Customer #27).
Affective Experience
Hoteliers expected to provide customers a pleasant experience through human service.
Nonetheless, customer and hotelier informants noted that human services were normal. Customers
even said their experiences were boring. For example, Customer #5 explained that he waited for
several minutes for an employee to check his room. What is more, customers indicated that service
employees could exhibit poor attitudes. Such behavior made patrons uncomfortable and distressed,

170
motivating their preferences for SSTs. In terms of ordering room service, Hotelier #1 explained,
“As you can see, if we pick up the phone, it always makes us feel rushed. We need to decide quickly.
Is it right?” As a result, she preferred SSTs that enabled customers to place orders independently.
Customer #1 agreed: “If [a service employee] has been waiting for me, I feel embarrassed. Every
time I am very entangled in making an order. Consequently, it would be better if I could make an
order myself.” Moreover, overwhelming service made some customers feel stressed:
“Room service, for example, is very polite. It is just that there are certain behaviors that
usually make me feel a little bit stressed. For example, when I order takeout outside, some
restaurants with good service will make me afraid to order their food. Food delivery
persons from these restaurants bow [to me]. I am really stressed about this kind of
behavior.” (Customer #4)
Additionally, customers indicated the need to pay attention to their words when talking to people,
which was not necessary when interacting with a machine (Customer #16).
Cognitive Experience
According to customers and hoteliers, service employees offered more direct and complete
information than SSTs, contributing to their preferences for human services over SSTs:
“Service employees can give remediation. Sometimes, we can only see the name and
shape of [food] dishes on the iPad. However, we still need service employees to express
the taste of the dishes. When service employees tell you the raw materials and the story
of the dish, it is not only a dish but more like a kind of art. It probably makes you enjoy
the beauty. It could even be a luxury, luxury in spirit. This is what cannot be achieved by
machines but people.” (Hotelier #8)
Nonetheless, Hotelier #13 mentioned that service employees “have no time to explain the dish to
you [customers] in detail. Because other customers are waiting for them. … If you serve this bottle
of orange juice to me, will you tell me when you squeezed the orange? You will not.”

171
Besides, customers and managers in this research revealed that human services were sometimes
inconvenient and inefficient, resulting in their preference for more convenient and efficient SSTs.
For example, Customer #22 explained, “If human services are relatively slow, I may prefer to use
machines. … However, it seems that the speeds of human services and SST-based services are
similar.” For informants, service employees’ work efficiency could be easily reduced by various
factors (e.g., Customer #2). Informants also believed that service employees were more likely than
SSTs to make mistakes, promoting their preferences for SSTs. Among hotel managers, service
employees were liable to forget customer needs, not understand such needs, or handle customer
needs incorrectly. For example, Hotelier #10 stated that service employees may not realize
customers’ needs if patrons spoke with an accent. Hotelier #3 said front desk employees could
likely generate an inaccurate bill. Customer informants shared similar views.
Hoteliers and customers both indicated that employees’ service delivery could be troublesome,
further enhancing their preferences for SSTs. For example, “It would bother me to call [the front
desk] to say something. I have to say which room I am in and what I need” (Customer #2). By
contrast, as Hotelier #12 indicated, the development of technology could alter these circumstances;
customers may have the option to complete tasks as they wish, such as checking in quickly.
What is more, according to customers in this research, frowsy experiences with traditional in-room
facilities control caused them to prefer SSTs. This notion was illustrated in the following statement:
“There was no need for me to worry that dust would fall all over me when closing the curtains.
Therefore, I prefer using a control panel [to close the curtains]” (Customer #9). Customer #14
indicated that she worried about the cleanliness of a product delivered by a service employee. She
wondered if it might have fallen to the ground inadvertently or be showered in spit, whereas a
service employee would never disclose such information to the customer.
However, if human services were more cognitive than SSTs, informants would prefer the former.
Similarly, customers and hoteliers indicated that if the current human services were smooth and
direct, they would likely not prefer or continue using SSTs. For instance, Customer #27 considered
opening an app to be annoying: “Why cannot we just press [a traditional switch for lights] to close
[lights]?” Customers #19 and #26 explained they preferred human services because service
172
employees would prepare everything for them, eliminating the need to do it themselves. Thereby,
they did not need to worry.
Social Experience
Managers indicated that customers did not trust service employees. For instance, Hotelier #2 said
that if employees did not allow customers to see available rooms, customers may think the staff
was lying. In her opinion, customers did not believe that the front desk staff would provide a
satisfactory room compared with choosing a room online themselves. Additionally, customer
informants indicated that human services might involve safety issues. Customer #22 stated, “If
[services are] controlled by people, the safety would be less safe than with SSKs. That is my
thought.”
Nevertheless, according to managers and customers, human services could give customers a sense
of being put first, causing customers to feel valued and well served. Customers naturally expected
to be respected and to gain others’ care and attention. Current SSTs were incapable of this,
decreasing customers’ and hoteliers’ preferences for them. As proven in the following excerpt: “I
think robots cannot bring a sense of service. Humans can provide customers a sense of service
compared with technologies” (Customer #8).
4.8 Chapter Summary
This chapter reported findings from the qualitative study. This chapter opened with a discussion
of available SSTs along with individual and organizational preferences at different service delivery
stages. Data analysis revealed that customers’ and hoteliers’ preferences were distinct across
service delivery encounters. Subsequently, six influencing dimensions were identified and
described in detail.
The external environment affected customers’ and hoteliers’ preferences. Aside from public
readiness, several other factors influenced customers’ and hotels’ preferences for SSTs:
government regulations, labor issues, industry and technology development, social values, and
expected effects on society (i.e., human apathy and environmental protection).
173
Organizational aspects, including a hotel’s profile and perceived benefits of SSTs for hotels,
further shaped customers’ and hoteliers’ preferences. Incompatibility, top management, and
technology company contributions were exclusively reported by hoteliers.
Moreover, SST attributes and features of human services informed customers’ and hoteliers’
preferences. According to informants, SSTs were usually standardized, easy to use, and reliable
but useless, whereas human services were high-touch and useful.
The features of service tasks, consisting of service task attributes and customer needs, exerted
further influences on customers’ and hoteliers’ preferences for SSTs.
Customer demographics, personality, trip profile, and prior experience influenced customers’ and
hoteliers’ preferences as well.
Last but not least, customers’ experiences with SSTs and human services affected customers’ and
hoteliers’ preferences. The data analysis revealed a five-dimension structure of customer
experience, including aesthetic experience, affective experience, cognitive experience, actional
experience, and social experience.
174
CHAPTER 5: DISCUSSION AND CONCLUSION OF
QUALITATIVE STUDY
Drawing on results from in-depth interviews, this chapter summarized findings from the preceding
chapter and compared them with extant literature. The chapter started with discussions with
preference differences by hotel service stages followed by individual influencing factors coupled
with corresponding hypotheses for the subsequent quantitative study.
5.1 Distinct Preferences at Different Hotel Service Stages
Hotel service delivery is rather more complicated than a single service encounter (e.g., checking
out at a retail store or checking in at an airport). Aside from check-in, hotel service delivery
involves room service, restaurant dining, and check-out (Danaher & Mattsson, 1994; Yung &
Chan, 2002). These service encounters are distinct, likely evoking unique preferences for SSTs or
service employees. Research has demonstrated the influences of task complexity on customers’
preferences for SSTs in retail, bank, rail station, and post office contexts (Simon & Usunier, 2007;
C. Wang et al., 2012). However, studies on SSTs in hospitality and tourism examined customers’
adoption of hotel SSTs in general (Oh et al., 2013; Rosenbaum & Wong, 2015) or on the basis of
a single service encounter (i.e., check-in) (Kim & Qu, 2014; Kokkinou & Cranage, 2015; Mäkinen,
2016). The qualitative findings in this study revealed that customers’ preferences for SSTs and
service employees were distinct across service delivery stages (e.g., check-in, room service,
restaurant service delivery, and check-out). They are multiple-channellers. This finding
underscores the need to explore customers’ preferences for specific SSTs by dividing the service
delivery process into different service encounters, thus enhancing knowledge of technology
adoption in a hospitality context. Accordingly, a hypothesis warrants further consideration:
H1a: Customers’ preferences between SSTs and service employees differ by service delivery
stage.
Moreover, research in government service has revealed that different service delivery channels
provide specific advantages in specific task completion (Pieterson & Ebbers, 2008), wherein
citizens’ channel selection is a question of channel sequencing rather than a binary preference

175
(Reddick & Turner, 2012). Likewise, the qualitative results of this research suggest that customers’
channel sequencing may result from specific advantages of a given channel in completing a
particular task. One reason for this trend may be task-technology fit, which refers to the fit among
task requirements, customers’ abilities, and the functionality of technology (Figure 5.1) (Goodhue
& Thompson, 1995). That is, adoption of a specific channel may follow from enhanced assistance
in handling a particular service.
Figure 5.1 Service-Channel-Fit Conceptual Framework
(Adapted from task-technology fit; Goodhue and Thompson, 1995)
Aside from the individual level, this study revealed that hotels’ preferences are not binary choices
but instead vary by service encounter. This is similar to customers’ opinions. However, in terms
of specific preferences during specific service encounters, hoteliers’ and customers’ positions
differed. For example, customer informants tended to prefer robots and service employees equally

176
in terms of service delivery at restaurants, whereas hoteliers favored service employees serving
customers at restaurants. The following hypotheses are thus proposed:
H1b: Hoteliers’ preferences between SSTs and service employees differ by service delivery stage.
H1c: Customers’ and hoteliers’ behavioral intentions to use SSTs or human services are different.
H1d: Customers’ and hoteliers’ preferences between SSTs and service employees differ by service
delivery stage.
Overall, the specific features of different service stages and the fit among service requirements,
customer capability, and technology functionality likely informed customers’ preferences at
different service delivery stages. This is consistent with Pieterson and Van Dijk (2007) who noted
that citizens’ choices of a government service channel heavily depend on task and channel
characteristics. The same situation may apply at the organizational level. Just as governments offer
diverse service delivery channels according to citizens’ needs (Pieterson & Ebbers, 2008; Reddick
& Turner, 2012), hotels wish to offer SSTs along with human services to better serve customers.
5.2 External Environmental Context
The findings of this qualitative research proved that external environmental factors influence
hotels’ and customers’ preferences for SSTs. In an environmental context, hotels consider more
factors compared with customers. Prior studies have shown that the external environment plays a
crucial role in organizational technology adoption and greatly affects a hotel’s success and
development (Hameed et al., 2012; Yadegaridehkordi et al., 2018). In the past literature,
environmental factors pertinent to hotels include perceived pressure from competitors, partners,
and customers (e.g., expectations, preferences, image, and behavior), all of which influence hotels’
technology adoption (Cobos, Mejia, Ozturk, & Wang, 2016; Leung et al., 2015; Racherla & Hu,
2008; Song et al., 2015). The factors presented in Section 4.2 (Table 4.2) enrich our understanding
of how environmental factors inhibit and facilitate organizational preferences for SSTs.
The current study empirically verified that public readiness (i.e., consumption habits and
misbehavior) influence hotels’ SST preferences. The relevance of consumption habits affirms the

177
research indicating that customers’ evolving preferences have motivated hotels to incorporate
technology (Leung et al., 2015; Song et al., 2015). Misbehavior appears to negatively influence
hotels’ adoption of technology via portable technology loss, providing new insight into how hotels
adopt technology strategically. Hotels can deploy portable SSTs when customer misbehavior is
corrected. Alternatively, hotels may include the cost of technology in the room rate.
Industry development also influences organizational preferences. Notably, aside from competitive
pressure examined in prior literature (Cobos et al., 2016; Sahadev & Islam, 2005; Song et al.,
2015), this study identified that peers’ successful technology applications affected organizational
preferences for SSTs. Presumably, effective peer application may reduce hotels’ uncertainty about
the outcomes of new technologies. This explanation is supported by a previous finding that “hotel
companies generally do not embrace technology until it is well integrated and applied in the
industry” (Leung et al., 2015, p. 399). Aside from intra-industry influences, this study found that
applying SSTs in other industries (e.g., food takeout, banks, and airports) shaped hotels’ SST
preferences. External industry applications together with intra-industry pressure and experience
should thus be considered in future research along with practical applications.
In addition, the nature of the service industry and government regulations have been shown to
inhibit hotels’ preferences for SSTs. Although these negative influences were not previously
discussed in a hotel context, they were confirmed in studies on organizational technology adoption
in other fields (Baker, 2011) such as the grocery industry (Kurnia et al., 2015). Although studies
have also highlighted the influences of government support on organizational technology adoption
(Hameed et al., 2012; Kuo, Chen, & Tseng, 2017), hoteliers in this study did not report this effect
despite the Chinese government has signed documents to support technology development; such
as Notice on the Action Plan of the Implement of “Tourism + Internet” (2015), Made in China
2025 (2015), and Development Planning for a New Generation of Artificial Intelligence (2017).
Two explanations may rationalize this finding. First, these support documents were not targeted
toward a hotel context; hotels likely do not benefit from these documents directly, whereas check-
in regulations are aimed specifically at hotels. Thus, hotelier informants criticized this regulation
and did not voice support for other endeavors. Second, according to reference-dependent
178
preference, “losses are weighted more than gains” (Masiero, Pan, & Heo, 2016, p. 18).
Accordingly, hoteliers paid more attention to the regulation rather than government support.
Besides, this qualitative study identified labor issues contributing to hotels’ preferences for SSTs.
Customer informants also mentioned the influences of high labor costs but did not consider such
costs a reason to replace human services with SSTs. Customer informants stated that they had paid
for human services, and labor costs in mainland China are not high enough to warrant full
technological replacement. The absence of this dimension in prior studies in organizational
technology adoption may be due to the unique features of SSTs. Specifically, SSTs eliminate the
need for service employees’ direct involvement, whereas previous technologies were designed to
facilitate customer-employee interactions rather than substituting humans with robots to serve
customers. The finding also confirms that environmental factors are not always consistent. Indeed,
scholars have assumed that different technologies or contexts involve varied factors (Baker, 2011;
Teo et al., 2009). Moreover, the influences of high labor costs can be explained by reference-
dependent preference, which emphasizes that decision making is influenced by a reference point
(Kahneman & Tversky, 1979). In this sense, the status quo of service employees influences hotels’
SST adoption, representing an alternative to service employees.
The direction and extent of technology development exerted mixed effects on hotels’ preferences
for SSTs. Hotels preferred to use SSTs because such technology is trendy. Nonetheless, hotels may
not adopt SSTs immediately since current iterations are not well developed. This finding unveils
avenues for future research and practical applications. In addition to the characteristics of
technology, the direction and extent of technology development from a whole-environment
perspective deserves attention.
Aside from these antecedents, the data analysis indicated that informants’ anticipated outcomes
(i.e., human apathy and environmental protection) influenced their preferences, thus extending
knowledge of organizational technology adoption. Another interesting finding is that a smaller but
similar set of environmental factors shaped customers’ preferences for SSTs, although few studies
have discussed environmental influences relative to individual technology adoption. Thus,
customers’ cited environmental factors should help fill this gap.

179
In short, numerous themes (Figure 5.2) from Section 4.2 improve our understanding of how
environmental factors inhibit and facilitate organizational and individual preferences. These
factors either substantiate earlier studies (e.g., industry nature, competitive pressure, and
government regulations) or have been newly identified in a hotel context regarding SST
application and adoption. Theoretically, these themes provide evidence of distinct environmental
factors influencing technology adoption in specific contexts (Baker, 2011; Teo et al., 2009).
Additionally, these findings fill a research void around the influences of environmental factors on
individual technology adoption, albeit customers noted fewer environmental factors compared
with hoteliers. Practically, the first contribution of this research extends insight into how hotels
can strategically adopt SSTs based on the external environment.
Figure 5.2 Overview of Influences of External Environmental Context
+ denotes positive influence; - denotes negative influence; ± denotes mixed influence. Bold themes mean that they are newly identified in this research.
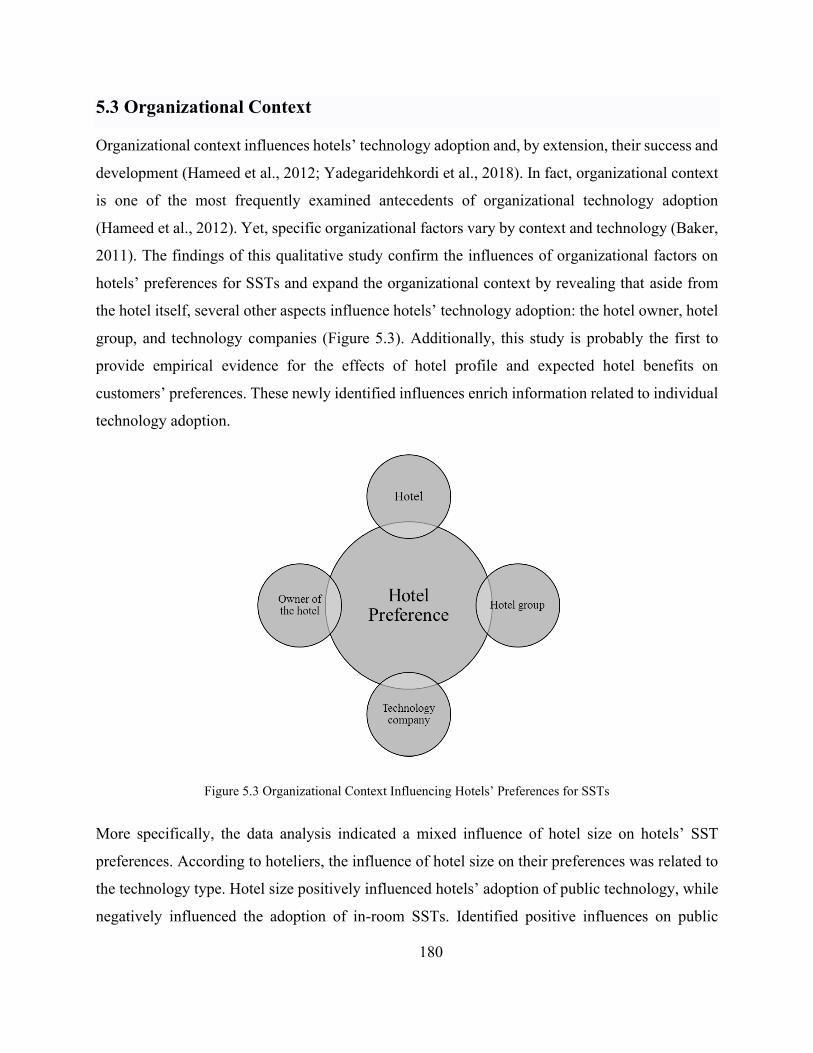
180
5.3 Organizational Context
Organizational context influences hotels’ technology adoption and, by extension, their success and
development (Hameed et al., 2012; Yadegaridehkordi et al., 2018). In fact, organizational context
is one of the most frequently examined antecedents of organizational technology adoption
(Hameed et al., 2012). Yet, specific organizational factors vary by context and technology (Baker,
2011). The findings of this qualitative study confirm the influences of organizational factors on
hotels’ preferences for SSTs and expand the organizational context by revealing that aside from
the hotel itself, several other aspects influence hotels’ technology adoption: the hotel owner, hotel
group, and technology companies (Figure 5.3). Additionally, this study is probably the first to
provide empirical evidence for the effects of hotel profile and expected hotel benefits on
customers’ preferences. These newly identified influences enrich information related to individual
technology adoption.
Figure 5.3 Organizational Context Influencing Hotels’ Preferences for SSTs
More specifically, the data analysis indicated a mixed influence of hotel size on hotels’ SST
preferences. According to hoteliers, the influence of hotel size on their preferences was related to
the technology type. Hotel size positively influenced hotels’ adoption of public technology, while
negatively influenced the adoption of in-room SSTs. Identified positive influences on public
181
technology adoption were consistent with findings from Ozturk and Hancer (2014), Wang et al.
(2016), and Teo et al. (2009). They found firm size to positively affect organizational adoption of
RFID technology, mobile reservation systems, and e-procurement. Customers in the present study
also provided support for this positive effect, noting that crowded hotels were better suited to using
SSKs. Siguaw et al. (2000) reported that once the hotel size reaches a certain level, reliance on
technology will be reduced. This finding may elucidate why hoteliers felt SSTs were suitable in
hotels with 100 or 150 rooms rather than in those with 600 rooms. Aside from direct influences,
Racherla and Hu (2008) suggested an indirect positive effect of hotel size on hotels’ adoption of
CRM given positive influences on organizational readiness and top management support. This
may explain why hoteliers in the current study mentioned that international chain hotels were more
likely to promote SSTs. As large hotel groups, their technology support and resources would be
stronger than those of small single hotels.
Both hoteliers and customers reported that new hotels are more appropriate sites for the application
of SSTs, consistent with work from Sahadev and Islam (2005). Besides, data analysis revealed that
resort and luxury hotels were less suitable for SSTs compared to business and economy hotels,
albeit customers indicated that luxury hotels should have the same features (and more) as economy
hotels. The reason may lie in that the removal of staffs’ direct involvement appears inconsistent
with luxury hotels’ beliefs (Wang et al., 2016). Luxury hotels have traditionally valued the
importance of customer-employee encounters (Kucukusta et al., 2014), partially refuting studies
in which luxury hotels are likely to adopt more new technologies than economy hotels (Sahadev
& Islam, 2005; Siguaw et al., 2000). This deviation highlights the need to invest in SST adoption,
which is distinct from other ICT technologies designed to facilitate customer-employee
interaction.
Additionally, in-depth interviews with customers revealed that their SST preferences were
associated with hotel characteristics (e.g., hotel size, age, and position). Victorino et al. (2005)
revealed that hotel type was significantly associated with the influence of service innovation on
customers’ hotel choice. In their studies, service innovation exerted a greater effect on customers’
hotel choices if they stay at economy hotels. Nevertheless, this influence has not been discussed
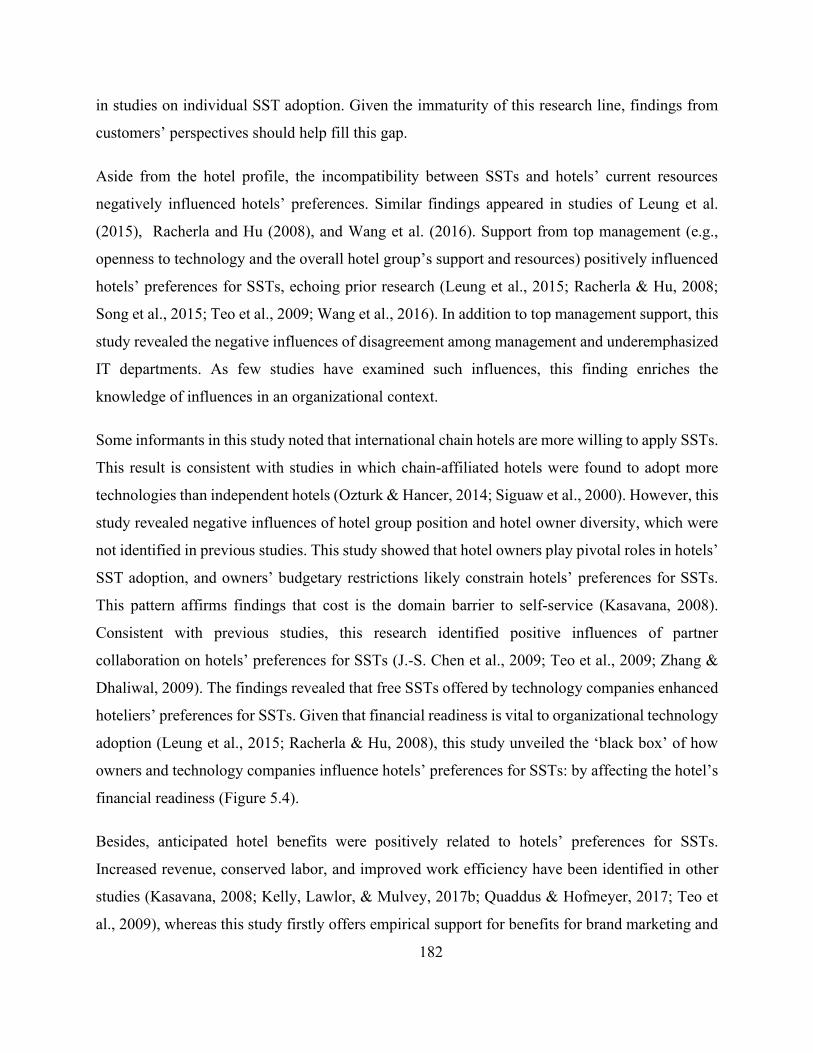
182
in studies on individual SST adoption. Given the immaturity of this research line, findings from
customers’ perspectives should help fill this gap.
Aside from the hotel profile, the incompatibility between SSTs and hotels’ current resources
negatively influenced hotels’ preferences. Similar findings appeared in studies of Leung et al.
(2015), Racherla and Hu (2008), and Wang et al. (2016). Support from top management (e.g.,
openness to technology and the overall hotel group’s support and resources) positively influenced
hotels’ preferences for SSTs, echoing prior research (Leung et al., 2015; Racherla & Hu, 2008;
Song et al., 2015; Teo et al., 2009; Wang et al., 2016). In addition to top management support, this
study revealed the negative influences of disagreement among management and underemphasized
IT departments. As few studies have examined such influences, this finding enriches the
knowledge of influences in an organizational context.
Some informants in this study noted that international chain hotels are more willing to apply SSTs.
This result is consistent with studies in which chain-affiliated hotels were found to adopt more
technologies than independent hotels (Ozturk & Hancer, 2014; Siguaw et al., 2000). However, this
study revealed negative influences of hotel group position and hotel owner diversity, which were
not identified in previous studies. This study showed that hotel owners play pivotal roles in hotels’
SST adoption, and owners’ budgetary restrictions likely constrain hotels’ preferences for SSTs.
This pattern affirms findings that cost is the domain barrier to self-service (Kasavana, 2008).
Consistent with previous studies, this research identified positive influences of partner
collaboration on hotels’ preferences for SSTs (J.-S. Chen et al., 2009; Teo et al., 2009; Zhang &
Dhaliwal, 2009). The findings revealed that free SSTs offered by technology companies enhanced
hoteliers’ preferences for SSTs. Given that financial readiness is vital to organizational technology
adoption (Leung et al., 2015; Racherla & Hu, 2008), this study unveiled the ‘black box’ of how
owners and technology companies influence hotels’ preferences for SSTs: by affecting the hotel’s
financial readiness (Figure 5.4).
Besides, anticipated hotel benefits were positively related to hotels’ preferences for SSTs.
Increased revenue, conserved labor, and improved work efficiency have been identified in other
studies (Kasavana, 2008; Kelly, Lawlor, & Mulvey, 2017b; Quaddus & Hofmeyer, 2017; Teo et
al., 2009), whereas this study firstly offers empirical support for benefits for brand marketing and

183
convenience in operations and management. An interesting thing is that this study empirically
proved that customers also took hotels’ expected benefits into account, offering new insights into
individual technology adoption.
Figure 5.4 Overview of Influences of Organizational Context
+ denotes positive influence; - denotes negative influence; ± denotes mixed influence. Bold themes were newly discussed in this study.
the relationship is derived from literature review.
5.4 Channel Attributes
The qualitative findings indicated that attributes of SSTs and human services influence hotels’ and
customers’ preferences for SSTs. The influences of channel attributes on SST preferences among
hoteliers and customers are similar; the four use dimensions in each perspective are identical.
Differences lie in standardization and usefulness. Customer informants mentioned the positive
influences of the consistency of SST-based service, while hoteliers did not. Customers’ emphasis
on consistency reflects the advantage of service automation mentioned by Selnes and Hansen
(2001). That is, service automation experiences fewer deviations in service quality, presumably

184
due to the standardization of SST-based services (Schumann et al., 2012). Such consistency
improves service quality (Kaushik et al., 2015; Kim & Qu, 2014) and customers’ preferences for
SSTs (Figure 5.5). Therefore, hotels can promote the consistency of SSTs when marketing these
devices.
Figure 5.5 Influencing Process of Consistent Standardization on Customers’ Preferences
The second difference is that hoteliers mentioned the negative influences of various functionalities
of service employees, whereas customers did not. However, both groups criticized the simplistic
functionality of current SSTs. Informants cited negative effects of SSTs’ futility on their
preferences. This is a back-handed tribute to the positive influences of perceived usefulness on
SST adoption (Kaushik et al., 2015). Technology companies should, therefore, strive to design
more functional and useful SSTs.
Data analysis was also used to compare the attributes of SSTs and service employees among
customers and hoteliers (Figure 5.6). The phenomenon of diffusion of innovation indicates that
the relative advantage of technology over the products it supersedes is positively related to its
adoption (Rogers, 1995). This statement supports that of and Meuter et al. (2000) who revealed
that better than the alternative contribute to customers’ satisfaction with SST-based service
encounters. Hoteliers and customers criticized SSTs’ inflexibility, emotionless nature, and futility
by noting that human services were flexible, personalized, emotional, and useful. This distinction
supports evidence that SSTs come at the cost of the merits of human services (Ba et al., 2010;
Kokkinou & Cranage, 2013; Kucukusta et al., 2014). However, previous studies came to different

185
conclusions regarding the flexibility of SSTs. For example, Ba et al. (2010) feared that the
flexibility of personal services would be lost in SST-based service encounters, whereas Kim and
Qu (2014) and Kucukusta et al. (2014) highlighted SSTs’ inherent flexibility. The findings of this
study may explain this discrepancy. According to informants, SSTs provide 24/7 access and thus
enable customers to access service at any time. However, SST-based services are standardized.
Thereby they are not flexible when dealing with customers’ instant and diverse needs or service
failure. In short, the influences of flexibility are perspective-dependent.
Figure 5.6 Overview of Influences of Channel Attributes
+ denotes positive influence; - denotes negative influence; ± denotes mixed influence. Bold themes were newly discussed in this study.
Prior studies have addressed the importance of technological factors and human services on hotels’
success and development, respectively (Bitner et al., 1990; Yadegaridehkordi et al., 2018). For
example, research has revealed that technology availability plays an important role in
organizational and individual technology adoption (Baker, 2011; Kim & Qu, 2014) and is
thereafter vital to organizational ROI, productivity, and competitive edge (Kasavana, 2008).
Nonetheless, scholars have not mentioned the influences of the availability of service employees,
which customers and hoteliers in this study emphasized. As Customer #6 stated, “If there is a

186
service employee, I will not prefer to use an iPad to order food.” This trend echoes findings
wherein the availability of government service channels affected citizens’ channel choices. A retail
study found that multi-channel service attributes influenced customers’ loyalty intentions based
on whether attributes are above or below market levels (Cassab, 2009). Similarly, the present
study’s comparison of SST and human service attributes highlights the necessary to explore SST
adoption in light of service employee attributes. SSTs should thus be investigated to understand
users’ preferences and intentions to use SSTs amidst all channels instead of in isolation (Eriksson
& Nilsson, 2007; Gelderman et al., 2011).
5.5 Service Task Features
SST adoption can be influenced by the nature of delivered services (Kaushik et al., 2015; Ong,
2010). Studies have shown that task complexity influences customers’ technology preferences and
adoption (Selnes & Hansen, 2001; Simon & Usunier, 2007; Wang et al., 2012). Dovetailing with
Simon and Usunier (2007) and Selnes and Hansen (2001), who called for future research to explore
the dimensions underlying service complexity, this study revealed that the influences of task
complexity on technology adoption are related with whether the service was originally provided
by service employees (Figure 4.5). In other words, the conventional channel that SSTs substitute
moderates the influences of task complexity on technology adoption (Figure 5.7). Moreover,
certain services involve a high degree of freedom and allow for executional latitude, whereas
others are largely standardized (Shostack, 2006). The finding that task standardization and
frequency affect customers’ preferences provides new knowledge about the influences of task
features and answers a call for research on other dimensions of service features, such as service
divergence (Shostack, 2006; Simon & Usunier, 2007).
Figure 5.7 Overview of Influences of Service Task Features
+ denotes positive influence; - denotes negative influence; ± denotes mixed influence. Bold themes were newly discussed in this research.

187
Aside from the features of a task itself, this study found that customer needs also consist of service
task features. Whether customers have a clear purpose or special needs is associated with service
task features and then affects customers’ preferences for SSTs. This result substantiates
information from Goodhue and Thompson (1995), who measured task characteristics by whether
tasks were ill-defined, ad-hoc, non-routine, and unexpected; and Pieterson and Van Dijk (2007)
who indicated that task ambiguity affects citizens’ choices of government service channels. Studies
have differed regarding the influence of the need for interaction on customers’ SST adoption. For
instance, Kaushik et al. (2015) and Curran and Meuter (2005) did not find that such a need
significantly influenced attitudes toward SST adoption, whereas Oh et al. (2013) and Lu et al.
(2009) found the need for interaction to negatively influence customers’ intentions to use SSTs.
The need for interaction is likely associated with customers’ needs. As shown in this study, when
customers have a clear purpose without other unique needs, they will not require interaction and
thus turn to SSTs. On the contrary, if they have ambiguous or unique needs, they may need to
interact with service employees.
A similar set of task features was found to affect hoteliers’ preferences for SSTs, albeit few prior
studies have mentioned service task features as influences on organizational technology adoption.
The identified task characteristics confirm that future research should consider service or task
characteristics when exploring organizational SST applications (Baker, 2011; Hameed et al., 2012;
Hansen, 1995). Considering this research gap, the various task factors cited by hoteliers should be
incorporated into subsequent studies.
5.6 Customer Difference
Customer adoption and acceptance exert a prominent influence on managers’ technology-related
decisions (Hansen, 1995; Sahadev & Islam, 2005; Wei et al., 2016; Wünderlich et al., 2013). In
Hansen’s framework for the implementation of mass information systems, a fundamental decision
involves identifying target customers whose adoption is influenced by their demographics and
behavioral traits (Hansen, 1995; Sahadev & Islam, 2005). Scholars have quantitively confirmed
the influences of demographic characteristics and prior experience on customers’ technology
adoption (Castillo-Manzano & López-Valpuesta, 2013; Lu et al., 2011; Meuter et al., 2003).
Similar to Lu et al. (2011), Castillo-Manzano and López-Valpuesta (2013), and Simon and Usunier

188
(2007), this study indicated that younger people tend to prefer SSTs compared with the elderly.
Contrary to the consistent influence of age, the effects of gender identified in this study oppose
those of Lu et al. (2011) and Castillo-Manzano and López-Valpuesta (2013), where women
preferred self-service check-in to traditional check-in counters at airports. This deviation may be
explained by Meuter et al. (2003), who found that men and women used different types of SSTs
differently. For example, men used travel/business SSTs more whereas women preferred daily use
SSTs. With respect to occupation, customer informants in the present study stated that they might
prefer SSTs in hotels because they worked in hospitality.
Hoteliers suggested that other sociodemographic factors might affect customers’ SST adoption,
such as education level, residence, and social status, albeit customers did not report these effects.
The influences of education level and residence (e.g., first-tier cities) corroborate work from
Castillo-Manzano and López-Valpuesta (2013) while opposing Meuter et al. (2003), who found
that the influence of education could be negative given the variety of SSTs. Additionally, the
finding that first-tier cities would more likely prefer SSTs, while the research of Donner and
Dudley (1997) indicates that rural residents preferred technology as an easy way to communicate
with bankers. In addition to demographics, this study revealed that customers’ preferences were
influenced by their personality. Although research has explored the influences of personality on
social media creation (Yoo & Gretzel, 2011), academia has not paid much attention to the
influences of personality on technology adoption, particularly SST adoption, to the best of our
knowledge. The findings from this study address this gap and provide new expertise around
individual technology adoption behavior.
Moreover, data analysis delineated the effects of previous experience (e.g., experience in other
fields and first-time experience) similarly to earlier studies (Bateson, 1985; Kim & Qu, 2014; Lu
et al., 2011). The influences of first-time experience may result from customers’ penchant to seek
novelty or experience new stimuli (Dabholkar & Bagozzi, 2002). In spite of that, this study
unveiled that after the first experience, customers were more likely to make decisions based on
rational judgments rather than a desire to try new technology. This finding aligns with Liao and
Lu (2008), who found that factors influencing adoption differed among consumers who had used
technology before compared with those who had not yet experienced it.

189
Informants in this study also mentioned the influence of trip profile, including travel frequency,
travel companions, trip purpose, trip arrangements, and familiarity with hotel. The data analysis
suggested that customers who travel frequently prefer SSTs, consistent with findings from Lu et
al. (2011) and Castillo-Manzano and López-Valpuesta (2013). The positive influence of frequent
travel may be justified by greater familiarity with a certain hotel or city, as noted in Castillo-
Manzano and López-Valpuesta (2013). Additionally, tourists’ preferences for package tours
differed. As Castillo-Manzano and López-Valpuesta (2013) explained that on many occasions,
tourists traveling on package tours cannot use self-check-in at airports. A similar situation may
apply in hotels. Alternatively, a tour guide may deal with check-in or check-out on guests’ behalf,
as Customer #27 explained. Accommodation companions can also influence customers’
preferences for SSTs. Traveling with friends or lovers was found to motivate preferences for SSTs.
Other studies, such as those by Castillo-Manzano and López-Valpuesta (2013) and Wang et al.
(2012), arrived at the same conclusion. However, Lu et al. (2011) found that airport passengers
traveling with fewer companions tended to use self-service kiosks or web check-in.
Furthermore, the findings of the present study show that business travelers are more likely to prefer
SSTs compared with leisure tourists. This finding coincides with that of Lu et al. (2011), who
indicated that business airport passengers preferred SSKs or web check-in. Other passengers have
been found to go to a check-in counter for assistance (Dresner, 2006). Conversely, Castillo-
Manzano and López-Valpuesta (2013) reported that business airport passengers prefer traditional
check-in because they often pay for business class fare, eliminating the need to wait at a desk. This
behavior is consistent with findings from the qualitative study wherein important guests may not
prefer SSTs over high-touch human services. This indicated that the influence of travel purpose is
associated with consumers’ social status. Although saved time can facilitate SST preferences
(Meuter et al., 2000), when the two queues (i.e., check-in counters and kiosks) are equally long,
airport passengers are likely to proceed to the check-in desk (Gelderman et al., 2011).
Notably, a comparison of hoteliers’ and customers’ opinions unveiled discrepancies between
customers’ expressed preferences and hoteliers’ perceptions of customers’ preferences. In terms
of demographics, hotelier informants revealed that customer education, residence, and social status
influenced customers’ preferences and in turn hotels’ preferences, whereas customers did not
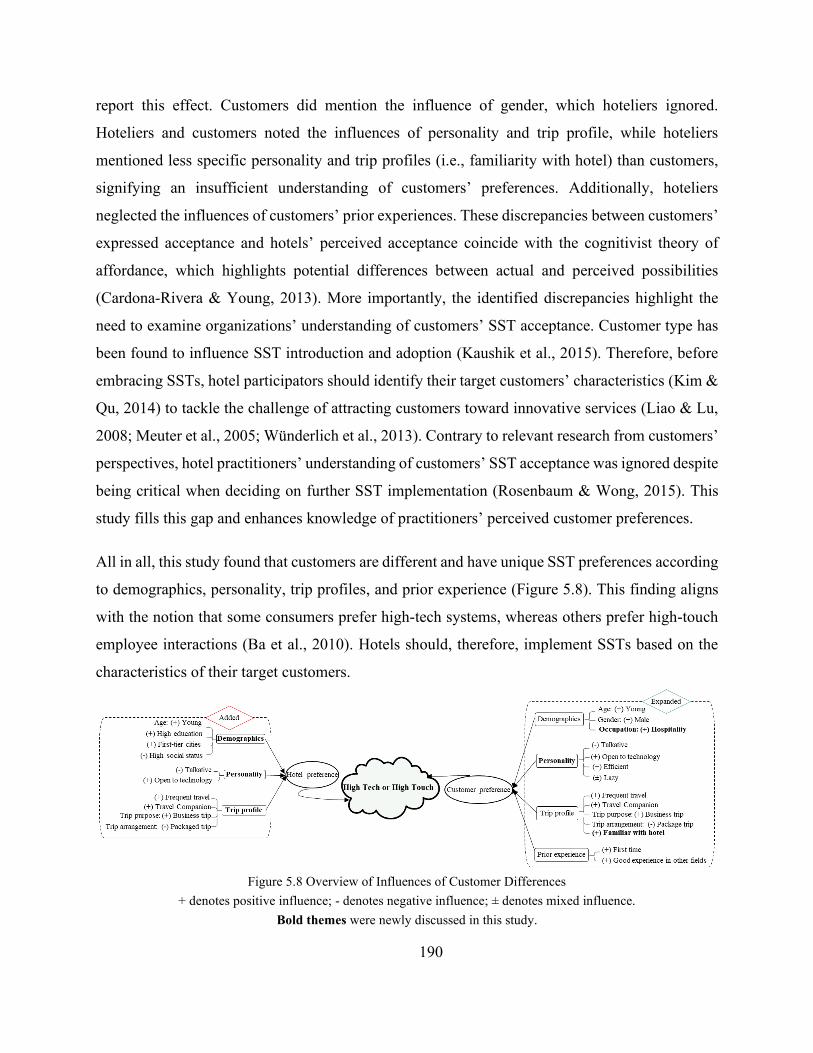
190
report this effect. Customers did mention the influence of gender, which hoteliers ignored.
Hoteliers and customers noted the influences of personality and trip profile, while hoteliers
mentioned less specific personality and trip profiles (i.e., familiarity with hotel) than customers,
signifying an insufficient understanding of customers’ preferences. Additionally, hoteliers
neglected the influences of customers’ prior experiences. These discrepancies between customers’
expressed acceptance and hotels’ perceived acceptance coincide with the cognitivist theory of
affordance, which highlights potential differences between actual and perceived possibilities
(Cardona-Rivera & Young, 2013). More importantly, the identified discrepancies highlight the
need to examine organizations’ understanding of customers’ SST acceptance. Customer type has
been found to influence SST introduction and adoption (Kaushik et al., 2015). Therefore, before
embracing SSTs, hotel participators should identify their target customers’ characteristics (Kim &
Qu, 2014) to tackle the challenge of attracting customers toward innovative services (Liao & Lu,
2008; Meuter et al., 2005; Wünderlich et al., 2013). Contrary to relevant research from customers’
perspectives, hotel practitioners’ understanding of customers’ SST acceptance was ignored despite
being critical when deciding on further SST implementation (Rosenbaum & Wong, 2015). This
study fills this gap and enhances knowledge of practitioners’ perceived customer preferences.
All in all, this study found that customers are different and have unique SST preferences according
to demographics, personality, trip profiles, and prior experience (Figure 5.8). This finding aligns
with the notion that some consumers prefer high-tech systems, whereas others prefer high-touch
employee interactions (Ba et al., 2010). Hotels should, therefore, implement SSTs based on the
characteristics of their target customers.
Figure 5.8 Overview of Influences of Customer Differences
+ denotes positive influence; - denotes negative influence; ± denotes mixed influence. Bold themes were newly discussed in this study.
191
5.7 Customer Experience
The data analysis conveyed a multidimensional customer experience structure and revealed its
influences on hotels’ and customers’ SST preferences.
Aesthetic Experience: an experience related to the anthropomorphism of SSTs,
including appearance and voice. Visual and acoustical appeal evokes aesthetic value.
Affective Experience: diverse emotions or feelings obtained when using SSTs, including
surprise, fresh, comfort, pleasure, fun, relaxation, and regret.
Cognitive Experience: pragmatic values evoked by SSTs, or the usefulness of using
SSTs to tackle customer needs (including SSTs’ ability to provide useful information,
convenience, efficiency, a simplified process, economic value, and fewer errors).
Actional Experience: a dimension of experience associated with customers’ actions or
participation. Aside from control and freedom, this kind of experience extends to
customers’ sharing behavior, self-attribution regarding service failure, and
reconsideration of life habits.
Social Experience: an experience involving other people and the social value customers
obtain (e.g., consideration for employees, respect, trust, fashion, privacy, and safety).
The customer may also be impressed by societal progress.
Although these dimensions are based on Schmitt’s (1999) five strategic experiential modules (i.e.,
sense, feel, think, act, and relate), the definitions and specific themes identified in this research
reveal some discrepancies. First, cognitive experience is more focused on functional values than
creative thinking. This finding is consistent with research in consumer choice, whereby cognitive
attributes intended to meet utilization needs and functional goals serve as the foundation of
customer experience (Kim & Perdue, 2013). Second, in addition to bodily habits and customs, the
actional experience is more about control, freedom, participation, sharing behavior, and self-
192
attribution, all of which are related to customer actions. Lastly, social values involve safety and
privacy, which informants in this study often discussed from a social perspective.
The identified multidimensional customer experience structure enriches our knowledge of
customers’ experiences with SSTs. Limited attention has otherwise been devoted to customer
experience with SSTs (Kelly et al., 2017a; Wei, Torres, et al., 2017) or customer adoption of
technology from an experiential view (Kim & Qu, 2014; Lu et al., 2011). Whereas a few studies
have considered the influences of previous experience, simplistic measurement cannot unveil the
complexity of such influences, including whether respondents have used these service delivery
channels before (Kim, Christodoulidou, & Brewer, 2012), the frequency of SST utilization
(Eastlick et al., 2012; Meuter et al., 2005), and SST failure/recovery (C. Wang et al., 2012). The
five identified customer experience dimensions with specific themes can ground future research
on customer experience with SSTs, dovetailing with Wei et al.’s (2016) contention that the
purposes of customers utilizing SSTs reveal migration from gaining functional to experiential
merits. In line with the present qualitative findings, two hypotheses are put forth:
H2: Customer experience with SSTs influence customers’ preferences for SSTs.
H5: Customer experience with SSTs influence hoteliers’ preferences for SSTs.
Furthermore, customer experiences with traditional human services influence customers’ and
hoteliers’ preferences. Aside from direct influences, data analysis revealed discrepancies between
customer experience with SSTs and human services on the basis of aesthetic, affective, cognitive,
and social experience. These findings inform the debate around enhanced customer experience
(Kasavana, 2008) and diminished customer experience (Meuter et al., 2003). Customer experience
can be enhanced across different dimensions or specific themes. For instance, customer experience
is improved in terms of freshness, while reduced in terms of respect compared with that provided
by human services. Considering these inconsistencies, service organizations should identify the
kind of customer experience they wish to provide and then decide whether to deploy SSTs (and
what kinds) accordingly. Furthermore, these results address deficiencies in empirical research
regarding the influences of experience from a comparative perspective. These comparative
findings align with prospect theory, namely reference-independent preference wherein decisions
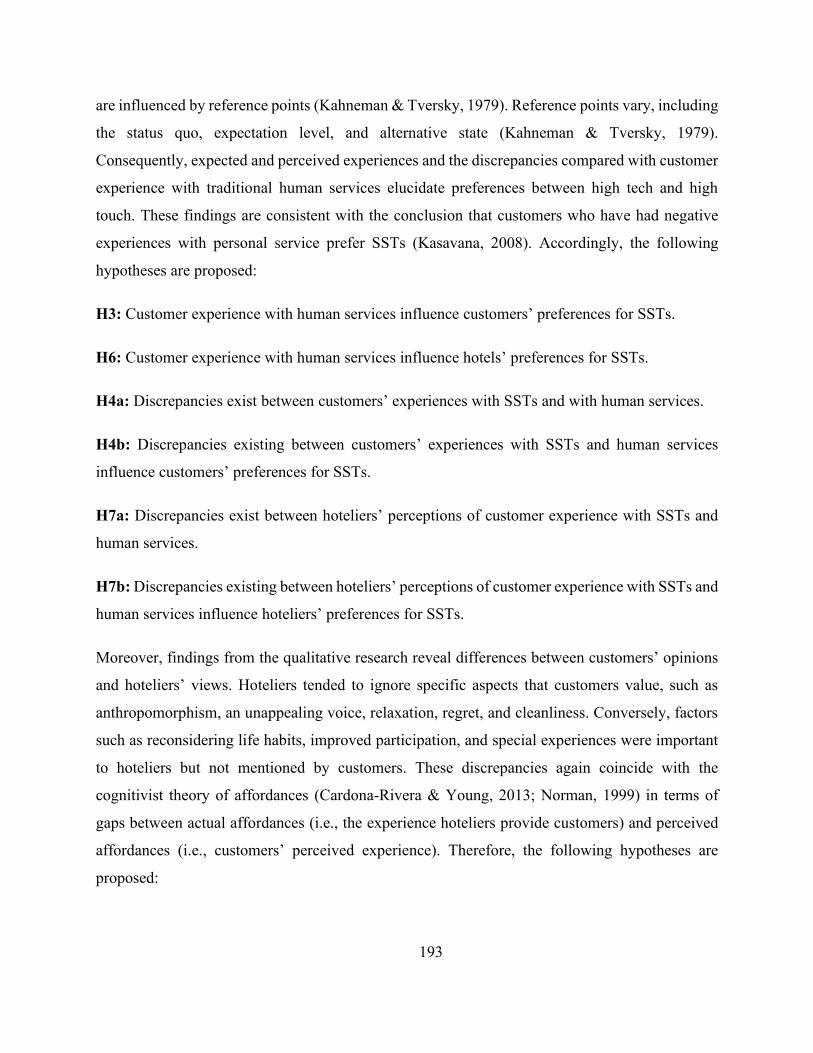
193
are influenced by reference points (Kahneman & Tversky, 1979). Reference points vary, including
the status quo, expectation level, and alternative state (Kahneman & Tversky, 1979).
Consequently, expected and perceived experiences and the discrepancies compared with customer
experience with traditional human services elucidate preferences between high tech and high
touch. These findings are consistent with the conclusion that customers who have had negative
experiences with personal service prefer SSTs (Kasavana, 2008). Accordingly, the following
hypotheses are proposed:
H3: Customer experience with human services influence customers’ preferences for SSTs.
H6: Customer experience with human services influence hotels’ preferences for SSTs.
H4a: Discrepancies exist between customers’ experiences with SSTs and with human services.
H4b: Discrepancies existing between customers’ experiences with SSTs and human services
influence customers’ preferences for SSTs.
H7a: Discrepancies exist between hoteliers’ perceptions of customer experience with SSTs and
human services.
H7b: Discrepancies existing between hoteliers’ perceptions of customer experience with SSTs and
human services influence hoteliers’ preferences for SSTs.
Moreover, findings from the qualitative research reveal differences between customers’ opinions
and hoteliers’ views. Hoteliers tended to ignore specific aspects that customers value, such as
anthropomorphism, an unappealing voice, relaxation, regret, and cleanliness. Conversely, factors
such as reconsidering life habits, improved participation, and special experiences were important
to hoteliers but not mentioned by customers. These discrepancies again coincide with the
cognitivist theory of affordances (Cardona-Rivera & Young, 2013; Norman, 1999) in terms of
gaps between actual affordances (i.e., the experience hoteliers provide customers) and perceived
affordances (i.e., customers’ perceived experience). Therefore, the following hypotheses are
proposed:
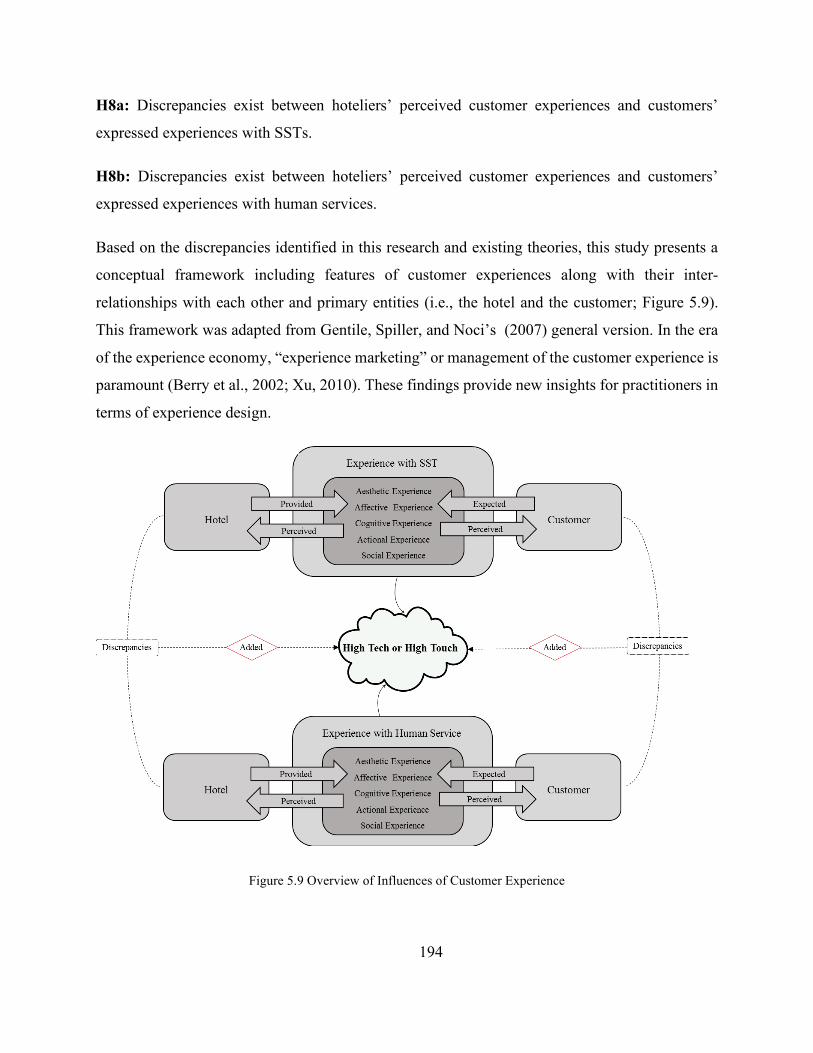
194
H8a: Discrepancies exist between hoteliers’ perceived customer experiences and customers’
expressed experiences with SSTs.
H8b: Discrepancies exist between hoteliers’ perceived customer experiences and customers’
expressed experiences with human services.
Based on the discrepancies identified in this research and existing theories, this study presents a
conceptual framework including features of customer experiences along with their inter-
relationships with each other and primary entities (i.e., the hotel and the customer; Figure 5.9).
This framework was adapted from Gentile, Spiller, and Noci’s (2007) general version. In the era
of the experience economy, “experience marketing” or management of the customer experience is
paramount (Berry et al., 2002; Xu, 2010). These findings provide new insights for practitioners in
terms of experience design.
Figure 5.9 Overview of Influences of Customer Experience

195
5.8 Development of Conceptual Framework
This qualitative study explored customers’ and hoteliers’ preferences for high-tech or high-touch
services from an experiential perspective. The findings convey a hierarchical structure of
experiential preference construction, ranging from the external environmental context to the
middle origination level and ultimately the core customer experience with service encounters
(Figure 5.10). The outermost layer encompasses the environmental context, wherein the current
environment and expected outcomes affect hotels’ and customers’ preference construction. More
specifically, hotels’ and customers’ preferences are influenced by public readiness, government
regulations, labor issues, industry, and technology development, and anticipated environmental
influences (e.g., human apathy and environmental protection).
Figure 5.10 Hierarchical Framework for Preference Construction from an Experiential Perspective
196
The second layer highlights collaboration and disagreements among organizations, including the
hotel itself, technology companies, and potentially hotel owners and hotel groups (Figure 5.3).
Expected benefits were found to influence hotels’ and customers’ preferences and experiences.
Hotel profile was also found to affect customers’ preferences.
The next layer involves service encounters, wherein customer and service channels co-produce
service. The characteristics of service tasks are included in this layer as well. This arrangement
coincides with task-technology fit (TTF), wherein the match among task requirements,
individuals’ abilities, and technology functionality is underlined (Goodhue, 1995). As discussed
in the literature review, TTF, a vital construct in the technology-to-performance chain model, also
explains technology adoption (Dishaw & Strong, 1999; Yen et al., 2010). The present study
extends technology functionality to service channel features. The features of the channel replaced
by SSTs also affect preferences for high-tech services. Moreover, the features of service encounter
influence customer experience. This association is consistent with studies in which SST attributes,
technology anxiety, customer involvement, and employee service shaped the customer experience
(Grace & O’Cass, 2004; Kelly et al., 2017a; Kraak & Holmqvist, 2017; Meuter et al., 2003; Wei,
Torres, et al., 2017; Yang, 2008). The core layer consists of customer experience with service
encounters. Customer experience was found to affect consumer behavior, consistent with (Parise,
Guinan, & Kafka, 2016). As discussed above, data from the qualitative study indicated that
perceived customer experience with high-tech service influences preferences, as do customer
experience with traditional human services and discrepancies between experience types.
The hierarchical framework, which contains a comprehensive set of influencing factors drawn
from the external environment, middle organization collaboration, and core service encounters,
presents a holistic view of influencing factors on preference construction and how these relate to
the customer experience. However, the derivation of these factors is not strictly vertical.
Customers’ and hotels’ preferences may be influenced by any layer of the model. Besides,
interplay may exist among layers. For example, customers’ social experience might be influenced
by external environmental. As Customer # 9 indicated that she felt being trusted by the hotel to
use portable in-room SSTs. That is, hotel’s adoption of SSTs was not influenced by some
197
customers’ misbehaviors (one aspect of public readiness mentioned in external environmental
context), or these misbehaviors has been corrected.
The development of the hierarchical experience framework is an extension of the integrated model
of the technology-organization-environment (TOE) and TTF frameworks (Figure 5.11).
According to the TOE framework, technological, organizational, and environmental contexts
influence organizational adoption of innovative technology (Baker, 2011; Kurnia et al., 2015).
Task characteristics and individual differences complement this framework (Baker, 2011;
Premkumar, 2003). However, researchers have not incorporated it or TTF into a common
framework for organizational and individual technology adoption. This qualitative study
integrated the two frameworks and extended them from an experiential perspective based on the
literature and the qualitative data. This incorporation affirms that one cannot apply a single theory
to fully explain organizational innovation adoption (Brancheau & Wetherbe, 1990). While not
advocating for any specific theory, these findings provide an example of building a holistic
framework for preference construction or technology adoption. Furthermore, the findings extend
an integrated model by adding new specific factors and customers’ experiences with different
service channels and experience discrepancies among them.
Figure 5.11 Extended and Integrated Framework of TOE and TTF from an Experiential Perspective

198
The hierarchical preference model provides an alternative view for understanding technology
adoption and experience. In the literature, technology adoption has commonly been explored based
on attitude/behavioral intentions, whereas experiential management is neglected. Although the
technology acceptance model remains useful for understanding technology adoption, the exclusive
and simplistic measurement of technology characteristics (e.g., perceived usefulness) limits the
explanation. Neither individual technology adoption nor organizational application of SSTs is
determined by a single factor but a constellation of factors. Although studies have introduced and
tested the effects of other factors such as customer demographics, these factors appear in different
research areas (Kim et al., 2012; Simon & Usunier, 2007). This information may, therefore, be
too scattered to be useful for academics and practitioners. As theory often underpins practice, data
from this study unveil a comprehensive explanation of preference construction from an
experiential perspective, which is the essence of behavioral intention (Slovic, 1995). The vertical
structure helps clarify the preferences of customers who probably are not clear about their own
preferences (Piccoli et al., 2017). The findings also enhance the expertise of customer experience
management in an SST-based experience economy in which customer-employee interaction is
omitted (Curran & Meuter, 2005; Kucukusta et al., 2014). SSTs and service employees excel in
different dimensions of the customer experience; one’s preference depends on the kind of
experience a hotel wants to offer customers and what customers hope to obtain. Using the
multidimensional customer experience structure model (Figure 5.9), practitioners can target the
experiences they wish to offer customers. For example, despite the importance of high-touch
services, overwhelming humanistic care might make customers uncomfortable. Besides,
consumers may argue that hotels should not shift their responsibilities to customers, under which
condition the improved customer participation might exert negative influences. Therefore, the
value customers gained from SSTs should be no less than their co-production role (Hilton et al.,
2013).
This study highlights experience-based service delivery channel management in the hotel industry
and other service sectors. Effective service management contributes to organizational profitability
and success in a competitive marketplace (Meuter et al., 2000). This qualitative study indicates
that customers’ and hoteliers’ preferences are not binary choices but distinct across service
delivery stages. This finding can help hoteliers determine the extent of SST application in their
199
establishment, which is closely related to a hotel’s financial performance (Hung et al., 2012).
Hoteliers can tailor service delivery channels for different service delivery phases to fulfill
customer needs (Buell et al., 2010). Moreover, customers’ and hoteliers’ discrepant opinions can
guide hoteliers in investing in their efforts. Although innovative technology is a selling point,
practitioners should not advertise unavailable technologies even if such devices are expected to
arrive soon; customers will only be disappointed by unrealistic marketing. In short, this study
provides insight into where different service channels excel in specific service tasks for particular
customers. Managers can use this information to select suitable channels at proper delivery stages
for customers.
5.9 Chapter Summary
Compared with the literature, this study corroborates previous studies and enhances knowledge of
individual and organizational technology adoption. Specifically, the identified environmental
enablers and inhibitors substantiate earlier work (e.g., industry nature, competitive pressure, and
government regulations) on organizational technology adoption. Other newfound environmental
factors enrich expertise around how hotels can strategically adopt SSTs according to external
environmental factors. Moreover, these findings fill a research gap in terms of how environmental
context influence customers’ technology adoption, even though customers mentioned such factors
less often than hoteliers.
In addition to confirming the influences of organizational factors on hotels’ preferences for SSTs,
the results of this research also expand the organizational context by revealing that hotel owners,
hotel groups, and technology companies inform hotels’ technology adoption. This study is
probably the first to provide empirical evidence of the effects of hotel profiles and expected hotel
benefits on customers’ preferences.
Customers’ and hoteliers’ comparisons of the attributes of SSTs and service employees supported
work by Rogers (1995) and Meuter et al. (2000). These findings also underscored the importance
of exploring SST adoption by considering service employees as opposed to isolating them from
other channels (Eriksson & Nilsson, 2007; Gelderman et al., 2011).
200
Aside from confirming the influences of task complexity in prior research (Selnes & Hansen, 2001;
Simon & Usunier, 2007; Wang et al., 2012), this study indicates that the influence of task
complexity on technology adoption is associated with the channels that SSTs are substituting.
Moreover, data from this study extends the knowledge of task features by pointing out the effects
of task standardization, task frequency, and customer needs. Given that the influences of task
features on organizational preferences for SSTs were not addressed previously, this finding offers
new insights into organizational technology behavior.
Besides, customers’ preferences were found to vary according to consumer demographics,
personality, trip profiles, and prior experience. This result is concordant with the assertion that
some consumers prefer high-tech systems whereas others prefer high-touch interactions with
employees (Ba et al., 2010). Discrepancies emerged between customers’ cited factors that
influenced their preferences and hoteliers’ perceptions of customers’ preferences. These
differences should enhance practitioners’ understanding of customer acceptance of SSTs, which
can inform decision making regarding further SST implementation (Rosenbaum & Wong, 2015).
Discrepancies between customer experience with SSTs and customer experience with human
services add new understanding to customers’ and organizations’ technology adoption. Based on
data from this study and the general framework proposed by Gentile et al. (2007), this research
presented a conceptual framework including five identified customer experience dimensions and
the relationships among them and with main entities (i.e., the hotel and the customer; Figure 5.9).
Last but not least, these discussions were combined into a hierarchical framework to elucidate how
customers and hoteliers develop preferences for innovative SSTs. This hierarchical framework,
containing a full set of influencing factors (i.e., the external environment, middle organization
collaboration, and core service encounter experience), should thoroughly (but perhaps not
completely) explain how these factors are related to customers’ experiences and preference
construction.
In short, according to reference-dependent preference, decisions are influenced by reference points
(e.g., alternative state) (Kahneman & Tversky, 1979). The qualitative study did find that
customers’ and hoteliers’ usually take SST’s alternative, human service into consideration. Their
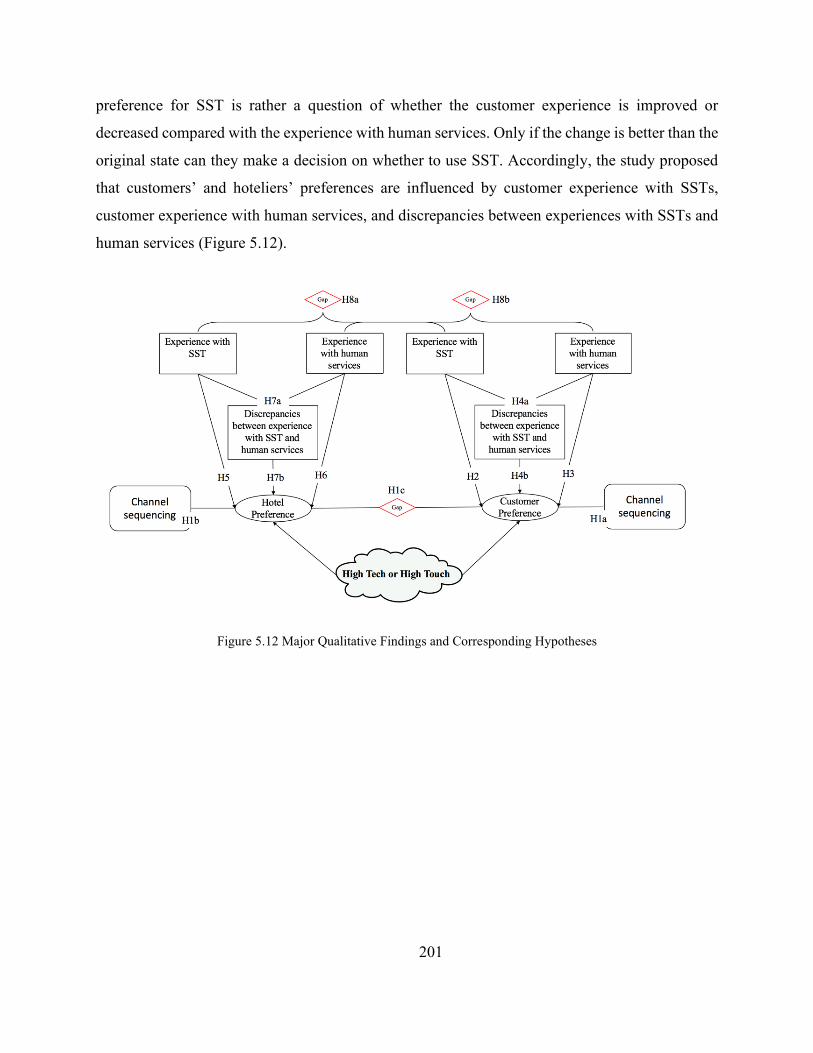
201
preference for SST is rather a question of whether the customer experience is improved or
decreased compared with the experience with human services. Only if the change is better than the
original state can they make a decision on whether to use SST. Accordingly, the study proposed
that customers’ and hoteliers’ preferences are influenced by customer experience with SSTs,
customer experience with human services, and discrepancies between experiences with SSTs and
human services (Figure 5.12).
Figure 5.12 Major Qualitative Findings and Corresponding Hypotheses
202
CHAPTER 6: RESULTS OF QUANTITATIVE STUDY
6.1 Purification of Experience Measures
Factor analysis coupled with a Cronbach's alpha reliability test of each component was conducted
and tested via IBM SPSS Statistics 25. Principal component analysis (PCA) with Varimax rotation
was performed to extract underlying constructs on Sample 1 (1st-round customer data; N = 193).
The results of the factor analysis of customer experience with SSTs and human services were
presented in detail in the following sub-sections.
6.1.1 EFA Results of Customer Experience with SSTs
Initially, all 27 items related to experiences with SSTs were included in rotation techniques. Then,
PCA and Cronbach’s alpha reliability test were conducted repeatedly on Sample 1 (N = 193) until
all retained items satisfied the requirements mentioned in Chapter 3. In accordance with
aforementioned standards (Chapter 3), five items were removed (“Were useful in meeting my
needs”, “Made me reconsider my daily habits”, “Surprised me”, “Gave me the impression that the
service was worth its cost”, and “Made me learn something new”). Twenty-two experiential
variables were retained and subjected to EFA again. According to Table 6.1, the 22 experiential
variables demonstrated a KMO of 0.933 > 0.900 and a significant Bartlett’s test of sphericity (p =
0.000), indicating that the data were appropriate for factor analysis. Communalities ranged from
0.630 to 0.879, exceeding the threshold of 0.5. Factor loadings ranging from 0.607 to 0.846, also
were greater than 0.5. Eigenvalues of the five extracted factors ranged from 2.529 to 4.377, all
greater than > 1. The identified five underlying constructs explained 77.812% of the overall
variance in the original data, exceeding 60% (Hair et al., 2006). These dimensions were labeled
(1) affective experience; (2) cognitive experience; (3) actional experience; (4) social experience;
and (5) fresh experience. Subsequent Cronbach's alpha reliability tests showed high internal
consistency for all factors, indicated by alpha values greater than 0.7 (Table 6.1). Another popular
extraction method, principal axis factoring (PAF) analysis with Promax rotation, was compared to
the results of PCA with Varimax rotation. Results showed that PAF successfully reproduced the
5-factor structure.
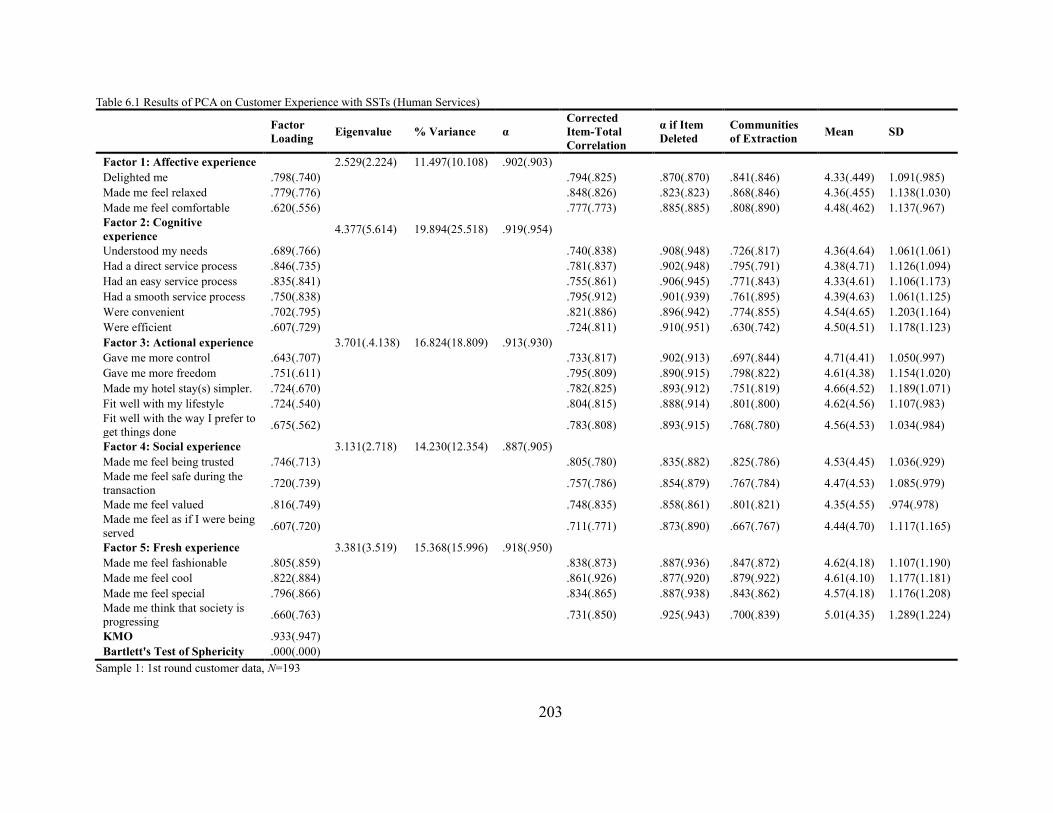
203
Table 6.1 Results of PCA on Customer Experience with SSTs (Human Services)
Factor Loading Eigenvalue % Variance α
Corrected Item-Total Correlation
α if Item Deleted
Communities of Extraction Mean SD
Factor 1: Affective experience 2.529(2.224) 11.497(10.108) .902(.903) Delighted me .798(.740) .794(.825) .870(.870) .841(.846) 4.33(.449) 1.091(.985) Made me feel relaxed .779(.776) .848(.826) .823(.823) .868(.846) 4.36(.455) 1.138(1.030) Made me feel comfortable .620(.556) .777(.773) .885(.885) .808(.890) 4.48(.462) 1.137(.967) Factor 2: Cognitive experience 4.377(5.614) 19.894(25.518) .919(.954)
Understood my needs .689(.766) .740(.838) .908(.948) .726(.817) 4.36(4.64) 1.061(1.061) Had a direct service process .846(.735) .781(.837) .902(.948) .795(.791) 4.38(4.71) 1.126(1.094) Had an easy service process .835(.841) .755(.861) .906(.945) .771(.843) 4.33(4.61) 1.106(1.173) Had a smooth service process .750(.838) .795(.912) .901(.939) .761(.895) 4.39(4.63) 1.061(1.125) Were convenient .702(.795) .821(.886) .896(.942) .774(.855) 4.54(4.65) 1.203(1.164) Were efficient .607(.729) .724(.811) .910(.951) .630(.742) 4.50(4.51) 1.178(1.123) Factor 3: Actional experience 3.701(.4.138) 16.824(18.809) .913(.930) Gave me more control .643(.707) .733(.817) .902(.913) .697(.844) 4.71(4.41) 1.050(.997) Gave me more freedom .751(.611) .795(.809) .890(.915) .798(.822) 4.61(4.38) 1.154(1.020) Made my hotel stay(s) simpler. .724(.670) .782(.825) .893(.912) .751(.819) 4.66(4.52) 1.189(1.071) Fit well with my lifestyle .724(.540) .804(.815) .888(.914) .801(.800) 4.62(4.56) 1.107(.983) Fit well with the way I prefer to get things done .675(.562) .783(.808) .893(.915) .768(.780) 4.56(4.53) 1.034(.984)
Factor 4: Social experience 3.131(2.718) 14.230(12.354) .887(.905) Made me feel being trusted .746(.713) .805(.780) .835(.882) .825(.786) 4.53(4.45) 1.036(.929) Made me feel safe during the transaction .720(.739) .757(.786) .854(.879) .767(.784) 4.47(4.53) 1.085(.979)
Made me feel valued .816(.749) .748(.835) .858(.861) .801(.821) 4.35(4.55) .974(.978) Made me feel as if I were being served .607(.720) .711(.771) .873(.890) .667(.767) 4.44(4.70) 1.117(1.165)
Factor 5: Fresh experience 3.381(3.519) 15.368(15.996) .918(.950) Made me feel fashionable .805(.859) .838(.873) .887(.936) .847(.872) 4.62(4.18) 1.107(1.190) Made me feel cool .822(.884) .861(.926) .877(.920) .879(.922) 4.61(4.10) 1.177(1.181) Made me feel special .796(.866) .834(.865) .887(.938) .843(.862) 4.57(4.18) 1.176(1.208) Made me think that society is progressing .660(.763) .731(.850) .925(.943) .700(.839) 5.01(4.35) 1.289(1.224)
KMO .933(.947) Bartlett's Test of Sphericity .000(.000)
Sample 1: 1st round customer data, N=193

204
6.1.2 EFA Results of Customer Experience with Human Services
To confirm the usefulness of the five dimensions for measuring customer experience with human
services, another PCA with Varimax rotation was performed to explore the dimensional structure
of these items. Results showed a KMO of 0.947 > 0.900 and a significant Bartlett’s test of
sphericity (p = .000), indicating that the data were suitable for factor analysis (Table 6.1).
Eigenvalues of the five extracted factors ranged from 2.224 to 5.614, all greater than > 1. As shown
in Table 6.1, all communalities and factor loadings were greater than 0.5. Five underlying
constructs were identified and explained 82.785% of the overall variance in the data, exceeding
60% (Hair et al., 2006). Cronbach's alpha results showed high internal consistency for all five
factors, with alpha values ranging from 0.903 to 0.954 (above 0.7). These results signified the
appropriateness of the five extracted dimensions. A PAF analysis with Promax rotation was then
conducted. A similar 5-factor structure was developed as from the results of PCA.
Based on the EFA results, the five initial constructs (i.e., affective, cognitive, actional, social, and
fresh experience) were presumed to underlie the 22 experience items and could be used to measure
customer experiences with SSTs and human services
6.2 Evaluation of Reliability and Validity of Experience Measures
To assess the reliability and validity of experience measures, the researcher conducted CFA on
Sample 2 (2nd-round customer data; N = 408). A two-step approach suggested by Anderson and
Gerbing (1988) was used to test the measurement model and subsequent structural model. The fit
between the data and the relationships of the 22 experience items and 5 first-order constructs were
examined in the measurement model. Then the structural model was tested to examine the
relationships between the 5 first-order latent constructs and 1 second-order latent factor labeled as
“customer experience” (Figure 3.6).
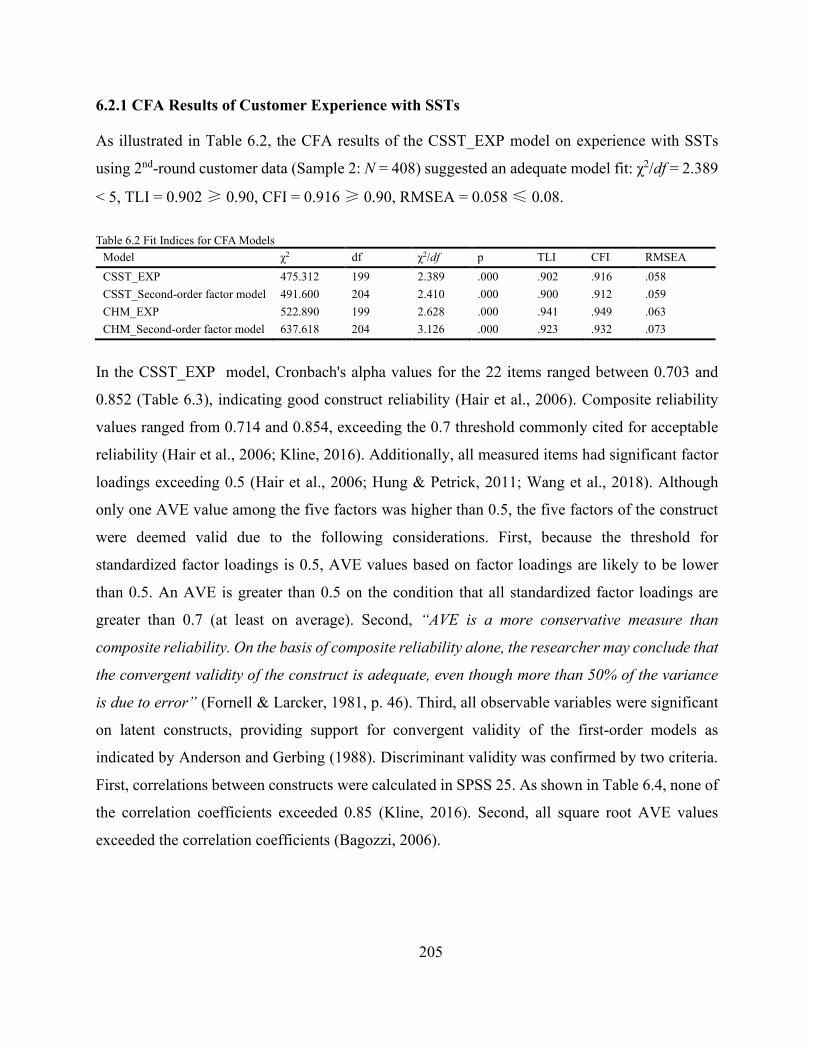
205
6.2.1 CFA Results of Customer Experience with SSTs
As illustrated in Table 6.2, the CFA results of the CSST_EXP model on experience with SSTs
using 2nd-round customer data (Sample 2: N = 408) suggested an adequate model fit: χ2/df = 2.389
< 5, TLI = 0.902 ≥ 0.90, CFI = 0.916 ≥ 0.90, RMSEA = 0.058 ≤ 0.08.
Table 6.2 Fit Indices for CFA Models Model χ2 df χ2/df p TLI CFI RMSEA CSST_EXP 475.312 199 2.389 .000 .902 .916 .058 CSST_Second-order factor model 491.600 204 2.410 .000 .900 .912 .059 CHM_EXP 522.890 199 2.628 .000 .941 .949 .063 CHM_Second-order factor model 637.618 204 3.126 .000 .923 .932 .073
In the CSST_EXP model, Cronbach's alpha values for the 22 items ranged between 0.703 and
0.852 (Table 6.3), indicating good construct reliability (Hair et al., 2006). Composite reliability
values ranged from 0.714 and 0.854, exceeding the 0.7 threshold commonly cited for acceptable
reliability (Hair et al., 2006; Kline, 2016). Additionally, all measured items had significant factor
loadings exceeding 0.5 (Hair et al., 2006; Hung & Petrick, 2011; Wang et al., 2018). Although
only one AVE value among the five factors was higher than 0.5, the five factors of the construct
were deemed valid due to the following considerations. First, because the threshold for
standardized factor loadings is 0.5, AVE values based on factor loadings are likely to be lower
than 0.5. An AVE is greater than 0.5 on the condition that all standardized factor loadings are
greater than 0.7 (at least on average). Second, “AVE is a more conservative measure than
composite reliability. On the basis of composite reliability alone, the researcher may conclude that
the convergent validity of the construct is adequate, even though more than 50% of the variance
is due to error” (Fornell & Larcker, 1981, p. 46). Third, all observable variables were significant
on latent constructs, providing support for convergent validity of the first-order models as
indicated by Anderson and Gerbing (1988). Discriminant validity was confirmed by two criteria.
First, correlations between constructs were calculated in SPSS 25. As shown in Table 6.4, none of
the correlation coefficients exceeded 0.85 (Kline, 2016). Second, all square root AVE values
exceeded the correlation coefficients (Bagozzi, 2006).
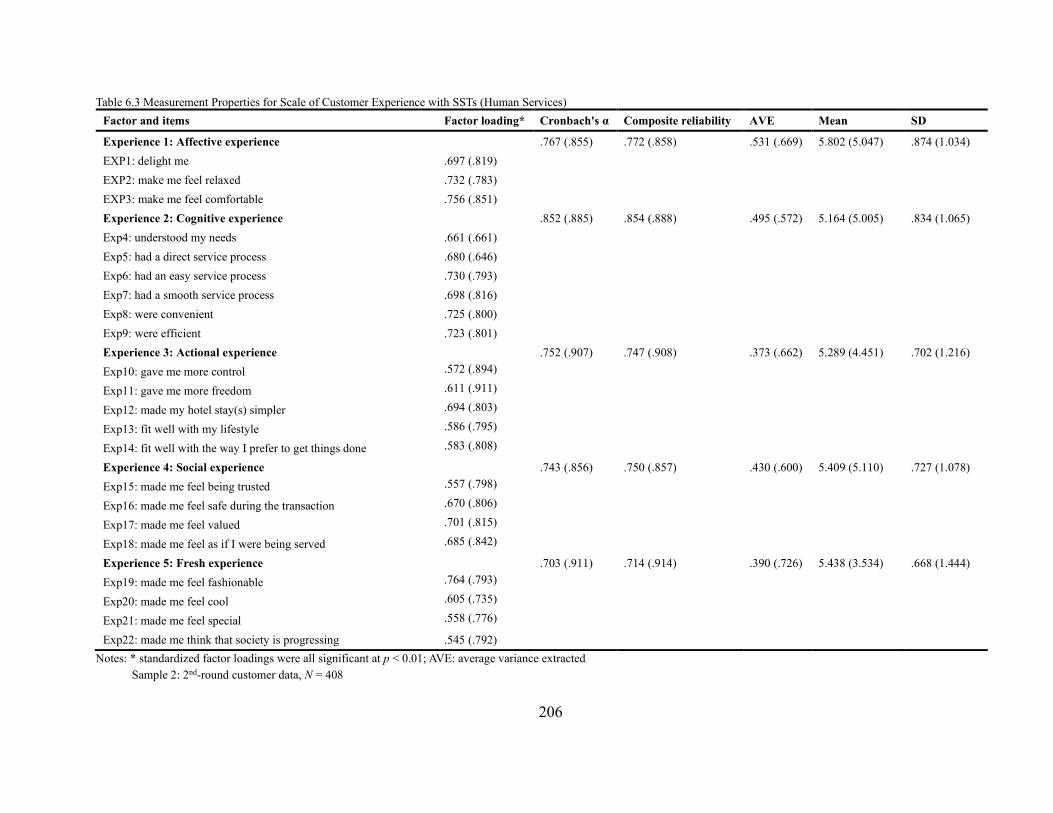
206
Table 6.3 Measurement Properties for Scale of Customer Experience with SSTs (Human Services) Factor and items Factor loading* Cronbach's α Composite reliability AVE Mean SD
Experience 1: Affective experience .767 (.855) .772 (.858) .531 (.669) 5.802 (5.047) .874 (1.034) EXP1: delight me .697 (.819) EXP2: make me feel relaxed .732 (.783) EXP3: make me feel comfortable .756 (.851) Experience 2: Cognitive experience .852 (.885) .854 (.888) .495 (.572) 5.164 (5.005) .834 (1.065) Exp4: understood my needs .661 (.661) Exp5: had a direct service process .680 (.646) Exp6: had an easy service process .730 (.793) Exp7: had a smooth service process .698 (.816) Exp8: were convenient .725 (.800) Exp9: were efficient .723 (.801) Experience 3: Actional experience .752 (.907) .747 (.908) .373 (.662) 5.289 (4.451) .702 (1.216) Exp10: gave me more control .572 (.894) Exp11: gave me more freedom .611 (.911) Exp12: made my hotel stay(s) simpler .694 (.803) Exp13: fit well with my lifestyle .586 (.795) Exp14: fit well with the way I prefer to get things done .583 (.808) Experience 4: Social experience .743 (.856) .750 (.857) .430 (.600) 5.409 (5.110) .727 (1.078) Exp15: made me feel being trusted .557 (.798) Exp16: made me feel safe during the transaction .670 (.806) Exp17: made me feel valued .701 (.815) Exp18: made me feel as if I were being served .685 (.842) Experience 5: Fresh experience .703 (.911) .714 (.914) .390 (.726) 5.438 (3.534) .668 (1.444) Exp19: made me feel fashionable .764 (.793) Exp20: made me feel cool .605 (.735) Exp21: made me feel special .558 (.776) Exp22: made me think that society is progressing .545 (.792)
Notes: * standardized factor loadings were all significant at p < 0.01; AVE: average variance extracted Sample 2: 2nd-round customer data, N = 408
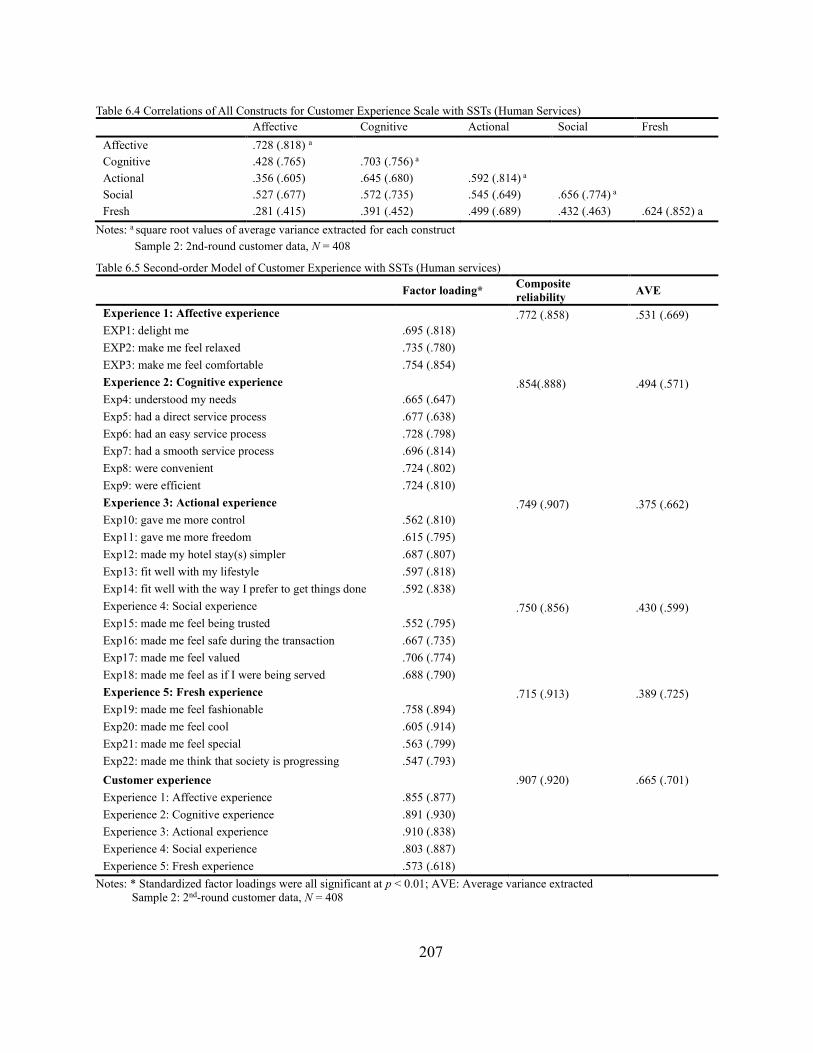
207
Table 6.4 Correlations of All Constructs for Customer Experience Scale with SSTs (Human Services) Affective Cognitive Actional Social Fresh Affective .728 (.818) a Cognitive .428 (.765) .703 (.756) a Actional .356 (.605) .645 (.680) .592 (.814) a Social .527 (.677) .572 (.735) .545 (.649) .656 (.774) a Fresh .281 (.415) .391 (.452) .499 (.689) .432 (.463) .624 (.852) a
Notes: a square root values of average variance extracted for each construct Sample 2: 2nd-round customer data, N = 408
Table 6.5 Second-order Model of Customer Experience with SSTs (Human services)
Factor loading* Composite reliability AVE
Experience 1: Affective experience .772 (.858) .531 (.669) EXP1: delight me .695 (.818) EXP2: make me feel relaxed .735 (.780) EXP3: make me feel comfortable .754 (.854) Experience 2: Cognitive experience .854(.888) .494 (.571) Exp4: understood my needs .665 (.647) Exp5: had a direct service process .677 (.638) Exp6: had an easy service process .728 (.798) Exp7: had a smooth service process .696 (.814) Exp8: were convenient .724 (.802) Exp9: were efficient .724 (.810) Experience 3: Actional experience .749 (.907) .375 (.662) Exp10: gave me more control .562 (.810) Exp11: gave me more freedom .615 (.795) Exp12: made my hotel stay(s) simpler .687 (.807) Exp13: fit well with my lifestyle .597 (.818) Exp14: fit well with the way I prefer to get things done .592 (.838) Experience 4: Social experience .750 (.856) .430 (.599) Exp15: made me feel being trusted .552 (.795) Exp16: made me feel safe during the transaction .667 (.735) Exp17: made me feel valued .706 (.774) Exp18: made me feel as if I were being served .688 (.790) Experience 5: Fresh experience .715 (.913) .389 (.725) Exp19: made me feel fashionable .758 (.894) Exp20: made me feel cool .605 (.914) Exp21: made me feel special .563 (.799) Exp22: made me think that society is progressing .547 (.793) Customer experience .907 (.920) .665 (.701) Experience 1: Affective experience .855 (.877) Experience 2: Cognitive experience .891 (.930) Experience 3: Actional experience .910 (.838) Experience 4: Social experience .803 (.887) Experience 5: Fresh experience .573 (.618)
Notes: * Standardized factor loadings were all significant at p < 0.01; AVE: Average variance extracted Sample 2: 2nd-round customer data, N = 408

208
The second step in the second-order CFA involved evaluating the relationship between the five
first-order dimensions and one second-order factor (customer experience). That is, how the five
factors resulted in an overall experience construct (Chu, 2008). The fit of the second-order model
of customer experience with SSTs was good (χ2/df = 2.410 < 5, TLI = 0.900 ≥ 0.90, CFI = 0.912
≥ 0.90, RMSEA = 0.059 ≤ 0.08). All factor loadings were greater than 0.5 and significant.
Composite reliability was greater than 0.7 (Table 6.5), reinforcing the hypothesized structure and
convergent validity of the scale.
Overall, the measurement properties of the two models indicated that the measurement scale for
customer experience with SSTs had adequate construct reliability, composite reliability, and
convergent and discriminant validity.
6.2.2 CFA Results of Measurement of Customer Experience with Human Services
Goodness-of-fit indices of the model on experiences with human services (CHM_EXP model)
using 2nd-round customer data (Sample 2; N = 408) were as follows: χ2/df = 2.628, TLI = 0.941,
CFI = 0.949, RMSEA = 0.063 (Table 6.2). These results exceeded the model adaptability standards
mentioned earlier (χ2/df < 5, NFI ≥ 0.90, CFI ≥ 0.90, RMSEA ≤ 0.08), exhibiting a good model
fit. For the five-factor CHM_EXP model, Cronbach's alpha values of the 22 items were between
0.855 and 0.911 (Table 6.3), indicating good construct reliability (Hair et al., 2006). Composite
reliability values ranged from 0.857 to 0.914. Both criteria exceeded the 0.7 threshold suggested
by Hair et al. (Hair et al., 2006) and Kline (2016). In terms of convergent validity, all measured
items had significant factor loadings above 0.5, ranging from 0.646 to 0.911 (p < 0.001) (Hair et
al., 2006). Hence, the 22 items appeared to adequately measure the five dimensions of customer
experience with human services. Additionally, AVE values for the five factors ranged from 0.572
to 0.726, all greater than 0.5. Consequently, the convergent validity of the measurement scale was
established. AVE values were also used to assess discriminant validity. As illustrated in Table
6.4, correlations between the five factors were between 0.415 to 0.765, all lower than 0.85 and the
square root AVE values (Bagozzi, 2006).
The fit of the second-order model of customers’ experiences with human services was good (χ2/df
= 3.126 < 5, TLI = 0.923 ≥ 0.90, CFI = 0.932 ≥ 0.90, RMSEA = 0.072 ≤ 0.08). All factor loadings

209
were greater than 0.5 and significant. As shown in Table 6.5, composite reliability values were all
greater than 0.7, and AVE values exceeded 0.5. Therefore, the hypothesized structure and
convergent validity of the scale was clear.
It is safe to conclude that the reliability and validity of the measurement experience scale for human
services were confirmed.
6.3 External Validity of Measurement Scale for Customer Experience
A structural model with a path from customer experience to behavioral intention was constructed
in AMOS 25 to assess the external validity of the experience measurement scale. Two structural
models were tested to examine the external validity of the scale for customer experience with SSTs
based on Samples 2 and 3, respectively. Another two structural models were tested to examine the
external validity of the measurement scale for customer experience with human services based on
Samples 2 and 3, respectively.
6.3.1 External Validity of Measurement Scale for Customer Experience with SSTs
Regarding external validity or nomological validity, relationships between customer experience
and customer behavioral intention were tested. Qualitative findings and prior studies on SSTs
substantiated the customer experience–behavioral intention link (Kasavana, 2008; C. Wang et al.,
2012). Measurement items on behavioral intention were adopted from prior studies (Kim & Qu,
2014; Zeithaml et al., 1996). A structural model with a path from customer experience to SST
intention was tested in AMOS using 2nd-round customer data (Sample 2). The original model fit
indices were as follows: χ2/df = 2.269 < 5, TLI = 0.894 < 0.90, CFI = 0.904 ≥ 0.90, RMSEA =
0.056 ≤ 0.08), indicating some structural concerns. To improve the model fit, modification indices
from the AMOS output were inspected. According to modification indices, two items
(SST_EXP13 “fit well with my lifestyle” and SST_EXP14 “fit well with the way I prefer to get
things done”) in the actional dimension were intercorrelated. The author eventually decided to
correlate these items to allow covariance (Gerbing & Anderson, 2002; Jöreskog & Sörbom, 1996;
Wei, Lu, et al., 2017). The results of the revised model showed acceptable model fit indices: χ2/df
= 2.098 < 5, TLI = 0.908 ≥ 0.90, CFI = 0.918 ≥ 0.90, RMSEA = 0.052 ≤ 0.08.
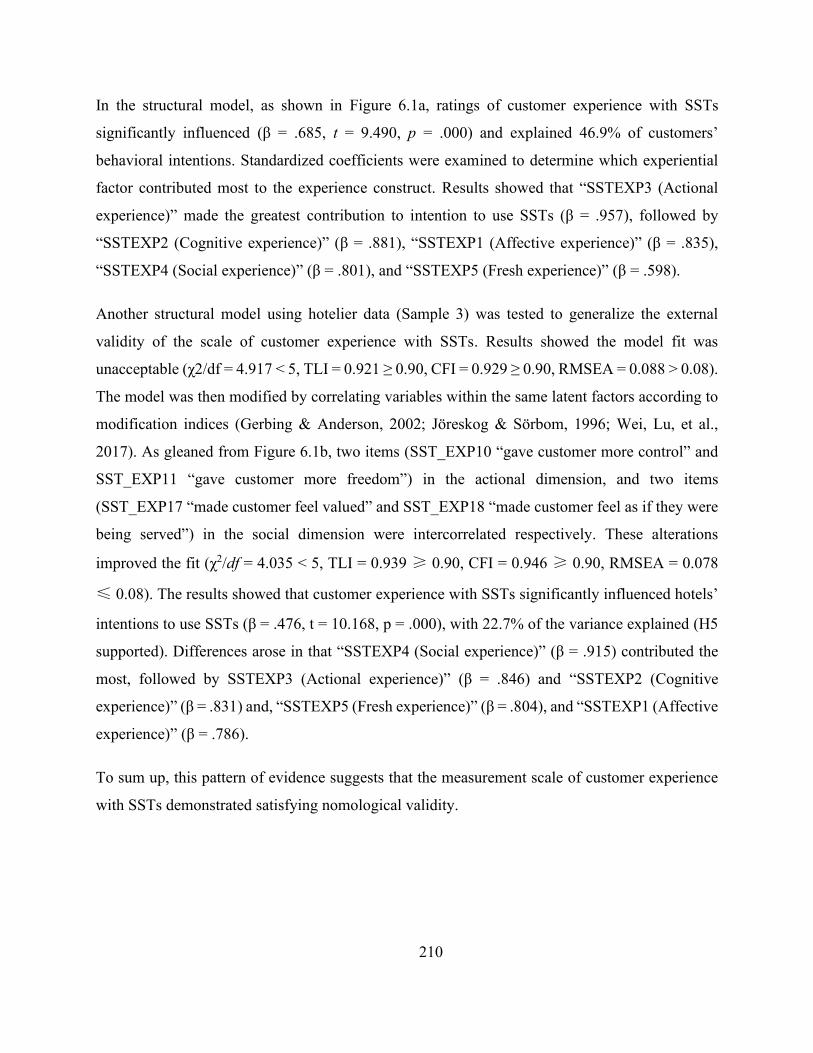
210
In the structural model, as shown in Figure 6.1a, ratings of customer experience with SSTs
significantly influenced (β = .685, t = 9.490, p = .000) and explained 46.9% of customers’
behavioral intentions. Standardized coefficients were examined to determine which experiential
factor contributed most to the experience construct. Results showed that “SSTEXP3 (Actional
experience)” made the greatest contribution to intention to use SSTs (β = .957), followed by
“SSTEXP2 (Cognitive experience)” (β = .881), “SSTEXP1 (Affective experience)” (β = .835),
“SSTEXP4 (Social experience)” (β = .801), and “SSTEXP5 (Fresh experience)” (β = .598).
Another structural model using hotelier data (Sample 3) was tested to generalize the external
validity of the scale of customer experience with SSTs. Results showed the model fit was
unacceptable (χ2/df = 4.917 < 5, TLI = 0.921 ≥ 0.90, CFI = 0.929 ≥ 0.90, RMSEA = 0.088 > 0.08).
The model was then modified by correlating variables within the same latent factors according to
modification indices (Gerbing & Anderson, 2002; Jöreskog & Sörbom, 1996; Wei, Lu, et al.,
2017). As gleaned from Figure 6.1b, two items (SST_EXP10 “gave customer more control” and
SST_EXP11 “gave customer more freedom”) in the actional dimension, and two items
(SST_EXP17 “made customer feel valued” and SST_EXP18 “made customer feel as if they were
being served”) in the social dimension were intercorrelated respectively. These alterations
improved the fit (χ2/df = 4.035 < 5, TLI = 0.939 ≥ 0.90, CFI = 0.946 ≥ 0.90, RMSEA = 0.078
≤ 0.08). The results showed that customer experience with SSTs significantly influenced hotels’
intentions to use SSTs (β = .476, t = 10.168, p = .000), with 22.7% of the variance explained (H5
supported). Differences arose in that “SSTEXP4 (Social experience)” (β = .915) contributed the
most, followed by SSTEXP3 (Actional experience)” (β = .846) and “SSTEXP2 (Cognitive
experience)” (β = .831) and, “SSTEXP5 (Fresh experience)” (β = .804), and “SSTEXP1 (Affective
experience)” (β = .786).
To sum up, this pattern of evidence suggests that the measurement scale of customer experience
with SSTs demonstrated satisfying nomological validity.
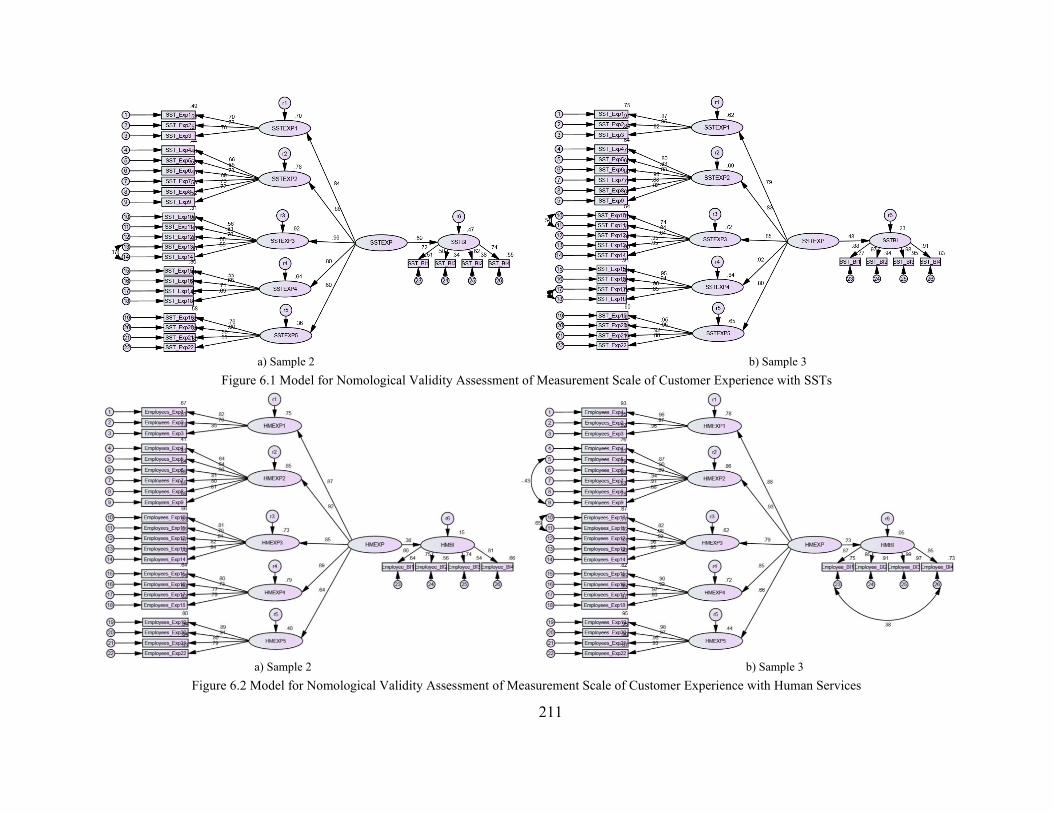
211
a) Sample 2 b) Sample 3
Figure 6.1 Model for Nomological Validity Assessment of Measurement Scale of Customer Experience with SSTs
a) Sample 2 b) Sample 3
Figure 6.2 Model for Nomological Validity Assessment of Measurement Scale of Customer Experience with Human Services
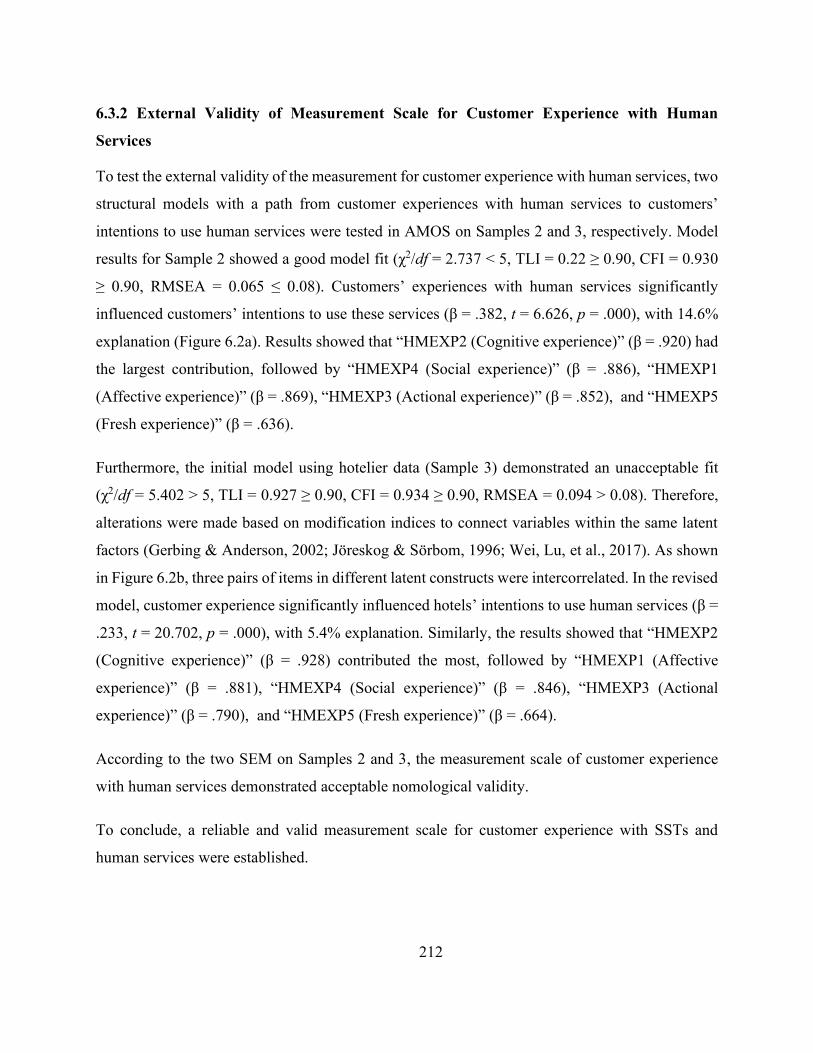
212
6.3.2 External Validity of Measurement Scale for Customer Experience with Human
Services
To test the external validity of the measurement for customer experience with human services, two
structural models with a path from customer experiences with human services to customers’
intentions to use human services were tested in AMOS on Samples 2 and 3, respectively. Model
results for Sample 2 showed a good model fit (χ2/df = 2.737 < 5, TLI = 0.22 ≥ 0.90, CFI = 0.930
≥ 0.90, RMSEA = 0.065 ≤ 0.08). Customers’ experiences with human services significantly
influenced customers’ intentions to use these services (β = .382, t = 6.626, p = .000), with 14.6%
explanation (Figure 6.2a). Results showed that “HMEXP2 (Cognitive experience)” (β = .920) had
the largest contribution, followed by “HMEXP4 (Social experience)” (β = .886), “HMEXP1
(Affective experience)” (β = .869), “HMEXP3 (Actional experience)” (β = .852), and “HMEXP5
(Fresh experience)” (β = .636).
Furthermore, the initial model using hotelier data (Sample 3) demonstrated an unacceptable fit
(χ2/df = 5.402 > 5, TLI = 0.927 ≥ 0.90, CFI = 0.934 ≥ 0.90, RMSEA = 0.094 > 0.08). Therefore,
alterations were made based on modification indices to connect variables within the same latent
factors (Gerbing & Anderson, 2002; Jöreskog & Sörbom, 1996; Wei, Lu, et al., 2017). As shown
in Figure 6.2b, three pairs of items in different latent constructs were intercorrelated. In the revised
model, customer experience significantly influenced hotels’ intentions to use human services (β =
.233, t = 20.702, p = .000), with 5.4% explanation. Similarly, the results showed that “HMEXP2
(Cognitive experience)” (β = .928) contributed the most, followed by “HMEXP1 (Affective
experience)” (β = .881), “HMEXP4 (Social experience)” (β = .846), “HMEXP3 (Actional
experience)” (β = .790), and “HMEXP5 (Fresh experience)” (β = .664).
According to the two SEM on Samples 2 and 3, the measurement scale of customer experience
with human services demonstrated acceptable nomological validity.
To conclude, a reliable and valid measurement scale for customer experience with SSTs and
human services were established.
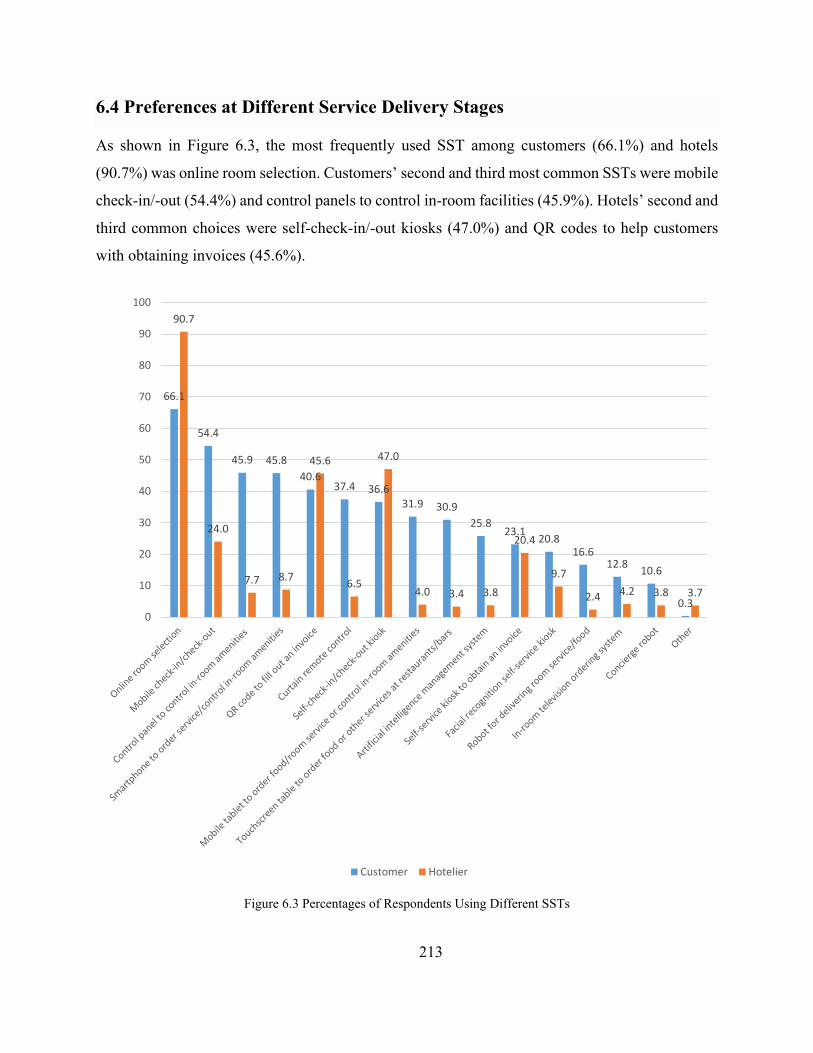
213
6.4 Preferences at Different Service Delivery Stages
As shown in Figure 6.3, the most frequently used SST among customers (66.1%) and hotels
(90.7%) was online room selection. Customers’ second and third most common SSTs were mobile
check-in/-out (54.4%) and control panels to control in-room facilities (45.9%). Hotels’ second and
third common choices were self-check-in/-out kiosks (47.0%) and QR codes to help customers
with obtaining invoices (45.6%).
Figure 6.3 Percentages of Respondents Using Different SSTs
66.1
54.4
45.9 45.840.6
37.4 36.631.9 30.9
25.823.1 20.8
16.612.8 10.6
0.3
90.7
24.0
7.7 8.7
45.6
6.5
47.0
4.0 3.4 3.8
20.4
9.7
2.4 4.2 3.8 3.7
0
10
20
30
40
50
60
70
80
90
100
Customer Hotelier
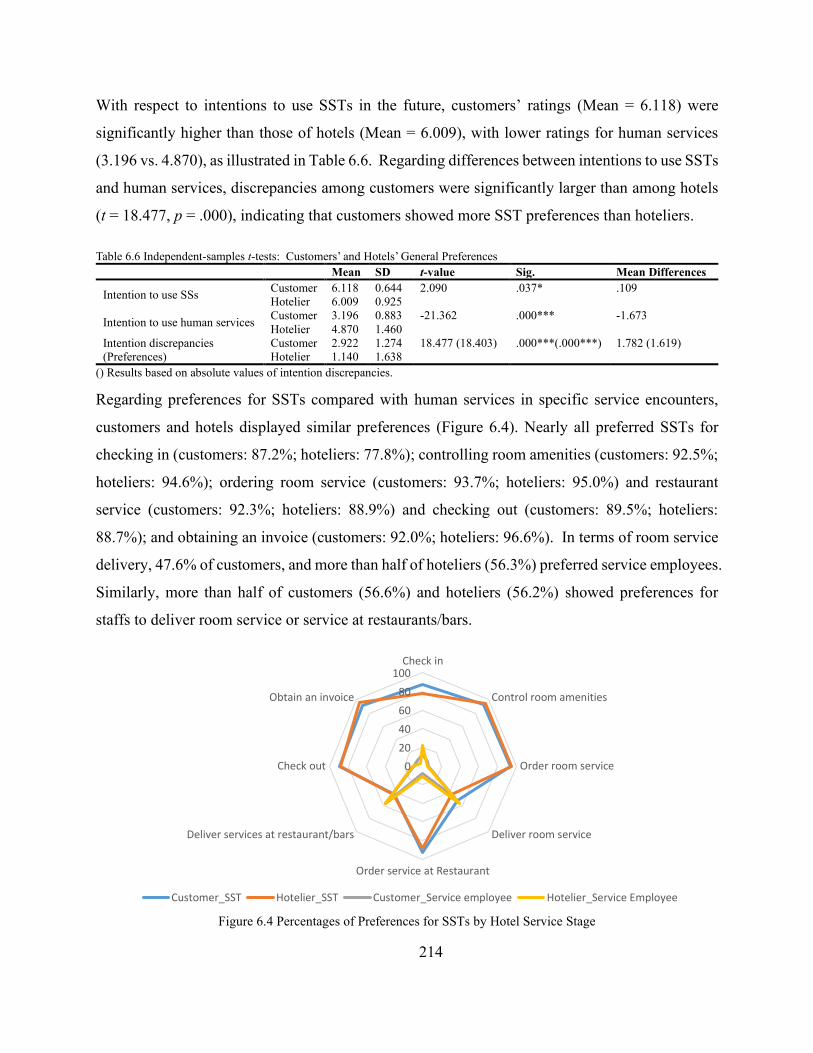
214
With respect to intentions to use SSTs in the future, customers’ ratings (Mean = 6.118) were
significantly higher than those of hotels (Mean = 6.009), with lower ratings for human services
(3.196 vs. 4.870), as illustrated in Table 6.6. Regarding differences between intentions to use SSTs
and human services, discrepancies among customers were significantly larger than among hotels
(t = 18.477, p = .000), indicating that customers showed more SST preferences than hoteliers.
Table 6.6 Independent-samples t-tests: Customers’ and Hotels’ General Preferences Mean SD t-value Sig. Mean Differences
Intention to use SSs Customer 6.118 0.644 2.090 .037* .109 Hotelier 6.009 0.925
Intention to use human services Customer 3.196 0.883 -21.362 .000*** -1.673 Hotelier 4.870 1.460
Intention discrepancies (Preferences)
Customer 2.922 1.274 18.477 (18.403) .000***(.000***) 1.782 (1.619) Hotelier 1.140 1.638
() Results based on absolute values of intention discrepancies.
Regarding preferences for SSTs compared with human services in specific service encounters,
customers and hotels displayed similar preferences (Figure 6.4). Nearly all preferred SSTs for
checking in (customers: 87.2%; hoteliers: 77.8%); controlling room amenities (customers: 92.5%;
hoteliers: 94.6%); ordering room service (customers: 93.7%; hoteliers: 95.0%) and restaurant
service (customers: 92.3%; hoteliers: 88.9%) and checking out (customers: 89.5%; hoteliers:
88.7%); and obtaining an invoice (customers: 92.0%; hoteliers: 96.6%). In terms of room service
delivery, 47.6% of customers, and more than half of hoteliers (56.3%) preferred service employees.
Similarly, more than half of customers (56.6%) and hoteliers (56.2%) showed preferences for
staffs to deliver room service or service at restaurants/bars.
Figure 6.4 Percentages of Preferences for SSTs by Hotel Service Stage
020406080
100Check in
Control room amenities
Order room service
Deliver room service
Order service at Restaurant
Deliver services at restaurant/bars
Check out
Obtain an invoice
Customer_SST Hotelier_SST Customer_Service employee Hotelier_Service Employee
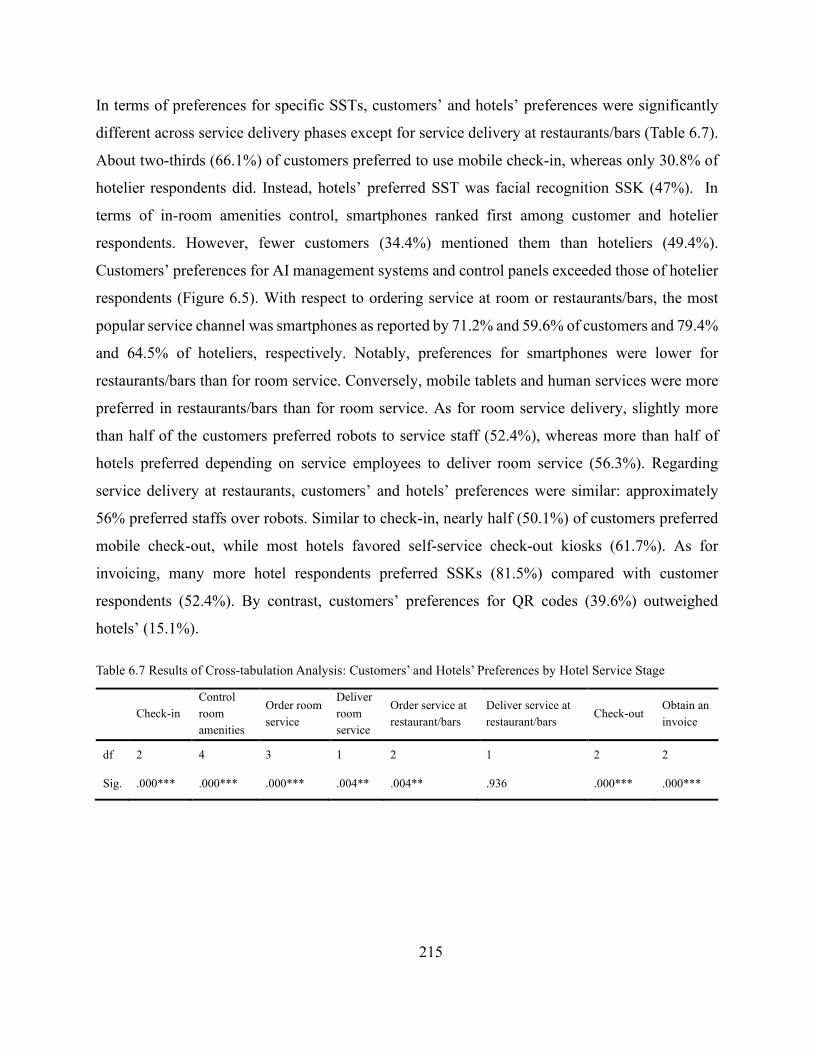
215
In terms of preferences for specific SSTs, customers’ and hotels’ preferences were significantly
different across service delivery phases except for service delivery at restaurants/bars (Table 6.7).
About two-thirds (66.1%) of customers preferred to use mobile check-in, whereas only 30.8% of
hotelier respondents did. Instead, hotels’ preferred SST was facial recognition SSK (47%). In
terms of in-room amenities control, smartphones ranked first among customer and hotelier
respondents. However, fewer customers (34.4%) mentioned them than hoteliers (49.4%).
Customers’ preferences for AI management systems and control panels exceeded those of hotelier
respondents (Figure 6.5). With respect to ordering service at room or restaurants/bars, the most
popular service channel was smartphones as reported by 71.2% and 59.6% of customers and 79.4%
and 64.5% of hoteliers, respectively. Notably, preferences for smartphones were lower for
restaurants/bars than for room service. Conversely, mobile tablets and human services were more
preferred in restaurants/bars than for room service. As for room service delivery, slightly more
than half of the customers preferred robots to service staff (52.4%), whereas more than half of
hotels preferred depending on service employees to deliver room service (56.3%). Regarding
service delivery at restaurants, customers’ and hotels’ preferences were similar: approximately
56% preferred staffs over robots. Similar to check-in, nearly half (50.1%) of customers preferred
mobile check-out, while most hotels favored self-service check-out kiosks (61.7%). As for
invoicing, many more hotel respondents preferred SSKs (81.5%) compared with customer
respondents (52.4%). By contrast, customers’ preferences for QR codes (39.6%) outweighed
hotels’ (15.1%).
Table 6.7 Results of Cross-tabulation Analysis: Customers’ and Hotels’ Preferences by Hotel Service Stage
Check-in Control room amenities
Order room service
Deliver room service
Order service at restaurant/bars
Deliver service at restaurant/bars
Check-out Obtain an invoice
df 2 4 3 1 2 1 2 2
Sig. .000*** .000*** .000*** .004** .004** .936 .000*** .000***
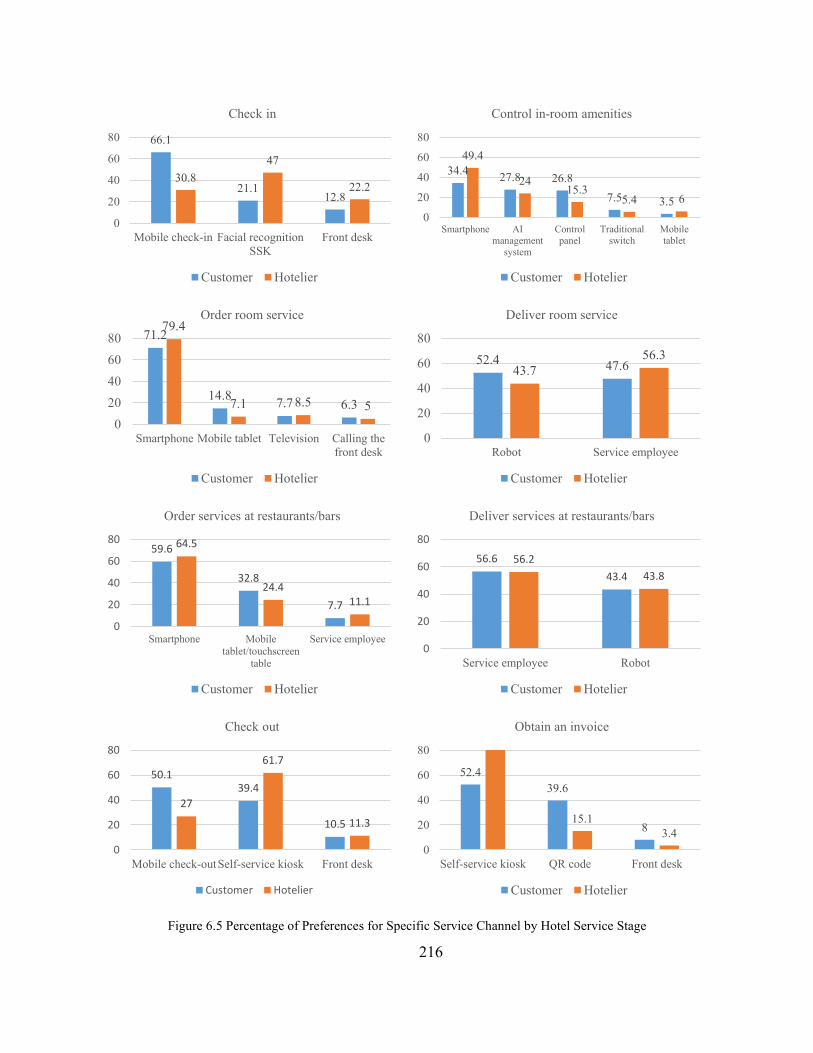
216
Figure 6.5 Percentage of Preferences for Specific Service Channel by Hotel Service Stage
66.1
21.112.8
30.847
22.2
0
20
40
60
80
Mobile check-in Facial recognitionSSK
Front desk
Check in
Customer Hotelier
34.4 27.8 26.87.5 3.5
49.4
2415.3
5.4 60
20
40
60
80
Smartphone AImanagement
system
Controlpanel
Traditionalswitch
Mobiletablet
Control in-room amenities
Customer Hotelier
71.2
14.8 7.7 6.3
79.4
7.1 8.5 50
20406080
Smartphone Mobile tablet Television Calling thefront desk
Order room service
Customer Hotelier
52.4 47.643.756.3
0
20
40
60
80
Robot Service employee
Deliver room service
Customer Hotelier
59.6
32.8
7.7
64.5
24.411.1
0
20
40
60
80
Smartphone Mobiletablet/touchscreen
table
Service employee
Order services at restaurants/bars
Customer Hotelier
56.643.4
56.243.8
0
20
40
60
80
Service employee Robot
Deliver services at restaurants/bars
Customer Hotelier
50.139.4
10.5
27
61.7
11.3
0
20
40
60
80
Mobile check-outSelf-service kiosk Front desk
Check out
Customer Hotelier
52.439.6
815.1
3.40
20
40
60
80
Self-service kiosk QR code Front desk
Obtain an invoice
Customer Hotelier
217
In summary, customers’ and hoteliers’ behavioral intentions to use SSTs or human services
differed (H1c supported). Overall, customers indicated more preferences for SSTs than hoteliers.
Both groups preferred using SSTs to check in, control room amenities, order service at
room/restaurants/bars, check-out, and obtain invoices, while both were more reluctant to use SSTs
for room and restaurant/bar service delivery (H1a and H1b supported). Furthermore, customers’
and hotels’ preferences for specific SSTs at different service delivery stages were distinct except
for service delivery at restaurants or bars (H1d partially supported). The most popular SSTs among
customer, in general, were smartphone-based SSTs. Hoteliers in general preferred SSKs to help
customers with check in, check out and obtain an invoice, while showed preferences for
smartphone-based SSTs for in-room facilities control and service order.
6.5 Customer Experience Discrepancies and Their Influences on Preferences
The qualitative findings suggested that customer experience with SSTs, customer experience with
human services, and the discrepancies between them influenced consumers’ and hoteliers’
preferences for SSTs. To test experiences discrepancies between experience with SSTs and human
services (H4a and H7a), Paired-sample t-tests were run in SPSS 25. To examine experience
differences between customers’ and hoteliers’ perceptions (H8a and H8b), independent-samples t-
tests were run in SPSS 25. To test the influences of experience on preferences (H2, H3, H4b, H5,
H6, and H7b), structural equation modeling was conducted in AMOS 25.
6.5.1 Customer Experience Discrepancies
As shown in Table 6.8, customers’ experiences with SSTs were significantly distinct from their
experiences with human services in the five identified customer dimensions (H4a). As for hoteliers,
their perceived significant differences between affective, cognitive, social and fresh experiences
with SSTs and human services, while no significant differences were reported concerning actional
experience (H7a partially supported). In general, customers rated their experiences with SSTs
more highly than human services, whereas hoteliers found human services more effective than
SSTs outside of the fresh dimension (Figure 6.6).
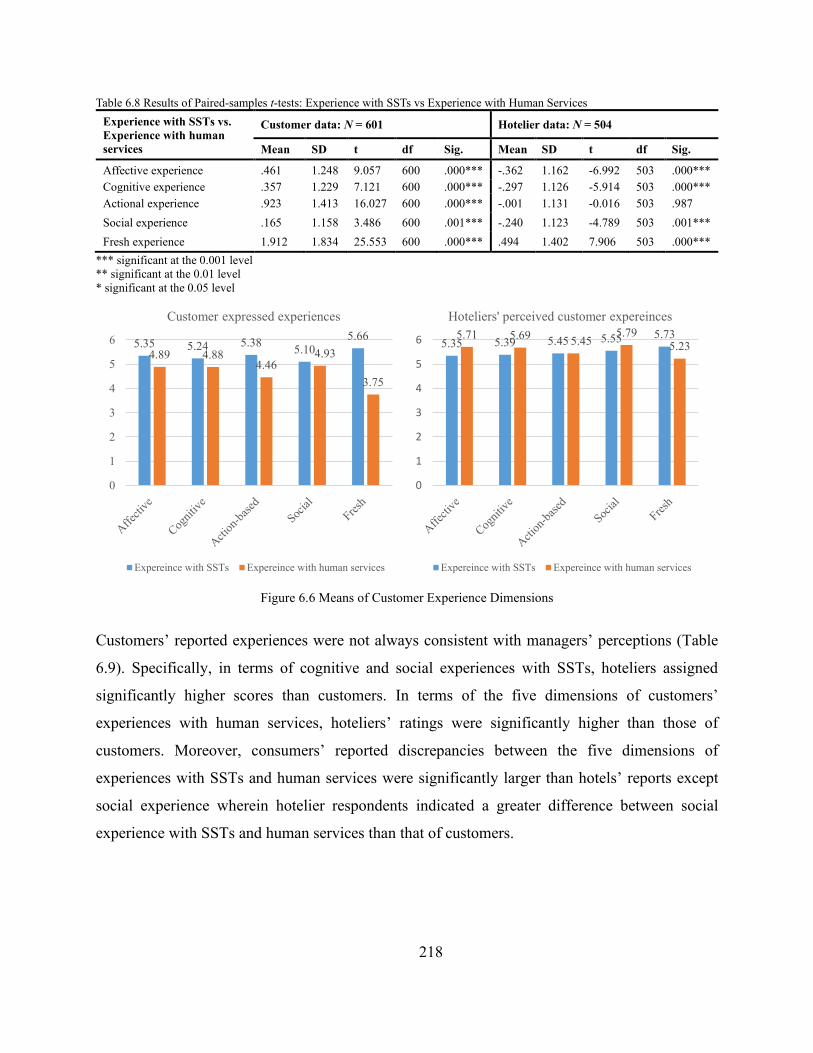
218
Table 6.8 Results of Paired-samples t-tests: Experience with SSTs vs Experience with Human Services Experience with SSTs vs. Experience with human services
Customer data: N = 601 Hotelier data: N = 504
Mean SD t df Sig. Mean SD t df Sig.
Affective experience .461 1.248 9.057 600 .000*** -.362 1.162 -6.992 503 .000*** Cognitive experience .357 1.229 7.121 600 .000*** -.297 1.126 -5.914 503 .000*** Actional experience .923 1.413 16.027 600 .000*** -.001 1.131 -0.016 503 .987 Social experience .165 1.158 3.486 600 .001*** -.240 1.123 -4.789 503 .001*** Fresh experience 1.912 1.834 25.553 600 .000*** .494 1.402 7.906 503 .000***
*** significant at the 0.001 level ** significant at the 0.01 level * significant at the 0.05 level
Figure 6.6 Means of Customer Experience Dimensions
Customers’ reported experiences were not always consistent with managers’ perceptions (Table
6.9). Specifically, in terms of cognitive and social experiences with SSTs, hoteliers assigned
significantly higher scores than customers. In terms of the five dimensions of customers’
experiences with human services, hoteliers’ ratings were significantly higher than those of
customers. Moreover, consumers’ reported discrepancies between the five dimensions of
experiences with SSTs and human services were significantly larger than hotels’ reports except
social experience wherein hotelier respondents indicated a greater difference between social
experience with SSTs and human services than that of customers.
5.35 5.24 5.38 5.105.66
4.89 4.884.46
4.93
3.75
0
1
2
3
4
5
6
Customer expressed experiences
Expereince with SSTs Expereince with human services
5.35 5.39 5.45 5.55 5.735.71 5.69 5.455.79
5.23
0
1
2
3
4
5
6
Hoteliers' perceived customer expereinces
Expereince with SSTs Expereince with human services
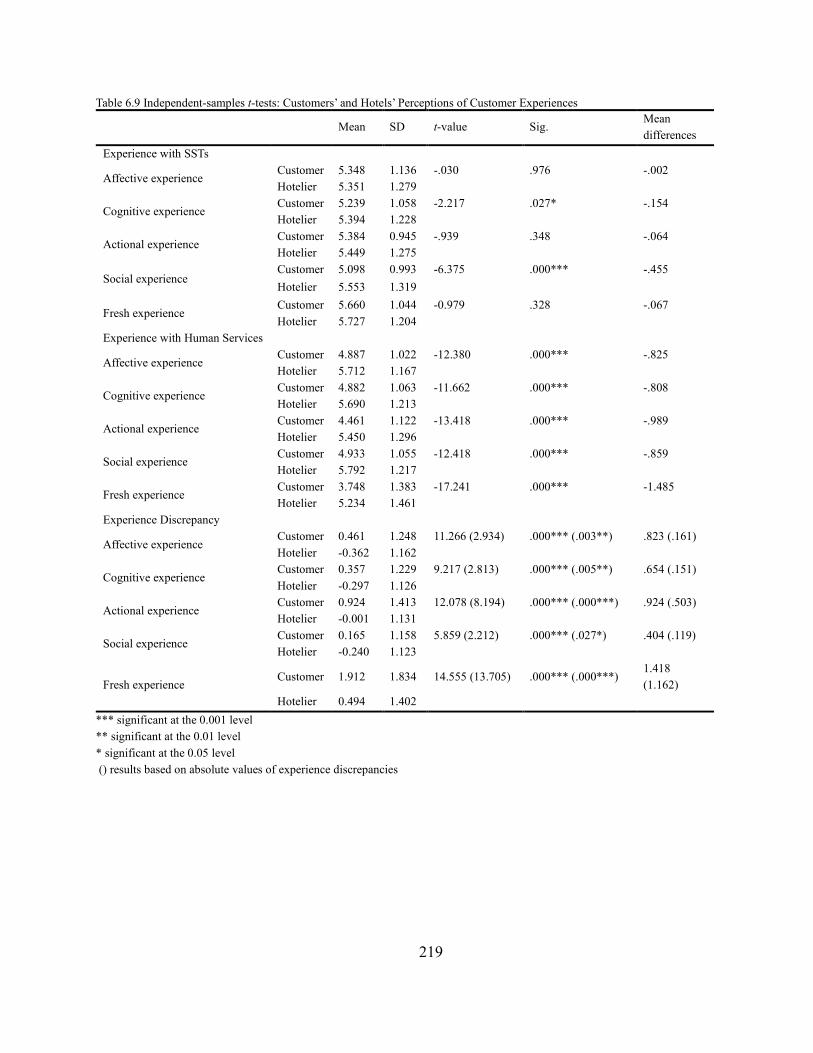
219
Table 6.9 Independent-samples t-tests: Customers’ and Hotels’ Perceptions of Customer Experiences
Mean SD t-value Sig. Mean differences
Experience with SSTs
Affective experience Customer 5.348 1.136 -.030 .976 -.002 Hotelier 5.351 1.279
Cognitive experience Customer 5.239 1.058 -2.217 .027* -.154 Hotelier 5.394 1.228
Actional experience Customer 5.384 0.945 -.939 .348 -.064 Hotelier 5.449 1.275
Social experience Customer 5.098 0.993 -6.375 .000*** -.455 Hotelier 5.553 1.319
Fresh experience Customer 5.660 1.044 -0.979 .328 -.067 Hotelier 5.727 1.204
Experience with Human Services
Affective experience Customer 4.887 1.022 -12.380 .000*** -.825 Hotelier 5.712 1.167
Cognitive experience Customer 4.882 1.063 -11.662 .000*** -.808 Hotelier 5.690 1.213
Actional experience Customer 4.461 1.122 -13.418 .000*** -.989 Hotelier 5.450 1.296
Social experience Customer 4.933 1.055 -12.418 .000*** -.859 Hotelier 5.792 1.217
Fresh experience Customer 3.748 1.383 -17.241 .000*** -1.485 Hotelier 5.234 1.461
Experience Discrepancy
Affective experience Customer 0.461 1.248 11.266 (2.934) .000*** (.003**) .823 (.161) Hotelier -0.362 1.162
Cognitive experience Customer 0.357 1.229 9.217 (2.813) .000*** (.005**) .654 (.151) Hotelier -0.297 1.126
Actional experience Customer 0.924 1.413 12.078 (8.194) .000*** (.000***) .924 (.503) Hotelier -0.001 1.131
Social experience Customer 0.165 1.158 5.859 (2.212) .000*** (.027*) .404 (.119) Hotelier -0.240 1.123
Fresh experience Customer 1.912 1.834 14.555 (13.705) .000*** (.000***)
1.418 (1.162)
Hotelier 0.494 1.402 *** significant at the 0.001 level ** significant at the 0.01 level * significant at the 0.05 level () results based on absolute values of experience discrepancies
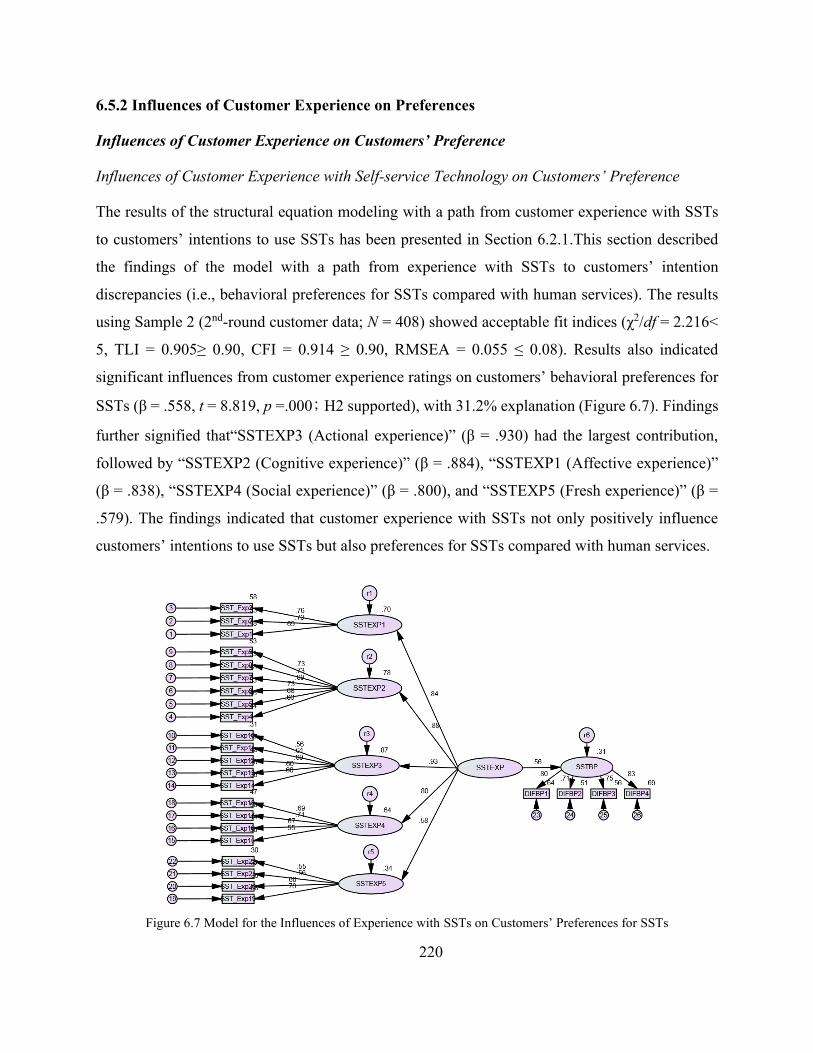
220
6.5.2 Influences of Customer Experience on Preferences
Influences of Customer Experience on Customers’ Preference
Influences of Customer Experience with Self-service Technology on Customers’ Preference
The results of the structural equation modeling with a path from customer experience with SSTs
to customers’ intentions to use SSTs has been presented in Section 6.2.1.This section described
the findings of the model with a path from experience with SSTs to customers’ intention
discrepancies (i.e., behavioral preferences for SSTs compared with human services). The results
using Sample 2 (2nd-round customer data; N = 408) showed acceptable fit indices (χ2/df = 2.216<
5, TLI = 0.905≥ 0.90, CFI = 0.914 ≥ 0.90, RMSEA = 0.055 ≤ 0.08). Results also indicated
significant influences from customer experience ratings on customers’ behavioral preferences for
SSTs (β = .558, t = 8.819, p =.000; H2 supported), with 31.2% explanation (Figure 6.7). Findings
further signified that“SSTEXP3 (Actional experience)” (β = .930) had the largest contribution,
followed by “SSTEXP2 (Cognitive experience)” (β = .884), “SSTEXP1 (Affective experience)”
(β = .838), “SSTEXP4 (Social experience)” (β = .800), and “SSTEXP5 (Fresh experience)” (β =
.579). The findings indicated that customer experience with SSTs not only positively influence
customers’ intentions to use SSTs but also preferences for SSTs compared with human services.
Figure 6.7 Model for the Influences of Experience with SSTs on Customers’ Preferences for SSTs

221
Influences of Customer Experience with Human Services on Customers’ Preference
The relationship between customer experience with human services and behavioral intentions to
use and preferences for SSTs compared with human services were tested separately. First, a
structural model with a path from customer experience with human services to customers’
intention was tested using Samples 2. The results showed good fit indices (χ2/df = 2.675 < 5, TLI
= 0.920 ≥ 0.90, CFI = 0.928 ≥ 0.90, RMSEA = 0.064 ≤ 0.08). Findings did not indicate significant
influences from customer experience ratings on customers’ behavioral intentions to use SSTs (β =
.095, t = 1.613, p = .107). However, results of another structural model showed that customer
experience with human services negatively influenced customers’ behavioral preferences for SSTs
compared with human services (β = -.218, t = -3.865, p = .000, with acceptable model fit indices
(χ2/df = 2.738 < 5, TLI = 0.921 ≥ 0.90, CFI = 0.929 ≥ 0.90, RMSEA = 0.065 ≤ 0.08). Yet,
experience with human services only explained 5% of the variance in preferences (Figure 6.8).
Findings indicated that “HMEXP2 (Cognitive experience)” (β = .926) had the largest contribution,
followed by “HMEXP4 (Social experience)” (β = .886), “HMEXP1 (Affective experience)” (β =
.873), “HMEXP3 (Actional experience)” (β = .845), and “HMEXP5 (Fresh experience)” (β =
.627). The results of the two models indicated that customer experience with human services did
not influence customers’ intentions to use SSTs directly but through negatively influencing
customers’ preferences for SSTs in comparison with human services (H3 supported).
Figure 6.8 Model for the Influences of Experience with Human Services on Customers’ Preferences for SSTs
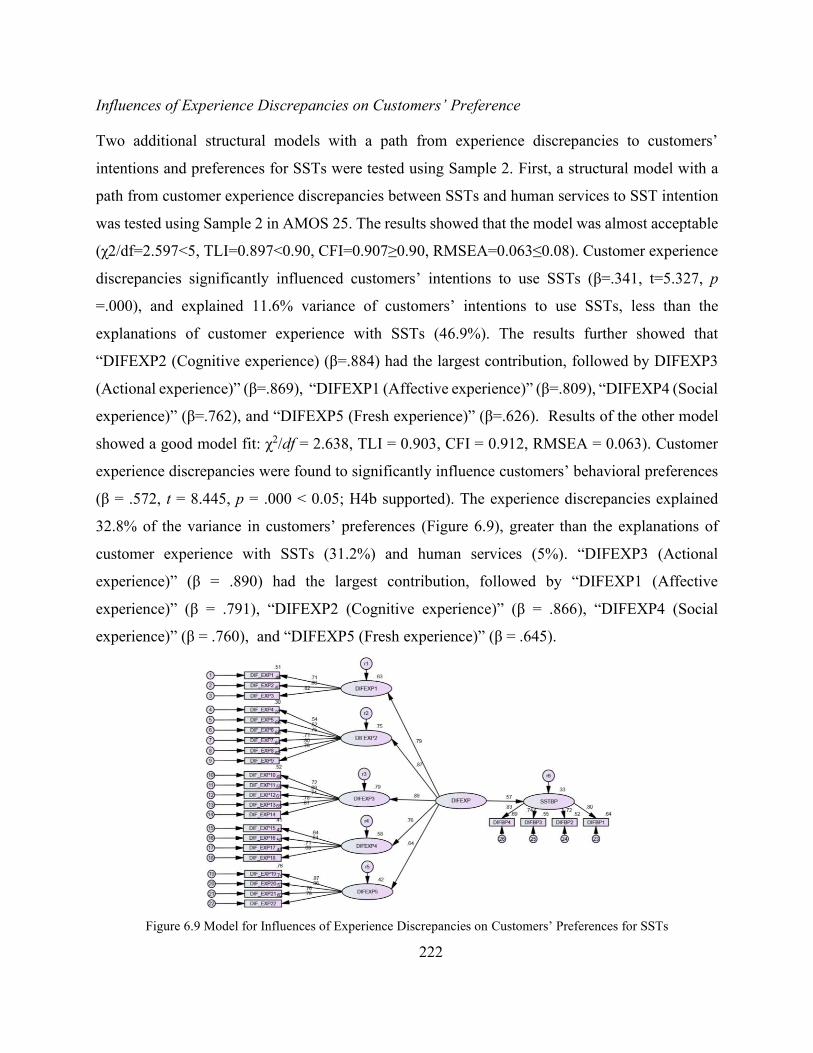
222
Influences of Experience Discrepancies on Customers’ Preference
Two additional structural models with a path from experience discrepancies to customers’
intentions and preferences for SSTs were tested using Sample 2. First, a structural model with a
path from customer experience discrepancies between SSTs and human services to SST intention
was tested using Sample 2 in AMOS 25. The results showed that the model was almost acceptable
(χ2/df=2.597<5, TLI=0.897<0.90, CFI=0.907≥0.90, RMSEA=0.063≤0.08). Customer experience
discrepancies significantly influenced customers’ intentions to use SSTs (β=.341, t=5.327, p
=.000), and explained 11.6% variance of customers’ intentions to use SSTs, less than the
explanations of customer experience with SSTs (46.9%). The results further showed that
“DIFEXP2 (Cognitive experience) (β=.884) had the largest contribution, followed by DIFEXP3
(Actional experience)” (β=.869), “DIFEXP1 (Affective experience)” (β=.809), “DIFEXP4 (Social
experience)” (β=.762), and “DIFEXP5 (Fresh experience)” (β=.626). Results of the other model
showed a good model fit: χ2/df = 2.638, TLI = 0.903, CFI = 0.912, RMSEA = 0.063). Customer
experience discrepancies were found to significantly influence customers’ behavioral preferences
(β = .572, t = 8.445, p = .000 < 0.05; H4b supported). The experience discrepancies explained
32.8% of the variance in customers’ preferences (Figure 6.9), greater than the explanations of
customer experience with SSTs (31.2%) and human services (5%). “DIFEXP3 (Actional
experience)” (β = .890) had the largest contribution, followed by “DIFEXP1 (Affective
experience)” (β = .791), “DIFEXP2 (Cognitive experience)” (β = .866), “DIFEXP4 (Social
experience)” (β = .760), and “DIFEXP5 (Fresh experience)” (β = .645).
Figure 6.9 Model for Influences of Experience Discrepancies on Customers’ Preferences for SSTs
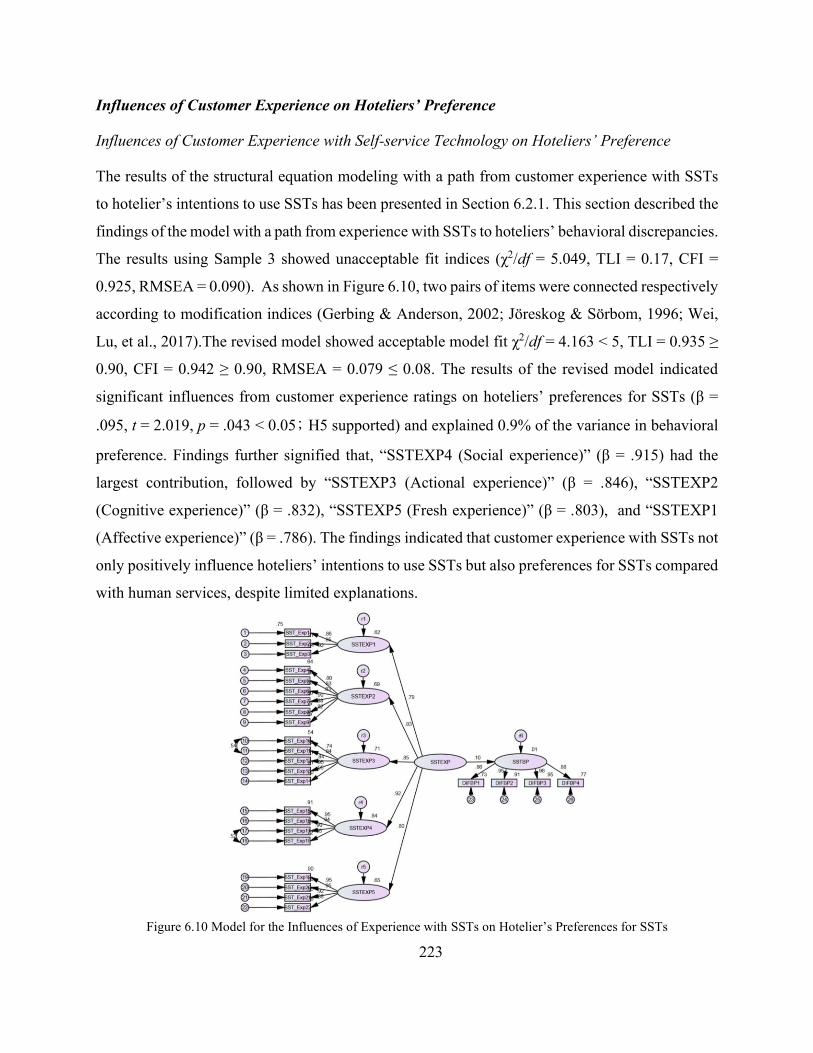
223
Influences of Customer Experience on Hoteliers’ Preference
Influences of Customer Experience with Self-service Technology on Hoteliers’ Preference
The results of the structural equation modeling with a path from customer experience with SSTs
to hotelier’s intentions to use SSTs has been presented in Section 6.2.1. This section described the
findings of the model with a path from experience with SSTs to hoteliers’ behavioral discrepancies.
The results using Sample 3 showed unacceptable fit indices (χ2/df = 5.049, TLI = 0.17, CFI =
0.925, RMSEA = 0.090). As shown in Figure 6.10, two pairs of items were connected respectively
according to modification indices (Gerbing & Anderson, 2002; Jöreskog & Sörbom, 1996; Wei,
Lu, et al., 2017).The revised model showed acceptable model fit χ2/df = 4.163 < 5, TLI = 0.935 ≥
0.90, CFI = 0.942 ≥ 0.90, RMSEA = 0.079 ≤ 0.08. The results of the revised model indicated
significant influences from customer experience ratings on hoteliers’ preferences for SSTs (β =
.095, t = 2.019, p = .043 < 0.05; H5 supported) and explained 0.9% of the variance in behavioral
preference. Findings further signified that, “SSTEXP4 (Social experience)” (β = .915) had the
largest contribution, followed by “SSTEXP3 (Actional experience)” (β = .846), “SSTEXP2
(Cognitive experience)” (β = .832), “SSTEXP5 (Fresh experience)” (β = .803), and “SSTEXP1
(Affective experience)” (β = .786). The findings indicated that customer experience with SSTs not
only positively influence hoteliers’ intentions to use SSTs but also preferences for SSTs compared
with human services, despite limited explanations.
Figure 6.10 Model for the Influences of Experience with SSTs on Hotelier’s Preferences for SSTs
224
Influences of Customer Experience with Human Services on Hoteliers’ Preference
Results of the initial model with a path from experience with human services to hoteliers’
intentions to use SSTs indicated dissatisfying model fit (χ2/df = 5.402 > 5, TLI = 0.927≥ 0.90, CFI
= 0.934 ≥ 0.90, RMSEA = 0.094 ≥ 0.08). Modifications were then made according to modification
indices in Amos output. The findings of the revised model showed that customer experience with
human services significantly influenced hotels’ intentions to use SSTs (β = .232, t = 4.993, p =
.000) with acceptable model fit indices (χ2/df = 4.162 < 5, TLI = 0.947 ≥ 0.90, CFI = 0.953 ≥ 0.90,
RMSEA = 0.079 ≤ 0.08). The positive influences may be explained that the better the human
services were, the more likely the hotel were better. A better hotel was more likely to seek
innovations to improve customer experience. Yet, customer experience with human services
explained 5.4% of hotels’ intentions to use SSTs, indicating significant but weak influences.
Findings further indicated that “HMEXP2 (Cognitive experience)” (β = .933) had the largest
contribution to the significant influences, followed by “HMEXP1 (Affective experience)” (β =
.881), “HMEXP4 (Social experience)” (β = .834), “HMEXP3 (Actional experience)” (β = .787),
and “HMEXP5 (Fresh experience)” (β = .658).
Another model with a path from experience with human services to hoteliers’ SST preferences
were tested in AMOS 25. Results showed that the original model was unacceptable (χ2/df = 5.449
> 5, TLI = 0.926 ≥ 0.90, CFI = 0.933 ≥ 0.90, RMSEA = 0.094 ≥ 0.08). Three pairs of items in
different latent constructs were connected respectively according to modification indices. The new
model has a good fit: χ2/df = 4.207, TLI = 0.946, CFI = 0.952, RMSEA = 0.080. However, no
significant influences of experience with human services on hoteliers’ preferences for SSTs
compared with human service services were found (β =.015, t = .312, p = 0.755; H6 not supported).
Influences of Experience Discrepancies on Hoteliers’ Preference
Another two structural models with paths from experience discrepancies between SSTs and human
services to hoteliers’ SST intention and preferences were tested in AMOS. The model fit of the
initial model with a path from experience discrepancies to hoteliers’ intention was unsatisfactory:
χ2/df = 5.424 > 5, TLI = 0.879 < 0.90, CFI = 0.891 < 0.90, RMSEA = 0.094 > 0.08. Then the model
fit was improved according to modification indices in Amos output: χ2/df = 4.138 < 5, TLI = 0.914
≥ 0.90, CFI = 0.923 ≥ 0.90, RMSEA = 0.079 ≤ 0.08. The results of the improved model showed

225
that experience discrepancies significantly influenced hotels’ intentions to use SSTs (β = .139, t =
2.635, p = .008 < 0.05). The experience discrepancies explained 1.9% variance of customers’
intentions to use SSTs, less than the explanations of customer experience with SSTs (22.7%) and
human services (5.4%). Furthermore, the results indicated that “DIFEXP3 (Actional experience)”
(β = .827) had the largest contribution, followed by “DIFEXP4 (Social experience)” (β = .699),
“DIFEXP2 (Cognitive experience)” (β = .615), “DIFEXP1 (Affective experience)” (β = .484), and
“DIFEXP5 (Fresh experience)” (β = .441).
The initial model fit of the model with path to hoteliers’ preferences was unsatisfactory: χ2/df =
5.400 > 5, TLI = 0.876 < 0.90, CFI = 0.888 < 0.90, RMSEA = 0.094 > 0.08. Based on modification
indices in AMOS output, the model was modified by connecting three pairs of items within the
same latent constructs (Figure 6.11). The altered model showed an acceptable fit: χ2/df = 4.119 <
5, TLI = 0.912 ≥ 0.90, CFI = 0.922 ≥ 0.90, RMSEA = 0.079 ≤ 0.08. These results suggested that
hotels’ preferences for SSTs to human services were affected by experience differences between
SSTs and human services (β = .130, t = 2.463, p = .014 < 0.05). The experience discrepancies
explained 1.7% of the variance in hoteliers’ behavioral preferences (Figure 6.11), greater than the
explanations of customer experience with SSTs (0.9%). In this case, “DIFEXP3 (Actional
experience)” (β = .821) had the largest contribution, followed by “DIFEXP4 (Social experience)”
(β = .696), “DIFEXP2 (Cognitive experience)” (β = .621), “DIFEXP5 (Fresh experience)” (β =
.491), and “DIFEXP1 (Affective experience)” (β = .444).
Figure 6.11 Model for Influences of Experience Discrepancies on Hoteliers’ Preferences for SSTs
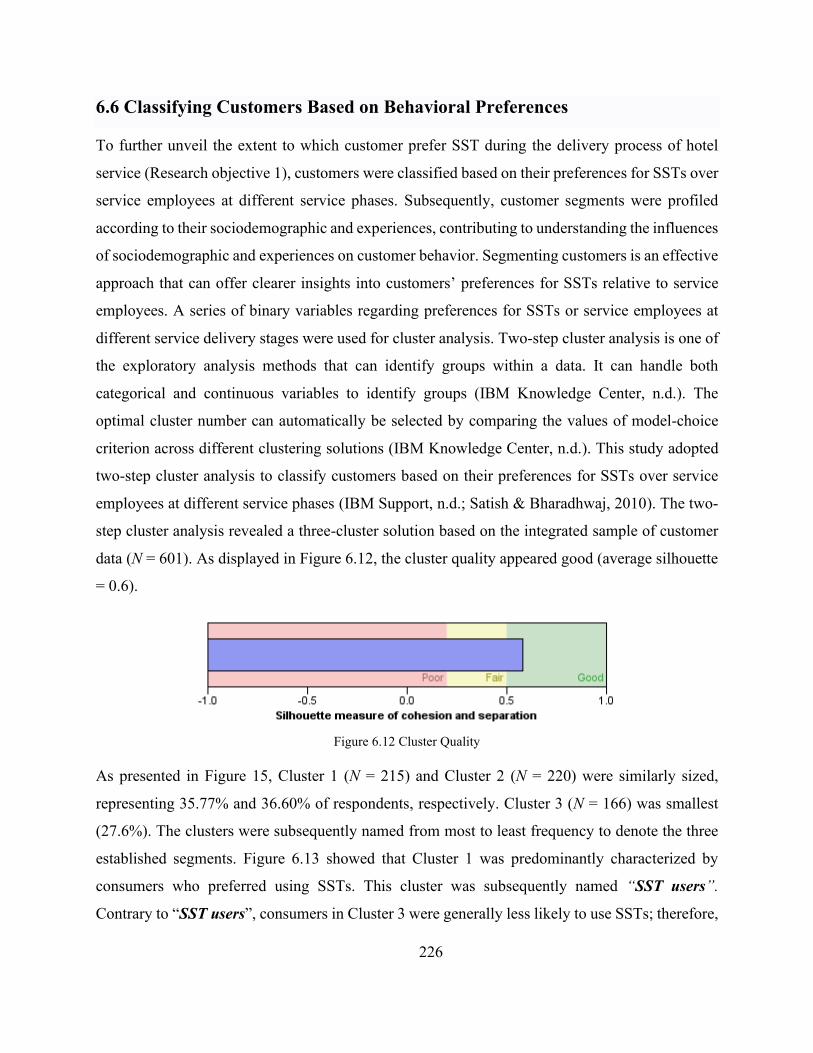
226
6.6 Classifying Customers Based on Behavioral Preferences
To further unveil the extent to which customer prefer SST during the delivery process of hotel
service (Research objective 1), customers were classified based on their preferences for SSTs over
service employees at different service phases. Subsequently, customer segments were profiled
according to their sociodemographic and experiences, contributing to understanding the influences
of sociodemographic and experiences on customer behavior. Segmenting customers is an effective
approach that can offer clearer insights into customers’ preferences for SSTs relative to service
employees. A series of binary variables regarding preferences for SSTs or service employees at
different service delivery stages were used for cluster analysis. Two-step cluster analysis is one of
the exploratory analysis methods that can identify groups within a data. It can handle both
categorical and continuous variables to identify groups (IBM Knowledge Center, n.d.). The
optimal cluster number can automatically be selected by comparing the values of model-choice
criterion across different clustering solutions (IBM Knowledge Center, n.d.). This study adopted
two-step cluster analysis to classify customers based on their preferences for SSTs over service
employees at different service phases (IBM Support, n.d.; Satish & Bharadhwaj, 2010). The two-
step cluster analysis revealed a three-cluster solution based on the integrated sample of customer
data (N = 601). As displayed in Figure 6.12, the cluster quality appeared good (average silhouette
= 0.6).
Figure 6.12 Cluster Quality
As presented in Figure 15, Cluster 1 (N = 215) and Cluster 2 (N = 220) were similarly sized,
representing 35.77% and 36.60% of respondents, respectively. Cluster 3 (N = 166) was smallest
(27.6%). The clusters were subsequently named from most to least frequency to denote the three
established segments. Figure 6.13 showed that Cluster 1 was predominantly characterized by
consumers who preferred using SSTs. This cluster was subsequently named “SST users”.
Contrary to “SST users”, consumers in Cluster 3 were generally less likely to use SSTs; therefore,

227
Cluster 3 was labeled “SST non-users”. Respondents in Cluster 2 did not prefer robots for service
delivery. Hence, this cluster was called “non-users of robots”. Overall, service delivery at
restaurant/bars contributed most to the segment (importance = 1), followed by room service
delivery (importance = 0.66).
a) Cluster Sizes b) Frequency of SSTs & Predictor importance
Figure 6.13 Customer Segments Based on Behavioral Preferences
Clusters were then profiled according to sociodemographic (age, gender, education level, type of
employment, annual household income, marital status, work experience in hotel industry, travel
times in total, times of use of SSTs) using cross-tabulation analysis (Table 6.10). Notably, when
conducting cross-tabulations, some of the items of demographic variables were merged given that
the percentages of the cells have expected count less than 5 outnumbered 20%. For example, the
five measure items of employment type (i.e., part-time employment, self-employed, retired,
unemployed, and other) were merged and labeled as other.
As the three clusters were all larger than 30 and were independent, one-way ANOVA was adopted
to profile clusters according to personal innovativeness, personality, customer experience, and
perceived task complexity using (Table 6.11). The personal innovativeness and measurement of
personality were drawn from previous literature (Goldberg, 1992; IPIP, 2018; John & Srivastava,
1999; Yi et al., 2006; Yoo & Gretzel, 2011). Before ANOVA test, Factor analysis and Cronbach's
alpha reliability test were conducted to confirm personal innovativeness, and the latent fives
construct of personality.

228
Table 6.10 Profile of Three Clusters According to Sociodemographic by Crosstabulation Analysis Cluster Variable
Cluster 1 Cluster 2 Cluster 3 Cluster 1
Cluster 2
Cluster 3
Age df = 8 Sig. = .023*
18–24 38 43 30 Gender df = 2 Sig. = .304
Female 131 118 96 % within cluster 17.7% 19.5% 18.3% % within cluster 60.9% 53.6% 57.8% 25–34 139 127 86 Male 84 102 70 % within cluster 64.7% 57.7% 52.4% % within cluster 39.1% 46.4% 42.2% 35–44 30 44 32
Education level df = 4 Sig. = .000**
2–3 years of college or less 17 13 10 % within cluster 14.0% 20.0% 19.5% % within cluster 7.9% 5.9% 6.0% 45–54 6 5 15 Four-year college/university 158 161 70 % within cluster 2.8% 2.3% 9.1% % within cluster 73.5% 73.2% 42.2% 55–64 2 1 1 Postgraduate level or higher 40 46 86 % within cluster 0.9% 0.5% 0.6% % within cluster 18.6% 20.9% 51.8%
Type of employment df = 4 Sig. = .000**
Student 25 28 36
Annual household income (CNY) df = 6 Sig. = .008**
Less than 100,000 14 19 23 % within cluster 11.6% 12.7% 21.7% % within cluster 6.5% 8.6% 13.9% Full-time employment 167 184 111 100,000–199,999 77 84 71 % within cluster 77.7% 83.6% 66.9% % within cluster 35.8% 38.2% 42.8% Other 23 8 19 200,000–599,999 91 101 55 % within cluster 10.7% 3.6% 11.4% % within cluster 42.3% 45.9% 33.1%
Marital status df = 6 Sig. = .223
Single/separated/divorced 58 59 58 More than 5999,999 33 16 17 % within cluster 27.0% 26.8% 34.9% % within cluster 15.3% 7.3% 10.2% With partner 29 30 28
Worked in hotel industry df = 2 Sig. = .000**
Yes 5 9 24 % within cluster 13.5% 13.6% 16.9% % within cluster 2.3% 4.1% 14.5% Married without children 23 27 21 No 210 211 142 % within cluster 10.7% 12.3% 12.7% % within cluster 97.7% 95.9% 85.5% Married with children 105 104 59 df 2 % within cluster 48.8% 47.3% 35.5% Sig. .007**
Travel times in total df = 8 Sig. = .001**
One trip 0 5 8 Times used SSTs in hotel in mainland China within the past 12 months df = 6 Sig. = .000**
Once 24 26 46 % within cluster 0.0% 2.3% 4.8% % within cluster 11.2% 11.8% 27.7% 2–3 trips 51 55 58 2–3 times 84 92 77 % within cluster 23.7% 25.0% 34.9% % within cluster 39.1% 41.8% 46.4% 4–5 trips 69 67 42 4–5 times 59 53 22 % within cluster 32.1% 30.5% 25.3% % within cluster 27.4% 24.1% 13.3% 6–12 trips 81 70 39 More than 5 times 48 49 21 % within cluster 37.7% 31.8% 23.5% % within cluster 22.3% 22.3% 12.7% More than 12 trips 14 23 19 % within cluster 6.5% 10.5% 11.4%
*** significant at the 0.001 level (2-sided) ** significant at the 0.01 level (2-sided) * significant at the 0.01 level (2-sided)

229
Table 6.11 Profile of Three Clusters According to Personality, Experience, and Task Complexity by ANOVA Test of
homogeneity Cluster 1
Cluster 2
Cluster 3
F value Sig. Scheffe
Personal innovativeness .018* 5.757 5.402 4.942 36.301 .000*** 1-2***, 1-3***,2-3***
Personality Extraversion .000*** 4.823 4.492 4.303 11.184 .000*** 1-2**, 1-3*** Agreeableness .027* 5.482 5.321 5.185 8.234 .000*** 1-2*, 1-3*** Conscientiousness .548 5.534 5.390 5.044 14.571 .000*** 1-3***, 2-3*** Neuroticism .002** 3.254 3.489 3.784 11.362 .000*** 1-3***,2-3*
Openness .001*** 5.676 5.425 5.028 32.455 .000*** 1-2***, 1-3***,2-3***
Experience with SST
Affective .077 5.767 5.392 4.747 43.460 .000*** 1-2**, 1-3***,2-3***
Cognitive .221 5.619 5.352 4.597 53.727 .000*** 1-2*, 1-3***,2-3***
Actional .000*** 5.792 5.424 4.805 57.700 .000*** 1-2***, 1-3***,2-3***
Social .396 5.530 5.030 4.628 45.355 .000*** 1-2***, 1-3***,2-3***
Fresh .000*** 6.061 5.723 5.059 46.945 .000*** 1-2***, 1-3***,2-3***
Experience with human Services
Affective .184 4.946 4.932 4.753 2.000 .136 Cognitive .050* 4.877 4.929 4.827 .478 .620 Actional .000*** 4.297 4.560 4.542 3.210 .041* Social .015* 4.963 5.026 4.771 3.382 .035* 2-3* Fresh .000*** 3.563 3.690 4.066 7.832 .000*** 1-3***,2-3* Experience discrepancy
Affective .455 .822 0.461 -.006 22.067 .000*** 1-2**, 1-3***,2-3***
Cognitive .018* .743 0.423 -.230 31.026 .000*** 1-2*, 1-3***,2-3***
Actional .000*** 1.495 0.864 .263 38.790 .000*** 1-2***, 1-3***,2-3***
Social .000*** .567 0.003 -.143 20.979 .000*** 1-2***, 1-3*** Fresh .649 2.498 2.033 .993 36.078 .000*** 1-2*, 1-3***,2-3*** Task complexity Checking in to the hotel .150 2.879 2.900 3.006 .498 .608 Using in-room amenities .061 2.409 2.477 2.759 4.479 .012* 1-3* Ordering room services .931 2.674 2.845 2.970 2.934 .054 Room service delivery .278 3.028 3.141 3.120 .561 .571 Ordering food at restaurants/bars .914 2.981 3.127 3.151 1.030 .358
Service delivery at restaurants/bars .499 3.028 3.123 3.211 1.021 .361
Checking out of the hotel .712 2.749 2.855 2.934 .824 .439 Obtaining an invoice .172 3.233 3.355 3.283 .347 .707
*** significant at the 0.001 level (2-sided) ** significant at the 0.01 level (2-sided) * significant at the 0.01 level (2-sided)

230
According to Table 6.10 and Table 6.11, no significant differences emerged among the three
clusters at the 90% confidence level in terms of gender, marital status, most perceived task
complexity (except using in-room amenities), and affective and cognitive experiences with human
services. By contrast, the means of the three clusters were significantly different for the following:
age (sig. = .023 < 0.05); type of employment (sig. = .000 < 0.05); education level (sig. = .000 <
0.05); annual household income (sig. = .008 < 0.05); worked in hotel industry (sig. = .000 < 0.05);
travel times in total (sig. = .001 < 0.05); use of hotel SSTs in past 12 months (sig. = .000 < 0.05);
personal innovativeness (sig. = .000 < 0.05); and personality, customer experience with SSTs, and
experience discrepancies between SSTs and human services (all p-values = .000 < 0.05). These
results also provided support for cluster validation. Based on these findings, the three clusters were
profiled as follows:
Cluster 1: Innovative users of SSTs. Consumers in this cluster showed the highest personal
innovativeness in technology (Mean = 5.757), extraversion (Mean = 4.823), agreeableness (Mean
= 5.482), conscientiousness (Mean = 5.534), and openness (Mean = 5.676). Additionally, Cluster
1 respondents tended to have better experiences with SSTs compared with the other two clusters.
A higher proportion had taken 6-12 trips within the past 12 months (37.7%), whereas the largest
proportion of Cluster 3 respondents had taken 2-3 trips (34.9%). On average, Cluster 1 respondents’
experiences with SSTs were much better than with human services in comparison the experience
differences among the other two clusters. The means of experience discrepancies ranged from
0.567 to 2.498.
Cluster 2: Actional non-users of robots. Higher percentages of customers in Cluster 2 had more
actional experience with human services (Mean = 4.560) compared with the other two clusters.
Consumers in this group also exhibited the highest cognitive (4.929) and social experience (5.026)
values with human services. A larger percentage of Cluster 2 respondents earned an annual
household income between 200,000 and 599,999 CNY (45.9%), whereas a higher percentage of
Cluster 3 earned between 100,000 and 199,999 CNY (42.8%).
Cluster 3: Neurotic non-users of SSTs. Customers in this cluster demonstrated more neuroticism
(3.784) compared with those in Clusters 1 and 2. A higher proportion was more than 44 years old
in comparison with those of the other two cluster respondents. Besides, a higher percentage of
231
Cluster 3 respondents had only used hotel SSTs once within the past 12 months (27.7%) compared
with the other two clusters (11.2% and 11.8%, respectively). Cluster 3 respondents’ ratings on
experiences with SSTs were lowest. On average, their experiences with SSTs were worse than
with human services aside from actional and fresh experience, while the other two clusters
indicated better experience with SSTs than experience with human services. Furthermore, their
perceived task complexity was generally higher than Cluster 1 and Cluster 2.
6.7 Chapter Summary
This chapter reported findings from the quantitative study. Key points are as follows. First, a scale
to simultaneously measure customer experience with SSTs and human services was developed.
Five dimensions of the 22-item experience measurement scale were identified (i.e., affective
experience, cognitive experience, actional experience, social experience, and fresh experience).
Based on the reliable and valid customer experience scale, this study quantitatively revealed
discrepancies between experiences with SSTs and human services. Generally, customers had better
experiences with SSTs than with human services, whereas hoteliers believed customer experience
with human services to exceed those with SSTs apart from the fresh dimension. Customers’
perceived experiences were not always consistent with managers’ perceptions (Table 6.9).
Results further indicated that customer experiences with SSTs and experience discrepancies
significantly influenced customers’ and hotels’ intention and preferences for SSTs (Table 6.12).
Customers’ experiences with human services were exclusively found to affect customers’ SSTs
preferences and hoteliers’ intentions to use SSTs. Customer experience with SSTs had the largest
explanation of the variances in customers’ and hoteliers’ intentions to use SSTs (customers:
46.9%: hoteliers: 22.7%), while experience discrepancies explained the most variances in
customers’ and hoteliers’ preference for SSTs compared with human services (customers: 32.8%;
hoteliers: 1.7%). Overall, the fresh experience had the least contribution compared with the other
four experience dimensions, as shown in Table 6.12.

232
Table 6.12 Summary of Influences of Experience on Customers’ and Hoteliers’ Intentions and Preferences
Customers’ perspective Hoteliers’ perspective
Experience with SSTs
Experience with human services
Experience discrepancy
Experience with SSTs
Experience with human services
Experience discrepancy
Intention
Explanation of variance 46.9% NA 11.6% 22.7% 5.4% 1.9%
Rank of experiences’ contribution (β)
Affective 3 (.835) NA 3 (.809) 5 (.786) 2 (.881) 4 (.484)
Cognitive 2 (.881) NA 1 (.884) 3 (.831) 1 (.933) 3 (.615)
Actional 1 (.957) NA 2 (.869) 2 (.846) 4 (.787) 1 (.827)
Social 4 (.801) NA 4 (.762) 1 (.915) 3 (.834) 2 (.699)
Fresh 5 (.598) NA 5 (.626) 4 (.804) 5 (.658) 5 (.441)
Preference
Explanation of variance 31.2% 5.0% 32.8% 0.9% NA 1.7%
Rank of experiences’ contribution (β)
Affective 3 (.838) 3 (.873) 2 (.791) 5 (.786) NA 5 (.444)
Cognitive 2 (.884) 1 (.926) 3 (.866) 3 (.831) NA 3 (.621)
Actional 1 (.930) 4 (.845) 1 (.890) 2 (.846) NA 1 (.821)
Social 4 (.800) 2 (.886) 4 (.760) 1 (.915) NA 2 (.696)
Fresh 5 (.579) 5 (.627) 5 (.645) 4 (.803) NA 4 (.491)
Additionally, customers’ and hoteliers’ behavioral intentions to use SSTs and human services
differed (Table 6.6). Overall, customers showed more preferences for SSTs than hoteliers. Both
groups preferred SSTs for checking in, controlling room amenities, ordering room or restaurant
service, checking out, and obtaining invoices, whereas they were more reluctant to use SSTs for
room and restaurant/bar service delivery (Figure 6.4). In terms of specific SSTs, customers’ and
hotels’ preferences at different service delivery stages were distinct except for service delivery at
restaurants or bars (Table 6.7). In general, customers were inclined to use smartphone-based SSTs,
whereas hotels preferred SSKs for check-in/-out with preferences for smartphone-based SSTs for
in-room facilities control and service order (Figure 6.5).
Three clusters of customers were identified based on customers’ preferences at different service
delivery stages, namely “innovative users of SSTs”, “actional non-users of robots”, and “neurotic
non-users of SSTs”. The three clusters were distinct across age, type of employment, education
level, annual household income, work in hotel industry, travel times in total, use of hotel SSTs
within past 12 months, personal innovativeness, personality, customer experiences with SSTs, and
experience discrepancies. No significant associations were identified among the three clusters and
gender, marital status, most perceived task complexity (except using in-room amenities), and
affective and cognitive experiences with human services.

233
CHAPTER 7: DISCUSSION AND CONCLUSION OF
QUANTITATIVE STUDY
7.1 Development of Measurement Scale of Customer Experience
The current research developed a measurement scale to assess customer experience with SSTs and
human services; hence, measurement items can be used to simultaneously evaluate customer
experiences with SSTs and human services in hotels. Following Churchill’s (1979) recommended
procedures, the measurement scale for customer experience with SSTs and measurement of
experiences with human services were developed separately and then compared. Findings showed
that the measurement scale for customer experience with SSTs and for customer experience with
human services had the same dimensions containing the same items. Reliable and valid
measurement scales for customer experience with SSTs and human services were thus established.
Given the increasing prevalence of SSTs and scarcity of research on this topic, particularly in terms
of customer experience (Shin & Perdue, 2019), the establishment of an experience scale for SSTs
makes a timely contribution to the literature and will hopefully act as a stepping stone to further
investigation in this field. In the literature, Kincaid and Baloglu (2006) measured overall
experiences with SSTs using a 5-point Likert-type scale (1 = poor and 5 = excellent). Others
focused on customer satisfaction (e.g., Kim & Qu, 2014) or previous experience (e.g., Kim et al.,
2012). Given that the means by which previous experience influences SST adoption are more
complicated than SST characteristics and other individual differences (C. Wang et al., 2012), the
development of the identical measurement scale for customer experience with SSTs and human
services enables scholars to explore the influences of experience discrepancies on SST adoption
and preference. According to prospect theory, decision making is influenced by reference points
(e.g., alternative states) (Kahneman & Tversky, 1979).
Quantitative results also revealed a positive association between experience with SSTs on
customers’ and hotels’ behavioral intentions and preferences for SSTs (H2 and H5). Besides, a
significant relationship was observed between experience discrepancies and customers’ and
hotels’ behaviors (H4b and H7b). These patterns indicate that people who have better experiences
with SSTs are more likely to use SSTs over service employees in the future. Likewise, hotels who

234
perceived SSTs as providing a better customer experience were inclined to deploy SSTs. These
findings validated the role of customer experience in decision making found in previous studies
and helped to resolve conflicting evidence surrounding customer experience with SSTs. Some
hoteliers appear interested in using SSTs to enhance customer experience to boost customer
satisfaction and loyalty and thus, increase return on investment (Kelly et al., 2017; Oh et al., 2016).
However, customers’ responses to SSTs have been inconsistent. Some have reported richer
experiences (Kasavana, 2008), whereas others cited negative experiences along with lower
satisfaction and reduced customer loyalty (Giebelhausen et al., 2014; Meuter et al., 2003; Selnes
& Hansen, 2001). The results of this study implied that customer experience with SSTs was
significantly distinct from that with human service on each of the five experience dimensions,
except the fresh dimension from hoteliers’ perspectives (H4a and H7a). Customers tended to rate
their experiences with SSTs more highly than human services, whereas hoteliers thought human
services were preferable to SSTs except the fresh dimension. Moreover, customers’ perceived
experiences were not always consistent with managers’ perceptions. Hence, these findings also
validated the gap between service providers’ perceptions of customer experiences and customers’
expressed experiences (H8a and H8b). An interesting thing resides in that the ratings of customer
experience with human services exerted no significant influences on hotels’ preferences for SSTs,
whereas significantly influenced customers’ preferences for SSTs (H6). Yet, the experience
discrepancies between SSTs and human services significantly influenced hotel’ preferences for
SSTs (H7b).
Different dimensions of the customer experience were identified in this study. Customers and
hoteliers expected to receive various benefits from using SSTs. Therefore, aside from the most
frequent cognitive experience in this qualitative study, SSTs designers and hoteliers should also
strive to fulfill customers’ desire for innovations that are affective, actional, social, and fresh. The
findings revealed that customers and hotels deviated on these dimensions’ contributions to
behavioral preferences (Table 6.12). For customers, “SSTEXP3 (Actional experience)”
contributed the most contribution to SSTs intentions and preferences. Presumably, customers
associated the use of SSTs with control, freedom, and lifestyle fit, which primarily motivated
consumers to use SSTs. On the contrary, “SSTEXP4 (Social experience)”, consisting of trust,
safety, value, and sense of service, played a primary role in stimulating hotels to use SSTs.

235
Customers and hoteliers also attached the most importance to “HMEXP2 (Cognitive experience)”,
which features efficiency, convenience, directness, simplicity, and a smooth service process as
well as an understanding of customer needs. Likewise, “DIFEXP2 (Cognitive experience)” made
the largest contribution to customers’ behavioral intentions to use SSTs, whereas “DIFEXP3
(Actional experience)” contributed most to customers’ SSTs preferences as well as hotels’ SSTs
intentions and preferences. In general, the fresh experience had the least contribution compared
with the other four experience dimensions, as shown in Table 6.12.
Customers’ and hoteliers’ differing opinions on contributions of the five experience dimensions
on behavioral preferences corresponded with the cognitivist theory of affordances, which
emphasizes differences between actual and perceived possibilities (Cardona-Rivera & Young,
2013). Industry practitioners’ understanding of customer acceptance of SSTs is important to
consider when further implementing SSTs (Rosenbaum & Wong, 2015). Thus, the identified gaps
regarding experience provide first-hand data for hotel practitioners to identify where they
misunderstand customers’ opinions and make modifications.
Last but not the least, because limited variance in behavioral preferences was explained by
customer experience in this research, future studies should incorporate other variables to more
fully understand individual and organizational preferences for SSTs relative to service employees.
The proposed framework provides a holistic view of various influencing factors (Figure 5.10).
Comparing or integrating customer experiences with these factors in future research may promote
knowledge of the essence of individuals’ behavioral intentions to use SSTs.
7.2 Preference Differences by Hotel Service Stage
Results of this study revealed that customers preferred SSTs to service employees, contrary to
Kattara and El-Said (2014) who suggested that hotel guests prefer to be served by service
employees instead of innovative technologies. These differences may be explained through the
following reasons. First of all, the study contexts were different (China vs. Egypt). The literature
has revealed that nationality significantly affects SST adoption (Fisher & Beatson, 2002; Lu et al.,
2011). Second, respondents in Kattara and El-Said’s (2014) study were five-star hotel guests,
whereas respondents in this study were guests of one-, two-, three-, four-, and five-star hotels.
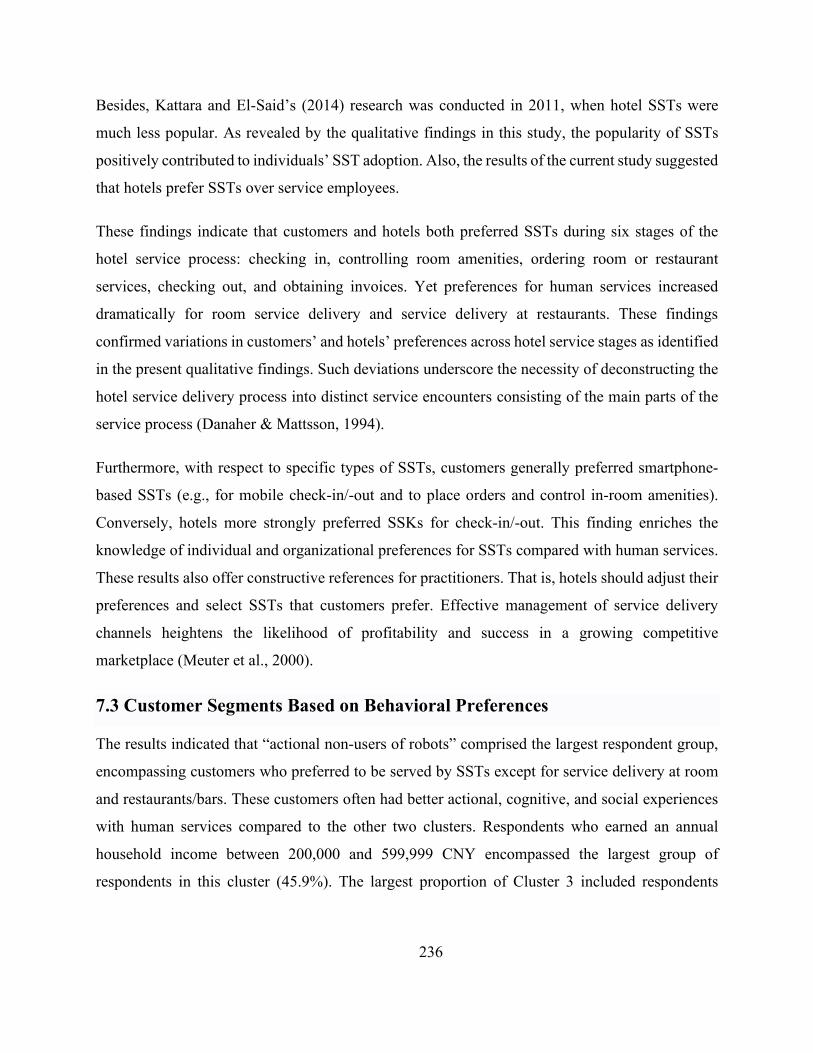
236
Besides, Kattara and El-Said’s (2014) research was conducted in 2011, when hotel SSTs were
much less popular. As revealed by the qualitative findings in this study, the popularity of SSTs
positively contributed to individuals’ SST adoption. Also, the results of the current study suggested
that hotels prefer SSTs over service employees.
These findings indicate that customers and hotels both preferred SSTs during six stages of the
hotel service process: checking in, controlling room amenities, ordering room or restaurant
services, checking out, and obtaining invoices. Yet preferences for human services increased
dramatically for room service delivery and service delivery at restaurants. These findings
confirmed variations in customers’ and hotels’ preferences across hotel service stages as identified
in the present qualitative findings. Such deviations underscore the necessity of deconstructing the
hotel service delivery process into distinct service encounters consisting of the main parts of the
service process (Danaher & Mattsson, 1994).
Furthermore, with respect to specific types of SSTs, customers generally preferred smartphone-
based SSTs (e.g., for mobile check-in/-out and to place orders and control in-room amenities).
Conversely, hotels more strongly preferred SSKs for check-in/-out. This finding enriches the
knowledge of individual and organizational preferences for SSTs compared with human services.
These results also offer constructive references for practitioners. That is, hotels should adjust their
preferences and select SSTs that customers prefer. Effective management of service delivery
channels heightens the likelihood of profitability and success in a growing competitive
marketplace (Meuter et al., 2000).
7.3 Customer Segments Based on Behavioral Preferences
The results indicated that “actional non-users of robots” comprised the largest respondent group,
encompassing customers who preferred to be served by SSTs except for service delivery at room
and restaurants/bars. These customers often had better actional, cognitive, and social experiences
with human services compared to the other two clusters. Respondents who earned an annual
household income between 200,000 and 599,999 CNY encompassed the largest group of
respondents in this cluster (45.9%). The largest proportion of Cluster 3 included respondents

237
earning an annual household income between 100,000 and 199,999 CNY (42.8%). Therefore,
annual household income may influence customers’ use of SSTs compared with service employees.
The second largest cluster, “innovative users of SSTs”, preferred SSTs to human services
irrespective of service delivery stage. Consumers in this cluster exhibited the greatest personal
innovativeness in technology. They were agreeable, conscientious, and open compared with the
other two clusters. Accordingly, customers’ preferences appeared associated with personality,
validating the qualitative findings and other studies in which personality was a particularly
influential trait in predicting behavior (Yoo & Gretzel, 2011). Despite that previous scholars have
paid attention to the influences of personality on social media creation (Yoo & Gretzel, 2011),
academia has not yet considered the influences of personality on technology adoption or SST
adoption, to the best of our knowledge. Given the limited interpretation of the role of personality
in technology adoption, the findings from this study help fill this gap and provide new insights
into customers’ technology adoption.
Besides, the largest segment of respondents in the “innovative users of SSTs” cluster had taken 6–
12 trips within the past 12 months (37.7%). The largest group of “neurotic non-users of SSTs”
included individuals who had taken 2–3 trips (34.9%), indicating the positive influence of travel
frequency on SST preferences. These results align with qualitative findings and prior research
(Castillo-Manzano & López-Valpuesta, 2013; Lu et al., 2011). Moreover, most respondents in this
cluster had a bachelor’s degree (73.5%), contrary to “neurotic non-users of SSTs” who mostly held
a postgraduate degree or above (51.8%). These results echo those of Meuter et al. (2003), who
found that the influence of education may be negative due to varied types of SSTs. Yet, this pattern
opposes hotelier interviewees’ opinions and Castillo-Manzano and López-Valpuesta’s (2013)
conclusion that education level positively affects customers’ SST use. Furthermore, on average,
consumers’ experiences with SSTs were much better than human services compared with the other
two clusters, providing support for the qualitative findings in this study.
The smallest cluster consisted of customers who were “neurotic non-users of SSTs”. These
customers were more neurotic than “actional non-users of robots” and “innovative users of SSTs”.
Additionally, larger proportions of these customers had only used hotel SSTs once within the past
12 months in comparison with the two other clusters. This finding is consistent with prior studies

238
that the number of times people have used SSTs is associated with customers’ SST adoption
(Eastlick et al., 2012; Zhu et al., 2007). On average, consumers’ experiences with SSTs were worse
than with human services except for actional and fresh experiences compared with the other two
clusters. Furthermore, perceived task complexity was generally higher than in the other two
clusters, although no significant differences were found across clusters except for the perceived
complexity of in-room facilities use. This pattern partially supports the literature and our
qualitative study, wherein task complexity negatively influences customers’ technology
preferences and adoption (Selnes & Hansen, 2001; Simon & Usunier, 2007; C. Wang et al., 2012).
Notably, the qualitative findings indicated a mixed influence of complexity on technology, which
depending on the conventional channel that SSTs substitute. This difference calls for special
quantitative future research on the influences on service complexity.
Albeit the largest groups among the three clusters consisted of consumers between 25 and 34 years
old, more respondents of “neurotic non-users of SSTs” were older than 44 compared with the other
two clusters, indicating that the younger people are, the more likely they are to prefer SSTs
(Castillo-Manzano & López-Valpuesta, 2013; Lu et al., 2011; Simon & Usunier, 2007).
Additionally, a higher percentage of respondents belongs to “ neurotic non-users of SSTs” had
worked in the hotel industry compared with the other two clusters, validating the qualitative
finding that customer interviewees indicated preferring SSTs in hotels because these respondents
worked in hospitality. Interestingly, contrary to aforementioned qualitative research and literature,
these three clusters were insignificantly associated with gender (Castillo-Manzano & López-
Valpuesta, 2013; Lu et al., 2011; Meuter et al., 2003).
7.4 Chapter Summary
Compared with the literature and qualitative findings, this study addressed several research gaps
by developing a scale to measure customer experiences with SSTs and human services. This scale
can thus be used to identify discrepancies between customer experiences with SSTs and human
services. This study also revealed the influences of such discrepancies on customers’ and hotels’
preferences for SSTs. The results also revealed variations in customers’ and hotels’ preferences
across service delivery stages and categorized customers into three clusters profiled by
demographics, personal innovativeness in technology, personality, customer experience, and

239
perceived task complexity. With these findings, this quantitative study remedies the academic void
regarding comparisons between SSTs and service employees and between customers and hotels.
Results echo the majority of those of prior studies and the present qualitative findings. These
findings also offer valuable reference points for hoteliers to make more rational decisions around
SST adoption and identify management strategies for service delivery channels.
240
CHAPTER 8: FINAL REMARKS AND IMPLICATIONS
Ongoing technological development has greatly altered service delivery (Meuter et al., 2005).
SSTs have revolutionized service delivery by enabling customers to have independent experiences
with minimum service staff involvement (Lema, 2009; Meuter et al., 2000). Hotels are no
exception to this trend and are increasingly investing in various SST applications (Shin & Perdue,
2019). The debate over a human-touch versus tech-focus in hospitality has emerged as a result
(Wei et al., 2016). Yet, studies have not presented a satisfactory way to address the dilemma
between SSTs and service employees. The literature on SSTs can be anatomized into two
dimensions: customers’ SST adoption and its outcomes. However, both streams overlook the
multichannel nature of service delivery, and some findings are inconsistent. Therefore, this study
adopted sequential mixed method (60 in-depth interviews followed by two rounds of surveys) to
develop a framework to explain how customers and hoteliers construct preferences for innovative
SSTs during hotel service delivery, by means of ascertaining whether customer experience was
enhanced by SSTs compared with customers’ typical experiences with human services. Such a
study extends knowledge of SSTs and the influences of human services to offer constructive
practical implications for real-world SST applications. This chapter revisited research gaps and
responses outlined in Table 2.10 (Chapter 2), summarized major findings from the qualitative and
quantitative studies (Chapters 4 and 6), and associated such findings with the literature to reveal
the theoretical contributions of this study. Then, practical implications, limitations and directions
for future research were described.
8.1 Revisiting Research Gaps and Responses in the Present Study
The summarized research gaps with corresponding recommendations should be revisited to check
whether identified gaps were addressed. As outlined in Table 8.1, the identified research gaps were
indeed tackled in this study. Major findings were presented in the following sections.

241
Table 8.1 Revisiting Summary of Research Gaps and Responses of this Study Field Main gaps Why should gaps be handled What has been done
Service delivery channel
Mainly focuses on government service but overlooks hotel context
Private service is distinct from government/public service
Investigated SSTs in a setting consisting of all service agents and channels, rather than in an isolated context in hotels
Overlooks different usages of delivery channels in distinct hotel service delivery stages
Hotel service delivery process is better understood through distinct service encounters
Anatomized hotel service delivery process into eight service encounters (e.g., checking in, controlling in-room facilities, and obtaining invoices)
Deficiency of research on service delivery process
Service delivery process is as important as service outcomes
Investigated customers’ and hotels’ preferences for SSTs compared with service employees during the service delivery process
Customer experience
Lack of uniform measurement of hotel customer experience
General measurement across different types of hotels is needed
Developed a uniform measurement scale for customer experiences with SSTs and human services; Explored discrepancies between customer experiences with SSTs and with human services
Enhanced customer experience versus negative customer experience with SSTs
Customer experience plays an important role
Lack of a commensurate measurement scale for customer experiences with SSTs and human services
The degree of changes brought by SSTs with reference to service employees matters
Lack of comprehensive measurement of previous experience with different service delivery channels
Previous experience is usually measured by whether customers ever used SSTs Conflicting findings regarding whether previous experience is significantly related to customers’ adoption of SSTs The means by which previous experience influences customers’ SST adoption is much more complicated than other factors
Lack of research on the experience hoteliers provided and perceived
Hoteliers design experience Explored the customer experiences with SSTs and human services that hoteliers provided and perceived;
Hoteliers determine available delivery channels used to deliver services
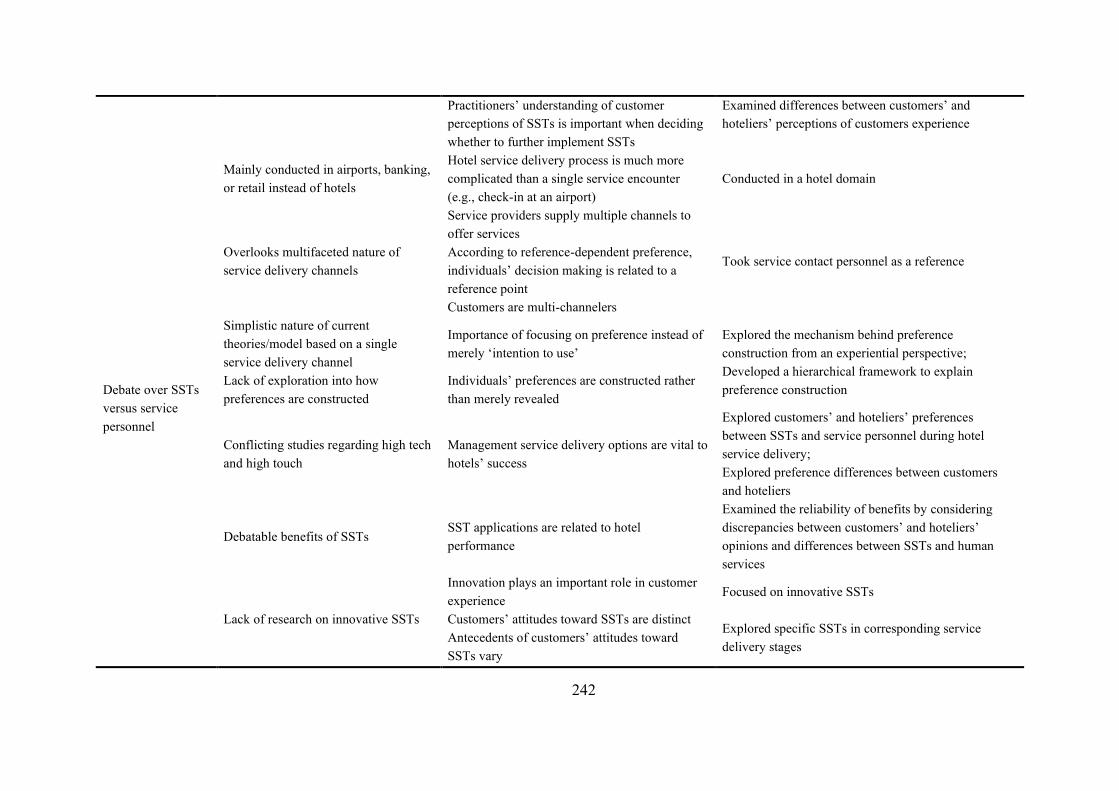
242
Practitioners’ understanding of customer perceptions of SSTs is important when deciding whether to further implement SSTs
Examined differences between customers’ and hoteliers’ perceptions of customers experience
Debate over SSTs versus service personnel
Mainly conducted in airports, banking, or retail instead of hotels
Hotel service delivery process is much more complicated than a single service encounter (e.g., check-in at an airport)
Conducted in a hotel domain
Overlooks multifaceted nature of service delivery channels
Service providers supply multiple channels to offer services
Took service contact personnel as a reference According to reference-dependent preference, individuals’ decision making is related to a reference point Customers are multi-channelers
Simplistic nature of current theories/model based on a single service delivery channel
Importance of focusing on preference instead of merely ‘intention to use’
Explored the mechanism behind preference construction from an experiential perspective; Developed a hierarchical framework to explain preference construction
Lack of exploration into how preferences are constructed
Individuals’ preferences are constructed rather than merely revealed
Conflicting studies regarding high tech and high touch
Management service delivery options are vital to hotels’ success
Explored customers’ and hoteliers’ preferences between SSTs and service personnel during hotel service delivery; Explored preference differences between customers and hoteliers
Debatable benefits of SSTs SST applications are related to hotel performance
Examined the reliability of benefits by considering discrepancies between customers’ and hoteliers’ opinions and differences between SSTs and human services
Lack of research on innovative SSTs
Innovation plays an important role in customer experience
Focused on innovative SSTs
Customers’ attitudes toward SSTs are distinct Explored specific SSTs in corresponding service delivery stages
Antecedents of customers’ attitudes toward SSTs vary
243
8.2 Major Findings
The 60 interviews provided an in-depth understanding of the construction mechanisms behind
customers’ and hotels’ preferences for SSTs (Research Question 2 and Research Objective 2)
and offered insights into customer experience with SSTs (Research Objective 3). Given this
study’s focus on customer experience, two rounds of surveys were conducted to develop a
commensurate measurement scale for customer experiences with SSTs and human services.
Experience discrepancies between customer experiences with SSTs and human services and
their influences on hotels’ and customers’ preferences were quantitatively examined using this
measurement scale (Research Objectives 2 and 3). Findings also revealed variations in
customers’ and hotels’ preferences during hotel service delivery (Research Question 1 and
Research Objective 1) along with experience and preference gaps between customers and
hotels (Research Question 3 and Research Objective 4). The research questions and objectives
can guide the presentation of the major findings from the qualitative and quantitative study.
8.2.1 Research Question 1: What SST do customers and hoteliers prefer at different hotel
service delivery stages?
Research Question 1 explored customers’ and hotels’ preferences during the hotel service
delivery process. Exploration of this research question was facilitated by asking interviewees
and questionnaire respondents to express their behavioral preferences among diverse delivery
channels by hotel service delivery stage. The qualitative and quantitative results revealed
preference variations during hotel service delivery. That is, customers’ and hotels’ preferences
for SSTs relative to service employees were not binary but involved channel sequencing.
Customers and hoteliers adopted multiple channels to handle different service tasks during
hotel service delivery process. In general, SSTs were much preferred over service employees
for checking in, controlling room amenities, ordering room or restaurant service, checking out,
and obtaining invoices, whereas both groups were more reluctant to use SSTs for service
delivery in room and restaurants.
Based on preferences by service delivery stages, customers were segmented into three types:
“innovative users of SSTs”, “actional non-users of robots”, and “neurotic non-users of SSTs”.
The three customer segments were distinct across various factors: demographics (e.g., age, type
of employment, education level, annual household income, work in hotel industry); trip profiles
244
(e.g., travel times in total); prior experience (e.g., use of hotel SSTs in past 12 months);
personal innovativeness; personality; customer experiences with SSTs; and experience
discrepancies. No significant relationships were observed among the three segments and
gender, marital status, most perceived task complexity (except in-room amenities control), and
affective and cognitive of customer experience with human services.
8.2.2 Research Question 2: How do customers and hoteliers develop preferences during
hotel service delivery?
Qualitative findings (Chapter 4) conveyed a hierarchical structure of experiential preference
construction (Figure 5.10). The outermost layer refers to the environmental context, wherein
current environment and expected outcomes affect hotels’ and customers’ preference
construction. Specifically, hotels’ and customers’ preferences were influenced by public
readiness, government regulation, labor issues, industry and technology development, and
expected influences on the environment (e.g., human apathy and environmental protection).
The second layer highlights the collaboration and disagreements among organizations,
including hotels themselves, technology companies, hotel owners, and hotel groups. Expected
benefits for hotels were also found to influence hotels’ and customers’ preferences and
experience. The next layer captures service encounters, wherein customer and service channels
collaborate to complete service tasks. The fit among task requirements, individuals’ abilities,
and features of channels affected customers’ and hotels’ preferences for high tech and customer
experience. The core layer represents customer experiences with service encounters. As
discussed in Chapters 4 and 5, data from the qualitative study indicated that experience with
SSTs, experience with traditional human services and discrepancies between these two types
of experience can influence customers’ and hotels’ preferences for high tech. However, the
results of the quantitative study revealed no significant influences of experience with human
services on hotels’ preferences for SSTs but did convey a significant relationship between
hotels’ intentions to use SSTs. Experience discrepancies explained the most variances in
customers’ and hoteliers’ preference for SSTs compared with human services. Compared with
the other four experience dimensions, the fresh experience had the least contributions to
customers’ and hotels’ SST behaviors (Table 6.12).
Moreover, the specific dimensions of customer experience identified in the qualitative study
were simplified by quantitative studies, according to Churchill’s (1979) guidelines for
245
measurement scale development. Finally, 22 items were retained and divided into five
dimensions (affective experience, cognitive experience, actional experience, social experience,
and fresh experience). The five-factor experience scale was found to be reliable and valid to
measure both customer experience with SSTs and customer experience with human services.
Notably, derivation of these factors in the hierarchical framework for experiential preference
construction (Figure 5.10) was not strictly vertical. Interplay could manifest among layers.
Therefore, customers’ and hotels’ preferences may be affected by any layer of the hierarchical
model.
8.2.3 Research Question 3: To what extent do customers’ preferences correspond to
hoteliers’ preferences for specific SSTs in associated service delivery stages?
According to the qualitative study in this research, hotel interviewees expressed inconsistent
preferences compared with customers during hotel service delivery. Although customers and
hotels both preferred using SSTs to control in-room facilities, order service, check out, and
obtain invoices, hotels favored combining SSTs and front desk staff to leave customers a choice
in check-in encounters while most customer respondents preferred SSTs. Moreover, despite
limited participants in this study, more hoteliers than customers preferred robots to deliver
room service. Additionally, customer informants expressed an equal preference for robots and
service employees in terms of service delivery at restaurants, while hotelier participants prefer
staffs to serve customers at restaurants. The quantitative results further verified the differences
between customer preference and hotel preference. With respect to specific SSTs in
corresponding service delivery stages, customers’ preferences distinct from hotels’ preferences
except service delivery at restaurants/bars (Table 6.7). In general, customers tended to use
smartphone-based SSTs, whereas hotels showed more preferences for SSKs for check-in/-out
with inclinations for smartphone-based SSTs for in-room facilities control and service order
(Figure 6.5).
Findings from the qualitative and quantitative studies also revealed gaps between customers’
and hoteliers’ opinions about customer experiences. The qualitative findings implied that
hoteliers tended to ignore some aspects that were important to customers, including
anthropomorphism, an unappealing voice, relaxation, regret, and cleanliness (Table 4.7). Some
experiences, such as rethinking life habits, improved participation, and special experiences,

246
were noted by hoteliers but not customers. The quantitative studies confirmed discrepancies
between customers’ and hoteliers’ perceptions of experiences (Table 6.9). Hoteliers assigned
significant higher scores on cognitive and social experiences with SSTs than did customers.
Regarding the five dimensions of customer experiences with human services, hoteliers’ ratings
were significantly higher than those of customers. Concerning discrepancies between the
dimensions of customer experience with SSTs and human services, discrepancies cited by
customers was significantly larger than those cited by hotels, except social experience.
The quantitative study further revealed that the five experience dimensions contributed
differentially to behavioral preferences. “SSTEXP3 (Actional experience)” contributed most
to customers’ behavioral intention and preferences for SSTs, whereas “SSTEXP4 (Social
experience)” and “HMEXP2 (Cognitive experience)” made the largest contributions to hotels’
SST intentions and preferences repsectively. For the effects of discrepancies between
experiences with SSTs and human services on behavioral intention, customers assigned
“DIFEXP2 (Cognitive experience)” the most importance, while hotels paid more attention to
“DIFEXP3 (Actional experience)”. With respect to influences of discrepancies on preferences,
both groups attached more importance to “DIFEXP3 (Actional experience)”. Overall, the fresh
experience had the least contribution compared with the other four experience dimensions
(Table 6.12).
8.3 Contributions of the Study
8.3.1 Theoretical Implications
The study is conducive to the research field of technology and hotels from four respects. First,
the framework for preference construction for SSTs versus service employees (Figure 5.10)
enriches understanding of consumer and organizational behavior and contributes to tackling
the ‘high tech vs. high touch’ debate. Conveying preferences via choices and decision making
is the essence of intelligent and intentional behavior (Slovic, 1995). As customers are likely
uncertain of their own preferences (Piccoli et al., 2017), the hierarchical structure of the
proposed framework can help customers understand their preferences (Piccoli et al., 2017).
Clarification of the construction of customers’ and hotels’ preferences for SSTs is
complementary to academic research on customer adoption of SST and fills a research void on
organizational adoption. Although theories such as TAM remain useful for understanding
247
technology adoption, an exclusive and simplistic measurement of technology characteristics
(i.e., perceived usefulness and ease of use) results in limited explanation. Neither individual
technology adoption nor organizational application of SSTs is determined by a single factor
but a constellation of diverse aspects. Albeit scholars have tried to introduce and test the effects
of other factors such as customer demographics, these factors have appeared in myriad research
areas (Kim et al., 2012; Simon & Usunier, 2007). Such information may, therefore, be too
scattered to be useful for academic and practitioners. Moreover, the qualitative study of the
research firstly found that environmental and organizational context exerted influences on
individuals’ technology adoption, while task attributes together with customer differences
make up for TOE framework which is usually used for organizational technology adoption.
Indeed, the hierarchical experience model is similar to an extended combination of the TOE
and TTF (Figure 5.11). According to the TOE framework, technological, organizational, and
environmental contexts influence organizational technology adoption (Baker, 2011; Kurnia et
al., 2015), while TTF highlights the match among task requirements, individuals’ abilities, and
technology functionality (Goodhue, 1995). Albeit task characteristics and individual
differences are considered complementary to the TOE framework (Baker, 2011; Premkumar,
2003), researchers have not incorporated TOE and TTF into a uniform framework for
technology adoption. While not advocating for any specific theory, the findings from this study
can serve as a stepping stone toward a holistic view on individual and organizational preference
construction or technology adoption by taking the external environment, middle organization,
and core service encounters and customer experience into consideration.
Second, these results offer an in-depth understanding of guests’ and hotels’ preferences for
high tech in hotel services. In the limited literature, researchers have either explored customers’
adoption of hotel SSTs in general (Oh et al., 2013; Rosenbaum & Wong, 2015) or within a
single service encounter (i.e., hotel check-in) (Kim & Qu, 2014; Kokkinou & Cranage, 2015;
Mäkinen, 2016). Albeit exploring service from the perspective of service delivery is as
important as service outcomes (Mohr & Bitner, 1995a; Parasuraman et al., 1985, 1988), studies
have largely neglected differences among service stages and hotels’ SST adoption. In reality,
hotel service delivery is much more complex than a single encounter (e.g., checking out at a
retail store or checking in at airports ). Hotel service delivery involves many service encounters
in addition to checking in, such as ordering room service, dining in restaurants, and checking
out (Danaher & Mattsson, 1994; Yung & Chan, 2002). The qualitative and quantitative findings

248
of this study suggest that customers’ and hotels’ preferences for SSTs vary during the hotel
service process. Customers and hotels were identified as multi-channelers. Their preferences
for SSTs or service employees were not binary but involved channel sequencing. This finding
showcases the need to explore customers’ preferences for specific SSTs by deconstructing the
service delivery process into service encounters consisting of main parts of the entire process,
consistent with Danaher and Mattsson (1994). Exploration of customers’ preferences for
specific SSTs via anatomizing service delivery into distinct service encounters (e.g., check-in,
room service order, and check-out) is much more detailed than studies focusing exclusively on
check-in encounters or overlooking distinctions among encounters. This study therefore
contributes to academic expertise around technology adoption in a hotel context and unveils
new research directions.
Third, these findings offer novel insights into customer experience with SSTs. Albeit customer
experience with SSTs are becoming increasingly popular in academic research (Kelly et al.,
2017a; Wei, Torres, et al., 2017), this field remains in a nascent state and warrants further
examination (Shin & Perdue, 2019). A comprehensive understanding of customer experience
with SSTs and how hotels perceive customer experience with SSTs provide innovative findings
while addressing research gaps in organizational understanding of customer experience.
Specifically, the results of this study update our expertise of customer experience management
in an SST-based experience economy in which interactions between customers and service
employees are eliminated (Curran & Meuter, 2005; Kucukusta et al., 2014). In this respect, the
present work encourages academics and practitioners to rethink the experience economy. The
experience economy has emphasized that experiences are generated through mutual
interactions between customers and service employees (Pine & Gilmore, 1998; Xu, 2010).
However, in SST-based encounters, interaction occurs exclusively between customers and
machines independent of direct service staff involvement. Some customers in this study argued
against hotels shifting their responsibilities to consumers. In an SST-based experience
economy, elevated customer participation should be at least equal to the value customers gain
from adopting SSTs (Hilton et al., 2013). Furthermore, a framework incorporating customer
experiences, their relationships, and inter-relationships with main entities (i.e., hotels and
customers) has been outlined (Figure 5.9) to provide a more thorough view of the customer
experience with multiple channels in an SST-based era of the experience economy.

249
Last but not the least, development of a corresponding measurement scale for customer
experience with human services enables the exploration of the influences of experience
discrepancies on SST adoption. Given the increasing prevalence of SSTs and the scarcity of
research on this topic, particularly regarding the customer experience (Shin & Perdue, 2019),
the establishment of an experience scale for SSTs makes a timely contribution to the literature
and may promote investigation in this field. Identified experience discrepancies between
customer experience with SSTs and human services and their influences on customers’ and
hotels’ SST preferences are consistent with prospect theory, which emphasized influences of
reference points (e.g., alternative states) (Kahneman & Tversky, 1979). The present findings
can, therefore, enrich expertise around service employees’ influences. Although retail-related
studies have found that multichannel service attributes influence customers’ loyalty intentions
(Cassab, 2009), most research has separately explored the significance of technological factors
and human services on hotels’ success and development (Bitner et al., 1990; Yadegaridehkordi
et al., 2018). Similarly, although studies on SST adoption have examined the influence of the
need for interaction (Oh et al., 2013), they have largely ignored the influences from other
aspects of staff services. The results of this study (i.e., discrepancies between experiences with
SSTs and with human services) confirm the importance of exploring SST adoption in a
multichannel context by jointly considering the effects of service employees as opposed to in
isolation (Eriksson & Nilsson, 2007; Gelderman et al., 2011).
8.3.2 Practical Implications
The practical implications of this work involve five aspects. First of all, armed with these
findings, hotel practitioners can make more rational decisions when introducing SSTs rather
than blindly focusing on relevant benefits. To accomplish this, hotel managers should carefully
consider environmental contexts, organizational features, the characteristics of service
encounters, and customer experience. SSTs are developing so rapidly that hotels may encounter
difficulties in updating their knowledge. In this study, up-to-date and integrated information
about SSTs (high tech) and human services (high touch) are gained through commentaries from
hoteliers and customers who had used hotel SSTs within the past 12 months. Recent
information enhances knowledge of SSTs. Given this comprehensive data related to the
changes brought by SSTs for human services, hotels may be more likely to implement SSTs
successfully. For instance, hotels’ perceived customer experience with human services were
250
better than their perceptions of experiences with SSTs apart from the fresh dimension. In this
sense, hotels aiming to provide affective, cognitive, actional, and social experiences for
customers should proceed cautiously when deciding whether to invest in SSTs rather than
blindly believing the media hype that SSTs can enhance customer experience. As the
quantitative results indicated that fresh experience usually has the least contributions to
customers’ and hoteliers’ behaviors, hotels aimed to use SSTs to offer customers fresh
experience should think twice before implementation. Moreover, according to the qualitative
findings, aside from hotels’ own conditions, hotels can also seek cooperation with technology
companies as well as support from hotel owners and hotel groups to promote SST applications.
Another important point is that hotels should carefully consider the time needed to introduce
SSTs. This study’s qualitative findings indicated that although hotel SSTs are trendy, most
SSTs are not perfect. Thus, hotels should test SSTs thoroughly before implementation or wait
to procure them until the devices are better developed.
Second, data from the qualitative research indicated that customers’ and hoteliers’ preferences
are not binary in a hotel context but distinct at different service delivery stages. This result can
help hoteliers decide the extent of SST applications in their settings, which is close to firms’
financial performance (Hung et al., 2012). Specifically, awareness of customers’ preferences
across different phases of service delivery enables hoteliers to tailor service offerings to satisfy
customer needs and enhance customer loyalty (Buell et al., 2010). In other words, the
elucidation of customers’ preferences during service delivery provides valuable references for
hotels to make corresponding enhancements to meet customer demands. The results of this
study revealed variations in customers’ and hotels’ preferences for SSTs and human service
throughout the service delivery process. These groups preferred SSTs for checking in,
controlling room amenities, ordering room or restaurant service, checking out, and obtaining
invoices, while service employees were favored for service delivery. These differences imply
that hotels should begin incorporating SSTs for check-in, in-room amenities, service orders,
checking out, and invoicing but perhaps not yet for service delivery.
Third, stronger strategies can be wielded to manage and deploy multiple channels during hotel
service delivery. Effective management of service delivery channels increases a hotel’s
likelihood of being profitable and successful within a growing competitive marketplace
(Meuter et al., 2000). The identified disconnect between customer experience/preference and

251
the experience/preference perceived by hoteliers can help hotels identify discrepancies and
modify their service delivery strategies to satisfy customer needs. For example, the findings
indicated that customers generally prefer smartphone-based SSTs such as mobile check-in/-
out, while hotels showed greater preferences for SSKs during check-in/-out. Hence, hotels
should select the types of SSTs customers prefer. In this respect, money and time can be saved
and used efficiently, and customer relationships and loyalty can be elevated to promote future
success. In short, this research offers insights into how different service channels excel in
specific service tasks for specific customers. Findings can help managers choose the most
suitable channels at appropriate stages for their respective customers. For instance, SSTs and
service employees excel in different dimensions of the customer experience. Preferences
depend on the type of experience a hotel wishes to offer its customers and what customers hope
to obtain. Using the proposed multidimensional customer experience structure model,
practitioners can target the experience they wish to provide customers, and the experience
customers want to achieve. For example, despite the emphasis on high-touch services,
overwhelming humanistic care may make customers uncomfortable. Albeit we devote attention
to improve customer participation, customers may argue that hotels should not shift their
responsibilities to customers, in accordance with the findings of Hilton et al. (2013) that the
value customers gain from SSTs should be no less than their co-production role.
Moreover, these findings can serve as a valuable reference for hotel practitioners in terms of
marketing. To begin with, hotels should not overpublicize technology innovation. Some
customers in this qualitative study recounted poor experiences with hotels when firms
publicized innovations that were not available. This kind of false advertising accomplishes
precisely the opposite of what hoteliers and customers want. When hotels do offer SSTs, they
may advertise the service consistency, which was emphasized by customer interviewees but
not hotelier informants. Also, hotels can help cultivate customers’ habits of using these devices
via appropriate promotion. For example, hotels should provide clear instructions, offer personal
assistance at first, highlight SSTs’ ease of use, or offer incentives to encourage customers to
use SSTs. Such incentives have proven useful in fostering customer habits. For instance, 3
years ago, Chinese were unfamiliar with take-out apps (e.g., Meituan and Eleme) or ridesharing
apps (e.g., Didi). However, with discounted prices and coupons, most residents of China now
cannot live without these apps.

252
Last but not least, customer segmentation can inform hotels’ decisions based on target
customers. This quantitative study identified three types of customers with unique demographic
characteristics, personal innovativeness in technology, personality, SST experience, and
experience discrepancies. With this information, hotels can deploy tailored means of service
delivery. For instance, if hotel customers tend to exhibit high personal innovativeness in
technology; are extraverted, agreeable, conscientious, and open; usually take more than five
trips per year, and have a bachelor’s degree and extensive experience with SSTs, then hotels
can more readily deploy SSTs throughout the service delivery process. Otherwise, hotels may
not wish to use robots to deliver services nor introduce too many SSTs.
In short, by applying these abundant findings, hoteliers can make more rational decisions
around SST adoption and service delivery management and marketing.
8.4 Limitations and Future Research
Despite that mixed methods were adopted to achieve the research objectives, couples of
limitations of this study must be acknowledged. First of all, albeit the reasons why China was
selected as the study setting was articulated in Chapter 3, customer and hotelier respondents
from diverse cultures should be recruited in future research for potentially better
generalizability; cross-cultural studies are needed. Second, for a simpler presentation, the
customer experience was described in general rather than by different service delivery stages.
Subsequent research should quantitatively examine the customer experience and satisfaction
with SSTs/human services in various service encounters and their influences on the overall
customer experience and satisfaction. Danaher and Mattsson (1994) noted that “to maintain
overall satisfaction, each encounter has to maintain its own satisfaction levels separately” (p.
14). To enhance the customer experience, each encounter should thus maintain its own
experience level. Moreover, in the past literature, customer experience has proven its influences
on customer satisfaction (Grace & O’Cass, 2004; Wu & Liang, 2009), while satisfaction has
proven its influences on technology adoption in both prior studies (Kim & Qu, 2014; Tseng,
2015; Yang, 2008). Therefore, it is also of importance and interest for future research to
examine the relationship among customer experience, satisfaction and behavioral preference.
Fourth, as revealed by reference-dependent preference, losses and gains in comparison with
reference point, exert different extents of influence on decision making; losses have been found
to exert stronger influences than gains (Kahneman & Tversky, 1979). That is, compared with
253
experience human services, the worse experience due to using SSTs exert stronger influences
on preferences than the better experience gained from SSTs. However, this kind of examination
was not conducted in the present study, given the research aims and questionnaire design.
Future research should include conjoint analysis or perform experiments to examine and
compare the effects of losses and gains from SSTs. Moreover, customer experience with SSTs
can be integrated into technology acceptance model (TAM) as a moderator variable. That is, it
is interesting to empirically examine the moderating effects of customer experience with SSTs
on the relationship among perceived usefulness, ease of use and behavioral intention. Sixth,
the importance of customer experience dimensions may vary. Scholars could conduct
importance-performance analysis to explore customer experience with specific service
channels and those channels’ effects on SST adoption and hotel performance. Besides, due to
limitations on time and money, the influences of environmental, organizational, and service
encounter factors identified in the qualitative study were not quantitatively examined; hence,
future research is warranted. The last limitation is that only eight service phases were examined
in the quantitative survey considering time, money, and literature. As reported in the qualitative
findings, other service encounters (such as taking an elevator and opening the door) exist except
these eight service encounters. Academia and industry should pay attention to the division of
hotel service delivery process and SSTs application in associated stages.
254
REFERENCES
Ağralı, S., Taşkın, Z. C., & Ünal, A. T. (2017). Employee scheduling in service industries with
flexible employee availability and demand. Omega, 66, 159–169.
Ahearne, M., Jones, E., Rapp, A., & Mathieu, J. (2008). High touch through high tech: The
impact of salesperson technology usage on sales performance via mediating mechanisms.
Management Science, 54(4), 671–685.
Aizstrauta, D., Ginters, E., & Eroles, M.-A. P. (2015). Applying theory of diffusion of
innovations to evaluate technology acceptance and sustainability. Procedia Computer
Science, 43, 69–77.
Ajzen, I. (1991). The theory of planned behavior. Organizational Behavior and Human
Decision Processes, 50(2), 179–211.
Ajzen, I., & Madden, T. J. (1986). Prediction of goal-directed behavior: Attitudes, intentions,
and perceived behavioral control. Journal of Experimental Social Psychology, 22(5),
453–474.
Alexander, M., MacLaren, A., O’Gorman, K., & Taheri, B. (2012). “He just didn’t seem to
understand the banter”: Bullying or simply establishing social cohesion? Tourism
Management, 33(5), 1245–1255.
Alhelalat, J. A., Habiballah, M. A., & Twaissi, N. M. (2017). The impact of personal and
functional aspects of restaurant employee service behaviour on customer satisfaction.
International Journal of Hospitality Management, 66, 46–53.
Anand, P., & Sternthal, B. (1989). Strategies for designing persuasive messages: Deductions
from the resource matching hypothesis. In P. Cafferata & A. M. Tybout (Eds.), Cognitive
and affective responses to advertising. Lexington, Mass: Lexington Books.
Anderson, E. (1995). High tech v. high touch: A case study of TQM implementation in higher
education. Managing Service Quality: An International Journal, 5(2), 48–56.

255
Anderson, J. C., & Gerbing, D. W. (1988). Structural equation modeling in practice: A review
and recommended two-step approach. Psychological Bulletin, 103(3), 411–423.
Anning-Dorson, T. (2017). Customer involvement capability and service firm performance:
The mediating role of innovation. Journal of Business Research.
Apte, U. M., & Vepsäläinen, A. P. J. (1993). High tech or high touch? Efficient channel
strategies for delivering financial services. Journal of Strategic Information Systems,
2(1), 39–54.
Ariza-Montes, A., Arjona-Fuentes, J. M., Han, H., & Law, R. (2017). Employee responsibility
and basic human values in the hospitality sector. International Journal of Hospitality
Management, 62, 78–87.
Ba, S., Stallaert, J., & Zhang, Z. (2010). Balancing IT with the human touch: Optimal
investment in IT-based customer service. Information Systems Research, 21(3), 423–442.
Baker, J. (2011). The technology–organization–environment framework. In Y. K. Dwivedi, M.
R. Wade, & S. L. Schneberger (Eds.), Information systems theory: Explaining and
predicting our digital society (Vol. 1, pp. 231–245). New York: Springer.
Bandura, A. (1977). Self-efficacy: Toward a unifying theory of behavioral change.
Psychological Review, 84(2), 191.
Bandura, A. (1986). Social foundations of thought and action : A social cognitive theory.
Englewood Cliffs, N.J: Prentice-Hall.
Bandura, A. (1997). Self-efficacy : The exercise of control. New York: W.H. Freeman.
Bandura, A., & Wood, R. (1989). Effect of perceived controllability and performance standards
on self-regulation of complex decision making. Journal of Personality and Social
Psychology, 56(5), 805.
Barnes, D. C., Ponder, N., & Hopkins, C. D. (2015). The impact of perceived customer delight
on the frontline employee. Journal of Business Research, 68(2), 433–441.
256
Barsalou, L. W. (1999). Perceptions of perceptual symbols. Behavioral and Brain Sciences,
22(04), 637–660.
Bateson, J. E. G. (1985). Self-service consumer: An exploratory study. Journal of Retailing,
61(3), 49–76.
Beatson, A., Coote, L. V, & Rudd, J. M. (2006). Determining consumer satisfaction and
commitment through self-service technology and personal service usage. Journal of
Marketing Management, 22(7–8), 853–882.
Behling, O., & Law, K. S. (2000). Translating questionnaires and other research instruments:
Problems and solutions (Vol. 133). Thousand Oaks: Sage Publications.
Berry, L. L. (1980). Services marketing is different. Business, 30(3), 24–29.
Berry, L. L., Bolton, R. N., Bridges, C. H., Meyer, J., Parasuraman, A., & Seiders, K. (2010).
Opportunities for innovation in the delivery of interactive retail services. Journal of
Interactive Marketing, 24(2), 155–167.
Berry, L. L., Carbone, L. P., & Haeckel, S. H. (2002). Managing the total customer experience.
MIT Sloan Management Review, 43(3), 85–89.
Best Western. (2015). Best Western® Timeline and story. Retrieved from
https://www.bestwestern.com/content/best-western/en_US/about/press-media/best-
western-timeline-and-story.html
Betancourt, R. R., Chocarro, R., Cortiñas, M., Elorz, M., & Mugica, J. M. (2016). Channel
choice in the 21st century: The hidden role of distribution services. Journal of Interactive
Marketing, 33, 1–12.
Bettencourt, L. A., & Gwinner, K. (1996). Customization of the service experience: The role
of the frontline employee. International Journal of Service Industry Management, 7(2),
3–20.
Bian, J., Guo, X., & Li, K. (2015). Distribution channel strategies in a mixed market.
International Journal of Production Economics, 162, 13-24.
257
Biedenbach, G., Bengtsson, M., & Wincent, J. (2011). Brand equity in the professional service
context: Analyzing the impact of employee role behavior and customer–employee
rapport. Industrial Marketing Management, 40(7), 1093–1102.
Bigné, J. E., & Andreu, L. (2004). Emotions in segmentation. Annals of Tourism Research,
31(3), 682–696.
Bitner, Mary Jo. (1990). Evaluating service encounters: The effects of physical surroundings
and employee responses. Journal of Marketing, 54(2), 69–82.
Bitner, Mary Jo, Booms, B. H., & Mohr, L. A. (1994). Critical service encounters: The
employee’s viewpoint. Journal of Marketing, 58(4), 95–106.
Bitner, Mary Jo, Booms, B. H., & Tetreault, M. S. (1990). The service encounter: Diagnosing
favorable and unfavorable incidents. Journal of Marketing, 54(1), 71–84.
Bitner, Mary Jo, Brown, S. W., & Meuter, M. L. (2000). Technology infusion in service
encounters. Journal of the Academy of Marketing Science, 28(1), 138–149.
Bitran, G., & Lojo, M. (1993). A framework for analyzing the quality of the customer interface.
European Management Journal, 11(4), 385–396.
Bonnin, G. (2006). Physical environment and service experience: An appropriation-based
model. Journal of Services Research, 6, 45–65.
Bowen, J. (1990). Development of a taxonomy of services to gain strategic marketing insights.
Journal of the Academy of Marketing Science, 18(1), 43–49.
Brancheau, J. C., & Wetherbe, J. C. (1990). The adoption of spreadsheet software: Testing
innovation diffusion theory in the context of end-user computing. Information Systems
Research, 1(2), 115–143.
Breaking Travel News. (2014). Hilton pushes digital check-in worldwide. Retrieved from
http://www.breakingtravelnews.com/news/article/hilton-worldwide-pushes-digital-
check-in-worldwide/#When:11:35:06Z
Bucklin, L. P. (1966). A theory of distribution channel structure. University of California.
258
Buell, R. W., Campbell, D., & Frei, F. X. (2010). Are self‐service customers satisfied or stuck?
Production and Operations Management, 19(6), 679–697.
Burghard, C. (2001). Balancing consumer needs for high-tech and “high-touch.” Managed
Healthcare Executive, 11(5), 52. Retrieved from
http://search.ebscohost.com/login.aspx?direct=true&db=bth&AN=4468749&site=ehost
-live
Busser, J. A., & Shulga, L. V. (2018). Co-created value: Multidimensional scale and
nomological network. Tourism Management, 65, 69–86.
Carbone, L. P., & Haeckel, S. H. (1994). Engineering customer experiences. Marketing
Management, 3(3), 8-19.
Cardona-Rivera, R. E., & Young, R. M. (2013). A cognitivist theory of affordances for games.
Proceedings of the Digital Games Research Conference: DeFragging Game Studies.
Cassab, H. (2009). Investigating the dynamics of service attributes in multi-channel
environments. Journal of Retailing and Consumer Services, 16(1), 25–30.
Castillo-Manzano, J. I., & López-Valpuesta, L. (2013). Check-in services and passenger
behaviour: Self service technologies in airport systems. Computers in Human Behavior,
29(6), 2431–2437.
Cen, C. D., & Gan, X. T. (2011). A study of customer participation and its antecedents in self-
service technologies [自助服务技术环境下的顾客参与及其影响因素研究 ].
Forecasting, 30(2), 21–27.
Chang, H.-L., & Yang, C.-H. (2008). Do airline self-service check-in kiosks meet the needs of
passengers? Tourism Management, 29(5), 980–993.
Chang, K.-C. (2016). Effect of servicescape on customer behavioral intentions: Moderating
roles of service climate and employee engagement. International Journal of Hospitality
Management, 53, 116–128.

259
Chen, F. (2014). The probe into the relationship between behavior intention and self-efficiency
of consumer on self-service technology [基于自助服务的顾客使用意向与自我放能的
关系研究]. Central China Normal University.
Chen, J.-S., Tsou, H. T., & Huang, A. Y.-H. (2009). Service delivery innovation: Antecedents
and impact on firm performance. Journal of Service Research, 12(1), 36–55.
Chen, J. K. C., Batchuluun, A., & Batnasan, J. (2015). Services innovation impact to customer
satisfaction and customer value enhancement in airport. Technology in Society, 43, 219–
230.
Chen, J., Liang, L., Yao, D.-Q., & Sun, S. (2017). Price and quality decisions in dual-channel
supply chains. European Journal of Operational Research, 259(3), 935–948.
Chen, S.-C., Chen, H.-H., & Chen, M.-F. (2009). Determinants of satisfaction and continuance
intention towards self-service technologies. Industrial Management & Data Systems,
109(9), 1248–1263.
China National Tourism Administration. (2015). Notice on the action plan of the implement of
“Tourism + Internet” [国家旅游局关于实施“旅游+互联网”行动计划的通知 ].
Retrieved from http://www.gov.cn/zhengce/2016-05/23/content_5075923.htm
ChinaIRN. (2013). The lack of workforce pushes the development of industrial automation [
国 内 劳 动 力 短 缺 推 动 工 业 自 动 化 产 业 发 展 ]. Retrieved from
http://www.chinairn.com/news/20131022/090825810.html
Chinanews. (2017). China published the first top 10 science and technology tourism bases [中
国 公 布 首 批 十 大 科 技 旅 游 基 地 ]. Retrieved from
http://finance.chinanews.com/cj/2017/03-28/8185913.shtml
Chinatimes. (2019). The labor supply has fallen by more than 30 million people in seven years
[劳动力供给 7 年减少 3000 余万人 专家称我国已掉入低生育率陷阱]. Retrieved
from http://finance.sina.com.cn/roll/2019-04-16/doc-ihvhiewr6473470.shtml
260
ChinaTravelNews. (2016). Alitrip integrates VR into impending “future hotels 2.0.” Retrieved
from http://www.chinatravelnews.com/article/103818
Choi, M., Lee, J.-S., & Seo, A. J. (2018). Shopping destination competitiveness: Scale
development and validation. Journal of Travel & Tourism Marketing, 35(8), 1087–1103.
Choice Hotels. (2016). A history of innovation. Retrieved from
https://www.choicehotels.com/about/corporate-history
Chu, K. H. L. (2008). A factorial validation of work value structure: Second-order confirmatory
factor analysis and its implications. Tourism Management, 29(2), 320–330.
Churchill, G. A. J. (1979). A paradigm for developing better measures of marketing constructs.
Journal of Marketing Research, 16(1), 64–73.
Cobos, L. M., Mejia, C., Ozturk, A. B., & Wang, Y. (2016). A technology adoption and
implementation process in an independent hotel chain. International Journal of
Hospitality Management, 57, 93–105.
Cohen, E. (1979). A phenomenology of tourist experiences. Sociology, 13(2), 179–201.
Collier, J. E., & Barnes, D. C. (2015). Self-service delight: Exploring the hedonic aspects of
self-service. Journal of Business Research, 68(5), 986–993.
Collier, J. E., Moore, R. S., Horky, A., & Moore, M. L. (2015). Why the little things matter:
Exploring situational influences on customers’ self-service technology decisions.
Journal of Business Research, 68(3), 703–710.
Connolly, D. J. (1999). Understanding information technology investment decision-making in
the context of hotel global distribution systems: A multiple-case study. Virginia
Polytechnic Institute and State University.
Considine, E., & Cormican, K. (2016). Self-service technology adoption: An analysis of
customer to technology interactions. Procedia Computer Science, 100, 103–109.

261
Cook, R. (2014). Balancing technology with the human touch. DIY Week. Retrieved from
http://search.ebscohost.com/login.aspx?direct=true&db=bth&AN=95506062&site=eho
st-live
Creswell, J. W. (2003). Research design : Qualitative, quantitative, and mixed methods
approaches (2nd ed.). Thousand Oaks: Sage Publications.
Creswell, J. W., & Clark, V. L. P. (2007). Designing and conducting mixed methods research
(V. L. Plano Clark, Ed.). Thousand Oaks: SAGE Publications.
Creswell, J. W., Clark, V. L. P., Gutmann, M. L., & Hanson, W. E. (2003). Advanced mixed
methods research designs. In Handbook of mixed methods in social & behavioral
research (pp. 209–240). Thousand Oaks: SAGE Publications.
Cunningham, L. F., Young, C. E., & Gerlach, J. (2009). A comparison of consumer views of
traditional services and self-service technologies. Journal of Services Marketing, 23(1),
11–23.
Curran, J. M., & Meuter, M. L. (2005). Self-service technology adoption: Comparing three
technologies. Journal of Services Marketing, 19(2), 103–113.
Curran, J. M., Meuter, M. L., & Surprenant, C. F. (2003). Intentions to use self-service
technologies: A confluence of multiple attitudes. Journal of Service Research, 5(3), 209–
224.
Dabholkar, P. A. (1994). Technology-based service delivery: A classification scheme for
developing marketing strategies. Advances in Services Marketing and Management, 3(1),
241–271.
Dabholkar, P. A. (1996). Consumer evaluations of new technology-based self-service options:
An investigation of alternative models of service quality. International Journal of
Research in Marketing, 13(1), 29–51.
Dabholkar, P. A., & Bagozzi, R. P. (2002). An attitudinal model of technology-based self-
service: Moderating effects of consumer traits and situational factors. Journal of the
Academy of Marketing Science, 30(3), 184–201.
262
Dabholkar, P. A., Michelle Bobbitt, L., & Lee, E.-J. (2003). Understanding consumer
motivation and behavior related to self-scanning in retailing: Implications for strategy
and research on technology-based self-service. International Journal of Service Industry
Management, 14(1), 59–95.
Dabholkar, P. A., Shepherd, C. D., & Thorpe, D. I. (2000). A comprehensive framework for
service quality: An investigation of critical conceptual and measurement issues through
a longitudinal study. Journal of Retailing, 76(2), 139–173.
Dabholkar, P. A., & Spaid, B. I. (2012). Service failure and recovery in using technology-based
self-service: Effects on user attributions and satisfaction. The Service Industries Journal,
32(9), 1415–1432.
Danaher, P. J., & Mattsson, J. (1994). Customer satisfaction during the service delivery
process. European Journal of Marketing, 28(5), 5–16.
Davis, F. D. (1985). A technology acceptance model for empirically testing new end-user
information systems: Theory and results. Massachusetts Institute of Technology.
Davis, F. D., Bagozzi, R. P., & Warshaw, P. R. (1989). User acceptance of computer
technology: a comparison of two theoretical models. Management Science, 35(8), 982–
1003.
Demirkan, H., & Spohrer, J. (2014). Developing a framework to improve virtual shopping in
digital malls with intelligent self-service systems. Journal of Retailing and Consumer
Services, 21(5), 860–868.
Denzin, N. K., & Lincoln, Y. S. (1994). Handbook of qualitative research. Thousand Oaks:
Sage Publications.
Dhar, R. L. (2015). Service quality and the training of employees: The mediating role of
organizational commitment. Tourism Management, 46, 419–430.
Dibra, M. (2015). Rogers theory on diffusion of innovation-The most appropriate theoretical
model in the study of factors influencing the integration of sustainability in tourism
businesses. Procedia - Social and Behavioral Sciences, 195, 1453–1462.
263
Dickey, M. D. (2003). Teaching in 3D: Pedagogical affordances and constraints of 3D virtual
worlds for synchronous distance learning. Distance Education, 24(1), 105–121.
Dillman, D. A. (2007). Mail and internet surveys: The tailored design method (2nd ed.).
Hoboken, N.J. : Wiley.
Dishaw, M. T., & Strong, D. M. (1999). Extending the technology acceptance model with task–
technology fit constructs. Information & Management, 36(1), 9–21.
Dodrill, E. R. (1999). Technicians and interpersonal dynamics: Instilling high touch in high
tech departments. Retrieved from
http://search.ebscohost.com/login.aspx?direct=true&db=eric&AN=ED450862&site=eh
ost-live
Donner, S., & Dudley, C. (1997). Balancing customer contact and high-tech delivery. ABA
Banking Journal, 89(1), 18,20. Retrieved from
http://search.ebscohost.com/login.aspx?direct=true&db=bth&AN=9708191352&site=e
host-live
Dresner, M. (2006). Leisure versus business passengers: Similarities, differences, and
implications. Journal of Air Transport Management, 12(1), 28–32.
Eastlick, M. A., Ratto, C., Lotz, S. L., & Mishra, A. (2012). Exploring antecedents of attitude
toward co-producing a retail checkout service utilizing a self-service technology. The
International Review of Retail, Distribution and Consumer Research, 22(4), 337–364.
Eriksson, K., & Nilsson, D. (2007). Determinants of the continued use of self-service
technology: The case of Internet banking. Technovation, 27(4), 159–167.
Fajen, B. R., Riley, M. A., & Turvey, M. T. (2009). Information, affordances, and the control
of action in sport. International Journal of Sport Psychology, 40(1), 79.
Fan, A., Wu, L., & Mattila, A. S. (2016). Does anthropomorphism influence customers’
switching intentions in the self-service technology failure context? Journal of Services
Marketing, 30(7), 713–723.

264
Ferrell, L., & Ferrell, O. C. (2012). Redirecting direct selling: High-touch embraces high-tech.
Business Horizons, 55(3), 273–281.
Fischer, E., Gainer, B., & Bristor, J. (1997). The sex of the service provider: does it influence
perceptions of service quality? Journal of Retailing, 73(3), 361–382.
Fishbein, M., & Ajzen, I. (1975). Belief, attitude, intention, and behavior : An introduction to
theory and research. Reading, Mass: Addison-Wesley Pub. Co.
Fisher, G., & Beatson, A. (2002). The impact of culture on self-service on technology adoption
in the hotel industry. International Journal of Hospitality & Tourism Administration,
3(3), 59–77.
Flynn, A. G., Seiders, K., & Voss, G. B. (2012). When is enough enough? Blancing on the fine
line in multichannel marketing communications. GfK-Marketing Intelligence Review,
4(2), 9–15. Retrieved from
http://search.ebscohost.com/login.aspx?direct=true&db=bth&AN=83290176&site=eho
st-live
Foroudi, P., Jin, Z., Gupta, S., Melewar, T. C., & Foroudi, M. M. (2016). Influence of
innovation capability and customer experience on reputation and loyalty. Journal of
Business Research, 69(11), 4882–4889.
Fortune, M. F., Shifflett, B., & Sibley, R. E. (2010). A comparison of online (high tech) and
traditional (high touch) learning in business communication courses in silicon valley.
Journal of Education for Business, 81(4), 210–214.
Franceschinis, C., Thiene, M., Scarpa, R., Rose, J., Moretto, M., & Cavalli, R. (2017).
Adoption of renewable heating systems: An empirical test of the diffusion of innovation
theory. Energy, 125, 313–326.
Froehle, C. M., & Roth, A. V. (2004). New measurement scales for evaluating perceptions of
the technology-mediated customer service experience. Journal of Operations
Management, 22(1), 1–21.

265
Gao, W., & Dong, D. (2011a). An overview of self-service technologies [自助服务技术研究
述评]. Science and Technology Management Research, (20), 192–197.
Gao, W., & Dong, D. (2011b). Review on antecedents and models of self-service technology
adoption [自助服务技术采纳的前因与模式:文献综述]. Technology Economics, 30(3),
36–40.
Gaver, W. W. (1991). Technology affordances. Proceedings of the SIGCHI Conference on
Human Factors in Computing Systems, 79–84. ACM.
Gelderman, C. J., Ghijsen, P. W. T., & van Diemen, R. (2011). Choosing self-service
technologies or interpersonal services—The impact of situational factors and technology-
related attitudes. Journal of Retailing and Consumer Services, 18(5), 414–421.
Gentile, C., Spiller, N., & Noci, G. (2007). How to sustain the customer experience: An
overview of experience components that co-create value with the customer. European
Management Journal, 25(5), 395–410.
Gerbing, D. W., & Anderson, J. C. (2002). On the meaning of within-factor correlated
measurement errors. Journal of Consumer Research, 11(1), 572.
Gibson, J. J. (1979). The ecological approach to visual perception. Boston: Houghton Mifflin.
Giebelhausen, M., Robinson, S. G., Sirianni, N. J., & Brady, M. K. (2014). Touch versus tech:
When technology functions as a barrier or a benefit to service encounters. Journal of
Marketing, 78(4), 113–124.
Gilmore, J. H., & Pine, B. J. (2002). Differentiating hospitality operations via experiences:
Why selling services is not enough. Cornell Hotel and Restaurant Administration
Quarterly, 43(3), 87–96.
Glenberg, A. M. (1997). What memory is for: Creating meaning in the service of action.
Behavioral and Brain Sciences, 20(1), 41–50.
Goldberg, L. R. (1992). The development of markers for the Big-Five factor structure.
Psychological Assessment, 4(1), 26.

266
Gong, W. (2014). Research on the effect of SST interactivity on consumer’s willingness of
continued using of the self-service technology [SST 交互对顾客继续使用自助服务技
术意 愿的影响研究]. Southwestern University of Finance and Economics.
Goodhue, D. L. (1995). Understanding user evaluations of information systems. Management
Science, 41(12), 1827–1844.
Goodhue, D. L., & Thompson, R. L. (1995). Task-technology fit and individual performance.
MIS Quarterly, 213–236.
Grace, D., & O’Cass, A. (2004). Examining service experiences and post‐consumption
evaluations. Journal of Services Marketing, 18(6), 450–461.
Griffy-Brown, C., Chun, M. W. S., & Machen, R. (2008). Hilton hotels corporation self-service
technology. Journal of Information Technology Case and Application Research, 10(2),
37–57.
Grönroos, C. (1984). A service quality model and its marketing implications. European Journal
of Marketing, 18(4), 36–44.
Guba, E. G., & Lincoln, Y. S. (1994). Competing paradigms in qualitative research. In N.
Denzin & Y. S. Lincoln (Eds.), Handbook of qualitative research (pp. 105–117).
Thousand Oaks: Sage Publications.
Guo, S., & Heese, H. (2017). Product variety and distribution channel structure. International
Journal of Production Research, 55(12), 3392–3410.
Gwinner, K. P., Bitner, M. J., Brown, S. W., & Kumar, A. (2005). Service customization
through employee adaptiveness. Journal of Service Research, 8(2), 131–148.
Hair, J. F., Black, W. C., Babin, B. J., & Anderson, R. E. (2002). Multivariate data analysis
(6th ed.). Englewood Cliffs, NJ: Prentice-Hall
Hameed, M. A., Counsell, S., & Swift, S. (2012). A conceptual model for the process of IT
innovation adoption in organizations. Journal of Engineering and Technology
Management, 29(3), 358–390.
267
Hanks, L., Line, N. D., & Mattila, A. S. (2016). The impact of self-service technology and the
presence of others on cause-related marketing programs in restaurants. Journal of
Hospitality Marketing & Management, 25(5), 547–562.
Hansen, H. R. (1995). Conceptual framework and guidelines for the implementation of mass
information systems. Information & Management, 28(2), 125–142.
Hartline, M. D., & Ferrell, O. C. (1996). The management of customer-contact service
employees: An empirical investigation. Journal of Marketing, 60(4), 52–70.
Hertzfeld, E. (2017). Hotel guests want more but hoteliers aren’t keeping up with their needs.
Retrieved from http://www.hotelmanagement.net/hotel-guests-want-more-but-
hotelier%0As-aren-t-keeping-up-their-needs%0A
Heskett, J. L., & Schlesinger, L. A. (1994). Putting the service-profit chain to work. Harvard
Business Review, 72(2), 164–174.
Hilton. (2016). A history of firsts. Retrieved from
https://www3.hilton.com/en/about/hilton/history/index.html
Hilton, T., Hughes, T., Little, E., & Marandi, E. (2013). Adopting self-service technology to
do more with less. Journal of Services Marketing, 27(1), 3–12.
Hirschman, E. C., & Holbrook, M. B. (1982). Hedonic consumption: Emerging concepts,
methods and propositions. Journal of Marketing, 46(3), 92–101.
Ho, S.-H., & Ko, Y.-Y. (2008). Effects of self-service technology on customer value and
customer readiness: The case of Internet banking. Internet Research, 18(4), 427–446.
Holbrook, M. B. (1994). The nature of customer value: An axiology of services in the consumption experience. In R. T. Rust & R. L. Oliver (Eds.), Service Quality: New Directions in Theory and Practice (pp. 21–71). Thousand Oaks: SAGE Publications.
Holbrook, M. B., & Hirschman, E. C. (1982). The experiential aspects of consumption:
Consumer fantasies, feelings, and fun. Journal of Consumer Research, 9(2), 132–140.
Holsti, O. R. (1968). Content analysis. The Handbook of Social Psychology, 2, 596–692.

268
Holsti, O. R. (1969). Content analysis for the social sciences and humanities. Reading, Mass.:
Addison-Wesley.
Hotel News Now. (2010). Checking in on self-service kiosks. Retrieved from
http://hotelnewsnow.com/Articles/5134/Checking-in-on-self-service-kiosks
Hsieh, J.-K. (2016). The effect of frontline employee co-creation on service innovation:
Comparison of manufacturing and service industries. Procedia - Social and Behavioral
Sciences, 224, 292–300. https://doi.org/10.1016/j.sbspro.2016.05.488
Huang, J. (2007). Customer-to-customer interaction impact on cruise experience and overall
vacation satisfaction. The Hong Kong Polytechnic University.
Huanqiu. (2017). “Internet + smart hotel self-service machines” appears on digital economic
conference [“互联网+智慧酒店自助机 ”亮相数字经济大会 ]. Retrieved from
http://tech.huanqiu.com/launch/2017-05/10756383.html?agt=15425
HUAZHU. (2019). Milestone of HUAZHU [关于华住集团]. Retrieved from Milestone of
HUAZHU
Hung, C. S., Yen, D. C., & Ou, C. S. (2012). An empirical study of the relationship between a
self-service technology investment and firm financial performance. Journal of
Engineering and Technology Management, 29(1), 62–70.
Hung, K., & Petrick, J. F. (2010). Developing a measurement scale for constraints to cruising.
Annals of Tourism Research, 37(7), 206–228.
Hung, K., & Petrick, J. F. (2011). Why do you cruise? Exploring the motivations for taking
cruise holidays, and the construction of a cruising motivation scale. Tourism
Management, 32(2), 386–393
IBM Support. (n.d.). Clustering binary data (should be avoided). Retrieved June 22, 2019, from
http://www-01.ibm.com/support/docview.wss?uid=swg21476716

269
IBM Knowledge Center. (n.d.). Two-Step Cluster Analysis. Retrieved from
https://www.ibm.com/support/knowledgecenter/SSLVMB_subs/statistics_mainhelp_dd
ita/spss/base/idh_twostep_main.html
IHG. (2015). Our history. Retrieved from https://www.ihgplc.com/about-us/our-history
International Federation of Robotics. (2018). Executive summary world robotics 2018
industrial robots. Retrieved from
https://www.ifr.org/downloads/press2018/Executive_Summary_WR_2018_Industrial_
Robots.pdf
IPIP. (2018). International personality item pool: A scientific collaboratory for the
development of advanced measures of personality traits and other individual differences.
Retrieved from https://ipip.ori.org/
Janowitz, N. (2007). High-tech eatery eliminates human waiters. Shopping Centers Today,
28(5), 136–140. Retrieved from
http://search.ebscohost.com/login.aspx?direct=true&db=bth&AN=25061264&site=eho
st-live
Jiang, L. (2013). Research on factors influencing use degree of self-service technologies [自
助服务技术使用程度影响因素研究]. Dalian University of Technology.
Jiemian. (2016). Airbnb 3.0: An unmanned and future hotel [Airbnb 3.0:全程无人化管理的
未来酒店]. Retrieved from http://www.jiemian.com/article/927677.html
Jimmieson, N. L., Tucker, M. K., & Campbell, J. L. (2017). Task conflict leads to relationship
conflict when employees are low in trait self-control: Implications for employee strain.
Personality and Individual Differences, 113, 209–218.
https://doi.org/10.1016/j.paid.2017.03.035
John, O. P., & Srivastava, S. (1999). The Big Five trait taxonomy: History, measurement, and
theoretical perspectives. In L. A. Pervin & O. P. John (Eds.), Handbook of personality:
Theory and research (2nd ed., pp. 102–138). New York: Guilford Press.
270
Johnson, B., & Turner, L. A. (2003). Data collection strategies in mixed methods research. In
C. Teddlie & A. Tashakkori (Eds.), Handbook of mixed methods in social & behavioral
research (pp. 297–319). Thousand Oaks: SAGE Publications.
Jones, R. A. (1995). Research methods in the social and behavioral sciences (2nd ed.).
Sunderland, Mass: Sinauer Associates.
Jöreskog, K. G., & Sörbom, D. (1996). LISREL 8: User’s reference guide. Chicago, IL:
Scientific Software International.
Joshi, S. (2014). Customer experience management: An exploratory study on the parameters
affecting customer experience for cellular mobile services of a telecom company.
Procedia - Social and Behavioral Sciences, 133, 392–399.
Kahneman, D., & Tversky, A. (1979). Prospect theory: An analysis of decision under risk.
Econometrica, 47(2), 263–291.
Karadag, E., & Dumanoglu, S. (2009). The productivity and competency of information
technology in upscale hotels. International Journal of Contemporary Hospitality
Management, 21(4), 479–490. https://doi.org/10.1108/09596110910955712
Kasavana, M. L. (2008). The convergence of self-service technology. Hospitality Upgrade
Magazine, 122–128.
Kattara, H. S., & El-Said, O. A. (2014). Customers’ preferences for new technology-based self-
services versus human interaction services in hotels. Tourism and Hospitality Research,
13(2), 67–82.
Kaushik, A. K., Agrawal, A. K., & Rahman, Z. (2015). Tourist behaviour towards self-service
hotel technology adoption: Trust and subjective norm as key antecedents. Tourism
Management Perspectives, 16, 278–289.
Kaushik, A. K., & Rahman, Z. (2015a). An alternative model of self-service retail technology
adoption. Journal of Services Marketing, 29(5), 406–420.

271
Kaushik, A. K., & Rahman, Z. (2015b). Innovation adoption across self-service banking
technologies in India. International Journal of Bank Marketing, 33(2), 96–121.
Kaushik, A. K., & Rahman, Z. (2016). Self-service innovativeness scale: Introduction,
development, and validation of scale. Service Business, 10(4), 799–822.
Kaushik, A. K., & Rahman, Z. (2017). An empirical investigation of tourist’s choice of service
delivery options: SSTs vs service employees. International Journal of Contemporary
Hospitality Management, 29(7), 1892–1913.
Kelley, S. W. (1989). Efficiency in service delivery: Technological or humanistic approaches?
Journal of Services Marketing, 3(3), 43–50.
Kelly, P., Lawlor, J., & Mulvey, M. (2017a). Customer roles in self-service technology
encounters in a tourism context. Journal of Travel & Tourism Marketing, 34(2), 222–
238.
Kelly, P., Lawlor, J., & Mulvey, M. (2017b). Self-service technologies: Service failures and
recovery. In E. Koc (Ed.), Service failures and recovery in tourism and hospitality: A
practical manual (pp. 100–121).
Kemper, E. A., Stringfield, S., & Teddie, C. (2003). Mixed methods sampling strategies in
social science research. In Handbook of mixed methods in social & behavioral research
(pp. 273–296). Thousand Oaks: SAGE Publications.
Kim, D., & Perdue, R. R. (2013). The effects of cognitive, affective, and sensory attributes on
hotel choice. International Journal of Hospitality Management, 35, 246–257.
Kim, J., Christodoulidou, N., & Brewer, P. (2012). Impact of individual differences and
consumers’ readiness on likelihood of using self-service technologies at hospitality
settings. Journal of Hospitality & Tourism Research, 36(1), 85–114.
Kim, M., & Qu, H. (2014). Travelers’ behavioral intention toward hotel self-service kiosks
usage. International Journal of Contemporary Hospitality Management, 26(2), 225–245.
272
Kim, W. G., & Cha, Y. (2002). Antecedents and consequences of relationship quality in hotel
industry. International Journal of Hospitality Management, 21(4), 321–338.
Kim, W. G., Cho, M., & Brymer, R. A. (2013). Determinants affecting comprehensive
property-level hotel performance: The moderating role of hotel type. International
Journal of Hospitality Management, 34, 404–412.
Kim, W. G., & Ham, S. (2006). The impact of information technology implementation on
service quality in the hotel industry. Information Technology in Hospitality, 4(4), 143–
151.
Kim, W. G., & Kim, D. J. (2004). Factors affecting online hotel reservation intention between
online and non-online customers. International Journal of Hospitality Management,
23(4), 381–395.
Kincaid, C. S., & Baloglu, S. (2006). An exploratory study on the impact of self-service
technology on restaurant operations. Journal of Foodservice Business Research, 8(3),
55–65.
King, C., So, K. K. F., & Grace, D. (2013). The influence of service brand orientation on hotel
employees’ attitude and behaviors in China. International Journal of Hospitality
Management, 34, 172–180.
Kingman-Brundage, J. (1989). The ABCs of service system blueprinting . In M J Bitner (Ed.),
Designing a winning service strategy (pp. 30–33). Chicago: American Marketing
Association.
Klaus, P. ‘Phil,’ & Maklan, S. (2013). Towards a better measure of customer experience.
International Journal of Market Research, 55(2), 227–246.
Kline, R. B. (2016). Principles and practices of structural equation modelling (4th ed), New
York, USA: Guilford publications.
Knutson, B. J., Beck, J. A., Kim, S., & Cha, J. (2009). Identifying the dimensions of the guest’s
hotel experience. Cornell Hospitality Quarterly, 50(1), 44–55.
273
Knutson, B., Stevens, P., Patton, M., & Thompson, C. (1993). Consumers’ expectations for
service quality in economy, mid-price and luxury hotels. Journal of Hospitality & Leisure
Marketing, 1(2), 27–43.
Kokkinou, A., & Cranage, D. A. (2013). Using self-service technology to reduce customer
waiting times. International Journal of Hospitality Management, 33, 435–445.
Kokkinou, A., & Cranage, D. A. (2015). Why wait? Impact of waiting lines on self-service
technology use. International Journal of Contemporary Hospitality Management, 27(6),
1181–1197.
Kolay, S. (2015). Manufacturer-provided services vs. Retailer-provided services: Effect on
product quality, channel profits and consumer welfare. International Journal of Research
in Marketing, 32(2), 124–154.
Kraak, J. M., & Holmqvist, J. (2017). The authentic service employee: Service employees’
language use for authentic service experiences. Journal of Business Research, 72, 199–
209.
Krolikowski, M., & Yuan, X. (2017). Friend or foe: Customer-supplier relationships and
innovation. Journal of Business Research, 78, 53–68.
Kucukusta, D., Heung, V., & Hui, S. (2014). Deploying self-service technology in luxury hotel
brands : Perceptions of business travelers. Journal of Travel & Tourism Marketing, 31(1),
55–70.
Kuo, C.-M., Chen, L.-C., & Tseng, C.-Y. (2017). Investigating an innovative service with
hospitality robots. International Journal of Contemporary Hospitality Management,
29(5), 1305–1321.
Kurnia, S., Karnali, R. J., & Rahim, M. M. (2015). A qualitative study of business-to-business
electronic commerce adoption within the Indonesian grocery industry: A multi-theory
perspective. Information & Management, 52(4), 518–536.
Kutner, J. S., Steiner, J. F., Corbett, K. K., Jahnigen, D. W., & Barton, P. L. (1999). Information
needs in terminal illness. Social Science & Medicine, 48(10), 1341–1352.

274
Larivière, B., Bowen, D., Andreassen, T. W., Kunz, W., Sirianni, N. J., Voss, C., … De Keyser,
A. (2017). “Service Encounter 2.0”: An investigation into the roles of technology,
employees and customers. Journal of Business Research.
Lau, P. Y. Y., Tong, J. L. Y. T., Lien, B. Y.-H., Hsu, Y.-C., & Chong, C. L. (2017). Ethical
work climate, employee commitment and proactive customer service performance: Test
of the mediating effects of organizational politics. Journal of Retailing and Consumer
Services, 35, 20–26.
Law, R., & Hsu, C. H. C. (2006). Importance of hotel website dimensions and attributes:
Perceptions of online browsers and online purchasers. Journal of Hospitality & Tourism
Research, 30(3), 295–312.
Law, R., & Wong, R. (2010). Analysing room rates and terms and conditions for the online
booking of hotel rooms. Asia Pacific Journal of Tourism Research, 15(1), 43–56.
Lee, H.-J., & Lyu, J. (2016). Personal values as determinants of intentions to use self-service
technology in retailing. Computers in Human Behavior, 60, 322–332.
Lee, H.-J., & Yang, K. (2013). Interpersonal service quality, self-service technology (SST)
service quality, and retail patronage. Journal of Retailing and Consumer Services, 20(1),
51–57.
Lee, J., & Ok, C. M. (2014). Understanding hotel employees’ service sabotage: Emotional
labor perspective based on conservation of resources theory. International Journal of
Hospitality Management, 36, 176–187.
Lee, L. Y.-S. (2016). Hospitality industry web-based self-service technology adoption model.
Journal of Hospitality & Tourism Research, 40(2), 162–197.
Lee, M. W., Yun, M. H., & Lee, J. S. (1996). High touch: Human factors in new product design.
Proceedings of the Human Factors and Ergonomics Society Annual Meeting, 40(7), 401–
405.
Lehtinen, U., & Lehtinen, J. R. (1991). Two approaches to service quality dimensions. Service
Industries Journal, 11(3), 287–303.
275
Lema, J. D. (2009). Preparing hospitality organizations for self-service technology. Journal of
Human Resources in Hospitality & Tourism, 8(2), 153–169.
Leonardi, P. M. (2011). When flexible routines meet flexible technologies: Affordance,
constraint, and the imbrication of human and material agencies. MIS Quarterly, 35(1),
147–167.
Leung, D., Lo, A., Fong, L. H. N., & Law, R. (2015). Applying the technology-organization-
environment framework to explore ICT initial and continued adoption: An exploratory
study of an independent hotel in Hong Kong. Tourism Recreation Research, 40(3), 391–
406.
Lewis, B. R., & Entwistle, T. W. (1990). Managing the service encounter: a focus on the
employee. International Journal of Service Industry Management, 1(3), 41–52.
Li, C. (2005). Employee flowing out of hotel and development of human resource management
[酒店员工流失及人力资源管理开发]. Tianjin University.
Li, J. (2015). Strongly promoting the rapid and health development of “Tourism + Internet” [
相融相盛 健康同行——大力促进我国“旅游+互联网”又好又快发展]. Retrieved
from http://www.cnta.gov.cn/xxfb/jdxwnew2/201509/t20150921_747586.shtml
Li, M., & Hsu, C. H. C. (2016). Linking customer-employee exchange and employee
innovative behavior. International Journal of Hospitality Management, 56, 87–97.
Li, Q.-H., & Li, B. (2016). Dual-channel supply chain equilibrium problems regarding retail
services and fairness concerns. Applied Mathematical Modelling, 40(15–16), 7349–
7367.
Liao, H.-L., & Lu, H.-P. (2008). The role of experience and innovation characteristics in the
adoption and continued use of e-learning websites. Computers & Education, 51(4),
1405–1416.
Liljander, V., Gillberg, F., Gummerus, J., & van Riel, A. (2006). Technology readiness and the
evaluation and adoption of self-service technologies. Journal of Retailing and Consumer
Services, 13(3), 177–191.
276
Lin, J.-S. C., & Hsieh, P.-L. (2006). The role of technology readiness in customers’ perception
and adoption of self‐service technologies. International Journal of Service Industry
Management, 17(5), 497–517.
Lin, J.-S. C., & Hsieh, P.-L. (2011). Assessing the self-service technology encounters:
Development and validation of SSTQUAL Scale. Journal of Retailing, 87(2), 194–206.
Liu, B., & Jin, O. (2009). Hotel self-service vending management system based on room key
card [基于房间锁匙卡的酒店自助售货管理系统]. Computer Systems & Applications,
(2), 22–25.
Liu, C., & Hung, K. (2019). Understanding self-service technology in hotels in China:
Technology affordances and constraints. In J. Pesonen & J. Neidhardt (Eds.), Information
and Communication Technologies in Tourism 2019 (pp. 225–236). Springer.
Liu, K. (2014). The moderating role of brand experience on the relationship between hotel
brand positioning and brand performance. The Hong Kong Polytechnic University.
Liu, Y. (2016). Customers’ sensing control, effect of self-efficacy for purchase intent in self-
service situation [自助服务情境下顾客感知控制、自我效能感对购买意向的影响].
The Guide of Science & Education, (3), 121–122, 154.
Locke, E. A. (1997). Self-efficacy: The exercise of control. In Personnel Psychology (Vol. 50).
New York: W.H. Freeman.
Lou, Z. (2010). Customers’ evaluation and use of SST: The moderating effects of company
image and self-efficacy [消费者对 SSTs 的评价与使用-企业形象、自我效能的调节
作用]. Management Review, 22(1), 29–36.
Lovelock, C. H. (1983). Classifying services to gain strategic marketing insights. Journal of
Marketing, 47(3) 9–20.
Lu, J.-L., Choi, J. K., & Tseng, W.-C. (2011). Determinants of passengers’ choice of airline
check-in services: A case study of American, Australian, Korean, and Taiwanese
passengers. Journal of Air Transport Management, 17(4), 249–252.

277
Lu, J.-L., Chou, H.-Y., & Ling, P.-C. (2009). Investigating passengers’ intentions to use
technology-based self check-in services. Transportation Research Part E: Logistics and
Transportation Review, 45(2), 345–356.
Lu, L., Cai, R., & Gursoy, D. (2019). Developing and validating a service robot integration
willingness scale. International Journal of Hospitality Management, 80, 36–51.
Lu, V. N., Capezio, A., Restubog, S. L. D., Garcia, P. R. J. M., & Wang, L. (2016). In pursuit
of service excellence: Investigating the role of psychological contracts and organizational
identification of frontline hotel employees. Tourism Management, 56, 8–19.
Luoh, H.-F., & Tsaur, S.-H. (2011). Customers’ perceptions of service quality: Do servers’ age
stereotypes matter? International Journal of Hospitality Management, 30(2), 283–289.
Lv, M., & Wang, X. (2009). Cause analysis of high hotel staff turnover rate [酒店员工高流失
率成因探析]. Northern Economy and Trade, (1), 132–133.
Lynne, G. D., Casey, C. F., Hodges, A., & Rahmani, M. (1995). Conservation technology
adoption decisions and the theory of planned behavior. Journal of Economic Psychology,
16(4), 581–598.
Maddux, J. E. (1995). Self-efficacy, adaptation, and adjustment : theory, research, and
application. New YorkLondon: Plenum Press.
Majchrzak, A., & Markus, M. L. (2012). Technology affordances and constraints in
management information systems (MIS). In E. Kessler (Ed.), Encyclopedia of
Management Theory (pp. 832–836). Thouasand Oaks: Sage Publications.
Mäkinen, O. (2016). Self-service technology in hotel reseption: Finnish customer perceptions.
University of Lapland.
Malhotra, N., Mavondo, F., Mukherjee, A., & Hooley, G. (2013). Service quality of frontline
employees: A profile deviation analysis. Journal of Business Research, 66(9), 1338–
1344.

278
Masiero, L., Pan, B., & Heo, C. Y. (2016). Asymmetric preference in hotel room choice and
implications on revenue management. International Journal of Hospitality Management,
56, 18–27.
Mathwick, C., Malhotra, N., & Rigdon, E. (2001). Experiential value: Conceptualization,
measurement and application in the catalog and Internet shopping environment. Journal
of Retailing, 77(1), 39–56.
Mattila, A. (1999a). An analysis of means-end hierarchies in cross-cultural context. Journal of
Hospitality & Leisure Marketing, 6(2), 19–28.
Mattila, A. (1999b). Consumers value judgments: How business travelers evaluate luxury-hotel
services. Cornell Hotel and Restaurant Administration Quarterly, 40(1), 40–46.
Mattila, A. (2001). Emotional bonding and restaurant loyalty. Cornell Hotel and Restaurant
Administration Quarterly, 42(6), 73–79.
Mattila, A., Cho, W., & Ro, H. (2011). The role of self-service technologies in restoring justice.
Journal of Business Research, 64(4), 348–355.
Mcgorry, S. Y. (2000). Measurement in a cross-cultural environment: Survey translation
issues. Qualitative Market Research: An International Journal, 3(2), 74–81.
McIntosh, A. J., & Siggs, A. (2005). An exploration of the experiential nature of boutique
accommodation. Journal of Travel Research, 44(1), 74–81.
Meade, N., & Islam, T. (2006). Modelling and forecasting the diffusion of innovation – A 25-
year review. International Journal of Forecasting, 22(3), 519–545.
Melián-González, S., & Bulchand-Gidumal, J. (2016). A model that connects information
technology and hotel performance. Tourism Management, 53, 30–37.
Melián-González, S., & Bulchand-Gidumal, J. (2017). Extending the scope of hotel client
reactions to employee injustice: Hotel employer reviews on the Internet. International
Journal of Hospitality Management, 63, 93–100.

279
Menguc, B., Auh, S., Fisher, M., & Haddad, A. (2013). To be engaged or not to be engaged:
The antecedents and consequences of service employee engagement. Journal of Business
Research, 66(11), 2163–2170.
Mest, C. E. (2014). Balancing high-tech and high-touch top marketing concerns. Hotel
Management, 7,72-73. Retrieved from
http://search.ebscohost.com/login.aspx?direct=true&db=bth&AN=96265185&site=eho
st-live
Meuter, M. L. & Bitner, M. J. (1998). Self-service technologies: Extending service frameworks
and identifying issues for research.. In D. Grewal & C. Pechmann (Eds.). AMA Winter
Educator’s Conference (Vol.9; pp. 12-19). Chicago, IL: American Marketing
Association.
Meuter, M. L., Bitner, M. J., Ostrom, A. L., & Brown, S. W. (2005). Choosing among
alternative service delivery modes: An investigation of customer trial of self-service
technologies. Journal of Marketing, 69(2), 61–83.
Meuter, M. L., Ostrom, A. L., Bitner, M. J., & Roundtree, R. (2003). The influence of
technology anxiety on consumer use and experiences with self-service technologies.
Journal of Business Research, 56(11), 899–906.
Meuter, M. L., Ostrom, A. L., Roundtree, R. I., & Bitner, M. J. (2000). Self-service
technologies: Understanding customer satisfaction with technology-based service
encounters. Journal of Marketing, 64(3), 50–64.
Meyer, C., & Schwager, A. (2007). Understanding Customer Experience. Harvard Business
Review, 85(2), 116–126.
Ministry of Culture and Tourism of the People’s Republic of China. (2019). The third quarter
statistical bulletin of national star hotels in 2018 [2018 年第三季度全国星级饭店统计
公 报 ]. Retrieved from
http://zwgk.mct.gov.cn/auto255/201902/t20190202_837197.html?keywords=

280
Mohr, L. A., & Bitner, M. J. (1995a). Process factors in service delivery: What employee effort
means to customers. Advances in Services Marketing and Management, 4, 91–117.
Mohr, L. A., & Bitner, M. J. (1995b). The role of employee effort in satisfaction with service
transactions. Journal of Business Research, 32(3), 239–252.
Mohr, L. A., & Henson, S. W. (1996). Impact of employee gender and job congruency on
customer satisfaction. Journal of Consumer Psychology, 5(2), 161–187.
Morris, A. (2015). A practical introduction to in-depth interviewing. London: SAGE.
Naisbitt, J. (1984). Megatrends : Ten new directions transforming our lives. New York, N.Y. :
Warner Books.
Naisbitt, J., Naisbitt, N., & Philips, D. (1999). High tech, high touch : Technology and our
search for meaning (1st ed.). New York: Broadway Books.
Ngo, L. V., & O’cass, A. (2013). Innovation and business success: The mediating role of
customer participation. Journal of Business Research, 66(8), 1134–1142.
Norman, D. A. (1988). The psychology of everyday things. New York: Basic Books.
Norman, D. A. (1999). Affordance, conventions, and design. Interactions, 6(3), 38–43.
Oh, H., Jeong, M., & Baloglu, S. (2013). Tourists’ adoption of self-service technologies at
resort hotels. Journal of Business Research, 66(6), 692–699.
Oh, H., Jeong, M., Lee, S., & Warnick, R. (2016). Attitudinal and situational determinants of
self-service technology use. Journal of Hospitality & Tourism Research, 40(2), 236–265.
Ong, L. I. (2010). Can self-service technologies work in the hotel industry in Singapore? A
conceptual framework for adopting self-service technology. University of Nevada, Las
Vegas.
Orel, F. D., & Kara, A. (2014). Supermarket self-checkout service quality, customer
satisfaction, and loyalty: Empirical evidence from an emerging market. Journal of
Retailing and Consumer Services, 21(2), 118–129.
281
Osmond, H. (1957). Function as the basis of psychiatric ward design. Psychiatric Services,
8(4), 23–27.
Otto, J. E., & Ritchie, J. R. B. (1996). The service experience in tourism. Tourism Management,
17(3), 165–174.
Overhill, H. (2012). JJ Gibson and Marshall McLuhan: A survey of terminology and a proposed
extension of the theory of affordances. Proceedings of the American Society for
Information Science and Technology, 49(1), 1–4.
Ozturk, A. B., & Hancer, M. (2014). Hotel and IT decision-maker characteristics and
information technology adoption relationship in the hotel industry. Journal of Hospitality
and Tourism Technology, 5(2), 194–206.
Palinkas, L. A., Horwitz, S. M., Green, C. A., Wisdom, J. P., Duan, N., & Hoagwood, K.
(2015). Purposeful sampling for qualitative data collection and analysis in mixed method
implementation research. Administration and Policy in Mental Health and Mental Health
Services Research, 42(5), 533–544.
Pan, B., Xiang, Z., Law, R., & Fesenmaier, D. R. (2011). The dynamics of search engine
marketing for tourist destinations. Journal of Travel Research, 50(4), 365–377.
Panda, A. K., Dash, S. K., & Rath, P. K. (2011). An investigation of reasons affecting customer
adoption and rejection of technology based self service (TBSS) on consumer satisfaction
and consumer commitment. BVIMR Management Edge, 4(2), 100–104.
Parasuraman, A. (2000). Technology Readiness Index (TRI): A multiple-item scale to measure
readiness to embrace new technologies. Journal of Service Research, 2(4), 307–320.
Parasuraman, A., Zeithaml, V. A., & Berry, L. L. (1985). A conceptual model of service quality
and its implications for future research. Journal of Marketing, 49(4), 41–50.
Parasuraman, A., Zeithaml, V. A., & Berry, L. L. (1988). Servqual: A multiple-item scale for
measuring consumer perc. Journal of Retailing, 64(1), 12.
282
Parise, S., Guinan, P. J., & Kafka, R. (2016). Solving the crisis of immediacy: How digital
technology can transform the customer experience. Business Horizons, 59(4), 411–420.
Patrício, L. (2005). Enhancing service delivery systems through technology: A
multidisciplinary perspective applied to internet banking. University of Porto.
Peng, Y. (2015). Research on the self-service remedy in other countries [国外自助服务补救
研究述评]. China Business and Market, (2), 65–71.
People’s network. (2017). The unmanned hotel of Ctrip without manual service [携程“无人酒
店 ” 全 程 无 需 人 工 服 务 ]. Retrieved from
http://sh.people.com.cn/n2/2017/0323/c134768-29906434.html
Piccoli, G., Lui, T.-W., & Grün, B. (2017). The impact of IT-enabled customer service systems
on service personalization, customer service perceptions, and hotel performance.
Tourism Management, 59, 349–362.
Pieterson, W., & Ebbers, W. (2008). The use of service channels by citizens in the Netherlands:
Implications for multi-channel management. International Review of Administrative
Sciences, 74(1), 95–110.
Pieterson, W., & Van Dijk, J. (2007). Channel choice determinants; An exploration of the
factors that determine the choice of a service channel in citizen initiated contacts. In
Proceedings of the 8th Annual International Conference on Digital Government
Research: Bridging Disciplines & Domains (pp. 173–182).
Pine, B. J., & Gilmore, J. H. (1998). Welcome to the experience economy. Harvard Business
Review, 76, 97–105.
Pizam, A., Uriely, N., & Reichel, A. (2010). The intensity of tourist-host social relationship
and its effects on satisfcation and change of attitudes: the case of working tourists in
Israel. Tourism Management, 21, 395–406.
283
Premkumar, G. (2003). A meta-analysis of research on information technology implementation
in small business. Journal of Organizational Computing and Electronic Commerce,
13(2), 91–121.
Price, L. L., Arnould, E. J., & Tierney, P. (1995). Going to extremes: Managing service
encounters and assessing provider performance. Journal of Marketing, 59(2), 83–97.
Prothro, J. W. (1956). Verbal shifts in the American presidency: A content analysis. American
Political Science Review, 50(3), 726–739.
Puccinelli, N. M., Goodstein, R. C., Grewal, D., Price, R., Raghubir, P., & Stewart, D. (2009).
Customer experience management in retailing: Understanding the buying process.
Journal of Retailing, 85(1), 15–30.
PWC. (2016). Tech breakthroughs megatrend: How to prepare for its impact. Retrieved from
https://www.pwc.in/assets/pdfs/publications/tech-breakthroughs-megatrend/tech-
breakthroughs-megatrend-how-to-prepare-for-its-impact.pdf
Qi, S., Law, R., & Buhalis, D. (2013). Who booked five-star hotels in Macau? A study of hotel
guests’ online booking intention. Journal of Hospitality and Tourism Management, 20,
76–83.
Quaddus, M., & Hofmeyer, G. (2017). An investigation into the factors influencing the
adoption of B2B trading exchanges in small businesses. European Journal of
Information Systems, 16(3), 202–215.
Racherla, P., & Hu, C. (2008). eCRM system adoption by hospitality organizations: A
technology-organization-environment (toe) framework. Journal of Hospitality and
Leisure Marketing, 17(1–2), 30–58.
Rangus, K., & Slavec, A. (2017). The interplay of decentralization, employee involvement and
absorptive capacity on firms’ innovation and business performance. Technological
Forecasting and Social Change, 120, 195–203.

284
Reddick, C. G., & Turner, M. (2012). Channel choice and public service delivery in Canada:
Comparing e-government to traditional service delivery. Government Information
Quarterly, 29(1), 1–11.
Rehman, T., McKemey, K., Yates, C. M., Cooke, R. J., Garforth, C. J., Tranter, R. B., …
Dorward, P. T. (2007). Identifying and understanding factors influencing the uptake of
new technologies on dairy farms in SW England using the theory of reasoned action.
Agricultural Systems, 94(2), 281–293.
Reid, R. D., & Sandler, M. (1992). The use of technology to improve service quality. Cornell
Hotel and Restaurant Administration Quarterly, 33(3), 68–73.
ResearchGate. (2016). Can the sample used for pilot testing be included in the final research
sample? Retrieved from
https://www.researchgate.net/post/Can_the_sample_used_for_pilot_testing_be_include
d_in_the_final_research_sample
Richter, R. (2000). How to give customers high-touch in high-tech web contact centers.
Electric Light & Power, 78(12), 31. Retrieved from
http://search.ebscohost.com/login.aspx?direct=true&db=bth&AN=3932062&site=ehost
-live
Rod, M., Ashill, N. J., & Gibbs, T. (2016). Customer perceptions of frontline employee service
delivery: A study of Russian bank customer satisfaction and behavioural intentions.
Journal of Retailing and Consumer Services, 30, 212–221.
https://doi.org/10.1016/j.jretconser.2016.02.005
Rogers, E. M. (1995). Diffusion of innovations (4th ed.). New York: Free Press.
Romps, N. G. (2007). Where Hi-Tech and the human touch intersect. (cover story). American
Gas, 89(3), 16–23. Retrieved from
http://search.ebscohost.com/login.aspx?direct=true&db=bth&AN=24727320&site=eho
st-live

285
Rosenbaum, M. S., & Wong, I. A. (2015). If you install it, will they use it? Understanding why
hospitality customers take “technological pauses” from self-service technology. Journal
of Business Research, 68(9), 1862–1868.
Rosenberg, H. R. (1994). High tech meets high touch. California Agriculture, 5.
Rust, R. T., & Espinoza, F. (2006). How technology advances influence business research and
marketing strategy. Journal of Business Research, 59(10–11), 1072–1078.
Sahadev, S., & Islam, N. (2005). Why hotels adopt ICTs: A study on the ICT adoption
propensity of hotels in Thailand. International Journal of Contemporary Hospitality
Management, 17(5), 391–401.
Saleh, F., & Ryan, C. (1992). Client perceptions of hotels: A multi-attribute approach. Tourism
Management, 13(2), 163–168.
Salem, I. E.-B., & Abdien, M. K. (2017). Implementation of employee cross-training during
perilous conditions in hotels. Tourism Management Perspectives, 23, 68–74.
Salomann, H., Dous, M., Kolbe, L., & Brenner, W. (2007). Self-service revisited: How to
balance high tech and high touch in customer relationships. European Management
Journal, 25(4), 310–319.
Salomann, H., Kolbe, L., & Brenner, W. (2006). Self-services in customer relationships:
Balancing high-tech and high-touch today and tomorrow. E-Service Journal, 4(2), 65–
84.
Satish, S. M., & Bharadhwaj, S. (2010). Information search behaviour among new car buyers:
A two-step cluster analysis. IIMB Management Review, 22(1–2), 5–15.
Schepers, J. J. L., Nijssen, E. J., & van der Heijden, G. A. H. (2016). Innovation in the frontline:
Exploring the relationship between role conflict, ideas for improvement, and employee
service performance. International Journal of Research in Marketing, 33(4), 797–817.

286
Scherer, A., & von Wangenheim, F. (2016). Man versus machine-How the service channel
affects customers’ responses to service encounters. 2016 AMA Winter Educators’
Proceedings, 27, K-4-K-5.
Schmitt, B. (1999). Experiential marketing : How to get customers to sense, feel, think, act,
and relate to your company and brands. New York: Free Press.
Schouten, J. W., McAlexander, J. H., & Koenig, H. F. (2007). Transcendent customer
experience and brand community. Journal of the Academy of Marketing Science, 35(3),
357–368.
Schumann, J. H., Wünderlich, N. V, & Wangenheim, F. (2012). Technology mediation in
service delivery: A new typology and an agenda for managers and academics.
Technovation, 32(2), 133–143.
Selnes, F., & Hansen, H. (2001). The potential hazard of self-service in developing customer
loyalty. Journal of Service Research, 4(2), 79–90.
Shamim, S., Cang, S., & Yu, H. (2017). Supervisory orientation, employee goal orientation,
and knowledge management among front line hotel employees. International Journal of
Hospitality Management, 62, 21–32.
Shareef, M. A., Dwivedi, Y. K., Kumar, V., & Kumar, U. (2016). Reformation of public service
to meet citizens’ needs as customers: Evaluating SMS as an alternative service delivery
channel. Computers in Human Behavior, 61, 255–270.
Sheppard, B. H., Hartwick, J., & Warshaw, P. R. (1988). The theory of reasoned action: A
meta-analysis of past research with recommendations for modifications and future
research. Journal of Consumer Research, 15(3), 325–343.
Shin, H., & Perdue, R. R. (2019). Self-service technology Research: A bibliometric co-citation
visualization analysis. International Journal of Hospitality Management, 80, 101–112.
Shostack, G. L. (1985). Planning the service encounter. In J. A. Czpiel, M. R. Soloman, & C.
F. Suprenat (Eds.), The service encounter (pp. 243–254). Lexicon, MA: Lexington
Books.
287
Shostack, G. L. (2006). Service positioning through structural change.Journal of Marketing,
51(1), 34.
Siguaw, J. A., Enz, C. A., & Namasivayam, K. (2000). Adoption of information technology in
US hotels: strategically driven objectives. Journal of Travel Research, 39(2), 192–201.
Silva, G. M., Styles, C., & Lages, L. F. (2017). Breakthrough innovation in international
business: The impact of tech-innovation and market-innovation on performance.
International Business Review, 26(2), 391–404.
Silvestro, R., Fitzgerald, L., Johnston, R., & Voss, C. (1992). Towards a classification of
service processes. International Journal of Service Industry Management, 3(3), 62–75.
Simon, F., & Usunier, J.-C. (2007). Cognitive, demographic, and situational determinants of
service customer preference for personnel-in-contact over self-service technology.
International Journal of Research in Marketing, 24(2), 163–173.
Simpson, G., & Clifton, J. (2017). Testing diffusion of innovations theory with data: Financial
incentives, early adopters, and distributed solar energy in Australia. Energy Research &
Social Science, 29, 12–22.
Sinclair-Maragh, G., Gursoy, D., & Vieregge, M. (2015). Residents׳ perceptions toward
tourism development: A factor-cluster approach. Journal of Destination Marketing &
Management, 4(1), 36–45.
Slovic, P. (1995). The construction of preference. American Psychologist, 50(5), 364–371.
Söderlund, M. (2017). Employee display of burnout in the service encounter and its impact on
customer satisfaction. Journal of Retailing and Consumer Services, 37, 168–176.
Söderlund, M., & Sagfossen, S. (2017). The depicted service employee in marketing
communications: An empirical assessment of the impact of facial happiness. Journal of
Retailing and Consumer Services, 38, 186–193.

288
Sohu. (2018). Notable progress has been made in the strategy of making China a manufacturing
powerhouse [制造强国战略成效显著,2018 年“中国制造 2025”在六大方面重点推
进]. Retrieved from http://www.sohu.com/a/220405778_99918913
Solomon, M. R., Surprenant, C., Czepiel, J. A., & Gutman, E. G. (1985). A role theory
perspective on dyadic interactions: The service encounter. Journal of Marketing, 49(1),
99–111.
Song, S. M., Kim, E., Tang, R. (Liang), & Bosselman, R. (2015). Exploring the determinants
of e-Commerce by integrating a technology–organization–environment framework and
an expectation–confirmation model. Tourism Analysis, 20(6), 689–696.
https://doi.org/10.3727/108354215x14464845878156
Sousa, R., & Voss, C. A. (2006). Service quality in multichannel services employing virtual
channels. Journal of Service Research, 8(4), 356–371.
Sparks, B. A., & Browning, V. (2011). The impact of online reviews on hotel booking
intentions and perception of trust. Tourism Management, 32(6), 1310–1323.
State Council. (2017). Development planning for a new generation of artificial intelligence [国
务 院 关 于 印 发 新 一 代 人 工 智 能 发 展 规 划 的 通 知 ]. Retrieved from
http://www.gov.cn/zhengce/content/2017-07/20/content_5211996.htm
State Taxation Administration. (2017). Announcement on issues related to the issuance of VAT
invoices [ 关 于 增 值 税 发 票 开 具 有 关 问 题 的 公 告 ]. Retrieved from
http://www.chinatax.gov.cn/n810341/n810755/c2644618/content.html
Stockdale, R. (2007). Managing customer relationships in the self-service environment of e-
tourism. Journal of Vacation Marketing, 13(3), 205–219.
Stoshikj, M., Kryvinska, N., & Strauss, C. (2016). Service systems and service innovation:
Two pillars of service science. Procedia Computer Science, 83, 212–220.
Su, C. S. (2011). The role of service innovation and customer experience in ethnic restaurants.
Service Industries Journal, 31(3), 425–440.
289
Sudarno, B. E. P. (2012). Analysis tracking online payment system. International Journal of Scientific & Technology Research.1(10), 55-60.
Sun, S. (1990). Tourism economy research in China [中国旅游经济研究]. Beijing: People’s
Publishing House.
Tashakkori, A., & Teddlie, C. (2003). Handbook of mixed methods in social & behavioral
research. Thousand Oaks: SAGE Publications.
Teddlie, C., & Tashakkori, A. (2003). Major issues and controveries inthe use of mixed
methods in the social and behvioral sciences. In Handbook of mixed methods in social &
behavioral research (pp. 3–50). Thousand Oaks: SAGE Publications.
Teddlie, C., & Yu, F. (2007). Mixed methods sampling: A typology with examples. Journal of
Mixed Methods Research, 1(1), 77–100.
Teo, T. S. H., Lin, S., & Lai, K. (2009). Adopters and non-adopters of e-procurement in
Singapore: An empirical study. Omega, 37(5), 972–987.
The Beijing News. (2015). Ali “Future Hotel”, promoting “Xinyongzhu” improve customer
experience [ 阿里 “ 未来酒店 ” 推 “ 信用住 ” 提升用户体验 ]. Retrieved from
http://epaper.bjnews.com.cn/html/2015-04/01/content_569306.htm?div=-1
The Central People’s Government of the People’s Republic of China. (2005). The law of the
People’s Republic of China on administrative penalties for public security [中华人民共
和 国 治 安 管 理 处 罚 法 ]. Retrieved from http://www.gov.cn/ziliao/flfg/2005-
08/29/content_27130.htm
The Ministry of Public Security of the People’s Republic of China. (2017). A draft of the new
regulation on the security administration of tourism [《旅馆业治安管理条例(征求意
见 稿 ) 》 ]. Retrieved from
http://www.mps.gov.cn/n2254536/n4904355/c5632516/content.html
Tornatzky, L. G., & Fleischer, M. (1990). The processes of technological innovation.
Lexington, MA: Lexington Books.

290
Travel Daily. (2017). Facial recognition system for check-in TenCent, alliance with eLong and
Zhuzher, launched “WeChat Eco Hotel” [刷脸入住 腾讯联合艺龙和住哲打造微信生
态酒店]. Retrieved from http://www.traveldaily.cn/article/110335
Triplett, T. E. D. (2013). An effective cross-sell strategy: Both high-tech and High-touch. ABA
Bank Marketing, 45(10), 34. Retrieved from
http://search.ebscohost.com/login.aspx?direct=true&db=bth&AN=92688935&site=eho
st-live
Tse, A., & Wu, J. (2018). Why ‘Made in China 2025’ triggered the wrath of President Trump.
Retrieved from https://multimedia.scmp.com/news/china/article/made-in-China-
2025/index.html
Tseng, S.-M. (2015). Exploring the intention to continue using web-based self-service. Journal
of Retailing and Consumer Services, 24, 85–93.
Turel, O., Connelly, C. E., & Fisk, G. M. (2013). Service with an e-smile: Employee
authenticity and customer use of web-based support services. Information &
Management, 50(2–3), 98–104.
Turkle, S. (2011). Alone together why we expect more from technology and less from each
other. New York: Basic Books.
van den Boer, Y., Arendsen, R., & Pieterson, W. (2016). In search of information: Investigating
source and channel choices in business-to-government service interactions. Government
Information Quarterly, 33(1), 40–52.
Veal, A. J. (2011). Research methods for leisure and tourism: A practical guide (4th ed.).
England: Pearson Education.
Venkatesh, V., Morris, M. G., Davis, G. B., & Davis, F. D. (2003). User acceptance of
information technology: Toward a unified view. MIS Quarterly, 27(3), 425–478.
Victorino, L., Verma, R., Plaschka, G., & Dev, C. (2005). Service innovation and customer
choices in the hospitality industry. Managing Service Quality: An International Journal,
15(6), 555–576.
291
Violino, B. (2009). Hight-touch industry turns to High tech. Baseline, (98), 32–34. Retrieved
from
http://search.ebscohost.com/login.aspx?direct=true&db=bth&AN=44103370&site=eho
st-live
Voelker, M. P. (2010). Using high tech to high touch. TechDecisions, S6–S9. Retrieved from
http://search.ebscohost.com/login.aspx?direct=true&db=bth&AN=52447734&site=eho
st-live
Waller, V., Farquharson, K., & Dempsey, D. (2016). Qualitative social research:
Contemporary methods for the digital age. London: SAGE.
Walls, A. R. (2013). A cross-sectional examination of hotel consumer experience and relative
effects on consumer values. International Journal of Hospitality Management, 32, 179–
192.
Wang, C., Harris, J., & Patterson, P. G. (2012). Customer choice of self-service technology:
The roles of situational influences and past experience. Journal of Service Management,
23(1), 54–78.
Wang, D., Park, S., & Fesenmaier, D. R. (2012). The role of smartphones in mediating the
touristic experience. Journal of Travel Research, 51(4), 371–387.
Wang, D., Xiang, Z., & Fesenmaier, D. R. (2014). Adapting to the mobile world: A model of
smartphone use. Annals of Tourism Research, 48, 11–26.
Wang, D. (2015). Research on the relationship of self-service quality, customer satisfaction
and channel migration [自助服务质量、顾客满意与渠道迁移关系研究]. Liaoning
University.
Wang, G., Wang, J., Ma, X., & Qiu, R. G. (2010). The effect of standardization and
customization on service satisfaction. Journal of Service Science, 2(1), 1–23.
Wang, J. (2012). Consumer satisfaction of empirical research-based on web self-service type
pivot [消费者满意度实证研究-以网络自助服务类型为研究枢轴]. Technoeconomic
& Management Research, (10), 61–64.

292
Wang, L., Law, R., Guillet, B. D., Hung, K., & Fong, D. K. C. (2015). Impact of hotel website
quality on online booking intentions: eTrust as a mediator. International Journal of
Hospitality Management, 47, 108–115.
Wang, Lisha, Song, H., & Wang, Y. (2017). Pricing and service decisions of complementary
products in a dual-channel supply chain. Computers & Industrial Engineering, 105, 223–
233.
Wang, Q. (2010). The impact of self-service technology on service firm performance in China:
A multi-case study [自助服务科技对企业绩效影响的多案例研究 ]. Zhejiang
Gongshang University.
Wang, S., Hung, K., & Li, M. (2018). Development of measurement scale for functional
congruity in guest houses. Tourism Management, 68, 23–31.
Wang, W. (2016). Research on self-service of libraries based on user experience [基于用户体
验的图书馆自助服务研究]. Library Research, 46(2), 87–90.
Wang, Y.-S. S., Li, H.-T. T., Li, C.-R. R., & Zhang, D.-Z. Z. (2016). Factors affecting hotels’
adoption of mobile reservation systems: A technology-organization-environment
framework. Tourism Management, 53, 163–172.
Wang, Y. (2013). The study of customer participation’s impact on customer value in SSTs
context—Illustrated by the case of e-bank [SSTs 下顾客参与对顾客价值的影响研究-
以网上银行为例]. Shandong University, Weihai.
Wang, Y. S., Li, H. T., Li, C. R., & Zhang, D. Z. (2016). Factors affecting hotels’ adoption of
mobile reservation systems: A technology-organization-environment framework.
Tourism Management, 53, 163–172.
Warren, W. E., Abercrombie, C. L., & Berl, R. L. (1989). Adoption of a service innovation: A
case study with managerial implications. Journal of Services Marketing, 3(1), 21–33.
Weber, R. M. (2002). High tech versus high touch. Journal of Financial Service Professionals,
56(2), 34.

293
Wei, W., Lu, Y., Miao, L., Cai, L. A., & Wang, C. (2017). Customer-customer interactions
(CCIs) at conferences: An identity approach. Tourism Management, 59, 154–170.
Wei, W., Torres, E., & Hua, N. (2016). Improving consumer commitment through the
integration of self-service technologies: A transcendent consumer experience
perspective. International Journal of Hospitality Management, 59, 105–115.
Wei, W., Torres, E. N., & Hua, N. (2017). The power of self-service technologies in creating
transcendent service experiences. International Journal of Contemporary Hospitality
Management, 29(6), 1599–1618.
Weijters, B., Rangarajan, D., Falk, T., & Schillewaert, N. (2007). Determinants and outcomes
of customers’ use of self-service technology in a retail setting. Journal of Service
Research, 10(1), 3–21.
Williams, M. D., Rana, N. P., & Dwivedi, Y. K. (2015). The unified theory of acceptance and
use of technology (UTAUT): a literature review. Journal of Enterprise Information
Management, 28(3), 443–488.
Willis, J. (2007). Foundations of qualitative research: Interpretive and critical approaches.
Thousand Oaks: Sage Publications.
Wittmer, A. (2011). Acceptance of self-service check-in at Zurich airport. Research in
Transportation Business & Management, 1(1), 136–143.
Wu, C. H.-J. J., & Liang, R.-D. Da. (2009). Effect of experiential value on customer satisfaction
with service encounters in luxury-hotel restaurants. International Journal of Hospitality
Management, 28(4), 586–593.
Wu, C. H. J., & Liang, R. Da. (2009). Effect of experiential value on customer satisfaction with
service encounters in luxury-hotel restaurants. International Journal of Hospitality
Management, 28(4), 586–593.
Wünderlich, N. V, Wangenheim, F. v, & Bitner, M. J. (2013). High tech and high touch: A
framework for understanding user attitudes and behaviors related to smart interactive
services. Journal of Service Research, 16(1), 3–20.
294
Xie, B. (2014). Self- vs traditional: Research on implicit attitude of consuming style [自助服
务 vs 人工服务:消费内隐态度影响]. Nanjing University.
Xu, B. J. (2010). Luxury hotel brand equity, customer experience, and their antecedents: A
study of business travellers in Hong Kong. The Hong Kong Polytechnic University.
Xu, H., Liu, Z. Z., & Zhang, S. H. (2012). A strategic analysis of dual-channel supply chain
design with price and delivery lead time considerations. International Journal of
Production Economics, 139(2), 654–663.
Yadegaridehkordi, E., Nilashi, M., Nasir, M. H. N. B. M., & Ibrahim, O. (2018). Predicting
determinants of hotel success and development using Structural Equation Modelling
(SEM)-ANFIS method. Tourism Management, 66(2018), 364–386.
Yang, Q., & Yin, Q. (2012). A simple analysis of the phenomenon and countermeasures of
China’s hotel staff turnover [浅析我国酒店员工流失现象及对策]. Business, (22), 53–
54.
Yang, S. Y. (2008). The resort hotel experience: Conceptualization, measurement, and relation
to antecedents and consequences. The Hong Kong Polytechnic University.
Yaşlıoğlu, M., Çalışkan, B. Ö. Ö., & Şap, Ö. (2013). The role of innovation and perceived
service quality in creating customer value: A study on employees of a call center
establishment. Procedia - Social and Behavioral Sciences, 99, 629–635.
Yee, R. W. Y., Yeung, A. C. L., & Cheng, T. C. E. (2008). The impact of employee satisfaction
on quality and profitability in high-contact service industries. Journal of Operations
Management, 26(5), 651–668.
Yee, R. W. Y., Yeung, A. C. L., & Edwin Cheng, T. C. (2010). An empirical study of employee
loyalty, service quality and firm performance in the service industry. International
Journal of Production Economics, 124(1), 109–120.
Yen, D. C., Wu, C.-S., Cheng, F.-F., & Huang, Y.-W. (2010). Determinants of users’ intention
to adopt wireless technology: An empirical study by integrating TTF with TAM.
Computers in Human Behavior, 26(5), 906–915.
295
Yeo, V. C. S., Goh, S.-K., & Rezaei, S. (2017). Consumer experiences, attitude and behavioral
intention toward online food delivery (OFD) services. Journal of Retailing and
Consumer Services, 35, 150–162.
Yi, M. Y., Jackson, J. D., Park, J. S., & Probst, J. C. (2006). Understanding information
technology acceptance by individual professionals: Toward an integrative view.
Information & Management, 43, 350–363.
Yoo, K.-H., & Gretzel, U. (2011). Influence of personality on travel-related consumer-
generated media creation. Computers in Human Behavior, 27(2), 609–621.
Yuan, Y.-H. “Erin", & Wu, C. “Kenny". (2008). Relationships among experiential marketing,
experiential value, and customer satisfaction. Journal of Hospitality & Tourism
Research, 32(3), 387–410.
Yung, E., & Chan, A. (2002). Business traveler satisfaction with hotel service encounters.
Journal of Travel & Tourism Marketing, 11(4), 29–41.
Zatori, A., Smith, M. K., & Puczko, L. (2018). Experience-involvement, memorability and
authenticity: The service provider’s effect on tourist experience. Tourism Management,
67, 111–126.
Zeithaml, V. A., Berry, L. L., & Parasuraman, A. (1996). The behavioral consequences of
service quality. Journal of Marketing, 60(2), 31–46.
Zeithaml, V. A., & Gilly, M. C. (1987). Characteristics affecting the acceptance of retailing
technologies: A comparison of elderly and nonelderly consumers. Journal of Retailing.
63(1), 49-68.
Zhang, C., & Dhaliwal, J. (2009). An investigation of resource-based and institutional theoretic
factors in technology adoption for operations and supply chain management.
International Journal of Production Economics, 120(1), 252–269.
Zhang, J., Cai, L. A., & Kavanaugh, R. R. (2008). Dimensions in building brand experience
for economy hotels—A case of emerging market. Journal of China Tourism Research,
4(1), 61–77.

296
Zhang, N., & Liu, Z. (2013). Self-service terminal interface design method based on users’
cognitive skills [基于用户认知能力的自助服务终端界面交互设计方法]. Application
Research of Computers, 30(8), 2455–2460.
Zhang, R. (2012). The research of the effect of the characteristic of self-service technology on
customer perceived value and cultural dimension [自助服务技术对顾客感知价值及文
化影响研究]. Southwestern University of Finance and Economics.
Zhang, Y. (2013). The opportunities and challenges faced by China’s self-service development
[我国自助服务发展面临的机遇与挑战]. Air Transport & Business, (11), 55–57.
Zhu, Z., Nakata, C., Sivakumar, K., & Grewal, D. (2007). Self-service technology
effectiveness: The role of design features and individual traits. Journal of the Academy
of Marketing Science, 35(4), 492–506.
Zhu, Z., Nakata, C., Sivakumar, K., & Grewal, D. (2013). Fix it or leave it? Customer recovery
from self-service technology failures. Journal of Retailing, 89(1), 15–29.
Zins, A. H. (1998). Leisure traveler choice models of theme hotels using psychographics.
Journal of Travel Research, 36(4), 3–15.
Zins, A. H. (2002). Consumption emotions, experience quality and satisfaction: A structural
analysis for complainers versus non-complainers. Journal of Travel & Tourism
Marketing, 12(2–3), 3–18.
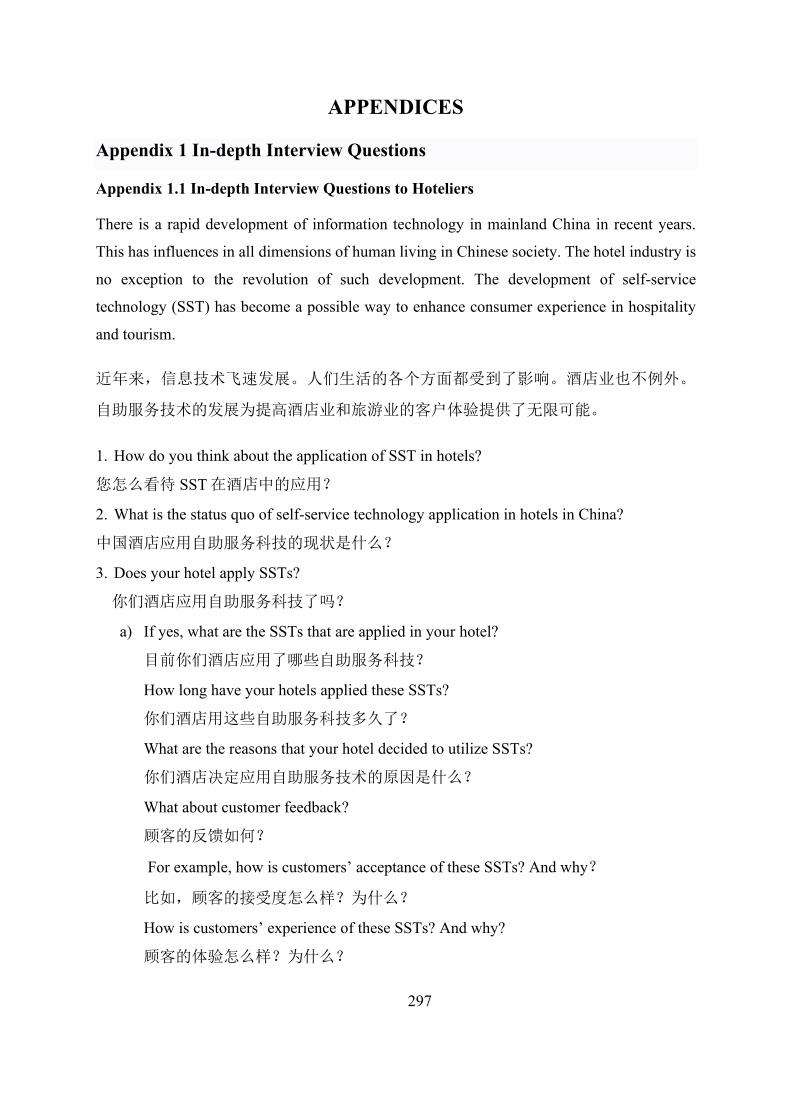
297
APPENDICES
Appendix 1 In-depth Interview Questions
Appendix 1.1 In-depth Interview Questions to Hoteliers
There is a rapid development of information technology in mainland China in recent years.
This has influences in all dimensions of human living in Chinese society. The hotel industry is
no exception to the revolution of such development. The development of self-service
technology (SST) has become a possible way to enhance consumer experience in hospitality
and tourism.
近年来,信息技术飞速发展。人们生活的各个方面都受到了影响。酒店业也不例外。
自助服务技术的发展为提高酒店业和旅游业的客户体验提供了无限可能。
1. How do you think about the application of SST in hotels?
您怎么看待 SST 在酒店中的应用?
2. What is the status quo of self-service technology application in hotels in China?
中国酒店应用自助服务科技的现状是什么?
3. Does your hotel apply SSTs?
你们酒店应用自助服务科技了吗?
a) If yes, what are the SSTs that are applied in your hotel?
目前你们酒店应用了哪些自助服务科技?
How long have your hotels applied these SSTs?
你们酒店用这些自助服务科技多久了?
What are the reasons that your hotel decided to utilize SSTs?
你们酒店决定应用自助服务技术的原因是什么?
What about customer feedback?
顾客的反馈如何?
For example, how is customers’ acceptance of these SSTs? And why?
比如,顾客的接受度怎么样?为什么?
How is customers’ experience of these SSTs? And why?
顾客的体验怎么样?为什么?
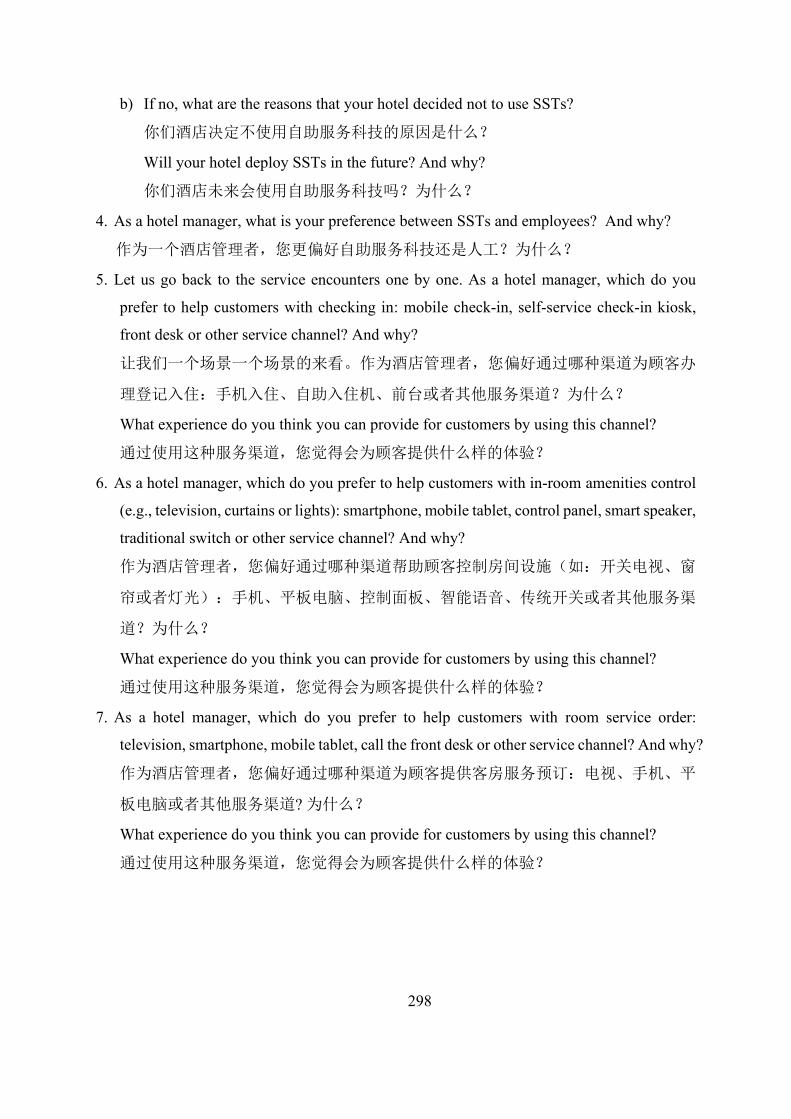
298
b) If no, what are the reasons that your hotel decided not to use SSTs?
你们酒店决定不使用自助服务科技的原因是什么?
Will your hotel deploy SSTs in the future? And why?
你们酒店未来会使用自助服务科技吗?为什么?
4. As a hotel manager, what is your preference between SSTs and employees? And why?
作为一个酒店管理者,您更偏好自助服务科技还是人工?为什么?
5. Let us go back to the service encounters one by one. As a hotel manager, which do you
prefer to help customers with checking in: mobile check-in, self-service check-in kiosk,
front desk or other service channel? And why?
让我们一个场景一个场景的来看。作为酒店管理者,您偏好通过哪种渠道为顾客办
理登记入住:手机入住、自助入住机、前台或者其他服务渠道?为什么?
What experience do you think you can provide for customers by using this channel?
通过使用这种服务渠道,您觉得会为顾客提供什么样的体验?
6. As a hotel manager, which do you prefer to help customers with in-room amenities control
(e.g., television, curtains or lights): smartphone, mobile tablet, control panel, smart speaker,
traditional switch or other service channel? And why?
作为酒店管理者,您偏好通过哪种渠道帮助顾客控制房间设施(如:开关电视、窗
帘或者灯光):手机、平板电脑、控制面板、智能语音、传统开关或者其他服务渠
道?为什么?
What experience do you think you can provide for customers by using this channel?
通过使用这种服务渠道,您觉得会为顾客提供什么样的体验?
7. As a hotel manager, which do you prefer to help customers with room service order:
television, smartphone, mobile tablet, call the front desk or other service channel? And why?
作为酒店管理者,您偏好通过哪种渠道为顾客提供客房服务预订:电视、手机、平
板电脑或者其他服务渠道? 为什么?
What experience do you think you can provide for customers by using this channel?
通过使用这种服务渠道,您觉得会为顾客提供什么样的体验?
299
8. As a hotel manager, which do you prefer to help customers with room service deliver: robot
or service employee? And why?
作为酒店管理者,您偏好通过哪种渠道为顾客递送客房服务:机器人还是服务员?
为什么?
What experience do you think you can provide for customers by using this channel?
通过使用这种服务渠道,您觉得会为顾客提供什么样的体验?
9. As a hotel manager, which do you prefer to help customers help customers with food or
other services order at restaurants in hotels: smartphone, mobile tablet, service employees,
or other service channel? And why?
作为酒店管理者,您偏好通过哪种渠道为顾客在餐厅里点餐或预订其他服务:手机、
平板电脑、服务员或者其他服务渠道? 为什么?
What experience do you think you can provide for customers by using this channel?
通过使用这种服务渠道,您觉得会为顾客提供什么样的体验?
10. As a hotel manager, which do you prefer to help customers with service delivery (e.g.,
service the dishes) at restaurants: robot or service employee? And why?
作为酒店管理者,您偏好通过哪种渠道为顾客在餐厅里递送服务(如:上菜):机
器人还是服务员?为什么?
What experience do you think you can provide for customers by using this channel?
通过使用这种服务渠道,您觉得会为顾客提供什么样的体验?
11. As a hotel manager, which do you prefer to help customers with checking out: mobile check
out, self-service check-out kiosk, front desk, or other service channel? And why?
作为酒店管理者,您偏好通过哪种渠道为顾客办理退房:手机、自助退房机、前台
或者其他服务渠道?为什么?
What experience do you think you can provide for customers by using this channel?
通过使用这种服务渠道,您觉得会为顾客提供什么样的体验?

300
12. As a hotel manager, which do you prefer to help customers with obtaining an invoice:
scan QR code, self-service kiosk, front desk, or other service channel? And why?
作为酒店管理者,您偏好通过哪种渠道为顾客开发票:扫二维码开发票、自助开发
票机、前台或者其他服务渠道?为什么?
What experience do you think you can provide for customers by using this channel?
通过使用这种服务渠道,您觉得会为顾客提供什么样的体验?
13. How do you think the application of SST in hotels in the future? And why?
您怎么看待自助服务技术未来在酒店的应用?为什么?
14. Demographics of Participant 受访者的人口统计学特征
Age 年龄:
Gender 性别:
Education level 受教育程度:
Position 职位:
How many years have you been a hotel manager?请问您当酒店经理有多少年了?
15. Demographics of Hotel:酒店的统计学特征
Name of hotel 酒店名称:
Number of rooms 客房数量:
The age of hotel 酒店年龄:
Hotel grades 酒店星级:
Hotel segment (e.g., Luxury and Economy) 酒店分类 (如:豪华型和经济型):
Hotel category (Business/ Leisure) 酒店类型(商务/度假):
Brand affiliation (International chain/Domestic chain/ Independent)
酒店隶属关系 (国际连锁/国内连锁/独立产权):
No._______________ Date_______________ Name_______________

301
Appendix 1.2 In-depth Interview Questions to Customers
1. How about your last accommodation? Let us go back to your check-in, room, restaurant….
您上次的住宿体验怎么样?让我们回想一下,从登记入住开始到客房到餐厅……
2. What are the reasons that you choose this hotel?
您选择这家酒店的原因是什么?
3. There is a rapid development of information technology in mainland China in recent years. This
has influences in all dimensions of human living in Chinese society. The hotel industry is no
exception to the revolution of such development. The development of self-service technology
(SST) has become a possible way to enhance consumer experience in hospitality and tourism.
近年来,信息技术飞速发展。人们生活的各个方面都受到了影响。酒店业也不例外。
自助服务技术的发展为提高酒店业和旅游业的客户体验提供了无限可能。
Does the hotel’s application of SST influence your choice of hotel?
酒店应用自助服务技术会影响你对酒店的选择吗?
To what extent? Any why?
多大程度上会影响你的选择? 为什么?
4. Has the hotel you stayed last time applied SSTs?
您上次住的酒店有自助服务科技吗?
a) If yes, did you used SST last time during your stay?
如果有,您上次使用了自助服务科技吗?
i) If yes, which type of SSTs did you use?
如果使用了,您使用了哪种自助服务科技
How about your experience with using SST?
您使用自助服务科技的体验如何?
ii) If no, what are the reasons that you did not use SSTs?
如果没有,您没有使用自助服务科技的原因是什么?
b) If no, go to question 5.
如果您上次住的酒店没有自助服务科技,跳至问题 5
302
5. Next time, if you have a chance to use SSTs during the hotel service delivery process (e.g.,
check-in, room, restaurant, and check out), will you use SSTs? Or retain to traditional human
services? Any why?
下一次,如果有机会在酒店服务过程中(如:登记入住、客房、餐厅和退房)使用自
助服务科技,您会使用自助服务科技吗?或者继续使用传统的人工服务? 为什么?
6. Let us go back to the service encounters one by one. In terms of check-in, which do you prefer:
mobile check-in, self-service check-in kiosk, front desk, or other service channel? Any why?
让我们一个场景一个场景的来看。关于登记入住,您偏好哪种:手机入住、自助入住
机、前台或者其他服务渠道?为什么?
What experience do you think you can obtain by using this channel?
通过使用这种服务渠道,您觉得您会获得什么样的体验?
7. In terms of control in-room amenities (e.g., television, curtains, or lights), which do you prefer:
smartphone, mobile tablet, control panel, smart speaker, traditional switch, or other service
channel? Any why?
关于使用房间设施 (如:开关电视、窗帘或灯光),您偏好哪种:手机、平板电脑、控
制面板、智能语音、传统开关或者其他服务渠道?为什么?
What experience do you think you can obtain by using this channel?
通过使用这种服务渠道,您觉得您会获得什么样的体验?
8. In terms of room service order, which do you prefer: television, smartphone, mobile tablet, call
the front desk, or other service channel? And why?
关于客房服务预订,您偏好哪种:电视、手机、平板电脑或者其他服务渠道? 为什么?
What experience do you think you can obtain by using this channel?
通过使用这种服务渠道,您觉得您会获得什么样的体验?
9. Regarding room service delivery, which do you prefer: robot or service employee? And why?
关于客房服务递送,您偏好哪种:机器人还是服务员?为什么?
What experience do you think you can obtain by using this channel?
通过使用这种服务渠道,您觉得您会获得什么样的体验?
303
10. Regarding food or other services order at restaurants, which do you prefer: smartphone, mobile
tablet, service employees, or other service channel? And why?
关于在餐厅里点餐或预订其他服务,您偏好哪种:手机、平板电脑、服务员或者其他
服务渠道? 为什么?
What experience do you think you can obtain by using this channel?
通过使用这种服务渠道,您觉得您会获得什么样的体验?
11. Regarding service delivery (e.g., service the dishes) at restaurants, which do you prefer: robot
or service employee? Any why?
关于在餐厅里递送服务(如:上菜),您偏好哪种:机器人还是服务员?为什么?
What experience do you think you can obtain by using this channel?
通过使用这种服务渠道,您觉得您会获得什么样的体验?
12. In terms of check out, which do you prefer: mobile check out, self-service check-out kiosk,
front desk, or other service channel? And why?
关于退房,您偏好哪种:手机、自助退房机、前台或者其他服务渠道?为什么?
What experience do you think you can obtain by using this channel?
通过使用这种服务渠道,您觉得您会获得什么样的体验?
13. In terms of obtaining an invoice, which do you prefer: scan QR code, self-service kiosk, front
desk or other service channel? And why?
关于开发票,您偏好哪种:扫二维码开发票、自助开发票机、前台或者其他服务渠道?
为什么?
What experience do you think you can obtain by using this channel?
通过使用这种服务渠道,您觉得您会获得什么样的体验?
14. How do you think the application of SST in hotels in the future? Any why?
您怎么看待自助服务技术未来在酒店的应用?为什么?
15. Demographics of Participant 受访者的人口统计学特征:
Age 年龄:
Gender 性别:
Education level 受教育程度:
304
16. Demographics of Hotel 酒店的统计学特征:
Name of hotel 酒店名称:
Number of rooms 客房数量:
The age of hotel 酒店年龄:
Hotel grades 酒店星级:
Hotel segment (e.g., Luxury and Economy) 酒店分类 (如:豪华型和经济型):
Hotel category (Business/ Leisure) 酒店类型(商务/度假):
Brand affiliation (International chain/Domestic chain/ Independent)
酒店隶属关系 (国际连锁/国内连锁/独立产权):
17. Accommodation Profile 住宿简要
Accommodation purpose 住宿目的:
Total stay duration 住宿时长:
Accommodation companion 住宿同伴:
How many trips take per year 一年旅行几次?
Do you usually travel outbound or domestically? 您经常去国外旅游还是国内旅游?
No._______________ Date_______________ Name_______________

305
Appendix 2 Interviewees’ Preferences by Hotel Service Stage
Appendix 2.1 Customer Interviewees’ Preferences by Hotel Service Stage (N = 30)
Informant No.
Check-in
Control In-room Facilities
Order room service
Deliver room service
Order service at restaurants/bars
Deliver service at restaurants/bars Check-out
Obtain an invoice
Control lights
Control curtains
Control television, air conditioners, or music
Customer #1
Front desk NA NA NA Mobile tablet NA Mobile tablet Robot or service
employee NA NA
Customer #2
Mobile check-in
NA NA NA Mobile tablet Robot Mobile tablet Robot or service employee SSK NA
Customer #3 SSK NA NA
AI management system
Mobile tablet Service employee
Service employee or mobile tablet
Robot or service employee Front desk NA
Customer #4
Mobile check-in
NA NA NA Mobile tablet or call front desk
Robot Mobile tablet Service employee Mobile check out NA
Customer #5
Front desk NA NA NA
AI management system
Service employee Service employee Service employee SST NA
Customer #6
Front desk NA NA NA
AI management system
Service employee Service employee NA Mobile
check-out NA
Customer #7
Mobile check-in
NA NA NA AI management system
NA Mobile tablet NA Television check-out system
NA
Customer #8
Front desk Control panel Control panel NA
Smartphone ordering system
Service employee Mobile tablet NA SSK SSK
Customer #9 SSK Control panel Control panel
AI management system
NA Robot Service employee or mobile tablet Robot Box Scan QR
code
Customer #10 SSK Control panel Control panel
AI management system
AI management system
Service employee Mobile tablet Robot NA NA
Customer #11
Front desk Control panel Control panel NA Call front
desk Robot Service employee or mobile tablet
Robot or service employee NA NA
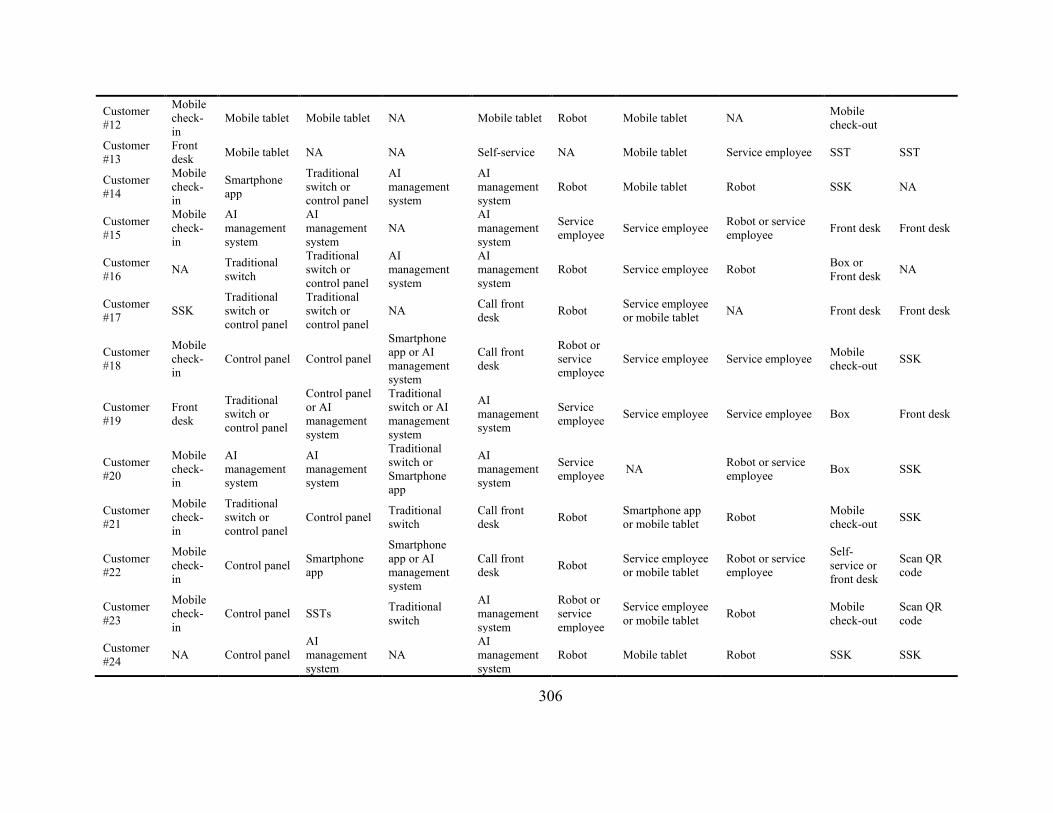
306
Customer #12
Mobile check-in
Mobile tablet Mobile tablet NA Mobile tablet Robot Mobile tablet NA Mobile check-out
Customer #13
Front desk Mobile tablet NA NA Self-service NA Mobile tablet Service employee SST SST
Customer #14
Mobile check-in
Smartphone app
Traditional switch or control panel
AI management system
AI management system
Robot Mobile tablet Robot SSK NA
Customer #15
Mobile check-in
AI management system
AI management system
NA AI management system
Service employee Service employee Robot or service
employee Front desk Front desk
Customer #16 NA Traditional
switch
Traditional switch or control panel
AI management system
AI management system
Robot Service employee Robot Box or Front desk NA
Customer #17 SSK
Traditional switch or control panel
Traditional switch or control panel
NA Call front desk Robot Service employee
or mobile tablet NA Front desk Front desk
Customer #18
Mobile check-in
Control panel Control panel
Smartphone app or AI management system
Call front desk
Robot or service employee
Service employee Service employee Mobile check-out SSK
Customer #19
Front desk
Traditional switch or control panel
Control panel or AI management system
Traditional switch or AI management system
AI management system
Service employee Service employee Service employee Box Front desk
Customer #20
Mobile check-in
AI management system
AI management system
Traditional switch or Smartphone app
AI management system
Service employee NA Robot or service
employee Box SSK
Customer #21
Mobile check-in
Traditional switch or control panel
Control panel Traditional switch
Call front desk Robot Smartphone app
or mobile tablet Robot Mobile check-out SSK
Customer #22
Mobile check-in
Control panel Smartphone app
Smartphone app or AI management system
Call front desk Robot Service employee
or mobile tablet Robot or service employee
Self-service or front desk
Scan QR code
Customer #23
Mobile check-in
Control panel SSTs Traditional switch
AI management system
Robot or service employee
Service employee or mobile tablet Robot Mobile
check-out Scan QR code
Customer #24 NA Control panel
AI management system
NA AI management system
Robot Mobile tablet Robot SSK SSK
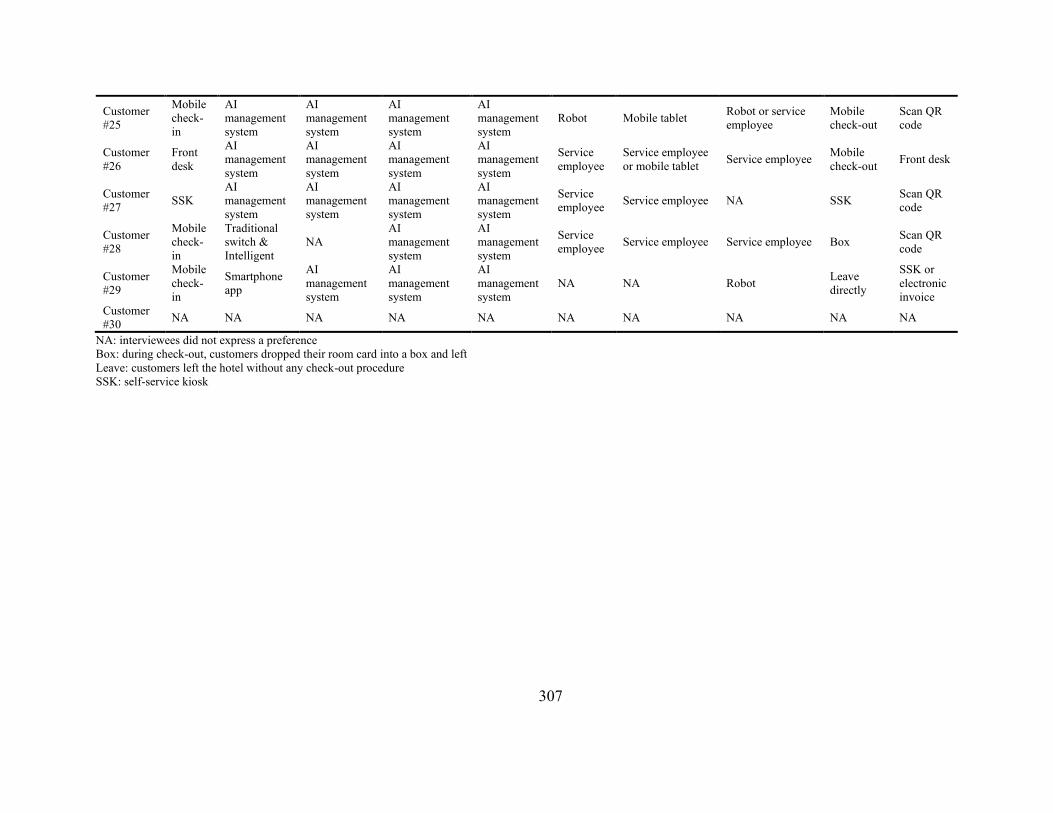
307
Customer #25
Mobile check-in
AI management system
AI management system
AI management system
AI management system
Robot Mobile tablet Robot or service employee
Mobile check-out
Scan QR code
Customer #26
Front desk
AI management system
AI management system
AI management system
AI management system
Service employee
Service employee or mobile tablet Service employee Mobile
check-out Front desk
Customer #27 SSK
AI management system
AI management system
AI management system
AI management system
Service employee Service employee NA SSK Scan QR
code
Customer #28
Mobile check-in
Traditional switch & Intelligent
NA AI management system
AI management system
Service employee Service employee Service employee Box Scan QR
code
Customer #29
Mobile check-in
Smartphone app
AI management system
AI management system
AI management system
NA NA Robot Leave directly
SSK or electronic invoice
Customer #30 NA NA NA NA NA NA NA NA NA NA
NA: interviewees did not express a preference Box: during check-out, customers dropped their room card into a box and left Leave: customers left the hotel without any check-out procedure SSK: self-service kiosk

308
Appendix 2.2 Hotelier Interviewees’ Preferences by Hotel Service Stage (N = 30)
Informant No. Check-in Control in-room
facilities Order room service Deliver room service
Order service at restaurant/bars
Deliver service at restaurants/bars
Check-out
Obtain an invoice
Hotelier #1 NA NA SST NA NA NA NA NA Hotelier #2 NA NA NA NA NA NA NA NA Hotelier #3 NA NA NA NA NA NA NA NA
Hotelier #4 SSK AI management system
AI management system Robot NA NA NA NA
Hotelier #5 SST Smartphone app or AI management system
Smartphone app or AI management system
NA NA NA NA NA
Hotelier #6 SSK AI management system
AI management system NA NA NA NA NA
Hotelier #7 SST & front desk NA NA NA Mobile tablet Service employee Front desk NA
Hotelier #8 SST & front desk
AI management system
AI management system
Robot & service employee
Mobile tablet & service employee
Robot & service employee SST NA
Hotelier #9 NA NA NA NA NA NA NA NA
Hotelier #10 NA AI management system NA NA NA NA NA NA
Hotelier #11 SST NA NA Robot NA Service employee Electronic invoice
Hotelier #12 SST NA SST & call front desk NA NA NA NA NA Hotelier #13 SST SST NA NA SST NA SST NA Hotelier #14 SST SST SST SST SST SST SST SST Hotelier #15 NA NA NA NA Smartphone app NA NA NA Hotelier #16 NA NA NA NA NA NA NA NA
Hotelier #17 Front desk SST NA NA Mobile tablet Service employee SST NA
Hotelier #18 SST & front desk NA NA NA NA Service employee SST NA

309
Hotelier #19 Mobile check-in NA Smartphone App NA NA NA Mobile
check out NA
Hotelier #20 SST & front desk NA NA Service
employee Mobile tablet & service employee Service employee Front desk NA
Hotelier #21 NA NA NA Robot NA Robot NA NA Hotelier #22 NA NA NA NA NA NA NA NA
Hotelier #23 SST & front desk NA NA NA Mobile tablet NA NA SST
Hotelier #24 SST & front desk NA NA NA NA NA SST SST
Hotelier #25 Front desk NA AI management system or call front desk
Service employee SST Service employee SST NA
Hotelier #26 NA SST NA NA NA NA SST SST
Hotelier #27 SST & front desk SST or call front desk NA Mobile tablet NA SST &
front desk NA
Hotelier #28 SST NA NA NA NA NA SST NA
Hotelier #29 Front desk NA Call front desk Service employee Mobile tablet Service employee NA NA
Hotelier #30 SST NA AI management system or call front desk
Robot NA Robot SST SST
NA: interviewees did not express a preference SSK: self-service kiosk
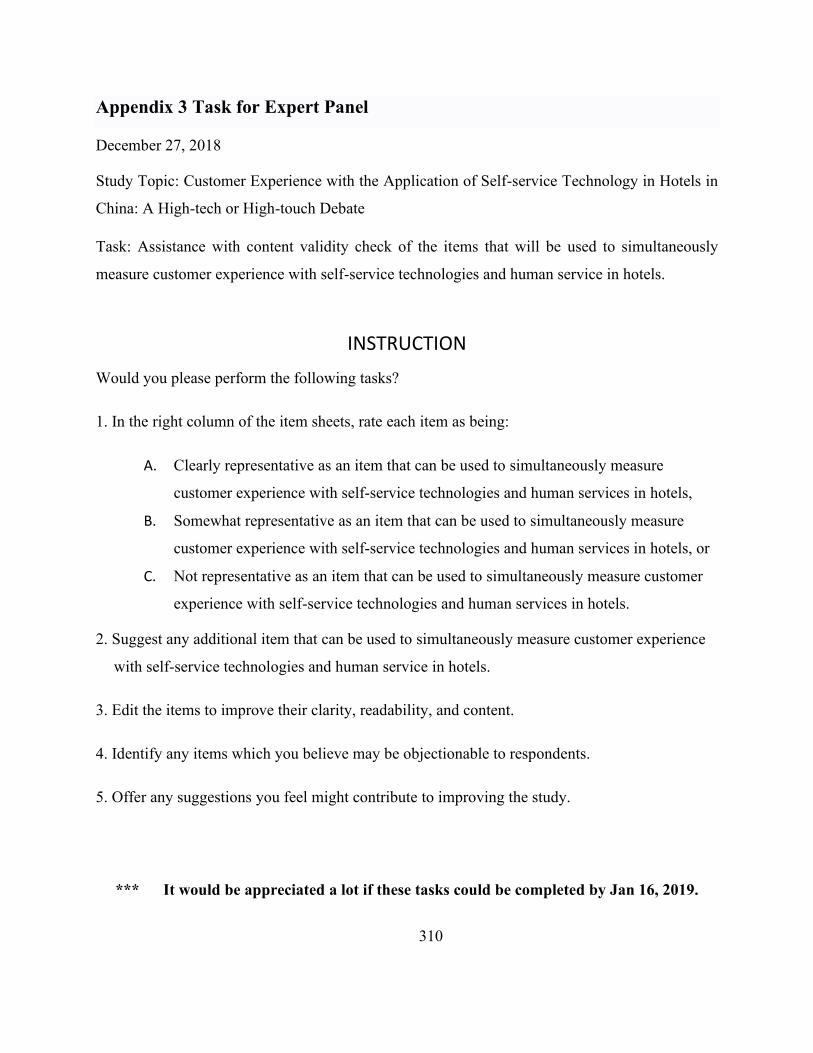
310
Appendix 3 Task for Expert Panel
December 27, 2018
Study Topic: Customer Experience with the Application of Self-service Technology in Hotels in
China: A High-tech or High-touch Debate
Task: Assistance with content validity check of the items that will be used to simultaneously
measure customer experience with self-service technologies and human service in hotels.
INSTRUCTION
Would you please perform the following tasks?
1. In the right column of the item sheets, rate each item as being:
A. Clearly representative as an item that can be used to simultaneously measure
customer experience with self-service technologies and human services in hotels,
B. Somewhat representative as an item that can be used to simultaneously measure
customer experience with self-service technologies and human services in hotels, or
C. Not representative as an item that can be used to simultaneously measure customer
experience with self-service technologies and human services in hotels.
2. Suggest any additional item that can be used to simultaneously measure customer experience
with self-service technologies and human service in hotels.
3. Edit the items to improve their clarity, readability, and content.
4. Identify any items which you believe may be objectionable to respondents.
5. Offer any suggestions you feel might contribute to improving the study.
*** It would be appreciated a lot if these tasks could be completed by Jan 16, 2019.
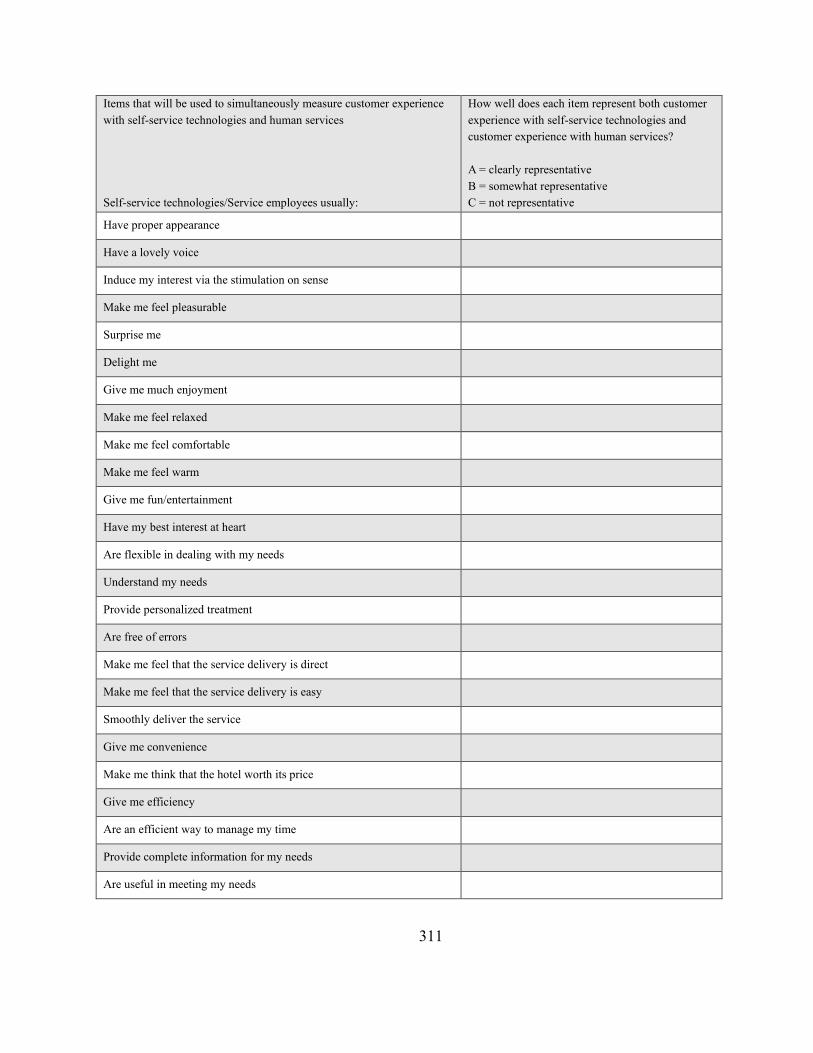
311
Items that will be used to simultaneously measure customer experience with self-service technologies and human services Self-service technologies/Service employees usually:
How well does each item represent both customer experience with self-service technologies and customer experience with human services? A = clearly representative B = somewhat representative C = not representative
Have proper appearance
Have a lovely voice
Induce my interest via the stimulation on sense
Make me feel pleasurable
Surprise me
Delight me
Give me much enjoyment
Make me feel relaxed
Make me feel comfortable
Make me feel warm
Give me fun/entertainment
Have my best interest at heart
Are flexible in dealing with my needs
Understand my needs
Provide personalized treatment
Are free of errors
Make me feel that the service delivery is direct
Make me feel that the service delivery is easy
Smoothly deliver the service
Give me convenience
Make me think that the hotel worth its price
Give me efficiency
Are an efficient way to manage my time
Provide complete information for my needs
Are useful in meeting my needs
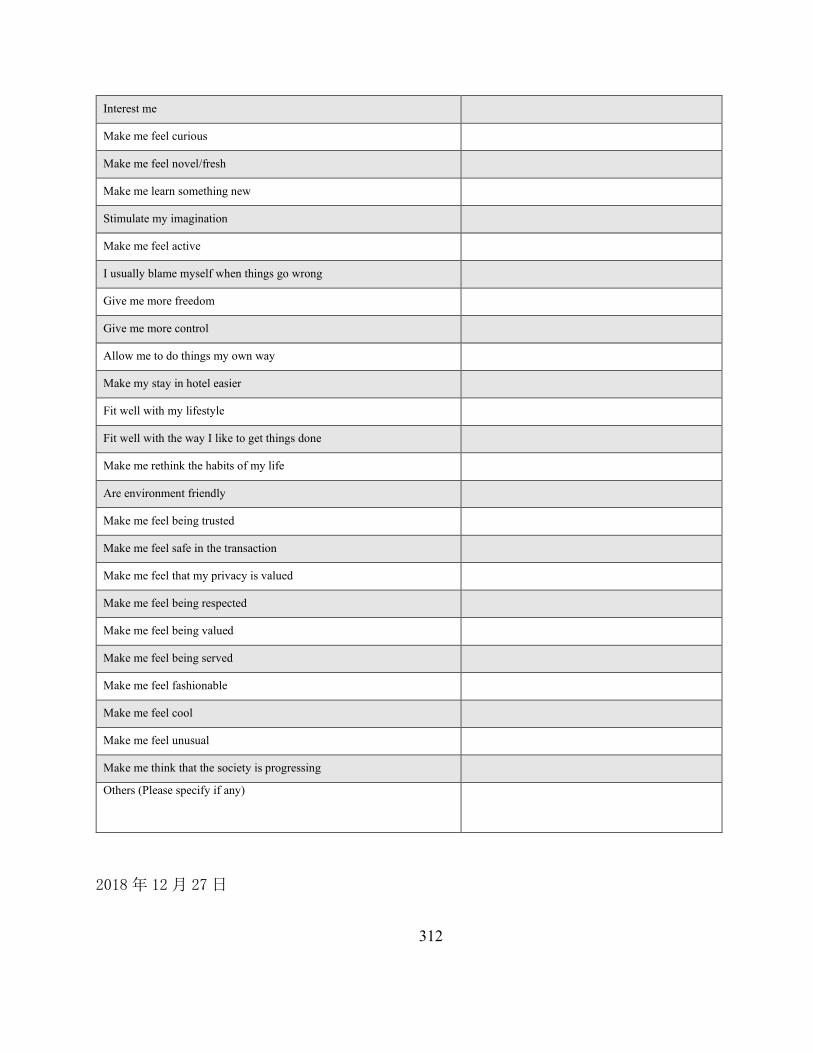
312
Interest me
Make me feel curious
Make me feel novel/fresh
Make me learn something new
Stimulate my imagination
Make me feel active
I usually blame myself when things go wrong
Give me more freedom
Give me more control
Allow me to do things my own way
Make my stay in hotel easier
Fit well with my lifestyle
Fit well with the way I like to get things done
Make me rethink the habits of my life
Are environment friendly
Make me feel being trusted
Make me feel safe in the transaction
Make me feel that my privacy is valued
Make me feel being respected
Make me feel being valued
Make me feel being served
Make me feel fashionable
Make me feel cool
Make me feel unusual
Make me think that the society is progressing
Others (Please specify if any)
2018年 12 月 27日
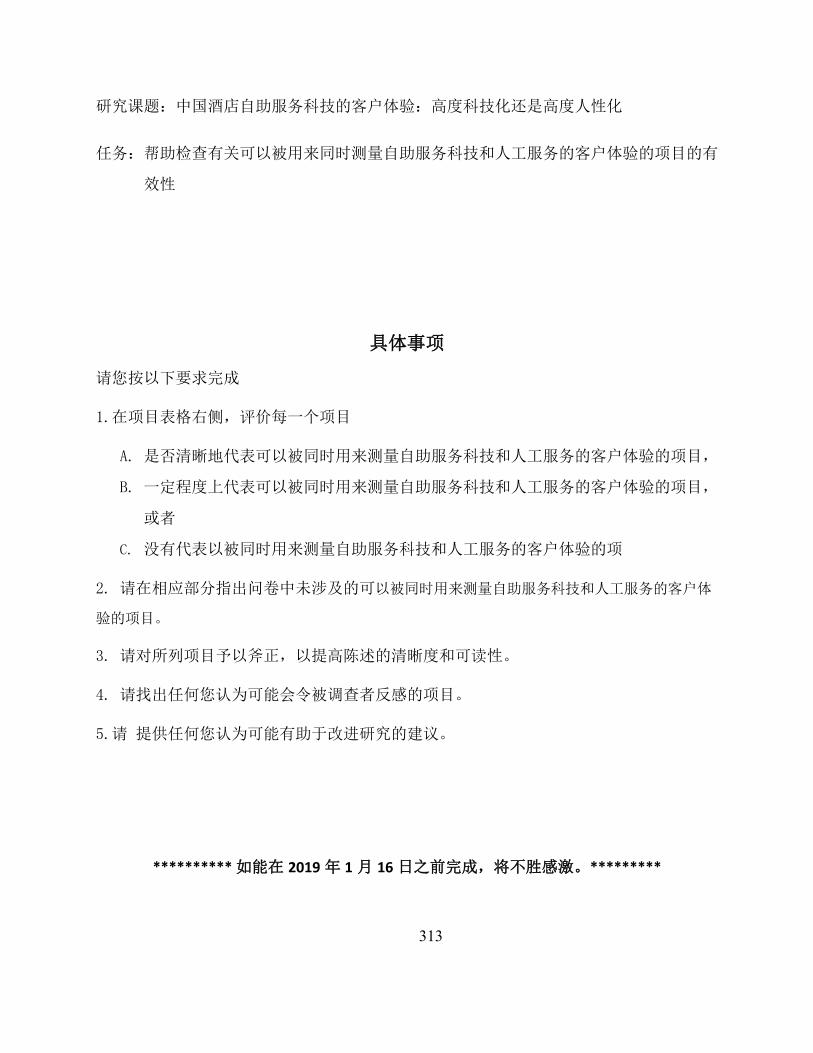
313
研究课题:中国酒店自助服务科技的客户体验:高度科技化还是高度人性化
任务:帮助检查有关可以被用来同时测量自助服务科技和人工服务的客户体验的项目的有
效性
具体事项
请您按以下要求完成
1.在项目表格右侧,评价每一个项目
A. 是否清晰地代表可以被同时用来测量自助服务科技和人工服务的客户体验的项目,
B. 一定程度上代表可以被同时用来测量自助服务科技和人工服务的客户体验的项目,
或者
C. 没有代表以被同时用来测量自助服务科技和人工服务的客户体验的项
2. 请在相应部分指出问卷中未涉及的可以被同时用来测量自助服务科技和人工服务的客户体
验的项目。
3. 请对所列项目予以斧正,以提高陈述的清晰度和可读性。
4. 请找出任何您认为可能会令被调查者反感的项目。
5.请 提供任何您认为可能有助于改进研究的建议。
********** 如能在 2019 年 1 月 16 日之前完成,将不胜感激。*********

314
可以被同时用来测量自助服务科技和人工服务的客户体验的项目 自助服务科技/人工服务通常:
以下项目是否可以同时代表自助服务科技
和人工服务的客户体验? A = 清楚代表 B = 在一定程度上代表 C = 不具有代表性
外观/仪容仪表合适
声音甜美
在感官上引起了用户兴趣
令用户愉悦
让用户感到惊讶
令用户高兴
让用户很享受
让用户感到放松
让用户感到舒服
让用户感到很温暖
给用户带来了乐趣
把用户的利益放在心上
灵活处理用户需求
理解用户的需求
可以提供个性化的服务
零失误
让用户感到服务过程直接
让用户感到服务过程简单
服务过程顺畅
可以为用户带来方便
让用户感到物有所值
高效
便于用户有效管理时间
可以提供用户想要的全部信息
可以满足用户需求
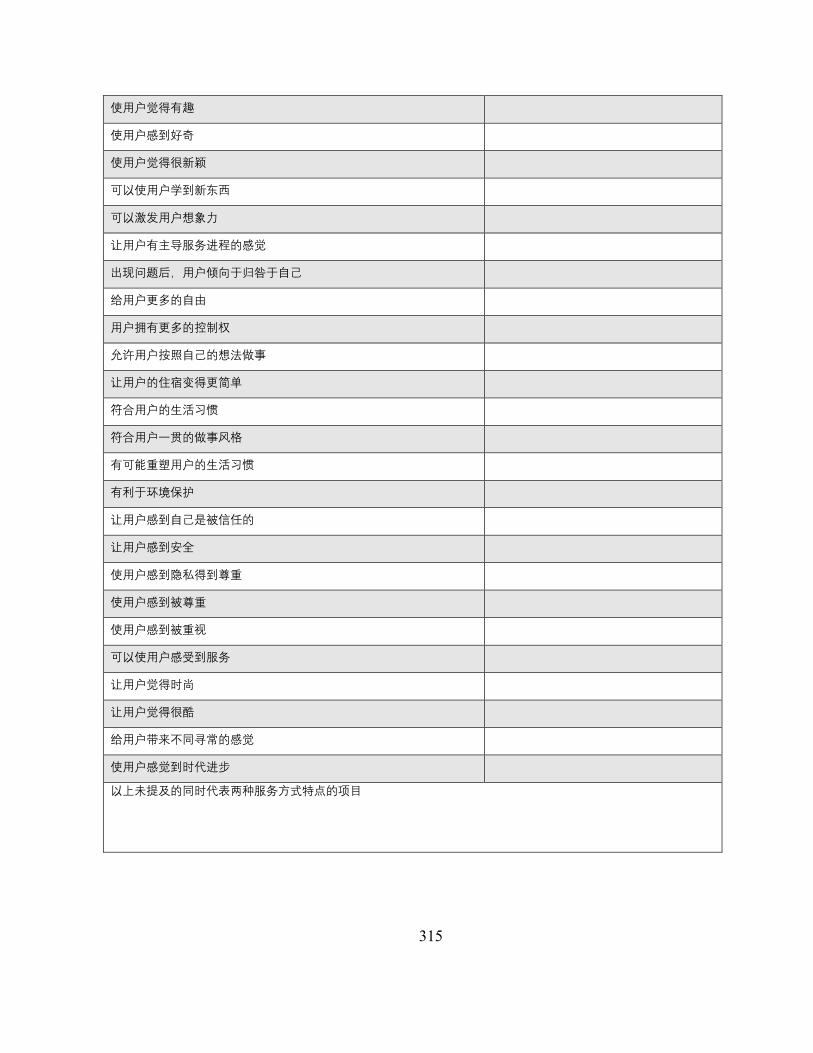
315
使用户觉得有趣
使用户感到好奇
使用户觉得很新颖
可以使用户学到新东西
可以激发用户想象力
让用户有主导服务进程的感觉
出现问题后,用户倾向于归咎于自己
给用户更多的自由
用户拥有更多的控制权
允许用户按照自己的想法做事
让用户的住宿变得更简单
符合用户的生活习惯
符合用户一贯的做事风格
有可能重塑用户的生活习惯
有利于环境保护
让用户感到自己是被信任的
让用户感到安全
使用户感到隐私得到尊重
使用户感到被尊重
使用户感到被重视
可以使用户感受到服务
让用户觉得时尚
让用户觉得很酷
给用户带来不同寻常的感觉
使用户感觉到时代进步
以上未提及的同时代表两种服务方式特点的项目
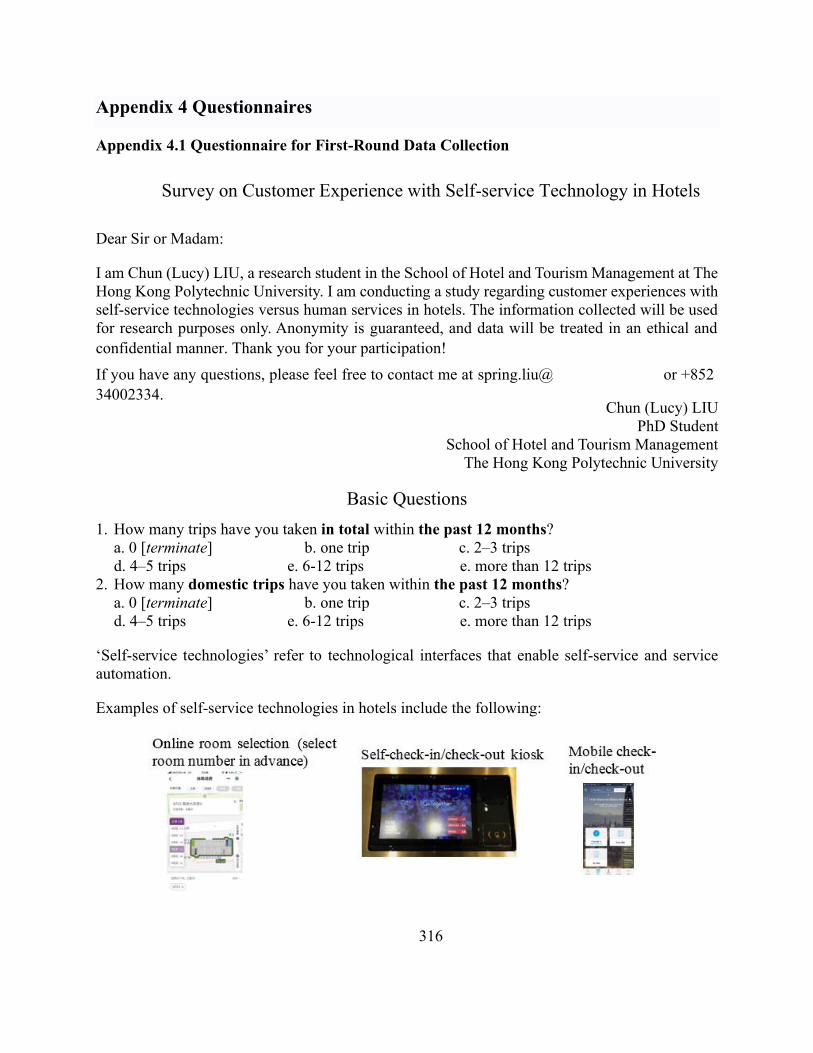
316
Appendix 4 Questionnaires
Appendix 4.1 Questionnaire for First-Round Data Collection
Survey on Customer Experience with Self-service Technology in Hotels
Dear Sir or Madam:
I am Chun (Lucy) LIU, a research student in the School of Hotel and Tourism Management at The Hong Kong Polytechnic University. I am conducting a study regarding customer experiences with self-service technologies versus human services in hotels. The information collected will be used for research purposes only. Anonymity is guaranteed, and data will be treated in an ethical and confidential manner. Thank you for your participation! If you have any questions, please feel free to contact me at spring.liu@ or +852 34002334.
Chun (Lucy) LIU PhD Student
School of Hotel and Tourism Management The Hong Kong Polytechnic University
Basic Questions 1. How many trips have you taken in total within the past 12 months?
a. 0 [terminate] b. one trip c. 2–3 tripsd. 4–5 trips e. 6-12 trips e. more than 12 trips
2. How many domestic trips have you taken within the past 12 months?a. 0 [terminate] b. one trip c. 2–3 tripsd. 4–5 trips e. 6-12 trips e. more than 12 trips
‘Self-service technologies’ refer to technological interfaces that enable self-service and service automation.
Examples of self-service technologies in hotels include the following:
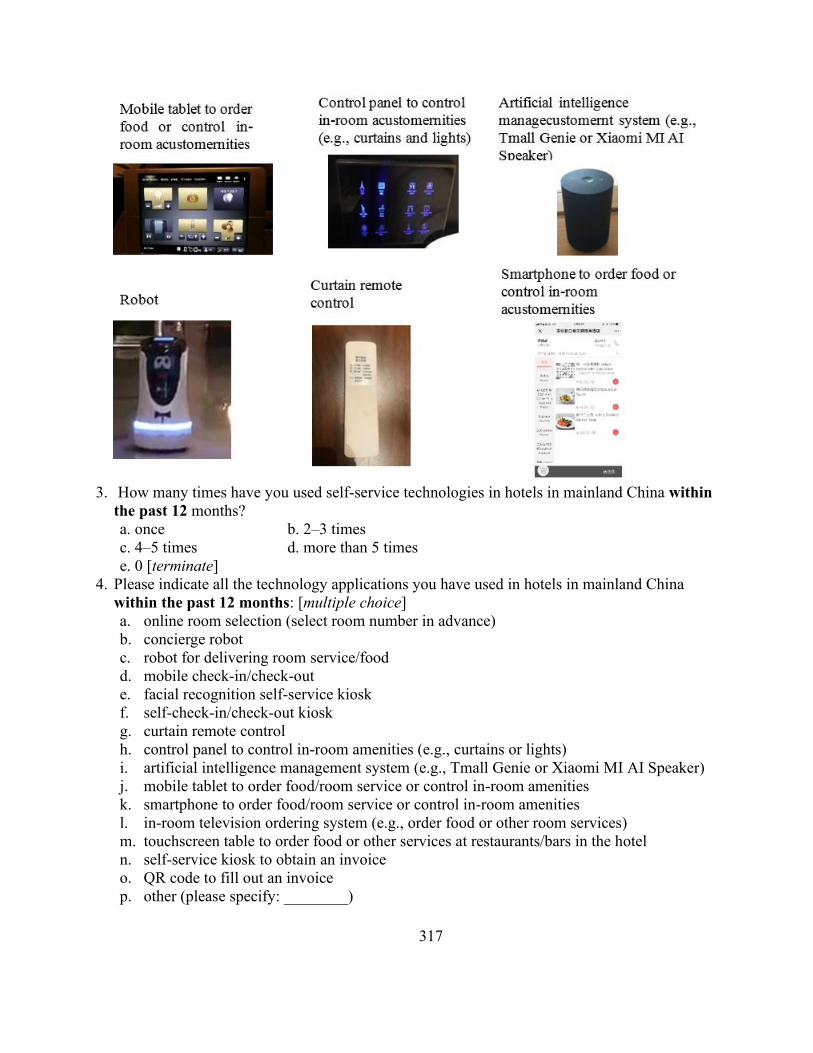
317
3. How many times have you used self-service technologies in hotels in mainland China within
the past 12 months? a. once b. 2–3 times c. 4–5 times d. more than 5 times e. 0 [terminate]
4. Please indicate all the technology applications you have used in hotels in mainland China within the past 12 months: [multiple choice] a. online room selection (select room number in advance) b. concierge robot c. robot for delivering room service/food d. mobile check-in/check-out e. facial recognition self-service kiosk f. self-check-in/check-out kiosk g. curtain remote control h. control panel to control in-room amenities (e.g., curtains or lights) i. artificial intelligence management system (e.g., Tmall Genie or Xiaomi MI AI Speaker) j. mobile tablet to order food/room service or control in-room amenities k. smartphone to order food/room service or control in-room amenities l. in-room television ordering system (e.g., order food or other room services) m. touchscreen table to order food or other services at restaurants/bars in the hotel n. self-service kiosk to obtain an invoice o. QR code to fill out an invoice p. other (please specify: ________)

318
Section 1: Service Encounter Characteristics
This survey is based on your experience with self-service technologies and human services in hotels in mainland China within the past 12 months. Please take a few seconds to reflect on your experience, then answer the following questions based on your experience within the past 12 months. 5. Please indicate your perception of the complexity of each service task in general during
your hotel stay(s) in mainland China within the past 12 months.
1 = very simple, 2 = simple, 3=rather simple, 4 = neither complex nor simple, 5 = rather complex, 6 = complex, 7 =very complex
Checking in to the hotel 1 2 3 4 5 6 7 Using in-room amenities (e.g., television, curtains, or lights) 1 2 3 4 5 6 7 Ordering room services (e.g., ordering food or requesting an extra bottle of water) 1 2 3 4 5 6 7
Room service delivery 1 2 3 4 5 6 7 Ordering food or other services at restaurants/bars in the hotel 1 2 3 4 5 6 7 Service delivery at restaurants/bars in the hotel (e.g., serving the meal) 1 2 3 4 5 6 7
Checking out of the hotel 1 2 3 4 5 6 7 Obtaining an invoice 1 2 3 4 5 6 7
Section 2: Customer Experience with Self-service Technologies
This survey is based on your experience with self-service technologies in hotels in mainland China within the past 12 months. Please take a few seconds to reflect on your experience, then answer the following questions based on your experience within the past 12 months. 6. Please indicate your general experience with self-service technologies in hotels in mainland
China within the past 12 months. Note that phrases on the same row have opposite meanings with “4” refers to neutral attitude.
In general, self-service technologies that I used in hotels in mainland China within the past 12 months…
were what I expected. 1 2 3 4 5 6 7 surprised me. upset me. 1 2 3 4 5 6 7 delighted me. made me feel worried. 1 2 3 4 5 6 7 made me feel relaxed. made me feel uncomfortable. 1 2 3 4 5 6 7 made me feel comfortable. did not understand my needs. 1 2 3 4 5 6 7 understood my needs. had an indirect service process. 1 2 3 4 5 6 7 had a direct service process. had a complicated service process. 1 2 3 4 5 6 7 had an easy service process. had an unsmooth service process. 1 2 3 4 5 6 7 had a smooth service process. were inconvenient. 1 2 3 4 5 6 7 were convenient.
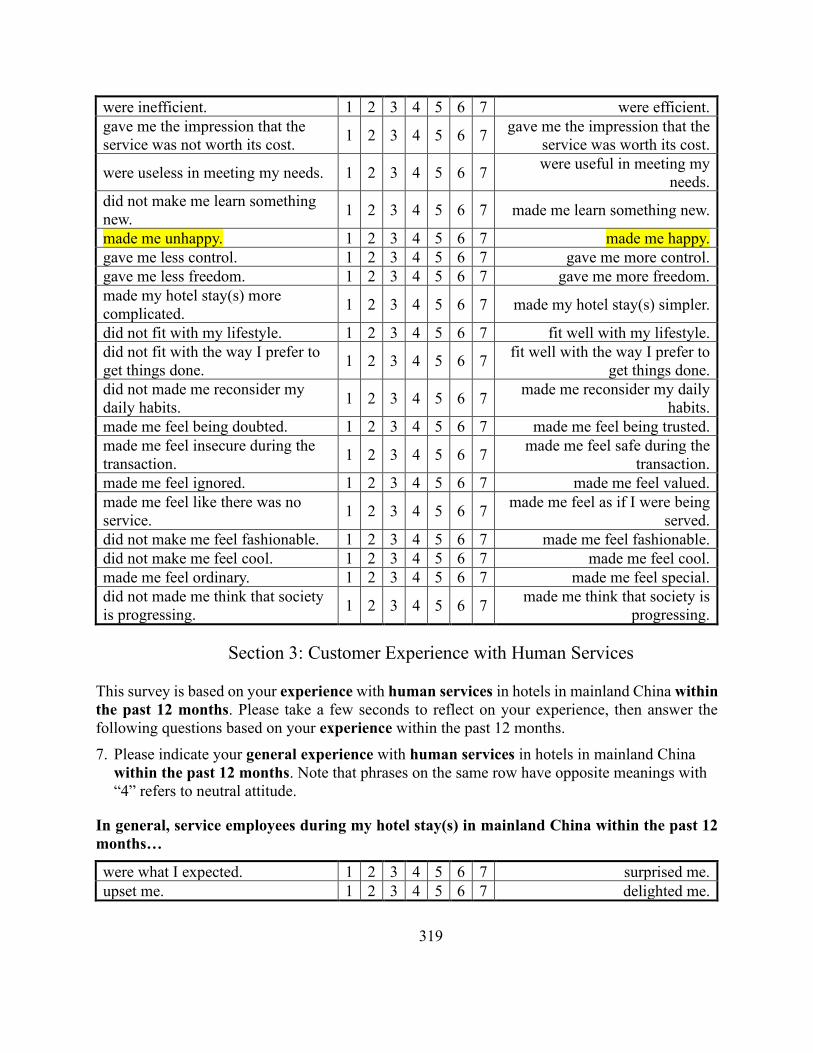
319
were inefficient. 1 2 3 4 5 6 7 were efficient. gave me the impression that the service was not worth its cost. 1 2 3 4 5 6 7 gave me the impression that the
service was worth its cost.
were useless in meeting my needs. 1 2 3 4 5 6 7 were useful in meeting my needs.
did not make me learn something new. 1 2 3 4 5 6 7 made me learn something new.
made me unhappy. 1 2 3 4 5 6 7 made me happy. gave me less control. 1 2 3 4 5 6 7 gave me more control. gave me less freedom. 1 2 3 4 5 6 7 gave me more freedom. made my hotel stay(s) more complicated. 1 2 3 4 5 6 7 made my hotel stay(s) simpler.
did not fit with my lifestyle. 1 2 3 4 5 6 7 fit well with my lifestyle. did not fit with the way I prefer to get things done. 1 2 3 4 5 6 7 fit well with the way I prefer to
get things done. did not made me reconsider my daily habits. 1 2 3 4 5 6 7 made me reconsider my daily
habits. made me feel being doubted. 1 2 3 4 5 6 7 made me feel being trusted. made me feel insecure during the transaction. 1 2 3 4 5 6 7 made me feel safe during the
transaction. made me feel ignored. 1 2 3 4 5 6 7 made me feel valued. made me feel like there was no service. 1 2 3 4 5 6 7 made me feel as if I were being
served. did not make me feel fashionable. 1 2 3 4 5 6 7 made me feel fashionable. did not make me feel cool. 1 2 3 4 5 6 7 made me feel cool. made me feel ordinary. 1 2 3 4 5 6 7 made me feel special. did not made me think that society is progressing. 1 2 3 4 5 6 7 made me think that society is
progressing.
Section 3: Customer Experience with Human Services
This survey is based on your experience with human services in hotels in mainland China within the past 12 months. Please take a few seconds to reflect on your experience, then answer the following questions based on your experience within the past 12 months. 7. Please indicate your general experience with human services in hotels in mainland China
within the past 12 months. Note that phrases on the same row have opposite meanings with “4” refers to neutral attitude.
In general, service employees during my hotel stay(s) in mainland China within the past 12 months…
were what I expected. 1 2 3 4 5 6 7 surprised me. upset me. 1 2 3 4 5 6 7 delighted me.
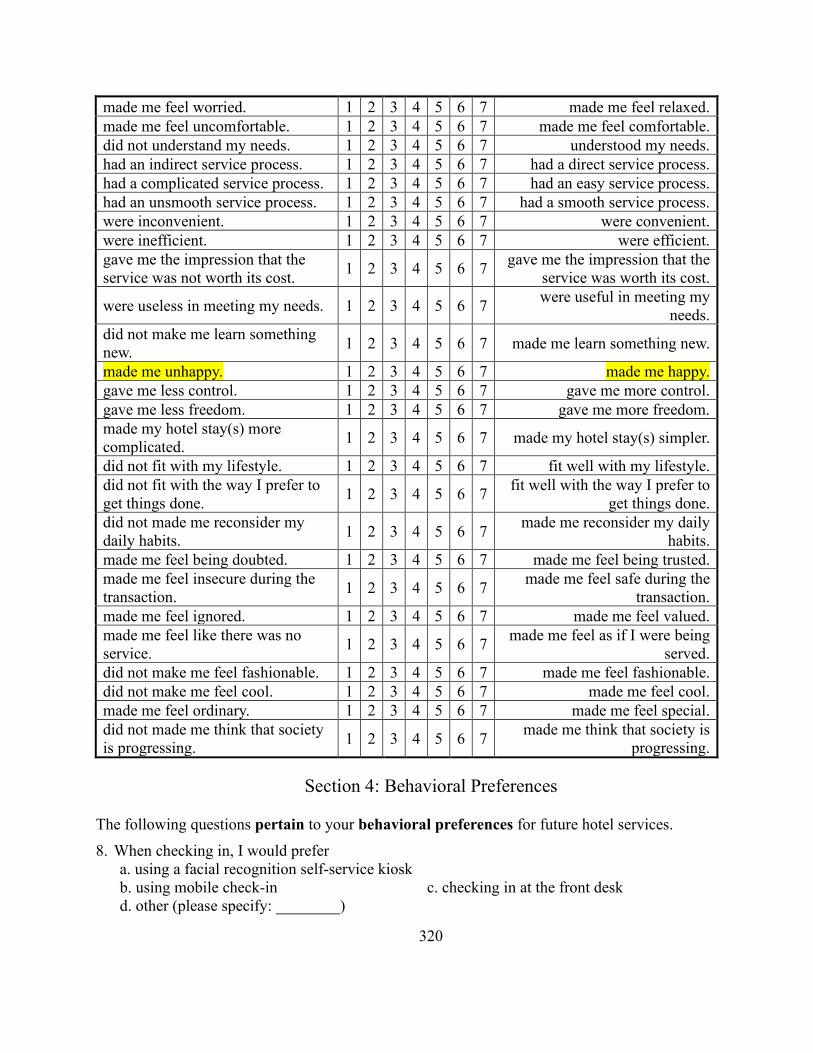
320
made me feel worried. 1 2 3 4 5 6 7 made me feel relaxed. made me feel uncomfortable. 1 2 3 4 5 6 7 made me feel comfortable. did not understand my needs. 1 2 3 4 5 6 7 understood my needs. had an indirect service process. 1 2 3 4 5 6 7 had a direct service process. had a complicated service process. 1 2 3 4 5 6 7 had an easy service process. had an unsmooth service process. 1 2 3 4 5 6 7 had a smooth service process. were inconvenient. 1 2 3 4 5 6 7 were convenient. were inefficient. 1 2 3 4 5 6 7 were efficient. gave me the impression that the service was not worth its cost. 1 2 3 4 5 6 7 gave me the impression that the
service was worth its cost.
were useless in meeting my needs. 1 2 3 4 5 6 7 were useful in meeting my needs.
did not make me learn something new. 1 2 3 4 5 6 7 made me learn something new.
made me unhappy. 1 2 3 4 5 6 7 made me happy. gave me less control. 1 2 3 4 5 6 7 gave me more control. gave me less freedom. 1 2 3 4 5 6 7 gave me more freedom. made my hotel stay(s) more complicated. 1 2 3 4 5 6 7 made my hotel stay(s) simpler.
did not fit with my lifestyle. 1 2 3 4 5 6 7 fit well with my lifestyle. did not fit with the way I prefer to get things done. 1 2 3 4 5 6 7 fit well with the way I prefer to
get things done. did not made me reconsider my daily habits. 1 2 3 4 5 6 7 made me reconsider my daily
habits. made me feel being doubted. 1 2 3 4 5 6 7 made me feel being trusted. made me feel insecure during the transaction. 1 2 3 4 5 6 7 made me feel safe during the
transaction. made me feel ignored. 1 2 3 4 5 6 7 made me feel valued. made me feel like there was no service. 1 2 3 4 5 6 7 made me feel as if I were being
served. did not make me feel fashionable. 1 2 3 4 5 6 7 made me feel fashionable. did not make me feel cool. 1 2 3 4 5 6 7 made me feel cool. made me feel ordinary. 1 2 3 4 5 6 7 made me feel special. did not made me think that society is progressing. 1 2 3 4 5 6 7 made me think that society is
progressing.
Section 4: Behavioral Preferences
The following questions pertain to your behavioral preferences for future hotel services. 8. When checking in, I would prefer
a. using a facial recognition self-service kiosk b. using mobile check-in c. checking in at the front desk d. other (please specify: ________)

321
9. When controlling in-room amenities (e.g., television, curtains, and lights), I would prefer a. using a smartphone b. using a control panel c. using an artificial intelligence management system (e.g., Tmall Genie) d. using a traditional switch e. other (please specify: ________)
10. When ordering room service (e.g., ordering food), I would prefer a. ordering via television b. ordering via smartphone c. ordering via mobile tablet d. calling the front desk by phone e. other (please specify: ________)
11. In terms of room service delivery, I would prefer a. delivery from a robot b. delivery from a service employee c. other (please specify: ________)
12. When ordering food or other services at restaurants/bars in hotels, I would prefer a. ordering via smartphone b. ordering via mobile tablet/touchscreen table c. ordering via a service employee d. other (please specify: ________)
13. In terms of service delivery at restaurants/bars in hotels (e.g., serving the meal), I would prefer a. delivery from a robot b. delivery from a service employee c. other (please specify: ________)
14. When checking out, I would prefer a. using a self-service kiosk b. using mobile check-out c. checking out at the front desk d. other (please specify: ________)
15. In terms of obtaining an invoice, I would prefer a. using a self-service kiosk b. using a QR code c. asking the front desk d. other (please specify: ________)
16. The following statements pertain to your behavioral preferences in the future in general; please indicate the extent to which you agree with each.
1 = strongly disagree, 2 =disagree, 3 = slightly disagree, 4 =neither agree nor disagree, 5 = slight agree, 6 = agree, 7 = strongly agree
I would prefer to increase my use of hotel self-service technologies rather than human services in the future. 1 2 3 4 5 6 7
I would encourage friends and relatives to use hotel self-service technologies rather than human services. 1 2 3 4 5 6 7
My likelihood of recommending hotel self-service technologies to a friend is higher than recommending personal services. 1 2 3 4 5 6 7
I intend to use hotel self-service technologies more than human services in the future. 1 2 3 4 5 6 7

322
Section 5: Personality
The following questions pertain to your personality and your attitudes toward technology. 17. The following statements pertain to your personality; please indicate the extent to which you
agree with each. 1 = strongly disagree, 2 =disagree, 3 = slightly disagree, 4 =neither agree nor disagree, 5 = slight agree, 6 = agree, 7 = strongly agree
I see myself as someone who…
is talkative. 1 2 3 4 5 6 7 feels comfortable around people. 1 2 3 4 5 6 7 tends to be quiet. R 1 2 3 4 5 6 7 starts conversations. 1 2 3 4 5 6 7 is reserved. R 1 2 3 4 5 6 7 sympathizes with others’ feelings. 1 2 3 4 5 6 7 is diligent. 1 2 3 4 5 6 7 is concerned about others. 1 2 3 4 5 6 7 tends to find fault with others. R 1 2 3 4 5 6 7 trusts what people say to me. 1 2 3 4 5 6 7 likes to cooperate with others. 1 2 3 4 5 6 7 does things efficiently. 1 2 3 4 5 6 7 pays attention to detail. 1 2 3 4 5 6 7 makes plans and sticks to them. 1 2 3 4 5 6 7 does a thorough job. 1 2 3 4 5 6 7 tends to be lazy. R 1 2 3 4 5 6 7 gets stressed out easily. 1 2 3 4 5 6 7 can be moody. 1 2 3 4 5 6 7 gets nervous easily. 1 2 3 4 5 6 7 fears the worst. 1 2 3 4 5 6 7 panics easily. 1 2 3 4 5 6 7 gets excited by new ideas. 1 2 3 4 5 6 7 enjoys thinking about things. 1 2 3 4 5 6 7 enjoys hearing new ideas. 1 2 3 4 5 6 7 prefers work that is routine. R 1 2 3 4 5 6 7 has a vivid imagination. 1 2 3 4 5 6 7

323
18. The following statements pertain to your attitudes toward technology; please indicate the extent to which you agree with each.
1 = strongly disagree, 2 =disagree, 3 = slightly disagree, 4 =neither agree nor disagree, 5 = slight agree, 6 = agree, 7 = strongly agree
If I hear of a new technology, I look for ways to experiment with it. 1 2 3 4 5 6 7 Among my peers, I am usually the first to try out new technologies. 1 2 3 4 5 6 7 I like to experiment with new technologies. 1 2 3 4 5 6 7
Section 6: Demographics
The following questions ask for your personal information. 19. Gender:
a. female b. male
20. Age: ________ [please specify]
21. City of Residence: ________ [please specify]
22. Level of education completed: a. less than high school b. high school c. 2–3 years of college d. four-year college/university e. postgraduate level or higher
23. Type of employment:
a. student b. full-time employment c. part-time employment d. self-employed e. retired f. unemployed g. other (please specify: ________)
24. Have you ever worked or are currently working in the hotel industry?
a. yes_________ (please specify the department) b. no
25. Please indicate your marital status: a. single b. with partner c. married without children d. married with children e. separated/divorced f. widowed
26. Annual household income (CNY): a. less than 100,000 b. 100,000–199,999 c. 200,000–599,999 d. 600,000–799,999 e. 800,000–1,999,999 f. more than 2,000,000

324
27. In the past 30 days, how many times have you used self-service technologies (e.g., self-check in at airport, self-check-out at a retailing store, self-ordering kiosks in McDonald's)? ______ times
28. Within the past 12 months, have you used one or more types of self-service technologies in hotels in mainland China? a. yes b. no
Section 7: Trip Profiles
The following questions pertain to your trips within the past 12 months. 29. How many oversea trips have you taken within the past 12 months?
a. 0 b. one trip c. 2–3 trips d. 4–5 trips e. 6-12 trips e. more than 12 trips
30. How many business trips have you taken within the past 12 months? a. 0 b. one trip c. 2–3 trips d. 4–5 trips e. 6-12 trips e. more than 12 trips
31. How many leisure trips have you taken within the past 12 months? a. 0 b. one trip c. 2–3 trips d. 4–5 trips e. 6-12 trips e. more than 12 trips
32. How many times have you stayed at a business hotel within the past 12 months? a. 0 b. once c. 2–3 times d. 4–5 times e. 6-12 times e. more than 12 times
33. How many times have you stayed at a resort hotel within the past 12 months? a. 0 b. once c. 2–3 times d. 4–5 times e. 6-12 times e. more than 12 times
34. How many times have you stayed at a convention hotel within the past 12 months? a. 0 b. once c. 2–3 times d. 4–5 times e. 6-12 times e. more than 12 times
35. How many times have you stayed at an upscale hotel within the past 12 months? a. 0 b. once c. 2–3 times d. 4–5 times e. 6-12 times e. more than 12 times
36. How many times have you stayed at a midscale hotel within the past 12 months? a. 0 b. once c. 2–3 times d. 4–5 times e. 6-12 times e. more than 12 times

325
37. How many times have you stayed at an economy hotel within the past 12 months? a. 0 b. once c. 2–3 times d. 4–5 times e. 6-12 times e. more than 12 times
Thank you very much for your participation!
Notes: “R” denotes reverse-scored items Highlight denotes reverse or homogeneous items to ensure the reliability of responses.

326
酒店自助服务科技的客户体验调查
尊敬的先生/女士,
您好!
我是来自香港理工大学酒店及旅游管理学院的博士研究生刘春。我正在进行一项关于酒店
自助服务科技与人工服务的客户体验的研究。恳请您如实填写,您提供的资料仅用于科学
研究。一切个人资料均绝对保密。感谢您的参与!
如果您有任何问题,请随时通过邮件(spring.liu@ )或电话(+852 34002334)与我联系。
刘春
博士研究生
香港理工大学酒店及旅游业管理学院
基本问题
1. 请问在过去 12 个月里,您总共旅行了多少次?
a. 0 次 [结束] b. 1 次 c. 2-3 次
d. 4-5 次 e. 6-12 次 f. 12 次以上
2. 请问在过去 12 个月里,您总共有多少次国内游?
a. 0 次 [结束] b. 1 次 c. 2-3 次
d. 4-5 次 e. 6-12 次 f. 12 次以上
自助服务科技是指能够实现自助服务和服务自动化的科技。
酒店自助服务科技示例:
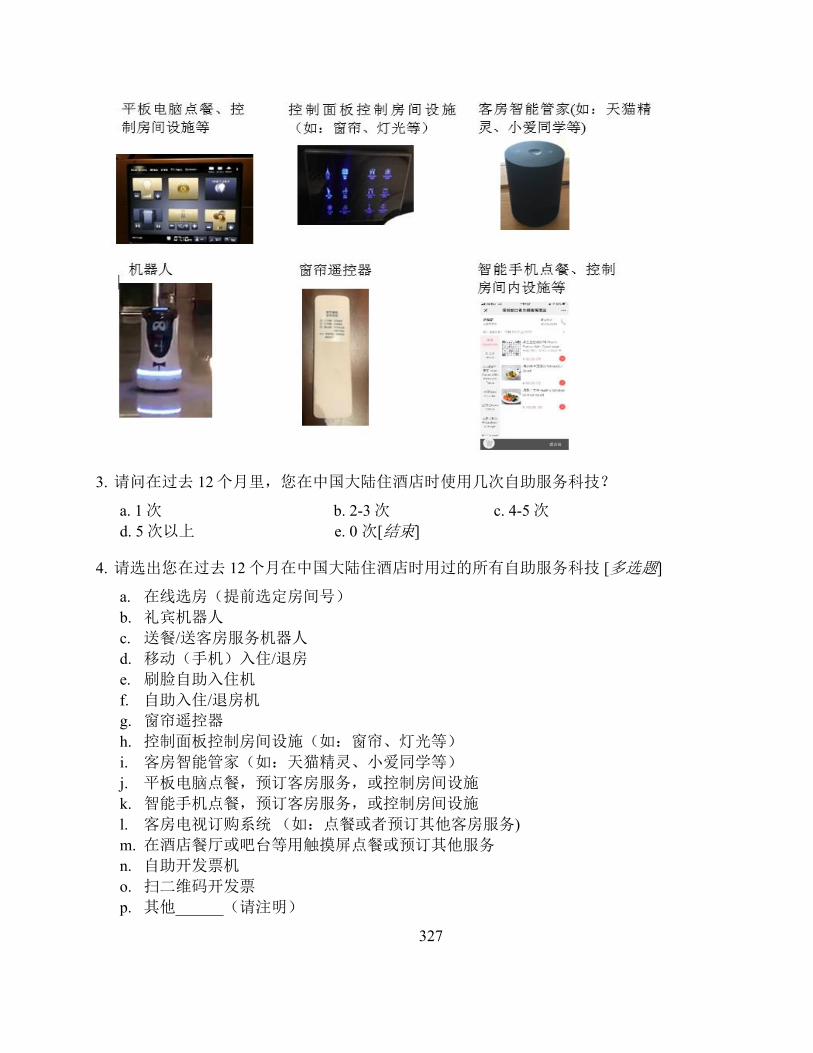
327
3. 请问在过去 12 个月里,您在中国大陆住酒店时使用几次自助服务科技?
a. 1 次 b. 2-3 次 c. 4-5 次 d. 5 次以上 e. 0 次[结束]
4. 请选出您在过去 12 个月在中国大陆住酒店时用过的所有自助服务科技 [多选题]
a. 在线选房(提前选定房间号) b. 礼宾机器人 c. 送餐/送客房服务机器人 d. 移动(手机)入住/退房 e. 刷脸自助入住机 f. 自助入住/退房机 g. 窗帘遥控器 h. 控制面板控制房间设施(如:窗帘、灯光等) i. 客房智能管家(如:天猫精灵、小爱同学等) j. 平板电脑点餐,预订客房服务,或控制房间设施 k. 智能手机点餐,预订客房服务,或控制房间设施 l. 客房电视订购系统 (如:点餐或者预订其他客房服务) m. 在酒店餐厅或吧台等用触摸屏点餐或预订其他服务 n. 自助开发票机 o. 扫二维码开发票 p. 其他______(请注明)

328
第一部分: 酒店服务场景的特点
本调查基于您在过去 12 个月在中国大陆住酒店时使用自助服务科技和人工服务的体验和
感受。请花几秒钟的时间回想一下您的体验和感受,然后根据您过去 12 个月的体验回答
问题。
5. 请表明您对过去 12 个月在中国大陆住酒店时每项服务任务自身的复杂性的整体看法。
1=非常简单;2=简单;3=较简单; 4=中立;5=较复杂;6=复杂; 7=非常复杂
办理登记入住 1 2 3 4 5 6 7 使用房间设施(如:开关电视、窗帘 或灯光等) 1 2 3 4 5 6 7 预订客房服务 (如:点餐或多要一瓶水等) 1 2 3 4 5 6 7 递送客房服务 1 2 3 4 5 6 7 在酒店的餐厅/酒吧点餐或预订其他服务 1 2 3 4 5 6 7 在酒店的餐厅/酒吧的服务递送 (如:上菜) 1 2 3 4 5 6 7 退房 1 2 3 4 5 6 7 开发票 1 2 3 4 5 6 7
第二部分:客户体验:自助服务科技
本调查基于您在过去 12 个月在中国大陆住酒店时使用自助服务科技的体验和感受。请花
几秒钟的时间回想一下您的体验和感受,然后根据您过去 12 个月的体验回答问题。
6. 请表明您在过去 12 个月在中国大陆住酒店时使用自助服务科技的体验和感受。请注意,
同一行中的短语含义相反。 4 代表中立。
总体来说,在过去 12 个月内,我在中国大陆住酒店时使用的自助服务科技…
如我所料 1 2 3 4 5 6 7 让我惊讶 令我沮丧 1 2 3 4 5 6 7 令我高兴 让我焦虑 1 2 3 4 5 6 7 让我感到放松 让我觉得不舒服 1 2 3 4 5 6 7 让我觉得舒服 不理解我的需求 1 2 3 4 5 6 7 理解我的需求 服务过程不直接 1 2 3 4 5 6 7 服务过程直接 服务过程复杂 1 2 3 4 5 6 7 服务过程简单 服务过程不顺畅 1 2 3 4 5 6 7 服务过程顺畅 不方便 1 2 3 4 5 6 7 方便 效率低下 1 2 3 4 5 6 7 高效
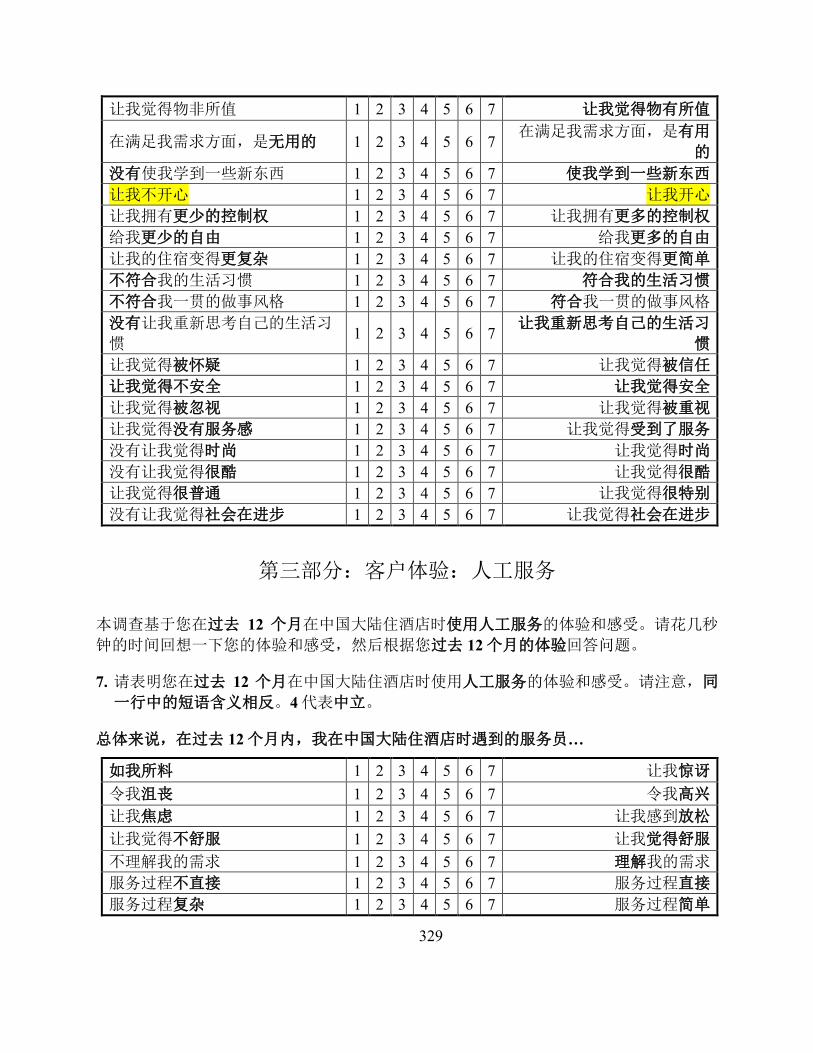
329
让我觉得物非所值 1 2 3 4 5 6 7 让我觉得物有所值
在满足我需求方面,是无用的 1 2 3 4 5 6 7 在满足我需求方面,是有用
的 没有使我学到一些新东西 1 2 3 4 5 6 7 使我学到一些新东西 让我不开心 1 2 3 4 5 6 7 让我开心 让我拥有更少的控制权 1 2 3 4 5 6 7 让我拥有更多的控制权 给我更少的自由 1 2 3 4 5 6 7 给我更多的自由 让我的住宿变得更复杂 1 2 3 4 5 6 7 让我的住宿变得更简单 不符合我的生活习惯 1 2 3 4 5 6 7 符合我的生活习惯 不符合我一贯的做事风格 1 2 3 4 5 6 7 符合我一贯的做事风格 没有让我重新思考自己的生活习
惯 1 2 3 4 5 6 7 让我重新思考自己的生活习
惯 让我觉得被怀疑 1 2 3 4 5 6 7 让我觉得被信任 让我觉得不安全 1 2 3 4 5 6 7 让我觉得安全 让我觉得被忽视 1 2 3 4 5 6 7 让我觉得被重视 让我觉得没有服务感 1 2 3 4 5 6 7 让我觉得受到了服务 没有让我觉得时尚 1 2 3 4 5 6 7 让我觉得时尚 没有让我觉得很酷 1 2 3 4 5 6 7 让我觉得很酷 让我觉得很普通 1 2 3 4 5 6 7 让我觉得很特别 没有让我觉得社会在进步 1 2 3 4 5 6 7 让我觉得社会在进步
第三部分:客户体验:人工服务
本调查基于您在过去 12 个月在中国大陆住酒店时使用人工服务的体验和感受。请花几秒
钟的时间回想一下您的体验和感受,然后根据您过去 12 个月的体验回答问题。
7. 请表明您在过去 12 个月在中国大陆住酒店时使用人工服务的体验和感受。请注意,同
一行中的短语含义相反。4 代表中立。
总体来说,在过去 12 个月内,我在中国大陆住酒店时遇到的服务员…
如我所料 1 2 3 4 5 6 7 让我惊讶 令我沮丧 1 2 3 4 5 6 7 令我高兴 让我焦虑 1 2 3 4 5 6 7 让我感到放松 让我觉得不舒服 1 2 3 4 5 6 7 让我觉得舒服 不理解我的需求 1 2 3 4 5 6 7 理解我的需求 服务过程不直接 1 2 3 4 5 6 7 服务过程直接 服务过程复杂 1 2 3 4 5 6 7 服务过程简单

330
服务过程不顺畅 1 2 3 4 5 6 7 服务过程顺畅 不方便 1 2 3 4 5 6 7 方便 效率低下 1 2 3 4 5 6 7 高效 让我觉得物非所值 1 2 3 4 5 6 7 让我觉得物有所值
在满足我需求方面,是无用的 1 2 3 4 5 6 7 在满足我需求方面,是有用
的 没有使我学到一些新东西 1 2 3 4 5 6 7 使我学到一些新东西 让我不开心 1 2 3 4 5 6 7 让我开心 让我拥有更少的控制权 1 2 3 4 5 6 7 让我拥有更多的控制权 给我更少的自由 1 2 3 4 5 6 7 给我更多的自由 让我的住宿变得更复杂 1 2 3 4 5 6 7 让我的住宿变得更简单 不符合我的生活习惯 1 2 3 4 5 6 7 符合我的生活习惯 不符合我一贯的做事风格 1 2 3 4 5 6 7 符合我一贯的做事风格 没有让我重新思考自己的生活习
惯 1 2 3 4 5 6 7 让我重新思考自己的生活习
惯 让我觉得被怀疑 1 2 3 4 5 6 7 让我觉得被信任 让我觉得不安全 1 2 3 4 5 6 7 让我觉得安全 让我觉得被忽视 1 2 3 4 5 6 7 让我觉得被重视 让我觉得没有服务感 1 2 3 4 5 6 7 让我觉得受到了服务 没有让我觉得时尚 1 2 3 4 5 6 7 让我觉得时尚 没有让我觉得很酷 1 2 3 4 5 6 7 让我觉得很酷 让我觉得很普通 1 2 3 4 5 6 7 让我觉得很特别 没有让我觉得社会在进步 1 2 3 4 5 6 7 让我觉得社会在进步
第四部分:行为偏好
以下问题主要是了解您关于未来酒店服务的行为偏好。
8. 当我办理登记入住的时候,我偏好
a. 刷脸入住 b. 使用移动(手机)自助入住 c. 前台登记入住 d. 其他________ (请注明)
9. 关于控制房间设施(如:电视、窗帘和灯光等),我偏好
a. 使用智能手机 b. 使用控制面板 c. 使用客房智能管家(如:天猫精灵) d. 使用传统的按钮开关 e. 其他________ (请注明)
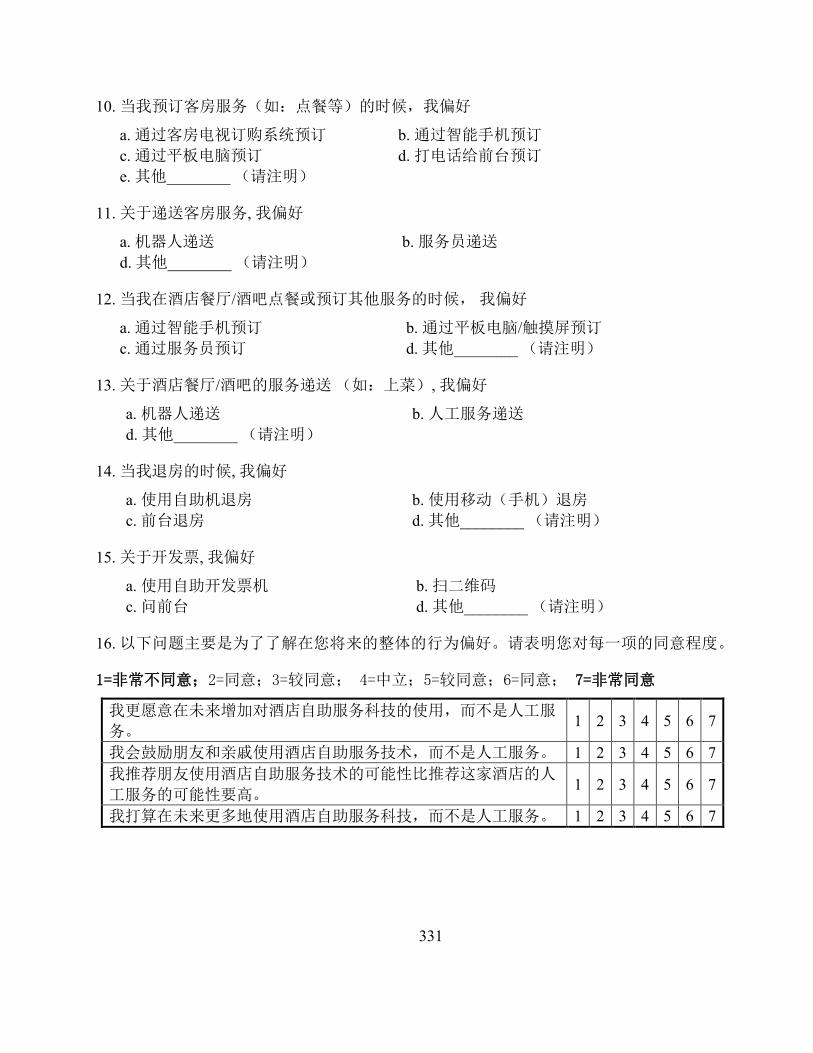
331
10. 当我预订客房服务(如:点餐等)的时候,我偏好
a. 通过客房电视订购系统预订 b. 通过智能手机预订 c. 通过平板电脑预订 d. 打电话给前台预订 e. 其他________ (请注明)
11. 关于递送客房服务, 我偏好
a. 机器人递送 b. 服务员递送 d. 其他________ (请注明)
12. 当我在酒店餐厅/酒吧点餐或预订其他服务的时候, 我偏好
a. 通过智能手机预订 b. 通过平板电脑/触摸屏预订 c. 通过服务员预订 d. 其他________ (请注明)
13. 关于酒店餐厅/酒吧的服务递送 (如:上菜), 我偏好
a. 机器人递送 b. 人工服务递送 d. 其他________ (请注明)
14. 当我退房的时候, 我偏好
a. 使用自助机退房 b. 使用移动(手机)退房 c. 前台退房 d. 其他________ (请注明)
15. 关于开发票, 我偏好
a. 使用自助开发票机 b. 扫二维码 c. 问前台 d. 其他________ (请注明)
16. 以下问题主要是为了了解在您将来的整体的行为偏好。请表明您对每一项的同意程度。
1=非常不同意;2=同意;3=较同意; 4=中立;5=较同意;6=同意; 7=非常同意
我更愿意在未来增加对酒店自助服务科技的使用,而不是人工服
务。 1 2 3 4 5 6 7
我会鼓励朋友和亲戚使用酒店自助服务技术,而不是人工服务。 1 2 3 4 5 6 7 我推荐朋友使用酒店自助服务技术的可能性比推荐这家酒店的人
工服务的可能性要高。 1 2 3 4 5 6 7
我打算在未来更多地使用酒店自助服务科技,而不是人工服务。 1 2 3 4 5 6 7

332
第五部分:个人性格
以下问题主要是为了了解您的性格和对待新科技的态度。
17. 以下问题主要是为了了解您的性格。请表明您对每一项的同意程度。
1=非常不同意;2=同意;3=较同意; 4=中立;5=较同意;6=同意; 7=非常同意
我认为我自己是一个….的人。
健谈的 1 2 3 4 5 6 7 和别人在一起觉得很自在 1 2 3 4 5 6 7 比较安静 R 1 2 3 4 5 6 7 话题开启者 1 2 3 4 5 6 7 保守 R 1 2 3 4 5 6 7 能感同身受 1 2 3 4 5 6 7 勤快 1 2 3 4 5 6 7 关心他人 1 2 3 4 5 6 7 爱挑剔别人 R 1 2 3 4 5 6 7 相信别人对我说的话 1 2 3 4 5 6 7 喜欢与人合作 1 2 3 4 5 6 7 做事有效率 1 2 3 4 5 6 7 注重细节 1 2 3 4 5 6 7 制定计划并严格执行 1 2 3 4 5 6 7 做事周密 1 2 3 4 5 6 7 懒惰 R 1 2 3 4 5 6 7 容易有压力 1 2 3 4 5 6 7 喜怒无常 1 2 3 4 5 6 7 容易紧张 1 2 3 4 5 6 7 害怕最坏的情况 1 2 3 4 5 6 7 容易恐慌 1 2 3 4 5 6 7 对新想法感到兴奋 1 2 3 4 5 6 7 喜欢思考问题 1 2 3 4 5 6 7 喜欢听到新想法 1 2 3 4 5 6 7 喜欢按部就班 R 1 2 3 4 5 6 7 想象力丰富 1 2 3 4 5 6 7

333
18. 以下问题主要是为了了解您对新科技的态度。请表明您对每一项的同意程度。
1=非常不同意;2=同意;3=较同意; 4=中立;5=较同意;6=同意; 7=非常同意
如果我听说了一种新科技,我会想办法去尝试她。 1 2 3 4 5 6 7 在我的同龄人中,我通常是第一批尝试新科技的人。 1 2 3 4 5 6 7 我喜欢尝试新的科技。 1 2 3 4 5 6 7
第六部分:个人资料
以下问题主要是为了了解您的一些个人资料。
19. 性别
a. 女 b. 男
20. 您是哪一年出生的: ________ (请选择)
21. 您的常住城市是:________ (请选择)
22. 最高学历
a. 初中及以下 b. 高中 c. 大专(2-3 年制) d. 大学(4 年制) e. 研究生或以上
23. 就业类型
a. 学生 b. 全职 c. 兼职 d. 自由职业者/个体经营者 e. 退休 f. 无业 g. 其他 ________ (请注明)
24. 请问您过往或现在是否曾在酒店业工作?
a. 是________(请注明所在部门) b. 否
25. 婚姻状态
a. 单身 b. 有稳定伴侣 c.已婚,没有孩子 d. 已婚,育有孩子 e. 分居/离婚 f. 鳏寡
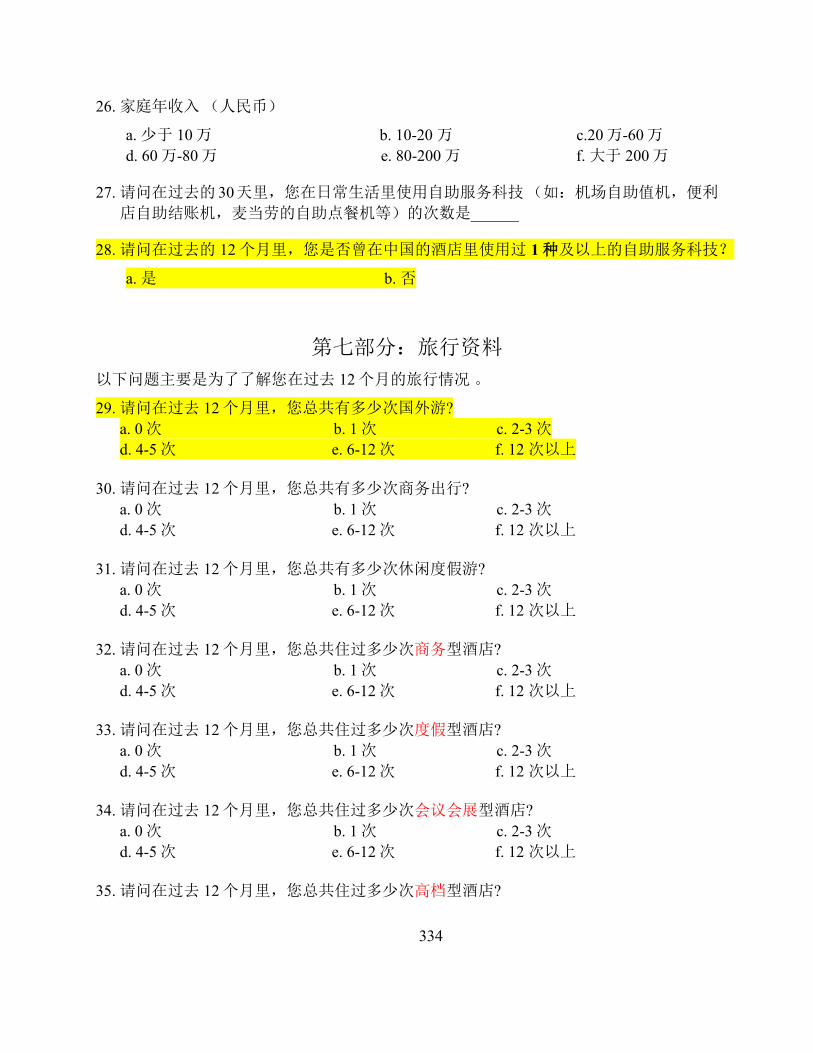
334
26. 家庭年收入 (人民币)
a. 少于 10 万 b. 10-20 万 c.20 万-60 万 d. 60 万-80 万 e. 80-200 万 f. 大于 200 万
27. 请问在过去的 30天里,您在日常生活里使用自助服务科技 (如:机场自助值机,便利
店自助结账机,麦当劳的自助点餐机等)的次数是______
28. 请问在过去的 12 个月里,您是否曾在中国的酒店里使用过 1 种及以上的自助服务科技?
a. 是 b. 否
第七部分:旅行资料 以下问题主要是为了了解您在过去 12 个月的旅行情况 。
29. 请问在过去 12 个月里,您总共有多少次国外游? a. 0 次 b. 1 次 c. 2-3 次 d. 4-5 次 e. 6-12 次 f. 12 次以上
30. 请问在过去 12 个月里,您总共有多少次商务出行? a. 0 次 b. 1 次 c. 2-3 次 d. 4-5 次 e. 6-12 次 f. 12 次以上
31. 请问在过去 12 个月里,您总共有多少次休闲度假游?
a. 0 次 b. 1 次 c. 2-3 次 d. 4-5 次 e. 6-12 次 f. 12 次以上
32. 请问在过去 12 个月里,您总共住过多少次商务型酒店?
a. 0 次 b. 1 次 c. 2-3 次 d. 4-5 次 e. 6-12 次 f. 12 次以上
33. 请问在过去 12 个月里,您总共住过多少次度假型酒店?
a. 0 次 b. 1 次 c. 2-3 次 d. 4-5 次 e. 6-12 次 f. 12 次以上
34. 请问在过去 12 个月里,您总共住过多少次会议会展型酒店?
a. 0 次 b. 1 次 c. 2-3 次 d. 4-5 次 e. 6-12 次 f. 12 次以上
35. 请问在过去 12 个月里,您总共住过多少次高档型酒店?

335
a. 0 次 b. 1 次 c. 2-3 次 d. 4-5 次 e. 6-12 次 f. 12 次以上
36. 请问在过去 12 个月里,您总共住过多少次中档型酒店?
a. 0 次 b. 1 次 c. 2-3 次 d. 4-5 次 e. 6-12 次 f. 12 次以上
37. 请问在过去 12 个月里,您总共住过多少次经济型酒店? a. 0 次 b. 1 次 c. 2-3 次 d. 4-5 次 e. 6-12 次 f. 12 次以上
非常感谢您的参与! 注释: “R” 代表反向评分的项目 高亮代表反向题目或同质题目以保证问卷的可信度

336
Appendix 4.2 Questionnaires for Second-Round Data Collection
Appendix 4.2.1 Questionnaires for Customers
Survey on Customer Experience with Self-service Technology in Hotels
Dear Sir or Madam:
I am Chun (Lucy) LIU, a research student in the School of Hotel and Tourism Management at The Hong Kong Polytechnic University. I am conducting a study regarding customer experiences with self-service technologies versus human services in hotels. The information collected will be used for research purposes only. Anonymity is guaranteed, and data will be treated in an ethical and confidential manner. Thank you for your participation! If you have any questions, please feel free to contact me at spring.liu@ or +852 34002334.
Chun (Lucy) LIU PhD Student
School of Hotel and Tourism Management The Hong Kong Polytechnic University
Basic Questions
1. What kind of purpose do you typically travel for?a. business b. leisurec. both business and leisure d. visiting friends/familye. other ________ [please specify]
2. What star hotel do you typically stay at?a. 1-2 star (economy) b. 3 star (midscale)c. 4 star (upscale) d. 5 star (luxury)
3. What kind of hotel do you typically stay at?a. business hotel b. resort hotelc. convention hotel d. other ________ [please specify]
4. How many trips have you taken in total within the past 12 months?a. 0 [terminate] b. one trip c. 2–3 tripsd. 4–5 trips e. 6-12 trips f. more than 12 trips
5. How many domestic trips have you taken within the past 12 months?a. 0 [terminate] b. one trip c. 2–3 tripsd. 4–5 trips e. 6-12 trips f. more than 12 trips
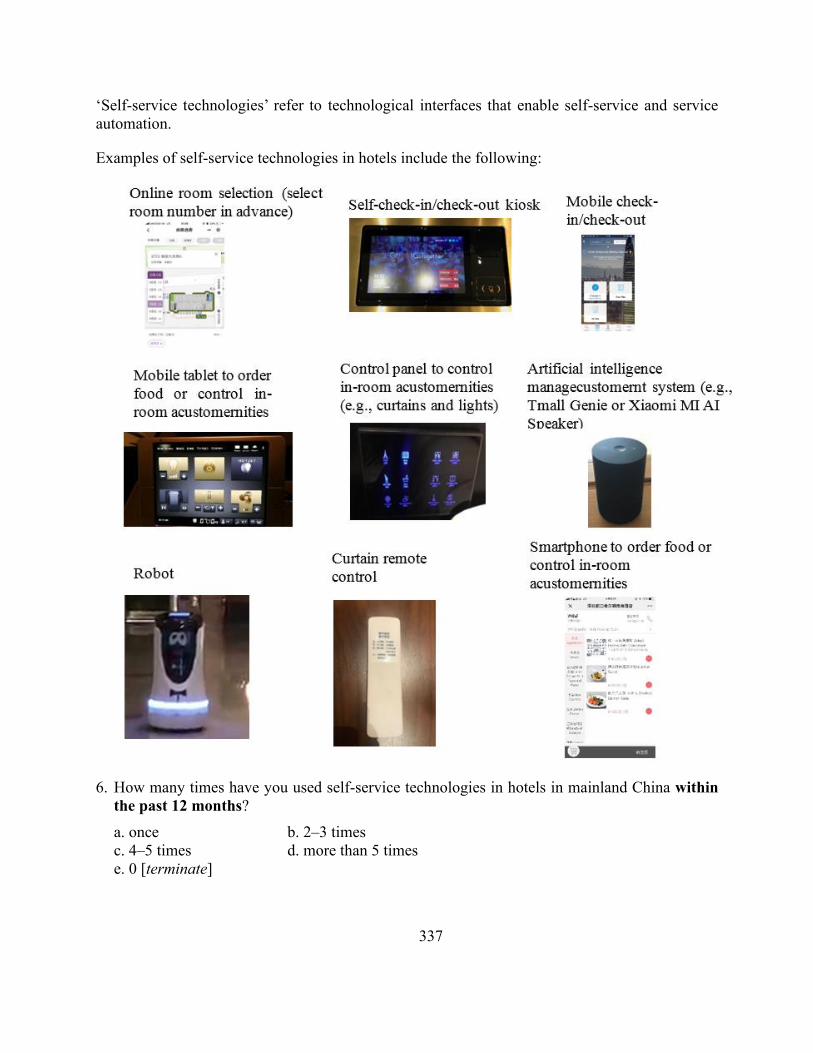
337
‘Self-service technologies’ refer to technological interfaces that enable self-service and service automation.
Examples of self-service technologies in hotels include the following:
6. How many times have you used self-service technologies in hotels in mainland China within the past 12 months? a. once b. 2–3 times c. 4–5 times d. more than 5 times e. 0 [terminate]
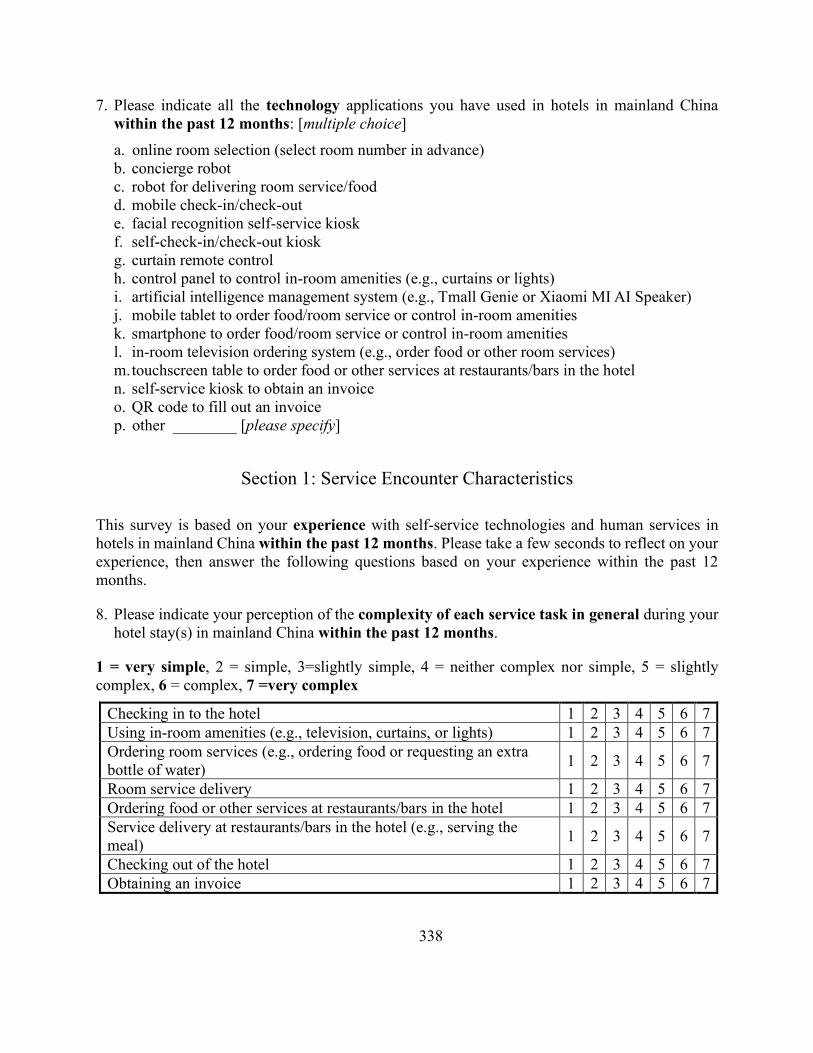
338
7. Please indicate all the technology applications you have used in hotels in mainland China within the past 12 months: [multiple choice] a. online room selection (select room number in advance) b. concierge robot c. robot for delivering room service/food d. mobile check-in/check-out e. facial recognition self-service kiosk f. self-check-in/check-out kiosk g. curtain remote control h. control panel to control in-room amenities (e.g., curtains or lights) i. artificial intelligence management system (e.g., Tmall Genie or Xiaomi MI AI Speaker) j. mobile tablet to order food/room service or control in-room amenities k. smartphone to order food/room service or control in-room amenities l. in-room television ordering system (e.g., order food or other room services) m. touchscreen table to order food or other services at restaurants/bars in the hotel n. self-service kiosk to obtain an invoice o. QR code to fill out an invoice p. other ________ [please specify]
Section 1: Service Encounter Characteristics
This survey is based on your experience with self-service technologies and human services in hotels in mainland China within the past 12 months. Please take a few seconds to reflect on your experience, then answer the following questions based on your experience within the past 12 months.
8. Please indicate your perception of the complexity of each service task in general during your hotel stay(s) in mainland China within the past 12 months.
1 = very simple, 2 = simple, 3=slightly simple, 4 = neither complex nor simple, 5 = slightly complex, 6 = complex, 7 =very complex
Checking in to the hotel 1 2 3 4 5 6 7 Using in-room amenities (e.g., television, curtains, or lights) 1 2 3 4 5 6 7 Ordering room services (e.g., ordering food or requesting an extra bottle of water) 1 2 3 4 5 6 7
Room service delivery 1 2 3 4 5 6 7 Ordering food or other services at restaurants/bars in the hotel 1 2 3 4 5 6 7 Service delivery at restaurants/bars in the hotel (e.g., serving the meal) 1 2 3 4 5 6 7
Checking out of the hotel 1 2 3 4 5 6 7 Obtaining an invoice 1 2 3 4 5 6 7

339
Section 2: Customer Experience with Self-service Technologies
This survey is based on your experience with self-service technologies in hotels in mainland China within the past 12 months. Please take a few seconds to reflect on your experience, then answer the following questions based on your experience within the past 12 months.
9. Please indicate your general experience with self-service technologies in hotels in mainland China within the past 12 months. Note that phrases on the same row have opposite meanings with “4” refers to neutral attitude.
In general, self-service technologies that I used in hotels in mainland China within the past 12 months…
upset me. 1 2 3 4 5 6 7 delighted me. made me feel worried. 1 2 3 4 5 6 7 made me feel relaxed. made me feel uncomfortable. 1 2 3 4 5 6 7 made me feel comfortable. did not understand my needs. 1 2 3 4 5 6 7 understood my needs. had an indirect service process. 1 2 3 4 5 6 7 had a direct service process. had a complicated service process. 1 2 3 4 5 6 7 had an easy service process.
had an unsmooth service process. 1 2 3 4 5 6 7 had a smooth service process. were inconvenient. 1 2 3 4 5 6 7 were convenient. were inefficient. 1 2 3 4 5 6 7 were efficient. This item is for attention check, please choose "2". 1 2 3 4 5 6 7 This item is for attention check,
please choose "2". gave me less control. 1 2 3 4 5 6 7 gave me more control. gave me less freedom. 1 2 3 4 5 6 7 gave me more freedom. made my hotel stay(s) more complicated. 1 2 3 4 5 6 7 made my hotel stay(s) simpler.
did not fit with my lifestyle. 1 2 3 4 5 6 7 fit well with my lifestyle. did not fit with the way I prefer to get things done. 1 2 3 4 5 6 7 fit well with the way I prefer to
get things done. made me feel being doubted. 1 2 3 4 5 6 7 made me feel being trusted. made me feel insecure during the transaction. 1 2 3 4 5 6 7 made me feel safe during the
transaction. made me feel ignored. 1 2 3 4 5 6 7 made me feel valued. made me feel like there was no service. 1 2 3 4 5 6 7 made me feel as if I were being
served. did not make me feel fashionable. 1 2 3 4 5 6 7 made me feel fashionable. did not make me feel cool. 1 2 3 4 5 6 7 made me feel cool. made me feel ordinary. 1 2 3 4 5 6 7 made me feel special. did not made me think that society is progressing. 1 2 3 4 5 6 7 made me think that society is
progressing.

340
Section 3: Customer Experience with Human Services
This survey is based on your experience with human services in hotels in mainland China within the past 12 months. Please take a few seconds to reflect on your experience, then answer the following questions based on your experience within the past 12 months.
10. Please indicate your general experience with human services in hotels in mainland China within the past 12 months. Note that phrases on the same row have opposite meanings with “4” refers to neutral attitude.
In general, service employees during my hotel stay(s) in mainland China within the past 12 months…
upset me. 1 2 3 4 5 6 7 delighted me. made me feel worried. 1 2 3 4 5 6 7 made me feel relaxed. made me feel uncomfortable. 1 2 3 4 5 6 7 made me feel comfortable. did not understand my needs. 1 2 3 4 5 6 7 understood my needs. had an indirect service process. 1 2 3 4 5 6 7 had a direct service process. had a complicated service process. 1 2 3 4 5 6 7 had an easy service process.
had an unsmooth service process. 1 2 3 4 5 6 7 had a smooth service process. were inconvenient. 1 2 3 4 5 6 7 were convenient. were inefficient. 1 2 3 4 5 6 7 were efficient. This item is for attention check, please choose "2". 1 2 3 4 5 6 7 This item is for attention check,
please choose "2". gave me less control. 1 2 3 4 5 6 7 gave me more control. gave me less freedom. 1 2 3 4 5 6 7 gave me more freedom. made my hotel stay(s) more complicated. 1 2 3 4 5 6 7 made my hotel stay(s) simpler.
did not fit with my lifestyle. 1 2 3 4 5 6 7 fit well with my lifestyle. did not fit with the way I prefer to get things done. 1 2 3 4 5 6 7 fit well with the way I prefer to
get things done. made me feel being doubted. 1 2 3 4 5 6 7 made me feel being trusted. made me feel insecure during the transaction. 1 2 3 4 5 6 7 made me feel safe during the
transaction. made me feel ignored. 1 2 3 4 5 6 7 made me feel valued. made me feel like there was no service. 1 2 3 4 5 6 7 made me feel as if I were being
served. did not make me feel fashionable. 1 2 3 4 5 6 7 made me feel fashionable. did not make me feel cool. 1 2 3 4 5 6 7 made me feel cool. made me feel ordinary. 1 2 3 4 5 6 7 made me feel special. did not made me think that society is progressing. 1 2 3 4 5 6 7 made me think that society is
progressing.

341
Section 4: Behavioral Preferences
The following questions pertain to your behavioral preferences for future hotel services.
11. The following statements pertain to your use of self-service technologies in the future in general; please indicate the extent to which you agree with each.
1 = strongly disagree, 2 =disagree, 3 = slightly disagree, 4 =neither agree nor disagree, 5 = slight agree, 6 = agree, 7 = strongly agree
I plan to increase my use of hotel self-service technologies in the future. 1 2 3 4 5 6 7
I would encourage friends and relatives to use hotel self-service technologies. 1 2 3 4 5 6 7
The likelihood that I would recommend use of hotel self-service technology to a friend is high. 1 2 3 4 5 6 7
I intend to use hotel self-service technologies more in the future. 1 2 3 4 5 6 7
12. The following statements pertain to your use of human services in the future in general; please indicate the extent to which you agree with each.
1 = strongly disagree, 2 =disagree, 3 = slightly disagree, 4 =neither agree nor disagree, 5 = slight agree, 6 = agree, 7 = strongly agree
I plan to increase my use of human services in the future. 1 2 3 4 5 6 7 I would encourage friends and relatives to use human services. 1 2 3 4 5 6 7 The likelihood that I would recommend use of human to a friend is high. 1 2 3 4 5 6 7
I intend to use human services more in the future. 1 2 3 4 5 6 7
13. When checking in, I would prefer a. using a facial recognition self-service kiosk b. using mobile check-in c. checking in at the front desk d. other ________ [please specify]
14. When controlling in-room amenities (e.g., television, curtains, and lights), I would prefer a. using a smartphone b. using a mobile tablet c. using a control panel d. using an artificial intelligence management system (e.g., Tmall Genie) e. using a traditional switch f. other [please specify: ________]

342
15. When ordering room service (e.g., ordering food), I would prefer a. ordering via television b. ordering via smartphone c. ordering via mobile tablet d. calling the front desk by phone e. other ________ [please specify]
16. In terms of room service delivery, I would prefer a. delivery from a robot b. delivery from a service employee c. other ________ [please specify]
17. When ordering food or other services at restaurants/bars in hotels, I would prefer a. ordering via smartphone b. ordering via mobile tablet/touchscreen table c. ordering via a service employee d. other ________ [please specify]
18. In terms of service delivery at restaurants/bars in hotels (e.g., serving the meal), I would prefer a. delivery from a robot b. delivery from a service employee c. other ________ [please specify]
19. When checking out, I would prefer a. using a self-service kiosk b. using mobile check-out c. checking out at the front desk d. other ________ [please specify]
20. In terms of obtaining an invoice, I would prefer a. using a self-service kiosk b. using a QR code c. asking the front desk d. other ________ [please specify]
Section 5: Personality
The following questions pertain to your personality and your attitudes toward technology.
21. The following statements pertain to your personality; please indicate the extent to which you agree with each.
1 = strongly disagree, 2 =disagree, 3 = slightly disagree, 4 =neither agree nor disagree, 5 = slight agree, 6 = agree, 7 = strongly agree
I see myself as someone who…
is talkative. 1 2 3 4 5 6 7 feels comfortable around people. 1 2 3 4 5 6 7 tends to be quiet. R 1 2 3 4 5 6 7 starts conversations. 1 2 3 4 5 6 7 is reserved. R 1 2 3 4 5 6 7
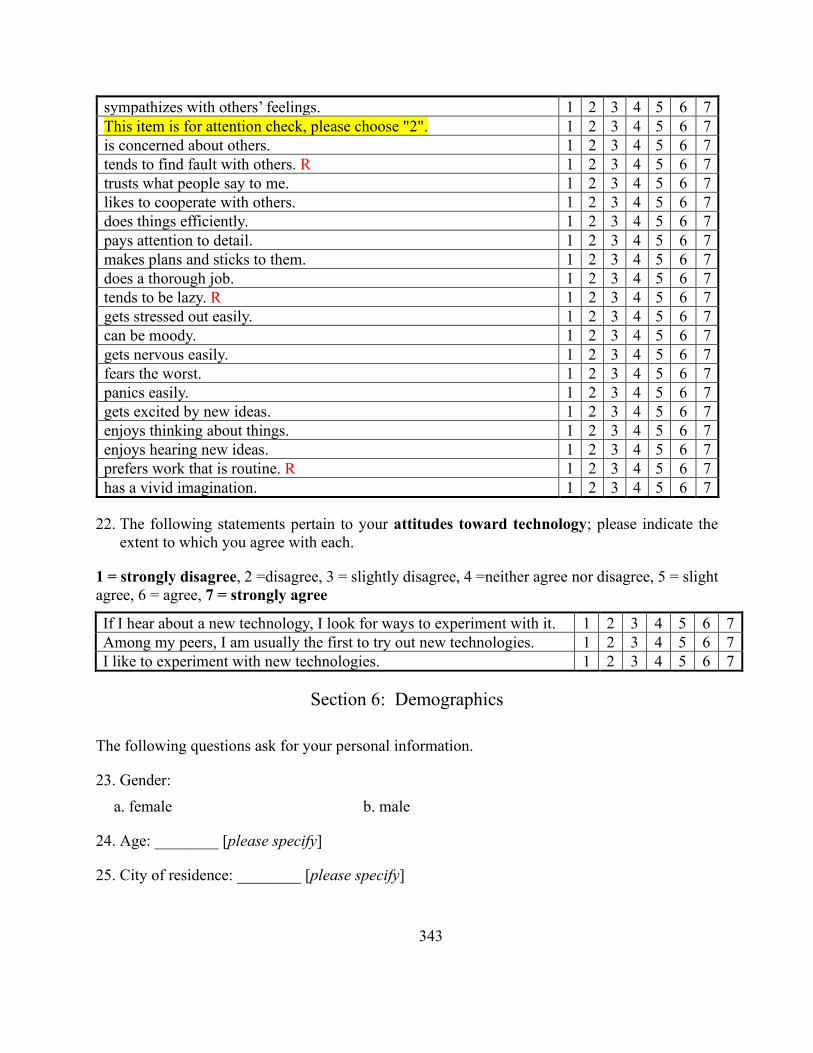
343
sympathizes with others’ feelings. 1 2 3 4 5 6 7 This item is for attention check, please choose "2". 1 2 3 4 5 6 7 is concerned about others. 1 2 3 4 5 6 7 tends to find fault with others. R 1 2 3 4 5 6 7 trusts what people say to me. 1 2 3 4 5 6 7 likes to cooperate with others. 1 2 3 4 5 6 7 does things efficiently. 1 2 3 4 5 6 7 pays attention to detail. 1 2 3 4 5 6 7 makes plans and sticks to them. 1 2 3 4 5 6 7 does a thorough job. 1 2 3 4 5 6 7 tends to be lazy. R 1 2 3 4 5 6 7 gets stressed out easily. 1 2 3 4 5 6 7 can be moody. 1 2 3 4 5 6 7 gets nervous easily. 1 2 3 4 5 6 7 fears the worst. 1 2 3 4 5 6 7 panics easily. 1 2 3 4 5 6 7 gets excited by new ideas. 1 2 3 4 5 6 7 enjoys thinking about things. 1 2 3 4 5 6 7 enjoys hearing new ideas. 1 2 3 4 5 6 7 prefers work that is routine. R 1 2 3 4 5 6 7 has a vivid imagination. 1 2 3 4 5 6 7
22. The following statements pertain to your attitudes toward technology; please indicate the extent to which you agree with each.
1 = strongly disagree, 2 =disagree, 3 = slightly disagree, 4 =neither agree nor disagree, 5 = slight agree, 6 = agree, 7 = strongly agree
If I hear about a new technology, I look for ways to experiment with it. 1 2 3 4 5 6 7 Among my peers, I am usually the first to try out new technologies. 1 2 3 4 5 6 7 I like to experiment with new technologies. 1 2 3 4 5 6 7
Section 6: Demographics
The following questions ask for your personal information.
23. Gender: a. female b. male
24. Age: ________ [please specify]
25. City of residence: ________ [please specify]
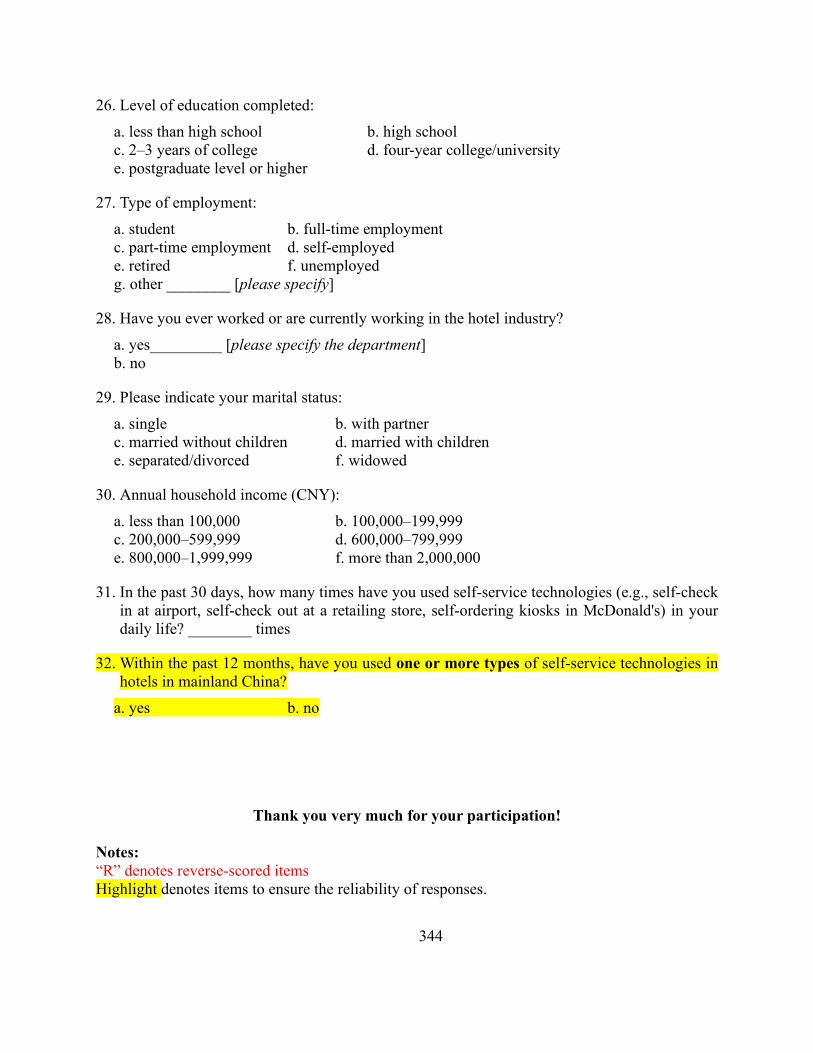
344
26. Level of education completed: a. less than high school b. high school c. 2–3 years of college d. four-year college/university e. postgraduate level or higher
27. Type of employment: a. student b. full-time employment c. part-time employment d. self-employed e. retired f. unemployed g. other ________ [please specify]
28. Have you ever worked or are currently working in the hotel industry?
a. yes_________ [please specify the department] b. no
29. Please indicate your marital status: a. single b. with partner c. married without children d. married with children e. separated/divorced f. widowed
30. Annual household income (CNY): a. less than 100,000 b. 100,000–199,999 c. 200,000–599,999 d. 600,000–799,999 e. 800,000–1,999,999 f. more than 2,000,000
31. In the past 30 days, how many times have you used self-service technologies (e.g., self-check in at airport, self-check out at a retailing store, self-ordering kiosks in McDonald's) in your daily life? ________ times
32. Within the past 12 months, have you used one or more types of self-service technologies in hotels in mainland China?
a. yes b. no
Thank you very much for your participation!
Notes: “R” denotes reverse-scored items Highlight denotes items to ensure the reliability of responses.
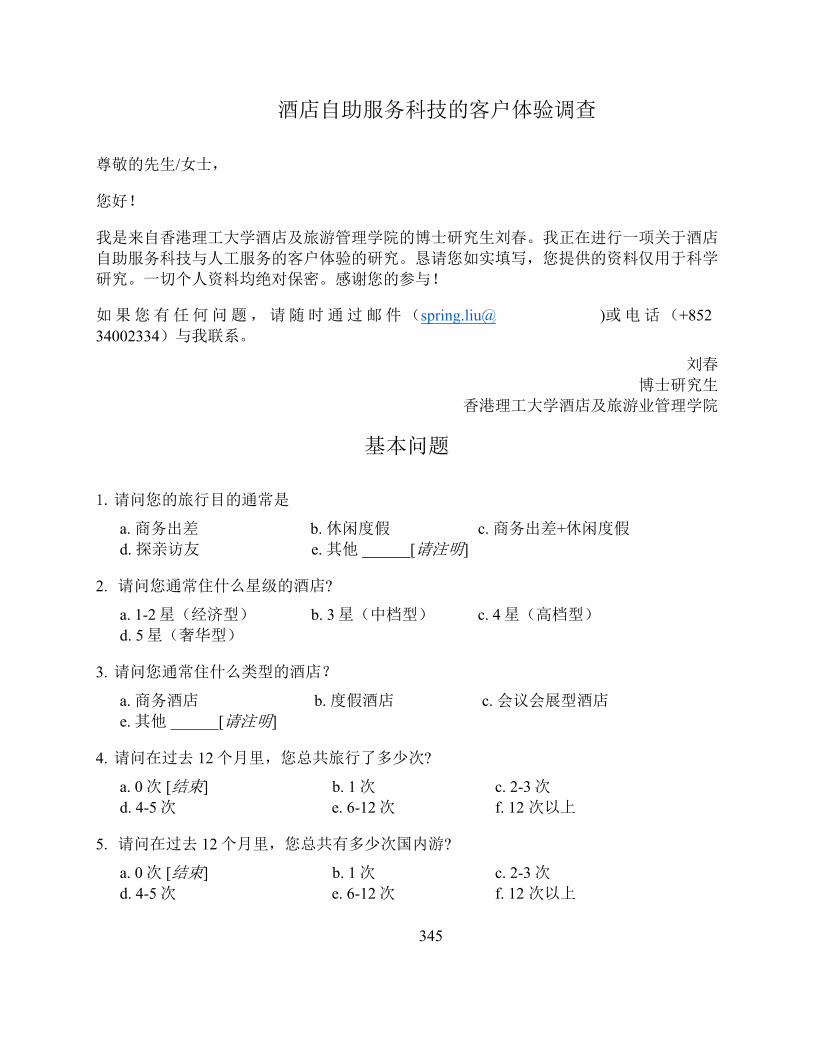
345
酒店自助服务科技的客户体验调查
尊敬的先生/女士,
您好!
我是来自香港理工大学酒店及旅游管理学院的博士研究生刘春。我正在进行一项关于酒店
自助服务科技与人工服务的客户体验的研究。恳请您如实填写,您提供的资料仅用于科学
研究。一切个人资料均绝对保密。感谢您的参与!
如果您有任何问题,请随时通过邮件(spring.liu@ )或电话(+852 34002334)与我联系。
刘春
博士研究生
香港理工大学酒店及旅游业管理学院
基本问题
1. 请问您的旅行目的通常是
a. 商务出差 b. 休闲度假 c. 商务出差+休闲度假
d. 探亲访友 e. 其他 ______[请注明]
2. 请问您通常住什么星级的酒店?
a. 1-2 星(经济型) b. 3 星(中档型) c. 4 星(高档型)
d. 5 星(奢华型)
3. 请问您通常住什么类型的酒店?
a. 商务酒店 b. 度假酒店 c. 会议会展型酒店
e. 其他 ______[请注明]
4. 请问在过去 12 个月里,您总共旅行了多少次?
a. 0 次 [结束] b. 1 次 c. 2-3 次
d. 4-5 次 e. 6-12 次 f. 12 次以上
5. 请问在过去 12 个月里,您总共有多少次国内游?
a. 0 次 [结束] b. 1 次 c. 2-3 次
d. 4-5 次 e. 6-12 次 f. 12 次以上
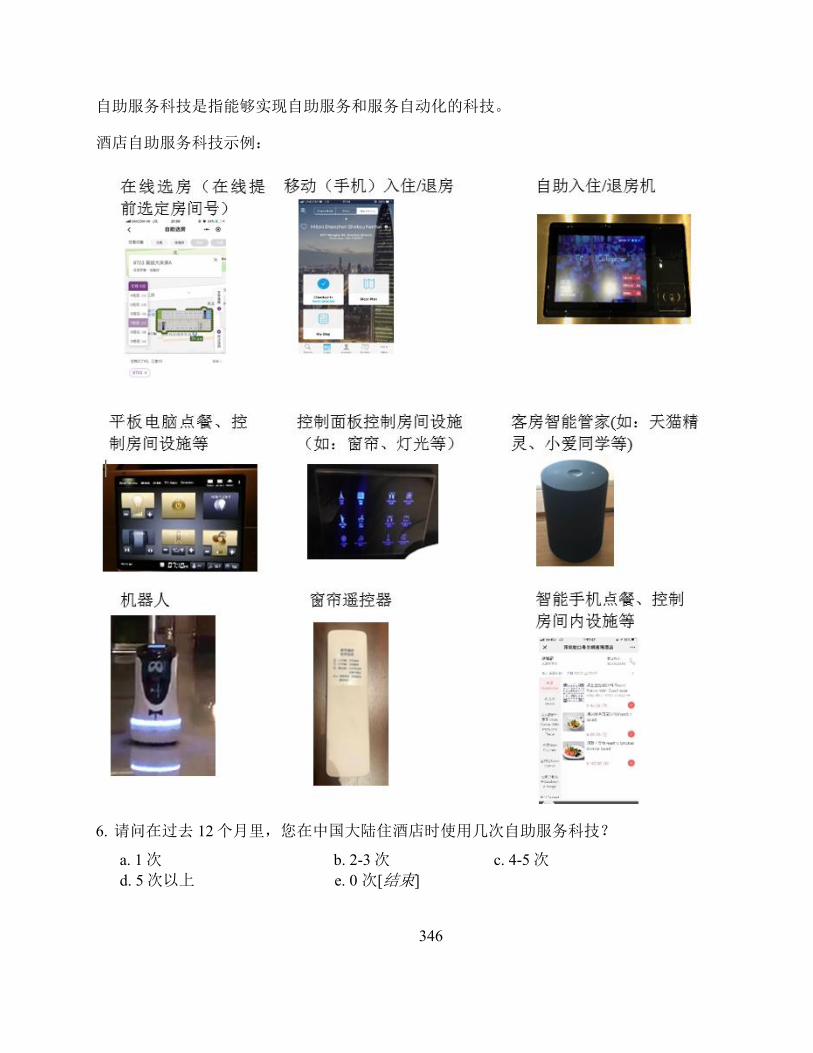
346
自助服务科技是指能够实现自助服务和服务自动化的科技。
酒店自助服务科技示例:
6. 请问在过去 12 个月里,您在中国大陆住酒店时使用几次自助服务科技?
a. 1 次 b. 2-3 次 c. 4-5 次 d. 5 次以上 e. 0 次[结束]
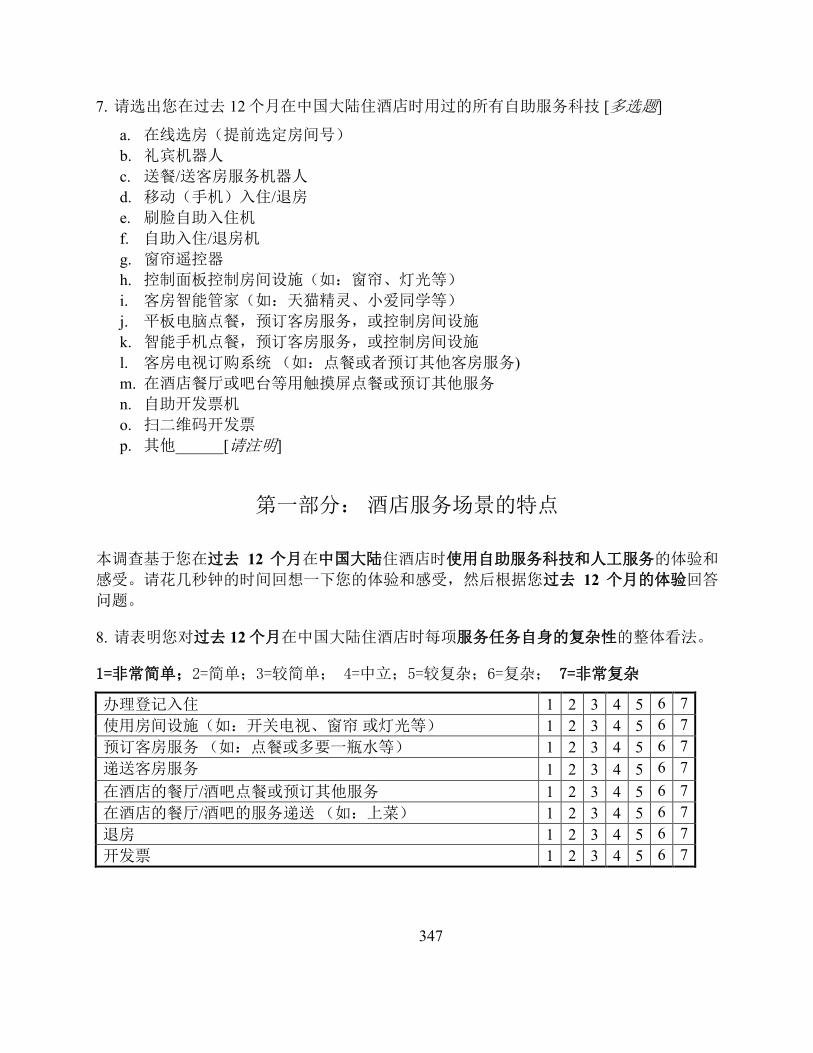
347
7. 请选出您在过去 12 个月在中国大陆住酒店时用过的所有自助服务科技 [多选题]
a. 在线选房(提前选定房间号) b. 礼宾机器人 c. 送餐/送客房服务机器人 d. 移动(手机)入住/退房 e. 刷脸自助入住机 f. 自助入住/退房机 g. 窗帘遥控器 h. 控制面板控制房间设施(如:窗帘、灯光等) i. 客房智能管家(如:天猫精灵、小爱同学等) j. 平板电脑点餐,预订客房服务,或控制房间设施 k. 智能手机点餐,预订客房服务,或控制房间设施 l. 客房电视订购系统 (如:点餐或者预订其他客房服务) m. 在酒店餐厅或吧台等用触摸屏点餐或预订其他服务 n. 自助开发票机 o. 扫二维码开发票 p. 其他______[请注明]
第一部分: 酒店服务场景的特点
本调查基于您在过去 12 个月在中国大陆住酒店时使用自助服务科技和人工服务的体验和
感受。请花几秒钟的时间回想一下您的体验和感受,然后根据您过去 12 个月的体验回答
问题。
8. 请表明您对过去 12 个月在中国大陆住酒店时每项服务任务自身的复杂性的整体看法。
1=非常简单;2=简单;3=较简单; 4=中立;5=较复杂;6=复杂; 7=非常复杂
办理登记入住 1 2 3 4 5 6 7 使用房间设施(如:开关电视、窗帘 或灯光等) 1 2 3 4 5 6 7 预订客房服务 (如:点餐或多要一瓶水等) 1 2 3 4 5 6 7 递送客房服务 1 2 3 4 5 6 7 在酒店的餐厅/酒吧点餐或预订其他服务 1 2 3 4 5 6 7 在酒店的餐厅/酒吧的服务递送 (如:上菜) 1 2 3 4 5 6 7 退房 1 2 3 4 5 6 7 开发票 1 2 3 4 5 6 7

348
第二部分:客户体验:自助服务科技
本调查基于您在过去 12 个月在中国大陆住酒店时使用自助服务科技的体验和感受。请花
几秒钟的时间回想一下您的体验和感受,然后根据您过去 12 个月的体验回答问题。
9. 请表明您在过去 12 个月在中国大陆住酒店时使用自助服务科技的体验和感受。请注意,
同一行中的短语含义相反。 4 代表中立。
总体来说,在过去 12 个月内,我在中国大陆住酒店时使用的自助服务科技…
令我沮丧 1 2 3 4 5 6 7 令我高兴 让我焦虑 1 2 3 4 5 6 7 让我感到放松 让我觉得不舒服 1 2 3 4 5 6 7 让我觉得舒服 不理解我的需求 1 2 3 4 5 6 7 理解我的需求 服务过程不直接 1 2 3 4 5 6 7 服务过程直接 服务过程复杂 1 2 3 4 5 6 7 服务过程简单 服务过程不顺畅 1 2 3 4 5 6 7 服务过程顺畅 不方便 1 2 3 4 5 6 7 方便 效率低下 1 2 3 4 5 6 7 高效 此项目为注意事项检查,请选
择“2”。 1 2 3 4 5 6 7 此项目为注意事项检查,请选
择“2”。 让我拥有更少的控制权 1 2 3 4 5 6 7 让我拥有更多的控制权 给我更少的自由 1 2 3 4 5 6 7 给我更多的自由 让我的住宿变得更复杂 1 2 3 4 5 6 7 让我的住宿变得更简单 不符合我的生活习惯 1 2 3 4 5 6 7 符合我的生活习惯 不符合我一贯的做事风格 1 2 3 4 5 6 7 符合我一贯的做事风格 让我觉得被怀疑 1 2 3 4 5 6 7 让我觉得被信任 让我觉得不安全 1 2 3 4 5 6 7 让我觉得安全 让我觉得被忽视 1 2 3 4 5 6 7 让我觉得被重视 让我觉得没有服务感 1 2 3 4 5 6 7 让我觉得受到了服务 没有让我觉得时尚 1 2 3 4 5 6 7 让我觉得时尚 没有让我觉得很酷 1 2 3 4 5 6 7 让我觉得很酷 让我觉得很普通 1 2 3 4 5 6 7 让我觉得很特别 没有让我觉得社会在进步 1 2 3 4 5 6 7 让我觉得社会在进步

349
第三部分:客户体验:人工服务
本调查基于您在过去 12 个月在中国大陆住酒店时使用人工服务的体验和感受。请花几秒
钟的时间回想一下您的体验和感受,然后根据您过去 12 个月的体验回答问题。
10. 请表明您在过去 12 个月在中国大陆住酒店时使用人工服务的体验和感受。请注意,同
一行中的短语含义相反。4 代表中立。
总体来说,在过去 12 个月内,我在中国大陆住酒店时遇到的服务员…
令我沮丧 1 2 3 4 5 6 7 令我高兴 让我焦虑 1 2 3 4 5 6 7 让我感到放松 让我觉得不舒服 1 2 3 4 5 6 7 让我觉得舒服 不理解我的需求 1 2 3 4 5 6 7 理解我的需求 服务过程不直接 1 2 3 4 5 6 7 服务过程直接 服务过程复杂 1 2 3 4 5 6 7 服务过程简单 服务过程不顺畅 1 2 3 4 5 6 7 服务过程顺畅 不方便 1 2 3 4 5 6 7 方便 效率低下 1 2 3 4 5 6 7 高效 此项目为注意事项检查,请选
择“2”。 1 2 3 4 5 6 7 此项目为注意事项检查,请选
择“2”。 让我拥有更少的控制权 1 2 3 4 5 6 7 让我拥有更多的控制权 给我更少的自由 1 2 3 4 5 6 7 给我更多的自由 让我的住宿变得更复杂 1 2 3 4 5 6 7 让我的住宿变得更简单 不符合我的生活习惯 1 2 3 4 5 6 7 符合我的生活习惯 不符合我一贯的做事风格 1 2 3 4 5 6 7 符合我一贯的做事风格 让我觉得被怀疑 1 2 3 4 5 6 7 让我觉得被信任 让我觉得不安全 1 2 3 4 5 6 7 让我觉得安全 让我觉得被忽视 1 2 3 4 5 6 7 让我觉得被重视 让我觉得没有服务感 1 2 3 4 5 6 7 让我觉得受到了服务 没有让我觉得时尚 1 2 3 4 5 6 7 让我觉得时尚 没有让我觉得很酷 1 2 3 4 5 6 7 让我觉得很酷 让我觉得很普通 1 2 3 4 5 6 7 让我觉得很特别 没有让我觉得社会在进步 1 2 3 4 5 6 7 让我觉得社会在进步
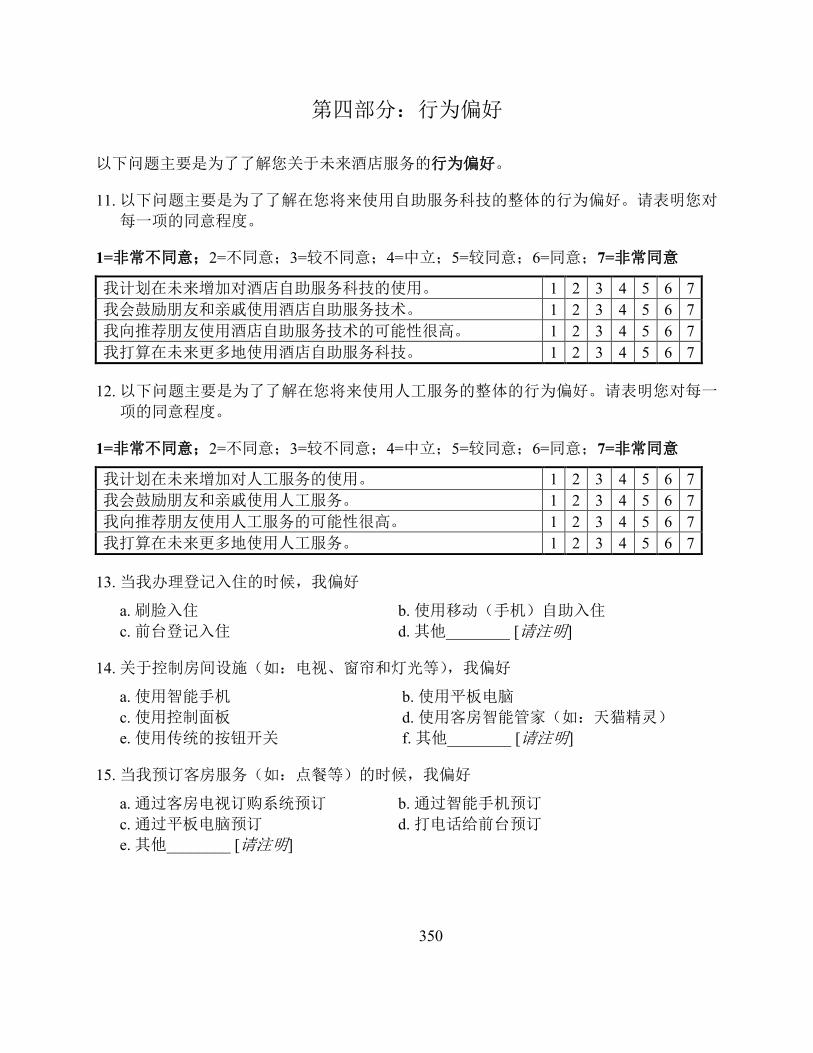
350
第四部分:行为偏好
以下问题主要是为了了解您关于未来酒店服务的行为偏好。
11. 以下问题主要是为了了解在您将来使用自助服务科技的整体的行为偏好。请表明您对
每一项的同意程度。
1=非常不同意;2=不同意;3=较不同意;4=中立;5=较同意;6=同意;7=非常同意
我计划在未来增加对酒店自助服务科技的使用。 1 2 3 4 5 6 7 我会鼓励朋友和亲戚使用酒店自助服务技术。 1 2 3 4 5 6 7 我向推荐朋友使用酒店自助服务技术的可能性很高。 1 2 3 4 5 6 7 我打算在未来更多地使用酒店自助服务科技。 1 2 3 4 5 6 7
12. 以下问题主要是为了了解在您将来使用人工服务的整体的行为偏好。请表明您对每一
项的同意程度。
1=非常不同意;2=不同意;3=较不同意;4=中立;5=较同意;6=同意;7=非常同意
我计划在未来增加对人工服务的使用。 1 2 3 4 5 6 7 我会鼓励朋友和亲戚使用人工服务。 1 2 3 4 5 6 7 我向推荐朋友使用人工服务的可能性很高。 1 2 3 4 5 6 7 我打算在未来更多地使用人工服务。 1 2 3 4 5 6 7
13. 当我办理登记入住的时候,我偏好
a. 刷脸入住 b. 使用移动(手机)自助入住 c. 前台登记入住 d. 其他________ [请注明]
14. 关于控制房间设施(如:电视、窗帘和灯光等),我偏好
a. 使用智能手机 b. 使用平板电脑 c. 使用控制面板 d. 使用客房智能管家(如:天猫精灵) e. 使用传统的按钮开关 f. 其他________ [请注明]
15. 当我预订客房服务(如:点餐等)的时候,我偏好
a. 通过客房电视订购系统预订 b. 通过智能手机预订 c. 通过平板电脑预订 d. 打电话给前台预订 e. 其他________ [请注明]

351
16. 关于递送客房服务, 我偏好
a. 机器人递送 b. 服务员递送 d. 其他________ [请注明]
17. 当我在酒店餐厅/酒吧点餐或预订其他服务的时候, 我偏好
a. 通过智能手机预订 b. 通过平板电脑/触摸屏预订 c. 通过服务员预订 d. 其他________ [请注明]
18. 关于酒店餐厅/酒吧的服务递送 (如:上菜), 我偏好
a. 机器人递送 b. 服务员递送 d. 其他________ [请注明]
19. 当我退房的时候, 我偏好
a. 使用自助机退房 b. 使用移动(手机)退房 c. 前台退房 d. 其他________ [请注明]
20. 关于开发票, 我偏好
a. 使用自助开发票机 b. 扫二维码 c. 问前台 d. 其他________ [请注明]
第五部分:个人性格
以下问题主要是为了了解您的性格和对待新科技的态度。
21. 以下问题主要是为了了解您的性格。请表明您对每一项的同意程度。
1=非常不同意;2=不同意;3=较不同意;4=中立;5=较同意;6=同意;7=非常同意
我认为我自己是一个….的人。
健谈的 1 2 3 4 5 6 7 和别人在一起觉得很自在 1 2 3 4 5 6 7 比较安静 R 1 2 3 4 5 6 7 话题开启者 1 2 3 4 5 6 7 保守 R 1 2 3 4 5 6 7 能感同身受 1 2 3 4 5 6 7 此项目为注意事项检查,请选择“2”。 1 2 3 4 5 6 7 关心他人 1 2 3 4 5 6 7
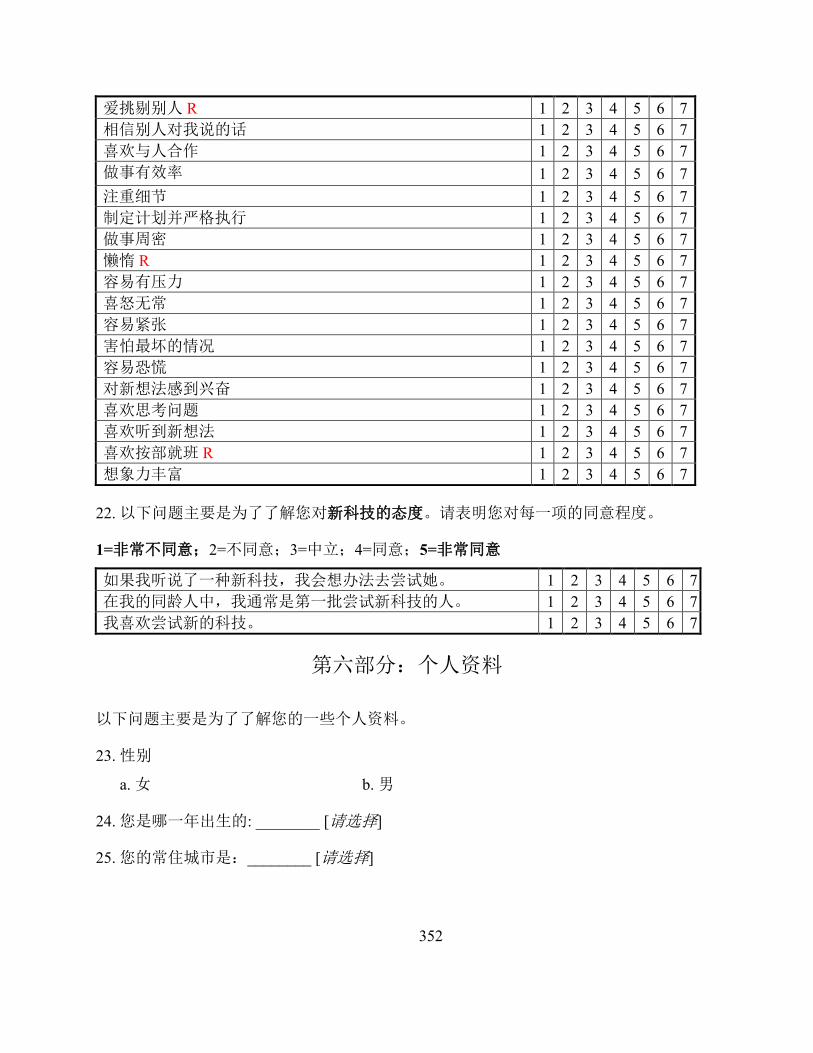
352
爱挑剔别人 R 1 2 3 4 5 6 7 相信别人对我说的话 1 2 3 4 5 6 7 喜欢与人合作 1 2 3 4 5 6 7 做事有效率 1 2 3 4 5 6 7 注重细节 1 2 3 4 5 6 7 制定计划并严格执行 1 2 3 4 5 6 7 做事周密 1 2 3 4 5 6 7 懒惰 R 1 2 3 4 5 6 7 容易有压力 1 2 3 4 5 6 7 喜怒无常 1 2 3 4 5 6 7 容易紧张 1 2 3 4 5 6 7 害怕最坏的情况 1 2 3 4 5 6 7 容易恐慌 1 2 3 4 5 6 7 对新想法感到兴奋 1 2 3 4 5 6 7 喜欢思考问题 1 2 3 4 5 6 7 喜欢听到新想法 1 2 3 4 5 6 7 喜欢按部就班 R 1 2 3 4 5 6 7 想象力丰富 1 2 3 4 5 6 7
22. 以下问题主要是为了了解您对新科技的态度。请表明您对每一项的同意程度。
1=非常不同意;2=不同意;3=中立;4=同意;5=非常同意
如果我听说了一种新科技,我会想办法去尝试她。 1 2 3 4 5 6 7 在我的同龄人中,我通常是第一批尝试新科技的人。 1 2 3 4 5 6 7 我喜欢尝试新的科技。 1 2 3 4 5 6 7
第六部分:个人资料
以下问题主要是为了了解您的一些个人资料。
23. 性别
a. 女 b. 男
24. 您是哪一年出生的: ________ [请选择]
25. 您的常住城市是:________ [请选择]

353
26. 最高学历
a. 初中及以下 b. 高中 c. 大专(2-3 年制) d. 大学(4 年制) e. 研究生或以上
27. 就业类型
a. 学生 b. 全职 c. 兼职 d. 自由职业者/个体经营者 e. 退休 f. 无业 g. 其他 ________ [请注明]
28. 请问您过往或现在是否曾在酒店业工作?
a. 是________[请注明所在部门] b. 否
29. 婚姻状态
a. 单身 b. 有稳定伴侣 c.已婚,没有孩子 d. 已婚,育有孩子 e. 分居/离婚 f. 鳏寡
30. 家庭年收入 (人民币)
a. 少于 10 万 b. 10-20 万 c.20 万-60 万 d. 60 万-80 万 e. 80-200 万 f. 大于 200 万
31. 请问在过去的 30天里,您在日常生活里使用自助服务科技 (如:机场自助值机,便利
店自助结账机,麦当劳的自助点餐机等)的次数是______
32. 请问在过去的 12 个月里,您是否曾在中国的酒店里使用过 1 种及以上的自助服务科技?
a. 是 b. 否
非常感谢您的参与!
注释: “R” 代表反向评分的项目 高亮题目用以问卷可信度检查

354
Appendix 4.2.2 Questionnaires for Hoteliers
Survey on Customer Experience with Self-service Technology in Hotels
Dear Sir or Madam:
I am Chun (Lucy) LIU, a research student in the School of Hotel and Tourism Management at The Hong Kong Polytechnic University. I am conducting a study regarding customer experiences with self-service technologies versus human services in hotels. The information collected will be used for research purposes only. Anonymity is guaranteed, and data will be treated in an ethical and confidential manner. Thank you for your participation! If you have any questions, please feel free to contact customer at spring.liu@ or +852 34002334.
Chun (Lucy) LIU PhD Student
School of Hotel and Tourism Management The Hong Kong Polytechnic University
Basic Questions
1. Are you a hotel practitioner?a. yes b. no[terminate]
2. How many years have you been a manager in hotel industry?a. 1-5 years b. 6-10 yearsc. 11-15 years d. 16-20 yearse. more than 20 years
3. Incumbent position:a. hotel group manager [jump to question 11]b. hotel managerc. manager of owner company [jump to question 11]d. owner representatives [jump to question 11]e. other ________ [please specify] [jump to question 11]
4. If you are a hotel manager, please indicate your incumbent position:a. general managerb. vice general managerc. front office managerd. finance directore. operation director

355
f. IT manager g. director/manager of human resources h. sales and marketing director/manager i. housekeeper j. director/ manager of food and beverage k. guest service manager l. purchasing manager m. other ________ [please specify]
5. Hotel location: ________ [please specify]
6. Opening date: ________ [please specify]
7. Number of rooms: ________ [please specify]
8. Hotel grade: a. 1-2 star (economy) b. 3 star (midscale) c. 4 star (upscale) d. 5 star (luxury)
9. Hotel category a. business hotel b. resort hotel c. convention hotel d. other ________ [please specify]
10. Brand affiliation
a. international chain b. domestic chain c. independent d. other ________ [please specify]
‘Self-service technologies’ refer to technological interfaces that enable self-service and service automation. Examples of self-service technologies in hotels include the following:

356
11. Please indicate all the technology applications your hotel has used: [multiple choice] a. online room selection (select room number in advance) b. concierge robot c. robot for delivering room service/food d. mobile check-in/check-out e. facial recognition self-service kiosk f. self-check-in/check-out kiosk g. curtain remote control h. control panel to control in-room amenities (e.g., curtains or lights) i. artificial intelligence management system (e.g., Tmall Genie or Xiaomi MI AI Speaker) j. mobile tablet to order food/room service or control in-room amenities k. smartphone to order food/room service or control in-room amenities l. in-room television ordering system (e.g., order food or other room services) m. touchscreen table to order food or other services at restaurants/bars in the hotel n. self-service kiosk to obtain an invoice o. QR code to fill out an invoice p. other ________ [please specify]

357
Section 1: Service Encounter Characteristics
This survey is based on your perception of service encounters.
12. Please indicate your perception of the complexity of each service task in your hotel(s).
1 = very simple, 2 = simple, 3=slightly simple, 4 = neither complex nor simple, 5 = slightly complex, 6 = complex, 7 =very complex
Checking in to the hotel 1 2 3 4 5 6 7 Using in-room amenities (e.g., television, curtains, or lights) 1 2 3 4 5 6 7 Ordering room services (e.g., ordering food or requesting an extra bottle of water) 1 2 3 4 5 6 7
Room service delivery 1 2 3 4 5 6 7 Ordering food or other services at restaurants/bars in the hotel 1 2 3 4 5 6 7 Service delivery at restaurants/bars in the hotel (e.g., serving the customeral) 1 2 3 4 5 6 7
Checking out of the hotel 1 2 3 4 5 6 7 Obtaining an invoice 1 2 3 4 5 6 7
Section 2: Customer Experience with Self-service Technologies
This survey is based on your opinions on the customer experience with self-service technologies in your hotel(s) in general.
13. Please indicate your opinions on the customer experience with self-service technologies in your hotel(s) in general. Note that phrases on the same row have opposite meanings with “4” refers to neutral attitude.
In general, self-service technologies used in my hotel (s) …
upset customer. 1 2 3 4 5 6 7 delight customer. make customer feel worried. 1 2 3 4 5 6 7 make customer feel relaxed.
make customer feel uncomfortable. 1 2 3 4 5 6 7 make customer feel comfortable.
do not understand customer needs. 1 2 3 4 5 6 7 understand customer needs. have an indirect service process. 1 2 3 4 5 6 7 have a direct service process. have a complicated service process. 1 2 3 4 5 6 7 have an easy service process. have an unsmooth service process. 1 2 3 4 5 6 7 have a smooth service process. are inconvenient. 1 2 3 4 5 6 7 are convenient. are inefficient. 1 2 3 4 5 6 7 are efficient. This item is for attention check, please choose"2". 1 2 3 4 5 6 7 This item is for attention check,
please choose"2".
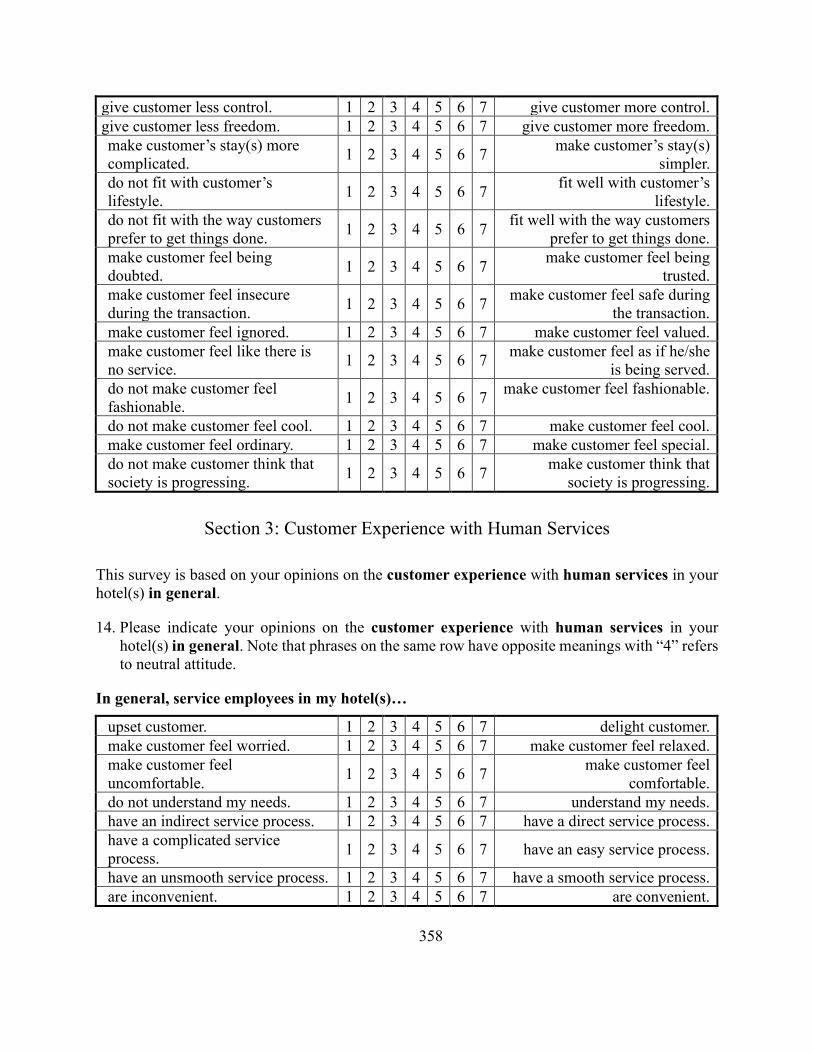
358
give customer less control. 1 2 3 4 5 6 7 give customer more control. give customer less freedom. 1 2 3 4 5 6 7 give customer more freedom. make customer’s stay(s) more complicated. 1 2 3 4 5 6 7 make customer’s stay(s)
simpler. do not fit with customer’s lifestyle. 1 2 3 4 5 6 7 fit well with customer’s
lifestyle. do not fit with the way customers prefer to get things done. 1 2 3 4 5 6 7 fit well with the way customers
prefer to get things done. make customer feel being doubted. 1 2 3 4 5 6 7 make customer feel being
trusted. make customer feel insecure during the transaction. 1 2 3 4 5 6 7 make customer feel safe during
the transaction. make customer feel ignored. 1 2 3 4 5 6 7 make customer feel valued. make customer feel like there is no service. 1 2 3 4 5 6 7 make customer feel as if he/she
is being served. do not make customer feel fashionable. 1 2 3 4 5 6 7 make customer feel fashionable.
do not make customer feel cool. 1 2 3 4 5 6 7 make customer feel cool. make customer feel ordinary. 1 2 3 4 5 6 7 make customer feel special. do not make customer think that society is progressing. 1 2 3 4 5 6 7 make customer think that
society is progressing.
Section 3: Customer Experience with Human Services
This survey is based on your opinions on the customer experience with human services in your hotel(s) in general.
14. Please indicate your opinions on the customer experience with human services in your hotel(s) in general. Note that phrases on the same row have opposite meanings with “4” refers to neutral attitude.
In general, service employees in my hotel(s)…
upset customer. 1 2 3 4 5 6 7 delight customer. make customer feel worried. 1 2 3 4 5 6 7 make customer feel relaxed. make customer feel uncomfortable. 1 2 3 4 5 6 7 make customer feel
comfortable. do not understand my needs. 1 2 3 4 5 6 7 understand my needs. have an indirect service process. 1 2 3 4 5 6 7 have a direct service process. have a complicated service process. 1 2 3 4 5 6 7 have an easy service process.
have an unsmooth service process. 1 2 3 4 5 6 7 have a smooth service process. are inconvenient. 1 2 3 4 5 6 7 are convenient.
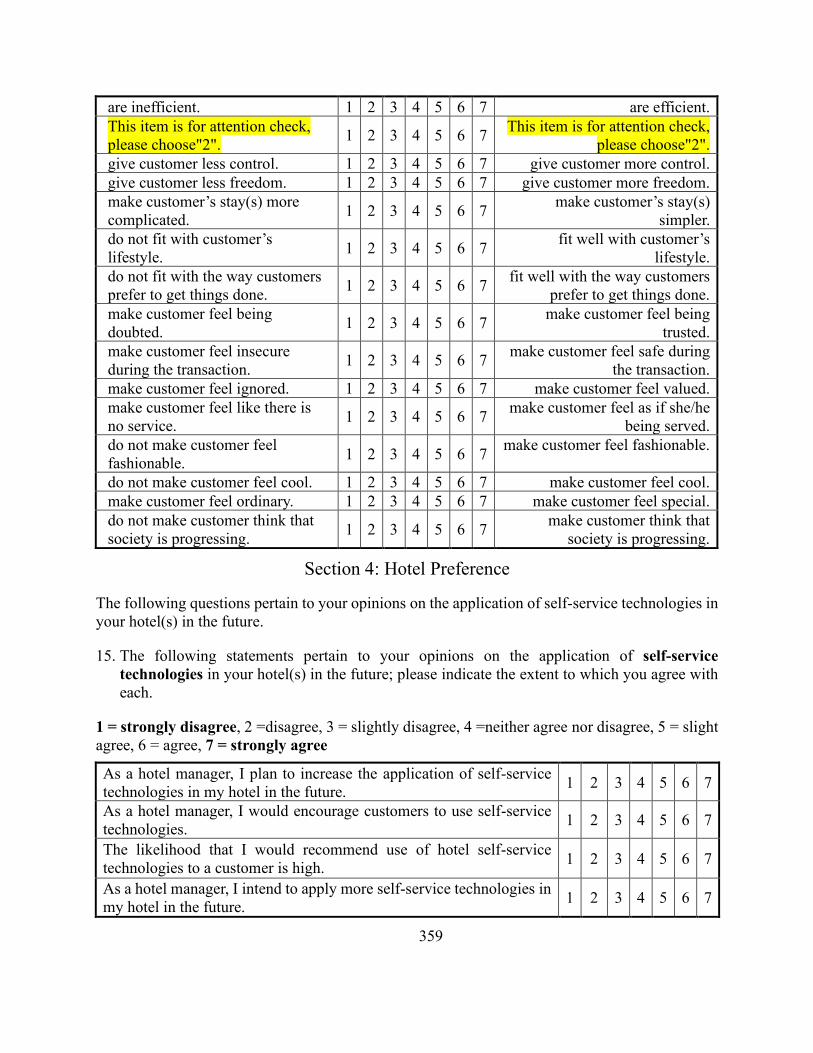
359
are inefficient. 1 2 3 4 5 6 7 are efficient. This item is for attention check, please choose"2". 1 2 3 4 5 6 7 This item is for attention check,
please choose"2". give customer less control. 1 2 3 4 5 6 7 give customer more control. give customer less freedom. 1 2 3 4 5 6 7 give customer more freedom. make customer’s stay(s) more complicated. 1 2 3 4 5 6 7 make customer’s stay(s)
simpler. do not fit with customer’s lifestyle. 1 2 3 4 5 6 7 fit well with customer’s
lifestyle. do not fit with the way customers prefer to get things done. 1 2 3 4 5 6 7 fit well with the way customers
prefer to get things done. make customer feel being doubted. 1 2 3 4 5 6 7 make customer feel being
trusted. make customer feel insecure during the transaction. 1 2 3 4 5 6 7 make customer feel safe during
the transaction. make customer feel ignored. 1 2 3 4 5 6 7 make customer feel valued. make customer feel like there is no service. 1 2 3 4 5 6 7 make customer feel as if she/he
being served. do not make customer feel fashionable. 1 2 3 4 5 6 7 make customer feel fashionable.
do not make customer feel cool. 1 2 3 4 5 6 7 make customer feel cool. make customer feel ordinary. 1 2 3 4 5 6 7 make customer feel special. do not make customer think that society is progressing. 1 2 3 4 5 6 7 make customer think that
society is progressing.
Section 4: Hotel Preference
The following questions pertain to your opinions on the application of self-service technologies in your hotel(s) in the future.
15. The following statements pertain to your opinions on the application of self-service technologies in your hotel(s) in the future; please indicate the extent to which you agree with each.
1 = strongly disagree, 2 =disagree, 3 = slightly disagree, 4 =neither agree nor disagree, 5 = slight agree, 6 = agree, 7 = strongly agree
As a hotel manager, I plan to increase the application of self-service technologies in my hotel in the future. 1 2 3 4 5 6 7
As a hotel manager, I would encourage customers to use self-service technologies. 1 2 3 4 5 6 7
The likelihood that I would recommend use of hotel self-service technologies to a customer is high. 1 2 3 4 5 6 7
As a hotel manager, I intend to apply more self-service technologies in my hotel in the future. 1 2 3 4 5 6 7

360
16. The following statements pertain to your opinions on the use of human services in your hotel(s) in the future; please indicate the extent to which you agree with each.
1 = strongly disagree, 2 =disagree, 3 = slightly disagree, 4 =neither agree nor disagree, 5 = slight agree, 6 = agree, 7 = strongly agree
As a hotel manager, I plan to increase the use of human services in my hotel(s) in the future. 1 2 3 4 5 6 7
As a hotel manager, I would encourage customers to use human services. 1 2 3 4 5 6 7
The likelihood that I would recommend use of human services to a customer is high. 1 2 3 4 5 6 7
As a hotel manager, I intend to apply more human services in my hotel(s) in the future. 1 2 3 4 5 6 7
17. As a hotel manager, I would prefer ________to help customers with checking in. a. using a facial recognition self-service kiosk b. using smartphone c. using a front desk employee d. other ________ [please specify]
18. As a hotel manager, I would prefer ________to help customers with controlling in-room amenities (e.g., television, curtains, and lights).
a. using a smartphone app b. using a mobile tablet c. using a control panel d. using an artificial intelligence management system (e.g., Amazon Echo or Tmall Genie) e. using a traditional switch f. other [please specify: ________]
19. As a hotel manager, I would prefer ________to help customers with room service order (e.g., food order).
a. using a television b. using a smartphone app c. using a mobile tablet d. calling a front desk employee e. other ________ [please specify]
20. As a hotel manager, I would prefer ________to deliver room service. a. a robot b. a service employee c. other ________ [please specify]
21. As a hotel manager, I would prefer ________to help customers with food or other services order at restaurants/bars in hotels.
a. using a smartphone app b. using a mobile tablet/touchscreen table c. using a service employee d. other ________ [please specify]

361
22. As a hotel manager, I would prefer ________to deliver service at restaurants/bars in hotels (e.g., serving the meal).
a. a robot b. a service employee c. other ________ [please specify]
23. As a hotel manager, I would prefer ________to help customers with checking out. a. using a self-check-out kiosk b. using a smartphone app c. using a front desk employee d. other ________ [please specify]
24. As a hotel manager, I would prefer ________to help customers with obtaining an invoice. a. using a self-service kiosk b. using a QR code c. using a front desk employee d. other ________ [please specify]
Section 5: Personality
The following questions pertain to your personality and your attitudes toward technology.
25. The following statement pertain to your personality; please indicate the extent to which you agree with each.
1 = strongly disagree, 2 =disagree, 3 = slightly disagree, 4 =neither agree nor disagree, 5 = slight agree, 6 = agree, 7 = strongly agree
I see myself as someone who…
is talkative. 1 2 3 4 5 6 7 feels comfortable around people. 1 2 3 4 5 6 7 tends to be quiet. R 1 2 3 4 5 6 7 starts conversations. 1 2 3 4 5 6 7 is reserved. R 1 2 3 4 5 6 7 sympathizes with others’ feelings. 1 2 3 4 5 6 7 This item is for attention check, please choose"2". 1 2 3 4 5 6 7 is concerned about others. 1 2 3 4 5 6 7 tends to find fault with others. R 1 2 3 4 5 6 7 trusts what people say to customer. 1 2 3 4 5 6 7 likes to cooperate with others. 1 2 3 4 5 6 7 does things efficiently. 1 2 3 4 5 6 7 pays attention to detail. 1 2 3 4 5 6 7 makes plans and sticks to them. 1 2 3 4 5 6 7 does a thorough job. 1 2 3 4 5 6 7 tends to be lazy. R 1 2 3 4 5 6 7 gets stressed out easily. 1 2 3 4 5 6 7

362
can be moody. 1 2 3 4 5 6 7 gets nervous easily. 1 2 3 4 5 6 7 fears the worst. 1 2 3 4 5 6 7 panics easily. 1 2 3 4 5 6 7 gets excited by new ideas. 1 2 3 4 5 6 7 enjoys thinking about things. 1 2 3 4 5 6 7 enjoys hearing new ideas. 1 2 3 4 5 6 7 prefers work that is routine. R 1 2 3 4 5 6 7 has a vivid imagination. 1 2 3 4 5 6 7
26. The following statement pertain to your attitudes toward technology; please indicate the extent to which you agree with each.
1 = strongly disagree, 2 =disagree, 3 = slightly disagree, 4 =neither agree nor disagree, 5 = slight agree, 6 = agree, 7 = strongly agree
If I hear about a new technology, I look for ways to experiment with it. 1 2 3 4 5 6 7
Among my peers, I am usually the first to try out new technologies. 1 2 3 4 5 6 7 I like to experiment with new technologies. 1 2 3 4 5 6 7
Section 6: Demographics
The following questions ask for your personal information.
27. Gender: a. female b. male
28. Age: ________ [please specify]
29. Level of education completed: a. less than high school b. high school c. 2–3 years of college d. four-year college/university e. postgraduate level or higher
30. Please indicate your marital status: a. single b. with partner c. married without children d. married with children e. separated/divorced f. widowed
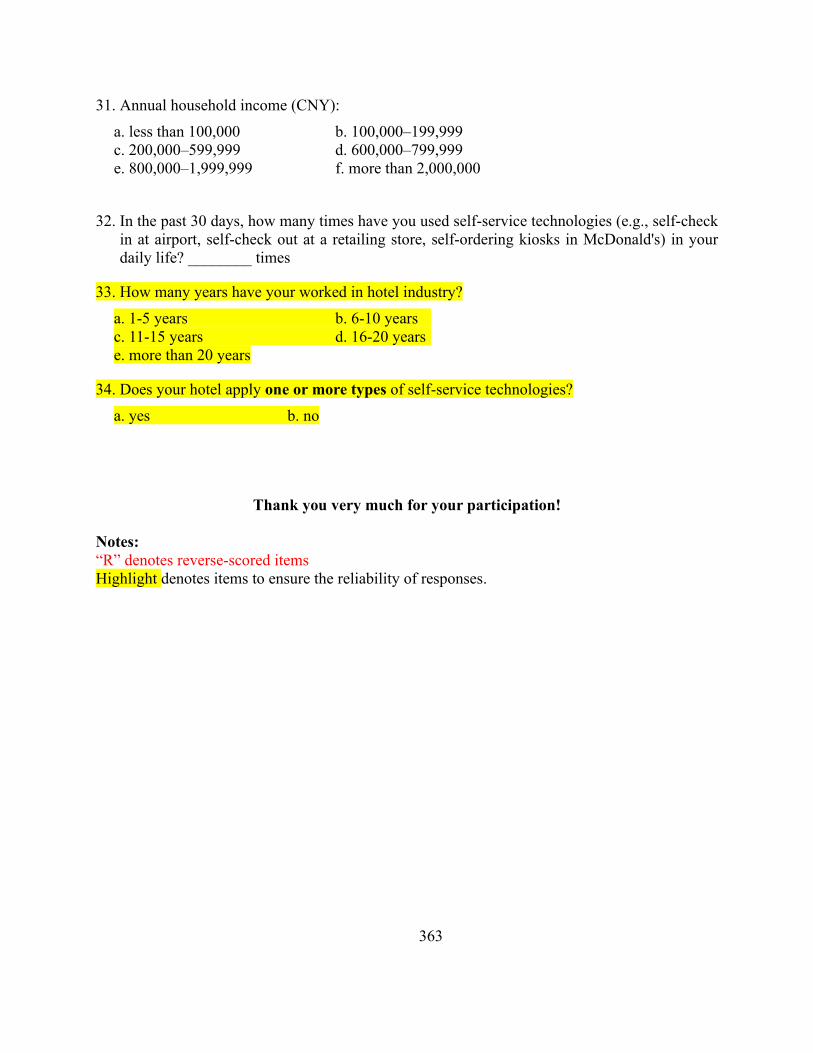
363
31. Annual household income (CNY): a. less than 100,000 b. 100,000–199,999 c. 200,000–599,999 d. 600,000–799,999 e. 800,000–1,999,999 f. more than 2,000,000
32. In the past 30 days, how many times have you used self-service technologies (e.g., self-check in at airport, self-check out at a retailing store, self-ordering kiosks in McDonald's) in your daily life? ________ times
33. How many years have your worked in hotel industry? a. 1-5 years b. 6-10 years c. 11-15 years d. 16-20 years e. more than 20 years
34. Does your hotel apply one or more types of self-service technologies? a. yes b. no
Thank you very much for your participation!
Notes: “R” denotes reverse-scored items Highlight denotes items to ensure the reliability of responses.
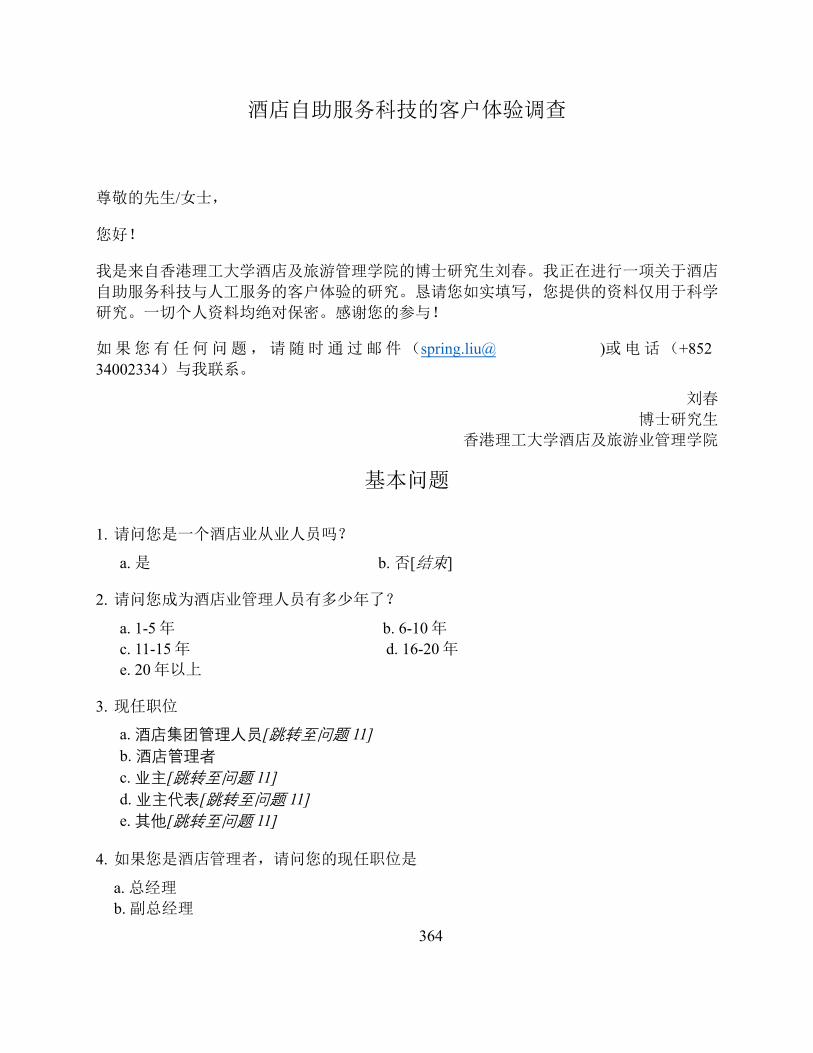
364
酒店自助服务科技的客户体验调查
尊敬的先生/女士,
您好!
我是来自香港理工大学酒店及旅游管理学院的博士研究生刘春。我正在进行一项关于酒店
自助服务科技与人工服务的客户体验的研究。恳请您如实填写,您提供的资料仅用于科学
研究。一切个人资料均绝对保密。感谢您的参与!
如果您有任何问题,请随时通过邮件(spring.liu@ )或电话(+852 34002334)与我联系。
刘春
博士研究生
香港理工大学酒店及旅游业管理学院
基本问题
1. 请问您是一个酒店业从业人员吗?
a. 是 b. 否[结束]
2. 请问您成为酒店业管理人员有多少年了?
a. 1-5 年 b. 6-10 年
c. 11-15 年 d. 16-20 年
e. 20 年以上
3. 现任职位
a.酒店集团管理人员[跳转至问题 11]b.酒店管理者c.业主[跳转至问题 11]d.业主代表[跳转至问题 11]e.其他[跳转至问题 11]
4. 如果您是酒店管理者,请问您的现任职位是
a. 总经理
b. 副总经理
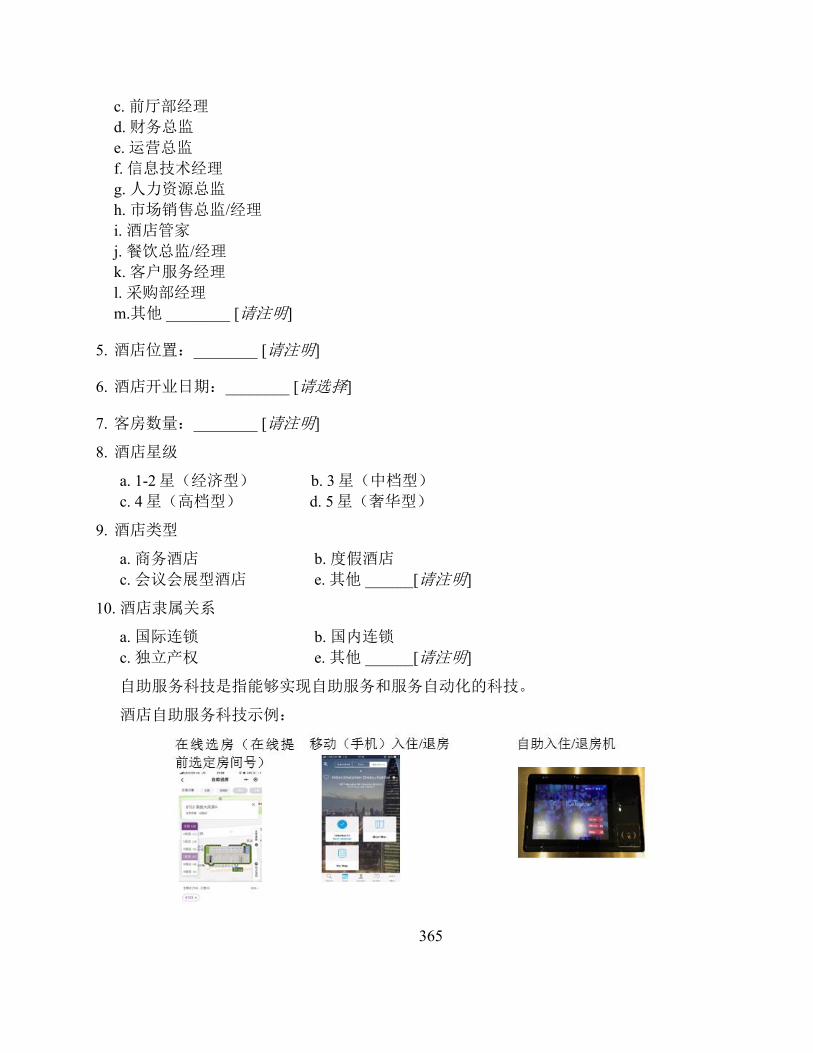
365
c. 前厅部经理 d. 财务总监 e. 运营总监 f. 信息技术经理 g. 人力资源总监 h. 市场销售总监/经理 i. 酒店管家 j. 餐饮总监/经理 k. 客户服务经理 l. 采购部经理 m.其他 ________ [请注明]
5. 酒店位置:________ [请注明]
6. 酒店开业日期:________ [请选择]
7. 客房数量:________ [请注明]
8. 酒店星级
a. 1-2 星(经济型) b. 3 星(中档型) c. 4 星(高档型) d. 5 星(奢华型)
9. 酒店类型
a. 商务酒店 b. 度假酒店 c. 会议会展型酒店 e. 其他 ______[请注明]
10. 酒店隶属关系
a. 国际连锁 b. 国内连锁 c. 独立产权 e. 其他 ______[请注明]
自助服务科技是指能够实现自助服务和服务自动化的科技。
酒店自助服务科技示例:

366
11. 请选出贵酒店用过的所有自助服务科技 [多选题]
a. 在线选房(提前选定房间号) b. 礼宾机器人 c. 送餐/送客房服务机器人 d. 移动(手机)入住/退房 e. 刷脸自助入住机 f. 自助入住/退房机 g. 窗帘遥控器 h. 控制面板控制房间设施(如:窗帘、灯光等) i. 客房智能管家(如:天猫精灵、小爱同学等) j. 平板电脑点餐,预订客房服务,或控制房间设施 k. 智能手机点餐,预订客房服务,或控制房间设施 l. 客房电视订购系统 (如:点餐或者预订其他客房服务) m. 在酒店餐厅或吧台等用触摸屏点餐或预订其他服务 n. 自助开发票机 o. 扫二维码开发票 p. 其他______[请注明]
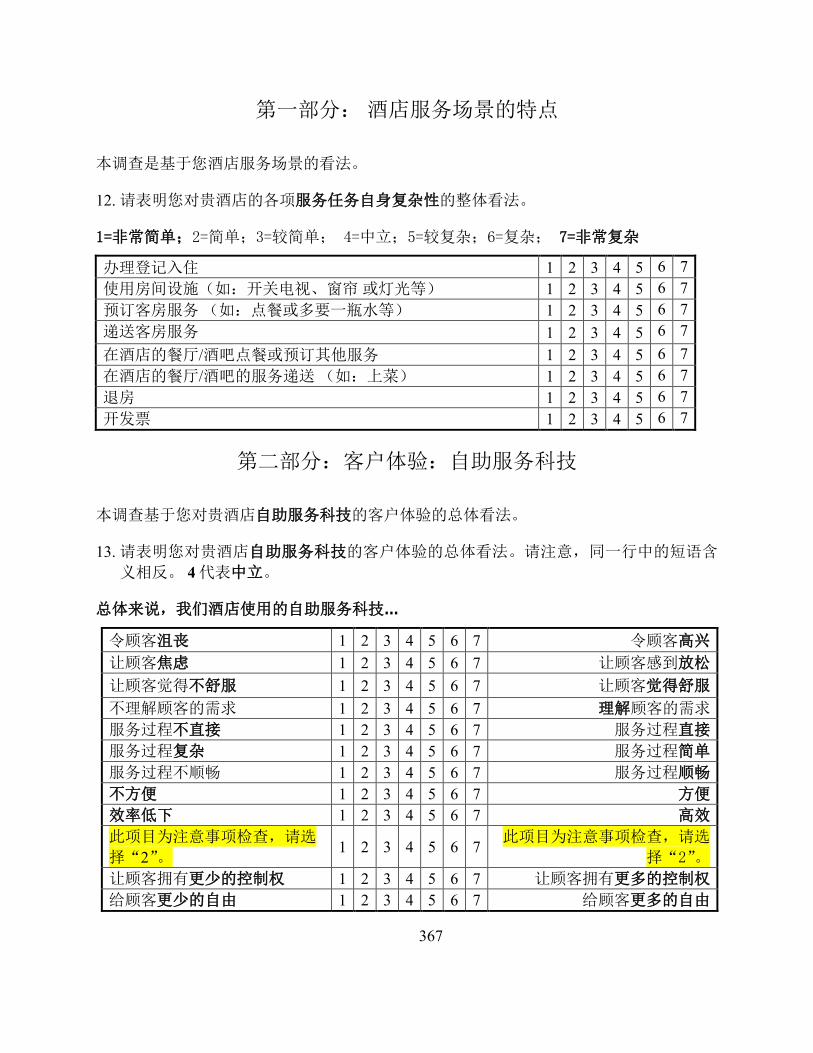
367
第一部分: 酒店服务场景的特点
本调查是基于您酒店服务场景的看法。
12. 请表明您对贵酒店的各项服务任务自身复杂性的整体看法。
1=非常简单;2=简单;3=较简单; 4=中立;5=较复杂;6=复杂; 7=非常复杂
办理登记入住 1 2 3 4 5 6 7 使用房间设施(如:开关电视、窗帘 或灯光等) 1 2 3 4 5 6 7 预订客房服务 (如:点餐或多要一瓶水等) 1 2 3 4 5 6 7 递送客房服务 1 2 3 4 5 6 7 在酒店的餐厅/酒吧点餐或预订其他服务 1 2 3 4 5 6 7 在酒店的餐厅/酒吧的服务递送 (如:上菜) 1 2 3 4 5 6 7 退房 1 2 3 4 5 6 7 开发票 1 2 3 4 5 6 7
第二部分:客户体验:自助服务科技
本调查基于您对贵酒店自助服务科技的客户体验的总体看法。
13. 请表明您对贵酒店自助服务科技的客户体验的总体看法。请注意,同一行中的短语含
义相反。 4 代表中立。
总体来说,我们酒店使用的自助服务科技…
令顾客沮丧 1 2 3 4 5 6 7 令顾客高兴 让顾客焦虑 1 2 3 4 5 6 7 让顾客感到放松 让顾客觉得不舒服 1 2 3 4 5 6 7 让顾客觉得舒服 不理解顾客的需求 1 2 3 4 5 6 7 理解顾客的需求 服务过程不直接 1 2 3 4 5 6 7 服务过程直接 服务过程复杂 1 2 3 4 5 6 7 服务过程简单 服务过程不顺畅 1 2 3 4 5 6 7 服务过程顺畅 不方便 1 2 3 4 5 6 7 方便 效率低下 1 2 3 4 5 6 7 高效 此项目为注意事项检查,请选
择“2”。 1 2 3 4 5 6 7 此项目为注意事项检查,请选
择“2”。 让顾客拥有更少的控制权 1 2 3 4 5 6 7 让顾客拥有更多的控制权 给顾客更少的自由 1 2 3 4 5 6 7 给顾客更多的自由

368
让顾客的住宿变得更复杂 1 2 3 4 5 6 7 让顾客的住宿变得更简单 不符合顾客的生活习惯 1 2 3 4 5 6 7 符合顾客的生活习惯 不符合顾客一贯的做事风格 1 2 3 4 5 6 7 符合顾客一贯的做事风格 让顾客觉得被怀疑 1 2 3 4 5 6 7 让顾客觉得被信任 让顾客觉得不安全 1 2 3 4 5 6 7 让顾客觉得安全 让顾客觉得被忽视 1 2 3 4 5 6 7 让顾客觉得被重视 让顾客觉得没有服务感 1 2 3 4 5 6 7 让顾客觉得受到了服务 没有让顾客觉得时尚 1 2 3 4 5 6 7 让顾客觉得时尚 没有让顾客觉得很酷 1 2 3 4 5 6 7 让顾客觉得很酷 让顾客觉得很普通 1 2 3 4 5 6 7 让顾客觉得很特别 没有让顾客觉得社会在进步 1 2 3 4 5 6 7 让顾客觉得社会在进步
第三部分:客户体验:人工服务
本调查基于您对贵酒店人工服务的客户体验的总体看法。
14. 请表明您对贵酒店人工服务的客户体验的总体看法。请注意,同一行中的短语含义相
反。 4 代表中立
总体来说,我们酒店的服务员…
令顾客沮丧 1 2 3 4 5 6 7 令顾客高兴 让顾客焦虑 1 2 3 4 5 6 7 让顾客感到放松 让顾客觉得不舒服 1 2 3 4 5 6 7 让顾客觉得舒服 不理解顾客的需求 1 2 3 4 5 6 7 理解顾客的需求 服务过程不直接 1 2 3 4 5 6 7 服务过程直接 服务过程复杂 1 2 3 4 5 6 7 服务过程简单 服务过程不顺畅 1 2 3 4 5 6 7 服务过程顺畅 不方便 1 2 3 4 5 6 7 方便 效率低下 1 2 3 4 5 6 7 高效 此项目为注意事项检查,请选
择“2”。 1 2 3 4 5 6 7 此项目为注意事项检查,请选
择“2”。 让顾客拥有更少的控制权 1 2 3 4 5 6 7 让顾客拥有更多的控制权 给顾客更少的自由 1 2 3 4 5 6 7 给顾客更多的自由 让顾客的住宿变得更复杂 1 2 3 4 5 6 7 让顾客的住宿变得更简单 不符合顾客的生活习惯 1 2 3 4 5 6 7 符合顾客的生活习惯 不符合顾客一贯的做事风格 1 2 3 4 5 6 7 符合顾客一贯的做事风格 让顾客觉得被怀疑 1 2 3 4 5 6 7 让顾客觉得被信任
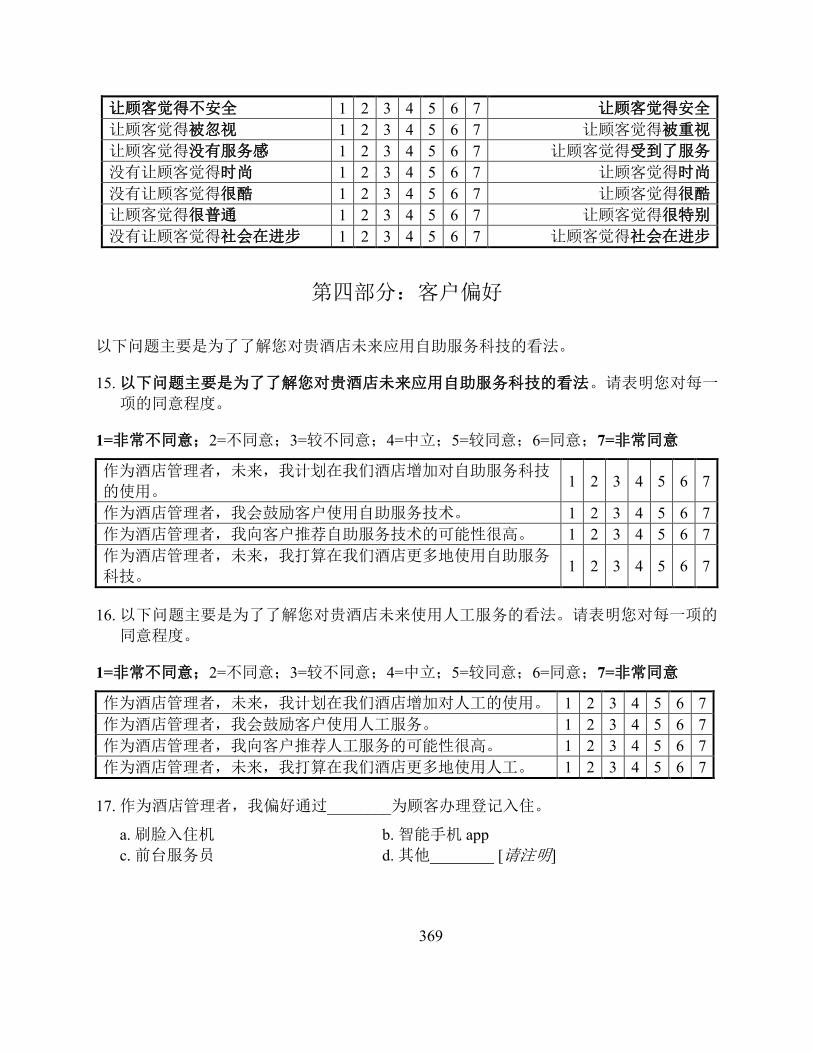
369
让顾客觉得不安全 1 2 3 4 5 6 7 让顾客觉得安全 让顾客觉得被忽视 1 2 3 4 5 6 7 让顾客觉得被重视 让顾客觉得没有服务感 1 2 3 4 5 6 7 让顾客觉得受到了服务 没有让顾客觉得时尚 1 2 3 4 5 6 7 让顾客觉得时尚 没有让顾客觉得很酷 1 2 3 4 5 6 7 让顾客觉得很酷 让顾客觉得很普通 1 2 3 4 5 6 7 让顾客觉得很特别 没有让顾客觉得社会在进步 1 2 3 4 5 6 7 让顾客觉得社会在进步
第四部分:客户偏好
以下问题主要是为了了解您对贵酒店未来应用自助服务科技的看法。
15. 以下问题主要是为了了解您对贵酒店未来应用自助服务科技的看法。请表明您对每一
项的同意程度。
1=非常不同意;2=不同意;3=较不同意;4=中立;5=较同意;6=同意;7=非常同意
作为酒店管理者,未来,我计划在我们酒店增加对自助服务科技
的使用。 1 2 3 4 5 6 7
作为酒店管理者,我会鼓励客户使用自助服务技术。 1 2 3 4 5 6 7 作为酒店管理者,我向客户推荐自助服务技术的可能性很高。 1 2 3 4 5 6 7 作为酒店管理者,未来,我打算在我们酒店更多地使用自助服务
科技。 1 2 3 4 5 6 7
16. 以下问题主要是为了了解您对贵酒店未来使用人工服务的看法。请表明您对每一项的
同意程度。
1=非常不同意;2=不同意;3=较不同意;4=中立;5=较同意;6=同意;7=非常同意
作为酒店管理者,未来,我计划在我们酒店增加对人工的使用。 1 2 3 4 5 6 7 作为酒店管理者,我会鼓励客户使用人工服务。 1 2 3 4 5 6 7 作为酒店管理者,我向客户推荐人工服务的可能性很高。 1 2 3 4 5 6 7 作为酒店管理者,未来,我打算在我们酒店更多地使用人工。 1 2 3 4 5 6 7
17. 作为酒店管理者,我偏好通过________为顾客办理登记入住。
a. 刷脸入住机 b. 智能手机 app c. 前台服务员 d. 其他________ [请注明]

370
18. 作为酒店管理者,我偏好通过________帮助顾客控制房间设施(如:电视、窗帘和灯
光等)。
a. 使用智能手机 app b. 使用平板电脑 c. 使用控制面板 d. 使用客房智能管家(如:天猫精灵) e. 使用传统的按钮开关 f. 其他________ [请注明]
19. 作为酒店管理者,我偏好________为顾客提供客房服务预订服务(如:点餐等)。
a. 通过客房电视订购系统 b. 通过智能手机 app c. 通过平板电脑 d. 通过打电话给前台 e. 其他________ [请注明]
20. 作为酒店管理者,我偏好通过________为顾客递送客房服务。
a. 机器人 b. 服务员 d. 其他________ [请注明]
21. 作为酒店管理者,我偏好________为顾客在酒店餐厅/酒吧提供点餐或预订其他服务。
a. 通过智能手机 app b. 通过平板电脑/触摸屏 c. 通过服务员 d. 其他________ [请注明]
22. 作为酒店管理者,我偏好通过________为顾客在酒店餐厅/酒吧递送服务(如:上菜)。
a. 机器人 b. 服务员 d. 其他________ [请注明]
23. 作为酒店管理者,我偏好通过________为顾客办理退房。
a. 自助退房机 b. 智能手机 app c. 前台服务员 d. 其他________ [请注明]
24. 作为酒店管理者,我偏好通过________为顾客开发票。
a. 使用自助开发票机 b. 使用二维码 c. 前台服务员 d. 其他________ [请注明]
第五部分:个人性格
以下问题主要是为了了解您的性格和对待新科技的态度。
25. 以下问题主要是为了了解您的性格。请表明您对每一项的同意程度。
1=非常不同意;2=不同意;3=较不同意;4=中立;5=较同意;6=同意;7=非常同意

371
我认为我自己是一个….的人。
健谈的 1 2 3 4 5 6 7 和别人在一起觉得很自在 1 2 3 4 5 6 7 比较安静 R 1 2 3 4 5 6 7 话题开启者 1 2 3 4 5 6 7 保守 R 1 2 3 4 5 6 7 能感同身受 1 2 3 4 5 6 7 此项目为注意事项检查,请选择“2”。 1 2 3 4 5 6 7 关心他人 1 2 3 4 5 6 7 爱挑剔别人 R 1 2 3 4 5 6 7 相信别人对我说的话 1 2 3 4 5 6 7 喜欢与人合作 1 2 3 4 5 6 7 做事有效率 1 2 3 4 5 6 7 注重细节 1 2 3 4 5 6 7 制定计划并严格执行 1 2 3 4 5 6 7 做事周密 1 2 3 4 5 6 7 懒惰 R 1 2 3 4 5 6 7 容易有压力 1 2 3 4 5 6 7 喜怒无常 1 2 3 4 5 6 7 容易紧张 1 2 3 4 5 6 7 害怕最坏的情况 1 2 3 4 5 6 7 容易恐慌 1 2 3 4 5 6 7 对新想法感到兴奋 1 2 3 4 5 6 7 喜欢思考问题 1 2 3 4 5 6 7 喜欢听到新想法 1 2 3 4 5 6 7 喜欢按部就班 R 1 2 3 4 5 6 7 想象力丰富 1 2 3 4 5 6 7
26. 以下问题主要是为了了解您对新科技的态度。请表明您对每一项的同意程度。
1=非常不同意;2=不同意;3=较不同意;4=中立;5=较同意;6=同意;7=非常同意
如果我听说了一种新科技,我会想办法去尝试她。 1 2 3 4 5 6 7 在我的同龄人中,我通常是第一批尝试新科技的人。 1 2 3 4 5 6 7 我喜欢尝试新的科技。 1 2 3 4 5 6 7

372
第六部分:个人资料
以下问题主要是为了了解您的一些个人资料。
27. 性别
a. 女 b. 男
28. 年龄: ________ [请注明]
29. 最高学历
a. 初中及以下 b. 高中 c. 大专(2-3 年制) d. 大学(4 年制) e. 研究生或以上
30. 婚姻状态
a. 单身 b. 有稳定伴侣 c.已婚,没有孩子 d. 已婚,育有孩子 e. 分居/离婚 f. 鳏寡
31. 家庭年收入 (人民币)
a. 少于 10 万 b. 10-20 万 c.20 万-60 万 d. 60 万-80 万 e. 80-200 万 f. 大于 200 万
32. 请问在过去的 30天里,您在日常生活里使用自助服务科技 (如:机场自助值机,便利
店自助结账机,麦当劳的自助点餐机等)的次数是______
33. 请问您在酒店行业工作了多少年了?
a. 1-5 年 b. 6-10 年 c. 11-15 年 d. 16-20 年 e. 20 年以上
34. 请问贵酒店是否曾使用过 1 种及以上的自助服务科技?
a. 是 b. 否
非常感谢您的参与! 注释: “R” 代表反向评分的项目 高亮题目用以问卷可信度检查