991021952836803411.pdf - PolyU Electronic Theses
156
Copyright Undertaking This thesis is protected by copyright, with all rights reserved. By reading and using the thesis, the reader understands and agrees to the following terms: 1. The reader will abide by the rules and legal ordinances governing copyright regarding the use of the thesis. 2. The reader will use the thesis for the purpose of research or private study only and not for distribution or further reproduction or any other purpose. 3. The reader agrees to indemnify and hold the University harmless from and against any loss, damage, cost, liability or expenses arising from copyright infringement or unauthorized usage. IMPORTANT If you have reasons to believe that any materials in this thesis are deemed not suitable to be distributed in this form, or a copyright owner having difficulty with the material being included in our database, please contact [email protected] providing details. The Library will look into your claim and consider taking remedial action upon receipt of the written requests. Pao Yue-kong Library, The Hong Kong Polytechnic University, Hung Hom, Kowloon, Hong Kong http://www.lib.polyu.edu.hk
-
Upload
khangminh22 -
Category
Documents
-
view
0 -
download
0
Transcript of 991021952836803411.pdf - PolyU Electronic Theses

Copyright Undertaking
This thesis is protected by copyright, with all rights reserved.
By reading and using the thesis, the reader understands and agrees to the following terms:
1. The reader will abide by the rules and legal ordinances governing copyright regarding the use of the thesis.
2. The reader will use the thesis for the purpose of research or private study only and not for distribution or further reproduction or any other purpose.
3. The reader agrees to indemnify and hold the University harmless from and against any loss, damage, cost, liability or expenses arising from copyright infringement or unauthorized usage.
IMPORTANT
If you have reasons to believe that any materials in this thesis are deemed not suitable to be distributed in this form, or a copyright owner having difficulty with the material being included in our database, please contact [email protected] providing details. The Library will look into your claim and consider taking remedial action upon receipt of the written requests.
Pao Yue-kong Library, The Hong Kong Polytechnic University, Hung Hom, Kowloon, Hong Kong
http://www.lib.polyu.edu.hk
COMPUTER VISION-BASED AUTOMATIC
FABRIC DEFECT DETECTION MODELS FOR
THE TEXTILE AND APPAREL INDUSTRIES
TONG LE
Ph.D
The Hong Kong Polytechnic University
2017
The Hong Kong Polytechnic University
Institute of Textiles and Clothing
Computer Vision-based Automatic FabricDefect Detection Models for the Textile
and Apparel Industries
Tong Le
A thesis submitted in partial fulfillment of the requirements
for the degree of Doctor of Philosophy
November 2016


TO MY FAMILY
For their constant love, support and encouragement
Abstract
Faced with increasingly fierce market competition, textile and apparel en-
terprises need to control cost and improve the quality of their products
in the manufacturing stage. Fabric quality inspection plays an important
role in this stage because locating possible fabric defects before cutting
is beneficial for reducing raw material waste and ensuring textile product
quality. Traditionally, in most textile and apparel companies, fabric quality
inspection is performed through a human visual system, which suffers from
high labor cost and low effectiveness. Automatic inspection techniques,
which can provide intelligent solutions for defect detection without human
intervention, are beneficial for improving detection accuracy and efficiency.
Over the past several decades, many computer vision-based defect detection
models have been proposed to address the fabric inspection problem. Most
existing approaches, such as statistical and structural approaches, rely on
feature extractions of fabric defects and normal texture to distinguish possible
defects. The difficulty in selecting the appropriate features that can be adapted
to different types of fabric texture significantly influenced the effectiveness of
these approaches. The primary purpose of this research is to develop effective
computer vision-based defect detection models that aims at different types
of fabric, such as plain fabric, twill fabric, and striped fabric. Woven fabric
with uniform texture is one of the most basic types of fabric, which can be
classified as plain fabric and twill fabric according to the fabric weaving
structure. On the basis of the analysis of the characteristic of defects in
plain and twill fabrics, two distinctive detection models were developed in
this research. In addition, another hybrid detection model was proposed for
striped fabric, which represents the most basic type of patterned fabric with a
single element and is widely used in our daily lives, such as shirts and pants.
Defects on plain fabric can be regarded as uneven edges on a very smooth
surface. Thus, an optimal Gabor filter-based detection model was developed
for plain fabric inspection. On the basis of a feature analysis of defects, only
i
two Gabor filters optimized by differential evolutionary algorithm were used
to significantly reduce the computational complexity.
With defects regarded as random noise in the image, a defect detection
model based on non-local sparse representation was proposed for twill fabric
inspection. Through the restoration of non-defective fabric texture on the
basis of dictionaries learnt from reference images, defects were successfully
segmented from the original inspection fabric images.
To detect the common fabric defects (errors in weaving structure) and pattern
defects (repeated pattern variants), a hybrid defect detection model was
developed to solve the inspection problem for fabric with a striped pattern.
Gabor filters were initially used to detect variants of the repeated pattern
and reduce the disturbance caused by the edge of repeated pattern. Sparse
representation was adopted to segment the remnant defects in the resultant
feature images in the second step.
On the basis of a textile texture database (TILDA) and the amount of real
fabric samples acquired from real apparel companies, extensive experiments
were conducted to evaluate the performance of the proposed methodologies.
Experimental results show that the proposed detection models are effective
in detecting various types of fabric defects and are superior to several
representative and popular defect detection models.
The results of this research demonstrate that computer vision and artificial
intelligence can offer satisfactory performance for the automatic defect
detection problems of various types of fabric in the textile and apparel
industries. They also reveal that considering the characteristics of different
types of fabric texture is of paramount significance to the establishment of
a practical fabric inspection model, which is highly sensitive, robust, and
efficient.
ii

Acknowledgements
First of all, I would like to express my sincere gratitude to my chief supervisor,
Prof. W. K. Wong, for his constructive guidance, advice, and encouragement
during this research. His enthusiastic attitude towards research will always
motivate me in future endeavors. I also thank my co-supervisor, Dr. C. K.
Kwong, for his guidance and many helpful suggestions in this research.
I extend my thanks to my colleagues, Jiajun Wen, Jielin Jiang, Can Gao, and
all others for their helps during these three years. I also extend my thanks to
my friends, Limei Ji, Yanghong Zhou, and all others for making my stay in
PolyU most memorable.
Finally, I am forever indebted to my husband Wei Du, my parents Libo Tong
and Ruihua Zhang, my parents-in-law Jun Du and Yidong Xiao. It is their
love, support and encouragement which makes this thesis possible.
iii

iv
Contents
Abstract i
Acknowledgements iii
List of Figures xi
List of Tables xv
1 Introduction 1
1.1 Background . . . . . . . . . . . . . . . . . . . . . . . . . . . 1
1.1.1 Fabric Inspection in the Textile and Apparel Industries 1
1.1.2 Computer Vision-based Automatic Fabric Inspection . 3
1.2 Problem Statement . . . . . . . . . . . . . . . . . . . . . . . 6
1.3 Objectives . . . . . . . . . . . . . . . . . . . . . . . . . . . . 8
1.4 Methodology . . . . . . . . . . . . . . . . . . . . . . . . . . 9
1.5 Significance of this Research . . . . . . . . . . . . . . . . . . 10
1.6 Structure of this Thesis . . . . . . . . . . . . . . . . . . . . . 11
v
vi CONTENTS
2 Literature Review 13
2.1 Statistical Approaches . . . . . . . . . . . . . . . . . . . . . 13
2.1.1 Defect Detection based on Bi-level Thresholding . . . 14
2.1.2 Defect Detection based on Mathematical Morphology 15
2.1.3 Defect Detection based on Gray-level Intensity . . . . 16
2.1.4 Defect Detection based on Fractals . . . . . . . . . . . 18
2.1.5 Defect Detection based on Co-occurrence Matrix . . . 19
2.2 Structural Approaches . . . . . . . . . . . . . . . . . . . . . 20
2.3 Model-based Approaches . . . . . . . . . . . . . . . . . . . . 22
2.4 Spectral Approaches . . . . . . . . . . . . . . . . . . . . . . 23
2.4.1 Defect Detection based on FT . . . . . . . . . . . . . 24
2.4.2 Defect Detection based on WT . . . . . . . . . . . . . 25
2.4.3 Defect Detection based on GT . . . . . . . . . . . . . 28
2.5 Learning-based Approaches . . . . . . . . . . . . . . . . . . 32
2.5.1 Defect Detection based on NN . . . . . . . . . . . . . 32
2.5.2 Defect Detection based on Sparse Representation . . . 33
2.6 Motif-based Approaches . . . . . . . . . . . . . . . . . . . . 35
2.7 Hybrid Approaches . . . . . . . . . . . . . . . . . . . . . . . 36
2.8 Summary . . . . . . . . . . . . . . . . . . . . . . . . . . . . 37
CONTENTS vii
3 Research Methodology 39
3.1 Solution Mechanisms . . . . . . . . . . . . . . . . . . . . . . 39
3.1.1 Research Methodology for Plain Fabric Inspection . . 41
3.1.2 Research Methodology for Twill Fabric Inspection . . 42
3.1.3 Research Methodology for Striped Fabric Inspection . 43
3.2 Gabor Transform . . . . . . . . . . . . . . . . . . . . . . . . 44
3.3 Sparse representation . . . . . . . . . . . . . . . . . . . . . . 47
3.4 Summary . . . . . . . . . . . . . . . . . . . . . . . . . . . . 49
4 Differential Evolution-based Optimal Gabor Filters Model for
Plain Fabric Inspection 50
4.1 Framework of Plain Fabric Inspection Model . . . . . . . . . 50
4.2 CoDE-based Optimal Gabor Filters . . . . . . . . . . . . . . . 52
4.2.1 Optimization Objective Function Design . . . . . . . 53
4.2.2 Gabor Filter Optimization by CoDE . . . . . . . . . . 55
4.3 Defect Detection based on Optimal Gabor Filters . . . . . . . 58
4.3.1 Adaptive Thresholding . . . . . . . . . . . . . . . . . 58
4.3.2 Binary Image Fusion . . . . . . . . . . . . . . . . . . 60
4.4 Experiment Results and Discussion . . . . . . . . . . . . . . . 61
4.4.1 Experimental Setup . . . . . . . . . . . . . . . . . . . 61
4.4.2 Performance Evaluation of the Proposed Defect De-
tection Model . . . . . . . . . . . . . . . . . . . . . . 63
viii CONTENTS
4.4.3 Comparison of Proposed Model and Other Four Pop-
ular Models . . . . . . . . . . . . . . . . . . . . . . . 66
4.5 Summary . . . . . . . . . . . . . . . . . . . . . . . . . . . . 69
5 Nonlocal Sparse Representation-based Defect Detection Model
for Twill Fabric Inspection 73
5.1 Framework of Twill Fabric Inspection Model . . . . . . . . . 73
5.2 Preprocessing via Gray-level Transformation . . . . . . . . . 76
5.3 Image Restoration based on Sparse Representation . . . . . . 77
5.3.1 Adaptive Sub-Dictionary Learning . . . . . . . . . . . 78
5.3.2 Sparse Representation Model based on Nonlocal Sim-
ilarities . . . . . . . . . . . . . . . . . . . . . . . . . 82
5.4 Defect Segmentation . . . . . . . . . . . . . . . . . . . . . . 84
5.5 Experiment Results and Discussion . . . . . . . . . . . . . . . 86
5.5.1 Experimental Setup . . . . . . . . . . . . . . . . . . . 86
5.5.2 Performance Evaluation of the Proposed Defect De-
tection Model . . . . . . . . . . . . . . . . . . . . . . 87
5.5.3 Comparison of the proposed model and two represen-
tative models . . . . . . . . . . . . . . . . . . . . . . 90
5.6 Summary . . . . . . . . . . . . . . . . . . . . . . . . . . . . 97
6 A Hybrid Defect Detection Model for Striped Fabric Inspection 98
6.1 The Framework of Twill Fabric Inspection Model . . . . . . . 98
6.2 Step One: Optimal Gabor Filtering based on CoDE . . . . . . 102
6.3 Step Two: Image Restoration-Based Defect Detection . . . . . 106
6.3.1 Image Restoration Based on Non-local Self-similarities 106
6.3.2 Defect Segmentation . . . . . . . . . . . . . . . . . . 108
6.4 Experiment Results and Discussion . . . . . . . . . . . . . . . 109
6.4.1 Performance Evaluation of the Proposed Defect De-
tection Model . . . . . . . . . . . . . . . . . . . . . . 109
6.5 Summary . . . . . . . . . . . . . . . . . . . . . . . . . . . . 113
7 Conclusions and Future Work 114
7.1 Conclusions . . . . . . . . . . . . . . . . . . . . . . . . . . . 114
7.2 Contributions of this Research . . . . . . . . . . . . . . . . . 116
7.2.1 Contributions to Woven Fabric Inspection for the
Textile and Apparel Industries . . . . . . . . . . . . . 116
7.2.2 Contributions to Automatic Plain Fabric Defect De-
tection . . . . . . . . . . . . . . . . . . . . . . . . . . 117
7.2.3 Contributions to Automatic Twill Fabric Defect De-
tection . . . . . . . . . . . . . . . . . . . . . . . . . . 117
7.2.4 Contributions to Automatic Striped Fabric Defect
Detection . . . . . . . . . . . . . . . . . . . . . . . . 118
7.3 Limitations and Future Work . . . . . . . . . . . . . . . . . . 119
7.4 Related Publications . . . . . . . . . . . . . . . . . . . . . . 120
Bibliography 121
ix

x
List of Figures
3.1 Inspection model for woven fabric: 1© offline training stage;
2© real-time inspection stage. . . . . . . . . . . . . . . . . . . 41
4.1 Gray-level images of defective fabric samples. . . . . . . . . . 51
4.2 Flowchart of the plain fabric inspection process: 1© detection
model; 2© Gabor filter optimization process. . . . . . . . . . . 52
4.3 Example of optimal Gabor filtering effect. . . . . . . . . . . . 58
4.4 Detection results for a piece of light blue plain fabric. . . . . . 65
4.5 Optimal Gabor filters for the inspection of fabric samples in
Fig. 4.4. . . . . . . . . . . . . . . . . . . . . . . . . . . . . . 65
4.6 Detection results for a piece of white plain fabric. . . . . . . . 66
4.7 Optimal Gabor filters for the detection of fabric samples in
Fig. 4.6. . . . . . . . . . . . . . . . . . . . . . . . . . . . . . 66
4.8 Detection results of plain fabric. . . . . . . . . . . . . . . . . 67
4.9 Results of comparison experiments on real fabric samples. . . 70
4.10 Results of comparison experiments on scanned fabric samples. 71
5.1 Defective samples of twill fabric. . . . . . . . . . . . . . . . . 74
xi
5.2 Flowchart of the twill defects detection process: 1© dictionary
learning; 2© detection model. . . . . . . . . . . . . . . . . . . 75
5.3 Examples of preprocessing results. (a) and (c) are the original
images. (b) and (d) are the images preprocessed by contrast-
stretching transformation. (e) - (h) are the corresponding
histograms of the images in the first row. . . . . . . . . . . . . 78
5.4 Gray-level examples of different patterns of white woven
fabric.(a) is plain weaving pattern; (b) is twill weaving
pattern; (c) and (d) are jacquard weaving patterns. . . . . . . . 79
5.5 Examples of sub-dictionaries. (a) and (j) demonstrate the
centroids of two sub-dictionaries after K-means clustering.
(b) - (i) show the nearest eight atoms to the centroid of the first
cluster. (k) - (r) show the nearest eight atoms to the centroid
of the second cluster. . . . . . . . . . . . . . . . . . . . . . . 81
5.6 Detection results of TILDA database. . . . . . . . . . . . . . 89
5.7 Detection results of missing yarn, thick yarn, and knots. . . . . 91
5.8 Detection results of stain defects. . . . . . . . . . . . . . . . . 92
5.9 Detection results of tiny defects. . . . . . . . . . . . . . . . . 92
5.10 Results of comparison experiments on real fabric samples. . . 94
5.11 Results of comparison experiments on scanned fabric samples. 95
5.12 Results of comparison experiments on tiny defects. . . . . . . 96
6.1 Several image samples of a striped fabric. . . . . . . . . . . . 99
6.2 Flowchart of the striped fabric inspection process. . . . . . . . 101
xii
6.3 Comparison of Gabor filtering result: 6.3(a) is the original
defective image; 6.3(b) is the filtering result through a
synclastic Gabor filter; 6.3(c) is the filtering result through
a perpendicular Gabor filter; 6.3(d) - 6.3(f) are the gradient
maps of the figures in the first row extracted by Sobel; 6.3(g)
- 6.3(i) are the corresponding histograms of the gradient maps. 103
6.4 Filtering results of striped fabric by optimal Gabor filters
perpendicular to the stripe pattern. . . . . . . . . . . . . . . . 105
6.5 Detection results of pattern defects on striped fabric. . . . . . 111
6.6 Detection results of common fabric defects on striped fabric. . 112
xiii

xiv
List of Tables
4.1 Properties of testing images . . . . . . . . . . . . . . . . . . . 62
4.2 Value ranges of parameters . . . . . . . . . . . . . . . . . . . 63
4.3 Performance evaluations of the proposed defect detection model 64
4.4 Performance comparison of defect detection models . . . . . . 68
4.5 Time cost comparison of defect detection models . . . . . . . 68
5.1 Performance of the proposed detection model on TILDA . . . 87
5.2 Performance of the proposed detection model on our own
database . . . . . . . . . . . . . . . . . . . . . . . . . . . . . 87
5.3 Performance comparison of defect detection models . . . . . . 94
6.1 Performance of the proposed detection model on striped
fabric samples of TILDA . . . . . . . . . . . . . . . . . . . . 110
xv

xvi
Chapter 1
Introduction
1.1 Background
1.1.1 Fabric Inspection in the Textile and Apparel Indus-
tries
In the textile and apparel industries, many issues must be considered in the
manufacturing stage of production, and fabric quality inspection is one of
them. Fabric quality inspection plays an indispensable role in maintaining
companies competitive edge in the global market. In weaving mills, fabric
quality directly determines the value of the products, and the main and costly
raw material of garments influences the cost control of apparel companies.
The various types of fabric defects can result in an income loss of 45%−65%
[1]. The objective of fabric inspection is to locate existing defects and confirm
whether the fabric has reached the quality standard.
Fabric quality is affected by yarn quality and loom defects, that is, poor yarns
and mechanical faults cause fabric defects. Woven fabric defects can exhibit a
variety of forms because of differences in the weaving structures of fabric. At
1

present, the textile industry has defined more than 70 types of fabric defects
[1]. In plain weaving, each weft thread crosses the warp threads by going over
one to form a simple flat and smooth criss-cross pattern [2]. Thus, defects
on plain fabric are relatively prominent compared with the non-defective
fabric structure. Twill weave is regarded as a pattern of diagonal parallel
ribs (in contrast with plain weave) formed by floating each weft or filling yarn
across the warp yarns in a progression of inter-lacings to the right or left.
Therefore, by contrast, defects on twill fabric are normally smaller and less
noticeable because of the slightly complicated weaving method. The case of
patterned fabrics (e.g., print fabric) is usually significantly more complicated.
In addition to the common defects that are likely to be confused with the
patterns, defects may occur on the pattern primitive itself or its arrangement.
Overall, the diversity of fabric defects makes the fabric quality inspection task
greatly difficult and important.
Traditionally, in most apparel companies, fabric inspection still relies on
visual checking by trained and experienced operators. However, manual
inspection has many limitations, such as low detection accuracy and effi-
ciency. Small defects are difficult to notice, and human errors may occur
because of fatigue and inattentiveness, thereby resulting in low success rate of
detection. According to some studies [1, 3], the accuracy of human inspection
in the textile industry is only approximately 60% − 75%. Moreover, human
inspectors usually need to identify the defects on a roll of fabric, which is
1.5 m to 2 m wide and driven with speeds that range from 10 m/min to 50
m/min. Even in the best cases, an expert almost cannot deal with fabrics wider
than 1.5 m and moving faster than 20 m/min [4]. Inefficiencies in industrial
processes are costly in terms of time, money, and consumer satisfaction. As a
result, automatic fabric defect detection techniques are in increasing demand.
In automation, fabric defect detection is a quality control process that aims
to identify and locate defects. Without manual intervention, the automatic
2
inspection of an industrial product, which is a prompt, real-time, and accurate
modern technology, has gradually become one of the trends of digitizing
production to improve product quality and reduce labor cost.
1.1.2 Computer Vision-based Automatic Fabric Inspection
With the advantages of computers and imaging devices, computer vision
seeks to develop algorithms that simulate the human visual system and
achieve human visual functions. The development of a flexible, efficient,
reliable, and integrated real-time vision system for industrial applications
is an essential issue in current and future research. Computer vision-based
systems have already been proven effective in quality inspections of film,
paper, steel roll, and others [5–7]. These objects are classified as uniform
materials whose surfaces are even and glossy. The product inspections are
usually fulfilled through the contrast between the test object and the reference
object owing to the obvious differences between defects and the background.
In the textile industry, woven fabric defects refer to any inhomogeneities that
appear different from the normal fabric background structure. However, the
surface structure of fabric classified as textured material is quite complex
because of the diversity of fabric weaving methods. Thus, developing specific
defect detection approaches is essentially necessary to effectively address the
inspection problem of fabric with different weaving structures.
From the view of computer vision, fabric defect detection is considered a
texture analysis problem because fabric surface can be recognized as a two-
dimensional (2D) texture that exhibits a high periodicity of sub-patterns.
Defects can be considered anomalous arrayed pixels in the image unlike non-
defective areas. The aim of an automatic inspection system is to identify the
shapes and locations of any possible fabric defect without human intervention.
Over the past several decades, with the use of computer vision and pattern
3
recognition techniques, numerous approaches have been proposed for fabric
defect detection.
A majority of studies focused on developing defect detection methods for
uniform texture fabric (plain and twill fabric). Gray-level co-occurrence
matrix (GLCM) [8], one of the most typical statistical methods, was able
to identify fabric defects through an analysis of the gray-level relationship
among image pixels. With the advantage of the fact that textile texture
is essentially repeated by sub-patterns, template matching approaches [9,
10] provide simple solutions that are easily implemented for fabric defect
detection. Fourier transformation [3], wavelet transform coefficients [11],
and Gabor filters [12, 13] addressed the fabric defect detection problem in
the spectral domain, which can significantly reduce the computational cost.
Neural networks (NN) were introduced in fabric inspection as a classifier that
could distinguish defects from normal texture [14, 15]. The use of multiple
features in defect classification was helpful in increasing detection accuracy.
Sparse representation, which was widely used in image denoising, has gained
increasing attention in defect detection [16–18]. Defects can be segmented
by comparing the original image with its non-defective version, which is
estimated through sparse representation.
Most studies only focused on the analysis of the features of fabric defects
but not on the structural differences between fabric types. Therefore, the
detection models did not show a stable performance on the various types
of fabric defect detection problems. For example, GLCM was useful in
detecting defects on simple textured materials, such as plain fabric, because
the disturbance of the gray-level distribution of such fabric is large enough to
be identified. However, the computational cost made the efficiency of this
method unsuitable for real-time application in the industrial environment.
Although template matching approaches were suited to the inspection of
fabric with a regular texture, the detection accuracy was not significantly
4

increased because of the strict alignment requirements of the methods.
In other words, the detection efficiency was also influenced in real-time
application in the textile and apparel industries. In the textile and apparel
industries, the requirements of the inspection of plain and twill fabric
are distinguished. The speed requirement of the plain fabric inspection
is high because the appearance probability of defects on plain fabric is
significantly lower than that on other types of fabric because of the simple
weaving structure. Without considering the advantages of the simple weaving
orientation characteristic, the computational cost of most existing detection
approaches was large while improving the detection accuracy. By contrast,
the blurriness of the boundaries of some defects on twill fabric with diagonal
ribs-like weaving structure causes difficulty in accurately locating the defects
barely through the feature extractions of defects in either the spatial or spectral
domain. Therefore, the primary goal of twill fabric inspection is to ensure
detection accuracy. Although NN-based approaches were superior to others
in detecting defect classification, the detection accuracy largely depended on
the amount of training data (defective fabric samples). However, detection
was nearly impossible because of the excessive types of fabric defects, and
new ones always emerged. Currently, even for uniform texture fabric, the
fabric defect detection problem is still a research difficulty because of the
diversity of fabric textures and fabric defects.
In patterned fabric inspection, with fabric printed pattern regarded as the
underlying lattice, some motif-based defect detection approaches employed
the characteristics of the smallest repeated unit in the fabric image [19, 20].
Learning the distribution of the statistical features of the image motif, which
constitutes the underlying lattice of the patterned texture, could amplify the
defect information of the defective motif. In theory, motif-based approaches
can address the detection of common fabric defects and pattern defects
simultaneously. However, the efficiency of these methods in defect detection
5
of the basic type of patterned fabric with a single element, such as striped
fabric, is low because considerable computational work would be wasted in
the motif extraction. In fabrics with complex patterns, such as floral patterns,
small defects may be missed because of their insignificant influence on the
overall lattice of the patterned texture. Therefore, specific analysis of different
designed patterns in the inspection of patterned fabric is necessary.
To effectively address the automatic fabric defect detection problem in the
textile and apparel industries, the most feasible solution is to develop different
detection approaches for different fabric types, according to the specific
fabric texture. Therefore, for the first time in this research, the automatic
fabric inspection problem will be investigated on the basis of the specific
analysis of fabric weaving structure. Three different defect detection models
will be developed for plain fabric, twill fabric, and striped fabric. The
proposed detection models are expected to achieve high detection accuracy
and efficiency.
1.2 Problem Statement
Without effective automatic fabric defect detection, the product quality
and productivity of garment manufacturing is significantly influenced. So
far, the existing detection models have not obtained satisfactory results in
the real environment of the textile and apparel industries despite many
studies conducted in the related research area. As discussed in Section
1.1, the existing studies related to fabric defect detection did not consider
the difference between the weaving structure of types of fabric, sacrificing
detection accuracy (sensitivity) or robustness in attempting to adapt to
most fabric types. With the use of computer vision and image processing
techniques, this research investigates the automatic fabric defect detection
6
problem on the basis of specific analysis of fabric weaving structure for the
first time, and the analysis is implemented by developing different inspection
models for three types of fabric: plain fabric, twill fabric, and striped fabric.
(1) Plain fabric inspection - Owing to the merits of basic criss-cross weaving
structure, defects on plain fabric are relatively prominent with respect to the
smooth surface texture of background in the image. Moreover, the detection
speed requirement is high because the appearance probability of plain fabric
defects is significantly lower under the mature weaving technology in today’s
industry. The problem is that the computational cost of the existing methods
is usually excessive, thereby making real-time applications unsuitable in the
environment of the industry.
(2) Twill fabric inspection - With the complex structure of twill weaving,
defects on twill fabric are normally significantly small and subtle, thereby
making the accurate feature extraction of defects difficult. The diagonal rib
weaving pattern may also introduce some noise interference in the images,
which causes high false alarm rates and influences the robustness of the
detection through the use of the existing detection approaches. Therefore,
the most challenging problem in this research is simultaneously increasing
the detection accuracy and robustness.
(3) Striped fabric inspection - Until now, no existing method has been
proposed especially for striped fabric inspection. Unlike uniform texture
fabric, in addition to common fabric defects, pattern variants, which refer
to the arrangement errors of the primitive unit (stripe), are also important
concerns in fabric inspection. Therefore, for striped fabric, investigating a
specific detection method that can effectively detect not only common fabric
defects but also pattern variants is significant.
7
1.3 Objectives
This research aims to develop automatic defect detection approaches for
plain and twill fabrics and strip patterned woven fabric, which are widely
used in our daily lives. On the basis of the specific analysis of each fabric
weaving structure, computer vision-based automated defect detection models
are proposed for each fabric type. All the proposed detection models are
expected to achieve a high detection rate with little false alarm in the specific
fabric inspection. The detailed objectives are listed as follows:
(1) This research aims to develop a framework for the defect detection model
for plain fabric on the basis of shape and orientation analysis of common
defects. With the use of direct feature extraction of plain fabric defects,
the proposed detection model is expected to address the detection speed
acceleration problem on the premise of high detection accuracy, which means
reducing the computational cost of the detection model.
(2) Furthermore, this study aims to investigate and develop a robust defect
detection model for twill fabric inspection, which is immune to the distur-
bance introduced by the special twill weaving texture. The proposed detection
model is expected to effectively identify small and subtle fabric defects and
to achieve low false alarm rate.
(3) Lastly, this study aims to investigate and develop a hybrid defect detection
model for striped fabric on the basis of feature analysis of stripe pattern. The
proposed detection model is expected to effectively detect common fabric
defects and pattern defects.
8
1.4 Methodology
This research improves the product quality control of apparel factories by
solving automatic fabric inspection problems. According to the distinctive
types of fabric structure texture, three different methodologies are developed
and described as follows:
(1) Differential evolution-based optimal Gabor filters, which could achieve
joint defect localizations in the spatial and spatial frequency domains,
were proposed to solve the defect detection of plain fabric. On the basis
of the analysis of the particular shape and orientation characteristics of
fabric defects, the features of defects were extracted by two Gabor filters
(in the horizontal and vertical directions), which could greatly reduce the
computational cost. The parameters of the Gabor filters were optimized by
differential evolution algorithms to achieve the best discrimination between
defects and normal fabric texture.
(2) A defect detection model that consists of image preprocessing, image
restoration, and thresholding operation was developed to address the twill
fabric inspection problem. The image was initially preprocessed by gray-
level transformation to improve the image contrast and make the details of
the defects more salient. Defects were labeled by comparing the input image
with its estimation, which was restored through sparse representation model
based on a learned dictionary. To increase the detection accuracy, the non-
local similarities of the fabric structural information were introduced in the
sparse coding.
(3) A hybrid defect detection model, which could address the detection of
common fabric defects and pattern defects in two steps, was proposed for
striped fabric. First, a Gabor filter was optimized to reduce the response
of stripe patterns and the corresponding disturbance caused by edge of
9
stripe patterns. In the following, image restoration-based defect detection
techniques were applied in the filtered feature image, which can be treated as
uniform texture fabric with remnant defects.
1.5 Significance of this Research
With the use of computer vision-based techniques for fabric inspection, the
significance of this research can be summarized in the following four aspects:
(1) A few of the existing detection approaches carefully analyzed the
specific characteristics of different fabric types and therefore cannot achieve
satisfactory detection results in practical applications. In this research, the
fabric inspection problem was addressed based on the analysis of fabric
weaving structure for the first time. For plain fabric, twill fabric, and stripe
patterned woven fabric, three distinctive automatic detection models were
developed, and they effectively improved the overall performance of fabric
inspection in the textile and apparel industries.
(2) The three newly proposed distinctive defect detection models solved the
problem where a few of the existing approaches can be universally applied
to most types of fabric textures and defects. For each specific fabric type,
different objectives have been achieved, such as improving the detection
efficiency of plain fabric inspection, enhancing detection effectiveness on
small twill defects, and solving the detection of two groups of defects on
striped fabric.
(3) The optimal Gabor filter-based detection model proposed for plain
fabric inspection addressed the computational complexity problem on the
premise of high detection accuracy, which makes it applicable for practical
application. The sparse representation-based detection model proposed
for twill fabric inspection successfully improved detection accuracy and
10
robustness, especially for the small and blurry defects. Moreover, in this
research, a hybrid detection model was specially investigated for striped fabric
inspection for the first time, addressing the detection problem of common
fabric defects and pattern defects.
(4) In the development of the inspection model for plain fabric, only two opti-
mal Gabor filters were used to extract the features of defects, which improved
the feature extraction accuracy and reduced the overall computational cost and
the disturbance caused by multi-channel filtering, compared with previous
research. In the development of a sparse representation-based detection model
for twill fabric, the introduction of non-local similarities of fabric structure
information greatly enhanced the detection effect on small defects, and it is
superior to the conventional regression representation used in existing studies.
The hybrid detection model has taken full advantage of the orientation and
frequency features of the stripe pattern, which makes it significantly more
effective than motif-based models in industrial applications.
1.6 Structure of this Thesis
The structure of this research can be summarized as follows:
Chapter 2 provides a comprehensive literature review related to automatic
fabric defect detection. The existing methods are classified into several
categories: statistical, structural, model-based, spectral, learning-based,
motif-based, and hybrid detection approaches.
Chapter 3 demonstrates the research methodology in detail, including the
concepts and principles of Gabor filters, differential evolution, sparse rep-
resentation and dictionary learning.
Chapters 4, 5, and 6 investigate the three distinctive defect detection models
11

for plain fabric, twill fabric, and striped fabric, respectively. The framework
of these three models are elaborated in detail. With the use of TILDA
database and real fabric samples collected from apparel companies, extensive
experiments are conducted to show the effectiveness of the proposed detection
models. Moreover, the performance of the proposed models is compared with
some representative models.
Chapter 7 summarizes the contributions and limitations of this research.
Suggestions for future studies are also provided.
12
Chapter 2
Literature Review
With the increasing competition in the fashion market, all textile and apparel
companies must enhance their competitiveness to maintain their competitive
edge in the global market. As a result, automatic fabric inspection techniques
used to ensure high-quality products are desperately expected in the textile
and apparel industries. They are also beneficial for improving manufacturing
productivity and reducing labor cost. Fabric defect detection has been a
widely considered research topic for many years. In the past several decades,
to achieve better performance, many intelligent detection approaches have
been proposed for fabric inspection. On the basis of the analysis of previous
surveys on fabric defect detection [1, 21], in this research, the existing defect
detection approaches are classified into six categories: statistical, spectral,
structural, model-based, learning-based, and hybrid approaches. For the rest
of this chapter, each class of approaches is reviewed in detail.
2.1 Statistical Approaches
In the statistical approaches, first-order statistics (e.g., mean and variance)
and second-order statistics (e.g., autocorrelation function and co-occurrence
13
matrices) are used to represent the textural features in texture discrimination.
The statistics of non-defective regions are assumed to be stationary, and
these regions cover the greatest portion of the images as the background.
The defective area is identified as the region that has a distinct statistical
behavior from the image background. For example, bi-level thresholding,
morphological filters, and gray-level intensity-based approaches distinguish
these two areas by detecting the boundaries of image intensity change,
whereas fractals and co-occurrence matrices label the pixels that break a
specific relationship as defects.
2.1.1 Defect Detection based on Bi-level Thresholding
Bi-level thresholding, which segments high-contrast defects directly through
the analysis of gray-level discrimination in an image, is the simplest statistical
method for fabric inspection. A high-contrast defect is assumed to cause
a significant intensity change in the image, thereby allowing the resultant
intensity mount or valley to be identified by thresholding operations.
In [22], two adaptive point-to-point threshold limits, which were determined
by first-order statistical parameters of the non-defective fabric images, were
adopted to obtain the binary feature image. Thereafter, local averaging was
applied to remove the noise caused by non-uniform illumination. In this study,
the detection of four basic types of defects, such as horizontal and vertical
defects, spots, and wrinkles, was solved.
[4] also adopted bi-level thresholding to address the fabric defect detection
problem. To overcome the uneven illumination problem, thresholding limits
were computed within a small window of the local area and applied variably
to the entire image. However, the proposed methods were applied to some
representative defects only, such as the warp float, broken pick, and hole,
14
which are composed of more than 16 pixels in the image.
The main advantages of bi-level thresholding-based defect detection are
low computational cost and easy implementation. However, the detection
accuracy of such techniques largely depends on the contrast between the
defects and the normal fabric texture. Normally, bi-level thresholding would
fail to detect defects that did not alter the average intensity of the image.
2.1.2 Defect Detection based on Mathematical Morphology
Mathematical morphology (MM) is a technique for extracting image compo-
nents, such as boundaries, skeletons, and convex hulls, by using geometrical
structural elements. Basic morphological operators include erosion, dilation,
opening, and closing. The geometric representation and description of
defects could be well extracted by MM-based detection approaches, which
are beneficial for fabric defect classification.
In [23], Fourier transform operations followed by morphological operations
were applied for fabric defect detection. Filtered by spatial filters in
the optical domain, only the aperiodic image structure was processed by
morphological operations, which were conducive to reducing information loss
caused by frequency transformation.
In [24], on the basis of the non-defective fabric texture extracted by a trained
Gabor wavelet network, the linear structure element was designed for several
morphological operations. After processing by an opening and two closing
operations, only defective areas remained in the detection results. Defective
samples scanned from a defect handbook [25] were used as subjects of the
experiments, the results of which revealed that morphological operations
were useful for the robustness of the detection model in terms of low false
alarm rate. Morphological processing could also be used to adjust the uneven
15
illumination of images [26]. Erosion and dilation operations were applied on
top-hat and bottom-hat filtered images, respectively.
In [27], for denim fabric inspection, morphological operation was adopted to
remove the noise in the linear filtered images to reduce the false alarm rate
of the detection model. In this study, the effectiveness of the proposed model
was evaluated through the detection of five types of defects.
MM was originally developed for binary images. Therefore, [28] applied mor-
phological operations on the bit plane of the images, in which the boundary of
the object is more prominent. A series of weighted morphological operations
was applied on the lower-order bit planes, which carry more subtle image
details.
The main features of the morphological operation-based detection model are
its simplicity and effectiveness in reducing false alarm rate by eliminating
small discrete points in the results. However, the detection accuracy of tiny
defects is also significantly influenced. Moreover, in the binary feature image,
distinguishing between the defects and noise is difficult, thereby making the
selection of structural element size a challenging task.
2.1.3 Defect Detection based on Gray-level Intensity
Bollinger bands, which were originally proposed for financial technical
analysis [29], could enhance the pattern of a trend for a certain period.
The principle of Bollinger bands is that periodic upper and lower bands
are generated by rows (columns) of the patterned fabric image. Therefore,
a defective region causes a prompt and a large variation in the standard
deviation of Bollinger bands. In [30], for each row and column in the image,
the upper and lower Bollinger bands were calculated based on the mean and
variance of the gray-level intensities of the corresponding row and column in
16
the image. The optimal thresholding limits were obtained from the average of
the Bollinger bands of all non-defective reference images. The performance
of the proposed method was evaluated through the detection of some obvious
defects on dot-patterned, star-patterned and check-patterned fabric samples.
For plain and twill fabric inspection, a directional Bollinger bands method
was proposed in [31]. Instead of global statistic features, moving average and
standard deviation were used to extract the features of defects. Nevertheless,
the Bollinger bands computation was applied in four directions for each
testing image, significantly increasing the computational cost of the detection
model.
Sum and difference histograms (SDH) were developed as an alternative to
the usual GLCM, which has a high computational cost [32]. SDH, which
is defined as the probabilities of the intensity sum and difference of two
pixels, could achieve classification results that are nearly as accurate as those
of GLCM. In addition, it could reduce the overall computation time and
memory storage requirement. In [33], seven features (e.g., energy, contrast,
and entropy) were first extracted from SDH and then processed by a gradient-
based searching strategy to detect possible fabric defects.
For the density inspection of yarn-dyed fabric, a mathematical statistics-
based two-step detection model was proposed in [34]. In the approximate
measurement, yarn density was estimated by counting the peak of the
projection curve of the whole image into HSV (Hue, Saturation, Value) mode.
Thereafter, the precise measurement was based on the projection curve of
the sub-images obtained based on the estimated yarn density. The fabric
yarn density was precisely calculated from the probability distribution map
of peaks generated from the projection curve of all sub-images.
However, through the aforementioned approaches, the identification of a
defective area largely depends on the variation of gray-level value distribution.
17
In addition, more than one statistical feature is usually needed to achieve
better detection results. Therefore, these approaches could not be universally
applied to most fabric types and defects.
2.1.4 Defect Detection based on Fractals
Fractals introduced in [35] are capable of characterizing the geometric
structures such as coastal lines, mountains, and trees in natural images. In
texture analysis applications, fractals are highly useful in representing not
only the roughness but also the affine self-similarity of the texture, which can
be used to distinguish between smooth and rough regions.
[36] applied estimated fractal dimension (FD) features in fabric inspection.
The defect decision depends on the variation of FD. Moreover, the differential
box counting method was adopted to reduce computational complexity and
enhance the efficiency of the detection model. However, only limited types of
defects were involved in the experiments, and the false alarm rate was as high
as 28%.
In [37], a Fourier-domain maximum likelihood estimator was derived to
estimate the fractal parameter, which could be used in subsequent defect
segmentation. Thereafter, the flexibility of the proposed detection method
was validated through geometric transformation tests such as rotation, size
rescaling, and gray-level shift. However, only three classic types of obvious
defects (i.e., stain spot, hole, and warp drop) were detected.
Later, [38] compared the four fractal features-based defect detection method
with the single fractal-based method in [37]. It claimed that even different
textures may have similar fractal features that are difficult to discriminate.
Under different measuring scales, four fractal features were extracted and
combined with support vector data description (SVDD) for defect classifi-
18
cation. In addition to fractal dimension, topothesy, known as an additional
fractal feature, was also useful in fabric inspection [39]. However, only four
types of defects were subject to the fabric inspection experiments.
The ability to characterize roughness and self-similarity makes fractals
effective in detecting the most common defects on smooth surfaces such as
plain fabric. However, to improve the detection rate, a certain computational
cost is required by extracting additional fractal features, which are unsuitable
to applications in the environment of industries.
2.1.5 Defect Detection based on Co-occurrence Matrix
Co-occurrence matrix, which describes the 2D spatial relationship of co-
occurring values, is usually applied to measure the texture of fabric images.
Various metrics of the matrix can be taken to obtain a useful set of
features, such as energy, mean, and variance, which can represent specific
characteristics of fabric texture. GLCM has been widely used for texture
analysis of wood and fabric [40].
In [8], after decomposition into several sub-bands, the image was divided into
non-overlapping patches. Co-occurrence features were extracted from each
of the image patches and then used to classify the image patch as defective or
non-defective. In [41], under different combinations of the distance between
the pixel pair d and the angular relation θ, several GLCM were computed to
represent the fabric texture. Therefore, four features (energy, homogeneity,
contrast, and correlation) of every GLCM were applied to label the testing
image as defective or non-defective according to the dissimilarity between
its GLCM features and that of non-defective samples. The performance of
the proposed method was evaluated offline through samples collected from
websites.
19
For yarn-dyed fabric defect detection, GLCM, together with autocorrelation
function, which is able to extract the minimum repeat unit of the fabric texture
pattern, was used to increase the accurate defect detection rate [42]. First, the
input image was divided into several non-overlapping patches according to
the pattern unit size calculated through autocorrelation function. Second, the
Euclidean distance between the GLCM of each patch and that of the template
pattern unit was computed to distinguish the defective image patch.
Although second-order statistics are invariant to intensity transformation and
are capable of providing more accurate texture information of the image, they
require high computational cost, which significantly influences the efficiency
of the detection model in industry applications. Furthermore, detection
models based on co-occurrence are mainly used to classify the input image
as defective or non-defective according to the second-order statistical feature.
Therefore, these detection models were unable to correctly detect the accurate
location and shape of the defects.
2.2 Structural Approaches
In structural approaches, with the advantage of replicated fabric structure by
texture primitives, texture analysis is performed by extracting the texture ele-
ments and inferring their replacement rules [43]. Normally, the defects can be
distinguished by comparing the inspection image with a template image that
represents the non-defective fabric texture. Only a few structural approaches
have been proposed because strict standards of the image alignment problem
and texture consistency are required in image comparison.
In [44], a texture blob-based detection method was developed for fabric
inspection. Texture blobs in different sizes and orientations could uniquely
characterize the basic structural elements of the inspection fabric texture.
20
With the occurrence of local intensity changes caused by fabric defects,
the attributes of the blobs would vary. Therefore, defective areas could be
distinguished through a comparison of the features of blobs extracted from
the non-defective fabric texture and the inspection fabric samples.
[45] first proposed a traditional image subtraction method for defect detection
on lace, which comprises a fine and complex pattern of threads. The prototype
image, which represents the reference pattern, was extracted from a binary
image through correlation function. Closed-loop feedback correction was
applied to distinguish real defects from false alarms in the second step because
inherent distortions in the lace result in false alarms in direct comparison.
In [10], patterned jacquard fabric defect detection was accomplished by
comparing the inspection image with a Golden image, which is subtracted
from the non-defective reference image and refers to its pattern unit. The
Golden image subtraction is performed from the first pixel of the first row to
the end of the last row, similar to a convolution filter. However, the validation
of this method is limited only to the fabric defects of holes and thick bars.
Image decomposition, which was optimized through the largest correlation
between a non-defective reference image and the inspection image, was
applied in patterned fabric defect detection [46]. A fabric image was
decomposed into a cartoon structure, which represents the defective object,
and a texture structure, which represents the repeat pattern of the fabric. The
performance of the proposed method was evaluated on dot-, star-, and box-
patterned fabric samples.
Although structural approaches were generally effective in the inspection of
fabric with a regular patterned texture, the detection accuracy largely depends
on the choice of matching template and alignment render. Moreover, because
of the weaving process, many stochastic variations appear in the real fabric
samples, and they lead to a high false alarm rate and low efficiency of real-
21
time applications.
2.3 Model-based Approaches
As a real texture, fabric is regarded as a mixture of stochastic and deter-
ministic components. Texture analysis can be addressed by exploiting the
relationships among pixels in the image. Several probabilistic models of the
textures have been used for fabric inspection. Autoregressive (AR) model
and Markov random field (MRF) are the two common techniques applied
in exploiting the relationships among pixels in a textural image. The linear
dependence among different pixels in a textural image can be exploited by
the AR model. MRF stresses that pixel intensity in an image depends on
the neighboring pixels only, and it can combine statistical and structural
information in pattern recognition.
A one-dimensional (1D) AR-based detection method was proposed in [47].
Regarded as a 1D series of gray-level fluctuations, the acquired image was
treated as a 1D stochastic process. According to the extracted AR coefficients,
the pixels, whose gray-level values were predicted to be different from the
originals, would be classified as defective. In [48], an unsupervised textured
image segmentation algorithm was proposed by using a 2D quarter plane
autoregressive model, the parameters of which were first estimated with a
probabilistic criterion. Thereafter, the label of distinctive texture was obtained
from a maximum a posteriori estimation by using a simulated annealing
method.
MRF, which depicts the intensity dependence between neighboring pixels,
was able to capture the local contextual information in an image. The
proposed detection approach in [49] attempted to model the normal fabric
texture by determining the parameters of a predefined MRF model. A
22
Gaussian MRF (GMRF) was first trained to fit small image patches obtained
from non-defective fabric samples. Thereafter, the statistical features were
extracted from GMRF and were used as the inputs of the defects classifier.
[50] addressed the fabric defect detection problem by using the wavelet-
domain hidden Markov tree (HMT) model. The HMT for the wavelet-
transformed defect-free template image is modeled using the expectation-
maximization (EM) algorithm. Thereafter, the log-likelihood map (LLM)
derived from the coefficients of HMT was constructed and used as the
measurement of defective samples.
The abovementioned detection approaches are sensitive to small defects
owing to their ability to characterize micro-textures according to the local
dependence among different pixels in the image. However, they are
insensitive to the translation of patterns of the fabric texture because of the
lack of depiction and estimation of the global trend of fabric texture and
pattern.
2.4 Spectral Approaches
A woven fabric texture is composed of the repetition of some basic texture
primitives, which are determined by the specific weaving pattern. With a
deterministic rule of displacement of the texture primitives, the fabric surface
texture exhibits a high periodicity of sub-patterns, which permits the use
of spectral features for the detection of defects. Psychophysical research
has also indicated that human visual system analyzes textured images in the
spatial frequency domain [21]. Spectral techniques have been the most widely
used approaches in fabric defect detection [51–55] because textural features
extracted in the frequency domain are less sensitive to noise and intensity
variation than in the spatial domain. In general, the techniques involved
23
in spectral approaches are Fourier transform (FT), wavelet transform (WT),
and Gabor transform (GT), which are described in detail in the following
subsections.
2.4.1 Defect Detection based on FT
Owing to the high periodicity of weaving patterns, the spatial periodicity of
a woven fabric image can be transferred to spatial frequency by fast FT. The
spatial domain is usually noise sensitive and arduous in locating defects, while
FT uses the frequency domain to characterize the defects. Texture pattern can
be extracted by analyzing the frequency spectrum of fabric sample images,
although the occurrence of defects changes the corresponding intensity of the
frequency spectrum.
In [56], a combination of discrete Fourier transform (DFT) and Hough
transform [57] was used for fabric and machined surface inspection. The
high-energy frequency components shown in the DFT of the original image
were detected by 1D Hough transform and removed to reconstruct a uniform
texture image through inverse DFT. The normal fabric texture could be
eliminated, and only defects remain in the resultant image.
Later, in [3], on the basis of the 3D frequency spectrum, fabric defects were
extracted by detecting the abnormal values in two central spatial frequency
spectrums. Subsequently, the classification of defects was based on seven
characteristic parameters extracted from the Fourier spectrum. In practice, the
defect classification is helpful in determining the problem in the production.
However, the DFT-based approaches are not effective for those fabric images
in which the frequency components associated with the homogenous and
defective images are highly mixed together in the spectral domain. This inef-
fectiveness is due to the difficulty in manipulating the frequency components
24
associated with homogenous regions without affecting the corresponding
components associated with the defective regions.
The power spectrum generated from FT provides rich structural information
on fabric texture, which was applied in fabric inspection [58]. Warp and
weft yarn periodicities are associated with the power spectrum peaks on
the principal horizontal and vertical lines, respectively. The Fourier power
at the origin reflects the average brightness (DC) of the image. Therefore,
DC-suppressed Fourier power spectrum (DCSFPS) was computed to obtain
the boundaries of fabric texture, which represent the weave pattern. In this
studies, 27 statistical features obtained from DCSFPS along with fabric cover
factor, which represents fabric performance features (e.g., wear resistance,
permeability, and flexural rigidity), were used as the inputs to an NN for
defect classification. The effectiveness of the proposed method was evaluated
on two types of fabric inspection.
The application of Fourier analysis in fabric defect detection is invariant to
rotation, translation, and rescaling, and is able to measure the coarseness of
fabric texture. However, it is unsuitable for detecting local defects because
of the difficulty in quantifying the contribution of each spectral component
of the infinite Fourier basis. Furthermore, without the support in the spatial
domain, the location of defects cannot be effectively confirmed.
2.4.2 Defect Detection based on WT
In the recent past, multi-resolution analysis has received considerable at-
tention as a textural feature extractor. WT is a multi-resolution analysis
method that can decompose the inspection image into a hierarchy of sub-
images with varying spatial resolutions. Unlike FT, WT is a time-frequency
function that consists of small waves of varying frequencies and limited
25
duration. WT provides conjoint analysis of textured images in the spatial
and spectral domains. Multi-channel modeling is capable of extracting the
intrinsic characteristics of a textural image at different scales, which makes
it well suited to the texture analysis problem. Wavelet-based defect detection
can be achieved by examining the significant features of these decomposed
images at every scale.
With the inspection image decomposed with a family of real orthogonal
wavelet bases, wavelet packets were used to detect surface defects in [59].
Shift-invariant features were computed from the wavelet packet coefficients
of a set of dominant frequency channels, which depict the significant textural
information of the image. Thereafter, the defects were identified by an NN
classifier on the basis of the computed features.
In [52], a multi-resolution approach based on wavelet transform and an
image restoration technique was proposed for textural surface inspection. At
each level of standard wavelet decomposition, a smooth sub-image and three
detailed sub-images, which contain fine structures with horizontal, vertical,
and diagonal orientations, were obtained to represent the reference textural
structure. Therefore, in the reconstructed image, the normal fabric texture was
removed, and only local anomalies were enhanced. Later, through the analysis
of the energy distribution of wavelet coefficients, an automatic wavelet band
selection procedure was developed to obtain the optimal image reconstruction
parameters, in order to improve the detection accuracy [60].
Discriminative detection models based on adaptive wavelet bases could be
designed for specific fabric inspection problems. In [61], the performance
of six WT-based defect detection methods was evaluated on the classification
of 466 defective and 434 non-defective samples. Results revealed that the
wavelet designed by the discriminative feature extraction (DFE) method
obtains the most accurate defect classification. Instead of empirically
26
selecting a wavelet from the standard wavelets, the adaptive wavelets were
designed to discriminate between defective and non-defective samples.
In [62], to achieve the adaptive wavelet bases for fabric defect detection, the
wavelet coefficients were optimized according to a cost function to represent
the texture of normal fabric. Therefore, processed by the adaptive WT, a
simple thresholding operation would be able to discriminate the difference
between the wavelet filtered responses of defective and non-defective areas in
the image.
[63] applied the visual attention mechanism of the wavelet domain to address
the dynamic detection of fabric defects. According to the theories of visual
attention mechanism [64], human attention is likely to be attracted by a salient
object, and a combination of feature maps extracted from a specific location
can form a better representation of the inspection object. In [63], feature
images extracted from the reference images were first decomposed into a
set of feature sub-maps by wavelet decomposition. Thereafter, the center-
surround operator was adopted to enhance the difference among sub-maps to
form a feature saliency map used to reflect the features of possible defects.
The experiments revealed that the concept of visual saliency is useful in
distributing computing resources reasonably and improving the effectiveness
of the fabric defect detection.
WT provides multi-resolution analysis of images, which allows it to detect
fabric defects of any size, especially some local defects. In addition,
the optimal wavelet bands are adaptive to the fabric texture of different
coarseness. However, when the detection model is highly accurate, more
wavelet bands must be optimized, thereby increasing the computational cost
significantly.
27
2.4.3 Defect Detection based on GT
GT is a special case of short-term FT. With its merits of optimal joint
localization in the spatial and frequency domains [65], 2D GT has become
a popular technique for various applications, such as boundary detection [66,
67], texture analysis [68], and palm vein recognition [69, 70]. Consequently,
owing to its small bandwidth in the spatial and frequency domains, GT is
regarded as a promising method for fabric defect detection. The parameters
of a Gabor filter can be selectively tuned to discriminate a known category
of defects. In general, the existing defect detection models based on GT can
be classified into two categories: models based on a Gabor filter bank and on
optimized Gabor filters.
Some researchers have proposed fabric inspection models based on a Gabor
filter bank, which consists of more than ten filters that essentially cover the
frequency domain. In [12], a set of twenty-four Gabor filters was generated
at four scales and six orientations to detect the possible defects that may
appear on the fabric. This method was based on the idea of multi-resolution
analysis, in which the detection of defects in any orientation and size can
be ensured by multiple Gabor filters. Features of defects were represented
by combining the outputs of all Gabor filters, the parameters of which were
predefined empirically. Although the implementation of this detection model
is quite easy, filtering by a Gabor filter bank can generate a large amount of
data, which might cause a disturbance to the texture discrimination problem
[71].
Thereafter, [72] applied feature selection on a predefined Gabor filter bank to
build a more compact filter bank that was able to produce low dimensional
feature representation with improved sample-to-feature ratio. However, the
performance of this approach primarily depends on the parameter settings of
the original Gabor filter bank. In [73], principal component analysis (PCA)
28

has been performed on the outputs of a Gabor filter bank, to reduce the
dimension of feature vectors. Thereafter, the Euclidean norm of the local
features was calculated to distinguish defective areas. The performance of
the proposed detection model was evaluated on two types of fabric textures,
which were selected from TILDA [74].
Some detection approaches based on optimized Gabor filters have also been
developed in recent years. These approaches usually employed only one or
several Gabor filters, the parameters of which were optimized toward specific
objectives. In [13], fabric defect detection was considered the problem
of segmenting a known non-defective texture from an unknown defective
texture. Along four directions, Gabor filters were optimized in a semi-
supervised mode to generate high response to non-defective fabric areas.
In the experiments, 35 different flawed homogeneous textures were used to
evaluate the effectiveness of the proposed method.
To alleviate the computational cost and the limitation of the rotation sen-
sitivity of 2D Gabor filters, [75] proposed processing 1D ring-projection
transformed image signal with a 1D Gabor filter. The average value of the
pixels covered by the ring projection was used to substitute the original image
intensities, which might possibly cause the loss of defect features. The 1D
Gabor filter was optimized to have the minimum responding energy toward
normal fabric texture through the use of an exhaustive searching algorithm.
However, insufficient experiments have been conducted to evaluate the
effectiveness of the proposed method.
For slub extraction in woven fabric, the parameters of a Gabor filter were
obtained in the frequency domain according to the frequency characteristics
of slubs. The central frequency of the Gabor filter was designed by comparing
the frequency spectra of slub yarn with a slub-free image in the frequency
feature space. The orientation of the Gabor filter was set perpendicular to the
29
slubs. However, only obvious defects would change the distribution of the
peaks in the frequency spectrum of the images, such that the effectiveness of
the proposed method is limited.
[76] proposed a defect detection system based on a non-linear network called
Gabor wavelet network (GWN) because the transfer function is a Gabor
wavelet function. Non-defective images were employed as the template
images of GWN. Characteristic parameters of the non-defective texture were
acquired by training the GWN to minimize an error function, and then they
were used to design the optimal parameters of the Gabor filters for fabric
inspection.
Similar to the previous studies, [77] used a non-defective fabric sample as the
template image to optimize Gabor filters at seven scales through the genetic
algorithm with the similar optimization objective in [76]. Thus, a set of
optimal Gabor filters were tuned to match the desired features under different
resolutions.
Two-step detection was once proposed for fabric stain release [78]. After
filtering by a Gabor filter bank initially, the histogram of the input image was
analyzed to predict the presence of possible defects. The most suitable Gabor
filter, whose parameters best matched the features of possible defects, was
selected in the coarse segmentation stage and iteratively refined in the fine
segmentation stage. However, only global defects, such as stain a that covers
the main area, could be detected by the proposed detection model because
local (small) defects would be neglected through histogram analysis.
In [79], defect detection was addressed by adopting an elliptical-ring Gabor
filter, the parameters of which, such as aspect ratio, center, and support of the
filter, were optimized by a simulated annealing algorithm. Ring Gabor filter is
the modification of a classical Gabor filter, fulfilling the texture discrimination
task in terms of higher accuracy with the ring-like filter pass field.
30

In general, fabric defect detection approaches based on a Gabor filter bank
have two main drawbacks: (1) They usually have high computational cost,
which is vital to the real-time inspection system; and (2) Without automatic
parameter adjustment, the empirical parameters cannot efficiently handle the
different situations of the defect detection problems.
Moreover, in the abovementioned studies, Gabor filters were optimized
in accordance with the features of non-defective fabrics. These optimal
Gabor filters would be good at determining the features of normal fabric
textures. However, without any prior knowledge about the common defects,
these filters may not perform well in detecting subtle defects that have not
significantly altered the spectral features of normal fabric. Therefore, building
the optimization model for Gabor filters is crucial for the defect detection
results.
Finally, in [80], the optimal parameters of the Gabor filter were acquired
by exhaustive searching in the theoretical region. This method was time
consuming, and it is not suitable for real-time operation. In [13], the Gabor
filters were optimized by sequential quadratic programming (SQP). SQP is a
gradient-based optimization method, the optimization results of which mainly
depend on the initial values of the variables. In [76], the training process
of GWN was conducted through the Levenberg-Marquardt algorithm, which
is also a gradient-based optimization algorithm. [79] adopted simulated
annealing (SA) algorithm, which is a stochastic optimization algorithm,
for Gabor filter optimization. Compared with gradient-based optimization
algorithm, SA has increased the probability of achieving the global optimal
solution by accepting some worse solutions with an adaptive probability in
the optimization. However, because only a single individual is employed in
the optimization, the performance of this algorithm is not stable. Moreover, it
requires a high computational time.
31
2.5 Learning-based Approaches
2.5.1 Defect Detection based on NN
NNs are among the best classifiers used for defect identification because of
their ability in analyzing the relationships among multiple features and to
describe complex decision regions.
In [81], fuzzification technique (fuzzy logic) and a back-propagation NN
were combined to achieve the classification of eight types of fabric defects
and some non-defective samples. Four input features (the ratio of projection
lengths in the horizontal and vertical directions, the gray-level mean and
standard deviation of the image, and the neighboring gray level dependence
matrix) were selected as the inputs to the NN. The fuzzification process was
useful in increasing the separability of classes in the feature space, thereby
improving classification accuracy.
[22] proposed a three-layer back-propagation artificial NN for fabric defect
classification. Only five hidden nodes were used to control the overall
computational cost. The outputs of the third layer indicated the general
classes of the possible defect types. Similarly, a low-cost solution using feed-
forward NN for fabric inspection was detailed in [15, 82]. PCA by singular
value decomposition was applied to reduce the dimension of feature vectors
which were generated from the gray-level arrangement of neighboring pixels
of every pixels in the image. Twill and plain fabric samples with commonly
occurring defects gathered from the loom were used in the experiments. In
[83], neighborhood-preserving cross-correlation feature vectors together with
probabilistic NN were used for the inspection of textile fabrics.
The main advantages of NN-based detection approaches are that they can
analyze and generalize multiple features of the inspection fabric samples
32
to improve the defect classification results. However, the robustness of
the network largely depends on the amount of training data (defective
fabric samples). The large number of training samples brings excessive
computational cost to the detection system, influencing detection efficiency.
Moreover, the new type of fabric defect constantly appears in the industry,
making the collection of all types of training samples impossible.
2.5.2 Defect Detection based on Sparse Representation
The fabric defects that appear as anomalous areas can also be regarded as
noise in the image. Therefore, with the use of image denoising techniques,
some defect detection models have been presented [16–18, 84, 85]. Through
sparse representation with a dictionary, the corresponding normal fabric
texture could be estimated according to the input defective samples. Hence,
the defective areas could be enhanced in the residual image, which is the result
of subtracting the estimated image from the input image.
In [16], on the basis of sparse coding, an over-complete dictionary was trained
from the inspection image itself, considering the fabric defect was small.
For a specific fabric type, each column of the image was considered the
training data of dictionary learning, which is beneficial for defect detection by
finding abnormal pixels in a 1D signal. However, to adapt to linear defects,
the algorithm was not only implemented on the original image but also on
its rotated version, thereby increasing the computation cost of the system
significantly. Moreover, the sparse representation was based on the basic
regression model, which is unsuitable for eliminating scattered noise (e.g.,
spot defects).
Later, in [17], after image restoration was performed by the regression model,
Euclidean distance and correlation coefficient between the original image and
33
its approximation were selected as the features in training an SVDD classifier,
which was adopted for discriminating novelty from normal samples. Similar
to NN-based approaches, a defect classifier could significantly improve the
robustness of fabric inspection. However, on the one hand, the problem also
lies in the difficulty in collecting enough defective fabric samples. On the
other hand, only two statistical features were used as the classification norm,
which cannot ensure the detection of small defects.
To overcome the computation problem, the projections of a fabric image on
all vectors of a small-scale dictionary, which was trained from non-defective
samples, could be considered the features in defect detection [18, 85]. A
Gabor filter, whose parameters were trained according to the features of
normal fabric texture, was introduced as preprocessing in the detection model.
Although the complexity of the input image signal and the influence of noise
could be greatly reduced after preprocessing, this method is not ideal for
improving detection accuracy. When defects are small and mixed with noise,
the contrast between defects and fabric texture background is reduced after
Gabor filtering as well. Consequently, the defect detection rate is greatly
influenced.
Overall, sparse representation-based approaches were more universally ap-
plicable to most types of fabric defects because they did not rely on the
feature extraction of defects. As long as the dictionary and sparse coding
model are reasonably chosen, even small defects are likely to be identified
through image restoration. However, the computational cost of sparse coding
is usually high. Thus, these approaches are more suitable for fabrics with
complex textures in the industry.
34
2.6 Motif-based Approaches
Patterned fabric surface can be regarded as a 2D patterned texture, which is
composed of underlying repeated units (lattice). The lattice can be further
decomposed into a lower level of elements called motifs. Usually, the lattice
is generated by a motif with at least one of the symmetry rules including
translational, rotational, reflectional, and glide-reflectional symmetry [86,
87].
In [19], the underlying lattice of fabric texture was first extracted to i-
dentify the representative motif of the non-defective patterned texture by
a crystallography-based pattern extraction model [88]. An energy-variance
(E-V) space was designed based on the energies of moving subtraction
and variance between any two motifs to illustrate the distribution of their
statistical behaviors. Therefore, the decision boundaries for defective and
non-defective motifs were determined by the subsequent feature classification
based on a max-min decision region (MMDR). The performance of the
proposed detection model was evaluated on a pattern texture that consists of
parallelogram, rectangle, and triangle motifs. Later, the effect of the shape
transform of irregular motifs on defect detection accuracy was studied in [89].
Before the E-V space of the motif feature was computed, all motifs were
transformed to rectangular shapes.
To improve the detection accuracy through MMDR in the E-V space, [20]
applied ellipsoidal decision region (EDR). The E-V values of non-defective
fabric samples were assumed to obey a 2D Gaussian mixture model (GMM),
on the basis of which the E-V values could be clustered into several
classes by K-means clustering. Thereafter, the boundaries of the ellipsoid
decision region were determined by finding the convex hull of each cluster.
Finally, the ellipsoid region with constant eccentricity could enhance the
detection performance on the ambiguous points, which were originally on
35
the boundaries of MMDR.
With the use of lattice and motif, these approaches provided solutions for the
simultaneous detection of two types of defects: common fabric defects and
pattern variants. However, because the detection decision boundaries were
all determined according to the features of motifs, the performances of these
approaches in detecting common defects are unsatisfactory. The influences of
small common defects on the features of motifs are not large enough.
2.7 Hybrid Approaches
A majority of the aforementioned approaches focus on analyzing the defect
detection problem from only one aspect, such as the statistical behavior in
the spatial domain, structural information of the texture, or the corresponding
frequency component. Thus, to improve the detection performance and avoid
the drawback of adopting a single method, some hybrid approaches have
also been proposed for fabric inspection, especially for some complex texture
discrimination, such as jacquard and patterned fabric.
In [90], wavelet preprocessed Golden image subtraction (GWIS) was pro-
posed for pattern fabric defect detection. WT was used as an image denosing
tool [91] because white Gaussian noise caused by the dirt in the real fabric
yarns was enhanced through histogram equalization, which was applied to
highlight the detail of the fabric texture. Thereafter, Golden image subtraction
was applied in representing the repeated pattern unit in the non-defective
fabric image and in detecting the possible defects that might distort the
extracted reference unit.
A method that combines the optimal Gabor filter and local binary patterns
(LBP) was developed for multi-texture segmentation [92]. LBP was selected
as a complementary tool for feature extraction from the image filtered by a
36
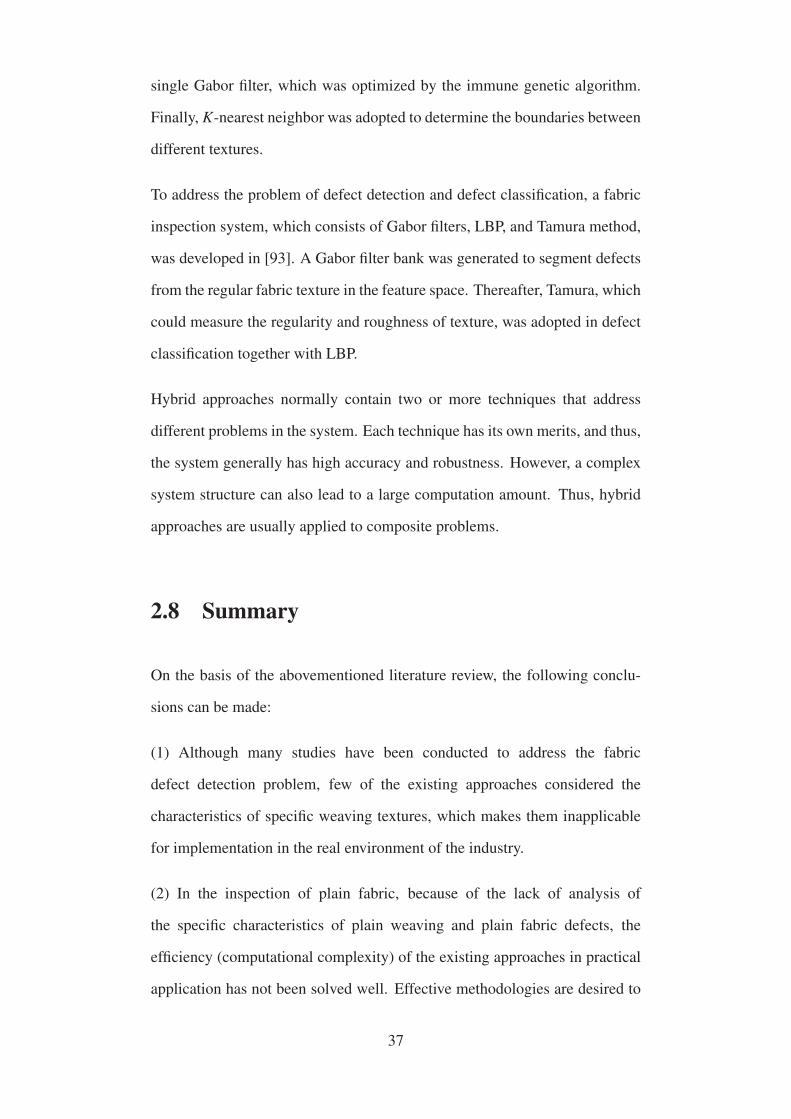
single Gabor filter, which was optimized by the immune genetic algorithm.
Finally, K-nearest neighbor was adopted to determine the boundaries between
different textures.
To address the problem of defect detection and defect classification, a fabric
inspection system, which consists of Gabor filters, LBP, and Tamura method,
was developed in [93]. A Gabor filter bank was generated to segment defects
from the regular fabric texture in the feature space. Thereafter, Tamura, which
could measure the regularity and roughness of texture, was adopted in defect
classification together with LBP.
Hybrid approaches normally contain two or more techniques that address
different problems in the system. Each technique has its own merits, and thus,
the system generally has high accuracy and robustness. However, a complex
system structure can also lead to a large computation amount. Thus, hybrid
approaches are usually applied to composite problems.
2.8 Summary
On the basis of the abovementioned literature review, the following conclu-
sions can be made:
(1) Although many studies have been conducted to address the fabric
defect detection problem, few of the existing approaches considered the
characteristics of specific weaving textures, which makes them inapplicable
for implementation in the real environment of the industry.
(2) In the inspection of plain fabric, because of the lack of analysis of
the specific characteristics of plain weaving and plain fabric defects, the
efficiency (computational complexity) of the existing approaches in practical
application has not been solved well. Effective methodologies are desired to
37
cope with the fabric inspection problem in a manner closer to reality.
(3) The case where some twill fabric defects are small and of low contrast has
not been investigated in existing studies, which do not satisfy the detection
accuracy of twill fabric inspection. Corresponding methodologies are desired
to improve the performance of twill fabric defect detection in the industry.
(4) None of the existing defect detection approaches are proposed for striped
fabric. Through the idea of hybrid detection approaches, common fabric
defects and pattern defects on striped fabric are expected to be identified in
two steps.
In summary, the performances of the existing approaches on plain fabric
inspection, twill fabric inspection, and striped fabric inspection are not satis-
fied, leaving much room for further research explorations. The current study
investigates the fabric inspection problem closer to reality, in which three
different defect detection approaches are proposed, taking the advantages of
specific characteristics of fabric weaving texture and defects. The detection
accuracy, robustness, and efficiency are significantly improved.
38

Chapter 3
Research Methodology
A detailed review of the up-to-date achievements in the field of automatic
fabric inspection was given in Chapter 2. Most studies focused on the feature
extraction of fabric defects, neglecting the structure differences among the
weaving textures of different types of fabric. However, so far, the existing
detection methods have had a limited effect on industrial applications despite
the widely accepted fact that effective automatic fabric defect detection is
helpful in improving the performances of production cost control.
In this chapter, first, the methodologies in investigating the automatic fabric
inspection models are clearly stated. Then, the Gabor filters and sparse
representation, which are adopted as the basis of the methodologies for
automatic fabric inspection, are presented.
3.1 Solution Mechanisms
According to the discussions in the previous chapters, the inspection of most
types of fabric through using only one detection approach is difficult because
the characteristics of fabric texture and defects vary with different weaving
39

methods. Therefore, in this research, three distinctive fabric defect detection
models are developed for the inspection of plain, twill, and striped fabrics.
(1) Plain fabric is the most basic fabric type. The smooth surface of
plain fabric means that plain fabric defects are more prominent than others
compared with non-defective fabric areas. Moreover, the orientation of most
plain fabric defects (e.g., slub, broken yarn, and missing yarn) are usually
limited in either the horizontal or vertical direction because of the simple
crisscross weaving pattern.
(2) Twill fabric texture is slightly more complex than that of plain fabric. The
surface of twill fabric is associated with diagonal parallel ribs, which cause
twill defects to mix easily with the weaving pattern, and the features of defects
are blurry in the image.
(3) Stripe is the one of the most basic elements in patterned fabric, which
is widely used in fashion apparel (e.g., business shirts and pants). Spectral
features (e.g., central frequency and frequency spectrum) are the dominant
characteristics of striped fabric. The greatest challenge is that common fabric
defects are usually confused with pattern defects.
On the basis of the abovementioned description, the inspection model for
woven fabric is proposed and shown in Fig. 3.1. As shown in this
figure, the inspection of each fabric type involves two stages, namely, the
offline training stage, which aims to obtain the optimal parameters for the
subsequent inspection, and the real-time inspection stage, in which the
inspection images are labeled as defective or non-defective. To achieve the
research objectives stated in Chapter 2, digital imaging, pattern recognition,
and optimization techniques are applied in this research. The details of the
research methodology are described in the remainder of this section.
40
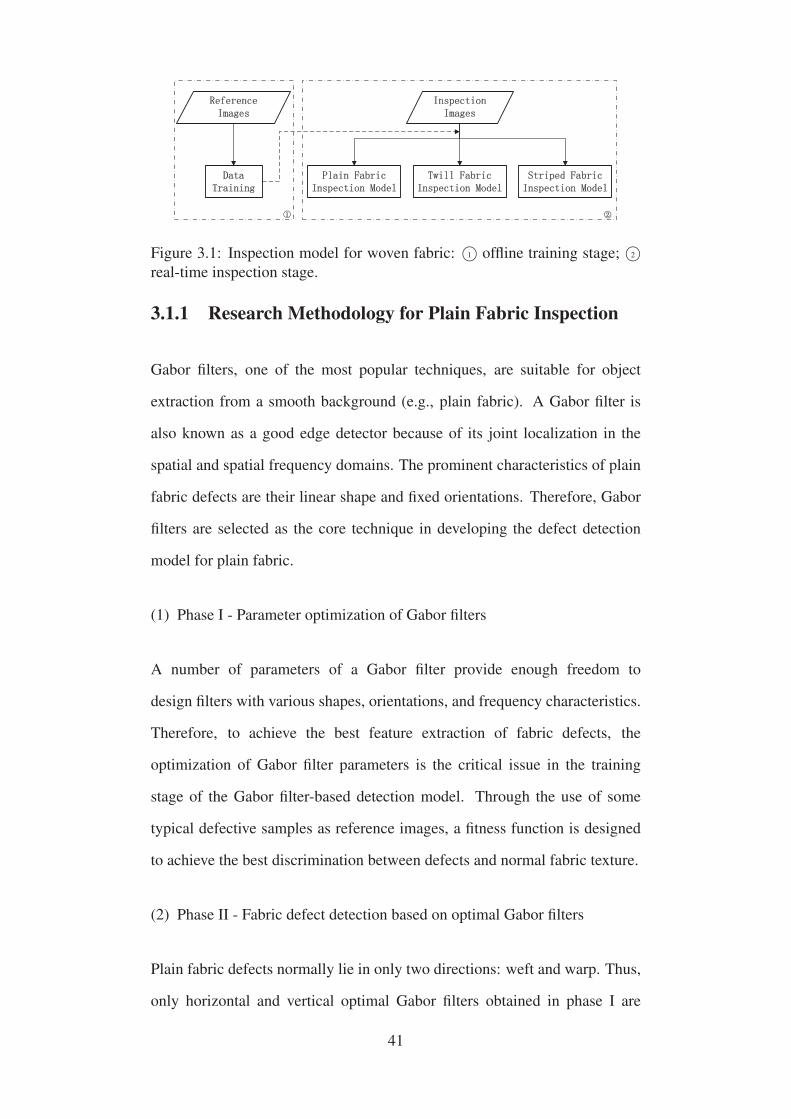
Figure 3.1: Inspection model for woven fabric: 1© offline training stage; 2©real-time inspection stage.
3.1.1 Research Methodology for Plain Fabric Inspection
Gabor filters, one of the most popular techniques, are suitable for object
extraction from a smooth background (e.g., plain fabric). A Gabor filter is
also known as a good edge detector because of its joint localization in the
spatial and spatial frequency domains. The prominent characteristics of plain
fabric defects are their linear shape and fixed orientations. Therefore, Gabor
filters are selected as the core technique in developing the defect detection
model for plain fabric.
(1) Phase I - Parameter optimization of Gabor filters
A number of parameters of a Gabor filter provide enough freedom to
design filters with various shapes, orientations, and frequency characteristics.
Therefore, to achieve the best feature extraction of fabric defects, the
optimization of Gabor filter parameters is the critical issue in the training
stage of the Gabor filter-based detection model. Through the use of some
typical defective samples as reference images, a fitness function is designed
to achieve the best discrimination between defects and normal fabric texture.
(2) Phase II - Fabric defect detection based on optimal Gabor filters
Plain fabric defects normally lie in only two directions: weft and warp. Thus,
only horizontal and vertical optimal Gabor filters obtained in phase I are
41

used to extract the features of defects. Combined with the thresholding and
feature fusion operations, the optimal Gabor filters can successfully segment
the possible defects from the original image background.
3.1.2 Research Methodology for Twill Fabric Inspection
Owing to their sensitivity to small aberrations in the image, denoising
techniques have shown their potential in addressing the detection of small
and blurry defects, such as defects on twill fabric. Considered stochastically
distributed noise, fabric defects can be detected by reconstructing the non-
defective fabric texture. Sparse representation, which can estimate the input
signal based on related dictionaries, is adopted to address the inspection
problem of twill fabric defects.
(1) Phase I - Adaptive dictionary learning
The selection of dictionary influences the accuracy of normal fabric texture
restoration, which in turn will affects the false alarm rate of the detection
model. In the training stage, non-defective fabric samples are used to learn
several sub-dictionaries, which can be adaptively selected in the subsequent
image estimation and provide related structural information for sparse coding.
(2) Phase II - Fabric defect detection based on sparse representation
With the adaptive dictionary learned in phase I, sparse representation should
estimate the non-defective version of the inspection images. Therefore,
possible defects can be eliminated. To increase estimation accuracy, non-
local similarities of the fabric structural information are considered in sparse
coding.
42

3.1.3 Research Methodology for Striped Fabric Inspection
Unlike in fabric of solid color, two groups of defects exist in striped fabric:
common fabric defects and repeat pattern variation. In addition, the edges of
stripe patterns usually cause disturbance in the extraction of common defects.
Therefore, a hybrid detection model, which can solve the disturbance problem
and address the detection of these two groups of defects in two steps, is
necessary.
(1) Step I - Reduction of disturbance caused by stripe patterns
The frequency of the stripe pattern is the most prominent component in the
frequency spectrum of striped fabric image. Thus, a Gabor filter in the
perpendicular direction to the stripe optimized according to the filter response
of non-defective fabric samples can successfully eliminate the stripe pattern,
while remaining pattern variations and common defects. Preprocessing with
pattern removal can significantly reduce such disturbance.
(2) Step II - Detection of common fabric defects
Common fabric defects are usually mixed with the repeat pattern on the
patterned fabric. After the repeat pattern removal is performed, inspection
procedures for fabric in solid color are useful for detecting remaining defects
in the filtered images. Although the optimal Gabor filters suppress only the
frequency response of the repeat patter, filtered by Gabor filters, part of the
detailed information of the rest of the fabric texture may have a slight degree
of loss. Therefore, an image restoration-based detection model is suitable for
the inspection of the feature image of striped fabric.
The details of the abovementioned defect detection models will be introduced
in Chapters 4, 5 ,and 6.
43
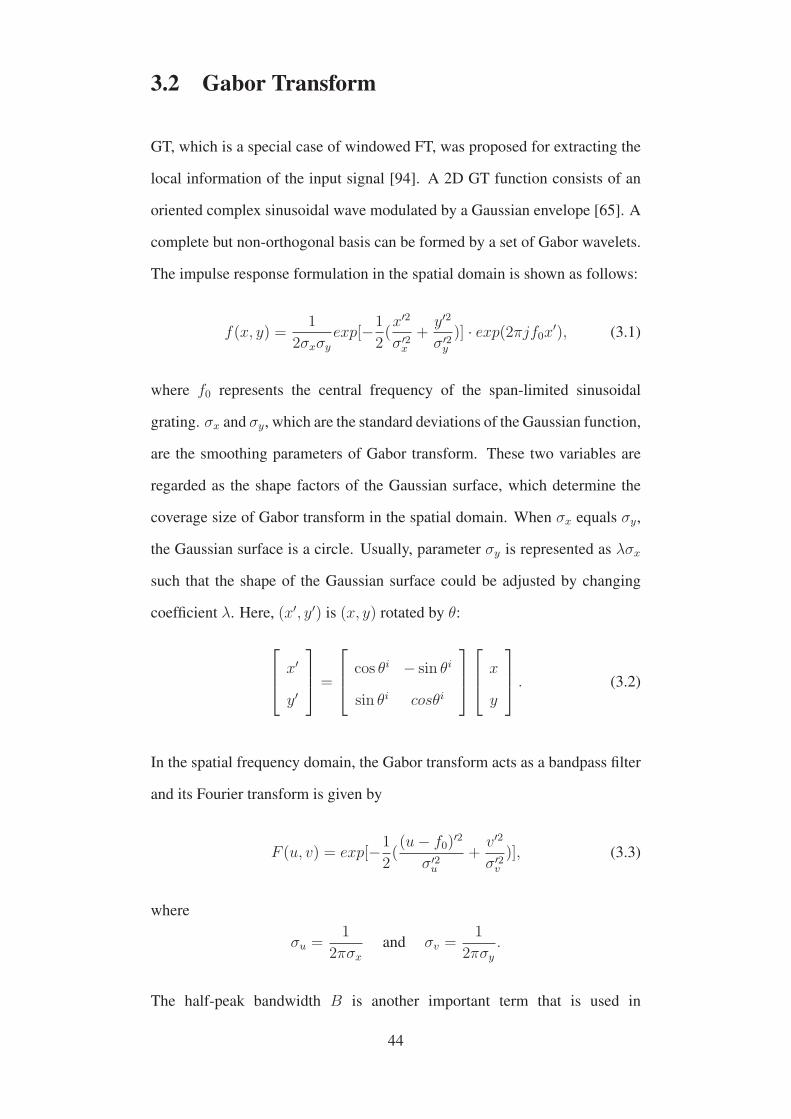
3.2 Gabor Transform
GT, which is a special case of windowed FT, was proposed for extracting the
local information of the input signal [94]. A 2D GT function consists of an
oriented complex sinusoidal wave modulated by a Gaussian envelope [65]. A
complete but non-orthogonal basis can be formed by a set of Gabor wavelets.
The impulse response formulation in the spatial domain is shown as follows:
f(x, y) =1
2σxσy
exp[−1
2(x′2
σ′2x
+y′2
σ′2y
)] · exp(2πjf0x′), (3.1)
where f0 represents the central frequency of the span-limited sinusoidal
grating. σx and σy, which are the standard deviations of the Gaussian function,
are the smoothing parameters of Gabor transform. These two variables are
regarded as the shape factors of the Gaussian surface, which determine the
coverage size of Gabor transform in the spatial domain. When σx equals σy,
the Gaussian surface is a circle. Usually, parameter σy is represented as λσx
such that the shape of the Gaussian surface could be adjusted by changing
coefficient λ. Here, (x′, y′) is (x, y) rotated by θ:
⎡⎢⎣ x′
y′
⎤⎥⎦ =
⎡⎢⎣ cos θi − sin θi
sin θi cosθi
⎤⎥⎦⎡⎢⎣ x
y
⎤⎥⎦ . (3.2)
In the spatial frequency domain, the Gabor transform acts as a bandpass filter
and its Fourier transform is given by
F (u, v) = exp[−1
2((u− f0)
′2
σ′2u
+v′2
σ′2v
)], (3.3)
where
σu =1
2πσx
and σv =1
2πσy
.
The half-peak bandwidth B is another important term that is used in
44

specifying the Gabor filter
B = log2σxf0π +
√ln22
σxf0π −√
ln22
. (3.4)
According to [65], the half-peak bandwidth is approximately 1-1.5 octaves
along the preferred orientation. The bandwidth determines the value of σx
whose value should not be specified directly but changed through frequency
bandwidth B. In this context, a small bandwidth corresponds to a large
σx. Owing to the small bandwidth of a Gabor filter in both spatial and
spatial frequency domains, this filter is widely used in texture analysis as
the bandpass filter. From the aforementioned definition of Gabor parameters,
the properties of a Gabor filter are mainly governed by parameter set
{f0, σx, σy, θ, B}. GT could provide a good description of local structural
information with the various selections of spatial frequency and orientation.
From Eq. (3.1) we know that the Gabor filter f forms a complex-valued
function that consists of real and imaginary parts, as shown in Eqs. (3.5) and
(3.6), respectively. The real part of the Gabor filter that acts as a proven blob
detector is even symmetric, while the imaginary part of Gabor filter acting as
a proven edge detector is odd symmetric [66, 95]. For convenience, in the rest
of this research, the real part of the Gabor filter is expressed as the real Gabor
filter, and the imaginary part of Gabor filter is expressed as the imaginary
Gabor filter.
fe(x, y) =1
2σxσy
exp[−1
2(x′2
σ′2x
+y′2
σ′2y
)] · cos(2πjf0x′), (3.5)
fo(x, y) =1
2σxσy
exp[−1
2(x′2
σ′2x
+y′2
σ′2y
)] · sin(2πjf0x′). (3.6)
45
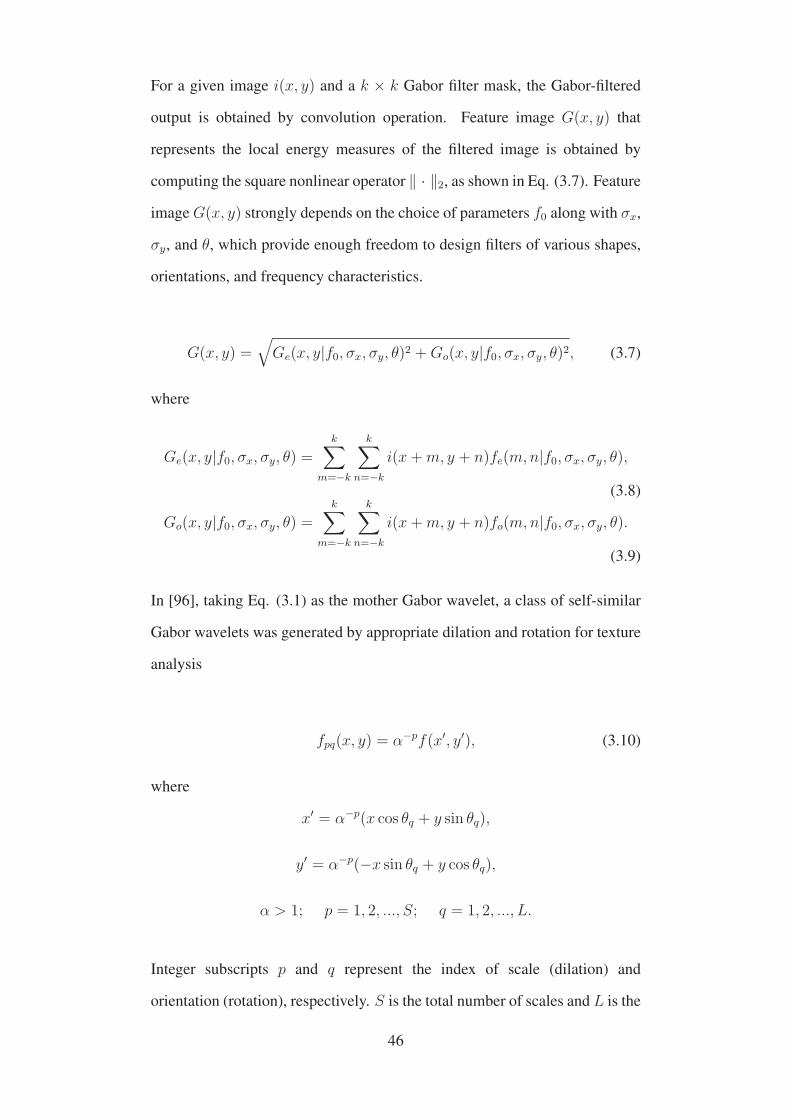
For a given image i(x, y) and a k × k Gabor filter mask, the Gabor-filtered
output is obtained by convolution operation. Feature image G(x, y) that
represents the local energy measures of the filtered image is obtained by
computing the square nonlinear operator ‖ · ‖2, as shown in Eq. (3.7). Feature
image G(x, y) strongly depends on the choice of parameters f0 along with σx,
σy, and θ, which provide enough freedom to design filters of various shapes,
orientations, and frequency characteristics.
G(x, y) =√
Ge(x, y|f0, σx, σy, θ)2 +Go(x, y|f0, σx, σy, θ)2, (3.7)
where
Ge(x, y|f0, σx, σy, θ) =k∑
m=−k
k∑n=−k
i(x+m, y + n)fe(m,n|f0, σx, σy, θ),
(3.8)
Go(x, y|f0, σx, σy, θ) =k∑
m=−k
k∑n=−k
i(x+m, y + n)fo(m,n|f0, σx, σy, θ).
(3.9)
In [96], taking Eq. (3.1) as the mother Gabor wavelet, a class of self-similar
Gabor wavelets was generated by appropriate dilation and rotation for texture
analysis
fpq(x, y) = α−pf(x′, y′), (3.10)
where
x′ = α−p(x cos θq + y sin θq),
y′ = α−p(−x sin θq + y cos θq),
α > 1; p = 1, 2, ..., S; q = 1, 2, ..., L.
Integer subscripts p and q represent the index of scale (dilation) and
orientation (rotation), respectively. S is the total number of scales and L is the
46

total number of orientations in the self-similar Gabor filters bank. The angle
for each orientation is given by
θq =π(q − 1)
L, q = 1, 2, ..., L. (3.11)
Therefore, a Gabor filter bank, which essentially covers the spatial frequency
domain, could be constructed for unsupervised fabric defect detection by
defining the number of scales and orientations.
By contrast, if the best combination of Gabor filter parameters could be
defined to represent the features of the object to be detected, then only one
or a small number of Gabor filters could be effectively used to solve detection
problems. For example, in [13, 76], Gabor filters were optimized according to
the filtering response of non-defective fabric texture. This step distinguished
defects from the background in the filtered images.
3.3 Sparse representation
According to the sparsity of the observed object, sparse representation was
proposed for describing nature images from their primary feature elements
[97]. The set of basic elements is known as the “dictionary”, most coefficients
of which are required to be zero in sparse coding. Sparse representation
has been widely applied in image restoration, face recognition, and image
classification [98–100].
Mathematically, the sparse representation model assumes that for an input
image y ∈ RN , we can have its corresponding estimation x ≈ Φαy, where
Φ ∈ RN×M(N < M) denotes an over-complete dictionary, and most of the
coefficients in α are close to zero. With the sparsity prior, an approximation
of x from a given image y with respect to dictionary Φ could be solved by the
47

most commonly used solution model [101]:
αy = argmin{‖ y −Φ ◦α ‖22 +λ ‖ α ‖0}, (3.12)
where λ denotes the regularization parameter that controls the balance
between sparse approximation of x and sparsity of α. The l2-norm ‖· ‖2 is computed to ensure that the error between the original image and
its estimation is as small as possible, which represents image restoration
accuracy. The l0-norm ‖ · ‖0 is a pseudo-norm that counts the number of
non-zero entries in α, which is known as sparse regulation term. However,
the regulation is usually relaxed to the convex l1-minimization, because l0-
minimization is an NP-hard optimization problem.
Dictionary learning and sparse coding are two key issues in solving the
image sparse representation. Sparse coding aims to find sparse representation
coefficients based on the input signal and a known dictionary. In the past
decade, several algorithms were proposed to solve the sparse representation
problem stated in Eq. (3.12). Matching pursuit (MP) [102] and the orthogonal
matching pursuit (OMP) [103] are the simplest algorithms. However, their
searching strategies are greedy and time consuming. Basis pursuit (BP) [104]
is another well-known pursuit approach, which replaces the non-convex l0
norm with convex l1 norm to achieve more sparse solutions.
Generally, the dictionary selected can be an over-complete and unspecified
set of functions, such as steerable wavelets, contourlets, and short-term
Fourier transforms. The main advantage of such dictionaries is that it leads
to simple and fast algorithms for sparse coding. However, the success
of such dictionaries in the application depends on how related they are to
the image local structure and how suitable they are to describe sparsely
input images. Recently, learning dictionaries from referencing images have
attracted attention in image sparse representation research, as these methods
48
could better characterize image structures [98, 105, 106]. Method of optimal
directions (MOD) [107] and K-SVD [105] are the two representativesof
over-complete dictionary learning algorithms. K-SVD, which alternatively
updates the dictionary and coefficients, has been more widely used in various
applications. Moreover, according to specific situation, PCA could perform
well in learning a complete dictionary.
3.4 Summary
This chapter presents the basic solution framework of the automatic fabric
inspection problem investigated in this research. Analysis was conducted on
the characteristics of fabric defect detection cases for three different types of
fabrics. Moreover, corresponding research methodologies are clearly stated.
Finally, on the basis of core techniques in the research methodologies, the
basic knowledge of Gabor transform and sparse representation are briefly
introduced.
49
Chapter 4
Differential Evolution-based
Optimal Gabor Filters Model for
Plain Fabric Inspection
Following the solution mechanism presented in Chapter 3, three automatic
defect detection models for three types of woven fabric are investigated. As
uniform texture fabrics are divided into plain and twill fabric according to
the weaving structure, this chapter will first investigate the defect detection
problem for plain fabric.
4.1 Framework of Plain Fabric Inspection Model
Fabric defects could be viewed as abnormal structures on fabric surface. Fig.
4.1 shows several typical defective samples of plain fabric. In the gray-level
image, compared with defects, the gray-level variation of non-defective area
is low such that it could be recognized as a continuous and homogeneous area.
By contrast, defects on the fabric surface (appearing as the discontinuous area)
could be identified as edges in the image. Hence, Gabor filters, which are
50
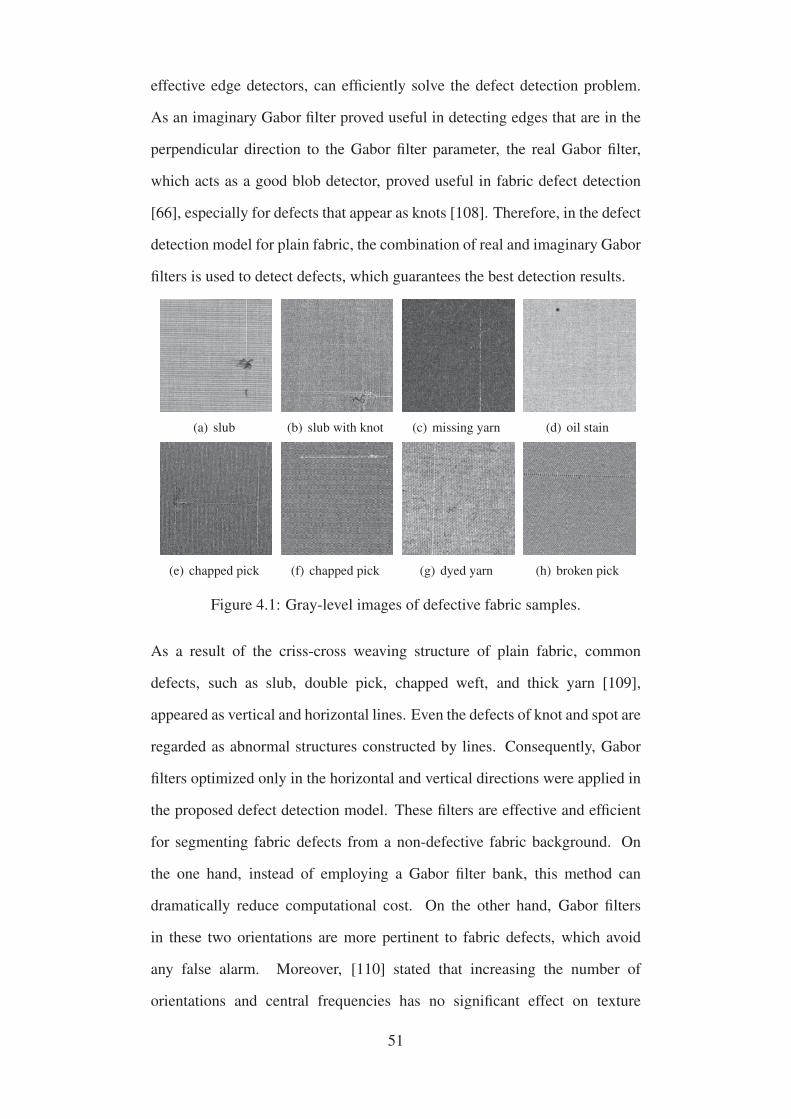
effective edge detectors, can efficiently solve the defect detection problem.
As an imaginary Gabor filter proved useful in detecting edges that are in the
perpendicular direction to the Gabor filter parameter, the real Gabor filter,
which acts as a good blob detector, proved useful in fabric defect detection
[66], especially for defects that appear as knots [108]. Therefore, in the defect
detection model for plain fabric, the combination of real and imaginary Gabor
filters is used to detect defects, which guarantees the best detection results.
(a) slub (b) slub with knot (c) missing yarn (d) oil stain
(e) chapped pick (f) chapped pick (g) dyed yarn (h) broken pick
Figure 4.1: Gray-level images of defective fabric samples.
As a result of the criss-cross weaving structure of plain fabric, common
defects, such as slub, double pick, chapped weft, and thick yarn [109],
appeared as vertical and horizontal lines. Even the defects of knot and spot are
regarded as abnormal structures constructed by lines. Consequently, Gabor
filters optimized only in the horizontal and vertical directions were applied in
the proposed defect detection model. These filters are effective and efficient
for segmenting fabric defects from a non-defective fabric background. On
the one hand, instead of employing a Gabor filter bank, this method can
dramatically reduce computational cost. On the other hand, Gabor filters
in these two orientations are more pertinent to fabric defects, which avoid
any false alarm. Moreover, [110] stated that increasing the number of
orientations and central frequencies has no significant effect on texture
51

analysis. The proposed horizontal and vertical optimal Gabor filters could
then directly accentuate the response of defective texture, while attenuating
other areas. Consequently, defective and non-defective areas are mapped into
two distinctive feature spaces.
On the basis of the above discussion, a defect detection model based
on CoDE-optimized Gabor filters is developed to handle the plain fabric
inspection problem. Defects can be featured first in the filtered image by
only two optimal Gabor filters and then segmented by solving a simple
thresholding problem. Fig. 4.2 shows the flowchart of the proposed defect
detection model. The real-time detection model consists of three operations,
namely, optimal Gabor filtering, thresholding, and image fusion. The details
of each operation are discussed in the next two sections.
Figure 4.2: Flowchart of the plain fabric inspection process: 1© detection
model; 2© Gabor filter optimization process.
4.2 CoDE-based Optimal Gabor Filters
Gabor filter optimization is conducted offline before fabric inspection. In
optimization, several typical defective samples together with non-defective
52
fabric samples are utilized as training images. Unlike the unsupervised
system in [12] and semi-supervised system in [13], with a priori knowledge
of the orientation and size of a most common defect sample, the Gabor filter
optimization could be regarded as a supervised process. It is a good practice
to define the optimization objective by adopting supervised models. The best
texture discrimination is easier to obtain when both features of defective and
non-defective samples are utilized in the objective function. The complicated
texture analysis problem could be converted into a simple binary thresholding
problem when features of the two texture exhibit small intra-class scatter and
large inter-class separation.
4.2.1 Optimization Objective Function Design
In Gabor filter optimization, for every type of plain fabric, a non-defective
fabric image if (x, y) and a defective image id(x, y) are needed. The feature
images obtained by using Eq. (3.7) are represented by If (x, y) and Id(x, y).
Each of these two feature images is divided into P non-overlapping patches
of l× l pixels. Then the average value and variance of each patch are obtained
by
μp =1
l × l
l∑i=1
l∑j=1
Ip(x, y), (4.1)
σp =
√√√√ 1
l × l
l∑i=1
l∑j=1
(Ip(x, y)− μp). (4.2)
Among all patches of each feature image, the maximum average value μmax
and the minimum average value μmin are determined. As described in
Section 4.1, the response of the defective texture will be accentuated in the
feature image when the input image is filtered by an optimal Gabor filter.
53
Consequently, among all patches of Id(x, y), the patch with the maximum
average value μmax should be a defective one, while the patch with the
minimum average value μmin should be a non-defective one. Therefore, to
realize the best discrimination between defective and non-defective area, the
fitness function is defined as
S1 =μdmax − μdmin
μdmin
, (4.3)
where μdmax and μdminrepresent the maximum and minimum average values
of patches derived from the defective sample image. S1 is derived from Fisher
distance, the largest value of which produces the best texture segmentation
result [78]. To ensure that as few pixels in non-defective areas as possible
are classified as defective pixels, on average, the response of this area should
be as low as possible. Furthermore, to improve the robustness of the defect
detection model, the variance of the filtered image should be as low as
possible. As a result, the final objective function adopted is
maximize J =S1
μfσf
=μdmax − μdmin
μdminμfσf
, (4.4)
where μf and σf are the average value and variance, respectively, of the
filtered non-defective sample. The performance of Gabor filters could
be evaluated according to energy response of defective and non-defective
textures. Compared with the works in [12], aside from maximizing the
difference between defects and normal fabric texture, the response of non-
defective texture could be limited in the feature image by minimizing μf
and σf . Consequently, the possibility of false alarm is greatly reduced.
Moreover, unlike the semi-supervised detection models in [77] and [79], the
proposed model could achieve a relatively high detection rate by employing
non-defective and defective fabric samples as reference images.
54
In Eq. (4.4), the difference value between μdmax and μdmincontrols the
discrimination degree between defective and non-defective areas. Meanwhile,
this method is effective in improving the robustness and reducing the
false alarm of the proposed defect detection model by applying the first-
order statistics of filtered non-defective image in the definition of the final
optimization fitness.
4.2.2 Gabor Filter Optimization by CoDE
Given that the proposed optimization objective function contains many local
optimal solutions, obtaining the optimal Gabor filter through adjusting the
filter responses of reference images is a complicated optimization problem.
The sequential quadratic programming (SQP) and the Levenberg-Marquardt
algorithm used in [13] and [76] are gradient-based optimization methods,
optimization results of which mainly depend on the initial values of vari-
ables. In [79], simulated annealing (SA) algorithm, which is a stochastic
optimization algorithm, employs only a single individual. This feature makes
the optimization result unstable. The evolutionary algorithm CoDE, which
has shown superior performance in solving multi-modal problems [111], is
selected as the optimization algorithm in this research. In the following, the
optimization process is illustrated in detail.
As described in Chapter 3, a Gabor transform function has five parameters,
which are f0, σx, σy, B, and θ, three of these need to be optimized, namely
f0, σx, and σy, because of the following reasons: (1) As the Gabor filter
optimization largely depends on the features of fabric defects, f0 denoting
the scale of defect is selected as the first variable in the optimization. (2)
Smoothing parameters σx and σy play significant roles in the performance
of Gabor filters [110]. These parameters determine the shape of a Gabor
filter that is related to the arrangement of texels in a specific fabric texture.
55
Accordingly, frequency bandwidth B, which determines the value of σx, is
selected as the second variable in the optimization as well. (3) Shape factor
λ is selected as the third variable because the value of σy is determined by
λ together with σx. In real fabric samples, the widths of the warp and weft
yarns are not always the same. Therefore, the shape of optimal Gabor filters
has to be adjusted adaptively by optimizing smoothing parameters σx and
σy, respectively, instead of predefining the ratio. The last parameter θ is set
as 0◦ and 90◦, because only two optimal Gabor filters are designed along
the orientation of fabric defects in the proposed defect detection model. To
sum up, central frequency f0, frequency bandwidth B, and shape factor λ
constitute the decision vector during optimization. The optimal Gabor filter
is composed of parameters that maximize objective function J . In the model,
J is used to optimize Gabor filters horizontally and vertically.
The specific optimization process is described below:
(1) Representation: The first step of the optimization process is to encode
solutions into decision vectors. For the fabric defect detection problem, the
decision vector has three dimensions, which are f0, B, and λ. The target is
to find the optimal combination of f0, B, and λ according to the objective
function.
(2) Population initialization: For the initialization of the population, we
randomly assign the real number in the specific range to each dimension of
the chromosomes. Two of the variables (B and λ) are continuous, while the
remaining f0 is discrete. To apply CoDE, which is a continuous evolutionary
algorithm, in our problem, we initialize the chromosome with real numbers at
first, while rounding down the dimension representing f0 when we evaluate
the population based on the objective function.
(3) Mutation, crossover and selection: After the initialization process, the
population needs to undergo mutation and crossover operations. CoDE is
56
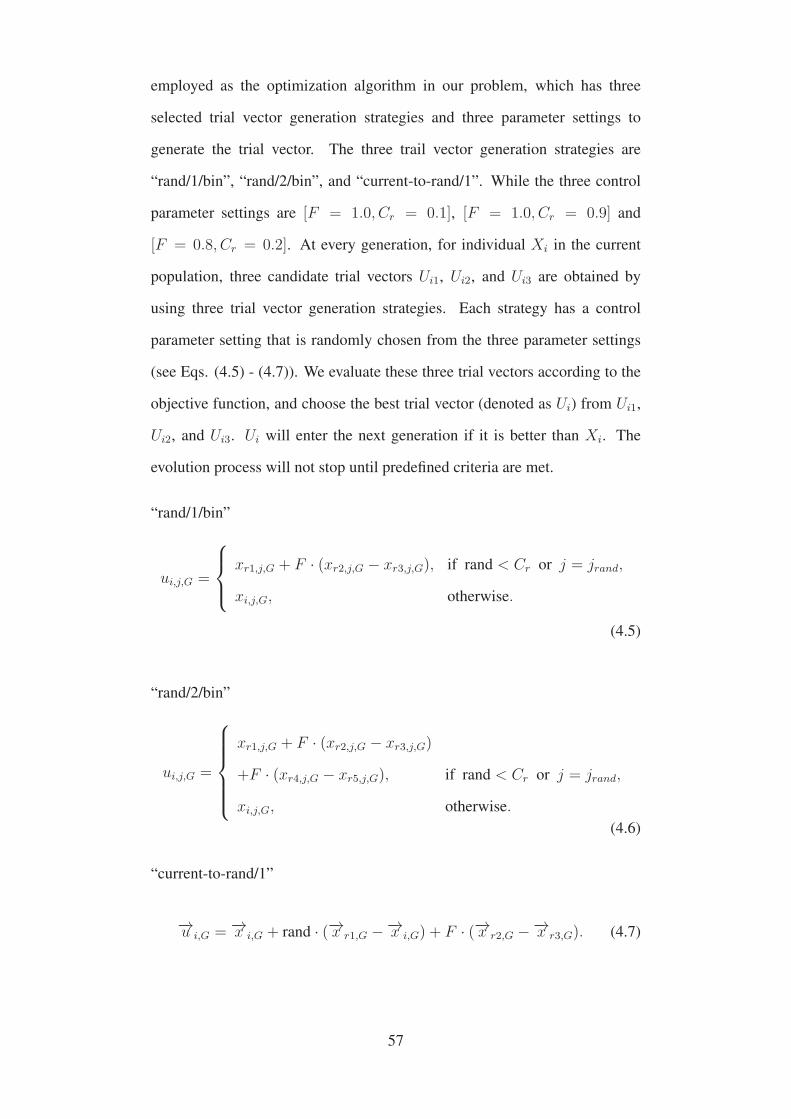
employed as the optimization algorithm in our problem, which has three
selected trial vector generation strategies and three parameter settings to
generate the trial vector. The three trail vector generation strategies are
“rand/1/bin”, “rand/2/bin”, and “current-to-rand/1”. While the three control
parameter settings are [F = 1.0, Cr = 0.1], [F = 1.0, Cr = 0.9] and
[F = 0.8, Cr = 0.2]. At every generation, for individual Xi in the current
population, three candidate trial vectors Ui1, Ui2, and Ui3 are obtained by
using three trial vector generation strategies. Each strategy has a control
parameter setting that is randomly chosen from the three parameter settings
(see Eqs. (4.5) - (4.7)). We evaluate these three trial vectors according to the
objective function, and choose the best trial vector (denoted as Ui) from Ui1,
Ui2, and Ui3. Ui will enter the next generation if it is better than Xi. The
evolution process will not stop until predefined criteria are met.
“rand/1/bin”
ui,j,G =
⎧⎪⎨⎪⎩
xr1,j,G + F · (xr2,j,G − xr3,j,G), if rand < Cr or j = jrand,
xi,j,G, otherwise.
(4.5)
“rand/2/bin”
ui,j,G =
⎧⎪⎪⎪⎪⎨⎪⎪⎪⎪⎩
xr1,j,G + F · (xr2,j,G − xr3,j,G)
+F · (xr4,j,G − xr5,j,G), if rand < Cr or j = jrand,
xi,j,G, otherwise.
(4.6)
“current-to-rand/1”
−→u i,G = −→x i,G + rand · (−→x r1,G −−→x i,G) + F · (−→x r2,G −−→x r3,G). (4.7)
57
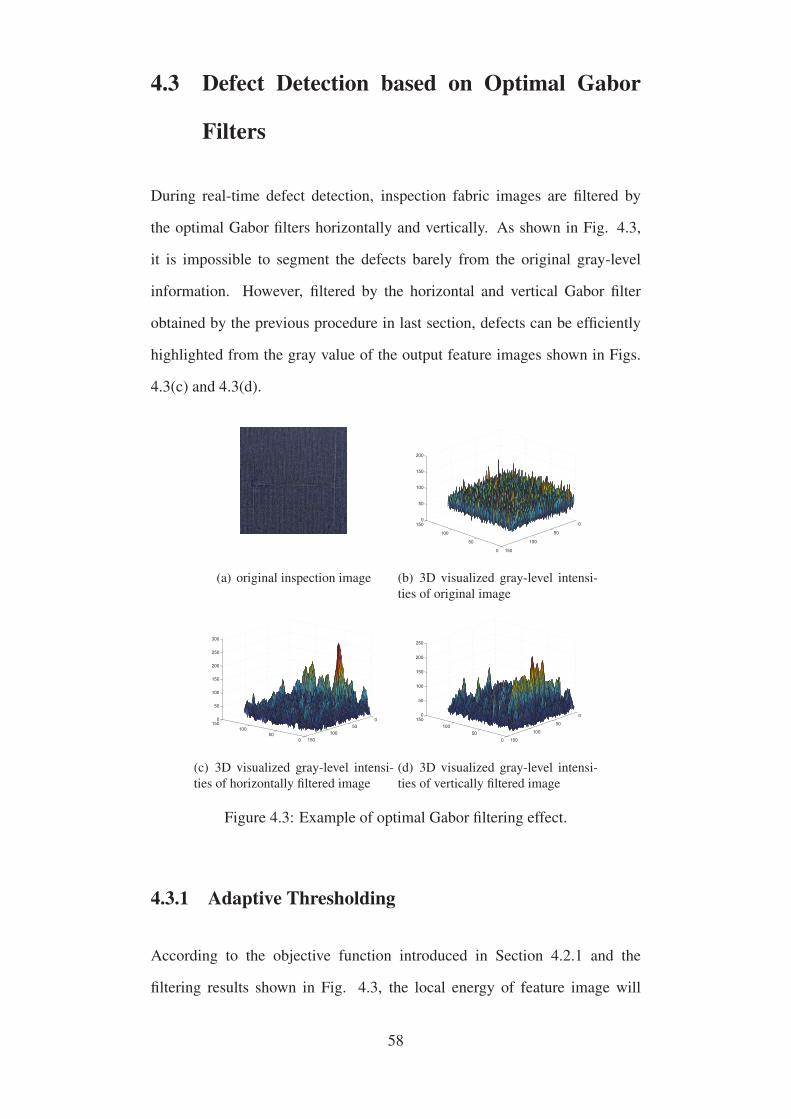
4.3 Defect Detection based on Optimal Gabor
Filters
During real-time defect detection, inspection fabric images are filtered by
the optimal Gabor filters horizontally and vertically. As shown in Fig. 4.3,
it is impossible to segment the defects barely from the original gray-level
information. However, filtered by the horizontal and vertical Gabor filter
obtained by the previous procedure in last section, defects can be efficiently
highlighted from the gray value of the output feature images shown in Figs.
4.3(c) and 4.3(d).
(a) original inspection image
0
50
100
150 0
50
100
150
0
50
100
150
200
(b) 3D visualized gray-level intensi-
ties of original image
050
100150
050
100150
0
50
100
150
200
250
300
(c) 3D visualized gray-level intensi-
ties of horizontally filtered image
050
100150
0
50
100
150
0
50
100
150
200
250
(d) 3D visualized gray-level intensi-
ties of vertically filtered image
Figure 4.3: Example of optimal Gabor filtering effect.
4.3.1 Adaptive Thresholding
According to the objective function introduced in Section 4.2.1 and the
filtering results shown in Fig. 4.3, the local energy of feature image will
58
be at the minimum when the optimal Gabor filter covers a homogeneous area
and, conversely, at the maximum for an inhomogeneous area. As a result, a
simple statistic technique that follows the spectral filtering could distinguish
defective pixels from homogeneous pixels in the feature image. Thresholding
technique is applied to the filtered image that resultes from the optimal Gabor
filter. Before thresholding operation, all filtered images are first normalized
by using:
fs(x, y) =f(x, y)− min(f(x, y))
max(f(x, y))− min(f(x, y)). (4.8)
In the normalization of the filtered image, the maximum and minimum
gray-level intensities max(f(x, y)) and min(f(x, y)), respectively, should be
selected from the whole range of gray-level intensities of the filtered defective
and non-defective images. Otherwise, the comparability between two images
will be lost.
Thresholding limits are derived from the feature image of a non-defective
reference sample, which is filtered by the optimal Gabor filters. The gray-
level intensity of the feature image is denoted as R(x, y). The upper and
lower thresholding limits are
ψupper = maxx,y∈W |R(x, y)|, (4.9)
ψlower = minx,y∈W |R(x, y)|, (4.10)
where W is a window centered at the feature image. Then, the two
thresholding limits ψupper and ψlower are obtained within window “W ” from
the feature image of a non-defective sample. The window size is obtained by
removing 10 pixels from each side of the image R(x, y) to avoid the distortion
59

effects caused by the borders of image [12].
It is assumed that the response of defective texture drops out the range which
is determined by thresholdings obtained from non-defective samples. Hence,
the binary image B(x, y) which represents the features of defects could be
obtained by
B(x, y) =
⎧⎪⎨⎪⎩
1, if G(x, y) > ψupper or G(x, y) < ψlower,
0, otherwise.(4.11)
4.3.2 Binary Image Fusion
After threshold processing, two binary feature images are obtained, which
represent the feature of defects horizontally and vertically, respectively. Given
that these two feature images are the filtered results in a pair of perpendicular
directions, they are not cross-correlated with each other. Thereafter, the final
step of the proposed detection model is to fuse these two binary feature images
to illustrate the whole defect detected by the optimal Gabor filters, as shown in
Fig. 4.2. The final detection result is obtained by combining the binary feature
outputs of the horizontal and vertical optimal filters with “OR” operation
B = Bh ∨ Bv, (4.12)
where B is a binary image that denotes the final detection result. Bh and Bv
are the binary feature outputs of horizontal and vertical optimal Gabor filters,
respectively. Symbol “∨” denotes logical operator “OR”.
60

4.4 Experiment Results and Discussion
In this section, the performance of the proposed plain fabric defect detection
model is evaluated by using a database that comprises 91 non-defective and 91
defective fabric samples acquired from an apparel factory in Mainland China
and scanned from the fabric defect handbook [25]. These fabric samples
contained common types of defects that always appear in the textile industry.
First, the experimental setup is introduced in detail. Second, the experiments
are conducted from two aspects, namely, (1) the proposed detection model is
applied for defect detection of the fabric database and (2) with the same fabric
samples, the performance of the proposed defect detection model is compared
with the other four popular models.
4.4.1 Experimental Setup
Images used in the experiments are acquired in two ways. Images of real
defect fabric samples were captured with a digital camera under day light
and flashlight. All images are of 256 × 256 pixels. Images from the fabric
defects handbook were scanned with 300 × 300 dpi. The defective plain
fabric samples mainly consist of slub, burl mark, broken end and broken pick.
Table 4.1 gives specific information related to images used in the experiments.
All detection models used in the experiments are realized under the image
processing toolbox of MATLAB prototyping environment. Experiments are
conducted on a personal computer with a Win8 operating system and an
Intel core i7 processor. The performance of the defect detection model is
visually assessed with binary feature images. In this research, the following
four measurements (expressed as percentages) are employed to evaluate the
performance of defect detection models:
61
Precision =TA
TA+FA, (4.13)
Sensitivity =TA
TA+FN, (4.14)
Specificity =TN
TN+FA, (4.15)
Accuracy =TA+TN
TA+TN+FA+TN, (4.16)
where correct detection with good localization is recoded as true alarm (TA).
Hence white pixels in the detection result cover only the defective area from
the original image. False alarm (FA) means that white pixels appear in the
detection result of a non-defective sample. True normal (TN) is recorded
if no white pixels appear in the detection result of a non-defective sample.
Conversely, false normal (FN) is recorded when no white pixels appear in the
detection result of a defective sample.
Table 4.1: Properties of testing images
Real fabric samples Defects handbook samplesDevice Canon 600D Scanner
Light camera flashlight –
Resolution 256× 256 256× 256dpi 72 300× 300
The selected Gabor filters will slide over the entire image on a pixel-by-pixel
basis such that the corresponding energy of every pixel in the image could be
determined. To compromise between detection rate and computational cost,
the size of the Gabor filter mask was set as 7 × 7 [12]. The population size
of CoDE is 50. Theoretically, the value range of parameter f0 should be 0 to
1 Hz. However, according to the specific optimization problem in this paper,
62
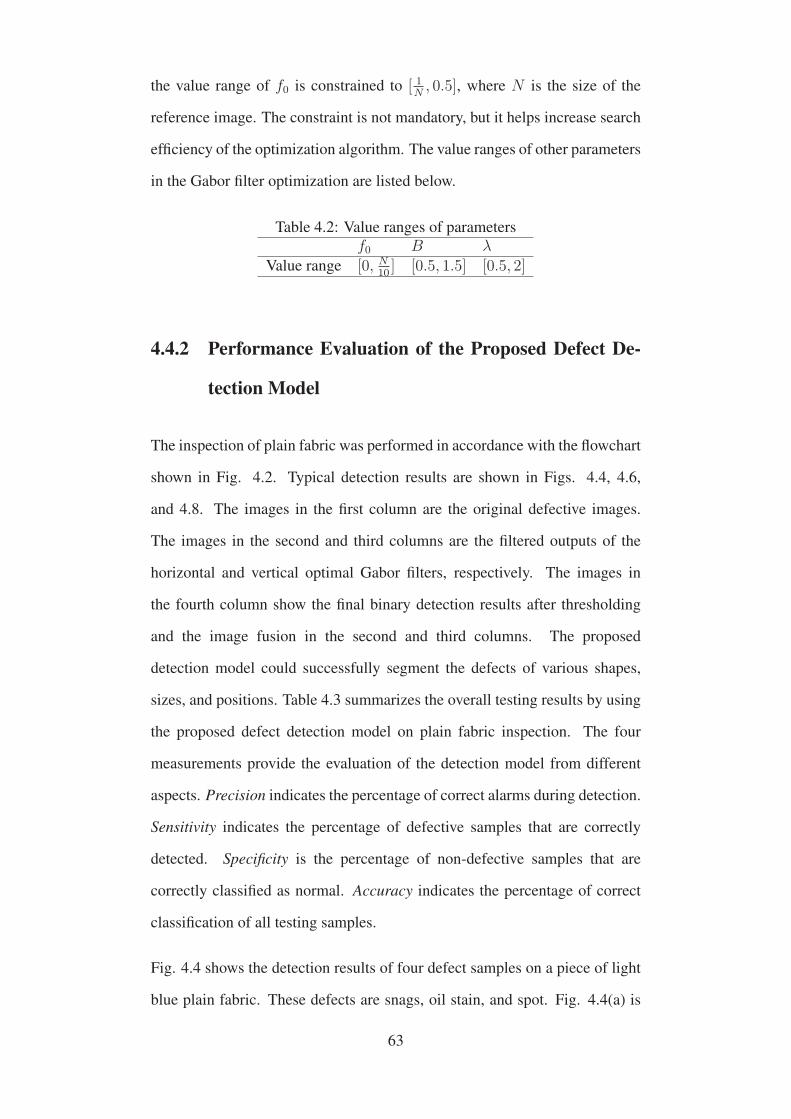
the value range of f0 is constrained to [ 1N, 0.5], where N is the size of the
reference image. The constraint is not mandatory, but it helps increase search
efficiency of the optimization algorithm. The value ranges of other parameters
in the Gabor filter optimization are listed below.
Table 4.2: Value ranges of parameters
f0 B λValue range [0, N
10] [0.5, 1.5] [0.5, 2]
4.4.2 Performance Evaluation of the Proposed Defect De-
tection Model
The inspection of plain fabric was performed in accordance with the flowchart
shown in Fig. 4.2. Typical detection results are shown in Figs. 4.4, 4.6,
and 4.8. The images in the first column are the original defective images.
The images in the second and third columns are the filtered outputs of the
horizontal and vertical optimal Gabor filters, respectively. The images in
the fourth column show the final binary detection results after thresholding
and the image fusion in the second and third columns. The proposed
detection model could successfully segment the defects of various shapes,
sizes, and positions. Table 4.3 summarizes the overall testing results by using
the proposed defect detection model on plain fabric inspection. The four
measurements provide the evaluation of the detection model from different
aspects. Precision indicates the percentage of correct alarms during detection.
Sensitivity indicates the percentage of defective samples that are correctly
detected. Specificity is the percentage of non-defective samples that are
correctly classified as normal. Accuracy indicates the percentage of correct
classification of all testing samples.
Fig. 4.4 shows the detection results of four defect samples on a piece of light
blue plain fabric. These defects are snags, oil stain, and spot. Fig. 4.4(a) is
63
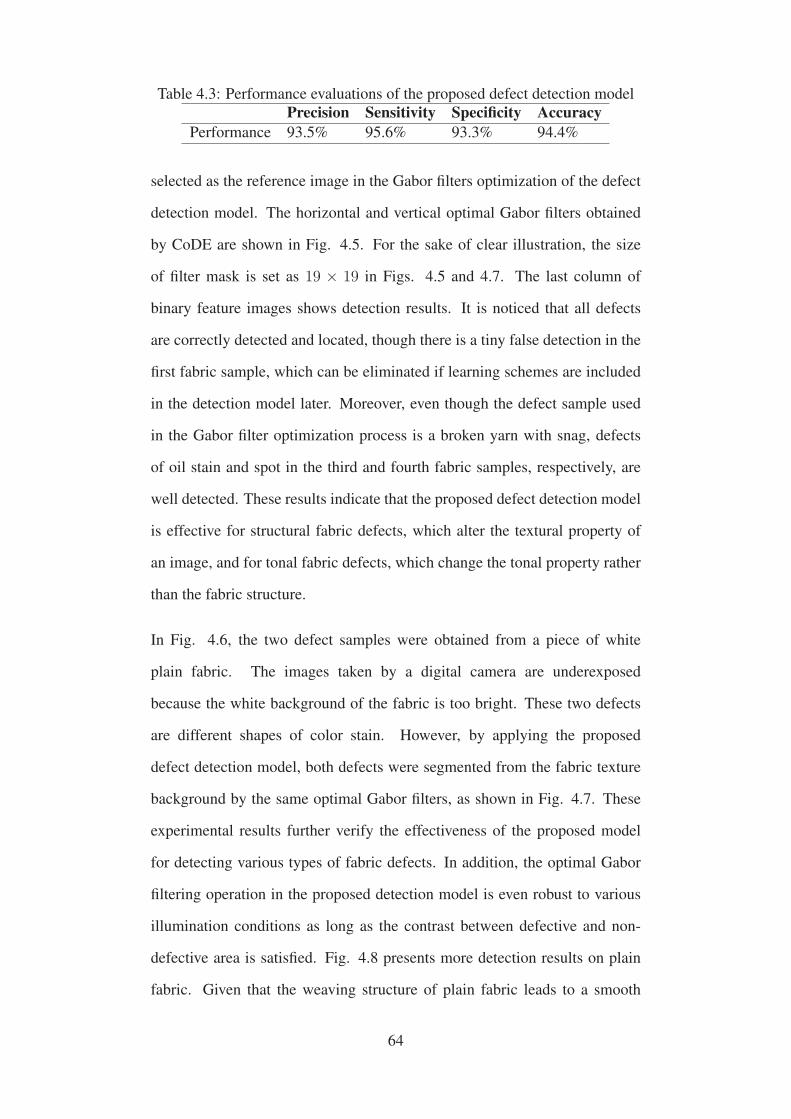
Table 4.3: Performance evaluations of the proposed defect detection model
Precision Sensitivity Specificity AccuracyPerformance 93.5% 95.6% 93.3% 94.4%
selected as the reference image in the Gabor filters optimization of the defect
detection model. The horizontal and vertical optimal Gabor filters obtained
by CoDE are shown in Fig. 4.5. For the sake of clear illustration, the size
of filter mask is set as 19 × 19 in Figs. 4.5 and 4.7. The last column of
binary feature images shows detection results. It is noticed that all defects
are correctly detected and located, though there is a tiny false detection in the
first fabric sample, which can be eliminated if learning schemes are included
in the detection model later. Moreover, even though the defect sample used
in the Gabor filter optimization process is a broken yarn with snag, defects
of oil stain and spot in the third and fourth fabric samples, respectively, are
well detected. These results indicate that the proposed defect detection model
is effective for structural fabric defects, which alter the textural property of
an image, and for tonal fabric defects, which change the tonal property rather
than the fabric structure.
In Fig. 4.6, the two defect samples were obtained from a piece of white
plain fabric. The images taken by a digital camera are underexposed
because the white background of the fabric is too bright. These two defects
are different shapes of color stain. However, by applying the proposed
defect detection model, both defects were segmented from the fabric texture
background by the same optimal Gabor filters, as shown in Fig. 4.7. These
experimental results further verify the effectiveness of the proposed model
for detecting various types of fabric defects. In addition, the optimal Gabor
filtering operation in the proposed detection model is even robust to various
illumination conditions as long as the contrast between defective and non-
defective area is satisfied. Fig. 4.8 presents more detection results on plain
fabric. Given that the weaving structure of plain fabric leads to a smooth
64
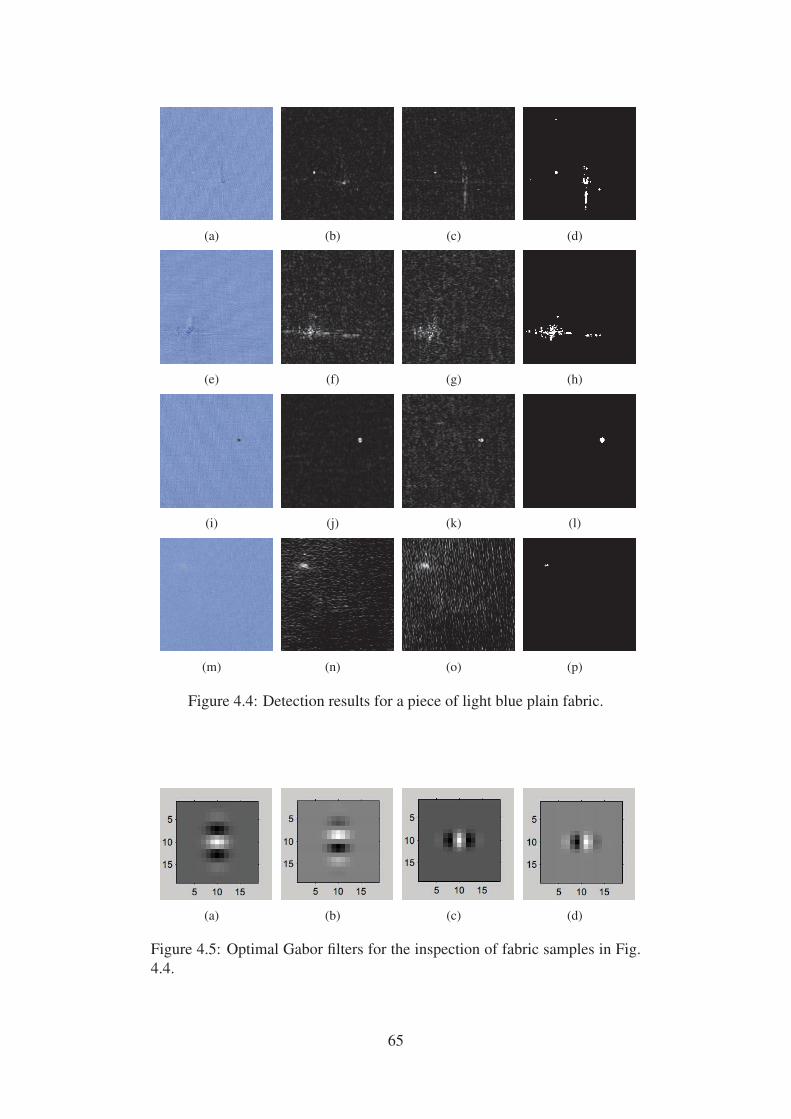
(a) (b) (c) (d)
(e) (f) (g) (h)
(i) (j) (k) (l)
(m) (n) (o) (p)
Figure 4.4: Detection results for a piece of light blue plain fabric.
(a) (b) (c) (d)
Figure 4.5: Optimal Gabor filters for the inspection of fabric samples in Fig.
4.4.
65

and even surface, the contrast between defects and background texture is
normally high. Therefore, utilizing optimal Gabor filters as edge detectors,
the proposed detection model could achieve outstanding performance in the
inspection of plain fabric.
(a) (b) (c) (d)
(e) (f) (g) (h)
Figure 4.6: Detection results for a piece of white plain fabric.
(a) (b) (c) (d)
Figure 4.7: Optimal Gabor filters for the detection of fabric samples in Fig.
4.6.
4.4.3 Comparison of Proposed Model and Other Four Pop-
ular Models
To further verify the effectiveness of the proposed model for plain fabric
inspection, the detection performance of the model is compared with that of
the other four popular detection approaches. The evaluations are under the
same environment and based on the initial set of 91 defective and 91 non-
66

(a) (b) (c) (d)
(e) (f) (g) (h)
(i) (j) (k) (l)
(m) (n) (o) (p)
Figure 4.8: Detection results of plain fabric.
67
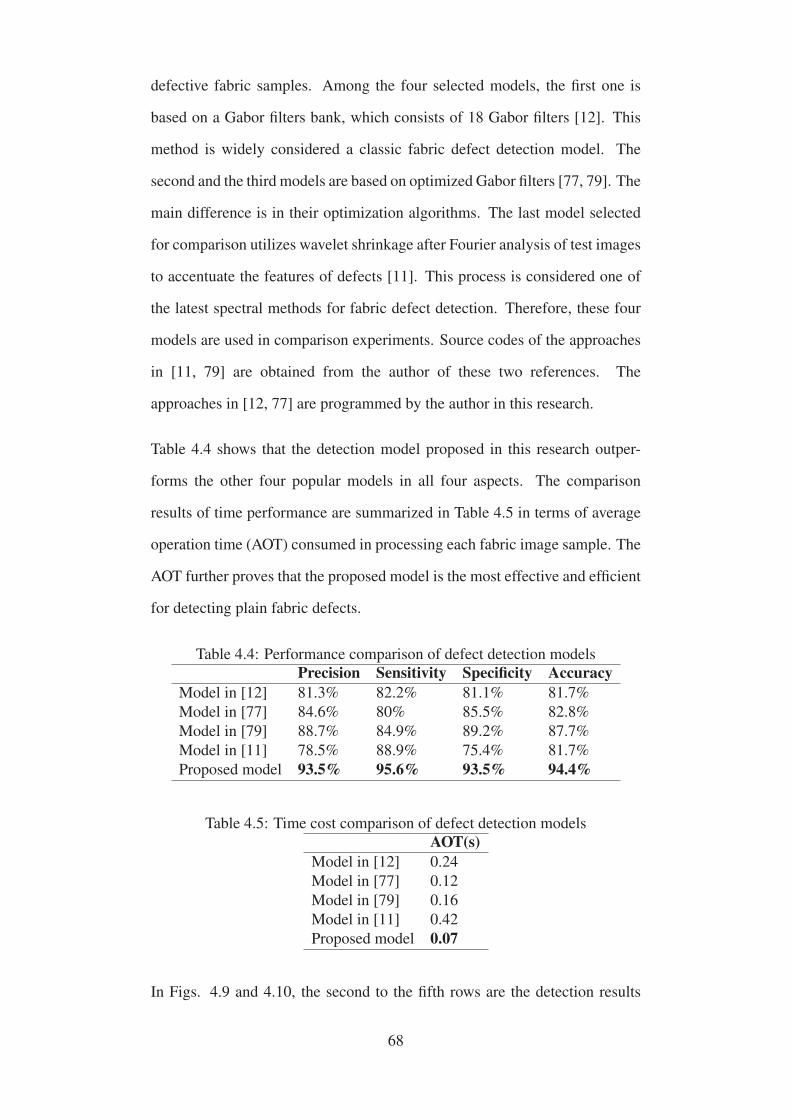
defective fabric samples. Among the four selected models, the first one is
based on a Gabor filters bank, which consists of 18 Gabor filters [12]. This
method is widely considered a classic fabric defect detection model. The
second and the third models are based on optimized Gabor filters [77, 79]. The
main difference is in their optimization algorithms. The last model selected
for comparison utilizes wavelet shrinkage after Fourier analysis of test images
to accentuate the features of defects [11]. This process is considered one of
the latest spectral methods for fabric defect detection. Therefore, these four
models are used in comparison experiments. Source codes of the approaches
in [11, 79] are obtained from the author of these two references. The
approaches in [12, 77] are programmed by the author in this research.
Table 4.4 shows that the detection model proposed in this research outper-
forms the other four popular models in all four aspects. The comparison
results of time performance are summarized in Table 4.5 in terms of average
operation time (AOT) consumed in processing each fabric image sample. The
AOT further proves that the proposed model is the most effective and efficient
for detecting plain fabric defects.
Table 4.4: Performance comparison of defect detection models
Precision Sensitivity Specificity AccuracyModel in [12] 81.3% 82.2% 81.1% 81.7%
Model in [77] 84.6% 80% 85.5% 82.8%
Model in [79] 88.7% 84.9% 89.2% 87.7%
Model in [11] 78.5% 88.9% 75.4% 81.7%
Proposed model 93.5% 95.6% 93.5% 94.4%
Table 4.5: Time cost comparison of defect detection models
AOT(s)Model in [12] 0.24
Model in [77] 0.12
Model in [79] 0.16
Model in [11] 0.42
Proposed model 0.07
In Figs. 4.9 and 4.10, the second to the fifth rows are the detection results
68
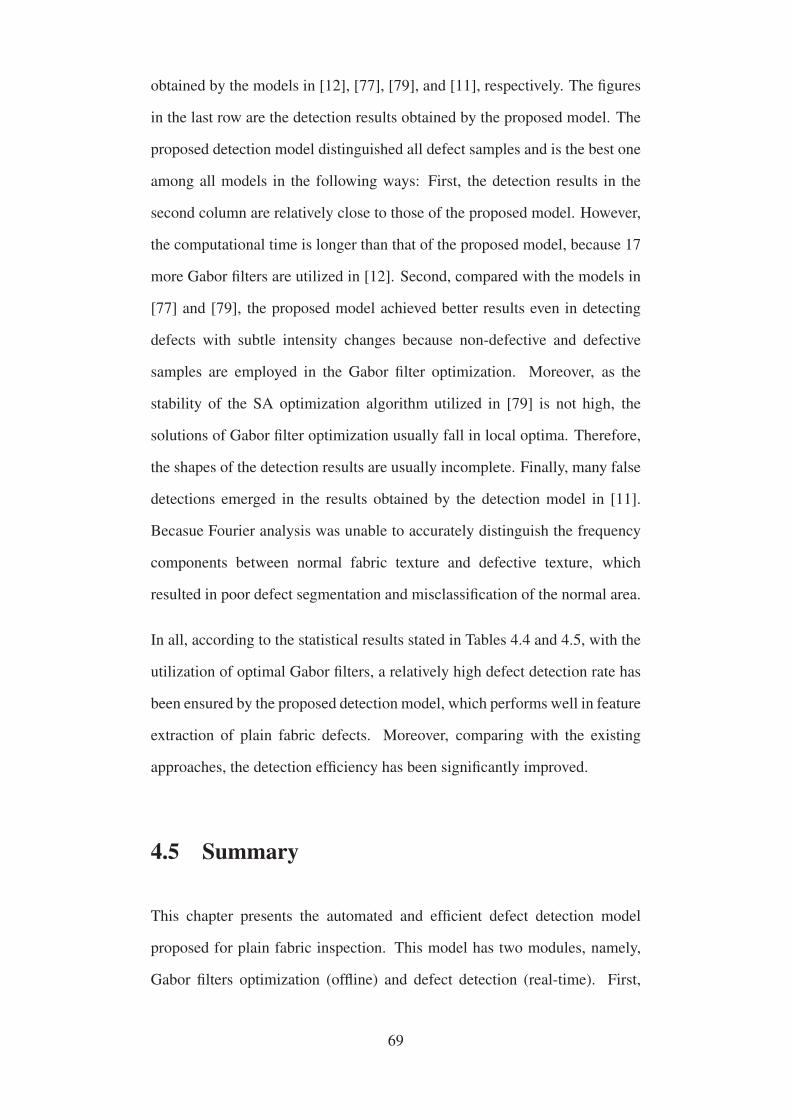
obtained by the models in [12], [77], [79], and [11], respectively. The figures
in the last row are the detection results obtained by the proposed model. The
proposed detection model distinguished all defect samples and is the best one
among all models in the following ways: First, the detection results in the
second column are relatively close to those of the proposed model. However,
the computational time is longer than that of the proposed model, because 17
more Gabor filters are utilized in [12]. Second, compared with the models in
[77] and [79], the proposed model achieved better results even in detecting
defects with subtle intensity changes because non-defective and defective
samples are employed in the Gabor filter optimization. Moreover, as the
stability of the SA optimization algorithm utilized in [79] is not high, the
solutions of Gabor filter optimization usually fall in local optima. Therefore,
the shapes of the detection results are usually incomplete. Finally, many false
detections emerged in the results obtained by the detection model in [11].
Becasue Fourier analysis was unable to accurately distinguish the frequency
components between normal fabric texture and defective texture, which
resulted in poor defect segmentation and misclassification of the normal area.
In all, according to the statistical results stated in Tables 4.4 and 4.5, with the
utilization of optimal Gabor filters, a relatively high defect detection rate has
been ensured by the proposed detection model, which performs well in feature
extraction of plain fabric defects. Moreover, comparing with the existing
approaches, the detection efficiency has been significantly improved.
4.5 Summary
This chapter presents the automated and efficient defect detection model
proposed for plain fabric inspection. This model has two modules, namely,
Gabor filters optimization (offline) and defect detection (real-time). First,
69
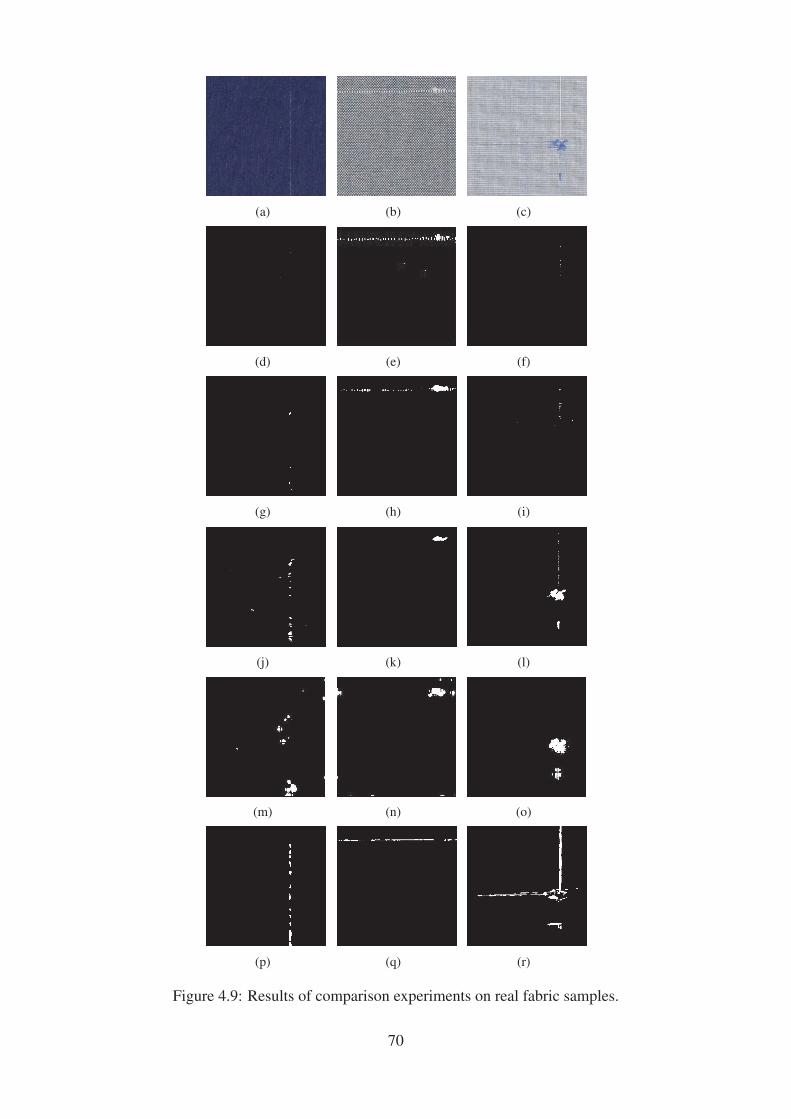
(a) (b) (c)
(d) (e) (f)
(g) (h) (i)
(j) (k) (l)
(m) (n) (o)
(p) (q) (r)
Figure 4.9: Results of comparison experiments on real fabric samples.
70
(a) (b) (c)
(d) (e) (f)
(g) (h) (i)
(j) (k) (l)
(m) (n) (o)
(p) (q) (r)
Figure 4.10: Results of comparison experiments on scanned fabric samples.
71

Gabor filter optimization problem is designed according to the features of
defects and standard fabric texture, such that the best texture discrimination
is easier to achieve. With the use of CoDE, global optimal Gabor filters,
which best segment the defects from the fabric texture background, are
obtained. Second, on the basis of the analysis of the orientation features of
fabric defects, the real-time defect detection module, which employs only
two optimal Gabor filters together with thresholding and fusion operations, is
capable of successfully locating fabric defects. Therefore, the computational
cost of the whole model is greatly reduced.
Extensive experiments were conducted. The performance of the proposed
defect detection model is evaluated based on real fabric samples. A
series of results demonstrates its effectiveness on the detection of defects
of various shapes, sizes, and locations. The proposed defect detection
model achieves a high successful detection rate and low false alarm rate.
Comparative experiments were conducted based on four popular detection
models. Detection results illustrate that the proposed defect detection model
performs the best in terms of detection accuracy and efficiency.
72
Chapter 5
Nonlocal Sparse
Representation-based Defect
Detection Model for Twill Fabric
Inspection
Compared with plain fabric, the weaving structure of twill fabric is more
complicated. Hence, detection of twill fabric defects is more challenging. The
twill fabric inspection problem will be investigated from the view of image
denoising, instead of feature extraction. A novel defect detection model will
be developed for twill fabric in this chapter.
5.1 Framework of Twill Fabric Inspection Model
On the basis of an observation of several defective samples of twill fabric
shown in Fig. 5.1, twill fabric is associated with a texture of diagonally
parallel ribs, whose orientation is variable with different weaving methods.
Therefore twill defects are usually not as sharp as plain fabric defects. On
73
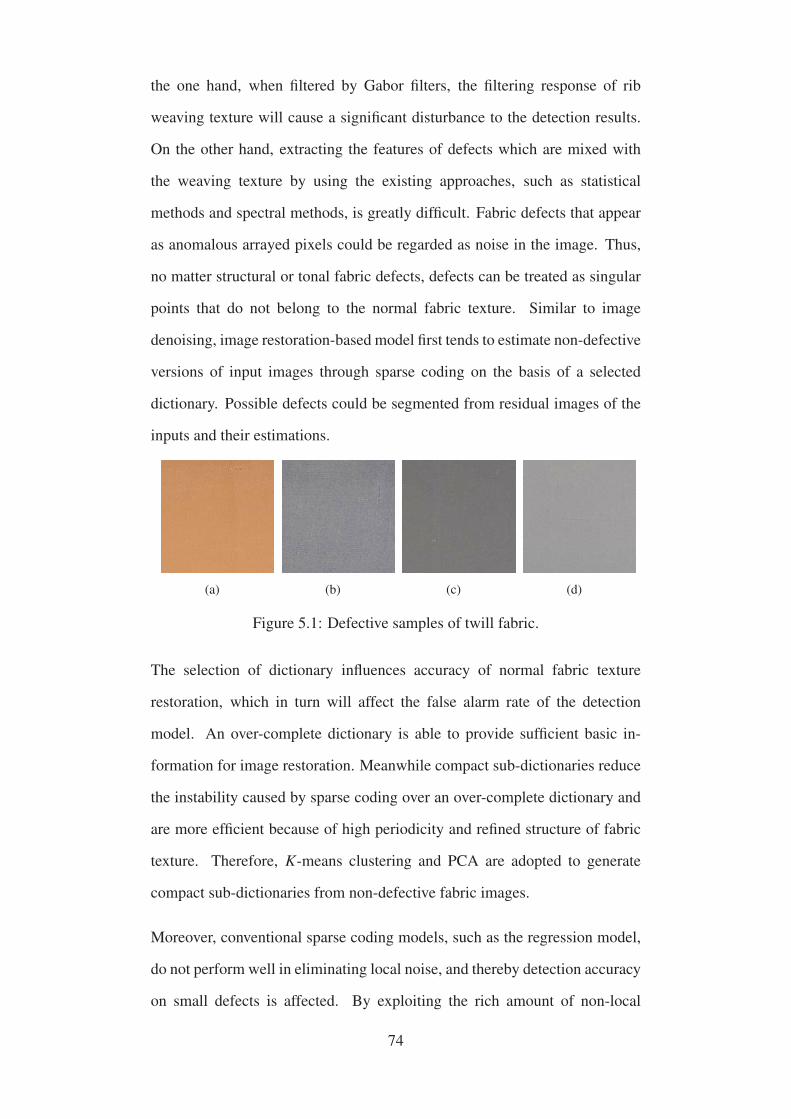
the one hand, when filtered by Gabor filters, the filtering response of rib
weaving texture will cause a significant disturbance to the detection results.
On the other hand, extracting the features of defects which are mixed with
the weaving texture by using the existing approaches, such as statistical
methods and spectral methods, is greatly difficult. Fabric defects that appear
as anomalous arrayed pixels could be regarded as noise in the image. Thus,
no matter structural or tonal fabric defects, defects can be treated as singular
points that do not belong to the normal fabric texture. Similar to image
denoising, image restoration-based model first tends to estimate non-defective
versions of input images through sparse coding on the basis of a selected
dictionary. Possible defects could be segmented from residual images of the
inputs and their estimations.
(a) (b) (c) (d)
Figure 5.1: Defective samples of twill fabric.
The selection of dictionary influences accuracy of normal fabric texture
restoration, which in turn will affect the false alarm rate of the detection
model. An over-complete dictionary is able to provide sufficient basic in-
formation for image restoration. Meanwhile compact sub-dictionaries reduce
the instability caused by sparse coding over an over-complete dictionary and
are more efficient because of high periodicity and refined structure of fabric
texture. Therefore, K-means clustering and PCA are adopted to generate
compact sub-dictionaries from non-defective fabric images.
Moreover, conventional sparse coding models, such as the regression model,
do not perform well in eliminating local noise, and thereby detection accuracy
on small defects is affected. By exploiting the rich amount of non-local
74
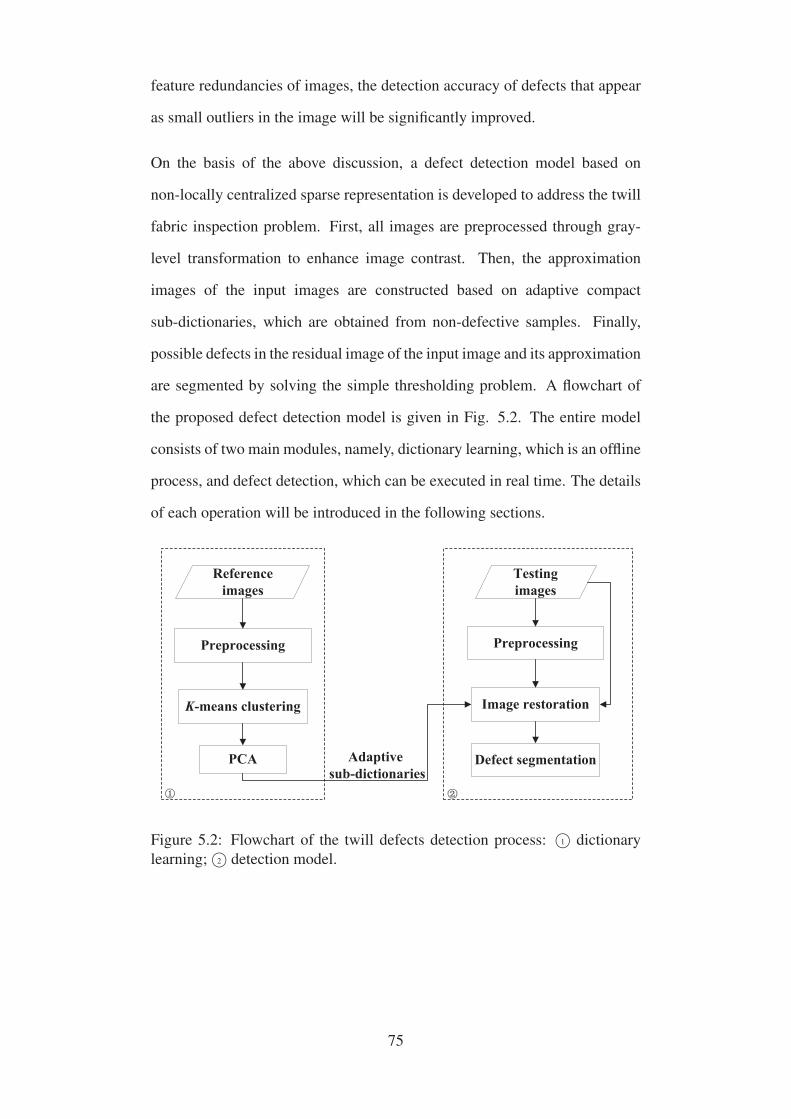
feature redundancies of images, the detection accuracy of defects that appear
as small outliers in the image will be significantly improved.
On the basis of the above discussion, a defect detection model based on
non-locally centralized sparse representation is developed to address the twill
fabric inspection problem. First, all images are preprocessed through gray-
level transformation to enhance image contrast. Then, the approximation
images of the input images are constructed based on adaptive compact
sub-dictionaries, which are obtained from non-defective samples. Finally,
possible defects in the residual image of the input image and its approximation
are segmented by solving the simple thresholding problem. A flowchart of
the proposed defect detection model is given in Fig. 5.2. The entire model
consists of two main modules, namely, dictionary learning, which is an offline
process, and defect detection, which can be executed in real time. The details
of each operation will be introduced in the following sections.
Figure 5.2: Flowchart of the twill defects detection process: 1© dictionary
learning; 2© detection model.
75
5.2 Preprocessing via Gray-level Transformation
Generally, fabric texture is synthetic and quite refined because of the fine raw
materials and precise weaving structure. The contrast between small defect
and the background will be influenced when the detail of the fabric texture
is not well presented in the digital image. As a result, the discrimination of
defects and normal fabric texture is a difficult task. Moreover, as the textile
material usually absorbs dust in the air, noise is hard to avoid in the image
and is sometimes mixed with the defects, which could increase the omission
ratio or the false alarm rate. To increase the contrast of the input images
and highlight the possible fabric defects, preprocessing is introduced into the
system before detection operation.
Among all contrast enhancement operations, such as log, gamma, and
contrast-stretching transformation, gray-level transformation is the simplest
and most straightforward one. Log transformation maps a narrow range
of low gray-level intensities into a wider range output, which is useful for
highlighting dark but important details. However, the method comprises
the dynamic range of the images and therefore the contrast of the image
as well. Gamma transformation is more versatile than log transformation,
because different transformation curves could be obtained through varying its
parameters. However, in a real fabric inspection environment, adjusting the
Gamma transformation parameter online to adapt to different colors of fabric
images is impractical. The preprocessing operation adopted in this research
is contrast-stretching transformation whose function is as follows:
s = T (r) =1
1 + (mr )ε, (5.1)
where r denotes the intensities of the input image; s is the corresponding
intensity of the output; ε and m control the slope and the center of gravity
76
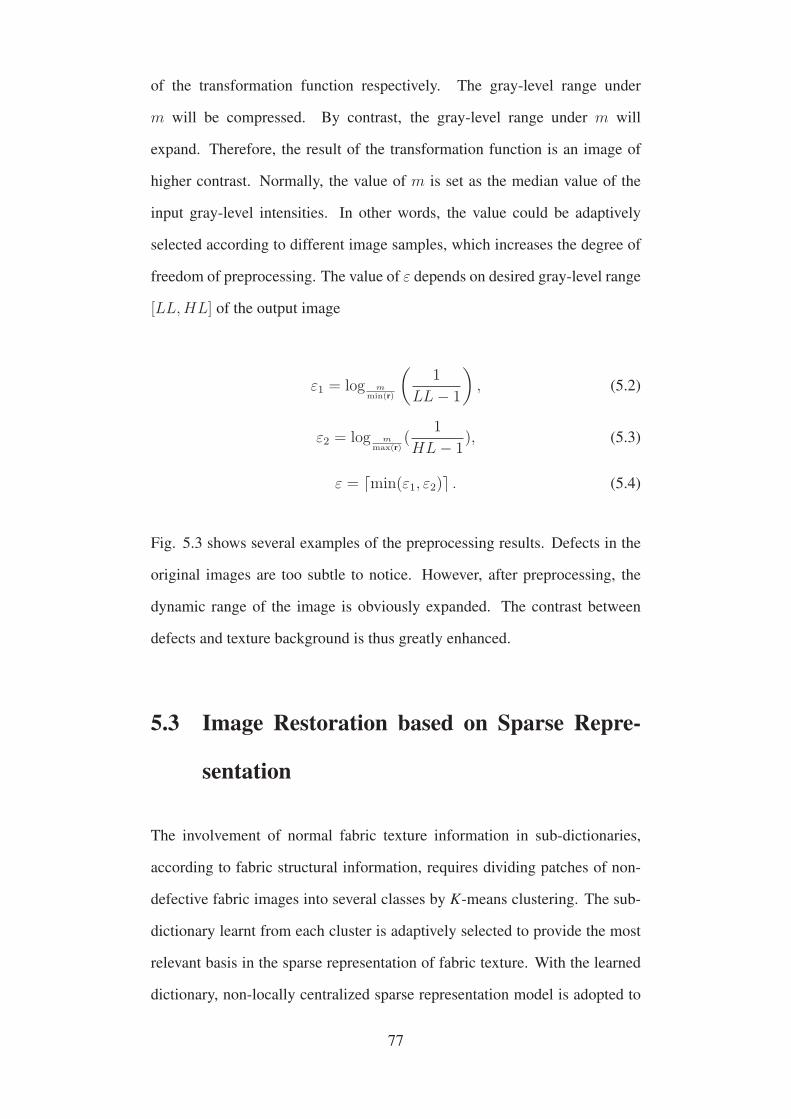
of the transformation function respectively. The gray-level range under
m will be compressed. By contrast, the gray-level range under m will
expand. Therefore, the result of the transformation function is an image of
higher contrast. Normally, the value of m is set as the median value of the
input gray-level intensities. In other words, the value could be adaptively
selected according to different image samples, which increases the degree of
freedom of preprocessing. The value of ε depends on desired gray-level range
[LL,HL] of the output image
ε1 = log mmin(r)
(1
LL− 1
), (5.2)
ε2 = log mmax(r)
(1
HL− 1), (5.3)
ε = min(ε1, ε2) . (5.4)
Fig. 5.3 shows several examples of the preprocessing results. Defects in the
original images are too subtle to notice. However, after preprocessing, the
dynamic range of the image is obviously expanded. The contrast between
defects and texture background is thus greatly enhanced.
5.3 Image Restoration based on Sparse Repre-
sentation
The involvement of normal fabric texture information in sub-dictionaries,
according to fabric structural information, requires dividing patches of non-
defective fabric images into several classes by K-means clustering. The sub-
dictionary learnt from each cluster is adaptively selected to provide the most
relevant basis in the sparse representation of fabric texture. With the learned
dictionary, non-locally centralized sparse representation model is adopted to
77

(a) (b) (c) (d)
0 0.2 0.4 0.6 0.8 10
0.01
0.02
0.03
0.04
0.05
0.06
0.07
Original Histogram
Num
ber
of p
ixel
s
(e)
0 0.2 0.4 0.6 0.8 10
0.01
0.02
0.03
0.04
0.05
0.06
0.07
Stretched Histogram
Num
ber
of p
ixel
s
(f)
0 0.2 0.4 0.6 0.8 10
0.005
0.01
0.015
0.02
0.025
0.03
Original Histogram
Num
ber
of p
ixel
s
(g)
0 0.2 0.4 0.6 0.8 10
0.005
0.01
0.015
0.02
0.025
0.03
Stretched Histogram
Num
ber
of p
ixel
s
(h)
Figure 5.3: Examples of preprocessing results. (a) and (c) are the original
images. (b) and (d) are the images preprocessed by contrast-stretching
transformation. (e) - (h) are the corresponding histograms of the images in
the first row.
find a sparse vector α = [α1;α2; ...;αm], such that x = Φα. Exploiting
non-local redundancies in an image ensures that possible fabric defects could
be successfully eliminated in the restored non-defective version of the input
image. In the rest of this section, sparse representation of fabric texture based
on learnt dictionaries is illustrated in detail.
5.3.1 Adaptive Sub-Dictionary Learning
Nowadays, the appearance of textiles changes because of the development
of fabric design. Even for uniform texture fabric, texture structure could
vary significantly across images, as shown in Fig. 5.4. With different
weaving method, the fabric textures exhibit slight differences in their structure
elements. Therefore, non-defective fabric images are divided into small
patches, which could be clustered according to their structural features. Each
cluster of patches represents a kind of fabric texture element. The objective
of sparse representation is to find a linear combination of a small number of
basic atoms to restore the signal with minimal approximation error. Thus,
effective representations of testing patches are easily to obtain over sub-
78
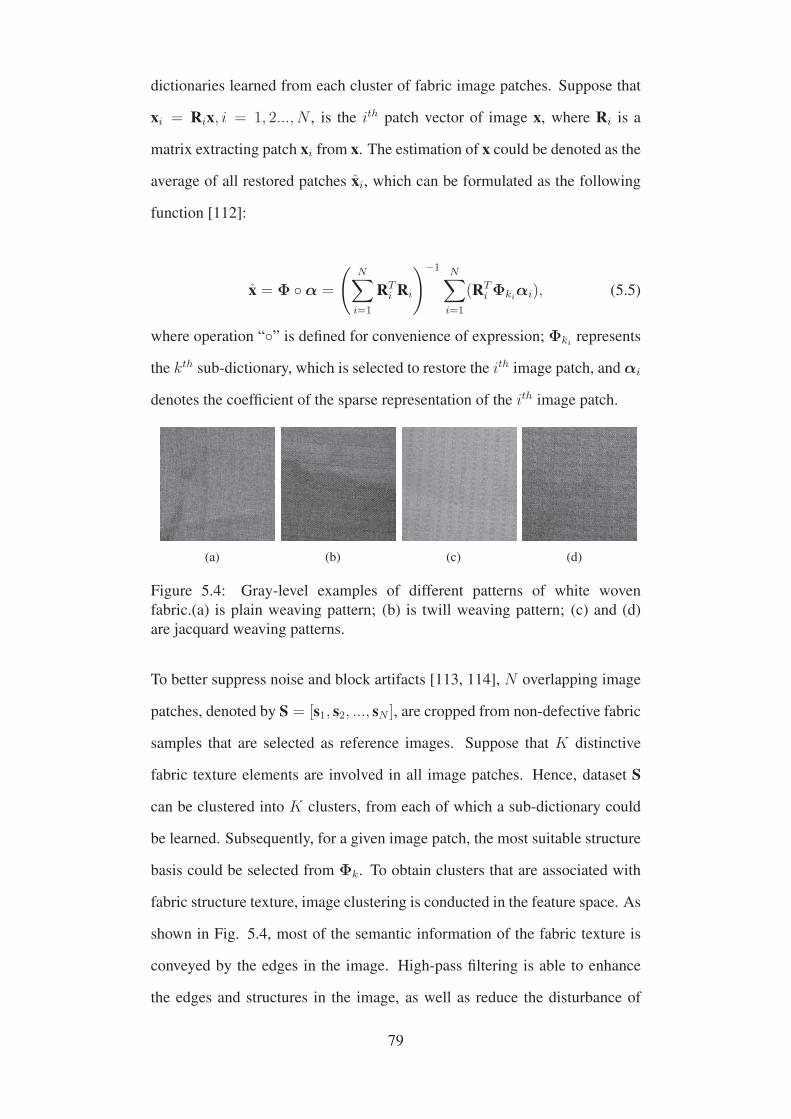
dictionaries learned from each cluster of fabric image patches. Suppose that
xi = Rix, i = 1, 2..., N , is the ith patch vector of image x, where Ri is a
matrix extracting patch xi from x. The estimation of x could be denoted as the
average of all restored patches xi, which can be formulated as the following
function [112]:
x = Φ ◦α =
(N∑i=1
RTi Ri
)−1 N∑i=1
(RTi Φkiαi), (5.5)
where operation “◦” is defined for convenience of expression; Φki represents
the kth sub-dictionary, which is selected to restore the ith image patch, and αi
denotes the coefficient of the sparse representation of the ith image patch.
(a) (b) (c) (d)
Figure 5.4: Gray-level examples of different patterns of white woven
fabric.(a) is plain weaving pattern; (b) is twill weaving pattern; (c) and (d)
are jacquard weaving patterns.
To better suppress noise and block artifacts [113, 114], N overlapping image
patches, denoted by S = [s1, s2, ..., sN ], are cropped from non-defective fabric
samples that are selected as reference images. Suppose that K distinctive
fabric texture elements are involved in all image patches. Hence, dataset S
can be clustered into K clusters, from each of which a sub-dictionary could
be learned. Subsequently, for a given image patch, the most suitable structure
basis could be selected from Φk. To obtain clusters that are associated with
fabric structure texture, image clustering is conducted in the feature space. As
shown in Fig. 5.4, most of the semantic information of the fabric texture is
conveyed by the edges in the image. High-pass filtering is able to enhance
the edges and structures in the image, as well as reduce the disturbance of
79
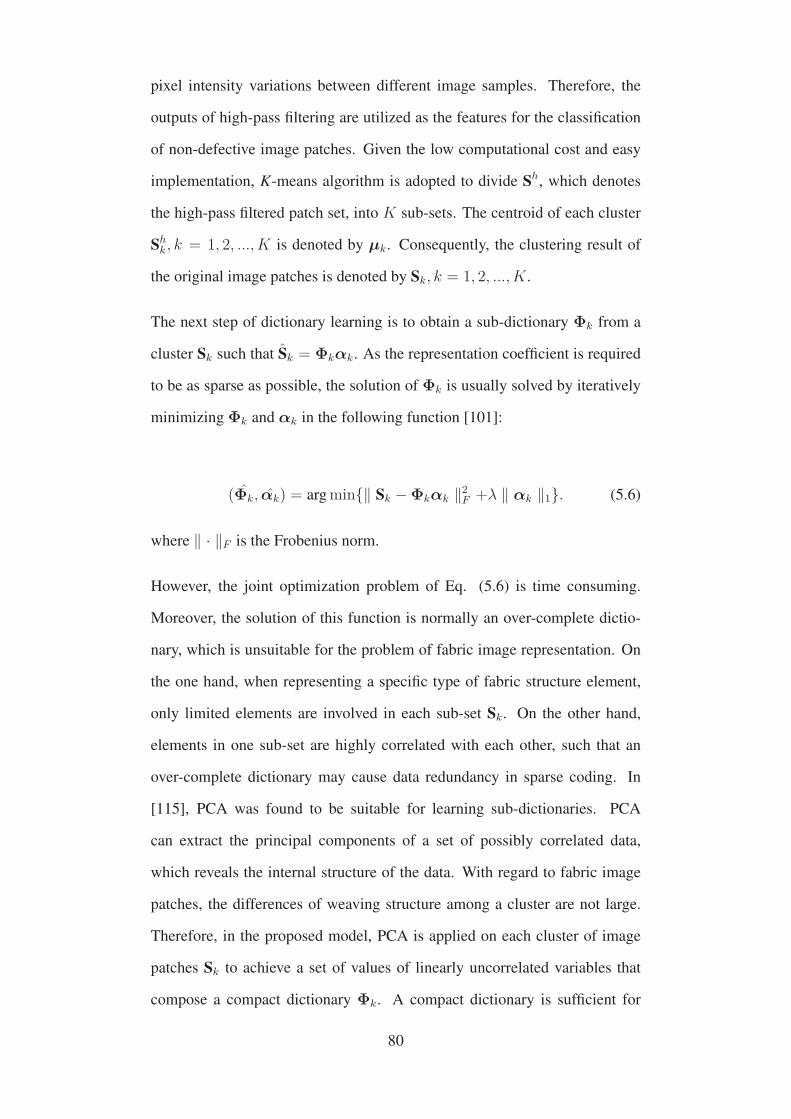
pixel intensity variations between different image samples. Therefore, the
outputs of high-pass filtering are utilized as the features for the classification
of non-defective image patches. Given the low computational cost and easy
implementation, K-means algorithm is adopted to divide Sh, which denotes
the high-pass filtered patch set, into K sub-sets. The centroid of each cluster
Shk , k = 1, 2, ..., K is denoted by μk. Consequently, the clustering result of
the original image patches is denoted by Sk, k = 1, 2, ..., K.
The next step of dictionary learning is to obtain a sub-dictionary Φk from a
cluster Sk such that Sk = Φkαk. As the representation coefficient is required
to be as sparse as possible, the solution of Φk is usually solved by iteratively
minimizing Φk and αk in the following function [101]:
(Φk, αk) = argmin{‖ Sk −Φkαk ‖2F +λ ‖ αk ‖1}. (5.6)
where ‖ · ‖F is the Frobenius norm.
However, the joint optimization problem of Eq. (5.6) is time consuming.
Moreover, the solution of this function is normally an over-complete dictio-
nary, which is unsuitable for the problem of fabric image representation. On
the one hand, when representing a specific type of fabric structure element,
only limited elements are involved in each sub-set Sk. On the other hand,
elements in one sub-set are highly correlated with each other, such that an
over-complete dictionary may cause data redundancy in sparse coding. In
[115], PCA was found to be suitable for learning sub-dictionaries. PCA
can extract the principal components of a set of possibly correlated data,
which reveals the internal structure of the data. With regard to fabric image
patches, the differences of weaving structure among a cluster are not large.
Therefore, in the proposed model, PCA is applied on each cluster of image
patches Sk to achieve a set of values of linearly uncorrelated variables that
compose a compact dictionary Φk. A compact dictionary is sufficient for
80
sparse representation of an image patch and reduces the computational cost of
the model. Fig. 5.5 shows examples of sub-dictionary learnt from the training
dataset. The centroids of two clusters are shown in the first column. The other
columns show the first several atoms in the corresponding sub-dictionaries.
(a) (b) (c) (d) (e) (f) (g) (h) (i)
(j) (k) (l) (m) (n) (o) (p) (q) (r)
Figure 5.5: Examples of sub-dictionaries. (a) and (j) demonstrate the
centroids of two sub-dictionaries after K-means clustering. (b) - (i) show
the nearest eight atoms to the centroid of the first cluster. (k) - (r) show the
nearest eight atoms to the centroid of the second cluster.
All sub-dictionaries together could be deemed as an over-complete dictionary
that characterizes all the local fabric structures. Thus, instead of a universal
and over-complete dictionary, a sub-dictionary is beneficial for avoiding the
visual artifacts and the considerable calculation generated by sparse coding
over a redundant dictionary.
The sub-dictionaries learned from clustered image patches adaptively ex-
ploited the local structure information of images. Thus, for a given local
image patch, the assignment of appropriate sub-dictionary could be adaptively
accomplished in the real-time model. Owing to the characteristic of fine
structure of fabric texture, the average noise level of fabric images is relatively
low. Therefore, the cluster attribute of a given image patch yi is directly
decided by the distance between its high-pass filtering output yhi and the
centroid μk of every cluster. The dictionary for image patch xi is selected
by the following function:
ki = argmink
‖ yhi − μk ‖2, (5.7)
81
where ki represents the sequence number of sub-dictionary for the ith image
patch.
5.3.2 Sparse Representation Model based on Nonlocal Sim-
ilarities
Unlike uniform distributed and Gaussian distributed noise, the distribution
of fabric defects in the image does not follow any specific rules or patterns.
Fabric defects usually occupy only a small proportion of area in the image,
which could be treated as outliers in the image. Moreover, the conventional
regression model only performs well in removing Gaussian distributed
noise. This feature makes such singular point noise removal is difficult by
approximating the high quality image x from the observed image y barely
on the basis of the l1 norm constraint. As discussed in [116], over a fixed
dictionary, errors may occur between sparse codes of x and y, which are
defined as sparse coding noise (SCN) vα = αy − αx, where αx = argminα
‖α ‖0, s.t. ‖ x−Φα ‖2≤ ε. Obviously, restoration result could be significantly
improved if suppressing the SCN is introduced into the sparse representation
model. Therefore, the image restoration will be based on the non-locally
centralized sparse representation model [116]:
αy = argminα
{‖ y −Φ ◦α ‖22 +λ∑i
‖ αi ‖1
+γ∑i
‖ αi − βi ‖1},(5.8)
where λ denotes the regularization parameter that controls the balance
between the sparse approximation of x and the sparsity of α; and βi is an
estimation of αxi ; γ is the regularization parameter.
82
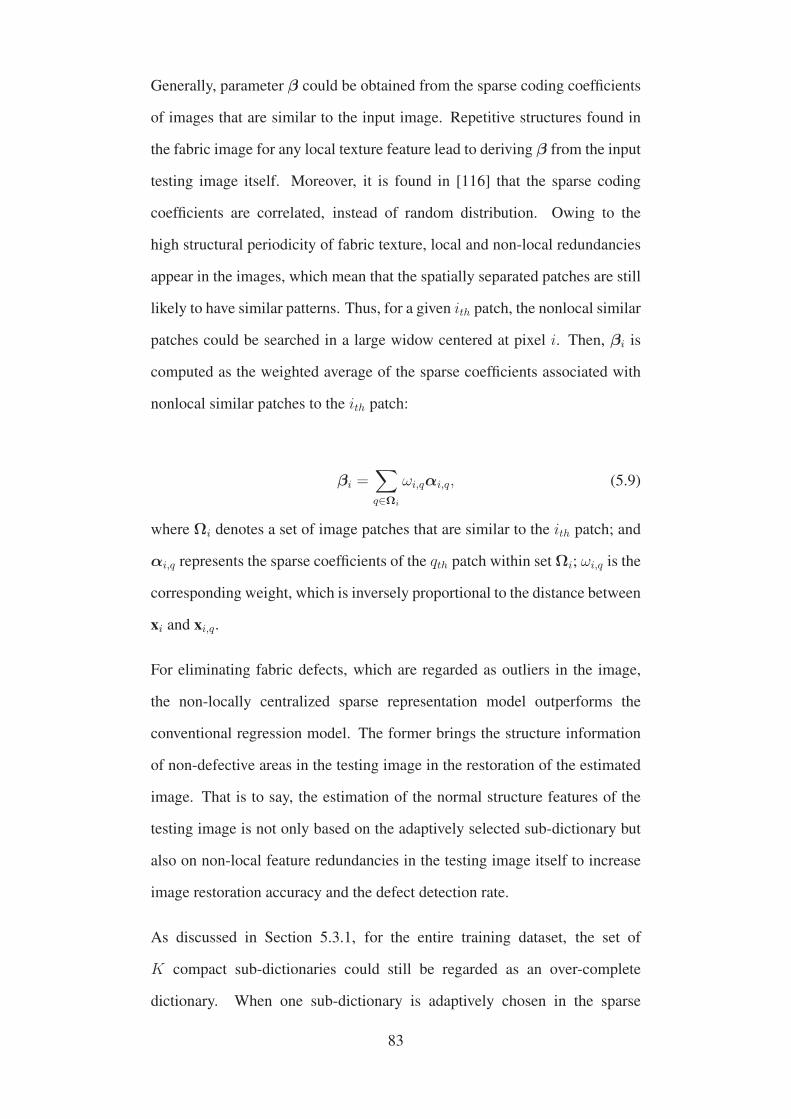
Generally, parameter β could be obtained from the sparse coding coefficients
of images that are similar to the input image. Repetitive structures found in
the fabric image for any local texture feature lead to deriving β from the input
testing image itself. Moreover, it is found in [116] that the sparse coding
coefficients are correlated, instead of random distribution. Owing to the
high structural periodicity of fabric texture, local and non-local redundancies
appear in the images, which mean that the spatially separated patches are still
likely to have similar patterns. Thus, for a given ith patch, the nonlocal similar
patches could be searched in a large widow centered at pixel i. Then, βi is
computed as the weighted average of the sparse coefficients associated with
nonlocal similar patches to the ith patch:
βi =∑q∈Ωi
ωi,qαi,q, (5.9)
where Ωi denotes a set of image patches that are similar to the ith patch; and
αi,q represents the sparse coefficients of the qth patch within set Ωi; ωi,q is the
corresponding weight, which is inversely proportional to the distance between
xi and xi,q.
For eliminating fabric defects, which are regarded as outliers in the image,
the non-locally centralized sparse representation model outperforms the
conventional regression model. The former brings the structure information
of non-defective areas in the testing image in the restoration of the estimated
image. That is to say, the estimation of the normal structure features of the
testing image is not only based on the adaptively selected sub-dictionary but
also on non-local feature redundancies in the testing image itself to increase
image restoration accuracy and the defect detection rate.
As discussed in Section 5.3.1, for the entire training dataset, the set of
K compact sub-dictionaries could still be regarded as an over-complete
dictionary. When one sub-dictionary is adaptively chosen in the sparse
83
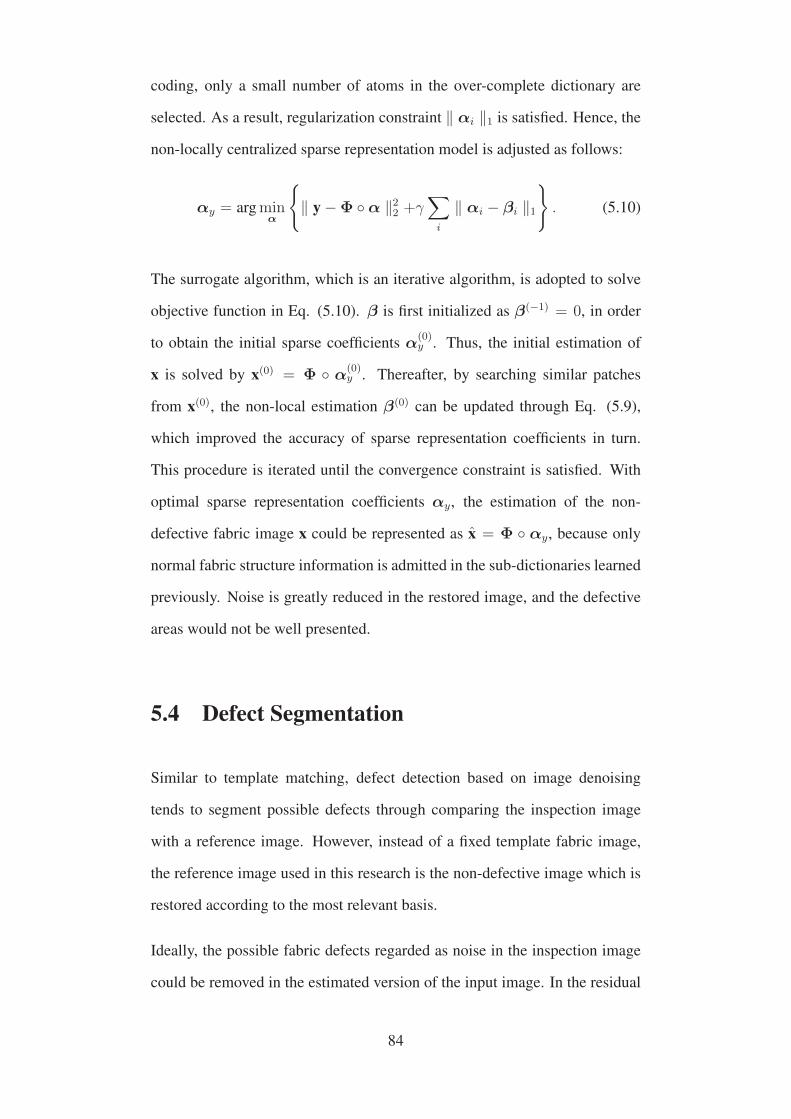
coding, only a small number of atoms in the over-complete dictionary are
selected. As a result, regularization constraint ‖ αi ‖1 is satisfied. Hence, the
non-locally centralized sparse representation model is adjusted as follows:
αy = argminα
{‖ y −Φ ◦α ‖22 +γ
∑i
‖ αi − βi ‖1}. (5.10)
The surrogate algorithm, which is an iterative algorithm, is adopted to solve
objective function in Eq. (5.10). β is first initialized as β(−1) = 0, in order
to obtain the initial sparse coefficients α(0)y . Thus, the initial estimation of
x is solved by x(0) = Φ ◦ α(0)y . Thereafter, by searching similar patches
from x(0), the non-local estimation β(0) can be updated through Eq. (5.9),
which improved the accuracy of sparse representation coefficients in turn.
This procedure is iterated until the convergence constraint is satisfied. With
optimal sparse representation coefficients αy, the estimation of the non-
defective fabric image x could be represented as x = Φ ◦ αy, because only
normal fabric structure information is admitted in the sub-dictionaries learned
previously. Noise is greatly reduced in the restored image, and the defective
areas would not be well presented.
5.4 Defect Segmentation
Similar to template matching, defect detection based on image denoising
tends to segment possible defects through comparing the inspection image
with a reference image. However, instead of a fixed template fabric image,
the reference image used in this research is the non-defective image which is
restored according to the most relevant basis.
Ideally, the possible fabric defects regarded as noise in the inspection image
could be removed in the estimated version of the input image. In the residual
84

image of the inspection image and its estimation, the gray-level intensity of
the defective area will be greater than that of the background area. Thus,
a simple thresholding operation would distinguish defective pixels from the
background in the residual image after image restoration.
The thresholding limits are derived from the reference residual image of a
standard non-defective sample and its estimation which is restored by the
procedures in Section 5.3. Instead of setting a fixed parameter, thresholding
limits could be adaptively selected for each fabric type to achieve good
detection results as much as possible. Meanwhile, the adaptively selected
parameter is beneficial to reduce false alarm rate because the noise and blurry
effects caused by dust will weaken in the restored image. Suppose that the
gray-level intensity of the reference residual image is denoted as R(x, y).
Then upper and lower thresholding limits are:
ψupper = maxx,y∈W
|R(x, y)|, (5.11)
ψlower = minx,y∈W
|R(x, y)|, (5.12)
where W is a window obtained by removing 10 pixels from each side of the
image R(x, y) to avoid distortion effects caused by the borders of the image.
Hence, the binary feature image B(x, y) could be obtained by:
B(x, y) =
⎧⎪⎨⎪⎩
1, if G(x, y) > ψupper or G(x, y) < ψlower,
0, otherwise,(5.13)
where G(x, y) denotes the gray-level intensities of the testing residual image.
85

5.5 Experiment Results and Discussion
The performance of the proposed fabric inspection model is validated through
two databases. The first one is TILDA, which is created by a workshop
on texture analysis of Deutsche Forschungsgemeinschaft Germany [74].
Samples in this database are gray-level images. Both structural and tonal
defects are included, such as holes, chafed yarn, flying yarn and dye streak.
The second one is a database created by the author, which consists of 102
non-defective and 102 defective fabric samples acquired from an apparel
factory in Mainland China and scanned from the fabric defect handbook
[25]. The most common types of defects that always appear in the textile
and apparel industries are all involved in these fabric samples, such as thick
yarn, missing yarn and rope mark. First, the proposed detection model is
applied on fabric databases to demonstrate its effectiveness. Then, with the
same fabric samples, the performance of the proposed defect detection model
is compared with the other three representative detection models, namely,
detection model based on Gabor filter bank [12], Fourier and wavelet-based
model [11], and adaptive sparse representation-based model [16]. Source
codes of these approaches are obtained from the authors and programmed
in this research.
5.5.1 Experimental Setup
Four kinds of woven fabric with a relatively coarse texture are included in
the TILDA database. Within each fabric type, four classes of defect were
defined. For each of the above classes, 50 images (768 × 512 pixels) were
acquired through relocation and rotation of the textile samples. In our own
database, images of the real fabric samples were captured at 1050 × 1050
pixels by a digital camera Canon 600D. In the experiments, the image
86

processing toolbox of MATLAB prototyping environment was adopted to
program all the detection models. Similar to the experiments in Chapter 4,
the binary feature images, which denote the detection results, were visually
assessed by experienced operators. Furthermore, the performance of defect
detection models was evaluated according to precision, sensitivity, specificity
and accuracy, which are clearly defined in Section 4.4.1. The rate of correct
detection alarm is indicated by precision. Sensitivity indicates the detection
rate of all defective samples. The rate of correct classification of non-defective
samples is given in terms of specificity. Accuracy manifests the rate of overall
correct classification of all testing samples.
5.5.2 Performance Evaluation of the Proposed Defect De-
tection Model
The inspection of twill fabric was conducted in accordance with the proce-
dures shown in Fig. 5.2. Several representative detection results are shown
in Figs. 5.6 - 5.9. For each fabric type, a set of non-defective image samples
were collected as the training data in the dictionary learning. The binary result
images revealed that defects of various shapes, sizes, and positions could
be successfully identified by the proposed detection model. Tables 5.1 and
5.2 summarize the overall experimental results by using the proposed defect
detection model on TILDA and our own database, respectively.
Table 5.1: Performance of the proposed detection model on TILDA
Precision Sensitivity Specificity AccuracyPerformance 92.0% 97.8% 91.5% 94.6%
Table 5.2: Performance of the proposed detection model on our own database
Precision Sensitivity Specificity AccuracyPerformance 92.5% 96.1% 92.2% 94.1%
Fig. 5.6 shows the detection results of four types of fabric in TILDA. For
87
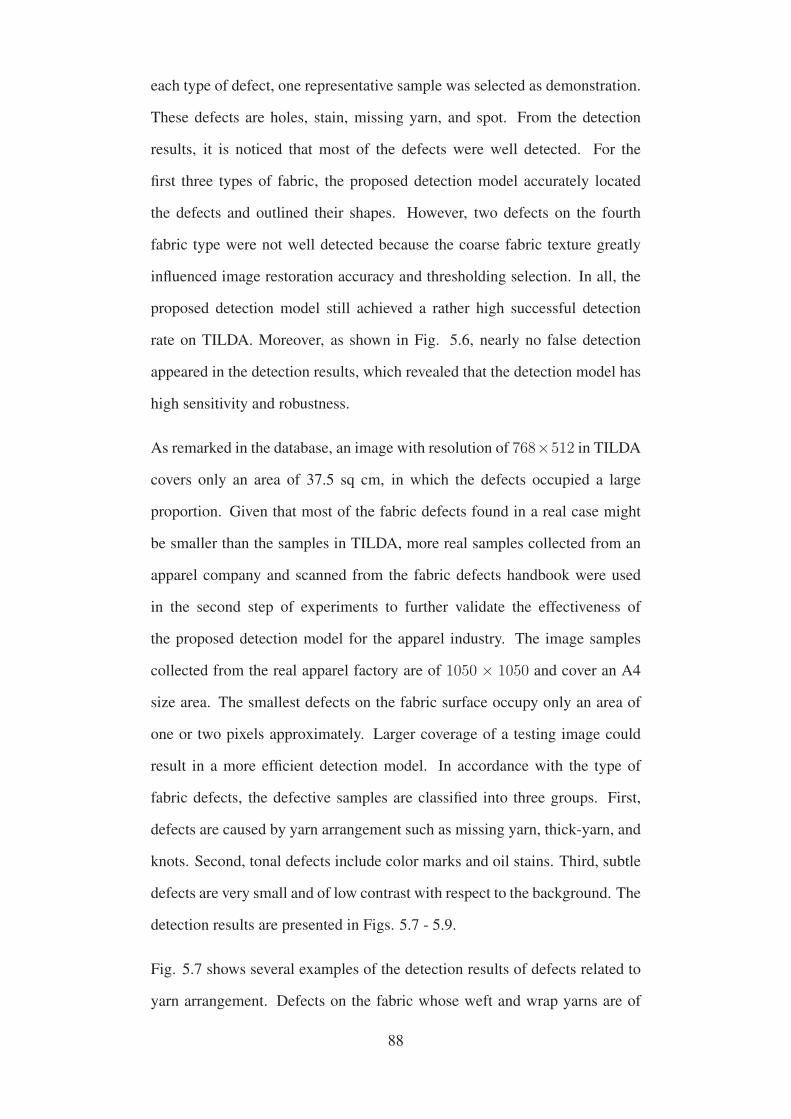
each type of defect, one representative sample was selected as demonstration.
These defects are holes, stain, missing yarn, and spot. From the detection
results, it is noticed that most of the defects were well detected. For the
first three types of fabric, the proposed detection model accurately located
the defects and outlined their shapes. However, two defects on the fourth
fabric type were not well detected because the coarse fabric texture greatly
influenced image restoration accuracy and thresholding selection. In all, the
proposed detection model still achieved a rather high successful detection
rate on TILDA. Moreover, as shown in Fig. 5.6, nearly no false detection
appeared in the detection results, which revealed that the detection model has
high sensitivity and robustness.
As remarked in the database, an image with resolution of 768×512 in TILDA
covers only an area of 37.5 sq cm, in which the defects occupied a large
proportion. Given that most of the fabric defects found in a real case might
be smaller than the samples in TILDA, more real samples collected from an
apparel company and scanned from the fabric defects handbook were used
in the second step of experiments to further validate the effectiveness of
the proposed detection model for the apparel industry. The image samples
collected from the real apparel factory are of 1050 × 1050 and cover an A4
size area. The smallest defects on the fabric surface occupy only an area of
one or two pixels approximately. Larger coverage of a testing image could
result in a more efficient detection model. In accordance with the type of
fabric defects, the defective samples are classified into three groups. First,
defects are caused by yarn arrangement such as missing yarn, thick-yarn, and
knots. Second, tonal defects include color marks and oil stains. Third, subtle
defects are very small and of low contrast with respect to the background. The
detection results are presented in Figs. 5.7 - 5.9.
Fig. 5.7 shows several examples of the detection results of defects related to
yarn arrangement. Defects on the fabric whose weft and wrap yarns are of
88

Figure 5.6: Detection results of TILDA database.
89
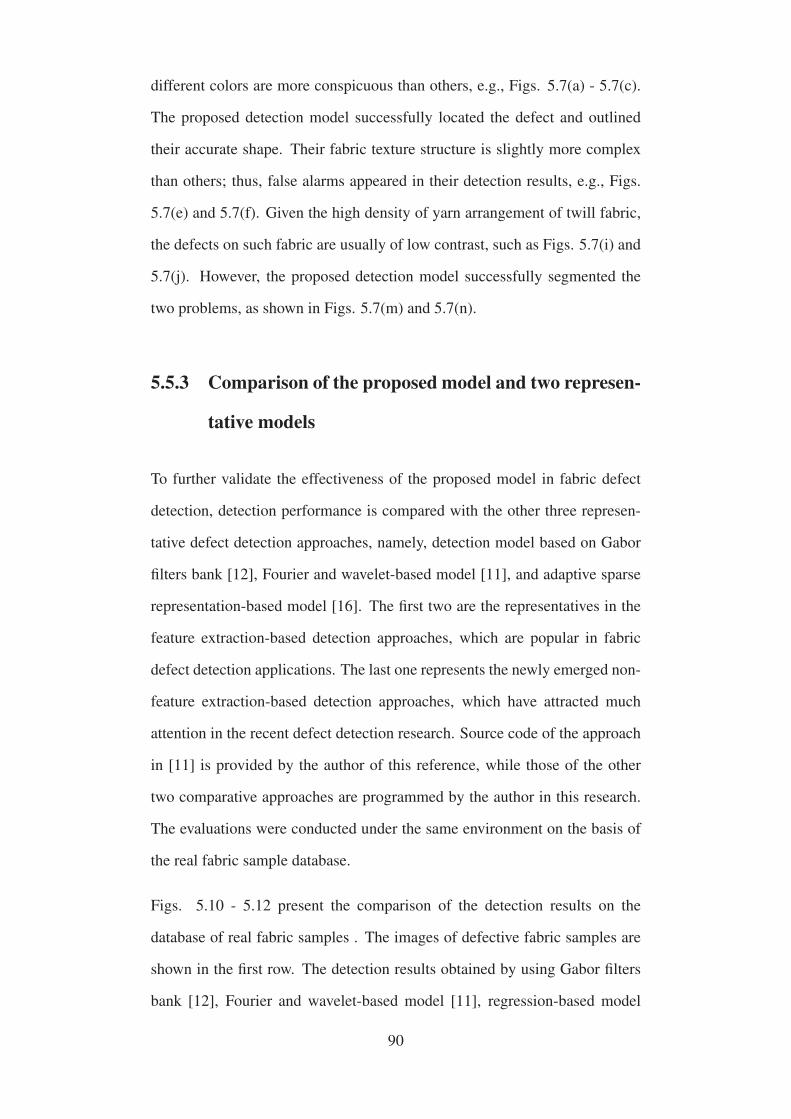
different colors are more conspicuous than others, e.g., Figs. 5.7(a) - 5.7(c).
The proposed detection model successfully located the defect and outlined
their accurate shape. Their fabric texture structure is slightly more complex
than others; thus, false alarms appeared in their detection results, e.g., Figs.
5.7(e) and 5.7(f). Given the high density of yarn arrangement of twill fabric,
the defects on such fabric are usually of low contrast, such as Figs. 5.7(i) and
5.7(j). However, the proposed detection model successfully segmented the
two problems, as shown in Figs. 5.7(m) and 5.7(n).
5.5.3 Comparison of the proposed model and two represen-
tative models
To further validate the effectiveness of the proposed model in fabric defect
detection, detection performance is compared with the other three represen-
tative defect detection approaches, namely, detection model based on Gabor
filters bank [12], Fourier and wavelet-based model [11], and adaptive sparse
representation-based model [16]. The first two are the representatives in the
feature extraction-based detection approaches, which are popular in fabric
defect detection applications. The last one represents the newly emerged non-
feature extraction-based detection approaches, which have attracted much
attention in the recent defect detection research. Source code of the approach
in [11] is provided by the author of this reference, while those of the other
two comparative approaches are programmed by the author in this research.
The evaluations were conducted under the same environment on the basis of
the real fabric sample database.
Figs. 5.10 - 5.12 present the comparison of the detection results on the
database of real fabric samples . The images of defective fabric samples are
shown in the first row. The detection results obtained by using Gabor filters
bank [12], Fourier and wavelet-based model [11], regression-based model
90
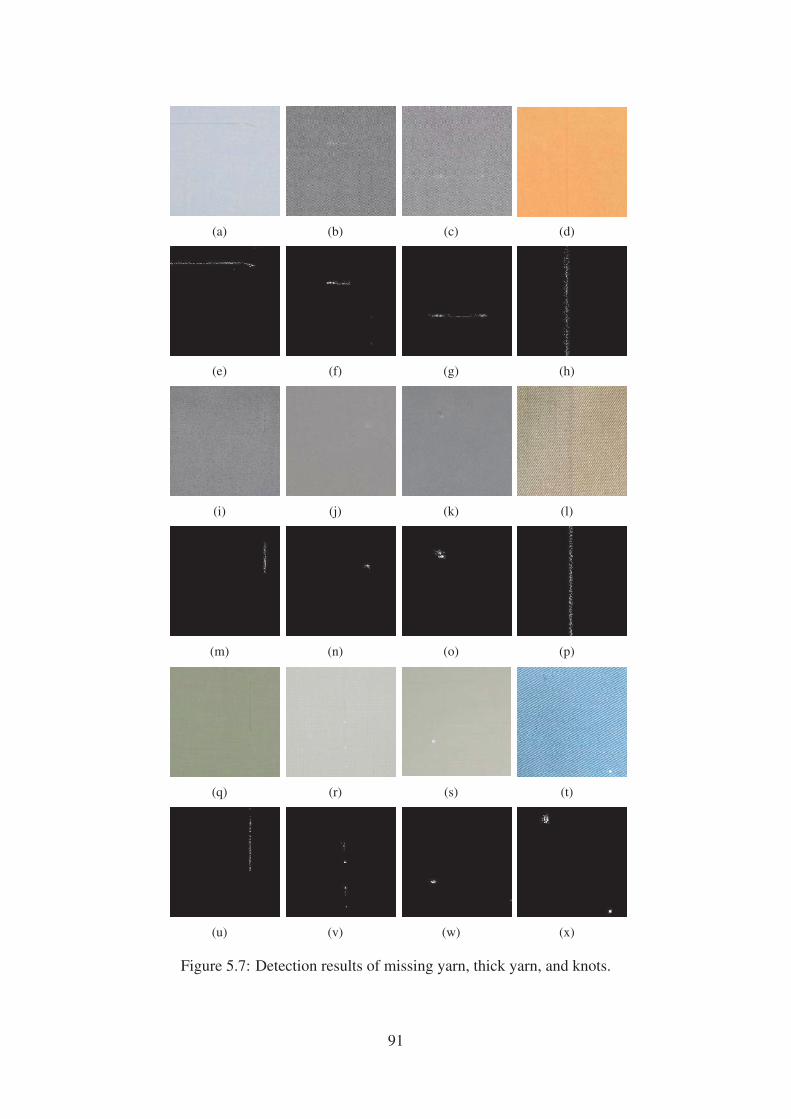
(a) (b) (c) (d)
(e) (f) (g) (h)
(i) (j) (k) (l)
(m) (n) (o) (p)
(q) (r) (s) (t)
(u) (v) (w) (x)
Figure 5.7: Detection results of missing yarn, thick yarn, and knots.
91

(a) (b) (c) (d)
(e) (f) (g) (h)
Figure 5.8: Detection results of stain defects.
(a) (b) (c) (d)
(e) (f) (g) (h)
Figure 5.9: Detection results of tiny defects.
92

[16], and the proposed detection model are shown in the second, third, fourth
and last rows, respectively. It is worth mentioning that the proposed detection
model distinguished all defect samples, and generally outperformed the other
three methods.
The detection model proposed in [12] and [11] mainly depends on the feature
extraction of defects. Hence, the sensitivity of the detection model would
not be satisfied when the boundaries of defects are blurry or the defects are
confused with normal fabric texture. For example, in Figs. 5.10(d) and
5.11(a), although the stain defects were successfully detected by all detection
models, structural defects were well located only by the proposed model.
Compared with the conventional regression-based model in [16], non-local
similarities of the fabric structure information were utilized to reduce noise
in the restored image in the proposed model, which in turn increased the
detection rate. Therefore, even for small and subtle defects, the proposed
detection model could achieve good performance, as shown in Figs. 5.10(q),
5.11(s), and 5.11(t).
The comparative detection results on several tiny defects are demonstrated in
Fig. 5.12. It is noticed that the three representative detection models failed to
detect most of the defects when the defects were hard to visually distinguish.
Moreover, uneven illumination in Figs. 5.12(b) and 5.12(c) resulted in lots
of false alarms in the detection results with the use of the detection model in
[16]. However, the utilization of features of non-local image patches makes
the proposed defect detection model immune to uneven illumination. Table
5.3 summarizes the performance comparison of the four detection models,
which revealed that the detection rate of the proposed detection model is high
than that of the other three models, and that a good balance between defect
detection rate and false alarm rate is ensured.
93
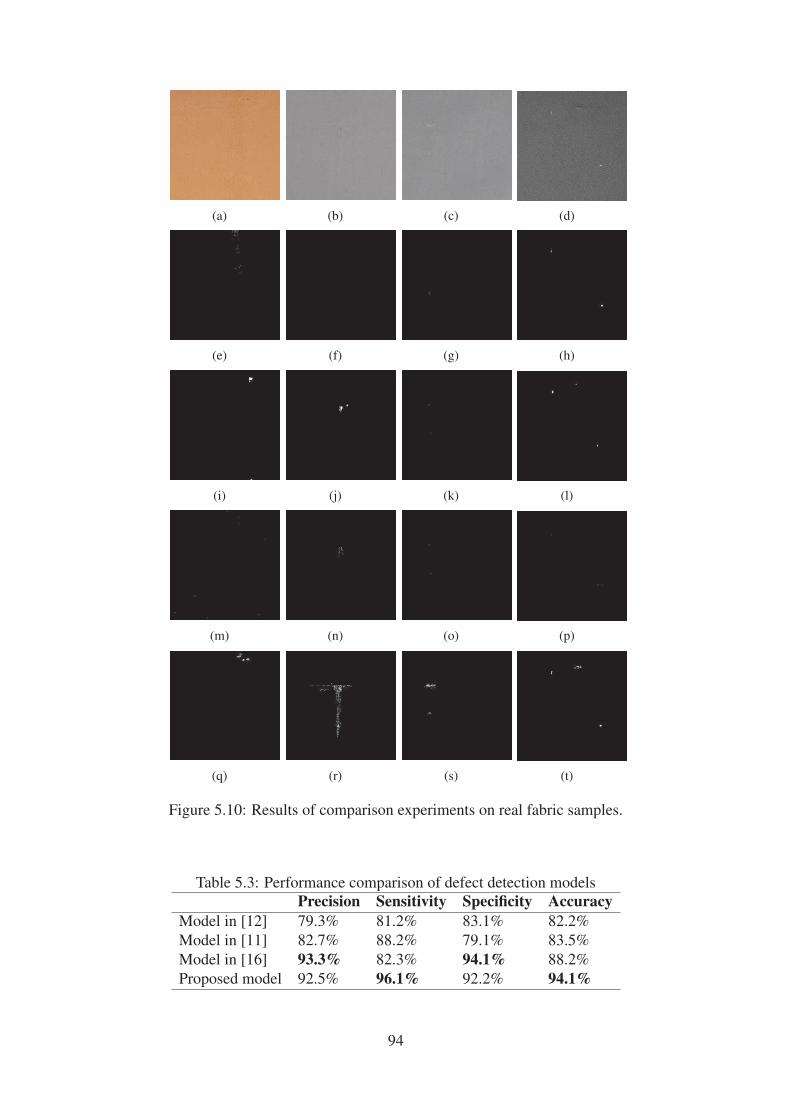
(a) (b) (c) (d)
(e) (f) (g) (h)
(i) (j) (k) (l)
(m) (n) (o) (p)
(q) (r) (s) (t)
Figure 5.10: Results of comparison experiments on real fabric samples.
Table 5.3: Performance comparison of defect detection models
Precision Sensitivity Specificity AccuracyModel in [12] 79.3% 81.2% 83.1% 82.2%
Model in [11] 82.7% 88.2% 79.1% 83.5%
Model in [16] 93.3% 82.3% 94.1% 88.2%
Proposed model 92.5% 96.1% 92.2% 94.1%
94
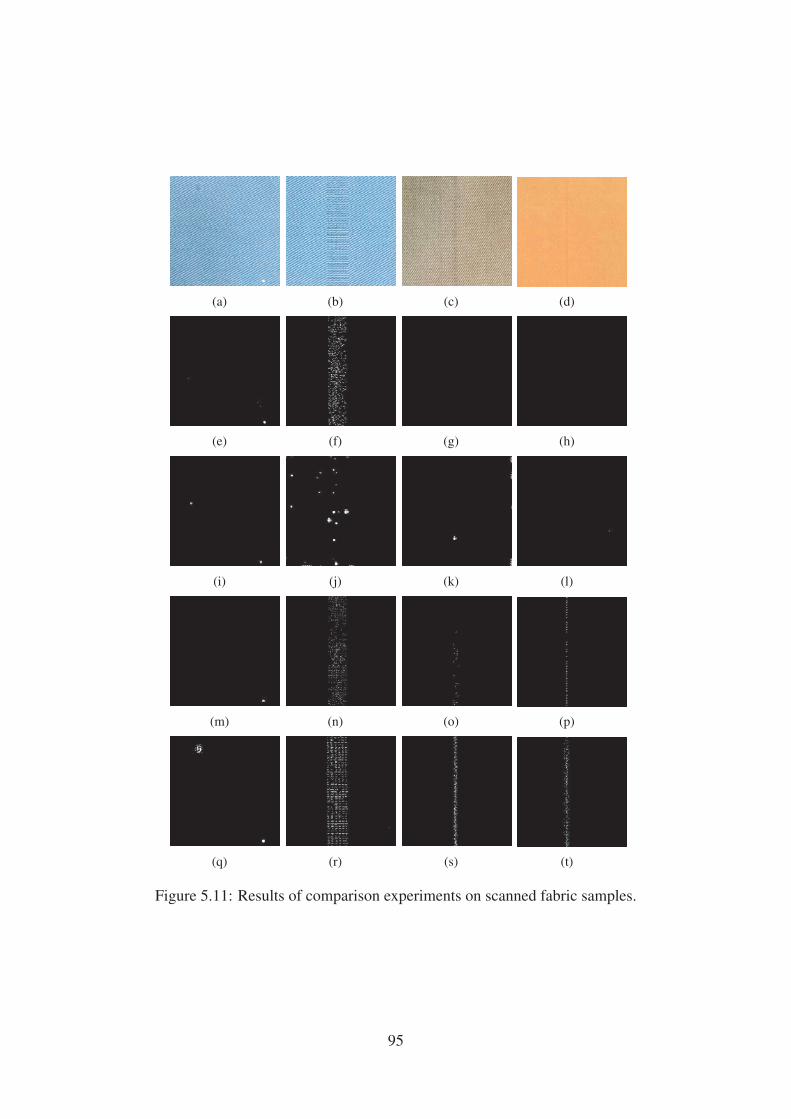
(a) (b) (c) (d)
(e) (f) (g) (h)
(i) (j) (k) (l)
(m) (n) (o) (p)
(q) (r) (s) (t)
Figure 5.11: Results of comparison experiments on scanned fabric samples.
95
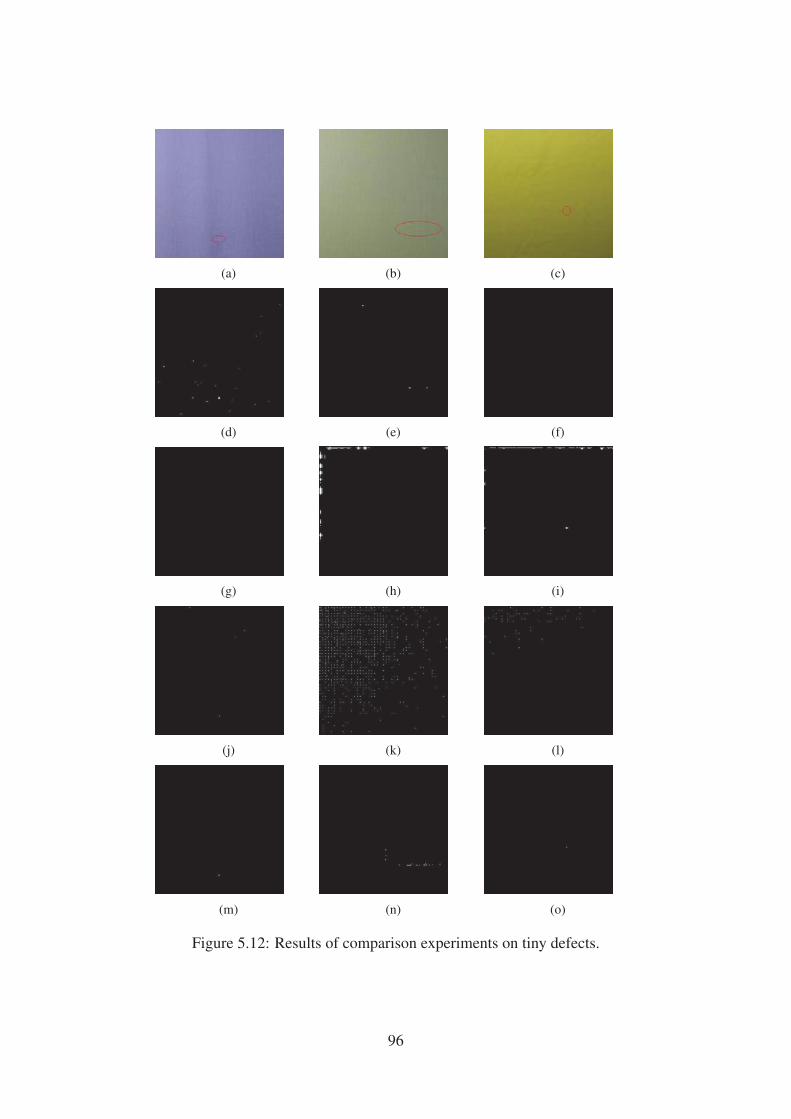
(a) (b) (c)
(d) (e) (f)
(g) (h) (i)
(j) (k) (l)
(m) (n) (o)
Figure 5.12: Results of comparison experiments on tiny defects.
96
5.6 Summary
In this chapter, a non-locally centralized sparse representation-based detection
model was developed to solve the intelligent inspection problem of twill
fabric. The proposed model is mainly based on two modules, which are
dictionary learning (offline) and defect detection through image restoration
(real-time). First, the compact sub-dictionaries learned from non-defective
samples could be adaptively selected in sparse coding to provide the most
relaxant fabric structure information for image restoration. Then, by adopting
the non-locally centralized sparse representation model, non-local similarities
of the fabric structure information are exploited to improve the image
restoration effect, thereby increasing the defect detection rate. This method
is more effective in detecting small defects because image restoration is a
pixel-based operation, which is sensitive to small aberrations.
Extensive experiments were conducted to validate the performance of the
proposed model. The TILDA database and real fabric samples were used to
evaluate the performance of the proposed detection model. The effectiveness
of the proposed model on various types of defects was verified by observations
of the amount of detection results. Further experiments that compared the
proposed model with three representative detection models manifest that the
proposed detection model had a higher successful detection rate and lower
false alarm rate than the other models.
97

Chapter 6
A Hybrid Defect Detection Model
for Striped Fabric Inspection
Different from plain and twill fabric in solid color, the image of striped fabric
consists of basic repeat unit and weaving texture, in which there lies two
groups of defects: pattern variants and common fabric defects. Therefore,
a hybrid defect detection model is developed to detect both types of defects
successfully.
6.1 The Framework of Twill Fabric Inspection
Model
Fig. 6.1 shows a few image samples of non-defective and defective striped
fabric. As discussed in Chapter 1, besides the common fabric defects,
variations of repeat pattern, which are regarded as pattern defects, greatly
impair fabric quality as well. For example, Fig. 6.1(c) shows a skewed stripe
pattern that is a typical type of pattern defect normally caused by restarting
a weaving machine. The variance of striped fabric is significantly larger
98
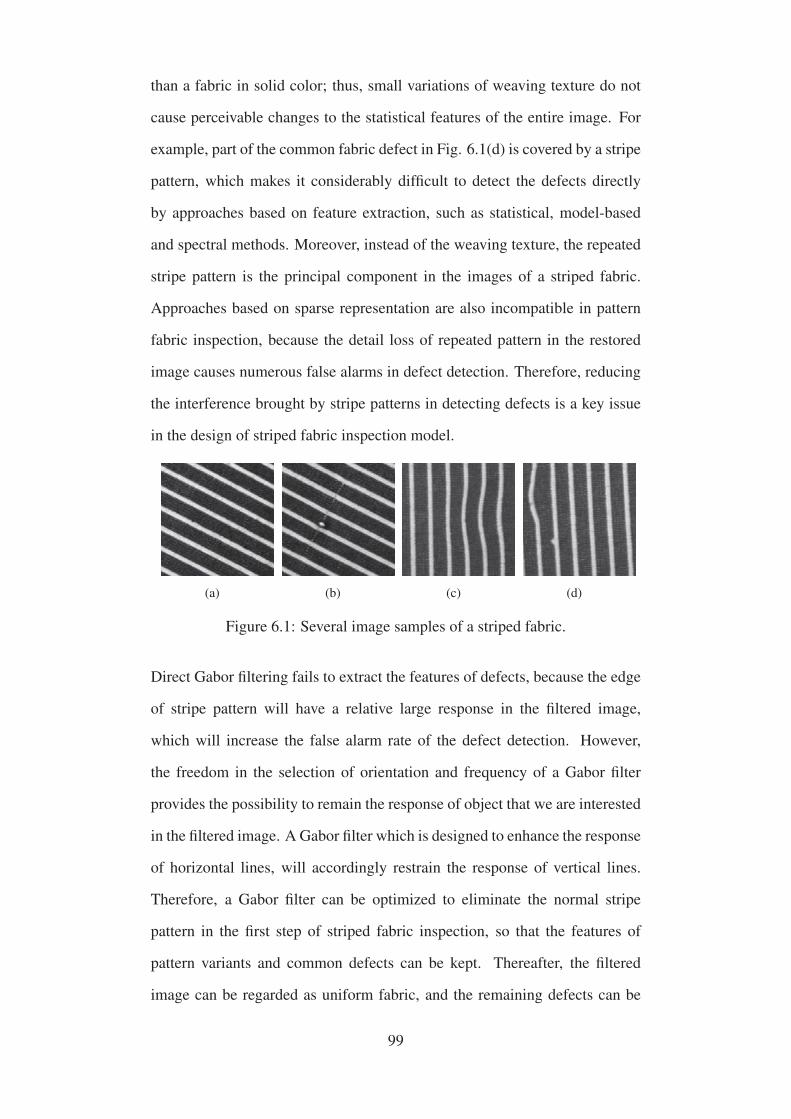
than a fabric in solid color; thus, small variations of weaving texture do not
cause perceivable changes to the statistical features of the entire image. For
example, part of the common fabric defect in Fig. 6.1(d) is covered by a stripe
pattern, which makes it considerably difficult to detect the defects directly
by approaches based on feature extraction, such as statistical, model-based
and spectral methods. Moreover, instead of the weaving texture, the repeated
stripe pattern is the principal component in the images of a striped fabric.
Approaches based on sparse representation are also incompatible in pattern
fabric inspection, because the detail loss of repeated pattern in the restored
image causes numerous false alarms in defect detection. Therefore, reducing
the interference brought by stripe patterns in detecting defects is a key issue
in the design of striped fabric inspection model.
(a) (b) (c) (d)
Figure 6.1: Several image samples of a striped fabric.
Direct Gabor filtering fails to extract the features of defects, because the edge
of stripe pattern will have a relative large response in the filtered image,
which will increase the false alarm rate of the defect detection. However,
the freedom in the selection of orientation and frequency of a Gabor filter
provides the possibility to remain the response of object that we are interested
in the filtered image. A Gabor filter which is designed to enhance the response
of horizontal lines, will accordingly restrain the response of vertical lines.
Therefore, a Gabor filter can be optimized to eliminate the normal stripe
pattern in the first step of striped fabric inspection, so that the features of
pattern variants and common defects can be kept. Thereafter, the filtered
image can be regarded as uniform fabric, and the remaining defects can be
99
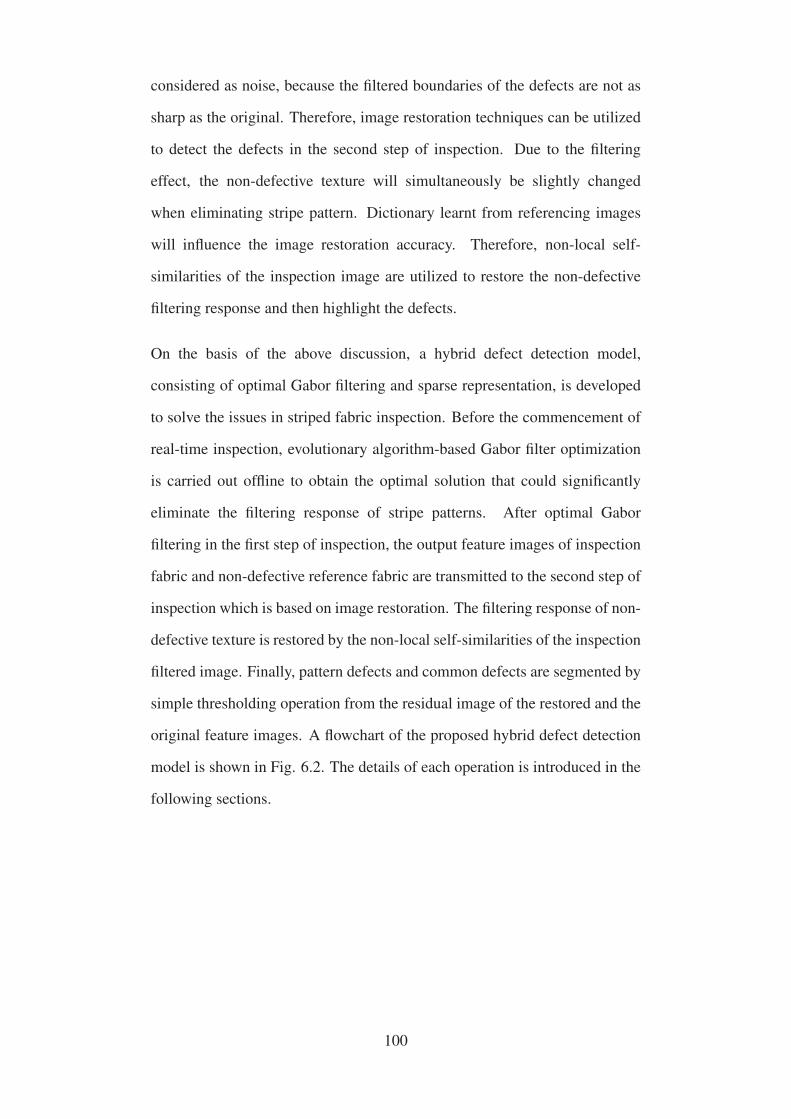
considered as noise, because the filtered boundaries of the defects are not as
sharp as the original. Therefore, image restoration techniques can be utilized
to detect the defects in the second step of inspection. Due to the filtering
effect, the non-defective texture will simultaneously be slightly changed
when eliminating stripe pattern. Dictionary learnt from referencing images
will influence the image restoration accuracy. Therefore, non-local self-
similarities of the inspection image are utilized to restore the non-defective
filtering response and then highlight the defects.
On the basis of the above discussion, a hybrid defect detection model,
consisting of optimal Gabor filtering and sparse representation, is developed
to solve the issues in striped fabric inspection. Before the commencement of
real-time inspection, evolutionary algorithm-based Gabor filter optimization
is carried out offline to obtain the optimal solution that could significantly
eliminate the filtering response of stripe patterns. After optimal Gabor
filtering in the first step of inspection, the output feature images of inspection
fabric and non-defective reference fabric are transmitted to the second step of
inspection which is based on image restoration. The filtering response of non-
defective texture is restored by the non-local self-similarities of the inspection
filtered image. Finally, pattern defects and common defects are segmented by
simple thresholding operation from the residual image of the restored and the
original feature images. A flowchart of the proposed hybrid defect detection
model is shown in Fig. 6.2. The details of each operation is introduced in the
following sections.
100
Figure 6.2: Flowchart of the striped fabric inspection process.
101
6.2 Step One: Optimal Gabor Filtering based on
CoDE
Fig. 6.3 shows the corresponding feature images of a defective striped
fabric sample filtered respectively by two optimal Gabor filters formulated
by sinusoidal function in different orientations. As mentioned in Chapter
3, imaginary part of Gabor filters which are formulated with sinusoidal
function perform well in detecting edges that are in the same direction as
them [66]. The response of objects in perpendicular direction are reduced
simultaneously; thus, a Gabor filter bank that essentially covers the frequency
domain is effective in detecting defects on a smooth surface (for example,
plain fabric) [12]. Therefore, the Gabor filter (formulated as Eq. (3.6)) is
optimized perpendicularly to the stripe to eliminate the structure of repeated
pattern. Only the samples of non-defective striped fabric are utilized as the
reference images in the Gabor filter optimization.
Fig. 6.3 shows that the prominent feature of the original striped fabric image
is its salient gradient. Based on Figs. 6.3(b) and 6.3(e), the edge structure of
stripe is enhanced in the feature image by a synclastic Gabor filter, and most of
the structural information of defects are lost. Conversely, the edge structure
is significantly eliminated in the feature image filtered by a perpendicular
Gabor filter, and the defects become considerable clearer (See Figs. 6.3(c)
and 6.3(f)). The corresponding histograms suggest that an image has more
pixels under high gray-level intensities when the stripe pattern is more salient.
Thus, minimizing the mathematical expectation of the histogram of the edge
image extracted from the filtered feature image by Sobel mask should be the
primary objective in the Gabor filter optimization to reduce the disturbance
caused by the stripe pattern. Suppose that the feature image F is of M × N
pixels with 8-bit gray levels. The objective S can be formulated as
102

(a) (b) (c)
(d) (e) (f)
0 0.2 0.4 0.6 0.8 1Original Sobel Histogram
0
0.005
0.01
0.015
0.02
0.025
0.03
0.035
Num
ber o
f pix
els
(g)
0 0.2 0.4 0.6 0.8 1Original Histogram
0
0.005
0.01
0.015
0.02
0.025
0.03
Num
ber o
f pix
els
(h)
0 0.2 0.4 0.6 0.8 1Original Histogram
0
0.01
0.02
0.03
0.04
0.05
0.06
0.07
Num
ber o
f pix
els
(i)
Figure 6.3: Comparison of Gabor filtering result: 6.3(a) is the original
defective image; 6.3(b) is the filtering result through a synclastic Gabor filter;
6.3(c) is the filtering result through a perpendicular Gabor filter; 6.3(d) - 6.3(f)
are the gradient maps of the figures in the first row extracted by Sobel; 6.3(g)
- 6.3(i) are the corresponding histograms of the gradient maps.
103
S =255∑i=0
iqi
M ×N, (6.1)
where i denotes the value of gray levels, and qi is the number of pixels under
ith gray level in the edge image extracted from F. This objective ensures that
the abrupt intensity changes at the edge of the stripe pattern is significantly
eliminated. Furthermore, the variance of the filtered feature image denoted
by σ should be as small as possible to ensure that the texture of the original
fabric sample is as uniform as possible after Gabor filtering. This condition is
beneficial for the robustness of defect detection. Therefore, the final objective
function adopted in the Gabor optimization is
maximize J = σ ×255∑i=0
iqi
M ×N. (6.2)
Based on the analysis of optimization method in Section 4.2, CoDE, one of
the powerful evolutionary algorithm, is adopted as the optimization algorithm
in obtaining the optimal set of parameters of Gabor filter. As stated in Section
6.1, only one Gabor filter can eliminate the filtering response of edges in
the striped fabric; the orientation parameter θ is designed perpendicularly to
the stripe pattern. Hence, three Gabor parameters should be optimized: the
central frequency of Gabor filter f0; and the frequency bandwidth B and shape
factor of Gabor filter λ, which jointly determine the smoothing parameters σx
and σy.
The specific optimization process is described as follows:
(1) Representation: The first step of the optimization process is to encode
solutions into decision vectors which are of three dimensions: f0, B, and λ.
(2) Population initialization: The initial chromosomes are assigned with real
numbers at the beginning while rounding down to discrete in evaluating
104
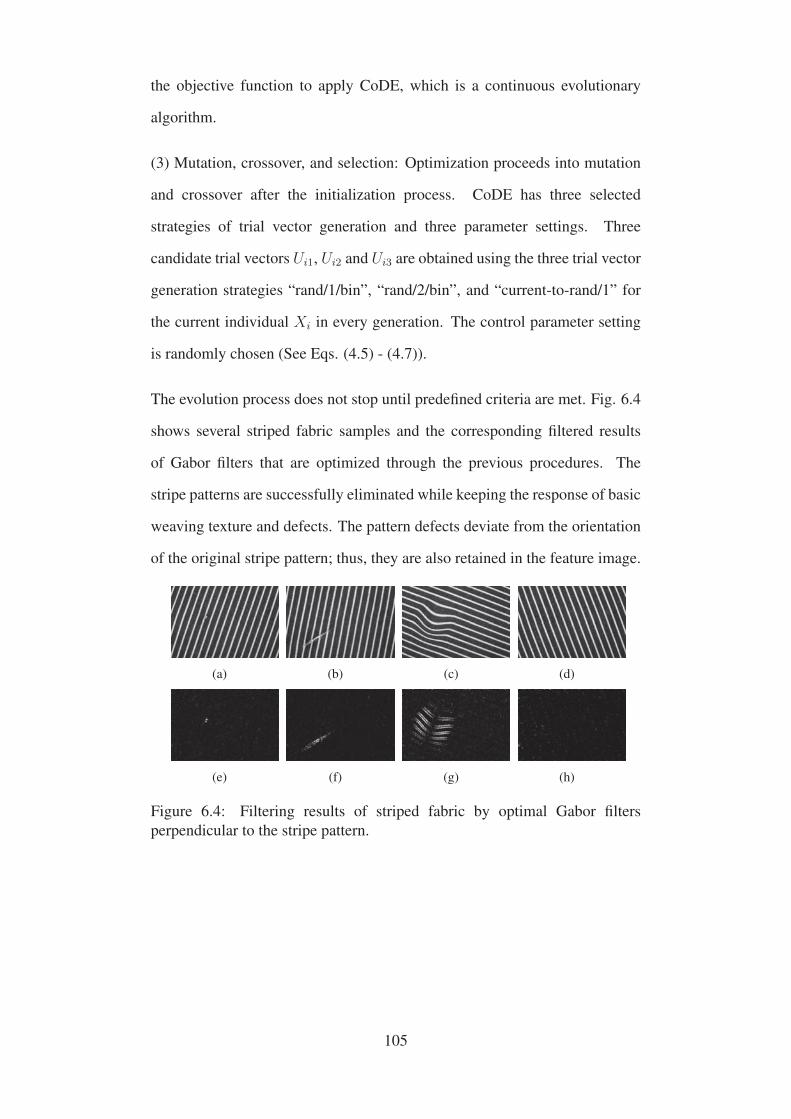
the objective function to apply CoDE, which is a continuous evolutionary
algorithm.
(3) Mutation, crossover, and selection: Optimization proceeds into mutation
and crossover after the initialization process. CoDE has three selected
strategies of trial vector generation and three parameter settings. Three
candidate trial vectors Ui1, Ui2 and Ui3 are obtained using the three trial vector
generation strategies “rand/1/bin”, “rand/2/bin”, and “current-to-rand/1” for
the current individual Xi in every generation. The control parameter setting
is randomly chosen (See Eqs. (4.5) - (4.7)).
The evolution process does not stop until predefined criteria are met. Fig. 6.4
shows several striped fabric samples and the corresponding filtered results
of Gabor filters that are optimized through the previous procedures. The
stripe patterns are successfully eliminated while keeping the response of basic
weaving texture and defects. The pattern defects deviate from the orientation
of the original stripe pattern; thus, they are also retained in the feature image.
(a) (b) (c) (d)
(e) (f) (g) (h)
Figure 6.4: Filtering results of striped fabric by optimal Gabor filters
perpendicular to the stripe pattern.
105
6.3 Step Two: Image Restoration-Based Defect
Detection
The interference of stripe edge structure is significantly reduced after the
Gabor filtering in the first step of inspection to make the inspection approaches
for basic weaving texture detect the remaining defects effectively. Fig. 6.4
demonstrates that the filtering response of the basic weaving texture in the
background is not as uniform as that of the plain fabric. Therefore, approach
based on optimal Gabor filter cannot be applied in this step. Moreover,
defect boundaries are slightly weakened. Therefore, image restoration-based
detection approach, which does not rely on feature extraction, is adopted to
find the defects from the Gabor-filtered images.
6.3.1 Image Restoration Based on Non-local Self-similarities
The structural information of the basic weaving texture in the filtered image is
changed compared with the original fabric images. The comparison of Figs.
6.4(e) and 6.4(f) shows that the regularity of background texture between
similar types of fabric is significantly smaller. Therefore, it is difficult to
learn an effective dictionary for texture representation of the filtered image.
However, for a given image patch, its estimation can be obtained based on
its non-local self-similarities [117]; thus, regarded as random noise, fabric
defects in the filtered feature image can be successfully removed.
Suppose that the feature image F is divided into K overlapping patches, Fi =
RiF, i = 1, 2..., K, is the ith patch vector of image F, where Ri is a matrix
extracting patch Fi from F. The fused image F through all image patches can
be formulated as
106
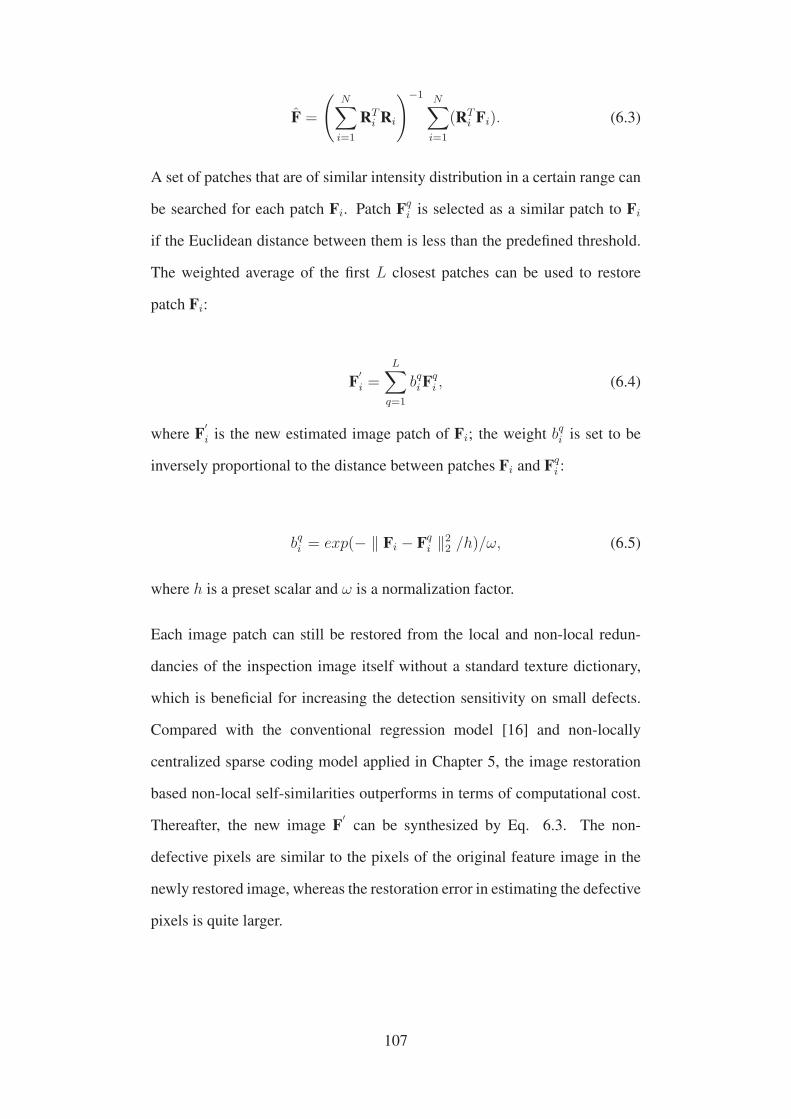
F =
(N∑i=1
RTi Ri
)−1 N∑i=1
(RTi Fi). (6.3)
A set of patches that are of similar intensity distribution in a certain range can
be searched for each patch Fi. Patch Fqi is selected as a similar patch to Fi
if the Euclidean distance between them is less than the predefined threshold.
The weighted average of the first L closest patches can be used to restore
patch Fi:
F′i =
L∑q=1
bqiFqi , (6.4)
where F′i is the new estimated image patch of Fi; the weight bqi is set to be
inversely proportional to the distance between patches Fi and Fqi :
bqi = exp(− ‖ Fi − Fqi ‖22 /h)/ω, (6.5)
where h is a preset scalar and ω is a normalization factor.
Each image patch can still be restored from the local and non-local redun-
dancies of the inspection image itself without a standard texture dictionary,
which is beneficial for increasing the detection sensitivity on small defects.
Compared with the conventional regression model [16] and non-locally
centralized sparse coding model applied in Chapter 5, the image restoration
based non-local self-similarities outperforms in terms of computational cost.
Thereafter, the new image F′can be synthesized by Eq. 6.3. The non-
defective pixels are similar to the pixels of the original feature image in the
newly restored image, whereas the restoration error in estimating the defective
pixels is quite larger.
107
6.3.2 Defect Segmentation
The defective pixels, which are regarded as noise, are replaced by non-
defective texture in the newly restored image. Thus, the defective area can
be highlighted in the residual image by comparing the restored image with
the original filtered image. A simple thresholding operation following image
subtraction can segment the defects from the background of the residual
image.
The threshold limits are derived from the reference residual image of a non-
defective sample and its estimation that is restored by the the non-local self-
similarities in the image, for each specific type of striped fabric. Suppose that
the gray-level intensity of the reference residual image is denoted as Fr(x, y).
Subsequently, the upper and lower threshold limits are
ψupper = maxx,y∈W
|Fr(x, y)|, (6.6)
ψlower = minx,y∈W
|Fr(x, y)|, (6.7)
where W is a window centered at the feature image obtained by removing 10
pixels from each side of the image Fr(x, y). Hence, the binary feature image
B(x, y) can be obtained by
B(x, y) =
⎧⎪⎨⎪⎩
1, if R(x, y) > ψupper or R(x, y) < ψlower,
0, otherwise,(6.8)
where R(x, y) denotes the gray-level of the testing residual image.
108
6.4 Experiment Results and Discussion
The experiments are conducted on the samples of striped fabric selected
from TILDA database, in which 50 non-defective samples and 300 defective
samples are included, to validate the effectiveness of the proposed defect
detection model. In the database, pattern defects include compactor crease
and pattern variants caused by mechanical fault; and common defects include
chafed yarn, flying yarn and color mark. The detection results of both pattern
defects and common fabric defects are demonstrated and analyzed.
The experiment setup is the same with those in Chapters 4 and 5. Image
samples in TILDA are of 768× 512 pixels. The image processing toolbox of
MATLAB prototyping environment is adopted to program all the detection
models. The performance of defect detection models is evaluated by
precision, sensitivity, specificity and accuracy, which are clearly defined in
Section 4.4.1.
6.4.1 Performance Evaluation of the Proposed Defect De-
tection Model
The inspection of striped fabric is conducted according to the procedures
shown in Fig. 6.2. Figs. 6.5 - 6.6 demonstrate several representative detection
results using the proposed defect detection model. A non-defective sample is
selected as the reference to optimize the Gabor filter at the beginning of the
inspection of each type of fabric. Images in the second column, which well be
restored in the second step of inspection, show the optimal filtering response
in the first step of inspection. The binary image in the third column shows
the final detection results. Table 6.1 summarizes overall experimental results
using the proposed defect detection model.
109

Table 6.1: Performance of the proposed detection model on striped fabric
samples of TILDA
Precision Sensitivity Specificity AccuracyPerformance 94.7% 90.0% 70.0% 87.1%
Fig. 6.5 demonstrates the detection results of pattern defects. The first three
samples are the variations of repeated stripe pattern usually caused by restart
of the weaving machine or a malfunction in the weaving tensor. The last
three samples are caused by fabric crease. All these defects are successfully
detected. The edges of the incorrectly arranged stripe are not eliminated in the
filtered images in the first step, because these misarranged stripes deviate from
the standard orientation of repeated patterns. Subsequently, the defects were
are segmented from the background based on the restored filtering response
of the non-defective fabric texture.
The detection results of several common defects on the striped fabric are
shown in Fig. 6.6. The first three are structural defects related to weaving
texture. Part of the first defect is of considerable low contrast, which is almost
drowned in the texture of image background. The defect can be highlighted
using the proposed detection model with the Gabor filter optimized through
the procedures stated in Section 6.2 while suppressing the stripe pattern.
Moreover, the second defect is on the side of the edge of the stripe pattern
and is enhanced in the filtered feature image. The least two are tonal defects
that only alter the local intensity value of the fabric but not the weaving
structure. Particularly, the proposed detection model has detected the defect
in the upper-right corner of the last image that overlaps the stripe pattern,
which further verifies that the proposed detection model is sensitive to most
types of fabric defects.
110
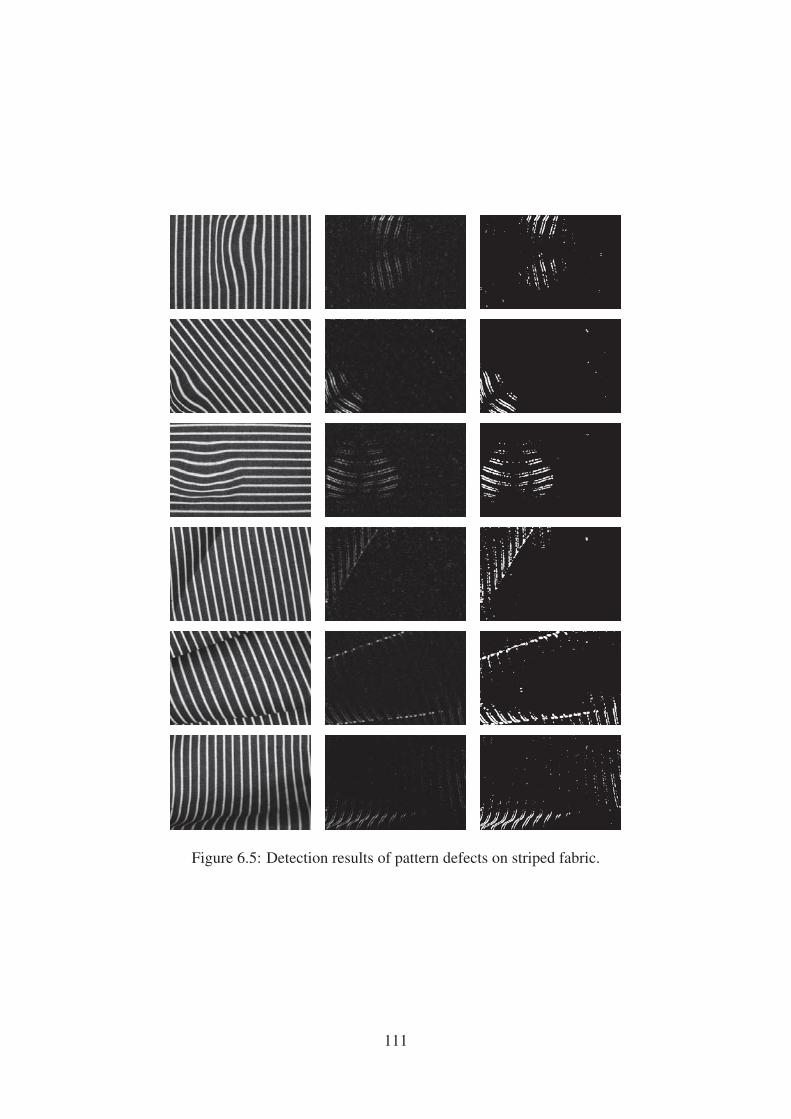
Figure 6.5: Detection results of pattern defects on striped fabric.
111

Figure 6.6: Detection results of common fabric defects on striped fabric.
112
6.5 Summary
In this chapter, with the use of Gabor filtering and image restoration
techniques, a hybrid defect detection model is developed for the inspection
of striped fabric. The proposed model can detect both pattern defects and
common fabric defects in two steps. First, a Gabor filter was optimized
to minimize the image gradient for each type of fabric, eliminating the
repeated stripe pattern in the filtered feature image. The feature image with
remaining defects are subject to image restoration, which is the second step
of the inspection. Only non-local self-similarities are utilized to estimate the
filtering response of non-defective texture in the image restoration, which
is beneficial in increasing restoration accuracy. Finally, the defects are
segmented from the residual image of the restored and original filtered
images.
The performance of the hybrid defect detection model is evaluated by
extensive experiments with the samples of striped fabric in TILDA database.
The experimental results on misarranged and crease defects indicate that
the proposed detection model is effective on any directional pattern defects
because of the selective orientation of Gabor filters. Accurate detection results
on common fabric defects also prove that the proposed model performs well
in detecting most types of fabric defects while reducing the interference of
stripe pattern.
113
Chapter 7
Conclusions and Future Work
This chapter starts with the conclusion of this research followed by its
contributions and limitations as well as suggestions for future work.
7.1 Conclusions
This research addresses the problem in automatic fabric inspection in the
textile and apparel industry, using computer vision techniques. The specific
fabric inspection model was designed for different types of fabric according to
their weaving structure characteristics for the first time. For plain, twill, and
striped fabrics, three defect detection models were developed to solve most
types of the common fabric defects and pattern defects, improving the overall
performance of fabric inspection in the textile and apparel industry.
A defect detection model based on optimal Gabor filters has been proposed
for plain fabric inspection in Chapter 4. The basic criss-cross plain weaving
structure leads to a smooth surface of plain fabric; thus, only two Gabor filters
were optimized by CoDE to extract the features of plain defects in horizontal
and vertical, respectively. Both non-defective and typical defect samples
114
were involved in the optimization of Gabor filters in this research. The
mathematical function of optimization objective was designed to maximize
the difference between the filtering response of non-defective and defective
fabric textures. Plain defects could be easily segmented from the normal
fabric texture filtered by the optimal Gabor filters by simple thresholding
operation. Extensive experiments demonstrated that the proposed detection
model perform well in terms of high detection sensitivity and efficiency.
In Chapter 5, a detection model based on sparse representation has been
developed to address the inspection. Approaches based on feature extraction
failed to achieve high detection accuracy because of the complex twill
weaving structure and the blurry boundaries of twill defects. Therefore,
image restoration techniques are utilized to detect twill defects as randomly
distributed noise in this research. Owing to the sparsity of fabric defects,
non-defective texture of the inspection image is estimated through non-locally
sparse representation; thus, the defect can be labeled in the residual image of
the inspection image and its estimation. Adaptive sub-dictionaries, which
could provide non-defective texture information, are learnt from reference
images by K-means algorithms and PCA in the offline stage. The experiment
results revealed that the proposed detection model is particularly sensitive to
small-sized defects.
A hybrid fabric inspection model has been developed in Chapter 6 to detect
defects on striped fabric. The proposed hybrid detection model provides
a two-step solution to detect pattern defects and common fabric defects.
The performance of detection approaches for fabric in solid color were not
satisfied in the inspection of striped fabric because of the complex texture
of stripe pattern. Therefore, a Gabor filter is optimized to suppress the
filtering response of the stripe pattern in the first step of the proposed
model. The mathematical function of optimization objective was designed
to minimize the gradient intensity and the variance of the filtered image;
115

thus, the feature image of the striped fabric could be treated as a fabric in
solid color after optimal Gabor filtering. Image restoration based on non-
local self-similarities and thresholding operation were applied to segment the
remaining defects, thereby increasing detection accuracy. The experiment
results indicated that the proposed detection model detected any directional
pattern defects effectively because of the selective orientation of Gabor filters;
the proposed model also identified most types of fabric defects while reducing
the interference of stripe pattern.
7.2 Contributions of this Research
This research enriches our understanding of automatic fabric defect detection
from both academic and industrial perspectives.
7.2.1 Contributions to Woven Fabric Inspection for the
Textile and Apparel Industries
In this research, an intelligent defect detection solution is proposed to address
the inspection problem of plain, twill, and striped fabrics in the textile and
apparel industries. In the proposed solution, computer vision techniques are
used to fulfill the fabric defect detection automatically, which could overcome
the limitations of the current human inspection system. The labor cost is
significantly reduced by integrating the proposed defect detection solution
into the traditional fabric inspection machine. Meanwhile, without the human
intervention, detection accuracy and efficiency are enhanced as well.
Given that the requirements of automatic fabric inspections vary with the
different types of fabric in the textile and apparel industries, the woven
fabric inspection problem is investigated on the basis of specific analysis
116
of different fabric weaving structures for the first time. The three proposed
defect detection models for plain, twill, and striped fabrics are proven to be
generally superior to several representatives of the existing models, in terms
of detection accuracy, robustness, and efficiency.
7.2.2 Contributions to Automatic Plain Fabric Defect De-
tection
Owing to the smooth characteristic of plain fabric surface, defects in plain
fabric are easy to notice, and therefore, the requirements of detection accuracy
and efficiency are high in the industrial applications. The proposed detection
model for plain fabric, which is based on optimal Gabor filters, has greatly
reduced the computational cost and increased the successful detection rate by
directly extracting the features of plain fabric defects.
Considering the shape and orientation characteristics of plain fabric defects,
the only two Gabor filters optimized by CoDE could avoid data redundancies
caused by Gabor filter bank in the feature extraction of defects. In addition,
the proposed model could obtain the best extraction of defects because of the
capacity of global optimization of CoDE, and thereby increasing the detection
accuracy. In all, the high detection accuracy and efficiency of the proposed
detection make it satisfied in the real-time industrial applications.
7.2.3 Contributions to Automatic Twill Fabric Defect De-
tection
The weaving structure of twill fabric is considerably more complex than plain
fabric, which makes the defects smaller and more inconspicuous. Moreover,
the interference caused by ribs-like twill texture influences the stability of
117

fabric inspection. With defects regarded as random distributed noise on the
surface of twill fabric, the detection model presented in this research has
improved detection robustness and sensitivity, especially on small and blurry
defects in complex texture.
By exploiting the cross-correlation of fabric structures, compact sub-dictionaries
learnt from non-defective reference images are beneficial for increasing
detection efficiency and reducing the false alarm rate. In addition, compared
with feature extraction-based approaches, image restoration based on non-
locally centralized sparse representation has greatly improved the detection
performance on tiny defects.
7.2.4 Contributions to Automatic Striped Fabric Defect
Detection
Striped fabric is one of the typical patterned fabrics, which is widely used
in our daily lives, such as business shirt and pants. However, specific defect
detection approaches have not yet been proposed for striped fabric. Most
of the existing approaches failed in striped fabric inspection because of the
salient intensity changes of the image and the similarities between the stripe
pattern and fabric defects. In this research, the newly proposed hybrid striped
inspection model could detect not only common fabric defects but also pattern
defects in two steps.
Owing to the frequency selectivity of Gabor filters, an optimal Gabor filter
has first obtained to reduce the response of stripe patterns, while remaining
the features of defects. Hence, detection robustness has been significantly
improved by eliminating interferences caused by stripe patterns. Considering
the filtered image as a fabric in solid color, image restoration based on
nonlocal self-similarities in the second step could enhance the detection rate
118
of the remaining defects.
7.3 Limitations and Future Work
This research can facilitate the development of automatic fabric inspection
for textile and apparel industry. However, this research still has limitations,
which can be an avenue for future research.
In this research, the three proposed defect detection models partly depend on
the abrupt intensity changes on the edge of defects, and the contrast between
defects and fabric image background with the samples of 2D fabric image.
This limitation results in difficulties in outlining defect shapes accurately.
The Gabor filters are good edge detector; however, they are insensitive to
color mark defects in the proposed plain fabric inspection model, because
tonality at the edge of a defect gradually changes. In the proposed twill fabric
inspection model, non-local similarities are utilized in image restoration to
increase restoration accuracy. However, this model also relies on the intensity
changes in labeling defects as noise. The features of defective texture are
likely to remain in the restored image if the original intensities are similar
with its surrounding pixels, thus influencing the accuracy of the following
defect segmentation. The structure of fabric texture is significantly fine that
any fabric defects will cause disturbances to the arrangement of yarns at that
location. The defect should be easily found by examining yarn arrangement
if the image of a fabric sample is acquired at a large resolution. Therefore,
the solution for fabric inspection based on yarn arrangement should be
investigated in the future.
As shown in the experiments in this research, the defective fabric samples are
limited. TILDA is the only public fabric texture database that is utilized as
testing data in most of the current studies. However, only four types of fabric
119
are included in this database, and the size of defects are comparatively large
that it does not conform to the actual situation in factories. Therefore, more
defective samples were acquired from an apparel factory in Mainland China.
However, the samples only consist of the most frequently encountered types
of defects, such as slub, broken end, thick yarn, flying yarn and holes. The
effectiveness of the proposed detection model on some types of defect, such
as color smear, dragging end and dye streak, cannot be verified. Therefore,
collecting more defective samples and constructing a more comprehensive
fabric defect database should be accomplished in the future work. It is very
necessary to expand the application of the proposed detection model on more
types of fabric, especially fabric with complex texture.
7.4 Related Publications
The author demonstrated the originality of this research through the following
publications:
[1] L. Tong, W. K. Wong, and C. K. Kwong. Fabric defect detection for
apparel industry: A nonlocal sparse representation approach. IEEE Access,
vol. 5, no. 1, pp. 5947-5964, Dec. 2017.
[2] L. Tong, W. K. Wong, and C. K. Kwong. Differential evolution-based
optimal Gabor filter model for fabric inspection. Neurocomputing, vol. 173,
no. 3, pp. 1386-1401, Jan. 2016.
120

Bibliography
[1] Henry Y. T. Ngan, Grantham K. H. Pang, and Nelson H. C. Yung.
Automated fabric defect detection–a review. Image and Vision
Computing, 29(7):442–458, 2011.
[2] Wikipidia. Plain weave. https://en.wikipedia.org/wiki/
Plain_weave.
[3] Chi-ho Chan and Grantham KH Pang. Fabric defect detection
by fourier analysis. IEEE Transactions on Industry Applications,
36(5):1267–1276, 2000.
[4] Che-Seung Cho, Byeong-Mook Chung, and Moo-Jin Park. Devel-
opment of real-time vision-based fabric inspection system. IEEE
Transactions on Industrial Electronics, 52(4):1073–1079, 2005.
[5] Christos Anagnostopoulos, D Vergados, Eleftherios Kayafas, Vassilis
Loumos, and G Stassinopoulos. A computer vision approach for textile
quality control. The Journal of Visualization and Computer Animation,
12(1):31–44, 2001.
[6] Ville Tirronen, Ferrante Neri, Tommi Karkkainen, Kirsi Majava,
and Tuomo Rossi. An enhanced memetic differential evolution in
filter design for defect detection in paper production. Evolutionary
Computation, 16(4):529–555, 2008.
[7] Jong Pil Yun, SungHoo Choi, Jong-Wook Kim, and Sang Woo Kim.
121

Automatic detection of cracks in raw steel block using Gabor filter
optimized by univariate dynamic encoding algorithm for searches
(udeas). NDT & E International, 42(5):389–397, 2009.
[8] A Latif-Amet, Aysin Ertuzun, and Aytul Ercil. An efficient method
for texture defect detection: sub-band domain co-occurrence matrices.
Image and Vision Computing, 18(6):543–553, 2000.
[9] Manuel FM Costa, Francisco Rodrigues, Joao Guedes, and Jorge
Lopes. Automated evaluation of patterned fabrics for defect detection.
In Education and Training in Optics and Photonics (ETOP’99), pages
403–407. International Society for Optics and Photonics, 2000.
[10] Henry YT Ngan, Grantham KH Pang, SP Yung, and Michael K Ng.
Defect detection on patterned jacquard fabric. In 32nd Applied Imagery
Pattern Recognition Workshop, 2003. Proceedings, pages 163–168.
IEEE, 2003.
[11] Guang-Hua Hu, Qing-Hui Wang, and Guo-Hui Zhang. Unsupervised
defect detection in textiles based on Fourier analysis and wavelet
shrinkage. Applied Optics, 54(10):2963–2980, 2015.
[12] Ajay Kumar and Grantham KH Pang. Defect detection in textured
materials using Gabor filters. IEEE Transactions on Industry
Applications, 38(2):425–440, 2002.
[13] Adriana Bodnarova, Mohammed Bennamoun, and Shane Latham.
Optimal Gabor filters for textile flaw detection. Pattern Recognition,
35(12):2973–2991, 2002.
[14] Jayanta K Chandra, Pradipta K Banerjee, and Asit K Datta. Neural
network trained morphological processing for the detection of defects
in woven fabric. The Journal of The Textile Institute, 101(8):699–706,
2010.
122
[15] HI Celik, LC Dulger, and M Topalbekiroglu. Development of
a machine vision system: real-time fabric defect detection and
classification with neural networks. The Journal of The Textile Institute,
105(6):575–585, 2014.
[16] Jian Zhou and Jun Wang. Fabric defect detection using adaptive
dictionaries. Textile Research Journal, pages 1846–1859, 2013.
[17] Jian Zhou, Dimitri Semenovich, Arcot Sowmya, and Jun Wang.
Dictionary learning framework for fabric defect detection. The Journal
of The Textile Institute, 105(3):223–234, 2014.
[18] Qiuping Zhu, Minyuan Wu, Jie Li, and Dexiang Deng. Fabric defect
detection via small scale over-complete basis set. Textile Research
Journal, 84(15):1634–1649, 2014.
[19] Henry YT Ngan, Grantham KH Pang, and Nelson HC Yung. Motif-
based defect detection for patterned fabric. Pattern Recognition,
41(6):1878–1894, 2008.
[20] Henry YT Ngan, Grantham KH Pang, and Nelson HC Yung.
Ellipsoidal decision regions for motif-based patterned fabric defect
detection. Pattern Recognition, 43(6):2132–2144, 2010.
[21] Ajay Kumar. Computer-vision-based fabric defect detection: a survey.
IEEE Transactions on Industrial Electronics, 55(1):348–363, 2008.
[22] Radovan Stojanovic, Panagiotis Mitropulos, Christos Koulamas,
Yorgos Karayiannis, Stavros Koubias, and George Papadopoulos.
Real-time vision-based system for textile fabric inspection. Real-Time
Imaging, 7(6):507–518, 2001.
[23] Bithika Mallik-Goswami and Asit K Datta. Detecting defects in fabric
with laser-based morphological image processing. Textile Research
Journal, 70(9):758–762, 2000.
123
[24] Kai-Ling Mak, P Peng, and KFC Yiu. Fabric defect detection using
morphological filters. Image and Vision Computing, 27(10):1585–
1592, 2009.
[25] S. C. Graniteville. Manual of standard fabric defects in the textile
industry. Graniteville Company, 1975.
[26] Mahmoud Abdel Aziz, Ali S Haggag, and Mohammed S Sayed. Fabric
defect detection algorithm using morphological processing and DCT.
In 2013 1st International Conference on Communications, Signal
Processing, and their Applications (ICCSPA), pages 1–4. IEEE, 2013.
[27] H Ibrahim Celik, L Canan Dulger, Mehmet Topalbekiroglu, et al.
Fabric defect detection using linear filtering and morphological
operations. Indian Journal of Fibre & Textile Research (IJFTR),
39(3):254–259, 2014.
[28] Vikrant Tiwari and Gaurav Sharma. Automatic fabric fault detection
using morphological operations on bit plane. International Journal of
Computer Science and Network Security (IJCSNS), 15(10):30, 2015.
[29] John Bollinger. Bollinger on Bollinger bands. McGraw Hill
Professional, 2001.
[30] Henry YT Ngan and Grantham KH Pang. Novel method for patterned
fabric inspection using Bollinger bands. Optical Engineering,
45(8):087202–087202, 2006.
[31] Henry YT Ngan and Grantham KH Pang. Robust defect detection
in plain and twill fabric using directional Bollinger bands. Optical
Engineering, 54(7):073106–073106, 2015.
[32] Michael Unser. Sum and difference histograms for texture
classification. IEEE Transactions on Pattern Analysis and Machine
Intelligence, (1):118–125, 1986.
124
[33] M Alper Selver, Vural Avsar, and Hakan Ozdemir. Textural fabric
defect detection using statistical texture transformations and gradient
search. The Journal of The Textile Institute, 105(9):998–1007, 2014.
[34] Jie Zhang, Ruru Pan, Weidong Gao, and Dandan Zhu. Automatic
inspection of yarn-dyed fabric density by mathematical statistics of
sub-images. The Journal of The Textile Institute, 106(8):823–834,
2015.
[35] Bidyut Baran Chaudhuri and Nirupam Sarkar. Texture segmentation
using fractal dimension. IEEE Transactions on Pattern Analysis and
Machine Intelligence, 17(1):72–77, 1995.
[36] Aura Conci and Claudia Belmiro Proenca. A fractal image analysis
system for fabric inspection based on a box-counting method.
Computer Networks and ISDN Systems, 30(20):1887–1895, 1998.
[37] Shih-Hsuan Chiu, Shen Chou, Jiun-Jian Liaw, and Che-Yen Wen.
Textural defect segmentation using a Fourier-domain maximum
likelihood estimation method. Textile Research Journal, 72(3):253–
258, 2002.
[38] Hong-gang Bu, Jun Wang, and Xiu-bao Huang. Fabric defect detection
based on multiple fractal features and support vector data description.
Engineering Applications of Artificial Intelligence, 22(2):224–235,
2009.
[39] Madasu Hanmandlu, Dilip Choudhury, and Sujata Dash. Detection of
defects in fabrics using topothesy fractal dimension features. Signal,
Image and Video Processing, 9(7):1521–1530, 2015.
[40] Richard W Conners, Charles W Mcmillin, Kingyao Lin, and Ramon E
Vasquez-Espinosa. Identifying and locating surface defects in wood:
125

Part of an automated lumber processing system. IEEE Transactions on
Pattern Analysis and Machine Intelligence, (6):573–583, 1983.
[41] Jagdish Lal Raheja, Sunil Kumar, and Ankit Chaudhary. Fabric defect
detection based on GLCM and Gabor filter: a comparison. Optik-
international Journal for Light and Electron Optics, 124(23):6469–
6474, 2013.
[42] Dandan Zhu, Ruru Pan, Weidong Gao, and Jie Zhang. Yarn-dyed fabric
defect detection based on autocorrelation function and glcm. Autex
Research Journal, 15(3):226–232, 2015.
[43] Dmitry Chetverikov. Pattern regularity as a visual key. Image and
Vision Computing, 18(12):975–985, 2000.
[44] M Bennamoun and A Bodnarova. Automatic visual inspection and
flaw detection in textile materials: Past, present and future. In IEEE
International Conference on Systems, Man, and Cybernetics, 1998.,
volume 5, pages 4340–4343. IEEE, 1998.
[45] Umer Farooq, Tim King, PH Gaskell, and N Kapur. Machine vision
using image data feedback for fault detection in complex deformable
webs. Transactions of the Institute of Measurement and Control,
26(2):119–137, 2004.
[46] Michael K Ng, Henry YT Ngan, Xiaoming Yuan, and Wenxing
Zhang. Patterned fabric inspection and visualization by the method
of image decomposition. IEEE Transactions on Automation Science
and Enginering, 11:943–947, 2014.
[47] SH Hajimowlana, R Muscedere, GA Jullien, and JW Roberts.
1D autoregressive modeling for defect detection in web inspection
systems. In Midwest Symposium on Circuits and Systems, 1998.
Proceedings, pages 318–321. IEEE, 1998.
126
[48] Olivier Alata and Clarisse Ramananjarasoa. Unsupervised textured
image segmentation using 2D quarter plane autoregressive model with
four prediction supports. Pattern Recognition Letters, 26(8):1069–
1081, 2005.
[49] Serhat Ozdemir and A Ercil. Markov random fields and karhunen-
loeve transforms for defect inspection of textile products. In IEEE
Conference on Emerging Technologies and Factory Automation, 1996.
EFTA’96. Proceedings, volume 2, pages 697–703. IEEE, 1996.
[50] Guang-Hua Hu, Guo-Hui Zhang, and Qing-Hui Wang. Automated
defect detection in textured materials using wavelet-domain hidden
markov models. Optical Engineering, 53(9):093107–093107, 2014.
[51] C Castellini, F Francini, G Longobardi, B Tiribilli, and P Sansoni. On-
line textile quality control using optical Fourier transforms. Optics and
Lasers in Engineering, 24(1):19–32, 1996.
[52] Du-Ming Tsai and Bo Hsiao. Automatic surface inspection using
wavelet reconstruction. Pattern Recognition, 34(6):1285–1305, 2001.
[53] Adriana Bodnarova, Mohammed Bennamoun, and Shane J Latham.
A constrained minimisation approach to optimise Gabor filters for
detecting flaws in woven textiles. In 2000 IEEE International
Conference on Acoustics, Speech, and Signal Processing, 2000.
ICASSP’00. Proceedings, volume 6, pages 3606–3609. IEEE, 2000.
[54] Rusen Meylani, Aysin Ertuzun, and Aytul Ercil. Texture defect
detection using the adaptive two-dimensional lattice filter. In
International Conference on Image Processing, 1996. Proceedings,
pages 165–168, 1996.
[55] PeiFeng Zeng and T Hirata. On-loom fabric inspection using multi-
scale differentiation filtering. In 37th IAS Annual Meeting, Conference
127

Record of the Industry Applications Conference, 2002, volume 1, pages
320–326. IEEE, 2002.
[56] D-M Tsai and C-Y Hsieh. Automated surface inspection for directional
textures. Image and Vision Computing, 18(1):49–62, 1999.
[57] Kyung-Jin Choi, Young-Hyun Lee, Jong-Woo Moon, Chong-Kug
Park, and Fumio Harashima. Development of an automatic stencil
inspection system using modified hough transform and fuzzy logic.
IEEE Transactions on Industrial Electronics, 54(1):604–611, 2007.
[58] V Jayashree and Shaila Subbaraman. Identification of twill grey fabric
defects using DC suppressed Fourier power spectrum sum features.
Textile Research Journal, pages 1485–1497, 2012.
[59] Ajay Kumar and Grantham Pang. Identification of surface defects in
textured materials using wavelet packets. In Thirty-Sixth IAS Annual
Meeting, Conference Record of the 2001 IEEE Industry Applications
Conference, 2001, volume 1, pages 247–251. IEEE, 2001.
[60] Du-Ming Tsai and Cheng-Huei Chiang. Automatic band selection for
wavelet reconstruction in the application of defect detection. Image
and Vision Computing, 21(5):413–431, 2003.
[61] Xuezhi Yang, Grantham Pang, and Nelson Yung. Discriminative
training approaches to fabric defect classification based on wavelet
transform. Pattern Recognition, 37(5):889–899, 2004.
[62] Zhijie Wen, Junjie Cao, Xiuping Liu, and Shihui Ying. Fabric defects
detection using adaptive wavelets. International Journal of Clothing
Science and Technology, 26(3):202–211, 2014.
[63] Shengqi Guan and Zhaoyuan Gao. Fabric defect image segmentation
based on the visual attention mechanism of the wavelet domain. Textile
Research Journal, 84(10):1018–1033, 2014.
128
[64] Anne M Treisman and Garry Gelade. A feature-integration theory of
attention. Cognitive Psychology, 12(1):97–136, 1980.
[65] John G Daugman. Uncertainty relation for resolution in space,
spatial frequency, and orientation optimized by two-dimensional visual
cortical filters. JOSA A, 2(7):1160–1169, 1985.
[66] Rajiv Mehrotra, Kameswara Rao Namuduri, and Nagarajan Ran-
ganathan. Gabor filter-based edge detection. Pattern Recognition,
25(12):1479–1494, 1992.
[67] Linlin Shen and Songhao Zheng. Hyperspectral face recognition using
3D Gabor wavelets. In 21st International Conference on Pattern
Recognition (ICPR), 2012, pages 1574–1577. IEEE, 2012.
[68] David A Clausi and M Ed Jernigan. Designing Gabor filters for optimal
texture separability. Pattern Recognition, 33(11):1835–1849, 2000.
[69] Wei-Yu Han and Jen-Chun Lee. Palm vein recognition using adaptive
Gabor filter. Expert Systems with Applications, 39(18):13225–13234,
2012.
[70] Linlin Shen, Ziyi Dai, Sen Jia, Meng Yang, Zhihui Lai, and Shiqi
Yu. Band selection for Gabor feature based hyperspectral palmprint
recognition. In 2015 International Conference on Biometrics (ICB),
pages 416–421. IEEE, 2015.
[71] Philippe Vautrot, Noel Bonnet, and Michel Herbin. Comparative
study of different spatial/spatial-frequency methods (Gabor filters,
wavelets, wavelets packets) for texture segmentation/classification. In
International Conference on Image Processing, 1996. Proceedings,
volume 3, pages 145–148. IEEE, 1996.
[72] Weitao Li, Kezhi Mao, Hong Zhang, and Tianyou Chai. Selection of
Gabor filters for improved texture feature extraction. In 2010 IEEE
129
International Conference on Image Processing, pages 361–364. IEEE,
2010.
[73] Lucia Bissi, Giuseppe Baruffa, Pisana Placidi, Elisa Ricci, Andrea
Scorzoni, and Paolo Valigi. Automated defect detection in uniform
and structured fabrics using Gabor filters and PCA. Journal of Visual
Communication and Image Representation, 24(7):838–845, 2013.
[74] Deutsche Forschungsgemeinschaft Germany. Tilda textile texture-
database. http://lmb.informatik.uni-freiburg.de/
resources/datasets/tilda.en.html. Version 1.0, 1996.
[75] D-M Tsai and C-P Lin. Fast defect detection in textured surfaces
using 1D Gabor filters. The International Journal of Advanced
Manufacturing Technology, 20(9):664–675, 2002.
[76] Kai Ling Mak and P Peng. An automated inspection system for textile
fabrics based on Gabor filters. Robotics and Computer-Integrated
Manufacturing, 24(3):359–369, 2008.
[77] Kai-Ling Mak, Pai Peng, and Ka-Fai Cedric Yiu. Fabric defect
detection using multi-level tuned-matched Gabor filters. Journal of
Industrial and management optimization, 2012.
[78] Cui Mao, Arunkumar Gururajan, Hamed Sari-Sarraf, and Eric Hequet.
Machine vision scheme for stain-release evaluation using gabor filters
with optimized coefficients. Machine Vision and Applications,
23(2):349–361, 2012.
[79] Guang-Hua Hu. Optimal ring Gabor filter design for texture
defect detection using a simulated annealing algorithm. In 2014
International Conference on Information Science, Electronics and
Electrical Engineering (ISEEE), volume 2, pages 860–864. IEEE,
2014.
130
[80] D-M Tsa and S-K Wu. Automated surface inspection using Gabor
filters. The International Journal of Advanced Manufacturing
Technology, 16(7):474–482, 2000.
[81] Chang-Chiun Huang and I-Chun Chen. Neural-fuzzy classification for
fabric defects. Textile Research Journal, 71(3):220–224, 2001.
[82] Ajay Kumar. Neural network based detection of local textile defects.
Pattern Recognition, 36(7):1645–1659, 2003.
[83] AS Tolba. Neighborhood-preserving cross correlation for automated
visual inspection of fine-structured textile fabrics. Textile Research
Journal, 81(19):2033–2042, 2011.
[84] Tao Qu, Lian Zou, Qinglin Zhang, Xi Chen, and Cien Fan. Defect
detection on the fabric with complex texture via dual-scale over-
complete dictionary. The Journal of The Textile Institute, 107(6):743–
756, 2016.
[85] Jian Zhou and Jun Wang. Unsupervised fabric defect segmentation
using local patch approximation. The Journal of The Textile Institute,
107(6):800–809, 2016.
[86] Liping Zhao and James O Coplien. Symmetry in class and type
hierarchy. In Proceedings of the Fortieth International Conference
on Tools Pacific: Objects for Internet, Mobile and Embedded
Applications, pages 181–189. Australian Computer Society, Inc., 2002.
[87] Hagit Zabrodsky, Shmuel Peleg, and David Avnir. Symmetry as
a continuous feature. IEEE Transactions on Pattern Analysis and
Machine Intelligence, 17(12):1154–1166, 1995.
[88] Yanxi Liu, Robert T Collins, and Yanghai Tsin. A computational model
for periodic pattern perception based on frieze and wallpaper groups.
131
IEEE Transactions on Mattern Analysis and Machine Intelligence,
26(3):354–371, 2004.
[89] Henry YT Ngan, Grantham KH Pang, and Nelson HC Yung.
Performance evaluation for motif-based patterned texture defect
detection. IEEE Transactions on Automation Science and Engineering,
7(1):58–72, 2010.
[90] Henry YT Ngan, Grantham KH Pang, SP Yung, and Michael K Ng.
Wavelet based methods on patterned fabric defect detection. Pattern
Recognition, 38(4):559–576, 2005.
[91] Stephane G Mallat. A theory for multiresolution signal decomposition:
the wavelet representation. IEEE Transactions on Pattern Analysis and
Machine Intelligence, 11(7):674–693, 1989.
[92] Ma Li and Richard C Staunton. Optimum Gabor filter design and local
binary patterns for texture segmentation. Pattern Recognition Letters,
29(5):664–672, 2008.
[93] Junfeng Jing, Huanhuan Zhang, Jing Wang, Pengfei Li, and Jianyuan
Jia. Fabric defect detection using Gabor filters and defect classification
based on LBP and Tamura method. Journal of The Textile Institute,
104(1):18–27, 2013.
[94] Dennis Gabor. Theory of communication. part 1: The analysis of
information. Journal of the Institution of Electrical Engineers-Part
III: Radio and Communication Engineering, 93(26):429–441, 1946.
[95] David P Casasent and John S Smokelin. Neural net design of macro
Gabor wavelet filters for distortion-invariant object detection in clutter.
Optical Engineering, 33(7):2264–2271, 1994.
[96] Bangalore S Manjunath and Wei-Ying Ma. Texture features for
132
browsing and retrieval of image data. IEEE Transactions on Pattern
Analysis and Machine Intelligence, 18(8):837–842, 1996.
[97] Bruno A Olshausen et al. Emergence of simple-cell receptive field
properties by learning a sparse code for natural images. Nature,
381(6583):607–609, 1996.
[98] Julien Mairal, Michael Elad, and Guillermo Sapiro. Sparse
representation for color image restoration. IEEE Transactions on
Image Processing, 17(1):53–69, 2008.
[99] John Wright, Allen Y Yang, Arvind Ganesh, S Shankar Sastry,
and Yi Ma. Robust face recognition via sparse representation.
IEEE Transactions on Pattern Analysis and Machine Intelligence,
31(2):210–227, 2009.
[100] Chia-Po Wei, Yu-Wei Chao, Yi-Ren Yeh, and Yu-Chiang Frank Wang.
Locality-sensitive dictionary learning for sparse representation based
classification. Pattern Recognition, 46(5):1277–1287, 2013.
[101] Joel A Tropp and Stephen J Wright. Computational methods for
sparse solution of linear inverse problems. Proceedings of the IEEE,
98(6):948–958, 2010.
[102] Stephane G Mallat and Zhifeng Zhang. Matching pursuits with time-
frequency dictionaries. IEEE Transactions on Signal Processing,
41(12):3397–3415, 1993.
[103] Yagyensh Chandra Pati, Ramin Rezaiifar, and PS Krishnaprasad.
Orthogonal matching pursuit: Recursive function approximation with
applications to wavelet decomposition. In 1993 Conference Record
of The Twenty-Seventh Asilomar Conference on Signals, Systems and
Computers, 1993., pages 40–44. IEEE, 1993.
133
[104] Scott Shaobing Chen, David L Donoho, and Michael A Saunders.
Atomic decomposition by basis pursuit. SIAM Review, 43(1):129–159,
2001.
[105] Michal Aharon, Michael Elad, and Alfred Bruckstein. K-SVD:
An algorithm for designing overcomplete dictionaries for sparse
representation. IEEE Transactions on Signal Processing, 54(11):4311–
4322, 2006.
[106] Ron Rubinstein, Michael Zibulevsky, and Michael Elad. Double
sparsity: Learning sparse dictionaries for sparse signal approximation.
IEEE Transactions on Signal Processing, 58(3):1553–1564, 2010.
[107] Kjersti Engan, Sven Ole Aase, and J Hakon Husoy. Method of optimal
directions for frame design. In 1999 IEEE International Conference
on Acoustics, Speech, and Signal Processing, 1999. Proceedings,
volume 5, pages 2443–2446. IEEE, 1999.
[108] Ajay Kumar and Grantham Pang. Fabric defect segmentation using
multichannel blob detectors. Optical Engineering, 39(12):3176–3190,
2000.
[109] Institut fur Textilmaschinenbau und Textilindustrieder ETH. Cata-
logue of types of fabric defects in grey goods. Schlieren, Schweiz:
International Textile Service, Switzerland, 2 edition, 1989.
[110] Francesco Bianconi and Antonio Fernandez. Evaluation of the
effects of Gabor filter parameters on texture classification. Pattern
Recognition, 40(12):3325–3335, 2007.
[111] Yong Wang, Zixing Cai, and Qingfu Zhang. Differential evolution with
composite trial vector generation strategies and control parameters.
IEEE Transactions on Evolutionary Computation, 15(1):55–66, 2011.
134
[112] Michael Elad and Michal Aharon. Image denoising via sparse and
redundant representations over learned dictionaries. IEEE Transactions
on Image Processing, 15(12):3736–3745, 2006.
[113] Marius Lysaker and Xue-Cheng Tai. Iterative image restoration
combining total variation minimization and a second-order functional.
International Journal of Computer Vision, 66(1):5–18, 2006.
[114] Julien Mairal, Francis Bach, Jean Ponce, Guillermo Sapiro, and
Andrew Zisserman. Non-local sparse models for image restoration. In
2009 IEEE 12th International Conference on Computer Vision, pages
2272–2279. IEEE, 2009.
[115] Weisheng Dong, Lei Zhang, Guangming Shi, and Xiaolin Wu. Image
deblurring and super-resolution by adaptive sparse domain selection
and adaptive regularization. IEEE Transactions on Image Processing,
20(7):1838–1857, 2011.
[116] Weisheng Dong, Lei Zhang, Guangming Shi, and Xin Li. Nonlocally
centralized sparse representation for image restoration. IEEE
Transactions on Image Processing, 22(4):1620–1630, 2013.
[117] Jielin Jiang, Jian Yang, Yan Cui, Wai Keung Wong, and Zhihui Lai.
Sparse nonlocal priors based two-phase approach for mixed noise
removal. Signal Processing, 116:101–111, 2015.
135