97 7 9 ÿ 5314 - CDN Site
155
-
Upload
khangminh22 -
Category
Documents
-
view
4 -
download
0
Transcript of 97 7 9 ÿ 5314 - CDN Site

������������ �������������������������������� �!�����"#�#�$%"��&'(�)')'$�������"�*�%"�!(�*� ���#�
Jefferson County School District No. R-1Jefferson County, Colorado
Comprehensive Annual
Financial Report For the Fiscal Year Ended June 30, 2020
Presented to the Board of Education
Board MembersSusan Harmon, President
Brad Rupert, First Vice PresidentRon Mitchell, Second Vice President
Stephanie Schooley, SecretarySusan Miller, Treasurer
Interim SuperintendentKristopher Schuh
Prepared by the Financial Services DivisionNicole Stewart, Interim Chief Financial Officer
Lisa Anderson, Controller

Jefferson County School District, No. R-1
Comprehensive Annual Financial Report
June 30, 2020
Table of Contents
Introductory Section Page
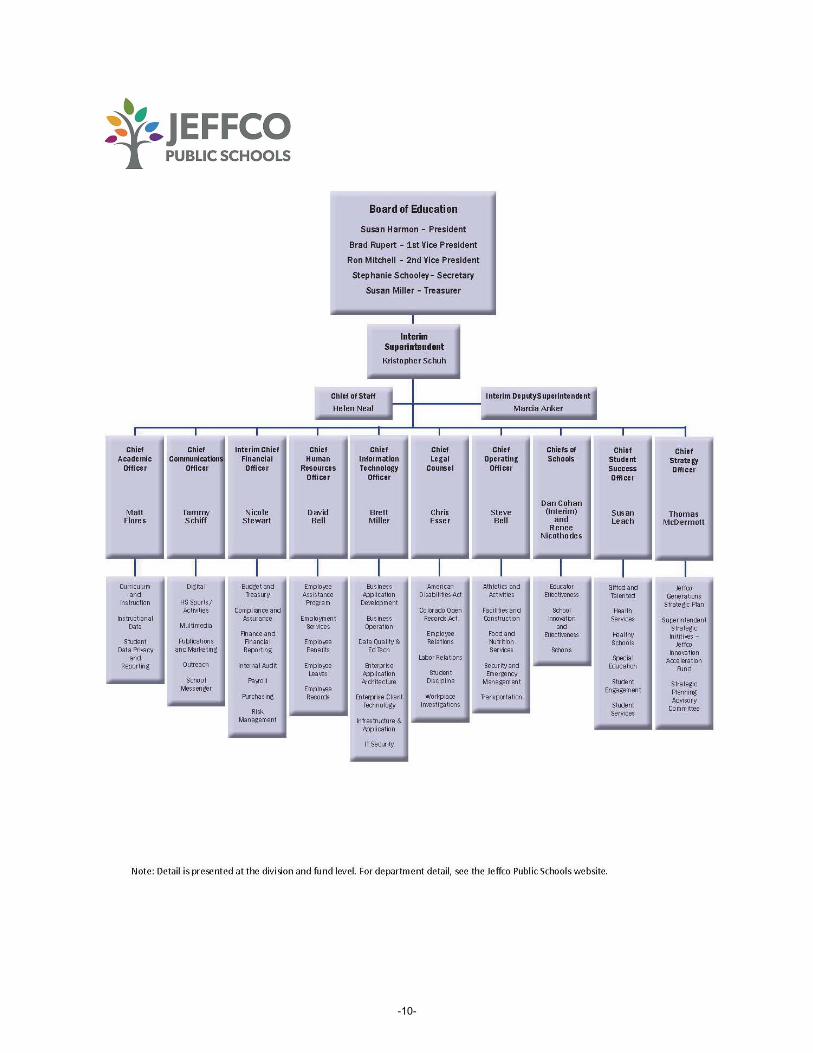
Letter of Transmittal...................................................................................................................................................1 GFOA Certificate of Achievement.............................................................................................................................9 Organizational Chart ............................................................................................................................................... 10 Members of the Superintendent’s Cabinet ............................................................................................................... 11
Financial SectionIndependent Auditors’ Report .................................................................................................................................. 13 Management’s Discussion and Analysis .................................................................................................................17Basic Financial Statements:
Government-wide Financial Statements:Statement of Net Position ..........................................................................................................................32Statement of Activities...............................................................................................................................33
Fund Financial Statements:Balance Sheet – Governmental Funds .......................................................................................................34Reconciliation of Governmental Funds Balance Sheet to Statement of Net Position ................................37Statement of Revenues, Expenditures and Changes in Fund Balances – Governmental Funds.................38Reconciliation of Revenues, Expenditures and Changes in Fund Balances
of Governmental Funds to the Statement of Activities .......................................................................40Statement of Revenues, Expenditures and Changes in
Fund Balance - Budget and Actual – General Fund............................................................................41Statement of Revenues, Expenditures and Changes in
Fund Balance - Budget and Actual – Grants Fund..............................................................................43Statement of Net Position – Proprietary Funds ..........................................................................................44Statement of Revenues, Expenses, and Changes in Fund Net Position – Proprietary Funds .................... 45Statement of Cash Flows - Proprietary Funds............................................................................................ 46
Notes to Basic Financial Statements .................................................................................................................47Required Supplementary Information:
Schedule of the District’s Proportionate Share of the Net Pension Liability.....................................................80Schedule of the District’s Proportionate Share of the Net OPEB Liability....................................................... 83 Schedule of Pension Contributions and Related Ratios .................................................................................... 84 Schedule of OPEB Contributions and Related Ratios....................................................................................... 86
Supplementary Information:Combining and Individual Fund Statements and Schedules:
Combining Balance Sheet – Nonmajor Governmental Funds – Special Revenue Funds ................................. 92 Combining Statement of Revenues, Expenditures, and
Changes in Fund Balances – Nonmajor Governmental Funds – Special Revenue Funds ......................... 93
-i-

Schedules of Revenues, Expenditures and Changes inFund Balances (Deficit) - Budget and Actual:
Bond Redemption Debt Service Fund................................................................................................. 94 Capital Reserve - Capital Projects Fund ............................................................................................. 95 Building Fund - Capital Projects Fund ...............................................................................................96Campus Activity Special Revenue Fund............................................................................................. 97 Transportation Fund ............................................................................................................................98Food & Nutrition Services Special Revenue Fund .............................................................................99
Combining Statement of Net Position – Internal Service Funds.....................................................................102Combining Statement of Revenues, Expenses, and Changes in Fund Net Position –Internal
Service Funds .......................................................................................................................................... 104Combining Statement of Cash Flows - Internal Service Funds.......................................................................106 Component Units:Combining Statement of Net Position............................................................................................................. 110Combining Statement of Activities ................................................................................................................. 113Combining Balance Sheet ............................................................................................................................... 114Combining Statement of Revenues, Expenditures, and Changes in Fund Balances (Deficit)......................... 116
\
Statistical SectionNet Assets/Net Position by Component ................................................................................................................. 120Changes in Net Assets/Net Position ....................................................................................................................... 122Fund Balances of Governmental Funds .................................................................................................................126 Changes in Fund Balances of Governmental Funds............................................................................................... 128Assessed Value and Estimated Actual Value of Taxable Property ........................................................................ 130Direct and Overlapping Property Tax Rates........................................................................................................... 132Principal Property Tax Payers ................................................................................................................................ 133Property Tax Levies and Collections ..................................................................................................................... 135Ratios of Outstanding Debt by Type ......................................................................................................................136 Ratios of Net General Bonded Debt Outstanding and Legal Debt Margin ............................................................ 138Demographic and Economic Statistics ................................................................................................................... 140Principal Employers ............................................................................................................................................... 141Full-time Equivalent District Employees by Category........................................................................................... 142Operating Statistics ................................................................................................................................................ 144School Building Information.................................................................................................................................. 145Certificated Staff Data – Number of certificated staff by salary level with average salaries ................................. 146
Colorado Department of Education Auditor’s Electronic Financial Data Integrity Check Figures
Colorado Department of Education Auditor’s Electronic Financial Data Integrity Check Figures ....................... 149
-ii-

November 16, 2020
To the Board of Education and citizens of Jefferson County Public Schools:
The Comprehensive Annual Financial Report for the Jefferson County School District (the district) as of and for the fiscal year ended June 30, 2020, is submitted herewith. State law requires that all local governments publish within five months of the close of each fiscal year a complete set of financial statements presented in conformity with generally accepted accounting principles and audited in accordance with generally accepted auditing standards by a firm of licensed certified public accountants.
The responsibility for both the accuracy of the data and the completeness of the presentation, including all disclosures, rests with the management of the district. This report was prepared by Financial Services, and to the best of our knowledge and belief, the enclosed data is accurate in all material respects and is reported in a manner to present fairly the financial position and results of operations of the various funds of the district. The district’s comprehensive framework of internal controls provides assurance of the accuracy of the reports. District management is responsible for establishing and maintaining internal controls designed to ensure the assets of the district are protected from loss, theft, or misuse and to ensure that adequate accounting data is compiled to allow for the preparation of financial statements in conformity with generally accepted accounting principles. As the cost of internal controls should not outweigh the benefits, the outcome is to provide reasonable, rather than absolute, assurance that the financial statements are free of any material misstatements.
Under provisions of Article 29-1-603, Colorado Revised Statutes, 1973, an independent public accounting firm must perform an annual audit of the district’s accounts. CliftonLarsonAllen LLP, Certified Public Accountants, have issued an unmodified (“clean”) opinion on the district’s financial statements for the year ended June 30, 2020. The independent auditor’s report is located at the front of the financial section of this report.
Readers of this report are encouraged to consider the information presented here in conjunction with additional information presented in Management’s Discussion and Analysis found on pages 17–29 of this report. All disclosures necessary to enable the reader to gain an understanding of the financial activities for the fiscal year ended June 30, 2020, have been included.
For the 2019/2020 fiscal year, the single audit will not be included within this report but will be published as a stand-alone document. Due to delays in audit guidance for the Coronavirus Relief Funds (CRF), the single audit was not completed at the time of publishing the Comprehensive Annual Financial Report.
The District’s ProfileJefferson County School District, No. R-1 (Jeffco) is the second largest K-12 school district in the state of Colorado. The district was formed in 1950 when 39 independent districts were consolidated into a countywide district encompassing the 773 square miles of Jefferson County and five square miles of the City and County of Broomfield, Colorado. The district is a legally separate, primary government entity that operates under an elected five member Board of Education. The Board of Education is the policy-making body of the district. The Board is responsible for educational planning and evaluation, staffing and appraisal, school facilities, financial resources and communication. Board members are elected to alternating four-year terms with elections held every two years. Board members represent a specific area of the county but are elected at large. The district provides a full range of educational programs and services authorized by Colorado state statute to approximately 83,000 enrolled students. District
Financial Services 1829 Denver West Drive, Building #27
Golden, Colorado 80401-3120 phone: 303-982-6843
fax: 303-982-6826 www.jeffcopublicschools.org/finance
-1-
programs and services include basic K-12 education in elementary schools, middle schools, high schools, option schools, special education, vocational education, preschool and numerous other programs.
In 2020, the district has 16 operating charter schools that are legally separate entities. The charter schools are funded based on the Colorado Department of Education stated per pupil revenue. This revenue is directly allocated to each charter school. The charter schools are disclosed as discretely presented component units of the district.
Colorado state statutes require that the district adopts the budget in June prior to the beginning of the subsequent fiscal year. Budget revisions may be adopted prior to January. The district maintains numerous budgetary controls. The objective of these controls is to ensure compliance with legal provisions embodied in the annual appropriated budgetadopted by the Board of Education. Activities of all funds are included in this report. The level of budgetary control (that is, the level at which expenditures cannot legally exceed the appropriated amount) is established by fund. The district also maintains an encumbrance accounting system as one technique of accomplishing budgetary control. Encumbered amounts lapse at year end and are generally re-established in the following year as an obligation against that year’s appropriated budget. As demonstrated by the statements and schedules included in the financial section of this report, the district continues to meet its responsibility for sound financial management.
Consequences of COVID-19 PandemicIn early December, the United States was made aware of a virus rapidly spreading throughout the world. By the spring of 2020, the country experienced a deep economic recession due to the impacts of the coronavirus COVID-19pandemic. A “stay at home order” was issued by Governor Polis that also directed business closures resulting in mass layoffs. As the largest employer in Jefferson County, the district was aware that actions taken by Jeffco Public Schools could have a long-range impact on our students, employees and community. Knowing this, the district made a decision to not implement any staff layoffs for the 2019/2020 school year. The district immediately moved to a remote learning model that allowed students to continue their education from home. Emergency federal funds through the Coronavirus Aid, Relief and Economic Security (CARES) Act signed into law on March 27, 2020, were made available to states and school districts to cover COVID-19 related expenditures. These funds helped the district avoid budget reductions for 2019/2020; however, whether those fund will be available for 2020/2021 is yet to be determined.
District leadership continues to monitor the impacts related to COVID-19. The pandemic presents an unprecedented challenge for education nationwide including what funding will become available and whether or not a resurgence of COVID-19 will result in further education interruptions and economic damage. District leadership expects state budgetary pressure and anticipates a large budget shortfall that will require substantial budget reductions.
Assessment of the District’s Economic ConditionThe national economy was greatly impacted by the pandemic and more than 22.1 million jobs were lost between February and April. With the help of unprecedented federal monetary policy, large-scale fiscal aid helped to offset some of the impacts of business closures allowing the nation to add back 2.5 million jobs in May. The boost of onetime economic impact payments, paycheck protection program incentives, and enhanced unemployment insurance benefits contributed to a bump in household incomes and supplemented consumer activity; however, it is expected that as federal aid ends, economic activity will slow.
The impacts of COVID-19, business closures and stay at home orders that swept across the nation, ended the longest U.S. economic expansion on record. The national real gross domestic product (GDP) declined at an annualized rate of 5.7 percent in the first quarter of 2020 and 32.9 percent in the second quarter. Economists continue to update projections to account for the economic impacts of the pandemic. Without knowing when the pandemic will be over and what additional economic disruption could occur due to new waves of COVID-19, uncertainty exists as to how soon the economy will recover and what economic activity will look like.
Colorado’s economy was strong for the first three quarters of the fiscal year, but took a severe shift in the fourth quarter due to the impacts of COVID-19.
Colorado State revenue continues to look bleak with mixed results from the election on November 3, 2020. The Gallagher Amendment Repeal (Amendment B) passed, preventing further loss of local property tax revenues and Proposition 116 (Initiative 306) passed, lowering the state tax rate and income to the state. The net effect of these
-2-
changes will depend on decisions at the state for how they will impact schools. An increase on nicotine tax also passed, providing funding for four year olds in preschool, beginning in 2023. There is concern the state will not be able to backfill the loss of revenue or hold harmless the loss of student enrollment from the pandemic which will have a severe impact to the district for 2020/2021 and 2021/2022.
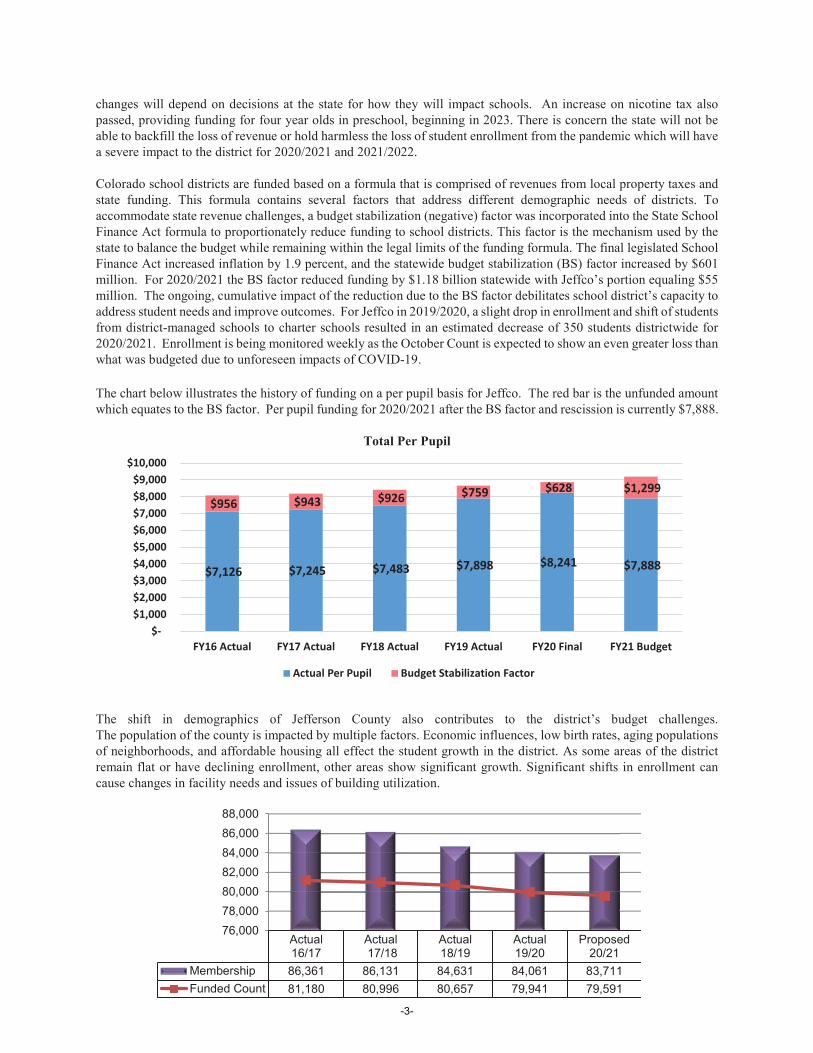
Colorado school districts are funded based on a formula that is comprised of revenues from local property taxes and state funding. This formula contains several factors that address different demographic needs of districts. To accommodate state revenue challenges, a budget stabilization (negative) factor was incorporated into the State School Finance Act formula to proportionately reduce funding to school districts. This factor is the mechanism used by the state to balance the budget while remaining within the legal limits of the funding formula. The final legislated School Finance Act increased inflation by 1.9 percent, and the statewide budget stabilization (BS) factor increased by $601 million. For 2020/2021 the BS factor reduced funding by $1.18 billion statewide with Jeffco’s portion equaling $55million. The ongoing, cumulative impact of the reduction due to the BS factor debilitates school district’s capacity to address student needs and improve outcomes. For Jeffco in 2019/2020, a slight drop in enrollment and shift of students from district-managed schools to charter schools resulted in an estimated decrease of 350 students districtwide for 2020/2021. Enrollment is being monitored weekly as the October Count is expected to show an even greater loss than what was budgeted due to unforeseen impacts of COVID-19.
The chart below illustrates the history of funding on a per pupil basis for Jeffco. The red bar is the unfunded amount which equates to the BS factor. Per pupil funding for 2020/2021 after the BS factor and rescission is currently $7,888.
Total Per Pupil
The shift in demographics of Jefferson County also contributes to the district’s budget challenges. The population of the county is impacted by multiple factors. Economic influences, low birth rates, aging populations of neighborhoods, and affordable housing all effect the student growth in the district. As some areas of the district remain flat or have declining enrollment, other areas show significant growth. Significant shifts in enrollment can cause changes in facility needs and issues of building utilization.
$7,126 $7,245 $7,483 $7,898 $8,241 $7,888
$956 $943 $926 $759 $628 $1,299
$- $1,000 $2,000 $3,000 $4,000 $5,000 $6,000 $7,000 $8,000 $9,000
$10,000
FY16 Actual FY17 Actual FY18 Actual FY19 Actual FY20 Final FY21 Budget
Actual Per Pupil Budget Stabilization Factor
Actual16/17
Actual 17/18
Actual18/19
Actual19/20
Proposed20/21
Membership 86,361 86,131 84,631 84,061 83,711Funded Count 81,180 80,996 80,657 79,941 79,591
76,00078,00080,00082,00084,00086,00088,000
-3-

Major Initiatives
Jeffco GenerationsJeffco Public Schools (district) has deep and meaningful generational ties that crisscross our community and a tradition of quality on which to build. But the district must also adapt and change to prepare our students for their future. A central element of this change will be to take on entrepreneurial spirit and a willingness to innovate and adapt. District leadership continues to engage community members, students, and staff to elevate Jeffco’s values and desired educational experiences for Jeffco students. This engagement resulted in the Jeffco Generations Vision and Strategic Plan. The Jeffco Generations Vision and Strategic Plan define the characteristics needed for Jeffco graduates to lead and participate in tomorrow’s economy and society.
The Jeffco Generations Strategic Plan focuses on “keeping the main thing, the main thing,” and the main thing is learning. More specifically a focus on authentic, relevant and engaging learning experiences for all students. These learning experiences include the incorporation of the Jeffco Generations Skills:
Content MasteryCivic & Global EngagementSelf-Direction & Personal ResponsibilityCommunicationCritical & Creative ThinkingCollaboration & Leading by InfluenceAgility & Adaptability
In addition to a focus on the student learning experiences, Jeffco Generations recognizes that students come to school with different strengths, backgrounds, advantages and challenges. To meet the needs of all Jeffco’s students, the strategic plan additionally identifies priorities in “Conditions for Learning” and “Readiness for Learning.”
The Jeffco Generations Strategic Plan is organized in three major strategies (Learning, Conditions for Learning, and Readiness for Learning) and more specific areas of focus within each strategy referred to as “tactics”:
Learning StrategyTransform Student TaskResponsive TeachingCustomized PathwaysTechnology to Transform LearningExpanding (the full range of) Human Experiences
Conditions for Learning StrategyProfessional Model of TeachingHigh ExpectationsCommitment to EquityEducator Learning
Readiness for Learning StrategySchools as Community HubsSocial-Emotional SupportsExpand Early Childhood EducationFamily and Community Engagement
Budget Development ProcessThe budget development process is a long-term initiative that aligns available resources to positively impact student achievement using two budget modeling processes—Student Based Budgeting and Budgeting for Outcomes. The district’s approach encourages communication and leverage between organizational units within the entire district and
-4-
focuses attention on district goals. Staff and community input during the process is a key component of its success. The district is committed to the continued process of long range planning with the strategic plan as a benchmark for decisions. Please refer to the 2020/2021 Adopted Budget for details on the budgeting process.
Student Based BudgetingStudent based budgeting (SBB) continues to provide the opportunity for principals to make site-specific, student based decisions on the deployment of resources to obtain the greatest student achievement. It provides greater flexibility to support students’ needs and goals, is a uniform and consistent funding model across all schools, and provides better transparency for school funding. District leadership continues to partner with principals, ensuring the SBB model continues to support such needs.
Budgeting For OutcomesThe district fully implemented Budgeting for Outcomes (BFO) in 2017/2018. BFO continues to use an explicitplanning process to identify district-wide goals and aims to fund programs that will directly contribute to the success of those identified goals. Recognizing that Jeffco’s community requires change from year to year, BFO allows for budgeting based on current goals for the upcoming budget year and consideration for other departments’ future needs. Please refer to the 2020/2021 Adopted Budget for details on specific department BFO forms.
Fiscal Management and Strategic PoliciesThe district has adopted a conservative approach for long-range planning to improve the financial condition of the district. The following are the key components of this plan:
The budget cycle for each budget year will begin in the fall to ensure adequate time for input and any program adjustments due to projected revenue increases or decreases.The district’s annual budget is projected for the next four years to enable long-range planning, identify and correct possible issues, and ensure fiscal responsibility.The district continues to support the internal audit department to provide site evaluations of accounting and internal control processes.An independent citizen Financial Oversight Committee meets to review district financial management practices, activities, make recommendations, and report to the Board of Education.The Audit Committee assists and supports the Board of Education with fulfilling its fiduciary responsibilities. The committee is comprised of members of the Board of Education and community.Quarterly financial reports are a Board of Education agenda item. The Board reviews the quarterly reports with the Financial Oversight Committee and the Audit Committee. The reports are designed to meet the Colorado Revised Statute 22-45-102 requirements.
Student AchievementThe district’s focus on student achievement includes meeting the goals defined by Jeffco’s Board of Education, the Colorado Department of Education and the federal government as indicated below:
1) Jeffco’s Board of Education has defined specific academic targets in the following Board Policy Ends:
Ends 1: Every school and the district will have an engaging climate and culture.Ends 2: Every school and the district will ensure that every student has the opportunity to work towards
being connected to career, college and/or life aspirations through systems and practices.Ends 3: Every school and the district will have effective learning systems and shared leadership.
Jeffco Public Schools has identified system indicators to measure outcomes for the district’s strategic plan.
2) The Education Accountability Act of 2009 (SB 09-163) holds the state, districts, and individual public schools accountable for performance on the same set of indicators and related measures statewide. The state accountability system is administered by the Colorado Department of Education (CDE). Colorado
-5-
aims to prepare all students for postsecondary learning or to enter the workforce by the time they graduate from the K-12 system. CDE has defined three performance indicator areas key to achieving this outcome:• Academic Achievement• Academic Growth• Postsecondary and Workforce Readiness (high school only) CDE’s District Performance Framework and School Performance Framework reports provide information about the levels of attainment in each of the three state performance indicators. For districts, the overall evaluation leads to their accreditation. For schools, the overall evaluation leads to the type of plan schools will implement.
3) The Federal government passed the Every Student Succeeds Act (ESSA) in December 2015 and CDE has continued the implementation of the state ESSA plan in the current school year. Under ESSA, schools are identified for targeted or comprehensive support with additional requirements for their Unified Improvement Plans.
Due to the state of the economy related to COVID-19, exceptions are being made from testing requirements.
Licensed Employee Compensation ChallengesHaving an effective teacher in every classroom remains at the center of the Human Resources work. Multiple factors contribute to this including a robust selection process; performance management and feedback processes; and competitive pay and benefits. For 2019/2020, the Board ratified an agreement with the Jefferson County Education Association (JCEA) that included a step increase to eligible employees, educational achievement level change to eligible employees, a cost of living increase of 2.5 percent, and implementation of longevity compensation to honor the past pay freezes incurred by JCEA staff. A 2.67 percent increase had been approved in March 2019 with the passage of the 5A Mill Levy Override (MLO). The Board ratified an agreement with the Jeffco Educational Support Professionals Association (JESPA) that included a 2.52 percent salary schedule adjustment (from 5A MLO ongoing dollars), minor structural changes to the salary schedule, step increases for eligible employees, and a cost of living increase of 2.5 percent.
21st Century Learning Environments – Capital ImprovementsThe condition of the physical infrastructure is integral to the core mission of the district. The district transfers revenue to the capital reserve fund in order to expand, improve and maintain its existing property portfolio. This capital improvement process extends over multiple years to multiple decades and is measured in the context of long-term life-cycle management. Once constructed, a facility has a service life of at least 50 years as demonstrated by a number of facilities that are over 50, 60 and approaching 70 years old.
The district’s policy for capital improvement funding has been that all large scale capital improvement projects are financed through the use of general obligation bonds. Those projects include construction of new facilities and capital renewal including, but not limited to, additions to existing facilities, major renovations, replacement of roofing, envelope improvements (doors, windows), and building systems such as heating/ventilating, electrical and plumbing. When bond funding has not been available and there is a critical need for new buildings or additions, certificates of participation or reserves have been used as a funding vehicle.
All smaller scale capital improvements are financed from the capital reserve fund. The capital reserve fund will spend between $17 million and $19 million each year for capital improvements to facilities. The amount, while seemingly large, becomes small when put in the perspective of supporting 88 elementary schools, six K-8 schools, four preschool centers, 17 middle schools, 15 high schools, two 7-12 schools, 18 districtwide/option schools, four stadiums, and numerous other programs and support facilities with an area of approximately 12 million square feet and replacement value of $2.94 billion. The district’s facility master planning process is critical in prioritizing the needs for schools. Projects in this category include improvement or replacement of finishes, fixtures and furnishings, security systems, fire alarm, parking lots, site work and minor remodeling.
-6-
The Capital Asset Advisory Committee monitors the planning of capital needs and the implementation of capital projects, including bond programs. The Capital Asset Advisory Committee is made up of independent citizens with experience in the construction industry.
District Wide Facilities Master Plan
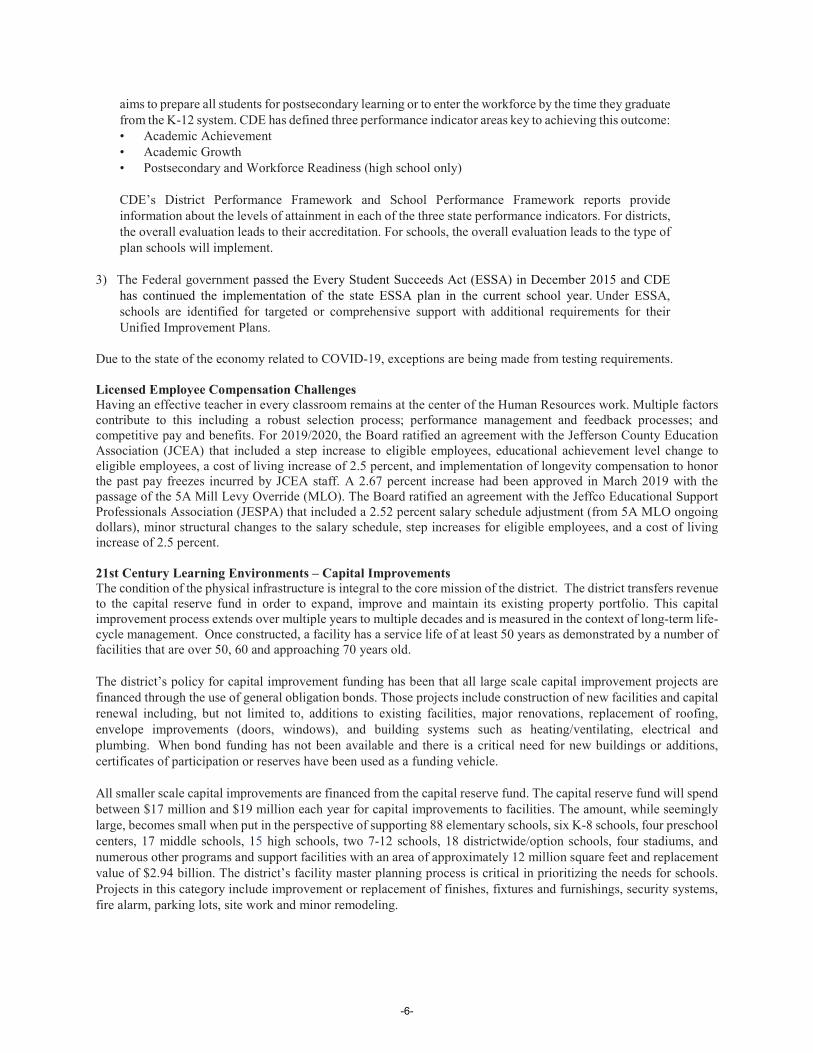
In compliance with district policies, long-term facilities planning and the development of a district-wide Facilities Master Plan (FMP) is continuing work, of which, current and accurate data is the foundation. In 2009, to ensure consistent and objective collection of data, the district authorized a comprehensive assessment of its facilities. The assessment consisted of a capacity analysis, an educational adequacy assessment, a building condition assessment and a review of all site and building systems with a life cycle renewal forecast. The first Facility Condition Assessment Summary of findings was published in September 2010. Each year, staff completes the annual cycle of assessing one-third of the district’s facilities, as well as updated cost estimates and life cycle forecasts. These up-to-date assessments are used for planning and prioritization of all capital spending. Part of the assessment process assigns a Facility Condition Index (FCI) to district facilities. The FCI provides a relative scale of the overall condition of the facility or group of facilities within a facility portfolio. The district will continue to be diligent in analysis, monitoring and management of facilities. The facilities master plan is considered as part of the overall financial plan. Below is a summary of FCI by Site Location from the 2019-2020 Summary of Findings.
In November 2018, the voters of Jefferson County approved a $567 million general obligation bond as part of a six-year, $700-750 million capital improvement program. Planning commenced for district projects that will be constructed during FY21 and beyond.
Renewed Instructional and Business Technology SystemsThe District Technology Plan guides the district’s technology decisions, and because of the rapid changes in technology, the plan is refreshed every year. The plan objectives, expectations and measurements are reviewed and modified every three years in order to accommodate technology changes and/or funding challenges. The District Technology Plan articulates a common district vision and identifies strategies for the use of technology in promoting guaranteed and viable curriculum standards and for developing critical thinking skills that are essential for academic and workplace success. During the spring of 2015/2016 school year, a Technology Convocation team consisting of principals, teachers, digital librarians and staff from the Educational Research and Design (ERD) and Information Technology (IT) departments met to revise the previous 2011-2015 technology plan and complete the 2016-2019 version. Work has begun to publish the 2020-2023 Technology Plan incorporating the Jeffco Generations vision and the tactics associate with technology in the classroom that supports student learning.
-7-
In addition to the work from Jeffco Generations the multi-year technology plan will include the International Society for Technology in Education (ISTE) standards.
The 2020-2023 Technology Plan will focus on the following key principles:• Innovation• Enhancing the user experience• Quality and availability of information• Efficiency in delivery technology
In addition, the Technology and Data Privacy Advisory Committee (TDPAC) advises the Board of Education on district technology strategies, systems and overall data governance. The committee reviews the District’s Technology Plan considering alignment with instructional goals and opportunities for technology innovation as well as district privacy policies and practices. Data governance and the protection of student and staff information is also a critical focus at the district. Ensuring that data is protected with all technology processes is required to create a consistent and secure handling of the data across the district.
Jeffco has maintained its status as a national K-12 technology leader with the collaboration of technology and instructional staff to develop and implement robust data systems. As the district thinks strategically about emerging instructional trends, the Information Technology department is leading efforts to plan and implement the build-out of our IT infrastructure. A three-phase approach was developed to address these critical infrastructure needs: Classroom Wireless Access, Internet Access, and Wide Area Network (WAN) which connects schools (buildings) to the district offices (Ed Center/Quail) our “School Links.” The IT department has completed two of the three phases: 1) The Mobile Device Readiness (MDR) program funded in 2010 is ongoing and sustains the classroom wireless learning environment; and 2) Internet access was implemented in 2016 with the addition of the Front Range GigaPop Fiber Ring that allows internet speeds capable of delivering the demand for our students and educators. The final phase focuses on providing Gigabit fiber connectivity to our schools and re-architecting the network they use to connect to the internet. This phase involves completing a 14-school proof of concept (POC) in the Northwest Arvada area where we have partnered with the City of Arvada to build the next generation network. The work on this pilot and the development of Intergovernmental Agreements (IGAs) with the City of Arvada will provide a template for future work with the remaining municipalities in the district and their divisions such as (emergency services, libraries, etc.).
Awards and AcknowledgementsThe Government Finance Officers’ Association of the United States and Canada (GFOA) awarded a Certificate of Achievement for Excellence in Financial Reporting to the Jefferson County School District, No. R-1, for its comprehensive annual financial report (CAFR) for the fiscal year ended June 30, 2019. This was the thirty-seventhconsecutive year the district has received this prestigious award. In order to be awarded a Certificate of Achievement, the district published an easily readable and efficiently organized comprehensive annual financial report. This report satisfied both generally accepted accounting principles and applicable legal requirements. A Certificate of Achievement is valid for a period of one year only. We believe that our current CAFR continues to meet the Certificate of Achievement Program’s requirements, and we are submitting it to the GFOA to determine its eligibility for another certificate.
We would like to thank our Interim Superintendent Kristopher Schuh and the Board of Education for their interest and support in planning and conducting the financial operations of the Jefferson County School District in a responsible and professional manner. We would also like to express our appreciation to the district’s independent auditors, CliftonLarsonAllen LLP, for the expert manner in which they have accomplished the audit.
Respectfully submitted,
Nicole StewartInterim Chief Financial Officer
-8-
-9-
-10-
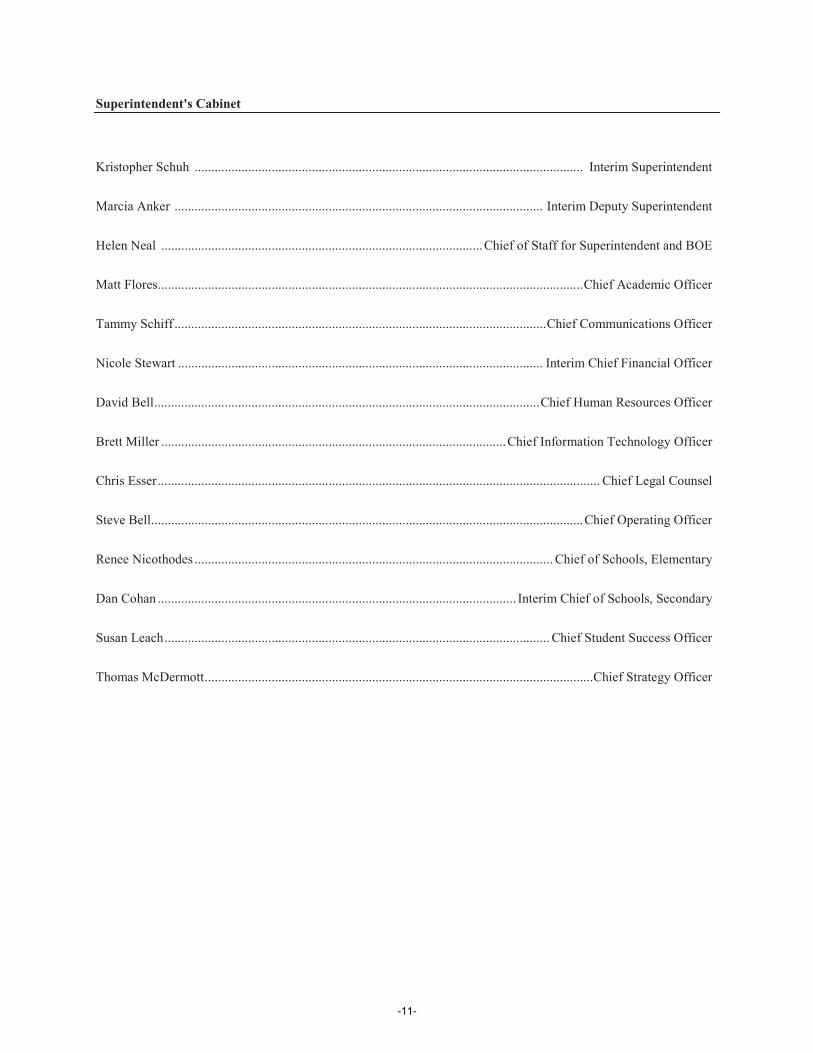
Superintendent's Cabinet
Kristopher Schuh .................................................................................................................... Interim Superintendent
Marcia Anker .............................................................................................................. Interim Deputy Superintendent
Helen Neal ................................................................................................Chief of Staff for Superintendent and BOE
Matt Flores...............................................................................................................................Chief Academic Officer
Tammy Schiff ...............................................................................................................Chief Communications Officer
Nicole Stewart ............................................................................................................. Interim Chief Financial Officer
David Bell...................................................................................................................Chief Human Resources Officer
Brett Miller .......................................................................................................Chief Information Technology Officer
Chris Esser.................................................................................................................................... Chief Legal Counsel
Steve Bell................................................................................................................................. Chief Operating Officer
Renee Nicothodes ........................................................................................................... Chief of Schools, Elementary
Dan Cohan ........................................................................................................... Interim Chief of Schools, Secondary
Susan Leach................................................................................................................... Chief Student Success Officer
Thomas McDermott....................................................................................................................Chief Strategy Officer
-11-

-12-
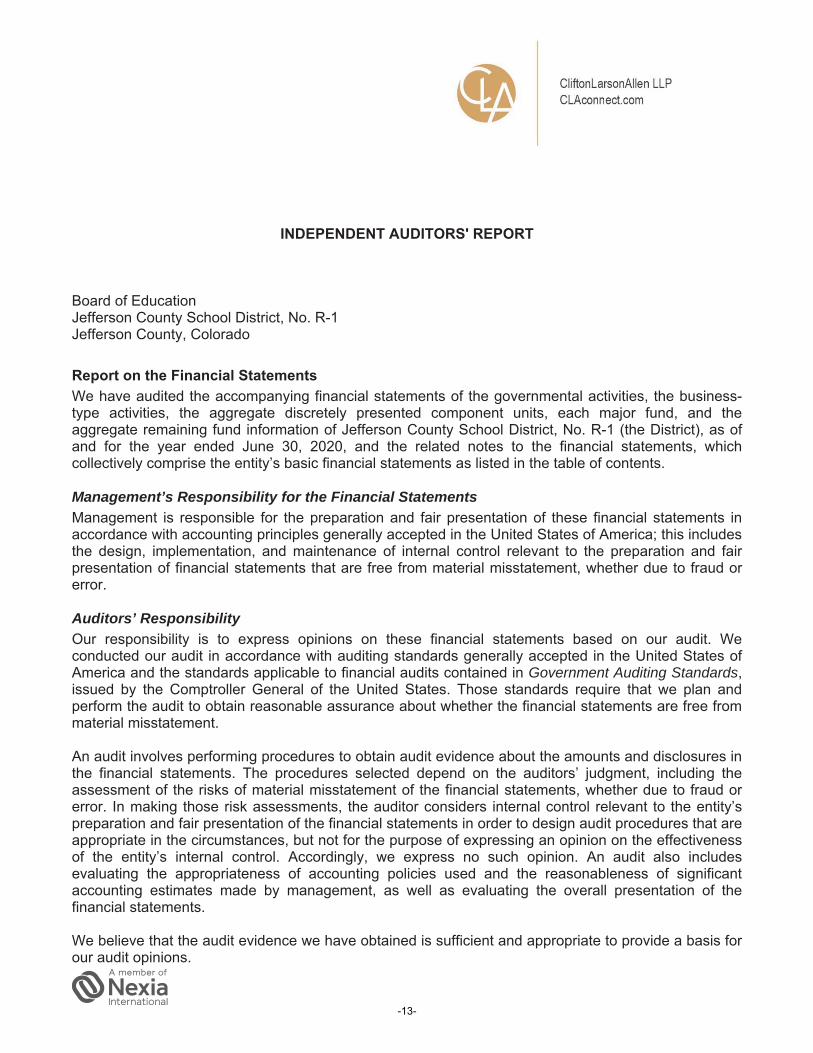
INDEPENDENT AUDITORS' REPORT
Board of Education Jefferson County School District, No. R-1 Jefferson County, Colorado
Report on the Financial Statements We have audited the accompanying financial statements of the governmental activities, the business-type activities, the aggregate discretely presented component units, each major fund, and the aggregate remaining fund information of Jefferson County School District, No. R-1 (the District), as of and for the year ended June 30, 2020, and the related notes to the financial statements, which collectively comprise the entity’s basic financial statements as listed in the table of contents.
Management’s Responsibility for the Financial Statements Management is responsible for the preparation and fair presentation of these financial statements in accordance with accounting principles generally accepted in the United States of America; this includes the design, implementation, and maintenance of internal control relevant to the preparation and fair presentation of financial statements that are free from material misstatement, whether due to fraud or error.
Auditors’ Responsibility Our responsibility is to express opinions on these financial statements based on our audit. We conducted our audit in accordance with auditing standards generally accepted in the United States of America and the standards applicable to financial audits contained in Government Auditing Standards, issued by the Comptroller General of the United States. Those standards require that we plan and perform the audit to obtain reasonable assurance about whether the financial statements are free from material misstatement.
An audit involves performing procedures to obtain audit evidence about the amounts and disclosures in the financial statements. The procedures selected depend on the auditors’ judgment, including the assessment of the risks of material misstatement of the financial statements, whether due to fraud or error. In making those risk assessments, the auditor considers internal control relevant to the entity’s preparation and fair presentation of the financial statements in order to design audit procedures that are appropriate in the circumstances, but not for the purpose of expressing an opinion on the effectiveness of the entity’s internal control. Accordingly, we express no such opinion. An audit also includes evaluating the appropriateness of accounting policies used and the reasonableness of significant accounting estimates made by management, as well as evaluating the overall presentation of the financial statements.
We believe that the audit evidence we have obtained is sufficient and appropriate to provide a basis for our audit opinions.
-13-
Board of Education Jefferson County School District, No. R-1
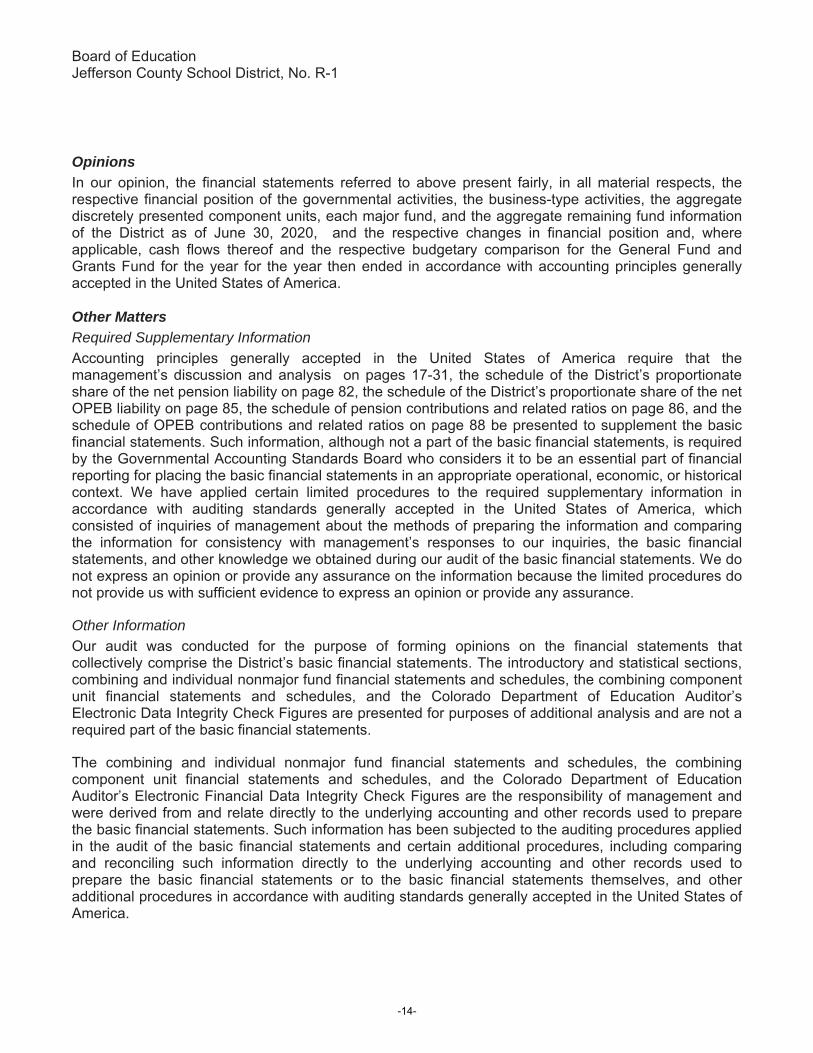
Opinions In our opinion, the financial statements referred to above present fairly, in all material respects, the respective financial position of the governmental activities, the business-type activities, the aggregate discretely presented component units, each major fund, and the aggregate remaining fund information of the District as of June 30, 2020, and the respective changes in financial position and, where applicable, cash flows thereof and the respective budgetary comparison for the General Fund and Grants Fund for the year for the year then ended in accordance with accounting principles generally accepted in the United States of America. Other Matters Required Supplementary Information Accounting principles generally accepted in the United States of America require that the management’s discussion and analysis on pages 17-31, the schedule of the District’s proportionate share of the net pension liability on page 82, the schedule of the District’s proportionate share of the net OPEB liability on page 85, the schedule of pension contributions and related ratios on page 86, and the schedule of OPEB contributions and related ratios on page 88 be presented to supplement the basic financial statements. Such information, although not a part of the basic financial statements, is required by the Governmental Accounting Standards Board who considers it to be an essential part of financial reporting for placing the basic financial statements in an appropriate operational, economic, or historical context. We have applied certain limited procedures to the required supplementary information in accordance with auditing standards generally accepted in the United States of America, which consisted of inquiries of management about the methods of preparing the information and comparing the information for consistency with management’s responses to our inquiries, the basic financial statements, and other knowledge we obtained during our audit of the basic financial statements. We do not express an opinion or provide any assurance on the information because the limited procedures do not provide us with sufficient evidence to express an opinion or provide any assurance.
Other Information Our audit was conducted for the purpose of forming opinions on the financial statements that collectively comprise the District’s basic financial statements. The introductory and statistical sections, combining and individual nonmajor fund financial statements and schedules, the combining component unit financial statements and schedules, and the Colorado Department of Education Auditor’s Electronic Data Integrity Check Figures are presented for purposes of additional analysis and are not a required part of the basic financial statements.
The combining and individual nonmajor fund financial statements and schedules, the combining component unit financial statements and schedules, and the Colorado Department of Education Auditor’s Electronic Financial Data Integrity Check Figures are the responsibility of management and were derived from and relate directly to the underlying accounting and other records used to prepare the basic financial statements. Such information has been subjected to the auditing procedures applied in the audit of the basic financial statements and certain additional procedures, including comparing and reconciling such information directly to the underlying accounting and other records used to prepare the basic financial statements or to the basic financial statements themselves, and other additional procedures in accordance with auditing standards generally accepted in the United States of America.
-14-
Board of Education Jefferson County School District, No. R-1
In our opinion, the combining and individual nonmajor fund financial statements and schedules, the combining component unit financial statements and schedules, and the Colorado Department of Education Auditor’s Electronic Financial Data Integrity Check Figures are fairly stated, in all material respects, in relation to the basic financial statements as a whole.
The introductory section and statistical section listed in the table of contents have not been subjected to the auditing procedures applied in the audit of the basic financial statements, and accordingly, we do not express an opinion or provide any assurance on them. Other Reporting Required by Government Auditing Standards In accordance with Government Auditing Standards, we have also issued our report dated November 16, 2020, on our consideration of the District's internal control over financial reporting and on our tests of its compliance with certain provisions of laws, regulations, contracts, and grant agreements and other matters. The purpose of that report is solely to describe the scope of our testing of internal control over financial reporting and compliance and the results of that testing, and not to provide an opinion on the effectiveness of the District’s internal control over financial reporting or on compliance. That report is an integral part of an audit performed in accordance with Government Auditing Standards in considering the District’s internal control over financial reporting and compliance.
a CliftonLarsonAllen LLP
Greenwood Village, Colorado November 16, 2020
-15-

-16-

Management’s Discussionand Analysis
-17-

$(2,500,000,000)
$(2,000,000,000)
$(1,500,000,000)
$(1,000,000,000)
$(500,000,000)
$-
$500,000,000
Net investmentin capital assets
Grants Debt Service Food Services TABOR Unrestricted
Fiscal Year 2019 Fiscal Year 2020
$-
$100,000,000
$200,000,000
$300,000,000
$400,000,000
$500,000,000
$600,000,000
IntergovernmentalState Equalization
Local Property Taxes Earnings onInvestments
Specific OwnershipTaxes - Non Finance
Act
Grants andContributions
Charges For Services
Fiscal Year 2019
Fiscal Year 2020
Primary GovernmentGovernment-wideNet Position:Increased$288 millionfrom prior year
Primary GovernmentGovernment-wide Revenues: Increased $51million from prior year.
-18-
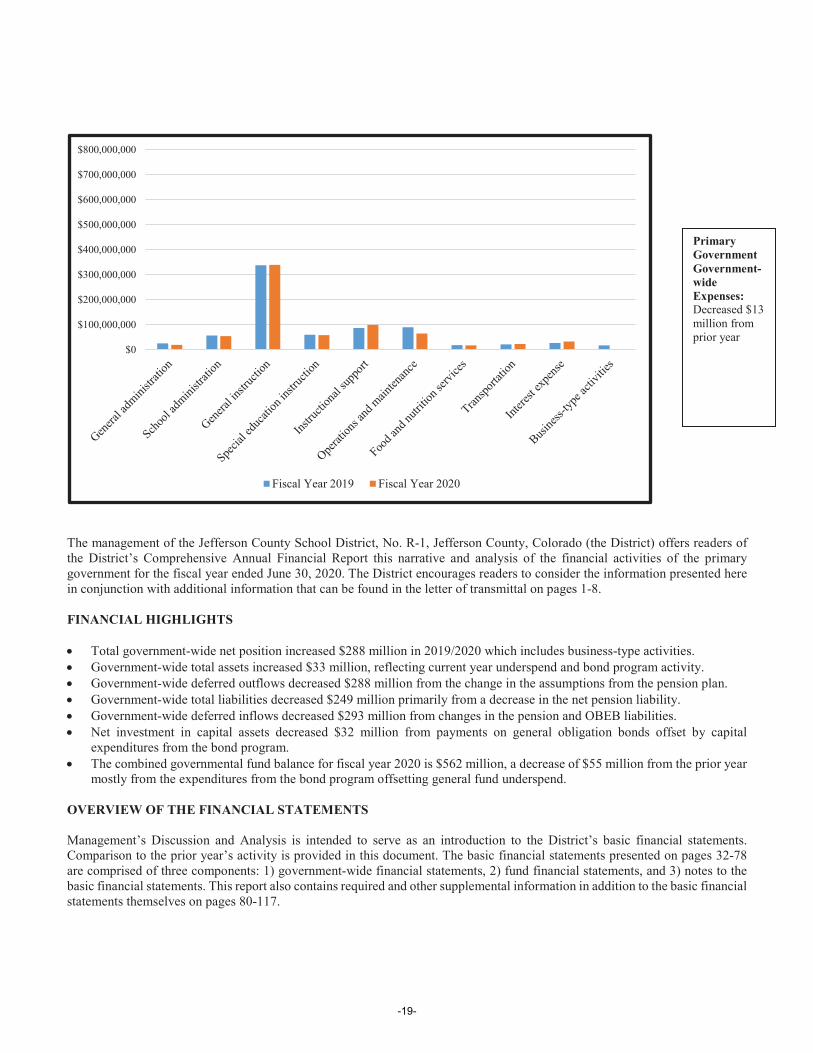
The management of the Jefferson County School District, No. R-1, Jefferson County, Colorado (the District) offers readers of the District’s Comprehensive Annual Financial Report this narrative and analysis of the financial activities of the primary government for the fiscal year ended June 30, 2020. The District encourages readers to consider the information presented here in conjunction with additional information that can be found in the letter of transmittal on pages 1-8.
FINANCIAL HIGHLIGHTS
Total government-wide net position increased $288 million in 2019/2020 which includes business-type activities.Government-wide total assets increased $33 million, reflecting current year underspend and bond program activity.Government-wide deferred outflows decreased $288 million from the change in the assumptions from the pension plan.Government-wide total liabilities decreased $249 million primarily from a decrease in the net pension liability. Government-wide deferred inflows decreased $293 million from changes in the pension and OBEB liabilities. Net investment in capital assets decreased $32 million from payments on general obligation bonds offset by capital expenditures from the bond program. The combined governmental fund balance for fiscal year 2020 is $562 million, a decrease of $55 million from the prior yearmostly from the expenditures from the bond program offsetting general fund underspend.
OVERVIEW OF THE FINANCIAL STATEMENTS
Management’s Discussion and Analysis is intended to serve as an introduction to the District’s basic financial statements. Comparison to the prior year’s activity is provided in this document. The basic financial statements presented on pages 32-78are comprised of three components: 1) government-wide financial statements, 2) fund financial statements, and 3) notes to the basic financial statements. This report also contains required and other supplemental information in addition to the basic financial statements themselves on pages 80-117.
$0
$100,000,000
$200,000,000
$300,000,000
$400,000,000
$500,000,000
$600,000,000
$700,000,000
$800,000,000
Fiscal Year 2019 Fiscal Year 2020
Primary GovernmentGovernment-wide Expenses:Decreased $13 million from prior year
-19-
Government-wide financial statements
The government-wide financial statements are designed to provide the reader of the District’s Comprehensive Annual Financial Report a broad overview of the financial activities in a manner similar to a private sector business. The government-wide financial statements include the statement of net position and the statement of activities. The statement of net position presents information about all of the District’s assets, deferred outflows of resources, deferred inflows of resources and liabilities. The difference between assets plus deferred outflows of resources and deferred inflows of resources plus liabilities is reported as net position.Over time, changes in net position may serve as a useful indicator whether the financial position of the District is improving or deteriorating.
The statement of activities presents information showing how the net position of the District changed during the current fiscal year. Changes in net position are recorded in the statement of activities when the underlying event occurs, regardless of the timing of related cash flows. Thus, revenues and expenses are reported in this statement even though the resulting cash flow may be recorded in a future period.
The government-wide financial statements consolidate governmental and internal service activities that are supported from taxes and intergovernmental revenues and business-type activities that are intended to recover all or most of their costs from user fees and charges. Governmental activities consolidate governmental funds including the general fund, debt service fund, capital reserve capital projects fund, building fund, grants fund and special revenue funds with internal services funds including the employee benefits fund, the central services fund, the insurance reserve fund and the technology fund. Business-type activities consolidate funds that include the child care fund and property management fund.
The government-wide financial statements also include information on component units that are legally separate from the District(known as the primary government). At the close of the current fiscal year, the District has included information for two component units, the Jefferson County School Finance Corporation and Charter Schools.
The only activity of the District’s Finance Corporation is to act as a conduit for the transfer of funds relating to the issuance and refunding of COPs. The Corporation has no assets or liabilities at June 30, 2020; and, therefore, has no financial impact on the District. Financial information for Charter Schools is presented separately from the primary government because the Charter Schools are considered discrete component units of the District. The financial statements for the Charter School component units can be found on pages 110-117.
The government-wide financial statements can be found on pages 32-33.
Fund financial statements
Fund financial statements are designed to demonstrate compliance with finance-related legal requirements. A fund is a grouping of related accounts that is used to maintain control over resources that have been segregated for specific objectives. Fund financial statements for the District include two of the three possible fund types. The fund types presented here are governmental funds and proprietary funds. The District currently does not use fiduciary fund types.
Governmental funds account for essentially the same information reported in the governmental activities of the government-wide financial statements. However, unlike the government-wide statements, the governmental fund financial statements focus on near-term financial resources and fund balances. Such information may be useful in evaluating the financing requirements in the near term.
Since the governmental funds and the governmental activities report information using the same functions, it is useful to compare the information presented. Because the focus of each report differs, reconciliation is provided on the fund financial statements to assist the reader in comparing the near-term requirements with the long-term needs.
The District maintains eight different governmental funds. The major funds are the general fund, the capital reserve capital projects fund, building fund, the bond redemption debt service fund, and grants fund. They are presented separately in the fund financial statements with the remaining governmental funds combined into a single aggregated presentation labeled other governmental funds. Individual fund information for the non-major funds is presented as supplementary information in this document.
-20-
The District adopts an annual appropriated budget for each of the governmental funds. Budgetary comparison statements for the general fund and grants fund are included in the fund financial statements to demonstrate compliance with the adopted budget. The remaining governmental funds budgetary comparisons are reported as supplementary information.
The basic governmental fund financial statements can be found on pages 34-43.
The District maintains proprietary funds: enterprise funds and internal service funds. Enterprise funds are used to present the same functions as the business-type activities presented in the government-wide financial statements. The fund financial statements of the enterprise funds provide the same information as the government-wide financial statements only in more detail. Internal service funds are used to accumulate and allocate costs internally among the governmental functions.
The enterprise funds (child care fund and property management fund) are listed individually and are considered to be major funds. Individual internal service fund information is presented as other supplementary information in this document. The District’s internal service funds are the central services fund, the employee benefits fund, the insurance reserve fund and the technology fund.
The basic proprietary fund financial statements are presented on pages 44-46.
Notes to the basic financial statements
The notes to the basic financial statements provide additional information that is essential to a full understanding of the data provided in the basic financial statements. The notes can be found on pages 47-78 of this report.
Other information
In addition to the basic financial statements and accompanying notes, this report also contains supplementary information concerning the District’s governmental funds, internal service funds and component units. Combining and individual fund statements and schedules can be found on pages 92-107 of this report.
GOVERNMENT-WIDE FINANCIAL ANALYSIS
Government-wide net position
As noted earlier, net position over time may serve as a useful indicator of a government’s financial position. The District’s net position increased $288 million from the prior year primarily due to the on-behalf payment from the State to PERA for contributions during fiscal year 2020, which reduced the pension liability for the district.
Cash and investments account for 45 percent of the total assets. These assets are available to provide resources for near-term operations of the District and capital construction. Receivables increased over the prior year primarily from slower property tax collections. Due dates were extended for taxpayers impacted by economic closures from the Coronavirus pandemic. The Districtreceives over 64 percent of the annual property tax assessment between March and June. Capital assets are used in the operations of the District. The total capital assets increased in fiscal year 2020 with the 2018 bond program construction projects. Capital assets are discussed in greater detail in the section titled, Capital Assets and Debt Administration, elsewhere in this analysis.
Deferred outflows of resources decreased from prior year with adjustments that reflect the on behalf payment from the state to PERA. The recognition of the difference between expected and actual experience, contributions after the plan measurement date, changes in assumptions, changes in proportionate share, and loss of refunding resulted in a $204 million ending balance, less than the $492 million ending balance the prior year. .
Total liabilities include $1.3 billion in pension liability and $66 million in other postemployment benefit (OPEB) liability. This represents the District’s share in the School Division of PERA. Long term liabilities are discussed in greater detail in the section titled, Capital Assets and Debt Administration, elsewhere in this analysis. The total assets and deferred outflows of resources of the primary government activities are exceeded by liabilities and deferred inflows of resources by $1.4 billion with a negativeunrestricted net position balance of $1.9 billion.
-21-
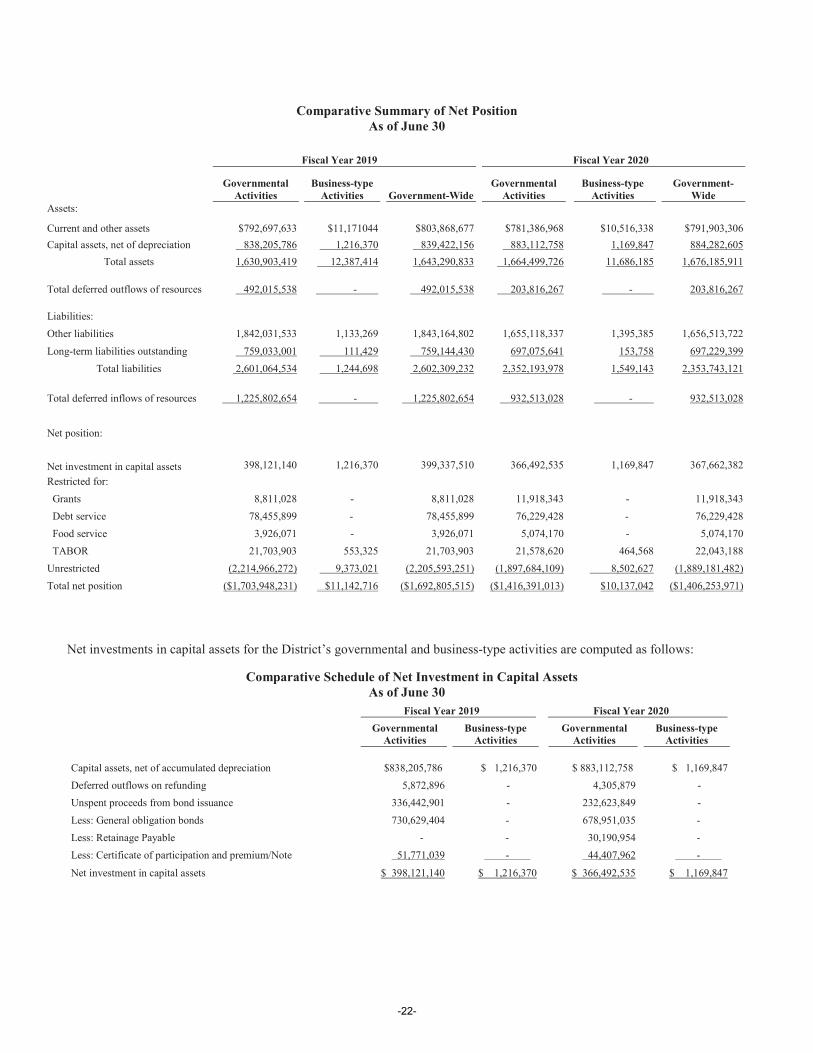
Comparative Summary of Net PositionAs of June 30
Fiscal Year 2019 Fiscal Year 2020
Governmental Activities
Business-type Activities Government-Wide
Governmental Activities
Business-type Activities
Government-Wide
Assets:
Current and other assets $792,697,633 $11,171044 $803,868,677 $781,386,968 $10,516,338 $791,903,306Capital assets, net of depreciation 838,205,786 1,216,370 839,422,156 883,112,758 1,169,847 884,282,605
Total assets 1,630,903,419 12,387,414 1,643,290,833 1,664,499,726 11,686,185 1,676,185,911
Total deferred outflows of resources 492,015,538 - 492,015,538 203,816,267 - 203,816,267
Liabilities:Other liabilities 1,842,031,533 1,133,269 1,843,164,802 1,655,118,337 1,395,385 1,656,513,722Long-term liabilities outstanding 759,033,001 111,429 759,144,430 697,075,641 153,758 697,229,399
Total liabilities 2,601,064,534 1,244,698 2,602,309,232 2,352,193,978 1,549,143 2,353,743,121
Total deferred inflows of resources 1,225,802,654 - 1,225,802,654 932,513,028 - 932,513,028
Net position:
Net investment in capital assets 398,121,140 1,216,370 399,337,510 366,492,535 1,169,847 367,662,382Restricted for:
Grants 8,811,028 - 8,811,028 11,918,343 - 11,918,343Debt service 78,455,899 - 78,455,899 76,229,428 - 76,229,428Food service 3,926,071 - 3,926,071 5,074,170 - 5,074,170TABOR 21,703,903 553,325 21,703,903 21,578,620 464,568 22,043,188
Unrestricted (2,214,966,272) 9,373,021 (2,205,593,251) (1,897,684,109) 8,502,627 (1,889,181,482)Total net position ($1,703,948,231) $11,142,716 ($1,692,805,515) ($1,416,391,013) $10,137,042 ($1,406,253,971)
Net investments in capital assets for the District’s governmental and business-type activities are computed as follows:
Comparative Schedule of Net Investment in Capital AssetsAs of June 30
Fiscal Year 2019 Fiscal Year 2020Governmental
ActivitiesBusiness-type
ActivitiesGovernmental
ActivitiesBusiness-type
Activities
Capital assets, net of accumulated depreciation $838,205,786 $ 1,216,370 $ 883,112,758 $ 1,169,847Deferred outflows on refunding 5,872,896 - 4,305,879 -Unspent proceeds from bond issuance 336,442,901 - 232,623,849 -Less: General obligation bonds 730,629,404 - 678,951,035 - Less: Retainage Payable - - 30,190,954 - Less: Certificate of participation and premium/Note 51,771,039 - 44,407,962 -
Net investment in capital assets $ 398,121,140 $ 1,216,370 $ 366,492,535 $ 1,169,847
-22-
Government-wide activities
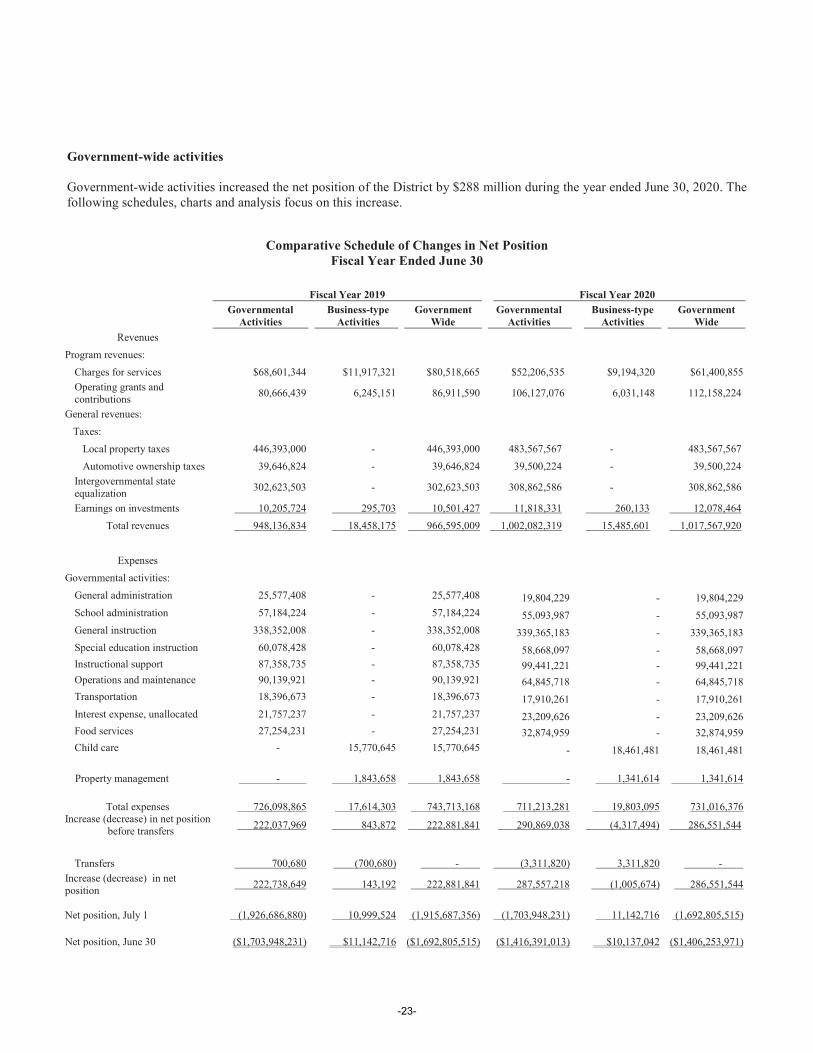
Government-wide activities increased the net position of the District by $288 million during the year ended June 30, 2020. The following schedules, charts and analysis focus on this increase.
Comparative Schedule of Changes in Net PositionFiscal Year Ended June 30
Fiscal Year 2019 Fiscal Year 2020Governmental
ActivitiesBusiness-type
ActivitiesGovernment
WideGovernmental
ActivitiesBusiness-type
ActivitiesGovernment
WideRevenues
Program revenues:Charges for services $68,601,344 $11,917,321 $80,518,665 $52,206,535 $9,194,320 $61,400,855Operating grants and contributions 80,666,439 6,245,151 86,911,590 106,127,076 6,031,148 112,158,224
General revenues:Taxes:
Local property taxes 446,393,000 - 446,393,000 483,567,567 - 483,567,567Automotive ownership taxes 39,646,824 - 39,646,824 39,500,224 - 39,500,224
Intergovernmental state equalization 302,623,503 - 302,623,503 308,862,586 - 308,862,586
Earnings on investments 10,205,724 295,703 10,501,427 11,818,331 260,133 12,078,464 Total revenues 948,136,834 18,458,175 966,595,009 1,002,082,319 15,485,601 1,017,567,920
ExpensesGovernmental activities:
General administration 25,577,408 - 25,577,408 19,804,229 - 19,804,229School administration 57,184,224 - 57,184,224 55,093,987 - 55,093,987General instruction 338,352,008 - 338,352,008 339,365,183 - 339,365,183Special education instruction 60,078,428 - 60,078,428 58,668,097 - 58,668,097Instructional support 87,358,735 - 87,358,735 99,441,221 - 99,441,221Operations and maintenance 90,139,921 - 90,139,921 64,845,718 - 64,845,718Transportation 18,396,673 - 18,396,673 17,910,261 - 17,910,261 Interest expense, unallocated 21,757,237 - 21,757,237 23,209,626 - 23,209,626Food services 27,254,231 - 27,254,231 32,874,959 - 32,874,959 Child care - 15,770,645 15,770,645 - 18,461,481 18,461,481
Property management - 1,843,658 1,843,658 - 1,341,614 1,341,614
Total expenses 726,098,865 17,614,303 743,713,168 711,213,281 19,803,095 731,016,376Increase (decrease) in net position before transfers 222,037,969 843,872 222,881,841 290,869,038 (4,317,494) 286,551,544
Transfers 700,680 (700,680) - (3,311,820) 3,311,820 -
Increase (decrease) in net position 222,738,649 143,192 222,881,841 287,557,218 (1,005,674) 286,551,544
Net position, July 1 (1,926,686,880) 10,999,524 (1,915,687,356) (1,703,948,231) 11,142,716 (1,692,805,515)
Net position, June 30 ($1,703,948,231) $11,142,716 ($1,692,805,515) ($1,416,391,013) $10,137,042 ($1,406,253,971)
-23-
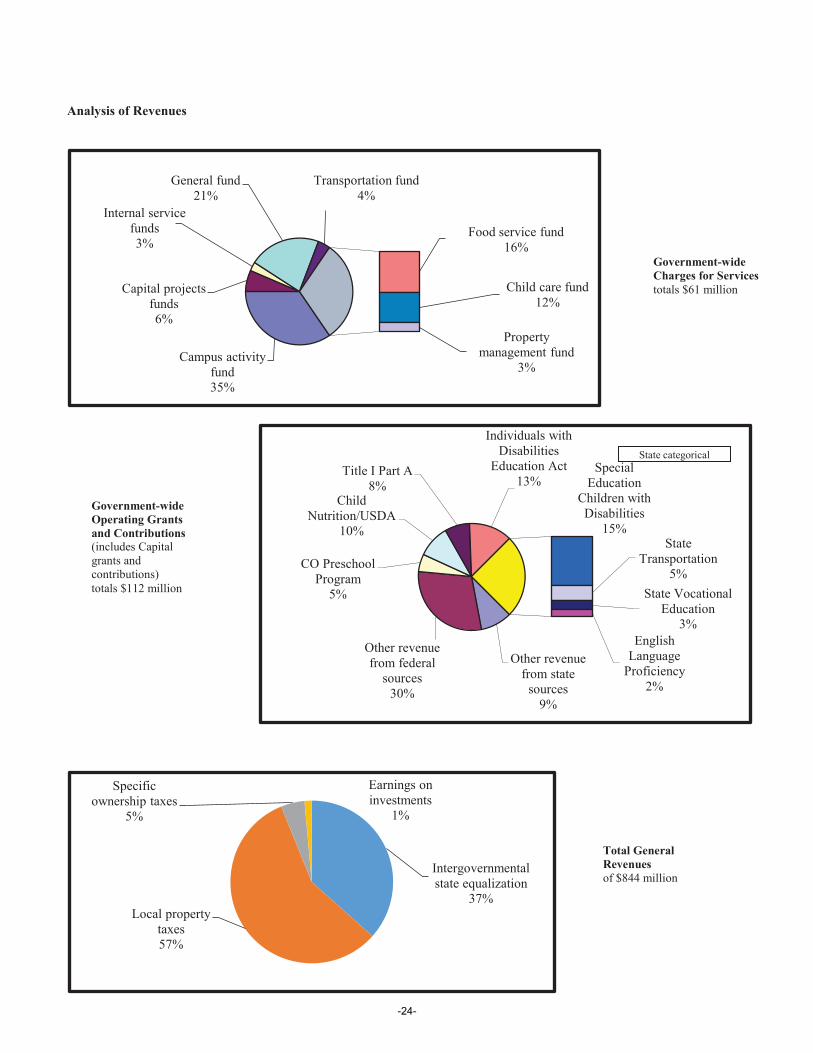
Analysis of Revenues
Campus activity fund 35%
Capital projects funds 6%
Internal service funds 3%
General fund 21%
Transportation fund 4%
Food service fund 16%
Child care fund 12%
Property management fund
3%
Other revenue from state
sources9%
Other revenue from federal
sources30%
CO Preschool Program
5%
Child Nutrition/USDA
10%
Title I Part A8%
Individuals with Disabilities
Education Act 13%
Special Education
Children with Disabilities
15%State
Transportation5%
State Vocational Education
3%English
Language Proficiency
2%
State categorical
Intergovernmental state equalization
37%Local property
taxes57%
Specific ownership taxes
5%
Earnings on investments
1%
Government-wideOperating Grants and Contributions (includes Capital grants and contributions) totals $112 million
Government-wide Charges for Services totals $61 million
Total General Revenues of $844 million
-24-
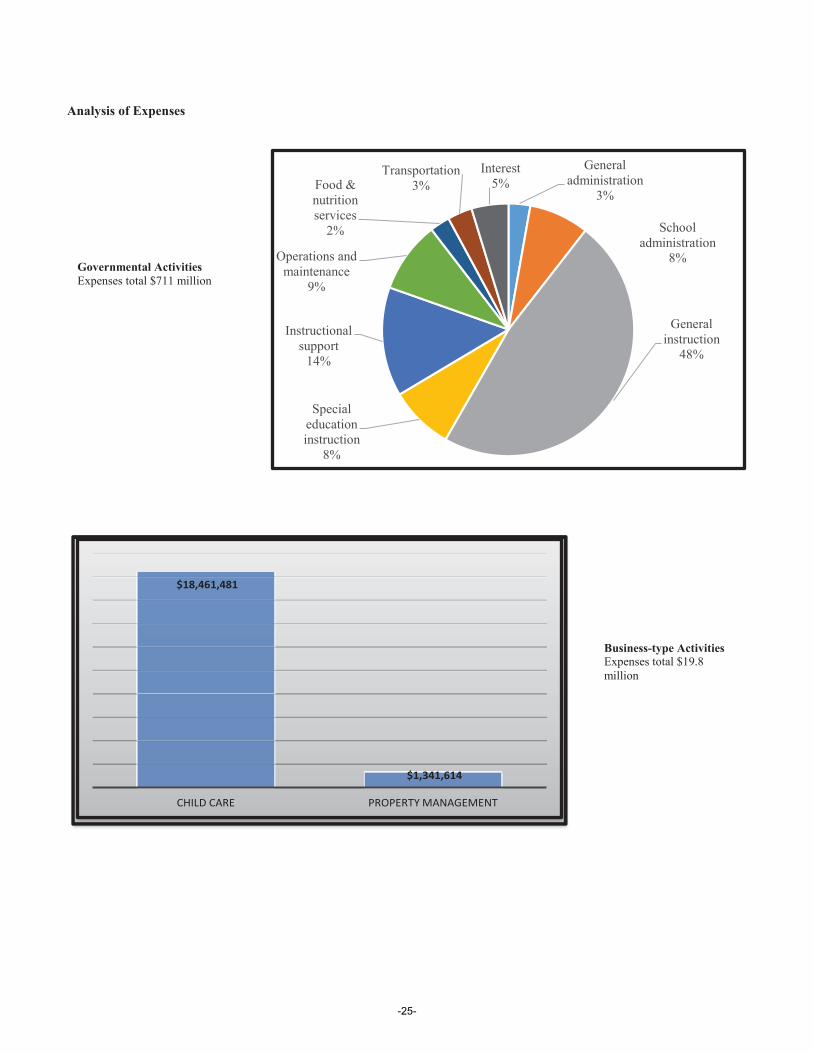
Analysis of Expenses
General administration
3%
School administration
8%
General instruction
48%
Special education instruction
8%
Instructional support
14%
Operations and maintenance
9%
Food & nutrition services
2%
Transportation3%
Interest 5%
$18,461,481
$1,341,614
CHILD CARE PROPERTY MANAGEMENT
Governmental ActivitiesExpenses total $711 million
Business-type Activities Expenses total $19.8 million
-25-

Government-wide revenues
Government-wide revenues increased $51 million from the prior year. Local property taxes increased $37 million from increased assessed values. State equalization funding (state share) increased by $6.2 million due to increased per student funding from the state. Investment income accounted for an additional $1.5 million over prior year. Charges for services decreased $19 million from the prior year due to the pandemic and the closure of schools in March 2020. Grants and other contributions are up $25 million due to Coronavirus Aid, Relief and Economic Security Act (CARES) funding.
Government-wide expenses
Government-wide expenses decreased $12 million from the prior year. Expenditures were lower from closure of schools and conservative spending in fourth quarter due to the pandemic.
Proprietary funds
Governmental activities—internal service funds for the District provide greater detail of the same information presented in the government-wide financial statements. Combining fund financial statements of the internal service funds can be found on pages 102-107of this report. Following are highlights of activity in the District’s internal service funds for fiscal year 2020.
Central services provide copier and printing services for the District. The central services fund ended the year with a net loss of $717,961 compared to the planned net loss of $117,807 and prior year net loss of $95,159. Revenue and expenditures were down from budget and the prior year due to a decrease in the copier program from the new Paper Cut print management software system and building closures as a result COVID-19. The employee benefits fund accounts for dental and vision self-insurance for the District. The fund ended the year better than prior year due to increased participation and a slight increase in premiums. The insurance reserve fund accounts for self-insured property, liability, worker’s compensation and other insurance as needed for the District. Revenues and expenditures are both down over prior year due to the May 2017 hailstorm claim.While the revenue and expenditures for the hailstorm are finished, the large premium increase resulting from statewidelosses continues. The technology fund supports the District’s technology initiatives and systems. Revenues were higher than prior year mostly due to filling vacant positions, wireless access point purchases and district-wide phone replacements.
The District’s business-type activities net position decreased $1 million in 2019/2020 for child care and property management. The basic proprietary fund financial statements are presented on pages 44-46. Key elements that highlight the activities in fiscal year 2020 are as follows:
The child care fund accounts for fees from preschool and before and after school care programs. Despite a 6 percent tuition increase for school age enrichment programs, the overall tuition is lower due to programs being closed for thefourth quarter due to COVID-19. Preschool also experienced a significant drop in tuition due to COVID-19 closures. Services were expanded this fiscal year to one additional school for before/after care and three schools (Dutch Creek, Hutchinson and Colorow) with five additional classrooms for preschool. Expenses are higher than last year due to the increased costs to support the additional classrooms/programs and compensation increases. Transfers were up over the prior year due to the increase in the general fund transfer to cover the expansion of preschool and compensation cost increases. The property management fund accounts for revenues and expenses related to the public use of District property. Building rental revenues and expenditures are down compared to last year primarily as a result of closing facilitiesrelated to COVID-19.
FINANCIAL ANALYSIS OF THE DISTRICT’S GOVERNMENTAL FUNDS
As noted earlier, the District uses fund accounting to ensure and demonstrate compliance with generally accepted accounting principles (GAAP), the School Finance Act and other related legal requirements.
The governmental funds of the District provide information on near-term inflows, outflows and balances of spendable resources. Such information is useful in assessing the District’s financing requirements. Unassigned fund balance, in particular, measures the District’s net resources available for spending at the end of the fiscal year.
-26-
Unassigned fund balance for the District at the end of the fiscal year is comprised of the general fund balance of $108 million,$20 million up from the prior year. Conservative spending from school closures during the pandemic created underspend for the year.
The general fund is the primary operating fund of the District with the majority of funding based on School Finance Act per pupil revenue and property tax. For 2019/2020, the School Finance Act funded 2.7 percent for inflation and decreased the budget stabilization factor $100 million statewide, increasing base per pupil funding. The student funded enrollment for the whole District, including component unit charter schools, decreased by 716 students in both component unit charter schools and district management schools.
Actual expenditures for the general fund were running less than 3 percent lower than plan at the end of the second quarter 2019/2020. With the onset of COVID-19, the school district closed schools to comply with the Governor’s statewide stay at home orders on March 16, 2020. Normal spending trends for the District were interrupted. The funds most impacted were the food service and child care funds from loss of revenues to offset ongoing costs. The Board of Education authorized additional transfers to the food service and child care funds to offset the quarter losses. Coronavirus relief funds (CRF) of $36 million from the state were received in the fourth quarter in the grants fund. $15 million in eligible costs from the general fund were charged to the grant in 2019/2020, creating an additional reserved assigned for subsequent expenditures of $15 million. This reserve will be used in 2020/2021 to help offset cuts in state funding. The CRF funds must be expended by December 31, 2020.
The bond redemption debt service fund has a fund balance of $77 million. This fund accounts for the voter-approved property taxes collected to repay general obligation debt. The current fund balance will be used to make the December 2020 principal and interest payments. The levy to accumulate resources for the June 2021 interest payments and December 2021 principal and interest payments will be certified in December 2020. In compliance with Senate Bill 237, the District has contracted with a third party custodian to administer bond principal and interest payments. The capital reserve capital projects fund is funded with an annual transfer from the general fund. The 2019/2020 transfer was $24 million from the general fund. A portion of transfers for 2019 and 2020 through 2026 will be saved to be used for the 2018 bond program.
The building fund capital projects fund was established to account for the voter approved $326 million of bond proceeds for the 2018 bond program. The projects to be completed with these funds are part of the six year capital improvement plan that was mapped out by site level project scopes.
The grants fund revenues and expenditures were higher than the prior year from the receipt of CRF funds as noted above in the general fund narrative
The campus activity fund accounts for extracurricular student programs and fundraising revenues and expenditures. The closure of schools lowered the revenue and expense by $5 million as activities ceased.
Per state statute, districts that charge a fee for transportation must account for those activities in a separate special revenue fund. The district is required to make a transfer from the general fund, if needed, to balance the fund. The transportation fund does not reflect the impacts from the school closures. Revenue and expenditures are slightly up from the prior year. Even though bus services to students were reduced during the fourth quarter, salaries were continued to be paid to staff.
GENERAL FUND BUDGETARY HIGHLIGHTS
The 2019/2020 Adopted Budget incorporated the additional School Finance Act and local funding to increase compensation to employees and provide additional funding for specific programs. The budget was revised on October 10, 2019 to increase revenue estimates for specific ownership tax and interest and to adjust expense budgets for compensation with the completion of negotiations with the Jefferson County Education Association in August 2019.
A further supplemental appropriation in June 2020 was needed to adjust the budget for additional special education funding andCOVID-19 impacts as follows:
$2.1 million increase to general fund revenue for state categorical special education funding$2.1 million increase in special education instruction for increase in students
-27-
$5.1 million increase in transfers to the food service fund to cover losses and campus activity for increased needs for at-risk students
General fund expenditures were 94 percent of the final budget. The unassigned fund balance for the general fund at the end ofthe fiscal year is $108 million, higher than the prior year due to conservative spending in the fourth quarter. $10 million in 5Amill levy override funds were assigned for use 2020/2021.
As a measure of the general fund’s liquidity, it may be useful to compare both unassigned fund balance and total fund balance to total fund expenditures. Actual expenditures of the general fund including other financing uses—transfers out, amounted to $765million. Unassigned fund balance represents 14 percent of expenditures while total fund balance represents 23 percent of expenditures. This percent for unassigned reserves and fund balance increased from the prior year.
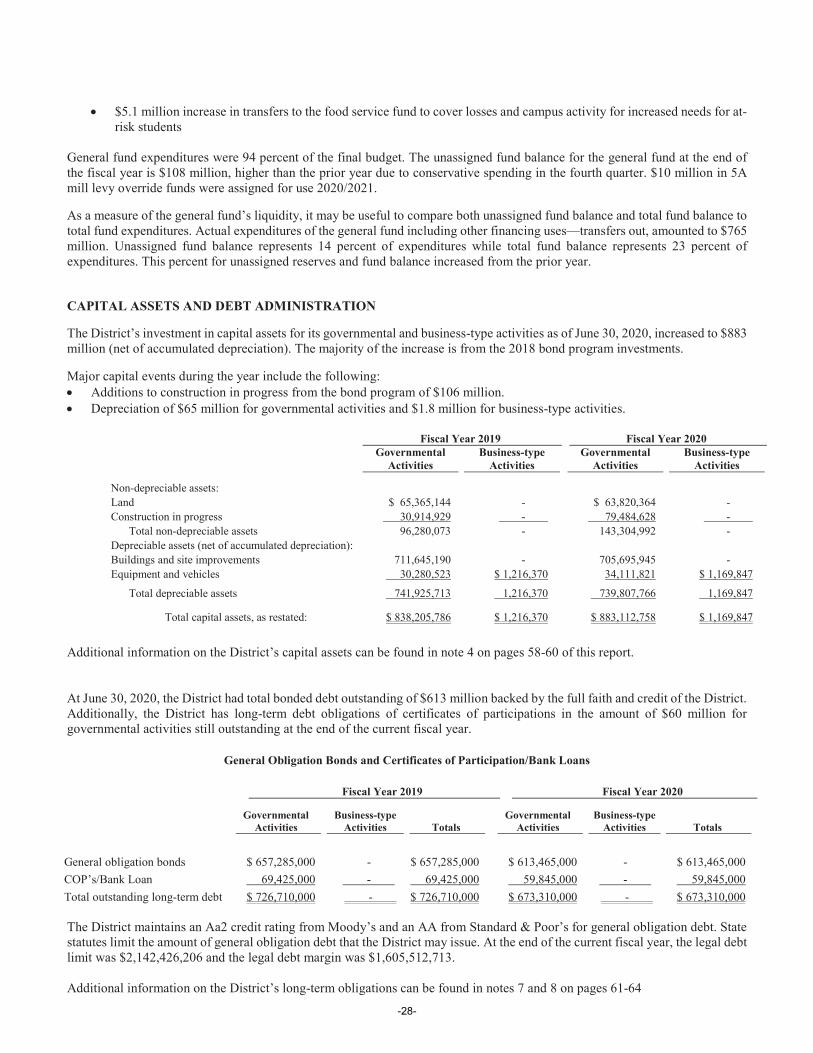
CAPITAL ASSETS AND DEBT ADMINISTRATION
The District’s investment in capital assets for its governmental and business-type activities as of June 30, 2020, increased to $883million (net of accumulated depreciation). The majority of the increase is from the 2018 bond program investments.
Major capital events during the year include the following:Additions to construction in progress from the bond program of $106 million. Depreciation of $65 million for governmental activities and $1.8 million for business-type activities.
Fiscal Year 2019 Fiscal Year 2020Governmental
ActivitiesBusiness-type
ActivitiesGovernmental
ActivitiesBusiness-type
Activities
Non-depreciable assets:Land $ 65,365,144 - $ 63,820,364 - Construction in progress 30,914,929 - 79,484,628 -
Total non-depreciable assets 96,280,073 - 143,304,992 - Depreciable assets (net of accumulated depreciation):Buildings and site improvements 711,645,190 - 705,695,945 - Equipment and vehicles 30,280,523 $ 1,216,370 34,111,821 $ 1,169,847
Total depreciable assets 741,925,713 1,216,370 739,807,766 1,169,847
Total capital assets, as restated: $ 838,205,786 $ 1,216,370 $ 883,112,758 $ 1,169,847
Additional information on the District’s capital assets can be found in note 4 on pages 58-60 of this report.
At June 30, 2020, the District had total bonded debt outstanding of $613 million backed by the full faith and credit of the District.Additionally, the District has long-term debt obligations of certificates of participations in the amount of $60 million for governmental activities still outstanding at the end of the current fiscal year.
General Obligation Bonds and Certificates of Participation/Bank Loans
Fiscal Year 2019 Fiscal Year 2020
Governmental Activities
Business-type Activities Totals
Governmental Activities
Business-type Activities Totals
General obligation bonds $ 657,285,000 - $ 657,285,000 $ 613,465,000 - $ 613,465,000COP’s/Bank Loan 69,425,000 - 69,425,000 59,845,000 - 59,845,000Total outstanding long-term debt $ 726,710,000 - $ 726,710,000 $ 673,310,000 - $ 673,310,000
The District maintains an Aa2 credit rating from Moody’s and an AA from Standard & Poor’s for general obligation debt. State statutes limit the amount of general obligation debt that the District may issue. At the end of the current fiscal year, the legal debt limit was $2,142,426,206 and the legal debt margin was $1,605,512,713.
Additional information on the District’s long-term obligations can be found in notes 7 and 8 on pages 61-64
-28-

GENERAL BUDGETARY HIGHLIGHTS AND ECONOMIC FACTORS
For the 2020/2021 budget, the Board of Education established objectives to be met by the budget process. They determined that the budget would:
Effectively allocate monetary resources to enhance student achievement.Clearly communicate the financial state of the District to the public.Comply with all state, federal, and local statutes and regulations as well as internal organizational controls.Identify all budgetary changes from year to year.Set appropriations to ensure positive reserve balances in all funds.
The budget process will continue to:
Meet specified deadlines while producing a comprehensive and accurate budget.Provide opportunities for community and staff input.Identify budget assumptions used for the development process.Use forecasting to anticipate future needs and resources.Review all programs and department budgets.
The District’s Adopted Budget takes into consideration a variety of factors when making budget assumptions: Colorado School Finance Act increases or decreases, changes in student funded counts, compensation increases, benefit cost increases, retirementsavings and capital infrastructure needs. For the 2020/2021 Adopted Budget, the largest impact was decreased funding from the state. With the downturn in the economy from COVID-19 the state experienced a large loss of revenue. As K-12 education is the largest part of the state budget, reductions were inevitable. The receipt of CARES act and CRF funds was critical in preserving programs from being eliminated or compensation reductions. However, these are one time funds, if new funding is not added from the state in the near future, reductions will need to be implemented to balance the budget in the future.
The budget cycle begins in July and ends in June with the Board adopting the budget. The cycle includes review of all programand department budgets to help establish the budget assumptions. Economic conditions are factored in with the demographic changes for the District. Community forums, surveys and public comment provide significant and valuable input to the process. The budget development process is detailed in the 2020/2021 Adopted Budget: http://www.jeffcopublicschools.org/finance/index.html.
REQUESTS FOR INFORMATION
This financial report is designed to provide a general overview of the District’s finances for all those with an interest in the District. Questions concerning any of the information provided in this report or requests for additional information should be addressed to:
Nicole Stewart, Interim Chief Financial Officer Jefferson County School District, No. R-1
1829 Denver West Drive, Building 27Golden, Colorado 80401
-29-

-30-

Basic Financial Statements
-31-

Component UnitsGovernmental Business-type Charter
Activities Activities Total SchoolsAssets
Cash $ 2,542,776 $ 750 $ 2,543,526 $ 24,939 Restricted cash 37,000 - 37,000 14,867,042 Cash held by county treasurer 14,754,771 - 14,754,771 - Equity in pooled cash with investments 466,165,425 10,396,563 476,561,988 28,877,642 Investments 260,897,762 - 260,897,762 - Property taxes receivable 14,670,998 - 14,670,998 - Accounts receivable 3,634,163 119,025 3,753,188 397,062 Intergovernmental receivable 8,662,460 - 8,662,460 - Inventories 3,800,330 - 3,800,330 - Prepaid expenses 6,221,283 - 6,221,283 -
Capital assets Land and construction in progress 143,304,992 - 143,304,992 42,476,009 Depreciable assets 1,937,867,900 2,931,882 1,940,799,782 124,881,674 Accumulated depreciation (1,198,060,134) (1,762,035) (1,199,822,169) (39,784,617)
Total capital assets 883,112,758 1,169,847 884,282,605 127,573,066 Total assets 1,664,499,726 11,686,185 1,676,185,911 171,739,751
Deferred outflows of resourcesLoss on refunding $ 4,305,879 $ - $ 4,305,879 $ 1,097,377 Pension 194,314,399 194,314,399 14,909,831 OPEB 5,195,989 5,195,989 404,448
Total deferred outflows of resources 203,816,267 - 203,816,267 16,411,656
LiabilitiesAccounts payable $ 36,961,336 $ 24,660 $ 36,985,996 $ 1,735,412 Accrued salaries and benefits 97,125,463 1,267,585 98,393,048 3,387,342 Payroll withholding 28,810,781 - 28,810,781 - Unearned revenue 20,393,356 103,140 20,496,496 105,016 Liability claims/premiums 6,531,059 - 6,531,059 - Interest payable 1,301,745 - 1,301,745 544,342 Early retirement 1,120,000 - 1,120,000 - Long term liabilities Due within 1 year 49,330,000 - 49,330,000 1,955,940 Due in more than 1 year 691,493,997 - 691,493,997 79,778,929 Compensated absences (long term) 5,581,644 153,758 5,735,402 - Net pension liability 1,347,298,359 - 1,347,298,359 104,005,196 Net OPEB liability 66,246,238 - 66,246,238 5,113,904
Total liabilities 2,352,193,978 1,549,143 2,353,743,121 196,626,081
Deferred inflows of resourcesPension $ 919,368,228 $ - $ 919,368,228 $ 70,970,971 OPEB 13,144,800 - 13,144,800 1,014,718
Total deferred inflows of resources 932,513,028 - 932,513,028 71,985,689
Net position Net investment in capital assets 366,492,535 1,169,847 367,662,382 56,493,461 Restricted for:
Grants 11,918,343 - 11,918,343 - Debt service 76,229,428 - 76,229,428 7,592,438 Food services 5,074,170 - 5,074,170 - TABOR 21,578,620 464,568 22,043,188 2,267,633
Unrestricted (1,897,684,109) 8,502,627 (1,889,181,482) (146,813,895)Total net position $ (1,416,391,013) $ 10,137,042 $ (1,406,253,971) $ (80,460,363)
The notes to the financial statements are an integral part of this statement.
Primary Government
JEFFERSON COUNTY SCHOOL DISTRICT, NO. R-1Statement of Net Position
June 30, 2020
-32-
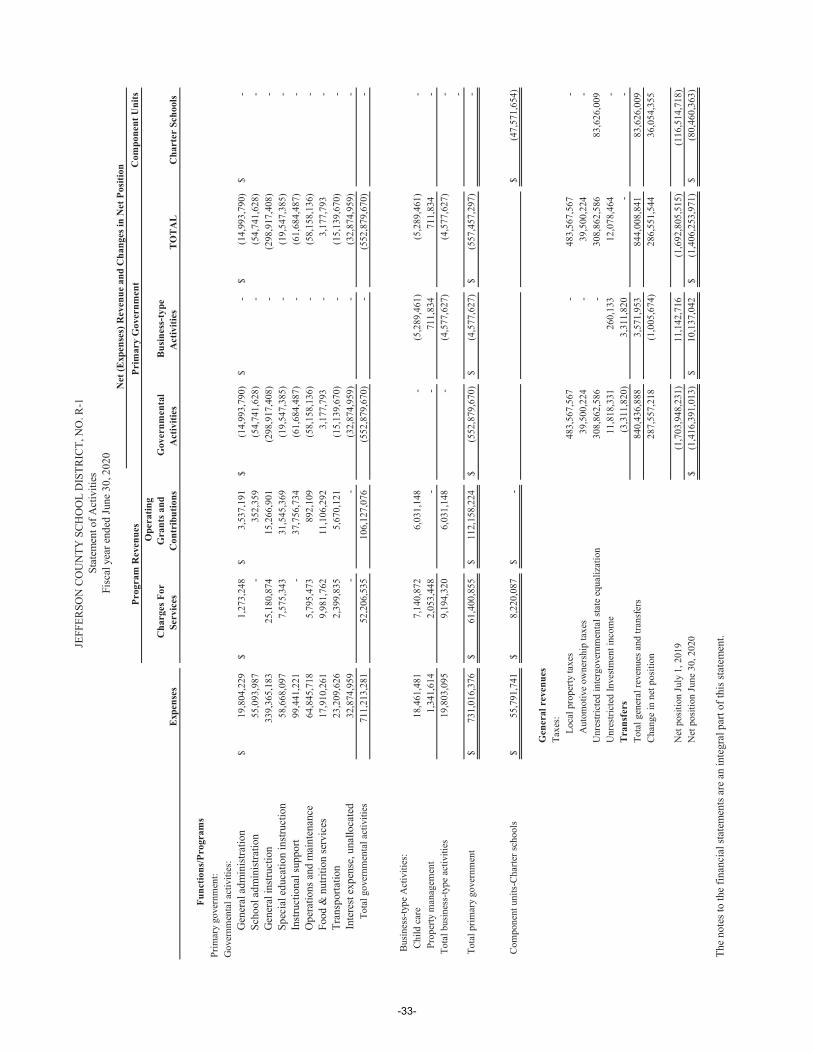
Com
pone
nt U
nits
Exp
ense
s C
harg
es F
or
Serv
ices
Ope
ratin
g G
rant
s and
C
ontr
ibut
ions
G
over
nmen
tal
Act
iviti
es
Bus
ines
s-ty
pe
Act
iviti
es
TO
TA
L
Cha
rter
Sch
ools
Func
tions
/Pro
gram
sPr
imar
y go
vern
men
t:G
over
nmen
tal a
ctiv
ities
:
Gen
eral
adm
inis
tratio
n$
19,8
04,2
29$
1,27
3,24
8$
3,53
7,19
1$
(14,
993,
790)
$-
$(1
4,99
3,79
0)$
-
Sch
ool a
dmin
istra
tion
55,0
93,9
87-
352,
359
(54,
741,
628)
-(5
4,74
1,62
8)-
G
ener
al in
stru
ctio
n33
9,36
5,18
325
,180
,874
15,2
66,9
01(2
98,9
17,4
08)
-(2
98,9
17,4
08)
-
Spe
cial
edu
catio
n in
stru
ctio
n58
,668
,097
7,57
5,34
331
,545
,369
(19,
547,
385)
-(1
9,54
7,38
5)-
In
stru
ctio
nal s
uppo
rt99
,441
,221
-37
,756
,734
(61,
684,
487)
-(6
1,68
4,48
7)-
O
pera
tions
and
mai
nten
ance
64,8
45,7
185,
795,
473
892,
109
(58,
158,
136)
-(5
8,15
8,13
6)-
F
ood
& n
utrit
ion
serv
ices
17,9
10,2
619,
981,
762
11,1
06,2
923,
177,
793
-3,
177,
793
-
Tra
nspo
rtatio
n23
,209
,626
2,39
9,83
55,
670,
121
(15,
139,
670)
-(1
5,13
9,67
0)-
Inte
rest
exp
ense
, una
lloca
ted
32,8
74,9
59-
-(3
2,87
4,95
9)-
(32,
874,
959)
-To
tal g
over
nmen
tal a
ctiv
ities
711,
213,
281
52,2
06,5
3510
6,12
7,07
6(5
52,8
79,6
70)
-(5
52,8
79,6
70)
-
Bus
ines
s-ty
pe A
ctiv
ities
:C
hild
car
e18
,461
,481
7,14
0,87
26,
031,
148
-(5
,289
,461
)(5
,289
,461
)-
Prop
erty
man
agem
ent
1,34
1,61
42,
053,
448
--
711,
834
711,
834
-To
tal b
usin
ess-
type
act
iviti
es19
,803
,095
9,19
4,32
06,
031,
148
-(4
,577
,627
)(4
,577
,627
)- -
Tota
l prim
ary
gove
rnm
ent
$73
1,01
6,37
6$
61,4
00,8
55$
112,
158,
224
$(5
52,8
79,6
70)
$(4
,577
,627
)$
(557
,457
,297
)-
Com
pone
nt u
nits
-Cha
rter s
choo
ls$
55,7
91,7
41$
8,22
0,08
7$
-$
(47,
571,
654)
Gen
eral
rev
enue
sTa
xes:
Loca
l pro
perty
taxe
s48
3,56
7,56
7-
483,
567,
567
-A
utom
otiv
e ow
ners
hip
taxe
s39
,500
,224
-39
,500
,224
-U
nres
trict
ed in
terg
over
nmen
tal s
tate
equ
aliz
atio
n30
8,86
2,58
6-
308,
862,
586
83,6
26,0
09U
nres
trict
ed In
vest
men
t inc
ome
11,8
18,3
3126
0,13
312
,078
,464
-T
rans
fers
(3,3
11,8
20)
3,31
1,82
0-
-To
tal g
ener
al re
venu
es a
nd tr
ansf
ers
840,
436,
888
3,57
1,95
384
4,00
8,84
183
,626
,009
Cha
nge
in n
et p
ositi
on28
7,55
7,21
8(1
,005
,674
)28
6,55
1,54
436
,054
,355
Net
pos
ition
Jul
y 1,
201
9(1
,703
,948
,231
)11
,142
,716
(1,6
92,8
05,5
15)
(116
,514
,718
)N
et p
ositi
on J
une
30, 2
020
$(1
,416
,391
,013
)$
10,1
37,0
42$
(1,4
06,2
53,9
71)
$(8
0,46
0,36
3)
The
note
s to
the
finan
cial
stat
emen
ts a
re a
n in
tegr
al p
art o
f thi
s sta
tem
ent.
Fisc
al y
ear e
nded
June
30,
202
0St
atem
ent o
f Act
iviti
esJE
FFER
SON
CO
UN
TY S
CH
OO
L D
ISTR
ICT,
NO
. R-1
Pri
mar
y G
over
nmen
t N
et (E
xpen
ses)
Rev
enue
and
Cha
nges
in N
et P
ositi
on
Pro
gram
Rev
enue
s
-33-
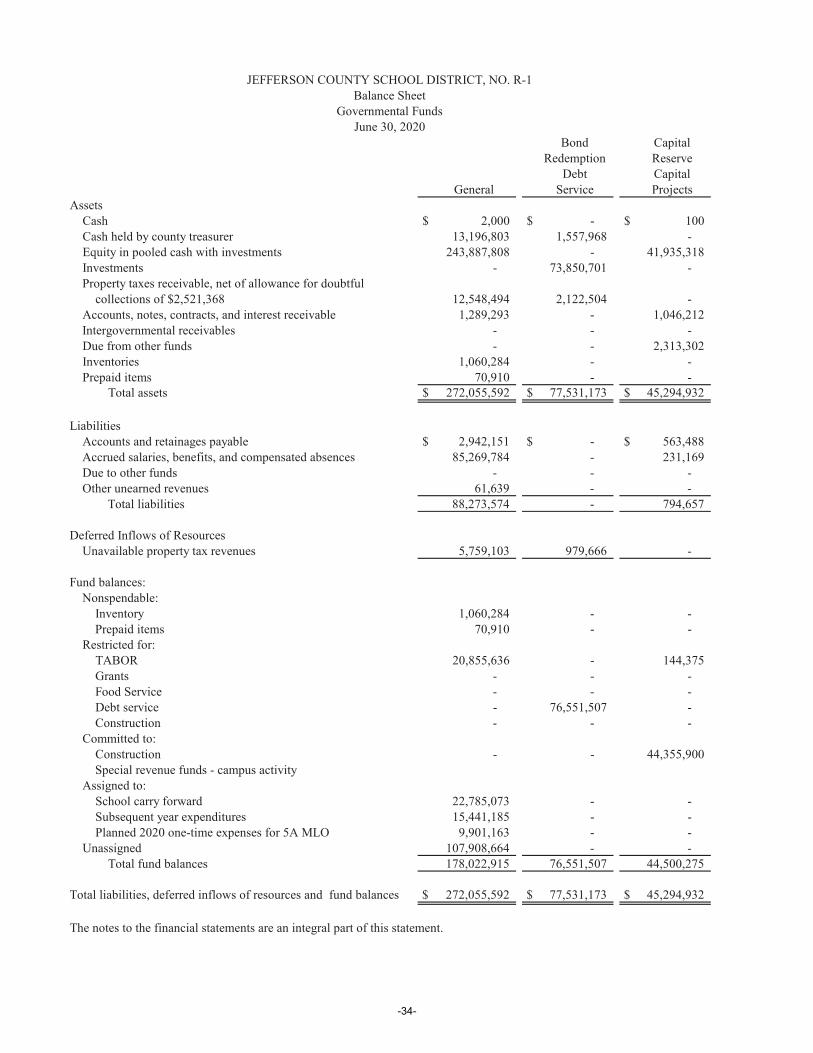
Bond CapitalRedemption Reserve
Debt CapitalGeneral Service Projects
Assets Cash $ 2,000 $ - $ 100 Cash held by county treasurer 13,196,803 1,557,968 - Equity in pooled cash with investments 243,887,808 - 41,935,318 Investments - 73,850,701 - Property taxes receivable, net of allowance for doubtful collections of $2,521,368 12,548,494 2,122,504 - Accounts, notes, contracts, and interest receivable 1,289,293 - 1,046,212 Intergovernmental receivables - - - Due from other funds - - 2,313,302 Inventories 1,060,284 - - Prepaid items 70,910 - - Total assets $ 272,055,592 $ 77,531,173 $ 45,294,932
Liabilities Accounts and retainages payable $ 2,942,151 $ - $ 563,488 Accrued salaries, benefits, and compensated absences 85,269,784 - 231,169 Due to other funds - - - Other unearned revenues 61,639 - - Total liabilities 88,273,574 - 794,657
Deferred Inflows of Resources Unavailable property tax revenues 5,759,103 979,666 -
Fund balances: Nonspendable: Inventory 1,060,284 - - Prepaid items 70,910 - - Restricted for: TABOR 20,855,636 - 144,375 Grants - - - Food Service - - - Debt service - 76,551,507 - Construction - - - Committed to: Construction - - 44,355,900 Special revenue funds - campus activity Assigned to: School carry forward 22,785,073 - - Subsequent year expenditures 15,441,185 - - Planned 2020 one-time expenses for 5A MLO 9,901,163 - - Unassigned 107,908,664 - - Total fund balances 178,022,915 76,551,507 44,500,275
Total liabilities, deferred inflows of resources and fund balances $ 272,055,592 $ 77,531,173 $ 45,294,932
The notes to the financial statements are an integral part of this statement.
JEFFERSON COUNTY SCHOOL DISTRICT, NO. R-1Balance Sheet
Governmental FundsJune 30, 2020
-34-
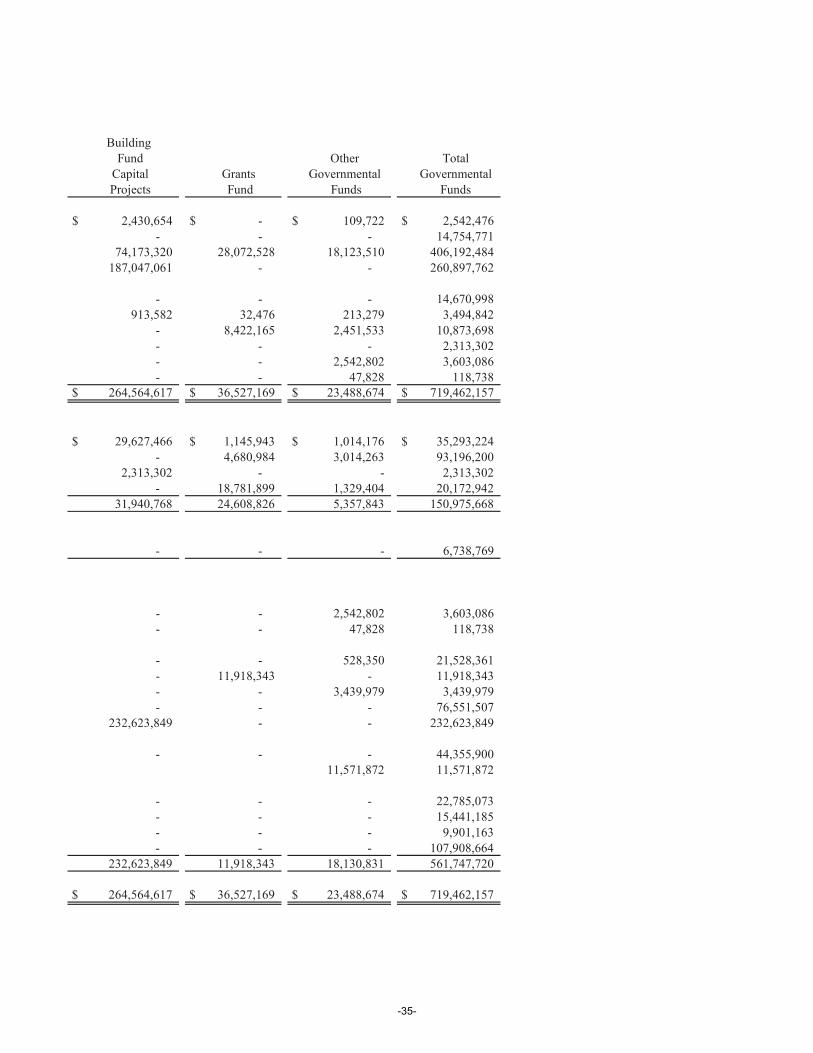
Building Fund Other Total
Capital Grants Governmental GovernmentalProjects Fund Funds Funds
$ 2,430,654 $ - $ 109,722 $ 2,542,476- - - 14,754,771
74,173,320 28,072,528 18,123,510 406,192,484187,047,061 - - 260,897,762
- - - 14,670,998913,582 32,476 213,279 3,494,842
- 8,422,165 2,451,533 10,873,698- - - 2,313,302- - 2,542,802 3,603,086- - 47,828 118,738
$ 264,564,617 $ 36,527,169 $ 23,488,674 $ 719,462,157
$ 29,627,466 $ 1,145,943 $ 1,014,176 $ 35,293,224- 4,680,984 3,014,263 93,196,200
2,313,302 - - 2,313,302- 18,781,899 1,329,404 20,172,942
31,940,768 24,608,826 5,357,843 150,975,668
- - - 6,738,769
- - 2,542,802 3,603,086- - 47,828 118,738
- - 528,350 21,528,361- 11,918,343 - 11,918,343- - 3,439,979 3,439,979- - - 76,551,507
232,623,849 - - 232,623,849
- - - 44,355,90011,571,872 11,571,872
- - - 22,785,073- - - 15,441,185- - - 9,901,163- - - 107,908,664
232,623,849 11,918,343 18,130,831 561,747,720
$ 264,564,617 $ 36,527,169 $ 23,488,674 $ 719,462,157
-35-

-36-
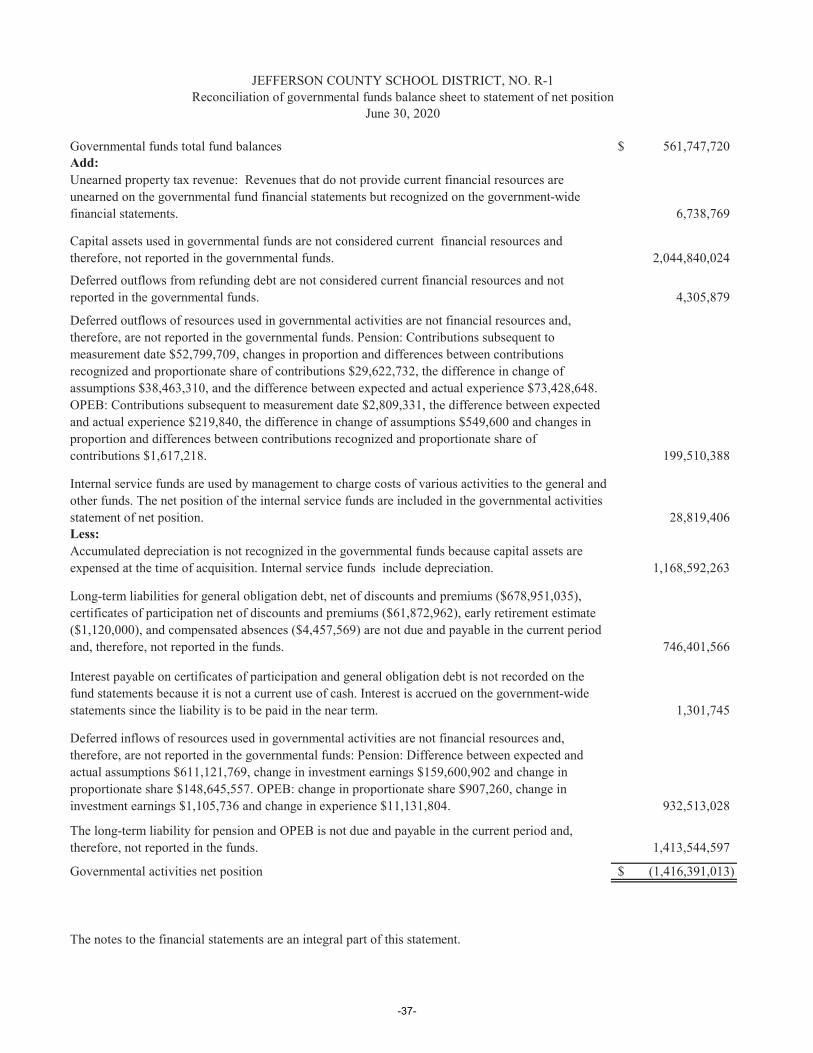
Governmental funds total fund balances 561,747,720$Add:
6,738,769
2,044,840,024
4,305,879
199,510,388
28,819,406Less:
1,168,592,263
746,401,566
1,301,745
932,513,028
1,413,544,597
Governmental activities net position (1,416,391,013)$
The notes to the financial statements are an integral part of this statement.
Deferred outflows from refunding debt are not considered current financial resources and not reported in the governmental funds.
JEFFERSON COUNTY SCHOOL DISTRICT, NO. R-1Reconciliation of governmental funds balance sheet to statement of net position
June 30, 2020
Unearned property tax revenue: Revenues that do not provide current financial resources are unearned on the governmental fund financial statements but recognized on the government-wide financial statements.
Capital assets used in governmental funds are not considered current financial resources and therefore, not reported in the governmental funds.
The long-term liability for pension and OPEB is not due and payable in the current period and, therefore, not reported in the funds.
Deferred outflows of resources used in governmental activities are not financial resources and, therefore, are not reported in the governmental funds. Pension: Contributions subsequent to measurement date $52,799,709, changes in proportion and differences between contributions recognized and proportionate share of contributions $29,622,732, the difference in change of assumptions $38,463,310, and the difference between expected and actual experience $73,428,648. OPEB: Contributions subsequent to measurement date $2,809,331, the difference between expected and actual experience $219,840, the difference in change of assumptions $549,600 and changes in proportion and differences between contributions recognized and proportionate share of contributions $1,617,218.
Internal service funds are used by management to charge costs of various activities to the general and other funds. The net position of the internal service funds are included in the governmental activities statement of net position.
Accumulated depreciation is not recognized in the governmental funds because capital assets are expensed at the time of acquisition. Internal service funds include depreciation.
Long-term liabilities for general obligation debt, net of discounts and premiums ($678,951,035), certificates of participation net of discounts and premiums ($61,872,962), early retirement estimate ($1,120,000), and compensated absences ($4,457,569) are not due and payable in the current period and, therefore, not reported in the funds.
Interest payable on certificates of participation and general obligation debt is not recorded on the fund statements because it is not a current use of cash. Interest is accrued on the government-wide statements since the liability is to be paid in the near term.
Deferred inflows of resources used in governmental activities are not financial resources and, therefore, are not reported in the governmental funds: Pension: Difference between expected and actual assumptions $611,121,769, change in investment earnings $159,600,902 and change in proportionate share $148,645,557. OPEB: change in proportionate share $907,260, change in investment earnings $1,105,736 and change in experience $11,131,804.
-37-
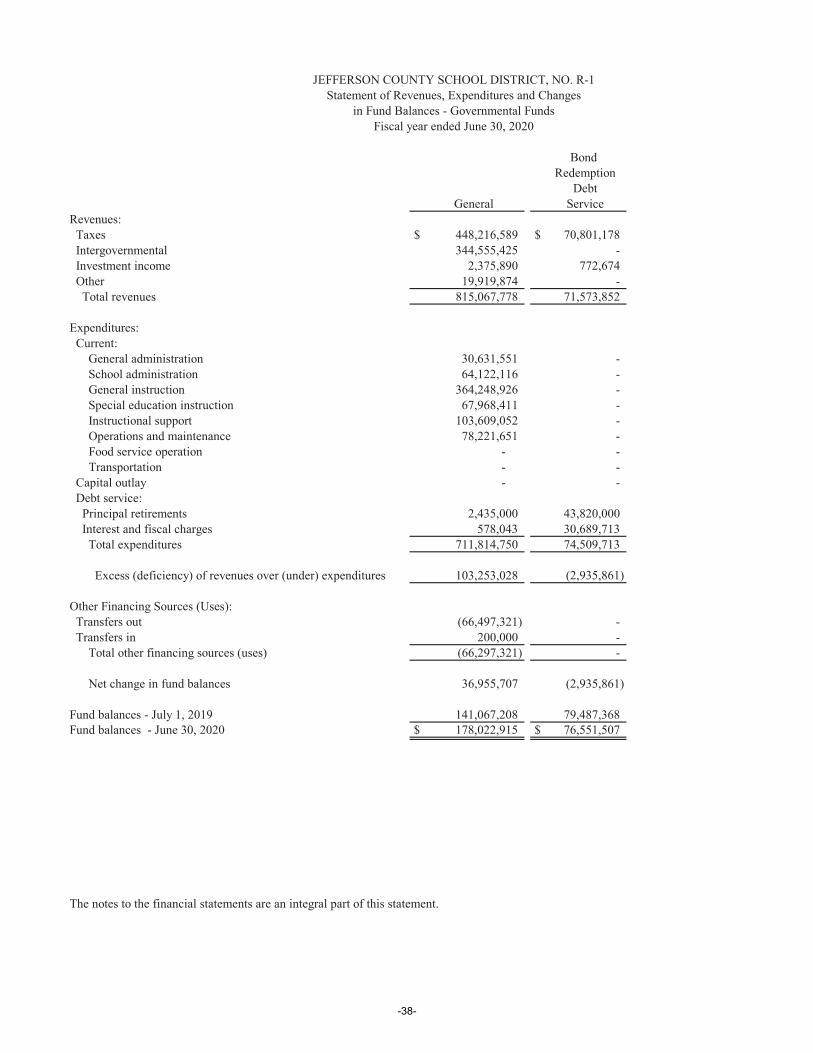
Bond Redemption
DebtGeneral Service
Revenues: Taxes $ 448,216,589 $ 70,801,178 Intergovernmental 344,555,425 - Investment income 2,375,890 772,674 Other 19,919,874 - Total revenues 815,067,778 71,573,852
Expenditures: Current: General administration 30,631,551 - School administration 64,122,116 - General instruction 364,248,926 - Special education instruction 67,968,411 - Instructional support 103,609,052 - Operations and maintenance 78,221,651 - Food service operation - - Transportation - - Capital outlay - - Debt service: Principal retirements 2,435,000 43,820,000 Interest and fiscal charges 578,043 30,689,713 Total expenditures 711,814,750 74,509,713
Excess (deficiency) of revenues over (under) expenditures 103,253,028 (2,935,861)
Other Financing Sources (Uses): Transfers out (66,497,321) - Transfers in 200,000 - Total other financing sources (uses) (66,297,321) -
Net change in fund balances 36,955,707 (2,935,861)
Fund balances - July 1, 2019 141,067,208 79,487,368Fund balances - June 30, 2020 $ 178,022,915 $ 76,551,507
The notes to the financial statements are an integral part of this statement.
JEFFERSON COUNTY SCHOOL DISTRICT, NO. R-1Statement of Revenues, Expenditures and Changes
in Fund Balances - Governmental FundsFiscal year ended June 30, 2020
-38-
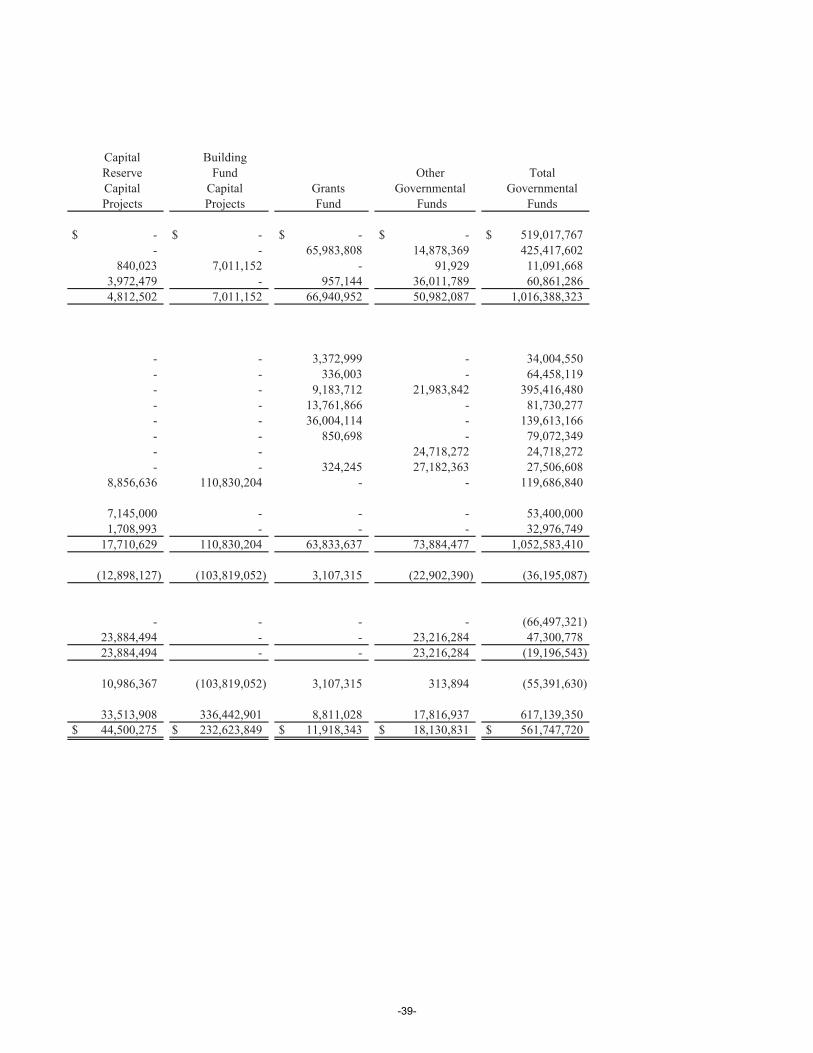
Capital BuildingReserve Fund Other TotalCapital Capital Grants Governmental GovernmentalProjects Projects Fund Funds Funds
$ - $ - $ - $ - $ 519,017,767- - 65,983,808 14,878,369 425,417,602
840,023 7,011,152 - 91,929 11,091,6683,972,479 - 957,144 36,011,789 60,861,2864,812,502 7,011,152 66,940,952 50,982,087 1,016,388,323
- - 3,372,999 - 34,004,550- - 336,003 - 64,458,119- - 9,183,712 21,983,842 395,416,480- - 13,761,866 - 81,730,277- - 36,004,114 - 139,613,166- - 850,698 - 79,072,349- - 24,718,272 24,718,272- - 324,245 27,182,363 27,506,608
8,856,636 110,830,204 - - 119,686,840
7,145,000 - - - 53,400,0001,708,993 - - - 32,976,749
17,710,629 110,830,204 63,833,637 73,884,477 1,052,583,410
(12,898,127) (103,819,052) 3,107,315 (22,902,390) (36,195,087)
- - - - (66,497,321)23,884,494 - - 23,216,284 47,300,77823,884,494 - - 23,216,284 (19,196,543)
10,986,367 (103,819,052) 3,107,315 313,894 (55,391,630)
33,513,908 336,442,901 8,811,028 17,816,937 617,139,350$ 44,500,275 $ 232,623,849 $ 11,918,343 $ 18,130,831 $ 561,747,720
-39-
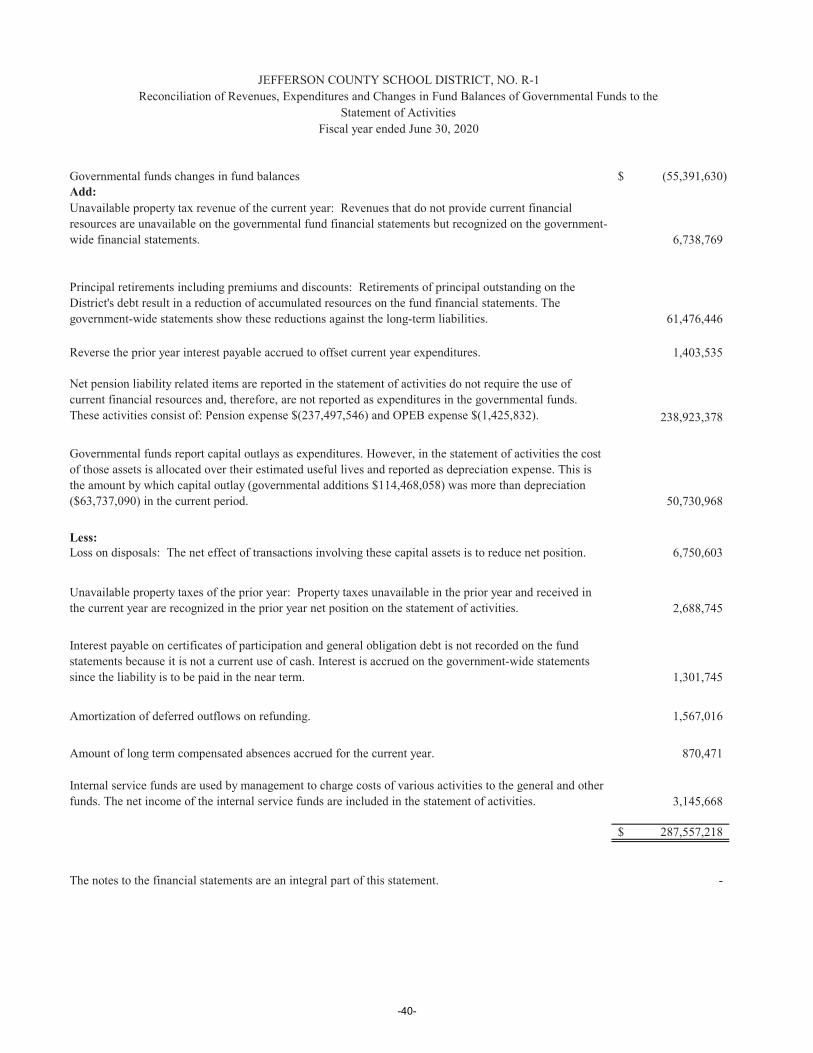
Governmental funds changes in fund balances (55,391,630)$Add:
6,738,769
61,476,446
1,403,535
238,923,378
50,730,968
Less:6,750,603
2,688,745
1,301,745
Amortization of deferred outflows on refunding. 1,567,016
870,471
3,145,668
287,557,218$
The notes to the financial statements are an integral part of this statement. -
Reconciliation of Revenues, Expenditures and Changes in Fund Balances of Governmental Funds to theJEFFERSON COUNTY SCHOOL DISTRICT, NO. R-1
Fiscal year ended June 30, 2020Statement of Activities
Unavailable property tax revenue of the current year: Revenues that do not provide current financial resources are unavailable on the governmental fund financial statements but recognized on the government-wide financial statements.
Internal service funds are used by management to charge costs of various activities to the general and other funds. The net income of the internal service funds are included in the statement of activities.
Interest payable on certificates of participation and general obligation debt is not recorded on the fund statements because it is not a current use of cash. Interest is accrued on the government-wide statements since the liability is to be paid in the near term.
Unavailable property taxes of the prior year: Property taxes unavailable in the prior year and received in the current year are recognized in the prior year net position on the statement of activities.
Principal retirements including premiums and discounts: Retirements of principal outstanding on the District's debt result in a reduction of accumulated resources on the fund financial statements. The government-wide statements show these reductions against the long-term liabilities.
Loss on disposals: The net effect of transactions involving these capital assets is to reduce net position.
Governmental funds report capital outlays as expenditures. However, in the statement of activities the cost of those assets is allocated over their estimated useful lives and reported as depreciation expense. This is the amount by which capital outlay (governmental additions $114,468,058) was more than depreciation ($63,737,090) in the current period.
Net pension liability related items are reported in the statement of activities do not require the use of current financial resources and, therefore, are not reported as expenditures in the governmental funds. These activities consist of: Pension expense $(237,497,546) and OPEB expense $(1,425,832).
Reverse the prior year interest payable accrued to offset current year expenditures.
Amount of long term compensated absences accrued for the current year.
-40-
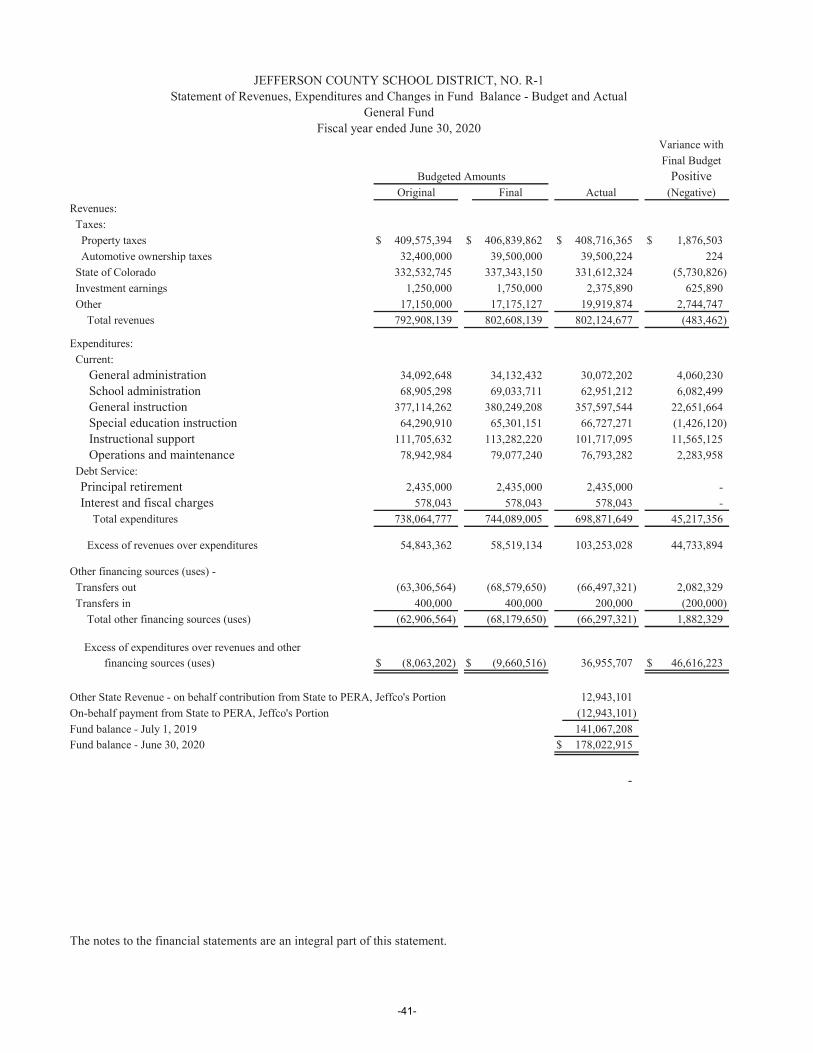
Variance withFinal Budget
PositiveFinal Actual (Negative)
Revenues: Taxes: Property taxes $ 409,575,394 $ 406,839,862 $ 408,716,365 $ 1,876,503 Automotive ownership taxes 32,400,000 39,500,000 39,500,224 224 State of Colorado 332,532,745 337,343,150 331,612,324 (5,730,826) Investment earnings 1,250,000 1,750,000 2,375,890 625,890 Other 17,150,000 17,175,127 19,919,874 2,744,747 Total revenues 792,908,139 802,608,139 802,124,677 (483,462)
Expenditures: Current: General administration 34,092,648 34,132,432 30,072,202 4,060,230 School administration 68,905,298 69,033,711 62,951,212 6,082,499 General instruction 377,114,262 380,249,208 357,597,544 22,651,664 Special education instruction 64,290,910 65,301,151 66,727,271 (1,426,120) Instructional support 111,705,632 113,282,220 101,717,095 11,565,125 Operations and maintenance 78,942,984 79,077,240 76,793,282 2,283,958 Debt Service:
Principal retirement 2,435,000 2,435,000 2,435,000 -Interest and fiscal charges 578,043 578,043 578,043 -
Total expenditures 738,064,777 744,089,005 698,871,649 45,217,356
Excess of revenues over expenditures 54,843,362 58,519,134 103,253,028 44,733,894
Other financing sources (uses) - Transfers out (63,306,564) (68,579,650) (66,497,321) 2,082,329 Transfers in 400,000 400,000 200,000 (200,000) Total other financing sources (uses) (62,906,564) (68,179,650) (66,297,321) 1,882,329
Excess of expenditures over revenues and other financing sources (uses) $ (8,063,202) $ (9,660,516) 36,955,707 $ 46,616,223
Other State Revenue - on behalf contribution from State to PERA, Jeffco's Portion 12,943,101On-behalf payment from State to PERA, Jeffco's Portion (12,943,101)Fund balance - July 1, 2019 141,067,208Fund balance - June 30, 2020 $ 178,022,915
-
The notes to the financial statements are an integral part of this statement.
Original
JEFFERSON COUNTY SCHOOL DISTRICT, NO. R-1
General FundStatement of Revenues, Expenditures and Changes in Fund Balance - Budget and Actual
Fiscal year ended June 30, 2020
Budgeted Amounts
-41-

-42-
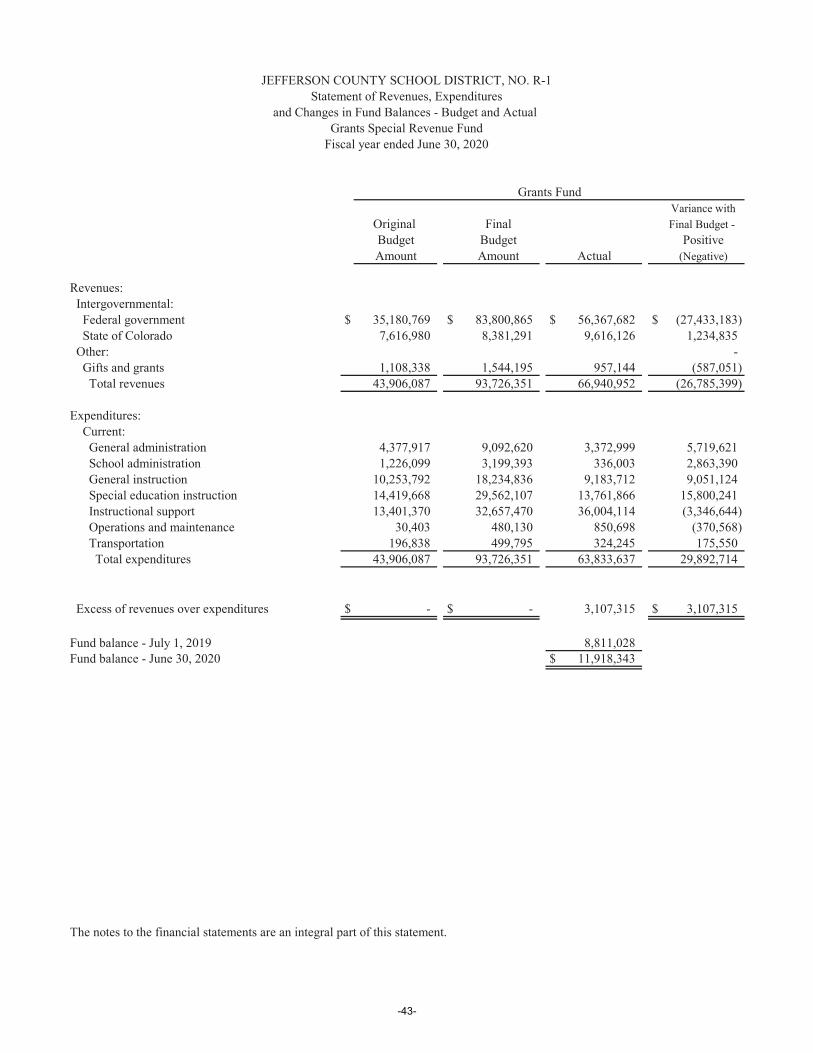
Variance withOriginal Final Final Budget - Budget Budget PositiveAmount Amount (Negative)
Revenues: Intergovernmental: Federal government $ 35,180,769 $ 83,800,865 $ 56,367,682 $ (27,433,183) State of Colorado 7,616,980 8,381,291 9,616,126 1,234,835 Other: - Gifts and grants 1,108,338 1,544,195 957,144 (587,051) Total revenues 43,906,087 93,726,351 66,940,952 (26,785,399)
Expenditures: Current: General administration 4,377,917 9,092,620 3,372,999 5,719,621 School administration 1,226,099 3,199,393 336,003 2,863,390 General instruction 10,253,792 18,234,836 9,183,712 9,051,124 Special education instruction 14,419,668 29,562,107 13,761,866 15,800,241 Instructional support 13,401,370 32,657,470 36,004,114 (3,346,644) Operations and maintenance 30,403 480,130 850,698 (370,568) Transportation 196,838 499,795 324,245 175,550 Total expenditures 43,906,087 93,726,351 63,833,637 29,892,714
Excess of revenues over expenditures $ - $ - 3,107,315 $ 3,107,315
Fund balance - July 1, 2019 8,811,028Fund balance - June 30, 2020 $ 11,918,343
The notes to the financial statements are an integral part of this statement.
Actual
Fiscal year ended June 30, 2020
JEFFERSON COUNTY SCHOOL DISTRICT, NO. R-1Statement of Revenues, Expenditures
and Changes in Fund Balances - Budget and Actual Grants Special Revenue Fund
Grants Fund
-43-
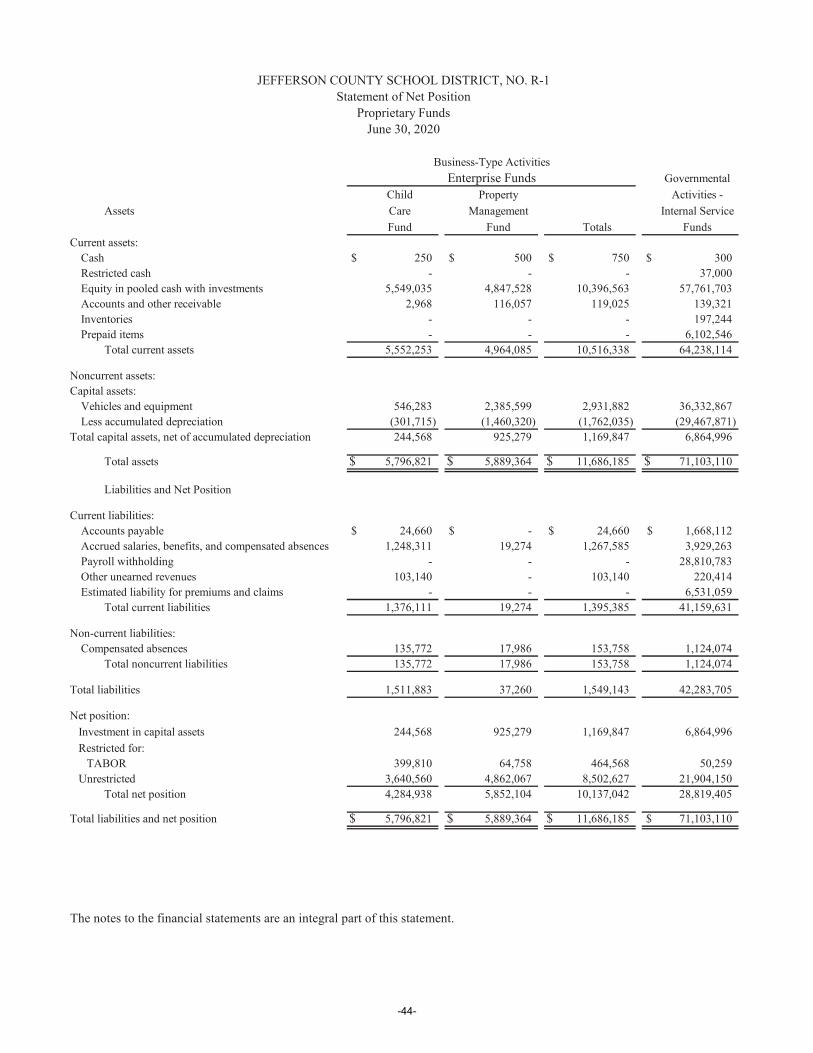
GovernmentalChild Property Activities -
Assets Care Management Internal ServiceFund Fund Totals Funds
Current assets:Cash $ 250 $ 500 $ 750 $ 300 Restricted cash - - - 37,000 Equity in pooled cash with investments 5,549,035 4,847,528 10,396,563 57,761,703 Accounts and other receivable 2,968 116,057 119,025 139,321 Inventories - - - 197,244 Prepaid items - - - 6,102,546
Total current assets 5,552,253 4,964,085 10,516,338 64,238,114
Noncurrent assets:Capital assets:
Vehicles and equipment 546,283 2,385,599 2,931,882 36,332,867 Less accumulated depreciation (301,715) (1,460,320) (1,762,035) (29,467,871)
Total capital assets, net of accumulated depreciation 244,568 925,279 1,169,847 6,864,996
Total assets $ 5,796,821 $ 5,889,364 $ 11,686,185 $ 71,103,110
Liabilities and Net Position
Current liabilities:Accounts payable $ 24,660 $ - $ 24,660 $ 1,668,112 Accrued salaries, benefits, and compensated absences 1,248,311 19,274 1,267,585 3,929,263 Payroll withholding - - - 28,810,783 Other unearned revenues 103,140 - 103,140 220,414 Estimated liability for premiums and claims - - - 6,531,059
Total current liabilities 1,376,111 19,274 1,395,385 41,159,631
Non-current liabilities:Compensated absences 135,772 17,986 153,758 1,124,074
Total noncurrent liabilities 135,772 17,986 153,758 1,124,074
Total liabilities 1,511,883 37,260 1,549,143 42,283,705
Net position: Investment in capital assets 244,568 925,279 1,169,847 6,864,996 Restricted for:
TABOR 399,810 64,758 464,568 50,259 Unrestricted 3,640,560 4,862,067 8,502,627 21,904,150 Total net position 4,284,938 5,852,104 10,137,042 28,819,405
Total liabilities and net position $ 5,796,821 $ 5,889,364 $ 11,686,185 $ 71,103,110
The notes to the financial statements are an integral part of this statement.
Enterprise FundsBusiness-Type Activities
JEFFERSON COUNTY SCHOOL DISTRICT, NO. R-1Statement of Net Position
Proprietary FundsJune 30, 2020
-44-
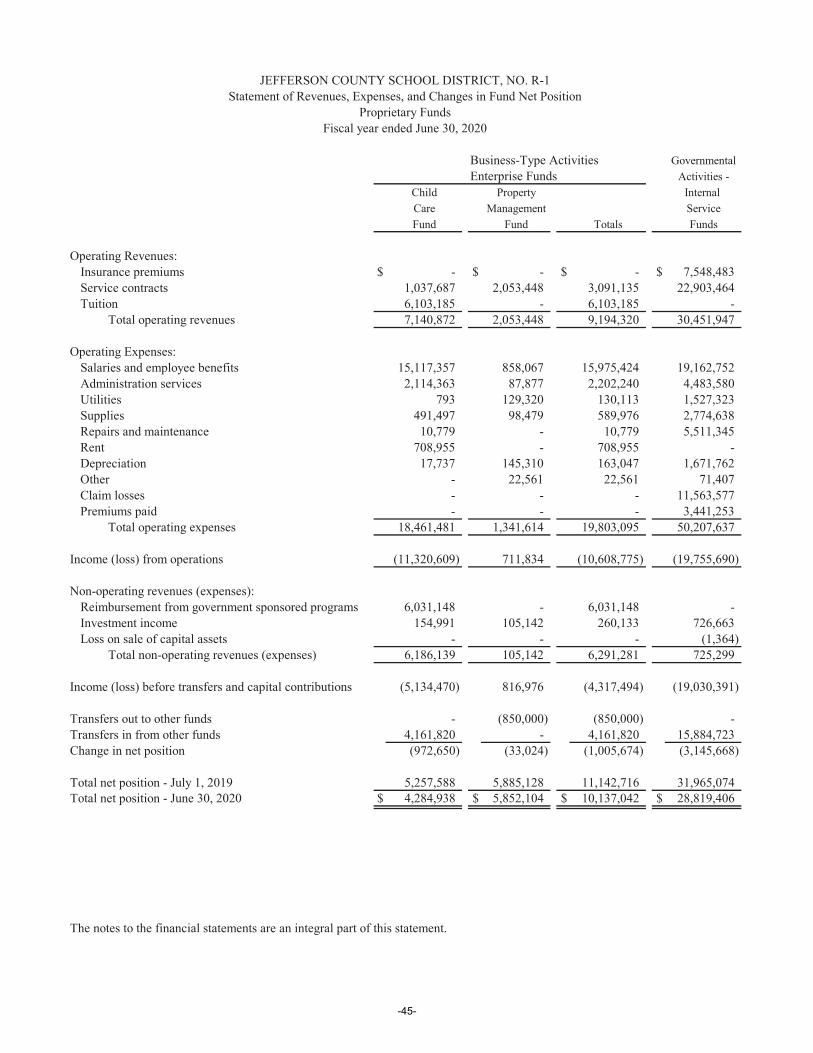
Business-Type Activities GovernmentalEnterprise Funds Activities -
Child Property Internal Care Management ServiceFund Fund Totals Funds
Operating Revenues:Insurance premiums $ - $ - $ - $ 7,548,483 Service contracts 1,037,687 2,053,448 3,091,135 22,903,464 Tuition 6,103,185 - 6,103,185 -
Total operating revenues 7,140,872 2,053,448 9,194,320 30,451,947
Operating Expenses:Salaries and employee benefits 15,117,357 858,067 15,975,424 19,162,752 Administration services 2,114,363 87,877 2,202,240 4,483,580 Utilities 793 129,320 130,113 1,527,323 Supplies 491,497 98,479 589,976 2,774,638 Repairs and maintenance 10,779 - 10,779 5,511,345 Rent 708,955 - 708,955 - Depreciation 17,737 145,310 163,047 1,671,762 Other - 22,561 22,561 71,407 Claim losses - - - 11,563,577 Premiums paid - - - 3,441,253
Total operating expenses 18,461,481 1,341,614 19,803,095 50,207,637
Income (loss) from operations (11,320,609) 711,834 (10,608,775) (19,755,690)
Non-operating revenues (expenses):Reimbursement from government sponsored programs 6,031,148 - 6,031,148 - Investment income 154,991 105,142 260,133 726,663 Loss on sale of capital assets - - - (1,364)
Total non-operating revenues (expenses) 6,186,139 105,142 6,291,281 725,299
Income (loss) before transfers and capital contributions (5,134,470) 816,976 (4,317,494) (19,030,391)
Transfers out to other funds - (850,000) (850,000) - Transfers in from other funds 4,161,820 - 4,161,820 15,884,723 Change in net position (972,650) (33,024) (1,005,674) (3,145,668)
Total net position - July 1, 2019 5,257,588 5,885,128 11,142,716 31,965,074 Total net position - June 30, 2020 $ 4,284,938 $ 5,852,104 $ 10,137,042 $ 28,819,406
The notes to the financial statements are an integral part of this statement.
JEFFERSON COUNTY SCHOOL DISTRICT, NO. R-1Statement of Revenues, Expenses, and Changes in Fund Net Position
Proprietary FundsFiscal year ended June 30, 2020
-45-
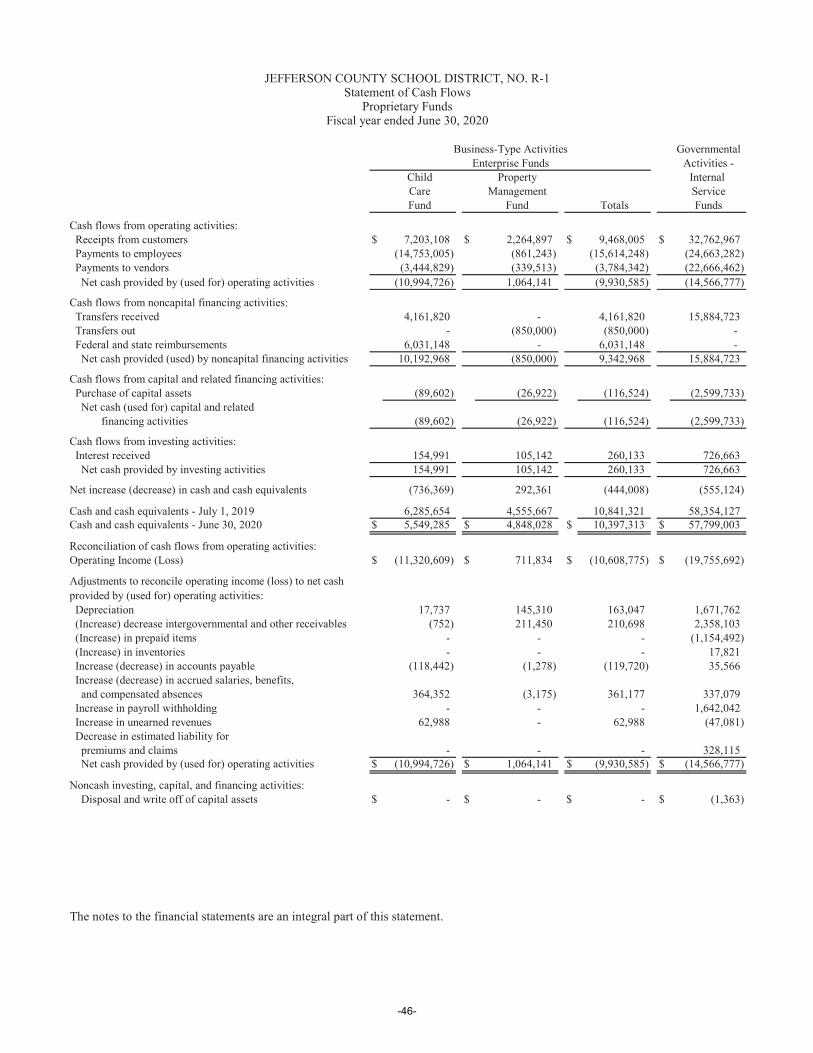
GovernmentalActivities -
Child Property Internal Care Management ServiceFund Fund Totals Funds
Cash flows from operating activities: Receipts from customers $ 7,203,108 $ 2,264,897 $ 9,468,005 $ 32,762,967 Payments to employees (14,753,005) (861,243) (15,614,248) (24,663,282) Payments to vendors (3,444,829) (339,513) (3,784,342) (22,666,462) Net cash provided by (used for) operating activities (10,994,726) 1,064,141 (9,930,585) (14,566,777)
Cash flows from noncapital financing activities: Transfers received 4,161,820 - 4,161,820 15,884,723 Transfers out - (850,000) (850,000) - Federal and state reimbursements 6,031,148 - 6,031,148 - Net cash provided (used) by noncapital financing activities 10,192,968 (850,000) 9,342,968 15,884,723
Cash flows from capital and related financing activities: Purchase of capital assets (89,602) (26,922) (116,524) (2,599,733) Net cash (used for) capital and related financing activities (89,602) (26,922) (116,524) (2,599,733)
Cash flows from investing activities: Interest received 154,991 105,142 260,133 726,663 Net cash provided by investing activities 154,991 105,142 260,133 726,663
Net increase (decrease) in cash and cash equivalents (736,369) 292,361 (444,008) (555,124)
Cash and cash equivalents - July 1, 2019 6,285,654 4,555,667 10,841,321 58,354,127 Cash and cash equivalents - June 30, 2020 $ 5,549,285 $ 4,848,028 $ 10,397,313 $ 57,799,003
Reconciliation of cash flows from operating activities:Operating Income (Loss) $ (11,320,609) $ 711,834 $ (10,608,775) $ (19,755,692)
Adjustments to reconcile operating income (loss) to net cash provided by (used for) operating activities: Depreciation 17,737 145,310 163,047 1,671,762 (Increase) decrease intergovernmental and other receivables (752) 211,450 210,698 2,358,103 (Increase) in prepaid items - - - (1,154,492) (Increase) in inventories - - - 17,821 Increase (decrease) in accounts payable (118,442) (1,278) (119,720) 35,566 Increase (decrease) in accrued salaries, benefits, and compensated absences 364,352 (3,175) 361,177 337,079 Increase in payroll withholding - - - 1,642,042 Increase in unearned revenues 62,988 - 62,988 (47,081) Decrease in estimated liability for premiums and claims - - - 328,115 Net cash provided by (used for) operating activities $ (10,994,726) $ 1,064,141 $ (9,930,585) $ (14,566,777)
Noncash investing, capital, and financing activities: Disposal and write off of capital assets $ - $ - $ - $ (1,363)
The notes to the financial statements are an integral part of this statement.
Enterprise FundsBusiness-Type Activities
JEFFERSON COUNTY SCHOOL DISTRICT, NO. R-1Statement of Cash Flows
Proprietary FundsFiscal year ended June 30, 2020
-46-

Notes to Basic Financial Statements
-47-
June 30, 2020
1. Summary of significant accounting policies
The summary of significant accounting policies of Jefferson County School District, R-1 (the District) is presentedto assist in understanding the District’s financial statements. A summary of the significant accounting polices applied in the preparation of the basic financial statements is described below.
A) Reporting entity
Governmental Accounting Standards Board (GASB) Statement No. 14, The Financial Reporting Entity (GASB No. 14), as amended by GASB Statements 39 and 61, describes the financial reporting entity as it relates to governmental accounting. According to this Statement, the financial reporting entity consists of a) the primary government, b) organizations for which the primary government is financially accountable and c) other organizations whose exclusion from the reporting entity’s financial statements would cause those statements to be misleading orincomplete. Any organizations that can be described by these last two items are included with the primary government in the financial statements as component units.
The District is not included in any other governmental reporting entity as defined in GASB No. 14 and amended by GASB No. 39 and 61. As required by accounting principles generally accepted in the United States, these basic financial statements present the District (the primary government) and its component units. The component units discussed below are included in the District's reporting entity as required by the Colorado Department of Education. None of the component units are considered to be a major component unit.
Discretely presented component units - charter schools
The State of Colorado Legislature in 1993 enacted the “Charter School Act – Colorado Revised Statutes (CRS) Section 22-30.5-101.” This Act permits the District to contract with individuals and organizations for the operation of schools within the District. The statutes define these contracted schools as “Charter Schools.” Charter schools are financed from state School Finance Act revenues, property taxes and from revenues generated by the charter school, within the limits established by the Charter School Act and per GASB statement No. 14, paragraph 21b. Charter Schools have separate governing boards; however, the Jefferson County School District’s Board of Education must approve all charter school applications and budgets. The charter schools are required to be presented as component units by the Colorado Department of Education. All charter schools are required to have individual independent audits.
Blended component unit - Jefferson County School District Finance Corporation
The purpose of the Jefferson County School Finance Corporation (the Corporation) is to provide a mechanism to issue certificates of participation. Because the Board of Directors is appointed by the Board of Education and must obtain the Board of Education's approval for renovation and expansion decisions, issuance of debt, disbursements of funds, and any amendments to the articles of incorporation, the Corporation is considered to be a part of the District.
B) Government-wide and fund financial statements
The government-wide financial statements (i.e., the statement of net position and the statement of activities) report information on all of the activities of the District and its component units. For the most part, the effect of interfund activity has been removed from these statements. Governmental activities, which normally are supported by taxes and intergovernmental revenues, are reported separately from business-type activities, which rely to a significant extent on fees and charges for support. Likewise, the primary government is reported separately from certain legally separate component units.
The statement of activities demonstrates the degree to which the direct expenses of a given function or programs are offset by program revenue. Direct expenses are those that are clearly identifiable with a specific function. Program revenues include 1) charges to customers or applicants who purchase, use, or directly benefit from goods, services, or
-48-

privileges provided by a given function and 2) grants and contributions that are restricted to meeting the operational or capital requirements of a particular function. Taxes and other items not properly included among program revenues are reported as general revenues.
Separate financial statements are provided for governmental funds and proprietary funds. Major individual governmental funds (general fund, bond redemption debt service fund, capital reserve capital projects funds, building fund, and grants fund) and individual enterprise funds (child care fund and property management fund) are reported as separate columns in the fund financial statements.
C) Measurement focus, basis of accounting, and financial statement presentation
The accounting and financial reporting treatment applied to a fund is determined by its measurement focus. The government-wide financial statements are presented using the economic resources measurement focus and the accrual basis of accounting, as are the proprietary fund statements. Revenues are recorded when earned and expenses arerecorded when a liability is incurred, regardless of the timing of related cash flows. Property taxes are recognized as revenues in the year for which they are levied. Grants and similar items are recognized as revenue as soon as all eligibility requirements imposed by the provider have been met.
As a general rule, the effect of interfund activity has been eliminated from the government-wide financial statements. Exceptions to this general rule are charges between the District’s governmental and business-type activities and component units. Elimination of these charges would distort the direct costs and program revenues reported for the various functions concerned.
Governmental fund financial statements are reported using the current financial resources measurement focus and the modified accrual basis of accounting. With this measurement focus, operating statements present increases and decreases in net current assets and fund balance as a measure of available spendable resources. This means that only current liabilities are generally included on their balance sheets.
All governmental fund types use the modified accrual basis of accounting. Revenues are recognized as soon as they are both measurable and available. Measurable means the amount of the transaction can be determined and available means collectible within the current period, or soon enough thereafter, to pay liabilities of the current period. Property tax revenues are considered to be available if collected within 60 days after year-end. All other revenues are considered to be available if collected within 120 days after year end. Property and automotive ownership taxes are reported as receivables and deferred inflows of resources when levied and as revenues when due for collection in the following year and determined to be available.
Expenditures are recorded when the related fund liability is incurred with the exception of general obligation and capital lease debt service which is recognized when due and certain accrued sick and personal pay which are accounted for as expenditures when expected to be liquidated with expendable available financial resources.
The proprietary fund types are accounted for on the accrual basis of accounting. Revenues are recognized when earned and expenses are recognized when incurred. The measurement focus in these funds is on the flow of economic resources and emphasizes the determination of net income. All assets and all liabilities associated with their activity are included on their statements of net position. Proprietary fund type operating statements present increases (revenues) and decreases (expenses) in net total position.
Proprietary funds distinguish operating revenues and expenses from nonoperating items. Operating revenues and expenses generally result from providing goods and services in connection with a proprietary fund’s ongoing operations. The principal operating revenues of the District’s proprietary funds are charges to customers for sales and services. Operating expenses for enterprise funds and internal service funds include the cost of sales and services, administrative expenses, and depreciation on capital assets. All revenue and expenses not meeting this definition are reported as nonoperating revenues and expenses.
When both restricted and unrestricted resources are available for use, it is the District’s policy to use restricted resources first, then unrestricted resources, as they are needed.
-49-
D) Fund accounting
The accounts of the District are organized on the basis of funds, each of which is considered to be a separate accounting entity. The operations of each fund are accounted for with a separate set of self-balancing accounts that comprise its assets, deferred inflows of resources, liabilities, deferred outflows of resources, fund equity, revenues and expenditures, or expenses, as appropriate. Resources are allocated to and accounted for in individual funds based upon the purposes for which they are to be spent and the means by which spending activities are controlled. The major funds presented in the accompanying basic financial statements are as follows:
Major governmental funds1. General fund – the general operating fund of the District; used to account for all resources that are not required
legally or by sound financial management to be accounted for in another fund.2. Bond redemption debt service fund - used to account for the accumulation of resources for, and the payment
of, long-term general obligation debt principal, interest, and related costs.3. Capital reserve capital projects fund - used to account for resources to be used for the acquisition or
construction of major capital facilities (other than those financed by proprietary funds). 4. Building fund – Capital projects – used to account for resources to be used from the 2018 voter approved
bond for a capital improvement plan that will span over 6 years. Each issuance of debt will be spent in 3 years.
5. Grants fund – used to account for federal, state and private sector grant programs.
Major proprietary funds-business-type activitiesEnterprise funds - used to account for operations that are financed and operated in a manner similar to private business enterprises, where the intent is that the costs (including depreciation) of providing goods or services to the general public on a continuing basis be financed or recovered primarily through user charges. Enterprise funds are considered major funds because of community interests in the activities and sources of funding supporting these operations.
1. Child care fund - this fund accounts for all financial activities associated with the District’s school-age child care and preschool program.
2. Property management fund - this fund accounts for all financial activities associated with the District’s facilities.
Internal service fundsInternal service funds account for central services, employee benefits, insurance reserve and technology operations. These services are provided to other funds of the District on a cost reimbursement basis.
E) Cash and investments
The pooled cash concept is used whereby cash balances of each of the District's funds are pooled and invested in certain investments. The District is allowed to invest in the following types of investments: short-term certificates of deposit, repurchase agreements, money market deposit accounts, mutual funds, government pools, U.S. instruments and U.S. Treasury Obligations. The Districts investment in CSAFE and money market funds are recorded at amortized cost. The District records nonparticipating interest-earning investment contracts at amortized cost. All other securities are recorded at fair value. It is the intention of the investment pool to maximize interest income, and securities are selected according to their risk, marketability, and diversification. Income earned or losses arising from the investment of pooled cash balances are allocated to the various funds based on their respective average periodic equity in pooled cash. The pooled cash and investments are used essentially as demand deposit accounts and are considered to be cash equivalents for cash flow purposes. Component units are included with the District’s pooled cash.
-50-
F) Fair value measurement and application
The District adopted GASB 72 in fiscal year 2016, which addresses accounting and financial reporting issues related to fair value measurements. The fair value is the price that would be received by the District to sell an asset or paid by the District to transfer a liability in an orderly transaction between market participants and the measurement date. The fair value measurement for financial reporting at fiscal year end June 30, 2020 and the application used is determined by a hierarchy of one of three levels. Level one is the most reliable and is quoted prices in active markets for identical assets or liabilities, level two is reliable and consists of quoted prices for similar assets or liabilities, other observable inputs, interest rates, credit spreads, condition of the asset, activity level of markets for observable input, and level three is least reliable which is based on unobservable inputs. All donated assets are measured at the estimated acquisition value.
G) Restricted cash
Certain assets of the employee benefits fund and Component Units are classified as restricted because their use is restricted to liabilities relating to deposits and capital leases.
H) Receivables
Property taxes levied in 2019 but not yet collected as of June 30, 2020 are identified as property taxes receivable and deferred inflows of resources if not received within sixty days of year end, and are presented net of an allowance for uncollectable taxes. Intergovernmental receivables of $10,873,698 include amounts due from grantors for specific program grants. Program grants are recorded as receivables and revenues at the time reimbursable project costs are incurred. As of June 30, 2020, the District had $10,449,479 and $424,219 due from the Federal and State government, respectively, reflected as intergovernmental receivables in the accompanying basic financial statements.
I) Inventories and prepaid items
Materials and supplies inventories are stated at average cost. Inventories recorded in the Food Services fund consistof purchased and donated commodities. Purchased inventories are stated at average cost. Donated inventories, received at no cost under a program supported by the Federal Government, are recorded at their estimated value at the date of receipt. The cost of all inventories is recorded as an asset when the individual inventory items are purchased, and as an expenditure or expense when consumed. Fund balance is considered nonspendable and for the inventory balances; the district reports $1,060,284 and $2,542,802 for the general fund and other governmental funds, including food and nutrition services fund, respectively.
Certain payments to vendors reflect costs applicable to future accounting periods and are recorded as prepaid items using the consumption method in both government-wide and fund financial statements. Fund balance is nonspendable for the prepaid balances of $70,909 and $47,828 for general fund and other governmental funds respectively.
J) Capital assets
Capital assets, which include property, vehicles and equipment, are utilized for general District operations and are capitalized at actual or estimated cost. Donations of such assets are recorded at acquisition value at the time of donation or at estimated acquisition value if the acquisition value is unknown. Capital assets are reported in the applicable governmental or business-type activities columns in the government-wide financial statements.
Maintenance, repairs, and minor renovations are recorded as expenditures when incurred. Major additions and improvements are capitalized. When assets used in the operation of the governmental fund types are sold, the proceeds of the sale are recorded as revenues in the appropriate fund. The District does not capitalize interest on the construction of capital assets.
The monetary threshold for capitalization of assets is $5,000. The District’s capital assets are depreciated using the straight-line method over the estimated useful lives of the capital assets. Depreciation of all capital assets used by proprietary funds is charged as an expense against their operations. No depreciation is recorded in the year of acquisition with the remaining depreciation being recorded in the year of disposition.
-51-
Estimated useful lives are:
Motor vehicles 5 to 15 yearsEquipment, movable 3 to 20 yearsBuildings and improvements 10 to 30 years
K) Deferred outflows of resources
For current refundings and advance refundings, resulting in defeasance of debt reported by governmental activities and component units, the difference between the reacquisition and the net carrying amount of the old debt is reported as a deferred outflow of resources or a deferred inflow of resources. The District refundings have resulted in deferred outflows of resources of $4,305,879 and $1,097,377 for component units. Deferred outflows of resources for pension and OPEB activity is included and referenced below (note 12 &13).
L) Liabilities
In the government-wide financial statements, and proprietary fund types in the fund financial statements, long-term debt and other long-term obligations are reported as liabilities in the applicable governmental activities, business-type activities, or proprietary fund type statement of net position.
The District’s general obligation bonds are serviced from property taxes of the Bond Redemption Debt Service fund. Certificates of participation are serviced from school finance act, property taxes and other revenues of the General fund. Capital leases are funded from school finance act and other revenue of the component units. The long-term accumulated unpaid vacation, accrued sick and personal leave, and estimated liability for insurance claims (note 10)are serviced from property taxes and other revenues by the respective fund type from future appropriations.
M) Pension and OPEB Pension. The District participates in the School Division Trust Fund (SCHDTF), a cost sharing multiple-employer defined benefit pension fund administered by the Public Employees’ Retirement Association of Colorado (PERA). The net pension liability, deferred outflows of resources and deferred inflows of resources related to pensions, pension expense, information about the fiduciary net position and additions to/deductions from the fiduciary net position of the SCHDTF have been determined using the economic resources measurement focus and the accrual basis of accounting. For this purpose, benefit payments (including refunds of employee contributions) are recognized when due and payable in accordance with the benefit terms. Investments are reported at fair value.
OPEB. The District participates in the Health Care Trust Fund (HCTF), a cost-sharing multiple-employer defined benefit OPEB fund administered by the Public Employees’ Retirement Association of Colorado (“PERA”). The net OPEB liability, deferred outflows of resources and deferred inflows of resources related to OPEB, OPEB expense, information about the fiduciary net position and additions to/deductions from the fiduciary net position of the HCTF have been determined using the economic resources measurement focus and the accrual basis of accounting. For this purpose, benefits paid on behalf of health care participants are recognized when due and/or payable in accordance with the benefit terms. Investments are reported at fair value.
N) Constitutional amendment
In November 1992, Colorado voters approved Article X of the Colorado Constitution by adding Section 20, commonly known as the Taxpayer's Bill of Rights (TABOR). TABOR contains revenue, spending, tax and debt limitations, which apply to the State of Colorado and local governments. It requires, with certain exceptions, advance voter approval for any new tax, tax rate increase, mill levy above that for the prior year, extension of an expiring tax, or tax policy change directly causing a net tax revenue gain to any entity.
On November 2, 1999, the District conducted a TABOR revenue and expenditure override election and the Jefferson County voters approved the measure exempting the District from the TABOR revenue and expenditure limits. Management believes it is in compliance with the provisions of TABOR. However, the provisions are complex and subject to interpretation. Many of the provisions may require judicial interpretation.
-52-
Except for refinancing bonded debt at a lower interest rate or adding new employees to existing pension plans, TABOR requires advance voter approval for the creation of any multiple-fiscal year debt or other financial obligation unless adequate present cash reserves are pledged irrevocably and held for payments in all future years. TABOR requires local governments to restrict emergency reserves to be used for declared emergencies only. Emergencies, as defined by TABOR, exclude economic conditions, revenue shortfalls, or salary or fringe benefit increases. These restricted fund balances are required to be three percent or more of fiscal year spending (excluding bonded debt service). As of June 30, 2020, for budgetary purposes the District restricted $20,855,636 in the general fund, $144,375in the capital reserve capital projects fund, $528,350 in other governmental funds, $399,810 in the child care fund, $64,758 in the property management fund, $50,259 in internal service funds and $2,267,633 was restricted in the component units charter schools for this purpose.
O) Property taxes
Under Colorado law, all property taxes are due and payable in the year following the year levied. The property tax calendar for Jefferson County was as follows:
Levy date December 22Lien date January 1Tax bills mailed January 1First installment due March 2 Second installment due June 15If paid in full, due April 30
P) Accumulated sick and personal leave and vacation
District policy allows unlimited accumulation of sick and personal leave, and annual carry-over of vacation to a maximum of 40 days. Up to 40 days accrued vacation is paid to employees upon termination of employment. Payment for unused sick and personal leave days is made upon meeting eligibility requirements at the rate of .0015 times annual rate of pay times accumulated days up to a maximum of 660 hours. Each fund liquidates the accrued vacation, personal and sick leave for its respective liabilities.
As of June 30, 2020, a summary of changes in accumulated vacation is as follows:
Accumulated Vacation
Balance Balance Due withinFund June 30, 2019 Additions Deletions June 30, 2020 one year
General $ 4,467,618 $ 1,652,570 $ (694,023) $ 5,426,165 $ 1,807,130Grants Fund 156,185 126,920 (37,091) 246,014 81,923Special Revenue 545,877 241,751 (81,360) 706,268 235,188Capital Projects 210,967 96,923 (2,998) 304,892 101,529Enterprise 167,143 85,793 (22,299) 230,637 76,879Internal Service 1,440,690 375,897 (130,476) 1,686,111 562,037
$ 6,988,480 $ 2,579,854 $ (968,247) $ 8,600,087 $ 2,864,686
Accumulated vacation pay is recorded as accrued salaries, benefits and compensated absences with the current portion reported as current liabilities in the government-wide financial statements. The short-term portion is included in the District’s accrued salaries and benefits and the long-term portion is included in compensated absences in the government-wide financial statements.
-53-
Q) Fund balance
Fund balance of governmental funds is reported in various categories based on the nature of any limitations requiring the use of resources for specific purposes. The District itself can establish limitations on the use of resources through either a commitment (committed fund balance) or an assignment (assigned fund balance).
Fund balances are classified in one of five categories: 1) nonspendable, 2) restricted, 3) committed, 4) assigned and 5) unassigned. Nonspendable fund balance represents assets that will never be converted to cash. Restricted fund balances reflect resources that are subject to externally enforceable legal restrictions. Committed fund balance includes amounts that can be used only for the specific purposes that are limited by actions of the Board of Education, the highest level of decision-making authority at the District. The committed reserves are established during the budget appropriation process and cannot be used for other purposes without a formal board resolution. Assigned fund balance displays the District’s intended use of these resources. The Board of Education executive limitations policy (EL-5), directs the Superintendent to submit the financial plan that includes any assignments for fund balance. The Superintendent or the Chief Financial Officer, as designee, is allowed by Board policy to make any necessary adjustments to this assignment. Unassigned fund balance for the general fund represents the net resources in excess of the prior classifications. The District does have a formal fund balance reserve policy for all funds to establish a level of reserves above the statutorily required TABOR amount to insure a continued strong financial position. This reserve does not meet the GASB Statement No. 54 requirements for a stabilization agreement and is included in unassigned. When expenditures are incurred for purposes for which both restricted and unrestricted fund balance is available, the District considers restricted funds to have been spent first. When an expenditure is incurred for which committed, assigned or unassigned fund balances are available, the District considers amounts to have been spent first out of committed funds, then assigned funds and finally unassigned funds, as needed, unless the Board of Education has provided otherwise in its commitment or assignment actions. Fund balance is adopted annually by the Board of Education during the budget process.
R) On-Behalf Payments
GAAP requires that direct on-behalf payments for fringe benefits and salaries made by one entity to a third party recipient for the employees of another, legally separate entity be recognized as revenue and expenditures by the employer government. The State of Colorado makes direct on-behalf payments for retirement benefits to Colorado PERA. Beginning on July 1, 2018, the State of Colorado is required to make a payment to PERA each year equal to $225 million. PERA allocates the contribution to the trust funds of the State, School, Denver Public Schools, and Judicial Division Trust Funds of PERA, as proportionate to the annual payroll of each division. This annual payment is required on July 1st of each year thereafter until there are no unfunded actuarial accrued liabilities of any division of PERA that receives the direct distribution. The amount of on-behalf payments made for the District by the State of Colorado has been recorded in the fund financial statements.
S) New and Future Accounting Pronouncements
Future announcements that are being reviewed by management include GASB Statement No. 87 Leases that will be required to be included in financial statements starting with fiscal year December 31, 2020.
2. Budgetary information
The District follows these procedures in establishing the budgetary data reflected in the basic financial statements:1. Within the fourth quarter of the fiscal year, the Superintendent submits to the Board of Education a
proposed operating budget for the fiscal year commencing the following July 1. The operating budget includes proposed expenditures and the means of financing them.
2. Public hearings and citizen reviews are conducted at special meetings and at regular Board of Education meetings to obtain taxpayer comments.
3. Prior to June 30, the budget is legally adopted by the Board of Education.
-54-
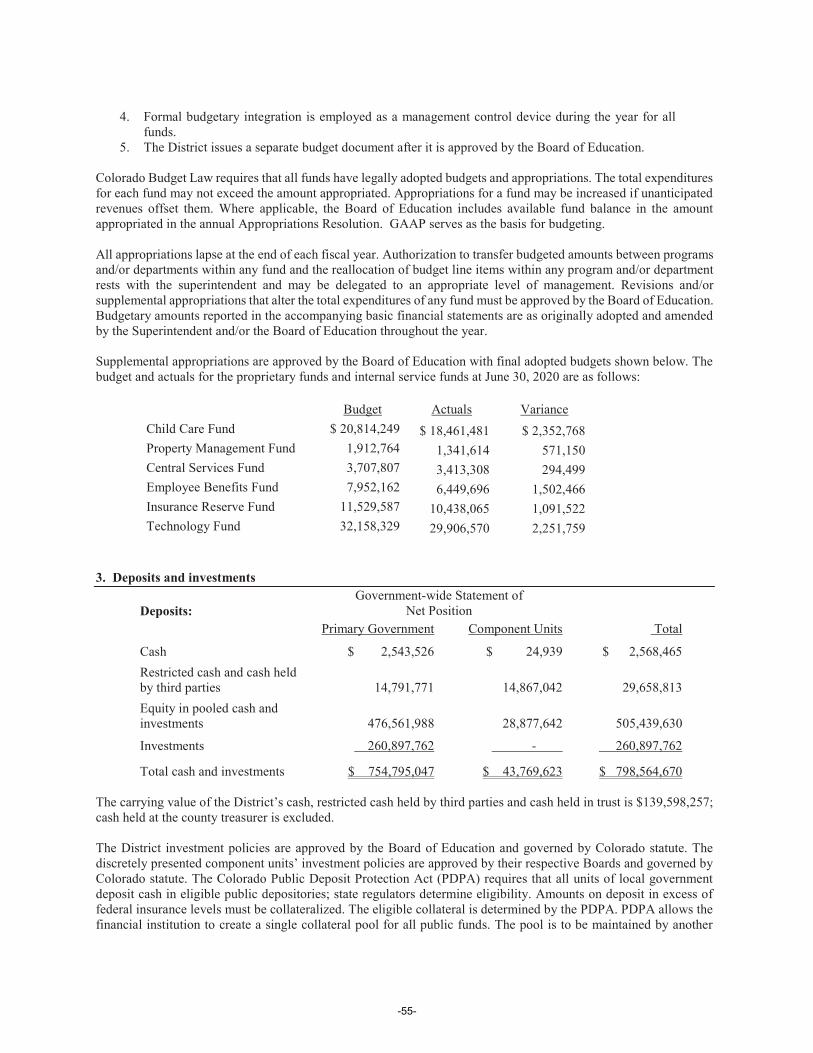
4. Formal budgetary integration is employed as a management control device during the year for all funds.
5. The District issues a separate budget document after it is approved by the Board of Education.
Colorado Budget Law requires that all funds have legally adopted budgets and appropriations. The total expenditures for each fund may not exceed the amount appropriated. Appropriations for a fund may be increased if unanticipated revenues offset them. Where applicable, the Board of Education includes available fund balance in the amount appropriated in the annual Appropriations Resolution. GAAP serves as the basis for budgeting.
All appropriations lapse at the end of each fiscal year. Authorization to transfer budgeted amounts between programs and/or departments within any fund and the reallocation of budget line items within any program and/or department rests with the superintendent and may be delegated to an appropriate level of management. Revisions and/or supplemental appropriations that alter the total expenditures of any fund must be approved by the Board of Education.Budgetary amounts reported in the accompanying basic financial statements are as originally adopted and amended by the Superintendent and/or the Board of Education throughout the year.
Supplemental appropriations are approved by the Board of Education with final adopted budgets shown below. The budget and actuals for the proprietary funds and internal service funds at June 30, 2020 are as follows:
Budget Actuals VarianceChild Care Fund $ 20,814,249 $ 18,461,481 $ 2,352,768Property Management Fund 1,912,764 1,341,614 571,150Central Services Fund 3,707,807 3,413,308 294,499Employee Benefits Fund 7,952,162 6,449,696 1,502,466Insurance Reserve Fund 11,529,587 10,438,065 1,091,522Technology Fund 32,158,329 29,906,570 2,251,759
3. Deposits and investments
Deposits: Government-wide Statement of
Net PositionPrimary Government Component Units Total
Cash $ 2,543,526 $ 24,939 $ 2,568,465Restricted cash and cash held by third parties 14,791,771 14,867,042 29,658,813Equity in pooled cash and investments 476,561,988 28,877,642 505,439,630
Investments 260,897,762 - 260,897,762
Total cash and investments $ 754,795,047 $ 43,769,623 $ 798,564,670 The carrying value of the District’s cash, restricted cash held by third parties and cash held in trust is $139,598,257;cash held at the county treasurer is excluded.
The District investment policies are approved by the Board of Education and governed by Colorado statute. The discretely presented component units’ investment policies are approved by their respective Boards and governed by Colorado statute. The Colorado Public Deposit Protection Act (PDPA) requires that all units of local government deposit cash in eligible public depositories; state regulators determine eligibility. Amounts on deposit in excess of federal insurance levels must be collateralized. The eligible collateral is determined by the PDPA. PDPA allows the financial institution to create a single collateral pool for all public funds. The pool is to be maintained by another
-55-
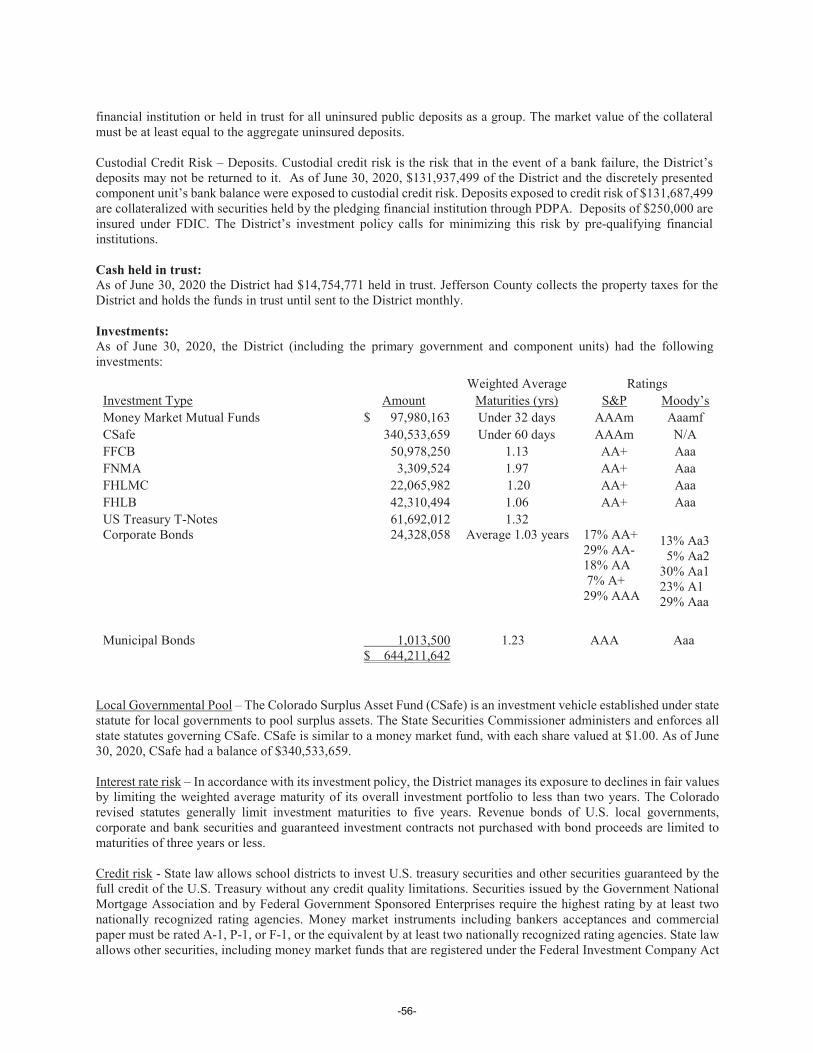
financial institution or held in trust for all uninsured public deposits as a group. The market value of the collateral must be at least equal to the aggregate uninsured deposits.
Custodial Credit Risk – Deposits. Custodial credit risk is the risk that in the event of a bank failure, the District’s deposits may not be returned to it. As of June 30, 2020, $131,937,499 of the District and the discretely presented component unit’s bank balance were exposed to custodial credit risk. Deposits exposed to credit risk of $131,687,499are collateralized with securities held by the pledging financial institution through PDPA. Deposits of $250,000 are insured under FDIC. The District’s investment policy calls for minimizing this risk by pre-qualifying financial institutions.
Cash held in trust:As of June 30, 2020 the District had $14,754,771 held in trust. Jefferson County collects the property taxes for the District and holds the funds in trust until sent to the District monthly.
Investments:As of June 30, 2020, the District (including the primary government and component units) had the following investments:
Weighted Average RatingsInvestment Type Amount Maturities (yrs) S&P Moody’sMoney Market Mutual Funds $ 97,980,163 Under 32 days AAAm AaamfCSafe 340,533,659 Under 60 days AAAm N/AFFCB 50,978,250 1.13 AA+ AaaFNMA 3,309,524 1.97 AA+ AaaFHLMC 22,065,982 1.20 AA+ AaaFHLB 42,310,494 1.06 AA+ AaaUS Treasury T-Notes 61,692,012 1.32 Corporate Bonds 24,328,058 Average 1.03 years 17% AA+
29% AA- 18% AA 7% A+29% AAA
13% Aa35% Aa2
30% Aa123% A129% Aaa
Municipal Bonds 1,013,500 1.23 AAA Aaa$ 644,211,642
Local Governmental Pool – The Colorado Surplus Asset Fund (CSafe) is an investment vehicle established under state statute for local governments to pool surplus assets. The State Securities Commissioner administers and enforces all state statutes governing CSafe. CSafe is similar to a money market fund, with each share valued at $1.00. As of June 30, 2020, CSafe had a balance of $340,533,659.
Interest rate risk – In accordance with its investment policy, the District manages its exposure to declines in fair values by limiting the weighted average maturity of its overall investment portfolio to less than two years. The Colorado revised statutes generally limit investment maturities to five years. Revenue bonds of U.S. local governments, corporate and bank securities and guaranteed investment contracts not purchased with bond proceeds are limited to maturities of three years or less.
Credit risk - State law allows school districts to invest U.S. treasury securities and other securities guaranteed by the full credit of the U.S. Treasury without any credit quality limitations. Securities issued by the Government National Mortgage Association and by Federal Government Sponsored Enterprises require the highest rating by at least two nationally recognized rating agencies. Money market instruments including bankers acceptances and commercial paper must be rated A-1, P-1, or F-1, or the equivalent by at least two nationally recognized rating agencies. State law allows other securities, including money market funds that are registered under the Federal Investment Company Act
-56-
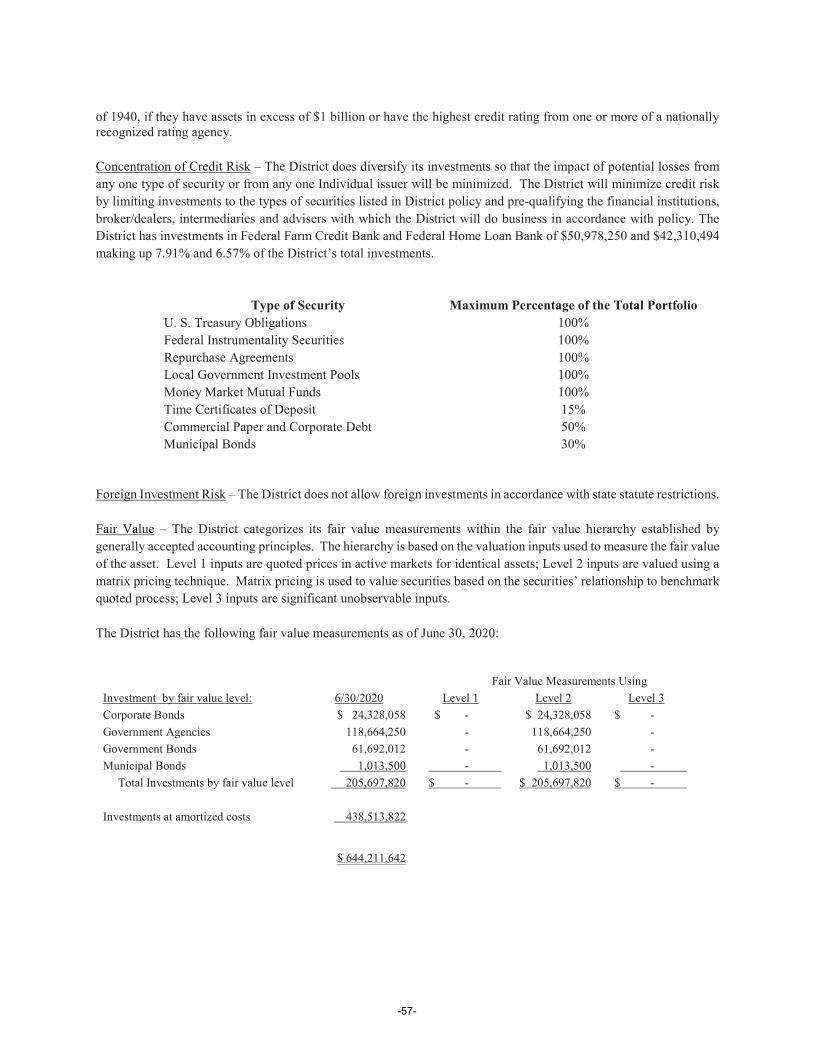
of 1940, if they have assets in excess of $1 billion or have the highest credit rating from one or more of a nationally recognized rating agency.
Concentration of Credit Risk – The District does diversify its investments so that the impact of potential losses from any one type of security or from any one Individual issuer will be minimized. The District will minimize credit risk by limiting investments to the types of securities listed in District policy and pre-qualifying the financial institutions, broker/dealers, intermediaries and advisers with which the District will do business in accordance with policy. The District has investments in Federal Farm Credit Bank and Federal Home Loan Bank of $50,978,250 and $42,310,494 making up 7.91% and 6.57% of the District’s total investments.
Type of Security Maximum Percentage of the Total PortfolioU. S. Treasury Obligations 100%Federal Instrumentality Securities 100%Repurchase Agreements 100%Local Government Investment Pools 100%Money Market Mutual Funds 100%Time Certificates of Deposit 15%Commercial Paper and Corporate Debt 50%Municipal Bonds 30%
Foreign Investment Risk – The District does not allow foreign investments in accordance with state statute restrictions.
Fair Value – The District categorizes its fair value measurements within the fair value hierarchy established by generally accepted accounting principles. The hierarchy is based on the valuation inputs used to measure the fair value of the asset. Level 1 inputs are quoted prices in active markets for identical assets; Level 2 inputs are valued using a matrix pricing technique. Matrix pricing is used to value securities based on the securities’ relationship to benchmark quoted process; Level 3 inputs are significant unobservable inputs.
The District has the following fair value measurements as of June 30, 2020:
Fair Value Measurements UsingInvestment by fair value level: 6/30/2020 Level 1 Level 2 Level 3Corporate Bonds $ 24,328,058 $ - $ 24,328,058 $ - Government Agencies 118,664,250 - 118,664,250 - Government Bonds 61,692,012 - 61,692,012 - Municipal Bonds 1,013,500 - 1,013,500 -
Total Investments by fair value level 205,697,820 $ - $ 205,697,820 $ -
Investments at amortized costs 438,513,822
$ 644,211,642
-57-
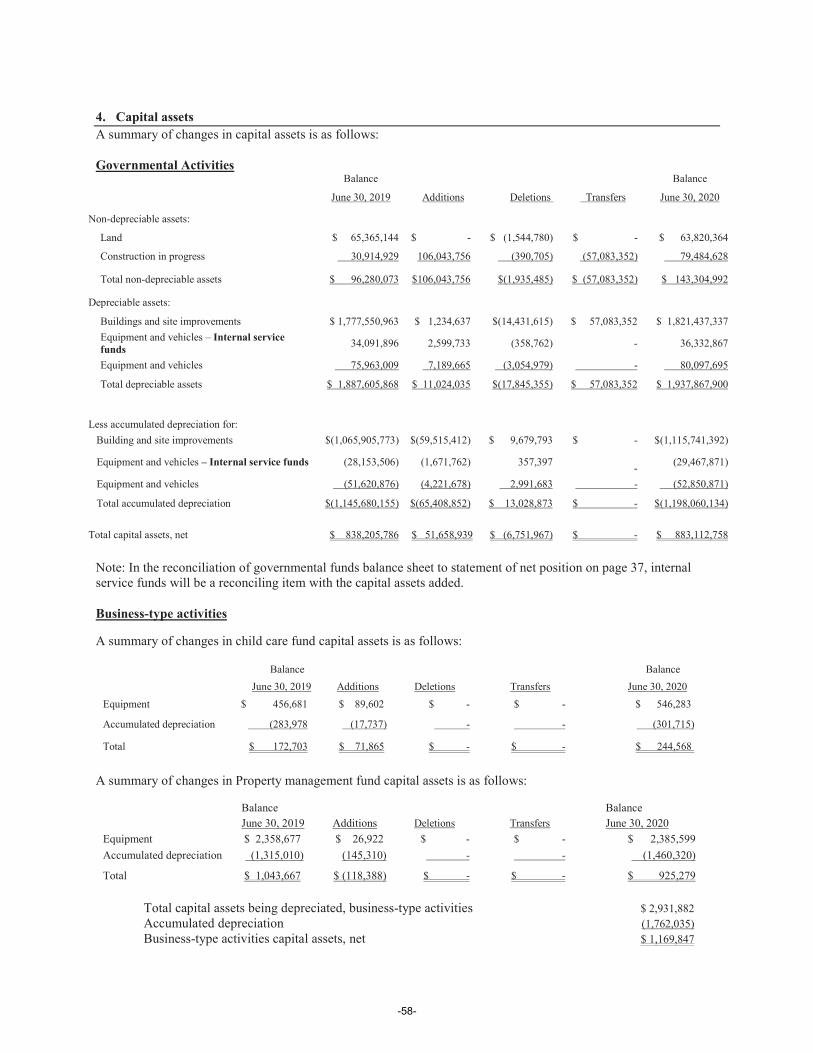
4. Capital assetsA summary of changes in capital assets is as follows:
Governmental ActivitiesBalance Balance
June 30, 2019 Additions Deletions Transfers June 30, 2020
Non-depreciable assets:
Land $ 65,365,144 $ - $ (1,544,780) $ - $ 63,820,364
Construction in progress 30,914,929 106,043,756 (390,705) (57,083,352) 79,484,628
Total non-depreciable assets $ 96,280,073 $106,043,756 $(1,935,485) $ (57,083,352) $ 143,304,992
Depreciable assets:
Buildings and site improvements $ 1,777,550,963 $ 1,234,637 $(14,431,615) $ 57,083,352 $ 1,821,437,337Equipment and vehicles – Internal service funds 34,091,896 2,599,733 (358,762) - 36,332,867
Equipment and vehicles 75,963,009 7,189,665 (3,054,979) - 80,097,695
Total depreciable assets $ 1,887,605,868 $ 11,024,035 $(17,845,355) $ 57,083,352 $ 1,937,867,900
Less accumulated depreciation for:Building and site improvements $(1,065,905,773) $(59,515,412) $ 9,679,793 $ - $(1,115,741,392)
Equipment and vehicles – Internal service funds (28,153,506) (1,671,762) 357,397 - (29,467,871)
Equipment and vehicles (51,620,876) (4,221,678) 2,991,683 - (52,850,871)
Total accumulated depreciation $(1,145,680,155) $(65,408,852) $ 13,028,873 $ - $(1,198,060,134)
Total capital assets, net $ 838,205,786 $ 51,658,939 $ (6,751,967) $ - $ 883,112,758
Note: In the reconciliation of governmental funds balance sheet to statement of net position on page 37, internalservice funds will be a reconciling item with the capital assets added.
Business-type activities
A summary of changes in child care fund capital assets is as follows:
Balance BalanceJune 30, 2019 Additions Deletions Transfers June 30, 2020
Equipment $ 456,681 $ 89,602 $ - $ - $ 546,283
Accumulated depreciation (283,978 (17,737) - - (301,715)
Total $ 172,703 $ 71,865 $ - $ - $ 244,568
A summary of changes in Property management fund capital assets is as follows:
Balance BalanceJune 30, 2019 Additions Deletions Transfers June 30, 2020
Equipment $ 2,358,677 $ 26,922 $ - $ - $ 2,385,599Accumulated depreciation (1,315,010) (145,310) - - (1,460,320)
Total $ 1,043,667 $ (118,388) $ - $ - $ 925,279
Total capital assets being depreciated, business-type activities $ 2,931,882 Accumulated depreciation (1,762,035) Business-type activities capital assets, net $ 1,169,847
-58-
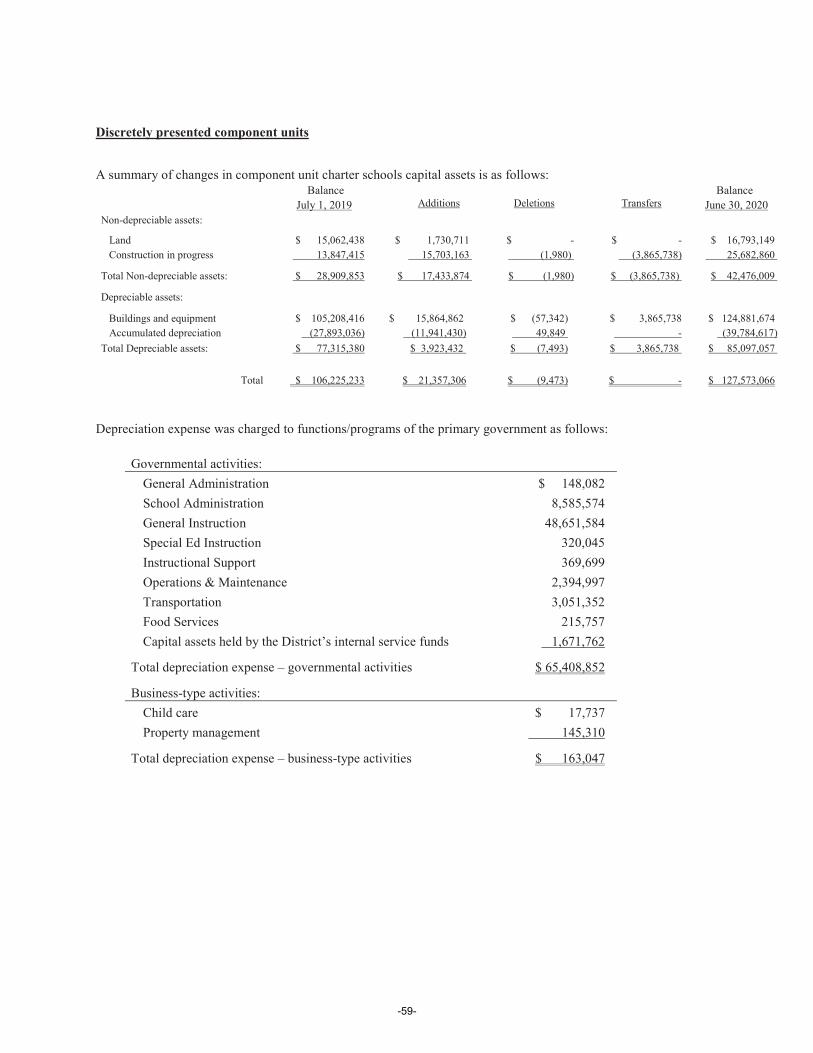
Discretely presented component units
A summary of changes in component unit charter schools capital assets is as follows:Balance Balance
July 1, 2019 Additions Deletions Transfers June 30, 2020Non-depreciable assets:
Land $ 15,062,438 $ 1,730,711 $ - $ - $ 16,793,149Construction in progress 13,847,415 15,703,163 (1,980) (3,865,738) 25,682,860
Total Non-depreciable assets: $ 28,909,853 $ 17,433,874 $ (1,980) $ (3,865,738) $ 42,476,009
Depreciable assets:
Buildings and equipment $ 105,208,416 $ 15,864,862 $ (57,342) $ 3,865,738 $ 124,881,674Accumulated depreciation (27,893,036) (11,941,430) 49,849 - (39,784,617)
Total Depreciable assets: $ 77,315,380 $ 3,923,432 $ (7,493) $ 3,865,738 $ 85,097,057
Total $ 106,225,233 $ 21,357,306 $ (9,473) $ - $ 127,573,066
Depreciation expense was charged to functions/programs of the primary government as follows:
Governmental activities:General Administration $ 148,082School Administration 8,585,574General Instruction 48,651,584Special Ed Instruction 320,045Instructional Support 369,699Operations & Maintenance 2,394,997Transportation 3,051,352Food Services 215,757Capital assets held by the District’s internal service funds 1,671,762
Total depreciation expense – governmental activities $ 65,408,852
Business-type activities:Child care $ 17,737Property management 145,310
Total depreciation expense – business-type activities $ 163,047
-59-
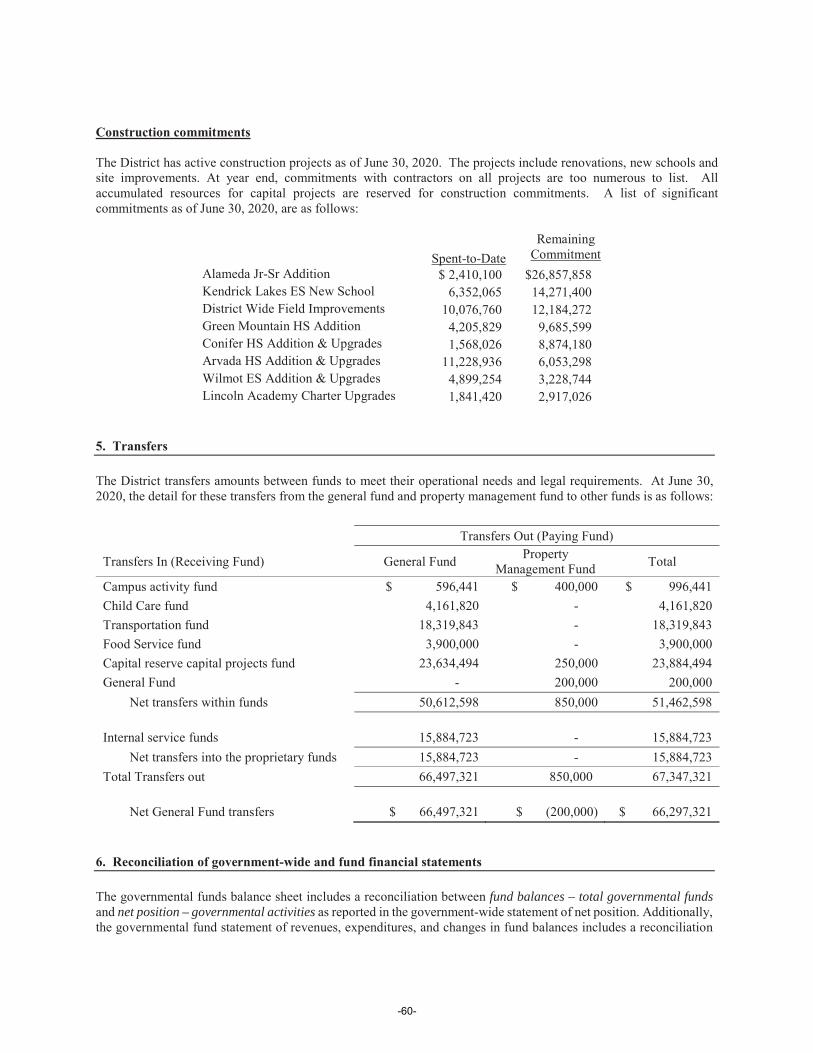
Construction commitments
The District has active construction projects as of June 30, 2020. The projects include renovations, new schools and site improvements. At year end, commitments with contractors on all projects are too numerous to list. All accumulated resources for capital projects are reserved for construction commitments. A list of significantcommitments as of June 30, 2020, are as follows:
Spent-to-DateRemaining
CommitmentAlameda Jr-Sr Addition $ 2,410,100 $26,857,858Kendrick Lakes ES New School 6,352,065 14,271,400District Wide Field Improvements 10,076,760 12,184,272Green Mountain HS Addition 4,205,829 9,685,599Conifer HS Addition & Upgrades 1,568,026 8,874,180Arvada HS Addition & Upgrades 11,228,936 6,053,298Wilmot ES Addition & Upgrades 4,899,254 3,228,744Lincoln Academy Charter Upgrades 1,841,420 2,917,026
5. Transfers
The District transfers amounts between funds to meet their operational needs and legal requirements. At June 30, 2020, the detail for these transfers from the general fund and property management fund to other funds is as follows:
6. Reconciliation of government-wide and fund financial statements
The governmental funds balance sheet includes a reconciliation between fund balances – total governmental fundsand net position – governmental activities as reported in the government-wide statement of net position. Additionally, the governmental fund statement of revenues, expenditures, and changes in fund balances includes a reconciliation
Transfers Out (Paying Fund)
Transfers In (Receiving Fund) General Fund Property Management Fund Total
Campus activity fund $ 596,441 $ 400,000 $ 996,441Child Care fund 4,161,820 - 4,161,820Transportation fund 18,319,843 - 18,319,843Food Service fund 3,900,000 - 3,900,000Capital reserve capital projects fund 23,634,494 250,000 23,884,494General Fund - 200,000 200,000
Net transfers within funds 50,612,598 850,000 51,462,598 Internal service funds 15,884,723 - 15,884,723
Net transfers into the proprietary funds 15,884,723 - 15,884,723Total Transfers out 66,497,321 850,000 67,347,321
Net General Fund transfers $ 66,497,321 $ (200,000) $ 66,297,321
-60-
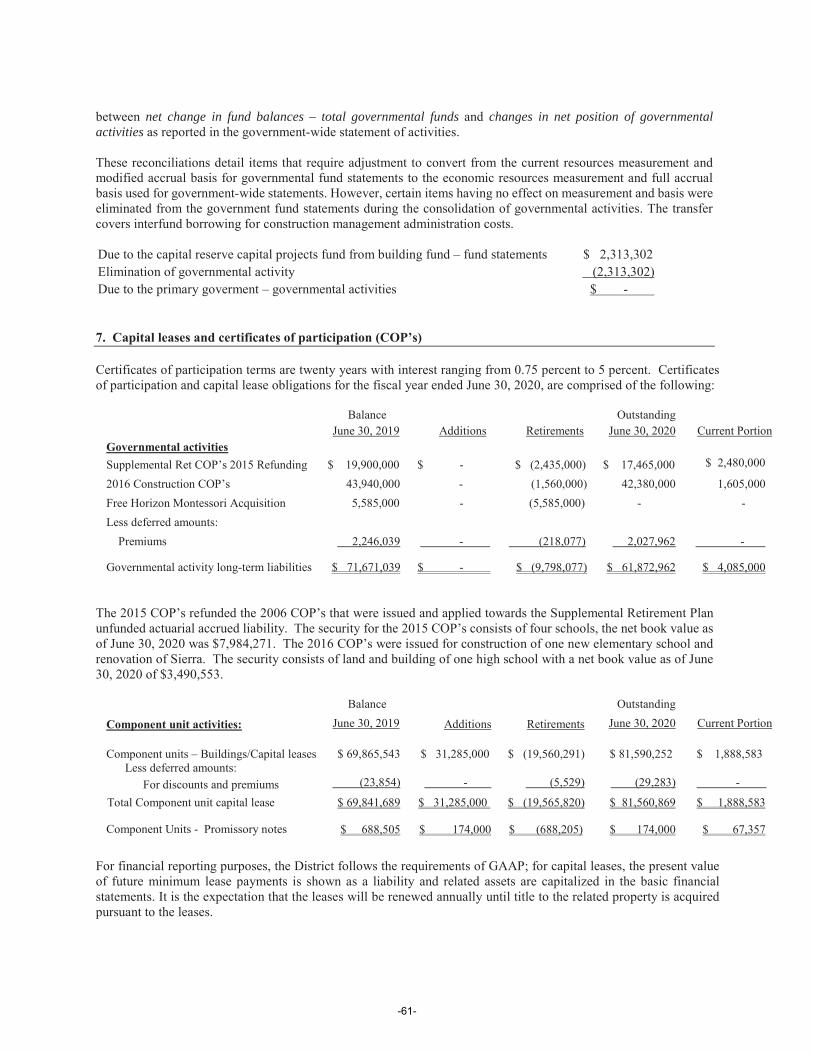
between net change in fund balances – total governmental funds and changes in net position of governmental activities as reported in the government-wide statement of activities.
These reconciliations detail items that require adjustment to convert from the current resources measurement and modified accrual basis for governmental fund statements to the economic resources measurement and full accrual basis used for government-wide statements. However, certain items having no effect on measurement and basis were eliminated from the government fund statements during the consolidation of governmental activities. The transfer covers interfund borrowing for construction management administration costs.
Due to the capital reserve capital projects fund from building fund – fund statements $ 2,313,302 Elimination of governmental activity (2,313,302)Due to the primary goverment – governmental activities $ -
7. Capital leases and certificates of participation (COP’s)
Certificates of participation terms are twenty years with interest ranging from 0.75 percent to 5 percent. Certificates of participation and capital lease obligations for the fiscal year ended June 30, 2020, are comprised of the following:
Balance OutstandingJune 30, 2019 Additions Retirements June 30, 2020 Current Portion
Governmental activitiesSupplemental Ret COP’s 2015 Refunding $ 19,900,000 $ - $ (2,435,000) $ 17,465,000 $ 2,480,000
2016 Construction COP’s 43,940,000 - (1,560,000) 42,380,000 1,605,000Free Horizon Montessori Acquisition 5,585,000 - (5,585,000) - -Less deferred amounts:
Premiums 2,246,039 - (218,077) 2,027,962 -
Governmental activity long-term liabilities $ 71,671,039 $ - $ (9,798,077) $ 61,872,962 $ 4,085,000
The 2015 COP’s refunded the 2006 COP’s that were issued and applied towards the Supplemental Retirement Plan unfunded actuarial accrued liability. The security for the 2015 COP’s consists of four schools, the net book value as of June 30, 2020 was $7,984,271. The 2016 COP’s were issued for construction of one new elementary school and renovation of Sierra. The security consists of land and building of one high school with a net book value as of June 30, 2020 of $3,490,553.
Balance Outstanding
Component unit activities: June 30, 2019 Additions Retirements June 30, 2020 Current Portion
Component units – Buildings/Capital leases $ 69,865,543 $ 31,285,000 $ (19,560,291) $ 81,590,252 $ 1,888,583Less deferred amounts:
For discounts and premiums (23,854) - (5,529) (29,283) -
Total Component unit capital lease $ 69,841,689 $ 31,285,000 $ (19,565,820) $ 81,560,869 $ 1,888,583
Component Units - Promissory notes $ 688,505 $ 174,000 $ (688,205) $ 174,000 $ 67,357
For financial reporting purposes, the District follows the requirements of GAAP; for capital leases, the present value of future minimum lease payments is shown as a liability and related assets are capitalized in the basic financial statements. It is the expectation that the leases will be renewed annually until title to the related property is acquired pursuant to the leases.
-61-
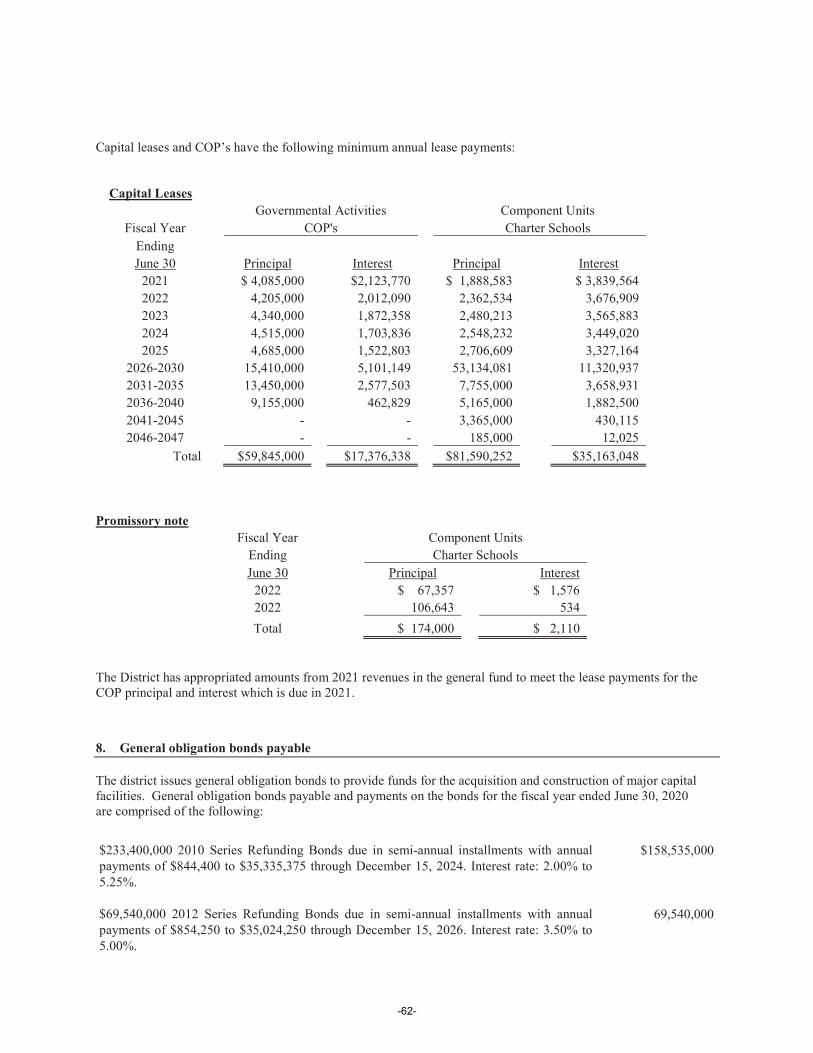
Capital leases and COP’s have the following minimum annual lease payments:
Capital Leases Governmental Activities Component Units
Fiscal Year COP's Charter SchoolsEnding June 30 Principal Interest Principal Interest
2021 $ 4,085,000 $2,123,770 $ 1,888,583 $ 3,839,5642022 4,205,000 2,012,090 2,362,534 3,676,9092023 4,340,000 1,872,358 2,480,213 3,565,8832024 4,515,000 1,703,836 2,548,232 3,449,0202025 4,685,000 1,522,803 2,706,609 3,327,164
2026-2030 15,410,000 5,101,149 53,134,081 11,320,9372031-2035 13,450,000 2,577,503 7,755,000 3,658,9312036-2040 9,155,000 462,829 5,165,000 1,882,5002041-2045 - - 3,365,000 430,1152046-2047 - - 185,000 12,025
Total $59,845,000 $17,376,338 $81,590,252 $35,163,048
Promissory noteFiscal Year Component Units
Ending Charter SchoolsJune 30 Principal Interest
2022 $ 67,357 $ 1,5762022 106,643 534Total $ 174,000 $ 2,110
The District has appropriated amounts from 2021 revenues in the general fund to meet the lease payments for the COP principal and interest which is due in 2021.
8. General obligation bonds payable
The district issues general obligation bonds to provide funds for the acquisition and construction of major capital facilities. General obligation bonds payable and payments on the bonds for the fiscal year ended June 30, 2020 are comprised of the following:
$233,400,000 2010 Series Refunding Bonds due in semi-annual installments with annual payments of $844,400 to $35,335,375 through December 15, 2024. Interest rate: 2.00% to 5.25%.
$158,535,000
$69,540,000 2012 Series Refunding Bonds due in semi-annual installments with annual payments of $854,250 to $35,024,250 through December 15, 2026. Interest rate: 3.50% to 5.00%.
69,540,000
-62-
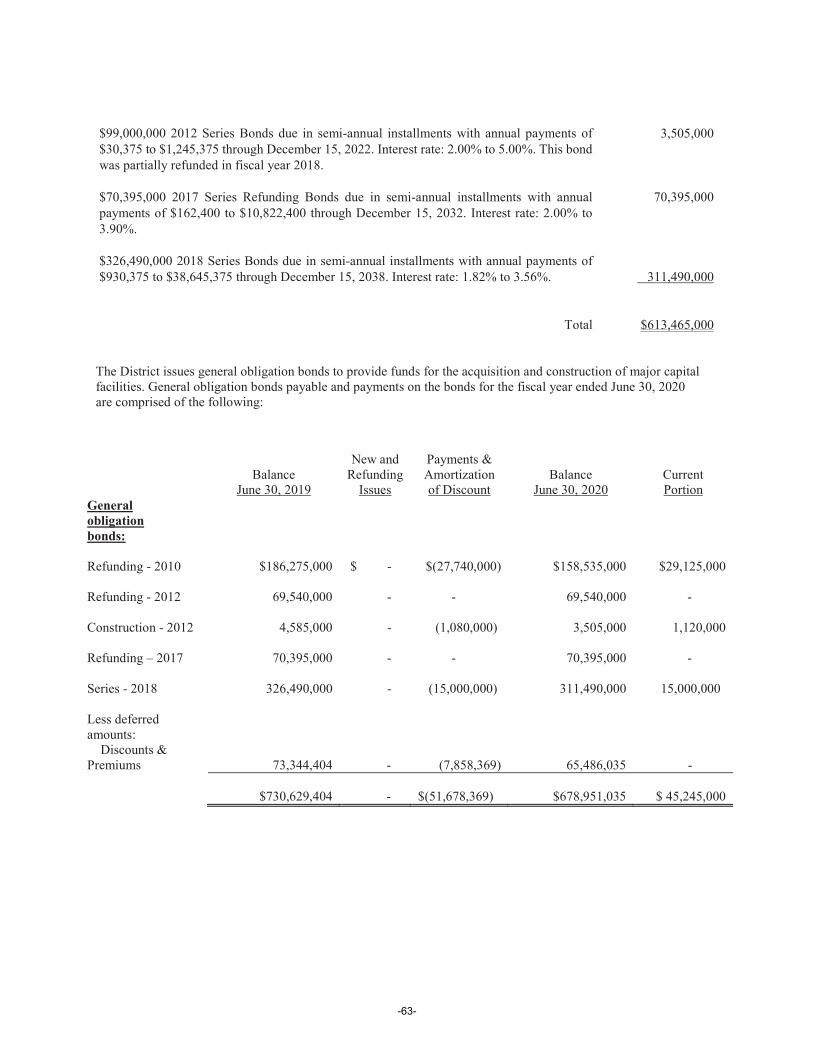
The District issues general obligation bonds to provide funds for the acquisition and construction of major capital facilities. General obligation bonds payable and payments on the bonds for the fiscal year ended June 30, 2020are comprised of the following:
$99,000,000 2012 Series Bonds due in semi-annual installments with annual payments of $30,375 to $1,245,375 through December 15, 2022. Interest rate: 2.00% to 5.00%. This bond was partially refunded in fiscal year 2018.
3,505,000
$70,395,000 2017 Series Refunding Bonds due in semi-annual installments with annual payments of $162,400 to $10,822,400 through December 15, 2032. Interest rate: 2.00% to 3.90%.
70,395,000
$326,490,000 2018 Series Bonds due in semi-annual installments with annual payments of $930,375 to $38,645,375 through December 15, 2038. Interest rate: 1.82% to 3.56%. 311,490,000
Total $613,465,000
New and Payments &Balance Refunding Amortization Balance Current
June 30, 2019 Issues of Discount June 30, 2020 PortionGeneral obligation bonds:
Refunding - 2010 $186,275,000 $ - $(27,740,000) $158,535,000
$29,125,000
Refunding - 2012 69,540,000 - - 69,540,000 -
Construction - 2012 4,585,000 - (1,080,000) 3,505,000 1,120,000
Refunding – 2017 70,395,000 - - 70,395,000 -
Series - 2018 326,490,000 - (15,000,000) 311,490,000 15,000,000
Less deferred amounts:
Discounts & Premiums 73,344,404 - (7,858,369) 65,486,035 -
$730,629,404 - $(51,678,369) $678,951,035 $ 45,245,000
-63-
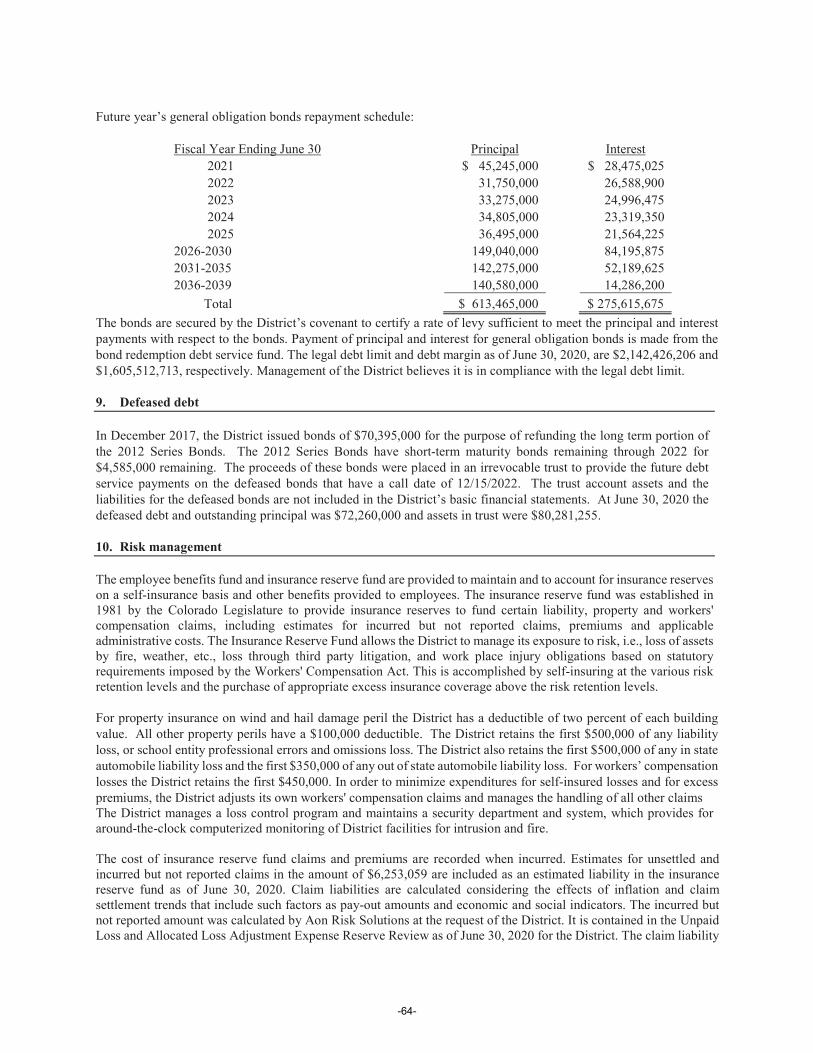
Future year’s general obligation bonds repayment schedule:
Fiscal Year Ending June 30 Principal Interest 2021 $ 45,245,000 $ 28,475,025 2022 31,750,000 26,588,900 2023 33,275,000 24,996,475 2024 34,805,000 23,319,350 2025 36,495,000 21,564,2252026-2030 149,040,000 84,195,8752031-2035 142,275,000 52,189,6252036-2039 140,580,000 14,286,200
Total $ 613,465,000 $ 275,615,675The bonds are secured by the District’s covenant to certify a rate of levy sufficient to meet the principal and interest payments with respect to the bonds. Payment of principal and interest for general obligation bonds is made from the bond redemption debt service fund. The legal debt limit and debt margin as of June 30, 2020, are $2,142,426,206 and $1,605,512,713, respectively. Management of the District believes it is in compliance with the legal debt limit.
9. Defeased debt
In December 2017, the District issued bonds of $70,395,000 for the purpose of refunding the long term portion of the 2012 Series Bonds. The 2012 Series Bonds have short-term maturity bonds remaining through 2022 for $4,585,000 remaining. The proceeds of these bonds were placed in an irrevocable trust to provide the future debt service payments on the defeased bonds that have a call date of 12/15/2022. The trust account assets and the liabilities for the defeased bonds are not included in the District’s basic financial statements. At June 30, 2020 the defeased debt and outstanding principal was $72,260,000 and assets in trust were $80,281,255.
10. Risk management
The employee benefits fund and insurance reserve fund are provided to maintain and to account for insurance reserves on a self-insurance basis and other benefits provided to employees. The insurance reserve fund was established in 1981 by the Colorado Legislature to provide insurance reserves to fund certain liability, property and workers' compensation claims, including estimates for incurred but not reported claims, premiums and applicable administrative costs. The Insurance Reserve Fund allows the District to manage its exposure to risk, i.e., loss of assets by fire, weather, etc., loss through third party litigation, and work place injury obligations based on statutory requirements imposed by the Workers' Compensation Act. This is accomplished by self-insuring at the various risk retention levels and the purchase of appropriate excess insurance coverage above the risk retention levels.
For property insurance on wind and hail damage peril the District has a deductible of two percent of each building value. All other property perils have a $100,000 deductible. The District retains the first $500,000 of any liability loss, or school entity professional errors and omissions loss. The District also retains the first $500,000 of any in state automobile liability loss and the first $350,000 of any out of state automobile liability loss. For workers’ compensation losses the District retains the first $450,000. In order to minimize expenditures for self-insured losses and for excess premiums, the District adjusts its own workers' compensation claims and manages the handling of all other claimsThe District manages a loss control program and maintains a security department and system, which provides for around-the-clock computerized monitoring of District facilities for intrusion and fire.
The cost of insurance reserve fund claims and premiums are recorded when incurred. Estimates for unsettled and incurred but not reported claims in the amount of $6,253,059 are included as an estimated liability in the insurance reserve fund as of June 30, 2020. Claim liabilities are calculated considering the effects of inflation and claim settlement trends that include such factors as pay-out amounts and economic and social indicators. The incurred but not reported amount was calculated by Aon Risk Solutions at the request of the District. It is contained in the Unpaid Loss and Allocated Loss Adjustment Expense Reserve Review as of June 30, 2020 for the District. The claim liability
-64-
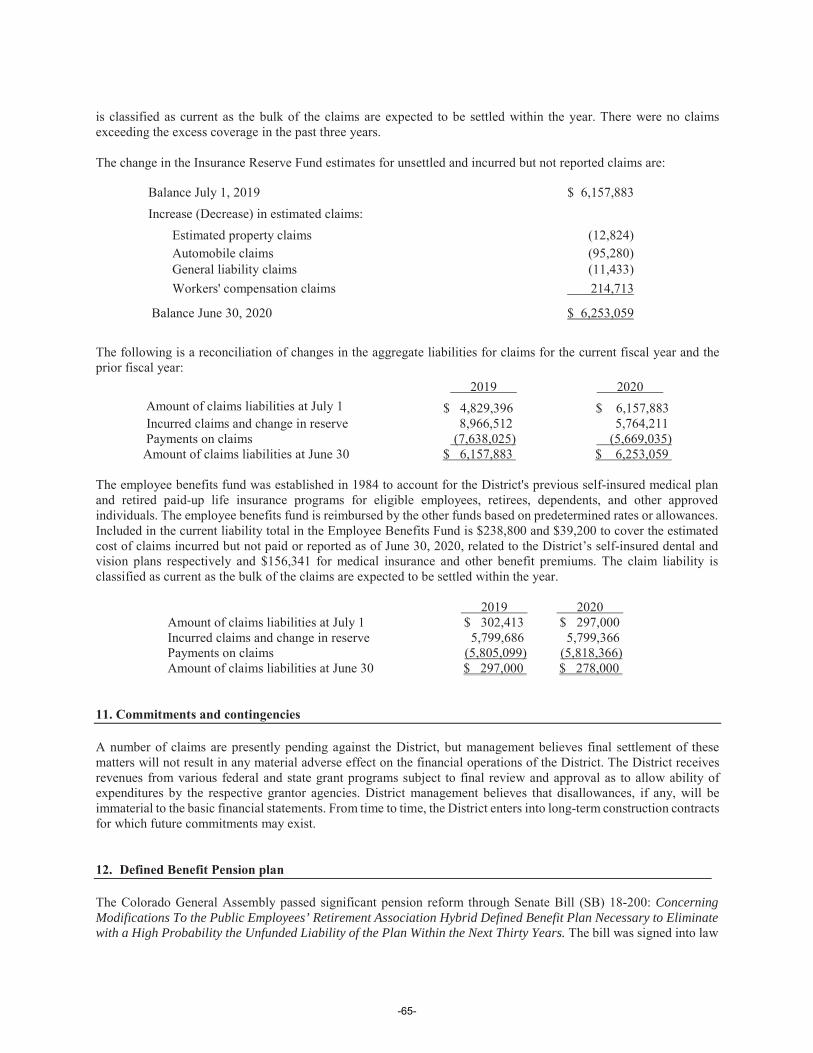
is classified as current as the bulk of the claims are expected to be settled within the year. There were no claims exceeding the excess coverage in the past three years.
The change in the Insurance Reserve Fund estimates for unsettled and incurred but not reported claims are:
Balance July 1, 2019 $ 6,157,883Increase (Decrease) in estimated claims:
Estimated property claims (12,824)Automobile claims (95,280)General liability claims (11,433)Workers' compensation claims 214,713
Balance June 30, 2020 $ 6,253,059
The following is a reconciliation of changes in the aggregate liabilities for claims for the current fiscal year and the prior fiscal year:
2019 2020 Amount of claims liabilities at July 1 $ 4,829,396 $ 6,157,883 Incurred claims and change in reserve 8,966,512 5,764,211 Payments on claims (7,638,025) (5,669,035) Amount of claims liabilities at June 30 $ 6,157,883 $ 6,253,059
The employee benefits fund was established in 1984 to account for the District's previous self-insured medical plan and retired paid-up life insurance programs for eligible employees, retirees, dependents, and other approved individuals. The employee benefits fund is reimbursed by the other funds based on predetermined rates or allowances. Included in the current liability total in the Employee Benefits Fund is $238,800 and $39,200 to cover the estimated cost of claims incurred but not paid or reported as of June 30, 2020, related to the District’s self-insured dental and vision plans respectively and $156,341 for medical insurance and other benefit premiums. The claim liability is classified as current as the bulk of the claims are expected to be settled within the year.
2019 2020 Amount of claims liabilities at July 1 $ 302,413 $ 297,000 Incurred claims and change in reserve 5,799,686 5,799,366 Payments on claims (5,805,099) (5,818,366) Amount of claims liabilities at June 30 $ 297,000 $ 278,000
11. Commitments and contingencies
A number of claims are presently pending against the District, but management believes final settlement of these matters will not result in any material adverse effect on the financial operations of the District. The District receives revenues from various federal and state grant programs subject to final review and approval as to allow ability of expenditures by the respective grantor agencies. District management believes that disallowances, if any, will be immaterial to the basic financial statements. From time to time, the District enters into long-term construction contracts for which future commitments may exist.
12. Defined Benefit Pension plan
The Colorado General Assembly passed significant pension reform through Senate Bill (SB) 18-200: Concerning Modifications To the Public Employees’ Retirement Association Hybrid Defined Benefit Plan Necessary to Eliminate with a High Probability the Unfunded Liability of the Plan Within the Next Thirty Years. The bill was signed into law
-65-
by Governor Hickenlooper on June 4, 2018. SB 18-200 makes changes to certain benefit provisions. Some, but not all, of these changes were in effect as of 6/30/2020.
General Information about the Pension PlanPlan description. Eligible employees of the District are provided with pensions through the School Division Trust Fund (SDTF)—a cost-sharing multiple-employer defined benefit pension plan administered by PERA. Plan benefits are specified in Title 24, Article 51 of the Colorado Revised Statutes (C.R.S.), administrative rules set forth at 8 C.C.R. 1502-1, and applicable provisions of the federal Internal Revenue Code. Colorado State law provisions may be amended from time to time by the Colorado General Assembly. PERA issues a publicly available comprehensive annual financial report (CAFR) that can be obtained at www.copera.org/investments/pera-financial-reports.
Benefits provided as of December 31, 2019. PERA provides retirement, disability, and survivor benefits. Retirement benefits are determined by the amount of service credit earned and/or purchased, highest average salary, the benefit structure(s) under which the member retires, the benefit option selected at retirement, and age at retirement. Retirement eligibility is specified in tables set forth at C.R.S. § 24-51-602, 604, 1713, and 1714.
The lifetime retirement benefit for all eligible retiring employees under the PERA benefit structure is the greater of the:
Highest average salary multiplied by 2.5 percent and then multiplied by years of service credit.
The value of the retiring employee’s member contribution account plus a 100 percent match on eligible amounts as of the retirement date. This amount is then annuitized into a monthly benefit based on life expectancy and other actuarial factors.
In all cases the service retirement benefit is limited to 100 percent of highest average salary and also cannot exceed the maximum benefit allowed by federal Internal Revenue Code.
Members may elect to withdraw their member contribution accounts upon termination of employment with all PERA employers; waiving rights to any lifetime retirement benefits earned. If eligible, the member may receive a match of either 50 percent or 100 percent on eligible amounts depending on when contributions were remitted to PERA, the date employment was terminated, whether 5 years of service credit has been obtained and the benefit structure under which contributions were made.
As of December 31, 2019, benefit recipients who elect to receive a lifetime retirement benefit are generally eligible to receive post-retirement cost-of-living adjustments in certain years, referred to as annual increases in the C.R.S.Pursuant to SB 18-200, there are no annual increases (AI) for 2019 for all benefit recipients. Thereafter, benefit recipients under the PERA benefit structure who began eligible employment before January 1, 2007 and all benefit recipients of the benefit structure will receive an annual increase, unless PERA has a negative investment year, in which case the annual increase for the next three years is the lesser of 1.5 percent or the average of the Consumer Price Index for Urban Wage Earners and Clerical Workers (CPA-W) for the prior calendar year. Benefit recipients under the PERA benefit structure who began eligible employment after January 1, 2007 will receive the lessor of an annual increase of 1.5 percent of the average CPI-W for the prior calendar year, not to exceed 10 percent of PERA’s Annual Increase Reserve (AIR) for the SCHDTF. The automatic adjustment provision may raise or lower the aforementioned AI for a given year by up to one-quarter of 1 percent based on the parameters specified in C.R.S. § 24-51-413.
Disability benefits are available for eligible employees once they reach five years of earned service credit and are determined to meet the definition of disability. The disability benefit amount is based on the lifetime retirement benefit formula(s) shown above considering a minimum 20 years of service credit, if deemed disabled.
Survivor benefits are determined by several factors, which include the amount of earned service credit, highest average salary of the deceased, the benefit structure(s) under which service credit was obtained, and the qualified survivor(s) who will receive the benefits.
-66-
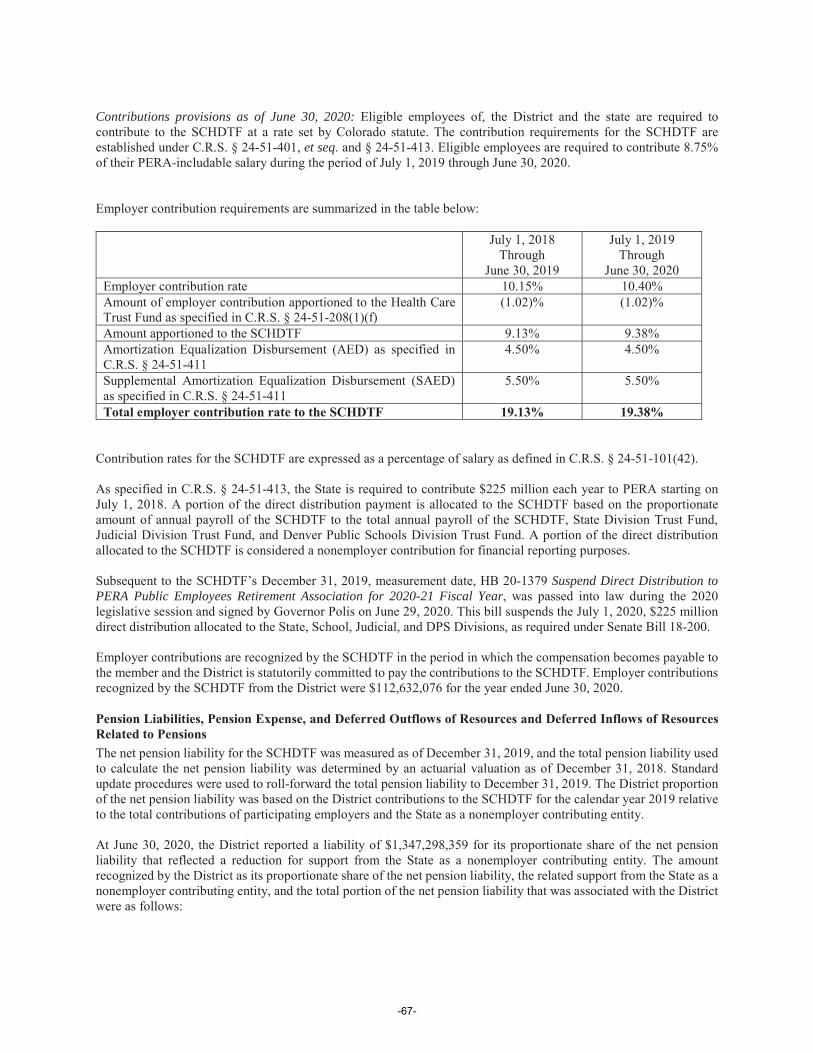
Contributions provisions as of June 30, 2020: Eligible employees of, the District and the state are required to contribute to the SCHDTF at a rate set by Colorado statute. The contribution requirements for the SCHDTF are established under C.R.S. § 24-51-401, et seq. and § 24-51-413. Eligible employees are required to contribute 8.75% of their PERA-includable salary during the period of July 1, 2019 through June 30, 2020.
Employer contribution requirements are summarized in the table below:
July 1, 2018Through
June 30, 2019
July 1, 2019Through
June 30, 2020Employer contribution rate 10.15% 10.40%Amount of employer contribution apportioned to the Health Care Trust Fund as specified in C.R.S. § 24-51-208(1)(f)
(1.02)% (1.02)%
Amount apportioned to the SCHDTF 9.13% 9.38%Amortization Equalization Disbursement (AED) as specified in C.R.S. § 24-51-411
4.50% 4.50%
Supplemental Amortization Equalization Disbursement (SAED) as specified in C.R.S. § 24-51-411
5.50% 5.50%
Total employer contribution rate to the SCHDTF 19.13% 19.38%
Contribution rates for the SCHDTF are expressed as a percentage of salary as defined in C.R.S. § 24-51-101(42).
As specified in C.R.S. § 24-51-413, the State is required to contribute $225 million each year to PERA starting on July 1, 2018. A portion of the direct distribution payment is allocated to the SCHDTF based on the proportionate amount of annual payroll of the SCHDTF to the total annual payroll of the SCHDTF, State Division Trust Fund, Judicial Division Trust Fund, and Denver Public Schools Division Trust Fund. A portion of the direct distribution allocated to the SCHDTF is considered a nonemployer contribution for financial reporting purposes.
Subsequent to the SCHDTF’s December 31, 2019, measurement date, HB 20-1379 Suspend Direct Distribution to PERA Public Employees Retirement Association for 2020-21 Fiscal Year, was passed into law during the 2020 legislative session and signed by Governor Polis on June 29, 2020. This bill suspends the July 1, 2020, $225 million direct distribution allocated to the State, School, Judicial, and DPS Divisions, as required under Senate Bill 18-200.
Employer contributions are recognized by the SCHDTF in the period in which the compensation becomes payable to the member and the District is statutorily committed to pay the contributions to the SCHDTF. Employer contributions recognized by the SCHDTF from the District were $112,632,076 for the year ended June 30, 2020.
Pension Liabilities, Pension Expense, and Deferred Outflows of Resources and Deferred Inflows of Resources Related to PensionsThe net pension liability for the SCHDTF was measured as of December 31, 2019, and the total pension liability used to calculate the net pension liability was determined by an actuarial valuation as of December 31, 2018. Standard update procedures were used to roll-forward the total pension liability to December 31, 2019. The District proportion of the net pension liability was based on the District contributions to the SCHDTF for the calendar year 2019 relative to the total contributions of participating employers and the State as a nonemployer contributing entity.
At June 30, 2020, the District reported a liability of $1,347,298,359 for its proportionate share of the net pension liability that reflected a reduction for support from the State as a nonemployer contributing entity. The amount recognized by the District as its proportionate share of the net pension liability, the related support from the State as a nonemployer contributing entity, and the total portion of the net pension liability that was associated with the District were as follows:
-67-
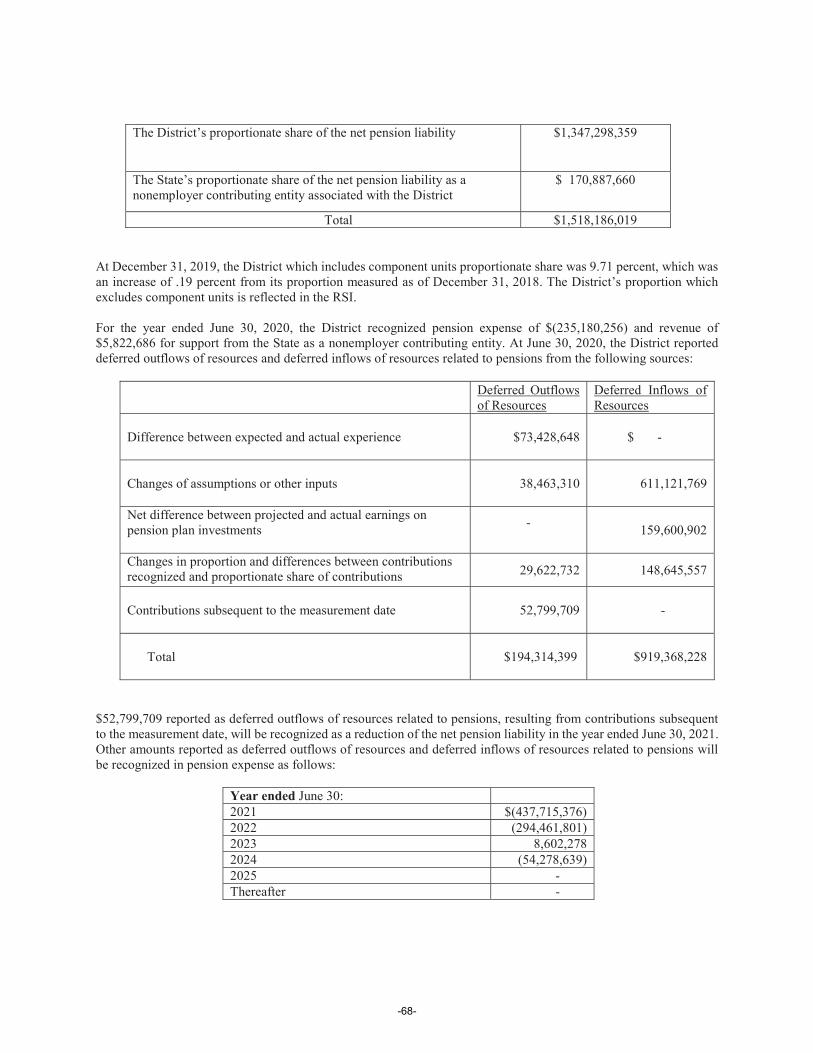
The District’s proportionate share of the net pension liability $1,347,298,359
The State’s proportionate share of the net pension liability as a nonemployer contributing entity associated with the District
$ 170,887,660
Total $1,518,186,019
At December 31, 2019, the District which includes component units proportionate share was 9.71 percent, which was an increase of .19 percent from its proportion measured as of December 31, 2018. The District’s proportion which excludes component units is reflected in the RSI.
For the year ended June 30, 2020, the District recognized pension expense of $(235,180,256) and revenue of $5,822,686 for support from the State as a nonemployer contributing entity. At June 30, 2020, the District reported deferred outflows of resources and deferred inflows of resources related to pensions from the following sources:
Deferred Outflows of Resources
Deferred Inflows of Resources
Difference between expected and actual experience $73,428,648
$ -
Changes of assumptions or other inputs
38,463,310
611,121,769
Net difference between projected and actual earnings on pension plan investments -
159,600,902
Changes in proportion and differences between contributions recognized and proportionate share of contributions 29,622,732 148,645,557
Contributions subsequent to the measurement date
52,799,709 -
Total $194,314,399 $919,368,228
$52,799,709 reported as deferred outflows of resources related to pensions, resulting from contributions subsequent to the measurement date, will be recognized as a reduction of the net pension liability in the year ended June 30, 2021.Other amounts reported as deferred outflows of resources and deferred inflows of resources related to pensions will be recognized in pension expense as follows:
Year ended June 30:2021 $(437,715,376)2022 (294,461,801)2023 8,602,2782024 (54,278,639)2025 -Thereafter -
-68-
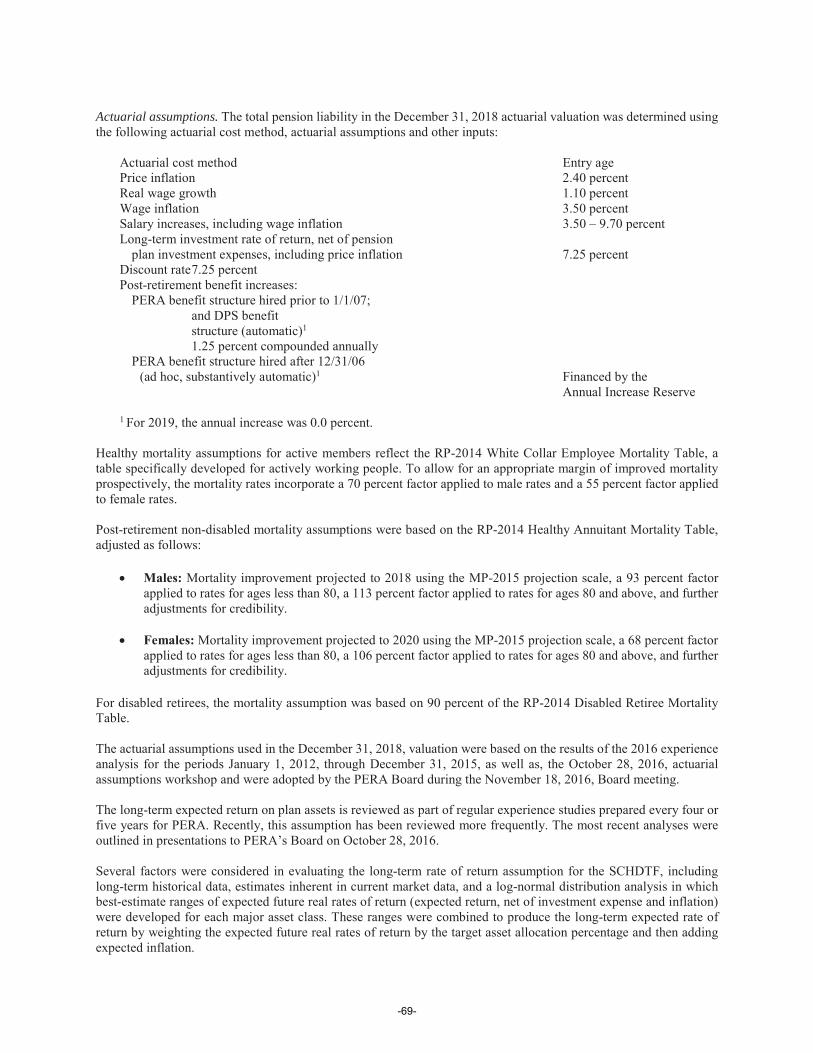
Actuarial assumptions. The total pension liability in the December 31, 2018 actuarial valuation was determined using the following actuarial cost method, actuarial assumptions and other inputs:
Actuarial cost method Entry agePrice inflation 2.40 percent Real wage growth 1.10 percentWage inflation 3.50 percentSalary increases, including wage inflation 3.50 – 9.70 percentLong-term investment rate of return, net of pension
plan investment expenses, including price inflation 7.25 percentDiscount rate7.25 percentPost-retirement benefit increases:
PERA benefit structure hired prior to 1/1/07; and DPS benefit structure (automatic)1
1.25 percent compounded annuallyPERA benefit structure hired after 12/31/06
(ad hoc, substantively automatic)1 Financed by the Annual Increase Reserve
1 For 2019, the annual increase was 0.0 percent.
Healthy mortality assumptions for active members reflect the RP-2014 White Collar Employee Mortality Table, a table specifically developed for actively working people. To allow for an appropriate margin of improved mortality prospectively, the mortality rates incorporate a 70 percent factor applied to male rates and a 55 percent factor applied to female rates.
Post-retirement non-disabled mortality assumptions were based on the RP-2014 Healthy Annuitant Mortality Table, adjusted as follows:
Males: Mortality improvement projected to 2018 using the MP-2015 projection scale, a 93 percent factor applied to rates for ages less than 80, a 113 percent factor applied to rates for ages 80 and above, and further adjustments for credibility.
Females: Mortality improvement projected to 2020 using the MP-2015 projection scale, a 68 percent factor applied to rates for ages less than 80, a 106 percent factor applied to rates for ages 80 and above, and further adjustments for credibility.
For disabled retirees, the mortality assumption was based on 90 percent of the RP-2014 Disabled Retiree Mortality Table.
The actuarial assumptions used in the December 31, 2018, valuation were based on the results of the 2016 experience analysis for the periods January 1, 2012, through December 31, 2015, as well as, the October 28, 2016, actuarial assumptions workshop and were adopted by the PERA Board during the November 18, 2016, Board meeting.
The long-term expected return on plan assets is reviewed as part of regular experience studies prepared every four or five years for PERA. Recently, this assumption has been reviewed more frequently. The most recent analyses were outlined in presentations to PERA’s Board on October 28, 2016.
Several factors were considered in evaluating the long-term rate of return assumption for the SCHDTF, including long-term historical data, estimates inherent in current market data, and a log-normal distribution analysis in which best-estimate ranges of expected future real rates of return (expected return, net of investment expense and inflation) were developed for each major asset class. These ranges were combined to produce the long-term expected rate of return by weighting the expected future real rates of return by the target asset allocation percentage and then adding expected inflation.
-69-
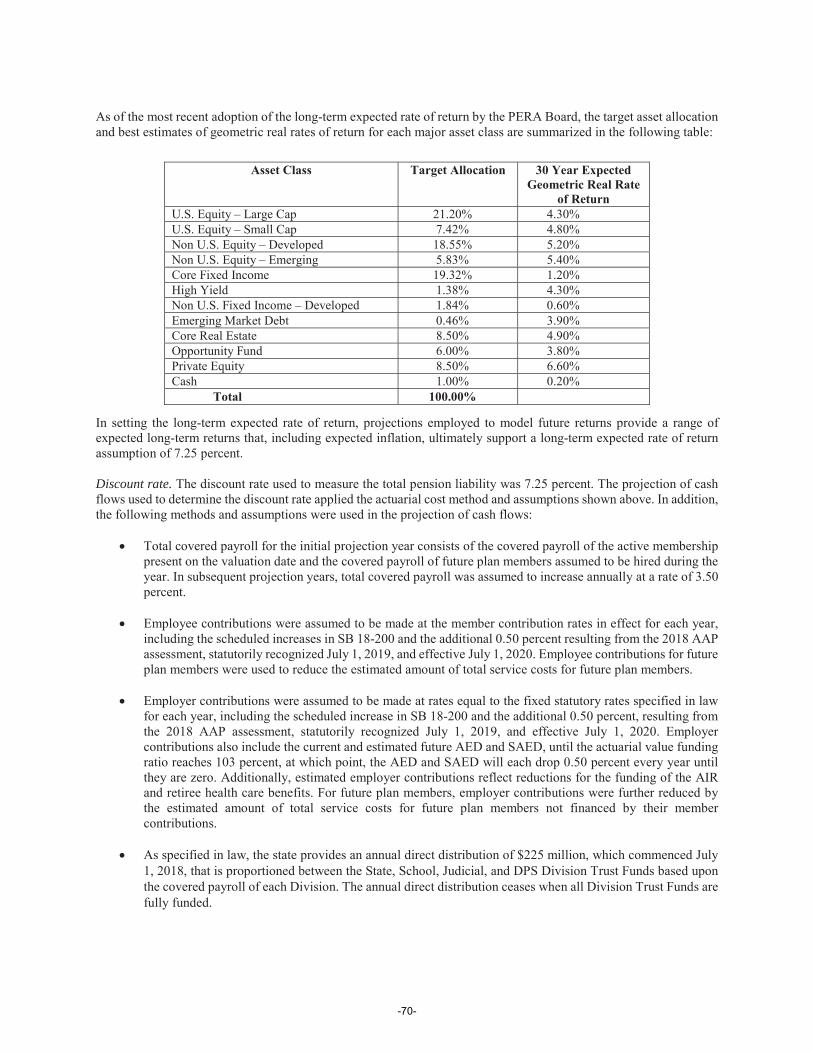
As of the most recent adoption of the long-term expected rate of return by the PERA Board, the target asset allocation and best estimates of geometric real rates of return for each major asset class are summarized in the following table:
In setting the long-term expected rate of return, projections employed to model future returns provide a range of expected long-term returns that, including expected inflation, ultimately support a long-term expected rate of return assumption of 7.25 percent.
Discount rate. The discount rate used to measure the total pension liability was 7.25 percent. The projection of cash flows used to determine the discount rate applied the actuarial cost method and assumptions shown above. In addition, the following methods and assumptions were used in the projection of cash flows:
Total covered payroll for the initial projection year consists of the covered payroll of the active membership present on the valuation date and the covered payroll of future plan members assumed to be hired during the year. In subsequent projection years, total covered payroll was assumed to increase annually at a rate of 3.50percent.
Employee contributions were assumed to be made at the member contribution rates in effect for each year, including the scheduled increases in SB 18-200 and the additional 0.50 percent resulting from the 2018 AAP assessment, statutorily recognized July 1, 2019, and effective July 1, 2020. Employee contributions for future plan members were used to reduce the estimated amount of total service costs for future plan members.
Employer contributions were assumed to be made at rates equal to the fixed statutory rates specified in law for each year, including the scheduled increase in SB 18-200 and the additional 0.50 percent, resulting from the 2018 AAP assessment, statutorily recognized July 1, 2019, and effective July 1, 2020. Employer contributions also include the current and estimated future AED and SAED, until the actuarial value funding ratio reaches 103 percent, at which point, the AED and SAED will each drop 0.50 percent every year until they are zero. Additionally, estimated employer contributions reflect reductions for the funding of the AIR and retiree health care benefits. For future plan members, employer contributions were further reduced by the estimated amount of total service costs for future plan members not financed by their member contributions.
As specified in law, the state provides an annual direct distribution of $225 million, which commenced July 1, 2018, that is proportioned between the State, School, Judicial, and DPS Division Trust Funds based upon the covered payroll of each Division. The annual direct distribution ceases when all Division Trust Funds are fully funded.
Asset Class Target Allocation 30 Year Expected Geometric Real Rate
of ReturnU.S. Equity – Large Cap 21.20% 4.30%U.S. Equity – Small Cap 7.42% 4.80%Non U.S. Equity – Developed 18.55% 5.20%Non U.S. Equity – Emerging 5.83% 5.40%Core Fixed Income 19.32% 1.20%High Yield 1.38% 4.30%Non U.S. Fixed Income – Developed 1.84% 0.60%Emerging Market Debt 0.46% 3.90%Core Real Estate 8.50% 4.90%Opportunity Fund 6.00% 3.80%Private Equity 8.50% 6.60%Cash 1.00% 0.20% Total 100.00%
-70-
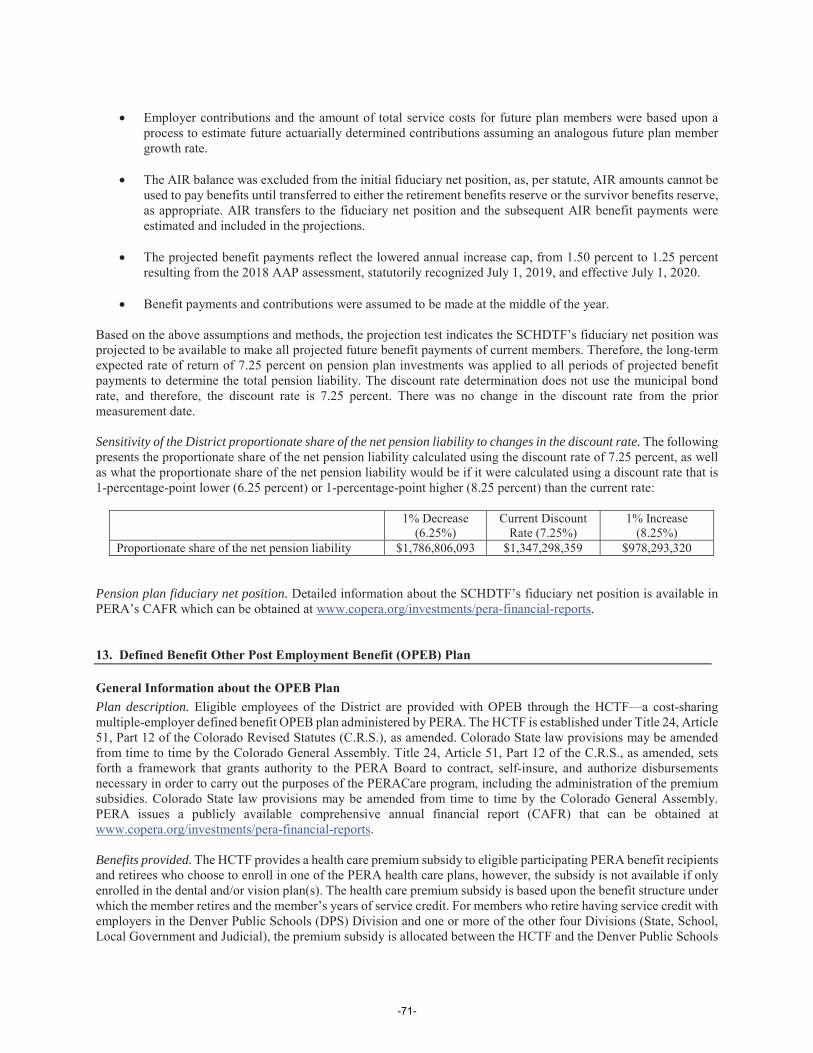
Employer contributions and the amount of total service costs for future plan members were based upon a process to estimate future actuarially determined contributions assuming an analogous future plan member growth rate.
The AIR balance was excluded from the initial fiduciary net position, as, per statute, AIR amounts cannot be used to pay benefits until transferred to either the retirement benefits reserve or the survivor benefits reserve, as appropriate. AIR transfers to the fiduciary net position and the subsequent AIR benefit payments were estimated and included in the projections.
The projected benefit payments reflect the lowered annual increase cap, from 1.50 percent to 1.25 percentresulting from the 2018 AAP assessment, statutorily recognized July 1, 2019, and effective July 1, 2020.
Benefit payments and contributions were assumed to be made at the middle of the year.
Based on the above assumptions and methods, the projection test indicates the SCHDTF’s fiduciary net position was projected to be available to make all projected future benefit payments of current members. Therefore, the long-term expected rate of return of 7.25 percent on pension plan investments was applied to all periods of projected benefit payments to determine the total pension liability. The discount rate determination does not use the municipal bond rate, and therefore, the discount rate is 7.25 percent. There was no change in the discount rate from the prior measurement date.
Sensitivity of the District proportionate share of the net pension liability to changes in the discount rate. The following presents the proportionate share of the net pension liability calculated using the discount rate of 7.25 percent, as wellas what the proportionate share of the net pension liability would be if it were calculated using a discount rate that is1-percentage-point lower (6.25 percent) or 1-percentage-point higher (8.25 percent) than the current rate:
1% Decrease (6.25%)
Current Discount Rate (7.25%)
1% Increase (8.25%)
Proportionate share of the net pension liability $1,786,806,093 $1,347,298,359 $978,293,320
Pension plan fiduciary net position. Detailed information about the SCHDTF’s fiduciary net position is available in PERA’s CAFR which can be obtained at www.copera.org/investments/pera-financial-reports.
13. Defined Benefit Other Post Employment Benefit (OPEB) Plan
General Information about the OPEB PlanPlan description. Eligible employees of the District are provided with OPEB through the HCTF—a cost-sharing multiple-employer defined benefit OPEB plan administered by PERA. The HCTF is established under Title 24, Article 51, Part 12 of the Colorado Revised Statutes (C.R.S.), as amended. Colorado State law provisions may be amended from time to time by the Colorado General Assembly. Title 24, Article 51, Part 12 of the C.R.S., as amended, sets forth a framework that grants authority to the PERA Board to contract, self-insure, and authorize disbursements necessary in order to carry out the purposes of the PERACare program, including the administration of the premium subsidies. Colorado State law provisions may be amended from time to time by the Colorado General Assembly. PERA issues a publicly available comprehensive annual financial report (CAFR) that can be obtained at www.copera.org/investments/pera-financial-reports.
Benefits provided. The HCTF provides a health care premium subsidy to eligible participating PERA benefit recipients and retirees who choose to enroll in one of the PERA health care plans, however, the subsidy is not available if only enrolled in the dental and/or vision plan(s). The health care premium subsidy is based upon the benefit structure under which the member retires and the member’s years of service credit. For members who retire having service credit with employers in the Denver Public Schools (DPS) Division and one or more of the other four Divisions (State, School, Local Government and Judicial), the premium subsidy is allocated between the HCTF and the Denver Public Schools
-71-
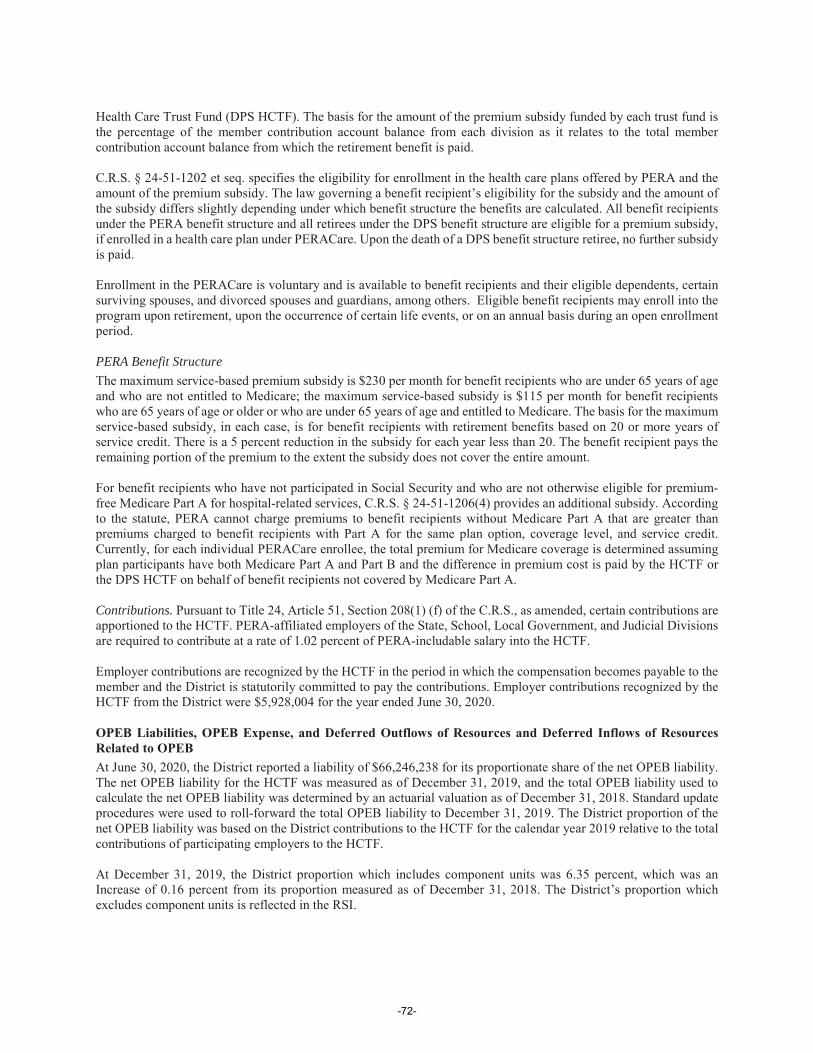
Health Care Trust Fund (DPS HCTF). The basis for the amount of the premium subsidy funded by each trust fund is the percentage of the member contribution account balance from each division as it relates to the total member contribution account balance from which the retirement benefit is paid.
C.R.S. § 24-51-1202 et seq. specifies the eligibility for enrollment in the health care plans offered by PERA and the amount of the premium subsidy. The law governing a benefit recipient’s eligibility for the subsidy and the amount of the subsidy differs slightly depending under which benefit structure the benefits are calculated. All benefit recipients under the PERA benefit structure and all retirees under the DPS benefit structure are eligible for a premium subsidy, if enrolled in a health care plan under PERACare. Upon the death of a DPS benefit structure retiree, no further subsidy is paid.
Enrollment in the PERACare is voluntary and is available to benefit recipients and their eligible dependents, certain surviving spouses, and divorced spouses and guardians, among others. Eligible benefit recipients may enroll into the program upon retirement, upon the occurrence of certain life events, or on an annual basis during an open enrollment period.
PERA Benefit Structure The maximum service-based premium subsidy is $230 per month for benefit recipients who are under 65 years of age and who are not entitled to Medicare; the maximum service-based subsidy is $115 per month for benefit recipients who are 65 years of age or older or who are under 65 years of age and entitled to Medicare. The basis for the maximum service-based subsidy, in each case, is for benefit recipients with retirement benefits based on 20 or more years of service credit. There is a 5 percent reduction in the subsidy for each year less than 20. The benefit recipient pays the remaining portion of the premium to the extent the subsidy does not cover the entire amount.
For benefit recipients who have not participated in Social Security and who are not otherwise eligible for premium-free Medicare Part A for hospital-related services, C.R.S. § 24-51-1206(4) provides an additional subsidy. According to the statute, PERA cannot charge premiums to benefit recipients without Medicare Part A that are greater than premiums charged to benefit recipients with Part A for the same plan option, coverage level, and service credit. Currently, for each individual PERACare enrollee, the total premium for Medicare coverage is determined assuming plan participants have both Medicare Part A and Part B and the difference in premium cost is paid by the HCTF or the DPS HCTF on behalf of benefit recipients not covered by Medicare Part A.
Contributions. Pursuant to Title 24, Article 51, Section 208(1) (f) of the C.R.S., as amended, certain contributions are apportioned to the HCTF. PERA-affiliated employers of the State, School, Local Government, and Judicial Divisions are required to contribute at a rate of 1.02 percent of PERA-includable salary into the HCTF.
Employer contributions are recognized by the HCTF in the period in which the compensation becomes payable to the member and the District is statutorily committed to pay the contributions. Employer contributions recognized by the HCTF from the District were $5,928,004 for the year ended June 30, 2020.
OPEB Liabilities, OPEB Expense, and Deferred Outflows of Resources and Deferred Inflows of Resources Related to OPEBAt June 30, 2020, the District reported a liability of $66,246,238 for its proportionate share of the net OPEB liability. The net OPEB liability for the HCTF was measured as of December 31, 2019, and the total OPEB liability used to calculate the net OPEB liability was determined by an actuarial valuation as of December 31, 2018. Standard update procedures were used to roll-forward the total OPEB liability to December 31, 2019. The District proportion of the net OPEB liability was based on the District contributions to the HCTF for the calendar year 2019 relative to the total contributions of participating employers to the HCTF.
At December 31, 2019, the District proportion which includes component units was 6.35 percent, which was an Increase of 0.16 percent from its proportion measured as of December 31, 2018. The District’s proportion which excludes component units is reflected in the RSI.
-72-
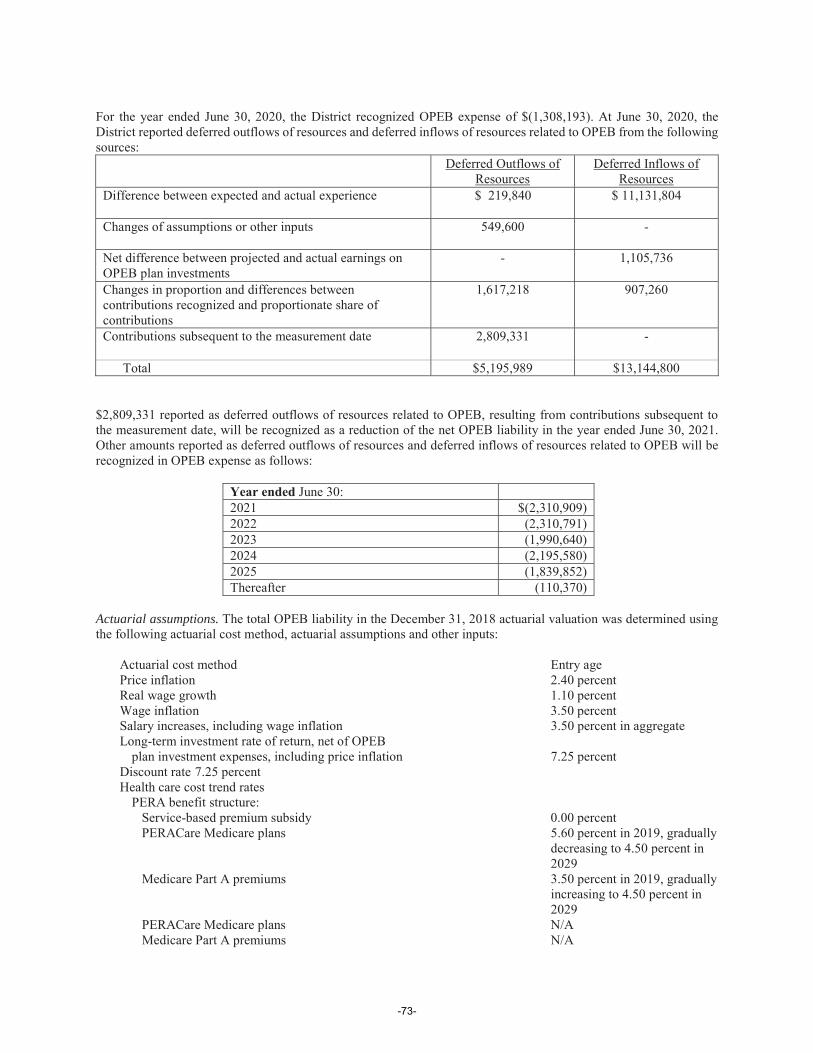
For the year ended June 30, 2020, the District recognized OPEB expense of $(1,308,193). At June 30, 2020, theDistrict reported deferred outflows of resources and deferred inflows of resources related to OPEB from the following sources:
Deferred Outflows of Resources
Deferred Inflows of Resources
Difference between expected and actual experience $ 219,840 $ 11,131,804
Changes of assumptions or other inputs 549,600 -
Net difference between projected and actual earnings on OPEB plan investments
- 1,105,736
Changes in proportion and differences between contributions recognized and proportionate share of contributions
1,617,218 907,260
Contributions subsequent to the measurement date 2,809,331 -
Total $5,195,989 $13,144,800
$2,809,331 reported as deferred outflows of resources related to OPEB, resulting from contributions subsequent to the measurement date, will be recognized as a reduction of the net OPEB liability in the year ended June 30, 2021.Other amounts reported as deferred outflows of resources and deferred inflows of resources related to OPEB will be recognized in OPEB expense as follows:
Year ended June 30:2021 $(2,310,909)2022 (2,310,791)2023 (1,990,640)2024 (2,195,580)2025 (1,839,852)Thereafter (110,370)
Actuarial assumptions. The total OPEB liability in the December 31, 2018 actuarial valuation was determined using the following actuarial cost method, actuarial assumptions and other inputs:
Actuarial cost method Entry agePrice inflation 2.40 percentReal wage growth 1.10 percentWage inflation 3.50 percentSalary increases, including wage inflation 3.50 percent in aggregate Long-term investment rate of return, net of OPEB
plan investment expenses, including price inflation 7.25 percentDiscount rate 7.25 percentHealth care cost trend rates
PERA benefit structure:Service-based premium subsidy 0.00 percentPERACare Medicare plans 5.60 percent in 2019, gradually
decreasing to 4.50 percent in 2029
Medicare Part A premiums 3.50 percent in 2019, gradually increasing to 4.50 percent in 2029
PERACare Medicare plans N/AMedicare Part A premiums N/A
-73-
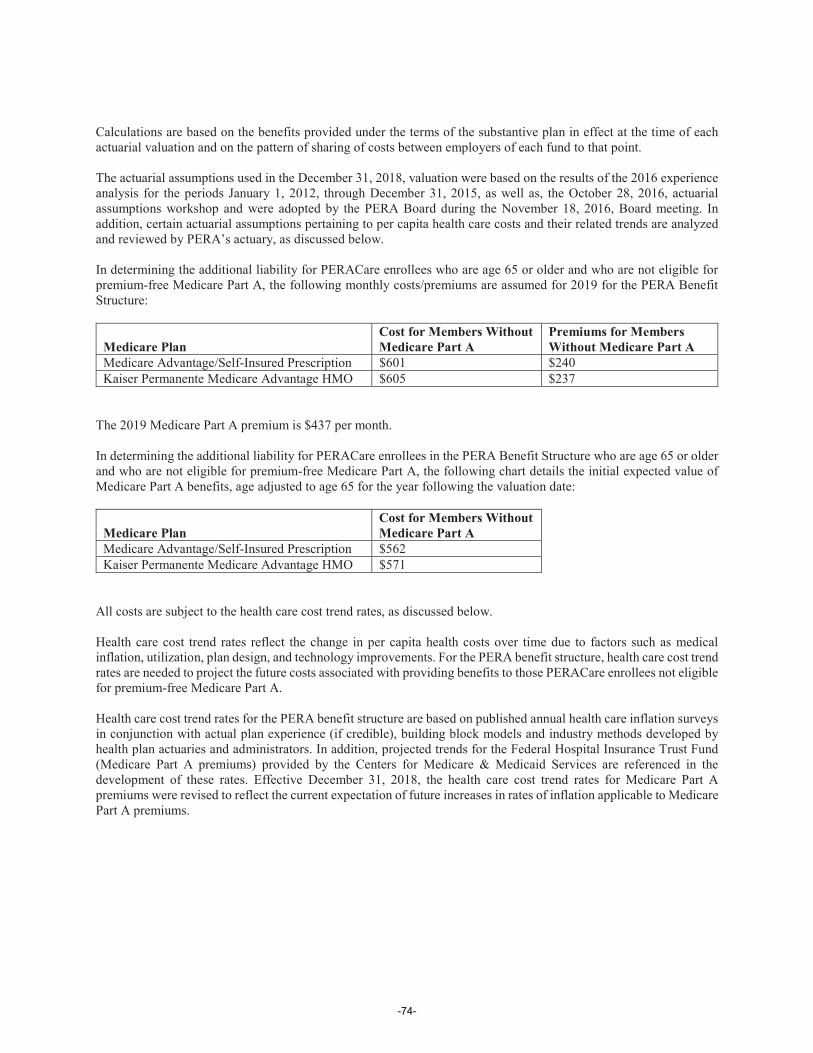
Calculations are based on the benefits provided under the terms of the substantive plan in effect at the time of each actuarial valuation and on the pattern of sharing of costs between employers of each fund to that point.
The actuarial assumptions used in the December 31, 2018, valuation were based on the results of the 2016 experience analysis for the periods January 1, 2012, through December 31, 2015, as well as, the October 28, 2016, actuarial assumptions workshop and were adopted by the PERA Board during the November 18, 2016, Board meeting. In addition, certain actuarial assumptions pertaining to per capita health care costs and their related trends are analyzed and reviewed by PERA’s actuary, as discussed below.
In determining the additional liability for PERACare enrollees who are age 65 or older and who are not eligible for premium-free Medicare Part A, the following monthly costs/premiums are assumed for 2019 for the PERA Benefit Structure:
Medicare PlanCost for Members Without Medicare Part A
Premiums for Members Without Medicare Part A
Medicare Advantage/Self-Insured Prescription $601 $240Kaiser Permanente Medicare Advantage HMO $605 $237
The 2019 Medicare Part A premium is $437 per month.
In determining the additional liability for PERACare enrollees in the PERA Benefit Structure who are age 65 or older and who are not eligible for premium-free Medicare Part A, the following chart details the initial expected value of Medicare Part A benefits, age adjusted to age 65 for the year following the valuation date:
Medicare PlanCost for Members Without Medicare Part A
Medicare Advantage/Self-Insured Prescription $562Kaiser Permanente Medicare Advantage HMO $571
All costs are subject to the health care cost trend rates, as discussed below.
Health care cost trend rates reflect the change in per capita health costs over time due to factors such as medical inflation, utilization, plan design, and technology improvements. For the PERA benefit structure, health care cost trend rates are needed to project the future costs associated with providing benefits to those PERACare enrollees not eligible for premium-free Medicare Part A.
Health care cost trend rates for the PERA benefit structure are based on published annual health care inflation surveys in conjunction with actual plan experience (if credible), building block models and industry methods developed by health plan actuaries and administrators. In addition, projected trends for the Federal Hospital Insurance Trust Fund (Medicare Part A premiums) provided by the Centers for Medicare & Medicaid Services are referenced in the development of these rates. Effective December 31, 2018, the health care cost trend rates for Medicare Part A premiums were revised to reflect the current expectation of future increases in rates of inflation applicable to Medicare Part A premiums.
-74-
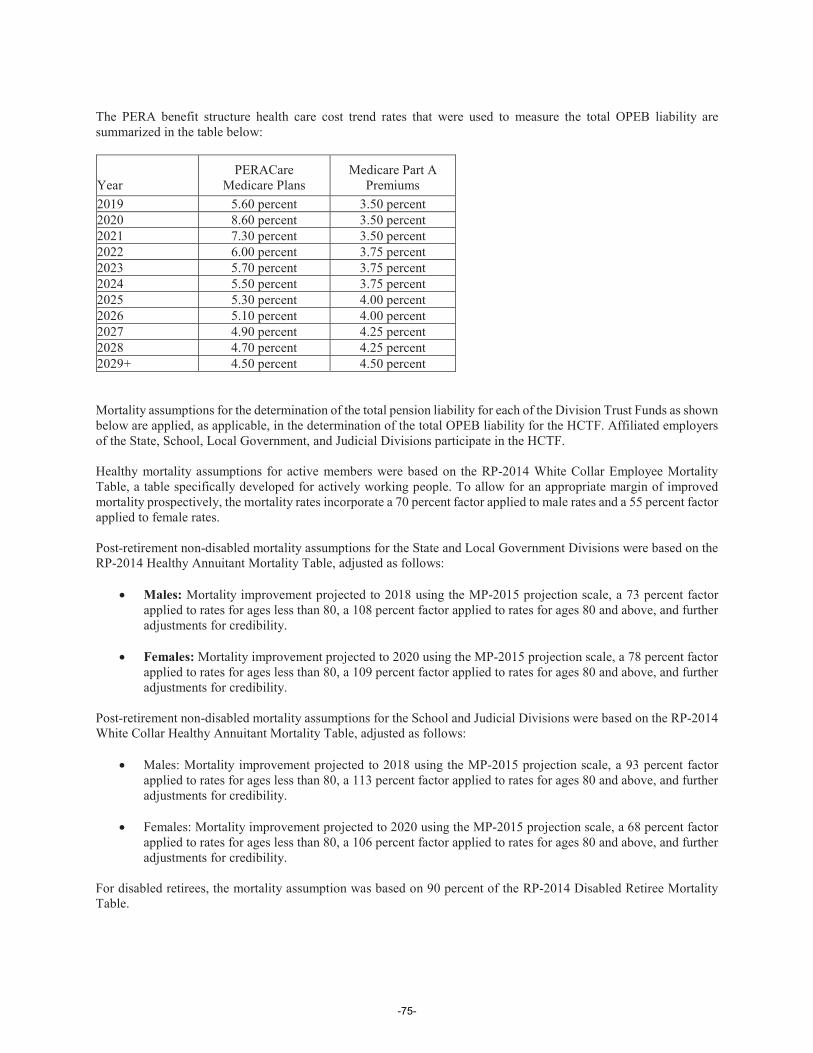
The PERA benefit structure health care cost trend rates that were used to measure the total OPEB liability are summarized in the table below:
YearPERACare
Medicare PlansMedicare Part A
Premiums2019 5.60 percent 3.50 percent2020 8.60 percent 3.50 percent2021 7.30 percent 3.50 percent2022 6.00 percent 3.75 percent2023 5.70 percent 3.75 percent2024 5.50 percent 3.75 percent2025 5.30 percent 4.00 percent2026 5.10 percent 4.00 percent2027 4.90 percent 4.25 percent2028 4.70 percent 4.25 percent2029+ 4.50 percent 4.50 percent
Mortality assumptions for the determination of the total pension liability for each of the Division Trust Funds as shown below are applied, as applicable, in the determination of the total OPEB liability for the HCTF. Affiliated employers of the State, School, Local Government, and Judicial Divisions participate in the HCTF.
Healthy mortality assumptions for active members were based on the RP-2014 White Collar Employee Mortality Table, a table specifically developed for actively working people. To allow for an appropriate margin of improved mortality prospectively, the mortality rates incorporate a 70 percent factor applied to male rates and a 55 percent factor applied to female rates.
Post-retirement non-disabled mortality assumptions for the State and Local Government Divisions were based on the RP-2014 Healthy Annuitant Mortality Table, adjusted as follows:
Males: Mortality improvement projected to 2018 using the MP-2015 projection scale, a 73 percent factor applied to rates for ages less than 80, a 108 percent factor applied to rates for ages 80 and above, and further adjustments for credibility.
Females: Mortality improvement projected to 2020 using the MP-2015 projection scale, a 78 percent factor applied to rates for ages less than 80, a 109 percent factor applied to rates for ages 80 and above, and further adjustments for credibility.
Post-retirement non-disabled mortality assumptions for the School and Judicial Divisions were based on the RP-2014White Collar Healthy Annuitant Mortality Table, adjusted as follows:
Males: Mortality improvement projected to 2018 using the MP-2015 projection scale, a 93 percent factor applied to rates for ages less than 80, a 113 percent factor applied to rates for ages 80 and above, and further adjustments for credibility.
Females: Mortality improvement projected to 2020 using the MP-2015 projection scale, a 68 percent factor applied to rates for ages less than 80, a 106 percent factor applied to rates for ages 80 and above, and further adjustments for credibility.
For disabled retirees, the mortality assumption was based on 90 percent of the RP-2014 Disabled Retiree Mortality Table.
-75-
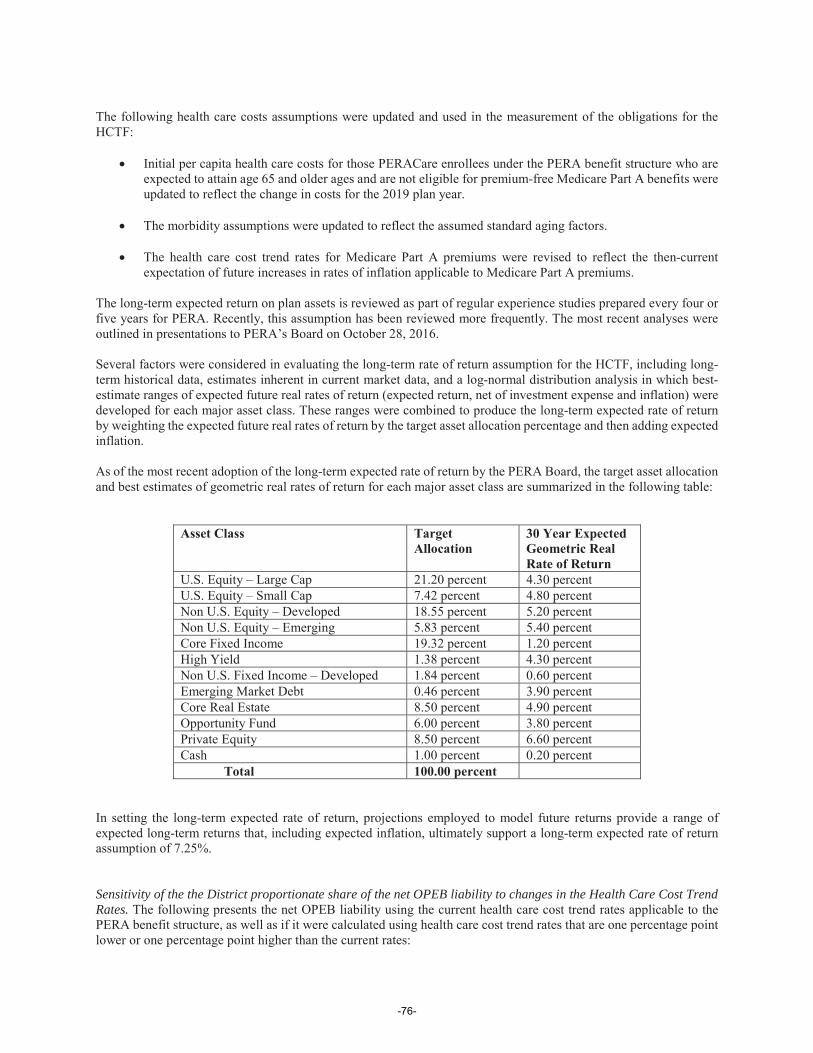
The following health care costs assumptions were updated and used in the measurement of the obligations for the HCTF:
Initial per capita health care costs for those PERACare enrollees under the PERA benefit structure who are expected to attain age 65 and older ages and are not eligible for premium-free Medicare Part A benefits were updated to reflect the change in costs for the 2019 plan year.
The morbidity assumptions were updated to reflect the assumed standard aging factors.
The health care cost trend rates for Medicare Part A premiums were revised to reflect the then-current expectation of future increases in rates of inflation applicable to Medicare Part A premiums.
The long-term expected return on plan assets is reviewed as part of regular experience studies prepared every four or five years for PERA. Recently, this assumption has been reviewed more frequently. The most recent analyses were outlined in presentations to PERA’s Board on October 28, 2016. Several factors were considered in evaluating the long-term rate of return assumption for the HCTF, including long-term historical data, estimates inherent in current market data, and a log-normal distribution analysis in which best-estimate ranges of expected future real rates of return (expected return, net of investment expense and inflation) were developed for each major asset class. These ranges were combined to produce the long-term expected rate of return by weighting the expected future real rates of return by the target asset allocation percentage and then adding expected inflation.
As of the most recent adoption of the long-term expected rate of return by the PERA Board, the target asset allocation and best estimates of geometric real rates of return for each major asset class are summarized in the following table:
Asset Class Target Allocation
30 Year Expected Geometric Real Rate of Return
U.S. Equity – Large Cap 21.20 percent 4.30 percentU.S. Equity – Small Cap 7.42 percent 4.80 percentNon U.S. Equity – Developed 18.55 percent 5.20 percentNon U.S. Equity – Emerging 5.83 percent 5.40 percentCore Fixed Income 19.32 percent 1.20 percentHigh Yield 1.38 percent 4.30 percentNon U.S. Fixed Income – Developed 1.84 percent 0.60 percentEmerging Market Debt 0.46 percent 3.90 percentCore Real Estate 8.50 percent 4.90 percentOpportunity Fund 6.00 percent 3.80 percentPrivate Equity 8.50 percent 6.60 percentCash 1.00 percent 0.20 percent Total 100.00 percent
In setting the long-term expected rate of return, projections employed to model future returns provide a range of expected long-term returns that, including expected inflation, ultimately support a long-term expected rate of return assumption of 7.25%.
Sensitivity of the the District proportionate share of the net OPEB liability to changes in the Health Care Cost Trend Rates. The following presents the net OPEB liability using the current health care cost trend rates applicable to the PERA benefit structure, as well as if it were calculated using health care cost trend rates that are one percentage point lower or one percentage point higher than the current rates:
-76-
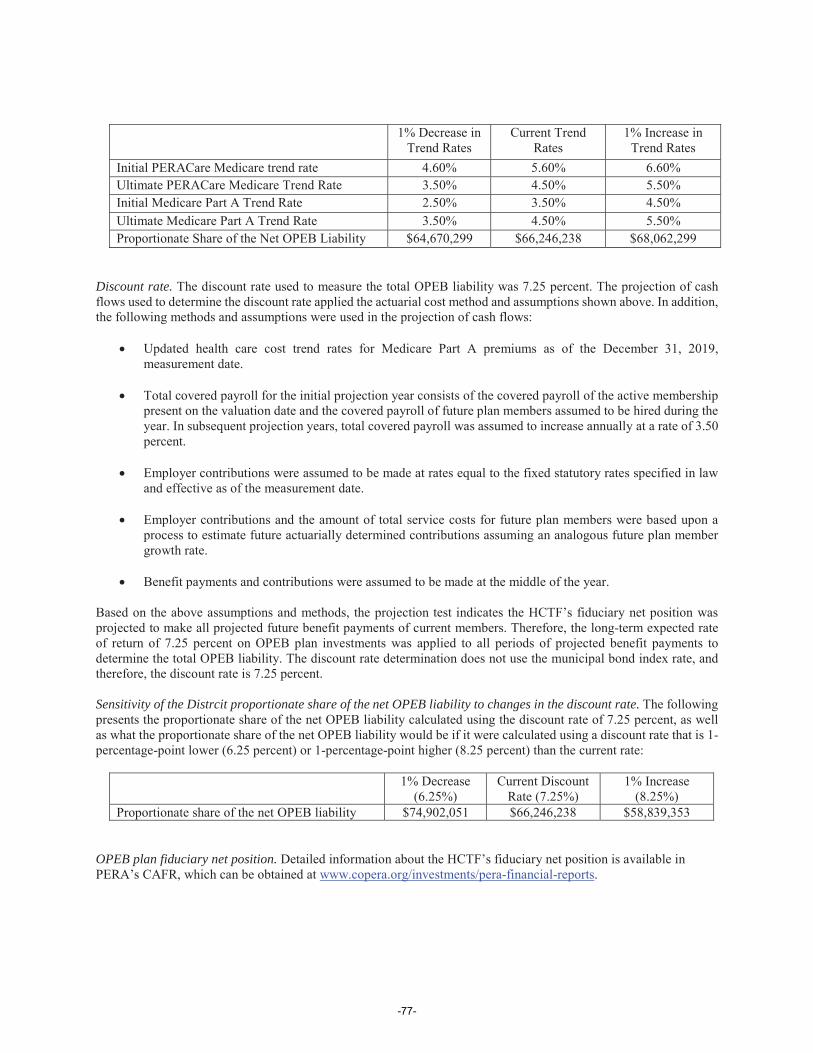
1% Decrease in Trend Rates
Current Trend Rates
1% Increase in Trend Rates
Initial PERACare Medicare trend rate 4.60% 5.60% 6.60%Ultimate PERACare Medicare Trend Rate 3.50% 4.50% 5.50%Initial Medicare Part A Trend Rate 2.50% 3.50% 4.50%Ultimate Medicare Part A Trend Rate 3.50% 4.50% 5.50%Proportionate Share of the Net OPEB Liability $64,670,299 $66,246,238 $68,062,299
Discount rate. The discount rate used to measure the total OPEB liability was 7.25 percent. The projection of cash flows used to determine the discount rate applied the actuarial cost method and assumptions shown above. In addition, the following methods and assumptions were used in the projection of cash flows:
Updated health care cost trend rates for Medicare Part A premiums as of the December 31, 2019, measurement date.
Total covered payroll for the initial projection year consists of the covered payroll of the active membership present on the valuation date and the covered payroll of future plan members assumed to be hired during the year. In subsequent projection years, total covered payroll was assumed to increase annually at a rate of 3.50 percent.
Employer contributions were assumed to be made at rates equal to the fixed statutory rates specified in law and effective as of the measurement date.
Employer contributions and the amount of total service costs for future plan members were based upon a process to estimate future actuarially determined contributions assuming an analogous future plan member growth rate.
Benefit payments and contributions were assumed to be made at the middle of the year.
Based on the above assumptions and methods, the projection test indicates the HCTF’s fiduciary net position was projected to make all projected future benefit payments of current members. Therefore, the long-term expected rate of return of 7.25 percent on OPEB plan investments was applied to all periods of projected benefit payments to determine the total OPEB liability. The discount rate determination does not use the municipal bond index rate, and therefore, the discount rate is 7.25 percent.
Sensitivity of the Distrcit proportionate share of the net OPEB liability to changes in the discount rate. The following presents the proportionate share of the net OPEB liability calculated using the discount rate of 7.25 percent, as well as what the proportionate share of the net OPEB liability would be if it were calculated using a discount rate that is 1-percentage-point lower (6.25 percent) or 1-percentage-point higher (8.25 percent) than the current rate:
1% Decrease (6.25%)
Current Discount Rate (7.25%)
1% Increase (8.25%)
Proportionate share of the net OPEB liability $74,902,051 $66,246,238 $58,839,353
OPEB plan fiduciary net position. Detailed information about the HCTF’s fiduciary net position is available in PERA’s CAFR, which can be obtained at www.copera.org/investments/pera-financial-reports.
-77-
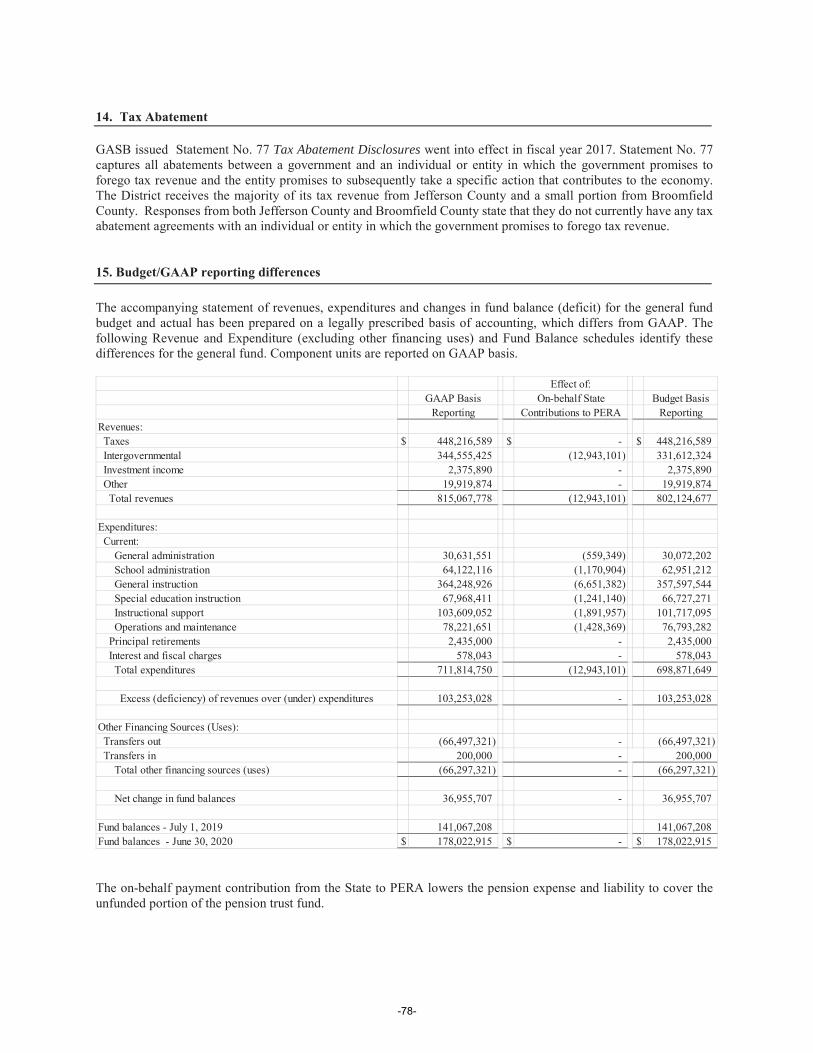
14. Tax Abatement
GASB issued Statement No. 77 Tax Abatement Disclosures went into effect in fiscal year 2017. Statement No. 77 captures all abatements between a government and an individual or entity in which the government promises to forego tax revenue and the entity promises to subsequently take a specific action that contributes to the economy. The District receives the majority of its tax revenue from Jefferson County and a small portion from Broomfield County. Responses from both Jefferson County and Broomfield County state that they do not currently have any tax abatement agreements with an individual or entity in which the government promises to forego tax revenue.
15. Budget/GAAP reporting differences
The accompanying statement of revenues, expenditures and changes in fund balance (deficit) for the general fund budget and actual has been prepared on a legally prescribed basis of accounting, which differs from GAAP. The following Revenue and Expenditure (excluding other financing uses) and Fund Balance schedules identify these differences for the general fund. Component units are reported on GAAP basis.
The on-behalf payment contribution from the State to PERA lowers the pension expense and liability to cover the unfunded portion of the pension trust fund.
Effect of:GAAP Basis On-behalf State Budget Basis
Reporting Contributions to PERA ReportingRevenues: Taxes $ 448,216,589 $ - $ 448,216,589 Intergovernmental 344,555,425 (12,943,101) 331,612,324 Investment income 2,375,890 - 2,375,890 Other 19,919,874 - 19,919,874 Total revenues 815,067,778 (12,943,101) 802,124,677
Expenditures: Current: General administration 30,631,551 (559,349) 30,072,202 School administration 64,122,116 (1,170,904) 62,951,212 General instruction 364,248,926 (6,651,382) 357,597,544 Special education instruction 67,968,411 (1,241,140) 66,727,271 Instructional support 103,609,052 (1,891,957) 101,717,095 Operations and maintenance 78,221,651 (1,428,369) 76,793,282 Principal retirements 2,435,000 - 2,435,000 Interest and fiscal charges 578,043 - 578,043 Total expenditures 711,814,750 (12,943,101) 698,871,649
Excess (deficiency) of revenues over (under) expenditures 103,253,028 - 103,253,028
Other Financing Sources (Uses): Transfers out (66,497,321) - (66,497,321) Transfers in 200,000 - 200,000 Total other financing sources (uses) (66,297,321) - (66,297,321)
Net change in fund balances 36,955,707 - 36,955,707
Fund balances - July 1, 2019 141,067,208 141,067,208Fund balances - June 30, 2020 $ 178,022,915 $ - $ 178,022,915
-78-
Required Supplementary Information
-79-

2019 2018 2017District's proportion (percentage) of the
collective net pension liability 9.0181922946% 8.8525295467% 10.1435305492%
District's proportionate share of thecollective pension liability 1,347,298,359$ 1,567,522,188$ 3,280,057,279$
State's Proportionate Share of the 170,887,660 214,336,891 -Net Pension Liability
1,518,186,019$ 1,781,859,079$ 3,280,057,279$
Covered payroll 570,877,669$ 511,406,769$ 464,620,159$
District's proportionate share of the net pensionliability as a percentage of itscovered payroll 236.00% 306.51% 705.97%
Plan fiduciary net position as a percentage of thetotal pension liability 64.52% 57.01% 43.96%
The amounts presented for each fiscal year were determined as of December 31.This schedule is presented to illustrate the requirement to show information for 10 years. Since years prior to 2013 were not reported in accordance with the current GASB standards, the information is not available. Primary government only, does not include component units.
JEFFERSON COUNTY SCHOOL DISTRICT, NO. R-1Schedule of the District's Proportionate Share of the Net Pension Liability
Last 10 Measurement Periods (began in 2013)
-80-
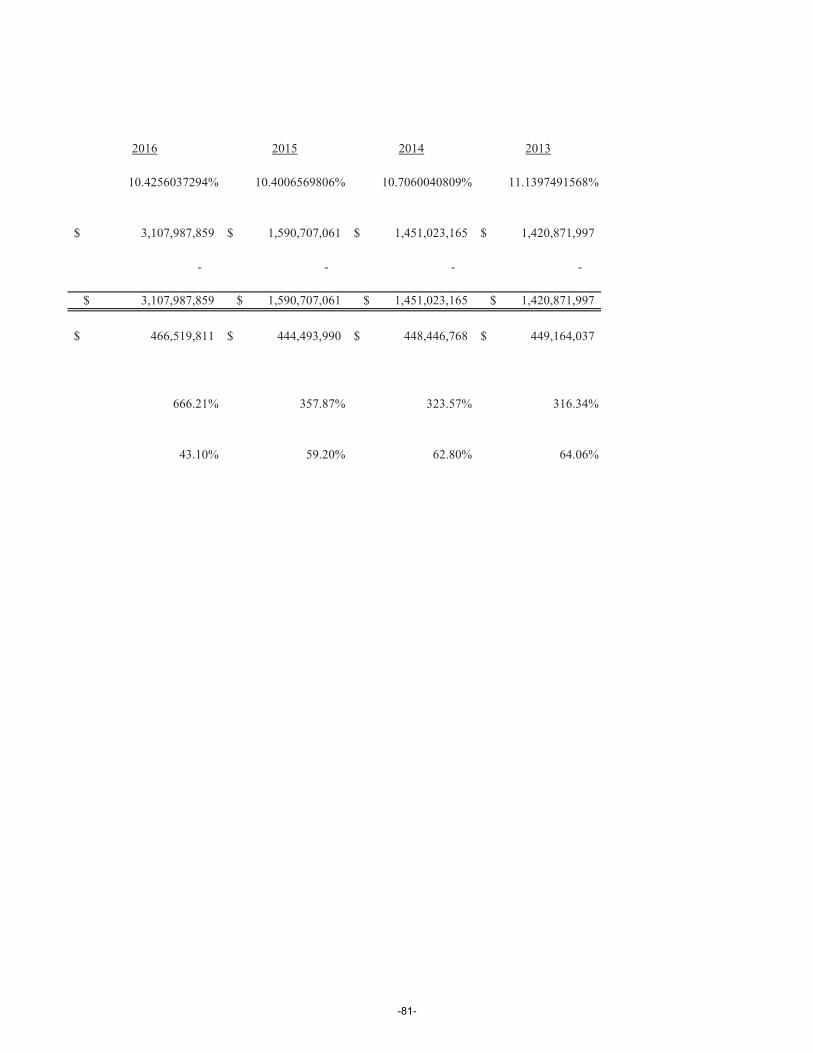
2016 2015 2014 2013
10.4256037294% 10.4006569806% 10.7060040809% 11.1397491568%
3,107,987,859$ 1,590,707,061$ 1,451,023,165$ 1,420,871,997$
- - - -
3,107,987,859$ 1,590,707,061$ 1,451,023,165$ 1,420,871,997$
466,519,811$ 444,493,990$ 448,446,768$ 449,164,037$
666.21% 357.87% 323.57% 316.34%
43.10% 59.20% 62.80% 64.06%
-81-

-82-

2019 2018 2017 2016District's proportion (percentage) of the
collective net OPEB liability 5.8938040284% 5.7542079222% 5.7635097638% 5.9259699159%
District's proportionate share of thecollective OPEB liability 66,246,238$ 78,288,417$ 74,902,573$ 76,832,214$
Covered payroll 570,877,669$ 511,406,769$ 464,620,159$ 466,519,811$
District's proportionate share of the net OPEBliability as a percentage of itscovered payroll 11.60% 15.31% 16.12% 16.47%
Plan fiduciary net position as a percentage of thetotal OPEB liability 24.49% 17.03% 17.53% 16.72%
The amounts presented for each fiscal year were determined as of December 31.This schedule is presented to illustrate the requirement to show information for 10 years. Since years prior to 2013 were not reported in accordance with the current GASB standards, the information is not available. Primary government only, does not include component units.
JEFFERSON COUNTY SCHOOL DISTRICT, NO. R-1Schedule of the District's Proportionate Share of the Net OPEB Liability
Last 10 Measurement Periods (began in 2016)
-83-
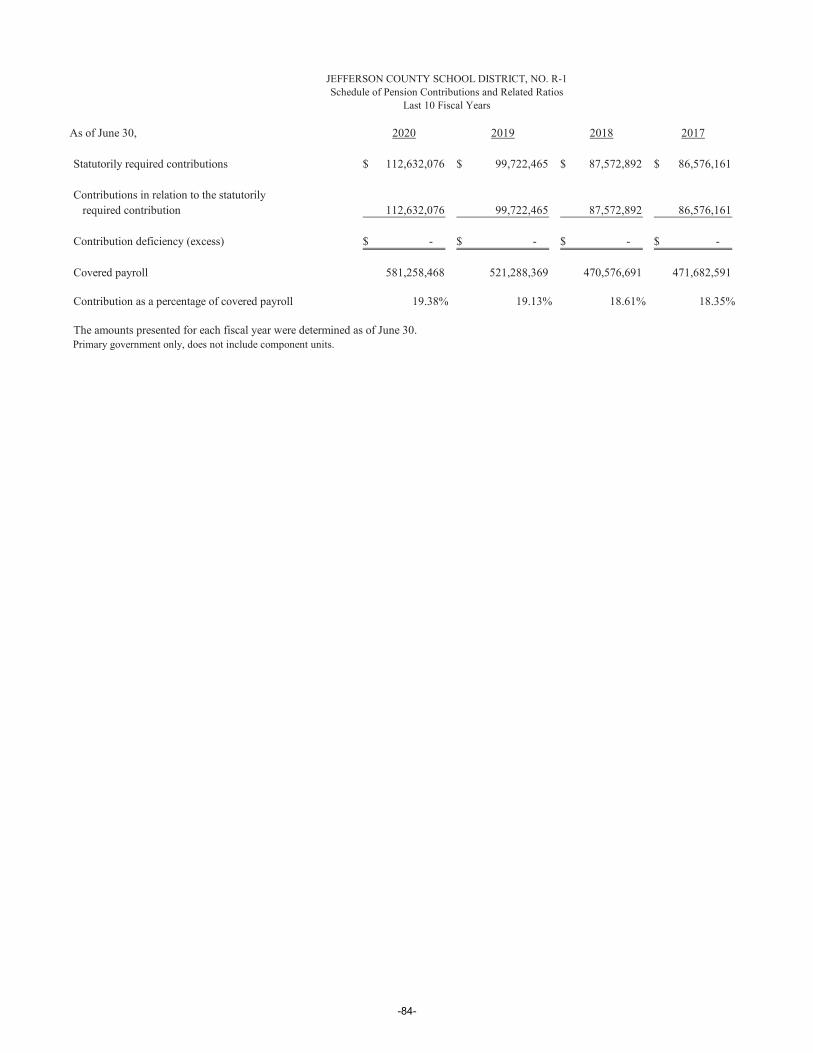
As of June 30, 2020 2019 2018 2017
Statutorily required contributions 112,632,076$ 99,722,465$ 87,572,892$ 86,576,161$
Contributions in relation to the statutorilyrequired contribution 112,632,076 99,722,465 87,572,892 86,576,161
Contribution deficiency (excess) -$ -$ -$ -$
Covered payroll 581,258,468 521,288,369 470,576,691 471,682,591
Contribution as a percentage of covered payroll 19.38% 19.13% 18.61% 18.35%
The amounts presented for each fiscal year were determined as of June 30.Primary government only, does not include component units.
Schedule of Pension Contributions and Related RatiosJEFFERSON COUNTY SCHOOL DISTRICT, NO. R-1
Last 10 Fiscal Years
-84-
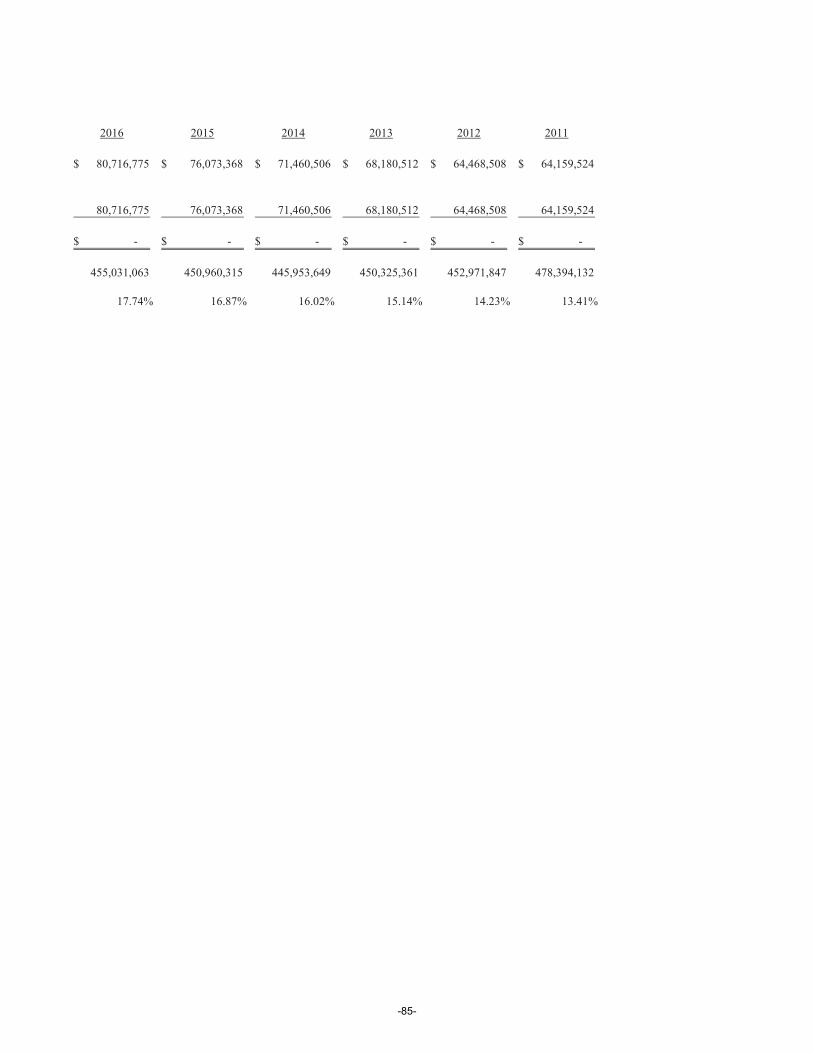
2016 2015 2014 2013 2012 2011
80,716,775$ 76,073,368$ 71,460,506$ 68,180,512$ 64,468,508$ 64,159,524$
80,716,775 76,073,368 71,460,506 68,180,512 64,468,508 64,159,524
-$ -$ -$ -$ -$ -$
455,031,063 450,960,315 445,953,649 450,325,361 452,971,847 478,394,132
17.74% 16.87% 16.02% 15.14% 14.23% 13.41%
-85-
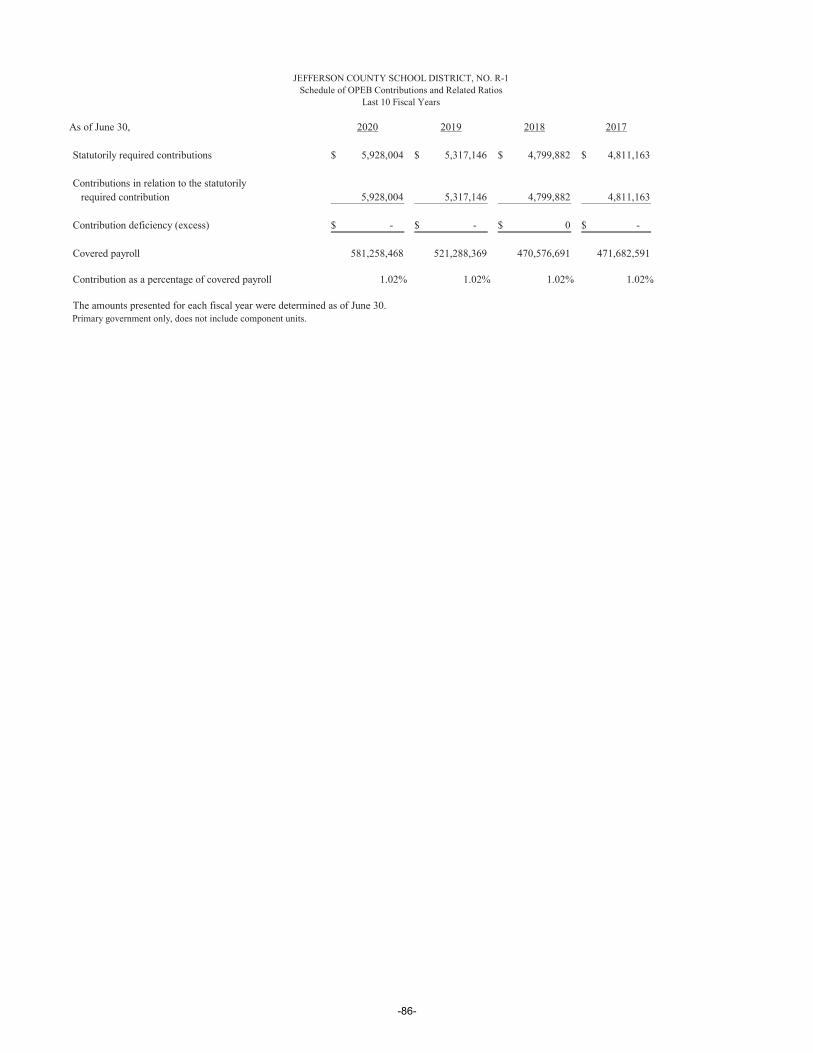
As of June 30, 2020 2019 2018 2017
Statutorily required contributions 5,928,004$ 5,317,146$ 4,799,882$ 4,811,163$
Contributions in relation to the statutorilyrequired contribution 5,928,004 5,317,146 4,799,882 4,811,163
Contribution deficiency (excess) -$ -$ 0$ -$
Covered payroll 581,258,468 521,288,369 470,576,691 471,682,591
Contribution as a percentage of covered payroll 1.02% 1.02% 1.02% 1.02%
The amounts presented for each fiscal year were determined as of June 30.Primary government only, does not include component units.
JEFFERSON COUNTY SCHOOL DISTRICT, NO. R-1Schedule of OPEB Contributions and Related Ratios
Last 10 Fiscal Years
-86-
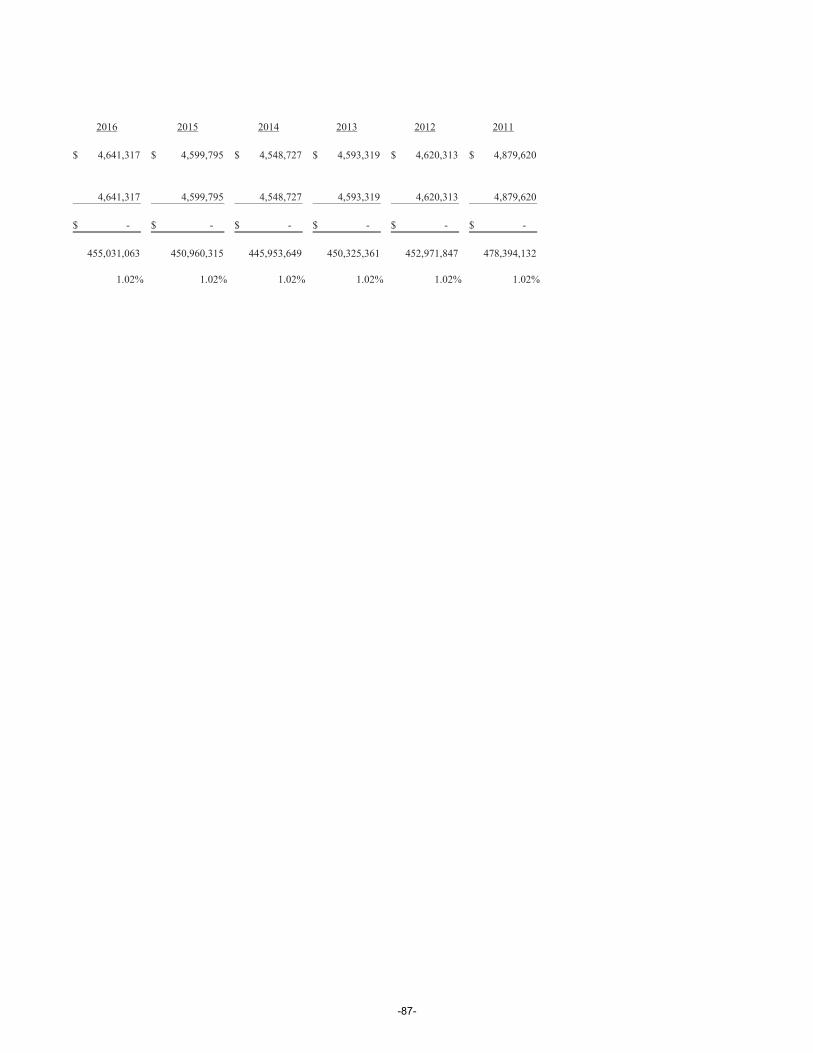
2016 2015 2014 2013 2012 2011
4,641,317$ 4,599,795$ 4,548,727$ 4,593,319$ 4,620,313$ 4,879,620$
4,641,317 4,599,795 4,548,727 4,593,319 4,620,313 4,879,620
-$ -$ -$ -$ -$ -$
455,031,063 450,960,315 445,953,649 450,325,361 452,971,847 478,394,132
1.02% 1.02% 1.02% 1.02% 1.02% 1.02%
-87-

-88-

Supplementary Information
The Combining Financial Statements represent the second level of financial reporting for
the District. These financial statements present more detailed information for the
individual funds in a format that segregates information by fund type.
-89-

-90-

Nonmajor Governmental Funds
Special Revenue Funds
Special revenue funds account for revenues that are legally restricted to expenditures for specified purposes.
Campus Activity Fund – This fund is used to account for revenues collected on behalf of the participants who will benefit from the expenditures.
Transportation Fund – This fund is used to account for student transportation services.
Food and Nutrition Services Fund – This fund is used to account for all food services related to serving student meals.
Major Governmental Funds
Bond Redemption Debt Service
Bond Redemption Debt Service Fund – This fund is used to account for the accumulation of resources for, and the payment of, long-term general obligation debt principal, interest, and related costs.
Capital Projects
Capital Reserve Capital Projects Fund – This fund is authorized by Colorado School Law and is used to fund ongoing capital needs such as site acquisition, building additions and equipment purchases.
Building Fund – Capital Projects – This fund is used to account for resources from the 2018 voter approved bond for a six year capital improvement program.
-91-
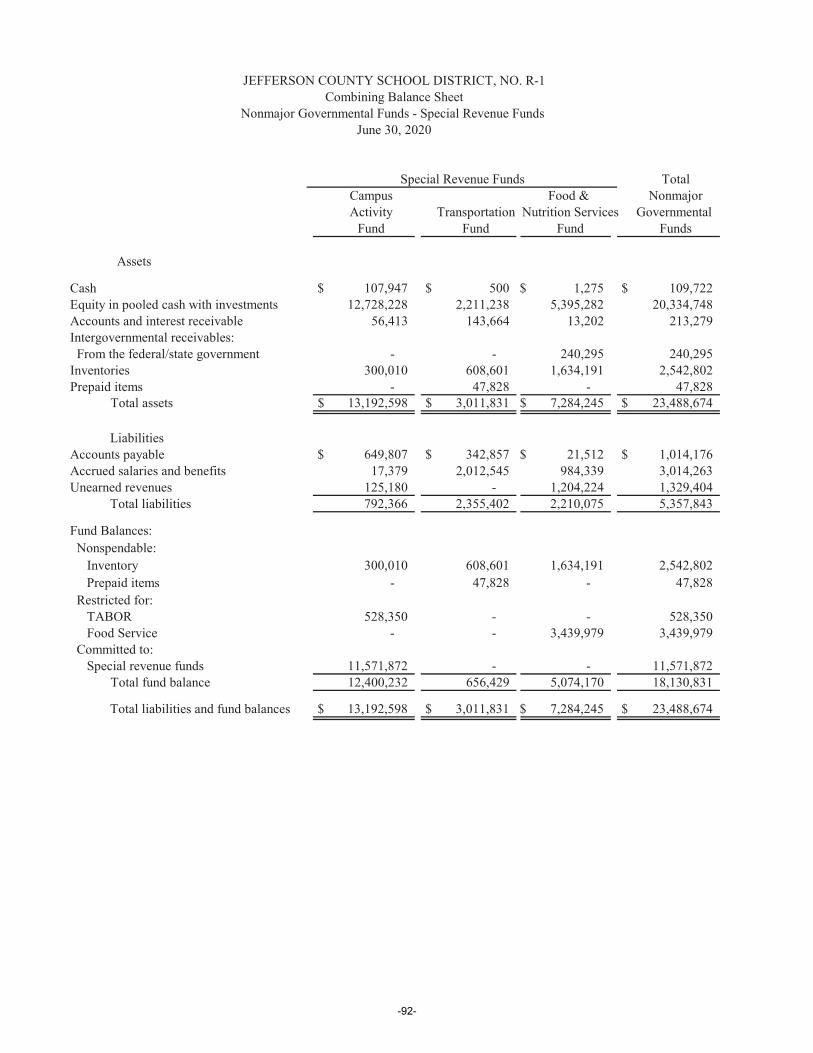
TotalCampus Food & NonmajorActivity Transportation Nutrition Services Governmental
Fund Fund Fund Funds
Assets
Cash $ 107,947 $ 500 $ 1,275 $ 109,722Equity in pooled cash with investments 12,728,228 2,211,238 5,395,282 20,334,748Accounts and interest receivable 56,413 143,664 13,202 213,279Intergovernmental receivables: From the federal/state government - - 240,295 240,295Inventories 300,010 608,601 1,634,191 2,542,802Prepaid items - 47,828 - 47,828 Total assets $ 13,192,598 $ 3,011,831 $ 7,284,245 $ 23,488,674
LiabilitiesAccounts payable $ 649,807 $ 342,857 $ 21,512 $ 1,014,176Accrued salaries and benefits 17,379 2,012,545 984,339 3,014,263Unearned revenues 125,180 - 1,204,224 1,329,404 Total liabilities 792,366 2,355,402 2,210,075 5,357,843
Fund Balances: Nonspendable: Inventory 300,010 608,601 1,634,191 2,542,802 Prepaid items - 47,828 - 47,828 Restricted for: TABOR 528,350 - - 528,350 Food Service - - 3,439,979 3,439,979 Committed to: Special revenue funds 11,571,872 - - 11,571,872 Total fund balance 12,400,232 656,429 5,074,170 18,130,831
Total liabilities and fund balances $ 13,192,598 $ 3,011,831 $ 7,284,245 $ 23,488,674
JEFFERSON COUNTY SCHOOL DISTRICT, NO. R-1
Nonmajor Governmental Funds - Special Revenue Funds Combining Balance Sheet
June 30, 2020
Special Revenue Funds
-92-
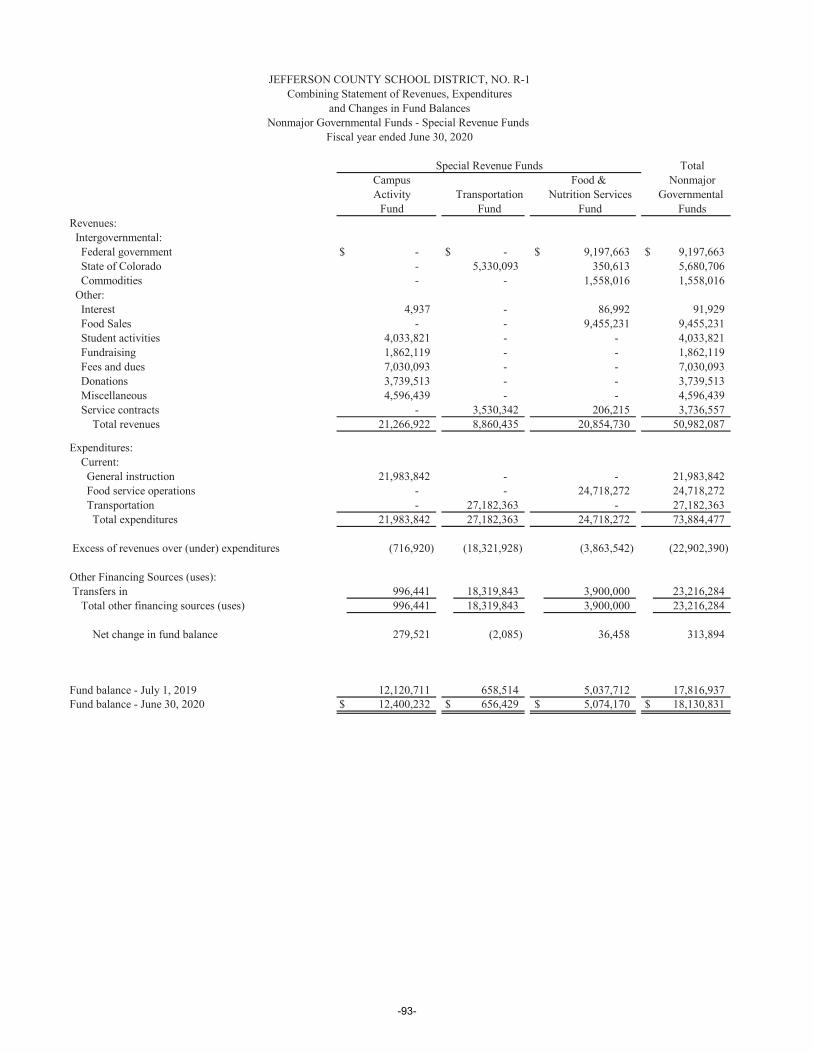
TotalCampus Food & NonmajorActivity Transportation Nutrition Services Governmental
Fund Fund Fund FundsRevenues: Intergovernmental: Federal government $ - $ - $ 9,197,663 $ 9,197,663 State of Colorado - 5,330,093 350,613 5,680,706 Commodities - - 1,558,016 1,558,016 Other: Interest 4,937 - 86,992 91,929 Food Sales - - 9,455,231 9,455,231 Student activities 4,033,821 - - 4,033,821 Fundraising 1,862,119 - - 1,862,119 Fees and dues 7,030,093 - - 7,030,093 Donations 3,739,513 - - 3,739,513 Miscellaneous 4,596,439 - - 4,596,439 Service contracts - 3,530,342 206,215 3,736,557 Total revenues 21,266,922 8,860,435 20,854,730 50,982,087
Expenditures: Current: General instruction 21,983,842 - - 21,983,842 Food service operations - - 24,718,272 24,718,272 Transportation - 27,182,363 - 27,182,363 Total expenditures 21,983,842 27,182,363 24,718,272 73,884,477
Excess of revenues over (under) expenditures (716,920) (18,321,928) (3,863,542) (22,902,390)
Other Financing Sources (uses): Transfers in 996,441 18,319,843 3,900,000 23,216,284 Total other financing sources (uses) 996,441 18,319,843 3,900,000 23,216,284
Net change in fund balance 279,521 (2,085) 36,458 313,894
Fund balance - July 1, 2019 12,120,711 658,514 5,037,712 17,816,937Fund balance - June 30, 2020 $ 12,400,232 $ 656,429 $ 5,074,170 $ 18,130,831
Fiscal year ended June 30, 2020
Special Revenue Funds
JEFFERSON COUNTY SCHOOL DISTRICT, NO. R-1
Nonmajor Governmental Funds - Special Revenue Funds
Combining Statement of Revenues, Expendituresand Changes in Fund Balances
-93-
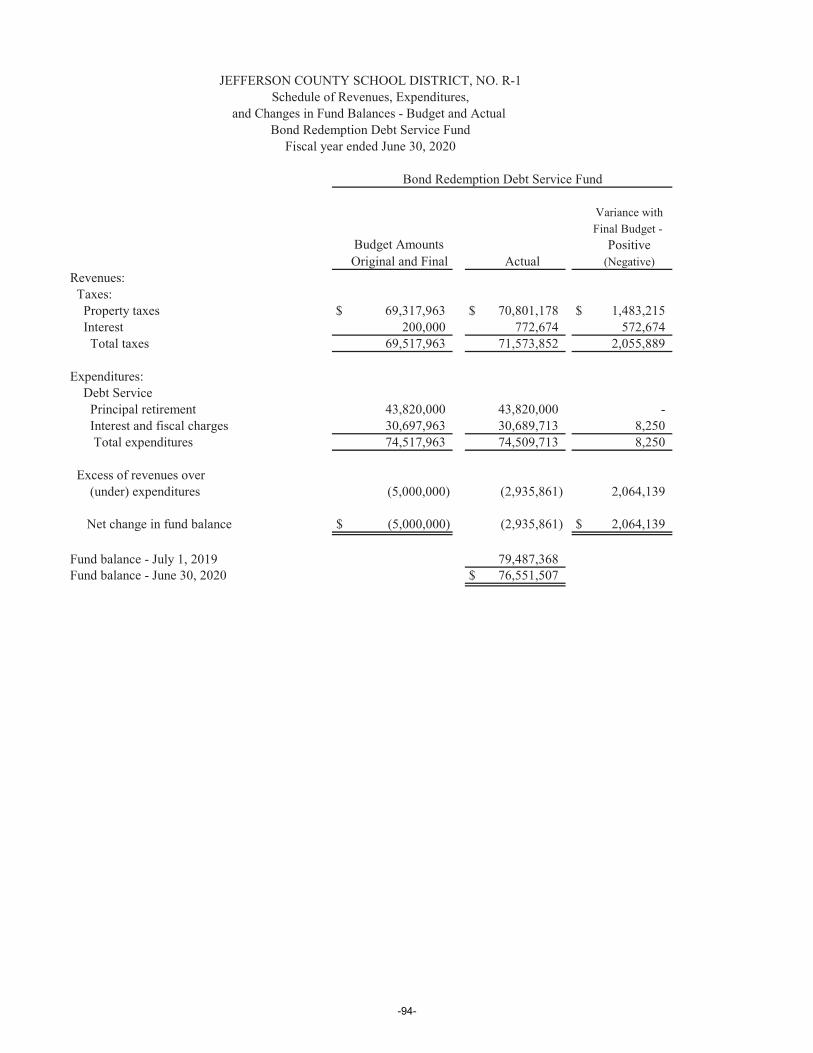
JEFFERSON COUNTY SCHOOL DISTRICT, NO. R-1Schedule of Revenues, Expenditures,
and Changes in Fund Balances - Budget and Actual Bond Redemption Debt Service Fund
Fiscal year ended June 30, 2020
Variance withFinal Budget -
PositiveOriginal and Final Actual (Negative)
Revenues: Taxes: Property taxes $ 69,317,963 $ 70,801,178 $ 1,483,215 Interest 200,000 772,674 572,674 Total taxes 69,517,963 71,573,852 2,055,889
Expenditures: Debt Service Principal retirement 43,820,000 43,820,000 - Interest and fiscal charges 30,697,963 30,689,713 8,250 Total expenditures 74,517,963 74,509,713 8,250
Excess of revenues over (under) expenditures (5,000,000) (2,935,861) 2,064,139
Net change in fund balance $ (5,000,000) (2,935,861) $ 2,064,139
Fund balance - July 1, 2019 79,487,368Fund balance - June 30, 2020 $ 76,551,507
Bond Redemption Debt Service Fund
Budget Amounts
-94-
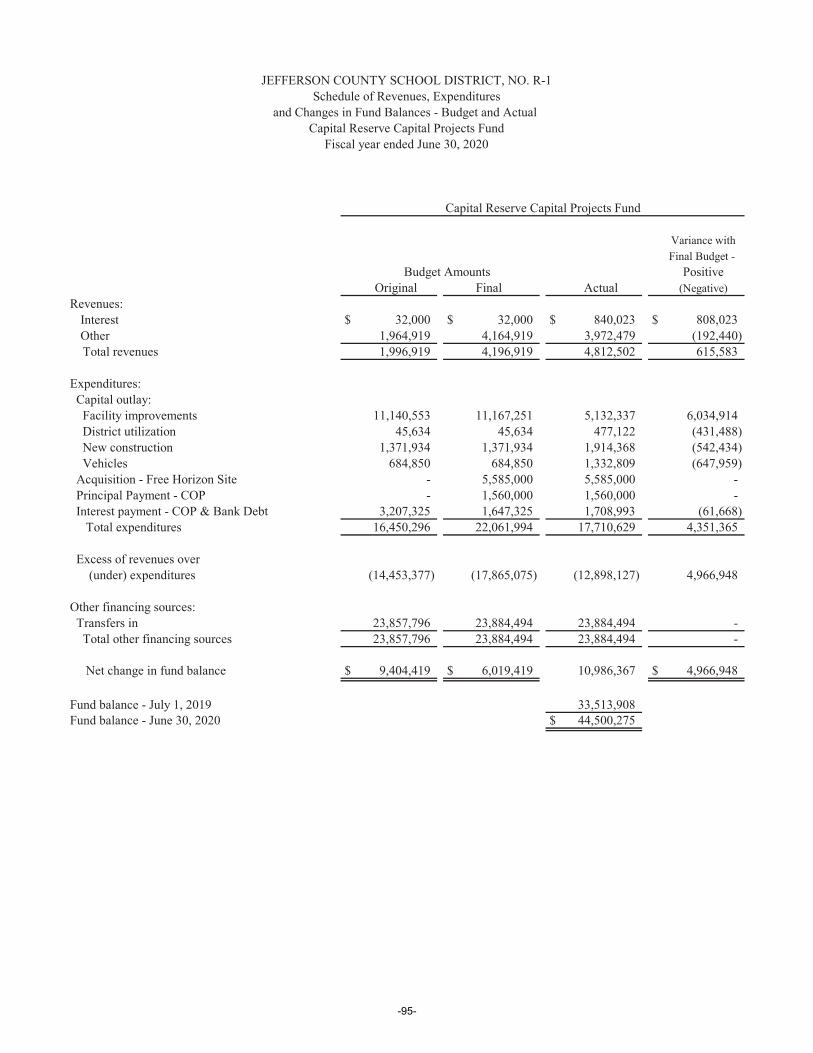
JEFFERSON COUNTY SCHOOL DISTRICT, NO. R-1Schedule of Revenues, Expenditures
and Changes in Fund Balances - Budget and Actual
Fiscal year ended June 30, 2020
Variance withFinal Budget -
PositiveOriginal Actual (Negative)
Revenues:Interest $ 32,000 $ 32,000 $ 840,023 $ 808,023Other 1,964,919 4,164,919 3,972,479 (192,440)
Total revenues 1,996,919 4,196,919 4,812,502 615,583
Expenditures: Capital outlay: Facility improvements 11,140,553 11,167,251 5,132,337 6,034,914 District utilization 45,634 45,634 477,122 (431,488) New construction 1,371,934 1,371,934 1,914,368 (542,434) Vehicles 684,850 684,850 1,332,809 (647,959) Acquisition - Free Horizon Site - 5,585,000 5,585,000 - Principal Payment - COP - 1,560,000 1,560,000 - Interest payment - COP & Bank Debt 3,207,325 1,647,325 1,708,993 (61,668) Total expenditures 16,450,296 22,061,994 17,710,629 4,351,365
Excess of revenues over (under) expenditures (14,453,377) (17,865,075) (12,898,127) 4,966,948
Other financing sources: Transfers in 23,857,796 23,884,494 23,884,494 - Total other financing sources 23,857,796 23,884,494 23,884,494 -
Net change in fund balance $ 9,404,419 $ 6,019,419 10,986,367 $ 4,966,948
Fund balance - July 1, 2019 33,513,908Fund balance - June 30, 2020 $ 44,500,275
Capital Reserve Capital Projects Fund
Capital Reserve Capital Projects Fund
FinalBudget Amounts
-95-
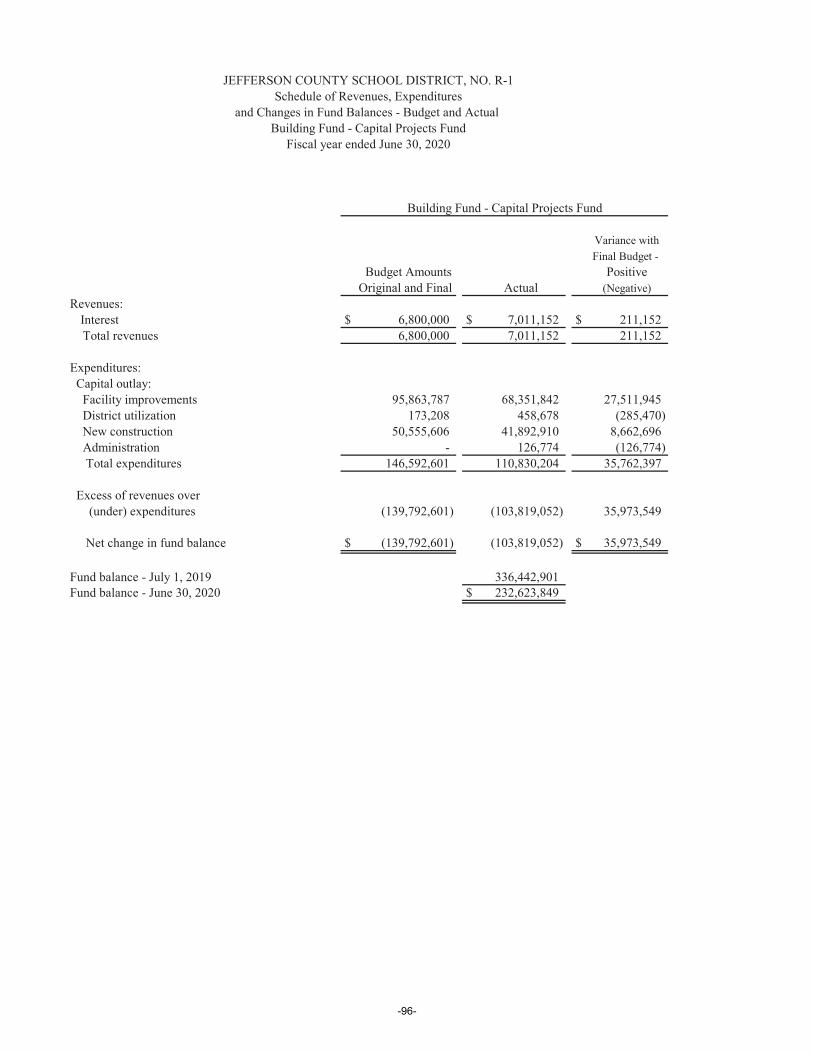
JEFFERSON COUNTY SCHOOL DISTRICT, NO. R-1Schedule of Revenues, Expenditures
and Changes in Fund Balances - Budget and Actual
Fiscal year ended June 30, 2020
Variance withFinal Budget -
PositiveOriginal and Final Actual (Negative)
Revenues:Interest $ 6,800,000 $ 7,011,152 $ 211,152
Total revenues 6,800,000 7,011,152 211,152
Expenditures: Capital outlay: Facility improvements 95,863,787 68,351,842 27,511,945 District utilization 173,208 458,678 (285,470) New construction 50,555,606 41,892,910 8,662,696 Administration - 126,774 (126,774) Total expenditures 146,592,601 110,830,204 35,762,397
Excess of revenues over (under) expenditures (139,792,601) (103,819,052) 35,973,549
Net change in fund balance $ (139,792,601) (103,819,052) $ 35,973,549
Fund balance - July 1, 2019 336,442,901Fund balance - June 30, 2020 $ 232,623,849
Building Fund - Capital Projects Fund
Building Fund - Capital Projects Fund
Budget Amounts
-96-
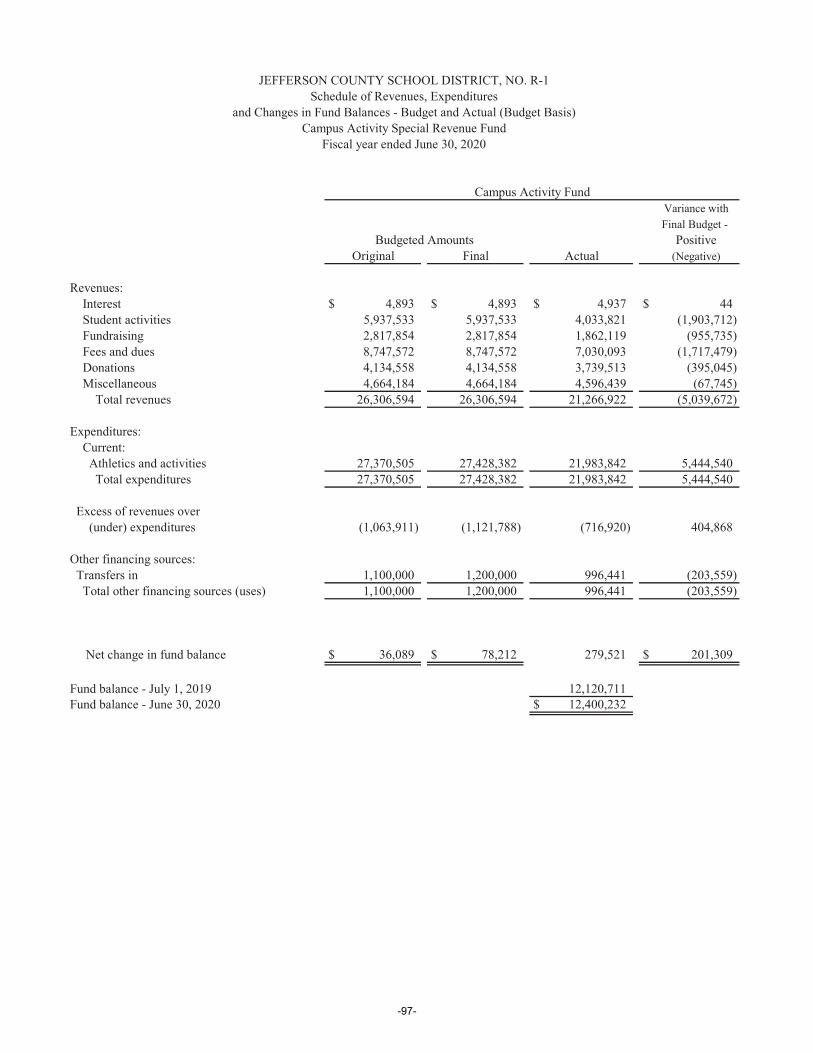
Variance withFinal Budget -
Positive(Negative)
Revenues: Interest $ 4,893 $ 4,893 $ 4,937 $ 44 Student activities 5,937,533 5,937,533 4,033,821 (1,903,712) Fundraising 2,817,854 2,817,854 1,862,119 (955,735) Fees and dues 8,747,572 8,747,572 7,030,093 (1,717,479) Donations 4,134,558 4,134,558 3,739,513 (395,045) Miscellaneous 4,664,184 4,664,184 4,596,439 (67,745) Total revenues 26,306,594 26,306,594 21,266,922 (5,039,672)
Expenditures: Current: Athletics and activities 27,370,505 27,428,382 21,983,842 5,444,540 Total expenditures 27,370,505 27,428,382 21,983,842 5,444,540
Excess of revenues over (under) expenditures (1,063,911) (1,121,788) (716,920) 404,868
Other financing sources: Transfers in 1,100,000 1,200,000 996,441 (203,559) Total other financing sources (uses) 1,100,000 1,200,000 996,441 (203,559)
Net change in fund balance $ 36,089 $ 78,212 279,521 $ 201,309
Fund balance - July 1, 2019 12,120,711Fund balance - June 30, 2020 $ 12,400,232
Campus Activity Fund
Original ActualFinalBudgeted Amounts
JEFFERSON COUNTY SCHOOL DISTRICT, NO. R-1
Campus Activity Special Revenue Fund
Schedule of Revenues, Expendituresand Changes in Fund Balances - Budget and Actual (Budget Basis)
Fiscal year ended June 30, 2020
-97-
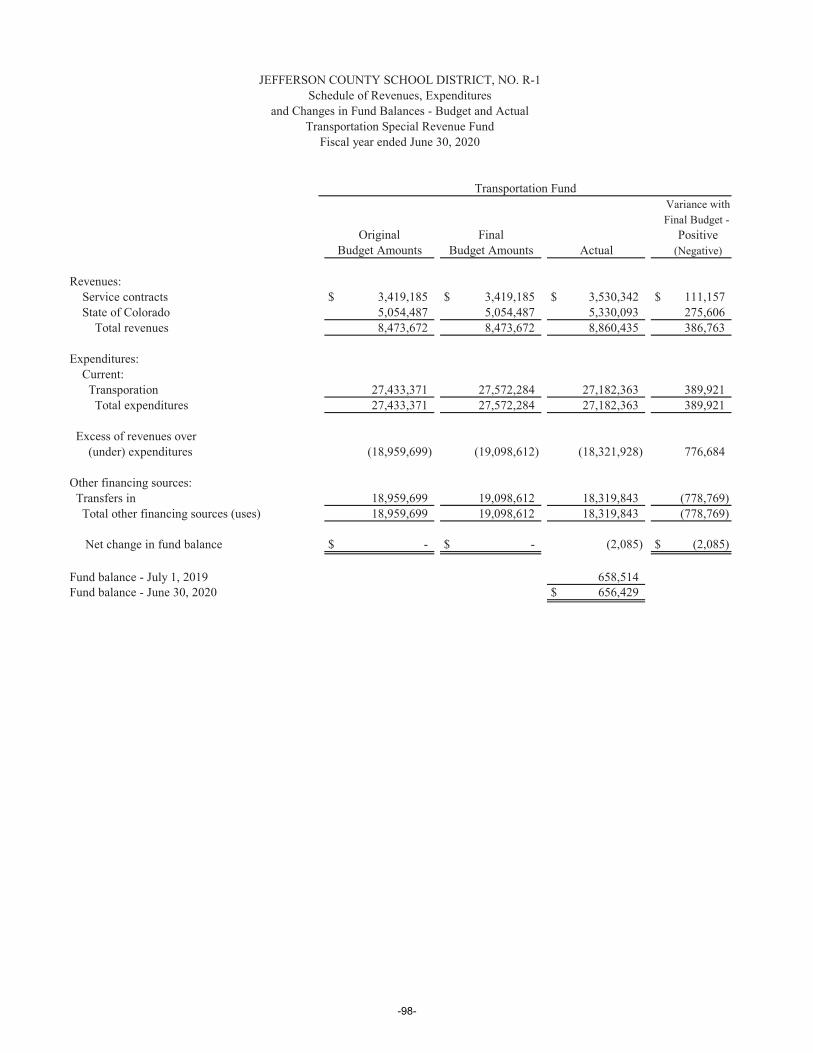
Variance withFinal Budget -
Positive(Negative)
Revenues: Service contracts $ 3,419,185 $ 3,419,185 $ 3,530,342 $ 111,157 State of Colorado 5,054,487 5,054,487 5,330,093 275,606 Total revenues 8,473,672 8,473,672 8,860,435 386,763
Expenditures: Current: Transporation 27,433,371 27,572,284 27,182,363 389,921 Total expenditures 27,433,371 27,572,284 27,182,363 389,921
Excess of revenues over (under) expenditures (18,959,699) (19,098,612) (18,321,928) 776,684
Other financing sources: Transfers in 18,959,699 19,098,612 18,319,843 (778,769) Total other financing sources (uses) 18,959,699 19,098,612 18,319,843 (778,769)
Net change in fund balance $ - $ - (2,085) $ (2,085)
Fund balance - July 1, 2019 658,514Fund balance - June 30, 2020 $ 656,429
FinalBudget Amounts Budget Amounts
Transportation Fund
OriginalActual
JEFFERSON COUNTY SCHOOL DISTRICT, NO. R-1Schedule of Revenues, Expenditures
and Changes in Fund Balances - Budget and ActualTransportation Special Revenue Fund
Fiscal year ended June 30, 2020
-98-
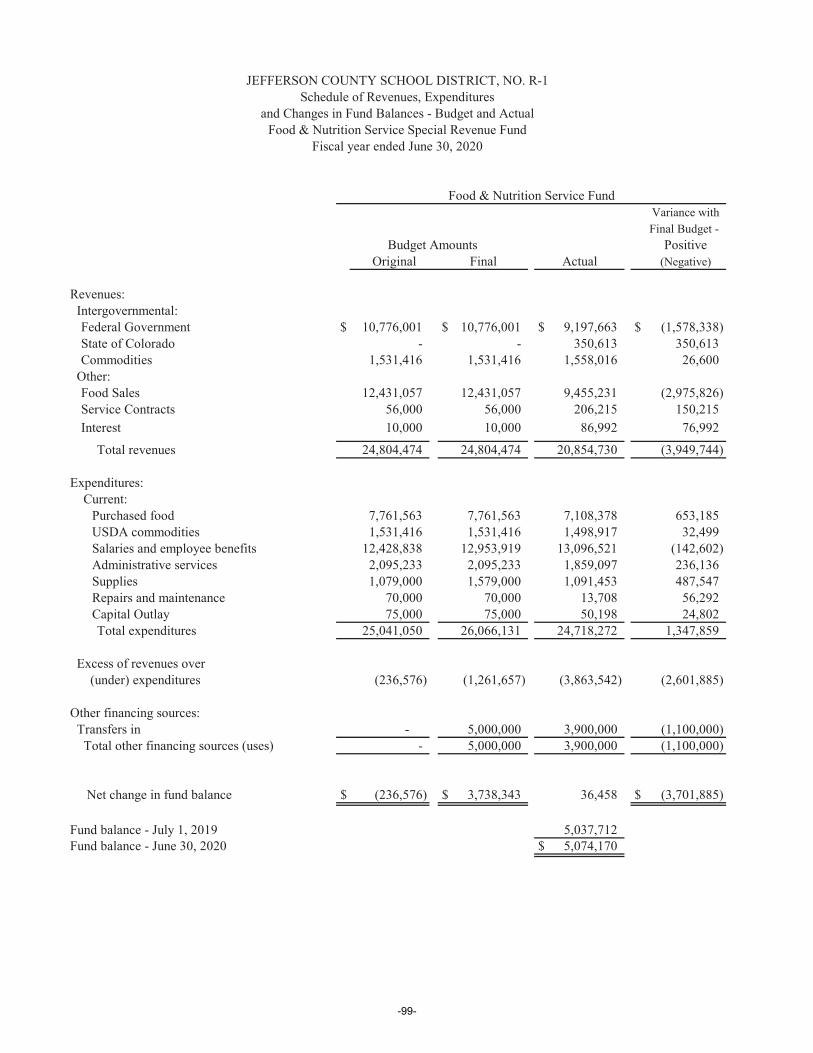
Variance withFinal Budget -
Positive(Negative)
Revenues: Intergovernmental:
Federal Government $ 10,776,001 $ 10,776,001 $ 9,197,663 $ (1,578,338)State of Colorado - - 350,613 350,613Commodities 1,531,416 1,531,416 1,558,016 26,600
Other:Food Sales 12,431,057 12,431,057 9,455,231 (2,975,826)Service Contracts 56,000 56,000 206,215 150,215Interest 10,000 10,000 86,992 76,992
Total revenues 24,804,474 24,804,474 20,854,730 (3,949,744)
Expenditures: Current:
Purchased food 7,761,563 7,761,563 7,108,378 653,185USDA commodities 1,531,416 1,531,416 1,498,917 32,499Salaries and employee benefits 12,428,838 12,953,919 13,096,521 (142,602)Administrative services 2,095,233 2,095,233 1,859,097 236,136Supplies 1,079,000 1,579,000 1,091,453 487,547Repairs and maintenance 70,000 70,000 13,708 56,292Capital Outlay 75,000 75,000 50,198 24,802
Total expenditures 25,041,050 26,066,131 24,718,272 1,347,859
Excess of revenues over (under) expenditures (236,576) (1,261,657) (3,863,542) (2,601,885)
Other financing sources: Transfers in - 5,000,000 3,900,000 (1,100,000) Total other financing sources (uses) - 5,000,000 3,900,000 (1,100,000)
Net change in fund balance $ (236,576) $ 3,738,343 36,458 $ (3,701,885)
Fund balance - July 1, 2019 5,037,712Fund balance - June 30, 2020 $ 5,074,170
Food & Nutrition Service Fund
JEFFERSON COUNTY SCHOOL DISTRICT, NO. R-1Schedule of Revenues, Expenditures
and Changes in Fund Balances - Budget and ActualFood & Nutrition Service Special Revenue Fund
Fiscal year ended June 30, 2020
Budget AmountsFinal ActualOriginal
-99-

-100-

Internal Service Funds
Internal Service Funds are used to account for the financing of goods or services provided by one department to other departments and schools on a cost-reimbursement basis.
Central Services Fund – This fund accounts for costs of operations to various users. Costs of operations include all direct costs plus depreciation, space rental, utilities, interest, and maintenance costs. Programs include: Copier, Printing, and Equipment Repair.
Employee Benefits Fund – This fund accounts for the self-insurance programs for dental, vision and group life.
Insurance Reserve Fund – This fund is authorized by state law to allow the District to maintain an insurance reserve for self-insurance purposes and to fund liability, workers’ compensation, and property insurance premiums.
Technology Fund – This fund is used to allocate the costs for the various technology-related activities to schools and departments.
-101-
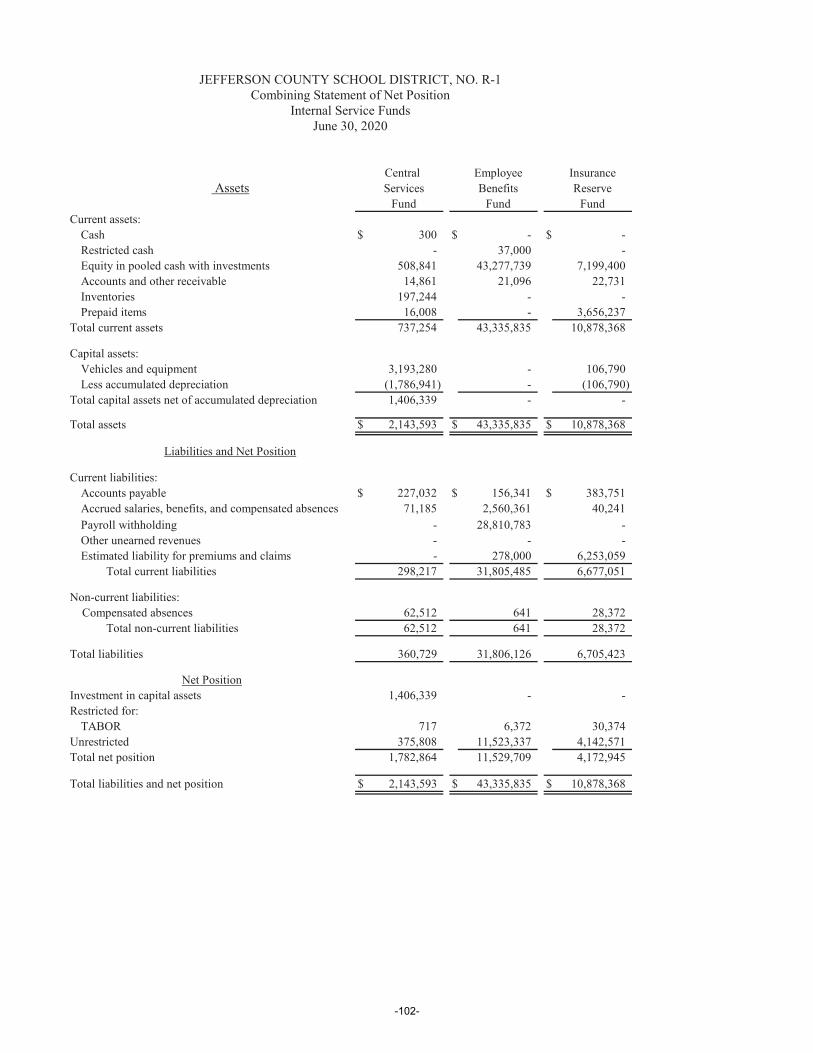
Central Employee Insurance Assets Services Benefits Reserve
Fund Fund FundCurrent assets:
Cash $ 300 $ - $ -Restricted cash - 37,000 -Equity in pooled cash with investments 508,841 43,277,739 7,199,400Accounts and other receivable 14,861 21,096 22,731Inventories 197,244 - -Prepaid items 16,008 - 3,656,237
Total current assets 737,254 43,335,835 10,878,368
Capital assets:Vehicles and equipment 3,193,280 - 106,790Less accumulated depreciation (1,786,941) - (106,790)
Total capital assets net of accumulated depreciation 1,406,339 - -
Total assets $ 2,143,593 $ 43,335,835 $ 10,878,368
Liabilities and Net Position
Current liabilities:Accounts payable $ 227,032 $ 156,341 $ 383,751Accrued salaries, benefits, and compensated absences 71,185 2,560,361 40,241Payroll withholding - 28,810,783 -Other unearned revenues - - -Estimated liability for premiums and claims - 278,000 6,253,059
Total current liabilities 298,217 31,805,485 6,677,051
Non-current liabilities: Compensated absences 62,512 641 28,372 Total non-current liabilities 62,512 641 28,372
Total liabilities 360,729 31,806,126 6,705,423
Net PositionInvestment in capital assets 1,406,339 - -Restricted for:
TABOR 717 6,372 30,374Unrestricted 375,808 11,523,337 4,142,571Total net position 1,782,864 11,529,709 4,172,945
Total liabilities and net position $ 2,143,593 $ 43,335,835 $ 10,878,368
JEFFERSON COUNTY SCHOOL DISTRICT, NO. R-1
Internal Service FundsCombining Statement of Net Position
June 30, 2020
-102-
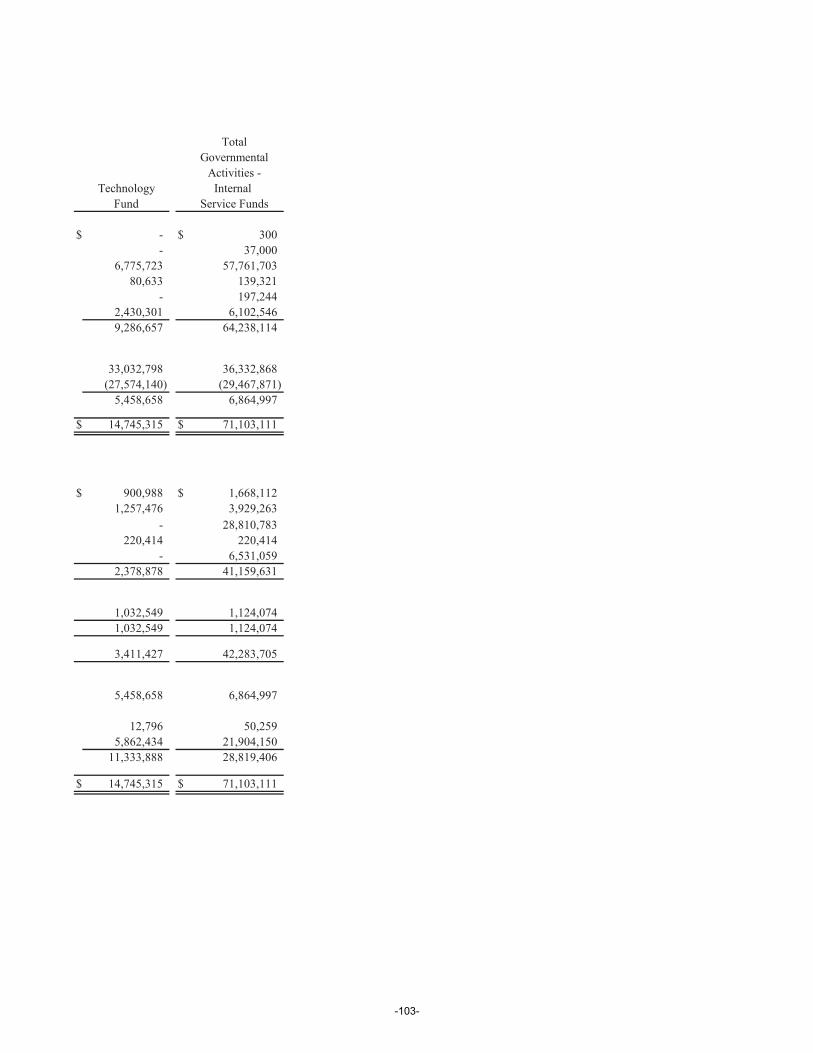
TotalGovernmental
Activities -Technology Internal
Fund Service Funds
$ - $ 300- 37,000
6,775,723 57,761,70380,633 139,321
- 197,2442,430,301 6,102,5469,286,657 64,238,114
33,032,798 36,332,868(27,574,140) (29,467,871)
5,458,658 6,864,997
$ 14,745,315 $ 71,103,111
$ 900,988 $ 1,668,1121,257,476 3,929,263
- 28,810,783220,414 220,414
- 6,531,0592,378,878 41,159,631
1,032,549 1,124,0741,032,549 1,124,074
3,411,427 42,283,705
5,458,658 6,864,997
12,796 50,2595,862,434 21,904,150
11,333,888 28,819,406
$ 14,745,315 $ 71,103,111
-103-
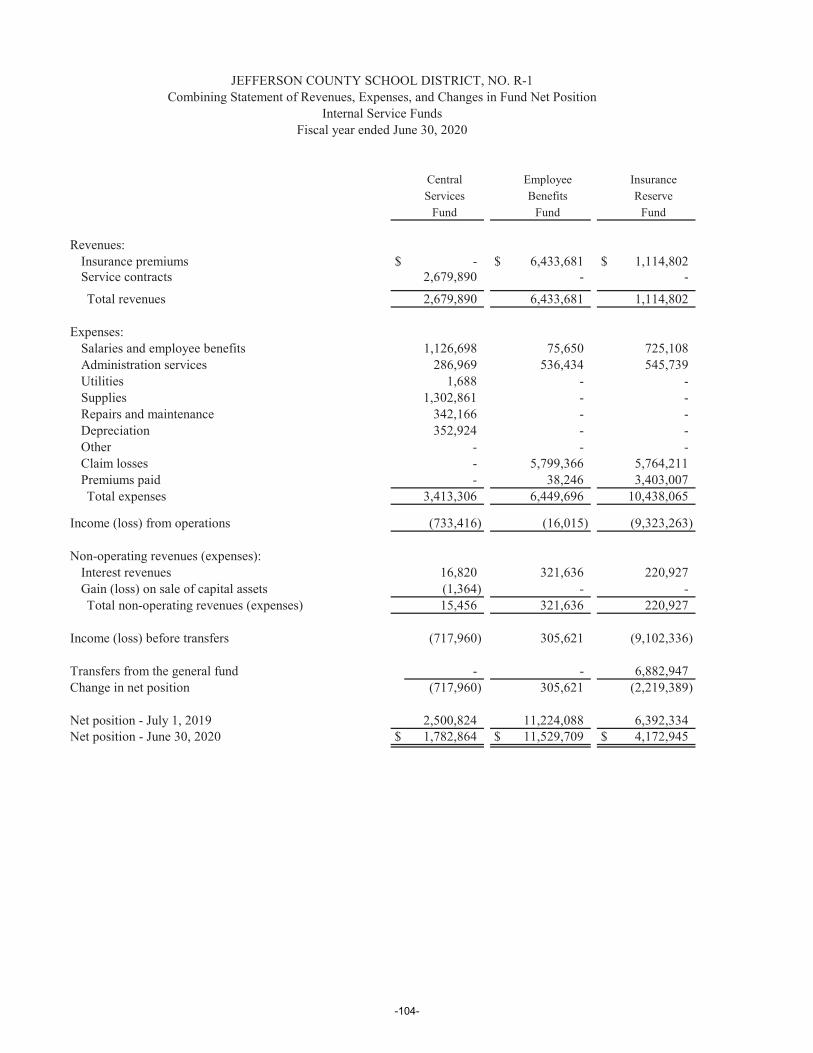
Central Employee InsuranceServices Benefits Reserve
Fund Fund Fund
Revenues:Insurance premiums $ - $ 6,433,681 $ 1,114,802Service contracts 2,679,890 - -
Total revenues 2,679,890 6,433,681 1,114,802
Expenses:Salaries and employee benefits 1,126,698 75,650 725,108Administration services 286,969 536,434 545,739Utilities 1,688 - -Supplies 1,302,861 - -Repairs and maintenance 342,166 - -Depreciation 352,924 - -Other - - -Claim losses - 5,799,366 5,764,211Premiums paid - 38,246 3,403,007
Total expenses 3,413,306 6,449,696 10,438,065
Income (loss) from operations (733,416) (16,015) (9,323,263)
Non-operating revenues (expenses):Interest revenues 16,820 321,636 220,927Gain (loss) on sale of capital assets (1,364) - -
Total non-operating revenues (expenses) 15,456 321,636 220,927
Income (loss) before transfers (717,960) 305,621 (9,102,336)
Transfers from the general fund - - 6,882,947Change in net position (717,960) 305,621 (2,219,389)
Net position - July 1, 2019 2,500,824 11,224,088 6,392,334Net position - June 30, 2020 $ 1,782,864 $ 11,529,709 $ 4,172,945
JEFFERSON COUNTY SCHOOL DISTRICT, NO. R-1
Internal Service FundsCombining Statement of Revenues, Expenses, and Changes in Fund Net Position
Fiscal year ended June 30, 2020
-104-
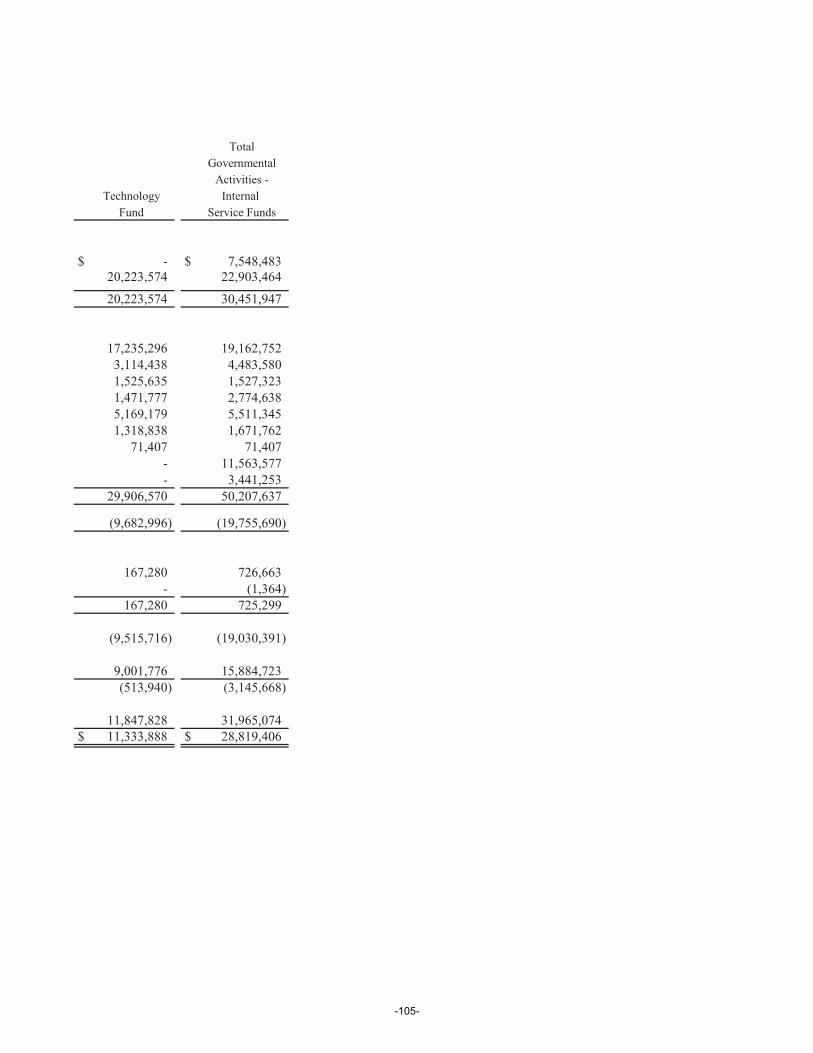
TotalGovernmental
Activities -Technology Internal
Fund Service Funds
$ - $ 7,548,48320,223,574 22,903,464
20,223,574 30,451,947
17,235,296 19,162,7523,114,438 4,483,5801,525,635 1,527,3231,471,777 2,774,6385,169,179 5,511,3451,318,838 1,671,762
71,407 71,407- 11,563,577- 3,441,253
29,906,570 50,207,637
(9,682,996) (19,755,690)
167,280 726,663- (1,364)
167,280 725,299
(9,515,716) (19,030,391)
9,001,776 15,884,723(513,940) (3,145,668)
11,847,828 31,965,074$ 11,333,888 $ 28,819,406
-105-

Central Employee InsuranceServices Benefits Reserve
Fund Fund Fund
Cash flows from operating activities: Cash received from customers $ 2,681,165 $ 6,431,635 $ 3,470,684 Cash paid to employees (1,125,091) (5,894,159) (701,888) Cash paid to vendors (1,819,226) 1,063,801 (10,023,879) Net cash provided by (used for) in operating activities (263,152) 1,601,277 (7,255,083)
Cash flows from noncapital financing activities: Transfers in and (out) - - 6,882,947 Net cash provided by noncapital financing activities - - 6,882,947
Cash flows from capital and related financing activities: Purchase of capital assets (262,068) - - Net cash (used for) capital and related financing activities (262,068) - -
Cash flows from investing activities: Interest received 16,820 321,636 220,927 Net cash provided by investing activities 16,820 321,636 220,927
Net increase (decrease) in cash and cash equivalents (508,400) 1,922,913 (151,209)
Cash and cash equivalents - July 1, 2019 1,017,541 41,391,826 7,350,609Cash and cash equivalents - June 30, 2020 $ 509,141 $ 43,314,739 $ 7,199,400
Reconciliation of cash flows from operating activities:Income (Loss) from operations $ (733,418) $ (16,015) $ (9,323,263)
Cash flows from operating activities: Depreciation 352,924 - - (Increase) decrease intergovernmental and other receivables 1,275 (2,046) 2,355,882 (Increase) decrease in prepaid items 1,180 - (680,843) Increase in other inventories 17,821 - - Increase (decrease) in accounts payable 95,460 - - Increase (decrease) in accrued salaries, benefits, and compensated and compensated balances 1,606 19,104 23,218 Increase in payroll withholding - 1,642,042 - Increase in estimated liability for - - - premiums and claims - (41,808) 369,923 Net cash provided by (used for) in operating activities $ (263,152) $ 1,601,277 $ (7,255,083)
Noncash investing, capital, and financing activities: Disposal and write off of capital assets $ (1,364) $ - $ -
JEFFERSON COUNTY SCHOOL DISTRICT, NO. R-1Combining Statement of Cash Flows
Internal Service FundsFiscal year ended June 30, 2020
-106-
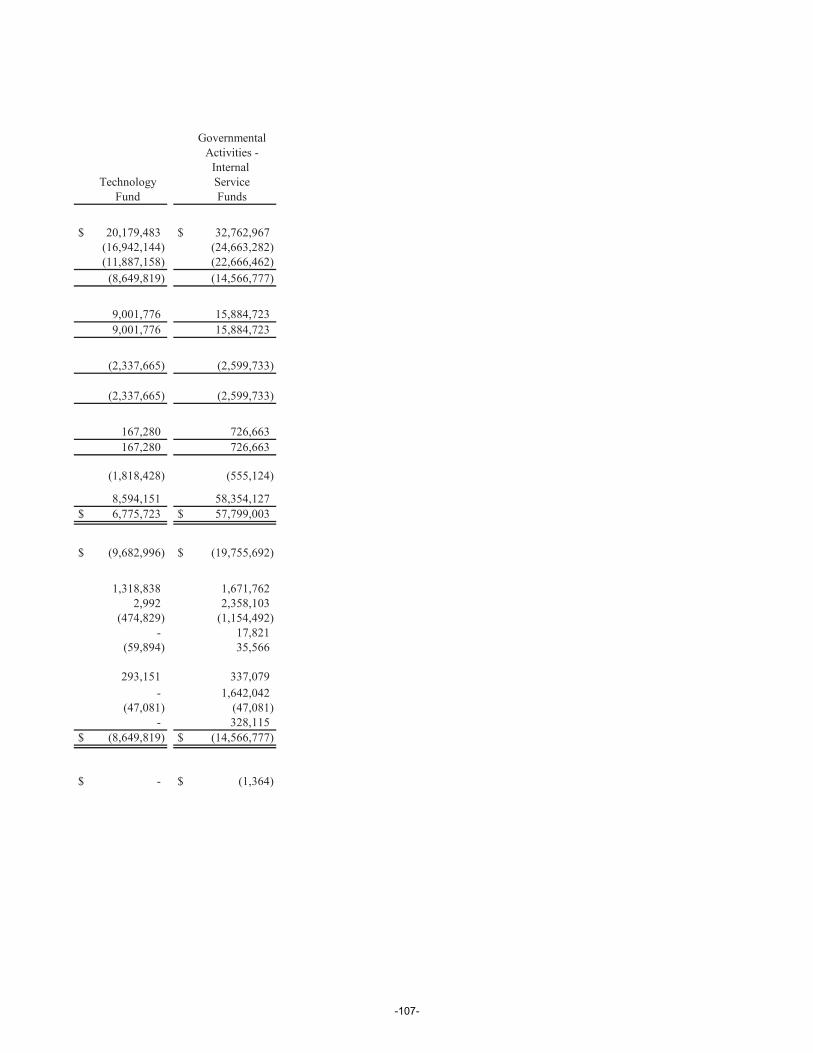
GovernmentalActivities -
Internal Technology Service
Fund Funds
$ 20,179,483 $ 32,762,967(16,942,144) (24,663,282)(11,887,158) (22,666,462)
(8,649,819) (14,566,777)
9,001,776 15,884,7239,001,776 15,884,723
(2,337,665) (2,599,733)
(2,337,665) (2,599,733)
167,280 726,663167,280 726,663
(1,818,428) (555,124)
8,594,151 58,354,127$ 6,775,723 $ 57,799,003
$ (9,682,996) $ (19,755,692)
1,318,838 1,671,7622,992 2,358,103
(474,829) (1,154,492)- 17,821
(59,894) 35,566
293,151 337,079- 1,642,042
(47,081) (47,081)- 328,115
$ (8,649,819) $ (14,566,777)
$ - $ (1,364)
-107-

-108-
Component Units
The component units consist of sixteen charter school administrative units: Addenbrooke Classical Academy,
Collegiate Academy of Colorado, Compass Montessori - Wheatridge, Compass Montessori – Golden, Doral Academy,
Excel, Great Work Montessori School, Jefferson Academy, Lincoln Academy, Montessori Peaks, Mountain Phoenix,
New America, Rocky Mountain Academy Evergreen, Rocky Mountain Deaf School, Two Roads High School and
Woodrow Wilson Charter Schools. The schools have separate governing boards.
-109-
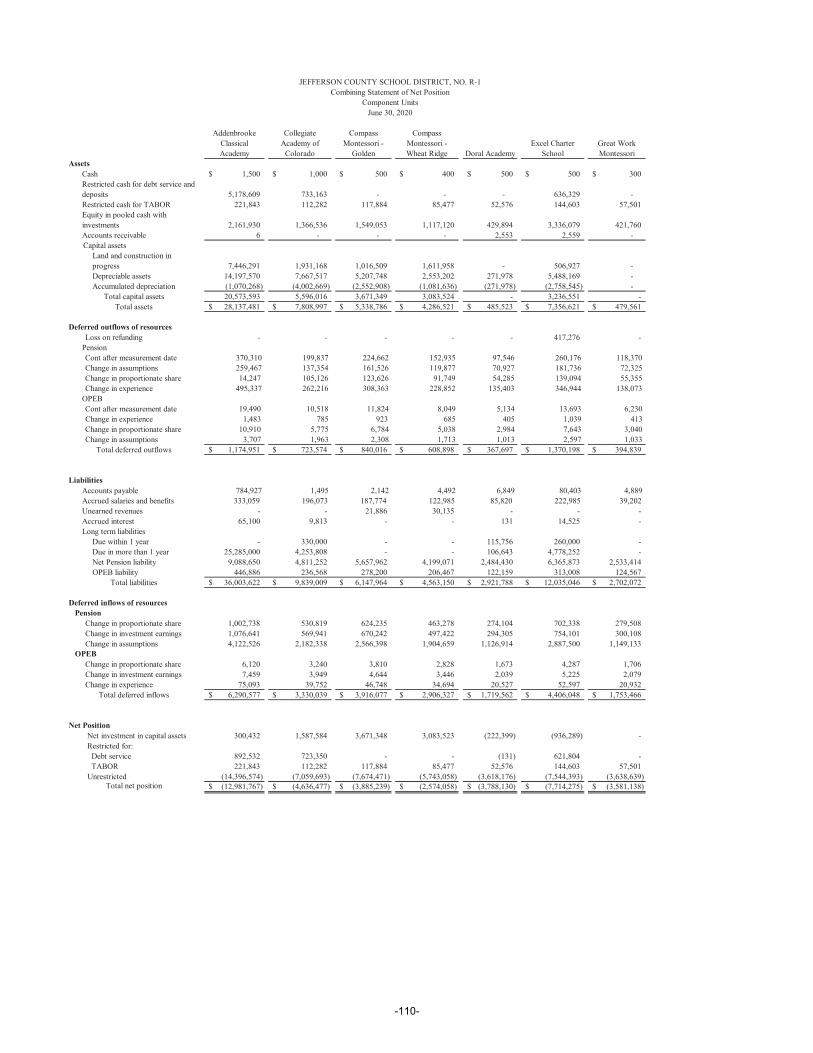
Addenbrooke Classical Academy
Collegiate Academy of
Colorado
Compass Montessori -
Golden
Compass Montessori - Wheat Ridge Doral Academy
Excel Charter School
Great Work Montessori
AssetsCash 1,500$ 1,000$ 500$ 400$ 500$ 500$ 300$Restricted cash for debt service and deposits 5,178,609 733,163 - - - 636,329 -Restricted cash for TABOR 221,843 112,282 117,884 85,477 52,576 144,603 57,501Equity in pooled cash with investments 2,161,930 1,366,536 1,549,053 1,117,120 429,894 3,336,079 421,760Accounts receivable 6 - - - 2,553 2,559 -
Capital assets Land and construction in progress 7,446,291 1,931,168 1,016,509 1,611,958 - 506,927 - Depreciable assets 14,197,570 7,667,517 5,207,748 2,553,202 271,978 5,488,169 - Accumulated depreciation (1,070,268) (4,002,669) (2,552,908) (1,081,636) (271,978) (2,758,545) -
Total capital assets 20,573,593 5,596,016 3,671,349 3,083,524 - 3,236,551 -Total assets 28,137,481$ 7,808,997$ 5,338,786$ 4,286,521$ 485,523$ 7,356,621$ 479,561$
Deferred outflows of resources Loss on refunding - - - - - 417,276 -
Pension Cont after measurement date 370,310 199,837 224,662 152,935 97,546 260,176 118,370 Change in assumptions 259,467 137,354 161,526 119,877 70,927 181,736 72,325 Change in proportionate share 14,247 105,126 123,626 91,749 54,285 139,094 55,355 Change in experience 495,337 262,216 308,363 228,852 135,403 346,944 138,073
OPEB Cont after measurement date 19,490 10,518 11,824 8,049 5,134 13,693 6,230 Change in experience 1,483 785 923 685 405 1,039 413 Change in proportionate share 10,910 5,775 6,784 5,038 2,984 7,643 3,040 Change in assumptions 3,707 1,963 2,308 1,713 1,013 2,597 1,033
Total deferred outflows 1,174,951$ 723,574$ 840,016$ 608,898$ 367,697$ 1,370,198$ 394,839$
LiabilitiesAccounts payable 784,927 1,495 2,142 4,492 6,849 80,403 4,889 Accrued salaries and benefits 333,059 196,073 187,774 122,985 85,820 222,985 39,202 Unearned revenues - - 21,886 30,135 - - -Accrued interest 65,100 9,813 - - 131 14,525 -Long term liabilities Due within 1 year - 330,000 - - 115,756 260,000 - Due in more than 1 year 25,285,000 4,253,808 - - 106,643 4,778,252 - Net Pension liability 9,088,650 4,811,252 5,657,962 4,199,071 2,484,430 6,365,873 2,533,414 OPEB liability 446,886 236,568 278,200 206,467 122,159 313,008 124,567
Total liabilities 36,003,622$ 9,839,009$ 6,147,964$ 4,563,150$ 2,921,788$ 12,035,046$ 2,702,072$
Deferred inflows of resources Pension Change in proportionate share 1,002,738 530,819 624,235 463,278 274,104 702,338 279,508 Change in investment earnings 1,076,641 569,941 670,242 497,422 294,305 754,101 300,108 Change in assumptions 4,122,526 2,182,338 2,566,398 1,904,659 1,126,914 2,887,500 1,149,133 OPEB Change in proportionate share 6,120 3,240 3,810 2,828 1,673 4,287 1,706 Change in investment earnings 7,459 3,949 4,644 3,446 2,039 5,225 2,079 Change in experience 75,093 39,752 46,748 34,694 20,527 52,597 20,932
Total deferred inflows 6,290,577$ 3,330,039$ 3,916,077$ 2,906,327$ 1,719,562$ 4,406,048$ 1,753,466$
Net Position Net investment in capital assets 300,432 1,587,584 3,671,348 3,083,523 (222,399) (936,289) - Restricted for: Debt service 892,532 723,350 - - (131) 621,804 - TABOR 221,843 112,282 117,884 85,477 52,576 144,603 57,501 Unrestricted (14,396,574) (7,059,693) (7,674,471) (5,743,058) (3,618,176) (7,544,393) (3,638,639)
Total net position (12,981,767)$ (4,636,477)$ (3,885,239)$ (2,574,058)$ (3,788,130)$ (7,714,275)$ (3,581,138)$
JEFFERSON COUNTY SCHOOL DISTRICT, NO. R-1Combining Statement of Net Position
June 30, 2020Component Units
-110-
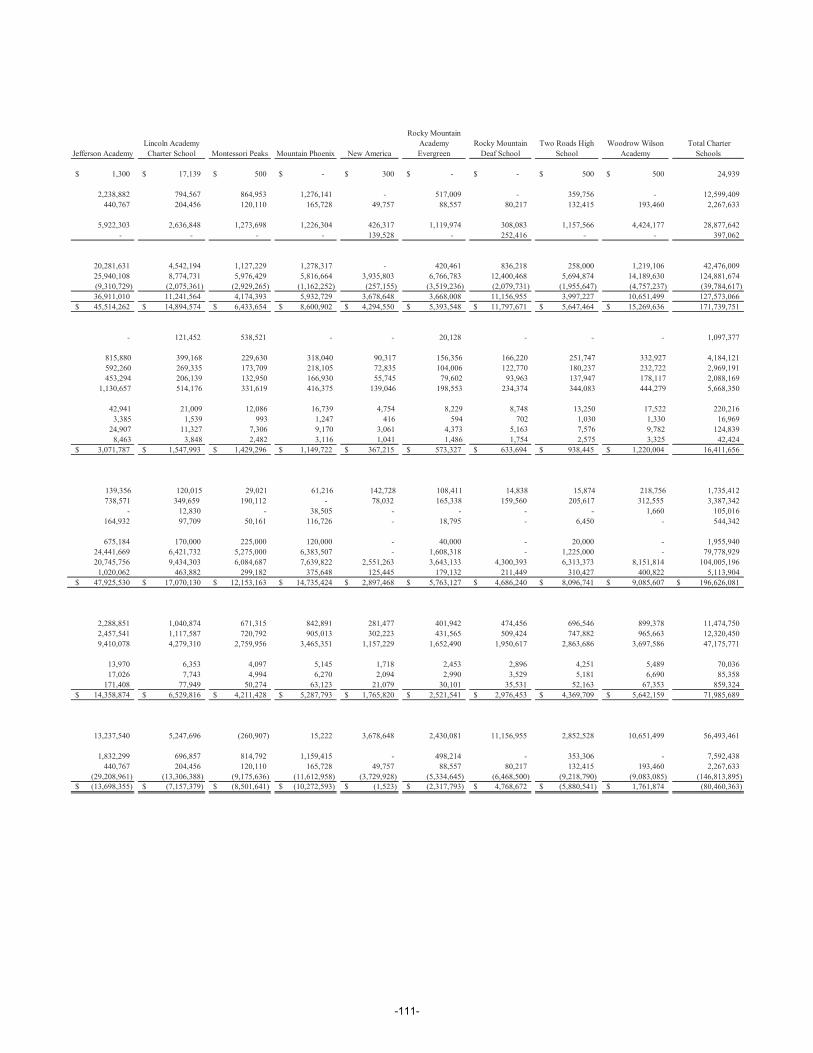
Jefferson AcademyLincoln Academy Charter School Montessori Peaks Mountain Phoenix New America
Rocky Mountain Academy Evergreen
Rocky Mountain Deaf School
Two Roads High School
Woodrow Wilson Academy
Total Charter Schools
1,300$ 17,139$ 500$ -$ 300$ -$ -$ 500$ 500$ 24,939
2,238,882 794,567 864,953 1,276,141 - 517,009 - 359,756 - 12,599,409440,767 204,456 120,110 165,728 49,757 88,557 80,217 132,415 193,460 2,267,633
5,922,303 2,636,848 1,273,698 1,226,304 426,317 1,119,974 308,083 1,157,566 4,424,177 28,877,642- - - - 139,528 - 252,416 - - 397,062
20,281,631 4,542,194 1,127,229 1,278,317 - 420,461 836,218 258,000 1,219,106 42,476,00925,940,108 8,774,731 5,976,429 5,816,664 3,935,803 6,766,783 12,400,468 5,694,874 14,189,630 124,881,674(9,310,729) (2,075,361) (2,929,265) (1,162,252) (257,155) (3,519,236) (2,079,731) (1,955,647) (4,757,237) (39,784,617)36,911,010 11,241,564 4,174,393 5,932,729 3,678,648 3,668,008 11,156,955 3,997,227 10,651,499 127,573,06645,514,262$ 14,894,574$ 6,433,654$ 8,600,902$ 4,294,550$ 5,393,548$ 11,797,671$ 5,647,464$ 15,269,636$ 171,739,751
- 121,452 538,521 - - 20,128 - - - 1,097,377
815,880 399,168 229,630 318,040 90,317 156,356 166,220 251,747 332,927 4,184,121 592,260 269,335 173,709 218,105 72,835 104,006 122,770 180,237 232,722 2,969,191 453,294 206,139 132,950 166,930 55,745 79,602 93,963 137,947 178,117 2,088,169 1,130,657 514,176 331,619 416,375 139,046 198,553 234,374 344,083 444,279 5,668,350
42,941 21,009 12,086 16,739 4,754 8,229 8,748 13,250 17,522 220,216 3,385 1,539 993 1,247 416 594 702 1,030 1,330 16,969 24,907 11,327 7,306 9,170 3,061 4,373 5,163 7,576 9,782 124,839 8,463 3,848 2,482 3,116 1,041 1,486 1,754 2,575 3,325 42,424
3,071,787$ 1,547,993$ 1,429,296$ 1,149,722$ 367,215$ 573,327$ 633,694$ 938,445$ 1,220,004$ 16,411,656
139,356 120,015 29,021 61,216 142,728 108,411 14,838 15,874 218,756 1,735,412 738,571 349,659 190,112 - 78,032 165,338 159,560 205,617 312,555 3,387,342
- 12,830 - 38,505 - - - - 1,660 105,016164,932 97,709 50,161 116,726 - 18,795 - 6,450 - 544,342
675,184 170,000 225,000 120,000 - 40,000 - 20,000 - 1,955,94024,441,669 6,421,732 5,275,000 6,383,507 - 1,608,318 - 1,225,000 - 79,778,92920,745,756 9,434,303 6,084,687 7,639,822 2,551,263 3,643,133 4,300,393 6,313,373 8,151,814 104,005,1961,020,062 463,882 299,182 375,648 125,445 179,132 211,449 310,427 400,822 5,113,904
47,925,530$ 17,070,130$ 12,153,163$ 14,735,424$ 2,897,468$ 5,763,127$ 4,686,240$ 8,096,741$ 9,085,607$ 196,626,081$
2,288,851 1,040,874 671,315 842,891 281,477 401,942 474,456 696,546 899,378 11,474,7502,457,541 1,117,587 720,792 905,013 302,223 431,565 509,424 747,882 965,663 12,320,4509,410,078 4,279,310 2,759,956 3,465,351 1,157,229 1,652,490 1,950,617 2,863,686 3,697,586 47,175,771
13,970 6,353 4,097 5,145 1,718 2,453 2,896 4,251 5,489 70,03617,026 7,743 4,994 6,270 2,094 2,990 3,529 5,181 6,690 85,358
171,408 77,949 50,274 63,123 21,079 30,101 35,531 52,163 67,353 859,32414,358,874$ 6,529,816$ 4,211,428$ 5,287,793$ 1,765,820$ 2,521,541$ 2,976,453$ 4,369,709$ 5,642,159$ 71,985,689
13,237,540 5,247,696 (260,907) 15,222 3,678,648 2,430,081 11,156,955 2,852,528 10,651,499 56,493,461
1,832,299 696,857 814,792 1,159,415 - 498,214 - 353,306 - 7,592,438440,767 204,456 120,110 165,728 49,757 88,557 80,217 132,415 193,460 2,267,633
(29,208,961) (13,306,388) (9,175,636) (11,612,958) (3,729,928) (5,334,645) (6,468,500) (9,218,790) (9,083,085) (146,813,895)(13,698,355)$ (7,157,379)$ (8,501,641)$ (10,272,593)$ (1,523)$ (2,317,793)$ 4,768,672$ (5,880,541)$ 1,761,874$ (80,460,363)
-111-

-112-
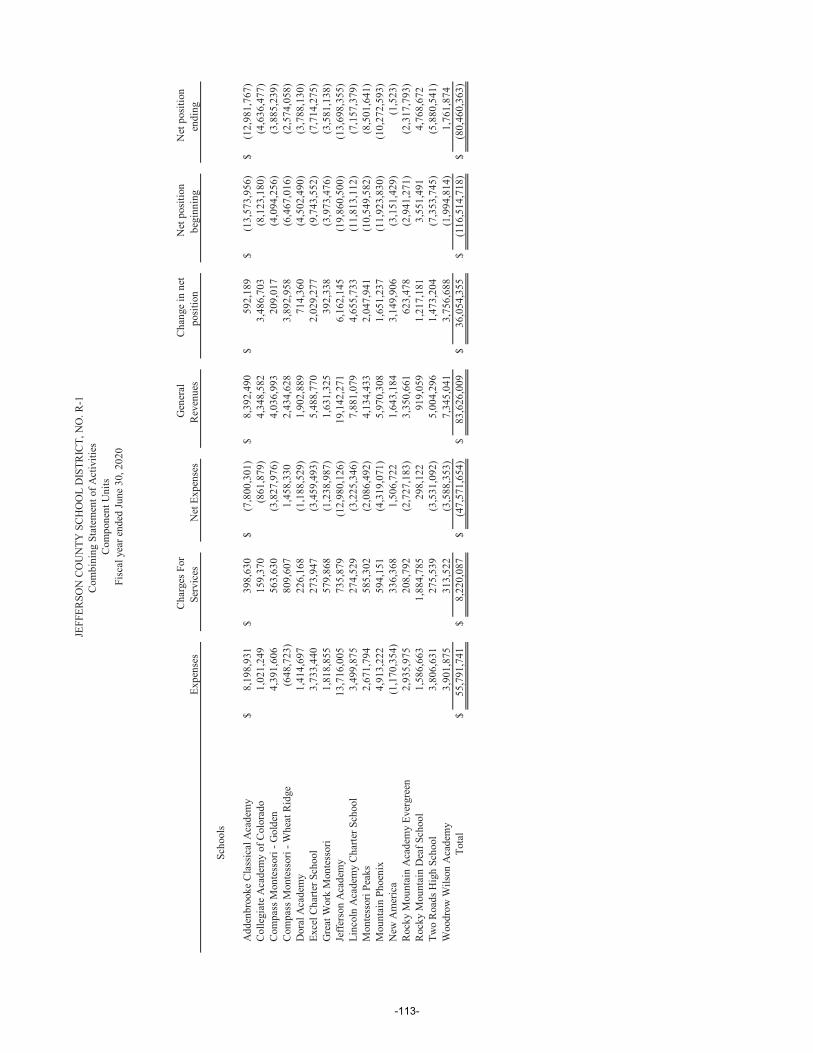
Exp
ense
s C
harg
es F
or
Serv
ices
N
et E
xpen
ses
Gen
eral
R
even
ues
Cha
nge
in n
et
posi
tion
Net
pos
ition
be
ginn
ing
Net
pos
ition
en
ding
Scho
ols
Add
enbr
ooke
Cla
ssic
al A
cade
my
$8,
198,
931
$39
8,63
0$
(7,8
00,3
01)
$8,
392,
490
$59
2,18
9$
(13,
573,
956)
$(1
2,98
1,76
7)C
olle
giat
e A
cade
my
of C
olor
ado
1,02
1,24
915
9,37
0(8
61,8
79)
4,34
8,58
23,
486,
703
(8,1
23,1
80)
(4,6
36,4
77)
Com
pass
Mon
tess
ori -
Gol
den
4,39
1,60
656
3,63
0(3
,827
,976
)4,
036,
993
209,
017
(4,0
94,2
56)
(3,8
85,2
39)
Com
pass
Mon
tess
ori -
Whe
at R
idge
(648
,723
)80
9,60
71,
458,
330
2,43
4,62
83,
892,
958
(6,4
67,0
16)
(2,5
74,0
58)
Dor
al A
cade
my
1,41
4,69
722
6,16
8(1
,188
,529
)1,
902,
889
714,
360
(4,5
02,4
90)
(3,7
88,1
30)
Exce
l Cha
rter S
choo
l3,
733,
440
273,
947
(3,4
59,4
93)
5,48
8,77
02,
029,
277
(9,7
43,5
52)
(7,7
14,2
75)
Gre
at W
ork
Mon
tess
ori
1,81
8,85
557
9,86
8(1
,238
,987
)1,
631,
325
392,
338
(3,9
73,4
76)
(3,5
81,1
38)
Jeffe
rson
Aca
dem
y13
,716
,005
735,
879
(12,
980,
126)
19,1
42,2
716,
162,
145
(19,
860,
500)
(13,
698,
355)
Linc
oln
Aca
dem
y C
harte
r Sch
ool
3,49
9,87
527
4,52
9(3
,225
,346
)7,
881,
079
4,65
5,73
3(1
1,81
3,11
2)(7
,157
,379
)M
onte
ssor
i Pea
ks2,
671,
794
585,
302
(2,0
86,4
92)
4,13
4,43
32,
047,
941
(10,
549,
582)
(8,5
01,6
41)
Mou
ntai
n Ph
oeni
x4,
913,
222
594,
151
(4,3
19,0
71)
5,97
0,30
81,
651,
237
(11,
923,
830)
(10,
272,
593)
New
Am
eric
a(1
,170
,354
)33
6,36
81,
506,
722
1,64
3,18
43,
149,
906
(3,1
51,4
29)
(1,5
23)
Roc
ky M
ount
ain
Aca
dem
y Ev
ergr
een
2,93
5,97
520
8,79
2(2
,727
,183
)3,
350,
661
623,
478
(2,9
41,2
71)
(2,3
17,7
93)
Roc
ky M
ount
ain
Dea
f Sch
ool
1,58
6,66
31,
884,
785
298,
122
919,
059
1,21
7,18
13,
551,
491
4,76
8,67
2Tw
o R
oads
Hig
h Sc
hool
3,80
6,63
127
5,53
9(3
,531
,092
)5,
004,
296
1,47
3,20
4(7
,353
,745
)(5
,880
,541
)W
oodr
ow W
ilson
Aca
dem
y3,
901,
875
313,
522
(3,5
88,3
53)
7,34
5,04
13,
756,
688
(1,9
94,8
14)
1,76
1,87
4To
tal
$55
,791
,741
$8,
220,
087
$(4
7,57
1,65
4)$
83,6
26,0
09$
36,0
54,3
55$
(116
,514
,718
)$
(80,
460,
363)
JEFF
ERSO
N C
OU
NTY
SC
HO
OL
DIS
TRIC
T, N
O. R
-1C
ombi
ning
Sta
tem
ent o
f Act
iviti
es
Com
pone
nt U
nits
Fisc
al y
ear e
nded
June
30,
202
0
-113-
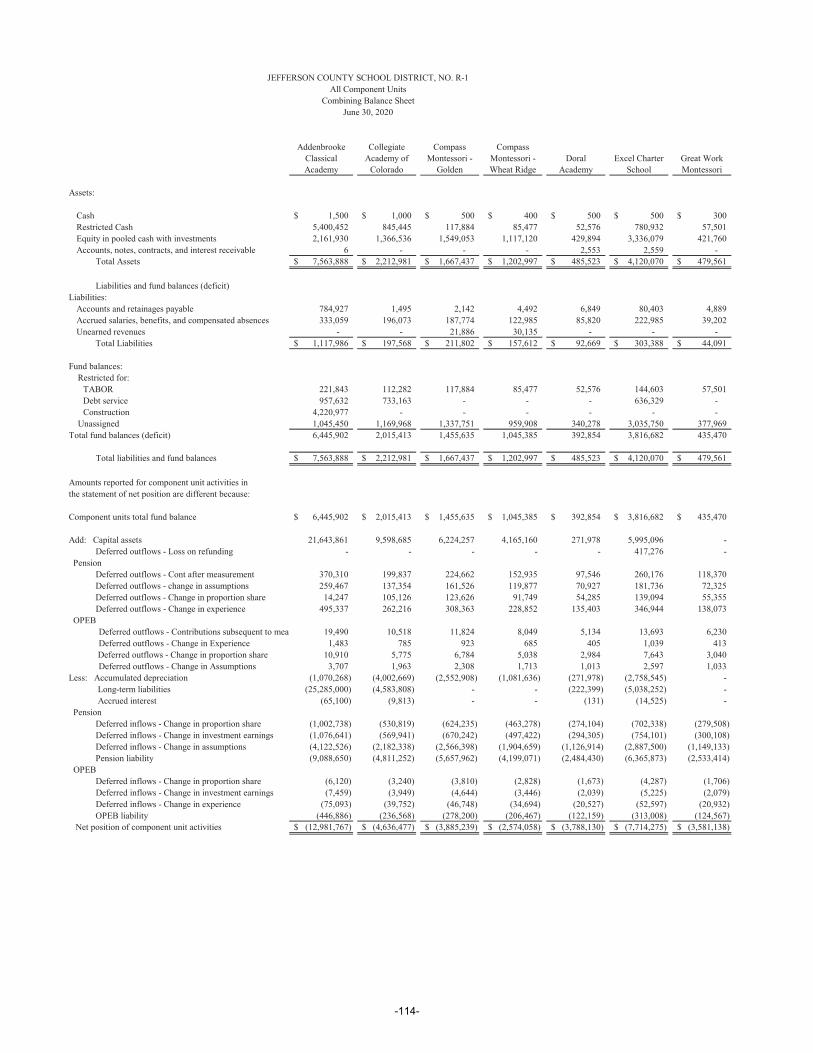
Addenbrooke Classical Academy
Collegiate Academy of
Colorado
Compass Montessori -
Golden
Compass Montessori - Wheat Ridge
Doral Academy
Excel Charter School
Great Work Montessori
Assets:
Cash 1,500$ 1,000$ 500$ 400$ 500$ 500$ 300$Restricted Cash 5,400,452 845,445 117,884 85,477 52,576 780,932 57,501Equity in pooled cash with investments 2,161,930 1,366,536 1,549,053 1,117,120 429,894 3,336,079 421,760Accounts, notes, contracts, and interest receivable 6 - - - 2,553 2,559 -
Total Assets 7,563,888$ 2,212,981$ 1,667,437$ 1,202,997$ 485,523$ 4,120,070$ 479,561$
Liabilities and fund balances (deficit)Liabilities:
Accounts and retainages payable 784,927 1,495 2,142 4,492 6,849 80,403 4,889 Accrued salaries, benefits, and compensated absences 333,059 196,073 187,774 122,985 85,820 222,985 39,202 Unearned revenues - - 21,886 30,135 - - -
Total Liabilities 1,117,986$ 197,568$ 211,802$ 157,612$ 92,669$ 303,388$ 44,091$
Fund balances: Restricted for:
TABOR 221,843 112,282 117,884 85,477 52,576 144,603 57,501 Debt service 957,632 733,163 - - - 636,329 - Construction 4,220,977 - - - - - -
Unassigned 1,045,450 1,169,968 1,337,751 959,908 340,278 3,035,750 377,969Total fund balances (deficit) 6,445,902 2,015,413 1,455,635 1,045,385 392,854 3,816,682 435,470
Total liabilities and fund balances 7,563,888$ 2,212,981$ 1,667,437$ 1,202,997$ 485,523$ 4,120,070$ 479,561$
Amounts reported for component unit activities in the statement of net position are different because:
Component units total fund balance 6,445,902$ 2,015,413$ 1,455,635$ 1,045,385$ 392,854$ 3,816,682$ 435,470$
Add: Capital assets 21,643,861 9,598,685 6,224,257 4,165,160 271,978 5,995,096 - Deferred outflows - Loss on refunding - - - - - 417,276 - Pension Deferred outflows - Cont after measurement 370,310 199,837 224,662 152,935 97,546 260,176 118,370 Deferred outflows - change in assumptions 259,467 137,354 161,526 119,877 70,927 181,736 72,325 Deferred outflows - Change in proportion share 14,247 105,126 123,626 91,749 54,285 139,094 55,355 Deferred outflows - Change in experience 495,337 262,216 308,363 228,852 135,403 346,944 138,073 OPEB Deferred outflows - Contributions subsequent to mea 19,490 10,518 11,824 8,049 5,134 13,693 6,230 Deferred outflows - Change in Experience 1,483 785 923 685 405 1,039 413
Deferred outflows - Change in proportion share 10,910 5,775 6,784 5,038 2,984 7,643 3,040 Deferred outflows - Change in Assumptions 3,707 1,963 2,308 1,713 1,013 2,597 1,033
Less: Accumulated depreciation (1,070,268) (4,002,669) (2,552,908) (1,081,636) (271,978) (2,758,545) - Long-term liabilities (25,285,000) (4,583,808) - - (222,399) (5,038,252) - Accrued interest (65,100) (9,813) - - (131) (14,525) - Pension Deferred inflows - Change in proportion share (1,002,738) (530,819) (624,235) (463,278) (274,104) (702,338) (279,508) Deferred inflows - Change in investment earnings (1,076,641) (569,941) (670,242) (497,422) (294,305) (754,101) (300,108) Deferred inflows - Change in assumptions (4,122,526) (2,182,338) (2,566,398) (1,904,659) (1,126,914) (2,887,500) (1,149,133) Pension liability (9,088,650) (4,811,252) (5,657,962) (4,199,071) (2,484,430) (6,365,873) (2,533,414) OPEB Deferred inflows - Change in proportion share (6,120) (3,240) (3,810) (2,828) (1,673) (4,287) (1,706) Deferred inflows - Change in investment earnings (7,459) (3,949) (4,644) (3,446) (2,039) (5,225) (2,079) Deferred inflows - Change in experience (75,093) (39,752) (46,748) (34,694) (20,527) (52,597) (20,932) OPEB liability (446,886) (236,568) (278,200) (206,467) (122,159) (313,008) (124,567) Net position of component unit activities (12,981,767)$ (4,636,477)$ (3,885,239)$ (2,574,058)$ (3,788,130)$ (7,714,275)$ (3,581,138)$
JEFFERSON COUNTY SCHOOL DISTRICT, NO. R-1All Component Units
Combining Balance SheetJune 30, 2020
-114-
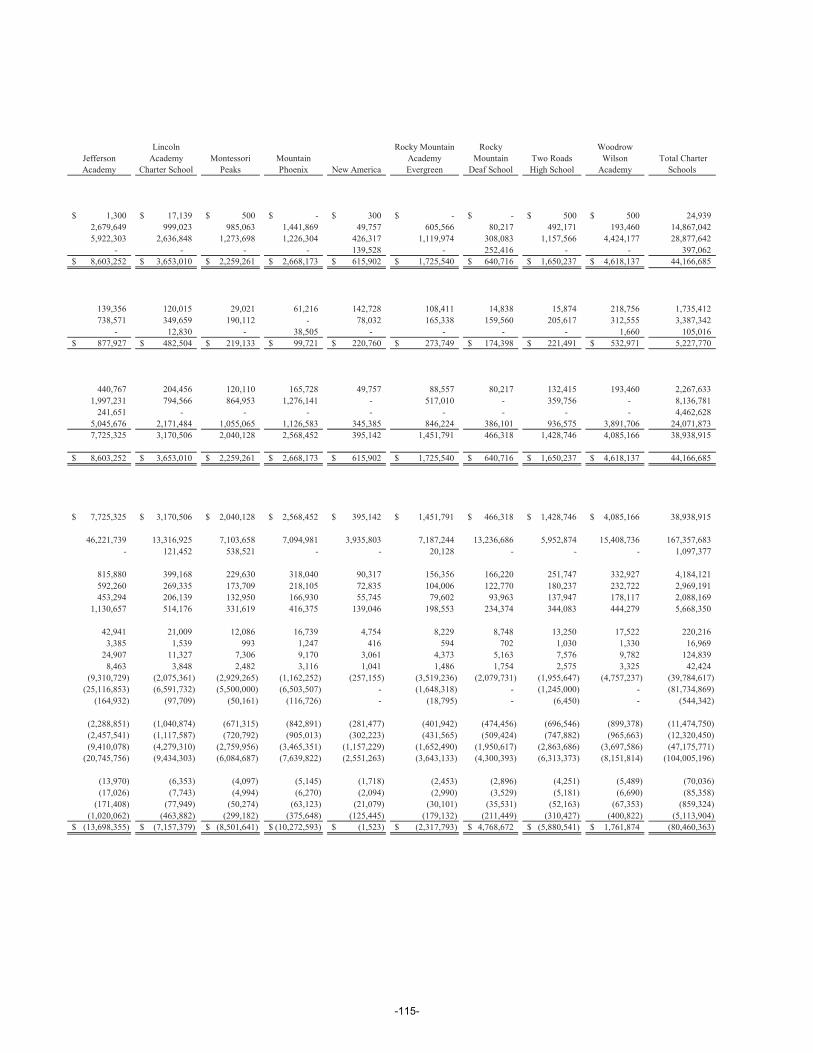
Jefferson Academy
Lincoln Academy
Charter SchoolMontessori
PeaksMountain Phoenix New America
Rocky Mountain Academy Evergreen
Rocky Mountain
Deaf SchoolTwo Roads High School
Woodrow Wilson
Academy Total Charter
Schools
1,300$ 17,139$ 500$ -$ 300$ -$ -$ 500$ 500$ 24,9392,679,649 999,023 985,063 1,441,869 49,757 605,566 80,217 492,171 193,460 14,867,0425,922,303 2,636,848 1,273,698 1,226,304 426,317 1,119,974 308,083 1,157,566 4,424,177 28,877,642
- - - - 139,528 - 252,416 - - 397,0628,603,252$ 3,653,010$ 2,259,261$ 2,668,173$ 615,902$ 1,725,540$ 640,716$ 1,650,237$ 4,618,137$ 44,166,685
139,356 120,015 29,021 61,216 142,728 108,411 14,838 15,874 218,756 1,735,412738,571 349,659 190,112 - 78,032 165,338 159,560 205,617 312,555 3,387,342
- 12,830 - 38,505 - - - - 1,660 105,016877,927$ 482,504$ 219,133$ 99,721$ 220,760$ 273,749$ 174,398$ 221,491$ 532,971$ 5,227,770
440,767 204,456 120,110 165,728 49,757 88,557 80,217 132,415 193,460 2,267,6331,997,231 794,566 864,953 1,276,141 - 517,010 - 359,756 - 8,136,781
241,651 - - - - - - - - 4,462,6285,045,676 2,171,484 1,055,065 1,126,583 345,385 846,224 386,101 936,575 3,891,706 24,071,8737,725,325 3,170,506 2,040,128 2,568,452 395,142 1,451,791 466,318 1,428,746 4,085,166 38,938,915
8,603,252$ 3,653,010$ 2,259,261$ 2,668,173$ 615,902$ 1,725,540$ 640,716$ 1,650,237$ 4,618,137$ 44,166,685
7,725,325$ 3,170,506$ 2,040,128$ 2,568,452$ 395,142$ 1,451,791$ 466,318$ 1,428,746$ 4,085,166$ 38,938,915
46,221,739 13,316,925 7,103,658 7,094,981 3,935,803 7,187,244 13,236,686 5,952,874 15,408,736 167,357,683- 121,452 538,521 - - 20,128 - - - 1,097,377
815,880 399,168 229,630 318,040 90,317 156,356 166,220 251,747 332,927 4,184,121592,260 269,335 173,709 218,105 72,835 104,006 122,770 180,237 232,722 2,969,191453,294 206,139 132,950 166,930 55,745 79,602 93,963 137,947 178,117 2,088,169
1,130,657 514,176 331,619 416,375 139,046 198,553 234,374 344,083 444,279 5,668,350
42,941 21,009 12,086 16,739 4,754 8,229 8,748 13,250 17,522 220,2163,385 1,539 993 1,247 416 594 702 1,030 1,330 16,969
24,907 11,327 7,306 9,170 3,061 4,373 5,163 7,576 9,782 124,8398,463 3,848 2,482 3,116 1,041 1,486 1,754 2,575 3,325 42,424
(9,310,729) (2,075,361) (2,929,265) (1,162,252) (257,155) (3,519,236) (2,079,731) (1,955,647) (4,757,237) (39,784,617)(25,116,853) (6,591,732) (5,500,000) (6,503,507) - (1,648,318) - (1,245,000) - (81,734,869)
(164,932) (97,709) (50,161) (116,726) - (18,795) - (6,450) - (544,342)
(2,288,851) (1,040,874) (671,315) (842,891) (281,477) (401,942) (474,456) (696,546) (899,378) (11,474,750)(2,457,541) (1,117,587) (720,792) (905,013) (302,223) (431,565) (509,424) (747,882) (965,663) (12,320,450)(9,410,078) (4,279,310) (2,759,956) (3,465,351) (1,157,229) (1,652,490) (1,950,617) (2,863,686) (3,697,586) (47,175,771)
(20,745,756) (9,434,303) (6,084,687) (7,639,822) (2,551,263) (3,643,133) (4,300,393) (6,313,373) (8,151,814) (104,005,196)
(13,970) (6,353) (4,097) (5,145) (1,718) (2,453) (2,896) (4,251) (5,489) (70,036)(17,026) (7,743) (4,994) (6,270) (2,094) (2,990) (3,529) (5,181) (6,690) (85,358)
(171,408) (77,949) (50,274) (63,123) (21,079) (30,101) (35,531) (52,163) (67,353) (859,324)(1,020,062) (463,882) (299,182) (375,648) (125,445) (179,132) (211,449) (310,427) (400,822) (5,113,904)
(13,698,355)$ (7,157,379)$ (8,501,641)$ (10,272,593)$ (1,523)$ (2,317,793)$ 4,768,672$ (5,880,541)$ 1,761,874$ (80,460,363)
-115-
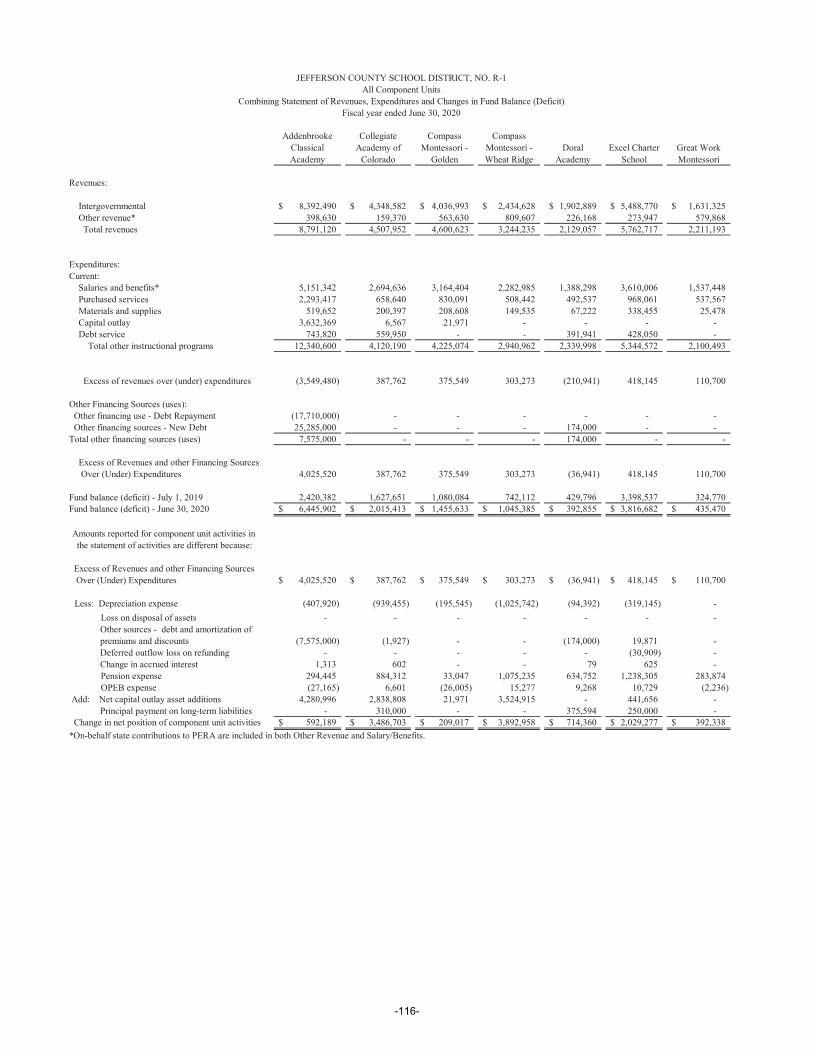
JEFFERSON COUNTY SCHOOL DISTRICT, NO. R-1All Component Units
Combining Statement of Revenues, Expenditures and Changes in Fund Balance (Deficit)Fiscal year ended June 30, 2020
Addenbrooke Classical Academy
Collegiate Academy of
Colorado
Compass Montessori -
Golden
Compass Montessori - Wheat Ridge
Doral Academy
Excel Charter School
Great Work Montessori
Revenues:
Intergovernmental 8,392,490$ 4,348,582$ 4,036,993$ 2,434,628$ 1,902,889$ 5,488,770$ 1,631,325$ Other revenue* 398,630 159,370 563,630 809,607 226,168 273,947 579,868 Total revenues 8,791,120 4,507,952 4,600,623 3,244,235 2,129,057 5,762,717 2,211,193
Expenditures: Current: Salaries and benefits* 5,151,342 2,694,636 3,164,404 2,282,985 1,388,298 3,610,006 1,537,448 Purchased services 2,293,417 658,640 830,091 508,442 492,537 968,061 537,567 Materials and supplies 519,652 200,397 208,608 149,535 67,222 338,455 25,478 Capital outlay 3,632,369 6,567 21,971 - - - - Debt service 743,820 559,950 - - 391,941 428,050 - Total other instructional programs 12,340,600 4,120,190 4,225,074 2,940,962 2,339,998 5,344,572 2,100,493
Excess of revenues over (under) expenditures (3,549,480) 387,762 375,549 303,273 (210,941) 418,145 110,700
Other Financing Sources (uses): Other financing use - Debt Repayment (17,710,000) - - - - - - Other financing sources - New Debt 25,285,000 - - - 174,000 - -Total other financing sources (uses) 7,575,000 - - - 174,000 - -
Excess of Revenues and other Financing Sources Over (Under) Expenditures 4,025,520 387,762 375,549 303,273 (36,941) 418,145 110,700
Fund balance (deficit) - July 1, 2019 2,420,382 1,627,651 1,080,084 742,112 429,796 3,398,537 324,770Fund balance (deficit) - June 30, 2020 6,445,902$ 2,015,413$ 1,455,633$ 1,045,385$ 392,855$ 3,816,682$ 435,470$
Amounts reported for component unit activities in the statement of activities are different because:
Excess of Revenues and other Financing Sources Over (Under) Expenditures 4,025,520$ 387,762$ 375,549$ 303,273$ (36,941)$ 418,145$ 110,700$
Less: Depreciation expense (407,920) (939,455) (195,545) (1,025,742) (94,392) (319,145) - Loss on disposal of assets - - - - - - -
Other sources - debt and amortization of premiums and discounts (7,575,000) (1,927) - - (174,000) 19,871 - Deferred outflow loss on refunding - - - - - (30,909) - Change in accrued interest 1,313 602 - - 79 625 - Pension expense 294,445 884,312 33,047 1,075,235 634,752 1,238,305 283,874 OPEB expense (27,165) 6,601 (26,005) 15,277 9,268 10,729 (2,236)
Add: Net capital outlay asset additions 4,280,996 2,838,808 21,971 3,524,915 - 441,656 - Principal payment on long-term liabilities - 310,000 - - 375,594 250,000 - Change in net position of component unit activities 592,189$ 3,486,703$ 209,017$ 3,892,958$ 714,360$ 2,029,277$ 392,338$*On-behalf state contributions to PERA are included in both Other Revenue and Salary/Benefits.
-116-

Jefferson Academy
Lincoln Academy
Charter SchoolMontessori
PeaksMountain Phoenix New America
Rocky Mountain Academy Evergreen
Rocky Mountain
Deaf SchoolTwo Roads High School
Woodrow Wilson
Academy Total Charter
Schools
19,142,271$ 7,881,079$ 4,134,433$ 5,970,308$ 1,643,184$ 3,350,661$ 919,059$ 5,004,296$ 7,345,041$ 83,626,009735,879 274,529 585,302 594,151 336,368 208,792 1,884,785 275,539 313,522 8,220,087
19,878,150 8,155,608 4,719,735 6,564,459 1,979,552 3,559,453 2,803,844 5,279,835 7,658,563 91,846,096
11,059,785 5,402,422 3,216,859 4,220,591 1,334,474 2,191,159 2,390,103 3,454,986 4,587,777 57,687,2753,583,180 1,186,531 987,655 1,050,210 817,697 709,606 392,509 1,019,949 1,157,159 17,193,2511,049,079 223,705 178,414 312,044 53,053 174,813 78,685 149,457 291,097 4,019,6945,356,685 201,834 6,272 108,900 513,138 145,262 - 45,787 922,634 10,961,4191,578,872 855,198 522,305 585,925 - 177,340 - 98,450 - 5,941,851
22,627,601 7,869,690 4,911,505 6,277,670 2,718,362 3,398,180 2,861,297 4,768,629 6,958,667 95,803,490
(2,749,451) 285,918 (191,770) 286,789 (738,810) 161,273 (57,453) 511,206 699,896 (3,957,394)
- - - - - - - - - (17,710,000)6,000,000 - - - - - - - - 31,459,0006,000,000 - - - - - - - - 13,749,000
3,250,549 285,918 (191,770) 286,789 (738,810) 161,273 (57,453) 511,206 699,896 9,791,606
4,474,773 2,884,588 2,231,898 2,281,663 1,133,952 1,290,518 523,771 917,538 3,385,270 29,147,3037,725,322$ 3,170,506$ 2,040,128$ 2,568,452$ 395,142$ 1,451,791$ 466,318$ 1,428,744$ 4,085,166$ 38,938,909
3,250,549$ 285,918$ (191,770)$ 286,789$ (738,810)$ 161,273$ (57,453)$ 511,206$ 699,896$ 9,791,606
(3,629,417) (378,398) (579,702) (212,340) (3,548) (1,095,946) (420,200) (1,552,101) (1,087,579) (11,941,430)- - - - - (9,473) - - - (9,473)
(6,000,000) (2,316) - (7,400) - (2,699) - - - (13,743,471)- (5,280) (33,658) - - (1,342) - - - (71,189)
(40,265) 4,213 1,890 2,013 - (16,982) - (457) - (46,969)3,657,868 2,136,901 1,475,064 915,632 236,694 (291,340) 940,165 827,677 1,847,494 16,190,125
21,677 26,386 19,566 (5,674) (4,530) (26,648) 10,509 (2,684) 22,553 47,6248,253,586 2,043,254 1,146,551 557,217 3,660,100 1,841,635 744,160 1,669,563 2,274,324 33,298,736
648,147 545,055 210,000 115,000 - 65,000 - 20,000 - 2,538,7966,162,145$ 4,655,733$ 2,047,941$ 1,651,237$ 3,149,906$ 623,478$ 1,217,181$ 1,473,204$ 3,756,688$ 36,054,355
-117-

-118-
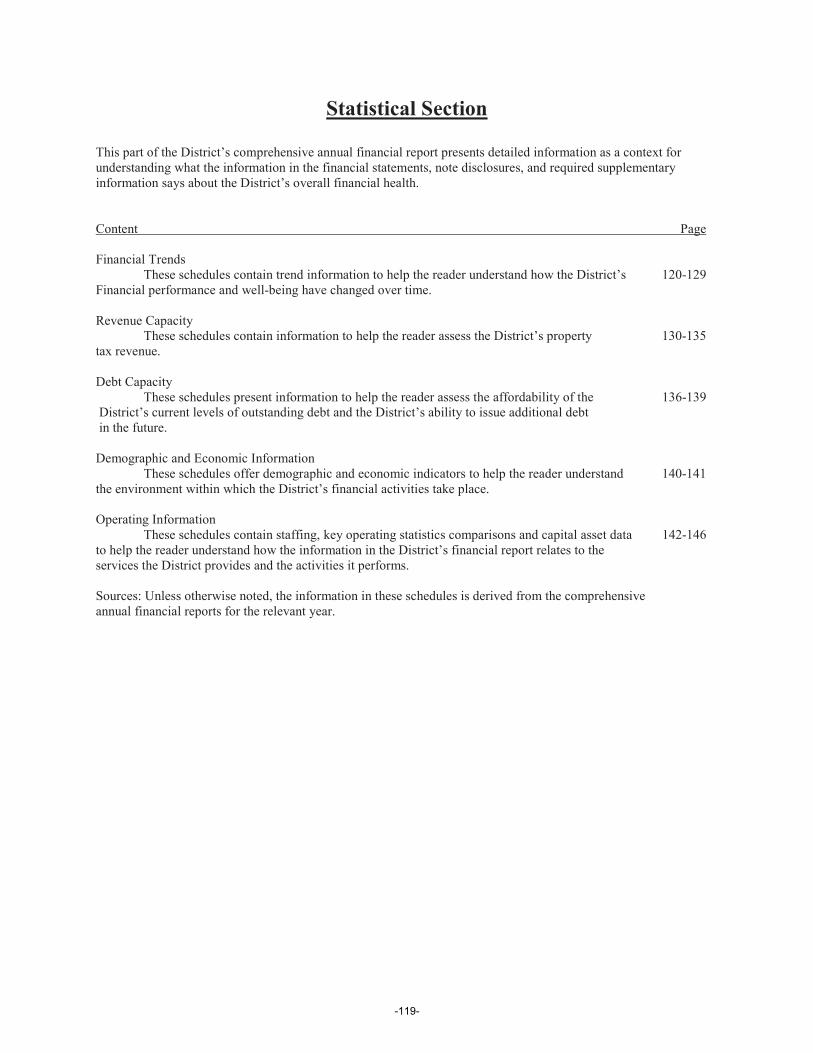
Statistical Section
This part of the District’s comprehensive annual financial report presents detailed information as a context for understanding what the information in the financial statements, note disclosures, and required supplementary information says about the District’s overall financial health.
Content Page
Financial TrendsThese schedules contain trend information to help the reader understand how the District’s 120-129
Financial performance and well-being have changed over time.
Revenue CapacityThese schedules contain information to help the reader assess the District’s property 130-135
tax revenue.
Debt CapacityThese schedules present information to help the reader assess the affordability of the 136-139
District’s current levels of outstanding debt and the District’s ability to issue additional debtin the future.
Demographic and Economic InformationThese schedules offer demographic and economic indicators to help the reader understand 140-141
the environment within which the District’s financial activities take place.
Operating InformationThese schedules contain staffing, key operating statistics comparisons and capital asset data 142-146
to help the reader understand how the information in the District’s financial report relates to theservices the District provides and the activities it performs.
Sources: Unless otherwise noted, the information in these schedules is derived from the comprehensiveannual financial reports for the relevant year.
-119-
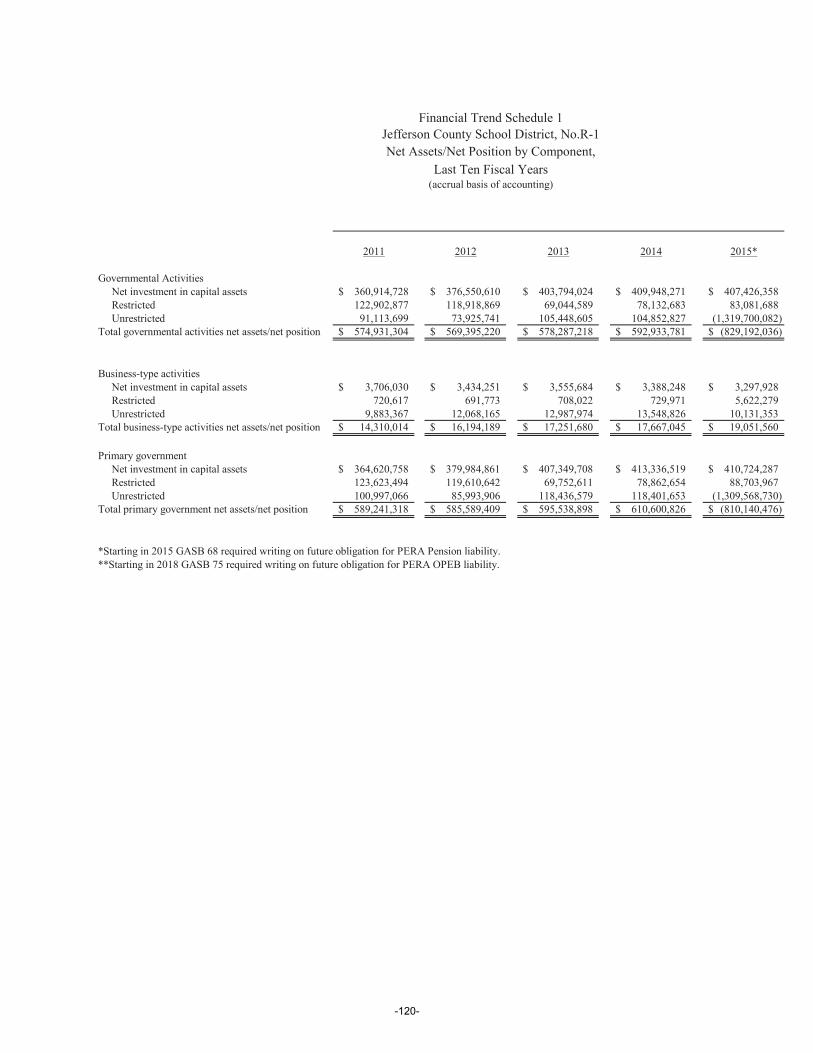
2011 2012 2013 2014 2015*
Governmental Activities Net investment in capital assets 360,914,728$ 376,550,610$ 403,794,024$ 409,948,271$ 407,426,358$ Restricted 122,902,877 118,918,869 69,044,589 78,132,683 83,081,688 Unrestricted 91,113,699 73,925,741 105,448,605 104,852,827 (1,319,700,082)Total governmental activities net assets/net position 574,931,304$ 569,395,220$ 578,287,218$ 592,933,781$ (829,192,036)$
Business-type activities Net investment in capital assets 3,706,030$ 3,434,251$ 3,555,684$ 3,388,248$ 3,297,928$ Restricted 720,617 691,773 708,022 729,971 5,622,279 Unrestricted 9,883,367 12,068,165 12,987,974 13,548,826 10,131,353Total business-type activities net assets/net position 14,310,014$ 16,194,189$ 17,251,680$ 17,667,045$ 19,051,560$
Primary government Net investment in capital assets 364,620,758$ 379,984,861$ 407,349,708$ 413,336,519$ 410,724,287$ Restricted 123,623,494 119,610,642 69,752,611 78,862,654 88,703,967 Unrestricted 100,997,066 85,993,906 118,436,579 118,401,653 (1,309,568,730)Total primary government net assets/net position 589,241,318$ 585,589,409$ 595,538,898$ 610,600,826$ (810,140,476)$
*Starting in 2015 GASB 68 required writing on future obligation for PERA Pension liability.**Starting in 2018 GASB 75 required writing on future obligation for PERA OPEB liability.
Last Ten Fiscal Years(accrual basis of accounting)
Financial Trend Schedule 1Jefferson County School District, No.R-1Net Assets/Net Position by Component,
-120-

2016 2017 2018** 2019 2020
364,870,945$ 393,437,822$ 410,495,440$ 398,121,140$ 366,492,535$91,018,886 87,661,174 94,757,855 112,896,901 114,800,561
(1,291,788,213) (1,802,185,821) (2,422,242,967) (2,214,966,272) (1,897,684,109)(835,898,382)$ (1,321,086,825)$ (1,916,989,672)$ (1,703,948,231)$ (1,416,391,013)$
3,422,469$ 3,230,241$ 1,362,898$ 1,216,370$ 1,169,847$775,822 6,905,076 521,857 553,325 464,568
15,264,044 9,175,963 9,114,769 9,373,021 8,502,62719,462,335$ 19,311,280$ 10,999,524$ 11,142,716$ 10,137,042$
368,293,414$ 396,668,063$ 411,858,338$ 399,337,510$ 367,662,382$91,794,708 94,566,250 95,279,712 113,450,226 115,265,129
(1,276,524,169) (1,793,009,858) (2,413,128,198) (2,205,593,251) (1,889,181,482)(816,436,047)$ (1,301,775,545)$ (1,905,990,148)$ (1,692,805,515)$ (1,406,253,971)$
Fiscal Year
-121-

2011 2012* 2013 2014Expenses *Governmental activities: School administration -$ 57,409,152$ 54,996,871$ 56,613,420$ General instruction - 408,204,654 405,528,254 410,335,528 Special education instruction - 65,020,783 69,392,712 71,357,688 Instructional support - 67,648,351 64,686,916 68,774,854 Operations and maintenance - 69,998,170 67,985,826 78,844,714 Food services ** - - - - Direct instruction 488,170,063 - - - Indirect instruction 148,378,364 - - - Transportation 20,850,913 23,703,443 24,115,123 23,177,884 Custodial services 26,864,799 - - - Field services 21,763,434 - - - Telecommunications, networking and utilities 21,974,077 - - - Support services 25,168,348 - - - General administration 3,909,716 27,898,413 27,617,388 25,908,579 District-wide 596,970 - - - Interest expense, unallocated 28,681,991 25,666,711 25,135,731 24,692,063Total governmental activities expenses 786,358,675 745,549,677 739,458,821 759,704,730Business-type activities Food services ** 24,402,366 22,995,136 24,588,376 24,059,390 Child care 14,277,646 13,664,939 14,253,323 15,669,253 Property management 1,288,442 1,276,209 1,298,134 1,653,841 Other enterprise - - - -Total business-type activities expenses 39,968,454 37,936,284 40,139,833 41,382,484Total primary government expenses 826,327,129$ 783,485,961$ 779,598,654$ 801,087,214$
Program RevenuesGovernmental activities: Charges for services: General administration -$ 1,152,290$ 1,323,748$ 2,669,066$ General instruction - 25,645,123 26,903,962 27,047,349 Special education instruction - 4,713,718 4,932,848 3,195,644 Operations and maintenance - 3,842,879 4,929,770 6,116,159 Direct instruction 5,148,800 - - - Indirect instruction 28,066,756 - - - Food services ** - - - - Transportation 354,195 1,386,407 1,974,372 2,133,779 Field services 3,747,188 - - - District-wide 1,358,775 - - - Operating grants and contributions: General administration - 3,652,537 3,889,298 3,706,405 School administration - 861,829 - 49,851 General instruction - 14,548,969 16,103,053 16,423,080 Special education instruction - 25,408,016 24,338,028 27,343,034 Instructional support - 16,402,238 15,731,027 16,251,832 Operations and maintenance - 797,353 165,699 7,920,034 Food services ** - - - - Direct instruction 69,228,523 - - - Indirect instruction 13,358,689 - - - Transportation 4,866,106 5,103,034 5,009,964 5,275,093Total governmental activities program revenues 126,129,032 103,514,393 105,301,769 118,131,326Business-type activities Charges for services: Food services ** 11,634,444 11,514,984 11,049,462 9,830,452 Child care 10,281,161 9,867,724 10,630,601 11,111,356 Property management 1,763,175 1,595,449 1,796,862 1,920,377 Other enterprise - - - - Operating grants and contributions: Food services ** 11,709,247 12,716,967 13,520,079 13,389,433 Child Care - - - - Capital grants and contributions: Food services 352,528 84,766 135,253 96,924 Property management - - - - Other enterprise - - - -Total business-type activities program revenues 35,740,555 35,779,890 37,132,257 36,348,542Total primary government program revenues 161,869,587$ 139,294,283$ 142,434,026$ 154,479,868$
Net (Expense)/RevenueGovernmental activities (660,229,643)$ (642,035,284)$ (634,157,052)$ (641,573,404)$Business-type activities (4,227,899) (2,156,394) (3,007,576) (5,033,942)Total primary government net expense (664,457,542)$ (644,191,678)$ (637,164,628)$ (646,607,346)$
*Recategorized expense types starting in fiscal year 2012.**Food Services became a special revenue fund in fiscal year 2018
Financial Trend Schedule 2Jefferson County School District, No.R-1
Changes in Net Assets/Net Position, Last Ten Fiscal Years(accrual basis of accounting)
-122-

2015 2016 2017 2018 2019 2020
61,622,289$ 63,315,375$ 100,562,166$ 107,454,780$ 57,184,224$ 55,093,987$440,423,884 433,932,814 679,657,697 689,803,039 338,352,008 339,365,183
76,419,427 74,429,360 121,065,638 125,986,386 60,078,428 58,668,09793,132,858 91,727,374 151,608,229 177,535,468 87,358,735 99,441,22187,346,892 82,019,992 129,182,158 125,858,843 90,139,921 64,845,718
- - - 43,950,669 18,396,673 17,910,261- - - - - -- - - - - -
27,654,266 27,781,099 44,542,645 46,130,547 21,757,237 23,209,626- - - - - -- - - - - -- - - - - -- - - - - -
25,647,057 25,347,367 46,268,361 34,010,421 25,577,408 19,804,229- - - - - -
26,445,984 19,888,625 18,707,099 28,918,125 27,254,231 32,874,959838,692,657 818,442,006 1,291,593,993 1,379,648,278 726,098,865 711,213,281
24,335,013 23,708,332 24,943,806 - - -16,365,381 13,553,606 13,509,401 14,329,881 15,770,645 18,461,481
1,881,209 1,643,904 1,722,727 1,805,591 1,843,658 1,341,614- - - - - -
42,581,603 38,905,842 40,175,934 16,135,472 17,614,303 19,803,095881,274,260$ 857,347,848$ 1,331,769,927$ 1,395,783,750$ 743,713,168$ 731,016,376$
906,896$ 931,133$ 977,969$ 1,163,075$ 1,232,924$ 1,273,248$27,346,106 33,178,144 33,960,682 35,857,623 36,890,661 25,180,874
5,435,234 6,048,054 6,393,941 7,122,128 6,852,969 7,575,3434,685,037 5,162,139 6,371,921 9,521,864 10,113,814 5,795,473
- - - - - -- - - - - -- - - 12,021,320 11,484,300 9,981,762
1,979,155 2,066,642 2,052,196 3,330,780 2,026,676 2,399,835- - - - - -- - - - - -
4,002,024 3,447,090 2,609,255 2,084,224 2,974,340 3,537,1913,883 17,761 82,198 51,326 363,945 352,359
17,807,677 15,976,711 16,748,158 16,358,570 15,958,015 15,266,90126,830,057 28,050,732 26,427,242 27,879,724 28,436,367 31,545,36918,028,401 16,368,008 12,777,100 13,002,528 15,392,691 37,756,734
6,609,171 1,044,100 266,611 95,563 346,352 892,109- - - 12,641,266 11,931,665 11,106,292- - - - - -- - - - - -
5,383,718 5,653,141 5,103,470 3,863,626 5,263,064 5,670,121119,017,359 117,943,655 113,770,743 144,993,617 149,267,783 158,333,611
10,612,859 10,641,334 10,978,683 - - -11,417,547 6,804,445 7,383,970 8,310,307 9,014,931 7,140,872
2,276,591 2,256,716 2,415,137 2,887,289 2,902,390 2,053,448- - - - - -
14,083,555 14,024,955 13,877,640 - - -5,526,102 5,748,802 5,952,792 6,066,190 6,245,151 6,031,148
234,780 - - - - -- - - - - -- - - - - -
44,151,434 39,476,252 40,608,222 17,263,786 18,162,472 15,225,468163,168,793$ 157,419,907$ 154,378,965$ 162,257,403 167,430,255 173,559,079
(719,675,298)$ (694,998,351)$ (1,177,823,250)$ (1,234,654,661)$ (576,831,082)$ (552,879,670)$1,569,831 570,410 432,288 1,128,314 548,169 (4,577,627)
(718,105,467)$ (694,427,941)$ (1,177,390,962)$ (1,233,526,347)$ (576,282,913)$ (557,457,297)$
Fiscal Year
-123-
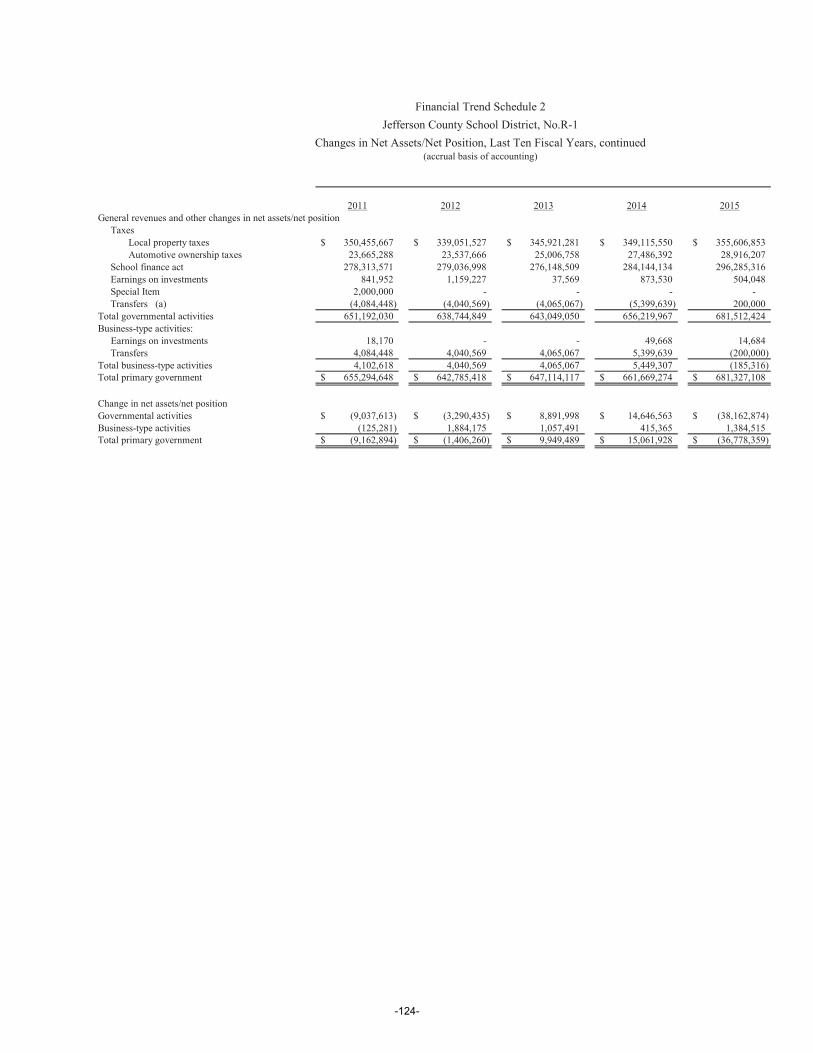
2011 2012 2013 2014 2015General revenues and other changes in net assets/net position Taxes Local property taxes 350,455,667$ 339,051,527$ 345,921,281$ 349,115,550$ 355,606,853$ Automotive ownership taxes 23,665,288 23,537,666 25,006,758 27,486,392 28,916,207 School finance act 278,313,571 279,036,998 276,148,509 284,144,134 296,285,316 Earnings on investments 841,952 1,159,227 37,569 873,530 504,048 Special Item 2,000,000 - - - - Transfers (a) (4,084,448) (4,040,569) (4,065,067) (5,399,639) 200,000Total governmental activities 651,192,030 638,744,849 643,049,050 656,219,967 681,512,424Business-type activities: Earnings on investments 18,170 - - 49,668 14,684 Transfers 4,084,448 4,040,569 4,065,067 5,399,639 (200,000)Total business-type activities 4,102,618 4,040,569 4,065,067 5,449,307 (185,316)Total primary government 655,294,648$ 642,785,418$ 647,114,117$ 661,669,274$ 681,327,108$
Change in net assets/net positionGovernmental activities (9,037,613)$ (3,290,435)$ 8,891,998$ 14,646,563$ (38,162,874)$Business-type activities (125,281) 1,884,175 1,057,491 415,365 1,384,515Total primary government (9,162,894)$ (1,406,260)$ 9,949,489$ 15,061,928$ (36,778,359)$
Financial Trend Schedule 2Jefferson County School District, No.R-1
Changes in Net Assets/Net Position, Last Ten Fiscal Years, continued(accrual basis of accounting)
-124-
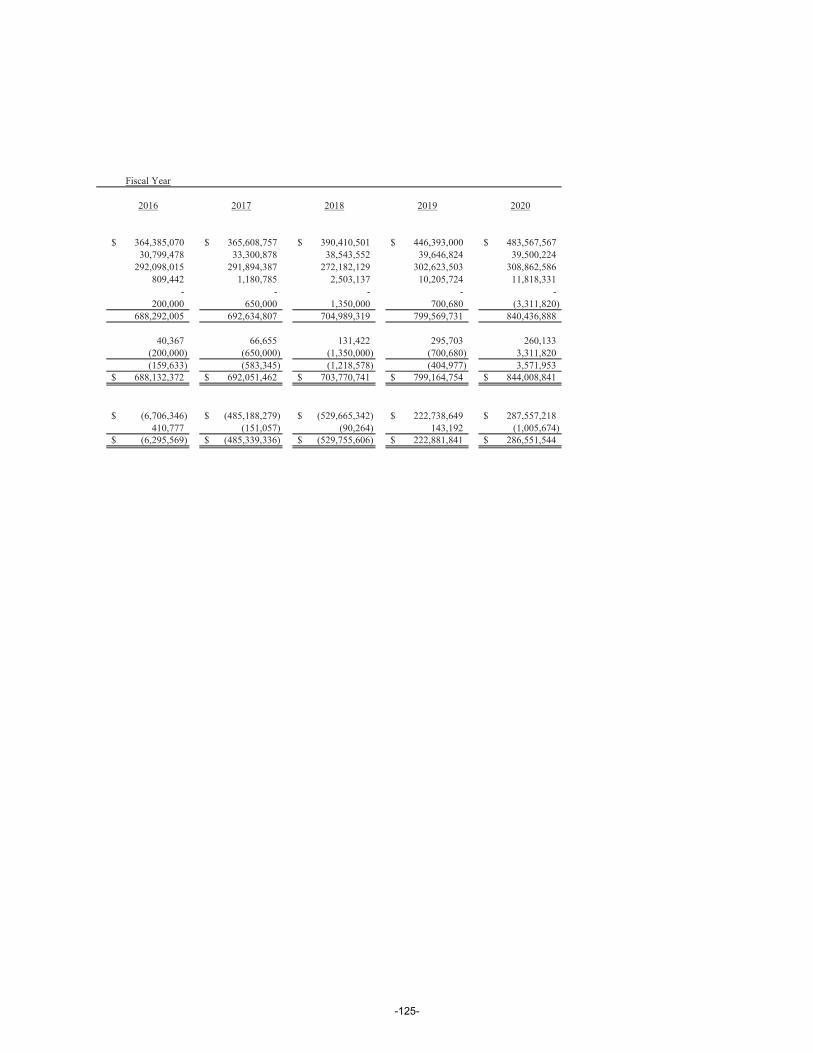
2016 2017 2018 2019 2020
364,385,070$ 365,608,757$ 390,410,501$ 446,393,000$ 483,567,567$30,799,478 33,300,878 38,543,552 39,646,824 39,500,224
292,098,015 291,894,387 272,182,129 302,623,503 308,862,586809,442 1,180,785 2,503,137 10,205,724 11,818,331
- - - - -200,000 650,000 1,350,000 700,680 (3,311,820)
688,292,005 692,634,807 704,989,319 799,569,731 840,436,888
40,367 66,655 131,422 295,703 260,133(200,000) (650,000) (1,350,000) (700,680) 3,311,820(159,633) (583,345) (1,218,578) (404,977) 3,571,953
688,132,372$ 692,051,462$ 703,770,741$ 799,164,754$ 844,008,841$
(6,706,346)$ (485,188,279)$ (529,665,342)$ 222,738,649$ 287,557,218$410,777 (151,057) (90,264) 143,192 (1,005,674)
(6,295,569)$ (485,339,336)$ (529,755,606)$ 222,881,841$ 286,551,544$
Fiscal Year
-125-

2011 2012 2013 2014General fund Nonspendable 1,533,815$ 1,159,891$ 982,570$ 942,951$ Restricted 15,932,358 15,839,341 15,756,129 16,494,681 Committed 2,000,000 2,000,000 2,000,000 2,000,000 Assigned 13,300,000 13,860,000 11,500,000 9,600,000 Unassigned 21,994,915 3,195,321 19,727,866 32,260,251
Reserved - - - - Unreserved - - - -Total general fund 54,761,088$ 36,054,553$ 49,966,565$ 61,297,883$
All other governmental funds Nonspendable 410,265$ 895,860$ 1,058,751$ 909,314$ Restricted 108,862,085 106,895,470 169,532,657 147,439,129 Committed - - 20,833,322 16,731,273 Assigned 9,760,257 9,426,449 9,344,242 9,620,670 Reserved - - - - Unreserved, reported in: Special revenue funds - - - -Total all other governmental funds 119,032,607$ 117,217,779$ 200,768,972$ 174,700,386$
Financial Trend Schedule 3Jefferson County School District, No.R-1
Fund Balances, Governmental Funds, Last Ten Fiscal Years(modified accrual basis of accounting)
-126-
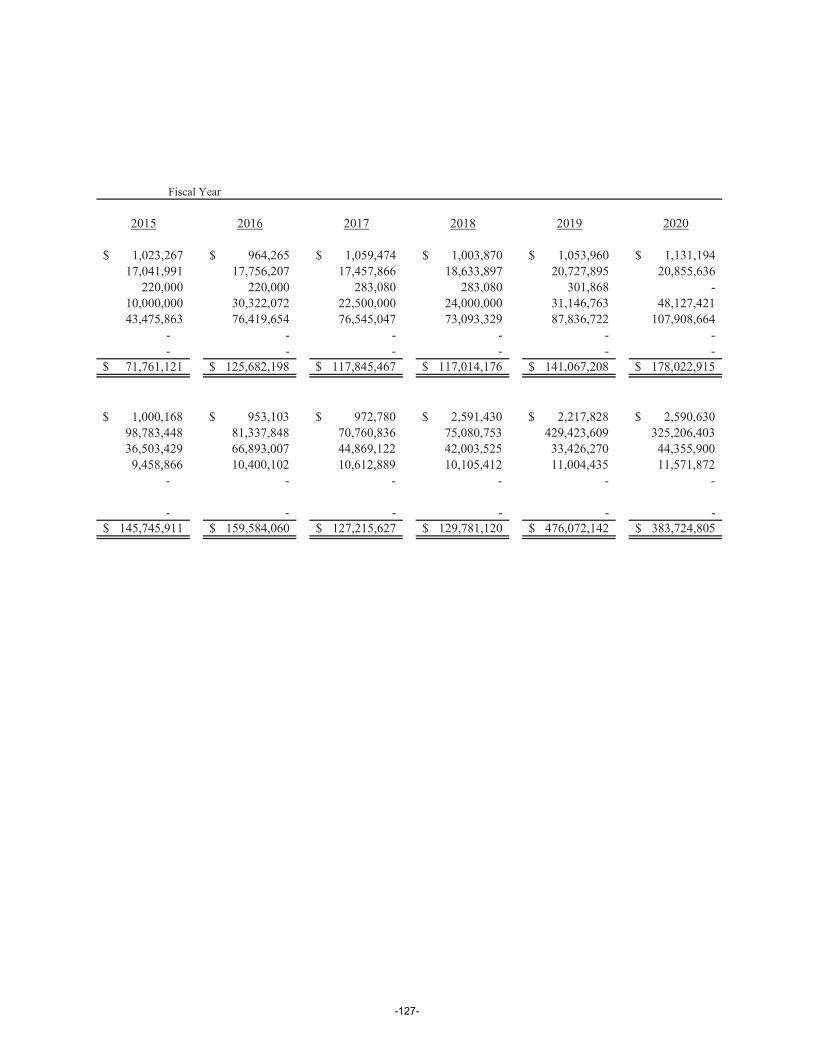
2015 2016 2017 2018 2019 2020
1,023,267$ 964,265$ 1,059,474$ 1,003,870$ 1,053,960$ 1,131,194$17,041,991 17,756,207 17,457,866 18,633,897 20,727,895 20,855,636
220,000 220,000 283,080 283,080 301,868 -10,000,000 30,322,072 22,500,000 24,000,000 31,146,763 48,127,42143,475,863 76,419,654 76,545,047 73,093,329 87,836,722 107,908,664
- - - - - -- - - - - -
71,761,121$ 125,682,198$ 117,845,467$ 117,014,176$ 141,067,208$ 178,022,915$
1,000,168$ 953,103$ 972,780$ 2,591,430$ 2,217,828$ 2,590,630$98,783,448 81,337,848 70,760,836 75,080,753 429,423,609 325,206,40336,503,429 66,893,007 44,869,122 42,003,525 33,426,270 44,355,9009,458,866 10,400,102 10,612,889 10,105,412 11,004,435 11,571,872
- - - - - -
- - - - - -145,745,911$ 159,584,060$ 127,215,627$ 129,781,120$ 476,072,142$ 383,724,805$
Fiscal Year
-127-
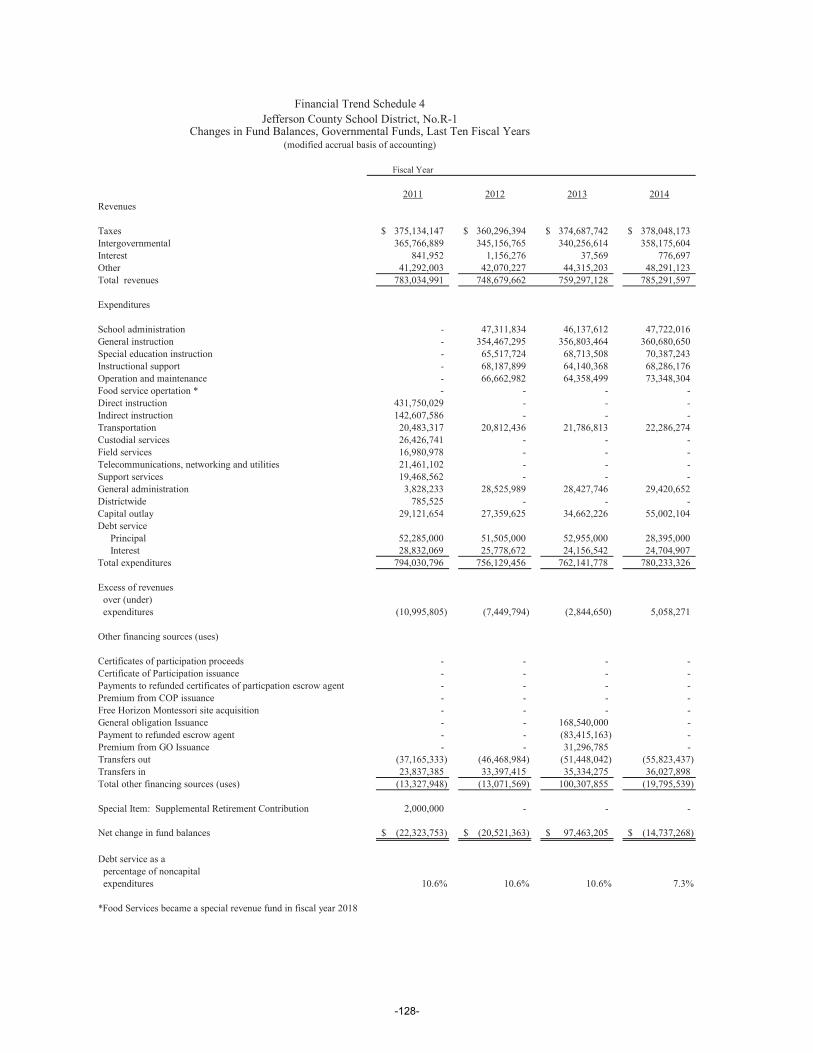
Fiscal Year
2011 2012 2013 2014Revenues
Taxes 375,134,147$ 360,296,394$ 374,687,742$ 378,048,173$Intergovernmental 365,766,889 345,156,765 340,256,614 358,175,604Interest 841,952 1,156,276 37,569 776,697Other 41,292,003 42,070,227 44,315,203 48,291,123Total revenues 783,034,991 748,679,662 759,297,128 785,291,597
Expenditures
School administration - 47,311,834 46,137,612 47,722,016General instruction - 354,467,295 356,803,464 360,680,650Special education instruction - 65,517,724 68,713,508 70,387,243Instructional support - 68,187,899 64,140,368 68,286,176Operation and maintenance - 66,662,982 64,358,499 73,348,304Food service opertation * - - - -Direct instruction 431,750,029 - - -Indirect instruction 142,607,586 - - -Transportation 20,483,317 20,812,436 21,786,813 22,286,274Custodial services 26,426,741 - - -Field services 16,980,978 - - -Telecommunications, networking and utilities 21,461,102 - - -Support services 19,468,562 - - -General administration 3,828,233 28,525,989 28,427,746 29,420,652Districtwide 785,525 - - -Capital outlay 29,121,654 27,359,625 34,662,226 55,002,104Debt service Principal 52,285,000 51,505,000 52,955,000 28,395,000 Interest 28,832,069 25,778,672 24,156,542 24,704,907Total expenditures 794,030,796 756,129,456 762,141,778 780,233,326
Excess of revenues over (under) expenditures (10,995,805) (7,449,794) (2,844,650) 5,058,271
Other financing sources (uses)
Certificates of participation proceeds - - - -Certificate of Participation issuance - - - -Payments to refunded certificates of particpation escrow agent - - - -Premium from COP issuance - - - -Free Horizon Montessori site acquisition - - - -General obligation Issuance - - 168,540,000 -Payment to refunded escrow agent - - (83,415,163) -Premium from GO Issuance - - 31,296,785 -Transfers out (37,165,333) (46,468,984) (51,448,042) (55,823,437)Transfers in 23,837,385 33,397,415 35,334,275 36,027,898Total other financing sources (uses) (13,327,948) (13,071,569) 100,307,855 (19,795,539)
Special Item: Supplemental Retirement Contribution 2,000,000 - - -
Net change in fund balances (22,323,753)$ (20,521,363)$ 97,463,205$ (14,737,268)$
Debt service as a percentage of noncapital expenditures 10.6% 10.6% 10.6% 7.3%
*Food Services became a special revenue fund in fiscal year 2018
Financial Trend Schedule 4Jefferson County School District, No.R-1
Changes in Fund Balances, Governmental Funds, Last Ten Fiscal Years(modified accrual basis of accounting)
-128-
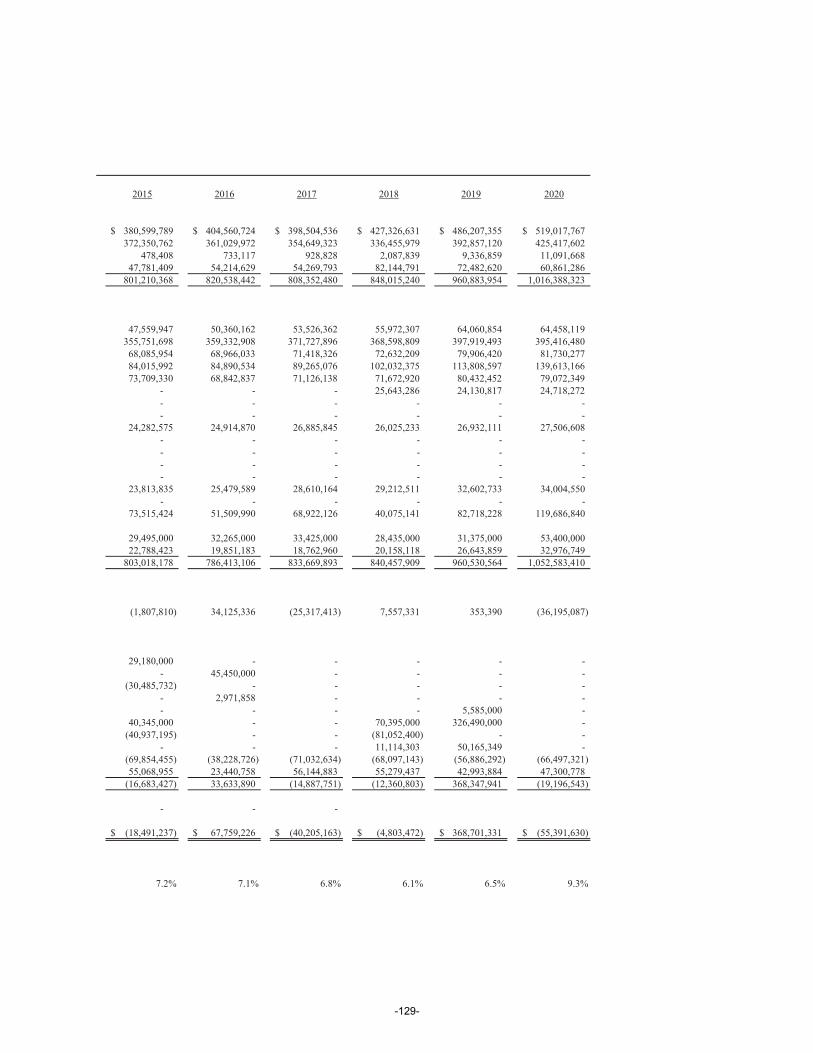
2015 2016 2017 2018 2019 2020
380,599,789$ 404,560,724$ 398,504,536$ 427,326,631$ 486,207,355$ 519,017,767$372,350,762 361,029,972 354,649,323 336,455,979 392,857,120 425,417,602
478,408 733,117 928,828 2,087,839 9,336,859 11,091,66847,781,409 54,214,629 54,269,793 82,144,791 72,482,620 60,861,286
801,210,368 820,538,442 808,352,480 848,015,240 960,883,954 1,016,388,323
47,559,947 50,360,162 53,526,362 55,972,307 64,060,854 64,458,119355,751,698 359,332,908 371,727,896 368,598,809 397,919,493 395,416,48068,085,954 68,966,033 71,418,326 72,632,209 79,906,420 81,730,27784,015,992 84,890,534 89,265,076 102,032,375 113,808,597 139,613,16673,709,330 68,842,837 71,126,138 71,672,920 80,432,452 79,072,349
- - - 25,643,286 24,130,817 24,718,272- - - - - -- - - - - -
24,282,575 24,914,870 26,885,845 26,025,233 26,932,111 27,506,608- - - - - -- - - - - -- - - - - -- - - - - -
23,813,835 25,479,589 28,610,164 29,212,511 32,602,733 34,004,550- - - - - -
73,515,424 51,509,990 68,922,126 40,075,141 82,718,228 119,686,840
29,495,000 32,265,000 33,425,000 28,435,000 31,375,000 53,400,00022,788,423 19,851,183 18,762,960 20,158,118 26,643,859 32,976,749
803,018,178 786,413,106 833,669,893 840,457,909 960,530,564 1,052,583,410
(1,807,810) 34,125,336 (25,317,413) 7,557,331 353,390 (36,195,087)
29,180,000 - - - - -- 45,450,000 - - - -
(30,485,732) - - - - -- 2,971,858 - - - -- - - - 5,585,000 -
40,345,000 - - 70,395,000 326,490,000 -(40,937,195) - - (81,052,400) - -
- - - 11,114,303 50,165,349 -(69,854,455) (38,228,726) (71,032,634) (68,097,143) (56,886,292) (66,497,321)55,068,955 23,440,758 56,144,883 55,279,437 42,993,884 47,300,778
(16,683,427) 33,633,890 (14,887,751) (12,360,803) 368,347,941 (19,196,543)
- - -
(18,491,237)$ 67,759,226$ (40,205,163)$ (4,803,472)$ 368,701,331$ (55,391,630)$
7.2% 7.1% 6.8% 6.1% 6.5% 9.3%
-129-
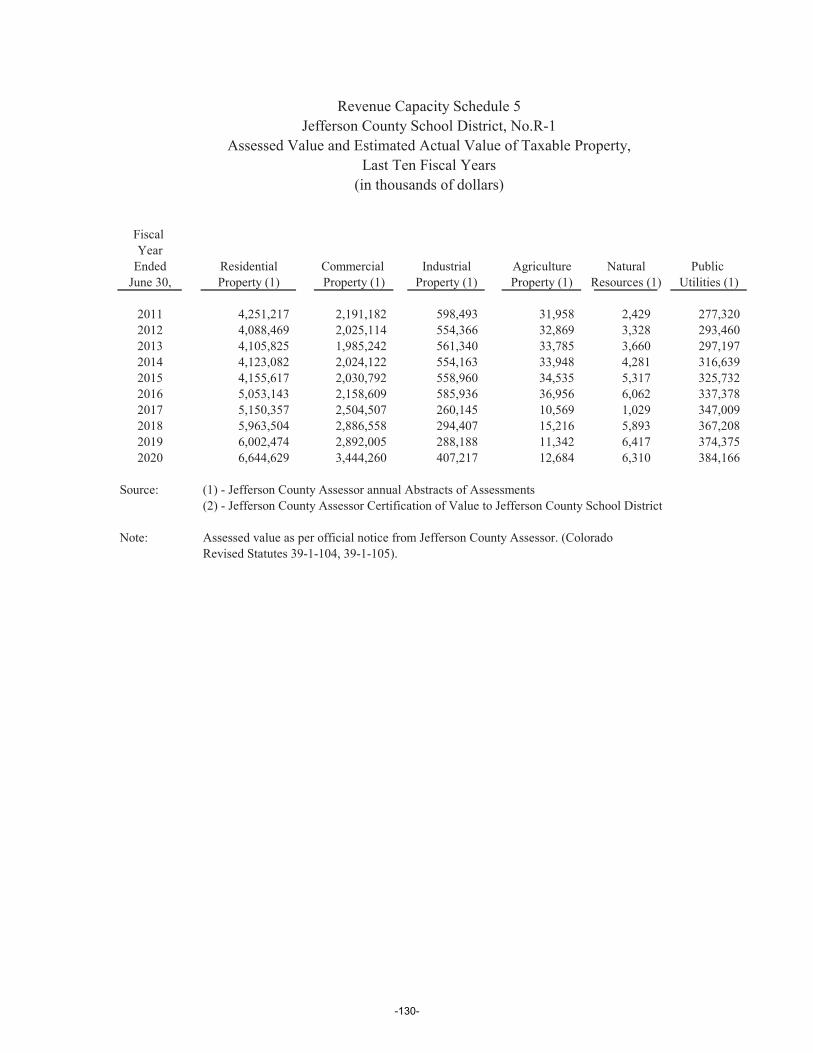
Fiscal Year
Ended Residential Commercial Industrial Agriculture Natural Public June 30, Property (1) Property (1) Property (1) Property (1) Resources (1) Utilities (1)
2011 4,251,217 2,191,182 598,493 31,958 2,429 277,3202012 4,088,469 2,025,114 554,366 32,869 3,328 293,4602013 4,105,825 1,985,242 561,340 33,785 3,660 297,1972014 4,123,082 2,024,122 554,163 33,948 4,281 316,6392015 4,155,617 2,030,792 558,960 34,535 5,317 325,7322016 5,053,143 2,158,609 585,936 36,956 6,062 337,3782017 5,150,357 2,504,507 260,145 10,569 1,029 347,0092018 5,963,504 2,886,558 294,407 15,216 5,893 367,2082019 6,002,474 2,892,005 288,188 11,342 6,417 374,3752020 6,644,629 3,444,260 407,217 12,684 6,310 384,166
Source: (1) - Jefferson County Assessor annual Abstracts of Assessments(2) - Jefferson County Assessor Certification of Value to Jefferson County School District
Note: Assessed value as per official notice from Jefferson County Assessor. (Colorado Revised Statutes 39-1-104, 39-1-105).
(in thousands of dollars)
Revenue Capacity Schedule 5Jefferson County School District, No.R-1
Assessed Value and Estimated Actual Value of Taxable Property,Last Ten Fiscal Years
-130-
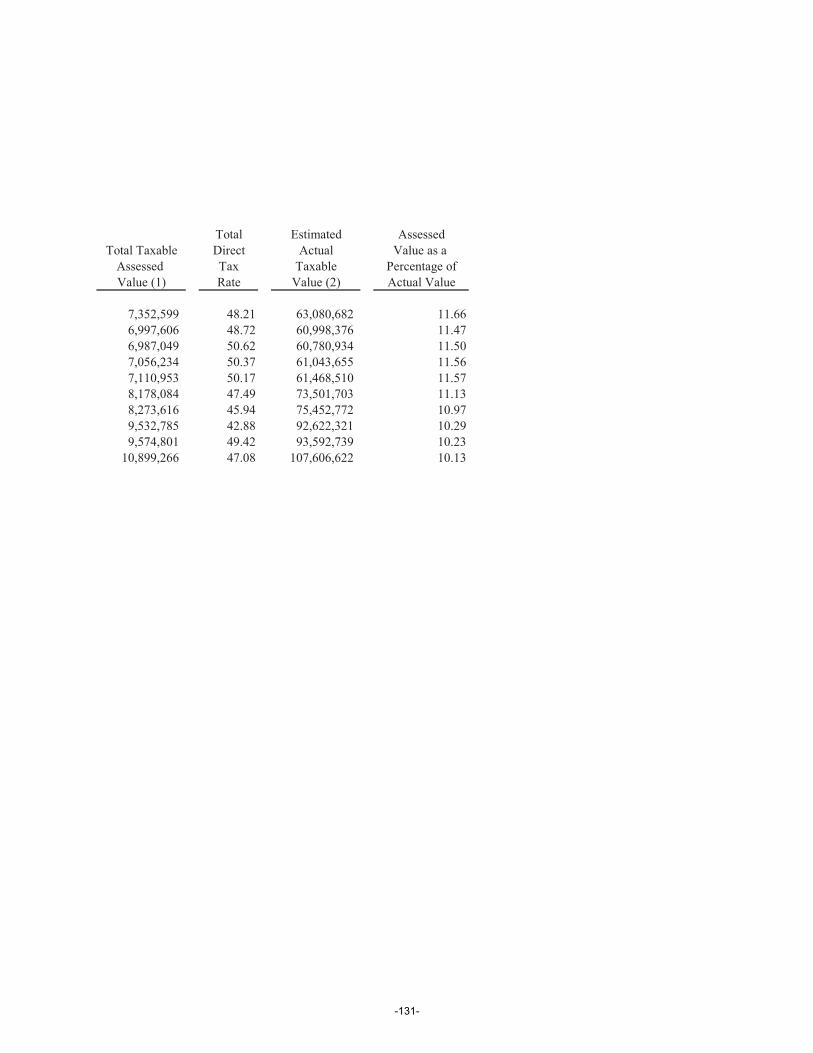
Total Estimated AssessedTotal Taxable Direct Actual Value as a
Assessed Tax Taxable Percentage ofValue (1) Rate Value (2) Actual Value
7,352,599 48.21 63,080,682 11.666,997,606 48.72 60,998,376 11.476,987,049 50.62 60,780,934 11.507,056,234 50.37 61,043,655 11.567,110,953 50.17 61,468,510 11.578,178,084 47.49 73,501,703 11.138,273,616 45.94 75,452,772 10.979,532,785 42.88 92,622,321 10.299,574,801 49.42 93,592,739 10.23
10,899,266 47.08 107,606,622 10.13
-131-
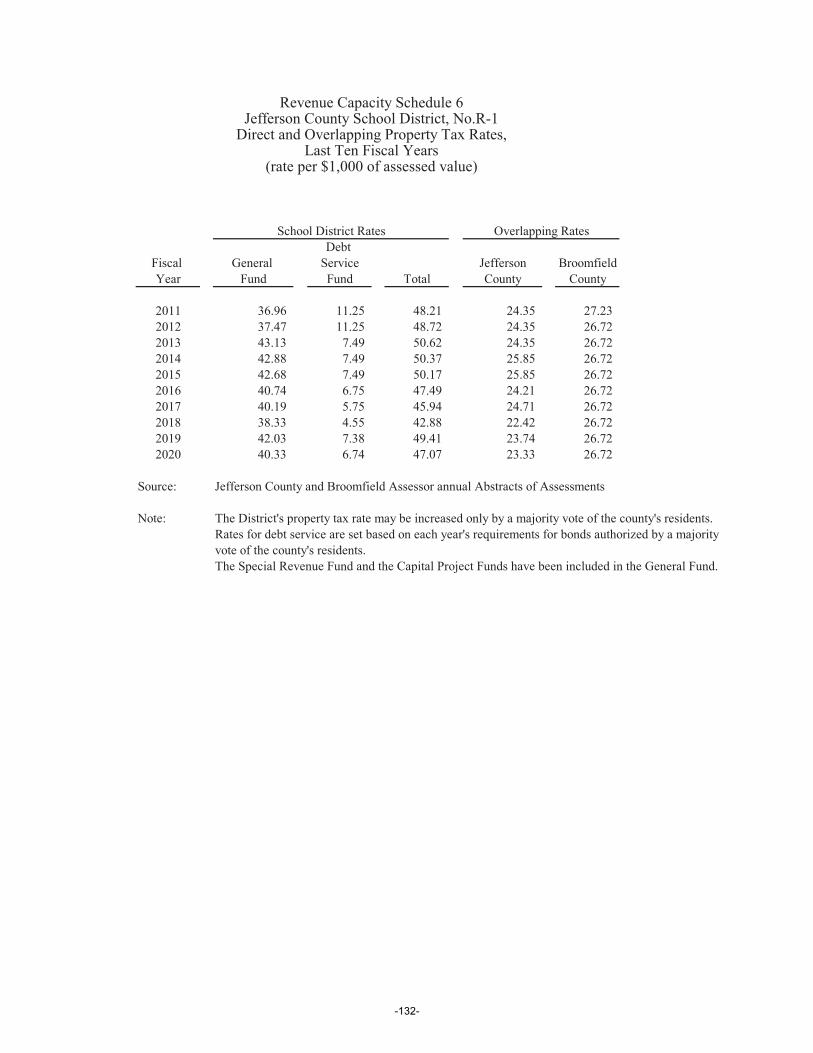
Debt Fiscal General Service Jefferson BroomfieldYear Fund Fund Total County County
2011 36.96 11.25 48.21 24.35 27.232012 37.47 11.25 48.72 24.35 26.722013 43.13 7.49 50.62 24.35 26.722014 42.88 7.49 50.37 25.85 26.722015 42.68 7.49 50.17 25.85 26.722016 40.74 6.75 47.49 24.21 26.722017 40.19 5.75 45.94 24.71 26.722018 38.33 4.55 42.88 22.42 26.722019 42.03 7.38 49.41 23.74 26.722020 40.33 6.74 47.07 23.33 26.72
Source: Jefferson County and Broomfield Assessor annual Abstracts of Assessments
Note: The District's property tax rate may be increased only by a majority vote of the county's residents.Rates for debt service are set based on each year's requirements for bonds authorized by a majorityvote of the county's residents.The Special Revenue Fund and the Capital Project Funds have been included in the General Fund.
Revenue Capacity Schedule 6
School District Rates Overlapping Rates
Direct and Overlapping Property Tax Rates,Jefferson County School District, No.R-1
Last Ten Fiscal Years(rate per $1,000 of assessed value)
-132-
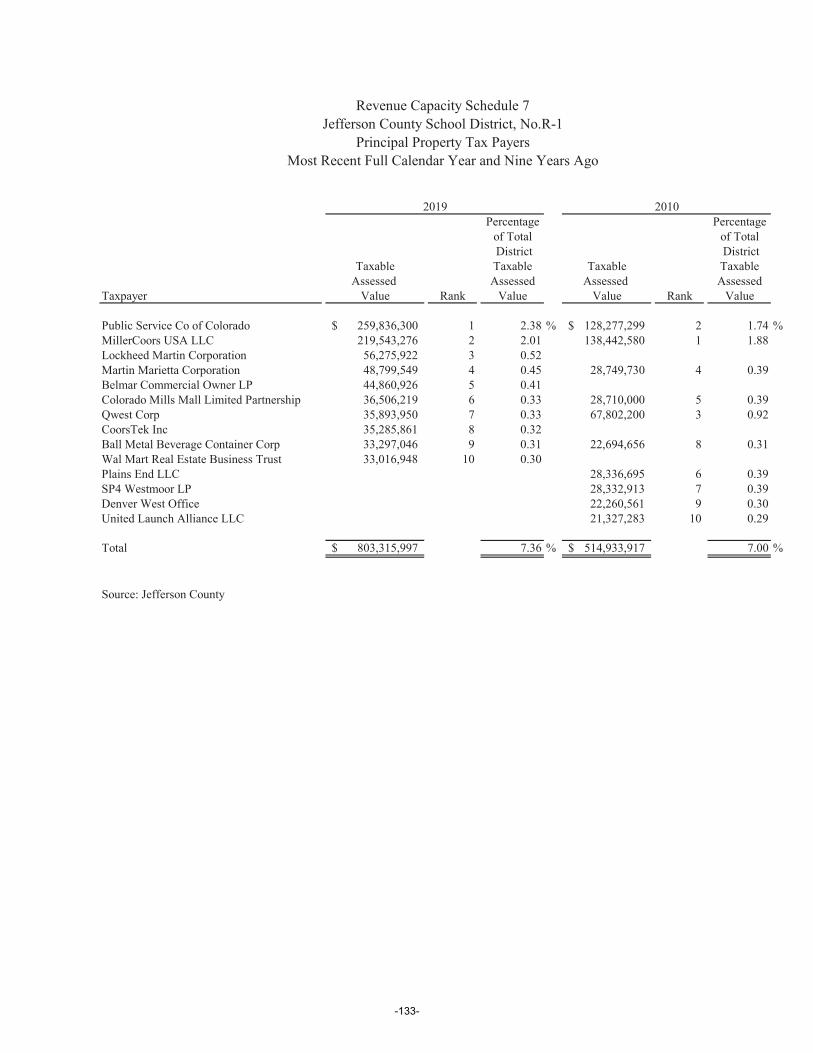
Percentage Percentageof Total of Total District District
Taxable Taxable Taxable TaxableAssessed Assessed Assessed Assessed
Taxpayer Value Rank Value Value Rank Value
Public Service Co of Colorado 259,836,300$ 1 2.38 % 128,277,299$ 2 1.74 %MillerCoors USA LLC 219,543,276 2 2.01 138,442,580 1 1.88Lockheed Martin Corporation 56,275,922 3 0.52Martin Marietta Corporation 48,799,549 4 0.45 28,749,730 4 0.39Belmar Commercial Owner LP 44,860,926 5 0.41Colorado Mills Mall Limited Partnership 36,506,219 6 0.33 28,710,000 5 0.39Qwest Corp 35,893,950 7 0.33 67,802,200 3 0.92CoorsTek Inc 35,285,861 8 0.32Ball Metal Beverage Container Corp 33,297,046 9 0.31 22,694,656 8 0.31Wal Mart Real Estate Business Trust 33,016,948 10 0.30Plains End LLC 28,336,695 6 0.39SP4 Westmoor LP 28,332,913 7 0.39Denver West Office 22,260,561 9 0.30United Launch Alliance LLC 21,327,283 10 0.29
Total 803,315,997$ 7.36 % 514,933,917$ 7.00 %
Source: Jefferson County
Most Recent Full Calendar Year and Nine Years Ago
Revenue Capacity Schedule 7Jefferson County School District, No.R-1
Principal Property Tax Payers
2019 2010
-133-

-134-
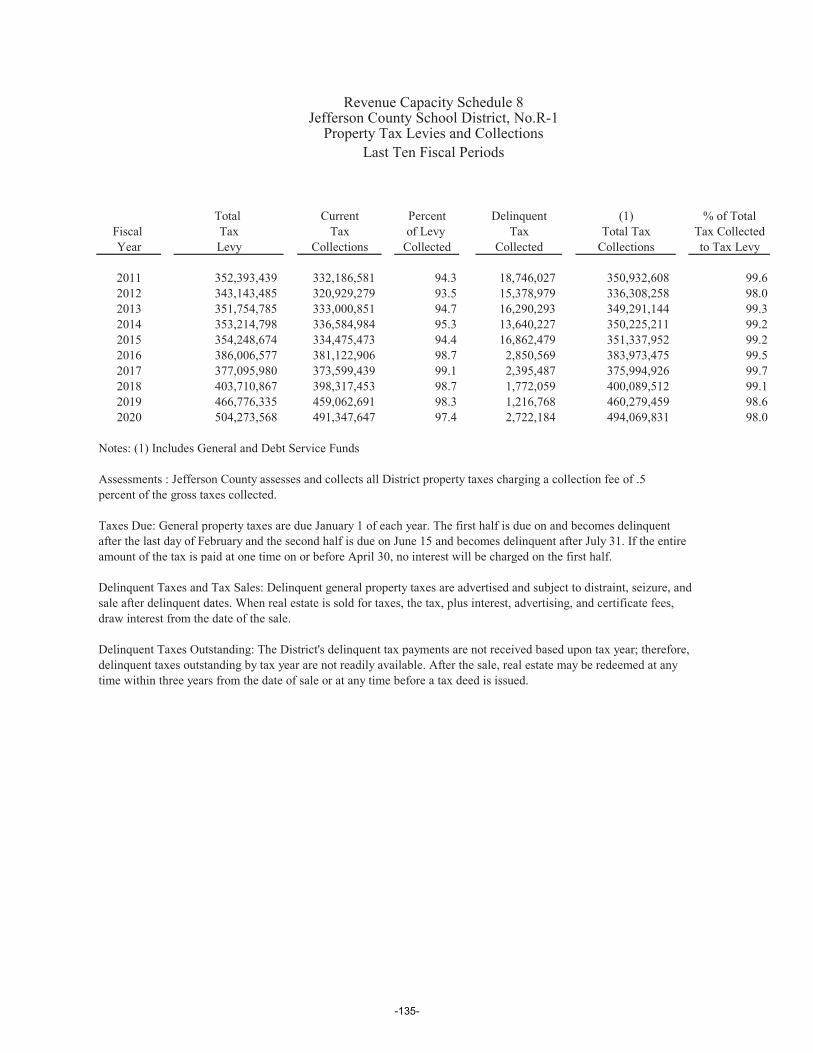
Total Current Percent Delinquent (1) % of TotalFiscal Tax Tax of Levy Tax Total Tax Tax CollectedYear Levy Collections Collected Collected Collections to Tax Levy
2011 352,393,439 332,186,581 94.3 18,746,027 350,932,608 99.62012 343,143,485 320,929,279 93.5 15,378,979 336,308,258 98.02013 351,754,785 333,000,851 94.7 16,290,293 349,291,144 99.32014 353,214,798 336,584,984 95.3 13,640,227 350,225,211 99.22015 354,248,674 334,475,473 94.4 16,862,479 351,337,952 99.22016 386,006,577 381,122,906 98.7 2,850,569 383,973,475 99.52017 377,095,980 373,599,439 99.1 2,395,487 375,994,926 99.72018 403,710,867 398,317,453 98.7 1,772,059 400,089,512 99.12019 466,776,335 459,062,691 98.3 1,216,768 460,279,459 98.62020 504,273,568 491,347,647 97.4 2,722,184 494,069,831 98.0
Notes: (1) Includes General and Debt Service Funds
Assessments : Jefferson County assesses and collects all District property taxes charging a collection fee of .5percent of the gross taxes collected.
Taxes Due: General property taxes are due January 1 of each year. The first half is due on and becomes delinquentafter the last day of February and the second half is due on June 15 and becomes delinquent after July 31. If the entireamount of the tax is paid at one time on or before April 30, no interest will be charged on the first half.
Delinquent Taxes and Tax Sales: Delinquent general property taxes are advertised and subject to distraint, seizure, andsale after delinquent dates. When real estate is sold for taxes, the tax, plus interest, advertising, and certificate fees, draw interest from the date of the sale.
Delinquent Taxes Outstanding: The District's delinquent tax payments are not received based upon tax year; therefore,delinquent taxes outstanding by tax year are not readily available. After the sale, real estate may be redeemed at anytime within three years from the date of sale or at any time before a tax deed is issued.
Revenue Capacity Schedule 8Jefferson County School District, No.R-1
Property Tax Levies and CollectionsLast Ten Fiscal Periods
-135-
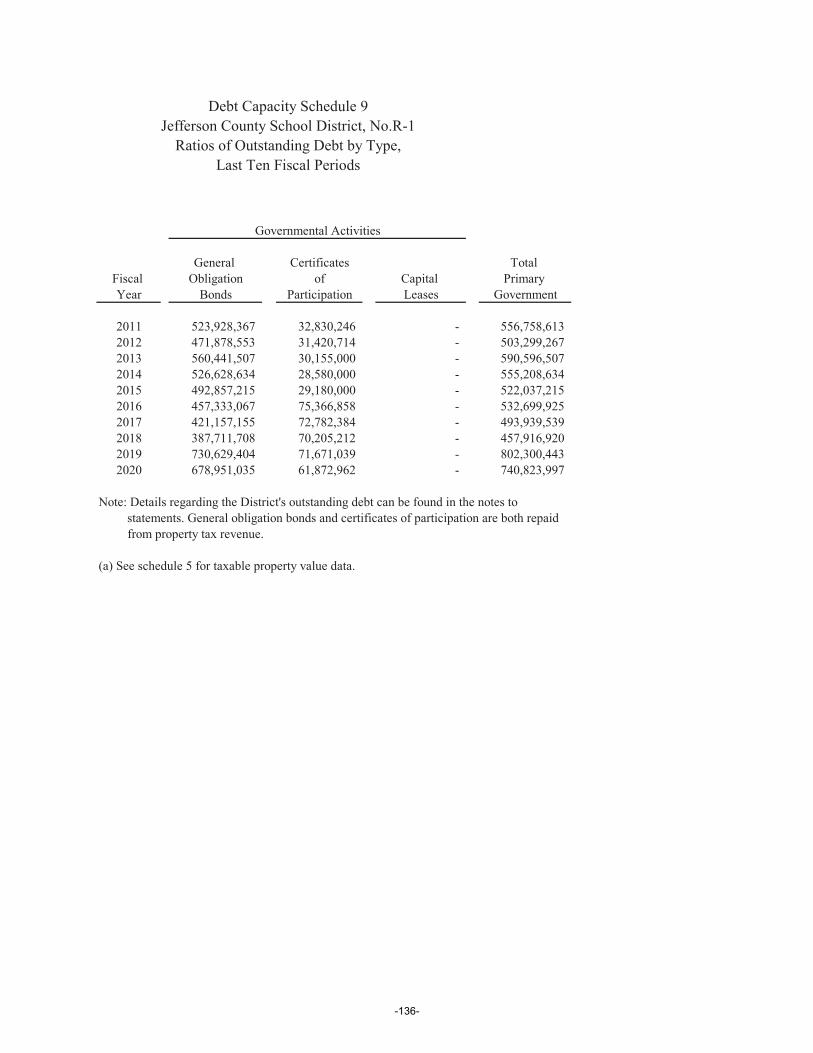
General Certificates Total Fiscal Obligation of Capital Primary Year Bonds Participation Leases Government
2011 523,928,367 32,830,246 - 556,758,6132012 471,878,553 31,420,714 - 503,299,2672013 560,441,507 30,155,000 - 590,596,5072014 526,628,634 28,580,000 - 555,208,6342015 492,857,215 29,180,000 - 522,037,2152016 457,333,067 75,366,858 - 532,699,9252017 421,157,155 72,782,384 - 493,939,5392018 387,711,708 70,205,212 - 457,916,9202019 730,629,404 71,671,039 - 802,300,4432020 678,951,035 61,872,962 - 740,823,997
Note: Details regarding the District's outstanding debt can be found in the notes to statements. General obligation bonds and certificates of participation are both repaid from property tax revenue.
(a) See schedule 5 for taxable property value data.
Governmental Activities
Debt Capacity Schedule 9Jefferson County School District, No.R-1
Ratios of Outstanding Debt by Type,Last Ten Fiscal Periods
-136-

Ratio of Net Percentage Debt Net of
to Assessed Debt Per PersonalValue (a) Capita Population Income
7.57% 1,042 534,543 1.97.11% 936 537,487 2.28.45% 1,080 546,653 2.17.87% 1,010 549,643 2.17.34% 934 558,896 2.16.51% 943 565,106 1.75.97% 864 571,775 1.54.80% 791 578,627 1.48.38% 1,384 579,631 2.36.80% 1,270 583,105 2.1
-137-

2011 2012 2013 2014General bonded debt outstanding General obligation debt $502,790,000 $452,710,000 $500,785,000 $473,965,000
Percentage of estimated property value (a) 0.80% 0.74% 0.82% 0.78%
Per capita (b) 941 842 916 862
Less: Amounts set aside to repay general debt (72,341,627) (76,032,525) (53,644,274) (54,882,086)
Total net debt applicable to debt limit 430,448,373 376,677,475 447,140,726 419,082,914
Legal debt limit (c) 1,461,910,139 1,408,606,084 1,389,895,624 1,402,508,676
Legal debt margin (d) $1,031,461,766 $1,031,928,609 $942,754,898 $984,412,410
Legal debt margin as a percentage of the debt limit 70.56% 73.26% 67.83% 70.19%
Note: Details regarding the District's outstanding debt can be found in the notes to the financial statements. The debt reflected is all direct and there is no overlapping debt to display.(a) Property value data can be found in Schedule 5: Taxable Assessed and Estimated Full Value of Property.(b) Population data can be found in Schedule 9: Ratios of Outstanding Debt by Type.(c) Colorado Revised Statute 22-42-104 limits the District's available borrowing to no more than 20% of the assessed value of property.(d) The legal debt margin is the District's available borrowing authority calculated by subtracting the net debt applicable to the legal debt from the debt limit.
Debt Capacity Schedule 10Jefferson County School District, No.R-1
Ratios of Net General Bonded Debt Outstanding and Legal Debt MarginLast Ten Fiscal Periods
-138-
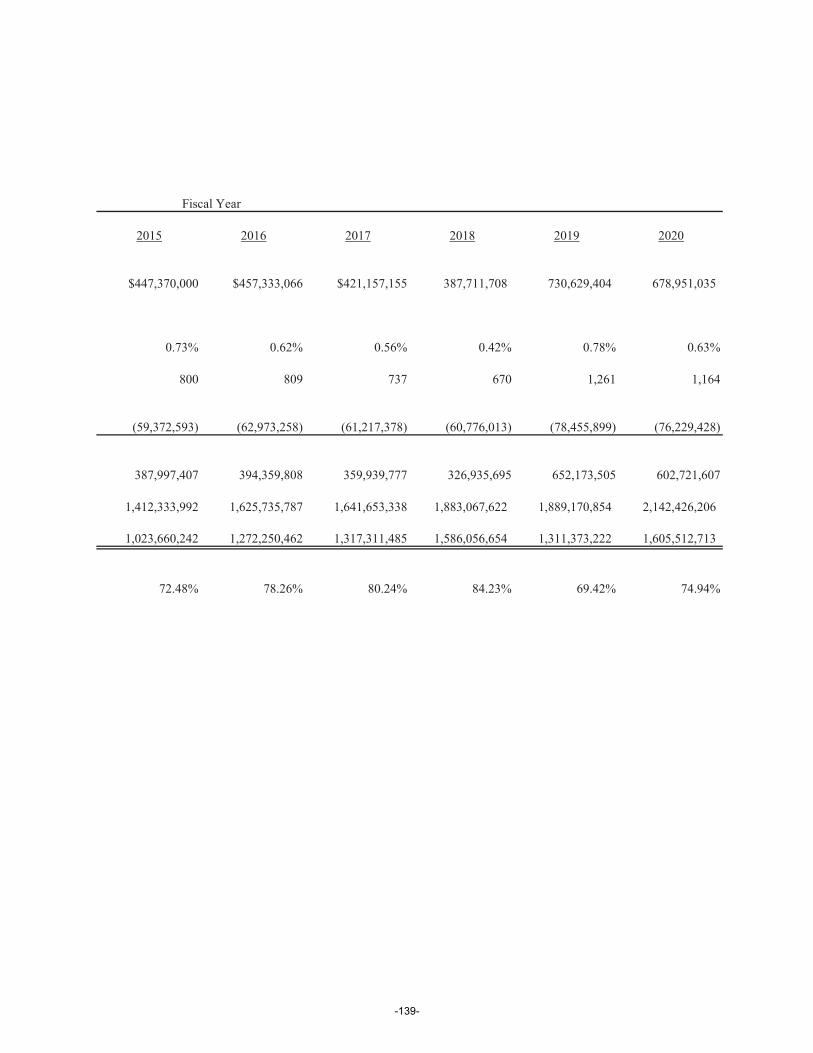
2015 2016 2017 2018 2019 2020
$447,370,000 $457,333,066 $421,157,155 387,711,708 730,629,404 678,951,035
0.73% 0.62% 0.56% 0.42% 0.78% 0.63%
800 809 737 670 1,261 1,164
(59,372,593) (62,973,258) (61,217,378) (60,776,013) (78,455,899) (76,229,428)
387,997,407 394,359,808 359,939,777 326,935,695 652,173,505 602,721,607
1,412,333,992 1,625,735,787 1,641,653,338 1,883,067,622 1,889,170,854 2,142,426,206
1,023,660,242 1,272,250,462 1,317,311,485 1,586,056,654 1,311,373,222 1,605,512,713
72.48% 78.26% 80.24% 84.23% 69.42% 74.94%
Fiscal Year
-139-
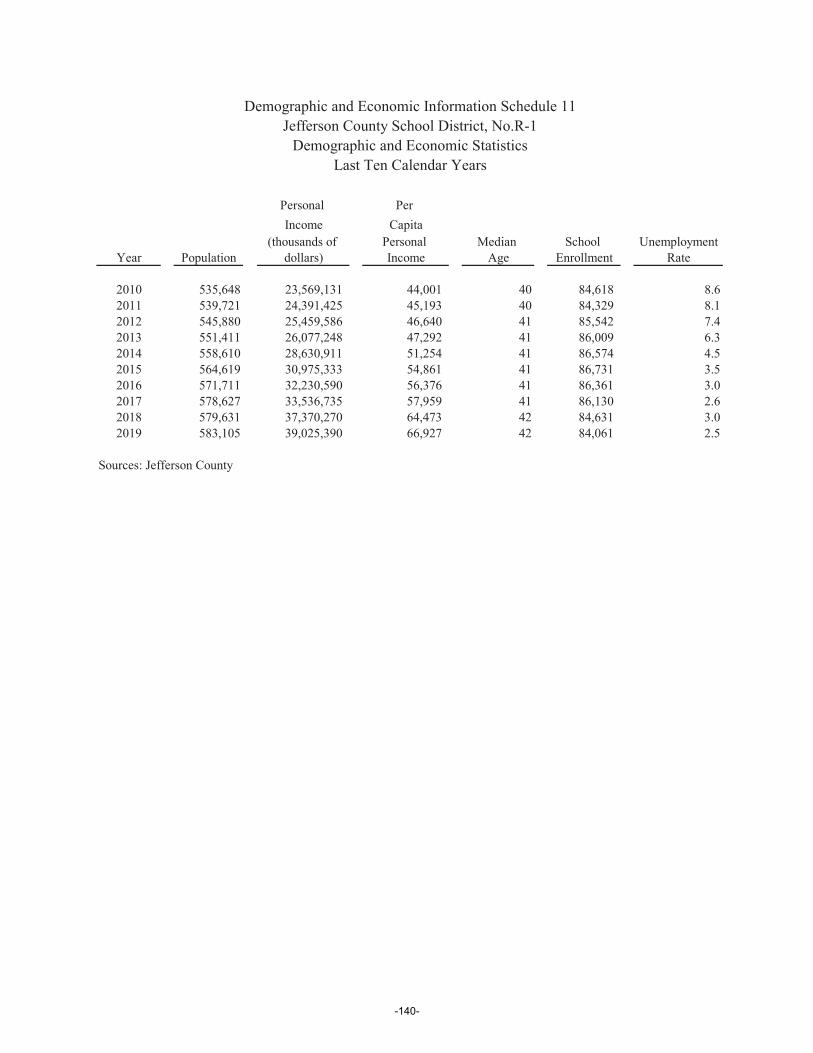
Personal Per Income Capita
(thousands of Personal Median School UnemploymentYear Population dollars) Income Age Enrollment Rate
2010 535,648 23,569,131 44,001 40 84,618 8.62011 539,721 24,391,425 45,193 40 84,329 8.12012 545,880 25,459,586 46,640 41 85,542 7.42013 551,411 26,077,248 47,292 41 86,009 6.32014 558,610 28,630,911 51,254 41 86,574 4.52015 564,619 30,975,333 54,861 41 86,731 3.52016 571,711 32,230,590 56,376 41 86,361 3.02017 578,627 33,536,735 57,959 41 86,130 2.62018 579,631 37,370,270 64,473 42 84,631 3.02019 583,105 39,025,390 66,927 42 84,061 2.5
Sources: Jefferson County
Demographic and Economic Information Schedule 11Jefferson County School District, No.R-1
Demographic and Economic StatisticsLast Ten Calendar Years
-140-
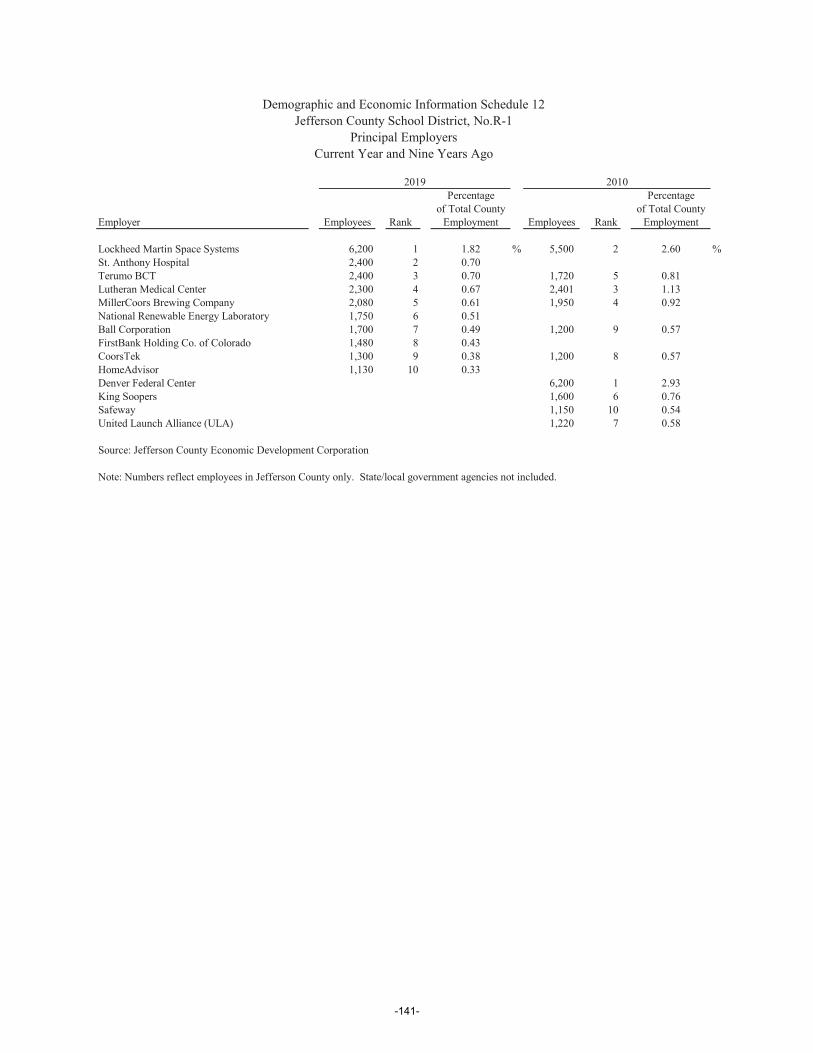
Percentage Percentageof Total County of Total County
Employer Employees Rank Employment Employees Rank Employment
Lockheed Martin Space Systems 6,200 1 1.82 % 5,500 2 2.60 %St. Anthony Hospital 2,400 2 0.70Terumo BCT 2,400 3 0.70 1,720 5 0.81Lutheran Medical Center 2,300 4 0.67 2,401 3 1.13MillerCoors Brewing Company 2,080 5 0.61 1,950 4 0.92National Renewable Energy Laboratory 1,750 6 0.51Ball Corporation 1,700 7 0.49 1,200 9 0.57FirstBank Holding Co. of Colorado 1,480 8 0.43CoorsTek 1,300 9 0.38 1,200 8 0.57HomeAdvisor 1,130 10 0.33Denver Federal Center 6,200 1 2.93King Soopers 1,600 6 0.76Safeway 1,150 10 0.54United Launch Alliance (ULA) 1,220 7 0.58
Source: Jefferson County Economic Development Corporation
Note: Numbers reflect employees in Jefferson County only. State/local government agencies not included.
2010
Demographic and Economic Information Schedule 12Jefferson County School District, No.R-1
Principal EmployersCurrent Year and Nine Years Ago
2019
-141-
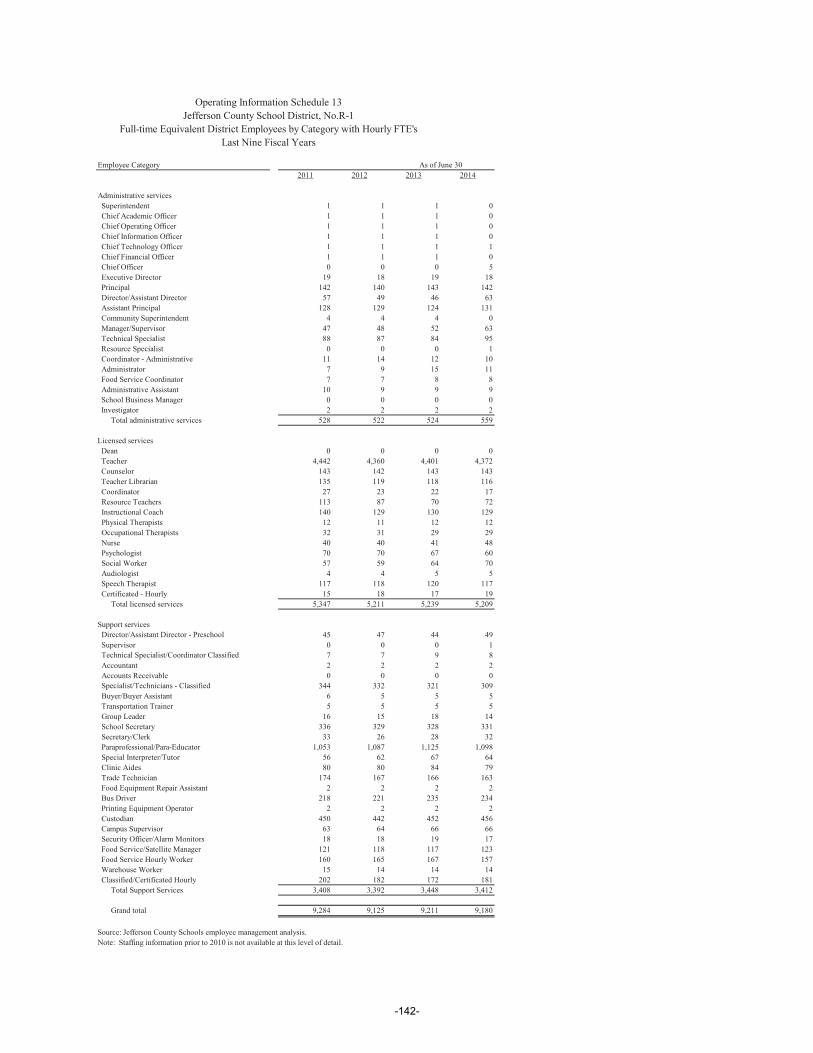
Employee Category2011 2012 2013 2014
Administrative services Superintendent 1 1 1 0 Chief Academic Officer 1 1 1 0 Chief Operating Officer 1 1 1 0 Chief Information Officer 1 1 1 0 Chief Technology Officer 1 1 1 1 Chief Financial Officer 1 1 1 0 Chief Officer 0 0 0 5 Executive Director 19 18 19 18 Principal 142 140 143 142 Director/Assistant Director 57 49 46 63 Assistant Principal 128 129 124 131 Community Superintendent 4 4 4 0 Manager/Supervisor 47 48 52 63 Technical Specialist 88 87 84 95 Resource Specialist 0 0 0 1 Coordinator - Administrative 11 14 12 10 Administrator 7 9 15 11 Food Service Coordinator 7 7 8 8 Administrative Assistant 10 9 9 9 School Business Manager 0 0 0 0 Investigator 2 2 2 2 Total administrative services 528 522 524 559
Licensed services Dean 0 0 0 0 Teacher 4,442 4,360 4,401 4,372 Counselor 143 142 143 143 Teacher Librarian 135 119 118 116 Coordinator 27 23 22 17 Resource Teachers 113 87 70 72 Instructional Coach 140 129 130 129 Physical Therapists 12 11 12 12 Occupational Therapists 32 31 29 29 Nurse 40 40 41 48 Psychologist 70 70 67 60 Social Worker 57 59 64 70 Audiologist 4 4 5 5 Speech Therapist 117 118 120 117 Certificated - Hourly 15 18 17 19 Total licensed services 5,347 5,211 5,239 5,209
Support services Director/Assistant Director - Preschool 45 47 44 49 Supervisor 0 0 0 1 Technical Specialist/Coordinator Classified 7 7 9 8 Accountant 2 2 2 2 Accounts Receivable 0 0 0 0 Specialist/Technicians - Classified 344 332 321 309 Buyer/Buyer Assistant 6 5 5 5 Transportation Trainer 5 5 5 5 Group Leader 16 15 18 14 School Secretary 336 329 328 331 Secretary/Clerk 33 26 28 32 Paraprofessional/Para-Educator 1,053 1,087 1,125 1,098 Special Interpreter/Tutor 56 62 67 64 Clinic Aides 80 80 84 79 Trade Technician 174 167 166 163 Food Equipment Repair Assistant 2 2 2 2 Bus Driver 218 221 235 234 Printing Equipment Operator 2 2 2 2 Custodian 450 442 452 456 Campus Supervisor 63 64 66 66 Security Officer/Alarm Monitors 18 18 19 17 Food Service/Satellite Manager 121 118 117 123 Food Service Hourly Worker 160 165 167 157 Warehouse Worker 15 14 14 14 Classified/Certificated Hourly 202 182 172 181 Total Support Services 3,408 3,392 3,448 3,412
Grand total 9,284 9,125 9,211 9,180
Source: Jefferson County Schools employee management analysis.Note: Staffing information prior to 2010 is not available at this level of detail.
Operating Information Schedule 13Jefferson County School District, No.R-1
Full-time Equivalent District Employees by Category with Hourly FTE'sLast Nine Fiscal Years
As of June 30
-142-
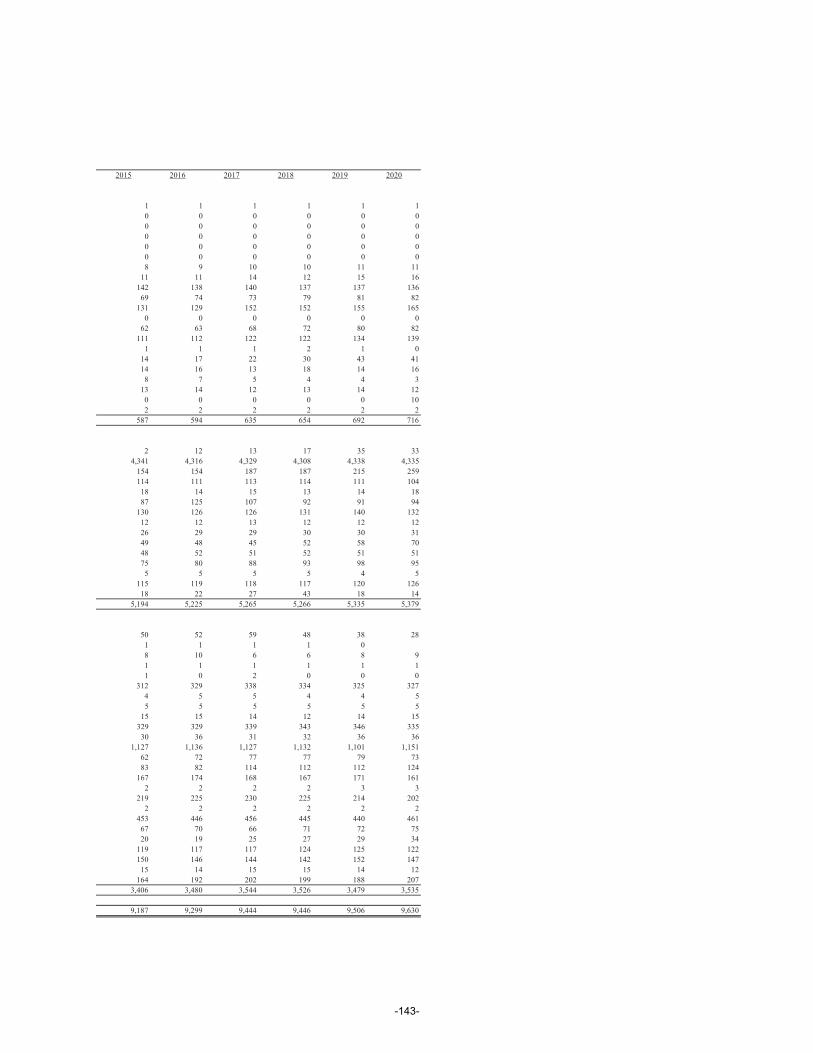
2015 2016 2017 2018 2019 2020
1 1 1 1 1 10 0 0 0 0 00 0 0 0 0 00 0 0 0 0 00 0 0 0 0 00 0 0 0 0 08 9 10 10 11 11
11 11 14 12 15 16142 138 140 137 137 136
69 74 73 79 81 82131 129 152 152 155 165
0 0 0 0 0 062 63 68 72 80 82
111 112 122 122 134 1391 1 1 2 1 0
14 17 22 30 43 4114 16 13 18 14 16
8 7 5 4 4 313 14 12 13 14 12
0 0 0 0 0 102 2 2 2 2 2
587 594 635 654 692 716
2 12 13 17 35 334,341 4,316 4,329 4,308 4,338 4,335
154 154 187 187 215 259114 111 113 114 111 104
18 14 15 13 14 1887 125 107 92 91 94
130 126 126 131 140 13212 12 13 12 12 1226 29 29 30 30 3149 48 45 52 58 7048 52 51 52 51 5175 80 88 93 98 95
5 5 5 5 4 5115 119 118 117 120 126
18 22 27 43 18 145,194 5,225 5,265 5,266 5,335 5,379
50 52 59 48 38 281 1 1 1 08 10 6 6 8 91 1 1 1 1 11 0 2 0 0 0
312 329 338 334 325 3274 5 5 4 4 55 5 5 5 5 5
15 15 14 12 14 15329 329 339 343 346 335
30 36 31 32 36 361,127 1,136 1,127 1,132 1,101 1,151
62 72 77 77 79 7383 82 114 112 112 124
167 174 168 167 171 1612 2 2 2 3 3
219 225 230 225 214 2022 2 2 2 2 2
453 446 456 445 440 46167 70 66 71 72 7520 19 25 27 29 34
119 117 117 124 125 122150 146 144 142 152 147
15 14 15 15 14 12164 192 202 199 188 207
3,406 3,480 3,544 3,526 3,479 3,535
9,187 9,299 9,444 9,446 9,506 9,630
-143-
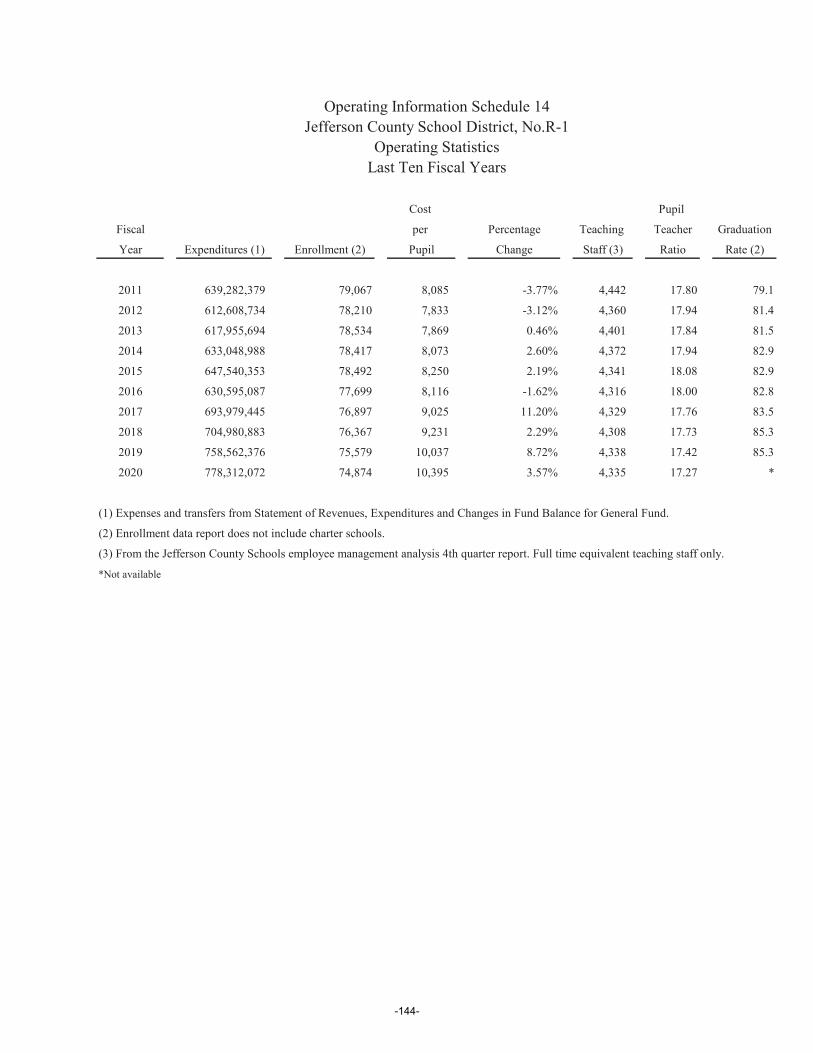
Cost Pupil
Fiscal per Percentage Teaching Teacher Graduation
Year Expenditures (1) Enrollment (2) Pupil Change Staff (3) Ratio Rate (2)
2011 639,282,379 79,067 8,085 -3.77% 4,442 17.80 79.1
2012 612,608,734 78,210 7,833 -3.12% 4,360 17.94 81.4
2013 617,955,694 78,534 7,869 0.46% 4,401 17.84 81.5
2014 633,048,988 78,417 8,073 2.60% 4,372 17.94 82.9
2015 647,540,353 78,492 8,250 2.19% 4,341 18.08 82.9
2016 630,595,087 77,699 8,116 -1.62% 4,316 18.00 82.8
2017 693,979,445 76,897 9,025 11.20% 4,329 17.76 83.5
2018 704,980,883 76,367 9,231 2.29% 4,308 17.73 85.3
2019 758,562,376 75,579 10,037 8.72% 4,338 17.42 85.3
2020 778,312,072 74,874 10,395 3.57% 4,335 17.27 *
(1) Expenses and transfers from Statement of Revenues, Expenditures and Changes in Fund Balance for General Fund.
(2) Enrollment data report does not include charter schools.
(3) From the Jefferson County Schools employee management analysis 4th quarter report. Full time equivalent teaching staff only.
*Not available
Operating Information Schedule 14Jefferson County School District, No.R-1
Operating StatisticsLast Ten Fiscal Years
-144-

2011 2012 2013 2014 2015 2016 2017 2018 2019 2020
Elementary/Pre-K campuses 101 101 99 99 99 100 99 99 98 98 Total square feet 4,616,761 4,592,792 4,582,688 4,583,299 4,579,989 4,746,203 4,714,483 4,824,248 4,775,087 4,768,127 Total program capacity 50,711 48,670 43,088 43,408 43,408 43,013 44,600 45,507 45,194 44,970 Enrollment 40,874 40,274 40,774 40,670 40,652 40,017 39,371 38,837 35,463 34,250
Middle school campuses 19 19 19 19 19 17 17 17 17 17 Total square feet 2,037,237 2,037,237 2,037,237 2,037,237 2,037,237 1,817,299 1,817,299 1,817,299 1,856,465 1,898,936 Total program capacity 16,410 15,943 15,786 15,786 15,786 15,786 14,199 14,199 15,039 15,907 Enrollment 10,755 10,686 10,720 10,757 10,745 10,060 10,052 9,986 12,224 12,707
High school campuses 17 17 17 17 17 17 17 17 17 17 Total square feet 3,692,357 3,692,357 3,692,597 3,692,597 3,692,597 3,724,284 3,724,284 3,724,284 3,724,309 3,724,307 Total program capacity 30,063 30,019 29,764 29,764 29,764 29,835 29,835 29,835 29,835 29,835 Enrollment 23,384 23,219 22,958 22,959 22,935 23,589 23,388 23,496 23,062 23,075
Option schools/Innovation 15 15 15 15 15 17 17 17 18 17 Total square feet 900,062 923,062 928,709 930,932 907,020 956,482 956,481 952,978 1,006,690 980,287 Total program capacity 5,711 5,817 5,868 5,868 5,868 6,344 6,344 6,277 6,862 6,527 Enrollment 4,054 4,031 3,801 4,031 4,160 4,033 4,086 4,048 4,830 4,842
Charter schools 14 14 15 16 16 17 18 18 17 17 Enrollment 5,551 6,119 7,008 7,592 8,082 9,032 9,464 9,763 9,052 9,187
Support facilities Total square feet 534,434 491,806 485,210 493,488 493,488 493,488 525,595 527,123 559,068 656,871
Sources: Jefferson County Schools Enrollment Data Jefferson County Schools Facilities Conditions Assessment Report
Operating Information Schedule 15Jefferson County School District, No.R-1
School Building InformationLast Ten Fiscal Years
-145-
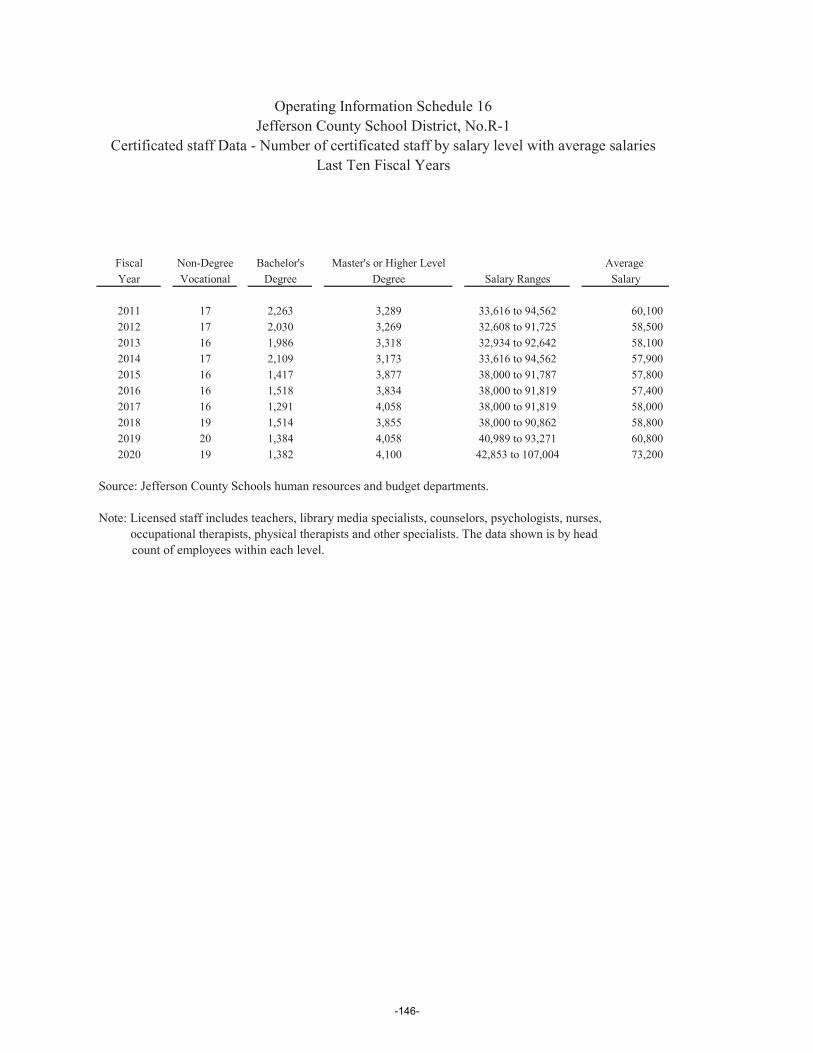
Fiscal Non-Degree Bachelor's Master's or Higher Level Average Year Vocational Degree Degree Salary Ranges Salary
2011 17 2,263 3,289 33,616 to 94,562 60,1002012 17 2,030 3,269 32,608 to 91,725 58,5002013 16 1,986 3,318 32,934 to 92,642 58,1002014 17 2,109 3,173 33,616 to 94,562 57,9002015 16 1,417 3,877 38,000 to 91,787 57,8002016 16 1,518 3,834 38,000 to 91,819 57,4002017 16 1,291 4,058 38,000 to 91,819 58,0002018 19 1,514 3,855 38,000 to 90,862 58,8002019 20 1,384 4,058 40,989 to 93,271 60,8002020 19 1,382 4,100 42,853 to 107,004 73,200
Source: Jefferson County Schools human resources and budget departments.
Note: Licensed staff includes teachers, library media specialists, counselors, psychologists, nurses, occupational therapists, physical therapists and other specialists. The data shown is by head count of employees within each level.
Operating Information Schedule 16Jefferson County School District, No.R-1
Certificated staff Data - Number of certificated staff by salary level with average salariesLast Ten Fiscal Years
-146-
Colorado Department of Education
Auditor’s Electronic Financial Data
Integrity Check Figures
The Auditor’s Electronic Financial Data Integrity Check Figures is a fiscal year report of each fund according to the provisions of section 22-44-204(3), Colorado Revised Statutes (C.R.S.), concerning the use of the Financial Policies and Procedures Handbook adopted by the State Board of Education. C.R.S. 29-1-603
-147-

-148-
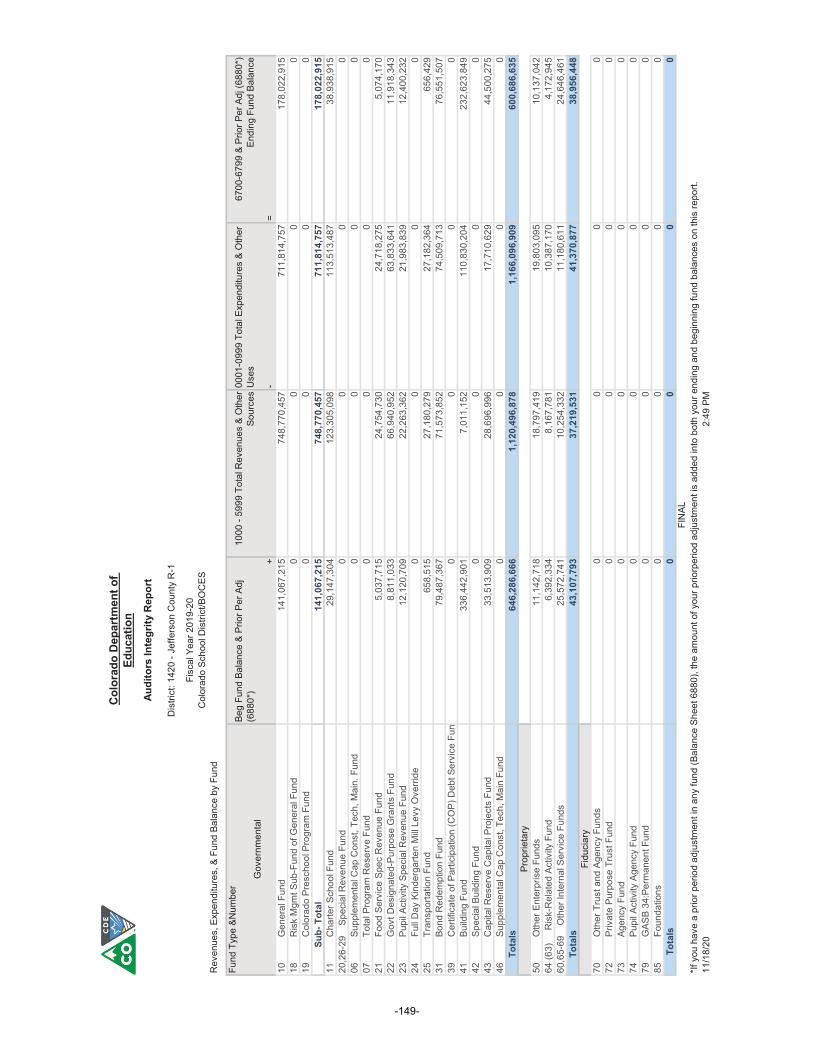
Audi
tors
Inte
grity
Rep
ort
Fisc
al Y
ear 2
019-
20C
olor
ado
Scho
ol D
istri
ct/B
OC
ES
Fund
Typ
e &N
umbe
r
Gov
ernm
enta
l+
-=
10
Gen
eral
Fun
d14
1,06
7,21
574
8,77
0,45
771
1,81
4,75
717
8,02
2,91
518
R
isk
Mgm
t Sub
-Fun
d of
Gen
eral
Fun
d0
00
019
C
olor
ado
Pres
choo
l Pro
gram
Fun
d0
00
0
Sub
- Tot
al14
1,06
7,21
574
8,77
0,45
771
1,81
4,75
717
8,02
2,91
511
C
harte
r Sch
ool F
und
29,1
47,3
0412
3,30
5,09
811
3,51
3,48
738
,938
,915
20,2
6-29
S
peci
al R
even
ue F
und
00
00
06
Sup
plem
enta
l Cap
Con
st, T
ech,
Mai
n. F
und
00
00
07
Tot
al P
rogr
am R
eser
ve F
und
00
00
21
Foo
d Se
rvic
e Sp
ec R
even
ue F
und
5,03
7,71
524
,754
,730
24,7
18,2
755,
074,
170
22
Gov
t Des
igna
ted-
Purp
ose
Gra
nts
Fund
8,81
1,03
366
,940
,952
63,8
33,6
4111
,918
,343
23
Pup
il Ac
tivity
Spe
cial
Rev
enue
Fun
d12
,120
,709
22,2
63,3
6221
,983
,839
12,4
00,2
3224
F
ull D
ay K
inde
rgar
ten
Mill
Levy
Ove
rride
00
00
25
Tra
nspo
rtatio
n Fu
nd65
8,51
527
,180
,279
27,1
82,3
6465
6,42
931
B
ond
Red
empt
ion
Fund
79,4
87,3
6771
,573
,852
74,5
09,7
1376
,551
,507
39
Cer
tific
ate
of P
artic
ipat
ion
(CO
P) D
ebt S
ervi
ce F
un0
00
041
B
uild
ing
Fund
336,
442,
901
7,01
1,15
211
0,83
0,20
423
2,62
3,84
942
S
peci
al B
uild
ing
Fund
00
00
43
Cap
ital R
eser
ve C
apita
l Pro
ject
s Fu
nd33
,513
,909
28,6
96,9
9617
,710
,629
44,5
00,2
7546
S
uppl
emen
tal C
ap C
onst
, Tec
h, M
ain
Fund
00
00
Tota
ls64
6,28
6,66
61,
120,
496,
878
1,16
6,09
6,90
960
0,68
6,63
5Pr
oprie
tary
50
Oth
er E
nter
pris
e Fu
nds
11,1
42,7
1818
,797
,419
19,8
03,0
9510
,137
,042
64 (6
3)
Ris
k-R
elat
ed A
ctiv
ity F
und
6,39
2,33
48,
167,
781
10,3
87,1
704,
172,
945
60,6
5-69
O
ther
Inte
rnal
Ser
vice
Fun
ds25
,572
,741
10,2
54,3
3211
,180
,611
24,6
46,4
61
To
tals
43,1
07,7
9337
,219
,531
41,3
70,8
7738
,956
,448
Fidu
ciar
y70
O
ther
Tru
st a
nd A
genc
y Fu
nds
00
00
72
Priv
ate
Purp
ose
Trus
t Fun
d0
00
073
A
genc
y Fu
nd0
00
074
P
upil
Activ
ity A
genc
y Fu
nd0
00
079
G
ASB
34:P
erm
anen
t Fun
d0
00
085
F
ound
atio
ns0
00
0
T
otal
s0
00
0
11/1
8/20
2:49
PM
Col
orad
o D
epar
tmen
t of
Educ
atio
n
Dis
trict
: 142
0 - J
effe
rson
Cou
nty
R-1
Rev
enue
s, E
xpen
ditu
res,
& F
und
Bala
nce
by F
und
*If y
ou h
ave
a pr
ior p
erio
d ad
just
men
t in
any
fund
(Bal
ance
She
et 6
880)
, the
am
ount
of y
our p
riorp
erio
d ad
just
men
t is
adde
d in
to b
oth
your
end
ing
and
begi
nnin
g fu
nd b
alan
ces
on th
is re
port.
Beg
Fund
Bal
ance
& P
rior P
er A
dj
(688
0*)
1000
- 59
99 T
otal
Rev
enue
s &
Oth
er
Sour
ces
0001
-099
9 To
tal E
xpen
ditu
res
& O
ther
U
ses
6700
-679
9 &
Prio
r Per
Adj
(688
0*)
Endi
ng F
und
Bala
nce
FIN
AL
-149-

-150-