army program value added analysis 90-97 (vaa 90-97) - DTIC
205
AD-A245 880 STUDY REPORT CAA-SR-91-9 ARMY PROGRAM VALUE ADDED ANALYSIS 90-97 (VAA 90-97) r AUGUST 1991 DTIC PREPARED BY FORCE SYSTEMS DIRECTORATE US ARMY CONCEPTS ANALYSIS AGENCY 8120 WOODMONT AVENUE BETHESDA, MARYLAND 20814-2797 'seo, o - a o 9-03191 jfor publil, relend a~ "1 9 0319 its1 d "IIIIIIIII tibI II II U II 11111 II Ifl I
-
Upload
khangminh22 -
Category
Documents
-
view
0 -
download
0
Transcript of army program value added analysis 90-97 (vaa 90-97) - DTIC

AD-A245 880
STUDY REPORTCAA-SR-91-9
ARMY PROGRAM VALUE ADDEDANALYSIS 90-97
(VAA 90-97)
r AUGUST 1991
DTIC
PREPARED BYFORCE SYSTEMS DIRECTORATE
US ARMY CONCEPTS ANALYSIS AGENCY8120 WOODMONT AVENUE
BETHESDA, MARYLAND 20814-2797
'seo, o - a o 9-03191jfor publil, relend a~ "1 9 0319 its1
d "IIIIIIIII tibI II II U II 11111 II Ifl I

DISCLAIMER
The findings of this report are not to be construedas an official Department of the Army position,policy or decision unless so designated by otherofficial documentation. Comments orsuggestions should be addressed to:
DirectorU.S. Army Concepts Analysis AgencyATTN: CSCA-FS8120 Woodmont AvenueBethesda, MD 20814-2797

CAA-SR-91-9
SECURITY CLASSIFICATION OF THIS PAGE
Form ApprovedREPORT DOCUMENTATION PAGE OMB No 0704-0188
Ia. Report Security Classification lb. Restnctive Markings
UNCLASSIFIED
2a. Security Classification Authority 3. Distribution/Availability of Report
2b. Dedassification/Downgrading Schedule
4. Performing Organization Report Number(s, 5. Monitoring Organization Report Number(s)
CAA-SR-91-96a. Name of Performing Organization 6b Office Symbol 7a. Name of Monitoring Organization
US Army Concepts Analysis (if acpcable)
Agency CSCA-FSR
6c. Address (City, State, and ZIP Code) 7b. Address (City. State. and ZIP Code)
8120 Woodmont AvenueBethesda, MD 20814-2797
Ba Name of Fundinq/S onsonnq Organzation 8b. Office Symbol 9. Procurement Instrument Identification NumberDir, DPAE;Tech Advisor, (ifapplicable)DCSOPS
8c Address (City, State, and ZIP Code) t0. Source of Funding Numbers
PROGRAM PROJECT TASK WORK UNITWashington, DC 20310 ELEMENT NO. NO. NO. ACCESSION NO
1I. Title (Include Security Classification)
Army Program Value Added Analysis 90-97 (VAA 90-97)
12. Personal Author(s)
LTC Robert R. Koury13a. Type of Report 13b. Time Covered 14. Date of Report (Year. Month, Day) 1S Page Count
Final FromOct88 ToAuQ_9_ 1991 August 220
16. Supplementary Notation
17. COSATI Codes 18, Subect Terms (Continue on reverse if necessary and identifyby block number)
FIELD GROUP SUB-GROUP
Decision support, PPBES, programming, forcedevelopment
Abstract (Continue on reverse if necessary and identify by block number)?he Value Added Analysis (VAA) methodology is a decision support system that will assistdecisionmakers in evaluating and prioritizing competing alternatives in the POM building process.The Value Added Analysis concept uses a family of models to measure an alternative's explicit(objective) contribution to the program as an incremental or decremental change to the currentprogram base. A hierarchical assessment framework is used to develop an alternative's scores. Thisassessment framework is used to evaluate changes against the current program base as theconsequences of program alternatives are considered. Value Added Analysis results in measuringan alternative's relative value in the context of a larger value system. This relative value is eitherused directly by decisionmakers or is fed into a mathematical optimization model whichsimultaneously determines an alternative's cost-benefit and conducts a tradeoff betweenalternatives.20 Distribution/Availabity of Abstract 21 Abstract Security Classification
:x UNCLASSIFIED/UNLIMITED C3 SAME ASRPT :] OTIC USERS
22a Name of Resoonsible Individual 22b Teleohone (Include Area Code) 22c Office Symbol
LTC Robert R. Koury (301)295-5291 CSCA-FSR
DD Form 1473, JUN 86 Previous editions are obsolete. SECURITY CLASSIFICATION OF THIS PAGE

STUDY REPORTCAA-SR-91-9
ARMY PROGRAM VALUE ADDED ANALYSIS 90-97(VAA 90-97)
0J
August 1991 .
Statement A per teleconLtc Robert R. Koury CAA/CSCA-FSRBethesda, MD 20814-2797
NWW 2/12/92
Prepared by
FORCE SYSTEMS DIRECTORATE
US Army Concepts Analysis Agency8120 Woodmont Avenue
Bethesda, Maryland 20814-2797

CAA-SR-9 1-9
DEPARTMENT OF THE ARMYUS ARMY CONCEPTS ANALYSiS AGENCY
8120 WOOOMONT AVENUEBETHESDA, MARYLAND 20814-2797
0.,PLYTC
ArMN1NOF: 27 JAN 1992CSCA-FSR (5-5d)
MEMORANDUM FOR
DIRECTOR, PROGRAM ANALYSIS AND EVALUATION (DPAE), OFFICE OF THECHIEF OF STAFF, U.S. ARMY, WASHINGTON, DC 20310-0200
TECHNICAL ADVISOR TO THE DEPUTY CHIEF OF STAFF FOR OPERATIONSAND PLANS, WASHINGTON, DC 20310-0410
SUBJECT: Army Program Value Added Analysis 90-97 (VAA 90-97)Study
1. Reference memorandum, Office of the Chief of Staff, U.S.Army, 10 May 1989, subject: Army Program Value Added Analysis90-97 (VAA 90-97).
2. Reference memorandum requested that the U.S. Army ConceptsAnalysis Agency (CAA) conduct a study to provide the Director,Program Analysis and Evaluation and the Office of the DeputyChief of Staff for Operations and Plans (ODCSOPS) an analyticalmethodology and decision support system for the development ofa balanced and effective Army Program.
3. This final report documents the results of our analysis andincorporates your comments on the interim report. The ValueAdded Analysis (VAA) methodology is a decision support systemthat will assist decisionmakers in evaluating and prioritizingcompeting alternatives in the POM building process. The ValueAdded Analysis concept uses a family of models to measure analternative's explicit (objective) contribution to the prog-amas an incremental or decremental change to the current prcrambase. A hierarchical assessment framework is used to de%-elopan alternative's scores. This assessment framework is jied toevaluate changes against the current program base as *econsequences of program alternatives are considered. ValueAdded Analysis results in measuring an alternative's relativevalue in the context of a larger value system. This relativevalue is either used directly by decisionmakers or is fed intoa mathematical optimization model which simult.rieouslydetermines an alternative's cost-benefit and ;onducts atradeoff between alternatives.
iii

CAA-SR-91-9
CSCA-FSR (5-5d) 2 7 JAN 1992SUBJECT: Army P -gram V-'lue-Added Analysis 90-97 (VAA 90-97)Study
4. This Agency expresses appreciation to all commands andagencies which have contributed to this study. Questionsand/or inquiries should be directed to the Assistant Director,Force Systems Directorate, U.S. Army Concepts Analysis Agency,8120 Woodmont Avenue, Bethesda, MD 20814-2797, DSN 296-1546.
_ E. B. ANDI IIIDire cr
2
IV

I ARMY PROGRAM VALUE ADDED STUDY..... ANALYSIS 90-97 SUMMARY
(VAA 90-97) CAA-SR-91-9
THE REASON FOR PERFORMING THE STUDY was to provide the Director forProgram Analysis and Evaluation, and the Deputy Chief of Staff for Operationsand Plans (DCSOPS) an analytical methodology and capability to support thedevelopment of a balanced and effective Army Program.
THE STUDYSPONSORS are the Director for Program Analysis and Evaluation(DPAE), Office of the Chief of Staff, Army, and the Technical Advisor, Officeof the Deputy Chief of Staff for Operations and Plans (ODCSOPS), Head-quarters, Department of the Army (HQDA).
THE STUDY OBJECTIVES were to:
(1) Formulate an analytic method for estimating the marginal value ofcompeting management decision packages (MDEP) to the Army. The methodologywill provide a common understandable basis for the analysis of affordabilityissues.
(2) Identify or develop prototype models that support the Value AddedAnalysis methodology and provide management tools for the analytic methoddeveloped.
(3) Establish within DPAE and ODCSOPS an in-house capability to conductprogram issue tradeoffs.
(4) Conduct a proof of concept analysis during the building of the 92-97Program Objectivw Memorandum (POM).
THE SCOPE OFTHE STUDY included the research, development, and acquisition(RDA) appropriations for selected items of equipment in fiscal year (FY) 1999and FY 2004.
THE MAINASSUMPTION of this study is that HQDA needs a relatively quickmethod for conducting program tradeoffs which has sound analyticalunderpinnings.
THE BASIC APPROACH of this study was to:
(1) Identify and develop an analytical approach to evaluate program issuetradeoffs.
(2) Develop a capability for implementing the methodology to includesoftware modules where appropriate.
v

(3) Demonstrate the methodology and capability by using issues from the90-97 POM issue cycle.
THE PRINCIPAL FINDINGS of the study were:
(1) Two generalized categories of measures of effectiveness (explicit andimplicit) were determined to be important in Judging relative value.
(2) A linear combination of value components appears to be useful increating a single measure of an investment's marginal value.
(3) VAA uses a system of judgment weights which measures an investment'svalue in a dual context.
(4) The VAA methodology as demonstrated holds promise as the decisionanalysis framework that should be used for conducting Army program tradeoffanalyses. Further work in the areas of quick turnaround combat modeling,dynamic costing, and data collection need to be conducted.
(5) A highly aggregated combat model can provide useful insights foranswering macro-level program tradeoff questions and, to a more limiteddegree, is capable of providing specific program guidance.
(6) In order for aggregated combat models to be useful, they must becalibrated to more detailed models and data.
(7) HQDA has a perspective which does not include the Training andDoctrine Connand's (TRADOC) blueprint of the battlefield per se. Theirheadquarters is organized along the lines of Planning, Programming,Budgeting, and Estimation System (PPBES) functions, and, although theheadquarters has some overlap, the specific thrust is the generation offorces through planning and programming.
(8) The cost-benefit analysis in the form of the optimization modelrequires further research into the use of dynamic costing of the procurementcosts.
THE STUDY EFFORT was directed by LTC James A. Richmann, Force SystemsDirectorate, US Army Concepts Analysis Agency (CAA).
COMMENTSAND QUESTIONS may be sent to the Director, US Army ConceptsAnalysis Agency, ATTN: CSCA-FSR, 8120 Woodmont Avenue, Bethesda, Maryland20814-2797.
Tear-out copies of this synopsis are at back cover.
vi

CAA-SR-91-9
CONTENTS
CHAPTER Page
1 EXECUTIVE SUMMARY . ... .. .............. 1-1Problem .. ...................................... 1-1Study Purpose .. ................................ I-1Background .. ................................... 1-IStudy Objectives ............................. 1-2Study Scope ................................... 1-2Study Limitations ............................ 1-2Timeframe .. .................................... 1-3Key Assumptions .. .............................. i-3Study Methodology ............................ 1-4Essential Elements of Analysis (EEA) ......... 1-5Other Key Findings ........................... 1-7
2 INTRODUCTION .................................. 2-1Overview .. ................................. 2-1Problem Background ........................... 2-1Scope/Limitations/Timeframe .................. 2-2Key Methodological Assumptions ............... 2-3Influences to the Approach ................... 2-3Summary .. ...................................... 2-7
3 STUDY METHODOLOGY .......................... 3-1Introduction .. ................................. 3-1Overview .. ..................................... 3-1Issue Clarification Module ................... 3-3Costing Module ............................... 3-6Effectiveness Module ......................... 3-9Optimization Module ........................... 3-21Resource Allocation Module ................... 3-24Results and Display Module ................... 3-24
4 ISSUE CLARIFICATION ......................... 4-1Introduction .. ................................. 4-1Receive the Issue ............................ 4-2Obtain Broad Guidance ........................ 4-2Describe Issue Relationships ................. 4-3Determine How the Methodology Will Be Used ... 4-4
5 EXPLICIT MEASURES OF VALUE ............... 5-1Introduction .. ................................. 5-1Combat Effectiveness ......................... 5-2Noncombat Effectiveness ...................... 5-12Summary .. ...................................... 5-20
6 VALUE ADDED COSTING ......................... 6-1Introduction ................................. 6-1Deelopment of the Costing Context 6-3Determine Appropriate Models and Tools 6-4
vii

CAA-SR-91-9
CHAPTER Page
Implement Analytical Models and Tools 6-10Analyze Results 6-17Summary and Observations 6-19
7 IMPLICIT MEASURES OF EFFECTIVENESS ...... 7-1Introduction .. ................................. 7-1SIAM Factors .. ................................. 7-2Summary .. ...................................... 7-16
8 EFFECTIVENESS INTEGRATION ................... 8-1Introduction ....................... 8-1Develop Context For Effectiveness Integration 8-3Select and Develop Appropriate Analytical
Models and Tools ............................ 8-4Implement Analytical Models and Tools 8-5Summary .. ...................................... 8-8
9 COST EFFECTIVENESS ANALYSIS ............ 9-1Introduction .. ................................. 9-1Develop Context for Acquisition Strategy 9-2Select and Develop Appropriate Analytical
Models and Tools .......................... 9-4Implement Analytical Models and Tools 9-5Summary .. ...................................... 9-10
10 SUMMARY AND FINDINGS ......................... 10-1Introduction ................................. 10-1Summary .. ...................................... 10-iObservation and Findings ....................... 10-iVAA Future Development ......................... 0-5
APPENDIX
A Study Contributors ........................... A-iB Study Directive ................................ B-IC Bibliography ................................. C-iD VAA Module Matrix ............................ D-IE Classified Results ............................. E-1F Cost Learning Curves ............................ F-IG TOPSIS User Notes .............................. G-iH FOMOA User Notes .. ............................. H-II Study Sponsors' Comments ....................... I-iJ Distribution List ............................ J-1
GLOSSARY ............................................. Glossary-i
STUDY SUMMARY (tear-out copies)
viii
CAA-SR-91-9
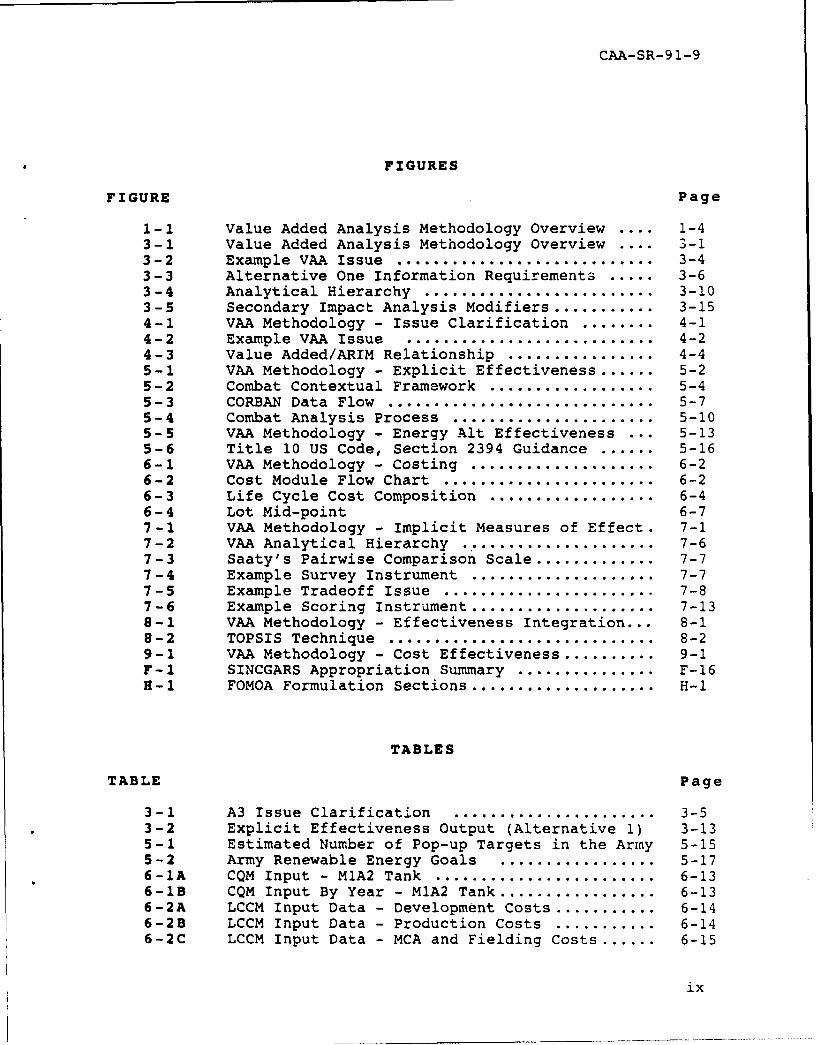
FIGURES
FIGURE Page
1-1 Value Added Analysis Methodology Overview .... 1-43-1 Value Added Analysis Methodology Overview 3-13-2 Example VAA Issue ............................ 3-43-3 Alternative One Information Requirements ..... 3-63-4 Analytical Hierarchy ......................... 3-103-5 Secondary Impact Analysis Modifiers ........... 3-154-1 VAA Methodology - Issue Clarification ........ 4-14-2 Example VAA Issue ........................... 4-24-3 Value Added/ARIM Relationship ................ 4-45-1 VAA Methodology - Explicit Effectiveness ...... 5-25-2 Combat Contextual Framework .................. 5-45-3 CORBAN Data Flow ............................. 5-75-4 Combat Analysis Process ...................... 5-105-5 VAA Methodology - Energy Alt Effectiveness ... 5-135-6 Title 10 US Code, Section 2394 Guidance ...... 5-166-1 VAA Methodology - Costing .................... 6-26-2 Cost Module Flow Chart ....................... 6-26-3 Life Cycle Cost Composition .................. 6-46-4 Lot Mid-point 6-77-1 VAA Methodology - Implicit Measures of Effect. 7-17-2 VAA Analytical Hierarchy ..................... 7-67-3 Saaty's Pairwise Comparison Scale ............. 7-77-4 Example Survey Instrument .................... 7-77-5 Example Tradeoff Issue ....................... 7-87-6 Example Scoring Instrument .................... 7-138-1 VAA Methodology - Effectiveness Integration... 8-18-2 TOPSIS Technique ............................. 8-29-1 VAA Methodology - Cost Effectiveness .......... 9-1F-1 SINCGARS Appropriation Summary ............... F-16H-i FOMOA Formulation Sections .................... H-i
TABLES
TABLE Page
3-1 A3 Issue Clarification ...................... 3-53-2 Explicit Effectiveness Output (Alternative 1) 3-135-1 Estimated Number of Pop-up Targets in the Army 5-155-2 Army Renewable Energy Goals ................. 5-176-1A CQM Input - M1A2 Tank ........................ 6-136-1B CQM Input By Year - MIA2 Tank ................. 6-136-2A LCCM Input Data - Development Costs ........... 6-146-2B LCCM Input Data - Production Costs ........... 6-146-2C LCCM Input Data - MCA and Fielding Costs ...... 6-15
ix

CAA-SR-91-9
6-2D LCCM Input Data - Sustainment Costs ........... 6-166-2E Link Between Appropriation Summary ............ 6-17
TABLE Page
6-3 CQM Output - MIA2 Tank ....................... 6-186-4 Avg Unit Production Costs of Optimized Qtys... 6-186-5 Major Weapon System Cost Definitions - MIA2... 6-197-i Example Decision !;atrix ..................... . 7-87-2 Example Scoring Matrix ........................ .7-14F-i Cost & Quantity Data .......................... F-4F-2 Cost, Quantity, and Rate Data ................. F-7F-3 Cost, Quantity, and Rate Data ................. F-10F-4 Estimated Experience Curve Parameters ........ F-IIF-5 Estimate of Total Cost ........................ F-12F-6 Production Phase Breakdown .................... F-14F-7 Sample Output for Big 5 Categories ............ F-15G-i Example Input .. ............................... G-2G-2 Example Output ................................. G-3H-i Input File By Type ........................... H-8H-i Example Output .. ............................... H-9
x

CAA-SR-91-9
CHAPTER 1
EXECUTIVE SUMMARY
1-1. PROBLEM. The leadership at Department of the Armyneeds analysis to support the development of a balanced andeffective Army program that is within Department of Defenseresource guidance.
1-2. STUDY PURPOSE. The purpose of the Army ProgramValue Added Analysis (VAA) was to provide the Director forProgram Analysis and Evaluation (DPAE), and the Deputy Chiefof Staff for Operations and Plans (DCSOPS) with an analyticaltradeoff methodology and capability that would assist thedevelopment of a balanced and effective Army program throughthe use of a comprehensive cost-benefit analysis.
1-3. BACKGROUND
a. Traditionally, Army program development is accom-plished during the Planning, Programming, Budgeting, andExecution System (PPBES) Program Objective Memorandum (POM)building process using some form of functional or missionarea panels. The processes that evolved do not includeadequate means of integrating these functional subprogramsinto a balanced total Army program. Furthermore, thetraditional POM process allowed each panel to use its ownmethods for prioritization. This lack of standardizationprevents the senior leadership from making the most effectivetradeoffs across functional areas.
b. Virtually all analysis currently performed in programevaluation focuses on defining individual Management DecisionPackage (MDEP) issues. When MDEP analysis is conducted, thesenior Army leadership lacks the visibility or analysisnecessary to help identify the marginal value of resourceswithin, or across, MDEPs.
c. Analysis of the total Army Program requires anunderstanding of how individual MDEPs contribute to the Armymission and strategy so as to determine which MDEPs andresource levels have the greatest return on investment. Oneapproach to this problem is to estimate the "value added" byindividual MDEPs, or groups of MDEPs--expressed as programenhancement packages or alternative solutions--to the totalArmy program as measured by their contribution to Armyobjectives.
1-I

CAA-SR-91-9
d. The Value Added Analysis concept uses a family ofmodels to measure an issue's explicit (objective) contri-bution to the program as an incremental or decremental changefrom the current program base. A pairwise comparisonframework is used to develop an issue's implicit (subjective)contribution to the program through the development ofindividual alternative's scores. Saaty's analyticalhierarchy technique is used to provide a structure fordeveloping weights for both the explicit and implicitmeasures of value.
1-4. STUDY OBJECTIVES were to:
a. Formulate an analytic method for estimating themarginal value of competing MDEPs to the Army. Themethodology will provide a common understandable basis forthe analysis of affordability issues.
b. Identify or develop prototype models that providemanagement tools and support the Value Added Analysismethodology.
c. Establish within PAED and ODCSOPS an in-housecapability to analyze program issue tradeoffs.
d. Conduct a proof of concept analysis during thebuilding of the Fiscal Year (FY) 92-97 POM.
1-5. STUDY SCOPE. Only research, development andacquisition (RDA) appropriations and associated life cyclecosts for selected items of equipment were included.
1-6. STUDY LIMITATIONS
a. Since this study is a proof of concept demonstration,the analysis included only the RDA appropriations Only RDAwas considered because of the need to limit the scope of thestudy to those appropriations with good data availability andissue definition. However, the final methodology should becapable of examining tradeoffs across the full range ofprogram issues.
b. Because the modeling and effectiveness data for thenoncombat issues are less developed than the combat areas,the study focused principally on combat tradeoff issues.
C. The original list of equipment issues for this studyincluded 23 systems. Limited data available for combat
1-2

CAA-SR-91-9
modeling did not permit the inclusion of more than 12 systemsin the analysis.
d. The initial data collection design called for systemeffectiveness, force structure, cost, and production data forFYs 1991, 1999, and 2004. Effectiveness data could not becollected for all three years in a timely manner. Therefore,only FY 1999 and FY 2004 data were used.
e. RDA appropriations provide only 22 percent of the Armyprogram dollars.
1-7. TIMEFRAME. This proof of concept analysis addressestradeoff issues during the period beginning in FY 99 andending in FY 04.
1-8. KEY ASSUMPTIONS
a. The methodology assumes that all tradeoff issues willonly be those on the margin, and does not purport to realignprevious (years prior to current POM) MDEP funding levels orquantities. The Value Added Analysis will not be used tobuild a completely new program from a zero base. Allprevious POM decisions which resulted in the current programwould remain unaltered. VAA would only be used to deal withincrements and decrements starting from a base represented bythe current POM (FY 92-97) position.
b. The Value Added Analysis can be executable in a quickturnaround environment. Therefore,the combat models appliedmust process at a lower level of resolution using data thathas been aggregated from more detailed models or data bases.
c. VAA must be compatible with the manner in which thesenior Army leadership makes decisions.
d. The Value Added Analysis assumes a two-tier decisionprocess wherein the senior Army leadership provides guidanceregarding Total Obligation Authority (TOA ) allocation (firsttier), and the VAA methodology is used to decide on tradeoffissues within this guidance (second tier). However, the TOAguidance may or may not be developed using the Value Addedmethodology.
e. The methodology must allow for prioritizing betweendissimilar program alternatives.
1-3

CAA-SR-9 1-9
1-9. STUDY METHODOLOGY
a. The Value Added Analysis concept uses a hierarchicalassessment framework for developing a single measure ofbenefit. This assessment framework is used to portrayexisting capability (current program levels) and evaluatescapability changes against this base level as the impact ofalternative solutions for program tradeoffs issues areconsidered. The contribution of a program alternative ismeasured both explicitly (using combat models and otherquantitative methods) and implicitly (using Thomas L. Saaty'spairwise comparison techniquel). VAA results in measuring analternative's relative value in the context of a larger valuecontext. This relative value is used either directly bydecisionmakers or is input into a linear program to determinean alternative's cost effectiveness, and, in turn,acquisition strategy
b. The current application of the VAA methodology uses fourtypes of models: combat models, costing models,multiattribute models, and linear programing models. All ofthem use existing, well-accepted operations researchtechniques to eliminate any debate over those specifictechniques used. Furthermore, by using techniques which manypeople are already familiar with, the learning curve forusing the VAA methodology would be shortened. Figure 1-1depicts the overall Value Added methodology.
ISSUE CLARIFICATION EXPLICIT EFFECTIVENES IMPLICIT EFFECTIVENESSMODULE MODULE EFFECTIVENESS INTEGRATION
I ||
|MODULE MODULE
Rcltd twnod e
Appvrod oM IZTI
eVued aOSier sMhog
AO-4ATIONCOSTDODUL
RESULTS &DISPLAY
MODULE1-1Figure 1-1. Value Added Analysis Methodology Overview
1-4

CAA-SR-91-9
c. The combat and costing models are used to obtain theexplicit (objective) measures of effectiveness of aninvestment alternative. The implicit measures of effec-tiveness are developed through the use of two surveys. Thefirst survey is given to the Army leadership as a means ofderiving decision weights.for subjective decision criteria(e.g., Congressional opinion). These criteria are referredto as secondary impact analysis modifiers (SIAM factors) andare developed using Saaty's pairwise comparison technique.The second survey is given to subject matter experts, who areasked to value or score investment alternatives in light ofthe SIAM factors.
d. The explicit measures of benefit are combined with theimplicit (subjective) measures using a model called TOPSIS(Technique for Order Preference by Similarity to IdealSolution). This combined measure of benefit is evaluatedagainst cost using a multiobjective linear program calledFOMOA (Force Modernization Analyzer). FOMOA producesefficient acquisition strategy based upon a cost effectivecriterion. This display may be used as is or processedfurther using a future enhancement which will allow theanalyst to distribute equipment or program items by unit oractivity.
e. The previous paragraphs of this chapter provide abrief outline of the VAA methodology. Readers desiring afundamental understanding of this study and the VAAmethodology should read Chapters 2, 3, 10, and Appendix E.Those needing a more detailed explanation should readChapters 2 through 10 and Appendices D and E. Individualswishing to implement the VAA methodology should read Chapters2 through 10 plus Appendices D through H.
1-10. ESSENTIAL ELEMENTS OF ANALYSIS (EEA). Theessential elements of analysis and basic findings for eachare as follows:
a. EEA 1: What measures of effectiveness (MOE)are appropriate for judging relative value among allMDEPs in the program? Two generalized categories ofmeasures of effectiveness were determined to be important injudging relative value.
(1) The first (called explicit effectiveness) consistsof three subdivided elements (combat effectiveness, soldierquality of life, and other Army goals and objectives). Theyare those measures which can be directly quantified. Thesemeasures include such MOE as force exchange ratios (FER),
1-5

CAA-SR-91-9
correlation of forces and means (COFM), day care days, amountof energy savings, etc. These MOE were selected for theiiability to appropriately measure the issue in its owncontext.
(2) The second category of MOE (SIAM factors) measuresimplicit effectiveness and includes those measures which areinherently qualitative, such as political risk and insti-tutional stability. These MOE were selected because theyexpress subjective values which are best measured throughexpert judgment.
b. EEA 2: Should a linear combination of valuecomponents be used to arrive at a single measure ofvalue added? If so, what system of judgment weightsshould be used?
(1) A linear combination of value components appearsto be useful in creating a single measure of an issue'smarginal value.
(2) VAA uses a system of judgment weights whichmeasures the value of an issue in a dual context. Themethodology seeks two sets of estimates. The first set ofestimates is created by surveying the Army leadership todetermine both the set of judgmental factors and theirweights in accordance with the group's value set and worldview. The second set of estimates is created by scoringindividual issues using subject matter experts and thejudgmental factors developed by surveying the leadership.Both sets of surveys appear to yield consistent andinformative values. These approaches are successful incapturing the multiple attributes used by the decisionmakersin the PPBES programing decision process.
C. EEA 3: What decision analysis framework shouldbe used? The VAA methodology as demonstrated in Phase Iholds promise as the decision analysis framework that shouldbe used for conducting Army program tradeoff analyses.Further work in the areas of quick turn-around combatmodeling,dynamic costing,and data collection need to beconducted.
d. EEA 4: Does a highly aggregated combat modelprovide useful insights for answering program-widetradeoff questions? If so, can such a model becalibrated to a more detailed model if necessary?
(1) A highly aggregated combat model can provideuseful insights for answering macro-level program tradeoff
1-6

CAA-SR-91-9
questions and, to a more limited degree, is capable ofproviding specific program guidance.
(2) In order for aggregated combat models to be fullyuseful, they must be calibrated. In order to calibrate them,one must be able to establish some benchmark values orcalibration points using data or output from accepted and"known" sources. These points do not necessarily need to bedeveloped from other models of higher resolution.Calibration can be done using other models, empirical data,or historical data. The VAA Study attempted to calibrated amedium resolution combat model (Corps Battle Analyzer(CORBAN]) with a more detailed medium resolution model(Vector-In-Commander [VIC]). This effort at calibrating onemodel with results from another was not fully successfulbecause we did not have both models available to use (VIC wasnot run at CAA). The team was only successful at matching thetempo of the battles in CORBAN in relation to the 6.3scenario in VIC. Further work on calibration should beconducted.
e. EEA 5: What Blueprint (of the battlefield)options provide the most useful framework for theanalysis of change to the Army's materiel, forcestructure, etc? TRADOC's Blueprint of the Battlefield,which this EAA was directed towards, appears not to be usefulwithin the context of VAA. The blueprint concept is orientedby its very nature toward a requirements perspective and doesnot necessary address the issues of affordability orduplication of capability. The AHP process appears to holdthe greatest possibilities in this regard.
1-11. OTHER KEY FINDINGS
a. The Value Added methodology is data intensive.Accuracy and timeliness of input data, especially productiondata, is of crucial importance in making the value addedprocess operational.
b. The technique used to survey the Army leadershipallowed decision making attitudes and behaviors to beaccurately reflected.
c. The Value Added methodology will "buy" the most costeffective systems subject to constraints.However, in using a
fixed average unit cost (AUC) in the optimization model thecurrent configuration creates a shortcoming which needs to beaddressed. The danger exists that in recomputing AUC afterthe optimization has been completed the total cost of thequantities recommended could exceed the TOA given. VAA PhaseII must address dynamic costing within the optimization so asto recompute the procurement cost as part of the optimizationprocess.
1-7

CAA-SR-91-9
d. The study developed a modular "living" methodologywith a high degree of flexibility which can be used with avariety of techniques and models.
e. The methodology provides a standardized quick reactionapproach that uses operations research/systems analysis(ORSA) techniques. it evaluates program tradeoff issues byfunctional area experts and decisionmakers. ORSA expertiseis required during the preparatory analysis, consisting ofthe combat modeling, costing, and surveying. The functionalanalysis which would take place during the POM building anddefense, consisting of the actual tradeoffs, does not requireextensive ORSA expertise when using the VAA methodology.
f. The scope of Value Added Analysis needs to be expandedbeyond the RDA appropriations, since these contain only about22 percent of the Army program dollars.
1-8

CAA-SR-91-9
CHAPTER 2
INTRODUCTION
2-1. OVERVIEW. The purpose of this chapter is to provide adiscussion of the background which influenced the development of theValue Added methodology. Chapter 3 provides an overview of themethodology without respect to those demonstration case studies thatwere actually conducted during this study. The case studies andtheir results are presented in Appendix E, which is publishedseparately. Subsequent chapters (4-9) will present a more detaileddiscussion of the methodology using an example tradeoff issue forarmor/antiarmor systems. It should be noted from the study directivethat VAA was to be limited to development of a methodology andprototype models. By the very nature of this study, the teamunderstood that subsequent efforts aimed at refinement would benecessary. Therefore, a section of the summary chapter willidentify, where possible, those areas requiring further work.Chapter 2 is structured as follows:
a. Problem Background
b. Scope/Limitations/Timeframe
c. Key Methodological Assumptions
d. Influences on the Approach
e. Summary
2-2. PROBLEM BACKGROUND
a. The growing federal budget deficit and the breakout of peacein Europe have put great pressure on all the armed services to re-evaluate and restructure their budget and programs. This isespecially true for the Army because of the changing perception ofthe threat in Western Europe. There is more need now for cost-benefit analysis than ever before. This analysis must be conductedin support of developing a balanced and effective Army program withinDepartment of Defense resource guidance. Traditionally, the Army hasused functional area panels to build its POM. The processes thathave evolved do not include adequate means of integrating andbalancing the functional programs into the Total Army Program. TheValue Added Analysis has been conceived as a means of assisting inaccomplishing this integration and balancing.
b. The environment in which Value Added Analysis must beconducted is characterized by minimal time for analysis, ever-changing assumptions, often incomplete data, and increasing emphasison verifiable results. Traditional staff processes and supportingoperations research studies often do not meet this challenge. Thisfailure occurs because traditional approaches require a long time and
2-1
CAA-SR-91-9
highly trained personnel to produce high quality, fully integrated,and very detailed analysis.
c. The requirement for a Value Added Analysis (VAA) methodologywas conceived by the Director, PAED as a means of conducting programtradeoff analyses. In early 1989, the Director, PAED, asked theTechnical Advisor, Deputy Chief of Staff for Operations and Plans, tojointly sponsor a study to be conducted by the US Army ConceptsAnalysis Agency (CAA) to develop the methodology.
2-2. SCOPE/LIMITATIONS/TIMEFRAME
a. The VAA Study was designed as a proof of concept to include thebuilding of a prototype decision support system. Because the workwas developmental, we limited the scope to weapon system tradeoffsand did not attempt to address force structure, personnel,infrastructure, or other issues. The methodology is, however,designed to be generic and used across all the functional areas ofthe Army Program.
b. Because the first objective of this study was to develop amethodology, it was decided to limit the program alternativetradeoffs to weapon system mix issues. This limitation by its verynature focused the study on the RDA appropriation. Research, _development, testing, and evaluation (RDTE) and other equipment-related appropriations such as operation and maintenance, Army (OMA)(for operation and sustainment (O&S)) were either not considered orused in a very limited manner. However, it is clear that themethodology must be capable of examining tradeoffs across the fullrange of program issues and therefore across all appropriations.
c. The VAA study directive required that the methodology considerboth combat and noncombat measures of effectiveness. However,principally because of limited time, limited data, and inadequatenoncombat models, the study focused primarily on combat relatedtradeoff issues.
d. The VAA study directive required that the methodologyconsider implementation in an IBM PC-compatible computerenvironment. This requirement was identified because PAED andother major Army Staff (ARSTAF) agencies conduct their work inthe IBM environment.
e. The following terms of reference were used in developing the
VAA Study.
(1) FY 90/91 amended budget.
(2) FY 94 program force for the base.
(3) NATO Central Europe scenario.
(4) Conventional conflict (no chemical or nuclear).
2-2

CAA-SR-91-9
f. As part of the study directive, TRAC (TRADOC AnalysisCommand), Fort Leavenworth, was tasked to assist CAA in conductingthe corps-level combat simulations. The VAA effort was a significantaddition to TRADOC's Army Regulation (AR) 5-25 FY 90 study program.Because VAA represented an unplanned additional requirement, TRADOCrequested that VAA be linked to the ODCSOPS Army Requirements andCapabilities Study (ARCPS). One outgrowth of this linkage was theselection of timeframes for the VAA Study. ARCPS required a set ofdates that allowed for looking at program growth starting at the endof the budget year, going through the POM years and ending 7 yearsinto the extended planning years. This requirement resulted in thefollowing years being selected for data collection and combatsimulations--FY 1991, FY 1999, and FY 2004. However, because of datalimitations, FY 1991 was deleted from the study.
2-3. KEY METHODOLOGICAL REQUIREMENTS
a. The analysis will expand to other appropriations andissues as the methodology matures.
b. The decision support system and related models must becapable of operating in a quick turnaround environment, definedas 1 week or less.
c. The above requirement led to the following additionalrequirements:
(1) Combat models for use in Value Added Analysis mustprocess aggregated data and be calibrated to higher resolutionmodels, empirical data, or historical data.
(2) Data manipulation must be easy and very quick.
(3) The decision support system must tap majorauthoritative Army data bases such as the Total Army EquipmentDistribution Program (TAEDP), Force Accounting System (FAS), andline item number (LIN) Price.
d. The methodology must accommodate the manner in which thesenior Army leadership makes decisions.
e. The methodology must allow for prioritizing betweendissimilar program alternatives (weapon systems versus trainingversus family member support).
f. Input data will come from a wide variety of sources, mayprove to be difficult to obtain, and must be scrubbed forverification/validation.
2-4. INFLUENCES TO THE APPROACH
a. A Definition of Value
2-3

CAA-SR-91-9
(1) As one thinks about the term "value," it becomes clearthat value is always contextual. In making judgments about the valueof something, we normally measure that item against a standard.These standards may be developed from a complex system of comparativeexamples, such as the value system we help imbue in our children. Orthe standard may be as simple as a single measure such as, "How muchdoes my house cost (in dollars) in relation to others on the market?"In both cases, criterion and means to measure an alternative againstthe criterion were established. Value is "in the eye of thebeholder," and therefore is inextricably linked to the decision-makers' value system. This is also true for the Value AddedAnalysis. The process of determining value can be viewed as thedefining of a context, the establishment of criterion and associatedstandard, and the selection of a means to measure choices(alternatives) against the criterion and standard.
(2) For the Value Added Analysis methodology, the idea ofdefining a context is the most important concept to understand. It isfrom context that the whole evaluation process obtains its meaning.For example, the demonstration case study uses a context of a NATOCentral Europe battle (pre-CFE). However, it is just as valid to usea Southwest Asia or Northeast Asia scenario. In fact, one might wantto look at all three scenarios to gain insights on how the value of aparticular set of alternatives changes from theater to theater.Furthermore, this theater context may be modified by the fact thatthe Federal budget, and therefore the Army budget, is decreasing.VAA, as envisioned by the sponsors of this study, embraces thecontext of the importance of judging program alternatives against theoverall Army objective of conducting combat operations. It would bejust as valid to view the tradeoffs from the dual position of bothpeacetime and wartime. Each of these perspectives helps define avalue system. For example, suppose as a decisionmaker, you have anadditional million dollars to spend on procuring either SpecialOperations Forces (SOF) aircraft or additional M1 tanks. Assume SOFaircraft cost a third as much as the Ml and is equally effective inits mission. Furthermore, as the decisionmaker, if you think thenext war to be fought will be an insurgency in a specific mountainoustheater, then likely you will value SOF aircraft over tanks. If,however, you believe the next battle will be an armor-heavy fight onthe plains of Europe, then tanks will be valued over SOF aircraft.
(3) It was clear that the Army leadership viewed the value ofprogram alternatives in terms of their contribution to combat. Inconducting interviews with decisionmakers, it became obvious to thestudy team that decisionmakers other than the sponsor viewed theproblem from a sightly different perspective. There are otherinterest groups such as Congress, the Executive Branch, or the Officeof the Secretary of Defense which may view the PPBES process somewhatdifferently. These "non-Army" groups may, in fact, view the armedforces as an agent of peaceful change within our own society. Thesegroups, although ultimately interested in the ability of the Army toconduct combat operations, may be influenced by other objectives suchas budget constraints, power projection, or social change. This factnot only reinforces the general concept of context, but points out
2-4

CAA-SR-91-9
the need to categorize decisionmakers by interest group. Eachinterest group will have its own biases, criteria, and issuerelationships.
(4) The idea of identifying interest groups and their valuestructure is only one aspect of the concept of context. Another, andequally important, aspect is the need to define the parameters of theissue. This process includes identifying the policies, systems,organizations, and other factors which influence the decisionmakingprocess. Policy statements will influence the choice made throughidentifying objectives or requirements which must be met. Forexample, analysis of Army energy investment alternatives areinfluenced by provisions in Title 10 of the US Code. Weapon systemsand Army organizations provide a physical and structural context.For example, the Army may wish to look at the modernization of theantitank systems for the forward-deployed forces. And finally,thereis a multitude of other items which may affect a decision includingsuch things as the economy, a leader's world view (pre-CFE versusparity versus regional conflicts as the most likely war to be fought)or his (the decisionmaker) position in the organization.
(5) Chapter 4 (Issue Clarification) and Chapter 7 (ImplicitEffectiveness) specifically address this idea of context. Chapter 4focuses on the need to clearly frame the issue in a way that alldecisionmakers, regardless of their interest group, have a commonunderstanding of the issue parameters. Chapter 7 attempts to capturethe decisionmaker's criteria for judging tradeoffs and at the sametime trying to minimize bias.
b. Measuring Value
(1) As the study team conducted its literature search andreviewed associated work, it became evident that any Value Addedconcept must include a means to measure value. Two documents inparticular influenced the study team in developing the Value AddedAnalysis methodology: a US Army Concepts Analysis report (Study ofEffects of Alternate Allocation of ArmyDollar Resources at VariousBudget Levels - Phase II - Final Report), and a TRADOC White Paper(Combined Hierarchical Assessment and Capital Budgeting Framework,Ft. Leavenworth, KS.). A major contributor to the CAA document wasparticularly helpful in relating his observations and in discussingthe need to include sufficient capability for decisionmakers toinfluence the decision when using the VAA methodology. Dr.Anderson's white paper was helpful in assisting the team in devel-oping a construct for measuring value. Furthermore, the need toincorporate a means by which subjective decisionmaker judgment couldinfluence the process became a fundamental requirement for themethodology. Often, attempts to develop a program development andtradeoff methodology, such as Value Added, failed because thesemethodologies concentrated on quantifiable measures of effectivenessalmost exclusively. These preceding methodologies did not accom-modate those other subjective factors which decisionmakers felt wereimportant. This issue eventually was addressed by the development oftwo categories of effectiveness called explicit effectiveness
2-5

CAA-SR-91-9
(directly quantifiable) and implicit effectiveness (subjective orindirectly quantifiable).
(2) The problem of how to measure value contextually was anessential issue during the development of the Value Added method-ology. Furthermore, the study team knew that the methodologyrequired a means of capturing subjective decisionmaker judgment.Solving these problems motivated the development of a judgmentframework and two evaluation approaches for separate'y measuringexplicit and iplicit effectiveness.
(a) The analytical hierarchy technique is used to develop aframework for weighting the importance of the explicit and implicitmeasures of effectiveness. These subjective weights are used todepict (or capture) the decisionmaker's value system. The twoevaluation approaches are then used to measure an alternative'scapability.
(b) The study team calls the approach for measuring expliciteffectiveness the hierarchical measures of effectiveness (MOEs).This approach provides a means of quantifying the value of an issueacross functional areas so that each alternative can be evaluated inthe appropriate context by the appropriate analytical tool. Eventhough this study uses a combat example, the concept applies tononcombat issues as well.
(c) The approach used to measure the implicit (subjective)factors uses a subjective scoring system. Each alternative is scoredby subject matter experts against a set of criteria developed as par-of the analytical hierarchy work.
C. Data Requirements
(1) One fact became very clear to the study team regardingdata requirements for the Value Added Analysis. Data for thisanalysis was going to be complex, extensive, and varied. This factalone became the driving factor in searching for a flexible computerarchitecture and environment for the Value Added Analysis.
(2) Our current thought about the Valued Added Analysisseparates our data requirements into two categories--quantitative andnarrative. These two categories cover a wide spectrum of data typesranging from cost data, which is mostly-numerical, to policy data,which is mostly text. Furthermore, the integration requirementsacross the two categories are both horizontal and vertical. Keys maybe as simple as the title of tue alternative or as complex as linkingappropriation pieces for the alternative with other relatedalternatives or issues.
(3) The data collected for Value Added Analysis serves twopurposes. First, the spectrum of data must be sufficiently richacross functional areas to help inform (educate) the decisionmakerusing VAA about the issues and choices. Access to the alternative'sdefinition (performance specifications, support requirements, and
2-6

CAA-SR-91-9
related equipment/systems), the issues associated with thealternative(s), cost data, organizational implications, andapplicable policy data must be simple and easy to use. Second, thedata must be in sufficient detail to feed the VAA models.
2-5. SUMMARY. The VAA Study was designed to develop amethodology to conduct program alternative tradeoffs. Thisreport describes a comprehensive cost-benefit methodology whichenables the conducting of these program issue tradeoffs. As ameans of illustrating the methodology, Chapter 3 introduces anarmor/antiarmor example tradeoff issue which is carried through-out the remaining chapters of the report. A case study of theValue Added Analysis methodology using realistic issues and datais presented in Appendix E
2-7

CAA-SR-9 1-9
CHAPTER 3
VALUE ADDED ANALYSIS METHODOLOGY
3-1. INTRODUCTION. The purpose of this chapter is to pro-vide a comprehensive discussion of the Value Added methodol-ogy. Subsequent chapters (5-9) will present a more detaileddiscussion of those portions of the methodology that were morefully implemented during this study. This chapter is struc-tured as follows: (1) overview of the methodology; (2)description of each module in the methodology; and (3)summary.
3-2. OVERVIEW
a. Introduction. The first objective of this study, asoutlined in the study directive, was to formulate an analytic methodfor estimating the marginal value of competing Army program alter-natives. The VAA methodology has been developed to provide a roadmap for conducting these analyses. The methodology provides ageneric approach for cost-benefit analysis. An important feature ofthis methodology is that it is flexible and may be used in both astandardized or ad hoc approach. The VAA standardized approach woulduse the complete methodology as described in this chapter, to includeall of the current techniques developed. The ad hoc approach uses
ISU LAIIMPLIC EFFECTVENESSODU LRFCT XLICI MOECTVNS EFFECTIVENESS INTEGRATION
MODULE MODU LE
Is~ m ica|ee e tm ie m atm
Figure 3-1. Vralue Adenalysi Mehdlg Ovrve
I. Policy 61911adti me we~ohs
Reled to m s tderQua nlity of' Wle "r3
Dansim Mesm
Relaed t Ot r)bOD LAnrmy Objectl" " -vm } MDL
Goals A
SALLOCATION| MODULE
|RESLT~S & --DISPLAY
M 'iODULE
Figure 3-1. Value Added Analysis Methodology Overview
only those modules and techniques pertinent to the issue being inves
3-1

CAA-SR-91-9
tigated. This flexibility is achieved by using a modularmethodological framework . Figure 3-1 depicts the complete"standardized" VAA methodology with its eight modules.
b. VAA Modules. Each of the modules is designed to be self-contained in that they can stand alone if needed. This autonomousstructure allows the analyst the flexibility to use the methodologyin its entirety (standardized approach) or to customize themethodology in such a way that it addresses the needs of the currentissue tradeoff analysis. The following is a listing of the modulescontained in the standardized VAA methodology and a short descriptionof each:
(1) Issue Clarification. This module is the initial stepin the VAA methodology and consists of defining and understanding theissue.
(2) Explicit Effectiveness. The explicit effectivenessmodule is divided into three submodules whose purpose is to measurethe direct or quantitative components of value. The explicitcontribution of a program alternative is defined by the MOE derivedfrom the combat, soldier quality of life, or other Army objectivessubmodules (see Figure 3-1).of the explicit effectiveness module.
(3) Costing. The costing module assists in identifying andcalculating the costs associated with each alternative for the issuebeing investigated.
(4) Implicit Effectiveness. The implicit effectivenessmodule's purpose is to measure the qualitative or subjectivecomponents of value through the use of leadership surveys and subjectmatter experts. The implicit contribution of a program alternativeis defined by a set of secondary impact analysis modifiers which ineffect serve as implicit MOE.
(5) Effectiveness Integration. Both explicit andimplicit measures of value are combined within the effectivenessintegration module to develop a single measure of benefit.
(6) Optimization. The marginal value of program alter-natives is calculated in the optimization module. This calculationis accomplished by relating the Value Added coefficients developed inthe effectiveness integration module with the costs developed in thecosting module according to established cost-benefit criteria. Thesecost-benefit criteria specify the appropriate conditions ofoptimality.
(7) Resource Allocation. The resource allocation moduleis used to distribute the optimized mix of program alternatives tothe Army force structure and organizations.
(8) Result and Display. The purpose of this module is topresent the result of the analysis.
3-2

CAA-SR-91-9
c. VAA Methodology Structure. The dotted lines outliningvarious parts of Figure 3-1 are used to graphically depict the eightmodules of the methodology. Each module is defined by a process,technique, input, assumptions, and output. Appendix D contains a setof two matrices which outlines these elements for each module. Thismodularity is an important aspect of the VAA methodology because itallows the analyst to investigate wide-ranging problems and issueswhich are inherent in the PPBES process. Although specific data,models, and techniques may change from analysis to analysis, theapproach and the general form of each module remain unchanged.
d. VAA Methodology Concept. As currently envisioned, the VAAmethodology concept characterizes a Value Added study or analysis aseither using a standardized or an ad hoc approach. This distinctionis important because it determines how the VAA methodology will beused. In the standardized approach, all modules and techniques ofthe methodology as described in this report would be implemented.The standardized approach would most likely be used by actionofficers for the more traditional program tradeoff exercises, such asthe PEG (Program Evaluation Group) process, or POM issue defense. Inan ad hoc approach, the analyst would use only those modules andtechniques which are pertinent to the issue being investigated. Anexample of this type study might be the FY 90 QUICKSILVER reviews.
e. Standardized VAA Methodology. The current standardizedVAA methodology contains eight modules, and within them, there arefour generic types of models: expert systems, simulation, decisionsupport, and optimization. All of the models use existing and well-accepted operations research techniques. The VAA methodologypurposely relies on analytical tools which are well known in order toease concern over modeling and computational adequacy. For purposesof this report, any reference to the VAA methodology will pertain tothe standardized approach unless specific reference is made to the adhoc approach instead. Each module of the Value Added Analysismethodology is discussed in its own paragraph of this chapter exceptfor the three effectiveness modules which are discussed jointly inparagraph 3-4.
3-3. ISSUE CLARIFICATION MODULE
a. Introduction. The first module in the Value Added Analysismethodology is issue clarification. The first and most importantstep for the VAA methodology is to spend some time identifying theelements of the tradeoff issue and the issue-related questions andproblems. In the prototype work, the study team has seen time andagain the importance of this step. If this issue clarification stepis not thorough and fully understood, the entire analysis from thispoint will be misdirected at best and irrelevant at worst. Figure3-2 is an example of an initial VAA issue.
3-3

CAA-SR-9 1-9
Representative Armor/Antiarmor SystemsIu." Given limited dollar resources, which mix of A3 systems
should be procured?
Base case Europe Scenario 6.3 with 25 systems
• AMS-H* BRADLEY BLK III" M1A2" MLRS SADARM" NLOS-AT
Figure 3-2. Example VAA Issue
In this example, the analyst is asked to conduct a tradeoff analysisto select the best mix of armor/antiarmor systems. The analyst isprovided guidance in the form of a cost constraint, a Europeanscenario (context), and a description of the baseline force and twoproposed alternative weapon system mixes. The alternatives weredeveloped as part of the Armor Antiarmor Study conducted at HQDA bythe A3 task force. These two particular alternatives were selected bythe task force as representative mixes and not necessarily to beperscriptive. Both alternatives were developed from a single list ofsystems. The A3 example will be used from this point on in thereport to help illustrate the VAA methodology. In the final anal-ysis, we will actually be trading off the single list of systems toprovide what would amount to a VAA alternative.
b. Processes. The issue as depicted above may seem clear, butin terms of the VAA methodology more is required. There are threeprocesses associated with the clarification module. The processesare:
" Obtain Broad Guidance" Describe Issue Relationships" Determine how the Methodology Will be Used
(1) Obtain Broad Guidance. Figure 3-2 does not indicatewhat guidance or factors may be important to the decisionmaker inconducting this particular Value Added Analysis. The analyst mustobtain answers to such questions as: is there a budget cut looming?Do we need to consider a particular investment strategy? Whattheaters and OPLANs do we need to consider, if any? These kinds ofquestions must be formulated and discussed by the analyst with theappropriate set of decisionmakers in order to obtain and clarify any
3-4

CAA-SR-91-9
guidance he needs. Additionally, the analyst needs to conduct athorough review of policy statements that may impact upon the issuebeing investigated.
(2) Describe Issue Relationships. Describe issue rela-tionships by system, organization, policy, and appropriation. Atthis point, the Value Added methodology requires a clear descriptionof the systems involved in each alternative, a breakout of otherrelated systems with their equipment, costs, and other factors whichmay impact on the decision. For example, the analyst should ask suchquestions a., "Are there force development issues or Congressionalappropriation guidelines which impact upon this analysis?" Table 3-.provides some examples of the types of relationships the analystmight explore during the issue clarification step of the illustrativeA3 Value Added Analysis.
Table 3-1. A3 Issue Clarification
Category Issue RelationshipsSystem Procurement Data System Definition CapabilitiesOrganization Fielding Force StructurePolicy AMM 'Priority Investment Policy Defense GuidanceAppropriation Dollar Cost Manpower TOA Guidance
Each of the alternatives and the base case would be characterizedusing the four categories listed in the column on the left of thetable. Figure 3-3 depicts (for three alternatives of thearmor/antiarmor issue) a rudimentary example of the complexity of thedata required to conduct a Value Added Analysis and the form in whichthat data might be presented. Procurement data is numerical andrelates to the production line capacity and the ability of theindustrial base to produce the quantities desired. Cost data issubdivided into appropriation categories in order to relate it inPPBES terms. The major item system map (MISM) tree (alphanumericdata) refers to a detailed breakdown of the system and associateditems of equipment and provides a standard definition of the systemfor costing and modeling. Other pieces of information, such as theAMM priority and short notes, provide policy guidance and are bothnumeric and text in character. From this chart it should becomereadily apparent that the information needs of the Value AddedAnalysis are varied and complex.
1AMM Priority - Army Modernization Memorandum priority is developed through the Concepts BasedRequirements System conducted at TRADOC in support of the Long Range Research and Development
Modernization Plan (LRRAMP).
3-5

CAA-SR-91-9
I1 Information Matrix: A3 AlternativesSys nm Tak A Antitank Submunition B
Missile AAttribute
Procurement Data
Number ot Lines 2 1 5Number of Shifts 2 1
Hours/Shift 8 8 8Systems/Month 180 54 68
Cost
RDTE(SM) 170 58 43
OMA($M) 14.7 43 1.2Spaces(Pzrs/Unit) NA -58 NA
MISM Tree B54690 C67900 E66300UN GA0167
AMMPriority 4 23
Short Notes These alternatives address shortfalls in maneuver,direct fire, and counterfire for the closecombat heavy functional area.
Figure 3-3. A3 Alternative Information Requirements
(3) Determine How the Methodology Will be Used.Determine the degree or extent to which this application of themethodology will be standardized or ad hoc. Not until the issue isfully understood should the analyst decide on one of the twogeneralized forms of the methodology. This decision is a function ofnot only the issue itself, but of the particular analysis objective,data, models, and other input items to the methodology.
3-4. COSTING MODULE
a. Introduction. The second module in the Value Added Analysismethodology pertains to costing. This module is intended to identifyall appropriate costs associated with each alternative for the issuebeing investigated. These costs will usually be monetary but are notlimited to dollars alone. Other measures of cost may be includedsuch as time lost, or force structure reductions/increases, and soforth. This module also includes three sections similar to thosefound in the explicit effectiveness module: develop a context,select or develop appropriate analytical models and tools, andimplement analytical models and tools. Matrix 1 in Appendix Ddepicts the full framework for the costing module.
3-6

CAA-SR-91-9
b. Develop A Context. The first section of the costing moduleis used to develop the costing context for the alternatives beinginvestigated as part of this particular analysis. Three processesare associated with the section on "develop cost context." Theprocesses are:
* Identify Assumptions* Identify Cost Policy* Determine Lexicon
(1) Identify Assumptions. Develop a list of assumptionsregarding the costing of the alternatives to be investigated.Identify costs which must be developed from surrogate information oranalogous costs. Identify those alternatives which can usecost/quantity relationships and those which require differenttechniques for costing.
(2) Identify Cost Policy. Identify appropriate costpolicies and their associated sources. Determine if the policies arerelevant and applicable to the issue being investigated.
(3) Determine Lexicon. Identify and understand the costterminology and coding to be used as part of the analysis. Definethe resolution and composition of the costing to be conducted.
c. Select or Develop Appropriate Analytical Models andTools. The second section of the costing module is exercised inorder to determine the appropriate models and tools to be used ininvestigating the alternatives being analyzed. Five processes areassociated with the second section. The processes are:
* Identify Selection Criteria* Determine Lexicon* Determine Measures of Effectiveness* Review Alternative Costing Methods* Select Costing Models and Tools
(1) Identify Selection Criteria. Determine attributesneeded in the costing model(s) required for this analysis.
(2) Determine Measures of Effectiveness. Identify modeloutputs required to conduct the analysis.
(3) Review Alternative Costing Methods. Conductliterature review for appropriate existing models and tools anddetermine feasibility for use in the analysis.
(4) Select Costing Models and Tools. Apply selectioncriteria in order to select appropriate models and tools for theanalysis.
d. Implement Analytical Models and Tools. The thirdsection of the costing module implements the models and tools
3-7

CAA-SR-91-9
selected in section two. Seven processes are associated with thesecond section. The processes are:
* Identify Data Requirements* Determine Lexicon* Obtain Modeling Capability* Develop an Experimental Design for Costing* Use Models and Tools* Analyze Results* Present Results or Pass Data to Next Module
(1) Identify Data Requirements. Determine attributesneeded in the costing model(s) required for this analysis.
(2) Obtain Modeling Capability. The analyst conducting aValue Added Analysis would at this point obtain the capability toexercise the models and tools selected to be used for the analysis.This effort may require learning the models and how to use them, ordeveloping from scratch a new model or tool. In the case of thisprototype VAA Study, two costing models were revised and incorporatedin the Value Added methodology--the Cost Quantity Model (CQM), andthe Life Cycle Cost Model (LCCM). The CQM is used to provide theaverage annual weapon system cost, considering experience andproduction rate curves.(e.g., procurement cost) for input into FOMOA.CQM is used again to cost the optimal annual quantities computed byFOMOA. The LCCM can then be utilized to estimate the life cyclecosts for the P92 cost elements, which are guidelines established bythe US Army Cost and Economic Analysis Center (CEAC) for generatingbaseline cost estimates (BCE). A more detailed explanation of themodels can be found in Chapter 6.
(3) Develop an Experimental Design for Costing. Thecost analyst (or analysis team) needs to develop an experimentaldesign based on the alternatives to be investigated. The experi-mental design step becomes more important if the analyst is workingwith costs which are not well understood, such as costs fordevelopmental systems. If one could think of costs as a continuumwith the left side being costs which are well known (such ashistorical data, through empirical data, to the right side which mayconsist of cost estimates), then the importance of a good experi-mental design becomes evident. The analyst needs to determine theappropriate experimental design using standard statisticaltechniques.
(4) Use Models and Tools. The analyst, using theexperimental design developed in the previous step, conducts theappropriate model runs or calculations. The analyst shouldorganize the results in a logical framework for displaying anddocumenting the results.
(5) Analyze Results. For the costing module there is aneed to ensure that all costing elements are included and understood.Because some of the costs are developed through modeling, it is
3-8

CAA-SR-91-9
important for the analyst to conduct some "common sense" checksagainst a sample of more rigorously obtained costing results.
(6) Present Results or Pass Data to Next Module. Asindicated in step 5, the analysis team must analyze and save theresults of the modeling work for later presentation. The resultsshould be prepared in two forms. First, the analyst should preparevalues for each MOE by each alternative to be passed to theoptimization module. Secondly, the analyst should develop a"traditional" presentation of the modeling work consisting of vu-graph slides, graphs, and charts.
3-5. EFFECTIVENESS
a. Introduction
(1) This paragraph of Chapter 3, unlike the other paragraphs,combines the discussion of three of the VAA methodological modules--Explicit Effectiveness, Implicit Effectiveness, and EffectivenessIntegration. The modules are combined under the heading ofeffectiveness because of their close linkage to one another and themanner in which they interact within the overall value assessmentframework. As the Value Added Analysis Study progressed, it becameclear that there were two components of issue effectiveness whichwere instrumental in the decision process. These components ofeffectiveness may be generally characterized as being either explicit(quantifiable) or implicit (qualitative or subjective). The implicitmeasures of effectiveness may be thought of as modifiers orsupplemental to the explicit, and therefore "secondary."
(2) The Value Added Analysis concept uses a hierarchicalassessment framework for developing a single measure of benefit.This framework is used in VAA to provide the logical skeleton inwhich to build an alternative's effectiveness value. The analyticalhierarchy process (AHP) is particularly effective in building adecision framework and for eliciting experts' subjective judgments.Figure 3-4 outlines the current analytical hierarchy for astandardized Value Added Analysis.
3-9

CAA-SR-91-9
ANALYTICALNHIERARCHY
Value AddedEffectiveness Level 1.0Coefficients
I I I, ILevel 2.0Combat Soldier Quality Other Army Secondary Impac lEffectiveness of Life Objectives Analysis Modifiers
Level 3.0
Figure 3-4. Alternative One Information Requirements
Each level of the hiearchy is weighted by the decisionmaker. Level1.0 represents the overall objective of the hierarchy, which is todevelop Value Added Effectiveness Coefficients (the single measure ofbenefit) for passing onto the optimization module. The intermediateboxes (level 2.0) are a hierarchical breakdown of level 1.0 and areused to represent the components of value. The MOE as represented bythe lines beneath each box (level 3.0) in Figure 3-4 are the founda-tion of the hierarchy and are the fundamental measures of value.Each of these MOE is evaluated either using quantitative models orsubjective scoring. This hierarchy is used in conjunction with theeffectiveness integration module to build a single measure of value.
(3) The first component of value (explicit effective-ness) is measured by that category of MOEs which lend themselvesto direct quantification. This first component of value isrepresented as the first three subdivisions of the 2.0 level ofthe Value Added analytical hierarchy.
(4) The second component of value (implicit effective-ness) is measured by that category of MOE which are qualitativeor subjective in nature. In analyzing how program decisions areactually made within the Pentagon and the Department of theArmy, it became very clear that other factors also influencedthe decision process. These factors became known to the studyteam as secondary impact analysis modifiers (SIAM factors) andare shown in Figure 3-4 as the fourth subdivision of level 2.0of the hierarchy.
b. Explicit Effectiveness Module
(1) Introduction. The purpose of the third module in theValue Added Analysis methodology is to develop the expliciteffectiveness values. The Explicit Effectiveness Module containsthree submodules. These submodules are: Combat Effectiveness,
3-10

CAA-SR-91-9
Soldier Quality of Life, and Other Army Objectives. Although eachsubmodule measures a different functional area of the Army, they allhave two things in common. First, the techniques associated with thesubmodule can measure the output of an alternative directly, andsecond, each submodule uses a common structure. This structureincludes three sections: develop a context, select or developappropriate analytical models and tools, and implement analyticalmodels and tools. Matrix 1 in Appendix D depicts the full structurefor the combat submodule. Even though there are three submodules inthe methodology, only the Combat Effectiveness Submodule will bediscussed because of the limited scope of this prototype study.
(a) The Combat Effectiveness Dubmodule is as its nameimplies. The techniques used are the traditional combat analysisapproaches currently accepted in the Army.
(b) The second submodule refers to those Army programs andfunctions which address military personnel and family member issues.These include such issues as pay, child care, commissaries, medicalcare, etc. These issues must be considered separately because theycannot currently be measured directly in any of the current combatapproaches. However, their impact on readiness is accepted by all ofthe decisionmakers interviewed.
(c) The last submodule refers to all the other objectives,functions and missions that the Army is required to meet. Theseitems would include such things as nation building missions, equalopportunity, sustaining base, etc. These too are not easily relatedto combat but are certainly important to the overall Army mission.
(2) Develop A Context. The first section of the modules isused to develop the explicit effectiveness context for thealternatives being investigated as part of a Value Added Analysis.Six processes are associated with the section on context development.The processes are:
* Identify Assumptions* Identify Force Structure* Identify Appropriate Doctrine* Identify Resources* Develop Scenarios* Determine Lexicon
(a) Identify Assumptions. Develop a list ofassumptions regarding explicit effectiveness. The analyst mustunderstand the issue(s) and associated alternatives well enough toidentify critical elements of information. Furthermore, the analystmust recognize which critical elements of information may not havedata available. This lack of data must be handled either through theuse of assumptions (which allows the use of surrogate data) oranalogous approaches to data development. For example, in theillustrative A3 problem, a European scenario was assumed to be themost important world view and therefore the one to use in thesetradeoffs.
3-11

CAA-SR-91-9
(b) Identify Force Structure. Identify the forcestructure and levels that are consistent with the context beingdeveloped.
(c) Identify Appropriate Doctrine. Identify allappropriate doctrine to be used or which would influence the combatmodeling.
(d) Identify Resources. Identify all the resources tobe played.
(e) Develop Appropriate Scenarios. Develop scenariosconsistent with the context being developed.
(f) Determine Lexicon. Identify and understand anyunique terminology associated with the issue and alternatives.
(3) Select or Develop Appropriate Analytical Modelsand Tools. The second section of the module is exercised in orderto determine the appropriate models and tools to be used ininvestigating the alternatives being analyzed. Five processes areassociated with the second section. The processes are:
* Identify Selection Criteria* Determine Lexicon* Determine Measures of Effectiveness* Review Alternative Analytical Methods* Select Models and Tools
(a) Identify Selection Criteria. Determine the set ofattributes required to evaluate the applicability of a model for theValue Added Analysis to be conducted. A set of judgment criterianeeds to be developed to allow the analyst to select the appropriatemodels and tools for the study. Fcr the armor/antiarmor illustrativeexample, the team determined that a corps-level combat simulationcapable of measuring the synergistic effects of weapons systems wasneeded. Furthermore, a model was needed which had sufficientresolution and breadth to adequately reflect changes in weapon systemcharacteristics (such as probability of kill [PK], rate of fire,basic load, etc.).
(b) Determine Measures of Effectiveness. Identifymodel outputs required to conduct the analysis. The explicit MOEhave been, for the most part, the traditional criteria for judgingeffectiveness. These MOE might include such things as systemexchange ratios, loss exchange ratios, tons of supply moved, days ofsupply, soldiers per month retained by category, child care days,etc. The results of this module (MOE values for each alternative)are passed to the effectiveness integration module. Table 3-2 showsan example of output values from this module to be passed for threeof the alternatives from the A3 illustrative example.
3-12

CAA-SR-91-9
Table 3-2. Explicit Effectiveness Output(Selected A3 Alternatives)1
Systems T MnE
COFM MFCM BFSMlA2 2.39 134.4 39NLOS-AT 3.81 133.1 41MLRS SADARM 2.95 132.6 39
(c) Review Alternative Analytical Methods. Conductliterature review for appropriate existing models and tools anddetermine feasibility for use in the analysis.
(d) Select Models and Tools. Apply the selectioncriteria in order to identify appropriate models and tools for theanalysis.
(4) Implement Analytical Models and Tools. The thirdsection of the explicit effectiveness module implements the modelsand tools selected in section 2. Seven processes are associated withthe second section. The processes are:
* Identify Data Requirements* Determine Lexicon* Obtain Modeling Capability* Develop An Experimental Design* Use Models and Tools* Analyze Results* Present Results or Pass Data to Next Module.
(a) Identify Data Requirements. Based on the issueand alternatives to be analyzed, review the models and tools selectedfor input data requirements. The analyst should develop a datacollection plan and means by which to manipulate the data. For theA3 illustrative example, the analysis team would collect scenario,weapon characteristics data, and force structure data. As envisionedby the study team, the final form of the Value Added AnalysisDecision Support System will contain a centralized data base engineto assist in this step.
(b) Obtain Modeling Capability. The analystconducting a Value Added Analysis would at this point obtain thecapability to exercise the models and tools selected to be used for
ITable 3-2 shows example data output by system. This may also be calculated by package. In our example thebase case and the two alternatives would be packages. A selected set of systems from the A3 alternatives arepresented here in order to show how a full matrix might look. The following definitions are provided for iheacronyms found in the table:
1. COFM = Correlaion of Forces and Means (a measure of Red strength vs Blue strength)2. MFCM = Movement Force Center of Mass(a measure of performan,e based on the
distance the center of mass of a force has moved toward its objective.3I BFS = Blue Force Surviving (the number of blue units still combat effective
3-13

CAA-SR-91-9
the analysis. This effort may require learning the models and how touse them, or developing from scratch a new model or tool. For thearmor/antiarmor example, the study team developed a capability to usethe Corps Battle Analyzer (CORBAN) Model. The effort to obtain thiscapability required the building of a modeling team, training theteam, obtaining physical space, and obtaining the use of appropriatecomputer hardware.
(c) Develop An Experimental Design. The analyst(or analysis team) needs to develop an experimental design basedon the solutions to be investigated. An essential requirementis to determine if any groupings of solutions should beconsidered. The issue clarification module can be helpful as asource for identifying initial groupings. The groupings maygrow out of alternative dependencies such as physical,operational or doctrinal. The development of groupings assistgreatly in scaling down the size and extent of the experimentaldesign. After all groupings have been completed, the analystneeds to determine the appropriate experimental design usingstandard statistical techniques.
(d) Use Models and Tools. The analyst, using theexperimental design developed in the previous step, conducts theappropriate model runs or calculations. The analyst shouldorganize the results in a logical framework for displaying anddocumenting the results.
(e) Analyze Results. Always an important aspect of anystudy, this step is extremely important for the Value Added Analysismethodology. At first reading, one may feel that the VAA methodologyonly requires a set of output numbers. The methodology does indeedrequire the results to be boiled down to MOE values (for passing tofollow-on modules). However, the reasons for the MOE values must beidentified and kept visible and available to provide detailedexplanations of the results. Detailed results are always importantfor the insights they provide, but in the case of the VAAmethodology, the detailed results specifically become important as ameans of building decisionmaker confidence in the VAA processresults.
(f) Present Results or Pass Data to Next Module. Asindicated in step five, the analysis team must analyze and save theresults of the modeling work for later presentation. The resultsshould be prepared in two forms. First, the analyst should preparespreadsheet values for each MOE by each alternative to be passed tothe effectiveness integration module. Secondly, the analyst shoulddevelop a "traditional" presentation of the modeling work consistingof vu-graph slides, graphs, and charts. Using the illustrativeexample from the A3 issue, the analyst would develop a cost andquantity stream presentation by weapon system by year.
3-14

CAA-SR-91-9
C. Implicit Effectiveness Module
(1) Introduction. The fourth module in the Value AddedAnalysis methodology develops the hierarchical weights for both theexplicit and implicit components of value and develops the impliciteffectiveness values. This module is intended to accomplish twoobjectives. The first objective consists of weighting all the levelsof the assessment hierarchy and the individual criteria. The secondobjective consists of scoring each alternative using the SIAMfactors. Both of these objectives are aimed at capturing thesubjective aspects of the decisionmaking process. As discussed inChapter 2, previous attempts at program tradeoff methodologies didnot accommodate the decisionmaker and the process by which decisionsare made. The implicit effectiveness module was specificallydesigned to quantify the subjective elements of 'he decision processin a way that it could be used to conduct tradeofi aialyses. Thismodule also includes three sections similar to those found in theexplicit effectiveness module. Matrix 1 in Appendix D depicts thefull framework for the Implicit Effectiveness Module.
(a) The implicit (subjective) value component of the VAAmethodology consists of a set of decision criteria, called SIAMfactors. These SIAM factors are the implicit criteria. There were11 SIAM factors established for the Value Added Analysis and acomplete discussion of these factors, including full definitions foreach, can be found in Chapter 7. These factors are considered tomeasure implicit value because their intent is to capture those itemswhich influence the decisionmaking process but resist beingquantified directly. These factors are shown in Figure 3-5.
3-15

CAA-SR-91-9
I Secondary Impact Analysis Modifiers |
" Contribution to Industrial Preparedness" Political Risk
-- Public OpinionYes
<ed- - Congressional OpinionNos? -- Executive Branch Opinion
-- Internal Army Opinion" Institutional Stability (Amount of Change)" Program Flexibility" Program Difficulty" Asset Versatility and Deployability" Operational and Technological Risk• Criticality of Need as Related to Current Capability
Figure 3-5. Secondary Impact Analysis Modifiers
(b) Values for the SIAM factors were developed through theuse of two surveys.
.1. The first survey was given to decisionmakers at thesenior executive service and general officer level. The VAA SIAMfactors were developed prior to the implementation of the survey andwere modified, added, or deleted as part of the weighting process.Teams interviewed and surveyed the Army leadership residing ininterest groups such as the Army Staff (ARSTAF), major Army commands(MACOMs), commanders in chief (CINCs), Office of the Secretary ofDefense (OSD), etc. The final result of this first survey is a set ofsecondary factors that have been weighted as well as the remainder ofthe analytical hierarchy (see Figure 3-4, page 3-10).
2. The second survey was given to a group different fromthe decisionmakers. This second group consisted of subject matterexperts (SME). An individual is selected to be part of this SMEgroup because of his expertise regarding the systems (or issues).These experts are asked to score a system (or issue) on its own meritin relation to the SIAM factors. The end result of this portion ofthe implicit effectiveness module is a set of scores for each system
3-16

CAA-SR-91-9
which are equivalent to the MOE values coming out of the combatmodeling.
(c) These three elements--decisionmaker weights, explicitMOE values, and SME scores--can be used either directly by decision-makers or fed into a multiobjective linear program to determine analternative's cost effectiveness and, in turn, acquisition strategy.In either case, the explicit MOE and the implicit MOE are given aweight by the decisionmakers as a means of rank ordering the MOE asto importance.
(2) Develop a Context. The first section of the module isused to develop the implicit effectiveness context for the alter-natives being investigated as part of this particular analysis. Twoprocesses are associated with the section on "develop context." Theprocesses are:
* Identify Assumptions* Determine Degree or Extent of Secondary Factors
(a) Identify Assumptions. Develop a list of assumptionsregarding the alternatives to be investigated. In the A3 illus-trative example, a key assumption was the decreasing federal budgetand therefore the need to decrement the procurement accounts.
(b) Determine Degree or Extent. Determine if thesecondary factors are to be applied.
(3) Select or Develop Appropriate Analytical Modelsand Tools. The second section of the module is exercised in orderto determine the appropriate models and tools to be used in investi-gating the alternatives being analyzed. Five processes areassociated with the second section. The processes are:
* Identify Selection Criteria* Determine Lexicon* Determine Measures of Effectiveness* Review Alternative Methods* Select Models and Tools
(a) Identify Selection Criteria. Determine attributesneeded in the model(s) required for this analysis. For our example,we needed to capture the factors which decisionmakers that theDepartment of the Army felt were important in trading off alternativeprograms.
(b) Determine Measures of Effectiveness. Identifymodel outputs required to conduct the analysis. In our illustrativeexample, this was the scoring for the 11 SIAM factors on a scale of Ito 9.
(c) Review Alternative Methods. - Conduct literaturereview for appropriate existing models and tools and determinefeasibility for use in the analysis. During the building of the
3-17

CAA-SR-91-9
prototype methodology, the literature review resulted in twoapproaches, to include a decision tree analysis and Saaty's pairwisecomparison technique.
(d) Select Models and Tools. Apply selection criteriain order to select appropriate models and tools for the analysis. Weselected the pairwise comparison technique because it was quick,easily understood by the decisionmakers, and easy to implement.
(4) Implement Analytical Models and Tools. The thirdsection of the module implements the models and tools selected insection two. Seven processes str associated with the third section.They are:
* Identify Data Requirements* Determine Lexicon* Obtain Modeling Capability* Develop An Experimental Design* Use Models and Tools* Analyze Results
Present Results or Pass Data to Next Module.
(a) Identify Data Requirements. Determine attributesneeded in the model(s) required for this analysis. The strawman SIAMfactors were helpful in focusing the data requirements. It wasdetermined that a survey of military judgment based on a standardizedscale would be sufficient to meet the data needs.
(b) Obtain Modeling Capability. The analystconducting a Value Added Analysis would at this point obtain thecapability to exercise the models and tools selected to be used forthe analysis. This effort may require learning the models and how touse them, or developing from scratch a new model or tool. In ourexample, we created a standardized survey briefing and scoringinstrument. We developed a survey team and conducted some practicesurveys to refine the techniques.
(c) Develop an Experimental Design. The analyst (oranalysis team) needs to develop an experimental design based on thealternatives to be investigated. The experimental design stepbecomes more important if the analyst is working with data which arenot well understood. The analyst needs to determine the appropriateexperimental design using standard statistical techniques. Thedecisionmakers and PA&E and the technical advisor's office helped toidentify the appropriate respondents for this first cut prototypeeffort.
(d) Use Models and Tools. The analyst, using theexperimental design developed in the previous step, conducts theappropriate model runs or calculations. The analyst shouldorganize the results in a logical framework for displaying anddocumenting the results. The survey team conducted the surveysover a 3-week period.
3-18

CAA-SR-91-9
(e) Analyze Results. The methodology also requires theresults of the implicit effectiveness module to be boiled down to MOEvalues (for passing to follow-on modules). However, the reasons forthe MOE values must be identified and kept visible and available toprovide detailed explanations of the results. This is much moredifficult for this module than for the explicit effectiveness becausethe weights and scores are developed in the minds of both thedecisionmakers and the subject matter experts. Whenever possible,the study team tried to capture narrative comments reqarding theweighting and scoring to provide a flavor of the reasoning behind thefinal numbers developed. The study team created a series ofspreadsheets from the results of the surveys and conducted bothcorrelation analysis and consistency analysis on the data. AppendixE contains the detailed results of this analysis. Because of theclassification of the results, Appendix E is published separately inorder to keep this report unclassified.
(f) Present Results or Pass Data to Next Module. Asindicated in step 5, the analysis team must analyze and save theresults of the modeling work for later presentation. The resultsshould be prepared in two forms. First, the analyst should preparespreadsheet values for each MOE by each alternative to be passed tothe optimization module. Secondly, the analyst should develop a"traditional" presentation of the modeling work consisting of vu-graph slides, graphs, and charts. The team created a compositionspreadsheet and passed the aata contained therein to the TOPSIS(Technique for Ordered Preference by Similarity to Ideal Solution)Model in the Effectiveness Integration Module.
3-19

CAA-SR-91-9
d. Effectiveness Integration Module
(1) Introduction. The fifth module in the Value AddedAnalysis methodology combines the explicit and the impliciteffectiveness values with the decisionmakers' weights. The currentconfiguration of the standardized Value Added Analysis methodologyfor this module uses a model called TOPSIS. This technique allows usto develop a single measure of benefit. This single measure ispassed as a program value coefficient into the linear programingmodel. Matrix 1 in Appendix D depicts the full framework for thismodule.
(2) Develop a Context. The first section of the module isused to develop the effectiveness integration context for thealternatives being investigated as part of this particular analysis.Three processes are associated with the section on "develop context."The processes are:
* Identify Assumptions* Identify Policy* Determine Degree or Extent of Effectiveness Integration
(a) Identify Assumptions. Develop a list ofassumptions regarding the alternatives to be investigated. Thesingle most important assumption associated with this module refersto the objective function of each SIAM factor. The TOPSIS modelrequires the analyst to declare if the factor is to be maximized orminimized. This max/min declaration is applied to all alternativesand therefore assumes that the objective function will not changefrom one alternative to the next.
(b) Identify Policy. Identify appropriate policies andtheir associated sources. Determine if the policies are relevant andapplicable to the issue being investigated. In the illustrativeexample, the objective function for program flexibility was set tomaximize" based on the policy that programs should be flexible.
(c) Determine Degree or Extent of EffectivenessIntegration. Determine if the effectiveness is to be completelyintegrated or partially. If effectiveness to be incorporated in thefollow-on modules or extracted at this point and provided as rawoutput.
(d) Determine Lexicon. Identify and understand theterminology to be used. Ensure that the max/min relationship foreach factor is understood and fully defined.
(3) Select or Develop Appropriate Analytical Modelsand Tools. The second section of the module is exercised in orderto determine the appropriate models and tools to be used ininvestigating the alternatives being analyzed. Five processes areassociated with the second section. The processes are:
3-20

CAA-SR-91-9
* Identify Selection Criteria* Determine Lexicon* Determine Measures of Effectiveness* Review Alternative Methods* Select Models and Tools
(a) Identify Selection Criteria. Determine attributesneeded in the effectiveness integration model(s) required for thisanalysis. The need to combine multiple attributes was the keycriterion in selecting a model for this module. Furthermore, VAAneeded a way in which this combination could be quantified andconsolidated into a single value.
(b) Determine Measures of Effectiveness. Identifymodel outputs required to conduct the analysis. The MOE for thismodule was set by EEA 2 in which we hypothesized that a linearcombination of value components could be used to arrive at a singlenumeric measure of value. For this prototype effort, the TOPSISvalue measuring the distance of an alternative from an ideal solutionin a Euclidean space became this single measure of value.
(c) Review Alternative Methods. Conduct literaturereview for appropriate existing models and tools and determinefeasibility for use in the analysis. Our literature review did notidentify candidates other than TOPSIS.
(d) Select Models and Tools. Apply selection criteriain order to select appropriate models and tools for the analysis.TOPSIS was selected because it was available and met the need tocreate a linear combination of value components.
(4) Implement Analytical Models and Tools. The thirdsection of the module implements the models and tools selected insection 2. Seven processes are associated with the second section.The processes are:
* Identify Data Requirements* Determin-e Lexicon* Obtain Modeling Capability* Develop an Experimental Design* Use Models and Tools* Analyze Results* Present Results or Pass Data to Next Module.
(a) Identify Data Requirements. Determine attributesneeded in the model(s) required for this analysis. The data neededfor this module is directly provided by the explicit and impliciteffectiveness modules and includes the decisionmaker's weights, thecombat simulation results (MOE), and the scoring of the 11 SIAMfactors.
(b) Obtain Modeling Capability. The analystconducting a Value Added Analysis would at this point obtain thecapability to exercise the models and tools selected to be used for
3-21

CAA-SR-91-9
the analysis. This effort may require learning the models and how touse them, or developing from scratch a new model or tool. The TOPSISmodel was written in "C" programming language by the team forinclusion in the METAPHOR TI1 environment and subsequent VAA DecisionSupport System. For more information on TOPSIS, see Appendix G.
(C) Develop an Experimental Design. The analyst (oranalysis team) needs to develop an experimental design based on thealternatives to be investigated. For this prototype analysis, wedeveloped a design which investigated the differences in the singlemeasure of value when we chose different MOE for the expliciteffectiveness module. In particular, there was concern expressedregarding the nontraditional MOEs of Blue force surviving, correla-tion of forces and means, and movement force center of mass. Theteam looked at loss exchange ratios (LER), system exchange ratios(SER), and fractional exchange ratios (FER) as substitutes for theMOE we originally selected.
(d) Use Models and Tools. The analyst, using theexperimental design developed in the previous step, conducts theappropriate model runs or calculations. For our illustrativeexample, this step was very simple and took a matter of seconds.
(e) Analyze Results. Some parametric analysis wasconducted on the input data (especially the combat MOE) to gaininsight into which factors truly influenced the outcome. Forexample, we used both the original set of explicit MOE (BFS, COFM,and MFCM) and the fractional exchange ratio to see how the range ofthe TOPSIS values would change for each alternative.
(f) Present Results or Pass Data to Next Module. Asindicated in step 5, the analysis team must analyze and save theresults of the modeling work for later presentation. The results forthis module for our illustrative example were prepared in two forms.First, a spreadsheet of program value coefficients for eachalternative was prepared and passed to the optimization module.Secondly, a "traditional" presentation of the modeling work wasdeveloped consisting of vugraph slides.
3-6. OPTIMIZATION MODULE
a. Introduction. The sixth module in the Value Added Analysismethodology uses the program value coefficients developed in theEffectiveness Integration Module and the costs from the CostingModule to conduct a cost-benefit analysis. The optimization toolprovideS thc cans for integrating the costs and benefits into acomprehensive cost-benefit analysis. There is a shortcoming in thepresent configuration of the cost-benefit analysis We consider onlyprocurement costs here. O&S costs are used in the prototype foraccounting purposes only. Furthermore the cost values used for the
I METAPHOR is a trademark of the Metaphor Computer Corporation. Metaphor software provides anicon-based user interface to Standard Query 1anguage (SOL)-based relational data bases.
3-22

CAA-SR-9 1-9
optimization constitute average unit costs. Costs are actually afunction of the quantity produced (see chapter 6). No provision wasmade in this formulation to take into account this functionalrelationship. Therefore the possibility exists that using averageunit costs as an approximation could result in a violation of thebudget constraint when the true cost is considered. Another possibleresult is suboptimality in the solution. Unfortunately, this problemhas plagued analysts for years, and its solution was beyond the scopeof this study. This problem should be addressed in future ValueAdded Analysis applications
b. The cost-benefit analysis is characterized as an optimizationof an alternative mix and affordability problem. It is within thismodule that the marginal value of an alternative is translated intomeaningful tradeoffs. The current configuration of the standardizedValue Added Analysis methodology for this module uses an optimizationmodel called FOMOA (Force Modernization Analyzer). Matrix 1 inAppendix D depicts the full framework for this module.
b. Develop a Context. The first section of the module is usedto develop the optimization context for the alternatives beinginvestigated as part of this particular analysis. Three processesare associated with the section on "develop context". The processesare:
* Identify Assumptions* Identify Policy* Determine Lexicon
(1) Identify Assumptions. Develop a list of assumptionsregarding the alternatives to be investigated. For this prototypestudy, an objective of maximizing the total value subject to forcestructure and dollar constraints.
(2) Identify Policy. Identify appropriate policies andtheir associated sources. Determine if the policies are relevant andapplicable to the issue being investigated. As part of the issueclarification work conducted for the VAA proof of concept case studypolicies regarding production line start dates and capacities wereidentified as key policy factor.
(3) Determine Lexicon. Identify and understand theterminology to be used. Define the resolution and composition of theconstraints.
c. Select or Develop Appropriate Analytical Models andTools. The second section of the module is exercised in order toaetermine the appropriate models and tools to be used ininvestigating the alternatives being analyzed. Five processes areassociated with the second section. The processes are:
* Identify Selection Criteria* Determine Lexicon* Determine Measures of Effectiveness
3-23

CAA-SR-91-9
* Review Alternative Methods* Select Models and Tools
(1) Identify Selection Criteria. Determine attributesneeded in the model(s) required for this analysis. The key modelingattribute needed for this module was the ability to optimizealternatives using a cost-benefit framework.
(2) Determine Measures of Effectiveness. Identify modeloutputs required to conduct the analysis. The MOE selected for thismodule included ease of optimization formulation, the ability tohandle production line constraint information, a generalizedalgebraic formulation which created a very flexible and robust model,and the ability to run on multiple platforms.
(3) Review Alternative Methods. Conduct literaturereview for appropriate existing models and tools and determinefeasibility for use in the analysis. The literature review for thismodule was not extensive because of previous work completed at CAA.The Value Added team incorporated this previous work because of itsdirect applicability to the VAA Study.
(4) Select Models and Tools. Apply selection criteriain order to select appropriate models and tools for the analysis. Theselection criteria were in part created as we reviewed the previousoptimization work completed at CAA. This step was, in effect,simultaneous with step 2 above.
d. Implement Analytical Models and Tools. The thirdsection of the module implements the models and tools selected insection two. There are six processes associated with the secondsection. The processes are:
* Identify Data Requirements* Obtain Modeling Capability* Develop An Experimental Design* Use Models and Tools* Analyze Results* Present Results or Pass Data to Next Module
(1) Identify Data Requirements. Determine attributesneeded in the model(s) required for this analysis. The datarequired that was unique to this module was focused on dollar andproduction line constraint information.
(2) Obtain Modeling Capability. The analyst conducting aValue Added Analysis would at this point obtain the capability toexercise the models and tools selected to be used for the analysis.For the prototype study, the team used an optimization approach andformulation develop by CAA for use in building modernization plans.We modified this model and installed it on a Macintosh IIcx. Theteam was up and using the new model approximately 2 days afterinstallation.
3-24

CAA-SR-91-9
(3) Develop an Experimental Design. The analyst (oranalysis team) needs to develop an experimental design based on thealternatives to be investigated. The experimental design for ourillustrative example was driven by the budget decrement exercisesbeing conducted at the Pentagon during the spring and summer of 1990.We also included in the design a set of runs which would allow us toinvestigate the sensitivity of the model to selected inputparameters.
(4) Use Models and Tools. The analyst, using theexperimental design developed in the previous step, conducts theappropriate model runs or calculations. We conducted two setsof model runs based on two views of the 92-97 POM. The firstwas based on a pre-CFE view, and the second was based on a post-QUICKSILVER (post-CFE view) dollar decrement.
(5) Analyze Results. For our illustrative example, welooked at the interactions taking place because of the variousconstraints and input data. The team tried to isolate the mostimportant data for future investigation.
(6) Present Results or Pass Data to Next Module. Asindicated in step five, the analysis team must analyze and save theresults of the modeling work for later presentation. The results ofour illustrative example were presented as "typical' funding andquantity streams one would find presented in the Army POM.
3-7. RESOURCE ALLOCATION MODULE. The seventh module in theValue Added Analysis methodology uses results of the optimizationmodule to distribute the mix of alternatives to the appropriate Armyorganization or agency. For this prototype study, we did not developthis module. Matrix 1 in Appendix D depicts the full framework forthis module.
3-8. RESULTS AND DISPLAY MODULE. The eighth module in theValue Added Analysis methodology contains the set of models andtools required to analyze and present the results in a meaning-ful manner. The VAA methodology requires a flexible data basemanipulator to provide responsive data handling for both outputand input data. Furthermore, this methodology requires acomputer environment which will assist the analyst in the taskof integrating all of the modules into a coherent decisionsupport system. The METAPHOR"" environment has permitted thisintegration by providing a single architecture for manipulatingissue description data, system definition data, the TOPSISModel, the FOMOA Model, and a variety of display screens, and bycombining these elements into a single decision support system.We have not developed a set of presentation formats nor reports.Our objective for this module during this prototype study was toidentify the requirement and propose a capability to be furtherdeveloped in the future.
3-25
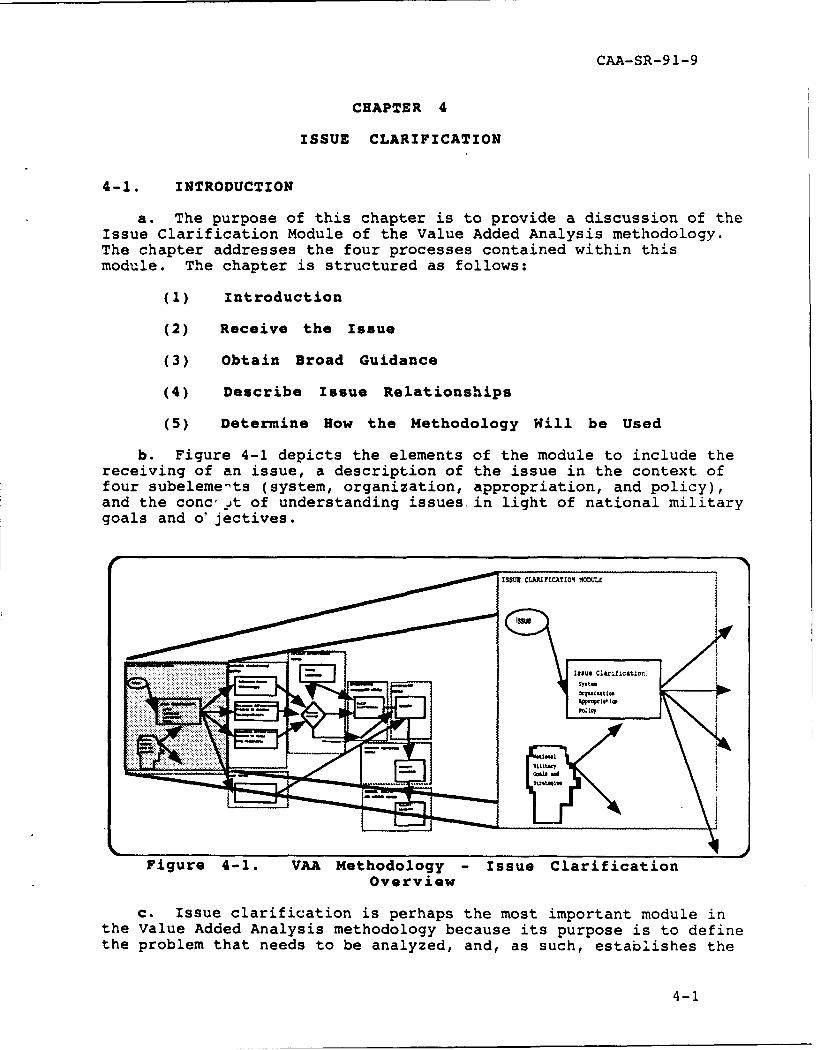
CAA-SR-91-9
CHAPTER 4
ISSUE CLARIFICATION
4-1. INTRODUCTION
a. The purpose of this chapter is to provide a discussion of theIssue Clarification Module of the Value Added Analysis methodology.The chapter addresses the four processes contained within thismodule. The chapter is structured as follows:
(1) Introduction
(2) Receive the Issue
(3) Obtain Broad Guidance
(4) Describe Issue Relationships
(5) Determine How the Methodology Will be Used
b. Figure 4-1 depicts the elements of the module to include thereceiving of an issue, a description of the issue in the context offour subeleme-ts (system, organization, appropriation, and policy),and the concr t of understanding issues in light of national militarygoals and o' jectives.
ISSUE CLAPFCATIoN MODULE
Figure 4-1. VA Methodology , Issue Clarification
Overview
c. Issue clarification is perhaps the most important module inthe Value Added Analysis methodology because its purpose is to definethe problem that needs to be analyzed, and, as such, establishes the
4-i
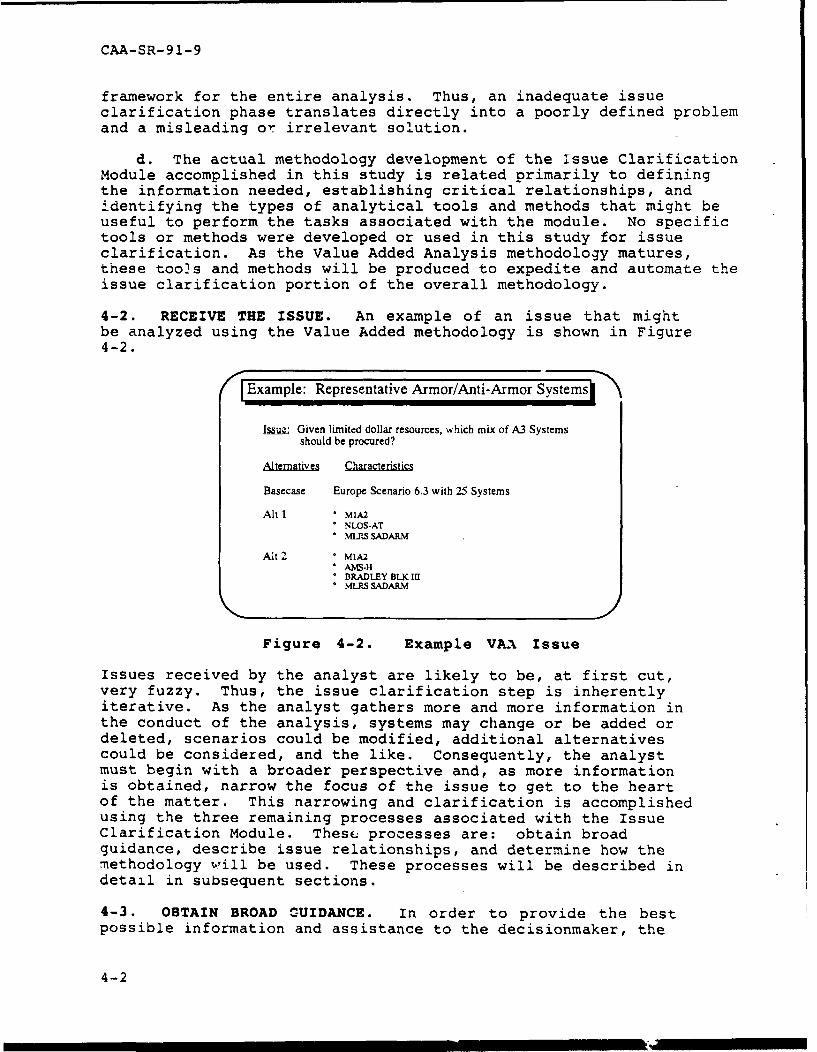
CAA-SR-91-9
framework for the entire analysis. Thus, an inadequate issueclarification phase translates directly into a poorly defined problemand a misleading or irrelevant solution.
d. The actual methodology development of the Issue ClarificationModule accomplished in this study is related primarily to definingthe information needed, establishing critical relationships, andidentifying the types of analytical tools and methods that might beuseful to perform the tasks associated with the module. No specifictools or methods were developed or used in this study for issueclarification. As the Value Added Analysis methodology matures,these too2s and methods will be produced to expedite and automate theissue clarification portion of the overall methodology.
4-2. RECEIVE THE ISSUE. An example of an issue that mightbe analyzed using the Value Added methodology is shown in Figure4-2.
Example: Representative Armor/Anti-Armor Systems"
, y- Given limited dollar resources, which mix of A3 Systemsshould be procured?
Altematives C
Basecase Europe Scenario 6.3 with 25 Systems
Alt1 * MIA2NLOS-AT
• MIL.S SADARM
Alt 2 MIA2"AMS-H
B BRADLEY BLK II• MLRS SADARM
Figure 4-2. Example VAA Issue
Issues received by the analyst are likely to be, at first cut,very fuzzy. Thus, the issue clarification step is inherentlyiterative. As the analyst gathers more and more information inthe conduct of the analysis, systems may change or be added ordeleted, scenarios could be modified, additional alternativescould be considered, and the like. Consequently, the analystmust begin with a broader perspective and, as more informationis obtained, narrow the focus of the issue to get to the heartof the matter. This narrowing and clarification is accomplishedusing the three remaining processes associated with the IssueClarification Module. These processes are: obtain broadguidance, describe issue relationships, and determine how themethodology will be used. These processes will be described indetail in subsequent sections.
4-3. OBTAIN BROAD CUIDANCE. In order to provide the bestpossible information and assistance to the decisionmaker, the
4-2

CAA-SR-91-9
analyst must have a clear idea of the viewpoint of the decision-maker, his "World View," and the decisionmaking environment withrespect to the factors that are most important to consider. Forexample, the decisionmaker's opinion as to the most probablenext conflict scenario must be considered when evaluatingalternatives. Another example involves the investment strategyof the decisionmaker. If the strategy entails more emphasis onresearch and development and less on procurement, the thrust ofthe analysis would be different. One must also be cognizant ofthe constraints under which the decision will be made. Forinstance, if Congress has mandated that a particular systemshould or should not be fielded, or if a particular program ishighly unpopular politically, the analysis should take thesefactors into consideration.
4-4. DESCRIBE ISSUE RELATIONSHIPS
a. Introduction. In order to properly place an issue orgroup of issues into the appropriate context, the analyst mustbe able to describe the relationships of the issue by system,organization, policy, and appropriation. Only then can theimpacts of the decision be evaluated in the broadest sense. Inorder to accomplish this portion of the analysis, a significantamount of research is req,.ired on the part of the analyst toensure that all areas af'ecting the issue and affected by theissue are examined. Fzor the most part, this research must bedone by consultin- subject matter experts, documents, and databases to obtain this necessary information. The possibilityexists that some expert system approach to data identificationand collection would be useful in this process. An example ofthe type of software/model combination needed in this module isthe Stakeholder software/model developed at the University ofArizona, Tucson, as part of their Group Decision SupportLaboratory. The models and software designed for this sectionof the module must help identify interest groups, categorizedata, and discern relationships between various factors.
b. Organizational Relationships. Of equal importanceto the impacts of a decision from a systems perspective areimpacts relating to organizations. For example, the theatersthat would be affected and the types of impacts on thosetheaters must be considered. One impact might be the need tomodify operation plans (OPLANs) as the result of the implemen-tation of some alternative. Consideration must also be given tothe units that are affected by these decisions.
c. Policy Relationships. Policy relationships aredirectly related to the decisionmaking environment that exists.Policy statements will influence the choices made throughidentifying objectives or requirements that must be met. Forthe Value Added Analysis methodclogy, this portion of the moduleshould be closely aligned to major policy documents such as theDefense Guidance (DG), The Army Plan (TAP), or the Army Long-Range Plan. Additionally, any policy decisions which have been
4-3

CAA-SR-91-9
specifically made regarding the issue to be analyzed must befully understood. One example of this type of policy is thedecision to try and develop armor/antiarmor systems using acommon vehicle chassis.
d. System Relationships. The Value Added Analysismethodology requires a clear description of the systems involvedin each alternative. The Army Resource Integration andManagement (ARIM> Study performed by CAA suggests a method ofmanagement of systems(AMIS - Army Major Item Systems) throughthe use of a comprehensive coding logic. In this method, eachsystem is defined with respect to its primary equipment,associated items of equipment (ASIOE), personnel requirements,associated facilities, secondary items, and training items.Through the coding schema, the system definition can be relatedto its costs, budgeting, force structure considerations, and thelike. The ARIM methodology can be used to identify the impact,from a system perspective, of the various issue alternatives.ARIM was designed for incorporation into the Value AddedAnalysis Methodology. Figure 4-4 depicts this incorporation.
-Secondary Item-Personnel
-Training Devices COST BREAKDOWN
- 'unitions
Figure 4-3. Value Added/ARIM Relationship
4-5. DETERMINE HOW THE METHODOLOGY WILL BE USED
a. Introduction. The Value Added Analysis methodology iscomprised of many components and modules. Each part serves aparticular purpose and provides a certain portion of theinformation needed to support the decisionmaking process.
4-4

CAA-SR-91-9
Factors such as the scope of the study, the alternatives beingconsidered, the type of decision that needs to be made, and thetimeframe in which study results must be provided will drive theinformation and analysis requirements of the investigation.Often these and other factors will dictate whether or not theentire methodology will be utilized. In some cases, only a fewof the VAA modules will be needed to respond to analyticalrequirements. For these cases, the methodology is sufficientlyflexible to allow individual models and methods to be usedseparately to provide input to the decisionmakers. Clearly, acomplete understanding of the problem to be solved is criticalin determining what approach should be used to attack theproblem. This understanding will have been generated in thethree processes of the Issue Clarification Module. Thisknowledge can then be used to determine whether a full-scale,standardized, implementation of the VAA methodology should beused, or if some reduced scale, ad hoc, method is appropriate.
b. Standardized Methodology. The full-scale imple-mentation of the Value Added Analysis methodology involves thecoordinated and comprehensive use of all the modules. As such,large amounts of data will need to be collected, potentiallygreat numbers of simulation runs will need to made, new surveyswill need to be developed and administered, and all of theassembled information will need to be analyzed and checked forconsistency in order to use the rest of the VAA models andtools, and ultimately, to ensure high-quality input to thedecisionmaker. Obviously the expected duration of such a studyeffort would be on the order of months, and a great deal ofprior planning is necessary to produce results in a timelyfashion. The standardized implementation of the VAA methodologywill be required whenever major changes in study assumptions,input data, or decisionmakers occur. The standardized VAAmethodology is the subject of subsequent chapters of this studyreport.
c. Ad Hoc Implementation. An ad hoc implementation ofthe Value Added Analysis methodology is characterized by lessthan full utilization of the entire VAA system. In theseinstances, the output of some intermediate module is sufficientto answer the question that is asked. For example, a recentstudy was performed concerning command and communication systemswhere the issue was already clarified, and only the output ofthe implicit and explicit modules and the effectiveness inte-gration module was needed. Care must be exercised, however, toensure that all questions are satisfactorily addressed.
4-5

CAA-SR-91-9
CHAPTER 5
EXPLICIT MEASURES OF VALUE
5-1. INTRODUCTION
a. The purpose of this chapter is to provide a discussion of theExplicit Effectiveness Module of the Value Added methodology. Thechapter addresses one of the three submodules in detail,Combat. Theother submodules, Soldier Quality of Life and Other Army Objectives,are not discussed in much detail because of the limited scope of thisfirst Value Added Study. These submodules are included in themethodology in order to lay out completely the methodology ascurrently envisioned. This chapter is structured as follows:
(1) Introduction
(2) Combat Effectiveness
(3) Noncombat Effectiveness
(4) Summary
b. Figure 5-1 depicts the three submodules of the ExplicitEffectiveness Mndule. Although the chart implies that all threesubmodules are used, this is not necessarily true for all issuesto be investigated. The effectiveness of some program issuesand their associated alternatives may, in fact, develop expliciteffectiveness values from all three of the submodules. However,experience has shown that most issues will require only one ortwo of the submodules be used to develop the expliciteffectiveness for a program issue. The decision to use singleor multiple measures of explicit effectiveness will grow out ofthe work completed in the Issue Clarification Module.
c. Most decisionmakers interviewed for this study indicated theneed to explicitly relate issues to the Army's number one objectiveof conducting combat operations. However, not all Planning,Programming, Budgeting, and Execution System (PPBES) issues aremeasured by their direct contribution to combat effectiveness. Someissues, such as base operations or soldier retention, do not lendthemselves to combat simulation or combat-related analysis. SomePPBES issues, by their very nature, do not directly contribute tocombat, but without these functions, the Army would not be preparedto conduct combat operations. It was from this fact that the need tomeasure explicit effectiveness as more than combat MOE wasidentified.
5-1

CAA-SR-91-9
!XI'LICIT EFECTXVENESS
Aermin ombjat
Figure 5-1. VAA Methodology - Explicit EffectivenessOverview
d. Because VAA is a marginal analysis, the MOE are computed asincremental changes from some known baseline. In the example, thebaseline is determined by developing a base case scenario for thecombat simulation. This base case represents a known pcint such as
the current program force and Red threat for a particular fiscal year(FY). After the base case is verified and accepted is representativeof current capability, each alternative is investigated by incor-
porating the alternative into the base case. This new simulation iscalled an excursion. Changes in the MOE values as a result of anexcursion are recorded. It is this incremental change from the basethat becomes the explicit value of the alternative portrayed in the
excursion.
e. Although our example uses only a combat framework fordetermining the explicit effectiveness, the preceding approachwould be used for the other modules as well. An issue beinginvestigated may need to be measured by one of the expliciteffectiveness submodules, or two, or all three. The decision touse one or multiple submodules will be based on identifying all
of the appropriate MOE. The explicit MOE chosen must be perti-nent to the issue, must directly measure output, and must besensitive enough to measure changes as a result of trading offalternatives.
5-2. COMBAT EFFECTIVENESS
a. Development of Combat Context
(1) The purpose of the combat effectiveness aspect ofValue Added Analysis is to develop a cohesive, rational frame-work for measuring combat effectiveness. As a result of thesurvey of Army leadership, it was found that the importance of
5-2

CAA-SR-91-9
combat effectiveness was as much as 6 to 1 over the SIAM factorsand the noncombat effectiveness. Because of the importancegiven to combat effectiveness by the decisionmakers, it isnecessary to carefully establish the environment in which thecombat effectiveness values are developed. It is from thescenarios modeled, the force structure (both Red and Blue)portrayed, the doctrine used, and a variety of assumptions thatthe combat context will be defined. This context sets theperspective for the explicit effectiveness. It is importantthat the assumptions, policies and terminology used are con-sistent with the decisionmaker's view of the world. Thedecisionmaker's confidence in the programming decisionsresulting from the VAA approach depends entirely on hisacceptance of the combat simulations conducted.
(2) Another important aspect of combat context dealswith the adequacy of a model to analyze the alternativesassociated with the issue being investigated. For the combatoutput to be accepted, the models used must be capable ofinvestigating the alternatives at the appropriate level ofresolution. The need to have the appropriate level of reso-lution leads to the requirement for multiple models, some ofwhich will be designed to look at the whole battle and somewhose purpose is to model functional areas. In order to conductthe marginal value tradeoffs inherent in the VAA methodology,all of the alternatives must be modeled using the same model orequivalent models. This problem of resolution can only besolved by using a hierarchy of models. A linkage betweenfunctional area models of high resolution and larger "forcestructure models" of lesser resolution must be achieved. Thelinkage that is required is difficult to achieve because ofproblems of model synchronization, data resolution, and battledynamics.
(3) In order to overcome the linkage problem, a form ofcalibration must be accomplished between the models residing atdifferent levels of the hierarchy. The study team developed aconcept of hierarchical MOEs which, when used in conjunctionwith standard scenarios, equivalent data, and equivalentassumptions, can provide the linkage necessary. The hierar-chical MOEs are characterized as overarching MOEs, translationalMOEs, and functional MOEs. These MOEs are used in combinationwith one another to explore an alternative's benefit within itsfunctional arena while relating it to a larger context. Theoverarching MOEs are calculated in a larger context "forcestructure model" and are used to measure the comprehensive"whole" battle. The model used to do this must capture all ofthe effects of the systems or force structure alternatives to beinvestigated and will probably be a lower resolution model. Theoutput for each alternative will vary in level of detail. Someof the output will be of sufficient detail to be used directlyin the Value Added Analysis without further high-resolutionmodeling. However, there will be other alternatives for whichthis larger (low-resolution) model will not provide sufficient
5-3

CAA-SR-9 1-9
detail. In order to investigate these other alternatives, wemust find a way to link the low-resolution model with higher-resolution models (usually functional area models). Thetranslational MOEs are the link. These MOEs can be measured inboth the low-resolution and the higher-resolution model. Thetranslational MOE is used to transfer the results of the low-resolution model (in terms of sufficiency criteria) to thehigher-resolution model. The functional MOE are used to measureoutput in the higher-resolution model. Figure 5-2 depicts howmodels and these MOEs are linked.
Building a Contextual Framework for Quantitative Analysi
Overarching MOE's
A Fa c Sid I Sid 2*Aggregated Dia
Low-Resotuon _I
T Ia Large Context Model
A A (Capture Synergism)NDA Certified Sour'. Data Translational MOE'sR •DoctieD Organization Dynamic
:,Materiel Scenario
S Threat Data
KN t Program Alternative DataA
R HghWltoliskmHI opi Functional Context Model
I Functional OE's
Figure 5-2. Combat Contextual Framework
(4) The overarching MOE is derived from a model which is usedto put the issue in the largest context possible. In our example,Vector-In-Command (VIC) or Corps Battle Analyzer (CORBAN) isidentified as the highest (in terms of our hierarchy) level model.The overarching MOEs used in this figure are COFM, BFS, and MFCM.The overarching MOE are selected based on two criteria. First, doesthe MOE measure parametric changes (input) in the model withsufficient discrimination to conclude that the change was the causeof the new MOE value? And second, can we a priori provide a levelof sufficiency for the MOE? The concept of sufficiency allows forsetting goals or levels of value which, when defined by thedecisionmaker(s), indicate a breakpoint or culminating criteria.
(5) The idea of sufficiency does not necessarily have to bean a priori value. There are occasions when the use of the higher-level model will help define where this point exists. In the abovefigure, the parametric dial represents the ability to explorecriterion by varying input. An analyst may run the larger contextmodel to discover the breakpoints. In either case, the purpose for
5-4

CAA-SR-91-9
using the Overarching MOE is to allow the analyst and decisionmakerto identify at the highest contextual level a point at which anacceptable solution has been achieved. Once this acceptable solutionhas been reached, we can determine from the simulation a set oftranslational MOEs. These translational MOEs are selected becausethey are found in both the lower-resolution model (larger context)and in the higher-resolution functional model (more narrow context).Because these translational MOEs exist in both categories of models(the Translational MOE is a measure which is found in both thehigher-level model [VIC/CORBAN, etc.] and the lower-level model(MACATK/COMO III, etc.]), they can be used to translate sufficiencyfrom the higher-level model to the lower-level model. The ability totranslate sufficiency is important because we can use thesetranslational MOE to calibrate across many different functionalmodels. The calibration allows us to create equivalent model runswhich then can be compared against one another. By setting all ofthe functional models to equivalent scenarios, data, and levels ofperformance (sufficiency) , we believe one can assume that a 10percent change in one model is equivalent to a 10 percent change inanother. Some example translational MOEs may be loss exchangeratios, repair return rate, system exchange ratios, and so forth.Ultimately, this concept is useful because it allows the analyst toinvestigate issues in their "Native" environment by the use offunctional models and reporting the results using functional MOEs.
(6) The ability to investigate issues within afunctional context is important because it allows analysts anddecisionmakers from these functional areas to describe value interms they understand and with which they are familiar. It alsoeliminates the need to force a result into an MOE which may notmeet the need. The translational MOE provide decisionmakers atone level the ability to communicate in a very structured waytheir view of the need or level of sufficiency to decisionmakersand analysts at another level. Furthermore, this ability to setcriteria at a level which accommodates the whole allows one toset criteria in many different functional areas.
5-5

CAA-SR-91-9
b. Analytical Models and Tools
(1) Introduction. As part of the methodology devel-opment, the study team conducted a review of currently availablecombat models. One important criterion for selection of thecombat model for the VAA Study was the need for a fast runningmodel. In fact, the team had initially decided to use a highlyaggregated spreadsheet combat model called Corps Model (CORMO),developed under contract to PA&E by CACI, Inc.-Federal. CORMOwas selected because of its speed and ability to give good "ballpark" effectiveness output. However, as the methodologymatured, it became apparent that selecting the resolution of themodel was extremely important. This insight was importantenough that the team abandoned its original model choice anddeveloped an entirely new capability that would simulate, indetail, a weapon system's effect on a large-scale conflict.
(a) CORBAN (the Corps Battle Analyzer) was chosen tosimulate the large-scale battle. VAA required the use of acorps-level combat model to help determine the combat effec-tiveness value added to the corps battle by various weaponsystems.
(b) This focus on the corps level is importantbecause this level encompasses a fuller mixture of maneuver,fire support, environment, logistics, and command and control(C2) than other levels that we currently model. CORBAN, as afast-running corps-level model, has the sensitivity necessary toevaluate weapon systems and their effect on the corps battle insufficient detail for the VAA methodology.
(2) Model Overview
CORBAN is a time-stepped, closed-loop, stochastic,combat simulation that models combat at the corps/army level.
CORBAN is a data driven model: values are entered bythe analyst, not fixed by the code.
CORBAN can simulate a range of battles from onebattalion versus another, to eight corps versus eight Redarmies. Resolution of the model is at battalion level.However, individual weapon types and their characteristics aremodeled.
CORBAN runs on the VAX family of computers. The modelis written primarily in FORTRAN. A MIDAS compiler is used tocompact the code and data. The model consists of approximately30,000 lines of code and an equal amount of input data.
While running on a VAX 8600, the model executed mostVAA runs at 8 to 1 (simulation hours to CPU hours).
5-6

CAA-SR-9 1-9
(3) Input Data. Figure 5-3 depicts the CORBAN dataflow as used for the Value Added Analysis Study.
r CORBAN DATA FLOW
INPUTOUTPUT
SCENARIO AND PLANSTASK ORGANIZATIONSITUATION CORBAN MEASURES OF EFFECTIVENESSMISSION PROCESS CORRELATION OF FORCESEXECUTION FORCE RATIOSSERVICE SUPPORT 3 CYCLES IN EACH LOSS EXCHANGE RATIOSCOMMAND AND SIGNAL Io-MIN TIME FRACTIONAL EXCHANGE RATIOS
INTERVALS SYSTEM EFFECTIVENESSSHOOT RATIOSSOP FOR OPERATIONS MOVE
ASSET CHARACTERISTICS RECOVEREX. SSPK 12 TARGET TYPES DEBUGGING
FIRE RATEPROB ACO DECISION TRACESAMMO TYPE COMMUNICATIONS TRACESFUEL USE PERCEPTION UNIT STATUS
OCCURS ATTRITION TRACESCREW LEVELS STOCHASTICALLY COMBAT PROCESSESVULNERABILITIES IN EACH CYCLE LOGISTICS TRACESRAM FACTORS MOVEMENT TRACES
TERRAINSEARCH PATTERNSSENSOR CLASSES
Figure 5-3. CORBAN Data Flow
(a) Scenario and Plans
Task organization. CORBAN allows the analyst totask-organize combat formations using a chain of commandapproach.
Situation. The situation defines the environmentof the simulation including the terrain and notes, if any.Missions of other units are given in the orders. The CORBANbattlefield is overlaid with a nested-hexagonal coordinatesystem (each large hex has a number of smaller hexes containedwithin). This nested-hexagon coordinate system can define hexdiameters from 729 m to 8,575 km. Currently, there are threelevels of hexagons defined, at the 25-km level, the 9-km level,and the 3.5-km level (size is defined as center of the hex tocenter of the adjacent hex). Terrain features are defined onlyfor the lowest hexagon level (currently the 3.5-km level).
5-7

CAA-SR-91-9
Terrain within a hex is homogeneous and is described by acombination of five factors: level of urbanization, level offorestation, level of ruggedness, the quality and direction ofthe road network within the hex, and the fordability andlocation of rivers. Effects of urbanization, forestation, andruggedness cover the entire hex. Roads run from hex center tohex center, and rivers flow along the borders of the hex.Originally, terrain data bases were developed by TRAC-FLVN forthe CORDIVEM Model based on digitized terrain. This data wasthen translated into CORBAN terrain data. Currently, Korea,Persian Gulf, and Central European terrain has been defined.
Mission. Both sides (Red and Blue) are givenforces, objectives, contingencies, and time constraints underwhich to achieve these objectives.
Execution. Every unit is given one or more orders,either at the start of the simulation or later when a contin-gency arises. There are three types of orders in CORBAN--simple, complex, and templated. The simple order is a one-lineentry giving a mission and an objective. The simple order isgenerally used for separate units that do not have unique phasesor subordinate units. A complex order is given to larger unitsthat have subordinate units and that require unique phasing ofoperations. Complex orders are usually given to Blue divisionsand corps and to Red armies. Templated orders are usually givento Blue battalions and brigades and to Red battalions, brigades,and divisions. Each templated order is given a unique desig-nator that can be passed as a mission by means of a simple orcomplex order. Templated orders can be thought of as a unitstanding operating procedure (SOP).
Service Support. CORBAN models several aspects ofservice support. First, every unit is given ammunition and fuelamounts. Then assets of the unit, as they move or engage incombat, consume the unit's supplies. As the battle progresses,requests for resupply are made, and logistical units dispatchconvoys to resupply the combat (fighting) units. Additionally,CORBAN models the repair of assets and distribution of major enditems to units.
Command and Signal. To execute the missionsassigned, CORBAN uses an ingenious command and control system.Every unit on the battlefield has its status defined with aseries of 64 1-bit flags. When certain user-defined eventsoccur, a flag for the unit is turned on. Based upon theseflags, the mission which is currently being executed couldchange. Superior units have the ability to change theirmissions based upon reading subordinate oostures. This allows acommander to reassign logistic priorities, inform helicopterunits to support maneuver units, and give priorities toartillery support. Units in CORBAN can pass information to acommander, a subordinate, or to all units. Through the command
5-8

CAA-SR-91-9
and control system, information can also be passed globally toall units, Red or Blue.
(b) TOE. Units consist of a collection of equipmentand assets given to the unit by the TOE. These TOEs are notlike regular TOEs known by most people associated with the Army.Most CORBAN TOEs represent a battalion task force equipped forcombat. Some TOEs represent separate companies or batteries inorder to portray their characteristics more accurately e.g.,MLRS battalion. Both the Blue and Red sides are modeled atthese levels of resolution. The modeler has the capability toportray any unit at any echelon determined appropriate, based onother input data available. The type and amount of equipment ineach unit is scenario dependent and can be different for eachunit (e.g., two different armor task forces may containdifferent amounts and types of equipment).
(c) Asset Characteristics. CORBAN explicitlyplays the majority of all major weapon systems. Additionally,fuel and ammunition (including tank, artillery, and specialweapons) are modeled. Also, support assets such as supplytrucks are represented. The capabilities of every asset aredefined by the analyst. These capabilities include:
1. SSPK versus 12 target types over 4 range bandsand 8 firer-target postures (e.g., stationary firer versusstationary, fully exposed target).
2. Type of ammunition fired versus each targettype.
3. Fire rate.4. Maximum and minimum ranges.5. Allocation of fire among target types.6. Acquisition capability of the onboard sensors.7. The vulnerability of the weapon system to
different ammunition types.8. Fuel usage and loss factors.9. Ammunition usage and loss factors.10. Crew-level requirements.11. RAM (reliability, availability, and maintain-
ability) factor
Sensor classes are used by assets to acquire enemy assets duringcombat. The capability of the sensor is defined for fourranges, and the probability of detecting a target asset type invarious postures, for both day and night.
(d) Search Patterns. Search patterns represent aunit's ability to detect enemy units. The search pattern isused when attempting to evaluate a unit's environment (locationof enemy units for movement purposes) and to build target lists.Additionally, information about enemy units that are detectedmay be transferred to other friendly units.
5-9

CAA-SR-91-9
(4) Combat Analysis (Figure 5-4)
COMBAT ANALYSIS PROCESS
OBTAIN OBTAIN PROGRAM OBTAIN FORCE
TRADOC'S ISSUES AND STRUCTURE, WEAPONEURCPE 6.9 DATA(PA&E DISTRIBUTION, ANDSCENARIO, iCW ODCSOPS) EAMMO AVAILABILITYMODEL, AND ODCSOPS ICW PA&E)
DATA
INPUT TO CORBAN
AND MAKE IT WO!
RUN CORB AVERAGE SEEDS,REPS FOR CASES A YZE, REPORT INPUT TO TOPSIS
Figure 5-4. Combat Analysis Process
(a) CORBAN uses a time-stepped and simultaneouscombat process. All units go through three cycles in each timeinterval. These three cycles are shoot, move, and recover.Analysts can set the time interval. The VAA CORBAN Modelinterval was set for 10 minutes.
(b) Most of the processes in CORBAN are deter-ministic. These include combat, logistics, fire support, andmovement. The only stochastic process in CORBAN is perception.As a result, the detection of target units and evaluation ofenemy threats is stochastic.
(c) Shoot cycle: during each shoot cycle, everyground unit does the following--evaluates its own strength,determines threats and subsequent force ratios, builds targetlists, determines target priorities, performs combat, calls forfire support, and requests logistical support. HQ units assignfire support missions to supporting units.
(d) Move cycle: during each move cycle, every unitperceives the environment, evaluates its own strength, selects amovement path, and moves if required. Air bases, helicopterunits, and logistic units create sorties and convoys and movethem.
5-10

rAA-SR-91-9
(e) Recover cycle: during the recover cycle, allunits apply attrition and suppression received during the shootcycle, recover from effects of previous suppression, recon-stitute, resupply, and maintain units.
(5) Output
(a) The CORBAN Model is rich in the output that itprovides. There are three main categories of output that themodel provides. First, through "debug" flags, errors in datacan be found and corrected. Second, various types of simplemeasures of effectiveness can be created from a model run.Finally, CORBAN has a number of postprocessing programs thatwill manipulate output data to look at more complicated measuresof effectiveness.
(b) The MOE that CORBAN analysts most commonly useare:
1. Correlation of forces and means (COFM): this isa measure of the Red force strength in an attack corridor withrespect to the Blue combat strength in the same corridor.
2. Force ratios (FR): this is a measure of theoverall Red forces remaining with respect to the overall Blueforces remaining.
3. Loss exchange ratios (LER): this is a measureof the combat value of Red systems lost to the combat value ofthe Blue combat systems lost.
4. Fractional exchange ratios (FER): this is aratio of proportion of Red systems value lost to the proportionof Blue systems value lost.
5. System effectiveness ratios (SER): this is aratio of the number of Red systems killed by a Blue system tothe number of Blue systems killed.
6. Killer-victim tables: these tables show lossesand killers by asset and asset category
7. Effective battalions remaining (EBR): thismeasure evaluates the number of battalions (generally maneuver,artillery, rocket, and helicopter) remaining on each side thatare still combat effective.
8. Movement of force center of mass (MFCM): thismeasure evaluates the performance of a attacker by examining thedistance the center of mass of all of his forces has travelled.
9. Mission accomplishment (MA): qualitativemeasure of whether or not each side's missions have beenaccomplished.
5-11

CAA-SR-91-9
10. Front line trace: this qualitative measure isused to evaluate such items as potential, or real breakthroughs,and key objectives siezed or lost.
11. Plots of unit locations: allows an analyst toevaluate a specific unit's performance based on its positionrelative to the enemy and to evaluate a large formation's (e.g.,division) intermediate, or final dispositions.
(6) Debugging. Much of the information for themeasures of effectiveness comes from setting certain outputflags in the model. Raw data that can be quickly output fromthe CORBAN Model includes:
(a) Decision Trace. This information informs theanalyst when a unit sets a situation flag and when a unitresponds to a contingency based upon those flags. It also tellsan analyst what mission or tactical SOP a unit is executing.Finally, it gives information on the movement pattern andlocation of all units in the simulation.
(b) Communications Trace. This file informs theanalyst when information is sent to a superior, a subordinate,or to all units.
(c) Unit Status. This information, gained atintervals throughout the run, tells the analyst where all unitsare, what they are doing, and their posture and strength.
(d) Engagement Trace. Similar to the decisiontrace, this file records all engagements by time step, unit, andlocation.
5-3. NONCOMBAT EFFECTIVENESS
a. Introduction. The purpose of this section is toillustrate a method for analyzing a noncombat effectivenessissue in the Army. In particular, what are the costs andbenefits of using photovoltaic (PV) solar systems to rechargebatteries versus the conventional method used currently forrecharging batteries that power pop-up targets used in Army tanktraining. This application illustrates the issue clarification,cost, noncombat effectiveness (NCE) and optimization modules ofthe Value Added methodology (see Figure 5-5).
5-12

CAA-SR-91-9
EXPLICIT Z"ECTIVENESS
MODULE
Figure 5-5. VAA Methodology - Energy AlternativeEffectiveness
b. Photovoltaic (PV) Systems Background. Photo-voltaic cells convert solar energy to electricity which can beused in many different tasks such as battery charging andsupplying power to pocket calculators. There are numerous PV
applications in government and industry. The Tank andAutomotive Command (TACOM) is currently testing PV-poweredtrickle chargers for use in trucks, tanks, and armored personnelcarriers which have long periods of inactivity between uses.Communications and Electronics Command (CECOM) is investigatingthe use of PV systems for battery charging portable communi-cation sets. PV systems have the following beneficial features:high reliability, modularity, low or no maintenance,nonpolluting, silent power, and no fuel or water requirements.Arthur D. Little, Inc., under contract to US Army Construction
Engineering Research Laboratory (CERL), conducted a study onpotential PV applications in selected Army facilities. Thefollowing PV the applications for the Army were cited in the
CERL study:
5-13

CAA-SR-91-9
(1) "A" Stations (measures target distances for testingweapon systems)
(2) Battery Chargers (for emergency power of waterwells)
(3) Clearance Lights(4) Bugle Recorders(5) Global Positioning Systems (GPS)(6) Mobile Firing Ranges(7) Mobile Generators(8) Radio Repeaters(9) Firing Range Guns(10) Range Surveillance Videos(11) Microwave Towers(12) Remote Data Acquisition(13) Meteorological Towers(14) Storage Facilities (Igl.oos)(15) Microwave Repeaters(16) Pop-up Targets
c. Issue Clarification. The issue selected as thenoncombat effectiveness case study was whether to acqui:photovoltaic panels or to continue using conventional rneans torecharge batteries that power radio operated pop-up targets usedin tank training Army-wide. Table 5-1 gives an estimate of thequantity of radio operated pop-up targets powered by batteriesin the Army. According to the Army Training Support Center,there are batteries at the 3,320 battery-powered pop-up targetsused for tank training in the Army (not including USAREUR). Pop-up targets exist in USAREUR, but data on the quantity is notcurrently available. The specific issue addresses whether thebatteries at the 3,320 radio controlled pop-up targets shouldremain battery powered continue to be recharged at battery shopfacilities (conventional method) or should be recharged by on-site PV panels. The noncombat measure of effectiveness appliedin this case study is energy required to operate the pop-uptargets.
5-14

CAA-SR-9 1-9
Table 5-1. Estimated Number of Pop-up Targets in the Army(Excludes USAREUR)
Battery Operated Radio ControlledPop-up Targets
Armor8th Army 73FORSCOM 993Total 1066
Infantr
8th Army 199FORSCOM 1668WESTCOM 387Total 2254
Armor and Infantry Total 3320
Source: Training Support Center, Ft Eustis.
d. DOD and Army Energy Policy
(1) DOD Energy Policy. Figure 5-6 displays Title 10,US Code Section 2394 guidance for DOD energy policy. The policyrequires procurement of renewable forms of energy (e.g., PV)when it is cost effective, provides guidelines for thecomputation of the life cycle costs of renewable energy systems,and mandates reports to Congress by the Secretary of Defensewithin two year intervals, of the results of studies conductedwith respect to the use of renewable forms of energy insupplying the energy needs of DOD. Cost effectiveness refers tothe lowest cost energy source that can meet a given set ofenergy requirements in support of specified mission objectives.The pop-up target case study presented here serves as a simpleexample of the kind of analysis that could be conducted insupport of DOD energy policy.
5-15

CAA-SR-9 1-9
Title 10, U.S. Code Section 2394
2394a. Procurement of energy systems using renewable forms of energy
(a) In procunng energy systems the Secretary of a militav department shall procure ysterns that use solar eneriz orother renewable forms ofenergy whenever the Secretary derermines that such procurement is posvible and will he coai e refive. reliable, and otherwise suited to supplving the energy needs of the militaty department under his jursdicnon
(bX) The Secretarv of Defense shall from time to time yudv use-5 for solar energy and other renewable forms of ener), todetermine what uses of such Ibrms of energv may be cost eliecttve and reliable in supplying the energy needy of/the Depart-ment of Defense. The Secretary of Defense. based upon the reyults of such srudiea shall from nime to time Lssue policy giade-lines to beJbllowed by the Secretaries of the militarv departments in carrying out subsection (a) and section 2857 of ths "tWe
(2) The Secretar. of Defense shall submit to the Committees on Armed Services of the Senate and'House of Repre.enta-tive7 not lesi often than every two years a report on the studies conducted pursuant to paragraph (I). Each such report shallinclude any findings of the Secretary with respect to the use of solar energy and other renewable forms of energy ins upplVingthe energy needs of the Department of Defense and any recommendations of the Secrtary for changes in law that may heappropriate in light of such studies.
(cXl) For the purposes of this section. an energi systern using solar energy or other renewable forms of enermv 5hall beconsidered to be cost eftive if the difference between (A) the orginal investment cost of the energy system using such a formof energy. and (B) the original investment cost of the energy system not using such aform of energy can be recovered over theexpected life of the system.
(2) A determination under paragraph (1) of whether a cost-differential can be recovered over the expected life of a -ystemshall be made using accepted life-cycle cosnng procedures and shall include -
(A) the use of all capital expenses and all operating and maintenance expenses associated with the energy s ,tern using solar energy or other renewable forms of energy, and not using such a form of energy. over the epected hi a, !he.vsrem or dunng a period of 25 years whichever is shorter:
(B) the use offosilfuel costs (and a rate of cost growth Jbrfosstlfuel costs) as determined by the Secretary of Dei'nse.
and
(C) the use of a discount 'ate of 7 percent per ,ear for all expenses of the energy system.
(3) For the purpove of any li.ecycle corv analbi' under t uhecton. the orginal investment cot of the nerrii ,7 7n
using solar energy or other reneowable Jbrms c/energy 5ha,' he reduced hv 10 percent to reflect an allowance toran investment cost credit.
(Added Pub. L 97-321. title V'7I 801(aXl. Oct. 15. 1982. 96 Stat. 1569. and amended Pub. L 98.525. ttle XV' "40536)Oc. 19. 1984. 98 Star. 2623.)
Figure 5-6. Title 10 US Code, Section 2394 Guidance
5-16

CAA-SR-91-9
(2) Army Energy Policy Objectives. The Army EnergyOffice in ODCSLOG presents the Army's current energy goals inthe Army Energy Resources Management Plan (FY 86-95). The Planincludes goals regarding the Army's use of renewable energysources--sunlight, wind, geothermal, hydropower, ocean thermal,and biomass. In particular, the Army aims to increase its useof renewable energy technologies between FY 86 and 95 by 5percent or 27,975 MBtu (millions of British Thermal units).This estimate is based upon FY 1985 renewable energy use of559,510 MBtu in the Army. The amount of energy required topower the pop-up targets in this time period (1985-1995) isestimated to be 22,180 MBtu.1 If this energy requirement were"cost effectively" met by PV technologies, then about 80 percentof the Army's renewable energy objectives would be satisfied.Although not addressed in this report, a more complex case studywould compare the economics of conventionally rechargedbatteries against all technically applicable renewabletechnologies - not just photovoltaics. This kind of analysisshould consider both pop-up target energy requirements and thechange in the Army's renewable energy usage as noncombat MOE.However, because of the Army's success with photovoltaicapplications and to simply illustrate the concept, thediscussion will be limited to photovoltaics.
e. Cost-Benefit Analysis. The issue of whether tocontinue recharging batteries conventionally or to invest inphotovoltaics for pop-up targets requires identification of therelative costs and benefits. The focus of this case study willbe on monetary costs and benefits (cost savings) as stipulatedby Title 10, U.S. Code Section 2394. The investment criterionapplied (as required by Title 10) is the number of years thatthe photovoltaic alternative "pays back" (in discounteddollars).
(1) Cost Assumptions. The following assumptionswere used in estimating Life Cycle Costs (LCC) for both theccnventional and PV methods for recharging batteries used topower pop-up targets:
Economic useful life of a PV system: 20 years2
Economic useful life of a battery: 2 years3
t Based on: Applications Survey for Remote Photovoltaic Power Systems, Arthur D.Little, Inc., October 1989, Table 1. (Estimated energy savings from PV recharging:3320 batteries x 480 WH/day x 120 days = 191.2 MWH x 11.6 BTU/WH = 2218 MBTU).2 Source: Life Cycle Cost Analysis of Photovoltaic Power Systems, U.S. ArmyEngineering and Housing Support Center. (Engineering and Housing SupportCenter).3 Average figure for operating training center ranges and life of battery based ondiscussions with ODCSOPS (DAMO-TR) and CERL.
5-17
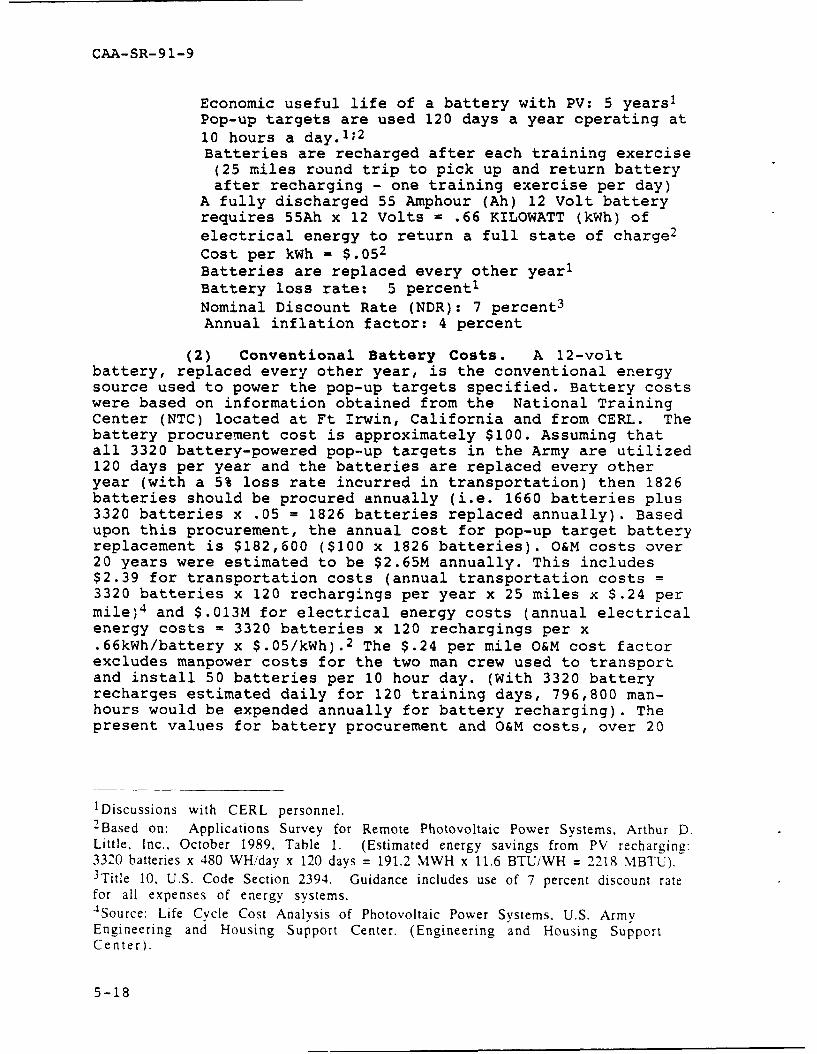
CAA-SR-91-9
Economic useful life of a battery with PV: 5 years1Pop-up targets are used 120 days a year cperating at10 hours a day.';
2
Batteries are recharged after each training exercise(25 miles round trip to pick up and return batteryafter recharging - one training exercise per day)
A fully discharged 55 Amphour (Ah) 12 Volt batteryrequires 55Ah x 12 Volts = .66 KILOWATT (kWh) ofelectrical energy to return a full state of charge2
Cost per kWh = $.052Batteries are replaced every other year1
Battery loss rate: 5 percent!Nominal Discount Rate (NDR): 7 percent3
Annual inflation factor: 4 percent
(2) Conventional Battery Costs. A 12-voltbattery, replaced every other year, is the conventional energysource used to power the pop-up targets specified. Battery costswere based on information obtained from the National TrainingCenter (NTC) located at Ft Irwin, California and from CERL. Thebattery procurement cost is approximately $100. Assuming thatall 3320 battery-powered pop-up targets in the Army are utilized120 days per year and the batteries are replaced every otheryear (with a 5% loss rate incurred in transportation) then 1826batteries should be procured annually (i.e. 1660 batteries plus3320 batteries x .05 = 1826 batteries replaced annually). Basedupon this procurement, the annual cost for pop-up target batteryreplacement is $182,600 ($100 x 1826 batteries). O&M costs over20 years were estimated to be $2.65M annually. This includes$2.39 for transportation costs (annual transportation costs =3320 batteries x 120 rechargings per year x 25 miles x $.24 permile)4 and $.013M for electrical energy costs (annual electricalenergy costs = 3320 batteries x 120 rechargings per x.66kWh/battery x $.05/kWh). 2 The $.24 per mile O&M cost factorexcludes manpower costs for the two man crew used to transportand install 50 batteries per 10 hour day. (With 3320 batteryrecharges estimated daily for 120 training days, 796,800 man-hours would be expended annually for battery recharging). Thepresent values for battery procurement and O&M costs, over 20
1Discussions with CERL personnel.2Based on: Applications Survey for Remote Photovoltaic Power Systems, Arthur D.Little, Inc., October 1989, Table 1. (Estimated energy savings from PV recharging:3320 batteries x 480 WH/day x 120 days = 191.2 MWH x 11.6 BTU/WH = 2218 MBTU).3 Title 10, U.S. Code Section 2394. Guidance includes use of 7 percent discount ratefor all expenses of energy systems.-Source: Life Cycle Cost Analysis of Photovoltaic Power Systems. U.S. ArmyEngineering and Housing Support Center. (Engineering and Housing SupportCenter).
5-18

CAA-SR-91-9
years, amounted to $1.93M and $34.55M, respectively. Thepresent value of conventional battery life cycle costs for the20 year period is $37.4M.
(3) PV Costs. PV investment costs per pop-uptarget were estimated at $300 by CERL. The 3320 operating pop-up targets in CONUS require 3320 PV systems. Thus, the totalinitial investment for PV amounts to $.996M (3320 batteries x$300.00) with an annual recurring cost for operation andmaintenance at 7.5 percent of investment cost or about $74,500per year.2 . Since battery life is extended to 5 years and thereis no requirement to transport batteries with PV systems,battery costs are reduced to $66,400 annually (1/5 x 3320batteries x $100 per battery). The present value (over 20 years)for the initial PV investment is $.996M, $1.08M for PV O&M costsand $.96M for battery replacement costs. Total present valuecosts for the PV alternative is $3.04 million.
f. Cost Benefit Results. The use of PV as anenergy source to recharge batteries for pop-up targets was foundto be more cost beneficial when compared to the use ofconventional batteries as a power source. Over the 20-yeareconomic useful life of a PV system, total present value costsavings from PV investment was estimated to be $37.4M-$3.04M =$34.36M. This amounts to an average annual rate of return of56.5 percent. The discounted payback for an initial investmentof $.996M would be less than 2 years.
g. Cost Benefit Finding. Title 10, US Code,Section 2394, indicates that renewable energy investment with apayback within its economic life (20 years) is considered to becost effective and should be undertaken. The PV case studydescribed in this chapter pays back in less than 2 years.Furthermore, it has been indicated that the PV investmentspecified significantly contributes to the Army's renewableenergy objectives. Additional benefits would be realized by PVinvestment, such as its contribution to Army environmental goals(such as less handling and disposing of batteries), but were notquantified in this study. The execution of the remainingmodules in the VAA methodology (e.g., implicit factors) was notconsidered necessary for this particular issue, since the PVinvestment described met the cost effectiveness criterionprovided in Title 10.
5-4. SUMMARY. The development of the Value Added methodologyspecifically included two components (Explicit and Implicit) tothe valuation portion of VAA. The explicit effectiveness
'Title 10, U.S. Code Section 2394. Guidance includes use of 7 percent discount ratefor all expenses of energy systems.2 Source for cost factors: Photovoltaics for Military Applications, MeridianCorporation, May 1988.
5-19

CAA-SR-91-9
investment described met the cost effectiveness criterionprovided in Title 10.
5-4. SUMMARY. The development of the Value Added methodologyspecifically included two components (Explicit and Implicit) tothe valuation portion of VAA. The explicit effectivenesscomponent was specifically designed to measure the quantifiableelement of value. The methodology, as currently envisioned,uses traditional analysis tools such as combat simulations,historical data, or mathematical formula to measure the explicitcontribution an alternative would provide to the Total ArmyProgram. This explicit value is always measured from a baselineposition, e.g., in our illustrative example, we used the FY 94Program Force. The module appears to be flexible enough tohandle a wide range of quantification models and methods. Theresults of this module are passed to the EffectivenessIntegration Module as changes from the baseline position.
5-20

CAA-SR-91-9
CHAPTER 6
VALUE ADDED COSTING
6-1. INTRODUCTION
a. The purpose of this chapter is to provide a discussionof the Costing Module of the Value Added methodology. Includedin this discussion are the methods and processes selected andtheir relationship to the optimization module. The Value Addedmethodology required a breakdown of life cycle weapon system(s)cost elements coupled with a mechanism for adjusting costs toaccount for variations in procurement quantities. Consequently,two PC-based models were developed--the Cost Quantity Model(CQM) and the Weapon System Life Cycle Cost Model (LCCM). Inaddition to the two PC-based models, the Costing Module uses amethodology for developing weapon system definitions based onthe Army Resources Integration Management (ARIM) Study. Thischapter is structured as follows:
(1) Introduction
(2) Costing Context
(3) Select or Develop Models and Tools
(4) Implement Analytical Models and Tools
(5) Summary and Observations
b. Figure 6-1 depicts the placement of the Costing Module in theoverall Value Added methodology. The majority of the inputs for thismodule are fed to it from the Issue Clarification Module. Theoutputs generated in the costing module are passed to theoptimization module for the conduct of a cost benefit analysis.Costing output also can be passed to the Results and Display Modulefor direct analysis and presentation.
6-1

CAA-SR-91-9
1
Figure 6-1. VAA Methodology -Costing Overview
c. Figure 6-2 provides a flow chart of the Costing Module.
Determine Cost/QuantityOpizerelationships when--Appropriate with CQM or Qatte
FLYAAYOST] other Cost/Quanitiy logic I
WEAPON SYSTEM COST
PROCUREMENT COST
PROGRAM ACQUISITION COST
LIFE CYCLE COSTJFO A
Data tSources
BCE PROBEACP _Other
Figure 6-2. Costing Module Flow Chart
6-2
CAA-SR-91-9
6-2. DEVELOPMENT OF THE COSTING CONTEXT
a. Identify Assumptions
(1) Experience curves for weapon systems are computed atthe component level. Models rolling up component-level cost andquantity data reside with the program manager of each system.The Value Added Analysis methodology may address several weaponsystems simultaneously, making use of component-driven modelsimpractical in a quick reaction environment.
(2) Regression analysis of historical or projectedannual weapon system production costs can be used to calculatesystem first unit costs and experience and production ratecurves that generate average annual production cost within anacceptable margin of error.
(3) Similarly, P92 cost codes for the five major costcategories (development, production, military construction,fielding, and sustainment) can be prorated with the impact onthe affected appror iation category based on experience/production rate curves and cost factors generated from availabledata.
b. Identify Cost Policy. Army weapon system costingpolicy is addressed in Army Regulation (AR) 70-2 (Integration ofWeapon Systems Costing Programing and Execution ManagementSystems, June 1986). CEAC is the proponent for Army weaponsystem costing. Army inflation guidance is provided every 2years by the Army Materiel Command (AMC).
c. Determine Lexicon. Definitions for the fivecategories of weapon system cost were identified as: Fly Away,Procurement, Weapon System, Program Acquisition, and Total LifeCycle Costs. Procurement/production costs were selected as thebasis for optimizing system procurement. The P92 cost elementsas defined by CEAC in DCA -P92(r) report were used as a point ofdeparture for identifying costs elements for a weapon system.TheArmy Resource Integration and Management (ARIM) Study addressedthe problem of consistent weapon system definition. As part ofthat effort, the costs for the five major weapon system descrip-tions were identified. These five major types of weapon systemcosts are: Fly Away, Weapon System, Procurement, ProgramAcquisition, and Life Cycle as shown in Figure 6-3 with therespective cost compositions.
6-3

CAA-SR-91-9
PLUS PLUS PLUS PLUS
- Manufacturing Tachr-Cal Data - Initial Spares - RDT&! - Operations
- Enqineerinq - Contractor Service - Facility & Support- ?ooling - Support Equipment Construction (Includes Post
- Quality Control - Tzaining Equipment production support)- Nnrecurrinq "Start Up* - Factory Training - Disposal
- Allowance for Changes
FLYAWAY COST
WEAPON SYSTEM COST
PROCUREMENT COST
PROGRAM ACQUISITION COST
LIFE CYCLE COST
Figure 6-3. Life Cycle Cost Composition
6-3. DETERMINE APPRORIATE MODELS AND TOOLS
a. Identify Selection Criteria
(1) Models and analytical tools used in the Value AddedAnalysis methodology for costing were selected based on thefollowing criteria:
(a) The ability to perform quick reaction weaponsystem cost estimates considering variation in procurementquantities.
(b) The ability to provide consistency among allweapon systems in the computation of cost/quantityrelationships.
(c) The ability to estimate broad cost categories andtheir relationship to Army appropriations that are of interestto budget/programing decisionmakers.
(2) The study team conducted a subjective analysis ofthe candidate technique using the above criteria. This analysisconsisted of:
(a) Determining analytical tools that can providesame day cost estimates.
(b) Determining a consistent cost format for allweapon systems.
6-4

CAA-SR-91-9
(c) Providing the capability to cross-referencebetween weapon system cost elements and Army appropriations.
b. Determine Measures of Effectiveness. Thefollowing MOE are relevant for the Value Added Analysismethodology model/tool selection:
(1) Timeliness. Costing for the Value Added Analysismethodology requires extremely quick reaction turnaround becausethe environment in which these types of decisions are conductedis characterized by short timelines.
(2) Accuracy. Cost estimates must be accurate withinan acceptable margin of error to be of any value in theanalysis. A tradeoff exists between the timeliness and accuracyof MOEs. Given the tradeoff with timeliness and the anticipatedbroad scope of Value Added Analysis applications, selection ofmodels/tools were made with an implicit goal of providing costestimates with less than a 15 percent margin of error.
c. Review Alternative Costing Methods
(1) Cost Quantity Alternatives
(a) Program Manager Level Models. Productioncosts of a weapon system are conventionally estimated byaggregating the costs of the individual components. The costsof the components are calculated using learning curves, therequired quantities, and the first unit costs of each component.This method requires considerable computation, especially whenthe number of ccmponents is large. Models performing these"component" aggregation cost estimates are complex and usuallyresidt at the program manager level.
(b) Composite Learning Curves. An estimationprocedure was developed aimed at reducing the computationaleffort required to aggregate component-level costs whileyielding reasonably accurate weapon system costs. Thisproceduze replaces individual component-level learning curveswith a composite learning curve. It allowed for the calculationof production costs with simplified computations but with a lossof some accuracy. However, tie laborious task of gatheringcomponent-level learning curve data exits with this method.
(2) The CQM Method. The CQM utilizes eAperience curvetheory to estimate average unit production costs. Base experi-ence curve theory specifies unit cost as a function of thequantity produced. The tenet is that as production of aparticular good (weapon system) doubles, production costdecreases at some constant rate. The base experience curvemethod is an accepted technique to forecast production costsfrom the known costs of past production. It is specified asfollows:
6-5

CAA-SR-91-9
[6.01]
Y=AXb
where:
Y= average unit costA = cost of the first unit producedX= cumulative quantity of units producedb= experience curve slope coefficient.
(a) The CQM employs an altered form of the baseexperience curve. This is due to the wide recognition that theproduction rate plays an important role in production costs. Inlight of this, a production rate variable has been added to thebase method. This reveals the following experience curvefunction, which is utilized by the CQM. 1
[6.02]
Y- AQbRc
where:
Q - cumulative lot mid-point
b= cost/lot mid-point slope coefficientR= production ratec= cost/rate slope coefficient
All other variables are as previously defined.
j. In addition to the inclusion of the productionrate variable, [6.02] above has been altered in another way.The cumulative quantity variable (X) has been substituted by thecumulative lot mid-point (Q). This is necessary because weaponsystem(s) program managers generally do not keep cost data onindividual units of output. Instead, they maintain cost data on"lots' of output. Since the cost of individual units isunknown, estimation of the experience curve as specified by thebase method is impossible.
,. One method to remedy this is use of thecumulative lot mid-point. The lot mid-point is that unit in agiven lot of output whose cost is equal to the average cost ofall the units in the lot. This can be seen graphically in
1See Bemis. John C. The Cost Implications of Production Rate. Concepts, Spring1981, Volun, . Number 2. Pgs 84-94.
6-6

CAA-SR-91-9
Figure 6-4. Unit cost is plotted along the vertical axis, whilethe number of units produced lies along the horizontal axis.Three separate lots of output are drawn in the figure. Theplots marked by QI, Q2, and Q3 represent those units whose costequals the average cost of the entire lot. In the figure, acurve has been drawn through the respective lot mid-points.
1. This method is helpful because weapon system(s)program managers do maintain data on the number of unitsproduced in a given lot. Coupling this with the cost of thatlot allows a cost/quantity relationship to be established. Thisallows the experience curve to be estimated. The estimator forthe cumulative lot mid-point is presented on the next page.2
unit cost
Y=AX~b
lot 1 lot 2 lot 3
Q1 Q2 Q3units produced
[6.03]
F+L + 2 - FL
4
Figure 6-4. Lot Mid-Point
where,
Q- approximate cumulative lot mid-pointF= first unit in the lotL= last unit in the lot
Table F-2 in Appendix F lists examples of cumulative lot mid-point calculations.
2 Cost Estimating for Engineers. ALM-63-3126-LC. Pgs 210-212.
6-7
CAA-SR-91-9
J. Once all the necessary data is acquired, theexperience curve function of equation [6.02] can be estimated.This is done by applying ordinary least squares regression toequation [6.02]. In order to do so, [6.02] must first be madelog-linear. Ordinary least squares is then applied to the log-transformed variables of [6.02]. This is all done by the CQM.The only user requirement is entry of the variable data.
.. Output from CQM will include experience curveestimates and descriptive statistics. In cases whlLee theproduction rate variable is found to be statisticallyinsignificant, CQM allows the user to drop that variable and re-estimate the curve. Included in the output are the experiencecurve percentages. These reveal the percentage of the firstunit cost to which first unit cost decreases when productionquantity doubles. Refer to Appendix F for further explanation.
k. Total production costs for a given weapon systemare found by finding the area under the experience curve (seeAppendix F, paragraph F-6). The average unit cost for theprojected production quantity for each affected year iscalculated from the estimated first unit cost, experience curve,and production rate curve. This average unit cost for theaffected years is then used as input to FOMOA, which computesthe optimal procurement quantities. After the new procurementquantities are determined the CQM should be run one moreiteration to compute the average unit costs (by year) for theoptimal production quantities generated by FOMOA.The use of aconstant average unit cost (AUC) for production did not, forthis demonstration, create a s...ation in which a stablesolution was unattainable. However, the danger does exist thatwith repeated iterations convergence to a stable solution maynot be obtainable. Further work in regards to dynamic costingwithin the linear program must be conducted as part of the VAAPhase II study.
(3) BCE Costing Updating
(a) The BCE is a generic term denoting a compre-hensive, detailed and fully documented estimate of materiel lifecycle costs accomplished by the weapon system project manager.The BCE is a dynamic document, refined and updated throughoutthe acquisition cycle. The BCE serves, after review andvalidation, as the principal cost estimate for the system and isused as:
I. The principal institutional source document forcost information related to materiel systems.
2. The basis for projecting funding requirementsfor acquisition and operation of the materiel system.
6-8

CAA-SR-91-9
.. The benchmark (initial BCE) and source (updatedBCEs) for system cost tracking.
.J. The basis for cost inputs to such reports as theSelected Acquisition Report (SAR).
(b) It would be impractical to update BCEs to addressissues associated with Value Added Analysis applications.Therefore, a suitable strategy to estimate key cost elementscomprising total life cycle cost of a weapon system wasundertaken.
(4) The LCCM Method. Once the c,?timal procurementquantities and production costs are calculated, the LCCMredistributes production, fielding and sustainment costs. Thisis accomplished by inputing cost factors generated from theBCE/ACP source data on the first of two LCCM spreadsheets.These prorated cost estimates can be used as input to FOMOA forspecific "what if" exercises that require optimization toaddress issues such as those associated with horseblanketdrills.
(a) Current Method for Prorating ProductionCosts. Ideally, variations in production costs would beaccompanied by the concurrent changes in the P92 cost cate-gories. This is not possible in the limited timeframe foraddressing a Value Added issue. if production quantities areincreased or decreased, the CQM is used to determine the totalproduction ccsts for those quantities. LCCM redistributes totalproduction costs by the percentage of total production costs foreach P92 production cost element. These factors are calculatedfor the BCE/ACP source data in the first spreadsheet. Forexample, if 2.03 Engineering Changes accounted for 3 percent oftotal production costs on the BCE/ACP, the second spreadsheetcontaining the revised production quantities would estimate theP92 cost element 2.03 Engineering Changes to be 3 percent of thenew total production costs.
(b) Methodology for Prorating Fielding andSustainment Costs. Again, based on the BCE/ACP source datain the first spreadsheet, per unit/system P92 costs are calcu-lated for each cost element. The second spreadsheet reflectsthe revised costs for new fielding and sustainment quantitiessimply by multiplying the new quantities by the per unit costscalculated from the BCE/ACP source data in the firstspreadsheet.
(c) Calculation of Military Construction, Army(MCA and Development Costs). MCA and development costs arenot changed with variations in production quantities. In mostapplications, this is appropriate, since these costs would notvary significantly with relatively small production quantitychanges. In instances where quantities are changed signif-
6-9

CAA-SR-91-9
icantly, MCA and development costs would have to be reevaluatedbased on the idiosyncrasies associated with the particularsystem's development and MCA requirement.
6-4. IMPLEMENT ANALYTICAL MODELS AND TOOLS
a. Identify Data Requirements
(1) Life Cycle Cost Data. Life cycle cost data areobtained from BCE or Army cost positions (ACP) in order toprovide cost quantity data for inclusion in the VAA methodology.BCEs are generated by the weapon system program managers (PMs).The CEAC performs independent cost estimates (ICEs) to validatethe BCE. Differences between the BCE and ICE are reconciled ina cost analysis brief (CAB). The CAB results in an ACP used tosupport the POM. ACP or BCE data are used in VAA depending onwhich is the most current. Updated BCEs should be available onan annual basis. BCE updates also occur when the approvedquantities, operating tempo, or other cost determining factorsfor a particular weapon system have changed significantly..
(2) Inflation Indices. Inflation indices guidanceare provided annually from AMC in the form of a memorandum. AMCguidance provides inflation indices for each Army appropriationas well as distinguishing aircraft, missiles, wea'oons/trackcdcombat vehicles, and ammunition procurement. The inflationindices or escalation factors are needed to convert constant(e.g., FY 90) dollars to current (i.e., inflated or escalated)dollars. The indices are also used in the conversion of currentdollars to constant dollars. The indices are important becauseVAA requires consistency among the types of costs used in orderto make comparisons between alternatives.
(3) Minimum/Maximum Production Rates. Rates ofproduction data are required as constraints in the FOMOA(optimization module) Model and can be obtained from AssistantSecretary of the Army for Research, Development, and Acquisition(ASARDA) or the PMs. Systems can only be produced between theparameter of the minimum sustaining rate and the maximumproduction rate. The minimum sustaining rate (MSR) is definedas a level of production which will keep a production line openwhile maintaining a responsive vendor and supplier base (i.e.,warm production base). The assumption inherent in the MSR isthat the plant must operate one shift, 8 hours per shift, 5 daysa week. Conversely, the maximum production rate is defined as alevel of production which maximizes the capacity of the existingtooling or facilities without requiring an additional investmentto increase the production capacity. This definition assumesthree shifts of 8 hours per shift, 7 days a week.
6-10

CAA-SR-91-9
b. Obtain Modeling Capability
(1) The Cost Quantity Model (CQM)
(a) The CQM provides a practical tool to estimateaverage unit production costs of a given weapons system. Itutilizes experience curve theory to make these estimates. CQMallows the user to specify unit production cost as either afunction of the quantity produced, or of the quantity producedand production rate. A complete description of experience curvetheory and the use of the cost/quantity/rate method is providedin Appendix F.
(b) The CQM Model performs two principal functions.The first is to estimate the experience curve for a givenweapons system. This is done through the use of historicalproduction cost, quantity, and rate data. Once the experiencecurve is estimated, the model yields other needed calculations.This includes the system's first unit cost and the experiencecurve percentages (see Appendix F for a description ofexperience curve percentages).
(c) The estimates obtained in the first function ofthe CQM are inputs to the second. The second function of CQMallows production costs to be computed, given the quantitiesdesired. The model also allows for constrained budgets andother factors that might shift the underlying experience curve(such as technological change, contract competition, etc.). Themodel produces estimates on the average and cumulative averageunit production costs, in both constant and current dollars.
(2) The Life Cycle Cost Model (LCCM)
(a) LCCM is a modified version of the InformationSystem Life Cycle Cost Model developed by CEAC. Modificationsand enhancements were made to conform to weapon system lifecycle cost data and to provide the capability to redistributecost elements concurrent with variations in procurementquantities. All formulas and macros were written using QuattroPro. All computations and final values are workable andaccurate in Lotus 1-2-3 spreadsheets with the exception of themacros that realign the columns and provide two graph options.Therefore, it is recommended that Quattro Pro be used whenentering data and performing sensitivity analysis on the costcategories and procurement quantities.
(b) LCCM comprises two spreadsheets. The firstspreadsheet contains a blank template for the data to be enteredbased on the general structure and organization of the P92 costcategories developed for BCE and ACP. P92 cost categories arethe cost codes established by the Office of the Comptroller ofthe Army as part of the integration of weapon system costing,programming, and execution of management systems. The second
6-11

CAA-SR-91-9
spreadsheet is linked to the first and recomputes the new majorcategory quantity and cost values of each of the cells by unitcost based on the proportion of the previous entries of theBCE/ACP data. A display of the LCCM spreadsheet with the P92cost codes utilized is shown in Appendix F, Figure F-i.
(c) A summary of the five major cost categories iscomputed by year and for the life of the system. Allowance wasmade for data 13 years beyond the current year set by the user;however, more cells for additional outyears can be added whennecessary. A summation of the following appropriations is madefor research, development, testing, and evaluation (RDTE),Military Construction Army (MCA), Operations and Maintenance(OMA), Procurement Army (PA), and Military Pay and Allowances(MPA). Costs for associated items of equipment of each systemare entered on the first spreadsheet and unit costs for eachASIOE calculated to apply to new production quantities on thesecond.
(d) The model is time-phased by appropriation, andthe life cycle costs of the weapon system are computed in bothconstant dollars (then year dollars) and current dollars(dollars of the current fiscal year). Based on the current yearthat the user enters, the prior year and the previous years arecomputed as is the budget year, the subsequent POM years, andthe outyears. Inflation from the US Army Material Command isused.' The inflation factors are recorded on the spreadsheet inprotected mode and can only be changed by using the disableprotection command in Quattro Pro or Lotus 1-2-3.
c. Experimental Design. The average unit cost for theprojected production quantity for each affected year iscalculated from the estimated first unit cost, experience curve,and production rate curve considering the prior quantityproduced. The average unit cost for affected years is then usedas input to FOMOA, which computes the optimal procurementquantities. CQM is run again to compute the average unit costsfor the optimal quantities generated by FOMOA.
d. Use Models and Tools
(1) Illustrative Example
(a) This paragraph provides an illustrative exampleof the application of CQM and the potential for use of the LCCMModel. The M1A2 Abrams main battle tank from the armor/antiarmor illustrative case study will be used to demonstratethese two models. Table 6-1 displays the CQM inputs for theM1A2 tank.
1See memorandum. Headquarters. U.S. Army Material Command. Subject: InflationGuidance. Issued 28 December 1989.
6-12

CAA-SR-91-9
Table 6-1A. CQM Input - M1A2 Tank ($ FY 90 in $M)
Inputs Curve factorsIst Unit Cost 58.00 A=58.00Experience Curve (B%) 90.0% B= -0.15200Production Rate Curve 81.0% C= -0.30401
Previous Quantity 7,786 (I+B) 0.84800
Table 6-lB. CQM Input by Year - MIA2 Tank ($ FY 90 in $M)
Production FY 1991 1992 1993 1994 1995 1996 1997Proj Shift +/- (%) 20.00 0.00 0.00 0.00 0.00 0.00 0.00Desired Quantity 261 516 516 516 516 420 181Constant $ Budget 1,179.6 1,754.4 1,709.0 1,698.4 1,330.0 1,150.0 635.0Inflation Factors 1.0000 1.0000 1.0000 1.0000, 1.0000 1.0000 1.0000
LShift Factor 1 1.20 1.20 1.201 1.20 1.20 1.20 1.20
(1) The experience curve (B) and the production ratecurve (C) were estimated from historical production data for theMl tank series using the cost/quantity/rate method described indetail in Appendix F, paragraph F-5. The first unit cost wasestimated to be $58M, the cost/quantity curve at 90 percent, andthe production rate curve at 81 percent. Prior quantities of M1tanks produced were 7,786. The desired annual productionquantities, with the projected annual budget dollars are inputinto the model, and the average annual unit production cost (inFY 90 constant dollars for this example) is computed (see Table6-3). These average annu L unit production costs are then usedas input to the FOMOA Mod..l which computes the optimal produc-tion quantities considering both budget dollars available,combat effectiveness, and competing alternative weapon systems.Once the optimal MIA2 quantities were computed by FOMOA, theaverage unit production costs for the optimized productionquantities were calculated by a second application of the CQM.A 20 percent projected shift factor was included in the firstyear of production of the MIA2 (1991) to account for the averageunit production cost delta for the M1A2 tank over the MIAl tank.
(2) The LCCM input is extracted from BCE/ACP data andentered into the Life Cycle Cost Model. The input format forthe LCCM is shown in Tables 6-2A through 6-2E.
6-13

CAA-SR-9 1-9
Table 6-2A. LCCM Input Data - Development Costs ($M)
Category Cost element Appn Total Prior Current Budget POM POM Etc.previous year year year yr 1 yr 2years 1989 1990 1991 1992 1993
1.0 Development RDTE X X X X X X X1.01 Dev Eng, Acq RDTE X X X X X X X1.011 Engineering RDTE X X X X X X X1.012 Prod, Eng & Plan RDTE X x x X x X X1.013 Tooling RDTE X X X x X X X
1.02 Data RDTE X X X X X X X
1.03 System Test RDTE X X X X X X x
1.04 System Proj Mgmt RDTE X X X X X X X1.05 Training Service RDTE X X X X X X X1.06 Facilitiesj RDTE X x x X X X x1.07 Other Dev Costs RDTE X x x x x X X
Table 6-2B. LCCM Input Data - Production Costs ($M)
Category Cost element Appn Total Prior Current Budget POM POM Etc.
previous year year year yr 1 Yr 2
years 1989 1990 1991 1992 1993
2.0 Production PA X X X X x X X2.01 Nonrecurring PA t X X X X X X
2.011 Initial Prod Fac PA X X X X X X X2.012 Prod Base Spt PA X x x X X X X2.013 DMPE PA X X X X x X X2.014 Other N'nrecurring PA x X X X x X X
2.02 Recurri:ig PA X X X X X X X2.021 Manufacturing PA x X x x x X X2.0211 Contract PA X X X X x X X2.0211 In-house PA x X x x x X X2.0213 Warranty PA X X X X X X X
2.0214 Other PA X X X X x X X
2.022 Rec Engineering PA X X x X X X X
2.023 Tooling PA X X X X X X X
2.024 Quality Control PA X K K K K K X
2.03 ECOs PA X x X X X X X
2.04 Data PA x X X X X X X
2.05 Sys Test & Eval PA X X x X x X X
2.06 Train Serv & PA X X X X X x xEquipment
2.07 Intial Spares PA X x x X X x x
2.08 Operate/Site PA X X X X X X X
2.09 Other Prod Fund PA K K K K K x X
6-14

CAA-SR-91-9
Table 6-2C. LCCM Input Data - MCA and Fielding Costs ($M)
Category Cost element Appn Total Prior Current Budget POM POM Etc.previous year year year yr 1 yr 2years 1989 1990 1991 1992 1993
3.0 Military Constr MCA X X X X X X X
4.0 Fielding OMA X X X X X X X4.01 System Test OMA X I x X X X X
4.02 Training, OMA X X X X X X XServ/Eguipment
4.03 Transportation OMA X X X X X X X
4.04 Intial Repair Part OMA X X X X X x X
4.041 Intial Repair Part OMA X X X X X X X
4.0411 OMA Funded OMA x X x X X X x
4.0412 Procurement Funded PA X K x X X X X4.042 Init Supplies/Con OMA x X X X X X X
4.05 Sys Spec Base OMA x X x X x X X
4.051 Civilian OMA X X X X X X x
4.052 Military OMA x X X x X X X
4.053 Contractor OMA X x X X X X X4.054 Other OMA X x X X X x X
4.06 Other Fund Field OMA x x X X X X X
4.061 Other OMA Fund OMA x X X K K K X4.062 Other PA Fund PA K K K K K K K
6-15

CAA-SR-91-9
Table 6-2D. LCCM Input Data - Sustainment Costs ($M)
Category Cost element Appn Total Prior Current Budget POM POM Etc.previous year year year yr 1 yr 2years 1989 1990 1991 1992 1993
5.0 Sustainment OMA X X X X X X X5.0! Replenishment OMA X X X X X X x5.011 Replenish Repair OMA X X X X X X X5.0111 OMA Funded OMA X x X X X X X5.0112 Procurement Funded PA X X X X X X x5.012 Replenish Spares OMA X X X x X X X5.0121 OMA Funded OMA X X X X X X X5.0122 Procurement Funded PA X X X X X X X5.013 War Reserve Repair OMA X X X X X X X
5.014 War Reserve Spares OMA X X X x X X X5.0141 OMA Funded OMA X X X X X X X5.0142 Procurement Funded PA X X X X X x X
5.015 War Reserve Repair OMA X X X X X X X5.0151 OMA Funded OMA X X X X X X X5.0152 Procurement Funded PA X X X x X X X5.03 AMMo/Missile OMA X X X X X X X5.031 Train-Ammo / Msl PA X X X X X X X5.032 War Reserve PA x X X X X X X
Ammo /Ms 15.04 Depot Maint OMA X X X x X X X
5.041 Depot Maint Civil OMA X X X X X X X
5.0411 Veh OH Civl Lab OMA X X X X X X X
5.0412 Veh OH Mat Lab OMA X X X X X X X
5.0412 Civilian OMA X X X X X X X
5.0412 Military OMA X X x X X X X
5.0412 Contract OMA x X X X X X X
5.0412 Other OMA X X X x X X x
5.042 Depot Maint Mat OMA x X X x X X X
5.0421 Military OMA X X x X X X X
5.0421 Contract OMA X X X X X X X
5.0421 Other OMA x x x x x x x
5.0422 Comp OH Mat OMA X X X x X X X
5.043 Material (Proc) PA X X X x x X X
5.044 Maint Spt Act OMA X X x X X X X
5.05 Field Maint Civil OMA X X X X X X x
5.06 Transportation OMA X x x K X X
5.07 Repl Training OMA X X x X x x X
5.071 Ammo/Msl/Equipment PA X X X X X X X
5.072 System/Trng/Srv OMA X x x K K K X
5.073 Contract OMA x X X X X X X
[5.074 _ Other OMA X X X x X x
6-16

CAA-SR-91-9
Table 6-2D. (continued) LCCM Input Data - SustainmentCosts ($M)
Category Cost element Appn Total Prior Current Budget POM POM Etc.
previous year year year yr 1 yr 2years 1989 1990 1991 1992 1993
5.08 MPA MPA X X X X X X X
5.09 Sys/Proj Mgmt Civ PA X X X X X X X
5.10 Modification Kits PA X X X X X X X
5.101 Hardware PA X X X X X X X
5.102 Application PA X X X X X X A
5.111 Other OA fund OMA X X X X X X X5.112 Life Cycle Sftwr PA X XX X X X X
Table 6-2E. Link Between Appropriation Summary and MajorCost Categories
Category Appn Total Prior Current Budget POM POM Etc.previous year year year yr 1 yr 2years 1989 1990 1991 1992 1993
Development RDTE X X X X X X X
Production OMA X X X X X X XPA
Military Construction MCA X X X X X X X
Fielding OMA X X X X X X XPA
Sustainment OMA X K K K X K XMPL
PA _ _ _ _ ____ _ _ _ __ _ _
NOTES:Constant or Current $1M PA X K K X X
6-5. ANALYZE RESULTS
a. Introduction. This paragraph provides the CQM inputsand outputs for the M1A2 tank illustrative example. Alsoincluded is the incorporation of an application of the LCCM andthe results of an ARIM type weapon system definition (using theM1A2 tank illustrative example).
b. CQM Results. Table 6-3 provides the CQM results forthe planned procurement quantities presented in the May 1989M1A2 ACP. Average unit costs declined until the last 2 yearswhen the reduced quantities increased the average unit costs(Table 6-4). The CQM estimates were within 13 percent of thecosts generated by the ACP.
6-17

CAA-SR-91-9
Table 6-3. CQM Output MlA2 -$ FY90/$M (A3 example)
YEAR 1991 1992 1993 1994 1995 1996 1997
PROPOSED RATE 261 516 516 516 516 420 _ __ JACTUAL 1ST ITEM 1.00 262.00 778.00 1294.00 1810.00 2326.00 2746.00ACTUAL LAST ITEM 261.00 777.00 1293.00 1809.00 2325.00 2745.00 2926.00ACTUAL PROD QTY 261.00 516.00 516.00 516.00 516.00 420.00 181.00
CUMUL ACTUAL QTY 261.00 777.00 1293.00 1809.00 2325.00 2745.00 2926.00ACT PROD CONSTANT $ 855.00 1364.10 1353.70 1340.00 1329.10 1143.60 633.80CUMUL CONSTANT $ 855.00 2219.20 3570.80 4910.90 6240.00 7383.60 8017.40ACTUAL PROD CURR $ 855.00 1364.10 1353.70 1340.00 1329.10 1143.60 633.80
CONSTANT $ AVG UNIT1PROD COST 3.28 2.64 2.62 2.60 2.58 2.72 3.50
Table 6-4. Average Unit Production Costs of OptimizedQtys - MlA2
YEAR 19951 19961 1997 1 19981 19991 20001OPTIMIZED QTYS 641 641 641 641 641 641AVG UNIT PROD COSTS $5.031 $5.03 1 $5.021 $5.011 $5.011 $5.001
The CQM provided a useful tool for the quick reaction costquantity data required by the Value Added Analysis methodology.The Cost Quantity Model has been used successfully in conjunc-tion with FOMOA to optimize acquisition strategies for severalmodernization plans, including armor systems modernization (ASM)and helicopters. FOMOA cannot currently dynamically account forchanges in unit weapon system costs as a result of experienceand production rate curves. CQM accounts for this by providingthe adjusted unit production costs by year for the optimal quan-tities computed in an initial FOMOA run (based on an averageunit cost FOMOA is then rerun utilizing the adjusted unit costs,considering the experience and production curves. The result isa more accurate optimization of procurement quantities, by year,given constrained annual budgets. The feasibility of incorpo-ration of the CQM or CQM methodology into FOMOA directly may beaddressed in the future.
c. The LCCM output provides the same cost elements as theinput shown in Tables 6-2A through 6-2E. The cost elements thatrelate to the five major weapon system type definitions for theM1A2 tank are shown in Table 6-5
6-18
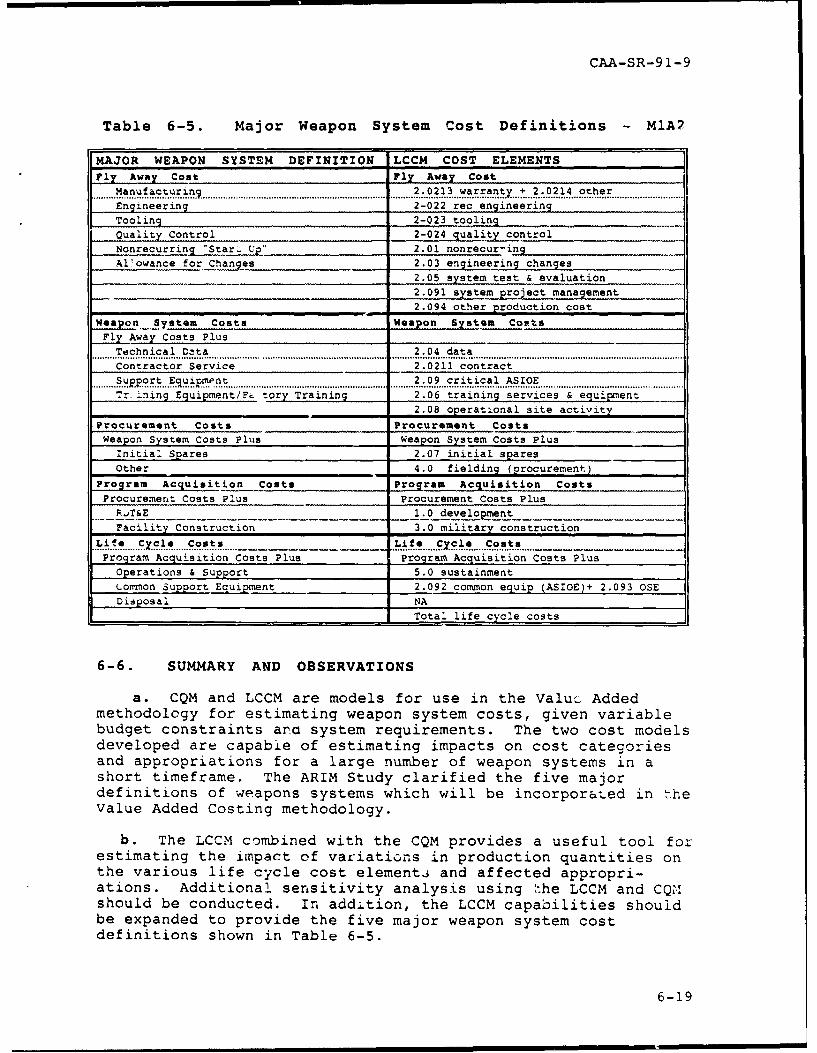
CAA-SR-91-9
Table 6-5. Major Weapon System Cost Definitions - M1A2
MAJOR WEAPON SYSTEM DEFINITION LCCM COST ELEMENTSFly Away Cost Fly Away Cost
Manufacturin.9............................... 2.0213 warranty + 2.0214 otherEngineering 2-022 rec engineeringTooling 2-023 tooling
Quality Control 2-024 quality controlNonrecurring "Star. Up" 2.01 nonr ecuringAl'owance for Changes 2.03 engineering changes
2.05 system test & evaluation
2.091 s ystem project management
2.094 other production cost
weapn ._system Costs Wap Sstem CoatsFly Away Costs PlusTechnical Data 2.04 dataContractor Service 2.0211 contract........ .e ... ~ f ........... I.................................................. ............... ..... .. ...................... ...... .. ..........
Tr, ining Equi2ment/Fc.tory Training 2.06 training services & equipment2.08 operational site activity
Procurement Costs Procurement CostsWeapon System Costs Plus Weapon System Costs Plus
Initial Spares 2.07 initial sparesOther 4.0 fielding (procurement)
Program Acquisition Costs Program Acquisition Costs
Procurement Costs Plus Procurement Costs PlusFjT&E 1.0 develo___ntFacility Construction 3.0 military construction
.. . _ ..... C.. ...t. ....... c Cos-s ............. .. .. ....Program Acquisition Costs Plus Program Acquisition Costs Plus
Operations & Support 5.0 sustainmentcommon Support Equipment 2.092 common equip (ASIOE)+ 2.093 OSEDisposal NA
Total life cycle costs
6-6. SUMMARY AND OBSERVATIONS
a. CQM and LCCM are models for use in the Valu- Addedmethodology for estimating weapon system costs, given variablebudget constraints an. system requirements. The two cost modelsdeveloped are capabie of estimating impacts on cost categoriesand appropriations for a large number of weapon systems in ashort timeframe. The ARIM Study clarified the five majordefinitions of weapons systems which will be incorporated in theValue Added Costing methodology.
b. The LCCM combined with the CQM provides a useful tool forestimating the impact of variations in production quantities onthe various life cycle cost elements and affected appropri-ations. Additional sensitivity analysis using The LCCM and CQMshould be conducted. In addition, the LCCM capabilities shouldbe expanded to provide the five major weapon system costdefinitions shown in Table 6-5.
6-19

CAA-SR-91-9
c. The CQM and LCCM provide useful tools for the quickreaction cost analysis required in the budget process. CQM is amechanism for the estimation of cost/quantity and cost/raterelationships. LCCM approximates the impact of variations inprocurement quantities on the various subcategories of costelements and affected appropriations. Both of these modelsprovide cost data that can be incorporated into the optimizationmodel if required.
d. There is an absence of a central data base containingweapon system cost data at either the BCE level of detail or atthe summary level of detail. This data is required for ValueAdded applications as well as numerous other applicationsthroughout the Army. The responsibility for collecting andaccessing data is consistent with the missions and functions forCEAC. Currently, this data is forwarded to or generated byCEAC, but there is no mechanism in place for centralizing weaponsystem data. A recent effort by A4C to install standardizedautomated BCE formats at the program managers (PMs) shouldprovide impetus for the centralization of BCE data.
6-20

CAA-SR-91-9
1CHAPTER 7
IMPLICIT MEASURES OF EFFECTIVENESS
7-1. INTRODUCTION
a. The purpose of this chapter is to provide a discussion of theformal analytical framework used to perform quantitative analysis ofsubjective data which we call implicit measures of effectiveness.This chapter also provides a detailed discussion of how theseimplicit values will be used in the Value Added Analysis. Thischapter is structured as follows:
(1) Introduction
(2) SIAM Factors
(3) Summary
b. Figure 7-1 depicts the Implicit Effectiveness Module andhow it relates to the overall VAA methodology. The overviewchart indicates that there are two elements within the module, aleadership survey element and a decision element. Theleadership survey is conducted to obtain weights for use in theeffectiveness integration module and in helping define thesecondary factors. The secondary factors decision box ispresent within the module to indicate that the VAA methodologyat this point requires a decision. The analyst may, at thispoint in the analysis, decide to include or exclude the SIAMfactors as part of the single measure of value.
7-1

CAA-SR-9 1-9
IMPLZCT ZYCTIVKIZSS140DULZ
SurvOyLeadership
<ractors?
Figure 7-1. VAA Methodology -Implicit Effectivenessoverview
c. The study team decided early in the Value Added Analysisto quantify subjective judgments because of the following1 :
(1) A formal analytical framework supports decision-makers in their attempt to consider relevant informationsystematically and to examine options and consequences one at atime.
(2) Analysts can break an unmanageable problem intomanageable parts and then synthesize information about the partsin a rational fashion.
(3) A formal framework allows sensitivity analysis onalternative judgments, tradeoffs among alternative judgments,study of effects of variations in subjective judgments onoutcomes; and it is repeatable.
This group of implicit measures (subjective judgments) arecollectively called SIAM factors.
7-2. SIAM FACTORS
a. Development of the Context for SIAM
(1) As indicated in paragraph 2-2, we defined value asbeing contextual. We have already discussed in Chapter 5 someof the most direct contextual items. These included the
1 Crawford, Gordon and Cindy Williams. The Analysis of SubjectiveJudgment Matrices, RAND Document R-2572-1-AF, May 1985 (AD-A157399) (UNCLASSIFIED), page 2.
7-2

CAA-SR-91-9
identification of theaters of interest, doctrine, tactics,weapons systems, and model assumptions. All of these items wereused to obtain the explicit measures of effectiveness throughcombat modeling. However, in analyzing how program decisionsare actually made within the Pentagon and the Department of theArmy, it became very clear that other factors also influencedthe decisions. These factors became known as SIAM factors.
(2) The SIAM factors do reflect context. The manner inwhich context is achieved is twofold. First, context is createdas a function of who decides what is a SIAM factor, i.e., whichspecial interest group, such as the Congress, Office ofManagement and Budget (OMB), Office of the Secretary of Defense(OSD), CINCs, ARSTAF, or major Army command (MACOM) commanders.Second, these factors provide context through groups weightingeach of the factors so that they reflect the group's valuejudgments. Context in this sense refers to what foreign anddomestic issues impact upon the decisionmakers and how theyassimilate these issues to make judgments.
b. Terms and Definitions. This paragraph is designedto provide the reader an understanding of the lexicon used indeveloping the implicit measures of effectiveness.
(1) Combat Effectiveness. The contribution towarfighting capability.
(2) Noncombat Effectiveness. The contribution towarfighting capabilities other than warfighting. This termincludes such factors as nation building, operating facilitiesto support soldier quality of life and contributions to specialprograms of national interest such as fighting drugs, en-vironmental protection and energy conservation.
(3) Secondary Impact Analysis Modifiers. Keyfactors which are considered in the decisionmaking process, butare not official Army measures of effectiveness. For example,political risk.
(4) Blue Force Surviving. A measure of combateffectiveness obtained from a combat simulation. It is thepercentage of the Blue combat power remaining after the end of aRed first echelon attack.
(5) Correlation of Forces and Means. A measure ofcombat effectiveness obtained from a combat simulation. Thismeasure is computed as the ratio of Red and Blue combat power inthe strike sector remaining after the end of a Red first echelonattack. It is commonly used to infer the denial of the enemy'stactical objectives.
(6) Movement of Force Center of Mass. A measure ofcombat effectiveness obtained from a combat simulation. WhenBlue is on the defensive, it is a geographical measure of loss
7-3

CAA-SR-91-9
of territory. Minimum movement is commonly used to infer theaccomplishment of a Blue defensive objective. When Blue is onthe offensive, success is measured as movement toward theobjective.
(7) Contribution to Industrial Preparedness. Ameasure of the impact of a proposed program on the ability ofthe industrial base of the nation to respond to extraordinaryproduction requirements.
(8) Political Risk: Public Opinion. The publicopinion measure of political risk is a subjective evaluation ofthe attitudes of the general public toward a proposed program.It ranges from significant positive support for the program tosignificant opposition to the program.
(9) Political Risk: Congressional Opinion. TheCongressional opinion measure of political risk is a subjectiveevaluation of the attitudes of the Congress toward a proposedprogram. It ranges from significant positive support for theprogram to significant opposition to the program.
(10) Political Risk: Executive Branch Opinion.The executive branch opinion measure of political risk is asubjective evaluation of the attitudes of the OMB, OSD, and JCStoward a proposed program. It ranges from significant positivesupport for the program to significant opposition to theprogram.
(11) Political Risk: Internal Army Opinion. Theinternal Army opinion measure of political risk is a subjectiveevaluation of the attitudes of special interest groups withinthe Army toward a proposed program. It ranges from significantpositive support for the program to significant opposition tothe program.
(12) Institutional Stability. A measure of theamount of change which is associated with a program. Change ismeasured in terms of the impact on the personnel, logistical,and training systems of the Army. Change is subjectivelymeasured on a scale ranging from extreme change to marginalchange.
(13) Program Flexibility. A measure of the fundingflexibility associated with a program. In other words, itmeasures how much latitude is available to reprogram resourcesor change decisions with regard to the program. For example, amultiyear contract with a significant penalty clause would havelow flexibility.
(14) Program Feasibility. A subjective measure ofthe number of obstacles which might prevent program execution.Programs which are extremely complex or slow to implement have
7-4
CAA-SR-91-9
negative ratings for feasibility, while programs with fewbureaucratic hurdles have positive ratings for feasibility.
(15) Asset Versatility and Deployability. Assetversatility and deployability measures the applicability of aprogram to multiple theaters of operation. For example, aprogram that bought new weapons that could be used in alltheaters wou.d have relatively high ratings for assetversatility.
(16) Operational and Technical Risk. Operationaland technical risk is a subjective measure of the probabilityassociated with a program meeting all of its stated performancecriteria. For materiel systems, this factor will roughlycorrespond to the stage of materiel development for the system.For example, a system in 6.1 will have a higher risk than asystem in stage 6.3.
7-5

CAA-SR-91-9
(17) Need as Related to Current Capability.Program need is a subjective measure of the current status ofthe mission area or function associated with a program, and therelative fraction of improvement that is expected. For example,programs that only enhance an adequate capability receive a morenegative rating for need than those which address an area thathas no current capability.
C. Decisionmakers (DMs) and the Pairwise ComparisonApproach. Experts in decision theory recognize the Pairwisecomparison approach, used in the Analytic Hierarchy Process(AHP) and developed by Thomas L. Saaty in the 1970s, as beingparticularly effective in eliciting experts' subjectivejudgments free from the usual negative effects of grouppressure. As discussed in Chapter 1, some facets of the problemof developing the most desired POM lack any well-defined,scalar-valued measures of merit and involves a great manyinterrelated issues such as: combat MOEs, noncombat MOEs, andSIAM MOEs.
(1) An initial decision hierarchy (strawman), whichallows the DM to break the complex problem into its constituentelements, is developed using literature reviews, brainstorming,and expert opinion.
(2) A final decision hierarchy is constructed withvalidated factors only after considerable discussion of thestrawman with functional experts, the sponsor and various otherDMs. The overall objective is the only element in Level One.Level Two consists of the judgment criteria the DMs considerimportant to the decision; each criteria can be furthersubdivided. Level Three contains the attributes (elements) ofthe previous higher level.
7-6

CAA-SR-91-9
ANALYTICAL HIERARCHY3
DESIRED POM
Combat 1 Noncombat Secondary Impact
Effectivenes Effectiveness Analysis Modifers
Correlation of Forces Conrbutilon To& Means - Nato Building Industial Prep
Pol Risk: Public- Blue Force Surviving - commissaries Pol Risk: Congress
Movement Force Medical Po' Risk: ExecutiveCenter of Mass
Housing Pol Risk: Army
- OL Programs - Institutional Stability
Envlonmental Issues - Program Flexibility
Counter-Narcotics - Program DifficultyAsset Versatility &DeployabilityLOperationsi & Tech Risk
Criticality of Need AsRelated to current Capai
Figure 7-2. VAA Analytical Hierarchy
(3) The solicitation of judgments will be accomplishedby means of a deskside briefing on the Value Added AnalysisStudy, followed by a survey of the attributes. The surveyparticipants should cover a broad range of Department of theArmy specialties, all required to make daily decisions relatingto the Army program. During this phase of the study, the DMmakes his or her preferences known, using a modified version ofSaaty's AHP comparison scale (Figure 7-2). All participantsshould receive the same survey. However, there is no necessityfor comparisons to be in the same sequence and in fact should berandom if possible as a means of dealing with bias.
7-7

CAA-SR-91-9
SAATT PAIRWISM COMPARISON SCALZ
9 7 5 3 1 3 5 7 9
00 1 0 ( 0 13 00 0 0 n30
Equal Importance of Both ElementsWeak Importance of One Element over Anothe
Strong Importance of One Element over Anoth
Very Stong Importance of One Element Over Anothe"--''
L' Absolute Importance of One Element Over Anoth,
Note[] Indicates Intermediate Values
Figure 7-3. SAATY'S Pairwise Comparison Scale
(4) The establishment of priorities is accomplished bymaking pairwise comparisons, that is "to compare the elements inpairs against a given criterion."'
(5) A pairwise comparison matrix is developed for eachrespondent after conducting the confidential interviews todetermine the order of attribute priority with relative weights.The study team used a set of survey instruments such as the onedepicted in Figure 7-3.
I SURVEY INSTRUMENTIContribution to vs. Political Risk:
Industrial Preparedness Public Opinion
The contribution to industrial preparedness The public opinion measure of politicalmeasures the impact of a proposed program risk is a subjective evaluation of the atti-on the ability of the industrial base of the tudes of the gcnel publis toward a pro-nation to respond to extraordinary produc- posed program It ranges from significanttion requirements. positive support for the program to signifi-
cant opposition to the program.
Absolute Very Strong Week PA-1 Week Strong Very AbSolute
Strong Strong
0 0 0 0 0 0 oo 0 n o n 0 0 Check the box which you believe is presently the best measure of theimportance of the item an the left as compared to the item on the right.
Figure 7-4. Example Survey Instrument
1 Saaty, T. L. Decision Making for Leaders: The Analytic Hierarchy Process forDecisions in a Complex World. Belmont, CA: LifetimeLearning Publications, 1982(UNCLASSIFIED) Page 76.
7-8

CAA-SR-91-9
(6) The following is an illustrative example of a pair-wise comparison and the calculation of the weights. Figure 7-4is an example of a tradeoff issue in which the decisionmaker isseeking the most cost effective mix of armor and antiarmor (A3)systems.
'[Example: Representative Armor/Anti-Armor Systems|
huiGiven limited dollar resources, which mix of A3 Systems
should be procured?
Alternatives Characteristic
Basecase Europe Scenario 6.3 with 25 Systems
Alt I MIA2NLOS.ATM.RSSADARM
Alt2 MIA2'AMS.H
* BRADLEY BLK IH° RSSADARM
Figure 7-5. Example Tradeoff Issue
Table 7-1 is how one would form a matrix for comparing theissues as outlined in the previous figure. The numeric valuesshow the relative importance to the decisionmaker of the threesample SIAM factors in relation to the mix of A3 systems.
Table 7-1. Example Decision Matrix
Political Risk Asset Versa- Operational andCongressional tility and Technical RiskOpinion Deployability
Political RiskCongressional 1 1/2 1/5OpinionAsset Versa-tility and 2 1 1/2DeployabilityOperationaland Technical 5 2 1Risk
(7) Priority weights are computed by the geometric meanmethod, rather than the more commonly used eigenvector method,because it gives rise to a more meaningful measure of consis-tency with known statistical properties. The RAND study'
1Crawford, Gordon and Cindy Williams. The Analysis of Subjective
7-9

CAA-SR-9 1-9
appropriately points out that the geometric mean vector is"rooted in a mathematical approach to estimation," providing anintuitive understanding to the problem as well as means toassess the method's suitability. The geometric mean is computedas follows:
STEP 1: Compute[7.01]
1/n
M-(r a,) fori n
where:V, - Non - normalized weight for attribute "i",n = total number of attributes,i= row attribute index,
j = column attribute index,ai = value for position ij in decision matrix A,
V = vector of geometric means.
STEP 2: For Vsuch that[7.02]
-V1.V- V2
V3
[7.03]
( (1/2) (1/5))1/3]- 0.4641589V= ((2) (1) (1,2)) 1 3 " = 1.0000000
((5) (2) (1))1/3 .2.1544347
STEP 3: Compute thp sum of the elements of V,[7.04]
V- , 3.6185936
Judgment Matrices, RAND Document R-2572-1-AF, May 1985 (AD-A157399) (UNCLASSIFIED), Page 6.
7-10

CAA-SR-91-9
(8) The normalized geometric mean vector, Vn' iscomputed by dividing each element of the geometric mean vectorby the sum of all the elements in the geometric mean vector.The sum of the elements of the normalized geometric mean vectoris one.
STEP 4: Compute Vn as[7.05)
Lv,
V2.
3
[7.06]
0. 4641589
3.6185936 [0.1282705"1.0000000 0.2763505
3.61859362.1544347 0.595379
3.61859361
STEP 5: Check the sum of the elements of Vn,[7.07]
V-~ 2 -V.+K+ 3n
SV, = 0.1282705 + 0.2763505 + 0.595379 =1
(9) Though consistency is not required from the DM whenmaking pairwise comparisons, we must concern ourselves withknowing the degree of his consistency:
"...Consistency ...informs the judges about theadequacy of their knowledge and whether they needto study the matter further in order to obtaingreater coherence in their understanding of theproblem."'
1Wind, Y. and T. L. Saaty. "Marketing Applications of the
7-11

CAA-SR-91-9
(a) We do not want the decision to be based onjudgment with low consistency with results of the surveyappearing to be random.' Thus, a certain degree of consistencyis needed to obtain valid results. Low consistency or highinconsistency may also indicate that: (1) the decisionmakerdces not understand the pariwise comparison process, (2) thedecisionmaker did not take necessary time to perform thecomparisons, or (3) the decisionmaker has internal conflicts orinconsistencies himself. A consistency ratio (CR) measures theoverall consistency of judgments and provides an indication thatthe decisionmaker's values did not change dramatically duringthe rating process. It is through the proportionality of thepreferences that the decisionmaker indirectly provides thismeasurement.
(b) The CR is calculated as the consistency index (CI)
divided by the average random index (RI). It is expressed as:
[7.08]
C IC.R.-----.
R.I.
A CR of 0.10 or less is considered acceptable; a CR greater than0.10 makes the judgments appear random and indicates a need toimprove the judgments or to restructure the hierarchy.3 Whenthe CR is zero, you have complete consistency. The goal is notto minimize the CR, but to make good sound judgments anddecisions. The principle or maximum eigenvalue, imax , and thenumber of elements for a given matrix determine the consistencyindex (clcseness to consistency), or inconsistency index as itis sometimes called. This consistency index is represented bythe following expression:4
[7.09]
C.. Xmax-fn-1
where,
Xm== the maximum eigenvector (sum of the product ofthe pairwise comparison matrix and the normalized
Analytic Hierarchy Process,"Management Science, 26: 641-658(July 1980), Page 647.1Saaty, T. L. The Analytic Hierarchy Process. New York: McGraw-Hill Book Company, 1980, page 21.2 ibid., Page 21.3 ibid., Page 21.4 ibid., Page 21.
7-12

CAA-SR-91-9
geometric mean vector).
n = the order of the pairwise comparison matrix (thenumber of activities).
(c) Let A equal the pairwise comparison matrix before
weighting. To determine the value of = in the illustrativeexample, the pairwise comparison matrix A (3x3) is multiplied bythe normalized geometric mean vector (3xl) and the elements ofthat vector are summed as shown, resulting in a scaler value
STEP 1: Compute[7.10j
VlnA'
AV" VfnAm V2nA
V3nA
giving
[7.11]
[1 1/2 1/51 "0.1282705 0.3855216
1 1/2 x 0.2763505 =10.830581
2 1 0.595379 1.789433
STEP 2: Calculate Az.as follows.[7.12]
Ama. -VM4 + KM + V3.4
Am, = 0.3855216 + 0.830581 + 1.789433 - 3.005536
(d) The consistency index is then calculated as
[7.13]
C.I. - (3.00536 -3) _ 0.0027682 , using [7.09].
7-13

CAA-SR-91-9
The denominator of the consistency ratio is the randomcc..sistency. That random value is specified by the number ofelements or activities for a given matrix according to a randomindex table. The random index table used in this study todetermine the random consistency was generated at the Oak RidgeNational Laboratory:'
Thus,[7.14]
_0.002768
C.R.= -0.00477240.58
NOTE: R.I.= 0.58 (this random index value is obtainedfrom Saaty's text).
The consistency ratio for the A3 mix is less than the 10 percentSaaty uses to rate consistency in the pairwise comparison matrixand indicates the decisionmaker's values did not dramaticallychange during the pairwise rating process.
d. Subject Matter Experts and Weapon SystemScoring. A second methodology was used to obtain the subjec-tive judgments of subject matter experts (Modernization ProgramExecution Group (PEG]) on the relative value of 23 weaponsystems with respect to the SIAM factors. Experts were asked torate each of the weapon systems on the rating instruments basedon a standard scale from 1 to 9 (see Figure 7-5). The scoresgiven by each expert were then summed to determine the combinedscore for each of the 23 systems. The results of this analysisconfirmed that key air defense and assault helicopter weaponsystems were viewed as more versatile, deployable, and morecritically needed.
libid., Page 21.
7-14

CAA-SR-9 1-9
TERMINALLY GUIDED WEAPON (TGW) SCORING
POLITICAL RISK:CONGRESSIONAL OPINION
DEFINITON: The congressional opinion measure of politicalrisk is a subjective evaluation of the attitudes of thecongress toward a proposed program. It ranges fromsignificant positive support for the program to significantopposition to the program.
SCORES: 0 0EUE]LJE J0 J
1 2 3 4 5 6 7 8 9
uiqaif Cant medium positive
opposition support support
(bad) (good)
Figure 7-6. Example Scoring Instrument
(1) An initial scoring instrument was developed usingliterature reviews, brainstorming, and expert opinion. Thisexample instrument was validated using senior staff officerswithin the Department of the Army Staff.
(2) A final scoring instrument was constructed using theresults of the validation process. The study sponsor assistedthe team in selecting a final panel for conducting the weaponsystem scoring based on their expertise and positions on theArmy Staff.
(3) The solicitation of scores from this final panel wasconducted in a two-step process. The first step consisted ofproviding each scorer a complete set of scoring instruments.The experts were asked to use appropriate documents, such asmedia articles, Congressional reports, technical papers, COEAs,CBRS, and Modernization plans etc., to develop a knowledge basefor each of the systems (to be used during the scoring process).The second step consisted of a deskside briefing to ensure therespondents understood and felt comfortable with the Value Addedmethodology and approach.
(4) The following is an illustrative example of how thescoring would be completed. Table 7-2 is an example of atradeoff issue in which the decisionmaker is seeking the mostcost effective mix of armor and antiarmor systems.
Table 7-2. Example Scoring Matrix
PRCO* AV/D** OTRWEIGHTS 0.1282705 0.2763505 0.595378
BASE CASE 31 19 36
7-15

CAA-SR-91-9
IALTi 1 29 I36 I27ALT 2 16 24 17
*-Political Risk: Congressional Opinion-Asset Versatility and Deployablility-operational and Technical Risk
Figure 7-6 summarizes the scoring for five subject matterexperts as calculated using the following steps:
7-16

CAA-SR-9 1-9
STEP 1: Collect the raw data and organize into a matrix.
Case SIAM Subject matterfactors experts
S1 S2 S3 S4 S5
PRCO 6 5 7 8 5BC
AVID 3 5 4 4 3
OTR 8 7 6 8 7
S1 S2 S3 S4 S5
PRCO 6 5 6 7 5Alt 1AVID 8 6 7 8 7
OTR 5 6 5 4 7
S1 S2 S3 S4 S5
PRCO 4 2 5 3 2Alt 2
AVID 4 6 5 5 4
OTR 2 3 5 3 4
Figure 7-6. Illustrative Example of SME Scoring
STEP 2: Compute the individual SIAM factor score for each case,where
[7.15]
5
1SLM,, j for i = 1,2,3 and j = 12,3n-I I
Resulting in summed scores for each SIAM factor (see Figure 7-7)
BC Alt 1 At 2
PRCO 31 29 16
AVID 19 36 24
OTR 36 27 17
Figure 7-7. Illustrative Example of Summary Scores
7-17

CAA-SR-91-9
e. Analysis. The results of the analysis associated withthis portion of the method are contained in Appendix E. Thestudy team wanted to keep the main body of the reportunclassified.
(1) The methodology used in this study to help thedecisionmaker determine the most desirable RDA portion of thePOM to meet the program year's requirements can be used in otherareas as well. It can be used for any decision with multiplecriteria to evaluate the relative strength of the variables.The methodology can be used to compare alternative weaponsystems, deployment options, training devices, etc. Conse-quently, the methodology can aid the decisionmaker in ensuringthat a force is properly resourced. The flexibility and sim-plicity of the Analytic Hierarchy Process allow the decision-maker to better understand complex systems of interrelatedcomponents, such as resources, desired outcomes, or objectives.
(2) The analysis shows the decisionmakers believe that,of the major criteria, the combat objective holds the mostrelative importance; the most relatively important combat sub-objective is correlation of forces and means; while the fourmost relatively important SIAM subobjectives are asset versa-tility and deployability, criticality of need as related tocurrent capability, political risk with respect to Congressionalopinion, and operational and technical risk. Judgments were nottaken on the noncombat subobjectives. As a result of feedbackreceived from the senior leadership during the conduct of thesurvey, this area was expanded and will be more thoroughlyevaluated during Value Added Phase II.
7-3. SUMMARY. The development of the Value Added methodologyspecifically included two components (explicit and implicit) tothe valuation portion of VAA. The implicit effectivenesscomponent was specifically designed to measure the subjectiveelement of value. This measurement of the subjective element ofdecisionmaking was included in the VAA methodology based on thefindings of previous work done in this area for both the Armyand others. One of the key findings of our literature reviewstressed the importance of including the secondary factors whichimpact upon decisions. The methodology, as currently envi-sioned, uses an approach that is based on the AnalyticalHierarchy Process and appears to be very useful in helpingdecisionmakers focus their attitudes and identify the factorswhich impact upon PPBES programming decisions. The results ofthis module are passed to the Effectiveness Integration Modulein order to combine their effects with those of the ExplicitEffectiveness Module.
7-18

CAA-SR-91-9
CHAPTER 8
EFFECTIVENESS INTEGRATION
8-1. INTRODUCTION
a. The purpose of this chapter is to provide a discussion of theintegration of multiple measures of effectiveness into a singlemeasure. This chapter also discusses the implementation of a ValueAdded Analysis tool for this function
(1) Introduction
(2) Develop Context for Effectiveness Integration
(3) Select and Develop Appropriate Models and Tools
(4) Implement Models and Tools
(5) Summary
b. Figure 8-1 depicts the Effectiveness Integration Moduleand how it relates to the overall VAA methodology. The Effec-tiveness Integration Module is the section of the VAA method-ology which produces the single measure of value associated withVAA and is used to conduct a cost effectiveness evaluation. Theoutput of this module consists of program value coefficients foreach of the alternatives being investigated.
EFFECTIVENESSINTEGRATION MODULE
BuildCoefficients
Figure 8-1. VAA Methodology - Effectiveness IntegrationOverview
8-1

CAA-SR-91-9
c. The Value Added methodology recognizes both theadvantages and limitations of combining multiple measures ofeffectiveness, and consequently allows decision analysis eitherin an integrated mode or in a mode which only displays themeasures of effectiveness in tabular form. Thus, this chaptercan be viewed as a discussion of an optional part uf themethodology. In practice, however, because of the insightsgained from integrated measures of effectiveness, and because ofthe input requirements of "downstream" tools such as FOMOA,integration has almost always been performed. In fact, theoutputs of the tool discussed in this chapter provide ameaningful analysis product in their own right for comparingalternatives.
d. The analytic tool selected for measure of effectivenessintegration is the Technique for Order Preference by Similarityto an Ideal Solution, better known by its acronym, TOPSIS. Thistechnique was developed by Ching-Lai Hwang' and Kwangsun Yoon atKansas State University and has been widely used by the Army andtaught in operations research classes at the Army LogisticsManagement Center. It is based upon the concept of choosingalternatives which lie in an n-dimensional (see Figure 8-2)Euclidean space closest to a theoretically ideal position andfarthest from a theoretically worst position.
r TOPSIS
Technique for Order Preferenceby Similarity to an Ideal Solution
Attribute X+Two 0
0 0 0o 0
Attribute One
Figure 8-2. TOPSIS Technique
e. Computer software to implement TOPSIS was the first tooldesigned and implemented to operate in the capsule environment
1 Hwang, Ching-Lai and Yoon, Kwangusn, Multiple Attribute Decision Making.Methods and Applications, Springer-Verlag, Berlin, 1981.
8-2

CAA-SR-91-9
of the data base computer chosen for the Value Added prototype.While software to compute TOPSIS coefficients was availablepreviously, the Value Added team designed and wrote a TOPSIStool from scratch in order to ensure wide applicability of themethodology and to overcome inherent problem size limitations ofthe existing software. The TOPSIS software described waswritten in ANSI standard C language and has been successfullycompiled and used on MS-DOS and Macintosh microcomputers andUNIX workstations. Because TOPSIS is useful in its own right, astandalone version has been implemented and extensively testedas part of this study. A brief set of instructions for use ofthe stand alone TOPSIS software in the MS-DOS environment isprovided in Appendix G. Instructions for use of TOPSIS andother Value Added Analysis tools in the METAPHOR environmentwill be provided as part of Phase II of the Value Added project.
8-2. DEVELOP CONTEXT FOR EFFECTIVENESS INTEGRATION
a. Nature of the Problem. Techniques for integrationof multiple decision criteria, such as TOPSIS, are well suitedto the type of management decision problem typified by ValueAdded Analysis. These problem characteristics include:
(1) A requirement to build a rank-ordered preferencelist of candidate systems from among a relatively constrainedset of initial alternatives.
(2) A requirement to be able to compare the relativestrength of preference (cardinal rank) among the candidates.
(3) A set of quantifiable criteria related to attributesassociated with each alternative.
(4) A set of weights which express the relative measureof importance the decision authority attaches to each criteria.
(5) A modicum of confidence in the statisticalindependence and reliability of the measures associated with thedifferent criteria. This confidence may be "subjective" basedupon the decision authority's judgment.
(6) A requirement for sensitivity measures associatedwith variance in input values or decision authority tolerance toerror.
b. Operational Considerations. Operational constraintsrequire the use of a measure of effectiveness integration tool.Interviews with sponsors and review of decision scienceliterature substantiated the following operationalcharacteristics:
(1) Real-world problems contain too many alternatives (n> 50) and too many decision criteria (n > 10) for human
8-3

CAA-SR-91-9
comprehension in tabular form. Some simplification procedure isrequired.
(2) Available optimization techniques (e.g., linear anddynamic programming) require objectively quantified andintegrated measures of effectiveness. In particular, eventechniques which deal with multiple measures of effectiveness(e.g., goal programming) always contain either an explicit orimplicit combining function.
(3) Even when mathematically precise measures ofeffectiveness are not available or integration of availablemeasures appears infeasible, operational estimates must be madewith sufficient precision to allow meaningful analysis toproceed.
c. Problem Domain. The problem domain (prioritizedallocation of resources in construction of the Army POM) issuited to the use of a measure of effectiveness integrationtool. Important characteristics include:
(1) A hierarchical schema for relating measures ofeffectiveness has been defined (see Chapter 7).
(2) Integration tools of this type (including TOPSISitself) have been previously and are currently being used withvarying degrees of success in this domain. In particular,TRADOC has extensive experience in using the TOPSIS methodologyto construct the Field Long-Range Research and Development Plan.
(3) Key decision authorities are knowledgeable con-cerning the underlying assumptions, capabilities and limitationsof this approach in this problem domain.
8-3. SELECT AND DEVELOP APPROPRIATE ANALYTICAL MODELSAND TOOLS
a. Criteria. The following criteria led to the selectionof the TOPSIS tool:
(1) The chosen integration technique must be known andaccepted within the decision science literature.
(2) The chosen integration technique must be capable ofbeing implemented and used within the time constraintsavailable.
(3) The chosen integration technique must not have datarequirements that exceed the collection capability of theanalysis effort.
(4) The chosen integration technique must produceoutputs compatible with other Value Added Analysis tools,especially the Force Modernization Analyzer.
8-4

CAA-SR-91-9
b. Review and Evaluate Alternatives. Severalalternatives were extensively considered for use in lieu ofTOPSIS. They were found to be unsuitable for the followingreasons:
(1) Multiple attribute utility functions were notaccepted because of the lack of consensus on the definition ofthe output measure ("utils"). Utility measures (based onconsumer preference theory) have the most extensive theoreticalliterature background, but they are also much more difficult todevelop, implement, and document.
(2) Probability-based decision trees were not chosenbecause of the difficulty of collecting data related to theattributes and probabilities required for such an analysis. Anextensive case study related to multiple theaters of conflictand multiple levels of conflict intensity was prepared, andshowed potential because it made a direct link to the Armystrategic planning process. However, as the methodologydeveloped, the decision tree approach was later abandonedbecause of an inability to properly define all of the decisionpaths and alternatives. A by-product of this effort was thatValue Added Analysis became much more focused toward weaponsystem acquisition, wherein alternatives are more clearlydefined.
(3) Other methods of combination (e.g., count of advan-tages and disadvantages) were considered but rejected becausethey either did not produce the desired cardinal preferenceweight or because they were relatively unknown to the decisionauthorities.
8-4. IMPLEMENT ANALYTICAL MODELS AND TOOLS
a. Notation. The following notation is used in theTOPSIS methodology.
8-5
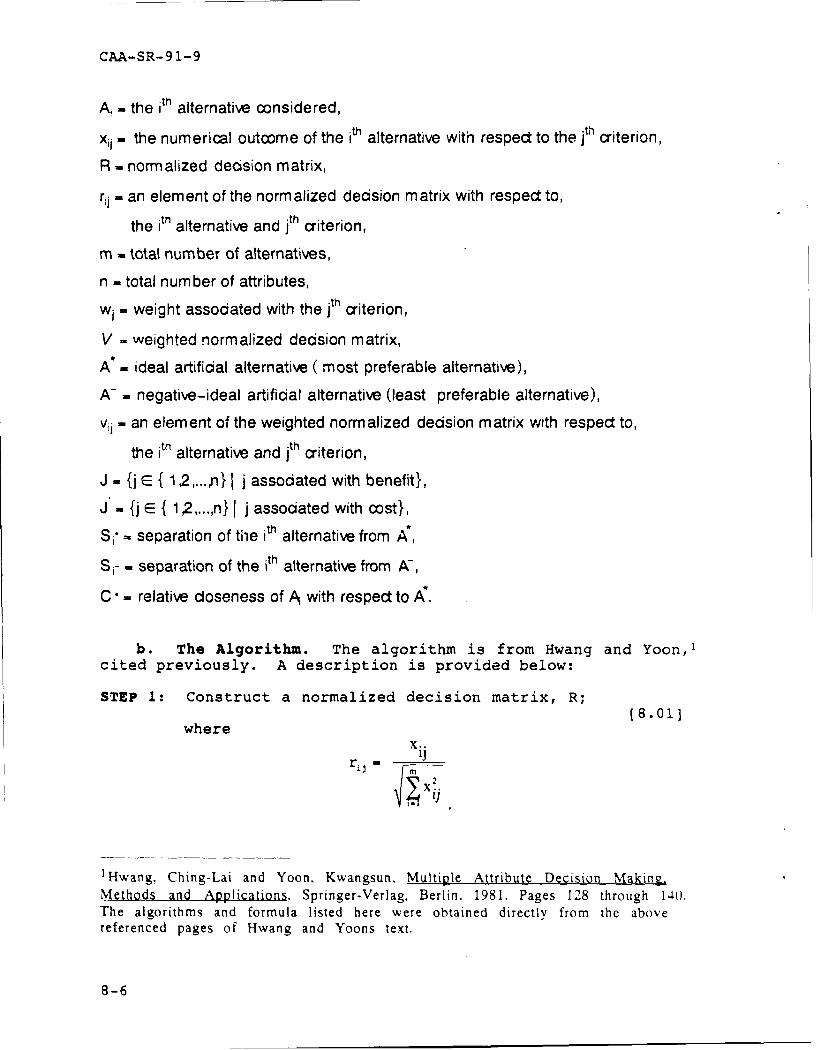
CAA-SR-9 1-9
Al - the ith alternative considered,
xij - the numerical outcome of the it alternative with respect to the j criterion,
R - normalized decision matrix,
rij- an element of the normalized decision matrix with respect to,
the it h alternative and jth criterion,
m-, total number of alternatives,
n - total number of attributes,
wj - weight associated with the jth criterion,
V - weighted normalized decision matrix,
A* - ideal artificial alternative ( most preferable alternative),
A- negative-ideal artificial alternative (least preferable alternative),
vii an element of the weighted normalized decision matrix with respect to,
the itt' alternative and jth criterion,
J - {j e { 1,2,...,n} j assodated with benefit},
J - {j E= 1 2,...,n} j J associated with cost},
Sj* separation of the ith alternative from A*,
S- - separation of the ith alternative from A-,
C-" . relative closeness of A with respect to A7.
b. The Algorithm. The algorithm is from Hwang and Yoon,'cited previously. A description is provided below:
STEP 1: Construct a normalized decision matrix, R;(8.01]
whereX..
,j
1 Hwang, Ching-Lai and Yoon, Kwangsun, Multiple Attribute Decision Making,Methods and Applications. Springer-Verlag, Berlin, 1981. Pages 128 through 140.The algorithms and formula listed here were obtained directly from the abovereferenced pages of Hwang and Yoons text.
8-6

CAA-SR-91-9
STEP 2: Construct the weighted normalized decision matrix,V;such that
(8.02]
~Vi v 12 Vfl1 [w 1 rn W 2rn wnVrl 1V . 'i i2 1) in Wl, W2 r 1 W,,r,
v 1 V,2 V.. twr.,1 Wr 1 wnr..
STEP 3: Determine ideal and negative-ideal solutions; Let the
two artificial alternatives A' and A- be defined as:[8.03]
- {(max v,,i EJ), (mi vjeJ)i. i -
A -{f(rniin viiij GJ), (m Iax IvjjIEJ)i- i 1,2 ... m} - -2'---.
STEP 4: Calculate the separation measure. The separationbetween each alternative can be measured by the n-dimensionalEuclidean distance. The separation of each alternative from theideal alternative is given by:
[8.04]
S. = - v) 2 i= 1,2m....rn
Similarly, the separation from the negative-ideal alternative isgiven by:
[8.05]
V-)2S,_ - ; v -v;) 2 i m2,..r
STEP 5: Calculate the relative closeness to the idealsolution.
[8.06]
C. C O<C. <1, i=1,2,...,m( s. +s.,
STEP 6: Rank the preference order.
STEP 7: Perform sensitivity analysis and graphically portrayresults.
8-7

CAA-SR-91-9
c. The Implementation. A C language computer softwareprogram was designed and written to support the Value AddedAnalysis effort. This program has the following modules:
(1) General Purpose Math Support Routine Module.This module contains memory allocation routines and numericconversion routines that are broadly applicable to all of theValue Added Analysis support software. The support routines arebased upon similar routines contained in Numerical Recipes in Cby Press, Flannery, Teukolsky, and Vettering.
(2) TOPSIS Matrix Input-Output Routine Module.This module contains special purpose routines to read in theTOPSIS input file and allocate memory for the TOPSIS matrix. Ofspecial importance are the procedures which determine the numberof rows and columns in the matrix. The software is constructedso that the size of the TOPSIS matrix is not predetermined andworks with large sizes limited only by available memory. On aMacintosh microcomputer, matrices of sizes up to 120 rows andcolumns have been tested. Considering that each floating pointnumber takes 8 bytes, matrices with hundreds of thousands ofcells are possible. Appendix G contains example inputs andoutputs using the A3 illustrative example.
(3) TOPSIS Calculation Ro..4ne Module. This moduleactually encodes the TOPSIS alaorithm as described by Hwang andYoon. All TOPSIS specific calculation is performed in thismodule.
(4) Main Program Module. This module contains thetop level routine ("main") and calls all other modules. Itsprimary purpose is to parse the command line interface argumentsand open the appropriate input and output files.
8-4. SUMMARY. The closeness value becomes the program valuecoefficient and is the single measure of benefit used in thefollow-on modules. This value is used in the optimizationmodule as a means of calculating the VAA cost effectiveness.The closeness value can also be used to rank order alternativesbased solely on the criterion used in the TOPSIS calculations.This capability provides us with a flexibility to stop theanalysis at this juncture or continae based on the needs of thedecisionmaker.
1 Press; Flannery; Teukolsky; and Vettering, Numerical Recipes in C, Oxford
University Press, 1988.
8-8

CAA-SR-9 1-9
CHAPTER 9
COST EFFECTIVENESS ANALYSIr
9-1. INTRODUCTION
a. The purpose of this chapter is to provide a discussionof the optimization tool used to produce an acquisition strategygiven costs and relative measures of benefit. This chapter alsodiscusses the implementation of a Value Added Analysis tool forthis function.
(1) Introduction
(2) Develop Context for Acquisition Strategy
(3) Select and Develop Appropriate Models & Tools
(4) Implement Models and Tools
(5) Summary
b. Figure 9-1 depicts the Optimization Module and how itrelates to the overall VAA methodology. The Optimization Moduleis the section of the VAA methodology that is used to conductthe cost effectiveness evaluation. The module allows us tosimultaneously trade off alternatives based on their cost andeffectiveness and also to schedule the alternatives acquisition.The output of this module consists of a funding and acquisitionstream very similar to the streams found in the Ar - POM.
OPTIMIZATION-- MODULE
Optimize
Figure 9-1. VAA Methodology - Cost Effectiveness Overview
9-1

CAA-SR-91-9
(1) The Value Added methodology does not require theproduction of a procurement strategy. However, the optimizationtool does provide the integration of costs and benefits into acomprehensive cost-benefit analysis. Thus, this chapter can beviewed as a discussion of an optional part of the methodology,but in practice, an acquisition strategy and cost benefitanalysis has almost always been performed.
(2) The analytic tool selected for development of theacquisition strategy was the Force Modernization Analyzer,better known by its acronym, FOMOA. This technique wasdeveloped by Robert Schwabauerl at the US Army Concepts AnalysisAgency and has been widely used by the Army for the productionof weapon system modernization plans. It is based upon theconcept of linear programming and econometric modeling of cost-quantity relationships. The Value Added FOMOA formulationconsiders production, total obligation authority (TOA), andforce structure constraints in conjunction with cost and benefitdata in order to determine an optimal mix of weapon systemprocurements by year.
(3) Computer software to implement FOMOA for Value AddedAnalysis differs from that described by Schwabauer. For ValueAdded Analysis, a tool was designed and implemented to operatein the capsule environment of the data base computer chosen forthe Value Added prototype. The more traditional FOMOA operatesusing commercially procured software only in the environment ofan Apple Macintosh microcomputer spreadsheet. As such, thedesign of the FOMOA software reflects the "icon-and-arrow" database technology discussed by Cunningham,2 et al. The FOMOAsoftware described was written in ANSI standard C language andhas been successfully compiled and used on MS-DOS and Macintoshmicrocomputers and UNIX workstations. For the Value AddedAnalysis Project, Dr. Schwabauer prepared an original algebraicformulation of the weapon systems acquisition strategy problem,which was independent of the specific weapon system costs andparameters involved. A total separation of problem formulationand data was thereby achieved. Because FOMOA is useful in itsown right, a standalone version has been implemented andextensively tested as part of this study. A brief set ofinstructions for use of the standalone FOMOA software in theMacintosh environment is provided at the end of this chapter.Instructions for use of FOMOA and other Value Added Analysistools in the environment of the data base machine will beprovided as part of Phase II of the Value Added project.
1 Schwabauer, Robert. "User's Manual for Force Modernization Analyzer (FOMOA)Level l," US Army Concepts Analysis Agency Report CAA-D-89-3, Bethesda, MD.November 1989.2 Cunningham, Van; Koury, Robert; and Richmann, James, "Less Expensive, MorePowerful Database Analysis," Database 90 Conference, US Navy AutomationSystems Command, San Diego CA, June 1990.
9-2

CAA-SR-91-9
9-2. DEVELOP CONTEXT FOR ACQUISITION STRATEGYDEVELOPMENT
a. Nature of the Problem. Techniques for developmentof acquisition strategies such as FOMOA are well suited to thetype of management decision problem typified by Value AddedAnalysis. These problem characteristics include:
(1) A requirement to project procurements by dollars andquantities for candidate systems by year.
(2) A requirement to be able to consider the effects ofchanging production and TOA constraints on the weapon mix.Changes to constraints will be made frequently and results mustbe obtained on a time sensitive basis. Responsiveness is moreimportant than precision for this requirement.
(3) A set of quantifiable attributes that can beassociated with each candidate system including cost, anintegrated measure of benefit, production constraints, and forcestructure requirements.
(4) A requirement to determine sensitivity measuresassociated with variance in input values or decision authoritytolerance to error.
b. Operational Considerations. Operational constraintsrequire the use of an acquisition strategy tool. Interviewswith sponsor management and review of decision science liter-ature substantiated the following operational characteristics:
(1) Value Added acquisition strategy problems containmultiple alternatives (n > 50) and multiple types of constraints(n > 10). Some simplification procedure is required. Also, thepreferred solution is usually a mix of systems rather than theselection of only one system for procurement.
(2) All optimization techniques (e.g., linear anddynamic programming) require extensive analysis during theformulation stage in order to tailor the algebraic specificationto the problem at hand. Typically, this formulation is providedas data coefficients which form the input to the mathematicaloptimization tool. This approach usually requires long timeperiods to collect, validate, and prepare data inputs. Anability to generalize the formulation so that data can beobtained automatically from a data base query would reduceerrors in transcription and formulation.
(3) Even when mathematically precise cost and effec-tiveness data are not available or optimization of the acqui-sition strategy appears infeasible, operational estimates andpreliminary plans must be made with sufficient precision toallow programming and budgeting to proceed.
9-3

CAA-SR-91-9
(4) All programming and budgeting tradeoffs must accom-modate multiple and sometimes conflicting goals. The acquisi-tion strategy tool must be able to optimize the mix of systemswhile considering these multiple goals. The FOMOA formulationdeveloped during Phase I of Value Added Analysis does not ade-quately address multiple goals simultaneously. In order toconsider multiple goals, separate formulations must beconstructed and run.
9-3. SELECT AND DEVELOP APPROPRIATE ANALYTICAL MODELSAND TOOLS
a. Criteria. The following criteria led to the selectionof the FOMOA tool:
(1) The chosen optimization technique must be known andaccepted within the decision science literature.
(2) The chosen optimization technique must be capable ofbeing implemented and used within the time constraintsavailable.
(3) The chosen optimization technique must not have datarequirements that exceed the collection capability of theanalysis effort.
(4) The chosen optimization technique must addressessential constraints (e.g., production limits by year and forcestructure requirement maximums by year). Without these con-straints, no acquisition strategy would be considered valid.
(5) The chosen optimization technique must be capable ofbeing used by personnel with a wide variety of backgrounds andeducational experiences. This objective was only partiallyachieved during Phase I of Value Added Analysis and is apriority requirement for Phase II.
(6) The chosen optimization technique must produceoutputs required by the study sponsor. In particular, the toolmust produce a time-phased acquisition plan in a formatrecognizable as input to the Army POM.
b. Review and Evaluate Alternatives. Several alter-natives were extensively considered for use in lieu of FOMOA.None were selected for the following reasons:
9-4

CAA-SR-91-9
(1) The use of a Leontifl Input-Output Model asdescribed in the Army Dollar Resource Study2 was not acceptedbecause leadership viewed the technique as a "black box," toocomplex for management understanding of the effects of changinginputs. Also, the model developed for the Army Dollar ResourceStudy was memoryless in that previous decisions were easilychanged during subsequent analysis. Management considered itimportant that decisions made in the past, and in the process ofimplementation, should not be revisited. Stability is animportant criterion.
(2) The use of a capital budgeting technique asdescribed by Michael Anderson,3 which uses vectors of cost-benefit swapped in and out of a proposed solution set based uponTOA and relative cost-benefit comparisons was not used becausethe technique was relatively inflexible in accounting formultiple measures of benefit. In particular, the technique didnot adequately address subjective measures of value.
(3) The use of simple rank order preference was con-sidered but not used because it did not analytically integrateall appropriate information in arriving at an acquisitionstrategy. It should be noted that simple rank order preferenceis the technique currently used to construct the Army POM. Itwas the strong opinion of the study sponsor that the existingmethod was not sufficiently analytic and resulted in competitionamong proponents based upon suboptimal decision criteria.
9-4. IMPLEMENT ANALYTICAL MODELS AND TOOLS
a. Formulation. The formulation of the optimizationproblem solved in this module can be summarized as follows.
(1) Objective. The objective is to maximize the totalvalue added by the systems in the force over the planninghorizon. The objective coefficients are the value addedcoefficients computed in TOPSIS. These coefficients are givenas a function of time period and equipment system.
(2) Constraints. There are three classes ofconstraints. The first class consists of funding constraintswhich limit expenditures for procurement to be no greater thanthe total obligation authority for those systems. The secondset of constraints deals with force structure. A minimum andmaximum number of each system, based on force structure
1 Leontif, Wassily W. "The World Economy of the Year 2000," ScientificAmerican, September 1980.2 Army Dollar Resource Allocation ii Study, US Army Concepts Analysis Agency.1978.3 Anderson, Michael, "Capital Budgeting White Paper," US Army Training andDoctrine Command. unpublished paper, 1989.
9-5

CAA-SR-91-9
requirements, is specified, constraining the number of system ofeach type in the force. The final class of constraints dealswith production limitations. A minimum production quantitymight be specified to ensure an economic quantity is produced.The maximum production capacity is addressed by constraining thetotal number of systems of each type that can be produced.
(3) Decision Variables. The answer to theoptimization problem consists of the number of each type ofsystem produced during each time period. For the purpose ofValue Added Analysis, these time periods will be fiscal yearsthat are included in the POM and EPA.
(4) Notation. The following notation is defined forthe Value Added version of the FOMOA Model. This formulationand notation were based on the original work developed at CAA(see Appendix H, paragraph H-2).
9-6

CAA-SR-9 1-9
ai - value added ooeffident for system i in time period j,
xij = number of system i produced in time period j,
-- number of systems i produced in time period j
without considering production line status,
Mi- total obligation authority in time period j,
si - inherited assets of system i available in year 1,
fik = programed fielding in year k for system i where,
k - 1 denotes 2 years before planning period,
and k - 2 denotes 1 year before planning period,
Yij -number of systems retired in time period j,
eij - number of systems on-hand in time period j,
Cpij - procurement cost of system i in time period j,
coij - O&S ost of system i in tim e period j,
elij - lower limit on number of system i required in time period j,
euil - upper limit on number of system i required in time period j,
Xbi - lower production limit on number of system i in time period j,
xti, - upper production limit on number of system i in time period j,
pi1 - production line status in time period j for system i,
where pij - 1 if line is open, and 0 otherwise,
I - set of all systems,
J = set of all time periods.
(5) Dependent Relationships Among Variables. Thefollowing relation is defined for determining the number ofsystems onhand during each time period.
[9.01]
9-7

CAA-SR-9 1-9
ej, - si+f1 j-yj, V i E I,
ei2 m si+fij-Y2, ViEE I,
eij - ei(j_ 1)+Xi(j _2)-Yi j, V i C I, V j > 2.
Note here that in order to take into consideration thestatus of the production lines, we must perform the followingpreprocessing step.
[9.02]
kij if Pij - 1,
Xii - PijXij W"
0 otherwise.
Thus, xij is constrained to be zero when the productionline is not open in particular time period j for system i.
(6) Objective Function. The following objectivefunction maximizes the total "Value Added" by the procuredsystems over the entire planning horizon.
[9.031
III IJI
(7) Constraints. As discussed above, there are threeclasses of constraints. The first class involves fundingconstraints.
[9.04]
II
c iiXij ! 9, V j e J.
Notice that we consider only procurement costs here.O&S costs are used in the prototype for accounting purposesonly. Notice also that cost values used here constitute averageunit costs. Costs are actually a function of the quantityproduced (see chapter 6). No provision was made in thisformulation to take into account this functional relationship.
9-8
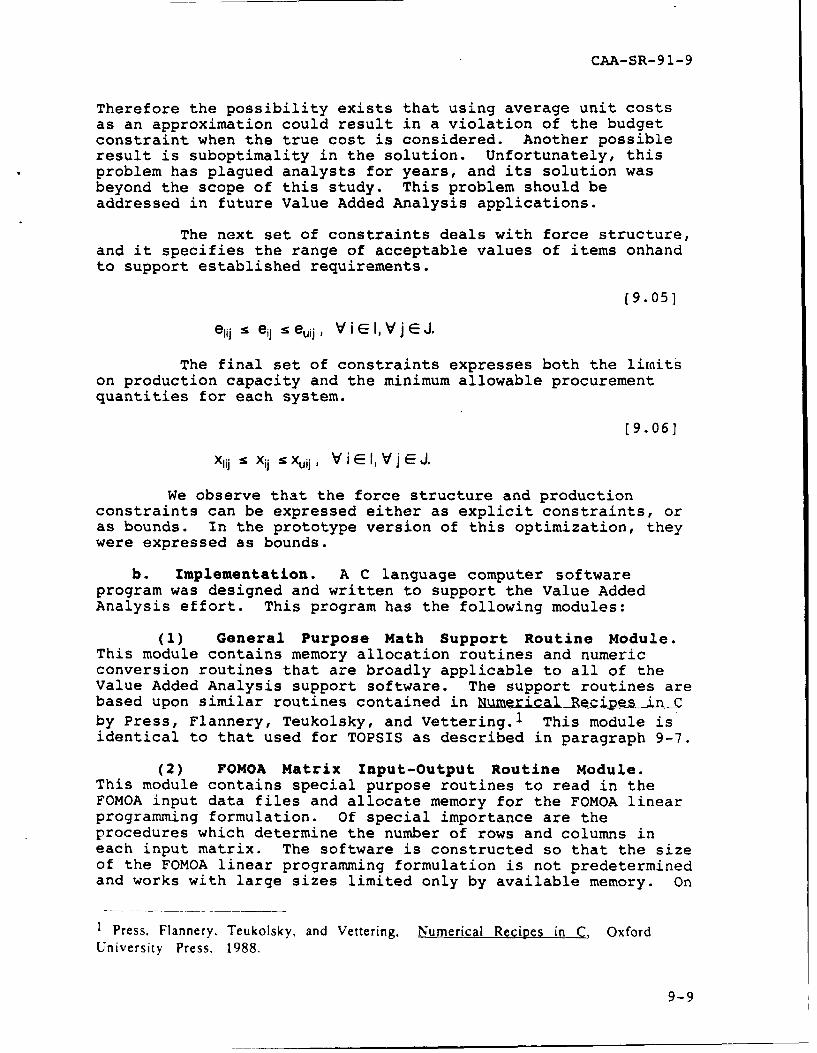
CAA-SR-91-9
Therefore the possibility exists that using average unit costsas an approximation could result in a violation of the budgetconstraint when the true cost is considered. Another possibleresult is suboptimality in the solution. Unfortunately, thisproblem has plagued analysts for years, and its solution wasbeyond the scope of this study. This problem should beaddressed in future Value Added Analysis applications.
The next set of constraints deals with force structure,and it specifies the range of acceptable values of items onhandto support established requirements.
(9.05]
elij s e uij, Viel, Vj C J.
The final set of constraints expresses both the limitson production capacity and the minimum allowable procurementquantities for each system.
[9.06]
Xij S Xij :9 Xij , V i C l, V j C O.
We observe that the force structure and productionconstraints can be expressed either as explicit constraints, oras bounds. In the prototype version of this optimization, theywere expressed as bounds.
b. Implementation. A C language computer softwareprogram was designed and written to support the Value AddedAnalysis effort. This program has the following modules:
(1) General Purpose Math Support Routine Module.This module contains memory allocation routines and numericconversion routines that are broadly applicable to all of theValue Added Analysis support software. The support routines arebased upon similar routines contained in Numerical Recipes in Cby Press, Flannery, Teukolsky, and Vettering. 1 This module isidentical to that used for TOPSIS as described in paragraph 9-7.
(2) FOMOA Matrix Input-OutpUt Routine Module.This module contains special purpose routines to read in theFOMOA input data files and allocate memory for the FOMOA linearprogramming formulation. Of special importance are theprocedures which determine the number of rows and columns ineach input matrix. The software is constructed so that the sizeof the FOMOA linear programming formulation is not predeterminedand works with large sizes limited only by available memory. On
1 Press, Flannery. Teukolsky, and Vettering, Numerical Recipes in C, Oxford
University Press, 1988.
9-9

CAA-SR-91-9
a Macintosh microcomputer optimization problems with up to 120decision variables and 1000 constraints with an average nonzerodensity (i.e., sparse matrices) of 10 percent have been tested.Appendix H contains example inputs and outputs using the A3illustrative example.
9-10

CAA-SR-91-9
(3) FOMOA Formulation Input Module. This modulereads and decodes the FOMOA formulation in the algebraiclanguage specified by Schwabauer. The formulation language is aspecial purpose notation designed for the specification oflinear programming problems. Its syntax is a limited subset ofcommercially available specification languages such as GAMS andLINGO. This module is actually a series of subprograms whichlexically analyze, parse, and interpret the FOMOA language andproduce an LP problem matrix for use by the LP Solver Module.The FOMOA language interpreter was written using UNIX parsergenerating software ("lex" and "yacc") and has a compact grammarspecification which conforms to standard UNIX conventions.
(4) Linear Programming Solver Module. This modulecontains the linear programming engine which solves the problemgenerated by the FOMOA Formulation Input Module. This solveruses a revised product form simplex algorithm with compactstorage of sparse input matrices.
(5) Main Program Module. This module contains thetop level routine ("main") and calls all other modules. Itprimarily serves to parse the command line interface argumentsand open the appropriate input and output files.
9-5. SUMMARY. The linear program formulation used for theprototype VAA case study was a simplification of the workdeveloped at CAA for use in creating modernization plans for theOffice of the Chief Staff for Operations and Plans. We haveincluded the more generalized form of the formulation inAppendix H. Also included in this appendix is a set ofinstructions for users of the software developed for thismodule. The software currently is based on Mac Lingo, an off-the-shelf product, but could be exported to other commercialsolvers. This algebraic approach using commercial products wefeel provides a great degree of flexibility and exportability.
9-11

CAA-SR-91-9
CHAPTER 10
SUMMARY AND FINDINGS
10-1. INTRODUCTION. The purpose of this chapter is to providethe summary and findings for the Value Added Analysis Study. Chapter10 is structured as follows:
(1) Introduction
(2) Summary
(3) Observations and Findings
(4) Future Development
10-2. SUMMARY. The purpose of the Army Program Value AddedAnalysis was to create an analytical methodology and decisionsupport system for the development of a balanced and effectiveArmy Program. We have been successful in creating a flexibleand rational methodology to support the POM process and Armyprogram development. Although we were not able to completelyautomate the decision support system, this study does provide asolid foundation for finishing this aspect of the study. Theteam has found that a linear combination of value componentscreating a single measure of an issue's marginal value iseffective in ranking alternatives and conducting tradeoffanalyses. We were successful in capturing the subjectiveelements used by decisionmakers in conducting tradeoffs betweenalternatives through the use of judgment weights. This studyalso provided some important insights into the POM decisionprocess which suggest areas to be explored further, such as theuse of aggregated effectiveness models, new costing approaches,and issue clarification techniques.
10-3. OBSERVATIONS AND FINDINGS
a. EEA Observations and Findings. The observationsand findings contained in this section of the chapter are keyedto the EEA as listed in the study directive.
(1) EEA 1: What measures of effectiveness (MOE)are appropriate for judging relative value among allMDEPs in the program?
(a) Two generalized categories of measures werediscovered to be important in judging relative value. The first(called explicit effectiveness) consists of three subdividedelements ( combat effectiveness, soldier quality of life, andother Army goals and objectives) and includes those measureswhich can be directly quantified. These measures include suchMOE as fractional exchange ratios (FER), correlation of forcesand means (COFM), day care days, energy Btus saved, etc. These
10-1

CAA-SR-91-9
MOE are selected for their ability to appropriately measure theissue in its own context. The second set of MOE is calledimplicit and includes those measures which are qualitative;political risk, institutional stability, and importance of needare examples of implicit measures. These MOE are selectedbecause they express subjective vilues which are best measuredthrough expert judgment.
(b) Viewing system effectiveness as an integratedpiece of force effectiveness, instead of measuring pure weaponsystem performance, yields a more rational view of weapon systemcontribution across systems and mission areas. Traditionalweapon system-on-weapon system performance used by the combatdevelopments community does not yield the insights required bythe PPBES programing community. We believe that the total forceeffectiveness perspective yields a more useful measure forprogramming decisions. A weapon system's "Value Added" changes,depending on the force mix with which the system interacts, andis not normally captured using the traditional approach.
(c) Implicit effectiveness factors (SIAM factors)beyond explicit (pure combat) effectiveness are a significantcomponent of the DA decision process, and a management surveycan yield important inputs into this process.
(d) No one single measure of combat effectiveness isadequate to measure the contribution of weapon systems. Morework on combat effectiveness MOE is required.
(e) Establishing a hierarchy of MOE was found to bean effective way to use results from different models. The useof different levels of MOE in conjunction with sufficiencycriteria allows the analyst to compare results from differentfunctional models and use those results as if the models wereequivalent.
(2) EEA 2: Should a linear combination of valuecomponents be used to arrive at a single measure ofvalue added? If so, what system of judgment weightsshould be used?
(a) A linear combination of value components appearsto be useful in creating a single measure of an issue's marginalvalue.
(b) VAA uses a system of judgment weights which meas-ures the value of an issue in a dual context. The methodologyseeks two sets of estimates. The first set of estimates iscreated by surveying the Army leadership to determine both theset of judgmental factors and their weights in accordance withthe group's value set and world view. The second set of esti-mates is created by scoring individual systems using subjectmatter experts and the judgmental factors developed by surveyingthe leadership. Both sets of surveys appear to yield consistent
10-2

CAA-SR-91-9
and informative values. These approaches are successful incapturing the multiple attributes used by the decisionmakers inthe PPBES programming decision process.
(c) TOPSIS as a method of integrating multiplemeasures of effectivene3s into a single measure of value isuseful and effective; however, it may have several analyticalweaknesses including scale compression, inadequate treatment ofequivalence classes and sensitivity to probabilistic inputs.However, none of 1,ese potential problems have been manifestedin this prototype proof of concept.
(3) EEA 3: What decision analysis frameworkshould be used?
(a) The VAA methodology as demonstrated in Phase Iholds promise as the decision analysis framework that should beused for conducting Army program tradeoff analyses. Further workin the areas of quick turn-around combat modeling,dynamiccosting,and data collection need to be conducted. Although somelimitations in the methodology exist, it has been shown thatthis methodology is viable for the conduct of these analyses,and will provide senior Army leaders with a good and feasiblestarting point for decision making, and a way to further analyzethe appropriateness of various alternatives.
(b) We believe that VAA is a decision analysisframework that can be used to give decisionmakers the capabilityto group decisions by stakeholder (interest group) and by theappropriate context for the issue. For example, the CINCs maybe one stakeholder group which would like to look at theirissues in a context of combat operations based on theirscenarios and OPLANs. Congress could be another group whosecontext is both the Illustrative Planning Scenario (IPS) andconstrained federal budgets.
(c) The theory of cost-benefit analysis as detailedin the Value Added methodology is fundamentally sound. Thesystematic specification of costs and benefits within a consis-tent framework understood by both analyst and decisionmaker isan extremely positive feature of the methodology. The possi-bility of apparently anomalous results exists, however. Anexample of such a case that arose in this study concerned TGW.This system was determined to be the number one VAA priority.Combat simulation results and the explicit measures for the TGWsystem were found to be totally consistent with those of TRADOC,the program manager, and RAND Corporation analyses. However, alarge percentage of the senior Army leadership expressed concernabout achievinq the level of results reported. As a result, thede._'s4on was made to fund only the RDTE portion of the program.The positive aspect of this type of occurrence is that a seriousissue was brought to the attention of both analysts and deci-sionmakers. Clearly, additional work was needed to show, oneway or another, what could reasonably be expected with regard to
10-3

CAA-SR-91-9
the performance of this system. Identification and illuminationof these issues is an extremely important function of analysis,and VAA seems to be very useful in this area.
(d) The ability to modularize (plug in, pull out)components of the Value Added methodology is critical to asuccessful implementation. The analysis framework must bestandardized, and yet sufficiently flexible to accommodate avariety of input data and a wide range of PPBES issues. Theoutput of each module provides significant analytical results inits own right. These intermediate results will prove useful toa variety of decisionmakers at different levels.
(e) It is clear that sufficient information is notalways present during the construction of the POM to providedetailed acquisition strategies and distribution plans.Therefore, the VAA methodology must be capable of usinginformation at various levels of detail while still providingmeaningful results.
(3) EEA 4: Does a highly aggregated combat modelprovide useful insights for answering program-widetradeoff questions? If so, can such a model becalibrated to a more detailed model if necessary?
(a) A highly aggregated combat model can provideuseful insights for answering macro level program tradeoffquestions. To a more limited degree, such a model is alsocapable of providing specific program guidance. However,decisionmakers require sufficient detail to understand thereasons for combat outcomes to assist them in specific programdecisions. For example, it was important during the sponsorrequested presentations to senior decisionmakers that expla-nations be given regarding an apparent anomalous result in theprocurement of AH-64 over the LHX.
(b) In order for aggregated combat models to beuseful, they must be calibrated. In order to calibrate them,one must be able to establish some landmark values or calibra-tion points using data or output from accepted and "known"sources. These points do not necessarily need to be developedfrom other models of higher resolution. Calibration can be doneusing other models, empirical data, or historical data.Calibrating one model with results from another has been acommonly used procedure in hierarchical analysis.
(4) EEA 5: What Blueprint (of thebattlefield) options provide the most usefulframework for the analysis of change to the Army'smateriel, force structure, etc? TRADOC's Blueprint ofthe Battlefield, which this EAA was directed towards,appears not to be useful within the context of VAA. Theblueprint concept is oriented by its very nature toward arequirements perspective and does not necessary address the
10-4

CAA-SR-91-9
issues of affordability or duplication of capability. TheAHP process appears to hold the greatest possibilities inthis regard.
b. Other Observations and Findings. The observationsand findings contained in this paragraph of the chapter are notnecessarily keyed to the original questions proposed in thestudy directive but are insights obtained as a result of thework completed in this study.
(1) The Value Added methodology is data intensive.Accuracy and timeliness of input data, especially productiondata, is of crucial importance in making the value added processoperational.
(2) The initial goal of value added was to be quickturnaround for all components. What was found was that anextensive front-end process (especially combat modeling andcosting) was required which consumed large amounts of time.Once this front end work was completed, then quick-responseexcursions were possible.
(3) The Value Added methodology will "buy" the most costeffective systems subject to constraints.
(4) The study developed a modular "living" methodologywith extreme flexibility that can be used with a variety oftechniques and models.
(5) The methodology provides a standardized quickreaction approach that uses ORSA techniques. It evaluatesprogram tradeoff issues by functional area experts and deci-sionmakers. ORSA expertise is required during the preparatoryanalysis, consisting of the combat modeling, costing, andsurveying. The functional analysis which would take placeduring the POM building and defense, consisting of the actualtradeoffs, do not require extensive ORSA expertise when usingthe VAA methodology.
(6) Issue clarification is difficult, and it appearsthat senior decisionmakers have difficulty focusing issues.Therefore, issue clarification is key to the success of thefollow-on modules and analysis.
(7) The technique used to survey the Army leadershipallows decisionmaking attitudes and behaviors to be accuratelymodeled. Administration of the management survey under tightlystructured and controlled conditions yielded statisticallyreliable results.
10-5

CAA-SR-91-9
10-4. VAA FUTURE DEVELOPMENT
a. Methodology. The study team believes the followingmethodological improvements or research should be conducted toenhance the VAA capability
(1) The issue clarification module requires betterdefinition to include appropriate models and algorithms.
(2) Research is needed into the use of response curvesor some other emulation method for developing a quick turnaroundcombat modeling capability.
(3) The analytical hierarchy portion of the impliciteffectiveness module must be completed. It must include thelevel 3 elements of the soldier quality of life and other Armygoals and objectives.
(4) The ability to provide a "supervalue" for a par-ticular SIAM factor needs to be incorporated into the method-ology. For example, a particular issue or piece of equipmentmay have high operational risk associated with it. This riskmay be so important that it overshadows all other factors, toinclude the explicit measures of value. The methodology shouldidentify these types of issues during the process.
(5) The methodology should be capable of handlinguncertainty associated with the scores SMEs give to an issue orpiece of equipment. The process may include some kind ofparametric sensitivity mechanism to accommodate the imprecisionof the values provided.
(6) Research into the potential TOPSIS weaknesses ofscale compression, inadequate treatment of equivalence classesand sensitivity to probabilistic inputs must be performed.
(7) A more complete and detailed formulation of theoptimization LP must be determined in order to better addressdecisionmakers' concerns.The LP should include dynamic costingfor procurement costs.
(8) An effective methodology for presenting VAA resultsmust be developed to more clearly convey information to thedecisionmakers.
b. Implementation. The study team believes thefollowing implementation questions should be addressed infollow-on work.
(1) A VAA desk top for the METAPHOR architecture toinclude associated icons and capsules must be developed andimplemented.
10-6

CAA-SR-91-9
(2) Software to implement the issue clarification modelsand algorithms must be developed. ARIM, as part of this effortfor both issue clarification and costing, must be fullyimplemented.
(3) The CQM and LCCM models in the METAPHOR environmentmust be implemented.
(4) A family of combat effectiveness models to includean additional force level model and appropriate functional areamodels must be developed.
(5) The implementation of expert systems to assist incapturing the experience of SMEs and decisionmakers should beexplored.
(6) An automated or networked collection system may behelpful in collecting the data needed to build weights andscores.
c. Management. The study team believes the followingmanagement issues should be considered in the future.
(1) The survey technique needs to be institutionalizedwithin the Department of the Army to include groups to besurveyed, timing in relation to the PPBES cycle, documentationof the survey process, and development of criteria for selectingsurvey teams.
(2) A default standardized Value Added Analysis approachshould be institutionalized.
(3) The scope of value added analysis needs to beexpanded beyond the RDA appropriations since these contain onlyabout 22 percent of the Army program dollars.
10-7

CAA-SR-91-9
APPENDIX A
STUDY CONTRIBUTORS
1. STUDY TEAM
a. Study Director
LTC James A. Richmann, Force Systems Directorate
b. Team Members
MAJ George A. Broadnax, Surveys/Data CollectionMr. Daniel A. Citrenbaum, CostingMr. Karsten G. Engelmann, CORBAN ModelingMr. Joe Gordon, CostingMr. Duane E. Gory, CostingLTC Robert R. Koury, Methodology/Data CollectionCORBAN Modeling/Editor
MAJ Andrew G. Loerch, MethodologyMr. Ronald P. Reale, Computer ProgrammingDr. Robert J. Schwabauer, Linear ProgrammingLTC Rodney K. Stuart, CORBAN Team ChiefCPT Patrick M. Williams, CORBAN Modeling
2. PRODUCT REVIEW BOARD
Mr. Ronald Iekel, ChairmanMs. Patricia A. MurphyMr. Robert Solomonic
3. EXTERNAL CONTRIBUTORS
LTC Robert R. Koury, HQDA, DACS-DPZMAJ George A. Broadnax, HQDA, DACS-DPZMAJ Danny Sanders, TRAC-FLVN,ATRC-FMs. Gail Lankford, HQDA, DAMO-ZDCPT Michael Lemaire, TRAC-FLVN,ATRC-FMr. Allen Pink, TRAC-FLVN,ATRC-F
A-I

CAA-SR-91-9
APPENDIX 8
STUDY DIRECTIVE
OEPARTMENT OF THE ARMY
Off,-[ O I. C CO f Sl f
DACS-DPZ
MEMORANDUM FOR DIRECTOR, CONCEPTS ANALYSIS AGENCYDEPUTY CHIEF OF STAFF FOR COMBAT DEVELOPMENTS, TRADOC
SUBJECT: Army Program Value Added Analysis (Value Added Analysis 90-97)
1. PURPOSE OF STUDY DIRECTIVE: This memorandum tasks;
a. The U.S. Army Concepts Analysis Agency (CAA) in coordination with thePAED Modeling Cell and the ODCSOPS Technical Advisor to develop a programtrade-off analysis methodology that fits within the Value Added concept asdeveloped'by PAED for building the POM (see enclosure 1).
b. U.S. Army Training and Doctrine Comrand (TRADOC), in particular TRADOCAnalysis Command (TRAC), to provide Corps level force on force analysissupport. Efforts in support of the Army Requirements and CapabilitiesStudies (ARCPS) will be incorporated wherever possible to take advantage ofuseful methods, data, and methodologies; and provide consistency between'ARCPS and the Value Added Analysis.
2. STT ITLE. Army Program Value Added Analysis (Short title: Value AddedAnalysis 90-97)
3. _A.RN HQDA needs a.ialysis to support the development of a balancedand effective Army Program within Department of Defense resource guidance.Traditionally this has been accomplished during the POM building process withfunctional area panels. Tle processes that have evolved do not includeadequate means of integrating and balancing the functional programs into thetotal Army Program.
a. Early in the process TOA is provided to each panel and, within thepanel,. a prioritizacion is conducted. The methods used vary from panel topanel and subjective judgement is often used.
b. Virtually all analysis currently performed in program evaluationfocuses on defining individual Management Decision Package (MDEP) issues.When MDZP analysis is conducted the senior Army leadership lacks the analys.snecessary to help identify the marginal value o resources within a MDEP oracross MDEPs.
c. Analysis of the tota: Army Program requires an understanding of howIndividual KDEP contribute to the Army mission and strategy so as todetermine which MDEPs and resource levels have the greatest return oninvestment and to assess affordability. One approach to this problem is to
B-I

CAA-SR-91-9
DACS.DPZSUBJECT: Army Program Value Added Analysis (Value Added Analysis 90-97)
estimate the value added by individual KDEPs, or groups of MDEPs (expressedas program enhancement packages) to the Army as measured by theircontribution to the warfightlng capability of the Army.
d.The Value Added Analysis concept developed by PAED uses a hierarchialassessment framework for assessing how resource changes relate to bat lefle!dcapability. This assessment framework is used to portray exiscing capabili.:*and measures shortfalls against a postulated objective requirement. Thecontribution of program alternatives (enhancement packages) will be evaluazetwithin the hierarchial framework. The methodology is based on using combacsimulations and models to identify how alternatives impact relevant MOEs.These relationships in conjunccion with the funding resources, will form :.einput values which will be used in a decision analysis framework.
4. STUDY SPONSORS:
a. The Director Program Analysis and Evaluation (DPAE), Office of theChief of Staff Army, is a co-sponsor. DPAE is responsible for the ArmyProgram and for building the Program Objective Memorandum (POM).
b. The Technical Advisor to the Deputy Chief of Staff for Operations andPlans is a co-sponsor. The Technical Advisor is responsible for providingadvice and assistance on analytical issues to the DCSOPS.
c. The Study Sponsor's Representative is MAJ Robert R. Koury, PAED
(DACS-DPZ).
5. STUDY AGENCIES: CAA is the lead study agency.
a. CAA will identify, and where necessary develop, models and quantitativetechniques to assist in tht refinement and implementation of analytic methodsfor estimating the marginal. value to the Army of competing MDEPs.
b. TRAC will assist CAA as required.
c. The U.S. Army Materiel Command (AMC), the US Army Cost and EconomicAnalysis Center (CEAq), and other agencies will assist as required.
6. OBECIVS
a. Formulate an analytic method for estimating the marginal value ofcompeting MDEPs to the Army. The methodology will provide a commonunderstandable basis for the analysis of affordability issues.
b. Identify or develop prototype models that support the Value AddedAnalysis Methodology and provide management tools for the analytic methoddeveloped in a, above.
2
B-2

CAA-SR-91-9
DACS-DPZSUBJECT: Army Program Value Added Analysis (Value Added Analysis 90-97)
c. Establish within PAED an in-house capability to conduct program issuestrade-ofts.
d. Conduct a proof of concept analysis during the building of the 92-97PO1.
7. TEPMS OF REFERENCE:
a. Use Amended Budget FY90/91 and Prcgram Force (FY94) As Baseline
b. Scenario Conditions: NATO Central Europe, IPS ScenarioTRADOC approved scenario(s)Scenario v~riations necessary for sensitivity
analysis.
c. Conflict Duraticn: TBD '
d. Conflict Type: Conventional
a. Measures of Effectiveness: (For Example)
* Independent Measures (Note 1)Blue Force: SurvivingCorrelation of Forces and Means
" Dependent Measures (Note 2)Air Defense - Time Ai Space DeniedCSS - Short Tons/ DayClose Combat - Force Exchange Ratio
Note 1: Establish an overall force effectiveness.
Note 2: Establish effectiveness values for specific battlefieldfunctional areas.
8. LIZL£
a. Time for developing the prototype analysis will not exceed 1 August1989.
b. Since this initial effort will be a proof of concept validation, theanalysis will exam only the RDA appropriations. However, the finalmethodology must eventually be capable of examining trade-offs across thefull range of program issues. The analysis will expand to the otherappropriations as the methodology matures.
3
6-3

CAA-SR-91-9
DACS-DPZSUBJECT: Army Program Value Added Analysis (Value Added Analysis 90-97)
c. President Reagan's Budget position will be used for both PROBE andRDAISA databases.
d. Software must operate in an IBM PC compatible environment.
9. ASSU.PT1ONS AND THEIR SIGNIFICANCE: The study's major assumptions arelisted below. Scenario-based assumptions will be described in the final s:.dvreport annex dealing with the warfight scenarios:
a. Any set of value added models to be used in the POM building processmust be quick turn-around and IBM PC compatible based. Because the ValueAdded Analysis models must execute in a quick turn-around environment, theinherent combat models must process aggregated data and way need to becalibrated to higher fidelity models as a means of increasing theircredibility.
SIGNIFICANCE: This assumption drives us to a low-resolucion modelwhich captures the effects and inceraction3 of the warfighc; NOT necessarilythe process of the warfight itself.
b. The Program Value Added Analysis must accommodate the manner in whichthe senior Army leadership makes decisions.
SIGNIFICANCE: The decision framework and models developed must beacceptable to the senior Aimy leadership,
c. The Program Value Added Analysis must allow for prioritizing betweendissimilar MDEPs, i.e., Weapon system procurement, logistical improvements,force structure changes, etc.
SIGNIFICA1CE: In order to provide a means to trade-off betweendifferent KDEPs, the analysis must be capable of relating the MDEPscontribution to the Army warfight capability.
d. Input data will come from a wide variety of sources and may prove tobe difficult to obtakn at times.
SIGNIFICANCE: This lack of data will be handled, most likely, byparametric analysis for those data elements which cannot be obtained.
10. ESSENTIAL ELEMENTS OF THE ANALYSIS;
a. What dependent measures of effectiveness (NOEs) are the mostappropriate means of Judging relative value added?
4
B-4

CAA-SR-9 1-9
DACS-DPZSUBJECT: Army Program Value Added Analysis (Value Added Analysis 90-97)
b. What system of Judgement weights should be used7
c. What decision analysis framework should be used?
d. Does a highly aggregated macro level analytical methodology provideuseful insights for answering total Army program trade-off questions?
a. What Blueprint options provide the most useful framework for theanalysis of change to the Army's materiel, force structure, etc.?
11. RESPONSIBILITIES:
a. D,PAE will:
(1) Provide the study sponsor representative and study guidance.
(2) Provide a study team member.
b. Technical Advisor to the DCSOPS will:
(1) Provide study guidance to the study sponsor's representative.
(2) Provide a study team member.
(3) Coordinate the input of ARCPS data to the study.
c. CAA will:
(I) Designate a study director and provide the study team.
(2) Coordinate/communicate with the PAED, ODCSOPS, TRAC, CEAC, and A.MCfor data and information to accomplish the study,
(3) Providt periodic in-process reviews (IPRs) as requested by thestudy sponsors and provide the study products as listed in paragraph 12 ofthis tasker.
(4) Assist PAED in establishing an in-house capability for linking theprototype models and analytical tools into a coherent analytical approach.
(5) Assist PAED in conducting a proof of concept analysis using theprototype models on specific program issues which will be identified prior tothe building of the 92-97 POM (I July 89).
5
B-5

CAA-SR-91-9
DACS-DPZSUBJECT: Army Program Value Added Analysis (Value Added Analysis 90-97)
12. STUDY PRODUCTS: CAA will produce, in coordination with TRAC and the PAE2Modeling Cell:
a. A final study report which will thoroughly documents the ValueAdded Methodology.
b. A working Value Added Methodology to include the underlying analy:.'za.concepts, software and hardware linkages.
c. Briefings as required.
13. ADMINISTRATIVE:
a. Support.
(1) Funds for travel/per diem will be provided by the parentorganization of each study participant.
(2) Clerical support will be provided by CAA and/or TRAC as requi:ed.
(3) ADPE support will be provided by CAA and by TRAC as required.
b. Milestone Schedule. The proposed schedule is at enclosure 2
C. Control Procedure. The study sponsor's representative will provideguidance within the HQDA scaff and between the ARSTAFF and the studyagencies.
d. Coordination. This directive has been coordinated with CAA and TAC.
2 Encl WILLIAM H. RENOMajor General, GSDirector, Program Analysisand Evaluation.
JOHN A. RIENTETechnical Advisor to theDeputy Chief of Staff forOperations and Plans
6
B-6

CAA-SR-91-9
APPENDIX C
BIBLIOGRAPHY
DEPARTMENT OF THE AIR FORCE
US Air Force Institute of Technology
Broadnax, George A. A Multiple Attribute Decision Analysis ofHigh-to-medium-Altitude Air Defense Command and Control Systems.Masters Degree Thesis, AFIT/GST/ENS/88M-1. School ofEngineering, Air Force Institute of Technology (AU), Wright-Patterson AFB OH, March 1988 (AD-A191-061) (UNCLASSIFIED)
Graney, R. E. An-Optimization Methodology for MulticriteriaComparison Using Response Surface Methods and MathematicalProgramming. Masters Degree Thesis, AFIT/GST//OS/84M-11.School of Engineering, Air Force Institute of Technology (AU),Wright-Patterson AFB OH, March 1984 (AD-A141 169) (UNCLASSIFIED)
DEPARTMENT OF THE ARMY
US Army Combined Arms Combat Development Activity
Wade, B., D. Hillis, and others. Maneuver and Fire SupportStud . Ft. Leavenworth, KS: Combat Operations AnalysisDirectorate, CACDA, December 1978 (AD C017350) (CONFIDENTIAL)
US Army Concepts Analysis Agency
Army Dollar Resource Allocation II Study, Bethesda MD: , CAA,1978 (UNCLASSIFIED)
Schwabauer, Robert. User's Manual For Force ModernizationAnlayzer (FOMOA)(Level 1), Bethesda MD: Force SystemsDirectorate, CAA, November 1989 (CAA-D-89-3) (UNCLASSIFIED)
US Army Logistics Management Center
Cost Estimating for Engineers, Ft. Lee, VA: ALM 63-3126-LC(UNCLASSIFIED)
US Army TRADOC Analysis Command
Anderson Michael R. White Paper - Combined HierarchicalAssesment-_nd Capital Budgeting Framework, Ft. Leavenworth, KS:Systems Analysis Directorate, TRAC-FLVN, November 1988(UNCLASSIFIED)
MISCELLANEOUS
C-I

CAA-SR-91-9
Bemis, John C.. "The Cost Implications of Production Rate".Concepts, (Spring 1981 Volume 4 Number 2) (UNCLASFT1 ,
Buede D. M. and others. Applications of Decision Analysis tothe U.S. Army Affordability Study. McLean, VA: Decisions &Designs, Inc., December 1978 (AD A064442) (UNCLASSIFIED)
Bunn, Derek W. Applied Decision Analysis. New York: McGraw-Hill Book Company, 1984 (UNCLASSIFIED)
Carlsson, Christer and Yevgeny Kochetkov. Theory and Practiceof Multiple Criteria Decision Making. New York: North-HollandPublishing Company, 1983 (UNCLASSIFIED)
Coutinho, John de S. Advanced Systems Development Management.New York: John Wiley & Sons, Inc., 1977 (UNCLASSIFIED)
Crawford, Gordon and Cindy Williams. The Analysis of SubjectiveJudgment Matrices, RAND Document R-2572-1-AF, May 1985 (AD-A157399) (UNCLASSIFIED)
Flannery, Teukolsky, and Vettering. Numerical Recipes In C,Oxford University Press, 1988 (UNCLASSIFIED)
Fowler, Theodore C. Value Analysis in Design, New York, VanNostrand Reinhold, 1990 (UNCLASSIFIED)
Hwang, Ching-Lai and Yoon, Kwangusn,. Multiple AttributeD!eilsion Making, Methods and Applications, Berlin, Springer-Verlag, 1981 (UNCLASSIFIED)
Keeney, Ralph L. and Howard Raiffa. Decisions with MultipleQbjecties: Preferences and Value Trade-offs. New York: JohnWiley & Sons, Inc., 1976 (UNCLASSIFIED)
Kmenta, Jan. Elements of Econometric". New York: MacmillanPublishing Co.., 1986 (UNCLASSIFIED)
Little, Arthur D. Inc Applications Survey for RemotePhotovotaiPoweSystems. 1989 (UNCLASSIFIED)
Leontif, Wassily W. "The World Economy of the Year 2000".Scientific American, (September 1980) (UNCLASSIFIED)
Meridian Corporation, Photovoltaics for Military Appications.1989 (UNCLASSIFIED)
Porter, Michael E. Competitive Advantgie Creating andSustainingSuperior Performance. New York: The Free Press 1985(UNCLASSIFIED)
C-2

CAA-SR-91-9
Quade, E. S. and W. I. Boucher. Systems Analysis and PolicyPlanning: Applications in Defense R-439-PR (Abridged). SantaMonica, CA: RAND Corp., June 1968 (UNCLASSIFIED)
Robinson, M. and Jeffrey Grotte. The Analytic HierarchyProces Critical Assumptions and Critical Literature(Bibliographies (UNCLASSIFIED)
Report to the 58th MORSS. Alexandria, VA: Institute forDefense Analyses, June 1990 (UNCLASSIFIED)
Roman, Daniel E. Science. Technology, and Innovation: ASystems Approach. Columbus, Ohio: Grid ?ublishing, Inc., 1980(UNCLASSIFIED)
Saaty, T. L. The Analytic Hierarchy Process. New York:McGraw-Hill Book Company, 1980 (UNCLASSIFIED)
Saaty, T. L. and J. M. Alexander. Thinking with Models:Mathematical Models in the Physical, Biological, and SocialSciences. New York: Pergamon Press, 1981 (UNCLASSIFIED)
Saaty, T. L. Decision Making for Leaders: The AnalyticHierarchy Process for Decisions in a Complex World. Belmont,CA: Lifetime Learning Publications, 1982 (UNCLASSIFIED)
Saaty, T. L. "W )rity Setting in Complex Problems," IEEETransactions on 5ngineering Management, EM-30: 140-158 (August1983) (UNCLASXIFIED)
Souder, Williams E. ManagementDecision Methods. New York:Van Nostrand Reinhold Co., 1980 (UNCLASSIFIED)
Smith, Jason "Learning Curve for Cost Control," Institute ofIndustrial Engineers (1989) (UNCLASSIFIED)
Vargas, L. and J. Dougherty III. "The Analytic HierarchyProcess and Multicriterion Decision- Making." American Journalof Mathematical and Management Sciences, 2: 59-92 (1982)(UNCLASSIFIED)
Wind, Y. and T. L. Saaty. "Marketing Applications of theAnalytic Hierarchy Process," Management Science. 26: 641-658(July 1980) (UNCLASSIFIED)
ZAh-eii, F. "The Analytic Hierarchy Process, A Survey of theMethod and its Application," Interfaces, 16: 96-108 (July-August 1986) (UNCLASSIFIED)
Zeleny, Milan. Multiple Criteri Decision Makin . New York:McGraw-Hill Book Co., 1982 (TITCLASSIFIED)
C-3

CAA-SR-91-9
APPENDIX D
VAA MODULE MATRIX ( PROCESSESS, TECHNIQUES AND PRODUCTS)
G-1. INTRODUCTION. The VAA module matrix was developed toprovide, in a single document, an outline of the methodology andthe processes associated with the VAA concept.The matrix isdivided into two parts. Each section represents a module of themethodology and is labeled with the module name. The first partoutlines the processess, techniques and products associated witheach module. The second part is organized to relate the inputdata, sources of data and assumptions back to each process andmodule.
G-2. MATRIX ORGANIZATION. This section will briefly outlineeach of the matrices:
a. Annex 1 Matrix 1. There are eight sections to thismatrix covering seven of the eight modules. No discussion of theresults and display module is provided because it is yet to bedetermined and will be defined as part of VAA Phase II.Processes are located in the second column of the matrix and arelinked to subsections of the modules. The intent of this matrixwas to show the relationship within and between modules and howprocesses are related to analytical techniques.
b. Annex 2 Matrix 2. There are also eight sections tomatrix 2 covering seven of the eight modules. Processes arelocated in the second column of the matrix in a short hand styleand are linked to subsections of the modules. The intent of thismatrix was to show the relationship of input data to the modulesand processes of the VAA Methodology..
D-1

-4 -4
4.
48 48
00
a6d
1'4 -4 48
q0480 lclLd' a m U
6 600 US 0 'A1. -N 0 4 .01 -. .0 1 -0 m 0 A wI1. ~ ~ 4 4A a4d~a * o ~
~'n a a 0 ... 0 0 0 U48 'm
0c 6 030
z8 481 . 8 .8 . .4 -. . ..44A A4A6 Ato A u 4 vO Aa 6 ~6.4.84
or .3 ~ ~ ~ ~ : g o X N ~ E .14~~- nO5 3 w45 5. U vs~ w~* 04 H
0. 0.0
a A 0 .k
S.414 0 1 .0 0. . .?
61 . -2 4
4 24. 0 6 4a 44 -4 -4%4.4 .4 48 -4 A 48
6U a .4
A A
u 41 48.-46A ;,
48 144 0 648 ~ 4 U34
06 6 5. 6 04 016* 6. 40 U 04
i!~~~~~t A ~ as!.0'4 ~ -0 6 1 M. U U*1*
.3 A I I 4 8~0~
ft.~ a 10 8 .840844
I Us

0U
A.- .41
0 a 4U . 1aW 00N. 0
a
a. 9 4A V .l 04r
OHM 144 Ni4'0
I:. 4',~
064 -6.4 A -40:4 4 0 k-6 1 . : . ~ .l
OA4UA0U.j l j6 '6 6 4l A. 64 4.4 . 4 .6
Aa I tu 'i~ 'u V u 4 7aA a a on
4 X -. 00%4 As N US b
41 : 064 3~~0 01 U a . .0 j ... '8 .4 U6.A U4p- 4044 1
.- 804 - k 4 4 4' U 0 4
p. 3 3 ~ ' 0~ -4 1 .0U.4 0 . U 6 ' U 6 ~ C
.4 -. -0~..% A 4 14.16. S14.0N 64 404 4 60 0A~.4 a.4 -S~ U
I 4' 4A &-A -50 1 ~ . U 4' 1 21.
0 A'3' I3 a7 " A. a4 104 A -.
1.6
I~
0g
01 1 '
14~ X .010 14 4 ' 44all a

~0u
4A 6t
41 34
0 S
4 01- M .411
41 401 41A
1~~~ C6a I
94 04 d60 41
0(1 6 0 64
14
k1. t; 4k p 0k 4 .:
tp~ V~ *- r~ I A* -0 II 2.* :63% 24..0 z a.
'a- 414W 4 P~ -4 a' a?6a. N"n1446r o '0 4 3~4 p a &VA
.4 k*4A 1.44141 6 6.4 45 666 044114 -- 4
J *0, : .10 10 41 U.IUU - sJ44 14
- I loS S SS S I
DO ,0 ,4 4 .4 U O U4 4 m rA~~~~~q
6A4A. 4144 2141 w M vo
0
a . -" 466 06
'4 .Ac-4 4- 40 60 1,O
14. 0..4 41 0.4 14.*~~. a. 0 D..4142 6
-,Oo-~ * A5 81 0 .0 O0
* A t - 1 4 65u 1.. Q6 4141 k6.4. Ch .0 40141. 40 a 0a4 a6 ( . 0- a. 0. r k- m 410
00I ;-- c a a .0464 0 .4
L. S6 S. 0 4 g-114 4. -4 .1 .41 - 0. . f 1 4
0 44 U6I 1 04.00- a~~~U up 14-414 4 r
'41.4 . 60 q4. 4- N: 3 06 14 1 01 4~.SH6-40.60 a. u 6 M t 0 -00"b -4 -.0 6. -o*~~4 414 .4- 40 41 404 A .1
* 04 ~ -t . 64 41 6 .046
LI~0. 00 a a 44-644 04, 0~ 064441, 0 0 a41 4 1
I1 0.4. - .a1.; A 6 , .W A
a4 m' -4 w 4. 34 uM
0 .
-4 .4
* *101

'4
0.0
-4 A-A4 6
eu"I a
'40
04 0 .
.0 6 0046 . 041
U, 00, 14 U,
41~ 14 00 4 4 6 0 1
m Mt-4 . 410 -4 u s66 4 01
14 U um6
3. 32)--- N: 21b4a D%- a 0
40 -40 -. 0 %4-.4 ,.4 0-o a 040 0 0 a56 SAW 4 6.4 4
II.44 -4 -
*Ao 0.40 pIs,4*41~
I ~ ~ ~ ~ ~ l 8 ..~6 3-4
50

L z4
u 4
~~* I4 *
0 U
4.4
a I
0 '0
0..4
*01 .4
IL-
a.,W- gxflag .0 '~ i I m " .2 ~~~ 1 A. !4 r. h4 194 -. 4q
0 '
- a - UIUA ass1
0.0j
06 x0 H.4

04a4 0 141 -4
AA 0
4-1 --j - 0 1
a AA 446
a p4644 A .0 A6kA;0 .40
II. o
4 , -. A-I I'~ --* 'A 1-4'00 ' g0a60.~~ .. .~'* 60
41 M 464 k k4% 6 w4 46 4p1 %4
-4 C4a 0k.c o
640 k .
0 t a ~ A- a m04(3 u. a4 6 .&4a
66 06-U 1 .44 4411 1
6!1, k4 t... aa- .k4 00 j 16 I 0 u
OW0 1 .... J C4 44
40. -k 9 aU44 k30 w 6600002A 6a 0 64 644
93 Ink
644. A46 064 .44 W; 0.Iz 4.4 a4%
.446. 64 60 .:b~&Ib. a e. 0~oI
0. 6 -4 ... 4444464 4~.44 4 40660 4.A46~~~ k.A 46 6 6 46444p ~ II066 ~ . 4j .6 444~m.
~ ~ aa6-46~4 4.2 *S2~1 .40:4 4.4 6 446~ 4fl66 .4. 464
60.,6.6k6il~i. ad 1-4044 614-446.41k 06 6 a0k 14 .I.,~ 040U44 0 0k .4 06
* L14u~4~U 0690 6 06 640 0A000 Cr a-40
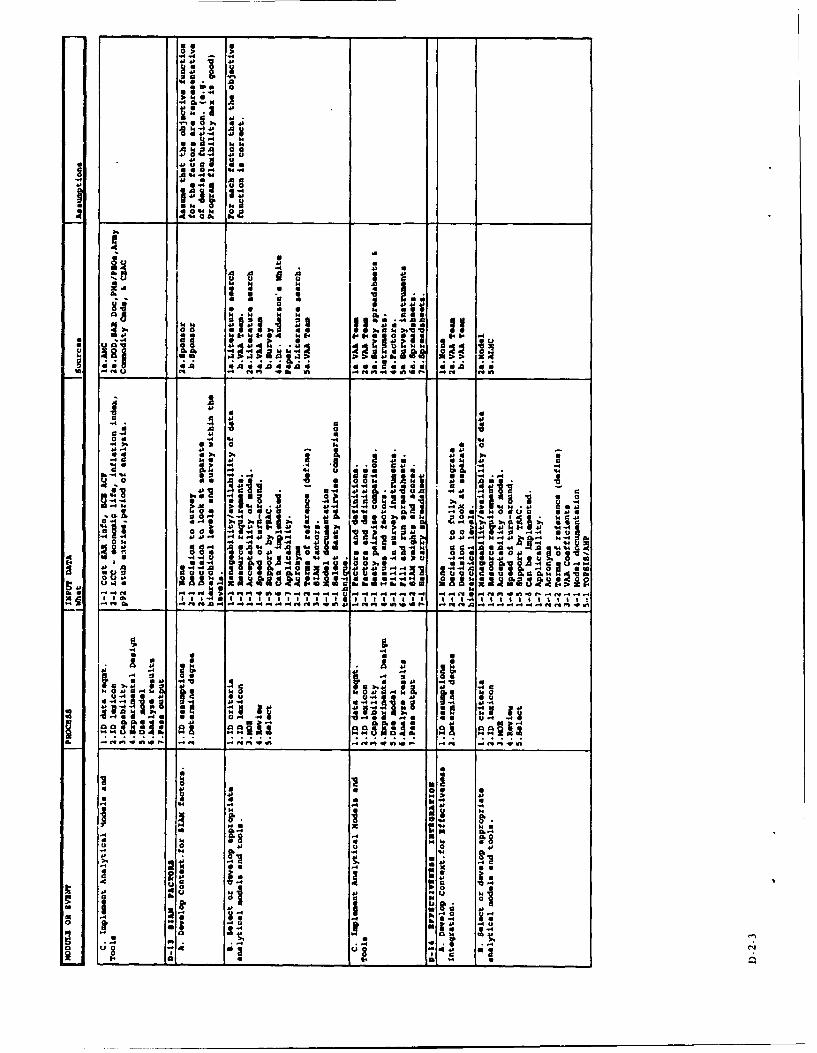
do 1 a2
41.4 .4
4, 0 4
4. .0 14 *
~k6
4 A
AkU4 00 00V14 -4 fbi t.
-4 4, 14A
z, a
42 4, .a 0
8.8 40 44
05 a~ a4 ... AA
U. .l1 I a a.. O
.0 . 0e 0a* 44'0 4.4 4A . . -4 -.44 44
.. 4 a aI &0M4~ I a t 13. a H..a 5Cd~ 44. u. a a.aa. ~U 4,41 4 4
444P -. m Vf0 04, 44 ..114 0- 1--I-14 U m ear 10 A4 'I
60 -mm- 400 04 66 mm 4
N F,2a
AA
41
4,~C -4jtP.So~ C 1
04. .40-45 ~ 44

us76k
00
i
014 low 4,S
cam - 0 m. -n44-- kmf
416 *6 41
0 6.
4141 41 v.
.. 4~..5 64k1 e 4
c8 -A m4 0. 06 4.4 1W
44
6 . 4 1% o
41 414.414
oo -44
414 .4 3.4 4. -
a~ 1 1
i04 k 0
t 80 144 1411a a
u40
a . -a
41 -4 I-4
.4 4 um 1
14to~~~~ t 4 4. 4~M~4'4 I 14010-440. .0u~gO laIj~ to

S
Aaa
a -U
-4 -4 5U 6 -4
M ~
.1*u 0 a a0
SAW .41qd~4I4 ~*. a
& ~
Ia
IaU
.3I
-oa
03
I.

CAA-SR-9 1-9
APPENDIX E
STUDY CLASSIFIED RESULTS
VAA Phase I Classified Results are Published Under Separate Cover
E-1

CAA-SR-91-9
APPENDIX F
COST LEARNING CURVES
F-1. INTRODUCTION
a. Experience curves have been a tool historicallyemployed by government and industry to forecast productioncosts. Their origins lie chiefly in the aircraft industry ofthe 1930s and World War II. Relying on data from previousproduction experience, these curves map out a relationshipbetween the costs of producing a particular good and thequantity of that good made. The costs can be measured invarious forms, such as labor input per unit or dollars perunit. Although they were originally utilized in theproduction of aircraft, they are easily applied to otherproducts (such as tanks, trucks, etc.).
b. When speaking of experience curves, one is referringto the general case. There are many factors involved in theproduction of a good. The two most common are capital andlabor. Each factor of production has its own underlyingexperience curve. For example, the curve for labor is oftenreferred to as the "learning curve." Thus, the term"experience" can be used with labor, machinery, management,etc. It is a general concept that applies to all the factorsof production.
F-2. EXPERIENCE CURVE THEORY
a. Experience curve theory simply states that as produc-tion of a particular good doubles, the production costdecreases at some constant rate.1 This is due to the"experience" aspect of performing tasks repetitively. As anexample, consider the case of labor. As workers performtasks again and again, they become more efficient inexecuting a given task. Since worker efficiency rises, lesslabor input is required in the production of additionalunits. This reduces production costs.
b. In general, experience curve theory appears in twoforms. One refers to the incremental unit costs of produc-tion. This form states that as production doubles, the perunit cost of a good at a given quantity will decrease at aconstant rate. The other form is similar and deals with theaverage costs of production. Here, the theory states that asproduction doubles, the average costs of production up to agiven quantity will decrease at a constant rate. Forsimplicity, the following discussion will refer to experience
ICost Estimating for Engineers Correspondence Text (CEE),ALM-63-3126-LC(C). Page. 201.
F-1

CAA-SR-91-9
curves on the incremental cost basis. Any conclusions can beeasily extended to the average cost basis.
c. There is a whole host of factors that contribute tothe decrease in production costs as output rises. 2 Some ofthese include learning on the behalf of management, machineryimprovements, technological change, etc. All of thesefactors will have a substantial impact on production costs.Despite this, it is viewed by some that worker learningthrough repetition is the dominant factor in experience curvetheory. 3 This notion of the dominant role of labor is notuniversally accepted.
4
F-3. BASE EXPERIENCE CURVE
a. The experience curve is traditionally represented bythe following function:
1) y.AXb
where:
Y = unit costA = cost of the first unitX = the unit numberb = experience curve slope coefficient.
The slope coefficient (b) is usually constrained to lie
between zero and negative one. That is,
2) -1 b 50.
The slope coefficient (b) can be viewed as the marginalchange in the unit cost (Y) that would occur if one more unitof output (X) were produced. Given (2), it can easily beverified from (1) that as (b) approaches zero, the experiencecurve effect diminishes. In fact, should (b) take the valuezero, then unit cost (Y) would be equal to the first unitcost (A).5 This implies that increases in the number ofunits produced has no impact upon unit cost. That is, thereis no experience effect. This would be termed a 100 percentexperience curve.
2 See CEE ALM-63-3126-LC(C), Page 201, and Smith, Jason. 1989. LearningCurve for Cost Control. Institute of Industrial Engineers. Pages 14 and15.3 This will be more true for those industries that are labor-intensive.4 See Smith, Jason. 1989. Learning Curve for Cost Control. Institute of IndustrialEngineers. Pages 13-17, 20.5 Let (b) equal zero. This implies Xb =O will always equal one. From (1), thisreveals: Y=A. In a graph with the horizontal axis the number of units and thevertical axis being unit cost, there would be a horizontal line at Y=A.
F-2

CAA-SR-91-9
b. The examt opposite occurs as (b) approaches (-1).Here, the expe.Jence effect becomes large. Should (b) equal(-1), then a doubling of the number of units produced wouldlead to a 50 percent reduction in unit cost. This outcomewould be called a 50 percent experience curve.
F-4. ESTIMATING THE BASE EXPERIENCE CURVE
a. The most precise method of estimating the experiencecurve is through the use of ordinary least squares regression(OLSQ). To do this, equation (1) must first be put in linearform. From above,
1.a) Y-AX-b
Note that the learning curve exponent (b) is negative. Thisis due to the constraint placed by (2). Taking the logarithmof (1.a) yields,
3) In(Y) - In(A)- bln(X).
Since equation (3) is now log-linear, it can be estimated byOLSQ. The resultant regression coefficients will be ln(A)and (b). To determine the first unit cost (A), the anti-logof ln(A) must be taken. The experience curve slope (b) isfound directly from its estimated coefficient.
b. The experience curve percentage can be determined inthe following manner.6 Allow (%) to represent the fractionto which unit cost decreases as production doubles. Then,
4)
where:
Y = unit costY= the unit cost of the xth unit
Y= the unit cost of twice the xth unit.
Substitution from (1) above gives
52 bA (2x)' bY AXb 2
This can be rewritten as
6RAND Corporation, The Learning Curve, RM-6103-SA. Pages 96-97.
F-3

CAA-SR-91-9
6) ln(%) = b ln(2).
From (6), the experience curve percentage can be determined.
c. Consider the following example. Unit cost and quantitydata for a certain weapons system is presented in Table F-i.These variables will be represented by (Y) and (X), respec-tively. Also listed in the table are the logarithm values ofeach variable. To estimate the experience curve for thissystem, equation (3) must first be estimated. This is doneby utilizing OLSQ regression. From the data in Table F-i,the following OLSQ results were found:
3.a) ln(Y)-2.002-0.1181n(X)
Table F-1.Cost & Quantity Data for a
Given Weapon System(cost data in millions of dollars)
Fiscal Unit ln(Y) # Units ln(X)year cost(y) (X)
1996 4.995 1.608 29.15 3.3721997 3.869 1.353 234.23 5.4561998 3.451 1.239 657.84 6.4891999 3.225 1.171 1168.18 7.0632000 3.072 1.122 1672.19 7.4222001 2.980 1.091 2174.34 7.6842002 2.923 1.073 2675.68 7.8922003 2.892 1.062 3137.04 8.051
The "hat" above the unit cost variable (Y) denotes it as thepredicted, or fitted value of (Y).
d. From (3.a) the slope coefficient (b) can be takendirectly. Here, (b) is equaJ to (-0.118). The first unitcost value (A) is not as simply determined. From (3) above,it can be seen that the OLSQ regression of (I.dj gives thelog value of (A). Since we are not interested in Lhelogarithmic value of (A), but (A) itself, the anti-log of (A)
F-4

CAA-SR-91-9
must be taken.7 Doing so reveals that (A) is equal to7.406.8
d. The experience curve percentage can be found byapplying equation (6):
6.a) ln(%) = b ln(2)= (-0.118)(0.693)
ln(%) = -0.081774.
Note that we are interested in (%), not its logarithm. Thus,
the anti-log of [ln(%)] must be found. Doing so reveals,
% = 0.92 or 92 percent.
Below is a summary of the estimated experience curve from thedata in table F-i:
Estimated Equation: Y-7.406X-""Slope of cost/quantity line = 0.92
F-5. COST/QUANTITY/RATE METHOD
a. It is widely recognized that the rate of productionplays an important role in unit production costs. One methodof accounting for this effect has been proposed by Bemis. 9
He has altered the traditional experience curve in two ways.First, the functional form of the experience curve has beenchanged to:
7) Y-AQ-bR -c
where
Y = average unit costQ = cumulative lot mid-pointR = production rateb = cost/quantity slope coefficientc = cost/rate slope coefficient.
7 This can easily be done on a hand-held calculator. Simply take the log valuein question, and press the (inverse) and (In) keys (in that order).
The regression found ln(A)=2.002 (the constant term). The anti-log of thisvalue is equal to 7.406. See footnote (7).9 Bemis, John C. The Cost Implications of Production Rate. Concepts, Spring1981, Volume 4, Number 2. Pgs. 84-94.
F-5
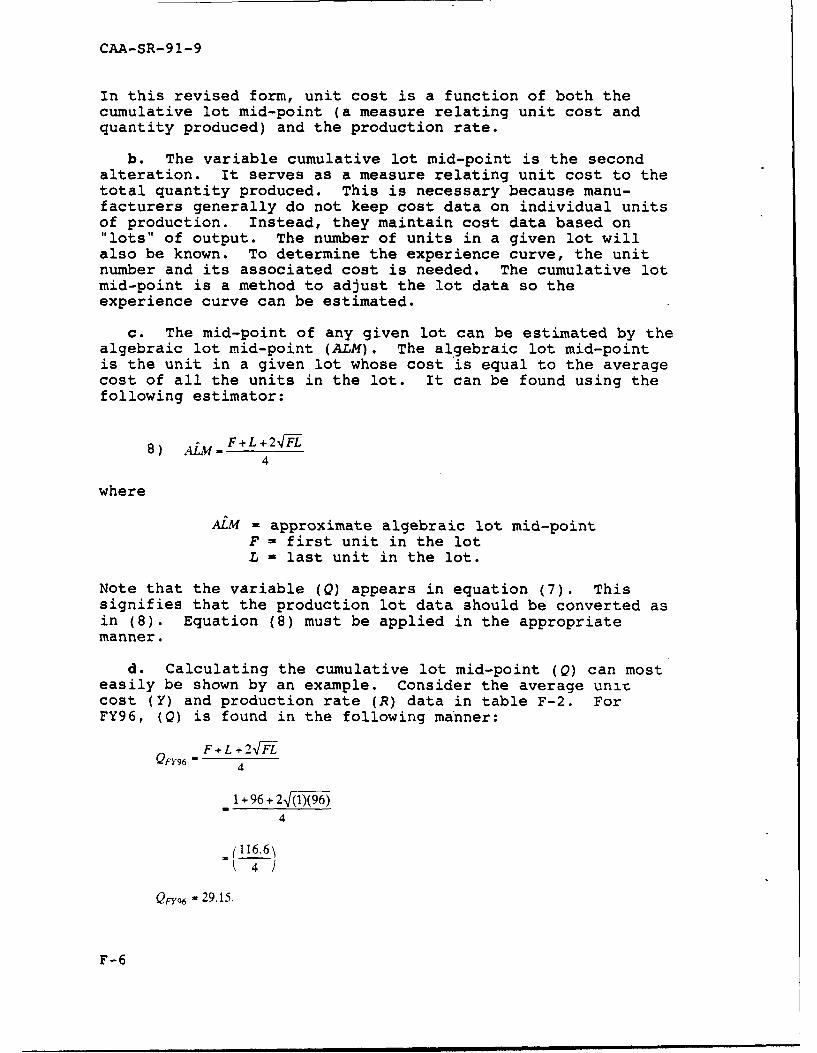
CAA-SR-91-9
In this revised form, unit cost is a function of both thecumulative lot mid-point (a measure relating unit cost andquantity produced) and the production rate.
b. The variable cumulative lot mid-point is the secondalteration. It serves as a measure relating unit cost to thetotal quantity produced. This is necessary because manu-facturers generally do not keep cost data on individual unitsof production. Instead, they maintain cost data based on"lots" of output. The number of units in a given lot willalso be known. To determine the experience curve, the unitnumber and its associated cost is needed. The cumulative lotmid-point is a method to adjust the lot data so theexperience curve can be estimated.
c. The mid-point of any given lot can be estimated by thealgebraic lot mid-point (ALM). The algebraic lot mid-pointis the unit in a given lot whose cost is equal to the averagecost of all the units in the lot. It can be found using thefollowing estimator:
8) AM-F+L+2NF-h
4
where
ALM = approximate algebraic lot mid-point
F = first unit in the lotL = last unit in the lot.
Note that the variable (Q) appears in equation (7). Thissignifies that the production lot data should be converted asin (8). Equation (8) must be applied in the appropriatemanner.
d. Calculating the cumulative lot mid-point (Q) can mosteasily be shown by an example. Consider the average unixcost (Y) and production rate (R) data in table F-2. ForFY96, (Q) is found in the following manner:
-F L + 2 fL4
1 + 96 + 2 -1)(96)
4
(116.6k41
QFy% - 29.15.
F-6

CAA-SR-91-9
Table F-2.Cost, Quantity, and Rate Data for a
Given Weapon System(cost data in millions of dollars)
Production Lot mif-Fiscal year Unit cost(Y) rate (R) point (Q)
1996 4.995 96 29.151997 3.869 335 234.231998 3.451 500 657.841999 3.225 500 1168.182000 3.072 500 1672.192001 2.980 500 2174.342002 2.923 500 2675.682003 2.892 418 3137.04
For FY 97, the cumulative lot mid-point is:
- F + L4- 2+,f-4
97+ 431 + 2,(97)(431)4
QIy - 234.23.
The remaining entries in Table F-2 can be found in a likefashion.
e. Estimation of the cost/quantity/rate equation issimilar to the base experience curve. OLSQ regression isperformed on the log transformed variables of (7). Thedependent variable is average unit cost (Y), and theexplanatory variables are the cumulative lot mid-point (Q)and production rate (R). The cost/quantity/rate equation tobe estimated is,
9) In(Y)-In(A)-bln(Q)-cln(R). [D.12]
From the regression results of (9) the slope coefficients canbe taken directly.
f. The data in Table F-2 can serve as an example of thecost/quantity/rate method. Estimating (9) with this data byOLSQ reveals:
10) ln(Y) - 2.04- 0.114 n(Q)- O.0121n(R).
Following the techniques previously presented, the follow-ing was determined:
F-7

CAA-SR-91-9
Estimated Equation: Y -7.7Q-'1R-°02Slope of the cost/quantity curve = 0.92Slope of the cost/rate curve = 0.*99Multiple Regression Coefficient (R2) = 0.99
g. It should be noted that the multiple regressioncoefficient (R2) is usually presented. R2 is a measure of the"goodness of fit" of a given regression line. It simplydescribes the proportion of variance in the dependent vari-able that can be attributed to the explanatory variable(s).Since it is a proportion, it is bounded to lie between (0)and (1). At the extremes, a R2 value equal to zero wouldimply that none of the variation in the dependant variablecan be described by the regression line. When R2 equals (1),this means that all of the variation in the dependantvariable is captured by the regression line. Thus, as thevalue of R2 becomes larger, more of the variation in thedependent variable is explained by the regression line. Thegeneral rule is the larger the value of R2 , the better theestimating equation. 10
F-6. CQM COST QUANTITY MODEL
a. Ideally, military procurement personnel would like todeal in a world of unlimited financial resources. There,they could purchase every piece of equipment or systemdesired. Analysts would only have to compile a "shoppinglist" of goods and set about acquiring them. But in the realworld, equipment procurement is not so simple. The Armyfunctions in an environment of limited resources (which willprobably shrink in future years). The quantity and types ofequipment and systems obtained are largely restricted by thefunding decisions of the Executive Branch and Congress.
b. Given this environment of budgetary constraints,analysts need tools to assist them in deciding how muchequipment or how many systems to purchase. That is, todetermine the optimal quantity given a certain budgetaryconstraint. One method of doing this was developed by the USArmy's Cost and Economic Analysis Center. CEAC developed amodel that was constructed in the fcrm of a Lotus 1-2-3spreadsheet. In application, this model proved difficult towork with due to a "circular reference" in the spreadsheetsprogramming. This circular reference resulted in an endlessloop, which made the model nearly impossible to copy.
10 A good discussion on R2 can be found in Kmenta, Jan, Elements ofEconometrics. Macmillan Publishing Company, New York, 1986. Pages 237-243.
F-8

CAA-SR-91-9
c. Because of this difficulty, the CEAC model wasmodified into the CQM presented below. The CQM is designedto provide equipment production and cost estimates based onexperience curve theory. Estimates are provided in terms ofboth constant and current dollars. In cases where there arebudget constraints, the model will compute how many items maybe procured with the constrained funds. While stillretaining USACEAC's original outline, CQM also provides thefollowing:
(1) Experience curve parameter estimation.
(2) Current and constant dollar estimates.
(3) A method of providing for programmed andunprogrammed changes in costs through shifts to theexperience curve.
d. The CQM model is based on the cost/quantity/rateexperience curve method of (7) above. That is,
7. i) Y-AQ-bR -c
where all variables are as previously defined. The CQM modelproduces estimates of the experience curve parameters. Italso produces the experience curve percentages and otherdescriptive statistics. There is an option to drop theproduction rate (R) variable if it is found to bestatistically insignificant. If that should be the case, CQMcan e timate the experience curve without this variable.
e. Total production costs are found by examining the areaunder Lhe experience curve. The total production cost isdetermined by the following:11
Lo051_) TC-0 AQbRcdx
where:
TC- totel production costF- unit number of the first item producedL- unit number of the last item produced.
Equation (11) can be modified to determine the total cost ofany given lot. This is done below.
11CEC, ALM-63-3126-LC Page 214.
F-9

CAA-SR-9 1-9
0.5
11. a) TCg "fo.:AQbRcdx
where
TC$- total production cost of a given lotF- unit number of the first item producedL- unit number of the last item produced.
f. Table F-3 provides a listing of sample data used toconstruct and test the results of the CQM. This tableconsists of 8 years of production cost data. A total of3,349 units are to be purchased at a budgeted cost of $10,810million. Average unit cost is found by dividing lot cost bylot size. The cumulative lot mid-point is computed byequation (8) as presented above.
g. Equation (7.a) is estimated in the usual manner, byapplying
Table F-3.
Cost, Quantity, and Rate Data for aGiven Weapons System
(cost data in millions of dollars)
Lot mid- Production
Fiscal year Unit cost point (Q) rate (R)____ ____ ____ (Y) __ _ _ _ _ _ _ _ _ _ _ _
1996 4.995 29.15 961997 3.869 234.23 3351998 3.451 657.84 5001999 3.225 1,168.18 5002000 3.072 1,672.19 5002001 2.980 2,174.34 5002002 2.923 2,675.68 5002003 2.892 3,137.04 418
OLSQ to the log-transformed variables. The average unit costvariable (Y) is the dependent variable, and the explanatoryvariables are the cumulative lot mid-point (Q) and productionrate (R). Table F-4 displays the regression results from thedata of Table F-3. Also included are the results as they arepresented by the CQM.
F-10

CAA-SR-91-9
h. The experience curve coefficient estimates are thenutilized to determine the total cost (TC). This result canbe seen in Table F-5.
Table F-4.
Estimated Experience Curve Parameters(based on data from Table F-3)
Regression output: CQM Model output:First Unit Cost = 7.743
Constant = 2.04677426 QTY Slope (b) = -0.11404b = -0.114044 Cost/Qty slope = 0.9240c -0.0118126 Rate Slope (c) = -0.01181
R squared = 0.999 Cost/Rate slope = 0.9918
As can be verified, the CQM estimates the total cost of thisparticular system to be $10,792.5 million. Presented also inTable F-5 are the projected total costs of the system. Theprojected total cost amounts to $10,810 million. Comparisonof the model's estimate to the projected total costs revealsthat the model forecast projected total costs quite well.
i. The portion of the CQM devoted to computing productioncosts given desired quantities and possible budget con-straints is divided into three sections. The first is theinput section, which requires the user to enter certain keydata. This data includes:
(1) First Unit Cost (A). It should be noted that thisvariable must be based on an annual production rate. 12
(2) Quantity slope (b)
(3) Rate slope (c)
(4) Production rate (R) by fiscal year.
12 This portion of CQM does not perform the regression estimates of equation(7 a). This must be done in another portion of the model, and then manuallyentered.
F-1i

CAA-SR-91-9
Table F-5.Estimate of Total Cost
and Lot Costs(based on data from Table F-3)
Fiscal Production Projected Model est.year rate (R) lot cost* lot cost*1996 96 480 470.11997 335 1,296 1,295.01998 500 1,726 1,714.51999 500 1,613 1,607.02000 500 1,536 1,542.92001 500 1,490 1,497.42002 500 1,462 1,462.52003 418 1,209 1,203.2
TOTAL 3,349 10,810 10,792.5*In millions of dollars.
(4) Previous quantity produced.
(5) First fiscal year of procurement
(6) Projected shifts of first unit cost, by fiscalyear. These can be positive or negative.
(7) Desired quantities, by fiscal year.
(8) Budget constraints, by fiscal year. These shouldbe entered in terms of current dollars.
(9) Inflation factors, by fiscal year.
The second section is the Desired Production at MaximumRate Section. This section computes the constant dollarsneeded to produce the desired amount of items. Also calcu-lated by this section are the number of items that can beproduced given the budget constraints, budgeted funds againstestimated production costs, and whether there is a surplus orshortage of budgeted funds.
The final section is the Actual Production at MaximumRate Section. This section will compute the total number ofitems that can be produced given the budget constraints.These items will be presented based on the assumption thatthey can be produced at a rate equal to the originallydesired annual rate. In the case of a severe budgetconstraint, this would be analogous to a manufacturerproducing at top capacity for the first few months of thefiscal year and then halting production for the remainder ofthe fiscal year.
F-12

CAA-SR-91-9
r-7. SPREADSHEET VERSION OF CQM
a. The three sections discussed above also appear in aspreadsheet version of the CQM. The model depends upon theuser entering string and formula data into the spreadsheet.This projects production and budget information for twofiscal years. Information on subsequent fiscal years isfound by copying the formulas.
b. The spreadsheet version of CQM is operated in thefollowing manner:
(1) Template Expansion. The model's template onlyprovides data for 2 fiscal years. But it can easily beextended to account for additional years. This is done bycopying the spreadsheet's fourth column to the nth column,where n is the number of additional fiscal years to beconsidered.
(2) Data Entry. The input variables discussed inparagraph F-6i above are entered.
c. The model can be modified to account for inflation.The model assumes that future budget estimates are made interms of then year dollars. If appropriate inflation factorsare entered, then a constant dollar baseline can be obtained.It should be mentioned that when a baseline is chosen, thefirst unit cost (A) should be expressed in terms of thebaseline dollars.
d. The CQM also has the ability to account for signif-icant changes to recurring production costs. This isaccomplished by shifting the experience curve.
e. The CQM provides the capability to develop productionestimates based on budgetary constraints. Through the use ofshifts in the unit cost curve, the model provides thecapability to quickly assess the effects of significantchanges to recurring production costs.
F-8. LIFE CYCLE COST MODEL (LCCM)
a. The purpose of the LCCM is to examine the baselinecost estimate and ACP of a weapon system by the P92 subcate-gories within each of the Big Five cost categories. Thevalues input into the BCE are derived from the cost historiesof weapon system programs. Systems include the following:aircraft, missiles, air defense combat support, and firesupport, among others.
b. The LCCM is a large spreadsheet-based model that isintended to recompute new values, e.g., due to sensitivityanalysis on specific quantities and cost levels, current
F-13
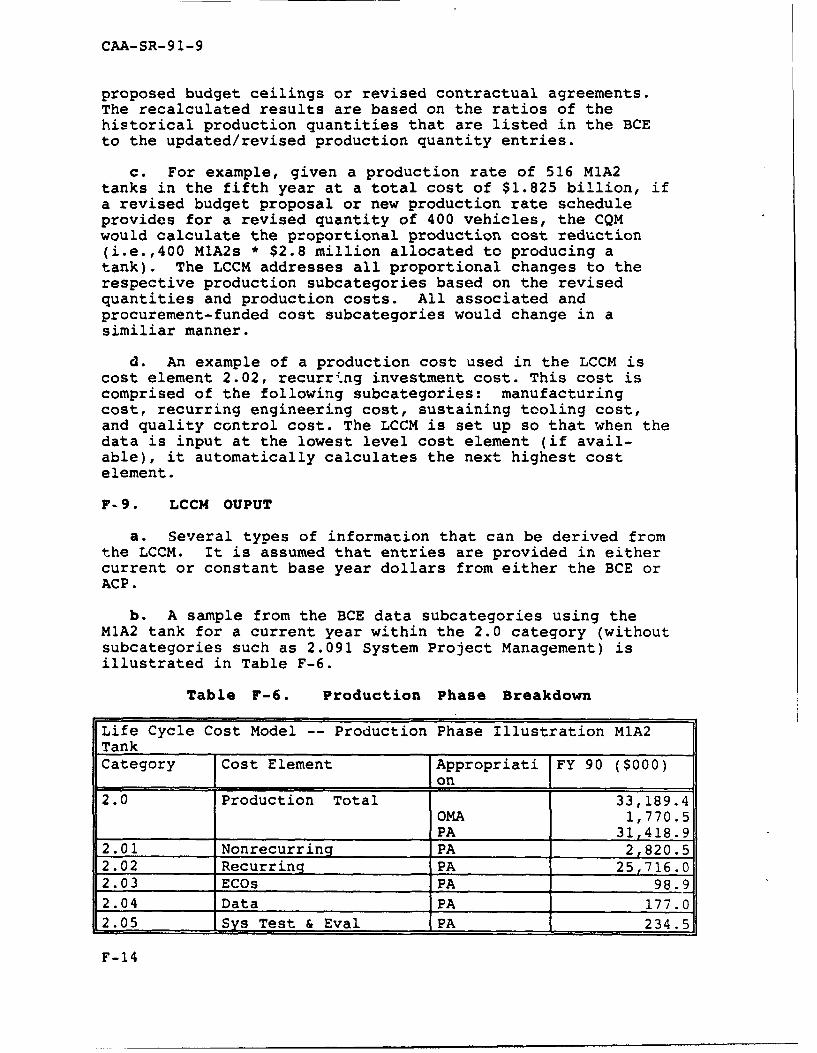
CAA-SR-91-9
proposed budget ceilings or revised contractual agreements.The recalculated results are based on the ratios of thehistorical production quantities that are listed in the BCEto the updated/revised production quantity entries.
c. For example, given a production rate of 516 MIA2tanks in the fifth year at a total cost of $1.825 billion, ifa revised budget proposal or new production rate scheduleprovides for a revised quantity of 400 vehicles, the CQMwould calculate the proportional production cost reduction(i.e.,400 M1A2s * $2.8 million allocated to producing atank). The LCCM addresses all proportional changes to therespective production subcategories based on the revisedquantities and production costs. All associated andprocurement-funded cost subcategories would change in asimiliar manner.
d. An example of a production cost used in the LCCM iscost element 2.02, recurr4.ng investment cost. This cost iscomprised of the following subcategories: manufacturingcost, recurring engineering cost, sustaining tooling cost,and quality control cost. The LCCM is set up so that when thedata is input at the lowest level cost element (if avail-able), it automatically calculates the next highest costelement.
F-9. LCCM OUPUT
a. Several types of information that can be derived fromthe LCCM. It is assumed that entries are provided in eithercurrent or constant base year dollars from either the BCE orACP.
b. A sample from the BCE data subcategories using theMlA2 tank for a current year within the 2.0 category (withoutsubcategories such as 2.091 System Project Management) isillustrated in Table F-6.
Table F-6. Production Phase Breakdown
Life Cycle Cost Model -- Production Phase Illustration MlA2TankCategory Cost Element Appropriati FY 90 ($000)
1 I~onI
2.0 Production Total 33,189.4OMA 1,770.5PA 31,418.9
2.01 Nonrecurring PA 2,820.52.02 Recurring PA 25,716.02.03 ECOs PA 98.92.04 Data PA 177.02.05 Sys Test & Eval PA 234.5
F-14

CAA-SR-91-9
2.06 Train Serv & Equipment PA 519.702.07 Intial Spares OMA 1,770.52.08 Operate/Site PA2.09 Other Prod Fund PA 1,852 .3
c. A sample of the output format showing the rolled upcosts for the Big 5 cost categories over is illustrated belowin Table F-7. Total life cycle costs -for the weapon systemare also calculated.
Table F-7. Sample Output for Big 5 Categories
POM POM POM POM POM POM1 2 3 4 5 6 Total Total Total
Category 1992 1993 1994 1995 1996 1997 POM Outyears LifeCycle
Dev X X X X X X X X XProd X X X X X X X X XMCA X X X X X X X X XFldq X X X X X X X X X
Sustain X X X X IX X X X X
d. Another form of output is designed to provide abreakdown of all costs by appropriation: OMA, MPA, MCA, andPA. Moreover, another depiction is provided by procurementfunded costs (total fly away cost, total weapon systems cost,total procurement cost, and total program acquisition cost)in both constant and current dollars for a given base year.
e. The basic spreadsheet template was developed using aPC-based application, Quattro Pro. The file is initially setup in protected mode so the formulas cannot be overwritten;however, an option is available for overwriting the formulasby changing the defau't to unprotected mode when input datais provided at a higher level, e.g., 2.011 instead of 2.01.The step is for the analyst to copy the template to anotherspreadsheet file (one which has substantive meaning such asMLRS.WQ1 or BFVS.WQ1) so that the basic formulas and layoutmaintain a standard format.
f. The output of the LCCM provides several rollups, inboth current and constant dollars, with an indexed base yearwhich is contingent on the budget year for the given system.Output formats inclvde total requirements by appropriationcategory, Big 5 category, procurement funded cost as well asa listing of the systems' associated items of equipment(ASIOE). Timeframes of interest include previous yearsthrough the current year, budget year, POM years, totaloutyears, and total life cycle cost.g. Bar graphs can easily be called up and viewed within
each weapon system spreadsheet. A sample illustration of the
F-15

CAA-SR-91-9
total life cycle cost (FY 91 current dollars) of the singlechannel ground and radio airborne system (SINCGARs) by eachapplicable appropriation is illustrated in Figure F-i.
?A 35%
MCA
p ,
I I
*
I 10 2000 47 M 00
Cost (SM)
Figure F-1. SINCGARS Appropriation Summary
h. In conclusion, the LCCM provides a useful tool toperform life cycle costing for a given weapon system. Theinput is based on the BCE; however, other data can be used ifdesired. Assuming all the input values are converted to fitinto the structure of the spreadsheet template, costs in manymodes of display are calculated. (Note: in order tosuccessfully use the model, a 286-based machine running at12MZ is recommended as a minimum standard with availableexpanded memory of at least 1MB.)
F-16

CAA-SR-91-9
APPENDIX G
TOPSIS USER NOTES
G-1. INTRODUCTION. The analytic tool selected for measureof effectiveness integration was the "Technique for OrderPreference by Similarity to an Ideal Solution, better known byits acronym, TOPSIS. This technique was developed by Ching-LaiHwang I and Kwangsun Yoon at Kansas State University and has beenwidely used by the Army and taught in operations researchclasses at the Army Logistics Management Center.
G-2. USER'S INSTRUCTIONS FOR MS-DOS. To execute theTOPSIS software independent from the capsule environment, thefollowing steps should be taken:
a. Preparation of Input. An ASCII text file forms theinput for the TOPSIS calculation engine. The text file is usedto mimic the relational tables found in the data baseenvironment. Because of this "table" structure, the input has aparticular structure, but is relatively free format otherwise.You never have to count columns or use numeric format codes.The text file may be prepared using a normal text editor, but ismost commonly prepared with a microcomputer spreadsheet programsuch as Microsoft Excel. Since all spreadsheets support thedisplay of multiple rows and columns of data, they are particu-larly advan-ageous as a user interface. When the spreadsheetcontaining the inputs is finished, it is only necessary to savethe output as "text," an option supported by all known spread-sheet products.
b. File Format. The format for the input file is asfollows:
(1) The first three lines of the file are "header" lineswhich label the decision attributes associated with eachalternative. These three lines all begin with a TAB character(or a sequence of spaces) to distinguish them as header lines.
(2) The first line of the file contains the names of thedecision attributes. Each name can have any number ofcharacters, but must not contain any blanks, tabs, carriagereturns, or commas, as these characters are used as fieldseparators.
(3) The second line of the file contains either a plussign ("+") or a minus sign ("-") indicating that the attribute
1Hwang, Ching-Lai and Yoon, Kwangusn, Multiple Attribute Decsion Making,'jM thds and Applications, Springer-Verlag, Berlin, 1981.
G-1

CAA-SR-91-9
in this column is either a benefit or a cost measurerespectively.
(4) The third line of the file contains the weightassociated with the attribute. This is a number 1netween 0 and1, and is computed using the methods described in Chapter 7.
(5) All subsequent lines after the third line containrows of the decision matrix with the scores associated with eachalterna-tive. Each row begins with an alternative name (whichagain can contain no blanks or tab characters), followed by thescores associated with that alternative for each attribute.
c. Command Line Invocation. To use the engine, simplytype the command TOPSIS followed by the data file name of thefile containing the input data. (On the Macintosh, double clickon the application icon. You will be prompted for the inputfile name.) This input file must end with the extension ".dat"in order to be found correctly. After TOPSIS has computed itsresults, a file with the same name, but with extension ".out",will automatically be generated. If there are no errors, TOPSISwill opezate silently, producing no further output to thecommand interface.
d. Output File. The output file contains a mirror imageof the input data with two new columns in the matrix. The firstnew column is the TOPSIS coefficient, and the second column isthe relative rank among the listed alternatives.
e. Example Input. The following is a small input file(named "example.dat") formatted properly for use with thestandalone version of TOPSIS.
Table G-1. Example Input
Political Asset OperationalRisk Versatility andCongressional and TechnicalOpinion Deployability Risk
WEIGHTS 0.1282705 0.2763505 0.595378BASE CASE 31 19 36ALT 1 29 36 27ALT 2 16 24 17
f. Example Command Line: To run TOPSIS on the above
data, the following command line invocation is used:
C:> topsis example
g. Example Output. The following is the output filegenerated by the above input.
G-2

CAA-SR-91-9
Table G-2. Example Output
EXMPLEcoef EXAMPLE_rank
BASE CASE 31 19 36 0.327866 2ALT 1 29 36 27 0.895215 1ALT 2 16 24 17 0.255277 3
h. Possible Errors. The following are typical errors,
and the recommended corrective action:
(1) "Could not open <filename> for input."
This error is usually the result of misspelling theinput file name, or not having the appropriate extension(.dat) on the input file name. Also common when theinput file is in another directory besides the currentdirectory. Provide either the complete path anddirectory name or "cd" to the appropriate directorybefore running TOPSIS.
(2) "Could not allocate r."
This error is usually the result of trying to run TOPSISon a machine with insufficient memory. MS-DOS machineshave the most restricted memory; There is little youcan do. Try using a Macintosh, which can handle muchlarger problems. If the problem persists on theMacintosh, turn multifinder off.
(3) "Invalid vector length" <Next line shows defectivevector>
This error is usually the result of having too many ortoo few attribute scores in a particular row. Countthem again. Also, look for blanks in the name of thealternative.
G-3

CAA-SR-91-9
APPENDIX H
FOMOA USER NOTES
H-1. INTRODUCTION
a. The analytic tool selected for development of theacquisition strategy was the Force Modernization Analyzer,better known by its acronym, FOMOA.. It has been widely used bythe Army for the production of weapon system modernizationplans. It is based upon the concept of linear programming andeconometric modeling of cost-quantity relationships. The ValueAdded FOMOA formulation considers production, TOA, and forcestructure constraints in conjunction with cost and benefit datain order to determine an optimal mix of weapon systemprocurements by year.
H-2. GENERAL FORM OF THE OPTIMIZATION MODEL
a. The Formulation. Documentation for the generalformulation of the Value Added FOMOA is provided within thisparagraph of the appendix.
b. Key Words. The model formulation contains thefollowing key words: SETS, ENDSETS, MODEL, DATA, ENDDATA, andEND. The formulation begins following the SETS section. Thedata files are listed near the end of the program after the keywor DATA. Figure H-i shows the relative arrangement of themajor sections of the formulation file. The formulation filename ends with the extension "<filename>.mod".
SETSMODELDATA
Figure H-1. FOMOA Formulation Sections
The general form for each of the sets listed in the subsequentparagraphs of this appendix is: set name, elements of the set,and finally attribute(s) for the elements. For example:
T/1..12/: TOA;
T = Set Name/1..12/= Elements:TOA Attribute.
H-i

CAA-SR-91-9
c. Comments, Etc. Anything between an exclamation mark(!) and a semicolcn (;) is a comment. FOMOA does notdistinguish between lower and upper case. Index variables(I,J,K,L below) could be typed in lower case, but in the output,they would be in upper case. Value Added FOMOA, except forcomments, is written entirely in upper case.
d. Time. The first lines of the SETS section contain the
following statement:
T/1..12/: TOA;
(1) The elements 1, 2, ...12 of the set T are indicatedbetween the two slash (/) delimiters. In terms of mnemonics, Tis, of course, time. (In this formulation, Value Added FOMOA iscurrently executed using only 12 planning years. In the eventof a larger implementation, only two lines of code need bechanged--this set line and the line in the DATA sectionaccessing a 12-year data file.)
(2) After the colon (:), attributes of the elements arelisted. (The semicolon (;) indicates the end of the statement.)Attributes pertain either to input data or program variables.The values for data attributes appear in an input data fileassociated with each attribute and named "<attribute name>.dat".The TOA attribute data would be in a file called "TOA.dat" andthe attribute has the following definition:
TOA(I) Funding level for procurement for year I.
e. Time and Mission. The next two statements define theset M of vehicle missions/roles/force packages which vary withtime. It should be noted that while the formulation explicitlyaccounts for missions/roles/force packages, in Phase I of ValueAdded Analysis, we considered onlyone mission per system.
M /TK, IN, AT, EN, AR, AM/:;
TM(T,M) : EQM, WM, RM, LM, UM;
(1) The variable attributes of TM are:
EQM(I,J) The size in terms of number of vehicles inyear I of mission J (of all types K--see below).
WM(I,J) The total modernization weight of the vehiclesin year I in mission J (see definitionof the modernizationweight W of vehicle types of the Time, Mission, and Equipmentparagraph below).
H-2

CAA-SR-91-9
(2) The data attributes of TM are:
RM(I,J) Minimum fraction modernization required inyear I in mission J (weight divided by size--see missionconstraints section below).
LM(I,J) Lower limit on number of vehicles in year I -inmission J (i.e., total number of required vehicles in year I inmission J).
UM(I,J) Upper limit on number of vehicles in year I inmission J.
f. Mission and Equipment. The next several lines asso-ciate each equipment type with a mission and give attributes ofequipment that do not vary with time. (They involve planningyears 1 or 2.)
E / @file(equip.dat) /:
ME (M,E) / @file(mission.dat)/: ST, FE1, FE2;
(1) ME is a subset of the direct product of M and E.The definition of ME is given by the parenthetical expression(M,E) and a list of specified elements of between the slash(I) delimiters.
(2) The attributes of ME are all of the data category.They are:
ST(J,K) Inherited assets available for year 1(starting year) in mission J of type K.
FE1(J,K) Programmed fielding in year 1 (programmedbuys 2 years before planning period) for vehicles in mission Jof type K.
FE2(J,K) Programmed fielding in year 2 (programmedbuys 1 year before planning period) for vehicles in mission J oftype K.
g. Time, Mission, and Equipment. The next line of thecode defines the set TME and is the capstone of what has gonebefore. It gives the equipment attributes that can vary withtime.
TME (T,ME): X,Y,EQ, CP,CO,W,LX,UX,UE;
(1) The variable attributes of TME are:
X(I,J,K) Number of vehicles purchased in year I inmission J of type K.
H-3

CAA-SR-91-9
Y(I,J,K) Number of vehicles retired in year I inmission J of type K.
EQ(I,J,K) The number of vehicles in year I in missionJ of type K (force composition).
(2) The data attributes are:
CP(I,J,K) Purchase cost of a vehicle in year I inmission J of type K.
CO(I,J,K) O&S cost of a vehicle in year I in mission Jof type K.
W(I,J,K) Modernization weight of a vehicle in year Iin mission J of type K. This weight is a user input valuebetween 0 and 1. Fully modernized vehicles have weight 1,completely obsolete vehicles have weight 0.
LX(I,J,K) Lower limit on number of vehicles procuredin year I in mission J of type K.
UX(I,J,K) Upper limit on number of vehicles procuredin year I in mission J of type K.
UE(I,J,K) Upper limit on number of vehicles in year Iin mission J of type K. (Used only in minimum cost runs toremove old systems with low operation and support costs.)
h. Production Lines. The next several lines name theproduction lines, specify the equipment type each produces, andgive the line attributes, all of which can vary with time. Itshould be noted that while the formulation explicitly accountsfor multiple production lines per system, in Phase I of ValueAdded Analysis, only one production line per system wasconsidered.
P. /@file(lines.dat)/:PME (P,M,E) / @file(PME.dat)/;TP (T,P): XP,LP,UP,Z;
The variable attribute of TP is:
XP(I,L) Total number of vehicles produced in time I online L.
The data attributes of TP are:
LP(I,L) Lower annual production limit in year I forline L.
H-4

CAA-SR-91-9
UP(I,L) Upper annual production limit in year I forline L.
Z(I,L) Open/close production line status in year I forproduction line L. If the line is open, the status value is 1;0, otherwise.
i. Dependent and Decision Variable
(1) The variables EQM and WM of set TM are both definedin term of the variable EQ of set TME as follows:
[H.01]
EQM(I,J) = EQ(I,J,K) for lET, JEM.K (.ZK )ENZ
[H.02]
WM(I,J) = EQ(I,J,K)*W(I,J,K) for I E T, J E M.X 1(J.K )E E
(2) The variable EQ is in turn defined in term of the
more basic variables X and Y of TME as follows:
For (J,K) E ME and I > 2
EQ(1,J,K) = ST(J,K) + FE1(J,K) - Y(1,JK)EQ(2,J,K) = EQ(1,J,K) + FE2(J,K) - Y(2,J,K)EQ(I,J,K) = EQ(I-1,J,K) + X(I-2,J,K) - Y(IJ,K)
Note that vehicles prc:ured in year 1-2 are fielded in year Ibecause of a 2-year lag between the purchase year and theoperational year.
(3) The variable XP is defined in terms of the variableX as follows:
[H.03]
XP(IL) = ZO,L)*X(I,JK) for I ETLXI E PME
(4) The variables EQM, WM, EQ, and XP can be consideredas functions of the decision variables X and Y. There is one
other decision variable, TMSTAR. It can be thought of as atechnical maximizer. It occurs in the maximization objectivefunction and in a set of six constraints. These constraints
H-5

CAA-SR-91-9
maximize the minimum of the six ratios EQM(5,J) to LM(5,J)involving the target (5th) planning year and the six missions J.
j. Objective Function
(1) Objective Function for the Minimum CostVersion. This objective function minimizes the sum of allprocurement costs and all operations and support costs over the5 year planning period. It is given by:
[H.04]
Minimize CP*X+CO *EQ)
(2) Objective Function for the MaximumModernization Version. This objective function maximizesthe sum of the technical maximizer times 1000 and the annualtotal mission modernization weights WM. Any relatively largenumber can be used in place of 1000. It is given by:
[H.05]
Maximize 1000 *TMSTAR + WMTM
k. Constraints
(1) Funding Constraints. The following providesannual funding limits on procurement dollars:
[H.06]
I CP(I,J,K)*X(I,J,K) ) < TOA(I) for I ET.X~, )E ME
(2) Production Line Constraints. The boundsstatement on XP in the code provides the following annual lowerand upper limits on the production lines:
LP(I,)s XP(I,J) :s UP(I,J)for I E T, L E P.
(3) Mission Constraints
(a) Minimum total requirements by mission. Thebounds statement on EQM in the code provides the following:
LM(I,J) s EQM(I,J) UM(I,J) for I E T, J E M.
H-6

CAA-SR-91-9
(b) Minimum modernization fraction requirements bymission. The following enforce a minimum mission weight tomission size ratio:
WM (1,J) 2 RM (I,J)*EQM (I,J) for I E T, J E M.
(4) Constraints on Vehicle Types (Other than Sumsover Vehicle Types)
(a) Constraints on retirement decision variables forall vehicle types. The following ensure that no more vehiclesof a given type are retired than are in the force the previousyear.
Y(1,J,K) & ST(1,KJ, for (JK) E MEY(I,J,) s EQ(I-1,J,K) for (JK ( ME and I > 1.
(b) Constraints on number of vehicles. The followingcan be used to retire old vehicle types:
EQ(I,J,KI : UE(I,J,K) for (I,J,K) (E TME.
(5) Technical Constraints. These constraints areonly for maximization runs. See discussion of the decisionvariable TMSTAR and of the maximization objective function3jove. (Multiplication by 100 is done below for scaling
purposes to counteract the large denominator involving LM.)
TMSTAR s 100*WM(SIZE("),J) / LM(SIZE(T),J) for J E M.
(6) Procurement Constraints. The bounds statement
on X provides the following:
LX(I,J,K) & X(I,J,[< & UX(I,J,K)
for (1,J,K) E TME.
H-3. USER'S INSTRUCTIONS FOR MS-DOS. To execute theFOMOA software independent from the capsule environment, thefollowing steps should be taken:
a. Preparation of Input. A series of ASCII text filesform the input for the FOMOA calculation engine. Each text fileis used to mimic a relational table found in the databaseenvironment. Because of this "table" structure, the input has aparticular structure, but is relatively free format otherwise.You never have to count columns or use numeric format codes.The text file may be prepared u3ing a normal text editor, but is
H-7

CAA-SR-91-9
most commonly prepared with a microcomputer spreadsheet programsuch as Microsoft Excel. Since all spreadsheets support thedisplay of multiple rows and columns of data, it is particularlyadvantageous as a user interface. When the spreadsheetcontaining the inputs is finished, it is only necessary to savethe output as "text," an option supported by all knownspreadsheet products.
b. File Format. The format for all input files isgenerally as follows:
(1) Each input file is either a matrix or a vector (seeTable H-i). At the beginning of the file are a series ofoptional "header" lines which label the vector or matrix columnassociated with each alternative. The header lines all beginwith a TAB character (or a sequence of spaces) to distinguishthem as header lines. There may be zero or any number of headerlines in each file.
Table H-i. Input Files by Type
Input File Name Type File Data Content
E - @FILE(eq_list.dat) Vector List of Equipment NamesTOA - @FILE(toa.dat); Vector Accumulative Dollars By YearCP - @FILE(cp.dat); Vector Procurement Dollars By SystemCO - OFILE(co.dat); Vector O&S Dollars By SystemLX - @FILE(lx.dat); Vector Lower Production Limit By SystemUX - @FILE(ux.dat); Vector Upper Production Limit By SystemLM - @FILE(lm.dat); Vector Lower Force Structure Limit By SystemUM - @FILE(um.dat); Vector Upper Force Structure Limit By SystemST - @FILE(st.dat); Vector Starting Inventory By SystemFEl - @FILE(fel.dat); Vector 1st Year Previous FieldingsFE2 - @FILE(fe2.dat); Vector 2nd Year Previous FieldingsZ @ @FILE(z.dat); Matrix Production Line Start/Stop By Year
By SystemVA - @FILE(va.dat); Matrix Value Added Coefficent By Year By
_System
(2) All subsequent lines after the header lines containelements of the vector or rows of the matrix associated witheach alternative. Each row begins with an alternative name(which can contain no blanks or tab characters), followed by thevalues associated with that alternative.
(3) Each data file has a particular name associated withthe name of the vector or matrix in the formulation. The nameitself is not hard-coded, but is specified by name in theformulation source file. For example, in the formulation thereis a statement to associate the vector variable "TOA" with thedata file "toa.dat" as follows:
TOA = @FILE(toa.dat);
H-8

CLA-SR-91-9
c. Command Invocation. To use the FOMOA engine, simplydouble click on the application icon. You will be prompted forthe input file name. This input file must end with theextension ".mod" in order to be found correctly. After FOMOAhas computed its results, a file with the same name, but withextension ".out" will automatically be generated in the samefolder. If there are no errors, FOMOA will operate silentlyproducing no further output to the command interface.
d. Output File. The output file contains a detailedlisting of the values associated with each decision variable inthe linear programming formulation. A table of output valueslists the number of systems to be procured by year for each yearof the planning horizon. The number of years in the planninghorizon is specified in the problem formulation source file.Table H-2 provides the output for the A3 case study.
Table H-2. Example Output
System 1992 1993 1994 1995 1996 1997 1998 1999 2000 I20011 2002 Lower Upe
SA ,ARM 513 391 382 360 360 360 360 360 360 360 513
AUMSH 0 240 240 180 180 180 180 180 180 180 180 180 240
NLOS 0 0 16 16 16 16 16 16 16 0 0 0 16
M1A2 0 0 0 64 64 64 64 64 64 0 0 0 318
RADLEY 0 0 0 0 0 0 0 0 0 0 1 0 0 0 198
e. Possible Errors. The following are typical errors,
and the recommended corrective action:
(1) "Could not open <filename> for input."
Usually the result of misspelling the input file name,or not having the appropriate extension (.dat) on theinput file name. Also common when the input file is inanother directory folder besides the current directory.Provide either the complete path and folder name orplace the FOMOA icon in the appropriate directorybefore running FOMOA.
(2) "Could not allocate xxx."
Usually the result of trying to run FOMOA on a machinewith insufficient memory. MS-DOS machines have the mostrestricted memory and there is little you can do. Tryusing a Macintosh, which can handle much largerproblems. If the problem persists on the Macintosh,turn multifinder off.
H-9

CAA-SR-91-9
(3) "Invalid vector length." <Next line showsdefective vector>
Usually the result of having too many or too fewattribute scores in a particular row. Count themagain. Also, look for blanks in the name of thealternative.
(4) "Invalid formulation statement." <Next lineshows defective statement>
Usually the result of a syntax error in the originalproblem formulation. Error recovery for formulationsyntax errors is not sophisticated. One error maygenerate (and most often does) numerous errorstatements. Some common syntax errors include:
-- Failure to end each statement with a semicolon.-- Failure to declare an index or variable name priorto use.-- Unmatched parenthesis.-- Unrecognized arithmetic operator.- - Incorrect number of arguments in a formulationlanguage function.-- Failure to include or use an inappropriate indexfor a decision set.
H-10

CAA-SR-91-9
APPENDIX I
SPONSOR'S COMMENTS
DACS-DPA 4 December 1991
MEMORANDUM FOR US ARMY CONCEPTS ANALYSIS AGENCY
SUBJECT: Value Added Analysis (VAA) 9C-97 Study Critique
1. The following report gives comments regarding your draftreport #CAA-SR-91-9, dated October 1991, titled Army ProgramValue Added Analysis 90-97 (VAA 90-97) Study:
a. There were no specific editorial comments.
b. All key issues planned for analysis were adequatelyaddressed in the report.
c. The methcdology used to conduct the study wasadequate.
d. This study will be useful to this organization bybeing a primary source document in formulating questions foranalysis and in answering specific questions regarding themethodology.
e. I believe that this study is a good initial reporton the VAA methodology.
2. I hope that these comments are helpful. Please feelfree to direct any questions regarding this critique tomyself or to MAJ Carlton in my office, phone: (703) 225-7737, or (AV) 695-7737.
,OBERT B. CLARKEI Co±onel, GS
Chief, Acquisition and SupportProgram Analysis Division
1-1
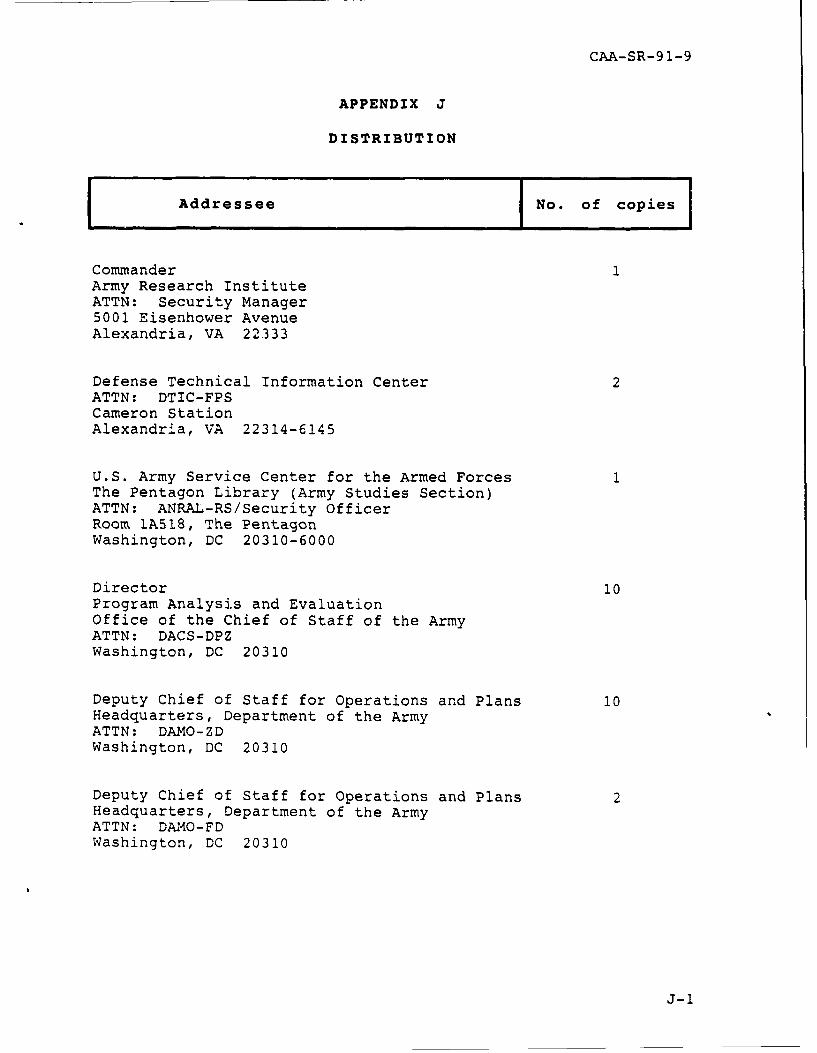
CAA-SR-91-9
APPENDIX J
DISTRIBUTION
Addressee No. of copies
CommanderArmy Research InstituteATTN: Security Manager5001 Eisenhower AvenueAlexandria, VA 22333
Defense Technical Information Center 2ATTN: DTIC-FPSCameron StationAlexandria, VA 22314-6145
U.S. Army Service Center for the Armed Forces 1The Pentagon Library (Army Studies Section)ATTN: ANRAL-RS/Security OfficerRoom 1A518, The PentagonWashington, DC 20310-6000
Director 10Program Analysis and EvaluationOffice of the Chief of Staff of the ArmyATTN: DACS-DPZWashington, DC 20310
Deputy Chief of Staff for Operations and Plans 10Headquarters, Department of the ArmyATTN: DAMO-ZDWashington, DC 20310
Deputy Chief of Staff for Operations and Plans 2Headquarters, Department of the ArmyATTN: DAMO-FDWashington, DC 20310
J-1

CAA-SR-91-9
IAddr ssee1 No. of copies
Deputy Chief of Staff for Operations and Plans 2Headquarters, Department of the ArmyATTN: DAMO-FDRWashington, DC 20310
CommanderUS Army Training and Doctrine CommandATTN: ATCD-PFort Monroe, VA 23651-5000
CommanderTRADOC Analysis CommandATTN: ATRC-FFort Leavenworth, KS 66027-5200
DirectorRPD, HQ TRACATTN: ATRC-RPFort Monroe, VA 23651-5143
US Military Academy 2Department of Systems EngineeringWest Point, NY 10996
Internal Distribution:
Reference Copy:Unclassified Library 2
Record Copy:Originating office (CSCA-FSR) 35
J-2

CAA-SR-91-9
GLOESARY
ABBREVIATIONS, ACRONYMS, AND SHORT TERMS
A3 armor antiarmor
AAO Army authorization objective
ACP Army cost position
AHP analytical hierarchy process
ALM algebraic lot mid-point
AMC US Army Materiel Command
AMM Army modernization memorandum
ARCPS Army Capabilities Study
ARIM Army Resource Integration and Management (study)
ARSTAF Army Staff
ASARDA Assistant Secretary of the Army for Research,Development, and Acquisition
ASIOE associated item(s) of equipment
ASM armor systems modernization
BCE baseline cost estimate
BFS Blue force surviving
BTU British thermal unit
CAA US Army Concepts Analysis Agency
CAB cost analysis brief
CEAC US Army Cost and Economic Analysis Center
CECOM Communications and Electronics Command
CER cost estimating relationship
CERL US Army Construction Engineering ResearchLaboratory
CFV cavalry fighting vehicle
CI consistency index
Glossary-I

CAA-SR-91-9
CINC commander in chief
COFM correlation of forces and means
CORBAN Corps Battle Analyzer
CORMO Corps Model
CQM Cost Quality Model
CR consistency ratio
CY calendar year
DA Department of the Army
DG Defense Guidance
DM decisionmaker(s)
DOD Department of Defense
DPAE Director, Program Analysis and Evaluation
EBR effective battalions remaining
EEA essential element(s) of analysis
EUL economic useful life
FAS Force Accounting System
FER force exchange ratio
FOMOA Force Modernization Analyzer
FORSCOM Forces Command
FR force ratio
FY fiscal year
GPS global positioning systems
hex hexagon
km kilometer(s)
HQDA Headquarters, Department of the Army
IPR in-process review
IPS Illustrative Planning Scenario
Glossary-2

CAA-SR-91-9
JCS Joint Chiefs of Staff
LCC life cycle cost
LCCM Life Cycle Cost Model
LER loss exchange ratio
LIN line item number
LP linear programming
LRRAMP Long-Range Research and DevelopmentModernization Plan\
m meter(s)
MA mission accomplishment
MACOM major Army command
max maximum
mBtu millions of British thermal units
MCA military construction, Army
MDEP Management Decision Package
MFCM movement force center of mass
MILP mixed integer linear drogramming model
min minimum
MISM major item system map
MOE measure(s) of effectiveness
MSR minimum sustaining rate
NDR nominal discount rate
NATO North Atlantic Treaty Organization
NCE noncombat effectiveness
NTC National Training Center
OCSA Office of the Chief of Staff, Army
Glossary-3

CAA-SR-91-9
ODCSOPS Office of the Deputy Chief of Staff forOperations and Plans
OLSQ ordinary least squares regression
O&M operation and maintenance
OMA operation and maintenance, Army
OMB Office of Management and Budget
OPLAN operation plan
ORSA operations research and analysis
O&S operation and sustainment
OSD Office of the Secretary of Defense
PAED Program Analysis Evaluation Directorate
PEG Program Evauation Group
PEO Program Executive Office
PK probability of kill
PM program manager
PO procurement objective
POM Program Objective Memorandum
PPBES Program Planning Budgeting and Execution System
PV photovoltaic
RAM reliability, availability, and maintainability
RDA research, development, and acquisition
RDT&E research, development, testing, and evaluation
SER system exchange ratio
SIAM secondary impact analysis modifiers
SLEP service life extension program
SME subject matter expert
SOF Special Operations Forces
Glossary-4

CAA-SR-91-9
SSPK single shot probability of kill
TACOM Tank-Automotive Command
TAEDP Total Army Equipment Distribution Program
TAP The Army Plan
TC total cost
TGW terminally guided weapon
TOA total obligation authority
TOE table(s) of organization and equipment
TOPSIS Technique for Order Preference by Similarity toIdeal Situation
TRAC TRADOC Analysis Center
TRAC-FLVN TRADOC Analysis Center, Fort Leavenworth
TRADOC US Army Training and Doctrine Command
USAREUR US Army, Europe
VAA Value Added Analysis
VIC Vector-In-Commander
WESTCOM Western Command
Wh watt-hours
Glossary-5

ARMY PROGRAM VALUE ADDED ISTUDYANALYSIS 90-97 SUMMARYCA'. (VAA 90-97) CAA-SR-91-9
STA 10
THE REASON FOR PERFORMING THE STUDY was to provide the Director forProgram Analysis and Evaluation, and the Deputy Chief of Staff for Operations
and Plans (DCSOPS) an analytical methodology and capability to support thedevelopment of a balanced and effective Army Program.
THE STUDY SPONSORS are the Director for Program Analysis and Evaluation(DPAE), Office of the Chief of Staff, Army, and the Technical Advisor, Officeof the Deputy Chief of Staff for Operations and Plans (ODCSOPS), Head-quarters, Department of the Army (HQDA).
THE STUDY OBJECTIVES were to:
(1) Formulate an analytic method for estimating the marginal value ofcompeting management decision packages (MDEP) to the Army. The methodologywill provide a common understandable basis for the analysis of affordabilityissues.
(2) Identify or develop prototype models that support the Value AddedAnalysis methodology and provide management tools for the analytic methoddeveloped.
(3) Establish within DPAE and ODCSOPS an in-house capability to conductprogram issue tradeoffs.
(4) Conduct a proof of concept analysis during the building of the 92-97Program Objective Memorandum (POM).
THE SCOPE OF THE STUDY included the research, development, and acquisition(RDA) appropriations for selected items of equipment in fiscal year (FY) 1999and FY 2004.
THE MAIN ASSUMPTION of this study is that HQDA needs a relatively quickmethod for conducting program tradeoffs which has sound analyticalunderpinnings.
THE BASIC APPROACH of this study was to:
(1) Identify and develop an analytical approach to evaluate program issuetradeoffs.
(2) Develop a capability for implementing the methodology to includesoftware modules where appropriate.

(3) Demonstrate the methodology and capability by using issues from the
90-97 POM issue cycle.
THE PRINCIPAL FINDINGS of the study were:
(1) Two generalized categories of measures of effectiveness (explicit andimplicit) were determined to be important in judging relative value.
(2) A linear combination of value components appears to be useful increating a single measure of an investment's marginal value.
(3) VAA uses a system of judgment weights which measures an investment'svalue in a dual context.
(4) The VAA methodology as demonstrated holds promise as the decisionanalysis framework that should be used for conducting Army program tradeoffanalyses. Further work in the areas of quick turnaround combat modeling,dynamic costing, and data collection need to be conducted.
(5) A highly aggregated combat model can provide useful insights foranswering macro-level program tradeoff questions and, to a more limiteddegree, Is capable of providing specific program guidance.
(6) In order for aggregated combat models to be useful, they must becalibrated to more detailed models and data.
(1) HQDA has a perspective which does not include the Training andDoctrine Command's (TRADOC) blueprint of the battlefield per se. Theirheadquarters Is organized along the lines of Planning, Programming,Budgeting, and Estimation System (PPBES) functions, and, although theheadquarters has some overlap, the specific thrust is the generation offorces through planning and programming.
(8) The cost-benefit analysis in the form of the optimization modelrequires further research into the use of dynamic costing of the procurementcosts.
THE STUDY EFFORT was directed by LTC James A. Richmann, Force SystemsDirectorate, US Army Concepts Analysis Agency (CAA).
COMMENTS AND QUESTIONS may be sent to the Director, US Army ConceptsAnalysis Agency, ATTN: CSCA-FSR, 8120 Woodmont Avenue, Bethesda, Maryland20814-2797.

AAE ARMY PROGRAM VALUE ADDED STUDYCA - ANALYSIS 90-97 SUMMARY
$ (VAA 90-97) CAA-SR-91-9
THE REASON FOR PERFORMING THE STUDY was to provide the Director forProgram Analysis and Evaluation, and the Deputy Chief of Staff for Operationsand Plans (DCSOPS) an analytical methodology and capability to support thedevelopment of a balanced and effective Army Program.
THE STUDY SPONSORS are the Director for Program Analysis and Evaluation(DPAE), Office of the Chief of Staff, Army, and the Technical Advisor, Officeof the Deputy Chief of Staff for Operations and Plans (ODCSOPS), Head-quarters, Department of the Army (HQDA).
THE STUDY OBJECTIVES were to:
(1) Formulate an analytic method for estimating the marginal value ofcompeting management decision packages (MDEP) to the Army. The methodologywill provide a common understandable basis for the analysis of affordabilityissues.
(2) Identify or develop prototype models that support the Value AddedAnalysis methodology and provide management tools for the analytic methoddeveloped.
(3) Establish within DPAE and ODCSOPS an in-house capability to conductprogram issue tradeoffs.
(4) Conduct a proof of concept analysis during the building of the 92-97Program Objective Memorandum (POM).
THE SCOPE OF THE STUDY included the research, development, and acquisition(RDA) appropriations for selected items of equipment in fiscal year (FY) 1999and FY 2004.
THE MAINASSUMPTION of this study is that HQDA needs a relatively quickmethod for conducting program tradeoffs which has sound analyticalunderpinnings.
THE BASIC APPROACH of this study was to:
(1) Identify and develop an analytical approach to evaluate program issuetradeoffs.
(2) Develop a capability for implementing the methodology to includesoftware modules where appropriate.

(3) Demonstrate the methodology and capability by using issues from the90-97 POM issue cycle.
THE PRINCIPAL FINDINGS of the study were:
(1) Two generalized categories of measures of effectiveness (explicit andimplicit) were determined to be important in judging relative value.
(2) A linear combination of value components appears to be useful increating a single measure of an investment's marginal value.
(3) VAA uses a system of judgment weights which measures an investment'svalue in a dual context.
(4) The VAA methodology as demonstrated holds promise as the decisionanalysis framework that should be used for conducting Army program tradeoffanalyses. Further work in the areas of quick turnaround combat modeling,dynamic costing, and data collection need to be conducted.
(5) A highly aggregated combat model can provide useful insights foranswering macro-level program tradeoff questions and, to a more limiteddegree, is capable of providing specific program guidance.
(6) In order for aggregated combat models to be useful, they must becalibrated to more detailed models and data.
(7) HQDA has a perspective which does not include the Training andDoctrine Command's (TRADOC) blueprint of the battlefield per se. Theirheadquarters is organized along the lines of Planning, Programming,Budgeting, and Estimation System (PPBES) functions, and, although theheadquarters has some overlap, the specific thrust is the generation offorces through planning and programming.
(8) The cost-benefit analysis in the form of the optimization modelrequires further research into the use of dynamic costing of the procurementcosts.
THE STUDY EFFORT was directed by LTC James A. Richmann, Force SystemsDirectorate, US Army Concepts Analysis Agency (CAA).
COMMENTS AND QUESTIONS may be sent to the Director, US Army ConceptsAnalysis Agency, ATTN: CSCA-FSR, 8120 Woodmont Avenue, Bethesda, Maryland20814-2797.

-f ARMY PROGRAM VALUE ADDED STUDYI., UAA ANALYSIS 90-97 SUMMARY
(VAA 90-97) CAA-SR-91-9
THE REASON FOR PERFORMING THE STUDY was to provide the Director forProgram Analysis and Evaluation, and the Deputy Chief of Staff for Operationsand Plans (DCSOPS) an analytical methodology and capability to support thedevelopment of a balanced and effective Army Program.
THE STUDY SPONSORS are the Director for Program Analysis and Ev 'uation(DPAE), Office of the Chief of Staff, Army, and the Technical Advisor, Officeof the Deputy Chief of Staff for Operations and Plans (ODCSOPS), Head-quarters, Department of the Army (HQDA).
THE STUDY OBJECTIVES were to:
(1) Formulate an ana-ytic method for estimating the marginal value ofcompeting management decision packages (MDEP) to the Army. The methodologywill provide a common understandable basis for the analysis of affordabilityissues.
(2) Identify or develop prototype models that support the Value AddedAnalysis methodology and provide management tools for the analyti, methoddeveloped.
(3) Establish within DPAE and OOCSOPS an in-house capability to conductprogram issue tradeoffs.
(4) Conduct a proof of concept analysis during the building of the 92-97Program Objective Memorandum (POM).
THE SCOPE OF THE STUDY included the research, development, and acquisition(RDA) appropriations for selected items of equipment in fiscal year (FY) 1999and FY 2004.
THE MAINASSUMPTION of this study is that HQDA needs a relitively quickmethod for conducting program tradeoffs which has sound analyticalunderpinnings.
THE BASIC APPROACH of this study was to:
(1) Identify and develop an analytical approach to evaluate program issuetradeoffs.
(2) Develop a capability for implementing the methodology to includesoftware modules where appropriate.

(3) Demonstrate the methodology and capability by using issues from the90-97 POM issue cycle.
THE PRINCIPAL FINDINGS of the study were:
(1) Two generalized categories of measures of effectiveness (explicit andimplicit) were determined to be important in judging relative value.
(2) A linear combination of value components appears to be useful increating a single measure of an investment's marginal value.
(3) VAA uses a system of judgment weights which measures an investment'svalue in a dual context.
(4) The VAA methodology as demonstrated holds promise as the decisionanalysis framework that should be used for conducting Army program tradeoffanalyses. Further work in the areas of quick turnaround combat modeling,dynamic costing, and data collection need to be conducted.
(5) A highly aggregated combat model can provide useful insights foranswering macro-level program tradeoff questions and, to a more limiteddegree, is capable of providing specific program guidance.
(6) In order for aggregated combat models to be useful, they must becalibrated to more detailed models and data.
(7) HQDA has a perspective which does not include the Training andDoctrine Command's (TRADOC) blueprint of the battlefield per se. Theirheadquarters is organized along the lines of Planning, Programming,Budgeting, and Estimation System (PPBES) functions, and, although theheadquarters has some overlap, the specific thrust is the generation offorces through planning and programming.
(8) The cost-benefit analysis in the form of the optimization modelrequires further research into the use of dynamic costing of the procurementcosts.
THE STUDY EFFORT was directed by LTC James A. Richmann, Force SystemsDirectorate, US Army Concepts Analysis Agency (CAA).
COMMENTS AND QUESTIONS may be sent to the Director, US Army ConceptsAnalysis Agency, ATTN: CSCA-FSR, 8120 Woodmont Avenue, Bethesda, Maryland20814-2797.