Location based services and location based behavior in a ...
Facility Location / Facility Layout
ByH.S.Pundle
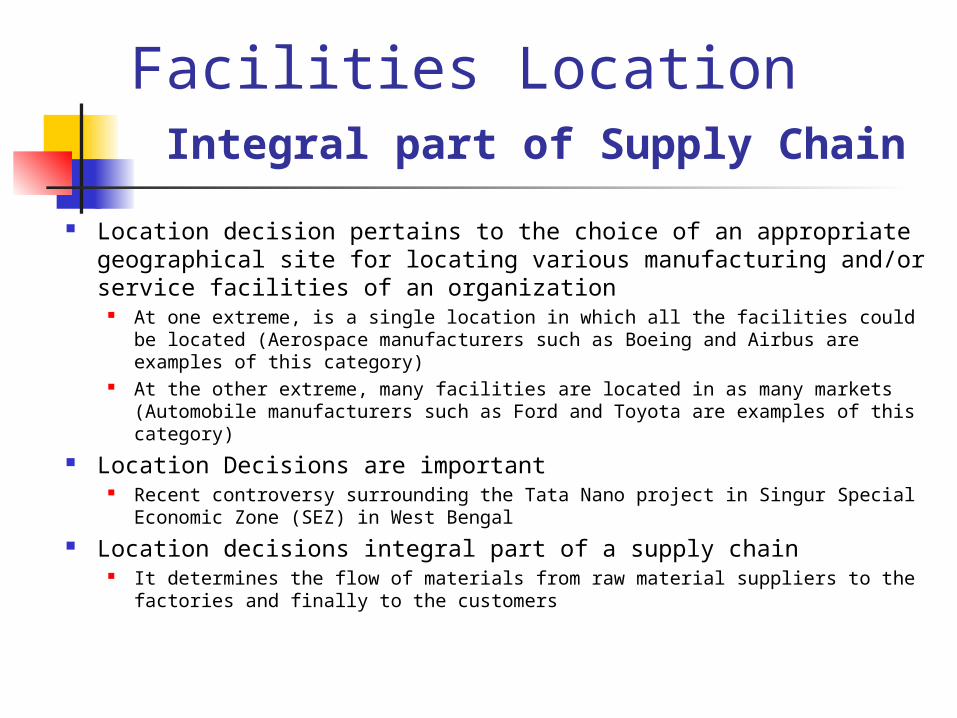
Facilities Location Integral part of Supply Chain
Location decision pertains to the choice of an appropriate geographical site for locating various manufacturing and/or service facilities of an organization
At one extreme, is a single location in which all the facilities could be located (Aerospace manufacturers such as Boeing and Airbus are examples of this category)
At the other extreme, many facilities are located in as many markets (Automobile manufacturers such as Ford and Toyota are examples of this category)
Location Decisions are important Recent controversy surrounding the Tata Nano project in Singur Special
Economic Zone (SEZ) in West Bengal Location decisions integral part of a supply chain
It determines the flow of materials from raw material suppliers to the factories and finally to the customers
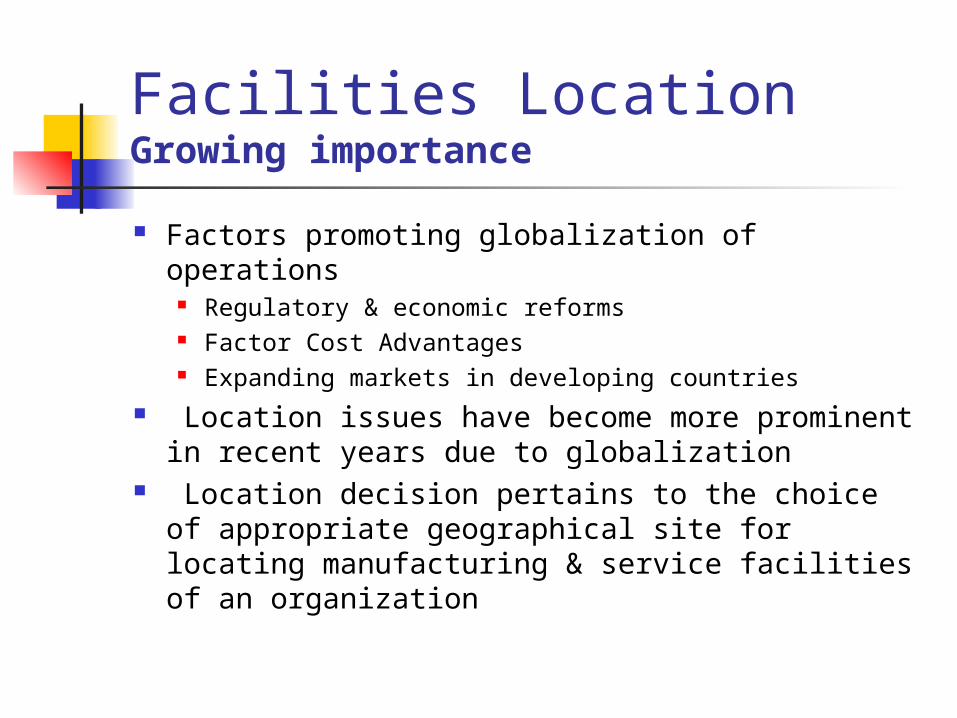
Facilities Location Growing importance Factors promoting globalization of operations
Regulatory & economic reforms Factor Cost Advantages Expanding markets in developing countries
Location issues have become more prominent in recent years due to globalization
Location decision pertains to the choice of appropriate geographical site for locating manufacturing & service facilities of an organization
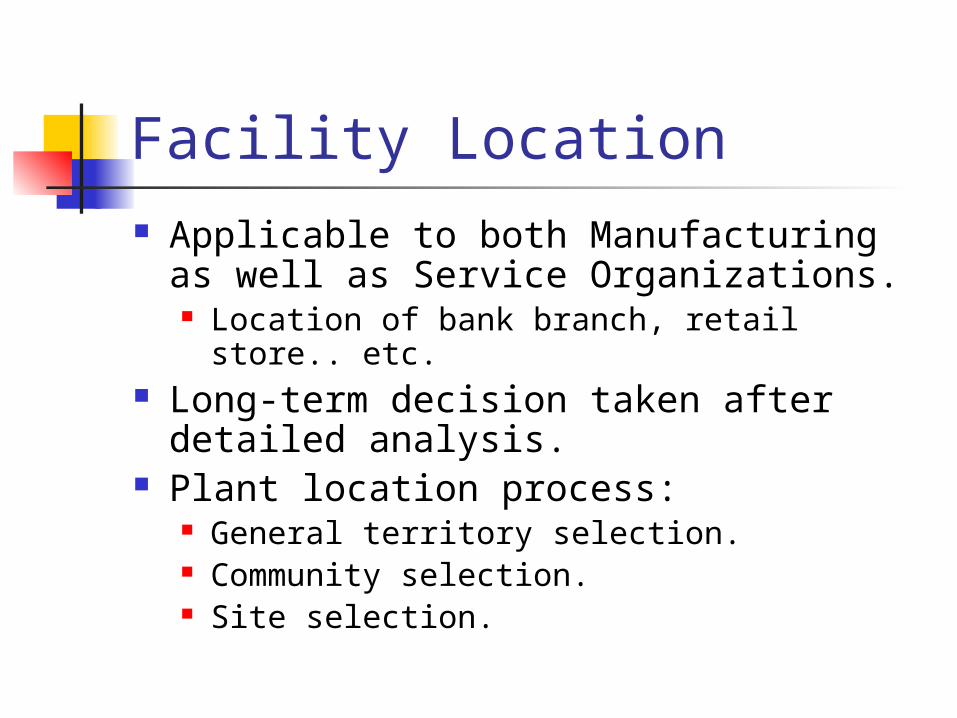
Facility Location Applicable to both Manufacturing as well as Service Organizations. Location of bank branch, retail store.. etc.
Long-term decision taken after detailed analysis.
Plant location process: General territory selection. Community selection. Site selection.
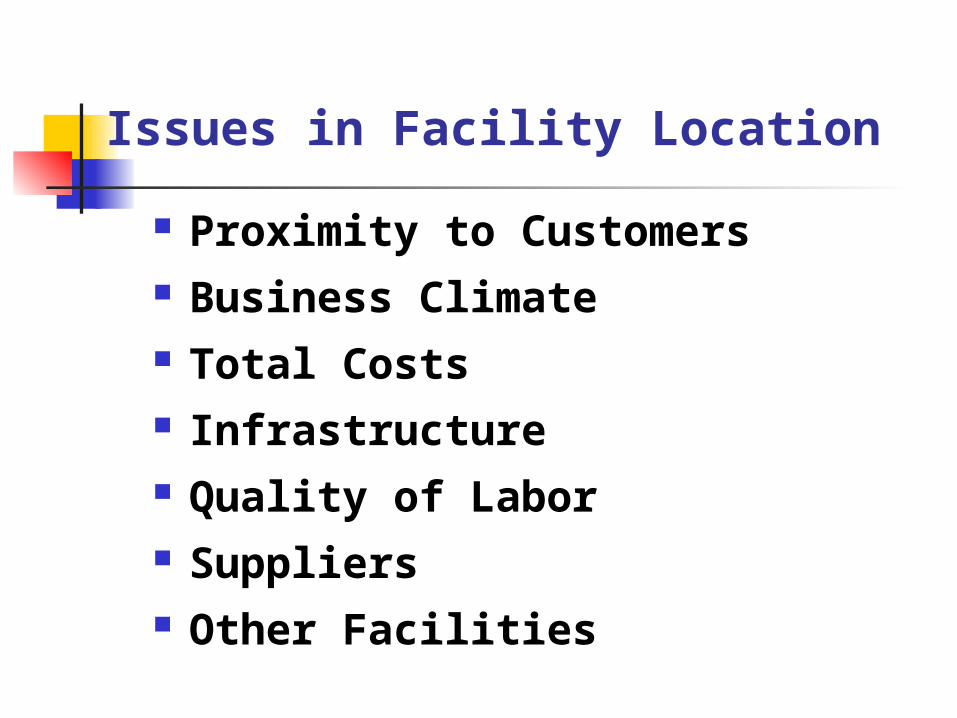
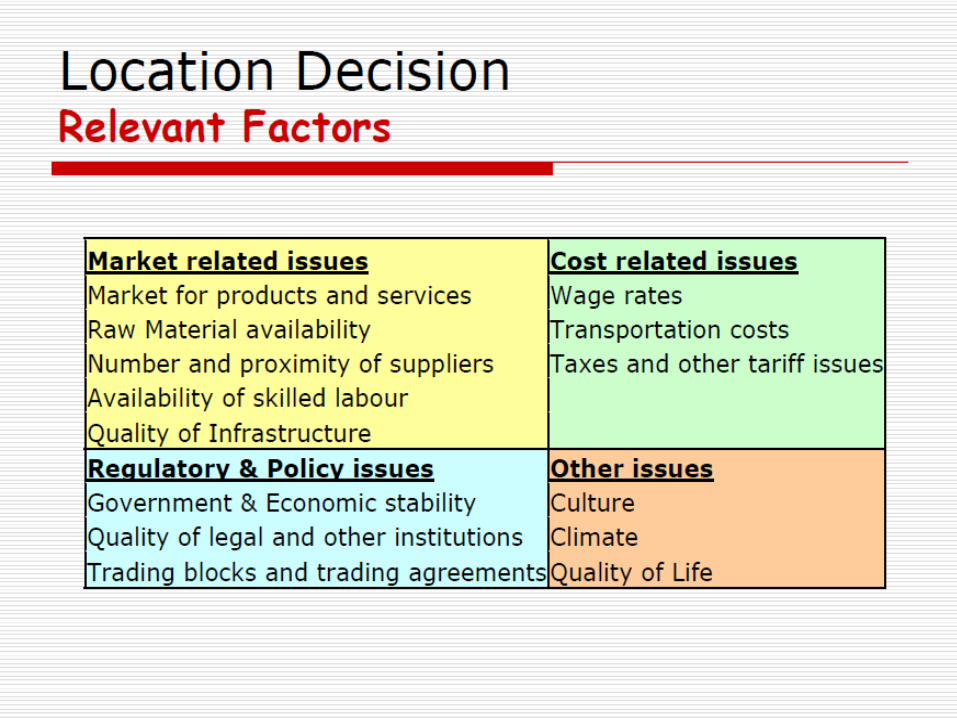
Issues in Facility Location Proximity to Customers Business Climate Total Costs Infrastructure Quality of Labor Suppliers Other Facilities

Issues in Facility Location Free Trade Zones Political Risk Government Barriers Trading Blocs Environmental Regulation Host Community Competitive Advantage
Factors Influencing Plant Location 1) Proximity to Market Particularly important when:
Product is fragile. Susceptible to spoilage. Prompt service is required. Product is relatively in-expensive & transportation adds significantly to cost.
E.g. Bread, Soap manufacturing units.
Factors Influencing Plant Location 2) Proximity to Source of Raw Material.
Particularly important when: Raw material is perishable in nature. Expensive to transport. Weight is substantially reduced during process.
E.g. Sugar, Cement, Steel manufacturing units.
Factors Influencing Plant Location 3) Infrastructure: Availability of Power, Water. Disposal of Waste. Particularly important:
Power for Aluminum Plant. Disposal of waste for leather hides.
Water for paper pulp.
Factors Influencing Plant Location 4) Transport facilities:
Rail, Road, Air, Sea, Pipe line. 5) Labour & Wages:
Easy availability of required labour.
E.g. IT Industry. Productivity of labour.
E.g. West Bengal or Kerala. Wage pattern & Industrial relations.

Factors Influencing Plant Location 6) Legislation & Taxation:
Issues relating to Licensing, Environmental clearances.
Octroi, Sales Tax, Subsidies. 7) Climatic Condition:
Textile mills in humid climate. Relatively less important these days; due to climate control/ Air-conditioning.
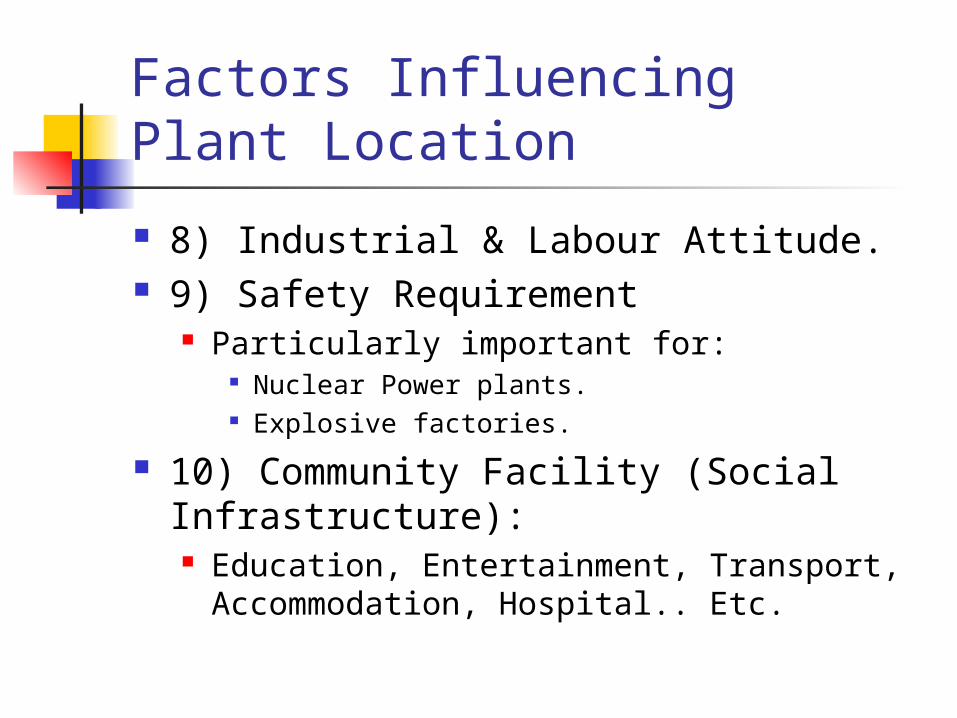
Factors Influencing Plant Location 8) Industrial & Labour Attitude. 9) Safety Requirement
Particularly important for: Nuclear Power plants. Explosive factories.
10) Community Facility (Social Infrastructure): Education, Entertainment, Transport, Accommodation, Hospital.. Etc.
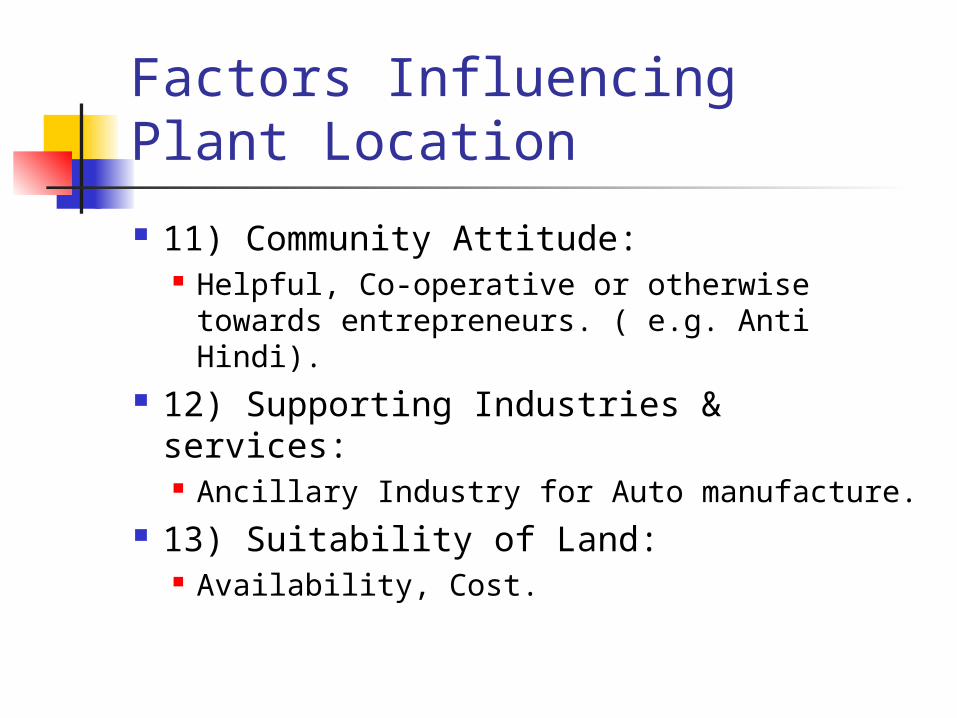
Factors Influencing Plant Location 11) Community Attitude:
Helpful, Co-operative or otherwise towards entrepreneurs. ( e.g. Anti Hindi).
12) Supporting Industries & services: Ancillary Industry for Auto manufacture.
13) Suitability of Land: Availability, Cost.
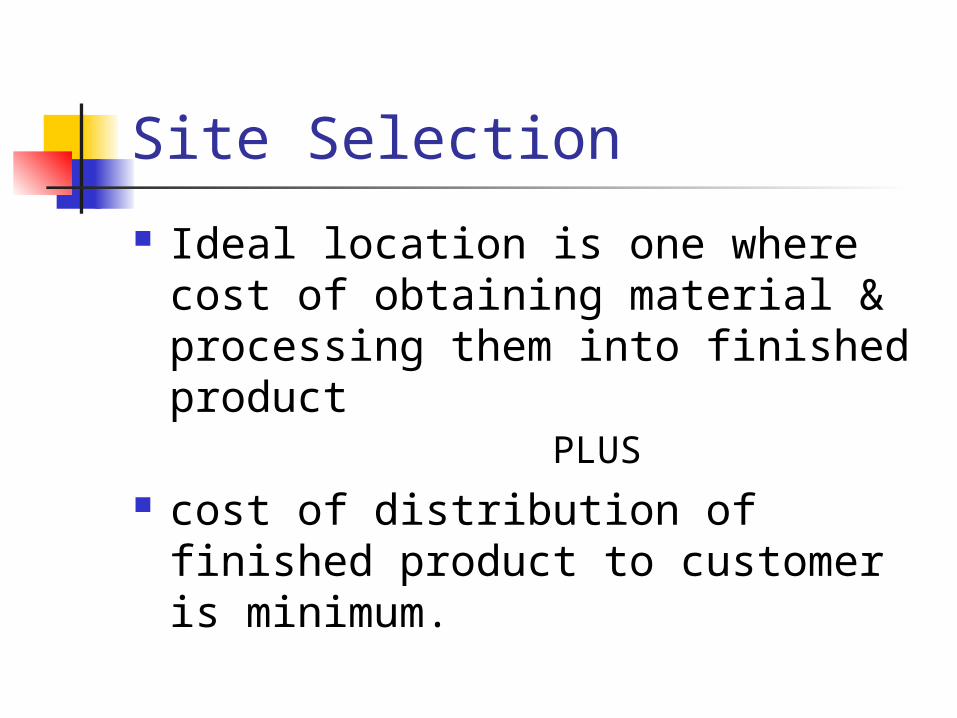
Site Selection Ideal location is one where cost of obtaining material & processing them into finished product PLUS
cost of distribution of finished product to customer is minimum.
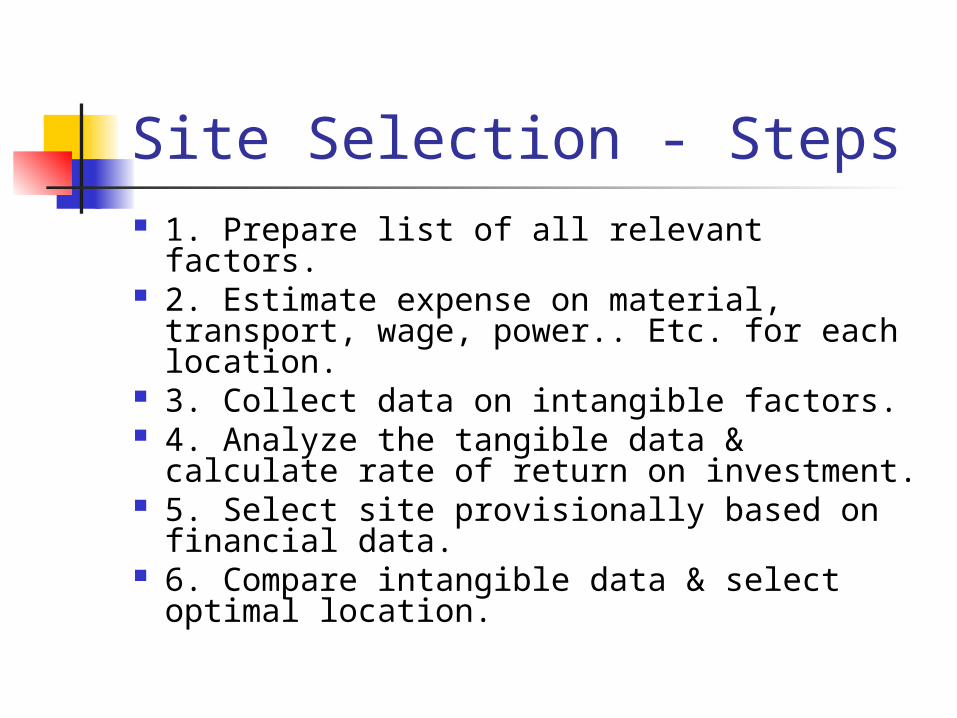
Site Selection - Steps 1. Prepare list of all relevant factors.
2. Estimate expense on material, transport, wage, power.. Etc. for each location.
3. Collect data on intangible factors. 4. Analyze the tangible data & calculate rate of return on investment.
5. Select site provisionally based on financial data.
6. Compare intangible data & select optimal location.
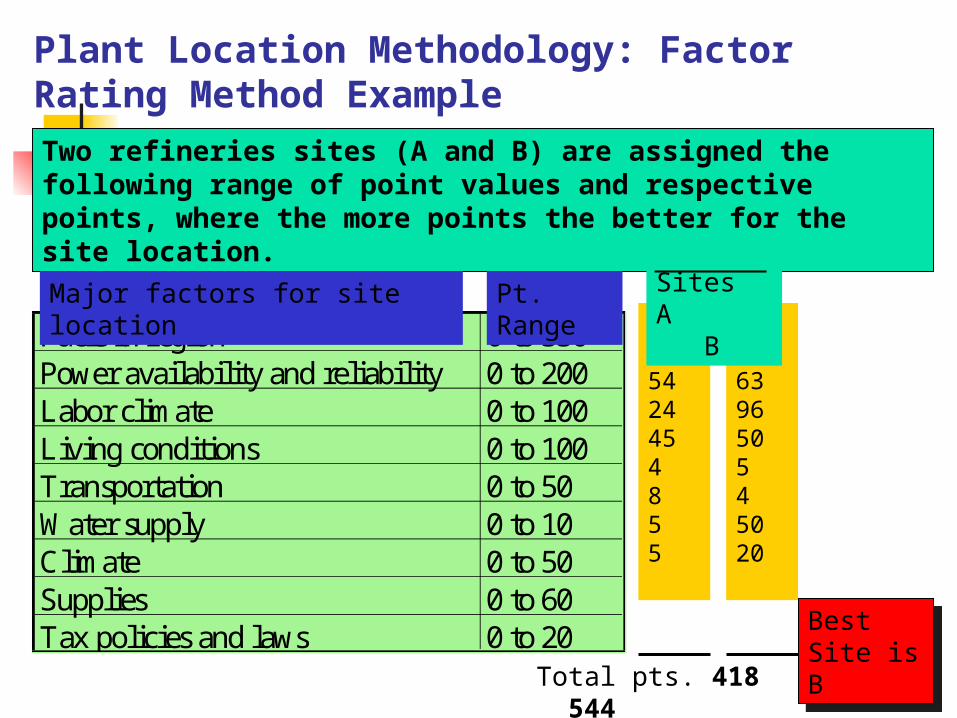
Plant Location Methodology: Factor Rating Method Example
Fuels in region 0 to 330Power availability and reliability 0 to 200Labor clim ate 0 to 100Living conditions 0 to 100Transportation 0 to 50W ater supply 0 to 10Clim ate 0 to 50Supplies 0 to 60Tax policies and laws 0 to 20
Two refineries sites (A and B) are assigned the following range of point values and respective points, where the more points the better for the site location.
1231505424454855
Major factors for site location
Pt. Range 156
100639650545020
SitesA B
Total pts. 418 544
Best Site is B
Plant Location Methodology: Transportation Method of Linear Programming
Transportation method of linear programming seeks to minimize costs of shipping n units to m destinations or its seeks to maximize profit of shipping n units to m destinations
Plant Location Methodology: Centroid Method
The centroid method is used for locating single facilities that considers existing facilities, the distances between them, and the volumes of goods to be shipped between them
This methodology involves formulas used to compute the coordinates of the two-dimensional point that meets the distance and volume criteria stated above
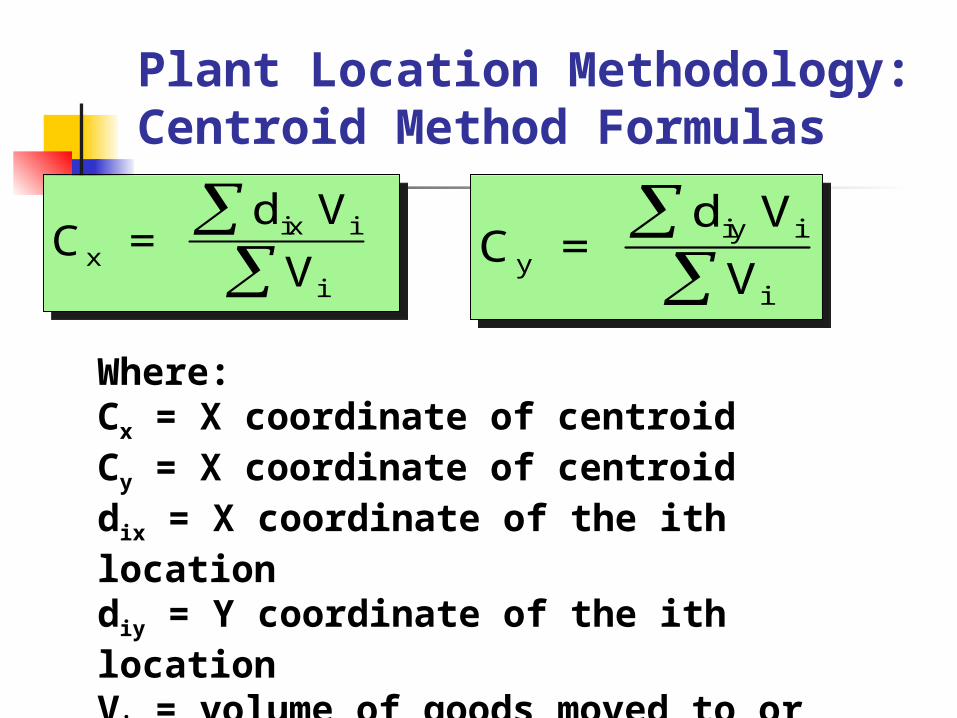
Plant Location Methodology: Centroid Method Formulas
C = d VV xix i
i
Where:Cx = X coordinate of centroidCy = X coordinate of centroiddix = X coordinate of the ith locationdiy = Y coordinate of the ith locationVi = volume of goods moved to or from ith location
C = d VVyiy i
i
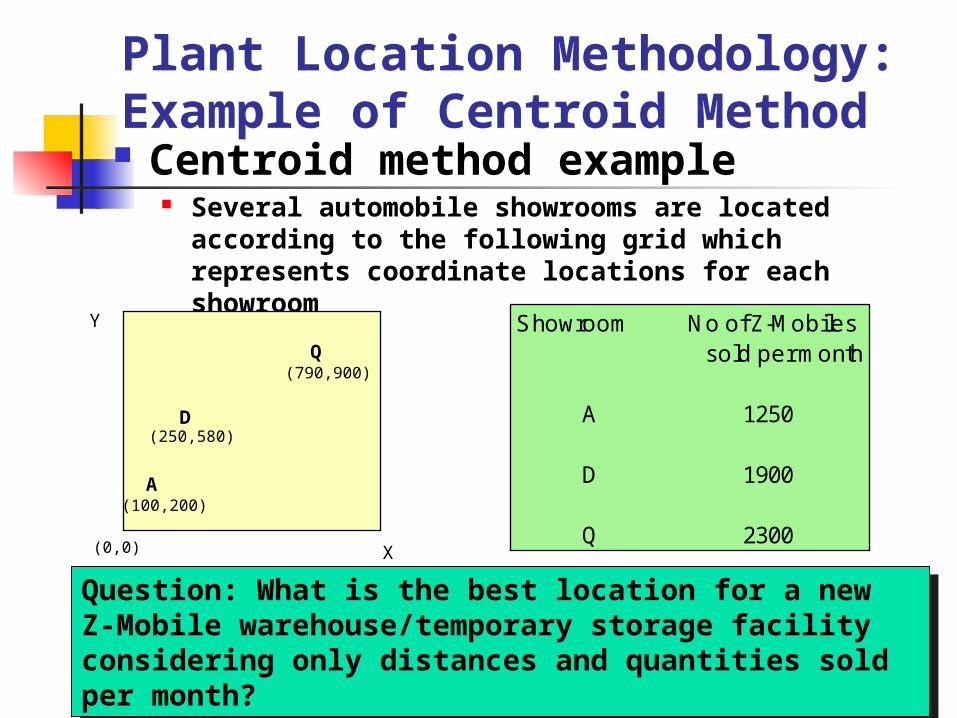
Plant Location Methodology: Example of Centroid Method
Question: What is the best location for a new Z-Mobile warehouse/temporary storage facility considering only distances and quantities sold per month?
Centroid method example Several automobile showrooms are located according to the following grid which represents coordinate locations for each showroom
Showroom N o of Z-M obiles sold per m onth
A 1250
D 1900
Q 2300X
Y
A(100,200)
D(250,580)
Q(790,900)
(0,0)

Plant Location Methodology: Example of Centroid Method (Continued): Determining Existing Facility Coordinates
To begin, you must identify the existing facilities on a two-dimensional plane or grid and determine their coordinates.
X
Y
A(100,200)
D(250,580)
Q(790,900)
(0,0)
You must also have the volume information on the business activity at the existing facilities.
Showroom N o of Z-M obiles sold per m onth
A 1250
D 1900
Q 2300
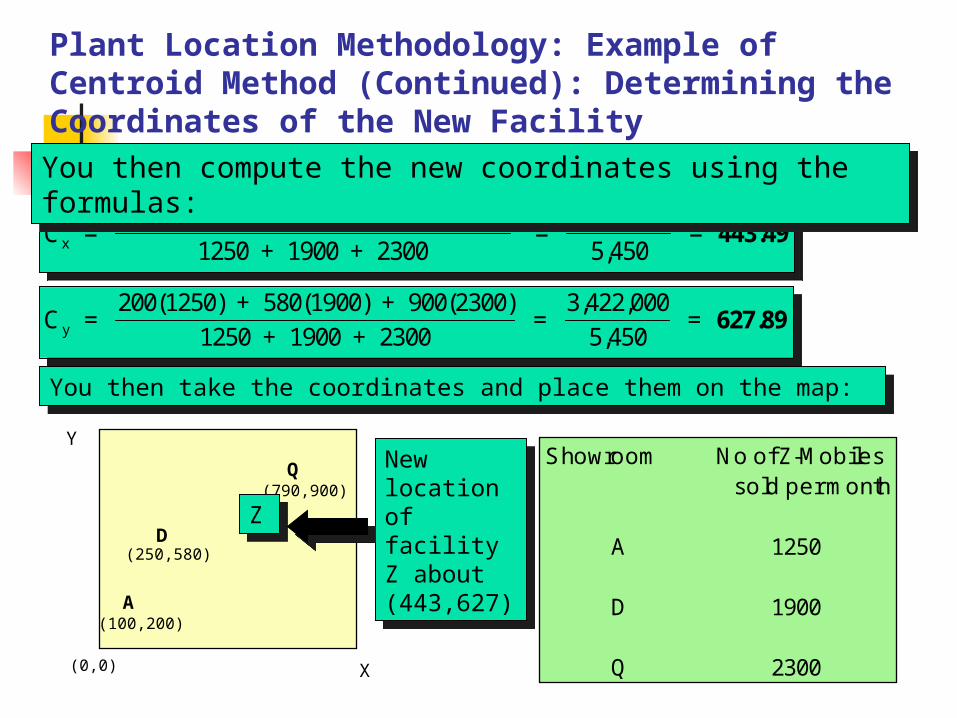
Plant Location Methodology: Example of Centroid Method (Continued): Determining the Coordinates of the New Facility
C = 100(1250) + 250(1900) + 790(2300)1250 + 1900 + 2300 = 2,417,0005,450 = x 443.49
C = 200(1250) + 580(1900) + 900(2300)1250 + 1900 + 2300 = 3,422,0005,450 = y 627.89
Showroom No of Z-M obiles sold per m onth
A 1250
D 1900
Q 2300X
Y
A(100,200)
D(250,580)
Q(790,900)
(0,0)
You then compute the new coordinates using the formulas:
Z
New location of facility Z about (443,627)
You then take the coordinates and place them on the map:
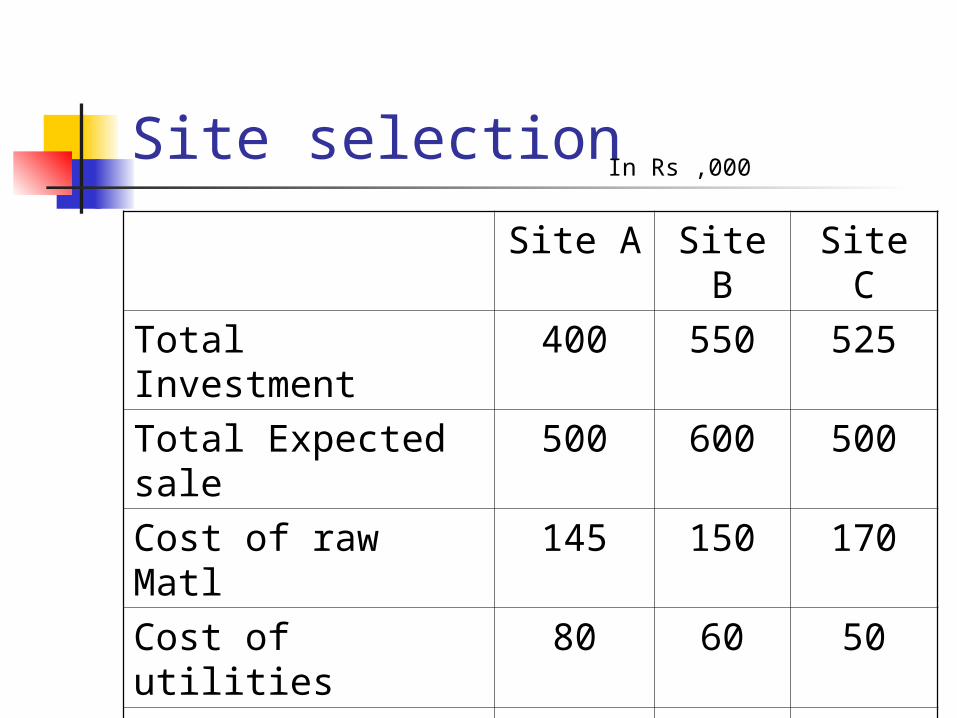
Site selectionSite A Site
BSite C
Total Investment
400 550 525
Total Expected sale
500 600 500
Cost of raw Matl
145 150 170
Cost of utilities
80 60 50
Cost of distribution
75 80 150
Salary & wages 40 50 40
In Rs ,000
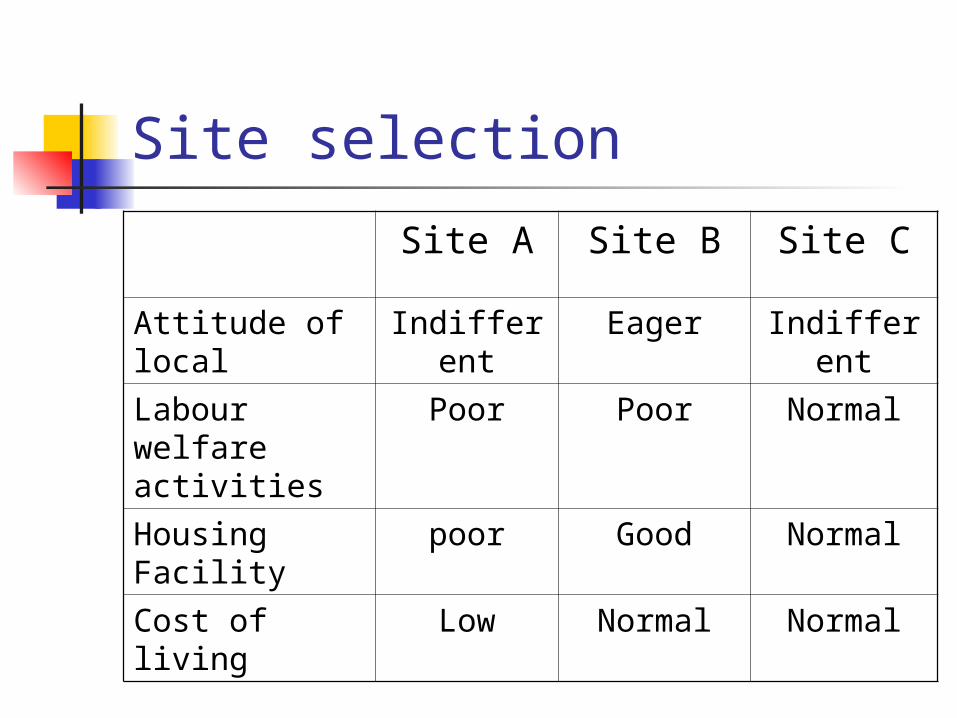
Site selectionSite A Site B Site C
Attitude of local
Indifferent
Eager Indifferent
Labour welfare activities
Poor Poor Normal
Housing Facility
poor Good Normal
Cost of living
Low Normal Normal
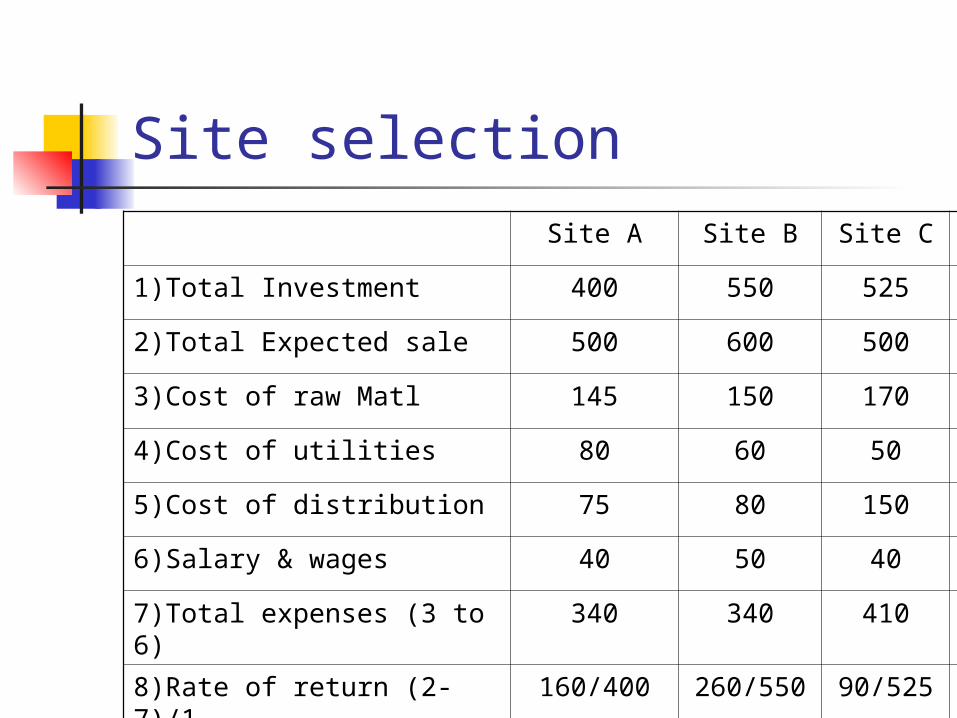
Site selectionSite A Site B Site C
1)Total Investment 400 550 525
2)Total Expected sale 500 600 500
3)Cost of raw Matl 145 150 170
4)Cost of utilities 80 60 50
5)Cost of distribution 75 80 150
6)Salary & wages 40 50 40
7)Total expenses (3 to 6)
340 340 410
8)Rate of return (2-7)/1
160/400 260/550 90/525

Capacity Management
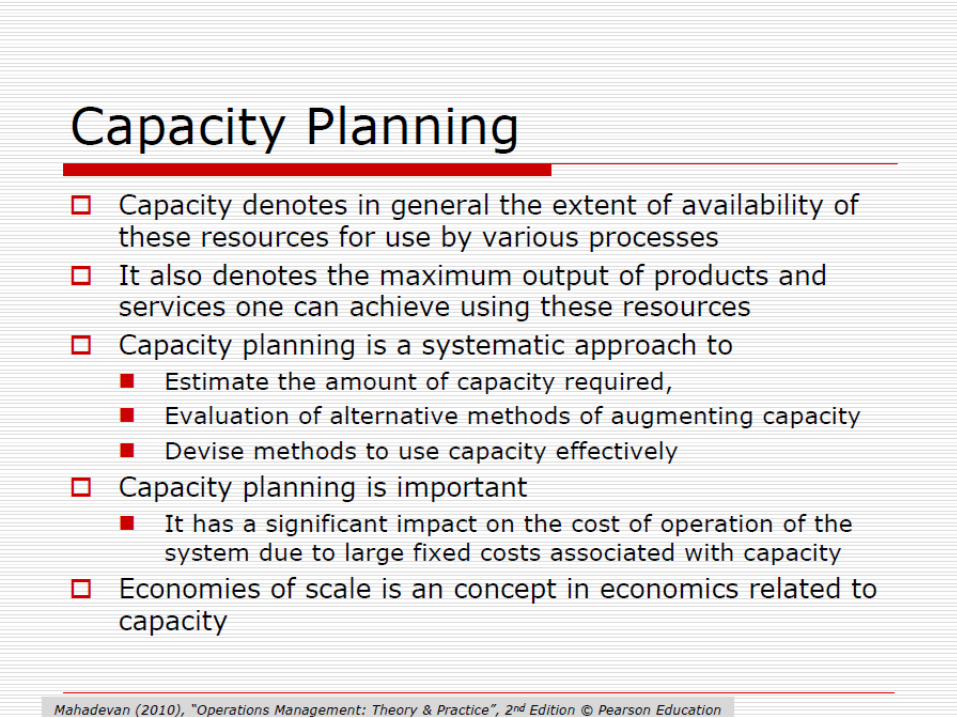
Strategic Capacity Planning Capacity can be defined as the ability to hold, receive, store, or accommodate
Strategic capacity planning is an approach for determining the overall capacity level of capital intensive resources, including facilities, equipment, and overall labor force size
Strategic Capacity Planning Decisions taken with respect to
The amount of capacity that an operating unit has The manner in which the existing capacity is put to use
will lead to loss of productivity & overall reduction in the profitability of the operating system
Examples Excessive delay and waiting in service systems such as a teller counter in a bank
Some factories working with near 100 percent utilization of their resources

Issues in Capacity Planning
Do I have adequate number of resources to meet the demand? If I need to add some extra resources where should I add?
What is the utilization of my resources? If I need to increase the capacity of my system how should I modify the process? Should I add some more resources? What will the cost of my operation?
One can find answers to the above questions by Capacity Planning/Process analysis.
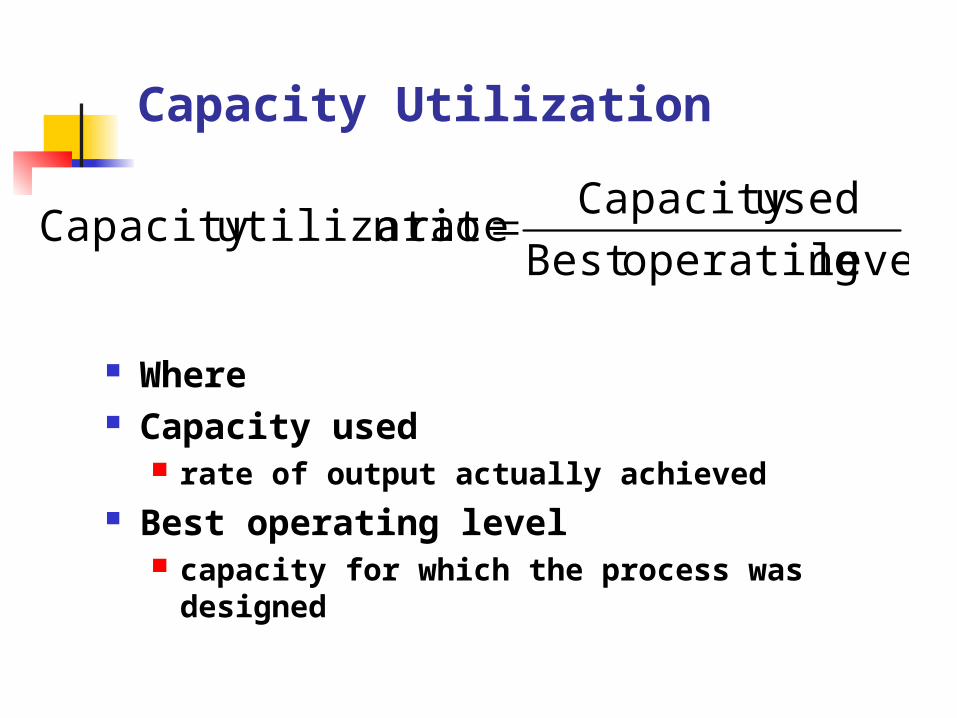
Capacity Utilization
Where Capacity used
rate of output actually achieved Best operating level
capacity for which the process was designed
level operating BestusedCapacity rate nutilizatioCapacity
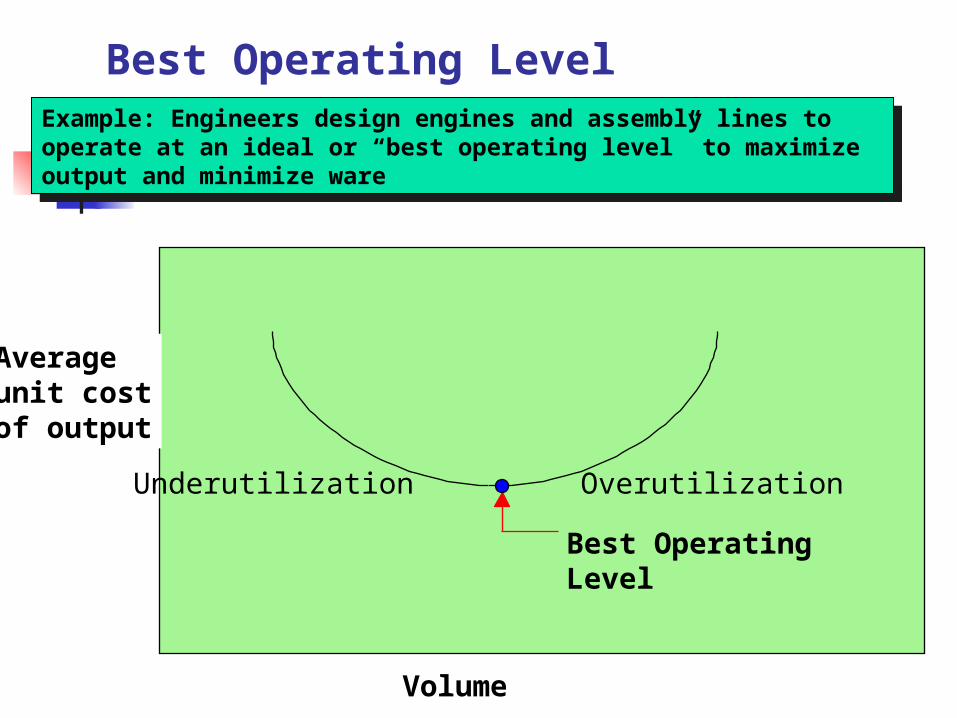
Best Operating LevelExample: Engineers design engines and assembly lines to operate at an ideal or “best operating level” to maximize output and minimize ware
Underutilization
Best OperatingLevel
Averageunit costof output
Volume
Overutilization
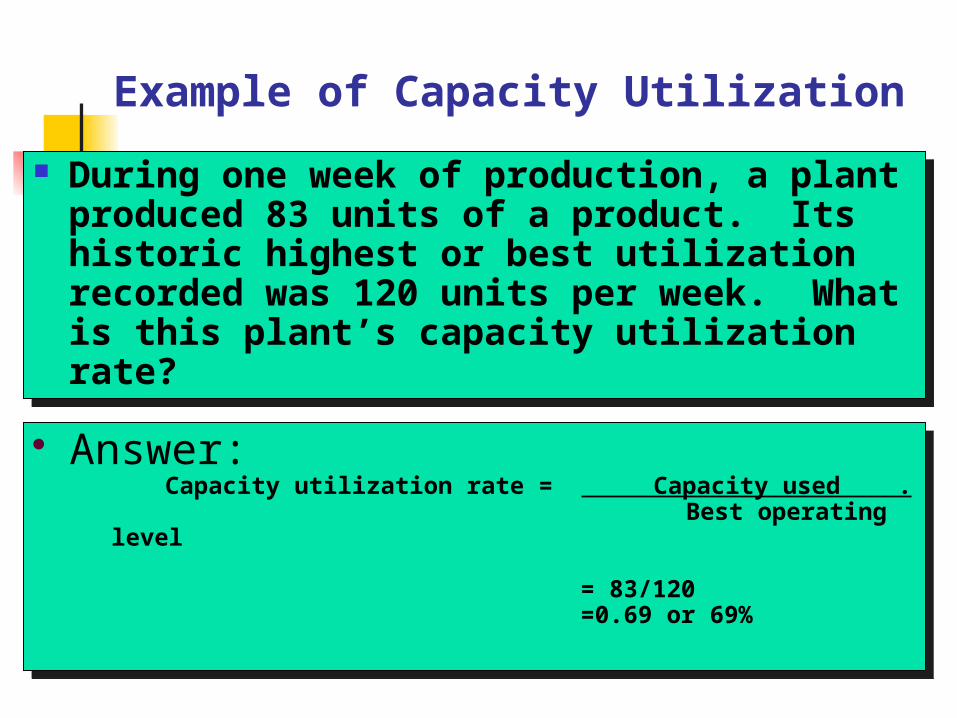
Example of Capacity Utilization During one week of production, a plant produced 83 units of a product. Its historic highest or best utilization recorded was 120 units per week. What is this plant’s capacity utilization rate?
Answer: Capacity utilization rate = Capacity used .
Best operating level
= 83/120 =0.69 or 69%
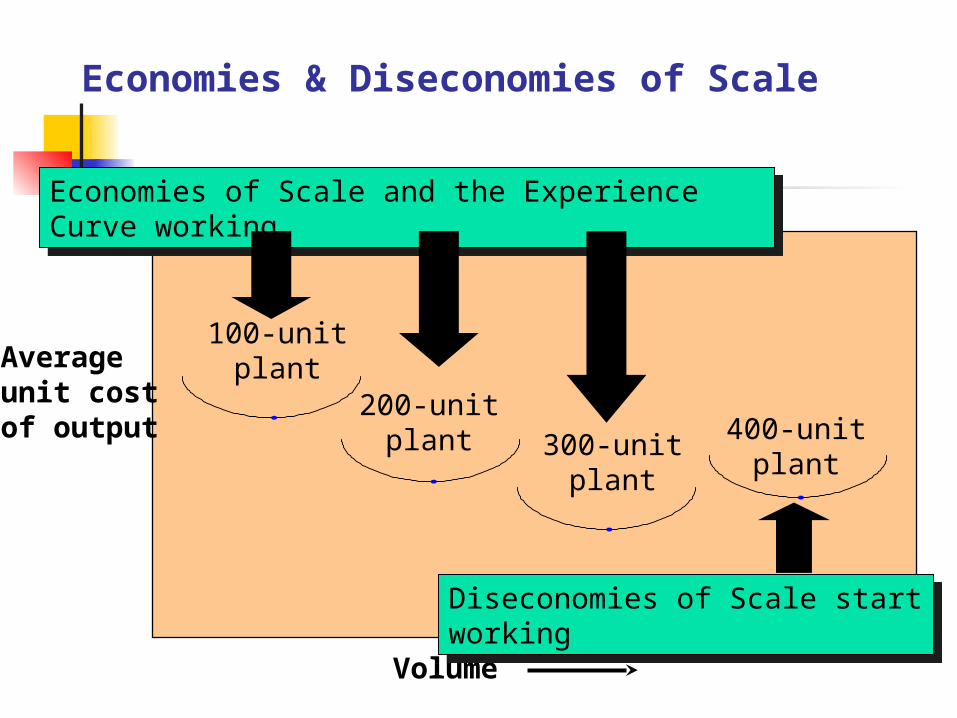
Economies & Diseconomies of Scale
100-unitplant
200-unitplant 300-unit
plant400-unitplant
Volume
Averageunit costof output
Economies of Scale and the Experience Curve working
Diseconomies of Scale start working
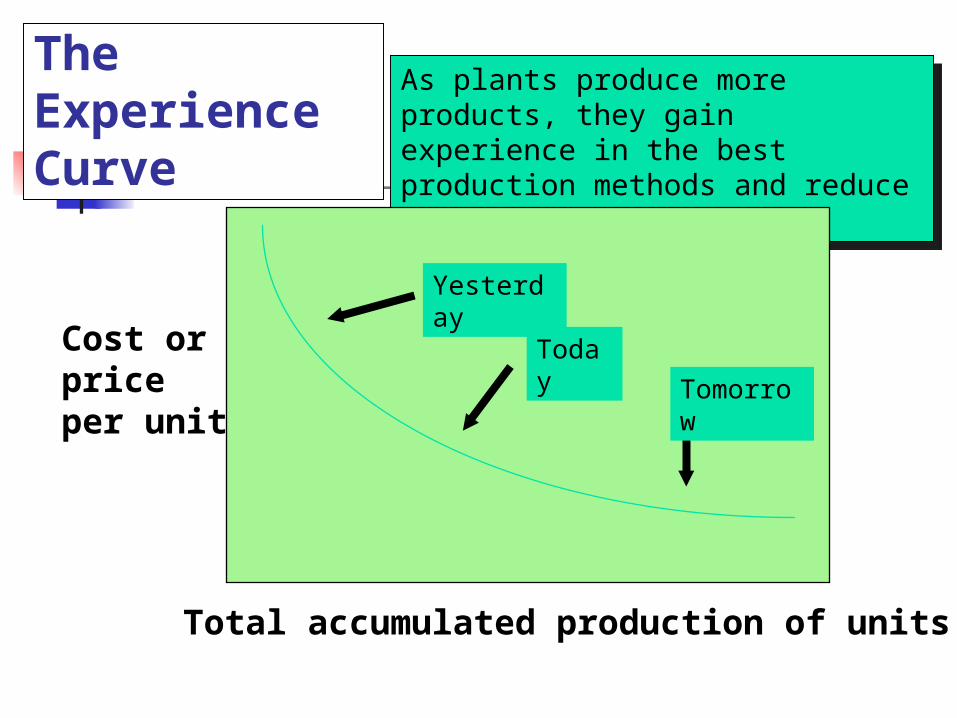
The Experience Curve
As plants produce more products, they gain experience in the best production methods and reduce their costs per unit
Total accumulated production of units
Cost orpriceper unit
Yesterday
Today Tomorro
w
Capacity Focus
The concept of the focused factory holds that production facilities work best when they focus on a fairly limited set of production objectives
Plants Within Plants (PWP) Strategic Business Unit (SBU) Extend focus concept to operating level
Capacity Flexibility
Flexible plants
Flexible processes
Flexible workers
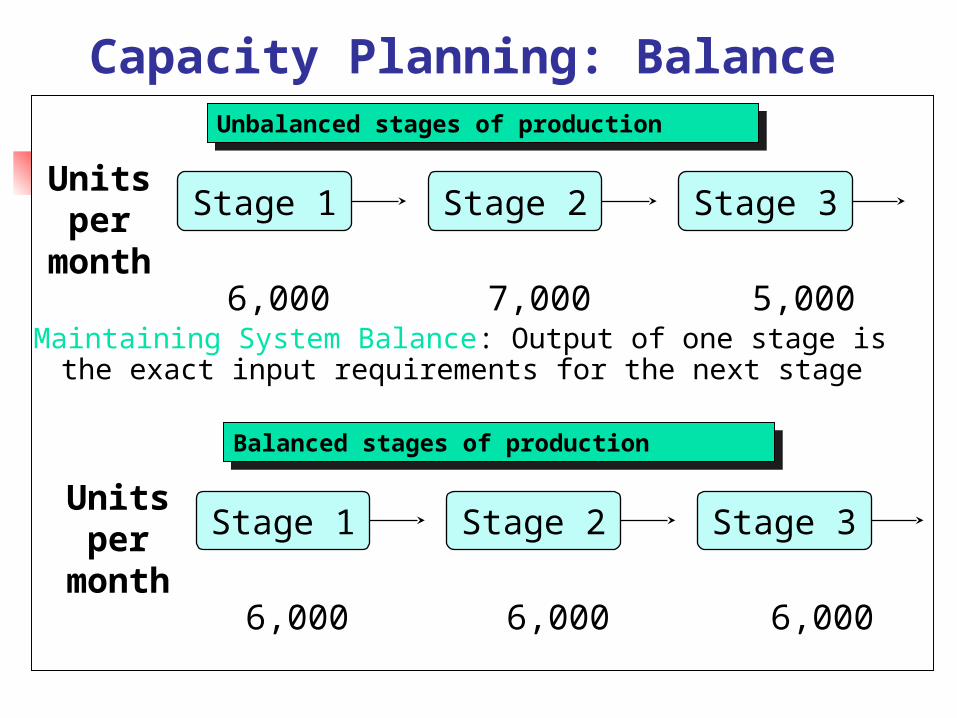
Capacity Planning: Balance
Stage 1 Stage 2 Stage 3Unitspermonth
6,000 7,000 5,000
Unbalanced stages of production
Stage 1 Stage 2 Stage 3Unitsper
month6,000 6,000 6,000
Balanced stages of production
Maintaining System Balance: Output of one stage is the exact input requirements for the next stage
Capacity Planning
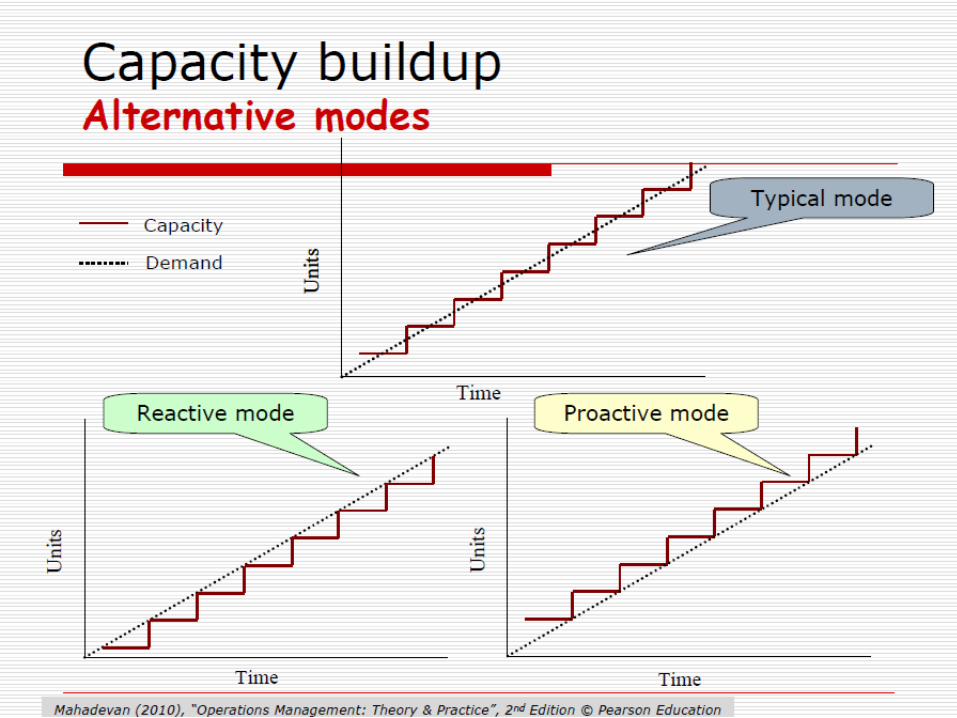
Frequency of Capacity Additions
External Sources of Capacity
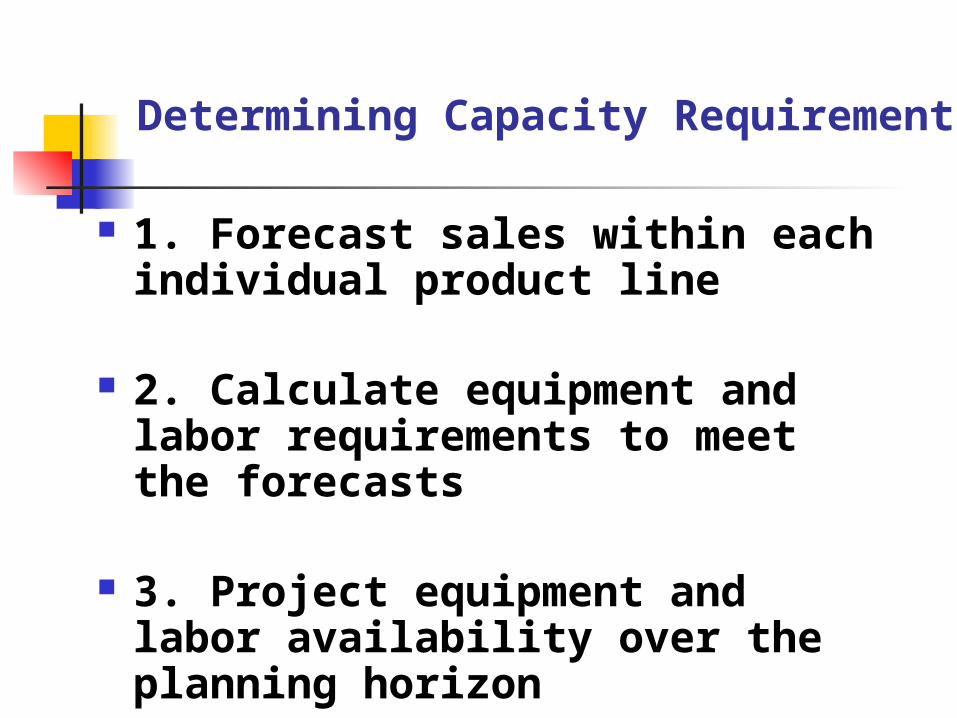
Determining Capacity Requirements
1. Forecast sales within each individual product line
2. Calculate equipment and labor requirements to meet the forecasts
3. Project equipment and labor availability over the planning horizon
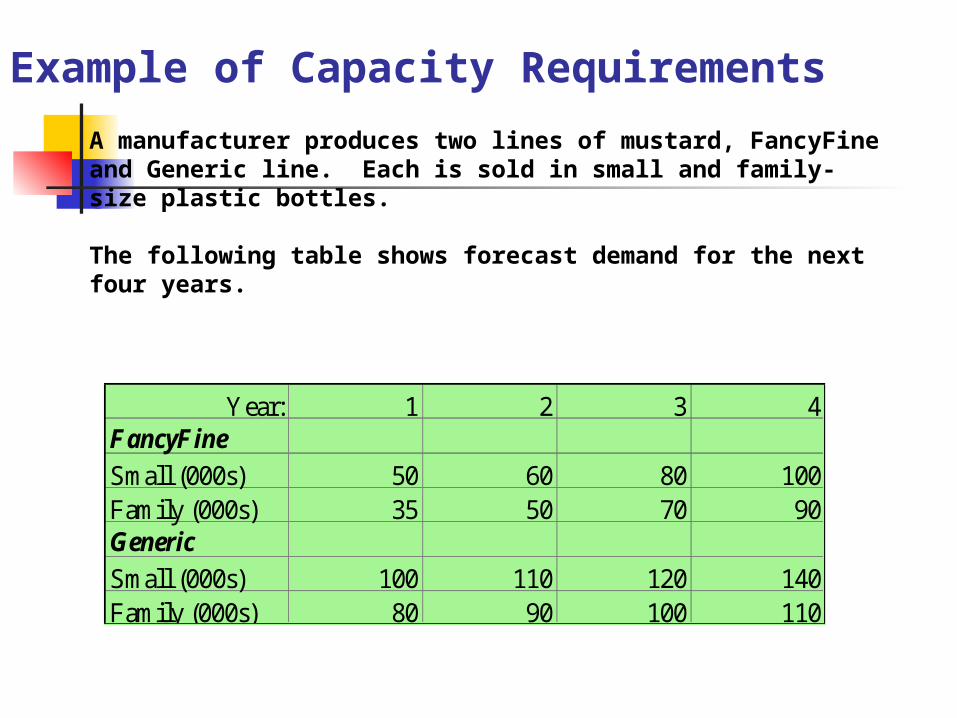
Example of Capacity RequirementsA manufacturer produces two lines of mustard, FancyFine and Generic line. Each is sold in small and family-size plastic bottles.
The following table shows forecast demand for the next four years.
Year: 1 2 3 4F ancyF ineSmall (000s) 50 60 80 100Family (000s) 35 50 70 90GenericSmall (000s) 100 110 120 140Family (000s) 80 90 100 110
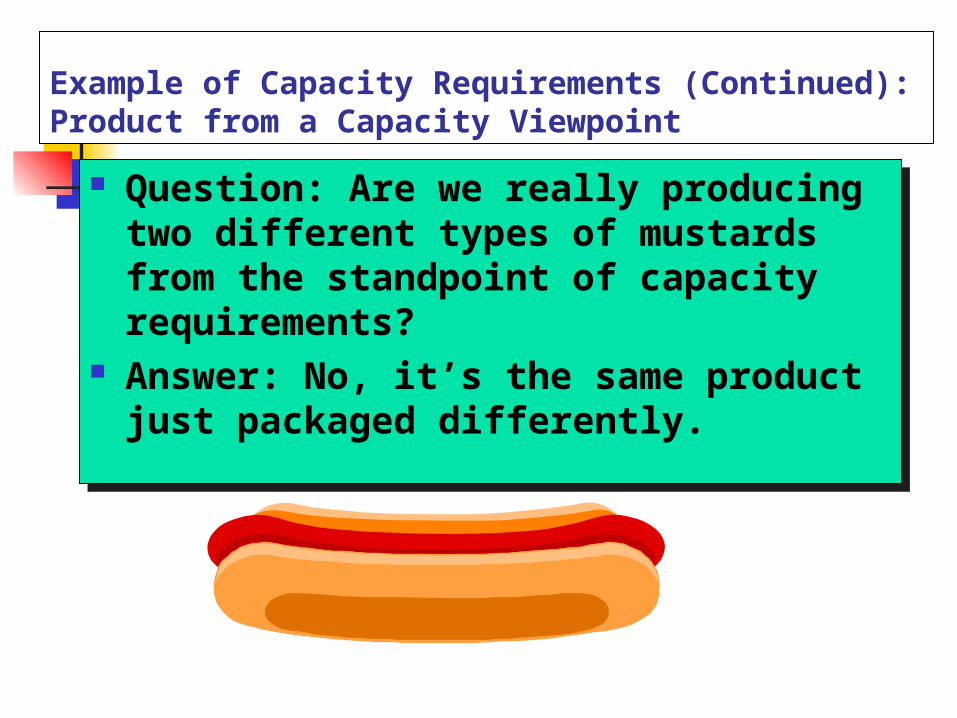
Example of Capacity Requirements (Continued): Product from a Capacity Viewpoint
Question: Are we really producing two different types of mustards from the standpoint of capacity requirements?
Answer: No, it’s the same product just packaged differently.
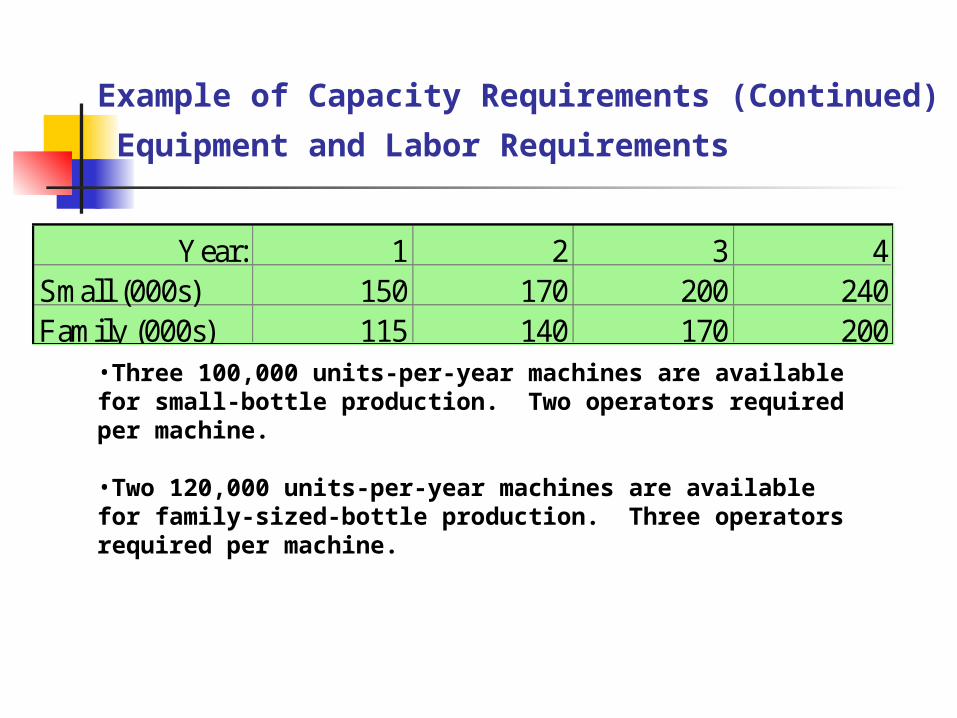
Example of Capacity Requirements (Continued) : Equipment and Labor Requirements
Year: 1 2 3 4Small (000s) 150 170 200 240Family (000s) 115 140 170 200
•Three 100,000 units-per-year machines are available for small-bottle production. Two operators required per machine.
•Two 120,000 units-per-year machines are available for family-sized-bottle production. Three operators required per machine.
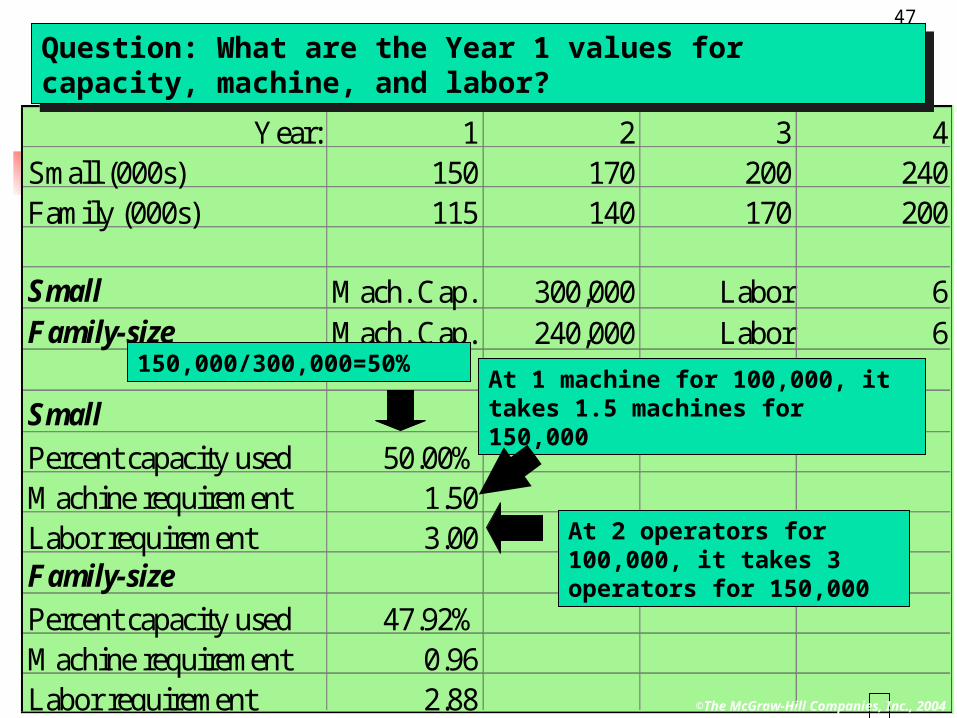
Year: 1 2 3 4Small (000s) 150 170 200 240Family (000s) 115 140 170 200
Small M ach. Cap. 300,000 Labor 6F amily-size M ach. Cap. 240,000 Labor 6
SmallPercent capacity used 50.00%M achine requirement 1.50Labor requirement 3.00F amily-sizePercent capacity used 47.92%M achine requirement 0.96Labor requirement 2.88
Question: What are the Year 1 values for capacity, machine, and labor?
150,000/300,000=50%
At 2 operators for 100,000, it takes 3 operators for 150,000
At 1 machine for 100,000, it takes 1.5 machines for 150,000
©The McGraw-Hill Companies, Inc., 2004
47

Year: 1 2 3 4Small (000s) 150 170 200 240Family (000s) 115 140 170 200
Small M ach. Cap. 300,000 Labor 6F amily-size M ach. Cap. 240,000 Labor 6
SmallPercent capacity used 50.00%M achine requirement 1.50Labor requirement 3.00F amily-sizePercent capacity used 47.92%M achine requirement 0.96Labor requirement 2.88
Question: What are the values for columns 2, 3 and 4 in the table below?
56.67%1.703.40
58.33%1.173.50
66.67%2.004.00
70.83%1.424.25
80.00%2.404.80
83.33%1.675.00
48
©The McGraw-Hill Companies, Inc., 2004
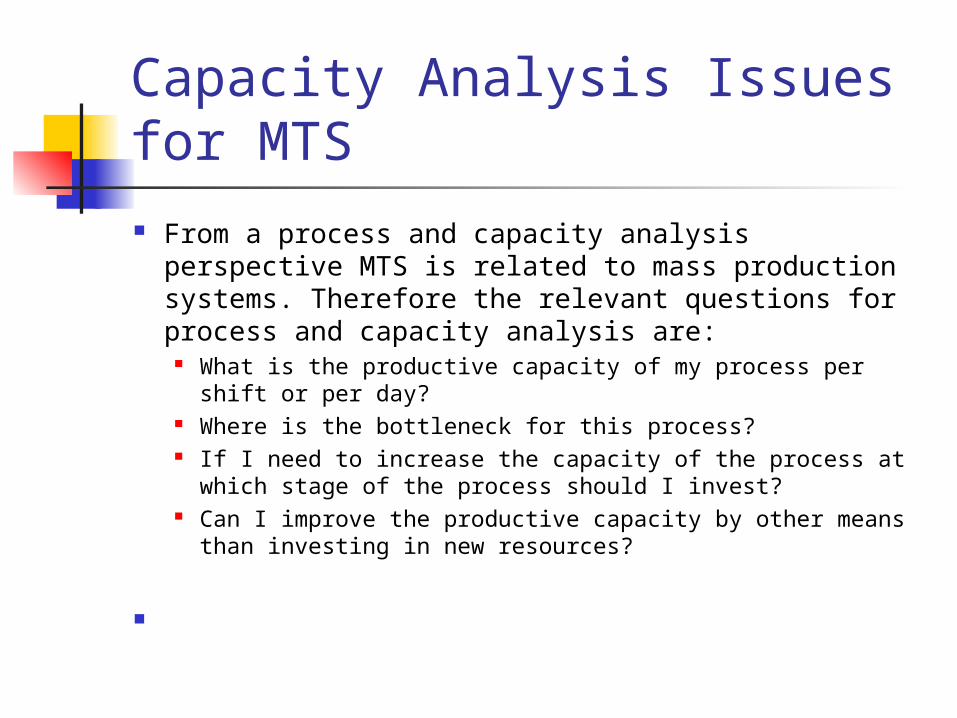
Capacity Analysis Issues for MTS From a process and capacity analysis perspective MTS is related to mass production systems. Therefore the relevant questions for process and capacity analysis are:
What is the productive capacity of my process per shift or per day?
Where is the bottleneck for this process? If I need to increase the capacity of the process at which stage of the process should I invest?
Can I improve the productive capacity by other means than investing in new resources?
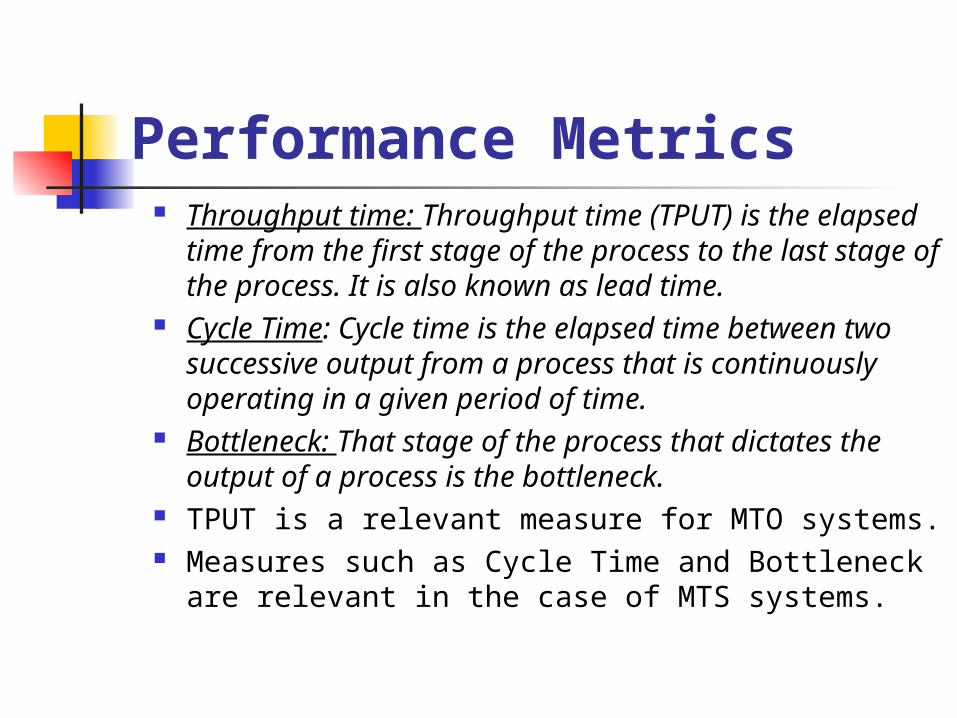
Performance Metrics Throughput time: Throughput time (TPUT) is the elapsed
time from the first stage of the process to the last stage of the process. It is also known as lead time.
Cycle Time: Cycle time is the elapsed time between two successive output from a process that is continuously operating in a given period of time.
Bottleneck: That stage of the process that dictates the output of a process is the bottleneck.
TPUT is a relevant measure for MTO systems. Measures such as Cycle Time and Bottleneck are relevant in the case of MTS systems.
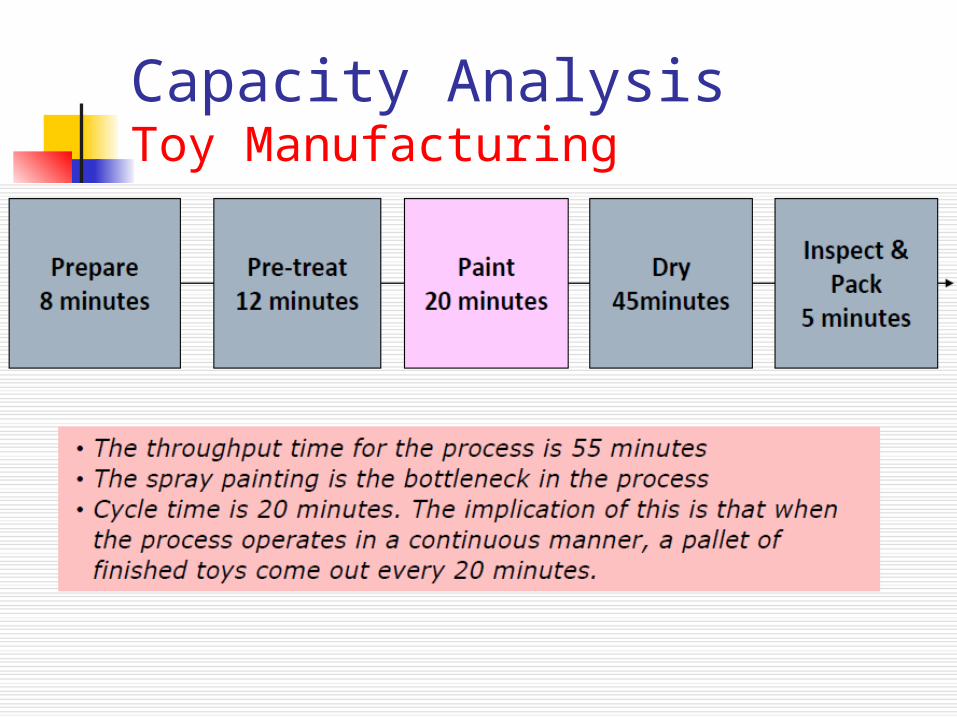
Capacity AnalysisToy Manufacturing

Graphical Analysis of Capacity
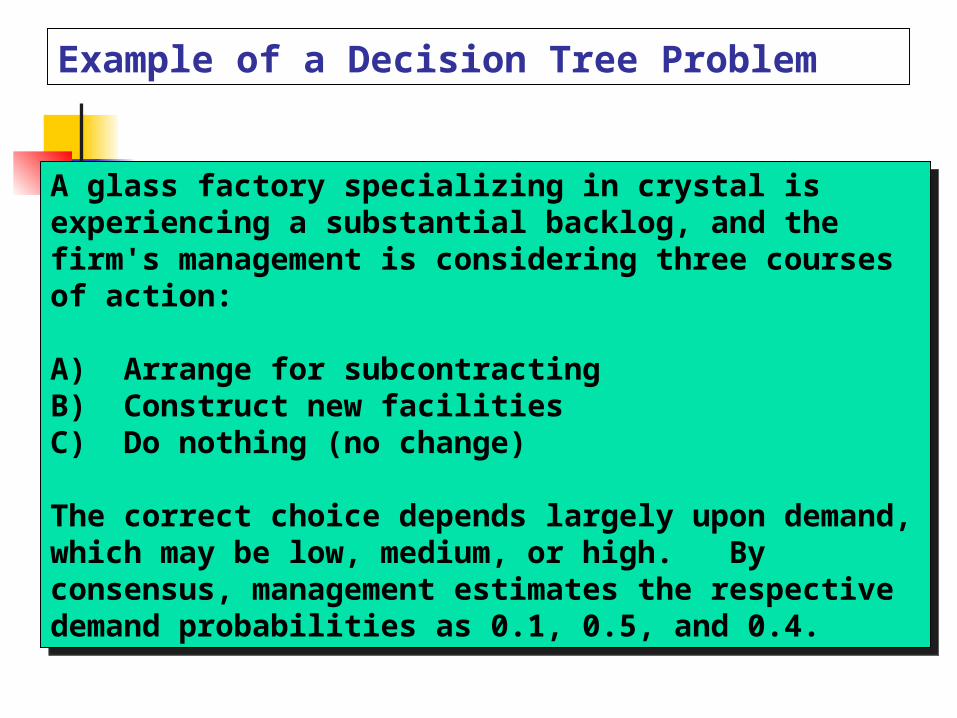
Example of a Decision Tree Problem
A glass factory specializing in crystal is experiencing a substantial backlog, and the firm's management is considering three courses of action:
A) Arrange for subcontractingB) Construct new facilitiesC) Do nothing (no change)
The correct choice depends largely upon demand, which may be low, medium, or high. By consensus, management estimates the respective demand probabilities as 0.1, 0.5, and 0.4.
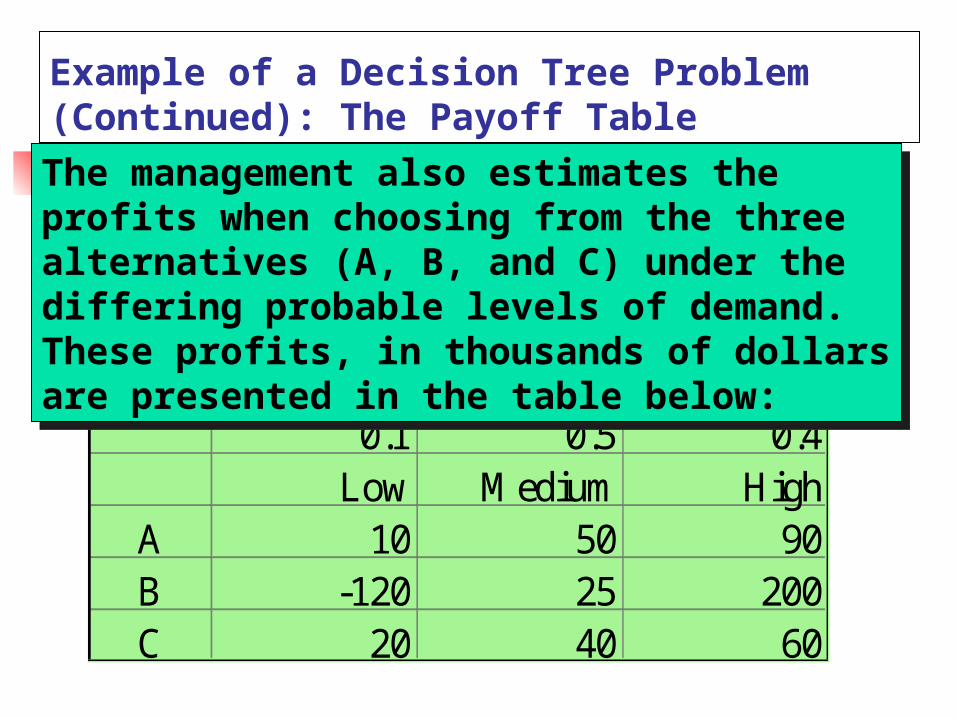
Example of a Decision Tree Problem (Continued): The Payoff Table
0.1 0.5 0.4Low M edium High
A 10 50 90B -120 25 200C 20 40 60
The management also estimates the profits when choosing from the three alternatives (A, B, and C) under the differing probable levels of demand. These profits, in thousands of dollars are presented in the table below:
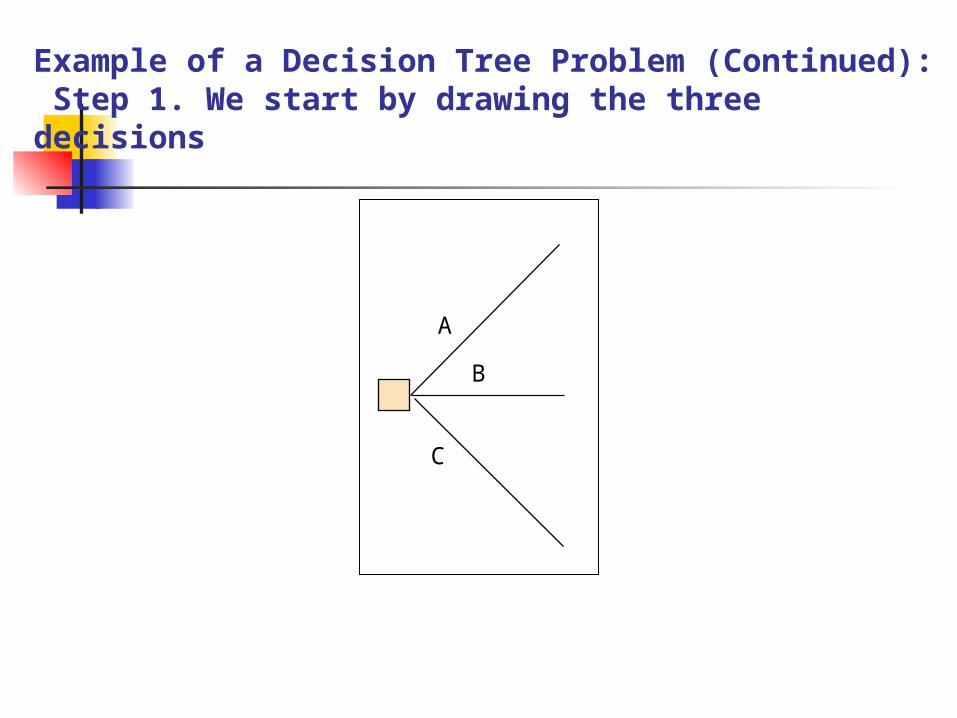
Example of a Decision Tree Problem (Continued): Step 1. We start by drawing the three decisions
AB
C
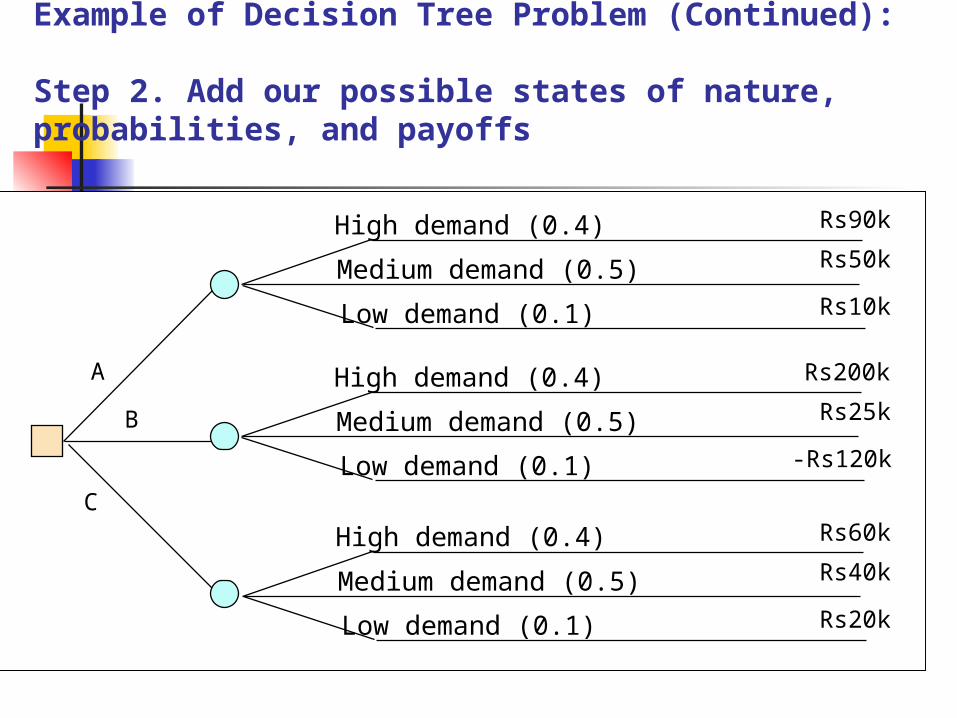
Example of Decision Tree Problem (Continued):
Step 2. Add our possible states of nature, probabilities, and payoffs
AB
C
High demand (0.4)Medium demand (0.5)Low demand (0.1)
Rs90kRs50kRs10k
High demand (0.4)Medium demand (0.5)Low demand (0.1)
Rs200kRs25k
-Rs120k
High demand (0.4)Medium demand (0.5)Low demand (0.1)
Rs60kRs40kRs20k
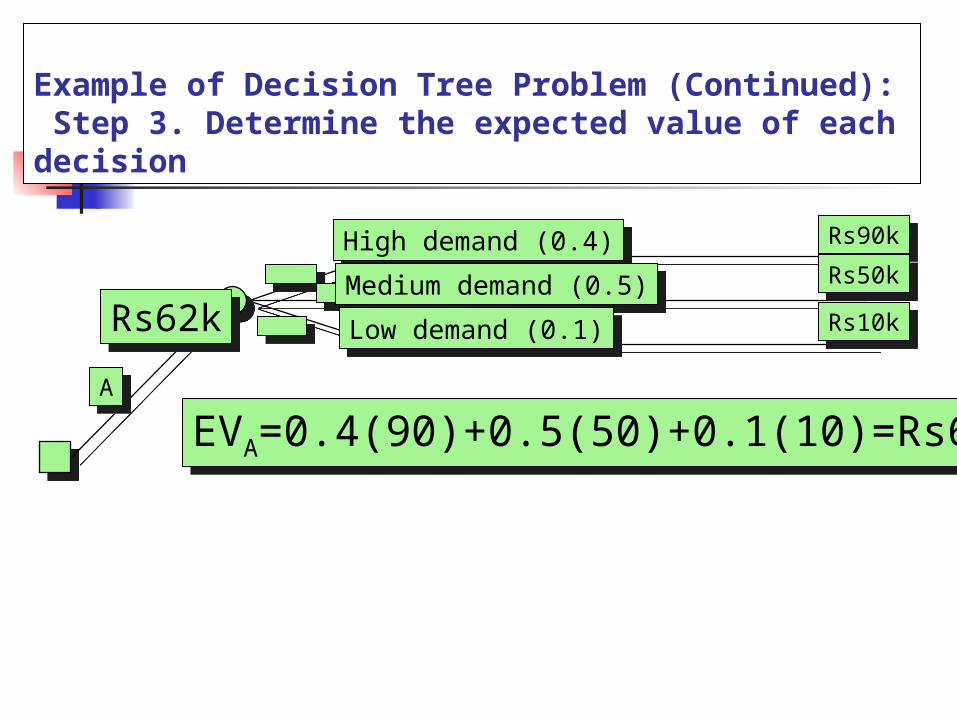
Example of Decision Tree Problem (Continued): Step 3. Determine the expected value of each decision
High demand (0.4)Medium demand (0.5)Low demand (0.1)
A
Rs90kRs50kRs10k
EVA=0.4(90)+0.5(50)+0.1(10)=Rs62k
Rs62k
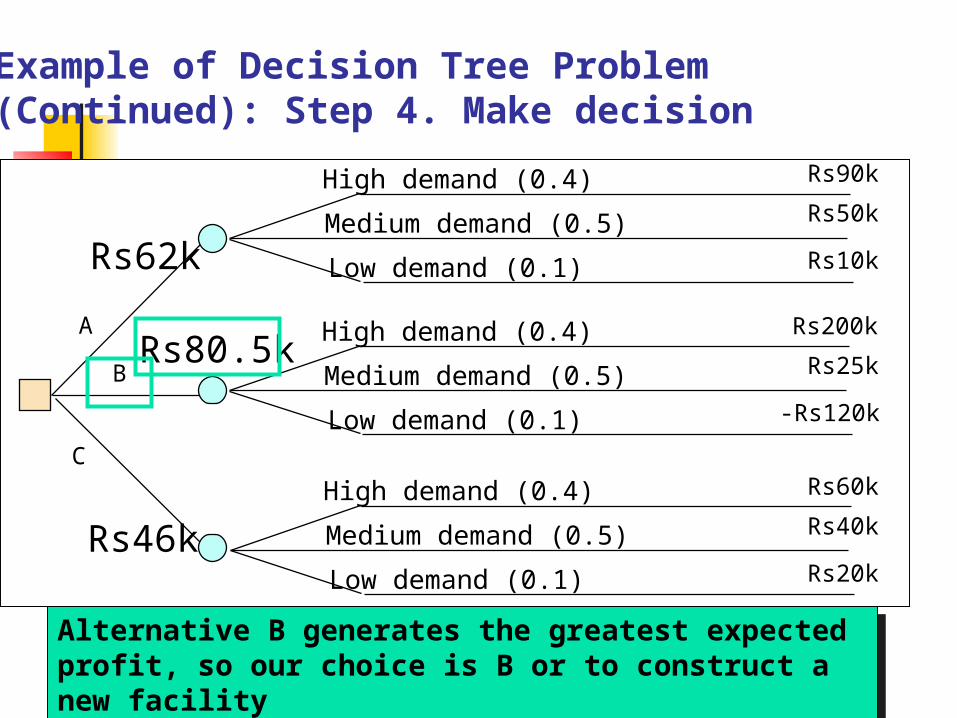
Example of Decision Tree Problem (Continued): Step 4. Make decision
High demand (0.4)Medium demand (0.5)Low demand (0.1)
High demand (0.4)Medium demand (0.5)Low demand (0.1)
AB
CHigh demand (0.4)Medium demand (0.5)Low demand (0.1)
Rs90kRs50kRs10k
Rs200kRs25k
-Rs120k
Rs60kRs40kRs20k
Rs62k
Rs80.5k
Rs46k
Alternative B generates the greatest expected profit, so our choice is B or to construct a new facility
Planning Service Capacity vs. Manufacturing Capacity
Time: Goods can not be stored for later use and capacity must be available to provide a service when it is needed
Location: Service goods must be at the customer demand point and capacity must be located near the customer
Volatility of Demand: Much greater than in manufacturing
Capacity Utilization & Service Quality
Best operating point is near 70% of capacity
From 70% to 100% of service capacity, what do you think happens to service quality?
Capacity PlanningGeneric Premises Three generic planning premises are in use in operations management
Make-to-Stock (MTS): more amenable for systems with fewer product varieties and high production volume as in the case of continuous and streamlined flow systems
Assemble-to-order (ATO): useful for intermittent flow systems catering to the mid-volume mid- variety situations
Make-to-order (MTO): organizations typically belong to manufacturer of high product variety (jumbled flow process systems) use this planning process

Improving a Banking System Problem Context
Consider a branch of the State Bank of India in a centrally located place that has observed an increase in the waiting time of the customers
We want to understand the impact of alternative operational choices to address this problem:
Adding two more counters Increasing the service rate by deploying some technology choices Adding some waiting spaces and Resorting to other mechanisms of reducing the demand placed on the servers
In order to analyze these alternatives we need to build a model of the system and study its behavior with respect to key performance metrics such as waiting time
Copyright © 2022 FDOKUMEN