Carbon Emission Based Optimisation Approach for the Facility Location Problem
12
Carbon Emission Based Optimisation Approach for the Facility Location Problem Sinem BÜYÜKSAATÇI and Şakir ESNAF Department of Industrial Engineering, Istanbul University, Faculty of Engineering, Avcılar / İstanbul, Turkey E-mail: [email protected] Abstract: In today’s global competitive economy, companies should create value for customer and create value for environment to protect their competitive strengths and/or obtain competitive advantages. Creation of value depends on developing strategic approaches like determining carbon emission level to consider environmental effects. Furthermore, the financial incentives and governmental pressures on companies to reduce their emissions force companies to change and optimize their internal and external processes in order to reduce their greenhouse gas emissions. In this paper, a carbon emission based facility location problem is discussed. A new hyrid method that aims to reduce the amount of CO2 emission in distribution network is presented. Fuzzy C-Means and Gustafson-Kessel algorithms are used to perform clustering analyses. This is followed by the selection of appropriate facility location through the minimization of CO2 emission levels resulting from transportation activities between the facilities and customers by using the emission based center of gravity method which is a new method developed from classical center of gravity method Keywords: Green logistics, carbon emission, multiple facility location problems, fuzzy clustering, center of gravity. Introduction Parallel to the economic and technological developments, the destruction and deterioration of environmental assets along with the inability of developed societies to find solutions to the global problems such as famine, starvation, greenhouse effects etc. and the uncertainty with respect to the future of human kind (McMichael et al., 2006) has increased the awareness on environmental issues particularly in the second half of the 20 th century while bringing up the concept of environmental management. In spite of the legislative reforms, changes in customer demands and inline with the international certification standards, various companies operating in different sectors have started furnishing services and manufacturing products as well as providing after-sales customer care from an environmentally conscious standpoint. In this regard, they started focusing on creating ecological assets taking up a sense of social responsibility and recently green policies have become more popular than ever. Within the literature environmental consciousness as a general approach has become the center of attention for many disciplines, while modern logistics and supply chain management disciplines also started taking environmental issues into account. The impacts of environmental issues on several logistics decisions such as facility, warehouse and distribution centers locations or raw material sources determination, distribution types and network selection, are especially evident (Wu and Dunn, 1995). The facility location problem has strategic significance for logistics network design (Harris et al., 2009). The term “location problem” depends on the modeling, formulation and solution of a group of problems related to locating facilities in a given space. Until today the models for facility location were used in various applications. The difference between these models emanated from the type of function, distance measurement value used, the number and the size of the sites to be established and many other variables that required decision-making (Farahani and Hekmatfar, 2009). TOJSAT : The Online Journal of Science and Technology- January 2014, Volume 4, Issue 1 9
Transcript of Carbon Emission Based Optimisation Approach for the Facility Location Problem

Carbon Emission Based Optimisation Approach for the Facility Location Problem
Sinem BÜYÜKSAATÇI and Şakir ESNAF
Department of Industrial Engineering, Istanbul University, Faculty of Engineering, Avcılar / İstanbul, Turkey
E-mail: [email protected]
Abstract: In today’s global competitive economy, companies should create value for customer and create value for environment to protect their competitive strengths and/or obtain competitive advantages. Creation of value depends on developing strategic approaches like determining carbon emission level to consider environmental effects. Furthermore, the financial incentives and governmental pressures on companies to reduce their emissions force companies to change and optimize their internal and external processes in order to reduce their greenhouse gas emissions. In this paper, a carbon emission based facility location problem is discussed. A new hyrid method that aims to reduce the amount of CO2 emission in distribution network is presented. Fuzzy C-Means and Gustafson-Kessel algorithms are used to perform clustering analyses. This is followed by the selection of appropriate facility location through the minimization of CO2 emission levels resulting from transportation activities between the facilities and customers by using the emission based center of gravity method which is a new method developed from classical center of gravity method
Keywords: Green logistics, carbon emission, multiple facility location problems, fuzzy clustering, center of gravity.
Introduction
Parallel to the economic and technological developments, the destruction and deterioration of environmental assets along with the inability of developed societies to find solutions to the global problems such as famine, starvation, greenhouse effects etc. and the uncertainty with respect to the future of human kind (McMichael et al., 2006) has increased the awareness on environmental issues particularly in the second half of the 20th century while bringing up the concept of environmental management. In spite of the legislative reforms, changes in customer demands and inline with the international certification standards, various companies operating in different sectors have started furnishing services and manufacturing products as well as providing after-sales customer care from an environmentally conscious standpoint. In this regard, they started focusing on creating ecological assets taking up a sense of social responsibility and recently green policies have become more popular than ever.
Within the literature environmental consciousness as a general approach has become the center of attention for many disciplines, while modern logistics and supply chain management disciplines also started taking environmental issues into account. The impacts of environmental issues on several logistics decisions such as facility, warehouse and distribution centers locations or raw material sources determination, distribution types and network selection, are especially evident (Wu and Dunn, 1995).
The facility location problem has strategic significance for logistics network design (Harris et al., 2009). The term “location problem” depends on the modeling, formulation and solution of a group of problems related to locating facilities in a given space. Until today the models for facility location were used in various applications. The difference between these models emanated from the type of function, distance measurement value used, the number and the size of the sites to be established and many other variables that required decision-making (Farahani and Hekmatfar, 2009).
TOJSAT : The Online Journal of Science and Technology- January 2014, Volume 4, Issue 1
9
In general, it is possible to classify the facility location models according to the structure of the physical region as continuous, discrete and network-based models. In continuous models, the facilities can be located at any point within the multidimensional space while in discrete models; the location of the facility is selected from the pre-determined alternative location groups (Sule, 2001).
With regards to facility location problem, the type of the objective function is usually the cost minimization function. In the cost function, the total cost is expressed as the sum of all distribution costs and fixed costs. In addition to this, other objects used within the facility location problems include: institutional expenses, total annual transaction costs, average time/distance covered, minimization of variables such as the number of facilities located and maximization of facilities that are provided with services and responses.
Recently the environmental and social objectives that rely on issues such as costs related to energy and structure as well as pollution, noise, quality of life, fossil fuel crisis have all become significant for facility location problems (Farahani et al., 2010). Specifically the decisions related to the determination of the optimum number and location of services in the process of redesigning the logistic networks and these are directly related to the impacts of greenhouse effects are taken into account when realizing environmental objectives (Harris et al., 2011). However, the question of formulizing an critical environmental issue such as the carbon emission that comes up as a result of logistic activities is still among the challenges frequently discussed. The optimization methods that include carbon emission are increasing gradually in recent years.
Yurimoto and Katayama (2002) developed an algorithm for obtaining the optimal number and locations of public distribution centers in Tokyo with the aim of reducing the amount of truck CO2 emissions while minimizing logistics costs. Ramudhin et al. (2008) introduced a mixed integer mathematical model formulation for the “Carbon-Market Sensitive - Green Supply Chain Network Design” problem and they provided decision makers to understand the trade-offs between total logistics costs and the impact of greenhouse gases reduction. Li et al. (2008) propose a bi-objective mathematical programming methodology, which aims to maximize the profits of the supply chain and to minimize the carbon emission of the supply chain while optimizing distribution center locations. They investigate the impact of crude oil price changes on location decisions. Pan et al. (2009) explored the effect of merging supply chains on reducing CO2 emissions from transport with two possible modes, road and rail and showed that the logistical mutualisation is an efficient approach to reducing CO2 emissions. Diabat and Simchi-Levi (2009) presented a novel optimization model for green supply chain management that integrates a mixed-integer programming model with carbon emission considerations. Govindan and Kannan (2010) developed a bi-objective model to minimize the cost function and energy consumption for a reverse logistic network design. Iakovou et al. (2010) provided a strategic decision methodological framework that identifies the optimal mixture of offshoring/nearshoring policy, while capturing quantitatively free trade and sustainability related parameters. Xiaoli et al. (2010) suggested a model of distribution centers location decision based on minimizing the carbon emissions of logistics. Based on this model, genetic algorithm was used to optimize the locations of distribution centers. Paksoy et al. (2011) proposed a multi objective mathematical model to solve the closed-loop supply chain problem for the green impacts and focused to minimize total CO2 emissions. Wang et al. (2011) introduced a green supply chain network design model, which consider of environmental element that includes environmental level of the facility and environmental influence in the handling and transportation process. Bouzembrak et al. (2011) considered two objective functions with their multiobjective optimization model, which were total cost and total CO2 emission in all the supply chain. Santibanez-Gonzalez et al. (2011) introduced mixed-integer 0-1 model for solving sustainable supply chain network design problem in public sector. The model involved inputs for reducing the greenhouse gas emissions produced by the transportation and the operation of the facilities and solved using a genetic algorithm. Shaw et al. (2012) proposed a model that embodied carbon footprint of the raw material and trade credit amount over the purchased item in the design phase of the sustainable supply chain. They used multi-objective goal programming to optimize total cost, total direct carbon emission, total indirect emission in a supply chain by considering different types of trucks having different emission level.
This study examines the question of facility location by applying it in the distribution network of a company in Turkey with a view to minimization of CO2 emission levels and therefore looks into the new green logistics approach in Turkey. The remainder of the study is organized as follows: In the next section, the methods used in the study are discussed analyses. Fuzzy C-Means and Gustafson-Kessel algorithms are used to perform clustering analyses. This is followed by the selection of appropriate facility location through the minimization of CO2 emission levels resulting from transportation activities among the facilities and customers by using the proposed emission
TOJSAT : The Online Journal of Science and Technology- January 2014, Volume 4, Issue 1
10
based center of gravity method. Results and detailed discussion of the case study are presented in the third and fourth parts respectively. Finally in the last section, the conclusions are thoroughly discussed.
Materials and Method
This study considers the facility location problem as part of the supply chain management cases and takes up a different perspective to develop a new optimization method based on carbon emission.
This new method, which does not yet exist within the literature, aims to minimize the CO2 emission levels which come out in the supply chain distribution networks by pairing the demand points with facilities. The supply chain that is considered as part of this study includes the assignment of several demand points with two or more facilities in a geographical region. During the distribution activities among these facilities and demand points, CO2
emission emanates. The facility locations are determined in accordance with the objective of minimizing this CO2
emission. This method is developed as two steps and during the first step the demand points are clustered into the pre-
determined number of groups depending on their geographic coordinates through the fuzzy clustering analysis methods. Following this, in the second step each group is considered as a single facility location problem within itself and the optimum facility location is selected by carbon emission based center of gravity method, which is presented here first. Fuzzy Clustering Analysis
Organizing objects among themselves according to their similarities is called clustering analysis. These analyses form clusters of those objects that similar to each other more than the others (Jain et al., 1999).
The clusters formed within clustering analyses can be regarded as a subset of the data group. The clustering methods can be determined as crisp or fuzzy depending upon the data assigns to these subsets.
Fuzzy clustering analysis is an unsupervised method and allows the clustering of data points according to their membership degrees between 0 and 1. This provides the flexibility for data points to be expressed as belonging to more than one cluster. Thus these membership degrees would lead to better grading of the details of the data model (Döring et al., 2006). Fuzzy C-Means (FCM) Algorithm
Fuzzy C-Means clustering algorithm is the most common partitioned clustering technique and is founded upon the minimization of an end function named as C-Means function (Bezdek and Dunn, 1975). This algorithm was first proposed by Dunn in 1973 and further developed by Bezdek in 1981 (Höppner et al., 1999).
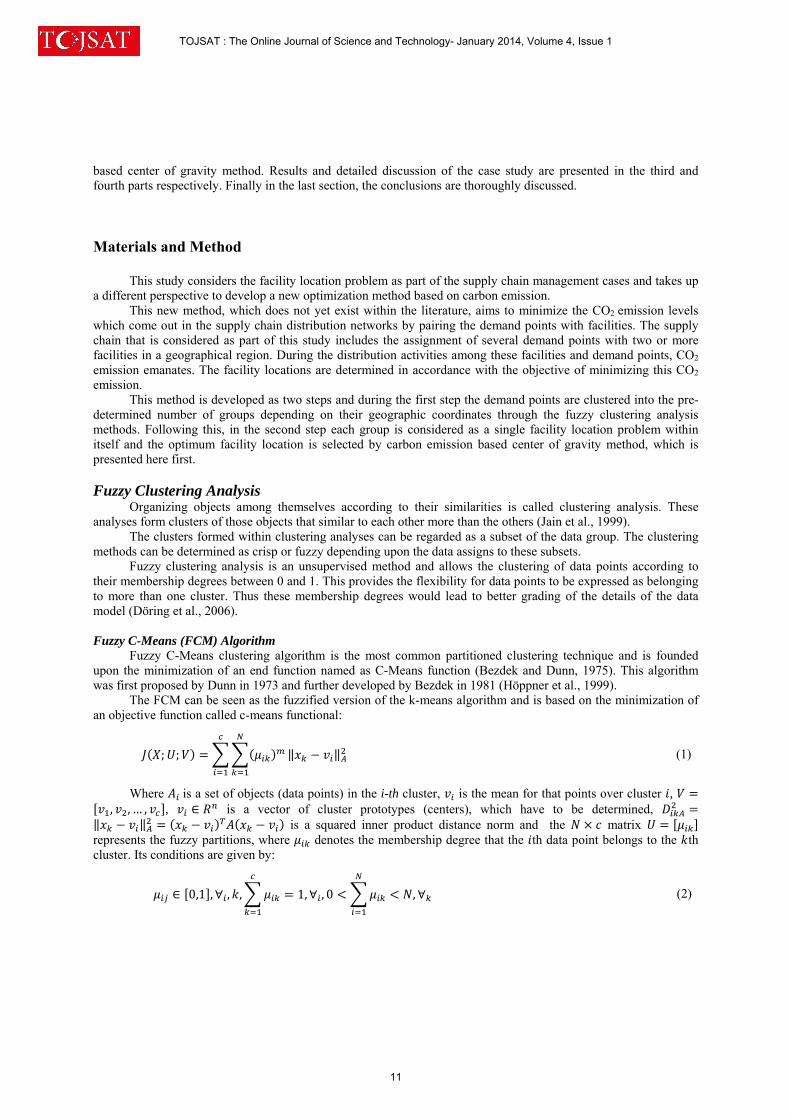
The FCM can be seen as the fuzzified version of the k-means algorithm and is based on the minimization of an objective function called c-means functional:
; ; ‖ ‖ (1)
Where is a set of objects (data points) in the i-th cluster, is the mean for that points over cluster , , , … , , ∈ is a vector of cluster prototypes (centers), which have to be determined,
‖ ‖ is a squared inner product distance norm and the matrix represents the fuzzy partitions, where denotes the membership degree that the th data point belongs to the th cluster. Its conditions are given by:
∈ 0,1 , ∀ , , 1, ∀ , 0 , ∀ (2)
TOJSAT : The Online Journal of Science and Technology- January 2014, Volume 4, Issue 1
11
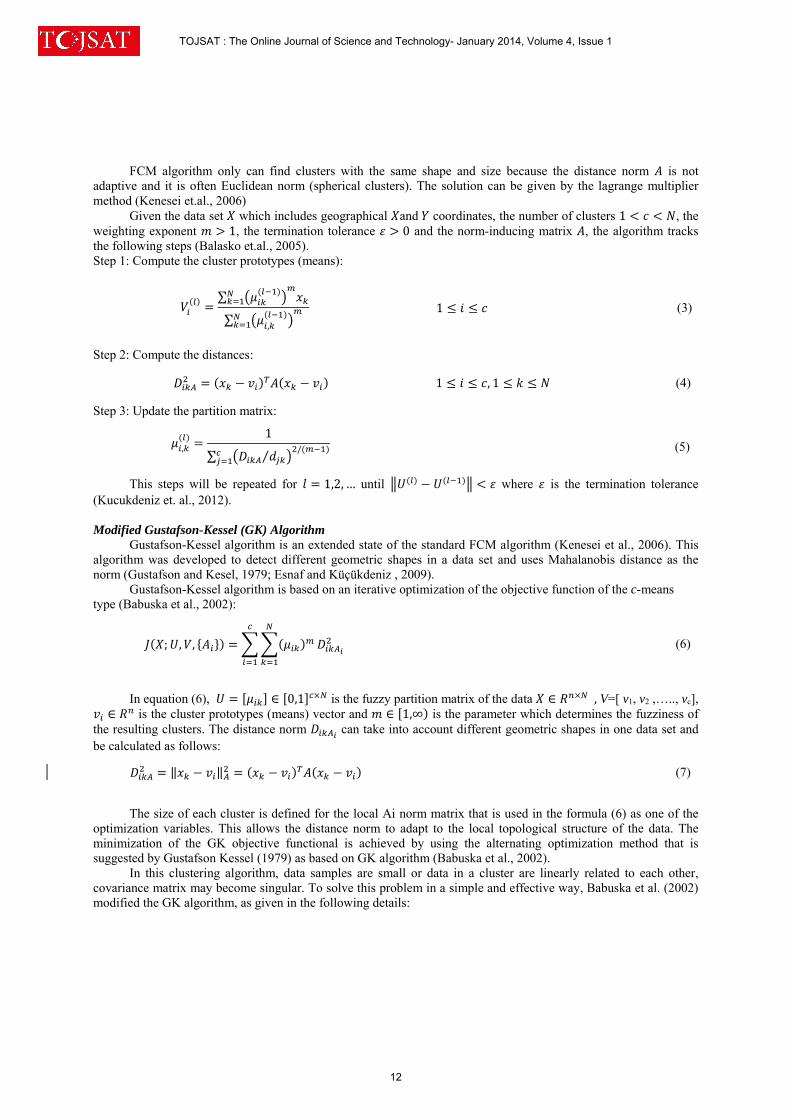
FCM algorithm only can find clusters with the same shape and size because the distance norm is not adaptive and it is often Euclidean norm (spherical clusters). The solution can be given by the lagrange multiplier method (Kenesei et.al., 2006)
Given the data set which includes geographical and coordinates, the number of clusters 1 , the weighting exponent 1, the termination tolerance 0 and the norm-inducing matrix , the algorithm tracks the following steps (Balasko et.al., 2005). Step 1: Compute the cluster prototypes (means):
∑
∑ ,
1 (3)
Step 2: Compute the distances:
1 , 1 (4)
Step 3: Update the partition matrix:
,
1
∑ ⁄/ (5)
This steps will be repeated for 1,2, … until where is the termination tolerance (Kucukdeniz et. al., 2012). Modified Gustafson-Kessel (GK) Algorithm
Gustafson-Kessel algorithm is an extended state of the standard FCM algorithm (Kenesei et al., 2006). This algorithm was developed to detect different geometric shapes in a data set and uses Mahalanobis distance as the norm (Gustafson and Kesel, 1979; Esnaf and Küçükdeniz , 2009).
Gustafson-Kessel algorithm is based on an iterative optimization of the objective function of the c-means type (Babuska et al., 2002):
; , , (6)
In equation (6), ∈ 0,1 is the fuzzy partition matrix of the data ∈ , V=[ v1, v2 ,….., vc],
∈ is the cluster prototypes (means) vector and ∈ 1,∞ is the parameter which determines the fuzziness of the resulting clusters. The distance norm can take into account different geometric shapes in one data set and be calculated as follows:
‖ ‖ (7)
The size of each cluster is defined for the local Ai norm matrix that is used in the formula (6) as one of the
optimization variables. This allows the distance norm to adapt to the local topological structure of the data. The minimization of the GK objective functional is achieved by using the alternating optimization method that is suggested by Gustafson Kessel (1979) as based on GK algorithm (Babuska et al., 2002).
In this clustering algorithm, data samples are small or data in a cluster are linearly related to each other, covariance matrix may become singular. To solve this problem in a simple and effective way, Babuska et al. (2002) modified the GK algorithm, as given in the following details:
TOJSAT : The Online Journal of Science and Technology- January 2014, Volume 4, Issue 1
12
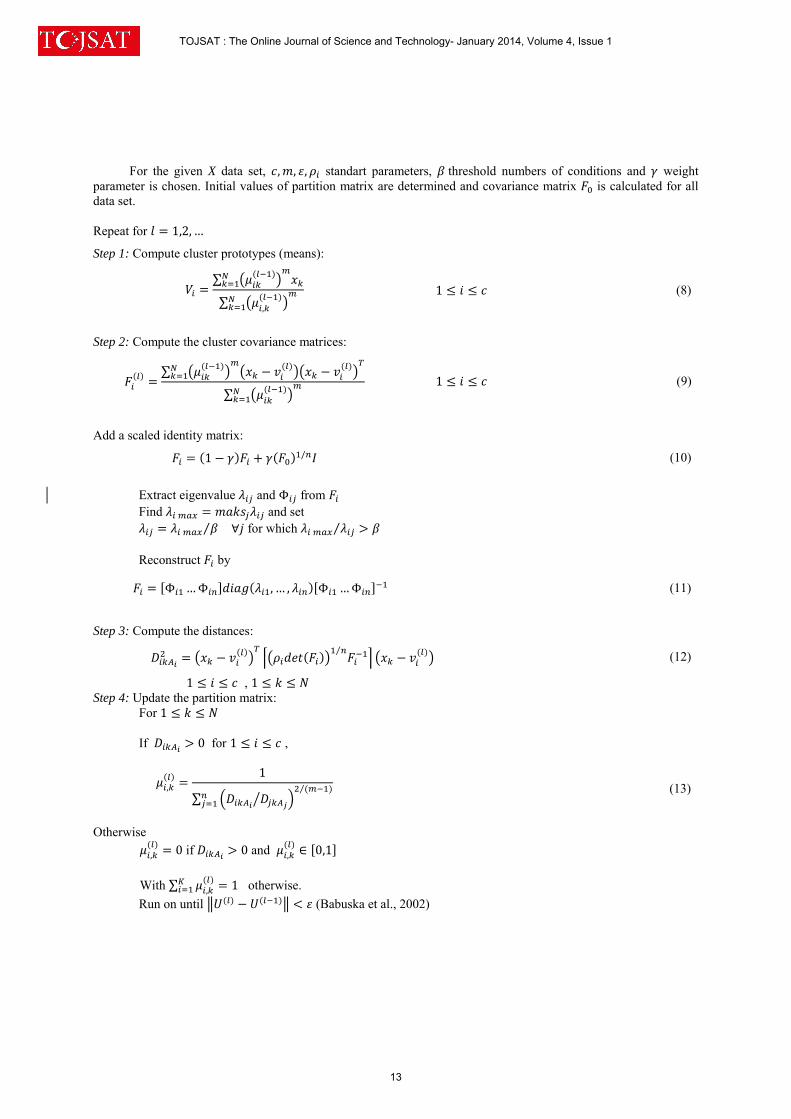
For the given X data set, , , , standart parameters, threshold numbers of conditions and weight parameter is chosen. Initial values of partition matrix are determined and covariance matrix is calculated for all data set.
Repeat for 1,2,…
Step 1: Compute cluster prototypes (means):
∑
∑ ,
1 (8)
Step 2: Compute the cluster covariance matrices:
∑
∑ 1 (9)
Add a scaled identity matrix:
1 / (10)
Extract eigenvalue and Φ from Find and set
⁄ ∀ for which ⁄ Reconstruct by
Φ …Φ ,… , Φ …Φ (11)
Step 3: Compute the distances:
⁄ (12)
1 , 1 Step 4: Update the partition matrix:
For 1 If 0 for 1 ,
,
1
∑⁄ (13)
Otherwise
, 0 if 0 and , ∈ 0,1
With ∑ , 1 otherwise.
Run on until (Babuska et al., 2002)
TOJSAT : The Online Journal of Science and Technology- January 2014, Volume 4, Issue 1
13
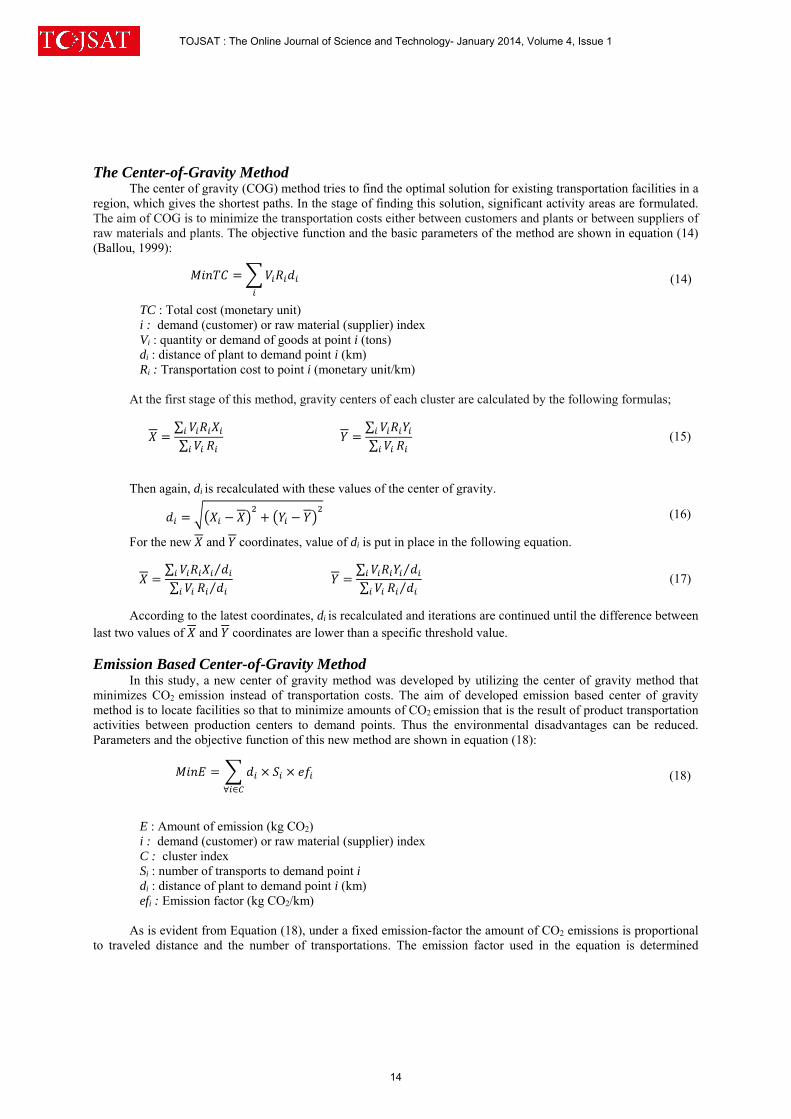
The Center-of-Gravity Method The center of gravity (COG) method tries to find the optimal solution for existing transportation facilities in a
region, which gives the shortest paths. In the stage of finding this solution, significant activity areas are formulated. The aim of COG is to minimize the transportation costs either between customers and plants or between suppliers of raw materials and plants. The objective function and the basic parameters of the method are shown in equation (14) (Ballou, 1999):
(14)
TC : Total cost (monetary unit) i : demand (customer) or raw material (supplier) index Vi : quantity or demand of goods at point i (tons) di : distance of plant to demand point i (km) Ri : Transportation cost to point i (monetary unit/km)
At the first stage of this method, gravity centers of each cluster are calculated by the following formulas;
∑∑
∑∑
(15)
Then again, di is recalculated with these values of the center of gravity.
(16)
For the new and coordinates, value of di is put in place in the following equation.
∑ ⁄∑ ⁄
∑ ⁄∑ ⁄
(17)
According to the latest coordinates, di is recalculated and iterations are continued until the difference between last two values of and coordinates are lower than a specific threshold value. Emission Based Center-of-Gravity Method
In this study, a new center of gravity method was developed by utilizing the center of gravity method that minimizes CO2 emission instead of transportation costs. The aim of developed emission based center of gravity method is to locate facilities so that to minimize amounts of CO2 emission that is the result of product transportation activities between production centers to demand points. Thus the environmental disadvantages can be reduced. Parameters and the objective function of this new method are shown in equation (18):
∀ ∈
(18)
E : Amount of emission (kg CO2)
i : demand (customer) or raw material (supplier) index C : cluster index Si : number of transports to demand point i di : distance of plant to demand point i (km) efi : Emission factor (kg CO2/km)
As is evident from Equation (18), under a fixed emission-factor the amount of CO2 emissions is proportional
to traveled distance and the number of transportations. The emission factor used in the equation is determined
TOJSAT : The Online Journal of Science and Technology- January 2014, Volume 4, Issue 1
14
according to the type of vehicle. Due to the emission factor will vary according to the structure of the supply chain, when there is more than one type of transportation at the same time, this method can be used.
At the first stage of the emission-based center of gravity method, the center of each cluster is calculated in the following equation (19) by the emission factor and the number of transportation, which is demand connected variable:
∑∑
∑∑
(19)
Then, the distance value is calculated with Euclidean distance formula as shown in equation (20).
(20)
After the value of has been calculated, the value is put in place in equation (21) for new and coordinates.
∑ ⁄∑ ⁄
∑ ⁄∑ ⁄
(21)
According to the latest coordinates, recalculated and iterations are continued until the difference between last two values of and coordinates are lower than a predetermined threshold value.
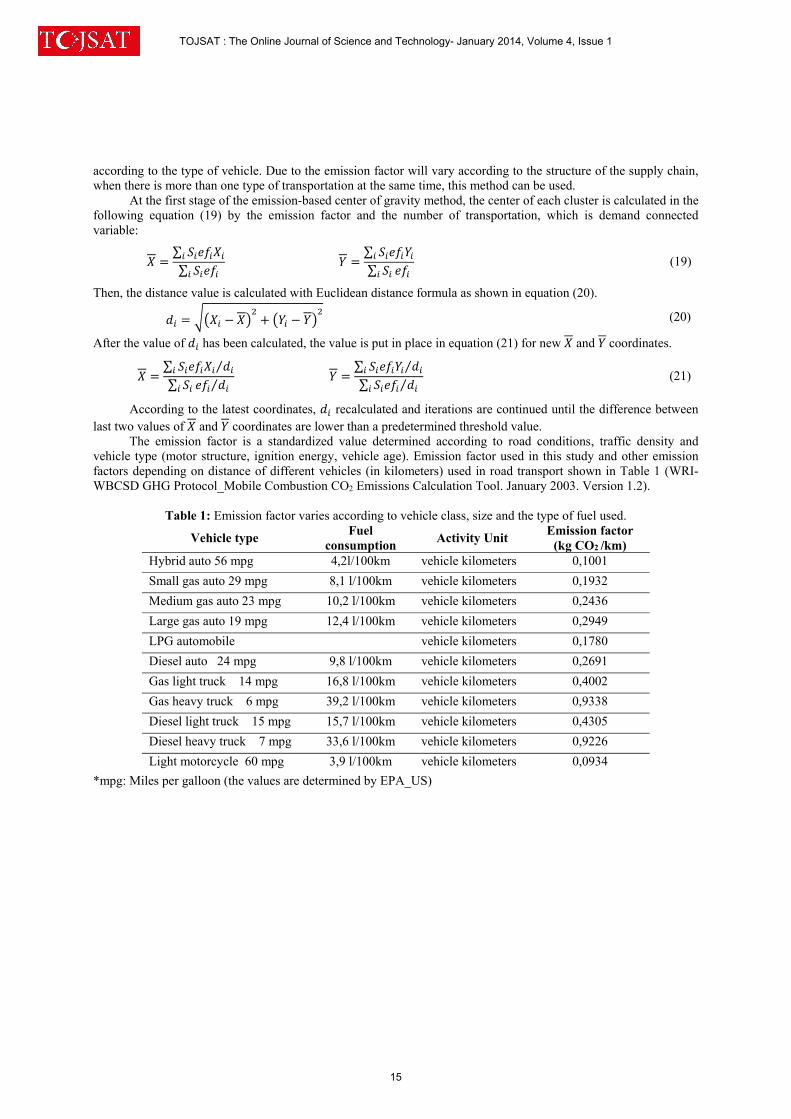
The emission factor is a standardized value determined according to road conditions, traffic density and vehicle type (motor structure, ignition energy, vehicle age). Emission factor used in this study and other emission factors depending on distance of different vehicles (in kilometers) used in road transport shown in Table 1 (WRI-WBCSD GHG Protocol_Mobile Combustion CO2 Emissions Calculation Tool. January 2003. Version 1.2).
Table 1: Emission factor varies according to vehicle class, size and the type of fuel used.
Vehicle type Fuel
consumption Activity Unit
Emission factor (kg CO2 /km)
Hybrid auto 56 mpg 4,2l/100km vehicle kilometers 0,1001
Small gas auto 29 mpg 8,1 l/100km vehicle kilometers 0,1932
Medium gas auto 23 mpg 10,2 l/100km vehicle kilometers 0,2436
Large gas auto 19 mpg 12,4 l/100km vehicle kilometers 0,2949
LPG automobile vehicle kilometers 0,1780
Diesel auto 24 mpg 9,8 l/100km vehicle kilometers 0,2691
Gas light truck 14 mpg 16,8 l/100km vehicle kilometers 0,4002
Gas heavy truck 6 mpg 39,2 l/100km vehicle kilometers 0,9338
Diesel light truck 15 mpg 15,7 l/100km vehicle kilometers 0,4305
Diesel heavy truck 7 mpg 33,6 l/100km vehicle kilometers 0,9226
Light motorcycle 60 mpg 3,9 l/100km vehicle kilometers 0,0934
*mpg: Miles per galloon (the values are determined by EPA_US)
TOJSAT : The Online Journal of Science and Technology- January 2014, Volume 4, Issue 1
15

Results In this study, the data of Esnaf and Küçükdeniz (2009) are used. Esnaf and Küçükdeniz (2009) aimed to
determine optimal facility locations and identify customers that will be assigned to the facilities for an asphalt company by minimizing transportation costs. They considered shipments of suppliers-to-facilities and facilities-to-customers while calculating transportation costs. They used the amount of demands and the coordinates of the demand points appeared both the European and Asian sides of Istanbul. In this study, only the data of 51 demand points (the coordinates of demand points and amounts of demand) on the European side are considered to minimize the amount of CO2 emissions for the uncapacitated facility location problem. In application, three different numbers of clusters were tested. Moreover two different types of vehicles, which are diesel light truck and diesel heavy truck, were assigned randomly to these demand points.
In the first step, demand points in European side are clustered into 2, 3, and 4 clusters according to their geographic locations by using MATLAB 6.5 Fuzzy Toolbox (Balasko et al., 2005) for FCM and GK fuzzy clustering algorithms which are developed in. These clusters centers have been accepted as the initial locations of facilities for the following step. In the second step, the facility locations are recalculated using the proposed emission-based center of gravity method in order to minimize the amount of CO2 emissions between demand points and facilities.
In the case study, the vehicles, which transport between customers and facilities, are diesel heavy truck with a capacity of 20 tons and diesel light truck with a capacity of 12 tons. Furthermore, the emission factors are taken as 0.9226 kg CO2 / km for diesel heavy truck and 0.4305 kg CO2 / km for diesel light truck. According to the five different random number set that assign trucks to demand points, X, Y coordinates for the facilities that are found with the emission-based center of gravity hybrid methods with FCM and GK clustering algorithms are shown in Table 2.
The amount of CO2 emissions for the different methods, are shown in the Table 3: The average amount of CO2 emissions for the different methods, are shown in the Table 4:
Table 3: The amount of CO2 emissions as a result of locating facilities directly to the cluster centers that are calculated by center of gravity or emission based center of gravity hybrid methods with FCM and GK algorithms
Number of
clusters
Total amount of CO2 emission (ton CO2) Random
number set
FCM-COG
FCM-EBCOG hybrid method
GK-COG
GK-EBCOG hybrid method
2
1 2 3 4 5
818.061 824.107 820.327 816.694 824.681
810.316 816.928 812.357 810.147 818.751
1166.549 1179.072 1155.313 1174.668 1169.606
1164.958 1177.381 1153.357 1173.864 1169.401
3
1 2 3 4 5
718.227 720.634 701.761 715.357 723.339
713.524 716.328 699.353 714.087 722.753
748.215 746.233 750.016 744.339 746.916
741.099 738.520 741.643 738.071 740.309
4
1 2 3 4 5
624.890 629.001 612.144 623.409 626.554
618.598 622.978 605.693 617.927 621.794
747.590 746.557 744.638 755.726 759.967
743.566 742.231 742.138 754.527 759.295
TOJSAT : The Online Journal of Science and Technology- January 2014, Volume 4, Issue 1
16
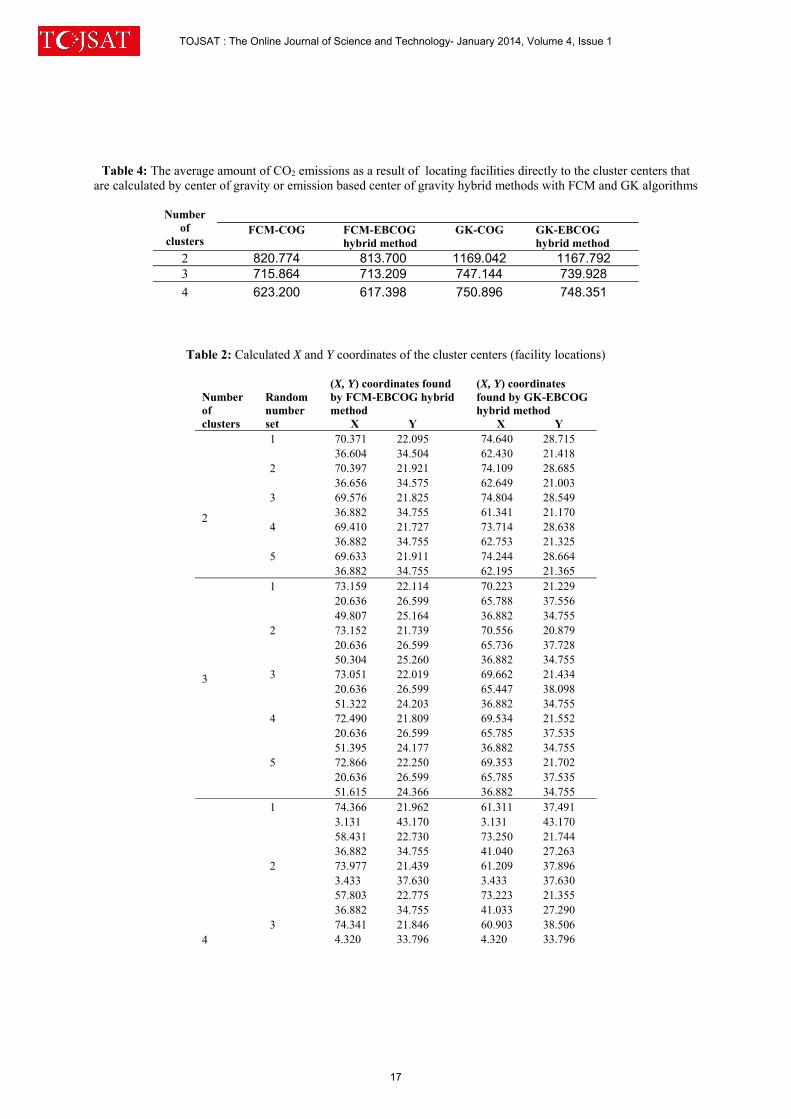
Table 4: The average amount of CO2 emissions as a result of locating facilities directly to the cluster centers that are calculated by center of gravity or emission based center of gravity hybrid methods with FCM and GK algorithms
Number
of clusters
FCM-COG
FCM-EBCOG hybrid method
GK-COG
GK-EBCOG hybrid method
2 820.774 813.700 1169.042 1167.792 3 715.864 713.209 747.144 739.928
4 623.200 617.398 750.896 748.351
Table 2: Calculated X and Y coordinates of the cluster centers (facility locations)
Number of clusters
Random number set
(X, Y) coordinates found by FCM-EBCOG hybrid method X Y
(X, Y) coordinates found by GK-EBCOG hybrid method X Y
2
1 2 3 4 5
70.371 22.095 36.604 34.504 70.397 21.921 36.656 34.575 69.576 21.825 36.882 34.755 69.410 21.727 36.882 34.755 69.633 21.911 36.882 34.755
74.640 28.715 62.430 21.418 74.109 28.685 62.649 21.003 74.804 28.549 61.341 21.170 73.714 28.638 62.753 21.325 74.244 28.664 62.195 21.365
3
1 2 3 4 5
73.159 22.114 20.636 26.599 49.807 25.164 73.152 21.739 20.636 26.599 50.304 25.260 73.051 22.019 20.636 26.599 51.322 24.203 72.490 21.809 20.636 26.599 51.395 24.177 72.866 22.250 20.636 26.599 51.615 24.366
70.223 21.229 65.788 37.556 36.882 34.755 70.556 20.879 65.736 37.728 36.882 34.755 69.662 21.434 65.447 38.098 36.882 34.755 69.534 21.552 65.785 37.535 36.882 34.755 69.353 21.702 65.785 37.535 36.882 34.755
4
1 2 3
74.366 21.962 3.131 43.170 58.431 22.730 36.882 34.755 73.977 21.439 3.433 37.630 57.803 22.775 36.882 34.755 74.341 21.846 4.320 33.796
61.311 37.491 3.131 43.170 73.250 21.744 41.040 27.263 61.209 37.896 3.433 37.630 73.223 21.355 41.033 27.290 60.903 38.506 4.320 33.796
TOJSAT : The Online Journal of Science and Technology- January 2014, Volume 4, Issue 1
17
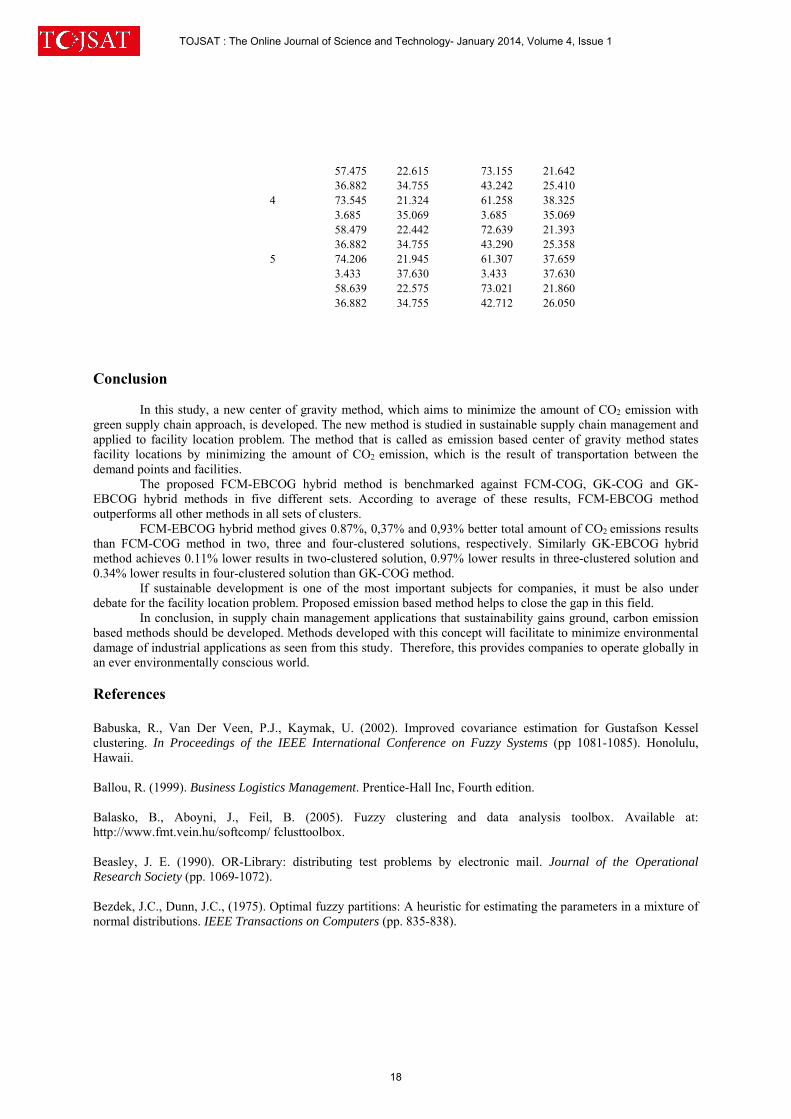
4 5
57.475 22.615 36.882 34.755 73.545 21.324 3.685 35.069 58.479 22.442 36.882 34.755 74.206 21.945 3.433 37.630 58.639 22.575 36.882 34.755
73.155 21.642 43.242 25.410 61.258 38.325 3.685 35.069 72.639 21.393 43.290 25.358 61.307 37.659 3.433 37.630 73.021 21.860 42.712 26.050
Conclusion
In this study, a new center of gravity method, which aims to minimize the amount of CO2 emission with green supply chain approach, is developed. The new method is studied in sustainable supply chain management and applied to facility location problem. The method that is called as emission based center of gravity method states facility locations by minimizing the amount of CO2 emission, which is the result of transportation between the demand points and facilities.
The proposed FCM-EBCOG hybrid method is benchmarked against FCM-COG, GK-COG and GK-EBCOG hybrid methods in five different sets. According to average of these results, FCM-EBCOG method outperforms all other methods in all sets of clusters.
FCM-EBCOG hybrid method gives 0.87%, 0,37% and 0,93% better total amount of CO2 emissions results than FCM-COG method in two, three and four-clustered solutions, respectively. Similarly GK-EBCOG hybrid method achieves 0.11% lower results in two-clustered solution, 0.97% lower results in three-clustered solution and 0.34% lower results in four-clustered solution than GK-COG method.
If sustainable development is one of the most important subjects for companies, it must be also under debate for the facility location problem. Proposed emission based method helps to close the gap in this field.
In conclusion, in supply chain management applications that sustainability gains ground, carbon emission based methods should be developed. Methods developed with this concept will facilitate to minimize environmental damage of industrial applications as seen from this study. Therefore, this provides companies to operate globally in an ever environmentally conscious world.
References Babuska, R., Van Der Veen, P.J., Kaymak, U. (2002). Improved covariance estimation for Gustafson Kessel clustering. In Proceedings of the IEEE International Conference on Fuzzy Systems (pp 1081-1085). Honolulu, Hawaii. Ballou, R. (1999). Business Logistics Management. Prentice-Hall Inc, Fourth edition. Balasko, B., Aboyni, J., Feil, B. (2005). Fuzzy clustering and data analysis toolbox. Available at: http://www.fmt.vein.hu/softcomp/ fclusttoolbox. Beasley, J. E. (1990). OR-Library: distributing test problems by electronic mail. Journal of the Operational Research Society (pp. 1069-1072). Bezdek, J.C., Dunn, J.C., (1975). Optimal fuzzy partitions: A heuristic for estimating the parameters in a mixture of normal distributions. IEEE Transactions on Computers (pp. 835-838).
TOJSAT : The Online Journal of Science and Technology- January 2014, Volume 4, Issue 1
18

Bouzembrak, Y., Allaoui, , H., Goncalves, , G., Bouchriha, , H. (2011). A Multi-Objective Green Supply Chain Network Design. 4th International Conference on Logistics (LOGISTIQUA) (pp. 357-361). Diabat, A. and Simchi-Levi, D. (2009). A Carbon-Capped Supply Chain Network Problem. IEEE International Conference on Industrial Engineering and Engineering Management (pp. 523-527). Doring, C., Lesot, M., Kruse, R. (2006). Data analysis with fuzzy clustering methods. Computational Statistics & Data Analysis, Vol.51 (pp. 192-214). Esnaf, Ş., Küçükdeniz, T. (2009). A Fuzzy Clustering-Based Hybrid Method for a Multi-Facility Location Problem. Journal of Intelligent Manufacturing, Vol.20, No:2 (pp. 259-265). Farahani, R.Z. ve Hekmatfar, , M. (2009). Facility Location: Concepts, Models, Algorithms and Case Studies. Springer-Verlag, Heidelberg. Farahani, R.Z., Steadieseifi, M., Asgari, N. (2010). Multiple Criteria Facility Location Problem:A Survey. Applied Mathematical Modelling, Vol.34 (pp. 1689-1709). Govindan, K., Kannan, D., (2010). A Bi Objective Reverse Logistics Network Design Model. International Conference on Computers & Industrial Engineering (CIE). Gustafson, D.E., Kessel, W.C. (1979). Fuzzy clustering with fuzzy covariance matrix. In Proceedings of the IEEE (pp. 761-766). CDC, San Diego. Harris, I., Mumford, C., Naim, M. (2009). The Multi-Objective Uncapacitated Facility Location Problem for Green Logistics. IEEE Congress on Evolutionary Computation. Harris, I., Naim, M., Palmer, A., Potter, A., Mumford, C. (2011). Assessing the impact of cost optimization based on infrastructure modelling on CO2 emissions. International Journal of Production Economics, Vol. 131, Issue 1, (pp. 313-321). Hoppner, F., Klawonn, F., Kruse, R. and Runkler, T. (1999). Fuzzy Cluster Analysis: methods for classification, data analysis, and image recognition. John Wiley&Sons. Iakovou, E., Vlachos, D., Chatzipanagioti, M., Mallidis, I., (2010). A Comprehensive Optimisation Framework for Sustainable Supply Chain Networks. In Seventh International Conference on Logistics and Sustainable Transport, Slovenia. Jain, A.K., Murty, M.N., Flynn, P.J. (1999). Data Clustering: A Review. ACM Computing Surveys, Vol.31, No.3, (pp.264-323). Kenesei, T., Balasko, B. and Abony, J. (2006). A MATLAB toolbox and its web based variant for fuzzy cluster analysis. In Proceedings of the 7th International Symposium on Hungarian Researchers on Computational Intelligence, November 24–25, Budapest, Hungary. Küçükdeniz T, Baray A, Ecerkale K, Esnaf Ş. (2012). Integrated use of fuzzy c-means and convex programming for capacitated multi-facility location problem. Expert Systems with Applications, Vol. 39, No.4, (pp. 4306-4314). Li, F., Liu, T., Zhang, H., Cao, R., Ding, W., Fasano, J.P. (2008). Distribution center location for green supply chain. International Conference on Service Operations and Logistics, and informatics (IEEE) (pp. 2951–2956). McMichael, A.J., Woodruff, R.E., Hales, S. (2006). Climate change and human health: present and future risks. Lancet, Vol. 367, Issue 9513, (pp. 859-869).
TOJSAT : The Online Journal of Science and Technology- January 2014, Volume 4, Issue 1
19
Osman, I. H. and Christofides, N. (1994). “Capacitated clustering problems by hybrid simulated annealing and tabu search”, International Transactions in Operational Research, Vol.1, No. 3, pp. 317-336. Paksoy, T., Özceylan, E., Weber, G-W. (2011). A Multi Objective Model for Optimization of a Green Supply Chain. Global Journal of Technology and Optimization, Vol. 2, (pp. 84-96). Pan, S., Ballot, E., Fontane, F. (2009). The reduction of greenhouse gas emissions from freight transport by merging supply chains. International Conference of Industrial Engineering and Systems Managment, IESM, Montreal, Canada. Ramudhin, A., Chaabane, A., Kharoune, M., Paquet, M. (2008). Carbon Market Sensitive Green Supply Chain Network Design. IEEE International Conference on Industrial Engineering and Engineering Management (pp. 1093–1097). Santibanez-Gonzalez, E., Del, R., Robson Mateus, G., Pacca Luna, H. (2011). Solving a public sector sustainable supply chain problem: A Genetic Algorithm approach. In: Proc. of Int. Conf. of Artificial Intelligence (ICAI) (pp. 507–512), Las Vegas, USA. Shaw, K., Shankara, R., Yadava, S.S., Thakurb, L.S., (2012). Modeling a low-carbon garment supply chain, Production Planning & Control (pp. 1-15). Sule, D.R. (2001), “Logistics of Facility Location and Allocation”, Marcel Dekker Inc., New York Wang, F, Lai, X., Shi, N. (2011). A Multi-Objective Optimization for Green Supply Chain Network Design. Decision Support Systems, Vol. 51, (pp. 262–269). WRI-WBCSD GHG Protocol Initiative, Mobile Combustion CO2 Emissions Calculation Tool. June 2003. Version 1.2, available at: http://www.scribd.com/doc/8676658/Mobile-Combustion-CO2-Emissions-Calculation-Tool Wu, H.-J. and Dunn, S. (1995). Environmentally responsible logistics systems. International Journal of Physical Distribution & Logistics Management, Vol. 25 No. 2, (pp. 20-38). Xiaoli, L., Jun, W., Jun, L. (2010). Research on the Optimization of Carbon emissions of Distribution Centers Location Decision. International Conference on Communications, Circuits and Systems (ICCCAS) (pp. 87-89) Yurimoto, S. and Katayama, N. (2002). A Model for the Optimal Number and Locations of Public Distribution Centers and Its Application to the Tokyo Metropolitan Area. International Journal of Industrial Engineering: Theory, Applications and Practice, Vol. 9, (pp. 363-371).
TOJSAT : The Online Journal of Science and Technology- January 2014, Volume 4, Issue 1
20