564 Synthesis of Cu2+ Doped ZnO by the Combination of Sol ...
11
Indones. J. Chem., 2021, 21 (3), 564 - 574 Sherly Kasuma Warda Ningsih et al. 564 Synthesis of Cu 2+ Doped ZnO by the Combination of Sol-Gel-Sonochemical Methods with Duck Egg Albumen as Additive for Photocatalytic Degradation of Methyl Orange Sherly Kasuma Warda Ningsih 1* , Hary Sanjaya 2 , Bahrizal 1 , Edi Nasra 3 , and Syuhada Yurnas 1 1 Inorganic Chemistry Laboratory, Faculty of Mathematics and Natural Sciences, Universitas Negeri Padang, Kampus Air Tawar, Jl. Prof. Dr. Hamka, West Sumatera 25131, Indonesia 2 Physical Chemistry Laboratory, Faculty of Mathematics and Natural Sciences, Universitas Negeri Padang, Kampus Air Tawar, Jl. Prof. Dr. Hamka, West Sumatera 25131, Indonesia 3 Analytical Chemistry Laboratory, Faculty of Mathematics and Natural Sciences, Universitas Negeri Padang, Kampus Air Tawar, Jl. Prof. Dr. Hamka, West Sumatera 25131, Indonesia * Corresponding author: email: [email protected] Received: June 20, 2020 Accepted: February 11, 2021 DOI: 10.22146/ijc.57077 Abstract: Cu 2+ doped ZnO by green synthesis was successfully prepared by using a combination of the Sol-Gel-Sonochemical method. Duck egg albumen was used as an additive, a substitute for chemical additives, such as monoethanolamine (MEA) and diethanolamine (DEA). Zn(CH 3 COO) 2 ·2H 2 O was used as a precursor, Cu(CH 3 COO) 2 ·H 2 O was used as a dopant source with concentrations of 5 wt.%, and isopropanol was used as the solvent. The addition of albumen variations was 10, 20, 30, 40, and 50 mL. The prepared catalyst was applied for the degradation of the methyl orange dyes by using photosonolysis with variations of the degradation time of methyl orange for 30, 60, 90, 120, 150, 180, and 240 min. FTIR spectra showed stretching at 400– 550 cm –1 indicating the presence of Zn–O and Zn–O–Cu metal oxides. The optimum bandgap energy value was 2.82 eV with the addition of 30 mL of albumen. XRD analysis showed the optimum particle size of 16.62–53.21 nm after adding 30 mL of additives. The SEM image showed a spherical shape with an average diameter of 2.7 μm. The optimum percentage of degradation obtained was 94.88%, with the irradiation time under UV light for 210 min. Keywords: Cu 2+ doped ZnO; duck egg albumen; sol-gel-sonochemistry; spherical; methyl orange ■ INTRODUCTION ZnO is a nanostructured semiconductor material with high conductivity and low thermal expansion. ZnO nanostructured has environmental stability and low cost [1] as compared with other binary metal oxide nanoparticles [2-3]. Electrical and optical properties are what make this semiconductor widely applied to gas sensors, catalysts, to solar cell conversion. ZnO is a semiconductor group II-VI [4] because, in the periodic table, zinc and oxygen are group II and group VI respectively. ZnO has a band gap of 3.37 eV [5] with the ability to bind free electrons of 60 MeV at room temperature [6]. Pure ZnO has the disadvantage that the surface area of the small volume and the energy of the band gap is less suitable when applied to visible light, so to optimize the properties of the semiconductor, it is necessary to do the doping. Doping is the process of inserting other atoms in a semiconductor to give a band gap value that is smaller than the original material. In this research, Cu is used as a dopant. Cu is chosen because it has an ionic radius that is smaller than Zn, has conductivity properties similar to Zn, has abundant resources, and is a relatively cheap metal. Cu is preferred for the doping of ZnO as compared with other transition metals due to the easily overlapping process of its d electrons with the ZnO valence bond [7]. Cu doping can improve the electrical,
-
Upload
khangminh22 -
Category
Documents
-
view
4 -
download
0
Transcript of 564 Synthesis of Cu2+ Doped ZnO by the Combination of Sol ...

Indones. J. Chem., 2021, 21 (3), 564 - 574
Sherly Kasuma Warda Ningsih et al.
564
Synthesis of Cu2+ Doped ZnO by the Combination of Sol-Gel-Sonochemical Methods with Duck Egg Albumen as Additive for Photocatalytic Degradation of Methyl Orange
Sherly Kasuma Warda Ningsih1*, Hary Sanjaya2, Bahrizal1, Edi Nasra3, and Syuhada Yurnas1 1Inorganic Chemistry Laboratory, Faculty of Mathematics and Natural Sciences, Universitas Negeri Padang, Kampus Air Tawar, Jl. Prof. Dr. Hamka, West Sumatera 25131, Indonesia 2Physical Chemistry Laboratory, Faculty of Mathematics and Natural Sciences, Universitas Negeri Padang, Kampus Air Tawar, Jl. Prof. Dr. Hamka, West Sumatera 25131, Indonesia 3Analytical Chemistry Laboratory, Faculty of Mathematics and Natural Sciences, Universitas Negeri Padang, Kampus Air Tawar, Jl. Prof. Dr. Hamka, West Sumatera 25131, Indonesia
* Corresponding author:
email: [email protected]
Received: June 20, 2020 Accepted: February 11, 2021
DOI: 10.22146/ijc.57077
Abstract: Cu2+ doped ZnO by green synthesis was successfully prepared by using a combination of the Sol-Gel-Sonochemical method. Duck egg albumen was used as an additive, a substitute for chemical additives, such as monoethanolamine (MEA) and diethanolamine (DEA). Zn(CH3COO)2·2H2O was used as a precursor, Cu(CH3COO)2·H2O was used as a dopant source with concentrations of 5 wt.%, and isopropanol was used as the solvent. The addition of albumen variations was 10, 20, 30, 40, and 50 mL. The prepared catalyst was applied for the degradation of the methyl orange dyes by using photosonolysis with variations of the degradation time of methyl orange for 30, 60, 90, 120, 150, 180, and 240 min. FTIR spectra showed stretching at 400–550 cm–1 indicating the presence of Zn–O and Zn–O–Cu metal oxides. The optimum bandgap energy value was 2.82 eV with the addition of 30 mL of albumen. XRD analysis showed the optimum particle size of 16.62–53.21 nm after adding 30 mL of additives. The SEM image showed a spherical shape with an average diameter of 2.7 μm. The optimum percentage of degradation obtained was 94.88%, with the irradiation time under UV light for 210 min.
Keywords: Cu2+ doped ZnO; duck egg albumen; sol-gel-sonochemistry; spherical; methyl orange
■ INTRODUCTION
ZnO is a nanostructured semiconductor material with high conductivity and low thermal expansion. ZnO nanostructured has environmental stability and low cost [1] as compared with other binary metal oxide nanoparticles [2-3]. Electrical and optical properties are what make this semiconductor widely applied to gas sensors, catalysts, to solar cell conversion. ZnO is a semiconductor group II-VI [4] because, in the periodic table, zinc and oxygen are group II and group VI respectively. ZnO has a band gap of 3.37 eV [5] with the ability to bind free electrons of 60 MeV at room temperature [6]. Pure ZnO has the disadvantage that the
surface area of the small volume and the energy of the band gap is less suitable when applied to visible light, so to optimize the properties of the semiconductor, it is necessary to do the doping.
Doping is the process of inserting other atoms in a semiconductor to give a band gap value that is smaller than the original material. In this research, Cu is used as a dopant. Cu is chosen because it has an ionic radius that is smaller than Zn, has conductivity properties similar to Zn, has abundant resources, and is a relatively cheap metal. Cu is preferred for the doping of ZnO as compared with other transition metals due to the easily overlapping process of its d electrons with the ZnO valence bond [7]. Cu doping can improve the electrical,
Indones. J. Chem., 2021, 21 (3), 564 - 574
Sherly Kasuma Warda Ningsih et al.
565
magnetic, and optical properties of ZnO [8]. In addition, the results of Cu ion insertion on Zn have been successful with certain concentrations of dopants to produce hexagonal wurtzite.
Cu doped ZnO synthesis has been reported with various methods such as solvothermal [9], hydrothermal method [10], coprecipitation method [11-13], sonochemical method [14] and sol-gel method [15]. The solvothermal method is a method with the principle of crystal growth based on the solubility of the material in the solvent under high-pressure conditions so that when a work accident occurs, it will cause more fatal consequences. The hydrothermal method is a process that involves heating reactants in an autoclave using water with the weakness of corrosive hydrothermal slurry, which can cause danger when an accident occurs. The coprecipitation method is a method of synthesis of nanoparticles by the addition of a precipitating agent. Still, this method has the disadvantage that the resulting particle size is not homogeneous. In contrast, sonochemical methods have good homogeneity, and sol-gel is a method that produces better sizes and can take place at low temperatures and does not require expensive costs in the synthesis process. Based on the mentioned methods, the sol-gel and sonochemical methods were chosen because of their superiority, such as they can control the size and growth of crystalline.
The sonochemical method can control the growth of ZnO crystals, which is successful in controlling the shape and size of the particles produced [16]. This method also has the advantage of being able to break the aggregates from large crystals into nano-sized crystals. The sonolysis method has a working principle that is utilizing ultrasonic waves with a high frequency, which are irradiated into the solution.
Additives are substances that can produce materials with high homogeneity and are stabilizing. The addition of this additive can produce products that have a large per volume surface area [17]. One of the additives commonly used in the synthesis of a nanomaterial is monoethanolamine (MEA). The MEA molecule contains 3 hydrogen atoms, 1 nitrogen atom, and 2 CH2 molecules. MEA is an additive that is relatively expensive. The
downside makes researchers interested in looking for alternatives that are environmentally friendly and are expected to be a substitute for MEA as an additive to synthesize a nanoparticle.
The albumen of the duck egg and the chicken egg can be used as an additive replacing MEA in nanoparticle synthesis. The albumen of the duck egg has an alkaline pH that ranges from 9–11. The albumen of the chicken egg has a lower pH (7.6) than the duck egg white. ZnO nanoparticles can be synthesized by using egg whites (albumen) [18-20] through the sol-gel method. The main advantage obtained in the synthesis of nanoparticles using egg white additives is egg white (albumen) acting as a gelling agent and emulsifier to give a long-term stability of the nanoparticles by preventing agglomeration (accumulation of crystal particles). Egg white can control the crystal size of ZnO particles [21]. Albumen in egg white plays a role in increasing the rate of reaction and producing nano-sized ZnO crystals.
Methyl orange dye is a dye that has a very high toxic level, contamination in water, causes turbidity to water, and is very dangerous for the environment [22]. Methyl orange can cause irritation to the skin, eyes, digestive disorders, and respiratory disorders. Organic compounds are stable, which makes them difficult to degrade, so the need for a compound or catalyst that can degrade these dyes to reduce the threat to the environment. Methyl orange has been widely used in foodstuffs, textiles [23], and paper [24]. ZnO is very stable and has the catalytic activity that can degrade methyl orange [25]. Therefore, it is expected that ZnO metal oxides [26] doped with Cu can degrade methyl orange dyes.
Photosonolysis is a process that combines photolysis and sonolysis [27-28]. Irradiation of the catalyst with UV light will cause an excited state of electrons from the valence band to the conduction band in the semiconductor. Electrons are excited after absorbs sufficient energy that will cause holes (electron holes) that can interact with water solvents to form OH radicals that are reactive to decompose organic compounds.
In this paper, we report the synthesis of Cu doped ZnO by using duck egg albumen as an additive and the

Indones. J. Chem., 2021, 21 (3), 564 - 574
Sherly Kasuma Warda Ningsih et al.
566
application of Cu doped ZnO nanoparticles that have the lowest band gap for degradation of methyl orange by photosonolysis.
■ EXPERIMENTAL SECTION
Materials
The materials used include Zn(CH3COO)2·2H2O (Merck), Cu(CH3COO)2·H2O (Merck), isopropanol (p.a), and duck egg albumen, methyl orange, deionized water.
Instrumentation
The equipments used were glassware, magnetic stirrer (brand ATE VELP Screntipica magnetic stirer) stirrer bar, digital ultrasonic cleaner machine (45 Hz) used for sonication, porcelain cups, analytical balance, (precisa XT 220 A brand), oven (Oven) France Etuves XU 225) and furnaces (NEYCRAFT), X-Ray Diffraction (XRD) X-Pert3 Pro material PAnaltycal, Fourier Transform Infra-Red (FTIR) Perkin Elmer Frontier Optica, UV-Vis Diffuse Reflectance Spectrophotometer (UVDRS) Analytik Jena, Scanning Electron Microscopy (SEM) Hitachi (Hitachi FlexSEM 100), and UV-Vis Spectrophotometer Agilent 8453.
Procedure
Preparation of catalyst Zn(CH3COO)2.2H2O was dissolved in isopropanol
and stirred with a magnetic stirrer for 40 min. Cu(CH3COO)2·H2O in the amount of 5 wt.% was added to the solution. The solution was continuously stirred for 40 min. The albumen of the duck egg was added to the solution with the various volumes of 10, 20, 30, 40, and 50 mL and stirred for 60 min. The solution was placed in a container for sonication for 30 min at 45 W. The solution was left one night to get a stable sol, placed into the vaporizer cup, and dried in the oven at 110 °C for 1 h. The formed gel was calcined in the furnace at 600 °C for 3 h.
Characterization The peaks obtained in the XRD data were compared
with the database contained in the ICDD (International Center for Diffraction Data). After this comparison, the type of phase corresponding to the Cu2+ doped ZnO sample was obtained. The estimated average size of
crystallite Cu2+ doped ZnO particles can be calculated by using the Scherrer formula.
kDCosλ
=β θ
(1)
where: D = diameter of crystallite; K = Scherrer's constant (0.89); λ = wavelength of the X-ray diffraction used (λ = 1.5406 Å); β = overall width of half the maximum diffraction peak (FWHM); θ = angle comes to the field of Bragg.
Photocatalytic activity test The methyl orange solution was prepared by
dissolving 0.5 g of methyl orange in deionized water to the boundary mark in a 1 L flask (10 ppm). Methyl orange mother liquor in the amount of 20 mL was taken and put into a 1000 mL volumetric flask. The solution was homogenized so that a solution of methyl orange was obtained with a concentration of 10 ppm. Degradation of methyl orange was carried out by taken 80 mL of 10 ppm methyl orange solution. The Cu2+ doped ZnO catalyst was added in an amount of 0.1 g to the methyl orange solution. The photosonolysis irradiation times were 30, 60, 90, 120, 150, 150, 180, and 240 min. After the degradation process, the solution was centrifuged for 10 min.
■ RESULTS AND DISCUSSION
Cu2+ doped ZnO can be synthesized through several steps consisting of sample preparation by dissolving precursors, dopants, and additives. The results of this stage are soles that can be stabilized by additives. The additive used was albumen. The second step was drying the sol to get a stiffer gel structure, followed by the calcination step to obtain the metal oxide, which will be characterized using FTIR (Fourier Transform-Infra Red) to determine the metal oxide bond formed from Cu2+ doped ZnO nanoparticles, UV-DRS (UV-Diffuse reflectance) to determine the band gap values obtained from Cu2+ doped ZnO nanoparticles, XRD (X-Ray Diffraction Spectroscopy) to determine the crystal structure and Cu2+ doped ZnO particle size, and SEM (Scanning Electron Microscopy) to determine the surface morphology of ZnO doped Cu2+ doped nanoparticles.
Indones. J. Chem., 2021, 21 (3), 564 - 574
Sherly Kasuma Warda Ningsih et al.
567
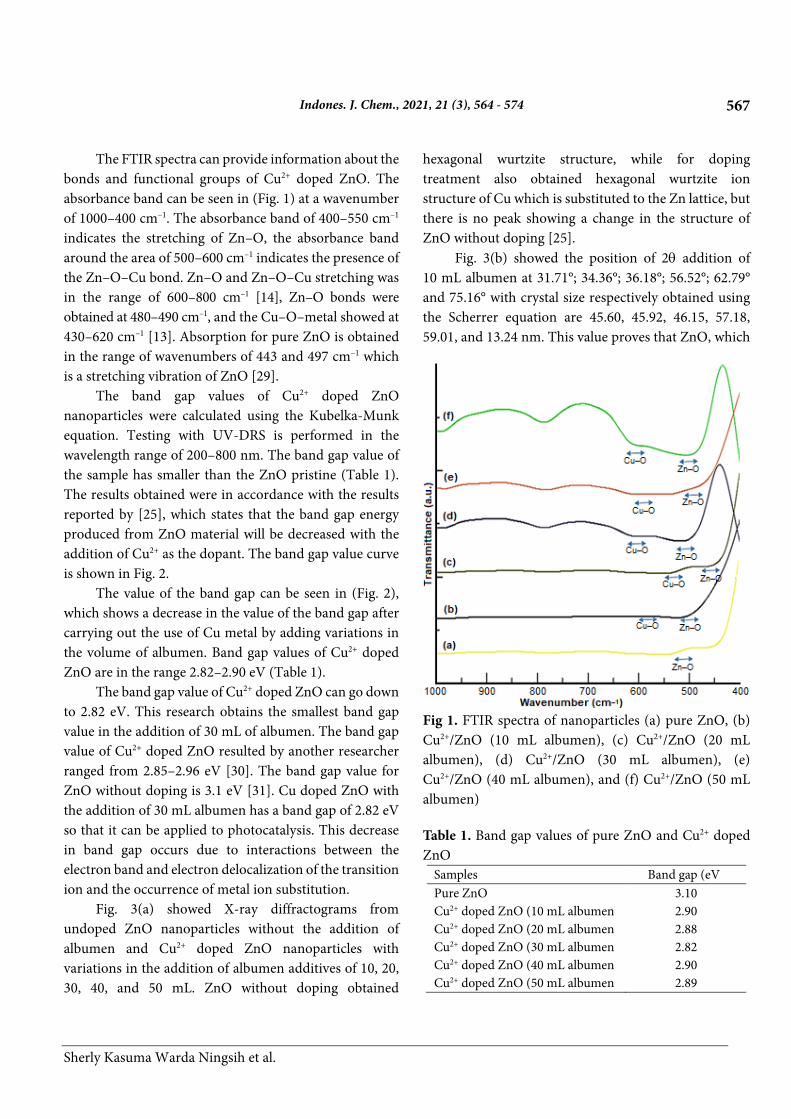
The FTIR spectra can provide information about the bonds and functional groups of Cu2+ doped ZnO. The absorbance band can be seen in (Fig. 1) at a wavenumber of 1000–400 cm–1. The absorbance band of 400–550 cm–1 indicates the stretching of Zn–O, the absorbance band around the area of 500–600 cm–1 indicates the presence of the Zn–O–Cu bond. Zn–O and Zn–O–Cu stretching was in the range of 600–800 cm–1 [14], Zn–O bonds were obtained at 480–490 cm–1, and the Cu–O–metal showed at 430–620 cm–1 [13]. Absorption for pure ZnO is obtained in the range of wavenumbers of 443 and 497 cm–1 which is a stretching vibration of ZnO [29].
The band gap values of Cu2+ doped ZnO nanoparticles were calculated using the Kubelka-Munk equation. Testing with UV-DRS is performed in the wavelength range of 200–800 nm. The band gap value of the sample has smaller than the ZnO pristine (Table 1). The results obtained were in accordance with the results reported by [25], which states that the band gap energy produced from ZnO material will be decreased with the addition of Cu2+ as the dopant. The band gap value curve is shown in Fig. 2.
The value of the band gap can be seen in (Fig. 2), which shows a decrease in the value of the band gap after carrying out the use of Cu metal by adding variations in the volume of albumen. Band gap values of Cu2+ doped ZnO are in the range 2.82–2.90 eV (Table 1).
The band gap value of Cu2+ doped ZnO can go down to 2.82 eV. This research obtains the smallest band gap value in the addition of 30 mL of albumen. The band gap value of Cu2+ doped ZnO resulted by another researcher ranged from 2.85–2.96 eV [30]. The band gap value for ZnO without doping is 3.1 eV [31]. Cu doped ZnO with the addition of 30 mL albumen has a band gap of 2.82 eV so that it can be applied to photocatalysis. This decrease in band gap occurs due to interactions between the electron band and electron delocalization of the transition ion and the occurrence of metal ion substitution.
Fig. 3(a) showed X-ray diffractograms from undoped ZnO nanoparticles without the addition of albumen and Cu2+ doped ZnO nanoparticles with variations in the addition of albumen additives of 10, 20, 30, 40, and 50 mL. ZnO without doping obtained
hexagonal wurtzite structure, while for doping treatment also obtained hexagonal wurtzite ion structure of Cu which is substituted to the Zn lattice, but there is no peak showing a change in the structure of ZnO without doping [25].
Fig. 3(b) showed the position of 2θ addition of 10 mL albumen at 31.71°; 34.36°; 36.18°; 56.52°; 62.79° and 75.16° with crystal size respectively obtained using the Scherrer equation are 45.60, 45.92, 46.15, 57.18, 59.01, and 13.24 nm. This value proves that ZnO, which
Fig 1. FTIR spectra of nanoparticles (a) pure ZnO, (b) Cu2+/ZnO (10 mL albumen), (c) Cu2+/ZnO (20 mL albumen), (d) Cu2+/ZnO (30 mL albumen), (e) Cu2+/ZnO (40 mL albumen), and (f) Cu2+/ZnO (50 mL albumen)
Table 1. Band gap values of pure ZnO and Cu2+ doped ZnO
Samples Band gap (eV Pure ZnO 3.10 Cu2+ doped ZnO (10 mL albumen 2.90 Cu2+ doped ZnO (20 mL albumen 2.88 Cu2+ doped ZnO (30 mL albumen 2.82 Cu2+ doped ZnO (40 mL albumen 2.90 Cu2+ doped ZnO (50 mL albumen 2.89

Indones. J. Chem., 2021, 21 (3), 564 - 574
Sherly Kasuma Warda Ningsih et al.
568
Fig 2. Band gap energy curves of Cu2+ doped ZnO (a) 10 mL, (b) 20 mL, (c) 30 mL, (d) 40 mL, and (e) 50 mL
is doped with Cu with the addition of albumen additives, is a nanoparticle material.
The resulting peaks address the hexagonal wurtzite crystal structure according to ICSD-ICDD (Inorganic Structure Database-International Center for Diffraction Data) data No. 01-076-0704 for Cu2+ doped ZnO nanoparticles with the addition of 10 mL of albumen. Egg white (albumen) is a gelling agent as well as an emulsifier that has a role in the long-term stability of nanoparticles,
which can prevent agglomeration (accumulation of crystal particles) so that with the presence of albumen, the particle size can be well controlled. Particle sizes for ZnO without doping and without the addition of albumen additives were around 38–74 nm [31].
Fig. 3(c) showed the position of 2θ addition of 20 mL of albumen at 31.72°; 34.38°; 36.20°; 56.53°; 62.80° and 83.39° with the crystal size obtained using the Scherrer equation is 53.21, 53.58, 46.15, 71.48, 73.76, and 14.05 nm,

Indones. J. Chem., 2021, 21 (3), 564 - 574
Sherly Kasuma Warda Ningsih et al.
569
Fig 3. Diffractogram of nanoparticles (a) Cu2+/ZnO (10 mL of albumen), (b) Cu2+/ZnO (20 mL of albumen), (c) Cu2+/ZnO (30 mL of albumen), (d) Cu2+/ZnO (40 mL of albumen), and (e) Cu2+/ZnO (50 mL of albumen) respectively. Fig. 3(d) showed the position of 2θ addition of 30 mL of albumen at 31.68°; 34.34°; 35.45°;36,17°; 56.48° and 81.47° with the corresponding crystal sizes obtained using the Scherrer equation is 53.21, 45.92, 40.30, 46.15, 47.64, and 16.62 nm, respectively. Fig. 3(e) showed the position of 2θ addition of 40 mL of albumen at 10.40°; 31.69 °; 34.36°; 35. 45°; 36.17°; and 56.50° with the respective crystal sizes being obtained using the Scherrer equation is 12.85, 53.21, 45.92, 46.06, 40.36, and 58.11 nm. Fig. 3(f) showed the position of 2θ addition of 50 mL of albumen at 31.704°, 34.36°, 36.18°; 21.86°; 56.51°
and 62.8° with the crystal size successively obtained using Scherrer's equation is 53.21, 45.92, 46.15, 19.55, 71.47, and 59.01 nm. This value proves that ZnO, which is doped with Cu with the addition of albumen additives, is a nanoparticle material. Albumen prevents the buildup of crystal particles so that with the presence of albumen, the particle size can be controlled properly.
Egg white has the ability to associate with metal ions in solution, and egg white is used as a binder to form a nanoparticle [32]. In general, high and sharp peak intensities are obtained at 2θ, which is the peak

Indones. J. Chem., 2021, 21 (3), 564 - 574
Sherly Kasuma Warda Ningsih et al.
570
characteristic of Cu2+ doped ZnO nanoparticle samples. This shows that the sample shows a high degree of crystallinity, the width of the peak indicates the sample is nano-sized (Table 2).
The surface analysis of Cu2+ doped ZnO samples with the addition of 30 mL of albumen can be seen in Fig. 4. SEM is an analytical technique used to see the topography and surface of a material. SEM images resulting from Cu2+ doped ZnO nanoparticle samples with the addition of albumen obtained a spheric shape with a diameter of 2.72–2.89 μm for ZnO doped Cu samples. The results of the characterization using SEM (Figure 4) showed that the presence of dopant on the morphology of ZnO nanoparticles is characterized by Cu in the form of needle-shaped crystals. The morphology of ZnO nanoparticles was influenced by the dopants [33].
Degradation of methyl orange (Fig. 5) was measured by UV-Vis at a wavelength of 400–800 nm. The maximum wavelength for methyl orange was 511 nm. Degradation is done by varying the time during irradiation under UV light that is 30, 60, 90, 120, 150, 180, 210, and 240 min.
The curves of each absorbance are shown in Fig. 6. Fig. 6 shows the absorbance value of methyl orange
after being degraded with a Cu doped ZnO catalyst. The results of initial absorbance measurements of methyl orange with a concentration of 10 ppm are used as a comparison of absorbance after degradation. The percent degradation can be calculated by using the following formula:
0 t
0
A AD 1 00%
A−
= × (2)
where: A0 is the initial absorbance, At is the absorbance of methyl orange after degradation at time t [34].
Table 2. Particle sizes of pure ZnO and Cu2+ doped ZnO Samples Particle sizes (nm
Pure ZnO 40-61 Cu2+ doped ZnO (10 mL of albumen 13.24-59.01 Cu2+ doped ZnO (20 mL of albumen 14.05-73.71 Cu2+ doped ZnO (30 mL of albumen 16.62-53.21 Cu2+ doped ZnO (40 mL of albumen 12.85-58.11 Cu2+ doped ZnO (50 mL of albumen 19.55-71.47
Fig 4. SEM Images of Cu2+ doped ZnO nanoparticles with magnification of (a) 5000×, (b) 10000×, (c) 20000×, (d) 40000×

Indones. J. Chem., 2021, 21 (3), 564 - 574
Sherly Kasuma Warda Ningsih et al.
571
Fig 5. Methyl orange (a) before degradation, (b) after degradation process (30, 60, 90, 120, 150 min), (c) after degradation process (210 and 240 min)
Based on measurements by using UV-DRS, absorbance decreases until 210 min with a percent degradation of 94.88% so that the degradation percent increases and the absorbance increases at 240 min so that the degradation percent decreases. Increased absorbance caused by excess •OH is generated so that it reacts with H2O2, which causes the formation of •OOH, which is unstable. This decrease in absorbance occurs due to contact between the solution of methyl orange and Cu doped ZnO catalyst with the help of UV light and sonication, which will accelerate degradation.
Fig. 7 shows the percent degradation of the methyl orange dyes by using the photosonolysis method. The data shows the optimum degradation process is found after 210 min with a degradation percentage of 94.88%, due to the more photons that hit the catalyst. This process increases the amount of •OH radicals attacking the dyes to give a stable bond in the dye, such as the azo group. Degradation of methyl orange can also be influenced by the particle size and band gap values of the material. The smallest particle size has the greatest kinetic energy, so the reaction is faster. The band gap energy increases between the valence band and the conduction band by decreasing the particle size. This is due to the confinement of the holes and electrons. The electron can easily be excited and easily produce •OH if the band gap value is small and the catalytic activity will increase under visible light.
Percent degradation of the methyl orange has decreased after 240 min. This is due to the excess of the H2O2 that has been produced during the sonication process,
Fig 6. Absorbance curves of (a) methyl orange before degradation (0 min), (b) after 30 min degradation, (c) after 60 min degradation, (d) after 90 min degradation, (e) after 120 min degradation, (f) after 150 min degradation, (g) after 180 min degradation, (h) after 210 min degradation and (i) after 240 min degradation
Fig 7. Photosonolysis curve for degradation of methyl orange
Indones. J. Chem., 2021, 21 (3), 564 - 574
Sherly Kasuma Warda Ningsih et al.
572
and the H2O2 reacts with •OH to produce hydroperoxy radicals (•OOH). H2O2 [35] is the factor that decreases the percent degradation of the methyl orange. A general equation for the reaction that occurs during photosonolysis degradation can be written as follows:
2H O ))) OH H+ • + • 2 2 2 2 2 2H O )))1 2H 1 2H O H O h 2 OH+ + + υ •
2 2H O ))) 2 OH+ • where ))) shows the sonication process [35].
Photolysis takes place through UV radiation, which causes the bonding of a compound by OH•. The principle of photolysis is the chemical reactions by using light and solid catalysts.
2 32H O H O OH+ −↔ +
OH h OH− •+ υ→ Degradation of the methyl orange is done by using
ultrasonication in a water medium. It can produce OH•, and H• during the sonication and cavitation effects. The cavitation effect will produce bubbles that will be broken down by ultrasonic waves. The Reaction can be written as follows:
2H O ~~ H OH+ → •+ • [36] ~~ = ultrasonic wave
■ CONCLUSION
Albumen can influence the synthesis of Cu2+ doped ZnO in terms of particle size makes them smaller than pure ZnO. Characterization of Cu2+ doped ZnO using FTIR shows the presence of metal oxide bonds at wavenumbers of 400–800 cm–1. The smallest bandgap value measured by UV-DRS was obtained from the addition of 30 mL of albumen with particle size measured using XRD ranging at 16.62–53.21 nm. The morphology produced after being measured using SEM has a spherical shape. Cu2+ doped ZnO catalyst can degrade methyl orange dyes with the most optimum percent degradation that is 94.88%, with an irradiation time of 210 min.
■ ACKNOWLEDGMENTS
The authors would like to thank the Ministry of Research and Higher Education, Indonesia, for providing financial support through research decentralization,
Penelitian Strategis Nasional Institusi (PSNI) No. 830/UN35.2/PG/2018.
■ REFERENCES
[1] Beitollahi, H., Tajik, S., Nejad, F.G., and Safaei, M., 2020, Recent advances in ZnO nanostructure-based electrochemical sensors and biosensors, J. Mater. Chem. B, 8 (27), 5826–5844.
[2] Saravanan, R., Karthikeyan, S., Gupta, V.K., Sekaran, G., Narayanan, V., and Stephen, A., 2013, Enhanced photocatalytic activity of ZnO/CuO nanocomposite for the degradation of textile dye on visible light illumination, Mater. Sci. Eng., C, 33 (1), 91–98.
[3] Karimi-Shamsabadi, M., Behpour, M., Babaheidari, A.K., and Saberi, Z., 2017, Efficiently enhancing photocatalytic activity of NiO-ZnO doped onto nanozeoliteX by synergistic effects of p-n heterojunction, supporting and zeolite nanoparticles in photo-degradation of Eriochrome Black T and methyl orange, J. Photochem. Photobiol., A, 346, 133–143.
[4] Ningsih, S.K.W., Nizar, U.K., Bahrizal, Nasra, E., and Suci, R.F., 2019, Effect of egg white as additive for synthesis and characterization of Al doped ZnO nanoparticles by using sol-gel method, J. Phys.: Conf. Ser., 1185, 012029.
[5] Trandafilović, L.V., Jovanović, D.J., Zhang, X., Ptasińska, S., and Dramićanin, M.D., 2017, Enhanced photocatalytic degradation of methylene blue and methyl orange by ZnO:Eu nanoparticles, Appl. Catal., B, 203, 740–752.
[6] Omri, K., Najeh, I., Dhahri, R., El Ghoul, J., and El Mir, L., 2014, Effects of temperature on the optical and electrical properties of ZnO nanoparticles synthesized by sol-gel method, Microelectron. Eng., 128, 53–58.
[7] Khan, S.A., Noreen, F., Kanwal, S., Iqbal, A., and Hussain, G., 2018, Green synthesis of ZnO and Cu-doped ZnO nanoparticles from leaf extracts of Abutilon indicum, Clerodendrum infortunatum, Clerodendrum inerme and investigation of their

Indones. J. Chem., 2021, 21 (3), 564 - 574
Sherly Kasuma Warda Ningsih et al.
573
biological and photocatalytic activities, Mater. Sci. Eng., C, 82, 46–59.
[8] Ghahramanifard, F., Rouhollahi, A., and Fazlolahzadeh, O., 2018, Electrodeposition of Cu-doped p-type ZnO nanorods; Effect of Cu doping on structural, optical and photoelectrocatalytic property of ZnO nanostructure, Superlattices Microstruct., 114, 1–14.
[9] Wu, C., Shen, L., Yu, H., Zhang, Y., and Huang, Q., 2012, Solvothermal synthesis of Cu-doped ZnO nanowires with visible light-driven photocatalytic activity, Mater. Lett., 74, 236–238.
[10] Lee, J.S., Lee, Y.M., and Boo, J.H., 2015, Doping control of Cu in pH-tuned hydrothermal growth of ZnO nanowires, Appl. Surf. Sci., 354, 66–70.
[11] Prasad, N., and Karthikeyan, B., 2017, Cu-doping and annealing effect on the optical properties and enhanced photocatalytic activity of ZnO nanoparticles, Vacuum, 146, 501–508.
[12] Kanade, K.G., Kale, B.B., Baeg, J.O., Lee, S.M., Lee, C.W., Moon, S.J., and Chang, H., 2007, Self-assembled aligned Cu doped ZnO nanoparticles for photocatalytic hydrogen production under visible light irradiation, Mater. Chem. Phys., 102 (5), 98–104.
[13] Singhal, S., Kaur, J., Namgyal, T., and Sharma, R., 2012, Cu-doped ZnO nanoparticles: Synthesis, structural and electrical properties, Physica B, 407 (8), 1223–1226.
[14] Othman, A.A., Ali, M.A., Ibrahim, E.M.M., and Osman, M.A., 2016, Influence of Cu doping on structural, morphological, photoluminescence, and electrical properties of ZnO nanostructures synthesized by ice-bath assisted sonochemical method, J. Alloys Compd., 683, 399–411.
[15] Omri, K., Bettaibi, A., Khirouni, K., and El Mir, L., 2018, The optoelectronic properties and role of Cu concentration on the structural and electrical properties of Cu doped ZnO nanoparticles, Physica B, 537, 167–175.
[16] Yadav, R.S., Mishra, P., and Pandey, A.C., 2008, Growth mechanism and optical property of ZnO nanoparticles synthesized by sonochemical method, Ultrason. Sonochem., 15 (5), 863–868.
[17] Ningsih, S.K.W., 2016, Sintesis Anorganik, UNP Press, Padang, Indonesia.
[18] Camaratta, R., Orozco-Messana, J., and Bergmann, C.P., 2015, Synthesis of ZnO through biomimetization of eggshell membranes using different precursors and its characterization, Ceram. Int., 41 (10), 14826–14833.
[19] Bhunia, A.K., Kamilya, T., and Saha, S., 2016, Synthesis, characterization of ZnO nanorods and its interaction with albumin protein, Mater. Today: Proc., 3 (2), 592–597.
[20] Dhara, S., and Bhargava, P., 2001, Egg white as an environmentally friendly low-cost binder for gelcasting of ceramics, J. Am. Ceram. Soc., 84 (12), 3048–3050.
[21] Thangaraj, P., Rajan, J., Durai, S., Kumar, S., Ratnaphani, A., and Neri, G., 2011, The role of albumen (egg white) in controlled particle size and electrical conductivity behavior of zinc oxide nanoparticles, Vacuum, 86 (2), 140–143.
[22] Torres-Hernández, J.R., Ramírez-Morales, E., Rojas-Blanco, L., Pantoja-Enriquez, J., Oskam, G., Paraguay-Delgado, F., Escobar-Morales, B., Acosta-Alejandro, M., Díaz-Flores, L.L., and Pérez-Hernández, G., 2015, Structural, optical and photocatalytic properties of ZnO nanoparticles modified with Cu, Mater. Sci. Semicond. Process., 37, 87–92.
[23] Subha, P.P., and Jayaraj, M.K., 2015, Solar photocatalytic degradation of methyl orange dye using TiO2 nanoparticles synthesised by sol–gel method in neutral medium, J. Exp. Nanosci., 10 (14), 1106–1115.
[24] Chen, T., Zheng, Y., Lin, J.M., and Chen, G., 2008, Study on the photocatalytic degradation of methyl orange in water using Ag/ZnO as catalyst by liquid chromatography electrospray ionization ion-trap mass spectrometry, J. Am. Soc. Mass Spectrom., 19 (7), 997–1003.
[25] Prasad, N., Saipavitra, V.M.M., Swaminathan, H., Thangaraj, P., Viswanathan, M.R., and Balasubramanian, K., 2016, Microstress, strain, band gap tuning and photocatalytic properties of

Indones. J. Chem., 2021, 21 (3), 564 - 574
Sherly Kasuma Warda Ningsih et al.
574
thermally annealed and Cu-doped ZnO nanoparticles, Appl. Phys. A Mater. Sci. Process., 122 (6), 590.
[26] Kumar, R., Kumar, G., and Umar, A., 2013, ZnO nano-mushrooms for photocatalytic degradation of methyl orange, Mater. Lett., 97, 100–103.
[27] He, Y., Grieser, F., and Ashokkumar, M., 2011, The mechanism of sonophotocatalytic degradation of methyl orange and its products in aqueous solutions, Ultrason. Sonochem., 18 (5), 974–980.
[28] Kumar, R., Kumar, G., Akhtar, M.S., and Umar, A., 2015, Sonophotocatalytic degradation of methyl orange using ZnO nano-aggregates, J. Alloys Compd., 629, 167–172.
[29] Ali, I., Suhail, M., Alothman, Z.A., and Alwarthan, A., 2018, Recent advances in syntheses, properties and applications of TiO2 nanostructures, RSC Adv., 8, 30125–30147.
[30] Amutha, C., Thanikaikarasan, S., Ramadas, V., and Natarajan, B., 2015, Structural, morphological and optical properties of Albumen mediated ZnO nanoparticles, Optik, 126 (24), 5748–5752.
[31] Ningsih, S.K.W., Nizar, U.K., and Novitria, U., 2017, Sintesis dan karakterisasi nanopartikel ZnO doped
Cu2+ melalui metoda sol-gel, Eksakta, 18 (2), 39–51. [32] Ahmed, M.A., Okasha, N., and El-Dek, S.I., 2011,
Novelty, preparation, characterization and enhancement of magnetic properties of Mn nanoferrites using safety binder (egg white), Solid State Sci., 13 (10), 1840–1843.
[33] Labhane, P.K., Huse, V.R., Patle, L.B., Chaudhari, A.L., and Sonawane, G.H., 2015, Synthesis of Cu doped ZnO nanoparticles: Crystallographic, optical, FTIR, morphological and photocatalytic study, J. Mater. Sci. Chem. Eng., 3 (7), 39–51.
[34] Sriram, S., Lalithambika, K.C., and Thayumanavan, A., 2017, Experimental and theoretical investigations of photocatalytic activity of Cu doped ZnO nanoparticles, Optik, 139, 299–308.
[35] Joseph, C.G., Taufiq-Yap, Y.H., and Krishnan, V., 2017, Ultrasonic assisted photolytic degradation of reactive black 5 (RB5) simulated wastewater, ASEAN J. Chem. Eng., 17 (2), 37–50.
[36] Sanjaya, H., Rida, P., and Ningsih, S.K.W., 2017, Degradasi methylene blue menggunakan katalis ZnO-PEG dengan metode fotosonolisis, Eksakta, 18 (2), 21–29.