
First-Principles Calculations of Clean and Defected ZnO Surfaces
10
First-Principles Calculations of Clean and Defected ZnO Surfaces Nunzio Roberto D’Amico, †,‡ Giovanni Cantele,* ,† and Domenico Ninno ‡,† † CNR-SPIN, Complesso Universitario Monte Sant’Angelo, Dipartimento di Scienze Fisiche, Via Cintia, 80126 Napoli, Italy ‡ Universita ̀ degli Studi di Napoli “Federico II”, Dipartimento di Scienze Fisiche, Complesso Universitario Monte Sant’Angelo, Via Cintia, 80126 Napoli, Italy ABSTRACT: We report on a theoretical study of the nonpolar ZnO (101̅0) and (112̅0) surfaces carried out in the framework of density functional theory, aiming to elucidate the thermodynamic and kinetic stability of the clean surface against the formation and diffusion of oxygen vacancies. At variance with other oxide materials and ZnO surfaces with different orientation, we show that, under exposure to molecular oxygen in the gas phase, no significant amounts of oxygen vacancies can be sustained by the surface, in agreement with recent Scanning Tunnelling Microscope (STM) observations. However, our calculations show also that under ultrahigh vacuum and high-temperature conditions the observation of oxygen vacancies might be possible, as reported in earlier experiments of Gö pel and Lampe. 1 We characterize the defected surfaces electronic and structural properties as a function of the position of the defect with respect to the surface and discuss the diffusion paths of such defects both parallel and across the surface. ■ INTRODUCTION The detection of specific gas molecules in mixtures of various gases is increasingly required for the control and monitoring of several industrial and medical processes. 2,3 Solid-state gas sensors based on metal−oxide−semiconductor materials have attracted considerable attention during the past decade 4−10 due to low cost, small dimensions, and high compatibility with microelectronics processing. The conventional sensing mech- anism relies on the charge transfer between the absorbed gas and the metal oxide surface. Depending on the semiconductor type, the charge transfer will either increase or decrease the concentration of the majority carriers, thereby increasing or decreasing the sensor electrical conductance. 9,10 Zinc oxide (ZnO), tin dioxide (SnO 2 ), and titanium dioxide (TiO 2 ) nanostructures have been identified as promising gas- sensitive materials with many well-documented applica- tions. 10−16 In particular, ZnO is interesting because of its mixed covalent/ionic character in the chemical bonding, with peculiar properties such as large exciton binding energy (60 meV) and direct band gap (3.4 eV). The versatility and multifunctionality of this material are testified by the wide range of possible applications in varistors, 17 surface acoustic wave devices, 18 transparent conducting oxide electrodes, 19 solar cells, 20 blue/UV light emitting devices, 21 self-powered (nano)- devices, 22 and, as mentioned, gas sensors. 23,24 Of course, it is expected that photocatalysis and gas sensing applications require a precise control of the surface morphology, chemistry, and composition: usually, nanostructures with different surface facets are employed, the (101̅0) and (112̅0) surfaces/facets being the most stable and abundant ones. 25,26 Since the ZnO properties are highly sensitive to the nature and concentration of lattice imperfections, 27,28 understanding the thermodynamics and kinetics of point defects in ZnO is not only of fundamental but also of significant technological interest. For example, zinc migration, which is believed to proceed through the migration of intrinsic defects in the vicinity of grain boundariesmost likely zinc interstitialshas been discussed in connection with the degradation of varistors devices. 29,30 Moreover, it has been argued that the presence of native surface and subsurface point defects, their concentration, and depth distribution can strongly affect the electronic properties and electrical response of metal−ZnO interfaces and Schottky barriers, as well as the gas adsorption on specific ZnO surfaces. 31 Some ab initio density functional theory (DFT) calculations have been performed in the past to elucidate the behavior of both intrinsic 32−35 and extrinsic point defects. 36,37 It is widely accepted that oxygen vacancies can be considered as the most abundant and the chemically most reactive kind of atomic defects for a large variety of oxides. 38 Previous theoretical studies of the bulk ZnO and its surfaces have proven the impact of oxygen deficiency on the electronic and structural proper- ties. 39−43 Nevertheless, a systematic study of the vacancy diffusion along and across the ZnO nonpolar (101̅0) and (112̅0) surfaces together with the implications on relevant material properties is still lacking. Moreover, the actual Received: July 9, 2012 Revised: September 12, 2012 Published: September 14, 2012 Article pubs.acs.org/JPCC © 2012 American Chemical Society 21391 dx.doi.org/10.1021/jp306785z | J. Phys. Chem. C 2012, 116, 21391−21400
Transcript of First-Principles Calculations of Clean and Defected ZnO Surfaces
First-Principles Calculations of Clean and Defected ZnO SurfacesNunzio Roberto D’Amico,†,‡ Giovanni Cantele,*,† and Domenico Ninno‡,†
†CNR-SPIN, Complesso Universitario Monte Sant’Angelo, Dipartimento di Scienze Fisiche, Via Cintia, 80126 Napoli, Italy‡Universita degli Studi di Napoli “Federico II”, Dipartimento di Scienze Fisiche, Complesso Universitario Monte Sant’Angelo, ViaCintia, 80126 Napoli, Italy
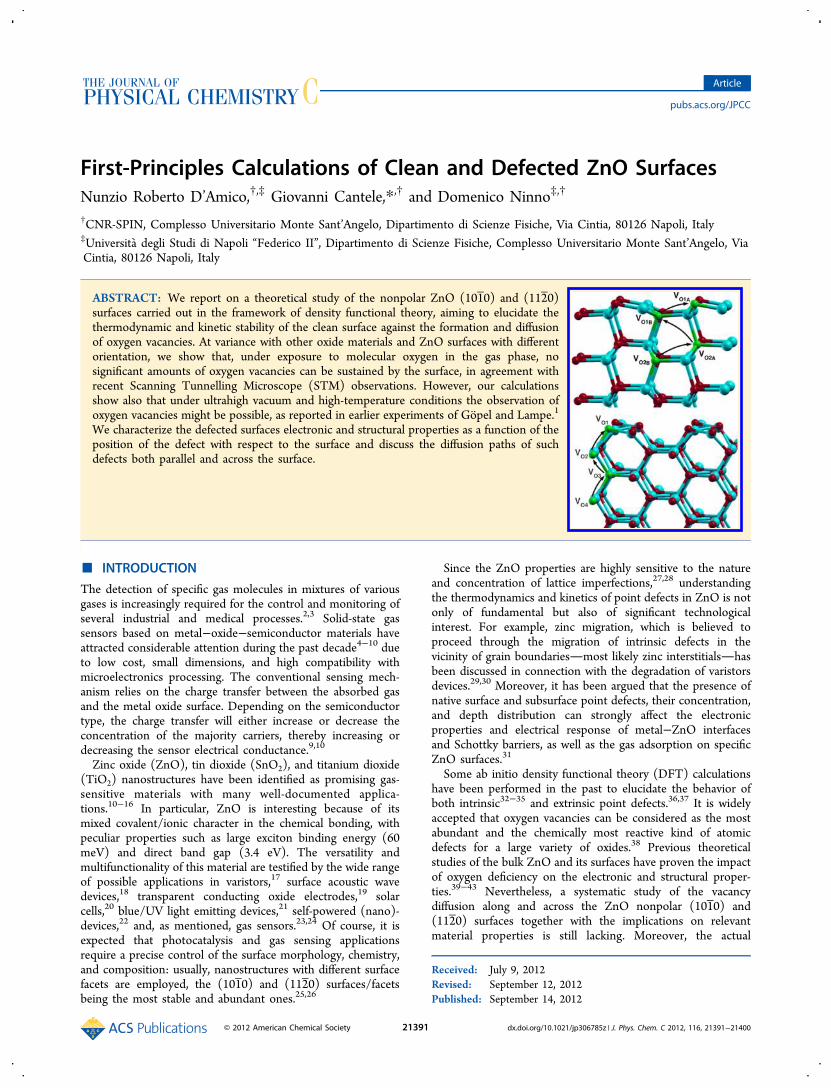
ABSTRACT: We report on a theoretical study of the nonpolar ZnO (101 0) and (112 0)surfaces carried out in the framework of density functional theory, aiming to elucidate thethermodynamic and kinetic stability of the clean surface against the formation and diffusionof oxygen vacancies. At variance with other oxide materials and ZnO surfaces with differentorientation, we show that, under exposure to molecular oxygen in the gas phase, nosignificant amounts of oxygen vacancies can be sustained by the surface, in agreement withrecent Scanning Tunnelling Microscope (STM) observations. However, our calculationsshow also that under ultrahigh vacuum and high-temperature conditions the observation ofoxygen vacancies might be possible, as reported in earlier experiments of Gopel and Lampe.1
We characterize the defected surfaces electronic and structural properties as a function of theposition of the defect with respect to the surface and discuss the diffusion paths of suchdefects both parallel and across the surface.
■ INTRODUCTION
The detection of specific gas molecules in mixtures of variousgases is increasingly required for the control and monitoring ofseveral industrial and medical processes.2,3 Solid-state gassensors based on metal−oxide−semiconductor materials haveattracted considerable attention during the past decade4−10 dueto low cost, small dimensions, and high compatibility withmicroelectronics processing. The conventional sensing mech-anism relies on the charge transfer between the absorbed gasand the metal oxide surface. Depending on the semiconductortype, the charge transfer will either increase or decrease theconcentration of the majority carriers, thereby increasing ordecreasing the sensor electrical conductance.9,10
Zinc oxide (ZnO), tin dioxide (SnO2), and titanium dioxide(TiO2) nanostructures have been identified as promising gas-sensitive materials with many well-documented applica-tions.10−16 In particular, ZnO is interesting because of itsmixed covalent/ionic character in the chemical bonding, withpeculiar properties such as large exciton binding energy (60meV) and direct band gap (3.4 eV). The versatility andmultifunctionality of this material are testified by the wide rangeof possible applications in varistors,17 surface acoustic wavedevices,18 transparent conducting oxide electrodes,19 solarcells,20 blue/UV light emitting devices,21 self-powered (nano)-devices,22 and, as mentioned, gas sensors.23,24 Of course, it isexpected that photocatalysis and gas sensing applicationsrequire a precise control of the surface morphology, chemistry,and composition: usually, nanostructures with different surfacefacets are employed, the (101 0) and (112 0) surfaces/facetsbeing the most stable and abundant ones.25,26
Since the ZnO properties are highly sensitive to the natureand concentration of lattice imperfections,27,28 understandingthe thermodynamics and kinetics of point defects in ZnO is notonly of fundamental but also of significant technologicalinterest. For example, zinc migration, which is believed toproceed through the migration of intrinsic defects in thevicinity of grain boundariesmost likely zinc interstitialshasbeen discussed in connection with the degradation of varistorsdevices.29,30 Moreover, it has been argued that the presence ofnative surface and subsurface point defects, their concentration,and depth distribution can strongly affect the electronicproperties and electrical response of metal−ZnO interfacesand Schottky barriers, as well as the gas adsorption on specificZnO surfaces.31
Some ab initio density functional theory (DFT) calculationshave been performed in the past to elucidate the behavior ofboth intrinsic32−35 and extrinsic point defects.36,37 It is widelyaccepted that oxygen vacancies can be considered as the mostabundant and the chemically most reactive kind of atomicdefects for a large variety of oxides.38 Previous theoreticalstudies of the bulk ZnO and its surfaces have proven the impactof oxygen deficiency on the electronic and structural proper-ties.39−43 Nevertheless, a systematic study of the vacancydiffusion along and across the ZnO nonpolar (101 0) and(112 0) surfaces together with the implications on relevantmaterial properties is still lacking. Moreover, the actual
Received: July 9, 2012Revised: September 12, 2012Published: September 14, 2012
Article
pubs.acs.org/JPCC
© 2012 American Chemical Society 21391 dx.doi.org/10.1021/jp306785z | J. Phys. Chem. C 2012, 116, 21391−21400
possibility of observing stable (sub)surface oxygen defects hasbeen experimentally proven in the early 80s1,44 but questionedby recent STM experiments.45,46
In this work, we discuss the structural and electronicproperties [band structure, density of states (DOS), defectand surface formation energies] of oxygen-deficient surfaces asa function of the defect position with respect to the surface.Oxygen vacancy migration paths are characterized in theframework of the climbing image nudged elastic band methodconsidering the diffusion both parallel and across the surface.The calculated energy barriers and activation temperaturesinvolved in the diffusion process are discussed and comparedwith the respective bulk counterparts. Moreover, in the case ofthe (101 0) surface, we try to elucidate the apparentdisagreement of the available experimental data, which report,depending on the preparation conditions, the observation of afinite concentration of oxygen vacancies or the lack of themclose to the surface. With this aim, we also consider theenergetics of ZnO-dimer and Zn vacancies, which might occuras the prevailing atomic defects under suitable conditions oftemperature and pressure.
■ COMPUTATIONAL DETAILS AND SURFACEMODELS
All first-principles calculations are carried out within the DFTframework as implemented in the QUANTUM ESPRESSOpackage.47 We use the generalized gradient approximation(GGA) parametrized with the Perdew, Burke, and Ernzerhof(PBE) exchange−correlation functional48 and Vanderbiltultrasoft pseudopotentials49,50 to mimic the ion cores. Thekinetic-energy cutoff for the plane waves is set to 40 Ry and thecutoff for the augmented density to 320 Ry. The crystal/surfacegeometries are optimized with the direct energy minimizationtechnique of Broyden−Fletcher−Goldfarb−Shanno.51 Theoptimization is stopped when each Cartesian component ofthe force acting on each atom is less than 0.026 eV/Å and thetotal energy difference between two consecutive steps of theminimization procedure is less than 10−4 eV. All the propertiespresented in the following are referring to the optimizedsystems.To test the reliability of the methods and of the
pseudopotentials, the bulk ZnO structural and electronicproperties have been computed. The ZnO polymorph ofinterest for the present study is the wurtzite structure, for whichthe first Brillouin zone (BZ) is sampled using a 16 × 16 × 12Monkhorst−Pack k-point mesh.52 The crystallographic param-eters are computed from the Birch−Murnaghan equation ofstate53 and are listed in Table 1, from which a good comparisonwith the experimental results can be inferred. At variance withthe structural properties, the computed band gap (also shownin Table 1) severely underestimates the experimental value, butit is consistent with previous DFT calculations.34 While theDFT failure in predicting the band gap is a well-known fact, theunderestimation in the case of ZnO goes well beyond thetypical errors found for other materials. The road we havefollowed for curing this problem is that proposed by Janotti andcoworkers,40 who employ the DFT+U scheme. The Hubbard Uvalues we included are 12.0 eV on the Zn 3d orbitals and 6.5 eVon the oxygen 2p orbitals, which have already been shown towork well for ZnO.54 The lattice parameters, recomputedwithin the DFT+U scheme, change by about 1%, but with asubstantial improvement of the electronic properties descrip-tion (see Table 1). Since only the electronic properties are
significantly modified using the DFT+U scheme, following ref54 we first optimize the atomic positions at the standard DFTlevel and only after we include the Hubbard correction for thecalculation of the electronic properties.The ZnO (101 0) and (1120) surfaces are modeled using a
slab geometry of periodically repeated supercells containing 12atomic planes.57 A vacuum width of 15 Å separates each slabfrom its periodic images to avoid spurious interactions betweenrepeated slabs. As evidenced by Figure 1, the [101 0] direction
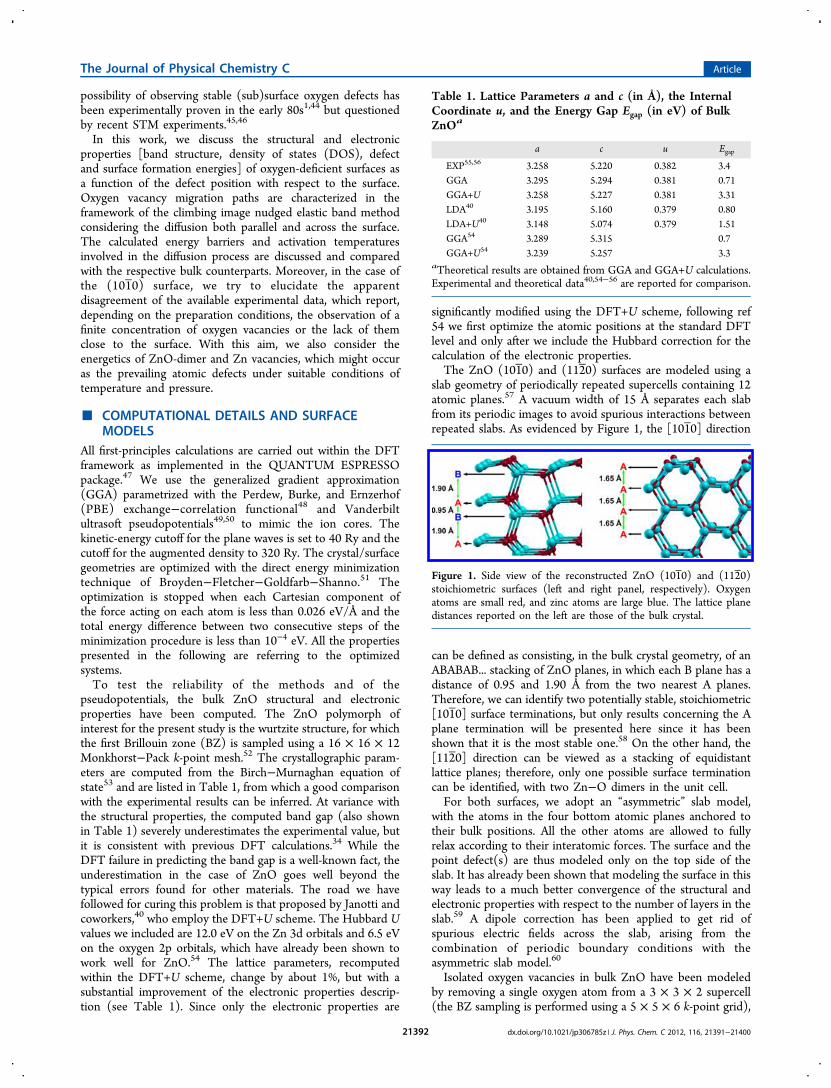
can be defined as consisting, in the bulk crystal geometry, of anABABAB... stacking of ZnO planes, in which each B plane has adistance of 0.95 and 1.90 Å from the two nearest A planes.Therefore, we can identify two potentially stable, stoichiometric[101 0] surface terminations, but only results concerning the Aplane termination will be presented here since it has beenshown that it is the most stable one.58 On the other hand, the[112 0] direction can be viewed as a stacking of equidistantlattice planes; therefore, only one possible surface terminationcan be identified, with two Zn−O dimers in the unit cell.For both surfaces, we adopt an “asymmetric” slab model,
with the atoms in the four bottom atomic planes anchored totheir bulk positions. All the other atoms are allowed to fullyrelax according to their interatomic forces. The surface and thepoint defect(s) are thus modeled only on the top side of theslab. It has already been shown that modeling the surface in thisway leads to a much better convergence of the structural andelectronic properties with respect to the number of layers in theslab.59 A dipole correction has been applied to get rid ofspurious electric fields across the slab, arising from thecombination of periodic boundary conditions with theasymmetric slab model.60
Isolated oxygen vacancies in bulk ZnO have been modeledby removing a single oxygen atom from a 3 × 3 × 2 supercell(the BZ sampling is performed using a 5 × 5 × 6 k-point grid),
Table 1. Lattice Parameters a and c (in Å), the InternalCoordinate u, and the Energy Gap Egap (in eV) of BulkZnOa
a c u Egap
EXP55,56 3.258 5.220 0.382 3.4GGA 3.295 5.294 0.381 0.71GGA+U 3.258 5.227 0.381 3.31LDA40 3.195 5.160 0.379 0.80LDA+U40 3.148 5.074 0.379 1.51GGA54 3.289 5.315 0.7GGA+U54 3.239 5.257 3.3
aTheoretical results are obtained from GGA and GGA+U calculations.Experimental and theoretical data40,54−56 are reported for comparison.
Figure 1. Side view of the reconstructed ZnO (101 0) and (112 0)stoichiometric surfaces (left and right panel, respectively). Oxygenatoms are small red, and zinc atoms are large blue. The lattice planedistances reported on the left are those of the bulk crystal.
The Journal of Physical Chemistry C Article
dx.doi.org/10.1021/jp306785z | J. Phys. Chem. C 2012, 116, 21391−2140021392
while for the study of oxygen vacancies at the ZnO (101 0) andZnO (112 0) surfaces, we have considered, respectively, 2 × 2and 2 × 1 surface supercells to study the dependence of thecalculated properties as a function of the defect depth withrespect to the surface. These supercells correspond to aminimum vacancy−vacancy distance of 9.8, 6.6, and 5.3 Å forthe defected bulk, (101 0), and (112 0) ZnO surfaces,respectively. Convergence tests with respect to the vacancy−vacancy distance showed small variations (within 0.1 eV) of thevacancy formation energies and of the surface band gap. Yet,electronic levels localized around the defect did show a largersensitivity to the vacancy concentration. As such, defectedsurface band structure calculations were performed using a 3 ×3 supercell.To shed light on the stability of the above-mentioned
defected surface and bulk ZnO models, we have carried out anextensive thermodynamic and kinetic analysis, aimed to identifythe most favorable configurations as well as migration paths foroxygen vacancies in thermally activated diffusion processes.According to a well-established methodology,61−64 the relativestability (against oxidation and reduction processes) of different(defected or undefected) surfaces in equilibrium with anoxygen atmosphere at a given pressure p and temperature T isfound by calculating the surface formation energy (per unitarea) defined as
σ
μ
= − +
+ Δ − −
⎡⎣⎢
⎤⎦⎥
T pA
E N E NE
N T pA
E N E
( , )1
2
( , )1
2[ ]
slab Zn ZnObulk
vacO
vac O slab0
Zn ZnObulk
2
(1)
where Eslab is the total energy of the slab under investigation;NZn and Nvac are the number of Zn atoms and oxygen vacanciesin the slab supercell; A is the surface supercell area; EZnO
bulk is theenergy of bulk ZnO per formula unit; Eslab
0 is the energy of thestoichiometric slab with the atoms fixed at their ideal bulkpositions; EO2
is the total energy of the spin-polarized O2
molecule; and ΔμO(T, p) is the variation, at given pressure andtemperature, of the oxygen chemical potential.The term (1/2A)[Eslab
0 − NZnEZnObulk ] in eq 1 is the surface
formation energy of a stoichiometric slab with the atoms fixedat their bulk positions. It must be subtracted to get rid of thecontribution of the “unrelaxed” side of the slab to the formationenergy, as a consequence of the asymmetric supercell model wehave adopted.Equation 1 is simply derived by taking into account that
experimentally the chemical potentials of the O and Zn atomscannot be varied without bounds. Indeed, the O and Zn atomsare assumed to form no condensate on the surface.Consequently, the chemical potential of each species must belower than the Gibbs free energy of an atom in the stable phaseof the considered species (assumed to be the hcp Zn bulk metaland the O2 molecule in the gas phase, respectively). Moreover,if there is enough bulk material to act as a thermodynamicreservoir, the chemical potentials of O and Zn are notindependent but related by the Gibbs free energy of the bulkoxide: μZn(T, p) + μO(T, p) = gZnO
bulk (T, p) where gZnObulk (T, p) is
the Gibbs free energy of bulk ZnO per formula unit. It is alsoworth pointing out that, in principle, eq 1 should contain theGibbs free energies of the system, rather than the DFT totalenergies. Nevertheless, it has been argued that the vibrational
contribution to the Gibbs free energy either can be neglectedwith respect to the other contributions or does not significantlyaffect the physical conclusions,64 even though in specialsituations such approximations might not be valid. From eq 1we observe that σ(T, p) is a function of only ΔμO(T, p) whosetemperature and pressure dependence is defined by
μ μΔ = Δ +⎛⎝⎜
⎞⎠⎟T p T p k T
pp
( , ) ( , )12
lnO O0
B 0(2)
where p0 = 1 atm. The temperature dependence of ΔμO(T, p0)includes contributions from molecular vibration and rotations,as well as ideal-gas entropy at 1 atm pressure. These data can befound in thermodynamic tables.65 By employing eq 2, one canprovide the diagrams of the thermodynamic stability with aclear physical meaning behind the calculated curves.For all stoichiometric and defected slabs, formation energy
calculations are performed at the DFT level of the theory.Indeed, a complication arises when total DFT+U energies areused in calculations involving energy differences because of theneed of calculating elemental reference energies, e.g., metallicbulk Zn and O2 molecule in our case. On one hand, theappropriate U value for the Zn d states should be smaller in themetal than in ZnO, due to the difference in screening. On theother hand, total energies should in practice be compared onlyfor the same U.66,67 Thus, the DFT+U vacancy formationenergies might not be accurate, if different values of U are takenfor the semiconductor and the metal.According to the transition state theory,68 the kinetics
underlying the thermally activated process of vacancy diffusionis governed by the energy barrier Eb to be overcome for thevacancy to jump from one site to a neighbor one. Thecalculation of Eb is performed by employing the climbing imagenudged elastic band method,69 aimed to find the minimumenergy path (MEP) connecting an initial and a final stateconfiguration corresponding to two minima of the potentialenergy surface. An accurate sampling of the MEP is performedusing 11 intermediate images (between the initial and finalpoint of the path). Forces along the MEP were minimized toless than 0.1 eV/Å to ensure convergence. Once Eb is known,the process rate is easily defined as Γ = Γo exp(−(Eb/kBT)),where the prefactor Γo is the ratio of the vibrational frequenciesat the initial configuration to the frequencies at the saddlepoint; kB is the Boltzmann constant; and T is the temperature.A reasonable estimate of the temperature at which the oxygenvacancy becomes mobile can be obtained by taking the usualdefinition of the activation temperature, i.e., the temperature atwhich the jump rate Γ is 1 s−1. To a good approximation Γo canbe taken as a typical phonon frequency, i.e., 1013 s−1. Therefore,we can use Γ = 1 s−1, Γo = 1013 s−1, and the calculated Eb valuesfor each path to estimate the annealing temperature (thistypically slightly overestimates the temperature at which oxygenvacancies become mobile).As a final remark, it is worth mentioning that careful tests
have been performed to ensure full convergence of the maincomputed properties (formation energies, energy barriers indiffusion paths, etc.) with respect to the parameters enteringthe calculations (cutoff, BZ sampling, etc.).
■ RESULTS AND DISCUSSIONClean ZnO (1010) and ZnO (1120) Surfaces. The
nonpolar ZnO (101 0) and (112 0) surfaces are obtained bycutting the bulk crystal along planes parallel to the c axis. The
The Journal of Physical Chemistry C Article
dx.doi.org/10.1021/jp306785z | J. Phys. Chem. C 2012, 116, 21391−2140021393
respective surface geometries are sketched in Figure 1. While inthe bulk Zn and O atoms are 4-fold coordinated, on the (101 0)and (1120) surfaces they become 3-fold coordinated. Theresulting reconstruction keeps limited to surface atoms. Forexample, for the (1010) surface the surface Zn and theuppermost O atoms relax inward by 0.341 and 0.003 Å,respectively (to be compared with the LEED experimentaloutcomes70 of 0.3 ± 0.15 Å and 0.1 ± 0.05 Å). On the otherhand, only a slight reduction of the Zn−O bond length (from2.02 to 2.01 Å) on the subsurface layer is observed. The surfacerelaxation leads to a shortening of Zn−O bonds (from 2.02 to∼1.9 Å) and to a tilt of the Zn−O dimers by 10.3° and 7.7° forthe (101 0) and (112 0) surfaces, respectively. This relativelysmall tilt angle, together with the Zn−O bond lengthcontraction of about 7%, is a signature of the mixed characterof the chemical bond which turns out to be highly ionic butwith a significant covalent contribution.The surface formation energies per unit area obtained from
eq 1 with Nvac = 0 are 0.052 and 0.055 eV/Å2 for the (1010)and (112 0) surfaces, respectively. The (slightly) lower stabilityof the latter can be ascribed to its rougher morphology (whencompared with the (1010) surface) and agrees withexperimental STM results.45,71 Our results are compatiblewith the calculations of Meyer and Marx72 that use a symmetricslab model. However, a discrepancy is found with the results ofSpencer et al.73 These authors use an asymmetric slab modelwith fixed bottom layers (the same strategy as ours) but do notsubtract, as we do in eq 1, the contribution coming from theunrelaxed side, thus reporting the slab cleavage energy (withcontributions coming from both the relaxed and the unrelaxedsides of the slab).Electronic band structure calculations, performed within the
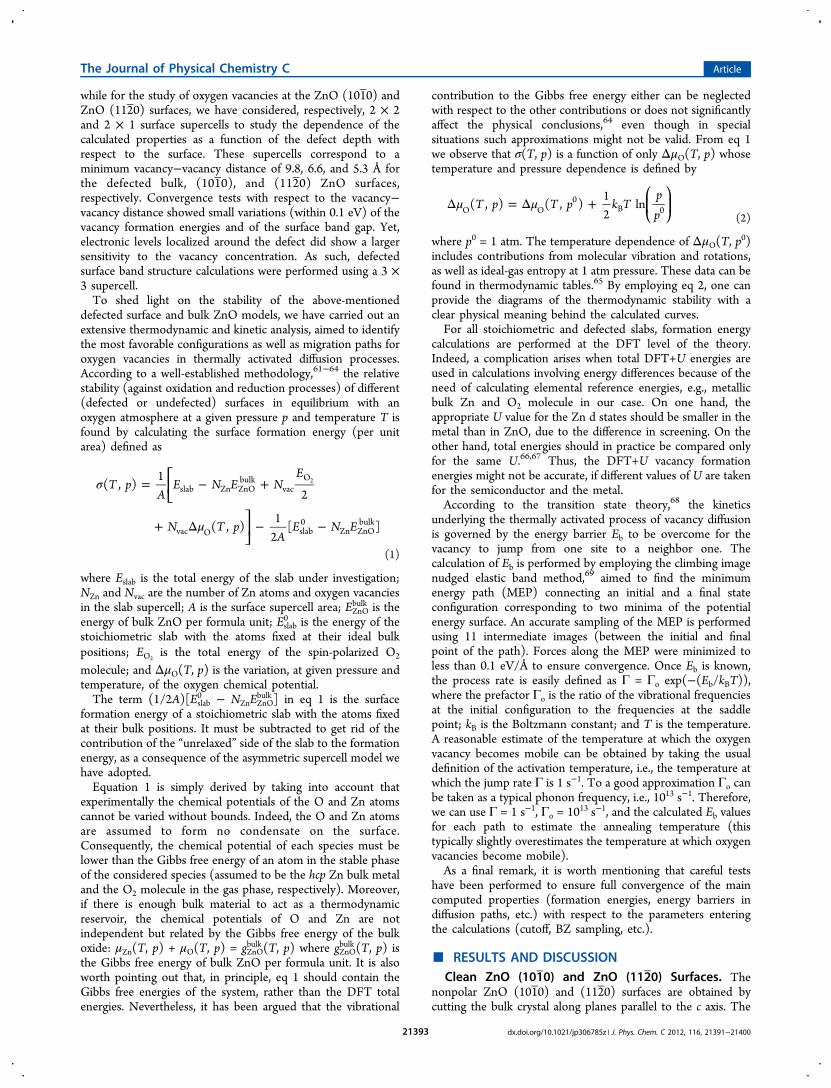
GGA+U, give a direct band gap for both surfaces. As a technicalremark, we point out that, because we use an asymmetric slabmodel, some spurious intragap surface states show up that areassociated with the bulk-like side of the slab. For this reason,both the surface band structure and the total DOS have beenobtained by retaining the only contributions coming fromelectronic states with a significant projection (>0.2) onto theatomic orbitals associated to the layers that have beenoptimized during the calculations. When compared with thebulk value (3.31 eV), the band gap gets reduced (3.17 eV) forthe (101 0) surface, whereas a larger value (3.47 eV) is obtainedfor the (112 0) surface. The character of the near-gap states canbe inferred from the analysis of the projected DOS (PDOS) onatomic orbitals, shown in Figure 2. For both the (101 0) and(112 0) surfaces, the top valence band is mainly derived fromthe p orbitals of O atoms with Zn atoms giving negligiblecontribution. On the other hand, the bottom conduction bandis strongly dominated by the bulk contributions as seen in thefigure insets. These results are in agreement with recent first-principles studies.74
Oxygen-Deficient Surfaces. We now have all the basicelements for discussing the effects due to oxygen vacancy. Asfar as the structural properties are concerned, the presence of avacancy in the topmost layer induces an inward displacement ofthe unpaired Zn atom so as to restore a bulk-like 4-foldcoordination with the two neighbor Zn atoms of the secondlayer, in agreement with previous theoretical studies.58,75−77
Significant relaxation effects are also observed when the vacancyis located in the first two subsurface layers. For deepervacancies, relaxation effects are more moderate and very similarto those observed in the defected bulk crystal. Moreover, the
vacancy-induced distortions are mostly localized around thedefect, whereas the geometry of the stoichiometric system isalmost preserved in the regions far from the defect site.A key issue in the applications of such surfaces in more
complex systems, such as gas sensors and ZnO contacts, isgiven by the defect concentration and depth distribution (forexample, such factors have been shown to play a role in theelectronic processes occurring at ZnO Schottky barriers31). Toget insight into this point, the vacancy formation energy, whichmeasures the energy required to remove an oxygen atom fromthe stoichiometric surface, has been calculated as a function ofthe vacancy position with respect to the surface. This energy isdefined as
= + × −E E N E E12vf slab vac O slab
st2 (3)
where Eslab and Eslabst are the DFT total energies of the slab
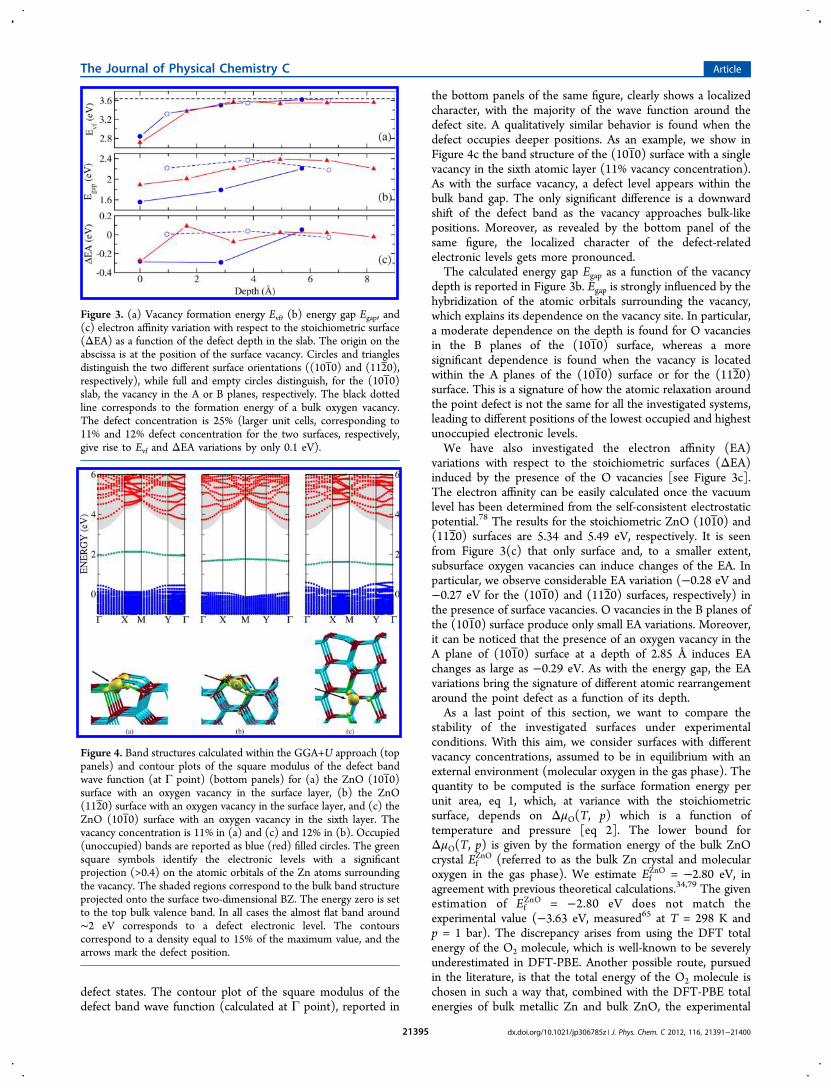
containing the defect(s) and of the stoichiometric slab,respectively. The computed values of Evf as a function of theoxygen vacancy position and for a defect concentration of 25%are plotted in Figure 3(a). The surface vacancy corresponds to0 Å depth and has the lowest formation energy (2.84 and 2.72eV for the (101 0) and (112 0) surfaces, respectively). Higherformation energies are obtained for deeper positions of thevacancy (for example, 3.32 and 3.37 eV for subsurface vacanciesin the (101 0) and (112 0) surface, respectively), monotonicallyapproaching the bulk limit of 3.64 eV for sufficiently deep sites(even in the case of the (101 0) surface in which, as previouslymentioned, an A−B stacking of the atomic planes can beidentified).In Figure 4a and Figure 4b, we show the band structure
(calculated using the GGA+U approach) of the ZnO (101 0)and (112 0) surfaces in the presence of a single oxygen vacancyin the supercell (with a concentration of 11% and 12%,respectively). The presence of the defect is responsible for theappearance of an occupied dispersionless band which is locatedabout 2 eV above the bulk crystal top valence band. Such aband, as revealed by the PDOS analysis, is mainly derived fromthe Zn4s atomic orbitals belonging to the atoms surroundingthe vacancy, with a smaller contribution coming from O2porbitals of the atoms closest to the vacancy itself. This isconfirmed by the electron charge density distribution of the
Figure 2. PDOS in the near-gap region for the (101 0) and (112 0)surfaces (left and right panel, respectively). The insets show a zoom inproximity of the conduction band edge. The projections are made on:(i) surface atomic orbitals (Zn 4s and O 2p states) and (ii) atomicorbitals belonging to a bulk-like layer (we choose the eighth layer andproject onto either all the atomic orbitals or only Zn 4s statesbelonging to it). This allows us to distinguish between “surface” and“bulk” contributions as well as between O and Zn atomic orbitalcontributions.
The Journal of Physical Chemistry C Article
dx.doi.org/10.1021/jp306785z | J. Phys. Chem. C 2012, 116, 21391−2140021394
defect states. The contour plot of the square modulus of thedefect band wave function (calculated at Γ point), reported in
the bottom panels of the same figure, clearly shows a localizedcharacter, with the majority of the wave function around thedefect site. A qualitatively similar behavior is found when thedefect occupies deeper positions. As an example, we show inFigure 4c the band structure of the (1010) surface with a singlevacancy in the sixth atomic layer (11% vacancy concentration).As with the surface vacancy, a defect level appears within thebulk band gap. The only significant difference is a downwardshift of the defect band as the vacancy approaches bulk-likepositions. Moreover, as revealed by the bottom panel of thesame figure, the localized character of the defect-relatedelectronic levels gets more pronounced.The calculated energy gap Egap as a function of the vacancy
depth is reported in Figure 3b. Egap is strongly influenced by thehybridization of the atomic orbitals surrounding the vacancy,which explains its dependence on the vacancy site. In particular,a moderate dependence on the depth is found for O vacanciesin the B planes of the (101 0) surface, whereas a moresignificant dependence is found when the vacancy is locatedwithin the A planes of the (1010) surface or for the (112 0)surface. This is a signature of how the atomic relaxation aroundthe point defect is not the same for all the investigated systems,leading to different positions of the lowest occupied and highestunoccupied electronic levels.We have also investigated the electron affinity (EA)
variations with respect to the stoichiometric surfaces (ΔEA)induced by the presence of the O vacancies [see Figure 3c].The electron affinity can be easily calculated once the vacuumlevel has been determined from the self-consistent electrostaticpotential.78 The results for the stoichiometric ZnO (1010) and(112 0) surfaces are 5.34 and 5.49 eV, respectively. It is seenfrom Figure 3(c) that only surface and, to a smaller extent,subsurface oxygen vacancies can induce changes of the EA. Inparticular, we observe considerable EA variation (−0.28 eV and−0.27 eV for the (101 0) and (112 0) surfaces, respectively) inthe presence of surface vacancies. O vacancies in the B planes ofthe (101 0) surface produce only small EA variations. Moreover,it can be noticed that the presence of an oxygen vacancy in theA plane of (1010) surface at a depth of 2.85 Å induces EAchanges as large as −0.29 eV. As with the energy gap, the EAvariations bring the signature of different atomic rearrangementaround the point defect as a function of its depth.As a last point of this section, we want to compare the
stability of the investigated surfaces under experimentalconditions. With this aim, we consider surfaces with differentvacancy concentrations, assumed to be in equilibrium with anexternal environment (molecular oxygen in the gas phase). Thequantity to be computed is the surface formation energy perunit area, eq 1, which, at variance with the stoichiometricsurface, depends on ΔμO(T, p) which is a function oftemperature and pressure [eq 2]. The lower bound forΔμO(T, p) is given by the formation energy of the bulk ZnOcrystal Ef
ZnO (referred to as the bulk Zn crystal and molecularoxygen in the gas phase). We estimate Ef
ZnO = −2.80 eV, inagreement with previous theoretical calculations.34,79 The givenestimation of Ef
ZnO = −2.80 eV does not match theexperimental value (−3.63 eV, measured65 at T = 298 K andp = 1 bar). The discrepancy arises from using the DFT totalenergy of the O2 molecule, which is well-known to be severelyunderestimated in DFT-PBE. Another possible route, pursuedin the literature, is that the total energy of the O2 molecule ischosen in such a way that, combined with the DFT-PBE totalenergies of bulk metallic Zn and bulk ZnO, the experimental
Figure 3. (a) Vacancy formation energy Evf, (b) energy gap Egap, and(c) electron affinity variation with respect to the stoichiometric surface(ΔEA) as a function of the defect depth in the slab. The origin on theabscissa is at the position of the surface vacancy. Circles and trianglesdistinguish the two different surface orientations ((101 0) and (112 0),respectively), while full and empty circles distinguish, for the (101 0)slab, the vacancy in the A or B planes, respectively. The black dottedline corresponds to the formation energy of a bulk oxygen vacancy.The defect concentration is 25% (larger unit cells, corresponding to11% and 12% defect concentration for the two surfaces, respectively,give rise to Evf and ΔEA variations by only 0.1 eV).
Figure 4. Band structures calculated within the GGA+U approach (toppanels) and contour plots of the square modulus of the defect bandwave function (at Γ point) (bottom panels) for (a) the ZnO (101 0)surface with an oxygen vacancy in the surface layer, (b) the ZnO(112 0) surface with an oxygen vacancy in the surface layer, and (c) theZnO (101 0) surface with an oxygen vacancy in the sixth layer. Thevacancy concentration is 11% in (a) and (c) and 12% in (b). Occupied(unoccupied) bands are reported as blue (red) filled circles. The greensquare symbols identify the electronic levels with a significantprojection (>0.4) on the atomic orbitals of the Zn atoms surroundingthe vacancy. The shaded regions correspond to the bulk band structureprojected onto the surface two-dimensional BZ. The energy zero is setto the top bulk valence band. In all cases the almost flat band around∼2 eV corresponds to a defect electronic level. The contourscorrespond to a density equal to 15% of the maximum value, and thearrows mark the defect position.
The Journal of Physical Chemistry C Article
dx.doi.org/10.1021/jp306785z | J. Phys. Chem. C 2012, 116, 21391−2140021395
value of EfZnO is correctly predicted.42,80 In this case, because the
formation energy of an O vacancy becomes larger but the rangeof allowed chemical potentials (horizontal axis in Figure 5) is
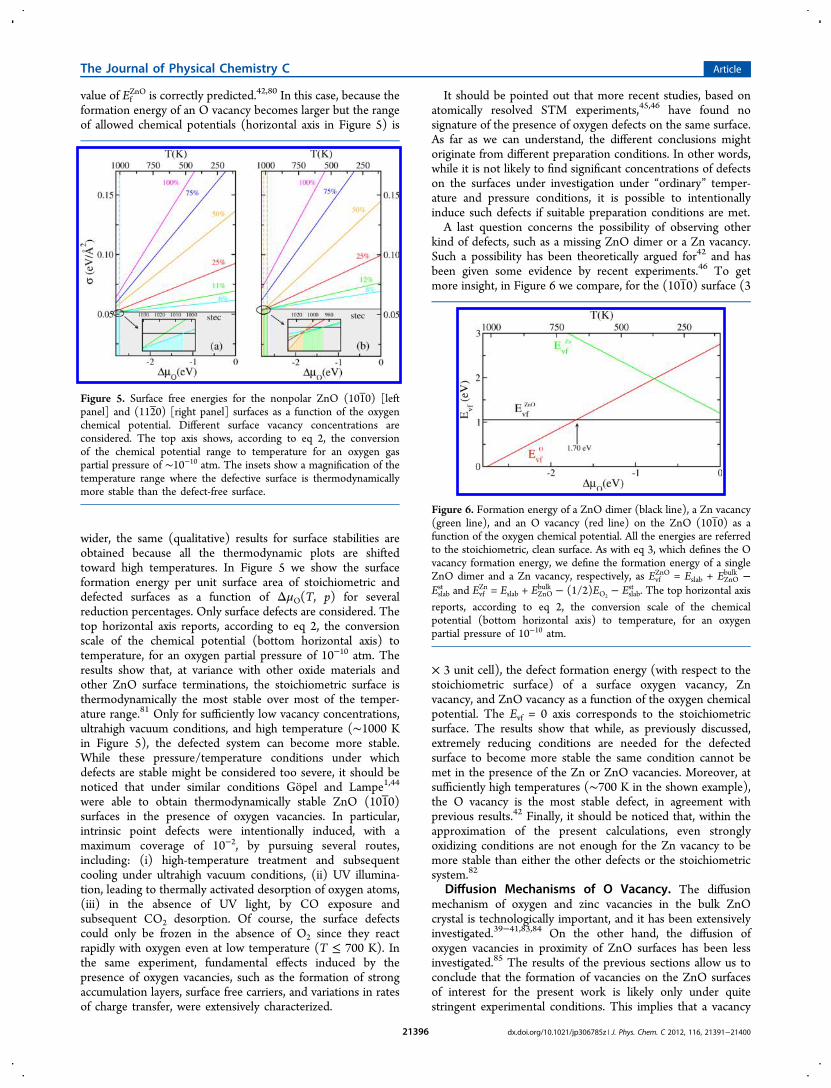
wider, the same (qualitative) results for surface stabilities areobtained because all the thermodynamic plots are shiftedtoward high temperatures. In Figure 5 we show the surfaceformation energy per unit surface area of stoichiometric anddefected surfaces as a function of ΔμO(T, p) for severalreduction percentages. Only surface defects are considered. Thetop horizontal axis reports, according to eq 2, the conversionscale of the chemical potential (bottom horizontal axis) totemperature, for an oxygen partial pressure of 10−10 atm. Theresults show that, at variance with other oxide materials andother ZnO surface terminations, the stoichiometric surface isthermodynamically the most stable over most of the temper-ature range.81 Only for sufficiently low vacancy concentrations,ultrahigh vacuum conditions, and high temperature (∼1000 Kin Figure 5), the defected system can become more stable.While these pressure/temperature conditions under whichdefects are stable might be considered too severe, it should benoticed that under similar conditions Gopel and Lampe1,44
were able to obtain thermodynamically stable ZnO (1010)surfaces in the presence of oxygen vacancies. In particular,intrinsic point defects were intentionally induced, with amaximum coverage of 10−2, by pursuing several routes,including: (i) high-temperature treatment and subsequentcooling under ultrahigh vacuum conditions, (ii) UV illumina-tion, leading to thermally activated desorption of oxygen atoms,(iii) in the absence of UV light, by CO exposure andsubsequent CO2 desorption. Of course, the surface defectscould only be frozen in the absence of O2 since they reactrapidly with oxygen even at low temperature (T ≤ 700 K). Inthe same experiment, fundamental effects induced by thepresence of oxygen vacancies, such as the formation of strongaccumulation layers, surface free carriers, and variations in ratesof charge transfer, were extensively characterized.
It should be pointed out that more recent studies, based onatomically resolved STM experiments,45,46 have found nosignature of the presence of oxygen defects on the same surface.As far as we can understand, the different conclusions mightoriginate from different preparation conditions. In other words,while it is not likely to find significant concentrations of defectson the surfaces under investigation under “ordinary” temper-ature and pressure conditions, it is possible to intentionallyinduce such defects if suitable preparation conditions are met.A last question concerns the possibility of observing other
kind of defects, such as a missing ZnO dimer or a Zn vacancy.Such a possibility has been theoretically argued for42 and hasbeen given some evidence by recent experiments.46 To getmore insight, in Figure 6 we compare, for the (101 0) surface (3
× 3 unit cell), the defect formation energy (with respect to thestoichiometric surface) of a surface oxygen vacancy, Znvacancy, and ZnO vacancy as a function of the oxygen chemicalpotential. The Evf = 0 axis corresponds to the stoichiometricsurface. The results show that while, as previously discussed,extremely reducing conditions are needed for the defectedsurface to become more stable the same condition cannot bemet in the presence of the Zn or ZnO vacancies. Moreover, atsufficiently high temperatures (∼700 K in the shown example),the O vacancy is the most stable defect, in agreement withprevious results.42 Finally, it should be noticed that, within theapproximation of the present calculations, even stronglyoxidizing conditions are not enough for the Zn vacancy to bemore stable than either the other defects or the stoichiometricsystem.82
Diffusion Mechanisms of O Vacancy. The diffusionmechanism of oxygen and zinc vacancies in the bulk ZnOcrystal is technologically important, and it has been extensivelyinvestigated.39−41,83,84 On the other hand, the diffusion ofoxygen vacancies in proximity of ZnO surfaces has been lessinvestigated.85 The results of the previous sections allow us toconclude that the formation of vacancies on the ZnO surfacesof interest for the present work is likely only under quitestringent experimental conditions. This implies that a vacancy
Figure 5. Surface free energies for the nonpolar ZnO (101 0) [leftpanel] and (112 0) [right panel] surfaces as a function of the oxygenchemical potential. Different surface vacancy concentrations areconsidered. The top axis shows, according to eq 2, the conversionof the chemical potential range to temperature for an oxygen gaspartial pressure of ∼10−10 atm. The insets show a magnification of thetemperature range where the defective surface is thermodynamicallymore stable than the defect-free surface.
Figure 6. Formation energy of a ZnO dimer (black line), a Zn vacancy(green line), and an O vacancy (red line) on the ZnO (101 0) as afunction of the oxygen chemical potential. All the energies are referredto the stoichiometric, clean surface. As with eq 3, which defines the Ovacancy formation energy, we define the formation energy of a singleZnO dimer and a Zn vacancy, respectively, as Evf
ZnO = Eslab + EZnObulk −
Eslabst and Evf
Zn = Eslab + EZnObulk − (1/2)EO2
− Eslabst . The top horizontal axis
reports, according to eq 2, the conversion scale of the chemicalpotential (bottom horizontal axis) to temperature, for an oxygenpartial pressure of 10−10 atm.
The Journal of Physical Chemistry C Article
dx.doi.org/10.1021/jp306785z | J. Phys. Chem. C 2012, 116, 21391−2140021396
in proximity of the surface will immediately recombine withambient oxygen under ordinary conditions. Nevertheless, it islegitimate to wonder what happens to a defect which has beencreated in deeper positions. The magnitude of the diffusionbarriers might induce defect migration (and successiverecombination) of the defect toward the surface or preventsuch a mechanism. In particular, it is relevant to point outpossible differences arising in the diffusion pathways withinplanes parallel to the surface or along the direction orthogonalto it.As far as the oxygen vacancy diffusion in the bulk crystal is
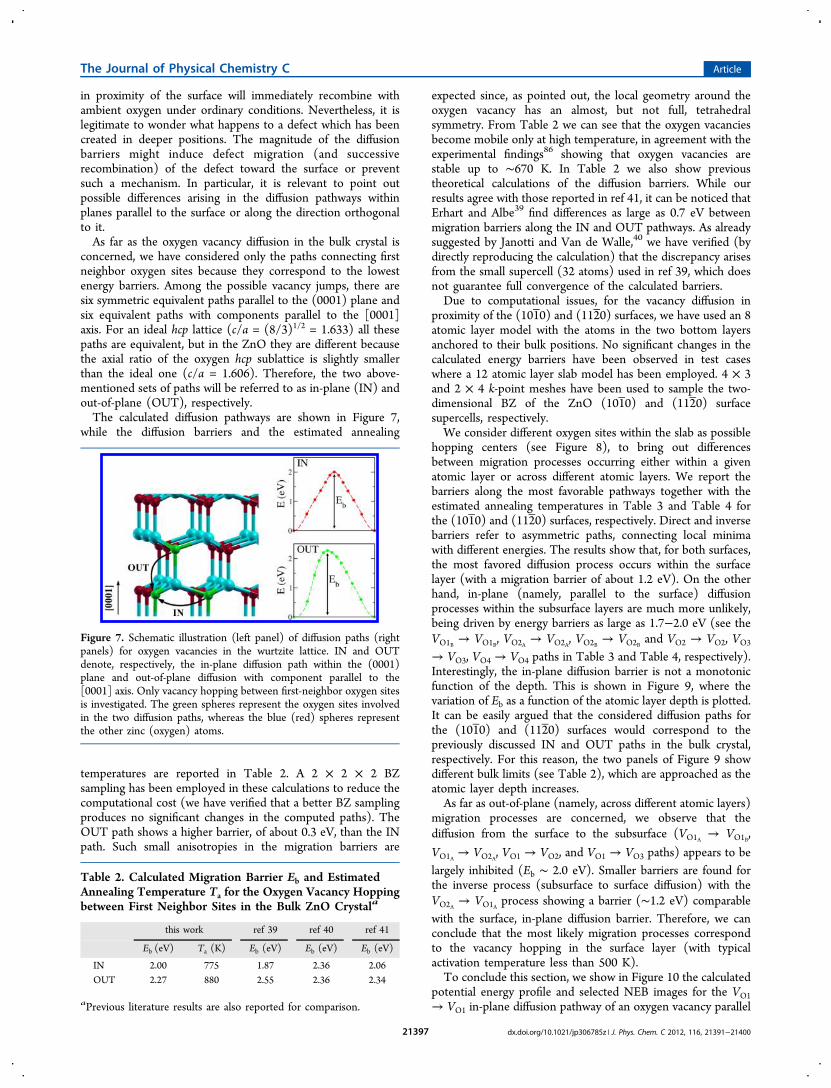
concerned, we have considered only the paths connecting firstneighbor oxygen sites because they correspond to the lowestenergy barriers. Among the possible vacancy jumps, there aresix symmetric equivalent paths parallel to the (0001) plane andsix equivalent paths with components parallel to the [0001]axis. For an ideal hcp lattice (c/a = (8/3)1/2 = 1.633) all thesepaths are equivalent, but in the ZnO they are different becausethe axial ratio of the oxygen hcp sublattice is slightly smallerthan the ideal one (c/a = 1.606). Therefore, the two above-mentioned sets of paths will be referred to as in-plane (IN) andout-of-plane (OUT), respectively.The calculated diffusion pathways are shown in Figure 7,
while the diffusion barriers and the estimated annealing
temperatures are reported in Table 2. A 2 × 2 × 2 BZsampling has been employed in these calculations to reduce thecomputational cost (we have verified that a better BZ samplingproduces no significant changes in the computed paths). TheOUT path shows a higher barrier, of about 0.3 eV, than the INpath. Such small anisotropies in the migration barriers are
expected since, as pointed out, the local geometry around theoxygen vacancy has an almost, but not full, tetrahedralsymmetry. From Table 2 we can see that the oxygen vacanciesbecome mobile only at high temperature, in agreement with theexperimental findings86 showing that oxygen vacancies arestable up to ∼670 K. In Table 2 we also show previoustheoretical calculations of the diffusion barriers. While ourresults agree with those reported in ref 41, it can be noticed thatErhart and Albe39 find differences as large as 0.7 eV betweenmigration barriers along the IN and OUT pathways. As alreadysuggested by Janotti and Van de Walle,40 we have verified (bydirectly reproducing the calculation) that the discrepancy arisesfrom the small supercell (32 atoms) used in ref 39, which doesnot guarantee full convergence of the calculated barriers.Due to computational issues, for the vacancy diffusion in
proximity of the (1010) and (1120) surfaces, we have used an 8atomic layer model with the atoms in the two bottom layersanchored to their bulk positions. No significant changes in thecalculated energy barriers have been observed in test caseswhere a 12 atomic layer slab model has been employed. 4 × 3and 2 × 4 k-point meshes have been used to sample the two-dimensional BZ of the ZnO (1010) and (112 0) surfacesupercells, respectively.We consider different oxygen sites within the slab as possible
hopping centers (see Figure 8), to bring out differencesbetween migration processes occurring either within a givenatomic layer or across different atomic layers. We report thebarriers along the most favorable pathways together with theestimated annealing temperatures in Table 3 and Table 4 forthe (101 0) and (1120) surfaces, respectively. Direct and inversebarriers refer to asymmetric paths, connecting local minimawith different energies. The results show that, for both surfaces,the most favored diffusion process occurs within the surfacelayer (with a migration barrier of about 1.2 eV). On the otherhand, in-plane (namely, parallel to the surface) diffusionprocesses within the subsurface layers are much more unlikely,being driven by energy barriers as large as 1.7−2.0 eV (see theVO1B → VO1B, VO2A → VO2A, VO2B → VO2B and VO2 → VO2, VO3
→ VO3, VO4 → VO4 paths in Table 3 and Table 4, respectively).Interestingly, the in-plane diffusion barrier is not a monotonicfunction of the depth. This is shown in Figure 9, where thevariation of Eb as a function of the atomic layer depth is plotted.It can be easily argued that the considered diffusion paths forthe (101 0) and (112 0) surfaces would correspond to thepreviously discussed IN and OUT paths in the bulk crystal,respectively. For this reason, the two panels of Figure 9 showdifferent bulk limits (see Table 2), which are approached as theatomic layer depth increases.As far as out-of-plane (namely, across different atomic layers)
migration processes are concerned, we observe that thediffusion from the surface to the subsurface (VO1A → VO1B,
VO1A → VO2A, VO1 → VO2, and VO1 → VO3 paths) appears to belargely inhibited (Eb ∼ 2.0 eV). Smaller barriers are found forthe inverse process (subsurface to surface diffusion) with theVO2A → VO1A process showing a barrier (∼1.2 eV) comparablewith the surface, in-plane diffusion barrier. Therefore, we canconclude that the most likely migration processes correspondto the vacancy hopping in the surface layer (with typicalactivation temperature less than 500 K).To conclude this section, we show in Figure 10 the calculated
potential energy profile and selected NEB images for the VO1→ VO1 in-plane diffusion pathway of an oxygen vacancy parallel
Figure 7. Schematic illustration (left panel) of diffusion paths (rightpanels) for oxygen vacancies in the wurtzite lattice. IN and OUTdenote, respectively, the in-plane diffusion path within the (0001)plane and out-of-plane diffusion with component parallel to the[0001] axis. Only vacancy hopping between first-neighbor oxygen sitesis investigated. The green spheres represent the oxygen sites involvedin the two diffusion paths, whereas the blue (red) spheres representthe other zinc (oxygen) atoms.
Table 2. Calculated Migration Barrier Eb and EstimatedAnnealing Temperature Ta for the Oxygen Vacancy Hoppingbetween First Neighbor Sites in the Bulk ZnO Crystala
this work ref 39 ref 40 ref 41
Eb (eV) Ta (K) Eb (eV) Eb (eV) Eb (eV)
IN 2.00 775 1.87 2.36 2.06OUT 2.27 880 2.55 2.36 2.34
aPrevious literature results are also reported for comparison.
The Journal of Physical Chemistry C Article
dx.doi.org/10.1021/jp306785z | J. Phys. Chem. C 2012, 116, 21391−2140021397
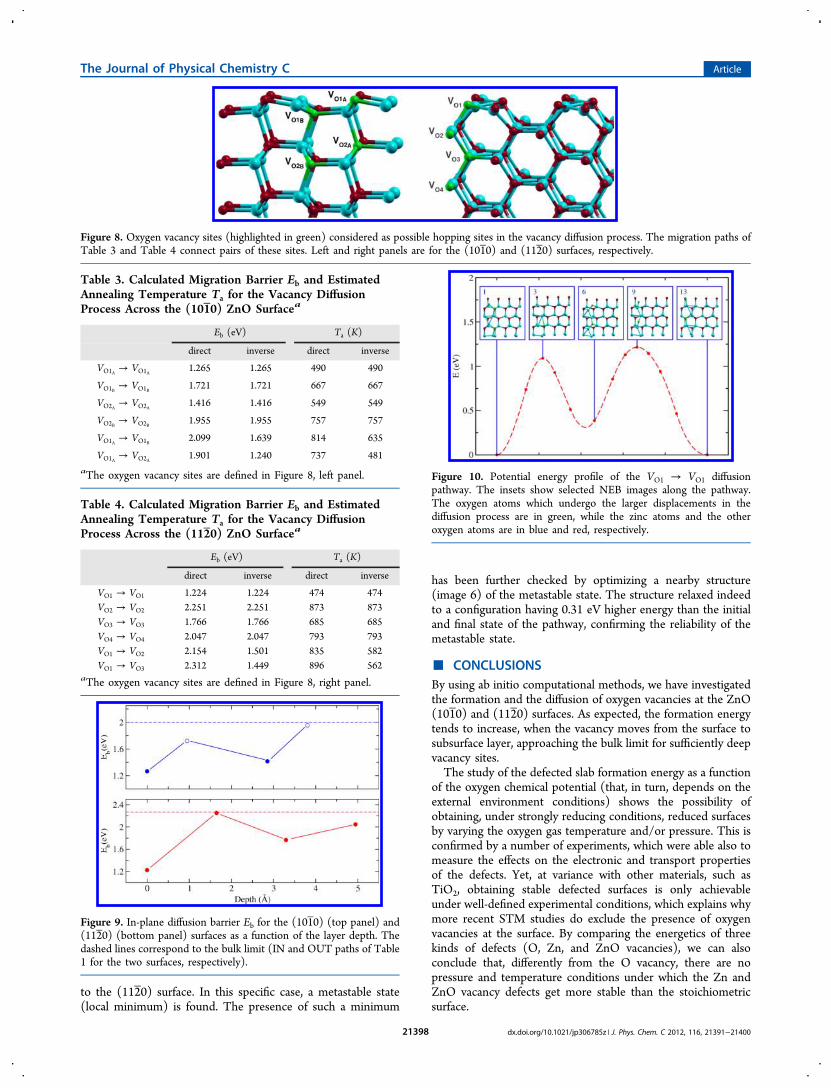
to the (112 0) surface. In this specific case, a metastable state(local minimum) is found. The presence of such a minimum
has been further checked by optimizing a nearby structure(image 6) of the metastable state. The structure relaxed indeedto a configuration having 0.31 eV higher energy than the initialand final state of the pathway, confirming the reliability of themetastable state.
■ CONCLUSIONSBy using ab initio computational methods, we have investigatedthe formation and the diffusion of oxygen vacancies at the ZnO(101 0) and (112 0) surfaces. As expected, the formation energytends to increase, when the vacancy moves from the surface tosubsurface layer, approaching the bulk limit for sufficiently deepvacancy sites.The study of the defected slab formation energy as a function
of the oxygen chemical potential (that, in turn, depends on theexternal environment conditions) shows the possibility ofobtaining, under strongly reducing conditions, reduced surfacesby varying the oxygen gas temperature and/or pressure. This isconfirmed by a number of experiments, which were able also tomeasure the effects on the electronic and transport propertiesof the defects. Yet, at variance with other materials, such asTiO2, obtaining stable defected surfaces is only achievableunder well-defined experimental conditions, which explains whymore recent STM studies do exclude the presence of oxygenvacancies at the surface. By comparing the energetics of threekinds of defects (O, Zn, and ZnO vacancies), we can alsoconclude that, differently from the O vacancy, there are nopressure and temperature conditions under which the Zn andZnO vacancy defects get more stable than the stoichiometricsurface.
Figure 8. Oxygen vacancy sites (highlighted in green) considered as possible hopping sites in the vacancy diffusion process. The migration paths ofTable 3 and Table 4 connect pairs of these sites. Left and right panels are for the (101 0) and (112 0) surfaces, respectively.
Table 3. Calculated Migration Barrier Eb and EstimatedAnnealing Temperature Ta for the Vacancy DiffusionProcess Across the (101 0) ZnO Surfacea
Eb (eV) Ta (K)
direct inverse direct inverse
VO1A → VO1A 1.265 1.265 490 490
VO1B → VO1B 1.721 1.721 667 667
VO2A → VO2A 1.416 1.416 549 549
VO2B → VO2B 1.955 1.955 757 757
VO1A → VO1B 2.099 1.639 814 635
VO1A → VO2A 1.901 1.240 737 481
aThe oxygen vacancy sites are defined in Figure 8, left panel.
Table 4. Calculated Migration Barrier Eb and EstimatedAnnealing Temperature Ta for the Vacancy DiffusionProcess Across the (112 0) ZnO Surfacea
Eb (eV) Ta (K)
direct inverse direct inverse
VO1 → VO1 1.224 1.224 474 474VO2 → VO2 2.251 2.251 873 873VO3 → VO3 1.766 1.766 685 685VO4 → VO4 2.047 2.047 793 793VO1 → VO2 2.154 1.501 835 582VO1 → VO3 2.312 1.449 896 562
aThe oxygen vacancy sites are defined in Figure 8, right panel.
Figure 9. In-plane diffusion barrier Eb for the (101 0) (top panel) and(112 0) (bottom panel) surfaces as a function of the layer depth. Thedashed lines correspond to the bulk limit (IN and OUT paths of Table1 for the two surfaces, respectively).
Figure 10. Potential energy profile of the VO1 → VO1 diffusionpathway. The insets show selected NEB images along the pathway.The oxygen atoms which undergo the larger displacements in thediffusion process are in green, while the zinc atoms and the otheroxygen atoms are in blue and red, respectively.
The Journal of Physical Chemistry C Article
dx.doi.org/10.1021/jp306785z | J. Phys. Chem. C 2012, 116, 21391−2140021398
The defect formation affects the surface electronic structure,in that an intragap occupied state shows up, with a “localized”character around the oxygen vacancy. The energy of theintragap state depends on the oxygen vacancy depth inside thematerial. Moreover, other fundamental properties, such as thesurface gap energy and electron affinity, can be significantlyaltered by the presence of the defect and strongly depend on itsposition with respect to the surface.Finally, we have also performed a detailed first-principles
study of the diffusion behavior of oxygen vacancies both in thebulk ZnO crystal and in the ZnO (101 0) and (112 0) surfaces.We have found that the oxygen vacancies diffuse much moreeasily in the surface layer than in the bulk. In particular, we haveverified that the surface diffusion can be activated at relativelymodest temperature (490 K and 481 K for the (101 0) and(112 0) surfaces, respectively). Moreover, migration paths in thedirection orthogonal to the surface show asymmetric barriers,which are smaller (by 0.5−0.9 eV) in the direction toward thesurface, thus showing that the diffusion from subsurface layersto the surface is favored. Of course, it is expected that surfacedefects will remain stable only in the absence of O2 since thesurface vacancy sites are expected to be very reactive even atlow temperatures.1
■ AUTHOR INFORMATION
Corresponding Author*E-mail: [email protected].
NotesThe authors declare no competing financial interest.
■ ACKNOWLEDGMENTSFinancial support from the European Union Seventh Frame-work Program (FP7/2007-2013) under grant agreement N.264098−MAMA is acknowledged.
■ REFERENCES(1) Gopel, W.; Lampe, U. Phys. Rev. B 1980, 22, 6447−6462.(2) Yamazoe, N. Sens. Actuators, B 1991, 5, 7−19.(3) Sberveglieri, G. Sens. Actuators, B 1995, 23, 103−109.(4) Azad, A. M.; Akbar, S. A.; Mhaisalkar, S. G.; Birkefeld, L. D.;Goto, K. S. J. Electrochem. Soc. 1992, 139, 3690−3704.(5) Choi, K. J.; Jang, H. W. Sensors 2010, 10, 4083−4099.(6) Korotcenkov, G. Mater. Sci. Eng., B 2007, 139, 1−23.(7) Barsan, N.; Koziej, D.; Weimar, U. Sens. Actuators, B 2007, 121,18−35.(8) Moos, R.; Sahner, K.; Fleischer, M.; Guth, U.; Barsan, N.;Weimar, U. Sensors 2009, 9, 4323−4365.(9) Wang, C.; Yin, L.; Zhang, L.; Xiang, D.; Gao, R. Sensors 2010, 10,2088−2106.(10) Batzill, M. Sensors 2006, 6, 1345−1366.(11) Batzill, M.; Katsiev, K.; Burst, J. M.; Diebold, U.; Chaka, A. M.;Delley, B. Phys. Rev. B 2005, 72, 165414.(12) Batzill, M.; Diebold, U. Prog. Surf. Sci. 2005, 79, 47−154.(13) Koshizaki, N.; Oyama, T. Sens. Actuators, B 2000, 66, 119−121.(14) Trani, F.; Causa, M.; Ninno, D.; Cantele, G.; Barone, V. Phys.Rev. B 2008, 77, 245410.(15) Chen, X.; Mao, S. S. Chem. Rev. 2007, 107, 2891−2959.(16) (a) Iacomino, A.; Cantele, G.; Ninno, D.; Marri, I.; Ossicini, S.Phys. Rev. B 2008, 78, 075405. (b) Iacomino, A.; Cantele, G.; Trani, F.;Ninno, D. J. Phys. Chem. C 2010, 114, 12389−12400. (c) Hameeuw,K.; Cantele, G.; Ninno, D.; Trani, F.; Iadonisi, G. Phys. Status Solidi A2006, 203, 2219−2222.(17) Viswanath, R.; Ramasamy, S.; Ramamoorthy, R.; Jayavel, P.;Nagarajan, T. Nanostr. Mater. 1995, 6, 993−996.
(18) Wu, M.; Azuma, A.; Shiosaki, T.; Kawabata, A. IEEE Trans.Ultrasonics Ferroelectr. Freq. Control 1989, 36, 442−445.(19) Jayaraj, M.; Antony, A.; Ramachandran, M. Bull. Mater. Sci.2002, 25, 227−230.(20) Keis, K.; Bauer, C.; Boschloo, G.; Hagfeldt, A.; Westermark, K.;Rensmo, H.; Siegbahn, H. J. Photochem. Photobiol. A 2002, 148, 57−64.(21) Yang, P.; Yan, H.; Mao, S.; Russo, R.; Johnson, J.; Saykally, R.;Morris, N.; Pham, J.; He, R.; Choi, H.-J. Adv. Funct. Mater. 2002, 12,323−331.(22) (a) Hu, Y.; Lin, L.; Zhang, Y.; Wang, Z. L. Adv. Mater. 2012, 24,110−114. (b) Hu, Y.; Zhang, Y.; Xu, C.; Lin, L.; Snyder, R. L.; Wang,Z. L. Nano Lett. 2011, 11, 2572−2577.(23) Roy, S.; Basu, S. Bull. Mater. Sci. 2002, 25, 513−515.(24) Raju, A.; Rao, C. Sens. Actuators, B 1991, 3, 305−310.(25) Patolsky, F.; Timko, B. P.; Zheng, G.; Lieber, C. M. MRS Bull.2007, 32, 142−149.(26) Pan, Z. W.; Dai, Z. R.; Wang, Z. L. Science 2001, 291, 1947−1949.(27) McCluskey, M. D.; Jokela, S. J. J. Appl. Phys. 2009, 106, 071101.(28) Dutta, S.; Chattopadhyay, S.; Sarkar, A.; Chakrabarti, M.; Sanyal,D.; Jana, D. Prog. Mater. Sci. 2009, 54, 89−136.(29) Gupta, T. K.; Carlson, W. G. J. Mater. Sci. 1985, 20, 3487−3500.(30) Ramanachalam, M. S.; Rohatgi, A.; Schaffer, J. P.; Gupta, T. K. J.Appl. Phys. 1991, 69, 8380−8386.(31) Brillson, L. J.; Lu, Y. J. Appl. Phys. 2011, 109, 121301 andreferences therein.(32) Kohan, A. F.; Ceder, G.; Morgan, D.; Van de Walle, C. G. Phys.Rev. B 2000, 61, 15019−15027.(33) Zhang, S. B.; Wei, S.-H.; Zunger, A. Phys. Rev. B 2001, 63,075205.(34) Oba, F.; Nishitani, S. R.; Isotani, S.; Adachi, H.; Tanaka, I. J.Appl. Phys. 2001, 90, 824−828.(35) Erhart, P.; Klein, A.; Albe, K. Phys. Rev. B 2005, 72, 085213.(36) Yan, Y.; Zhang, S. B.; Pantelides, S. T. Phys. Rev. Lett. 2001, 86,5723−5726.(37) Limpijumnong, S.; Zhang, S. B.; Wei, S.-H.; Park, C. H. Phys.Rev. Lett. 2004, 92, 155504.(38) Pacchioni, G. ChemPhysChem 2003, 4, 1041−1047.(39) Erhart, P.; Albe, K. Phys. Rev. B 2006, 73, 115207.(40) Janotti, A.; Van de Walle, C. G. Phys. Rev. B 2007, 76, 165202.(41) Huang, G.-Y.; Wang, C.-Y.; Wang, J.-T. J. Phys.: Condens. Matter2009, 21, 345802.(42) Kovacik, R.; Meyer, B.; Marx, D. Angew. Chem., Int. Ed. 2007,46, 4894−4897.(43) Wang, Q.; Sun, Q.; Chen, G.; Kawazoe, Y.; Jena, P. Phys. Rev. B2008, 77, 205411.(44) Gopel, W.; Brillson, L. J.; Brucker, C. F. J. Vac. Sci. Technol.1980, 17, 894−898.(45) Diebold, U.; Koplitz, L. V.; Dulub, O. Appl. Surf. Sci. 2004, 237,336−342.(46) Shao, X.; Fukui, K.-I.; Kondoh, H.; Shionoya, M.; Iwasawa, Y. J.Phys. Chem. C 2009, 113, 14356−14362.(47) Giannozzi, P.; Baroni, S.; Bonini, N.; Calandra, M.; Car, R.;Cavazzoni, C.; Ceresoli, D.; Chiarotti, G. L.; Cococcioni, M.; Dabo, I.;et al. J. Phys.: Condens. Matter 2009, 21, 395502.(48) Perdew, J. P.; Burke, K.; Ernzerhof, M. Phys. Rev. Lett. 1996, 77,3865−3868.(49) Vanderbilt, D. Phys. Rev. B 1990, 41, 7892−7895.(50) We used the pseudopotentials O.pbe-van_ak.UPF and Zn.pbe-van.UPF from http://www.quantum-espresso.org.(51) Mordecai, A. Nonlinear Programming: Analysis and Methods;Dover: New York, 2003.(52) The BZ sampling meshes for all the other systems underinvestigation are scaled so as to be consistent, as close as possible, withthat used for the bulk unit cell.(53) Birch, F. J. Geophys. Res. 1978, 83, 1257.(54) Calzolari, A.; Ruini, A.; Catellani, A. J. Am. Chem. Soc. 2011, 133,5893−5899.
The Journal of Physical Chemistry C Article
dx.doi.org/10.1021/jp306785z | J. Phys. Chem. C 2012, 116, 21391−2140021399
(55) Decremps, F.; Datchi, F.; Saitta, A. M.; Polian, A.; Pascarelli, S.;Di Cicco, A.; Itie, J. P.; Baudelet, F. Phys. Rev. B 2003, 68, 104101.(56) Ozgur, U.; Alivov, Y. I.; Liu, C.; Teke, A.; Reshchikov, M. A.;Dogan, S.; Avrutin, V.; Cho, S.-J.; Morkoc, H. J. Appl. Phys. 2005, 98,041301.(57) This slab thickness proved to be sufficient to ensure goodconvergence of the calculated properties when the point defect ismoved towards the bulk-like (deeper) positions.(58) Cooke, D. J.; Marmier, A.; Parker, S. C. J. Phys. Chem. B 2006,110, 7985−7991.(59) Hameeuw, K. J.; Cantele, G.; Ninno, D.; Trani, F.; Iadonisi, G. J.Chem. Phys. 2006, 124, 024708.(60) Bengtsson, L. Phys. Rev. B 1999, 59, 12301−12304.(61) Kaxiras, E.; Bar-Yam, Y.; Joannopoulos, J. D.; Pandey, K. C.Phys. Rev. B 1987, 35, 9625−9635.(62) Qian, G.-X.; Martin, R. M.; Chadi, D. J. Phys. Rev. B 1988, 38,7649−7663.(63) Northrup, J. E. Phys. Rev. Lett. 1989, 62, 2487−2490.(64) Reuter, K.; Scheffler, M. Phys. Rev. B 2001, 65, 035406.(65) Linstrom, P. J.; Mallard, W. G. NIST Chemistry WebBook, NISTStandard Reference Database Number 69; National Institute ofStandards and Technology: Gaithersburg MD, 20899, 2003.(66) Kulik, H. J.; Cococcioni, M.; Scherlis, D. A.; Marzari, N. Phys.Rev. Lett. 2006, 97, 103001.(67) Franchini, C.; Podloucky, R.; Paier, J.; Marsman, M.; Kresse, G.Phys. Rev. B 2007, 75, 195128.(68) Vineyard, G. H. J. Phys. Chem. Solids 1957, 3, 121−127.(69) (a) Henkelman, G.; Johannesson, G.; Jonsson, H. Prog. Theor.Chem. Phys. 2000, 269. (b) Henkelman, G.; Uberuaga, B. P.; Jonsson,H. J. Chem. Phys. 2000, 113, 9901−9904.(70) Duke, C. B.; Meyer, R. J.; Paton, A.; Mark, P. Phys. Rev. B 1978,18, 4225−4240.(71) Dulub, O.; Boatner, L. A.; Diebold, U. Surf. Sci. 2002, 519, 201−217.(72) Meyer, B.; Marx, D. Phys. Rev. B 2003, 67, 035403 andreferences therein..(73) Spencer, M. J.; Wong, K. W.; Yarovsky, I. Mater. Chem. Phys.2010, 119, 505−514.(74) Marana, N. L.; Longo, V. M.; Longo, E.; Martins, J. B. L.;Sambrano, J. R. J. Phys. Chem. A 2008, 112, 8958−8963.(75) Yan, Y.; Al-Jassim, M. M.; Wei, S.-H. Phys. Rev. B 2005, 72,161307.(76) Calzolari, A.; Catellani, A. J. Phys. Chem. C 2009, 113, 2896−2902.(77) Kaewmaraya, T.; Pathak, B.; Araujo, C. M.; Rosa, A. L.; Ahuja,R. Europhys. Lett. 2012, 97, 17014.(78) Borriello, I.; Cantele, G.; Ninno, D.; Iadonisi, G.; Cossi, M.;Barone, V. Phys. Rev. B 2007, 76, 035430.(79) Clark, S. J.; Robertson, J.; Lany, S.; Zunger, A. Phys. Rev. B 2010,81, 115311.(80) Meyer, B. Phys. Rev. B 2004, 69, 045416.(81) If we use instead the total energy of the O2 molecule as obtainedfrom the experimental measurements of Ef
ZnO, the stability of thedefected surface at the lowest considered vacancy concentration occursat ∼1250 K.(82) As previously observed, if we use instead the total energy of theO2 molecule as obtained from the experimental measurements of Ef
ZnO,the shift of the thermodynamic plots to high temperature is such that,in the O-rich limit (low-temperature limit), the Zn vacancy canbecome stable in a small temperature range,42 up to ∼250 K in theexample of Figure 6.(83) Huang, G.-Y.; Wang, C.-Y.; Wang, J.-T. Solid State Commun.2009, 149, 199−204.(84) Erhart, P.; Albe, K. Appl. Phys. Lett. 2006, 88, 201918.(85) Gui-Yang, H.; Chong-Yu, W.; Jian-Tao, W. Chin. Phys. B 2010,19, 013101.(86) (a) Vlasenko, L. S.; Watkins, G. D. Phys. Rev. B 2005, 72,035203. (b) Vlasenko, L. S.; Watkins, G. D. Phys. Rev. B 2005, 71,125210.
The Journal of Physical Chemistry C Article
dx.doi.org/10.1021/jp306785z | J. Phys. Chem. C 2012, 116, 21391−2140021400