Cu2+ probe of metal-ion binding sites in melanin using electron paramagnetic resonance spectroscopy
15
ARCHIVES OF BI~CHEMISTRYANDBIOPHYSICS Vol. 202, No. 1, June, pp. 289-303, 1980 Cu*+ Probe of Metal-Ion Binding Sites in Melanin Using Electron Paramagnetic Resonance Spectroscopy I. Synthetic Melanin9 W. FRONCISZ,’ T. SARNA,* AND JAMES S. HYDE3 National Biomedical ESR Center, Department of Radiology, Medical College of Wisconsin, 8701 Watertown Plank Road, Milwaukee, Wisconsin 53226 Received May 10, 1979; revised December 5, 1979 The isotope 63Cu2+ has been used to probe the metal-ion binding sites of synthetic (autoxi- dized) catechol and 3,4-dihydroxyphenylalanine melanins using electron paramagnetic resonance spectroscopy. Samples were in aqueous media over a wide range of pH values. Assignments of the structures of the melanin-copper complexes are based in part on model studies of the complexes formed with melanin precursors, catechol and 3,4-dihydroxyphenyl- alanine, and with phenanthroline. Nearly all complexes involve just one or two ligands from melanin. In catechol melanin below pH 5.0, complexes with carboxyl groups are formed; above 6.0, Cu2+ forms complexes with phenolic hydroxyl groups. These same complexes were found in 3,4-dihydroxyphenylalanine melanin and binding of CuZ+at amino acid type sites also was detected. After partial reduction of copper ions bound to 3,4-dihydroxy- phenylalanine melanin, a weak signal of copper with four melanin ligands (oxygen and nitrogen in various combinations) was observed. The black heterogeneous polymers formed by autoxidation of catechol and also of DOPA are useful synthetic models of the biological pigment melanin and are commonly described as “catechol melanin” and “DOPA melanin,” respectively. A detailed study of metal-ion binding sites of these synthetic polymers is presented here. The chemistry of these materials is representative of redox polymers and cation exchange resins, and as such the work is of general chemical interest (1). Our motivation, however, is to use the results of the study as a basis for investigations of natural melanins. Melanins contain phenolic hydroxyl, carboxyl, and amine groups, which are effective metal-ion binding sites. Potts et al. 1 This work was supported by National Science Foundation Grant PCM ‘7614831 and by National Institutes of Health Grant 5P41 RR01008 2 Present address: Institute of Molecular Biology, Department of Biophysics, Jagellonian University, Grodzka 53, 31-001 Krakow, Poland. 3 Person to whom correspondence should be sent. 4 Abbreviation used: DOPA, 3,4-dihydroxyphenyl- alanine. (2) have estimated that the number of such sites is 20% of the number of monomeric subunits in the polymer. Melanins contain stable free radicals that appear to be of the semiquinone type. Felix et al. (3) have shown that the binding of diamagnetic metal ions creates new free radicals, and have explained this result as a metal ion induced shift in equilibrium between quinone, quinol, and semiquinone moieties. Sarna et al. (4) have shown that the binding of paramagnetic metal ions, particularly CL?+,results in an apparent loss of EPR intensity of the free-radical signal, and have explained this result as a conse- quence of magnetic dipolar interaction be- tween free radical and metal ion. These authors also reported results of a back- titration experiment in which the binding sites were saturated with a diamagnetic metal ion and then the intensity of the free-radical signal was plotted as a function of the concentration of paramagnetic metal ions. Steps in this plot suggested the ex- istence of several types of binding sites. In the studies of Refs. (3) and (4) the 289 0003-9861/80/0’70289-15$02.00/O Copyright 0 1980 by Academic Press, Inc. All rights of reproduction in any form reserved.
-
Upload
independent -
Category
Documents
-
view
2 -
download
0
Transcript of Cu2+ probe of metal-ion binding sites in melanin using electron paramagnetic resonance spectroscopy

ARCHIVES OF BI~CHEMISTRYANDBIOPHYSICS Vol. 202, No. 1, June, pp. 289-303, 1980
Cu*+ Probe of Metal-Ion Binding Sites in Melanin Using Electron Paramagnetic Resonance Spectroscopy
I. Synthetic Melanin9
W. FRONCISZ,’ T. SARNA,* AND JAMES S. HYDE3
National Biomedical ESR Center, Department of Radiology, Medical College of Wisconsin, 8701 Watertown Plank Road, Milwaukee, Wisconsin 53226
Received May 10, 1979; revised December 5, 1979
The isotope 63Cu2+ has been used to probe the metal-ion binding sites of synthetic (autoxi- dized) catechol and 3,4-dihydroxyphenylalanine melanins using electron paramagnetic resonance spectroscopy. Samples were in aqueous media over a wide range of pH values. Assignments of the structures of the melanin-copper complexes are based in part on model studies of the complexes formed with melanin precursors, catechol and 3,4-dihydroxyphenyl- alanine, and with phenanthroline. Nearly all complexes involve just one or two ligands from melanin. In catechol melanin below pH 5.0, complexes with carboxyl groups are formed; above 6.0, Cu2+ forms complexes with phenolic hydroxyl groups. These same complexes were found in 3,4-dihydroxyphenylalanine melanin and binding of CuZ+ at amino acid type sites also was detected. After partial reduction of copper ions bound to 3,4-dihydroxy- phenylalanine melanin, a weak signal of copper with four melanin ligands (oxygen and nitrogen in various combinations) was observed.
The black heterogeneous polymers formed by autoxidation of catechol and also of DOPA are useful synthetic models of the biological pigment melanin and are commonly described as “catechol melanin” and “DOPA melanin,” respectively. A detailed study of metal-ion binding sites of these synthetic polymers is presented here. The chemistry of these materials is representative of redox polymers and cation exchange resins, and as such the work is of general chemical interest (1). Our motivation, however, is to use the results of the study as a basis for investigations of natural melanins.
Melanins contain phenolic hydroxyl, carboxyl, and amine groups, which are effective metal-ion binding sites. Potts et al.
1 This work was supported by National Science Foundation Grant PCM ‘7614831 and by National Institutes of Health Grant 5P41 RR01008
2 Present address: Institute of Molecular Biology, Department of Biophysics, Jagellonian University, Grodzka 53, 31-001 Krakow, Poland.
3 Person to whom correspondence should be sent. 4 Abbreviation used: DOPA, 3,4-dihydroxyphenyl-
alanine.
(2) have estimated that the number of such sites is 20% of the number of monomeric subunits in the polymer.
Melanins contain stable free radicals that appear to be of the semiquinone type. Felix et al. (3) have shown that the binding of diamagnetic metal ions creates new free radicals, and have explained this result as a metal ion induced shift in equilibrium between quinone, quinol, and semiquinone moieties. Sarna et al. (4) have shown that the binding of paramagnetic metal ions, particularly CL?+, results in an apparent loss of EPR intensity of the free-radical signal, and have explained this result as a conse- quence of magnetic dipolar interaction be- tween free radical and metal ion. These authors also reported results of a back- titration experiment in which the binding sites were saturated with a diamagnetic metal ion and then the intensity of the free-radical signal was plotted as a function of the concentration of paramagnetic metal ions. Steps in this plot suggested the ex- istence of several types of binding sites.
In the studies of Refs. (3) and (4) the
289 0003-9861/80/0’70289-15$02.00/O Copyright 0 1980 by Academic Press, Inc. All rights of reproduction in any form reserved.

290 FRONCISZ, SARNA, AND HYDE
free radical served as a natural label or probe that permitted indirect investigation of the binding of metal ions to melanin. In the present work, the structures and prop- erties of binding sites are investigated directly by detailed analysis of the EPR spectra of Cu2+ probes.
Usually the ligands of Cu2+ in biological molecules are arranged in a distorted octa- hedral environment about the metal ion with four ligands lying in an approximate plane close to the copper and thus strongly bound (i.e., a square-planar copper complex). The other two ligands are axially arranged above and below the plane. These are much more weakly bound and play a minor role in both magnetic and optical properties of the copper complex (5).
The EPR spectra are of the powder type, with all orientations of the metal-ion binding sites with respect to the laboratory coordinate system equally probable. The diagonalized tensors describing the electron Zeeman and copper hyperfine interactions have substan- tially parallel axes and axial or nearly axial symmetry. The notation gl and A, is as- signed to the high field end of the spectrum, which arises from all orientations of the dc magnetic field in the plane of the complex, while the notation gil and A,, refers to the low field end of the spectrum corresponding to the magnetic field along the principal axis of the complex. A single copper isotope 63Cu with nuclear spin 3/2 was used in all experi- ments reported here. This results in better resolution than is possible using copper con- taining both 63Cu and 65Cu isotopes. Four hyperfine lines corresponding to A,, can fre- quently be observed at the low field end of the spectrum. In much of the work that fol- lows, particular attention has been paid to the hyperflne line observed at lowest field. Comparison of the measurements of A,, and g,, with values obtained from the literature on simpler model systems permits assign- ment of the melanin-copper ligands.
To our knowledge there has been only one earlier attempt to utilize EPR in the investi- gation of copper bound to melanin. Blois et al. (6) established that copper bound to natural melanin (1 copper ion per 200 melanin monomers) exhibits an EPR spectrum of the axial type with g, = 2.073, g,, = 2.27-
2.31, A,, = 348-3’78 MHz (110-117 G).5 Comparing these parameters with the re- sults of Malmstriim and Vanngard (7), these authors concluded that copper could be bound to four oxygens, four nitrogens, or two of each and that the results suggested an ionic rather than covalent binding. Gergely and Kiss (8), Pilbrow et al. (9), and Boggess and Martin (10) reported on complexes of copper with melanin precursors.
EXPERIMENTAL SECTION
Chemicals. All chemicals were of analytical reagent grade without additional purification. Doubly deionized and filtered water was used. “Vu was obtained from Oak Ridge National Laboratory in the form of 63Cu0 with a copper isotope purity of 99.89%. A stock solu- tion of 63CuSG4 at a concentration of 2 X 10” M was prepared by dissolving p3Cu0 in a stoichiometric amount of dilute HZSO,.
Catechol melanin. A solution of 15 g of catechol in 3 liters of deionized water was brought to pH 8 with ammonium hydroxide, and then air was bubbled through the stirred solution for 4 days. The resulting melanin was precipitated by addition of concentrated hydro- chloric acid to bring the pH to 2, then washed with dilute HCl and dialyzed against deionized water for several days to remove H+ and Cl-ions. The concentra- tion of the melanin suspension was estimated by drying an aliquot in vacuum over phosphorus pentoxide and weighing. Oxidized catechol melanin was prepared by adding 10 ml of 10” M potassium ferricyanide to 30 mg of melanin and incubating for 10 min. The suspension was then spun down, washed twice with deionized water, and suspended in 5 ml of deionized water.
DOPA melanin. The procedure for autoxidation of 3,4-dihydroxyphenylalanine to yield DOPA melanin was the same as used to produce catechol melanin from catechol.
Measurement of pH. The concentrations ofhydrogen ions were measured with a Radiometer glass electrode GK2321C using a Radiometer pH meter type pHM 64. Acid-base titrations were carried out under nitrogen to avoid possible oxidation.
Centrifugatio-n. Some melanin samples were concen- trated using an IEC HN-SII centrifuge (DamotiIEC Division) for 5-10 min at 2000 ‘pm.
Preparation ofcopper complexes. To 0.5 to 1 ml of an aqueous suspension of melanin (or aqueous solution of melanin precursors) containing 30-60 mg of melanin was added 1.25 ml of 4 M sodium per-chlorate solution
5 Hyperfme couplings should in principle be expressed in units of energy, either wavenumbers or hertz, but it is common practice to use gauss. A,,(MHz)/@g,J = A (gauss) where /3 is the Bohr magnetron.
CL?+ BINDING IN SYNTHETIC MELANINS 291
OH
OH
equwalents of OH-
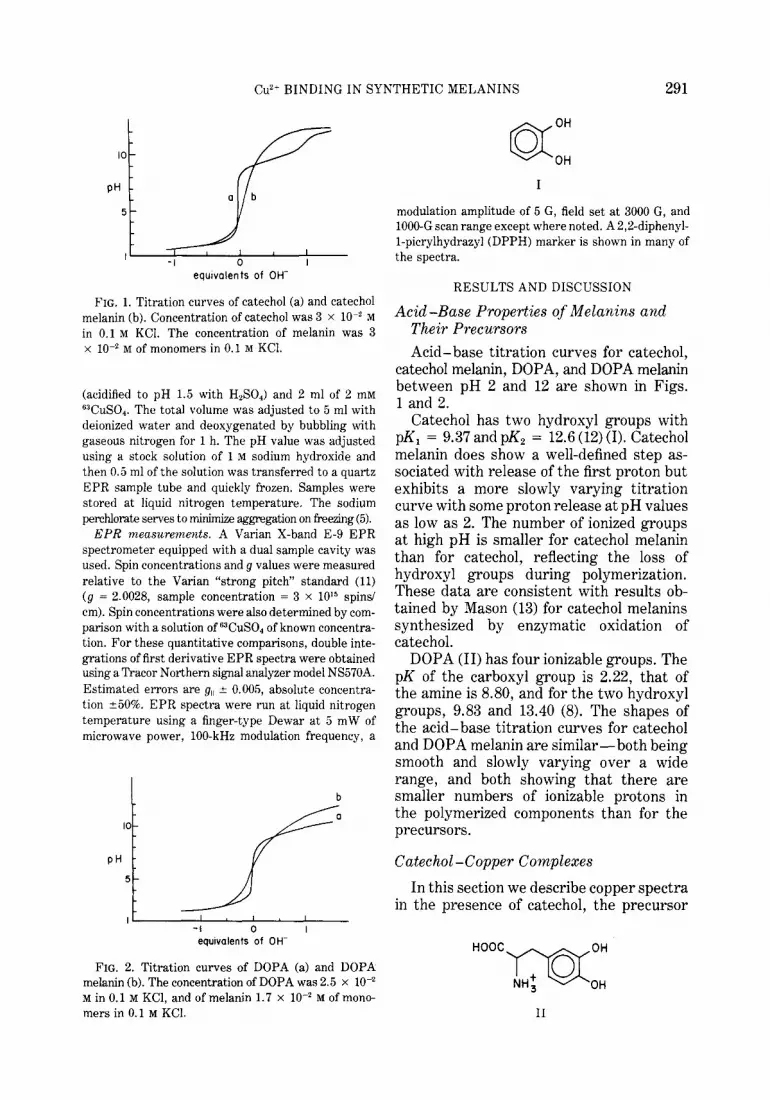
FIG. 1. Titration curves of catechol (a) and catechol melanin (b). Concentration of catechol was 3 x lo-’ M in 0.1 M KCI. The concentration of melanin was 3 x IO-* M of monomers in 0.1 M KCl.
(acidified to pH 1.5 with H,SO,) and 2 ml of 2 tnM GRC~S04. The total volume was adjusted to 5 ml with deionized water and deoxygenated by bubbling with gaseous nitrogen for 1 h. The pH value was adjusted using a stock solution of 1 M sodium hydroxide and then 0.5 ml of the solution was transferred to a quartz EPR sample tube and quickly frozen. Samples were stored at liquid nitrogen temperature. The sodium perchlorate serves to minimize aggregation on freezing (5).
EPR measurements. A Varian X-band E-9 EPR spectrometer equipped with a dual sample cavity was used. Spin concentrations and g values were measured relative to the Varian “strong pitch” standard (11) (g = 2.0028, sample concentration = 3 x 1O’j spinsi cm). Spin concentrations were also determined by com- parison with a solution of 63CuS0, of known concentra- tion. For these quantitative comparisons, double inte- grations of first derivative EPR spectra were obtained using a Tracer Northern signal analyzer model NS570A. Estimated errors are g,, + 0.005, absolute concentra- tion 250%. EPR spectra were run at liquid nitrogen temperature using a finger-type Dewar at 5 mW of microwave power, lOO-kHz modulation frequency, a
b
PH
5
eqwalents of OH-
FIG. 2. Titration curves of DOPA (a) and DOPA melanin (b). The concentration of DOPA was 2.5 x 10m2 M in 0.1 M KCl, and of melanin 1.7 x lo-* M of mono- mers in 0.1 M KCI.
modulation amplitude of 5 G, field set at 3000 G, and 1000-G scan range except where noted. A 2,2-diphenyl- I-picrylhydrazyl (DPPH) marker is shown in many of the spectra.
RESULTS AND DISCUSSION
Acid -Base Properties of Melanins and Their Precursors
Acid-base titration curves for catechol, catechol melanin, DOPA, and DOPA melanin between pH 2 and 12 are shown in Figs. 1 and 2.
Catechol has two hydroxyl groups with pK, = 9.37 and pK, = 12.6 (12) (I). Catechol melanin does show a well-defined step as- sociated with release of the first proton but exhibits a more slowly varying titration curve with some proton release at pH values as low as 2. The number of ionized groups at high pH is smaller for catechol melanin than for catechol, reflecting the loss of hydroxyl groups during polymerization. These data are consistent with results ob- tained by Mason (13) for catechol melanins synthesized by enzymatic oxidation of catechol.
DOPA (II) has four ionizable groups. The pK of the carboxyl group is 2.22, that of the amine is 8.80, and for the two hydroxyl groups, 9.83 and 13.40 (8). The shapes of the acid-base titration curves for catechol and DOPA melanin are similar-both being smooth and slowly varying over a wide range, and both showing that there are smaller numbers of ionizable protons in the polymerized components than for the precursors.
Catechol -Copper Complexes
In this section we describe copper spectra in the presence of catechol, the precursor
HoocpQl;; II

292 FRONCISZ, SARNA, AND HYDE
t
A 4 3 w
FIG. 3. EPR spectra of 0.001 M catechol, 0.001 M copper sulfate, 1 M sodium perchlorate aqueous solu- tions at 77°K. (A) pH 4.2, (B) pH 6.2, (C) pH 7.0, (D) pH 10.2. Relative gains are: (A) x5, (B) x16, (C) x10, (D) x63.
of melanin, as a function of pH. At low pH, no catechol-copper complexes are formed (Fig. 3A); the EPR spectrum is from Cu- (H,O)g+ (14). At intermediate pH values, spectra of two types are superimposed (Figs. 3B and C), corresponding to the 1:l bidentate complex [Cu(H,O), catechol1° and the 1:2 bidentate complex [Cu(catechol),12- (8). At high pH (Fig. 3D), a spectrum from a single species is observed which arises from the 1:2 bidentate complex. Hyperfine and Zee- man interactions for these three complexes are given in Table I. We note, following the work of Peisach and Blumberg (15), that the magnetic parameters of copper complexes are primarily determined by the ligand ele-
ments and the net charge of the complex (ignoring axial ligands). While these assign- ments seem plausible, EPR spectra alone cannot distinguish, for example, between Cu(OH), catechol12- and [Cu(catechol)2]2-.
Integrated copper EPR intensities are given in Table I. The loss of intensity as the pH is increased from 4.2 to 6.2 is at- tributed to formation of Cu(OH), precipitate (14) and depends on the competition be- tween catechol and hydroxyl ligands. A sub- sequent increase in integrated intensity to 50% at pH 10.2 is observed. In these samples the concentrations of catechol and copper are the same. Thus formation of 1:2 com- plexes results in complex formation with 50% of the copper as observed at pH 10.2 -the other half being lost as Cu(OH),. These EPR intensity measurements support the 1:2 bidentate assignment.
Catechol Melanin-Copper Complexes For complexes having the same atoms of
ligation, Peisach and Blumberg (15) found that a decrease in charge of the complex decreases gl, and increases A,,. If one of four oxygen ligands is changed to nitrogen with- out a change in charge, there is a decrease in g,, and a slight increase in A,,. It follows from these two rules that if neutral oxygen is replaced by negative nitrogen, there is a relatively greater decrease in g,, and greater increase in A,,.
TABLE I
MAGNETICPARAMETERSOF CATECHOL-COPPER COMPLEXEF
PH
Integral intensityb A,, * 5 Po.wc
(o/o) g,, -+ 0.005 (MHz) (db)
4.2 100 2.400 450 0 6.2 20 2.308 543 9.5 7.0 30 2.308 543 9.5
2.273 573 11.5 10.2 50 2.272 573 11.5
a Measurements were made at 77°K. * Value of the double integral as a percentage of
the double integral of the 63CuS0, standard solution. c Attenuation of the available microwave power in
db below 200 mW required to reduce the signal to 67% of what it would be in the absence of saturation.
Cu2+ BINDING IN SYNTHETIC MELANINS 293
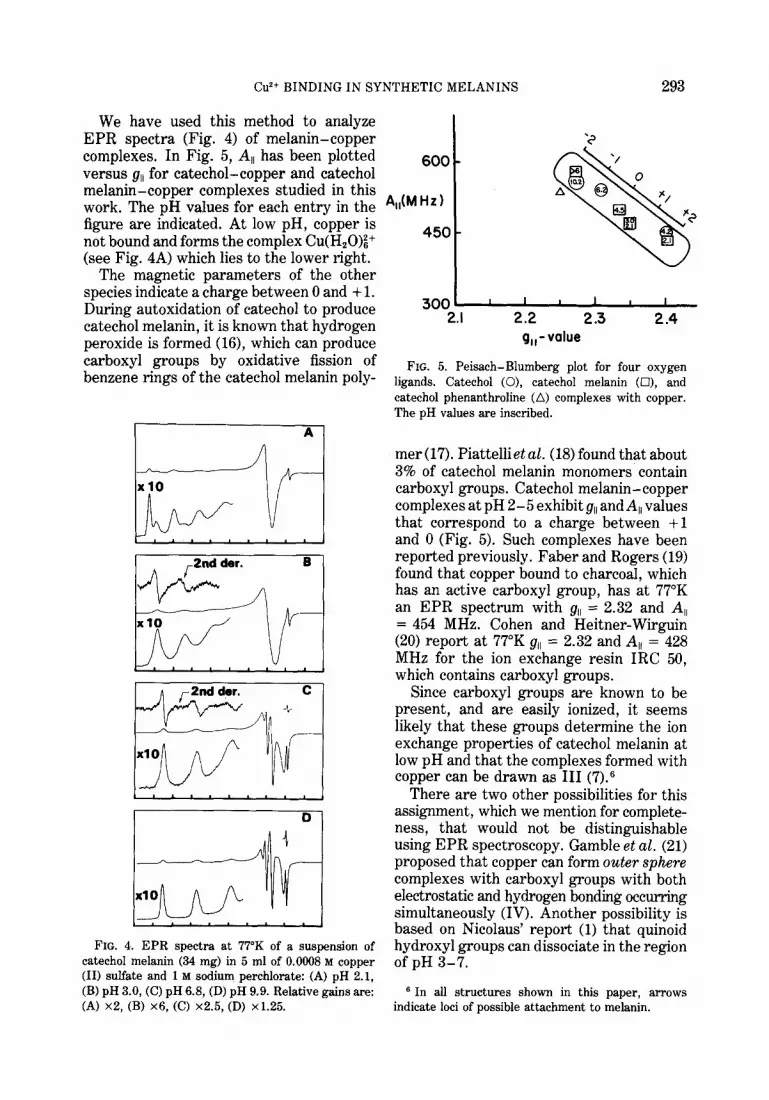
We have used this method to analyze EPR spectra (Fig. 4) of melanin-copper complexes. In Fig. 5, A,, has been plotted versus gll for catechol-copper and catechol melanin-copper complexes studied in this work. The pH values for each entry in the figure are indicated. At low pH, copper is not bound and forms the complex Cu(H20)g+ (see Fig. 4A) which lies to the lower right.
The magnetic parameters of the other species indicate a charge between 0 and + 1. During autoxidation of catechol to produce catechol melanin, it is known that hydrogen peroxide is formed (16), which can produce carboxyl groups by oxidative fission of benzene rings of the catechol melanin poly-
FIG. 4. EPR spectra at 77°K of a suspension of catechol melanin (34 mg) in 5 ml of 0.0008 M copper (II) sulfate and 1 M sodium perchlorate: (A) pH 2.1, (B) pH 3.0, (C) pH 6.8, (D) pH 9.9. Relative gains are: (A) x2, (B) x6, (C) x2.5, (D) x1.25.
300 i 2.1 2.2 2.3 2.4
g,,- value
FIG. 5. Peisach-Blumberg plot for four oxygen ligands. Catechol (0), catechol melanin (Cl), and catechol phenanthroline (A) complexes with copper. The pH values are inscribed.
mer (17). Piattelli et al. (18) found that about 3% of catechol melanin monomers contain carboxyl groups. Catechol melanin-copper complexes at pH 2-5 exhibit gll and A,, values that correspond to a charge between +l and 0 (Fig. 5). Such complexes have been reported previously. Faber and Rogers (19) found that copper bound to charcoal, which has an active carboxyl group, has at 77°K an EPR spectrum with gl, = 2.32 and A,, = 454 MHz. Cohen and Heitner-Wirguin (20) report at 77°K g,, = 2.32 and A,, = 428 MHz for the ion exchange resin IRC 50, which contains carboxyl groups.
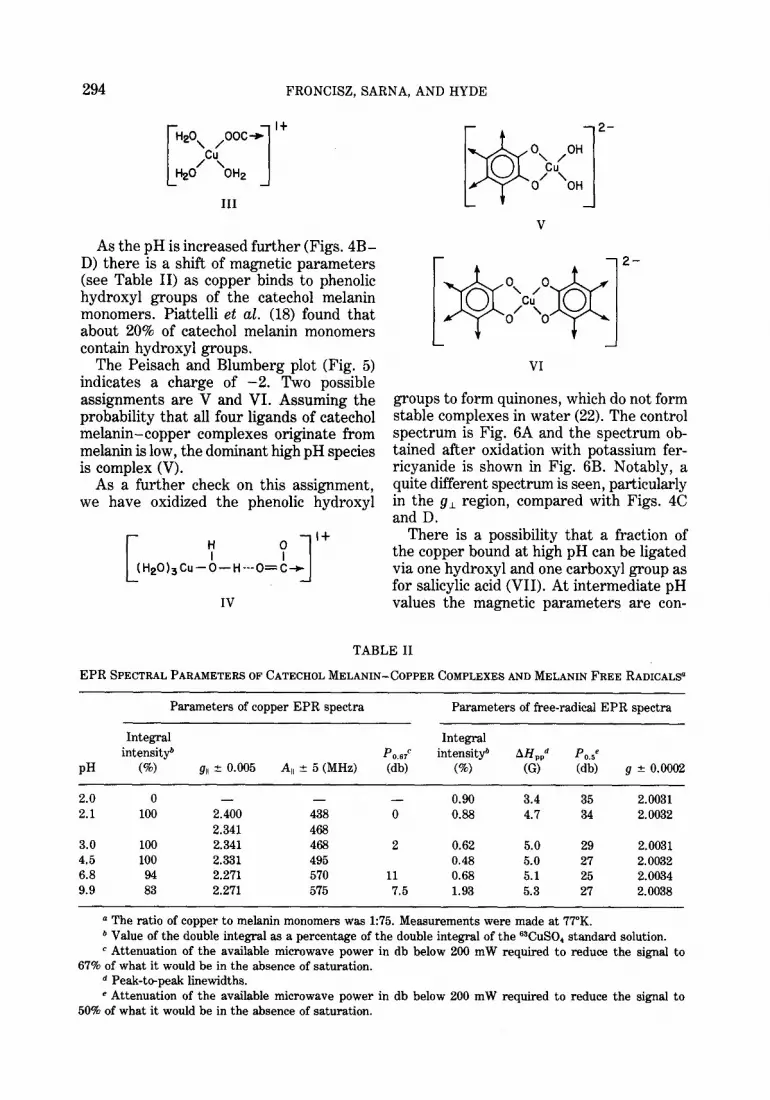
Since carboxyl groups are known to be present, and are easily ionized, it seems likely that these groups determine the ion exchange properties of catechol melanin at low pH and that the complexes formed with copper can be drawn as III (7).6
There are two other possibilities for this assignment, which we mention for complete- ness, that would not be distinguishable using EPR spectroscopy. Gamble et al. (21) proposed that copper can form outer sphere complexes with carboxyl groups with both electrostatic and hydrogen bonding occurring simultaneously (IV). Another possibility is based on Nicolaus’ report (1) that quinoid hydroxyl groups can dissociate in the region of pH 3-7.
6 In all structures shown in this paper, arrows indicate loci of possible attachment to melanin.
294 FRONCISZ, SARNA, AND HYDE
[ 1 It H20, ,ooc+ P\
Hz0 OH2
III
As the pH is increased further (Figs. 4B- D) there is a shift of magnetic parameters (see Table II) as copper binds to phenolic hydroxyl groups of the catechol melanin monomers. Piattelli et al. (18) found that about 20% of catechol melanin monomers contain hydroxyl groups,
The Peisach and Blumberg plot (Fig. 5) indicates a charge of -2. Two possible assignments are V and VI. Assuming the probability that all four ligands of catechol melanin-copper complexes originate from melanin is low, the dominant high pH species is complex (V).
As a further check on this assignment, we have oxidized the phenolic hydroxyl I+
IV
V
groups to form quinones, which d 0 not form stable complexes in water (22). The control spectrum is Fig. 6A and the spectrum ob- tained after oxidation with potassium fer- ricyanide is shown in Fig. 6B. Notably, a quite different spectrum is seen, particularly in the g1 region, compared with Figs. 4C and D.
There is a possibility that a fraction of the copper bound at high pH can be ligated via one hydroxyl and one carboxyl group as for salicylic acid (VII). At intermediate pH values the magnetic parameters are con-
TABLE II
EPR SPECTRALPARAMETERSOFCATECHOLMELANIN-COPPERCOMPLEXESANDMELANINFREE RADICALS=
Parameters of copper EPR spectra Parameters of free-radical EPR spectra
Integral Integral intensitp P 0.67' intensitp IIH,,,~ PO.,"
PH (%I g,, -c 0.005 A,, h 5 (MHz) (db) (o/o) (G) (db) g -c 0.0002
2.0 0 - - - 0.90 3.4 35 2.0031 2.1 100 2.400 438 0 0.88 4.7 34 2.0032
2.341 468 3.0 100 2.341 468 2 0.62 5.0 29 2.0031 4.5 100 2.331 495 0.48 5.0 27 2.0032 6.8 94 2.271 570 11 0.68 5.1 25 2.0034 9.9 83 2.271 575 7.5 1.93 5.3 27 2.0038
D The ratio of copper to melanin monomers was 1:75. Measurements were made at 77°K. b Value of the double integral as a percentage of the double integral of the “CuSO, standard solution. c Attenuation of the available microwave power in db below 200 mW required to reduce the signal to
67% of what it would be in the absence of saturation. * Peak-topeak linewidths. e Attenuation of the available microwave power in db below 200 mW required to reduce the signal to
50% of what it would be in the absence of saturation.

Cu*+ BINDING IN SYNTHETIC MELANINS 295
A I COOH
OH
VII
sistent with a neutral charge and an assign- ment of [Cu(H,O), catechol].
Other changes in the copper spectra were noted and are reported in Table II. The integrated intensity of the copper spectrum decreases somewhat as the pH is increased. In addition, EPR spectra recorded for vari- ous pH values exhibit different microwave power saturation characteristics. Spectra at low pH are more difficult to saturate than spectra at high pH.
Changes occur in the resonance char- acteristics of the free radical (Table II). The free-radical spectrum can be altered in line- shape, saturation characteristics, and line- width by dipole-dipole interaction with copper, and in integrated intensity by the comproportionation reaction of Felix et al. (3) and also by change in pH (23). Integra- tions were over 40-G intervals. The integrals are expressed in terms of percentage of the copper EPR signal measured at a pH of 2.1.
Al
FIG. 6. EPR spectrum at 7’7°K of copper bound to catechol melanin in the ratio of 1:150. Melanin was suspended in 0.1 M NaCl at pH 6.6. (A) Nonoxidized melanin; (B) melanin oxidized with potassium ferri- cyanide. Relative gain, (A) x2.5, (B) x5.
FIG. 7. EPR spectrum at 77°K of a suspension of catechol melanin (15 mg) in deionized water saturated with copper at pH 5.0. (A) Before reduction, (B) after reduction with sodium dithionite (50 mg), (C) after exposure to air for a period of 2 days. Relative gain: (A) x5, (B) x630, (C) x630.
After saturation of catechol melanin with copper, a poorly resolved EPR copper spec- trum is obtained (Fig. 7A). Addition of sodium dithionite reduces substantially all copper, and restores the intensity of the free- radical signal (which had been broadened beyond detection by dipolar coupling with CL?+) (Fig. 7B). Exposure of this sample to air for 2 days resulted in partial restora- tion of the copper spectrum (Fig. 7C).
Catechol Melanin-Copper- Phenanthrolin Complexes
Experiments have been carried out in which l,lO-phenanthroline (VIII) was intro- duced in various ways to the catechol melanin-copper system.
A first experiment was as follows: copper was bound to melanin at pH 6.6 in a ratio of 1 copper to 200 catechol monomers and then phenanthroline was added in the ratio of 1:l copper to phenanthroline. The melanin suspension was spun down and the resulting precipitate checked by EPR (Fig. 8). The spectrum shows in the g, region superhyper- fine patterns that are characteristic of nitro- gen ligands. Copper magnetic parameters

FRONCISZ, SARNA, AND HYDE
FIG. 8. EPR spectra at 7’7°K of a copper-melanin suspension in the ratio of copper to melanin mono- mers of 1:200 after addition of phenanthroline in a 1:l ratio of phenanthroline to copper. The solvent was deionized water at pH 6.6.
are A,, = 550 MHz, gll = 2.25. The linewidth of the free-radical signal was 4.8 G and the saturation parameter was Po.s = 24 db, in- dicative of copper-free-radical dipole-dipole interaction. Thus it is concluded that copper is bound both to phenanthroline and to melanin as catechol melanin-cu-phen- anthroline. The magnetic parameters fall in the 0 charge region of the Peisach-Blum- berg plot for 2 N and 2 0 ligands.
A second experiment was to bind copper to an excess of phenanthroline (1 Cu:3 phen- anthroline) and then to add the resulting complex to a melanin suspension in the ratio of 1 Cu:50 melanin monomers. Almost all phenanthroline copper complexes were bound to melanin (Fig. 9A) since upon centrifugation no copper signal remained in the supernatant. However, the linewidth of the free-radical signal was 4 G, and P,, = 33 db, indicating a much reduced free- radical-copper interaction and binding of the complex to melanin in a different way than in the first experiment of this section.
/--\ m VIII
It is speculated that the flat [Cu(phenanthro- line)J*+ complex intercalates into a layered region of melanin where it is held by ionic and van der Waals forces.
A third experiment was to bind copper to
:;
4
I B
FIG. 9. EPR spectra at 77°K of copper-phenanth complexes added to catechol melanin suspension in deionized water at pH 6.4. The ratio of copper to melanin monomers was 1:50 and the ratio of copper to phenanthroline was (A) 1:3, (B) 1:l.

Cu*+ BINDING IN SYNTHETIC MELANINS 297
phenanthroline in a 1:l stoichiometry and then add the resulting complex to melanin in the ratio of 1 copper to 50 melanin mono- mers. The resulting EPR spectrum is shown in Fig. 9B. One can see that the free-radical signal is nearly quenched by the copper, in contrast to the situation described in the second experiment.
The results in this section provide models for copper complexes with DOPA and natural melanin where nitrogen is present. The results are consistent with a model of melanin-copper complexes where only two ligands can be supplied by melanin because spatial constraints make it difficult for the melanin itself to arrive at a sufficient con- centration of square-planar configurations of ligands. The results show that phenan- throline can compete with water but not with catechol in providing copper ligands. The type of binding evidenced in the experi- ment where [Cu(phenanthrolineJ+ was added appears new in the context of melanin studies.
DOPA -Copper Complexes
DOPA can bind copper through an amino acid type 0, N bonding at the alanine side chain and also through a catechol type 0, 0 bonding at the ortho-phenolic hydroxyl groups. In solution, DOPA forms various types of monomeric and polymeric complexes with copper, depending on the ratio of con- centrations of DOPA:Cu*+, the pH, the ionic strength, and the solvent (8). EPR param- eters of DOPA-Cu complexes are known from the literature only for nonaqueous (24) and methanol-water solvents (8). We have therefore studied DOPA-copper complexes in order to lay a foundation for experiments on DOPA melanin-copper complexes.
At low pH (1.5-3-O) copper does not bind to DOPA. The EPR spectrum is character- istic of Cu(H,O)g+ (Fig. 10A) and is the same as for catechol-copper complexes at low pH (Fig. 3A). Above pH 3.0, copper starts to bind to DOPA (Fig. IOB) and at pH 4.7 somewhat more than 50% of the copper
, ,b 2100
FIG. 10. EPR spectra at 77°K of 0.001 M DOPA, 0.001 M copper sulfate, 1 M sodium perchlorate aqueous solutions. (A) pH 1.6, (B) pH 3.87, (C) pH 4.8, (D) pH 5.9, (E) pH 11, (F) pH 11. Relative gain: (A) xl, (B) x0.25, (C) x2, (D) x10, (E) ~6.3, (F) x50. Microwave power: (A-E) 5 mW, (F) 180 mW; modulation amplitude: (A-E) 5 G, (F) 10 G.

298 FRONCISZ, SARNA, AND HYDE
ions are bound. The magnetic parameters are given in Table III and are plotted in Fig. 11. In this figure the solid line sur- rounds the region of four oxygen ligands given by Peisach and Blumberg (15), while the dotted line surrounds the region associ- ated with three oxygens and one nitrogen. The figure shows that the nitrogen of the amine group is involved in at least a portion of the copper complexes that can be formed.
The entry on Fig. 11 for the dominant species in DOPA-copper at pH 5.0 indicates a charge between 0 and -1 if one nitrogen is involved, and, based on plots given by Peisach and Blumberg, a charge between 0 and +1 if two nitrogens are involved. Thus the magnetic parameters found by us are a better fit to the structure [Cu(DOPA)JO than to [Cu(H,O),DOPA]+‘. Gergely and Kiss (8), using pH metric, visible, uv, and EPR spectra studies, reach the conclusion that the compound [Cu(H,O),DOPA]‘+ is at high- est concentration in the conditions of this experiment. In order to resolve this conflict, we prepared a DOPA-copper complex at pH 5.2 using lo-fold more DOPA than cop- per, which should result in [Cu-(DOPA),] as the dominant species. The resulting EPR parameters (g,, = 2.25, A,, = 185 G) cor- respond to the less abundant complexes (see Table III) obtained when the stoichiometry is 1:l. Thus we agree with the assignment
TABLE III
MAGNETIC PARAMETERS OF DOPA-COPPER COMPLEXEF
Integral intermit9 A,, 2 5 Po.,s
PH (%I g,, 2 0.005 (MHz) Mb)
1.65 100 2.400 438 0 3.6 100 2.392 447 0
2.303 532 5.5 4.8 2.390 447 0
2.300 532 5.5 5.2 2.390 447 0
2.300 532 5.5 2.250 582
5.9 46 Dimer 10.0 66 Dimer
a A 1:l concentration ratio in 1 M sodium perchlorate aqueous solution was used. Measurements were at ‘77°K.
b Value of the double integral as a percentage of the double integral of the QCuSO, standard solution.
c Attenuation of the available microwave power in db below 200 mW required to reduce the signal to 67% of what it would be in the absence of saturation.
of Gergely and Kiss and-recognize that the Peisach- Blumberg approach for assigning copper ligands serves only as an approximate guide.
At pH 5.9 and above, complexes are formed with DOPA involving two or more
600 -
A,,hlHz)
450 -
300 1 2.1
I I 2.2 2.3
g,, -value
I 2.4
FIG. 11. Peisach-Blumberg plot for four oxygen ligands (solid enclosure) and three oxygen ligands, one nitrogen ligand (dotted enclosure). DOPA (d), DOPA melanin (El), DOPA melanin low ionic strength (A). The pH values are inscribed.
Cuz+ BINDING IN SYNTHETIC MELANINS 299
copper ions. The spectrum at pH 11 appears to be a dimeric species; the spectrum at pH 5.9 appears to be a mixture of this dimeric complex and low pH monomeric complex. The high pH complex also exhibits a low- field (1100-1’700 G) spectrum (Fig. 10F). This part of the spectrum is attributed to Ams = -+2 transitions and its existence is strong evidence for the formation of dimeric complexes.
DOPA Melanin-Copper Complexes
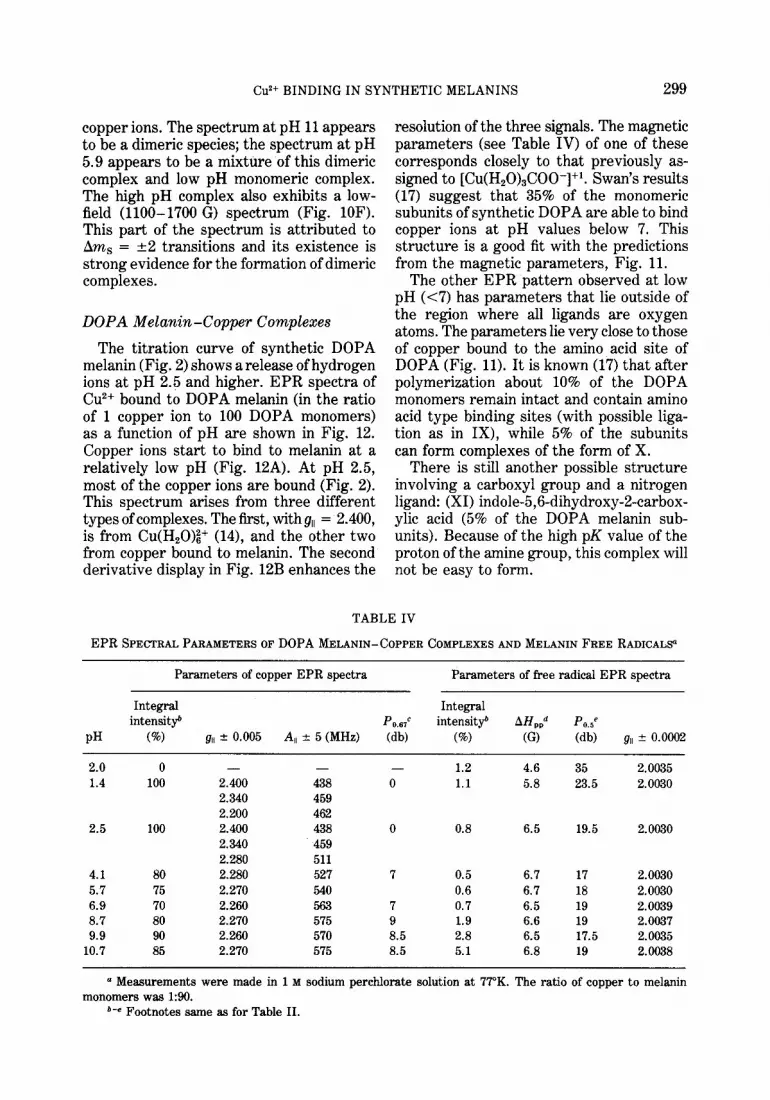
The titration curve of synthetic DOPA melanin (Fig. 2) shows a release of hydrogen ions at pH 2.5 and higher. EPR spectra of Cu2+ bound to DOPA melanin (in the ratio of 1 copper ion to 100 DOPA monomers) as a function of pH are shown in Fig. 12. Copper ions start to bind to melanin at a relatively low pH (Fig. 12A). At pH 2.5, most of the copper ions are bound (Fig. 2). This spectrum arises from three different types of complexes. The first, withg,, = 2.400, is from Cu(H,O)i+ (14), and the other two from copper bound to melanin. The second derivative display in Fig. 12B enhances the
resolution of the three signals. The magnetic parameters (see Table IV) of one of these corresponds closely to that previously as- signed to [Cu(H,O),COO-I+‘, Swan’s results (17) suggest that 35% of the monomeric subunits of synthetic DOPA are able to bind copper ions at pH values below 7. This structure is a good fit with the predictions from the magnetic parameters, Fig. 11.
The other EPR pattern observed at low pH (~‘7) has parameters that lie outside of the region where all ligands are oxygen atoms. The parameters lie very close to those of copper bound to the amino acid site of DOPA (Fig. 11). It is known (17) that after polymerization about 10% of the DOPA monomers remain intact and contain amino acid type binding sites (with possible liga- tion as in IX), while 5% of the subunits can form complexes of the form of X.
There is still another possible structure involving a carboxyl group and a nitrogen ligand: (XI) indole-5,6-dihydroxy-Z-carbox- ylic acid (5% of the DOPA melanin sub- units). Because of the high pK value of the proton of the amine group, this complex will not be easy to form.
TABLE IV
EPR SPECTRALPARAMETERSOFDOPA MELANIN-C• PPERCOMPLEXESANDMELANINFREE RADICALZ?
Parameters of copper EPR spectra Parameters of free radical EPR spectra
Integral Integral intensitp P o.& intensitp AHppd pLUe
PH (So) g,, + 0.005 A,, k 5 (MHz) (db) 60) (G) (db) g,, + 0.0002
2.0 0 - - - 1.2 4.6 35 2.0035 1.4 100 2.400 438 0 1.1 5.8 23.5 2.0030
2.340 459 2.200 462
2.5 100 2.400 438 0 0.8 6.5 19.5 2.0030 2.340 459 2.280 511
4.1 80 2.280 527 7 0.5 6.7 17 2.0030 5.7 75 2.270 540 0.6 6.7 18 2.0030 6.9 70 2.260 563 7 0.7 6.5 19 2.0039 8.7 80 2.270 575 9 1.9 6.6 19 2.0037 9.9 90 2.260 570 8.5 2.8 6.5 17.5 2.0035
10.7 85 2.270 575 8.5 5.1 6.8 19 2.0038
a Measurements were made in 1 M sodium perchlorate solution at 77°K. The ratio of copper to melanin monomers was 1%.
** Footnotes same as for Table II.

FRONCISZ, SARNA, AND HYDE
1 I+
L - 6H2
IX
The remaining 65% of melanin monomers contain nitrogen without neighboring car- boxy1 groups and presumably are not in- volved in complex formation at low pH. At pH 4.1, all copper is bound to melanin (Fig. 12C). At still higher pH values, the value of A,, increases and structure becomes apparent in the gll region (Figs. 12D-F). The mag- netic parameters and spectral features are similar to those of catechol melanin-copper complexes at pH > 6.0. Thus at high pH copper forms with DOPA melanin the same complexes as it does with catechol melanin (5, 6).
x
Binding of copper ions is a time-depend- ent process. After 15 min incubation of the melanin suspension in copper sulfate aqueous solution at pH 1.7, the EPR spectrum shows a significant concentration of unbound cop- per ions (Fig. 13A). If the incubation is prolonged for 3 days, almost all copper ions are bound despite the low pH value. In this case, binding at two sites occurs (Fig. 13B), with EPR parameters as follows: gi = 2.29, A’ = 480 MHz, g;4 = 2.34, A; = 458 MHz.
The EPR parameters of copper bound to
E
FIG. 12. EPR spectra at ‘77°K of a suspension of DOPA melanin (70 mg) in 5 ml of deionized water containing 0.007 M copper sulfate and 1 M sodium per-chlorate. (A) pH 1.4, (B) pH 2.5, (C) pH 4.1, (D) pH 6.9, (E) pH 9.9, (F) pH 10.7. For the first derivative EPR spectra relative gains were: (A) x2.5, (B) x2.5, (C) x2.4, (D) x4, (E) x1.6, (F) xl. For the second derivative spectrum, microwave power was 20 mW. Second derivative spectra were obtained using double field modulation and phase-sensitive detection. Both field modulation amplitudes were 10 G and relative gains in all spectra were the same.

Cu2+ BINDING IN SYNTHETIC MELANINS 301
xY(yy./i - 1 ,
FIG. 13. EPR spectra at 77°K of a melanin suspension containing copper ions in the ratio of melanin monomers to copper of 2009, in 1 M sodium perchlorate aqueous solution at pH 2.5. The incubation time was: (A) 15 min, (B) 3 days. Relative gains: (A) x3.2, (B) x5.
melanin also depend on the ionic strength of the solvent. For example, at low ionic strength (<O.Ol M) at pH 4.0, Cu2+ bound to DOPA melanin results in gil = 2.29, A,, = 480 MHz. The hyperflne splitting is less than is found at the same pH and high ionic strength (1 M sodium perchlorate) (see Table IV). This is probably associated with shift of the pK value and change of the stability constant of the melanin-copper complex since reduc- ing the pH from 4.0 to 1.5 results in glI = 2.29, A,, = 480 MHz (Fig. 12B). We remark that it is known that perchlorate ions do not bind
or bind very weakly to metal ions in aqueous solution (25).
The free-radical EPR spectra also provide a good indicator of binding of copper. The value of P1,2 is particularly sensitive to binding and shows that all copper is bound at pH above 4.1.
Because of the dimer formation observed in DOPA-copper samples at pH > 5.9, we have searched for similar dimer formation in DOPA melanin-copper samples without success.
Reduction of Copper Ions Bound to Synthetic DOPA Melanin
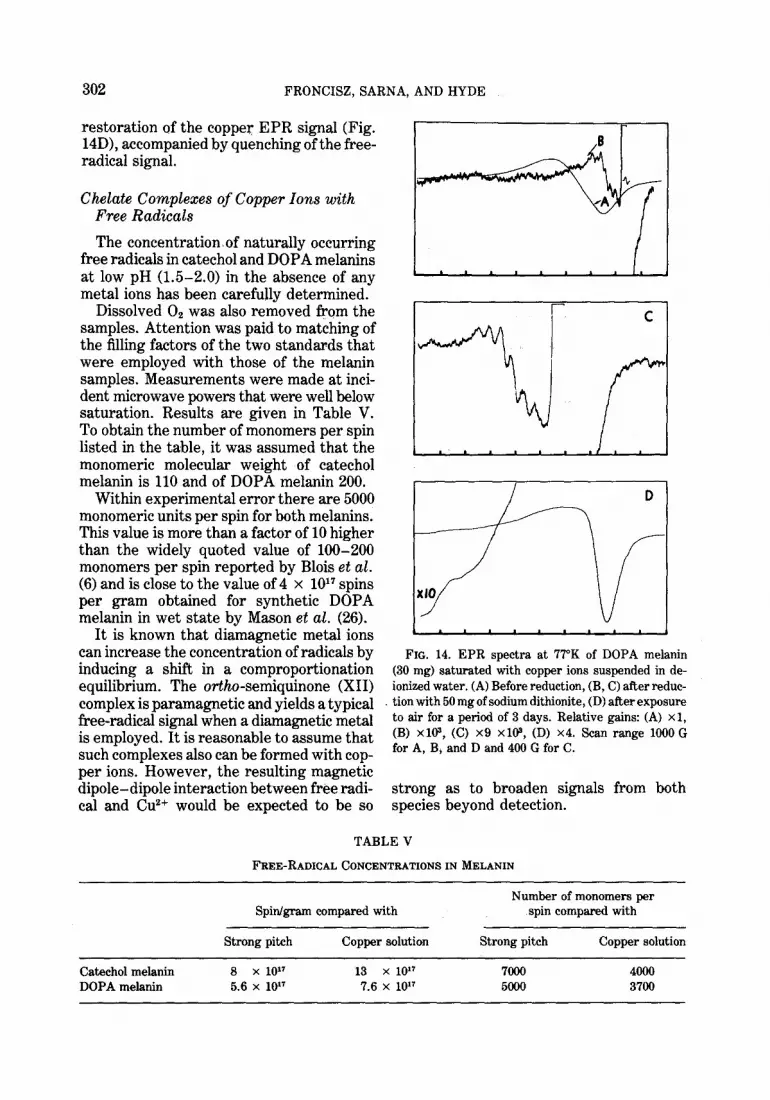
Synthetic DOPA melanin saturated with copper ions shows a broad poorly resolved EPR spectrum (Fig. 14A). The free-radical EPR signal has been quenched by dipolar coupling with the paramagnetic copper ions. Addition of sodium dithionite reduces the copper, causing a diminution of the copper EPR signal by more than loo-fold, and a restoration of the free-radical EPR spec- trum. The residual copper spectrum (Fig. 14B) differs from others reported here. One can see well-resolved structure with at least six lines and a splitting of about 18 G (Fig. 14C). It is suggested that this residual site arises from those few sites that exist in DOPA melanin where copper can be bound to four melanin ligands (oxygen and nitro- gen, in various combination). Exposure of the sample to air results in almost complete
302 FRONCISZ, SARNA, AND HYDE
restoration of the copper EPR signal (Fig. 14D), accompanied by quenching of the free- radical signal.
Chelate Complexes of Copper Ions with Free Radicals
The concentration. of naturally occurring free radicals in catechol and DOPA melanins at low pH (1.5-2.0) in the absence of any metal ions has been carefully determined.
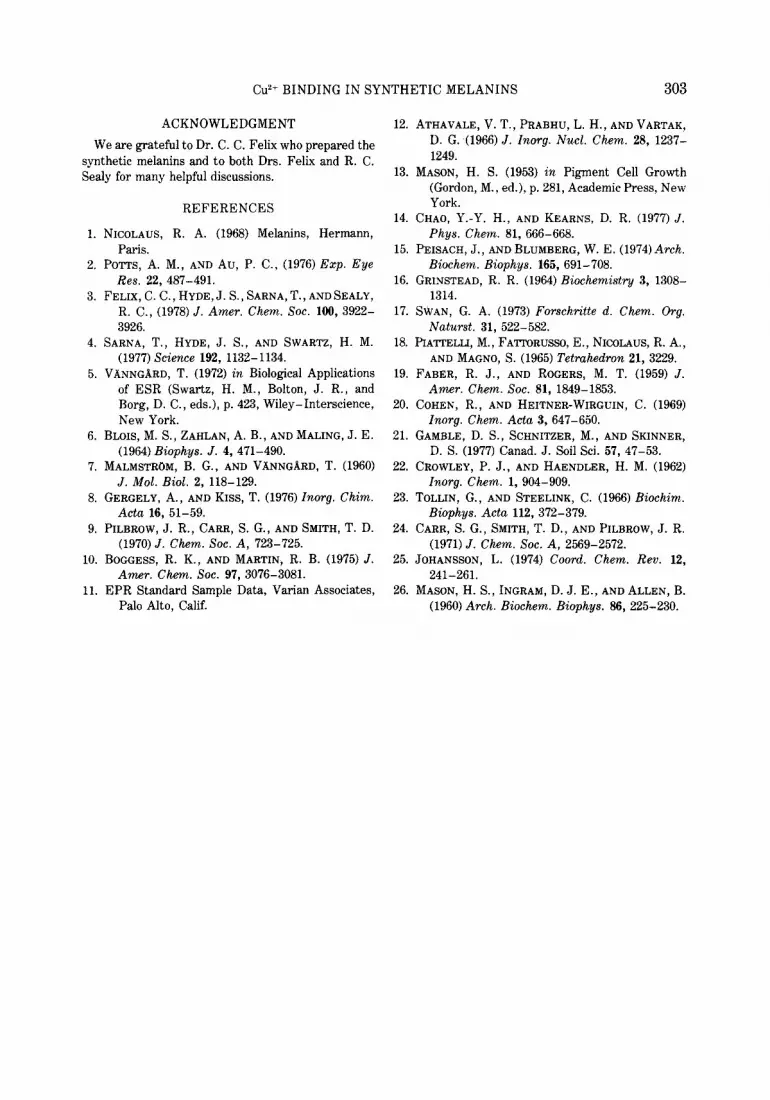
Dissolved 0, was also removed from the samples. Attention was paid to matching of the filling factors of the two standards that were employed with those of the melanin samples. Measurements were made at inci- dent microwave powers that were well below saturation. Results are given in Table V. To obtain the number of monomers per spin listed in the table, it was assumed that the monomeric molecular weight of catechol melanin is 110 and of DOPA melanin 200.
Within experimental error there are 5000 monomeric units per spin for both melanins. This value is more than a factor of 10 higher than the widely quoted value of 100-200 monomers per spin reported by Blois et al. (6) and is close to the value of 4 x 10” spins per gram obtained for synthetic DOPA melanin in wet state by Mason et al. (26).
It is known that diamagnetic metal ions can increase the concentration of radicals by inducing a shift in a comproportionation equilibrium. The ortho-semiquinone (XII) complex is paramagnetic and yields a typical free-radical signal when a diamagnetic metal is employed. It is reasonable to assume that such complexes also can be formed with cop- per ions. However, the resulting magnetic dipole-dipole interaction between free radi- cal and Cu2+ would be expected to be so
FIG. 14. EPR spectra at 7’7°K of DOPA melanin (30 mg) saturated with copper ions suspended in de- ionized water. (A) Before reduction, (B, C) after reduc- tion with 50 mg of sodium dithionite, (D) after exposure to air for a period of 3 days. Relative gains: (A) xl, (B) x101, (C) x9 x109, (D) x4. Scan range 1000 G for A, B, and D and 400 G for C.
strong as to broaden signals from both species beyond detection.
TABLE V
FREE-RADICAL CONCENTRATIONS IN MELANIN
Catechol melanin DOPA melanin
Spin/gram compared with
Strong pitch Copper solution
8 x 10” 13 x 10” 5.6 x 10” 7.6 x 10”
Number of monomers per spin compared with
Strong pitch Copper solution
moo 4000 5000 3700
Cu2+ BINDING IN SYNTHETIC MELANINS 303
ACKNOWLEDGMENT
We are grateful to Dr. C. C. Felix who prepared the synthetic melanins and to both Drs. Felix and R. C. Sealy for many helpful discussions.
REFERENCES
1. NICOLAUS, R. A. (1968) Melanins, Hermsnn, Paris.
2. POTTS, A. M., AND Au, P. C., (1976) Exp. Eye Res. 22, 487-491.
3. FELIX, C. C., HYDE, J. S., SARNA, T., ANDSEALY, R. C., (1978) J. Amer. Chem. Sot. 100, 3922- 3926.
4. SARNA, T., HYDE, J. S., AND SWARTZ, H. M. (1977) Science 192, 1132-1134.
5. VANNGARD, T. (1972) in Biological Applications of ESR (Swartz, H. M., Bolton, J. R., and Borg, D. C., eds.), p. 423, Wiley-Interscience, New York.
6. BLOIS, M. S., ZAHLAN, A. B., AND MALING, J. E. (1964) Biophys. J. 4, 471-490.
7. MALMSTR~M, B. G., AND V.‘~NNGARD, T. (1960) J. Mol. Biol. 2, 118-129.
8. GERGELY, A., AND KISS, T. (1976) Znorg. Chim. Acta 16, 51-59.
9. PILBROW, J. R., CARR, S. G., AND SMITH, T. D. (1970) J. Chem. Sot. A, 723-725.
10. BOGGESS, R. K., AND MARTIN, R. B. (1975) J. Amer. Ch.em. Sot. 97, 3076-3081.
11. EPR Standard Sample Data, Varian Associates, Palo Alto, Calif.
12. ATHAVALE, V. T., PRABHU, L. H., AND VARTAK, D. G. (1966) J. Znorg. Nucl. Chem. 28, 1237- 1249.
13. MASON, H. S. (1953) in Pigment Cell Growth (Gordon, M., ed.), p. 281, Academic Press, New York.
14. CHAO, Y.-Y. H., AND KEARNS, D. R. (1977) J. Phys. Chem. 81, 666-668.
15. PEISACH, J., AND BLUMBERG, W. E. (1974) Arch. Biochem. Biophys. 165, 691-708.
16. GRINSTEAD, R. R. (1964) Biochemistry 3, 1308- 1314.
17. SWAN, G. A. (1973) Forschritte d. Chem. 0rg. Naturst. 31, 522-582.
18. PIA~ELLI, M., FA~RUSSO, E., NICOLAUS, R. A., AND MAGNO, S. (1965) Z’etmhedron 21, 3229.
19. FABER, R. J., AND ROGERS, M. T. (1959) J. Amer. Chem. Sot. 81, 1849-1853.
20. COHEN, R., AND HEITNER-WIRGUIN, C. (1969) Znorg. Chem. Acta 3, 647-650.
21. GAMBLE, D. S., SCHNITZER, M., AND SKINNER, D. S. (1977) Canad. J. Soil Sci. 57, 47-53.
22. CROWLEY, P. J., AND HAENDLER, H. M. (1962) Znorg. Chem. 1, 904-909.
23. TOLLIN, G., AND STEELINK, C. (1966) Biochim. Biophys. Acta 112, 372-379.
24. CARR, S. G., SMITH, T. D., AND PILBROW, J. R. (1971) J. Ch.em. Sot. A, 2569-2572.
25. JOHANSSON, L. (1974) Coord. Chem. Rev. 12, 241-261.
26. MASON, H. S., INGRAM, D. J. E., AND ALLEN, B. (1960) Arch. Biochem. Biophys. 86, 225-230.