5 advancement of helical gear design technology usaavlabs ...
258
'00 so ^ 41 to Q *5 ADVANCEMENT OF HEL I CAL GEAR DES I GN TECHNOLOGY USAAVLABS TFCHN I CAL REPORT 68-47 iy Vayu L. Mditin Ttrry A. Lyii lily IMS U. S. ARMY AVIATION MATER I EL LABORATOR I ES FORT EUSTIS, VIRGINIA CONTRACT DA 44-177-AMC-450(T) ALLISON DIVISION-GENERAL MOTORS INDIANAPOLIS, INDIANA This document has been approved for public release and sale; its distribution is unlimited. Reproduced by the CLEARINGHOUSE for Fe feral Scientific & Technical P O C SEP 3 0 1353 „ iJ u E l J c. jfF Information Springfield Va. 22151 le „ .i ... -
-
Upload
khangminh22 -
Category
Documents
-
view
1 -
download
0
Transcript of 5 advancement of helical gear design technology usaavlabs ...
'00 so ^ 41
to Q *5 ADVANCEMENT OF HELICAL GEAR DESIGN TECHNOLOGY
USAAVLABS TFCHNICAL REPORT 68-47
iy
Vayu L. Mditin
Ttrry A. Lyii
lily IMS
U. S. ARMY AVIATION MATERIEL LABORATORIES FORT EUSTIS, VIRGINIA
CONTRACT DA 44-177-AMC-450(T) ALLISON DIVISION-GENERAL MOTORS
INDIANAPOLIS, INDIANA
This document has been approved for public release and sale; its distribution is unlimited.
Reproduced by the C L E A R I N G H O U S E
for Fe feral Scientific & Technical
P O C
SEP 3 0 1353
„ iJ u E l J c.
jfF Information Springfield Va. 22151
l e „ . i . . . -
DEPARTMENT OF THE ARMY U. S. ARMY AVIATION MATERIEL CAHORATORIES
FORT EUSTIS. VIRGINIA 23604
This report represents a pert of a continuing program to derive more accurate and uniform gear design formulae for aircraft pro- pulsion systems than currently available. The report presents the results of an analytical and experimental program to derive a precise bending strength formula for helical gear teeth and to provide an IBM 7090 computer program for the use of this formula. Positive results were obtained from the program, and the infor- mation contained herein can be immediately considered by gear de- signers.
This connand concurs in the conclusions made by the contractor.

■
Task 1G125901A01410
Contract DA 44-177-AMC-450(T) USAAVLABS Technical Report 68-47
July 1968
ADVANCEMENT OF HELICAL GEAR DESIGN TECHNOLOGY
Final Report
by
Wayne L. Mclntire and
Terry A, Lyon
Allison Division Report EDR 5503
Prepared by
Allison Division • General Motors Indianapolis, Indiana
for
U. S. ARMY AVIATION MATERIEL LABORATORIES FORT EUSTIS, VIRGINIA
This document has been approved for public release and sale; its distribution is unlimited.
.

( SUMMARY
This report presents the results of an analytical and experimental pro- gram to derive and substantiate a bending strength design formula for helical gears. The program consisted of the following:
• Static single-tooth fatigue testing of four gear designs to determine the effect of two geometric variables (pressure angle and helix angle) and two tooth load positions (tip loading inboard of the tooth corner and tip loading at the tooth corner)
• Evaluation of the ability of five current calculation methods—AGMA, Lewis, Heywood, Almen-Straub, Cantilever Plate—to predict the relative ranking of the four fatigue test gear endurance limits for comparison with the basic material strength
• Statistical analyses of the fatigue test data to develop a predictive formula which reflects the basic material strength and relative sig- nificance values of the two geometric variables
• R. R. Moore rotating beam fatigue tests of the gear material to es- tablish basic material strength for comparison with fatigue test en- durance limits and the five calculation methods
• Strain gage measurements to determine the load distribution at the root fillet
• Measurement of the fatigue test gear crack location for comparison with location of the weakest section as predicted by the Lewis calcula- tion method
• Metallurgical examination of fatigue test gears to verify material processing and mode of failure
• Dynamic testing at high pitch line velocity on helical gears (up to 20, 000 feet per minute) to determine the speed effect on gear tooth bending stress
• Development of a computer program to calculate gear tooth bending stress from the basic gear geometry
A modification to the existing AGMA method for calculating helical tooth bending strength was necessary to produce correlation between the calcu- lated and actual endurance limit strength. The modification to AGMA Standard 221. 02 consists of an accurate determination of the helical factor, CHI and use of the factor as a direct stress mod'ler as presented
# in the Discussion of Results. This modification, in add ion to speed ef- fects, has been included in the final computer program.
iii
•
The detailed results of the program are as follows.
• The AGMA and Cantilever Plate methods of calculating gear tooth bending stress accurately predicted the ranking of the strongest and weakest gear configurations. Both methods provided close correla- tion between calculated and actual gear fatigue life. The average en- durance limit calculated by the Cantilever Plate method was 161,564 pounds per square inch, while the average calculated endurance limit for AGMA was 152,000 pounds per square inch.
• The average endurance limit of the gear material as determined by R. R. Moore rotating beam fatigue testing was 175,000 pounds per square inch for single directional loading. The Cantilever Plate method calculated the endurance limit to be within 8 percent of this established value, and the AGMA method was within 13 percent. A design stress value (1 percent failure) was statistically established to be 115,000 pounds per square inch for single directional loading.
• Dynamic testing of helical gears indicated a speed effect on tooth bending stress. The maximum bending stress measured was a squared function of speed. The calculated hoop stress was included In the computer program bending stress determination for high speed gears.
• The dynamic test measured dynamic fluctuating gear tooth bending stresses. The measured stresses indicated the stress to be increas- ing with the square of the speed. Testing to 20,000 feet per minute pitch line velocity resulted in a dynamic factor of 1.12.
• A comparison of the calculated endurance limits, based on applied load, was made by statistical tests of significance. Helix angle and pressure angle had a significant effect on gear tooth bending strength, and these effects were predicted by the AGMA and Cantilever Plate formulae. The effect of a change in load position was not proved to be significant.
• The strain gage stress values obtained were lower than values ex- pected considering the R. R. Moore determined material strength. Actual crack locations on failed gears indicated that the area of maxi- mum stress occurred approximately 0.030 inch below the location of the strain gages, accounting for the lower strain gage values. The measured strain gage stress values were within approximately 8 per- cent of Cantilever Plate stress calculations and within approximately 5 percent of AGMA calculations.
• Metallurgical examinations verified good processing of the fatigue test gears and fatigue as the mode of failure. Failures were initiated in the tooth root on the loaded side of the gear and were located in the general area of analytical maximum bending moment.
iv
-■-4*
I
Accurate determination of the helical factor used to modify the AGMA and Cantilever Plate bending stress formulae was found to be the most important criterion for correlating fatigue results, actual ma- terial strength, and calculated bending strength. The computer program developed accurately determined the root fillet configuration depending on tool (hob) dimensions. The tooth form factor is accurately determined by iteration. The gear tooth dimensions determined are used in a modification of the AGMA for- mula to determine bending stress. The modification consists of using the helical factor, CH, to modify calculated stress directly rather than as an operator on the Lewis determined tooth form factor, X. A subroutine in the computer program accurately calculates the helical factor. A hoop stress at the root diameter is then calculated to account for the effect of speed on gear tooth bending stress. The steady hoop stress and the periodic bending stress are combined by means of a modified Goodman diagram to produce a combined stress and an expected failure life.
■ •
■
.
FOREWORD
This is the final report on the Allison project entitled "Advancement of Helical Gear Design Technology. " This project was conducted during the 20-month period from 22 June 1966 through 22 February 1968 for the U.S. Army Aviation Materiel Laboratories (USAAVLABS) under Con- tract DA 44-177-AMC-450 ^T).
USAAVLABS technical direction was provided by Mr. R. Givens.
The principal Investigators at Allison were Mr. T. A. Lyon. Mr. F. G. Leland. Mr. M. R. Chaplin. Mr. K. V. Young, and Mr. W. W. Gunkel. The program was reviewed periodically by Mr. R. L. Mattscn of General Motors Research for suggestions and comments.
Permission was obtained from the American Gear Manufacturers Asso- ciation (AGMA) to print AGMA 221. 02. Tentative AGMA Standard for Rating the Strength of Helical and Herringbone Gear Teeth, in this final report.
vii
- —
TABLE OF CONTENTS
Pag
SUMMARY ili
FOREWORD vii
LIST OF ILLUSTRATIONS xi
LIST OF TABLES xix
INTRODUCTION 1
ANALYSIS OF PROBLEM 3
Historical Review 3 Design of Experiment 6 Design of Fatigue Test Gears 9 Manufacture of Fatigue Test Gears 15 Test Rig Design and Procedure 21
RESULTS 35
Fatigue Tests 35 Failed Gear Tooth Crack Measurements 35 Metallurgical Investigations 52 R. R. Moore Tests 54 Experimental Investigations 67 Dynamic Tests 80
DISCUSSION OF RESULTS 87
Evaluation Procedure 87 Predictive Ability of Calculation Methods 87 Strain Gage Data 92 Effect of Variables of Gear Fatigue Tests 92 Basic Material Strength 105 Development of Design Value 114 Evaluation of Dynamic Effects 117 Establishment of Computer Program 122
ix
•
Page
CONCLUSIONS 125
LITERATURE CITED 127
SELECTED BIBLIOGRAPHY 129
APPENDIXES
I. Fatigue Test Gear Drawings 131
n. Sample Process Routing Sheets 145
III. Description of Computer Program 155
IV. Statistical Treatment of Test Data 193
V. AGMA Standard 221.02 215
DISTRIBUTION 237
■ . .
LIST OF ILLUSTRATIONS
Figure? Page
1 Lewis Construction and Gear Tooth Bending Stress Formula 7
2 Almen-Straui Construction and Gear Tooth Bending Stress Formula 8
3 Heywood Construction and Gear Tooth Bending Stress Formula H
4 Test Rig Schematic 22
5 Allison Vibration Facility 23
6 Fatigue Test Rig Mounted on Electromagnetic Shaker ... 24
7 Fatigue Rig Indexing Fixture, Mounted Test Gear, and Load Member Shown in Test Position 24
8 Fatigue Test Load Cell Load Member Showing Strain Gage Instrumentation 25
9 Overall View of Load Cell Calibration Equipment 27
10 Close-up of Load Cell Calibration Equipment 27
11 Typical Load Cell Calibration Curve 28
12 Load Member Tip Instrumentation Used to Determine Load Distribution 29
13 Tooth Root Strain Distribution With Nonuniform Load Distribution 30
14 Test Rig Installation Showing Load Member Flexure Device 31
15 Tooth Root Strain Distribution With Uniform Load Distribution 32
xi
•

.■ ■ ,,
•
V '••
Figure Page
16 Typical Fatigue Test Gear 33
17 Typical .Strip Chart Recording of Test Gear Dynamic Load 34
18 Fatigue Test Results—EX-84117 44
19 Fatigue Test Results—EX-84118 45
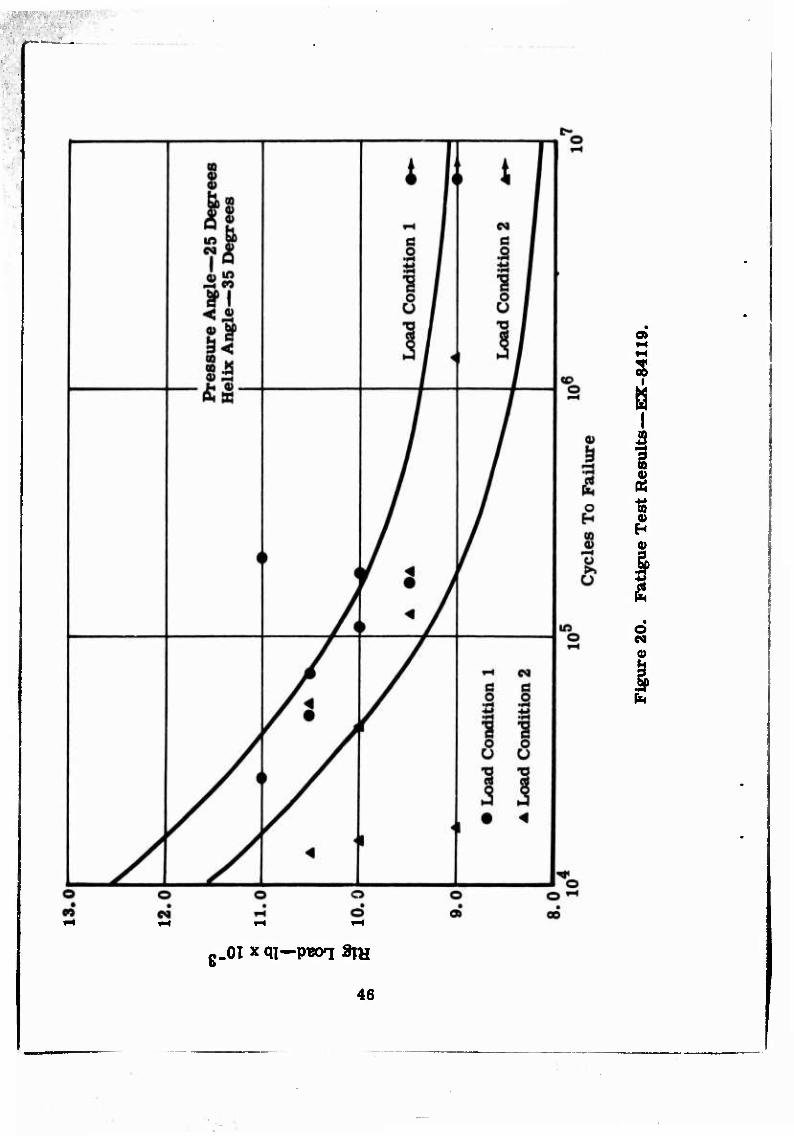
20 Fatigue Test Results—EX-84119 46
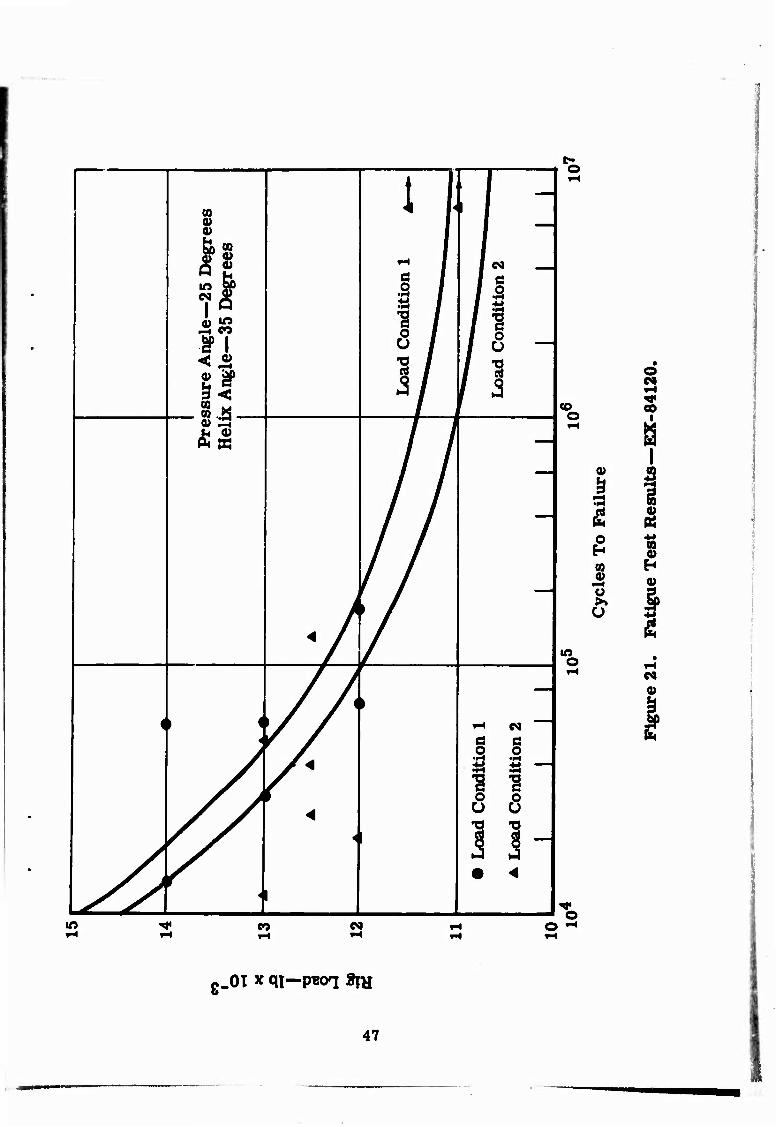
21 Fatigue Test Results—EX-84120 47
22 Failure Origin Results—EX-84117 48
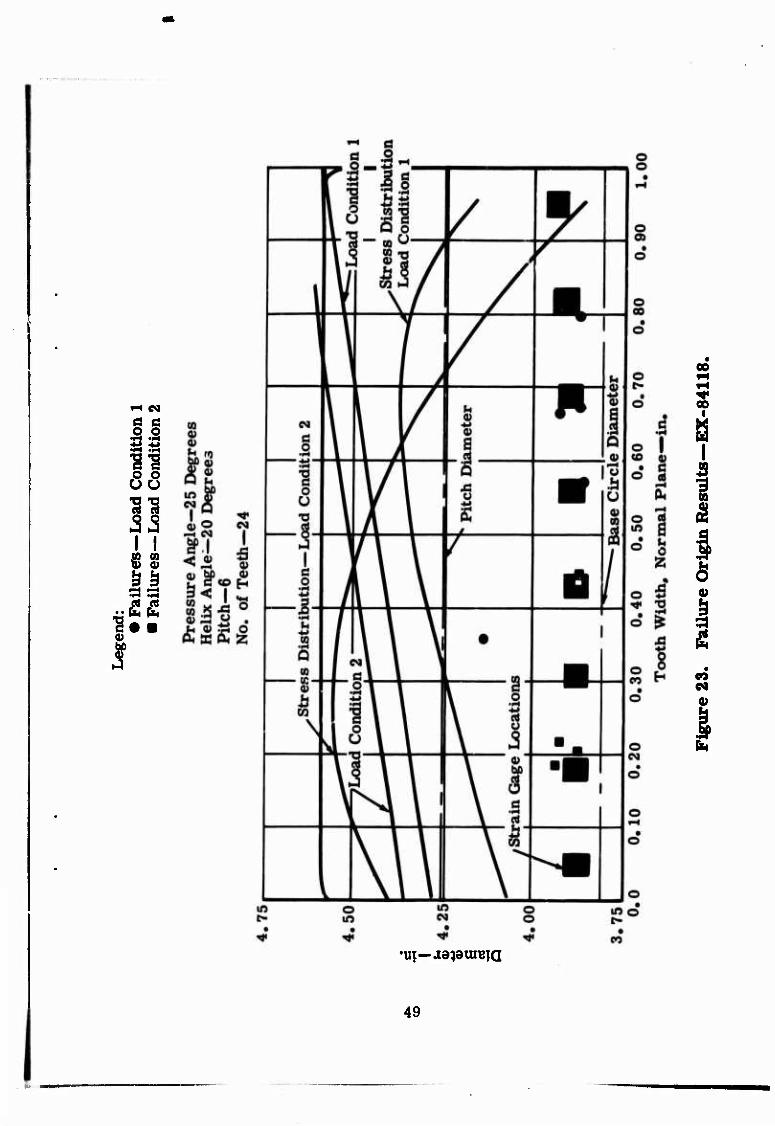
23 Failure Origin Results—EX-84118 49
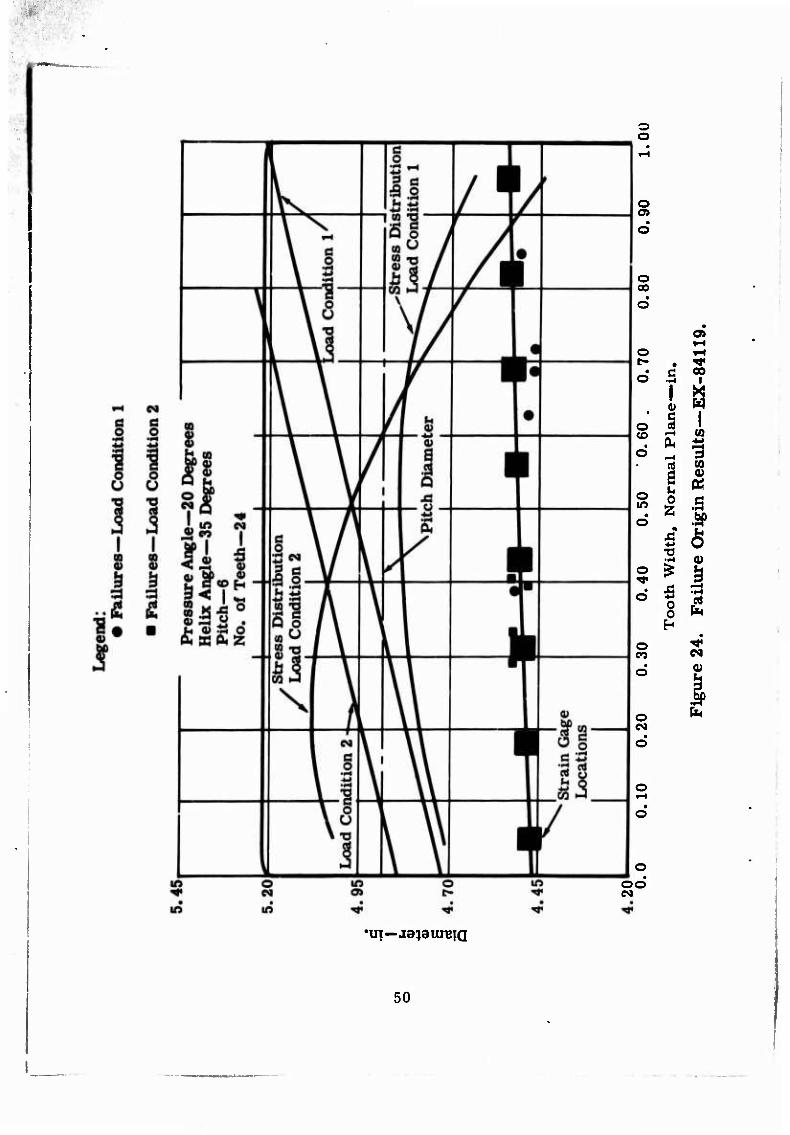
24 Faüure Origin Results—EX-84119 50
25 Faüure Origin Results—EX-84120 51
26 Fractographs of Failure Surface of Tooth Number 6 Showing Fatigue Progressing Away From Surface 53
27 Fractographs of Failure Surface of Tooth Number 6 Showing Fatigue Progressing Away From Loaded Surface 53
28 Detail Views of Failure Surfaces, Showing Flat Failure Surface Typical of Fatigue 55
29 Detail View of Failure Surface. Showing Progressive Failure Originating in Multiple Points Along Base of Involute 56
30 Detail View of Surface Failure, Showing Progressive Failure Originating Near the Center of the Involute Base 56
31 Detail View of Failure Surface, Showing Progressive Failure Originating Near the Center of the Involute Base 57
xii
. '.
I Figure Page
32 Detail View of Failure Surface, Showing Progressive Failure Originating From a Single Point 57
33 Photomicrographs of Transverse Sections Through Test Gear, Showing Typical Micrestructure of the Carburized Case and the Tempered Martensitic Core at the Approx- imate Origin of the Fatigue Failure 58
34 Photomicrographs of Transverse Sections Through the Approximate Origins of Failure, Showing Transgranular Failures Typical of Fatigue Through the Carburized Case Hardened Surfaces 59
35 Selection Through Test Gear, Showing Carburized Case Depth and Material Cleanliness 60
36 Blacklight Photograph of Test Gear, Showing a Crack Indicated by Fluorescent Penetrant Inspection Across the Helical Involute Surface of a Test Tooth 60
37 Blacklight Photograph of Test Gear, Showing a Crack Across the Helical Involute and Section Through Tooth Showing Carburized Case Depth ,.,... 61
38 Blacklight Photograph of Test Gear, Showing a Crack Across the Helical Involute and Section Through Tooth Showing Carburized Case Depth 62
39 Blacklight Photograph of Test Gear, Showing a Crack Across the Helical Involute and Section Through Tooth Showing Carburized Case Depth 63
40 Section Through Test Gear, Showing Carburized Case Depth and Material Cleanliness 64
41 A Typical R, R. Moore Fatigue Specimen From the Helical Gear Program Exposing the Carburized Case on the Fracture Surface With the Characteristic Fatigue Pattern Representing the Origin of Failure 64
42 Helical Gear Strain Gage Location 67
43 Typical Test Gear Strain Gage Installation 68
xiii
"igure Page
44 Calibration Curve for Load Condition 1 69
45 Calibration Curve for Load Condition 2 69
46 Calibration Curve for Test Gear EX-84117 70
47 Calibration Curve for Test Gear EX-84118 70
48 Calibration Curve for Test Gear EX-84119 71
49 Calibration Curve for Test Gear EX-84120 71
50 Tooth Root Stress Distribution—EX-84117 72
51 Tooth Root Stress Distribution—EX-84117 73
52 Tooth Root Stress Distribution—EX-84118 74
53 Tooth Root Stress Distribution—EX-84118 75
54 Tooth Root Stress Distribution—EX-84119 76
55 Tooth Root Stress Distribution—EX-84119 77
56 Tooth Root Stress Distribution—EX-84120 78
57 Tooth Root Stress Distribution—EX-84120 79
58 Gear Tooth Bending Stress Schematic 81
59 Diagram Showing Expected Effect of Speed on Gear Tooth Stresses 81
60 Instrumentation of Pinion Shaft Gear 82
61 Strain Gages Located on Pinion Shaft Gear Tooth 83
62 Effect of Speed on Gear Tooth at No-Load Condition .... 84
63 Effect of Speed on Loaded Gear Tooth Stress 86
64 Calculated Endurance Limit Stress Compared With R. R. Moore Endurance 88
xiv
Figure Page
65 Strain Versus Face Width—EX-84117 93
66 Strain Versus Face Width—EX-84118 94
67 Strain Versus Face Width—EX-84119 95
68 Strain Versus Face Width—EX-84120 96
69 Effect of Face Width on Tooth Root Bending Moment Distribution—Test Gear EX-84117 100
70 Effect of Face Width on Tooth Root Bending Moment Distribution—Test Gear EX-84118 101
71 Effect of Face Width on Tooth Root Bending Moment Distribution—Test Gear EX-84119 102
72 Effect of Face Width on Tooth Root Bending Moment Distribution—Test Gear EX-84120 103
73 Effect of Test Variables on Endurance Limit 107
74 Effect of Test Variables on Endurance Limit 108
75 Basic Bending Strength of the Carburized AMS-6265 Material of the Test Gears 109
76 Modified Goodman Diagram 109
77 Fatigue Test Data as Calculated Stress—EX-84117 .... Ill
78 Fatigue Test Data as Calculated Stress—EX-84118 .... Ill
79 Fatigue Test Data as Calculated Stress—EX-84119 .... 112
80 Fatigue Test Data as Calculated Stress—EX-84120 .... 112
81 Average Fatigue Endurance Strength Compared With the R. R. Moore Data 113
82 Transformed Fatigue Test Data—Modified AGMA Stress Versus Transformed Life 115
83 Modified AGMA Average S/N Curve and Design Value ... 116
xv
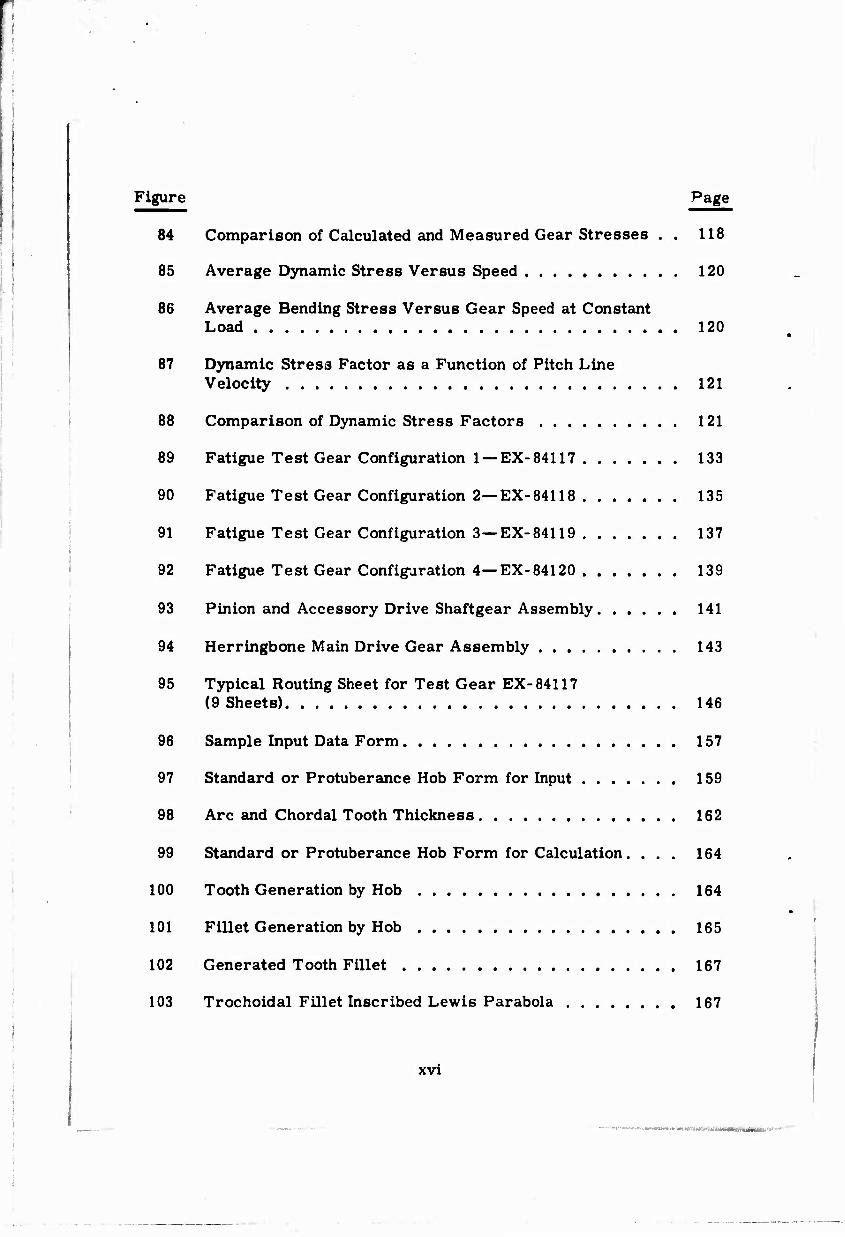
Figure Page
84 Comparison of Calculated and Measured Gear Stresses . . 118
85 Average Dynamic Stress Versus Speed 120
86 Average Bending Stress Versus Gear Speed at Constant Load 120
87 Dynamic Stress Factor as a Function of Pitch Line Velocity 121
88 Comparison of Dynamic Stress Factors 121
89 Fatigue Test Gear Configuration 1 —EX-84117 133
90 Fatigue Test Gear Configuration 2—EX-84118 135
91 Fatigue Test Gear Configuration 3—EX-84119 137
92 Fatigue Test Gear Configuration 4—EX-84120 139
93 Pinion and Accessory Drive Shaftgear Assembly 141
94 Herringbone Main Drive Gear Assembly 143
95 Typical Routing Sheet for Test Gear EX-84117 (9 Sheets) 146
96 Sample Input Data Form 157
97 Standard or Protuberance Hob Form for Input 159
98 Arc and Chordal Tooth Thickness 162
99 Standard or Protuberance Hob Form for Calculation. ... 164
100 Tooth Generation by Hob 164
101 Fillet Generation by Hob 165
102 Generated Tooth Fillet 167
103 Trochoidal Fillet Inscribed Lewis Parabola 167
xvi
- -niniwi iiiniiiljiiiiiiiaMMi

Figure Page
104 Radius of Curvature at Weakest Section 167
105 Diameter of Weakest Section and Lewis X Value 168
106 Coordinates at Center of True Fillet Radius—Base Circle Below Root Diameter 169
107 Coordinates at Center of True Fillet Radius—Base Circle Above Root Diameter 170
108 True Fillet Radius Inscribed Lewis Parabola 172
109 Determination of Maximum Bending Moment 174
110 Results of R. R. Moore Tests on Notched 4340 Steel ... 194
111 R. R. Moore Rotating Bending Test Data 195
112 Fatigue Test Results—Applied Load Versus Life (EX-84117) 202
113 Fatigue Test Results—Applied Load Versus Life (EX-84117) 202
114 Fatigue Test Results—Applied Load Versus Life (EX-84118) 203
115 Fatigue Test Results—Applied Load Versus Life (EX-84118) 204
116 Fatigue Test Results—Applied Load Versus Life (EX-84119) 205
117 Fatigue Test Results—Applied Load Versus Life (EX-84119) 206
118 Fatigue Test Results—Applied Load Versus Life (EX-84120) 207
119 Fatigue Test Results—Applied Load Versus Life (EX-84120) 208
xvii

Figure Page
120 Fatigue Test Results—Applied Load Versus Transformed Life (EX-84117) 209
121 Fatigue Test Results—Applied Load Versus Transformed Life (EX-84117) 210
122 Fatigue Test Results—Applied Load Versus Transformed Life (EX-84118) 211
123 Fatigue Test Results—Applied Load Versus Transformed Life (EX-84n8) 211
124 Fatigue Test Results—Applied Load Versus Transformed Life (EX-84119) 212
125 Fatigue Test Results—Applied Load Versus Transformed Life (EX-84119) 212
126 Fatigue Test Results—Applied Load Versus Transformed Life (EX-84120) 213
127 Fatigue Test Results—Applied Load Versus Transformed Life (EX-84120) 213
xviii
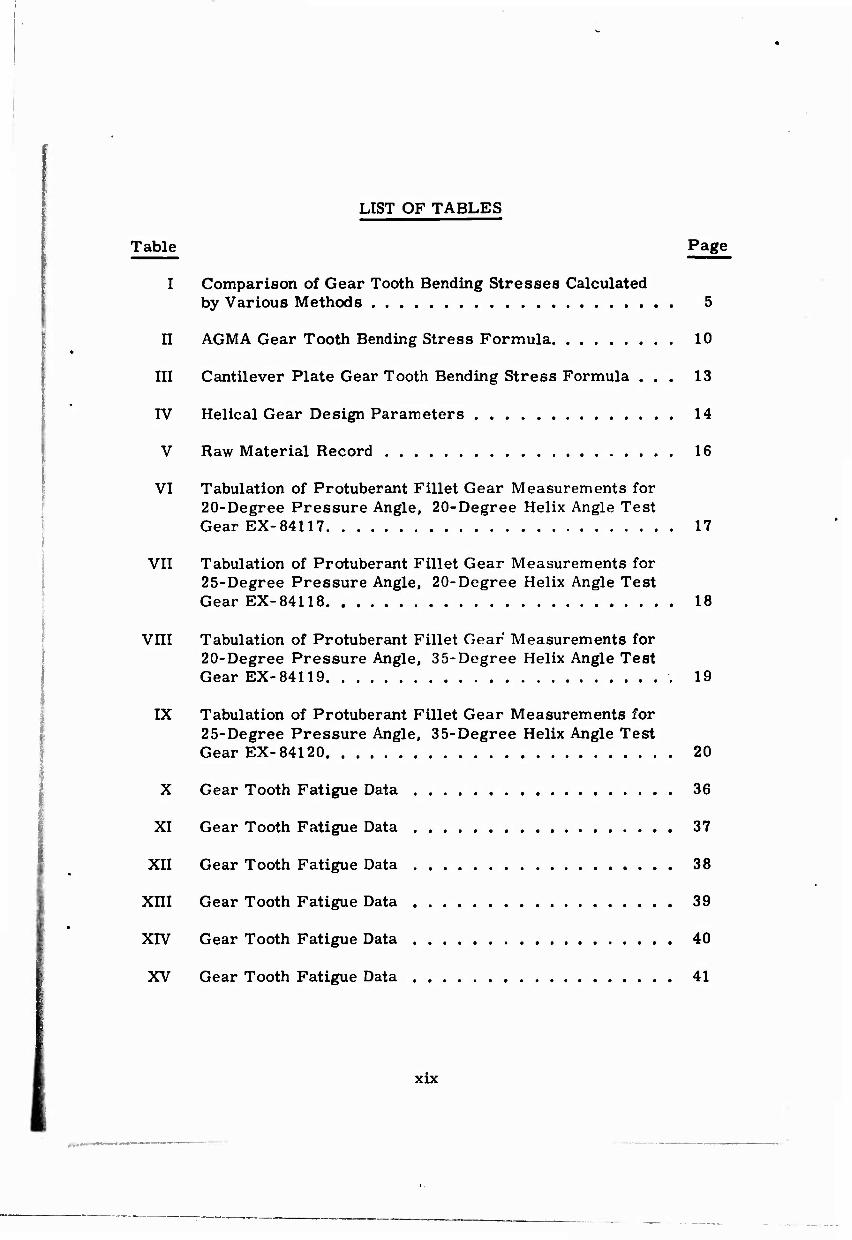
LIST OF TABLES
Table Page
I Comparison of Gear Tooth Bending Stresses Calculated by Various Methods 5
IT AGMA Gear Tooth Bending Stress Formula 10
III Cantilever Plate Gear Tooth Bending Stress Formula ... 13
IV Helical Gear Design Parameters 14
V Raw Material Record 16
VI Tabulation of Protuberant Fillet Gear Measurements for 20-Degree Pressure Angle, 20-Degree Helix Angle Test Gear EX-84117 17
VII Tabulation of Protuberant Fillet Gear Measurements for 25-Degree Pressure Angle, 20-Degree Helix Angle Test Gear EX-84118 18
VIII Tabulation of Protuberant Fillet Gear" Measurements for 20-Degree Pressure Angle, 35-Degree Helix Angle Test Gear EX-84119 19
IX Tabulation of Protuberant Fillet Gear Measurements for 25-Degree Pressure Angle, 35-Degree Helix Angle Test Gear EX-84120 20
X Gear Tooth Fatigue Data 36
XI Gear Tooth Fatigue Data 37
XII Gear Tooth Fatigue Data 38
XIII Gear Tooth Fatigue Data 39
XIV Gear Tooth Fatigue Data 40
XV Gear Tooth Fatigue Data 41
xix

Table Page
XVI Gear Tooth Fatigue Data 42
XVII Gear Tooth Fatigue Data 43
XVIII Record of Hardness Gradient Tests on Helical Teeth of Fatigue Test Gears from the Advancement of Gear Technology Program 65
XIX Specimen Process Routing Procedure 66
XX R. R. Moore Test Results 66
XXI Ranked Endurance Limits for Various Calculation Methods 89
XXII Gear Configuration Ranking Comparison 91
XXIII Comparison of Calculated and Measured Endurance Limit Stress 97
XXIV Effect of Pressure Angle 104
XXV Effect of Helix Angle 104
XXVI Tabular Presentation of Significance 106
xx
■. jL*. -V- ---'•-■■
INTRODUCTION
The purposes of this project were to determine the effect of tooth geom- etry and tooth load position on helical gear tooth bending strength and to derive factors and formulae which can be used to appraise accurately helical gear tooth bending strength for aircraft applications.
The objectives of the project included substantiation of an accurate helical gear bending strength formula and the providing of an IBM 7090 computer program using the substantiation formula. Correlation of the basic ma- terial strength with this formula was also desired.
There are four common modes of gear failure: tooth breakage, surface pitting, scoring, and wear. Tooth breakage, which may be caused by foreign object interference or repetitive high bending stresses in the tooth root, is the most severe and often causes considerable secondary damage and catastrophic failure of an entire gear unit.
Many factors affecting the bending fatigue strength of gear teeth are not treated with precision in current helical gear design formula because the magnitude and interrelationship of the various factors involved have not been accurately assessed. Helical gear tooth bending strength is a function of geometric variables; i. e., pressure angle, helix angle, diametral pitch, tooth width, root fillet form, and root fillet radius. The bending strength is also influenced by manufacturing variables; i.e., surface finish, residual stress, material, and processing tech- nique. Operating variables (i.e., speed, alignment, dynamic loading, and vibration) also affect the gear fatigue life. A thorough analysis of these variables will permit more accurate assessment of gear life ex- pectancy.
Considerable research has been accomplished in analyzing gear tooth bending strength. Most of this research has been conducted on spur gears, and the results have been applied, often with modifying factors, to helical gears. There is a wide variation in the type of analysis« test data, and field experience. Application of these data to carburized gears designed to current standard geometric proportions often requires extensive extrapolation. The program described in this report was con- ducted in an effort to establish correlation between analytical methods and actual test results for lightweight aircraft gearing.
Current methods of calculating helical gear tooth bending stress are based on analytical studies and photoelastic tests conducted mainly on

spur gears. These methods produce calculated stresses which are ap- preciably lower than measured gear stresses and basic material strengths. Thus the calculations are most often used tc compare simi- lar designs. An "ideal" gear tooth bending strength formula would re- late the operating gear tooth stress to the basic material strength to produce a gear life substantiated by standardized fatigue tests. It was the intent of this program to provide a more accurate bending stress formula by also relating calculated stress and fatigue test results to the basic material strength. R. R. Moore tests of carburized speci- mens were used to provide the basic material strength.
The following analytical and experimental analyses were conducted dur- ing this investigation:
Design Analysis—An analytical review was made of current helical gear tooth bending strength formulae. Each formula was analyzed and compared to determine the effects of design variables. Experimental Evaluation—Each test gear configuration was instru- mented with strain gages and statically loaded to obtain strain meas- urements for correlation with stress calculations. Gear Tooth Fatigue Tests—A single tooth fatigue test was conducted to investigate the effect of pressure angle, helix angle, and load position on fatigue life. Thirty-two gears were manufactured. Ex- treme care was taken to reduce all manufacturing variables which might affect fatigue life. Metallurgical investigations of the fatigue failures were made to ensure that the basic material was sound and was properly heat treated and that the failure mode was fatigue. Six teeth on each gear were available for fatigue testing. R. R. Moore Tests — R. R. Moore tests were conducted using the same heat material used to manufacture the test gears. The data obtained were used for comparison with the bending endurance strengths from the gear fatigue tests. Final Computer Program—Data collected during the program were formulated into an IBM 7090 computer program for helical gear bending strength.
ANALYSIS OF PROBLEM
HISTORICAL REVIEW
A review of helical gear tooth bending strength theory was made. The results of this review are discussed in the following paragraphs.
In 1892, Mr. Wilfred Lewis presented a paper which related gear tooth bending strength to tooth geometry. The Lewis method for computing tooth bending stress assumes that the tooth proportions approximate loading of a parabolic cantilever beam and determines the bending stress at an "assumed weakest section" of the tooth. The "assumed weakest section" is found by inscribing a uniform strength parabola in the tooth so that the vertex of the parabola is placed at the intersection of the load line with the radial center line of the tooth. The point of tangency of the parabola with the fillet of the tooth establishes the "assumed weakest section" of the tooth.
Mr. T. J. Dolan and Mr. E. S. Broghamer have established that the theory of flexure assumed by Mr. Lewis to determine the stress in the fillet is applicable only to constant cross-section members and that at any abrupt change in section of a stressed member (i.e., the root fillet of a gear tooth), localized stresses of relatively large magnitude are de- veloped. Dolan and Broghamer conducted a photoelastic study of stresses in gear tooth fillets at the University of Illinois Engineering Experiment Station in 1942. This study resulted in a series of stress correction factors dependent on gear geometry which have been incorporated in the current AGMA Standard 221.02.
The existence of stresses other than bending stresses was recognized at an early date. The shear stress in the tooth root due to the tangential component of tooth load and the compressive stresses caused by the radial component of the tooth load are examples of these additional stresses. Several current tooth strength formulae include these stresses. These static stresses are present in the photoelastic models used to determine stress correction factors and are included in the stress correction factor employed in the AGMA formula. See Appendix IV.
This previous investigative effort has been directed toward the solution of spur gear problems, and the results are directly applicable primarily to spur gears. The most common method used to calculate bending stress in helical gear teeth has been to consider an infinitely thin section of the helical gear tooth as a spur gear tooth and to calculate bending stress using conventional spur gear equations.
I
This procedure ignores the fundamental difference between the tooth loading characteristics of the helical and spur gears. The helical gear tooth contact line is inclined to the tooth tip, while the spur gear tooth contact line is parallel to the tooth tip.
The effect of the inclined load line on the root bending moment distribu- tion was investigated by Wellauer and Seireg.1 A semiempirical method to determine the bending moment distribution was also advanced which gave good correlation between theoretical and actual strain-gage investi- gations. This investigation was based on prior work done by MacGregor,2
Holl,3 and Jaramillo4 to define the moments and deflections of a canti- lever plate caused by concentrated transverse loads. Wellauer and Seireg extended this work to include the bending moment distribution in cantilever plates caused by loads impressed on the plate at various in- clination angles and load intensities. The result of the investigation was to develop a correction factor based on the maximum bending moment produced by load application on the inclined line and that which would be produced in a gear loaded "parallel to axis" at the tooth tip.
The correction factor (c) in the Cantilever Plate theory is simply the ratio of maximum bending moment produced by a loading applied along the oblique helical contact line to the root bending moment produced by the same intensity of loading applied parallel to and at the tooth tip. This correction factor is applied directly in the Cantilever Plate bending stress formula. The inverse of the same helical correction factor is used in the AGMA bending stress formula to modify the Lewis form factor which is used to calculate the geometry factor (J).
Several helical gear bending strength formulae use a stress modifying factor based on the tooth-to-tooth load transfer ability of helical gears. The Almen-Straub equation5 uses the minimum length of the transverse line of action to modify the basic Lewis bending strength formula. The Cantilever Plate formula1 uses a load sharing factor equivalent to the ratio of the minimum length of the oblique contact lines to the gear face width to modify the stress formula. The AGMA formula uses the same load sharing ratio in an inverse form as a modifier of J.
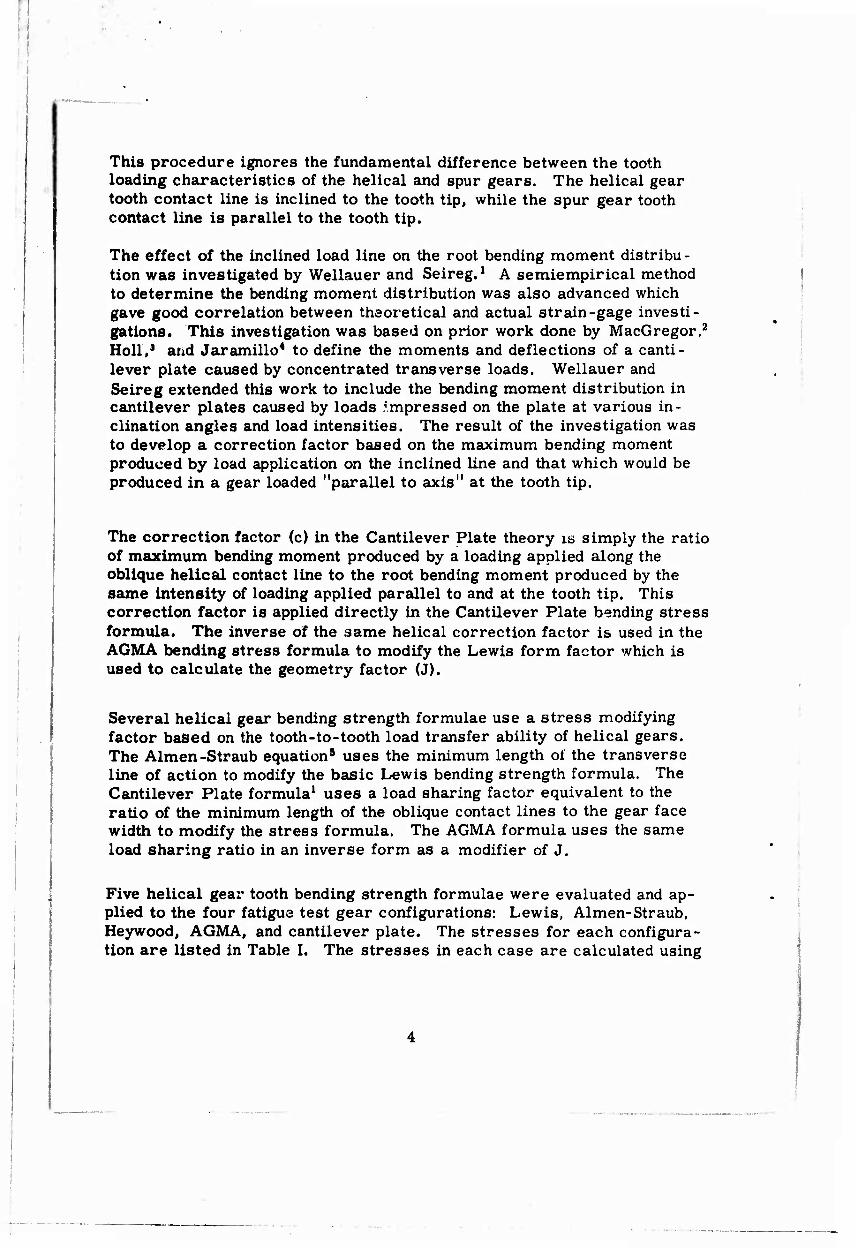
Five helical gear tooth bending strength formulae were evaluated and ap- plied to the four fatigue test gear configurations: Lewis, Almen-Straub, Heywood, AGMA, and cantilever plate. The stresses for each configura- tion are listed in Table I. The stresses in each case are calculated using
i
< s SO l- to i-
u o Ift CO to •-• in m (O •* 0) «r, 6 ^H Ol o o ai o > J- i. s- •r; ™
5 ° 1 -t f—1 M _ •J in ■* a>l o o o o U ^
ndin
tr
ess
psi
) in a' o o o
o o CM
IP 0) «1 CO CO o" in
m*~ Ol ~* ^ ^1 W -- N -* ^^
< w S t- IO m c- to in
1 H ü in M d o in —■ d d
^ s >-
< y. l^ 1*5 00 CO t* CO CO
i° ^H
" ^^ ""' ^H ^H '", ^
W r—i | tf 0) M _ lOl in 'T (Ml o o o o
X c ^ ^ pol in CJ (^1 o c »n o
H 3 m C Oil m nl oo t» Ol
en F h o- t-l "* ID «fl I a> r- r- to'
(gs- NI ^ N N M M M CM
BE
ND
ING
T
HO
DS
l—J ^"^ ■1
(0
< S Ü
cr,
in CO in
r- •r
CO in
P-
c
< t£) 00 t- o CD a r- o
M _ in 3 Jol in CO _, CN 00 01 C " _ M M c") m o 00 IO IO
S W E
Ben
di
Str
es
(psi
) in m O 1 l'~ »r o
8g < n "H iffl PO
'S <• 4 o 1 J
•t* CO to in"
^o 1 =L < s 00 c- <r
1 M i a t- f CO
OF G
EA
R
BY V
AR
I 3- Ü •r ro ^J 00 s i" co pj CO < < t- CO m in 5 • i o
t^- CO in in
-O
i o
(A
* 01 J
>?
M. M] to o El o o o o
0 ■nd
in
tres
s p
si) 60
inj
(O 1 ^ M
d H 01 a,
o in
to'
o
to
o o
c
d
OH
in T i L.
t/5
o"5 " u a
1 "i 1 01 1 (<
» M ._ ol 1 o o °1 o o o o
MP
AR
I L
CU
LA
AG
MA
- B
cnd
in
Str
ess
(psi
) ^ t"
1 o o o sl o
o o 00
in CM
o 0!
dl *r o" ml (N in CM
^ ! f » 0 < !
ress
ur
An
gle
egre
e;
Ol
u u o if) o ^4
o in CM
o in CM >> 6
u n • o, S 8 ■3
^^ ■c
J i o o in in o o in in
Ol
2 a,
u I
'S. N N ro cr (M N CO CO CO H
CQ i < i u T3 !
< 2 Si I
"""""] n 1}
I* 00 O) o r- OO 05 o c u w ■_( •^ N n
c U X, 'S if
00 S CO 00 3 00 3 3
^l X X t
X 1
X >< >< 1
x s. a« 1 00 0 1 U u u u u u u u •o
10
cula
te
10 o> a
-5 S 1 *\ OJ in o in o o o o A^ <n o C*5 o o o o 2 ,-< 1 " I c 0) C3 a> o o o o _i et M
^ \ to to to to | n " ^
u a o OJ eo T ►-» N n ^f ^ U 7 •• » * 11
■
a 1000-pound load applied normal to the tooth surface along the inclined load line and for a constant unit load of 6000 pounds per inch. Unit load is defined as the equivalent tangential load at the pitch diameter on a tooth having a diametral pitch of 1 and a face width of 1 inch.
All of the formulae, with the exception of the Almen-Straub formula, identified the same configurations as having the highest and lowest stresses (boxed numbers in Table I). The Heywood method calculates the highest stresses in all cases.
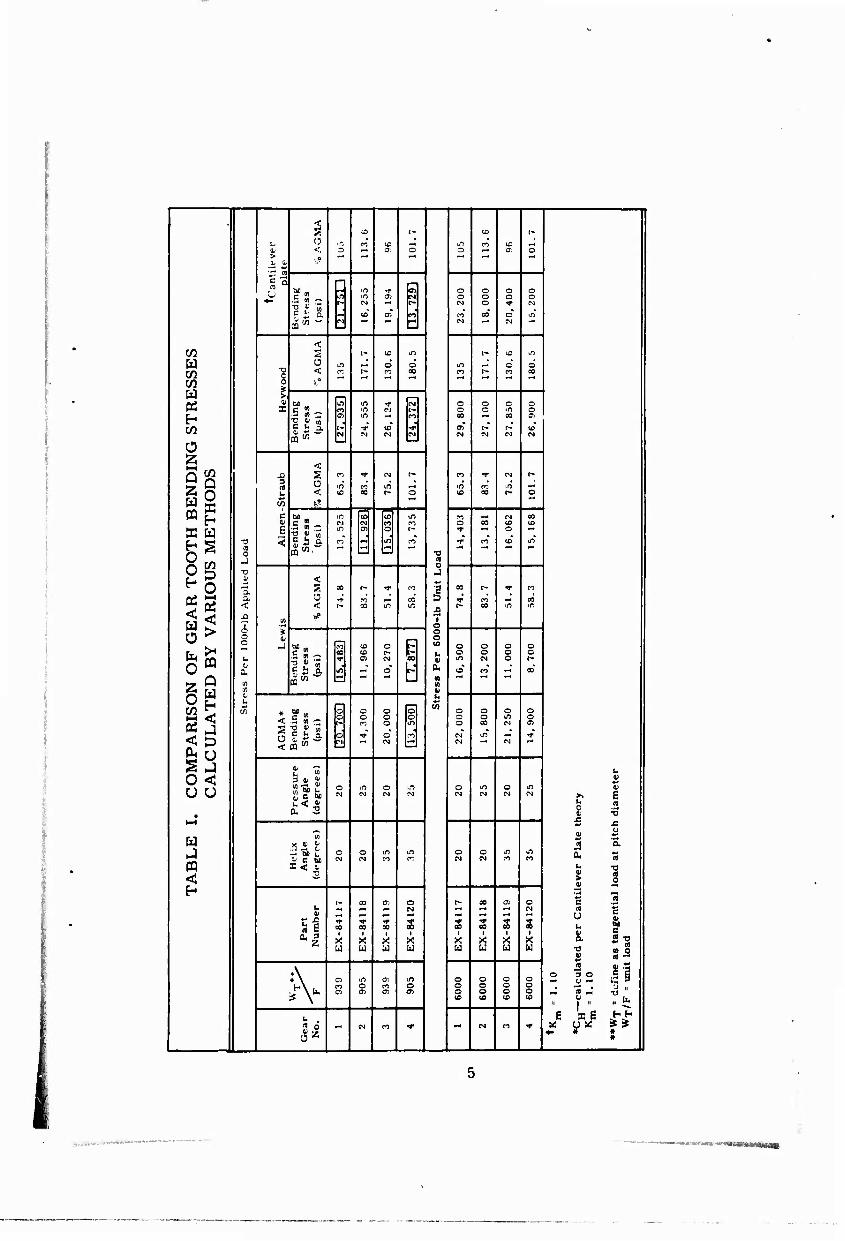
The geometric construction and formula for each of the five gear tooth strength calculation methods are shown in Figures 1, 2, and 3 and in Tables II and III. The Lewis and Almen-Straub methods use the Lewis geometric construction (Figures 1 and 2) in the normal plane of the gear. The AGMA and Cantilever Plate methods use the Lewis geometric construction in the normal plane at one diametral pitch. The Lewis and Almen-Straub methods do not include a stress concentration factor, while a stress con- centration factor is included in both the AGMA and Cantilever Plate theory.
The Heywood construction method (Figure 3) locates the maximum fillet stress point as a function of the fillet radius of curvature only. It should be applicable, therefore, to any gearing system for which the fillet cur- vature is definable.
In summary, a review of the literature indicated that a wide variation of bending stress could be calculated for a given configuration. Limited data are available which attempt to correlate the actual endurance limit stress of a material as determined by laboratory tests and the calculated endurance limit stress of a gear manufactured from the material. It was apparent that a controlled fatigue experiment with full size tooth propor- tions could aid the development of a more accurate method of calculating helical gear bending strength. Correlation of the calculated endurance limit stress with basic material strength data from R. R. Moore fatigue tests would enhance the analysis.
DESIGN OF EXPERIMENT
Two factors of gear tooth geometry and two factors of tooth load position were investigated in a statistically designed experiment. Each of the factors was expected to affect gear tooth fatigue life. The experiment was designed to determine if these factors interact and if the observed results
were statisticaMy significant. The factors evaluated were:
Factor
Pressure angle
Helix angle
Load position
Levels Values Assigned
2 20 and 25 degrees
2 20 and 35 degrees
2 Load through tip of tooth at corner and load through tip of tooth 0. 250 in. inboard from corner
Sb w
'F Vp v 1 X
3 P t* 4h
Sb ■W
where
W
F
tangential component of load applied at vertex of inscribed parabola
face width of tooth
St, ■ maximum bending stress
h ■ height of equivalent constant stress parabolic beam
t ■ thickness of beam at weakest section
P • circular pitch
Figure 1. Lewis Construction and Gear Tooth Bending Stress Formula.
I
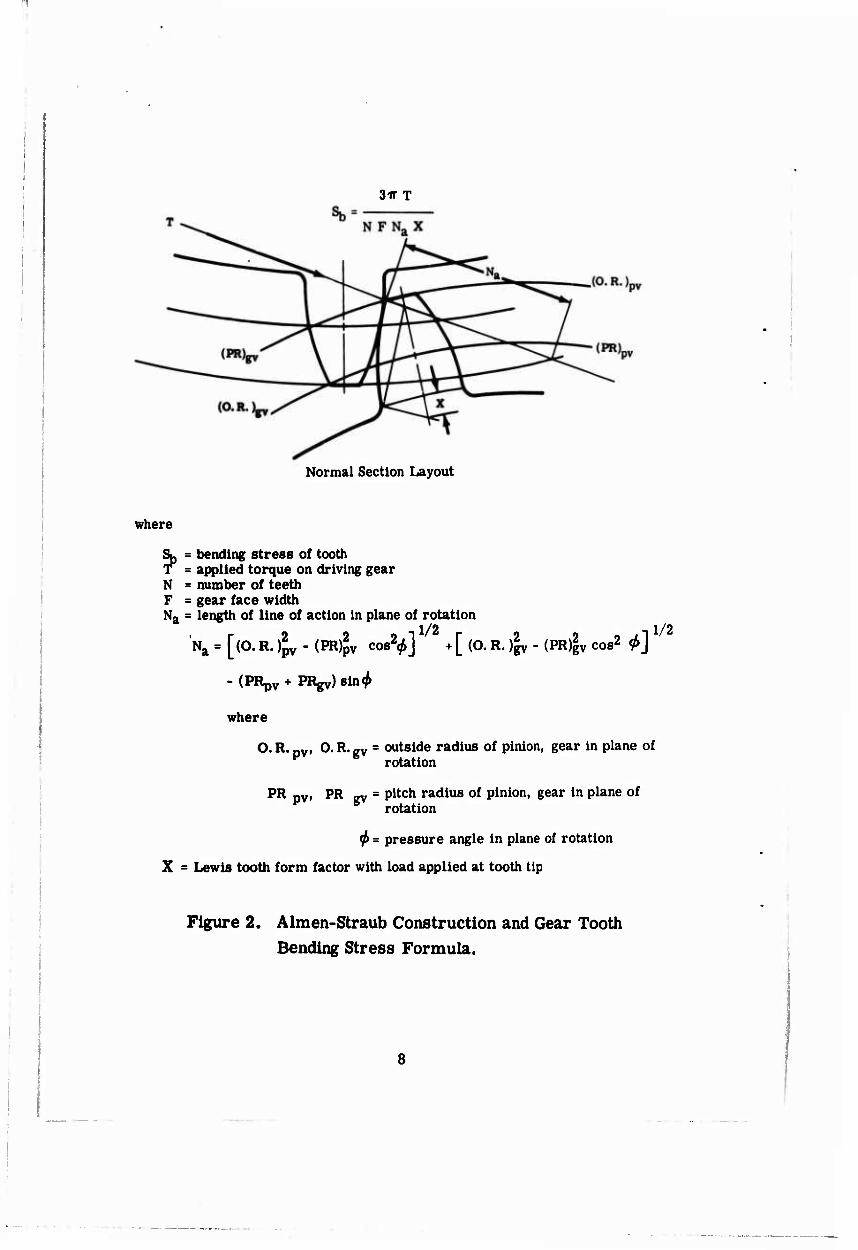
3ir T
Normal Section Layout
where
Sjj = bending stress of tooth applied torque on driving gear
N = number of teeth F = gear face width Ng = length of line of action in plane of rotation
1/2 1/2 Na = [(O. R. ^v - (PR)5v cos2^] + [ (O. R. )|v - (PR)gv cos2 0] '
- (PRpV + PRgy) sin^
where
O. R. pV> O. R. gV = outside radius of pinion, gear in plane of rotation
PR pv» PR gv = Pitch radiu8 of Pinion, gear in plane of rotation
<f> =■ pressure angle in plane of rotation
X = Lewis tooth form factor with load applied at tooth tip
Figure 2. Almen-Straub Construction and Gear Tooth Bending Stress Formula.
8
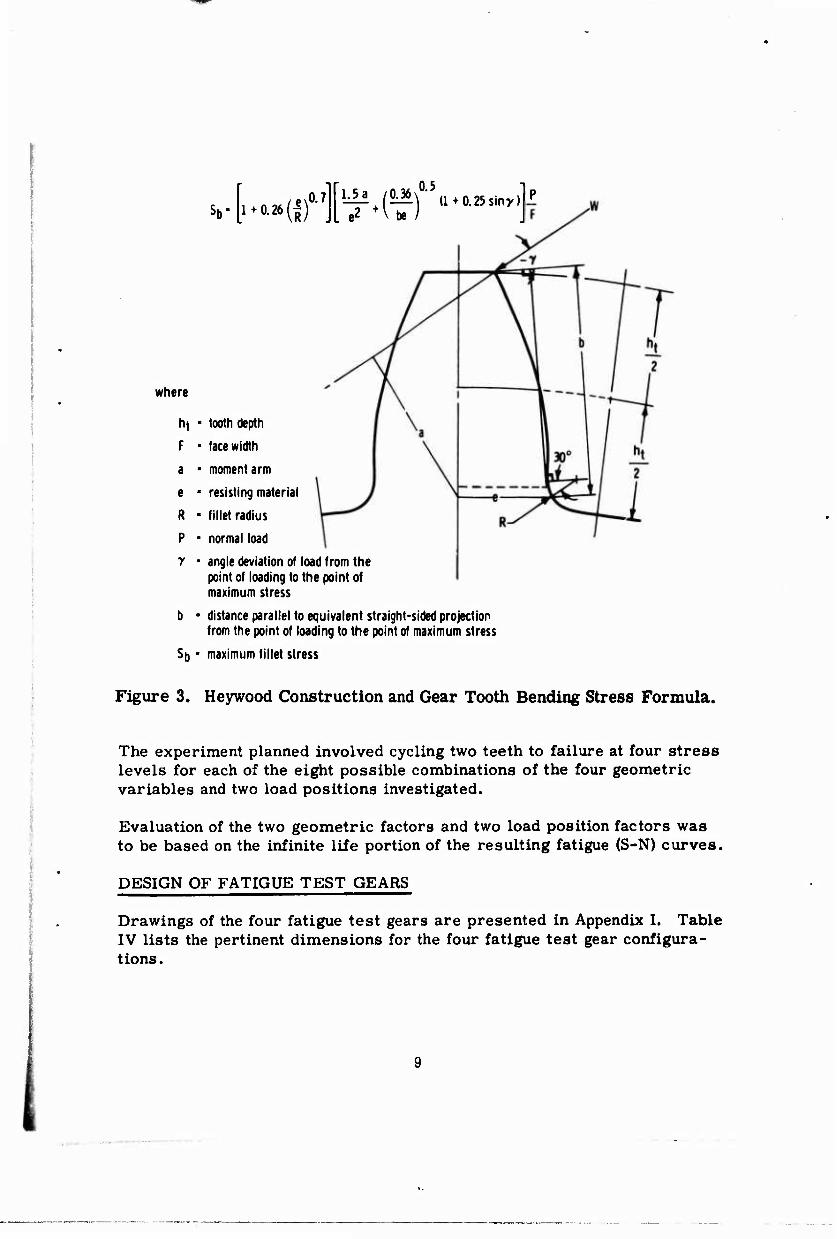
Sb- ^*{ittf^fiü^r\
where
ht ■ tooth depth
F • face width
a • moment arm
e • resisting material
R • fillet radius
P ■ normal load
7 • angle deviation of load from the point of loading to the point of maximum stress
b • distance parallel to equivalent straight-sided projection from the point of loading to the point of maximum stress
Sb ■ maximum fillet stress
Figure 3. Heywood Construction and Gear Tooth Bending Stress Formula.
The experiment planned involved cycling two teeth to failure at four stress levels for each of the eight possible combinations of the four geometric variables and two load positions investigated.
Evaluation of the two geometric factors and two load position factors was to be based on the infinite life portion of the resulting fatigue (S-N) curves.
DESIGN OF FATIGUE TEST GEARS
Drawings of the four fatigue test gears are presented in Appendix I. Table IV lists the pertinent dimensions for the four fatigue test gear configura- tions.
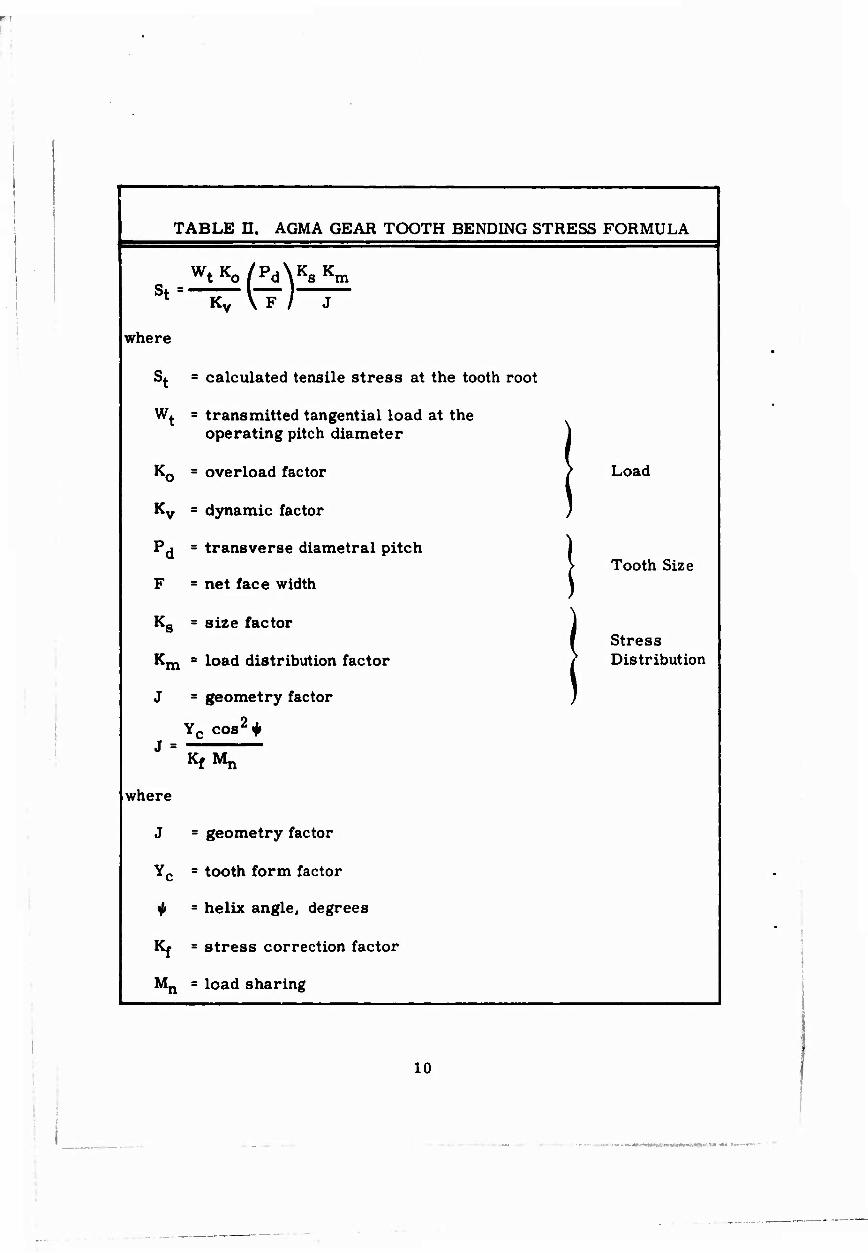
TABLE ü. AGMA GEAR TOOTH BENDING STRESS FORMULA
WtK0/Pd\KsKm
St Kv \ F / J
where
S^ = calculated tensile stress at the tooth root
Wt = transmitted tangential load at the operating pitch diameter J
K0 = overload factor ) Load
Ky. = dynamic factor J
Pjj = transverse diametral pitch j Tooth Size
F = net face width ' >
Ks = size factor |
1 Stress Km = load distribution factor y Distribution
J = geometry factor , )
yc cos2*
where
J = geometry factor
Yc = tooth form factor
^ - helix angle, degrees
Kj = stress correction factor
Mn = load sharing
10
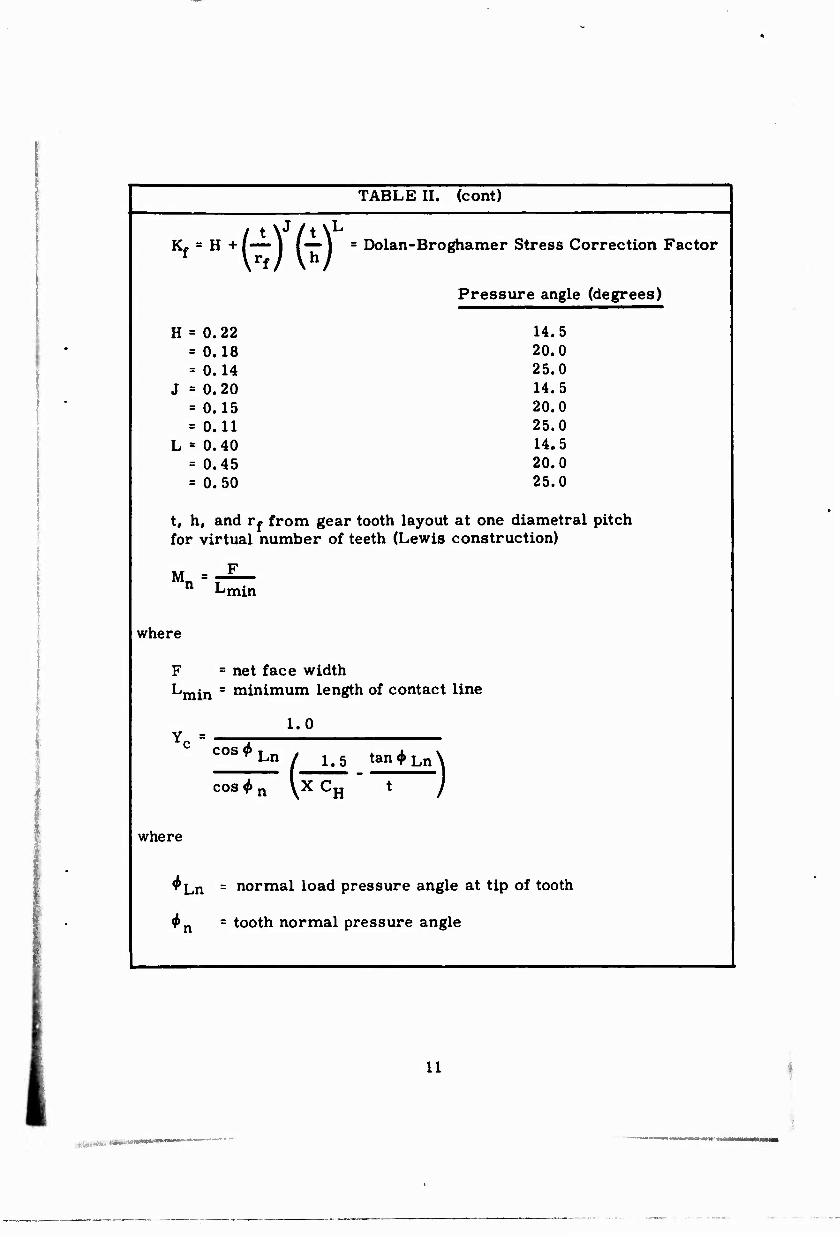
TABLE II. (cont)
/ t \J/t\L
Kf = H + (— I |— I = Dolan-Broghamer Stress Correction Factor W/ \h/
Pressure angle (degrees)
H = 0.22 = 0.18 = 0.14
J =0.20 = 0.15 = 0.11
L = 0.40 = 0.45 = 0.50
t, h, and r^ from gear tooth layout at one diametral pitch for virtual number of teeth (Lewis construction)
14. 5 20. 0 25. 0 14. 5 20. 0 25. 0 14. 5 20. 0 25. 0
M n Lmin
where
F L
= net face width min = minimum length of contact line
1.0 Yc = T cos 9
cos 4*
Ln / 1.5 tan <► Ln \
n U CH ' t /
where
^Ln - normal load pressure angle at tip of tooth
^n = tooth normal pressure angle
11
i-taa»-**-***"
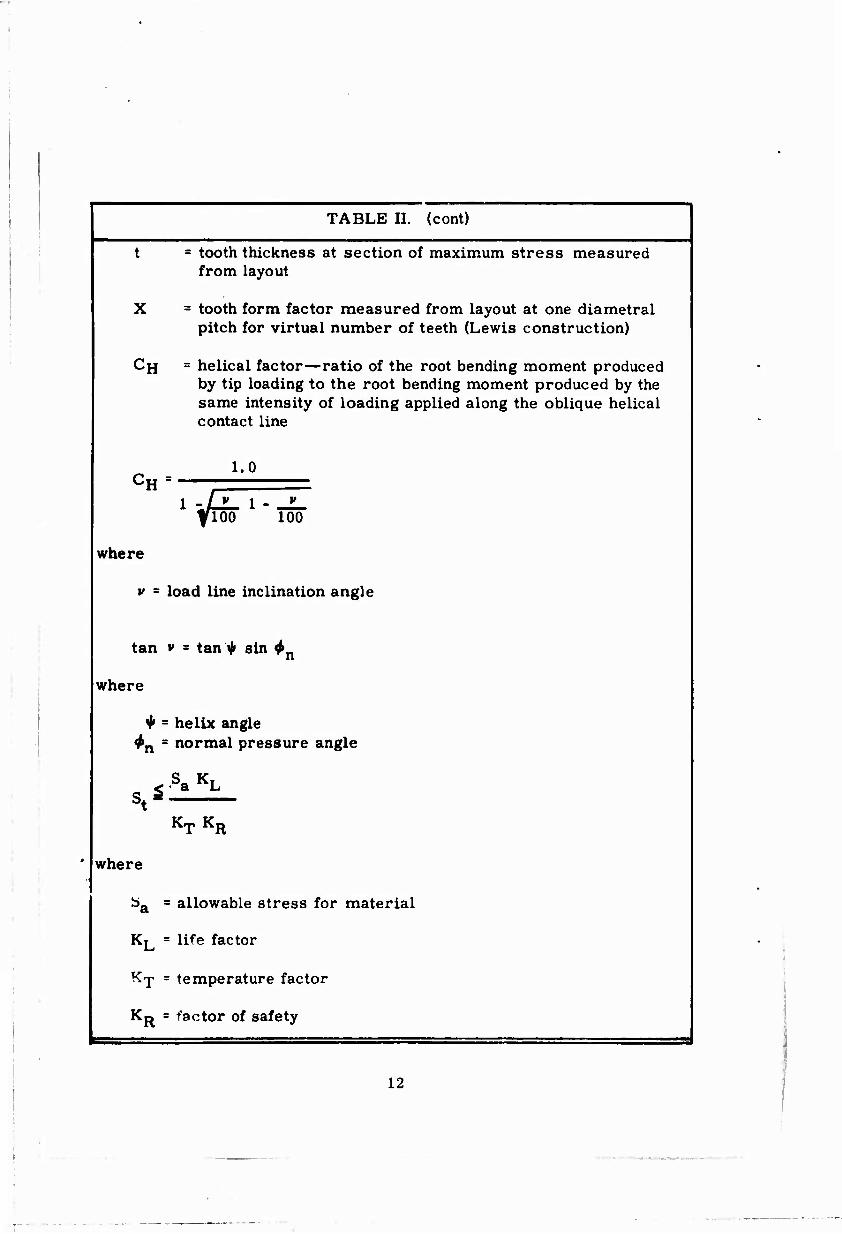
TABLE II. (cont)
t = tooth thickness at section of maximum stress measured from layout
X = tooth form factor measured from layout at one diametral pitch for virtual number of teeth (Lewis construction)
CH = helical factor—ratio of the root bending moment produced by tip loading to the root bending moment produced by the same intensity of loading applied along the oblique helical contact line
CH 1.0
1 -JJL- 1 - " yioo loo
where
v = load line inclination angle
tan v = tan + sin ^n
where
* ' helix angle
*n 8 normal pressure angle
*t* .SaKL
KT KR
where
*a = allowable stress for material
KL = life factor
KT = temperature factor
KR = factor of safety
12
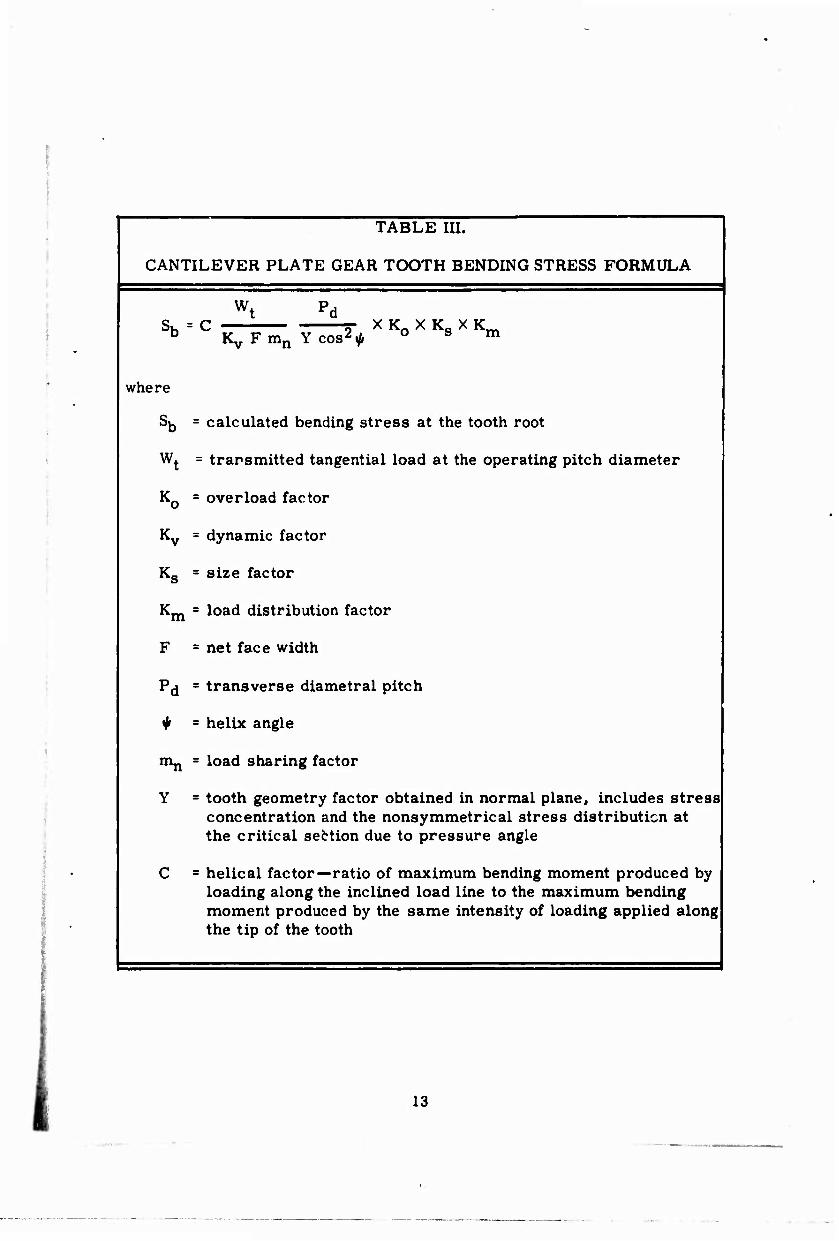
TABLE III. 1
CANTILEVER PLATE GEAR TOOTH BENDING STRESS FORMULA
sb
Wt Pd 1 Kv F mn Y cos2^ o s m |
where
Sb = calculated bending stress at the tooth root |
wt = transmitted tangential load at the operating pitch diameter
Ko = overload factor !
Kv = dynamic factor
Ks = size factor }
Km = load distribution factor
F = net face width j
Pd = transverse diametral pitch
* = helix angle
«Hi = load sharing factor
Y = tooth geometry factor obtained in normal plane, includes stress concentration and the nonsymmetrical stress distribution at the critical sebtion due to pressure angle
C = helical factor—ratio of maximum bending moment produced by loading along the inclined load line to the maximum bending moment produced by the same intensity of loading applied along the tip of the tooth
13
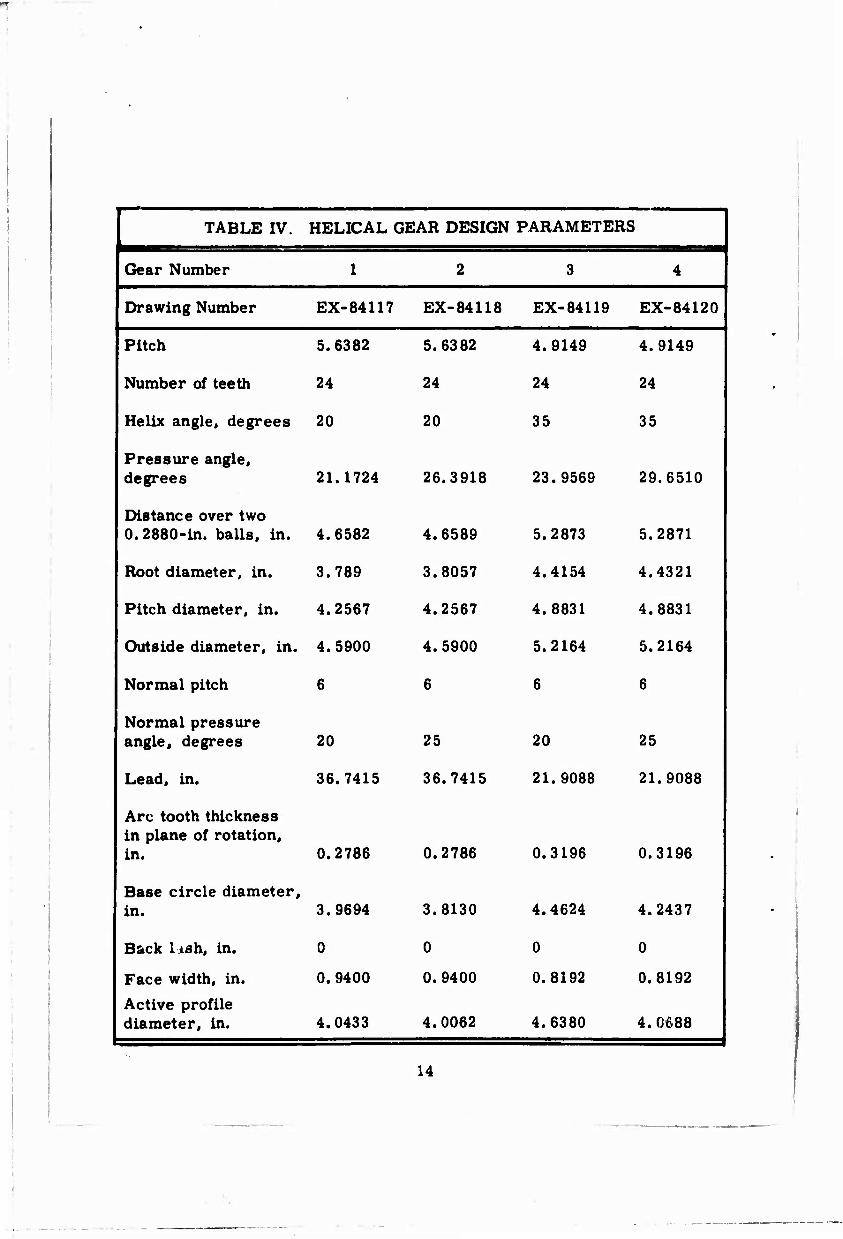
TABLE IV. HELICAL GEAR DESIGN PARAMETERS
Gear Number 1 2 3 4
Drawing Number EX-84117 EX-84118 EX-84119 EX-84120
Pitch 5.6382 5.6382 4.9149 4.9149
Number of teeth 24 24 24 24
Helix angle, degrees 20 20 35 35
Pressure angle, degrees 21.1724 26.3918 23.9569 29.6510
Distance over two 0. 2880-in. balls, in. 4.6582 4.6589 5.2873 5.2871
Root diameter, in. 3.789 3.8057 4.4154 4.4321
Pitch diameter, in. 4.2567 4.2567 4.8831 4.8831
Outside diameter, in. 4.5900 4.5900 5.2164 5.2164
Normal pitch 6 6 6 6
Normal pressure angle, degrees 20 25 20 25
Lead, in. 36.7415 36.7415 21.9088 21.9088
Arc tooth thickness in plane of rotation, in. 0.2786 0.2786 0.3196 0.3196
Base circle diameter, in. 3.9694 3.8130 4.4624 4.2437
Back liah, in. 0 0 0 0
Face width, in. 0. 9400 0.9400 0.8192 0.8192
Active profile diameter, in. 4.0433 4.0062 4.6380 4.0688
14
1
A normal diametral pitch of six was selected for all test gears. This pitch selection is consistent with current design practice for lightweight aircraft main power train gearing and would also allow comparison of test results with spur gear results from the investigation conducted under Contract DA 44-177-AMC-318(T) and reported in USAAVLABS Technical Report 66-85. All gears were protuberance hobbed. Pressure angles of 20 and 25 degrees were selected, since they represent current gear design practice.
Helix angles of 20 and 35 degrees were selected, since they represent current design practice and a reasonable variation in this factor.
Gear face widths were selected to produce a 1-in. face width in the normal plane.
All gears were shot peened in the root and black oxide treated prior to testing.
The fatigue test gears were made v/ithout a rim and web to eliminate possible complications. Twenty-four tooth gears were chosen to avoid undercutting and to provide reasonable gear sizes to make it possible to relate fatigue life results to the 24-tooth fatigue life results obtained on the aforementioned spur gear program.
MANUFACTURE OF FATIGUE TEST GEARS
Fatigue test gear manufacturing was controlled to minimize variation within and between each of the four groups and to maintain constant metallurgical microstructure and surface treatment. Specific items of control were as follows:
• The material used was of the same specification (AMS-6265) as the material used to conduct the spur gear program. The gears were manufactured from 6-in. bar stock of AMS-6265 material (supplied by Composite Forge—heat number 513C). The raw material record is given in Table V.
• All heat treatments and surface finish processes were accomplished at the same time on all test gears.
• All machining processes for each gear configuration were completed on the same machine and with the initial machine setup.
• Copper plating prior to hardening and stripping of copper plate after hardening were each accomplished simultaneously on all parts.
• Shot blasting and peening were accomplished simultaneously on all gears.
15

TABLE V. RAW MATERIAL RECORD
Allison Purchase Order Number K8-13020
STEEL SUPPLIER DATA—COMI ^JITE FORCINGS, INCORPORATED
Material specification—AMS-6265 Heat number— 513C Material size—6-;.r, diameter
MICRO INCLUSION RATING
B D Inclusion Type A Inclusion Size Thick Thin Thick Thin Thick Thin Thick Thin Top 1 0 10 0 0 1.5 1 Bottom 1 0 110 0 1.5 1
Chemical analysis
C MN P S Si CR Ni Mo
0.09 0.50 0.007 0.004 0.28 1.25 3.20 0.15
ALLISON METALLURGICAL INSPECTION RECORD
Coarse etch—okay
Magnaflux step-down bars—okay
Chemical analysis
C MN P S
0.07 0.69 — -
Si CR Ni Mo
0.21 1.19 3.17 0.12
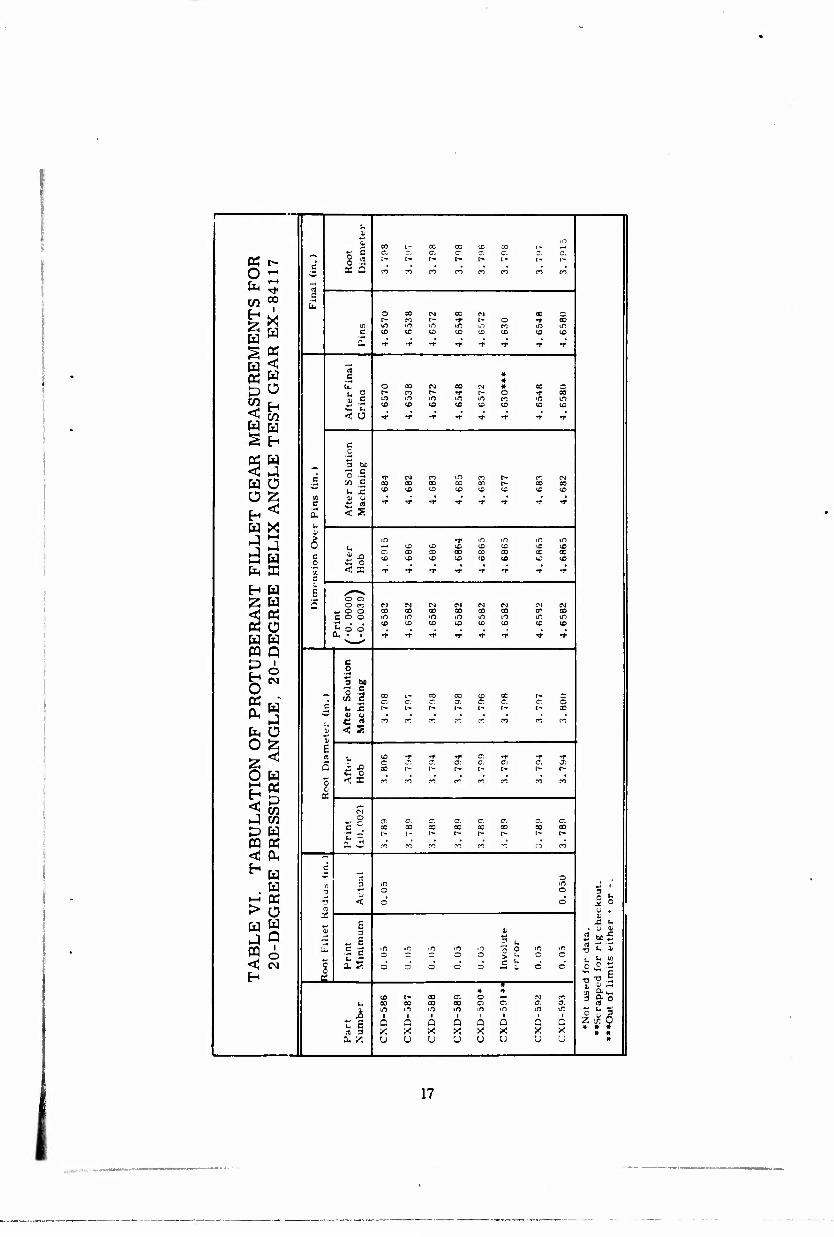
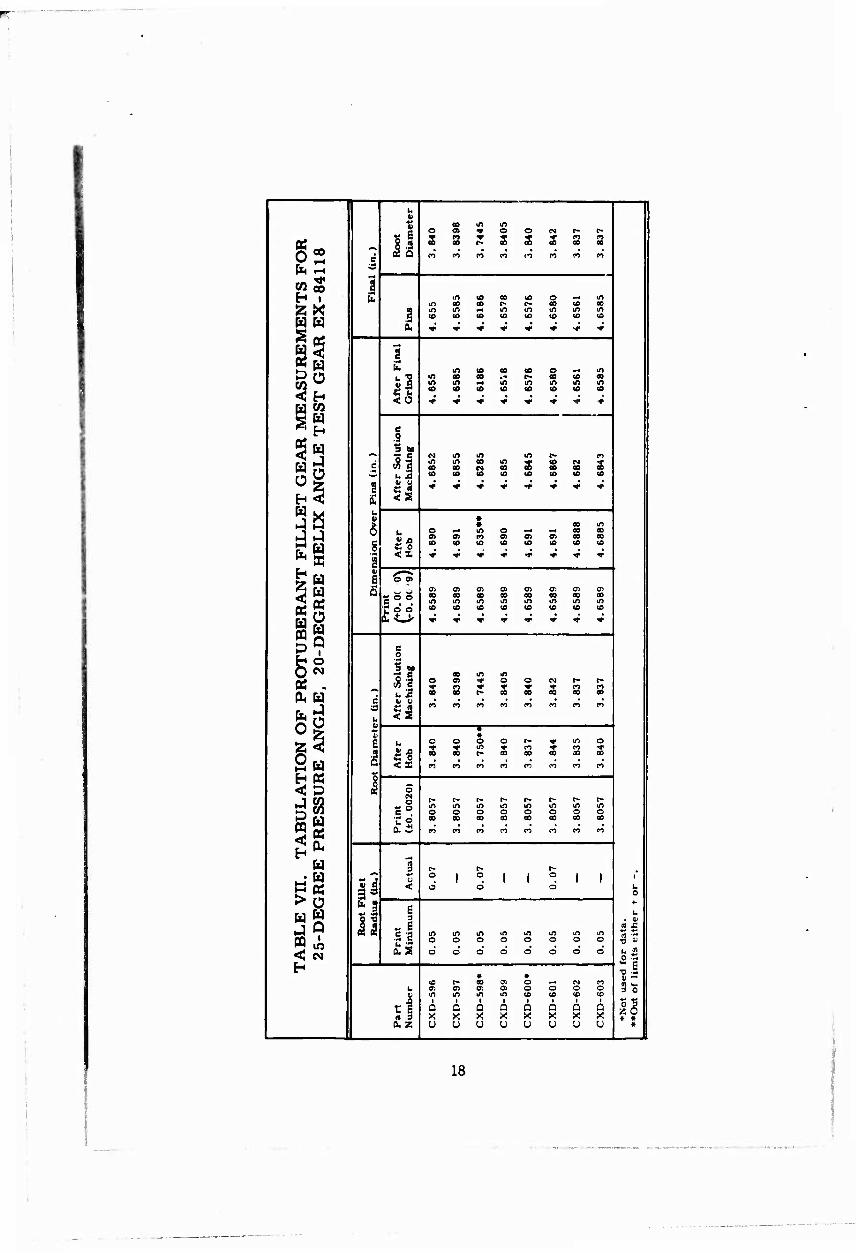
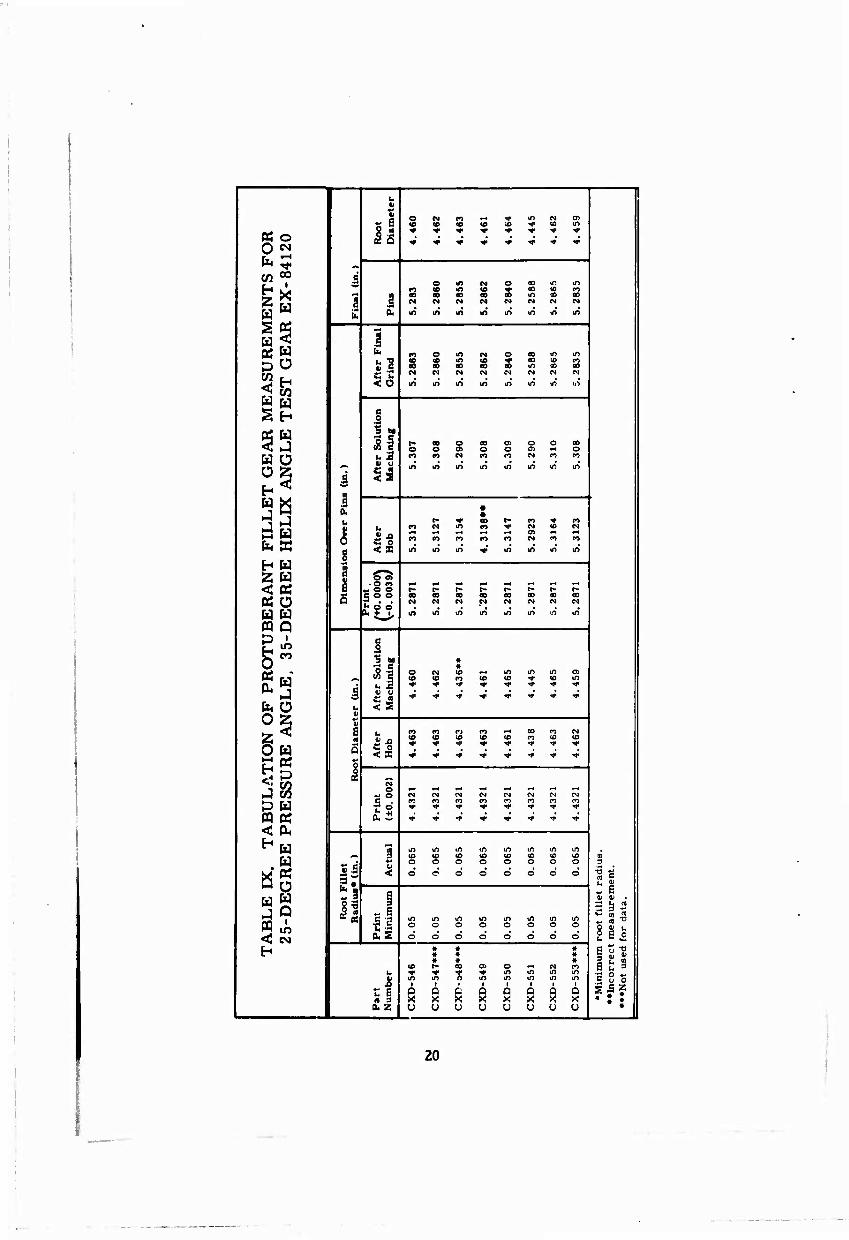
Many in-process and finished part measurements were made to define stock removal and to record the final geometry of each part. Tables VI, VII, VIII, and IX list the gear measurements and analysis. The root diameter, tooth thickness (dimension over pins), root radius, and pro- tuberance undercut depth are the critical dimensions for the fatigue speci- mens.
16
1
L,
x l- X 00 iD X ,_ IO
a r. c. c ~. c. J. c. Pi t- c § .2 r*
|~ 1- 1^ 1- i- ■' '- O -' K O ro ro cn ro ro ro t*i ro
TJ
s O X (M CO ~i X O t- r; 1- -r r- O -r 00
a m in in ifi !/) m in in c
T •r
to CO CD
-r
CD
T -r
^5 C * « po iT o X rj 00 rj # X o t. D t- M r- »r r- c *r 00
1 W r. S C «n in in in in rr >n IT)
< Ü
(0 (0 CD CD CD <D
T
CD
W H c
T G
EA
R
AN
GL
E
c
3 U
0 .S m H 00
CD
CM CO X
in X X
<D
I--
CD X
CO
c D U
< s -r T -r T T -r -r ■f
W X
d w 6 L,
in ts CD CD
in CD
in CD 10 CO
c. X X 00 X X X 00
0 C o X to CO CD CO CD CD U3
1 1
< X -r T *T T -r -r T •r
/<^v
1 Z w 3 o o O c: N CS TJ C^l CN cs M w
1 < « « o o CO X X CO X X X CO coo in in •n in m in tO in
i « Ü > d d (C to CD CD CD ■D ID to
| PQ Q
L ■>■ i -r -r T -r V T t T
^ 0 1 3 M
O II £3
'*' 00 i- c
X X a.
CD a-.
X
c. 03 5 1 £ i- r- (^
■^ m PI
[ fe Ü o ^ 1 ^ < S
i £
AT
ION
S
UR
E A
« i_ to -r T T c-. t T ■r
5
1 1 C 0 < I
c CO
CO
i-
M
a. c. 1-
C.
CO
CJ
J w o ai C. C c. c. c. 3. a.
P W | c -; r o
X X X X X X X
l-
00
PQ « iS en -' M -: « -* n M
i '"*
1 ^w c
rt 3
1 H 1 X 3
3 in o
in o 3 1
St tf I < d d ^ 0 1
[ > Ü 1 Ij 1
^ 9 5 £
- £
c .5 S u ■-•
m c o
in in c
o
O
3!
o o
It in O
d
in o
d fell ! H l 1
CO i- X <r. o *
CM m ll-s u 00 X X 00 c; C: J: a. n D
1 X in
i C
in in i
G
»n
Q
if)
Q
in t
in i
in III eg 3 X X X X X X >? >< « « 0, Z u U u u U u U U * |
I 17
^^^"—
>. « t oo m in
II o Ol * o o CM C- t*
ö2 e
s s en
■r 00 S
CO
S CO CO
3 h i i>) in m eo 10 o ^^ m £>< .3
in in
so m to
oo
to
c- in IB
in IO
00 m (0
IO m to
X in IO w w ^
ASU
RE
M
T G
EA
R
—* 1 o IO 00 IO o ^^ m
in eo 00 f 00 IO 9
11 tn m in m in m m <o 10 <e 10 to to IO to
M CO
d
_ 1? N m m in t- CO
e IA g m 00
m 00
00 M
in 00 s £ ss s
i to <s (0 IO <o IO 10 IO
M c ■«
UB
ER
AN
T F
ILL
ET
-D
EG
RE
E H
EL
IX A
£ <s
1 I 1
li s • • m en (O 10 to
a IO
S CO
CO
•
m 00 00 IO
fe« OI Ol O) a o> o> Ol ai « to oo oo 00 00 00 00
.s° • too 10 m in in in in in m <o <o 10 (0 to to to to
io * •* «r 'f i" ♦ * ♦
e 0
PR
OT
E
, 2
0
o oo 0)
in m o o C>) r- t-
CO s s • oo s s s
og <9 $1
n m n (■■)' cj
*
^
E
1 o o o o t~ *« in o
II s n
s n
CO oo
eo
s CO
s CO
3
h« 1 <: B o
TA
BU
L
PR
ESS
e in in
t* m
t- in
t*
in in
c . o o o o o o o o
6,5 CO 00 oo
CO
00
CO
oo
CO
00
CO
CO
CO*
00
P5
a 3 c- c- 1-
II <
o o
1 o d 1 1 O
d 1 1 1- 0
- 1 d 9 in in in in in in in in
• t> li
; 1 o o
o d
o d
o d
o d
o d
o d
o d
IO t- 00 a. o ^ M CO « w 11 3 0 11 la O) en O) O) o o o O
V in m in m to to IO CO
r^ i i Q a 1
Q a i
Q fl 11 a § X X X X X X X X DUZ u Ü u u u u u (J * 11
18

tf 0 03 fe ^
l-H
CO t H w
s^ pw w Ü
SOT ^W tfh
<1 w W J Ü 0
JX 1 *->
fc w hK
z w <; w « (S W Ü PQ w PQ
Ss « ^w fc J 0 Ü
*o*<
LA
TI
SU
RE
p w PQ W < ttJ H^
, w
>ü Hg jQ WA <3 N
ä c
O Tl
tl
Is
lb
< u
3 00
bl C « < s
v- O < i
o o <» to t» m 00 00 00 M N CM
O a o o> <s o in 00 oo 00 oo N CM CM CM
^ M ^H <-» -t o en o
m en cn CO CO CO en CO
in in in m in in m m
c o 3 M
Al o u C " < s
» ^3 C o < X
0,2.
3 ^ s .S'S a. S
t G « 3 a, z
***"»•
00 o 00 o
Q Q Q Q Q Q a Q X X X X X X X X U U U U U U u u
19
b ""■" 1
•< •>• § o M m „4 : in (M 01
<o IS <t> IP ^ •O m
13 •* ♦ * <• ^ T ■* ■♦ K o ^t "* YJ1 «}<
0 w
fe^ ^ m~~~ M «f i 0 m CM o OO in m
»m 1 s • m to s s 00 IS
9 CO oo 1 N N N N CM CM (M CM
£ 0. in in in in in in in in
1 a: W h m o m C>4 o oo in in
EA
SU]
ES
T G
11 £ s m 00 s s 00
in to 00 s
N CM N CM CM w CM CM
5ü ■n in in in in in in in
SH |
§S 5 M
SI o to o § oo
o o o o oo
O
Ü g u 2 <<> m N n « es CO CO
i II in m' in in in m" in in
P p. h
1 u N
n
• • oo to •-1
CO
eo M
CM
s CO
CO CM
CO c o ! < X in in in * in lO in in
1 ^ w f$ tf Ü
• o m « o o i- t* r- t* r-
5 s o o CO 00
M 00 00
CM 00 CM
00 oo CM
w w iti in in in in in 10 in
n Q c
Sw 1 » •s c
* •
£« ^1 O N IS m in m a> ^^ m e m IS (0 ■* (0 in
1 * ^
■*
v
^ *
f
^ fa Ü h < s 0^ 41
ti ^p g en PS n CO ^H 00 CO CM
•5 M S n us IP IB to to ro to <o
0 U s §1 ^ V
^ ** **■ f
*0 it*
LA
TI
SSU
R
1 J « N CM <N CM N CM
p w c . m n n CO « CO CO CO
t S * f *r ■«• ^f f f ^r
PQ tf ii f 'T ■t ^r ^ ■»• ■t •*■
< Ok
1 m in in m »n in m in 10 IS <o w CO to « lO n
25
as
1 o
d o
d o
d o
d o
d o
d o
d o
d 3
11 M H
^9 s 9
_ 8 a! ti .
c -d in in in in in m in in ^ S TI ffl in < N h
a S o
d o
d o
d o
d o
d o
d o
d o d 1 § t-
» « • * » • • « 2 " » « t- 00 o> o N CO 6 u 3
u T •"»• ■* f m in m in •^ O *j
-1 in i
D a n
i in
i a
m i
m i
Q m
i 0
in i a
5 ° o
a 3 X X X X X X X • ; I a. z U u Ü u u U u u •
20
Some gears had dimensional deviations; however, most were within the dimensional tolerance limits. In some cases, involute error, tooth thick- ness error, and root grinding marks were found. When this occurred, the gears or gear teeth in question were excluded from the fatigue test program. Tables VI through IX also list the discrepancies found and identify the excluded gears. Sample routing sheets for a typical fatigue test gear (EX-84117) are given in Appendix n.
TEST RIG DESIGN AND PROCEDURE
The test rig was designed for single tooth testing. Single tooth testing was selected to permit accurate control of test variables and to render the results applicable to previous single tooth testing performed on spur gears.1 A tooth adjacent to each test tooth was removed from the gear to provide clearance for the luad member.
A 30,000-pound Ling electromagnetic shaker was selected for the input loading device. This electromagnetic shaker loading device, which had excellent dynamic stability, allowed close control and accurate measure- ment of dynamic tooth load.
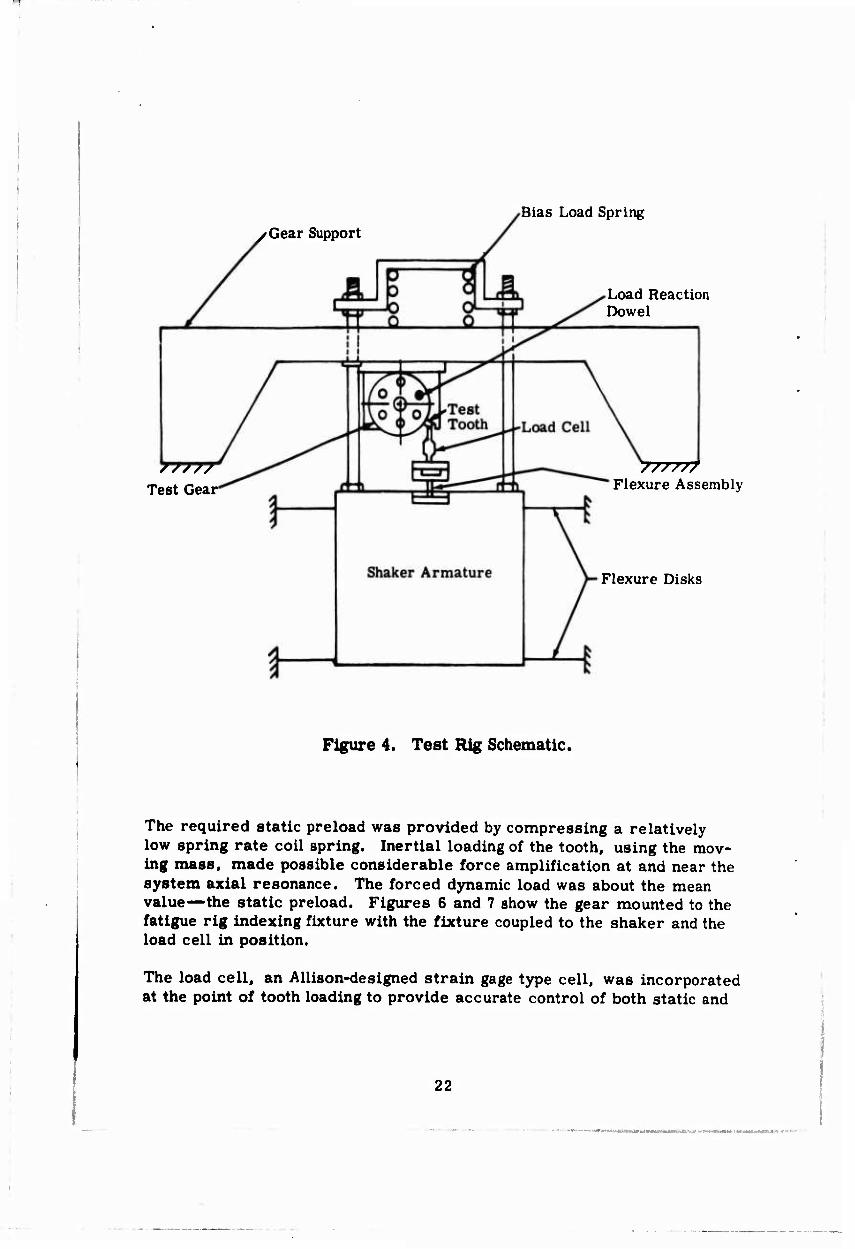
To achieve the designed operational requirements, the main design em- phasis for the test rig was placed on method of loading, reacting, and indexing the test gear. The fatigue test rig was designed with high axial stiffness of the load reacting components. High radial stiffness of the fatigue test rig was inherent in the shaker armature design. A degree of flexibility was built into the load member-flexure assembly to ensure uniform tooth load distribution under dynamic conditions during tooth roll and unequal tooth deflections present in loaded helical gear teeth. The fatigue test rig was coupled to the Ling electromagnetic shaker. Operation at or near a system resonance of 115 c.p.s. was realized. The principle of operation of the fatigue test is shown schematically in Figure 4. The relative size and construction of the facility are shown in Figure 5.
The shaker driving force was applied directly by the mass of the shaker armature which loaded the gear tooth through a load cell. The mass (shaker armature) is flexibly supported in the axial direction with flexure plates built within the main structure of the electromagnetic shaker. Radial stabilization of the mass was ensured by the same disk-type flex- ible plates.
21
Bias Load Spring »Gear Support
Load Reaction Dowel
Test Gear 777777
Flexure Assembly
Flexure Disks
Figure 4. Test Rig Schematic.
The required static preload was provided by compressing a relatively low spring rate coil spring. Inertial loading of the tooth, using the mov- ing mass, made possible considerable force amplification at and near the system axial resonance. The forced dynamic load was about the mean value—the static preload. Figures 6 and 7 show the gear mounted to the fatigue rig indexing fixture with the fixture coupled to the shaker and the load cell in position.
The load cell, an Allison-designed strain gage type cell, was incorporated at the point of tooth loading to provide accurate control of both static and
22
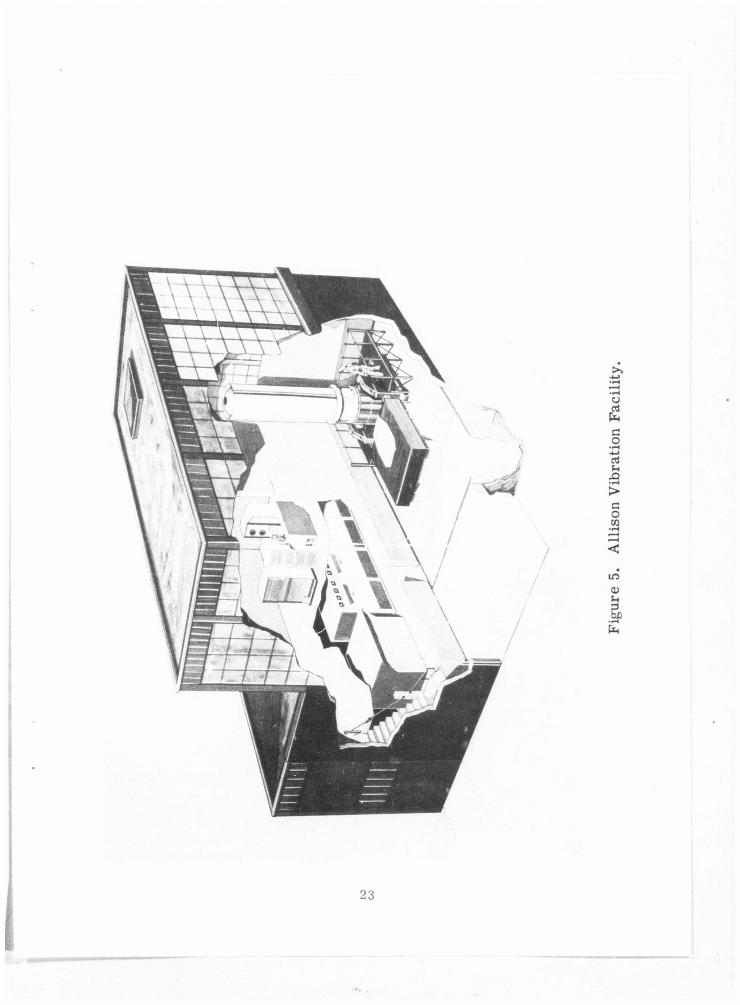

Figure 6. Fatigue Test Rig Mounted On Electromagnetic Shaker.
Figure 7. Fatigue Kig indexing Fixture, Mounted Test Uear, and Load Member Shown in Test Position.
24
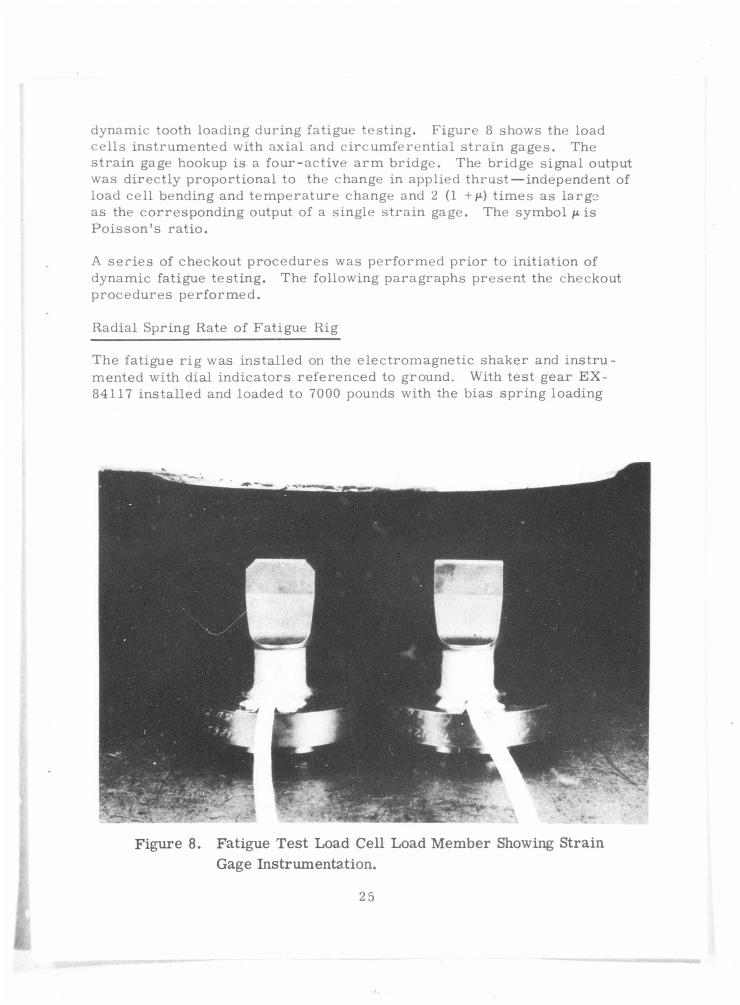
dynamic tooth loading during fatigue tes t ing. Figure 8 shows the load cel ls ins t rumented with axial and c i rcumferen t ia l s t ra in gages. The s t r a in gage hookup is a four -ac t ive a r m br idge. The bridge signal output was direct ly proport ional to the change in applied thrust—independent of load cell bending and t empera tu re change and 2 (1 +f*) t imes as largo as the corresponding output of a single s t r a in gage. The symbol is Po i s son ' s ra t io .
A s e r i e s of checkout p rocedures was pe r fo rmed pr ior to initiation of dynamic fatigue tes t ing. The following paragraphs present the checkout p rocedures pe r fo rmed .
Radial Spring Rate of Fatigue Rig
The fatigue r i g was installed on the e lec t romagnet ic shaker and i n s t r u -mented with dial indicators r e fe renced to ground. With tes t gear EX-84117 instal led and loaded to 7000 pounds with the bias spr ing loading
Figure 8. Fatigue Test Load Cell Load Member Showing Strain Gage Instrumentation.
25
device, the radial deflections were measured. The radial spring rate was determined to be 5, 000, 000 pounds per inch. This high radial spring rate verified the design objective of high system stiffness and allowed accurate load application and good alignment of all moving parts during operation.
Dimensional Checkout
The test fixture positioned the gear in such a manner that loading oc- curred along a straight line on the tooth profile tangent to the base circle. Measurements were made to verify center line locations of the gear mounting block pilot shaft with respect to the tip of the load cell. All parts were dimensionally checked to the drawing requirements, and no deviations were found.
Dynamic Resonance Frequency
To determine the system operating frequency, a frequency scan was made versus shaker drive current. The frequency scan was made between 50 and 300 c.p.s. with test gear EX-84117 installed and preloaded to 2000 pounds. The frequency scan indicated a system resonance of 115 c. p. s.
Dynamic Separation
To ensure continued contact between the gear tooth and the load member tip, it was necessary to determine the static/dynamic load margin neces- sary to maintain contact. The load cr'il output signal was displayed on an oscilloscope, and the dynamic load was cycled about a constant preload. Wave shape analysis of the output signal indicated that a minimum differ- ential load margin of 50 pounds was required to maintain contact between the tooth and the tip of the load member.
Load Cell Calibration
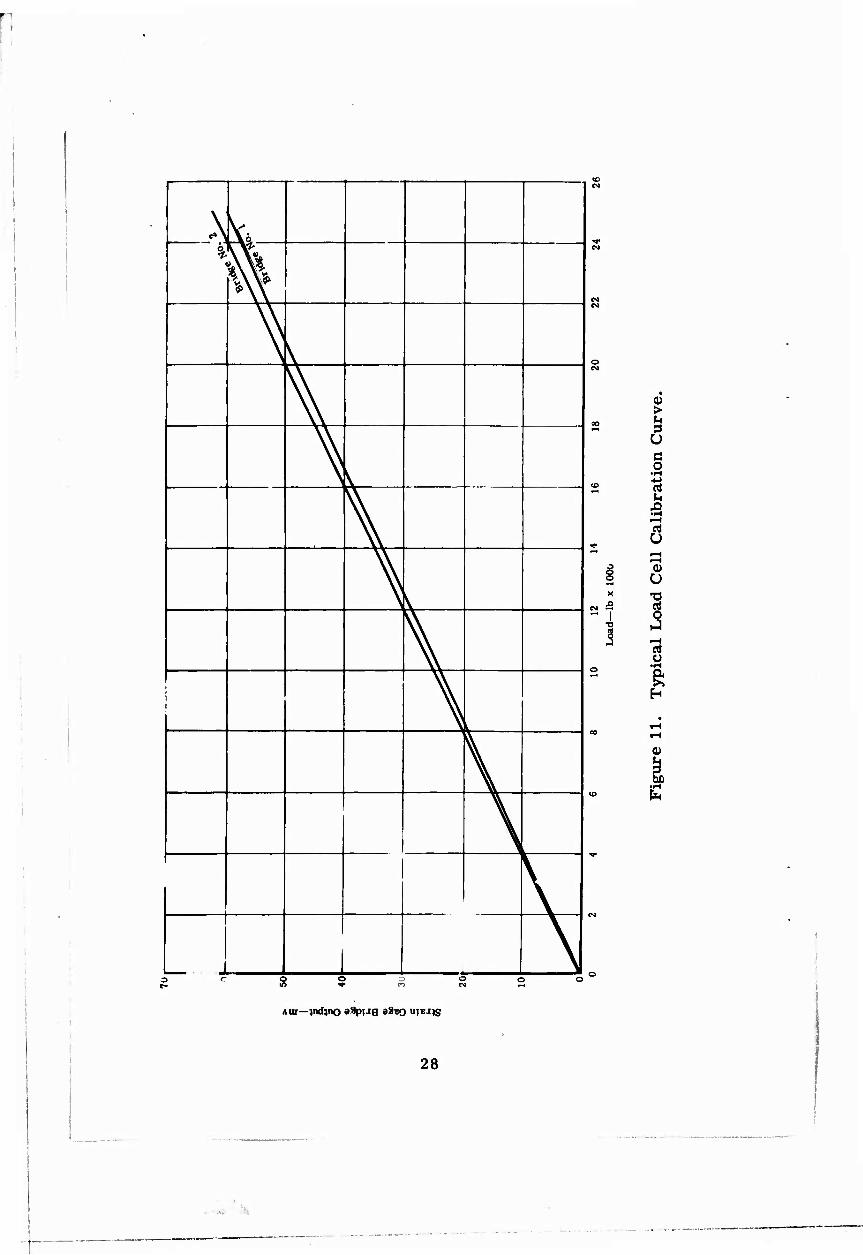
To eliminate inaccuracies in the load; a precise static calibration of the load cell was performed. The load ceil was loaded with a Baldwin press as shown in Figures 9 and 10. Incremental loads of 1000 pounds were ap- plied to a maximum of 25,000 pounds, and the output of the load cell strain gage bridge was recorded. The procedure was repeated four times on each load cell to ensure repeatability. Figure 11 shows typical calibration data. Recalibration of the load cells was accomplished at 30 and 60 percent fatigue test completion points and cell output versus load data repeated within 1 and 2 percent, respectively.
26
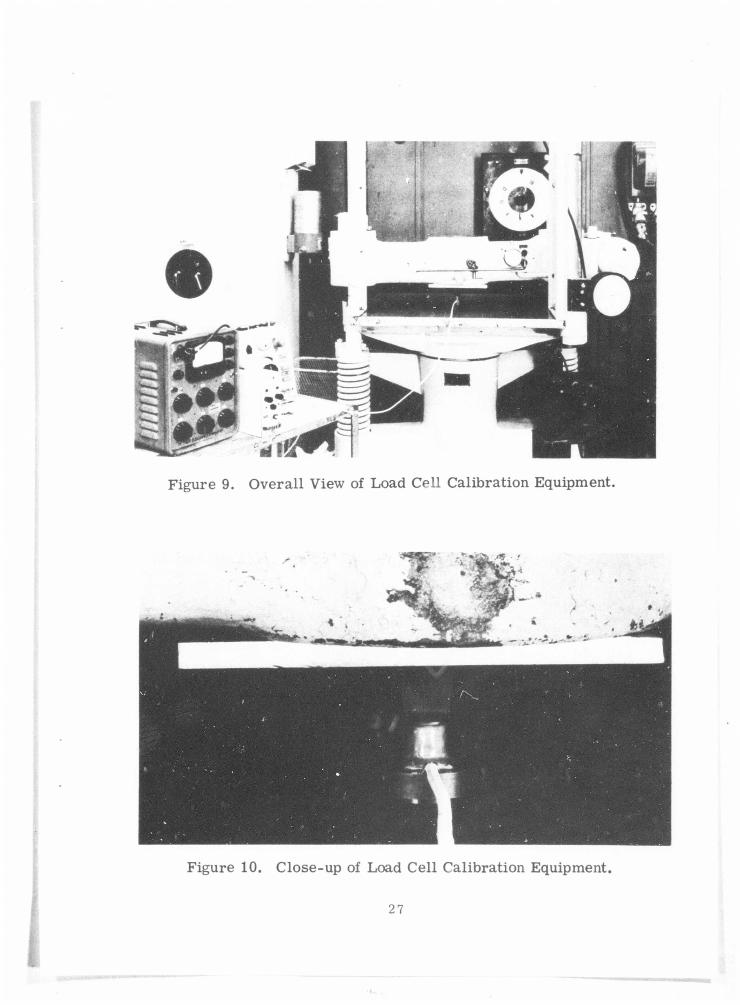
Figure 9. Overall View of Load Cell Calibration Equipment.
Figure 10. Close-up of Load Cell Calibration Equipment.
\ V*
m
V V v i \
l V i
\
VL
k
\
\
V >
CO b r^ ö a o
•FH •M
to rt U a •—i ci U
•-, i
i—i ^ » t-<
u X •o
« 5 rt ^ 3
:i -H rt ü
0)
Aur—jndjno aSpi-ig 98«o "TEJ^S
28
Tooth Load Distribution
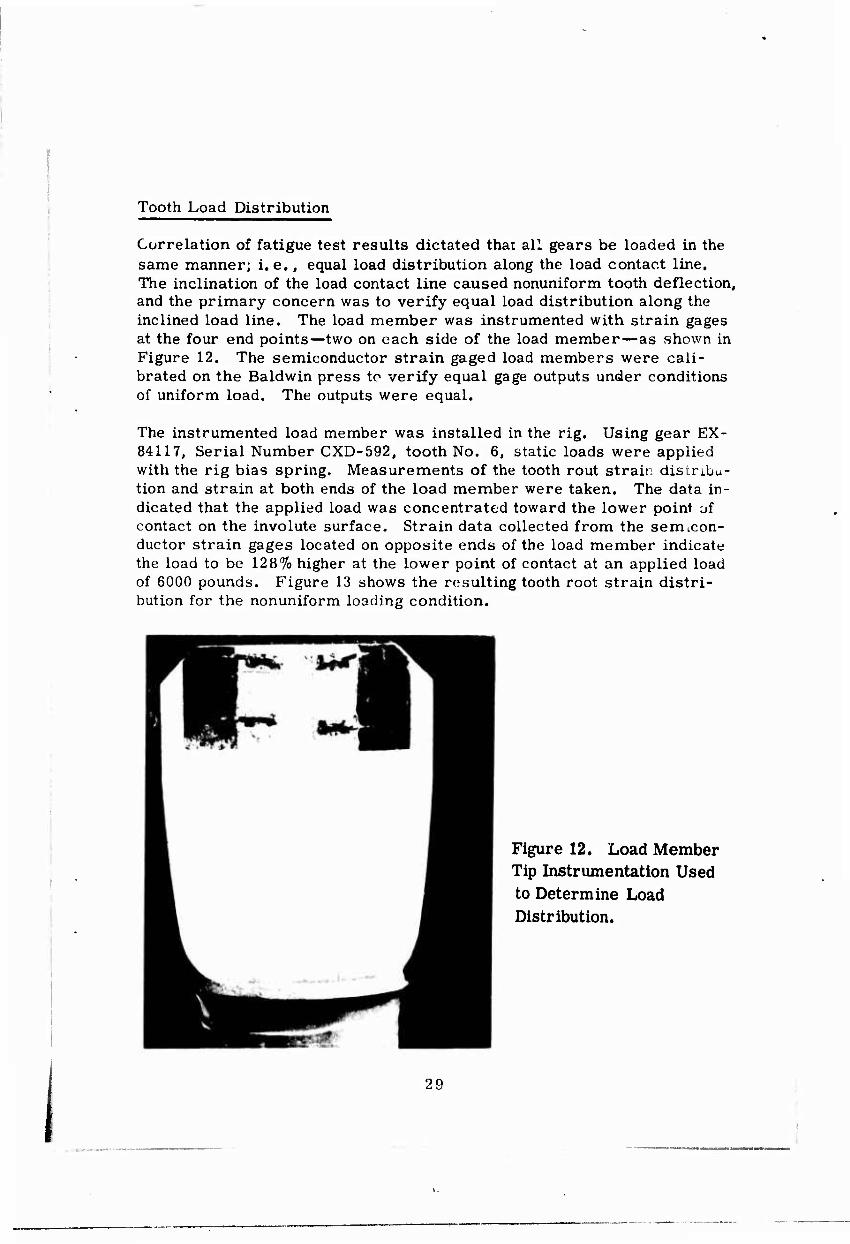
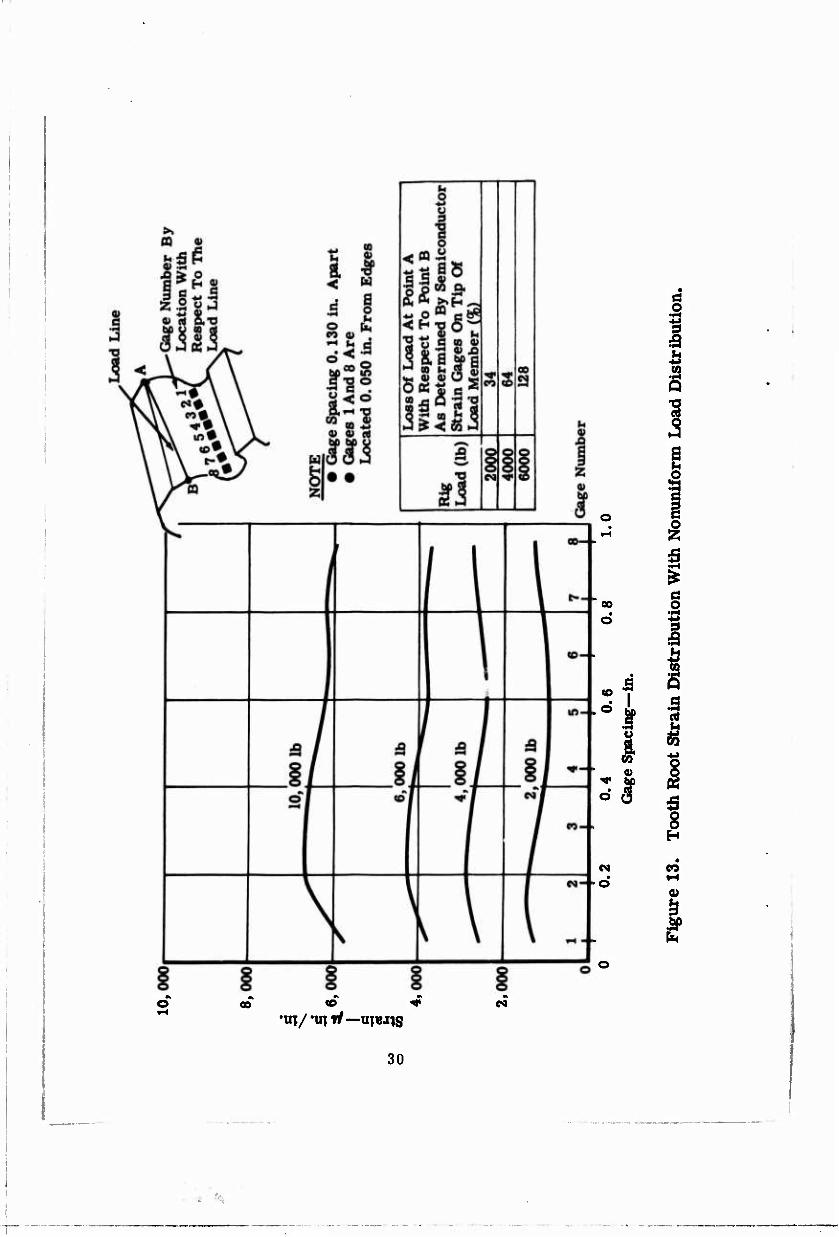
Correlation of fatigue test results dictated that all gears be loaded in the same manner; i.e., equal load distribution along the load contact line. The inclination of the load contact line caused nonuniform tooth deflection, and the primary concern was to verify equal load distribution along the inclined load line. The load member was instrumented with strain gages at the four end points—two on each side of the load member—as shown in Figure 12. The semiconductor strain gaged load members were cali- brated on the Baldwin press to verify equal gage outputs under conditions of uniform load. The outputs were equal.
The instrumented load member was installed in the rig. Using gear EX- 84117, Serial Number CXD-592, tooth No. 6, static loads were applied with the rig bias spring. Measurements of the tooth rout strain distribu- tion and strain at both ends of the load member were taken. The data in- dicated that the applied load was concentrated toward the lower point uf contact on the involute surface. Strain data collected from the semcon- ductor strain gages located on opposite ends of the load member indicate the load to be 128% higher at the lower point of contact at an applied load of 6000 pounds. Figure 13 shows the resulting tooth root strain distri- bution for the nonuniform loading condition.
Figure 12. Load Member Tip Instrumentation Used to Determine Load Distribution.
29
00
o 0.
1 Sp
acin
g—
el u &
o> Q
d $ 5 H
CM •
• rH o o
•tiT/*UTr/—uiw^g «
30
*
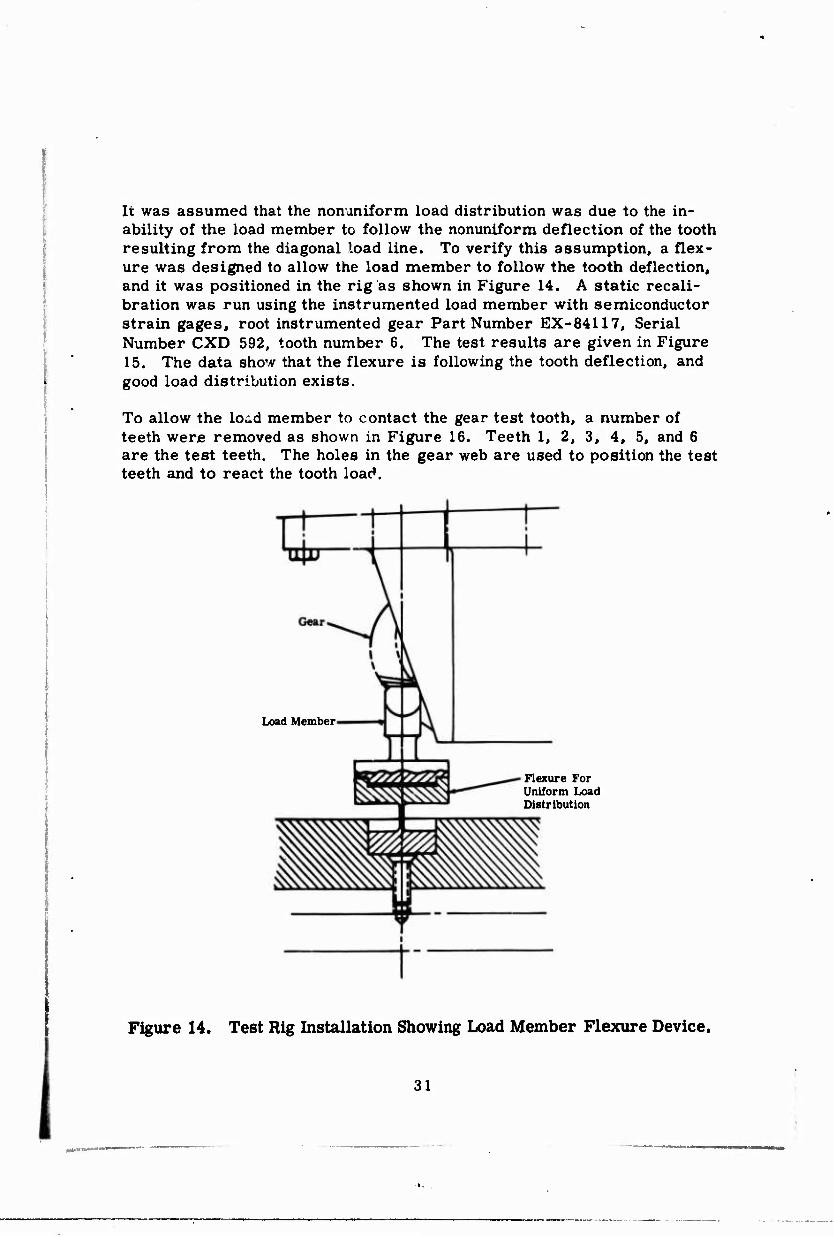
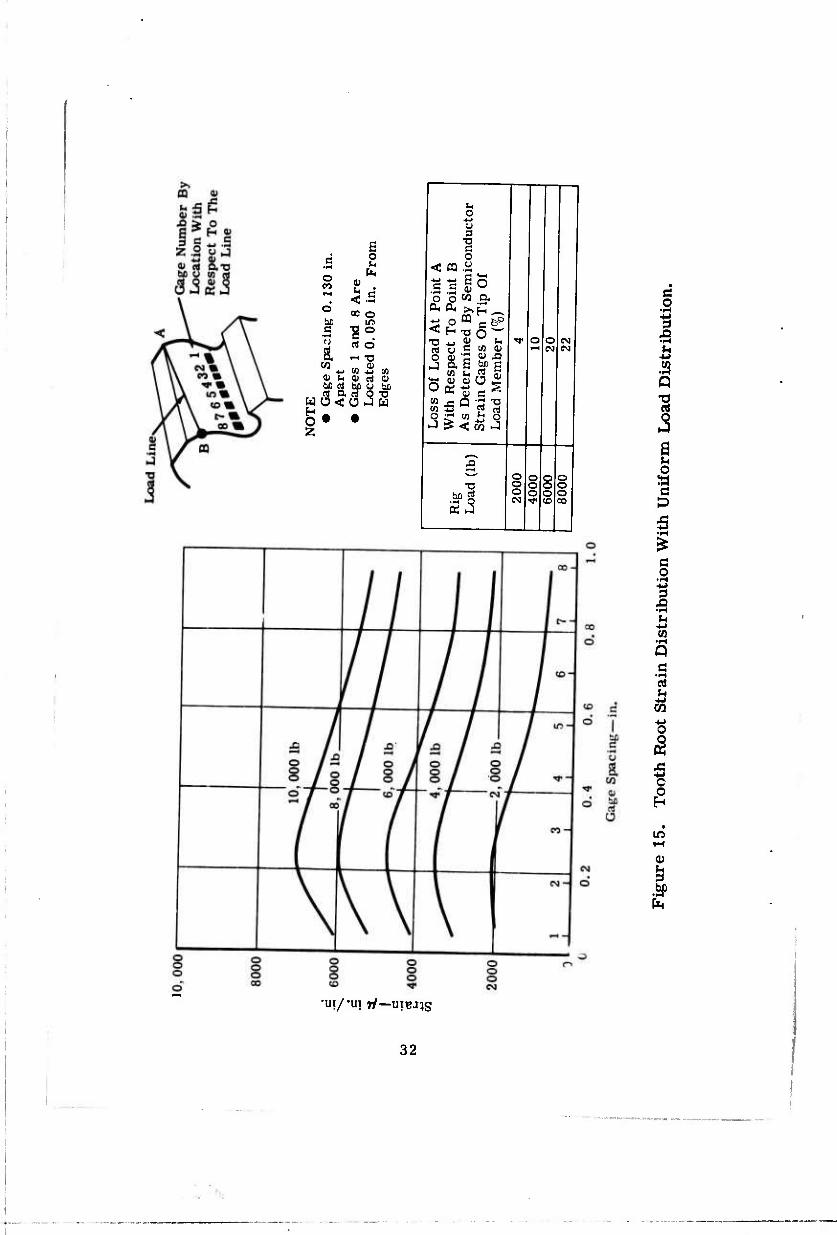
It was assumed that the nonuniform load distribution was due to the in- ability of the load member to follow the nonuniform deflection of the tooth resulting from the diagonal load line. To verify this assumption, a flex- ure was designed to allow the load member to follow the tooth deflection, and it was positioned in the rig as shown in Figure 14. A static recali- bration was run using the instrumented load member with semiconductor strain gages, root instrumented gear Part Number EX-84117, Serial Number CXD 592, tooth number 6. The test results are given in Figure 15. The data show that the flexure is following the tooth deflection, and good load distribution exists.
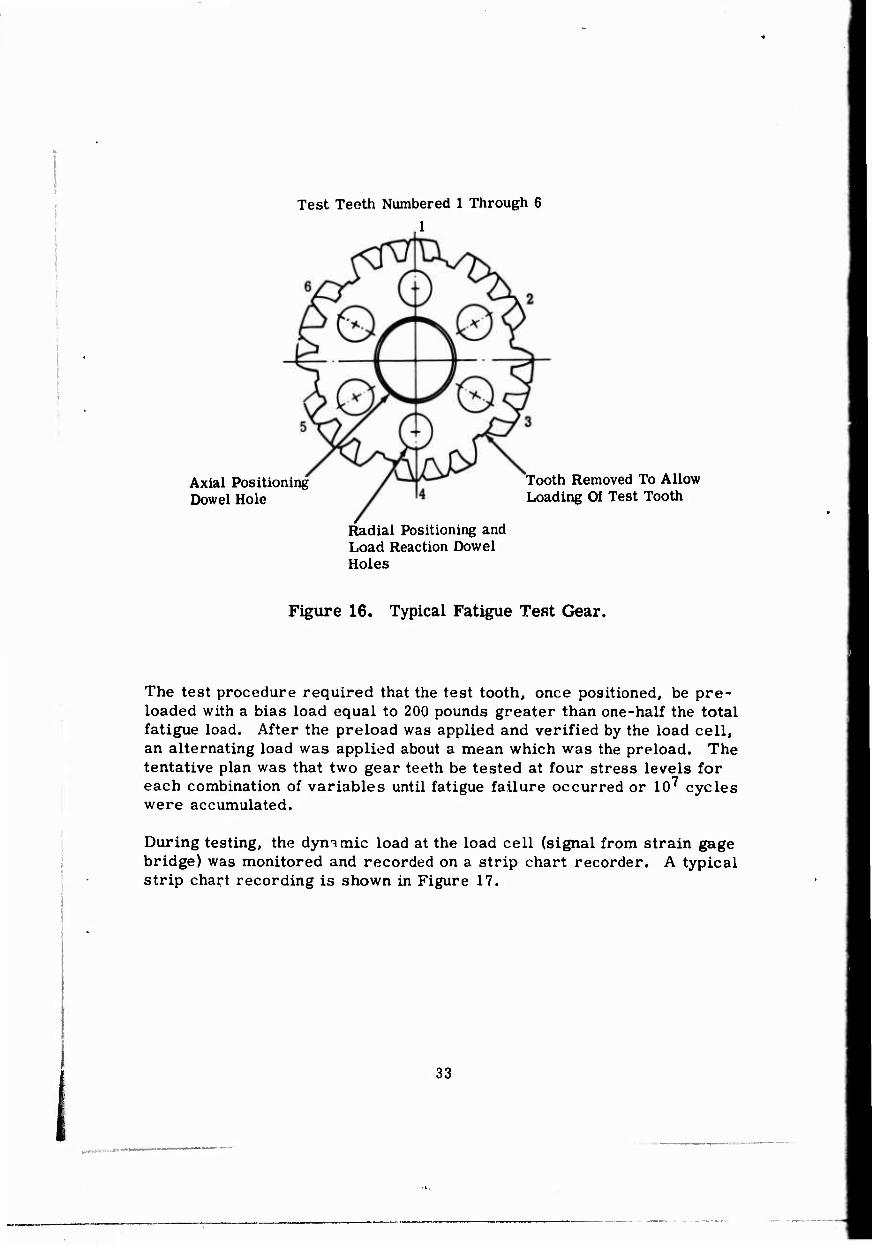
To allow the loü.d member to contact the gear test tooth, a number of teeth were removed as shown in Figure 16. Teeth 1, 2, 3, 4, 5, and 6 are the test teeth. The holes in the gear web are used to position the test teeth and to react the tooth load.
Load Member
Flexure For Uniform Load Distribution
Figure 14. Test Rig Installation Showing Load Member Flexure Device.
I 31
o CO
gp
0) u <
i < CQ.y
c c
o in o
a : w ■o (0 Ä a» rt be u be d
rt a rf Q wü<a J w
(2 o H
w a» K
o o 3
o
So co a
*<
eg or CO 0)
«II en >-J
X!
o
o 00
Ö .2
I a w Q
1
o a
I -M to
s .s rt u
s
m
fa
•ui/-ui r/—utBJ^s
32
Test Teeth Numbered 1 Through 6 1
Axial Positioning Dowel Hole
Radial Positioning and Load Reaction Dowel Holes
Tooth Removed To Allow Loading Of Test Tooth
Figure 16. Typical Fatigue Test Gear.
The test procedure required that the test tooth, once positioned, be pre- loaded with a bias load equal to 200 pounds greater than one-half the total fatigue load. After the preload was applied and verified by the load cell, an alternating load was applied about a mean which was the preload. The tentative plan was that two gear teeth be tested at four stress levels for each combination of variables until fatigue failure occurred or 10^ cycles were accumulated.
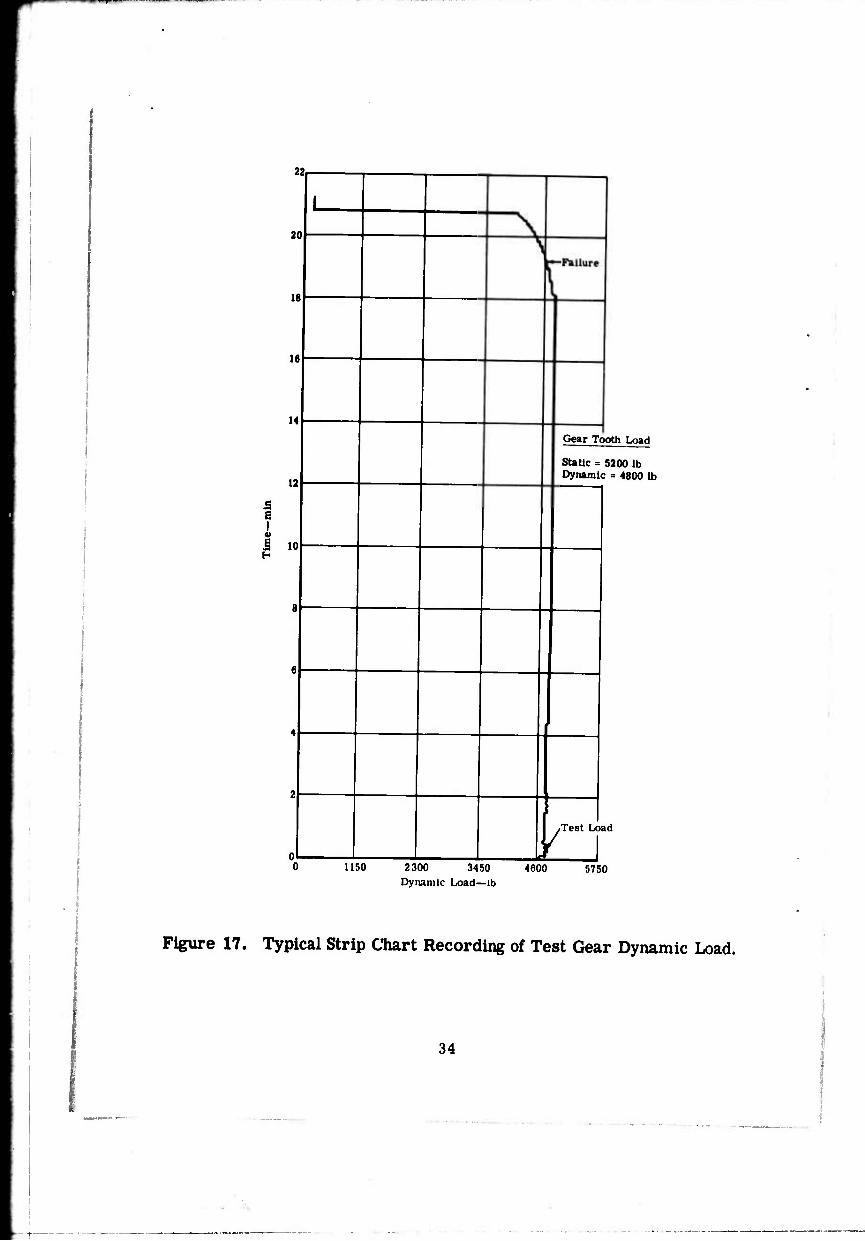
During testing, the dymmic load at the load cell (signal from strain gage bridge) was monitored and recorded on a strip chart recorder. A typical strip chart recording is shown in Figure 17.
1 33
22p
20l
18
16
14
12
a e I
«i
.§ io
1150 2300 3450 Dynamic Load—lb
Gear Tooth Load
Static = 5200 lb Dynamic = 4800 lb
t Test Load
4600 5750
Figure 17. Typical Strip Chart Recording of Test Gear Dynamic Load.
34
RESULTS
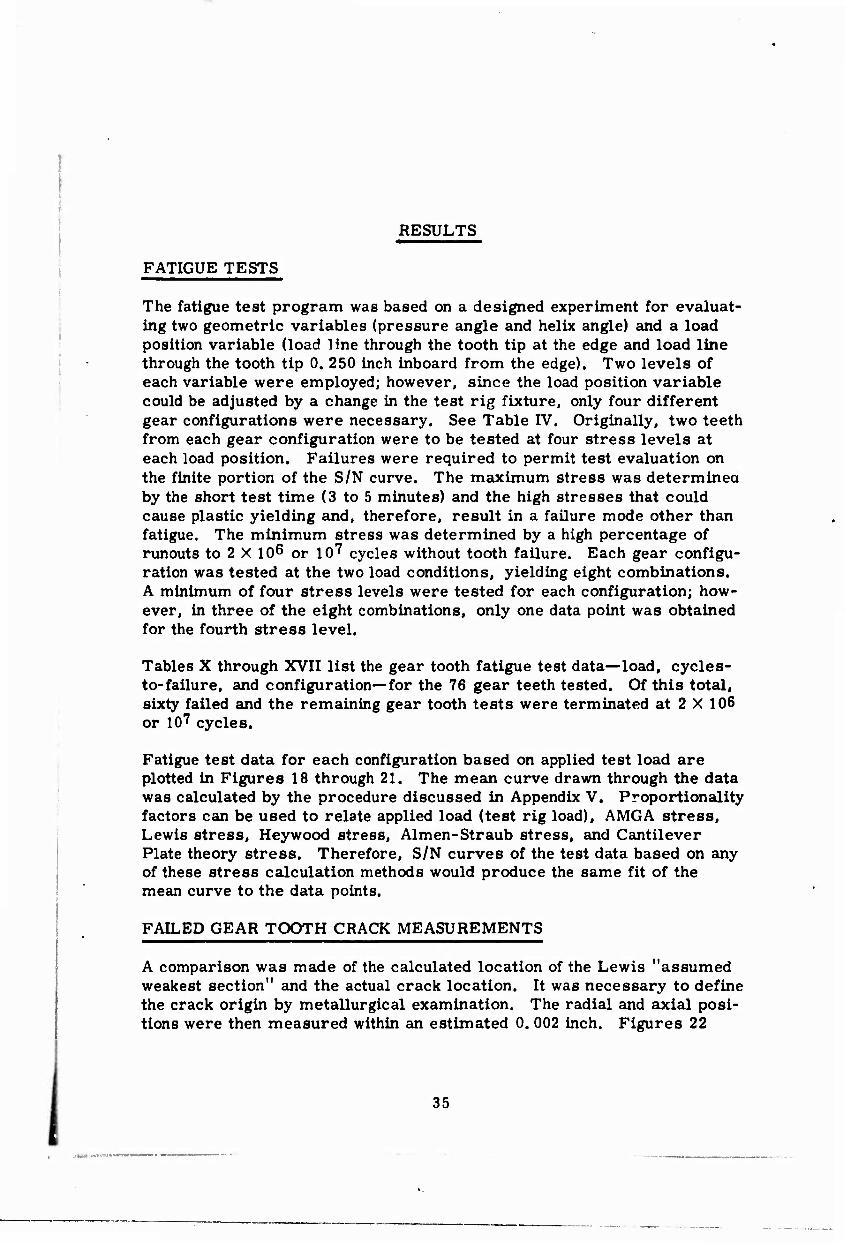
FATIGUE TESTS
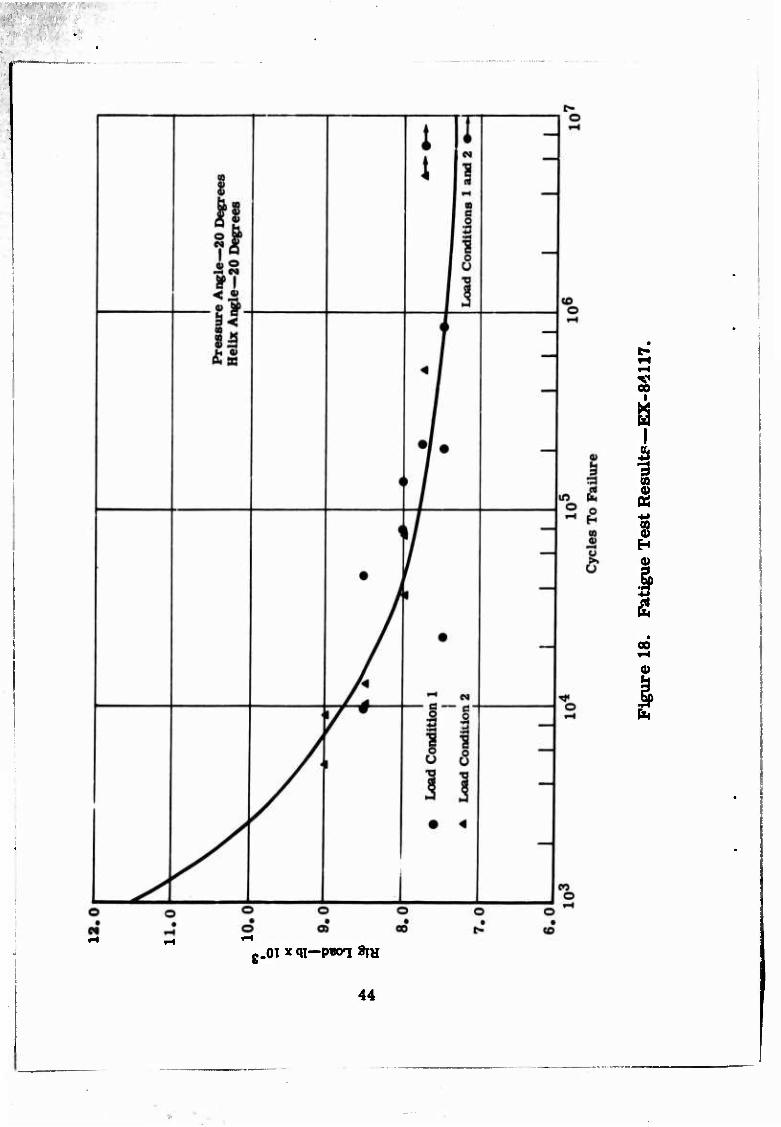
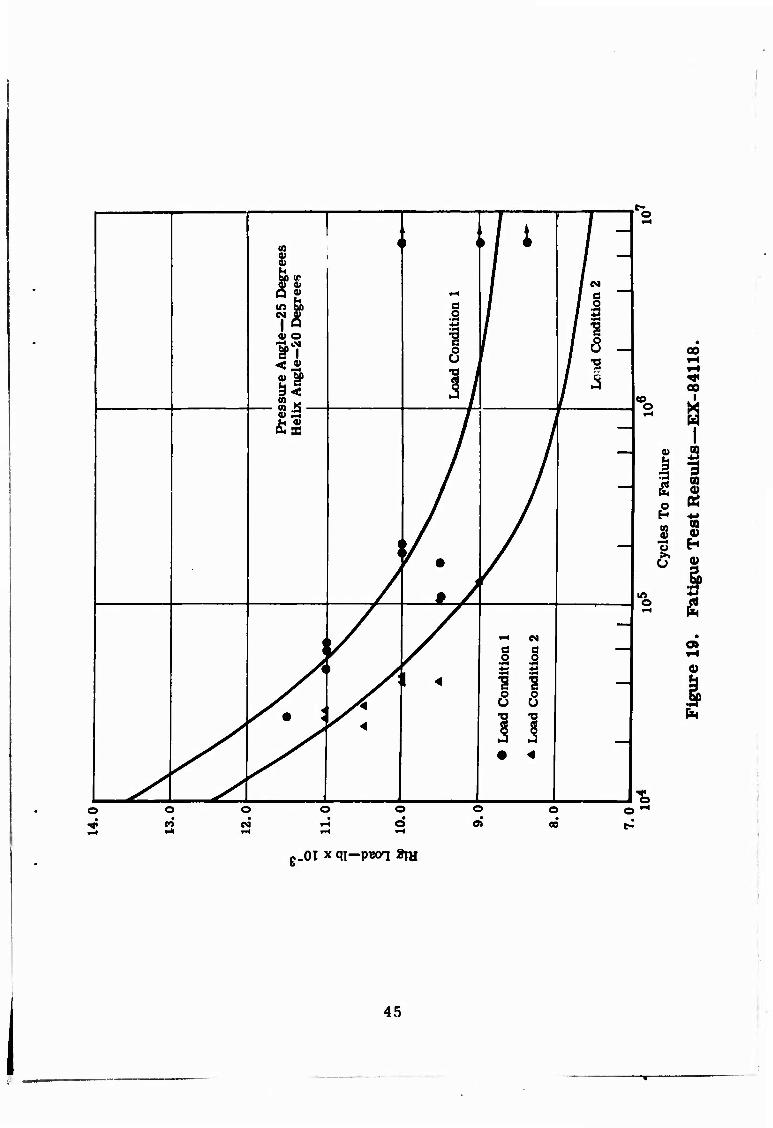
The fatigue test program was based on a designed experiment for evaluat- ing two geometric variables (pressure angle and helix angle) and a load position variable (load line through the tooth tip at the edge and load line through the tooth tip 0. 250 inch inboard from the edge). Two levels of each variable were employed; however, since the load position variable could be adjusted by a change in the test rig fixture, only four different gear configurations were necessary. See Table IV. Originally, two teeth from each gear configuration were to be tested at four stress levels at each load position. Failures were required to permit test evaluation on the finite portion of the S/N curve. The maximum stress was determinea by the short test time (3 to 5 minutes) and the high stresses that could cause plastic yielding and, therefore, result in a failure mode other than fatigue. The minimum stress was determined by a high percentage of runouts to 2 X 10^ or 10^ cycles without tooth failure. Each gear configu- ration was tested at the two load conditions, yielding eight combinations. A minimum of four stress levels were tested for each configuration; how- ever, in three of the eight combinations, only one data point was obtained for the fourth stress level.
Tables X through XVII list the gear tooth fatigue test data—load, cycles- to-failure, and configuration—for the 76 gear teeth tested. Of this total, sixty failed and the remaining gear tooth tests were terminated at 2 X 10⁶ or 10^ cycles.
Fatigue test data for each configuration based on applied test load are plotted in Figures 18 through 21. The mean curve drawn through the data was calculated by the procedure discussed in Appendix V. Proportionality factors can be used to relate applied load (test rig load), AMGA stress, Lewis stress, Heywood stress, Almen-Straub stress, and Cantilever Plate theory stress. Therefore, S/N curves of the test data based on any of these stress calculation methods would produce the same fit of the mean curve to the data points.
FAILED GEAR TOOTH CRACK MEASUREMENTS
A comparison was made of the calculated location of the Lewis "assumed weakest section" and the actual crack location. It was necessary to define the crack origin by metallurgical examination. The radial and axial posi- tions were then measured within an estimated 0. 002 inch. Figures 22
35
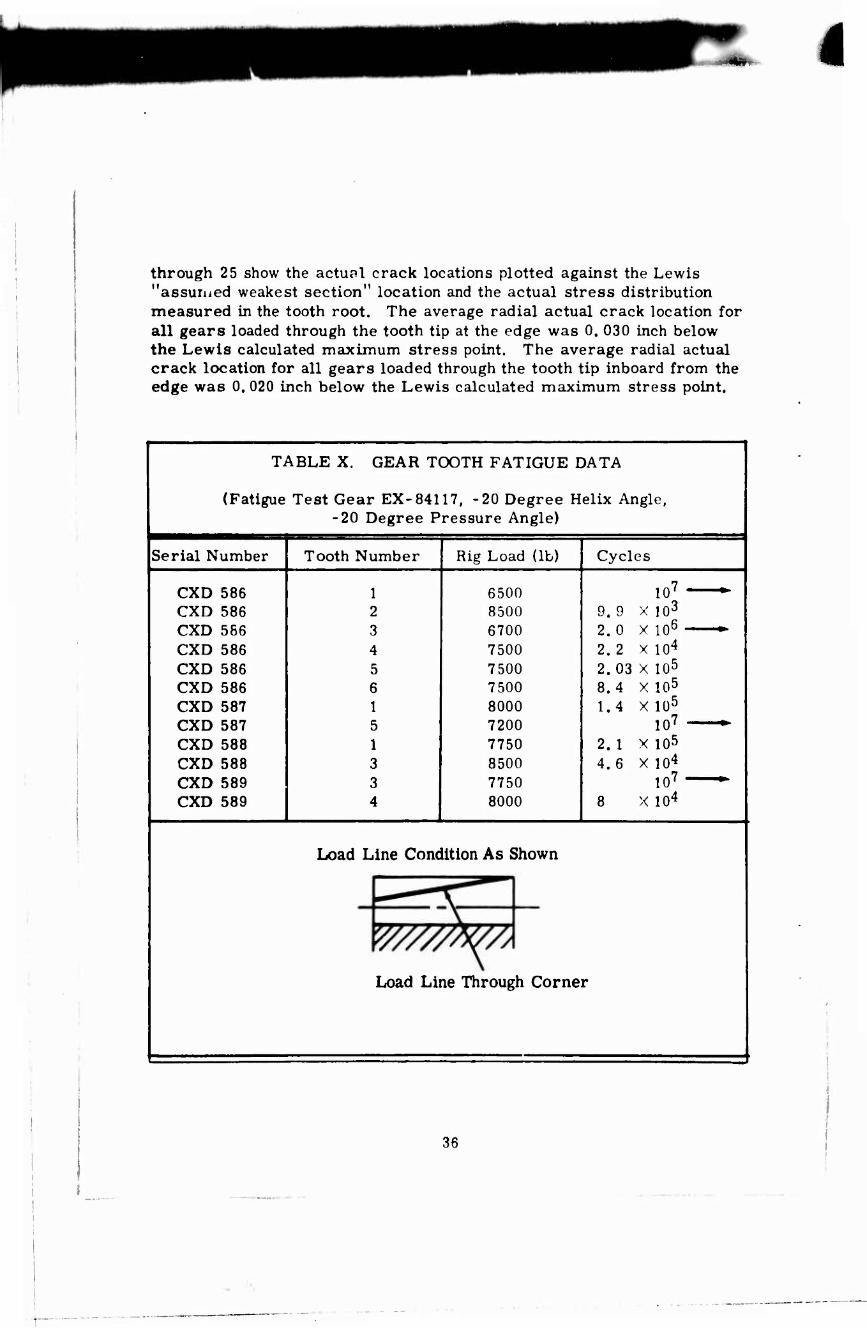
through 25 show the actual crack locations plotted against the Lewis "assuriied weakest section" location and the actual stress distribution measured in the tooth root. The average radial actual crack location for all gears loaded through the tooth tip at the edge was 0. 030 inch below the Lewis calculated maxünum stress point. The average radial actual crack location for all gears loaded through the tooth tip inboard from the edge was 0. 020 inch below the Lewis calculated maximum stress point.
TABLE X. GEAR TOOTH FATIGUE DATA
(Fatigue Test Gear EX-84117, -20 Degree Helix Angle, -20 Degree Pressure Angle)
Serial Number
CXD 586 CXD 586 CXD 586 CXD 586 CXD 586 CXD 586 CXD 587 CXD 587 CXD 588 CXD 588 CXD 589 CXD 589
Tooth Number
1 2 3 4 5 6 1 5 1 3 3 4
Rig Load (lb)
6500 8500 6700 7500 7500 7500 8000 7200 7750 8500 7750 8000
Cycles
9. 9 2.0 2.2 2.03 8.4 1.4
2.1 4.6
8
10' X 103
X 106
X 104
X 105
X 105
X 1Ü5
10? X 105 X 104
10? X 104
Load Line Condition As Shown
Load Line Through Corner
36
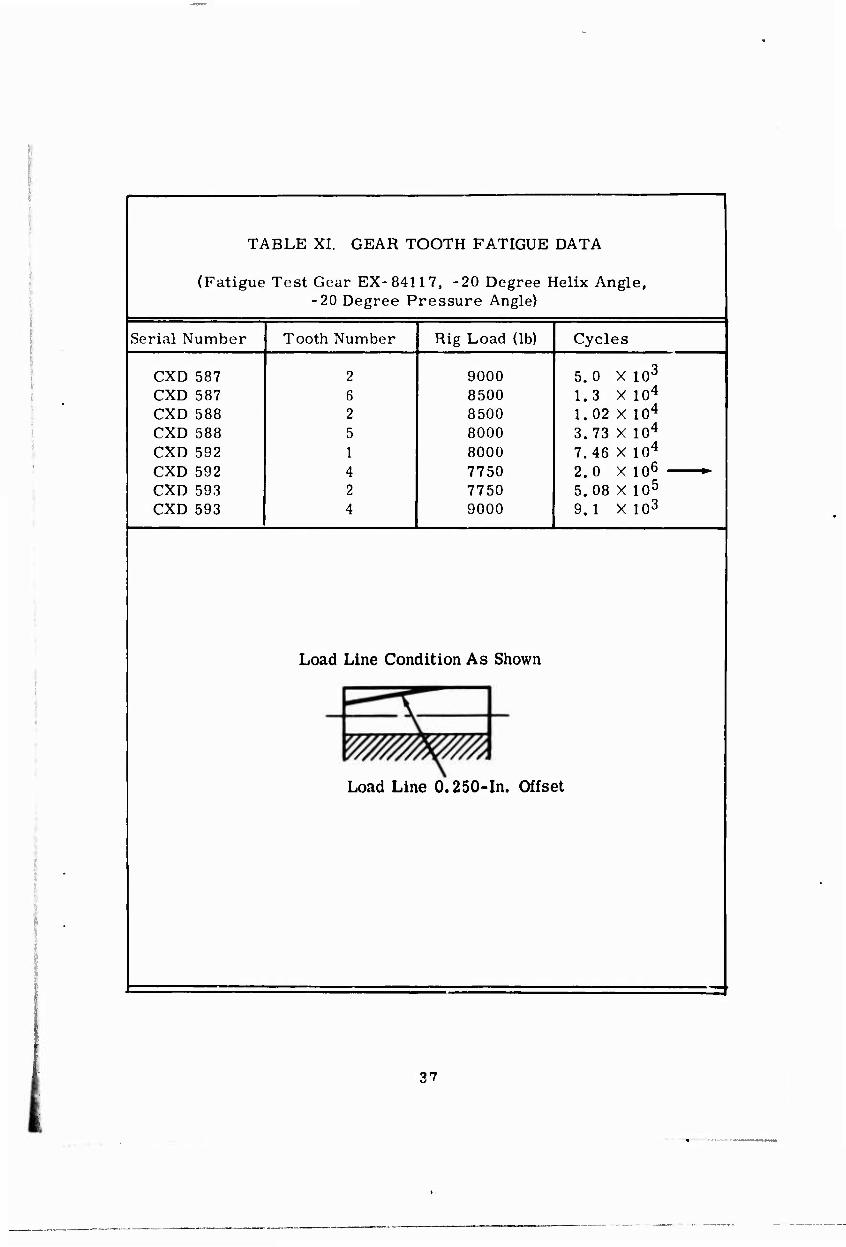
TABLE XL GEAR TOOTH FATIGUE DATA
(Fatigue Test Gear EX-84117, -20 Degree Helix Angle. -20 Degree Pressure Angle)
Serial Number Tooth Number Rig Load (lb) Cycles
CXD 587 CXD 587 CXD 588 CXD 588 CXD 592 CXD 592 CXD 593 CXD 593
2 6 2 5 1 4 2 4
9000 5. 0 X 10° 8500 1.3 X 10⁴
8500 1.02 X 10⁴
8000 3.73 X 10⁴
8000 7.46 X 10⁴
7750 2. 0 X 106 — —•» 7750 5.08 X 10⁵
9000 9. 1 X 10³
Load Line Condition As Shown
Load Line 0.250-In. Offset
37
TABLE Xü. GEAR TOOTH FATIGUE DATA
(Fatigue Test Gear EX-84118, -20 Degree Helix Angle, -25 Degree Pressure Angle)
Serial Number Tooth Number Rig Load Hh) Cycles
CXD 596 CXD 597 CXD 597 CXD 599 CXD 601 CXD 601 CXD 602 CXD 602 CXD 603 CXD 603
6 3 4 1 2 5 2 4 1 5
11,000 11,000 8,000
10,500 9,000 0,500
10,500 9,500
10,000 10,000
2.9 2.7
X 10- X 104
2.0 X10⁶ - —». 3.1 X10⁴
1.3 X10⁵
1.06 X 10⁵
2.4 X10⁴
4.1 X 10⁴
4.2 4.3
X104
X104
Load Line Condition As Shown
w/m(/A Load Line 0.250-In. Offset
38
.
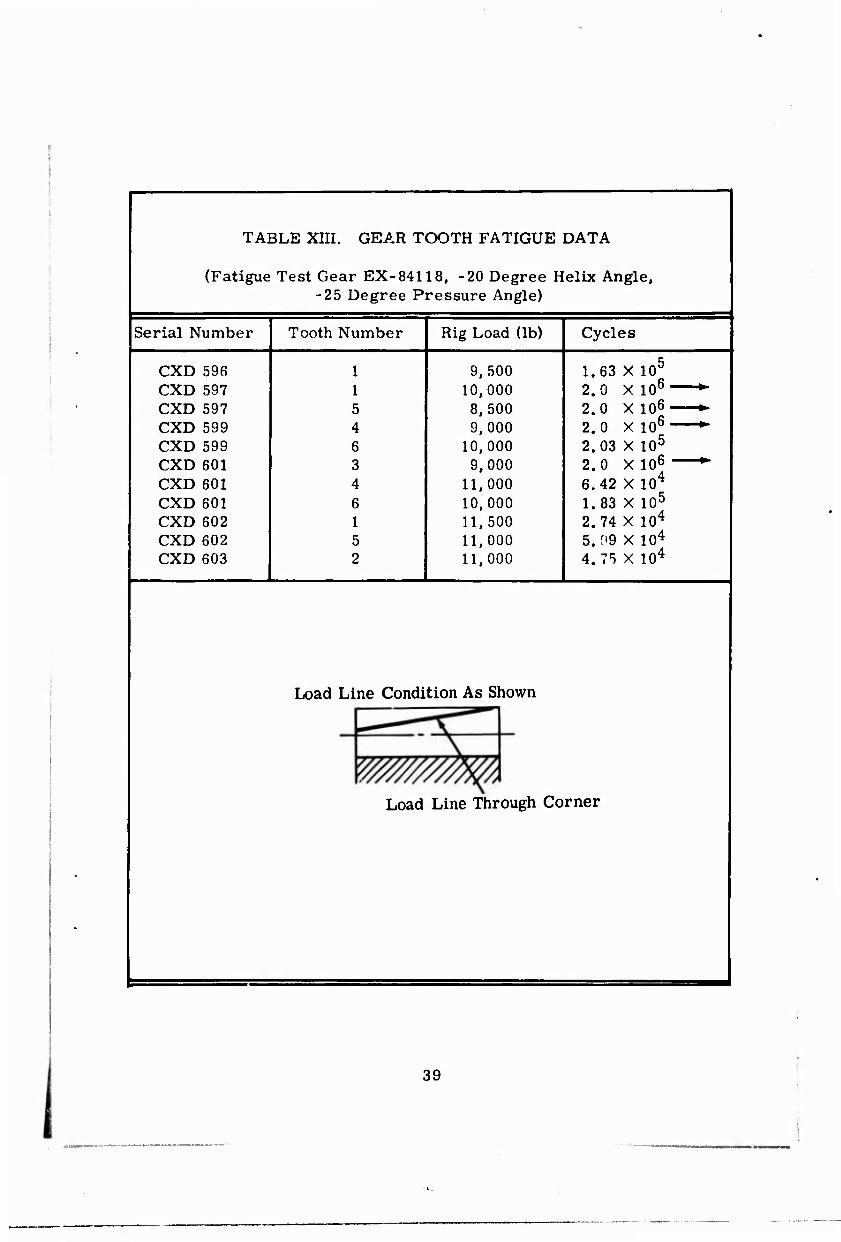
TABLE XIII. GEAR TOOTH FATIGUE DATA
(Fatigue Test Gear EX-84118, -20 Degree Helix Angle, -25 Degree Pressure Angle)
Serial Number Tooth Number Rig Load (lb) Cycles
CXD 596 CXD 597 CXD 597 CXD 599 CXD 599 CXD 601 CXD 601 CXD 601 CXD 602 CXD 602 CXD 603
1 1 5 4 6 3 4 6 1 5 2
9,500 10,000 8,500 9,000
10,000 9,000
11,000 10,000 11,500 11,000 11,000
1.63 2.0 2.0 2.0 2.03 2.0 6.42 1.83 2.74 5.09 4.7^
X 105
X 106
X 106
X 106
X 105
X 106
X 104
X 105
X104
X104
X104
Load Line Condition As Shown
Load Line Through Corner
1 39

■ .
-
TABLE XIV. GEAR TOOTH FATIGUE DATA
(Fatigue-Test Gear EX-84119, -35 Degree Helix ^ngle, -20 Degree Pressure Angle)
Serial Number Tooth Number Rig Load (lb) Cycles
CXD 522 1 9,000 1.4 X 10⁶
CXD 522 4 9,500 2.0 X 10⁶
CXD 522 6 10,000 1.09 X 10⁵
CXD 523 3 10,500 1.71 X 10⁴
CXD 523 4 11,000 2.05X 10⁴
CXD 525 3 11,000 2.7 X10⁴
CXD 525 5 10,000 1.79 X lOJj 2.0 X 10° 1.67 X 10⁵
CXD 527 1 9,000 CXD 527 3 9,500 CXD 527 5 10,500 1.48 X 10⁵
Load Line Condition As Shown
Load Line Through Corner
40

TABLE XV. GEAR TOOTH FATIGUE DATA
(Fatigue Test Gear EX-84119, -35 Degree Helix Angle, -20 Degree Pressure Angle)
Serial Number Tooth Number Rig Load (lb) Cycles
CXD 522 CXD 522 CXD 523 CXD 523 CXD 523 CXD 524 CXD 525 CXD 525 CXD 527 CXD 527
3 5 1 2 6 5 1 2 2 6
10, 0J0 10,500 9, 000
10,000 9,500 9,500 8,500 9,500
10,500 9,000
4.33 1.33 1.33 1.5 1.26 1.71 2.0 1.8 5.38 2.02
X 10 X 10' X 10(
X 10^ X 10" X ID' X icj X 10' X 10^ X io'
Load Line Condition As Shown
Load Line 0.250-In. Offset
41

■ ».
TABLE XVI. GEAR TOOTH FATIGUE DATA
(Fatigue Test Gear EX-84120, -35 Degree Helix Angle, -25 Degree Pressure Angled
Serial Number Tooth Number Rig Load (lb) Cycles
CXD 546 CXD 546 CXD 549 CXD 550 CXD 550 CXD 551 CXD 552
1 5 1 4 6 2 3
10,400 12,000 14.000 14,000 12,000 13,000 13,000
2.0 X 10⁶
7. 15X 104
1.33 X 10⁴
5.79X 10⁴
1.68X 10⁵
3.0 X 10⁴
5. 83 X 104
Load Line Condition As Shown
Load Line Through Corner
42
» V
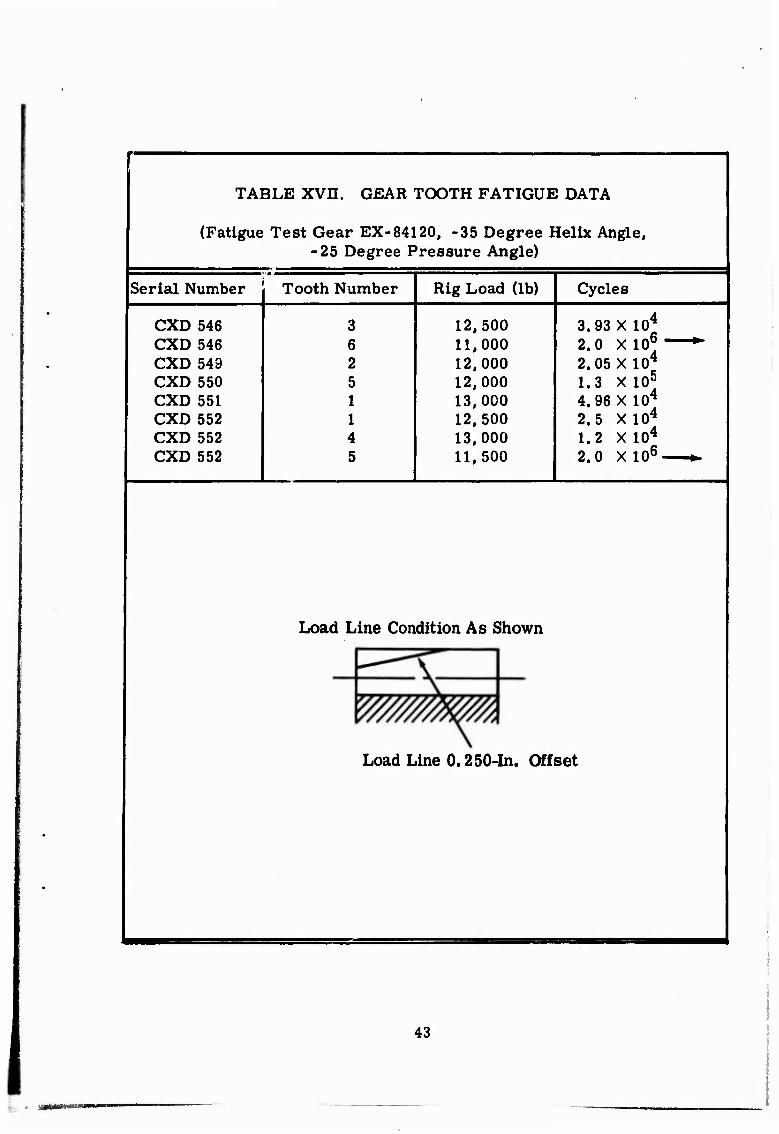
TABLE XVE. GEAR TOOTH FATIGUE DATA
(Fatigue Test Gear EX-84120, -35 Degree Helix Angle, -25 Degree Pressure Angle)
Serial Number Tooth Number Rig Load (lb) Cycles
CXD 546 CXD 546 CXD 549 CXD 550 CXD 551 CXD 552 CXD 552 CXD 552
3 6 2 5 1 1 4 5
12,500 11,000 12,000 12,000 13,000 12,500 13,000 11,500
3.93 X 10* 2.0 X 106
2.05X 10⁴
1.3 X 10⁵
4.96 X 10⁴
2.5 1.2 2.0
XIO^ X104
X 10e
Load Line Condition As Shown
Load Line 0.250-In. Offset
sas
43
■■■■
■li 1
00
n i
I CO 0) K CO «
00
4)
g_oi x qi-pwn 8IH
44
1 • M / J 00 < » < / n % / / H bo (T / / ff a* f / *• i Q ^ ^H / / e H m ät d / / 1 »1 <u O 1 f -S 1
ssu
re A
ngle
—
x A
ngl
e-20
D
■o J
/
Loa
d C
ondi
1
4) P-4 i —i
.
££
j
/
\i f •
—1
1 / 1 > /
ion
l
ion
2 —1 S* t >
ndit
ndit
/ 1 4 —j s o 0
/
/. : X
' < 1 I • 4
—1
/ /
00
o
I 11 .2
to
00 0) H
in o £
0)
o 2
o eg
o o
o
g_0I x qi-pwn 8|H
45
s I
I
o N 0)
46
(0 t 111 - i 1 "
ssu
re A
ngle
—25
De
x A
ngle
—35
Deg
ree iH 1
1 / /
Loa
d C
ondi
tion
2
1 1
Pre
H
eli
V IJ —
// |
—
<
< 1
• L
oad
Con
diti
on 1
A L
oad
Con
diti
on 2
1
1 1
ys\ 1
o
o
0)
09 0)
o
in eo C9 o
o ^
g.OI x qi—ptsoq 8|H
47

II s§
I
j if if
I S i
i
I
•u|-ja?amBTa
48
i
»H CM
a a £ 2
1| 36 |1 I I
(0 0)
rrt
•u|—ja^aureia
I 49
o o
o
o 00
o CM
O
o
oo CM
•u|—ja^aureKI
50
o>
00 O .H 1
1 9) u
' s 1 o rt 1 to •—• (0
. Pu o ^ 1 i
BJ QQ
0.50
Nor
m;
S •a •i-t «
s ^ | -: -ß a 0 'S ed
8 & H
o •
CO ca 0)

§
»H CM
G Ö Q Q
t 'S o o U u T3 TJ (4 rt 3^
1 1 M «j <U 0)
U 1 ^3 •^H rt rt
-, » (K
? §f • ■
M U (U
Q in CM
I
w a> w in be
CO
< £
Ä a c^
1 "^ c o
1 « l\ ii / >
•
0
i \ «B 1 \ Q o M
/ j /l • o
o 00
\
1 ^
d
^ \ / V ■ •
O
\ \ K L 0
\ A ii • o
\/ \\ s
A \ ■
• o
A \ ! o
/\ ^ 1; • o
c o i
1 -rH ro |
1 \ 3 .2 *
a» ll
o
Dis
trib
ut
Jond
ition
i
1
cs, e .2 s
1 ? 1 •
o
o
Str
ess
Loa
dC
V \ 1
\
1 I t !
CO i
• o
o
\ \ \ J /
• o
\ \ T 1 o •
u
i
i o o H
o
00
I 1 1 s
s I
0)
ITS
in
O
in
in o Ift CM
•m—ja^auiBTa
51
i
The fact that all crack origins were inboard of the tooth edge and in the area of actual measured maximum stress indicates the consistency of fatigue test gear manufacturing and test.
METALLURGICAL INVESTIGATIONS
Metallurgical examinations of failed test gears were conducted to deter- mine mode of failure, origin of failure, microstructure, cas depth, hardness gradient, and material cleanliness. The following ti 3 gears were submitted for metallurgical investigations:
Gear Part Number Gear Serial Number
EX-84117 CXD 586 EX-84117 CXD 592 EX-84118 CXD 599 EX-84119 CXD 522 EX-84120 CXD 551
The conclusions derived from these metallurgical investigations are as follows:
• Failure of the tested teeth occurred predominantly in fatigue. • The failures of the tested gear teeth originated in the carburized case
of the root radius below the loaded involute. • The failure origins, as determined by electron fractography, were
predominantly singular and well defined. • The microstructure of the tested gears was typical of a rich carbu-
rized case with some noncontinuous carbide network near the sur- face. The core microstructures were of tempered martensite.
• The effective case depth, measured to the Rc = 50 level, was approxi- mately 0. 045 to Ü. 050 inch.
• The test gear material was free from inclusions and processing de- fects which could have contributed to the failures.
• The gear material conformed to the compositional requirements of AMS-6265.
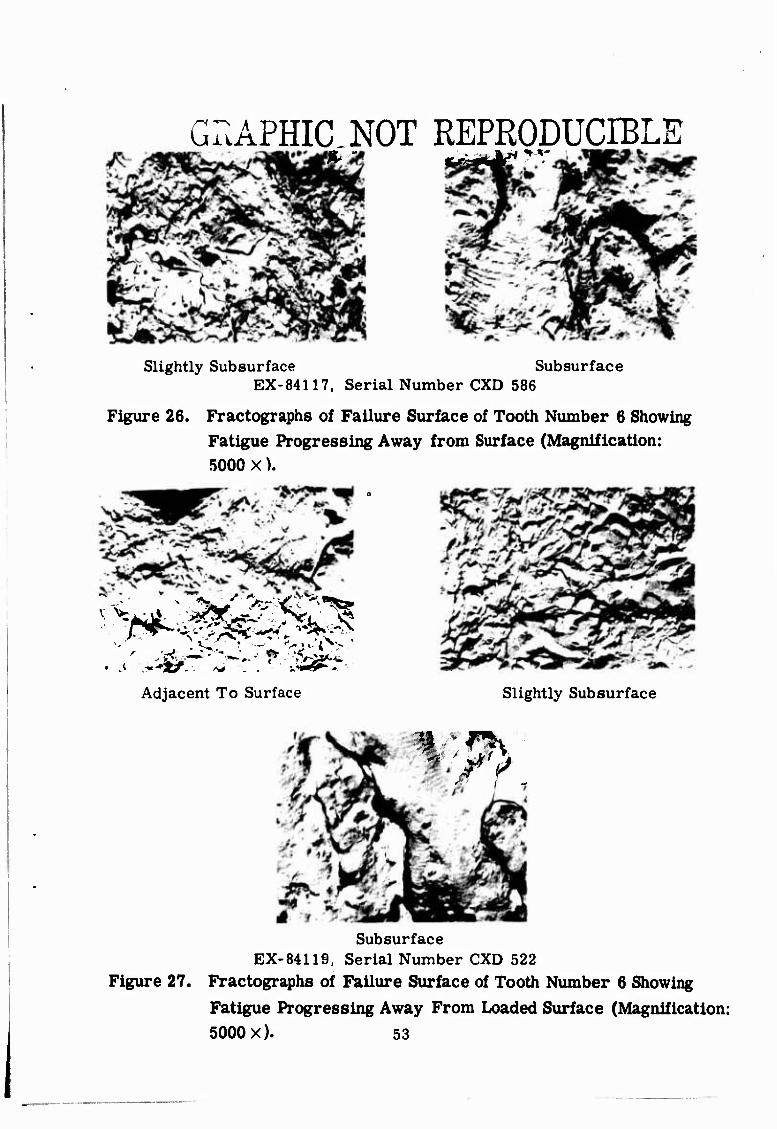
Electron fractographs of the failure surfaces of two failed teeth (one from test gear EX-84117, CXD 586 and one from test gear EX-84119, CXD 522) confirmed a fatigue failure mode on each surface as shown in Figures 26 and 27. Visual examination of the failure surfaces of all test gears submitted for examination revealed a flat failure surface showing
52
GRAPHIC NOT REPRODUCIBLE
Slightly Subsurface Subsurface EX-84117. Serial Number CXD 586
Figure 26. Fractographs of Failure Surface of Tooth Number 6 Showing Fatigue Progressing Away from Surface (Magnification: 5000 X).
Adjacent To Surface Slightly Subsurface
mP>
Subsurface EX-84119, Serial Number CXD 522
Figure 27. Fractographs of Failure Surface of Tooth Number 6 Showing Fatigue Progressing Away From Loaded Surface (Magnification: 5000 x). 53
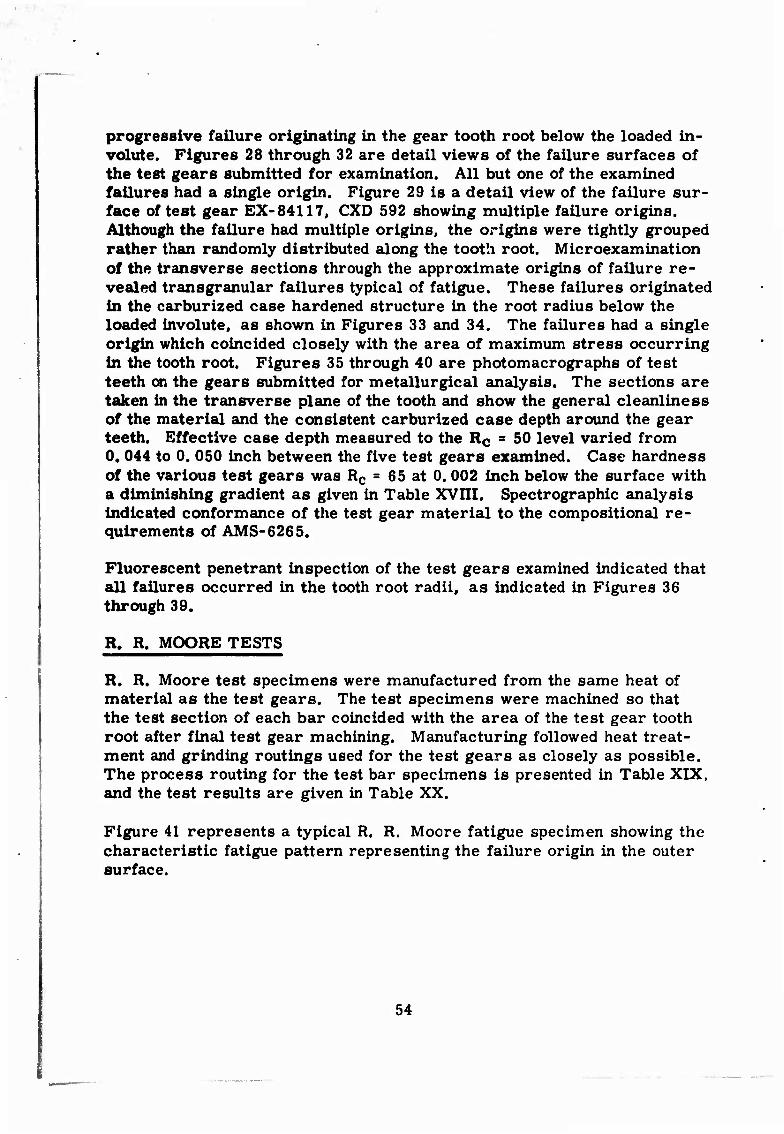
progressive failure originating in the gear tooth root below the loaded in- volute. Figures 28 through 32 are detail views of the failure surfaces of the test gears submitted for examination. All but one of the examined failures had a single origin. Figure 29 is a detail view of the failure sur- face of test gear EX-84117. CXD 592 showing multiple failure origins. Although the failure had multiple origins, the origins were tightly grouped rather than randomly distributed along the tooth root. Microexamination of the transverse sections through the approximate origins of failure re- vealed transgranular failures typical of fatigue. These failures originated in the carburized case hardened structure in the root radius below the loaded involute, as shown in Figures 33 and 34. The failures had a single origin which coincided closely with the area of maximum stress occurring in the tooth root. Figures 35 through 40 are photomacrographs of test teeth on the gears submitted for metallurgical analysis. The sections are taken in the transverse plane of the tooth and show the general cleanliness of the material and the consistent carburized case depth around the gear teeth. Effective case depth measured to the Rc « 50 level varied from 0. 044 to 0. 050 inch between the five test gears examined. Case hardness of the various test gears was Rc = 65 at 0. 002 inch below the surface with a diminishing gradient as given in Table XVIII. Spectrographic analysis indicated conformance of the test gear material to the compositional re- quirements of AMS-6265.
Fluorescent penetrant inspection of the test gears examined indicated that all failures occurred in the tooth root radii, as indicated in Figures 36 through 39.
R. R. MOORE TESTS
R. R. Moore test specimens were manufactured from the same heat of material as the test gears. The test specimens were machined so that the test section of each bar coincided with the area of the test gear tooth root after final test gear machining. Manufacturing followed heat treat- ment and grinding routings used for the test gears as closely as possible. The process routing for the test bar specimens is presented in Table XIX, and the test results are given in Table XX.
Figure 41 represents a typical R. R. Moore fatigue specimen showing the characteristic fatigue pattern representing the failure origin in the outer surface.
54
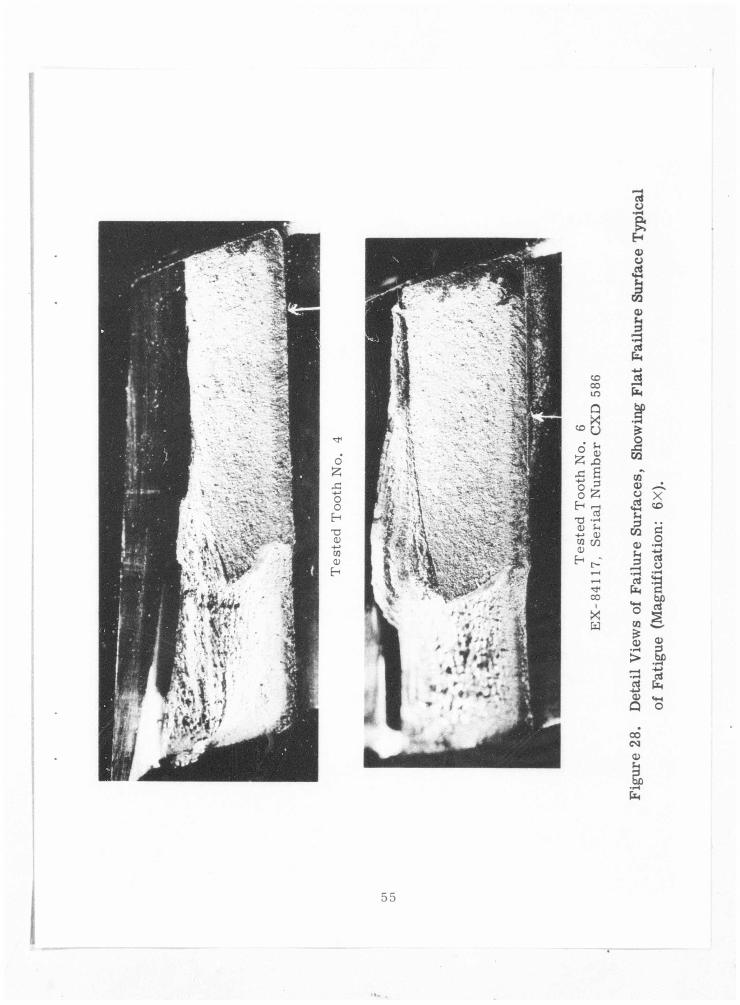
ci u
I CD CO lO
Q
o £ x: +-> o o H TJ (1)
a; X! 6 3
r - H rt u <u
CO CO d> H -
00
X w
a> CJ
(U u 3 a rt fa
£ O
X ! W
co <u ^ 3 x
<o Ul
w § 0) *rH tH ' ' 3 Pi o rt fa
bfi o CO S . £ « 2 •>H 3 > .a3
ci [24
5? Q O
00 CM 0> SH
S> •»H
fa
55
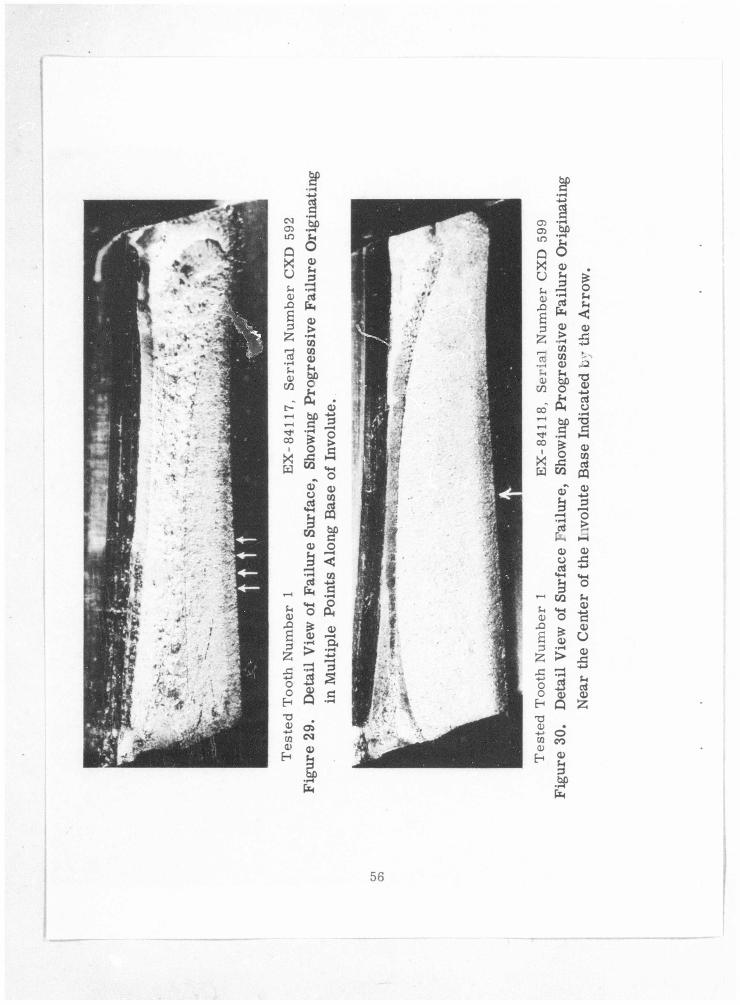
SH 0)
-Q s 3 2
56
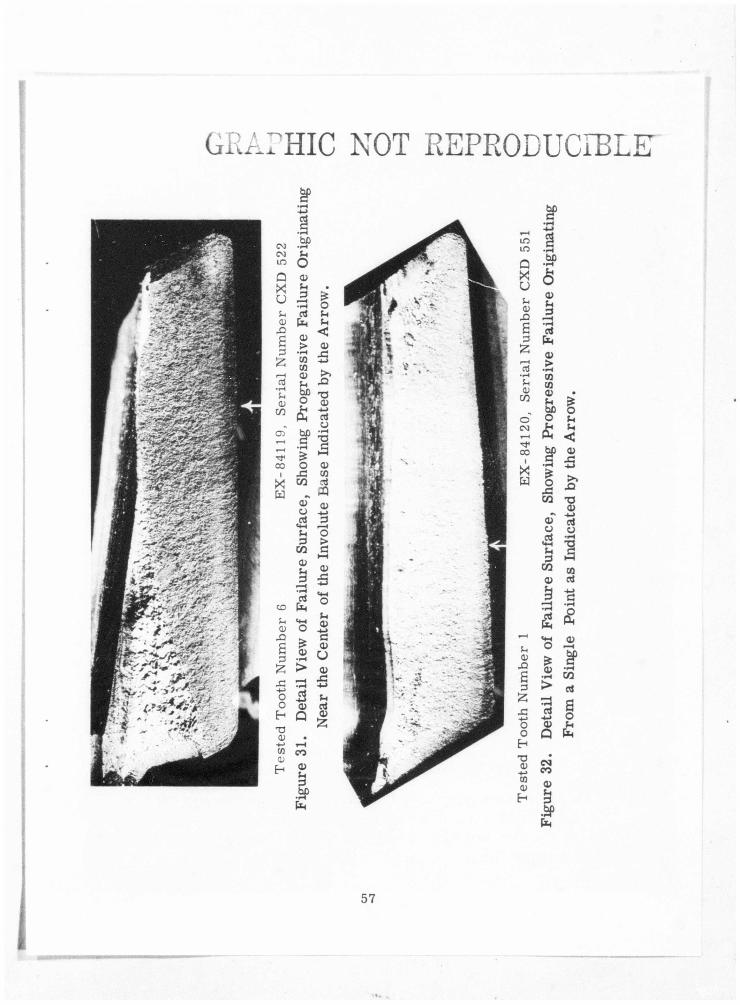
GRAPHIC NOT REPRODUCIBLE
CQ CM m O X u
CO i
bQ • H u O CU u 3
SH OJ qj fa
£ £
<D CO
CTT
I < <D x:
o £ !>
• H £ o
J3 X w W » <u
o aS
t H
3 CO a>
£ bfi TS
a> *-> cri CJ
• rH
a 0) ca sJ 03 OJ
o > c
u, « 1 5 d
co fa <«
0) o
s % 3 2 x 3̂
H T3 <D
-+-> i -H CO CO 0
H a, 3 bC • H fa
(H (II •*•> C a> <J V x:
„ u. a> rt 0) £
i n ID
Q X U
(H (1)
X s 3 £
In 0)
W
o" CO r-H ** 00
I
X a
u a;
X I S 3 £ X o o H T3 0)
-4-» CO QJ H
2 • H -*-> a • H bfi
• H
<u u 3
r-H • H rt fa 0) >
• H CO CO a> (H tsc o
S
8 t * Si
< aj
i i CO TS
Q) •» -<-> cu ci o o rt 3̂ <M TJ 3 ^
W co a> rt
M o £ *
0)
d -«-> v Q
CO rt a o '« fa
CM co 0)
•Sf> fa
.
57
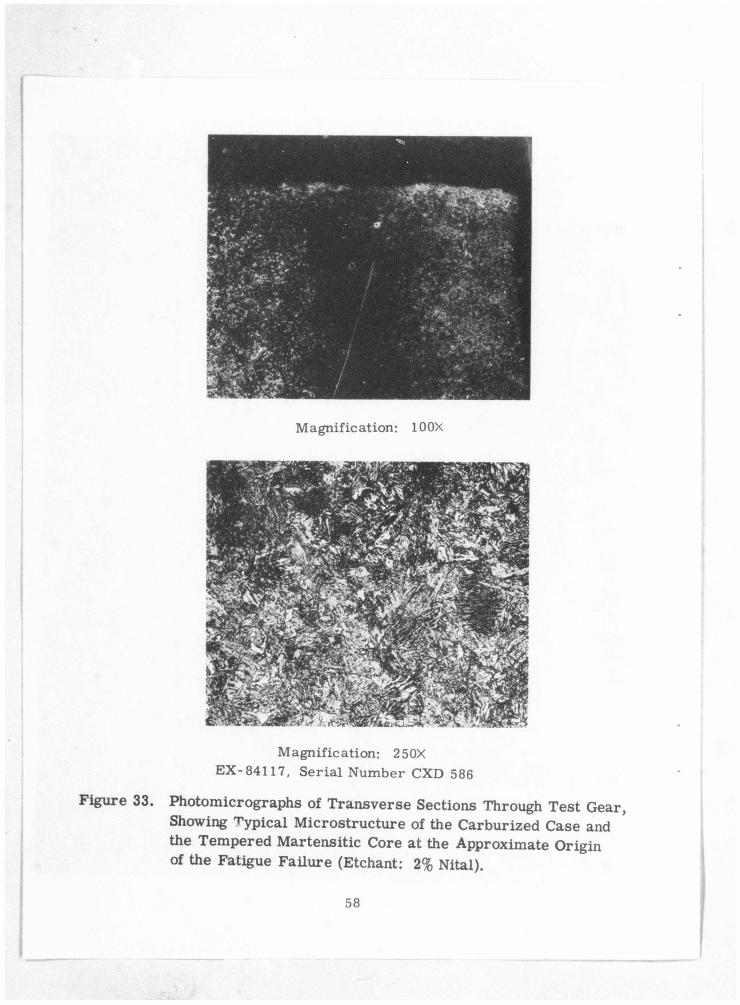
Magnification: 100X
Magnification: 2 5 OX EX-84117, Serial Number CXD 586
Figure 33. Photomicrographs of Transverse Sections Through Test Gear, Showing typical Microstructure of the Carburized Case and the Tempered Martensitic Core at the Approximate Origin of the Fatigue Failure (Etchant: 2% Nital).
58
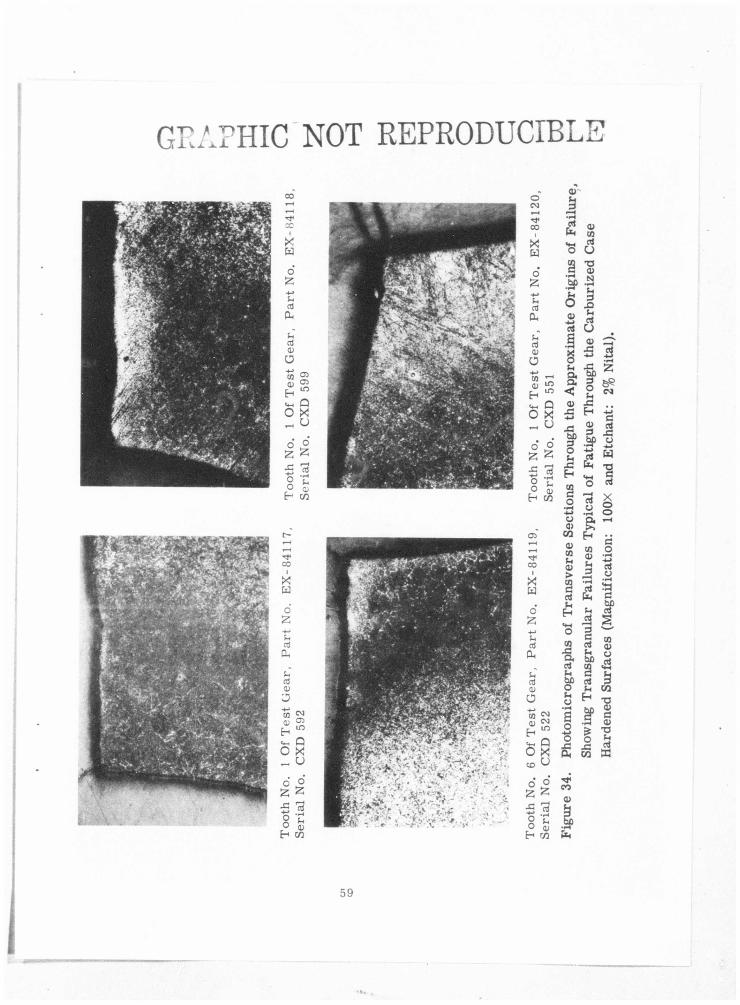
GRAPHIC NOT REPRODUCIBL H
- , . y
' . - . x.- •*" i . •» , • -r-7'.K v V • -
o eg T-H
00 I
X W o £ - M
03 CU
OJ V o
•4—' w 0>
H
0)
£
H m
CO I
X w 6 £ -l-» $4 Ctf CU J-T ClJ CD o W ^ Qi CV3
H 10
O x CO U
° 5 £ £
o S E-i <z>
in m Q X U
fa w •s o S-o 0) .3> -s o 5 iJ c« rt u S IV S 5 •&
3 O (4 x: H
( H
a a < CD .c
5 • H
2
o o £ ^
c !7S x: y
.2 H §
<u 3 5 __ eS W fa T3 «-c S O TO
O etf X o o 4) CO <0 CO •« V > CO e a j S-i H
.y o
CO •a ci JH bfi O o
• H s o *-* o £
& H CO a> u j 3 •»H Ctf
&H
iS fi ctf bL § ctf
H
I * o .c
CO
a o • H - M OJ V
• H
s SP S 0) 0) u 43 £
CO T3 <U c <u
TJ U rt 53
-#1 CO
<u % £P fa
59

EX-84117, Serial Number CXD 586
Figure 35. Selection Through Test Gear, Showing Carburized Case Depth and Material Cleanliness (Magnification: 6x and Etchant: Nital).
EX-84117, Serial Number CXD 586
Figure 36. Blacklight Photograph of Test Gear, Showing a Crack Indicated by Fluorescent Penetrant Inspection Across the Helical Involute Surface of a Test Tooth (Magnification: IX).
60
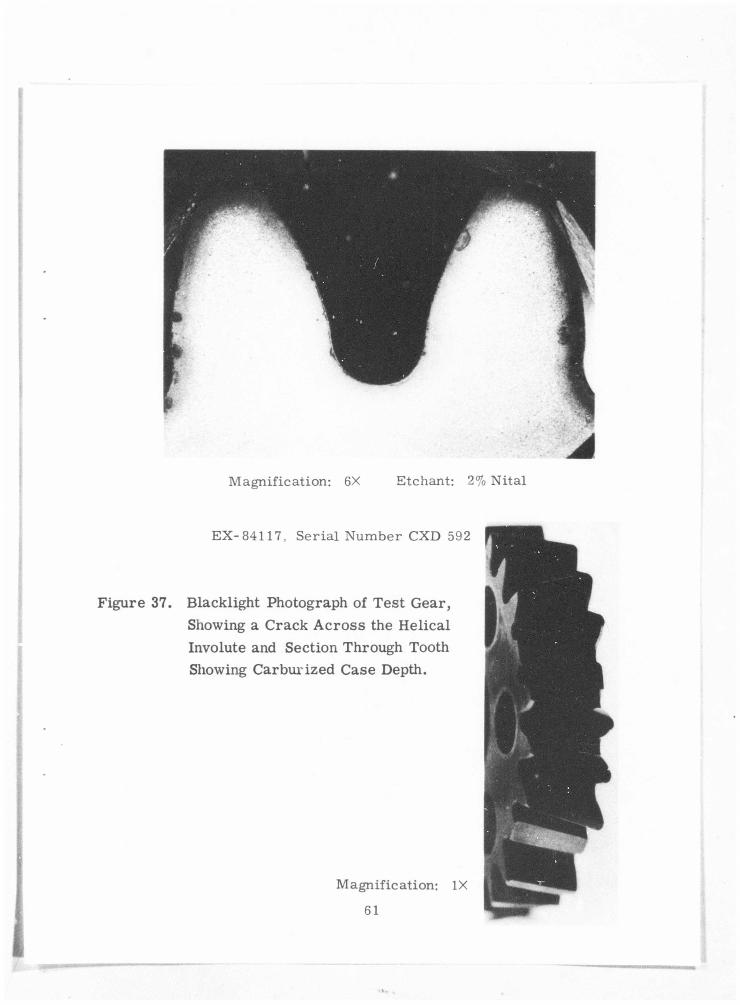
EX-84117, Serial Number CXD 592
Figure 37. Blacklight Photograph of Test Gear, Showing a Crack Across the Helical Involute and Section Through Tooth Showing Carburized Case Depth.
Magnification: IX 61
Etchant: 2% Nital
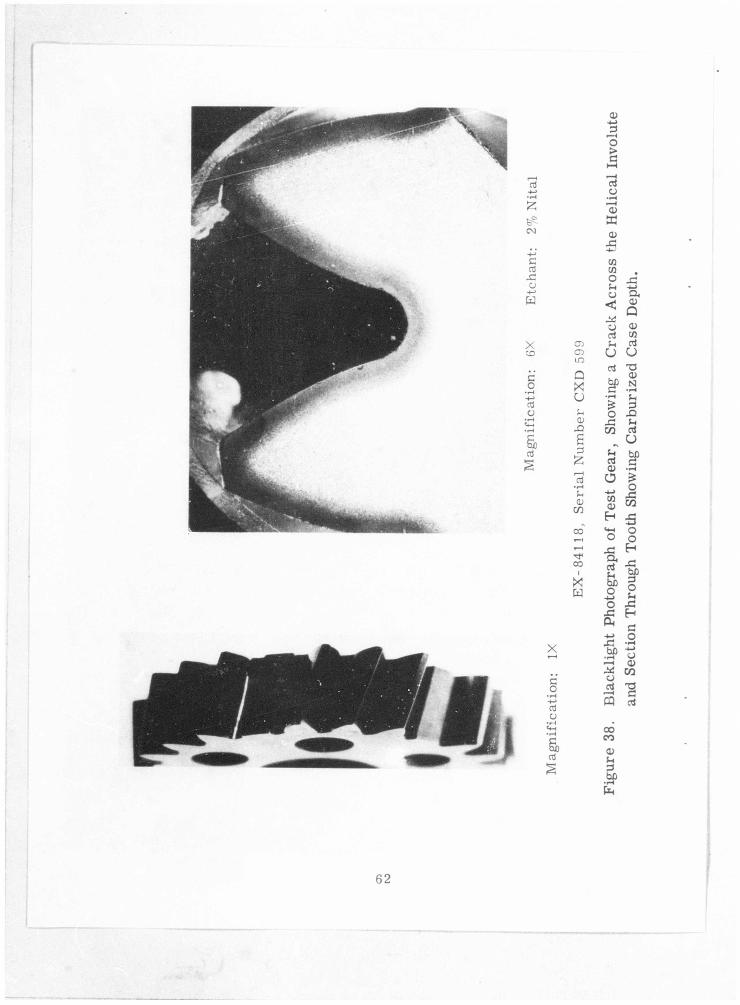
62
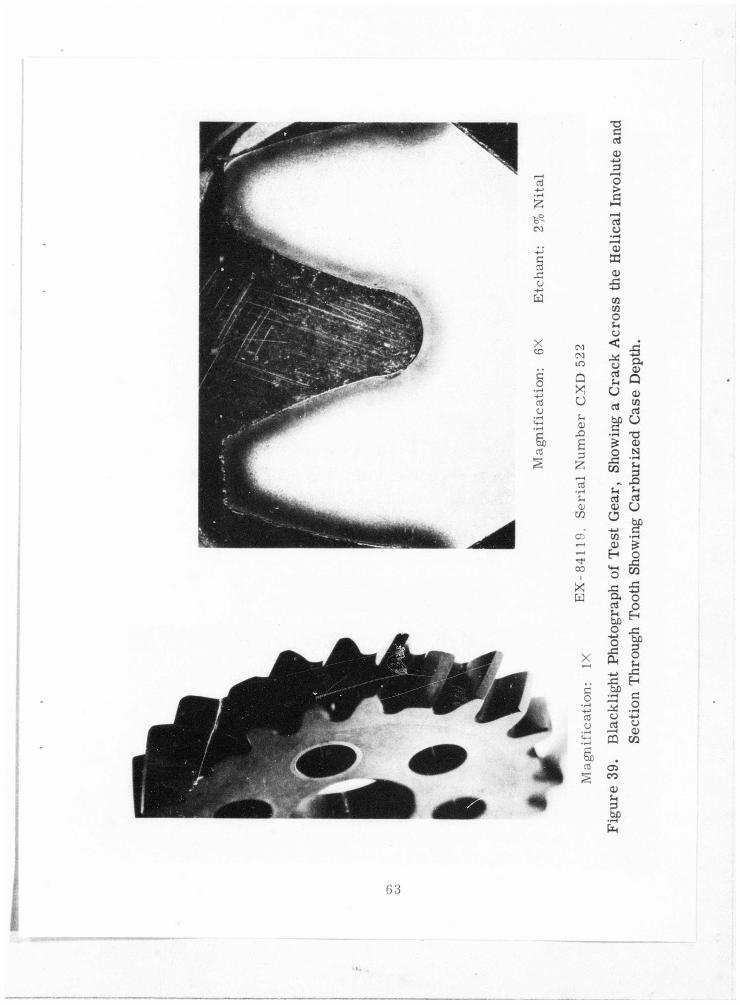
CM
G a -G o •+-> W
X CD
G O
03 O
& 03
01 CM LO
Q X! U u CD
X) S £
*4 0)
CD
Tt< 00
I
X w
G crj CD
O G
ctf O
• H i - H <D S a) 5 co CO o o < A ! o ctS SH U as
2 « •£ CD O N X —<
3 ~ .Q
^ h a <D O o
5 a a> Q a) CO al O
J3 CO
co tu H
fac e • H £ o
X I w 5 o o H
X
c o rt y
a
JC a n! '« &A 0 ^
1 §P &< 2 ^ x; "& « G 3 .2 a -*-* 5 ® CQ W
OJ CO
0) fn 3 bfi
I 63
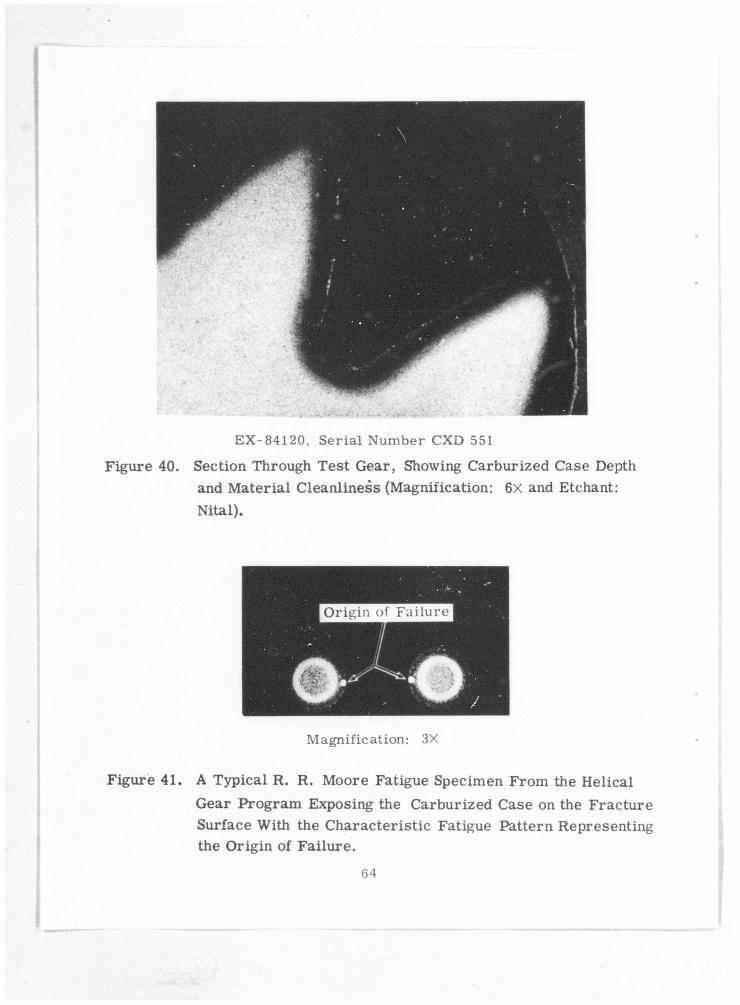
EX-84120, Serial Number CXD 551
Figure 40. Section Through Test Gear, Showing Carburized Case Depth and Material Cleanliness (Magnification: 6X and Etchant: Nital).
Origin of Failure
Magnification: 3X
Figure 41. A Typical R. R. Moore Fatigue Specimen From the Helical Gear Program Exposing the Carburized Case on the Fracture Surface With the Characteristic Fatigue Pattern Representing the Origin of Failure.
64
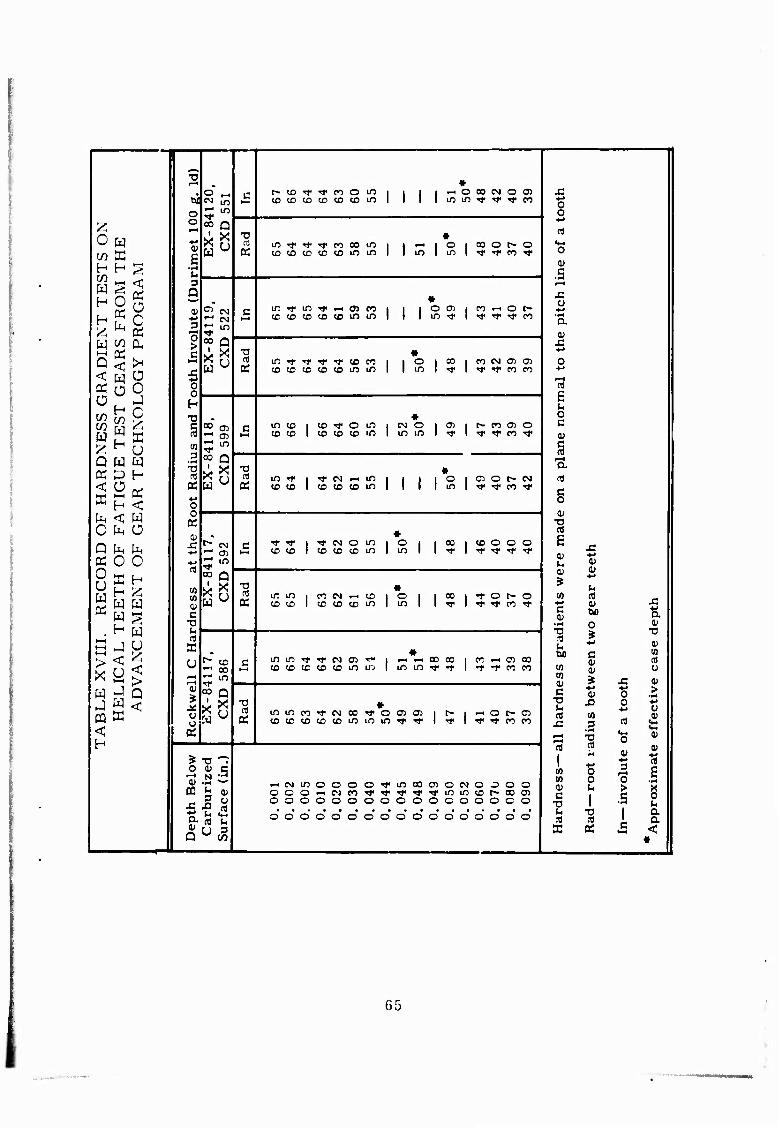
^ »-H „ *
# o _, t~ to TT TJ< Co 0 m 1 1 1 1 ^ 0 00 CM O 03 A w M li-J (O ID CO CD CO co m 1 1 1 1 in m ^ ^ rf CO
'A o o CO Q
0 H £
•l-l
3 a
Cd u
T5 m "t1 t »t co 00 m 1 1 '~l
« 1 <=> 1 00 0 t- 0 «M
t/5 ÜI CC to co co co co m in 1 1 m 1 m 1 t 'J' CO Tf O
EX
T T
ES
T
S F
RO
M T
P
RO
GR
AM
0)
.5
0 02 ^., c *—<
in »r m TJ< ^ o> eo 1 1 |
* 0 03 1 CO rt 0 t»
'S > 8411
D 5
2:
co co co co co m m 1 1 1 in TJ- 1 t i« •<r co a
Q < ^ < U C5
c i—* ^ m »t TP T T co co 1
♦ 1 0 1 ^ 1 co w 02 a> O
K co co <o co co m in 1 1 in 1 ■* 1 «»< ^J« CO CO ■•->
RD
XE
SS G
R
UE T
ES
T G
: T
EC
HX
OL
O o
o H T3
§ w 3
•rH
g O c 00* m C m co 1 co t 0 m 1
* CM O 1 ^ 1 t^ CO CD O
EX
-841
1 C
XD 5
9!
co co 1 co co co m 1 in in 1 -r 1 Tf- »r co TT
•3. ■a m Tf 1 ■<r CM ^- 10 1 1 1
« I 0 I C3 O t~ CM
F H
A
AT
IG
EA
R DC
0
« co co 1 co co co m 1 1 1 1 m 1 Tf "*< CO TJ<
§ a)
0 fe Ü • Q t [n c •<»• »r 1 Tf CM 0 in 1
to to 1 co co co m 1 s 1 1 % 1 CO 0 0 0 f t f ^ J3
II.
RE
CO
R
L T
EE
TH O
C
EM
EN
T O
(Ti
w CO
00 Q
vx u
0
(A
'S
U ^ in m 1 M CM ^H co 1 « 0 1 1 co 1 t 0 r- 0
c u CD
K
Cd ^ K co to 1 co to co in I in 1 1 "T 1 t 'f CO Tt c
■v a u
m be 0
Xi
ID •a
4J
E X
VI
LIC
A:
DV
AN
U i-H
t-" tn c in m *r ^ CM 03 T« 1 #
00 00 1 CO -< O) 00 t>o c
01 co n)
8411
D 5
8( *-* to to to co co m in 1 in in Tf *r I »t -r co eo
CO
0) C 0)
y
.2:
pq ffi <
*S « mmco^cMOO^o CJ5 OS 1 ^ 1 ^H 0 r- 03
"2 CO to
0 *• 0 03 Ä cococococoininm t ■<»• 1 t I ^ ^ CO CO .2 ctf
'S 01
^ -a 'r 1 M ^s O 0) C 0) -^ '-' ^-CMinOOOOrJ« in 00 O O CM 0000
co co
0 0
3
> .5
1
E
g a a
OQ h ^ OOO^-PJCO'T't rjf rj- ^r m m co r- oo 03 c T3 U cd
1 00000000 0 0 000 0000 1
IS 0 0 0' 0' 0' 0* 0* 0* 0* 0* 0' 0' 0" o" 0' 0' o"
Q W OT X OS c
1—1 < *
G5
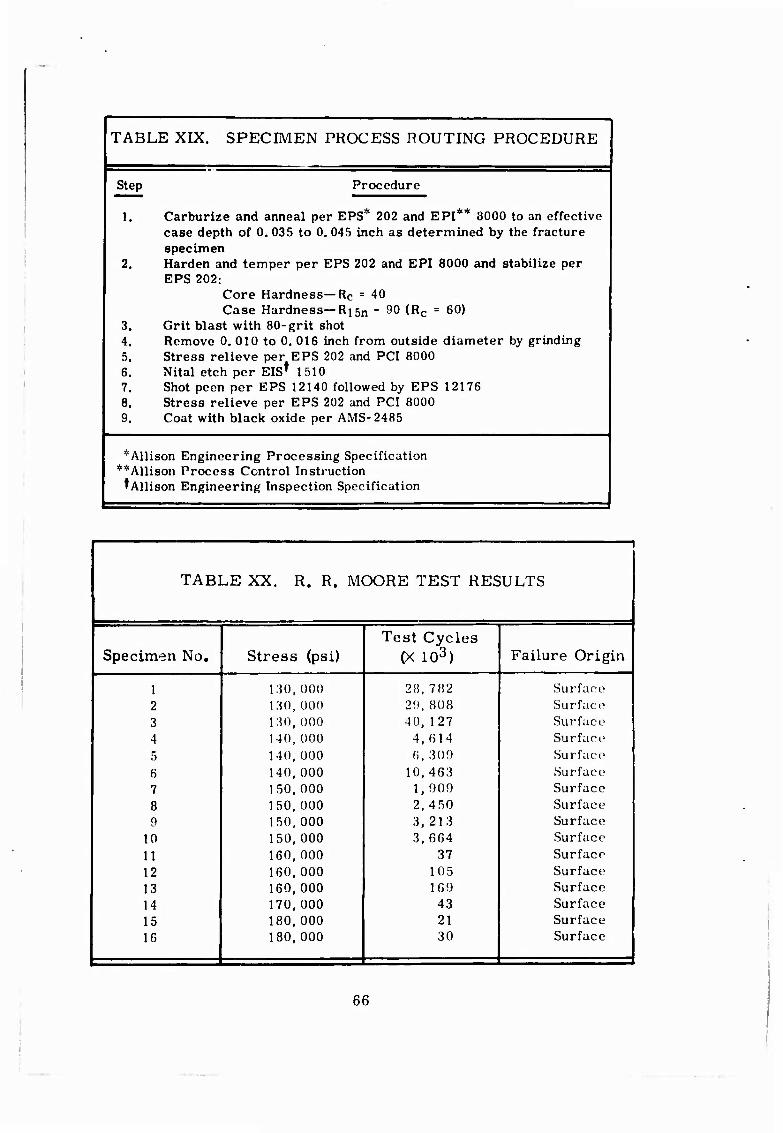
TABLE XIX. SPECIMEN PROCESS ROUTING PROCEDURE
Step Procedure
1. Carburize and anneal per EPS* 202 and EPI** 8000 to an effective case depth of 0. 035 to 0, 045 inch as determined by the fracture specimen
2. Harden and temper per EPS 202 and EPI 8000 and stabilize per EPS 202:
Core Hardness—Re = 40 Case Hardness—Ri5n - 90 (Rc = 60)
3. Grit blast with 80-grit shot 4. Remove 0. 010 to 0. 016 inch from outside diameter by grinding 5. Stress relieve per EPS 202 and PCI 8000 6. Nital etch per EIS* 1510 7. Shot peen per EPS 12140 followed by EPS 12176 8. Stress relieve per EPS 202 and PCI 8000 9. Coat with black oxide per AMS-2485
''■'Allison Engineering Processing Specification **Allison Process Control Instruction ^Allison Engineering Inspection Specification
1 1
TABLE XX. R. R. MOORE TEST RESULTS
Test Cycles Specimen No, Stress (psi) (X 103) Failure Origin
1 130,000 28, 782 Surface 2 130, 000 29, 808 Surface 3 130,000 40, 127 Surface
4 140,000 4,614 Surface i
j •' 140,000 6, 300 Surface 1 6 140,000 10.463 Surface 7 150.000 1.009 Surface 8 150,000 2,450 Surface | 9 150.000 3, 213 Surface !
10 150,000 3,664 Surface 1
i 11 160,000 37 Surface 12 160,000 105 Surface | 13 160,000 169 Surface |i 14 170,000 43 Surface f 15 180,000 21 Surface
I 16 180,000 30 Surface
66

EXPERIMENTAL INVESTIGATIONS
In this phase of the program, strain gages were used to investigate the magnitude and distribution of the tooth root bending stress.
One tooth from each gear geometry configuration was instrumented with eight strain gages distributed equally along the root of the tooth. The strain gages were located at the point of maximum stress as determined by the Lewis inscribed parabola tangency point in the tooth root. Each tooth was assumed to be uniformly loaded along an inclined load line through the tip at the tooth edge. The point of maximum root stress was calculated assuming a tooth load applied at eight equally spaced points along the inclined load line. The actual gage location is shown in Figure 42. A typical strain gage installation is shown in Figure 43.
0.31- — 0.18 —
h-0.05
■0.95- -0.82.
•0.69- ■0.56-
•0.43-
D-r D D -^ ÜT
Part No. a b c d e f g h
IEX-84117 3.87 3.875 3.88 3.89 3.89 3.90 3.90 3.91
EX-84118 3.865 3.874 3.882 3.89 3.897 3.90 3.91 3.92
EX-84119 4.47 4.48 4.49 4.50 4.51 4.52 4.53 4.54
EX-84120 4.46 4.47 4.48 4.49 4.50 4.51 4.52 4.54
Figure 42. Helical Gear Strain Gage Location.
67
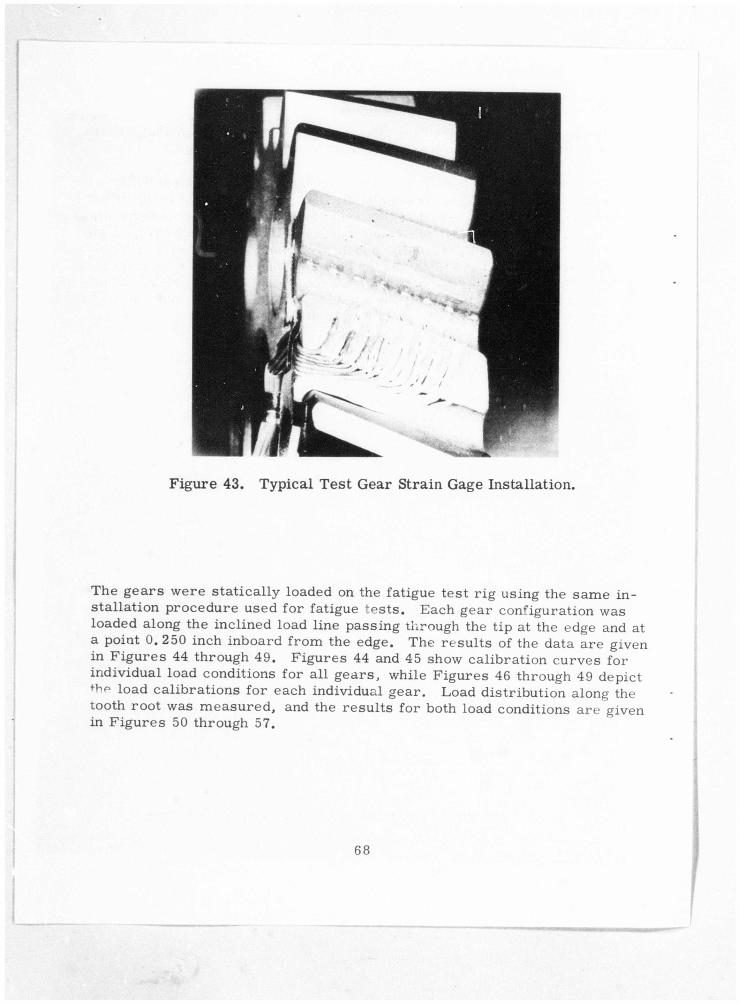
Figure 43. Typical Test Gear Strain Gage Installation.
The g e a r s were s ta t ical ly loaded on the fatigue tes t r ig using the same in-stallat ion procedure used for fatigue t e s t s . Each gear configuration was loaded along the inclined load line passing through the tip at the edge and at a point 0. 250 inch inboard f rom the edge. The resu l t s of the data a re given in F igures 44 through 49. F igures 44 and 45 show calibrat ion curves for individual load conditions for all gea r s , while F igures 46 through 49 depict
load cal ibrat ions for each individual gea r . Load distr ibution along the tooth root was measured , and the resu l t s for both load conditions a re given in F igures 50 through 57.
68
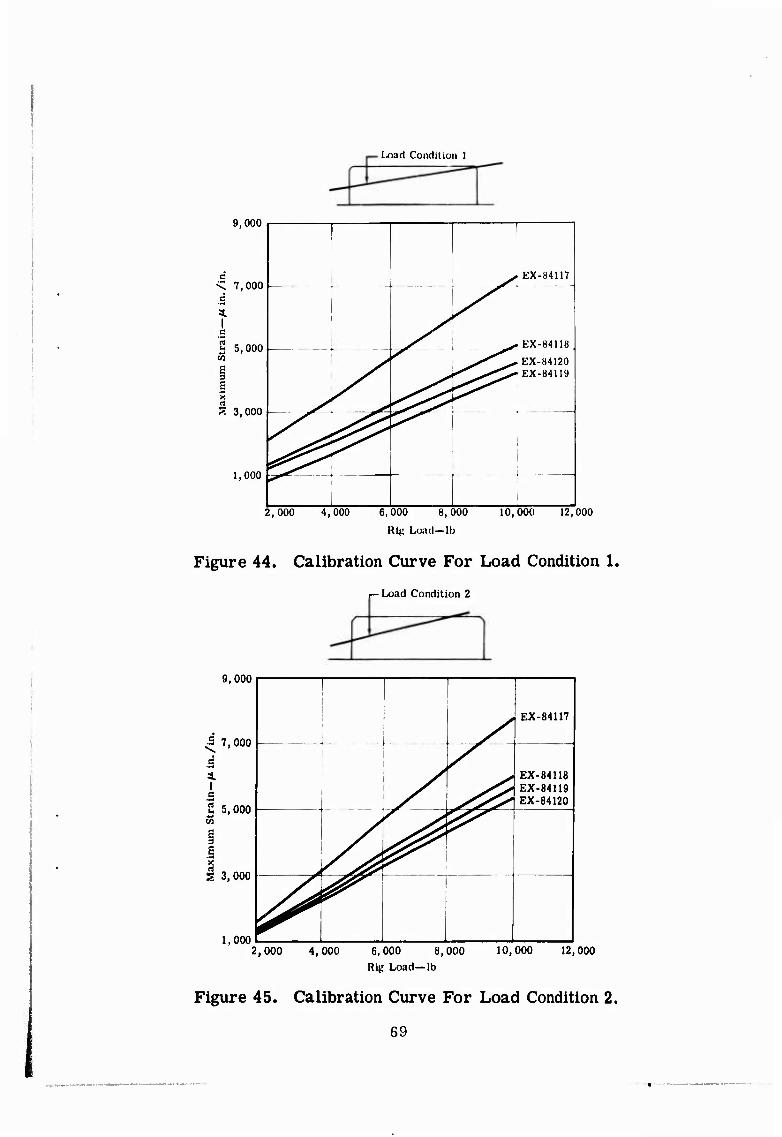
Load Condition 1
9,000
< 7,000 | c St I c
2 5,0001
1 S 3,000
1,000
^s EX-84117J
1
^r
^
EX-84118 J
EX-84120 EX-84119
1 2,000 4,000 6,000 8,000 10,000 12,000
Rig Load—lb
Figure 44. Calibration Curve For Load Condition 1.
,- Load Condition 2
9,000
7,000
.s
I
1 1 1 1 . .
^
EX-84117
EX-84118 EX-84119 EX-84120
^
r^ i
^
^
E 5,000 w
a S 3,000
1,000 2,000 4,000 6,000 8,000 10,000 12,000
Rig Load-lb
Figure 45. Calibration Curve For Load Condition 2.
69

9,000
£ 7,000
a. I 5 5,000
I 3,000
1,000 ______ 2,000 4,000 6,000 8,000 10,000 12,000
Rig Load—lb
Figure 46. Calibration Curve For Test Gear EX-84117.
9,000
5 £ 7,000
I a 5,000
.1
3,000
1, 000.
25-Degree Pressure Angle 20-Degree Helix Angle
Load Line 0.250-In. Offset
•Load Line Through Corner
2,000 4,000 6,000 8,000 10,000 12,000 Rig Load—lb
Figure 47. Calibration Curve For Test Gear EX-84118.
70

8,000
< 6,000 .2 a. I a | 4,000 CO
S 2,000
1 \ 20-Degree Pressure Angle 35-Degree Helix Angle
Load Line 0.250-In. Offset
-Load Line Through Corner
2,000 4,000 6,000 8,000 10,000 12,000 Rig Load—lb
Figure 48. Calibration Curve For Test Gear EX-84119.
9,000
« ;S 7,000
• •S 4. I 5 g 5,000
I a § 3,000
25-Degree Pressure Angle 35-Degree Helix Angle
Load Line 0.250-In. Offset
1,000,
Load Line Through Corner
2,000 4,000 6,000 8,000 10,000 12,000 Rig Load-lb
Figure 49. Calibration Curve For Test Gear EX-84120.
71
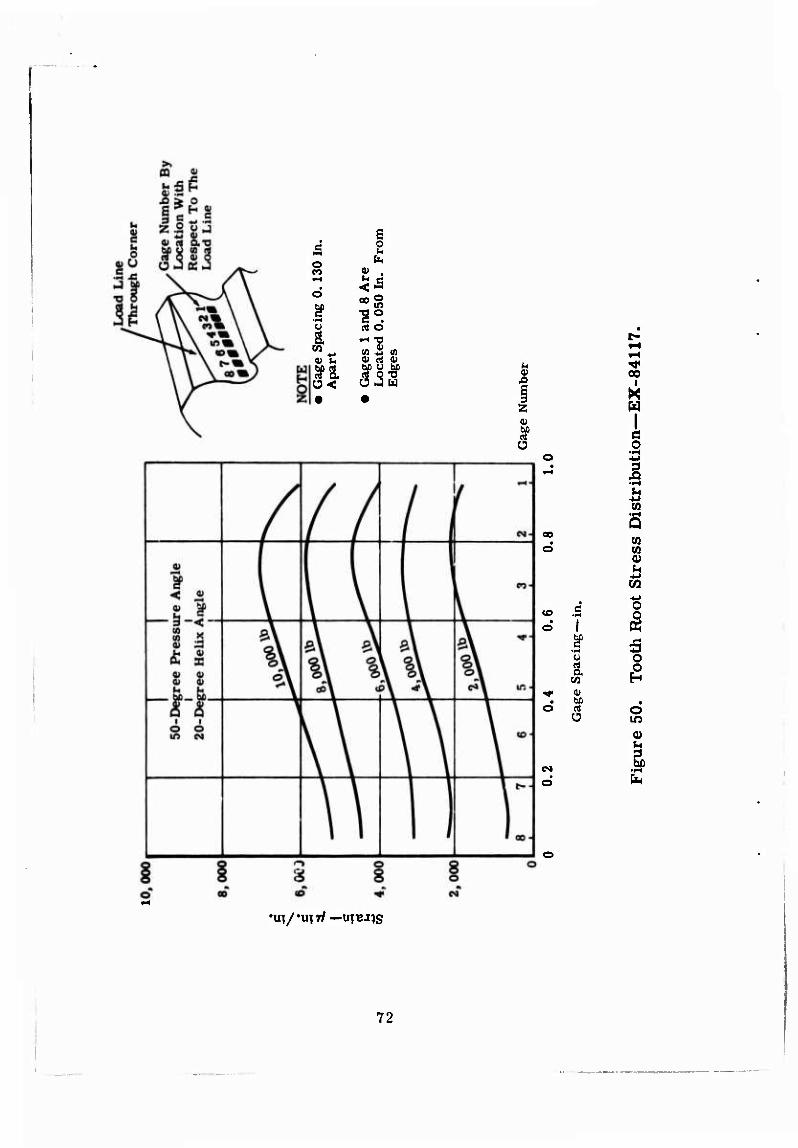
E ä 2
h n v , y-l <5 O «s 2 in
'S0. u (4 O
-'S ca u to
v u 0) rt 0)
(3 »JU • •
£1
2
Ü
o
00 I
X w
I s ca a>
03
CD • o c
.F-l
1 •IH 5 o o
s ^ «
• bß o rt o Ü in
CM • o fa
•U^/'UIT/—UTBJ^g
72
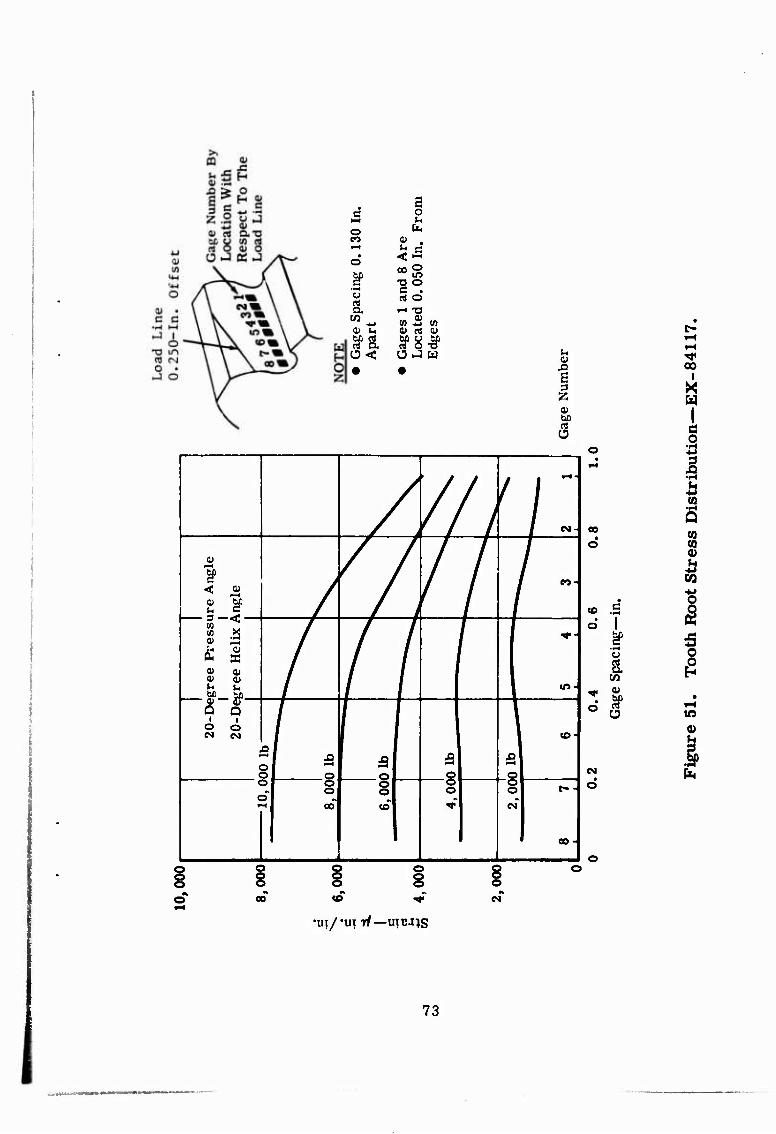
a c o
»-H tl
o b CO « . *-H fc" c • o <Ä
oo 0
gp in •o o c . a o
a -" "C CO
■tj «5 *j tfl (U u « rt <u
Sfl ^8^ Ü< Ü J w 0)
Ä S 3
a> be 'S Ü
/ // f
/ "■
/, v/ ».
0)
a> br /
//
// -
s 1 / //
^'■
gre
e
gree
/ / / \ in-
a a / / \
N CM / to- a -* -» a £ a a D
o Q <? o o o 00 «O
o o
o o i»-
eo-
^r 00
X w
1 e o o 13 • 3 55
H •w (0
•i-l
Q oo
(0 o CO
0)
is CO ■«->
» .s Q d 1 K
gp 5 o o
CO S d 1
• 0 Ü Iß
0)
d
o 8
o S 8 o
CM
•UI/'UIT/—UTB-HS
73
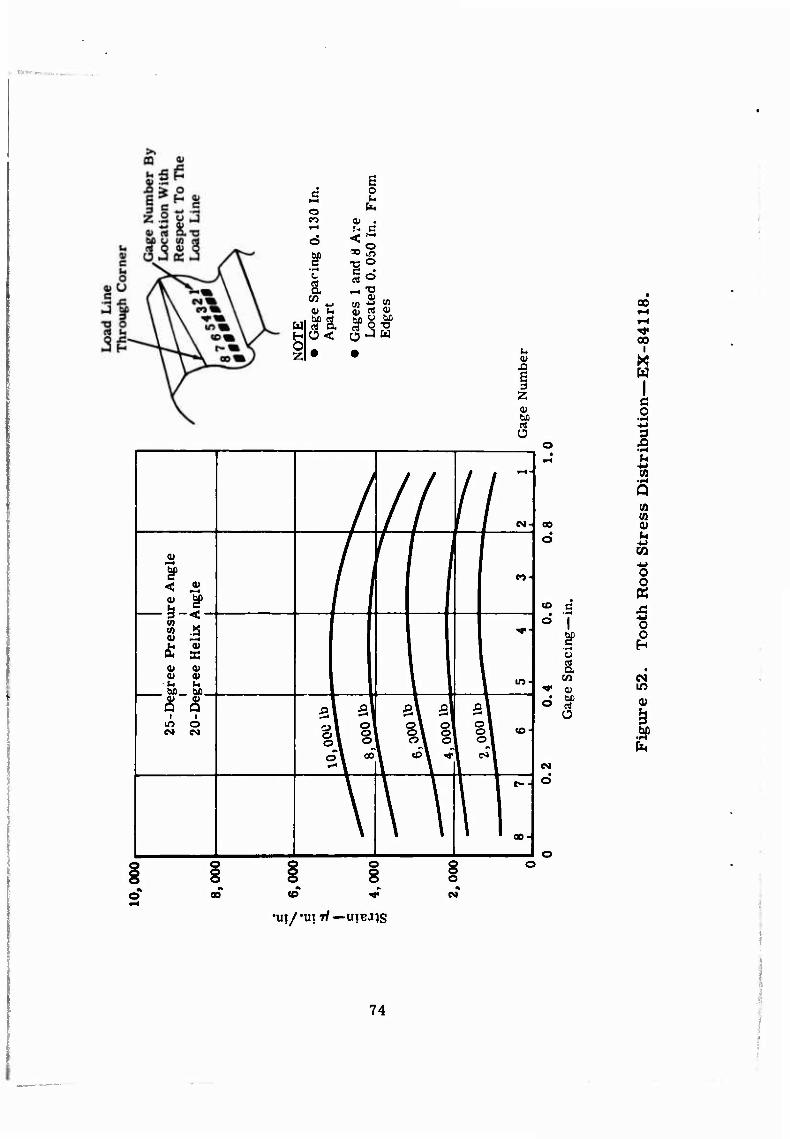
■ ■
u H O Z
s c o
o h CO 0) . t—1 N C 6 <o ä5
■c o
C3 lo
a -" V M« M -u «3 01 t- (U rt a>
ilä ^fS^ Ü< ü J w • • 4)
z 0)
I
/ 1// hJ
ire
An
gle
Lng
le 1 ^ f i
eo-j
gree
Pre
ssu
gree
Hel
ix ß
!
\
^ 1
J
25-D
e
20-D
e
3
c c l o
■4 1
i o
r «o-l
\ \\ i
i
ao
o
to c • o 1
% •^H
u rt a
C/5 ^r 0) • o ^
Ü
O
o 8
CM
00
00 I
X W
o •H
3
■M CO •H Q CO CO 0) Jt
CO
•UI/'UTT/—UIBJ;S
74

(1>
CO «
A > o
I § « J be U W c4 rt O <U O Ü JKJ
o CO
CO ■fcl
rt a
i u
01
o in o
65 en
i
s
0)
3
00
00 I
W I Ö p
// / / i ///
/
re A
ngle
kngl
e
/
/ /
/ -
i ^ Ä / / / /
^i
flj CD
1 hn hf, / /
/ m -j
25-D
e
20-D
e
o § o
5
o i 00
£ o o o cc
1 £ j o 1 o 1 0
1 "r ■
5 ol o o
«3-1
l 1
\ ' \ 1 \ \ \ \ LJ
I u CO
Q CO co o h CO
CO c Q o T 05
t 5 rt
o o
a H V3
d OJ b£ •
CO in
d
o §
o s
o o o co
o § 8 o
•in/-ut rf —unu^s
7 5

a
.S > o
w H O
5 o
o £ CO ?• .
• o
00 O
^ — 1« 32 o c . u rt d a ^•g CO *> to *. (0 0) u a> rt a»
^SL ^S-^ o< Ü J W 00 I
X W
I c .2
a u
-M (0
Q CO 03 <U
■M CO
•UI/ "UJ T/-UIBJJS
76
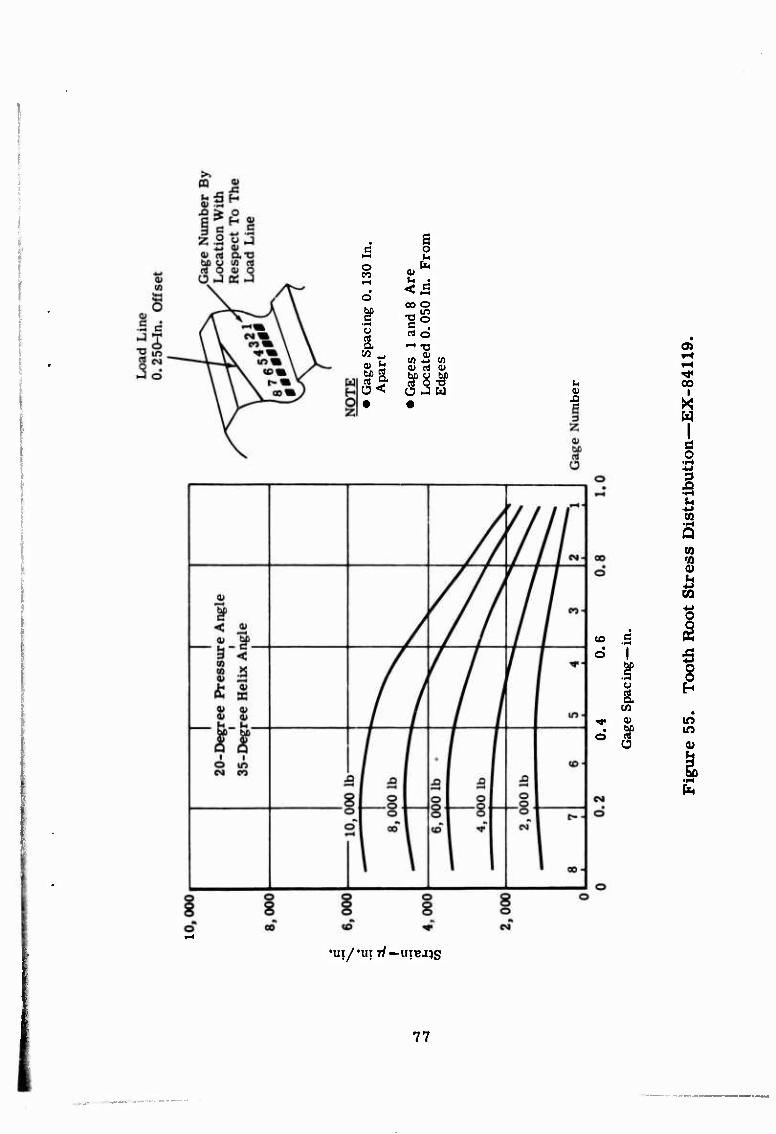
s a o
u o «. ^ CO 0) iH • <a o oo o %
■I-* C . rt rt o a ^H 73
Gag
e S
Apar
t 5 (0 -w CO 0) rt <u
Ü J w • •
00
><
£5 O
.»-4
a ■M CO
5 CO ■a v (i
-M CO
(O K o 1 5
if 8 H
CO • »»• 0) m
• o 1 in
a 0)
•Uj/'UI W —UIBJ^g
77
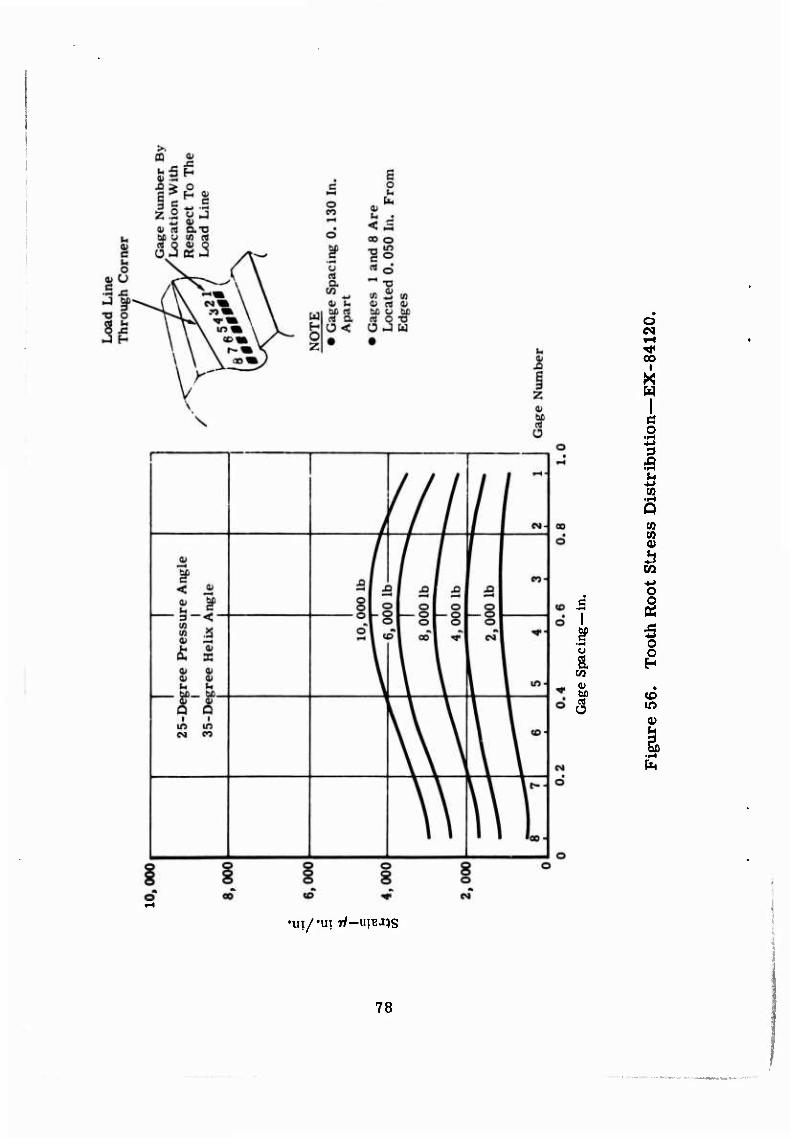
a m <u be
6
•UI/-UI TZ-UIBJ^S
78
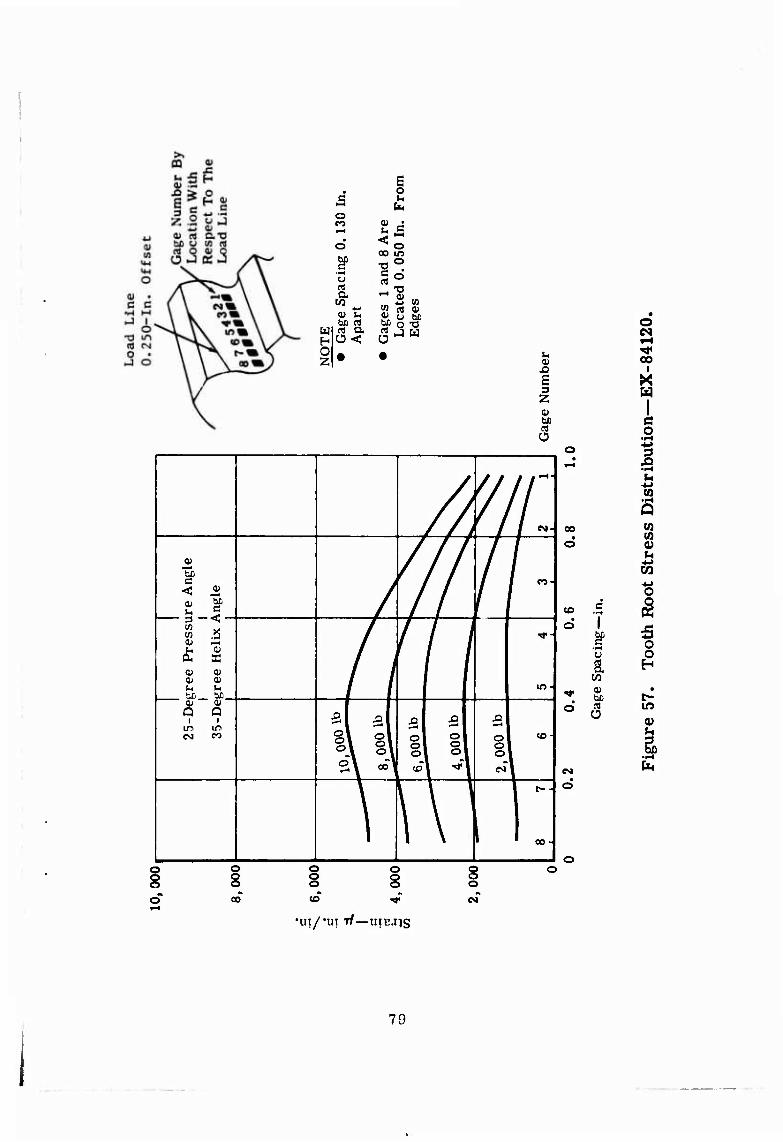
g = £ o CO * j
• h c < o ^ o oo in
^ •2° —< So rt T3 a ^ 5
OT ,« -w w .*-* (0 (A a»
0) (H 9» o be be rt bß o -O W H a < Ü JW
0 • •
6 3
Ü
/A y/i:
ire
Ang
le
Vng
le V 1 r
gre
e P
ress
t
gre
e H
elix
I
/i i in-
25-D
e
35-D
e
A i 3\ «1
a 8 o CO
o I a § o
to-
1
1 U' 11:
oo
o
«o .5 d I
a
0 Ü
O
O CM
oo i
X u Ö .2 -M
a CO •f*
Q w CO 0)
■M 03
o (2
8 oo
o o o to ^
•Ul/'UI T/ — UIB-nS
8 o CM
79
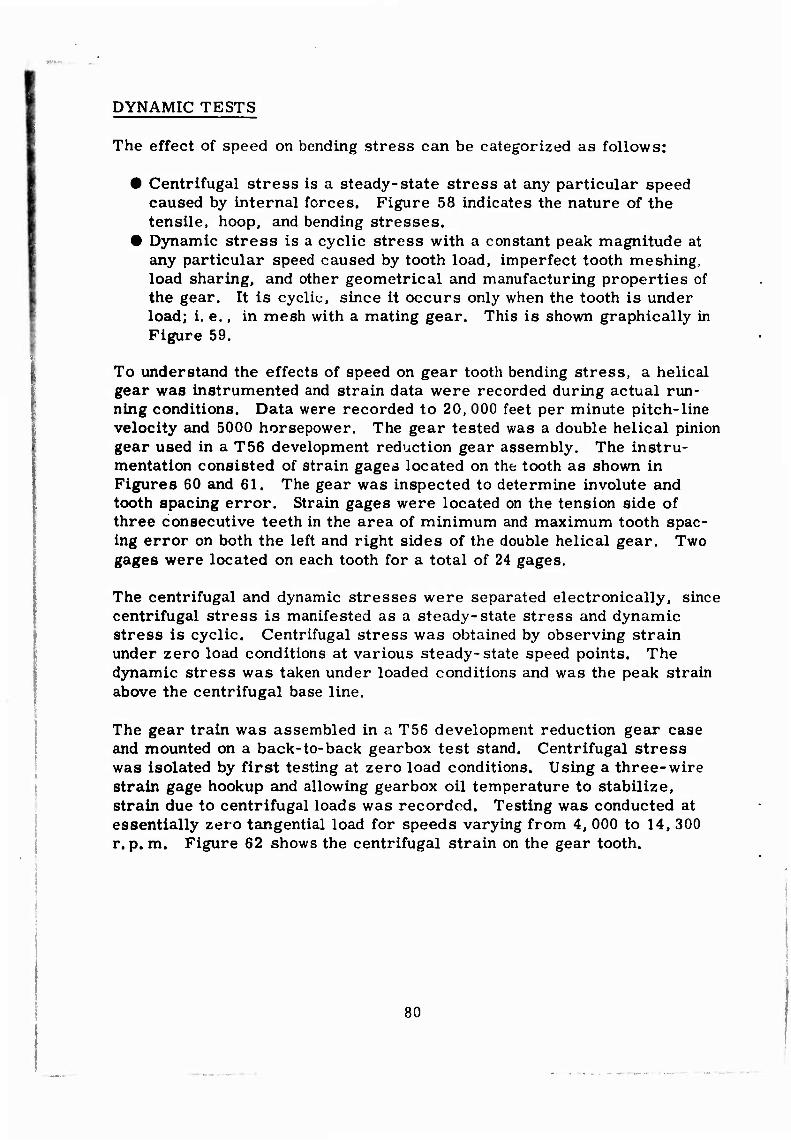
DYNAMIC TESTS
The effect of speed on bending stress can be categorized as follows:
• Centrifugal stress is a steady-state stress at any particular speed caused by internal forces. Figure 58 indicates the nature of the tensile, hoop, and bending stresses.
• Dynamic stress is a cyclic stress with a constant peak magnitude at any particular speed caused by tooth load, imperfect tooth meshing, load sharing, and other geometrical and manufacturing properties of the gear. It is cyclic, since it occurs only when the tooth is under load; i. e., in mesh with a mating gear. This is shown graphically in Figure 59.
To understand the effects of speed on gear tooth bending stress, a helical gear was instrumented and strain data were recorded during actual run- ning conditions. Data were recorded to 20, 000 feet per minute pitch-line velocity and 5000 horsepower. The gear tested was a double helical pinion gear used in a T56 development reduction gear assembly. The instru- mentation consisted of strain gages located on the tooth as shown in Figures 60 and 61. The gear was inspected to determine involute and tooth spacing error. Strain gages were located on the tension side of three consecutive teeth in the area of minimum and maximum tooth spac- ing error on both the left and right sides of the double helical gear. Two gages were located on each tooth for a total of 24 gages.
The centrifugal and dynamic stresses were separated electronically, since centrifugal stress is manifested as a steady-state stress and dynamic stress is cyclic. Centrifugal stress was obtained by observing strain under zero load conditions at various steady-state speed points. The dynamic stress was taken under loaded conditions and was the peak strain above the centrifugal base line.
The gear train was assembled in a T56 development reduction gear case and mounted on a back-to-back gearbox test stand. Centrifugal stress was isolated by first testing at zero load conditions. Using a three-wire strain gage hookup and allowing gearbox oil temperature to stabilize, strain due to centrifugal loads was recorded. Testing was conducted at essentially zero tangential load for speeds varying from 4, 000 to 14, 300 r. p. m. Figure 62 shows the centrifugal strain on the gear tooth.
80
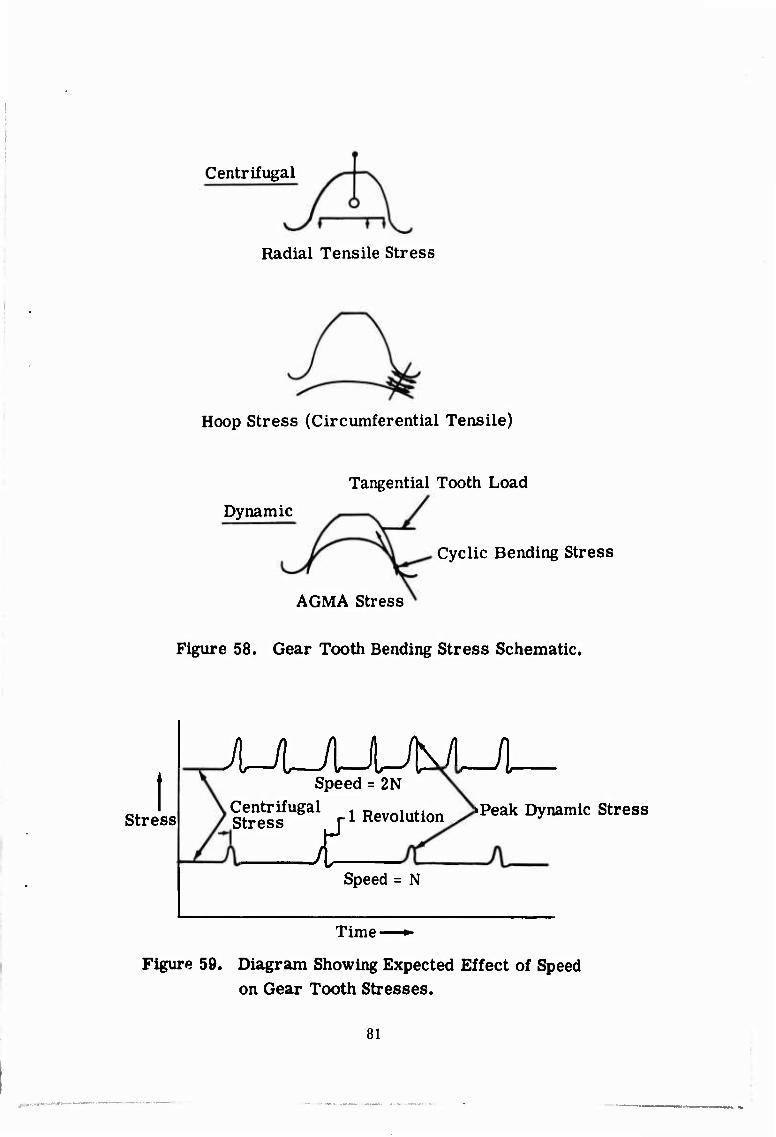
Centrifugal
i rr Radial Tensile Stress
Hoop Stress (Circumferential Tensile)
Tangential Tooth Load
Dynamic
Cyclic Bending Stress
AGMA Stress
Figure 58. Gear Tooth Bending Stress Schematic.
Stress
JUUUJl Speed = 2N
Centrifugal Stress 1 Revolution >Peak Dynamic Stress
Speed = N
Time—^
Figure 59. Diagram Showing Expected Effect of Speed on Gear Tooth Stresses.
81
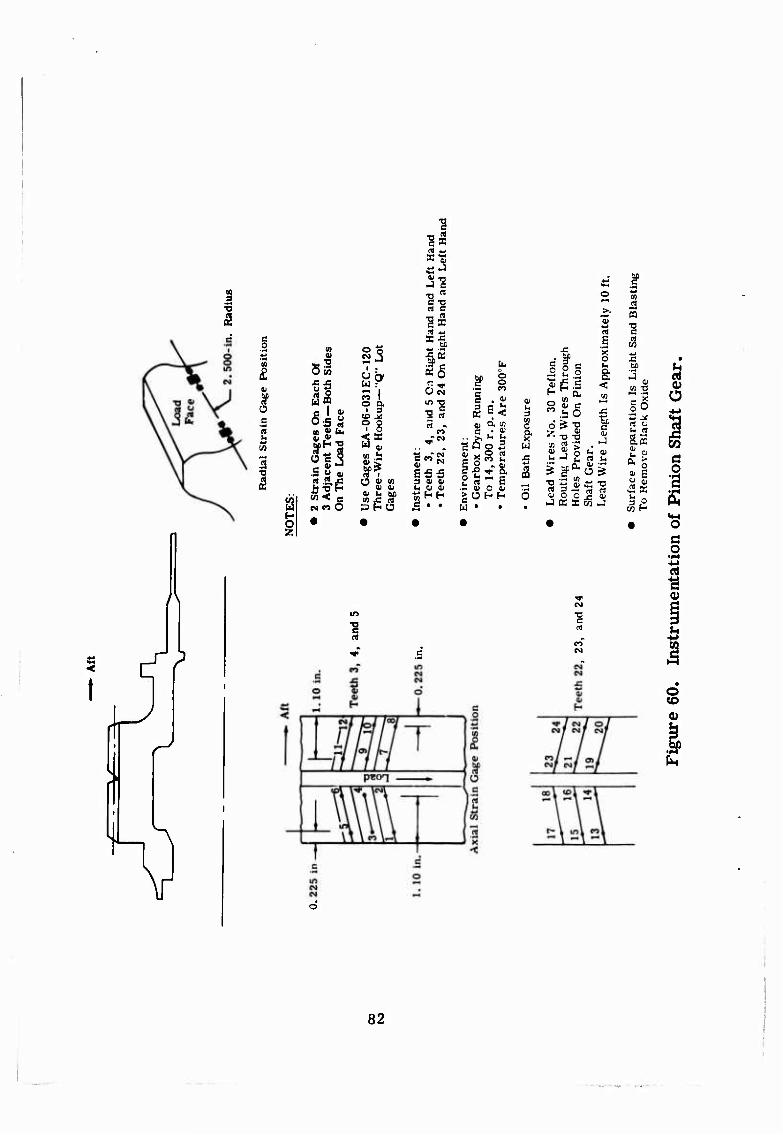
s
Ü c '3
.3 XI
5
S M
äs to « U.
-a 4» «.2,-c
co ■< e M CO O
o 'S 2 J
W : S I o a
I 3
o o I o
2 j,
IK 0) <K fc. in ä .. D H Ü 5
IS
rt 'S
x -c Mi
bo
OS o
in ■o
Sf 3 m a» h 41 01 tSHH
1
o O CO
. u
Q. in
-3 Hi o a; >ÜHH
gf
3
01 e
E
u
s u
ill ■s el ,-, m S <" c
.S O
^- T3 T3 m S 'S a» ^ o
■OS 2 rt 3 ü 01 O O J K X
_>, 01
I ?* o hi a <
x: § c 01
_ J C oi r3 u. 01 ^r O^
1
CO CM
82


N s^ix ^ Jv0^ D
to
\ V V \\ ^
i—(
eg
rtl \l w M o V*J
W J r \
^H
QQ Q O CM O ^ •-• CM A
¥ /
yj ri a> I-* c i> ^H ^4 eg c
oog(a< > iä 1 /
/ UJ
BQ CQ CQ CQ to eg •«' <o ^H
OD<3C>
i? "J1
< < eo in eo in «I .i
*oOOo
1 c
CO
o
X •
6 • a u I
■a i) 1
CO
u rt
Ü
o o ao
o o o 00
o CM
5 o o
3 o
| a»
I to 0)
UOISU31 uotssajdiuoo
•UI/'UI»/—UTBJ^S
84
The gear train was then loaded to obtain stress versus speed data. The strain gage instrumentation was routed through a slip-ring assembly, and the gage output signal was recorded by a 16-channel Miller oscillograph recorder. The gear was tested at speeds of 8, 000 to 14, 300 r. p. m. and at a constant torque of 24, 160 inch-pounds (5000 horsepower). Figure 63 shows the data from 13 strain gages.
85
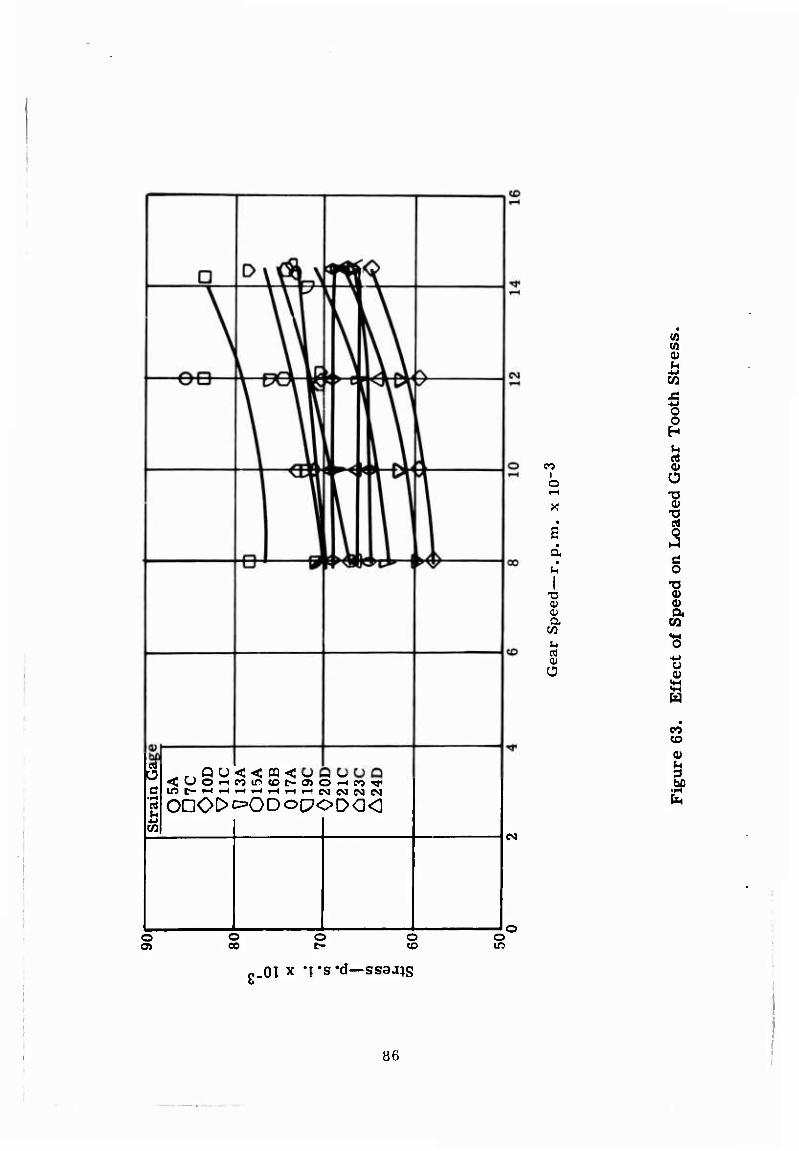
o d
-M CO
Q U < < PQ •< w M w CM Cvj
ODO^^ODo^oOO^
CO I o
X
s
u
T3
a> a
O
N
o o 00
o o CD
o in
CO co
CO
o o H
ei
O -o 0) 'S
o
0) 0) a
«2
0)
W
,01 x "t's'd—ssaa^s
86
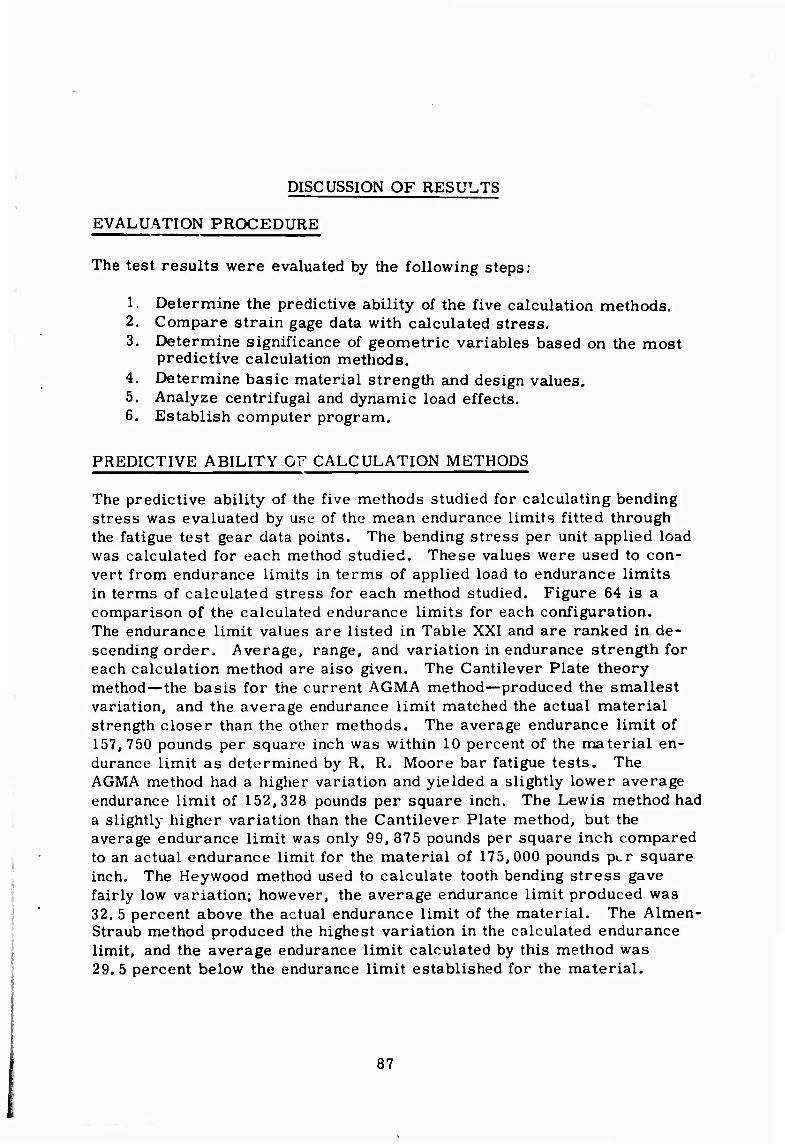
DISCUSSION OF RESULTS
EVALUATION PROCEDURE
The test results were evaluated by the following steps:
1. Determine the predictive ability of the five calculation methods. 2. Compare strain gage data with calculated stress, 3. Determine significance of geometric variables based on the most
predictive calculation methods. 4. Determine basic material strength and design values. 5. Analyze centrifugal and dynamic load effects. 6. Establish computer program.
PREDICTIVE ABILITY OF CALCULATION METHODS
The predictive ability of the five methods studied for calculating bending stress was evaluated by use of the mean endurance limits fitted through the fatigue test gear data points. The bending stress per unit applied load was calculated for each method studied. These values were used to con- vert from endurance limits in terms of applied load to endurance limits in terms of calculated stress for each method studied. Figure 64 is a comparison of the calculated endurance limits for each configuration. The endurance limit values are listed in Table XXI and are ranked in de- scending order. Average, range, and variation in endurance strength for each calculation method are also given. The Cantilever Plate theory method—the basis for the current AGMA method—produced the smallest variation, and the average endurance limit matched the actual material strength closer than the other methods. The average endurance limit of 157,750 pounds per square inch was within 10 percent of the material en- durance limit as determined by R. R. Moore bar fatigue tests. The AGMA method had a higher variation and yielded a slightly lower average endurance limit of 152,328 pounds per square inch. The Lewis method had a slightly higher variation than the Cantilever Plate method, but the average endurance limit was only 99, 875 pounds per square inch compared to an actual endurance limit for the material of 175,000 pounds per square inch. The Heywood method used to calculate tooth bending stress gave fairly low variation; however, the average endurance limit produced was 32. 5 percent above the actual endurance limit of the material. The Almen- Straub method produced the highest variation in the calculated endurance limit, and the average endurance limit calculated by this method was 29. 5 percent below the endurance limit established for the material.
87

o o o
I» o.
09 «
CO
o c
250
200
+. 150
100
50
300 - illlii:i!Silllll
Agma Cantilever Plate Luwis Almen - Straub Heywood
i—R. R. Moore Material Strength For Infinite Life
I I I I I I I
I I I I I I
I I I I I
EX-84117 EX-84118 EX - 84119 20-Degree 25-Degree 20-Degree Pressure Pressure Pressure Angle, 20-Degree Angle, 20-Degree Angle, 35-Degree Helix Angle Helix Angle Helix Angle
EX - 84120 25-Degree Pressure Angle, 35-Degree Helix Angle
Figure 64. Calculated Endurance Limit Stress Compared With R. R, Moore Endurance.
88
■
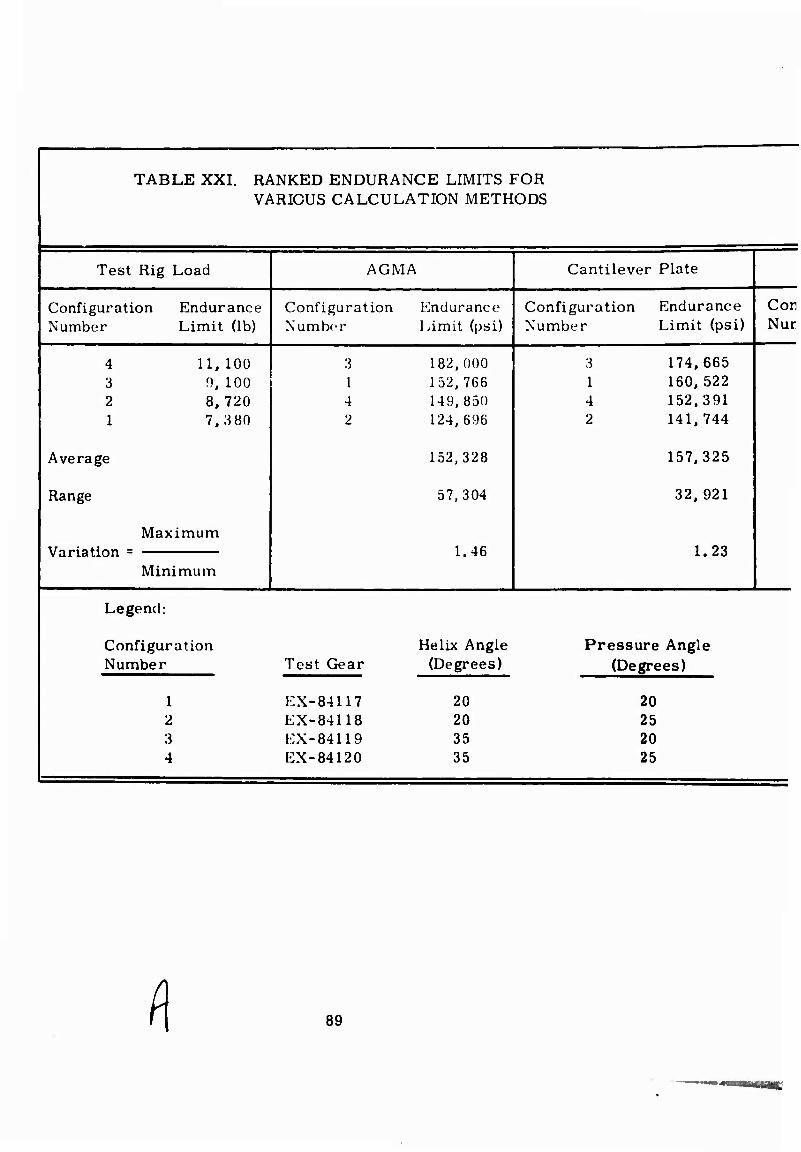
! TABLE XXI. RANKED ENDURANCE LIMITS FOR VARIOUS CALCULATION METHODS
Test Rig Load AGMA Cantilever Plate
Configuration Endurance Number Limit (lb)
Configuration Endurance Number Limit (psi)
Configuration Endurance Number Limit (psi)
Cor Nur
j 4 11,100 I 3 9, 100
2 8,720 i 1 7,3 80
Average
Range
1 Maximum
3 182,000 1 152,766 4 149,850 2 124,696
152,328
57,304
1.46
3 174,665 1 160,522 4 152,391 2 141,744
157,325
32,921
1.23 vanaiion - ■ Minimum
j Legend:
j Configuration Helix Angle I Number Test Gear (Degrees)
Pressure Angle (Degrees)
1 2 3
1 4
EX-84117 20 EX-84118 20 EX-84119 35 EX-84120 35
20 25 20 25
f\ 89
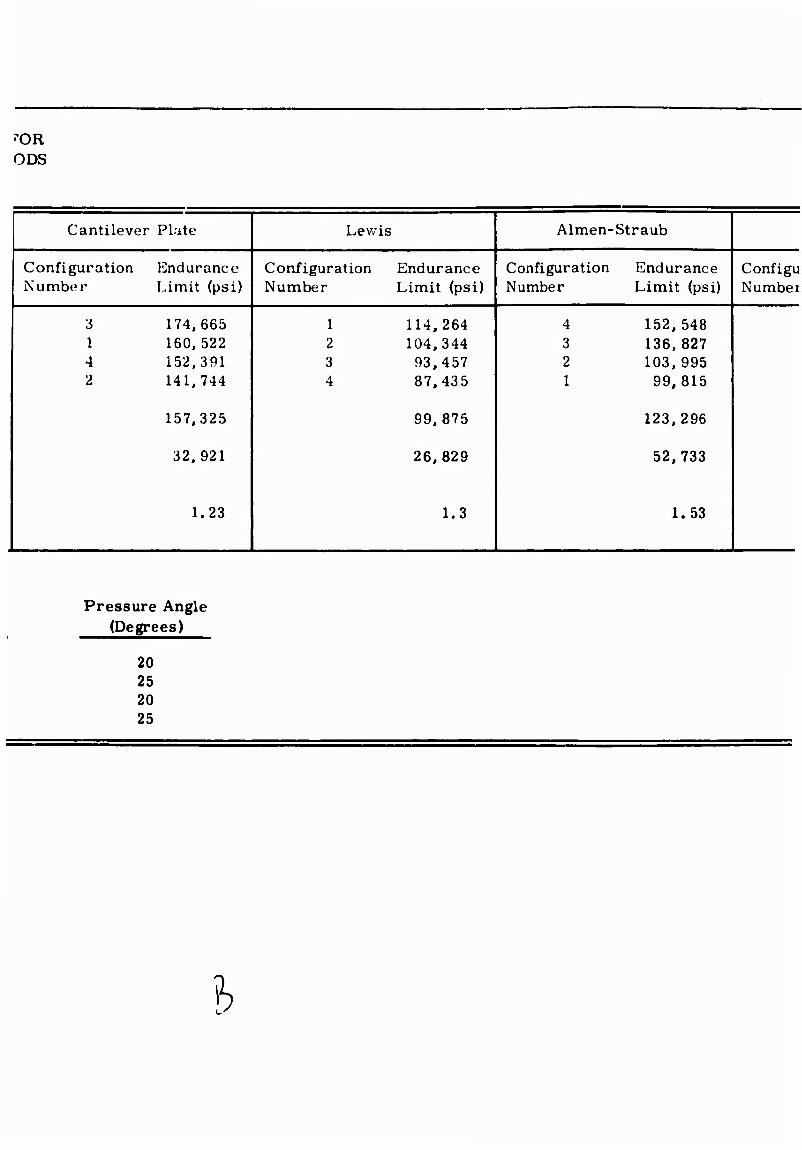
i'OR ODS
Cantilever Plate Lewis Almen- Straub
Configuration Number
Endurance Limit (psi)
Configuration Endurance Number Limit (psi)
Configuration Number
Endurance Limit (psi)
Configu Numbei
3 I 4 2
174,665 160.522 152.391 141,744
1 114,264 2 104,344 3 93,457 4 87,435
4 3 2 1
152,548 136,827 103.995 99,815
157,325 99,875 123,296
32,921 26,829 52,733
1.23 1.3 1.53
Pressure Angle (Degrees)
20 25 20 25
h
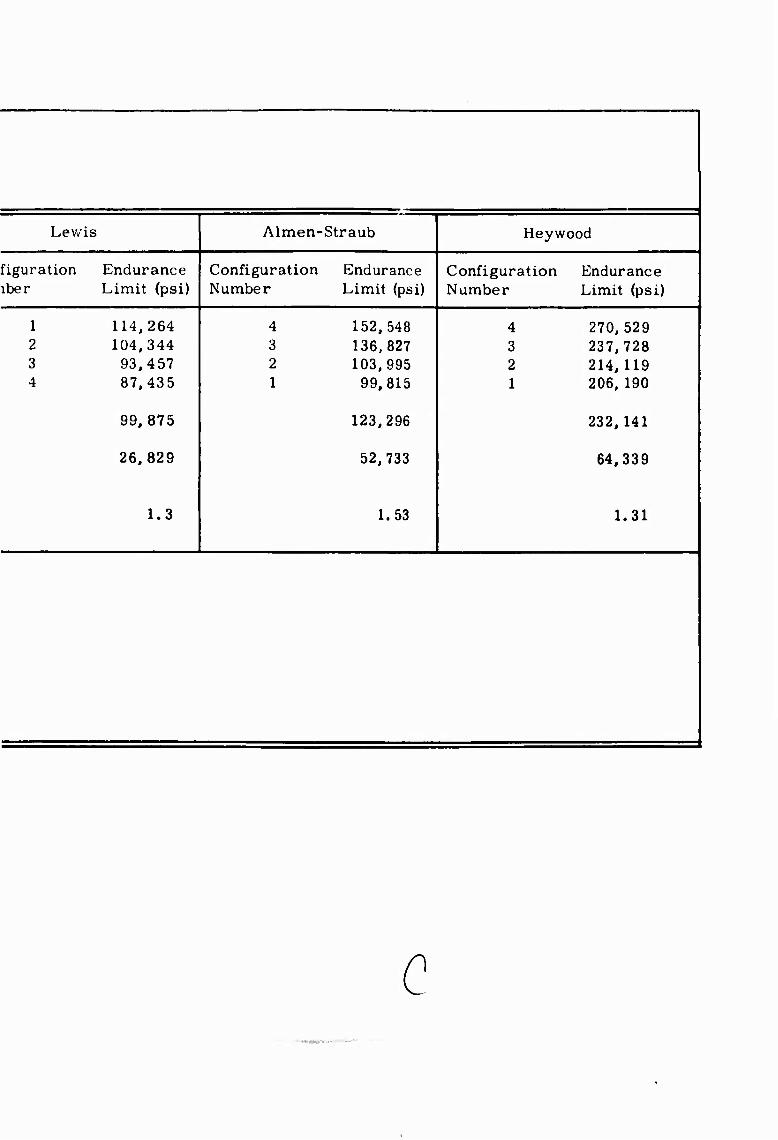
Lewis Almen- Straub Heywood
figuration Endurance iber Limit (psi)
Configuration Number
Endurance Limit (psi)
Configuration Endurance Number Limit (psi)
1 114,264 2 104,344 3 93,457 4 87,435
99,875
26.829
1.3
4 3 2 1
152,548 136.827 103,995 99,815
123,296
52,733
1.53
4 270,529 3 237,728 2 214,119 1 206, 190
232,141
64,339
1.31
c
* r
iMMMMAtf •a.m
BLANK PAGE
wm
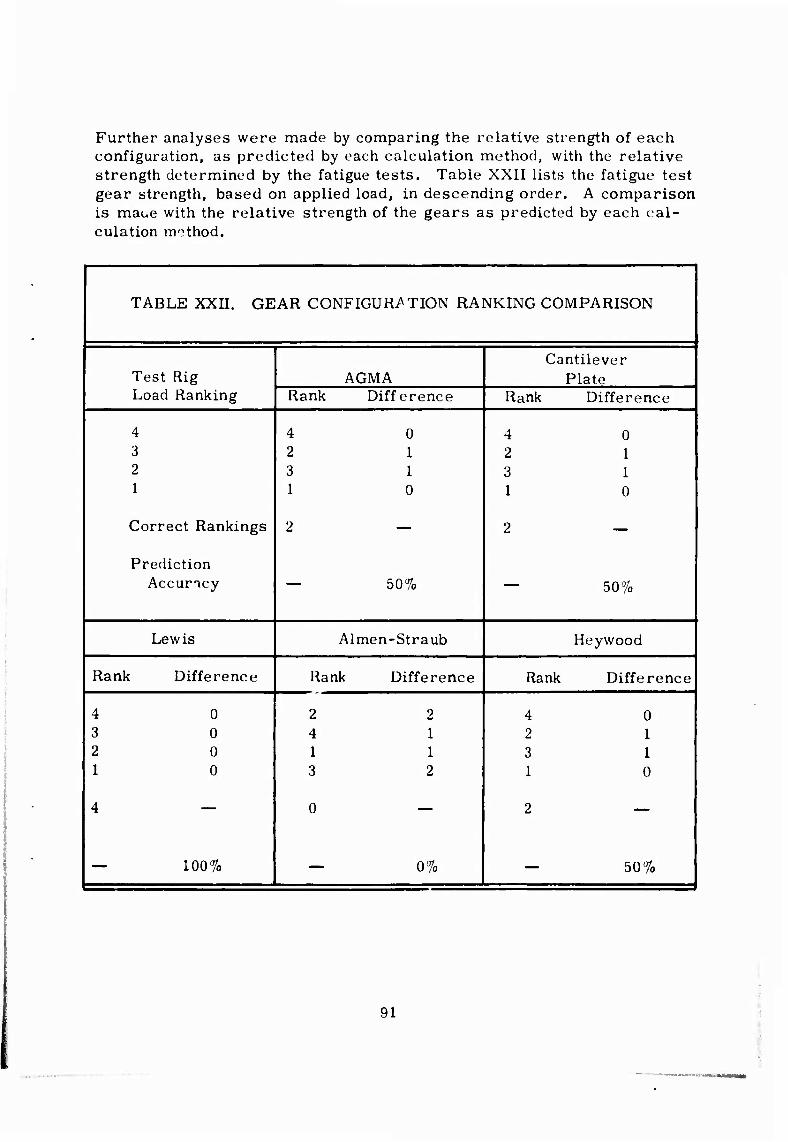
Further analyses were made by comparing the relative strength of each configuration, as predicted by each calculation method, with the relative strength determined by the fatigue tests. Table XXII lists the fatigue test gear strength, based on applied load, in descending order. A comparison is maue with the relative strength of the gears as predicted by each cal- culation method.
TABLE XXII. GEAR CONFIGURATION RANKING COMPARISON
j Test Rig Load Ranking
AGMA Cantilever
Plate 1 Rank Difference Rank Difference 1
4
1 3 i 2
1 1
' Correct Rankings
I Prediction 1 Accuracy
4 0 2 1 3 1 1 0
2 —
— 50%
4 0 2 1 3 1 1 0
2 —
— 50% j
Lewis Almen-Straub Heywood i
Rank Difference Rank Difference Rank Difference
4 0 3 0 2 0 1 0
4 —
— 100%
2 2 4 1 1 1 3 2
0 —
— 0%
4 0 2 1 3 1 1 0
2 —
- 50%
91
The Lewis formula predicted the rank position in every case, but was deficient in predicting the correct magnitude of endurance limit stress. The AGMA, Cantilever Plate, and Heywood formulae predicted the rank position correctly in two of the four cases. The Almen-Straub equation predicted the rank position incorrectly in every case.
STRAIN GAGE DATA
The difficulty encountered in placing strain gages in the root of helical gear teeth to accurately measure both maximum strain and strain distri- bution tends to limit the degree of confidence assigned to conclusions drawn from these data. Figures 65 through 68 show measured strain distribution as predicted by the Cantilever Plate theory for an 8000- pound load applied through the tip of the tooth at the unsupported edge. The theoretical and actual curve shapes are similar. The helical factor used in both the AGMA and the Cantilever Plate bending stress formulae is a proportional modifying factor and need not predict the actual level of stress or stress distribution. Only the ratio of maximum stress produced by tip loading to maximum stress produced by equal loading along the in- clined helical load line is necessary.
Table XXIII lists the endurance limit in terms of strain gage data and the endurance limit stress calculated by the various methods. The percent deviation shows the magnitude of difference between the measured and calculated endurance limit stress. The AGMA method produced the lowest average deviation at 5%. The Cantilever Plate method was only slightly higher at 8. 5%.
EFFECT OF VARIABLES OF GEAR FATIGUE TESTS
The following studies of the data evaluate the three variables of the gear fatigue test. Derivation of the mathematical model used to determine the S/N curves for each configuration was developed previously, but is re- peated briefly in Appendix V.
This method was used to determine the characteristic and fit of the S/N curve for all the fatigue test points, stress curves, and R. R. Moore curves. S/N curves were fitted to the gear tooth fatigue data wit' respect to basic applied load, AGMA calculated stress, and Cantilever Plate cal- culated stress. The test rig load was used as a base line, since it is not affected by calculations. The Cantilever Plate and AGMA equations were of prime interest, since they were determined to be the best predictive calculation methods.
92
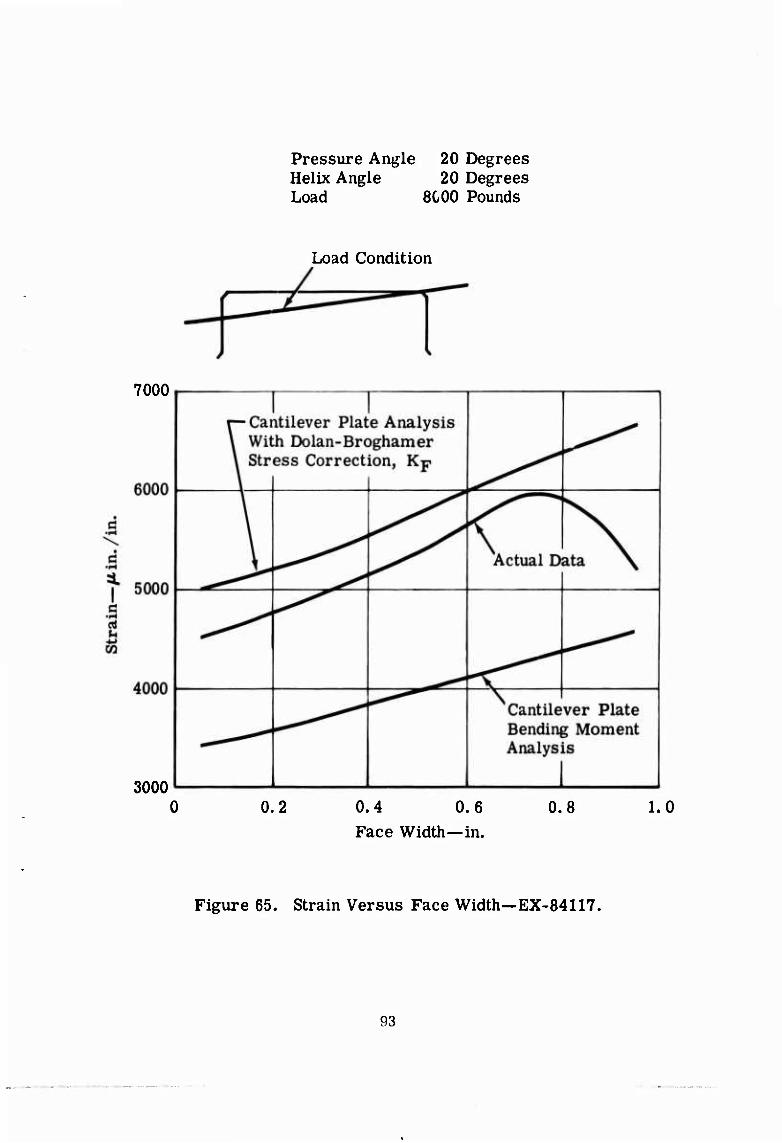
Pressure Angle 20 Degrees Helix Angle 20 Degrees Load 8000 Pounds
Load Condition
7000
3000 0 0.2 0. 4 0.6
Face Width—in. 0.8 1.0
Figure 65. Strain Versus Face Width—EX-84117.
93
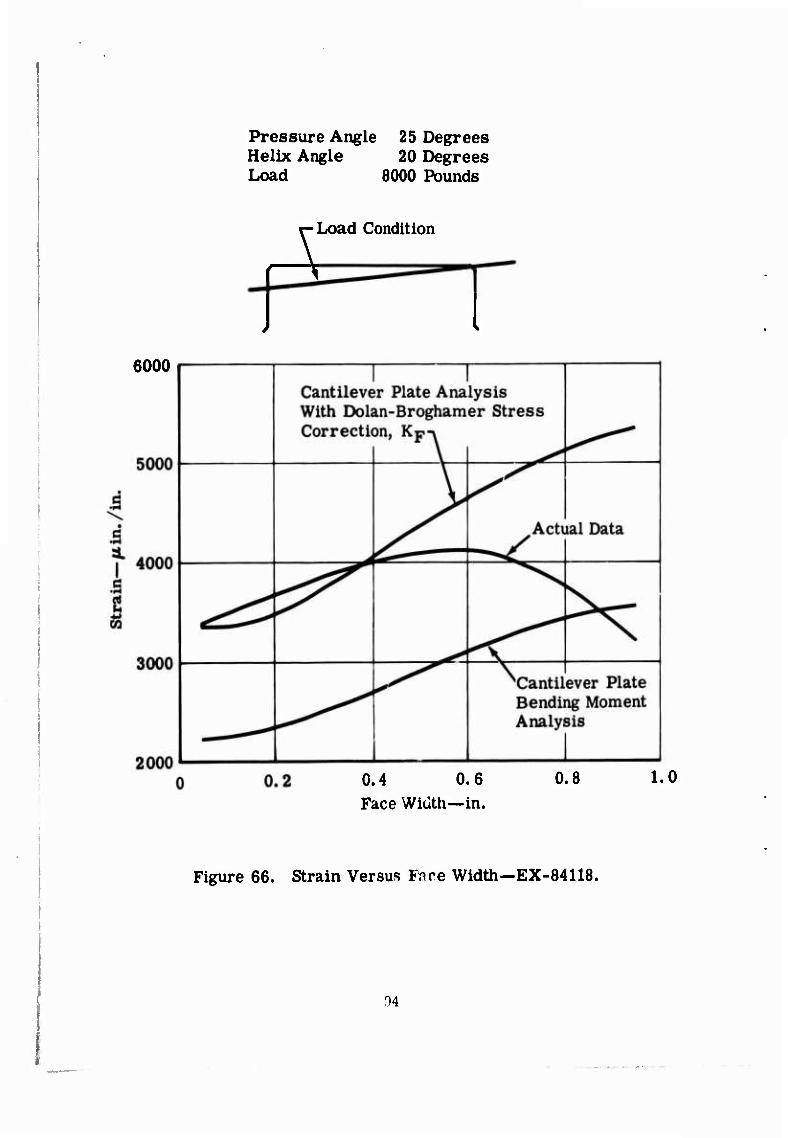
Pressure Angle 25 Degrees Helix Angle 20 Degrees Load 8000 Pounds
A Load Condition
6000
0.4 0.6 Face Width—in.
Figure 66. Strain Versus Fnce Width-EX-84118.
04
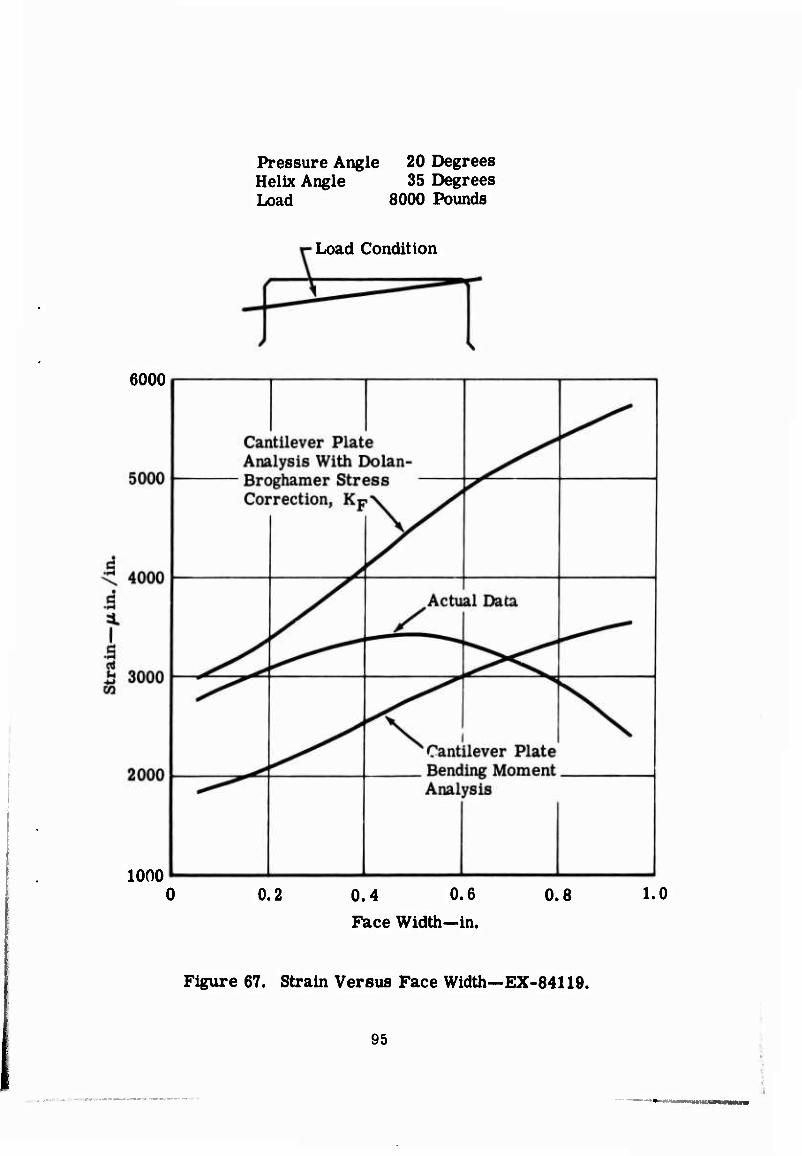
Pressure Angle 20 Degrees Helix Angle 35 Degrees Load 8000 Pounds
Load Condition
6000
1000 0.2 0.4 0.6
Face Width—in. 0.8 1.0
Figure 67. Strain Versus Face Width—EX-84119.
95 ■
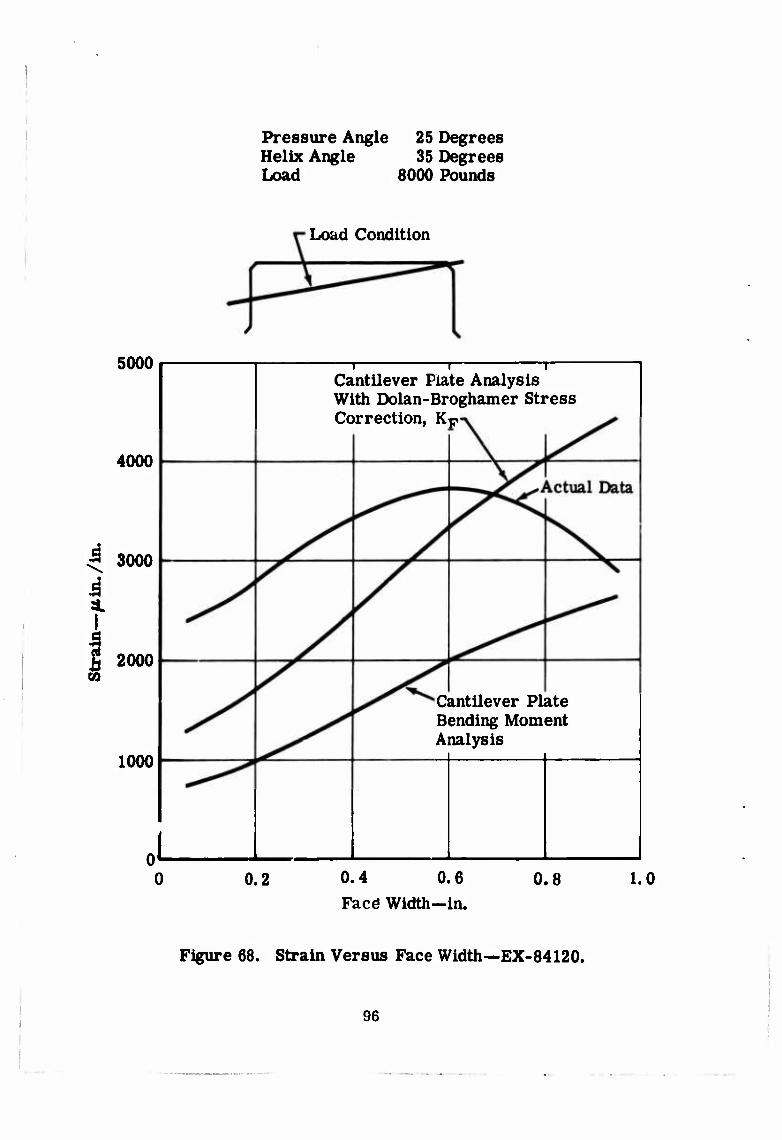
Pressure Angle 25 Degrees Helix Angle 35 Degrees Load 8000 Pounds
Load Condition
5000
4000
3 3000
i a. i
2000
1000
0 0.2
—i 1 1
Cantilever Plate Analysis With Dolan-Broghamer Stress Correction, KF"
Cantilever Plate Bending Moment Analysis
0.4 0.6 Face Width-in.
0.8 1.0
Figure 68. Strain Versus Face Width—EX-84120.
96
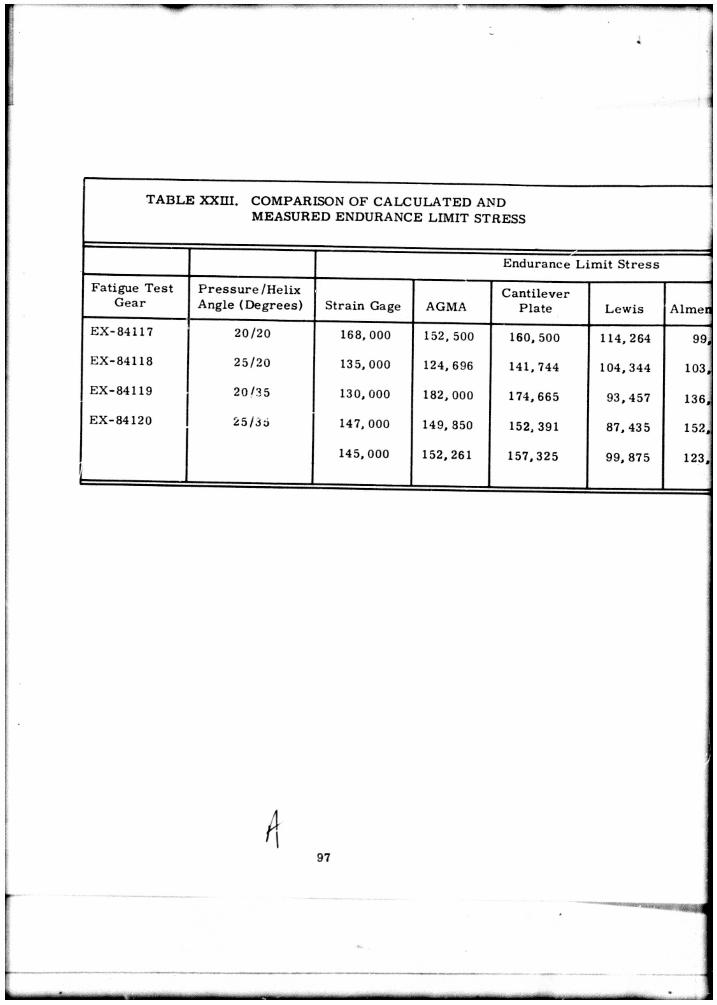
T A B L E XXIII. COMPARISON O F C A L C U L A T E D AND M E A S U R E D ENDURANCE LIMIT STRESS
E n d u r a n c e L i m i t S t r e s s
F a t i g u e T e s t G e a r
P r e s s u r e / H e l i x Ang le ( D e g r e e s ) S t r a i n Gage AGMA
C a n t i l e v e r P l a t e L e w i s A i m e r
E X - 8 4 1 1 7 2 0 / 2 0 1 6 8 , 0 0 0 152 ,500 1 6 0 , 5 0 0 1 1 4 , 2 6 4 99,
E X - 8 4 1 1 8 2 5 / 2 0 135, 000 124, 696 141 ,744 1 0 4 , 3 4 4 103,
E X - 8 4 1 1 9 2 0 / 3 5 1 3 0 , 0 0 0 1 8 2 , 0 0 0 174, 665 93, 457 136,
E X - 8 4 1 2 0 2 5 / 3 6 147, 000 149, 850 152 ,391 8 7 , 4 3 5 152,
145, 000 152 ,261 1 5 7 , 3 2 5 9 9 , 8 7 5 123,
h 97
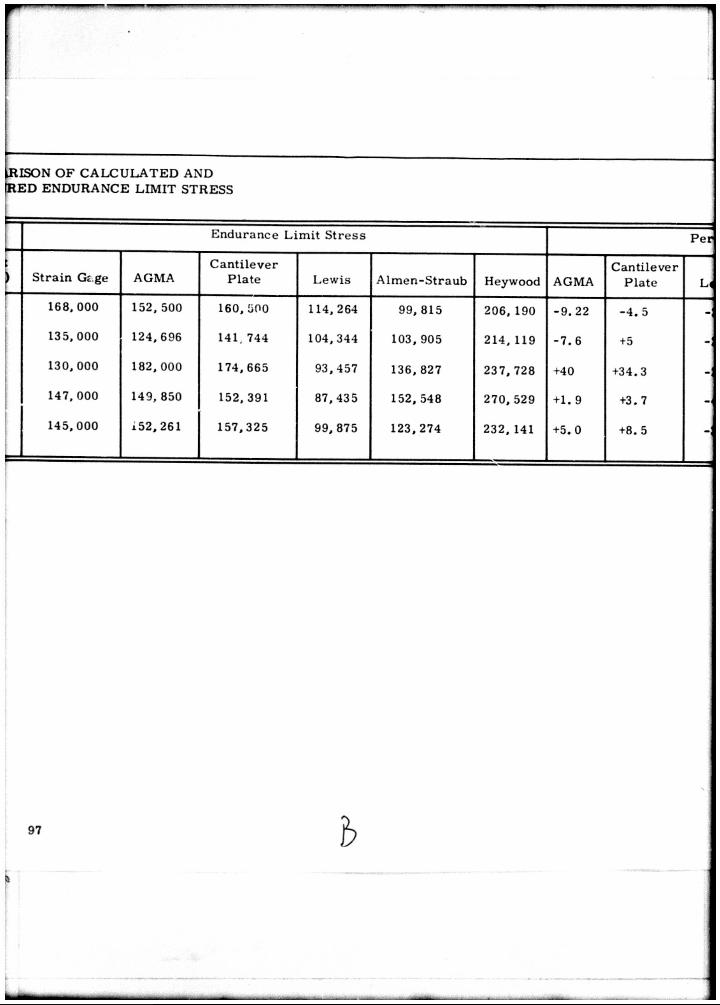
iRISON O F C A L C U L A T E D AND IRED E N D U R A N C E LIMIT S T R E S S
E n d u r a n c e L i m i t S t r e s s P e r
S t r a i n GE ge AGMA C a n t i l e v e r
P l a t e L e w i s A l m e n - S t r a u b Heywood AGMA C a n t i l e v e r
P l a t e L<
168, 000
135, 000
1 3 0 , 0 0 0
1 4 7 , 0 0 0
145, 000
152,500
124,696
182,000
149, 850
i52,261
160,500
141. 744
174,665
152,391
157,325
114,264
104,344
93,457
87, 435
99,875
99,815
103,905
136,827
152,548
123,274
206,190
214, 119
237,728
270.529
232,141
-9.22
-7.6
+40
+1. 9
+5.0
-4. 5
+ 5
+34.3
+3. 7
+8. 5
b a
t.
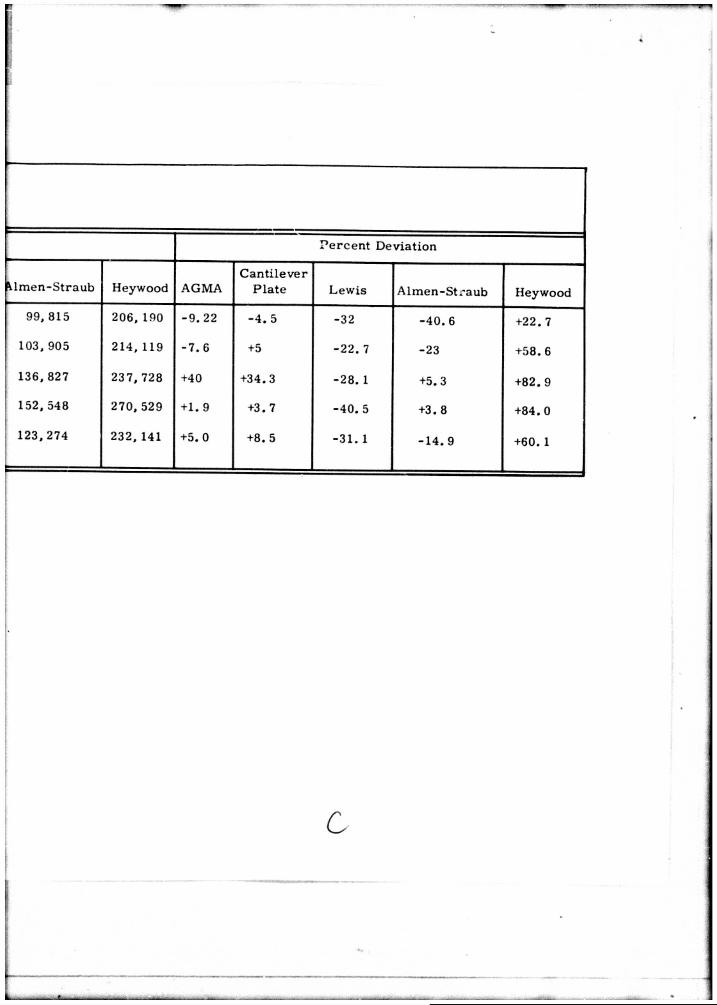
P e r c e n t Dev ia t ion
U m e n - S t r a u b Heywood AGMA C a n t i l e v e r
P l a t e L e w i s A l m e n - S t r a u b Heywood
99, 815 2 0 6 , 1 9 0 - 9 . 22 - 4 . 5 - 3 2 - 4 0 . 6 +22. 7
1 0 3 , 9 0 5 2 1 4 , 1 1 9 - 7 . 6 +5 - 2 2 . 7 - 2 3 +58. 6
1 3 6 , 8 2 7 237, 728 +40 + 3 4 . 3 - 2 8 . 1 +5 .3 +82. 9
1 5 2 , 5 4 8 2 7 0 , 5 2 9 +1. 9 +3 .7 - 4 0 . 5 +3. 8 +84. 0
1 2 3 , 2 7 4 2 3 2 , 1 4 1 +5. 0 +8. 5 - 3 1 . 1 - 1 4 . 9 +60. 1
c
• »" mm -, r<
BLANK PAGE
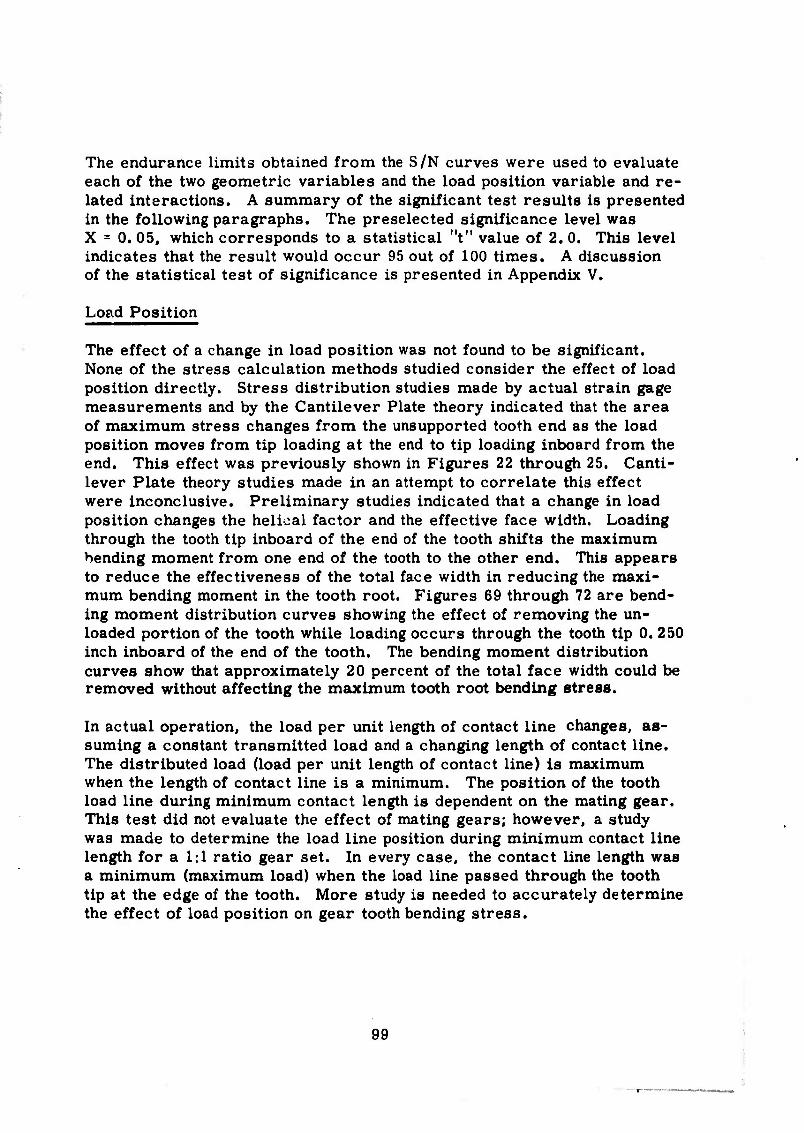
The endurance limits obtained from the S/N curves were used to evaluate each of the two geometric variables and the load position variable and re- lated interactions. A summary of the significant test results is presented in the following paragraphs. The preselected significance level was X = 0. 05, which corresponds to a statistical "t" value of 2. 0. This level indicates that the result would occur 95 out of 100 times. A discussion of the statistical test of significance is presented in Appendix V.
Load Position
The effect of a change in load position was not found to be significant. None of the stress calculation methods studied consider the effect of load position directly. Stress distribution studies made by actual strain gage measurements and by the Cantilever Plate theory indicated that the area of maximum stress changes from the unsupported tooth end as the load position moves from tip loading at the end to tip loading inboard from the end. This effect was previously shown in Figures 22 through 25. Canti- lever Plate theory studies made in an attempt to correlate this effect were inconclusive. Preliminary studies indicated that a change in load position changes the helical factor and the effective face width. Loading through the tooth tip inboard of the end of the tooth shifts the maximum bending moment from one end of the tooth to the other end. This appears to reduce the effectiveness of the total face width in reducing the maxi- mum bending moment in the tooth root. Figures 69 through 72 are bend- ing moment distribution curves showing the effect of removing the un- loaded portion of the tooth while loading occurs through the tooth tip 0. 250 inch inboard of the end of the tooth. The bending moment distribution curves show that approximately 20 percent of the total face width could be removed without affecting the maximum tooth root bending stress.
In actual operation, the load per unit length of contact line changes, as- suming a constant transmitted load and a changing length of contact line. The distributed load (load per unit length of contact line) is maximum when the length of contact line is a minimum. The position of the tooth load line during minimum contact length is dependent on the mating gear. This test did not evaluate the effect of mating gears; however, a study was made to determine the load line position during minimum contact line length for a 1:1 ratio gear set. In every case, the contact line length was a minimum (maximum load) when the load line passed through the tooth tip at the edge of the tooth. More study is needed to accurately determine the effect of load position on gear tooth bending stress.
99

o •iH
E
G
a I S 'S CQ
Legend O —Full Tooth A —20% Reduction of Tooth Width a —25% Reduction of Tooth Width O —29% Reduction of Tooth Width
0.4 0.6
Face Width—in.
Figure 71. Effect of Face Width on Tooth Root Bending Moment
Distribution—Test Gear EX-84119.
102
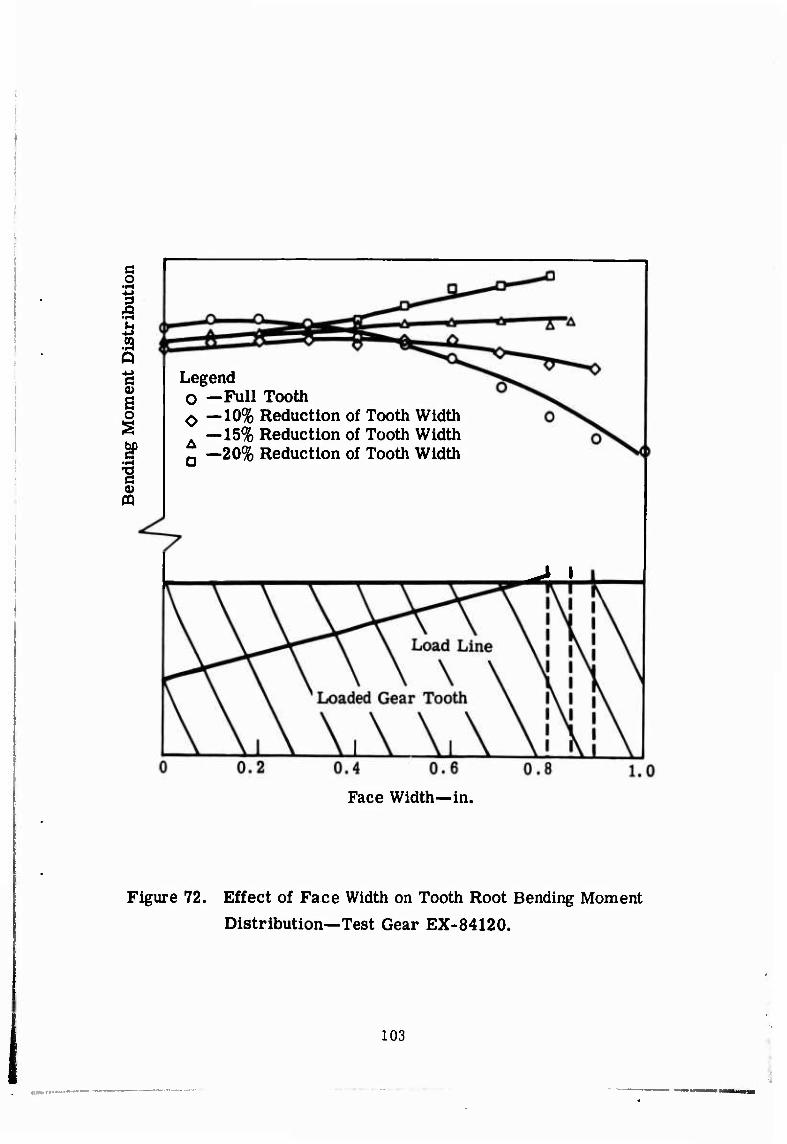
Legend O —Full Tooth 0—10% Reduction of Tooth Width
—15% Reduction of Tooth Width —20% Reduction of Tooth Width
J I
Face Width—in.
Figure 72. Effect of Face Width on Tooth Root Bending Moment
Distribution—Test Gear EX-84120.
103

Pressure Angle
Based on applied load, a change in pressure angle was found to signifi- cantly affect the strength of gear teeth. Table XXIV lists the effect of pressure angle on fatigue strength at a constant helix angle and compares the actual results with the results predicted by the calculation methods.
TABLE XXIV. EFFECT OF PRESSURE ANGLE
Pressure Angle (degrees)
Increase of Actual Fatigue Strength {%)
Predicted Increase of Fatigue Strength (%)
From 20 to 25 16.5 AGMA Cantilever Plate
31 26.5
Both methods predicted that a change in pressure angle would significantly affect the fatigue strength of the gear tooth. The Cantilever Plate theory predicted the degree of significance more accurately.
Helix Angle
Based on applied load, a change in helix angle was found to significantly affect the strength of gear teeth. Table XXV lists the effect of a change in helix angle at constant pressure angle, comparing actual results with the results predicted by the calculation methods.
TABLE XXV. EFFECT OF HELIX ANGLE
Helix Angle (degrees)
Increase of Average Fatigue Strength (%)
Predicted Increase of Fatigue Strength (%)
From 20 to 25 24.2 AGMA Cantilever Plate
5 16
The AGMA method underestimated the significance of the change in helix angle on tooth strength. The Cantilever Plate method predicted the
104
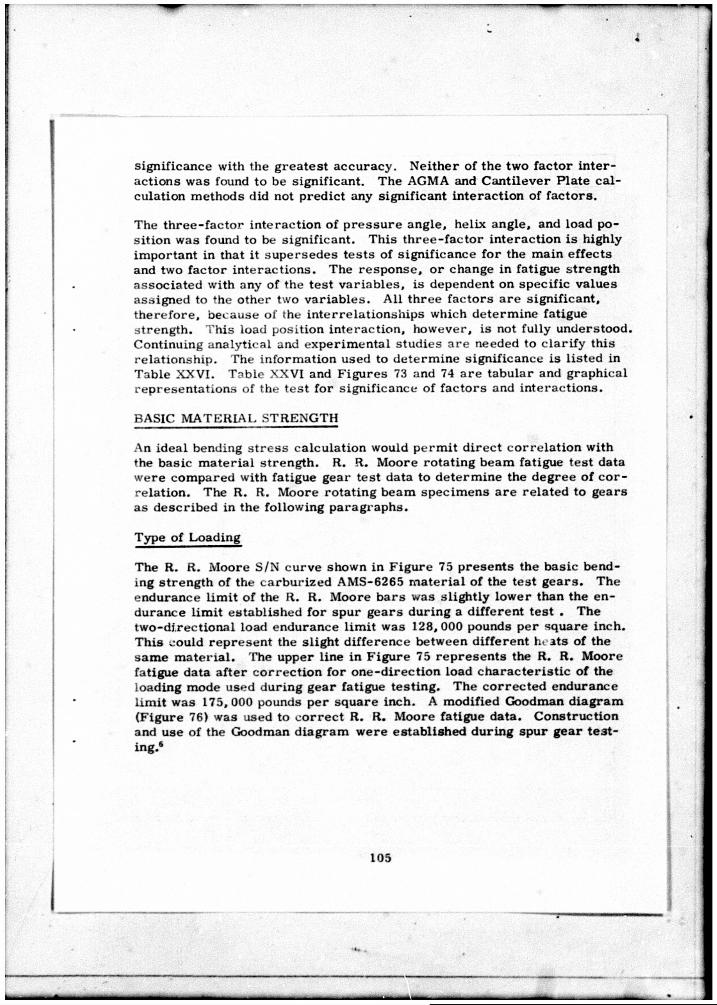
significance with the grea tes t accuracy. Neither of the two factor in ter -actions was found to be significant. The AGMA and Canti lever Plate cal -culation methods did not predict any significant interaction of fac tors .
The th ree - fac to r interaction of p r e s s u r e angle, helix angle, and load po-sition was found to be significant . This th ree - fac to r interact ion is highly important in that it supersedes tes t s of significance for the main ef fec ts and two factor in terac t ions . The response , or change in fatigue s t rength associated with any of the test var iab les , is dependent on specif ic values assigned to the other two var iab les . All th ree fac tors a r e significant, the re fore , because of the in terre la t ionships which determine fatigue s t rength. This load position interact ion, however, is not fully understood. Continuing analytical and experimental s tudies a r e needed to c la r i fy this re lat ionship. The information used to de termine significance is l isted in Table XXVI. Table XXVI and Figures 73 and 74 a r e tabular and graphical representa t ions of the tes t for significance of f ac to r s and interact ions .
BASIC MATERIAL STRENGTH
An ideal bending s t r e s s calculation would permi t d i rec t cor re la t ion with •he basic mater ia l s t rength . R. R. Moore rotat ing beam fatigue test data were compared with fatigue gear test data to de termine the degree of c o r -relation. The R. R. Moore rotat ing beam specimens a r e related to gears a s descr ibed in the following pa ragraphs .
Type of Loading
The R. R. Moore S/N curve shown in Figure 75 p resen t s the basic bend-ing s t rength of the carbur ized AMS-6265 mate r ia l of the test g e a r s . The endurance limit of the R. R. Moore ba r s was slightly lower than the en-durance limit establ ished for spur gears during a different test . The two-direct ional load endurance limit was 128,000 pounds per square inch. This ^ould represen t the slight d i f ference between different ht ats of the same mate r ia l . The upper line in Figure 75 r ep re sen t s the R. R. Moore fatigue data a f t e r cor rec t ion for one-direct ion load cha rac te r i s t i c of the loading mode used during gear fatigue test ing. The cor rec ted endurance limit was 175,000 pounds per square inch. A modified Goodman d iagram (Figure 76) was used to co r r ec t R. R. Moore fatigue data. Construct ion and use of the Goodman d iagram were established during spur gear t e s t -ing.6
105
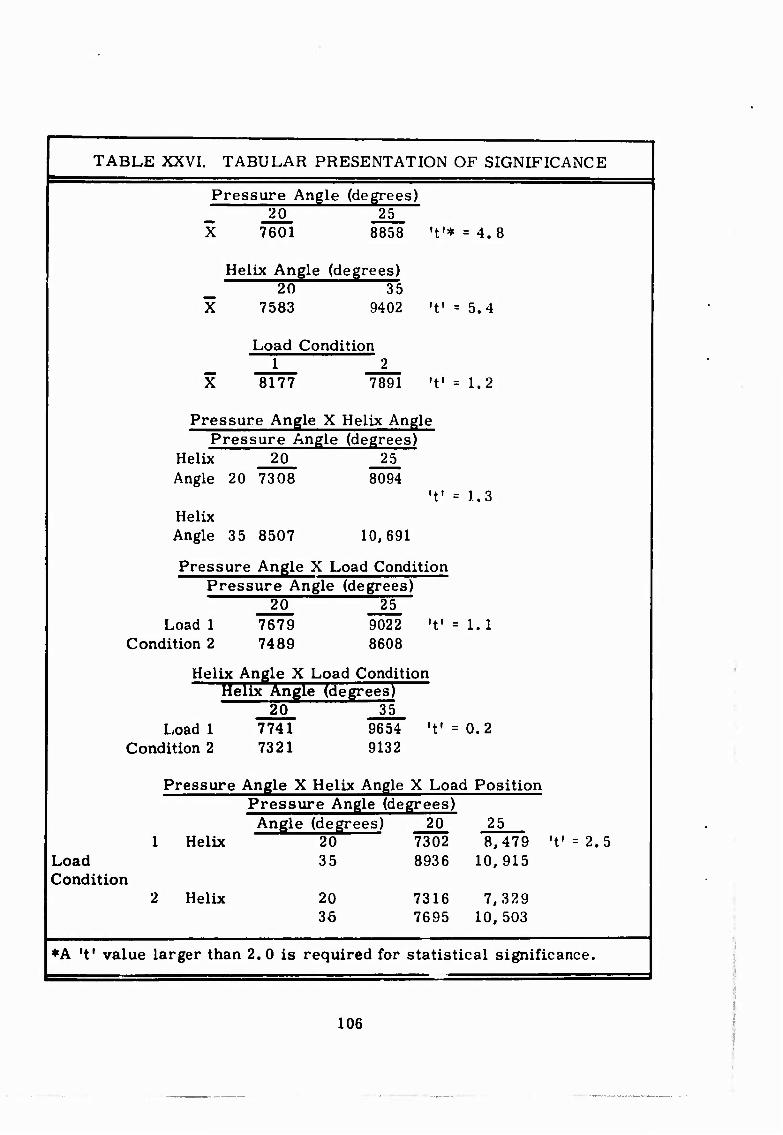
TABLE XXVI. TABULAR PRESENTATION OF SIGNIFICANCE
Pressure Angle (degrees) 20 25
X 7601 8858 't'* = 4.8
Helix Angle (degrees) 20 35
X 7583 9402 •ft =
Load Condition
X 8177 7891 • ♦•
5.4
1.2
Pressure Angle X Helix Angle Pressure Angle (degrees)
Helix 20 25 Angle 20 7308 8094
1.3 Helix Angle 35 8507 10,691
Pressure Angle X Load Condition Pressure Angle (degrees)
20 25 Load 1 7679 9022 't' = 1.1
Condition 2 7489 8608
Helix Angle X Load Condition Helix Angle (degrees)
20 35 Load 1 7741 9654
Condition 2 7321 9132 •t1 0.2
Load Condition
Pressure Angle X Helix Angle X Load Position Pressure Angle (degrees) Angle (degrees) 20
1 Helix 20 " 7302 35 8936
25 8,479 't' = 2.5
10.915
Helix 20 30
7316 7,329 7695 10,503
♦A 't' value larger than 2.0 is required for statistical significance.
106
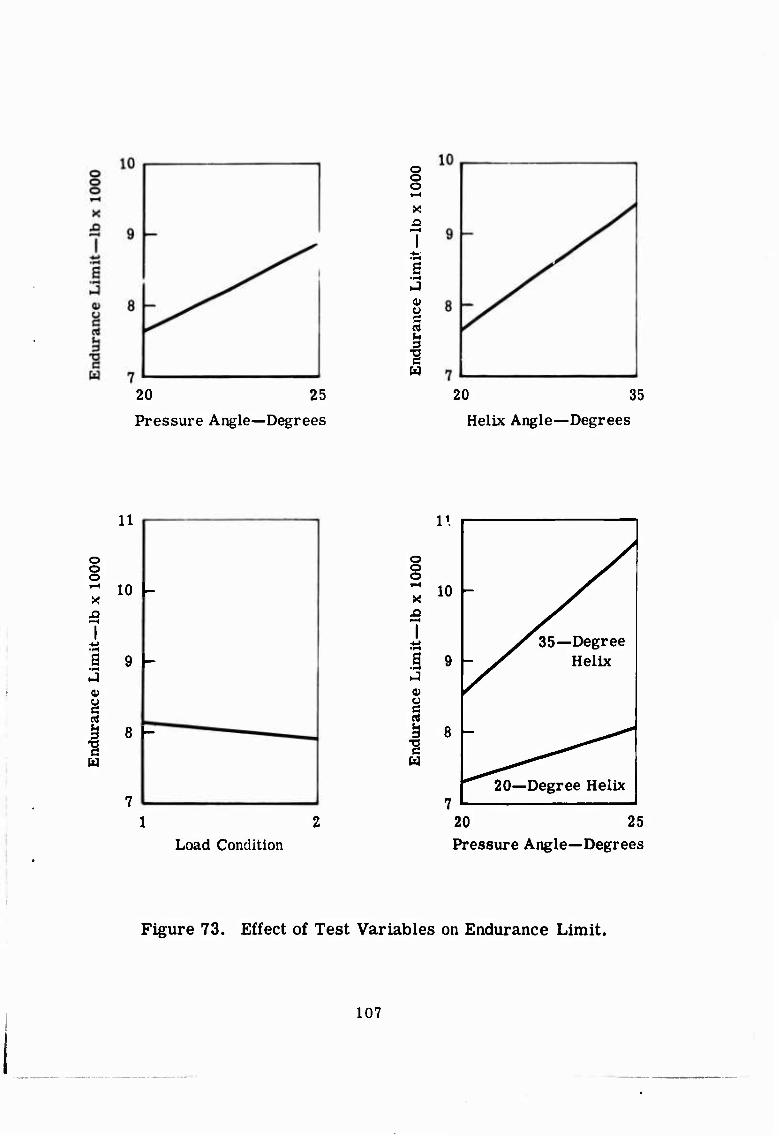
20 25
Pressure Angle—Degrees
o o o i-H
X ja
u c u
I 20 35
Helix Angle—Degrees
o o o r-t
X XI
S •.-I
A at
| I
11
10 -
9 -
8 -
o o o
X
0)
'S
i1.
10
I 9 35 —Degree
Helix
20—Degree Helix
Load Condition 20 25 Pressure Angle—Degrees
Figure 73. Effect of Test Variables on Endurance Limit.
107
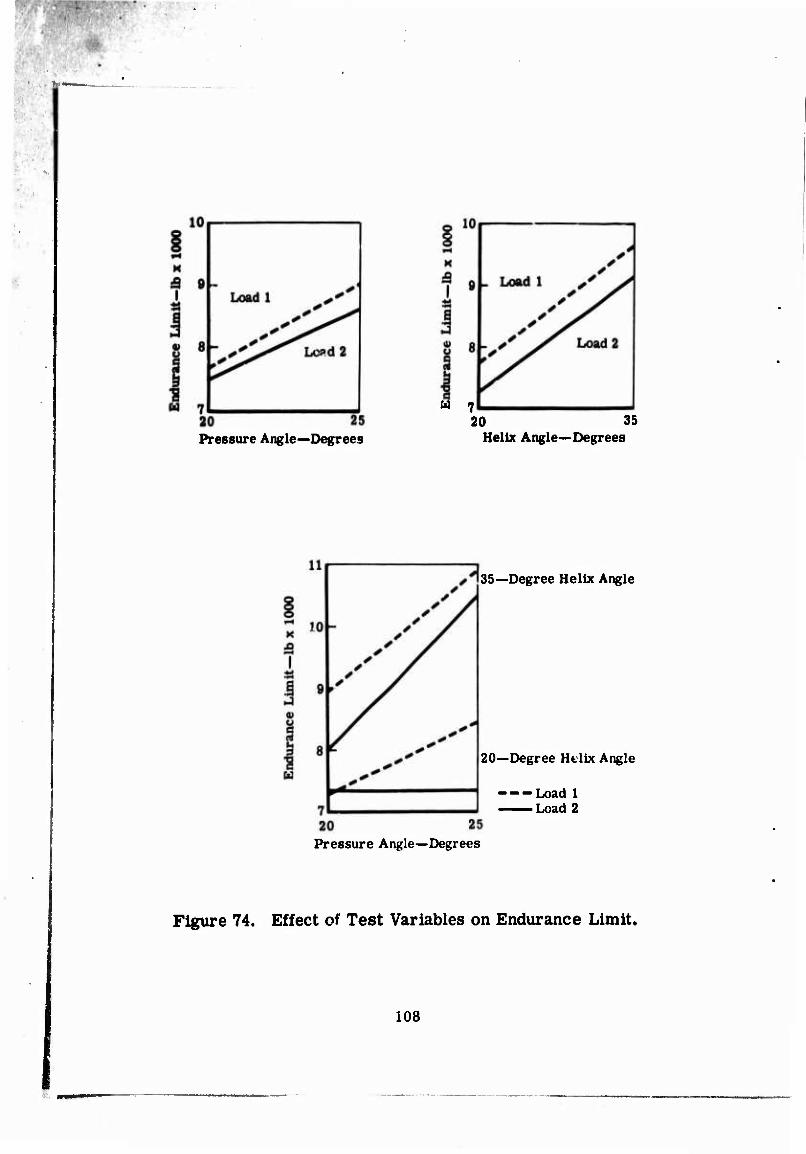
H 7
Pressure Angle—Degrees 20 35
Helix Angle—Degrees
35—Degree Helix Angle
20—Degree Helix Angle
Load 1 Load 2
Pressure Angle—Degrees
Figure 74. Effect of Test Variables on Endurance Limit.
I 108
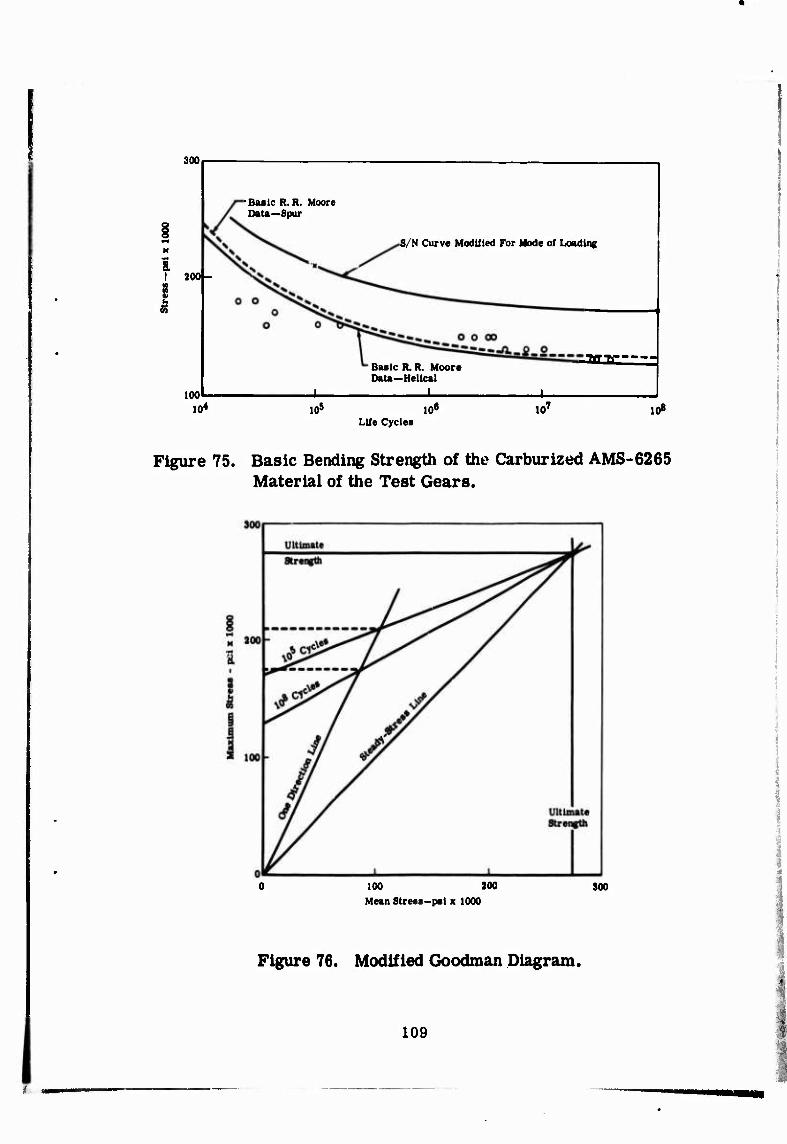
300
I S
200-
100
-Basic R.R. Moore Data—Spur
S/N Curve Modified For Mode of Loading
' Baalc R. R, Moore Data—Helical
aaa
10< 10» JO« 10' 10« Life Cycles
Figure 75. Basic Bending Strength of the Carburized AMS-6265 Material of the Test Gears.
100 200 Mean Stress—pel x 1000
300
Figure 76. Modified Goodman Diagram.
109
■ <■
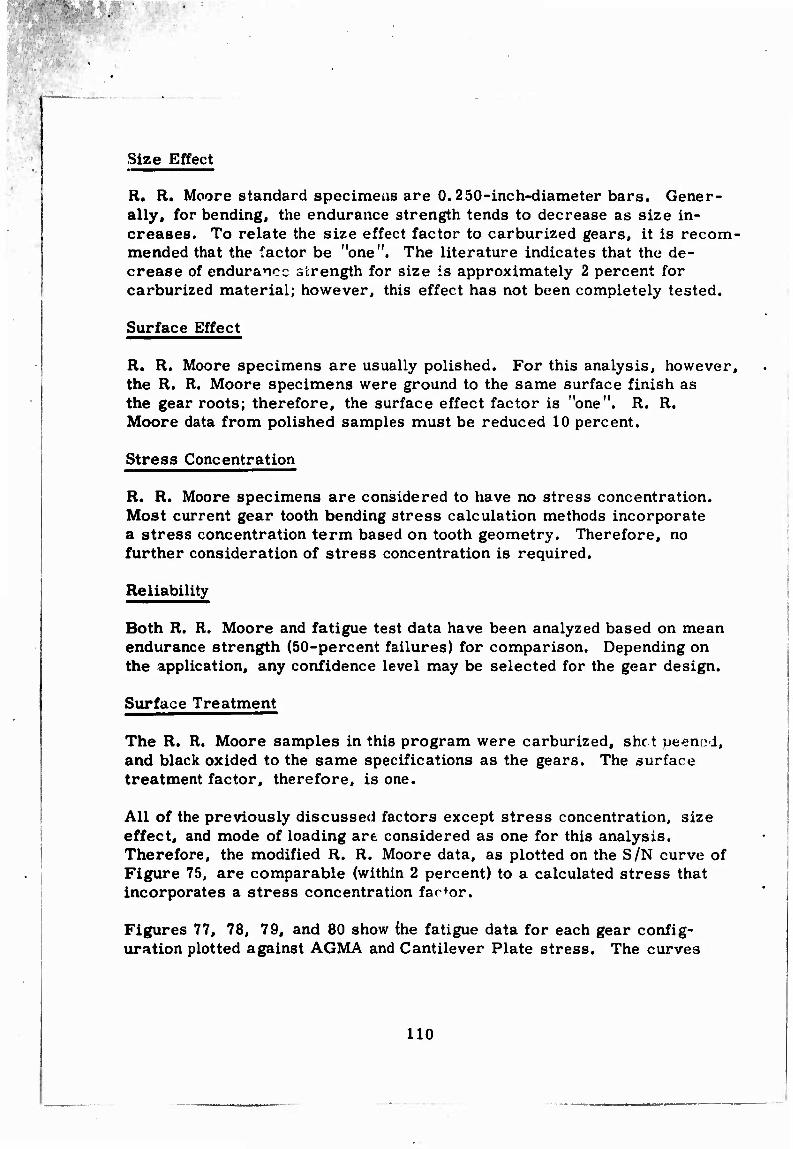
Size Effect
R. R. Moore standard speciraeiis are 0.250-inch-diameter bars. Gener- ally, for bending, the endurance strength tends to decrease as size in- creases. To relate the size effect factor to carburized gears, it is recom- mended that the factor be "one". The literature indicates that the de- crease of endurance strength for size is approximately 2 percent for carburized material; however, this effect has not been completely tested.
Surface Effect
R. R. Moore specimens are usually polished. For this analysis, however, the R. R. Moore specimens were ground to the same surface finish as the gear roots; therefore, the surface effect factor is "one". R. R. Moore data from polished samples must be reduced 10 percent.
Stress Concentration
R. R. Moore specimens are considered to have no stress concentration. Most current gear tooth bending stress calculation methods incorporate a stress concentration term based on tooth geometry. Therefore, no further consideration of stress concentration is required.
Reliability
Both R. R. Moore and fatigue test data have been analyzed based on mean endurance strength (50-percent failures) for comparison. Depending on the application, any confidence level may be selected for the gear design.
Surface Treatment
The R. R. Moore samples in this program were carburized, shet peenci, and black oxided to the same specifications as the gears. The surface treatment factor, therefore, is one.
All of the previously discussed factors except stress concentration, size effect, and mode of loading are considered as one for this analysis. Therefore, the modified R. R. Moore data, as plotted on the S/N curve of Figure 75, are comparable (within 2 percent) to a calculated stress that incorporates a stress concentration far+or.
Figures 77, 78, 79, and 80 show the fatigue data for each gear config- uration plotted against AGMA and Cantilever Plate stress. The curves
110

300 r-
Pressure Angle 20 Degrees Helix Angle 20 Degrees Pitch 6 Teeth 24
V
(0
I 200 to
b
100
r R. R. Moore Material Strength
D—Cantilever Plate O — AGMA
Life Cycles
Figure 77. Fatigue Test Data As Calculated Stress—EX-84117.
300
Pressure Angle 25 Degrees Helix Angle 20 Degrees Pitch t Teeth 24
I in in 0)
100
Life Cycles
Figure 78. Fatigue Test Data As Calculated Stress—EX-84118.
ill

. '
.
Pressure Angle 20 Degrees Helix Angle 35 Degrees Pitch 6 Teeth 24
' R. R. Moore Material Strength
O-AGMA O—Cantilever Plate
Life Cycles
Figure 79. Fatigue Test Data As Calculated Stress—EX-84119.
8. «0 « 0)
Life Cycles
Figure 80. Fatigue Test Data As Calculated Stress—EX-84120.
112
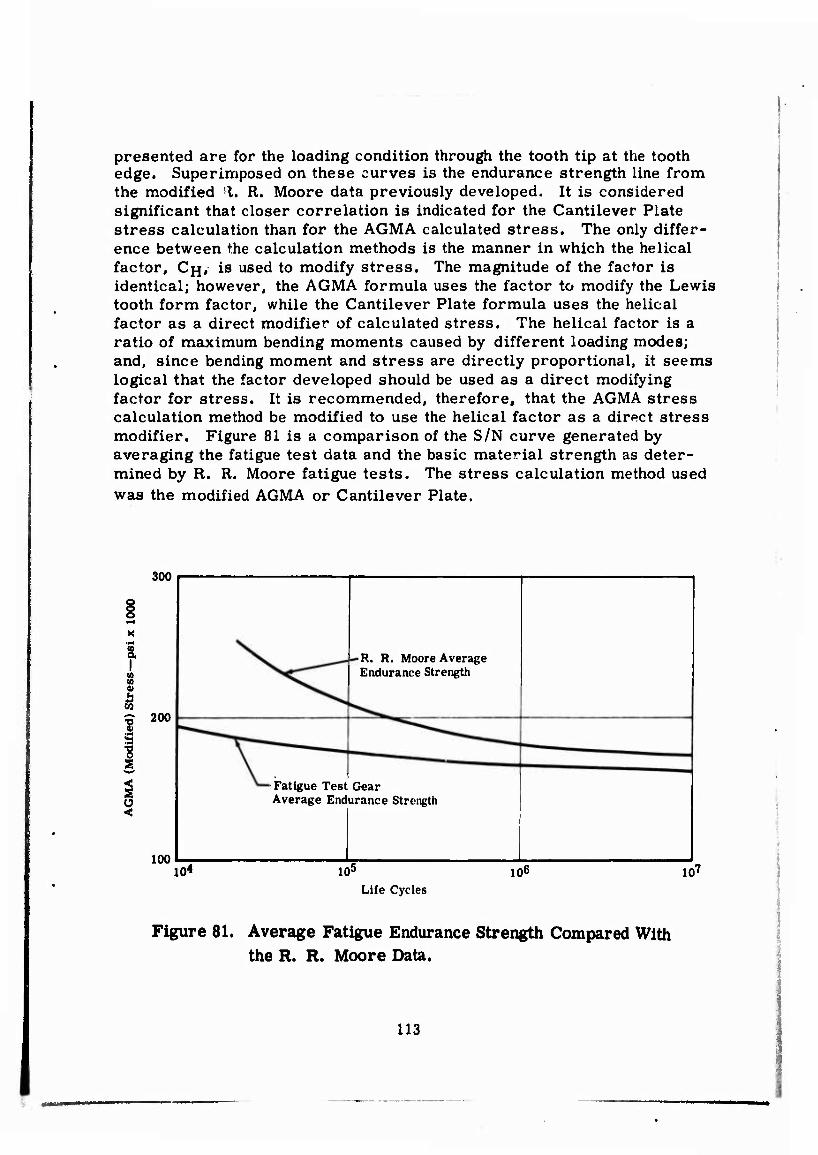
presented are for the loading condition through the tooth tip at the tooth edge. Superimposed on these curves is the endurance strength line from the modified l. R. Moore data previously developed. It is considered significant that closer correlation is indicated for the Cantilever Plate stress calculation than for the AGMA calculated stress. The only differ- ence between the calculation methods is the manner in which the helical factor, CJJ, is used to modify stress. The magnitude of the factor is identical; however, the AGMA formula uses the factor to modify the Lewis tooth form factor, while the Cantilever Plate formula uses the helical factor as a direct modifier of calculated stress. The helical factor is a ratio of maximum bending moments caused by different loading modes; and, since bending moment and stress are directly proportional, it seems logical that the factor developed should be used as a direct modifying factor for stress. It is recommended, therefore, that the AGMA stress calculation method be modified to use the helical factor as a direct stress modifier. Figure 81 is a comparison of the S/N curve generated by averaging the fatigue test data and the basic material strength as deter- mined by R. R. Moore fatigue tests. The stress calculation method used was the modified AGMA or Cantilever Plate.
300
a i 8 h m | 200
1
100
•R. R. Moore Average Endurance Strength
■ Fatigue Test Gear Average Endurance Strength
10* 105 106 107 Life Cycles
Figure 81. Average Fatigue Endurance Strength Compared With the R. R. Moore Data.
113
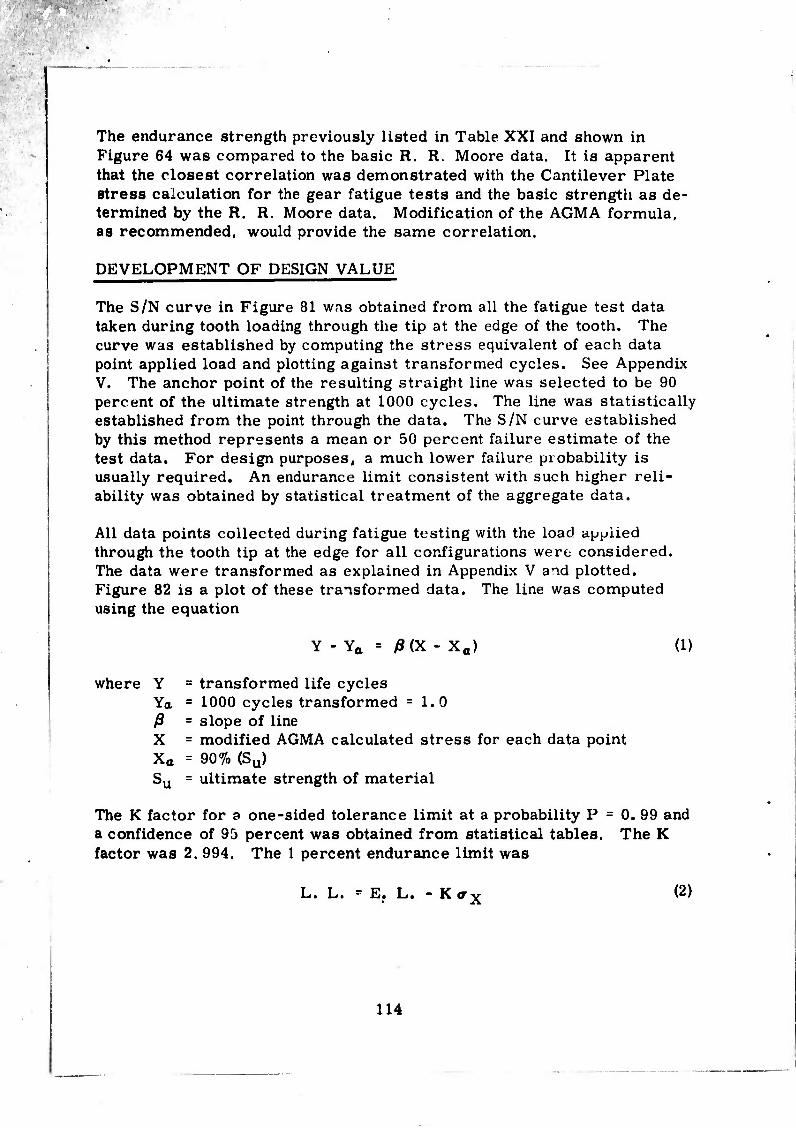
■
•
The endurance strength previously listed in Table XXI and shown in Figure 64 was compared to the basic R. R. Moore data. It is apparent that the closest correlation was demonstrated with the Cantilever Plate stress calculation for the gear fatigue tests and the basic strength as de- termined by the R. R. Moore data. Modification of the AGMA formula, as recommended, would provide the same correlation.
DEVELOPMENT OF DESIGN VALUE
The S/N curve in Figure 81 wns obtained from all the fatigue test data taken during tooth loading through the tip at the edge of the tooth. The curve was established by computing the stress equivalent of each data point applied load and plotting against transformed cycles. See Appendix V. The anchor point of the resulting straight line was selected to be 90 percent of the ultimate strength at 1000 cycles. The line was statistically established from the point through the data. The S/N curve established by this method represents a mean or 50 percent failure estimate of the test data. For design purposes, a much lower failure probability is usually required. An endurance limit consistent with such higher reli- ability was obtained by statistical treatment of the aggregate data.
All data points collected during fatigue testing with the load applied through the tooth tip at the edge for all configurations were considered. The data were transformed as explained in Appendix V and plotted. Figure 82 is a plot of these transformed data. The line was computed using the equation
Y - Ya = ß(X- Xa) (1)
where Y = transformed life cycles Ya = 1000 cycles transformed = 1.0 ß = slope of line X = modified AGMA calculated stress for each data point Xa = 90% (Su) Su = ultimate strength of material
The K factor for a one-sided tolerance limit at a probability P = 0. 99 and a confidence of 95 percent was obtained from statistical tables. The K factor was 2. 994. The 1 percent endurance limit was
L. L. = E. L. - K <r X (2)
114
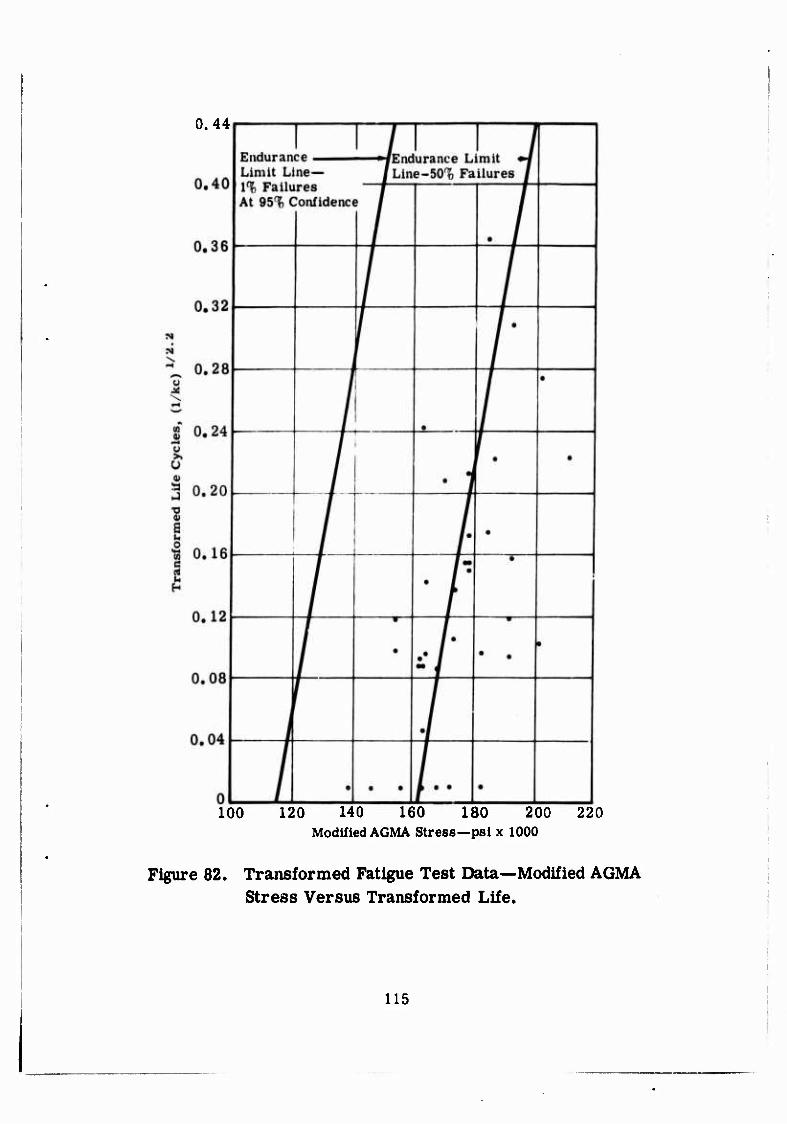
0.44
100 120 140 160 180 200 220 Modified AGMA Stress—psi x 1000
Figure 82. Transformed Fatigue Test Data—Modified AGMA Stress Versus Transformed Life.
115
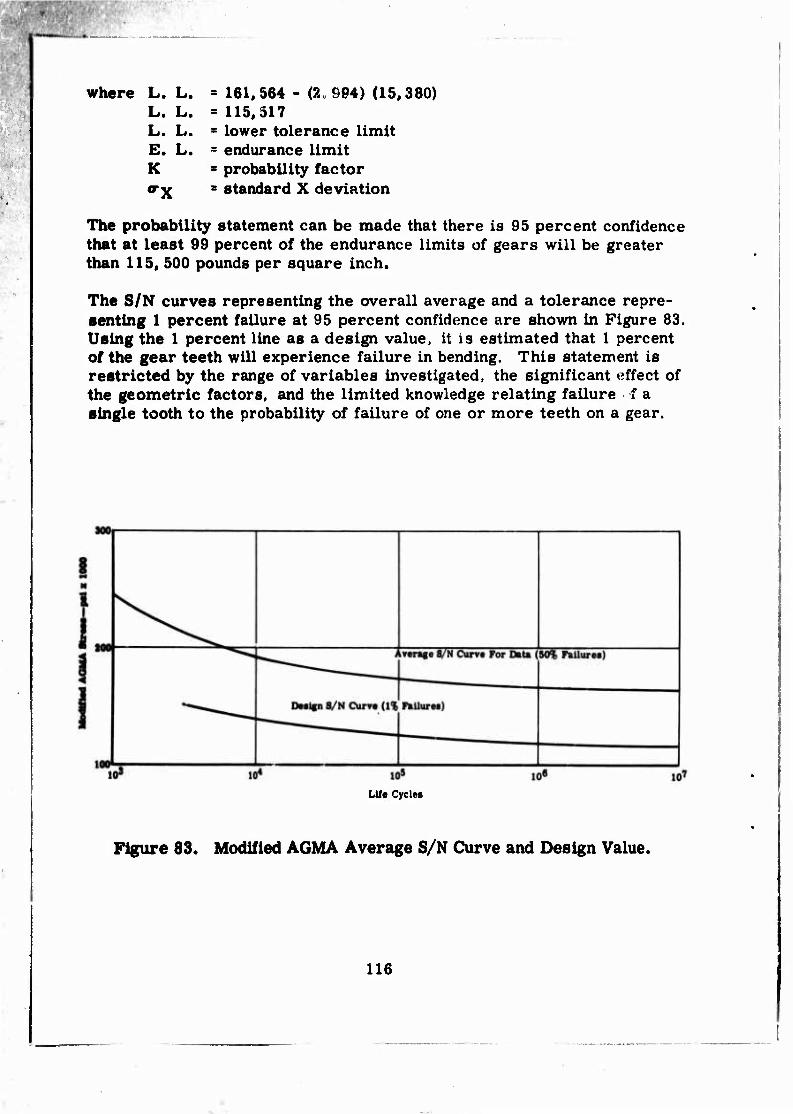
where L. L. « 161.564 - (2 994) (15,380) L. L. = 115,317 L. L. ■ lower tolerance limit E. L. = endurance limit K ■ probability factor
^X ■ standard X deviation
The probability statement can be made that there is 95 percent confidence that at least 99 percent of the endurance limits of gears will be greater than 115, 500 pounds per square inch.
The S/N curves representing the overall average and a tolerance repre- senting 1 percent failure at 95 percent confidence are shown in Figure 83. Using the 1 percent line as a design value, it is estimated that 1 percent of the gear teeth will experience failure in bending. This statement is restricted by the range of variables investigated, the significant effect of the geometric factors, and the limited knowledge relating failure f a single tooth to the probability of failure of one or more teeth on a gear.
Life Cycle*
Figure 83. Modified AGMA Average S/N Curve and Design Value.
116
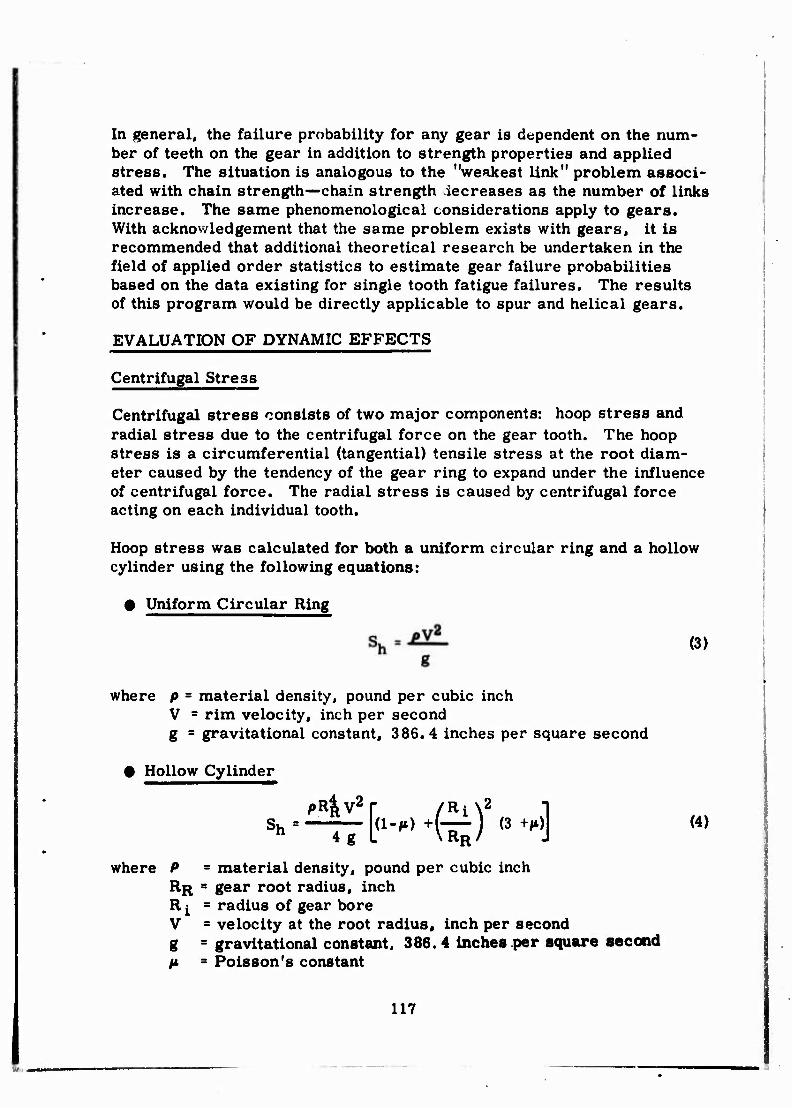
In general, the failure probability for any gear is dependent on the num- ber of teeth on the gear in addition to strength properties and applied stress. The situation is analogous to the "weakest link" problem associ- ated with chain strength—chain strength iecreases as the number of links increase. The same phenomenological considerations apply to gears. With acknowledgement that the same problem exists with gears« it is recommended that additional theoretical research be undertaken in the field of applied order statistics to estimate gear failure probabilities based on the data existing for single tooth fatigue failures. The results of this program would be directly applicable to spur and helical gears.
EVALUATION OF DYNAMIC EFFECTS
Centrifugal Stress
Centrifugal stress consists of two major components: hoop stress and radial stress due to the centrifugal force on the gear tooth. The hoop stress is a circumferential (tangential) tensile stress at the root diam- eter caused by the tendency of the gear ring to expand under the influence of centrifugal force. The radial stress is caused by centrifugal force acting on each individual tooth.
Hoop stress was calculated for both a uniform circular ring and a hollow cylinder using the following equations:
Uniform Circular Ring
(3)
where /> = material density, pound per cubic inch V = rim velocity, inch per second g = gravitational constant, 386.4 inches per square second
Hollow Cylinder
[(1.M) +g)2 (3 +M,] (4) pR^V2r /R^2
Sh = 4g L \RR
where P = material density, pound per cubic inch RR " gear root radius, inch R i = radius of gear bore V * velocity at the root radius« inch per second g s gravitational constant. 386.4 inches per square second /* » Poisson's constant
117
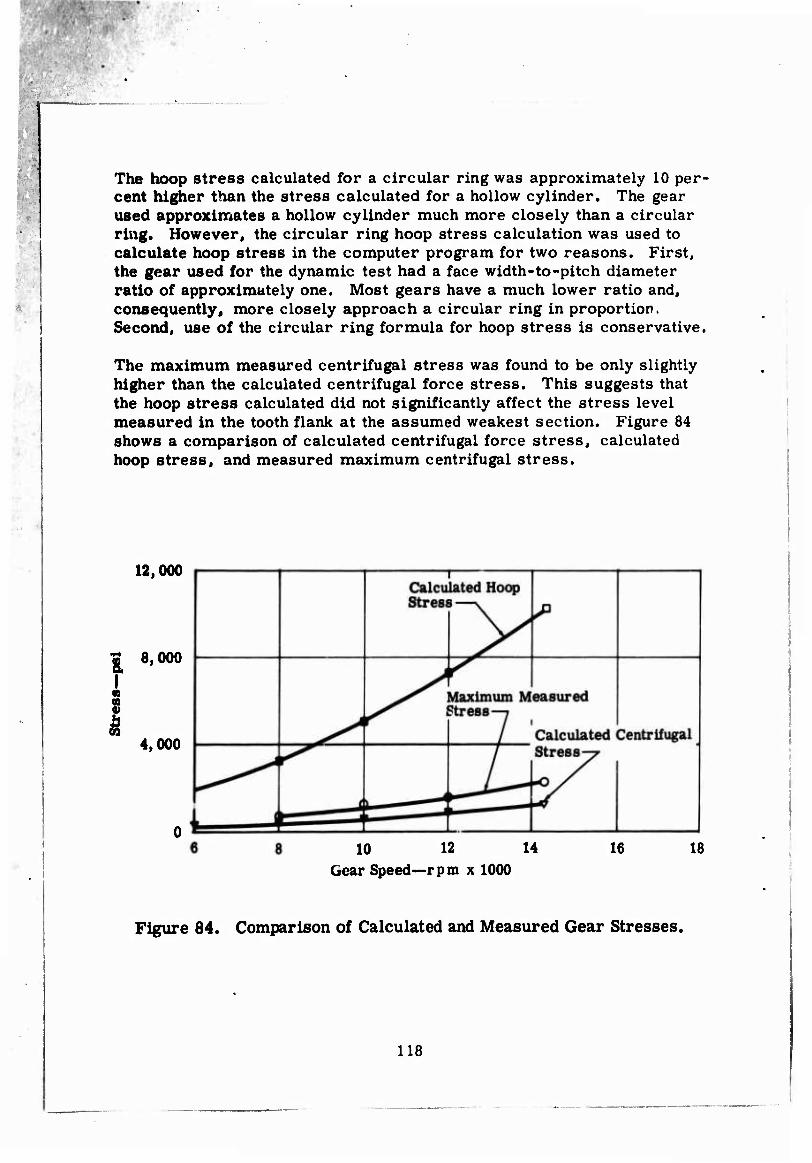
The hoop stress calculated for a circular ring was approximately 10 per- cent higher than the stress calculated for a hollow cylinder. The gear used approximates a hollow cylinder much more closely than a circular ring. However, the circular ring hoop stress calculation was used to calculate hoop stress in the computer program for two reasons. First, the gear used for the dynamic test had a face width-to-pitch diameter ratio of approximately one. Most gears have a much lower ratio and, consequently« more closely approach a circular ring in proportion. Second, use of the circular ring formula for hoop stress is conservative.
The maximum measured centrifugal stress was found to be only slightly higher than the calculated centrifugal force stress. This suggests that the hoop stress calculated did not significantly affect the stress level measured in the tooth flank at the assumed weakest section. Figure 84 shows a comparison of calculated centrifugal force stress, calculated hoop stress, and measured maximum centrifugal stress.
12,000
8. i S
8,000
4,000
10 12 14 Gear Speed—rpm x 1000
Figure 84. Comparison of Calculated and Measured Gear Stresses.
118
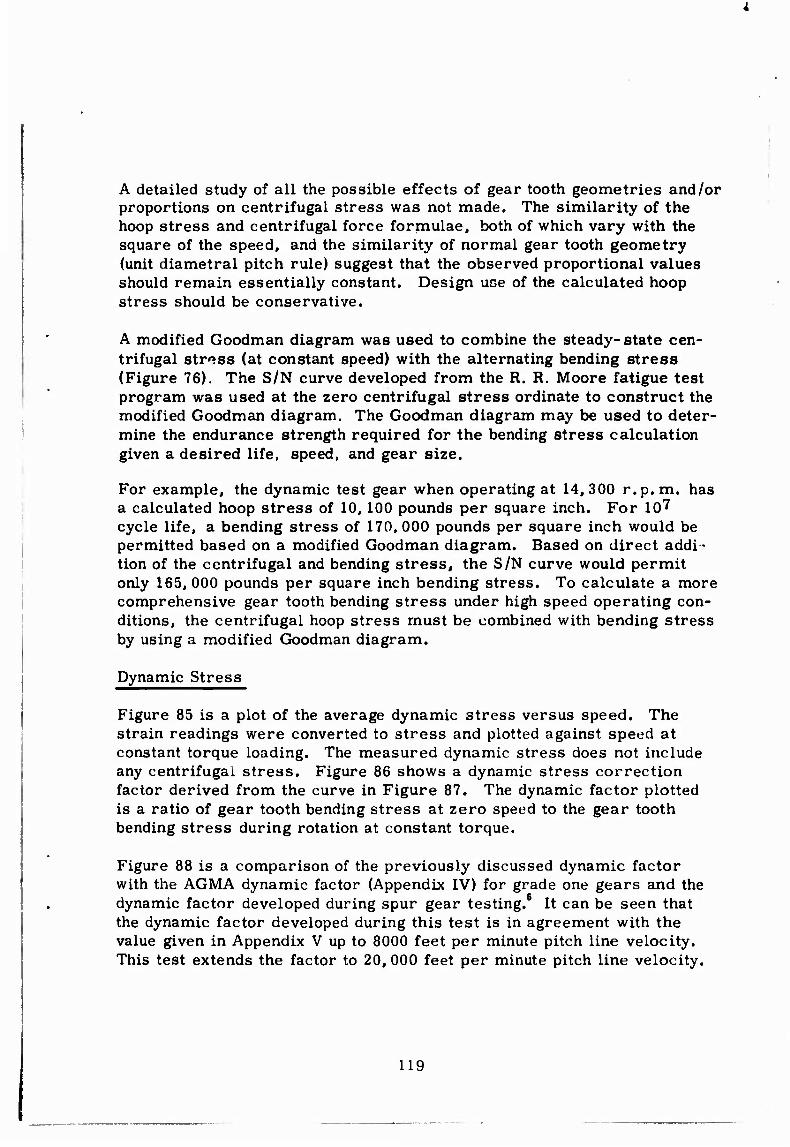
A detailed study of all the possible effects of gear tooth geometries and/or proportions on centrifugal stress was not made. The similarity of the hoop stress and centrifugal force formulae, both of which vary with the square of the speed, and the similarity of normal gear tooth geometry (unit diametral pitch rule) suggest that the observed proportional values should remain essentially constant. Design use of the calculated hoop stress should be conservative.
A modified Goodman diagram was used to combine the steady-state cen- trifugal stress (at constant speed) with the alternating bending stress (Figure 76). The S/N curve developed from the R. R. Moore fatigue test program was used at the zero centrifugal stress ordinate to construct the modified Goodman diagram. The Goodman diagram may be used to deter- mine the endurance strength required for the bending stress calculation given a desired life, speed, and gear size.
For example, the dynamic test gear when operating at 14,300 r.p.m. has a calculated hoop stress of 10,100 pounds per square inch. For 10^ cycle life, a bending stress of 170,000 pounds per square inch would be permitted based on a modified Goodman diagram. Based on direct addi- tion of the centrifugal and bending stress, the S/N curve would permit only 165, 000 pounds per square inch bending stress. To calculate a more comprehensive gear tooth bending stress under high speed operating con- ditions, the centrifugal hoop stress must be combined with bending stress by using a modified Goodman diagram.
Dynamic Stress
Figure 85 is a plot of the average dynamic stress versus speed. The strain readings were converted to stress and plotted against speed at constant torque loading. The measured dynamic stress does not include any centrifugal stress. Figure 86 shows a dynamic stress correction factor derived from the curve in Figure 87. The dynamic factor plotted is a ratio of gear tooth bending stress at zero speed to the gear tooth bending stress during rotation at constant torque.
Figure 88 is a comparison of the previously discussed dynamic factor with the AGMA dynamic factor (Appendix IV) for grade one gears and the dynamic factor developed during spur gear testing. It can be seen that the dynamic factor developed during this test is in agreement with the value given in Appendix V up to 8000 feet per minute pitch line velocity. This test extends the factor to 20, 000 feet per minute pitch line velocity.
119
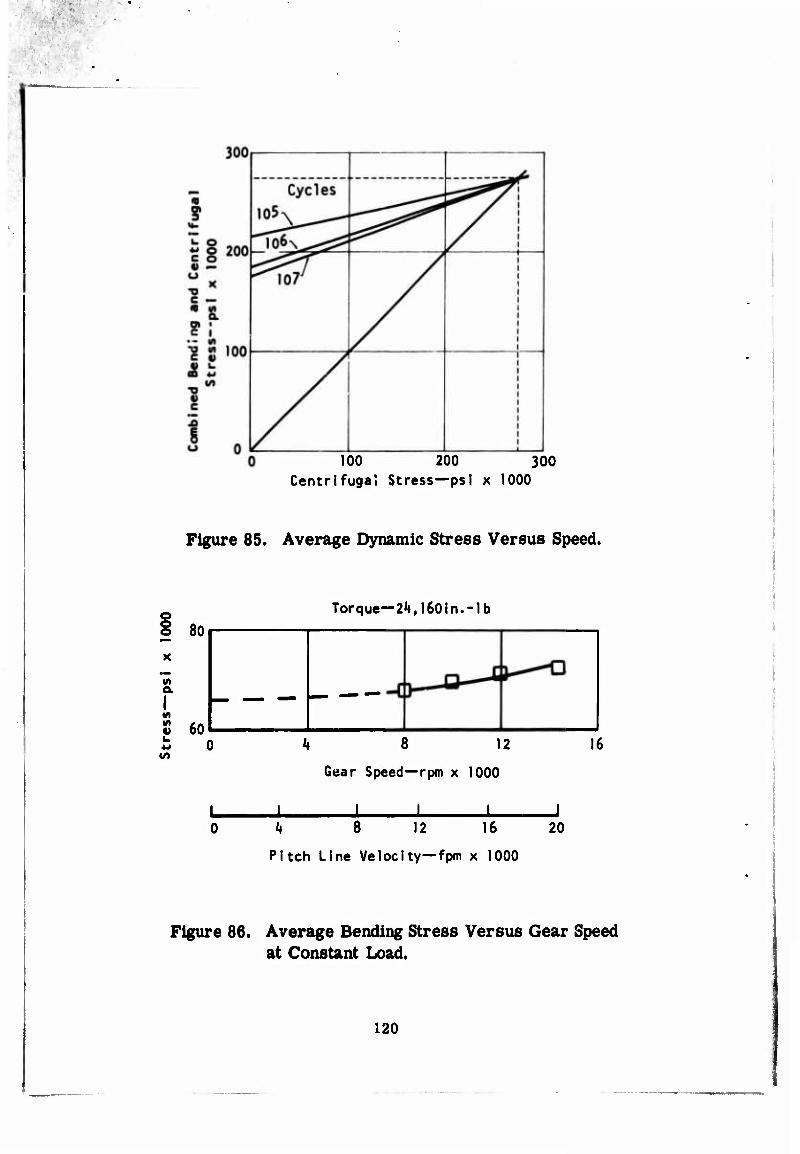
100 200 300 Centrlfuga» Stress—psl x 1000
Figure 85. Average Dynamic Stress Versus Speed.
80
in a
t 60 «/>
Torque—2*», 1601 n.-lb
i« 8 12
Gear Speed—rpm x 1000
I I J. k 8 12 16
Pitch Line Velocity—fpm x 1000
20
16
Figure 86. Average Bending Stress Versus Gear Speed at Constant Load.
120
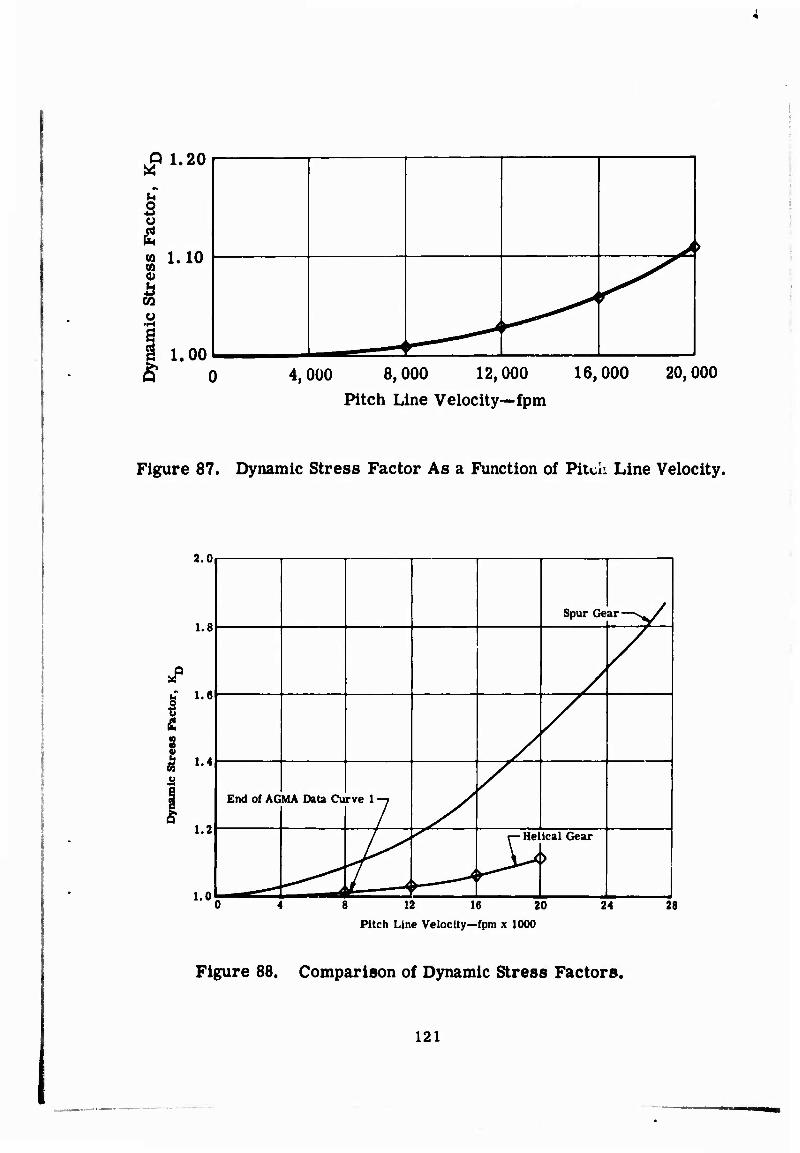
^1.20
»4
2 u &
S i-io
1.00 i
4,000 8,000 12,000 16,000 20,000 Pitch Line Velocity—fpm
Figure 87. Dynamic Stress Factor As a Function of Pitch Line Velocity.
2.0
1.8
b 1.6 I &
s «I
1.2
1.0
Spur Ge ar->y/
/
/
/
/
End of AG MA DataCu rve 1-7 /
k S r-Hel ical Gear
>
12 16 20 Pitch Line Velocity—fpm x 1000
24 28
Figure 88. Comparison of Dynamic Stress Factors.
121
■ • ■ .
■
l
■
The magnitude of the dynamic factor developed for helical gears is sig- nificantly different from that developed for spur gears. The spur gear used to develop the dynamic factor was a thin webbed gear operating in a multiple gear, gear train. Therefore, it would be more subject to tor- sional vibrations and resonances. The helical gear used was a short, heavy, webbed gear operating in a single-stage reduction unit. This shape. In conjunction with the inherently higher overlap ratio (load sharing) avail- able with helical gearing, should combine to reduce the dynamic effect on bending stress considerably. The dynamic factor curve (Figure 88) shown may represent the design limits that should be observed. Further definition of the dynamic factor will require an extensive program to define the effect of overlap ratio, gear geometry, rim-web proportions, etc. Although the dynamic data presented are limited, they do indicate trends for high speed helical gearing. It is recommended, therefore, that Figure 88 be used to extend the AGMA dynamic factor curve from 8000 to 20, 000 feet per minute.
ESTABLISHMENT OF COMPUTER PROGRAM
Analysis of the fatigue test data indicates that the Cantilever Plate formu- la produces the least variation in calculated endurance limits, reasonably predicts the actual tooth root stress, and accommodates the effect of the geometric variables with reasonable accuracy. Analysis of the AGMA and Cantilever Plate calculation methods showed that the only difference between the two methods was in the use of the helical modifying factor; however, the absolute value of the factor is the same in both formulae. It is therefore recommended that the AGMA formula be modified so that the helical factor is used to modify stress directly rather than used to modify the magnitude of the tooth form factor. The form of the modified AGMA formula would be
(5,
where S^ = bending stress Cjj = helical factor—ratio of the maximum bending moment
caused by tip loading to the maximum bending moment pro- duced by equal intensity loading along the inclined load line
W^ = transmitted tangential load P^X = transverse diametral pitch F = net face width J = geometry factor
122

where Y = tooth form factor =
J = Y COs2^ (6) Kf mn
1.0
cos
COS
*__Ln f1'5 tan g Ln "I ^n L X t J n
(See Appendix V for definition of terms)
The geometry factor is established in the transverse plane for the specific tooth geometry under consideration. The computer program does not re- quire a consideration of a virtual equivalent spur gear at one diametral pitch to establish the geometry factor. The Lewis inscribed parabola for tip loading is used to establish the location of the weakest section of the actual tooth. Computer calculation of the geometry factor should be more accurate than the values obtained from graphical layouts.
Inclusion of the helical factor in the AGMA formula requires accurate de- termination of the helical factor to produce an accurate calculated stress. The helical factor for the narrow face width gears used in this test varied from the value given in Figure A-3 of AGMA 221. 02 (Appendix V) by as much as 12 percent. Accordingly, the computer program incorporates a subroutine to calculate the helical factor. The subroutine calculates the helical factor by the principle of superposition of the moment-image Cantilever Plate bending moment distribution curves as proposed by Wellauer and Seirig.1 Use of the subroutine to calculate the helical factor eliminates the need for total reliance on the AGMA helical factor graph, and also eliminates the need for a time-consuming graphical analysis to determine the helical factor.
A dynamic factor is an input item of the computer program. The dynamic factor for a given application may be obtained from existing AGMA curves, the curve presented in Figure 88, literature sources, or from direct "in-house" measurements.
Hoop stress is calculated in the program and combined with the AGMA calculated bending stress based on the modified Goodman diagram. A mathematical expression for the combined stress is
US [US - (Sh - St)] Sc = US - (7) c US - Sh
123

where Sc = combined stress, psi S^ = hoop stress, psi (Equation 3) St = tensile stress (AGMA), psi (Table II) US = ultimate strength of the material, psi
Life cycles are then determined from the combined stress and the S/N curve based on R. R. Moore rotating beam tests of the gear material. The life may be modified further by the AGMA temperature factor and reliability factor (factor of safety) as indicated by the expression
L = f (Sc KT KR)
where L = life, cycles Sc = combined stress, psi K-p = AGMA temperature factor (Table II) KR » AGMA factor of safety (Table II)
Both AGMA bending stress and the combined bending and hoop stresses are printed out. Life is printed out if it is in the finite life area of the modified Goodman diagram; otherwise, an infinite life or an excessive stress note is printed.
124

CONCLUSIONS
The following conclusions are made from this study.
• A modified form of AGMA Standard 221. 02 was found to provide ac- curate correlation with the actual material strength. The modification consisted of utilizing the helical factor, Cy, as a direct stress modi- fier rather than as a tooth form factor operator.
• A basic material strength curve for carburized AMS-6265 was estab- lished by R. R. Moore specimens. This strength curve correlated with the stress which was calculated by the modified AGMA bending stress formula.
• A design S/N curve was established. For design purposes, a 1- percent failure endurance strength of 115,000 pounds per square inch was statistically established.
• A curve of dynamic factor versus pitch line velocity was developed for applications to 20, 000 feet per minute pitch line velocity.
• A centrifugal speed factor is necessary for high pitch line velocity applications and is included in the final computer program (Appendix III).
• The investigation of two geometric variables and tooth load positions indicated that the endurance strength was significantly affected by changes in pressure and helix angles. These changes were accurately predicated by the AGMA formula.
• The AGMA formula modified to use the helical factor as a direct stress modifier, to incorporate a centrifugal speed effect, to incorpo- rate a dynamic factor for high speed applications, and to use estab- lished R. R. Moore fatigue strength data will produce an accurate estimate of gear tooth bending stress and life. The dynamic fluctuat- ing stress calculated by the modified AGMA formula,
1 Wt K0 Pa KsKmKfM n S. = — 1 CH Kv F Y cos2 </r '
V2
is combined with the steady centrifugal hoop stress formula, S^ =P ; o
to produce a combined stress, Sc,
UsfuS. /Sh +St\l S = US 1 Lü ILL (8)
c US - sh
125
The terms are defined in Equation 7. Life cycles may then be deter- mined from an S/N curve based on R. R. Moore rotating beam fatigue tests of the gear material. The life may be modified by the AGMA temperature and reliability factors as
L = f (Sc Kt Kr) (9)
126
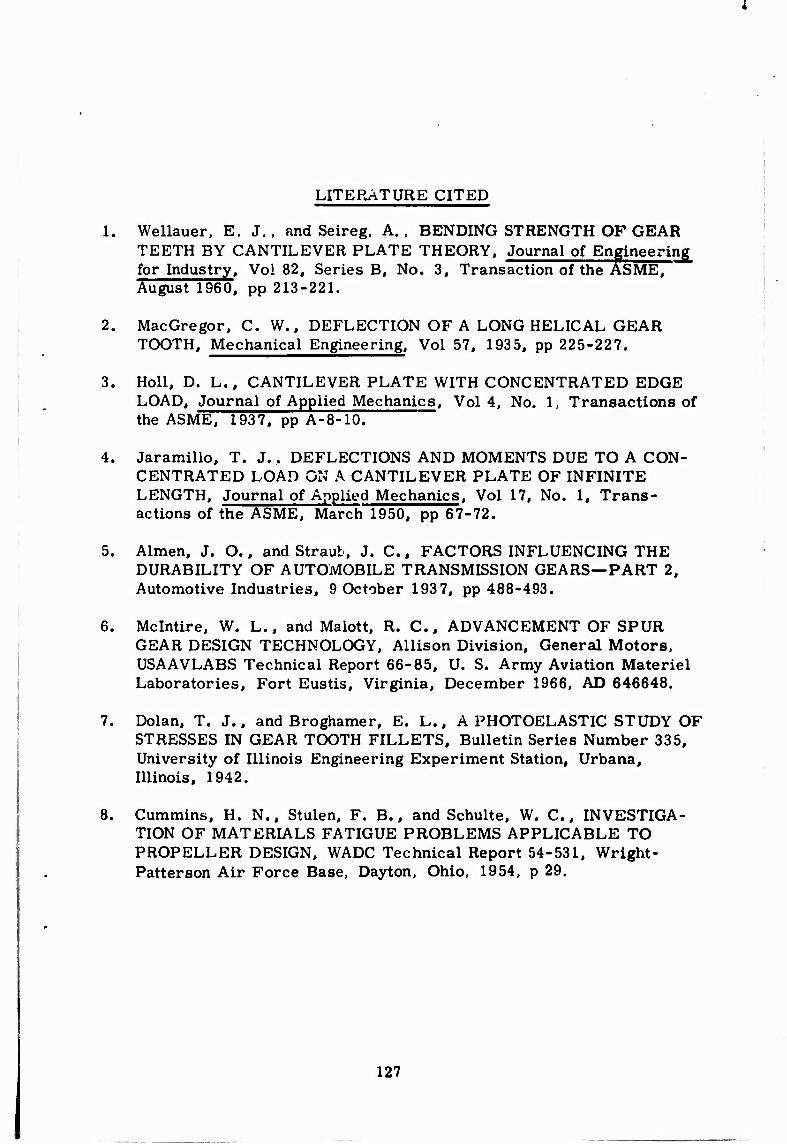
LITERATURE CITED
1. Wellauer, E. J. , and Seireg, A.. BENDING STRENGTH OF GEAR TEETH BY CANTILEVER PLATE THEORY, Journal of Engineering for Industry, Vol 82, Series B, No. 3, Transaction of the ASME, August 1960, pp 213-221.
2. MacGregor, C. W., DEFLECTION OF A LONG HELICAL GEAR TOOTH, Mechanical Engineering, Vol 57, 1935, pp 225-227.
3. Holl, D. L., CANTILEVER PLATE WITH CONCENTRATED EDGE LOAD, Journal of Applied Mechanics, Vol 4, No. 1, Transactions of the ASME, 1937, pp A-8-10.
4. Jaramillo, T. J., DEFLECTIONS AND MOMENTS DUE TO A CON- CENTRATED LOAD ON A CANTILEVER PLATE OF INFINITE LENGTH, Journal of Applied Mechanics. Vol 17, No. 1, Trans- actions of the ASME, March 1950, pp 67-72.
5. Almen, J. O., and Straub, J. C, FACTORS INFLUENCING THE DURABILITY OF AUTOMOBILE TRANSMISSION GEARS—PART 2, Automotive Industries, 9 October 193 7, pp 488-493.
6. Mclntire, W. L., and Malott. R. C, ADVANCEMENT OF SPUR GEAR DESIGN TECHNOLOGY, Allison Division, General Motors, USAAVLABS Technical Report 66-85, U. S. Army Aviation Materiel Laboratories, Fort Eustis, Virginia, December 1966, AD 646648.
7. Dolan, T. J., and Broghamer, E. L., A PHOTOELASTIC STUDY OF STRESSES IN GEAR TOOTH FILLETS, Bulletin Series Number 335, University of Illinois Engineering Experiment Station, Urbana, Illinois, 1942.
8. Cummins, H. N., Stulen, F. B., and Schulte, W. C, INVESTIGA- TION OF MATERIALS FATIGUE PROBLEMS APPLICABLE TO PROPELLER DESIGN, WADC Technical Report 54-531, Wright- Patterson Air Force Base, Dayton, Ohio, 1954, p 29,
127

.
9. Davies, O. L., et al. STATISTICAL METHODS IN RESEARCH AND PRODUCTION, Third Edition, New York, Hafner Publishing Company, 1958.
128
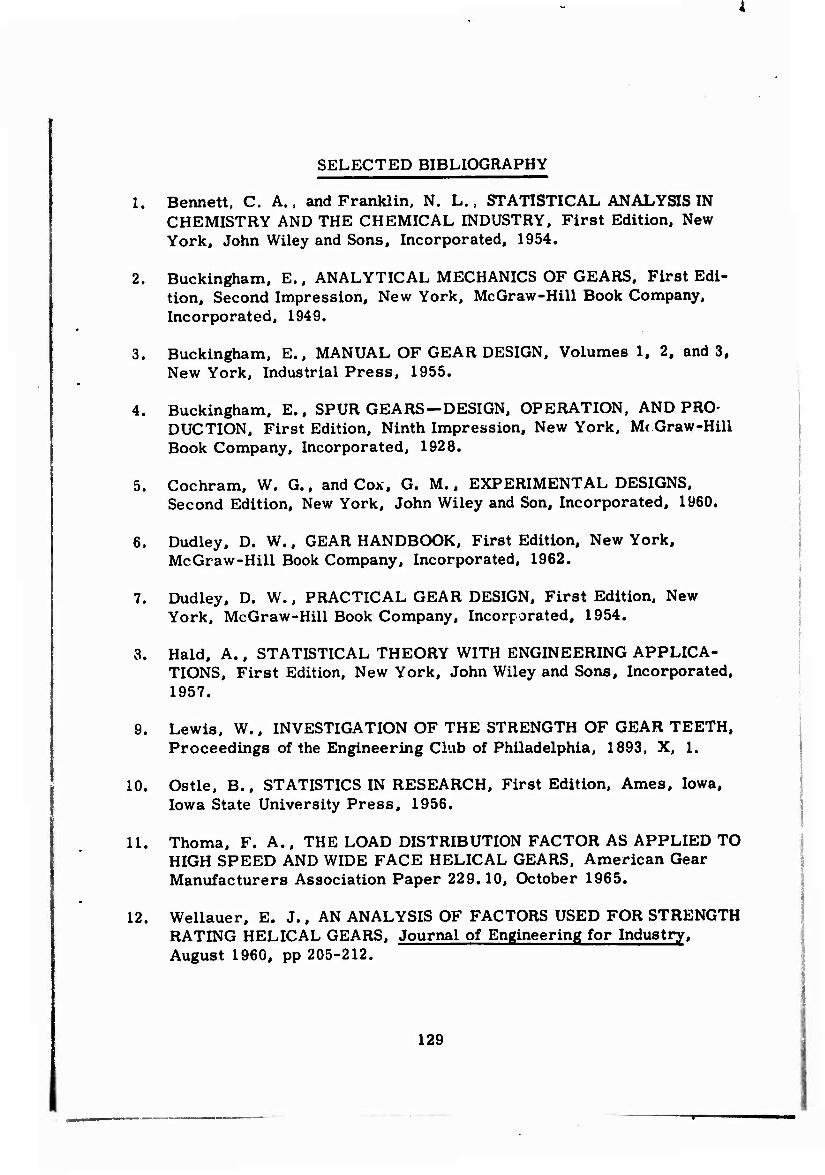
SELECTED BIBLIOGRAPHY
1. Bennett, C. A., and Franklin. N. L., STATISTICAL ANALYSIS IN CHEMISTRY AND THE CHEMICAL INDUSTRY, First Edition, New York, John Wiley and Sons, Incorporated, 1954.
2. Buckingham, E., ANALYTICAL MECHANICS OF GEARS, First Edi- tion, Second Impression, New York, McGraw-Hill Book Company, Incorporated, 1949.
3. Buckingham, E., MANUAL OF GEAR DESIGN, Volumes 1, 2, and 3, New York, Industrial Press, 1955.
4. Buckingham, E., SPUR GEARS—DESIGN, OPERATION, AND PRO- DUCTION, First Edition, Ninth Impression, New York, Mc Graw-Hill Book Company, Incorporated, 1928.
5. Cochram, W. G., and Cox, G. M., EXPERIMENTAL DESIGNS, Second Edition, New York, John Wiley and Son, Incorporated, 1960.
6. Dudley, D. W., GEAR HANDBOOK, First Edition, New York, McGraw-Hill Book Company, Incorporated, 1962.
7. Dudley, D. W., PRACTICAL GEAR DESIGN, First Edition, New York, McGraw-Hill Book Company, Incorporated, 1954.
3. Hald, A., STATISTICAL THEORY WITH ENGINEERING APPLICA- TIONS, First Edition, New York, John Wiley and Sons, Incorporated, 1957.
9. Lewis, W., INVESTIGATION OF THE STRENGTH OF GEAR TEETH, Proceedings of the Engineering Club of Philadelphia, 1893, X, 1.
10. Ostle, B., STATISTICS IN RESEARCH, First Edition, Ames, Iowa, Iowa State University Press, 1956.
11. Thoma, F. A., THE LOAD DISTRIBUTION FACTOR AS APPLIED TO HIGH SPEED AND WIDE FACE HELICAL GEARS, American Gear Manufacturers Association Paper 229.10, October 1965.
12. Wellauer, E. J., AN ANALYSIS OF FACTORS USED FOR STRENGTH RATING HELICAL GEARS, Journal of Engineering for Industry, August 1960, pp 205-212.
129

13. Wellauer, E. J., THE NATURE OF THE HELICAL GEAR OBLIQUE CONTACT LINE, Reprint from Industrial Mathematics. Volume II, Part 2.
14. Wellauer, E. J., HELICAL AND HERRINGBONE GEAR TOOTH DURABILITY—DERIVATION OF CAPACITY AND RATING FORM- ULAS, American Gear Manufacturers Association Paper 229.06, June 1962.
130
APPENDIX I
FATIGUE TEST GEAR DRAWINGS
This appendix consists of the fatigue test gear drawings for the four con- figurations tested. These drawings are shown in Figures 89 through 92. The helical gear propeller reduction drive pinion and propeller drive gear are shown in Figures 93 and 94, respectively.
131
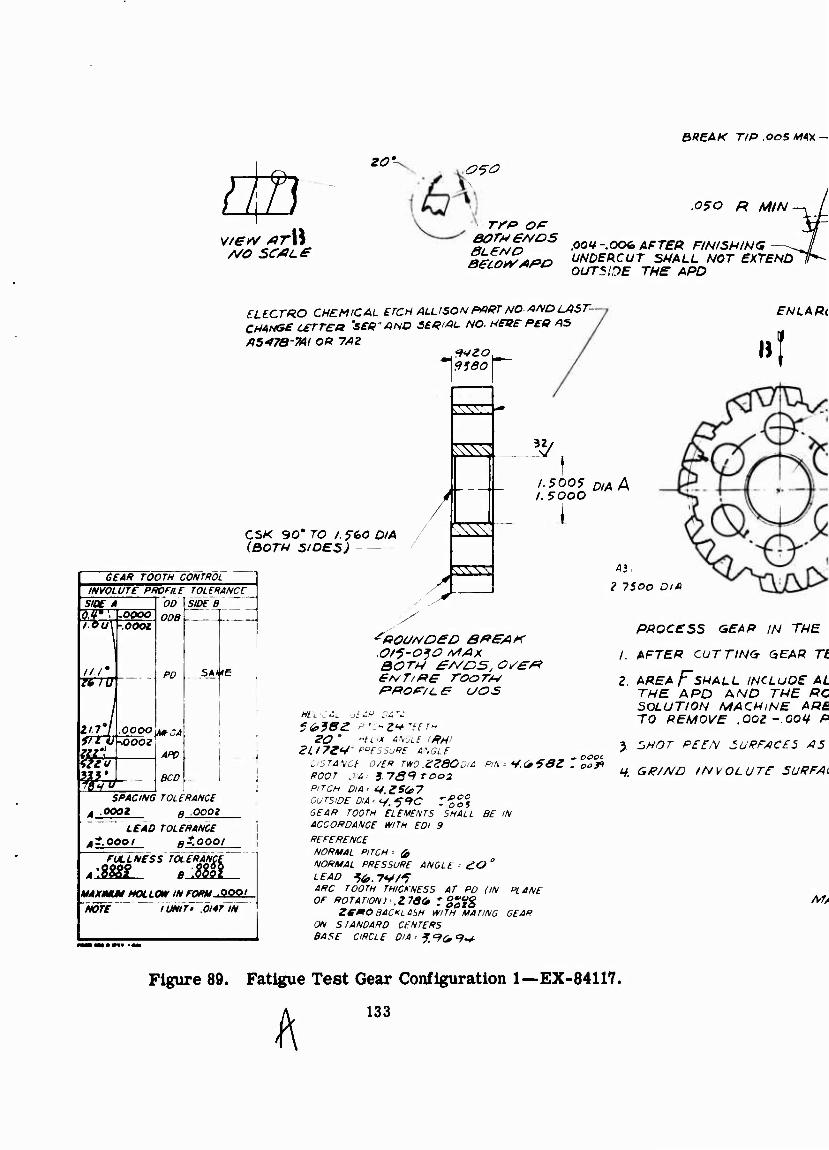
[fn A/O SC/3L e
zo*- o^o
eor*esvos 8L€ND
BREAK T/P.OOSMAK-
.05O R MIN —, /
-I .001*-.OCX, AFTER FINISHING UNDERCUT SHALL NOT EXTEND OUTSiDE THE APD
ELECTRO CHEMICAL ETCH ALLISON PART NO WD LAST- CHANsecerrea 'see-AND SB^AL NO. HEVFPEO AS
AS^TB-W Oft 7AZ
\9ieo 1
CSK 90* JO I. ffeO OIA (BOTH SIDES)
GEAR TOOTH CONTROL INVOLUTE PROFILE TOLERANCE
OOVSJDEB'' .OQOO I 0Dg
SIOE A
-.ooot
u.r TSTU
ZlTI A frrij-.
mt
OOOO MCA JOOOZ
APD
BCD
PD
s
SSI
ss *y
ss ssss
EHLARc
»I
A 500? D,AA I.5000
v
SAME
SPACING TOLERANCE ■ooez R oooz
LEAD TOLERANCE A -. 000; fti.oooi
TÜLLME5S fOLERANCE'
tJML B M MAXIMUM HOLLO* IN FORM .OOP'
'NOTE ' / UNI~TT~014/1/^
*ROUrtO£D S*EAK .0/J-0*0 MAX BOTH e/vas, o/e& e*/T/&e roorts fz&or/c e uos
5<i>3BZ PT^Zi+JEETH SO ' "fi-1* ANVLI IRH!
2LI7Z*S• PPE5SuRE AUGLE L '5 ra \ct OVER TWO .ZSQODIA PIN -- V. ^> 58Z ROOT JiA' 3.7,59 TO02 PITCH D16 ■■ C4,ZS<e7 ou T51DE ö/-a -■ y. 5 9C r ^ g j GEAR TOOTH ELEMENTS SHALL BE IN ACCORDANCE WITH EDI 9
REFERENCE NORMAL PITCH ■■ & NORMAL PRESSURE ANGLE ■■ dO" LEAD ice.!*/*} ARC TOOTH THICKNESS AT PD (IN PLANE OF RO TA TION) .173(0 * %%%%
ZemOBACXLi^H WITH MATING GEAR ON SIANDARD CENTERS BASE CIRCLE 0/4 •• J. «?<> <?.*
OOOL 00 n
? 7500 DlA
PßOCeSS GEAP IN THE
1. AFTER CUTTINGr CEAR Tt
2. AREA FSHALL INCLUDE AL THE APD AND THE RC SOLUTION MACHINE ARE TO REMOVE .OOZ-.OOH P
5. SHOT PEEN 3U/?F/IC£S 45
V. GK/ND INVOLUTE SURFAi.
M/
Figure 89. Fatigue Test Gear Configuration 1—EX-84117.
133
A
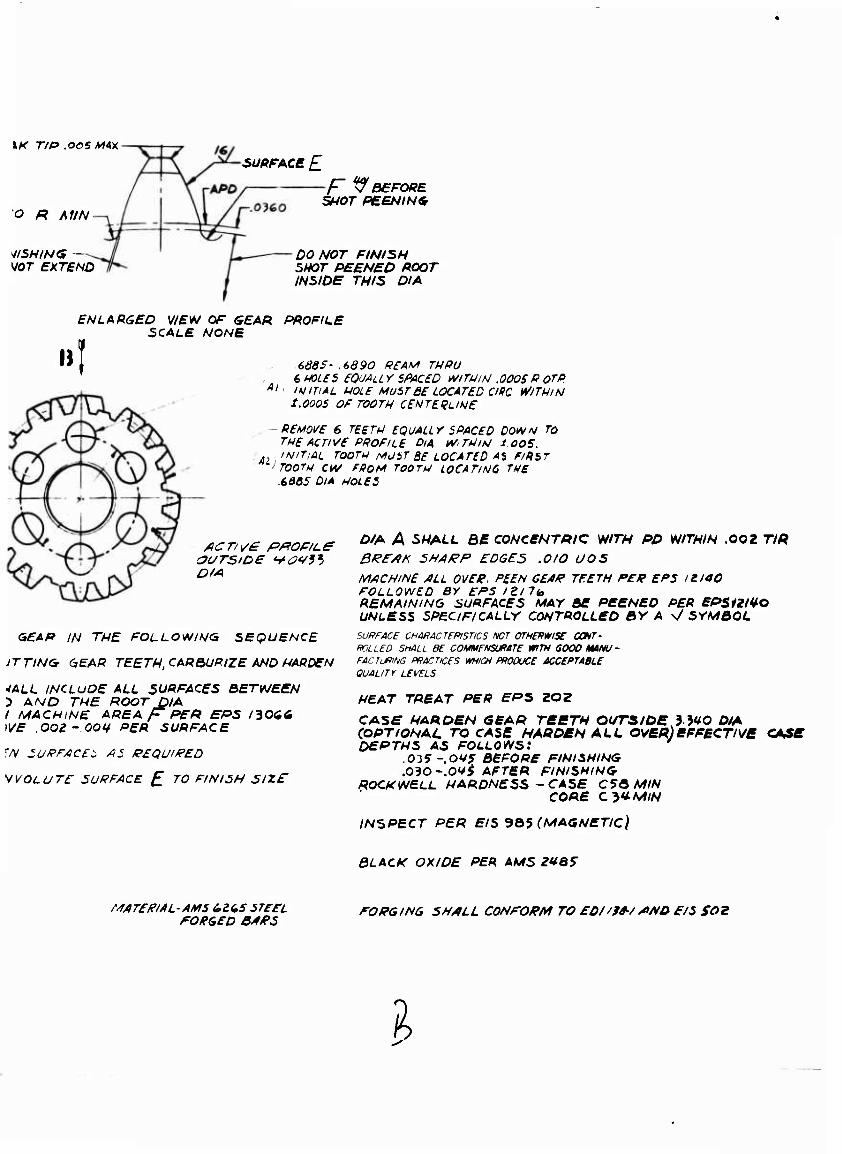
\K TIP .OOS MAX
O R Af/N
ASHING — VOr EXTEND
SURFACE £
f ?? BEFORE SHOT PEENIN6
00 NOT FINISH SHOT PEENED ROOT INSIDE THIS DIA
»I ENLARGED VIEW OF SEAR PROFILE
SCALE NONE
Al
-6885-6890 REAM THRU 6 HOifS eOUALL Y SPACED WlTÜlN .0005 R OTR IMITIAL HOLE MUSTe£ LOCATED CIRC WITHIN
t.OOOS Of TOOTH CENTERLINE
Al
-REMOVE 6 TEETH EQUALLY SPACED DOWN To THE ACTIVE PROFILE OlA W/THlN i.OOS. INlTiAL TOOTH MOST flf LOCATED Ai f/RST
J TOOTH CHS ffiOf* TOOTH LOCATING THE 6805 DIA HOLES
ACT/^e P&OF/Le OUTSIDE VC?V?? D/A
GEAP IN THE FOLLOWIMG SEQUENCE
JTTlNGr CEAR TEETH, CAf*&URlZE WD HARDEN
■IALL INCLUDE ALL SURFACES ÖETNEEN D AND THE ROOT DIA I MACHINE AREA F PER fPS /306Ä »Vff .OO2-0OV PER SURFACE
rN SURFACES A5 /P£QU'PED
yVOLUTE SURFACE £ TO FINISH SIZE"
Ö/A A SHALL BE CONCENTRIC WITH PP WITHIN .002 TIR
BREAK SHARP EDGES .010 UOS
MACHINE ALL OVEt. PEEN GESR TEETH PER EPS I £140 FOLLOWED BY EPS IZllio REMAINING SURFACES MAY BE PEENED PER EPS12IVO UNLESS SPECIFICALLY CONTROLLED RY A s/ SYMBOL
SURFACE CHA/fACTSmsTICS NOT OTHERWISE CONT- ROLLED SHALL BE COMMENSURATE WITH GOOD MANU- FACTORING PRACTICES WICH PRODUCE ACCEPTABLE QUALITY LEVELS
HEAT TREAT PER EPS 202
CASE HARDEN SEAR TSBTH OUTSIDE 3 5^0 O/A (OPTIONAL TO CASE HAODMN ALL OVER)EFFECTIVe CASE DEPTHS AS FOLLOWS:
.03f-.OVy BEFORE FIHISUING
.03O~.0V5 AFTER FINISHING- ROCKWELL HARDNESS -CASE C^B MIN
CORE CJU-NIIN
INSPECT PER EIS ^Ö5 (MAGNETIC)
BLACK OXIDE PER AMS 2^85"
MATE PIA L-AMS 6265 STEEL FORGED BARS
FORGING SHALL CONFORM TO ED//?*■/A/W E/S SOZ
I
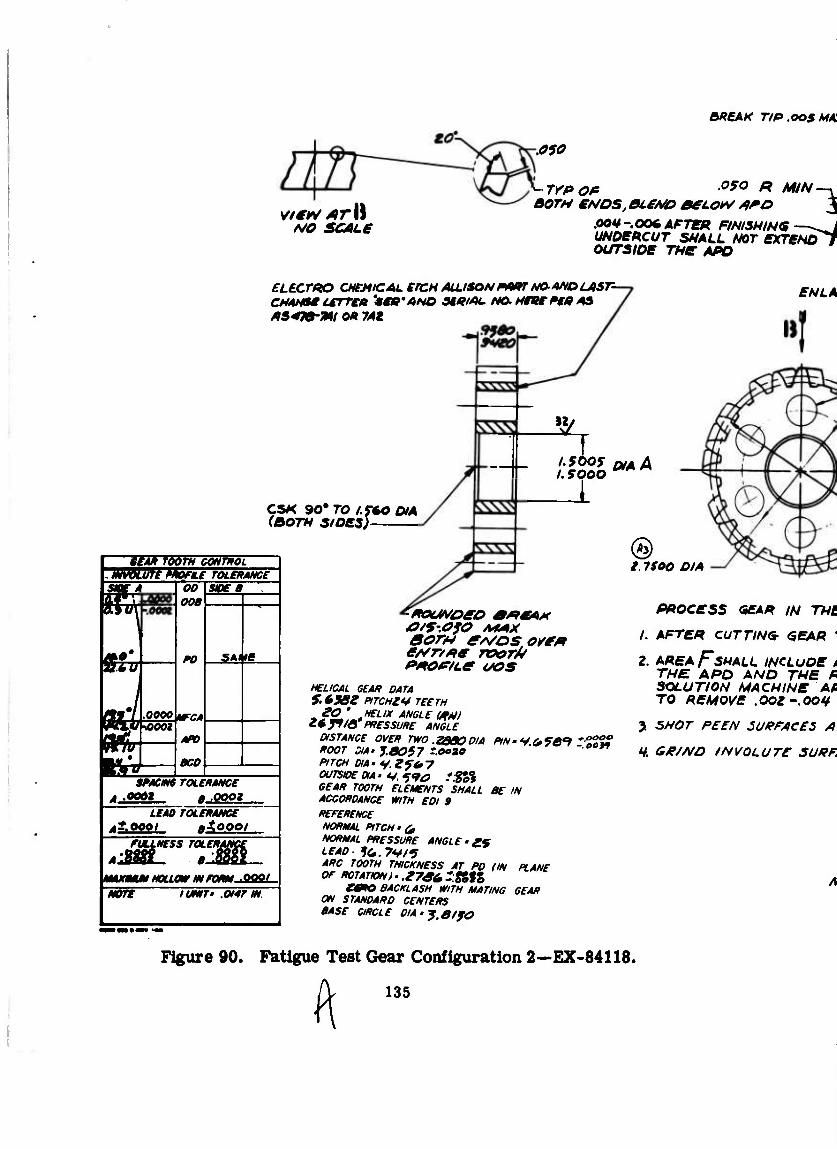
NO SCAte
050
rrpop
aR£AK T/P.OOSHA
■090 R MIN ^TrP OP ' ' " wv—\ BOTH CMOS, BteA/O e€LO*V /IPO 3
.OOtt-.00^ AFTER FINISHING—^J UNOSHCUT SHALL NOT eXTßNDT OUTSIDE THe APD
ELECTRO CHEMICAL CrCH ALLISON P*RT NO-ANOUISr- CNAHt* tCTTEm 'MtP'ANO MRIAL. NO. Hneßt» AS P547e-MI Oft 74«
EN LA
CSK 90* TO l.ftO OIA (BOTH SIDES)
itAk r&m CÖRmöT bvdiuft kkoru roLe*ä*ce
f/\K90M
WSTJ
täööi
00 oo§
PO
OOOOUfCA
BCD
we»
$*¥*
SPACm rOL£*4MC£
*** * 000* UM TOLEHAHCE
**.oooi mi.0001 rULLMSS TOLERi
\jmxmui HOLLO* m mm^aa&L NOfTE I UNIT- .0147 IN
12 ylL
._rj /. 5000
■poowoeo **SA* a/S:0fO A*AX BOTH eA/OSO*E* e//rtpe roor* pmortLe uos
HELICAL GEAR DATA S. 63BZ PITCHW TEETH
ZO ' HELIX ANCLE (**) HJHB PRESSURE ANGLE
DISTANCE OVER TWO .ZOBODIA PlN'W.OfB"* *:tSU ROOT S/A' 1.3057 *0020 PITCH DIA"/.Zf&7 OUTSIDE UA • </. ^90 fSo% GEAR TOOTH ELEMENTS SHALL BE IN ACCORDANCE WITH EDI 9 REFERENCE NORMAL PITCH •& NORMAL PRESSURE ANGLE • gf LEAD- te.7V/5 ARC TOOTH THICKNESS AT PD {IN PLANE OP ROTATION) • ,17S6 -tolo
emO BACKLASH WITH MATING GEAR ON STANDARD CENTERS BASE CIRCLE DIA'f.ßffO
/. 1500 DIA
PROCESS GEAR IN THt
1. AFTER CUTTING GEAR ',
2. AREA FSHALL INCLUDE d THE APO AND THE fi SOLUTION MACHINE Ali TO REMOVE .OOl-.OOV
y SNOT PEEN 5UPFACE5 A,
H. GP/AfD INVOLUTE SURF,
Figure 90. Fatigue Test Gear Configuration 2—EX-84118.
135 A
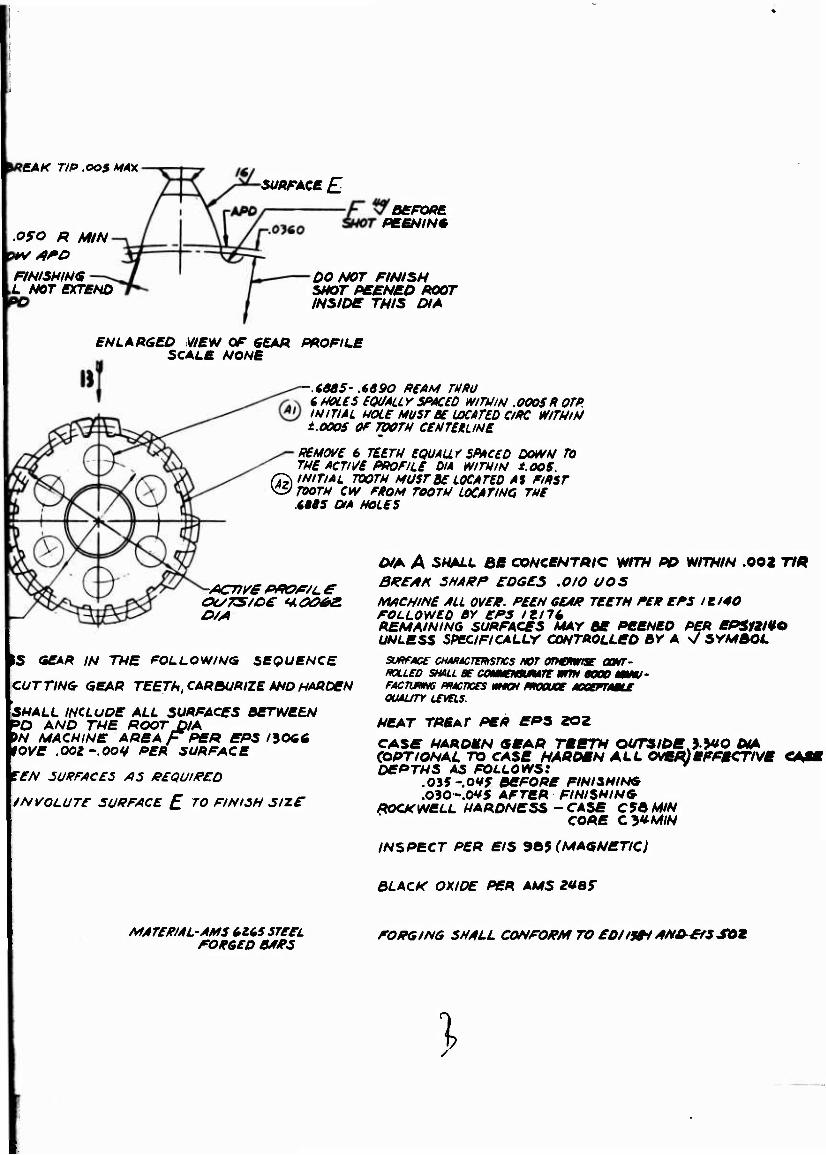
iRCAK T/P.OOSMAX
.OfO R MIN
F/MSH/N9 ,L NOT exreND
SURFACE £
BSFORE PEENIN*
ENLARGED VIEW OF SEAR SCALE NONE
DO NOT FINISH SHOT PEENED MOT INSIDE THIS DIA
PROFILE
iOaS- .6690 R€AM THRU 6 MH.eS EQUALLYSFACeD W7V/M .0005R OTP. INITIAL HOLE MUSTK UXATM CIRC WlTHlH t.OOOS Of TVOTH CEHTiltLINE
REMOVE 6 TEITH SQUAUr SPACED DOWN TO THE ACTIVE PROFILE DIA WlTHlH t.OOS.
©INITIAL TOOTH MUST BE LOCATED AS FIRST TOOTH CW FROM TOOTH LOCATINC THE AUS DfA HOLES
S GEAR IN THE FOLLOWING SEQUENCE
CUTTING GEAR TEETM, CAR3URIZE AND HARDEN
SHALL INCLUDE ALL SURFACES BETWEEN *0 AND THE ROOT DIA *N MACHINE AREA /? PER 4FPS HOGG 10VE .001-OOV PER SURFACE
TEN SURFACES AS BEQUIPED
iNVOLUTE SURFACE £ TO FINISH SIZE
DfA A SHALL BE CONCENTRIC WITH PP WITHIN .002 77ft BREAK SHARP EDGES .010 UOS MACHINE ALL OVER. PEEH GEAR TEETH PER EPS IE 140 FOLLOWED BY EPS I ZUG REMAINING SURFACES MAY BE PEENED PER ERSfllMO UNLESS SPECIFICALLY CONTROLLED BY A s/ SYMBOL
SURFACE CHAHACTmSTICS NOT OTHOmSE OOHT- ROLLED SHALL BE COMMEMSUtAfE OTT* «009 «W/- FACTVUNS PMCTKES WHKH moOUOE AOGEFTABU OUAUTY LEVELS-
HEAT TREAT PER ERS 20Z
CASE HARDEN SEAR TEETH OUTSIDE JWO DIA (OPTIONAL TO CASE HARDEN ALL OVER)EFFECTIVE DEPTHS AS FOLLOWS! *
.OlS-.OIS BEFORE FIHISHING
.030 -.0V5 AFTER FINISHING ROCKWELL HARDNESS-CASE CSBWN
CORE Cyi-MIN
INSPECT PER EIS 9Ö9 (MAGNETIC)
BLACK OXIDE PER AMS 2169
MATERIAL-AMS 6265 STEEL FORGED BARS
FORGING SHALL CONFORM TO £009*1 AW&EfSSOE
\
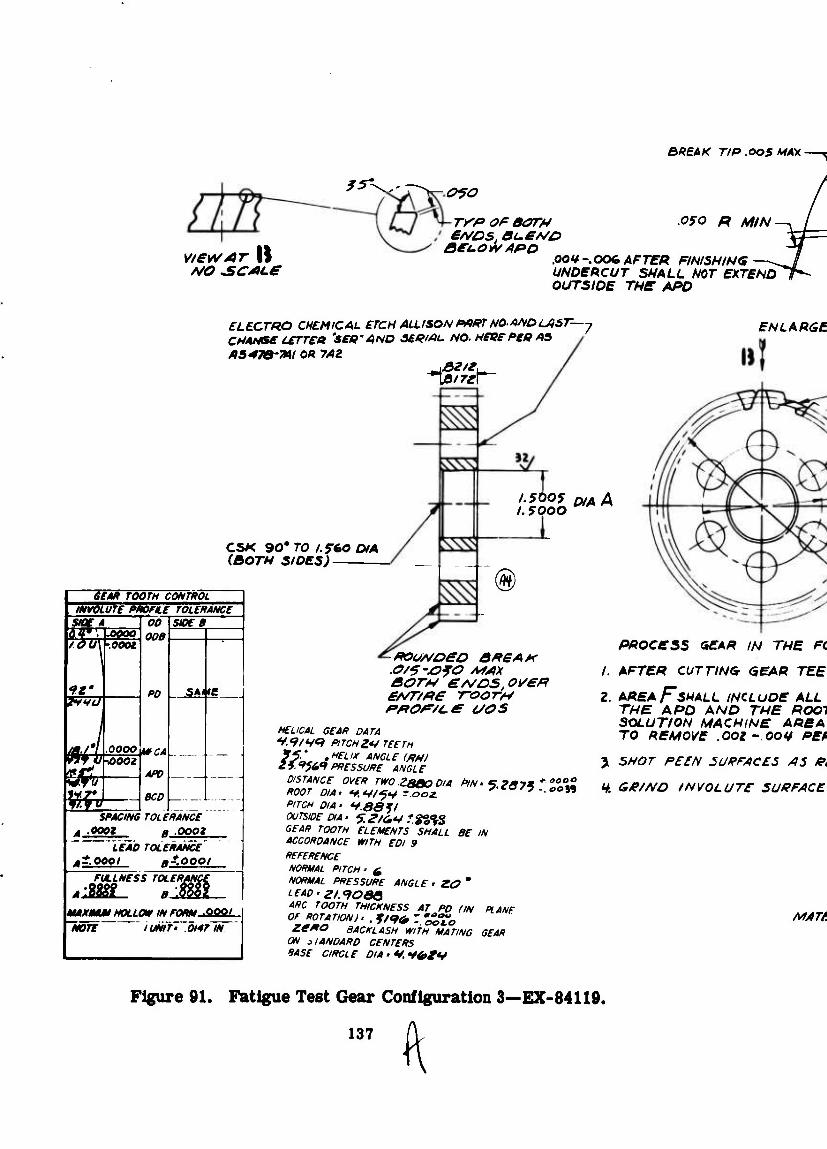
BREAK 77P.0O5AMX
/^
HO ^CALC
o?o
TXf» OP BOTH
oei.ow APD
.050
.001*-.OOt AFTER FINISHING ^7 UNDERCUT SHALL NOT EXTEND 1*^ OUTSIDE THE APD
ELECTRO CHEMICAL ETCH ALLISON PART NO. AMDUiST—y CNAHse urrea 'se»' AND SER/AL. NO. HE*? PER AS
A5 479-7*1 OR 7AZ
ENLARGE
CSK 90'TO l.reo&A (BOTH SIOE5)
6EM TOOTH CONTROL INVOLUTE PROFILE TOLERANCE sue* 5 *-r
T^
LÖÖÖÖ .0001
9Z'
7.0000 <7%00O2
gg
OP 00«
«0 U5A*e
«Co _
5/0f «
SPACING TOLERANCE A 0001 H OOOZ
LEAD TOLERANCE tt. OOP I R*.OOOt
EULLNfSS TOLERi AJSSL. a
1.5000
®
\MAJfmMI HOLLOW IN FORtt^QSJ— NOTE i'tmr* .orirm
ROUA/OeO SREAH .O/5-jOfO MAX aor* e/s/DSjOren EAST/tiE TOOTH r*or/ce vas
HELICAL GEAR DATA V. 9/ V<? Rl TCH 2</ TEE TH 25- ' , HELIX ANCL E (AH) ii-^iR PRESSURE ANGLE
DISTANCE OVER TWO .Zgßo DIA PIN' 5^671 T ZVn ROOT DIA' V.V/^V^ooi PITCH DIA- v.asfi OUTSIDE DIA- 5?/<i*S TgffrS GEAR TOOTH ELEMENTS SHALL BE IN ACCORDANCE WITH EDI 9 REFERENCE NORMAL PITCH' ^ NORMAL PRESSURE ANGLE- SO ' LEAD ■ zi.qoea ARC TOOTH THICKNESS AT^PD (IN OFmROTATlONJ- . f/?* :•££,
HANF
ZeAO BACKLASH WITH MATING GEAR ON ilANDARD CENTERS 9ASE CIRCLE DIA-*.**&&
PROCESS QEAR IN THE FC
1. AFTER CUTTING GEAR TEE
2. AREA FSHALL INCLUDE ALL THE APD AND THE ROOl SOLUTION MACHINE AREA TO REMOVE .001-OO^ REfi
y SHOT PEEN SURFACES AS Rt
V. 6R/MD tNVOLUTE SURFACE
MATf.
Figure 91. Fatigue Test Gear Configuration 3—EX-84119.
137
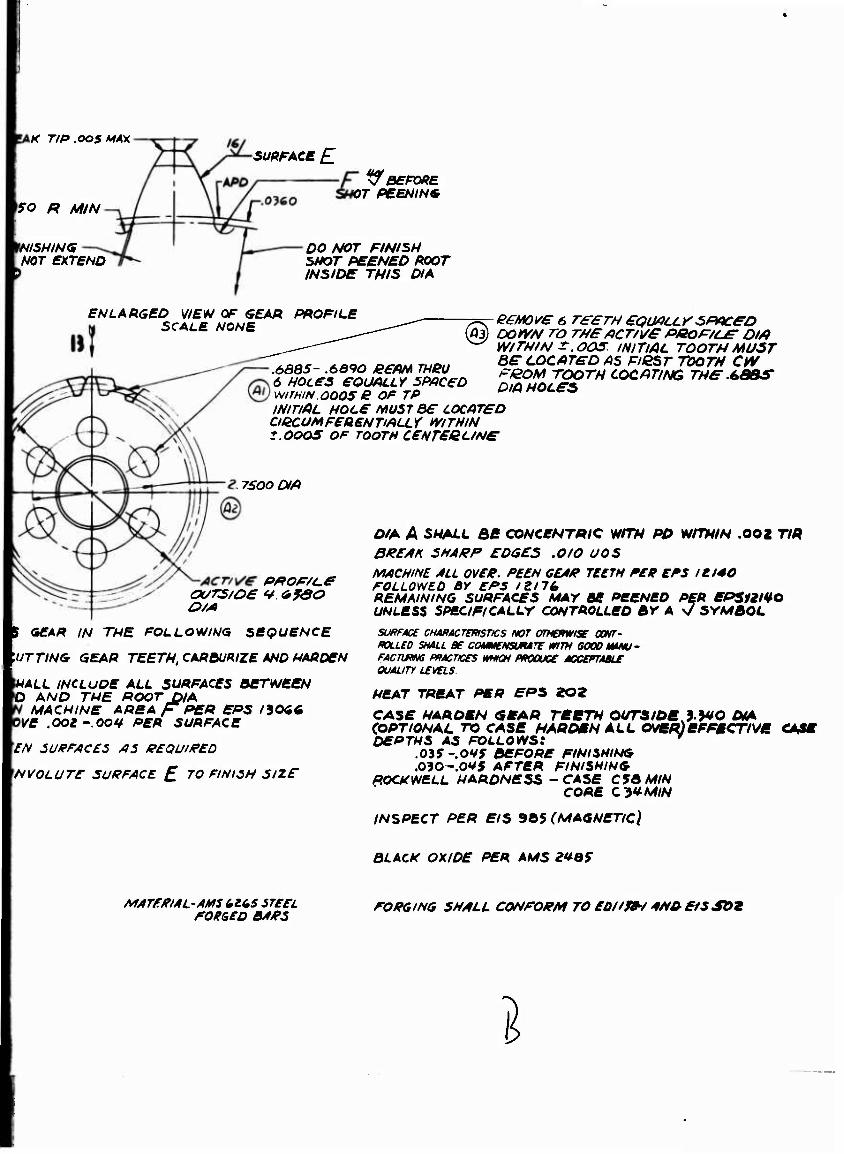
IAK T/P .OOS MAX
FO R MIN
SURFACE £
W/5H/HG NOT EXTEND
ty BEFORE OT PEBNIN*
00 NOT FINISH SHOT PEENED MOT INSIDE THIS DIA
ENLARGED VIEW OF SEAR PROFILE SCALE NONE
@
6885- .6090 ßEHM THRU 6 HOLES EOUALLY SPACED WITHIN .0005 B OF TP INITIAL HOLE MUST BE LOCATED ClßCUMFEIi£NTiALLY MTHlN t.OOOS OF TOOTH CENreSL/NC
eeMOVE 6 TEETH EQlMILCr SPACED DOWN TO THEACT/VS PaortLE" DM W/THIN Z.OOS INITIAL TOOTH MUST BE LOCATED AS F/ßST TOOTH CW FßOM TOOTH LOCATING THC .tOSS DlA HOLES
7S00 DIA
PROF/LE OUTS/DE U &9SO
% OEAR IN THE FOLLOWING SEQUENCE
lUTTINGr GEAR TEETH, CARBURIZE AHD HARDEN
HALL INCLUDE ALL SURFACES BETNEEN O AND THE ROOT DIA N MACHINE AREA F PER EPS 13066 WE ,002-00V PER SURFACE
\£N 2UFFACE5 AS PSQU/PED
INVOLUTE SURFACE £ TO FINISH SIZE
Of A A SHALL BE CONCENTRIC WITH PD WITHIN .002 77ft BREAK SHARP EDGES .010 UOS
MACHINE ALL 0V£E. FEEN GEAP TEETH FEH EF5 It 140 FOLLOWED BY EPS /2/76 REMAINING SURFACES MAY BE PEENED PER ERSfil¥o UNLESS SPECIFICALLY CONTROLLED BY A \/ SYMBOL
SURFACE CHARACTmSTICS NOT OTHCPW/X OONT- ROLLED SHALL BE COUHENSURATE WITH 6000 MANU- FACTWINS PRACTICES WHCM PRODUCE ACCEPTABLE OUALITT LEVELS
HEAT TRBAT PER EPS 202
CASE HARDEN SEAR TEETH OUTSIDE J.^UO DHA (OPTIONAL TO CASE HARDEN ALL OVER)EFFECTIVE DEPTHS AS FOLLOWS: y
.015-.OHf BEFORE FINISHING
.03O-.0V5 AFTER FINISHING ROCKWELL HARDNESS - CASE C5B MIN
CORE CtU-MlN
INSPECT PER EIS 9Ö5 (MAGNETIC)
BLACK OXIDE PER AMS ZHBS
MATERIAL-AMS 6265 STEEL FORGED BARS
FORGING SHALL CONFORM TO EONfM ANDE/SSDZ
I
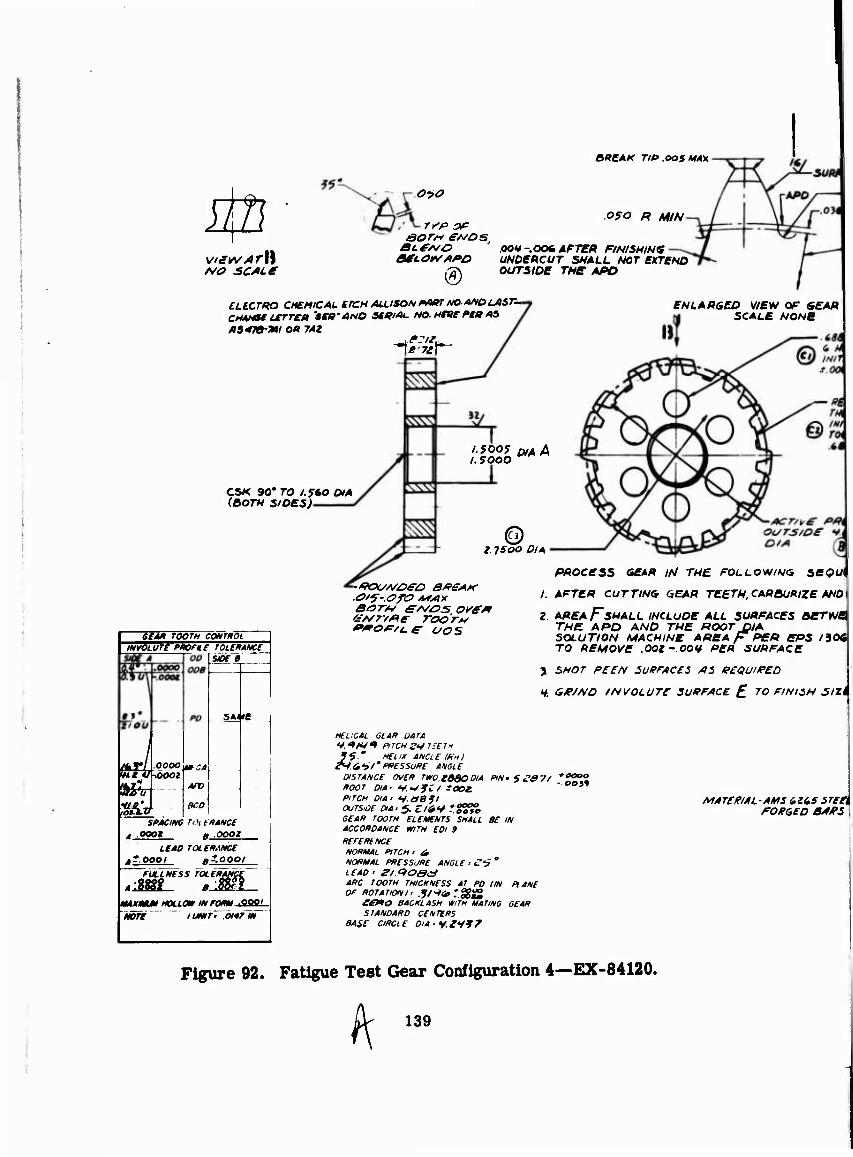
42 na scAte
o^o
&R£A* T/f>.OOSMAX
°fo R MIN
® OOt-.OOtAFTCR FtNUHINS UNDERCUT SMALL NOT CXTENO OUTSIDe THC APD
ELCCTRO CHEMICAL CfCH ALLISON PART NO-AJiO LAST- CHAHseurrem 'SWANO 3**/**. NO-HfeertOAS AS470-*I OA 7/42
CSK 90'TO I. ftO DIA (BOTH SIDES)
ENLARGED V/EW OF SEAR \ SCALE NONE
1.5005 DIA A 1.5000 *
© I. 7SOO DlA
6CM TOOTH CONTROL INVOLUTE MKfie TOURMKC
I hoooi
BCD
sax B
5A*e
■O'f-.OfO MAX
GAsryae roor*
PROCESS GEAR lN THE. FOLLOWING, SEQUl
AFTER CUTTING SEAR TEETH.CAR&URIZE AND
AREA FSHALL INCLUDE ALL SURFACES ÖETHE THE. APD AND THE ROOT DIA SOLUTION MACHINE AREA f? PER SPS HOQ TO REMOVE .OOl-.OOtl PER SURFACE
SHOT P££H 3UPFAC£5 A5 e£QUIf?ED
Gß/A/D INVOLUTe SURFACE £ TO FINISH SIZ^
oon
SPACING TOLf»MCE A ooot g OOOZ
LtM TOLPIANCC ti.oooi H-.0001
.Ml" T1 \mxmu* HOLLO» IN roMt^sasL iton' i uNiT~di4flir
HELICAL GLAR DATA V.^/V^ PITCH S*/lSEI* iS' HELIX ANCLE I**) &6^/' PRESSURE ANGLE
DISTANCE OVER TWO.teSODIA PIN- ^^97/ *0000
ROOT DIA- V.VJt/ TOOe. PITCH DlA' V-tf«?/ OUTSiOE DlA. $. £7dV '52% GEAR TOOTH ELEMENTS SHALL BE IN ACCORDANCE WITH EDI 9
REFER! NCE NORMAL PITCH - ^ NORMAL PRESSURE ANGLE. Cj' LEAD . s/.^oea ARC TOOTH THICKNESS AT PD (IN PLANE OF ROTATION). .J/^&'SS
eemo BACKLASH WITH MATING GEAR STANDARD CENTERS
BASE CIRCLE DlA.y.ZII?
MATei?IAL-AM5 62W5 STeEk FOIf&£D BAPS
Figure 92. Fatigue Test Gear Configuration 4—EX-84120.
for 139

to v/ew or SEAR SCALE HONB
ty Be FORE PEENIN*
DO NOT FINISH SHOT PEENEO ROOT INSIDE THIS DIA
PROFILE
■ 6335- .6890 JiA REAr* THRJ 6 HOLES EOOAur SPACED WITHIN .OOOSR OTP INITIAL HOLE MUST BE LOCATED CIRC WTHlH *. OOOS OF TOOTH CEHTERL INE
RSMO/E 6 TEETH EQUALL / SPACED DOW/J TO THE ACTIVE PROFILE D/A WlTUlH f OOS. INITIAL TVOTM MOST Be LOCATED AS FltiT TOOTH cw FROM voorn LocATiHC, rue .teas DIA Hocei
D/A
OLLOWIKKä SEQUENCE
TTH, CAROURIZE AND HARDEN
SURFACES BETlNEeN TJDIA \r PER EPS 13066 n SURFACE
W<3i/ii?£0
', £ TO FINISH size
DIA A SHALL BE CONCENTRIC WITH PD WITHIN .002 TIR
BRBAK SHARP £DG£5 .010 (JOS
MACHINE ALL OVEB. R££N GEAR TEETH R£R EPS it 140 FOLLOWED BY EPS IZIH, REMAINING SURFACES MAY BE PEENEO PER EPSIHVO UNLESS SPECIFICALLY CONTROLLED BY A \/ SYMBOL
^URftCE CHARACTERISTICS NOT OTHmmSE OCNT- ROLLED SHALL BE COHMENSURATC WITH GOOD MANU- FtCTtMHO PRACTICES WHICH PROOUCE ACCEPTAtLE QUALITY LEVELS
HEAT TREAT PER EPS 202
CASE HARDEN SEAR TEETH OUTSIDE ?.)«0 D/A (OPTIONAL TO CASE HARDEN ALL OVER)EFFECTIVE CAM DEPTHS AS FOLLOWS: ' r^-
OSf-OV5 BEFORE FINISHING .030-.OV5 AFTER FINISHING
ROCKWELL HARDNESS -CASE C5B MIN CORE Cfl-MIN
INSPECT PER EIS 905 (MAGNETIC)
exsvfi
BLACK OXIDE PER AMS 2189
XRIAL-AMS 6265 STEEL PORGED BAPS
FORGING SHALL CONPOPM TO EONItrl AND StSSOZ
I
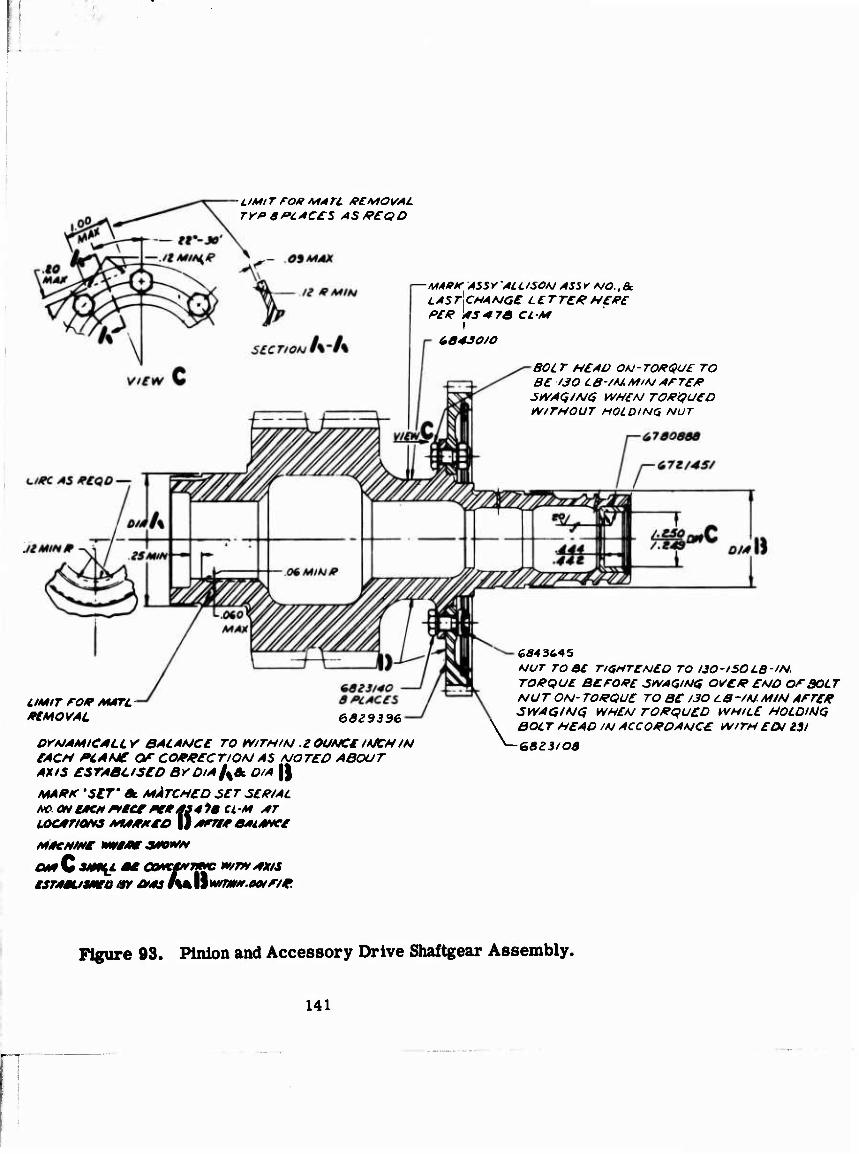
k J.
•UMlTrORMATL #£.HIO\SAL Tyrafcsces AS^EQD
MABK^ ASSr 'ALL'SOAJ ASS Y MO., & L AS TCHAHGE L£T r£# HSPE
I
80L T H£AD OU-TO*QU£ TO B£ /SO LB-/H.MiHArT£/? SWAQ/HG WH£M TO#QU£D W/THOUT HOLDING NUT
LIMIT SO* MAfTf tiMOVAL 6829336
OrtJAMlCALLV 3*CAMC£ TO MTH/M .2OUHCtItJCNIN £ACH PC4H£ OF CO**£CTlOH AS /<JOT£D ABOUT AXIS CSTABUS£D ßrD'A fate. O/A ||
MA** 'SIT' St M*TCH£D S£T 3£*tAL NC ON iJKM *te* ßC* £34tB CLM *T uootriotta MtA/ffteo W *rr£* OALAMC*
om C amtfC se ooMCMM-mc mm *xts gsrAäuame m oss ls*JAwrrm*.ooirt*.
684 3145 NOT TO a£ TIGHTENED TO 130-150LB-'N. TORQUE B£rOff£ 3WAQ/HG OVER END Of BOLT NU T ON- TORQUE TO BE I30 L B -/A/ AHN AFTHf SWAQING WHEN TOKQUED WHILE HOLDING BOLT HEAD /N ACCORDANCE WITH EOS Z3I
■6823103
Figure 93. Pinion and Accessory Drive Shaftgear Assembly.
141
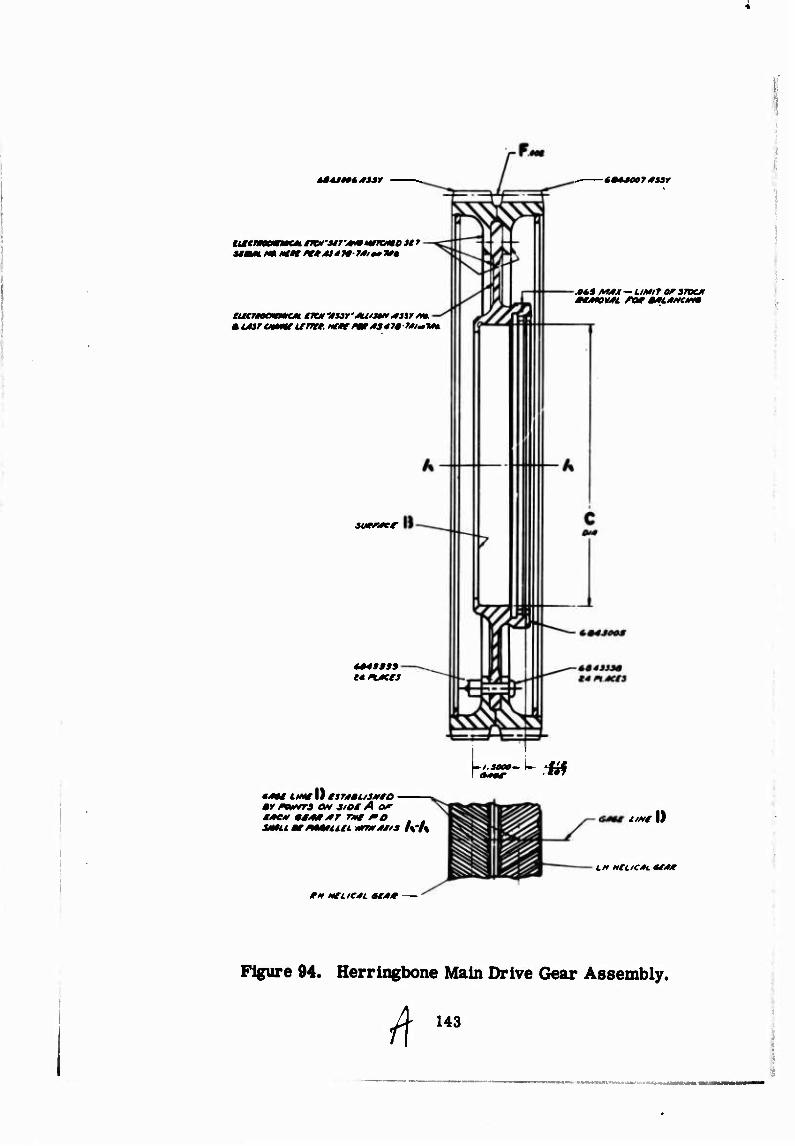
*04J—**ur
Uittmemmc* mruf/mmmnomo ur
• IMTmmtum», nettrmtts*"»» f*t~y**
iuenter
*»**O07**3y
€4»t LtMg I) tir4*U3**0 ■ m* /wtrs ON 310* A or MAC* 9*4* *r rme ro 3M0LL armtmuiei wmt/uta A*/«
e* Mtue/H. MM» —
M5 MAM — LIMIT OT SfOC* /TCMOV/H /-or amAMe**
*f
iwe I)
LM HCUCts. tUtMt
Figure 94. Herringbone Main Drive Gear Assembly.
A 143
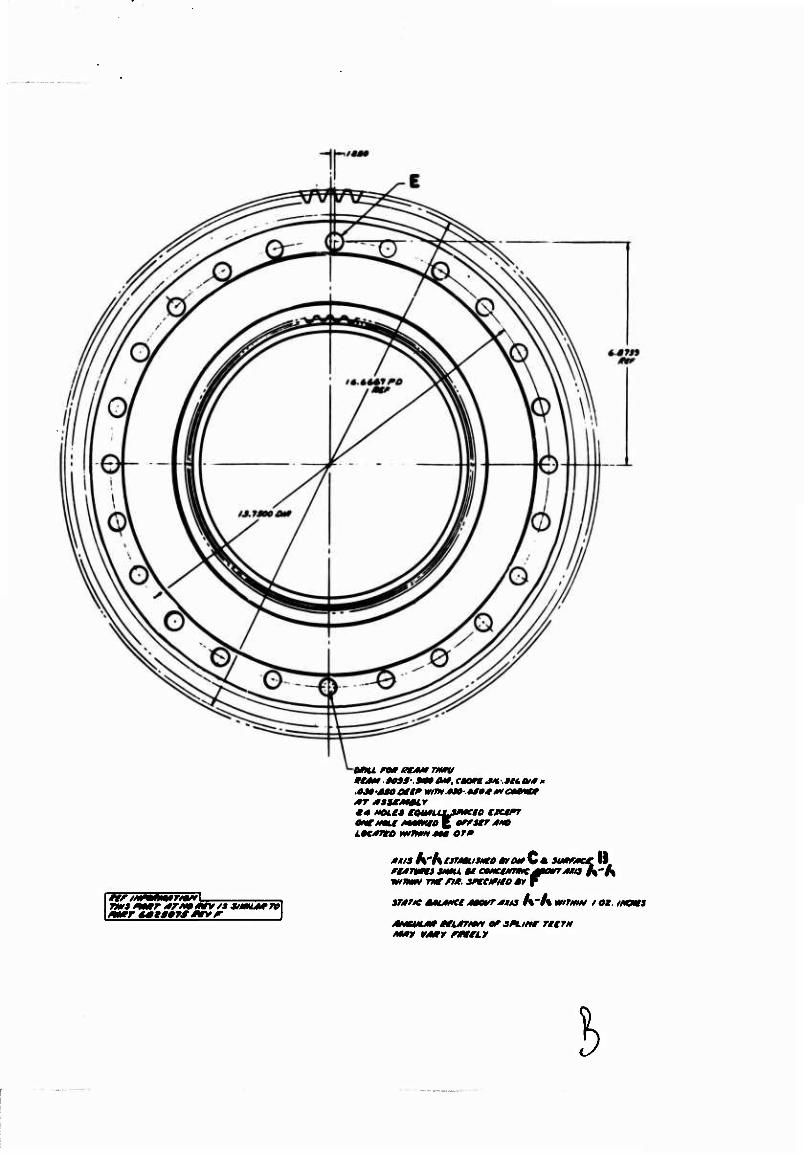
AMU ro» fftMITimi UM» »ess-.smMt, caonmatiot** .«Jt-Mooet* wmMO-f» 0» g—wcr
OMgtmu Mkumta E orrsrr Am L»c/mo mmmMa erm
ndinma JMMU «r eotteiMmcjfoifTMua A'A www TMT /7/r. vvcmeo i
amnc mumtg MOUTMU A-A Mwmwv / at. intma
MNCIMJI* MlfTM* 0P3ßLlnr TttTH M09 VMIV FMgLV
I
APPENDIX II
SAMPLE PROCESS ROUTING SHEETS
This appendix consists of sample process routing sheets for test gear EX- 84117 (Figure 95). The processing routings for all four fatigue test gears were identical.
145

'S
0)
J3 CO
00
0) Ü CO
H
o
0)
X!
.1 ■3
! U
|
146

147
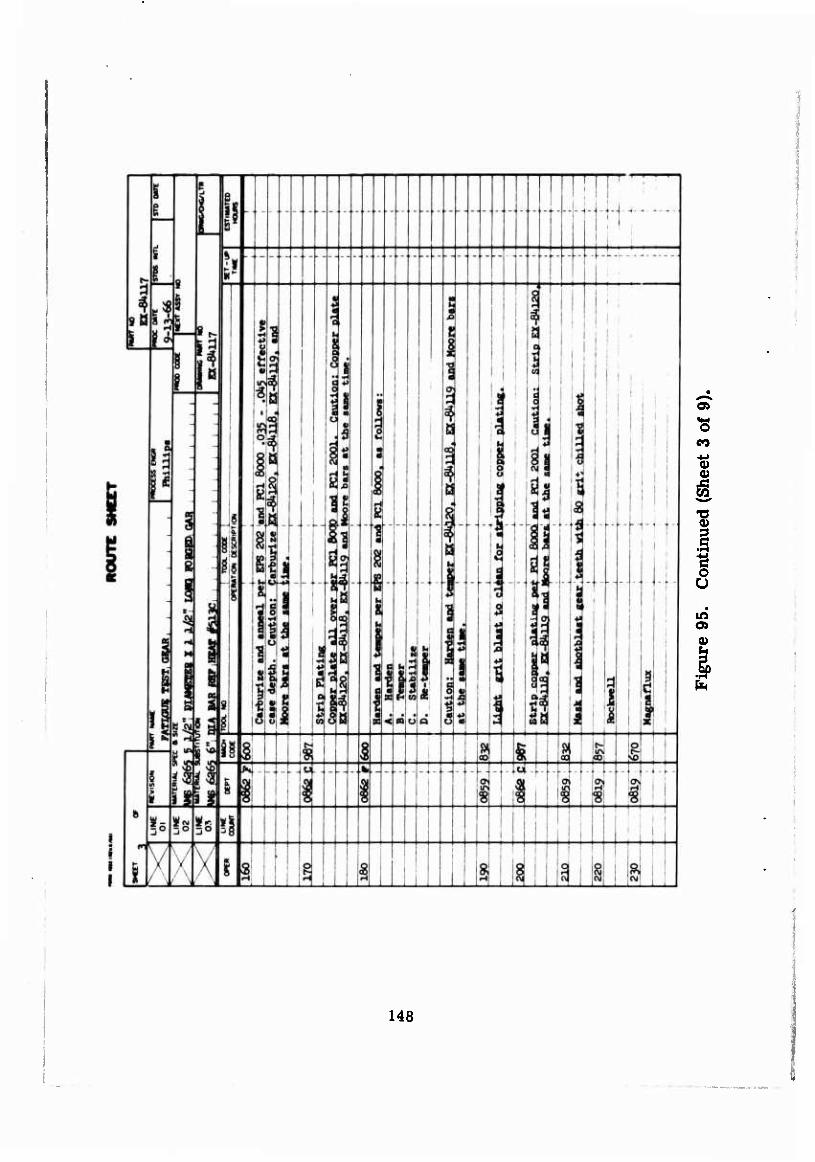
Oi
CO
% o
t .3 o
in o»
148
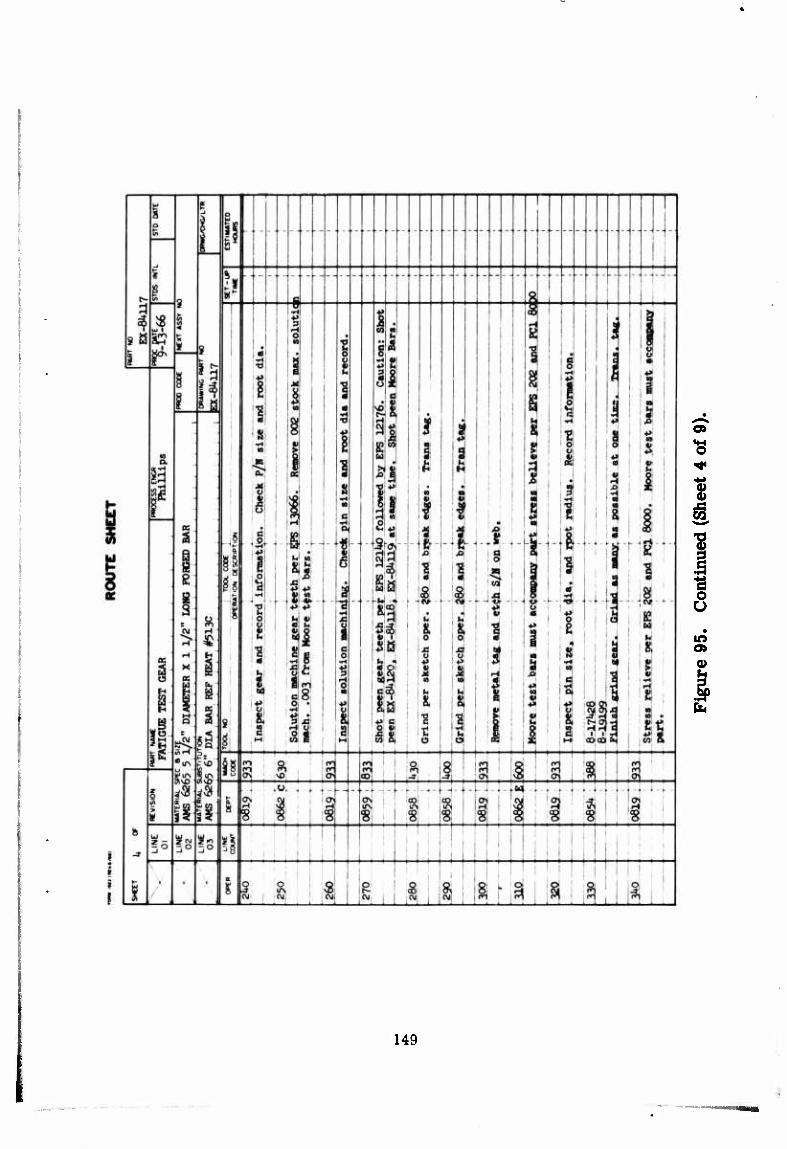
'S
0) 0)
1 o ü
149
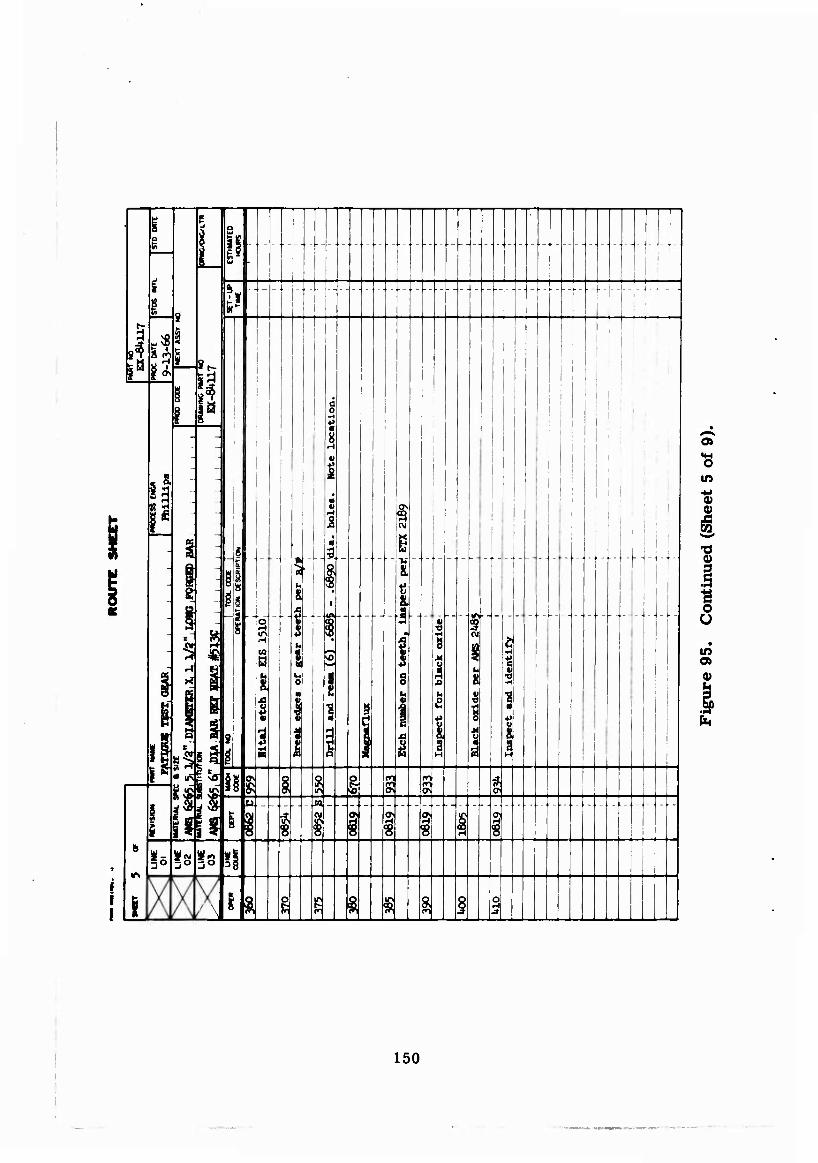
t-
£
iö
i ^
^S
H
m
Oiu
si
i s
dp ti
*8
J »
SI
§
I
a. i
M
vO
I
B
CM
I
8 I
a
ö
i
11 I !
I
... -i.
'S in
IS 0)
1 o u Ift
f
150
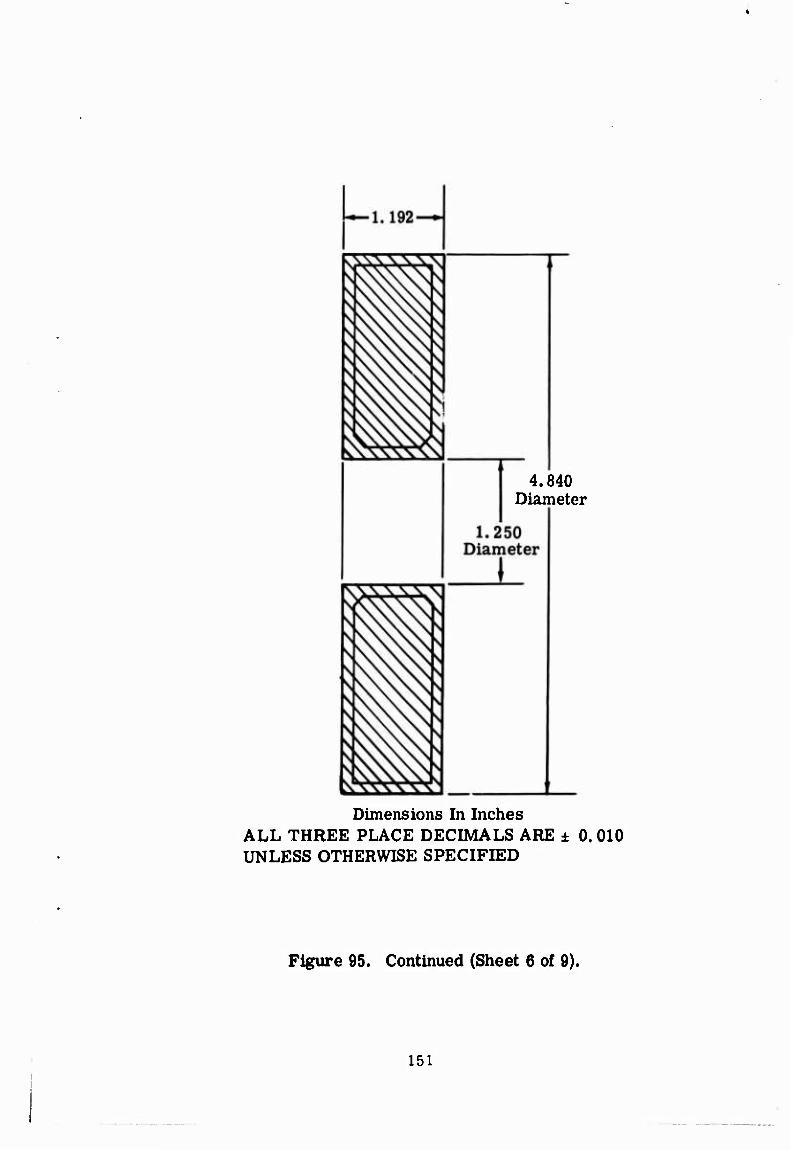
4.840 Diameter
Dimensions In Inches ALL THREE PLACE DECIMALS ARE ± 0. 010 UNLESS OTHERWISE SPECIFIED
Figure 95. Continued (Sheet 6 of 9).
151
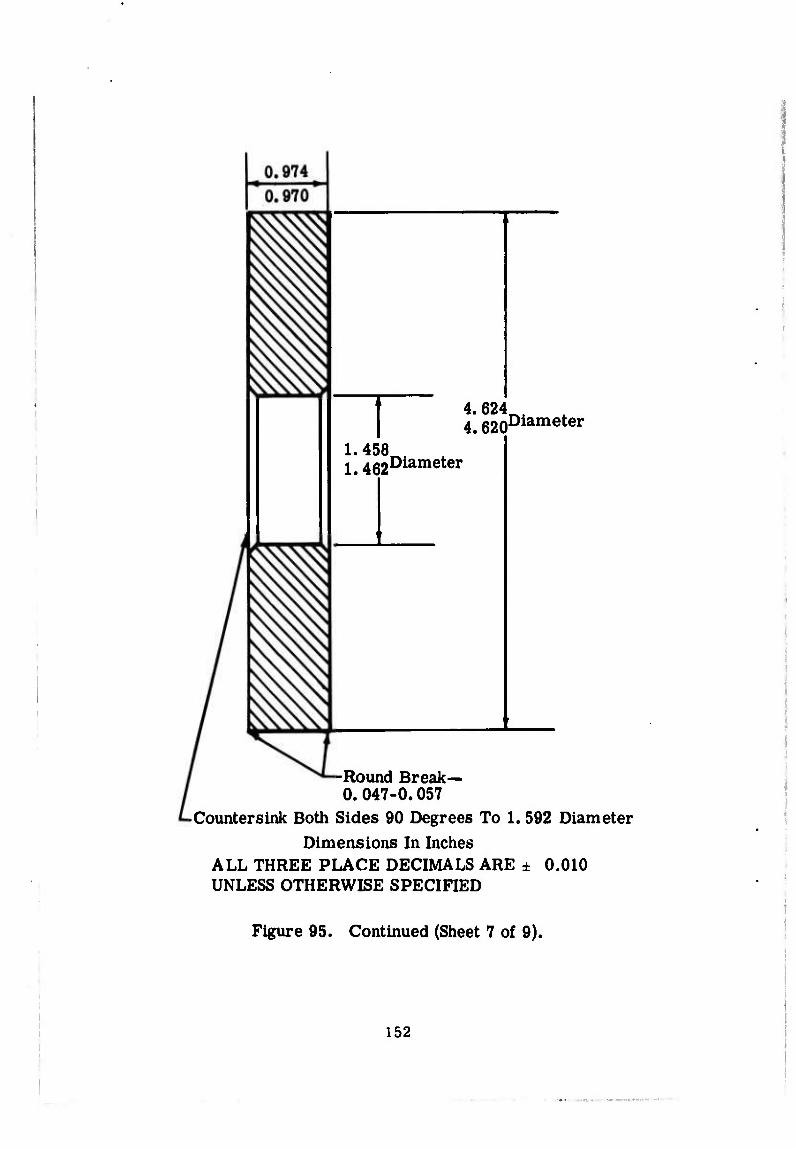
4. 624 4.620Diameter
1.458^ 1.4(j2^ame^er
-Round Break— 0. 047-0.057
•Countersink Both Sides 90 Degrees To 1. 592 Diameter Dimensions In Inches
ALL THREE PLACE DECIMALS ARE ± 0.010 UNLESS OTHERWISE SPECIFIED
Figure 95. Continued (Sheet 7 of 9).
152
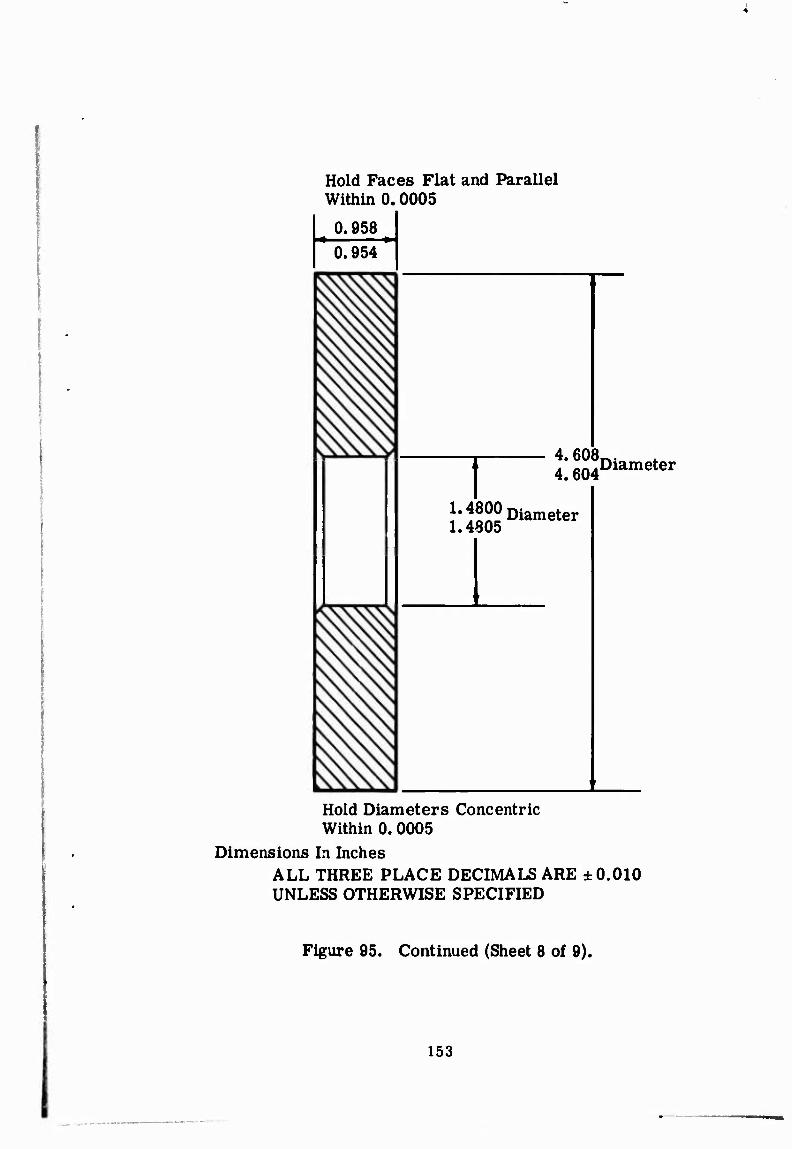
Hold Faces Flat and Parallel Within 0.0005
0.958 0.954
4.608 4.604
J'^OO Diameter 1.4805
Diameter
Hold Diameters Concentric Within 0.0005
Dimensions In Inches ALL THREE PLACE DECIMALS ARE ±0.010 UNLESS OTHERWISE SPECIFIED
Figure 95. Continued (Sheet 8 of 9).
153
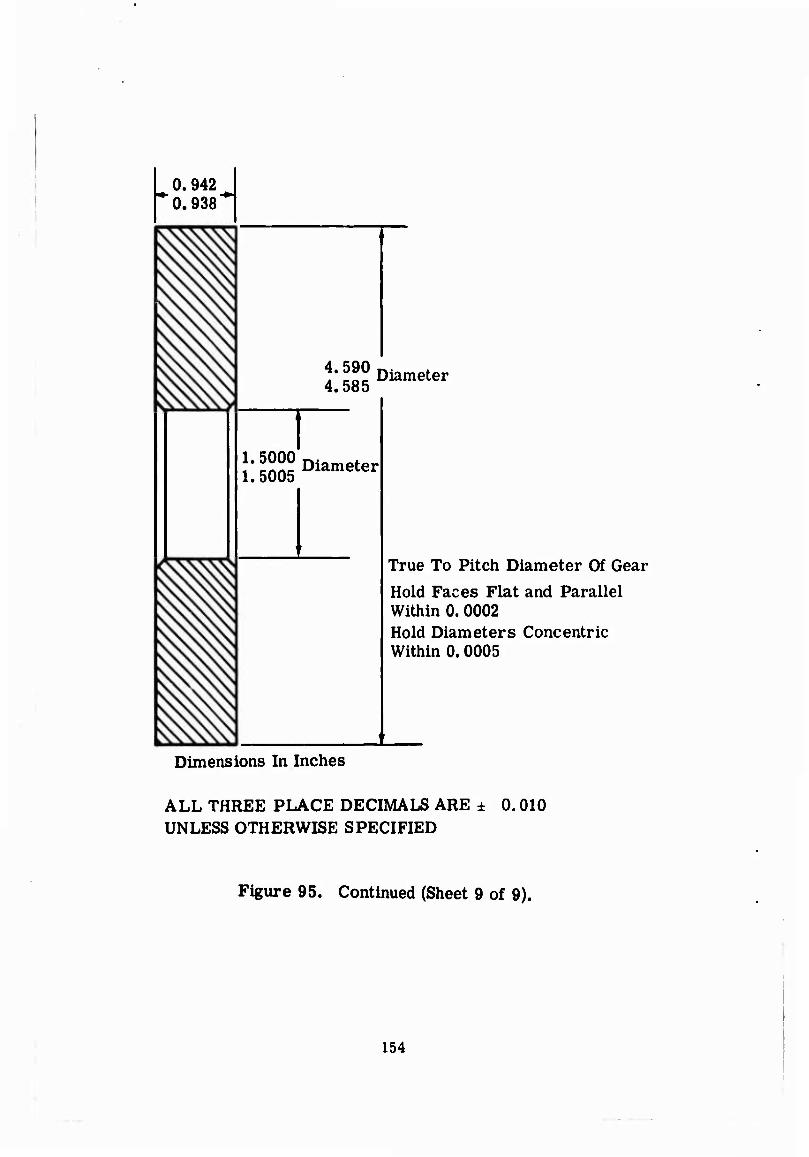
0.942 0.938
4.590 4.585
Diameter
1. 5000 1. 5005
Diameter
True To Pitch Diameter Of Gear
Hold Faces Flat and Parallel Within 0. 0002 Hold Diameters Concentric Within 0.0005
Dimensions In Inches
ALL THREE PLACE DECIMALS ARE ± 0.010 UNLESS OTHERWISE SPECIFIED
Figure 95. Continued (Sheet 9 of 9).
154
APPENDIX III
DESCRIPTION OF COMPUTER PROGRAM
This appendix consists of a complete description of the computer program and includes the program equations, input data sheet, source program print-out, and a sample problem. The equations are given in both engi- neering and computer program terms.
DESCRIPTION OF PROBLEM
Gear tooth bending strength is one of the major criteria in gear design. Gear tooth loading is cyclic in nature, subjecting the material to fatigue. The critical section is close to the root diameter. Failure usually re- sults in fracture of an entire tooth from the gear rim.
Calculation of gear tooth bending stress requires geometrically precise description of the root fillet contour and location of the critical section. The point of the involute tooth profile at which the transmitted load pro- duces the maximum bending stress is also required. Knowledge of the mounting and operating conditions of the unit in which the gear is as- sembled is required to assess the increase in bending stress caused by misalignment, overloads, system dynamics, and centrifugal forces. Gear material ultimate strength and fatigue data must be known to convert the calculated stress to anticipated gear life.
The purpose of this program is to calculate gear tooth bending stress con- sidering these factors.
METHOD OF SOLUTION
The gear tooth geometry has been developed using basic formulae avail- able in the literature. The hob dimensions have been used in the program to generate the trochoidal fillet contour resulting on a finished gear from some gear processing procedures. A true radius fillet is used when a shaped contour is specified in the program input. The program uses an iteration routine to inscribe a parabola (per Lewis construction) and to locate its tangency point with the root fillet contour. The program also uses an iteration process to establish the helical factor by computing and comparing the maximum bending moment for total tip loading and equal intensity loading along the inclined load line through the tooth tip edge. The calculated parameters are then used in the AGMA formula given in Appendix V to calculate a bending stress. The AGMA temperature, safety, and load distribution factors are applied to the bending stress.
155
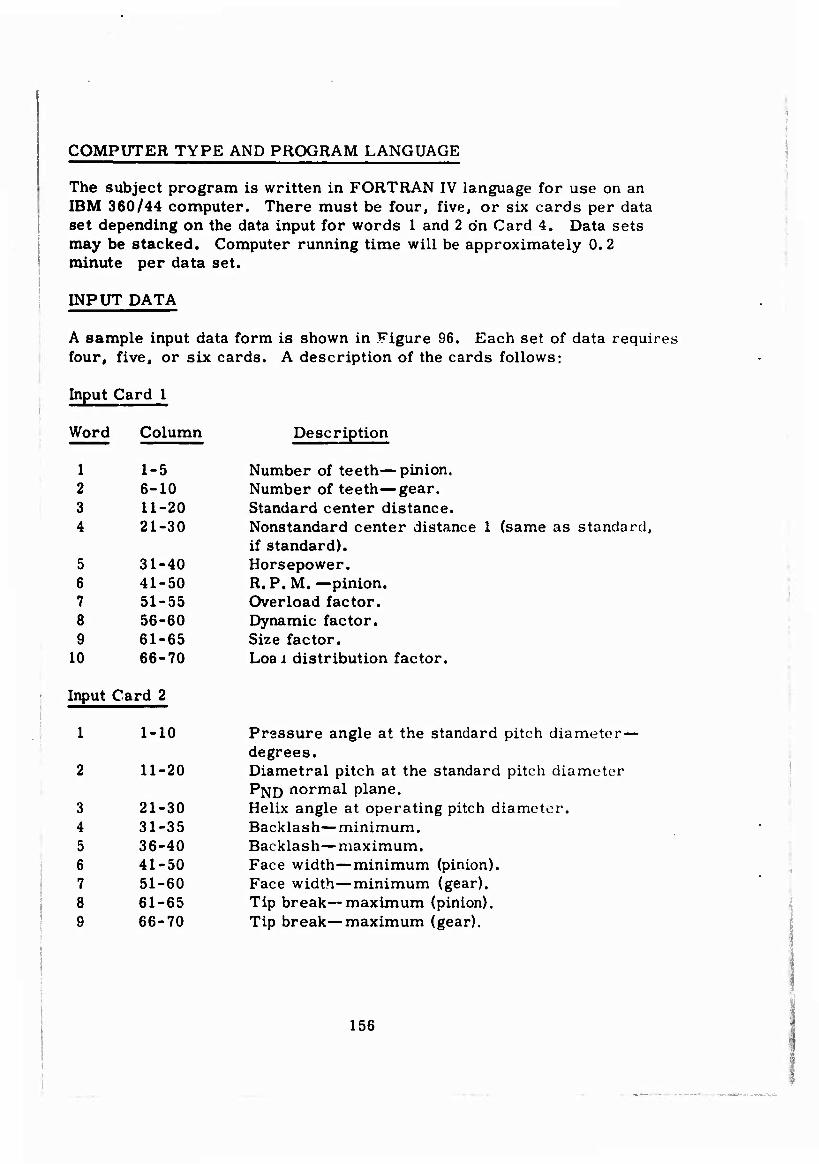
COMPUTER TYPE AND PROGRAM LANGUAGE
The subject program is written in FORTRAN IV language for use on an IBM 360/44 computer. There must be four, five, or six cards per data set depending on the data input for words 1 and 2 on Card 4. Data sets may be stacked. Computer running time will be approximately 0. 2 minute per data set.
INPUT DATA
A sample input data form is shown in Figure 96. Each set of data requires four, five, or six cards. A description of the cards follows:
Input Card 1
Word Column
1 1-5 2 6-10 3 11-20 4 21-30
5 31-40 6 41-50 7 51-55 8 56-60 9 61-65
10 66-70
Input Card 2
1 1-10
11-20
3 21-30 4 31-35 5 36-40 6 41-50 7 51-60 8 61-65 9 66-70
Description
Number of teeth—pinion. Number of teeth—gear. Standard center distance. Nonstandard center distance 1 (same as standard, if standard). Horsepower. R.P. M. —pinion. Overload factor. Dynamic factor. Size factor. Loa i distribution factor.
Pressure angle at the standard pitch diameter- degrees. Diametral pitch at the standard pitch diameter PND normal plane. Helix angle at operating pitch diameter. Backlash—minimum. Backlash— maximum. Face width—minimum (pinion). Face width—minimum (gear). Tip break—maximum (pinion). Tip break—maximum (gear).
156
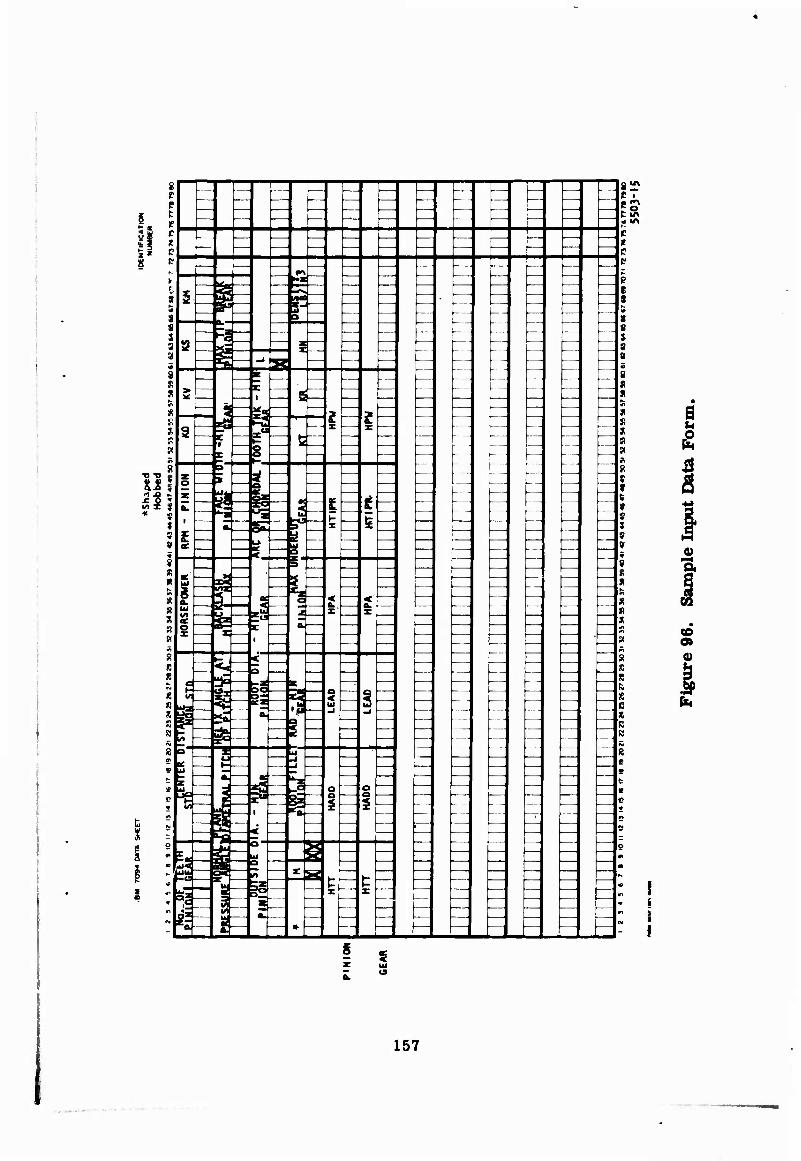
i I- LZ r" TT! r" i r" r" 1 L —
p i e 1 "" 1—i ■ ■" 1 r~—
1
1
£ o tR
k * 3| c j- " ■'"
si c i e
r « (S - I *ml 1
c
r PS —
E s — ,—
• > «
s 8 s
— r
—
$ Ea — — _.- — S « 3 r "—— —
TJ ■—
—
E ' ' — — 8 a
8
» ~i
8 m S ac S S r ■
Tl ft
* in
* » r be
r i *-—
^T' —r * £ X
—— - -
- —j
K S s
St 1 p 1 '" 8
111 III
|
a.
— -^1 ids g
—
» 2
1 9 » 9
i Z Td» i 1
L f 1
i M ' =
^ » 9
iJ 8 ft R
s Ui
i l/t
a «
— a *t3
-j^ 3 |a
t
X —
— i—
1 1
- - — 1 s «
R o X
3= c oJ—1 • M 1 [■—j — — PI O»
a ►- , < ^" Si 0)
8 a 1
<4
) ä "L y -- ~ '—! 1
fa *
alS i J so
h a. 1'
^—i« > c t 1 ' — -1 „ , ~\ ^\ n
gj ^ae r. ~^ 1 1 R B
l/t is —] 1
—\ ~ 1 8 Ci ^^"1 ji i ~~" IUJ 1
8 - CI ' P | j 1 c * Iti W— • " z ~\ •> —r tic > 1 o 1 —J
Iff
J 1 j i
< —r j i J IU $
-j J - j ^j EJ "j N
§ ^ c J 4,3
H f ^ —1_
rj X
-j
—
j ~^\
-J ^A
9 • •
1
« s —la 3 * 1
—1''
i J L—
H s « i 2
157

Input Card 3
Word Column
1 1-10 2 11-20 3 21-30 4 31-40 5 41-50 6 51-60 7 62
Description
Outside diameter—minimum (pinion). Outside diameter—minimum (gear). Root diameter—minimum (pinion). Root diameter—minimum (gear). Arc or chordal tooth thickness—minimum (pinion). Arc or chordal tooth thickness—minimum (gear). This must be one of the following in Column 62:
0—if Columns 41 through 60 are arc tooth thickness
1—if Columns 41 through 60 are chordal tooth thickness
Input Card 4
1 1-6
7 8
— 9-10 3 11-20
4 21-30
5 31-40
6 41-50
7 51-55 8 56-60 9 61-65
10 66-72
This must be one of the following beginning in Column 1:
SHAPED HOBBED
Blank. This must be one of the following:
0—if pinion is "HOBBED" 1 —if gear is "HOBBED" 2 —if pinion and gear are "HOBBED" Blank—if "SHAPED" is in Columns 1 through 6
Blank Fillet radius (true)—minimum (pinion). Blank if pinion is "HOBBED. " Fillet radius (true)—minimum (gear). Blank if gear is "HOBBED. " Maximum undercut—pinion Blank if pinion is "HOBBED. " Maximum undercut—gear. Blank if gear is "HOBBED". Temperature factor. Safety factor. Load sharing ratio. Density—pounds per cubic inch.
158
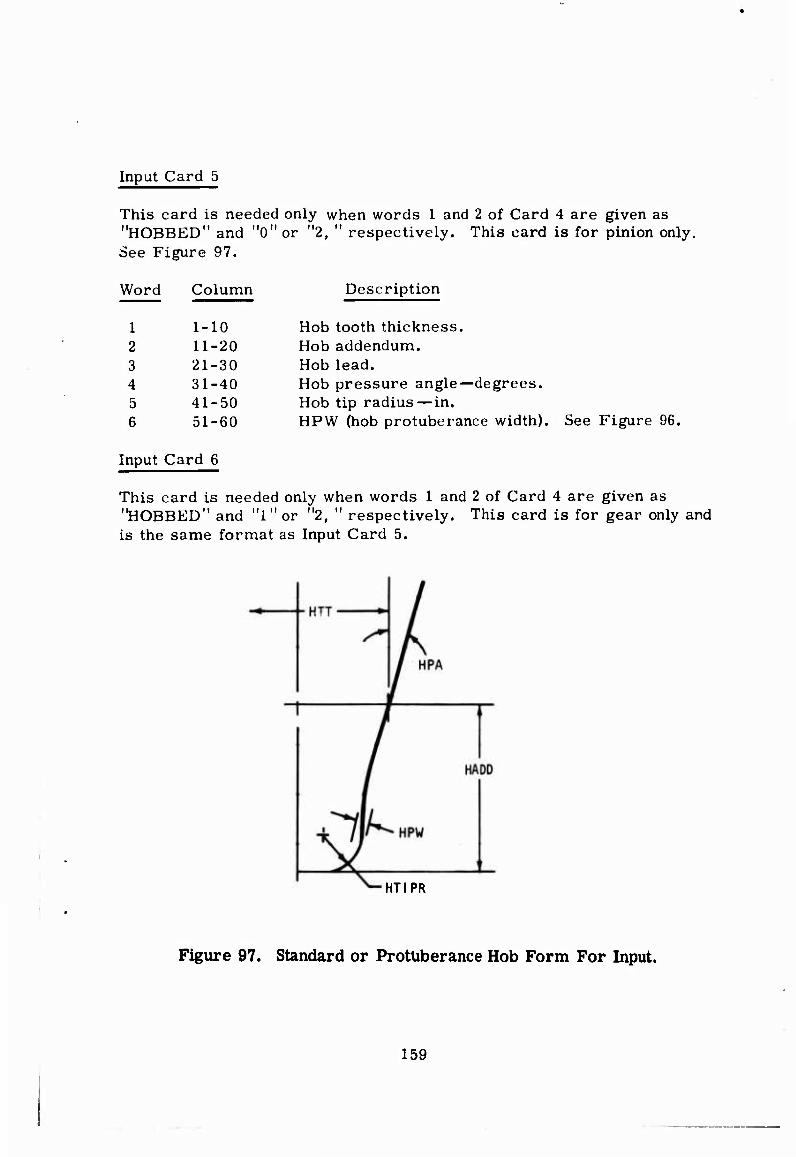
Input Card 5
This card is needed only when words 1 and 2 of Card 4 are given as "HOBBED" and "0" or "2, " respectively. This card is for pinion only. See Figure 97.
Description
Hob tooth thickness. Hob addendum. Hob lead. Hob pressure angle—degrees. Hob tip radius — in. HPW (hob protuberance width). See Figure 96.
This card is needed only when words 1 and 2 of Card 4 are given as "HOBBED" and "l " or "2, " respectively. This card is for gear only and is the same format as Input Card 5.
Word Column
1 1-10 2 11-20 3 21-30 4 31-40 5 41-50 6 51-60
Input Card 6
HTIPR
Figure 97. Standard or Protuberance Hob Form For Input.
159
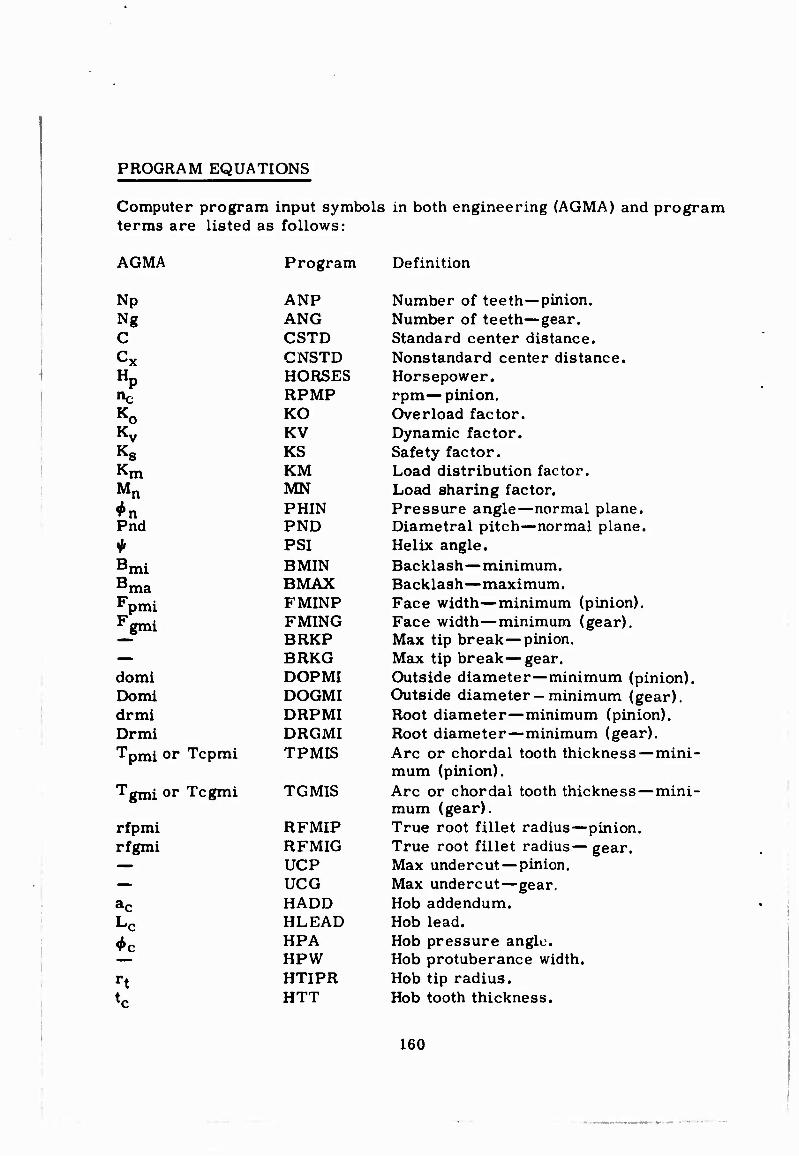
PROGRAM EQUATIONS
Computer program input symbols in both engineering (AGMA) and program terms are listed as follows:
AGMA Program Definition
Np Ng C
Cx Hp
Ko Kv
Kg Km Mn
^n Pnd
Bmi Bma ^pmi Fgmi
domi Do mi drmi Drmi Tpmi or Tcpmi
Tgmi or Tcgmi TGMIS
rfpmi rfgmi
1C rt
ANP Number of teeth—pinion. ANG Number of teeth—gear. CSTD Standard center distance. CNSTD Nonstandard center distance. HORSES Horsepower. RPMP rpm—pinion. KO Overload factor. KV Dynamic factor. KS Safety factor. KM Load distribution factor. MN Load sharing factor. PHIN Pressure angle—normal plane. PND Diametral pitch—normal plane. PSI Helix angle. BMIN Backlash—minimum. BMAX Backlash—maximum. FMINP Face width—minimum (pinion). FMING Face width—minimum (gear). BRKP Max tip break—pinion. BRKG Max tip break—gear. DOPMI Outside diameter—minimum (pinion). DOGMI Outside diameter - minimum (gear). DRPMI Root diameter—minimum (pinion). DRGMI Root diameter—minimum (gear). TPMIS Arc or chordal tooth thickness — mini-
mum (pinion). Arc or chordal tooth thickness—mini- mum (gear).
RFMIP True root fillet radius—pinion. RFMIG True root fillet radius—gear. UCP Max undercut—pinion. UCG Max undercut—gear. HADD Hob addendum. HLEAD Hob lead. HPA Hob pressure angle. HPW Hob protuberance width. HTIPR Hob tip radius. HTT Hob tooth thickness.
160
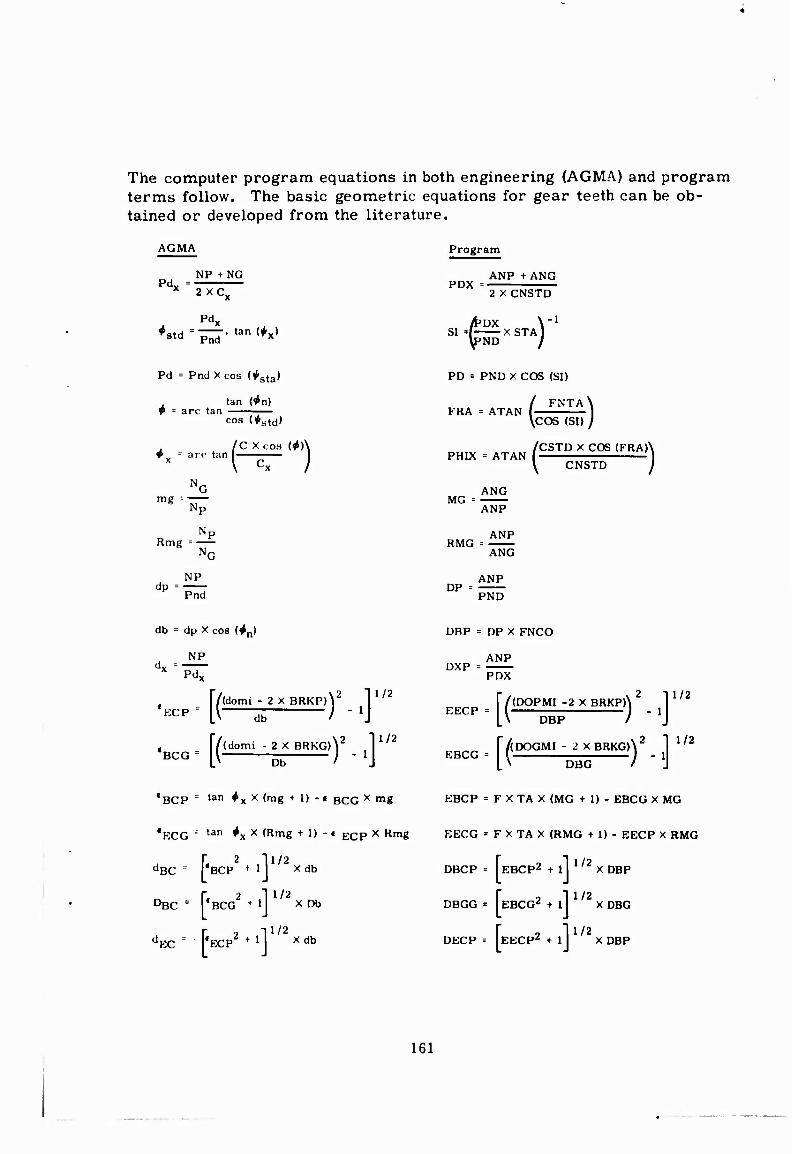
The computer program equations in both engineering (AGMA) and program terms follow. The basic geometric equations for gear teeth can be ob- tained or developed from the literature.
AGMA
Pdv NP + NO
2 XC„
Pdx $std ~- «an (,>x)
Pd = Pnd Xcos (^sta)
tan (^n) ^ = arc tan
cos (*std)
^ = arc ta
mg =•
/C X cos (*)\
V Cx )
Rmg
dp NP
Pnd
db = dp X cos (^n)
NP
Pdv
KCP
BCG
[/(domi - 2 X BRKPA2 1 1/2 = H—z ) -i\ [/(domi - 2 X BRKGA2 1 1
'eCP = ,an *x x <rng + 1) -« BCG x m«
'EGG = tan *x x <Rmg + 1) - t ECp x Rmg
dBC = I'BCP + lj X
DßC = ['BCG2 + lj
d^ = ['ECP2 f lT
db
'EC
BCG +1 X I*
1/2 x db
Program
ANP + ANG PDX
2 X CNSTD
-1 SI =/- XSTA)
\ftiD }
PD = PND X COS (SI)
FNTA ERA = ATAN
PHIX = ATAN
(FNTA\
COS (SI) j
/CSTD X COS
CNSTD
(FRA)\
MG = ANG
ANP
RMG ANP
ANG
DP = ANP
PND
DBP = DP X FNCO
ANP DXP =
PDX
EECP
EBCG
(DQPMI -2 X BRKP)
DBP
DOGMI - 2 X BRKG) \2 I 1/2
DBG
EBCP = F X TA X (MG + 1) - EBCG X MG
EECG = F X TA X (RMG + 1) - EECP X RMG
DBCP ' EBCP2 + 1 ' '2 X DBP
1/2 DBGG = EBCG2 + 1
DECP = IEECP2 + 1
XDBG
1/2 X DBP
161
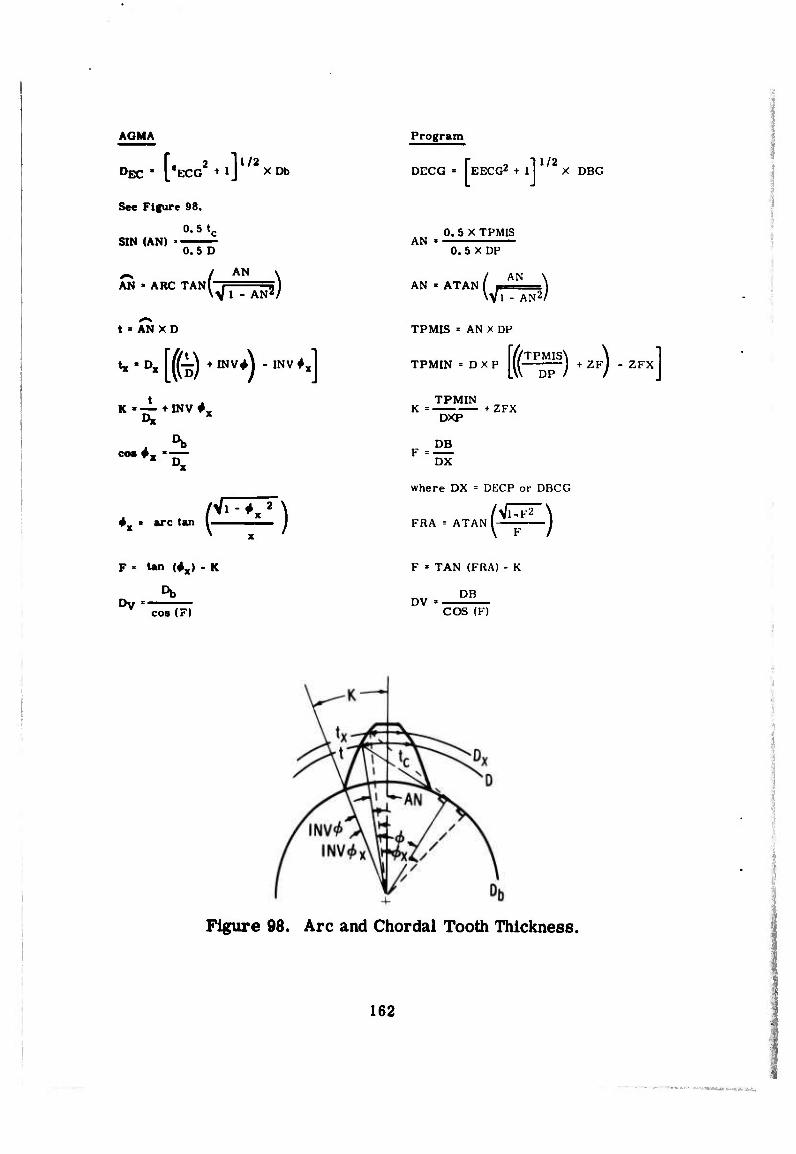
AGMA
r. 2 ii/2 DEC ' L ECG + lj X Db
See Figure 98.
0.5 t. SIN (AN)
0.5 D
W1 - AN2/ AN > ARC TAN
t • AN X D
t, - Dx [((■5) + mVA - INV ♦xl
K .-L +INV#V
co-*x- —
4X • arc tan (VTTT-)
F • tan {4X) . K
Db Dv
COB (F)
Program
I EECG2 + 11 1/2
DECO = EECG2 + 1 X DBG
AN 0. 5 X TPMIS
0. 5 X DP
AN * ATAN / ANX
TPMIS = AN X DP
TPMIN DXP [((1Tr)+ ZF) -ZFX] TPMIN
K = + ZFX DXP
DB F =•
DX
where DX = DECP or DBCG
FRA = ATANl (VEL)
F = TAN (FRA) - K
DB DV ■•
COS (F)
Figure 98. Arc and Chor dal Tooth Thickness.
162
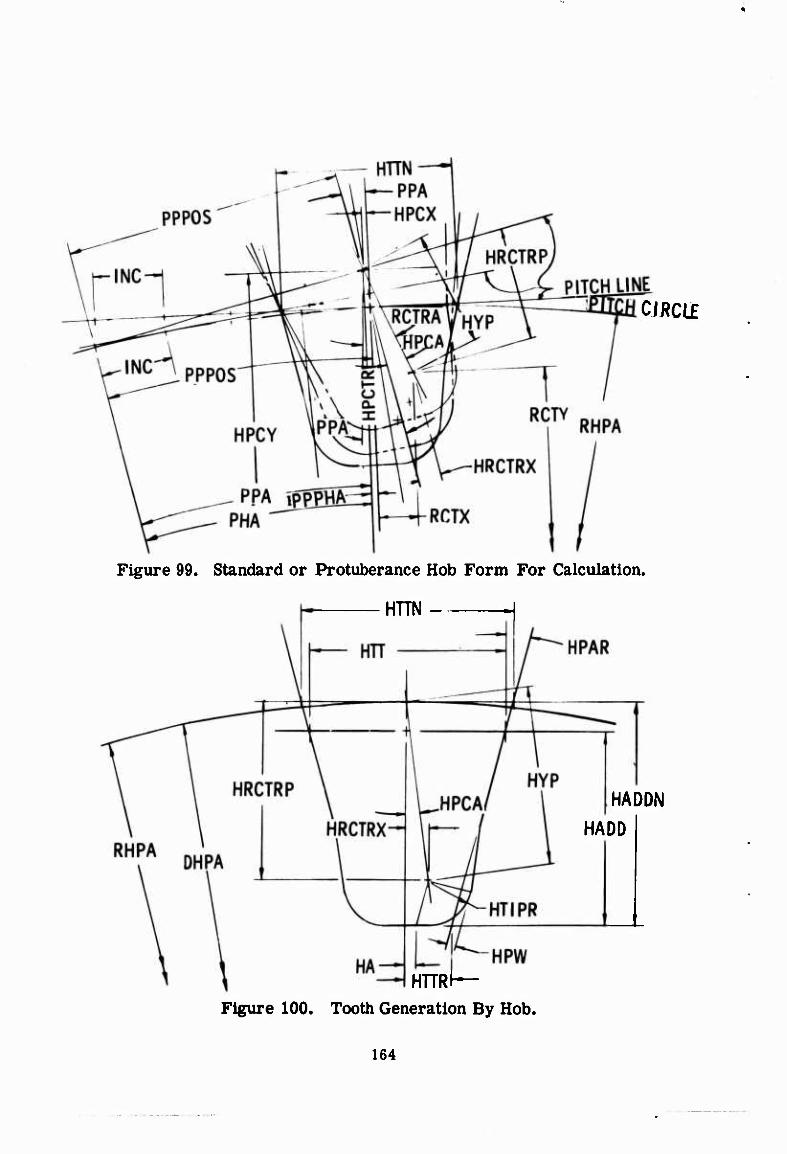
CJJ?CLE
Figure 99. Standard or Protuberance Hob Form For Calculation.
HTTN
HADDN
HADD
HTTRf— Figure 100. Tooth Generation By Hob.
164
., . r
'
1
[
' BLANK PAGE •
■
. 1
!
1
■
-
■
*
I
'■
■■
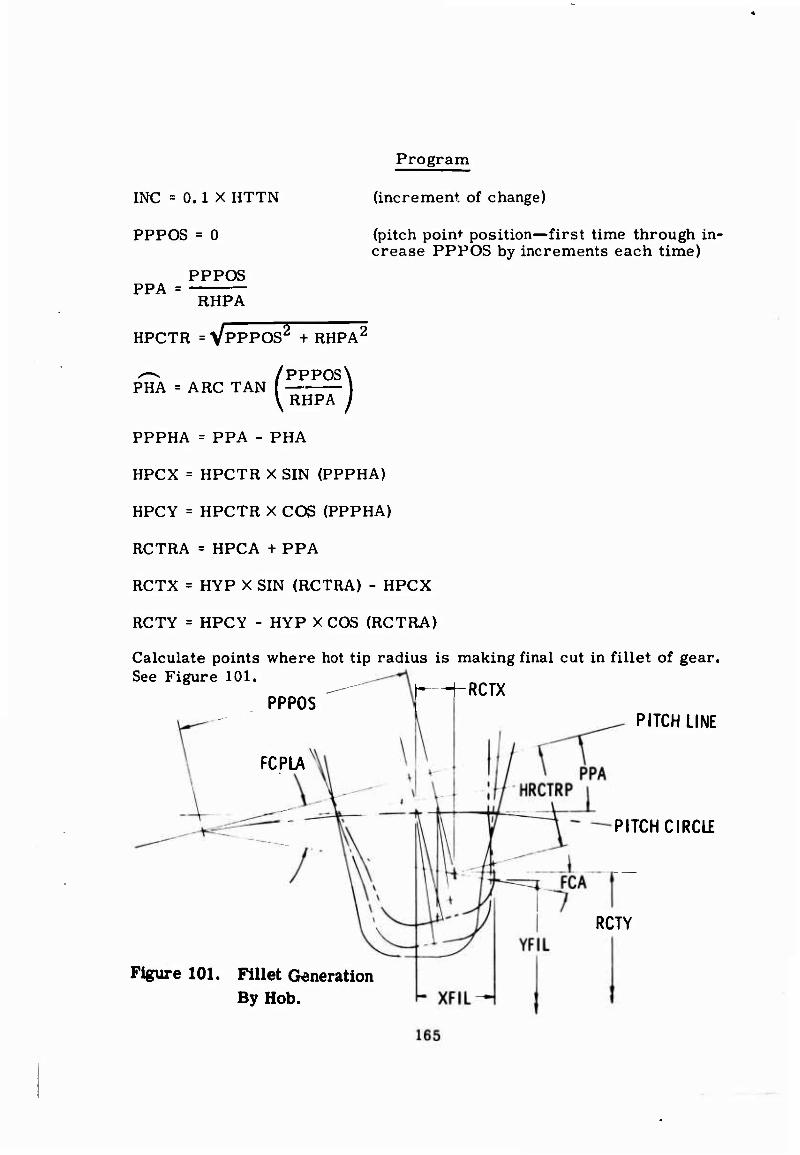
Program
INC = 0.1 X HTTN
PPPOS = 0
PPPOS
(increment, of change)
(pitch point position—first time through in- crease PPPOS by increments each time)
PPA = RHPA
HPCTR = VPPPOS2 + RHPA2
PHA = ARC TAN / PPPOS \
\RHPA j
PPPHA = PPA - PHA
HPCX = HPCTR X SIN (PPPHA)
HPCY = HPCTR X COS (PPPHA)
RCTRA = HPCA + PPA
RCTX = HYP X SIN (RCTRA) - HPCX
RCTY = HPCY - HYP X COS (RCTRA)
Calculate points where hot tip radius is making final cut in fillet of gear. See Figure 101.
4 -hRCTX PPPOS
FCPLA
Figure 101. Fillet Generation By Hob.
PITCH LINE
PITCH CIRCLf
RCTY
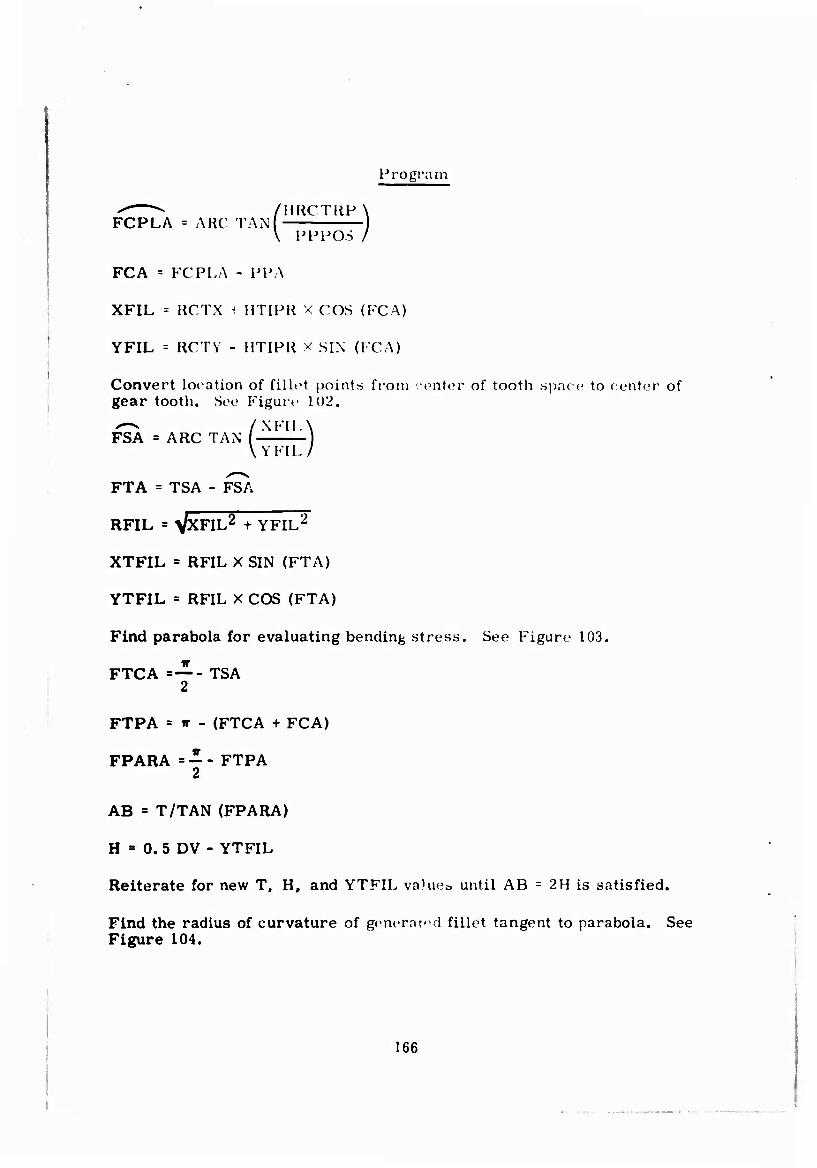
Program
/HRCTRP\ FCPLA = Al
/HRCTRP\ «RC TAN
\ PPPOS /
FCA = FCPLA - PPA
XFIL = RCTX ^ HTIPR X COS (FCA)
YFIL = RCTY - HTIPR X SIX (FCA)
Convert location of fillet points from 'enter of tooth space to center of gear tooth. See Figure 102.
FSA = ARC TAN
FTA = TSA - FSA
\YFIL/
RFIL = VXFIL2 + YFIL2
XTFIL = RFIL X SIN (FTA)
YTFIL = RFIL X COS (FTA)
Find parabola for evaluating bending stress. See Figure 103.
FTC A ~- TSA 2
FTPA = ir - (FTCA + FCA)
FPARA = - - FTPA 2
AB = T/TAN (FPARA)
H = 0. 5 DV - YTFIL
Reiterate for new T, H, and YTFIL va)ue0 until AB = 2H is satisfied.
Find the radius of curvature of generntod fillet tangent to parabola. See Figure 104.
166
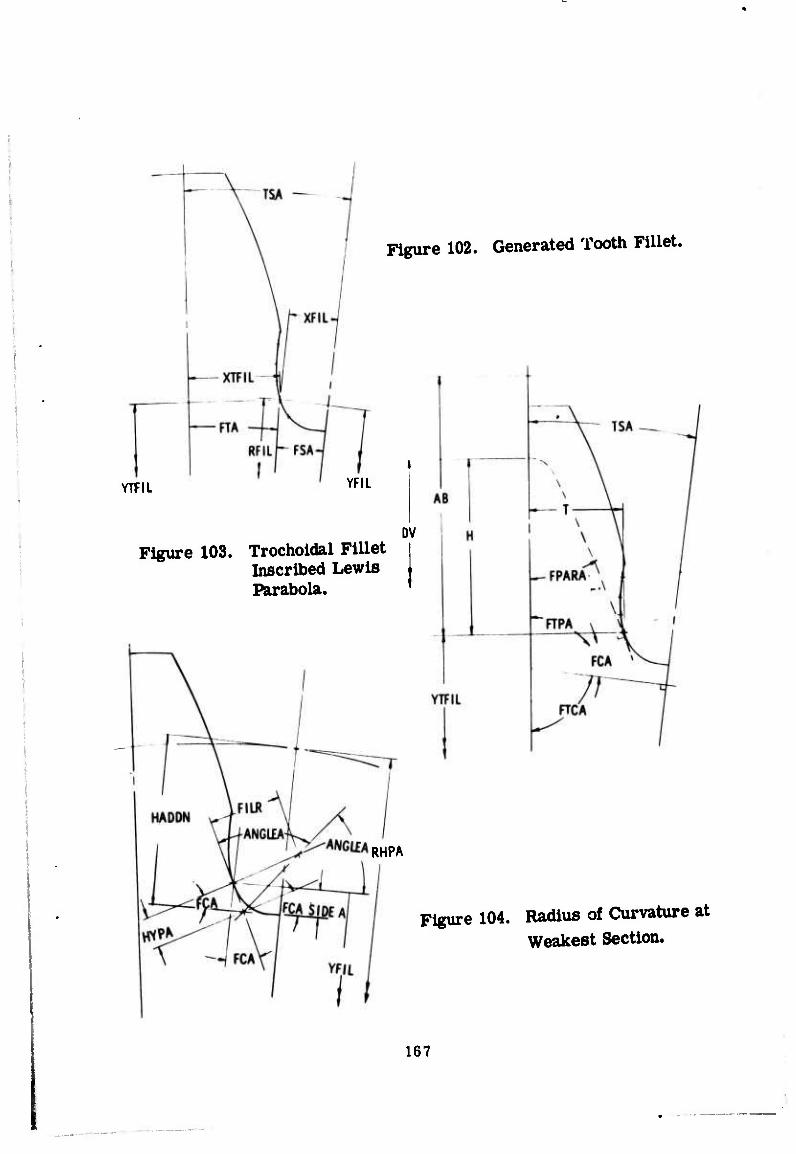
Figure 102. Generated Tooth Fillet.
YTTIL YFIL
Figure 103. Trochoidal Fillet Inscribed Lewis Parabola.
DV
RHPA
Figure 104. Radius of Curvature at Weakest Section.
167
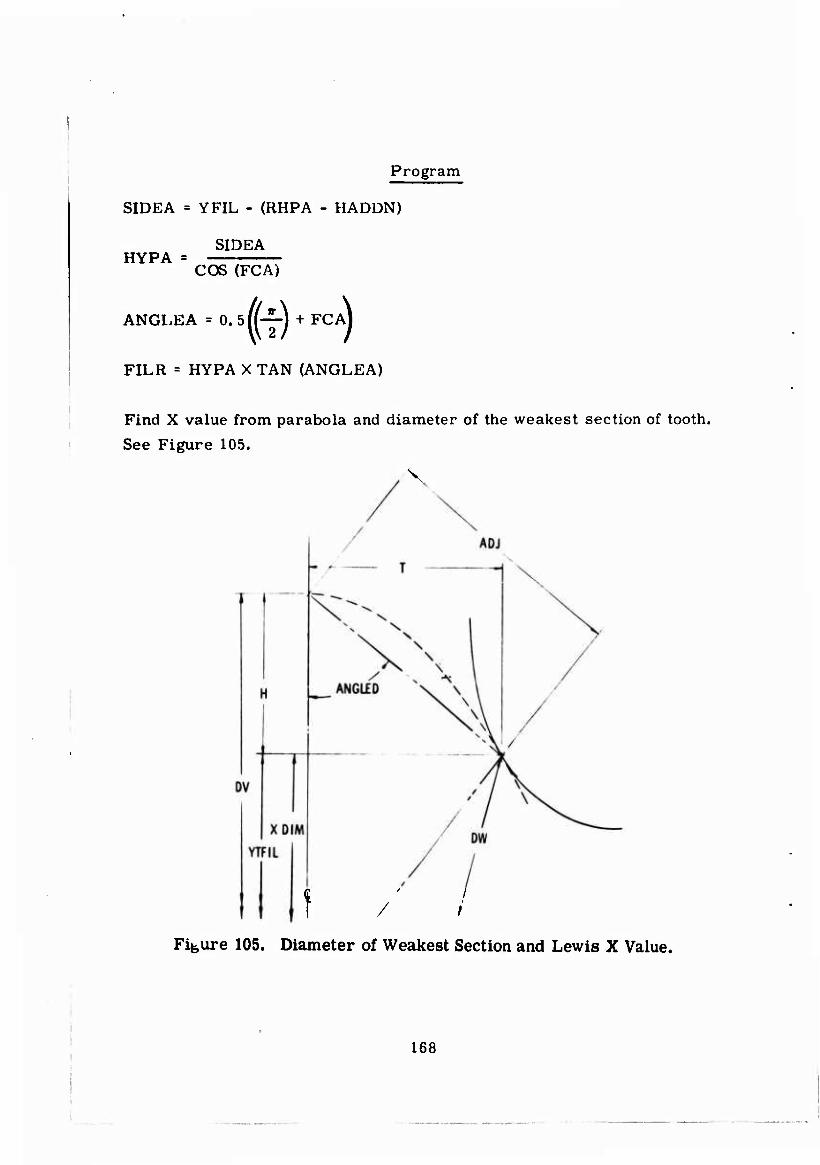
Program
SIDEA = YFIL - (RHPA - HADDN)
HYPA = SIDEA
COS (FCA)
ANGL
FILR = HYPA X TAN (ANGLEA)
LEA = O.sfp-j + FCAj
Find X value from parabola and diameter of the weakest section of tooth.
See Figure 105.
Figure 105. Diameter of Weakest Section and Lewis X Value.
168

Program
ANGLED = ARC TAN
T
© ADJ =
XDIM
SIN (ANGLED)
ADJ - H
COS (ANGLED)
DW = 2\T2 + YTFIL2
Find coordinates to center of true fillet radius. See Figures 106 and 107.
DR H = + RF
2
DB When <H, then (Figure 106):
CPR = 0.5 DB
H
Figure 106. Coordinates at Center of True Fillet Radius—Base Circle Below Root Diameter.
169
Figure 107. Coordinates at Center of True Fillet Radius—Base Circle Above Root Diameter.
Program
(Vl - CPR2 \ —T^Z J CPR /
OPP = >/H2 - (0. 5 DB)2
A = OPP - RF
HI = VA2 + (0. 5 DB)2
0.5 DB CA =
HI
CARA = ARC TAN M 170
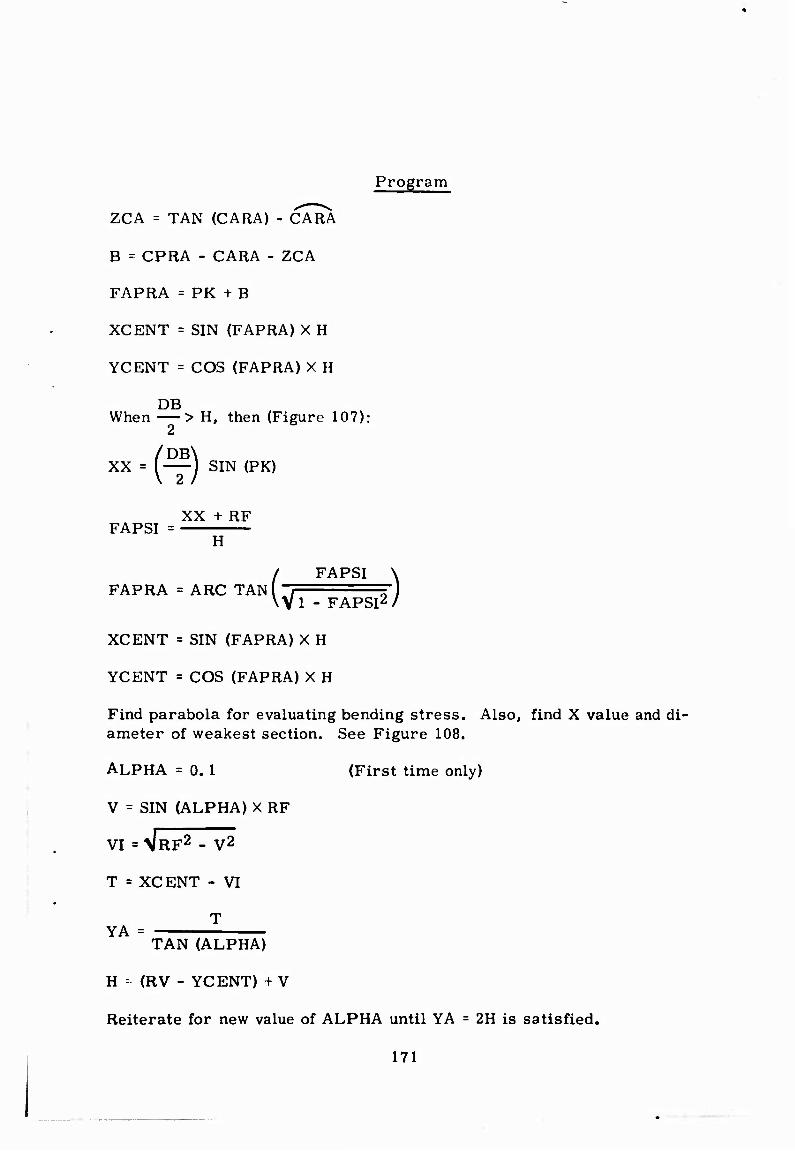
Program
ZCA = TAN (CARA) - CARA
B = CPRA - CARA - ZCA
FAFRA = FK + B
XCENT = SIN (FAFRA) X H
YCENT = COS (FAFRA) X H
When > H, then (Figure 107):
/DB\ XX = ( ) SIN (FK)
FAFSI = XX + RF
H
FAFRA = ARC TAN / FAFSI \
Wl - FAPSI2/
XCENT = SIN (FAFRA) X H
YCENT = COS (FAFRA) X H
Find parabola for evaluating bending stress. Also, find X value and di- ameter of weakest section. See Figure 108.
ALPHA = O. I (First time only)
V = SIN (ALPHA) X RF
vi = VRF2 - V2
T = XCENT - VI
T YA =
TAN (ALPHA)
H -- (RV - YCENT) + V
Reiterate for new value of ALPHA until YA = 2H is satisfied.
171
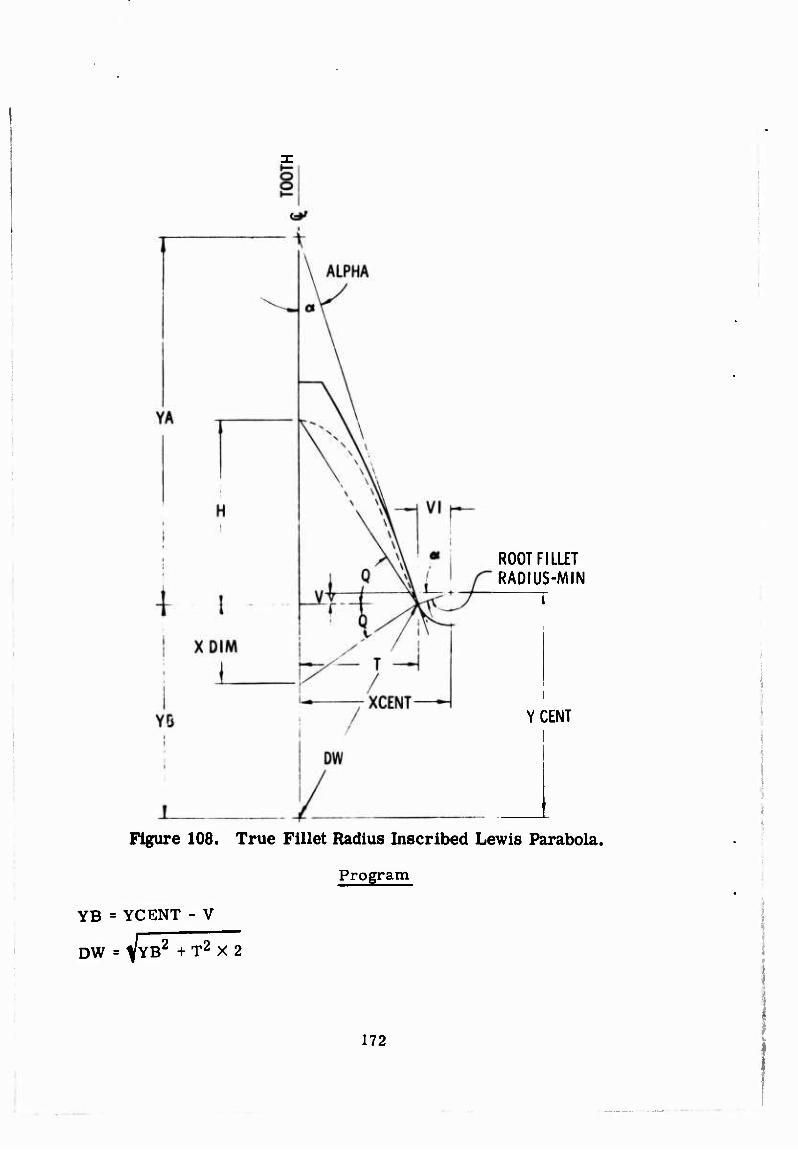
ROOT FILLET RADIUS-MIN
»
YCENT
Figure 108. True Fillet Radius Inscribed Lewis Parabola.
Program
YB = YCENT - V
DW = VYB2 + T2 X 2
172

(T) Q = ARC TAN
Q.--Q
XDIM = T X TAN (Q)
AGMA
T = 63025 X HP
1p
Wt 2 X T
"P
G = 1p X R mg
Sh pV*
bi = b - r^-
Rp +b1
rf - rj + rT
Kf = 0.22 + 0.20
© (T) /T\0-15 /T\(
K^0-18+(7f) W / I\0-11/T\ K^0-14 + (7;) W
0.11/T,\0,50
Y -■ PDX
cos
J =■
cos
Y COB2 »
Kj X mn
»Ln [2. tan ^Ln] *n L X Tw J
1 Wt Ko PD KS KM
* ' CH Kv F J
Program
173
Program i£
TQ
WT
63025 X HORSKS
RPMP
2 X TQ
RPMP
RPMG = RPMP X RMG
SHOOP = RHO 386.064
Bl ■■ HADD - HTIPR
Rl *■ Bl'
RP +81
RFMI •= Rl + HTIPR
KF = 0. 22 +
KF = 0. 18 +
/ T \0.20/T\0.40
\RFMI/ llT/
i T \ 0. 15 ^'p\0'45
.RFMI/
KF 14 + [• T V
RFMI/
PDX
0.11 0.50
COS^LI iLT 1.5 TAN * L]
♦ NLXDIM ' TW J
J =
COS
Y COS2 (»)
KFX MN
1 WT X KO PD KS X KM SB • *■" ^^^~' ■*" ■"^■■*~* """^~™"~'
CH ' FMINP J
C^ » a factor calculated by the principle of superposition of the moment image Cantilever Plate bending moment dis- tribution curves as proposed by Wellauer and Seireg.1 This procedure is based on the work done by Jaramillo4 to determine bending mo-
ment distribution in a loaded Cantilever Plate. See Figure 109.
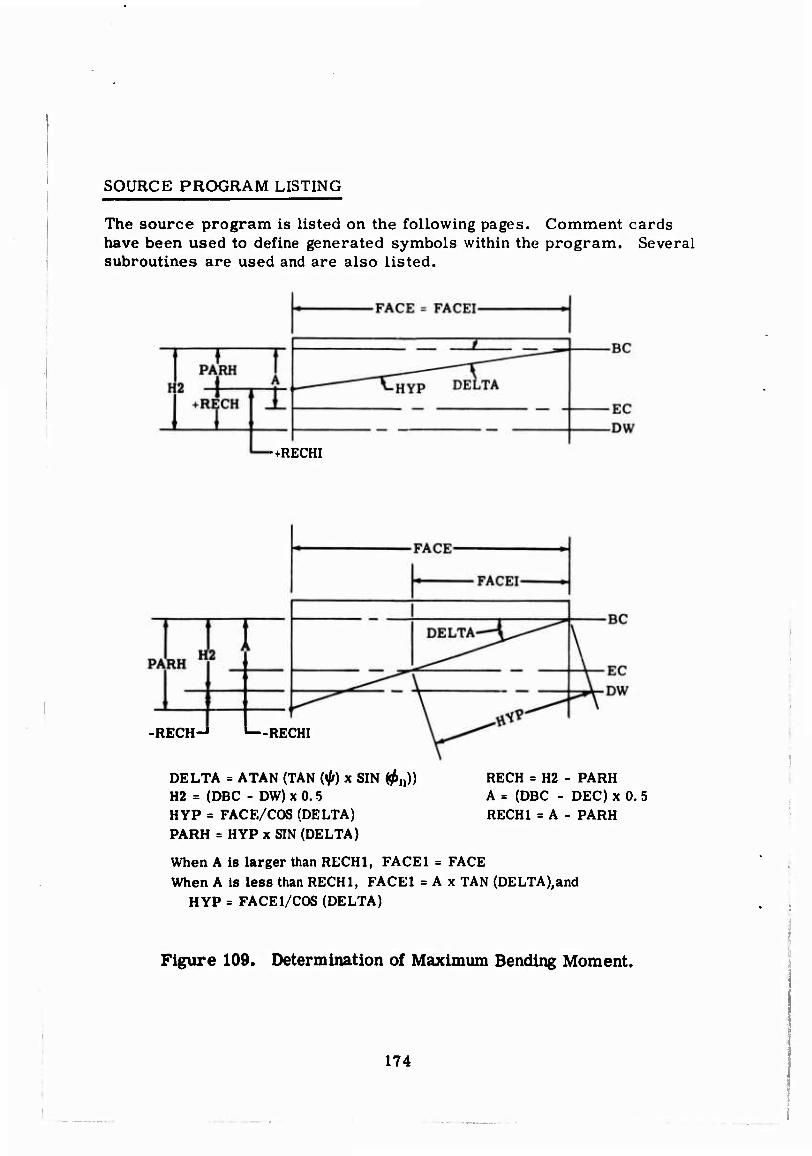
SOURCE PROGRAM LISTING
The source program is listed on the following pages. Comment cards have been used to define generated symbols within the program. Several subroutines are used and are also listed.
•+RECHI
-RECH-1 '—RECHI
DELTA = ATAN (TAN (^) x SIN ^n)) H2 = (DEC - DW) x 0. 5 HYP = FACE/COS (DELTA) PARK = HYP x SIN (DELTA)
RECH = H2 - PARH A = (DBC - DEC) x 0. 5 RECHI = A - PARH
When A is larger than RECHI, FACE! = FACE When A is less than RECHI, FACE1 = A x TAN (DELTA),and
HYP = FACE1/COS (DELTA)
Figure 109. Determination of Maximum Bending Moment.
174
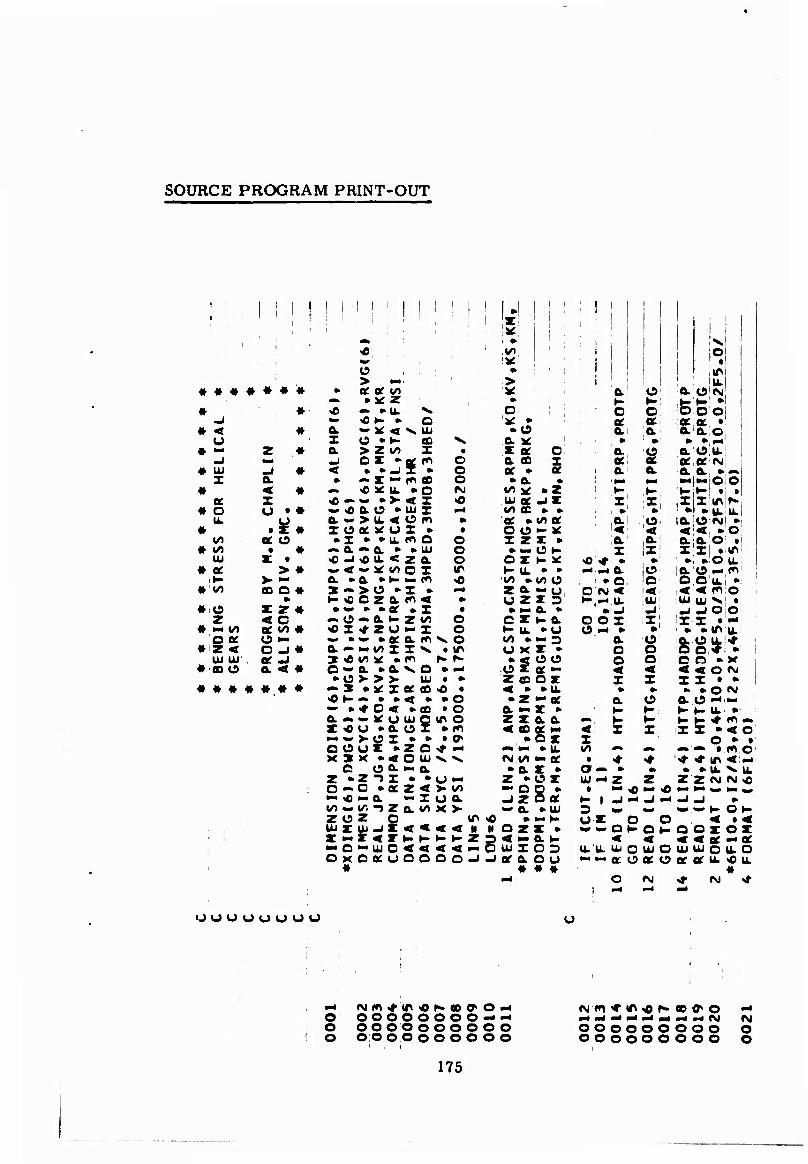
SOURCE PROGRAM PRINT-OUT
# < u
• •- mi
# UJ z
«
« o u.
# bO ai
# Of .»-
» «/* ♦ o
z # — CO
O of #:« <
UJ UJ # CD O
«
*
z ,# -J *
< « Z o • ♦ .*?«
0£ O t *
X • > •
CD O «
z z * < c ec f) * o •- o -J ♦ or -J a < *
I i
o > m. ee or vo • ^ z
,0 »
a z a
•*««*«*
— «o o. «- z o • z
*• a <o -I — < a • ar - • «*
«o z «> • a — » <e o - — »
«^ » & — z « o o x ar
e z • o — •-< 4) t/) «■» z Ü UJ z z <- M O O X
«
<0
o • >z ox » •
— z •0 iC
fr o > u. • »
— a >o a. — ^ a • >o oz
•> * — a ^•z •^ •
a » v >
'TO w MT U ► >-o OX X •
z ■» o • — a v, -i z Ul -J X <
O (K
► o < «s. ai K 00 vo Z
-J Z • ** m «D U. »O >• < Z »iti X
< O fr» u z • u. en O » » UJ <za U50 Z H — fO ► z ► a »n <
or »z K Z oi o •- z ec a rr) v Z Z V •
a v o • >■ UJ t Z ee eo <o » < • »
< » eo • O UJ Q IT a. u Z • z • • • »z o ^
< o uj v a »- Q. Z • » w QC Z < >■ - Z O
r a. «^ x z < « < Z K H ^ O < < < U O O O
! I
O O o rsj
• o o o «r
• o o o
t o o o
WO ft. >-
< H »- Z < »«
•
O *: • • o a x x « o a eo x ee » of ► o. • <^ ^ » z
UJ 0C -J X «/)£»» oc • v) or O o •- »£ Z Z X »■ » M C K
O X K ^ H U. » » «/> • U) O z a i-o U Z X 3 » M ft »
C Z ^ ft K u. »o «/) ► *- 3 O X X • • < O Ü o x a •- Z CD O X « •> »u. • z •- oc
ft M z • Z Z ft ft < ao oe M
rj u) •- of • ft Z » z »o z «-op» _j z o a *- ft ••UJ
II o Z X • 8< •- ft ^
UJ Z O D -J Of ft o u
« * «
ft ►- o Of ft »
ft Of ft
ift' z
«o > » ^ »4 ft
O CVJ <
o o Of A'
<
< IUJ!
Of ft
Ivl
O'rsj
•OO; Of, •
ft o u. of of <VJ a. ft •-. »-|«iOiO
• l • :i: ''
OOZ Z| o -- •> »
ft o Q O o o < < z z
< z z z (/»MM
t 4- * or— • • UJ -4 z z t *■ 4) M <0
K | -J -« -J »- D — -» U X O O *-«- OH O »-
< < U. IL UJ O UJ O *- •- Of O Of o
X
O fM
. _:u.l Ift O «Nil »I <:< *o;
ft;ft O »j Z z »yr 1 ». • o u.; ift'O (-* ro:
O O U. •: < < f^O UJ UJ X! • _J -I o o z z •-
i » •> IT u.
e o < < o z z •
•« • O »M ft O *«n- H H U. • K H <♦ m « Z Z •< O
o ► • «» — # mo '^ * »r <!— • »U. V u.
Z Z (VJ <M <0 •M •» ^ »■ ^
-J -J » «_K OK
O O Z O Z « < Of »■* Of UJ UJ o U. O Of Of u. « u.
» * «M ^
«JUUUOOUU
«4 M(«>^ir\«^.floo>OiM O OOOOOOOO^^ O OOOOOOOOOO O OOOOOOOOOO
rg m <r tf^ <0 h* «0 9" O ~*
ooooooooo o ooooooooo o
175

I i
I I
o
O O
» o •t
a. r> a>
Ui (D U) » of a o * z « »CD
O *
5?i ar M ux »u.
o • »> a «/> z u*- • z
< u.
< Z M ft. CD O z •«
«^
t«
z a K o *- Of z •> o z K Z o »
;Z • a ^■ a st o o »ir
M u z so o ••►- O Q. O U O • DO
•M » z o a M o z o u.
O or a. ».
a Of a
I: »
a <
Zi , •> a. o < UJ
■Z » a o
o o;
^ <• <o z » •
CD 0. OK <0 K' • I1
O • o z <o o
o o Of a o
a c a « *• a. K •- z
a. o
o a. < z a z •
o O Ui * -J ui z si ! * z ft. • o
o lo o < o z
^ fc!
►- x
•: o1
Of «I < • Ui, ■•-•I O ft-
IT
o» • •r> o — eo * —
• •-• m & H n •- z
a « V* • z Sz — ft. N N
Ui z o u.
--o < <u< Of Of Z Of zzu. z U U V u.
Z MU) « •-C Z H V> U u. z H H H U, -O« » »2u>-z z zz u. u a. u KJ
< < Of Of I/) V)
z to i-O i/> U N H
«/) u
o o
U) ft. i^ z N «
wo 2
«A •' 9 Ui •
Oft. ztz
Z'Z
3
OZON O <Q 4) O o; • »o »</) o •
O' * o • »«JtO -i
OO—IZ' ■«• H N ft -
ft. O UJ
o o o
O
a » <« ao « < o: oi ZZO O; U. (/) — —i Of * •
00 o o
00 o o
*OD •>• 3 8- z ui O — o o a oio
MO*-- »-J ui O ui M;ui
-j •► • _.ir\ ml ITS I
gu. «11 U. U. 0t| Z U Of of of z;ft. — »
o ss
o «0
o o
O Of ox
Si «0
BflH"" Ui D K O UI Z UJ O Ui O Ui »»». wH>jl- »- H H
K «M kM1 (M M«
s u of u. of a of o of o — z — zozoz •
«Oi CD O o. o — -6 «O «
i I oi ft * m « f» «o* o «•Nm * «v «o b-oo a« o —;
,^ _ _ — _ ... _ _ _ « -. 0 0 0 0 0,001 O O O O O O; Ol
O O o o o o op o o o o o a a o o o o op o o o o o
oo oo
I 176
oo o o o o o
i i
00 ff> o
sss ooo
—IM W
ooo opo
♦ •ft oo oo
c o Of | i ! 1
! 1 i 1
1 t ,
Of '■ 1 i 1 :
A. 1 I , •M 1
; ' ' i ■
K 1 i i • I j vo
i
C r i ■ Z i
< 1 1 : . i i : i O • a 1 * i •-• X 1 1 ; i : ' K • ' 1 ^M
1 * o 1 , i i ' : ! O o 1 1 1
! ig1 I
< t I 1 I o ^ ««
UJ, , 1 1 , u • t
^l 1 ! 1 1 i { | ^,«*i
z: I ) • ! ill i , V '1,11
•> I i ^ ' * 1 ' 'Z' <M eg
8; 1 i! 1 i , i i 1 '
,r '* • i« «;
1
o 1 , * ' UJ '«« «« ! ' < ! i i ■ 1 o a o I; 1 i . , i '
g IB CD m* •u
I ^ ■
1 O o o
o | 0m K i z :v v z H »» U. i UJ «» «ft #
5 '»M , >. a o o * i dm, ; i ■ UJ K X u
• * * K (M , l i i z ec ec 10 ae ^ *m «*' V) * * ' H' CD CD UI * a v) «» z* 1 '■ i . 1 :* * » H* 1 *■! UK o ^ i • •' T
Ui i/i • tr> vu. a 1 < ■M fsj
o z -• «V - 1 v. i 1 I .•■> I o — W Ä • ■Q — X (/> *m *m ' t
«hJ « < H> O < -< Z -* o ! u. Z Z \m* CO • ^ ec u < a «. QL < a «ft ^
* a o %a
o (M 1^ o — "V oc 11. K — — O ec ^ ec v < < o o o o1 «. • wo — < u. ^ oc < < u o < «« u. -« ec ec z o o z »-4 v _ *• «/)»- 1 oc «^ J a: ot x UJ ae o ft-O u. u. < «" ft« «« •l - O's «- z — OOI^KKILOK u »/) o «x »»■ ft» ft« o ♦
D! o z - bO U. < UJ u — u. u. •^ # u z O X iS> x to X z — -a z < O z a IUO o «- oc O • Z w « < 1 o X u. ua. c o o o a >- >- z < H Juu id v «- u zu. ♦ Q<z^«^a:<Z Oi# • « o u a o u a •i ec oc < V. X -1 = a x z * <•— < K K *- o>X X »- 0. a a — mm mm o. * v a # v. »— o o v a. u.
z z o < o i-;z QC to < «^ uu. u.xva^ao.a *ft 0. a v u o 00 I</) «/) O Z !*> Ui M — 0. H z < < U. U II II II II 11 u. — v *- «• «v ft" a o Z:0 o z & H II Z < N K h- II — < a ii H- MI<- < M o < x II a •■* a 11 11 Z II II :Z N II
a H oo Ui a. o < ii a
z K II II 42 H <- ii oc v» o>- •- X « a n JC II X H a ;u u II IUJ CD o
o u « o o « « a. XXX X X x x u. z H x (0 CD CD OL 0 XlO CD X 1 Z 09 X u !a u) (^ a. U-IM o. u. u, u. u-.u. a M a o. a. o. a a oo oo o o I UI UI Z CK Ui
o
1« ! . i
1 i 1 i
1 ; 1 I
i i i
( V
i i ■
1 i 1 . 1 '
0i ' i
1 : '
j
I 1 .
1
i 1 1
1 i
' i i 1 i i 1 i
1
i 1 1
;
tJ
.
1 ..
i i ! :0
III
1'! ! ■ ! ■ 1
i
1
•Cf-
i i ' i i .
«(f o
j
1 j
!
« K«0
1 i I 1 1 ' 1
GO,** fJ t*\ * in
1 i 1
ee 0>
1
O:P4 r^i«i{
1
! i ' 1
! 1 ' '^ IT «0 ^ CD
tf\;ir IMT « «0 «« ««««<«« ,* fk, j«. r» p» ^ ^ r^r-, r* r- OO'QD <0 00 00 00 CO CO 00 es o ooo oo o oo o oo ooo o o o ooo o o o o o o o o o o O o ^ 1 i 1
oo ooo 1 1
o oo oo ooio 1 1 1 1
o ooo © o o o o o o oo oo
177
i i I i
s: : ' : : S; Qf' (M « «< A. i ' *' 0 0.00-0 o (U tt 2 B 8) «0 UJ p O O O w* ♦ « •,
: • «0 «9 «J «J ,
>» ♦ • ♦ •' , • %SS1S ! j «UQUU «aSiUi'uii |
MMtctcec u.ooc»a
U ÜiÜ u u
i i
X
o ae ? o
a « u.
x
i
i i i
X. I— o. o ft
§
lIMl
I
M 4»
ae: v
o
o « IT
z
IT w • K;
«• OC ^ a
>» a M v o z oz zo < • o< • 55*55 <;» ,«f» ,< n
< •.'» < •-,
z a iz Jr o
1 t ! ■oi !; M 1 «
t 1
i i i
lu; o.o
1 1
i
is! I 1 l ! '
I'M <
O
'X o
O
o
UJ a o tu X
X
o Oi
U or
UJ
< Si' u '< u
u. u. MM J^ I
u. u. M IM
X !0. bo i
^IM'IL U. r x M M, O. O «4 v9! >- h- -» — w w O O ,•» «r'K.Xl •>«• o o o o z z ,o o z z
N II A O
ZZ H N O O Ü »C >-i»- a o
i«NJ '00,
I • I I
I 1
u.
*
o
o,
s o a. «-'töi"» uzw z UJ < flD < OIK O K
O. N O! H » < (D <C o.^og
U. IT U.
a. o — o o
<;o:o.<,o tf 0 >ICK CD a o o o o U. »HIU.II
K'O.IOK O „,_„_, N{>|>;N > u. u-it a. u. olatiU. o
OC Ä *« OOIZ
0!Ol • # # a» < <;UJ
u.iu.3
HO. N
' I
H UJ O OIU.
u.iu.l-1 I i
1 I
o oo
I !
o o
IT
O iO
« h> to* o o» o> 0» 0« o O O.O O P4 o otooo
lo oo ol ** ** ** -* o o o o
178
\*s «:^ 51*0 •-rN « O O.O 00 •* <-i-« M
iri«|
o'ö'öiöiö'o'olbjölolöie
o Ü
o c c o a a. Ot QC a a Q- 0- » • » ft
Q. c a o •» ft ft » K « a or
^ a a. o
Q. a a a X X X *« »M ^« fc« ft* ft« ft« to« K K *~ »- o c o o I z z z X X X X » » ft ft ft ft ft ft
a o a o o e. a o < < < < z X X X a. a a a o o o o X z z z •• ft ft ft » • ft ♦ o 1 1 o
& o 0. o z z o o c o ft ft ft » < < < < *» o mm a aft «ft
% o
UJ UJ UJ UJ O z o X o o X
^ mi
5! ^ ft ►- ft K ft ft K K «ft m*
Z o ft a ft 0. o ft ft o. o » » •> •> z * z ^ z z X X z z a o o & i UJ
o o ft
UJ u
0. ft
UJ UJ u u
a »
o u u ft ft o •« c — o-o- >- o > a >- >- & o a u a o < o < c < c < o ft ec ft 00 ft ft CO CD uu z z z u z u z o z o o o a. c a o o o CD CD ft« ft* » vo • a> ft W. • WO z ft z ft z z ft ft OO X X
-^ a «. Ü » a »o * UJ o UJ a UJ u. a o ft ft U. u. 4-»- a t- o K a »- o o X o X u o X X ► H r K Z ►- Zl- z X U. X u. X X u. u. »ft ft» »ft «ft
PsJ I a z a T 0- Z Q. ft QC ft oc ft ft QC oc < < ftrf ftM
* • -J • _J ft-J »J X ft ^ ft ^ * ft ft oc a ft-«-' »«> < •» < — < — < o
^ a a Q. O a. o a o a. o
o — • —* » ftd ft «^ ft ft ft z ft ft z z tt22 •*«-»- w «rf «. »^ w «d o UJ 0. UJ a. o UJ UJ o. » o ► a. • a •■ ft« u mm u »« ft« u u ■»»« ft »
> 2 > r >z >z X V X V X X V > < < a. o a oc C OC o or o a u. ft u- ft u. u. ft ft oc oc u u » » ft • ft ft ft ft oc o oc a. QC QC & o o. O ec UJ 0. •- o - a I-. c •- ft z ft z • ft z z u. u. c o z a. z a z a z o. •— UJ M UJ kft ft« UJ UJ ft» ft» ft ft < » < • < •• < •. r u X o X X u (J Z Z Q. O • a • <j ftO. »o o X 0L X a c X X «T < U U - I — z ft. I - x oc ft a ft oc oc ft ft H H UJ CD x • T • X •! ft coo o Q- a O C 0. O 0. o *, - c O a. Q. o o a. a o o •u > •> u > • • u u > > 1 1 ft» ft» * » a » tt x a x O 3 0C a 3 oc a O 3 3 oc oc X X o t- o»- et-ot- CD v» «V CD o ft» CO (B tJ US ft» M a c oc oc
•~ «» » I» ft w ft M » o o aft a a. a» o o a o •■> »ft --o o — CD a OC O CD a oo o
OD S CD X fSJ W ft« * o w ft* * o ft» w ft" ft« X o X o Z 2 I- K Z
OD X « eo X ec X < ft f\J z < • l\J X X < ft < ft LL ■■ ft« ü O <- I oo^oo-toooo^vu. UJ ~4 If» >• a. UJ -« in >- > u. u. UJ —I UJ »« =3 t« I« < < z
z • z ► Z »Z • x oc X » X a X ft X X QC QC X •. X ft z 11 M u. u. o. x a o o o a c c II o o ii a O II II a o ft» a o II — -J X K -J X »- -J o J z ►- -J a -j z »- j -i a o -J z -J z ►- D O _i -J <-
-J M -/ ft- -J •- -J - -J X -J a -J z _/ a -1 -i X X mJ a. -J a z QC OC -J -J Z u.<oo<co<o<oo<u. < _) o < u. < -J o < < u. u. < .J < -1 o G o < < a M U K OU><Oo><OKOUacu<ou«o< Ouuocacu<o« o U CJ O «J ^ « * ft » • « » ft
o fNJ »t <> oc o PsJ *• «r «• «t >r IT tr
CO a o — M fO 'f IC »0 ^ 00 O« O »- «NJ m ^ m ^) r* oo (T v4 -rf fM eg fM «M M (NJ PsJ <NJ CsJ rg m fo f« 'H ^ f^ fO fO CH «*)
a o o o o o oooo o a o o oooooo
O -- fvj Cl .* l/> <♦ >r 4- <«> ^ 4- o o o o a o
179
■
OO U> IT
• • t • • • * • * * « *
o o IT If*
« « # #
0* * ** w* »-» v
li li • *
l>i CM # «
• • IM pg * «
• •
# * ~i ** -H *4 •- fM
(TW
PI
ITW
GC
o o »
o o «*- 4-
■> C fsl K O
pg
< U. >— w « V ft. N, a -» r • U. 2 •- Z «- «J e j Z 1^ K U. < «« V w K V) IT Z
-J 11 M II U. < 00 O
<
X o a ii ft. u >
o
*
oo o
< u. -<•» o«> o<- u. o z o -2 j-Z Z -J O -J < a. x it M (/> IT) Z (9 O • < ZO —>- _i H II II a. <« eo o
<fi # # ^ o o ^ IM M » • •
«M# # — # #
•a o eo M M OTX <*■ u. a.
oc «
* * IT IT
• • * * * •
# *
« «
Z u. ec v.
o X
ft. c r z u. u. « a v
CD w
u -• ft • a I < et # « 0 Z ft. ft. a W </) M O M # • >- — H < O-I-I — Ol •-• I N, (4 N. • ft. N^ K »- I D # 0C C 3 O * II a o z < «« a H «~ — I m <-■ o u II z o it u. •* <- a. >. M M s QC ec
o o
CD u IT
C • O oe ♦ ot a o a MO M H •» >-
i •v m «o O <M — O o # oc ^ O ♦ II < ^t o o Z CD M (. II II Z -« -4 U. O oc ae ee c
o
CD
IT ft. • ft. ec * a: & & a »- o *• H- «-• K I-X I N. Id a (M «4 o * et o ♦ II < ^ CL Z CD M II H Z
IM «M
ft. c
t • fM CM • «
<M fM ♦ *
& X
O ft- o
di ec et t-i
l4v9(M«dfaSIMfa>W «MN-tfoeaO'T^^ (M <M MM MM • •o**o**
H H H II II K II II a u ft. c ft o u.u.Ou.u.Ou.a.
«M O 4"
<6 CO OO
»M M M
« ft. u. X
CM « ♦ o a «/> « ft. u > II a -» o «M
<0 K CO o> * * * * M M M M o o o o
O m4r*f*\ *■ IT IT IT IT IT M M M M M o o o o o
it\ < h-CO C O M «NJ fr» ^ if» < pi. «o 0» O M «M f» <# IT «o r- m tf\ iruMO <e « <o «o « <o « « « «r* ^ ^ ^ h> ^ ^> ^ M MMMMMMMMMMP4MMMMMMMMMM M
O O OO OO O O O O O O O OOO OO O O O O O
180
< c z
UJ
(/> a < UJ 0
*■* X #« 0 ^0 ft Z M X U >< O V* VOM O »v • ^ mi *•!*»< - O # # »-
mi — — UJ ft c z 1 ■> V ^ J -» *. < z z? *.* te • • UJ «/)«/)►- s^ *: x V w Ul M «>
O # ♦ K
V) ^ tf» ft OZ z z 0 M M Z zz
a o u. u. c -v«sZ z z ^ o. a X X <
z ec or 0 0 z V >. ft ft 0
& rf* -A* *■• ^ !■» «^ «^ w»
u. UJ UJ # * X ^ «/) «r a o N «> ot OC X X «>«>(*> >. o o o c > > X pg X C I "».>. x x m # ♦ z # - «» W N » • oc • a. o OO -< O (Ti « IT oo XXX o (V a CM K H
ft &^ \A o z o « • * m a. m • • K ►"' O «O OC «O «Ni <M »»H u *^ N "^ ** «V •» w < >• n
H O N N H a z o a. o
N HZ ft 0 oe o Oft. OK 5; CD aoo
^ »- OC H X (/)</) IL
o o o
ft <*. ft v, I O v, Z Z H J X
Q. i/) < < O ec z uJ
X z ec of M O C O CD
^Z z m ►- x 1 x ft
ro r> rsj N« u OC X -rf K
Ul « X UJ x o co x
O K ^ < u) a «/> v. z
u x • 1 «/51« ^> en oc x • -«
< O in •-< x X ft -< »0
H X < U. Z o uj ro M
< ^ o • z X «
o in # 1 UJ Z M o O •■« I z — u. •-
K < z »o K M rvj M
3 U> ft • X ~ Z ~*
0. o r\j v4 uj ^ u. u z ee x • <
ui IT o u. •- H v. • x X z z «*> ^ (Ti UJ X <-• ^ r^ u x a. x K x N • eo ^ IT X ^ Z ■< •* ©> • «/» V. X U) ^4 « v. m X -* -I V X X u. x «/> K »vj • u U) Ul X »o < UJ UJ 0* • CD OC K > «VJ I ^ X ^4 eo «/) U. X U. x
O M »CO O X * x Z % & *m ** •- C O x -J O Z X «^ Ul Z X X »x uj rsj <M «r x CD «x K •<■ lA
x trt x x X tf> Z IT 0" # « « « •
i
o o
u oc
c o
< a oc o X u X
9- >
ft X «0 X IT — ec « < • UJ o x o ^ m z u. ^« * »x x ,0 <r * • z z ^^ •« o ^ z
Z » I I
ft • < < X Psl "- *- «O—O o X u. X * o c < • o o Z — OC tt X »- Z I «T IL «•• -* X • ^ »- <o *■ X X z • ec co « o« z z z u. ** - X*M z Z
X «O I I « • UJ «M < <
u. o
X • IT O X -^ CD a. o • Z<6 ft • X ^' X tL
z oc
xo
»A X X « KZ * *
o
o z
UJ o
D o X
X V OD oc z < UJ c X ^■
x ac ^0
o o »■ UJ Zft — < ft X x«^ <e x x irv « ^ OC X < tf\ U. V c v X rsj * «- X X
z •
z — »• P>4
ft u. X • X • <C M ec ~* <u. UJ • o <e X • X »-* «0 U.
Vi V, z • UJ z
X u
Z CO Z -J XX fsj 0" X X CO IT oc ♦*> x ac X < <NJ UJ x O 00 X
XX-. x r- «r (NJ Z • X O O ^ ■« p^ K Z U.
u ft. • « x <o Ul <0 t o x •>«-. Z O -« I D of u. I
< •> I X UJ <o < o • < Z I MK !'»• — < (M X U. O ^ ^ • X Z IT CD K o • o Z •-< *M Z « z — Z ^U. I
V » ft z z X
ec ft
X X IT X 00 < ft X X 1* X
e < UJ mi X — < IT X • o» — o — o u. < • x »r X • * ~* X -*
o <o I a. »I ■* • o z »r> I Z IM <*> • X
X • X -4 m —* X u. 00 »
V • I« «M
» o u X
ft »u
O X a • CD 19 00
ft^ U ft CD O o >
o c co x c u
o u OZ X M OZ • o
ft K X » o z
X Z O ft ft H » •
ft •• X •»
11 o -
M *4 0C X tf> « « -« ^ *»
X X J IT tfN Z •v V —
' 3 " N ^- Z H X < •< < z Z X z >- oc o« ec O X ox IL X U. »-
«M f«' o o o o
ft u. X » « « X • •c o
z • ec 4- Om*.
;#• ♦I o o
II
►--«U.X UJ Q »in -IUJCM v -I CO "-v,
Jx 3^ S3<z ax1 IM« geirxo S viixtk #•♦ ♦
I 1 49 1 o I ' o
(M U. X • ♦ IT
• Vl »4 Vl ^4 C
O ft
o
< uv
u.
n CO o o
*i
o u UJ o » ft:
■I?
o
ft z ft ec
CD« I/I •« »z
ft ft CD 0C «/> o
mftl •i»
7^ I
c o • •• •
«o • < 00 o 00 m ^) m
M O IM ♦ z ♦ # ft •
o z a xo oc oc «OH ft «1(9 ft Ha.
I I
! I .
00 9> o ** Mm h> 00 00 00 CO «4 *4 Prt *4:p4 O OOOO
* UV« 00 coco
000
<oo; co
|o| |oi
181
o
o
J3S - J
a •n ♦ «**! _
1 •« ««. H »4 OOOO
I
■
& X Ui »
o »
fr I
rg to
«o CM
O
in
ss o. o a u CD ao & a
t' L 5
IUUI «!»
•>• O. Ü a. o, < <
UL U.: < <
» • »V ir\ IT Z m
O
M
» fVJ 4) »
eg <0
■- QC •-
Z
*tSt • o o o-o o mo «ro* ^ o^. »V» M N
CL p O oog .z -t x >a •» o tO cD «A UJ «/)
• z 19 • a
o , -o -. «n o CD, o «no o ^ o «M »< «v * l «i 3 0. 2 OO O «
Ui «/) lU o
>- m u « K » • o
M fT) «^ <o a. » >o
< <o X
■O i o » o • to CD Q
— ^•
OO
uu o
CO o o »
3'
O K Ui »
o
I
U >■ u X
>■
3- o » o o z o:
o Ui Ui u X u* z
f> X
X Ui *u. v «
V> Ui Ui K
"It a z i
I a x 5 • »o
i« o o < < in fg Oi^
W» W» u. W) U) D Ui ;Ui « OCK
W» W» Z
pg
4
U CD Z 00 X fO CM
o Ui
o u
Z Ui o oc CD K
usss MO.**« O CD
I/) Ui o
lb!
u. ae u. oe u. «' o — z »- at i- »■ o
! ♦' «■ co o: «r I IM, CM M m «y !mm in in ^
< U. OC! O U M. Si o
«© CO'Oi MM; ml «o «i«
«"iu» MlS
o z Ui CD Z in m, Ix
K1
©I* ••« ;«
M UJ
U)UJ « a.; CD or
Z3 • m o o^z o X UJ o m ♦ Vuit r*i«vz fVi>»»-
V^lz
K co o» o <-« M m »»»coco .« «i «4M MMM O O O O O O O
oooo MMMM OOOO
C0> O -* M W O O ^ -♦ -» d M MMMM(\ iOOOQOO
M 0>{ KVO
UJ
iS
iS!
eg
<z
:MMM{MI :90:0'Oi I I I I I
IC0l9S
« z tritt, «ni
I«i i s M,
ID. >o 1 CD
o i© M
ig
:Ui
O
O
UI 'CD Z in M X M
IÜ U O
or o
»I
M
| o I
M
1
1
1
i
M M Ml M 0 «1
> Mi
l!5»i
182
I I CLIO.
IT: • !
,111 «i
'OJiH- »H K;>;UJ(*U.
|V.Z:<;U.{M
#:Pxi •>- , I'XiniHu
! UJ m i z
i <u.a.;cD oi iXlX
tu x 0" r«-
h> VO •< P^'-MI
Sui'X oO ecu < m
o. a >• in • ,«■»'•-om
it- A. Z «4 ; »•: * u. D X OÜ X ••
£ < 00 IT
9> 5 O -4 — Ü — «VJ
II K « Z u. If (M M M <
ix ► ^ x m IT 0C X «-• -J fn ^. «M ^ u K ID -^ v, ee «ox **• •- t-i o ^ m u
if-« ai »r • ix o # o ai t«* o -««/> >- I — u. «t I K U. II CO V- O II XX i<p. '-^ ir x H x -« « x OK o ♦ — — N a. p- IU X »*
I' |V V :v IT
: • X' [m >|X- own.
1 l«f» •! j x.u' «iifti-»!
V.IiU.,"»,«^! IT «i »iXl-*1
• «-jin •< a. mix »ix; »i
• v a. v <# in v;xir— • m u • u.
la • x w* P4 ro M «^ o u. -4 x u. o. < U. M »X M » M IT •» om V •
• IT * O h» h- • W IT U »- W U, I < U, *4 it 00 K < U. K X r w » x "> O D IT N IVJ U • X N.
Z ♦ M V O rg «^«/) .M.U. v u»
8K a u> ui u B • ac
tu tu fn h- Z M O «4 1^ r- zu.
H If Z < • fst W
-* X
IT Ui • 3t
0»
oc >*• O •- Ui m z 0L U. UJ O o o to*~ X > X i rg I «r o
u.;
uv
I u UI
a J
op
«/) «/» i
zz ! >>- !
O OM
•i • •< « CO O IV o i»> OM(M
• qoo
U. ^ ^ (V *• o
o lO'
M o •» *» m O ION «0 •
5o >-zz • IM •< < •
IJ—-»> >. -^ oo m •> •> • wOC <» —-»in
< u o o • ec x -J ^«^ • O •> ai*»<>» m
<^ «OZ Z » It'«' •* *t < • .*l X > v o
Uii • Z Z Z Z - »s MO a a O H *" •" ■" "* X 3(A «/)«/) v O Z Z Z « ae UJ u* IU «/> < SZ X X Z l-
«AO O O V O *
in o • » •.O
in d • • •lO
m • • o • •
oo
•i » »
moo Ofsim oo o • # • » » »
CM« O CVh» ♦ O O ^ • t • *> • » * 4 to h. o> a O •- M • • •
v v. ♦ CM in -* h> o oo u > ^ rn ro m • • t
» • » < < in o oc K K CM>> N «C < fVC« * o o • • •
« • •
u u.
N »i
K UM
O • • o. •«,
OK
a « ox »a.
£>■ ox <M ♦ • <
otf a X • < »0. ♦ X
t z
«?i o z, in o
• i
i I i
' I I I I I ■ I j I i
I !
I !
Z u. « <
II
in _i • uu • o » -* o «/>
• 0. in o • v
* Ui X u
Ui o i"1
*.
lw' »
o w
o
Z Z-il » Of < Of (/>«»««< # ft- o o. ft. I I I
X Z < H
"J
Ziui < u;u »- oc u-iin^ I! Hi IN
Ui o
O N M a M >- X X
N J« M <-» O Z Z O Z w ui »- « u •« u u < UJ II Ui U. < O a ae « ee M u. o
i i
o en
o
in «M «M o
MM oo oo o oo CMIM OOOO OOO OQOOOO ooo
183
o o o
<ro^Mc*vi««,in*K«DO« O ****** ~t] ********** ** oo OOOOOOooo OOOO o oo o o o o
I
! i '
o
o: W
IT
s
Ui o i/> o o. o> vx X ♦ HI IT
AC tU O I O« •
CM H U. » I I M O «.ua o U. UJ>> Z - a I IU
if> o ^ IT
O e z ID *
I
1 I
iSi «
o UJ ^ o
u UJ o
N UJ Z Q
J O ^t« ft. Q M •» > Z M tf Z UJ Z O «/> •» li ^ O H H N ui IT UJ o. UJ U O OC M O Ui — O H — •- O U) O U M I/)
«A
Zi
> IT »
O rr
•>
UI
X
•UJ
K O •• ec
o« < • »^ o M •
O H U"* O H MM ^4 H
«» M «J «> •- O O *" '-' *• o •• •« o -< «I o o of -j« a < o < < < K O O K K
o o
CM
5 ■>
i »
UJ
>
CM
*» UI — o
< «• X «3 «• ac
a < • H X
^ O II
M y^ «4
IT O M O — -- -J o o
-J oc ec O < < < oo x x
»r o
<
» IT» »
o CO
UI
> X
3; in
z ,2 < '<. >- . :>i • i •■
ir ; I"'» » , • o O fo i m • < •>
m 1 m w w h» V» • • ml ■J mi u UJ UJ • »
>• > •> •> X X
IT
o u> o id
X
^ o I«
«. UI MO «•> w o — < •» X o
Ü uu o
o < x
O N •""• O
M hj «> ^ O O ■-><-• »Ti,
X II •
— o -« II
M fcj •« O M «4
w
o o 0£
o ^ ec < o x a
J oc « « < < U X X
II Ü M CO
o o
o
X • II ' **
— OH M II M v9 — *m -4 \t\ » *« fM o o ^ * * - < <a X X o
o CM
O>*Mf0*IA«f*fl00>O «4;OJ f^ ^ «n « P* 00 0* O -< M ft *ir«Naoo>o»4
ooooooooooo 0,0 ooooooooooo oooooooo ooooooooooeooooooooooooooooooooo
184
> If»
«4
UJ
X
— o
o —
X o
<
O N
.* o
ox I
ar
in
o
UJ
2 <
UJ
> X
< >■ »
in
o
ÜJ »
>-
X
<
IT
O
u
UJ
v' X
— UJ •- o
c- a « < .- xo ^ * er • h- x •
• »-OH • »* O It U- O H
>4 o O I» »^ ID «* W *. «• W O •-' «J O O «^
<o<<<o X OO X X o
o
•. UJ » o
x o
K X • OH • — Ü — O « </)»-• H •» M W M O « -« O
_i u o ^ «I OC « < < < o U X X o
IT»
*• UJ — o •-> «d o — oc M < — x o — oc
< t- X O II • o-o VO ^- H M W «»
«too -J oc oc < < < u x X
o
— ib « o •» Id o- oc •-
Sc «cc
• K X ~*0 II
M to M IM «J
IT O M
-JOC §<<
ox
— «v
IT » U) O
< — >- o *a ** •~«/) 4-Z
wo o
— <
Z — < 00 >■ v
« 00
fsi Z
rj >•
Z — < r«- >• —
uo i
5
» o
1 ! .
'/» « • z-o < <0 H
« ^0 -
- zo H «I OC OV^ K «•) X
•
lyj' »
>- »
■X
o •'
^s oc •- « »» x o •» oc a> < o z •
• ^ X •* <■ ' «M K •- O H •> I» O
« fsJK
I I
i no— ^ «« »«-iKDON
a o »• o o «^ K K o — MOH-UMO MUOCSlOi || N(MK
8«<00300Z OXK'O^HH-O
0C
ES OC UJ
a o rg
O
icir^mirmiiMr«««« oooooooooooo
— «vfn4,«A'0^«oo»o <o « « « « « ^
ooooooo OÖOOOOOOOOOOOOOOOOO
K^ih.^.t*>K^r»N«o«oo oooooooooooo oooooooooooo
185
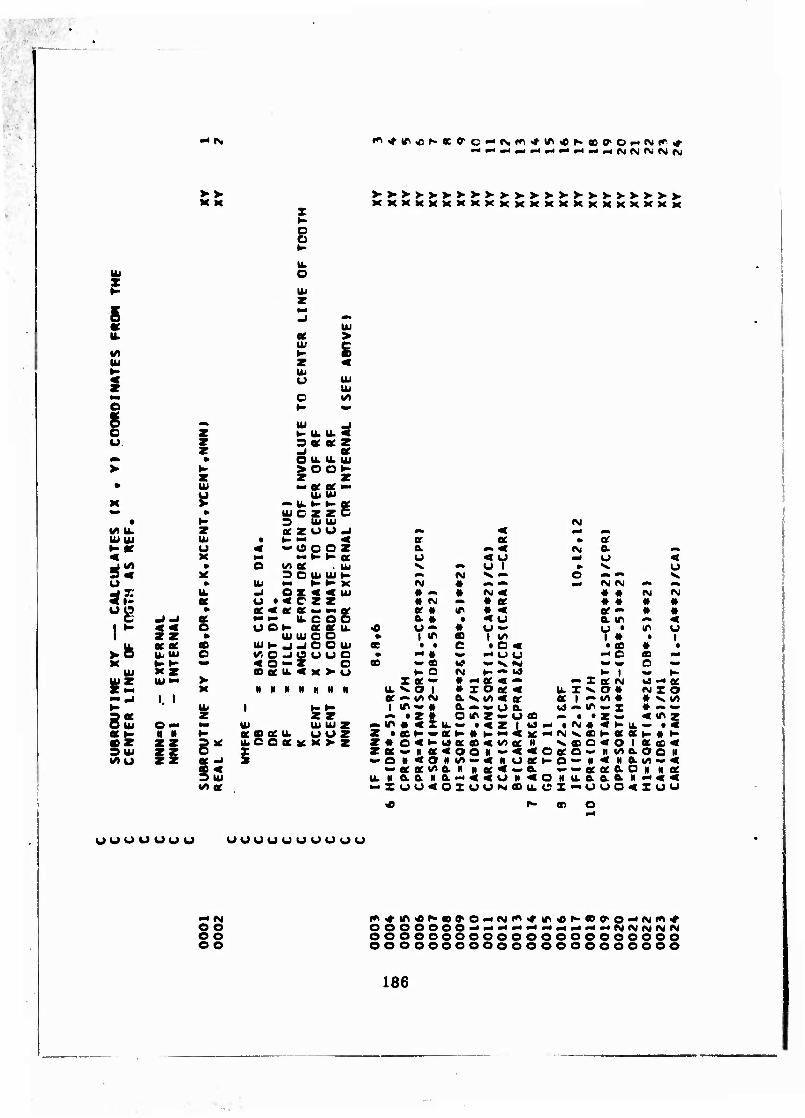
•
■ «rtr^r-eo^c^f^m^ir^p- oo a o •- <N «^ ^ >* »< M txj K N (SJ
K K I
g
KKMKKKKKXKXXXKXKKKKKKK
o
Ui ae >
M £ s Ui z < K Ui < u UJ X Ui
O •« o H w g Ä Ui _l o f ►- u. u. « u 3« ae z ^ -< at tfh ft O U U. Ui >•
z >OOK
• UI -SBS- X « u. K K ac
Ui c z z C •» ft • H 3 Ui UI »M
«*u. Z a z uo -J «to « ^< — IUUJ Ui t K - .*s: or u ft or N ae u < -o o o z & —« «so. *m « X ft« «K >- oc u
u T • v <
42 ft O V0 « . Ui ^ «* U X 3 O Ui UI K «M M >. — o • — V
u ft Ui » K K X *M « — — «< M (M •ft m.
^i^" u .J OX < < Ui # - « *M « * # IM M « u • < c z z # M » OC « « • « «g ft ae « er « M ft- tf er « ir * « tf -> * •
^ J « M* ft« u. c o a & • • <u a ir — « r <« 5 u OK oe « u. <o U — • «J ft- u • IT U X X ft UI Ui c o • 1 ^ CD I (^ I • • 1
>h « ec OD um* «J J O O UJ ec • • e • O « • s • U, Ui o w, O -1 o u u c ft — • «« ft4 u u -• o to M
X & 1» mm < o •- z n OD v CD w ft* V Nl •• «» o — UI z CD « U « X >> U t. O M K - « Kl w K
5^2 Ui »• > i«; - « — «<<» «~ x a (M <d »* K X N N H N II N N u. N. a i • X oar < uivo» *M X O
»- -j 1. 1 Of — V» M a. v u) < er oci*»««» # V«» K Uj 1 SESr 1 «r>«» # & •»«•oo. «j — ir — x ♦ •» •»
O UJ z • Z J| O IA Z —• U « » • • Z «» < in z
o V« »■ Ui ui ui z *• tr • < Z U «» t « Z 1 U> — •M«<KU. w • S at H N N 1» ot j oc u u u z z • aDHw«»»*K*«<X^fV>.CC»-aC(KK«l»
ss Z z g1' U*CO*XX>>Z z • O<^-v}0CA<V0tt)l VCDO«OI « OD «t
f z z zee ft-not^ooii—<««o«o— H«^aooM VIU z « -4 3 «^ o » <o It «^ — <iiooe>-o«-'H<iia<^w<
S * oe « v»a It ii of<ft-o.w — ococaa H N Of 3Ui u. M a a N a. m*
v) ec •« IOO<OIUU>M«Du.CI«-OUO-<IUU
an
uuuuuuu uuuuuuuuuu
o o eo oo
i**in^K<oe>Oft«N<*<rir«^cD»Oft*Nm* OOOOOOO-*«- — — «-«•--«»-"'«-NOiMfMOi oooooooooooooooooeoooo oooooooooooooooooooooo
186
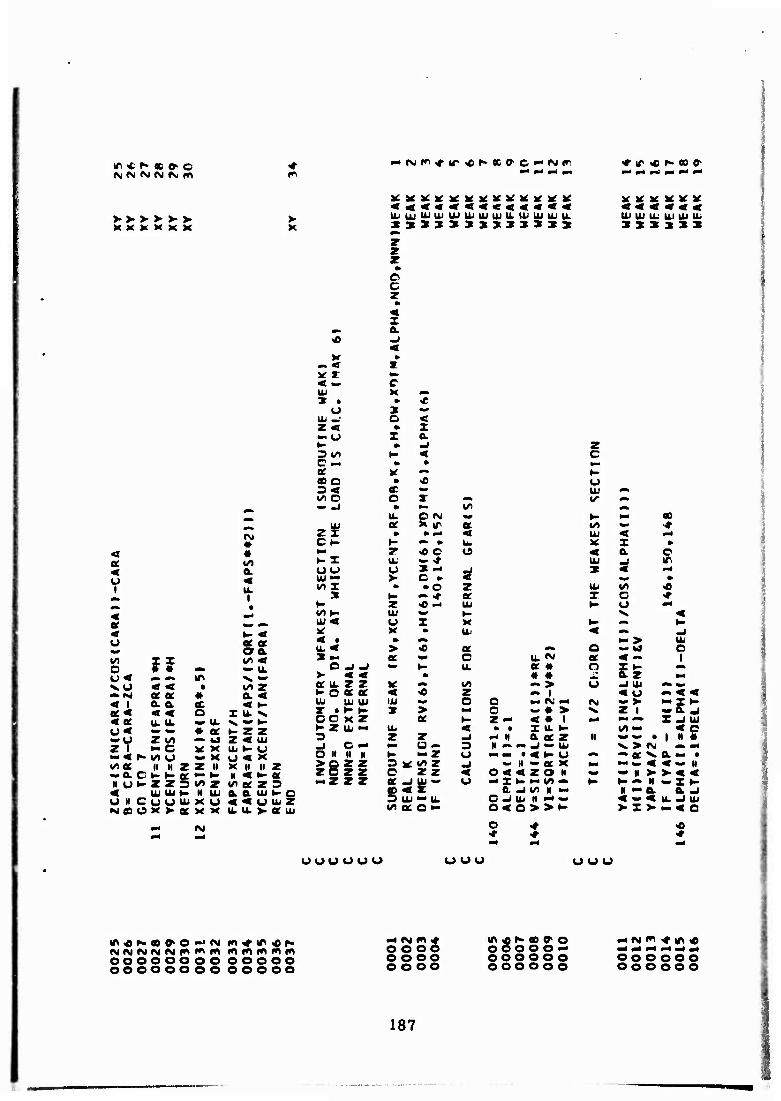
ir « ^ c o> o (M (M fSJ (SJ (Si «•>
•-ro^^ir^Nccac-'Mfr ♦ ir <c N oo a
X K K K X K K UJUJU)UJUUIUJUJIUU.UIUJUJIL
z z z * o c z
V K K X V X
UJ lu it ai ai a, X X X X X X
z &
CM
< * a «/> < a
V < u.
«» I «M • « m* a ^ ^* < ^ « u « Of
oa w fi - «/) < o — u. u< •» «• (T ^. •» vO « < • «/) z "»►g «a « a. < < 1 & a ec < ►- et< «r < o x u. »^ <ec u. u. «> a. >.«- ^- u* »• — ♦ ec K z z »Ü Z uo — k9 Z < UJ z I — O X X UJ K O •- < h- «/) U »" X o < x u>q£ tl H Z Z II x ii nz — a. c h- >- a "• n ufr- z z s «/>
K M < ^- « Z «^ « z D
< UJ UJ »- H UJ a a uj ^ O N c U U UJ X u < < o u. •sis o x >- « x X u. u. >> ee
fVJ
X * M « Z x a »• < M c UJ X «b
X • * < u 3 •w
Ui —.' O < z < • X M U X & ►- m mJ Z D»^ K < c C« » » •- ec X «• H too • <0 u z>< ec «V UJ 0m
*A O o T M tr ** — -J •
u. O N VI
t" mm eo UJ ec x tr a ist «w ■#
Z X • »»-* < UJ < m* C 1- »- ^ ♦ u. X X » tart z «e c o < Q. c 1- X u. — «»• UJ _l IT uu U x - i X S •4
UJ — >• o » ^ » \A X » • o z Ui «/> «
X »- — «r er X o * H z <e M UJ *~ a m* «^H UJ ^ »- v < UJ< u X X ^- «B K X X • Ur < mm -J « • » *m, » > UJ u.< > *> a MM Q •- td o X »- a ^ O u. CO ec « — I o «J -J «» H u. ec # q x>- •■t >• 4 < » * • ^ a z *rt « u. z z X «n «/» MM > u -1 UJ ** ^ 1- o K ec < <0 z «» 1 « u — < < UJ Uj uj uu ^ o c to« «Si wm rvi ->• = 5^ X • K *- X > *M o ^ « > v Z I oo X z K »- z M < • 1 Ml M -• X J UJ HZ UJ •-« u< < » t X u ^• U)"- < e 3 z Z U •-I H a ec Z II w «* • 1 N • .J C •* •« a - 3 II *» #^ ml v UJ V. > *VJ M mt O II II H H — z U »M to« • < ^- o MM — a ^ a — •
^g z z 3 X «^ Z mJ *0 II «r a X M« < <- n z z O zz < o < < z o II ^ •* H > x < MZ z z at -J UJ — u m* x>- ^* •/» gn H- H *• H — X >-
CD < Z & ml V) M MM N — a. O, ml 3 UJ M U. c -J u/ II m* ^ < m. « U. ^ UI Wl oc o •- o< O > > K >■ X >- -< e
o 4 i u uu u u o o u u uu u
in«f««oo>o-'(M w ♦ IT ,o K N(MN«M(Mm«ni«t mmmmm oooooooo ooooo ooooooooooooo
«4 (M ro « o o o o o o oo o o oo
IT <fl h> 00 a O OOOOO" O OO O O O o oo o o o
O O o oo o o o o oo o
187
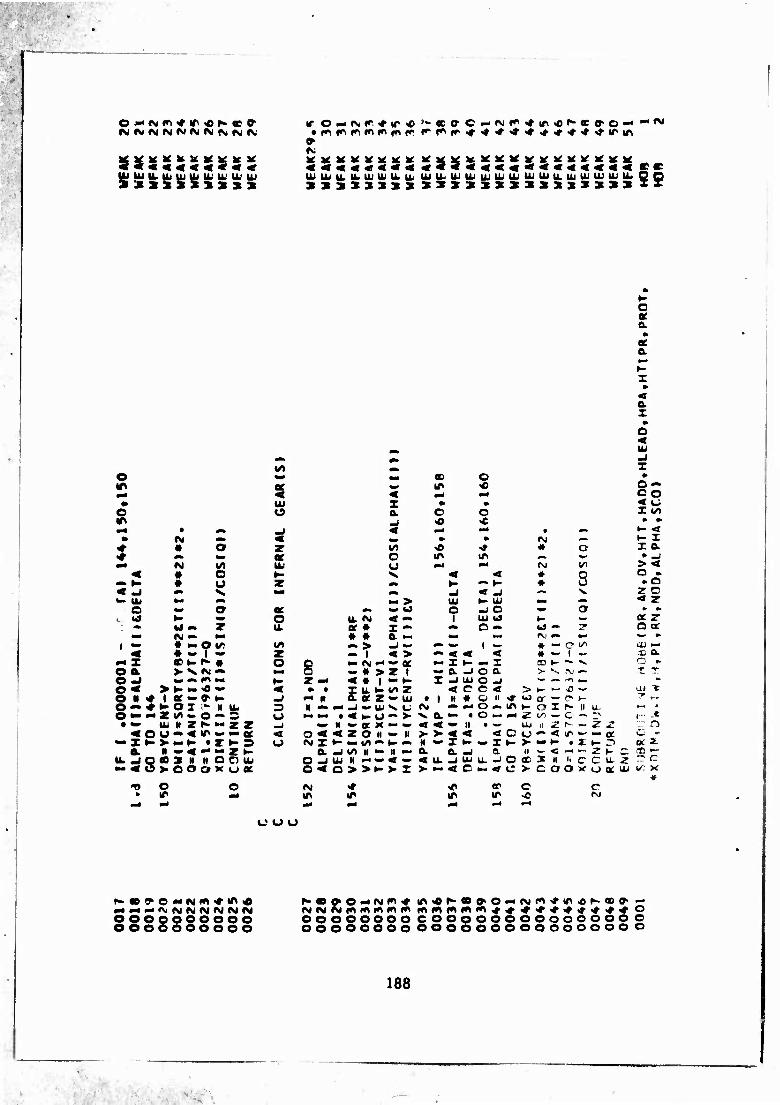
UIIUILUJUJU<U>'U>'ILIUJ
0> fv;
r o — «N»^♦^r«cl'~«co■c»-*^J«♦>^^r<o^•^c<^o■<"•c>*
K K K M; ^ K M SS KKMKy^KKVacacjK
UJUJU.U>UJUJU>UJ UJUJUJI1JUJUJUJUJUJU.UJU.'UJIÜUUQD sxxxxxxx xxxxxxxxxxxxxxxxx
o et a »
a.
a z »
< UJ
«■i •• •1 u» z
o M. eo o to «A ae ^ IT o o —
< « mt eo • Ui I » » 5^ s u a O o Z *o
u <o <c to to «4 t *• ^ < M^ m* • M« t- <r
•> M — 3t • » IM riM »- z
J • O z V? <o «» « o X a Of o u> IP «M. » -J
w« N \A IV u rrf •1 r>j v^ > < < • o *- V < < * o o «.
-» ^' • a z ^^ H ■~ K * u » o < -» — V «« _J « .J #« V T O «_ IK tori tm, - > Ui h- UJ •-« M < Z
O ~ o Of #» •» (O o -) O «v o •■ »
i. (J ^ *. o U. <M < — 1 Ui h» k- MW a ? • hi- 7 u. a • i — A o - w *» Z1 O ot M (M — M • « a *• tort k-l »SJ •* »« ^ to
1 ** * » O V! u» •> > -J — ** ^» 1 — ♦ IM e oo aj — «« • w 1 «- z < > — < < < » ** i w CO Q-
»< Z «». p> • o 8 •- CNJ i-i — ae — I ►- — z CD ►- •«. V O « Oft. >• V CM — «• « > Z 1 — 6. _l O 0- > %-. M «-. T T O -1 ^ ^ ^ •« »- z «- < • 1 »• ^• I -J ai o _i •-■ —* -n to. to o * >^ M -O» < » • z u. t- Ifl z < e e < > ►-■ ►- « —• ai ■« O N -# 1 Of — a ►- ^ «^ M o. orz — ai • 1 II « & II «r U3 or — 9 >-• T v-
♦ »»Oil- ll lb 3 It •^ -j — UJ >. c; fvi •- o — IA K O X r» II U —. * o~ •M z «^ «. o — 3 u »■ *•* • < *• u - >■ V. a •" • o — p^ ^ (^ *- c •«• — * i- _e • •» u M Z K«- Z Z ml ^ n *» K X •* «^ < < •» II • •»- UJ II ^ r- HM ? z - n
< O Ü -< IT*. — « < ◦ < < z o II >- ii > v < < < c o ^ < ir ^" w» ac Cj to
-1 •- > -♦- •«•»-3 u »v< X ►- ■• VO ^ -» II «-IK — Z H > •• K • X ►- r> tx s- o. N «^ ^ «rt «M z *- a _< WO II •— II — a. a -J Q II »^ < ••^ tn« z. K c «1 —
u. J 8 <0 X II II O O tu O -i UJ II — ** « — < U. -J UJ U. -J O <r X II Ii C c u. z r^ c *- « > o Oo x u ec o < Q > >H >• X > *- < c M <tf c >- COO K u a UJ
« -« o o «SJ •♦ .P (T c c » tr ~* IT IT IP ir vO fVJ
e o u
r^a»<TO<Mrgm<riA«0
OOOOOOOOOO OOOOOOOOOO
IP « fto co ...-.,•.,-.♦•»<•♦ <r «r * ^ ^ ^ * «r o oooooooocooooooooooooooc oooooooocooooooooooooooo
188
■
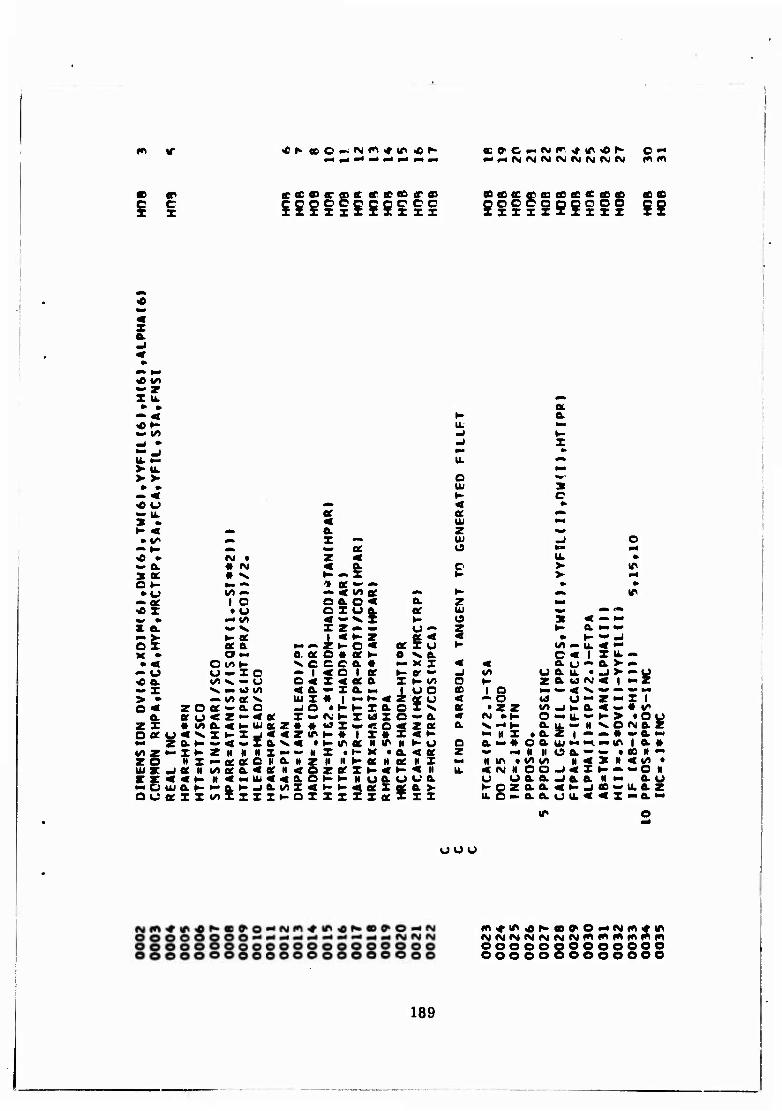
I« c «
c X
to c X
cccscreDctcrecctf'CD ADCDCCCDCDCDCCdCCDCD SOOCOQQOOO xxxxzxxxx
— X X U. «M
• • a •» < H & «►- U. Ma
~l/> «1 ►- •rf • ^ X "" «J 9* » u.~ u. ^ > XL ►■
> > o ^r<
» » UJ at «. < ►- c « u «» < • «- u. or a ^ X • « UJ •* K < «k a z •w • 1^ ^h X — UJ -> O
-• H «t — « o •- ■< <« » rv t z <« u. » — a • *M < a E >■ IT x at • v. »- - X > r* O J- >m ^ •»«*- — •• » • u •« — -«v»« •» ►- m* IT
•» ec 1 o o a o « & z ^t
«X • u o xua Of UJ ^ *» <• «» » ^u> < - V I i- o X « Mb »> x a •- V X z-» u «K § •- a •« «»
o^ i- ec 1 < fc- z
Z K o « f < » H •* mi oc a MM or u K U> -i U. « •*
K • OM Q. « o • ef »- e v a. c < J^ X U. «« »« o w^. N. e c c a • ^M X I « « a u a V «»
«. o O«- I C - 1 <o 1 « ^■ Of ^ i^ U O. U. • «J >■ z* «c a vo v — u o < x < oe a X »- u» o »- z a v3 «M < 1 - X ^ M h) M < & — x a « £ u o CD I o tart «■» < V «« «» ** kM
> • — w a v tu x # 1 —K < 1 u < o UJ a M z •M Z 1 o < z O oc — o. c «; o «H »- x a o V ec t z z U) -J K a < ^ • «/>
a er o < Z »4« x- «M- x «J I e ^» a « »VJ » ►- o M U. •* K > ♦ O U Z X « «Aa<^-ujQtr» • ••9 x *> «t o < Z ec a N. «4 H a. *T N »^ O (MB. Z
2*^ «^XKX_)««ZU>»-» 1 X» X •a *- ** tl X • a. ^ «» • »a ■-• a K — < — I a v « t ►- ir « « «r II ^- u o a MM « o a UJ M •^ *« »r 1 a. ♦
V> z *• z K Z II H H I «- w i, X t K X t a < ec z «^ —t it it o a •* ^ t OB M "« z o It X •- a- ac C II & il Z II II ►- Ot It ee it z »M N «r\ • V» V) M < X H 4 ^ • ai x. -j « II vo oc a < (K ii<ozori»-«»- < II u. < «M H O O J < X K •. «O II * SE < < 1-
^-aK-iaw)X<H-^-<aeI U U 0. U a a. a -J a. fr II w> «.S^ — o UJ a »~ i o. > H o z a & < »- j «e «p»
ouaexx^xxxzHOXXzxx« I I a, o ■• a a u U. < < X « & M
«JO u
fn^-m^KODO^Oativiffi^ir
ooooooooooooo ooooooeoooooo
189
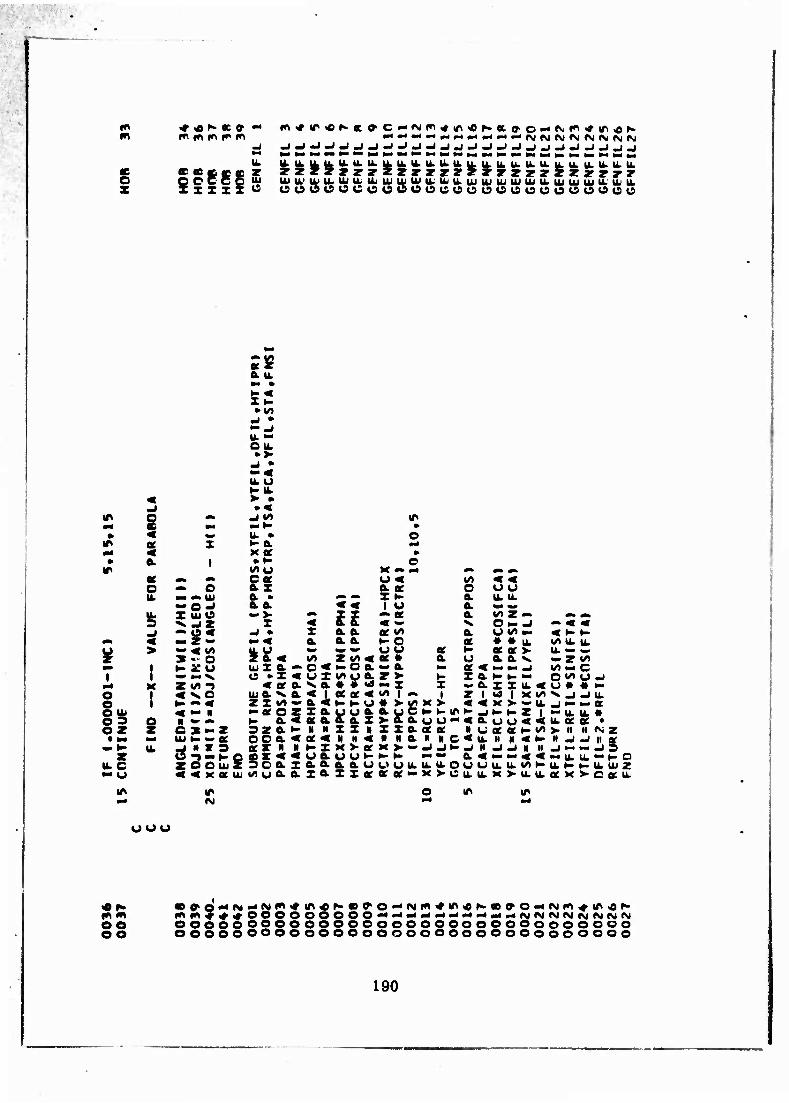
o z
-J -J-I-i-J J-J-J-J-»-»-J J-/-J J-»-J «I _J _t-J-J _l _l J
*«•««» 7 z z? F 7 7 z zr z zr!^ Ir ar z z ? £ z ? !r rlr SCCCO lU lUU'UllLUJlkUjlUaiUJItU/U.UJlUUJUiUJU.UJUJUJU.UJlL
xzzzu ISUCCOCCCCUOCOCUUUUOOOOOOU
a u.
u. •- ou. • >■
ILU
2 S
ft. * o u.
-I
X
I
M M Ui • O J
> — Z2Z
I
o e OUi fi 2 oz t M
u.c
I I o z
«/I jr«- o H zu w M V Z «^ 1 ^ — * < •- n II •• — c »«z tu ^ «> ec J H « D O -l — H-O Z OOluZ < 4t K « Ui
tr
u. • K a. K « • K
«/> u c« a z a • ft. ft. — V
X
UJ x a — u » x «
< or a UJ ft. V. OL Z X vo » •-Ot O Z h- ft. < 3ze- •- oo a < XT H * 5o a. z </) u ft. &
e X M P4
o u u u. u.
«« 1 u a « — < a <2 ft. vn Z — «» *■»
V O M U — < « x a. ft. ee vt & U«/> — < ►- »- a. ft. ft. *- o ae • « u. Vt U. U. «. ».«» uu ec H « «>■ u. — «. v> z ut « ae • ft. u a a v. — z «^ o < »• o a. » a •« a < — »" j «^ « c u x v^u a- z > 5 X a K t- — o «^ u ^ VCk. • • «d — z -ft.XXU.4U« *» < 1 oc « < «^ l -> 1 Z 1 «O 1 XI/)N._|_JU. ft.<Kt-0* >• «^ xauuft.ft.uc o(a.&ax>&a
K > < < X v — u. j i— — a ^.^-K>^_JH'>-Z 1 "- u. u. • uu ^«a.uu<<ii.oc« •
N NXXHXXft.«« * u « a t-vo > n ii rvj z N N C < U. H II « »- ii -j _i it a
HIKVOfX>- ml£ _l- - -1 D Uft. U U »- ^ H a « ~ >- < < «u. u. -»- O o.aa.ft.uuuu.u.u.ouuu.u.M^u.KKii.aiz laxiofor«*- KVCu.u.x>.u.u.Qexvcaeu.
IT ir
uuu
w m eo oo
• oiO',«o<a"M^><^in«r>«)(ro«4(Mm<rir4K«oao>4iMm^^«r> »«fflJ^^OOOOOOOOO-*-«««'--»-«-''^-^-« — «M»MIM«MfM<^M«NJ oooooooooooooooooooooooooooooooo oeooeooooooooooooooooooooooooooo
190
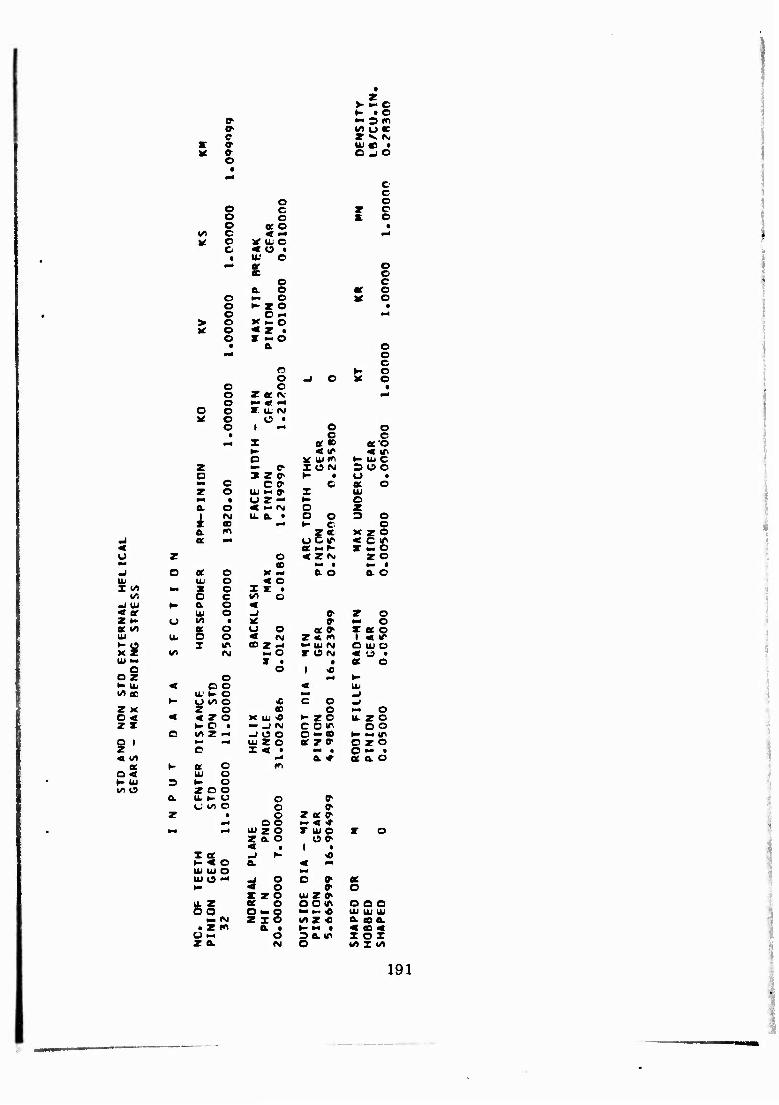
V »• c »- • o
o- ►- 3fn o> VI u oc e Z V IM
X o- UJ ee • * a o #
—
o o o
o c o
Of O
a .JO
c c o
z o s o •
«n c < .* |Hl M! o
c v ai c * Ü •
• U. o
a. §
o o c ac o
o ** o * o o t- z o • o c - mt
> o >t ■- o K o
o • ■M
o o o
z
z
z • -o a.
o o o J o KT
I.00000
O o X U. CM ^ o
o • —1
1
I
o
^4
K
o c
or« < IT uj tr\
o c oco
« IT t- UJ C
Z c XON soo o » zc H • o • ^ c C 0- C « o z o UJ M » X UJ krt • o z — »- o o. o « — M o z 1 CM u. a • o O 3 O
CO m* ►- c o a f»> gs K ZO
.J ec m4 o < C IT < ec «r- X - O u z o « ZfM zo
CO MM •
a o ec o *f mt ft O STo Oi w o < o I </i to« X o z z •
IA o c wn o ml Mi K fr o < * tt 111 o _l O1 z o z »- u 00 t >£ » ■• o Of f) « o u o « fr TS? OI tL O o « M z < m ^^ T \n CD z -< UJ N O Ul o
t* eg M O z e<M * 'J • UJ — » • f ac o
O o i <e o r o •» ►- t- u- < o o < UJ IA ec U.' fe> o mm mt
H O vo o <c c O _J z x z o w o M O o < < < z o X UJ <0 K zo u. z o z z >- o • *» _J IM c O^ o o c IA Z ~4 -J o o o -CO K ". IT O 1 to« -* UJ z o ec zo- o z o z c z < • tort • o >- • < 00 r* a ♦ ec a o
ac K a o fl o < tu o K UJ 3 ^■ o 1/1 o zoo o. It t- o
o o o z • o z ec a
—J o o k. « * ** m4 UJ z o r UJ o z o z a. o Off- < f i • X ec -J !*■ <0 K < O a. < UJ UJ o Ul C m*
^ o c » ac »- o 0> O z zo UJ zo>
H at o OOll> a o o o - o M «~« UJ UJ UJ
r* z zo utz <e a. CD a. » Z «1 a • >- M • < CD < o — o so. in X OX z a M o <A X IS)
191
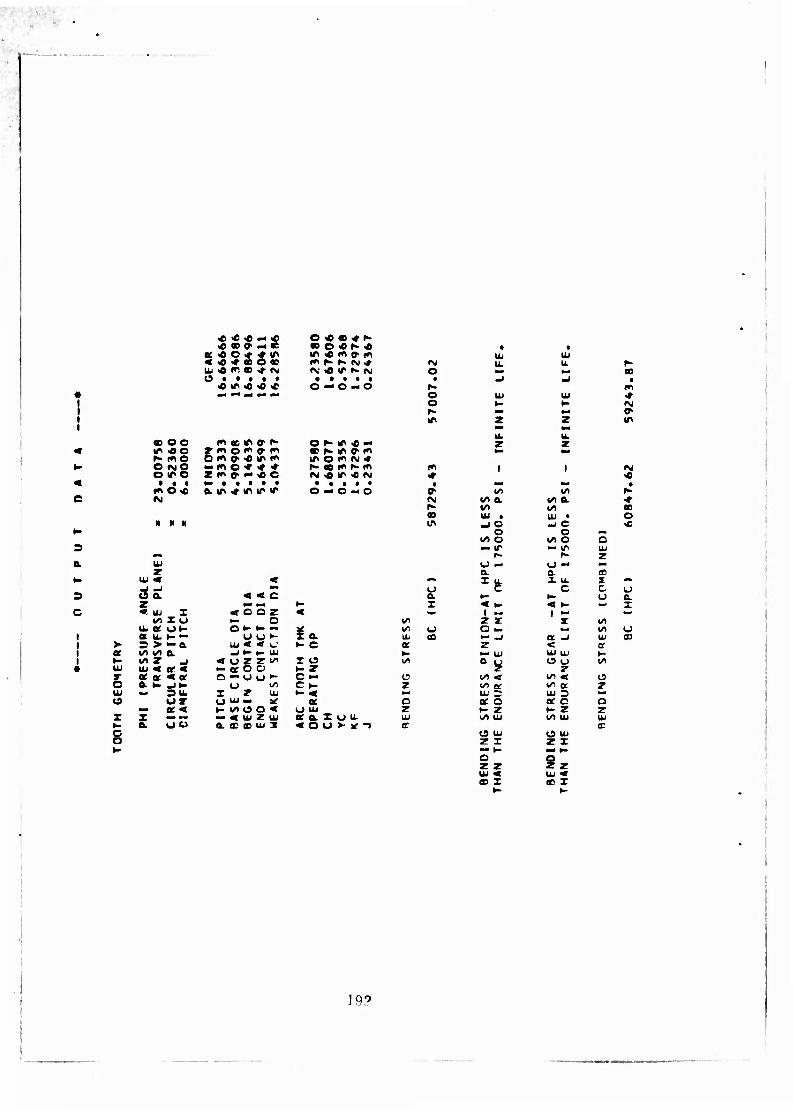
c
n a
«D O O IT «O K (*>© O «MO o ir o t • •
•nO« fg
M H II
I I I I «
a UJ T O
o X
o o
UJ
o a. z « uj X
1^ X U U, tt OK Ot U. H- •- 3 > »-a. i/i v) a «/I Z _( uj « «sr « oc or « or a »- .JK «. DU.
or »- oc < e. a a
<£<* — « O * OB «f f- * co a — « «C O «N * l t
« <« o 4- « in « <c ^ ce o «o
in « m » m UJ UJ »« K f- M * IM U. u r- tu « «n «o 4- «M rv; * IT N (Sj o to« CD 19 • • • • • • • • • t • -1 _J •
<« IT « <o <c o — o -o r- «»I V« •< M M M o
o f- m
UJ
z
UJ
z m
w • m a t' o K m -c -< Ik z z
y m O *" » f" o w O- •« (T »"
«r ^ m a »« in o «^ <VJ <#
-•« o * ^ <r ^- 00 r* N rri tr\ 1 1 IM z fr e. " <e o «M « in « N *• « »•<•••• • • • • • • IM k^ • a in ^ m IT ^ o — o - o o- 1/1 1/1 i>-
«M (^ 0. wn a <»■
r~ vi v» oe m UJ • UJ t o m •J c
o •J c
o „, <c (/> o un O o ••* mm UJ
z u nri u ** •«* OL a as < •^ I
fc X u. x *•
< <c £ H- i» c
u »* »M K x < ^- < K •* x
« o o z < 1 i MM
- o </) z r I »^ o»- ►- — ¥ »^ o a ^ 1/1 o
u u »- a Ul oQ _j a «1 UJ ai UJ « « »_• »- c a z < Of _J t- *. UJ k- ■_■ UJ UJ UJ K-
« o z z «^ X o t/1 & ^ o o 00
— ac o o k- z z o — o o ►- c •« c 00 < i^ « O
(J to c ►- z (/> Of IS> a r X Z UJ h- «« kN UJ UJ D O UJ — ^ oc o an 5 oc c o K 1^ O O < i) O) z ►- z K z r — « UJ Z UJ ac a X O u. UJ (/I UJ 01 UJ UJ OL 0C CD UJ 3 « O o >- ^ -> IT a
o uj O UJ z x z X ta^ »- mm k- o z z i z UJ « UJ < OD X « I
193
APPENDIX IV
STATISTICAL TREATMENT OF TEST DATA
This appendix consists of a description of the mathematical model de- veloped to linearize the test data, its substantiation, its use to determine an endurance limit, and the determination of the variability associated with this endurance limit. A description of the method used to determine the significance of main effects and interactions for the three experi- mental variables is included.
DERIVATION OF S/N CURVE
Linearizing Transformation " -~
A linearizing transformation was derived to facilitate the analysis of fatigue data. In general, the requirements for a successful transforma- tion are as follows:
• Transformed fatigue data should form a straight line graph with stress (or load) as the independent (or x) variable.
• The inherent variability, or variance, of transformed data should be equal for stress values or rig loads within the range of practical in- terest.
Transformed fatigue data can be used to compute S/N diagrams, endur- ance limits and associated variances, and standard deviations necessary for statistical tests of significance.
The transformation derived to express kilocycles to failure as a straight line function of stress is
(l/kc)l/2-2 = Y = A+BX (10)
where kc = kilocycles to failure X = stress or applied load
A and B = constants to be evaluated using the least squares tech- nique
Figures 110 and 111 show extensive fatigue data from another experiment in the transformed form and in the conventional S/N diagram. These charts provide a visual measure of the accuracy of the transformation and the derived straight line equation.
193
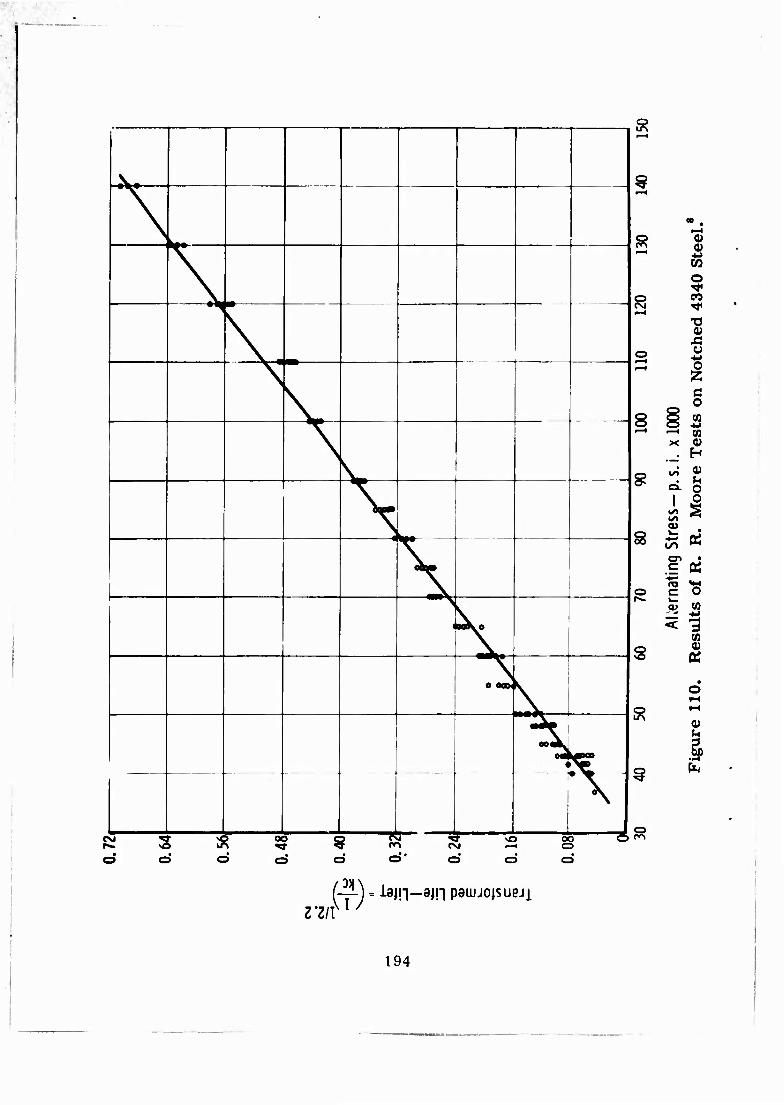
Jv. 9 \
\ !3
\ - * •^
\
CVJ
\. o
N \
i—i
8 r—•
\ > V o
\ 1— Q
N 00
p 1
<
\ s
CD
e ooo. \
00 «L
\
2 ! 3 \ % i s f c < J 5 S ! 2 > O
0) o w o co
•a « o -M
q o CO
•M CO 0) H «
a. o I o
CO ^
•E * "SS «a c O a> CO
3 CO
to
0)
/—!-j = lam—a^n paiujoisupji Z'ZIl
194

o
&
to o
EH
<U ffl
s 8 I
mi—icrr^uK^ i—i cT CM CVJ i—I i—< >—' ^H i-H
0001 x '!'s-d-ssajis ßimeujauv
195
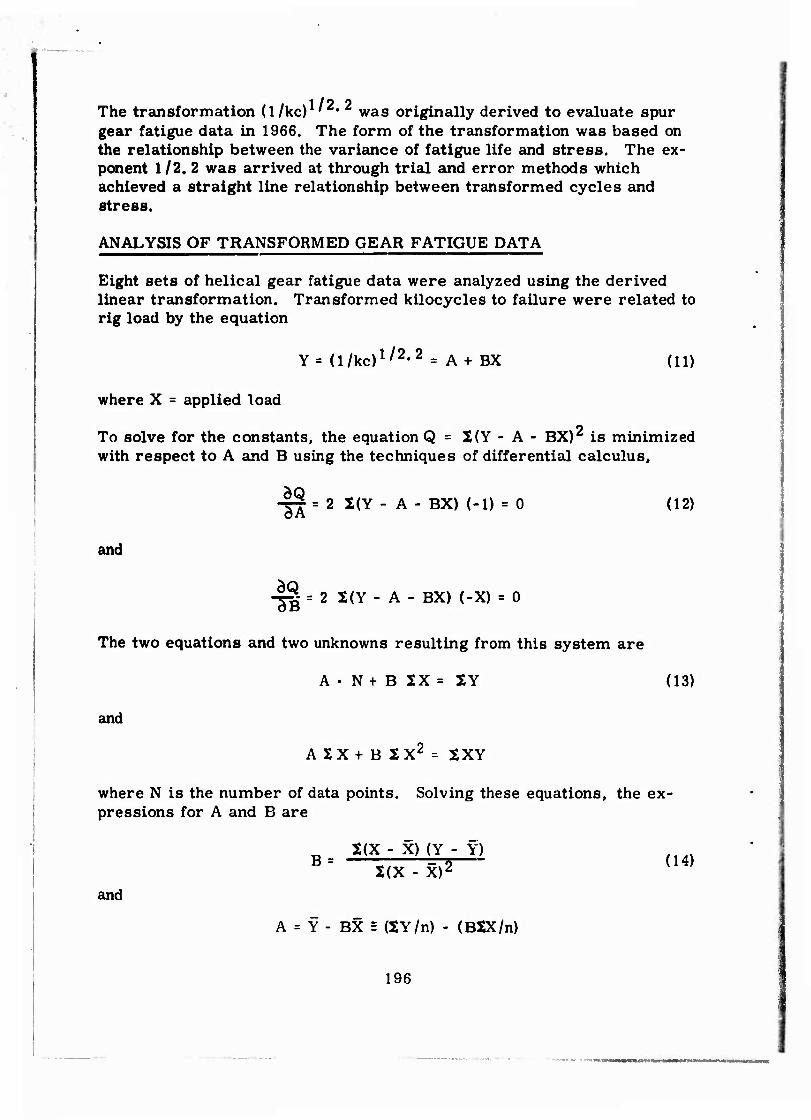
The transformation (l/kc) ' • was originally derived to evaluate spur gear fatigue data in 1966. The form of the transformation was based on the relationship between the variance of fatigue life and stress. The ex- ponent 1/2. 2 was arrived at through trial and error methods which achieved a straight line relationship between transformed cycles and stress.
ANALYSIS OF TRANSFORMED GEAR FATIGUE DATA
Eight sets of helical gear fatigue data were analyzed using the derived linear transformation. Transformed kilocycles to failure were related to rig load by the equation
Y = (l/kc)l/2-2 = A+ BX (11)
where X = applied load
To solve for the constants, the equation Q = 2(Y - A - BX)2 is minimized with respect to A and B using the techniques of differential calculus,
-|f = 2 2(Y- A- BX) (-1) = 0 (12)
and
-^ = 2 S(Y - A - BX) (-X) = 0
The two equations and two unknowns resulting from this system are
A • N + B 2X = tY (13)
and
A 2X+ B 2X2 = 2XY
where N is the number of data points. Solving these equations, the ex- pressions for A and B are
« X(X- X)(Y- Y) B = — =75 (14)
2(X - X)2
and
A = Y - BX S (SY/n) - (BJX/n)
196
In considering the equation Y = (l/kc)1'2, 2 = A + BX, note that Y ap- proaches zero as kilocycles approach infinity. The endurance limit can be obtained by setting Y = 0 and solving for X.
Endurance limit = - A/B
STATISTICAL SIGNIFICANCE TESTS
In general, the 't' test for significance is computed by obtaining a differ- ence and then dividing by the standard deviation of that difference; the computed 't* is then compared with a tabular 't' value to determine sig- nificance. The tabular 't' is determined by a preselected .significance level, o, and degrees of freedom. The significance level, o , is defined as the probability of falsely concluding that a difference exists, when in fact there is no response due to changing factor levels. Degrees of free- dom is the number of independent observations used to compute a standard deviation or variance.
In mathematical terms, the statistical significance test is determined by an assumption, termed the null hypothesis, which has the form H0: /*j= ^2' the null hypothesis implicitly states there is no differential response as- sociated with factor levels. An alternate hypothesis is also established which is Ha:/*i>'M2 for the two-tailed test. If H0 is true and o = 0. 05, there is a 1 in 20 chance that a 't' value larger than the critical 't' will be com- puted; or alternately expressed, the odds are 1 to 1? that H0 will be re- jected even though it is true. Mathematically, HQ can be rejected at any preselected value of o; the converse does not follow. H0 cannot be mathe- matically proven true or accepted at any probability level. If H0 is not rejected, judgment is reserved regarding the factor under consideration; however, the failure to reject H© may lead to the same course of action that would be indicated if H0 were indeed true.
The consequence of the foregoing discussion regarding tests of signifi- cance is that, in the absence of a significant difference, no assertion is made that any given factor has no true effect on fatigue strength. In fact, large differences may exist that are not detectable because of insufficient test data or excessive variability in the data.
To perform statistical tests of significance, it is necessary to obtain the variance of the endurance limits, V(E, L.):
197
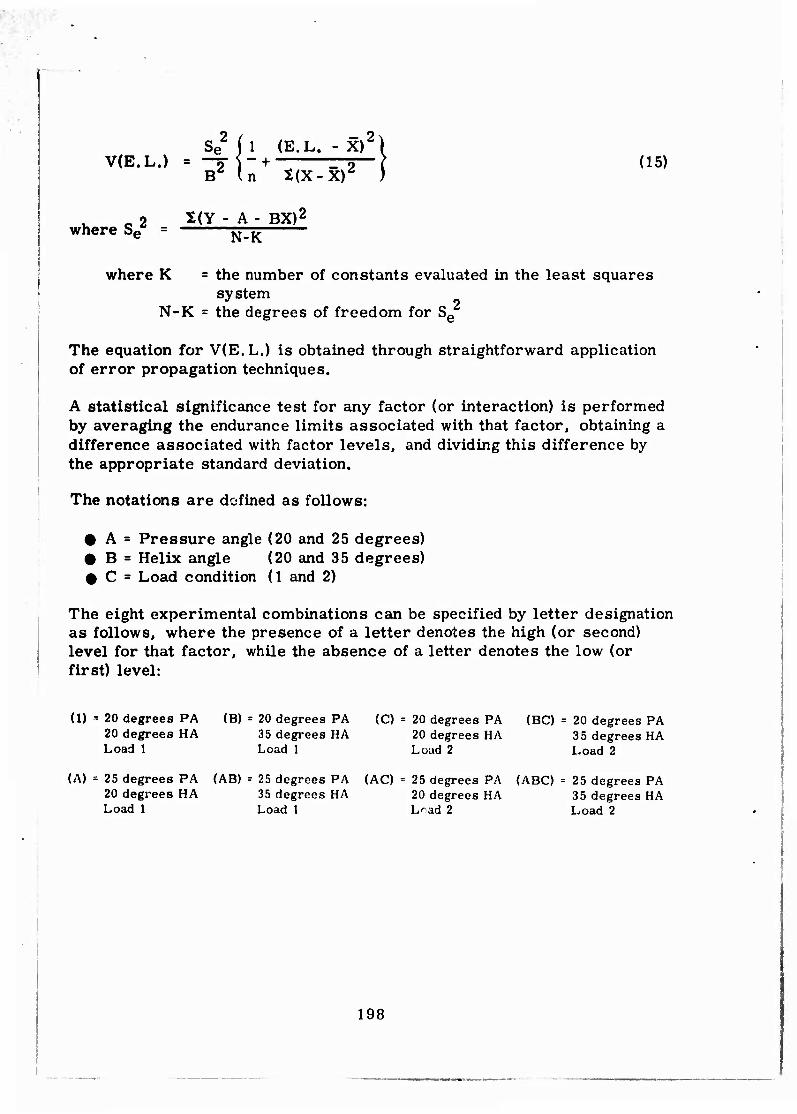
Se J 1 (E.L. - X)Ä| V(E.L.) * zj)~*i^m ] (15)
where S
L|I (E.L. - ft2
B2 In 2(X-X):
2 S(Y - A - BX)2
e = N-K
where K = the number of constants evaluated in the least squares system
N-K = the degrees of freedom for Se
The equation for V(E.L.) is obtained through straightforward application of error propagation techniques.
A statistical significance test for any factor (or interaction) is performed by averaging the endurance limits associated with that factor, obtaining a difference associated with factor levels, and dividing this difference by the appropriate standard deviation.
The notations are defined as follows:
# A = Pressure angle (20 and 25 degrees) # B = Helix angle (20 and 35 degrees) # C = Load condition (1 and 2)
The eight experimental combinations can be specified by letter designation as follows, where the presence of a letter denotes the high (or second) level for that factor, while the absence of a letter denotes the low (or first) level:
(1) « 20 degrees PA (B) = 20 degrees PA (C) = 20 degrees PA (BC) = 20 degrees PA 20 degrees HA 35 degrees HA 20 degrees HA 35 degrees HA Load 1 Load 1 Load 2 Load 2
(A) = 25 degrees PA (AB) = 25 degrees PA (AC) = 25 degrees PA (ABC) = 25 degrees PA 20 degrees HA 35 degrees HA 20 degrees HA 35 degrees HA Load 1 Load 1 Load 2 Load 2
198

The following procedures de/ine statistical tests of significance for the factors tested plus interactions:
• A linear combination involving all eight configurations of the experi- mental factors must be uniquely obtained for the factor or interaction to be tested.
• A standard deviation associated with the linear combination is then obtained using error propagation techniques.
• Degrees of freedom are estimated and a critical 't' value is established based on degrees of freedom and a preselected significance level.
• The test of significance is executed by dividing the linear combination by the standard deviation. The variable, or interaction, is significant if the computed 't' exceeds the critical 't1.
The linear combinations for all factors and interactions are as follows. The column headings designate the factor or interaction to be evaluated and the sign to be associated with each experimental configuration. To estab- lish a linear combination, endurance limits associated with experimental factor configurations are algebraically manipulated as indicated.
+ -
A (1) AB B AC C
iBC EC
B + -
B (1) AB A BC C
ABC AC
AB
(1) AB C
ABC
A B
AC BC
c + "
1 -'
c (1) AC A BC B
ABC AB
AC BC ABC + -
(1) A B C
AC AB ABC BC
+ -
(1) B A AB
BC C ABC AC
A B C
ABC
(1) AB AC BC
In mapped-out form, the linear combination for ABC is
ABC = |A + B + C + ABC| - |(1) + AB + AC + Be} (16)
In theory, the linear combination for ABC is obtained by inserting the ap- propriate endurance limits represented by the letter designation. In prac- tice, however, it was necessary to use weighted endurance limits; the
199
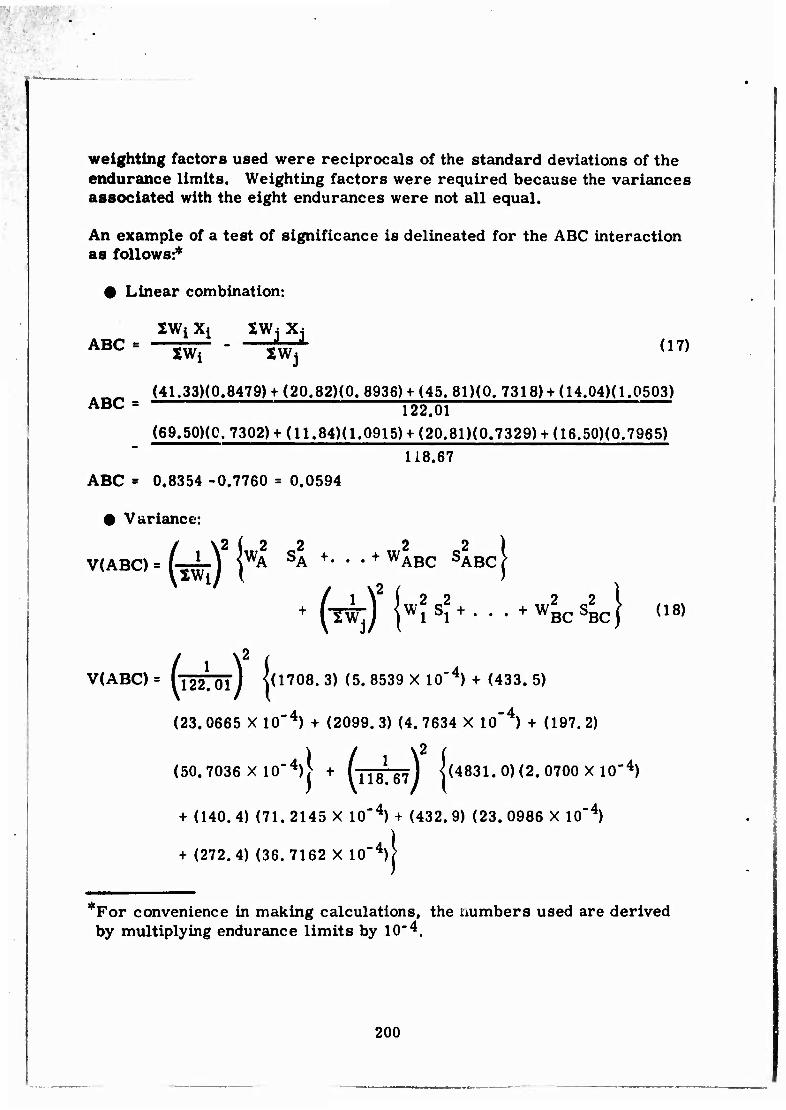
weighting factors used were reciprocals of the standard deviations of the endurance limits. Weighting factors were required because the variances associated with the eight endurances were not all equal.
An example of a test of significance is delineated for the ABC interaction as follows:*
• Linear combination:
IWi Xt 2Wj Xj ABC = XWi " XWj (17)
(41.33)(0.8479)-t-(20.82)(0. 8936)+ (45. 81)(0. 7318) f (14.04X1.0503) ABC = ' 122.01
(69.50)(0. 7302)-h (11.84)(1.0915) +(20.81)(0.7329)H-(16.50)(0.7965) 118.67
ABC = 0.8354 -0.7760 = 0.0594
• Variance:
(\2 ( 2 2 2 2 ) _Lj yA SA +- • • + WABC SABC}
+ (^j) risi + - • • +WBC4C|
<i8)
V(ABC) = (222. 01 1 ](1708. 3) (5. 8539 X 10"4) + (433. 5)
(23. 0665 X 10'4) + (2099. 3) (4. 7634 X 10_4) + (197. 2)
(50.7036 X 10'4)> + f 118167J <(4831.0)(2. 0700X10'4)
+ (140. 4) (71. 2145 X 10"4) + (432. 9) (23. 0986 X 10"4)
! + (272.4) (36.7162 X 10'4)
*For convenience in making calculations, the numbers used are derived by multiplying endurance limits by 10"4.
200

V(ABC) = 5.527 X 10'4
Standard deviation ABC = yV(ABC)
ABC = V5. 527 X 10"4 = 0. 0235
Degrees of freedom: The exact degrees of freed i is obscured by the complexity of calcu- lati^"e' ne»pd to cor pute the tandard deviation. Therefore, this equa- tion was used to compute degrees of freedom:
sip = aj Sj + a2 S2 + . . • + an S^, degrees of freedom is:
[4? (dn = 2 KÜ IM! hM
ai (dt)l + (df)2
+ • • • + (df)n
Using this equation, degrees of freedom for the three-factor inter- action was 114. The tabular 't' for 114 degrees of freedom and o = 0.05 is 2.0.
T test:
0.0594 0.0235
interaction is significant.
't' = 0 QOQC - 2. 5, which exceeds the critical value of 2.0, and the
A specific example of significance testing was provided for the three- factor interaction. The other six significance tests were performed in the same manner. In all tests, degrees of freedom were estimated to be 100, o = 0. 05, and the critical 't1 value remained at 2. 0.
S/N DIAGRAMS
The S/N diagrams, based on applied load rather than stress, are shown in both conventional and transformed form in Figures 112 through 127. On each figure, a lower 90 percent tolerance limit is also shown.
201
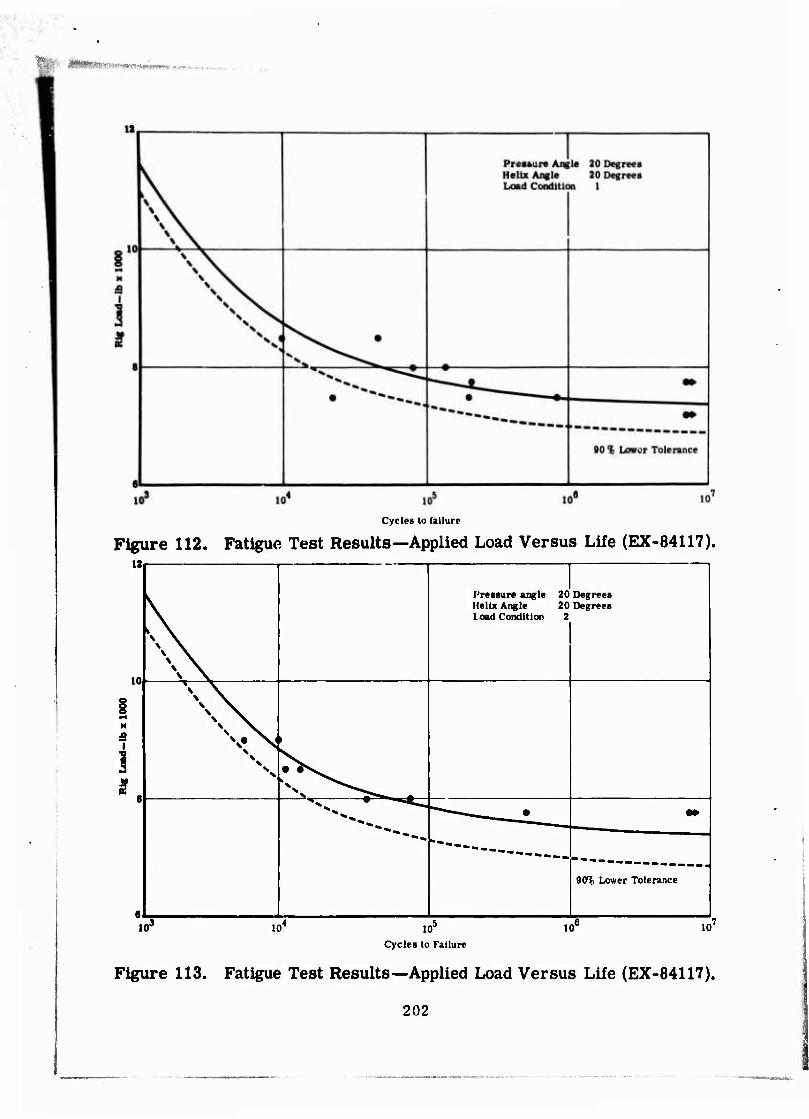
Cycles to failure
Figure 112. Fatigue Test Results—Applied Load Versus Life (EX-84117). 12
Pressure angle Kellx Angle load Condition
20 Degrees 20 Degrees
2
\ \ \ \ \ \ \ x \ x
§ M
a i
1
% x \ x \ x \ x
1
*. 1 >> ^^^.^
■--■--d **— > •»
90^ Lower Tolerance
A lO" 10' 10J 10"
Cycles to Failure
Figure 113. Fatigue Test Results—Applied Load Versus Life (EX-84117).
202
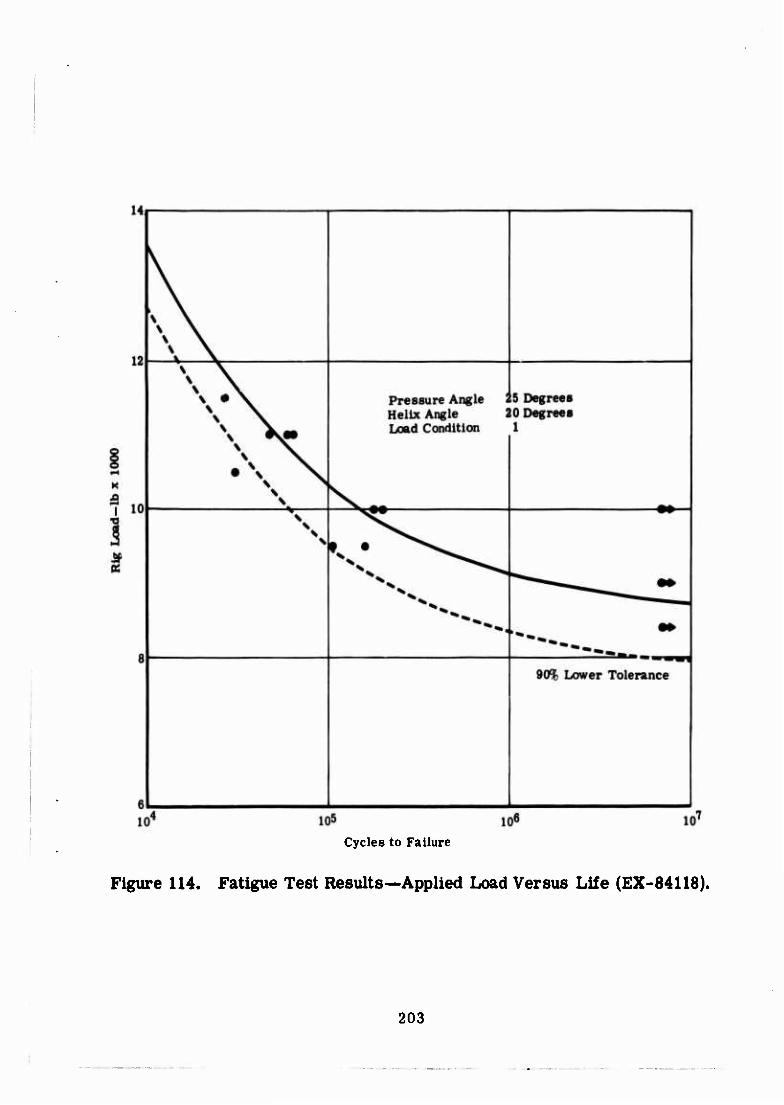
Cycles to Failure
Figure 114. Fatigue Test Results—Applied Load Versus Life (EX-84118).
203
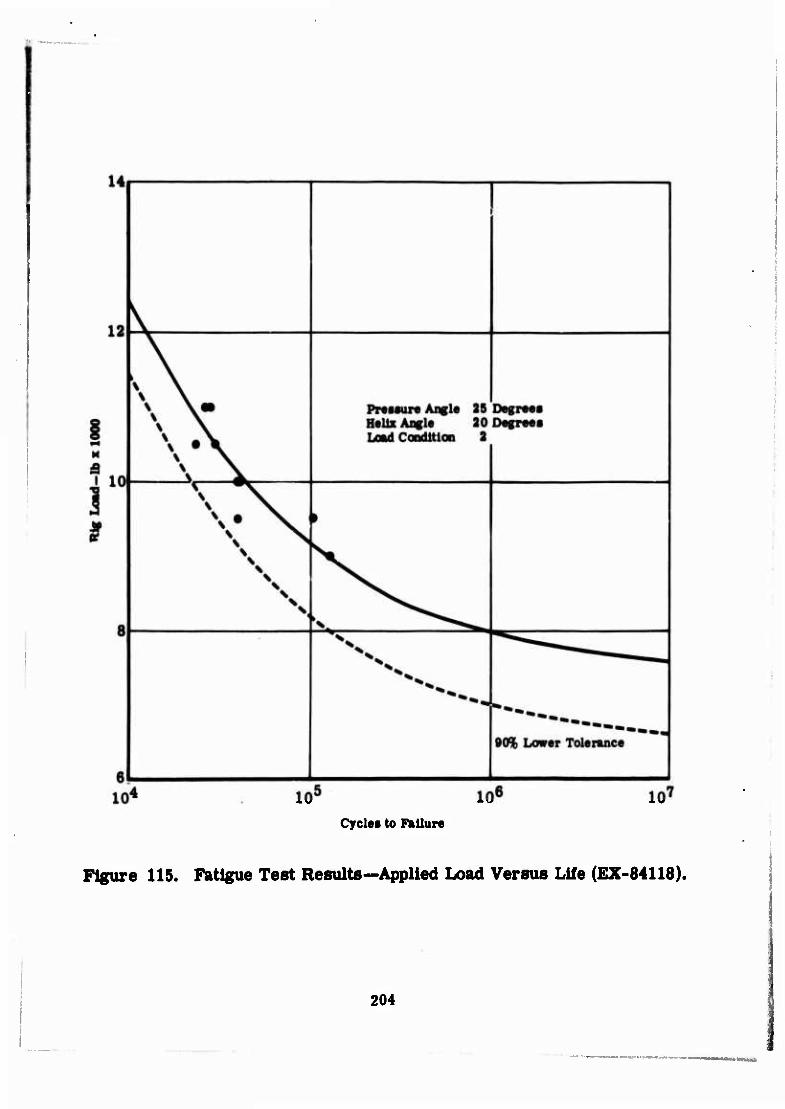
10u 106
Cyclei to Failure
Figure 115. Fatigue Test Results—Applied Load Versus Life (EX-84118).
204
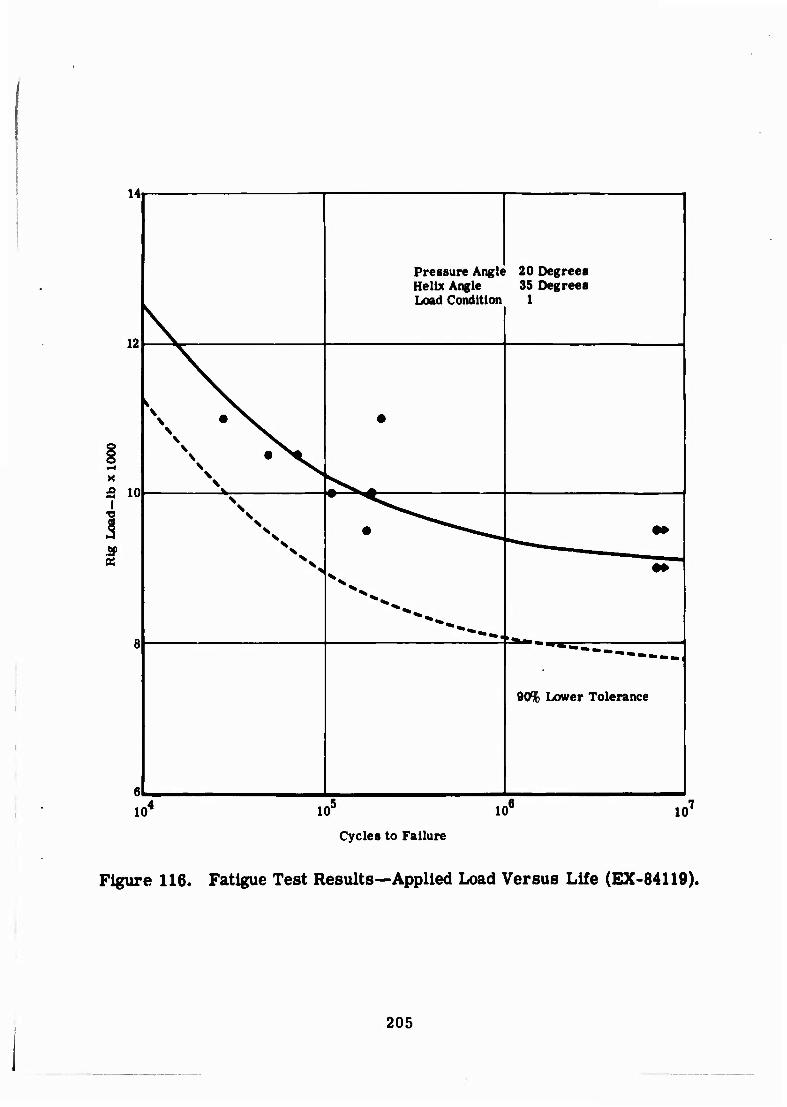
14
12
£ 10 I
1 Pressure Angle Helix Angle Troad Condition
20 Degrees 35 Degrees 1 1
•
V '■■■■■-■^ 'ä —. '
90% Lower Tolerance
lO" 10" 10" 10'
Cycles to Failure
Figure 116. Fatigue Test Results—Applied Load Versus Life (EX-84119).
205
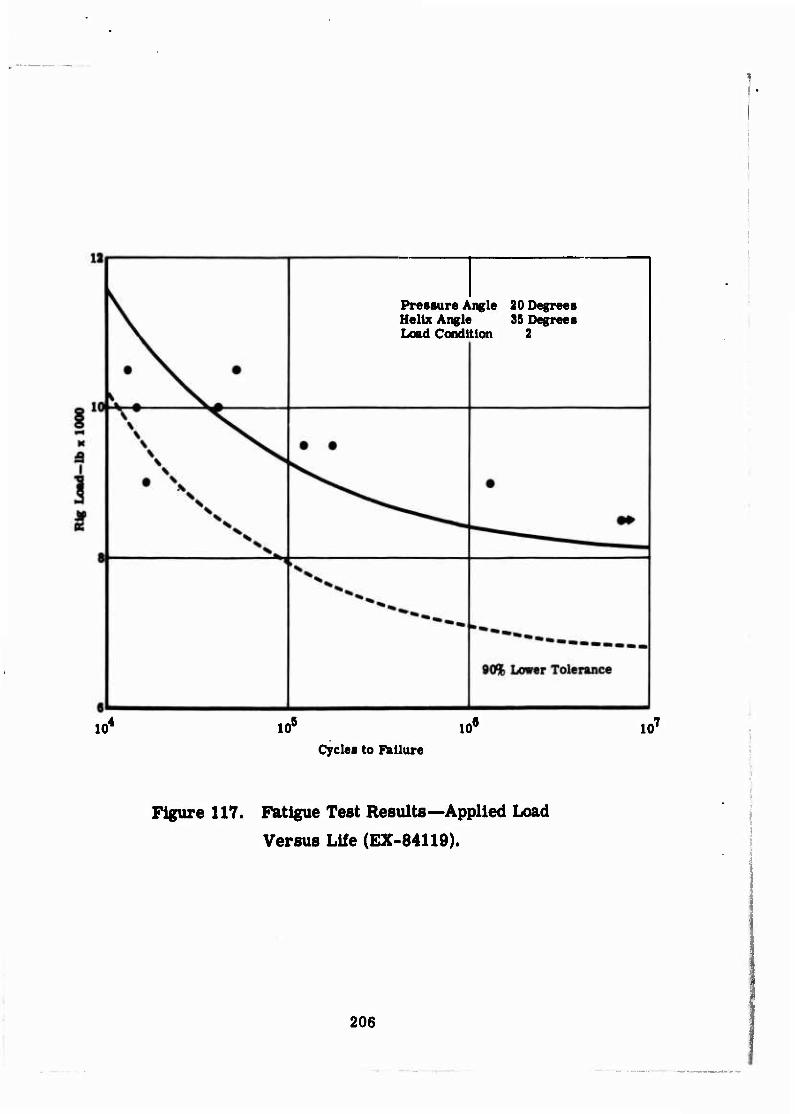
Pressure Angle 20 Degrees Helix Angle 35 Degrees Load Condition 2
10' 10° lO" 10' Cycles to Failure
Figure 117. Fatigue Test Results—Applied Load
Versus Life (EX-84119).
206
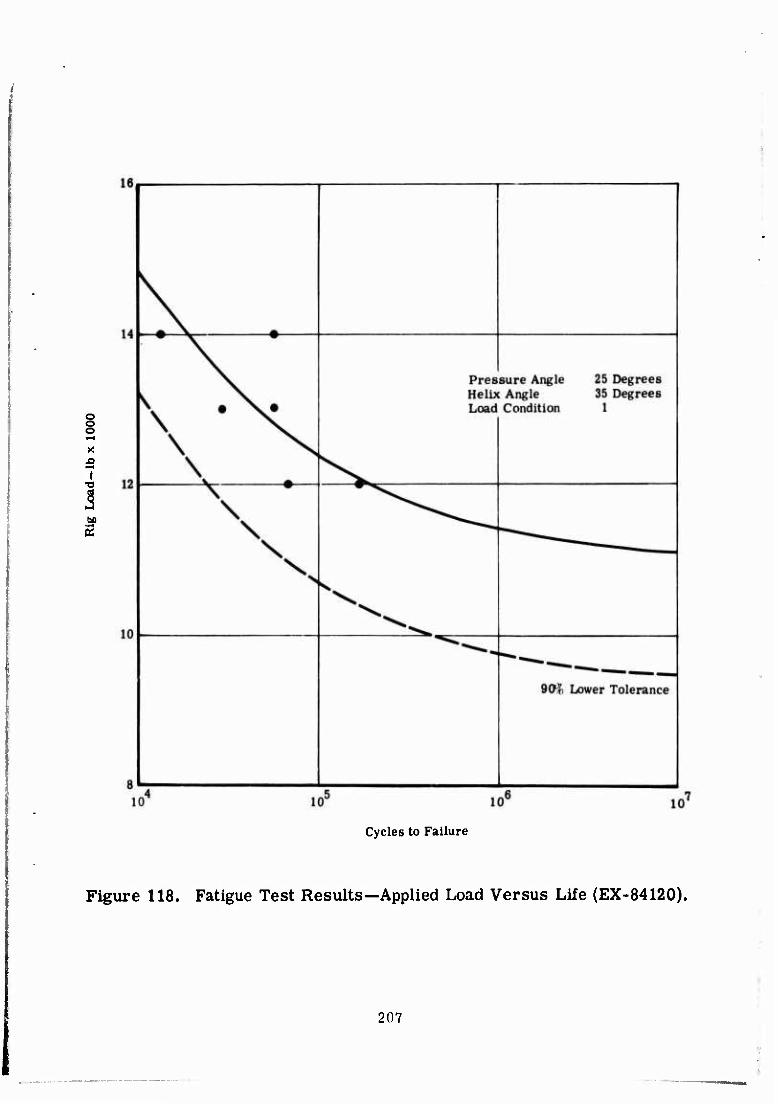
5 I
•a
S
Cycles to Failure
Figure 118. Fatigue Test Results—Applied Load Versus Life (EX-84120).
207

16
14
X
I
OS
12
10
Pr He Lo
•
assure Angle 25 Degrees lix Angle 35 Degrees ad Condition 2
\
^
—-^
9(fn Lower Tolerance
10^ 10a Kr Cycles to Failure
10'
Figure 119. Fatigue Test Results—Applied Load Versus Life (EX-84120).
208
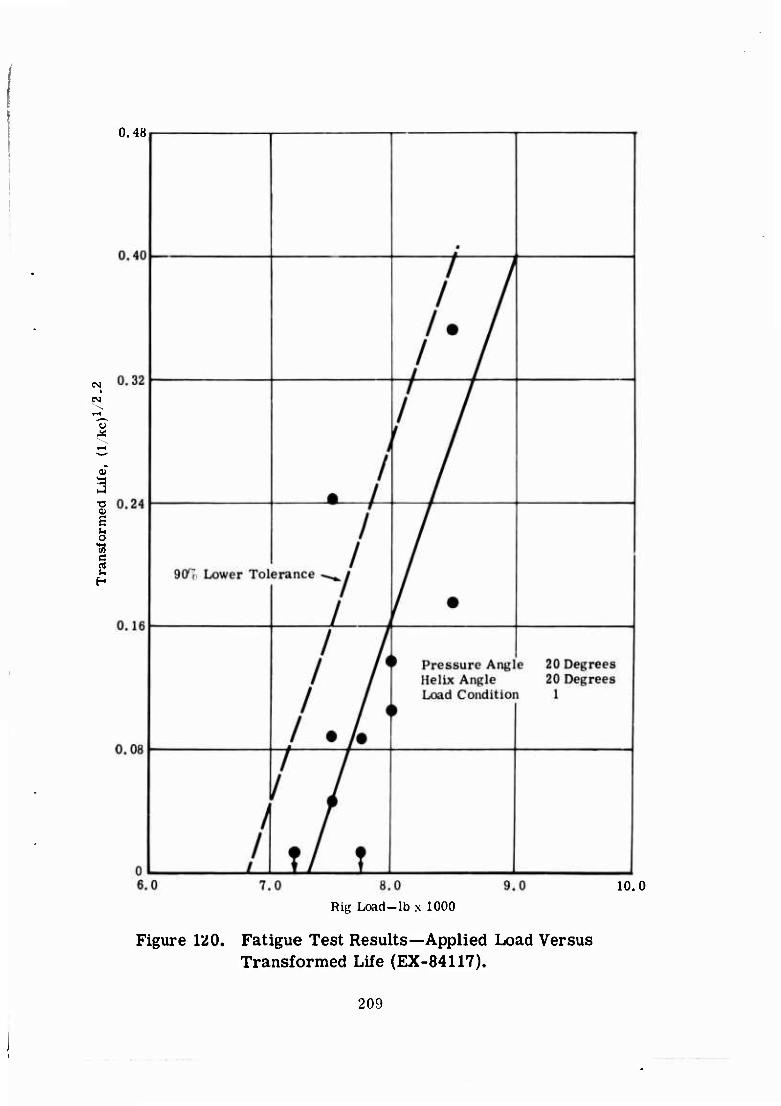
0.48
eg i
■a tu E u o
■a c rt t, H
10.0
Rig Load-lb x 1000
Figure 120. Fatigue Test Results—Applied Load Versus Transformed Life (EX-84117).
209
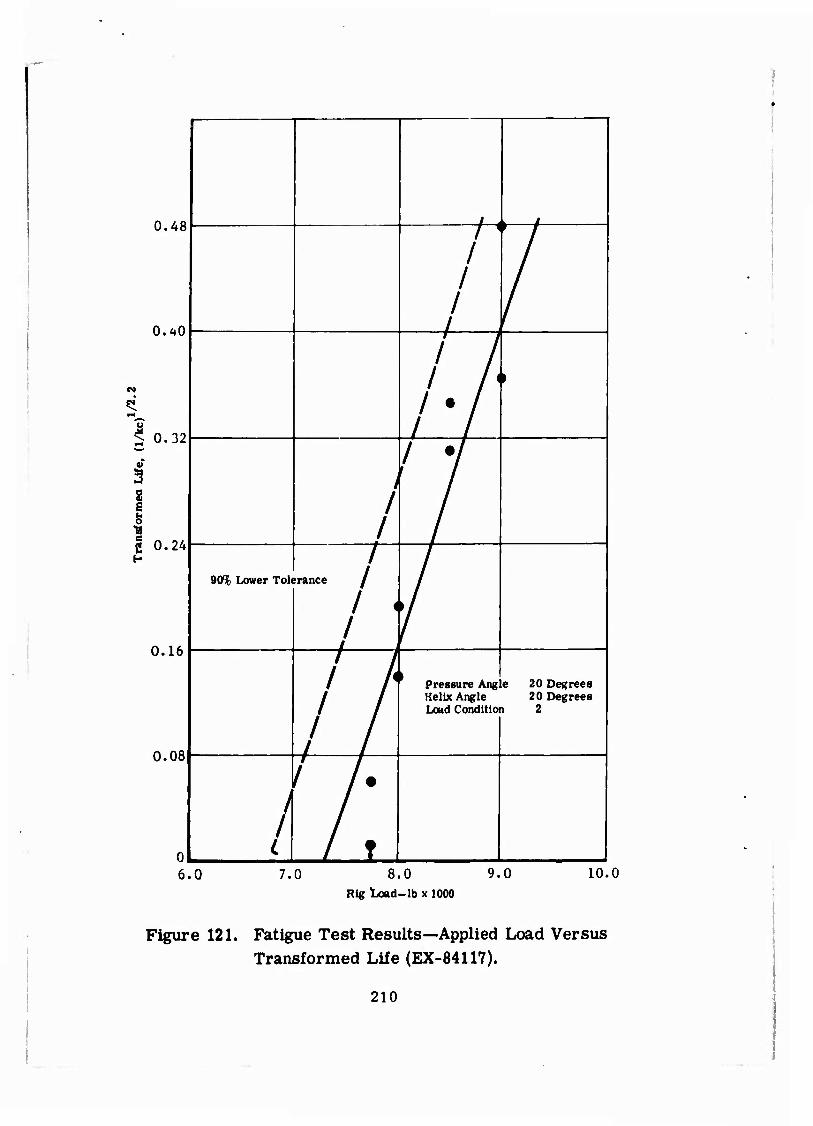
0.48 / - L 1 \
/ / '
/ /
/ / n iiO / , ' J t i
i 7 »
•
i •/ < 0.32
i / /
t / 7 1
1 1 E rt o / 1 ß 0*24 n
a
90% Lower Tolerance /
1 < ij /
A 1 £. / ' Ü. lb
1 1 § §
1 r Pressure Ang e 20 Degrees
1 Uelix Angle 20 Degrees | Loud Condltio i 2
1 0.081 i i t t
/
1 /.
0
/ L / T
6.0 7.0 8.0 Rig Load-lb x 1000
9.0 10.0
Figure 121. Fatigue Test Results—Applied Load Versus Transformed Life (EX-84117).
210
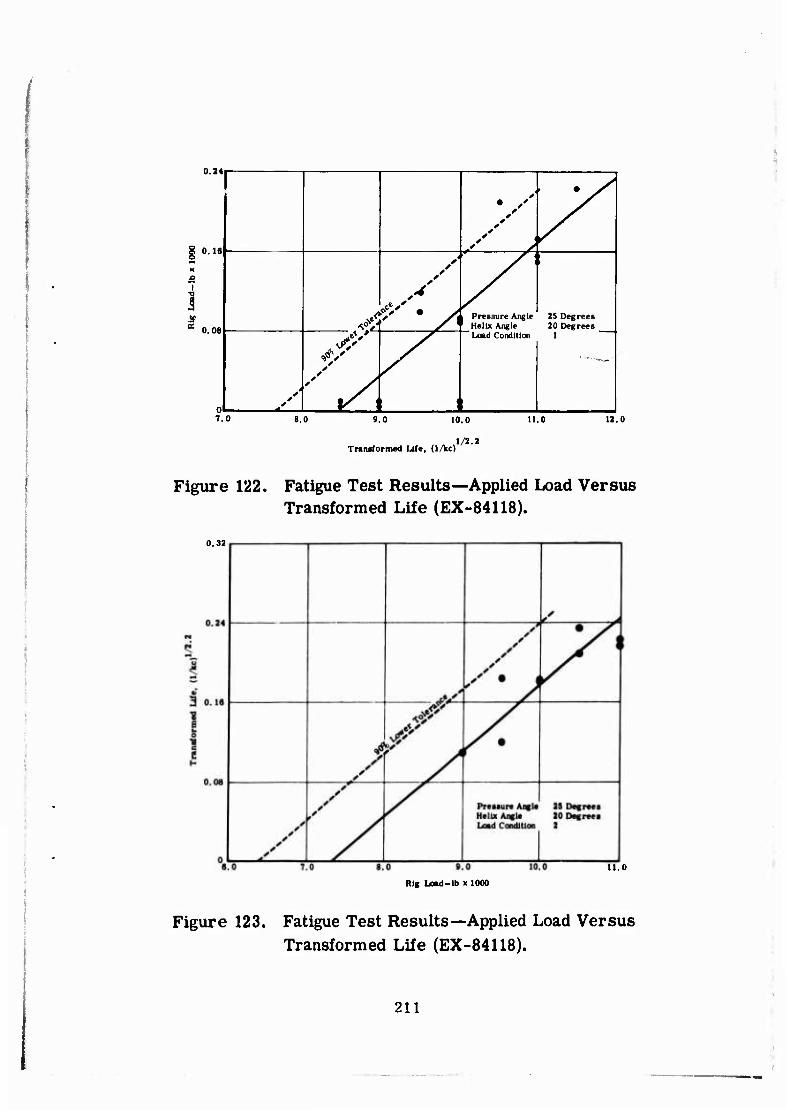
U. «1
0.16
0.08
n
//
^ > X, Pressure Angle S ' Helix Angle
25 Degrees 20 Degrees
1
,/ ^
v^ Load Condition
7.0 8.0 9.0
Transformed Life, (1/kc)
10.0
1/2.2
11.0 12.0
Figure 122. Fatigue Test Results—Applied Load Versus Transformed Life (EX-84118).
0.32
.0 9.0
Rig Load-lb x 1000
11.0
Figure 123. Fatigue Test Results—Applied Load Versus Transformed Life (EX-84118).
211
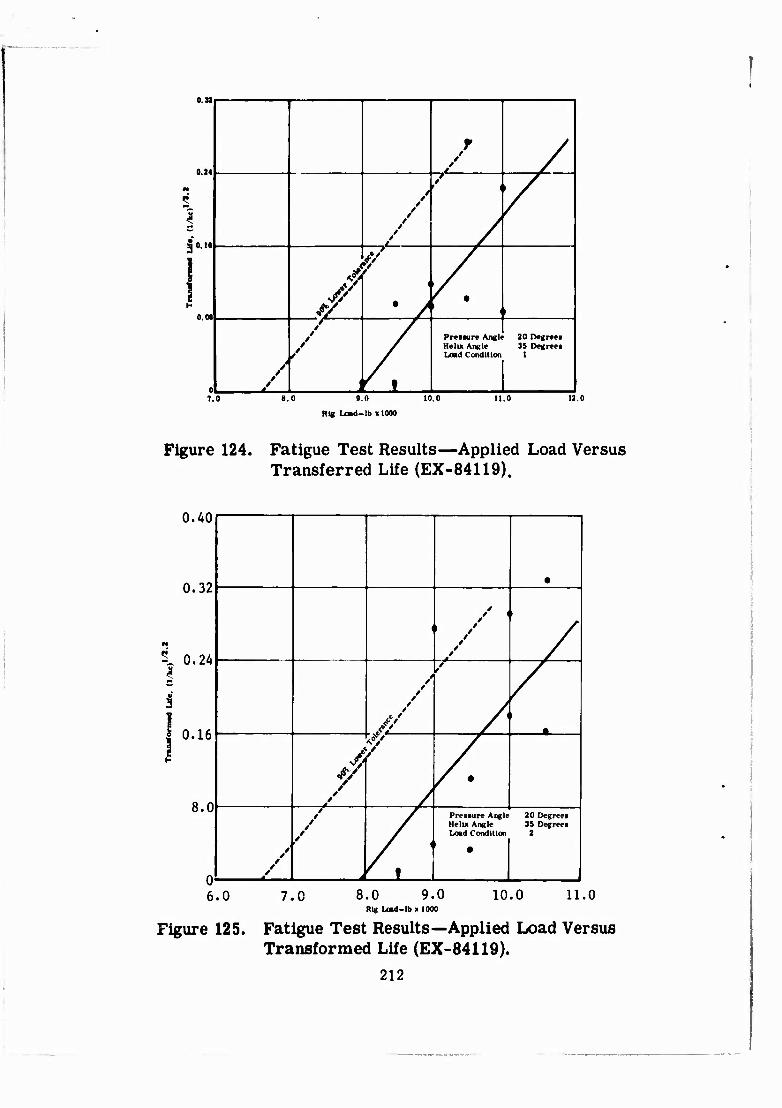
0.33
0 34 / /
ft
3 o.i«
/
/
/
/ > *
0 06 A f ./i
/ /
0 /
/
/
/
Pressure Angle Helix Angle Loud Condition
20 Degrees J5 Degrees
I
7.0 .0 9.0 10.0
Rig Load-lb > 1000
11.0 11.0
Figure 124. Fatigue Test Results—Applied Load Versus Transferred Life (EX-84119).
0.40
0.32
S. 0.24
I I 0.16
8.0
•
( 1
/
i
•
/
r / •
/
/ /
r f
Pressure Angle Helix Angle Load Condition
20 Degrees 35 Degrees
2
6.0 7.0 8.0 9.0 10.0 11.0 Rig Lwd-lb x 1000
Figure 125. Fatigue Test Results—Applied Load Versus Transformed Life (EX-84119).
212

0.32
0.24
= 0.16 i
I 0.08
0'
/ /
/ Y, / Y
/ J /
rressure Angl Helix Amtle Load Conditlor
e 25 Degree» 35 Degrees
1
9.0 10.0 11.0 12.0 13.0 14.0 Rig Load-lb « 1000
Figure 126. Fatigue Test Results—Applied Load Versus Transferred Life (EX-84120).
0.40
Figure 127. Fatigue Test Results—Applied Load Versus Transferred Life (EX-84120).
213
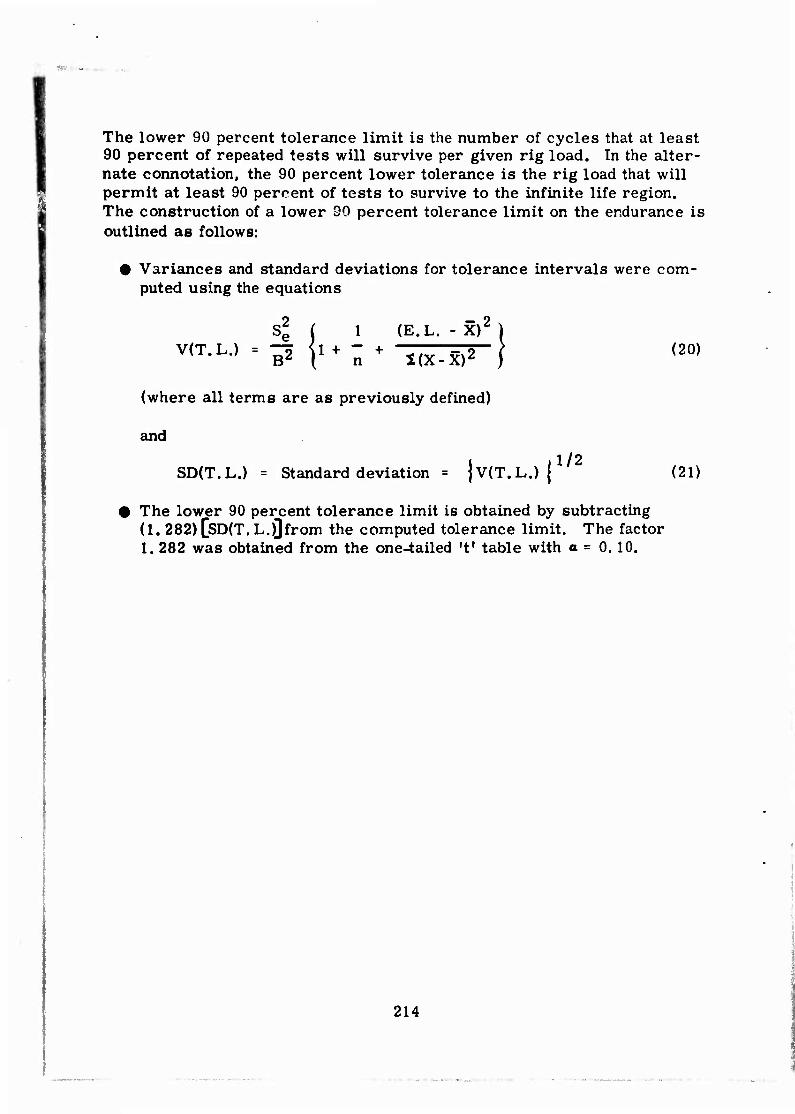
The lower 90 percent tolerance limit is the number of cycles that at least 90 percent of repeated tests will survive per given rig load. In the alter- nate connotation, the 90 percent lower tolerance is the rig load that will permit at least 90 percent of tests to survive to the infinite life region. The construction of a lower 90 percent tolerance limit on the endurance is outlined as follows:
• Variances and standard deviations for tolerance intervals were com- puted using the equations
S2e ( 1
V(T.L.) = Tä U + " B^ ( n
(E.L. - X)2 ) + Stt-X^ | (20)
(where all terms are as previously defined)
and
SD(T.L.) = Standard deviation = )v(T.L.) j (21)
The lower 90 percent tolerance limit is obtained by subtracting (1. 282) [SD(T. L. j]from the computed tolerance limit. The factor 1. 282 was obtained from the one^ailed 't' table with a = 0. 10.
214
APPENDIX V
AGMA STANDARD 221. 02
Following is a reprint of "Tentative AGMA Standard for Rating the Strength of Helical and Herringbone Gear Teeth," by permission of J. C. Sears, American Gear Manufacturers Association.
215
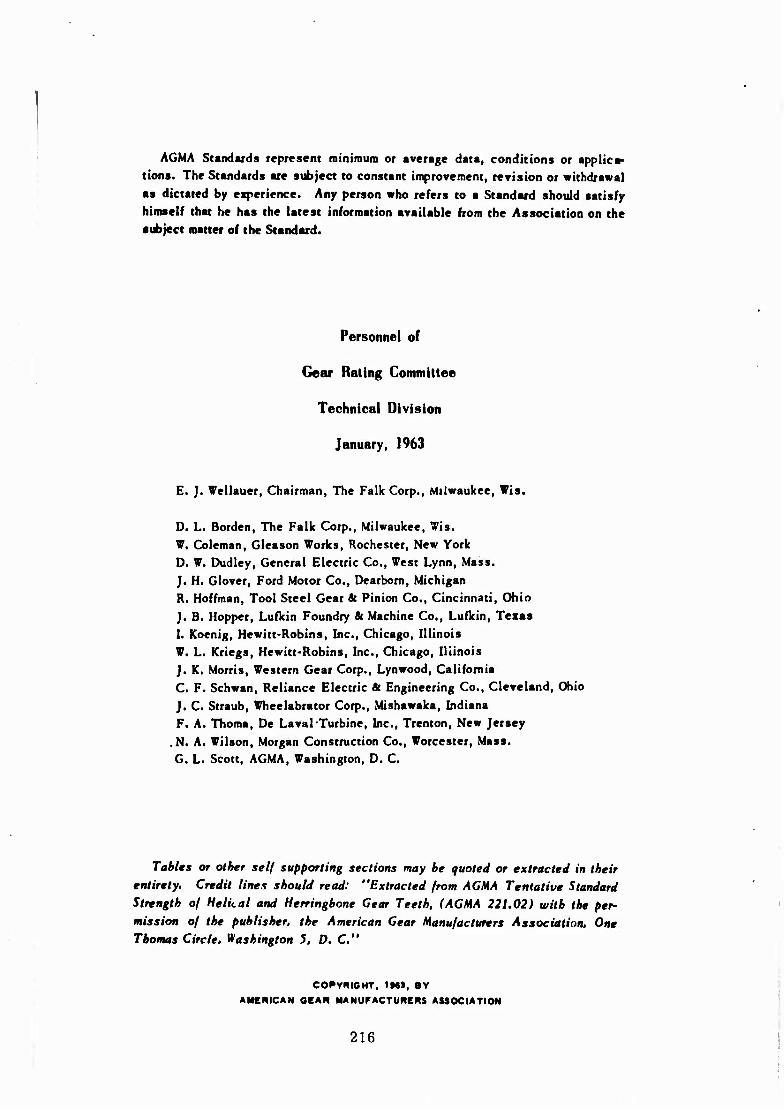
AGMA Standards represent roinirnum or average data, conditions or applica- tions. The Standards are subject to constant improvement, revision or withdrawal as dictated by experience. Any person who refers to a Standard should satisfy himself that he has the latest information available from the Association on the subject matter of the Standard.
Personnel of
Gear Baling Committee
Technical Division
January, 1963
E. J. Wellauer, Chairman, The Falle Corp., Milwaukee, Wis.
D. L. Borden, The Falle Corp., Milwaukee, Wis. W. Coleman, Gleason Works, Rochester, New York D. W. Dudley, General Electric Co., West Lynn, Mass. J. H. Glover, Ford Motor Co., Dearborn, Michigan R. Hoffman, Tool Steel Gear & Pinion Co., Cincinnati, Ohio J. B. Hopper, Lufkin Foundry & Machine Co., Lufkin, Texas I. Koenig, Hewitt-Robins, Inc., Chicago, Illinois W. L. Kriegs, Hewitt-Robins, Inc., Chicago, Illinois J. K. Morris, Western Gear Corp., Lynwood, California C. F. Schwan, Reliance Electric 8c Engineering Co., Cleveland, Ohio J. C. Straub, Wheelabrator Corp., Mishawaka, Indiana F. A. Thoma, De Laval-Turbine, Inc., Trenton, New Jersey
. N. A. Wilson, Morgan Construction Co., Worcester, Mass. G. L. Scott, AGMA, Washington, D. C.
Tables or other self supporting sections may be quoted or extracted in their entirety. Credit lines should read: "Extracted from AGHA Tentative Standard Strength of Helkal and Herringbone Gear Teeth, (AGMA 221.02) with the per- mission of the publisher, the American Gear Manufacturers Association, One Thomas Circle, Washington 3, D. C."
COPYRIGHT, IMS, BY
AMERICAN GEAR MANUFACTURERS ASSOCIATION
216
FOREWORD
This standard is for rating the strength of helical and herringbone gear teeth. It contains the following:
Basic Rating Formula
This section enumerates the factors known to affect strength. Numerical values are presented for those factors which have been evaluated by analytical means, test results or field experience. Suggestions are made for the factors which are not now capable of being expressed accurately. New knowledge and more definite measurement of these parameters will continually necessitate revisions and improvements.
In addition to the above, it is contemplated to publish design practices, such as AGMA 221.02A, having specific application under the heading of:
Design Practices for Specialized Applications
It is recognized that it is sometimes desirable to provide simplified design practice data applicable to a specialized field of application.
i These individual design practices will enable enclosed speed reducer, mill gear, aircraft or other specialized product designers to record the I modifications and limitations they wish to use.
This tentative standard was initially printed as an AGMA paper for presentation at the June, I960 Annual Meeting. It was approved by the AGMA membership in June, 1961. However, final printing of the standard was intentionally delayed in order to correlate copies of all the strength rating standards.
217
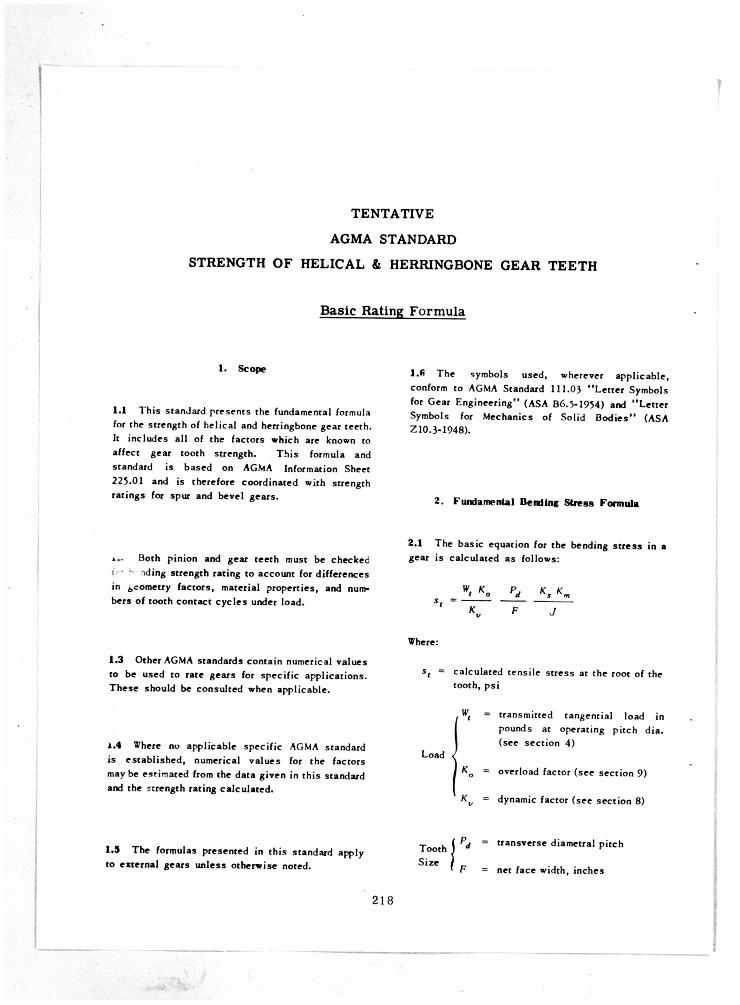
TENTATIVE
AGMA STANDARD
STRENGTH OF HELICAL & HERRINGBONE GEAR TEETH
Basic Rating Formula
1. Scope
1.1 This standard presents the fundamental formula for the strength of helical and herringbone gear teeth. It includes all of the factors which are known to affect gear tooth strength. This formula and standard is based on AGMA Information Sheet 225.01 and is therefore coordinated with strength ratings for spur and bevel gears.
l.fi The symbols used, wherever applicable, conform to AGMA Standard 111.03 "Letter Symbols for Gear Engineering" (ASA B6.5-1954) and "Letter Symbols for Mechanics of Solid Bodies" (ASA Z10.3-1948).
2. Fundamental Bending Stress Formula
Both pinion and gear teeth must be checlcec i • h iding strength rating to account for differences in geometry factors, material properties, and num-bers of tooth contact cycles under load.
2.1 The basic equation for the bending stress in a gear is calculated as follows:
. W> * o P< * , « ,
Kv F J
Where:
1.3 Other AGMA standards contain numerical values to be used to rate gears for specific applications. These should be consulted when applicable.
1.4 Where no applicable specific AGMA standard is established, numerical values for the factors may be esrimated from the data given in this standard and the strength rating calculated.
s, - calculated tensile stress at the root of the tooth, psi
. If. = transmitted tangential load in pounds at operating pitch dia. (see section 4)
= overload factor (see section 9)
Kv = dynamic factor (see section 8)
Load
, . . . ( Pd = t , a n sverse diametral pitch 1.3 The formulas presented in this standard apply loom 1 to external gears unless otherwise noted. S i " } p = f a c e w i d t h i n c h e s
218

AGMA STANDARD STRENGTH OF HELICAL & HERRINGBONE GEAR TEETH
' K = size factor (see section 7) Stress Dis- I K . tribu» tion
V/
= load distribution factor (see s tion 6)
= geometry factor (see section 5)
2.1.1 Note that the above equation is divided into three groups of terms, the first of which is concerned with the load, the second with tooth size, and the third with stress distribution.
P.. = tip d K., J s*t KL
126,000 Ko Km Kt Pd KR KT
Where:
Pal = allowable power of gear set in horsepower
np - pinion speed, rpm
d - operating pitch diameter of pinion, inches.
2.2 The relation of calculated stress to allowable stress is:
KT KR
Where:
sat = allowable stress for material, psi (see section 13)
s, = calculated stress, psi (see section 2.1)
KL = life factor (see section 11)
KT = temperature factor (see section 12)
KR = factor of safety (see section 10)
4. TraiwmUled Tangential Load
4.1 The transmitted tangential load is calculated directly from the power transmitted by the gear set. (When operating near a critical speed of the drive, a careful analysis of conditions must be made). When the transmitted load is not uniform, consideration should be given not only to the peak load and its anticipated number of cycles, but also to inter» mediate loads and their number of cycles.
4.2 The transmitted tangential load is:
"'. = P x 33,000 27 P x 126,000
tip d
3. Fundamental Power Formula
3.1 In preparing handbook data, for gear designs already developed, the following formula can be used to directly calculate the power which can be transmitted by a given gear set.
Where:
P
T
power transmitted in horsepower
pinion torque, pound inches
pitch line velocity, fpm
219 AGMA 221.02 —Sept., 1963

AGMA STANDARD STRENGTH OF HEUCAL & HERRINGBONE GEAR TEETH
S. GeoiiKtry Factor - J %.t Figures 3 and 4 illustrate misalignment and its
effect on load distribution.
5.1 The feometry factor evaluates the shape of the tooth, the position at which the most damaging
load is applied, stress correction due to geometric
shape, and the sharing of load between oblique lines
of contact.
6.3 The effect of different rates of helical gear
misalignment is shown in Figure 3.
5.2 See Appendix A for a further discussion of
helical gear geometry factors.
5.3 In helical gears, the critical point of load
application ia determined by the position of the
oblique line of contact. Figures 1, 24 and 2B show the approximate geometry factors for equal addendum
involute helical gears for the contact condition of
Figure A*2 of Appendix A.
6.4 When the misalignment is known, use Figure 3
to select Km. Fm represents the face width having
just 100 per cent contact for a given tangential load and alignment error. Generally Fm should ex-
ceed F. The misalignment represents the combined
effect of the helix error of the pinion, helix error of
the gear and misalignment of the pinion and gear
axes under load.
t. Load Dtotrlbiäion Factor - Km
9,1 The load distribution factor depends ifion the
combined effect of:
1) misalignment of axes of rotation;
2) lead deviations;
3) clastic deflection of shafts, bearings and
houaing.
6.9 Manufacturers of gears with face widths greater
than 6 inches generally find it necessary to control
misalignment by other meana than allowed rates of
misalignment. To handle such cases. Table 1
ahows appropriate values of Km,
6.6 When the estimated or actual misalignment is not known, the Km factor may be obtained from
Table 2.
220
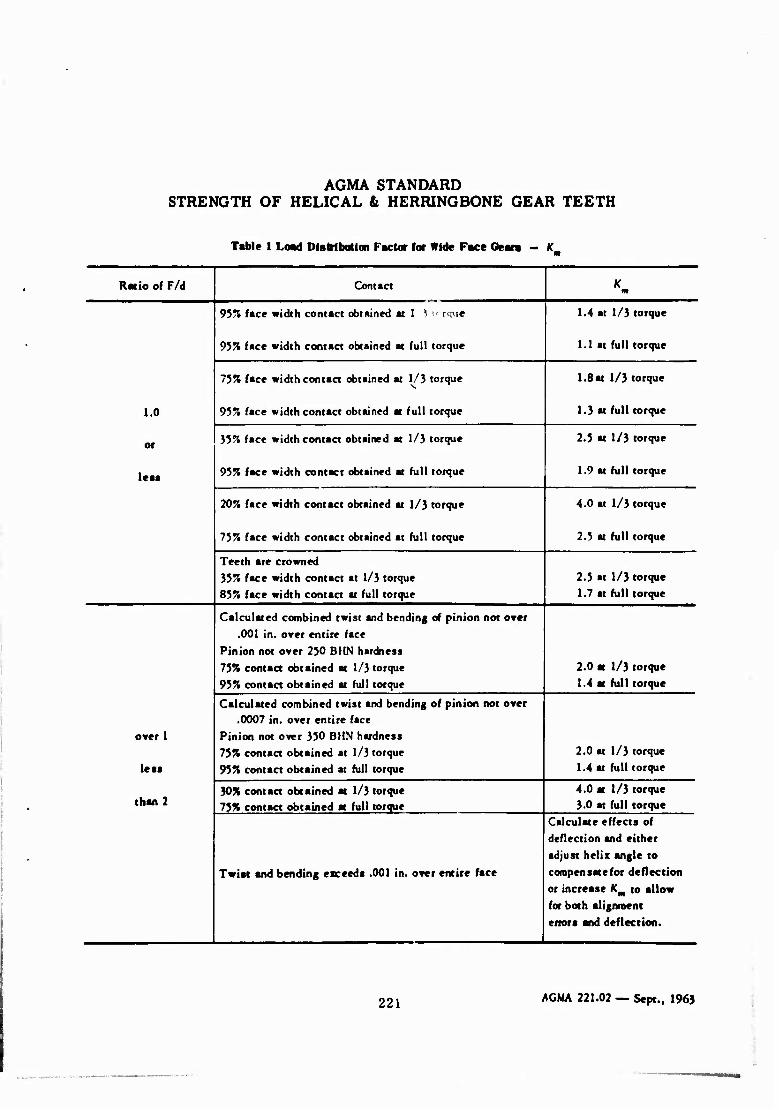
AGMA STANDARD STRENGTH OF HELICAL & HERRINGBONE GEAR TEETH
Table 1 Load DisMbutlon Factor for Wide Face Oean - K
Ratio of F/d Contact K m
95% face width contact obtained at 1 J i' rque 1.4 at 1/3 torque
95% face width contact obtained at full torque 1.1 at full torque
75% face width contact obtained at 1/3 torque 1.8 at 1/3 torque
1.0 95% face width contact obtained m full torque 1.3 at full torque
or 35% face width contact obtained at 1/3 torque 2.5 at 1/3 torque
lest 95% face width contact obtained at full torque 1.9 at full torque
20% face width contact obtained at 1/3 torque 4.0 at 1/3 torque
75% face width contact obtained at full torque 2.5 at full torque
Teeth are crowned 35% face width contact at 1/3 torque 2.5 at 1/3 torque 85% face width contact at full torque 1.7 at full torque
Calculated combined twist and bending of pinion not over .001 in. over entire face
Pinion not over 250 BUN hardness 75% contact obtained at 1/3 torque 2.0 at 1/3 torque
95% contact obtained at full torque 1.4 at full torque
Calculated combined twist and bending of pinion not over .0007 in. over entire face
over 1 Pinion not over 350 BHN hardness 75% contact obtained at 1/3 torque 2.0 at 1/3 torque
lets 95% contact obtained at full torque 1.4 at full torque
30% contact obtained at 1/3 torque 4.0 at 1/3 torque than 2 75% contact obtained m full torque 3.0 at full torque
Calculate effects of deflection and either adjust helix angle to
Twiat and bending exceeds .001 in. over entire face compensate for deflection or increase Km to allow for both alignment enora and deflection.
221 AGMA 221.02 — Sept., 1963

AGMA STANDARD STRENGTH OF HELICAL & HERRINGBONE GEAR TEETH
Table 2 Load Distribution Factor - K
Face Width, Inche s
Condition of Support 2
and
under 6 9
16 and
orer
Accurate mountings, low bearing clearances, minimum elastic
deflection, precision gears 1.2 1.3 1.4 1.7
Leaa rigid mountings, less accurate gears, contact across full
face 1.5 1.6 1.7 2.0
Accuracy and mounting such that less than full face
contact exists over 2
7. Sin Factor - K,
7.1 The size factor reflects non-uniformity of material properties. It depends primarily on:
1) tooth aize;
2) diameter of parts;
3) ratio tooth aize to diameter of part;
4) face width;
3) area of stress pattern;
6) ratio of case depth to tooth size;
7) hardenability and heat treatment of materi- als.
7.2 The size factor may be taken as unity for most helical and herringbone gears proTided a proper choice of ateel is made for the size of the parts and the case depth or hardness pattern is sdequate.
7.3 Standard size factors for helicsl teeth have not yet been established for cases where there is a
detrimental size effect. In such cases some size factor greater than unity should be used.
8. Dynamic Factor - *„
8.1 The dynamic factor depends on:
1) effect of tooth spacing and profile errors;
2) effect of pitch line speed and rpm;
3) inertia and stiffness of all rotating ele- ments;
4) transmitted load per inch of face;
5) tooth stiffness.
8.2 Figure 6 shows some of the dynamic factors that are commonly used.
Curve I — Used for high precision helical gears where the items listed in 8.1 are such that no appreciable dynamic load is developed.
Curve 2 — Used for high precision helical gears where the items listed in 8.1 can develop a
222

AGMA STANDARD STRENGTH OF HELICAL & HERRINGBONE GEAR TEETH
dynamic load. This curve is recommended fw conr mercial helical gears.
8.3 When milling cutters are used to cut the teeth or inaccurate teeth are generated, lower dynamic factors than shown in Figure 0 must be used.
9. Overload Factor - K
9.4 Service factors have been established where field data Is available for specific applications. These service factors include not only the overload factor, but also the life factor and factor of safety. Service factors for many applications are listed in AGMA standards, and should be used whenever applicable. If a specific service factor is used in place of the overload factor K0, use a value of 1.0 for Kg and K, .
9.1 The overload factor makes allowances for the roughness or smoothness of operation of both the driving and driven apparatus. Specific overload factors can be established only after considerable field experience is gained in a particular applica- tion.
9.2 In determining the overload factor, considera- tion should be given to the fact that many prime movers develop momentary overload torques appre- ciably greater than those determined by the name- plate ratings of either the prime mover or the driven apparatus.
9.3 In the absence of specific overload factors, the values in Table 3 should be used.
10. Factor of Safety - K.
10.1 The factor of safety is introduced in this equation to offer the designer in opportunity to design for high reliability or, in some instances, to design for a calculated risk. Table 4 shows a sug- gested list of factors of safety to be applied to the fatigue strength of the material rather than to the tensile strength. For this reason, the values are much smaller than customarily used in other branches of machine design.
10.1.1 Failure in the following table does not mean an immediate failure under applied load, but rather a shorter life than the minimum specified.
Table 3 Overload Factors - K.
Power Load On Driven Machine
Source Uniform
Moderate Shock
Heav/ Shock
Uniform 1.00 1.25 1.75
or higher
Light Shock 1.25 1.50 2.00
or higher
Medium Shock 1.50 1.75 2.25
or higher
Table 4 Factors of Safety - KR
Fatigue Strength
Requirements of
Application «R
High Reliability 1.50 or higher
Fewer than 1 failure in 100 1.00
Fewer than 1 failure in 3 0.70
223 AGMA 221.02 — Sept., 1963
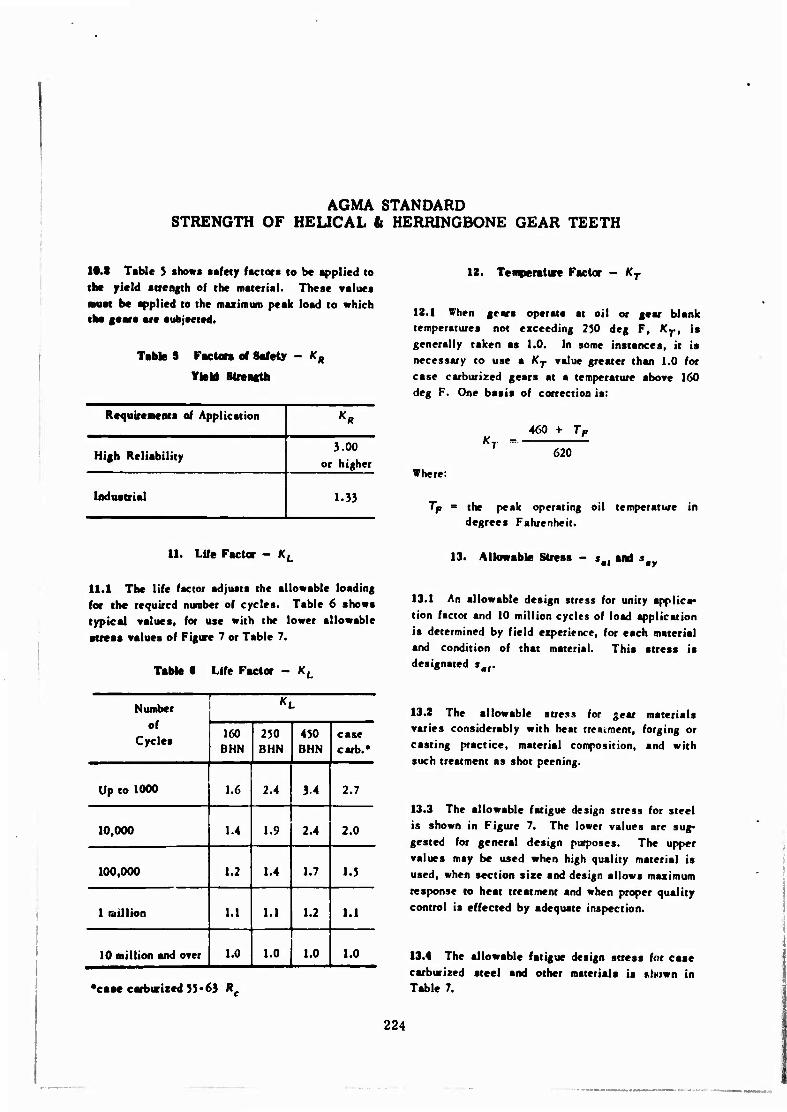
AGMA STANDARD STRENGTH OF HEUCAL & HERRINGBONE GEAR TEETH
lt.S Table 5 «hows safety factors to be applied to
the yield strength of the material. These values
must be applied to the mazimum peak load to which the gears are subjected.
Table 9 Factors of Safety - KK
YiaU Strencth
Requirements of Application KR
High Reliability 3.00
or higher
Industrial 1.33
12. Temperature Factor - KT
12.1 When gears operate at oil or gear blank temperatures net exceeding 2JO deg F, KT, is
generally taken as 1.0. In some instances, it is
necessary to use a KT value greater than 1.0 for
case carburized gears at a temperature above 160 deg F. One basis of correction is:
KT = 460 + 7>
620
Where:
Tp = the peak operating oil temperature in
degrees Fahrenheit.
11. Life Factor - KL
11.1 The life factor adjusts the allowable loading
for the required number of cycles. Table 6 shows
typical values, for use with the lower allowable
stress values of Figure 7 or Tsble 7.
Table « Life Factor - K.
13. Allowable Stress - sM and »
13.1 An allowable design stress for unity applica-
tion factor and 10 million cycles of load application
is determined by field esperience, for each material
and condition of that material. This stress is designated smr
Number «L
of Cycles 160
BHN 250 BHN
450 BHN
case carb.»
Up to 1000 1.6 2.4 34 2.7
10,000 1.4 1.9 2.4 2.0
100,000 1.2 1.4 1.7 1.5
1 million 1.1 1.1 1.2 1.1
10 million and over 1.0 1.0 1.0 1.0
•case cwbwized 55-63 ft.
13.2 The allowable stress for gear msterisls varies considerably with heat treatment, forging or
casting practice, material composition, snd with
such treatment as shot peening.
13.3 The allowable fatigue design stress for steel
is shown in Figure 7. The lower values sre sug-
gested for general design purposes. The upper
values may be used when high quality material is
used, when section size snd design allows maximum
response to heat treatment and when proper quality
control is effected by adequate inspection.
13.4 The allowable fatigue design stress for case
carburized steel and other materials is »ttown in Table 7.
224
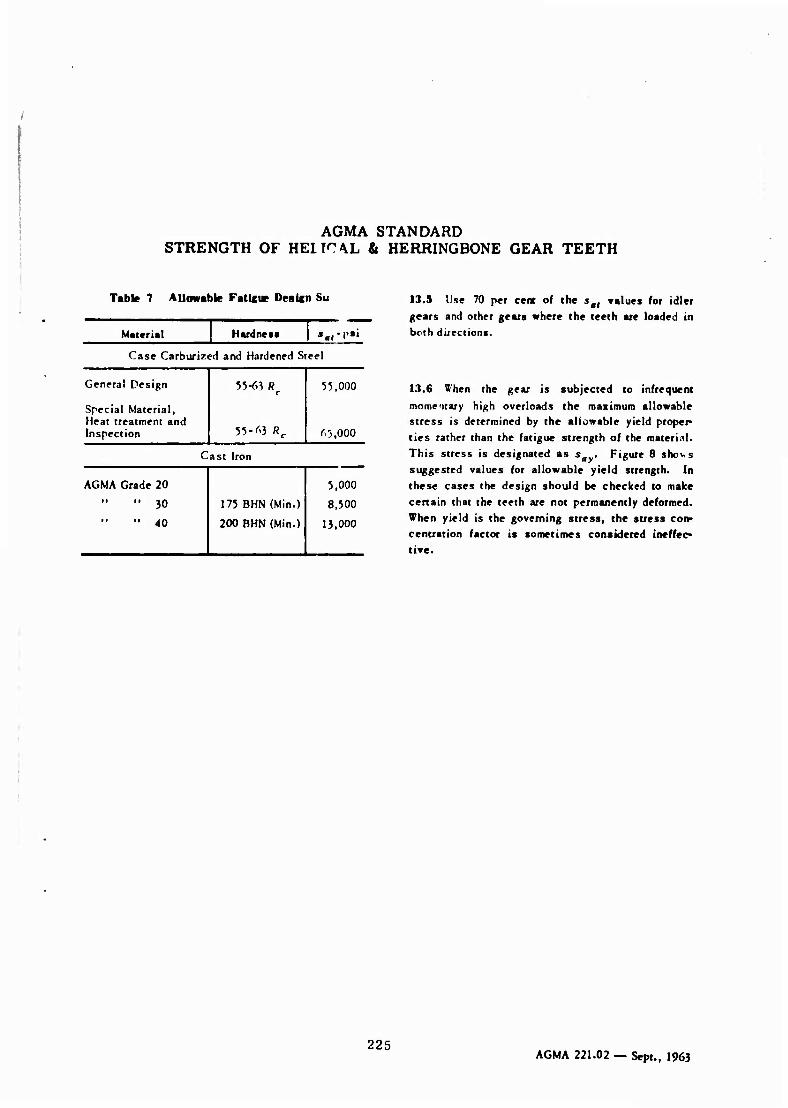
AGMA STANDARD STRENGTH OF HEITCAL & HERRINGBONE GEAR TEETH
Table 7 Allowable Fatlcue Design Su
Material Hardneaa j-.-P"
Case Carburizcd and Hardened Steel
General Design
Special Material, Heat treatment and Inspection
55-63 R
55-M R,
55,000
^5,000
c a st Iron
AGMA Grade 20 5,000 .. }0 175 BHN (Min.) 8,500
.. 4o 200 BHN (Min.) 13.000
13.9 Use 70 per cent of the sal values for idler gears and other gears where the teeth are loaded in both directions.
13.6 When the gear is subjected to infrequent mome'itary high overloads the maximum allowable stress is determined by the allowable yield proper ties rather than the fatigue strength of the material. This stress is designated as s . Figure 8 shows suggested values for allowable yield strength. In these cases the design should be checked to make certain that the teeth are not permanently deformed. When yield is the governing stress, the stress con- centration factor is sometimes considered ineffec- tive.
225 AGMA 221.02 — Sept., 1963

Hi33i JO swaawnN Po _
aH9l3H H1001
«i-
\o jo
e
ro
3 O z UJ o § Q
< O
I </)
i
UJ _J o z <
o UJ r> tr
13 (/) in UJ
o m CM
o: Q.
-j <
• ■)*■ 2
2 i o UJ _J o IO
e in
o o
o in
o o
< ^
UJ
r-dOJLOVJ Adl3KI039
cr o O <
>- cr. UJ
O UJ o
b
226
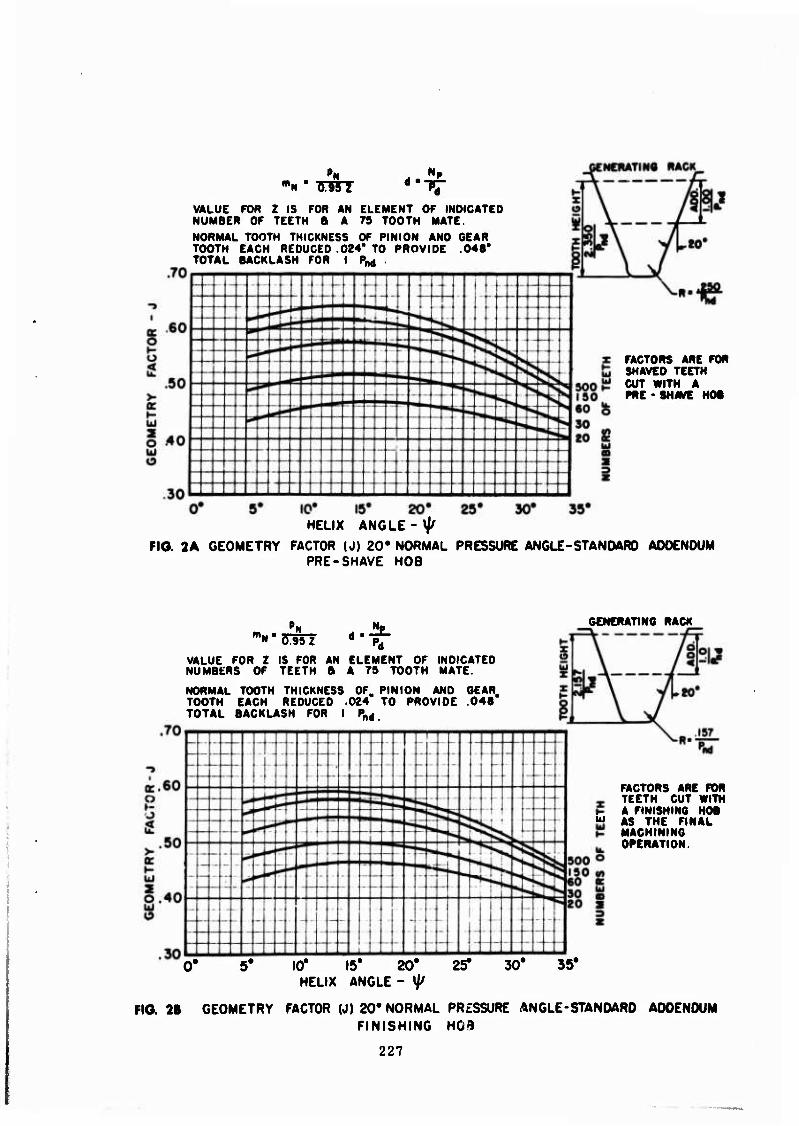
4 ■
VALUE FOR Z IS FOR AN ELEMENT OF INDICATED NUMBER OF TEETH a A 79 TOOTH MATE.
NORMAL TOOTH THICKNESS OF PINION AND GEAR TOOTH EACH REDUCED .024' TO PROVIDE .048* TOTAL BACKLASH FOR I Pnd .
FACTORS ARE FOR SHAVED TEETH CUT WITH A PRE • SHAVE HOB
10* IS* 20* 25' HELIX ANGLE-^
PIG. 2A GEOMETRY FACTOR (J) 20* NORMAL PRESSURE ANGLE-STANDARD ADDENDUM PRE-SHAVE HOB
"N'S^ST .*.
GENERATING RACK
VALUE FOR Z IS FOR AN ELEMENT OF INDICATED NUMBERS OF TEETH B A 75 TOOTH MATE.
NORMAL TOOTH THICKNESS OF. PINION AND GEAR. TOOTH EACH REDUCED .024 TO PROVIDE .048 TOTAL BACKLASH FOR I Pnd
FACTORS ARE FOR TEETH CUT WITH A FINISHING HOB
u AS THE FINAL MACHINING OPERATION.
0' 5* 10' 15' 20' HELIX ANGLE - <//
25* 30' 35*
FIO. 2B GEOMETRY FACTOR (J) 20* NORMAL PRESSURE ANGLE-STANDARD ADDENDUM FINISHING HOB
227
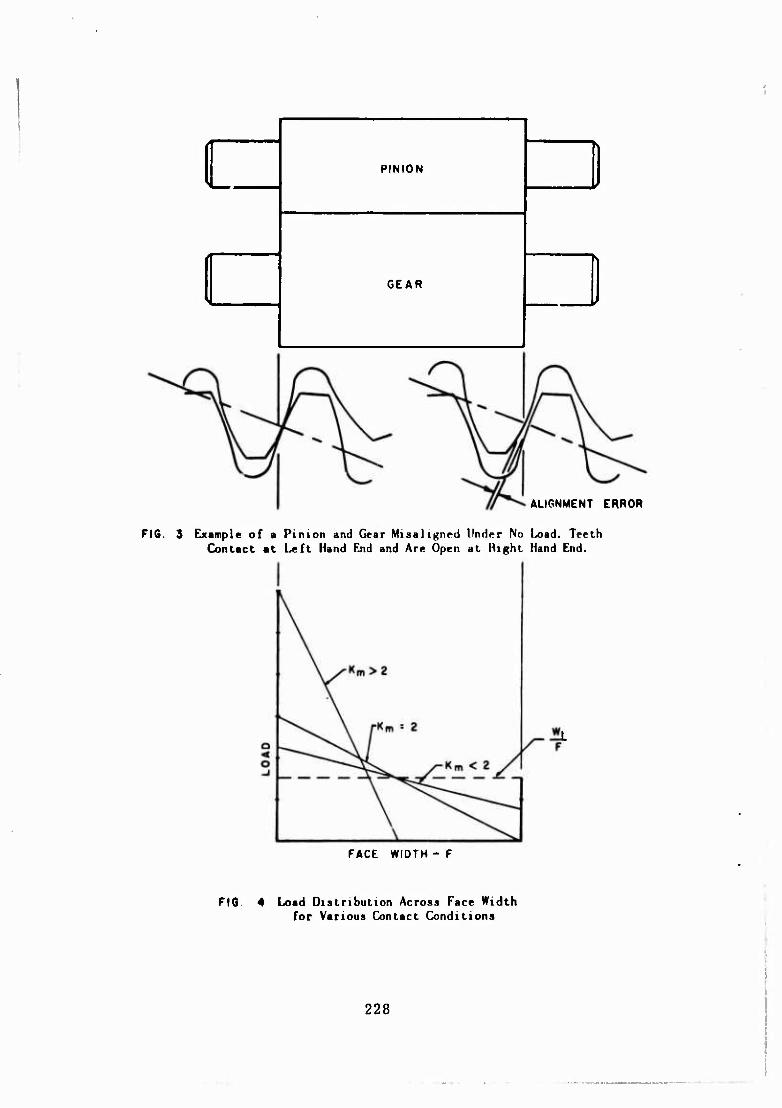
PINION
GEAR
■
ALIGNMENT ERROR
FIG. 3 Example of a Pinion and Gear Misaligned Under No Load. Teeth Contact at Left Hand End and Are Open at Right Hand End.
FACE WIDTH - F
FIO. 4 Load Distribution Across Face Width for Various Contact Conditions
228
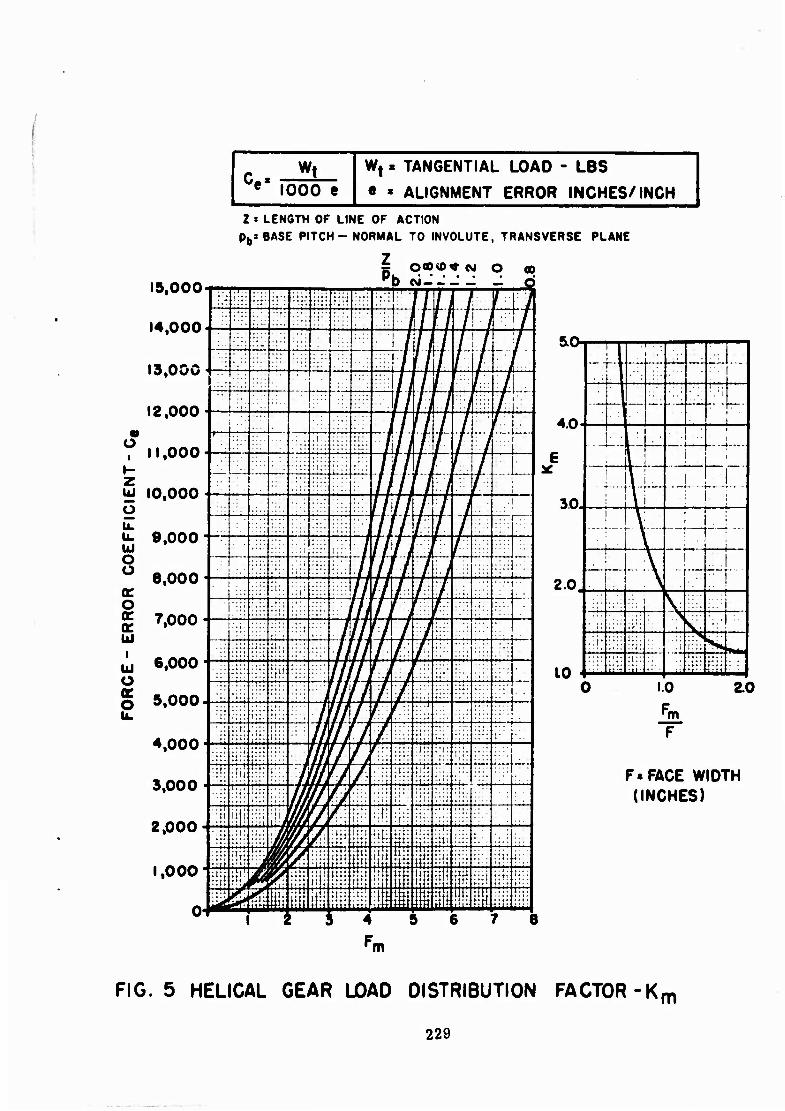
e 1000 e Wt • TANGENTIAL LOAD - LBS
« * ALIGNMENT ERROR INCHES/INCH Z » LENGTH OF LINE OF ACTION
Pb: BASE PITCH-NORMAL TO INVOLUTE, TRANSVERSE PLANE
O i
I- z
UJ O o a: o (r cc UJ i
u u a: o
is non. n; O 00
:.': :::: ■::■ ••': '•:r! :;:! ■; ;' • rr . :• I
14 000- ':!:
'■r'
;': ■ i: :- i i / '/
■;'■
.« 1 1^ ftfiil . l^lVwlS ' •-'::.: ■ i
-% if h 19 non . 1 ;': /// -/::;:
I / /
/ \\
11 ono■ _ t ;t :i:, . \n / 1 1 (VW
■■'[ ! ■:—
:i:: ;•":: : ■ ■ // ' /
io onn ■ I 7 /
i:/ w / ■'■\ i il t 1 8,000" r/r/TT^
P rtArt ■ ::i:
:i:; ///// / 7 ; 0,000 . :i:. _ ; j' N fl 1 i ■
7 rtrtrt . ':i: :;:i :;i; ////
l:i: ;;:.
',000 Hll /
£ /\/%/\ ■ iiii ;:ii fi:i lltfii
^ ;:::
6,000 ' ui! ::::
: ; i 7/ •t • ■
5 OOO. .;
:!:' TJi f y) ijil i::;
' t' i::! :!:: /f :i;:
;::: !i:.; i::: 7/ j J :•;: iii'
^,000 ■
;:';
'.it.'
für tri-
t::' +4 / // '.: fir! 1*1 IM;
11! iiii
7 / :: :j;; .,1. ::.: / :.:: •::•
3,000 ' ■tfrr tu
fiii / A i -rrf — i::' ': üij'i
■in iiii
<9 t\*\fS
frft n illl :i:;
ill/ t; 1; ;i!: ;:::
Z,000 * ■.::
;;;: 3 ftf Ttli ■Hi :' iiijii Il'i ijii
■'if 1 trr
^ m iiii
$1 i if I TT t
III!
i itii I'll 'iii ji;;
1,000' Hp 1 % iijlHjl mi 9:1 !;
i-lil t;r> t ii:i iv ....
/\j
rrrt 4 lilt i iiii ill hi! ;i Hit H iiii, iii M1! 1 M
f:::
Oi ( ( m r 4 5 ( B 7 6
aw
-H ■ i
40.
— — ■ . -i-
i':.
■
--
1 ■ t
i i
^0 ■L -
1 l\ '- — a... .._....
i
V _„j— 1
j
2.0. A — -— rr ■
::. v .
;>'! > si
.it* i::.
.4 iii; s* ÜM.
in . iiii :i:;
iiii .
'•'<'■■
i ) 1.0 ^o
F
F.FACE WIDTH (INCHES)
m
FIG. 5 HELICAL GEAR LOAD DISTRIBUTION FACTOR-Km
229
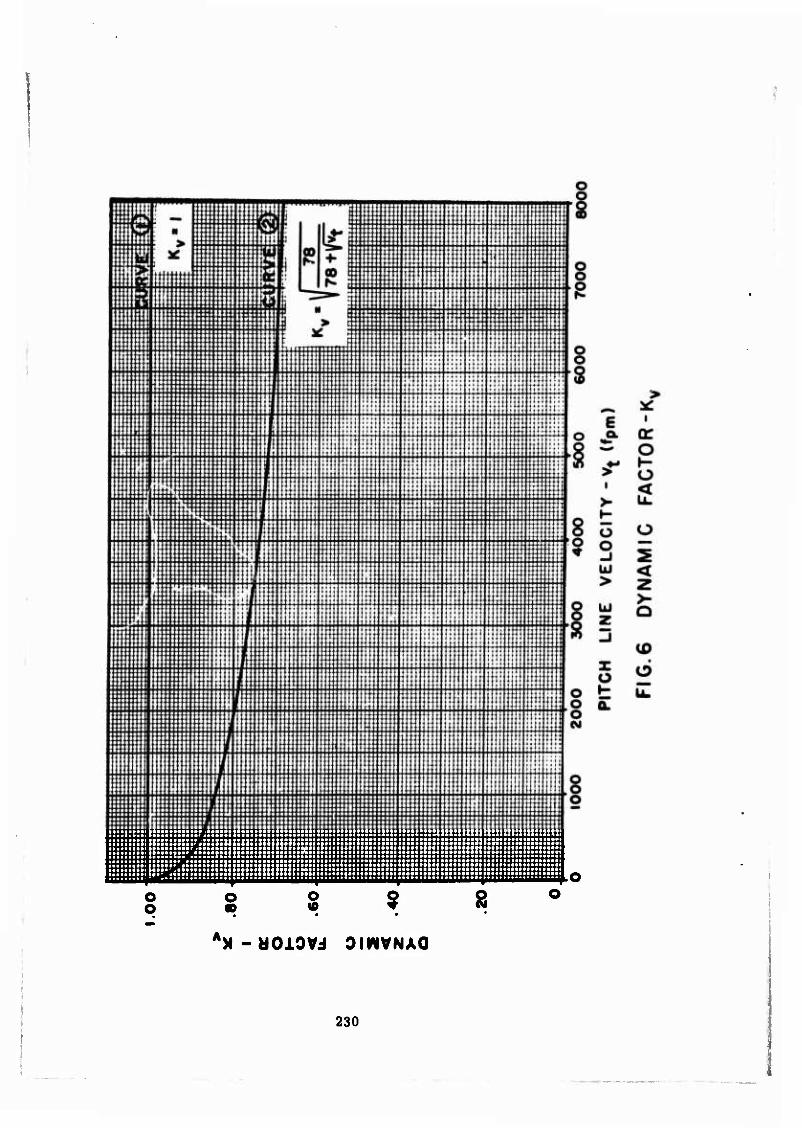
!:::!•&!&!!::;::::?;::::!! :i:::!!::!i::!:!:&:: iniiii tS:::!::s<m»itniSi»SSl:!ii: :::::::::; it:::::::::-.::::::: ::::::::::::::::::::::::::::::i::::::::::::::::::::::::::::ii:::::::::::: I::::::::::::::::::.::::::::::::::::::::::::»:::::::::::::::::::::::::::::::::::::::::::::::::::::::: • •■-■■••>> !•••••>•.« •••••••••• {»•■•■••••■■•■•■•••a ■•■••■•«■••■■•■•••••■■«»•■•••••«••■••••• •■■••••••••■> • «••■••■•••••■•a«* ••■■•••••••••••••••••§•••••••••••••••••••••••••••••••••"•••••••••••••••••••••••••••• ■ ■•■••••■• *••••' -.••••"»•••••••«•»••••••••••••••••••••■•••••••••■••»•■•••••••••••••••••••••••••••••••»••• !■• •••■■•■ !••• ••■■••■■••■•■•«■■••■••••#■•••■••■•• !•*•■■ ■*•■•«•■•••••••••••■■•••••••■•■•■■■■■•• ■■■•■•••<
o o
o o
'X-UOiOVJ OmVNAO
230
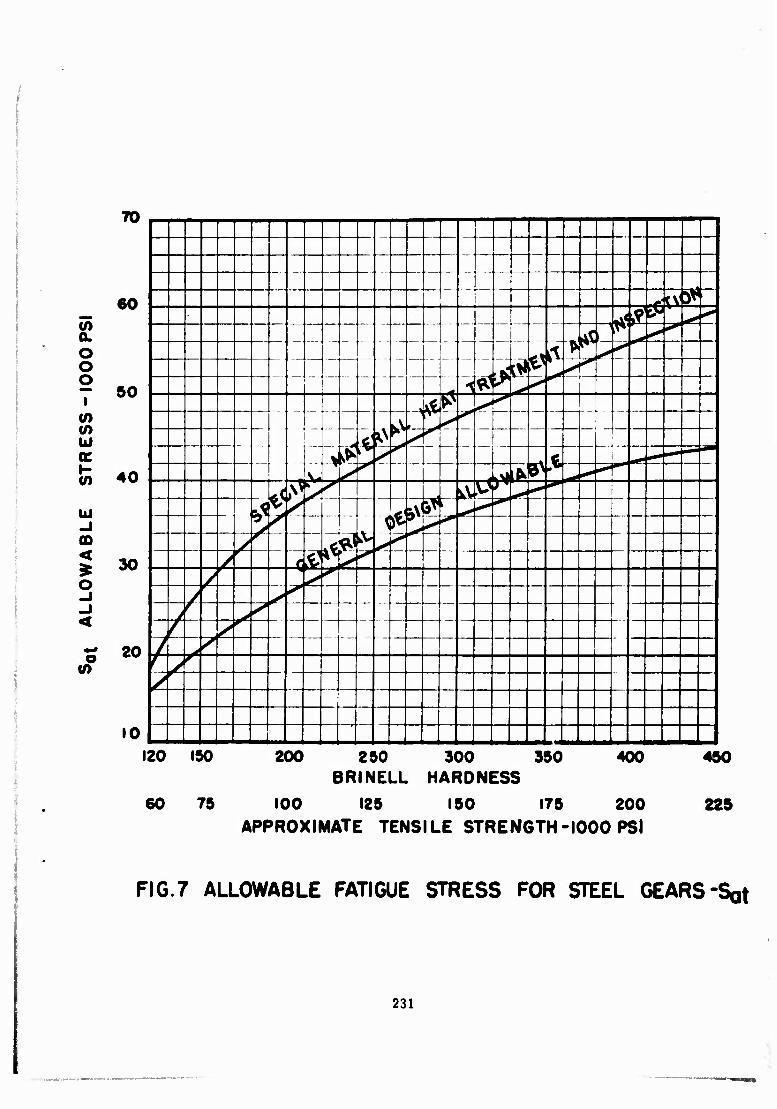
fV
— - — — —
60 -,^li™
j i
^ ^3PZ^ £ — —
\ K4C ^^^
O „^^^^ IT o — >L>^ IT
- 50 l 00
■it'' w UJ K — ^ c. ' -- —-",-i" in 40 ^L^' ^^ W) '^»^
>
* />
G
-- f i- *** UJ $$ jf ̂
-1 * ^ ■-
ffi /
r .
2 30 / at "^ /
s S
-i /
^ -i > s ^
/ s' — — —_ — 20 / ,'
s o tw
(0 f / /
10 120 ISO
60 79
200 400 250 500 550 BRINELL HARDNESS
100 125 150 175 200 APPROXIMATE TENSILE STRENGTH-1000 PSl
450
229
FIG.7 ALLOWABLE FATIGUE STRESS FOR STEEL GEARS-Sot
231
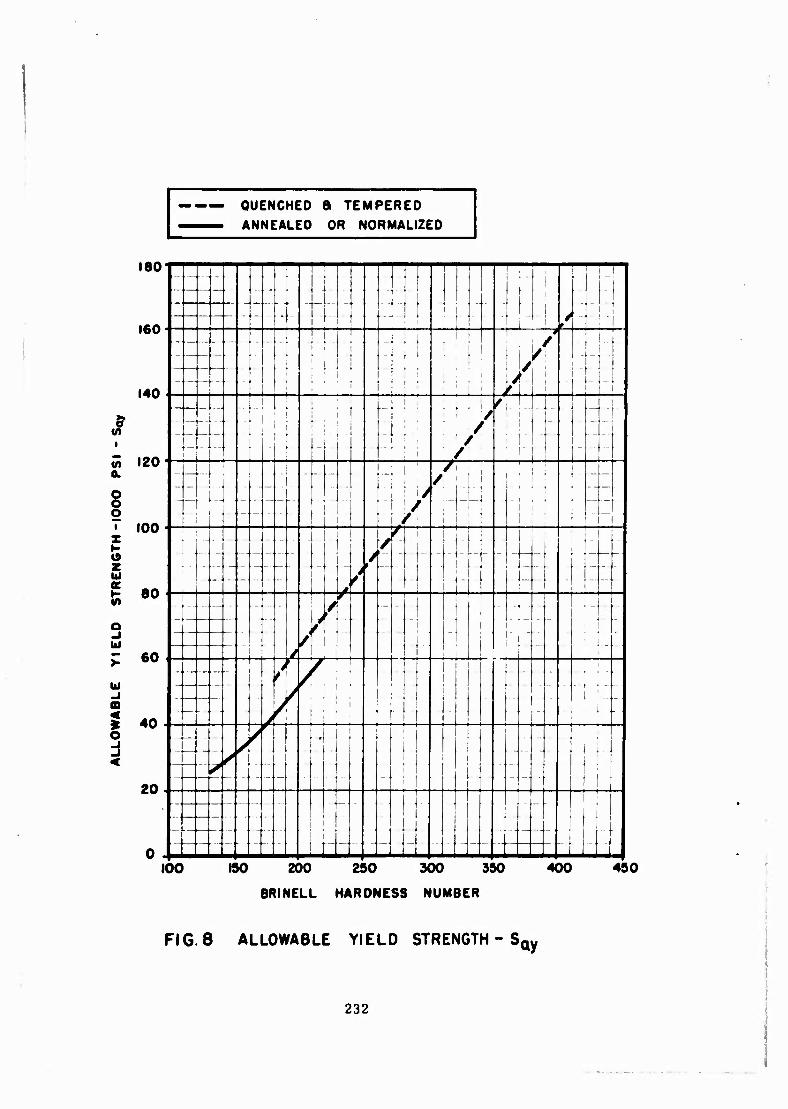
—.. QUENCHED a TEMPERED
—- ANNEALED OR NORMALIZED
(A Q.
8 O
z (9 Z Ui K
W
lü -I (D <
O
\ J . \
icn . ' Ml; 1 ' 1 .... ... ...MM / 1
. „. . i I : 1 M M > | - 1 no ! ■ MM! 1 /1 ; ' 0 .... . J 1 ; I. i ! ; M , 1 ^..La. -1
1 i /
:-:li ..._:. -:J : 1 ,/, .. .;! ■ i_ _ . . ...
100 . | /I 1 M 1 i — j - ■ \ /- \ i M , n ■ :.:i_-:::::; _ _^/l: - v :-:._: ::.:
nn 1 yl M BO ; \ f \
\ /. \ .... 60 1 L' 1 1 BO M / V ! j | — - ■■■ ' ;
40 ■ / '
20 " -—----■- -■ J ■ -- - ■ , |
■:=::M::.: - | -.- ||
0 1 1 100 ISO 200 290 300 390 400 490
BRINELL HARDNESS NUMBER
FIG. 8 ALLOWABLE YIELD STRENGTH - S ay
232
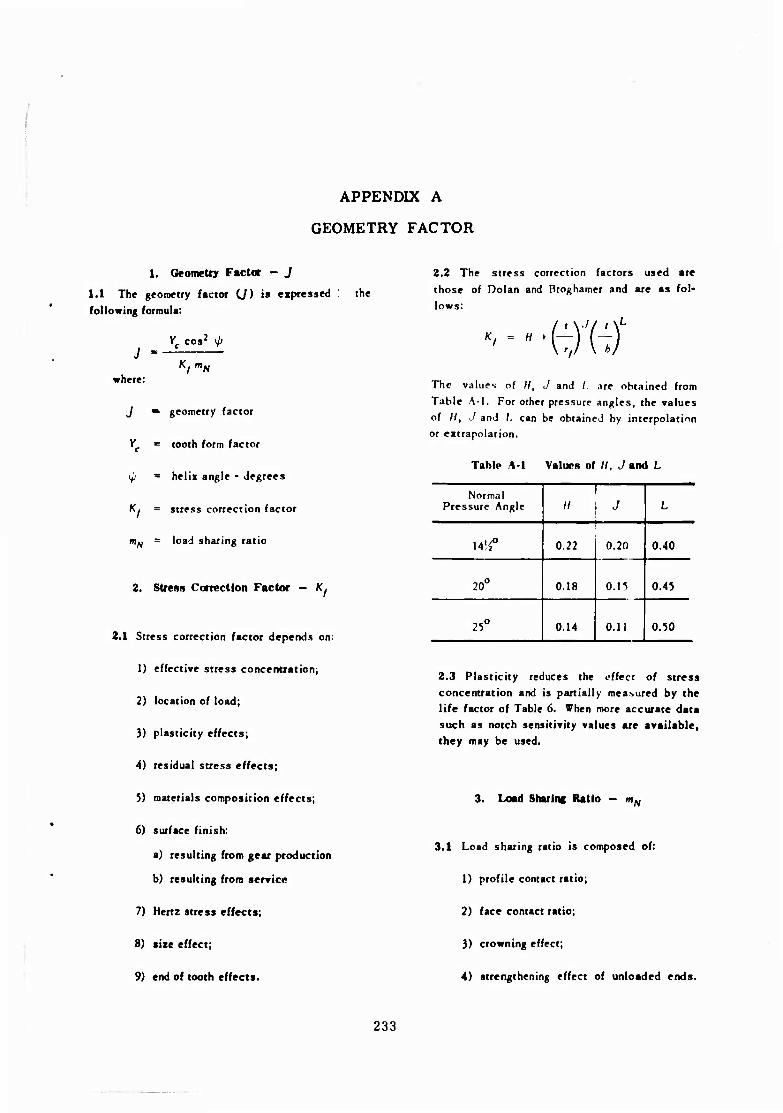
APPENDIX A
GEOMETRY FACTOR
1. Geometry Factor - J
1.1 The geometry factor (J) «s «pressed following formula:
the
J =
where:
V^ cos2 i//
J "• geometry factor
V. = tooth form factor
y/ = helii angle - degrees
K, = stress correction factor
mN = load sharing ratio
2. Stress Correction Factor - K/
2.1 Stress correction factor depends on:
1) effective stress concentration;
2) location of load;
3) plasticity effects;
4) residual stress effects;
5) materials composition effects;
6) surface finish:
a) resulting from gear production
b) resulting from service
7) Hertz stress effects;
8) size effect;
9) end of tooth effects.
2.2 The stress correction factors used are those of Dolan and ßroghamer and are as fol- lows: -m
The values of H, J and /. are obtained from Table A-l, For other pressure angles, the values of //, J and /. can be obtained by interpolation or extrapolation.
Table A-l Values of «, J and L
Normal Pressure Angle
! // J L
14^° 0.22 0.20 0.40
20° 0.18 0.15 0.45
2-5° 0.14 0.11 0.50
2.3 Plasticity reduces the effect of stress concentration and is partially measured by the life factor of Table 6. When more accurate data such as notch sensitivity values are available, they may be used.
3. Load Sharlnc Ratio - mN
3.1 Load sharing ratio is composed of:
1) profile contact ratio;
2) face contact ratio;
3) crowning effect;
4) strengthening effect of unloaded ends.
233

APPENDIX A
3.2 The load sharing ratio for helical and herringbone gears is:
F
L
For a conserracive estimate L can be taken as LmiH. For most helical gears having a face
L . contact ratio of 2 or more, mll exceeds 0.93 and
where:
PN
Z
F
L
»vt
mN PN
0.95 Z
normal base pitch
■ length of action in transverse plane*inches
■■ net face width, inches
~' length of lines of contact for worst condition — inches
^mim ~ ■"■»■■"um contact length — inches
L ■■ maiimum contact length — inches
"mi*
•ft
This value may also be used for internal gears.
For pinions the worst condition of oblique loading at the edge of the tooth occurs with maximum length of contact.
tooth profile in the normal plane at a scale of one diametral pitch (Pnjh The tooth layout is made for the equivalent number of teeth. The form factor ia calculated as follows:
Y = 1
cos 4>L,
cos 4>n
/ U tan 4>Ln\
S. Tooth Profile Layout Inforimtlon
9.1 Nomenclature of the form factor formula and Figure A-l are as follows:
dßi " equivalent root diameter for equiva- lent number of teeth, inches
dtr = equivalent base diameter for equivalent number of teeth, inches
de = equivalent pitch diameter for equivalent number of teeth, inches
dot "■ equivalent outside diameter for equivalent number of teeth, inches
a <=■ generated addendum to one normal diametral pitch - inches
b m generated dedendum to one normal diametral pitch - inches
't'Ln ~ normal load pressure angle at tip of tooth
4. Tooth Form Factor - Yc
4.1 Yc is determined for tip loading as shown in Figure A-l using the generated layout of the
4>n ~ tooth normal pressure angle
line at = normal load line, tangent to equiva-
lent base circle.
234
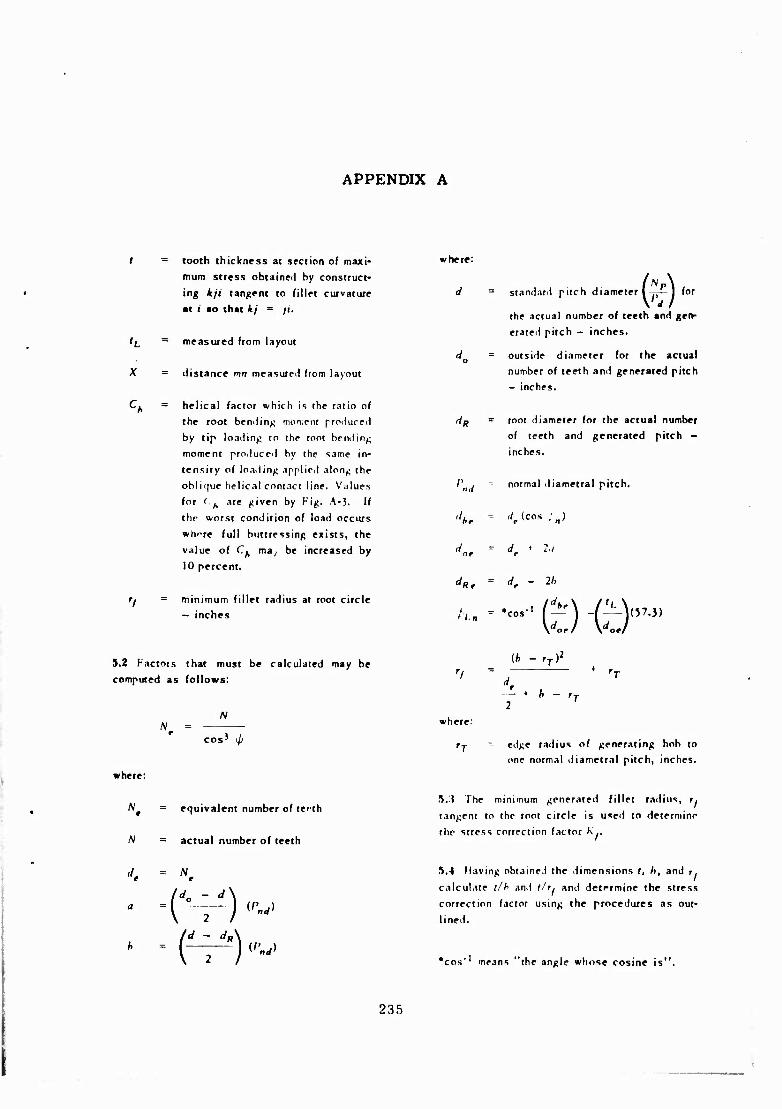
APPENDIX A
t = tooth thickness at section of maxi-
mum stress obtained by construct-
ing kfi tangent to fillet curvature
at i «o that kf = ft.
'L = measured from layout
X = distance mn measured from layout
Cj, = helical factor which is the ratio of
the root bending moment produced
by tip loading to the root bending
moment produced by the same in-
tensity of loading applied along the
oblit|iie helical contact line. Values
for (.^ are given by Fig. A-3. If
the worst condition of load occurs
whTe full buttressing exists, the
value of Cf, ma, be increased by
10 percent.
fi = minimum fillet radius at root circle
— inches
5.2 Factors that must be calculated may be
computed as follows:
N = N
cos' >p
where:
N t
N
= equivalent number of terth
= actual number of teeth
= N
'd„ - d
where:
d
•ul
dRr
h.n
'I
vhere:
rr
standard pitch diameter fe)
for
the actual number of teeth and geo-
erated pitch - inches.
outside diameter for the actual
number of teeth and generated pitch
- inches.
root diameter for the actual number
of teeth and generated pitch -
inches.
normal diametral pitch,
./„(cos ,•„)
dt * 2.1
(b - rT)2
- + h - r1
4 'T
edge radius of generating hob to
one normal diametral pitch, inches.
VJ The minimum generated fillet radius, r,
tangent to the root circle is used to deierminr
the stress correction factor K, v-
5.4 having obtained the dimensions t, h, and r.
calculate //A ami t/r, and determine the stress
correction factor using the procedures as out-
lined.
'cos means "the angle whose cosine is".
235
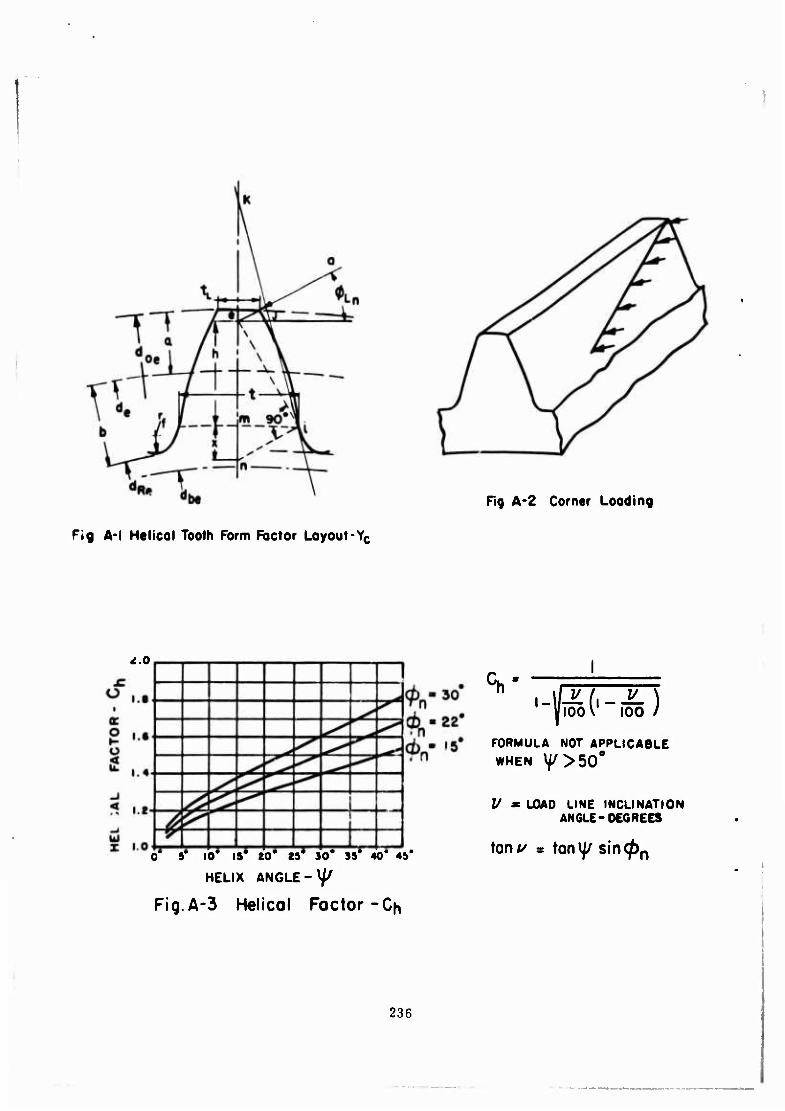
Fig A-2 Corner Loading
Fig A-l Helical Tooth Form Factor Layout-Yc
4.0
o $' 10* IS* 10* 25* 50* 3S* 40* 45*
HELIX ANGLE-y/
Flg.A-3 Helical Factor-Ch
V Vioov 100 /
FORMULA NOT APPLICABLE WHEN l//>50O
1/ * LOAD LINE INCLINATION ANGLE-DEGREES
ton// = tony/ sin^>n
236
DISTRIBUTION
US Army Materiel Command 6 US Army Aviation Materiel Command 5 United States Army, Pacific 1 US Army Forces Southern Command 1 Chief of R&D, DA 2 US Army R&D Group (Europe) 2 US Army Aviation Materiel Laboratories 33 US Army Ballistic Research Laboratories 2 Army Aeronautical Research Laboratory, Ames Research Center 1 US Army Test and Evaluation Command 1 US Army Connbat Developments Command, Fort Belvoir 2 US Army Combat Developments Command Experimentation
Command 1 US Army Combat Developments Command Transportation
Agency 1 US Army Transportation School 1 US Army Aviation School 1 Assistant Chief of Staff for Force Development 1 US Army Tank-Automotive Command 2 US Army Aviation Test Board 2 US Army Aviation Test Activity, Edwards AFB 2 Air Force Flight Test Center, Edwards AFB 2 US Army Field Office, AFSC, Andrews AFB 1 Air Force Aero Propulsion Laboratory, Wright-Patterson AFB 1 Air Force Materials Laboratory, Wright-Patterson AFB 2 Air Force Flight Dynamics Lavoratory, Wright-Patterson AFB 1 Systems Engineering Group, Wright-Patterson AFB 2 Naval Air Systems Command, DN 15 Office of Naval Research 2 Commandant of the Marine Corps 1 Marine Corps Liaison Officer, US Army Transportation School 1 Lewis Research Center, NASA 1 Ames Research Center, NASA 2 NASA Scientific and Technical Information Facility 2 NAFEC Library (FAA) 2 US Army Board for Aviation Accident Research 1 Bureau of Aviation Safety, National Transportation Safety Board 2 US Naval Aviation Safety Center, Norfolk 1 US Naval Air Station, Norfolk 1 Federal Aviaticn Administration, Washington DC 2 US Government Printing Office ] Defense Documentation Center 20 United States Army, Hawaii 1
237
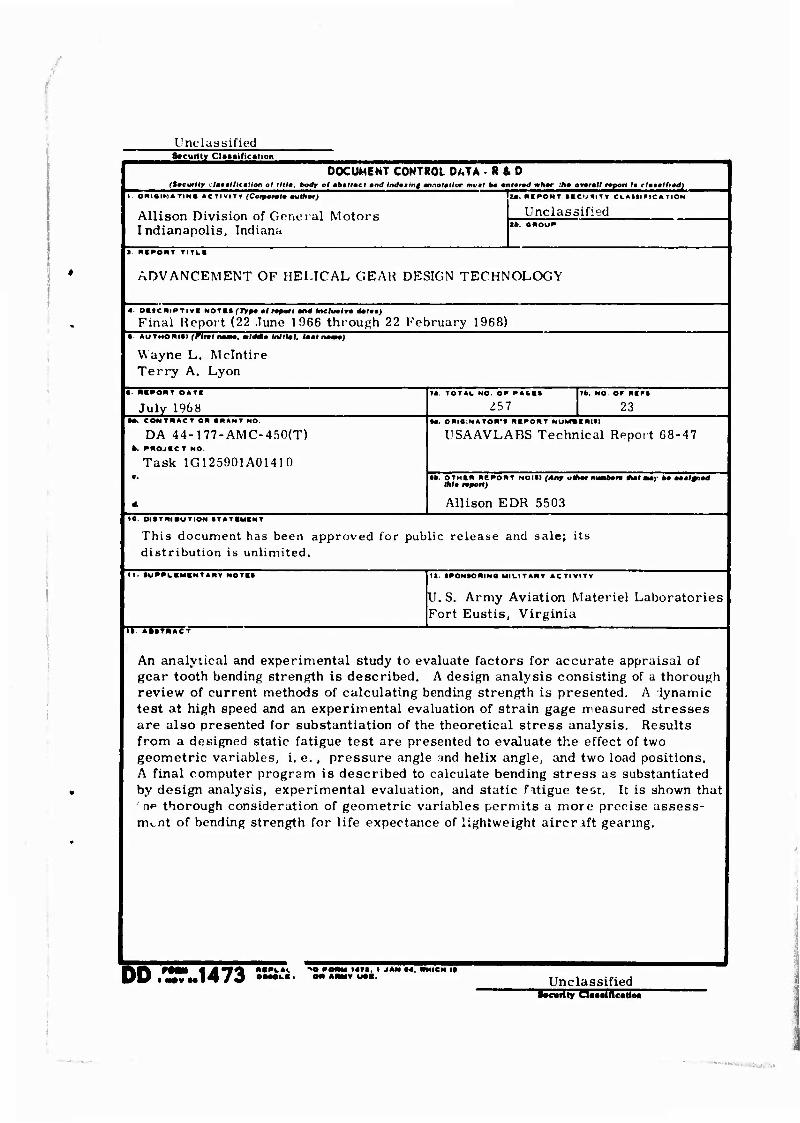
«
Unclassified 8»curtty CU«iific»lion
DOCUMENT CONTROL D/.TA -R&D (Smcurlty clm»atUca*toti of 11119, body ol mb»ltmct and indmrninj mnotmtlor mvt b* mnlmrmd whT :hm ovmrall report la (tmaalltmd)
OMieiM*TiN8 AcTiviry fCorporaM autfior;
Allison Division of General Motors Indianapolis, Indiana
U. KCPONT *CC'J4ITV CLAISIOICATION
Unclassified lb. GROUP
I RtPOHT TITLI
ADVANCEMENT OF HELICAL GEAR DESIGN TECHNOLOGY
4. OCICNiPTiv« MOTt* (T*pa el rapotl ltd Inclualr* dmlaa)
Final Report (22 June 1966 through 22 February 1968) • «uTHOnctl (Flnlnmmm, mld*a Mll»l, Imtl n»mm)
Wayne L. Mclntire Terry A. Lyon
• - mtmomr O*TI
July 1968 M. CONTRACT OR (RANT MO
DA 44-177-AMC-450(T) b. PROJICT MO.
Task 1G125901A01410
lb. TOTAL MO. OP PA6I1
Z57 Tfe. NO OF RIFI
23
USAAVLABS Technical Report 68-47
•6. OTHIN REPORT HOitt (Anr am—numi thlt nport)
Allison EDR 5503
ib»ra tfMff AM}- bm maalgnad
10. OKTRiauTION ITATIMIMT
This document has been approved for public release and sale; its distribution is unlimited.
U. )POMtORINa MILITARY ACTIVITY
U. S. Army Aviation Materiel Laboratories Fort Eustis, Virginia
II. ABSTRACT
An analytical and experimental study to evaluate factors for accurate appraisal of gear tooth bending strength is described. A design analysis consisting of a thorough review of current methods of calculating bending strength is presented. A iynamic test at high speed and an experimental evaluation of strain gage measured stresses are also presented for substantiation of the theoretical stress analysis. Results from a designed static fatigue test are presented to evaluate the effect of two geometric variables, i. e. , pressure angle and helix angle, and two load positions. A final computer program is described to calculate bending stress as substantiated by design analysis, experimental evaluation, and static fatigue test. It is shown that ne thorough consideration of geometric variables permits a more precise assess-
ment of bending strength for life expectance of lightweight aircraft gearing.
k »MM 4 Mfi »IPLA« to POM« KM. I JAM »A. DU •«•«••14/3 ••••'•• • •« •"-* «•■ Unclassified
■•curlty CUsdflcallM
"*-"-•'-
Unclassified Security Claiiidcalion
KEY WOROl
Helical Gear Teeth Bending Strength Rending Stress Dynamic Factor Endurance Limit Calculation Method Material Strer h Speed Factor
Unclassifu Security CUtilflcatlon