3D Mineral Map of Australia
38
3D Mineral Map of Australia Tom Cudahy, Mike Caccetta, Joanne Chia, Ryan Fraser, Klaus Gessner, Maarten Haest, Ian Lau, Carsten Laukamp, Cindy Ong, and Andrew Rodger WA Centre of Excellence for 3D Mineral Mapping CSIRO, Australian Resources Research Centre Kensington, WA, Australia
Transcript of 3D Mineral Map of Australia

3D Mineral Map of Australia
Tom Cudahy, Mike Caccetta, Joanne Chia, Ryan Fraser, Klaus Gessner, Maarten Haest, Ian Lau, Carsten Laukamp, Cindy Ong, and Andrew Rodger
WA Centre of Excellence for 3D Mineral MappingCSIRO, Australian Resources Research CentreKensington, WA, Australia

7ISDE, Perth August 2011
….are fundamental to all rocks and soils and is a key parameter to managing a sustainable Earth
minerals
Image source: www.mrfs.net

7ISDE, Perth August 2011
Mineralogy valuable for?
• Soil characterisation• Productive vertosols (related to smectite clays)• Acid and saline conditions
• Ground cover • Mobile <2 micron fraction (mainly clays) – dust and soil loss
management• Water catchment modelling
• Surface permeability (clay mineralogy)• Mineral and energy exploration
• Mineral/chemical vectors• Resource environmental management
• Baseline mapping, monitoring and closure criteria
But mineralogy is not listed in any current GEO task

7ISDE, Perth August 2011
Hematite : OMEGA
Anhydrous nanophase iron oxide
Ca-pyroxene : TESCa-pyroxene : OMEGA
Mars mineralogy
Polar orbiting hyperspectral sensors• OMEGA (ESA) • TES (USA)• CRISM (USA)
Hydrous clay minerals
OMEGA
There are complete mineral maps of Mars

7ISDE, Perth August 2011
Earth’s mineralogy?
Investment to date on sensor’s like:• Landsat MSS/TM• SPOT• MODIS• High spatial VNIR
There is no mineral map of the Earth
Designed to map green vegetation, not dry vegetation or minerals
The only “geoscience-tuned” satellite that provides global coverage is ASTER

7ISDE, Perth August 2011
• 2020 vision: a public, web-accessible, measured, traceable, 3D mineral map of Australia
• based on drill core logging, airborne and satellite “geoscience-tuned” data.
• CSIRO, government geosurveys, AuScope, iVEC, industry, overseas space agencies, partners, WA Dept Commerce, CSIRO, Centre for Exploration Targeting
• part of NPIEhttp://c3dmm.csiro.au

7ISDE, Perth August 2011
The challenges
• coordination of geoscience EO community • data access (national/international partnerships)
• global science-coordinated hyperspectral satellite systems
• data volumes (Terabytes+)• instrument/data calibration (wavelength, detector
linearity, radiometric, geometric)• removal of obscuring “background” effects:
• atmosphere, vegetation, BRDF, moisture• not-dependent on scene statistics
• geoscience products that are validated, traceable (including error analysis)
• geoscience product sharing standards (interoperability)
• metadata• efficient information access (web) system for users of
the data
Melbourne

7ISDE, Perth August 2011
Composition, wavelength and spectral resolution
-12
13.5
39
64.5
90
115.5
0.35 0.85 1.35 1.85 2.35-12
13.5
39
64.5
90
115.5
7.35 8.35 9.35 10.35 11.35 12.35
Electro-Magnetic Spectrum - Wavelength in Micrometer
Gro
und
Ref
lect
ance
(of
fset
for c
larit
y)
Gro
und
Emis
sivi
ty (
offs
et fo
r cla
rity)
dark soil
green vegetation
green vegetation
dark soil
limestone
limestone
sandstone
sandstone
dry vegetationdry vegetation
ARGUSHymapAsterLandsat TM
From Peter Hausknecht
VNIR
iron oxidesREEs
vegetationSWIR
OH-bearing hydroxyls(kaolin, chlorite, mica, amphibole)
sulphatescarbonates
TIR
Non-OH-bearing silicates(quartz, feldspars, pyroxene, garnet)
sulphatescarbonates
-12
13.5
39
64.5
90
115.5
0.35 0.85 1.35 1.85 2.35-12
13.5
39
64.5
90
115.5
7.35 8.35 9.35 10.35 11.35 12.35
Electro-Magnetic Spectrum - Wavelength in Micrometer
Gro
und
Ref
lect
ance
(of
fset
for c
larit
y)
Gro
und
Emis
sivi
ty (
offs
et fo
r cla
rity)
dark soil
green vegetation
green vegetation
dark soil
limestone
limestone
sandstone
sandstone
dry vegetationdry vegetation
ARGUSHymapAsterLandsat TM
Sensors
0.45
0.65
0.85
1.05
1.25
1.45
1.65
1.9 2.1 2.3 2.5
Wavelength (micrometer) =>
Laboratory
ARGUS / AVIRIS
HYMAP
ASTER
Landsat TM
Spectral Resolution
“multispectral”1-10 bands
“hyperspectral”~100 bands

7ISDE, Perth August 2011
Broken Hill
Redan
Byjerkerno2002
Broken HillBlock
HyMapsurvey
40 flight lines at 3.5 m pixels
http://img135.imageshack.us/i/rfdsduststormri2.jpg/ Dust source
MODIS (simulated) vs HyMap land surface composition mapping, Broken Hill
• 150 Gigabytes of airborne HS data collected in 2002 for GSNSW• L1b and L2 products made publicly available but only 1-2 copies downloaded• C3DMM processed to L3 mineral maps in 2009• together with other C3DMM data, over 60,000 products downloaded

7ISDE, Perth August 2011
Green vegetation content – leaf water @ 940 nm
GIS airborne mineral maps from http://c3dmm.csiro.au
Albedo @ 1650 nm
40 flight-lines
HyMap land surface composition mapping, Broken Hill

7ISDE, Perth August 2011
cellulose absorption depth @ 2080 nm
GIS airborne mineral maps from http://c3dmm.csiro.au
Albedo @ 1650 nm
HyMap land surface composition mapping, Broken Hill

7ISDE, Perth August 2011
Water vapour @930 nm
GIS airborne mineral maps from http://c3dmm.csiro.au
Surface water absorption depth @ 1900 nm
dry
wet
HyMap land surface composition mapping, Broken Hill
Precipitable water

7ISDE, Perth August 2011
MODIS simulation –dry vegetation (NPV) versus “DRY” bare soils
Canonical correlation analysis
Ban
d N
o.
Results show that these “extreme” surface types (pure dry vegetation and bare soil) show weak inverse correlation VNIR wavelengths and weak positive correlation at SWIR wavelength at MODIS spectral resolution
30 airborne hyperspectral pixel spectra collected from cellulose rich and cellulose-poor “dry, bare soil” pixels
Sample - pixel
positive correlationinverse correlation no correlation
Ban
d N
o.

7ISDE, Perth August 2011
MODIS simulation –dry vegetation (NPV) versus “WET” bare soils
Canonical correlation analysis
Ban
d N
o.
Sample - pixel
Results show that the relatively “wet, bare soil” pixels show positive correlation at all VNIR-SWIR wavelengths at MODIS spectral resolution.
30 airborne hyperspectral pixel spectra collected from cellulose rich and cellulose-poor “wet, bare soil” pixels
positive correlationinverse correlation no correlation

7ISDE, Perth August 2011
False colourDry vegetation (cellulose) content
Rodger and Cudahy (2009). Remote Sensing of Environment 113, 2243-2257
Paddock boundary
HyMap clay mapping, Broken Hill
cellulose map

7ISDE, Perth August 2011
False colourApparent kaolin content (exposed soil)
Rodger and Cudahy (2009). Remote Sensing of Environment 113, 2243-2257
HyMap clay mapping, Broken Hill
cellulose map

7ISDE, Perth August 2011
False colourKaolin content vegetation unmixed (as if there was zero groundcover)
Rodger and Cudahy (2009). Remote Sensing of Environment 113, 2243-2257
~40%content
~10%
HyMap clay mapping, Broken Hill
cellulose map

7ISDE, Perth August 2011
Cloud shadow effect
DEM
Tenosols“weakly developed soils”
Sodosols“Na-rich”
Chromosols“Hard clay-rich”
ASRIS Soil Map Level 3
Published soils and DEM, Broken Hill

7ISDE, Perth August 2011
Kaolin content Montmorillonite content
~40%content
~10%
Potential Vertosols?
40 flight-lines
~40%content
~10%
HyMap clay mapping, Broken Hill

7ISDE, Perth August 2011
ASTER Geoscience map of Australia
ASTER scene centreHyperion sceneHyMap surveys (WA)base-map - DEM (GADDS)
y = 0.679x + 966.45R2 = 0.8768
0
1000
2000
3000
4000
5000
6000
0 1000 2000 3000 4000 5000 6000 7000
Hyperion ASTER-convolved band 4
AST
ER b
and
4

7ISDE, Perth August 2011
ASTER Geoscience products
• False colour• Green vegetation content• CSIRO “regolith” ratios• Ferric oxide content• Ferrous iron content• Opaques• AlOH group (clay) content
• AlOH group composition • Kaolin and “Advanced argillic”• Fe-OH group content• MgOH/carbonate group• MgOH group composition• Ferrous iron content in MgOH• Ferric iron content in MgOH• “Water content” (new)
• A set of ~15 GIS compatible geoscience maps derived from available ASTER *VNIR-SWIR* data over WA. Products include:
TIR products (no current independent calibration data):• carbonate content• SiO2 content• quartz index• mafic mineral index (incl. pyroxene, garnet)

7ISDE, Perth August 2011
http://c3dmm2.ivec.org/gmap.html

7ISDE, Perth August 2011
WA ASTER Geoscience map – iron oxide content

7ISDE, Perth August 2011
WA ASTER Geoscience map
• Collaborative project with the Geological Survey of Western Australia and supported by the Exploration Incentive Scheme and MDU• Complete 10 year archive over Australia of over 30,000 scenes provided by NASA-JPL, ERDAC (Japan) and the USGS• WA ASTER map comprises ~1500 scenes • ~15 products (Version 1) released in the next couple of weeks • Basis for C3DMM’s “Google-zoom” demonstration
iron oxide5 40

7ISDE, Perth August 2011
WA ASTER Geoscience map
iron oxide5 40
Channel iron ore

7ISDE, Perth August 2011
Airborne hyperspectral mineral maps
airborne HS iron oxide content
iron oxide5 40
airborne HS kaolin disorder
crysallinitylow high
Channel iron ore

7ISDE, Perth August 2011
: RC cores with XRF: RC cores with XRF + HyLogging
Published geology, drilling and the 3rd dimension
In collaboration with Murchison Metals
7ISDE, Perth August 2011
Iron oxide content – spectra & XRF
In collaboration with Murchison Metals
7ISDE, Perth August 2011
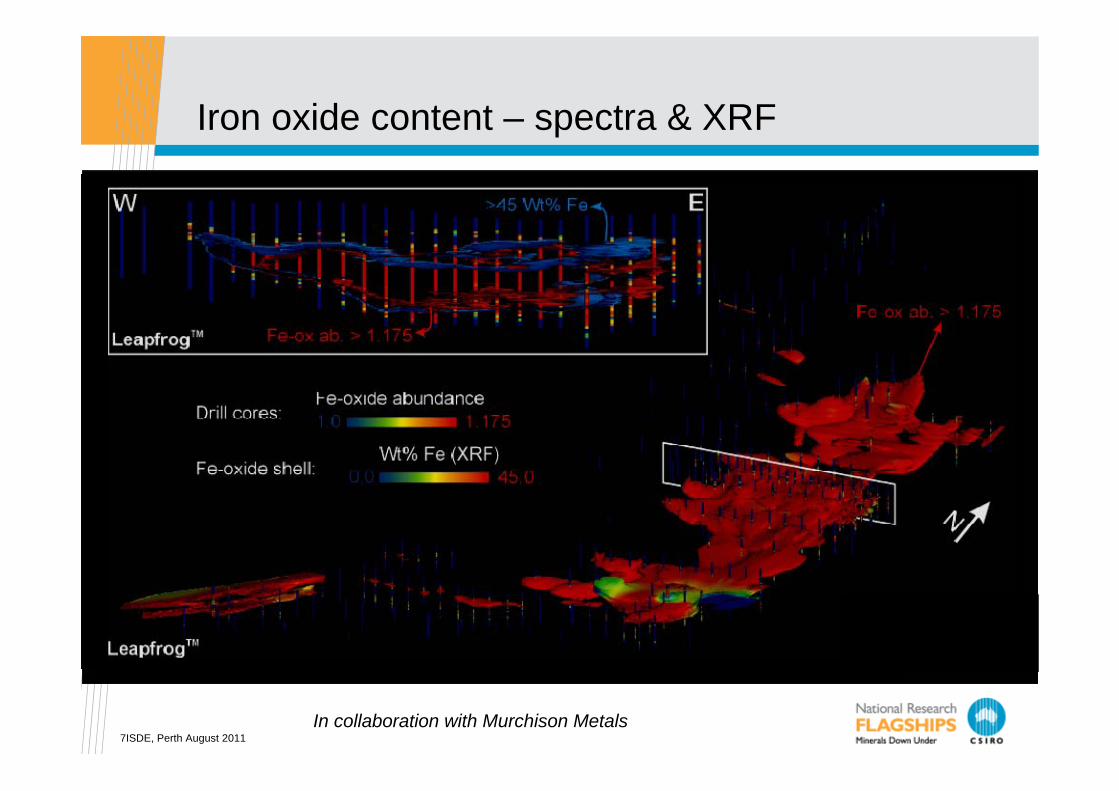
Clay composition – spectra & XRD
In collaboration with Murchison Metals

Oblique view SW


Poorly-ordered kaolinite (transported)
Well-ordered kaolinite (in-situ or below water table)
Clay composition characterisation

Poorly-ordered kaolinite (transported)
Well-ordered kaolinite (in-situ or below water table)

Poorly-ordered kaolinite (transported)
Well-ordered kaolinite (in-situ or below water table)

7ISDE, Perth August 201135
Auscope- Grid Discovery Portalhttp://portal.auscope.org/gmap.html
C3DMM

7ISDE, Perth August 2011
Conclusions
• New generation of geoscience-tuned systems can provide currently missing information on land surface composition (including mineralogy, dry vegetation and surface soil moisture)
• Methods for generating the ASTER geoscience map of Australia can be extended globally
• A suite of hyperspectral imaging satellites come on-stream from ~2015 and provide opportunity for accurate mapping and monitoring of the Earth’s land surface composition
• C3DMM is building capabilities to delver a 3D mineral map of Australia by 2020

7ISDE, Perth August 2011
Acknowledgments
• CSIRO Minerals Down Under• Geoscience Australia• Geological Survey of Western Australia• WA Exploration Incentive Scheme• WA Department of Commerce• Geological Survey of Queensland• Geological Survey of Western Australia• Murchison Metals• Auscope• iVEC• ERSDAC• NASA JPL• USGS

Thank you
Contact UsPhone: 1300 363 400 or +61 3 9545 2176Email: [email protected] Web: www.csiro.au
Dr Tom CudahyCSIRO Earth Science and Resource EngineeringDirector Western Australian CoE for 3D Mineral MappingChair International Society for Photogrammetry & Remote Sensing
Work Group VIII/5, Energy and Solid EarthTheme Leader 34IGC, Geoscience information from Proximal
and Remote Sensing Data
Phone: +61 8 6436 8630Email: [email protected]: http://c3dmm.csiro.au, http://nvcl.csiro.au, www.34igc.org, www.isprs2012.org,
http://c3dmm2.ivec.org/gmap.html, http://portal.auscope.org/gmap.html