2021 Preliminary Information Statement - SECURITIES AND ...
225
9/13/21, 11:25 PM EDGE Submission System https://edgesubmit.pse.com.ph/main.html 1/2 Yes No SECURITIES AND EXCHANGE COMMISSION SEC FORM 20-IS INFORMATION STATEMENT PURSUANT TO SECTION 17.1(b) OF THE SECURITIES REGULATION CODE 1. Check the appropriate box: Preliminary Information Statement Definitive Information Statement 2. Name of Registrant as specified in its charter FAR EASTERN UNIVERSITY, INC. 3. Province, country or other jurisdiction of incorporation or organization Philippines 4. SEC Identification Number PW538 5. BIR Tax Identification Code 000225442 6. Address of principal office Nicanor Reyes Street, Sampaloc, Manila Postal Code 1015 7. Registrant's telephone number, including area code 02-8735-8686 8. Date, time and place of the meeting of security holders October 16, 2021; 3:00PM; To be conducted virtually via Zoom meeting. Reference: https://www.feu.edu.ph/asm2021 9. Approximate date on which the Information Statement is first to be sent or given to security holders Sep 24, 2021 10. In case of Proxy Solicitations: Name of Person Filing the Statement/Solicitor - Address and Telephone No. - 11. Securities registered pursuant to Sections 8 and 12 of the Code or Sections 4 and 8 of the RSA (information on number of shares and amount of debt is applicable only to corporate registrants): Title of Each Class Number of Shares of Common Stock Outstanding and Amount of Debt Outstanding COMMON 24,055,763 13. Are any or all of registrant's securities listed on a Stock Exchange?
-
Upload
khangminh22 -
Category
Documents
-
view
2 -
download
0
Transcript of 2021 Preliminary Information Statement - SECURITIES AND ...

9/13/21, 11:25 PM EDGE Submission System
https://edgesubmit.pse.com.ph/main.html 1/2
Yes No
SECURITIES AND EXCHANGE COMMISSIONSEC FORM 20-IS
INFORMATION STATEMENT PURSUANT TO SECTION 17.1(b) OF THE SECURITIES REGULATION CODE
1. Check the appropriate box: Preliminary Information Statement Definitive Information Statement
2. Name of Registrant as specified in its charterFAR EASTERN UNIVERSITY, INC.
3. Province, country or other jurisdiction of incorporation or organizationPhilippines
4. SEC Identification NumberPW538
5. BIR Tax Identification Code000225442
6. Address of principal officeNicanor Reyes Street, Sampaloc, ManilaPostal Code 1015
7. Registrant's telephone number, including area code02-8735-8686
8. Date, time and place of the meeting of security holdersOctober 16, 2021; 3:00PM; To be conducted virtually via Zoom meeting. Reference:https://www.feu.edu.ph/asm2021
9. Approximate date on which the Information Statement is first to be sent or given to security holdersSep 24, 2021
10. In case of Proxy Solicitations:
Name of Person Filing the Statement/Solicitor-
Address and Telephone No.-
11. Securities registered pursuant to Sections 8 and 12 of the Code or Sections 4 and 8 of the RSA(information on number of shares and amount of debt is applicable only to corporate registrants):
Title of Each Class Number of Shares of Common Stock Outstanding and Amount of Debt OutstandingCOMMON 24,055,763
13. Are any or all of registrant's securities listed on a Stock Exchange?
9/13/21, 11:25 PM EDGE Submission System
https://edgesubmit.pse.com.ph/main.html 2/2
If yes, state the name of such stock exchange and the classes of securities listed therein:Philippine Stock Exchange, Inc.
The Exchange does not warrant and holds no responsibility for the veracity of the facts and representations contained in all corporatedisclosures, including financial reports. All data contained herein are prepared and submitted by the disclosing party to the Exchange,and are disseminated solely for purposes of information. Any questions on the data contained herein should be addressed directly tothe Corporate Information Officer of the disclosing party.
Far Eastern University, IncorporatedFEU
PSE Disclosure Form 17-5 - Information Statement for Annual or Special Stockholders' Meeting References: SRC Rule 20 and
Section 17.10 of the Revised Disclosure Rules
Date of Stockholders'Meeting Oct 16, 2021
Type (Annual orSpecial) Annual
Time 3:00 PMVenue To be conducted virtually via Zoom meeting. Reference: https://www.feu.edu.ph/asm2021Record Date Sep 27, 2021
Inclusive Dates of Closing of Stock Transfer Books
Start Date Sep 27, 2021End date Oct 16, 2021
Other Relevant Information
-

P W 0 0 0 0 0 5 3 8
F A R E A S T E R N U N I V E R S I T Y ,
I N C O R P O R A T E D
N I C A N O R R E Y E S S T R E E T
S A M P A L O C , M A N I L A
0 5 3 1 Preliminary Information Statement 1 0 1 6
-----------------------------------------------------------------------------------------------------------------------
Remarks = pls. use black ink for scanning purposes
To be accomplished by SEC Personel concerned
Dicument I. D. Cashier
S T A M P S
File Number L C U
Total Number of Barrowings1,509
Total No. of Stockholders Domestic Foreign
Calandar year Annual Meeting
Secondary License Type, If Applicable
Dept. Requiring this Doc. Amended articles Number/Section
Contact Person Company Telephone Number
Month Day FORM TYPE Month Day
SEC Form 20-IS
COVER SHEET
S.E.C. Registration Number
(Company's Full Name)
( Bussiness Address : No. Street City / Town / Province )
Atty. Anthony Raymond A. Goquingco 8 735-8686


SEC FORM 20-IS
Information Statement Pursuant to Section 20 of the Securities Regulation Code
1. Check the Appropriate Box: [ X ] Preliminary Information Statement [ ] Definitive Information Statement 2. Name of Registrant as specified in its charter: Far Eastern University, Inc.
3. Province, country or other : Manila, Philippines
jurisdiction of incorporation or organization 4. SEC Identification Number : 538
5. BIR Tax Identification Code : 000-225-442 6. Address of Principal Office : Nicanor Reyes Street, Sampaloc, Manila
Postal Code : 1015
7 Registrant's Telephone Number including area code : (632) 8 849-4000
8. Date, time and place of meeting : 16 October 2021 of security holders 3:00 p.m. Online via Zoom
https://us06web.zoom.us/j/82162450142? 9. Approximate date on which the Information Statement is first sent to the security holders: 27 September 2021
10. Securities registered pursuant to Sections 8 and 12 of the Code: Title of Each Class : Common
Authorized Capital Stock : ₱5,000,000,000.00
Shares outstanding : 24,055,763 11. Are any or all of registrant's securities listed on a Stock Exchange? All common shares of stocks are listed with the Philippine Stock Exchange, Inc.

PART I
INFORMATION REQUIRED IN INFORMATION STATEMENT
A. GENERAL INFORMATION
Item 1: Date, Time and Place of Meeting of Security Holders and Mailing Address:
a. Date: 16 October 2021 Time: 3:00 P.M. Place: Online via Zoom https://us06web.zoom.us/j/82162450142?
Registrant’s Mailing Address: Far Eastern University Nicanor Reyes Street Sampaloc, Manila 1015
b. The approximate date when the Information Statement and the form of Proxy shall first be sent or given to security holders is on 27 September 2021.
Item 2: Dissenter's Right of Appraisal
There are no matters or proposed corporate actions included in the Agenda of the Meeting which may give rise to a possible exercise by security holders of their appraisal rights. Generally, however, in the instances mentioned by the Revised Corporation Code of the Philippines, the stockholders of the corporation have the right of appraisal provided that the procedures and the requirements of Title X governing the exercise of the right is complied with and/or followed.
Item 3: Interest of Certain Persons in or Opposition to Matters to be Acted Upon
a. None of the members of the Board of Trustees or senior management have substantial interest in the matters to be acted upon other than election to office.
b. None of the members of the Board of Trustees have informed the Company in writing that he/she intends to oppose any action intended to be taken up at the Annual Stockholders’ meeting.
B. CONTROL AND COMPENSATION INFORMATION
Item 4: Voting Securities and Principal Holders Thereof
a. Class of Voting Securities:
Number of Shares Outstanding as of August 31, 2021 23,783,395 common shares (Local) 272,368 common shares (Foreign) 24,055,763 common shares (Total) Net of 37,331 Treasury Shares
Number of Votes Entitled: one (1) vote per share b. Record Date: All stockholders of record as of 27 September 2021 are entitled to notice and to vote at the Annual Stockholders’ Meeting.

- 2 -
c. Manner of Voting
A stockholder entitled to vote at the meeting shall have the right to vote in person or by proxy the number of shares of stock held in his name on the stock books of the Corporation, and said stockholder may vote such number of shares for as many persons as there are directors to be elected or he may cumulate said shares and give one candidate as many votes as the number of directors to be elected multiplied by the number of his shares shall equal, or he may distribute them on the same principle among as many candidates as he shall see fit.
d. Security Ownership of Certain Record and Beneficial Owners of more than 5% (as of 31 August 2021)
Title of Class Name and Address of Record Owner and
Relationship with Issuer
Name of Beneficial
Ownership and Relationship with Record Owner
Citizenship
Number of Shares
Percent of Holdings
Common Desrey, Incorporated1 10th Fl., Pacific Star Bldg. Cor. Makati & Gil Puyat Ave. Makati City
Stockholder
Desrey, Inc. Domestic corporation
1,924,956 8.00
Common Seyrel Investment and Realty Corporation2 10th Fl., Pacific Star Bldg. Cor. Makati & Gil Puyat Ave. Makati City
Stockholder
Seyrel Investment and Realty Corporation
Domestic
corporation 6,887,051 28.63
Common Sysmart Corporation3 10th Fl., L.V. Locsin Bldg. 6752 Ayala Cor. Makati Ave. Makati City
Stockholder
Sysmart Corporation
Domestic corporation
5,204,608 21.64
1Dr. Lourdes R. Montinola as President is authorized to vote for the shares of the Corporation.
2Ibid.
3Ms. Teresita T. Sy, Chairman of the Board

- 3 -
e. Security Ownership of Trustees and Management (as of 31 August 2021)
Title of Class Name of Beneficial
Owner/Position
Citizenship Shares
Owned
Nature of
Beneficial Ownership
Percent
of Class
Common Lourdes R. Montinola Chair Emeritus, Board of
Trustees
Filipino 11,627 D 0.04833
Common Aurelio R. Montinola III Chairman, Board of
Trustees
Filipino 458,165
6,656
D
I
1.90460
0.02767
Common Michael M. Alba
President and Trustee Filipino 1 I 0.00001
Common Angelina Palanca Jose (+)
Trustee Filipino 776,534
3,029
D
I
3.22806
0.01259
Common Antonio R. Montinola
Trustee Filipino 105,721 D 0.43948
Common Paulino Y. Tan Trustee
Filipino 1 I 0.00001
Common Edilberto C. de Jesus Independent Trustee
Filipino 329 D 0.00137
Common Sherisa P. Nuesa Independent Trustee
Filipino 2,219
262
D
I
0.00922
0.00109
Common Jose T. Sio
Independent Trustee Filipino 14 D 0.00006
Common Juan Miguel R. Montinola Chief Finance Officer and
Chief Risk Officer
Filipino 109,710
3,650
D
I
0.45607
0.01517
Common Rosanna E. Salcedo
Treasurer Filipino 734 D 0.00305
Common Glenn Z. Nagal Comptroller and
Compliance Officer
Filipino 256 D 0.00106
Common Gianna R. Montinola Senior Vice President for
Corporate Affairs
Filipino 106,033
7,314
D
I
0.44078
0.03040
Security Ownership of Trustees and Management as a Group Total Shares - 1,592,255 Percentage - 6.61902%

- 4 - f. Voting Trust Holders
The Registrant is not a party to any voting trust agreement. No security holder of the Registrant holds a voting trust or other similar agreements.
g. Changes in Control
There has been no recent change in the control of the Corporation.
Item 5: Trustees and Executive Officers
a. The following are the current trustees of the corporation:
Dr. Lourdes R. Montinola Mr. Aurelio R. Montinola III Dr. Michael M. Alba Ms. Angelina P. Jose (+)
Mr. Antonio R. Montinola Dr. Paulino Y. Tan Dr. Edilberto C. De Jesus (Independent Trustee) Ms. Sherisa P. Nuesa (Independent Trustee) Mr. Jose T. Sio (Independent Trustee)
Brief Background of Trustees and Executive Officers:
1. Lourdes R. Montinola, 93, Filipino: Chair Emeritus (August 2013 to present),
Chair (June 1989 to August 2013), Far Eastern University, Inc.
Other Corporate Affiliations: Chair, Board of Directors, FERN Realty Corporation; Chair and President, FEU Educational Foundation, Inc.; Chair Emeritus, Nicanor Reyes Educational Foundation, Inc.; Governor, Nicanor Reyes Memorial Foundation; Trustee, FEU-Dr. Nicanor Reyes Medical Foundation, Inc.; and Board Member, The English Speaking Union. She is also a Member of the Oriental Ceramic Society, and HABI: The Philippine Textile Council, Inc.
Dr. Montinola was Chairman of MEMORARE-Manila 1945 Foundation, Inc. until 2017. Dr. Montinola holds a Bachelor of Arts degree (cum laude) from Marymount College,
New York, U.S.A., and an M.A. in Cultural History from the Asean Graduate Institute of Arts. She completed the Management Development Program for College and University Administrators in the Institute for Educational Management, Graduate School of Education, Harvard University, U.S.A. She obtained her Ph.D. in English: Creative Writing from the University of the Philippines.
2. Aurelio R. Montinola III, 70, Filipino: Chairman of the Board of Trustees (August
2013 to present), Vice Chairman (June 1989 to August 2013), Far Eastern University, Inc.
Other Corporate Affiliations: Chairman, Amon Trading Inc., East Asia Computer Center, Inc., Far Eastern College Silang, Inc., Nicanor Reyes Educational Foundation, Inc., FEU High School, Inc., FEU Alabang, Inc., Roosevelt College, Inc., Ramon Magsaysay Award Foundation, and National Golf Association of the Philippines; Vice Chairman, Philippine Business for Education Foundation (PBED); President, Management Association of the Philippines; Director, BPI/MS Insurance Corporation; and Member, Makati Business Club. He was President of BPI from 2005-2013 and was a former President of the Bankers Association of the Philippines.
___________________
*Ms. Angelina P. Jose, passed away on 30 March 2021

- 5 -
He is currently a Director of the Bank of the Philippine Islands, and Independent Director of Roxas and Company Incorporated, both listed corporations.
He graduated with a BS Management Engineering degree at the Ateneo de Manila University in 1973, and received his MBA at Harvard Business School in 1977. He was awarded the 2005 and 2010 Asian Banker Leadership Award for the Philippines and the MAP Management Man of the Year Award in 2012.
3. Michael M. Alba, 64, Filipino: President and Trustee (October 2012 to present), Far Eastern University, Inc.
In the FEU Group of Schools, he is President concurrently of East Asia Computer Center, Inc.; Far Eastern College Silang, Inc.; FEU Alabang, Inc.; FEU High School, Inc.; Roosevelt College, Inc.; East Asia Educational Foundation, Inc.; and Nicanor Reyes Educational Foundation, Inc. He is also the Chairman of Edustria, Inc., a Governor of the Nicanor Reyes Memorial Foundation, and the President of the Foundation for Information Technology Education and Development. His affiliations include, among others: FEU Public Policy Center (President); Philippine Association of Colleges and Universities (Board Member); Coordinating Council of Philippine Educational Associations (Trustee, 2020‒2022); Association of Southeast Asian Institutions of Higher Learning–National Council of the Philippines (President, 2018‒2020); Southeast and South Asia and Taiwan Universities (Member, Steering Committee); Philippine Economic Society (Lifetime Member and President, 2007); Action for Economic Reforms (Fellow); Management Association of the Philippines (Member); and Leadership Council of Sustainability Development Solutions Network, Philippines (Member 2020‒2023).
He obtained his AB (Economics) degree from the Ateneo de Manila University in 1978, MA (Economics) degree from the University of the Philippines (Diliman) School of Economics in 1987, and PhD (Applied Economics) degree from Stanford University in 1993.
4. Angelina P. Jose (+), 68, Filipino: Trustee (June 1990 to present), Far Eastern
University, Inc.
*Ms. Angelina P. Jose, passed away on 30 March 2021. Before her demise, she held the following positions in various organizations:
Member, Board of Directors, FERN Realty Corporation and FEU Alabang, Inc.; Trustee, Nicanor Reyes Educational Foundation, Inc.; Treasurer and Trustee, FEU Educational Foundation, Inc.; Corporate Secretary and Governor, Nicanor Reyes Memorial Foundation; Member, Executive Committee, Far Eastern University, Inc.; Corporate Secretary and Director, Far Eastern College Silang, Inc.; Chair, Angel C. Palanca Peace
Program Foundation, Inc.; Chair, Board of Trustees, (April 2014 – April 2015 and April
2017 to April 2020) and Enrolled Member (2013 to present) Ahon Sa Hirap, Inc.
She was also the Corporate Secretary of Far Eastern University from February 1998 to January 2017.
Ms. Jose obtained her Bachelor of Science degree, major in Economics, from the University of the Philippines (Dean’s Medal).
5. Antonio R. Montinola, 68, Filipino: Trustee (November 2013 to present),
Far Eastern University, Inc.
Other Corporate Affiliations: President and Director FERN Realty Corporation and Monti-Rey, Inc.; Vice Chairman, Treasurer and Director, AMON Trading Corp., Director, Far Eastern College Silang, Inc., and Nicanor Reyes Educational Foundation, Inc.; and Trustee, FEU Educational Foundation, Inc.

- 6 -
Sports Affiliations: Member, Board of Managing Directors, Universities Athletic Association of the Philippines (UAAP); Team Manager, FEU Tamaraws; Member, Manila Golf Club; Member, Tagaytay Midlands Golf Club; Member, The Rockwell Club.
He worked with Procter & Gamble and Jardine Davies, Inc. in the Philippines and with General Mills Corp., based in Minneapolis, Minnesota, U.S.A.
Mr. Montinola holds an A. B. Economics Degree (honors course) from Ateneo de Manila University (1973) and an M.B.A. from Stanford University, Palo Alto, California, U.S.A. (1978).
6. Paulino Y. Tan, 75, Filipino: Trustee (June 1991 to present), Far Eastern University,
Inc.
Other Corporate Affiliations: At present, Member of the Board of Directors/Trustees of the following companies: Nicanor Reyes Educational Foundation, Inc., FEU Educational Foundation, Inc., East Asia Educational Foundation, Inc., East Asia Computer Center, Inc., Lyceum of Batangas, Lyceum of Laguna, SM Foundation, Inc., Asia Pacific Technology Educational Foundation, Asia Pacific Computer Technology Center, Inc., FERN Realty Corporation, Far Eastern College Silang, Inc., FEU High School, Inc., FEU Alabang, Inc., Roosevelt College, Inc. and Foundation for Information Technology Education and Development, Inc., MFI Polytechnic Institute, Inc.
Dr. Tan obtained the Degree of Bachelor of Science in Chemical Engineering from De La Salle University. He obtained both his M.S. and Ph.D. in Chemical Engineering from the University of Notre Dame, Indiana, U.S.A.
Please see CHED certification (Annex D).
7. Edilberto C. De Jesus, 79, Filipino: Independent Trustee (August 2012 to present) Far Eastern University, Inc.
Other Corporate Affiliations: Chairman, FEU Public Policy Center; Member, Board of Directors of Phinma, Inc., Cagayan de Oro College (a member of the Phinma Education Network); Independent Director of Far Eastern College-Silang, Inc. and Summer Institute of Linguistics (SIL) Philippines; Independent Trustee of Roosevelt College, Inc. and Nicanor Reyes Educational Foundation, Inc.; Member, Board of Trustees of InciteGov, Foundation for Liberty and Prosperity; Advisory Board of Integrity Initiative, Inc. and Philippine Business for Education; Professor Emeritus, Asian Institute of Management; Non-Resident Senior Research Fellow, Ateneo School of Government. Fellow, Institute of Corporate Directors, and Institute for Solidarity in Asia; Member, Makati Business Club.
He obtained a BA Honors Degree in the Humanities, cum laude at the Ateneo de Manila
University in 1962, and received his M. Phil. (1969) and Ph.D. degrees (1972) from Yale University. He served as president of: Far Eastern University (1995-2002); University of the Cordilleras (2008-2009); Asian Institute of Management (2009-2012); and Secretariat Director, Southeast Asia Ministers of Education Organization in Bangkok (2005-2007). He also served in the Cabinet of President Corazon Aquino as Deputy Peace Commissioner and Presidential Adviser on Rural Development (1987-1992) and as Secretary of Education in the Cabinet of President Gloria Arroyo (2002-2004).
- 7 -
8. Sherisa P. Nuesa, 66, Filipino: Independent Trustee (August 2010 to present), Far Eastern University, Inc.
Other Corporate Affiliations: Independent Director, East Asia Computer Center, Inc., and FERN Realty Corporation, Inc. She is also an Independent Director of Ayala Land, Inc., AC Energy Inc., Integrated Micro-Electronics, Inc., and Manila Water Company, all publicly-listed corporations. She also serves as a Senior Adviser to the
Boards of Vicsal Development Corporation and Metro Retail Stores Group, Inc.
A former Managing Director of conglomerate Ayala Corporation, she held various senior management positions in Ayala subsidiaries: Ayala Land, Inc., Manila Water Company
and Integrated Micro Electronics Inc.
Ms. Nuesa is a Trustee of the Financial Executives Institute of the Philippines (FINEX) Foundation and the Judicial Reform Initiative, where she also serves as Chairperson. She was President and Board Director of the ALFM Mutual Funds Group for nine years until March 2021.
She graduated with the degree of Bachelor of Science in Commerce (summa cum laude) at Far Eastern University in 1974 and received her Master of Business Administration degree from the Ateneo - Regis Graduate School of Business in 2010. She also attended post-graduate management programs at Harvard Business School and
Stanford University. She received the ING -FINEX CFO of the Year award in 2008.
9. Jose T. Sio, 81, Filipino: Independent Trustee (April 2019 to present), Far Eastern University, Inc.
Other Corporate Affiliations: Chairman of the Board of Directors of SM Investments Corporation; Director of Ortigas Land Corporation, Atlas Consolidated Mining and Development Corporation, NLEX Corporation, Belle Corporation, China Bank; Trustee of Asia Pacific Technology Educational Foundation, Inc. (Asia Pacific College); President of SM Foundation, Inc.
Previous Affiliations: Senior Partner of SGV & Co., Consultant at T. N. Soong & Co., CPA in Taipei, Taiwan and Audit Associate at Ernst and Whinney, CPA in New York, USA.
Mr. Sio was voted as CFO of the year in 2009 by the Financial Executives of the Philippines (FINEX). In various years, he received Asia’s Best CFO Award from Hong Kong–based publications such as Alpha Southeast Asia, Corporate Governance Asia, Finance Asia and The Asset. In 2018, he received the Asian Corporate Director Award from Corporate Governance Asia.
Mr. Sio is a Certified Public Accountant. He obtained his Bachelor of Science in Commerce Major in Accounting from University of San Agustin, Iloilo City. He completed his Master of Business Administration Major in Corporate Finance and Management in New York University, New York, USA.
10. Maria Teresa Trinidad P. Tinio, 56, Filipino: Senior Vice President for Academic
Affairs, Far Eastern University, Inc. (June 2011 to present)
PhD Southeast Asian Studies, National University of Singapore; Master of English, major in Literature and Cultural Studies, Ateneo de Manila University with academic units from the New School for Social Research, New York City; AB Humanities, Ateneo de Manila University.

- 8 -
Research focus in Philippine Literature, Sociolinguistics, and the Politics of Language in Southeast Asia. Publications include contributions to the CCP Encyclopaedia of the Arts, the Loyola Schools Review, Philippine Studies, and The Politics of English in Asia: Language Policy and Cultural Expression in South and Southeast Asia and the Asia Pacific published by John Benjamins (The Netherlands).
11. Gianna R. Montinola, 63, Filipino: Senior Vice President Corporate Affairs
(September 2019 to present), Vice President Corporate Affairs (November 2013 to September 2019), Far Eastern University, Inc.
Other Corporate Affiliations: Concurrently Director and Corporate Secretary of FERN Realty Corporation and Amon Trading Corporation; Director of Far Eastern College Silang, Inc., East Asia Computer Center, Inc. and Robinsons True Serve Hardware Phils, Inc. Trustee and Secretary, Foundation for Information Technology Education and Development, Inc. Co-founder of non-profit organizations Hands on Manila Foundation, Inc. and Peace Tech Inc. Associate lawyer of the Quisumbing Torres Law Office (an affiliate of the Baker & McKenzie Law Office, U.S.A.) from 1986 to 1992. Philippine Honorary Consul to the Republic of Peru from 1992 to 1996, Marketing and Business Development manager of Rockwell Land Corporation from 1996 to 1998.
She earned a Bchelor of Arts degree in International Relations from Mount Holyoke College, U.S.A. and a Bachelor of Laws (Ll.B.) degree, with honors, from the Ateneo de Manila School of Law. She obtained a Masters degree in Public Administration from the John F. Kennedy School of Government at Harvard University, U.S.A.
12. Juan Miguel R. Montinola, 60, Filipino: Chief Finance Officer, (September 2010 to
present), and Chief Risk Officer, (October 2018 to present), Far Eastern University, Inc.
Other Corporate Affiliations: Chair, FEU Health, Welfare and Retirement Fund Plan and Foundation for Information Technology Education and Development, Inc.; President, Amon Trading Corporation; Board Member of FERN Realty Corporation, East Asia Computer Center, Inc., Far Eastern College Silang, Inc., FEU Educational Foundation, Inc., Nicanor Reyes Memorial Foundation, Nicanor Reyes Educational Foundation, Inc., FEU Alabang, Inc, FEU High School, Inc., Urban Program for Livelihood Finance and Training, Roosevelt College, Inc. and Edustria Incorporated. Member of the Executive Committees of many of the organizations he serves as Director.
Mr. Montinola was Chief Executive Officer and Country Manager of Lafarge Cementi SA, Italy, from 2006 to 2008. From 1996 to 2006 he served as President and CEO of Republic Cement Corporation and concurrently as Senior Vice President for Commercial Business from 2002 to 2006, and Senior Vice President for Procurement from 2001 to 2002, for Lafarge Cement Services, Inc.
Prior to 1996, Mr. Montinola held various positions in Republic Cement Corporation and served as a member of the Board of Directors in different organizations.
Mr. Montinola has a Masters in Business Administration from International Institute of Management Development, Switzerland, and an AB Economics degree from College of William & Mary, Virginia, USA.
13. Myrna P. Quinto, 59, Filipino: Vice President for Academic Development,
Far Eastern University, Inc. (April 2014 to present)
Other Corporate Affiliations: She is a member of the Biology Teachers Association (BIOTA), Philippine Society of Microbiology (PSM), and the Association of Systematic Biologists of the Philippines (ASBP).

- 9 -
Among her relevant trainings abroad are the Educational Leadership Training in NTU, Singapore, the ASEAN University Network (AUN) Quality Assurance Training in Thailand, and the month-long CHED Training Program on the Internationalization of Philippine Higher Education held in Canada, in partnership with the Canadian Bureau of
International Education.
Dr. Myrna P. Quinto is a B.S. Biology graduate from the College of the Holy Spirit. She finished her Master of Arts in Education major in Biology at the University of the Philippines and her Doctor of Philosophy in Science Education major in Biology at De La Salle University, Manila, Philippines.
14. Anthony Raymond A. Goquingco, 46, Filipino: Corporate Secretary, Far Eastern
University, Inc. (April 2020 to present)
Atty. Anthony Raymond A. Goquingco has been a member of the legal profession since his admittance to the Philippine Bar in 2003. He has had extensive legal experience as a practicing lawyer and has held positions in the Philippine Judicial Academy of the Supreme Court of the Philippines, non-governmental organizations, law firms, and private corporations. Prior to joining the academe, Atty. Goquingco was Associate General Counsel of Aboitiz Equity Ventures, Inc. Atty. Goquingco joined the academe in 2014 and teaches Obligations and Contracts, Property Law, Negotiations, Special Issues in International Law, and International Moot Court at the Far Eastern University. In 2016, he was appointed as Associate Dean of the Juris Doctor – Master of Business Administration program of the Institute of Law of the Far Eastern University. He was appointed Associate Dean of the Juris Doctor Program of the Institute in 2018. He was appointed Corporate Secretary of the Far Eastern University in 2020. Atty. Goquingco graduated from the Ateneo de Manila University with an AB Political Science degree in 1997. He pursued his law studies at the same university graduating in 2002 with a Juris Doctor degree. In 2007, he graduated from the Georgetown University Law Center in Washington, D.C. with a Master of Laws in International Legal Studies with a Certificate in National Security Law. He specializes in International Business Law, Contract Law, Property Law, Contract Negotiations, International Law, and National Security Law. He is also the author of “Beyond Borders: Examining Special Issues in International Law”.
15. Edward R. Kilakiga, 47, Filipino: Vice President, Facilities and Technical
Services, Far Eastern University, Inc. (July 2017 to Present)
Other affiliations: Vice President, Facilities Managers Association for Schools (FMAS); Mission Director, Brotherhood of Christian Businessmen and Professionals (BCBP Manila Chapter); Member: Philippine Society of Mechanical Engineers (PSME Quezon City Chapter); American Society of Heating, Refrigeration and Air-Conditioning Engineers (ASHRAE Phil. Chapter); Institute of Integrated Electrical Engineers (IIEE); Institute of Hotel Engineers Association of the Philippines, National Master Plumber Association of the Philippines (NAMPAP); Philippine Integrated Fire Protection Organization (PIFPO); and Arise Philippines, Global Association of United Nations Office for Disaster Risk Reduction (UNDRR).
He graduated with a degree of BS Mechanical Engineering in 2009, BS Electrical Engineering in 1999 and Electrical Technology in 1994 at Rizal Technological University (RTU). He is a professional Electrical Engineer, a Professional Mechanical Engineer, a registered Master Plumber, and a Registered Master Electrician. Before joining FEU, he works in different hotels local and abroad for 19 years in different capacity from maintenance staff to head of Engineering Department.

- 10 -
He received a Pundasyon Award (Excellent in Engineering Award) from RTU Grand Alumni Association in 2019 and Lorenzo Ruiz Award for National Discipline in 1991 by AY Foundation Inc., Guadalupe Catholic School, Makati City.
16. Victorino T. Tolosa II, 48, Filipino: Chief Information Officer, Far Eastern University,
Inc. (May 2019 to May 2021)
Prior to joining FEU, Mr. Tolosa worked for 26 years with Jollibee Foods Corporation (JFC); started his career with Store Operations, then with Restaurant Systems and Development, then with Store Operations Opening Team. He spent the last 17 years with Information Management Division in various roles in IT Project Management and Account Management both in JFC Philippines and JFC International Operations. He was the head of the Enterprise Work Tools and Mobility group of JFC Business Technology division in 2018 until 4th of May 2019.
He was also a JFC Group Foundation volunteer and once held the post of Board Secretary of the JFC Cooperative (a P1.5B asset cooperative and with more than 6,000 members)
Mr. Tolosa obtained his AB major in Political Science degree, where he started as an academic scholar and active student council officer, from the University of Nueva Caceres, UNC (Naga City, Camarines Sur). He obtained his MBA degree from the De La Salle University (DLSU), Manila, where he held the post of Vice President of the Student Forum DLSU RCBC Campus in 2004.
17. Rosanna Esguerra-Salcedo, 56, Filipino: Treasurer, Far Eastern University, Inc.
(September 2014 to present)
Other Corporate Affiliations: Vice President for Finance of Roosevelt College, Inc.,
Trustee of East Asia Educational Foundation Inc, (EAEFI), Trustee of FEU HWRFP, Treasurer of Foundation for Information Technology Education (FIT-ED)
Before joining FEU, she worked at the Bayan Telecommunications, Inc., where she managed numerous departments: initially as Head of General Accounting and Accounts Payable, then, Budget Department and Revenue Accounting, and as Head of Billing and Collection. She also served as the Head of Treasury and Internal Audit of Mariwasa Manufacturing, Inc. for five years. Prior to joining the private sector, she worked for SGV & Co. both as an External Senior Auditor and Tax Senior Auditor.
Ms. Salcedo is a Certified Public Accountant. She obtained her BSBA Major in Accounting, cum laude, from the University of the East. She also completed her
Management Leadership Program at the Asian Institute of Management.
18. Glenn Z. Nagal, 63, Filipino: Comptroller (1996 to present), and Compliance Officer (April 2021 to present), Far Eastern University, Inc.
Other Corporate Affiliation: Director and Treasurer, FEU High School, Inc.
Professional experience includes External Auditor, Carlos J. Valdes and Company; Examiner, Central Bank of the Philippines; Internal Audit Manager, Far Eastern University; Chief Accountant and Budget Director, Far Eastern University; Compliance Officer, Far Eastern University; and Accounting Professor, Far Eastern University.
A Certified Public Accountant by profession, Mr. Nagal graduated with the degree of Bachelor of Science in Commerce, major in Accounting from Far Eastern University.

- 11 -
19. Pamela M. Hernandez, 44, Filipino: Chief Accountant and Budget Director, Far Eastern University, Inc. (August 2019 to present)
Ms. Hernandez had a combined 23 years of professional work experience, significantly acquired from public accounting practice, in her role as Audit Director for PWC Philippines, Audit Senior Manager for Grant Thornton Philippines and Audit Senior for Grant Thornton Chicago, USA. Her other prior work exposures were obtained from within corporate and educational sectors, as Financial and Tax Advisor for a large food concessionaire in the country, as Accounting and Budget Manager for a publicly listed cargo shipping company, and very early on in her career, as Internal Auditor for a top universal bank and as a Reviewer at her university.
She is a Certified Public Accountant. In 1998, she obtained her degree of Bachelor of Science in Accountancy, cum laude, from the Ateneo de Naga University. In 2010, she completed her Masters in Management post-graduate degree, with commendation, at
the Asian Institute of Management.
20. Rogelio C. Ormilon, Jr., 54, Filipino: Chief Audit Executive, Far Eastern University, Inc. (September 2015 to November 2020)
Professional experience includes Audit Director at R.G. Manabat & Co./KPMG Philippines; Audit Senior Manager at Isla Lipana & Co./PwC Philippines; Audit Senior Manager at Ernst & Young Ltd. Auckland, New Zealand; Compliance Officer, Far Eastern University (September 2015 to January 2017); and Risk Management Officer, Far Eastern University (September 2015 to October 2018).
He graduated with the degree of B.S. Business Administration, Major in Accounting from Philippine School of Business Administration, Quezon City Campus in 1987 and obtained his Master in Management at the Asian Institute of Management in 2004. He is also a Certified Public Accountant.
The Nomination Committee is chaired by Dr. Edilberto C. De Jesus (Independent Trustee). The members are: Dr. Paulino Y. Tan, Mr. Antonio R. Montinola and Atty. Gianna R. Montinola.
The nominees for the trustees and independent trustees have been pre-screened by the Nomination Committee composed of four (4) members, one of whom (the Chairman) is an Independent Trustee.
The following have been nominated members to the Board of Trustees for fiscal year 2021 – 2022:
Name
Ages Citizenship Position
Lourdes R. Montinola 93 Filipino Chair Emeritus, Board of Trustees
Aurelio R. Montinola III 70 Filipino Chairman, Board of Trustees
Michael M. Alba 64 Filipino President and Trustee
Sherisa P. Nuesa 66 Filipino Trustee
Antonio R. Montinola 68 Filipino Trustee
Paulino Y. Tan 75 Filipino Trustee
Edilberto C. De Jesus 79 Filipino Independent Trustee
Jose T. Sio 81 Filipino Independent Trustee
Consuelo D. Garcia 67 Filipino Independent Trustee
- 12 - The aforementioned nominees were submitted to the Nomination Committee of Far Eastern University. Dr. Edilberto C. De Jesus, Mr. Jose T. Sio and Ms. Consuelo D. Garcia were nominated as Independent Trustees by Ms. Fe V. Canilao, a shareholder, in compliance with the SRC Rule 38 (Requirements on Nomination and Election of Independent Directors). Ms. Fe V. Canilao is not related to any of the nominees for Independent Trustees.
Two of the nominated Independent Trustees, Mr. Jose T. Sio and Ms. Consuelo D. Garcia are not covered by SEC Memorandum Circular No. 4, Series of 2017, re Term Limit of Independent Directors considering that under said SEC Circular, the reckoning of the cumulative nine-year term limit is from 2012. Dr. Edilberto C. de Jesus has already reached the maximum cumulative nine-year term limit. The Corporation, however, has communicated with the Securities and Exchange Commission in writing on 16 August 2021 to allow Dr. de Jesus to remain an Independent Trustee considering the challenging conditions brought about the Covid-19 pandemic.
Please see the latest certifications of the Independent Trustees (Annex C pages 1-3).
b. Significant Employees
The corporation considers its entire work force as significant employees. Everyone is expected to work together as a team to achieve the corporation’s goals and objectives.
c. Family Relationship
The Chairperson, Mr. Aurelio R. Montinola III is the son of Dr. Lourdes R. Montinola, Chair Emeritus and Member of the Board of Trustees. He is also the sibling of Mr. Antonio R. Montinola, Member of the Board of Trustees, Atty. Gianna R. Montinola, Senior Vice President for Corporate Affairs, and Mr. Juan Miguel R. Montinola, Chief Finance Officer.
d. Legal Proceedings
Hereunder is the list of the legal proceedings involving the company which is being handled by Atty. Enrico G. Gilera, the University Chief Legal Counsel:
External Cases
Pending Court Cases as of 08 September 2021: 1. Jacqueline Alota vs. FEU, CA GR Case No. 237928
Status: Court of Appeals ruled in favor of FEU. Complainant appealed before the Supreme Court and is now pending decision. Nature: A dismissed faculty member’s attempt to seek FEU’s share in her retirement pay.
2. Century Iron Work, Inc. vs. FEU, G.R. No. 217329 Status: Pending with the RTC Caloocan City for presentation of CIWI’s evidence. Nature: Collection case filed against FEU’s contractor by a sub-contractor
3. Maricel Trinidad, vs. FEU, CA G.R. Case No. 256512
Status: Complainant’s Petition for Review at the Supreme Court.
Nature: Illegal dismissal case filed by a retrenched faculty member 4. Von Kirby German and Alex Cabaluna vs. FEU, NLRC NCR-06-11155-19
Status: Labor Arbiter ruled in favor of Complainants, FEU filed a Memorandum of Appeal before the NLRC. Nature: Illegal dismissal case filed by former IABF faculty members

- 13 -
5. Ivan Faronal vs. FEU, NLRC LAC N0. 02-000732-20 Status: Complainant’s filed a Petition for Review at Court of Appeals. Nature: Illegal dismissal filed by a former IABF faculty member
6. Percival B. Salise vs. FEU, NLRC Case No. 12-0104419
Status: Labor Arbiter dismissed the case and ruled in favor of FEU. Nature: Illegal dismissal case filed by a former Institute of Education contractual faculty member.
7. FEU-ELU vs. FEU, SP GR No. 247619 Status: Supreme Court dismissed the petition filed by FEU-ELU and ruled in favor
of FEU.
Nature: Payment of LA and SFA Special Bonus to rank-and-file employees
Involvement of Directors and Officers in Certain Legal Proceedings
None of the directors and officers of the registrant or any of its subsidiaries or affiliates
were involved during the past five (5) years in any bankruptcy proceeding. Neither have they been convicted by final judgment in any criminal proceeding or been subject to any order, judgment or decree of competent jurisdiction, permanently or temporarily enjoining barring, suspending, or otherwise limiting their involvement in any type of business, securities, commodities, or banking activities, nor found by any court or administrative body to have violated a securities or commodities law.
The registrant or any of its subsidiaries or affiliates is not a party to any pending legal proceedings in which any of their property is the subject.

- 14 -
Related Party Transactions and Relationships
The University recognizes a related party relationship with another entity if the Group or the other entity has the ability to control or exercise significant influence over the financial and operating decisions of its counter party. The University assess the form and substance of the relationships to determine the presence of related party transactions.
Among the Group’s related parties include:
1) Entities under common management 2) The University and its subsidiaries’ respective Retirement Funds 3) The University and its subsidiaries’ respective Officers, Directors, Stockholders and other
persons with related interests
The University has written policies and procedures on related party transactions, endorsed by the Board committee on Related Party Transactions, that addresses the regulatory requirements of the SEC, and foremost is, used as guiding principles in the Group management’s evaluation of transactions with related parties.
During the year, the Group, in its regular conduct of business, have entered into transactions with its related parties. Except for the Group’s related party transactions which is disclosed in Note 23 to the Consolidated Financial Statements, which is an integral part of this report, no other material transactions, without proper disclosures, was undertaken by the Group.
- 15 -
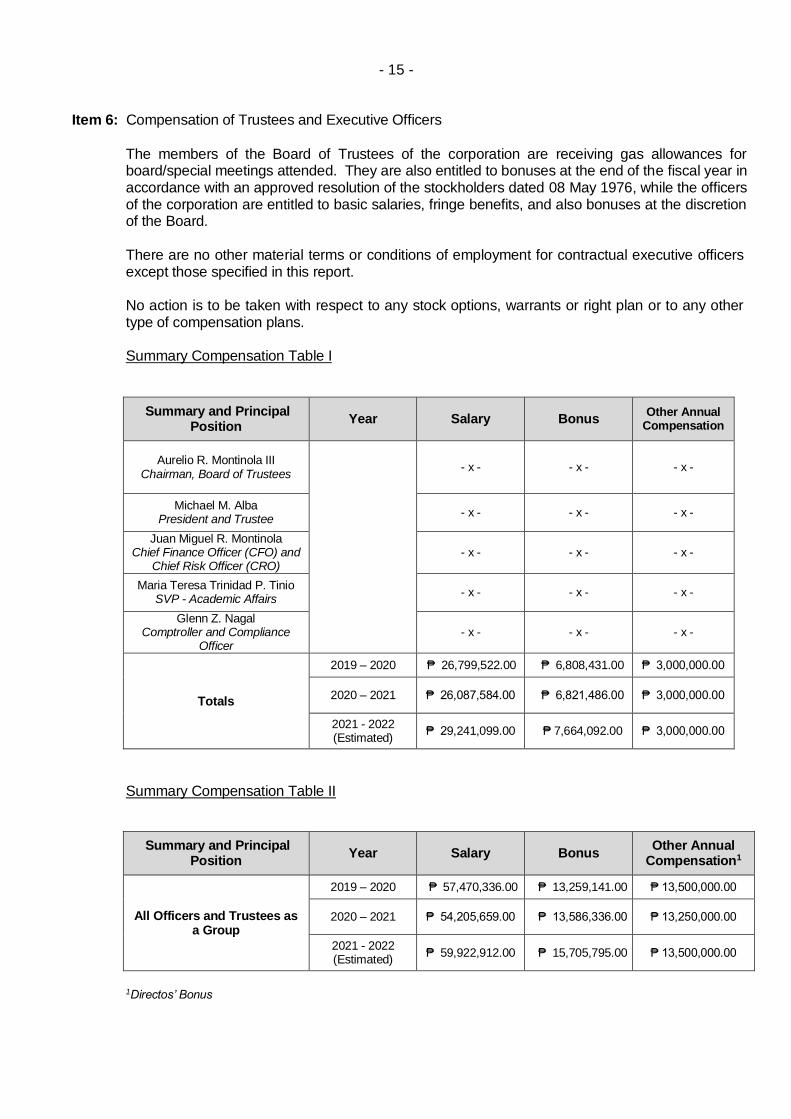
Item 6: Compensation of Trustees and Executive Officers
The members of the Board of Trustees of the corporation are receiving gas allowances for board/special meetings attended. They are also entitled to bonuses at the end of the fiscal year in accordance with an approved resolution of the stockholders dated 08 May 1976, while the officers of the corporation are entitled to basic salaries, fringe benefits, and also bonuses at the discretion of the Board.
There are no other material terms or conditions of employment for contractual executive officers except those specified in this report.
No action is to be taken with respect to any stock options, warrants or right plan or to any other type of compensation plans.
Summary Compensation Table I
Summary and Principal Position
Year Salary Bonus Other Annual
Compensation
Aurelio R. Montinola III Chairman, Board of Trustees
- x - - x - - x -
Michael M. Alba President and Trustee
- x - - x - - x -
Juan Miguel R. Montinola Chief Finance Officer (CFO) and
Chief Risk Officer (CRO) - x - - x - - x -
Maria Teresa Trinidad P. Tinio SVP - Academic Affairs
- x - - x - - x -
Glenn Z. Nagal Comptroller and Compliance
Officer - x - - x - - x -
Totals
2019 – 2020 ₱ 26,799,522.00 ₱ 6,808,431.00 ₱ 3,000,000.00
2020 – 2021 ₱ 26,087,584.00 ₱ 6,821,486.00 ₱ 3,000,000.00
2021 - 2022 (Estimated)
₱ 29,241,099.00 ₱ 7,664,092.00 ₱ 3,000,000.00
Summary Compensation Table II
Summary and Principal Position
Year Salary Bonus Other Annual
Compensation1
All Officers and Trustees as a Group
2019 – 2020 ₱ 57,470,336.00 ₱ 13,259,141.00 ₱ 13,500,000.00
2020 – 2021 ₱ 54,205,659.00 ₱ 13,586,336.00 ₱ 13,250,000.00
2021 - 2022 (Estimated)
₱ 59,922,912.00 ₱ 15,705,795.00 ₱ 13,500,000.00
1Directos’ Bonus

- 16 -
Item 7: Independent Public Accountant
The external auditor, Punongbayan & Araullo, audited the Financial Statements of the corporation for fiscal year ended 31 May 2021. The same accounting firm is recommended for re-appointment at the annual stockholders' meeting for almost the same remunerations in the previous year.
Representatives of Punongbayan & Araullo are expected to be present at the stockholders’ meeting; they will have the opportunity to make a statement if they desire to do so; and they are expected to be available to respond to appropriate questions.
Fees for services rendered:
External Auditor’s Fee
Audit of annual financial statements ₱1,185,000.00 FY 2020-2021 plus 12% VAT
Out of pocket expenses ₱ 94,800.00 plus 12% VAT
Except for the above mentioned external auditor’s fees, there are no other fees (tax fees, all other fees) for services rendered by the external auditors.
The Audit Committee is chaired by Ms. Sherisa P. Nuesa, an Independent Trustee. The members are: Dr. Edilberto C. de Jesus (Independent Trustee), Mr. Jose T. Sio, and Ms. Angelina P. Jose (+) (Alternate Member).
The Audit Committee’s approval of the policies and procedures covering the examination of FEU’s financial statements for fiscal year ending 31 May 2021, including other services, is covered by the minutes of the meeting of the Audit Committee dated 12 August 2021.
The signing partners of the external auditor shall be rotated every five (5) years of engagement. In case of a firm, the signing partner shall be rotated every after said period. The reckoning date for such rotation shall commence in year 2002. (SRC Rule 68 (3) (b) (iv).
There has been no recent change in and disagreements with accountants on accounting and financial disclosures.
Please see Audit Committee Report (Annex E).
Item 8: Compensation Plans
There are no matters or actions to be taken up in the meeting with respect to any compensation plan pursuant to which cash or non-cash compensation may be paid or distributed.

- 17 - C. ISSUANCE AND EXCHANGE OF SECURITIES
Item 9: Authorization or Issuance of Securities Other than for Exchange
There are no matters or actions to be taken up with respect to authorization or issuance of securities.
Item 10: Modification or Exchange of Securities
There are no matters or actions to be taken up for the modification of any class of the Company’s securities or the issuance or authorization for issuance of one class of the Company’s securities in exchange for outstanding securities of another class.
Item 11: Financial and Other Information
The audited financial statements as of 31 May 2021, Management’s Discussion and Analysis, Market Price of Shares and Dividends and other data related to the Company’s financial information are attached hereto as Annex F.
Item 12: Mergers, Consolidations, Acquisitions and Similar Matters
There are no matters or actions to be taken up in the annual stockholders’ meeting with respect to merger, consolidation, acquisition by sale, or liquidation of the Company.
Item 13: Acquisition or Disposition of Property
There are no matters or actions to be taken up in the annual stockholders’ meeting with respect to acquisition or disposition of any property by the Company.
Item 14: Restatement of Accounts
No restatement of accounts to be taken up in the annual stockholders’ meeting.
- 18 -
D. OTHER MATTERS
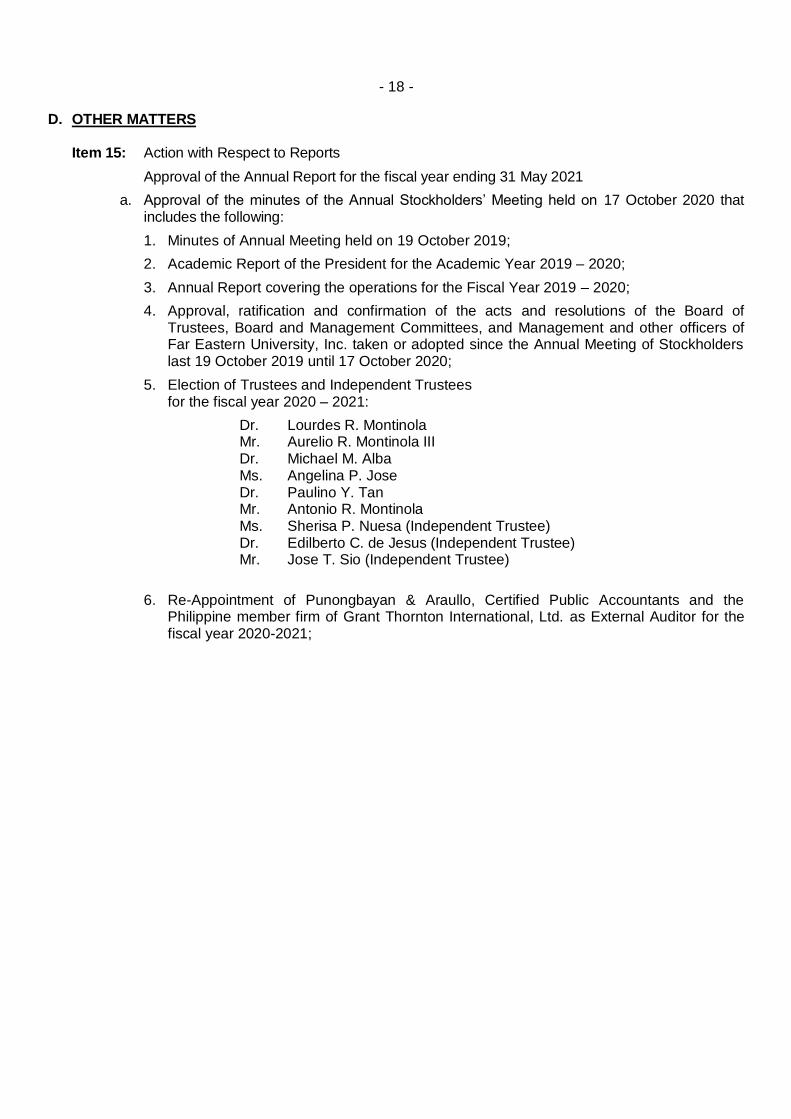
Item 15: Action with Respect to Reports
Approval of the Annual Report for the fiscal year ending 31 May 2021
a. Approval of the minutes of the Annual Stockholders’ Meeting held on 17 October 2020 that includes the following:
1. Minutes of Annual Meeting held on 19 October 2019;
2. Academic Report of the President for the Academic Year 2019 – 2020;
3. Annual Report covering the operations for the Fiscal Year 2019 – 2020;
4. Approval, ratification and confirmation of the acts and resolutions of the Board of Trustees, Board and Management Committees, and Management and other officers of Far Eastern University, Inc. taken or adopted since the Annual Meeting of Stockholders last 19 October 2019 until 17 October 2020;
5. Election of Trustees and Independent Trustees for the fiscal year 2020 – 2021:
Dr. Lourdes R. Montinola Mr. Aurelio R. Montinola III Dr. Michael M. Alba Ms. Angelina P. Jose Dr. Paulino Y. Tan Mr. Antonio R. Montinola Ms. Sherisa P. Nuesa (Independent Trustee) Dr. Edilberto C. de Jesus (Independent Trustee) Mr. Jose T. Sio (Independent Trustee)
6. Re-Appointment of Punongbayan & Araullo, Certified Public Accountants and the Philippine member firm of Grant Thornton International, Ltd. as External Auditor for the fiscal year 2020-2021;
- 19 -
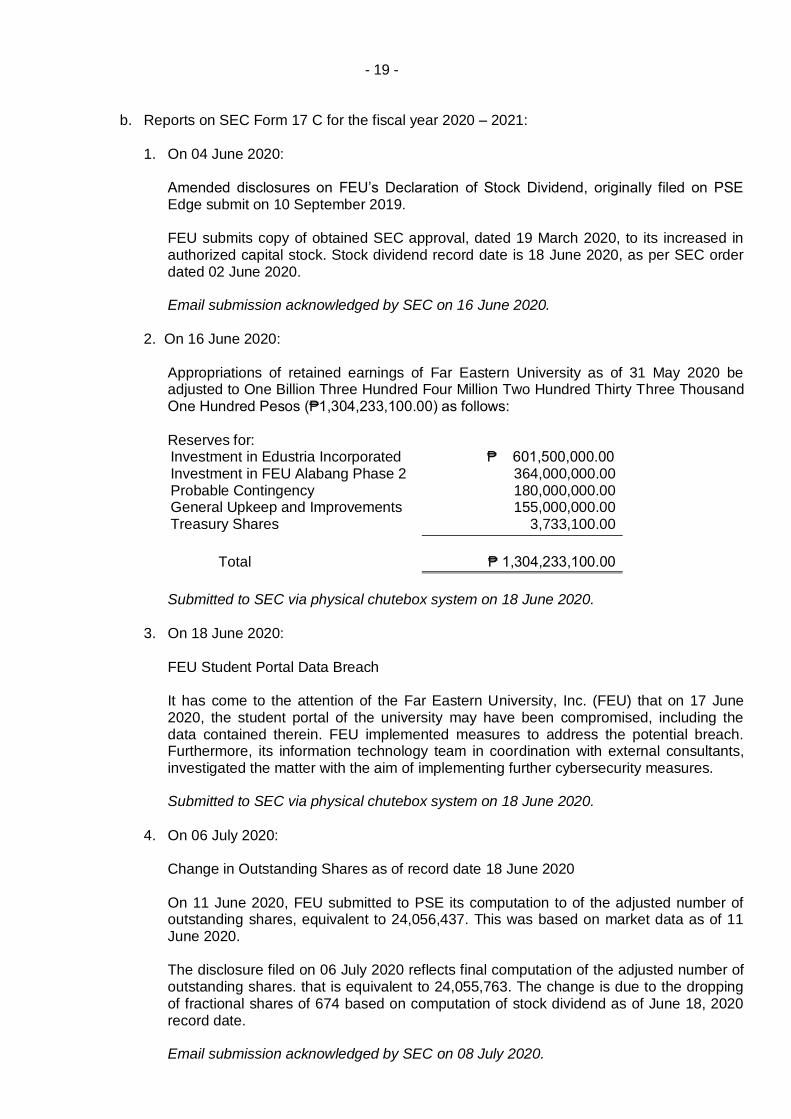
b. Reports on SEC Form 17 C for the fiscal year 2020 – 2021:
1. On 04 June 2020:
Amended disclosures on FEU’s Declaration of Stock Dividend, originally filed on PSE Edge submit on 10 September 2019.
FEU submits copy of obtained SEC approval, dated 19 March 2020, to its increased in authorized capital stock. Stock dividend record date is 18 June 2020, as per SEC order dated 02 June 2020.
Email submission acknowledged by SEC on 16 June 2020.
2. On 16 June 2020:
Appropriations of retained earnings of Far Eastern University as of 31 May 2020 be adjusted to One Billion Three Hundred Four Million Two Hundred Thirty Three Thousand One Hundred Pesos (₱1,304,233,100.00) as follows:
Reserves for: Investment in Edustria Incorporated Investment in FEU Alabang Phase 2 Probable Contingency General Upkeep and Improvements Treasury Shares
₱ 601,500,000.00 364,000,000.00 180,000,000.00 155,000,000.00
3,733,100.00
Total
₱ 1,304,233,100.00
Submitted to SEC via physical chutebox system on 18 June 2020.
3. On 18 June 2020:
FEU Student Portal Data Breach
It has come to the attention of the Far Eastern University, Inc. (FEU) that on 17 June 2020, the student portal of the university may have been compromised, including the data contained therein. FEU implemented measures to address the potential breach. Furthermore, its information technology team in coordination with external consultants, investigated the matter with the aim of implementing further cybersecurity measures.
Submitted to SEC via physical chutebox system on 18 June 2020.
4. On 06 July 2020:
Change in Outstanding Shares as of record date 18 June 2020
On 11 June 2020, FEU submitted to PSE its computation to of the adjusted number of outstanding shares, equivalent to 24,056,437. This was based on market data as of 11 June 2020.
The disclosure filed on 06 July 2020 reflects final computation of the adjusted number of outstanding shares. that is equivalent to 24,055,763. The change is due to the dropping of fractional shares of 674 based on computation of stock dividend as of June 18, 2020 record date.
Email submission acknowledged by SEC on 08 July 2020.
- 20 -
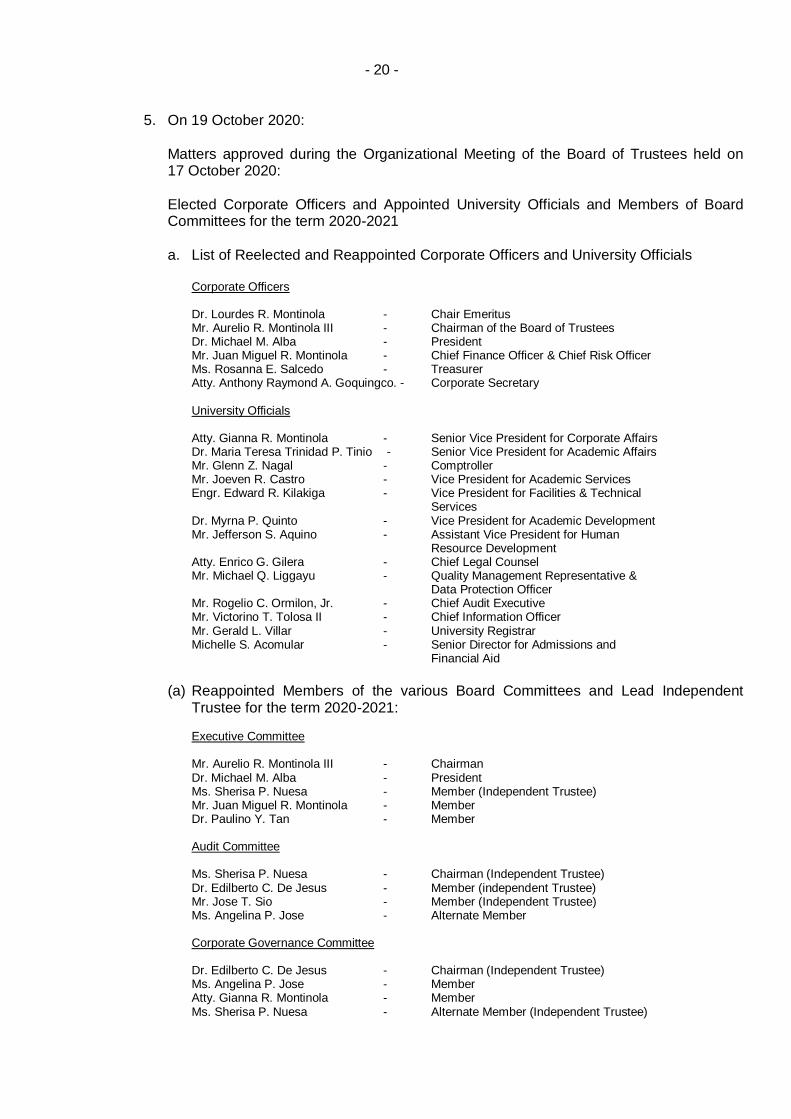
5. On 19 October 2020:
Matters approved during the Organizational Meeting of the Board of Trustees held on 17 October 2020:
Elected Corporate Officers and Appointed University Officials and Members of Board Committees for the term 2020-2021
a. List of Reelected and Reappointed Corporate Officers and University Officials
Corporate Officers
Dr. Lourdes R. Montinola - Chair Emeritus Mr. Aurelio R. Montinola III - Chairman of the Board of Trustees Dr. Michael M. Alba - President Mr. Juan Miguel R. Montinola - Chief Finance Officer & Chief Risk Officer Ms. Rosanna E. Salcedo - Treasurer Atty. Anthony Raymond A. Goquingco. - Corporate Secretary
University Officials
Atty. Gianna R. Montinola - Senior Vice President for Corporate Affairs Dr. Maria Teresa Trinidad P. Tinio - Senior Vice President for Academic Affairs Mr. Glenn Z. Nagal - Comptroller Mr. Joeven R. Castro - Vice President for Academic Services Engr. Edward R. Kilakiga - Vice President for Facilities & Technical
Services Dr. Myrna P. Quinto - Vice President for Academic Development Mr. Jefferson S. Aquino - Assistant Vice President for Human
Resource Development Atty. Enrico G. Gilera - Chief Legal Counsel Mr. Michael Q. Liggayu - Quality Management Representative &
Data Protection Officer Mr. Rogelio C. Ormilon, Jr. - Chief Audit Executive Mr. Victorino T. Tolosa II - Chief Information Officer Mr. Gerald L. Villar - University Registrar Michelle S. Acomular - Senior Director for Admissions and
Financial Aid
(a) Reappointed Members of the various Board Committees and Lead Independent
Trustee for the term 2020-2021:
Executive Committee
Mr. Aurelio R. Montinola III - Chairman Dr. Michael M. Alba - President Ms. Sherisa P. Nuesa - Member (Independent Trustee) Mr. Juan Miguel R. Montinola - Member Dr. Paulino Y. Tan - Member
Audit Committee
Ms. Sherisa P. Nuesa - Chairman (Independent Trustee) Dr. Edilberto C. De Jesus - Member (independent Trustee) Mr. Jose T. Sio - Member (Independent Trustee) Ms. Angelina P. Jose - Alternate Member
Corporate Governance Committee
Dr. Edilberto C. De Jesus - Chairman (Independent Trustee) Ms. Angelina P. Jose - Member Atty. Gianna R. Montinola - Member Ms. Sherisa P. Nuesa - Alternate Member (Independent Trustee)
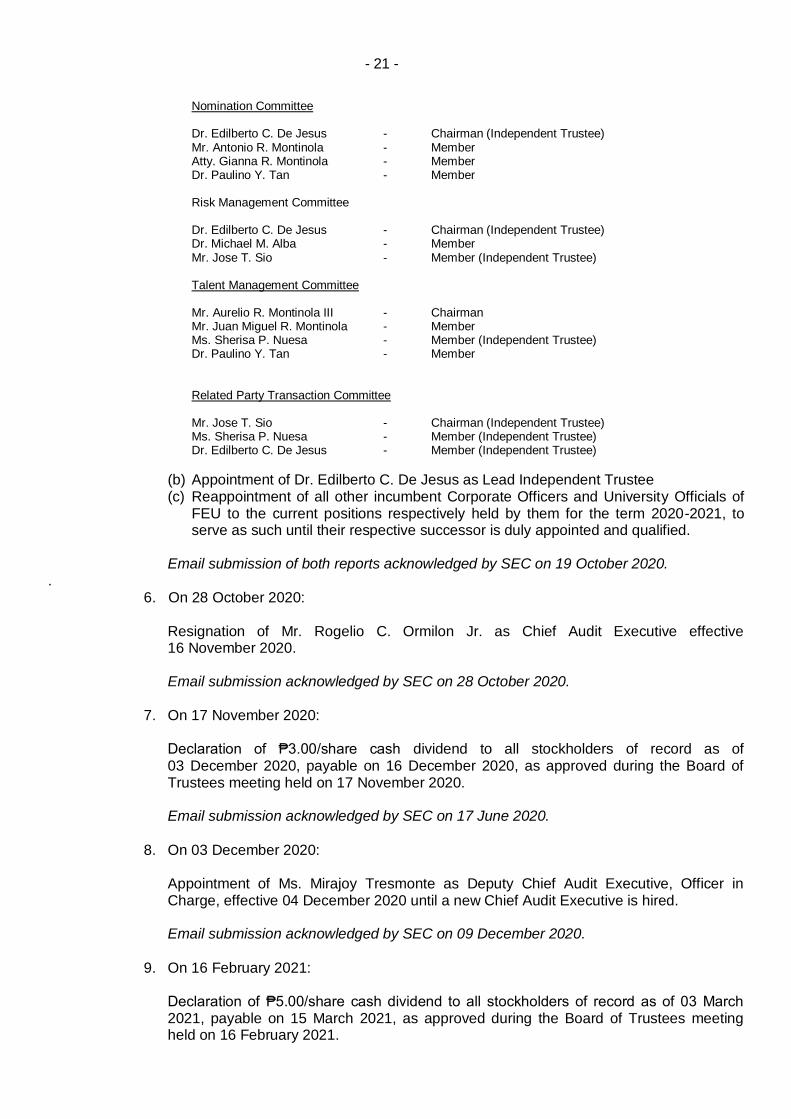
- 21 -
Nomination Committee
Dr. Edilberto C. De Jesus - Chairman (Independent Trustee) Mr. Antonio R. Montinola - Member Atty. Gianna R. Montinola - Member Dr. Paulino Y. Tan - Member
Risk Management Committee
Dr. Edilberto C. De Jesus - Chairman (Independent Trustee) Dr. Michael M. Alba - Member Mr. Jose T. Sio - Member (Independent Trustee)
Talent Management Committee
Mr. Aurelio R. Montinola III - Chairman Mr. Juan Miguel R. Montinola - Member Ms. Sherisa P. Nuesa - Member (Independent Trustee) Dr. Paulino Y. Tan - Member
Related Party Transaction Committee
Mr. Jose T. Sio - Chairman (Independent Trustee) Ms. Sherisa P. Nuesa - Member (Independent Trustee) Dr. Edilberto C. De Jesus - Member (Independent Trustee)
(b) Appointment of Dr. Edilberto C. De Jesus as Lead Independent Trustee (c) Reappointment of all other incumbent Corporate Officers and University Officials of
FEU to the current positions respectively held by them for the term 2020-2021, to serve as such until their respective successor is duly appointed and qualified.
Email submission of both reports acknowledged by SEC on 19 October 2020.
. 6. On 28 October 2020:
Resignation of Mr. Rogelio C. Ormilon Jr. as Chief Audit Executive effective 16 November 2020.
Email submission acknowledged by SEC on 28 October 2020.
7. On 17 November 2020:
Declaration of ₱3.00/share cash dividend to all stockholders of record as of 03 December 2020, payable on 16 December 2020, as approved during the Board of Trustees meeting held on 17 November 2020.
Email submission acknowledged by SEC on 17 June 2020.
8. On 03 December 2020:
Appointment of Ms. Mirajoy Tresmonte as Deputy Chief Audit Executive, Officer in Charge, effective 04 December 2020 until a new Chief Audit Executive is hired.
Email submission acknowledged by SEC on 09 December 2020.
9. On 16 February 2021:
Declaration of ₱5.00/share cash dividend to all stockholders of record as of 03 March 2021, payable on 15 March 2021, as approved during the Board of Trustees meeting held on 16 February 2021.

- 22 -
10. On 31 March 2021:
Demise of Ms. Angelina P. Jose, Member of the Board of Trustees, Ms. Jose was a Non-Executive Trustee.
Email submission acknowledged by SEC on 31 March 2021.
11. On 20 April 2021:
Appointment of Mr. Glenn Z. Nagal as Compliance Officer, effective 21 April 2021.
Email submission acknowledged by SEC on 20 April 2021.
12. On 10 May 2021:
Resignation of Victorino T. Tolosa as Chief Information Officer effective 25 May 2021.
Email submission acknowledged by SEC on 12 May 2021.
13. On 26 May 2021:
FERN Realty Corporation acquisition of 7,300 FEU shares, lodged with PCD Nominee Corporation (Filipino).
Email submission acknowledged by SEC on 26 February 2021.

- 23 - Item 16: Matters Not Required to be Submitted
There are no matters to be taken up in the meeting that will not require the vote of the stockholders as of the record date.
Item 17: Amendment of Charter, By-Laws or Other Documents
There is no proposal to amend the Charter, By-Laws or other documents that needs to be submitted to the stockholders for approval.
Item 18: Other Proposed Action
No other proposed action to be taken up in the annual meeting other than those stated in the agenda.

- 24 -
Item 19: Voting Procedures:
Voting upon all questions at all meetings of the stockholders shall be made by shares of stock and not per capita or otherwise, each share of stock being counted as one vote.
Registrant's shares of stock entitle the holders thereof to one vote at any stockholders' meeting. Stockholders are given cumulative voting rights for the election of trustees.
All other matters to be decided shall require the affirmative vote of the majority of the corporation’s shares present, or represented and entitled to vote at the Annual Meeting. Likewise, Trustees shall be elected with a majority vote of the shares present or represented.
With respect to the election of nine (9) trustees, each shareholder may vote such number of shares for as many as nine persons he may choose to be elected from the list of nominees, or he may cumulate said shares and give one candidate as many votes as the number of his shares multiplied by nine shall equal, or he may distribute them on the same principle among as many candidates as he shall see fit, provided that the total number of votes cast by him shall not exceed the number of shares owned by him multiplied by nine.
Using cumulative voting, the formula for finding the total number of votes needed for one seat in the Board is:
x = A x B
C + 1
where A = total number of shares voting
B = number of Directors desired to be elected C = number of Directors to be elected
For this year’s Annual Stockholders’ Meeting, the Board of Trustees approved a resolution allowing stockholders to participate via remote communication and to vote in absentia. Stockholder’s as of Record Date who have successfully registered their intention to participate in annual meeting via remote communication and to vote in absentia, duly verified and validated by the Corporation, shall be provided with unique log-in credentials to securely access the voting portal.
Stockholders and proxy holders can then cast their votes on specific matter for approval, including the election of directors. Votes will then be automatically tabulated and counted at the close of voting for each agenda item during the meeting.
Method by Which Votes Will be Counted
All matters subject to vote, except in cases where the law provides otherwise, shall be decided by the plurality vote of stockholders present in person or by proxy and entitled to vote thereat, a quorum being present.
The Corporate Secretary is the officer authorized to count the votes to be cast in the forthcoming annual stockholders’ meeting.
Pursuant to the Corporation’s By-laws, duly accomplished proxy forms must be submitted to the Corporate Secretary at least twenty-four (24) hours before the day of the annual meeting. Electronic copies of the duly signed proxy forms shall therefore be submitted no later than 3:00 p.m. on 15 October 2021 (Friday) at the Office of the Corporate Secretary, Far Eastern University, Nicanor Reyes St., Sampaloc, Manila for validation. A sample format of the proxy form for individual and corporate stockholders are attached and are also available at https://www.feu.edu.ph/asm2021.
The Corporate Secretary will lead the validation of proxies in coordination with the Corporation’s stock and transfer agent.
The detailed guidelines for participation and voting for this meeting are set forth in the “Guidelines for Participation via Remote Communication and Voting in Absentia”, attached as Annex “B” to this Information Statement.

PART II INFORMATION REQUIRED IN A PROXY FORM
Items 1 and 2:
FAR EASTERN UNIVERSITY, INC.
2021 Annual Stockholders’ Meeting 16 October 2021
PROXY
The undersigned stockholder of FAR EASTERN UNIVERSITY, INC. (FEU) hereby appoints
___________________________________ or in his/her absence,
Chairman of the Board of Trustees Aurelio R. Montinola III or in his absence, Chair Emeritus Lourdes R. Montinola or in her absence,
the Chairman of the Meeting
as attorney-in-fact and proxy, with power of substitution, to represent and vote all shares registered in his/her/its name, as proxy of the undersigned stockholder, at the Annual Meeting of Stockholders of FEU on 16 October 2021 and at any of the adjournments thereof for the purpose of acting on the following matters:
1. Approval of minutes of previous meeting. Yes No Abstain
2. Approval of Annual Report and Audited Financial Statements. Yes No Abstain
3. Ratification and confirmation of all acts and resolutions during the past year of the Board of Trustees, Board and Management Committees, and Management and other Officers. Yes No Abstain
4. Election of Trustees
Vote for all nominees listed below: Lourdes R. Montinola Aurelio R. Montinola III Michael M. Alba Sherisa P. Nuesa Antonio R. Montinola Paulino Y. Tan Edilberto C. De Jesus (Independent Trustee) Jose T. Sio (Independent Trustee)
Consuelo D. Garcia (Independent Trustee)
Withhold authority to vote for all nominees listed above.
Withhold authority to vote for the nominees listed below:
5. Appointment of Punongbayan & Araullo, Certified Public Accountants and the Philippine member firm of Grant Thornton International, Ltd. Yes No Abstain
6. At his/her discretion, the attorney-in-fact and proxy named above is authorized to vote upon such other business as may properly come before the meeting. Yes No Abstain
PRINTED NAME OF STOCKHOLDER
SIGNATURE OF STOCKHOLDER /
AUTHORIZED SIGNATORY
DATE
This proxy should be received by the Corporate Secretary on or before 3:00 p.m. of 15 October 2021, the deadline for submission of proxies.
This proxy, when properly executed, will be voted in the manner as directed herein by the stockholder/s. If no direction is made, this proxy will be voted “for” the election of all nominees and “for” the approval of the matters stated above and “for” such other matters as may properly come before the meeting in the manner described in the Information Statement and/or as recommended by Management or the Board of Trustees.
A stockholder giving a proxy has the power to revoke it at any time before the right granted is exercised. A proxy is also considered revoked if the stockholder attends the meeting in person and expressed his intention to vote in person.

- 25 - Item 3: Revocability of Proxy
The person giving the proxy has the right to revoke the proxy by personal appearance or execution of a proxy at a later date, subject to the pertinent requirements of the law and SEC Circular Number 5, Series of 1996.
Item 4: Persons Making the Solicitation
The solicitation is being made by the Registrant for the purpose of having the matters subject of the annual meeting approved by the stockholders, namely:
a. approval of the minutes of the annual meeting of stockholders held on 17 October 2020;
b. approval of the Annual Report of the Chairman and the Academic Report of the President to the stockholders for fiscal year ending 31 May 2021;
c. ratification and confirmation of the actions of the Board of Trustees, Board and Management Committees, and Management and Other Officers;
d. election of Trustees/Independent Trustees;
e. appointment of External Auditor;
f. such other matters as may properly come before the meeting and other actions of the Board of Trustees done and taken during the preceding year.
None of the members of the Board of Trustees has informed the Registrant in writing that he/she intends to oppose any action intended to be taken up at the meeting as aforementioned.
All costs of solicitation for the proxies are approximately in the amount of ₱250,000.00 which shall be borne by the Registrant.
Solicitation shall be conducted by the Registrant through Stock Transfer Service, Inc. (STSI), the company’s transfer agent by mail and personal delivery, and not by especially engaged employees. LBC Express, Inc., formerly known as Luzon Brokerage Corporation, the designated courier which will deliver the proxy statement has approximately 6,000 employees. It will charge a rate of ₱110.00 exclusive of 12% VAT for special delivery. No material features of the contract with the courier need to be disclosed. The Registrant has no knowledge if solicitation for purposes of opposing a solicitation will be conducted.
Item 5: Interest of Certain Persons in Matters to be Acted Upon
None of the members of the Board of Trustees or senior management has substantial interest in the matters to be acted upon by the stockholders in the annual stockholders’ meeting.


ANNEXES

ANNEX A
EXPLANATION OF AGENDA ITEMS
1. Call of meeting to order
Board of Trustees Chairman Aurelio R. Montinola III will preside and call the meeting to order at 3:00 p.m.
2. Proof of notice of meeting and determination of quorum
Corporate Secretary Anthony Raymond A. Goquingco will certify that copies of the
notice of meeting were sent to all stockholders of record as of 27 September 2021.
The Secretary will announce the percentage of those present, in person and by proxy, to the total issued and outstanding capital stock entitled to vote and represented at the meeting.
The Chairman of the Board will then declare the existence of a quorum.
3. Approval of minutes of the annual meeting of stockholders held on 17 October 2020
Stockholders who register for the online meeting can access the minutes of
17 October 2020 annual stockholders’ meeting for their approval at: https://investors.feu.edu.ph/reports%20new%20format/2020/10212020/2020%20Minutes%20of%20ASM.pdf
4. Academic Report of the President
Copies of the President’s Report for School Year 2020-2021 will be made available to those who register for the online meeting.
5. Approval of Annual Report and Audited Financial Statements
The Chairman will present the Annual Report with the Audited Financial Statements,
advance copies of which will be made available to those who register for the online meeting.
6. Ratification and confirmation of all acts and resolutions during the past year of
the Board of Trustees, Board and Management Committees, and Management and other Officers
All acts and resolutions of the Board of Trustees, Board and Management Committees, and Management and other Officers taken or adopted during the past year will be recommended to the stockholders for their ratification and confirmation.
7. Election of Trustees, including Independent Trustees
In accordance with the By-Laws, as amended, the Nomination Committee will determine whether the nominees for the Board of Trustees, including the nominees for Independent Trustees, have all the qualifications and none of the disqualifications to serve as members of the Board before submitting the nominees for election by the stockholders.

As determined by the Nomination Committee, the following were nominated (please see the profiles of the nominees to the Board of Trustees):
Trustees
Dr. Lourdes R. Montinola
Mr. Aurelio R. Montinola III
Dr. Michael M. Alba
Mr. Antonio R. Montinola
Ms. Sherisa P. Nuesa
Dr. Paulino Y. Tan
Independent Trustees
Dr. Edilberto C. De Jesus
Mr. Jose T. Sio
Ms. Consuelo D. Garcia
8. Appointment of External Auditor
The firm Punongbayan & Araullo, Certified Public Accountants and the Philippine member firm of Grant Thornton International, Ltd., will be recommended for reappointment as External Auditor for the ensuing year.
9. Consideration of such other business as may properly come before the meeting
Stockholders may raise such other relevant matters or issues that may be taken up at the meeting.
10. Adjournment
Upon determination that there are no other matters to be considered, the Chairman, upon motion made and seconded, will declare the meeting adjourned.

Nominees to the Board of Trustees for Election at the
Annual Stockholders' Meeting

Lourdes R. Montinola 93, Filipino: Chair Emeritus (August 2013 to present), Chair (June 1989 to August 2013),Far Eastern University, Inc.
Other Corporate Affiliations: Chair, Board of Directors, FERN Realty Corporation; Chair and President, FEU Educational Foundation, Inc.; Chair Emeritus, Nicanor Reyes Educational Foundation, Inc.; Governor, Nicanor Reyes Memorial Foundation; Trustee, FEU-Dr. Nicanor Reyes Medical Foundation, Inc.; and Board Member, The English Speaking Union. She is also a Member of the Oriental Ceramic Society, and HABI: The Philippine Textile Council, Inc.
Dr. Montinola was Chairman of MEMORARE-Manila 1945 Foundation, Inc. until 2017.
Dr. Montinola holds a Bachelor of Arts degree (cum laude) from Marymount College, New York, U.S.A., and an M.A. in Cultural History from the Asean Graduate Institute of Arts. She completed the Management Development Program for College and University Administrators in the Institute for Educational Management, Graduate School of Education, Harvard University, U.S.A. She obtained her Ph.D. in English: Creative Writing from the University of the Philippines.
Aurelio R. Montinola III70, Filipino: Chairman of the Board of Trustees (August 2013 to present),Vice Chairman (June 1989 to August 2013), Far Eastern University, Inc. Other Corporate Affiliations: Chairman, Amon Trading Inc., East Asia Computer Center, Inc., Far Eastern College Silang, Inc., Nicanor Reyes Educational Foundation, Inc., FEU High School, Inc., FEU Alabang, Inc., Roosevelt College, Inc., Ramon Magsaysay Award Foundation, and National Golf Association of the Philippines; Vice Chairman, Philippine Business for Education Foundation (PBED); President, Management Association of the Philippines; Director, BPI/MS Insurance Corporation; and Member, Makati Business Club. He was President of BPI from 2005-2013 and was a former President of the Bankers Association of the Philippines.
He is currently a Director of the Bank of the Philippine Islands, and Independent Director of Roxas and Company Incorporated, both listed corporations. He graduated with a BS Management Engineering degree at the Ateneo de Manila University in 1973, and received his MBA at Harvard Business School in 1977. He was awarded the 2005 and 2010 Asian Banker Leadership Award for the Philippines and the MAP Management Man of the Year Award in 2012.
Michael M. Alba64, Filipino: President and Trustee (October 2012 to present), Far Eastern University, Inc.
In the FEU Group of Schools, he is President concurrently of East Asia Computer Center, Inc.; Far Eastern College Silang, Inc.; FEU Alabang, Inc.; FEU High School, Inc.; Roosevelt College, Inc.; East Asia Educational Foundation, Inc.; and Nicanor Reyes Educational Foundation, Inc. He is also the Chairman of Edustria, Inc., a Governor of the Nicanor Reyes Memorial Foundation, and the President of the Foundation for Information Technology Education and Development. His affiliations include, among others: FEU Public Policy Center (President); Philippine Association of Colleges and Universities (Board Member); Coordinating Council of Philippine Educational Associations (Trustee, 2020‒2022); Association of Southeast Asian Institutions of Higher Learning–National Council of the Philippines (President, 2018‒2020); Southeast and South Asia and Taiwan Universities (Member, Steering Committee); Philippine Economic Society (Lifetime Member and President, 2007); Action for Economic Reforms (Fellow); Management Association of the Philippines (Member); and Leadership Council of Sustainability Development Solutions Network, Philippines (Member 2020‒2023).
He obtained his AB (Economics) degree from the Ateneo de Manila University in 1978, MA (Economics) degree from the University of the Philippines (Diliman) School of Economics in 1987, and PhD (Applied Economics) degree from Stanford University in 1993.

Paulino Y. Tan75, Filipino: Trustee, Far Eastern University, Inc. (June 1991 to present)
Other Corporate Affiliations: At present, Member of the Board of Directors/Trustees of the following companies: Nicanor Reyes Educational Foundation, Inc., FEU Educational Foundation, Inc., East Asia Educational Foundation, Inc., East Asia Computer Center, Inc., Lyceum of Batangas, Lyceum of Laguna, SM Foundation, Inc., Asia Pacific Technology Educational Foundation, Asia Pacific Computer Technology Center,Inc., FERN Realty Corporation, Far Eastern College Silang, Inc., FEU High School, Inc., FEU Alabang, Inc., Roosevelt College, Inc. and Foundation for Information Technology Education and Development, Inc., MFI Polytechnic Institute, Inc.
Dr. Tan obtained the Degree of Bachelor of Science in Chemical Engineering from De La Salle University. He obtained both his M.S. and Ph.D. in Chemical Engineering from the University of Notre Dame, Indiana, U.S.A.
Antonio R. Montinola68, Filipino: Trustee, Far Eastern University, Inc. (November 2013 to present)
Other Corporate Affiliations: President and Director FERN Realty Corporation and Monti-Rey, Inc.; Vice Chairman, Treasurer and Director, AMON Trading Corp., Director, Far Eastern College Silang, Inc., and Nicanor Reyes Educational Foundation, Inc.; and Trustee, FEU Educational Foundation, Inc.
Sports Affiliations: Member, Board of Managing Directors, Universities Athletic Association of the Philippines (UAAP); Team Manager, FEU Tamaraws; Member, Manila Golf Club; Member, Tagaytay Midlands Golf Club; Member, The Rockwell Club.
He worked with Procter & Gamble and Jardine Davies, Inc. in the Philippines and with General Mills Corp., based in Minneapolis, Minnesota, U.S.A.
Mr. Montinola holds an A. B. Economics Degree (honors course) from Ateneo de Manila University (1973) and an M.B.A. from Stanford University, Palo Alto, California, U.S.A. (1978).
Sherisa P. Nuesa66, Filipino: Regular Trustee, Far Eastern University, Inc. (August 2010 to present)Nominee, Trustee (October 2021), Far Eastern University, Inc.
Other Corporate Affiliations: President and Board Director, ALFM Mutual Funds Group and Independent Director, East Asia Computer Center, Inc., FERN Realty Corporation and Far Eastern College Silang, Inc. She is also an Independent Director of Manila Water Company, Ayala Land, Inc., AC Energy Phils., and Integrated Micro-Electronics, Inc., all publicly-listed corporations. She also serves as a Senior Adviser to the Boards of Vicsal Development Corporation and Metro Retail Stores Group, Inc. A former Managing Director of conglomerate Ayala Corporation, she held various senior management positions in Ayala subsidiaries: Ayala Land, Inc., Manila Water Company and Integrated Micro Electronics Inc. Ms. Nuesa is a Trustee of the Institute of Corporate Directors (ICD), the Financial Executives Institute of the Philippines (FINEX) Foundation and the Judicial Reform Initiative, where she also serves as Chairperson. She graduated with the degree of Bachelor of Science in Commerce (summa cum laude) at Far Eastern University in 1974 and received her Master of Business Administration degree from the Ateneo - Regis Graduate School of Business in 2010. She also attended post-graduate management programs at Harvard Business School and Stanford University. She received the ING -FINEX CFO of the Year award in 2008.

Jose T. Sio 81, Filipino: Independent Trustee, Far Eastern University, Inc. (April 2019 to present)
Other Corporate Affiliations: Chairman of the Board of Directors of SM Investments Corporation; Director of Ortigas Land Corporation, Atlas Consolidated Mining and Development Corporation, NLEX Corporation, Belle Corporation, China Bank; Trustee of Asia Pacific Technology Educational Foundation, Inc. (Asia Pacific College); President of SM Foundation, Inc.
Previous Affiliations: Senior Partner of SGV & Co., Consultant at T. N. Soong & Co., CPA in Taipei, Taiwan and Audit Associate at Ernst and Whinney, CPA in New York, USA.
Mr. Sio was voted as CFO of the year in 2009 by the Financial Executives of the Philippines (FINEX). In various years, he received Asia’s Best CFO Award from Hong Kong–based publications such as Alpha Southeast Asia, Corporate Governance Asia, Finance Asia and The Asset. In 2018, he received the Asian Corporate Director Award from Corporate Governance Asia.
Mr. Sio is a Certified Public Accountant. He obtained his Bachelor of Science in Commerce Major in Accounting from University of San Agustin, Iloilo City. He completed his Master of Business Administration Major in Corporate Finance and Management in New York University, New York, USA.
Edilberto C. de Jesus79, Filipino: Independent Trustee, Far Eastern University, Inc. (August 2012 to present) Other Corporate Affiliations: Chairman, FEU Public Policy Center; Member, Board of Directors of Phinma, Inc., Cagayan de Oro College (a member of the Phinma Education Network); Independent Director of Far Eastern College-Silang, Inc. and Summer Institute of Linguistics (SIL) Philippines; Independent Trustee of Roosevelt College, Inc. and Nicanor Reyes Educational Foundation, Inc.; Member, Board of Trustees of InciteGov, Foundation for Liberty and Prosperity; Advisory Board of Integrity Initiative, Inc. and Philippine Business for Education; Professor Emeritus, Asian Institute of Management; Non-Resident Senior Research Fellow, Ateneo School of Government. Fellow, Institute of Corporate Directors, and Institute for Solidarity in Asia; Member, Makati Business Club. He obtained a BA Honors Degree in the Humanities, cum laude at the Ateneo de Manila University in 1962, and received his M. Phil. (1969) and Ph.D. degrees (1972) from Yale University. He served as president of: Far Eastern University (1995-2002); University of the Cordilleras (2008-2009); Asian Institute of Management (2009-2012); and Secretariat Director, Southeast Asia Ministers of Education Organization in Bangkok (2005-2007). He also served in the Cabinet of President Corazon Aquino as Deputy Peace Commissioner and Presidential Adviser on Rural Development (1987-1992) and as Secretary of Education in the Cabinet of President Gloria Arroyo (2002-2004).
Consuelo D. Garcia 67, Filipino: Nominee, Independent Trustee (October 2021), Far Eastern University, Inc.
Other Corporate Affiliations: Independent Director, FEU Alabang, Inc., She is also an Independent Director of GT Capital Holdings and AC Energy Corporation, both are publicly-listed corporations. She also serves as Independent Director of The Philippine Stock Exchange, Inc., Sunlife Investment Management and Trust Corporation, and ING Foundation Philippines, Inc.
Ms. Garcia is also Senior Consultant for Challengers and Growth Markets, ING Bank, N.V,, Manila Branch. Member of the Board of Directors of the Financial Executives Institute of the Philippines (FINEX) and Liaison Director to the Finex Capital Markets Development Committee, and the Information, Communications and Technology Committee and member of the Capital Markets Development Council; Member of the Board of Trustees of the Finex Academy of the Philippines; and a Fellow of the Institute of Corporate Directors.
She was formerly the Country Manager and Head of Clients of ING Bank N.V. Manila from September 2008 - November 15, 2017. Ms. Garcia previously worked with SGV in audit and in the Bank of Boston, Philippine Branch.
Ms. Garcia is a Certified Public Accountant and she graduated Magna Cum Laude, Bachelor of Science in Business Administration, major in Accounting from the University of the East.


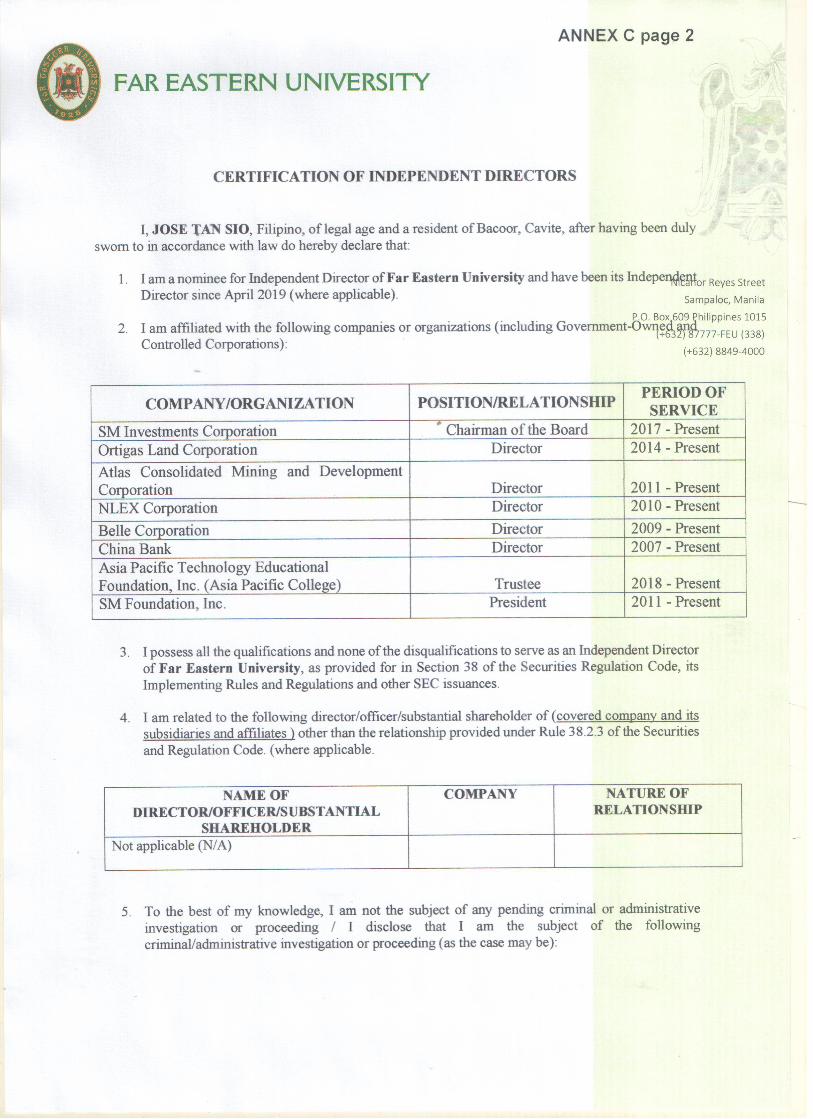
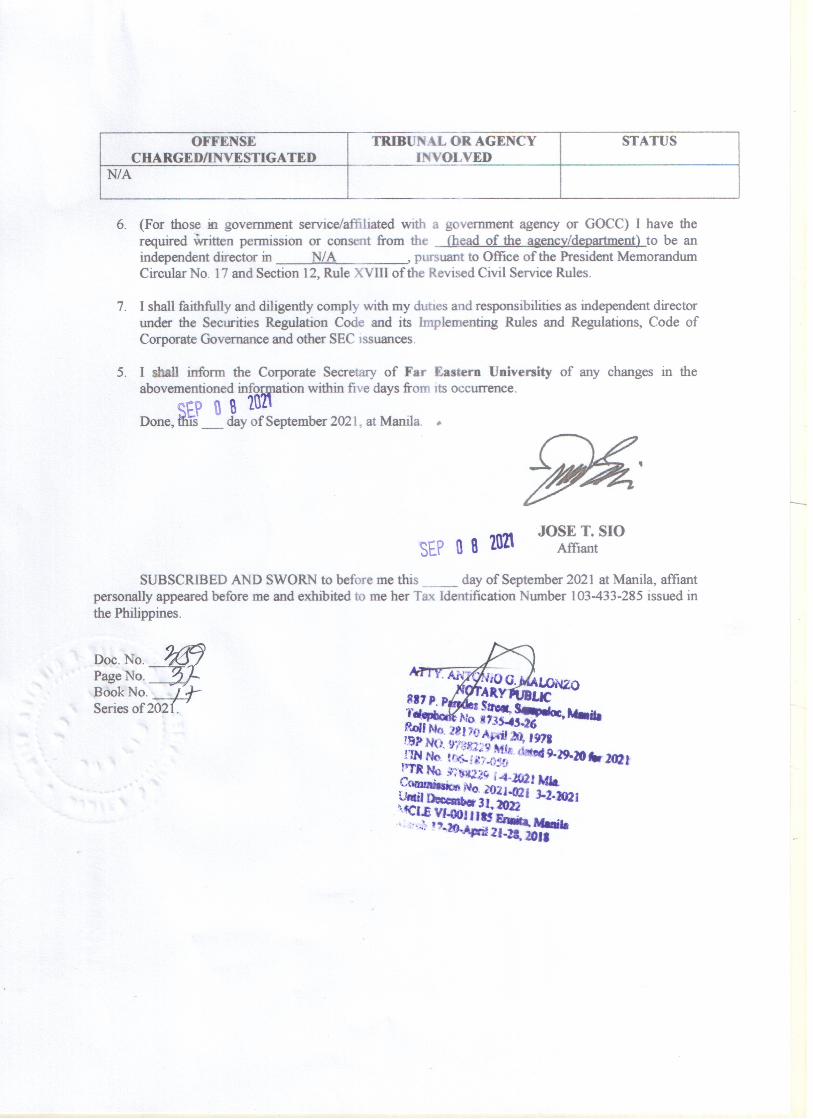

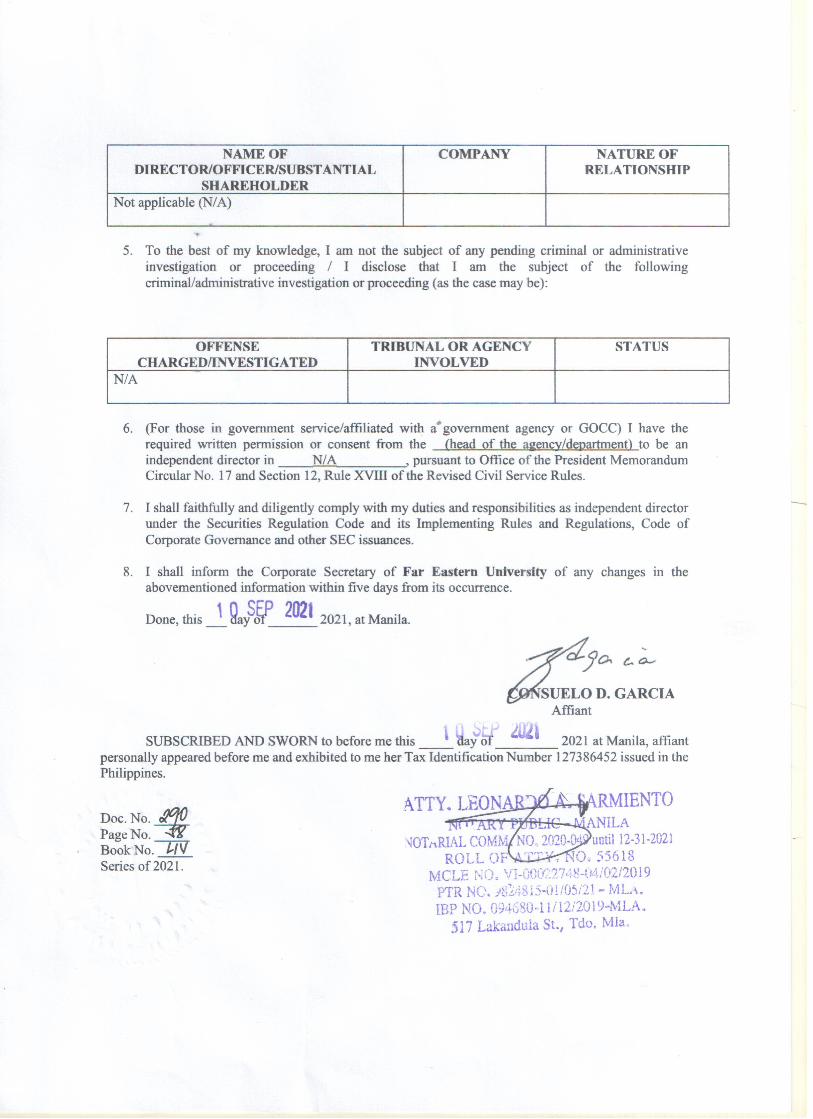


III. Financial Reporting
We reviewed, discussed, and endorsed for the approval of the Board, and subject to
the limitations of the Committee’s roles and responsibilities, the quarterly unaudited
and annual audited consolidated statements of Far Eastern University, Inc. and
Subsidiaries.
Based on the reviews and discussions undertaken, and subject to the limitations on our roles
and responsibilities referred to above, the Audit Committee recommends to the Board of
Directors that the audited consolidated financial statements be included in the Annual Report
for the fiscal year ended May 31, 2021 for filing with the Securities and Exchange
Commission and the Philippine Stock Exchange.
SHERISA P. NUESA EDILBERTO C. DE JESUS JOSE T. SIO
Chairperson Member Member
Independent Trustee Independent Trustee Independent Trustee

ANNEX F
MANAGEMENT REPORT
A. Brief Description of the General Nature and Scope of the Business of the Registrantand its Subsidiaries
B. Market Price and Dividends
C. Top 20 Stockholders as of 31 August 2021
D. Management Discussion and Analysis or Plan of Operation
E. Corporate Governance
F. Statement of Management’s Responsibility for Financial Statements
G. Audited Consolidated Financial Statements as of 31 May 2021, 31 May 2020 and 31 May 2019, with accompanying notes to Financial Statements

- 1 -
Business
Far Eastern University (FEU), Inc. – the business entity – was incorporated in 1933. It operates Far Eastern University – the higher education institution – and is the majority shareholder of East Asia Computer Center, Inc. (EACCI); FEU Alabang, Inc.; Far Eastern College Silang, Inc.; FEU High School, Inc.; and Roosevelt College, Inc. It is also a major shareholder in Fern Realty Corporation, which assists the FEU schools in their real estate requirements. In turn, EACCI does business under the names and styles FEU Institute of Technology (FEU Tech or FIT) and FEU Diliman, while Far Eastern College Silang, Inc., does so as FEU Cavite. In addition, Far Eastern University, Inc., owns 51% of Edustria, Inc., in a joint venture with the Technological Institute of the Philippines (T.I.P.), Inc., which has a 49% stake. Edustria, Inc., operates a high school under the same name in the Lipa-Malvar area of Batangas province. In the schools it operates, FEU, Inc., adopts a holistic approach to education, taking into consideration both academics and whole-person development, which includes, among others, the students’ social, ethical, and emotional growth. FEU schools purposefully endeavor to foster an inclusive, nurturing, safe, and secure space set in beautifully designed campuses conducive for learning.
On 19 February 2021, FEU, Inc., received the One Golden Arrowhead Recognition from the ASEAN Corporate Governance Scorecard (ACGS) for being a top-performing publicly listed company in the Philippines.
A. Brief Discussion of Business
Mother Company 1. FAR EASTERN UNIVERSITY
Far Eastern University (FEU) was founded in 1928 as a private, nonsectarian institution of learning. Guided by the core values of fortitude, excellence, and uprightness, it aims to be a university of choice in Asia. Committed to the highest intellectual, moral, and cultural standards, the university strives to produce principled and professionally competent graduates, and nurtures a service-oriented and environment-conscious community that seeks to contribute to the advancement of the global society.
Tuition and other fees, which are the main sources of revenues, are moderate and subject to government regulation. Full and partial scholarship grants are awarded to deserving students.
FEU maintains excellent facilities to support the schooling experience of students. These include, among others, a library with an expanding electronic footprint; various types of laboratories; audio-visual and multi-media rooms including smart classrooms; conference, meeting, and multi-function rooms; an auditorium; gyms and other sports facilities; a clinic; and an information-technology enabled gate security system. All classrooms are spacious and air-conditioned – the ambient temperature powered campus-wide by an environmentally friendly district-cooling system, the first and apparently still the only one in a Philippine campus setting. Enrollment and financial operations are managed on NetSuite, an integrated, cloud-based enterprise resource planning (ERP) platform, while academic activities are organized on the state-of-the-art Canvas learning management system.
The university’s high standard of quality is substantiated by numerous recognitions from the Philippine Commission on Higher Education (CHED); accrediting bodies such as the Philippine Association of Colleges and Universities Commission on Accreditation (PACUCOA) and the Philippine Accrediting Association of Schools, Colleges, and Universities (PAASCU); the ASEAN University Network – Quality Assurance (AUN-QA) system; and the World’s Universities with Real Impact (WURI).

- 2 -
The CHED first conferred on FEU the autonomous university status on 25 July 2012. Then, adopting the stricter quality-assurance framework of CHED Memorandum Order 46 series of 2012, the commission affirmed the status per CHED Memorandum Order 20 series of 2016, extending its effectivity to 31 May 2019. Subsequently, CHED Memorandum Order 12 series of 2019 reaffirmed the university’s autonomy through to 31 March 2021 and CHED Memorandum Order 7 series of 2021 extended it further to 31 May 2023.
For its part, the WURI ranked FEU 91st overall and 19th in the ethical value category during its inaugural run in 2020. In 2021, FEU’s WURI rankings improved to 79th overall, 16th in ethical value, 42nd in entrepreneurial spirit, and 12th on crisis management. In both years, FEU was the only Philippine higher education institution in the top 100 universities of the WURI list.
Product: Organized as seven institutes and an extension campus (in Makati), Far Eastern University offers the following baccalaureate and graduate programs:
1. Institute of Accounts, Business, and Finance (IABF) – Manila and Makati campuses
Baccalaureate Programs:
Bachelor of Science in Accountancy
Bachelor of Science in Business Administration (Business Analytics Track)
Bachelor of Science in Business Administration (Entrepreneurial Management Track)
Bachelor of Science in Business Administration (Financial Management Track)
Bachelor of Science in Business Administration (Leadership and Human Capital Track)
Bachelor of Science in Business Administration (Marketing Management Track)
Bachelor of Science in Internal Auditing
Graduate Programs:
Master of Business Administration
2. Institute of Architecture and Fine Arts (IARFA)
Baccalaureate Programs:
Bachelor of Fine Arts major in Studio Arts
Bachelor of Fine Arts major in Visual Communication
Bachelor of Science in Architecture (Building Construction Track)
Bachelor of Science in Architecture (Housing Design Track)
Bachelor of Science in Architecture (Urban Design Track)
3. Institute of Arts and Sciences (IAS)
Baccalaureate Programs:
Bachelor of Arts in Communication (Convergent Media Track)
Bachelor of Arts in Communication (Digital Cinema Track)
Bachelor of Arts in Interdisciplinary Studies (Global Development and Sustainability Track)
Bachelor of Arts in Interdisciplinary Studies (Philippine Arts, Culture, and Society Track)
Bachelor of Arts in Interdisciplinary Studies (Urban Spaces and Transitions Studies Track)
Bachelor of Arts in International Studies (International Development and Cooperation)
Bachelor of Arts in International Studies (International Relations and Diplomacy)
Bachelor of Arts in Language and Literature Studies (English Studies Track)
Bachelor of Arts in Language and Literature Studies (Literature Studies Track)
Bachelor of Arts in Political Science (Philippine Politics and Foreign Relations Track)
Bachelor of Science in Applied Mathematics (Data Science Track)
Bachelor of Science in Applied Mathematics (Information Technology Track)
Bachelor of Science in Biology (Medical Biology Track)

- 3 -
Bachelor of Science in Biology (Microbiology Track)
Bachelor of Science in Biology (Systematic Biology Track)
Bachelor of Science in Medical Technology
Bachelor of Science in Psychology
Graduate Programs:
Doctor of Philosophy in Psychology major in Clinical Psychology
Doctor of Philosophy in Psychology major in Forensic Psychology
Doctor of Philosophy in Psychology major in Industrial Psychology
Master of Arts in Communication
Master of Arts major in Letters
Master of Arts in Psychology with specialization in Clinical Psychology
Master of Arts in Psychology with specialization in Industrial Psychology
Master of Science in Biology
4. Institute of Education (IE)
Baccalaureate Programs:
Bachelor of Elementary Education
Bachelor of Physical Education
Bachelor of Science in Exercise and Sports Science major in Fitness and Sports Management
Bachelor of Secondary Education major in English
Bachelor of Secondary Education major in Mathematics
Bachelor of Secondary Education major in Science
Bachelor of Special Needs Education
Certificate Program:
Teacher Certificate Program
Graduate Programs:
Doctor of Education major in Curriculum and Instruction
Doctor of Education major in Educational Administration
Doctor of Education major in Language and Literature Education
Master of Arts in Education major in Curriculum and Instruction
Master of Arts in Education major in Educational Administration
Master of Arts in Education major in English Language Teaching
Master of Arts in Education major in Literature and Language Education (English)
Master of Arts in Education major in Special Education
Master in Physical Education
5. Institute of Law (IL)
Graduate Program:
Juris Doctor
6. Institute of Nursing (IN)
Baccalaureate Program:
Bachelor of Science in Nursing
Graduate Programs:
Master of Arts in Nursing specialized in Community Health
Master of Arts in Nursing specialized in Maternal-Child Health
Master of Arts in Nursing specialized in Medical-Surgical Nursing
Master of Arts in Nursing specialized in Mental Health and Psychiatric Nursing
Master of Arts in Nursing specialized in Nursing Systems Administration

- 4 -
7. Institute of Tourism and Hotel Management (ITHM)
Baccalaureate Programs:
Bachelor of Science in Hotel and Restaurant Management (Culinary Management Track)
Bachelor of Science in Hotel and Restaurant Management (Hotel Operations Track)
Bachelor of Science in Tourism Management (Events Management Track)
Bachelor of Science in Tourism Management (Travel and Tours Management Track)
All of these academic program offerings were approved and/or granted permits by the CHED or, in the case of the Juris Doctor program, the Legal Education Board, as well as other relevant government agencies. Program Accreditations
Far Eastern University continuously strives for excellence in teaching, research and development, and extension work. Validations of this institutional effort include CHED citations of the teacher education programs of the IE as a Center of Excellence and the Bachelor of Science in Business Administration program of the IABF as a Center of Development.
Local Accreditations
Almost all of the academic programs in the Manila campus are accredited by the PACUCOA. The following programs had PACUCOA Level IV accreditation status (the highest) for the period December 2015 to December 2020 and, due to the covid-19 pandemic, have had to undergo their first Level IV Reaccreditation Visit in April 2021 as a virtual exercise, the official results of which are still pending:
Bachelor of Arts in Communication
Bachelor of Elementary Education
Bachelor of Science in Accountancy
Bachelor of Science in Applied Mathematics with Information Technology
Bachelor of Science in Biology
Bachelor of Science in Business Administration
Bachelor of Science in Psychology
Bachelor of Secondary Education
The Bachelor of Science in Nursing is the only academic program in the Manila campus that is
accredited by the PAASCU. It has Level III Reaccredited status for the period August 2018 to November 2021.
The programs with PACUCOA Level III Reaccredited status from January 2020 to January 2022 Include:
Doctor of Education
Master of Arts in Education
Master of Arts in Psychology
The programs with PACUCOA Level II Reaccredited status from January 2020 to January 2025 are:
Bachelor of Arts in International Studies
Bachelor of Fine Arts
Bachelor of Science in Architecture
Bachelor of Science in Medical Technology
Bachelor of Science in Tourism Management
while those with the same status from May 2018 to May 2023 are:
Bachelor of Arts in Language and Literature Studies
Bachelor of Arts in Political Science
Bachelor of Science in Hotel and Restaurant Management
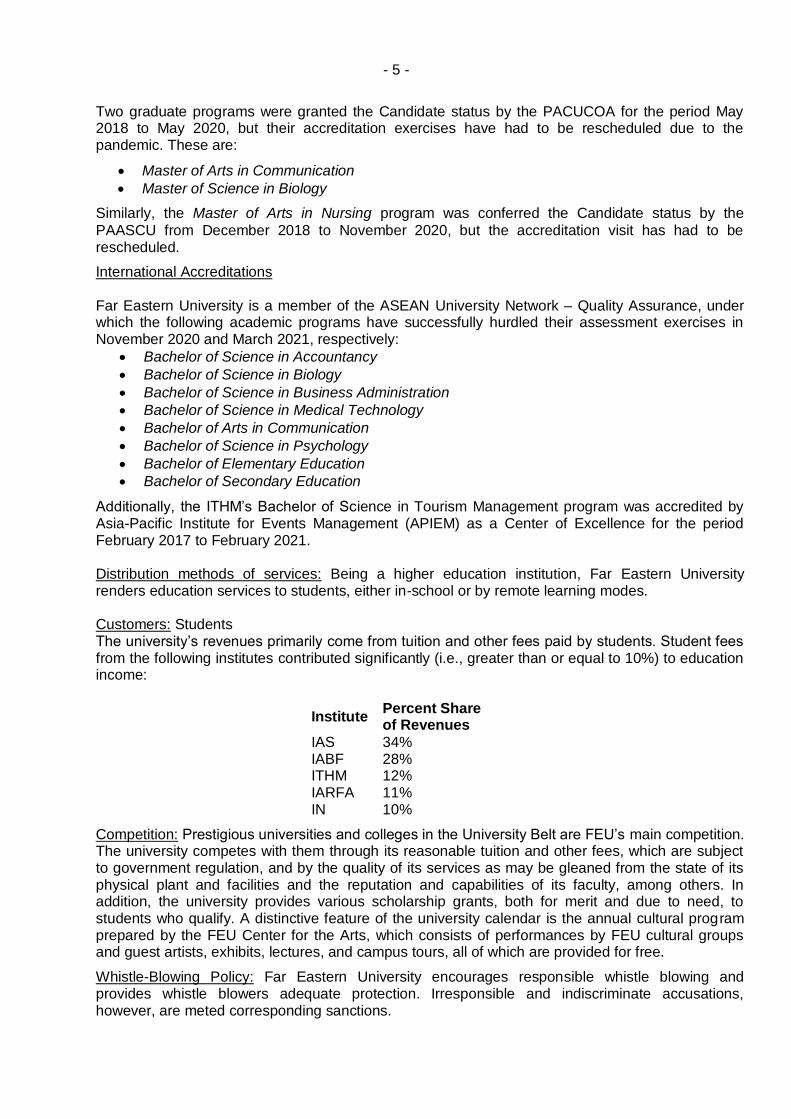
- 5 -
Two graduate programs were granted the Candidate status by the PACUCOA for the period May 2018 to May 2020, but their accreditation exercises have had to be rescheduled due to the pandemic. These are:
Master of Arts in Communication
Master of Science in Biology
Similarly, the Master of Arts in Nursing program was conferred the Candidate status by the
PAASCU from December 2018 to November 2020, but the accreditation visit has had to be rescheduled.
International Accreditations Far Eastern University is a member of the ASEAN University Network – Quality Assurance, under which the following academic programs have successfully hurdled their assessment exercises in November 2020 and March 2021, respectively:
Bachelor of Science in Accountancy
Bachelor of Science in Biology
Bachelor of Science in Business Administration
Bachelor of Science in Medical Technology
Bachelor of Arts in Communication
Bachelor of Science in Psychology
Bachelor of Elementary Education
Bachelor of Secondary Education
Additionally, the ITHM’s Bachelor of Science in Tourism Management program was accredited by Asia-Pacific Institute for Events Management (APIEM) as a Center of Excellence for the period February 2017 to February 2021. Distribution methods of services: Being a higher education institution, Far Eastern University renders education services to students, either in-school or by remote learning modes.
Customers: Students The university’s revenues primarily come from tuition and other fees paid by students. Student fees from the following institutes contributed significantly (i.e., greater than or equal to 10%) to education income:
Institute Percent Share of Revenues
IAS 34% IABF 28% ITHM 12% IARFA 11% IN 10%
Competition: Prestigious universities and colleges in the University Belt are FEU’s main competition. The university competes with them through its reasonable tuition and other fees, which are subject to government regulation, and by the quality of its services as may be gleaned from the state of its physical plant and facilities and the reputation and capabilities of its faculty, among others. In addition, the university provides various scholarship grants, both for merit and due to need, to students who qualify. A distinctive feature of the university calendar is the annual cultural program prepared by the FEU Center for the Arts, which consists of performances by FEU cultural groups and guest artists, exhibits, lectures, and campus tours, all of which are provided for free.
Whistle-Blowing Policy: Far Eastern University encourages responsible whistle blowing and provides whistle blowers adequate protection. Irresponsible and indiscriminate accusations, however, are meted corresponding sanctions.
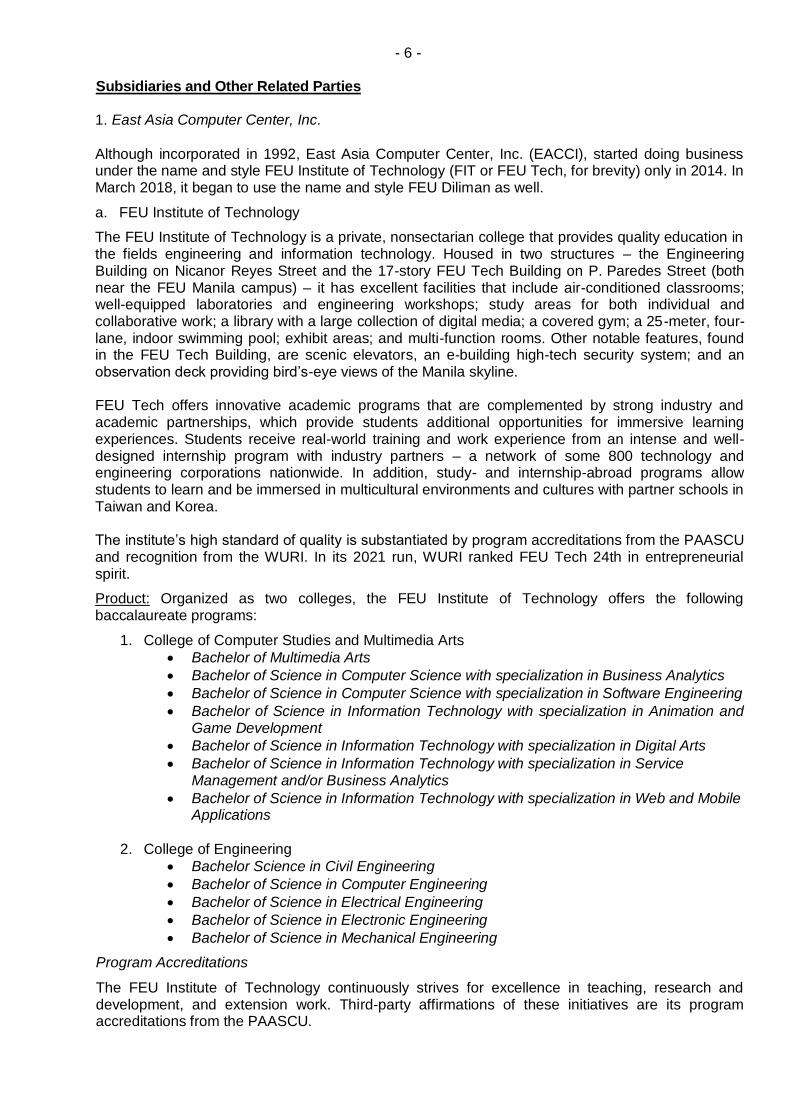
- 6 -
Subsidiaries and Other Related Parties
1. East Asia Computer Center, Inc.
Although incorporated in 1992, East Asia Computer Center, Inc. (EACCI), started doing business under the name and style FEU Institute of Technology (FIT or FEU Tech, for brevity) only in 2014. In March 2018, it began to use the name and style FEU Diliman as well.
a. FEU Institute of Technology
The FEU Institute of Technology is a private, nonsectarian college that provides quality education in the fields engineering and information technology. Housed in two structures – the Engineering Building on Nicanor Reyes Street and the 17-story FEU Tech Building on P. Paredes Street (both near the FEU Manila campus) – it has excellent facilities that include air-conditioned classrooms; well-equipped laboratories and engineering workshops; study areas for both individual and collaborative work; a library with a large collection of digital media; a covered gym; a 25-meter, four-lane, indoor swimming pool; exhibit areas; and multi-function rooms. Other notable features, found in the FEU Tech Building, are scenic elevators, an e-building high-tech security system; and an observation deck providing bird’s-eye views of the Manila skyline.
FEU Tech offers innovative academic programs that are complemented by strong industry and academic partnerships, which provide students additional opportunities for immersive learning experiences. Students receive real-world training and work experience from an intense and well-designed internship program with industry partners – a network of some 800 technology and engineering corporations nationwide. In addition, study- and internship-abroad programs allow students to learn and be immersed in multicultural environments and cultures with partner schools in Taiwan and Korea.
The institute’s high standard of quality is substantiated by program accreditations from the PAASCU and recognition from the WURI. In its 2021 run, WURI ranked FEU Tech 24th in entrepreneurial spirit.
Product: Organized as two colleges, the FEU Institute of Technology offers the following baccalaureate programs:
1. College of Computer Studies and Multimedia Arts
Bachelor of Multimedia Arts
Bachelor of Science in Computer Science with specialization in Business Analytics
Bachelor of Science in Computer Science with specialization in Software Engineering
Bachelor of Science in Information Technology with specialization in Animation and Game Development
Bachelor of Science in Information Technology with specialization in Digital Arts
Bachelor of Science in Information Technology with specialization in Service Management and/or Business Analytics
Bachelor of Science in Information Technology with specialization in Web and Mobile Applications
2. College of Engineering
Bachelor Science in Civil Engineering
Bachelor of Science in Computer Engineering
Bachelor of Science in Electrical Engineering
Bachelor of Science in Electronic Engineering
Bachelor of Science in Mechanical Engineering
Program Accreditations
The FEU Institute of Technology continuously strives for excellence in teaching, research and development, and extension work. Third-party affirmations of these initiatives are its program accreditations from the PAASCU.
- 7 –
Local Accreditations
Four academic programs of FEU Tech have Level II Accreditation status from the PAASCU:
Bachelor of Science in Computer Science with specialization in Software Engineering
Bachelor of Science in Information Technology with specialization in Web and Mobile Application Development
Bachelor of Science in Civil Engineering
Bachelor of Science in Computer Engineering
The first two enjoy their accreditation status until May 2021 and are due for reaccreditation in November 2021, while the last two have their status until May 2024.
b. FEU Diliman
FEU Diliman is a private, nonsectarian educational institution nestled in a neat10-hectare campus in Mapayapa Village, Quezon City. It offers the full spectrum of formal education from basic education (i.e., kindergarten, grade school, junior and senior high school) to college.
The school has an advanced basic education curriculum that gives special emphasis to English, science, and mathematics and that integrates 21st-century-skills development. The students’ holistic development is aimed for through their engagement in a wide array of sports, cultural, values formation, and socio-civic activities and programs. In addition, value-added courses are embedded in the curriculum to enable graduates to pursue higher education in the country’s top universities.
FEU Diliman’s higher education department aspires to become a professional institute (in the horizontal typology of CMO 46 series of 2012). Its academic programs are distinctive for their business-information technology fusion. The two pillars of its curriculum are the professional core courses for students to develop technical proficiency and long internships for students to gain deep familiarity with real-world practice. Using non-traditional, technology-facilitated delivery strategies, the academic programs foster deeper student engagement, better motivating the students to achieve the intended learning goals. Graduates are envisioned to be technology-empowered, highly qualified, and principled professionals and leaders who are poised to provide innovative solutions to the challenges they meet in their workplaces.
Product: Organized into a basic education department and two colleges, FEU Diliman offers the following programs:
1. Basic Education
Kindergarten
Grade School
Junior High School
Senior High School o Accountancy, Business, and Management o General Academic Strand o Humanities and Social Science o Science, Technology, Engineering, and Mathematics o Sports
2. College of Accounts and Business
Bachelor of Science in Accountancy
Bachelor of Science in Business Administration major in Financial Management and Business Analytics
Bachelor of Science in Business Administration major in Marketing Management and Multimedia Technology
Bachelor of Science in Business Administration major in Operations and Service Management

- 8 -
3. College of Computer Studies
Bachelor of Science in Information Technology with specialization in Animation and Game Development
Bachelor of Science in Information Technology with specialization in Web and Mobile Applications
2. FEU Alabang, Inc.
Founded in 2016, FEU Alabang, Inc., carries FEU’s mission to provide quality education to the south of Metro Manila. FEU Alabang – the school – is set in a 1.8-hectare campus accented by lush green spaces and a 200-seat, resplendent-in-white chapel in Filinvest City, Alabang, one of the most progressive areas in the southern Greater Manila area. Its 15-story academic building, which is equipped with modern classrooms and laboratories as well as an outdoor covered gym, welcomed its first batch of students in 2018.
Product: Organized as a senior high school department and three colleges, FEU Alabang offers the following programs:
1. Senior High School
Senior High School o Accountancy, Business, and Management o General Academic Strand o Humanities and Social Science o Science, Technology, Engineering, and Mathematics
2. College of Accounts and Business
Bachelor of Science in Accountancy
Bachelor of Science in Business Administration major in Financial Management and Business Analytics
Bachelor of Science in Business Administration major in Marketing Management and Multimedia Technology
Bachelor of Science in Business Administration major in Operations and Service Management
3. College of Engineering
Bachelor of Science in Civil Engineering
Bachelor of Science in Computer Engineering
Bachelor of Science in Electronics Engineering
Bachelor of Science in Electrical Engineering
Bachelor of Science in Mechanical Engineering
4. College of Computer Studies
Bachelor of Multimedia Arts
Bachelor of Science in Computer Science with specialization in Software Engineering
Bachelor of Science in Information Technology with specialization in Animation and Game Development
Bachelor of Science in Information Technology with specialization in Digital Arts
Bachelor of Science in Information Technology with specialization in Service Management and/or Business Analytics
Bachelor of Science in Information Technology with specialization in Web and Mobile Applications

- 9 -
3. Far Eastern College Silang, Inc.
Established in 2009, Far Eastern College Silang, Inc., does business under the name and style FEU Cavite (FEUC). Located inside MetroGate Silang Estates, a gated community in Silang, Cavite, it is the first subsidiary of FEU Inc. that operated outside Metro Manila. It admitted its first batch of pre-school, grade school, and college students in June 2010, and its first cohort of senior high school students in 2016. In School Year (SY) 2020‒2021, FEUC began accepting freshmen for three extension programs of FEU Manila: Bachelor of Arts in Communication, Bachelor of Arts in Political Science, and Bachelor of Science in Medical Technology. FEU Cavite aspires to be a school of choice in the Southern Tagalog region by pursuing the twin goals of inculcating a love for learning among its students and being an engine for the region’s socioeconomic development. It seeks to develop its students to be values-driven, service-oriented, and future-ready global citizens through a technology-empowered and individualized learning system. Its social mission is to fuel community growth by heritage preservation and environmental stewardship.
Product: Organized as three departments, FEU Cavite offers the following programs:
1. Basic Education
Pre-Kindergarten
Kindergarten
Grade School
Junior High School
2. Senior High School
Senior High School o Accountancy, Business, and Management o Humanities and Social Sciences o Science, Technology, Engineering, and Mathematics
3. Higher Education
Baccalaureate Programs:
Bachelor of Science in Accountancy
Bachelor of Science in Accounting Information System
Bachelor of Science in Business Administration (Financial Management Track)
Bachelor of Science in Business Administration (Marketing Management Track)
Bachelor of Science in Hospitality Management (Culinary Management Track)
Bachelor of Science in Hospitality Management (Hotel Operations Track)
Bachelor of Science in Information Technology
Bachelor of Science in Tourism Management (Events Management Track)
Bachelor of Science in Tourism Management (Travel and Tours Management Track)
Bachelor of Science in Psychology
Certificate Program:
Teacher Certificate Program
Extension Programs of FEU Manila
Baccalaureate Programs:
Bachelor of Arts in Political Science (Philippine Politics and Foreign Relations Track)
Bachelor of Arts in Communication (Convergent Media Track)
Bachelor of Arts in Communication (Digital Cinema Track)
Bachelor of Arts in Medical Technology

- 10 -
4. FEU High School, Inc.
FEU High School (FEU HS), Inc., was established as a subsidiary of Far Eastern University, Inc., in 2013 in response to Republic Act 10533 (otherwise known as the Enhanced Basic Education Act of 2013), which extended the Philippine basic education program to 13 years, adding Grades 11 and 12 to the secondary education level. Situated inside the FEU Manila campus, FEU HS welcomed its pioneer class of senior high school students in 2016.
Guided by the FEU core values, FEU High School provides quality education that prepares its graduates for college, the world of work, and life. Its curriculum is student-centered, values-driven, and competency-laden; its delivery methods are technology-enabled; and its learning activities are project based.
FEU HS’s mission is to equip its students with basic and future-ready skills; healthy habits of mind; and positive, resilient attitudes. Students who fully engage the curriculum develop a keen awareness of self and are empowered to interact with the world in different dimensions, create their own future, and contribute to nation-building.
FEU HS implements design thinking as a teaching strategy. Its academic offerings are complemented by special programs that foster experiential learning and the development of leadership and social skills as well as service orientation in students. The school has more than 70 student clubs and organizations, ranging from sports and arts to special interest groups.
Product: FEU High School offers the following programs:
1. Senior High School
Senior High School o Accountancy, Business, and Management o General Academic Strand with specialization in Arts and Design o General Academic Strand with specialization in Sports and Health o General Academic Strand with specialization in Tourism o Humanities and Social Sciences o Science, Technology, Engineering, and Mathematics
5. Roosevelt College, Inc.
Roosevelt College, Inc. (RCI), has a long history of providing quality education as a private, nonsectarian school, first as Marikina Academy in 1933 and as RCI since 1946. RCI became a member of the FEU Group of Schools in May 2016 when FEU Inc. purchased the 79.7% of RCI’s outstanding capital stock (since increased to 97.3%) and gained management control of all campuses and affiliated companies. In 2019, RCI started to do business under the name and style FEU Roosevelt (FEUR).
Significantly contributing to the expansion of the FEU Group’s geographic and demographic footprint and of basic education in its portfolio of program offerings, FEU Roosevelt is expected to carry FEU’s distinctive marks of quality education and excellent facilities while improving the accessibility of such to more Filipino families. It currently operates three campuses, which are located in Marikina City, Metro Manila, and the municipalities of Cainta and Rodriguez, both of which are in Rizal province.
FEUR envisions the formation of a productive and responsible citizenry who are empowered through education.
Product: Organized as three campuses, FEU Roosevelt offers the full spectrum of academic program offerings from basic education to graduate school.

- 11 -
1. FEUR Cainta
Basic Education Programs:
Developmental Kindergarten
Kindergarten
Grade School
Junior High School
Senior High School o Accountancy, Business, and Management o Humanities and Social Sciences o Science, Technology, Engineering, and Mathematics
Baccalaureate Programs:
Bachelor of Early Childhood Education
Bachelor of Elementary Education
Bachelor of Secondary Education major in English
Bachelor of Secondary Education major in Filipino
Bachelor of Secondary Education major in Mathematics
Bachelor of Secondary Education major in Science
Bachelor of Secondary Education major in Social Studies
Bachelor of Secondary Education major in Values Education
Bachelor of Science in Hospitality Management
Bachelor of Science in Business Administration (Human Resources Management Track)
Bachelor of Science in Business Administration (Marketing Management Track)
Bachelor of Science in Business Administration (Operations Management Track)
Certificate Program:
Teacher Certificate Program
Graduate Programs:
Master of Arts in Education major in Educational Management
Master of Arts in Education major in Educational Technology
Master of Arts in Education major in English Studies and Instruction
Master of Arts in Education major in Filipino Education
Master of Arts in Education major in Guidance and Counseling
Master of Arts in Education major in Mathematics Education
Master of Arts in Education major in Physical Education
Master of Arts in Education major in Science Education
Master of Arts in Education major in Social Studies
Master of Arts in Education major in Special Education
Master of Arts in Education major in Teaching in the Early Grades
Master of Arts in Education major in Values Education
2. FEUR Marikina
Basic Education Programs:
Developmental Kindergarten
Kindergarten
Grade School
Junior High School
Senior High School o Accountancy, Business, and Management o Humanities and Social Sciences o Science, Technology, Engineering, and Mathematics o Home Economics o Information and Computer Technology

- 12 -
Baccalaureate Programs:
Bachelor of Science in Information Technology
Bachelor of Science in Business Administration (Human Resources Management Track)
Bachelor of Science in Business Administration (Marketing Management Track)
Bachelor of Science in Business Administration (Operations Management Track)
3. FEUR Rodriguez
Basic Education Programs:
Developmental Kindergarten
Kindergarten
Grade School
Junior High School
Senior High School o Accountancy, Business, and Management o Humanities and Social Sciences o Science, Technology, Engineering, and Mathematics o Home Economics o Information and Computer Technology
6. Edustria, Inc.
Edustria, Inc., was established in 2019 as a joint venture of Far Eastern University and the Technological Institute of the Philippines. A contraction of “Education for Industry,” Edustria as an enterprise aims to deliver education that is relevant to industry needs. Doing business under the name and style Edustria High School, it admitted its first batches of Grade 7 and Grade 11 students in 2020.
Strategically located in the Lima Technology Center at Lipa City, Batangas, where more than 100 manufacturing companies from various industries have set up shop, Edustria partners with key firms in the technology park to bring its students in close proximity to the world of work. Work immersion is a key feature of Edustria’s teaching and learning strategy; students are not only taught the necessary content knowledge, they are also developed in their skills and competencies through industry-enriched curriculums and strengthened in their characters through work-values training. Edustria graduates are intended to be both work- and college-ready and to thrive in life in 21st century.
Product: Edustria High School offers the following programs:
Junior High School
Senior High School o Accountancy, Business, and Management o General Academic Strand o Humanities and Social Sciences o Science, Technology, Engineering, and Mathematics
7. Fern Realty Corporation
Fern Realty Corporation (FRC) was established in 1984 primarily to assist FEU and eventually its subsidiary schools in their real estate requirements. For this purpose, the corporation acquired properties in Metro Manila and Silang, Cavite, which are currently leased to the FEU schools. In Silang, it has also constructed dormitory facilities and farm laboratories for the use of students and faculty members and a staff house for officers of FEU Cavite.
FRC is also engaged in developing and acquiring real properties for sale or lease. With Ayala Land, Inc., it co-developed Ferndale Homes in Quezon City; and with Moldex Realty Corporation, Fern Parc, a premium subdivision within MetroGate Silang Estate in Silang, Cavite. Its prime condominium units and residential houses in Makati City, Quezon City, and Taguig City are leased to local and foreign corporations and individuals. The latest additions to its asset portfolio are condominium units in Arbor Lanes, Arca South, Taguig City, as well as in Proscenium Residences at Rockwell, Two Roxas Triangle, and Park Central – all three of which are located in Makati City.

- 13 - B. Market Prices of Common Stocks: (Phil. Stock Exchange, Inc.) and Dividends Declared The Philippine Stock Exchange, Inc. is the principal market where the shares of stock of the
corporation are being traded. Market Prices of Common Stocks: (Phil. Stock Exchange, Inc.)
Herewith are the high, low, and closing prices of shares of stock traded from June 2020 to August 2021:
2020 High
Low Close
June 965.00 575.34 771.00
July 770.00 550.00 600.00
Aug 605.00 552.00 575.00
Sep 560.00 528.00 555.00
Oct 564.00 488.20 550.00
Nov 660.00 550.00 650.00
Dec 650.00 555.00 630.00
2021
Jan 600.00 555.00 555.00
Feb 670.00 550.00 584.00
Mar 590.00 580.00 590.00
Apr 599.00 580.00 586.00
May 590.00 570.00 570.00
June 668.00 570.00 585.00
July 583.00 565.00 565.00
Aug 560.00 550.00 550.00
Sep* 550.00 550.00 550.00
* As of September 10, 2021
High and low sale prices for each quarter are as follows:
a. June 01, 2021 - August 31, 2021
Period High Low Close
First Quarter ₱ 603.67 ₱ 561.67 ₱ 566.67
b. June 01, 2020 - May 31, 2021
Period High Low Close
First Quarter ₱ 780.00 ₱ 559.11 ₱ 648.67
Second “ 594.67 522.07 585.00
Third “ 640.00 553.33 589.67
Fourth “ 593.00 576.67 582.00
c. June 01, 2019 - May 31, 2020
Period High High Low Low Close Close
(Adjusted) (Adjusted) (Adjusted)
First Quarter ₱895.00 ₱613.01 ₱890.00 ₱609.59 ₱891.67 ₱610.73
Second “ 923.67 632.65 890.00 609.59 918.00 628.77
Third “ 905.50 620.21 860.17 589.16 861.17 589,96
Fourth “ 830.00 568.49 815.00 558.22 815.00 558.22

- 14 -
Dividends:
Cash Dividend:
June 1, 2020 – May 31, 2021
Outstanding Cash Dividend Payment Date Shares Rate Amount
December 16, 2020 24,055,763 ₱3.00/share ₱ 72,167,289.00
March 15, 2021 24,055,763 5.00/share 120,278,815.00 ₱192,446,105.00 ============= June 1, 2019 – May 31, 2020
Outstanding Cash Dividend Payment Date Shares Rate Amount
October 09, 2019 16,477,023 ₱10.00/share ₱164,770,230.00
March 18, 2020 16,477,023 10.00/share 164,770,230.00 ₱329,540,460.00 =============
Stock Dividend:
No stock dividend for the period June 1, 2020 to May 31, 2021 was declared. However, the distribution of stock dividend declared in previous fiscal year was made on June 18, 2020.
Restrictions on Dividends
Cash dividend on common shares shall be paid based on the approval of the Board of Trustees up to the amount of the unrestricted retained earnings, while stock dividend on common shares shall be paid based on the approval of the Board of Trustees, ratified by the stockholders, based on the unrestricted retained earnings up to the approved authorized capital stock.

- 15 -
Recent Sales of Unregistered or Exempt Securities
There are no sales of unregistered or exempt securities including recent issuance of securities constituting an exempt transaction.
C. Number of Shareholders
There are 1,509 common stockholders holding a total of 24,055,763 outstanding shares as of 31 August 2021.
The following are the top 20 stockholders:
Title of Class
Name of Beneficial Owner
No. of Shares and Nature of
Beneficial Ownership
Citizenship
Percent Of Class
1. Common Seyrel Investment and Realty Corporation
6,887,051 – D
Filipino 28.63
2. Common Sysmart Corporation 5,204,608 – D Filipino 21.64
3. Common Desrey, Incorporated 1,924,956 – D Filipino 8.00
4. Common PCD Nominee Corporation (Filipino)
1,330,259 – D Filipino 5.53
5. Common Angelina D. Palanca 776,534 – D Filipino 3.23
6. Common Sr. Victorina D. Palanca 539,616 – D Filipino 2.24
7. Common ICM Sisters Phil. Mission Board, Inc.
527,352 – D Filipino 2.19
8. Common Aurelio Montinola III 458,165 – D Filipino 1.90
9. Common Marco P. Gutang 306,797 – D Filipino 1.28
10. Common Gonzaga-Lopez Enterprises, Inc 294,668 – D Filipino 1.22
11. Common Amon Trading Corporation 279,975 – D Filipino 1.16
12. Common Jomibel Agricultural Development Corporation
261,170 – D Filipino 1.09
13. Common ZARE, Inc. 121,707 – D Filipino 0.51
14. Common Rosario P. Melchor 118,292 – D Filipino 0.49
15. Common Juan Miguel R. Montinola 109,710 – D Filipino 0.46
16. Common Rosario Panganiban Melchor 107,385 – D Filipino 0.45
17. Common Gianna R. Montinola 106,033 – D Filipino 0.44
18. Common Antonio R. Montinola 105,721 – D Filipino 0.44
19. Common Consorcia P. Reyes 96,484 – D Filipino 0.40
20. Common The Caridad I. Santos Gifting Trust
81,678 – D Filipino 0.34
Total 19,638,161 81.64

D. Management’s Discussion and Analysis or Plan of Operation
As an academic institution, The Far Eastern University, Incorporated and its subsidiaries (The Group or FEU) is fully aware of the importance of education in nation building and to its students who benefit from quality instruction, research and community extension. The Group is committed to continuously uplift academic standards through updating of its curricula, developing the faculty, improving the services to its students, and providing the best educational facilities. Consolidated Financial Position
The Group continues to maintain a strong financial position, well enough to continuously sustain its operations and support its mission of delivering quality education to its students. For the past three years, the Group saw continuous asset growth, while managing liabilities and ensuring consistent build-up of stockholders’ equity.
The Group’s well-positioned balance sheet is characterized by its capacity to meet obligations, whether maturing currently or due within a longer time horizon. The Group’s assets are still mainly attributable to its shareholders, while maintaining a balanced leverage on creditor-provided financing. Presented below are the liquidity and solvency ratios for the respective reporting periods.
2021 2020 2019
Current ratio Total Current Assets /
Total Current Liabilities 2.35 : 1 1.56 : 1 1.21 : 1
Quick/Acid test ratio Quick Assets /
Total Current Liabilities 2.23 : 1 1.48 : 1 1.13 : 1
Debt-to-equity ratio Total Liabilities /
Total Stockholders’ Equity 37% 46% 43%
(Amounts in Million Philippine Peso)
Fiscal Year Ending
Consolidated Total
Assets
Increase Consolidated
Total Liabilities
Increase (Decrease) Consolidated
Net Assets
Increase
Amount % Amount % Amount %
May 31, 2018 P 13,187.4 P - - P 4,146.0 P - - P 9,041.4 P - -
May 31, 2019 14,080.0 892.6 7% 4,211.9 65.9 2% 9,868.1 826.7 9%
May 31, 2020 15,186.6 1,106.6 8% 4,768.8 556.9 13% 10,417.8 549.8 5%
May 31, 2021 15,421.4 234.8 2% 4,156.2 ( 612.5) -13% 11,265.1 847.3 8%
Average P 744.7 5% P 3.4 1% P 741.2 8%

Debt-to-asset ratio Total Liabilities /
Total Assets 27% 31% 30%
Equity-to-asset ratio Stockholders Equity /
Total Assets 73% 69% 70%
May 31, 2021 vs. May 31, 2020
The consolidated total assets as of May 31, 2021 grew by 2%, from P15,186.6 million last year to P15,421.4 million. Current assets went down by P370.5 million, from P4,531.8 million to P4,161.3 million, however, non-current assets registered an increment of P605.3 million, from P10,654.8 million to P11,260.0 million. The increase in the consolidated total assets is due to the satisfactory results of operations during the year. On a per account basis, much of the increase is on the Group’s investments – Financial assets at fair value through profit or loss (FVTPL), fair value through other comprehensive income (FVOCI) and investment securities at amortized cost. Consequently, Cash and cash equivalents declined due to outflows on investment and financing activities – financial investment acquisitions, debt repayments and cash dividend distribution. Asset increase was likewise tapered by fixed asset depreciation and amortization, and increased impairment losses on Trade and other receivables. Consolidated total liabilities was trimmed by 13%, from P4,768.8 million last year to P4,156.2 million as of the current report date, mainly on account of repayments of interest-bearing loans. Deferred revenues also went down as classes for the ongoing semester/term were already completed, allowing recognition into income of previously deferred fees, while Income Tax payable was minimized because of the reduction of income tax rate for proprietary educational institutions, as provided for by the CREATE law. Consolidated total equity sustained its growth trajectory mainly with the current year’s net income.
Total equity attributable to Parent company increased by 11%, while Non-controlling interest (NCI)
grew by 2%, with current balances of P8,355.6 million and 2,909.6 million, respectively. Other
than the net income, equity growth was due to an additional investment from NCI, by way of an
additional issuance of preferred shares by East Asia Computer Center, Inc. (EACCI) and FEU
Alabang, Inc. (FEUAI).
The Parent company was able to distribute cash dividends to stockholders amounting to P192.4 million and P329.5 million for the years ended May 31, 2021, and 2020, and stock dividends worth P757.9 million also in fiscal year 2020. May 31, 2020 vs. May 31, 2019
As of May 31, 2020, the consolidated total assets reached a milestone P15,186.6 million, which was 8% above the previous year’s P14,080.0 million. Current assets grew by 18%, from P3,848.9 million as of May 31, 2019 to P4,531.8 million as of May 31, 2020, while non-current assets inched higher by 4%, from P10,231.1 million as of May 31, 2019 to 10,654.8 million as of May 31, 2020.

The growth in consolidated total assets was fueled mainly by the results of operations during the year, financing from borrowings and investments from NCI. The Group saw balances of Cash and cash equivalents and Trade and other receivables grow significantly due to improvements in the operating activities as a result of the increase in student population. Property and equipment also increased due to the construction activities undertaken by FEUAI, EACCI and the University in its Manila campus. Consolidated total liabilities increased by 13% to P4,768.8 million as of May 31, 2020, compared
to previous year’s P4,211.9 million. The increase was mainly on account of the higher year-end
balance of Trade and other payables resulting from payment recording cut-off, and the
outstanding balances of additional bank loans obtained during the year.
Non-current liabilities grew to P1,855.2 million from previous year’s P1,041.2 million, while current liabilities declined to P2,913.6 million from P3,170.7 million last year. Consolidated total equity improved by 6%, from P9,868.1 million as of the beginning of the fiscal year to P10,417.8 million as of May 31, 2020. The Group’s consolidated equity, composed of the equity attributable to owners of the Parent company and NCI amounting to P7,556.5 million and P2,861.4 million, respectively, had sustained growths during the year. Consolidated Results of Operations During fiscal years 2019 and 2020, improved results of operations were expected as these years mark the first two years of return of freshmen enrollees in the tertiary schools as part of the K-12 transition. On the latter part of fiscal year 2020, however, unprecedented challenges brought about the corona virus disease (COVID-19) pandemic caused a cessation of the traditional face-to-face classes, and instead led to the transition to a remote learning modality. Fortunately, the FEU Group of schools had been investing heavily on online learning platforms since 2017, even before the onset of the pandemic – showing the Group’s commitment to continuous innovation and improvement of its content and delivery of instructions to students. Throughout the fiscal year 2021, the country remained under various quarantine restriction levels to curb the spread of COVID-19. Face-to-face classes remained suspended, due to people mobility and business activity restrictions. The Group faced certain challenges including the decline in enrollment, discounted assessed tuition fees, more relaxed financial accommodation for students to continue their education, higher default rates on student receivables and greater costs related to health and safety of personnel. Despite such challenges, the Group’s strict cost management measures, coupled with better than prior years’ returns from investments in financial assets, timing of lower interest rates on bank loans, and tax savings due to lowered income tax rates based on the CREATE law, produced encouraging results for the current fiscal year. Below are the measures of the Group’s operating performance for the fiscal years ended May 31, 2021, 2020 and 2019.
2021 2020 2019
Return on assets Net Income /
Average Total Assets 6% 5% 6%

Return on equity Net Income /
Average Total Equity 9% 7% 9%
Earnings per share Net Income /
Average Outstanding Shares P 40.28 P 25.92 P 31.41
May 31, 2021 vs. May 31, 2020 For the year ended May 31, 2021, the Group’s operating income, showed a modest increase of 3% from last year to P794.1 million. Educational revenues this year were affected by a student population decline of 11% and discounted tuition fees as a result of pandemic difficulties and full year online learning mode. Special credit considerations of an unprecedented volume for student promissory note availment representing 28% to total student population and 5% in absolute amount of total revenue were extended to students to assist with the continuation of their studies. The comparative previous years educational revenues were likewise depressed due to tuition rebates from the sudden schedule disruption at the onset of the COVID-19 pandemic and the resulting cancellation of the third term for the trimestral schools of the FEU Group. As a result educational revenue this year declined by only 1% and were recorded at P 3,522.4 million. Operating expenses were reduced by P119.3 million, or 4% compared to the amount incurred in fiscal year 2020. This includes however additional Impairment losses, of P173.2 million, a three-fold increase from last year’s P81.7 million. The Group recognized the need to provide additional allowance on its tuition fee receivables as a significant number of students with outstanding tuition balances did not enroll during the last two semesters or terms. In spite of the credit accommodations extended to students, it is still anticipated that some of the students’ families will be hard-hit by the adverse economic effects of the pandemic. The Group strictly managed usage and on-site driven expenses like utilities, outside services, supplies and materials, professional fees and transportation, among others. Other non-operating items provided boost to the Group’s performance as Finance and
Miscellaneous income grew by 40% and 13%, respectively, while Finance cost dropped by 57%.
Investment income improved as market prices of investments started to bounce back compared to its lowest points during March to May 2020. Moreover, favorable impact was recognized on the cost side as banks offered accommodative interest rates on loans in addition to the effect of significant loan repayments made during the year. The reduced income tax rate, from 10% to 1%, in accordance with the CREATE law also provided some relief. Profit before tax amounted to P1,016.3 million while tax expense was at P37.0 million, resulting to the Group’s net income after tax of P979.3 million, a 43% increase from last year.

May 31, 2020 vs. May 31, 2019 The Group’s operating income for the fiscal year ended May 31, 2020 was registered at P771.9 million, a 16% improvement from preceding year. The main driver for this was 7% growth in educational revenues, to P3,556.3 million. The educational revenues were generally expected to improve as this was the second year of
enrolled freshmen in the tertiary schools after the initial implementation of the K-12 program. The
anticipated revenue growth, however, was trimmed by fee rebates granted to students, amounting
to P115.9 million. The University returned unutilized miscellaneous fees resulting from the shift
to full online classes starting March 2020. The University’s second semester started out normally
during the first two months but had to switch to full online mode during the remaining three months.
Moreover, the expected full contribution to revenue from the trimestral schools of the Group, particularly EACCI and FEUAI, were curtailed by the COVID-19 pandemic, as a result of their third term revenue contribution of P153.0 million moved to August 2020 or to school year 2020-2021. While organic operations still showed an improvement despite the then looming effect of the COVID-19 pandemic, other income posted a significant decline as it dropped by 95%, to only P12.6 million from prior year’s P266.39 million. This is attributable to lower finance income already noted at the opening of year 2020 exacerbated by the slump in the financial markets caused by the nationwide lockdowns from March to May 2020, and further pulled down by increased interest charges on a larger loan principal base. Income before tax settled at P784.6 million, while tax expense amounted to P101.6 million, resulting to a net income after tax of P683.0 million. A Look at What Lies Ahead
With the COVID-19 pandemic affecting the Philippines and almost all countries around the world, management recognizes the Group’s exposure to the risks in its business environment. Despite the FEU Group of schools’ track record and proven capability to adapt to a remote learning environment, the continuous mutation of the COVID-19 resulting to potential surges in infections, pose a significant level of uncertainty, especially on the potential adverse economic impact on the general public’s household income. Despite such uncertainties, however, there is some reason for optimism as the government ramps up its vaccination efforts. To date, approximately 50% of the NCR population have received at least one dose of the vaccine. Moreover, the government’s changes in quarantine strategy to a more focused granular levels of alert instead of region-wide/province-wide lockdowns is seen to allow more businesses to operate, thus, improving the general business condition and economic outlook. As from the start, the Group continues its commitment to undertake actions necessary to contribute to solving the problem of COVID-19 – from strict adherence to health and safety protocols, to providing free vaccines for its employees and to adapting flexible working arrangements to ensure a balance of service delivery to all stakeholders, students and employees, alike, without compromise to safety. The management will continue to be prudent in the implementation of its business continuity plans, both at the corporate and the academic operational levels, to mitigate any foreseen
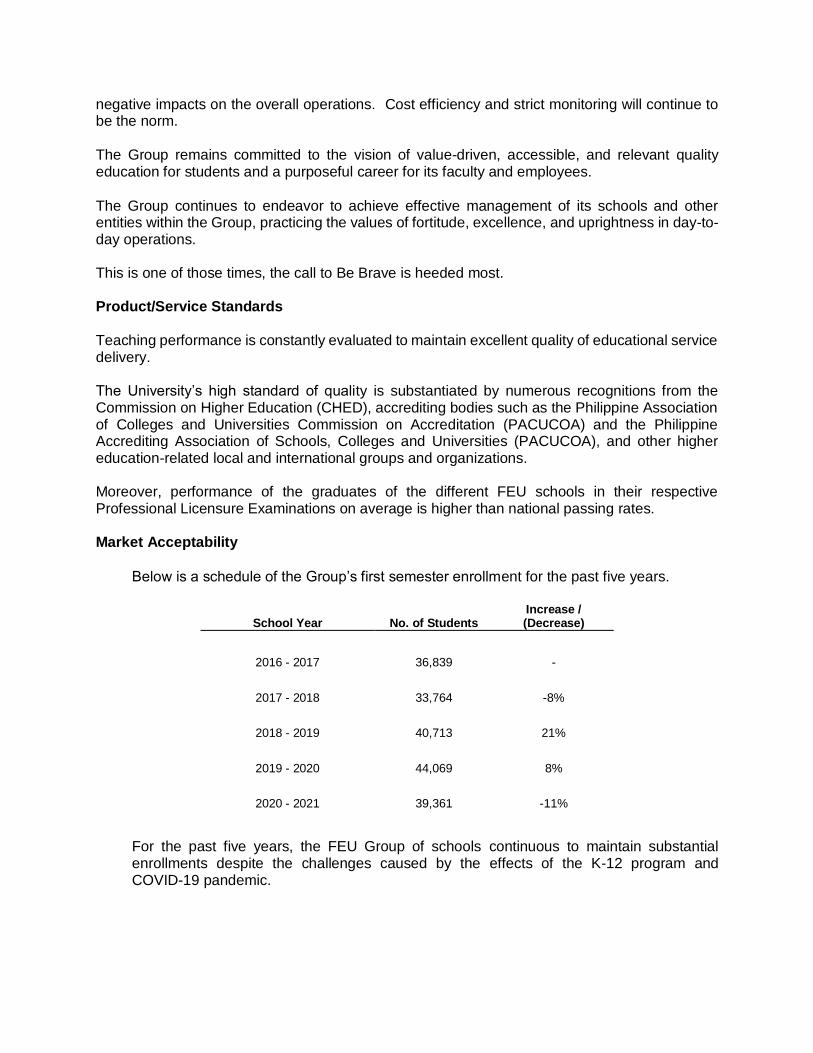
negative impacts on the overall operations. Cost efficiency and strict monitoring will continue to be the norm. The Group remains committed to the vision of value-driven, accessible, and relevant quality education for students and a purposeful career for its faculty and employees.
The Group continues to endeavor to achieve effective management of its schools and other entities within the Group, practicing the values of fortitude, excellence, and uprightness in day-to-day operations. This is one of those times, the call to Be Brave is heeded most. Product/Service Standards Teaching performance is constantly evaluated to maintain excellent quality of educational service delivery. The University’s high standard of quality is substantiated by numerous recognitions from the Commission on Higher Education (CHED), accrediting bodies such as the Philippine Association of Colleges and Universities Commission on Accreditation (PACUCOA) and the Philippine Accrediting Association of Schools, Colleges and Universities (PACUCOA), and other higher education-related local and international groups and organizations. Moreover, performance of the graduates of the different FEU schools in their respective Professional Licensure Examinations on average is higher than national passing rates. Market Acceptability
Below is a schedule of the Group’s first semester enrollment for the past five years.
School Year No. of Students Increase / (Decrease)
2016 - 2017 36,839 -
2017 - 2018 33,764 -8%
2018 - 2019 40,713 21%
2019 - 2020 44,069 8%
2020 - 2021 39,361 -11%
For the past five years, the FEU Group of schools continuous to maintain substantial enrollments despite the challenges caused by the effects of the K-12 program and COVID-19 pandemic.

Other Items
1. As of report date, certain economic factors affect the revenues and income from the Group’s operations. Such factors include the implementation of K-12 program (starting SY 2016-2017), the competition from tuition-free State Universities and Colleges, and the current COVID-19 pandemic being experienced around the world.
2. There are no known events that would result in any default or acceleration of an
obligation. 3. Other than those disclosed in the financial statements, there are no other known
events that will trigger direct or contingent financial obligation that may be material to the Group.
4. There are no other material off-balance sheet transactions, arrangements, obligations
(including contingent obligations), and other relationships of the Group with unconsolidated entities or other persons created during the reporting period.
5. The Group does not foresee any cash flow or liquidity problem in the next 12 months
immediately following the report date. The Group and each of the component entities can easily meet all its commitments with its present reserves and expected earnings.
6. There are no significant elements of income or loss from continuing operations.
7. There are no sales of Unregistered or Exempt Securities including Recent Issuance of
Securities Constituting an Exempt Transaction.
8. Seasonal aspects that have material effect on the financial statements: For FEU Manila and FEU Cavite (Tertiary), there are three school terms within a fiscal
year: Midyear Term (June to July for FEU Manila, while April to May for FEU Cavite), First Semester (August to December for FEU Manila, while June to October for FEU Cavite) and Second Semester (January to May for FEU Manila and November to March for FEU Cavite).
The first semester has the highest number of students enrolled. The second semester
enrollment is approximately at 90% of the first semester’s enrollment, while the midyear term is the lowest at an approximate of 33%. The maximum load, in terms of subject units, of a student during the summer term is only nine units, compared to 21 to 24 units during the first and second semesters.
For FEU Tech and FEU Alabang, there are three regular terms in a fiscal year: First
Term (August to November), Second Term (November to March) and Third Term (March to June).
The tuition fee increase, if any, usually takes effect during the first semester of a
particular school year. Thus, old rates are followed during the midyear term while new rates are applied during the first and second semesters. Since the first quarter is from June to August, the resulting income for the first quarter is at the lowest among the four quarters of the fiscal year.

9. The Group has no significant other operating segments beside education, its real estate activities are in place significantly to service the real estate needs of the operating schools. Investment and corporate activities are made to optimized reserve funds still with the objective of focusing resources in its core educational operations. The Group reports geographical segments between metropolitan and provincial where campuses of FEU Schools are diversely located. The segment information is disclosed in Note 7 of the Consolidated Notes to Financial Statements.
E. Corporate Governance
Compliance with Leading Practices on Corporate Governance
1. Board of Trustee’s Governance Responsibilities
1.1. Establish a Competent Board - Far Eastern University (FEU) is headed by a competent,
working Board of Trustees (Board). The Board is composed of Trustees with a collective
working knowledge, experience and expertise that are relevant to FEU’s education
industry.
1.2. Establish Clear Roles and Responsibilities of the Board - The fiduciary roles, responsibilities
and accountabilities of the FEU Board as provided under the law, FEU’s Articles of
Incorporation and By-Laws, as amended, and other legal pronouncements and guidelines
are clearly made known to all Trustees as well as to stockholders and other stakeholders
of FEU.
1.3. Establish Board Committees - All of the Board Committees of FEU are set up to support
the effective performance of the Board’s functions. The composition, functions and
responsibilities of all Board Committees established are contained in a publicly available
Committee Charter.
1.4. Foster Board Commitment - To show their full commitment to FEU, its Trustees devote the
time and attention necessary to properly and effectively perform their duties and
responsibilities, including sufficient time to be familiar with FEU’s business.
In amendments endorsed by the Corporate Governance Committee and ratified by the Board on 15 May 2018, FEU policies now (i) allow Trustees to attend meetings via tele-conferencing or videoconferencing conducted in accordance with SEC rules; (ii) provide that the absence of a Trustee in more than 50% of all Board meetings during his/her incumbency is a ground for disqualification in the succeeding election; (iii) limit Trustees from concurrently serving as directors/trustees to a maximum of five publicly listed companies; and (iv) require a Trustee to notify the Chairman of the Board when he/she is invited to join the board of directors/trustees of another company, and to review with the Corporate Governance Committee before he/she accepts the invitation any potential conflict issues that may need to be brought before the Board.
1.5 Reinforce Board Independence - The FEU Board endeavors to exercise objective and
independent judgment on all corporate affairs. And the Board has three Independent
Trustees, or one-third of the nine-member Board of Trustees.
1.6 Strengthen Board Ethics - The members of the FEU Board are duty-bound to apply high
ethical standards, taking into account the interests of all stakeholders.
2. Disclosure and Transparency
2.1. Enhance Disclosure Policies and Procedures - FEU had established corporate disclosure
policies and procedures that are practical and in accordance with best practices and
regulatory expectations.
2.2. Strengthen External Auditor’s Independence and Improve Audit Quality - FEU had
established standards for the appropriate selection of an External Auditor, and exercised
effective oversight of its External Auditor to strengthen the latter’s independence and
enhance audit quality.
2.3. Increase Focus on Non-Financial and Sustainability Reporting - FEU had ensured that the
material and reportable non-financial and sustainability issues are disclosed.
2.4. Promote a Comprehensive and Cost-Efficient Access to Relevant Information - FEU
maintains a comprehensive and cost-efficient communication channel for disseminating
relevant information. The channel is crucial for informed decision-making by investors,
stakeholders and other interested users.
3. Internal Control System and Risk Management Framework
3.1. Strengthen Internal Control System and Enterprise Risk Management Framework - FEU
has a strong and effective internal control system and enterprise risk management
framework that ensures the integrity, transparency and proper governance in the conduct
of its affairs.
3.2. FEU seeks external technical support in risk management when such competence is not
available internally.
4. Cultivate Synergic Relationship with Shareholders
4.1. Promote Shareholder Rights - FEU treats all shareholders fairly and equitably, and also
recognizes, protects and facilitates the exercise of their rights.
4.2. The minutes of the 17 October 2020 (a Saturday) Annual Meeting of FEU Stockholders
were posted on the FEU website on 21 October 2020, three business days from the end of
the meeting.
5. Duties to Stakeholders
5.1. Respect Rights of Stakeholders and Effective Redress for Violation of Stakeholders’ Rights
- FEU respects the rights of stakeholders established by law, contractual relations and
through voluntary commitments. In FEU, where stakeholders’ rights and/or interests are at
stake, stakeholders have the opportunity to obtain prompt and effective redress for the
violation of their rights.
5.2. Encourage Employees’ Participation - FEU had developed a mechanism for employee
participation that creates a symbiotic environment to realize FEU’s goals and participate in
its governance processes.
FEU has an active Union of its rank-and-file employees and another working Union of its faculty members. Both Unions have a collective bargaining agreement with FEU.
5.3. Encourage Sustainability and Social Responsibility - FEU is socially responsible in all its
dealings with the communities where it operates. FEU ensures that its interactions serve
its environment and stakeholders in a positive and progressive manner that is fully
supportive of its comprehensive and balanced developments.

P W 0 0 0 0 0 5 3 8
F A R E A S T E R N U N I V E R S I T Y
I N C O R P O R A T E D A N D S U B S I D I A R I E S
N I C A N O R R E Y E S S T R E E T ,
S A M P A L O C , M A N I L A
1 7 - A S E C
N I C A N O R R E Y E S S T R E E T ,
S A M P A L O C , M A N I L A
ATTY. ANTHONY RAYMOND A.
GOQUINGCO
8735 - 8686
Note: In case of death, resgination or cessation of office of the officer designated as contact person, such incident shall be reported to the Commission within thirty (30)
calendar days from the occurrence thereof with information and complete contact details of the new contact person designated.
Annual Meeting Fiscal Year
8735 - [email protected]
N/A
-
Contact Person's Address
1,509 16-Oct 31-May
CONTACT PERSON INFORMATIONThe designated contact person MUST be an Officer of the Corporation
Name of Contact Person Email Address Telephone Number/s Mobile Number
No. of Stockholders
Month/Day Month/Day
Form Type Department requiring the report Secondary License Type, If Applicable
COMPANY INFORMATION
Company's Email Address Company's Telephone Number/s Mobile Number
N/A
Principal Office ( No./Street/Barangay/City/Town)Province)
COVER SHEETCOVER SHEETCOVER SHEETCOVER SHEETforforforfor
AUDITED FINANCIAL STATEMENTSAUDITED FINANCIAL STATEMENTSAUDITED FINANCIAL STATEMENTSAUDITED FINANCIAL STATEMENTS
SEC Registration Number
Company Name
Punongbayan & Araullo (P&A) is the Philippine member firm of Grant Thornton International Ltd
Consolidated Financial Statements and Independent Auditors’ Report
Far Eastern University, Incorporated and Subsidiaries March 31, 2021, 2020 and 2019
FOR SEC FILING
Punongbayan & Araullo
20th Floor, Tower 1
The Enterprise Center
6766 Ayala Avenue
1200 Makati City
Philippines
T +63 2 8988 2288
a
Certified Public Accountants
Punongbayan & Araullo (P&A) is the Philippine member firm of Grant Thornton International Ltd.
Offices in Cavite, Cebu, Davao
BOA/ PRC Cert of Reg. No. 0002
SEC Accreditation No. 0002
grantthornton.com.ph
Report of Independent Auditors
The Board of Trustees and the Stockholders
Far Eastern University, Incorporated and Subsidiaries
Nicanor Reyes Street,
Sampaloc, Manila
Opinion
We have audited the consolidated financial statements of Far Eastern University, Incorporated
(the University) and subsidiaries (together hereinafter referred to as the Group), which
comprise the consolidated statements of financial position as at May 31, 2021, 2020 and 2019
and the consolidated statements of profit or loss, consolidated statements of comprehensive
income, consolidated statements of changes in equity and consolidated statements of
cash flows for each of the three years in the period ended May 31, 2021, and the notes to
consolidated financial statements, including a summary of significant accounting policies.
In our opinion, the accompanying consolidated financial statements present fairly, in all material
respects, the consolidated financial position of the Group as at May 31, 2021, 2020 and 2019,
and its consolidated financial performance and its consolidated cash flows for each of the three
years in the period ended May 31, 2021 in accordance with Philippine Financial Reporting
Standards (PFRS).
Basis for Opinion
We conducted our audits in accordance with Philippine Standards on Auditing (PSA). Our
responsibilities under those standards are further described in the Auditors’ Responsibilities for
the Audit of the Consolidated Financial Statements section of our report. We are independent
of the Group in accordance with the Code of Ethics for Professional Accountants in the
Philippines (Code of Ethics) together with the ethical requirements that are relevant to our
audits of the consolidated financial statements in the Philippines, and we have fulfilled our
other ethical responsibilities in accordance with these requirements and the Code of Ethics.
We believe that the audit evidence we have obtained is sufficient and appropriate to provide a
basis for our opinion.

Certified Public Accountants
Punongbayan & Araullo (P&A) is the Philippine member firm of Grant Thornton International Ltd.
- 2 -
Emphasis of Matter
We draw attention to Note 1 to the consolidated financial statements, which describes
management's assessment of the continuing impact on the Group's consolidated financial
statements of the business disruption brought by the COVID-19 pandemic. Our opinion is not
modified in respect of this matter.
Key Audit Matters
Key audit matters are those matters that, in our professional judgment, were of most
significance in our audit of the consolidated financial statements of the current period. These
matters were addressed in the context of our audit of the consolidated financial statements as a
whole, and in forming our opinion thereon, and we do not provide a separate opinion on these
matters.
(a) Recognition of Tuition and Other School Fees
Description of the Matter
Tuition and other school fees amounted to P3.5 billion, which accounts for 99% of the total
revenues of the Group, for the year ended May 31, 2021 as shown in the Group’s consolidated
statements of profit or loss and in Note 18 to the consolidated financial statements. It involves
significant volume of transactions and the Group is dependent on its information technology
infrastructure in processing such voluminous transactions. Relative to this, any potential
misstatements on tuition and other school fees could be material to the consolidated financial
statements. Growth in tuition and other school fees is also one of the key performance
measures used to assess the Group’s performance. We therefore identified the recognition
of tuition and other school fees as a significant risk requiring special audit consideration.
The Group’s policy for revenue recognition and significant judgements used by management related to revenue recognition are more fully described in Notes 2 and 3 to the consolidated financial statements.
How the Matter was Addressed in the Audit
Our audit procedures included, among others, the following:
• Obtaining an understanding of the tuition and other school fees revenue recognition policy of the Group and the related processes and controls, and evaluating the Group’s compliance with the requirements of PFRS 15, Revenue from Contracts with Customers;
• Testing of design and operating effectiveness of internal controls, including information technology general controls (i.e., security administration, program maintenance and program execution) and application controls, related to the Group’s recognition and measurement of tuition and other school fees, including the related scholarship merits and tuition fee discounts, and payments from students;
• Examining students’ enrollment transactions (i.e., through examination of tuition bills) and grant of scholarships merits and tuition fee discounts on a sampling basis during the school year;

Certified Public Accountants
Punongbayan & Araullo (P&A) is the Philippine member firm of Grant Thornton International Ltd.
- 3 -
• Performing revenue cut-off test procedures including, among others, examining tuition bill transactions near period end, and analyzing and reviewing revenue adjustments subsequent to period end to determine whether tuition and other school fees are appropriately recognized in the proper period; and,
• Performing substantive analytical review procedures over tuition and other school fees such as, but not limited to, current year’s components of tuition and other school fees (e.g., by student population and by institute or college) as a percentage of total revenues, and yearly and monthly analyses of enrolment transactions based on our expectations, which include corroborating evidence from other audit procedures, and verifying the underlying data used in the analyses are valid and complete.
(b) Assessment of Goodwill Impairment
Description of the Matter
As at May 31, 2021, the balance of goodwill amounts to P186.5 million, which arose from
the acquisition of Roosevelt College, Inc. (RCI) in May 2016 as disclosed in Note 3 to the
consolidated financial statements. Under PFRS, goodwill, having indefinite useful life, is not
subject to amortization but is required to be tested for impairment annually, or more frequently if
events or changes in circumstances indicate that the carrying value of goodwill may be
impaired. We have identified assessment of goodwill impairment as a key audit matter in
our audit because management’s assessment process is highly subjective being based on
significant assumptions, such as revenue growth rate and discount rate, to determine the
recoverable amount of the cash generating units (CGUs) where goodwill is allocated to and
the future cash flows of that particular CGUs which are affected by expected future market or
economic conditions. The more significant management’s assumptions include:
• RCI, the CGU on which the goodwill is allocated to, will continue as a going concern;
• RCI will have sufficient financial resources to finance its working capital requirements to achieve its projected forecast and to support the business needs; and,
• RCI’s growth in student population and viability of its performance forecasts for the next five years.
The Group’s accounting policy on impairment of goodwill is included in Note 2 to the
consolidated financial statements and the related disclosures are included in Note 3.
How the Matter was Addressed in the Audit
With the firm’s valuation specialists, we independently checked the reasonableness of the
assumptions and methodologies (i.e., discounted cash flows method) used by management,
particularly those relating to the forecasted tuition fee rates and number of students assumed to
project revenue growth and profit margins of RCI. In doing so, we have considered historical
and environmental trends. We also focused on the adequacy of the Group’s disclosure about
those assumptions to which the outcome of the impairment test is most sensitive, that is, those
that have the most significant effect on the determination of the recoverable amount of goodwill.

Certified Public Accountants
Punongbayan & Araullo (P&A) is the Philippine member firm of Grant Thornton International Ltd.
- 4 -
(c) Conduct of Audit Remotely
Description of the Matter
As disclosed in Note 1 to the consolidated financial statements, a novel strain of coronavirus
(COVID-19) started to become widespread in the Philippines in early March 2020. This caused
the government to declare the country in a state of public health emergency followed by
implementation of enhanced community quarantine (ECQ) and social distancing measures and
restrictions within the Luzon area with other cities and provinces in the country enacting similar
measures thereafter. The ECQ and social distancing measures implemented by the
government resulted in performing the engagement remotely.
The change in working conditions is relevant and significant to our audit since it creates an
increased risk of misstatements due to less in-person access to the Group’s management and
personnel, and lack of access to the physical records and original documents. Given the
changes in how the audit will be performed, the audit requires exercising enhanced
professional skepticism.
How the Matter was Addressed in the Audit
Our audit procedures to address the risk of performing the audit remotely included the
following:
• Considering the nature of the engagement and the engagement team’s knowledge of the entity and its environment when determining whether it is possible to perform a significant portion, if not all, of the engagement remotely;
• Following the requirements of PSA including providing proper supervision and review, even when working remotely;
• Obtaining information through electronic means, which includes sending and receiving of confirmation electronically, obtaining calculation in electronic form to check the mathematical accuracy, scanning of hard-copy items for review and using real-time inspection technology such as video and screen-sharing;
• Determining the reliability of audit evidence provided electronically using professional skepticism;
• Performing inquiries through video call in order to judge body language and other cues and to have a more interactive audit engagement; and,
• Examining critical electronic copy documents (e.g., contracts, progress billings, billing invoices, purchases invoices, and official receipts) in response to the risk in revenues and costs, which is considered to be significant.

Certified Public Accountants
Punongbayan & Araullo (P&A) is the Philippine member firm of Grant Thornton International Ltd.
- 5 -
Other Information
Management is responsible for the other information. The other information comprises the
information included in the Group’s Securities and Exchange Commission (SEC) Form 20-IS
(Definitive Information Statement) and SEC Form 17-A (but does not include the consolidated
financial statements and our auditors’ report thereon) and Annual Report for the year ended
May 31, 2021. The SEC Form 20-IS, SEC Form 17-A and Annual Report for the year ended
May 31, 2021 are expected to be made available to us after the date of this auditors’ report.
Our opinion on the consolidated financial statements does not cover the other information and
we will not express any form of assurance conclusion thereon.
In connection with our audits of the consolidated financial statements, our responsibility
is to read the other information identified above when it becomes available and, in doing so,
consider whether the other information is materially inconsistent with the consolidated financial
statements or our knowledge obtained in the audits, or otherwise appears to be materially
misstated.
Responsibilities of Management and Those Charged with Governance for the
Consolidated Financial Statements
Management is responsible for the preparation and fair presentation of the consolidated
financial statements in accordance with PFRS, and for such internal control as management
determines is necessary to enable the preparation of consolidated financial statements that are
free from material misstatement, whether due to fraud or error.
In preparing the consolidated financial statements, management is responsible for assessing the Group’s ability to continue as a going concern, disclosing, as applicable, matters related to going concern and using the going concern basis of accounting unless management either intends to liquidate the Group or to cease operations, or has no realistic alternative but to do so.
Those charged with governance are responsible for overseeing the Group’s financial reporting
process.
Auditors’ Responsibilities for the Audit of the Consolidated Financial
Statements
Our objectives are to obtain reasonable assurance about whether the consolidated financial
statements as a whole are free from material misstatement, whether due to fraud or error, and
to issue an auditors’ report that includes our opinion. Reasonable assurance is a high level of
assurance, but is not a guarantee that an audit conducted in accordance with PSA will always
detect a material misstatement when it exists. Misstatements can arise from fraud or error and
are considered material if, individually or in the aggregate, they could reasonably be expected
to influence the economic decisions of users taken on the basis of these consolidated financial
statements.
Certified Public Accountants
Punongbayan & Araullo (P&A) is the Philippine member firm of Grant Thornton International Ltd.
- 6 -
As part of an audit in accordance with PSA, we exercise professional judgment and maintain
professional skepticism throughout the audit. We also:
• Identify and assess the risks of material misstatement of the consolidated financial
statements, whether due to fraud or error, design and perform audit procedures responsive
to those risks, and obtain audit evidence that is sufficient and appropriate to provide a basis
for our opinion. The risk of not detecting a material misstatement resulting from fraud is
higher than for one resulting from error, as fraud may involve collusion, forgery, intentional
omissions, misrepresentations, or the override of internal control.
• Obtain an understanding of internal control relevant to the audit in order to design audit
procedures that are appropriate in the circumstances, but not for the purpose of expressing
an opinion on the effectiveness of the Group’s internal control.
• Evaluate the appropriateness of accounting policies used and the reasonableness of
accounting estimates and related disclosures made by management.
• Conclude on the appropriateness of management’s use of the going concern basis of
accounting and, based on the audit evidence obtained, whether a material uncertainty
exists related to events or conditions that may cast significant doubt on the Group’s
ability to continue as a going concern. If we conclude that a material uncertainty exists,
we are required to draw attention in our auditors’ report to the related disclosures in the
consolidated financial statements or, if such disclosures are inadequate, to modify our
opinion. Our conclusions are based on the audit evidence obtained up to the date of our
auditors’ report. However, future events or conditions may cause the Group to cease to
continue as a going concern.
• Evaluate the overall presentation, structure and content of the consolidated financial
statements, including the disclosures, and whether the consolidated financial statements
represent the underlying transactions and events in a manner that achieves fair
presentation.
• Obtain sufficient appropriate audit evidence regarding the financial information of the
entities or business activities within the Group to express an opinion on the consolidated
financial statements. We are responsible for the direction, supervision and performance of
the group audit. We remain solely responsible for our audit opinion.
We communicate with those charged with governance regarding, among other matters, the
planned scope and timing of the audit and significant audit findings, including any significant
deficiencies in internal control that we identify during our audit.
We also provide those charged with governance with a statement that we have complied with
relevant ethical requirements regarding independence, and communicate with them all
relationships and other matters that may reasonably be thought to bear on our independence,
and where applicable, related safeguards.

Certified Public Accountants
Punongbayan & Araullo (P&A) is the Philippine member firm of Grant Thornton International Ltd.
- 7 -
From the matters communicated with those charged with governance, we determine those
matters that were of most significance in the audit of the consolidated financial statements of
the current year and are therefore the key audit matters. We describe these matters in our
auditors’ report unless law or regulation precludes public disclosure about the matter or when,
in extremely rare circumstances, we determine that a matter should not be communicated in
our report because the adverse consequences of doing so would reasonably be expected to
outweigh the public interest benefits of such communication.
The engagement partner on the audits resulting in this independent auditors’ report is
Mailene Sigue-Bisnar.
PUNONGBAYAN & ARAULLO
By: Mailene Sigue-Bisnar Partner CPA Reg. No. 0090230 TIN 120-319-128 PTR No. 8533222, January 4, 2021, Makati City SEC Group A Accreditation Partner - No. 0396-AR-3 (until Oct. 1, 2021) Firm - No. 0002 (until Dec. 31, 2024) BIR AN 08-002511-20-2020 (until Dec. 21, 2023) Firm’s BOA/PRC Cert. of Reg. No. 0002 (until Aug. 27, 2024)
August 17, 2021

Notes 2021 2020 2019
CURRENT ASSETS
Cash and cash equivalents 8 1,191,146,185 P 1,798,366,234 P 1,520,192,490 P
Trade and other receivables - net 9 799,367,504 990,599,625 620,161,736
Financial assets at fair value through profit or loss 10 1,605,507,781 888,517,158 837,414,512
Financial assets at fair value through other comprehensive income 10 231,920,855 329,290,221 277,750,721
Investment securities at amortized cost 10 83,206,231 227,576,146 263,808,437
Real estate held-for-sale 11 122,880,159 123,533,559 123,533,559
Other current assets - net 15 127,297,249 173,963,347 206,017,421
Total Current Assets 4,161,325,964 4,531,846,290 3,848,878,876
NON-CURRENT ASSETS
Financial assets at fair value through other comprehensive income 10 1,179,709,098 387,166,693 428,946,151
Investment securities at amortized cost 10 501,560,477 303,042,121 523,684,713
Property and equipment - net 12, 13 8,887,089,812 9,363,421,490 8,708,590,224
Investment properties - net 14 277,070,909 194,193,727 154,874,322
Goodwill 1 186,487,019 186,487,019 186,487,019
Deferred tax assets - net 22 24,756,321 29,533,238 25,673,121
Other non-current assets - net 15 203,369,377 190,915,174 202,823,408
Total Non-current Assets 11,260,043,013 10,654,759,462 10,231,078,958
TOTAL ASSETS 15,421,368,977 P 15,186,605,752 P 14,079,957,834 P
FAR EASTERN UNIVERSITY, INCORPORATED AND SUBSIDIARIES
CONSOLIDATED STATEMENTS OF FINANCIAL POSITION
MAY 31, 2021, 2020 AND 2019
(Amounts in Philippine Pesos)
A S S E T S
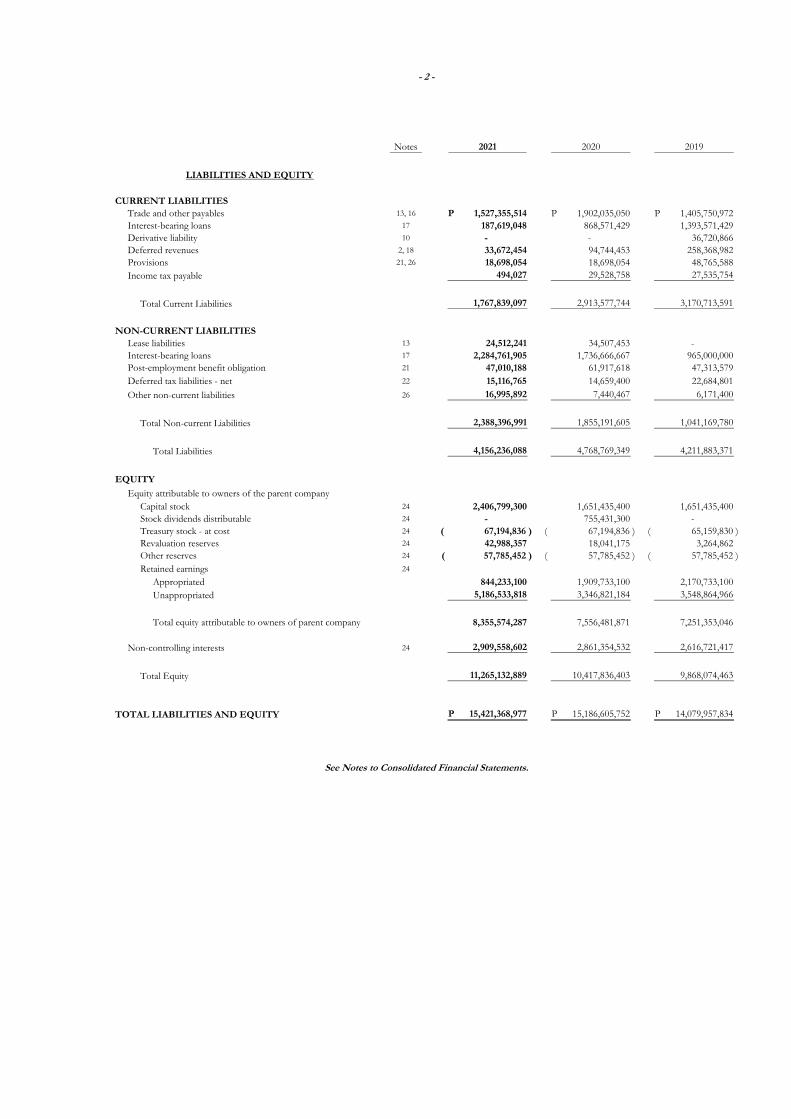
Notes 2021 2020 2019
CURRENT LIABILITIES
Trade and other payables 13, 16 1,527,355,514 P 1,902,035,050 P 1,405,750,972 P
Interest-bearing loans 17 187,619,048 868,571,429 1,393,571,429
Derivative liability 10 - - 36,720,866
Deferred revenues 2, 18 33,672,454 94,744,453 258,368,982
Provisions 21, 26 18,698,054 18,698,054 48,765,588
Income tax payable 494,027 29,528,758 27,535,754
Total Current Liabilities 1,767,839,097 2,913,577,744 3,170,713,591
NON-CURRENT LIABILITIES
Lease liabilities 13 24,512,241 34,507,453 -
Interest-bearing loans 17 2,284,761,905 1,736,666,667 965,000,000
Post-employment benefit obligation 21 47,010,188 61,917,618 47,313,579
Deferred tax liabilities - net 22 15,116,765 14,659,400 22,684,801
Other non-current liabilities 26 16,995,892 7,440,467 6,171,400
Total Non-current Liabilities 2,388,396,991 1,855,191,605 1,041,169,780
Total Liabilities 4,156,236,088 4,768,769,349 4,211,883,371
EQUITY
Equity attributable to owners of the parent company
Capital stock 24 2,406,799,300 1,651,435,400 1,651,435,400
Stock dividends distributable 24 - 755,431,300 -
Treasury stock - at cost 24 67,194,836 )( 67,194,836 )( 65,159,830 )(
Revaluation reserves 24 42,988,357 18,041,175 3,264,862
Other reserves 24 57,785,452 )( 57,785,452 )( 57,785,452 )(
Retained earnings 24
Appropriated 844,233,100 1,909,733,100 2,170,733,100
Unappropriated 5,186,533,818 3,346,821,184 3,548,864,966
Total equity attributable to owners of parent company 8,355,574,287 7,556,481,871 7,251,353,046
Non-controlling interests 24 2,909,558,602 2,861,354,532 2,616,721,417
Total Equity 11,265,132,889 10,417,836,403 9,868,074,463
TOTAL LIABILITIES AND EQUITY 15,421,368,977 P 15,186,605,752 P 14,079,957,834 P
See Notes to Consolidated Financial Statements.
- 2 -
LIABILITIES AND EQUITY

Notes 2021 2020 2019
REVENUES
Educational 18
Tuition fees - net 3,336,317,446 P 3,221,389,820 P 3,028,259,008 P
Other school fees 186,108,760 334,923,888 286,993,109
3,522,426,206 3,556,313,708 3,315,252,117
Rental 14 10,381,563 33,430,485 43,782,587
3,532,807,769 3,589,744,193 3,359,034,704
IMPAIRMENT LOSS
ON FINANCIAL ASSETS 9 254,842,087 )( 81,673,482 )( 27,028,023 )(
OTHER OPERATING EXPENSES 19 2,485,285,169 )( 2,777,758,711 )( 2,666,530,435 )(
OTHER OPERATING INCOME 14 1,447,139 41,633,237 2,720,649
OPERATING INCOME 794,127,652 771,945,237 668,196,895
FINANCE INCOME 20 190,258,064 136,080,528 152,094,620
FINANCE COSTS 20 106,575,649 )( 246,065,317 )( 98,276,377 )(
OTHER INCOME - NET 12, 16, 18 138,482,282 122,603,549 212,567,714
INCOME BEFORE TAX 1,016,292,349 784,563,997 934,582,852
TAX EXPENSE 22 36,976,292 )( 101,572,455 )( 126,111,125 )(
NET INCOME 979,316,057 P 682,991,542 P 808,471,727 P
Net Income Attributable to:
Owners of the parent company 25 965,682,303 P 621,398,818 P 753,271,625 P
Non-controlling interests 13,633,754 61,592,724 55,200,102
979,316,057 P 682,991,542 P 808,471,727 P
Earnings Per Share
Basic and Diluted 25 40.28 P 25.92 P 31.41 P
FAR EASTERN UNIVERSITY, INCORPORATED AND SUBSIDIARIES
CONSOLIDATED STATEMENTS OF PROFIT OR LOSS
FOR THE YEARS ENDED MAY 31, 2021, 2020 AND 2019
(Amounts in Philippine Pesos)
See Notes to Consolidated Financial Statements.

Notes 2021 2020 2019
NET INCOME 979,316,057 P 682,991,542 P 808,471,727 P
OTHER COMPREHENSIVE INCOME (LOSS)
Items that will be reclassified subsequently
to profit or loss
Net fair value gains (losses) reclassified to profit or loss on
debt securities classified as fair value through other
comprehensive income 10 6,722,480 )( 1,786,872 )( 14,833,998
Net fair value gains during the year 24,499,049 23,059,541 4,382,957
Tax effect 311,090 )( 2,127,267 )( 1,921,696 )(
17,465,479 19,145,402 17,295,259
Item that will not be reclassified subsequently
to profit or loss
Net fair value gains (losses) on equity securities classified as
financial assets at fair value through other
comprehensive income 10 5,602,115 898,729 15,525,963 )(
Gains (losses) on remeasurement of post-employment
benefit plan 21 4,629,577 8,463,371 )( 8,557,937 )(
Tax effect 179,055 )( 756,464 2,408,390
10,052,637 6,808,178 )( 21,675,510 )(
Other Comprehensive Income (Loss) - net of tax 27,518,116 12,337,224 4,380,251 )(
TOTAL COMPREHENSIVE INCOME 1,006,834,173 P 695,328,766 P 804,091,476 P
Total Comprehensive Income Attributable to:
Owners of the parent company 990,629,485 P 636,175,131 P 749,527,120 P
Non-controlling interests 16,204,688 59,153,635 54,564,356
1,006,834,173 P 695,328,766 P 804,091,476 P
See Notes to Consolidated Financial Statements.
FAR EASTERN UNIVERSITY, INCORPORATED AND SUBSIDIARIES
CONSOLIDATED STATEMENTS OF COMPREHENSIVE INCOME
FOR THE YEARS ENDED MAY 31, 2021, 2020 AND 2019
(Amounts in Philippine Pesos)

Stock Dividends Treasury Stock - Revaluation Other Non-controlling
Notes Capital Stock Distributable at Cost Reserves Reserves Appropriated Unappropriated Total Total Interests Total Equity
Balance at June 1, 2020 1,651,435,400 P 755,431,300 P 67,194,836 )( P 18,041,175 P 57,785,452 )( P 1,909,733,100 P 3,346,821,184 P 5,256,554,284 P 7,556,481,871 P 2,861,354,532 P 10,417,836,403 P
Transactions with owners
Issuance of shares of stock 24 755,363,900 755,431,300 )( - - - - 67,400 67,400 - 62,000,000 62,000,000
Cash dividends 24 - - - - - - 191,537,069 )( 191,537,069 )( 191,537,069 )( 30,000,618 )( 221,537,687 )(
755,363,900 755,431,300 )( - - - - 191,469,669 )( 191,469,669 )( 191,537,069 )( 31,999,382 159,537,687 )(
Appropriations of retained earnings
Reversal of appropriations during the year 24 - - - - - 1,155,500,000 )( 1,155,500,000 - - - -
Appropriations during the year 24 - - - - - 90,000,000 90,000,000 )( - - - -
- - - - - 1,065,500,000 )( 1,065,500,000 - - - -
Total comprehensive income
Net income for the year - - - - - - 965,682,303 965,682,303 965,682,303 13,633,754 979,316,057
Other comprehensive income 10, 21 - - - 24,947,182 - - - - 24,947,182 2,570,934 27,518,116
- - - 24,947,182 - - 965,682,303 965,682,303 990,629,485 16,204,688 1,006,834,173
Balance at May 31, 2021 2,406,799,300 P - 67,194,836 )( P 42,988,357 P 57,785,452 )( P 844,233,100 P 5,186,533,818 P 6,030,766,918 P 8,355,574,287 P 2,909,558,602 P 11,265,132,889 P
Balance at June 1, 2019 1,651,435,400 P - 65,159,830 )( P 3,264,862 P 57,785,452 )( P 2,170,733,100 P 3,548,864,966 P 5,719,598,066 P 7,251,353,046 P 2,616,721,417 P 9,868,074,463 P
Transactions with owners
Issuance of shares of stock 24 - - - - - - - - - 86,000,125 86,000,125
Investment of non-controlling interest in
a new subsidiary 24 - - - - - - - - - 171,500,000 171,500,000
Acquisition of treasury stock 24 - - 2,035,006 )( - - - - - 2,035,006 )( 32,110,055 )( 34,145,061 )(
Stock dividends distributable 24 - 755,431,300 - - - - 755,431,300 )( 755,431,300 )( - - -
Cash dividends 24 - - - - - - 329,011,300 )( 329,011,300 )( 329,011,300 )( 39,910,590 )( 368,921,890 )(
- 755,431,300 2,035,006 )( - - - 1,084,442,600 )( 1,084,442,600 )( 331,046,306 )( 185,479,480 145,566,826 )(
Appropriations of retained earnings
Reversal of appropriations during the year 24 - - - - - 336,000,000 )( 336,000,000 - - - -
Appropriations during the year 24 - - - - - 75,000,000 75,000,000 )( - - - -
- - - - - 261,000,000 )( 261,000,000 - - - -
Total comprehensive income (loss)
Net income for the year - - - - - - 621,398,818 621,398,818 621,398,818 61,592,724 682,991,542
Other comprehensive loss 10, 21 - - - 14,776,313 - - - - 14,776,313 2,439,089 )( 12,337,224
- - - 14,776,313 - - 621,398,818 621,398,818 636,175,131 59,153,635 695,328,766
Balance at May 31, 2020 1,651,435,400 P 755,431,300 P 67,194,836 )( P 18,041,175 P 57,785,452 )( P 1,909,733,100 P 3,346,821,184 P 5,256,554,284 P 7,556,481,871 P 2,861,354,532 P 10,417,836,403 P
FAR EASTERN UNIVERSITY, INCORPORATED AND SUBSIDIARIES
CONSOLIDATED STATEMENTS OF CHANGES IN EQUITY
FOR THE YEARS ENDED MAY 31, 2021, 2020 AND 2019
(Amounts in Philippine Pesos)
Attributable to Owners of the Parent Company
Retained Earnings
P
P
P
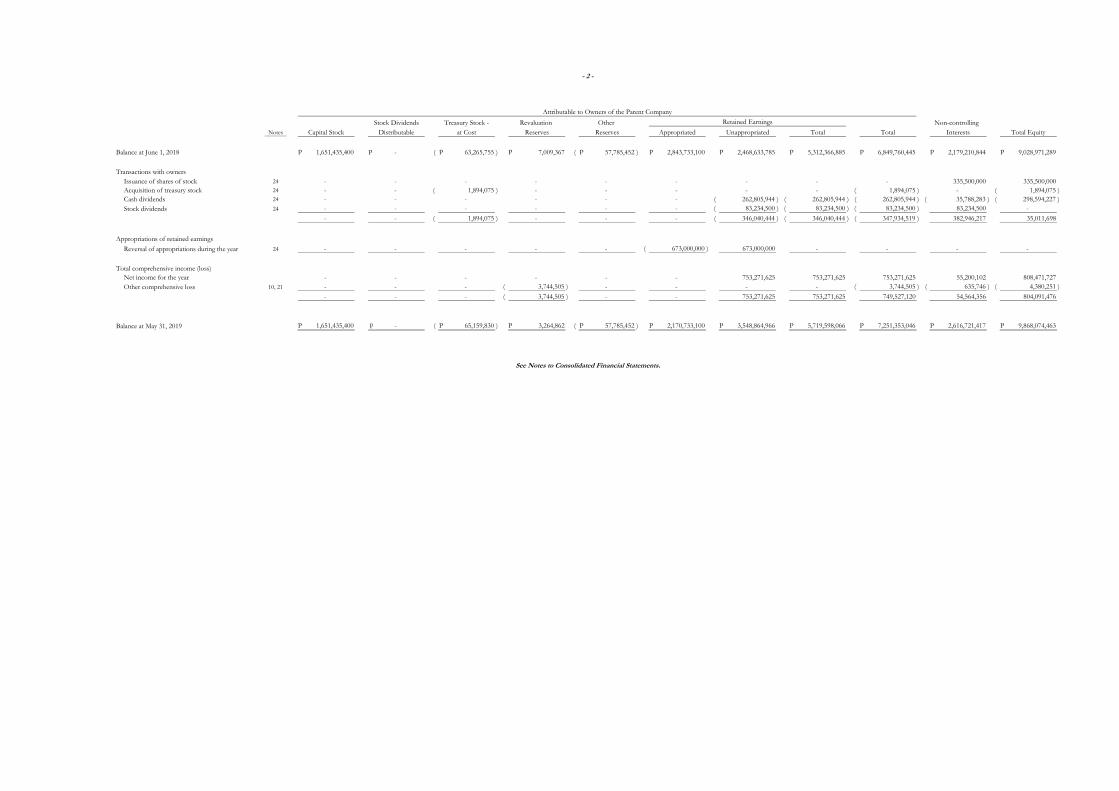
Stock Dividends Treasury Stock - Revaluation Other Non-controlling
Notes Capital Stock Distributable at Cost Reserves Reserves Appropriated Unappropriated Total Total Interests Total Equity
Balance at June 1, 2018 1,651,435,400 P - 63,265,755 )( P 7,009,367 P 57,785,452 )( P 2,843,733,100 P 2,468,633,785 P 5,312,366,885 P 6,849,760,445 P 2,179,210,844 P 9,028,971,289 P
Transactions with owners
Issuance of shares of stock 24 - - - - - - - - - 335,500,000 335,500,000
Acquisition of treasury stock 24 - - 1,894,075 )( - - - - - 1,894,075 )( - 1,894,075 )(
Cash dividends 24 - - - - - - 262,805,944 )( 262,805,944 )( 262,805,944 )( 35,788,283 )( 298,594,227 )(
Stock dividends 24 - - - - - - 83,234,500 )( 83,234,500 )( 83,234,500 )( 83,234,500 -
- - 1,894,075 )( - - - 346,040,444 )( 346,040,444 )( 347,934,519 )( 382,946,217 35,011,698
Appropriations of retained earnings
Reversal of appropriations during the year 24 - - - - - 673,000,000 )( 673,000,000 - - - -
Total comprehensive income (loss)
Net income for the year - - - - - - 753,271,625 753,271,625 753,271,625 55,200,102 808,471,727
Other comprehensive loss 10, 21 - - - 3,744,505 )( - - - - 3,744,505 )( 635,746 )( 4,380,251 )(
- - - 3,744,505 )( - - 753,271,625 753,271,625 749,527,120 54,564,356 804,091,476
Balance at May 31, 2019 1,651,435,400 P - 65,159,830 )( P 3,264,862 P 57,785,452 )( P 2,170,733,100 P 3,548,864,966 P 5,719,598,066 P 7,251,353,046 P 2,616,721,417 P 9,868,074,463 P
Attributable to Owners of the Parent Company
Retained Earnings
See Notes to Consolidated Financial Statements.
- 2 -
P
P
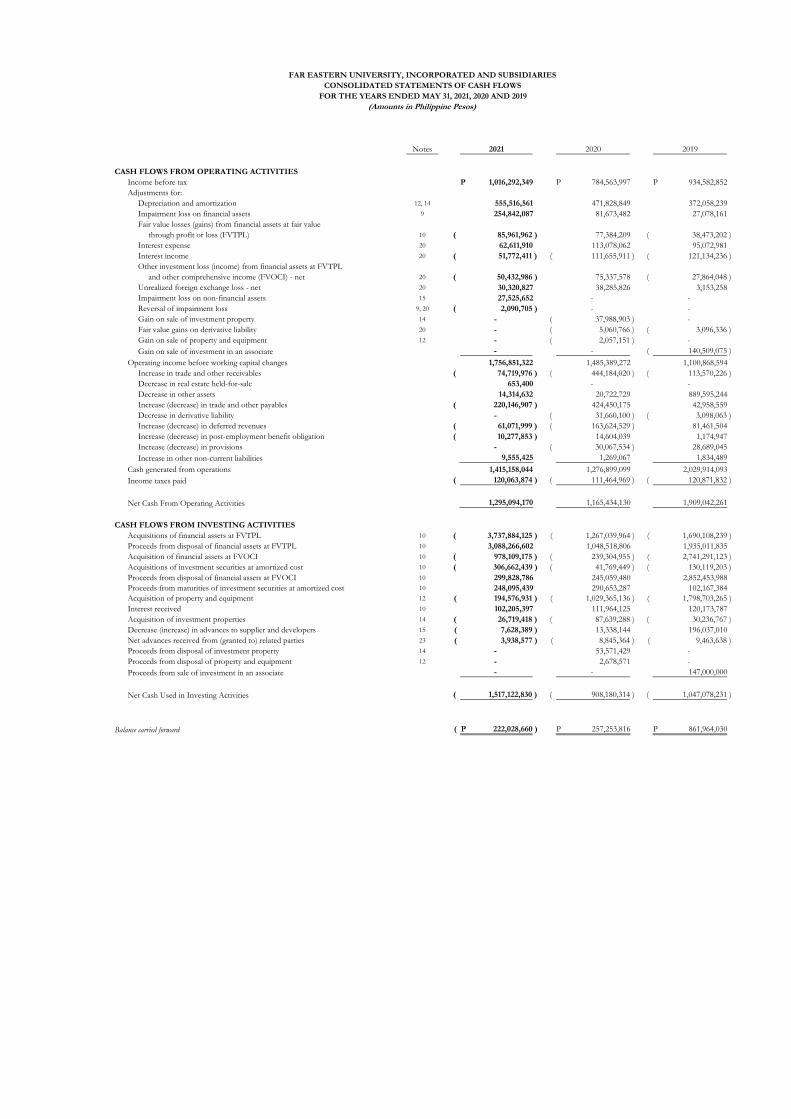
Notes 2021 2020 2019
CASH FLOWS FROM OPERATING ACTIVITIES
Income before tax 1,016,292,349 P 784,563,997 P 934,582,852 P
Adjustments for:
Depreciation and amortization 12, 14 555,516,561 471,828,849 372,058,239
Impairment loss on financial assets 9 254,842,087 81,673,482 27,078,161
Fair value losses (gains) from financial assets at fair value
through profit or loss (FVTPL) 10 85,961,962 )( 77,384,209 38,473,202 )(
Interest expense 20 62,611,910 113,078,062 95,072,981
Interest income 20 51,772,411 )( 111,655,911 )( 121,134,236 )(
Other investment loss (income) from financial assets at FVTPL
and other comprehensive income (FVOCI) - net 20 50,432,986 )( 75,337,578 27,864,048 )(
Unrealized foreign exchange loss - net 20 30,320,827 38,285,826 3,153,258
Impairment loss on non-financial assets 15 27,525,652 - -
Reversal of impairment loss 9, 20 2,090,705 )( - -
Gain on sale of investment property 14 - 37,988,903 )( -
Fair value gains on derivative liability 20 - 5,060,766 )( 3,096,336 )(
Gain on sale of property and equipment 12 - 2,057,151 )( -
Gain on sale of investment in an associate - - 140,509,075 )(
Operating income before working capital changes 1,756,851,322 1,485,389,272 1,100,868,594
Increase in trade and other receivables 74,719,976 )( 444,184,020 )( 113,570,226 )(
Decrease in real estate held-for-sale 653,400 - -
Decrease in other assets 14,314,632 20,722,729 889,595,244
Increase (decrease) in trade and other payables 220,146,907 )( 424,450,175 42,958,559
Decrease in derivative liability - 31,660,100 )( 3,098,063 )(
Increase (decrease) in deferred revenues 61,071,999 )( 163,624,529 )( 81,461,504
Increase (decrease) in post-employment benefit obligation 10,277,853 )( 14,604,039 1,174,947
Increase (decrease) in provisions - 30,067,534 )( 28,689,045
Increase in other non-current liabilities 9,555,425 1,269,067 1,834,489
Cash generated from operations 1,415,158,044 1,276,899,099 2,029,914,093
Income taxes paid 120,063,874 )( 111,464,969 )( 120,871,832 )(
Net Cash From Operating Activities 1,295,094,170 1,165,434,130 1,909,042,261
CASH FLOWS FROM INVESTING ACTIVITIES
Acquisitions of financial assets at FVTPL 10 3,737,884,125 )( 1,267,039,964 )( 1,690,108,239 )(
Proceeds from disposal of financial assets at FVTPL 10 3,088,266,602 1,048,518,806 1,935,011,835
Acquisition of financial assets at FVOCI 10 978,109,175 )( 239,304,955 )( 2,741,291,123 )(
Acquisitions of investment securities at amortized cost 10 306,662,439 )( 41,769,449 )( 130,119,203 )(
Proceeds from disposal of financial assets at FVOCI 10 299,828,786 245,059,480 2,852,453,988
Proceeds from maturities of investment securities at amortized cost 10 248,095,439 290,653,287 102,167,384
Acquisition of property and equipment 12 194,576,931 )( 1,029,365,136 )( 1,798,703,265 )(
Interest received 10 102,205,397 111,964,125 120,173,787
Acquisition of investment properties 14 26,719,418 )( 87,639,288 )( 30,236,767 )(
Decrease (increase) in advances to supplier and developers 15 7,628,389 )( 13,338,144 196,037,010
Net advances received from (granted to) related parties 23 3,938,577 )( 8,845,364 )( 9,463,638 )(
Proceeds from disposal of investment property 14 - 53,571,429 -
Proceeds from disposal of property and equipment 12 - 2,678,571 -
Proceeds from sale of investment in an associate - - 147,000,000
Net Cash Used in Investing Activities 1,517,122,830 )( 908,180,314 )( 1,047,078,231 )(
Balance carried forward 222,028,660 )( P 257,253,816 P 861,964,030 P
FAR EASTERN UNIVERSITY, INCORPORATED AND SUBSIDIARIES
CONSOLIDATED STATEMENTS OF CASH FLOWS
FOR THE YEARS ENDED MAY 31, 2021, 2020 AND 2019
(Amounts in Philippine Pesos)

Notes 2021 2020 2019
Balance brought forward 222,028,660 )( P 257,253,816 P 861,964,030 P
CASH FLOWS FROM FINANCING ACTIVITIES
Repayments of interest-bearing loans 17, 28 1,275,714,286 )( 948,333,333 )( 428,571,429 )(
Proceeds from additional interest-bearing loans 17, 28 1,142,857,143 1,195,000,000 270,000,000
Dividends paid 24, 28 239,359,822 )( 323,553,105 )( 249,095,841 )(
Interest paid 20, 28 62,802,729 )( 115,687,250 )( 125,827,490 )(
Proceeds from issuance of preferred shares to a
related party under common management 23 62,000,000 86,000,000 335,500,000
Repayment of lease liability 13, 28 12,061,585 )( 1,597,281 )( -
Acquisition of treasury shares 24 - 34,145,061 )( 1,894,075 )(
Net Cash Used in Financing Activities 385,081,279 )( 142,316,030 )( 199,888,835 )(
Effect of Exchange Rate Changes on Cash and Cash Equivalents 110,110 )( 8,264,042 )( 2,785,794
NET INCREASE (DECREASE) IN CASH AND CASH EQUIVALENTS 607,220,049 )( 106,673,744 664,860,989
NET INCREASE IN CASH DUE TO CONSOLIDATION OF A
NEW SUBSIDIARY 24 - 171,500,000 -
CASH AND CASH EQUIVALENTS AT BEGINNING OF YEAR 1,798,366,234 1,520,192,490 855,331,501
CASH AND CASH EQUIVALENTS AT END OF YEAR 1,191,146,185 P 1,798,366,234 P 1,520,192,490 P
Supplemental Information on Noncash Investing and Financing Activities:
1.) In 2020, the Group recognized right-of-use asset and lease liability both amounting to P13.5 million as at June 1, 2019 in relation to adoption of PFRS 16, Leases . Additional right-of-use
asset and lease liability were recognized during the year both amounting to P34.7 million due to a lease agreement entered by the Group as a lessee (see Notes 12 and 13). There were
no similar transaction in 2021 and 2019.
2.) In 2020, the University acquired 51% of the outstanding shares of Edustria, Inc. for a subscription price amounting to P255.0 million (see Note 24). There were no similar transaction
in 2021 and 2019.
3.) In 2021, 2020 and 2019, the Group capitalized borrowing costs amounting to P6.8 million, P17.0 million and P38.4 million, representing the actual borrowing costs incurred on loans
obtained to fund the construction project are recognized as part of Property and Equipment - net in the statements of financial position (see Notes 12 and 20).
4.) In 2019, certain assets amounting to P8.5 million was reclassified from Investment Property to Property and Equipment (see Notes 12 and 14).
5.) The Group declared cash dividends amounting to P191.5 million in 2021, P329.0 million in 2020 and P262.8 million in 2019, of which, P55.0 million, P10.8 million and P17.2 million
for years 2021, 2020 and 2019, respectively, were not paid in the year of declaration (see Notes 16 and 24). The outstanding liabilities are presented as part of Trade and other
payables in the statements of financial position.
6.) In 2021, FEU High School, Inc. and Fern Realty Corporation declared stock dividends totalling to P755.4 million consisting of 75,536 shares at par (see Note 24). No similar
transaction occurred in 2020 and 2019.
See Notes to Condensed Consolidated Financial Statements.
- 2 -

- 1 -
FAR EASTERN UNIVERSITY, INCORPORATED AND SUBSIDIARIES
NOTES TO CONSOLIDATED FINANCIAL STATEMENTS MAY 31, 2021, 2020 AND 2019 (Amounts in Philippine Pesos)
1. CORPORATE INFORMATION
1.1 Background of the University
The Far Eastern University, Incorporated (the University or FEU or Parent Company) is a 93-year-old Philippine-based proprietary educational institution founded in June 1928 and registered with the Securities and Exchange Commission (SEC) on October 27, 1933 and became a publicly-listed corporation with the Philippine Stock Exchange (PSE) on July 11, 1986. The University is a nonsectarian institution of learning, embracing equal opportunity, inclusivity and diversity. FEU is comprised of seven institutes as follows, under each, handling distinct courses and programs of study:
• Institute of Arts and Sciences;
• Institute of Accounts, Business and Finance;
• Institute of Education;
• Institute of Architecture and Fine Arts;
• Institute of Nursing;
• Institute of Tourism and Hotel Management; and,
• Institute of Law. FEU has been designated the Autonomous Status by the Commission on Higher Education (CHED) on July 25, 2012, with extended validity until May 31, 2023. Among the University’s flagship programs are the Teacher Education and Business Administration which are recognized by the CHED as Center of Excellence and Center of Development, respectively. On top of existing highly accredited programs of local accreditors, eight additional programs received the highest accreditation by the Philippine Association of Colleges and Universities Commission on Accreditation in 2021. Parallel International certifications by the ASEAN University Network – Quality Assurance were also granted similarly for eight programs namely Accountancy, Business Administration, Biology, Medical Technology, Psychology, Communication, Elementary and Secondary Education. While the Nursing program is accredited by the Philippine Accrediting Association of Schools, Colleges and Universities. Further in the 2021 World’s Universities with Real Impact (WURI) Ranking, FEU placed 79th in the Global Top 100 Innovative Universities. The University ascended the international rankings from last year’s 91st position. Compared to other educational ranking systems, which evaluate quantitative metrics such as the number of journal publications and employment rate of graduates, WURI evaluates universities’ flexible and innovative efforts to cultivate contributions to a workforce that meets the demands from industry and society at large.

- 2 -
As at May 31, 2021, 2020 and 2019, the University holds interest in the following subsidiaries which were all incorporated and are operating in the Philippines:
Percentage of Effective Ownership Company Name 2021 2020 2019
Subsidiaries:
East Asia Computer Center, Inc. (EACCI) 100% 100% 100% Far Eastern College – Silang, Inc. (FECSI) 100% 100% 100% FEU Alabang, Inc. (FEUAI) 100% 100% 100% FEU High School, Inc. (FEU High) 100% 100% 100% Roosevelt College, Inc. (RCI) 97.43% 97.43% 97.43% Roosevelt College Educational Enterprises (RCEE)* 97.43% 97.43% 97.43% Fern Realty Corporation (FRC)** 38.18% 38.04% 37.52% Edustria, Inc. (Edustria) 51% 51% -
* Indirectly through the University’s ownership of RCI which owns 100% ownership interest in RCEE **FEU’s interest held in FRC changed as a result of a reverse stock split made by FRC
The parent company and its subsidiaries are collectively referred to herein as the Group.
Except FRC, which is a real estate company leasing most of its investment properties to the University and other related parties, all other directly owned subsidiaries are operating as educational institutions offering basic education, senior high school and/or tertiary and post graduate courses of study. RCEE, prior to the cessation of its operations, was engaged in selling educational school supplies and food items in campuses of RCI.
1.2 Impact of COVID-19 Pandemic on the Group’s Operations
During fiscal years 2019 and 2020, improved results of operations were expected as these years marked the first two years of returning freshmen enrollees in the tertiary schools as part of the K-12 transition. However, the alarming pandemic level of COVID-19 on both a national and global scale brought about the 1st national level-mandated lockdown. Starting mid-March 2020, traditional face-to-face classes were suspended and full remote learning modality became the norm. Accordingly, the anticipated growth trajectory in student population, after K-12, came to an abrupt halt.
Throughout the fiscal year 2021, the country remained under various quarantine restriction levels to curb the spread of COVID-19. The resulting economic hardship on top of health concerns impacted students and their families greatly. The Group delivered academic instruction on an online basis for the entire year. On the health front, FEU invested in making the work and future study places as safe as possible. Information campaigns on safety protocols, health tracking systems and procedures, retro arranging spaces and investments in disinfection and ventilation equipment were all undertaken. Moderna vaccine supplies were also purchased for the entire workforce of FEU. Vaccination with owned vaccines has commenced and this effort together with the local government unit’s superb vaccination drive, will help reach the goal of top vaccination rate within the shortest possible time. The Group has also made the FEU Alabang campus available for the vaccination customers of Ayala Health.
- 3 -
On the operational front, face-to-face classes remained suspended throughout the year. The Group faced challenges including a decline in enrollment, reduced revenue from discounted assessed tuition fees, more relaxed financial accommodation to students intending to continue their education, higher receivable default rates and much higher but necessary costs related to health and safety of personnel.
The Group recognized additional impairment losses, a three-fold increase or P173.2 million increase from last fiscal year’s P81.7 million (see Note 9).
Despite the 11% decrease in the Group’s total student population in the fiscal year 2021, last year’s tuition rebates (see Note 18.3) and cancellation of the third term for the trimestral schools have somehow narrowed down the decrease in educational revenues to only 1% – as core revenues were recorded at P3,522.4 million. During the fiscal year 2021, the Group did not implement any increase in tuition fees and, instead, gave special credit considerations to assist students and ease the effect of the prevailing economic burden on students’ household. The University and its subsidiary schools combined, approved an unprecedented volume of student promissory note availment for the school year 2020-2021.
Fortunately, the FEU Group of schools invested heavily on this online learning platforms since 2017, as part of its strategic plans, even before the onset of the pandemic – showing the Group’s commitment to continuous innovation and improvement of its content and delivery of instructions to students. Despite such challenges, the Group’s strict cost management measures, coupled with better than prior years’ returns from investments in financial assets, timing of lower interest rates on bank loans, and tax savings due to lowered income tax rates, have produced optimistic results for the current fiscal year.
Management projects that the Group will continue to report positive results of operations in the future and would remain liquid to meet current obligation as they fall due. Accordingly, management has not determined material uncertainty that may cast significant doubt on the Group’s ability to continue as a going concern.
1.3 Other Corporate Information
The registered offices and principal places of business of the University and its subsidiaries are as follows: FEU, FRC and FEU High - Nicanor Reyes Street, Sampaloc, Manila EACCI - P. Paredes Street, Sampaloc, Manila FEUAI - Lot 1, Corporate Woods cor. South Corporate
Avenues, Woods District, Filinvest City, Alabang, Muntinlupa City
FECSI - Metrogate Silang Estates, Silang, Cavite RCI - No. 54 J. P. Rizal Street, Lamuan, Marikina City RCEE - Roosevelt College Compound, Sumulong Highway,
Cainta, Rizal Edustria - Block R & T, Lima Technology Center, Brgy.
Bugtong ng Pulo, Lipa City, Batangas
The University also has a campus in Makati, which offers programs mainly in Law, Accountancy and Business Administration.

- 4 -
1.4 Approval for Issuance of Consolidated Financial Statements
The consolidated financial statements of the Group as of and for the years ended May 31, 2021 (including the comparative consolidated financial statements as of and for the periods ended May 31, 2020 and 2019) were authorized for issue by the Group’s Board of Trustees (BOT) on August 17, 2021.
2. SUMMARY OF SIGNIFICANT ACCOUNTING POLICIES
The significant accounting policies that have been used in the preparation of these consolidated financial statements are summarized below and in the succeeding pages. These policies have been consistently applied to all the years presented, unless otherwise stated.
2.1 Basis of Preparation of the Consolidated Financial Statements
(a) Statement of Compliance with Philippine Financial Reporting Standards
The consolidated financial statements of the Group have been prepared in accordance with Philippine Financial Reporting Standards (PFRS). PFRS are adopted by the Financial Reporting Standards Council (FRSC) from the pronouncements issued by the International Accounting Standards Board (IASB), and approved by the Philippine Board of Accountancy. The consolidated financial statements have been prepared using the measurement bases specified by PFRS for each type of asset, liability, income and expense. The measurement bases are more fully described in the accounting policies that follow.
(b) Presentation of the Consolidated Financial Statements
The consolidated financial statements are presented in accordance with Philippine Accounting Standard (PAS) 1, Presentation of Financial Statements. The Group presents the consolidated statements of comprehensive income separate from the consolidated statements of profit or loss. The Group presents two comparative periods for the consolidated statements of financial position regardless whether the Group has or does not have retrospective restatement of items in its consolidated financial statements, or reclassifies items in the consolidated financial statements.
(c) Functional Currency
These consolidated financial statements are presented in Philippine pesos, the Group’s functional and presentation currency, and all values represent absolute amounts except when otherwise indicated.
Items included in the consolidated financial statements of the Group are measured using its functional currency. Functional currency is the currency of the primary economic environment in which the Group operates.
- 5 -
2.2 Adoption of New and Amended PFRS
(a) Effective in Fiscal Year 2021 that are Relevant to the Group
The Group adopted for the first time the following amendments to PFRS, which are mandatorily effective for annual periods beginning on or after January 1, 2020:
Conceptual Framework : Revised Conceptual Framework for Financial Reporting PAS 1 and PAS 8 (Amendments) : Presentation of Financial Statements and Accounting Policies, Changes in Accounting Estimates and Errors –
Definition of Material PFRS 3 (Amendments) : Business Combinations – Definition
of a Business
PFRS 7 and PFRS 9 (Amendments) : Financial Instruments: Disclosures and
Financial Instruments – Interest Rate Benchmark Reform
PFRS 16 (Amendments) : Leases – COVID-19-Related Rent Concessions
Discussed as follows are relevant information about these pronouncements, unless otherwise noted, the application of these changes had no significant impact to the Group’s financial statements:
(i) Revised Conceptual Framework for Financial Reporting. The revised conceptual
framework will be used in standard-setting decisions with immediate effect. Key changes include (a) increasing the prominence of stewardship in the objective of financial reporting, (b) reinstating prudence as a component of neutrality, (c) defining a reporting entity, which may be a legal entity, or a portion of an entity, (d) revising the definitions of an asset and a liability, (e) removing the probability threshold for recognition and adding guidance on derecognition, (f) adding guidance on different measurement basis, and, (g) stating that profit or loss is the primary performance indicator and that, in principle, income and expenses in other comprehensive income should be recycled where this enhances the relevance or faithful representation of the financial statements.
(ii) PAS 1 (Amendments), Presentation of Financial Statements, and PAS 8
(Amendments), Accounting Policies, Changes in Accounting Estimates and Errors – Definition of Material. The amendments provide a clearer definition of ‘material’ in PAS 1 by including the concept of ‘obscuring’ material information with immaterial information as part of the new definition, and clarifying the assessment threshold (i.e., misstatement of information is material if it could reasonably be expected to influence decisions made by primary users, which consider the characteristic of those users as well as the entity’s own circumstances). The definition of material in PAS 8 has been accordingly replaced by reference to the new definition in PAS 1. In addition, amendment has also been made in other standards that contain definition of material or refer to the term ‘material’ to ensure consistency.

- 6 -
(iii) PFRS 3 (Amendments), Business Combinations – Definition of Business. The amended definition of a business requires an acquisition to include an input and a substantive process that together significantly contribute to the ability to create outputs. The definition of the term ‘outputs’ is amended to focus on goods and services provided to customers, generating investment income and other income, and it excludes returns in the form of lower costs and other economic benefits. Also, the amendments will likely result in more acquisitions being accounted for as asset acquisitions.
(iv) PFRS 7 (Amendments), Financial Instruments: Disclosures, and PFRS 9
(Amendments), Financial Instruments – Interest Rate Benchmark Reform. The amendments clarify that an entity would continue to apply certain hedge accounting requirements assuming that the interest rate benchmark on which the hedged cash flows and cash flows from the hedging instrument are based will not be altered as a result of interest rate benchmark reform.
(v) PFRS 16 (Amendments), Leases – COVID-19-Related Rent Concessions. The
amendments permit lessees, as a practical expedient, not to assess whether particular rent concessions occurring as a direct consequence of the COVID-19 pandemic are lease modifications and instead to account for those rent concessions as if they are not lease modifications.
(b) Effective Subsequent to Fiscal Year 2021but not Adopted Early
There are amendments to existing standards effective for annual periods subsequent to fiscal year 2021, which are adopted by the FRSC. Management will adopt the following relevant pronouncements in accordance with their transitional provisions; and, unless otherwise stated, none of these are expected to have significant impact on the Group’s consolidated financial statements:
(i) PFRS 16 (Amendments), Leases – COVID-19-Related Rent Concessions beyond
June 30, 2021 (effective from April 1, 2021). The amendment extends for one year the use of practical expedient, not to assess whether rent concessions reducing payments up until June 30, 2022 occurring as a direct consequence of the COVID-19 pandemic are lease modification and instead to account for those rent concessions as if they are not lease modifications.
(ii) PFRS 3 (Amendments), Business Combination – Reference to the Conceptual Framework (effective from January 1, 2022). The amendments update an outdated reference to the Conceptual Framework in PFRS 3 without significantly changing the requirements in the standard.
(iii) PAS 16 (Amendments), Property, Plant and Equipment - Proceeds Before Intended Use
(effective from January 1, 2022). The amendments prohibit deducting from the cost of an item of property, plant and equipment any proceeds from selling items produced while bringing that asset to the location and condition necessary for it to be capable of operating in the manner intended by management. Instead, an entity recognizes the proceeds from selling such items, and the cost of producing those items, in profit or loss.

- 7 -
(iv) PAS 37 (Amendments), Provisions, Contingent Liabilities and Contingent Assets – Onerous Contracts – Cost of Fulfilling a Contract (effective January 1, 2022). The amendments specify that the ‘cost of fulfilling’ a contract comprises the ‘costs that relate directly to the contract’. Costs that relate directly to a contract can either be incremental costs of fulfilling that contract (examples would be direct labor, materials) or an allocation of other costs that relate directly to fulfilling contracts (an example would be the allocation of the depreciation charge for an item of property, plant and equipment used in fulfilling the contract).
(v) Annual Improvements to PFRS 2018-2020 Cycle. Among the improvements,
the following amendments, which are effective from January 1, 2022, are relevant to the Group:
• PFRS 9 (Amendments), Financial Instruments – Fees in the ‘10 per cent’ Test for Derecognition of Liabilities. The improvements clarify the fees a company includes when assessing whether the terms of a new or modified financial liability are substantially different from the terms of the original financial liability.
• Illustrative Examples Accompanying PFRS 16 – Lease Incentives. The improvement merely removes potential for confusion regarding lease incentives.
(vi) PAS 1 (Amendments), Presentation of Financial Statements – Classification of Liabilities
as Current or Non-current (effective January 1, 2023). The amendments aim to promote consistency in applying the requirements by helping companies determine whether, in the statement of financial position, debt and other liabilities with an uncertain settlement date should be classified as current (due or potentially due to be settled within one year) or non-current.
(vii) PFRS 10 (Amendments), Consolidated Financial Statements, and PAS 28
(Amendments), Investments in Associates and Joint Ventures – Sale or Contribution of Assets Between an Investor and its Associates or Joint Venture (effective date deferred indefinitely). The amendments to PFRS 10 require full recognition in the investor’s financial statements of gains or losses arising on the sale or contribution of assets that constitute a business as defined in PFRS 3 between an investor and its associate or joint venture. Accordingly, the partial recognition of gains or losses (i.e., to the extent of the unrelated investor’s interests in an associate or joint venture) only applies to those sale of contribution of assets that do not constitute a business. Corresponding amendments have been made to PAS 28 to reflect these changes. In addition, PAS 28 has been amended to clarify that when determining whether assets that are sold or contributed constitute a business, an entity shall consider whether the sale or contribution of those assets is part of multiple arrangements that should be accounted for as a single transaction.

- 8 -
2.3 Basis of Consolidation
The Group’s consolidated financial statements comprise the accounts of the University and its subsidiaries as enumerated in Note 1.1, after the elimination of intercompany transactions. All intercompany balances and transactions with subsidiaries, including income, expenses and dividends, are eliminated in full. Unrealized profits and losses from intercompany transactions that are recognized in assets are also eliminated in full. In addition, shares of stock of the parent company held by the subsidiaries are recognized as treasury stocks and are presented as deduction in the consolidated statement of changes in equity (see Note 2.19). Intercompany losses that indicate impairment are recognized in the consolidated financial statements.
The following subsidiaries prepare their financial statements for their respective reporting periods using consistent accounting principles as that of the University:
Subsidiaries: Reporting Period* FRC March 31, 2021 RCEE March 31, 2021 FECSI May 31, 2021 FEU High May 31, 2021 RCI May 31, 2021 Edustria May 31, 2021 EACCI June 30, 2021* FEUAI June 30, 2021*
*included in the Group’s May 31, 2021 consolidated balances
These subsidiaries follow their respective school years (i.e., trimestral and semestral), hence, the use of different reporting dates (non-coterminous year-ends) as compared with that of the University. The University accounts for its investments in subsidiaries and non-controlling interests (NCIs) as follows:
(a) Investments in Subsidiaries
Subsidiaries are entities over which the Group has control. The Group controls an entity when it is exposed, or has rights to, variable returns from its involvement with the entity and has the ability to affect those returns through its power over the entity. Subsidiaries are consolidated from the date the Group obtains control. The Group reassesses whether or not it controls an entity if facts and circumstances indicate that there are changes to one or more of the three elements of controls indicated above. Accordingly, entities are deconsolidated from the date that control ceases. The acquisition method is applied to account for acquired subsidiaries (see Note 2.4).
(b) Transactions with NCIs The Group’s transactions with NCIs that do not result in loss of control are
accounted for as equity transactions – that is, as transaction with the owners of the Group in their capacity as owners. The difference between the fair value of any consideration paid and the relevant share acquired of the carrying value of the net assets of the subsidiary is recognized in equity. Disposals of equity investments in NCIs result in gains and losses which the Group also recognizes in equity.

- 9 -
When the Group ceases to have control over a subsidiary, any retained interest in the entity is remeasured to its fair value at the date when control is lost, with the change in carrying amount recognized in consolidated profit or loss. The fair value is the initial carrying amount for purposes of subsequently accounting for the retained interest as an associate, joint venture or financial asset. In addition, any amounts previously recognized in consolidated comprehensive income in respect of that entity are accounted for as if the Group had directly disposed of the related assets or liabilities. This may mean that amounts previously recognized in consolidated statement of other comprehensive income are reclassified to consolidated profit or loss.
2.4 Business Combinations
Business acquisitions are accounted for using the acquisition method of accounting. This requires recognizing and measuring the identifiable assets acquired, the liabilities assumed and any NCI in the acquiree. The consideration transferred for the acquisition of a subsidiary is the fair values of the assets transferred, the liabilities incurred and the equity interests issued by the University, if any. The consideration transferred also includes the fair value of any asset or liability resulting from a contingent consideration arrangement. Acquisition-related costs are expensed as incurred and subsequent change in the fair value of contingent consideration is recognized directly in consolidated profit or loss. Identifiable assets acquired and liabilities and contingent liabilities assumed in a business combination are measured initially at their fair values at the acquisition date. On an acquisition-by-acquisition basis, the University recognizes any NCI in the acquiree, either at fair value or at the NCI’s proportionate share of the recognized amounts of acquiree’s identifiable net assets. Goodwill represents the excess of the cost of an acquisition over the fair value of the Group’s share of the net identifiable assets of the acquired subsidiary at the date of acquisition. Subsequent to initial recognition, goodwill is measured at cost less any accumulated impairment losses.
Gain on bargain purchase, which is the excess of the Group’s interest in the net fair value of net identifiable assets acquired over acquisition cost, is charged directly to income.
Gains and losses on disposal of an interest in a subsidiary include the carrying amount of goodwill relating to it.
If the business combination is achieved in stages, the acquirer is required to remeasure its previously held equity interest in the acquiree at its acquisition-date fair value and recognize the resulting gain or loss, if any, in the consolidated profit or loss or consolidated other comprehensive income, as appropriate.
Any contingent consideration to be transferred by the Group is recognized at fair value at the acquisition date. Subsequent changes to the fair value of the contingent consideration that is deemed to be an asset or liability is recognized in accordance with PAS 37, Provisions, Contingent Liabilities and Contingent Assets, either in consolidated profit or loss or as a charge to consolidated other comprehensive income. Contingent consideration that is classified as equity is not remeasured, and its subsequent settlement is accounted for within equity.

- 10 -
2.5 Financial Instruments
Financial assets and financial liabilities are recognized when the Group becomes a party to the contractual provisions of the financial instrument. (a) Financial Assets
For purposes of classifying financial assets, an instrument is considered as an equity instrument if it is non-derivative and meets the definition of equity for the issuer in accordance with the criteria under PAS 32, Financial Instruments: Presentation. All other non-derivative financial instruments are treated as debt instruments. Regular purchases and sales of financial assets are recognized on their trade date (i.e., the date that the Group commits to purchase or sell the asset). Deposits, amounts due to banks and customers, and loans are recognized when cash is received by the Group or advanced to the borrowers. (i) Classification, Measurement and Reclassification of Financial Assets
The classification and measurement of financial assets is driven by the Group’s business models for managing the financial assets and the contractual cash flow characteristics of the financial assets. The Group’s classification and measurement of financial assets are described below. Financial Assets at Amortized Cost
• the asset is held within the Group’s business model whose objective is to hold financial assets in order to collect contractual cash flows (“held-to-collect”); and,
• the contractual terms of the instrument give rise, on specified dates, to cash flows that are solely payments of principal and interest (SPPI) on the principal amount outstanding.
Except for receivables that do not contain a significant financing component and are measured at the transaction price in accordance with PFRS 15, Revenue from Contracts with Customers, all financial assets meeting these criteria are measured initially at fair value plus transaction costs. These are subsequently measured at amortized cost using the effective interest method, less allowance for expected credit loss (ECL).
Where the business model is to hold assets to collect contractual cash flows, the Group assesses whether the financial instruments’ cash flows represent SPPI. In making this assessment, the Group considers whether the contractual cash flows are consistent with a basic lending arrangement, i.e., interest includes only consideration for the time value of money, credit risk, other basic lending risks and a profit margin that is consistent with a basic lending arrangement [see Note 3.1(e)]. Where the contractual terms introduce exposure to risk or volatility that are inconsistent with a basic lending arrangement, the related financial asset is classified and measured at fair value through profit or loss (FVTPL).
Financial assets are measured at amortized cost if both of the following conditions are met:

- 11 -
The Group’s financial assets at amortized cost are presented in the consolidated statement of financial position as Cash and Cash Equivalents, Trade and Other Receivables, Short-term investments presented under Other Current Assets, Long-term investments and Refundable deposits presented under Other Non-current Assets and Investment Securities at Amortized Cost. Financial assets measured at amortized cost are included in current assets, except for those with maturities greater than 12 months after the end of reporting period, which are classified as non-current assets. In the presentation of cash flows, cash and cash equivalents comprise accounts with original maturities of three months or less, including cash. These generally include cash on hand, cash in bank, and short-term deposits.
Financial Assets at Fair Value Through Other Comprehensive Income (FVOCI)
The Group accounts for financial assets at FVOCI if the assets meet the following conditions:
• they are held under a business model whose objective is to hold to collect the associated cash flows and sell; and,
• the contractual terms of the financial assets give rise to cash flows that are SPPI on the principal amount outstanding.
At initial recognition, the Group can make an irrevocable election (on an instrument-by-instrument basis) to designate equity investments as at FVOCI; however, such designation is not permitted if the equity investment is held by the Group for trading or as mandatorily required to be classified as FVTPL. The Group has designated certain equity instruments as at FVOCI on initial recognition. Financial assets at FVOCI are initially measured at fair value plus transaction costs. Subsequently, they are measured at fair value, with no deduction for any disposal costs. Gains and losses arising from changes in fair value, including the foreign exchange component, are recognized in OCI, net of any effects arising from income taxes, and are reported as part of Revaluation Reserves account in equity. When the asset is disposed of, the cumulative gain or loss previously recognized in the Revaluation Reserves account is not reclassified to profit or loss but is reclassified directly to Retained Earnings, except for those debt securities classified as FVOCI wherein fair value changes are recycled to profit or loss. Any dividends earned on holding these equity instruments are recognized in profit or loss as part of Other investment income under Finance Income account in the consolidated statement of profit or loss, when the Group’s right to receive dividends is established, it is probable that the economic benefits associated with the dividend will flow to the Group, and the amount of the dividend can be measured reliably, unless the dividends clearly represent recovery of a part of the cost of the investment.

- 12 -
Financial Assets at FVTPL
Financial assets that are held within a different business model other than “hold to collect” or “hold to collect and sell” are categorized at FVTPL. Further, irrespective of business model, financial assets whose contractual cash flows are not SPPI are accounted for at FVTPL. Also, equity securities are classified as financial assets at FVTPL, unless the Group designates an equity investment that is not held for trading as at FVOCI at initial recognition. The Group’s financial assets at FVTPL include equity securities and investments in unit investment trust fund (UITF) which are held for trading purposes or designated as at FVTPL. Financial assets at FVTPL are measured at fair value with gains or losses recognized in profit or loss as part of Other investment income under Finance Income account in the consolidated statement of profit or loss. Related transaction costs are recognized directly as expense in profit or loss. The fair values of these financial assets are determined by reference to active market transactions or using valuation technique when no active market exists.
Dividend income earned on these investments is reported as part of Other investment income under Finance Income account in the consolidated statement of profit or loss.
Interest income on debt financial assets measured at amortized cost and FVOCI is recognized using the effective interest rate method. The effective interest rate is the rate that exactly discounts estimated future cash receipts through the expected life of the financial instrument or, when appropriate, a shorter period, to the net carrying amount of the financial asset.
The Group calculates interest income by applying the effective interest rate to the gross carrying amount of the financial assets, except for those that are subsequently identified as credit-impaired and or are purchased or originated credit-impaired assets (POCI assets). For financial assets that have become credit-impaired subsequent to initial recognition, interest income is calculated by applying the effective interest rate to the net carrying amount of the financial assets (after deduction of the loss allowance). If the asset is no longer credit-impaired, the calculation of interest income reverts to gross basis. For POCI assets, interest income is calculated by applying a credit-adjusted effective interest rate to the amortized cost of the asset. The calculation of interest income does not revert to a gross basis even if the credit risk of the POCI asset subsequently improves. Interest income earned is recognized in the statement of profit or loss as part of Finance Income. Financial assets with embedded derivatives are considered in their entirety when determining whether their cash flows are SPPI.

- 13 -
The Group can only reclassify financial assets if the objective of its business model for managing those financial assets changes. Accordingly, the Group is required to reclassify financial assets: (i) from amortized cost to FVTPL, if the objective of the business model changes so that the amortized cost criteria are no longer met; and, (ii) from FVTPL to amortized cost, if the objective of the business model changes so that the amortized cost criteria start to be met and the characteristic of the instrument’s contractual cash flows meet the amortized cost criteria. A change in the objective of the Group’s business model will take effect only at the beginning of the next reporting period following the change in the business model.
(ii) Impairment of Financial Assets
The Group assesses its ECL on a forward-looking basis associated with its investment securities carried at amortized cost and debt instruments at FVOCI. No impairment loss is recognized on equity investments. Recognition of credit losses or impairment is no longer dependent on the Group’s identification of a credit loss event. Instead, the Group considers a broader range of information in assessing credit risk and measuring expected credit losses, including past events, current conditions, reasonable and supportable forecasts that affect collectability of the future cash flows of the financial assets.
The Group applies the simplified approach in measuring ECL, which uses a lifetime expected loss allowance for all tuition and other school fee receivables. These are the expected shortfalls in contractual cash flows, considering the potential for default at any point during the life of the financial assets. To calculate the ECL, the Group uses its historical experience, external indicators and forward-looking information (FLI) to calculate the ECL using a provision matrix. The Group also assesses impairment of tuition and other school fee receivables on a collective basis as they possess shared credit risk characteristics, and have been grouped based on the number of semesters past due [see Note 4.2(b)].
For debt instruments measured at FVOCI and at amortized cost, the allowance for credit losses is based on the ECL associated with the probability of default of a financial instrument in the next 12 months, unless there has been a significant increase in credit risk since the origination of the financial asset, in such case, a lifetime ECL for a POCI asset, the allowance for credit losses is based on the change in the ECL over the life of the asset. The Group recognized a loss allowance for such losses at each reporting date. The Group’s definition of credit risk and information on how credit risk is mitigated by the Group are disclosed in Note 4.2. The key elements used in the calculation of ECL are as follows:
• Probability of Default (PD) – it is an estimate of likelihood of a borrower defaulting on its financial obligation over a given time horizon, either over the next 12 months (12-month PD) or over the remaining lifetime (lifetime PD) of the obligation.
- 14 -
• Loss Given Default (LGD) – it is an estimate of loss arising in case where a default occurs at a given time (either over the next 12 months or 12-month LGD), or over the remaining lifetime (lifetime LGD). It is based on the difference between the contractual cash flows of a financial instrument due from a counterparty and those that the Group would expect to receive, including the realization of any collateral. It is presented as a percentage loss per unit of exposure at the time of default.
• Exposure at Default (EAD) – it represents the gross carrying amount of the financial instruments subject to impairment calculation; hence, this is the amount that the Group expects to be owed at the time of default over the next 12 months (12-month EAD) or over the remaining lifetime (lifetime EAD). In case of a loan commitment, the Group shall include the undrawn balance (up to the current contractual limit) at the time of default should it occur.
The measurement of the ECL reflects: (i) an unbiased and probability-weighted amount that is determined by evaluating a range of possible outcomes; (ii) the time value of money; and, (iii) reasonable and supportable information that is available without undue cost or effort at the reporting date about past events, current conditions and forecasts of future economic conditions. Measurement of the ECL is determined by a probability-weighted estimate of credit losses over the expected life of the financial instrument.
(iii) Derecognition of Financial Assets
The financial assets (or where applicable, a part of a financial asset or part of a group of financial assets) are derecognized when the contractual rights to receive cash flows from the financial instruments expire, or when the financial assets and all substantial risks and rewards of ownership have been transferred to another party. If the Group neither transfers nor retains substantially all the risks and rewards of ownership and continues to control the transferred asset, the Group recognizes its retained interest in the asset and an associated liability for amounts it may have to pay. If the Group retains substantially all the risks and rewards of ownership of a transferred financial asset, the Group continues to recognize the financial asset and also recognizes a collateralized borrowing for the proceeds received.
(b) Financial Liabilities
Financial liabilities, which includes interest-bearing loans, trade and other payables [except tax-related liabilities, Deposits payable and National Service Training Program (NSTP) trust fund], Derivative Liability and Refundable deposits (presented under Other Non-current Liabilities) are recognized when the Group becomes a party to the contractual terms of the instrument. Interest-bearing loans are availed for capital expenditures and to provide general corporate funding requirements. Finance charges, including premiums payable on settlement or redemption and direct issue costs, are charged to profit or loss on an accrual basis using the effective interest method and are added to the carrying amount of the instrument to the extent that these are not settled in the period in which they arise.

- 15 -
Trade and other payables account includes deposits payable which represents funds collected from students or entities and are held by the Group. The Group has no control over its use and disburses the funds only upon instruction of the student or entity that made the deposit. [see Note 2.11(a)].
Financial liabilities are recognized initially at their fair values and subsequently measured at amortized cost, except derivative liability which is consistently measured at fair value, using the effective interest method for maturities beyond one year, less settlement payments. The Group is no longer a party to foreign cross-currency swaps in 2020.
Dividend distributions to shareholders are recognized as financial liabilities upon declaration by the respective entities’ BOD or BOT. Financial liabilities are classified as current liabilities if payment is due to be settled within one year or less after the reporting period, or the Group does not have an unconditional right to defer settlement of the liability for at least 12 months after the reporting period. Otherwise, these are presented as non-current liabilities.
Financial liabilities are derecognized from the consolidated statement of financial position only when the obligations are extinguished either through discharge, cancellation or expiration. The difference between the carrying amount of the financial liability derecognized and the consideration paid or payable is recognized in profit or loss.
(c) Offsetting Financial Instruments
Financial assets and financial liabilities are offset and the resulting net amount, considered as a single financial asset or financial liability, is reported in the consolidated statement of financial position when there is a legally enforceable right to set-off the recognized amounts and there is an intention to settle on a net basis, or realize the asset and settle the liability simultaneously. The right of set-off must be available at the end of the reporting period, that is, it is not contingent on future event. It must also be enforceable in the normal course of business, in the event of default, and in the event of insolvency or bankruptcy; and, must be legally enforceable for both entity and all counterparties to the financial instruments.
2.6 Real Estate Held-for-Sale
Acquisition costs of raw land intended for sale, including other costs and expenses incurred to effect the transfer of title of the property as well as related property development costs, are accumulated in this account.
Real estate held-for-sale is carried at the lower of cost and net realizable value. Net realizable value is the estimated selling price in the ordinary course of business, less estimated costs to complete and the estimated costs necessary to make the sale.
Real estate held-for-sale is expected to be sold within the normal operating cycle of FRC.

- 16 -
2.7 Prepayments and Other Assets Prepayments and other assets pertain to other resources controlled by the Group as a result of past events. They are recognized in the consolidated financial statements when it is probable that the future economic benefits will flow to the Group and the asset has a cost or value that can be measured reliably. Other recognized assets of similar nature, where future economic benefits are expected to flow to the Group beyond one year after the end of the reporting period, are classified as non-current assets. An asset’s carrying amount is written down immediately to its recoverable amount if the asset’s carrying amount is greater than its estimated recoverable amount (see Note 2.14). Prepayment and other current assets of the Group include inventoriable items such as books and merchandise. These are valued at the lower of cost and net realizable value. Cost is determined using the first-in, first-out method. The cost of these saleable inventories includes all costs directly attributable to acquisition, such as the purchase price, import duties, if any, and other taxes that are not subsequently recoverable from taxing authorities. An asset’s carrying amount is written down immediately to its recoverable amount if the asset’s carrying amount is greater than its estimated recoverable amount (see Note 2.14).
Net realizable value is the estimated selling price in the ordinary course of business, less the estimated costs necessary to make the sale.
2.8 Property and Equipment
Except for land, which is stated at cost less any impairment in value, property and equipment are stated at cost less accumulated depreciation, amortization and impairment in value, if any.
The cost of an asset comprises its purchase price and directly attributable costs of bringing the asset to working condition for its intended use. Expenditures for additions, major improvements and renewals are capitalized; expenditures for repairs and maintenance are charged to expense as incurred.
Depreciation and amortization are computed on the straight-line basis over the estimated useful lives of the assets as follows:
Building and improvements 20 years Furniture and equipment 3 - 6 years Miscellaneous equipment 5 years
Construction in progress represents properties under construction and is stated at cost. This includes cost of construction, borrowing costs and other direct costs (see Note 2.16). The account is not depreciated until such time that the assets are completed and available for use. Leasehold improvements are amortized over the estimated useful lives of 20 years or the remaining term of the lease, whichever is shorter. An asset’s carrying amount is written down immediately to its recoverable amount if the asset’s carrying amount is greater than its estimated recoverable amount (see Note 2.14).
- 17 -
The residual values, estimated useful lives and method of depreciation and amortization of property and equipment are reviewed and adjusted, if appropriate, at the end of each reporting period. Fully depreciated and amortized assets are retained in the accounts until they are no longer in use and no further charge for depreciation and amortization is made in respect of those assets.
An item of property and equipment, including the related accumulated depreciation, amortization and impairment losses, is derecognized upon disposal or when no future economic benefits are expected to arise from the continued use of the asset. Any gain or loss arising on derecognition of the asset (calculated as the difference between the net disposal proceeds and the carrying amount of the item) is included in consolidated profit or loss in the period the item is derecognized.
2.9 Investment Properties
Investment properties are measured initially at acquisition cost. Subsequently, investment properties, except land, are carried at cost less accumulated depreciation and impairment in value, if any. Depreciation and amortization of investment properties, which consist of buildings and improvements and land improvements, are computed using the straight-line method over its estimated useful life of 20 years and 5 years, respectively. Land is carried at cost less impairment in value, if any.
Investment properties include construction in progress which represents condominium units of FRC that are still under construction and are stated at cost. This includes cost of construction, applicable borrowing costs (see Note 2.16) and other direct costs. The account is not depreciated until such time that the assets are completed and available for use.
Transfers are made to and from investment property when, and only when, there is a change in use, evidenced by the end or commencement of owner-managed, commencement of an operating lease to another party, by the end of construction or development, or commencement of development with a view to sell.
For a transfer from investment property to owner-occupied property or inventories, the cost of property for subsequent accounting is its carrying value at the date of change in use. If an owner-occupied property becomes an investment property, the Group accounts for such property in accordance with the policy stated under Property and Equipment up to the date of change in use (see Note 2.8).
Investment property is derecognized upon disposal or when permanently withdrawn from use and no future economic benefit is expected from its disposal. Any gain or loss on the retirement or disposal of an investment property is recognized in consolidated profit or loss in the year of retirement or disposal. An asset’s carrying amount is written down immediately to its recoverable amount if the asset’s carrying amount is greater than its estimated recoverable amount (see Note 2.14).

- 18 -
2.10 Provisions and Contingencies
Provisions are recognized when present obligations will probably lead to an outflow of economic resources and they can be estimated reliably even if the timing or amount of the outflow may still be uncertain. A present obligation arises from the presence of a legal or constructive commitment that has resulted from past events.
Provisions are measured at the estimated expenditure required to settle the present obligation, based on the most reliable evidence available at the end of the reporting period, including the risks and uncertainties associated with the present obligation. Where there are a number of similar obligations, the likelihood that an outflow will be required in settlement is determined by considering the class of obligations as a whole. When time value of money is material, long-term provisions are discounted to their present values using a pretax rate that reflects market assessments and the risks specific to the obligation. The increase in the provision due to passage of time is recognized as interest expense. Provisions are reviewed at the end of each reporting period and adjusted to reflect the current best estimate.
In those cases where the possible outflow of economic resource as a result of present obligations is considered improbable or remote, or the amount to be provided for cannot be measured reliably, no liability is recognized in the consolidated financial statements. Similarly, possible inflows of economic benefits to the Group that do not yet meet the recognition criteria of an asset are considered contingent assets, hence, are not recognized in the consolidated financial statements. On the other hand, any reimbursement that the Group can be virtually certain to collect from a third party with respect to the obligation is recognized as a separate asset not exceeding the amount of the related provision.
2.11 Revenue and Expense Recognition
Revenue arises mainly from: (i) educational and related activities such as tuition and other school fees, income from sale of books and other merchandise, rental income from real estate and school campus’ food concessionaires; and, (ii) investment-related transactions such as, investment income, dividend income from Financial Assets at FVTPL and at FVOCI, interest income and others.
The management determined that the revenues arising from educational and related activities are within the scope of PFRS 15, while rental income is covered by PFRS 16 (see Note 2.12). Investment-related revenues are subject to the provisions of PFRS 9 (see Note 2.5).
To determine whether to recognize revenue, the Group follows a five-step process: 1. Identifying the contract with a customer; 2. Identifying the performance obligation; 3. Determining the transaction price; 4. Allocating the transaction price to the performance obligations; and, 5. Recognizing revenue when/as performance obligations are satisfied.

- 19 -
The Group determines whether a contract with customer exists by evaluating whether the following gating criteria are present:
(a) the parties to the contract have approved the contract either in writing, orally or in
accordance with other customary business practices; (b) each party’s rights regarding the goods to be transferred or performed can be identified; (c) the payment terms for the goods to be transferred or performed can be identified; (d) the contract has commercial substance (i.e., the risk, timing or amount of the future
cash flows is expected to change as a result of the contract); and, (e) collection of the consideration in exchange of the goods and services is probable.
Revenue is recognized only when (or as) the Group satisfies a performance obligation by transferring control of the promised goods or services to a customer. The transfer of control can occur over time or at a point in time.
A performance obligation is satisfied at a point in time unless it meets one of the following criteria, in which case it is satisfied over time: (a) the customer simultaneously receives and consumes the benefits provided by the
Group’s performance as the Group performs; (b) the Group’s performance creates or enhances an asset that the customer controls as the
asset is created or enhanced; and, (c) the Group’s performance does not create an asset with an alternative use to the Group
and the entity has an enforceable right to payment for performance completed to date.
The Group enters into transactions involving the tuition fees and other school fees and other school-related activities such as sale of school merchandise and books, and sale of real estate. There are no significant judgments used in determining the transaction price and the amount allocated to the performance obligations. Developing the knowledge and enhancing the abilities of the students represent promises to transfer a series of distinct goods that are substantially the same and that have the same pattern of transfer to the customer; therefore, the services rendered represent one performance obligation that is satisfied over time. The transaction price of the single performance obligation is recognized as revenue as the performance obligation is satisfied, which is usually throughout the school year or the semestral/trimestral period, whichever is applicable. With respect to the sale of school merchandise and books, the obligation is satisfied when the goods, particularly the merchandise and books are delivered to the customers. Hence, revenue is recognized at a point in time. As for real estate sales, the obligation is satisfied at the point the control over the properties is transferred by the FRC to the buyers. In addition, the following specific recognition criteria must also be met before revenue is recognized [significant judgments in determining the timing of satisfaction of the following performance obligations are disclosed in Note 3(b)]:
(a) Educational revenues – Revenue is recognized in profit or loss over the corresponding
school term. Tuition fee received in advance and applicable to a school term after the reporting period is not recognized in profit or loss until the next reporting period and is presented as part of Deferred Revenues account in the consolidated statement of financial position. Payment for tuition fees is due upon enrollment, which is before the school year starts, and can be made either in full payment or installment.
- 20 -
Revenues from NSTP trust fund are recognized upon fulfillment of conditions attached to the fund and/or extent that the related expenses have been incurred. Restricted funds for which restrictions and conditions have not yet been met are classified as NSTP trust funds (liability) recorded as part of the Trade and Other Payables account in the consolidated statement of financial position.
(b) Sale of books and other educational-related merchandise – Revenue is recognized at a
point in time when the control of the goods have been passed to the buyer. This is generally when the customer has acknowledged delivery of goods. The sale of this merchandise is made for the Group’s students. Payment for the transaction price is due immediately at the point the customer purchases the goods.
(c) Other fees – This pertains to but not limited to transcripts, certification and graduation
fees and fees for diplomas and identification cards. Revenue is recognized at the point in time when the related academic document is made available to requestors. Official receipts for the services are issued once request from students have been fulfilled.
(d) Real estate sales – This pertains to sale of lots and completed townhouses of FRC. Revenue is recognized at the point the control to the property is passed to the customer, that is, when the property is transferred to the buyer.
In obtaining customer contracts, the Group incurs incremental costs. As the expected amortization period of these costs, if capitalized, would be less than one year, the Group uses the practical expedient in PFRS 15 and expenses such costs as incurred. The Group also incurs costs in fulfilling contracts with customers. However, as those costs are within the scope of other financial reporting standards, the Group accounts for those costs in accordance with accounting. Cost and expenses are recognized in profit or loss upon utilization of goods or services or at the date such cost and expenses are incurred. All finance costs are reported in profit or loss on an accrual basis, except capitalized borrowing costs which are included as part of the cost of the related qualifying asset (see Note 2.16).
2.12 Leases
The Group accounts for its leases as follows:
(a) Group as Lessee
(i) Accounting for Leases in Accordance with PFRS 16 (beginning June 1, 2019) For any new contracts entered into on or after June 1, 2019, the Group considers whether a contract is, or contains, a lease. A lease is defined as a contract, or part of a contract, that conveys the right to use an asset (the underlying asset) for a period of time in exchange for consideration.

- 21 -
To apply this definition, the Group assesses whether the contract meets three key evaluations which are whether:
• the contract contains an identified asset, which is either explicitly identified in the contract or implicitly specified by being identified at the time the asset is made available to the Group;
• the Group has the right to obtain substantially all of the economic benefits from use of the identified asset throughout the period of use, considering its rights within the defined scope of the contract; and,
• the Group has the right to direct the use of the identified asset throughout the period of use. The Group assess whether it has the right to direct ‘how and for what purpose’ the asset is used throughout the period of use.
At lease commencement date, the Group recognizes a right-of-use asset (ROUA) and a lease liability. The ROUA is measured at cost, which is made up of the initial measurement of the lease liability, any initial direct costs incurred by the Group, an estimate of any costs to dismantle and remove the asset at the end of the lease, and any lease payments made in advance of the lease commencement date (net of any incentives received). Subsequently, the Group depreciates the ROUA on a straight-line basis from the lease commencement date to the earlier of the end of the useful life of the ROUA or the end of the lease term. The Group also assesses the ROUA for impairment when such indicators exist (see Note 2.14).
On the other hand, the Group measures the lease liability at the present value of the lease payments unpaid at the commencement date, discounted using the interest rate implicit in the lease if that rate is readily available or the Group’s incremental borrowing rate. Lease payments include fixed payments (including in-substance fixed) less lease incentives receivable, if any, variable lease payments based on an index or rate, amounts expected to be payable under a residual value guarantee, and payments arising from options (either renewal or termination) reasonably certain to be exercised. After initial measurement, the liability will be reduced for payments made and increased for interest. It is remeasured to reflect any reassessment or modification, or if there are changes in in-substance fixed payments. When the lease liability is remeasured, the corresponding adjustment is reflected in the ROUA, or profit and loss if the ROUA is already reduced to zero.
The Group has elected to account for short-term leases and leases of low-value assets using the practical expedients. Instead of recognizing a ROUA and lease liability, the payments in relation to these are recognized as an expense in profit or loss on a straight-line basis over the lease term.
In the consolidated statement of financial position, ROUA and current portion of lease liabilities have been presented as part of Property and Equipment and Trade and Other Payables, respectively. Non-current portion of lease liabilities, on the other hand, has been presented separately in the consolidated statement of financial position.

- 22 -
(i) Accounting for Leases in Accordance with PAS 17 (Prior to June 1, 2019) Leases which do not transfer to the Group substantially all the risks and benefits of ownership of the asset are classified as operating leases. Operating lease payments (net of any incentive received from the lessor) are recognized as expense in profit or loss on a straight-line basis over the lease term. Associated costs, such as repairs and maintenance and insurance, are expensed as incurred.
(b) Group as Lessor
Leases which do not transfer to the lessee substantially all the risks and benefits of ownership of the asset are classified as operating leases. Lease income from operating leases is recognized in profit or loss on a straight-line basis over the lease term and is presented as Rental in the consolidated statement of profit or loss.
The Group determines whether an arrangement is, or contains, a lease based on the substance of the arrangement. It makes an assessment of whether the fulfillment of the arrangement is dependent on the use of a specific asset or assets and the arrangement conveys a right to use the asset. 2.13 Foreign Currency Transactions and Translation
The accounting records of the Group are maintained in Philippine pesos. Foreign currency transactions during the year are translated into the functional currency at exchange rates which approximate those prevailing on transaction dates.
Foreign currency gains and losses resulting from the settlement of such transactions and from the translation at year-end exchange rates of monetary assets and liabilities denominated in foreign currencies are recognized in the consolidated statement of profit or loss.
Changes in the fair value of monetary financial assets denominated in foreign currency classified as financial assets at FVOCI and at FVTPL are analyzed between translation differences resulting from changes in the amortized cost of the security and other changes in the carrying amount of the security. Translation differences related to changes in amortized cost are recognized in consolidated profit or loss, and other changes in the carrying amount are recognized in consolidated other comprehensive income. 2.14 Impairment of Non-financial Assets
The Group’s property and equipment, investment properties, and certain other non-financial assets are tested for impairment whenever events or changes in circumstances indicate that the carrying amount may not be recoverable. Goodwill is tested for impairment annually.
- 23 -
For purposes of assessing impairment, assets are grouped at the lowest levels for which there are separately identifiable cash flows [cash-generating units (CGU)]. As a result, some assets are tested individually for impairment and some are tested at CGU level. An impairment loss is recognized in the consolidated profit or loss for the amount by which the asset’s or CGU’s carrying amount exceeds its recoverable amount. The recoverable amount is the higher of fair value, reflecting market conditions less costs to sell, and value in use, based on an internal evaluation of discounted cash flows. In determining value in use, management estimates the expected future cash flows from each CGU and determines the suitable interest rate in order to calculate the present value of those cash flows. The data used for impairment testing procedures are directly linked to the Group’s latest approved budget, adjusted as necessary to exclude the effects of asset enhancements.
Discount factors are determined individually for each CGU and reflect management’s assessment of respective risk profiles, such as market and asset-specific risk factors. Impairment loss is charged pro-rata to the other assets in the CGU.
All assets, except goodwill for which impairment loss is not reversed (see Note 2.4), are subsequently reassessed for indications that an impairment loss previously recognized may no longer exist. An impairment loss is reversed if the asset’s or CGU’s recoverable amount exceeds its carrying amount.
2.15 Employee Benefits The Group, except RCI, provides post-employment benefits to employees through a defined contribution plan subject to compliance to a minimum guarantee required by Republic Act (RA) No. 7641, The Retirement Pay Law, which is accounted for as a defined benefit plan, and various compensations mandated by law. Such application of the minimum guarantee prescribed by RA No. 7641 is based on the interpretations issued by the Philippine Interpretations Committee (PIC) in its Question and Answer on PAS 19 – Accounting for Employee Benefits Under a Defined Benefit Contribution Plan Subject to the Requirements of RA 7641.
(a) Post-employment Benefits
The Group maintains defined contribution and defined benefit plans. Under the defined contribution plan, the Group (except RCI) pays fixed contributions based on the employees’ monthly salaries.
RCI, which does not have a formal post-employment benefit plan, bases its determination of post-employment benefit obligation on RA No. 7641, which is considered a defined benefit plan. RA No. 7641 provides for a qualified employee a defined benefit minimum guarantee. The defined benefit minimum guarantee is equivalent to 75% of the last monthly salary of an employee at normal retirement age with the required credited years of service based on the provisions of RA No. 7641. The legal obligation for any benefits from this kind of post-employment plan remains with the entity even if plan assets, if any, for funding the defined benefit plan have been acquired.
Accordingly, the Group, (except RCI), recognizes its post-employment benefit obligation based on the higher of the defined benefit obligation relating to the minimum guarantee required by RA No. 7641 and the obligation arising from the defined contribution plan. On the other hand, RCI accrues its post-employment benefit obligation solely based on minimum guarantee requirement of RA No. 7641.

- 24 -
For defined benefit minimum guarantee plan, the liability is determined based on the present value of the excess of the projected defined benefit obligation over the projected defined contribution obligation at the end of the reporting period. The defined benefit obligation is calculated annually by a qualified independent actuary using the projected unit credit method. The present value of the defined benefit obligation is determined by discounting the estimated future cash outflows for expected benefit payments using a discount rate derived from the interest rates of a zero coupon government bonds [using the reference rates published by Bloomberg using its valuation technology, Bloomberg Valuation (BVAL)], that are denominated in the currency in which the benefits will be paid and that have terms to maturity approximating to the terms of the related post-employment liability. BVAL provides evaluated prices that are based on market observations from contributed sources. The Group determines the net interest expense (income) on the defined benefit liability (asset) for the period by applying the discount rate used to measure the defined benefit obligation at the beginning of the annual period to the net defined benefit liability (asset), taking into account any changes in the net defined benefit liability (asset) during the period as a result of contributions and benefit payments. Net interest expense and other expenses related to the defined benefit plan are recognized in profit or loss.
The defined contribution, on the other hand, is measured at the fair value of the defined contribution assets upon which the defined contribution benefits depend, with an adjustment for margin on asset returns, if any, where this is reflected in the defined contribution benefits. When the benefits of a plan are changed or when a plan is curtailed, the resulting change in benefit that relates to past service or the gain or loss on curtailment is recognized immediately in consolidated profit or loss. The Group recognizes gains or losses on the settlement of a defined benefit plan when the settlement occurs.
(b) Termination Benefits
Termination benefits are payable when employment is terminated by the Group before the normal retirement date, or whenever an employee accepts voluntary redundancy in exchange for these benefits. The Group recognizes termination benefits when it is demonstrably committed to either: (i) terminating the employment of current employees according to a detailed formal plan without possibility of withdrawal; or, (ii) providing termination benefits as a result of an offer made to encourage voluntary redundancy. Benefits falling due more than 12 months after the reporting period are discounted to their present value.
(c) Bonuses
The Group recognizes a liability and an expense for bonuses. The Group recognizes a provision where it is contractually obliged to pay the benefits, or where there is a past practice that has created a constructive obligation.
(d) Compensated Absences
Compensated absences are recognized for the number of paid leave days (including holiday entitlement) remaining at the end of the reporting period. These are included in the Trade and Other Payables account in the consolidated statement of financial position at the undiscounted amount that the Group expects to pay as a result of the unused entitlement.

- 25 -
2.16 Borrowing Costs
Borrowing costs are recognized as expenses in the period in which they are incurred, except to the extent that they are capitalized. Borrowing costs that are directly attributable to the acquisition, construction or production of a qualifying asset (i.e., an asset that takes a substantial period of time to get ready for its intended use or sale) are capitalized as part of cost of such asset. The capitalization of borrowing costs commences when expenditures for the asset and borrowing costs are being incurred and activities that are necessary to prepare the asset for its intended use or sale are in progress. Capitalization ceases when substantially all such activities are complete. Investment income, if any, earned on the temporary investment of specific borrowings pending their expenditure on qualifying assets is deducted from the borrowing costs eligible for capitalization.
2.17 Income Taxes
Tax expense recognized in profit or loss comprises the sum of current tax and deferred tax not recognized in other comprehensive income or directly in equity, if any. Current tax assets or current tax liabilities comprise those claims from, or obligations to, fiscal authorities relating to the current or prior reporting period, that are uncollected or unpaid at the end of the reporting period. They are calculated using the tax rates and tax laws applicable to the fiscal periods to which they relate, based on the taxable profit for the year. All changes to current tax assets or liabilities are recognized as a component of tax expense in profit or loss.
Deferred tax is accounted for using the liability method on temporary differences at the end of the reporting period between the tax base of assets and liabilities and their carrying amounts for financial reporting purposes. Under the liability method, with certain exceptions, deferred tax liabilities are recognized for all taxable temporary differences and deferred tax assets are recognized for all deductible temporary differences and the carryforward of unused tax losses and unused tax credits to the extent that it is probable that taxable profit will be available against which the deductible temporary differences can be utilized. Unrecognized deferred tax assets are reassessed at the end of each reporting period and are recognized to the extent that it has become probable that future taxable profit will be available to allow such deferred tax assets to be recovered. Deferred tax assets and deferred tax liabilities are measured at the tax rates that are expected to apply to the period when the asset is realized or the liability is settled provided such tax rates have been enacted or substantively enacted at the end of the reporting period. The carrying amount of deferred tax assets is reviewed at the end of each reporting period and reduced to the extent that it is probable that sufficient taxable profit will be available to allow all or part of the deferred tax asset to be utilized.
The measurement of deferred tax liabilities and deferred tax assets reflects the tax consequences that would follow from the manner in which the Group expects, at the end of the reporting period, to recover or settle the carrying amount of its assets and liabilities.
- 26 -
Most changes in deferred tax assets or deferred tax liabilities are recognized as a component of tax expense in the consolidated profit or loss. Only changes in deferred tax assets or liabilities that relate to items recognized in the consolidated other comprehensive income or directly in equity are recognized in the consolidated other comprehensive income or directly in equity, respectively.
Deferred tax assets and deferred tax liabilities are offset only if the Group or any of its subsidiaries has a legally enforceable right to set-off current tax assets against current tax liabilities and the deferred taxes relate to the same taxation authority.
2.18 Related Party Transactions and Relationships
Related party transactions are transfers of resources, services or obligations between the Group and its related parties, regardless of whether a price is charged.
Parties are considered to be related if one party has the ability to control the other party or exercise significant influence over the party in making financial and operating decisions. These parties include: (a) individuals owning, directly or indirectly through one or more intermediaries, control or are controlled by, or under common control with the Group; (b) associates; (c) individuals owning, directly or indirectly, an interest in the voting power of the Group that gives them significant influence over the Group and close members of the family of any such individual; and, (d) certain funded retirement plans administered by an organization, through its Retirement Board.
In considering each possible related party relationship, attention is directed to the substance of the relationship and not merely on the legal form. The Group established policies and procedures on related party transactions in accordance with the regulations of the SEC. All material related party transactions, which exceed the established materiality thresholds, must undergo prior internal review from Audit Committee before endorsing for approval of the BOT. Further, the Chief Executive Officer, President, or any member of the Audit Committee may request that a related party transaction, regardless of amount, be reviewed by the Audit Committee if such related party transaction meet any of the qualitative factors affecting materiality threshold. All individual material related party transactions shall be approved by at least two-thirds (2/3) vote of the BOT, with at least a majority of the independent trustees voting to approve such transactions. In case that a majority of the independent trustees’ vote is not secured, the material related party transaction may be ratified by the vote of the stockholders representing at least two thirds (2/3) of the outstanding capital stock. For aggregate related party transactions within a twelve (12) month period that breaches the materiality threshold, the same board approval would be required for the transaction that meets and exceeds the materiality threshold covering the same related party.
2.19 Equity
Capital stock represents the nominal value of shares that have been issued. Stock dividends distributable account is a stockholders’ equity (paid-in capital) account credited for the par or stated value of the shares distributable when recording the declaration of a stock dividend until the stock is issued to shareholders.
- 27 -
Treasury stocks are stated at the cost of reacquiring such shares and are deducted from equity attributable to the University’s equity holders until the shares are cancelled, reissued, retired, or disposed of. This also includes shares of the parent company held by a certain subsidiary (see Note 2.3).
Revaluation reserves comprise accumulated gains or losses arising from the revaluation of Financial Assets at FVOCI and remeasurements of post-employment defined benefit plan. Other reserves refer to the amount attributable to the parent company arising from the changes in the ownership of the NCI in the Group. Retained earnings, both restricted and available for dividend declaration, represent all current and prior period results of operations as reported in the consolidated statement of profit or loss. The appropriated portion represents the amount which is not available for distribution. NCI represents the interests not held by the Group in FRC and RCI. It also includes the preferred shares of stock of EACCI and FEUAI issued to a stockholder outside of the Group but under the Group’s common management (see Note 24.5).
2.20 Earnings Per Share
Basic earnings per share (EPS) is determined by dividing net profit or loss attributable to equity holders of the University by the weighted average number of shares subscribed and issued during the period after giving retroactive effect to stock dividend declared, stock split and reverse stock split during the current year, if any. Diluted EPS is computed by adjusting the weighted average number of ordinary shares outstanding to assume conversion of dilutive potential shares. The Group does not have dilutive potential shares outstanding that would require disclosure of diluted EPS in the consolidated statement of profit or loss.
2.21 Segment Reporting
Operating segments are reported in a manner consistent with the internal reporting provided to the Group’s strategic steering committee, its chief operating decision-maker. The strategic steering committee is responsible for allocating resources and assessing performance of the operating segments. In identifying its operating segments, management generally follows the Group’s major geographical areas as disclosed in Note 7, which represent the breadth and reach of the Group’s educational services.
Each of these operating segments is managed separately as each of these geographical areas requires different technologies and other resources, as well as marketing approaches. All intersegment transfers are carried out at arm’s length prices.
The measurement policies the Group uses for segment reporting under PFRS 8, Operating Segments, are the same as those used in its consolidated financial statements.
- 28 -
In addition, corporate assets which are not directly attributable to the business activities of any operating segment are not allocated to a segment. There have been no changes from prior periods in the measurement methods used to determine reported segment profit or loss. 2.22 Events After the End of the Reporting Period Any post-year-end event that provides additional information about the Group’s consolidated financial position at the end of the reporting period (adjusting event) is reflected in the consolidated financial statements. Post-year-end events that are not adjusting events, if any, are disclosed when material to the consolidated financial statements.
3. SIGNIFICANT ACCOUNTING JUDGMENTS AND ESTIMATES The preparation of the Group’s consolidated financial statements in accordance with PFRS requires management to make judgments and estimates that affect the amounts reported in the consolidated financial statements and related notes. Judgments and estimates are continually evaluated and are based on historical experience and other factors, including expectations of future events that are believed to be reasonable under the circumstances. Actual results may ultimately differ from these estimates.
3.1 Critical Management Judgments in Applying Accounting Policies
In the process of applying the Group’s accounting policies, management has made the following judgments, apart from those involving estimation. The following judgments have the most significant effect on the amounts recognized in the consolidated financial statements:
(a) Determination of Lease Term of Contracts with Renewal and Termination Options (2021 and
2020) In determining the lease term, management considers all relevant factors and circumstances that create an economic incentive to exercise a renewal option or not exercise a termination option. Renewal options and/or periods after termination options are only included in the lease term if the lease is reasonably certain to be extended or not terminated. For leases of buildings, the factors that are normally the most relevant are (a) if there are significant penalties should the Group pre-terminate the contract, and (b) if any leasehold improvements are expected to have a significant remaining value, the Group is reasonably certain to extend and not to terminate the lease contract. Otherwise, the Group considers other factors including historical lease durations and the costs and business disruption required to replace the leased asset. The Group did not include the renewal period as part of the lease term for leases of university buildings because the terms are renewable upon the mutual agreement of the parties. The lease term is reassessed if an option is actually exercised or not exercised or the Group becomes obliged to exercise or not exercise it. The assessment of reasonable certainty is only revised if a significant event or a significant change in circumstances occurs, which affects this assessment, and that is within the control of the Group.

- 29 -
(b) Determination of Timing of Satisfaction of Performance Obligations The management determines that its revenue from tuition fees shall be recognized over time. In making its judgment, the Group considers the timing of receipt and consumption of benefits provided by the Group to the students. This demonstrates that the customers simultaneously receive and consume the benefits as the Group performs its obligation. With respect to revenues from sale of merchandise and books, and various other school-related fees, the management deems that revenues shall be recognized at a point in time as control over the goods, particularly the merchandise, books and requested documents is transferred to the customers upon delivery. With respect to sale of lots and completed townhouses, the Group satisfies the performance obligation at the point in time when the property is transferred to the customer (i.e., upon acknowledgment of the customer).
(c) Determination of ECL on Tuition and Other Fee Receivables The Group uses a provision matrix to calculate ECL for tuition and other fee receivables. The loss rates are based on actual credit-impaired student accounts or those which are outstanding for two semesters and have not enrolled for the succeeding term [see Note 4.2(b)].
The Group’s management intends to calibrate on an annual basis the matrix to consider the historical credit loss experience with forward-looking information. Details about the ECL on the Group’s tuition fees and other receivables are disclosed in Notes 4.2 and 9.
(d) Application of ECL to Investment Securities at Amortized Cost and Financial Assets at
FVOCI The Group uses a general approach to calculate ECL for all debt instruments at FVOCI and amortized cost. The allowance for credit loss is based on the ECLs associated with the probability of default of a financial instrument in the next 12 months, unless there has been a significant increase in credit risk since origination of the financial instrument, in such case, a lifetime ECL for the instrument is recognized. The Group has established a policy to perform an assessment, at the end of each reporting period, whether a financial instrument’s credit risk has increased significantly since initial recognition, by considering the change in the risk of default occurring over the remaining life of the financial instrument.
(e) Evaluation of Business Model Applied in Managing Financial Instruments
The Group manages its financial assets based on business models that maintain adequate level of financial assets to match its expected cash outflows.

- 30 -
In determining the classification of a financial instrument under PFRS 9, the Group developed business models which reflect how it manages its portfolio of financial instruments. The Group’s business models need not be assessed at entity level or as a whole but shall be applied at the level of a portfolio of financial instruments and not on an instrument-by-instrument basis (i.e., not based on intention or specific characteristics of individual financial instrument). In determining the classification of a financial instrument under PFRS 9, the Group evaluates in which business model a financial instrument or a portfolio of financial instruments belong to taking into consideration the objectives of each business model established by the Group as those relate to the Group’s investment, trading strategies.
(f) Testing the Cash Flow Characteristics of Financial Assets and Continuing Evaluation of the
Business Model
In determining the classification of financial assets under PFRS 9, the Group assesses whether the contractual terms of the financial assets give rise on specified dates to cash flows that are SPPI on the principal outstanding, with interest representing time value of money and credit risk associated with the principal amount outstanding. The assessment as to whether the cash flows meet the test is made in the currency in which the financial asset is denominated. Any other contractual term that changes the timing or amount of cash flows (unless it is a variable interest rate that represents time value of money and credit risk) does not meet the amortized cost criteria.
In cases where the relationship between the passage of time and the interest rate of the financial instrument may be imperfect, known as modified time value of money, the Group assesses the modified time value of money feature to determine whether the financial instrument still meets the SPPI criterion. The objective of the assessment is to determine how different the undiscounted contractual cash flows could be from the undiscounted cash flows that would arise if the time value of money element was not modified (the benchmark cash flows). If the resulting difference is significant, the SPPI criterion is not met. In view of this, the Group considers the effect of the modified time value of money element in each reporting period and cumulatively over the life of the financial instrument. In addition, PFRS 9 emphasizes that if more than an infrequent sale is made out of a portfolio of financial assets carried at amortized cost, an entity should assess whether and how such sales are consistent with the objective of collecting contractual cash flows. In making this judgment, the Group considers certain circumstances documented in its business model manual to assess that an increase in the frequency or value of sales of financial instruments in a particular period is not necessarily inconsistent with a held-to-collect business model if the Group can explain the reasons for those sales and why those sales do not reflect a change in the Group’s objective for the business model.

- 31 -
(g) Determination of Control of Entities in which the University Holds Less than 50%
Management considers that the University has de facto control of FRC even though it holds less than 50% of the ordinary shares and voting rights in the latter. Although the University holds less than 50% of the voting shares of stock of FRC, it has control over FRC because it is exposed or has right to variable returns from its involvement with FRC and it has the ability to affect those returns through its power over FRC. It is able to do this primarily because the University has the power to cast the majority of votes at meetings of the BOD and elect officers of FRC. Accordingly, FRC is recognized as a subsidiary of the University (see Note 1.1).
(h) Distinction between Investment Properties and Owner-managed Properties
The Group determines whether a property qualifies as investment property. In making its judgment, the Group considers whether the property generates cash flows largely independent of the other assets held by an entity.
Owner-managed properties generate cash flows that are attributable not only to the property but also to other assets used in the process of providing educational services. Some properties comprise a portion that is held to earn rental or for capital appreciation and another portion that is held for use in the supply of services or for administrative purposes. If a portion can be sold separately (or leased out separately under finance lease), the Group accounts for such portion separately. If the portion cannot be sold separately, the property is accounted for as investment property only if an insignificant portion is held for use in the supply of services or for administrative purposes. Judgment is applied in determining whether ancillary services are so significant that a property does not qualify as investment property. The Group considers each property separately in making its judgment.
(i) Distinction between Real Estate for Sale and Investment Properties
Real estate for sale comprise lots that are held for sale in the ordinary course of business (see Note 11). Meanwhile, investment properties (see Note 14) comprise of land and buildings which are not occupied substantially for use by, or in the operations of, the Group, nor for sale in the ordinary course of business, but are held primarily to earn rental income and capital appreciation. The Group considers management’s intention over these assets in making its judgement.
(j) Distinction between Operating and Finance Lease (2019)
The Group has entered into various lease agreements as either a lessor or a lessee. Judgment was exercised by management to distinguish each lease agreement as either an operating or finance lease by looking at the transfer or retention of significant risk and rewards of ownership of the properties covered by the agreements. Failure to make the right judgment will result in either overstatement or understatement of assets and liabilities. Currently, all of the Group’s lease agreements are determined to be operating leases.
(k) Recognition of Provisions and Contingencies
Judgment is exercised by management to distinguish between provisions and contingencies. Accounting policies on recognition and disclosure of provisions and contingencies are discussed in Note 2.10 and relevant disclosures are presented in Note 26.

- 32 -
3.2 Key Sources of Estimation Uncertainty
The following are the key assumptions concerning the future, and other key sources of estimation uncertainty at the end of the reporting period, that have a significant risk of causing a material adjustment to the carrying amounts of assets and liabilities within the next reporting period:
(a) Determination of Appropriate Discount Rate in Measuring Lease Liabilities (2021 and 2020)
The Group measures its lease liabilities at present value of the lease payments that are not paid at the commencement date of the lease contract. The lease payments were discounted using a reasonable rate deemed by management equal to the Group’s incremental borrowing rate. In determining a reasonable discount rate, management considers the term of the leases, the underlying asset and the economic environment. Actual results, however, may vary due to changes in estimates brought about by changes in such factors.
(b) Estimation of Allowance for Impairment of Financial Instruments
The measurement of the allowance for ECL on financial assets at FVOCI and at investment securities at amortized cost is an area that requires the use of significant assumptions about the future economic conditions and credit behavior (e.g., likelihood of customers defaulting and the resulting losses). Explanation of the inputs, assumptions and estimation used in measuring ECL is further detailed in Note 4.2.
The Group uses a provision matrix to calculate ECL for its trade receivables which are based on the Group’s historical observed default rates. The Group’s management intends to calibrate on an annual basis the matrix to consider the historical credit loss experience with forward-looking information.
(c) Determination of Fair Value Measurement for Financial Instruments
Management applies valuation techniques to determine the fair value of financial instruments where active market quotes are not available. This requires management to develop estimates and assumptions based on market inputs, using observable data that market participants would use in pricing the instrument. Where such data is not observable, management uses its best estimate. Estimated fair values of financial instruments may vary from the actual prices that would be achieved in an arm’s length transaction at the end of the reporting period.
The carrying values of the Group’s Financial Assets at FVTPL and at FVOCI and the amounts of fair value changes recognized during the years on those assets are disclosed in Note 10 while fair value gains or losses on cross-currency swap agreements are presented as fair value gain or loss on derivative liability under Finance Income or Finance Costs in the consolidated statement of profit or loss (see Note 20).

- 33 -
(d) Estimation of Useful Lives of Investment Properties and Property and Equipment
The Group estimates the useful lives of investment properties and property and equipment based on the period over which the assets are expected to be available for use. The estimated useful lives of these assets are reviewed periodically and are updated if expectations differ from previous estimates due to physical wear and tear, technical or commercial obsolescence and legal or other limits on the use of the assets. The carrying amounts of property and equipment and investment properties are presented in Notes 12 and 14, respectively. Based on management’s assessment as at May 31, 2021, 2020 and 2019, there is no change in the estimated useful lives of the assets during those years. Actual results, however, may vary due to changes in factors mentioned above.
(e) Determination of Fair Value of Investment Properties
Investment properties are measured using the cost model. The fair value disclosed in Note 14 is determined by the Group based on the appraisal report prepared by independent appraisers using the relevant valuation methodology as discussed in Note 6.4.
For investment properties with appraisal conducted prior to the end of the current reporting period, management determines whether there are significant circumstances during the intervening period that may require adjustments or changes in the disclosure of fair value of those properties. The principal assumptions underlying management’s estimation of fair value are those related to the receipt of contractual rentals, expected future market rentals, and appropriate discount rates. These valuations are regularly compared to actual to market yield data, and actual transactions by the Group and those reported by the market. A significant change in these elements may affect the prices and the value of the assets. As of May 31, 2021, 2020 and 2019, the Group determined that there were no significant circumstances that may affect the fair value determination of investment properties.
(f) Estimation of Impairment of Non-financial Assets
The Group’s policy on estimating the impairment of non-financial assets is discussed in detail in Note 2.14. Though management believes that the assumptions used in the estimation of recoverable amounts are appropriate and reasonable, significant changes in these assumptions may materially affect the assessment of recoverable values and any resulting impairment loss could have a material adverse effect on the results of operations. Based on management’s assessment, no impairment loss is required to be recognized on the Group’s investment properties, property and equipment, goodwill and certain other non-financial assets as for the years ended May 31, 2021, 2020 and 2019.

- 34 -
As at the acquisition date of RCI on May 12, 2017, the fair value of the University’s share in RCI’s net identifiable assets amounts to P621.8 million resulting in the recognition of goodwill amounting to P186.5 million. The goodwill arising from the acquisition consists largely of the synergies and economies of scale expected from combining the operations of the University and RCI. The goodwill recognized is subject to annual impairment testing [see Notes 2.4 and 2.14]. For purposes of assessing impairment, the Group based on the value in use of the CGU (that is, RCI) to which the carrying value of goodwill is compared. This methodology is in accordance with PAS 36, Impairment of Assets. The management considers that the benefits of acquisition accrue to the University as a whole and not to a specific business unit nor department only.
In determining the value in use, discounted cash flows method was used. Some of the key assumptions that have been considered which have significant impact on the results of the determination of the value in use are as follows:
• RCI will continue as a going concern entity and will have sufficient financial resources to finance its working capital requirements to achieve its projected forecast and to support its business needs;
• RCI’s performance forecasts for the next five years from the end of each reporting period;
• In estimating the terminal value of the CGU, long-term growth rates at 2.0%, 1.0% and 1.2% (based on forecasted gross domestic product growth rate) as of May 31, 2021, 2020 and 2019 was used, respectively; and,
• In discounting the projected free cash flows, weighted average cost of capital of 4.88%, 4.76% and 6.79% was used in 2021, 2020 and 2019, respectively.
For the years ended May 31, 2021, 2020 and 2019, the Group has assessed that the recoverable amount of the goodwill of P3.7 billion, P3.0 billion and P1.6 billion, respectively, exceeds its carrying amount. Accordingly, no impairment loss is required to be recognized in 2021, 2020 and 2019.
(g) Determination of Recoverability of Deferred Tax Assets The Group reviews its deferred tax assets at the end of each reporting period and reduces the carrying amount to the extent that it is no longer probable that sufficient taxable profit will be available to allow all or part of the deferred tax asset to be utilized. Management assessed that the deferred tax assets as at May 31, 2021, 2020 and 2019 are fully recoverable and will be fully utilized within the prescribed periods, except for the related benefits of net operating loss carryover (NOLCO) and other temporary differences of certain subsidiaries which are not recognized, because it expects that the Group will generate sufficient taxable profits in the future against which the assets can be applied (see Note 22).

- 35 -
(h) Valuation of Post-employment Defined Benefit Obligation The determination of the obligation and cost of post-employment defined benefit is dependent on the selection of certain assumptions used by actuaries in calculating such amounts. Those assumptions include, among others, discount rates, expected rate of return on plan assets, salary rate increase, and employee turnover rate. A significant change in any of these actuarial assumptions may generally affect the recognized expense, other comprehensive income or losses and the carrying amount of the post-employment benefit obligation in the next reporting period.
The amounts of post-employment benefit obligation and expense and an analysis of the movements in the estimated present value of post-employment defined benefit, as well as the significant assumptions used in estimating such obligation are presented in Note 21(b).
4. RISK MANAGEMENT OBJECTIVES AND POLICIES
The Group is exposed to certain financial risks in relation to financial instruments. Its main purpose for its dealings in financial instruments is to fund operational and capital expenditures. The BOT has overall responsibility for the establishment and oversight of the Group’s risk management framework. It has a risk management committee headed by an independent trustee that is responsible for developing and monitoring the Group’s policies, which address risk management areas. Management is responsible for monitoring compliance with the Group’s risk management policies and procedures and for reviewing the adequacy of these policies in relation to the risks faced by the Group. The Group does not engage in trading of financial assets for speculative purposes nor does it write options. The most significant financial risks to which the Group is exposed to are described in the succeeding pages.
4.1 Market Risk
(a) Foreign Currency Risk
Most of the Group’s transactions are carried out in Philippine pesos, its functional currency. Exposures to currency exchange risk arise from certain cash and cash equivalents, financial assets at FVTPL, financial assets at FVOCI and investment securities at amortized cost that are primarily denominated in United States (US) dollars.
Financial assets denominated in US dollar, translated into Philippine pesos at the closing rate, as of May 31 are presented below.
2021 2020 2019
Short-term exposure – Financial assets P 663,078,157 P 409,534,498 P 561,752,399
Long-term exposure – Financial assets P 120,685,405 P 162,277,191 P 228,040,069

- 36 -
The following table illustrates the sensitivity of the Group’s profit or loss before tax with respect to changes in Philippine peso against US dollar exchange rates. The percentage changes in rates have been determined based on the average market volatility in exchange rates, using standard deviation, in the previous periods (for the years ended May 31, 2021, 2020 and 2019) at a 95% confidence level.
2021 2020 2019 Reasonably Effect in Reasonably Effect in Reasonably Effect in possible profit before Effect in possible profit before Effect in possible loss before Effect in change in rate tax equity change in rate tax equity change in rate tax equity PhP - USD 4.67% P 35,867,865 P 35,240,178 4.38% P 25,045,352 P 22,540,817 3.98% P 30,249,052 P 27,224,146
Exposures to US dollar exchange risk vary during the year depending on the volume of foreign currency denominated transactions. Nonetheless, the analysis above is considered to be representative of the Group’s currency risk. (b) Interest Rate Risk
The Group is exposed to changes in market interest rates through its cash and cash equivalents, short and long-term debt securities investments, and interest-bearing loans as of end of each reporting period, which are subject to variable interest rates, and is shown below. All other financial assets and financial liabilities have fixed interest rates.
Notes 2021 2020 2019
Cash and cash equivalents 8 P 1,191,146,185 P 1,798,366,234 P 1,520,192,490 Financial assets at FVOCI 10 1,239,740,426 542,005,510 537,594,985 Investment securities at amortized cost 10 584,766,708 530,618,267 787,493,150 Short-term investments 15 32,211,342 64,562,591 76,269,824 Long-term investments - net 15 10,706,000 11,280,724 16,425,700 Interest-bearing loans 17 ( 2,472,380,953) ( 2,105,238,095) ( 1,333,571,429 )
P 586,189,708 P 841,595,231 P 1,604,404,720
The table shown below illustrates the sensitivity of profit or loss before tax for the periods with regard to the Group’s interest-bearing financial instruments. These percentages have been determined based on the average market volatility rates, using standard deviation, in the periods ended May 31, 2021, 2020 and 2019, estimated at 95% level of confidence. The sensitivity analysis is based on the Group’s financial instruments held at May 31, 2021, 2020 and 2019.
2021 2020 2019 Reasonably Effect on Reasonably Effect on Reasonably Effect on possible profit before possible profit before possible loss before change in rate tax change in rate tax change in rate tax Cash and cash equivalents +/-0.73% P 8,695,367 +/-0.45% P 8,092,648 +/-0.75% P 11,401,444 Financial assets at FVOCI +/-0.69% 8,554,209 +/-4.26% 15,230,355 +/-4.26% 22,901,546 Investment securities at amortized cost +/-0.69% 4,034,890 +/-2.81% 14,910,373 +/-4.26% 33,547,208 Short-term investments +/-1.03% 331,777 +/-2.45% 1,581,783 +/-2.73% 2,082,166 Long-term investments +/-0.78% 83,507 +/-2.81% 316,988 +/-4.84% 795,004 Interest-bearing loans +/-0.69% ( 17,059,429 ) +/-0.75% ( 15,789,286) +/-2.73% ( 36,406,500) P 4,640,321 P 24,342,861 P 34,320,868

- 37 -
(c) Other Price Risk The Group’s exposure to price risk arises from its investments in equity securities, which are classified as part of the Financial Assets at FVOCI and Financial Assets at FVTPL accounts in the consolidated statements of financial position. These consist of publicly listed equity securities which are carried at fair value.
Management monitors its equity securities in its investment portfolio based on market indices. Material investments within the portfolio are managed on an individual basis.
For equity securities listed in the Philippines, an average volatility have been observed for the years ended May 31, 2021, 2020 and 2019 which was shown on the table below.
Effect on Total Comprehensive Income +/-% 2021 +/-% 2020 +/-% 2019 Financial assets at FTVPL 16.30% P 898,992,320 32.81% P 153,750,667 13.26% P 67,619,740 Financial assets at FVOCI 18.85% 171,889,527 19.00% 25,786,424 15.58% 21,029,362
No sensitivity analysis was provided for government and corporate bonds, and investments in UITF classified as Financial Assets at FVTPL as management deemed that the risk at the end of the period is not representative of a risk inherent in the Group’s financial instruments.
Certain investments are considered medium to long-term strategic investments. In accordance with the Group’s policies, no specific hedging activities are undertaken in relation to these investments. The investments are continuously monitored to ensure that returns of these equity instruments are timely utilized or reinvested in the Group’s favor.
4.2 Credit Risk
Credit risk represents the loss that the Group would incur if the counterparty fails to perform its contractual obligations.
The Group is mainly exposed to credit risk relating to its tuition and other school fees receivables due primarily to the student’s possible inability to pay and to fully settle his or her unpaid balance of tuition fees and other charges which are owed to the Group based on installment payment schemes. The Group has established controls and procedures to minimize risks of non-collection. Students are not allowed to enroll in the following semester unless the unpaid balance in the previous semester has been paid. The Group also withholds the academic records and clearance of the students with unpaid balances, thus ensuring that collectability is reasonably assured. The Group’s exposure to credit risk on its other receivables from debtors and related parties is managed through close account monitoring and setting limits.
Other than the foregoing, the Group is not exposed to significant credit risk and has no significant exposure to any individual customer or counterparty nor it has any other concentration of credit risk arising from counterparties in similar business activities, geographic region or economic parties.
With respect to credit risk arising from debt instruments, the Group’s maximum exposure is equal to the carrying amount, before any allowances for impairment, of these instruments.

- 38 -
The maximum exposure to credit risk at the end of the reporting period is as follows:
Notes 2021 2020 2019
Cash and cash equivalents 8 P 1,191,146,185 P 1,798,366,234 P 1,520,192,490 Trade and other receivables - net 9 782,189,376 970,146,864 608,223,874 Financial assets at FVOCI 10 1,239,740,426 542,005,510 537,594,985 Investment securities at amortized cost 10 584,766,708 530,618,267 787,493,150 Short-term investments 15 32,211,342 64,562,591 76,269,824 Long-term investments - net 15 10,706,000 11,280,724 16,425,700 Refundable deposits 15 22,819,818 16,235,991 9,975,338
P 3,863,579,885 P 3,933,216,181 P 3,556,175,361
a. Cash and Cash Equivalents, and Short-term Placements
The credit risk for cash and cash equivalents, and short-term placements herein is considered negligible or the probability of default from these reputable banks is remote since there has been no history of default from these counterparties and because of their high-quality external credit ratings.
Cash in banks are insured by the Philippine Deposit Insurance Corporation (PDIC) up to a maximum coverage of P0.5 million per depositor per banking institution, as provided for under RA No. 9576, Amendment to Charter of PDIC.
For cash and cash equivalents, and financial assets of similar nature, the Group applies the low credit risk simplification. The probability of default and loss given defaults are publicly available and are considered to be low credit risk investments. It is the Group’s policy to measure ECL on such instruments on a 12-month basis. However, when there has been a significant increase in credit risk since origination, the allowance will be based on the lifetime ECL. As of May 31, 2021, 2020 and 2019, management assessed that the allowance for ECL on these financial instruments is not material.
b. Trade and Other Receivables
The Group’s trade and other receivables include tuition fees and other school receivables, rental receivables and other miscellaneous receivables.

- 39 -
The Group applies the simplified approach in measuring ECL, which uses a lifetime expected loss allowance for tuition fees and other receivables. These are the expected shortfalls in contractual cash flows, considering the potential for default at any point during the life of the financial assets. To calculate the ECL, the Group uses its historical experience, external indicators and forward-looking information to calculate the ECL using a provision matrix. The loss rates are based on actual credit-impaired student accounts or those which are outstanding for two terms and have not enrolled for the succeeding term. In practice and considering the nature of its business, particularly with respect to its educational activities, the Group writes off such balances as collection becomes more unlikely as the concerned students did not return for enrollment. The Group also assesses impairment of tuition fees and other receivables on a collective basis as they possess shared credit risk characteristics.
The expected loss rates on these receivables are determined based on the history of credit-impaired student accounts. The Group analyses tuition and other school fees receivables based on the number of semesters the receivables have been outstanding. Student receivables that are outstanding for at least two semesters are assessed for credit impairment.
The historical loss rates, which are expressed as the relationship between the credit-impaired accounts and the related recognized tuition fees, are adjusted to reflect current and forward-looking information on macroeconomic factors affecting the ability of the students to settle the receivables. The Group assessed that the expected loss rates for tuition fees and other receivables are a reasonable approximation of the loss rates for these financial assets. As at May 31, 2021, 2020 and 2019, the weighted average loss rate, adjusted with FLI, used in the measurement of ECL is at 6.4%, 8.4% and 4.7%, respectively.
The Group incorporates FLI into both the assessment of whether the credit risk of an instrument has increased significantly since its initial recognition and the measurement of ECL. The most relevant macro-economic variable used in the measurement of ECL is consumer spending as at May 31, 2021, 2020 and 2019 based on the correlation of historical loss rates and FLI.
The Group writes off its receivables from students who have not enrolled for two terms and are not expected by management to re-enroll in the near future.
For the years ended May 31, 2021, 2020 and 2019, the Group recognized total impairment losses amounting to P254.8 million, P81.7 million and P27.0 million, respectively. A reconciliation of the allowance for ECL as at May 31, 2021, 2020 and 2019 to the opening loss allowance is presented in Note 9.
On the other hand, to calculate the ECL of rental receivables, these have been grouped based on shared credit risk characteristics and the days past due (age buckets). The rental receivables which relate to both third party and related party receivables have substantially the same risk characteristics. The Group has therefore concluded that the expected loss rates for all rental receivables, whether from third party or related party, are the same. The expected loss rates are based on the payment profiles of sales over a period of 36 months before May 31, 2021, 2020 and 2019, respectively, and the corresponding historical credit losses experienced within such period. The Group has identified the Philippine inflation rate to be the most relevant factor and has accordingly adjusted the historical loss rates based on expected changes in this factor. There are no past due rental receivables for the years ended May 31, 2021, 2020 and 2019.

- 40 -
On that basis, there is no additional loss allowance recognized based on management’s assessment as of March 31, 2021, 2020 and 2019, as the expected credit losses are assessed to be insignificant to the Group’s consolidated financial statements.
c. Debt Instruments Classified as Financial Assets at FVOCI and Amortized Cost
Debt securities measured at amortized cost and at FVOCI are considered to have low credit risk, and therefore, the loss allowance during the period is determined to be equivalent to 12 months ECL. Management considers “low credit risk” for listed bonds to be an investment grade credit rating with at least one major rating agency. Other instruments are considered to be low credit risk when they have a low risk of default and the issuer has a strong capacity to meet its contractual cash flow obligations in the near term.
The loss allowance are as follows:
Estimated Gross Company Internal External Carrying Amount Credit Rating Credit Rating ECL Rate at Default Allowance
2021 Investment Securities at Amortized Cost Performing A - AAA 0.00% - 0.05% P 516,046,376 P 146,262 Underperforming BB - BBB+ 0.23% - 0.45% 69,055,667 - Financial Assets at FVOCI Performing AAA 0.0% 177,230,169 - Underperforming BBB+ 0.00% - 0.09% 975,503,462 842,339 P 1,737,835,674 P 988,601
2020
Investment Securities at Amortized Cost Performing A - AAA 0.00% - 0.06% P 313,600,494 P 104,778 Underperforming BB - BBB+ 0.10% - 0.52% 217,546,529 423,978 Financial Assets at FVOCI Performing AAA 0.0% 338,646,198 - Underperforming BBB+ 0.00% - 0.11% 203,546,254 186,942 P 1,073,339.475 P 715,698
2019 Investment Securities at Amortized Cost Performing A - AAA 0.00% - 0.06% P 530,063,053 P 80,616 Underperforming BB - BBB+ 0.10% - 0.52% 257,934,691 423,978 Financial Assets at FVOCI Performing AAA 0.0% 359,209,640 - Underperforming BBB+ 0.00% - 0.11% 178,572,287 186,942 P 1,325,779,671 P 691,536
In 2021 and 2020, the Group did not recognize additional or reversal of ECL for debt securities at amortized cost and debt securities at FVOCI.

- 41 -
d. Refundable Deposits
Management has assessed that these financial assets have low probability of default since these relate to continuing lease contracts and any outstanding deposit balance can be applied against future monthly rentals. Also, these are no longer discounted since management believes that the effect of discounting is not material to the consolidated financial statements.
4.3 Liquidity Risk
The Group manages liquidity risk by maintaining a balance between continuity of funding and flexibility. Treasury controls and procedures are in place to ensure that sufficient cash is maintained to cover daily operational and working capital requirements. Management closely monitors the Group’s future and contingent obligations and ensures that future cash collections are sufficient to meet them in accordance with internal policies. The Group invests in cash placements when excess cash is obtained from operations.
As at May 31, 2021, 2020 and 2019, the Group’s financial liabilities (excluding lease liabilities – see Note 13) have contractual maturities which are presented below. Current Non-current
Within 6 to 12 1 to 5 6 Months Months Years Total 2021 Trade and other payables P 1,152,522,499 P - P - P 1,152,522,499 Interest-bearing loans 114,314,086 118,517,541 2,449,429,071 2,682,260,698 Refundable deposits (presented under Other Non-current Liabilities) - - 16,995,892 16,995,892 P 1,266,836,585 P 118,517,541 P 2,466,424,963 P 3,851,779,089 2020 Trade and other payables P 1,593,203,461 P - P - P 1,593,203,461 Interest-bearing loans 761,269,133 261,903,478 1,787,566,785 2,810,739,396 Refundable deposits (presented under Other Non-current Liabilities) - - 7,440,466 7,440,466 P 2,354,472,594 P 261,903,478 P 1,795,007,251 P 4,411,383,323 2019 Trade and other payables P 837,651,708 P 345,811,952 P - P 1,183,463,660 Interest-bearing loans 1,253,245,255 220,090,570 1,057,178,460 2,530,514,285 Derivative liability 36,720,866 - - 36,720,866 Refundable deposits (presented under Other Non-current Liabilities) - - 4,796,804 4,796,804 P 2,127,617,829 P 565,902,522 P 1,061,975,264 P 3,718,774,749
The contractual maturities presented above reflect the gross cash flows, which may differ from the carrying values of the liabilities at the end of the reporting period.

- 42 -
5. CATEGORIES AND OFFSETTING OF FINANCIAL ASSETS AND FINANCIAL LIABILITIES
5.1 Carrying Amounts and Fair Values by Category
The carrying amounts and fair values of financial assets and financial liabilities measured at fair value and an investment carried at amortized cost but whose fair value is required to be disclosed are shown below.
2021 2020 2019 Carrying Fair Carrying Fair Carrying Fair Notes Values Values Values Values Values Values Financial Assets At FVOCI: Debt securities 10 P 1,239,740,426 P 1,239,740,426 P 542,005,510 P 542,005,510 P 537,594,985 P 537,594,985 Equity securities 10 170,389,527 170,389,527 170,819,604 170,819,604 166,271,887 166,271,887 Golf club shares 10 1,500,000 1,500,000 3,631,800 3,631,800 2,830,000 2,830,000 1,411,629,953 1,411,629,953 716,456,914 716,456,914 706,696,872 706,696,872 At FVTPL: Equity securities 10 898,992,320 898,992,320 431,633,214 431,633,214 445,378,506 445,378,506 UITF 10 706,515,461 706,515,461 456,883,944 456,883,944 392,036,006 392,036,006 1,605,507,781 1,605,507,781 888,517,158 888,517,158 837,414,512 837,414,512 At Amortized Cost: Receivables 9 782,189,376 782,189,376 970,146,864 970,146,864 608,223,874 608,223,874 Investments – Debt securities 10 584,766,708 590,706,382 530,618,267 535,734,400 787,493,150 787,986,918 Refundable deposits 15 22,819,812 22,819,812 16,235,991 17,235,991 9,975,338 9,975,338 1,389,775,896 1,395,715,570 1,517,001,122 1,523,117,255 1,405,692,362 1,406,186,130
P 4,406,913,630 P 4,412,853,304 P 3,121,975,194 P 3,128,091,327 P 2,949,803,746 P 2,950,297,514 Financial Liabilities At amortized cost: Interest-bearing loans 17 P 2,472,380,953 P 2,299,852,978 P 2,605,238,096 P 2,555,915,182 P 2,358,571,429 P 2,326,214,523 Lease liabilities 13 34,510,986 34,510,986 46,572,571 46,572,571 - - Derivative liability – Cross-currency Swaps - - - - 36,720,866 36,720,866 P 2,506,891,939 P 2,334,363,964 P 2,651,810,667 P 2,602,487,753 P 2,395,292,295 P 2,362,935,389
Except for the financial assets and financial liabilities presented above, cash and cash equivalents, short-term investments, long-term investments, trade and other payables and refundable deposit, the Group has no other financial assets and/or financial liabilities that are carried at fair value or that are not carried at fair value but are required to be disclosed at fair value (see Note 6.3). Management determined that the carrying amounts of the other financial instruments are equal to or approximate their fair values; hence, no further comparison between their carrying amounts and fair values is presented. See Note 2.5 for a description of the accounting policies for each category of financial instruments. A description of the Group’s risk management objectives and policies for financial instruments is provided in Note 4.
5.2 Offsetting of Financial Assets and Financial Liabilities The Group’s cash in bank, which is presented as part of the Cash and Cash Equivalents account, and portion of Short-term investments under the Other Current Assets – net account in the consolidated statements of financial position (see Notes 8 and 15) are subject to offsetting, enforceable master netting arrangements and similar agreements as at May 31, 2021, 2020 and 2019, such as loan agreements, as presented in the succeeding page.

- 43 -
Gross Amounts Recognized Net Amount Related Amounts not in the Consolidated Presented Set-off in the
Statements of in the Consolidated Statements
Financial Position Consolidated of Financial Position Financial Financial Cash Financial assets Statements of Financial Collateral Net liabilities instruments Position Instruments Received Amount May 31, 2021 Interest-bearing loans P2,472,380,953 P - P 2,472,380,953 (P 264,699,879) P - P 2,207,681,074 May 31, 2020 Interest-bearing loans P2,605,238,095 P - P 2,605,238,095 (P 188,339,418) P - P 2,416,898,677 May 31, 2019 Interest-bearing loans P2,358,571,429 P - P 2,385,571,429 (P 189,368,822) P - P 2,169,202,607
For financial assets and financial liabilities subject to enforceable master netting agreements or similar arrangements above, each agreement between the Group and counterparties (i.e., depository bank) allows for net settlement of the relevant financial assets and financial liabilities (i.e., interest-bearing loans) when both elect to settle on a net basis. All other financial assets and financial liabilities are settled on a gross basis; however, each party to the financial instrument (i.e., related parties) will have the option to settle all such amounts on a net basis through the approval by both parties’ BOT or BOD. As such, the Group’s outstanding receivables from and payables to the same related parties, if any, can potentially be offset to the extent of their corresponding outstanding balances.
6. FAIR VALUE MEASUREMENT AND DISCLOSURES
6.1 Fair Value Hierarchy
In accordance with PFRS 13, Fair Value Measurement, the fair value of financial assets and financial liabilities and non-financial assets which are measured at fair value on a recurring or non-recurring basis and those assets and liabilities not measured at fair value but for which fair value is disclosed in accordance with other relevant PFRS, are categorized into three levels based on the significance of inputs used to measure the fair value. The fair value hierarchy is shown below.
• Level 1: quoted prices (unadjusted) in active markets for identical assets or liabilities that an entity can access at the measurable date;
• Level 2: inputs other than quoted prices included within Level 1 that are observable for the asset or liability, either directly (i.e., as prices) or indirectly (i.e., derived from prices); and,
• Level 3: inputs for the asset or liability that are not based on observable market data (unobservable inputs).
The level within which the asset or liability is classified is determined based on the lowest level of significant input to the fair value measurement.
For purposes of determining the market value at Level 1, a market is regarded as active if quoted prices are readily and regularly available from an exchange, dealer, broker, industry group, pricing service, or regulatory agency, and those prices represent actual and regularly occurring market transactions on an arm’s length basis.

- 44 -
For investments which do not have quoted market price, the fair value is determined by using generally acceptable pricing models and valuation techniques or by reference to the current market of another instrument which is substantially the same after taking into account the related credit risk of counterparties, or is calculated based on the expected cash flows of the underlying net asset base of the instrument. When the Group uses valuation technique, it maximizes the use of observable market data where it is available and relies as little as possible on entity specific estimates. If all significant inputs required to determine the fair value of an instrument are observable, the instrument is included in Level 2. Otherwise, it is included in Level 3.
6.2 Financial Instruments Measurement at Fair Value
The foregoing tables show the fair value hierarchy of the Group’s classes of financial assets and financial liabilities measured at fair value in the consolidated statements of financial position on a recurring basis as of:
Level 1 Level 2 Level 3 Total
May 31, 2021 Financial assets at FVOCI:
Debt securities: Government P 994,863,274 P - P - P 994,863,274 Corporate 244,877,152 - - 244,877,152 Equity securities 170,389,527 - - 170,389,527 Golf club shares - 1,500,000 - 1,500,000 Financial assets at FVTPL –
Equity securities 898,992,320 706,515,461 - 1,605,507,781 Investment securities at amortized cost 590,706,382 - - 590,706,382
P 2,899,828,655 P 708,015,461 P - P 3,607,844,116
May 31, 2020 Financial assets at FVOCI:
Debt securities: Government P 285,289,832 P - P - P 285,289,832 Corporate 256,715,678 - - 256,715,678 Equity securities 170,819,604 - - 170,819,604 Golf club shares - 3,631,800 - 3,631,800 Financial assets at FVTPL –
Equity securities 431,633,214 456,883,944 - 888,517,158 Investment securities at amortized cost 507,984,400 - 27,750,000 535,734,400
P 1,652,442,728 P 460,515,744 P 27,750,000 P 2,140,708,472

- 45 -
Level 1 Level 2 Level 3 Total
May 31, 2019
Financial assets at FVOCI: Debt securities: Government P 242,080,283 P - P - P 242,080,283 Corporate 295,514,702 - - 295,514,702 Equity securities 166,271,887 - - 166,271,887 Golf club shares - 2,830,000 - 2,830,000 Financial assets at FVTPL –
Equity securities 445,378,506 392,036,006 - 837,414,512 Investment securities at amortized cost 787,986,918 - - 787,986,918
P 1,937,232,296 P 394,866,006 P - P 2,332,098,302
Derivative liability – Cross-currency swaps P - (P 36,720,866 ) P - (P 36,720,866)
There were neither transfers between levels nor changes in levels of classification of instruments in all the years presented.
Following are the information about how the fair values of the Group’s classes of financial assets and financial liabilities are determined.
a) Equity Securities
As of May 31, 2021, 2020 and 2019, instruments included in Level 1 comprise of listed common and preferred shares which are classified as and designated at financial assets at FVTPL and FVOCI, respectively. The corporate shares were valued based on their market prices quoted in the PSE at the end of each reporting period. On the other hand, the fair value of investments in UITF are classified as Level 2, since fair values are generally measured based on the net asset value of the Group’s investment, computed and determined at the end of each reporting period based on the closing market and trade prices of the securities comprising the fund’s portfolio. This valuation approach takes into the account the period end performance of the funds including all trades made within the funds and the related income and expenses arising therefrom.
b) Golf Club Shares The Group’s golf club shares are included in Level 2 as their prices are not derived
from market considered as active due to lack of trading activities among market participants at the end or close to the end of the reporting period.
c) Debt Securities
The fair value of the Group’s debt securities which consist of government and corporate bonds is estimated by reference to quoted bid price in active market at the end of the reporting period and is categorized within Level 1. (i) Fair values of government securities issued by the Philippine government,
are determined based on the reference price per Bloomberg which used BVAL. These BVAL reference rates are computed based on the weighted price derived using an approach based on a combined sequence of proprietary BVAL algorithms of direct observations or observed comparable.
- 46 -
(ii) For corporate and other quoted debt securities, fair value is determined to be the current mid-price, which is computed as the average of as and bid prices as appearing on the Corporate Securities Board Summary.
d) Derivatives
Derivatives classified as financial liability at FVTPL are included in Level 2 as their prices are not derived from market considered as active due to lack of trading activities among market participants at the end or close to the end of the reporting period. The fair value of derivative financial instruments that are not quoted in an active market is determined through valuation techniques normally using the discounted cash flow.
Valuation techniques are used to determine fair values, which are validated and periodically reviewed. To the extent practicable, models use observable data, however, areas such as credit risk (both own and counterparty), volatilities require management to make estimates. Changes in assumptions and correlations affect reported fair value of financial instruments.
6.3 Financial Instruments Measured at Amortized Cost for which Fair Value is Disclosed As of May 31, 2021, 2020 and 2019, the fair value of debt securities categorized as Investment Securities at Amortized Cost amounted to P590.7 million, P535.7 million and P788.0 million, respectively, which is Level 1 in the hierarchy of fair values (see Note 5.1). On the other hand, the fair value of the Group’s interest-bearing loans amounted to P2,299.9 million, P2,555.9 million and P2,326.2 million as of May 31, 2021, 2020 and 2019, respectively. For interest-bearing loans with more than one year of maturity, its estimated fair value represents the discounted amount of the future cash flows expected to be paid which are discounted at current market rates. The fair values of the Group’s interest-bearing loans are classified under Level 3 of the fair value hierarchy.
Other than the investment securities at amortized cost and interest-bearing loans, management determined that due to the short-term duration of the other financial assets and financial liabilities measured at amortized costs of the Group, as described in Note 2.5, their fair values as at May 31, 2021, 2020 and 2019 equal or approximate their carrying amounts. Accordingly, the Group did not anymore present a comparison of their fair values with their carrying amounts and correspondingly, their level in the fair value hierarchy. Nevertheless, if presented in the hierarchy, only cash and cash equivalents and short-term investments would fall under Level 1 and the rest would be under Level 3.
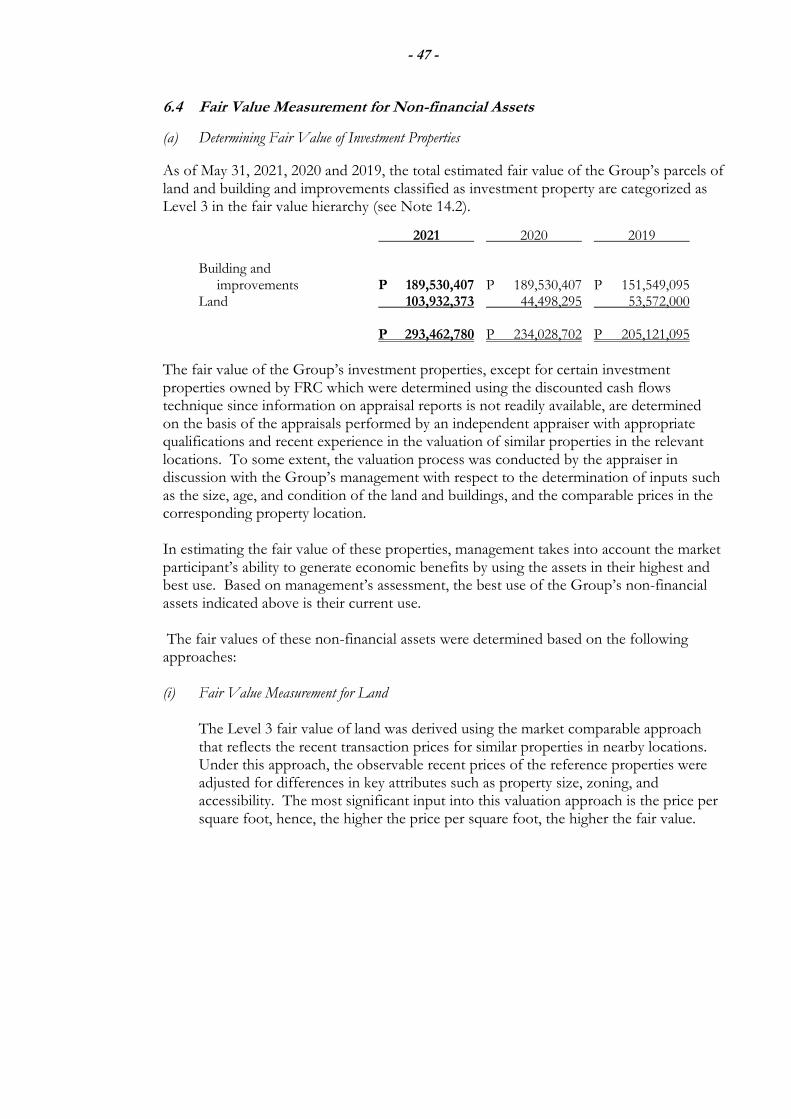
- 47 -
6.4 Fair Value Measurement for Non-financial Assets
(a) Determining Fair Value of Investment Properties
As of May 31, 2021, 2020 and 2019, the total estimated fair value of the Group’s parcels of land and building and improvements classified as investment property are categorized as Level 3 in the fair value hierarchy (see Note 14.2).
2021 2020 2019
Building and improvements P 189,530,407 P 189,530,407 P 151,549,095 Land 103,932,373 44,498,295 53,572,000 P 293,462,780 P 234,028,702 P 205,121,095
The fair value of the Group’s investment properties, except for certain investment properties owned by FRC which were determined using the discounted cash flows technique since information on appraisal reports is not readily available, are determined on the basis of the appraisals performed by an independent appraiser with appropriate qualifications and recent experience in the valuation of similar properties in the relevant locations. To some extent, the valuation process was conducted by the appraiser in discussion with the Group’s management with respect to the determination of inputs such as the size, age, and condition of the land and buildings, and the comparable prices in the corresponding property location. In estimating the fair value of these properties, management takes into account the market participant’s ability to generate economic benefits by using the assets in their highest and best use. Based on management’s assessment, the best use of the Group’s non-financial assets indicated above is their current use.
The fair values of these non-financial assets were determined based on the following approaches:
(i) Fair Value Measurement for Land
The Level 3 fair value of land was derived using the market comparable approach that reflects the recent transaction prices for similar properties in nearby locations. Under this approach, the observable recent prices of the reference properties were adjusted for differences in key attributes such as property size, zoning, and accessibility. The most significant input into this valuation approach is the price per square foot, hence, the higher the price per square foot, the higher the fair value.
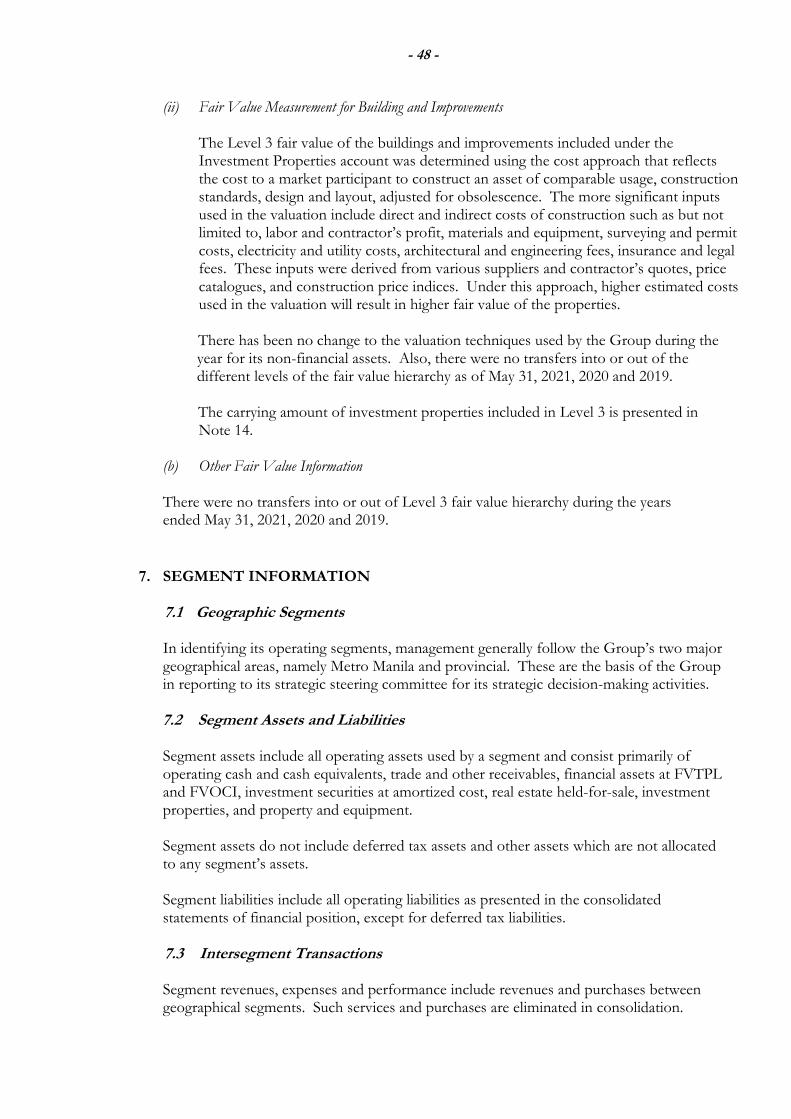
- 48 -
(ii) Fair Value Measurement for Building and Improvements The Level 3 fair value of the buildings and improvements included under the Investment Properties account was determined using the cost approach that reflects the cost to a market participant to construct an asset of comparable usage, construction standards, design and layout, adjusted for obsolescence. The more significant inputs used in the valuation include direct and indirect costs of construction such as but not limited to, labor and contractor’s profit, materials and equipment, surveying and permit costs, electricity and utility costs, architectural and engineering fees, insurance and legal fees. These inputs were derived from various suppliers and contractor’s quotes, price catalogues, and construction price indices. Under this approach, higher estimated costs used in the valuation will result in higher fair value of the properties. There has been no change to the valuation techniques used by the Group during the year for its non-financial assets. Also, there were no transfers into or out of the different levels of the fair value hierarchy as of May 31, 2021, 2020 and 2019. The carrying amount of investment properties included in Level 3 is presented in Note 14.
(b) Other Fair Value Information
There were no transfers into or out of Level 3 fair value hierarchy during the years ended May 31, 2021, 2020 and 2019.
7. SEGMENT INFORMATION
7.1 Geographic Segments In identifying its operating segments, management generally follow the Group’s two major geographical areas, namely Metro Manila and provincial. These are the basis of the Group in reporting to its strategic steering committee for its strategic decision-making activities.
7.2 Segment Assets and Liabilities
Segment assets include all operating assets used by a segment and consist primarily of operating cash and cash equivalents, trade and other receivables, financial assets at FVTPL and FVOCI, investment securities at amortized cost, real estate held-for-sale, investment properties, and property and equipment. Segment assets do not include deferred tax assets and other assets which are not allocated to any segment’s assets.
Segment liabilities include all operating liabilities as presented in the consolidated statements of financial position, except for deferred tax liabilities.
7.3 Intersegment Transactions
Segment revenues, expenses and performance include revenues and purchases between geographical segments. Such services and purchases are eliminated in consolidation.

- 49 -
7.4 Analysis of Segment Information
The Group’s geographical segment, which is based from location of all the Group’s school campuses, for the years ended May 31, 2021, 2020 and 2019 follows (in thousands).
Metro Manila Provincial Total
May 31, 2021 Segment revenues From external customers P 3,455,443 P 267,622 P 3,723,065 Intersegment revenues 314,008 - 314,008 Total revenues 3,769,451 267,622 4,037,073
Operating expenses ( 2,423,962 ) ( 314,295 ) ( 2,738,257 ) Segment operating profit P 1,345,489 ( P 46,673 ) P 1,298,816 Total segment assets P 17,323,272 P 2,891,008 P 20,214,280 Total segment liabilities P 5,325,940 P 1,176,126 P 6,502,066
May 31, 2020 Segment revenues From external customers P 3,423,300 P 302,525 P 3,725,825 Intersegment revenues 207,926 - 207,926 Total revenues 3,631,226 302,525 3,933,751
Operating expenses ( 2,598,145 ) ( 323,802 ) ( 2,921,947 ) Segment operating profit P 1,033,081 ( P 21,277 ) P 1,011,804 Total segment assets P 17,425,706 P 2,889,399 P 20,315,105 Total segment liabilities P 6,203,940 P 1,120,913 P 7,324,853 May 31, 2019 Segment revenues From external customers P 3,220,365 P 290,765 P 3,511,130 Intersegment revenues 186,547 - 186,547 Total revenues 3,406,912 290,765 3,697,677
Operating expenses ( 2,412,688 ) ( 280,871 ) ( 2,693,559 ) Segment operating profit P 994,224 P 9,894 P 1,004,118 Total segment assets P 14,931,368 P 1,593,890 P 16,525,258 Total segment liabilities P 4,219,484 P 839,040 P 5,058,524

- 50 -
7.5 Reconciliation
Presented below is a reconciliation of the Group’s segment information to the key financial information presented in its consolidated financial statements (in thousands).
2021 2020 2019 Revenue Total segment revenues P 4,037,074 P 3,933,751 P 3,697,677 Elimination of intersegment revenues ( 314,008 ) ( 207,926 ) ( 186,547 ) Finance income ( 190,258 ) ( 136,081 ) ( 152,095 ) Revenues as reported in consolidated profit or loss P 3,532,808 P 3,589,744 P 3,359,035
Profit or loss
Segment operating profit P 1,298,817 P 1,011,804 P 1,004,118 Other income 139,929 164,236 212,568 Finance costs ( 106,576 ) ( 246,065 ) ( 101,778 ) Other unallocated expense ( 315,878 ) ( 145,411 ) ( 180,325 ) Tax expense ( 36,976 ) ( 101,572 ) ( 126,111 ) Group net profit as reported in profit or loss P 979,316 P 682,992 P 808,472
Assets Segment assets P 20,214,280 P 20,315,105 P 16,525,258 Deferred tax assets – net 24,756 29,533 25,673 Goodwill 186,487 186,487 186,487 Elimination of intercompany accounts ( 5,004,154 ) ( 5,344,519 ) ( 2,657,460 ) Total Assets P 15,421,369 P 15,186,606 P 14,079,958
Liabilities
Segment liabilities P 6,502,066 P 7,324,853 P 5,058,524 Deferred tax liabilities – net 15,117 14,660 22,685 Elimination of intercompany accounts ( 2,360,947 ) ( 2,570.744 ) ( 869,326 ) Total Liabilities P 4,156,236 P 4,768,768 P 4,211,883
8. CASH AND CASH EQUIVALENTS
Cash and cash equivalents include the following components:
2021 2020 2019 Cash on hand and in banks P 1,006,820,540 P 748,186,077 P 549,674,206 Short-term placements 184,325,645 1,050,180,157 970,518,284
P 1,191,146,185 P 1,798,366,234 P 1,520,192,490 Cash in banks generally earn interest based on daily bank deposit rates. Short-term placements are made for varying periods of up to three months depending on the immediate cash requirements of the Group.

- 51 -
These placements earn effective annual interest as follows:
2021 2020 2019
Peso placements 0.1% to 2.6% 1.5% to 6.5% 0.8% to 6.0%
Interest income earned from cash and cash equivalents are presented as part of Finance Income in the consolidated statements of profit or loss (see Note 20.1). The related interest receivable from placements as of May 31, 2021, 2020 and 2019 is presented as part of Accrued interest under the Trade and Other Receivables account in the consolidated statements of financial position (see Note 9).
9. TRADE AND OTHER RECEIVABLES
This account is composed of the following:
Notes 2021 2020 2019 Non-related parties: Tuition and other school fees P 707,967,727 P 866,914,767 P 577,801,471 Rental receivables 108,561,659 34,214,279 28,195,961 816,529,386 901,129,046 605,997,432 Related parties: Other advances 23.1, 23.2, 23.7 67,292,199 102,398,435 43,732,028 Rental receivables 23.4(a), 23.4(b) - 13,122,403 10,643,063 67,292,199 115,520,838 54,375,091
Others: Advances to officers and employees 17,178,128 20,452,761 11,937,862 Accrued interest 8, 10, 15 3,886,074 5,981,939 6,290,153 Miscellaneous 83,464,030 49,770,963 20,909,743 104,528,232 76,205,663 39,137,758 988,349,817 1,092,855,547 699,510,281 Allowance for impairment on tuition and other school fees receivables ( 188,982,413) ( 102,255,922) ( 79,348,545) P 799,367,504 P 990,599,625 P 620,161,736
Non-related parties’ rental receivables relates to the FRC’s receivables from its lease contracts. Advances to officers and employees comprise of unsecured and noninterest-bearing advances, subject to liquidation within 15 days from the earlier date between the release of the advances and the event to which the advances are utilized.

- 52 -
A reconciliation of the allowance for impairment on receivables at the beginning and end of each of the reporting period is shown below.
2021 2020 2019
Balance at beginning of year P 102,255,922 P 79,348,545 P 77,327,375 Impairment losses during the year 254,842,087 81,673,482 27,028,023 Reversal of allowance ( 1,614,531 ) - - Recovery of previously written-off receivables - 724,809 - Receivables written-off during the year ( 166,501,065 ) ( 59,490,914) ( 25,006,853 )
Balance at end of year P 188,982,413 P 102,255,922 P 79,348,545
All of the Group’s receivables, which are subject to credit risk exposure [see Note 4.2(b)] have been reviewed for impairment. The Group applies the PFRS 9 simplified approach in measuring expected credit losses taking into consideration the expected loss rates determined through the assessment of credit impairment, which was observed for student receivables that are outstanding for at least two semesters/terms and are unenrolled in the previous term.
During the years ended May 31, 2021, 2020 and 2019, tuition and other school fees receivables were assessed for impairment and corresponding impairment losses were recognized as Impairment losses on receivables in the consolidated statements of profit or loss.
Miscellaneous receivables significantly pertain to due from brokers which pertains to the receivable by the Group’s trust funds and other various receivables from non-related parties.
10. FINANCIAL ASSETS 10.1 Financial Assets at FVTPL
The types of investments classified under Financial Assets at FVTPL as of May 31 are shown below.
2021 2020 2019
Equity securities P 898,992,320 P 431,633,214 P 445,378,506 UITF 706,515,461 456,883,944 392,036,006
P 1,605,507,781 P 888,517,158 P 837,414,512
The breakdown of Financial Assets at FVTPL as to currency denomination is as follows:
2021 2020 2019
Local P 958,144,678 P 499,767,405 P 447,066,961 Foreign 647,363,103 388,749,753 390,347,551
P 1,605,507,781 P 888,517,158 P 837,414,512
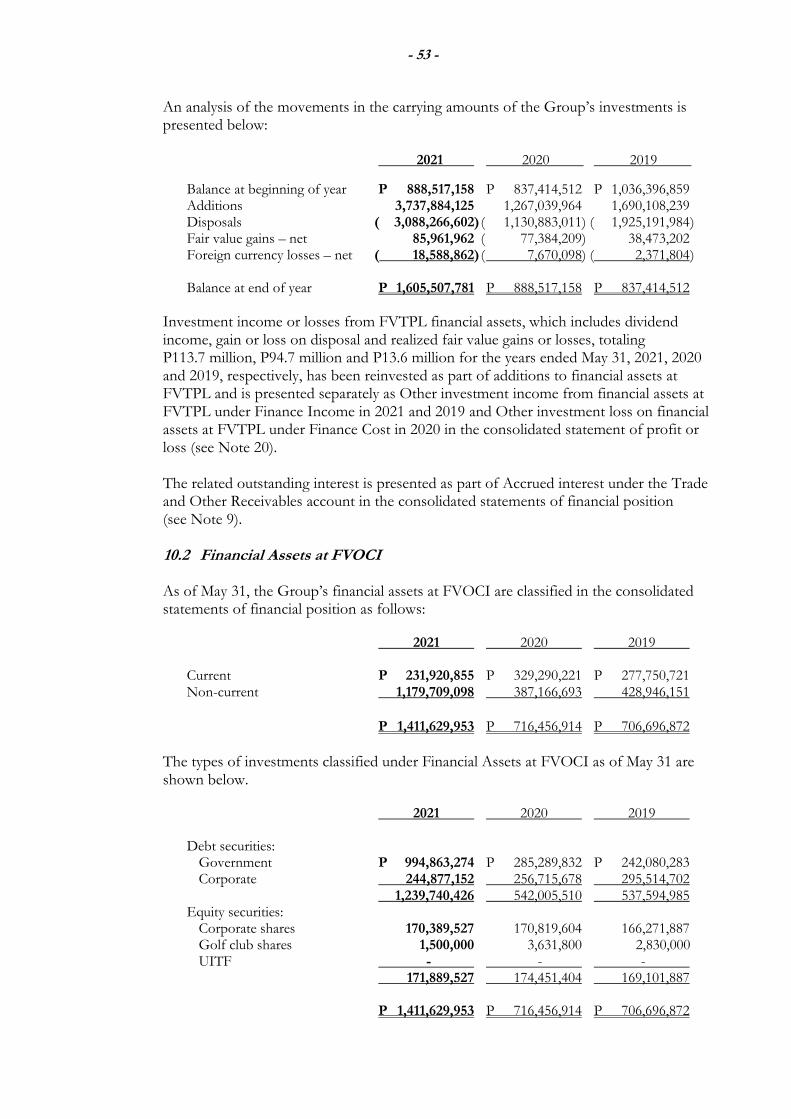
- 53 -
An analysis of the movements in the carrying amounts of the Group’s investments is presented below:
2021 2020 2019
Balance at beginning of year P 888,517,158 P 837,414,512 P 1,036,396,859 Additions 3,737,884,125 1,267,039,964 1,690,108,239 Disposals ( 3,088,266,602) ( 1,130,883,011) ( 1,925,191,984 ) Fair value gains – net 85,961,962 ( 77,384,209) 38,473,202 Foreign currency losses – net ( 18,588,862) ( 7,670,098) ( 2,371,804 ) Balance at end of year P 1,605,507,781 P 888,517,158 P 837,414,512
Investment income or losses from FVTPL financial assets, which includes dividend income, gain or loss on disposal and realized fair value gains or losses, totaling P113.7 million, P94.7 million and P13.6 million for the years ended May 31, 2021, 2020 and 2019, respectively, has been reinvested as part of additions to financial assets at FVTPL and is presented separately as Other investment income from financial assets at FVTPL under Finance Income in 2021 and 2019 and Other investment loss on financial assets at FVTPL under Finance Cost in 2020 in the consolidated statement of profit or loss (see Note 20). The related outstanding interest is presented as part of Accrued interest under the Trade and Other Receivables account in the consolidated statements of financial position (see Note 9).
10.2 Financial Assets at FVOCI As of May 31, the Group’s financial assets at FVOCI are classified in the consolidated statements of financial position as follows:
2021 2020 2019 Current P 231,920,855 P 329,290,221 P 277,750,721 Non-current 1,179,709,098 387,166,693 428,946,151
P 1,411,629,953 P 716,456,914 P 706,696,872
The types of investments classified under Financial Assets at FVOCI as of May 31 are shown below. 2021 2020 2019 Debt securities: Government P 994,863,274 P 285,289,832 P 242,080,283 Corporate 244,877,152 256,715,678 295,514,702 1,239,740,426 542,005,510 537,594,985 Equity securities: Corporate shares 170,389,527 170,819,604 166,271,887 Golf club shares 1,500,000 3,631,800 2,830,000 UITF - - - 171,889,527 174,451,404 169,101,887 P 1,411,629,953 P 716,456,914 P 706,696,872

- 54 -
Government securities bear annual interest rates ranging from 1.1% to 12.1% in 2021, 2.9% to 12.1% in 2020 and 3.4% to 12.1% in 2019. Corporate bonds bear interest rates ranging from 2.1% to 5.5% in 2021, 3.2% to 5.5% in 2020, and 3.3% to 7.0% in 2019. These securities were not used as collaterals for any borrowings of the Group.
The breakdown of quoted financial assets at FVOCI as to currency denomination is as follows:
2021 2020 2019 Local P 1,363,039,103 P 644,093,972 P 593,416,086 Foreign 48,590,850 72,362,942 113,280,786 P 1,411,629,953 P 716,456,914 P 706,696,872
In 2019, certain financial assets at FVOCI were reclassified as part of Investment Securities at Amortized Cost (see Note 10.3). Analyses of the movements in the carrying amounts of the Group’s financial assets at FVOCI are presented below.
2021 2020 2019
Balance at beginning of year P 716,456,914 P 706,696,872 P 800,667,386 Additions 978,136,132 239,304,955 2,741,291,123 Disposals ( 299,828,786 ) ( 257,527,621 ) ( 2,842,111,934 )
Fair value gains – net 22,861,582 31,831,992 3,957,638 Unrealized foreign exchange gains (losses) – net ( 5,995,889 ) ( 3,849,284) 2,892,659 Balance at end of year P 1,411,629,953 P 716,456,914 P 706,696,872
Investment income from Financial assets at FVOCI, which includes dividend income, gain or loss on disposal, and realized fair value gains or losses, totaling P42.0 million, P38.5 million, and P35.2 million for the years ended May 31, 2021, 2020 and 2019, respectively, have been reinvested as part of additions to financial assets at FVOCI and are presented separately as Interest income from financial assets at FVOCI and as Other investment income from financial assets at FVOCI under Finance Income in the consolidated statements of profit or loss (see Note 20.1). The related outstanding interest is presented as part of Accrued interest under the Trade and Other Receivables account in the consolidated statements of financial position (see Note 9).
The total fair value gains and losses from equity securities amounted to P5.6 million, P0.9 million and (P15.5 million) for the years ended May 31, 2021, 2020 and 2019 respectively, which are presented as an item that will not be reclassified subsequently to profit or loss, in the consolidated statements of comprehensive income. Total fair value losses amounting to P6.7 million and P1.8 million in 2021 and 2020, and total fair value gains amounting to P14.8 million in 2019, from debt securities are presented as an item that will be reclassified to profit or loss in the consolidated statements of comprehensive income.

- 55 -
10.3 Investment Securities at Amortized Cost
As of May 31, 2021, 2020 and 2019, the Group’s investment securities at amortized cost are classified in the consolidated statements of financial position as follows:
2021 2020 2019
Current P 83,206,231 P 227,576,146 P 263,808,437 Non-current 501,560,477 303,042,121 523,684,713 P 584,766,708 P 530,618,267 P 787,493,150
These investments are composed of investment in government and corporate bonds denominated in Philippine pesos and US dollars which bear fixed interest rates ranging from 2.0% to 7.8% per annum. These debt securities have maturities ranging from one to 10 years.
The breakdown of investment securities at amortized cost as to currency denomination is as follows:
2021 2020 2019
Local P 512,818,415 P 425,995,015 P 491,159,855 Foreign 72,094,555 105,152,008 296,837,889 584,912,970 531,147,023 787,997,744 Allowance for ECL ( 146,262) ( 528,756) ( 504,594)
P 584,766,708 P 530,618,267 P 787,493,150
Portion of the investments were foreign currency denominated bonds which all matured in 2020 but prior to maturity were previously subject to cross-currency swap agreement. As of May 31, 2019, these investments had carrying and fair values of P185.6 million. The underlying derivative of these cross-currency swaps had fair value amounting to P36.7 million and is presented as Derivative Liability in the 2019 consolidated statements of financial position.
An analysis of the movements in the carrying amount of the Group’s investment securities at amortized cost for the years ended May 31, 2021, 2020, and 2019 is presented below.
2021 2020 2019 Balance at beginning of year P 531,147,023 P 787,997,744 P 765,942,441 Additions 306,662,439 41,769,449 130,119,203 Maturities ( 248,095,439) ( 287,357,470) ( 102,167,384 ) Amortization of premium (discount) – net 824,913 ( 3,271,655) ( 3,460,815 ) Unrealized foreign currency losses – net ( 5,625,966) ( 7,991,045) ( 2,435,701 ) 584,912,970 531,147,023 787,997,744 Expected credit losses ( 146,262) ( 528,756) ( 504,594 )
Balance at end of year P 584,766,708 P 530,618,267 P 787,493,150
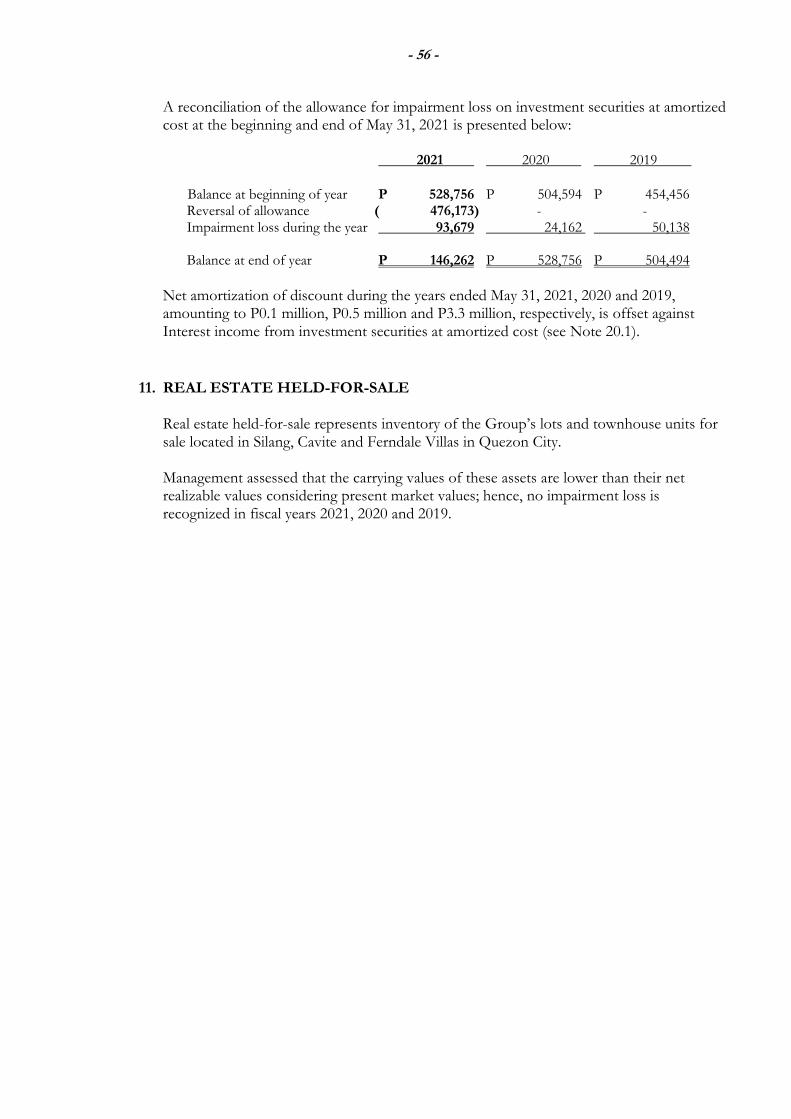
- 56 -
A reconciliation of the allowance for impairment loss on investment securities at amortized cost at the beginning and end of May 31, 2021 is presented below:
2021 2020 2019
Balance at beginning of year P 528,756 P 504,594 P 454,456 Reversal of allowance ( 476,173) - - Impairment loss during the year 93,679 24,162 50,138 Balance at end of year P 146,262 P 528,756 P 504,494
Net amortization of discount during the years ended May 31, 2021, 2020 and 2019, amounting to P0.1 million, P0.5 million and P3.3 million, respectively, is offset against Interest income from investment securities at amortized cost (see Note 20.1).
11. REAL ESTATE HELD-FOR-SALE Real estate held-for-sale represents inventory of the Group’s lots and townhouse units for sale located in Silang, Cavite and Ferndale Villas in Quezon City. Management assessed that the carrying values of these assets are lower than their net realizable values considering present market values; hence, no impairment loss is recognized in fiscal years 2021, 2020 and 2019.
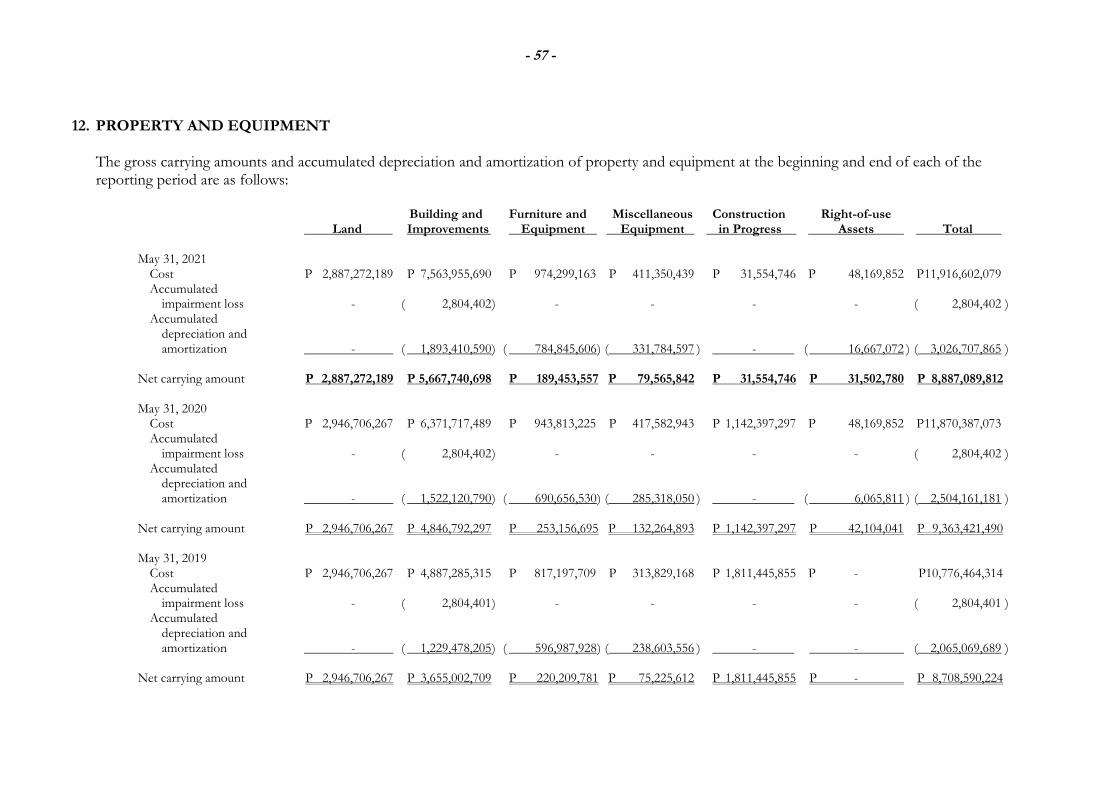
- 57 -
12. PROPERTY AND EQUIPMENT The gross carrying amounts and accumulated depreciation and amortization of property and equipment at the beginning and end of each of the reporting period are as follows:
Building and Furniture and Miscellaneous Construction Right-of-use Land Improvements Equipment Equipment in Progress Assets Total May 31, 2021 Cost P 2,887,272,189 P 7,563,955,690 P 974,299,163 P 411,350,439 P 31,554,746 P 48,169,852 P 11,916,602,079 Accumulated
impairment loss - ( 2,804,402 ) - - - - ( 2,804,402 ) Accumulated
depreciation and amortization - ( 1,893,410,590 ) ( 784,845,606 ) ( 331,784,597 ) - ( 16,667,072 ) ( 3,026,707,865 ) Net carrying amount P 2,887,272,189 P 5,667,740,698 P 189,453,557 P 79,565,842 P 31,554,746 P 31,502,780 P 8,887,089,812 May 31, 2020 Cost P 2,946,706,267 P 6,371,717,489 P 943,813,225 P 417,582,943 P 1,142,397,297 P 48,169,852 P 11,870,387,073 Accumulated
impairment loss - ( 2,804,402 ) - - - - ( 2,804,402 ) Accumulated
depreciation and amortization - ( 1,522,120,790 ) ( 690,656,530 ) ( 285,318,050 ) - ( 6,065,811 ) ( 2,504,161,181 ) Net carrying amount P 2,946,706,267 P 4,846,792,297 P 253,156,695 P 132,264,893 P 1,142,397,297 P 42,104,041 P 9,363,421,490 May 31, 2019 Cost P 2,946,706,267 P 4,887,285,315 P 817,197,709 P 313,829,168 P 1,811,445,855 P - P10,776,464,314 Accumulated
impairment loss - ( 2,804,401 ) - - - - ( 2,804,401 ) Accumulated
depreciation and amortization - ( 1,229,478,205 ) ( 596,987,928 ) ( 238,603,556 ) - - ( 2,065,069,689 ) Net carrying amount P 2,946,706,267 P 3,655,002,709 P 220,209,781 P 75,225,612 P 1,811,445,855 P - P 8,708,590,224

- 58 -
A reconciliation of the carrying amounts of property and equipment at the beginning and end of periods ended May 31, 2021, 2020 and 2019 is shown below and in the succeeding page.
Building and Furniture and Miscellaneous Construction Right-of-use Land Improvements Equipment Equipment in Progress Assets Total
Balance at June 1, 2020 net of accumulated depreciation and amortization P 2,946,706,267 P 4,846,792,297 P 253,156,695 P 132,264,893 P 1,142,397,297 P 42,104,041 P 9,363,421,490 Additions - 34,636,090 50,043,043 18,132,926 98,537,572 - 201,349,631 Reclassifications from (to) - net ( 59,434,078) 1,157,602,111 ( 19,557,105 ) ( 24,365,430 ) ( 1,209,380,123 ) - ( 155,134,625 ) Depreciation and amortization charges
for the year - ( 371,289,800 ) ( 94,189,076 ) ( 46,466,547 ) - ( 10,601,261 ) ( 522,546,684 )
Balance at May 31, 2021 net of accumulated depreciation and amortization P 2,887,272,189 P 5,667,740,698 P 189,453,557 P 79,565,842 P 31,554,746 P 31,502,780 P 8,887,089,812

- 59 -
Building and Furniture and Miscellaneous Construction Right-of-use Land Improvements Equipment Equipment in Progress Assets Total
Balance at June 1, 2019 net of accumulated depreciation and amortization P 2,946,706,267 P 3,655,002,709 P 220,209,781 P 75,225,612 P 1,811,445,855 P 13,517,469 P 8,722,107,693 Additions - 53,701,712 123,482,696 89,603,049 779,586,869 34,652,383 1,081,026,709 Disposals - - - ( 621,420 ) - ( 621,420 ) Reclassifications from (to) - net - 1,430,730,461 3,132,820 14,772,146 ( 1,448,635,427 ) - - Depreciation and amortization charges
for the year - ( 292,642,585 ) ( 93,668,602 ) ( 46,714,494 ) - ( 6,065,811 ) ( 439,091,492 )
Balance at May 31, 2020 net of accumulated depreciation and amortization P 2,946,706,267 P 4,846,792,297 P 253,156,695 P 132,264,893 P 1,142,397,297 P 42,104,041 P 9,363,421,490
Balance at June 1, 2018 net of accumulated depreciation and amortization P 2,942,991,320 P 2,828,843,445 P 147,728,641 P 56,864,390 P 1,229,203,637 P - P 7,205,631,433 Additions - 146,901,055 160,167,006 42,768,034 1,487,219,679 - 1,837,055,774 Disposals - - ( 26,835 ) ( 670,754 ) - - ( 697,589 ) Reclassifications from (to) - net 3,714,947 909,734,744 - - ( 904,977,461 ) - 8,472,230 Depreciation and amortization charges for the year - ( 230,476,535 ) ( 87,659,031 ) ( 23,736,058 ) - - ( 341,871,624 )
Balance at May 31, 2019 net of accumulated depreciation and amortization P 2,946,706,267 P 3,655,002,709 P 220,209,781 P 75,225,612 P 1,811,445,855 P - P 8,708,590,224

- 60 -
Construction in progress pertains to the costs incurred for the on-going construction of the school building of RCI in Rizal, and various on-going building additions and improvements of EACCI in Manila, FECSI in Cavite and the University in Manila.
In 2021, 2020 and 2019, RCI capitalized borrowing costs amounting to P6.8 million, P17.0 million and P4.7 million, respectively, representing the actual borrowing costs incurred on loans obtained to fund the construction project with capitalization rate of 1.92% to 4.70% (see Note 20.2).
In 2019, borrowing costs amounting to P33.7 million were capitalized, using the capitalization rate of 6.60%, incurred on loans obtained by the University to fund the construction of a new building in Lerma Street (see Note 20.2).
As of May 31, 2021, 2020 and 2019, certain fully depreciated assets with acquisition cost of P1,475.4 million, P810.2 million and P723.8 million, respectively, are still being used in the Group’s operations.
In 2020, the Group recognized gain on disposal of miscellaneous equipment amounting to P2.1 million and is shown as Other Income – net account in the 2020 consolidated statement of profit or loss. No similar transaction for the years ended May 31, 2021 and 2019.
As at May 31, 2021, 2020 and 2019, none of the Group’s property and equipment are used as collateral for any of the Group’s interest-bearing loans and borrowings. The table below describes the nature of the Group’s leasing activities by type of right-of-use asset recognized in the consolidated statements of financial position.
Number of Number of Number of Average leases with leases with right-of-use Range of remaining extension termination assets leased remaining term lease term options options
2021 Building and lot 2 3-4 years 3.5 years 2 2
2020 Building and lot 2 4 years 4 years 2 2
As at May 31, 2021 and 2020, none of the Group’s right-of-use assets are used as collateral for any of the Group’s interest-bearing loans and borrowings. The amount of depreciation on right-of-use assets is presented as part of Depreciation and amortization presented under Other Operating Expenses account (see Note 19).
13. LEASES
The Group has leases for certain university buildings, transportation equipment, and event venues. With the exception of leases of low-value underlying assets, Right-of-use Assets and current portion of lease liabilities are presented under Property and Equipment and Trade and Other Payables, respectively (see Notes 12 and 16). Non-current portion of lease liabilities, on the other hand, has been presented separately in the 2021 and 2020 consolidated statements of financial position.
- 60-

- 61 -
Each lease generally imposes a restriction that, unless there is a contractual right for the Group to sublet the asset to another party, the right-of-use asset can only be used by the Group. Leases are either non-cancellable or may only be cancelled by incurring a substantive termination fee. Some leases contain an extension of the lease for a further term. The Group is prohibited from selling or pledging the underlying leased assets as security. For leases over offices, the Group must keep those properties in a good state of repair and return the properties in good condition at the end of the lease. Further, the Group must insure the leased assets and incur maintenance fees on such items in accordance with the lease contracts.
13.1 Lease Liabilities
Current portion of lease liabilities are presented in the consolidated statements of financial position as part of Trade and other payables (see Note 16). On the other hand, the non-current portion is presented separately in the consolidated statements of financial position as of May 31, 2021 and 2020. The use of extension and termination options gives the Group added flexibility in the event it has identified more suitable premises in terms of cost and/or location or determined that it is advantageous to remain in a location beyond the original lease term. An option is only exercised when consistent with the Group’s regional markets strategy and the economic benefits of exercising the option exceeds the expected overall cost. Lease liabilities are presented in the consolidated statements of financial position as at May 31, 2021 and 2020 as follows:
2021 2020
Current P 9,998,745 P 12,065,118 Non-current 24,512,241 34,507,453
P 34,510,986 P 46,572,571
The lease liabilities are secured by the related underlying assets. The undiscounted maturity analysis of lease liabilities at May 31, 2021 and 2020 is as follows:
Within 1 to 2 2 to 3 3 to 4 1 year years years years Total 2021 Lease payments P 12,082,672 P 12,780,428 P 12,761,834 P 847,448 P 38,472,382 Finance charges ( 2,084,606 ) ( 1,352,823 ) ( 523,967 ) - ( 3,961,396 ) Net present value P 9,998,066 P 11,427,605 P 12,237,867 P 847,448 P 34,510,986
2020 Lease payments P 14,789,087 P 12,082,672 P 12,780,428 P 13,611,060 P 53,263,247 Finance charges ( 2,723,969 ) ( 2,084,606 ) ( 1,352,823 ) ( 529,278 ) ( 6,690,676 ) Net present value P 12,065,118 P 9,998,066 P 11,427,605 P 13,081,782 P 46,572,571
13.2 Lease Payments Not Recognized as Liabilities
The Group has elected not to recognize a lease liability for leases of low-value assets and short-term leases. Payments made under such leases are expensed on a straight-line basis. The expenses relating to leases of low-value assets and short term leases amounted to P1.2 million and P14.4 million and is presented as Rental under Operating Expenses in the May 31, 2021 and 2020 consolidated statements of profit or loss (see Note 19).

- 62 -
At May 31, 2020, the total future cash outflows for lease of low-value assets amounted P59,000 (nil in 2021).
13.3 Additional Profit or Loss and Cash Flow Information
The total cash outflow in respect of leases amounted to P14.8 million and P2.8 million in 2021 and 2020, respectively. Interest expense in relation to lease liabilities amounted to P2.8 million and P1.2 million and is presented as part of Interest expense under Finance Costs in the 2021 and 2020 consolidated statements of profit or loss (see Note 20.2).
14. INVESTMENT PROPERTIES
The gross carrying amounts and accumulated depreciation and amortization of investment properties at the beginning and end of each of the reporting period are shown below.
Building Construction
Land and in Land Improvements Improvements Progress Total
May 31, 2021 Cost P 66,244,078 P 14,340,361 P 407,792,431 P 74,745,037 P 563,121,907
Accumulated depreciation and amortization - ( 7,918,444) ( 278,132,554 ) - ( 286,050,998 )
Net carrying amount P 66,244,078 P 6,421,917 P 129,659,877 P 74,745,037 P 277,070,909 May 31, 2020 Cost P 6,810,000 P 11,143,171 P 372,675,205 P 56,646,472 P 447,274,848
Accumulated depreciation and amortization - ( 6,474,161) ( 246,606,960 ) - ( 253,081,121 )
Net carrying amount P 6,810,000 P 4,669,010 P 126,068,245 P 56,646,472 P 194,193,727
May 31, 2019 Cost P 6,810,000 P 10,821,740 P 460,004,458 P 15,423,919 P 493,060,117
Accumulated depreciation and amortization - ( 4,892,787) ( 333,293,008 ) - ( 338,185,795 )
Net carrying amount P 6,810,000 P 5,928,953 P 126,711,450 P 15,423,919 P 154,874,322
A reconciliation of the carrying amounts of investment properties at the beginning and end of each of the reporting period are shown in the succeeding page.

- 63 -
Building Construction Land and in Land Improvements Improvements Progress Total Balance at June 1, 2020, net of accumulated depreciation and amortization P 6,810,000 P 4,669,010 P 126,068,245 P 56,646,472 P 194,193,727 Additions - 1,473,624 2,227,422 23,018,372 26,719,418 Reclassifications 59,434,078 1,723,566 32,889,804 ( 4,919,807) 89,127,641 Depreciation and amortization charges for the period - ( 1,444,283) ( 31,525,594 ) - ( 32,969,877 ) Balance at May 31, 2021, net of accumulated depreciation and amortization P 66,244,078 P 6,421,917 P 129,659,877 P 74,745,037 P 277,070,909 Balance at June 1, 2019, net of accumulated depreciation and amortization P 6,810,000 P 5,928,953 P 126,711,450 P 15,423,919 P 154,874,322 Additions - 321,429 46,095,306 41,222,553 87,639,288 Disposal - - ( 15,582,526 ) - ( 15,582,526 ) Depreciation and amortization charges for the period - ( 1,581,372) ( 31,155,985 ) - ( 32,737,357 ) Balance at May 31, 2020, net of accumulated depreciation and amortization P 6,810,000 P 4,669,010 P 126,068,245 P 56,646,472 P 194,193,727 Balance at June 1, 2018, net of accumulated depreciation and amortization P 10,524,947 P 1,529,523 P 130,864,071 P 8,001,388 P 150,919,929 Additions 3,655,721 4,531,264 22,049,782 30,236,767 Reclassifications - net ( 3,714,947) 1,485,378 20,761,061 ( 14,627,251) 3,904,241 Depreciation and amortization charges for the period - ( 741,669) ( 29,444,946 ) - ( 30,186,615 ) Balance at May 31, 2019, net of accumulated depreciation and amortization P 6,810,000 P 5,928,953 P 126,711,450 P 15,423,919 P 154,874,322
In 2020, the Group recognized gain on disposal of building and improvements amounting to P38.0 million and is shown as part of Other Operating Income in the 2020 statements of profit or loss. No similar transaction for the years ended May 31, 2021 and 2019.
14.1 Related Income and Direct Expenses The total rental income earned by the Group from its investment properties amounting to P10.4 million, P33.4 million and P43.8 million for the periods ended May 31, 2021, 2020 and 2019, respectively, are presented as Rentals in the revenues section of the consolidated statements of profit or loss. The direct operating expenses, which include depreciation and amortization, insurance, and real property taxes incurred by the Group relating to investment properties, are presented as part of Depreciation and amortization, Property insurance, and Taxes and licenses, under Operating Expenses in the consolidated statements of profit or loss (see Note 19).

- 64 -
14.2 Fair Values of Investment Properties Based on the latest appraisal report of an independent appraiser, the total fair value of investment properties amounted to P293.5 million, P234.0 million and P205.1 million as of May 31, 2021, 2020 and 2019, respectively. Information about the fair value measurement and disclosures related to investment properties are presented in Note 6.4.
15. OTHER ASSETS The breakdown of this account is as follows:
2021 2020 2019
Current: Prepaid expenses P 57,020,916 P 58,324,013 P 68,142,305 Input value-added tax (VAT) 38,482,851 42,015,482 38,935,032 Short-term investments 32,211,342 64,562,591 76,269,824 Inventories 20,428,543 7,981,951 25,940,353 Others 14,018,463 12,113,487 7,710,804 162,162,115 184,997,524 216,998,318 Allowance for impairment of input VAT ( 34,864,866 ) ( 11,034,177) ( 10,980,897 ) P 127,297,249 P 173,963,347 P 206,017,421
Non-current:
Advances to suppliers and developers P 169,843,559 P 162,215,170 P 174,553,314 Refundable deposits 22,819,818 16,235,991 9,975,348 Long-term investments 14,400,963 11,280,724 16,425,700
Loans to employees - 1,183,289 1,869,046 207,064,340 190,915,174 202,823,408 Allowance for impairment of long-term investments ( 3,694,963 ) - -
P 203,369,377 P 190,915,174 P 202,823,408
Short-term investments, which consist of special savings deposits, investment in special deposit accounts and time deposits, earn interest ranging from 0.38% to 0.50%, from 0.88% to 2.50% and from 0.80% to 2.50% for the years ended May 31, 2021, 2020 and 2019, respectively (see Note 20.1). These investments are maturing beyond three months but within one year from the end of each reporting period. Related accrued interest is presented as part of the Trade and other Receivables account in the consolidated statements of financial position (see Note 9). Inventories consist of merchandise inventory items relating to the University’s bookstore. Advances to suppliers pertain to advances made by FECSI, EACCI, FEUAI and FEU High to its suppliers for the various projects, which will be applied as payment for progress billings of the contractors and suppliers within 12 months from the end of the reporting periods. Advances to developers represent the amount paid for FRC’s condominium units purchased at pre-selling stage that are not yet ready for occupancy or fully constructed at the end of the reporting periods.

- 65 -
Long-term investments includes investments in redeemable preference shares and time deposits that earn effective interest rates ranging from 6.13% to 6.63% for the years ended May 31, 2021 and 2020, and are maturing beyond one year from the date of placement as of the end of each reporting period. Additional allowance for impairment on input VAT and long-term investments amounting to P23.8 million and P3.7 million, respectively, were recognized by the Group in 2021 (see Note 19).
16. TRADE AND OTHER PAYABLES
This account consists of:
Notes 2021 2020 2019
Non-related parties: Accrued expenses 17 P 395,671,460 P 524,772,506 P 289,320,583 Deposits payable 260,934,435 228,268,324 150,324,252 Trade payables 216,772,114 435,821,724 307,494,724 Dividends payable 24.4(b), 28 175,203,878 223,026,631 215,371,368 Retention payable 108,249,973 217,842,363 208,812,713 Amounts due to students 103,431,861 63,899,888 37,446,294 NSTP and other trust funds 64,049,883 39,570,686 51,068,981 Lease liabilities 13.1 9,998,745 12,065,118 - 1,334,312,349 1,745,267,240 1,224,597,180 Related parties: Due to related parties 23.8 27,374,961 39,496,131 24,389,415
Others:
Accrued salaries and employee benefits 55,370,027 43,465,799 48,470,538 Withholding taxes and other payables 39,849,952 28,927,461 56,135,814 Miscellaneous 70,448,225 44,878,419 16,916,290 165,668,204 117,271,679 121,522,642
P 1,527,355,514 P 1,902,035,050 P 1,405,750,972
Accrued expenses include the Group’s accrual for salaries, professional’s fees, interest, utilities, rentals and directors’ bonuses, among others.
Deposits payable are amounts held by the Group on behalf of students and third parties for various specific activities. During the year ended May 31, 2020, certain deposits payable recognized in prior years amounting to P57.3 million, were recognized as income because the purpose for which the amounts were held have already been fulfilled. The related gains are presented as part of Other Income – net account in the 2020 consolidated statement of profit or loss. No similar transactions occurred during the year ended May 31, 2021 and 2019.

- 66 -
As of May 31, 2021, 2020 and 2019, retention payable includes portion of the consideration given for the acquisition of RCI which is retained by the University to ensure compliance by the selling shareholders of RCI to certain terms of the share purchase agreement. This amounts to P22.9 million as of May 31, 2021 and P42.2 million as of May 31, 2020 and 2019 and is currently maintained in an escrow account with a local bank. On the other hand, the remaining portion of retention payable pertains to the amounts owed to the Group’s contractors of its ongoing construction projects (see Note 12).
Amounts due to students represent excess payment of tuition and miscellaneous fees that are refundable to them.
The NSTP trust funds collected from students amounted to P19.5 million, P27.1 million and P28.3 million for the years ended May 31, 2021, 2020 and 2019, respectively. As of May 31, 2021, 2020 and 2019, the remaining balance is set aside as a contingency fund and is presented as part of NSTP and other funds.

- 67 -
17. INTEREST-BEARING LOANS
The Group’s interest-bearing loans as of May 31, 2021, 2020 and 2019 are as follows: Original Outstanding Principal Balance Interest Charges Accrued Interest Current Principal (in Million Pesos) (in Million Pesos) (in Million Pesos) Interest Maturity Principal Amount 2021 2020 2019 2021 2020 2019 2021 2020 2019 Rate* Security Date Repayment
P 542.9 P 542.9 P - P - P 8.7 P - P - P 1.3 P - P - 2.15% Unsecured July 2027 Quarterly 500.0 500.0 - - 2.1 - - 1.2 - - 2.15% Unsecured July 2027 Quarterly 425.0 425.0 425.0 - 10.0 16.3 - 1.1 6.4 - 2.15% Unsecured July 2027 Quarterly 300.0 300.0 300.0 - 6.5 12.7 - 0.7 3.1 - 4.67% Unsecured July 2027 End of Term 680.0 161.9 291.4 421.0 5.6 17.2 26.0 0.7 2.7 5.6 1.93% Unsecured June 2022 Quarterly 150.0 150.0 150.0 - 3.5 4.2 - 0.4 2.3 - 2.15% Unsecured July 2027 Quarterly 120.0 120.0 120.0 - 2.8 1.5 - 0.3 1.5 - 2.15% Unsecured July 2027 Quarterly 100.0 100.0 100.0 - 2.2 0.2 - 0.3 0.2 - 4.30% Unsecured July 2027 End of Term 50.0 50.0 - - 0.4 - - 0.1 - - 2.15% Unsecured July 2027 End of Term 50.0 50.0 - - 0.2 - - 0.1 - - 2.15% Unsecured July 2027 End of Term 200.0 47.6 85.7 123.8 1.7 5.0 7.6 0.2 0.8 1.8 1.93% Unsecured June 2022 Quarterly 100.0 25.0 45.0 65.0 0.9 2.6 4.0 0.1 0.4 1.0 1.93% Unsecured June 2022 Quarterly 800.0 - 495.2 609.5 3.7 27.4 38.0 - 6.2 2.0 4.16% Unsecured August 2020 End of Term 100.0 - 100.0 100.0 3.6 5.6 5.9 - 0.4 0.3 4.50% Unsecured February 2021 End of Term 100.0 - 100.0 100.0 3.6 5.6 1.6 - 0.3 0.5 4.50% Unsecured February 2021 End of Term 100.0 - 100.0 - 3.7 4.3 - - 0.1 - 4.50% Unsecured February 2021 End of Term 150.0 - 92.9 114.3 0.7 5.1 7.0 - 1.2 0.3 4.16% Unsecured August 2020 Quarterly 80.0 - 80.0 80.0 2.9 4.5 4.5 - - 0.2 4.50% Unsecured February 2021 End of Term 70.0 - 70.0 70.0 2.5 4.0 1.1 - 0.2 0.3 4.50 % Unsecured February 2021 End of Term 50.0 - 50.0 - 1.7 2.9 - - 0.1 - 4.50% Unsecured February 2021 End of Term 200.0 - - 200.0 - 1.8 11.2 - - 0.3 6.50% Unsecured July 2019 End of Term 175.0 - - 175.0 - 1.5 9.8 - - 0.1 6.50% Unsecured July 2019 End of Term 100.0 - - 100.0 - 1.5 2.7 - - - 1.92% Unsecured July 2027 End of Term 80.0 - - 80.0 - 1.2 2.2 - - - 1.92% Unsecured July 2027 End of Term 70.0 - - 70.0 - 1.1 1.9 - - - 1.92% Unsecured July 2027 End of Term 50.0 - - 50.0 - 0.4 2.8 - - 0.1 6.50% Unsecured July 2019 End of Term 500.0 - - - 2.1 - - - - - 4.25% Unsecured March 2021 End of Term 148.0 - - - - 1.4 - - - - 5.75% Unsecured February 2020 End of Term 60.0 - - - - - 2.0 - - - 6.55% Unsecured January 2019 End of Term P 2,472.4 P 2,605.2 P 2,358.6 P 69.1 P 128.0 P 128.3 P 6.5 P 26.9 P 12.5

- 68 -
Interest-bearing loans are presented in the consolidated statements of financial position as at May 31, 2021 and 2020 as follows:
2021 2020 2019
Current P 187,619,048 P 868,571,429 P 1,393,571,429 Non-current 2,284,761,905 1,736,666,667 965,000,000
P 2,472,380,953 P 2,605,238,096 P 2,358,571,429
All of the Group’s interest-bearing loans and borrowings are clean loans; no assets used and/or required as collaterals as of May 31, 2021, 2020 and 2019.
The total interest incurred by the Group on all of these loans, which are already exclusive of the capitalized borrowing costs on the property and equipment of the Group, are presented as part of Interest expense under Finance Costs in the consolidated statements of profit or loss (see Notes 12 and 20.2), while any outstanding interest payable is recognized as part of Accrued expenses under the Trade and Other Payables account in the consolidated statements of financial position (see Note 16).
Loans obtain with a local commercial bank are subject to loan covenants effective for the years ended May 31, 2021, 2020 and 2019, respectively, which require the Group to maintain a debt service coverage ratio of at least 1.2x and debt-to-equity ratio of not more than 2:1. As of May 31, 2021, 2020 and 2019, the Group has complied with its loan covenants.
18. EDUCATIONAL REVENUES
Details of net tuition and other school fees presented in the consolidated statements of profit or loss are as follows:
2021 2020 2019
Tuition fees P 3,669,594,355 P 3,565,824,098 P 3,243,801,630 Less rebates - 115,899,515 - 3,669,594,355 3,449,924,583 3,243,801,630 Less discounts: Scholarship 251,882,937 190,479,279 176,166,019 Cash 75,784,079 23,178,799 19,767,376 Family 5,609,893 14,876,685 19,609,227 333,276,909 228,534,763 215,542,622
3,336,317,446 3,221,389,820 3,028,259,008 Other school fees: Senior high school miscellaneous fees 52,639,245 78,210,312 87,115,575 Entrance fees 12,758,691 12,919,539 16,840,529 Identification cards 9,315,691 7,821,011 6,883,409 Diplomas 9,071,597 9,066,625 4,286,406 Developmental fees 7,299,500 54,126,154 54,299,978 Transcript fees 5,917,106 8,148,959 10,884,526 Certification fees 4,676,089 3,236,512 5,298,399 Graduation and commencement fees 609,617 15,081,427 8,675,865 Other registration fees 14,990,679 - 16,472,695 Miscellaneous 68,830,545 146,313,349 76,763,651 186,108,760 334,923,888 286,993,109
P 3,522,426,206 P 3,556,313,708 P 3,315,252,117
- 68 -

- 69 -
Miscellaneous fees include various fees such as transportation fees, insurance fees, laboratory fees, subject fees and other miscellaneous fees, which are required to be paid together with the tuition fees upon student enrollment.
18.1 Core Revenue Stream The Group derives revenues from transactions involving tuition fees, other school fees and other school-related activities such as sale of school merchandise and books. Revenues from tuition fees are recognized over time. All other revenue sources, such as other school fees and sale of school merchandise and books (presented as part of Other Income – net account in the consolidated statements of profit or loss), are recognized at a point in time. The Group presents below the disaggregation of its revenue based on school units for the years ended May 31, 2021, 2020 and 2019. The Group recognizes revenues over time in the following education levels:
2021
Levels
Tertiary Secondary Basic Nature Education Education Education Total Tuition fees - net P 2,813,705,713 P 464,917,732 P 57,694,001 P 3,336,317,446 Other school fees 94,161,793 89,487,667 2,459,300 186,108,760 Total P 2,907,867,506 P 554,405,399 P 60,153,301 P 3,522,426,206
2020 Levels
Tertiary Secondary Basic Nature Education Education Education Total Tuition fees - net P 2,664,403,788 P 410,161,875 P 146,824,157 P 3,221,389,820 Other school fees 172,386,351 158,399,267 4,138,270 334,923,888 Total P 2,836,790,139 P 568,561,142 P 150,962,427 P 3,556,313,708
2019 Levels
Tertiary Secondary Basic Nature Education Education Education Total Tuition fees - net P 2,542,498,599 P 397,271,065 P 88,489,344 P 3,028,259,008 Other school fees 131,380,427 151,508,144 4,104,538 286,993,109 Total P 2,673,879,026 P 548,779,209 P 92,593,882 P 3,315,252,117

- 70 -
18.2 Unearned Tuition Fees For the years ended May 31, 2021, 2020 and 2019, the Group, except FRC, has collected advance tuition fee payments from students who enrolled for the next school term which amounted to P33.7 million, P94.7 million and P258.4 million, respectively. These collections are presented as Deferred Revenues in the consolidated statements of financial position. These will be recognized as revenue once the performance obligation of the schools within the Group has been rendered. 18.3 Tuition Fee Rebates The implementation of the government measures in response to COVID-19 caused the temporary shutdown of Group’s operations from March until May 2020, together with the adoption of a skeleton workforce for designated employees with necessary and urgent functions. The remaining second semester of school year 2019-2020 was continued via full online learning platform, the strategic implementation of Canvas since three school years ago, made the Group’s quick transition to full online mode easier. However, with the shift of the learning platform, the Group found it necessary to return unutilized miscellaneous fees through a rebate to the students totaling P115.9 million as of May 31, 2020. For school year 2020-2021, the Group adopted full online classes for the continuation of learning of students as the quarantine restrictions ensues. Unlike in the preceding year there was no rebate provided as outright reduction or discounted rate were applied upon enrolment of student.
19. OPERATING EXPENSES
Operating expenses consist of:
Notes 2021 2020 2019
Salaries and allowances 23.5 P 982,904,329 P 1,087,287,688 P 997,763,344 Depreciation and amortization 12, 14.1 555,516,561 471,828,849 372,058,239 Employee benefits 21, 23.5 291,992,684 371,749,116 276,697,715 Repairs and maintenance 110,611,431 37,882,439 29,345,602 Professional fees 102,971,086 119,120,187 103,608,222 Outside services 77,249,380 130,857,284 113,987,193 Utilities 62,903,290 146,519,499 177,052,070 Taxes and licenses 14.1 56,664,742 91,478,300 286,500,769 Supplies and materials 35,093,645 98,277,046 82,156,258 Impairment losses 15 27,525,652 - - Trainings and seminars 19,111,635 31,036,447 28,956,177 Publicity and promotions 17,146,676 15,615,449 20,117,994 Directors’ bonus 14,500,000 14,506,928 13,125,000 Insurance 14.1 9,503,244 9,095,568 4,637,657 Rental 13.2 1,157,034 14,418,547 14,556,299 Others 120,433,780 138,085,364 145,967,896
P 2,485,285,169 P 2,777,758,711 P 2,666,530,435

- 71 -
In 2019, the University and EACCI recognized and paid basic local taxes in arrears amounting to P225.3 million, presented as part of Taxes and licenses, which covers taxable calendar years 2009 to 2018, as assessed and belatedly covered by tax amnesty by the local government of City of Manila. Others include expenses incurred by the Group for software licenses and subscriptions, transportation and travel, research and other miscellaneous expenses.
20. FINANCE INCOME AND FINANCE COSTS
20.1 Finance Income This consists of the following:
Notes 2021 2020 2019 Interest income from: Financial assets at FVOCI 10.2 P 19,365,582 P 19,141,331 P 20,924,170 Investment securities at amortized cost 10.3 16,793,882 34,657,034 48,563,514 Short-term investments 15 11,015,054 47,842,264 41,234,815 Cash and cash equivalents 8 4,597,893 10,015,282 7,751,966 Financial assets at FVTPL 10.1 - - 2,659,771 Other investment income from: Financial assets at FVTPL 10.1 113,711,327 - 13,564,356 Financial assets at FVOCI 10.2 22,683,621 19,363,851 14,299,692 Reversal of impairment loss 2,090,705 - - Fair value gain on derivative liability - 5,060,766 3,096,336 P 190,258,064 P 136,080,528 P 152,094,620
20.2 Finance Costs
This account is broken down into the following:
Notes 2021 2020 2019
Interest expense from: Interest-bearing loans 17 P 59,832,208 P 110,973,948 P 95,072,981 Lease liabilities 13.3 2,779,702 1,183,812 - Deficiency tax - 920,302 -
Foreign exchange loss-net 10 30,320,827 38,285,826 3,153,258 Other investment loss from financial asset at FVTPL 10.1 - 94,701,429 -
Fair value loss on derivative liability - - - Impairment loss on investment securities at amortized cost 10.3 - - 50,138
Others 13,642,912 - - P 106,575,649 P 246,065,317 P 98,276,377

- 72 -
In 2021, 2020 and 2019, an interest expense amounting to P6.8 million, P17.0 million and P38.4 million, respectively, have been capitalized as part of construction in progress under property and equipment account, which arose solely from specific borrowings (see Note 12). Other finance cost pertains to bank service charges for maintaining tuition collection facilities with depository banks, services provided by investment trust managers, wire transfer transactions, foreign currency payment transactions to suppliers, among others.
21. EMPLOYEES’ HEALTH, WELFARE AND RETIREMENT FUND
(a) Characteristics of the Defined Contribution and Defined Benefit Plans (i) The University, FECSI and EACCI
The University, FECSI and EACCI maintain tax-qualified, funded and contributory retirement plans, which fall under a defined contribution type of retirement plan, covering regular teaching and non-teaching personnel members. The University, FECSI and EACCI’s retirement plans were maintained since 1967, 2013 and 2017, respectively.
The respective retirement funds are under the administration of organizations, the FEU Health, Welfare and Retirement Fund, the FEU Cavite Health, Welfare and Retirement and Private Education Retirement Annuity Association (the Funds), through their respective Board of Governors. Contributions to these funds are in accordance with the defined contribution established by the Retirement Board, which is the sum of the employees’ and the University, FECSI and EACCI’s contributions.
As a policy, any contributions made by the University, FECSI and EACCI in the past years that were subsequently forfeited resulting from resignations of covered employees prior to vesting of their retirement pay can be applied to reduce employer contributions in the succeeding years.
(ii) RCI, FRC, FEUAI and FEU High RCI, FRC, FEUAI and FEU High have not yet established a formal post-employment plan. However, they accrue the estimated cost of post-employment benefits, actuarially determined, required by the provisions of RA No. 7641. These companies have discretion when to fund the minimum post-employment benefits calculated, however upon retirement of qualified employees, funds must be readily available for payment of employees’ retirement benefits. Retirement expense presented as part of Employee benefits under Other Operating Expenses in the consolidated statements of profit or loss amounted to P56.5 million, million, P71.6 million and P82.0 million for the years ended May 31, 2021, 2020 and 2019, respectively (see Note 19).

- 73 -
(b) Explanation of Amounts Disclosed in the Consolidated Financial Statements
Actuarial valuations are obtained: (i) to determine the higher of the defined benefit obligation relating to the minimum guarantee and the obligation arising from the defined contribution plan (for FEU, FECSI and EACCI); and, (ii) to update the retirement benefit costs for the others. All amounts presented below are based on the actuarial valuation reports obtained from an independent actuary for the years ended May 31, 2021, 2020 and 2019 (for FEU, FECSI and RCI) and June 30, 2021, 2020 and 2019 (for EACCI). The post-employment benefit obligation amounting to P47.0 million, P61.9 million and P47.3 million as of May 31, 2021, 2020 and 2019, respectively, pertains to RCI, EACCI and FRC’s defined benefit liability, which is presented under non-current liabilities in the consolidated statements of financial position. The movements in the present value of the post-employment benefit obligation recognized in the books are as follows:
2021 2020 2019 Balance at beginning of year P 61,917,618 P 47,313,579 P 46,138,632
Benefits paid ( 28,037,108) ( 2,072,257 ) ( 12,339,588 ) Current service cost 11,344,387 2,509,465 1,773,812
Interest expense 6,414,868 5,703,460 3,182,786 Remeasurements – actuarial (gain) losses arising from: Experience adjustments ( 1,260,818) 1,099,145 4,562,562 Changes in financial assumptions ( 3,368,759 ) 7,364,226 3,995,375 Balance at end of year P 47,010,188 P 61,917,618 P 47,313,579
The components of amounts recognized in profit or loss (as part of Employee benefits under Cost and Operating Expenses) and in other comprehensive income in respect of the post-employment defined benefit plan is shown below:
2021 2020 2019 Reported in profit or loss: Current service cost P 11,344,387 P 2,509,465 P 1,773,812 Interest expense 6,414,868 5,703,460 3,182,786 P 17,759,255 P 8,212,925 P 4,956,598 Reported in other comprehensive income: Actuarial gains (losses) from: Changes in financial assumptions P 3,368,759 (P 7,364,226 ) (P 3,995,375 ) Experience adjustments 1,260,818 ( 1,099,145 ) ( 4,562,562 ) P 4,629,577 (P 8,463,371 ) (P 8,557,937 )
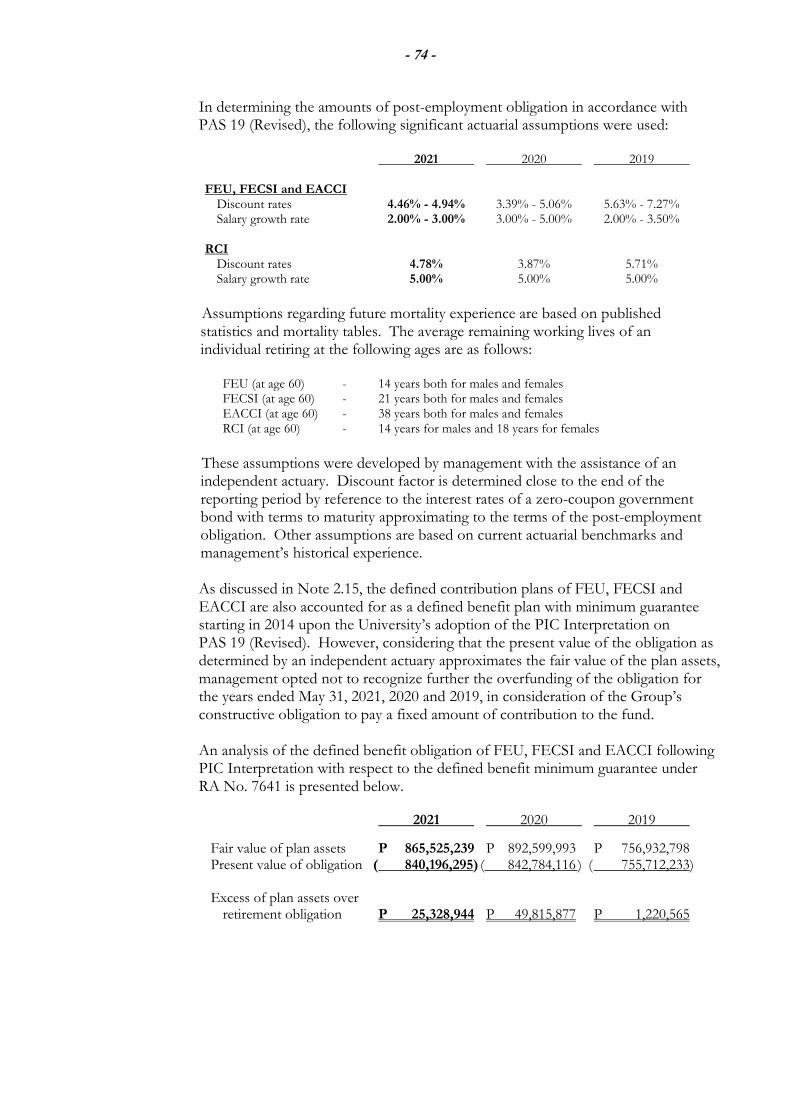
- 74 -
In determining the amounts of post-employment obligation in accordance with PAS 19 (Revised), the following significant actuarial assumptions were used:
2021 2020 2019 FEU, FECSI and EACCI Discount rates 4.46% - 4.94% 3.39% - 5.06% 5.63% - 7.27% Salary growth rate 2.00% - 3.00% 3.00% - 5.00% 2.00% - 3.50%
RCI Discount rates 4.78% 3.87% 5.71% Salary growth rate 5.00% 5.00% 5.00%
Assumptions regarding future mortality experience are based on published statistics and mortality tables. The average remaining working lives of an individual retiring at the following ages are as follows:
FEU (at age 60) - 14 years both for males and females FECSI (at age 60) - 21 years both for males and females EACCI (at age 60) - 38 years both for males and females RCI (at age 60) - 14 years for males and 18 years for females
These assumptions were developed by management with the assistance of an independent actuary. Discount factor is determined close to the end of the reporting period by reference to the interest rates of a zero-coupon government bond with terms to maturity approximating to the terms of the post-employment obligation. Other assumptions are based on current actuarial benchmarks and management’s historical experience. As discussed in Note 2.15, the defined contribution plans of FEU, FECSI and EACCI are also accounted for as a defined benefit plan with minimum guarantee starting in 2014 upon the University’s adoption of the PIC Interpretation on PAS 19 (Revised). However, considering that the present value of the obligation as determined by an independent actuary approximates the fair value of the plan assets, management opted not to recognize further the overfunding of the obligation for the years ended May 31, 2021, 2020 and 2019, in consideration of the Group’s constructive obligation to pay a fixed amount of contribution to the fund. An analysis of the defined benefit obligation of FEU, FECSI and EACCI following PIC Interpretation with respect to the defined benefit minimum guarantee under RA No. 7641 is presented below.
2021 2020 2019
Fair value of plan assets P 865,525,239 P 892,599,993 P 756,932,798 Present value of obligation ( 840,196,295) ( 842,784,116 ) ( 755,712,233) Excess of plan assets over retirement obligation P 25,328,944 P 49,815,877 P 1,220,565
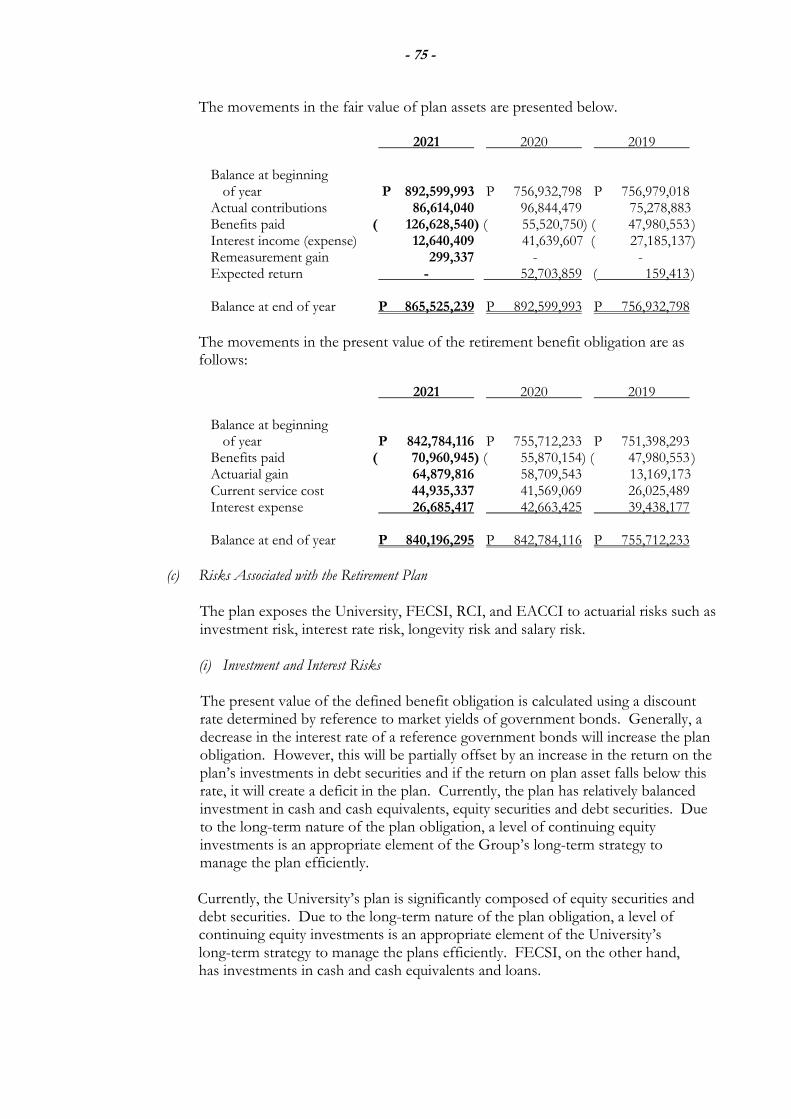
- 75 -
The movements in the fair value of plan assets are presented below. 2021 2020 2019 Balance at beginning of year P 892,599,993 P 756,932,798 P 756,979,018 Actual contributions 86,614,040 96,844,479 75,278,883 Benefits paid ( 126,628,540) ( 55,520,750) ( 47,980,553 ) Interest income (expense) 12,640,409 41,639,607 ( 27,185,137) Remeasurement gain 299,337 - - Expected return - 52,703,859 ( 159,413 ) Balance at end of year P 865,525,239 P 892,599,993 P 756,932,798
The movements in the present value of the retirement benefit obligation are as follows:
2021 2020 2019 Balance at beginning of year P 842,784,116 P 755,712,233 P 751,398,293 Benefits paid ( 70,960,945) ( 55,870,154) ( 47,980,553 ) Actuarial gain 64,879,816 58,709,543 13,169,173 Current service cost 44,935,337 41,569,069 26,025,489 Interest expense 26,685,417 42,663,425 39,438,177 Balance at end of year P 840,196,295 P 842,784,116 P 755,712,233
(c) Risks Associated with the Retirement Plan
The plan exposes the University, FECSI, RCI, and EACCI to actuarial risks such as investment risk, interest rate risk, longevity risk and salary risk.
(i) Investment and Interest Risks The present value of the defined benefit obligation is calculated using a discount rate determined by reference to market yields of government bonds. Generally, a decrease in the interest rate of a reference government bonds will increase the plan obligation. However, this will be partially offset by an increase in the return on the plan’s investments in debt securities and if the return on plan asset falls below this rate, it will create a deficit in the plan. Currently, the plan has relatively balanced investment in cash and cash equivalents, equity securities and debt securities. Due to the long-term nature of the plan obligation, a level of continuing equity investments is an appropriate element of the Group’s long-term strategy to manage the plan efficiently. Currently, the University’s plan is significantly composed of equity securities and debt securities. Due to the long-term nature of the plan obligation, a level of continuing equity investments is an appropriate element of the University’s long-term strategy to manage the plans efficiently. FECSI, on the other hand, has investments in cash and cash equivalents and loans.

- 76 -
(ii) Longevity and Salary Risks
The present value of the defined benefit obligation is calculated by reference to the best estimate of the mortality of the plan participants both during and after their employment, and to their future salaries. Consequently, increases in the life expectancy and salary of the plan participants will result in an increase in the plan obligation.
(d) Other Information
The information on the sensitivity analysis for certain significant actuarial assumptions, the asset-liability matching strategy of the University, FECSI and EACCI, and the timing and uncertainty of future cash flows related to the retirement plan are described below and in the succeeding pages.
(i) Sensitivity Analysis
The table shown below summarizes the effects of changes in the significant actuarial assumptions used in the determination of the defined benefit obligation as of:
Impact on Post-employment Benefit Obligation Increase/ Increase/ Change in (Decrease) in (Decrease) in Assumption Assumption Assumption May 31, 2021 RCI:
Discount rate +/-0.5% (P 1,635,842 ) P 1,787,573 Salary growth rate +/-1.0% 3,483,066 ( 2,989,382)
University: Discount rate +/-0.5% (P 263,694 ) P 359,029 Salary growth rate +/-1.0% 804,328 ( 481,181)
FECSI:
Discount rate +9.3%/11.1% (P 444,853 ) P 532,167 Salary growth rate +11.2%/-9.5% 537,443 ( 457,604 )
EACCI: Discount rate +/- 0.5% (P 19,793 ) P 28,837 Salary growth rate +4%/- 7.0% 296,543 ( 11,947,593 )
May 31, 2020 RCI:
Discount rate +/-0.5% (P 2,227,124 ) P 2,417,190 Salary growth rate +/-1.0% 4,671,546 ( 4,055,783 )
University: Discount rate +/-0.5% (P 402,278 ) P 566,798 Salary growth rate +/-1.0% 1,382,434 ( 730,879 )
FECSI:
Discount rate +/-1.0% (P 388,285 ) P 468,134 Salary growth rate +/-1.0% 478,443 ( 402,463 )
EACCI: Discount rate +/- 0.5% (P 522,416 ) P 849,669 Salary growth rate +/- 7.0% 2,200,865 ( 26,872,389 )

- 77 -
Impact on Post-employment Benefit Obligation Increase/ Increase/ Change in (Decrease) in (Decrease) in Assumption Assumption Assumption
May 31, 2019 RCI:
Discount rate +/-0.5% (P 1,767,052 ) P 1,645,369 Salary growth rate +/-1.0% 3,460,562 ( 3,041,321)
University: Discount rate +/-0.5% (P 486,352 ) P 646,334 Salary growth rate +/-1.0% 1,322,191 ( 861,361)
FECSI:
Discount rate +/-1.0% (P 367,333 ) P 442,623 Salary growth rate +/-1.0% 456,168 ( 383,387 )
The sensitivity analysis shown above is based on a change in an assumption while holding all other assumptions constant. This analysis may not be representative of the actual change in the defined benefit obligation as it is unlikely that the change in assumptions would occur in isolation of one another as some of the assumptions may be correlated. Furthermore, in presenting the above sensitivity analysis, the present value of the defined benefit obligation has been calculated using the projected unit credit method at the end of the reporting period, which is the same as that applied in calculating the defined benefit obligation recognized in the consolidated statements of financial position. The methods and types of assumptions used in preparing the sensitivity analysis did not change compared to the previous years.
(ii) Asset-liability Matching Strategies
To efficiently manage the retirement plan, the University through its Retirement Board, ensures that the investment positions are managed in accordance with its asset-liability matching strategy to achieve that long-term investments are in line with the obligations under the retirement scheme. This strategy aims to match the plan assets to the retirement obligations by investing in long-term fixed interest securities (i.e., government or corporate bonds) with maturities that match the benefit payments as they fall due and in the appropriate currency. The University actively monitors how the duration and the expected yield of the investments are matching the expected cash outflows arising from the retirement obligations. In view of this, investments are made in reasonably diversified portfolio, such that the failure of any single investment would not have a material impact on the overall level of assets.
There has been no change in the University’s strategies to manage its risks from previous periods.
Currently, EACCI and FECSI have no specific matching strategy between the plan assets and the plan liabilities.

- 78 -
(iii) Funding Arrangements and Expected Contributions
While there is no minimum funding requirement in the country for defined benefit plans, the size of the fund, bearing that it is significantly under a defined contribution regime, is also sufficient to cover the vested benefits of the higher between the RA No. 7641 or the Group’s retirement plan itself, when a significant number of employees are expected to retire in 13 to 20 years’ time.
The University expect to make contribution of P74.8 million to its plan during the next reporting period; FECSI and EACCI does not expect to make contributions to their plans during the next reporting period; while, RCI’s management is yet to determine when it shall establish a formal plan for its post-employment benefit obligation.
The maturity profile of RCI’s undiscounted expected benefit payments from the plan as of May 31 is shown below.
2021 2020 2019
Within one year P 8,616,949 P 8,672,753 P 9,896,529 More than one year to five years 14,137,839 19,895,300 17,648,623 More than five years to 10 years 18,653,370 24,611,035 29,547,720 More than 10 years to 15 years 35,922,605 35,982,283 34,686,504 More than 15 years to 20 years 23,611,028 36,977,745 35,173,132 More than 20 years 141,156,004 227,980,603 164,732,922 P 242,097,795 P 354,119,719 P 291,685,430
The weighted average duration of RCI’s defined benefit obligation at the end of the reporting period is 15 years.
The latest available audited statements of financial position of the University’s Fund, which comprised of both employer and employee share contributions, show the following as of December 31:
2021 2020 2019 Assets Cash and cash equivalents P 74,152,930 P 43,951,699 P 64,746,279 Receivables - net 67,520,237 58,835,006 50,056,975 Investment in debt securities: Government securities 320,422,304 235,406,954 201,987,635 Corporate bonds and other debt instruments 182,648,568 269,374,573 297,941,782 Investment in equity securities: Corporate shares 365,563,048 335,101,670 267,831,112 UITF 91,653,602 76,280,200 55,709,024 Others 106,932 160,961 173,746 1,102,067,621 1,019,111,063 938,446,553 Liabilities ( 37,223,416) ( 29,687,421) ( 24,577,883) Net Assets Available for Plan Benefits P 1,064,844,205 P 989,423,642 P 913,868,670
Shown in the succeeding page is the breakdown of the employer’s share in the University’s Fund’s net plan assets as to type of investments as of May 31, 2021, 2020 and 2019. These financial assets are maintained in trust funds under credible trustee-banks under control by the Fund through its Board of Governors.

- 79 -
2021 2020 2019 Cash and cash equivalents P 93,325,628 P 39,300,689 P 37,546,004 Domestic listed shares 272,326,305 200,610,035 283,751,057 Corporate bonds 94,395,345 138,953,332 128,563,323 Other securities and debt instruments 10,843,378 22,887,356 84,173,329 UITF 48,295,735 59,556,414 10,692,764 Government bonds 214,627,262 241,846,837 136,093,180 Fixed income loans - - 4,669,573 Others 50,950,693 64,320,982 23,706,082 P784,764,346 P 767,475,645 P 709,195,312
The breakdown of the Fund’s net plan assets, as shown above, is presented to show the composition of the plan assets used by the actuary in determining the net retirement obligation based on the minimum guarantee under RA 7641 as of May 31, 2021, 2020 and 2019.
22. INCOME TAXES
Under Philippine laws, the taxable income from operations related to school activities and passive investment income of proprietary educational institutions is subject to a tax of 10%. However, if 50% or more of the institution’s total gross income is from unrelated business activities, the regular corporate income tax (RCIT) of 30% will apply to the entire taxable income instead of the 10% preferential rate. Except FRC, which is subject to RCIT, all schools within the group are qualified to avail of the 10% preferential rate given their revenue profiles. In addition, all registered schools are not covered by the minimum corporate income tax (MCIT) provision of the 1997 Tax Code. In March 2021, RA No. 11534 or the Corporate Recovery and Tax Incentives for Enterprises Act (CREATE) has been passed into law which provides for a reduced tax rate of proprietary schools to 1% from the previous 10%, effective July 2021 until June 2023. On April 2021, however, the Bureau of Internal Revenue (BIR) issued Revenue Regulation (RR) No. 5 - 2021 excluding the private schools, which includes the University and its subsidiary-schools, from availing of the preferential tax and effectively increasing the tax rate to the 25% regular corporate income tax. In July 2021, the BIR issued the RR No. 14-2021 suspending certain provisions of RR No. 5-2021 including the 25% tax rate on private schools. Subsequently, House Bill No. 9913, a bill that seek to amend the National Internal Revenue Code (NIRC) to define the tax rates of proprietary schools to continue to allow them to avail of the preferential tax rate of 10%, and eventually the tax rate of 1% as provided by the CREATE law, has been filed and approved by the House of Representatives. Accordingly, the University and the subsidiary schools used the preferential tax rates of 10% and 1% for the computation of its income tax for the fiscal year ended May 31, 2021. Furthermore, FRC used the tax rates of 30% and 25% for the computation of RCIT for its fiscal year.

- 80 -
The major components of tax expense (income) reported in the consolidated statements of profit or loss are as follows:
2021 2020 2019
Current tax expense: RCIT at 25% P 13,773,998 P - P - Final tax at 20% and 15% 10,861,845 20,120,720 42,408,929 Special rate at 1% 10,821,044 - - Special rate at 10% 2,574,877 62,279,854 61,477,258 RCIT at 30% - 30,709,972 23,066,223 MCIT - - 1,776 38,031,764 113,110,546 126,954,186 Deferred tax income arising from the origination and reversal of temporary differences ( 1,055,472)( 11,538,091) ( 843,061)
P 36,976,292 P 101,572,455 P 126,111,125
A reconciliation of tax on pretax income computed at the applicable statutory rates to tax expense (income) reported in consolidated profit or loss is presented below:
2021 2020 2019 Tax on pretax income at 10 % (June 2020) and 1% (July 2020 to May 2021) P 23,280,561 P 78,456,400 P 93,458,285 Adjustments for income subjected to: Final tax 8,743,495 20,120,720 33,630,167 RCIT - 30,709,972 23,066,223 32,024,056 129,287,092 150,154,675 Tax effects of: Non-deductible expenses 6,703,183 11,091,941 111,971 Change in tax rate on deferred tax liabilities ( 2,887,397) - - Unrecognized deferred tax asset (DTA) on allowance for impairment 657,944 875,751 516,142 Unrecognized NOLCO ( 191,922) ( 2,093,027) 1,304,555 Non-taxable income - ( 36,755,676) ( 20,366,046) Excess of optional standard deduction (OSD) over itemized deductions - ( 9,920,465) ( 5,705,993) Unrecognized MCIT 1,776 Others 670,428 9,086,839 94,045 P 36,976,292 P 101,572,455 P 126,111,125

- 81 -
The net deferred tax assets and net deferred tax liabilities of the Group, as of May 31, 2021, 2020 and 2019, relates to the following:
Consolidated Statements of Financial Position Profit or Loss 2021 2020 2019 2021 2020 2019 Deferred tax assets: Change in tax rate P 18,642,111 P - P - P 18,642,111 P - P - Allowance for impairment losses on trade and other receivables – net 4,361,582 7,252,112 5,760,356 ( 2,890,530) ( 1,491,756 ) 557,209 NOLCO 1,776,437 1,909,467 5,528 ( 133,030) ( 1,903,939 ) 5,528 Unrealized fair value gains (losses) ( 805,154 ) 7,364,776 4,135,165 ( 8,169,930) ( 3,229,611 ) ( 309,634 ) Accrued rent expense 726,945 9,527,751 7,074,962 ( 5,536,725 ) ( 2,450,789 ) ( 1,378,431 ) Unrealized foreign currency gains (losses) 241,851 1,265,251 430,884 ( 1,023,400) ( 825,367 ) ( 3,601,192 ) Prepaid rent expense ( 226,546 ) - 920,622 ( 226,546 ) 920,622 - Allowance for impairment of investment - 47,616 504,691 ( 47,616) 457,075 - Accrued income - 1,281,128 360,506 ( 1,281,128) ( 920,622 ) - Post-employment benefit 39,095 885,137 6,480,407 ( 846,042) 5,595,270 51,187 Deferred tax assets – net P 24,756,321 P 29,533,238 P 25,673,121 Deferred tax expense (income) (P 1,512,836) (P 3,849,117 ) (P 4,675,333 ) Deferred tax liabilities: Accrued rent receivable ( P 21,517,237 ) (P 24,599,108 ) ( P 21,716,091) ( P 3,081,872 ) P 2,883,017 P 4,212,028 Revaluation surplus on land - ( 6,471,071 ) - ( 6,471,071 ) - Post-employment benefit 4,712,197 5,306,624 4,722,024 594,427 ( 248,173 ) 687,112 Unrealized foreign currency gains (losses) 1,329,586 4,068,705 ( 450,380 ) 2,739,119 ( 4,519,085 ) ( 462,625 ) Unearned rental income 358,689 147,536 813,874 ( 211,153 ) 666,338 ( 187,400 ) Allowance for impairment Accrual of expenses - 416,843 416,843 416,843 - ( 416,843 ) Deferred tax liabilities – net ( P 15,116,765 ) ( P 14,659,400 ) ( P 22,684,801 ) Deferred tax expense (income) P 457,364 (P 7,688,974 ) P 3,832,272 Deferred tax expense (income) – net (P 1,055,472) (P 11,538,091 ) P 843,061
RCI’s deferred tax expense amounting to P0.3 million and P0.3 million relates to the remeasurement of post-employment benefit plan during the years ended May 31, 2021 and 2020, (nil in 2019), respectively, and is recognized as a component of tax expense reported in the consolidated statement of comprehensive income. The net deferred tax assets of the University are not allowed to be offset against net deferred tax liabilities of other subsidiaries, or vice versa, for purposes of consolidation.
Presented below are the details of NOLCO of FECSI, FEUAI, Edustria and RCI.
Expired NOLCO Period Original Balance Applied in Remaining Valid Incurred Amount in 2020 Prior Years Balance Until May 31, 2021 P 60,237,929 P - P - P 60,237,929 2026 May 31, 2020 33,127,628 - - 33,127,628 2023 May 31, 2019 7,337,605 - - 7,337,605 2022 May 31, 2018 49,261,655 38,294,712 10,966,943 - 2021 P 149,964,817 P 38,294,712 P 10,966,943 P 100,703,162

- 82 -
The companies within the Group that were not entitled to avail of the preferential rate of 10% is subject to MCIT, which is computed at 2% of gross income as defined under the tax regulations, or RCIT, whichever is higher.
2021 2020 2019
Tax Base Tax Effect Tax Base Tax Effect Tax Base Tax Effect FEUAI – NOLCO P - P - P - P - P 23,238,638 P 2,323,864 MCIT 11,919 11,919 11,919 11,919 519,080 519,080 RCI: NOLCO P 8,470,660 P 84,707 P 34,493,676 P 3,449,368 P 48,019,928 P 4,801,993 Allowance for impairment 1,461,110 146,111 3,639,180 363,918 5,161,420 516,142 FECSI: NOLCO P 46,590,148 P 465,901 P 1,414,118 P 141,412 P 55,276 P 5,528 Allowance for impairment 906,965 90,697 710,177 71,018 5,528 5,528 Edustria: NOLCO P 45,642,354 P 456,424 P 17,680,549 - - -
No deferred tax assets were recognized by certain subsidiaries since management of the respective subsidiaries believes that no sufficient taxable profit will be realized against which deferred tax assets can be applied within the prescriptive period. RCI did not recognize the deferred tax assets pertaining to allowance for impairment of receivables amounting to P0.3 million and P2.5 million as at May 31, 2021 and 2020, respectively. Also, RCI did not recognize deferred tax assets on its NOLCO amounting to P0.1 million and P3.4 million as of May 31, 2021 and 2020, respectively. The management has yet to perceive whether the related tax benefit on NOLCO and allowance for impairment of receivables are realizable in the future.

- 83 -
23. RELATED PARTY TRANSACTIONS
The Group’s related parties include related parties under common management, key management personnel and others as described in Note 2.18. The following are the Group’s transactions with such related parties:
2021 2020 2019 Outstanding Outstanding Outstanding Amount of Receivable Amount of Receivable Amount of Receivable Notes Transaction (Payable) Transaction (Payable) Transaction (Payable) Terms Conditions Related Parties Under Common Management: Subscription of nonredeemable; preferred stock 23.1 P 62,000,00 P - P126,000,000 P 40,000,000 P112,500,000 P - non-controlling not applicable Advances to due and demandable; related parties 23.2 ( 20,121,600) 37,384,820 19,453,425 57,506,420 ( 9,229,702 ) 38,840,013 noninterest-bearing unsecured Advances due and demandable; from related party 23.2(c) 15,931,885 - ( 10,608,061) ( 15,931,885 ) ( 9,229,702 ) ( 5,323,824) noninterest-bearing unsecured Reimbursement of expenses 23.3 ( 15,792,810) 16,717,029 3,127,335 32,509,839 7,088,641 29,382,504 due and demandable; unsecured 23.4(a) payable within 30 days; Rental income 23.4(b) - - 19,222,576 13,122,403 19,951,790 10,643,063 noninterest-bearing unsecured due and demandable; Lease liabilities 23.4(c) ( 5,792,444) ( 8,276,801) ( 2,584,220 ) ( 14,069,245) - - interest bearing not applicable Right-of-use asset 23.4(c) ( 2,796,718) 7,924,033 ( 2,796,718) 10,720,751 - - not applicable not applicable payable within 30 days Rental expense 23.4(c) - - - - ( 3,135,996 ) ( 6,794,657) noninterest-bearing unsecured

- 84 -
2021 2020 2019 Amount of Outstanding Amount of Outstanding Amount of Outstanding Notes Transaction Receivable Transaction Receivable Transaction Receivable Terms Conditions Retirement Funds: 23.5 Retirement plan assets P - P 865,525,239 P - P 892,599,993 P - P756,932,798 not applicable not applicable Reimbursement due and demandable; of expenses 3,595,970 5,062,058 1,466,088 1,466,088 - - noninterest-bearing unsecured; not-impaired Others – Key management personnel compensation 23.6 116,417,150 - 136,661,205 - 145,341,733 - not applicable not applicable
In 2021, 2020 and 2019, the Group reviewed its receivables from related parties and were accordingly assessed for impairment. Except for those receivables provided with corresponding allowance, no impairment loss was necessary to be recognized for all other receivables in all years presented.

- 85 -
23.1 Subscription of Preferred Shares of Stock
(a) EACCI
During the years ended May 31, 2020 and 2019, East Asia Educational Foundation, Inc. (EAEF) entered into a subscription agreement for the purchase of 100,000 and 112,500 preferred shares with total consideration of P100.0 million and P112.5 million, respectively. Outstanding receivable arising from the transaction amounting P40.0 million as of May 31, 2020 is presented as part of Other advances to related parties under Trade and Other Receivables account (see Note 9), has been fully paid in 2021. (b) FEUA
During the year ended May 31, 2021 and 2020, EAEF, a related party under common management, entered into a subscription agreement for the purchase of 22,000 and 26,000 preferred shares of FEUA [see Note 24.5 (b)]. The total consideration paid by EAEF amounted to P22.0 million and P26.0 million for 2021 and 2020, respectively. There was no outstanding receivable arising from the transaction as the amount was fully paid by EAEF in the year of subscription.
23.2 Noninterest-bearing Advances (a) Advances of the University to a Related Party The University grants unsecured and noninterest-bearing advances, which are due and demandable to FEU Public Policy Foundation, Inc., related party under common management of the Group for working capital purposes. Summarized below are the outstanding receivables from these advances as of May 31, 2021, 2020 and 2019 recorded as part of Other advances to related parties under Trade and Other Receivables account in the consolidated statements of financial position (see Note 9):
2021 2020 2019 Balance at beginning of year P 2,779,304 P 1,673,060 P 1,185,000 Additional advances during the year 2,059,199 1,106,244 488,060 Balance at end of year P 4,838,503 P 2,779,304 P 1,673,060
As of May 31, 2021, management re-assessed that the entire amount of receivable is doubtful of collection, therefore, full allowance for impairment on these receivables were recognized. No allowance was provided in prior years.
- 85 -
- 86 -
(b) Advances between EACCI and EAEF
During the years ended May 31, 2021, 2020 and 2019, EACCI granted to EAEF cash advances for working capital requirements and other purposes. These advances are noninterest-bearing, unsecured and payable in cash upon demand. As of May 31, 2021, 2020 and 2019, outstanding advances to EAEF amounting to P29.1 million, P51.7 million and P34.1 million, respectively, are presented as part of Non-trade advances to related parties under the Trade and Other Receivables account in the consolidated statements of financial position (see Notes 9). No impairment loss is recognized by the Group on the receivables arising from advances. (c) Advances between EACCI and NREF
During the years ended May 31, 2021, 2020 and 2019, certain tuition and other school fees have been ceollected by NREF for the account of EAACI. Conversely, there were also collections received by EACCI for the account of NREF. These collections and remittances came about due to incorrect ID numbers used by the students. Subsequently, these collections were appropriately transmitted to the entities to which the related receivables are due. The receivable and payable accounts are unsecured, noninterest-bearing and payable in cash immediately upon demand. Outstanding payables amounting to P15.9 million and P5.3 million as of May 31, 2020 and 2019, respectively, (nil in 2021) are presented as part of Other advances from related parties under the Trade and Other Payables account in the consolidated statements of financial position (see Note 16).
(d) Advances of RCI to its Related Party RCI grants noninterest-bearing and unsecured advances to RCEE, Roosevelt College Scholarship Foundation and Roosevelt College Center for Teacher Education, related parties under common management, for working capital purposes. These advances are generally collectible in cash and are due upon demand or through offsetting arrangement. The outstanding balance from these transactions amounts to P3.6 million, P3.1 million and P2.3 million as of May 31, 2021, 2020 and 2019, respectively, are presented as part of Other advances to related parties under the |Trade and Other Receivables account in the consolidated statements of financial position (see Note 9). In 2021 and 2020, RCI’s management assessed that certain outstanding balances with the related parties were impaired; hence, impairment losses amounting to P0.2 million and P0.8 million, are recognized.
23.3 Reimbursement of Expenses
During the year ended May 31, 2021, 2020 and 2019, the University billed its related entities for the reimbursement of amounts it initially advanced to third party suppliers and service providers for certain expenses and various allocated expenses, at cost. These expenses pertain to those incurred in the normal course of operations of the University and its related entities, which include legal fees, various supplies, use of facilities, and salaries and benefits of seconded employees, among others.

- 87 -
2021 2020 2019
FEU Public Policy Center Foundation, Inc. P 12,190,775 P 9,613,117 P 5,615,114 NREF 4,526,254 18,004,707 18,875,375 EAEFI - 4,892,015 4,892,015
P 16,717,029 P 32,509,839 P 29,382,504
23.4 Leases
(a) Lease of Certain Floors to EAEF Outstanding receivables, arising from prior years’ lease of certain floors by the University and EACCI to EAEF, amounted to P2.9 million as of May 31, 2020 and 2019 (nil in 2021), and is presented as part of Rental receivable under Trade and Other Receivables account in the consolidated statements of financial position (see Note 9).
(b) Lease of Buildings to Nicanor Reyes Educational Foundation (NREF)
FRC leased out certain buildings to NREF with new effectivity January 31, 2013 to December 31, 2023 for an annual rental fee of P1.2 million or 10% of NREF’s annual gross income, whichever is higher. In January 2020, the FRC entered into an amended lease agreement with EACCI to cover the lease of certain buildings within campus premises collectively referred to as FEU Diliman Campus. The amended lease term is from February 1, 2020 to January 31, 2021 for an annual rental fee of 10% of EACCI’s annual gross income from tertiary and senior high school departments and 5% from basic education and junior high school department, but no lower than P25.0 million.
Total rental income of FRC from NREF amounted to P19.2 million and P20.0 million for the years ended May 31, 2020 and 2019 (nil in 2021), respectively, which is recorded as part of Rental under Revenues in the consolidated statements of profit or loss. Outstanding receivables from this transaction amount to P10.2 million and P7.7 million as of May 31, 2020 and 2019 (nil in 2021), respectively, are presented as part of Rental receivable under the Trade and Other Receivables account in the consolidated statements of financial position (see Note 9). No impairment loss is recognized by the Group on this receivable from NREF.
(c) Lease of Building from NREF
The University had lease agreement with NREF for its lease of facilities. The lease agreements are long-term and renewable.

- 88 -
Upon adoption of PFRS 16, the Group, as a lessee, recognized right-of-use asset and lease liabilities as at June 1, 2019. Amortization of the right-of-use asset arising from these transactions amounting to P2.8 million is presented as part of Depreciation and amortization under Cost and Operating Expenses in the 2021 and 2020 consolidated statements of profit or loss. Total interest expense on lease liabilities amounting to P0.4 million and P0.6 million for the years ended May 31, 2021 and 2020, respectively, is presented as part of Interest expense on lease liabilities under Finance Costs in the consolidated statements of profit or loss. The outstanding balances arising from these transactions as at May 31, 2021 and 2020, are presented as part of right-of-use asset under Property and Equipment, and Lease Liabilities (current portion under Trade and Other Payable) in the consolidated statements of financial position. Under PAS 17, total rental expense arising from the lease charged to operations amounting to P3.1 million for the year ended May 31, 2019, is presented as part of Rental under Operating Expenses in 2019 consolidated statement of profit or loss (see Note 19). Outstanding payable arising from the transaction amounting to P6.8 million as at May 31, 2019, is presented as part of Accrued expenses under the Trade and Other Payables account in the consolidated statements of financial position (see Note 16).
23.5 Retirement Funds
The University, FECSI and EACCI’s retirement funds are in the form of trustee-banks managed accounts. The fair value of the Group’s retirement plan assets amounted to P865.5 million in 2021, P892.6 million in 2020 and P757.0 million in 2019 [see Note 21(b)]. The University, FECSI and EACCI have no transactions with the retirement plans other than contributions and benefit payments in all periods presented. None of the retirement plan assets are invested in or provided to the University, EACCI or FECSI, their related parties, and to their officers in the form of advances or loans.
The retirement funds neither provide any guarantee nor surety for any obligation of the University, EACCI and FECSI. In January 2020, the FRC entered into an amended lease agreement with EACCI to cover the lease of certain buildings within campus premises collectively referred to as FEU Diliman Campus. The amended lease term is from February 1, 2020 to January 31, 2021 for an annual rental fee of 10% of EACCI’s annual gross income from tertiary and senior high school departments and 5% from basic education and junior high school department, but no lower than P25.0 million

- 89 -
23.6 Key Management Personnel Compensation
Total remunerations of the Group’s key management personnel for the years ended May 31, 2021, 2020 and 2019, which are presented as part of Employee benefits under Operating Expenses in the consolidated statements of profit or loss (see Note 21), are as follows:
2021 2020 2019
Short-term benefits P 101,367,997 P 123,069,612 P 131,260,806 Post-employment benefits 15,049,153 13,591,593 14,080,927
P 116,417,150 P 136,661,205 P 145,341,733
23.7 Financial Guaranty for Subsidiaries’ Loans In March 2017 and January 2018, the BOT approved that for and in consideration of the loan or credit facilities obtained by any subsidiary of the University, in which the University owns at least 75% of the outstanding voting capital stock of such subsidiary, from a certain local commercial bank, the University gives its full consent and authority to act as surety up to P500 million for the subsidiary’s obligations arising from any loan or availments from any credit facilities granted by the said local bank in favor of the subsidiary, as well as any renewals, increases, extensions of existing obligations obtained by or which may hereafter be obtained by the subsidiary from the local bank, whether direct or indirect, principal or secondary. As of May 31, 2021, 2020 and 2019, RCI has availed a loan amounting to P500.0 million, P400.0 million and P150.0 million, respectively, from the said local bank (see Note 17).
23.8 Others
In July 2014, the FRC’s declaration of stock dividend resulted in 291 fractional shares amounting to P0.3 million, which the FRC also opted to treat as treasury shares.
On October 8, 2019, the FRC’s BOD approved the proposal to increase its par value from P1,000 to P10,000, resulting to fractional shares for stockholders owning less than ten shares. Outstanding liability amounting to P27.1 million and P28.5 million as of May 31, 2021 and 2020, (nil in 2019), respectively, are presented as part of Due to related parties under Trade and Other Payables account in the consolidated statements of financial position (see Note 16).
24. EQUITY
24.1 Capital Stock
The University’s capital stock consists of common shares with details below.
2021 2020 2019 Authorized number of shares –
P100 par value per share 50,000,000 50,000,000 20,000,000 Total shares issued 24,093,094 16,514,354 16,514,354

- 90 -
On September 10, 2019 the BOT approved the increase of the University’s authorized capital stock. The same was ratified by the stockholders on October 19, 2019, and approved by the SEC on March 19, 2020.
In line with the increase in authorized capital stock of the University, the BOT also declared, which was subsequently ratified by the shareholders, 46% stock dividends amounting to P755.4 million. The approval for the issuance of such dividend shares was granted by the SEC on June 2, 2020, with distribution date set on June 18, 2020 (see Note 24.2). As of May 31, 2020, pending the approval from the SEC, the value of the stock dividends has been recognized and presented as Stock Dividends Distributable in the 2020 consolidated statement of financial position. Below is the ownership structure of the University’s outstanding shares as of May 31, 2021, 2020 and 2019.
2021 2020 2019
Number of shares held by related parties 15,959,877 10,840,053 10,788,176 Number of shares held by the public 8,016,071 5,582,302 5,637,180 Total shares issued and Outstanding* 23,975,948 16,422,355 16,425,356
*Net of those held in Treasury (see Note 24.2)
As of May 31, 2021, 2020 and 2019, the public owns 33.43%, 33.99% and 34.32%, respectively, of the University’s listed shares. As of May 31, 2021, there are 1,509 holders of the listed common shares owning at least one share.
All shares of the University are listed on the PSE, there had been no follow-on listing since the initial listing in 1986 at an offer price of P100. The closing price of the University’s listed shares was P570, P830 and P890 per share as of May 31, 2021, 2020 and 2019, respectively.
24.2 Treasury Stock
This account includes the University’s common shares held and acquired by FRC in various dates during the respective reporting periods. The changes in market values of these shares, recognized as fair value gains or losses by FRC, were reclassified to treasury stocks, as presented in the consolidated statements of changes in equity. As of May 31, 2021, 2020 and 2019, it consists of 117,146, 91,999 and 88,998 shares, respectively.
A portion of the University’s retained earnings is restricted from dividend declaration up to the cost of treasury stocks, excluding the amount acquired and held by FRC as this is considered as a cross-holding as of the end of the reporting period.

- 91 -
24.3 Revaluation Reserves The components and reconciliation of items of other comprehensive income (loss) presented in the consolidated statements of changes in equity at their aggregate amount under Revaluation Reserves account, are shown below.
Financial Retirement Assets Benefit at FVOCI Obligation Total
Balance as of June 1, 2020 P 25,031,515 ( P 6,990,340 ) P 18,041,175 Remeasurements of retirement benefit obligation - 4,510,596 4,510,596 Fair value gains on financial assets at FVOCI 20,880,938 - 20,880,938 Tax effect ( 482,316 ) 37,964 ( 444,352 ) Other comprehensive income 20,398,622 4,548,560 24,947,182
Balance as of May 31, 2021 P 45,430,137 ( P 2,441,780) P 42,988,357 Balance as of June 1, 2019 P 2,638,168 P 626,694 P 3,264,862 Remeasurements of retirement benefit obligation - ( 8,463,371 ) ( 8,463,371 ) Fair value gains on financial assets at FVOCI 24,881,497 - 24,881,497 Tax effect ( 2,488,150 ) 846,337 ( 1,641,813 ) Other comprehensive income 22,393,347 ( 7,617,034 ) 14,776,313
Balance as of May 31, 2020 P 25,031,515 ( P 6,990,340 ) P 18,041,175 Balance as of June 1, 2018 ( P 1,319,471 ) P 8,328,838 P 7,009,367 Remeasurements of retirement benefit obligation - ( 8,557,937 ) ( 8,557,937 ) Fair value gains on financial assets at FVOCI 4,397,376 - 4,397,376 Tax effect ( 439,737 ) 855,793 ( 416,056 ) Other comprehensive income 3,957,639 ( 7,702,144 ) ( 3,744,505 )
Balance as of May 31, 2019 P 2,638,168 P 626,694 P 3,264,862
24.4 Retained Earnings Significant transactions affecting Retained Earnings are shown below.
(a) Appropriation of Retained Earnings
As of May 31, 2021, 2020 and 2019, the University’s Appropriated Retained Earnings consists of appropriations for:
2021 2020 2019 Property and investment P 493,000,000 P 1,448,000,000 P 1,631,000,000 acquisition Purchase of equipment and improvements 257,000,000 167,000,000 92,000,000 Contingencies 90,000,000 180,000,000 190,000,000 Treasury stock 3,733,100 3,733,100 3,733,100 Expansion of facilities - 111,000,000 164,000,000 General retirement - - 90,000,000 P 844,733,100 P 1,909,733,100 P 2,170,733,100

- 92 -
The changes in Appropriated Retained Earnings are shown below.
2021 2020 2019 Balance at beginning of year P 1,909,733,100 P 2,170,733,100 P 2,843,733,100 Reversal of appropriations ( 1,155,500,000) ( 336,000,000) ( 670,000,000) Appropriations 90,000,000 75,000,000 - Balance at end of year P 844,233,100 P 1,909,733,100 P 2,170,733,100
(b) Dividend Declaration
The University’s BOT approved the following dividend declarations during the years ended:
Date of Declaration Record Payment/Issuance Amount
May 31, 2021 Cash dividend of P3 per share November 17, 2020 December 3, 2020 December 16, 2020 P 71,826,401 Cash dividend of P5 per share February 16, 2021 March 3, 2021 March 15, 2021 119,710,668
P 191,537,069 May 31, 2020
Cash dividend of P10 per share September 10, 2019 September 24, 2019 October 9, 2019 P 164,505,650 Cash dividend of P10 per share February 18, 2020 March 4, 2020 March 18, 2020 164,505,650 Stock dividend of 46% September 10, 2019 October 19, 2019 June 18, 2020 755,431,300
P 1,084,442,600
May 31, 2019 Cash dividend of P8 per share September 18, 2018 October 2, 2018 October 18, 2018 P 131,405,532 Cash dividend of P8 per share February 19, 2019 March 6, 2019 March 20, 2019 131,400,412
P 262,805,944
Unclaimed checks related to dividends declared as of May 31, 2021, 2020 and 2019 are presented as Dividends payable under the Trade and Other Payables account in the consolidated statements of financial position (see Note 18). 24.5 Subsidiaries with Material Non-controlling Interest
(a) FRC
The University holds 38.18%, 38.04% and 37.52% interest in FRC as of May 31, 2021, 2020 and 2019, respectively. Management considers that the University has de facto control over FRC even though it holds less than 50% of the voting shares of stock of FRC, because it is exposed or has right to variable returns through its power over FRC [see Notes 1.1 and 3.1(i)]. The accumulated NCI of FRC amounted to P785.5 million, P801.9 million and P814.7 million as of May 31, 2021, 2021 and 2019, respectively.

- 93 -
A summary of financial information of FRC as of and for the years ended May 31, 2021, 2020 and 2019 before intragroup eliminations are shown below.
2021 2020 2019 Current assets P 361,377,412 P 321,925,382 P 302,698,009 Non-current assets 1,139,837,024 1,132,066,986 1,077,932,619 Current liabilities 39,334,609 53,845,991 24,316,472 Non-current liabilites 38,835,480 28,610,615 28,311,279 Total equity 1,423,044,347 1,371,535,762 1,328,002,877 Total revenue 118,487,190 198,056,890 151,811,691 Net profit for the year 44,182,487 99,498,571 88,596,837 Other comprehensive income (loss) for the year 7,326,098 ( 3,936,554 ) ( 1,694,419 ) Total comprehensive income for the year 51,508,585 95,562,017 80,735210 Net cash from (used in) operating activities 77,583,687 ( 4,346,457) 93,631,571 Net cash from (used in)
investing activities ( 79,202,878) 7,039,282 ( 72,201,069 ) Net cash used in financing activities ( 274,729) ( 23,579,708) ( 13,502,726 )
( P 1,893,920) ( P 20,886,883) P 7,927,776
(b) EACCI and FEUAI
Prior to 2017, EACCI issued its newly authorized preferred shares to EAEF, a related party under common management. In 2020 and 2019, EACCI issued additional authorized preferred shares to NREF, a related party under common management (see Note 23.1). Total cost of preferred shares issued and outstanding amounts to P1.2 billion as of May 31, 2021 and 2020 and P1.1 billion as of May 31, 2019.
In 2021, 2020 and 2019, FEUAI also issued its newly authorized preferred shares to EAEF (see Note 23.1). Total cost of preferred shares issued and outstanding amounts to P750.0 million, P728.0 million and P702.0 million as of May 31, 2021, 2020 and 2019, respectively.
Both non-controlling interests in EACCI and FEUAI relate to non-voting shares.
EACCI and FEUAI’s preferred shares have the following features:
(a) Holders of the preferred stock have no pre-emptive right to subscribe to any or all issues or other disposition of shares of common stock or preferred stock of EACCI or FEUAI, including treasury stock, if any;
(b) Subject to availability of retained earnings and sufficient cash as may be
determined by EACCI’s BOT or FEUAI’s BOD, holders of the preferred stock are entitled to receive, out of unrestricted retained earnings of the EACCI or FEUAI, non-cumulative dividends at the rate of 3% per annum based on the issue value of each share, payable annually on such date as may be determined by the EACCI’s BOT or FEUAI’s BOD from time to time;
(c) Preferred stock shall be non-voting (except in instances specifically provided by law) and non-participating as to the payment of dividends;

- 94 -
(d) Preferred stock may be redeemed at the option of the issuer regardless of existence of unrestricted retained earnings at an issue price equal to the issue value and under terms and conditions as determined by the EACCI’s BOT or FEUAI’s BOD; and,
(e) In the event of any voluntary or involuntary liquidation, dissolution, distribution of assets or winding up of EACCI or FEUAI’s operations, the holders of preferred stock shall have preference and priority as to the net assets of EACCI or FEUAI or proceeds thereof over the holders of common stock.
During the years ended May 31, 2021, 2020 and 2019, the BOT of EACCI declared cash dividend to all of their stockholders. Accordingly, EAEF received P30.0 million, P27.5 million and P27.5 million from each of the said declarations in 2021, 2020 and 2019, respectively.
A summary of financial information of FEUAI and EACCI as of and for the years ended May 31, 2021, 2020 and 2019, before intragroup eliminations are shown below and in the succeeding page (in thousands).
EACCI FEUAI
May 31, 2021 Current assets P 1,312,347 P 87,042 Non-current assets 2,217,893 1,832,570 Current liabilities 270,402 193,466 Non-current liabilities 212,284 162,000 Total equity 3,047,553 1,564,146 Total revenue 898,858 247,978 Net income for the year 443,335 24,730 Other comprehensive income for the year 23,716 - Total comprehensive income for the year 467,051 24,730
Net cash from operating activities 523,641 93,395 Net cash used in investing activities ( 1,203,919 ) ( 13,591 ) Net cash used in financing activities ( 162,689 ) ( 87,691 )
(P 842,967 ) (P 7,887 ) May 31, 2020
Current assets P 1,860,273 P 112,785 Non-current assets 1,384,587 1,923,861 Current liabilities 288,943 312,231 Non-current liabilities 553,883 207,000 Total equity 2,690,977 1,517,414 Total revenue 758,062 288,003 Net income for the year 259,128 58,519 Other comprehensive income for the year 2,065 - Total comprehensive income for the year 261,193 58,519
Net cash from operating activities 330,366 123,801 Net cash used in investing activities ( 28,493 ) ( 141,603 ) Net cash used in financing activities ( 22,010 ) ( 67,000 )
P 279,863 ( P 84,802 )

- 95 -
EACCI FEUAI May 31, 2019
Current assets P 1,262,321 P 195,763 Non-current assets 1,455,043 1,854,664 Current liabilities 219,988 317,608 Non-current liabilities 93 300,000 Total equity 2,497,283 1,432,819 Total revenue 908,383 132,716 Net income (loss) for the year 416,511 ( 2,571 ) Other comprehensive income for the year 11,206 - Total comprehensive income (loss) for the year 427,717 ( 2,571 )
Net cash from (used in) operating activities 1,250,030 ( 24,676 ) Net cash used in investing activities ( 231,428 ) ( 364,133 ) Net cash from (used in) financing activities ( 303,340 ) 473,000 P 715,262 P 84,191
(c) Edustria
Upon incorporation of Edustria, the Parent Company subscribed to 225.0 million shares, representing 51% of the total issued and outstanding shares of Edustria. The NCI of Edustria, amounting to P171.5 million is presented as part of Non-controlling Interest in the 2021 and 2020 consolidated statements of financial position. A summary of financial information of Edustria as of for the years ended May 31, 2021 and 2020 before intragroup eliminations are shown below.
2021 2020
Current assets P 239,091,800 P 282,581,121 Non-current assets 80,842,303 85,946,223 Current liabilities 9,487,814 8,760.304 Non-current liabilities 19,025,860 26,230,652 Total equity 291,420,429 333,536,388 Total revenue 5,334,581 - Net loss for the year ( 25,652,347 ) ( 16,463,612 ) Other comprehensive income for the year - - Total comprehensive loss for the year ( 25,652,347 ) ( 16,463,612 )
Net cash used in operating activities ( 10,376,559 ) ( 14,024,851 ) Net cash used in investing activities ( 10,296,251 ) ( 50,935,849 ) Net cash from (used in) financing activities ( 6,778,913 ) 347,218,907
( P 27,451,723 ) P 282,258,207

- 96 -
25. EARNINGS PER SHARE
EPS amounts were computed as follows:
2021 2020 2019
Net profit attributable to owners of the parent company P 965,682,303 P 621,398,818 P 753,271,625 Divided by weighted average number of shares outstanding, net of treasury stock of 117,146, 91,999 and 88,998 as of May 31, 2021, 2020 and 2019, respectively 23,975,948 23,977,387 23,978,859*
Basic and diluted EPS P 40.28 P 25.92 P 31.41
*Restated after giving retrospective effect on the stock dividend declared on September 10, 2019.
The weighted average number of shares outstanding as of May 31, 2020 is computed below.
Weighted Number of Months Number Shares Outstanding of Shares
Balance at beginning of year 16,425,356 12 197,104,272 Adjustment for stock dividends distributable 7,553,593 12 90,643,116 Purchase of treasury stock during the period – August 2019 ( 1,249 ) 10 ( 12,490 ) February 2020 ( 1,000 ) 4 ( 4,000 ) March 2020 ( 752 ) 3 ( 2,256 ) Balance at end of period 23,975,948 287,728,642 Divided by total months during the year 12 Weighted average number of shares outstanding as of May 31, 2020 23,977,387
As of May 31, 2021, the weighted average and actual number of outstanding shares is the same.
The University has no potential dilutive common shares as of May 31, 2021, 2020 and 2019; accordingly, the diluted EPS is the same as the basic EPS in all the years presented.

- 97 -
26. COMMITMENTS AND CONTINGENCIES The following are the significant commitments and contingencies involving the Group:
26.1 Capital Commitments
As of May 31, 2021, 2020 and 2019, FRC has commitments of about P66.0 million, P84.1 million and P116.6 million, respectively, for the condominium units acquired at pre-selling stage that are currently under construction.
26.2 Operating Lease Commitments
(a) Group as Lessor As discussed in Note 23.4(a), FRC lease out certain buildings to EAEF and NREF for varying periods. FRC also lease out certain land and buildings to several non-related parties for a period of one to ten years. FRC also receives customer and security deposits relevant to its leasing activities as a lessor which is recognized under Other Non-current Liabilities in consolidated statements of financial position.
Future minimum rental receivables, excluding contingent rental, under these operating leases are shown below.
2021 2020 2019 Within one year P 4,497,842 P 12,880,020 P 23,123,123 After one year but not more than five years 8,770,915 22,528,952 42,890,129 More than five years - 808,245 7,568,490 P 13,268,757 P 36,217,216 P 73,581,742
(b) Group as Lessee The Group is a lessee under operating lease agreements covering rentals of event venues, transportation vehicles and small items of equipment used for various students’ and employees’ activities.
The future minimum rentals payable under these non-cancellable operating leases as of May 31, 2019 are as follows:
Within one year P 3,135,996 After one year but not more than five years 12,021,315 P 15,157,311
26.3 Other Provisions and Contingencies
As of May 31, 2021, the University and its subsidiaries has no record of any litigation not being contested or any that the University and its entities has accepted any liability in relation to labor cases and other civil cases.

- 98 -
Further, the previous tax case and its attendant omnibus motion filed by the University with the Court of Tax Appeals was withdrawn on March 15, 2021 to fully satisfy the requirements of the tax amnesty availed by the University in December 2019. There are other contingencies that arise in the normal course of business that are not recognized in the Group’s financial statements. Management believes that losses, if any, arising from these commitments and contingencies will not materially affect its financial statements, however, the University opted to appropriate portion of its retained earnings to cover for such contingencies.
The Group has entered into transactions which resulted to obligations that will probably result to an outflow of economic resources. Accordingly, the management has recognized the probable losses as Provisions in its consolidated statements of financial position. However, as allowed by relevant accounting standards, the Group did not disclose the nature and details of its provisions because it may prejudice the interest and position currently being taken by the Group.
27. CAPITAL MANAGEMENT OBJECTIVES, POLICIES AND PROCEDURES
The Group aims to provide returns on equity to shareholders while managing operational and strategic objectives. The Group manages its capital structure and makes adjustments to it, in the light of changes in economic conditions. To maintain or adjust capital structure, the Group may adjust the dividend payment to shareholders, return capital to shareholders, issue new shares or obtain debt financing.
The Group defines capital as paid-in capital stock and retained earnings, both appropriated and unappropriated. Other components of equity such as treasury stock and revaluation reserves are excluded from capital for purposes of capital management. The BOT has overall responsibility for monitoring of capital in proportion to risks. Profiles for capital ratios are set in the light of changes in the Group’s external environment and the risks underlying the Group’s business, operation and industry.
The University monitors capital on the basis of debt-to-equity ratio, which is calculated as total liabilities excluding deferred revenues divided by total adjusted equity (comprised of capital stock, stock dividends distributable and retained earnings) attributable to owners of the parent company. Capital for the reporting periods under review is summarized below.
2021 2020 2019
Total adjusted liabilities P 4,122,563,634 P 4,674,024,896 P 3,953,514,389 Total adjusted equity attributable to owners of the parent company 8,437,566,218 7,663,420,984 7,371,033,466
Debt-to-equity ratio 0.49 : 1.00 0.61 : 1.00 0.54 : 1.00
The Group’s goal in capital management is to maintain a lower liability compared with its adjusted equity or debt-to-equity structure ratio of not more than 1.00 : 1.00. This is in line with the Group’s bank covenants related to its borrowings, which requires the Group to maintain debt-to-equity ratio of not more than 2.00 : 1.00 and debt service coverage ratio of at least 1.2x.

- 99 -
The Group has complied with its covenant obligations, including maintaining the required debt-to-equity ratio and debt service coverage ratio for all the years presented
There was no significant change in the Group’s approach to capital management during the year.
28. RECONCILIATION OF LIABILITIES ARISING FROM FINANCING ACTIVITIES
Presented below is the reconciliation of liabilities arising from various financing activities in fiscal year 2021, 2020 and 2019.
Interest-bearing Lease Dividends Accrued Loans Liabilities Payable Interest (see Note 17) (see Note 13) (see Note 16) (see Note 17) Total
Balance at June 1, 2020 P 2,605,238,096 P 46,572,571 P 223,026,631 P 26,915,531 P 2,901,752,829 Cash flows from financing activities: Repayment of loans ( 1,275,714,286 ) - - - ( 1,275,714,286 ) Repayment of lease liabilities - ( 12,061,585 ) - - ( 12,061,585 ) Proceeds from additional loans 1,142,857,143 - - - 1,142,857,143 Dividends paid - - ( 239,359,822 ) - ( 239,359,822 ) Interest paid - ( 2,779,702 ) - ( 60,023,027 ) ( 62,802,729 ) Non-cash financing activities: Dividend declaration - - 191,537,069 - 191,537,069 Interest amortization in lease liabilities - 2,779,702 - - 2,779,702 Accrual of interest - - - 32,916,677 31,916,677 Capitalized borrowing cost - - - 6,772,700 6,772,700
Balance at May 31, 2021 P 2,472,380,953 P 34,510,986 P 175,203,878 P 6,581,881 P 2,688,677,698
Balance at June 1, 2019 P 2,358,571,429 P - P 215,371,368 P 12,515,531 P 2,586,458,328 Effect of adoption of PFRS 16 - 13,517,469 - - 13,517,469 Cash flows from financing activities: Repayment of loans ( 948,333,333 ) - - - ( 948,333,333 ) Repayment of lease liabilities - ( 1,597,281 ) - - ( 1,597,281 ) Proceeds from additional loans 1,195,000,000 - - - 1,195,000,000 Dividends paid - - ( 323,553,105 ) - ( 323,553,105 ) Interest paid - ( 1,183,812 ) - ( 114,503,438 ) ( 115,687,250 ) Non-cash financing activities: Dividend declaration - - 331,208,368 - 331,208,368 Additional lease liabilities - 34,652,383 - - 34,652,383 Interest amortization in lease liabilities - 1,183,812 - - 1,183,812 Accrual of interest - - - 111,894,250 111,894,250 Capitalized borrowing cost - - - 17,009,188 17,009,188
Balance at May 31, 2020 P 2,605,238,096 P 46,572,571 P 223,026,631 P 26,915,531 P 2,901,752,829
Interest-bearing Lease Dividends Accrued Loans Liabilities Payable Interest (see Note 17) (see Note 13) (see Note 16) (see Note 17) Total
Balance at June 1, 2018 P 2,517,142,858 P - P 201,661,265 P 9,615,531 P 2,728,419,654 Cash flows from financing activities: Proceeds from additional loans 270,000,000 - - - 270,000,000 Repayment of loans ( 428,571,429 ) - - - ( 428,571,429 ) Dividends paid - - ( 249,095,841 ) - ( 249,095,841 ) Interest paid - - - ( 125,827,490 ) ( 125,827,490 ) Non-cash financing activities: Dividend declaration - - 262,805,944 - 262,805,944 Accrual of interest - - - 95,072,981 95,072,981 Capitalized borrowing cost - - - 33,654,509 33,654,509
Balance at May 31, 2019 P 2,358,571,429 P - P 215,371,368 P 12,515,531 P 2,586,458,328

Independent Auditor’s Report on the SEC Supplementary Schedules Filed Separately
from the Basic Financial Statements
Supplementary Schedules to Consolidated Financial Statements (Form 17-A, Item 7)
Page
Schedule A Financial assets 2
Schedule B Amounts Receivable from Directors, Officers, Employees, Related Parties
and Principal Stockholders (Other Than Related Parties) 9
Schedule C Amounts Receivable from Related Parties Which are Eliminated During
the Consolidation of Financial Statements 18
Schedule D Intangible Assets / Other Assets 19
Schedule E Long-term Debt 20
Schedule F Indebtedness to Related Parties (Long-term Loans from Related Companies) 21
Schedule G Guarantees of Securities of Other Issuers N/A
Schedule H Capital Stock 22
Other Required Information
Reconciliation of Retained Earnings Available for Dividend Declaration 23
Map Showing the Relationships Between and Among the University and Its Related Parties 24
Financial Indicators 25
THE FAR EASTERN UNIVERSITY, INCORPORATED AND SUBSIDIARIES
INDEX TO SUPPLEMENTAL SCHEDULES
MAY 31, 2021

Punongbayan & Araullo
20th Floor, Tower 1
The Enterprise Center
6766 Ayala Avenue
1200 Makati City
Philippines
T +63 2 8988 2288
a
Certified Public Accountants
Punongbayan & Araullo (P&A) is the Philippine member firm of Grant Thornton International Ltd.
Offices in Cavite, Cebu, Davao
BOA/ PRC Cert of Reg. No. 0002
SEC Accreditation No. 0002
grantthornton.com.ph
Report of Independent Auditors
to Accompany Supplementary
Information Required by the
Securities and Exchange
Commission Filed Separately
from the Basic Consolidated
Financial Statements The Board of Trustees and the Stockholders Far Eastern University, Incorporated and Subsidiaries
Nicanor Reyes Street,
Sampaloc, Manila We have audited, in accordance with Philippine Standards on Auditing, the consolidated financial statements of Far Eastern University, Incorporated and subsidiaries (the Group) for the year ended May 31, 2021, on which we have rendered our report dated August 17, 2021. Our audit was made for the purpose of forming an opinion on the basic consolidated financial statements taken as a whole. The applicable supplementary information (see List of Supplementary Information) is presented for purposes of additional analysis in compliance with the requirements of the Revised Securities Regulation Code Rule 68, and is not a required part of the basic consolidated financial statements prepared in accordance with Philippine Financial Reporting Standards. Such supplementary information is the responsibility of the Group’s management. The supplementary information has been subjected to the auditing procedures applied in the audit of the basic consolidated financial statements and, in our opinion, is fairly stated in all material respects in relation to the basic consolidated financial statements taken as a whole.
PUNONGBAYAN & ARAULLO
By: Mailene Sigue-Bisnar Partner
CPA Reg. No. 0090230 TIN 120-319-128 PTR No. 853322, January 4, 2021, Makati City SEC Group A Accreditation Partner - No. 0396-AR-3 (until Oct. 1, 2021) Firm - No. 0002 (until Dec. 31, 2024) BIR AN 08-002511-020-2020 (until Dec. 21, 2023) Firm’s BOA/PRC Cert. of Reg. No. 0002 (until Aug. 27, 2024)
August 17, 2021
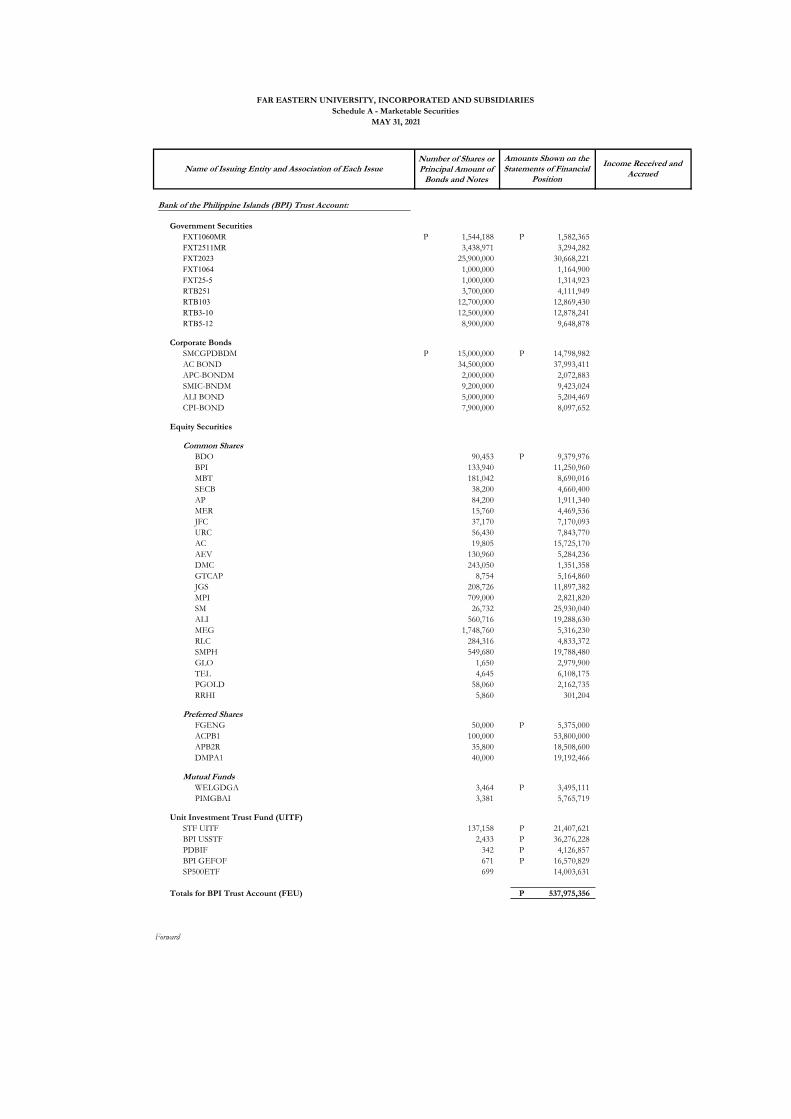
Number of Shares or Principal Amount of Bonds and Notes
Government Securities
FXT1060MR 1,544,188 P 1,582,365 P FXT2511MR 3,438,971 3,294,282 FXT2023 25,900,000 30,668,221 FXT1064 1,000,000 1,164,900 FXT25-5 1,000,000 1,314,923 RTB251 3,700,000 4,111,949 RTB103 12,700,000 12,869,430 RTB3-10 12,500,000 12,878,241 RTB5-12 8,900,000 9,648,878
Corporate Bonds
SMCGPDBDM 15,000,000 P 14,798,982 P AC BOND 34,500,000 37,993,411 APC-BONDM 2,000,000 2,072,883 SMIC-BNDM 9,200,000 9,423,024 ALI BOND 5,000,000 5,204,469 CPI-BOND 7,900,000 8,097,652
Equity Securities
Common Shares
BDO 90,453 9,379,976 P BPI 133,940 11,250,960 MBT 181,042 8,690,016 SECB 38,200 4,660,400 AP 84,200 1,911,340 MER 15,760 4,469,536 JFC 37,170 7,170,093 URC 56,430 7,843,770 AC 19,805 15,725,170 AEV 130,960 5,284,236 DMC 243,050 1,351,358 GTCAP 8,754 5,164,860 JGS 208,726 11,897,382 MPI 709,000 2,821,820 SM 26,732 25,930,040 ALI 560,716 19,288,630 MEG 1,748,760 5,316,230 RLC 284,316 4,833,372 SMPH 549,680 19,788,480 GLO 1,650 2,979,900 TEL 4,645 6,108,175 PGOLD 58,060 2,162,735 RRHI 5,860 301,204
Preferred Shares
FGENG 50,000 5,375,000 P ACPB1 100,000 53,800,000 APB2R 35,800 18,508,600 DMPA1 40,000 19,192,466
Mutual Funds
WELGDGA 3,464 3,495,111 P PIMGBAI 3,381 5,765,719
Unit Investment Trust Fund (UITF)
STF UITF 137,158 21,407,621 P BPI USSTF 2,433 36,276,228 P PDBIF 342 4,126,857 P BPI GEFOF 671 16,570,829 P SP500ETF 699 14,003,631
Totals for BPI Trust Account (FEU) 537,975,356 P
Forward
Bank of the Philippine Islands (BPI) Trust Account:
FAR EASTERN UNIVERSITY, INCORPORATED AND SUBSIDIARIES
Schedule A - Marketable Securities
MAY 31, 2021
Name of Issuing Entity and Association of Each IssueAmounts Shown on the Statements of Financial
Position
Income Received and Accrued

Number of Shares or Principal Amount of Bonds and Notes
Government Securities
FXT1064 6,850,000 P 8,036,812 P FXT2014 3,800,000 4,710,237 FXT2015 3,500,000 4,602,382 FXT2017 4,300,000 5,567,595 FXT2023 10,000,000 11,810,245 FXT5-75 50,000,000 52,500,786 RTB3-10 45,200,000 46,727,583 RTB5-11 1,000,000 1,033,006 RTB5-12 37,200,000 40,205,257 TBILL 042022 30,000,000 29,700,937 TBILL 051122 10,000,000 9,892,753
Corporate Bonds
ALI BOND 2.90% 31,200,000 P 31,200,000 P ALI BOND 3.09% 5,000,000 4,970,286 ALI BOND 5.095% 5,000,000 5,442,616 MBT BOND 5.04% 3,000,000 3,077,720 SMC GP 2,000,000 2,028,203 SMIC-BOND 8,000,000 8,078,136 SMPH-BOND 1,200,000 1,197,182
Equity Securities
Common Shares
AYALA CORP - (AC) 16,930 13,544,000 P ABOITIZ EQUITY VENTURES INC - (AEV) 159,400 6,718,710 ALLIANCE GLOBAL GROUP INC - (AGI) 124,100 1,260,856 AYALA LAND INC - (ALI) 493,200 17,779,860 ABOITIZ POWER CORP - (AP) 136,500 3,337,425 BDO UNIBANK INC - (BDO) 88,890 10,062,348 BANK OF THE PHILIPPINE ISLANDS - (BPI) 135,530 12,021,511 GLOBE TELECOM INC - (GLO) 2,420 4,452,800 GT CAPITAL HOLDINGS INC - (GTCAP) 7,680 4,661,760 JOLLIBEE FOODS CORP - (JFC) 12,810 2,736,216 JG SUMMIT HOLDINGS INC - (JGS) 189,948 11,805,268 METROPOLITAN BANK & TRUST CO - (MBT) 179,040 8,719,248 MEGAWORLD CORP - (MEG) 644,000 2,080,120 MANILA ELECTRIC CO - (MER) 5,160 1,430,352 METRO PACIFIC INVESTMENTS CORP - (MPI) 1,510,000 5,873,900 MANILA WATER CO INC - (MWC) 106,400 1,947,120 PUREGOLD PRICE CLUB INC - (PGOLD) 22,400 907,200 ROBINSONS LAND CORP - (RLC) 208,700 3,606,336 ROBINSONS RETAIL HOLDINGS INC - (RRHI) 44,100 2,368,170 SECURITY BANK CORP - (SECB) 49,430 5,832,740 SM INVESTMENTS CORP - (SM) 16,950 16,941,525 SM INVESTMENTS CORP - (SM) 453,400 16,549,100 PLDT, INC. - (TEL) 5,365 6,936,945 UNIVERSAL ROBINA CORP - (URC) 47,230 6,824,735
Preferred Shares
APB2R 8,000 4,188,000 P
Phil Corporates
AC ENERGY 200,000 10,641,915 P BDO-BOND 1,400,000 69,557,155
Mutual Funds
PIMBGAI 007000 1,380 2,410,051 P Wellington Opportunistic Fixed Income 16,983 9,862,158 Wellington Global Quality Growth 1,992 4,176,985
Unit Investment Trust Fund (UITF)
BPI INVEST USD STFUND 278 4,247,864 P BPI SHORT TERM FUND 565,428 88,128,468 Ishares Core MSCI World UCITS ETF- IWDA 7,119 28,779,217 SPDR s and P 500 ETF 402 8,397,511
Totals for BPI Trust Account (EACCI) 669,569,304 P
Forward
Bank of the Philippine Islands (BPI) Trust Account:
FAR EASTERN UNIVERSITY, INCORPORATED AND SUBSIDIARIES
Schedule A - Marketable Securities
MAY 31, 2021
Name of Issuing Entity and Association of Each IssueAmounts Shown on the Statements of Financial
Position
Income Received and Accrued
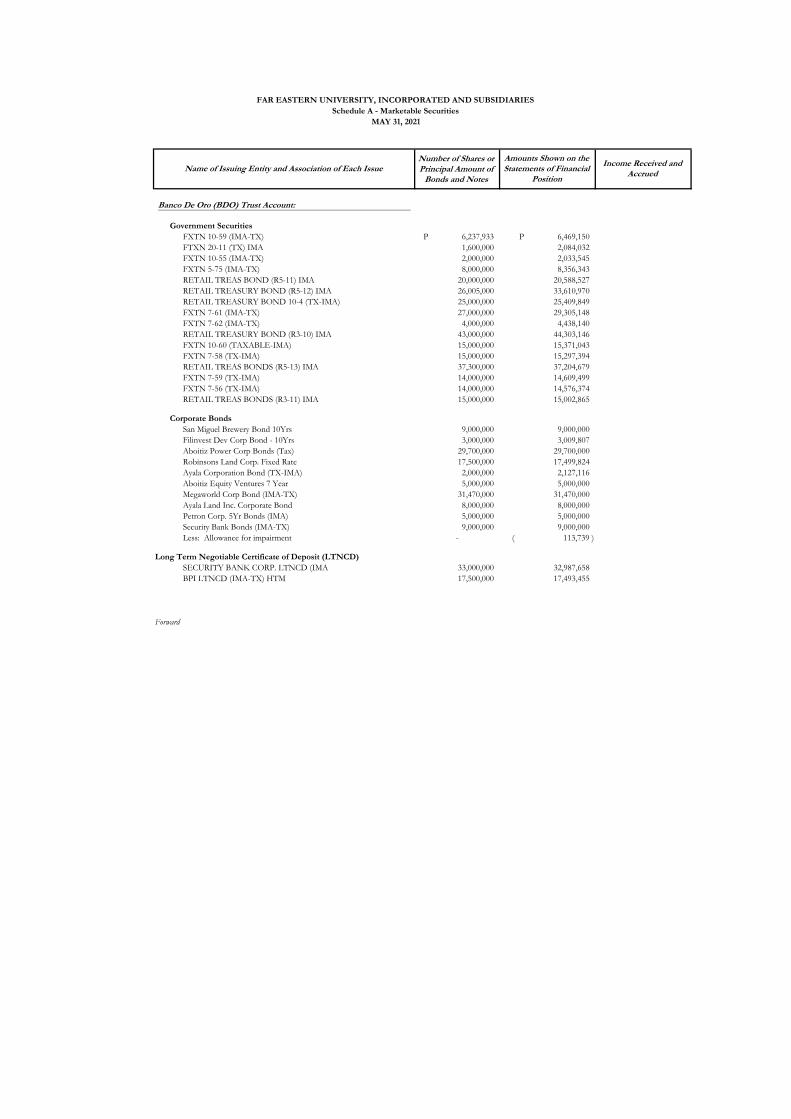
Number of Shares or Principal Amount of Bonds and Notes
Government Securities
FXTN 10-59 (IMA-TX) 6,237,933 P 6,469,150 P FTXN 20-11 (TX) IMA 1,600,000 2,084,032 FXTN 10-55 (IMA-TX) 2,000,000 2,033,545 FXTN 5-75 (IMA-TX) 8,000,000 8,356,343 RETAIL TREAS BOND (R5-11) IMA 20,000,000 20,588,527 RETAIL TREASURY BOND (R5-12) IMA 26,005,000 33,610,970 RETAIL TREASURY BOND 10-4 (TX-IMA) 25,000,000 25,409,849 FXTN 7-61 (IMA-TX) 27,000,000 29,305,148 FXTN 7-62 (IMA-TX) 4,000,000 4,438,140 RETAIL TREASURY BOND (R3-10) IMA 43,000,000 44,303,146 FXTN 10-60 (TAXABLE-IMA) 15,000,000 15,371,043 FXTN 7-58 (TX-IMA) 15,000,000 15,297,394 RETAIL TREAS BONDS (R5-13) IMA 37,300,000 37,204,679 FXTN 7-59 (TX-IMA) 14,000,000 14,609,499 FXTN 7-56 (TX-IMA) 14,000,000 14,576,374 RETAIL TREAS BONDS (R3-11) IMA 15,000,000 15,002,865
Corporate Bonds
San Miguel Brewery Bond 10Yrs 9,000,000 9,000,000 Filinvest Dev Corp Bond - 10Yrs 3,000,000 3,009,807 Aboitiz Power Corp Bonds (Tax) 29,700,000 29,700,000 Robinsons Land Corp. Fixed Rate 17,500,000 17,499,824 Ayala Corporation Bond (TX-IMA) 2,000,000 2,127,116 Aboitiz Equity Ventures 7 Year 5,000,000 5,000,000 Megaworld Corp Bond (IMA-TX) 31,470,000 31,470,000 Ayala Land Inc. Corporate Bond 8,000,000 8,000,000 Petron Corp. 5Yr Bonds (IMA) 5,000,000 5,000,000 Security Bank Bonds (IMA-TX) 9,000,000 9,000,000 Less: Allowance for impairment - 113,739 )(
Long Term Negotiable Certificate of Deposit (LTNCD)
SECURITY BANK CORP. LTNCD (IMA 33,000,000 32,987,658 BPI LTNCD (IMA-TX) HTM 17,500,000 17,493,455
Forward
Banco De Oro (BDO) Trust Account:
FAR EASTERN UNIVERSITY, INCORPORATED AND SUBSIDIARIES
Schedule A - Marketable Securities
MAY 31, 2021
Name of Issuing Entity and Association of Each IssueAmounts Shown on the Statements of Financial
Position
Income Received and Accrued

Number of Shares or Principal Amount of Bonds and Notes
Equity Securities
Common Shares
MEG 1,357,660 4,127,286 P GLO 2,852 5,150,712 TEL 5,152 6,774,880 URC 75,090 10,437,510 RLC 350,940 5,965,980 ALI 659,920 22,701,248 JGS 158,370 9,027,090 ICT 67,570 9,669,267 JFC 19,495 3,760,586 MBT 228,603 10,972,944 BPI 131,397 11,037,348 AC 24,264 19,265,616 MPI 1,633,070 6,499,619 SMPH 672,028 24,193,008 AEV 140,230 5,658,281 MER 16,020 4,543,272 DMC 191,230 1,063,239 BDO 161,850 16,783,845 SM 30,978 30,048,660 AP 248,660 5,644,582 PGOLD 52,690 1,962,703 GTCAP 7,469 4,406,710 RRHI 106,460 5,472,044 WLCON 204,500 3,762,800 AREIT 101,800 3,664,800
Preferred Shares
DD 49,000 4,968,600 P FGENF 145,000 15,587,500 FPHP 56,000 28,224,000 GLOBE PREF 96,240 48,793,680 GT Captial Holdings Inc. Series 4,500 4,500,000
UITF
BDO-TRUST & INV 259,163 31,906,048 P
Totals for BDO Trust Account (FEU) 825,408,682 P
Forward
Banco De Oro (BDO) Trust Account (continuation):
FAR EASTERN UNIVERSITY, INCORPORATED AND SUBSIDIARIES
Schedule A - Marketable Securities
MAY 31, 2021
Name of Issuing Entity and Association of Each IssueAmounts Shown on the Statements of Financial
Position
Income Received and Accrued

Number of Shares or Principal Amount of Bonds and Notes
Government Securities
FXTN 10-55 (IMA-TX) 6,157,000 P 6,249,511 P FXTN 10-59 (IMA-TX) 38,000,000 39,554,670 FXTN 10-60 (IMA-TX) 25,000,000 25,748,245 FXTN 3-25 (IMA-TX) 20,000,000 20,134,944 FXTN 5-75 (IMA-TX) 25,000,000 26,252,515 FXTN 5-76 (IMA-TX) 46,000,000 48,100,751 FXTN 7-58 (TX) IMA 11,200,000 11,471,621 FXTN 7-59 (IMA-TX) 11,960,000 12,542,187 FXTN 7-61 (IMA-TX) 32,000,000 34,848,913 FXTN 7-62 (IMA-TX) 14,000,000 15,614,187 RETAIL TREASURY BOND 10-4 (TX-IMA) 37,000,000 33,192,010 RETAIL TREASURY BOND (R5-11) IMA 6,050,000 6,250,076 RETAIL TREAS BOND (R5-12) IMA 54,300,000 58,691,214 RETAIL TREAS BOND (R5-13) IMA 33,000,000 32,005,329 RETAIL TREASURY BOND (R3-10) IMA 33,500,000 38,252,462
Corporate Bonds
ABOITIZ EQUITY VENTURES (TXI) 1,000,000 1,000,000 ABOITIZ POWER CORP 247,200,000 247,200,000 AYALA LAND CORP BND TRNCHE2 (I 1,000,000 1,000,000 AYALA LAND INC. CORP BOND (IMA 1,400,000 1,400,000 AYALA LAND INC. CORP. BOND (IM 3,900,000 3,900,000 BDO FIXED RATE BONDS (IMA-TX) 5,000,000 5,000,000 MEGAWORLD CORP. BOND (IMA-TX)- 1,000,000 1,000,000 NLEX CORP 7YR (IMA-TX)-HTC 4,030,000 4,030,000 PETRON CORP. 5 YR BONDS (IMA - 1,620,000 1,620,000 RCBC FIXED RATE BONDS (IMA-TX) 1,000,000 1,000,000 SECURITY BANK BONDS (IMA-TX) H 1,000,000 1,000,000 TREASURY BILLS (IMA-TX)- FVOCI 4,973,085 4,973,152 SMC BONDS (TX-IMA)-HTC 3,500,000 3,500,000
Long Term Negotiable Certificate of Deposit (LTNCD)
ROBINSONS BANK PESO LTNCD (IMA 5,000,000 5,033,677 SECURITY BANK CORP. LTNCD (IMA 1,000,000 1,000,875
Equity Securities
Common Shares
ABOITIZ EQUITY VENTURES INC - (AEV) 69,560 2,931,954 P ABOITIZ POWER CORP (APC) 67,000 1,638,150 AREIT INC 32,600 1,186,640 AYALA CORP - (AC) 11,665 9,332,000 AYALA LAND INC - (ALI) 308,520 11,122,146 BANK OF THE PHILIPPINE ISLANDS 49,329 4,375,482 BDO UNIBANK INC - (BDO) 66,884 7,571,269 DMCI HOLDINGS 9,420 59,252 GLOBE TELECOM INC - (GLO) 1,860 3,422,400 GT CAPITAL HOLDINGS INC - (GTCAP) 749 454,643 INT'L CONTAINER 18,830 3,082,471 JG SUMMIT HOLDINGS INC - (JGS) 94,184 5,853,536 JOLLIBEE FOODS CORP - (JFC) 8,300 1,772,880 MANILA ELECTRIC COMPANY 6,783 1,880,248 MEGAWORLD CORP - (MEG) 758,160 2,448,857 METRO PACIFIC INVESTMENTS CORP - (MPI) 696,210 2,708,257 METROPOLITAN BANK & TRUST CO - (MBT) 89,774 4,371,994 MONDE NISSIN CORPORATION 61,800 1,020,936 PLDT, INC. - (TEL) 3,150 4,072,950 PUREGOLD PRICECLUB INC 22,640 916,920 ROBINSONS LAND CORP - (RLC) 139,524 2,410,975 ROBINSONS RETAIL HOLDINGS INC - (RRHI) 21,680 1,164,216 SM INVESTMENTS CORP - (SM) 15,550 15,542,225 SM PRIME HOLDINGS 284,740 10,393,010 UNIVERSAL ROBINA CORP - (URC) 38,974 5,631,743 WILCON DEPOT INC 36,290 731,244
Preferred Shares
GT Captial Holdings Inc. Series 1,000 1,020,000 P SMC GL POWERS SENIOR 7650 39,347,618.33
UITF
BDO INST'L CASH RESERVE FUND 165,265 20,349,194.11
BDO MONEY MARKET FUND 187 1,310,712.27
Totals for BDO Trust Account (EACCI) 859,690,262 P
Forward
Banco De Oro (BDO) Trust Account:
FAR EASTERN UNIVERSITY, INCORPORATED AND SUBSIDIARIES
Schedule A - Marketable Securities
MAY 31, 2021
Name of Issuing Entity and Association of Each IssueAmounts Shown on the Statements of Financial
Position
Income Received and Accrued
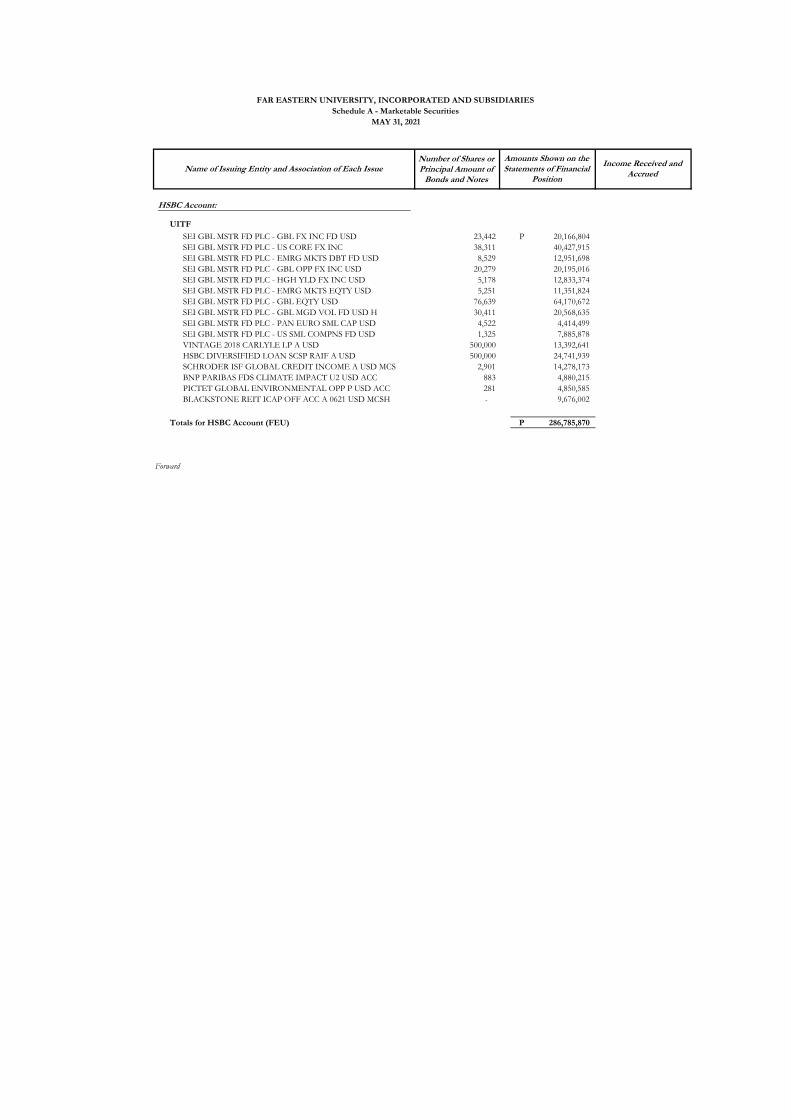
Number of Shares or Principal Amount of Bonds and Notes
UITF
SEI GBL MSTR FD PLC - GBL FX INC FD USD 23,442 20,166,804 P SEI GBL MSTR FD PLC - US CORE FX INC 38,311 40,427,915 SEI GBL MSTR FD PLC - EMRG MKTS DBT FD USD 8,529 12,951,698 SEI GBL MSTR FD PLC - GBL OPP FX INC USD 20,279 20,195,016 SEI GBL MSTR FD PLC - HGH YLD FX INC USD 5,178 12,833,374 SEI GBL MSTR FD PLC - EMRG MKTS EQTY USD 5,251 11,351,824 SEI GBL MSTR FD PLC - GBL EQTY USD 76,639 64,170,672 SEI GBL MSTR FD PLC - GBL MGD VOL FD USD H 30,411 20,568,635 SEI GBL MSTR FD PLC - PAN EURO SML CAP USD 4,522 4,414,499 SEI GBL MSTR FD PLC - US SML COMPNS FD USD 1,325 7,885,878 VINTAGE 2018 CARLYLE LP A USD 500,000 13,392,641 HSBC DIVERSIFIED LOAN SCSP RAIF A USD 500,000 24,741,939 SCHRODER ISF GLOBAL CREDIT INCOME A USD MCS 2,901 14,278,173 BNP PARIBAS FDS CLIMATE IMPACT U2 USD ACC 883 4,880,215 PICTET GLOBAL ENVIRONMENTAL OPP P USD ACC 281 4,850,585 BLACKSTONE REIT ICAP OFF ACC A 0621 USD MCSH - 9,676,002
Totals for HSBC Account (FEU) 286,785,870 P
Forward
HSBC Account:
FAR EASTERN UNIVERSITY, INCORPORATED AND SUBSIDIARIES
Schedule A - Marketable Securities
MAY 31, 2021
Name of Issuing Entity and Association of Each IssueAmounts Shown on the Statements of Financial
Position
Income Received and Accrued
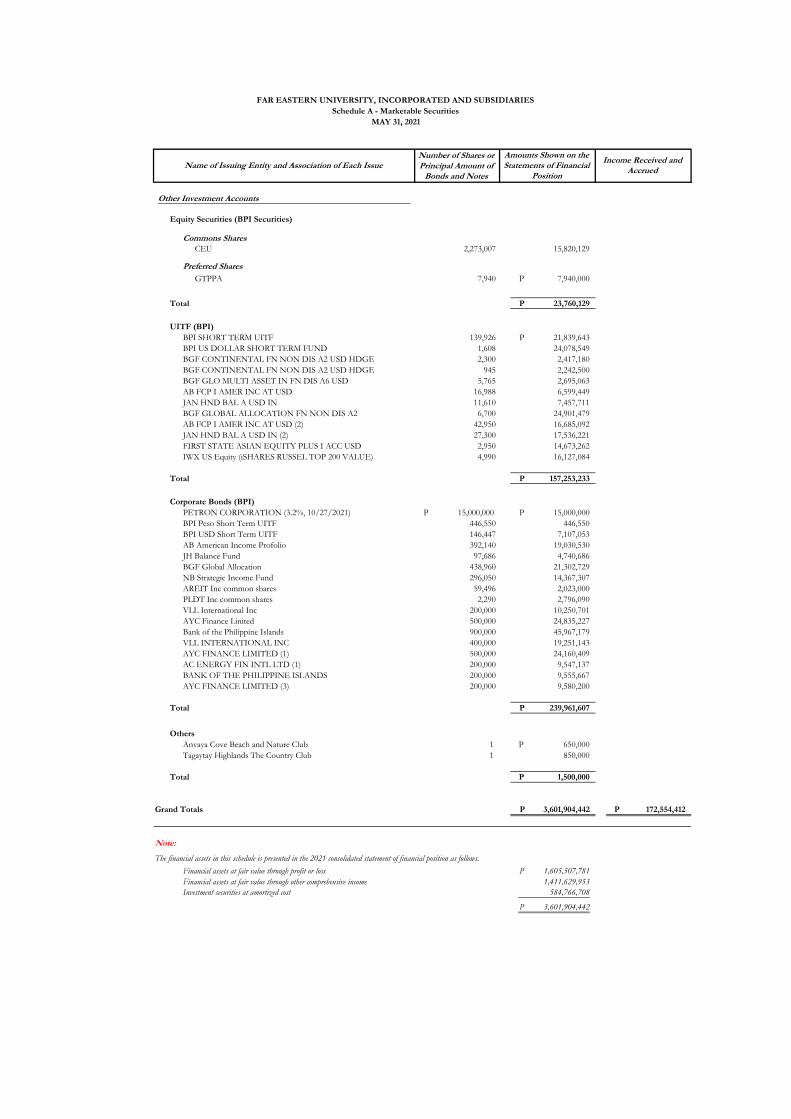
Number of Shares or Principal Amount of Bonds and Notes
Equity Securities (BPI Securities)
Commons SharesCEU 2,273,007 15,820,129
Preferred Shares
GTPPA 7,940 7,940,000 P
Total 23,760,129 P
UITF (BPI)
BPI SHORT TERM UITF 139,926 21,839,643 P BPI US DOLLAR SHORT TERM FUND 1,608 24,078,549 BGF CONTINENTAL FN NON DIS A2 USD HDGE 2,300 2,417,180 BGF CONTINENTAL FN NON DIS A2 USD HDGE 945 2,242,500 BGF GLO MULTI ASSET IN FN DIS A6 USD 5,765 2,695,063 AB FCP I AMER INC AT USD 16,988 6,599,449 JAN HND BAL A USD IN 11,610 7,457,711 BGF GLOBAL ALLOCATION FN NON DIS A2 6,700 24,901,479 AB FCP I AMER INC AT USD (2) 42,950 16,685,092 JAN HND BAL A USD IN (2) 27,300 17,536,221 FIRST STATE ASIAN EQUITY PLUS I ACC USD 2,950 14,673,262 IWX US Equity (iSHARES RUSSEL TOP 200 VALUE) 4,990 16,127,084
Total 157,253,233 P
Corporate Bonds (BPI)
PETRON CORPORATION (3.2%, 10/27/2021) 15,000,000 P 15,000,000 P BPI Peso Short Term UITF 446,550 446,550 BPI USD Short Term UITF 146,447 7,107,053 AB American Income Profolio 392,140 19,030,530 JH Balance Fund 97,686 4,740,686 BGF Global Allocation 438,960 21,302,729 NB Strategic Income Fund 296,050 14,367,307 AREIT Inc common shares 59,496 2,023,000 PLDT Inc common shares 2,290 2,796,090 VLL International Inc 200,000 10,250,701 AYC Finance Linited 500,000 24,835,227 Bank of the Philippine Islands 900,000 45,967,179 VLL INTERNATIONAL INC 400,000 19,251,143 AYC FINANCE LIMITED (1) 500,000 24,160,409 AC ENERGY FIN INTL LTD (1) 200,000 9,547,137 BANK OF THE PHILIPPINE ISLANDS 200,000 9,555,667 AYC FINANCE LIMITED (3) 200,000 9,580,200
Total 239,961,607 P
Others
Anvaya Cove Beach and Nature Club 1 650,000 P Tagaytay Highlands The Country Club 1 850,000
Total 1,500,000 P
Grand Totals 3,601,904,442 P 172,554,412 P
Note:
The financial assets in this schedule is presented in the 2021 consolidated statement of financial position as follows.
Financial assets at fair value through profit or loss 1,605,507,781 P
Financial assets at fair value through other comprehensive income 1,411,629,953
Investment securities at amortized cost 584,766,708
3,601,904,442 P
Other Investment Accounts
FAR EASTERN UNIVERSITY, INCORPORATED AND SUBSIDIARIES
Schedule A - Marketable Securities
MAY 31, 2021
Name of Issuing Entity and Association of Each IssueAmounts Shown on the Statements of Financial
Position
Income Received and Accrued
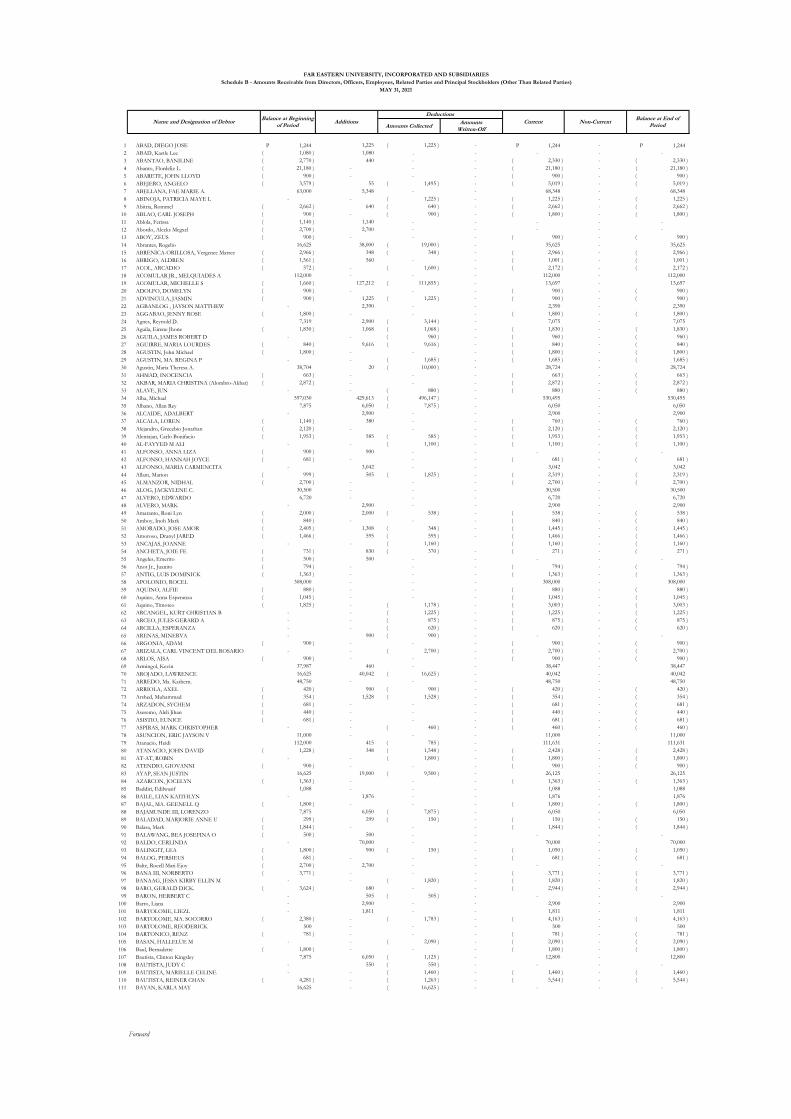
1 ABAD, DIEGO JOSE 1,244 P 1,225 1,225 )( - 1,244 P - 1,244 P
2 ABAD, Kastle Lee 1,080 )( 1,080 . - - - -
3 ABANTAO, BANILINE 2,770 )( 440 - - 2,330 )( - 2,330 )(
4 Abanto, Flordeliz L. 21,180 )( - - - 21,180 )( - 21,180 )(
5 ABARETE, JOHN LLOYD 900 )( - - - 900 )( - 900 )(
6 ABEJERO, ANGELO 3,579 )( 55 1,495 )( - 5,019 )( - 5,019 )(
7 ABELLANA, FAE MARIE A. 63,000 5,348 - - 68,348 - 68,348
8 ABINOJA, PATRICIA MAYE L - - 1,225 )( - 1,225 )( - 1,225 )(
9 Abitria, Rommel 2,662 )( 640 640 )( - 2,662 )( - 2,662 )(
10 ABLAO, CARL JOSEPH 900 )( - 900 )( - 1,800 )( - 1,800 )(
11 Ablola, Ferissa 1,140 )( 1,140 - - - - -
12 Abordo, Alecks Megxel 2,700 )( 2,700 - - - - -
13 ABOY, ZEUS 900 )( - - - 900 )( - 900 )(
14 Abrantes, Rogelio 16,625 38,000 19,000 )( - 35,625 - 35,625
15 ABRENICA-ORILLOSA, Vergenee Marree 2,966 )( 348 348 )( - 2,966 )( - 2,966 )(
16 ABRIGO, ALDREN 1,561 )( 560 - - 1,001 )( - 1,001 )(
17 ACOL, ARCADIO 572 )( - 1,600 )( - 2,172 )( - 2,172 )(
18 ACOMULAR JR., MELQUIADES A 112,000 - - - 112,000 - 112,000
19 ACOMULAR, MICHELLE S 1,660 )( 127,212 111,855 )( - 13,697 - 13,697
20 ADOLFO, DOMELYN 900 )( - - - 900 )( - 900 )(
21 ADVINCULA, JASMIN 900 )( 1,225 1,225 )( - 900 )( - 900 )(
22 AGBANLOG , JAYSON MATTHEW - 2,390 - - 2,390 - 2,390
23 AGGABAO, JENNY ROSE 1,800 )( - - - 1,800 )( - 1,800 )(
24 Agnes, Reynold D. 7,319 2,900 3,144 )( - 7,075 - 7,075
25 Aguila, Eirene Jhone 1,830 )( 1,068 1,068 )( - 1,830 )( - 1,830 )(
26 AGUILA, JAMES ROBERT D - - 960 )( - 960 )( - 960 )(
27 AGUIRRE, MARIA LOURDES 840 )( 9,616 9,616 )( - 840 )( - 840 )(
28 AGUSTIN, John Michael 1,800 )( - - - 1,800 )( - 1,800 )(
29 AGUSTIN, MA. REGINA P - - 1,685 )( - 1,685 )( - 1,685 )(
30 Agustin, Maria Theresa A. 38,704 20 10,000 )( - 28,724 - 28,724
31 AHMAD, INOCENCIA 663 )( - - - 663 )( - 663 )(
32 AKBAR, MARIA CHRISTINA (Alombro-Akbar) 2,872 )( - - - 2,872 )( - 2,872 )(
33 ALAVE, JUN - - 880 )( - 880 )( - 880 )(
34 Alba, Michael 597,030 429,613 496,147 )( - 530,495 - 530,495
35 Albano, Allan Rey 7,875 6,050 7,875 )( - 6,050 - 6,050
36 ALCAIDE, ADALBERT - 2,900 - - 2,900 - 2,900
37 ALCALA, LOREN 1,140 )( 380 - - 760 )( - 760 )(
38 Alejandro, Grecebio Jonathan 2,120 )( - - - 2,120 )( - 2,120 )(
39 Alentajan, Carlo Bonifacio 1,953 )( 585 585 )( - 1,953 )( - 1,953 )(
40 AL-FAYYED M ALI - - 1,100 )( - 1,100 )( - 1,100 )(
41 ALFONSO, ANNA LIZA 900 )( 900 - - - - -
42 ALFONSO, HANNAH JOYCE 681 )( - - - 681 )( - 681 )(
43 ALFONSO, MARIA CARMENCITA - 3,042 - - 3,042 - 3,042
44 Allam, Marion 999 )( 505 1,825 )( - 2,319 )( - 2,319 )(
45 ALMANZOR, NIDHAL 2,700 )( - - - 2,700 )( - 2,700 )(
46 ALOG, JACKYLENE C. 30,500 - - - 30,500 - 30,500
47 ALVERO, EDWARDO 6,720 - - - 6,720 - 6,720
48 ALVERO, MARK - 2,900 - - 2,900 - 2,900
49 Amaranto, Roni Lyn 2,000 )( 2,000 538 )( - 538 )( - 538 )(
50 Amboy, Inoh Mark 840 )( - - - 840 )( - 840 )(
51 AMORADO, JOSE AMOR 2,405 )( 1,308 348 )( - 1,445 )( - 1,445 )(
52 Amoroso, Dranyl JARED 1,466 )( 595 595 )( - 1,466 )( - 1,466 )(
53 ANCAJAS, JOANNE - - 1,160 )( 1,160 )( - 1,160 )(
54 ANCHETA, JOIE FE 731 )( 830 370 )( - 271 )( - 271 )(
55 Angeles, Emerito 500 )( 500 - - - - -
56 Anot Jr., Juanito 794 )( - - - 794 )( - 794 )(
57 ANTIG, LUIS DOMINICK 1,363 )( - - - 1,363 )( - 1,363 )(
58 APOLONIO, ROCEL 308,000 - - - 308,000 - 308,000
59 AQUINO, ALFIE 880 )( - - - 880 )( - 880 )(
60 Aquino, Anna Esperanza 1,045 )( - - - 1,045 )( - 1,045 )(
61 Aquino, Timoteo 1,825 )( - 1,178 )( - 3,003 )( - 3,003 )(
62 ARCANGEL, KURT CHRISTIAN B - - 1,225 )( - 1,225 )( - 1,225 )(
63 ARCEO, JULES GERARD A - - 875 )( - 875 )( - 875 )(
64 ARCILLA, ESPERANZA - - 620 )( - 620 )( - 620 )(
65 ARENAS, MINERVA - 900 900 )( - - - -
66 ARGONIA, ADAM 900 )( - - - 900 )( - 900 )(
67 ARIZALA, CARL VINCENT DEL ROSARIO - - 2,700 )( - 2,700 )( - 2,700 )(
68 ARLOS, AISA 900 )( - - - 900 )( - 900 )(
69 Armingol, Kevin 37,987 460 - - 38,447 - 38,447
70 AROJADO, LAWRENCE 16,625 40,042 16,625 )( - 40,042 - 40,042
71 ARREDO, Ma. Kathern. 48,750 - - - 48,750 - 48,750
72 ARRIOLA, AXEL 420 )( 900 900 )( - 420 )( - 420 )(
73 Arshed, Muhammad 354 )( 1,528 1,528 )( - 354 )( - 354 )(
74 ARZADON, SYCHEM 681 )( - - - 681 )( - 681 )(
75 Aseremo, Aleli Jihan 440 )( - - - 440 )( - 440 )(
76 ASISTIO, EUNICE 681 )( - - - 681 )( - 681 )(
77 ASPIRAS, MARK CHRISTOPHER - - 460 )( - 460 )( - 460 )(
78 ASUNCION, ERIC JAYSON V 11,000 - - - 11,000 - 11,000
79 Atanacio, Heidi 112,000 415 785 )( - 111,631 - 111,631
80 ATANACIO, JOHN DAVID 1,228 )( 348 1,548 )( - 2,428 )( - 2,428 )(
81 AT-AT, ROBIN - - 1,800 )( - 1,800 )( - 1,800 )(
82 ATENDIO, GIOVANNI 900 )( - - - 900 )( - 900 )(
83 AYAP, SEAN JUSTIN 16,625 19,000 9,500 )( - 26,125 - 26,125
84 AZARCON, JOCELYN 1,363 )( - - - 1,363 )( - 1,363 )(
85 Baddiri, Edilwasif 1,088 - - - 1,088 - 1,088
86 BAILE, LIAN KAITHLYN - 1,876 - - 1,876 - 1,876
87 BAJAL, MA. GEENELL Q 1,800 )( - - - 1,800 )( - 1,800 )(
88 BAJAMUNDE III, LORENZO 7,875 6,050 7,875 )( - 6,050 - 6,050
89 BALADAD, MARJORIE ANNE U 299 )( 299 150 )( - 150 )( - 150 )(
90 Balasa, Mark 1,844 )( - - - 1,844 )( - 1,844 )(
91 BALAWANG, BEA JOSEFINA O 500 )( 500 - - - - -
92 BALDO, CERLINDA - 70,000 - - 70,000 - 70,000
93 BALINGIT, LEA 1,800 )( 900 150 )( - 1,050 )( - 1,050 )(
94 BALOG, PERSIEUS 681 )( - - - 681 )( - 681 )(
95 Balte, Rocell Mari Ejoy 2,700 )( 2,700 - - - - -
96 BANA III, NORBERTO 3,771 )( - - - 3,771 )( - 3,771 )(
97 BANAAG, JESSA KIRBY ELLIN M - - 1,820 )( - 1,820 )( - 1,820 )(
98 BARO, GERALD DICK. 3,624 )( 680 - - 2,944 )( - 2,944 )(
99 BARON, HERBERT C - 505 505 )( - - - -
100 Barro, Liana - 2,900 - - 2,900 - 2,900
101 BARTOLOME, LIEZL - 1,811 - - 1,811 - 1,811
102 BARTOLOME, MA. SOCORRO 2,380 )( - 1,783 )( - 4,163 )( - 4,163 )(
103 BARTOLOME, REODERICK 500 - - - 500 - 500
104 BARTONICO, RENZ 781 )( - - - 781 )( - 781 )(
105 BASAN, HALLELUE M - - 2,090 )( - 2,090 )( - 2,090 )(
106 Baul, Bernadette 1,800 )( - - - 1,800 )( - 1,800 )(
107 Bautista, Clinton Kingsley 7,875 6,050 1,125 )( - 12,800 - 12,800
108 BAUTISTA, JUDY C - 550 550 )( - - - -
109 BAUTISTA, MARIELLE CELINE - - 1,460 )( - 1,460 )( - 1,460 )(
110 BAUTISTA, REINER CHAN 4,281 )( - 1,263 )( - 5,544 )( - 5,544 )(
111 BAYAN, KARLA MAY 16,625 - 16,625 )( - - - -
Forward
Amounts CollectedAmounts Written-Off
FAR EASTERN UNIVERSITY, INCORPORATED AND SUBSIDIARIES
Schedule B - Amounts Receivable from Directors, Officers, Employees, Related Parties and Principal Stockholders (Other Than Related Parties)
MAY 31, 2021
Name and Designation of DebtorBalance at Beginning
of PeriodAdditions
Deductions
Current Non-CurrentBalance at End of
Period

112 BAYANI, MARY ANN 2,700 )( P - - - 2,700 )( P - 2,700 )( P
113 BAYANIN, RAE MARIELLE M - - 1,820 )( - 1,820 )( - 1,820 )(
114 BAYBAYON, GILBERT 900 )( - - - 900 )( - 900 )(
115 BEJO, NOEL - 1,169 - - 1,169 - 1,169
116 Belardo, Amy 2,375 )( 19,000 21,375 )( - 4,750 )( - 4,750 )(
117 Belleza, Asuncion L. 17,451 19,000 19,000 )( - 17,451 - 17,451
118 BELTRAN, FRANCES 900 )( - - - 900 )( - 900 )(
119 Benicta, Eugeene Emmanuel 2,201 )( 620 - - 1,581 )( - 1,581 )(
120 Benoya, Serknight 1,800 )( - - - 1,800 )( - 1,800 )(
121 Bercede, Daniel 1,800 )( - - 1,800 )( - 1,800 )(
122 Bernaldez, Isachar 954 900 - - 1,854 - 1,854
123 BERNARDO, REDANTE R 179 )( 179 - - - - -
124 Berosil, Jaderick N. 2,200 )( - 1,050 )( - 3,250 )( - 3,250 )(
125 BESA, GRACE F. - 62,907 - - 62,907 - 62,907
126 Betia, Jem Ryn 8,855 6,050 7,875 )( - 7,030 - 7,030
127 BINARAO ,ROMAEL 781 )( - - - 781 )( - 781 )(
128 Bingculado, Roger 24,300 - - - 24,300 - 24,300
129 Blas, Maria Theresa 1,380 )( 1,380 - - - - -
130 Blas, Nikki 1,663 - - - 1,663 - 1,663
131 Bleza, Jewel - 40,000 - - 40,000 - 40,000
132 BOLO JR., BENJAMIN ARCANGEL 1,028 688 1,709 )( - 7 - 7
133 BONGOLAN, JENNY SHIEL S. 2,900 )( - - - 2,900 )( - 2,900 )(
134 BORGOÑA, EARL JOSEPH - 7,439 - - 7,439 - 7,439
135 BORINES, MARIA TALITHA ESTRELLA L. - - 900 )( - 900 )( - 900 )(
136 BORJA, GENESIS 663 )( - - - 663 )( - 663 )(
137 Borja, Sofriano 16,625 - 7,125 )( - 9,500 - 9,500
138 Borja, Victoria Ana - 13,328 - - 13,328 - 13,328
139 BRAGAIS, MA. ROSA 900 )( - - - 900 )( - 900 )(
140 Bravo, Arnel 2,900 )( - - - 2,900 )( - 2,900 )(
141 Bremner, Pamela Rose 1,440 )( 1,440 - - - - -
142 BRIOSO, JOHN OLIVER - 2,900 - - 2,900 - 2,900
143 Bronce, Roentgen 1,751 )( 460 460 )( - 1,751 )( - 1,751 )(
144 Buenafe, Maria Belinda 76,380 34,924 116,003 )( - 4,700 )( - 4,700 )(
145 BUENCONSEJO, ROSEMARIE 224,000 - - - 224,000 - 224,000
146 Bueno, Harold 2,900 )( 2,900 - - - - -
147 BUENO, PAOLO ROBERT P - - 2,315 )( - 2,315 )( - 2,315 )(
148 BULLAGO, JENINA CAMILLE G - - 2,450 )( - 2,450 )( - 2,450 )(
149 BULUSAN, LOVELY GRACE - - 1,280 )( - 1,280 )( - 1,280 )(
150 BUNAG, JOSE ANGELO 740 )( - - - 740 )( - 740 )(
151 Bustamante, Maria Christine 499 - - - 499 - 499
152 Caagbay, Elpidio Z. 18,120 7,125 )( - - 10,995 - 10,995
153 CABALIDA, ROAN JOYCE T - - 830 )( - 830 )( - 830 )(
154 Cabaltica, Leilani A. 2,130 - - - 2,130 - 2,130
155 CABANERO, ROBERT 540 )( - - - 540 )( - 540 )(
156 CABANZA III, LEO GUARIN 2,044 - - - 2,044 - 2,044
157 CABARLOC, BYRON 900 )( - - - 900 )( - 900 )(
158 Cabasal, Herwin 776 )( 19,074 19,074 )( - 776 )( - 776 )(
159 CABAUATAN, CECILIA - 70,000 - - 70,000 - 70,000
160 CABINTA, MA. DOLORES - 4,071 - - 4,071 - 4,071
161 Cabungan, Mike Christian 7,875 6,050 1,125 )( - 12,800 - 12,800
162 CAHIWAT, MARY LORNA C 900 )( 900 - - - - -
163 Cajuday, Noel 35,800 19,000 9,225 )( - 45,575 - 45,575
164 CALIMPAS, JOAN 23,857 )( - - - 23,857 )( - 23,857 )(
165 CALLAO, SHIELA B - - 2,450 )( - 2,450 )( - 2,450 )(
166 CALMA, MANAMI JOIE - 59,714 - - 59,714 - 59,714
167 CALUPAZ, MA. LUTGARDA 200 )( - 100 )( - 300 )( - 300 )(
168 CAMANA, LOVE 1,500 )( 3,766 - - 2,266 - 2,266
169 Canares, Jonathan 29,658 - 5,908 )( - 23,750 - 23,750
170 CANDO, CROMWEL - 129 - - 129 - 129
171 Cañero, Marvin 2,993 )( 348 348 )( - 2,993 )( - 2,993 )(
172 CANETE, GERALDINE 1,581 )( - - - 1,581 )( - 1,581 )(
173 CANO, EARL ADRIANNE A - - 1,595 )( - 1,595 )( - 1,595 )(
174 Canoza, Geraldine 47,107 - 11,800 )( - 35,307 - 35,307
175 Cao, Marilou F. 131,416 - - - 131,416 - 131,416
176 CARBO, KEVIN LOUIE T - - 1,800 )( - 1,800 )( - 1,800 )(
177 CARDENAL, JOFFREY 2,843 )( - - - 2,843 )( - 2,843 )(
178 CARDENAS, REINALYN 1,363 )( - - - 1,363 )( - 1,363 )(
179 CARDONA, VICTORIA D - - 2,300 )( - 2,300 )( - 2,300 )(
180 CARILLO, RENZ ROE 1,363 )( - - - 1,363 )( - 1,363 )(
181 CARILLO-RIVERA, KRISTINE BERNADETTE 15,462 - 6,736 )( - 8,726 - 8,726
182 CARIT, LALY I 820 )( - 900 )( - 1,720 )( - 1,720 )(
183 Casado, Eric - 3,450 - - 3,450 - 3,450
184 Casas, Criselda 1,570 - 1,570 )( - - - -
185 CASTELO, YVES MIKKA - 348 348 )( - - - -
186 CASTIL, KATHERINE - - 151 )( - 151 )( - 151 )(
187 CASTILLO, DIANAFE 1,581 )( - - - 1,581 )( - 1,581 )(
188 CASTILLO, JEFFREY 963 )( - - - 963 )( - 963 )(
189 CASTILLO, LAWRENCE 681 )( - - - 681 )( - 681 )(
190 Castro, Joeven 85,061 17,187 78,403 )( - 23,845 - 23,845
191 CASTRO, KARLA MARIE - 8,825 - - 8,825 - 8,825
192 CASTRONUEVO, ELLAINE 16,625 19,000 16,917 )( - 18,708 - 18,708
193 Catchillar, Ulysses 1,119 )( - - - 1,119 )( - 1,119 )(
194 CATLI, NERIZZA JAY P - - 2,450 )( - 2,450 )( - 2,450 )(
195 CEBU, JAYVEE C - - 1,225 )( - 1,225 )( - 1,225 )(
196 CELESTINO, LEONORA 720 )( 720 - - - - -
197 CELIZ, PRETTY B 900 )( 900 - - - - -
198 Ceniza, Sergio 2,057 )( 640 640 )( - 2,057 )( - 2,057 )(
199 Centeno, Raf Sopia 3,600 )( 3,600 - - - - -
200 Cervantes-Poco, Maria Patricia 1,197 )( 1,368 348 )( - 177 )( - 177 )(
201 CHAVEZ, JAYSON 79,265 )( - - - 79,265 )( - 79,265 )(
202 CHUA, ALEXIS 1,092 )( 900 150 )( - 342 )( - 342 )(
203 CIDRO, MARK GLEEN O - 1,225 1,549 )( - 324 )( - 324 )(
204 CIVIL, JERWIN JOHN Y 900 )( 900 - - - - -
205 CLAUD, FREEDIERICK 760 )( - - - 760 )( - 760 )(
206 CLEMENTE, WINNIE 900 )( 685 - - 215 )( - 215 )(
207 CO, LEAH REBECCA C. 272 - - - 272 - 272
208 Cobarrubias, Normita 25,371 5,648 - - 31,019 - 31,019
209 COLLADO, KLERVIN 900 )( - - - 900 )( - 900 )(
210 CONCHA, EZEKIEL 900 )( - - - 900 )( - 900 )(
211 Constantino, Michelle Anne 4,000 )( - - - 4,000 )( - 4,000 )(
212 Cordova, Maria Fleur 5,907 - - - 5,907 - 5,907
213 CORPUS, DAVID 681 )( - - - 681 )( - 681 )(
214 CORTES, LURHEN 2,481 )( 1,810 910 )( - 1,581 )( - 1,581 )(
215 CORTEZ, DALE JON - 415 415 )( - - - -
216 CORTEZ, DANILO 420 )( - - - 420 )( - 420 )(
217 CRUDA JR, VICTORIANO L 720 )( 720 476 )( - 476 )( - 476 )(
218 Cruz- LICOP, ANNA PAULINE - 19,000 2,375 )( - 16,625 - 16,625
219 CRUZ, DREXEL HEINZ 1,162 )( 888 888 )( - 1,162 )( - 1,162 )(
220 Cruz, Jayson 4,967 5,691 3,967 )( - 6,691 - 6,691
221 Cruz, Jim 1,800 )( - - - 1,800 )( - 1,800 )(
222 CRUZ, Kathleen Mae 1,800 )( - - - 1,800 )( - 1,800 )(
Forward
Non-CurrentBalance at End of
PeriodAmounts CollectedAmounts Written-Off
FAR EASTERN UNIVERSITY, INCORPORATED AND SUBSIDIARIES
Schedule B - Amounts Receivable from Directors, Officers, Employees, Related Parties and Principal Stockholders (Other Than Related Parties)
MAY 31, 2021
Name and Designation of DebtorBalance at Beginning
of PeriodAdditions
Deductions
Current

223 CRUZ, POPE JOHN P - - 2,360 )( - 2,360 )( P - 2,360 )( P
224 CRUZ, RAQUEL 900 )( - - - 900 )( - 900 )(
225 CU, NEUGENE ROWAN 780 )( - 1,225 )( - 2,005 )( - 2,005 )(
226 Cuario, Rishirl 1,063 )( - - - 1,063 )( - 1,063 )(
227 Cuason, Willy 4,017 )( 325 3,193 )( - 6,885 )( - 6,885 )(
228 CUCIO, MARIA RITA 776 )( - - - 776 )( - 776 )(
229 CUDOG, VENMAR 681 )( - - - 681 )( - 681 )(
230 CUERPO, VON BRYAN 2,499 )( 1,308 348 )( - 1,539 )( - 1,539 )(
231 Cuibillas, Jorge 8,400 )( - - - 8,400 )( - 8,400 )(
232 Culala, Harold John O. with cr from old 13,379 39,612 16,625 )( - 36,366 - 36,366
233 Dacela, Mark Anthony 1,080 )( - - - 1,080 )( - 1,080 )(
234 DADUFALZA, GRACE 2,263 )( - - - 2,263 )( - 2,263 )(
235 Dadulla Jr, Jose Pepito Yamongan 900 )( 3,800 2,375 )( - 525 - 525
236 DAGOHOY, FRANCISCO 681 - 360 )( - 321 - 321
237 DALIMEG, JUVENAL S - - 1,225 )( - 1,225 )( - 1,225 )(
238 DANGANAN JR., RUDY M - - 753 )( - 753 )( - 753 )(
239 Dating, Jaclyn 1,800 )( - - - 1,800 )( - 1,800 )(
240 Dayag, Kate Ashlyn 2,598 )( 18,669 18,669 )( - 2,598 )( - 2,598 )(
241 De Castro, Deo Lorenzo 745 )( - 2,375 )( - 3,120 )( - 3,120 )(
242 DE CASTRO, MA. CLARA - - 1,515 )( - 1,515 )( - 1,515 )(
243 De Guzman, Jonathan 7,875 6,050 7,875 )( 6,050 - 6,050
244 DE GUZMAN, KYLE PATRICK 1,800 )( - - - 1,800 )( - 1,800 )(
245 DE JESUS, EUGENE 2,391 )( - 930 )( - 3,321 )( - 3,321 )(
246 DE JESUS, GIAN CARLO P - 1,225 1,225 )( - - - -
247 DE JESUS, JELIANNE SHAREE 900 )( - - - 900 )( - 900 )(
248 DE LEO, RAN 900 )( - - - 900 )( - 900 )(
249 De Leon, Angelito 11,475 )( 19,000 19,400 )( - 11,875 )( - 11,875 )(
250 De Leon, Dino Robert 2,425 )( 505 505 )( - 2,425 )( - 2,425 )(
251 De Leon, John Angelo 10,167 )( - - - 10,167 )( - 10,167 )(
252 DE LEON, Kriselle 1,080 )( - - - 1,080 )( - 1,080 )(
253 De Leon, Lemuel 16,625 19,000 19,000 )( - 16,625 - 16,625
254 DE LEON, RYAN 2,040 )( 680 - - 1,360 )( - 1,360 )(
255 De Rosas, Dario 7,875 9,000 7,875 )( - 9,000 - 9,000
256 De Torres, Noreen 2,700 )( 2,700 - - - - -
257 DE VERA, DALE 1,440 )( - 900 )( - 2,340 )( - 2,340 )(
258 De Vera, Michael 57,348 - 57,348 )( - - - -
259 De Villa, Sienna Marie 1,800 )( - - - 1,800 )( - 1,800 )(
260 Deabanico, Eden Gay 1,800 )( - - - 1,800 )( - 1,800 )(
261 Decena, Jennelyn 680 )( - - - 680 )( - 680 )(
262 DEL OCAMPO, REYJANE 900 )( - - - 900 )( - 900 )(
263 DEL ROSARIO, ELAINE 2,458 )( 70,000 - - 67,543 - 67,543
264 DEL ROSARIO, JOHNCENT 6,000 - - - 6,000 - 6,000
265 Del Rosario, Julius 8,532 6,050 7,875 )( - 6,707 - 6,707
266 Del Rosario, Maria Theresa 558 - - - 558 - 558
267 Del Rosario, Mark 1,500 )( 1,500 - - - - -
268 DEL ROSARIO, RUTH O. 75,000 - - - 75,000 - 75,000
269 Dela Cruz Jr., Leonard 598 )( 370 370 )( - 598 )( - 598 )(
270 DELA CRUZ, ALMA EMERITA V 256,072 114,249 - - 370,320 - 370,320
271 DELARIARTE, CLARISSA - - 3,350 )( - 3,350 )( - 3,350 )(
272 Delgado, Emy 5,576 8,058 8,504 )( - 5,131 - 5,131
273 DELOS REYES, MARK JOED 1,800 )( - - - 1,800 )( - 1,800 )(
274 DELOS SANTOS, JOHN VINCENT 900 )( - - - 900 )( - 900 )(
275 Deveraturda, Joana Paula 2,590 )( 640 640 )( - 2,590 )( - 2,590 )(
276 DIANZON, EDRICK L - - 2,000 )( - 2,000 )( - 2,000 )(
277 Diaz Jr., Reynaldo 18,727 9,000 18,727 )( - 9,000 - 9,000
278 DIAZ, ROBERTO D 4,820 )( 5,280 - - 460 - 460
279 DICANG, CRISTOPHER JAMES D - - 1,100 )( - 1,100 )( - 1,100 )(
280 DIGO, IRISH SHERINA 900 )( - - - 900 )( - 900 )(
281 DILI, RAMCES 720 )( - - - 720 )( - 720 )(
282 Dimarucot, Heildenberg 541 )( - - - 541 )( - 541 )(
283 Dimzon, Marnelli 7,875 9,000 7,875 )( - 9,000 - 9,000
284 DINGLASAN, RENE JESUS ALFREDO R. - - 1,460 )( - 1,460 )( - 1,460 )(
285 DINO-APARICIO, CHENEE 1,498 )( - - - 1,498 )( - 1,498 )(
286 Dionisio, Joseph 14,415 2,412 10,000 )( - 6,827 - 6,827
287 Dionisio, Maricar 252,000 1,413 - - 253,413 - 253,413
288 DOCOT, RUDOLPH 22,237 )( 680 - - 21,557 )( - 21,557 )(
289 Dolor, Princess Patricia 3,600 )( 3,600 - - - - -
290 Dolores, Rea 1,800 )( - - - 1,800 )( - 1,800 )(
291 DOMINGUEZ JR., REX S - 31,772 - - 31,772 - 31,772
292 DONESA, LYNN 28,000 - - - 28,000 - 28,000
293 Dorega, John John J 938 )( - - - 938 )( - 938 )(
294 Ducut, Mirela 43,484 49,515 45,000 )( - 47,999 - 47,999
295 Dulay, Greg 76,157 - - - 76,157 - 76,157
296 Dulay, Sofronio 477,740 )( - - - 477,740 )( - 477,740 )(
297 EBRON, GREGORIO JR 900 )( - - - 900 )( - 900 )(
298 ENRIQUEZ, KENNETH BRYAN B - - 2,315 )( - 2,315 )( - 2,315 )(
299 Era, Joy 17,759 - - - 17,759 - 17,759
300 ERUM, FILJU - 2,807 - - 2,807 - 2,807
301 Escano, Juan Paolo Lorenzo 7,875 - 1,125 )( - 6,750 - 6,750
302 ESCARAMAN, ELAINE R 2,458 - - - 2,458 - 2,458
303 ESPALDON, JOSANNE 620 )( 1,260 640 )( - - - -
304 Espino, Marjorie Theresa Ann 1,120 )( 230 230 )( - 1,120 )( - 1,120 )(
305 Esquibel, Melissa 25 19,000 19,000 )( - 25 - 25
306 ESTEBAN, FRANCIZ/s 819 )( 2,900 - - 2,081 - 2,081
307 ESTEBAN, STEPHANIE JOY S - 1,225 1,225 )( - - - -
308 ESTOQUE, HOMELO 900 )( - - - 900 )( - 900 )(
309 Estrada, Gemee 1,500 - 1,980 )( - 480 )( - 480 )(
310 ESTRELLA, DAVIE BEN - 18,042 - - 18,042 - 18,042
311 Estrella, Luisito 16,625 32,421 16,625 )( - 32,421 - 32,421
312 EUSTAQUIO, PATRICK - - 1,800 )( - 1,800 )( - 1,800 )(
313 EVANGELISTA, ANNA 900 )( - - - 900 )( - 900 )(
314 EVANGELISTA, MICHELLE 681 )( - - - 681 )( - 681 )(
315 FABELLON, SAMANTHA MAE 681 )( - - - 681 )( - 681 )(
316 FABRICANTE, OLIVER. 900 )( - - - 900 )( - 900 )(
317 FAJARDO, ROLANDO - 2,900 - - 2,900 - 2,900
318 FAJATIN, ADRIANNE 2,700 )( 900 - - 1,800 )( - 1,800 )(
319 FELICES,CATHERINE - 70,000 - - 70,000 - 70,000
320 FELIPE, PATRICK JULIUS - 57,000 - - 57,000 - 57,000
321 FERNANDEZ, MAGDALAINE - 645 - - 645 - 645
322 FERNANDEZ, MELVIN 300 )( 300 - - - - -
323 FERRAREN, JENNYLYN 1,947 )( 207 207 )( - 1,947 )( - 1,947 )(
324 FERRER, ETHELDREDA. 2,900 )( - - - 2,900 )( - 2,900 )(
325 FILOTEO, JOYCELYN 3,352 23,946 3,352 )( - 23,946 - 23,946
326 FLORENDO, JOSEFINA 269,176 )( - - - 269,176 )( - 269,176 )(
327 FLORENTINO, NESTLE M 16,625 917 11,875 )( - 5,667 - 5,667
328 Flores, Arbie Diane 1,560 )( - - - 1,560 )( - 1,560 )(
329 Flores, Joyce Ann 598 )( 194 194 )( - 598 )( - 598 )(
330 Flores, Roberto 19,575 9,000 19,375 )( - 9,200 - 9,200
331 FLORES, RONALD 173 )( 618 618 )( - 173 )( - 173 )(
332 FLORIDA, JENNIFER 35,091 - - - 35,091 - 35,091
333 FORONDA, ALEXIS 900 )( 900 - - - - -
Forward
MAY 31, 2021
Name and Designation of Debtor Additions
Deductions
Current Non-CurrentBalance at End of
PeriodAmounts CollectedAmounts Written-Off
FAR EASTERN UNIVERSITY, INCORPORATED AND SUBSIDIARIES
Schedule B - Amounts Receivable from Directors, Officers, Employees, Related Parties and Principal Stockholders (Other Than Related Parties)

334 FORTADES, CEDRICK JEMINA - - 753 )( - 753 )( P - 753 )( P
335 Francisco, Dyan Nicole 1,620 )( 1,620 - - - - -
336 Fresnido, Roberto 7,875 6,050 1,125 )( - 12,800 - 12,800
337 Fulgar III, Ildefonso 116 )( 6,678 - - 6,563 - 6,563
338 GABUMPA, VON KARLO G - 1,225 1,225 )( - - - -
339 Gabunilas, Joana Marie Carina 592 )( 592 - - - - -
340 Galang Jr., Romeo 540 )( 540 - - 0 )( - 0 )(
341 GALANG, AIKO NINA O - - 1,370 )( - 1,370 )( - 1,370 )(
342 GALANG, ARCHIESYL T - 8,125 - - 8,125 - 8,125
343 GAMOLO, MARIA GIA G - 19,000 - - 19,000 - 19,000
344 Gan, Louwie 681 )( - - - 681 )( - 681 )(
345 GANA, RAUL - - 2,575 )( - 2,575 )( - 2,575 )(
346 Ganchoon, Fretti 2,265 )( 370 370 )( - 2,265 )( - 2,265 )(
347 GARCIA, CHANELL 681 )( - - - 681 )( - 681 )(
348 GARCIA, GINO RAY 1,307 )( 3,580 - - 2,273 - 2,273
349 GARCIA, LEONY ROSE - 230 230 )( - - - -
350 GARCIA, MERRY CAROLINE - 969 - - 969 - 969
351 GARCIA, SHARMAINE - - 1,800 )( - 1,800 )( - 1,800 )(
352 GARMA, PAUL FROILAN 1,305 )( - - - 1,305 )( - 1,305 )(
353 GASCON, RONDELL 2,044 )( - - - 2,044 )( - 2,044 )(
354 Gatbonton, Ryan Ray 1,440 )( 2,215 775 )( - - - -
355 Gavieta, Rommel 3,349 )( 325 2,833 )( - 5,856 )( - 5,856 )(
356 GELLA, FREDERICK S - 1,743 - - 1,743 - 1,743
357 GENESE, JOHN ALLENBER 681 )( - - - 681 )( - 681 )(
358 GENILO, JOSE EDUARDO 1,903 )( 348 348 )( - 1,903 )( - 1,903 )(
359 Geocaniga, Rommel 1,714 )( 1,720 1,060 )( - 1,054 )( - 1,054 )(
360 GIDALAGA, MARIELLE 900 )( - - - 900 )( - 900 )(
361 Gilera, Enrico 122,964 46,312 20,099 )( - 149,178 - 149,178
362 GIRADO, MARIE BEMBIE A - - 2,450 )( - 2,450 )( - 2,450 )(
363 GODOY, MARIETTE E 2,114 )( 1,700 - - 414 )( - 414 )(
364 Gongora, Marian 681 - - - 681 - 681
365 GONZAGA, GIAN CARLO 900 )( - - - 900 )( - 900 )(
366 GONZALES, EMMANUEL - 15,027 1,445 )( - 13,581 - 13,581
367 Gonzales, Jayson 613 9,000 7,875 )( - 1,738 - 1,738
368 Gonzales, Julieta 1,373 )( - - - 1,373 )( - 1,373 )(
369 GONZALEZ, Aurelle Marie 40,694 - - - 40,694 - 40,694
370 GONZALEZ, NOEL A 7,875 - 7,875 )( - - - -
371 GONZALEZ, Paola Katherina 1,260 )( - 335 )( - 1,595 )( - 1,595 )(
372 GOQUINGCO, ANTHONY RAYMOND 116,620 - 116,620 )( - - - -
373 Gudani, Vicente C 2,300 )( - - - 2,300 )( - 2,300 )(
374 Guevarra, Remedios 956 - - - 956 - 956
375 Gutierez, Jan Patrick 531 )( - - - 531 )( - 531 )(
376 Gutierrez, Mary Victory 252,000 84,000 224,000 )( - 112,000 - 112,000
377 HADLOS, ARVIN - - 900 )( 900 )( - 900 )(
378 HAGOSOJOS, BERNARDINO 1,384 660 - - 2,044 - 2,044
379 Halili, Marj Ingrid 1,800 )( - - - 1,800 )( - 1,800 )(
380 Hamero, Roselyn 7,875 9,000 7,875 )( - 9,000 - 9,000
381 HEIMBROD, CAMILLE CARMINA S - - 2,450 )( - 2,450 )( - 2,450 )(
382 HERNAL, NARY JOUYCE 681 - - - 681 - 681
383 HERNANDEZ, HAZEL ANNE A - - 1,955 )( - 1,955 )( - 1,955 )(
384 HERNANDEZ, Mary Hyacinth 1,800 )( - - - 1,800 )( - 1,800 )(
385 HERNANDEZ, PAMELA 20,850 15,362 38,758 )( - 2,546 )( - 2,546 )(
386 Hernandez, Paul 869 )( - - - 869 )( - 869 )(
387 HIDALGO, ERNEST VONDON M - - 1,190 )( - 1,190 )( - 1,190 )(
388 Hieras, Cydnie 800 )( 800 - - - - -
389 HOBO III, ROMULO G 640 )( 640 - - - - -
390 HOFILENA, RIZALDY 540 )( - - - 540 )( - 540 )(
391 Honorica, Wenceslao 16,625 - 7,125 )( - 9,500 - 9,500
392 HONTIVEROS, RYAN 2,026 )( - - - 2,026 )( - 2,026 )(
393 Hosingco, Bryan Darwin 680 )( - - - 680 )( - 680 )(
394 HUELAR, MARIA CORAZON 900 )( - 1,190 )( - 2,090 )( - 2,090 )(
395 HYATT, JANETH 2,044 - - - 2,044 - 2,044
396 Ignacio, Lourdes D. 606 - 738 )( - 132 )( - 132 )(
397 IMPORTADO, FERDINAND 658 )( 380 - - 278 )( - 278 )(
398 Inciong, Cherry Wyne 4,190 - - - 4,190 - 4,190
399 INSON, JESSAMAINE GAIL M 2,540 )( 1,300 400 )( - 1,640 )( - 1,640 )(
400 INTERNO, MARJIE 681 )( - - - 681 )( - 681 )(
401 IRENEO, RAFAEL 754 )( - - - 754 )( - 754 )(
402 Isip, Mark Gracer 7,875 - 7,875 )( - - - -
403 ISON, MARY ROSE 16,625 21,656 16,625 )( - 21,656 - 21,656
404 Israel, Marietta 19,762 )( - - - 19,762 )( - 19,762 )(
405 ISRAEL, WILFREDO S - - 2,450 )( - 2,450 )( - 2,450 )(
406 JABINES, AL VINCENT - - 1,800 )( - 1,800 )( - 1,800 )(
407 Jacinto, Archie 2,944 )( - - - 2,944 )( - 2,944 )(
408 JACOB III, ALVIN L - - 1,023 )( - 1,023 )( - 1,023 )(
409 JAVIER FILEMON RAY - - 1,680 )( - 1,680 )( - 1,680 )(
410 JAVIER, ROLAND PHILIP C - - 1,055 )( - 1,055 )( - 1,055 )(
411 JAYME, FATIMA WINNICLARE - 900 900 )( - - - -
412 JONSON, ANNA PAMELA 5,284 2,900 - - 8,184 - 8,184
413 JONSON, KISSARNE ALLYSA L 19,004 - 2,642 )( - 16,362 - 16,362
414 JUBAC JR., ANECITO. 1,800 )( - 495 )( - 2,295 )( - 2,295 )(
415 JULIAN, RAFAEL 1,581 )( - - - 1,581 )( - 1,581 )(
416 JULIANDA, SHIELA MAY 900 )( - - - 900 )( - 900 )(
417 JUMALON, NATHANIEL JOHN - - 1,800 )( - 1,800 )( - 1,800 )(
418 Jumamil, Ana Nelia 531 )( 4,307 - - 3,776 - 3,776
419 Junio, Nenitha 240 - - - 240 - 240
420 JUNTADO, DOMINIQUE 681 )( - - - 681 )( - 681 )(
421 Katigbak, Jovito Jose 1,080 )( - - - 1,080 )( - 1,080 )(
422 KAW, EUGENE 1,988 )( 460 460 )( - 1,988 )( - 1,988 )(
423 KILAKIGA, EDWARD 88,920 143,680 57,000 )( - 175,600 - 175,600
424 LABANGON, IRIANNE G - 900 900 )( - - - -
425 Lacaden, Raffy 363,119 - 28,000 )( - 335,119 - 335,119
426 LACHICA, ALAN 900 )( - - - 900 )( - 900 )(
427 LACHICA, PERLA 900 )( - - - 900 )( - 900 )(
428 LACORTE, LAARNI HANNAH C 900 )( - 900 - - - -
429 LACSON, ANNELYN 2,263 )( - - - 2,263 )( - 2,263 )(
430 Ladera, Renville 20,023 - - - 20,023 - 20,023
431 LADIC, RAINIER 900 )( - - - 900 )( - 900 )(
432 Laguimun,Armando - 10,245 273,130 )( - 262,885 )( - 262,885 )(
433 LALU, ERICKSON 2,720 )( - - - 2,720 )( - 2,720 )(
434 LANDAGAN, MYRA DELOS REYES 900 )( 900 - - - - -
435 Lantican, Mark Lixcel 56,000 - - - 56,000 - 56,000
436 Lantin, Rommel - 291 291 )( - - - -
437 LAPUZ, MARIA CARMEN B - 14,995 - - 14,995 - 14,995
438 LAPUZ, PAULA BIANCA P - - 2,450 )( - 2,450 )( - 2,450 )(
439 Las Pinas, Mary Grace 145,077 - 126,278 )( - 18,799 - 18,799
440 Laza, Benilda 3,755 - - - 3,755 - 3,755
441 Lazarte, Bernabe Jr 1,080 )( 753 753 )( - 1,080 )( - 1,080 )(
442 LAZO, REYMARK 1,281 - 2,280 )( - 999 )( - 999 )(
443 LEDESMA, GIAN CARLO 681 )( - - - 681 )( - 681 )(
444 LEDESMA, RODOLFO 1,436 )( 900 - 536 )( - 536 )(
Forward
Amounts CollectedAmounts Written-Off
FAR EASTERN UNIVERSITY, INCORPORATED AND SUBSIDIARIES
Schedule B - Amounts Receivable from Directors, Officers, Employees, Related Parties and Principal Stockholders (Other Than Related Parties)
MAY 31, 2021
Name and Designation of Debtor Additions
Deductions
Current Non-CurrentBalance at End of
Period

445 LEE, JASMIN 1,654 )( P 400 - - 1,254 )( P - 1,254 )( P
446 LEGASPI, AERON JOHN M - - 1,280 )( - 1,280 )( - 1,280 )(
447 LEGASPINA, HALIVIER 3,163 )( - - - 3,163 )( - 3,163 )(
448 LENGSON, MARIA OLIVIA 681 )( - - - 681 )( - 681 )(
449 LEUTERIO, JESSA C - - 2,450 )( - 2,450 )( - 2,450 )(
450 Licayan, Kebart 2,725 )( - - - 2,725 )( - 2,725 )(
451 LIM, IVY 3,119 )( - 2,703 )( - 5,822 )( - 5,822 )(
452 Lim, Jhon Nityananda 7,875 - 9,000 )( - 1,125 )( - 1,125 )(
453 Lim, Richmond 906 )( 906 - - - - -
454 Limson, Gladys Anne Marie 1,720 )( - - - 1,720 )( - 1,720 )(
455 Lirio, Mary Rose 2,344 - - - 2,344 - 2,344
456 Liwanag, Marichu 10,194 11,466 - - 21,660 - 21,660
457 LOGAN, GRACE - 4,744 - - 4,744 - 4,744
458 LONTOC, DON JONSON 647 )( - - - 647 )( - 647 )(
459 LOPEZ JR., ANASTACIO - 5,690 - - 5,690 - 5,690
460 LOPEZ, JILIAN VANESSA T 740 )( - - - 740 )( - 740 )(
461 LOPEZ, JOMELYN 83,125 - 83,125 )( - - - -
462 Lopez, Joseph 2,700 )( - - - 2,700 )( - 2,700 )(
463 Lopez, Martin Z. 115,706 - - - 115,706 - 115,706
464 Loresco, Justine James - - 1,800 )( - 1,800 )( - 1,800 )(
465 Luansing, Glenn 3,180 )( 1,900 820 )( - 2,100 )( - 2,100 )(
466 LUMABI, BETHANY 900 )( - - - 900 )( - 900 )(
467 MAALA, ALEXCEE 3,164 )( 360 - - 2,804 )( - 2,804 )(
468 Mabbagu, Reymund 1,800 )( - - - 1,800 )( - 1,800 )(
469 Mabuan, Romualdo 560 )( - - - 560 )( - 560 )(
470 Macadangdang Jr. Romulo 1,363 )( - - - 1,363 )( - 1,363 )(
471 MACALINAO. KAREN ANN - 415 415 )( - - - -
472 MACATUNO, JERRY 681 )( - - - 681 )( - 681 )(
473 MACLANG, EDWIN - 5,436 - - 5,436 - 5,436
474 Madriaga, Joventina 2,900 )( 2,900 - - - - -
475 Madrid, Lady DIANNE 681 )( - - - 681 )( - 681 )(
476 Madurar, A 39,666 - - - 39,666 - 39,666
477 MAGNO, ROSEMARIE 620 )( 620 - - - - -
478 MAGSALIN, CAMILLE 1,581 )( - - - 1,581 )( - 1,581 )(
479 MAGSINO, RIZA 3,593 )( - 720 )( - 4,313 )( - 4,313 )(
480 Magtibay, Marie Danielle 1,800 )( - - - 1,800 )( - 1,800 )(
481 Magumun, Van Angelo 1,528 380 - - 1,908 - 1,908
482 MALACURA, BILLY RAY 4,539 267 - - 4,806 - 4,806
483 MALLARI, EARL FRANCIS I - - 1,225 )( - 1,225 )( - 1,225 )(
484 MALLARI, MARIE JUNEAU 681 )( - - - 681 )( - 681 )(
485 Mallari, Neil Aldrin David 6,364 )( 840 - - 5,524 )( - 5,524 )(
486 Mallari, Roel 2,175 763 2,175 )( - 763 - 763
487 Malonzo, John 409 15,112 - - 15,521 - 15,521
488 MAMAAT, JOSE EDWARDO R - 19,000 2,120 )( - 16,880 - 16,880
489 MANALANG, FATIMA M - - 1,225 )( - 1,225 )( - 1,225 )(
490 Manalastas, Ma Barbara C 2,095 )( - 480 )( - 2,575 )( - 2,575 )(
491 MANANSALA, LORRAINE CHARMAYNE 1,117 )( - 1,390 )( - 2,507 )( - 2,507 )(
492 MANANSALA, MA. MELANIE 900 )( - - - 900 )( - 900 )(
493 MANANSALA, Mary Jane Joyce 1,800 )( - - - 1,800 )( - 1,800 )(
494 MANAOIS, FELY ROSE. 1,200 )( - - - 1,200 )( - 1,200 )(
495 Manarpiiz, Candido 226,347 )( - - - 226,347 )( - 226,347 )(
496 MANAS, KIREINA OTOKO M 1,140 )( 460 - - 680 )( - 680 )(
497 MANGUILIN, RAIZONELL 1,620 )( - 505 )( - 2,125 )( - 2,125 )(
498 MANIGAN, ALMA 49,875 57,000 52,250 )( - 54,625 - 54,625
499 MANILA, ANTONIO CEASAR 2,105 )( 2,568 348 )( - 115 - 115
500 Mano, Razna 2,860 )( 348 348 )( - 2,860 )( - 2,860 )(
501 Manongsong, Marie Joyce 1,869 )( 1,608 348 )( - 609 )( - 609 )(
502 Manzanares, William 1,800 )( - - - 1,800 )( - 1,800 )(
503 MANZANO, JOSEPH CHRISTIAN M - - 2,450 )( - 2,450 )( - 2,450 )(
504 MARANAN, CAROLINE 765 )( 540 - - 225 )( - 225 )(
505 MARCOS, PATRICIA 900 )( - - - 900 )( - 900 )(
506 Mariano, Maria Lourdes 61,041 - 57,375 )( - 3,666 - 3,666
507 Mariscotes, Maria Norlinda 3,409 435 - - 3,843 - 3,843
508 Martillo, Pocholo 645 - - - 645 - 645
509 Martinez, Maria Teresa 760 2,900 - - 3,660 - 3,660
510 Martinez, Oliver 1,363 )( - 1,800 )( 3,163 )( - 3,163 )(
511 MASA, JAN RACKY - 1,225 1,225 )( - - - -
512 MASANGCAY, JOHN ROY - 5,408 - - 5,408 - 5,408
513 MASANGYA, RAYMART 1,363 )( - - - 1,363 )( - 1,363 )(
514 MASAOAY, SHIELA MARIE 900 )( - - - 900 )( - 900 )(
515 MATANDAG, MARIVEL 1,138 )( - - - 1,138 )( - 1,138 )(
516 MATEO, AVERY PAUL 300 )( 300 - - - - -
517 MATEO, Pamela Ruth - - 1,800 )( - 1,800 )( - 1,800 )(
518 Medillo. Robert Joseph 414 )( 393 393 )( - 414 )( - 414 )(
519 MEDINA, RANNIE 2,372 299 - - 2,671 - 2,671
520 MENDENILLA, DONRICK 2,107 )( 1,680 - - 427 )( - 427 )(
521 MENDILLO, BENJAMIN 2,044 )( - - - 2,044 )( - 2,044 )(
522 Mendoza, Catherine 10,080 - - - 10,080 - 10,080
523 MENDOZA, FRANCIS ROBERT 19,920 - - - 19,920 - 19,920
524 Mendoza, Mariel - 62,708 - - 62,708 - 62,708
525 Mendoza, Norberto 3,445 9,411 3,445 )( - 9,411 - 9,411
526 MENESES, BENITA 1,843 )( - - - 1,843 )( - 1,843 )(
527 MERCADO, MARK JOSEPH 681 )( - - - 681 )( - 681 )(
528 Mercado, Ryan Christian 270 )( - - - 270 )( - 270 )(
529 MILANO, AMEERAH 2,726 )( - - - 2,726 )( - 2,726 )(
530 Miranda, Dennis 7,875 6,050 7,875 )( - 6,050 - 6,050
531 MOJICA, MICHAELA JAN 681 )( - - - 681 )( - 681 )(
532 Molina, Caryl Monique 7,875 - 7,875 )( - - - -
533 Molina, Mark Oliver 278,402 19,000 297,402 )( - - - -
534 MONDALA II, JONATHAN M - 38,000 2,375 )( - 35,625 - 35,625
535 Montinola, Antonio 115,680 - 100,000 )( - 15,680 - 15,680
536 Montinola, Aurelio 226,793 - 100,000 )( - 126,793 - 126,793
537 Montinola, Gianna 265,391 4,927 - - 270,318 - 270,318
538 Montinola, Juan Miguel R. 208,006 3,597,890 2,500,918 )( - 1,304,978 - 1,304,978
539 Monton, Jade 3,600 )( 3,600 - - - - -
540 MORAGA, MELVIN 2,683 )( 680 - - 2,003 )( - 2,003 )(
541 MORANTE, MARIA WILLA C - 483 483 )( - - - -
542 MORENO, BRYAN ANGELO - 7 - - 7 - 7
543 MUAN ,MARIA ETHEL - 2,087 - - 2,087 - 2,087
544 Muria, Ramel 4,022 )( 1,000 1,000 )( - 4,022 )( - 4,022 )(
545 MUTUC -- SHS 4,549 138,345 1,493 )( - 141,400 - 141,400
546 Nagal, Glenn Z. 6,479 )( 19,000 23,750 )( - 11,229 )( - 11,229 )(
547 Narval, Antonio G. 9,024 81,658 35,424 )( - 55,258 - 55,258
548 NATIVIDAD, JESSA MARIE 681 )( - - - 681 )( - 681 )(
549 Navarrete, Angelica 900 )( 900 - - - - -
550 Neo, Helen Azor cr from old 1,717 7,429 - - 9,146 - 9,146
551 NERIDA, CLARISSE MAE 90,045 - 27,593 )( - 62,452 - 62,452
552 NERY, LEO ANGELO 19,986 )( - - - 19,986 )( - 19,986 )(
553 NERY-CURA, MA. LOURDES S 2,700 )( 900 - - 1,800 )( - 1,800 )(
554 NG TSAI, FILBERT RICHERD N - - 2,100 )( - 2,100 )( - 2,100 )(
555 Nicolas, Lloyd Mark - 7,726 - - 7,726 - 7,726
Forward
Non-CurrentBalance at End of
PeriodAmounts CollectedAmounts Written-Off
FAR EASTERN UNIVERSITY, INCORPORATED AND SUBSIDIARIES
Schedule B - Amounts Receivable from Directors, Officers, Employees, Related Parties and Principal Stockholders (Other Than Related Parties)
MAY 31, 2021
Name and Designation of Debtor AdditionsDeductions
Current

556 Nierras Jr., Julius Felicisimo 7,875 P 6,050 P 1,125 )( P - 12,800 P - 12,800 P
557 Nisperos, Dulce Marie 1,250 - 1,250 )( - - - -
558 Nora, Jon Paolo 33,250 38,000 33,250 )( - 38,000 - 38,000
559 NOTARIO, ANTHONY 900 )( 900 - - - - -
560 NOVENARIO, IBRAHIM GIEM - 2,362 - - 2,362 - 2,362
561 NUCUM, JONALYN 45,985 - - - 45,985 - 45,985
562 NUESA, SHERISA P. 100,000 - 100,000 )( - - - -
563 NUNEZ, KRYZTL BOPEEP 681 )( - - - 681 )( - 681 )(
564 Nuqui, Paula Bianca 1,800 )( - - - 1,800 )( - 1,800 )(
565 Nuqui, Romeo 3,327 )( 9,059 - - 5,731 - 5,731
566 Obsid, Beatriz 1,800 )( - - - 1,800 )( - 1,800 )(
567 Ocampo, Wilfredo - OLD 17,775 20,753 7,125 )( - 31,403 - 31,403
568 OLIMPO, RHEA 380 )( - - - 380 )( - 380 )(
569 Olipany, Ruby - 15,504 - - 15,504 - 15,504
570 Olivo, Shirley 869 )( 869 - - 0 )( - 0 )(
571 ONDEVILLA, MIEL KRISTIAN 47,086 - - - 47,086 - 47,086
572 Ong, Johnson 2,300 - - - 2,300 - 2,300
573 ORBEGOSO, MICHAEL 1,320 )( - 927 )( - 2,247 )( - 2,247 )(
574 ORDIZ, LADY MAY P - 400 15,259 )( - 14,859 )( - 14,859 )(
575 ORDOÑA, MA. OLIVE GRACE - - 2,450 )( - 2,450 )( - 2,450 )(
576 ORMITA, LUZELLE 1,800 - - - 1,800 - 1,800
577 ORNUM, ROSARIO STEPHANIE F 900 )( 900 - - - - -
578 ORTUA, SHEREE ANN 900 )( - - - 900 )( - 900 )(
579 Pabiton, Jose Marlon 6,176 )( - - - 6,176 )( - 6,176 )(
580 Pablo, Victor 7,875 6,050 7,875 )( - 6,050 - 6,050
581 PADILLA, UNICE 680 )( - - - 680 )( - 680 )(
582 PADUAL, JENNIFER - 65,333 - - 65,333 - 65,333
583 Pahutan, Ludivinia 36,744 42,827 40,175 )( - 39,395 - 39,395
584 Pajuyo, Driselle 33,250 2,900 22,916 )( - 13,234 - 13,234
585 Palenzuela, Rowena 6,240 - - - 6,240 - 6,240
586 PALIS, FERNANDO 1,188 8,985 1,188 )( - 8,985 - 8,985
587 PALISOC, KATHERINE 900 )( 900 900 )( - 900 )( - 900 )(
588 PALPARAN, KAROLINE - 6,930 - - 6,930 - 6,930
589 PAMITTAN JR., GENEROSO 86,531 34,369 30,531 )( - 90,369 - 90,369
590 PANELA, KAREN LEE V. 681 - - - 681 - 681
591 Panesa, Isabelita 10,780 - 24,014 )( - 13,234 )( - 13,234 )(
592 Pangan, Eryka, Marie 1,800 )( - - - 1,800 )( - 1,800 )(
593 PAñO, DIANA ABIGAIL 141 348 348 )( - 141 - 141
594 PANTOLLA, HERNAN 1,800 )( - - - 1,800 )( - 1,800 )(
595 Parafina, Ria Zenice 1,240 )( - - - 1,240 )( - 1,240 )(
596 Paraiso, Lourdes Oliva- OLD 84,848 - - - 84,848 - 84,848
597 Paras, Eugene 2,304 )( 393 393 )( - 2,304 )( - 2,304 )(
598 PARAS, PERCIVAL 681 )( - - - 681 )( - 681 )(
599 PARCON, REY 746 )( 2,900 - - 2,154 - 2,154
600 Pascua, George 12,775 9,000 7,875 )( - 13,900 - 13,900
601 Pascua, Jennifer - OLD 45,628 2,900 - - 48,528 - 48,528
602 Pascual, Jhaydee 1,680 )( 1,680 620 )( - 620 )( - 620 )(
603 PASION, ELLINE ISABELLE 33,250 - 33,250 )( - - - -
604 PASON, ALVIN 1,800 )( 900 - - 900 )( - 900 )(
605 Patadlas, Marie Grace 1,119 )( - - - 1,119 )( - 1,119 )(
606 PATRICIO, STEPHEN SUCCOR 3,200 )( - - - 3,200 )( - 3,200 )(
607 Pe Benito, Galahad Richard 1,411 )( 370 370 )( - 1,411 )( - 1,411 )(
608 PE, MURPHY 1,363 )( - - - 1,363 )( - 1,363 )(
609 Pedregosa, Jeremy Floyd 7,626 )( 7,626 - - - - -
610 PEDRON, DIVINA 2,317 )( - - - 2,317 )( - 2,317 )(
611 Pelias, Christopher 9,719 - 8,758 )( - 961 - 961
612 PEñA, GIDEON 2,561 )( 708 708 )( - 2,561 )( - 2,561 )(
613 Peralis, Marie Dale 1,800 )( - - - 1,800 )( - 1,800 )(
614 PEREDA, JACQUELINE MARJORIE 1,880 )( 820 820 )( - 1,880 )( - 1,880 )(
615 PEREN, ANELYN - 2,703 - - 2,703 - 2,703
616 PEREZ, AIDILYN MAE - - 1,800 )( - 1,800 )( - 1,800 )(
617 PEREZ, WINNIE - 35,999 - - 35,999 - 35,999
618 PERILLO, CHERRIE MAE F - 38,000 - - 38,000 - 38,000
619 PERLAS, MARK ANECITO R. - - 2,460 )( - 2,460 )( - 2,460 )(
620 Permalino, Albert Emmanuel S. 7,061 - - - 7,061 - 7,061
621 PICHAY, Jane Laarni 2,720 )( 1,020 - - 1,700 )( - 1,700 )(
622 Pilapil, Angelo Carlo 1,680 )( 85 420 )( - 2,015 )( - 2,015 )(
623 PILAR, DULCE AMOR. 1,965 )( - - - 1,965 )( - 1,965 )(
624 Pineda, Annabelle SJ 1,800 )( - - - 1,800 )( - 1,800 )(
625 PINEDA, ROBERT 4,607 - 4,607 )( - - - -
626 PINZON, ROSARIO 1,427 )( 800 - - 627 )( - 627 )(
627 PITOC, MARK RAYMOND - - 620 )( - 620 )( - 620 )(
628 POBLACION, SAMANTHA 1,975 )( - - - 1,975 )( - 1,975 )(
629 Policarpio, Ma. Lourdes 1,000 )( 6,330 - - 5,330 - 5,330
630 Polido, Jelyca 49,453 57,000 57,000 )( - 49,453 - 49,453
631 PONELAS, RAQUEL E - 1,225 1,225 )( - - - -
632 PONES, RAYMOND 2,001 )( - 20 )( - 2,021 )( - 2,021 )(
633 PONSARAN, LEVY - 10,187 - - 10,187 - 10,187
634 PORTENTO, ALLAN J 100 )( - 100 )( - 200 )( - 200 )(
635 PORTUGAL, MERWIN R 900 )( 900 - - - - -
636 Prudencio, Philip 11,506 19,464 11,506 )( - 19,464 - 19,464
637 Pulido, Dennis 2,344 - - - 2,344 - 2,344
638 PUNZALAN, JEDDA 2,944 )( - 2,350 )( - 5,294 )( - 5,294 )(
639 Punzalan, Noel Oliver 1,320 )( - - - 1,320 )( - 1,320 )(
640 Quan, Ryan Jeremiah 1,965 )( 945 505 )( - 1,525 )( - 1,525 )(
641 QUERO, MARC DELVIN 820 )( - 640 )( - 1,460 )( - 1,460 )(
642 Quijencio Jr., Wilfredo 1,000 )( - - - 1,000 )( - 1,000 )(
643 Quinto, Myrna 797,376 760,242 820,573 )( - 737,044 - 737,044
644 RAGUINDIN, PRINCESS ZARLA J - - 2,450 )( - 2,450 )( - 2,450 )(
645 Ramirez, Percival 513 )( 14,221 - - 13,708 - 13,708
646 RAMO, PATRICIA LIANA 2,944 )( - - - 2,944 )( - 2,944 )(
647 RAMOS, CHRISTINE ANTONIETTE 2,700 )( 690 370 )( - 2,380 )( - 2,380 )(
648 RAMOS, GERARD ANDREW L - - 2,450 )( - 2,450 )( - 2,450 )(
649 RAMOS, JOHN ABRAHAM O - 1,225 1,225 )( - - - -
650 RAMOS, MARK ANTHONY 1,581 )( 900 - - 681 )( - 681 )(
651 Ramos, Rosemarie 27,206 19,000 28,650 )( - 17,556 - 17,556
652 RANCES, DOMNINA T - - 2,650 )( - 2,650 )( - 2,650 )(
653 RAñESES, MARLON 1,809 )( 900 - - 909 )( - 909 )(
654 RASGO, CRISTINA 540 )( - 1,165 )( - 1,705 )( - 1,705 )(
655 REAL JR, JOHN ROY ROBERT G. - 505 2,545 )( - 2,040 )( - 2,040 )(
656 Realin, John Guiller 1,062 )( - - - 1,062 )( - 1,062 )(
657 Rebosa, Antonio Alejandro 808 )( - - - 808 )( - 808 )(
658 RECTO, LUIS - - 920 )( - 920 )( - 920 )(
659 Refugia Jr., Manolo 7,875 6,050 1,125 )( - 12,800 - 12,800
660 Regalia, Marites R 960 )( - - - 960 )( - 960 )(
661 Rejano, Emrick Salven 1,800 )( - - - 1,800 )( - 1,800 )(
662 Relente, Miguelito 7,850 )( - - - 7,850 )( - 7,850 )(
663 RELINGO, JULIUS PAULO S - - 460 )( - 460 )( - 460 )(
664 RELUCIO, ROCHELLE ANN M - - 2,450 )( - 2,450 )( - 2,450 )(
665 REMOTO, DANTON - - 2,225 )( - 2,225 )( - 2,225 )(
666 REQUIDAN, JEROME 112,000 56,000 - 168,000 - 168,000
Forward
MAY 31, 2021
Name and Designation of Debtor AdditionsDeductions
Current Non-CurrentBalance at End of
PeriodAmounts CollectedAmounts Written-Off
FAR EASTERN UNIVERSITY, INCORPORATED AND SUBSIDIARIES
Schedule B - Amounts Receivable from Directors, Officers, Employees, Related Parties and Principal Stockholders (Other Than Related Parties)
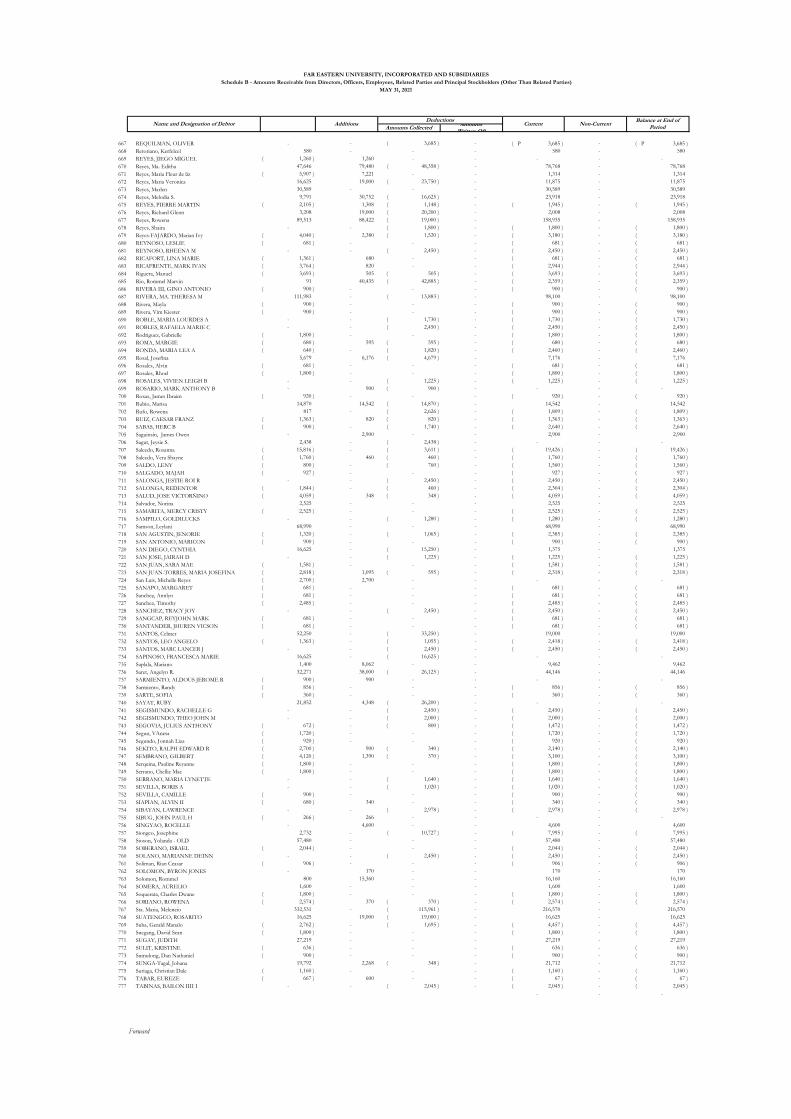
667 REQUILMAN, OLIVER - - 3,685 )( - 3,685 )( P - 3,685 )( P
668 Retoriano, Kerfelcel 580 - - - 580 - 580
669 REYES, JIEGO MIGUEL 1,260 )( 1,260 - - - - -
670 Reyes, Ma. Editha 47,646 79,480 48,358 )( - 78,768 - 78,768
671 Reyes, Maria Fleur de liz 5,907 )( 7,221 - - 1,314 - 1,314
672 Reyes, Maria Veronica 16,625 19,000 23,750 )( - 11,875 - 11,875
673 Reyes, Marlen 30,589 - - - 30,589 - 30,589
674 Reyes, Melodia S. 9,791 30,752 16,625 )( - 23,918 - 23,918
675 REYES, PIERRE MARTIN 2,105 )( 1,308 1,148 )( - 1,945 )( - 1,945 )(
676 Reyes, Richard Glenn 3,208 19,000 20,200 )( - 2,008 - 2,008
677 Reyes, Rowena 89,513 88,422 19,000 )( - 158,935 - 158,935
678 Reyes, Shaira - - 1,800 )( - 1,800 )( - 1,800 )(
679 Reyes-FAJARDO, Marian Ivy 4,040 )( 2,380 1,520 )( - 3,180 )( - 3,180 )(
680 REYNOSO, LESLIE 681 )( - - - 681 )( - 681 )(
681 REYNOSO, RHEENA M - - 2,450 )( - 2,450 )( - 2,450 )(
682 RICAFORT, LINA MARIE 1,361 )( 680 - - 681 )( - 681 )(
683 RICAFRENTE, MARK IVAN 3,764 )( 820 - - 2,944 )( - 2,944 )(
684 Riguera, Manuel 3,693 )( 505 505 )( - 3,693 )( - 3,693 )(
685 Rio, Rommel Marvin 91 40,435 42,885 )( - 2,359 )( - 2,359 )(
686 RIVERA III, GINO ANTONIO 900 )( - - - 900 )( - 900 )(
687 RIVERA, MA. THERESA M 111,983 - 13,883 )( - 98,100 - 98,100
688 Rivera, Mayla 900 )( - - - 900 )( - 900 )(
689 Rivera, Vim Kiester 900 )( - - - 900 )( - 900 )(
690 ROBLE, MARIA LOURDES A - - 1,730 )( - 1,730 )( - 1,730 )(
691 ROBLES, RAFAELA MARIE C - - 2,450 )( - 2,450 )( - 2,450 )(
692 Rodriguez, Gabrielle 1,800 )( - - - 1,800 )( - 1,800 )(
693 ROMA, MARGIE 680 )( 595 595 )( - 680 )( - 680 )(
694 RONDA, MARIA LEA A 640 )( - 1,820 )( - 2,460 )( - 2,460 )(
695 Rosal, Josefina 5,679 6,176 4,679 )( - 7,176 - 7,176
696 Rosales, Alvin 681 )( - - - 681 )( - 681 )(
697 Rosales, Rhoel 1,800 )( - - - 1,800 )( - 1,800 )(
698 ROSALES, VIVIEN LEIGH B - - 1,225 )( - 1,225 )( - 1,225 )(
699 ROSARIO, MARK ANTHONY B - 900 900 )( - - - -
700 Roxas, James Ibraim 920 )( - - - 920 )( - 920 )(
701 Rubio, Marisa 14,870 14,542 14,870 )( - 14,542 - 14,542
702 Rufo, Rowena 817 - 2,626 )( - 1,809 )( - 1,809 )(
703 RUIZ, CAESAR FRANZ 1,363 )( 820 820 )( - 1,363 )( - 1,363 )(
704 SABAS, HERC B 900 )( - 1,740 )( - 2,640 )( - 2,640 )(
705 Saguinsin, James Owen - 2,900 - - 2,900 - 2,900
706 Sagut, Jeysie S. 2,438 - 2,438 )( - - - -
707 Salcedo, Rosanna 15,816 )( - 3,611 )( - 19,426 )( - 19,426 )(
708 Salcedo, Vera Shayne 1,760 )( 460 460 )( - 1,760 )( - 1,760 )(
709 SALDO, LENY 800 )( - 760 )( - 1,560 )( - 1,560 )(
710 SALGADO, MAJAH 927 )( - - - 927 )( - 927 )(
711 SALONGA, JESTIE ROI R - - 2,450 )( - 2,450 )( - 2,450 )(
712 SALONGA, REDENTOR 1,844 )( - 460 )( - 2,304 )( - 2,304 )(
713 SALUD, JOSE VICTORÑINO 4,059 )( 348 348 )( - 4,059 )( - 4,059 )(
714 Salvador, Norina 2,525 - - - 2,525 - 2,525
715 SAMARITA, MERCY CRISTY 2,525 )( - - - 2,525 )( - 2,525 )(
716 SAMPILO, GOLDILUCKS - - 1,280 )( - 1,280 )( - 1,280 )(
717 Samson, Leylani 68,990 - - - 68,990 - 68,990
718 SAN AGUSTIN, JENORIE 1,320 )( - 1,065 )( - 2,385 )( - 2,385 )(
719 SAN ANTONIO, MARICON 900 )( - - - 900 )( - 900 )(
720 SAN DIEGO, CYNTHIA 16,625 - 15,250 )( - 1,375 - 1,375
721 SAN JOSE, JAIRAH D - - 1,225 )( - 1,225 )( - 1,225 )(
722 SAN JUAN, SARA MAE 1,581 )( - - - 1,581 )( - 1,581 )(
723 SAN JUAN-TORRES, MARIA JOSEFINA 2,818 )( 1,095 595 )( - 2,318 )( - 2,318 )(
724 San Luis, Michelle Reyes 2,700 )( 2,700 - - - - -
725 SANAPO, MARGARET 681 )( - - - 681 )( - 681 )(
726 Sanchez, Annlyn 681 )( - - - 681 )( - 681 )(
727 Sanchez, Timothy 2,485 )( - - - 2,485 )( - 2,485 )(
728 SANCHEZ, TRACY JOY - - 2,450 )( - 2,450 )( - 2,450 )(
729 SANGCAP, REYJOHN MARK 681 )( - - - 681 )( - 681 )(
730 SANTANDER, JHUREN VICSON 681 )( - - - 681 )( - 681 )(
731 SANTOS, Celmer 52,250 - 33,250 )( - 19,000 - 19,000
732 SANTOS, LEO ANGELO 1,363 )( - 1,055 )( - 2,418 )( - 2,418 )(
733 SANTOS, MARC LANCER J - - 2,450 )( - 2,450 )( - 2,450 )(
734 SAPINOSO, FRANCESCA MARIE 16,625 - 16,625 )( - - - -
735 Saplala, Mariano 1,400 8,062 - - 9,462 - 9,462
736 Saret, Angelyn R. 32,271 38,000 26,125 )( - 44,146 - 44,146
737 SARMIENTO, ALDOUS JEROME R 900 )( 900 - - - - -
738 Sarmiento, Randy 856 )( - - - 856 )( - 856 )(
739 SARTE, SOFIA 360 )( - - - 360 )( - 360 )(
740 SAYAT, RUBY 21,852 4,348 26,200 )( - - - -
741 SEGISMUNDO, RACHELLE G - - 2,450 )( - 2,450 )( - 2,450 )(
742 SEGISMUNDO, THEO JOHN M - - 2,000 )( - 2,000 )( - 2,000 )(
743 SEGOVIA, JULIUS ANTHONY 672 )( - 800 )( - 1,472 )( - 1,472 )(
744 Segun, VAnesa 1,720 )( - - - 1,720 )( - 1,720 )(
745 Segundo, Jonnah Liza 920 )( - - - 920 )( - 920 )(
746 SEKITO, RALPH EDWARD R 2,700 )( 900 340 )( - 2,140 )( - 2,140 )(
747 SEMBRANO, GILBERT 4,120 )( 1,390 370 )( - 3,100 )( - 3,100 )(
748 Serquina, Pauline Reyanne 1,800 )( - - - 1,800 )( - 1,800 )(
749 Serrano, Chellie Mae 1,800 )( - - - 1,800 )( - 1,800 )(
750 SERRANO, MARIA LYNETTE - - 1,640 )( - 1,640 )( - 1,640 )(
751 SEVILLA, BORIS A - - 1,020 )( - 1,020 )( - 1,020 )(
752 SEVILLA, CAMILLE 900 )( - - - 900 )( - 900 )(
753 SIAPIAN, ALVIN II 680 )( 340 - - 340 )( - 340 )(
754 SIBAYAN, LAWRENCE - - 2,978 )( - 2,978 )( - 2,978 )(
755 SIBUG, JOHN PAUL H 266 )( 266 - - - - -
756 SINGYAO, ROCELLE - 4,600 - - 4,600 - 4,600
757 Siongco, Josephine 2,732 - 10,727 )( - 7,995 )( - 7,995 )(
758 Sioson, Yolanda - OLD 57,480 - - - 57,480 - 57,480
759 SOBERANO, ISRAEL 2,044 )( - - - 2,044 )( - 2,044 )(
760 SOLANO, MARIANNE DEINN - - 2,450 )( - 2,450 )( - 2,450 )(
761 Soliman, Rian Ceasar 906 )( - - - 906 )( - 906 )(
762 SOLOMON, BYRON JONES - 170 - - 170 - 170
763 Solomon, Rommel 800 15,360 - - 16,160 - 16,160
764 SOMERA, AURELIO 1,600 - - - 1,600 - 1,600
765 Soquerata, Charles Dwane 1,800 )( - - - 1,800 )( - 1,800 )(
766 SORIANO, ROWENA 2,574 )( 370 370 )( - 2,574 )( - 2,574 )(
767 Sta. Maria, Melencio 332,531 - 115,961 )( - 216,570 - 216,570
768 SUATENGCO, ROSARITO 16,625 19,000 19,000 )( - 16,625 - 16,625
769 Suba, Gerald Manalo 2,762 )( - 1,695 )( - 4,457 )( - 4,457 )(
770 Sucgang, David Sean 1,800 )( - - - 1,800 )( - 1,800 )(
771 SUGAY, JUDITH 27,219 - - - 27,219 - 27,219
772 SULIT, KRISTINE 636 )( - - - 636 )( - 636 )(
773 Sumulong, Dan Nathaniel 900 )( - - - 900 )( - 900 )(
774 SUNGA-Tagal, Johana 19,792 2,268 348 )( - 21,712 - 21,712
775 Suriaga, Christian Dale 1,160 )( - - - 1,160 )( - 1,160 )(
776 TABAR, EUREZE 667 )( 600 - - 67 )( - 67 )(
777 TABINAS, BAILON IIII I - - 2,045 )( - 2,045 )( - 2,045 )(
- - -
Forward
Amounts CollectedAmounts Written-Off
FAR EASTERN UNIVERSITY, INCORPORATED AND SUBSIDIARIES
Schedule B - Amounts Receivable from Directors, Officers, Employees, Related Parties and Principal Stockholders (Other Than Related Parties)
MAY 31, 2021
Name and Designation of Debtor AdditionsDeductions
Current Non-CurrentBalance at End of
Period
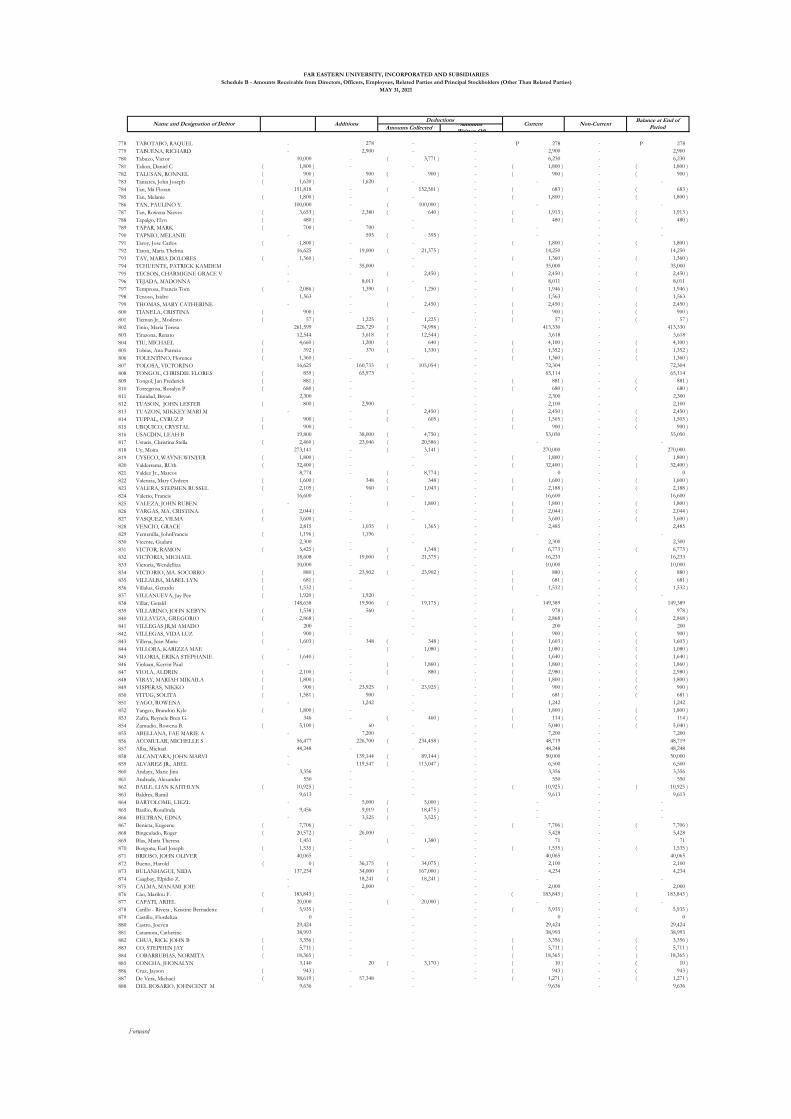
778 TABOTABO, RAQUEL - 278 - - 278 P - 278 P
779 TABUENA, RICHARD - 2,900 - - 2,900 - 2,900
780 Tabuzo, Victor 10,000 - 3,771 )( - 6,230 - 6,230
781 Talion, Daniel C 1,800 )( - - - 1,800 )( - 1,800 )(
782 TALUSAN, RONNEL 900 )( 900 900 )( - 900 )( - 900 )(
783 Tamares, John Joseph 1,620 )( 1,620 - - - - -
784 Tan, Ma Floran 151,818 - 152,501 )( - 683 )( - 683 )(
785 Tan, Melanie 1,800 )( - - - 1,800 )( - 1,800 )(
786 TAN, PAULINO Y. 100,000 - 100,000 )( - - - -
787 Tan, Rowena Nieves 3,653 )( 2,380 640 )( - 1,913 )( - 1,913 )(
788 Tapalgo, Elyn 480 )( - - - 480 )( - 480 )(
789 TAPAR, MARK 700 )( 700 - - - - -
790 TAPNIO, MELANIE - 595 595 )( - - - -
791 Taroy, Jose Carlos 1,800 )( - - - 1,800 )( - 1,800 )(
792 Taton, Maria Thelma 16,625 19,000 21,375 )( - 14,250 - 14,250
793 TAY, MARIA DOLORES 1,360 )( - - - 1,360 )( - 1,360 )(
794 TCHUENTE, PATRICK KAMDEM - 35,000 - - 35,000 - 35,000
795 TECSON, CHARMIGNE GRACE V - - 2,450 )( - 2,450 )( - 2,450 )(
796 TEJADA, MADONNA - 8,011 - - 8,011 - 8,011
797 Temprosa, Francis Tom 2,086 )( 1,390 1,250 )( - 1,946 )( - 1,946 )(
798 Tenoso, Isidro 1,563 - - - 1,563 - 1,563
799 THOMAS, MARY CATHERINE - - 2,450 )( - 2,450 )( - 2,450 )(
800 TIANELA, CRISTINA 900 )( - - - 900 )( - 900 )(
801 Ticman Jr., Modesto 57 )( 1,225 1,225 )( - 57 )( - 57 )(
802 Tinio, Maria Teresa 261,599 226,729 74,998 )( - 413,330 - 413,330
803 Tirazona, Renato 12,544 3,618 12,544 )( - 3,618 - 3,618
804 TIU, MICHAEL 4,660 )( 1,200 640 )( - 4,100 )( - 4,100 )(
805 Tobias, Ana Patricia 392 )( 370 1,330 )( - 1,352 )( - 1,352 )(
806 TOLENTINO, Florence 1,360 )( - - - 1,360 )( - 1,360 )(
807 TOLOSA, VICTORINO 16,625 160,733 105,054 )( - 72,304 - 72,304
808 TONGOL, CHRISDIE FLORES 859 )( 65,973 - - 65,114 - 65,114
809 Tongol, Jan Frederick 881 )( - - - 881 )( - 881 )(
810 Torregrosa, Rosalyn P 680 )( - - - 680 )( - 680 )(
811 Trinidad, Bryan 2,300 - - - 2,300 - 2,300
812 TUASON, JOHN LESTER 800 )( 2,900 - - 2,100 - 2,100
813 TUAZON, MIKKEY MARI M - - 2,450 )( - 2,450 )( - 2,450 )(
814 TUPPAL, CYRUZ P 900 )( - 605 )( - 1,505 )( - 1,505 )(
815 URQUICO, CRYSTAL 900 )( - - - 900 )( - 900 )(
816 USACDIN, LEAH B 19,800 38,000 4,750 )( - 53,050 - 53,050
817 Ustaris, Christina Stella 2,460 )( 23,046 20,586 )( - - - -
818 Uy, Moira 273,141 - 3,141 )( - 270,000 - 270,000
819 UYSECO, WAYNE WINTER 1,800 )( - - - 1,800 )( - 1,800 )(
820 Valderrama, RUth 32,400 )( - - - 32,400 )( - 32,400 )(
821 Valdez Jr., Marcos 8,774 - 8,774 )( - 0 - 0
822 Valencia, Mary Clydeen 1,600 )( 348 348 )( - 1,600 )( - 1,600 )(
823 VALERA, STEPHEN RUSSEL 2,105 )( 960 1,043 )( - 2,188 )( - 2,188 )(
824 Valerio, Francis 16,600 - - - 16,600 - 16,600
825 VALEZA, JOHN RUBEN - - 1,800 )( - 1,800 )( - 1,800 )(
826 VARGAS, MA. CRISTINA. 2,044 )( - - - 2,044 )( - 2,044 )(
827 VASQUEZ, VILMA 3,600 )( - - - 3,600 )( - 3,600 )(
828 VENCIO, GRACE 2,815 1,035 1,365 )( - 2,485 - 2,485
829 Ventenilla, JohnFrancis 1,196 )( 1,196 - - - - -
830 Vicente, Gudani 2,300 - - - 2,300 - 2,300
831 VICTOR, RAMON 5,425 )( - 1,348 )( - 6,773 )( - 6,773 )(
832 VICTORIA, MICHAEL 18,608 19,000 21,375 )( - 16,233 - 16,233
833 Victoria, Wendelliza 10,000 - - - 10,000 - 10,000
834 VICTORIO, MA. SOCORRO 880 )( 23,902 23,902 )( - 880 )( - 880 )(
835 VILLALBA, MABEL LYN 681 )( - - - 681 )( - 681 )(
836 Villaluz, Gerardo 1,532 )( - - - 1,532 )( - 1,532 )(
837 VILLANUEVA, Jay Pee 1,920 )( 1,920 - - - - -
838 Villar, Gerald 148,658 19,906 19,175 )( - 149,389 - 149,389
839 VILLARINO, JOHN KEBYN 1,538 )( 560 - - 978 )( - 978 )(
840 VILLAVIZA, GREGORIO 2,868 )( - - - 2,868 )( - 2,868 )(
841 VILLEGAS JR,M AMADO 200 - - - 200 - 200
842 VILLEGAS, VIDA LUZ 900 )( - - - 900 )( - 900 )(
843 Villena, Jean Marie 1,603 )( 348 348 )( - 1,603 )( - 1,603 )(
844 VILLORA, KARIZZA MAE - - 1,080 )( - 1,080 )( - 1,080 )(
845 VILORIA, ERIKA STEPHANIE 1,640 )( - - - 1,640 )( - 1,640 )(
846 Vinluan, Kervin Paul - - 1,860 )( - 1,860 )( - 1,860 )(
847 VIOLA, ALDRIN 2,100 )( - 880 )( - 2,980 )( - 2,980 )(
848 VIRAY, MARIAH MIKAILA 1,800 )( - - - 1,800 )( - 1,800 )(
849 VISPERAS, NIKKO 900 )( 23,925 23,925 )( - 900 )( - 900 )(
850 VITUG, SOLITA 1,581 )( 900 - - 681 )( - 681 )(
851 YAGO, ROWENA - 1,242 - - 1,242 - 1,242
852 Yangco, Brandon Kyle 1,800 )( - - - 1,800 )( - 1,800 )(
853 Zafra, Reynele Bren G. 346 - 460 )( - 114 )( - 114 )(
854 Zamudio, Rowena B. 5,100 )( 60 - - 5,040 )( - 5,040 )(
855 ABELLANA, FAE MARIE A - 7,200 - - 7,200 - 7,200
856 ACOMULAR, MICHELLE S 56,477 226,700 234,458 )( - 48,719 - 48,719
857 Alba, Michael 48,248 - - - 48,248 - 48,248
858 ALCANTARA, JOHN MARVI - 139,144 89,144 )( - 50,000 - 50,000
859 ALVAREZ JR., ABEL - 119,547 113,047 )( - 6,500 - 6,500
860 Andaya, Marie Jina 3,356 - - - 3,356 - 3,356
861 Andrade, Alexander 550 - - - 550 - 550
862 BAILE, LIAN KAITHLYN 10,925 )( - - - 10,925 )( - 10,925 )(
863 Baldres, Ramil 9,613 - - - 9,613 - 9,613
864 BARTOLOME, LIEZL - 5,000 5,000 )( - - - -
865 Basilio, Rosalinda 9,456 9,019 18,475 )( - - - -
866 BELTRAN, EDNA - 3,525 3,525 )( - - - -
867 Benicta, Eugeene 7,706 )( - - - 7,706 )( - 7,706 )(
868 Bingculado, Roger 20,572 )( 26,000 - - 5,428 - 5,428
869 Blas, Maria Theresa 1,451 - 1,380 )( - 71 - 71
870 Borgona, Earl Joseph 1,535 )( - - - 1,535 )( - 1,535 )(
871 BRIOSO, JOHN OLIVER 40,065 - - - 40,065 - 40,065
872 Bueno, Harold 0 )( 36,175 34,075 )( - 2,100 - 2,100
873 BULANHAGUI, NIDA 137,234 34,000 167,000 )( - 4,234 - 4,234
874 Caagbay, Elpidio Z. - 18,241 18,241 )( - - - -
875 CALMA, MANAMI JOIE - 2,000 - - 2,000 - 2,000
876 Cao, Marilou F. 183,843 )( - - - 183,843 )( - 183,843 )(
877 CAPATI, ARIEL 20,000 - 20,000 )( - - - -
878 Carillo - Rivera , Kristine Bernadette 5,935 )( - - - 5,935 )( - 5,935 )(
879 Castillo, Flordeliza 0 - - - 0 - 0
880 Castro, Joeven 29,424 - - - 29,424 - 29,424
881 Catamora, Catherine 38,993 - - - 38,993 - 38,993
882 CHUA, RICK JOHN B 3,356 )( - - - 3,356 )( - 3,356 )(
883 CO, STEPHEN JAY 5,711 )( - - - 5,711 )( - 5,711 )(
884 COBARRUBIAS, NORMITA 18,365 )( - - - 18,365 )( - 18,365 )(
885 CONCHA, JHONALYN 3,140 20 3,170 )( - 10 )( - 10 )(
886 Cruz, Jayson 943 )( - - - 943 )( - 943 )(
887 De Vera, Michael 58,619 )( 57,348 - - 1,271 )( - 1,271 )(
888 DEL ROSARIO, JOHNCENT M 9,636 - - 9,636 - 9,636
Forward
Non-CurrentBalance at End of
PeriodAmounts CollectedAmounts Written-Off
FAR EASTERN UNIVERSITY, INCORPORATED AND SUBSIDIARIES
Schedule B - Amounts Receivable from Directors, Officers, Employees, Related Parties and Principal Stockholders (Other Than Related Parties)
MAY 31, 2021
Name and Designation of Debtor AdditionsDeductions
Current

889 Del Rosario, Maria Theresa 1,576 )( P - - - 1,576 )( P - 1,576 )( P
890 DELA CRUZ, ALMA EMERITA V 30,531 )( - - - 30,531 )( - 30,531 )(
891 DELOS SANTOS, MARIE LENORE N 5,296 )( - - - 5,296 )( - 5,296 )(
892 DUKA, JHELMAR 50,063 587,816 546,216 )( - 91,663 - 91,663
893 EVIZA, ALYSSA FAYE R 3,314 )( 53,850 53,850 )( - 3,314 )( - 3,314 )(
894 FENNIS, ROGELYN 1,569 )( - - - 1,569 )( - 1,569 )(
895 FERNANDEZ, MAGDALAINE - 14,582 14,182 )( - 400 - 400
896 Flores, Roberto 11,500 )( 11,500 - - - - -
897 Fulgar III, Ildefonso 116 - - - 116 - 116
898 Galang Jr., Romeo 540 - 540 )( - - - -
899 GARCIA, MERRIE CAROLYNE 492 )( - - - 492 )( - 492 )(
900 Gonzales, Emmanuel 7,419 - 7,419 )( - - - -
901 Gonzales, Jayson 4,972 - - - 4,972 - 4,972
902 GONZALES, MARK NIKCO 2,259 - 1,150 )( - 1,109 - 1,109
903 GOQUINGCO, ANTHONY RAYMOND 117,680 )( 116,620 - - 1,060 )( - 1,060 )(
904 Grasparil, James Andrew 832 - 4,603 )( - 3,771 )( - 3,771 )(
905 HERNANDEZ, PAMELA 3,750 )( - - - 3,750 )( - 3,750 )(
906 Inciong, Cherry Wyne 14,000 51,875 25,125 )( - 40,750 - 40,750
907 JINTALAN, JOSEPH - 4,100 4,100 )( - - - -
908 JONSON, KISSARNE ALLYSA L 152,688 14,457 25,707 )( - 141,438 - 141,438
909 Junio, Nenitha 23,531 )( - - - 23,531 )( - 23,531 )(
910 KILAKIGA, EDWARD 2,000,000 100,000 2,100,001 )( - 1 )( - 1 )(
911 Lacaden, Raffy 28,000 )( 28,000 - - - - -
912 LAMSEN, JUDY ANN G 9,347 )( 9,347 - - - - -
913 Landicho, Jerrold 65,678 )( 62,922 )( 32,576 - 96,024 )( - 96,024 )(
914 LARANANG, ARIANE 31,000 3,474 34,474 )( - - - -
915 Las Pinas, Mary Grace 145,767 )( 207,024 61,257 )( - - - -
916 Laza, Benilda 34,281 6,000 - - 40,281 - 40,281
917 Lim, Richmond 40,065 - 906 )( - 39,159 - 39,159
918 LIPATA, URIEL PATRICK 2,922 - - - 2,922 - 2,922
919 Liwanag, Marichu 10,194 )( 26,400 12,000 )( - 4,206 - 4,206
920 Lopez, Martin Z. 305,704 5,365 135,365 )( - 175,704 - 175,704
921 LUNA, GINA - 94,200 62,800 )( - 31,400 - 31,400
922 Madriaga, Joventina 11,287 - 2,900 )( - 8,387 - 8,387
923 MAMAAT, JOSE EDWARDO 23,585 - - - 23,585 - 23,585
924 MANUEL, MA. ROWENA 16,200 - - - 16,200 - 16,200
925 MARANAN, ARNOLD 943 14,385 )( 33,385 - 19,943 - 19,943
926 Martillo, Pocholo 1 - - - 1 - 1
927 MASANGKAY,FREDERICK R 79,939 42,306 42,306 )( - 79,939 - 79,939
928 MATAMMU, LULETTE - 10,000 - - 10,000 - 10,000
929 Mendoza. Sophia - 4,000 - - 4,000 - 4,000
930 MILANEZ, GIOVANNI 47,402 48,879 39,769 )( - 56,512 - 56,512
931 Mintu, Cynthia 780 )( - - - 780 )( - 780 )(
932 Molina, Mark Oliver 506,313 )( 560,312 426,149 )( - 372,150 )( - 372,150 )(
933 Montinola, Antonio 86,840 - - - 86,840 - 86,840
934 Montinola, Juan Miguel R. 33,439 )( 33,439 - - - - -
935 Narval, Antonio G. 5,282 - 5,282 )( - - - -
936 NATIVIDAD, REUBEN RAMIRO 0 - - - 0 - 0
937 Neo, Helen Azor 3,262 - - - 3,262 - 3,262
938 NERIDA, CLARISSE MAE T 9,141 15,968 25,109 )( - 0 )( - 0 )(
939 Nisperos, Dulce Marie 1,250 )( 1,250 - - - - -
940 OCTA, KENNEDY P 3,559 13,953 14,652 )( - 2,860 - 2,860
941 Olivo, Shirley 6,765 - 869 )( - 5,896 - 5,896
942 ORDIZ, LADY MAY P 400 - 400 )( - - - -
943 ORMITA, LUZELLE ANNE 54,325 183,592 229,292 )( - 8,625 - 8,625
944 Pajuyo, Driselle 48,695 - - - 48,695 - 48,695
945 PAMITTAN JR., GENEROSO 30,531 )( 30,531 - - - - -
946 Pascua, Jennifer - 25,000 25,000 )( - - - -
947 PASION, ELLINE ISABELLE - 12,000 12,000 )( - - - -
948 Pedregosa, Jeremy Floyd 11,873 - 7,626 )( - 4,248 - 4,248
949 Peren, Anelyn 0 )( - - - 0 )( - 0 )(
950 Polido, Jelyca 1 )( - - - 1 )( - 1 )(
951 Quinto, Myrna 81,998 - - - 81,998 - 81,998
952 Ramos, Rosemarie 21 )( 21 - - 0 - 0
953 Relente, Miguelito 6,837 )( - - - 6,837 )( - 6,837 )(
954 REMIENDO, NORA LIZA - 81,720 81,720 )( - - - -
955 Requidan, Jerome 56,000 )( - 56,000 )( - 112,000 )( - 112,000 )(
956 RIVERA, MA. THERESA M 15,336 - - - 15,336 - 15,336
957 Rosal, Josefina 47,500 - 47,500 )( - - - -
958 Saguinsin, James Owen 500 - - - 500 - 500
959 Sagut, Jeysie S. 1,384 - - - 1,384 - 1,384
960 Salcedo, Rosanna 11,782 - - - 11,782 - 11,782
961 Saldivar, Adelaida 20 )( - - - 20 )( - 20 )(
962 Santos, Marie Lenore 3,536 - - - 3,536 - 3,536
963 SANTOS, MELANNIE C 140 - - - 140 - 140
964 SELDA, KAREN LAINE (June2019) 12,400 - - - 12,400 - 12,400
965 Sido, Ma. Victoria 58,156 - 79,226 )( - 21,070 )( - 21,070 )(
966 Sombilon, Imelda - 11,400 11,400 )( - - - -
967 SORIA, EULEGIO 79 - - - 79 - 79
968 Sta. Maria, Melencio 109,432 )( 109,432 - - 0 - 0
969 TABUENA, RICHARD 16,086 - - - 16,086 - 16,086
970 Tabuzo, Victor 11,751 )( 10,000 - - 1,751 )( - 1,751 )(
971 Talampas, Maria Cristina 340,000 - 340,000 )( - - - -
972 Talusan, Danilo B. 9,962 - - - 9,962 - 9,962
973 TCHUENTE, PATRICK KAMDEM - 35,000 - - 35,000 - 35,000
974 Tem, Joselito 10,118 - - - 10,118 - 10,118
975 TENORIO, MARY JANE 210 )( - - - 210 )( - 210 )(
976 Tinio, Maria Teresa 36,998 )( 36,998 - - - - -
977 TUASON, JOHN LESTER 52,890 37,750 65,640 )( - 25,000 - 25,000
978 Valdez Jr., Marcos 117 - - - 117 - 117
979 Valencia, Jean Pauline 29,737 14,878 79,719 )( - 35,104 )( - 35,104 )(
980 VICTORIA, MICHAEL - 52,590 52,590 )( - - - -
981 VILLAROSA, DEAN T 65 )( - - - 65 )( - 65 )(
982 Visda, Eric John 1 )( - - - 1 )( - 1 )(
983 Yago, Rowena - 27,998 27,998 )( - - - -
984 Yap, Avelina 30,385 )( 9,405 - - 20,980 )( - 20,980 )(
985 YAP, SANDRA 85,958 - - - 85,958 - 85,958
986 YSLA, MARK SALVADOR 148 )( - - - 148 )( - 148 )(
987 Zamudio, Rowena B. 5,823 1,977 7,800 )( - - - -
Others 3,209,447 - 2,642,553 )( - 566,894 - 566,894
Total for Parent Company 13,892,913 P 12,349,974 P 16,297,418 )( P - 9,945,470 P - 9,945,470 P
Advances to officers and employees - subsidiaries 7,232,658 P
TOTAL 17,178,128 P
Note:The total amount is reported as Advances to Officers and Employees under the Trade and Other Receivables account in the 2021 consolidated statement of financial position .
MAY 31, 2021
Name and Designation of Debtor AdditionsDeductions
Current Non-CurrentBalance at End of
PeriodAmounts CollectedAmounts Written-Off
FAR EASTERN UNIVERSITY, INCORPORATED AND SUBSIDIARIES
Schedule B - Amounts Receivable from Directors, Officers, Employees, Related Parties and Principal Stockholders (Other Than Related Parties)

FEU 706,271,422 P
Reimbursement of expenses 100,005,265 P 10,874,994 P - - 110,880,259 P - 110,880,259 P
Noninterest-bearing advances 235,564,735 - - - 235,564,735 - 235,564,735
Rental receivable 41,612,940 74,834,967 88,517,512 )( - 27,930,395 - 27,930,395
Dividend receivables 39,998,000 119,999,382 159,997,382 )( - - - -
417,180,940 P 205,709,343 P 248,514,894 )( P - 374,375,389 P - 374,375,389 P
FRC
Rental receivable 30,160,971 P 134,808,470 P 151,419,599 )( P - 13,549,842 P - 13,549,842 P
FECSI
Reimbursement of expenses 268,528 P 80,867 P - - 349,395 P - 349,395 P
EACCI
Interest-bearing loans to FEU Alabang, inclusive of interest 207,000,000 P 10,086,323 P - - - 217,086,323 P 217,086,323 P
Interest-bearing loans to FEU, inclusive of interest 10,044,611 - 10,044,611 )( - - - -
217,044,611 P 10,086,323 P 10,044,611 )( P - - 217,086,323 P 217,086,323 P
FEU High School, Inc.
Interest-bearing loans to FEU, inclusive of interest 162,889,831 P 382,400,000 P 444,379,358 )( P - 100,910,473 P - 100,910,473 P
Amounts CollectedAmounts Written-Off
THE FAR EASTERN UNIVERSITY, INCORPORATED AND SUBSIDIARIES
Schedule C - Amounts Receivable from Related Parties Which are Eliminated During the Consolidation of Financial Statements
MAY 31, 2021
Name and Designation of DebtorBalance at
Beginning of PeriodAdditions
Deductions
Current Non-CurrentBalance at End of
Period

Intangible Asset
Goodwill 186,487,019 P - - - - 186,487,019 P
Other Current Assets
Prepaid expenses 58,324,013 P - 1,303,097 )( P - - 57,020,916 P
Short-term investments 64,562,591 32,351,249 )( - - - 32,211,342
Input value-added tax (VAT) - net 30,981,305 3,532,631 )( 23,830,689 )( - - 3,617,985
Others 20,095,438 14,351,568 - - - 34,447,006
173,963,347 P 21,532,313 )( P 25,133,786 )( P - - 127,297,249 P
Other Non-current Assets
Advances to developers and suppliers 162,215,170 P 7,628,389 P - - - 169,843,559 P
Refundable deposits 16,235,991 6,583,827 - - - 22,819,818
Investment in time deposits 11,280,724 3,120,239 3,694,963 )( - - 10,706,000
Others 1,183,289 1,183,289 )( - - - -
190,915,174 P 16,149,166 P 3,694,963 )( P - - 203,369,377 P
Charged to Cost and Expenses
Charged to Other Accounts
Other Changes
Additions (Deductions)
THE FAR EASTERN UNIVERSITY, INCORPORATED AND SUBSIDIARIES
Schedule D - Intangible Assets / Other Assets
MAY 31, 2021
DescriptionBalance at Beginning
of Period
Additions (Disposals or Deductions)
at Cost
Deductions
Balance at End of Period
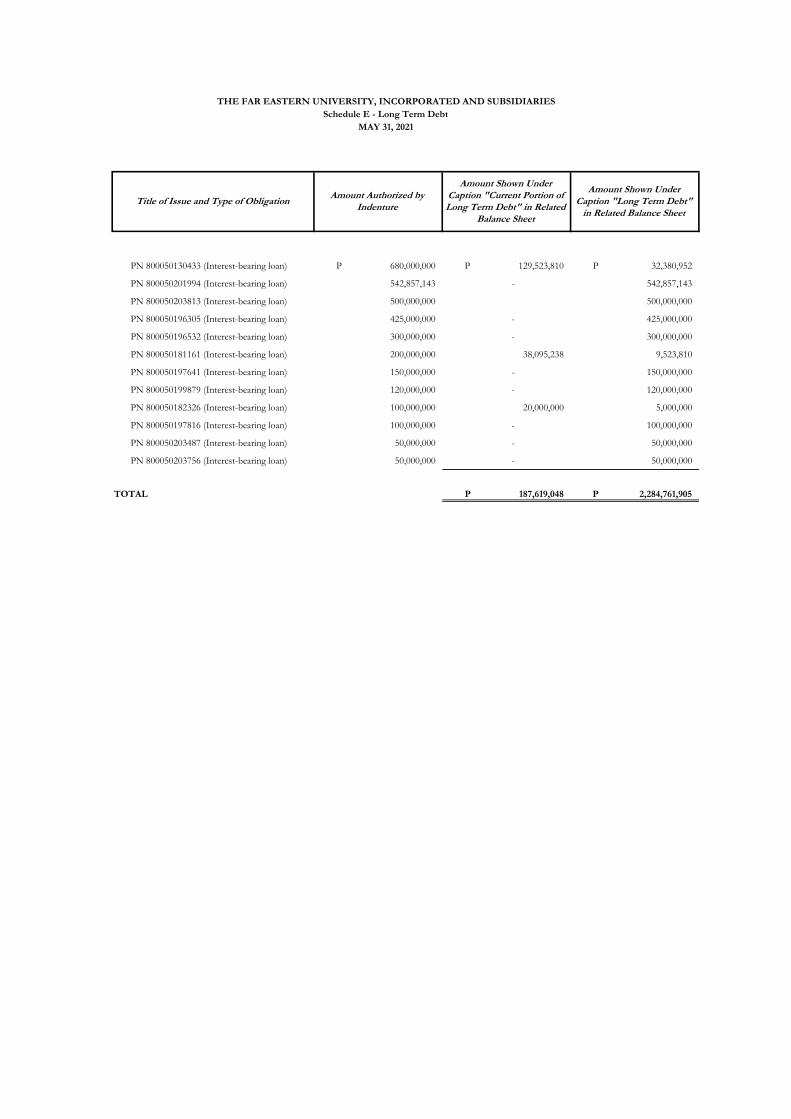
PN 800050130433 (Interest-bearing loan) 680,000,000 P 129,523,810 P 32,380,952 P
PN 800050201994 (Interest-bearing loan) 542,857,143 - 542,857,143
PN 800050203813 (Interest-bearing loan) 500,000,000 500,000,000
PN 800050196305 (Interest-bearing loan) 425,000,000 - 425,000,000
PN 800050196532 (Interest-bearing loan) 300,000,000 - 300,000,000
PN 800050181161 (Interest-bearing loan) 200,000,000 38,095,238 9,523,810
PN 800050197641 (Interest-bearing loan) 150,000,000 - 150,000,000
PN 800050199879 (Interest-bearing loan) 120,000,000 - 120,000,000
PN 800050182326 (Interest-bearing loan) 100,000,000 20,000,000 5,000,000
PN 800050197816 (Interest-bearing loan) 100,000,000 - 100,000,000
PN 800050203487 (Interest-bearing loan) 50,000,000 - 50,000,000
PN 800050203756 (Interest-bearing loan) 50,000,000 - 50,000,000
TOTAL 187,619,048 P 2,284,761,905 P
Title of Issue and Type of ObligationAmount Authorized by
Indenture
Amount Shown Under Caption "Current Portion of Long Term Debt" in Related
Balance Sheet
Amount Shown Under Caption "Long Term Debt" in Related Balance Sheet
THE FAR EASTERN UNIVERSITY, INCORPORATED AND SUBSIDIARIES
Schedule E - Long Term Debt
MAY 31, 2021

Balance at Beginning of Year
Balance at End of Year
Name of Related Party
-- Nothing to report --
THE FAR EASTERN UNIVERSITY, INCORPORATED AND SUBSIDIARIES
Schedule F - Indebtedness to Related Parties
MAY 31, 2021

Number of Shares Authorized
Number of Shares Issued and
Outstanding as Shown Under Related
Balance Sheet Caption
Number of Shares Reserved for Options, Warrants, Conversion and Other Rights
Number of Shares Held by Related
Parties
Directors, Officers and Employees
Others
Common shares - P100 par value 50,000,000 24,055,763 - 14,445,198 1,594,829 -
THE FAR EASTERN UNIVERSITY, INCORPORATED AND SUBSIDIARIES
Schedule H - Capital Stock
MAY 31, 2021
Title of Issue

Punongbayan & Araullo
20th Floor, Tower 1
The Enterprise Center
6766 Ayala Avenue
1200 Makati City
Philippines
T +63 2 8988 2288
Certified Public AccountantsCertified Public AccountantsCertified Public AccountantsCertified Public Accountants
Punongbayan & Araullo (P&A) is the Philippine member firm of Grant Thornton International Ltd.
Offices in Cavite, Cebu, Davao
BOA/ PRC Cert of Reg. No. 0002
SEC Accreditation No. 0002
grantthornton.com.phgrantthornton.com.phgrantthornton.com.phgrantthornton.com.ph
Report of Independent Auditors
to Accompany Supplementary
Information Required by the
Securities and Exchange Commission
Filed Separately from
the Basic Financial Statements
The Board of Trustees and the Stockholders
Far Eastern University, Incorporated
Nicanor Reyes, Sr. Street
Sampaloc, Manila
We have audited, in accordance with Philippine Standards on Auditing, the financial statements of Far Eastern University, Incorporated for the year ended May 31, 2021, on which we have rendered our report dated August 17, 2021. Our audit was made for the purpose of forming an opinion on the basic financial statements taken as a whole. The following applicable supplementary information are presented for purposes of additional analysis in compliance with the requirements under the Revised Securities Regulation Code Rule 68, and are not required part of the basic financial statements prepared in accordance with Philippine Financial Reporting Standards.
a. Reconciliation of Retained Earnings Available for Dividend Declaration; and,
b. Map showing the Relationship Between and among the University and its Related Parties.

Certified Public AccountantsCertified Public AccountantsCertified Public AccountantsCertified Public Accountants
Punongbayan & Araullo (P&A) is the Philippine member firm of Grant Thornton International Ltd.
- 2 -
Such supplementary information are the responsibility of management. The supplementary information have been subjected to the auditing procedures applied in the audit of the basic financial statements and, in our opinion, are fairly stated in all material respects in relation to the basic financial statements taken as a whole.
PUNONGBAYAN & ARAULLO
By: Mailene Sigue-Bisnar Partner
CPA Reg. No. 0090230
TIN 120-319-128
PTR No. 8533222, January 4, 2021, Makati City
SEC Group A Accreditation
Partner - No. 0396-AR-3 (until Oct. 1, 2021)
Firm - No. 0002 (until Dec. 31, 2024)
BIR AN 08-002511-020-2020 (until Dec. 21, 2023)
Firm’s BOA/PRC Cert. of Reg. No. 0002 (until Aug. 27, 2024)
August 17, 2021

Unappropriated Retained Earnings at Beginning of Year
As previously reported 1,210,901,742 P
Prior Years’ Outstanding Reconciling Items, net of tax
Deferred tax income 6,329,100 )(
Unappropriated Retained Earnings Available for
Dividend Declaration at Beginning of Year, as Adjusted 1,204,572,642
Net Profit Realized during the Year
Net profit per audited financial statements 456,910,828
Non-actual/unrealized income, net of tax −
Unrealized foreign exchange loss 24,185,074
Deferred tax income 1,272,473 25,457,547
482,368,375
Other Transactions During the Year
Reversal of appropriations during the year 1,065,500,000
Dividends declared 192,446,104 )( 873,053,896
Unappropriated Retained Earnings Available for
Dividend Declaration at End of Year 2,559,994,913 P
THE FAR EASTERN UNIVERSITY, INCORPORATED
Nicanor Reyes Street, Sampaloc, Manila
Reconciliation of Retained Earnings Available for Dividend Declaration
For the Year Ended May 31, 2021

Note:
Percentages indicated pertain to FEU’s effective ownership over the respective related parties, which are also disclosed in the consolidated financial statements.
FAR EASTERN UNIVERSITY, INCORPORATED AND SUBSIDIARIES
Map Showing the Relationships Between and Among the University and Its Related Parties
May 31, 2021
Far Eastern University, Incorporated (FEU)
Parent Company
Far Eastern College -
Silang, Inc. (FECSI)
Subsidiary - 100%
East Asia Computer Center, Inc. (EACCI)
Subsidiary - 100%
FEU Alabang, Inc. (FEUAI)
Subsidiary - 100%
FEU High School, Inc.
(FEU High)
Subsidiary - 100%
Fern Realty Corporation (FRC)
Subsidiary -38.18%
Rosevelt College, Inc.(RCI)
Subsidiary - 97.43%
RC Educational Enterprises Corporation (RCEE)
Edustria Incorporated
Subsidiary - 51%
Punongbayan & Araullo
20th Floor, Tower 1
The Enterprise Center
6766 Ayala Avenue
1200 Makati City
Philippines
T +63 2 8988 2288
a
Certified Public Accountants
Punongbayan & Araullo (P&A) is the Philippine member firm of Grant Thornton International Ltd.
Offices in Cavite, Cebu, Davao
BOA/ PRC Cert of Reg. No. 0002
SEC Accreditation No. 0002
grantthornton.com.ph
Report of Independent Auditors
on Components of
Financial Soundness Indicators
The Board of Trustees and the Stockholders Far Eastern University, Incorporated Nicanor Reyes Street, Sampaloc, Manila
We have audited, in accordance with Philippine Standards on Auditing, the consolidated
financial statements of Far Eastern University, Incorporated and subsidiaries (the Group) for
the years ended May 31, 2021, 2020 and 2019, on which we have rendered our report dated
August 17, 2021. Our audit was made for the purpose of forming an opinion on the basic
consolidated financial statements taken as a whole. The Supplementary Schedule on Financial
Soundness Indicators, including their definitions, formulas, calculation, and their
appropriateness or usefulness to the intended users, are the responsibility of the Group’s
management. These financial soundness indicators are not measures of operating
performance defined by Philippine Financial Reporting Standards (PFRS) and may not be
comparable to similarly titled measures presented by other companies. This schedule is
presented for the purposes of complying with the Revised Securities Regulation Code Rule 68
issued by the Securities and Exchange Commission, and is not a required part of the basic
consolidated financial statements prepared in accordance with PFRS. The components of
these financial soundness indicators have been traced to the Group’s consolidated financial
statements as at May 31, 2021, 2020 and 2019 and for each of the three years in the period
ended May 31, 2021 and no material exceptions were noted.
PUNONGBAYAN & ARAULLO
By: Mailene Sigue-Bisnar Partner CPA Reg. No. 0090230 TIN 120-319-128 PTR No. 8533222, January 4, 2021, Makati City SEC Group A Accreditation Partner - No. 0396-AR-3 (until Oct. 1, 2021) Firm - No. 0002 (until Dec. 31, 2024) BIR AN 08-002511-020-2020 (until Dec. 21, 2023) Firm’s BOA/PRC Cert. of Reg. No. 0002 (until Aug. 27, 2024)
August 17, 2021

Formula 2021 2020 2019
Current ratio Total Current Assets 2.35 1.56 1.21
Total Current Liabilities
Acid test ratio Cash and cash equivalents + Trade and other
receivables - net + Investments 2.23 1.48 1.13
Total Current Liabilities
Debt-to-asset ratio Total Liabilities 0.27 0.31 0.30
Total Assets
Equity-to-asset ratio Total Equity 0.73 0.69 0.70
Total Assets
Debt-to-equity ratio Total Liabilities 0.37 0.46 0.43
Total Equity
Assets-to-equity ratio Total Assets 1.37 1.46 1.43
Total Equity
Interest rate coverage ratio Earnings before Interest and Taxes 17.23 7.94 10.83
Interest Expense
Return on equity Net Profit 9% 7% 9%
Total Equity
Return on assets Net Profit 6% 5% 6%
Total Assets
Earnings per share Net Profit 40.28 P 25.92 P 31.41 P
Average outstanding shares
FAR EASTERN UNIVERSITY, INCORPORATED AND SUBSIDIARIES
Supplemental Schedule of Financial Soundness Indicators
May 31, 2021, 2020 and 2019
Indicators
Ratios / Percentages/ Amounts