PRELIMINARY OFFICIAL STATEMENT DATED ... - EMMA.MSRB.org.
354
NEW ISSUE-FULL BOOK ENTRY NOT RATED In the opinion of Jones Hall, A Professional Law Corporation, San Francisco, California, Bond Counsel, subject, however to certain qualifications described herein, under existing law, the interest on the 2015 Bonds is excluded from gross income for federal income tax purposes and such interest is not an item of tax preference for purposes of the federal alternative minimum tax imposed on individuals and corporations, although for the purpose of computing the alternative minimum tax imposed on certain corporations, such interest is taken into account in determining certain income and earnings. In the further opinion of Bond Counsel, such interest is exempt from California personal income taxes. See "TAX MATTERS" herein. $7,260,000 WESTERN HILLS WATER DISTRICT DIABLO GRANDE COMMUNITY FACILITIES DISTRICT NO. 1 SPECIAL TAX REFUNDING BONDS SERIES 2015 Dated: Date of Delivery Due: September 1, as shown below The $7,260,000 Western Hills Water District Diablo Grande Community Facilities District No. 1 Special Tax Refunding Bonds Series 2015 (the "2015 Bonds") are being issued by the Western Hills Water District (the "Water District") by and through its Diablo Grande Community Facilities District (the "District"). The 2015 Bonds are special tax obligations of the Water District, authorized pursuant to the Mello-Roos Community Facilities Act of 1982, as amended, being California Government Code Section 53311, et seq. (the "Mello-Roos Act"), and are issued pursuant to a Fiscal Agent Agreement dated as of August 1, 2001 and supplements thereto, by and between the Water District and The Bank of New York Mellon Trust Company, N.A., as Fiscal Agent. The 2015 Bonds are secured by Special Taxes (described herein) on parity with $38,450,000 outstanding principal amount of bonds issued by the Water District in 2014. The 2015 Bonds are issued to (i) refund certain outstanding bonds previously by the District in 2005; (ii) fund a reserve account; and (iii) to pay the costs of issuance of the 2015 Bonds. Interest on the 2015 Bonds is payable March 1, 2016, and thereafter semiannually on March 1 and September 1 of each year. The 2015 Bonds are being issued as fully registered bonds, registered in the name of Cede & Co. as nominee of The Depository Trust Company, New York, New York ("DTC"), and will be available to ultimate purchasers in the denomination of $5,000 or any integral multiple thereof, under the book-entry system maintained by DTC. See "APPENDIX H – BOOK-ENTRY SYSTEM." The 2015 Bonds are secured by and payable, on a parity with bonds issued in 2014, from a pledge of annual Special Taxes (as defined herein) to be levied by the Water District on real property within the boundaries of the District, from the proceeds of any foreclosure actions brought following a delinquency in the payment of the Special Taxes, and from amounts held in certain funds under the Fiscal Agent Agreement, all as more fully described herein. Land within the District consists of completed homes, land under development, and unimproved land planned for a primarily residential development in an area of Stanislaus County known as "Diablo Grande" near the City of Patterson. Unpaid Special Taxes do not constitute a personal indebtedness of the owners of the parcels within the District. In the event of delinquency, proceedings may be conducted only against the parcel of real property securing the delinquent Special Tax. There is no assurance the owners will be able to pay the Special Tax or that they will pay such Special Tax even though financially able to do so. To provide funds for payment of the bonds previously issued and the interest thereon as a result of any delinquent installments, the Water District established Reserve Accounts from proceeds of the bonds previously issued, which accounts will also be funded as described herein and maintained for the 2015 Bonds and outstanding 2014 Bonds. See "SECURITY AND SOURCES OF PAYMENT FOR THE BONDS.” Property in the District subject to the Special Tax is comprised of approximately 2,934 acres and currently includes completed homes, infrastructure improvements suitable for additional development, undeveloped land, one golf course (a second golf course was closed in May 2014, and is anticipated to be used for future home development, walking trails and other public amenities), a clubhouse and related outbuildings and improvements. The property is projected to be developed with 2,354 residential units and limited commercial sites, as well as the existing golf course and clubhouse and related amenities. Home construction began in 2004 and stopped in 2008 as a result of the real estate downturn and bankruptcy of the previous developer. Currently, home construction has resumed and homes are offered for sale. Most of the undeveloped land in the District is owned by World International LLC (the "Current Developer"), an entity which is not a homebuilder and intends to market residential lots to merchant homebuilders, custom homebuilders and individuals. See "THE DISTRICT." The 2015 Bonds are subject to optional and mandatory redemption prior to maturity as described herein. See "THE 2015 BONDS — Redemption." NEITHER THE FAITH AND CREDIT NOR THE TAXING POWER OF THE WATER DISTRICT, THE COUNTY OF STANISLAUS, THE STATE OF CALIFORNIA OR ANY POLITICAL SUBDIVISION THEREOF IS PLEDGED TO THE PAYMENT OF THE 2015 BONDS. THE 2015 BONDS DO NOT CONSTITUTE A DEBT OF THE WATER DISTRICT WITHIN THE MEANING OF ANY STATUTORY OR CONSTITUTIONAL DEBT LIMITATION. THE INFORMATION SET FORTH IN THIS OFFICIAL STATEMENT, INCLUDING INFORMATION UNDER THE HEADING "SPECIAL RISK FACTORS," SHOULD BE READ IN ITS ENTIRETY. This cover page contains certain information for general reference only. It is not a summary of all of the provisions of the 2015 Bonds. Prospective investors must read the entire Official Statement to obtain information essential to the making of an informed investment decision. See "SPECIAL RISK FACTORS" herein for a discussion of the special risk factors that should be considered, in addition to the other matters and risk factors set forth herein, in evaluating the investment quality of the 2015 Bonds. The 2015 Bonds are offered when, as and if issued, subject to approval as to their legality by Jones Hall, A Professional Law Corporation, San Francisco, California, Bond Counsel. Certain legal matters will also be passed on by Jones Hall, A Professional Law Corporation as Disclosure Counsel. Certain legal matters will be passed upon for the Water District by Griffith & Masuda, Turlock, California. It is anticipated that the 2015 Bonds will be available for delivery to DTC on or about July 15, 2015 in New York, New York. WESTHOFF, CONE & HOLMSTEDT The date of this Official Statement is June 16, 2015.
-
Upload
khangminh22 -
Category
Documents
-
view
1 -
download
0
Transcript of PRELIMINARY OFFICIAL STATEMENT DATED ... - EMMA.MSRB.org.

NEW ISSUE-FULL BOOK ENTRY NOT RATED
In the opinion of Jones Hall, A Professional Law Corporation, San Francisco, California, Bond Counsel, subject, however to certain qualifications described herein, under existing law, the interest on the 2015 Bonds is excluded from gross income for federal income tax purposes and such interest is not an item of tax preference for purposes of the federal alternative minimum tax imposed on individuals and corporations, although for the purpose of computing the alternative minimum tax imposed on certain corporations, such interest is taken into account in determining certain income and earnings. In the further opinion of Bond Counsel, such interest is exempt from California personal income taxes. See "TAX MATTERS" herein.
$7,260,000 WESTERN HILLS WATER DISTRICT
DIABLO GRANDE COMMUNITY FACILITIES DISTRICT NO. 1 SPECIAL TAX REFUNDING BONDS
SERIES 2015 Dated: Date of Delivery Due: September 1, as shown below
The $7,260,000 Western Hills Water District Diablo Grande Community Facilities District No. 1 Special Tax Refunding Bonds Series 2015 (the "2015 Bonds") are being issued by the Western Hills Water District (the "Water District") by and through its Diablo Grande Community Facilities District (the "District"). The 2015 Bonds are special tax obligations of the Water District, authorized pursuant to the Mello-Roos Community Facilities Act of 1982, as amended, being California Government Code Section 53311, et seq. (the "Mello-Roos Act"), and are issued pursuant to a Fiscal Agent Agreement dated as of August 1, 2001 and supplements thereto, by and between the Water District and The Bank of New York Mellon Trust Company, N.A., as Fiscal Agent. The 2015 Bonds are secured by Special Taxes (described herein) on parity with $38,450,000 outstanding principal amount of bonds issued by the Water District in 2014. The 2015 Bonds are issued to (i) refund certain outstanding bonds previously by the District in 2005; (ii) fund a reserve account; and (iii) to pay the costs of issuance of the 2015 Bonds. Interest on the 2015 Bonds is payable March 1, 2016, and thereafter semiannually on March 1 and September 1 of each year.
The 2015 Bonds are being issued as fully registered bonds, registered in the name of Cede & Co. as nominee of The Depository Trust Company, New York, New York ("DTC"), and will be available to ultimate purchasers in the denomination of $5,000 or any integral multiple thereof, under the book-entry system maintained by DTC. See "APPENDIX H – BOOK-ENTRY SYSTEM."
The 2015 Bonds are secured by and payable, on a parity with bonds issued in 2014, from a pledge of annual Special Taxes (as defined herein) to be levied by the Water District on real property within the boundaries of the District, from the proceeds of any foreclosure actions brought following a delinquency in the payment of the Special Taxes, and from amounts held in certain funds under the Fiscal Agent Agreement, all as more fully described herein. Land within the District consists of completed homes, land under development, and unimproved land planned for a primarily residential development in an area of Stanislaus County known as "Diablo Grande" near the City of Patterson. Unpaid Special Taxes do not constitute a personal indebtedness of the owners of the parcels within the District. In the event of delinquency, proceedings may be conducted only against the parcel of real property securing the delinquent Special Tax. There is no assurance the owners will be able to pay the Special Tax or that they will pay such Special Tax even though financially able to do so. To provide funds for payment of the bonds previously issued and the interest thereon as a result of any delinquent installments, the Water District established Reserve Accounts from proceeds of the bonds previously issued, which accounts will also be funded as described herein and maintained for the 2015 Bonds and outstanding 2014 Bonds. See "SECURITY AND SOURCES OF PAYMENT FOR THE BONDS.”
Property in the District subject to the Special Tax is comprised of approximately 2,934 acres and currently includes completed homes, infrastructure improvements suitable for additional development, undeveloped land, one golf course (a second golf course was closed in May 2014, and is anticipated to be used for future home development, walking trails and other public amenities), a clubhouse and related outbuildings and improvements. The property is projected to be developed with 2,354 residential units and limited commercial sites, as well as the existing golf course and clubhouse and related amenities. Home construction began in 2004 and stopped in 2008 as a result of the real estate downturn and bankruptcy of the previous developer. Currently, home construction has resumed and homes are offered for sale. Most of the undeveloped land in the District is owned by World International LLC (the "Current Developer"), an entity which is not a homebuilder and intends to market residential lots to merchant homebuilders, custom homebuilders and individuals. See "THE DISTRICT."
The 2015 Bonds are subject to optional and mandatory redemption prior to maturity as described herein. See "THE 2015 BONDS — Redemption."
NEITHER THE FAITH AND CREDIT NOR THE TAXING POWER OF THE WATER DISTRICT, THE COUNTY OF STANISLAUS, THE STATE OF CALIFORNIA OR ANY POLITICAL SUBDIVISION THEREOF IS PLEDGED TO THE PAYMENT OF THE 2015 BONDS. THE 2015 BONDS DO NOT CONSTITUTE A DEBT OF THE WATER DISTRICT WITHIN THE MEANING OF ANY STATUTORY OR CONSTITUTIONAL DEBT LIMITATION. THE INFORMATION SET FORTH IN THIS OFFICIAL STATEMENT, INCLUDING INFORMATION UNDER THE HEADING "SPECIAL RISK FACTORS," SHOULD BE READ IN ITS ENTIRETY.
This cover page contains certain information for general reference only. It is not a summary of all of the provisions of the 2015 Bonds. Prospective investors must read the entire Official Statement to obtain information essential to the making of an informed investment decision. See "SPECIAL RISK FACTORS" herein for a discussion of the special risk factors that should be considered, in addition to the other matters and risk factors set forth herein, in evaluating the investment quality of the 2015 Bonds.
The 2015 Bonds are offered when, as and if issued, subject to approval as to their legality by Jones Hall, A Professional Law Corporation, San Francisco, California, Bond Counsel. Certain legal matters will also be passed on by Jones Hall, A Professional Law Corporation as Disclosure Counsel. Certain legal matters will be passed upon for the Water District by Griffith & Masuda, Turlock, California. It is anticipated that the 2015 Bonds will be available for delivery to DTC on or about July 15, 2015 in New York, New York.
WESTHOFF, CONE & HOLMSTEDT
The date of this Official Statement is June 16, 2015.

MATURITY SCHEDULE
SERIAL BONDS
Maturity Date (September 1)
Principal Amount
Interest Rate Yield
CUSIP† (958324)
2017 $200,000 5.000% 2.250% DY8 2018 380,000 5.000% 2.750% DZ5
TERM BONDS
$1,255,000 3.625% Term Bonds Due September 1, 2021 — Price: 99.318% to Yield: 3.750% CUSIP† 958324EC5
$1,915,000 3.875% Term Bonds Due September 1, 2025 — Price: 98.146% to Yield: 4.100% CUSIP† 958324ED3
$3,510,000 4.500% Term Bonds Due September 1, 2035 — Price: 97.200% to Yield: 4.750% CUSIP† 958324EE1
† CUSIP® is a registered trademark of the American Bankers Association. CUSIP Global Services is managed on behalf of the American Bankers Association by S&P Capital IQ. Copyright© 2015 CUSIP Global Services. All rights reserved. CUSIP® data herein is provided by CUSIP Global Services. This data is not intended to create a database and does not serve in any way as a substitute for the CUSIP Service Bureau. CUSIP® numbers are provided for convenience of reference only. Neither the District nor the Underwriter takes any responsibility for the accuracy of such numbers.

GENERAL INFORMATION ABOUT THIS OFFICIAL STATEMENT
Use of Official Statement. This Official Statement is submitted in connection with the sale of
the Bonds referred to herein and may not be reproduced or used, in whole or in part, for any other purpose.
This Official Statement is not to be construed as a contract with the purchasers of the Bonds.
Statements contained in this Official Statement which involve estimates, forecasts or matters of opinion, whether or not expressly so described herein, are intended solely as such and are not to be construed as a representation of facts.
Estimates and Forecasts. When used in this Official Statement and in any continuing
disclosure by the Water District, in any press release and in any oral statement made with the approval of an authorized officer of the Water District, the words or phrases "will likely result", "are expected to", "will continue", "is anticipated", "estimate", "project", "forecast", "expect", "intend" and similar expressions may identify "forward looking statements." Such statements are subject to risks and uncertainties that could cause actual results to differ materially from those contemplated in such forward-looking statements. Any forecast is subject to such uncertainties. Inevitably, some assumptions used to develop the forecasts will not be realized and unanticipated events and circumstances may occur. Therefore, there are likely to be differences between forecasts and actual results, and those differences may be material. The information and expressions of opinion herein are subject to change without notice, and neither the delivery of this Official Statement nor any sale made hereunder shall, under any circumstances, give rise to any implication that there has been no change in the affairs of the Water District since the date hereof.
Limit of Offering. No dealer, broker, salesperson or other person has been authorized by the
Water District or the Underwriter to give any information or to make any representations other than those contained herein and, if given or made, such other information or representation must not be relied upon as having been authorized by any of the foregoing. This Official Statement does not constitute an offer to sell or the solicitation of an offer to buy nor shall there be any sale of the Bonds by a person in any jurisdiction in which it is unlawful for such person to make such an offer, solicitation or sale. This Official Statement is not to be construed as a contract with the purchasers of the Bonds.
Involvement of Underwriter. The Underwriter has reviewed the information in this Official
Statement in accordance with, and as a part of, its responsibilities to investors under the federal securities laws as applied to the facts and circumstances of this transaction, but the Underwriter does not guarantee the accuracy or completeness of such information. The information and expressions of opinions herein are subject to change without notice and neither delivery of this Official Statement nor any sale made hereunder shall, under any circumstances, create any implication that there has been no change in the affairs of the Water District since the date hereof. All summaries of the Fiscal Agent Agreement or other documents referred to in this Official Statement, are made subject to the provisions of such documents, respectively, and do not purport to be complete statements of any or all of such provisions.
IN CONNECTION WITH THIS OFFERING, THE UNDERWRITER MAY OVERALLOT OR
EFFECT TRANSACTIONS WHICH STABILIZE OR MAINTAIN THE MARKET PRICE OF THE BONDS OFFERED HEREBY AT A LEVEL ABOVE THAT WHICH MIGHT OTHERWISE PREVAIL IN THE OPEN MARKET. SUCH STABILIZING, IF COMMENCED, MAY BE DISCONTINUED AT ANY TIME. THE UNDERWRITER MAY OFFER AND SELL THE BONDS TO CERTAIN DEALERS, INSTITUTIONAL INVESTORS AND OTHERS AT PRICES LOWER THAN THE PUBLIC OFFERING PRICE STATED ON THE COVER PAGE HEREOF AND SAID PUBLIC OFFERING PRICE MAY BE CHANGED FROM TIME TO TIME BY THE UNDERWRITER.
THE BONDS HAVE NOT BEEN REGISTERED UNDER THE SECURITIES ACT OF 1933, AS
AMENDED, IN RELIANCE UPON AN EXCEPTION FROM THE REGISTRATION REQUIREMENTS CONTAINED IN SUCH ACT. THE BONDS HAVE NOT BEEN REGISTERED OR QUALIFIED UNDER THE SECURITIES LAWS OF ANY STATE.

WESTERN HILLS WATER DISTRICT STANISLAUS COUNTY, CALIFORNIA
Water District Board of Directors Guillermo Marrero, President
David Orris, Director Carmen Kearney, Director
Ruby Beltran, Director Douglas Kearney, Director
Water District Counsel
Griffith & Masuda, A Professional Law Corporation Turlock, California
SPECIAL SERVICES
Bond and Disclosure Counsel Jones Hall, A Professional Law Corporation
San Francisco, California
Fiscal Agent The Bank of New York Mellon Trust Company
Los Angeles, California
Appraiser Seevers Jordan Ziegenmeyer
Rocklin, California
Special Tax Consultant Goodwin Consulting Group, Inc.
Sacramento, California
Market Study Meyers Research LLC
Solano Beach, California

TABLE OF CONTENTS
INTRODUCTION ........................................ 1 THE 2015 BONDS ...................................... 7
Authority for Issuance .................................... 7 Description of the 2015 Bonds ....................... 7 Redemption .................................................... 8 Transfer or Exchange of 2015 Bonds .......... 10 2015 Bonds Mutilated, Lost, Destroyed or
Stolen ....................................................... 11 ESTIMATED SOURCES AND USES OF
FUNDS .................................................. 12 SECURITY AND SOURCES OF
PAYMENT FOR THE BONDS............... 13 Limited Obligation......................................... 13 Special Taxes ............................................... 13 Special Tax Methodology ............................. 15 Levy of Maximum Annual Special Tax and
Debt Service Coverage ............................ 17 Stanislaus County Tax Loss Reserve .......... 18 Special Tax Fund ......................................... 19 Deposit and Use of Proceeds of 2015
Bonds ....................................................... 19 Delinquent Payments of Special Tax;
Covenant for Superior Court Foreclosure .............................................. 20
Reserve Fund ............................................... 21 Additional Bonds .......................................... 22
DEBT SERVICE SCHEDULE AND COVERAGE .......................................... 23
THE WATER DISTRICT ........................... 25 THE DISTRICT ......................................... 26
Overview of the District ................................ 26 Location of the District .................................. 26 Development History of the Project .............. 31 Anticipated Development in the District ....... 36 Merchant Builder Property ........................... 38 Environmental Matters ................................. 38 Levy of Special Tax; Maximum Special
Tax Revenue ............................................ 39 Special Tax Collection and Delinquency
Rate .......................................................... 42 OWNERSHIP OF PROPERTY WITHIN
THE DISTRICT ...................................... 44 The Current Developer and Other
Undeveloped Land Owners ..................... 44
Projected Sale of Property Within the District ...................................................... 47
Current Developer's Financing Plan ............ 48 VALUE ESTIMATE OF PROPERTY
WITHIN THE DISTRICT .......................... 49 The Appraisal ............................................... 49 Assessed Valuation ..................................... 51 Value to Special Tax Burden Ratios ............ 52 Priority of Lien .............................................. 54
SPECIAL RISK FACTORS ....................... 56 No General Obligation of the Water District . 56 Levy and Collection of the Special Tax ........ 56 Property Tax Delinquencies ......................... 57 Risks Related to Homeowners With High
Loan-to-Value Ratios ............................... 58 Payment of Special Tax is Not a Personal
Obligation of the Property Owners .......... 58 Property Values ........................................... 58 California Drought; State of Emergency
Proclamation ............................................ 60 Other Possible Claims Upon the Value of
Taxable Property ..................................... 60 Failure to Develop Properties ...................... 61 Concentration of Ownership ........................ 61 FDIC/Federal Government Interests in
Properties................................................. 61 Depletion of Reserve Fund .......................... 63 Bankruptcy Delays ....................................... 63 Disclosure to Future Purchasers ................. 64 No Acceleration Provisions .......................... 64 Loss of Tax Exemption ................................ 64 IRS Audit of Tax-Exempt Bond Issues ........ 65 Impact of Legislative Proposals,
Clarifications of the Code and Court Decisions on Tax Exemption ................... 65
Secondary Market for Bonds ....................... 65 CONSTITUTIONAL LIMITATIONS ON
TAXATION AND APPROPRIATIONS ... 66 CONTINUING DISCLOSURE................... 67 UNDERWRITING ..................................... 67 LEGAL OPINION ...................................... 68 TAX MATTERS ........................................ 68 RATINGS .................................................. 69 NO LITIGATION ....................................... 69
APPENDIX A RATE AND METHOD OF APPORTIONMENT OF SPECIAL TAX APPENDIX B APPRAISAL OF CERTAIN PROPERTY IN THE DISTRICT APPENDIX C MARKET ASSESSMENT AND ANALYSIS REPORT APPENDIX D SUMMARY OF CERTAIN PROVISIONS OF THE FISCAL AGENT AGREEMENT APPENDIX E SELECTED DEMOGRAPHIC DATA APPENDIX F FORM OF OPINION OF BOND COUNSEL APPENDIX G FORM OF CONTINUING DISCLOSURE UNDERTAKING APPENDIX H BOOK-ENTRY SYSTEM

LOCATION MAP

__________________________________
OFFICIAL STATEMENT
__________________________________
$7,260,000 WESTERN HILLS WATER DISTRICT
DIABLO GRANDE COMMUNITY FACILITIES DISTRICT NO. 1 SPECIAL TAX REFUNDING BONDS
SERIES 2015
This Official Statement, including the cover page and all Appendices hereto, is provided to furnish certain information in connection with the issuance by the Western Hills Water District (the "Water District") by and through its Diablo Grande Community Facilities District No. 1 (the "Community Facilities District" or the "District") of $7,260,000 aggregate principal amount of bonds designated Western Hills Water District Diablo Grande Community Facilities District No. 1 Special Tax Refunding Bonds Series 2015 (the "2015 Bonds").
Any statements made in this Official Statement involving matters of opinion or of
estimates, whether or not so expressly stated, are set forth as such and not as representations of fact, and no representation is made that any of the estimates will be realized. Definitions of certain terms used herein and not defined herein shall have the meaning set forth in the Fiscal Agent Agreement.
INTRODUCTION
Creation of the District. The 2015 Bonds are issued pursuant to the provisions of the
Mello-Roos Community Facilities Act of 1982, as amended (Sections 53311, et seq., of the Government Code of the State of California) (the "Mello-Roos Act") and pursuant to a Fiscal Agent Agreement dated as of August 1, 2001, as amended and supplemented by a Supplemental Agreement No. 1 to Fiscal Agent Agreement dated as of December 1, 2002, a Supplemental Agreement No. 2 to Fiscal Agent Agreement dated as of May 1, 2004, a Supplemental Agreement No. 3 to Fiscal Agent Agreement dated as of January 1, 2005, a Supplemental Agreement No. 4 to Fiscal Agent Agreement dated as of July 1, 2014 and a Supplemental Agreement No. 5 to Fiscal Agent Agreement dated as of July 1, 2015 (together, the "Fiscal Agent Agreement") between the Water District and The Bank of New York Mellon Trust Company, N.A., Los Angeles, California, as fiscal agent (the "Fiscal Agent").
Registration of Ownership of 2015 Bonds. The 2015 Bonds shall be issued only as
fully registered bonds in book-entry form, registered in the name of Cede & Co., as nominee of The Depository Trust Company ("DTC"), without coupons, in the denomination of $5,000 or any integral multiple thereof and shall be dated as of and bear interest from the date of delivery thereof at the rate or rates set forth on the cover page hereof. Interest on the 2015 Bonds is

payable on March 1 and September 1 of each year (each an "Interest Payment Date"), commencing March 1, 2016. Ultimate purchasers of 2015 Bonds will not receive physical certificates representing their interest in the 2015 Bonds. So long as the 2015 Bonds are registered in the name of Cede & Co., as nominee of DTC, references herein to the Owners shall mean Cede & Co., and shall not mean the ultimate purchasers of the 2015 Bonds. Payments of the principal, premium, if any, and interest on the 2015 Bonds will be made directly to DTC, or its nominee, Cede & Co. so long as DTC or Cede & Co. is the registered owner of the 2015 Bonds. Disbursements of such payments to DTC’s Participants is the responsibility of DTC and disbursements of such payments to the Beneficial Owners is the responsibility of DTC’s Participants and Indirect Participants, as more fully described herein. See "APPENDIX H — BOOK-ENTRY SYSTEM."
Refunding Plan. The Water District has previously issued on behalf of the District its (i)
Western Hills Water District Diablo Grande Community Facilities District No. 1 Special Tax Bonds Series 2001 (the "2001 Bonds"), (ii) Western Hills Water District Diablo Grande Community Facilities District No. 1 Special Tax Bonds Series 2002 (the "2002 Bonds"), (iii) Western Hills Water District Diablo Grande Community Facilities District No. 1 Special Tax Bonds Series 2004 (the "2004 Bonds") and (iv) Western Hills Water District Diablo Grande Community Facilities District No. 1 Special Tax Bonds Series 2005 (the "2005 Bonds"), in each case, for the purpose of financing costs of acquiring and constructing certain public infrastructure improvements within the District. In 2014, the Water District issued on behalf of the District its Western Hills Water District Diablo Grande Community Facilities District No. 1 Special Tax Refunding Bonds Series 2014 (the "2014 Bonds") for the purpose of refunding the 2001 Bonds, the 2002 Bonds and the 2004 Bonds. The 2014 Bonds will remain outstanding and secured on parity with the 2015 Bonds.
The Water District is issuing the 2015 Bonds in order to refund the 2005 Bonds. The
2005 Bonds are currently outstanding in the aggregate principal amount of $7,320,000, which will be redeemed in full, on a current basis, on September 1, 2015 (the "Redemption Date") at a redemption price equal to 100% of their principal amount, together with interest coming due and payable on the Redemption Date.
In order to accomplish the refinancing plan, the net proceeds of the Bonds, together with
certain other funds on hand with respect to the 2005 Bonds, will be transferred to Bank of New York Mellon Trust Company, N.A., as fiscal agent for the 2005 Bonds, registrar and transfer agent, for deposit into a prior bonds redemption subaccount (the "Redemption Subaccount") to be established under Irrevocable Refunding Instructions given by the Water District to the Fiscal Agent.
Source of Payment of the 2015 Bonds. The 2015 Bonds are payable from the levy of
special taxes (the "Special Tax" or "Special Taxes") which are to be annually levied by the Water District on taxable real property within the boundaries of the District. The 2015 Bonds are secured and payable on parity with the Water District's 2014 Bonds, which are currently outstanding in an amount of $38,450,000. The Water District has issued the entire $57,000,000 authorized amount of bonds authorized for the District, and no Additional Bonds (described herein) may thereafter be issued by the Water District, except for refunding bonds. The Bonds are also payable from the proceeds of any foreclosure actions brought following a delinquency in the payment of the Special Taxes, and from amounts held in certain funds and accounts established pursuant to the Fiscal Agent Agreement, including a reserve fund, all as more fully described herein. The Special Tax applicable to each taxable parcel in the District will be levied and collected according to the tax liability determined by the Board of Directors of the Water
-2-

District through the application of the approved the rate and method of apportionment of Special Tax for the District (the "Special Tax Formula"). The Special Tax Formula is set forth in APPENDIX A hereto. The Special Taxes represent fixed liens on the parcels of land subject to a Special Tax under the proceedings and failure to pay the Special Tax could result in proceedings to foreclose title to the delinquent property. The Special Taxes do not constitute the personal indebtedness of the owners of taxed parcels and no proceedings to collect directly from an owner is permitted. See "SECURITY AND SOURCES OF PAYMENT FOR THE BONDS — Special Tax Methodology" and "APPENDIX A — RATE AND METHOD OF APPORTIONMENT OF SPECIAL TAX."
The Water District has previously directed the Fiscal Agent to establish a Reserve Fund
(the "Reserve Fund"), into which certain proceeds of the 2005 Bonds and 2014 Bonds were deposited. In connection with the issuance of the 2015 Bonds, the Water District will direct the Fiscal Agent to establish the 2015 Bonds Reserve Account in the Reserve Fund. The Reserve Fund is available to be transferred to the Bond Fund for pro rata payment of all series of Bonds in the event of delinquencies in the payment of the Special Taxes, to the extent of such delinquencies. See "SECURITY AND SOURCES OF PAYMENT FOR THE BONDS — Reserve Fund." If there are additional delinquencies after depletion of funds in the Reserve Fund, the Reserve Fund may be replenished from Special Taxes, however, the Water District is not obligated to pay the Bonds or supplement the Reserve Fund from its own funds.
Property Subject to the Special Tax. The District was initially comprised of all the land
within the Water District, however as property is subdivided certain parcels designated for open space and public uses become exempt from the Special Tax. The Water District is located in Stanislaus County (the "County") in the hills on the western edge of California’s Central Valley. Property in the District subject to the Special Tax was initially comprised of approximately 5,070 acres, much of which was planned for open space not ultimately subject to the Special Tax. Currently, the District contains approximately 2,934 acres subject to the Special Tax.
Land in the District currently includes 462 homes constructed, in construction or
preparing for the start of contruction. Much of the planned development project remains undeveloped with infrastructure in place, financed through funds of a previous developer and proceeds of the previous bonds. Existing infrastructure is at a level which readily facilitates additional homebuilding. The property was planned under an approved County specific plan to include 2,012 residential units, a hotel, a vineyard and winery, and two commercial sites, as well as substantial open space not subject to the Special Tax. Home construction began in 2004 but was curtailed by the real estate downturn in 2008. Diablo Grande Limited Partnership (the "Original Developer") owned all property in the District at the time of its formation. Beginning in 2004 the Original Developer sold 210 parcels to individuals (as custom home lots) and merchant builders Western Pacific Housing, Inc. (an affiliate of D.R. Horton) and Private Island Homes, who commenced building and selling homes. In November 2008, World International LLC (the "Current Developer"), an entity which is not a homebuilder, acquired all of the Original Developer's holdings through bankruptcy proceedings of the Original Developer, for a total of $21 million. The Current Developer is undertaking plans to continue development of the project, including expansion of the projected number of residential lots to 2,354, and marketing of residential lots to merchant homebuilders, custom homebuilders and individuals. The holdings encompass the approximately 29,500 acres (2,687 of which are in the District) originally owned by the Original Developer, net of the lots sold to individuals and merchant builders. See "OWNERSHIP OF PROPERTY WITHIN THE DISTRICT." Currently, home construction has resumed, with nine homes sold in 2014, 18 homes sold in 2015, and additional
-3-

homes under construction or preparing for the start of construction and being offered for sale by DeNova homes.
Land in the District currently includes 735 final mapped residential lots, of which 428
have been improved with completed homes, and 4 commercial lots. In addition to the completed homes, infrastructure improvements suitable for additional development is in place and new home construction has recently commenced after being idle for several years. Land in the District also includes undeveloped parcels, one golf course (a second golf course was closed in May 2014, and is anticipated to be used for future home development, walking trails and other public amenities), a clubhouse and related outbuildings and improvements, all as described in this Official Statement. See "THE DISTRICT."
The land in the District is the "Phase 1" development portion of the Original Developer’s
planned "Diablo Grande Project." At build-out, the various property uses within the District are planned to include a mix of urban uses, including 2,354 single-family residential units covering 818 acres, 39 acres of commercial land, 44 acres of vineyards, an existing 18-hole golf course and an existing clubhouse. A swim and tennis center, equestrian center, picnic areas, children’s playground, town center, shopping center, and resort hotel are also expected at build-out. A second existing golf course was closed in May 2014, and the Current Developer anticipates using its land for additional homesites (included in the 2,354 projection), walking trails and other public amenities. The Phase 1 project has vested entitlements created under a Specific Plan (described herein) approved by the County for residential lots, some of which have received final map approval and include homes completed and sold or under construction, a hotel site and winery site, all originally proposed by the Original Developer as Phase 1/Unit 1, the initial portion of the overall development.
All of the Improvements to be financed with proceeds of four previous series of bonds
(issued in 2001, 2002, 2004 and 2005) have been completed. The Current Developer is not a homebuilder and contemplates the continuation of selling residential lots to merchant homebuilders, custom homebuilders and individuals.
Currently, four of the five Board members of the Water District are persons who are
employed by or otherwise associated with the Current Developer. See "THE DISTRICT" and "OWNERSHIP OF PROPERTY WITHIN THE DISTRICT."
Market Report. A market assessment and analysis report was prepared by Meyers
Research LLC, dated as of June 2015 (collectively, the "Market Report"). The Market Report was commissioned by the Current Developer in connection with its evaluation of the current development potential of its undeveloped land in the District. The Market Report analyzed residential product types, pricing and absorption for the entirety of the Phase 1 Village master plan in the market as it existed on the date of the report, along with projections of the market demand for 2016-17 through an assumed potential buildout of the community. See "THE DISTRICT — Development History of the Project" and "APPENDIX C — Market Assessment and Analysis Report."
Security for the Bonds. Taxable property in the District is security for the Special Tax
and the Special Tax is security for the Bonds. The Water District authorized the preparation of an appraisal report for 300 undeveloped taxable parcels within the District, which appraisal sets forth a value of such undeveloped property of $58,492,000 as of May 16, 2015. In considering the estimates of value evidenced by the appraisal, it should be noted that the appraisal is based upon a number of standard and special assumptions which affected the estimates as to value.
-4-

See "VALUE ESTIMATE OF PROPERTY WITHIN THE DISTRICT" and “APPENDIX B — APPRAISAL OF CERTAIN PROPERTY IN THE DISTRICT.” For parcels subject to the Special Tax and not included in the appraisal, the 2014-15 County assessed valuation is $103,939,529. The aggregate value of the property in the District includes both the $58,492,000 appraised value of the 300 undeveloped parcels and the assessed value of the remainder. Based upon the $162,431,529 total valuation and an aggregate outstanding principal amount of 2014 Bonds of $38,450,000 and 2015 Bonds of $7,260,000, for a total amount of Bonds of $45,710,000, the value-to-lien ratio for property in the District is 3.6 to 1.
Unpaid Special Taxes do not constitute a personal indebtedness of the owners of
any of the parcels within the District. In the event of delinquency, proceedings may be conducted only against the real property on which the Special Tax is delinquent. The unpaid Special Taxes are not required to be paid upon sale of property within the District.
Risks of Investment. See the section of this Official Statement entitled "SPECIAL RISK
FACTORS" for a discussion of special factors that should be considered, in addition to the other matters set forth herein, in considering the investment quality of the 2015 Bonds.
Limited Obligation of the Water District. The general fund of the Water District is
not liable and the full faith and credit of the Water District is not pledged for the payment of the interest on, or principal of or redemption premiums, if any, on the Bonds. The Bonds are not secured by a legal or equitable pledge of or charge, lien or encumbrance upon any property of the Water District or any of its income or receipts, except the money in the Special Tax Fund (described herein) established under the Fiscal Agent Agreement, and neither the payment of the interest on nor principal of or redemption premiums, if any, on the Bonds is a general debt, liability or obligation of the Water District. The Bonds do not constitute an indebtedness of the Water District within the meaning of any constitutional or statutory debt limitation or restrictions and neither the Water District Board, the Water District nor any officer or employee thereof shall be liable for the payment of the interest on or principal of or redemption premiums, if any, on the Bonds other than from the proceeds of the Special Taxes and the money in the Special Tax Fund, as provided in the Fiscal Agent Agreement.
Summary of Information. Brief descriptions of certain provisions of the Fiscal Agent
Agreement, the 2015 Bonds and certain other documents are included herein. The descriptions and summaries of documents herein do not purport to be comprehensive or definitive, and reference is made to each such document for the complete details of all its respective terms and conditions, copies of which are available for inspection at the office of the Water District. All statements herein with respect to certain rights and remedies are qualified by reference to laws and principles of equity relating to or affecting creditors’ rights generally. Capitalized terms used in this Official Statement and not otherwise defined herein shall have the meanings ascribed to such terms in the Fiscal Agent Agreement. The information and expressions of opinion herein speak only as of the date of this Official Statement and are subject to change without notice. Neither delivery of this Official Statement, any sale made hereunder, nor any future use of this Official Statement shall, under any circumstances, create any implication that there has been no change in the affairs of the Water District or the District since the date hereof.
Any statements made in this Official Statement involving matters of opinion or of
estimates, whether or not so expressly stated, are set forth as such and not as representations of fact, and no representation is made that any of the estimates will be realized. For definitions
-5-

of certain terms used herein and not defined herein, see "APPENDIX D — SUMMARY OF CERTAIN PROVISIONS OF THE FISCAL AGENT AGREEMENT."
-6-
THE 2015 BONDS
Authority for Issuance The 2015 Bonds are issued pursuant to the Act and the Fiscal Agent Agreement,
approved by Resolution No. 2001-01 adopted by the Water District Board on July 5, 2001, and the supplement to the Fiscal Agent Agreement approved by a resolution adopted by the Water District Board on June 10, 2015. The Water District was formed by the Original Developer to facilitate development within the Water District boundaries. Currently, four of the five Board members of the Water District are persons who are employed by or otherwise associated with the Current Developer. See "THE WATER DISTRICT."
The District was established and authorized to incur bonded indebtedness in an
aggregate principal amount not to exceed $57,000,000. Pursuant to the Act, the Water District Board adopted Resolution No. 2000-03 on August 24, 2000 stating its intent to establish the District, to authorize the issuance of bonds and to hold an election pursuant to the Act. Under the provisions of the Act, since there were fewer than 12 registered voters residing within the District at a point during the 90-day period preceding the adoption of the Water District’s Resolution No. 2000-06 on September 24, 2000 (the "Resolution of Formation"), the sole qualified elector was the Original Developer who was entitled to cast one vote for each acre or portion of an acre of land owned within the District. The Original Developer voted to incur the indebtedness and to approve the annual levy of Special Taxes to be levied within the District, for the purpose of paying for the various improvements, including repaying any indebtedness of the District, replenishing the Reserve Fund and paying the administrative expenses of the District.
After issuing the 2005 Bonds, the Water District had issued the entire $57,000,000
amount of bonds authorized for the District.
Description of the 2015 Bonds The 2015 Bonds are being issued as fully registered bonds, registered in the name of
Cede & Co. as nominee of The Depository Trust Company, New York, New York ("DTC"), and will be available to ultimate purchasers in the denomination of $5,000 or any integral multiple thereof, under the book-entry system maintained by DTC. Ultimate purchasers of 2015 Bonds will not receive physical certificates representing their interest in the 2015 Bonds. So long as the 2015 Bonds are registered in the name of Cede & Co., as nominee of DTC, references herein to the Owners shall mean Cede & Co., and shall not mean the ultimate purchasers of the 2015 Bonds. Payments of the principal, premium, if any, and interest on the 2015 Bonds will be made directly to DTC, or its nominee, Cede & Co., by The Bank of New York Mellon Trust Company, N.A., Los Angeles, California, as the Fiscal Agent for the bonds, so long as DTC or Cede & Co. is the registered owner of the 2015 Bonds. Disbursements of such payments to DTC’s Participants is the responsibility of DTC and disbursements of such payments to the Beneficial Owners is the responsibility of DTC’s Participants and Indirect Participants, as more fully described herein. See "APPENDIX H — BOOK-ENTRY SYSTEM" below.
The 2015 Bonds will be dated as of and bear interest from the date of delivery thereof at
the rates and mature in the amounts and years, as set forth on the cover page hereof. The principal of the 2015 Bonds and premiums due upon the redemption thereof, if any, will be payable in lawful money of the United States of America at the principal corporate trust office of the Fiscal Agent in Los Angeles, California, or such other place as designated by the Fiscal Agent, upon presentation and surrender of the 2015 Bonds.
-7-

Interest on the 2015 Bonds, computed on the basis of a 360-day year consisting of
twelve 30-day months, will be paid in lawful money of the United States of America semiannually on March 1 and September 1 of each year (each an "Interest Payment Date"), commencing March 1, 2016. Interest on the 2015 Bonds (including the final interest payment upon maturity or earlier redemption) is payable by check of the Fiscal Agent mailed on the Interest Payment Dates by first class mail to the registered Owner thereof at such registered Owner’s address as it appears on the registration books maintained by the Fiscal Agent at the close of business on the Record Date preceding the Interest Payment Date, or by wire transfer made on such Interest Payment Date upon written instructions received by the Fiscal Agent on or before the Record Date preceding the Interest Payment Date, of any Owner of $1,000,000 or more in aggregate principal amount of 2015 Bonds; provided that so long as any 2015 Bonds are in book-entry form, payments with respect to such 2015 Bonds shall be made by wire transfer, or such other method acceptable by the Fiscal Agent, to DTC. See "APPENDIX H — BOOK-ENTRY SYSTEM" below.
Each 2015 Bond shall bear interest from the Interest Payment Date next preceding the
date of authentication thereof unless (i) it is authenticated on an Interest Payment Date, in which event it shall bear interest from such date of authentication, or (ii) it is authenticated prior to an Interest Payment Date and after the close of business on the Record Date preceding such Interest Payment Date, in which event it shall bear interest from such Interest Payment Date, or (iii) it is authenticated prior to the Record Date preceding the first Interest Payment Date, in which event it shall bear interest from the Dated Date; provided, however, that if at the time of authentication of a 2015 Bond, interest is in default thereon, such 2015 Bond shall bear interest from the Interest Payment Date to which interest has previously been paid or made available for payment thereon. So long as the 2015 Bonds are registered in the name of Cede & Co., as nominee of DTC, payments of the principal, premium, if any, and interest on the 2015 Bonds will be made directly to DTC, or its nominee, Cede & Co. Disbursements of such payments to DTC’s Participants is the responsibility of DTC and disbursements of such payments to the Beneficial Owners is the responsibility of DTC’s Participants and Indirect Participants, as more fully described herein. See "APPENDIX H — BOOK-ENTRY SYSTEM" below.
Redemption
Optional Redemption. The 2015 Bonds maturing on or before September 1, 2025 are
not subject to optional redemption prior to maturity. The 2015 Bonds maturing on or after September 1, 2026 (which consists solely of the Term 2015 Bonds maturing on September 1, 2031) are subject to optional redemption from any source of available funds prior to maturity, in whole, or in part, on any Interest Payment Date on or after September 1, 2025 at a redemption price equal to the principal amount of the 2015 Bonds to be redeemed, plus accrued interest thereon to the date of redemption, without premium.
Mandatory Redemption From Prepayments. The 2015 Bonds shall be subject to
mandatory redemption from Prepayments of the Special Tax by property owners, in whole or in part among maturities as shall be specified by the Water District and by lot within a maturity, on any Interest Payment Date at a redemption price equal to the principal amount of the 2015 Bonds to be redeemed), plus accrued interest thereon the date of redemption, without premium.
The proceeds of any such Prepayment shall be deposited in the Prepayment Account of
the Bond Fund and applied by the Fiscal Agent to pay the redemption price of the 2015 Bonds.
-8-

Mandatory Sinking Fund Redemption. The Term 2015 Bonds maturing September 1, 2021, September 1, 2025 and September 1, 2031 are subject to mandatory sinking payment redemption in part on September 1, 2019, September 1, 2022 and September 1, 2026, respectively, and on each September 1 thereafter to maturity, by lot, at a redemption price equal to one hundred percent (100%) of the principal amount thereof to be redeemed, without premium, in the aggregate respective principal amounts as set forth in the following tables:
Term 2015 Bonds due September 1, 2021
Mandatory Redemption Date
(September 1)
Sinking Fund
Payment 2019 $400,000 2020 $420,000 2021 $435,000
Term 2015 Bonds due September 1, 2025
Mandatory Redemption Date
(September 1)
Sinking Fund
Payment 2022 $455,000 2023 470,000 2024 485,000 2025 505,000
Term 2015 Bonds due September 1, 2031
Mandatory Redemption Date
(September 1)
Sinking Fund
Payment 2026 $525,000 2027 545,000 2028 570,000 2029 595,000 2030 625,000 2031 650,000
The amounts in the foregoing tables shall be reduced pro rata, in order to maintain
substantially level debt service, as a result of any prior partial optional redemption or mandatory redemption of the 2015 Bonds.
In lieu of redemption, moneys in the Bond Fund may be used and withdrawn by the
Fiscal Agent for purchase of Outstanding 2015 Bonds, upon the filing with the Fiscal Agent of an Officer’s Certificate requesting such purchase, at public or private sale as and when, and at such prices (including brokerage and other charges) as such Officer’s Certificate may provide, but in no event may 2015 Bonds be purchased at a price in excess of the principal amount thereof, plus interest accrued to the date of purchase.
Redemption Procedure by Fiscal Agent. The Fiscal Agent shall cause notice of any
redemption to be mailed by first class mail, postage prepaid, at least 30 days but not more than 60 days prior to the date fixed for redemption, to the Securities Depositories and to one or more
-9-

Information Services, and to the respective registered Owners of any 2015 Bonds designated for redemption, at their addresses appearing on the 2015 Bond registration books in the Principal Office of the Fiscal Agent; but such mailing shall not be a condition precedent to such redemption and failure to mail or to receive any such notice, or any defect therein, shall not affect the validity of the proceedings for the redemption of such 2015 Bonds.
Such notice shall state the redemption date and the redemption price and, if less than all
of the then Outstanding 2015 Bonds are to be called for redemption, shall designate the CUSIP numbers and 2015 Bond numbers of the 2015 Bonds to be redeemed by giving the individual CUSIP number and 2015 Bond number of each 2015 Bond to be redeemed or shall state that all 2015 Bonds between two stated 2015 Bond numbers, both inclusive, are to be redeemed or that all of the 2015 Bonds of one or more maturities have been called for redemption, shall state as to any 2015 Bond called in part the principal amount thereof to be redeemed, and shall require that such 2015 Bonds be then surrendered at the Principal Office of the Fiscal Agent for redemption at the said redemption price, and shall state that further interest on such 2015 Bonds will not accrue from and after the redemption date.
The Water District has the right to rescind any notice of the redemption of 2015 Bonds
by written notice to the Fiscal Agent on or prior to the dated fixed for redemption. Upon the payment of the redemption price of 2015 Bonds being redeemed, each check
or other transfer of funds issued for such purpose shall, to the extent practicable, bear the CUSIP number identifying, by issue and maturity, the 2015 Bonds being redeemed with the proceeds of such check or other transfer.
Whenever provision is made in the Fiscal Agent Agreement for the redemption of less
than all of the 2015 Bonds of any maturity, the Fiscal Agent shall select the 2015 Bonds to be redeemed, from all 2015 Bonds or such given portion thereof of such maturity by lot in any manner which the Fiscal Agent in its sole discretion shall deem appropriate. Upon surrender of 2015 Bonds redeemed in part only, the Water District shall execute and the Fiscal Agent shall authenticate and deliver to the registered Owner, at the expense of the Water District, a new 2015 Bond or 2015 Bonds, of the same series and maturity, of authorized denominations in aggregate principal amount equal to the unredeemed portion of the 2015 Bond or 2015 Bonds.
Effect of Redemption. From and after the date fixed for redemption, if funds available
for the payment of the principal of, and interest and any premium on, the 2015 Bonds so called for redemption shall have been deposited in the Bond Fund, such 2015 Bonds so called shall cease to be entitled to any benefit under the Fiscal Agent Agreement other than the right to receive payment of the redemption price, and no interest shall accrue thereon on or after the redemption date specified in such notice.
Transfer or Exchange of 2015 Bonds
So long as the 2015 Bonds are registered in the name of Cede & Co., as nominee of
DTC, transfers and exchanges of 2015 Bonds shall be made in accordance with DTC procedures. See "APPENDIX H — BOOK-ENTRY SYSTEM" below. Any 2015 Bond may, in accordance with its terms, be transferred or exchanged by the person in whose name it is registered, in person or by his duly authorized attorney, upon surrender of such 2015 Bond for cancellation, accompanied by delivery of a duly written instrument of transfer in a form approved by the Fiscal Agent. Whenever any 2015 Bond or 2015 Bonds shall be surrendered for transfer or exchange, the Water District shall execute and the Fiscal Agent shall authenticate and deliver
-10-

a new 2015 Bond or 2015 Bonds, for a like aggregate principal amount of 2015 Bonds of authorized denominations and of the same maturity. The cost for any services rendered or any expenses incurred by the Fiscal Agent in connection with any such transfer or exchange shall be paid by the Water District. The Fiscal Agent shall collect from the Owner requesting such transfer any tax or other governmental charge required to be paid with respect to such transfer or exchange.
No transfers or exchanges of 2015 Bonds shall be required to be made (i) within 15 days
prior to the date established by the Fiscal Agent for selection of 2015 Bonds for redemption or (ii) with respect to a 2015 Bond after such 2015 Bond has been selected for redemption.
2015 Bonds Mutilated, Lost, Destroyed or Stolen
If any 2015 Bond shall become mutilated, the Water District shall execute, and the Fiscal
Agent shall authenticate and deliver, a new 2015 Bond of like tenor and principal amount in exchange and substitution for the 2015 Bond so mutilated, but only upon surrender to the Fiscal Agent of the 2015 Bond so mutilated. Every mutilated 2015 Bond so surrendered to the Fiscal Agent shall be canceled by it and destroyed by the Fiscal Agent who shall deliver a certificate of destruction thereof to the Water District. If any 2015 Bond shall be lost, destroyed or stolen, evidence of such loss, destruction or theft may be submitted to the Fiscal Agent and, if such evidence be satisfactory to it and indemnity for the Fiscal Agent and the Water District satisfactory to the Fiscal Agent shall be given, the Water District shall execute, and the Fiscal Agent shall authenticate and deliver, a new 2015 Bond of like tenor and principal amount in lieu of and in substitution for the 2015 Bond so lost, destroyed or stolen. The Water District may require payment of a sum not exceeding the actual cost of preparing each new 2015 Bond delivered and of the expenses which may be incurred by the Water District and the Fiscal Agent for the preparation, execution, authentication and delivery.
-11-

Table 1 ESTIMATED SOURCES AND USES OF FUNDS
A summary of the estimated sources and uses of funds associated with the sale of the
2015 Bonds follows:
Estimated Sources of Funds: Principal Amount of 2015 Bonds $7,260,000 Less: Net Original Issue Discount (105,540.00) Plus: Sources Related to 2005 Bonds 1,346,055.59 Total $8,500,515.19
Estimated Uses of Funds:
Deposit into 2005 Bonds Redemption Subaccount (1) $7,524,486.25 Deposit to Reserve Fund 687,156.26 Costs of Issuance (2) 288,872.68 Total $8,500,515.19 (1) Will be used to defease and refund the 2005 Bonds. See "INTRODUCTION —
Refunding Plan" above. (2) Includes Underwriter's discount, fees of Bond Counsel and Disclosure Counsel,
expenses and charges of the Fiscal Agent, costs of printing the Official Statement, administrative fees of the Water District, and other costs of issuance.
-12-
SECURITY AND SOURCES OF PAYMENT FOR THE BONDS
The Bonds are limited obligations and not general obligations of the Water District, payable solely from the Special Taxes and the funds pledged therefor under the Fiscal Agent Agreement. Neither the faith and credit of the Water District nor of the State or any political subdivision thereof is pledged to the payment of the Bonds. Notwithstanding any other provision of the Fiscal Agent Agreement, the Water District is not obligated to advance available surplus funds from the Water District treasury to cure any deficiency in the payment of the Special Tax, provided, however, the Water District is not prevented, in its sole discretion, from so advancing funds.
Although the Special Tax as described herein is levied against taxable parcels
within the District, it does not constitute a personal indebtedness of the owners of property within the District. There is no assurance that the property owners will be financially able to pay the annual Special Tax or that they will pay such tax even if financially able to do so. See "SPECIAL RISK FACTORS."
THE WATER DISTRICT HAS NO OBLIGATION TO REPLENISH THE RESERVE
ACCOUNT AS DESCRIBED HEREIN EXCEPT FROM SPECIAL TAXES, INCLUDING DELINQUENT SPECIAL TAXES THAT ARE PAID OR COLLECTED FROM FORECLOSURE SALES.
Limited Obligation
The Bonds are special, limited obligations of the Water District, payable and
secured by the Special Tax and certain amounts held in funds under the Fiscal Agent Agreement. The Bonds do not constitute a charge against the general credit of the Water District, and under no circumstances is the Water District obligated to pay principal of or redemption premiums, if any, or interest on the Bonds except from the Special Taxes and other moneys pledged thereto under the Fiscal Agent Agreement. Neither the State of California nor any public agency (other than the Water District) is obligated to pay the principal of or redemption premiums, if any, or interest on the Bonds, and neither the faith and credit nor the taxing power of the Water District, the State of California or any public agency thereof is pledged to the payment of the principal of or redemption premiums, if any, or interest on the Bonds. The payment of the principal of or redemption premiums, if any, or interest on the Bonds does not constitute a debt, liability or obligation of the Water District, the State of California or any public agency (other than the Water District, to the limited extent set forth in the Fiscal Agent Agreement).
Special Taxes
The Act was enacted by the Legislature of the State of California (the "State") to provide
an alternative method of funding certain public capital facilities and services, especially in developing areas of the State. Once duly established, a community facilities district is a legally constituted governmental entity with defined boundaries, with the governing board or legislative body of the local agency acting on its behalf. Subject to approval by a two-thirds vote of the district’s qualified electors voting, and compliance with the provisions of the Act, a legislative body of a local agency may issue bonds for the district and may levy and collect a special tax within such district to repay such indebtedness.
Notwithstanding anything in the Fiscal Agent Agreement or in the Bonds, the Water
-13-

District shall not be required to advance any moneys derived from any source other than the Special Taxes and other assets pledged under the Fiscal Agent Agreement for any of the purposes in the Fiscal Agent Agreement mentioned, whether for the payment of the principal or Redemption Price of or interest on the Bonds or for any other purpose of the Fiscal Agent Agreement.
In the Fiscal Agent Agreement, the Water District agrees and covenants that, at each
time that Special Taxes are received, it will transfer the Special Taxes received to the Fiscal Agent; provided that, if the Water District determines, on or before any Interest Payment Date, that the Fiscal Agent will have sufficient money in the Special Tax Fund on such date to make the deposits required by the Fiscal Agent Agreement, the Water District may, from the Special Taxes received, deposit into the Community Facilities Fund the amount needed to pay its budgeted Administrative Expenses for the period prior to the next Interest Payment Date or to reimburse the Water District for the payment of unbudgeted Administrative Expenses during the prior six-month period (taking into account in such determination the amounts available in the Community Facilities Fund for such purpose).
The Fiscal Agent shall deposit any portion of the Special Taxes received that represents
prepaid Special Taxes into the Prepayment Fund. The Fiscal Agent shall deposit all other Special Taxes received into the Special Tax Fund established under the Fiscal Agent Agreement, which fund the Fiscal Agent shall establish and maintain. All money in the Special Tax Fund shall be held by the Fiscal Agent in trust hereunder and shall be disbursed, allocated and applied solely to the uses and purposes set forth in the Fiscal Agent Agreement.
Pledge of Special Taxes. Subject only to the provisions of the Fiscal Agent Agreement
permitting the application thereof for the purposes and on the terms and conditions set forth in the Fiscal Agent Agreement, all of the Special Taxes and all amounts (including proceeds of the Bonds) held by the Fiscal Agent in any fund or account established under the Fiscal Agent Agreement (except for amounts held in the Rebate Fund) are pledged to secure the payment of the principal of and interest on the Bonds in accordance with their terms and the provisions of this Fiscal Agent Agreement. This pledge constitutes a first lien on the Special Taxes and amounts in such funds and shall be valid and binding from and after delivery by the Fiscal Agent of the Bonds, without any physical delivery thereof or further act. The Special Taxes and other amounts are hereby pledged to the payment of Bonds without priority or distinction of one over the other and the Special Taxes and other amounts constitute a trust fund for the security and payment of the interest on and principal of the Bonds; but nevertheless out of Special Taxes and other amounts certain amounts may be applied for other purposes as provided herein. The pledge of Special Taxes and other amounts made is irrevocable until all of the Bonds are no longer outstanding.
A Special Tax applicable to each taxable parcel in the District shall be levied and
collected according to the tax liability determined by the Water District Board through the application of the Special Tax Formula and prepared by Goodwin Consulting Group, Inc., Sacramento, California (the "Special Tax Consultant") and set forth in APPENDIX A hereto for all taxable properties in the District. Interest and principal on the 2015 Bonds and 2014 Bonds is payable from the annual Special Taxes to be levied and collected on such property within the District and from the proceeds, if any, from the sale of such property for delinquency of such Special Taxes.
The Special Taxes are exempt from the property tax limitation of Article XIIIA of the
California Constitution, pursuant to Section 4 thereof as a "special tax" authorized by a two-
-14-

thirds vote of the qualified electors. The levy of the Special Taxes was authorized by the Water District pursuant to the Act in an amount determined according to the Special Tax Formula approved by the Water District. See "— Special Tax Methodology" below and "APPENDIX A — RATE AND METHOD OF APPORTIONMENT OF SPECIAL TAX."
The amount of Special Taxes that the District may levy in any year, and from which
principal and interest on the Bonds is to be paid, is strictly limited by the maximum rates approved by the qualified electors within the District which are set forth as the "Maximum Annual Special Tax" in the Special Tax Formula. Under the Special Tax Formula, Special Taxes for the purpose of making payments on the Bonds will be levied annually in an amount, not in excess of the Maximum Annual Special Tax. The Special Taxes and any interest earned on the Special Taxes shall constitute a trust fund for the principal of and interest on the Bonds pursuant to the Fiscal Agent Agreement and, so long as the principal of and interest on these obligations remains unpaid, the Special Taxes and investment earnings thereon shall not be used for any other purpose, except as permitted by the Fiscal Agent Agreement, and shall be held in trust for the benefit of the owners thereof and shall be applied pursuant to the Fiscal Agent Agreement. The Special Tax Formula apportions the Annual Costs (as defined in the Special Tax Formula and described below) among the taxable parcels of real property within the District according to the rate and methodology set forth in the Special Tax Formula. See "—Special Tax Methodology" below. See also "APPENDIX A — RATE AND METHOD OF APPORTIONMENT OF SPECIAL TAX."
The Water District may levy the Special Tax at the Maximum Annual Special Tax rate
authorized by the qualified electors within the District as set forth in the Special Tax Formula if conditions so require. The Water District has covenanted to annually levy the Special Taxes in an amount at least sufficient to pay the Annual Costs (as defined below).
The Water District may levy the Special Tax at the Maximum Annual Special Tax rate
authorized by the qualified electors within the District as set forth in the Special Tax Formula if conditions so require. Because each Special Tax levy is limited to the Maximum Annual Special Tax rates authorized as set forth in the Special Tax Formula, no assurance can be given that, in the event of Special Tax delinquencies, the amount of the Annual Costs will in fact be collected in any given year. See "SPECIAL RISK FACTORS — Insufficiency of Special Taxes" herein. The Special Taxes are collected for the Water District by the County in the same manner and at the same time as ad valorem property taxes.
Special Tax Methodology
The Special Tax authorized under the Act applicable to land within the District will be
levied and collected according to the tax liability determined by the Water District through the application of the appropriate amount or rate as described in the Special Tax Formula (defined terms set forth below in this section have the meanings set forth in the Special Tax Formula) set forth in "APPENDIX A — RATE AND METHOD OF APPORTIONMENT OF SPECIAL TAX." Each year, the Water District will determine the Annual Costs of the District for the upcoming fiscal year. The "Annual Costs" include the following items (i) debt service on the Bonds for the next Calendar Year; (ii) Administrative Expenses for such Fiscal Year; (iii) any amounts needed to replenish any reserve fund for bonds of the Water District; (iv) an amount equal to the amount of delinquencies in Special Taxes levied in the previous Fiscal Year and/or anticipated in the current Fiscal Year; and (v) pay-as-you-go expenditures for Authorized Facilities; less earnings on the reserve fund. The pay-as-you-go component of the Special Tax Formula is contemplated to be utilized over each of the next two fiscal years to generate funds for District
-15-

improvements. The pay-as-you-go moneys from the collection of Special Taxes are only available on an annual basis after payment of debt service on the 2014 Bonds and 2015 Bonds. The Annual Costs are the basis for the amount of Special Tax to be levied within the District. In no event may the Water District levy a Special Tax in any year above the Maximum Annual Special Tax identified for each parcel in the Special Tax Formula.
Parcels Subject to the Special Tax. The Water District will prepare a list of the parcels
subject to the Special Tax using the records of the Water District and the County Assessor. The Water District will tax all parcels within the District that are wholly or partially within the Pre-Development Plan Area (the "PDP") (described herein, and generally a development plan for the Diablo Grande Specific Plan) except tax-exempt parcels as described in the Special Tax Formula. Taxable parcels that are acquired by a public agency after the District is formed will remain subject to the Special Tax unless a "trade" resulting in no loss of Special Tax revenue can be made, as described in the Special Tax Formula. Parcels wholly outside the PDP Area may not be taxed.
Undeveloped Parcels are taxed on the Gross Taxable Acreage of the parcel. The Gross
Taxable Acreage includes a pro rata share of the acreage that is lost to public right-of-ways when a parcel is subdivided. The reason the parcel is taxed for Gross Taxable Acres rather than gross acres is to ensure that the overall special tax revenue base remains undiminished throughout the existence of the District. Undeveloped Parcels are the parcels that have been subdivided from the Original Parcels, but do not yet have their final use entitlements for development and assigned significantly higher tax rates. As these parcels are created, some taxable acreage may be lost to public right-of-ways, such as streets, roads, and landscaped corridors. Taxing these parcels on the Gross Taxable Acreage is a means of maintaining the special tax base. The District administrator will review the allocation of taxable acreage to Undeveloped Parcels to ensure that the maximum annual special tax for parcels reflects the development potential for each new Undeveloped Parcel. In no case shall the maximum annual special tax for the Undeveloped Parcel with the adjusted Gross Taxable Acreage exceed the special tax revenue for the parcel that would occur when the parcel achieves full development status.
Assignment of Maximum Annual Special Tax. The Special Tax Formula describes in
detail the method for assigning the Maximum Annual Special Tax to parcels within the District, which generally provides that each year the Water District will use the definitions contained in the Special Tax Formula to classify each parcel as tax-exempt or taxable. The Special Tax Formula assigns a total Maximum Annual Special Tax to the existing Original Parcels (as defined in the Special Tax Formula) and then reallocates the tax to Successor Parcels (as defined in the Special Tax Formula). Successor Parcels are further classified as a Developed Parcel, Golf Course Parcel, Undeveloped Parcel, Public Parcel, or Open Space Parcel. A Maximum Annual Special Tax is then assigned to each Successor Parcel using Attachment 2 of the Special Tax Formula.
Only that portion of a taxable parcel that lies within the boundaries of the PDP Area will
be taxed. For each Successor Parcel, the administrator will first determine the area of the parcel that lies within the PDP Area. Then the Maximum Annual Special Tax Rate and Maximum Annual Special Tax is assigned to the Successor Parcel by assigning a land use from Attachment 2. If a Successor Parcel has more than one land use, determine the Taxable Acreage for each land use, and assign a Maximum Annual Special Tax to the parcel by multiplying the Taxable Acreage for each use by the Maximum Annual Special Tax Rate for
-16-

each land use, then sum the total Maximum Annual Special Tax for each land use assigned to the parcel.
Developed Parcels are assigned a Maximum Annual Special Tax on a per unit basis for
Single Family Residential Use Parcels and Multi-family Residential Use Parcels. Commercial Use Parcels and Golf Course Parcels are assigned a Maximum Annual Special Tax by multiplying the Taxable Acreage by the Maximum Annual Special Tax Rate. The Maximum Annual Special Tax for Undeveloped Parcels is assigned on a pro rata basis, as described in the Special Tax Formula. Public Parcels and Open Space Parcels are tax-exempt. A tax-exempt parcel that is not needed for public use and is converted to a taxable use will become subject to the Special Tax and will be assigned a Maximum Annual Special Tax Rate and Maximum Annual Special Tax based on the assigned land use.
Termination of the Special Tax. The Special Tax will be levied and collected for as
long as needed to pay the principal and interest on the Bonds and other costs incurred in order to construct the Improvements and authorized District-funded facilities and to pay the Annual Costs. The Special Tax Formula provides that the Special Tax may not be levied on any parcel in the District after fiscal year 2039-40. When all Annual Costs incurred by the District have been paid, the Special Tax will cease to be levied.
Prepayment of the Special Tax. The Special Tax Formula provides that landowners
may permanently satisfy all or a portion of the Special Tax by a cash settlement with the Water District, pursuant to specific conditions, including a determination by the Water District that the prepayment of the Special Tax obligation does not jeopardize its ability to make timely payments of debt service on outstanding Bonds. The amount of a Full Prepayment or a Partial Prepayment (as defined in the Special Tax Formula) is calculated according to the methodology set forth in the Special Tax Formula, and is based on determining a "Benefit Share" of anticipated costs relating to the outstanding Bonds, fees, call premiums, and expenses incurred by the Water District, less a "Reserve Fund Share", as defined in the Special Tax Formula. See "APPENDIX A — RATE AND METHOD OF APPORTIONMENT OF SPECIAL TAX."
Levy of Maximum Annual Special Tax and Debt Service Coverage
The annual Special Tax will be calculated by the Water District and levied to provide
money for debt service on the Bonds, replenishment of the Reserve Fund, anticipated Special Tax delinquencies, administration of the District, and for payment of pay-as-you-go expenditures or reimbursements for costs of the Improvements or authorized District-funded facilities not funded from Bond proceeds.
The Maximum Annual Special Tax per taxable parcel is based on a uniform tax of
$1,350 per acre for Original Parcels and Undeveloped Parcels. For Successor Parcels, the Maximum Annual Special Tax ranges from $1,800 to $3,000 annually per unit for single family residential detached land uses, and from $900 to $1,200 per unit annually for apartments, condominiums, and townhouses. Commercial Use Parcels are assigned a Maximum Annual Special Tax Rate per acre ranging from $3,600 to $7,500 annually. In no event may the Water District levy a Special Tax in any year above the Maximum Annual Special Tax identified for each parcel in the Special Tax Formula. See "APPENDIX A — RATE AND METHOD OF APPORTIONMENT OF SPECIAL TAX" for a copy of the Special Tax Formula.
-17-

The following table shows the Maximum Annual Special Tax and Projected 2015-16 Special Tax for Successor Parcels in the District.
Table 2
Maximum Annual Special Tax Rate and Projected 2015-16 Special Tax Rate
for Successor Parcels
Tax Category Sub-Category Maximum Annual
Special Tax
Projected 2015-16
Special Tax Developed Parcels
Single-Family Residential Estate (Lots greater than 3 Acres) $3,000 per Unit $3,000 per Unit Single Family Residential 40,000 square foot minimum lots $3,000 per Unit $3,000 per Unit Single Family Residential 20,000 square foot minimum lots $3,000 per Unit $3,000 per Unit Single Family Residential 8,000 square foot minimum lots $2,400 per Unit $2,400 per Unit Single Family Residential 6,000 square foot minimum lots $2,250 per Unit $2,250 per Unit Single Family Residential 5.000 square foot minimum lots $2,100 per Unit $2,100 per Unit Single Family Residential Patio Home(1) $1,800 per Unit $1,800 per Unit Multi-Family residential Townhouses $1,200 per Unit $1,200 per Unit Multi-Family Residential Condominiums $900 per Unit $900 per Unit Multi-Family Residential Apartments $900 per Unit $900 per Unit Commercial Commercial Use Parcels $7,500 per Acre $7,500 per Acre Commercial Hotel Use Parcels $5,000 per Acre $5,000 per Acre Commercial Winery list Parcels $3,600 per Acre $3,600 per Acre
Undeveloped Parcels N/A $1,350 per Acre $1,134 per Acre Golf Course Parcels N/A $1,350 per Acre $1,134 per Acre Source: Goodwin Consulting Group, Inc. (1) Includes single family detached lots less than 5,000 square feet.
Proceeds of the annual Special Tax levy will first be used to pay the Annual Costs other
than pay-as-you-go expenditures and second, if the levy included a pay-as-you-go component, for deposit into the Improvement Fund for authorized costs not funded from bond proceeds.
The Current Developer utilized the pay-as-you-go component of the Special Tax
Formula in the 2014-15 fiscal year to generate approximately $1.7 million for additional District improvements As of the date of issuance of the 2015 Bonds, the Current Developer anticipates it will continue to utilize the pay-as-you-go component of the Special Tax Formula for each of the next two fiscal years, in order to generate an additional approximately $1.8 million of District improvements. See "VALUE ESTIMATE OF PROPERTY IN THE DISTRICT." See also "SECURITY AND SOURCES OF PAYMENTS FOR THE BONDS — Special Tax Methodology" above.
Stanislaus County Tax Loss Reserve
The County and the other political subdivisions within its boundaries operate under the
provisions of Sections 4701 through 4717, inclusive, of the Revenue and Taxation Code of the State of California, commonly referred to as the "Teeter Plan," with respect to property tax collection and disbursement procedures. These sections provide an alternative method of apportioning secured taxes whereby agencies levying taxes through the County roll may receive from the County 100% of their taxes at the time they are levied. The County treasury’s cash
-18-

position (from taxes) is insured by a special tax loss reserve fund accumulated from delinquent penalties.
The Teeter Plan is applicable to the collection of property taxes in the County, however,
it is not applicable to special taxes of community facilities districts. Accordingly, the Special Taxes securing the 2015 Bonds are not subject to the Teeter Plan.
Special Tax Fund
When received, the Special Taxes are required under the Fiscal Agent Agreement to
be deposited into a Special Tax Fund and held by the Fiscal Agent in trust for the benefit of the Water District and the Owners of the Bonds. Within the Special Tax Fund, the Fiscal Agent maintains two accounts, (i) the Debt Service Account, to the credit of which the Fiscal Agent deposits, immediately upon receipt from the Water District, all Special Tax revenue, and (ii) the Surplus Account, to the credit of which the Fiscal Agent deposits surplus Special Tax Revenue as described below. Moneys in the Special Tax Fund will be disbursed as provided below and, pending any disbursement, will be subject to a lien in favor of the Owners of the Bonds. From time to time, the Water District may request withdrawal from the Debt Service Account and/or the Surplus Account of the Special Tax Fund amounts needed to pay the Water District administrative expenses; provided that such transfers shall not be in excess of the portion of the Special Tax Revenues collected by the Water District that represent levies for administrative expenses.
All Special Tax Revenue are required to be forwarded to the Fiscal Agent by the Water
District for deposit upon receipt into the Debt Service Account no later than ten (10) Business Days prior to each Interest Payment Date, the Fiscal Agent will withdraw from the Debt Service Account of the Special Tax Fund and transfer (i) to the Reserve Fund, an amount which when added to the amount then on deposit therein is equal to the Reserve Requirement, and (ii) to the Bond Fund an amount, taking into account any amounts then on deposit in the Bond Fund such that the amount in the Bond Fund equals the principal, premium, if any, and interest due on the Bonds on the next Interest Payment Date. At such time as deposits to the Debt Service Account equal the principal, premium if any, and interest becoming due on the Bonds for the current Bond Year and the amount needed to restore the Reserve Fund balance to the Reserve Requirement, the amount in the Debt Service Account in excess of such amount may, at the discretion of and upon the request of, the Water District, be transferred to the Surplus Account, which shall occur on or after September 15th of each year. If there has been no levy for pay-as-you-go expenditures it is unlikely there will be amounts to be transferred to the Surplus Account.
Moneys in the Surplus Account may, at the Water District's discretion, be transferred to
the Improvement Fund to pay for costs of the Improvements or other authorized expenses of the District, to pay the principal of, premium, if any, and interest on the Bonds or to replenish the Reserve Fund to the amount of the Reserve Requirement. See "— Reserve Fund" below.
Deposit and Use of Proceeds of 2015 Bonds
The 2015 Bonds are additionally secured by amounts generated from proceeds of the
2015 Bonds, together with interest earnings thereon pledged under the Fiscal Agent Agreement. The proceeds of the initial purchase of the 2015 Bonds shall be paid to the Fiscal Agent, who shall deposit such proceeds in the Reserve Fund, the Redemption Fund, and the Costs of Issuance Fund established under the Fiscal Agent Agreement. See "APPENDIX D —
-19-

SUMMARY OF CERTAIN PROVISIONS OF THE FISCAL AGENT AGREEMENT" for information on use of the moneys, including investment earnings thereon, in the various funds established under the Fiscal Agent Agreement. See also "— Reserve Fund" below.
Delinquent Payments of Special Tax; Covenant for Superior Court Foreclosure
Special Tax Payments and Foreclosure Proceedings. The Special Tax will be
collected in the same manner and the same time as ad valorem property taxes, except at the Water District’s option, the Special Taxes may be billed directly to property owners. In the event of a delinquency in the payment of any installment of Special Taxes, the Water District is authorized by the Act to order institution of an action in superior court to foreclose the lien therefor.
The Water District has covenanted in the Fiscal Agent Agreement with and for the
benefit of the Owners of the Bonds that it will cause a special tax consultant to annually on or before September 1 of each year review the public records of the County relating to the collection of the Special Tax in order to determine the amount of the Special Tax collected in the prior fiscal year, and if the Water District determines on the basis of such review that the amount so collected is deficient by more than 5% of the total amount of the Special Tax levied in the District in such fiscal year, it will within 30 days thereafter institute foreclosure proceedings as authorized by the Act in order to enforce the lien of the delinquent installment of the Special Tax against each separate lot or parcel of land in the District for which such installment of the Special Tax is delinquent, and will diligently prosecute and pursue such foreclosure proceedings to judgment and sale; provided, that if the Water District determines on the basis of such review that (a) the amount so collected is deficient by less than 5% of the total amount of the Special Tax levied in the District in such fiscal year, but that property owned by any single property owner in the District is delinquent by more than $10,000 with respect to the Special Tax due and payable by such property owner in such fiscal year, or (b) property owned by any single property owner in the District is delinquent cumulatively by more than $5,000 with respect to the current and past Special Tax due (irrespective of the total delinquencies in the District) then the Water District will cause to the Fiscal Agent to institute, prosecute and pursue such foreclosure proceedings in the time and manner provided in the Fiscal Agent Agreement against each such property owner.
Under the Act, foreclosure proceedings are instituted by the bringing of an action in the
superior court of the county in which the parcel lies, naming the owner and other interested persons as defendants. The action is prosecuted in the same manner as other civil actions. In such action, the real property subject to the special taxes may be sold at a judicial foreclosure sale for a minimum price which will be sufficient to pay or reimburse the delinquent special taxes.
The owners of the Bonds benefit from the Reserve Fund established pursuant to the
Fiscal Agent Agreement; however, if delinquencies in the payment of the Special Taxes with respect to the Bonds are significant enough to completely deplete the Reserve Fund, there could be a default or a delay in payments of principal and interest to the owners of the Bonds pending prosecution of foreclosure proceedings and receipt by the Water District of the proceeds of foreclosure sales in an amount sufficient to pay delinquent amounts. Provided that it is not levying the Special Tax at the Maximum Annual Special Tax rates set forth in the Special Tax Formula, the Water District may adjust (but not to exceed the Maximum Annual Special Tax) the Special Taxes levied on all property within the District subject to the Special
-20-

Tax to provide an amount required to pay debt service on the Bonds and to replenish the Reserve Fund.
Under current law, a judgment debtor (property owner) has at least 140 days from the
date of service of the notice of levy in which to redeem the property to be sold. If a judgment debtor fails to redeem and the property is sold, his or her only remedy is an action to set aside the sale, which must be brought within 90 days of the date of sale. If, as a result of such an action a foreclosure sale is set aside, the judgment is revived and the judgment creditor is entitled to interest on the revived judgment as if the sale had not been made (California Code of Civil Procedure Section 701.680).
Foreclosure by court action is subject to normal litigation delays, the nature and extent of
which are largely dependent upon the nature of the defense, if any, put forth by the debtor and the condition of the calendar of the superior court of the county. Such foreclosure actions can be stayed by the superior court on generally accepted equitable grounds or as the result of the debtor’s filing for relief under the Federal bankruptcy laws. The Act provides that, upon foreclosure, the Special Tax lien will have the same lien priority as is provided for ad valorem taxes and special assessments. See "VALUE ESTIMATE OF PROPERTY WITHIN THE DISTRICT — Priority of Lien."
The Water District has foreclosed as described above on delinquent parcels and
the Current Developer has in all instances of foreclosures on the residential parcels designated for non-custom residential homes acquired the parcels at the foreclosure sale. These acquisitions totaled approximately $650,000 in 2013 and approximately $475,000 in 2014 and 2015 combined.
Reserve Fund
A Reserve Fund (the "Reserve Fund") was established under the original Fiscal Agent
Agreement, and reserve accounts thereunder were established with proceeds of the 2005 Bonds and 2014 Bonds, with all the Reserve Fund being held by the Fiscal Agent. Upon delivery of the 2015 Bonds, the amount of the 2015 Reserve Account (the “2015 Reserve Account”) shall be established by depositing certain proceeds of the 2015 Bonds into the 2015 Reserve Account such that the amount in the 2015 Reserve Account equals the "Reserve Requirement" for the 2015 Bonds, which is the lesser of 10% of the original principal amount of the 2015 Bonds, 100% of maximum annual debt service on the 2015 Bonds, or 125% of average annual debt service on the 2015 Bonds. Separately, the Fiscal Agent holds and will continue to hold a reserve account in the Reserve Fund for the 2014 Bonds, the Reserve Requirement for which equals the lesser of 10% of the original principal amount of the 2014 Bonds, 100% of maximum annual debt service on the 2014 Bonds, or 125% of average annual debt service on the 2014 Bonds. The Water District is required to cause to be maintained, but only from Special Taxes, an amount of money or other security equal to the Reserve Requirements for the 2014 Bonds and 2015 Bonds in the Reserve Fund at all times that the 2014 Bonds and 2015 Bonds, respectively, are outstanding.
All amounts deposited in the Reserve Fund shall be used and withdrawn by the Fiscal
Agent solely for the purpose of making transfers to the Bond Fund in the event of any deficiency at any time in the Bond Fund of the amount then required for payment of the principal of, and interest on, the 2014 Bonds and 2015 Bonds. Whenever transfer is made from the Reserve Fund to the Bond Fund due to a deficiency in the Bond Fund, the Fiscal Agent shall provide written notice thereof to the Water District. Whenever, on the Business Day prior to any Interest
-21-

Payment Date, the amount in the Reserve Fund exceeds the then applicable Reserve Requirement, the Fiscal Agent shall transfer an amount equal to the excess from the Reserve Fund to the Bond Fund or the Improvement Fund as provided below, except that investment earnings on amounts in the Reserve Fund may be withdrawn from the Reserve Fund for purposes of making payment to the Federal government to comply with rebate requirements.
Moneys in the Reserve Fund shall be invested and deposited in accordance with the
Fiscal Agent Agreement. Interest earnings and profits resulting from the investment of moneys in the Reserve Fund and other moneys in the Reserve Fund shall remain therein until the balance exceeds the Reserve Requirement; any amounts in excess of the Reserve Requirement shall be transferred to the Bond Fund to be used for the payment of the principal of and interest on the Bonds in accordance with the Fiscal Agent Agreement.
Whenever the balance in the Reserve Fund exceeds the amount required to redeem or
pay the Outstanding Bonds, including interest accrued to the date of payment or redemption and premium, if any, due upon redemption, and make any other transfer required under the Fiscal Agent Agreement, the Fiscal Agent shall transfer the amount in the Reserve Fund to the Bond Fund to be applied, on the next succeeding Interest Payment Date to the payment and redemption of all of the Outstanding Bonds. In the event that the amount so transferred from the Reserve Fund to the Bond Fund exceeds the amount required to pay and redeem the Outstanding Bonds, the balance in the Reserve Fund shall be transferred to the Water District, after payment of any amounts due the Fiscal Agent, to be used for any lawful purpose of the Water District.
Additional Bonds
After issuance of the 2005 Bonds, the Water District had issued the entire $57,000,000
amount of bonds authorized for the District; accordingly no Additional Bonds (as described in the Fiscal Agent Agreement) are authorized. However, the Water District may issue additional bonds secured by the Special Tax on parity with the 2014 Bonds and 2015 Bonds to refund any bonds issued for the District.
-22-

DEBT SERVICE SCHEDULE AND COVERAGE The annual debt service on the 2015 Bonds based on the interest rates and maturity
schedule set forth on the cover of this Official Statement is set forth below, followed by a coverage table which includes the scheduled aggregate debt service on the 2014 Bonds and the 2015 Bonds.
TABLE 3 DIABLO GRANDE COMMUNITY FACILITIES DISTRICT NO. 1
SPECIAL TAX REFUNDING BONDS, SERIES 2015 DEBT SERVICE
Year
Ending (Sept. 1)
2015 Bonds
Principal
2015 Bonds
Interest
2015 Bonds
Total 2016 -- $345,833 $345,833 2017 $200,000 306,650 506,650 2018 380,000 296,650 676,650 2019 400,000 277,650 677,650 2020 420,000 263,150 683,150 2021 435,000 247,925 682,925 2022 455,000 232,156 687,156 2023 470,000 214,525 684,525 2024 485,000 196,313 681,313 2025 505,000 177,519 682,519 2026 525,000 157,950 682,950 2027 545,000 134,325 679,325 2028 570,000 109,800 679,800 2029 595,000 84,150 679,150 2030 625,000 57,375 682,375 2031 650,000 29,250 679,250 Total $7,260,000 $3,131,221 $10,391,221
-23-

TABLE 4 DIABLO GRANDE COMMUNITY FACILITIES DISTRICT NO. 1
SPECIAL TAX REFUNDING BONDS, SERIES 2014 AND SERIES 2015 DEBT SERVICE COVERAGE
Maturity Series 2014 Series 2015 Aggregate Available Coverage (Sept. 1) Debt Service (1) Debt Service Debt Service Revenues (2) Ratio
2015 $1,949,996 $0 $1,949,996 $5,360,714 274.9% 2016 2,306,410 345,833 2,652,243 5,341,064 201.4% 2017 3,681,910 506,650 4,188,560 5,341,064 127.5% 2018 3,686,110 676,650 4,362,760 5,341,064 122.4% 2019 3,683,510 677,650 4,361,160 5,341,064 122.5% 2020 3,679,510 683,150 4,362,660 5,341,064 122.4% 2021 3,672,510 682,925 4,355,435 5,341,064 122.6% 2022 3,672,510 687,156 4,359,666 5,341,064 122.5% 2023 3,675,905 684,525 4,360,430 5,341,064 122.5% 2024 3,678,493 681,313 4,359,806 5,341,064 122.5% 2025 3,680,020 682,519 4,362,539 5,341,064 122.4% 2026 3,680,235 682,950 4,363,185 5,341,064 122.4% 2027 3,682,135 679,325 4,361,460 5,341,064 122.5% 2028 3,676,350 679,800 4,356,150 5,341,064 122.6% 2029 3,677,880 679,150 4,357,030 5,341,064 122.6% 2030 3,675,930 682,375 4,358,305 5,341,064 122.5% 2031 3,680,235 679,250 4,359,485 5,341,064 122.5%
Total $59,439,648 $10,391,221 $69,830,869 $90,817,738
(1) Reflects the redemption of $55,000 of Series 2014 Special Tax Refunding Bonds on March 1, 2015 from Special Tax prepayments.
(2) Based on the Projected Maximum Annual Special Tax for fiscal year 2015-16. The Maximum Annual Special Tax may increase upon further development. Available revenue decreased in 2015-16 due to Special Tax prepayments.
-24-
THE WATER DISTRICT
The Water District was formed in 1992 under Division 13, Sections 34000-38501 of the California Water Code, primarily for the purpose of providing water to the proposed development then contemplated by Diablo Grande Limited Partners (the "Original Developer") to be constructed within the approximate 29,500-acre Diablo Grande Project holdings of the Original Developer. The formation was constituted by an election on April 30, 1992, certified by the Board of Supervisors of the County of Stanislaus and recorded with the County Recorder on June 8, 1992. The Original Developer was the sole owner of all of the property in the Water District. The Water District was formed by the Original Developer solely for the purpose of facilitating development of the Original Developer's property and the Board of Directors of the Water District was for several years comprised of persons who were employed by or otherwise associated with the Original Developer. The directors are publicly elected by the owners of land within the District. Currently, the Board is comprised of persons who are employed by or otherwise associated with the Current Developer, except for one member who is a homeowner within the Water District's boundary. The District boundaries are coterminous with the Water District and do not currently encompass the entire original Diablo Grande Project. See "APPENDIX E — SELECTED DEMOGRAPHIC DATA" for general information on the area near the Water District.
Currently, four of the five Board members are persons who are employed by or
otherwise associated with the Current Developer.
-25-

THE DISTRICT The Developer has provided the following information with respect to development within
the District. No assurance can be given that all information is complete. No assurance can be given that development in the District will be completed, or that it will be completed in a timely manner. Since ownership of the property within the District is subject to change, the development plans outlined below may not be continued by a subsequent owner if the property is sold, however development by any subsequent owner will be subject to the District, the District’s water supply, and the lien of the Bonds, the Diablo Grande Specific Plan, local approvals, and the policies and requirements of the County. No assurance can be given that the plans or projections detailed below will actually occur.
Overview of the District
The District originally comprised approximately 5,070 acres (a substantial portion of
which will remain as open space and not be subject to the Special Tax), or approximately 17.2% of the approximate 29,500-acre "Diablo Grande" planned residential, golf and resort project (further described below). Land within the District includes substantial planned open space and as property in the District is subdivided for development, such open space parcels become exempt from the Special Tax. Land in the District subject to the Special Tax currently comprises 2,934 acres.
The District as originally formed comprised six County Assessor's parcels (25-05-04, 25-
10-05, 25-11-06, 25-15-06, 25-15-07, and 25-16-10), some parts of which were subsequently subdivided for initial residential development, with final maps now in place providing for 735 residential parcels and 4 commercial lots. Additional parcels are expected to be subdivided as development occurs, and the Current Developer now projects an estimated 2,354 residential units at buildout.
The District was formed to provide infrastructure improvements for the first stage (the
Original Developer's "Phase 1") of the Diablo Grande project located within the Diablo Grande Specific Plan (described herein) established by the County. The property in the District currently includes one completed, operational golf course (a second golf course was closed in May 2014, and is anticipated to be rezoned by the Current Developer), a clubhouse and related outbuildings and improvements, vineyards and completed homes sold to homeowners. Land in the District is surrounded by extensive vacant land and other than the golf course, clubhouse and newly developed or developing homes, is currently predominantly undeveloped. Location of the District
The District is located approximately 9 miles west of the City of Patterson, California in
western Stanislaus County (the "County"). The County lies between San Joaquin County on the north, Merced County on the south, and Santa Clara County on the west. The County is traversed by two major highways, Interstate 5 on the west side and State Highway 99 through its central region. The City of Modesto is the County seat with an estimated population of approximately 209,186 persons as of January 1, 2015.
The incorporated city nearest to the District is the City of Patterson, a rural community
with a January 1, 2015 population estimate of 21,094, near Interstate 5 between Los Banos and Tracy. The town lies about 60 minutes driving time to employment centers in Pleasanton, Livermore, Dublin, and San Ramon to the west, which are accessible from Interstate 5 via
-26-

Interstate 580. These employment centers have experienced significant growth due to the movement of growth from the San Francisco Bay Area.
The District is located in a mostly undeveloped area of the County in the hills forming a
portion of the western edge of California’s Central Valley. Other than highway–related retail at Interstate 5, the community is approximately 15 minutes away from retail facilities including a 50,000 square foot Save Mart grocery store, 158,000 square foot Super Walmart, CVS drugstore, Starbucks, and others. Patterson continues to grow with the recent opening of Grainger's 820,000 square foot distribution center, Amazon's 1,000,000+ square foot fulfillment center (a physical facility where product orders are processed, packed and shipped), and a 1,500,000 square foot warehouse and distribution center is also under construction for Restoration Hardware. CVS operates 807,000 square foot distribution center and Kohl's has a 400,700 square foot facility as well. The City expects that the State Enterprise Zone will continue to draw more companies and increase the local employment base. In addition, the County is planning development of Crows Landing, the former naval airfield adjacent to the City of Patterson. The Business Industrial Park is expected to add 6,000,000 sq. ft. to the area, open an executive airport, and improve the area’s infrastructure.
Utility and safety services are provided within the Distirict by the following providers:
police: Stanislaus County Sheriff's Office; Fire: West Stanislaus County Fire Protection District; Electric: Turlock Irrigation District; Telephone: Frontier.
Property west of Interstate 5 in the area of the District is generally hilly, steep, rough
terrain primarily used for dry farming or cattle grazing. Some exceptions extend along and near to Oak Flat Road where terrain is level to rolling to gentle hilly with some availability of water sources. These lands have been used to grow cherries, walnuts, almonds and citrus. Land area east of Interstate 5 is typical Central Valley agricultural terrain, primarily level with water availability and good soils for almonds, walnuts, apricots, raw crops, sod farms, and other crops. These land areas are heavily utilized for various crop types and have a long history of such uses.
Direct access to the District west from the "Patterson" exit of Interstate 5 is available on
Diablo Grande Parkway constructed by the Original Developer of the Diablo Grande Project, a portion of which includes the "cut-across" component funded in part with proceeds of the 2001 Bonds. The entrance gate to the project is approximately 8 miles from Interstate 5. All of Diablo Grande Parkway has been improved by the Original Developer to modern two-lane County standards.
-27-

LOCATION MAP
-28-

AERIAL VIEW OF THE DISTRICT1
-2�-2929-29-

DEVELOPMENT STATUS MAP1
-2�--30-

Entrance to the District is via an entrance gate to the project. Beyond the gate are private
streets, some of which traverse the existing golf course and vineyards, which currently extend from inside the gate to the existing golf clubhouse area, a distance of approximately 2 miles, and into newly constructed residential streets and homes sold and under construction.
Development History of the Project
Zoning and Specific Plan. Property in the District is currently a part of the County's
3,400-acre Diablo Grande Specific Plan (the "Specific Plan"). Land in the District subject to the special tax comprises approximately 2,934 acres of the Specific Plan area. Development of the property in the District is under the jurisdiction of the County and has been and will be governed by the Specific Plan, the Environmental Impact Report prepared in connection with the Specific Plan, the Mitigation Monitoring and Reporting Plan, and by all adopted project mitigation measures and conditions, including the specific conditions of approval related to existing and future Tentative Map applications.
Existing pre-zoning for the property in the District includes RC - resort commercial uses
including commercial, clubhouse, restaurant, conference and hotel center, retail and offices; RA - rural residential, 3 acre minimum; R1 - single family residential, 10,000 square-foot, 20,000 square-foot, and 40,000 square-foot lots; R2 - medium density residential with 4,500 minimum square-foot detached lots; R3 - multiple family residential with medium high densities.
As a result of the closure of one of the golf courses in the District in May 2014, and an
available bonus density plan, the Current Developer intends to apply for an amendment to the Specific Plan to facilitate an additional 342 residential units in the District in excess of the 2,012 approved under the Specific Plan. No definite plans have been formulated at this time and no assurance can be given that additional units will be finally approved by the County.
Property within the District subject to the Special Tax initially included the entirety of each
of the 6 County Assessor's Parcels that comprised the 5,070 acres in the District. The Special Tax Formula provides that as subdivision of the 6 County Assessor's Parcels occurs, the Special Tax will shift only to the developed parcels, which comprise land within the Original Developer’s Phase 1/Unit 1 development area. Land in the District subject to the Special Tax currently comprises 2,934 acres. Subdivided parcels designated for open space, public uses and parcels planned to remain as raw land and all parcels wholly outside of the Phase 1/Unit 1 development area will not be subject to Special Taxes and will not be security for the Bonds. See "APPENDIX A — RATE AND METHOD OF APPORTIONMENT OF SPECIAL TAX."
Water. A source of water for development is available to the District as identified by a
Certificate of Transfer of Water dated June 5, 2000 between Kern County Water Agency ("KCWA") and the Water District, the Point of Delivery Agreement between the California Department of Water Resources ("DWR"), and the KCWA dated June 8, 2000, the agreement between the Department of Water Resources, State of California, the KCWA and the Water District for construction, operation and maintenance of the Western Hills Turnout, a permanent turnout within the California Aqueduct Right-of-Way dated June 8, 2000. These documents provide for the transfer from KCWA to the Water District of a long term and stable source of up to 8,000 acre feet per annum of annual water supply of Kern County Water Agency's Pioneer Project water supply made available to the Water District by the Department of Water Resources by simultaneously exchanging KCWA’s State Water Project (the "SWP") water supply to the Water District at the aqueduct turnout completed by the Original Developer in 2001. The Water
-31-

District's delivery system consists of 4 pumping stations, a water treatment plant, a 1 million gallon water reservoir and approximately 22 miles of treated water pipelines and 7 miles of raw water pipelines.
In 2010, the District entered into an unbalanced water banking program agreement with
five SWP contractors. The initial term of the agreement is through 2019, and after 2019, the buyers may terminate the agreement on five years’ prior written notice. Under the agreement, the Water District sells and the contractors agree to buy that portion of the District’s SWP water in excess of in-district demands, which helps reduce the Water District’s annual raw water costs. In addition, the Water District earns a water bank credit of 500 acre feet per annum if at least 500 acre feet of excess water is provided to the contractors. The Water District is able to call on its accrued credits in order to meet in-district demands when SWP water is insufficient to meet those demands. So long as the Water District has accrued credits, it has the right to call on those credits for fifteen years after termination of the agreement.
Through 2013, the Water District had accrued 2,000 acre feet of water bank credits.
During 2014, because of the severity of the drought, DWR’s SWP water allocation was only 5% of its 8,000 acre feet entitlement, and was effectively zero for several months. The Water District and the Current Developer implemented severe water conservation measures and were able to reduce in-district water demands to only 552 acre feet. To meet that demand, the Water District received 400 acre feet of SWP water and ordered 152 acre feet of return water from the water bank. This reduced its accrued water bank credits to 1,848 acre feet. The existing DWR SWP water allocation for 2015 is 20% of its 8,000 acre feet entitlement, or 1,600 acre feet, which if unchanged, would meet in-district demands, provide water to the contractors, and accrue an additional 500 acre feet to the Water District’s water bank, increasing the credits to 2,348 acre feet. Assuming a normal year in-district demand of 750 acre feet per year, the then accrued credits would represent over three years of in-district demand. As demonstrated in 2014, the water banking arrangement is a significant water supply asset to the Water District in firming up its water supply through at least 2034.
The Water District projects that the 8,000 acre feet entitlement is sufficient to provide for
development of the currently anticipated 2,354 residential units and the commercial uses on approximately 2,250 acres based on the Current Developer’s current plans. For example, repurposing the now closed golf course is expected to reduce water requirements by approximately 800 acre feet per year. In addition, the Current Developer is revising the landscape design guidelines to require drought-tolerant planting materials for the remaining residential units moving forward.
The Water District’s 8,000 acre feet entitlement is currently permitted under DWR’s SWP
water rights by the State Water Resources Control Board for 466 acres of development. Development of the remaining acreage will require the Water District to request (through the KCWA) the DWR to petition the State Water Resources Control Board for expansion of the initially permitted area. The Water District contemplates doing so in a timely manner to facilitate further development.
Original Developer’s Development Plan. Land within the District is designated under
the Specific Plan. The Original Developer designated this area as Phase 1 of the Diablo Grande Project, and the Original Developer anticipated it to be developed in four "units." The Current Developer’s development plan for the planned Phase 1 is in conformance with the Specific Plan and applicable zoning ordinances, and no further discretionary approvals are required to allow all Phase 1 development to proceed as originally contemplated by the Original Developer upon
-32-

approval of tentative and final subdivision maps. Additionally, as a result of the closure of one of the golf courses in the District in May 2014, and an available bonus density plan, the Current Developer expects an additional 342 residential units in the District in excess of the 2,012 approved under the Specific Plan.
Development Under the Original Developer’s Development Plan. In December 1999
the County approved a tentative subdivision map (as amended) to create the 313 residential lots, a hotel site and winery site then-proposed for the first unit of the Original Developer’s Phase 1. A final subdivision map for 84 custom lots, and 52 production lots, referred to as "The Reserves," was recorded in May 2003. A final subdivision map for 51 production lots "Villas I" in Unit 1A and 47 patio home production lots "Villas I" (Unit 1A-2) was recorded in August 2004. A final map for a 66 production lot subdivision "Vineyards I" (Unit 2C) and a 130 production lot subdivision "The Cottages" (Unit 2C) was recoded in March 2006. An additional 112 production lot subdivision "Vineyards II" (Unit 2C) was recorded April 2006. A final map for 40 custom lots (Unit 1B) was recorded May 2006. A final map for 96 production lots "Villas II" (Unit 2A) was recorded July 2006. A final map for 39 custom lots (Unit 1D) was recorded October 2006. A final map for 19 production lots "Legends I" was recorded April 2008. To date, 735 residential lots are the subject of final maps.
Construction of Amenities By Original Developer. In connection with the golf
orientation originally envisioned for the Diablo Grande Project, the Original Developer created a clubhouse facility a result of remodeling the large main residence located on the ranch property at the time of acquisition of the land and constructed and operated two golf courses, the "Ranch" course, which was completed in 1996, and the "Legends" course, which was completed in 1997. The “Legends” golf course was closed in May 2014, and the Current Developer is in the process of repurposing the land into other uses, including additional homes, 28 miles of walking and hiking trails, and other public amenities. The Original Developer had planned to construct a winery and hotel on the property but those have not been built, however a vineyard was planted and remains a visual amenity.
Bankruptcy of Original Developer. On March 10, 2008 the Original Developer
commenced bankruptcy proceedings, largely resulting from the national real estate downturn resulting in a slowdown and stoppage of development and sale of lots and homes in the project. The Current Developer acquired most of the undeveloped land in the project in October 2008 as part of the disposition of assets under the bankruptcy proceeding.
Presently Existing Development. Nearly all of the presently existing homes were
constructed prior to the real estate downturn. As a result of the Original Developer's development activities, land in the District presently comprises 735 final mapped residential lots, of which 462 lots have been improved with homes constructed, in construction or preparing for the start of contruction. In addition to the completed homes, infrastructure improvements suitable for additional development are in place. Land in the District also includes undeveloped land, one golf course (a second golf course was closed in May 2014, and is anticipated to be used for future home development, walking trails and other public amenities), a clubhouse and related outbuildings and improvements. In addition to the 735 final mapped residential lots, the District includes 4 commercial lots (currently being used or contemplated to be used for a water treatment plant, Water District infrastructure area, clubhouse and hotel).
DeNova Homes is currently building and marketing homes in the District and, as of June
2015 had sold 18 homes, following 2014 sales of 9 homes. The average sales price for the homes sold in 2015 was approximately $288,000.
-33-

Top Ten Taxpayers. The table below shows the top 10 taxpayers in the District in fiscal
year 2014-15.
Table 5 Western Hills Water District
Community Facilities District No. 1 Top 10 Taxpayers
Owner No. of
Parcels Taxable
Acres Composite
Value
2014 & 2015 Bonds Debt
Burden
Value-to-Debt Ratio
World International LLC 100 2,711.36 $45,437,234 $30,129,121 1.5 Western Pacific Housing (DR Horton) 118 20.98 14,362,000 2,753,068 5.2 Pacific Blue LLC 2 61.47 810,757 987,153 0.8 Civic Diablo Grande LLC (De Nova Homes) 40 4.84 4,087,902 829,924 4.9 Oak Valley Community Bank 5 19.48 875,000 153,975 5.7 Capital Equity Management Group, Inc. 4 1.93 360,000 123,180 2.9 Private Owner 4 0.64 617,178 83,146 7.4 Private Owner 3 0.38 505,774 64,669 7.8 Private Owner 2 1.09 180,000 61,590 2.9 Starr Partners, LLC 1 0.96 447,020 61,590 7.3 Total 279 2,823.13 67,682,865 35,247,416 1.9
All Other Taxable Parcels 451 111.17 94,748,664 10,462,584 9.1
Prepaid Parcels 19 Parcels Created by Proposed Split (1) 2
Total 751 2,934.29 $162,431,529 $45,710,000 3.6
Sources: Appraised Values provided by Seevers, Jordan & Ziegenmeyer, compiled by Goodwin Consulting Group, Inc.
(1) Two of the finished lots on the current tax roll will be split into two lots each; therefore, there are two additional finished lots, based on information provided by the Current Developer.
Market Report. An updated market assessment and analysis report was prepared by
Meyers Research LLC ("Meyers"), dated June 2015 (the "Market Report"). The Market Report was commissioned by the Current Developer in connection with its evaluation of the current development potential of its undeveloped land in the District. The Market Report analyzed residential product types, pricing and absorption for the entirety of the Phase 1 Village master plan in the market as it existed on the date of the report, along with projections of the market demand for 2015 through an assumed potential buildout of the community. See "APPENDIX C — MARKET ASSESSMENT AND ANALYSIS REPORT."
Key findings of the Market Report include the following:
• Meyers generally concurs with the Diablo Grande District plan and its seven
distinct product lines spanning each of the various parcel densities at Diablo Grande: five conventional single family detached lines, one attached townhome product line, and one alley loaded product.
-34-

• Single family product represent the majority of the supply and demand in the greater Modesto market, both currently and historically. Approximately 83% of the product offered in Diablo Grande will be within the product lines as described above.
• The recommended base prices for Diablo Grande appear reasonably positioned above stand-alone communities in nearby Patterson, as well as other areas in the greater Modesto area.
• Pricing for the single family homes is consistent with DeNova's recent sales. • Pricing is generally consistent to slightly below sales in Manteca and Tracy and is
positioned well below Mountain House on a base price comparison. • Pricing is generally at or below all market comparables in order to make Diablo
Grandes competitive on a monthly payment basis. • Because of relatively high homeowners association fees and combined tax rate at
Diablo Grande, the recommended base prices are generally positioned in the middle of the market compared to other actively selling communities in the greater Modesto market on a monthly payment basis, higher than stand-alone product in Patterson and Modesto, similar to Manteca and Lathrop, and lower than Mountain House and Tracy.
• Targeting absorption rates ranging from 2.5 sales per month for 75-foot wide single family homes to 3.5 sales per month for the least expensive attached homes appears reasonable given the current competitive sales environment.
• Pricing and absorption are based on Meyers' assumption that Diablo Grande and its future builder partners will build at least to a similar specification level as the existing product within Diablo Grande and that additional community amenities will be improved and incorporated.
• The location and setting of the Diablo Grande Project offers many amenities and natural beauty.
• Target segments of home buyers should include predominantly primary and also some secondary buyers, including families, "empty nesters", and retirees.
• The master planned environment of the Diablo Grande Project should result in a competitive advantage in the local and regional market due to the relative lack of competing master planned communities in the region.
• Existing infrastructure and amenitites including extensive open space provide a strong foundation for new home sales.
• Home values and lot values have increased significantly in the Bay Area in the past year, which should positively affect the demand for further out locations.
• The project is located in the greater Modesto region but will likely attract buyers from areas outside the region, such as Stockton, Oakland, San Jose, and in particular the fast-growing Tri Valley area (Livermore, Pleasanton, and Dublin). The project is an approximately 60-minute drive from the Tri Valley area, which is benefitting from favorable job growth yet relatively high home prices – factors which should drive more of the Tri Valley workforce toward the District in search of new homes.
-35-

A history of new home sales in the District is shown below, along with the annual median new home sale price, followed by a table summarizing sales by price range.
Table 6
Diablo Grande – Annual Sales of New Production Homes 2004-2015(1)
Year Annual
New Home Sales Median New Home Price
2004 67 $353,500 2005 103 $505,500 2006 68 $430,500 2007 104 $347,350 2008 43 $282,000 2009 9 $136,000 2010 3 $105,000 2011 3 $195,000 2012 0 -- 2013 0 -- 2014 9 $303,900 2015 18 $266,700 Total 427
Source: Meyers Market Study and Analysis Report. (1) Data is for production home sales only (does not include custom lot sales).
Anticipated Development Plan of Current Developer
The Current Developer is of the opinion that the Original Developer's development plan
has some inefficiencies with regards to grading and backbone infrastructure and the lotting and phasing are outdated as to current market demands. Accordingly, the Current Developer does not presently intend to follow the specific lotting shown in the development plan of the Original Developer. The Current Developer expects to apply for approval by the County to allow additional units in the project, in addition to relocating some larger lots along the hillsides to areas closer to infrastructure and recreational amenities. The Current Developer projects seeking approval for a total of 2,354 residential units in Phase 1, an increase from the presently approved 2,012.
The Current Developer also contemplates that the golf course that closed in May 2014
will be repurposed into more cost efficient lots, and the addition of more contemporary and sustainable amenities, such as walking trails and bike paths, with an emphasis on the natural environment. The Current Developer has determined that approximately 15% of existing homeowners are golfers, and as such considers the allocation of a significant amount of water to the incremental amenity benefit associated with the existence of a second golf course not justified by added value to lots and homes. Work on the trails is currently underway.
Approximately $350,000 is available and has been committed to construct emergency
communication equipment, which is required prior to issuing additional building permits beyond 500. Emergency communications equipment allows firefighters, 911 responders and sheriff personnel to communicate with each other while in Diablo Grande. This emergency communication equipment is in addition to the construction of a fire station at Diablo Grande,
-36-
which has been approved for construction. The lack of these two items has negatively impacted the ability of landowners in the District to obtain building permits, with DeNova Homes unable to obtain building permits until the County accepted the commitment of the District to facilitate the emergency communication equipment.
There is currently one active production home project marketing homes in the Diablo
Grande development, “Villa Vista” by DeNova Homes. As of June 2015, 14 homes are under construction.
The following summarizes the Current Developer’s activities over the past 12 months. The Current Developer’s goal has been to achieve a profitable and sustainable
development plan, in response to changing homebuyer preferences and water conservation measures.
The Current Developer engaged several consultants who have conducted interviews with
current residents, determining the workable and non-workable elements of the current development, amenities that would appeal to their lifestyles, and obtaining support and buy-in for the repurposing of the golf course that was closed in May 2014. This outreach has extended beyond the District and reached into the regional pool of homebuyers actively seeking new homes within the next 24 months. From this research, the Current Developer developed the product segmentation that would yield the most value and generate the fastest absorption of new housing units. While Diablo Grande appeals to a relatively broad sector of the regional population, the Current Developer has found that the greatest demand will come from the mature families, empty nesters (pre-retirees), and retirees. These sectors seek the natural surroundings of Diablo Grande, its expansive open space, range lands, and proximity of wildlife. The Current Developer also believes that these homebuyers also have more equity in their current homes, greater incomes and credit strength. This allows better pricing flexibility and the ability to push the market once amenities have been integrated into the development.
Gates and Associates, a landscape planning firm, has been developing a 28 mile trail
system that will interconnect the current and future subdivisions, parks, commercial amenities, and expansive open space. The trail system is designed to provide access to all fitness levels and includes walking trails on flat or mildly inclined terrain, as well as more challenging hiking trails that move far up into the surrounding hills. Trail markers, guide posts, and maps are in development and will be installed in mid-summer 2015.
Dahlin Group, an architectural firm well respected amongst regional and national
homebuilders, was engaged to develop the community design standards and community amenities. An expansion and remodel of the existing clubhouse has been designed. It will include convenience retail, a second community pool, indoor recreational space, and an improved dining experience. Further, improvements have been made to the Ranch Golf Course, which is once again vibrant, green, and enjoying the play by golfers throughout a two-hour radius.
The new land plan should wrap up by mid-summer 2015 and the Current Developer’s
outreach to homebuilders will begin in earnest. The Current Developer has a consultant who has been on the acquisition side of the homebuilder industry, employed by several different builders. His skills in identifying profitable opportunities and his longtime relationships with area homebuilders, has kept the Current Developer’s development plans on track for future bulk lot sales to builders. The firm, Roni Hicks and Associates, specializes in the marketing of master
-37-

planned communities both to homebuilders, and master development marketing to the homebuyers. Roni Hicks has been working on the renewed identity for the community, as well as branding strategy and a marketing plan.
Changes to the existing land use plan will be within the entitlements rights. Regardless,
each time subdivisions are created, and entitlements allocated from the master plan to specific land areas, a Specific Plan Amendment is guided through County planning staff and put in front of the County board of supervisors for official approvals. The Current Developer anticipates having the application for a Specific Plan Amendment for review by the County by the end of Fall 2015. Merchant Builder Property
D.R. Horton (a division of Western Pacific Housing) owns a total of 118 finished lots. See "Table 5, Top 10 Taxpayers." The company has received Design Review Committee approval on its plans for the 112-lot Vineyards II and the company reports it is completing construction drawings in preparation of moving forward, pending funding of a fire station serving the District, for which the Water District is making arrangements.
DeNova Homes (under the ownership name Civic Diablo Grande LLC) purchased 38
finished lots in the District, nine of which were sold with completed homes in 2014 and 18 of which were sold with completed homes in 2015. DeNova is presently actively selling homes in its “Villa Vista” development with homes ranging from 1,776 to 2,265 square feet, with 14 homes currently under construction. See "Table 5, Top 10 Taxpayers."
Environmental Matters
Development Approvals. Since acquiring the property over 20 years ago, the Original Developer had encountered various environmental challenges in master panning the Diablo Grande Project. These challenges were consistently handled by counsel for the Original Developer and in some cases delayed the Original Developer’s development plans. At the current time all litigation related to the property has been concluded.
Flood Hazard Map Information. According to the Stanislaus County Public Works
Department, the property in the District is classified as being in Flood Zone X, described as areas outside of the 100- and 500-year flood plain (per www.floodmaps.com provided by Digital Media Services).
Wetland Conditions. The Developer has obtained a Clean Water Act Section 404
permit, which authorizes fill in areas the United States Army Corps of Engineers has delineated as "waters of the United States." The permit allows construction of the planned residential, commercial and other uses within the District. The permit ensures that the Developer is in full compliance with Section 404 of the Clean Water Act and that the Developer can conduct fill activity in conformance with the requirements of the permit.
Seismic Conditions. According to the Seismic Safety Commission, the District is
located within Zone 3, which is assigned to areas of moderate seismic activity. The location within this zone does not prevent development. There are only two zones in California. Zone 4 is assigned to areas of major faults. Zone 3 is assigned to areas with more moderate seismic activity. The District is not located within a Fault-Rupture Hazard Zone (formerly referred to as an
-38-

Alquist-Priolo Special Study Zone), as defined by Special Publication 42 (revised January 1994) of the California Department of Conservation, Division of Mines and Geology.
Levy of Special Tax; Maximum Special Tax Revenue Levy of Special Tax. The Special Tax will be levied and collected through the
application of the appropriate amount or rate as described in the Rate and Method each year in an amount at least sufficient to pay debt service on outstanding Bonds and administrative expenses of the District. See "SECURITY AND SOURCES OF PAYMENT FOR THE BONDS - Special Taxes" above and APPENDIX A.
For fiscal year 2014-15, the Maximum Annual Special Tax for the District is $5,360,714,
and for fiscal year 2015-16 the Maximum Annual Special Tax for the District is projected to be $5,341,064. The Maximum Annual Special Tax will change over the life of the Bonds as development occurs. For fiscal year 2014-2015, the Special Tax levy was $4,456,607, and for fiscal year 2015-16, the Special Tax levy is projected to be $4,453,003.
For application of the Projected Special Tax Formula for Fiscal Year 2015-16, the District
contained 735 "developed" residential lots (300 of which are classified as developed for purposes of the Special Tax Formula because they are final mapped lots but had no structure valuation per County Assessor records) that are taxed at their maximum rates. In addition, 19 parcels that were classified as Improved Residential Lots have prepaid their special tax obligation and are now considered Prepaid Parcels. There was also one parcel (13.66 acres) classified as a Hotel Use Parcel and one parcel (10.73 acres) classified as a Winery Use Parcel that are each taxed at their maximum special tax rates of $5,000 per acre and $3,600 per acre, respectively. Taxing these Developed Parcels at their maximum special tax rates is projected to generate approximately $1,775,228 in special tax revenue for Fiscal Year 2015-16, assuming no delinquencies. This amount is insufficient to fully fund the Annual Cost of $4,453,003 for 2015-16. As a result, the remaining $2,677,775 represented a levy on Undeveloped Parcels and Golf Course Parcels. Given that there are approximately 2,272.85 acres of Undeveloped Parcels and 88.51 acres of Golf Course Parcels within the District, each acre is projected to be taxed $1,134.00 in Fiscal Year 2015-16. This is approximately 84.00% of the maximum special tax rate of $1,350 per acre for Undeveloped and Golf Course Parcels. No Special Tax is projected to be levied on Original Parcels in Fiscal Year 2015-16
-39-
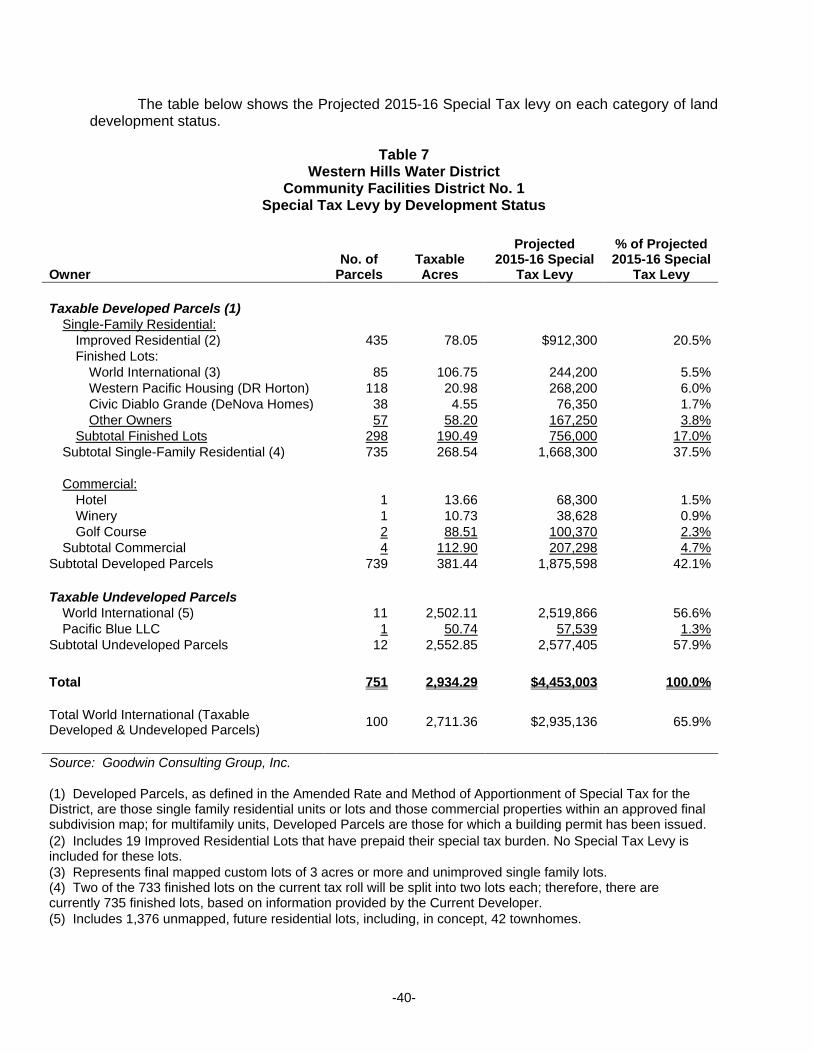
The table below shows the Projected 2015-16 Special Tax levy on each category of land development status.
Table 7
Western Hills Water District Community Facilities District No. 1
Special Tax Levy by Development Status
Owner No. of
Parcels Taxable Acres
Projected 2015-16 Special
Tax Levy
% of Projected 2015-16 Special
Tax Levy
Taxable Developed Parcels (1) Single-Family Residential: Improved Residential (2) 435 78.05 $912,300 20.5%
Finished Lots: World International (3) 85 106.75 244,200 5.5%
Western Pacific Housing (DR Horton) 118 20.98 268,200 6.0% Civic Diablo Grande (DeNova Homes) 38 4.55 76,350 1.7% Other Owners 57 58.20 167,250 3.8%
Subtotal Finished Lots 298 190.49 756,000 17.0% Subtotal Single-Family Residential (4) 735 268.54 1,668,300 37.5%
Commercial: Hotel 1 13.66 68,300 1.5%
Winery 1 10.73 38,628 0.9% Golf Course 2 88.51 100,370 2.3%
Subtotal Commercial 4 112.90 207,298 4.7% Subtotal Developed Parcels 739 381.44 1,875,598 42.1%
Taxable Undeveloped Parcels World International (5) 11 2,502.11 2,519,866 56.6%
Pacific Blue LLC 1 50.74 57,539 1.3% Subtotal Undeveloped Parcels 12 2,552.85 2,577,405 57.9%
Total 751 2,934.29 $4,453,003 100.0%
Total World International (Taxable Developed & Undeveloped Parcels) 100 2,711.36 $2,935,136 65.9%
Source: Goodwin Consulting Group, Inc.
(1) Developed Parcels, as defined in the Amended Rate and Method of Apportionment of Special Tax for the District, are those single family residential units or lots and those commercial properties within an approved final subdivision map; for multifamily units, Developed Parcels are those for which a building permit has been issued. (2) Includes 19 Improved Residential Lots that have prepaid their special tax burden. No Special Tax Levy is included for these lots. (3) Represents final mapped custom lots of 3 acres or more and unimproved single family lots. (4) Two of the 733 finished lots on the current tax roll will be split into two lots each; therefore, there are currently 735 finished lots, based on information provided by the Current Developer. (5) Includes 1,376 unmapped, future residential lots, including, in concept, 42 townhomes.
-40-

Special Tax Coverage. The Special Tax Formula apportions the Annual Costs among the taxable parcels of property within the District according to the rate and methodology set forth in the Special Tax Formula. The Maximum Annual Special Tax ranges from approximately $1,800 to $3,000 per single-family unit, depending on product type and lot size. No escalation of the Special Tax is permitted.
The following table shows the anticipated District debt service coverage for fiscal year
2015-16 based on the Projected 2015-16 levy amount, the Projected Maximum Annual Special Tax levy and debt service on bonds outstanding. Debt Service and Debt Service Coverage for each year can be found under “DEBT SERVICE COVERAGE AND SCHEDULE” above.
Table 8
Western Hills Water District Community Facilities District No. 1
2015-16 Debt Service Coverage
Projected Projected Series 2014 Series 2015 Total 2015-16
Maximum Special Tax
2015-16 Levy
Amount
2015-16 Debt
Service
2015-16 Debt
Service
2015-16 Debt
Service
2015-16 Debt Service
Coverage $5,341,064 $4,453,003 $2,306,410 $345,883 $2,652,293 201.4%
___________________________________ Source: Goodwin Consulting Group, Inc.
Limitations on Increases in Special Tax Levy. If owners are delinquent in the payment
of Special Taxes, the Water District may not increase Special Tax levies to make up for delinquencies for prior fiscal years above the Maximum Annual Special Tax rates specified for each category of property within the District. In addition, Section 53321(d) of the Act provides that the special tax levied against any parcel for which an occupancy permit for private residential use has been issued may not be increased as a consequence of delinquency or default by the owner of any other parcel within a community facilities district by more than 10% above the amount that would have been levied in such fiscal year had there never been any such delinquencies or defaults. In cases of significant delinquency, these factors may result in defaults in the payment of principal of and interest on the Bonds. See "SPECIAL RISK FACTORS."
-41-

Special Tax Collection and Delinquency Rate As of April 24, 2015, 43 parcels were delinquent in the total amount of $91,687, which is
2.06% of the fiscal year 2014-15 Special Tax levy. Of the total fiscal year 2014-15 Special Tax levy of $4,456,607, approximately $4,364,920 has been collected. No delinquent taxpayer is responsible for 5% of more of the total Special Tax levy. The table below shows the annual Special Tax levies and current delinquencies for the past 11 fiscal years.
Table 9 Western Hills Water District
Community Facilities District No. 1 Historical Special Tax Levies and Delinquencies(1)
(As of April 24, 2015)
Fiscal Year Total Levy
Number of Delinquent
Parcels
Currently
Delinquent Amount
Delinquent Percentage
2004-05 $3,541,297 0 $0 0.00% 2005-06 4,389,365 0 0 0.00% 2006-07 4,476,324 0 0 0.00% 2007-08 4,582,220 0 0 0.00% 2008-09 4,581,411 0 0 0.00% 2009-10 4,586,870 0 0 0.00% 2010-11 4,629,089 8 17,400 0.38% 2011-12 4,470,512 8 20,700 0.46% 2012-13 4,472,872 16 33,450 0.75% 2013-14 4,473,167 18 43,950 0.98% 2014-15 4,456,607 43 91,687 2.06%
Source: Delinquency information from Stanislaus County as of April 24, 2015; Compiled by Goodwin Consulting Group, Inc. (1) Does not include delinquent special taxes from fiscal years 2006-07 through 2009-10 that were removed from the County tax roll.
Future delinquencies in the payment of property taxes (including the Special Taxes) with
respect to property in the District could result in draws on the Reserve Fund established, and perhaps, ultimately, a default in the payment on the Bonds. See "SPECIAL RISK FACTORS."
The Water District has foreclosed as described above on delinquent parcels and the
Current Developer, in all instances of foreclosures on the residential parcels designated for non-custom residential homes, has acquired the parcels at the foreclosure sale. These acquisitions totalled approximately $650,000 in 2013 and approximately $475,000 in 2014 and 2015 combined.
Special Tax Enforcement and Collection Procedures. The Water District could receive
additional funds for the payment of debt service through foreclosure sales of delinquent property, but no assurance can be given as to the amount foreclosure sale proceeds or when foreclosure sale proceeds would be received. The Water District has covenanted in the Fiscal Agent Agreement to take certain enforcement actions and commence and pursue foreclosure proceedings against delinquent parcels under the terms and conditions described in this Official
-42-
Statement. See "SECURITY AND SOURCES OF PAYMENT FOR THE BONDS — Delinquent Payments of Special Tax; Covenant for Superior Court Foreclosure."
Foreclosure actions would include, among other steps, formal Board of Directors action to
authorize commencement of foreclosure proceedings, mailing multiple demand letters to the record owners of the delinquent parcels advising them of the consequences of failing to pay the applicable special taxes and contacting secured lenders to obtain payment. If these efforts were unsuccessful, they would be followed (as needed) by the filing of an action to foreclose in superior court against each parcel that remained delinquent.
Limitations on Increases in Special Tax Levy. If owners are delinquent in the payment
of Special Taxes, the Water District may not increase Special Tax levies to make up for delinquencies for prior fiscal years above the Maximum Annual Special Tax rates specified for each category of property within the District. See "SECURITY AND SOURCES OF PAYMENT FOR THE BONDS — Levy of Maximum Annual Special Tax and Debt Service Coverage." In addition, Section 53321(d) of the Act provides that the special tax levied against any parcel for which an occupancy permit for private residential use has been issued may not be increased as a consequence of delinquency or default by the owner of any other parcel within a community facilities district by more than 10% above the amount that would have been levied in such fiscal year had there never been any such delinquencies or defaults. In cases of significant delinquency, these factors may result in defaults in the payment of principal of and interest on the Bonds. See "SPECIAL RISK FACTORS."
-43-
OWNERSHIP OF PROPERTY WITHIN THE DISTRICT
Unpaid Special Taxes do not constitute a personal indebtedness of the owners of the parcels within the District. There is no assurance that the present owners or any subsequent owners have the ability to pay the Special Taxes or that, even if they have the ability, they will choose to pay such taxes. An owner may elect to not pay the Special Taxes when due and cannot be legally compelled to do so. Neither the Water District nor any 2015 Bondowner will have the ability at any time to seek payment directly from the owners of property within the District of the Special Tax or the principal or interest on the 2015 Bonds, or the ability to control who becomes a subsequent owner of any property within the District.
Much of the property in the District is currently owned by a single entity. The Current
Developer has provided the information set forth under the heading "OWNERSHIP OF PROPERTY WITHIN THE DISTRICT" below. The Water District has not verified the information and no assurance can be given that all information is complete. However, the Current Developer has provided a certification to the Water District that it has reviewed the information and that it is true, correct and complete.
No assurance can be given that development of the property will be completed, or that it
will be completed in a timely manner. The Special Taxes are not personal obligations of the Current Developer or of any subsequent landowners; the Bonds are secured only by the Special Taxes and moneys available under the Fiscal Agent Agreement. See "SECURITY AND SOURCES OF PAYMENT FOR THE BONDS" and "SPECIAL RISK FACTORS" herein.
The Current Developer and Other Undeveloped Land Owners
The Current Developer. In November 2008, the Current Developer acquired all of the
holdings of the Original Developer for a price of approximately $20 million through the bankruptcy proceedings of the Original Developer. Under the terms negotiated with the bankruptcy court, concurrently with closing, World contributed approximately $1 million to Diablo Grande’s water district in order to keep water supply and operations.
The Current Developer has invested approximately $75 million in the project to date,
principally comprised of the initial acquisition, special taxes, golf course operations, funding Water District expense shortfalls and, to a lesser extent, capital improvements to the water treatment facility, golf courses and clubhouse. The property is currently unencumbered by mortgage financing.
The Current Developer a single purpose entity is an affiliate of Three60, LLC, which acts
as a holding company in the United States for assets belonging to parent company FREL Mexico (“FREL”). FREL was founded in the late 1950s by Mr. Ramon Marcos and today the company is owned by the second generation including Rafael Marcos as its president and Linda Marcos, Elvira Marcos and Francis Marcos who actively participate in decision making through their formal Board of Directors.
FREL is a real estate developer focused on residential buildings, hotels & resorts,
regional shopping centers, office buildings and master plan developments. Over the past 60 years, the company has developed over 12 million square feet of commercial real estate, including headquarters for international corporations such as American Express, L’Oreal de Paris, and Kimberly Clark among other prominent organizations. FREL’s current income
-44-

producing portfolio includes 13 office buildings totaling approximately 5 million square feet of rentable space, 2 resorts including approximately 655 rooms and 40,000 square feet of meetings space. In addition, FREL is currently in the early stages of developing 2 residential towers and a large office building. The current book value of the portfolio exceeds $500 million, with leverage not exceeding 30% as a portfolio. FREL has a legacy banking relationship with BBVA Bancomer and commercial facilities with Santander Bank.
In 2013 FREL took its shopping center portfolio public in a joint venture with partners
owning additional shopping centers together forming a REIT vehicle known as Fibra Shop (www.fibrashop.mx). The partnership is listed in the Mexican Stock Exchange under the ticker symbol “FSHOP13”. Fibra Shop operates as a real estate investment trust, and the company primarily leases properties, in malls preferably with at a minimum of one anchor store targeting middle and upper class segments. Fibra Shop’s current market capitalization exceeds $550 million, and FREL retains 34.65% controlling interest in the trust that holds the assets.
In the United States, FREL’s shareholder via its holding company Three60, LLC owns a
variety of investments, including approximately $25 million equity contribution of the $200 million Ethika Diversified Opportunity Real Estate Fund (“Ethika”), where Rafael Marcos is the Investment Committee Chair. Ethika is a real estate platform tactically investing in opportunistic and value-add real estate, the fund targets hospitality and office sectors, predominately focused on top 30 MSAs.
In addition, Three60, LLC is an LP investor in a 300+ home master plan development in
Rancho Bernardo San Diego, deploying approximately $8 million of capital to date. As part of its growth in the United States and keeping consistent with its development
roots, in 2008 the principals of FREL/Three60, LLC via its single purpose entity World International, LLC acquired the Diablo Grande Project.
Recognizing that home sales during 2007-2010 have fallen significantly from the peak
between 2002-2006 in the nine-county area, principals of FREL/Three60, LLC saw an opportunity to capitalize on the home market rebounding. As experienced developers, they clearly understood from day one that markets trends are cyclical and that a mid-to-long term investment horizon strategy was needed to return to peak prices. The developer made its investment understanding that Diablo Grande holds quantifiable strengths that are unique to the asset, which combined with a stable and moderate growth in real estate markets should allow the developer to capitalize on its investment and achieve its financial goals. Since acquisition, the Current Developer has invested an additional $53.7 million in ongoing operational expenses of the development, including Water District operations, land acquisition and additional improvements in Diablo Grande. At the moment development plans are being revised to reflect current homebuyer preferences and address the growing housing needs in the area.
Management of Diablo Grande. Laurus Corporation (“Laurus”) has entered into a
development agreement with the Current Developer to provide certain development services. The agreement includes an initial phase where Laurus will be acting in an advisory role to the operation and its principals and upon achieving certain predefined targets, the companies have the option to form a joint venture to further develop the project.
Laurus Corporation and the principals of FREL/Three60, LLC have a long history of
investing together. Currently, Rafael Marcos, president of FREL, is a partner and Investment Committee Chair in Laurus’ affiliate Ethika Diversified Opportunity Real Estate Fund. In addition,
-45-

Laurus and holding company Three60, LLC are joint venture partners developing a 300+ home master plan community in Rancho Bernardo San Diego, CA. The history between the two companies dates back more than a decade.
Laurus Corporation (www.lauruscorporation.com) is a private real estate investment and
development firm established 1999 to acquire and reposition real estate assets. Its professionals have over $3 billion in real estate transaction and development service experience with a primary focus on the acquisition of fee-simple hospitality, office, retail and multifamily residential properties. Laurus’ experience and expertise is in complex distressed assets, sub-performing operations requiring intensive, aggressive post acquisition management. The company’s current portfolio includes approximately $750 million in real estate holdings, encompassing office buildings, hotels, multifamily and master plan community development.
Andres Szita is a co-founder and Chairman of Laurus. Since the inception of Laurus in
1999, he has been successful in providing accredited investors, developers, and family office investors with a wide variety of real estate investment vehicles and development services. Through these operations, the company established and expanded business relations and over $2.4 billion in real estate transaction experience in the hospitality industry, office, multifamily, mixed-use, and overall development.
Philip W. Cyburt is Chief Executive Officer of Laurus and has over 26 years of real estate
experience. Together with the founders, Mr. Cyburt leads the organization to ensure that the quality of each investment fulfills the greatest potential for investors and aligns with Laurus’ strategy. His career has engaged him to work closely with a wealth of well positioned contacts in the banking and real estate industries both nationally and internationally. Mr. Cyburt’s breadth of skills and knowledge in corporate restructuring, capital investment, acquisition, development, and disposition of billions of dollars in real estate transactions brings tremendous value to Laurus. Among his various roles, Mr. Cyburt has been a senior executive with two Fortune 500 companies, where he was responsible for the management of vast global real estate and development portfolios. His institutional real estate responsibilities have included corporate and structured finance; transaction structuring; debt/equity formation and negotiations; strategic planning; portfolio valuation and feasibility studies; as well as residential and commercial development.
Prior to Laurus, Mr. Cyburt, as Managing Director of Alvarez and Marsal, LLC, served as
interim CEO of Lehman Brothers Holdings real estate division, where he managed the debt and equity portfolio consisting of over $23 billion of assets. He co-founded Cyburt Hall Partners, where as Managing Director he acted as an investor, developer, and operator for approximately $250 million of real estate investments. As President of Boeing Realty Corporation, he successfully directed the company’s real estate portfolio ($9 billion in assets comprising of 125 million square feet in 26 states and 63 countries). In addition, Mr. Cyburt spear headed Boeing’s relocation of its world headquarters from Seattle to Chicago. He was also elected as President of McDonnell Douglas Realty Company, which serviced and restructured a $750 million commercial real estate loan portfolio in the early 1990’s. The portfolio consisted of nonperforming loans and REO properties including office, industrial, retail, and hotels located throughout the United States. Early in his career, he was also Director at Tishman Realty and Construction. Mr. Cyburt has a B.S. degree from Chapman University, attended graduate courses at Chapman University, Pepperdine University Executive MBA Program, and the investment real estate certificate program at University of Irvine.
-46-

Other Undeveloped Land Owners. As to the number of parcels and taxable acres owned by other than the Current Developer (World International LLC), see Table 5 and Table 7 above and Table 10 below under the caption "VALUE ESTIMATE OF PROPERTY WITHIN THE DISTRICT."
Assumption of Certain Obligations of the Water District. Upon acquisition of the
holdings of the Original Developer in 2008, the Current Developer assumed the existing "Master Agreement to Provide Water, Sewer, and Storm Drain Services" between the Original Developer and the Water District, dated June 4, 1998; and an amendment thereto dated May 14, 2009. Under the agreement, the Current Developer agrees to advance funds to the Water District to cover the shortfall of annually approved operational costs incurred after October 7, 2008, until such time that the Water District’s revenues are sufficient to meet the following costs:
• Annual Costs of Operations • Annual Costs for Capital Improvements and Replacements • Operating Reserve Fund as determined by the Water District’s Board of
Directors • Principal and Interest payments on any outstanding debt other than to the
Current Developer.
The Current Developer, at its discretion, may also advance funds for the purpose of replacing capital assets, and providing new capital assets. All said advances are treated as a loan to the Water District, and the Water District is to begin paying off this debt when it’s revenues begin to exceed the cost of it operations.
The Current Developer has funded approximately $9 million under the agreement and expects to fund a minimum of an additional $1.6 million under the agreement in fiscal year 2014-15. Projected Sale of Property Within the District
The Current Developer is not a builder and intends to sell all of the residential land within
the District to homebuilding entities or individuals. The Current Developer will continue to manage the construction of the Improvements. As tentative map approval is received from the County, the mapped residential parcels will be marketed for sale to one or more merchant builders or individuals, with closings to occur upon and subsequent to approval of the tentative map and, in some cases, upon completion of finished lot improvements. Alternatively, lot sales to homebuilders in some instances may be "paper lots" wherein the purchasing homebuilder will obtain tentative and final maps and construct the lot improvements. The Current Developer currently intends to hold certain non-residential land in the District, including the golf course, the hotel site and the winery site, as long term investment properties. See "THE DISTRICT — Anticipated Development in the District."
No assurance can be given that any sales of property will actually occur and no
assurance can be given that an owner of any parcel in the District will be the developer of its property in the District or will develop its property as contemplated in a finally approved tentative subdivision map.
-47-

Current Developer's Financing Plan Future cash flow needs include interest payments, general and administration costs, real
estate taxes, and parcel specific costs such as engineering and legal expenses. These costs are anticipated by the Current Developer to be funded from proceeds of land sales or from Current Developer's cash on hand.
In addition to Current Developer generated funds, the collections of Special Taxes
in previous years plus interest thereon in the Special Tax Fund created under the Fiscal Agent Agreement has generated approximately $1.5 million which is currently available for purposes authorized under the Resolution of Formation and the Act. In connection with the issuance of the 2015 Bonds, the Water District will cause the transfer of such available money, as well as additional proceeds generated in connection with the sale of the 2015 Bonds, to the Improvement Fund to be used for paying the cost of authorized facilities of the District, including approximately $350,000 on the construction of emergency communication equipment. The Water District also has the ability to generate pay-as-you-go moneys from the collection of Special Taxes after payment of debt service on the 2015 Bonds and 2014 Bonds. The Water District is currently contemplating utilizing such source over the next two fiscal years, and expects that it can generate approximately $3 million, providing a total of $4.5 million of additional funds for public improvements.
-48-

VALUE ESTIMATE OF PROPERTY WITHIN THE DISTRICT
The value of the land within the District is a critical factor in determining the investment quality of the Bonds. If a property owner defaults in the payment of a Special Tax, the Water District's only remedy is to foreclose on the delinquent property in an attempt to obtain funds with which to pay the delinquent Special Taxes. See "SECURITY AND SOURCES OF PAYMENT FOR THE BONDS — Covenant for Superior Court Foreclosure" and "SPECIAL RISK FACTORS — Bankruptcy Delays." Reductions in District property values due to a downturn in the economy, natural disasters such as earthquakes or floods, stricter land use regulations or other events could have an adverse impact on the security for payment of the Special Taxes.
Unpaid Special Taxes do not constitute a personal indebtedness of the owners of the
parcels within the District and the owners have made no commitment to pay the principal of or interest on the Bonds or to support payment of Bonds in any manner. There is no assurance that the owners have the ability to pay the Special Taxes or that, even if they have the ability, they will choose to pay such taxes. An owner may elect to not pay the Special Taxes when due and cannot be legally compelled to do so. Neither the Water District nor any Bondholder will have the ability at any time to seek payment from the owners of property within the District of any Special Tax or any principal or interest due on the Bonds, or the ability to control who becomes a subsequent owner of any property within the District.
In connection with valuing property in the District, the Water District has obtained the
2014-15 County assessed valuation (the "Assessed Valuation") of the property in the District; however in order to provide a more accurate valuation of 300 undeveloped parcels in the District the Water District ordered an appraisal of such land.
The Appraisal
The Water District ordered preparation of an appraisal report dated June 10, 2015 (the
"Appraisal"), of the estimated market values as of May 16, 2015, of 300 undeveloped parcels within the District. The Appraisal was prepared by Seevers Jordan Ziegenmeyer, Rocklin, California (the "Appraiser"). The Appraisal is set forth in APPENDIX B hereto. The description herein of the Appraisal is intended for limited purposes only; the Appraisal should be read in its entirety.
The appraised properties comprise undeveloped residential lots within the District not
improved with a single-family residence, which total 300 separate Assessor’s parcels, all of which are finished single-family residential lots. The Appraisal determines a cumulative, or aggregate, value estimate for the appraised properties for the individual ownerships, under the assumptions and conditions cited in the Appraisal. Approximately $37,335,463 is the estimated cost of remaining infrastructure work for Phase 1. The cumulative, or aggregate, value of the District accounts for the impact of the lien of the Special Tax securing the Water District's bonds. The effective date of the value is May 16, 2015. The Appraiser's estimate of value is a result of the Appraiser's analysis. The Appraiser's opinion that the cumulative, or aggregate, value of the fee simple interest in the appraised properties, in accordance with the assumptions and conditions set forth in the Appraisal is $58,492,000. See Table 10 following this section for allocation of the value among ownership.
The value estimate assumes a transfer would reflect a cash transaction on terms that are
considered to be equivalent to cash. The estimate is also premised on an assumed sale after reasonable exposure in a competitive market under all conditions requisite to a fair sale, with
-49-

buyer and seller each acting prudently, knowledgeably, for their own self interest and assuming that neither is under duress.
In general, the Appraiser used the sales comparison approach to estimate the market
value of each developable land use component comprising the appraised property (production-oriented residential lots and estate lots). The data set and other market indicators was utilized to establish the incremental value difference between each of the lot groupings larger and smaller than the typical lot size used for analysis. A discounted cash flow analysis was relied upon in the valuation of the remaining lots held by the Current Developer. Typically, the sales comparison approach is most pertinent when valuing land, single-family homes and small, owner-occupied commercial and industrial properties. The cumulative, or aggregate, value of the appraised properties represents the sum of the value estimates concluded for each ownership interest, which is not equivalent to the market value of the District as a whole. See "APPENDIX B — APPRAISAL OF CERTAIN PROPERTY IN THE DISTRICT."
Assumptions and Limiting Conditions. In considering the estimate of value evidenced
by the Appraisal, it should be noted that the Appraisal is based upon a number of standard and special assumptions which affect the estimate as to value. Because the Appraisal sets forth the Appraiser’s opinion as to value only as of the date of valuation set forth in such Appraisal, it does not reflect any changes to value that might have occurred since that date or which may occur in the future.
The appraised valuation is based upon a hypothetical condition that approximately $4.5
million of infrastructure improvements not presently in place will be installed in conjunction with this refunding. The Water District reports that of such $4.5 million, approximately $1.5 million is currently available from previous collections of Special Taxes and intended by the Water District to be used for infrastructure improvements. The Water District has additionally determined that it has the ability to generate pay-as-you-go moneys over the next two years in the approximate amount of $3 million from the collection of Special Taxes (after payment of debt service on the 2015 Bonds and 2014 Bonds) and will use such moneys for the remainder of the infrastructure contemplated under the Appraiser's hypothetical condition. See "OWNERSHIP OF PROPERTY WITHIN THE DISTRICT — Current Developer’s Financing Plan."
According to the Current Developer, approximately $350,000 has been committed to
construct the emergency communication equipment, which is required prior to issuing additional building permits beyond 500. The Appraiser specifically assumed the Current Developer and the County will provide necessary fire suppression services for the project to allow for the continuation of development (issuance of building permits) within Diablo Grande.
Since a substantial amount of the undeveloped residential lots (1,484) are held by the
Current Developer (World International LLC), a discounted cash flow analysis was utilized to provide the estimate of market value, in bulk, of those parcels. Similarly a bulk sale valuation was separately determined for the 121 estate lots owned by the Current Developer, and the total valuation of the Current Developer's undeveloped lot holdings was determined by adding the two value estimates together. In estimating the value of the Current Developer’s estate lots, the Appraiser estimated the estate lots could sell at a rate of approximately 1.5 per month, or approximately 48 months.
The Appraiser has assumed that there is no hazardous material on or used in the
construction or maintenance of any improvements on the property that would cause a loss in value. Should future conditions and events reduce the level of permitted development or delay
-50-

the completion of any projected development, the value of the undeveloped land would likely be reduced from that estimated by the Appraiser. See "SPECIAL RISK FACTORS — Property Values" below. See "APPENDIX B — APPRAISAL OF CERTAIN PROPERTY IN THE DISTRICT" hereto for a description of certain assumptions made by the Appraiser. Accordingly, because the Appraiser arrived at an estimate of market values based upon certain assumptions which may or may not be fulfilled, no assurance can be given that should the parcels become delinquent due to unpaid Special Taxes, and be foreclosed upon and offered for sale for the amount of the delinquency, that any bid would be received for such property or, if a bid is received, that such bid would be sufficient to pay such delinquent Special Taxes.
Property values may not be evenly distributed throughout the District; thus, certain
parcels may have a greater value than others. This disparity is significant because in the event of nonpayment of the Special Tax, the only remedy is to foreclose against the delinquent parcel.
No assurance can be given that the foregoing valuation can or will be maintained during
the period of time that the Bonds are outstanding in that the Water District has no control over the market value of the property within the District or the amount of additional indebtedness that may be issued in the future by other public agencies, the payment of which, through the levy of a tax or an assessment, may be on a parity with the Special Taxes. See "— Priority of Lien" below.
For a description of certain risks that might affect the assumptions made in the Appraisal,
see "SPECIAL RISK FACTORS" herein. The complete Appraisal is included as APPENDIX B. The conclusions reached in the
Appraisal are subject to certain assumptions and qualifications which are set forth in the Appraisal.
Assessed Valuation
In addition to the 300 parcels appraised, there are 428 additional parcels within the District that have vertical improvements constructed and are not part of the Appraisal. The Water District used Stanislaus County 2014-15 assessed valuation to estimate the value of such parcels.
For parcels subject to the Special Tax and not included in the Appraisal, the 2014-15
County assessed valuation is $103,939,529. As provided by Article XIIIA of the California Constitution, county assessors' assessed
values are to reflect market value as of the date the property was last assessed (or 1975, whichever is more recent), increased by a maximum of 2% per year. Properties may be reassessed by the County only upon a change of at least 51% ownership of existing property or upon new construction. The assessed values of parcels in the District thus reflect, for undeveloped parcels, the estimate of the County Assessor (the "Assessor") of market value when acquired (or 1975, whichever is later), possibly increased by 2% per year, and for parcels on which construction has occurred since their date of acquisition, the Assessor's estimate of market value as of the time of construction, possibly increased by 2% per year. Due to the variable timing of transfers of ownership, inaccuracies as to Assessor’s value estimates, and price declines, the County assessed valuations are not in all cases reflective of most current development status and value, as is the case with certain properties in the District. As such, the actual market value of parcels in the District, if sold at foreclosure, may be higher or lower than the Assessor's assessed values. The actual fair market value of any parcel can often be more
-51-

accurately established through an arm’s-length sale or an appraisal by an independent appraiser, which the Water District has not endeavored to undertake in connection with the sale of the Bonds.
Value to Special Tax Burden Ratios
The value of the land within the District is a critical factor in determining the investment
quality of the Bonds. If a property owner defaults in the payment of a Special Tax, the Water District's only remedy is to foreclose on the delinquent property in an attempt to obtain funds with which to pay the delinquent Special Taxes. See "SECURITY AND SOURCES OF PAYMENT FOR THE BONDS — Covenant for Superior Court Foreclosure" and "SPECIAL RISK FACTORS — Bankruptcy Delays." Reductions in District property values due to a downturn in the economy, natural disasters such as earthquakes or floods, stricter land use regulations or other events could have an adverse impact on the security for payment of the Special Taxes.
The Special Tax is levied on each parcel within the District and only the respective
individual parcel is responsible for such Special Tax. In comparing the value of the real property within the District and the principal amount of
the Bonds, it should be noted that only the real property upon which there is a delinquent Special Tax can be foreclosed upon, and the real property within the District cannot be foreclosed upon as a whole to pay delinquent Special Taxes of the owners of such parcels within the District unless all of the property is subject to a delinquent Special Tax. In any event, individual parcels may be foreclosed upon separately to pay delinquent Special Taxes levied against such parcels.
The Appraisal sets forth the estimated value, by ownership, of 300 undeveloped parcels
subject to the Special Tax lien to be $58,492,000 subject to the limiting conditions stated therein. (See "— The Appraisal" above and APPENDIX B hereto.) For parcels subject to the Special Tax and not included in the Appraisal, the 2014-15 County assessed valuation is $103,939,529, for a total value estimate of $162,431,529. The outstanding principal amount of 2014 Bonds is $38,450,000 and of the 2015 Bonds is $7,260,000 for total outstanding Bonds of $45,710,000. Consequently, the estimated value of the parcels in the District, subject to the Special Tax lien based on either their assessed value or appraised value is approximately 3.6 times the principal amount of the outstanding principal amount of Bonds.
The table on the following page summarizes the value-to-debt burden of parcels in the
District, based on the composite value of the assessed values in the fiscal year 2014-15 assessor's tax roll and the appraised values in the Appraisal.
-52-

Table 10 Western Hills Water District
Community Facilities District No. 1 Value-to-Debt Ratios by Development Status and Owner
Owner No. of
Parcels Taxable Acres
2014-15 Assessed
Value
Remaining Assessed Value (1)
Appraised Value
Composite Value
2014 & 2015 Bonds Debt
Burden
Value-to-Debt
Ratio (2) Taxable Developed Parcels (3)
Single-Family Residential: Improved Residential (4) 435 78.05 $92,276,887 $92,276,887 $0 $92,276,887 $9,364,744 9.9
Finished Lots: World International (5) 85 106.75 2,673,692 0 0 0 0 0.0
Western Pacific Housing (DR Horton) 118 20.98 2,965,000 0 14,362,000 14,362,000 2,753,068 5.2
Civic Diablo Grande (De Nova Homes) 38 4.55 509,320 0 3,807,000 3,807,000 783,731 4.9
Other Owners 57 58.20 2,605,007 0 5,953,000 5,953,000 1,716,818 3.5
Subtotal Finished Lots 298 190.49 8,753,019 0 24,122,000 24,122,000 5,253,618 4.6
Subtotal Single-Family Residential (6) 735 268.54 101,029,906 92,276,887 24,122,000 116,398,887 14,618,362 8.0
Commercial: Hotel 1 13.66 287,466 287,466 0 287,466 701,098 0.4
Winery 1 10.73 200,000 200,000 0 200,000 396,516 0.5
Golf Course 2 88.51 3,611,033 3,611,033 0 3,611,033 1,030,297 3.5
Subtotal Commercial 4 112.90 4,098,499 4,098,499 0 4,098,499 2,127,911 4.4
Subtotal Developed Parcels 739 381.44 105,128,405 96,375,386 24,122,000 120,497,386 16,746,273 7.2 Taxable Undeveloped Parcels
World International Parcels with Assessed Values (7) 5 2,101.92 6,953,386 6,953,386 0 6,953,386 24,467,314 0.3
World International Parcels with Appraised Values (7) 6 400.19 1,463,737 0 34,370,000 34,370,000 3,905,776 8.8
Pacific Blue LLC 1 50.74 610,757 610,757 0 610,757 590,637 1.0
Subtotal Undeveloped Parcels 12 2,552.85 9,027,880 7,564,143 34,370,000 41,934,143 28,963,727 1.4
Total Based on Combined Appraised and Assessed Values (8) 751
$103,939,529 $58,492,000 $162,431,529 $45,710,000 3.6
Exempt Parcels 82 0.00 104,765 Prepaid Parcels (9) 0 0.00 2,416,066 Total Based on Assessed Value (8) 833 2,934.29 114,156,285
World International Parcels World International Parcels with Appraised
Values 91 506.94 4,137,429 0 34,370,000 34,370,000 3,905,776 8.8 World International Parcels with Assessed Values 9 2,204.42 11,067,234 11,067,234 0 11,067,234 26,223,346 0.4
Total World International 100 2,711.36 15,204,663 11,067,234 34,370,000 45,437,234 30,129,121 1.5
Sources: Appraised Values provided by Seevers, Jordan & Ziegenmeyer, compiled by Goodwin Consulting Group, Inc. (1) Does not include Assessed Values for those properties included in the Appraisal. (2) Value-to-Debt ratios are based on the Composite Value.
(3) Developed Parcels, as defined in the Amended Rate and Method of Apportionment of Special Tax for CFD No. 1, are those single family residential units or lots and those commercial properties within an approved final subdivision map; for multifamily units, Developed Parcels are those for which a building permit has been issued. (4) Includes 19 Improved Residential Lots that have prepaid their special tax burden. No values or debt burdens have been included for these lots. Also includes four recently sold properties. (5) Represents final mapped custom lots of 3 acres or more and unimproved single family lots; the value and debt burden for these lots is included in the total of the World International properties shown in the table under Taxable Undeveloped Parcels. (6) Two of the 733 finished lots on the current tax roll will be split into two lots each; therefore, there are currently 735 finished lots, based on information provided by the Current Developer. (7) Includes 1,376 unmapped, future residential lots, including in concept, 42 townhomes. Also includes the value and debt burden of the 66 final mapped custom lots and 19 single family lots owned by World International shown under Taxable Developed Property in this table.
(8) Does not include assessed values of exempt or prepaid parcels.
(9) The 19 prepaid lots are included in "Improved Residential" above. Includes eight parcels that prepaid during fiscal year 2014-15, three of which had bonds retired in 2015.
-53-

The table below summarizes the fiscal year 2014-15 value to debt ratios.
Table 11 Western Hills Water District
Community Facilities District No. 1 Summary of Value to Debt Ratios
Value-to-Debt Category Number of
Parcels Composite Value
2014 & 2015 Bonds Debt
Burden
% of Bonded
Debt
20 : 1 to 29.9 : 1 2 $1,221,500 $49,272 0.1% 10 : 1 to 19.9 : 1 173 51,219,527 4,111,126 9.0% 5 : 1 to 9.9 : 1 345 56,134,752 8,130,518 17.8% 3 : 1 to 5 : 1 70 7,186,028 1,565,923 3.4% 1 : 1 to 3 : 1 42 4,858,870 2,382,457 5.2% 0 : 1 to 1 : 1 7 7,440,852 25,564,928 55.9%
World International Remaining Parcels 5 : 1 to 9.9 : 1 (1) 91 34,370,000 3,905,776 8.5%
Prepaid Parcels 19 Parcels Created by Proposed Split (2) 2
Total 751 $162,431,529 $45,520,000 100.0%
Sources: Appraised Values provided by Seevers, Jordan & Ziegenmeyer, compiled by Goodwin Consulting Group, Inc.
(1) Includes 91 properties owned by World International that were appraised in bulk. (2) Two of the finished lots on the current tax roll will be split into two lots each; therefore, there
are two additional finished lots, based on information provided by the Current Developer.
Priority of Lien The principal of and interest on the Bonds are payable from the Special Tax authorized to
be collected within the District, and payment of the Special Tax is secured by a lien on certain real property within the District. Such lien is co-equal to and independent of the lien for general taxes and any other liens imposed under the Act, regardless of when they are imposed on the property in the District. The imposition of additional special taxes, assessments and general property taxes will increase the amount of independent and co-equal liens which must be satisfied in foreclosure. The Water District, the County and certain other public agencies are authorized by the Act to form other community facilities districts and improvement areas and, under other provisions of State law, to form special assessment districts, either or both of which could include all or a portion of the land within the District.
Other public agencies whose boundaries overlap those of the District could, without the
consent of the Water District and in certain cases without the consent of the owners of the land within the District, impose additional taxes or assessment liens on the land within the District. The purpose would be to finance additional regional or local public improvements or services. The lien created on the land within the District through the levy of such additional taxes or assessments may be on a parity with the lien of the Special Tax. In addition, construction loans may be obtained by the Current Developer or home loans may be obtained by ultimate
-54-

homeowners. The deeds of trust securing such debt on property within the District, however, will be in a junior position to the lien of the Special Tax.
There can be no assurance that the property owners within the District will not petition for
the formation of other community facilities districts and improvement areas or for a special assessment district or districts and that parity special taxes or special assessments will not be levied by the County or some other public agency to finance additional public facilities, however no other special districts are currently contemplated by the Water District or the Current Developer.
Private liens, such as deeds of trust securing loans obtained by a property owner, may be
placed upon property in the District at any time. Under California law, the Special Taxes have priority over all existing and future private liens imposed on property subject to the lien of the Special Taxes.
-55-

SPECIAL RISK FACTORS
No General Obligation of the Water District The Bonds are not general obligations of the Water District but are limited obligations of
the Water District and the District payable solely from the proceeds of the Special Tax and certain funds held under the Fiscal Agent Agreement, including amounts deposited in the Reserve Fund and investment income thereon, and the proceeds, if any, from the sale of property in the event of a foreclosure. See "SECURITY AND SOURCES OF PAYMENT FOR THE BONDS." Any tax for the payment of the Bonds will be limited to the Special Tax to be collected within the jurisdiction of the District.
Levy and Collection of the Special Tax
General. The principal source of payment of principal of and interest on the Bonds is the
proceeds of the annual levy and collection of the Special Tax against property within the District. Limitation on Maximum Special Tax Rate. The annual levy of the Special Tax is
subject to the maximum annual Special Tax rate authorized in the Rate and Method. The levy cannot be made at a higher rate even if the failure to do so means that the estimated proceeds of the levy and collection of the Special Tax, together with other available funds, will not be sufficient to pay debt service on the Bonds.
In addition to the maximum annual Special Tax rate limitation in the Rate and Method,
Section 53321(d) of the Act provides that the special tax levied against any parcel for which an occupancy permit for private residential use has been issued may not be increased as a consequence of delinquency or default by the owner of any other parcel within a community facilities district by more than 10% above the amount that would have been levied in such fiscal year had there never been any such delinquencies or defaults. In cases of significant delinquency, these factors may result in defaults in the payment of principal of and interest on the Bonds.
Factors that Could Lead to Special Tax Deficiencies. The following are some of the
factors that might cause the levy of the Special Tax on any particular parcel of Taxable Property to vary from the Special Tax that might otherwise be expected:
Property Tax Delinquencies. Failure of the owners of Taxable Property to pay property
taxes (and, consequently, the Special Tax), or delays in the collection of or inability to collect the Special Tax by tax sale or foreclosure and sale of the delinquent parcels, could result in a deficiency in the collection of Special Tax revenues. See "— Property Tax Delinquencies" below. For a summary of recent Special Tax collection and delinquency rates in the District, see "THE DISTRICT — Special Tax Collection and Delinquency Rate."
Delays Following Special Tax Delinquencies and Foreclosure Sales. The Fiscal
Agent Agreement generally provides that the Special Tax is to be collected in the same manner as ordinary ad valorem property taxes are collected and, except as provided in the special covenant for foreclosure described in "SECURITY AND SOURCES OF PAYMENT FOR THE BONDS — Covenant for Superior Court Foreclosure" and in the Act, is subject to the same penalties and the same procedure, sale and lien priority in case of delinquency as is provided for ordinary ad valorem property taxes. Under these procedures, if taxes are unpaid for a period of five years or more, the property is deeded to the State and then is subject to sale by the County.
-56-

If sales or foreclosures of property are necessary, there could be a delay in payments to
owners of the Bonds pending such sales or the prosecution of foreclosure proceedings and receipt by the Water District of the proceeds of sale if the Reserve Fund is depleted. See "SECURITY AND SOURCES OF PAYMENT FOR THE BONDS — Covenant for Superior Court Foreclosure."
The ability of the Water District to collect interest and penalties specified by State law and
to foreclose against properties having delinquent Special Tax installments may be limited in certain respects with regard to properties in which the Federal Deposit Insurance Corporation (the "FDIC") has or obtains an interest. The FDIC would obtain such an interest by taking over a financial institution that has made a loan that is secured by property within the District. See " — FDIC/Federal Government Interests in Properties" below.
Other laws generally affecting creditors’ rights or relating to judicial foreclosure may affect
the ability to enforce payment of Special Taxes or the timing of enforcement of Special Taxes. For example, the Soldiers and Sailors Civil Relief Act of 1940 affords protections such as a stay in enforcement of the foreclosure covenant, a six-month period after termination of military service to redeem property sold to enforce the collection of a tax or assessment and a limitation on the interest rate on the delinquent tax or assessment to persons in military service if the court concludes the ability to pay such taxes or assessments is materially affected by reason of such service.
Transfers to Governmental Entities. The number of parcels of Taxable Property could
be reduced through the acquisition of Taxable Property by a governmental entity and failure of the government to pay the Special Tax based upon a claim of exemption or, in the case of the federal government or an agency thereof, immunity from taxation, thereby resulting in an increased tax burden on the remaining taxed parcels.
Property Tax Delinquencies
General. Delinquencies in the payment of property taxes and, consequently, the Special
Taxes, can occur because the owners of delinquent parcels may not have received property tax bills from the County in a timely manner, including situations in which the County initially sent property tax bills to the property developer or merchant builder at a time when the parcels in question had already been sold to individual homeowners. Delinquencies can also reflect economic difficulties and duress by the property owner. See "THE DISTRICT — Special Tax Levies and Delinquencies."
Numerous future delinquencies by the owners of Taxable Property in the District in the
payment of property taxes (and, consequently, the Special Taxes, which are collected on the ordinary property tax bills) when due could result in a deficiency in Special Tax Revenues necessary to pay debt service on the Bonds, which could in turn result in the depletion of the Reserve Fund, prior to reimbursement from the resale of foreclosed property or payment of the delinquent Special Tax. In that event, there could be a delay or failure in payments of the principal of and interest on the Bonds. See "SECURITY AND SOURCES OF PAYMENT FOR THE BONDS — Reserve Fund," and "THE DISTRICT — Special Tax Collection and Delinquency Rate."
Measures to Mitigate Consequences of Continuing Delinquencies. The Water
District intends to take certain actions designed to mitigate the impact of future delinquencies,
-57-

including: enforcing the lien of the Special Taxes through collection procedures that will include foreclosure actions under certain circumstances (see "SECURITY AND SOURCES OF PAYMENT FOR THE BONDS — Covenant to Commence Superior Court Foreclosure"); and increasing the levy of Special Taxes against non-delinquent property owners in the District, to the extent permitted under the Rate and Method and the Act and to the extent the Special Taxes are not already being levied at the Maximum Annual Special Tax rate. See "THE DISTRICT — Special Tax Collection and Delinquency Rate."
The Water District has foreclosed on delinquent parcels and the Current Developer has in
all instances of foreclosures on the residential parcels designated for non-custom residential homes has acquired the parcels at the foreclosure sale. The Current Developer indicates it likewise expects to acquire non-custom home residential lots in the future as well, however no assurance can be given that such intent to acquire will actually be carried out.
Risks Related to Homeowners With High Loan-to-Value Ratios
Any future decline in home values in the District could result in property owner
unwillingness or inability to pay mortgage payments, as well as ad valorem property taxes and Special Taxes, when due. Under such circumstances, bankruptcies are likely to increase. Bankruptcy by homeowners with delinquent Special Taxes would delay the commencement and completion of foreclosure proceedings to collect delinquent Special Taxes.
It is possible that laws could be enacted in the future to assist homeowners in default in
the payment of mortgages and property taxes. It is further possible that federal laws could be enacted that would adversely impact the ability of the Water District to foreclose on parcels with delinquent Special Taxes. No assurance can be given that any such laws will be enacted, or if enacted will be effective in assisting affected homeowners.
Payment of Special Tax is Not a Personal Obligation of the Property Owners
An owner of Taxable Property is not personally obligated to pay the Special Taxes.
Rather, the Special Taxes are an obligation running only against the parcels of Taxable Property. If, after a default in the payment of the Special Tax and a foreclosure sale by the Water District, the resulting proceeds are insufficient, taking into account other obligations also constituting a lien against the affected parcels of Taxable Property, the Water District has no recourse against the owner. Property Values
The value of Taxable Property within the District is a critical factor in determining the
investment quality of the Bonds. If a property owner defaults in the payment of the Special Tax, the Water District’s only remedy is to foreclose on the delinquent property in an attempt to obtain funds with which to pay the delinquent Special Tax. Land values could be adversely affected by economic and other factors beyond the Water District’s control, such as a general economic downturn, relocation of employers out of the area, shortages of water, electricity, natural gas or other utilities, destruction of property caused by earthquake, flood, wildfires, or other natural disasters, environmental pollution or contamination, or unfavorable economic conditions.
The following is a discussion of specific risk factors that could affect the value of property
in the District.
-58-

Risks Related to Availability of Mortgage Loans. The current state of the world-wide capital markets has adversely affected the availability of mortgage loans to homeowners, including potential buyers of homes within the District. Any such unavailability could hinder the ability of the current homeowners to resell their homes, or the ability to refinance existing loans.
Natural Disasters. The value of the Taxable Property in the future can be adversely
affected by a variety of natural occurrences, particularly those that may affect infrastructure and other public improvements and private improvements on the Taxable Property and the continued habitability and enjoyment of such private improvements.
The areas in and surrounding the District, like those in much of California, may be subject
to unpredictable seismic activity, including earthquakes. See "THE DISTRICT —Environmental Matters."
Other natural disasters could include, without limitation, floods, wildfires, droughts or
tornadoes. One or more natural disasters could occur and could result in damage to improvements of varying seriousness. The damage may entail significant repair or replacement costs and that repair or replacement may never occur either because of the cost, or because repair or replacement will not facilitate habitability or other use, or because other considerations preclude such repair or replacement. Under any of these circumstances there could be significant delinquencies in the payment of Special Taxes, and the value of the Taxable Property may well depreciate or disappear.
Legal Requirements. Other events that may affect the value of Taxable Property
include changes in the law or application of the law. Such changes may include, without limitation, local growth control initiatives, local utility connection moratoriums and local application of statewide tax and governmental spending limitation measures.
Hazardous Substances. One of the most serious risks in terms of the potential
reduction in the value of Taxable Property is a claim with regard to a hazardous substance. In general, the owners and operators of Taxable Property may be required by law to remedy conditions of the parcel relating to releases or threatened releases of hazardous substances. The federal Comprehensive Environmental Response, Compensation and Liability Act of 1980, sometimes referred to as "CERCLA" or the "Superfund Act," is the most well-known and widely applicable of these laws, but California laws with regard to hazardous substances are also stringent and similar. Under many of these laws, the owner or operator is obligated to remedy a hazardous substance condition of property whether or not the owner or operator has anything to do with creating or handling the hazardous substance. The effect, therefore, should any of the Taxable Property be affected by a hazardous substance, is to reduce the marketability and value of the parcel by the costs of remedying the condition, because the purchaser, upon becoming owner, will become obligated to remedy the condition.
The property values set forth in this Official Statement do not take into account the
possible reduction in marketability and value of any of the Taxable Property by reason of the possible liability of the owner or operator for the remedy of a hazardous substance condition of the parcel. Although the Water District is not aware that the owner or operator of any of the Taxable Property has such a current liability with respect to any of the Taxable Property, it is possible that such liabilities do currently exist and that the Water District is not aware of them.
Further, it is possible that liabilities may arise in the future with respect to any of the
Taxable Property resulting from the existence, currently, on the parcel of a substance presently
-59-
classified as hazardous but that has not been released or the release of which is not presently threatened, or may arise in the future resulting from the existence, currently on the parcel of a substance not presently classified as hazardous but that may in the future be so classified. Further, such liabilities may arise not simply from the existence of a hazardous substance but from the method of handling it. All of these possibilities could significantly affect the value of Taxable Property that is realizable upon a delinquency.
California Drought; State of Emergency Proclamation
On January 17, 2014, with California facing water shortfalls in the then-driest year in recorded state history, Governor Edmund G. Brown Jr. proclaimed a State of Emergency and directed state officials to take all necessary actions to prepare for these drought conditions. In the State of Emergency declaration, Governor Brown directed state officials to assist farmers and communities that are economically impacted by dry conditions and to ensure the State can respond if Californians face drinking water shortages. The Governor also directed state agencies to use less water and hire more firefighters and initiated a greatly expanded water conservation public awareness. In addition, the proclamation gave state water officials more flexibility to manage supply throughout California under drought conditions.
The Governor’s drought State of Emergency follows a series of actions the administration has taken to ensure that California is prepared for record dry conditions. In May 2013, Governor Brown issued an Executive Order to direct state water officials to expedite the review and processing of voluntary transfers of water and water rights. In December 2014, the Governor formed a Drought Task Force to review expected water allocations, California’s preparedness for water scarcity and whether conditions merit a drought declaration.
On April 1, 2015, for the first time in state history, the Governor directed the State Water Resources Control Board to implement mandatory water reductions in cities and towns across California to reduce water usage by 25 percent. This savings amounts to approximately 1.5 million acre-feet of water over the following nine months.
California set a new "low water" mark on April 1, 2015, with its early-April snowpack measurement. The statewide electronic reading of the snowpack's water content stood at 5 percent of the April 1st average. April 1, 2015’s content was only 1.4 inches, or 5 percent, of the 28-inch average. The lowest previous reading since 1950 was 25 percent of average, so water year 2015 is the driest winter in California's written record.
The implementation of mandatory water reductions is ongoing. The Water District cannot predict how long the drought conditions will last, what effect drought conditions may have on property values or whether or to what extent water reduction requirements may affect the District. Other Possible Claims Upon the Value of Taxable Property
While the Special Taxes are secured by the Taxable Property, the security only extends
to the value of such Taxable Property that is not subject to priority and parity liens and similar claims.
In addition, other governmental obligations may be authorized and undertaken or issued
in the future, the tax, assessment or charge for which may become an obligation of one or more of the parcels of Taxable Property and may be secured by a lien on a parity with the lien of the Special Tax securing the Bonds.
-60-
In general, as long as the Special Tax is collected on the County tax roll, the Special Tax and all other taxes, assessments and charges also collected on the tax roll are on a parity, that is, are of equal priority. Questions of priority become significant when collection of one or more of the taxes, assessments or charges is sought by some other procedure, such as foreclosure and sale. In the event of proceedings to foreclose for delinquency of Special Taxes securing the Bonds, the Special Tax will be subordinate only to existing prior governmental liens, if any. Otherwise, in the event of such foreclosure proceedings, the Special Taxes will generally be on a parity with the other taxes, assessments and charges, and will share the proceeds of such foreclosure proceedings on a pro rata basis. Although the Special Taxes will generally have priority over non-governmental liens on a parcel of Taxable Property, regardless of whether the non-governmental liens were in existence at the time of the levy of the Special Tax or not, this result may not apply in the case of bankruptcy. See "— Bankruptcy Delays" below.
Failure to Develop Properties
There can be no assurance that land development operations within the District will not
be adversely affected by a deterioration of the real estate market and economic conditions or the adoption of local, State and federal governmental policies relating to real estate development, the income tax treatment of real property ownership, or the national economy. A slowdown of the development process could adversely affect land values and reduce the ability or desire of the property owners to pay the annual Special Taxes. In that event, there could be a default in the payment of the Bonds.
Concentration of Ownership
A significant portion of the land within the District is currently owned by the Current
Developer. Although there are likely to be transfers of ownership of property within the District as development progresses, the timely payment of the Bonds depends upon the willingness and ability of all of the owners of taxable property withing the District to pay the Special Taxes when due. The only assets of the owners of property within the District which constitute security for the Bonds are such owners’ real property holdings located within the District, and each parcel may only be foreclosed against for delinquent Special Taxes levied against such parcel. If the current landowners choose to pay some but not all of the Special Taxes, they may, as owners of parcels in the District, choose to default on payments of the Special Tax on parcels. Also see "– Bankruptcy Delays" below.
FDIC/Federal Government Interests in Properties
General. The ability of the Water District to foreclose the lien of delinquent unpaid
Special Tax installments may be limited with regard to properties in which the Federal Deposit Insurance Corporation (the "FDIC"), the Drug Enforcement Agency, the Internal Revenue Service, or other federal agency has or obtains an interest.
Federal courts have held that, based on the supremacy clause of the United States
Constitution, in the absence of Congressional intent to the contrary, a state or local agency cannot foreclose to collect delinquent taxes or assessments if foreclosure would impair the federal government interest.
The supremacy clause of the United States Constitution reads as follows: "This
Constitution, and the Laws of the United States which shall be made in Pursuance thereof; and all Treaties made, or which shall be made, under the Authority of the United States, shall be the
-61-

supreme Law of the Land; and the Judges in every State shall be bound thereby, anything in the Constitution or Laws of any State to the contrary notwithstanding."
This means that, unless Congress has otherwise provided, if a federal governmental
entity owns a parcel that is subject to Special Taxes but does not pay taxes and assessments levied on the parcel (including Special Taxes), the applicable state and local governments cannot foreclose on the parcel to collect the delinquent taxes and assessments.
Moreover, unless Congress has otherwise provided, if the federal government has a
mortgage interest in the parcel and the Water District wishes to foreclose on the parcel as a result of delinquent Special Taxes, the property cannot be sold at a foreclosure sale unless it can be sold for an amount sufficient to pay delinquent taxes and assessments on a parity with the Special Taxes and preserve the federal government’s mortgage interest. In Rust v. Johnson (9th Circuit; 1979) 597 F.2d 174, the United States Court of Appeal, Ninth Circuit held that the Federal National Mortgage Association ("FNMA") is a federal instrumentality for purposes of this doctrine, and not a private entity, and that, as a result, an exercise of state power over a mortgage interest held by FNMA constitutes an exercise of state power over property of the United States.
The Water District has not undertaken to determine whether any federal governmental
entity currently has, or is likely to acquire, any interest (including a mortgage interest) in any of the parcels subject to the Special Taxes, and therefore expresses no view concerning the likelihood that the risks described above will materialize while the Bonds are outstanding.
FDIC. In the event that any financial institution making any loan which is secured by real
property within the District is taken over by the FDIC, and prior thereto or thereafter the loan or loans go into default, resulting in ownership of the property by the FDIC, then the ability of the District to collect interest and penalties specified by State law and to foreclose the lien of delinquent unpaid Special Taxes may be limited.
The FDIC’s policy statement regarding the payment of state and local real property taxes
(the "Policy Statement") provides that property owned by the FDIC is subject to state and local real property taxes only if those taxes are assessed according to the property’s value, and that the FDIC is immune from real property taxes assessed on any basis other than property value. According to the Policy Statement, the FDIC will pay its property tax obligations when they become due and payable and will pay claims for delinquent property taxes as promptly as is consistent with sound business practice and the orderly administration of the institution’s affairs, unless abandonment of the FDIC’s interest in the property is appropriate. The FDIC will pay claims for interest on delinquent property taxes owed at the rate provided under state law, to the extent the interest payment obligation is secured by a valid lien. The FDIC will not pay any amounts in the nature of fines or penalties and will not pay nor recognize liens for such amounts. If any property taxes (including interest) on FDIC-owned property are secured by a valid lien (in effect before the property became owned by the FDIC), the FDIC will pay those claims. The Policy Statement further provides that no property of the FDIC is subject to levy, attachment, garnishment, foreclosure or sale without the FDIC’s consent. In addition, the FDIC will not permit a lien or security interest held by the FDIC to be eliminated by foreclosure without the FDIC’s consent.
The Policy Statement states that the FDIC generally will not pay non-ad valorem taxes,
including special assessments, on property in which it has a fee interest unless the amount of tax is fixed at the time that the FDIC acquires its fee interest in the property, nor will it recognize the
-62-

validity of any lien to the extent it purports to secure the payment of any such amounts. Special taxes imposed under the Act and a special tax formula which determines the special tax due each year are specifically identified in the Policy Statement as being imposed each year and therefore covered by the FDIC’s federal immunity. The Ninth Circuit issued a ruling on August 28, 2001, in which it determined that the FDIC, as a federal agency, is exempt from special taxes levied under the Act.
The Water District is unable to predict what effect the application of the Policy Statement
would have in the event of a delinquency in the payment of Special Taxes on a parcel within the District in which the FDIC has or obtains an interest, although prohibiting the lien of the Special Taxes to be foreclosed out at a judicial foreclosure sale could reduce or eliminate the number of persons willing to purchase a parcel at a foreclosure sale. Such an outcome could cause a draw on the Reserve Fund and perhaps, ultimately, if enough property were to become owned by the FDIC, a default in payment on the Bonds.
Depletion of Reserve Fund
The Reserve Fund is to be maintained at an amount equal to the Reserve Requirement
for the 2015 Bonds and the 2014 Bonds. See "SECURITY AND SOURCES OF PAYMENT FOR THE BONDS — Reserve Fund." The Reserve Fund will be used to pay principal of and interest on the 2015 Bonds and the 2014 Bonds if insufficient funds are available from the proceeds of the levy and collection of the Special Tax against property within the District. If the Reserve Fund is depleted, it can be replenished from the proceeds of the levy and collection of the Special Taxes that exceed the amounts to be paid to the owners of the 2014 Bonds and the 2015 Bonds under the Fiscal Agent Agreement. However, because the Special Tax levy is limited to the annual Maximum Annual Special Tax rates, it is possible that no replenishment would be achieved if the Special Tax proceeds, together with other available funds, remain insufficient to pay all such amounts. Thus it is possible that the Reserve Fund will be depleted and not be replenished by the levy and collection of the Special Taxes. Bankruptcy Delays
The payment of the Special Tax and the ability of the Water District to foreclose the lien
of a delinquent unpaid Special Tax, as discussed in "SECURITY AND SOURCES OF PAYMENT FOR THE BONDS," may be limited by bankruptcy, insolvency or other laws generally affecting creditors' rights or by the laws of the State of California relating to judicial foreclosure. The various legal opinions to be delivered concurrently with the delivery of the Bonds (including Bond Counsel's approving legal opinion) will be qualified as to the enforceability of the various legal instruments by bankruptcy, insolvency, reorganization, moratorium and other similar laws affecting creditors' rights, by the application of equitable principles and by the exercise of judicial discretion in appropriate cases.
Although bankruptcy proceedings would not cause the Special Taxes to become
extinguished, bankruptcy of a property owner or any other person claiming an interest in the property could result in a delay in superior court foreclosure proceedings and could result in the possibility of Special Tax installments not being paid in part or in full. Such a delay would increase the likelihood of a delay or default in payment of the principal of and interest on the Bonds.
In addition, the amount of any lien on property securing the payment of delinquent
Special Taxes could be reduced if the value of the property were determined by the bankruptcy
-63-

court to have become less than the amount of the lien, and the amount of the delinquent Special Taxes in excess of the reduced lien could then be treated as an unsecured claim by the court. Any such stay of the enforcement of the lien for the Special Tax, or any such delay or non-payment, would increase the likelihood of a delay or default in payment of the principal of and interest on the Bonds and the possibility of delinquent Special Taxes not being paid in full.
To the extent that property in the District continues to be owned by a limited number of
property owners, the chances are increased that the Reserve Fund could be fully depleted during any such delay in obtaining payment of delinquent Special Taxes. As a result, sufficient moneys would not be available in the Reserve Fund to make up shortfalls resulting from delinquent payments of the Special Tax and thereby to pay principal of and interest on the Bonds on a timely basis.
Disclosure to Future Purchasers
The Water District has recorded a notice of the Special Tax lien in the Office of the
County Recorder. While title companies normally refer to such notices in title reports, there can be no guarantee that such reference will be made or, if made, that a prospective purchaser or lender will consider such special tax obligation in the purchase of a parcel of land or a home in the District or the lending of money secured by property in the District. The Act and the Goals and Policies require the subdivider of a subdivision (or its agent or representative) to notify a prospective purchaser or long-term lessor of any lot, parcel, or unit subject to a Mello-Roos special tax of the existence and maximum amount of such special tax using a statutorily prescribed form. California Civil Code Section 1102.6b requires that in the case of transfers other than those covered by the above requirement, the seller must at least make a good faith effort to notify the prospective purchaser of the special tax lien in a format prescribed by statute. Failure by an owner of the property to comply with these requirements, or failure by a purchaser or lessor to consider or understand the nature and existence of the Special Tax, could adversely affect the willingness and ability of the purchaser or lessor to pay the Special Tax when due. No Acceleration Provisions
The Bonds do not contain a provision allowing for their acceleration in the event of a
payment default or other default under the terms of the Bonds or the Fiscal Agent Agreement. Under the Fiscal Agent Agreement, a Bondholder is given the right for the equal benefit and protection of all Bondowners similarly situated to pursue certain remedies. So long as the Bonds are in book-entry form, DTC will be the sole Bondholder and will be entitled to exercise all rights and remedies of Bond holders.
Loss of Tax Exemption
As discussed under the caption "TAX MATTERS," interest on the Bonds might become
includable in gross income for purposes of federal income taxation retroactive to the date the Bonds were issued as a result of future acts or omissions of the Water District in violation of its covenants in the Fiscal Agent Agreement. The Fiscal Agent Agreement does not contain a special redemption feature triggered by the occurrence of an event of taxability. As a result, if interest on the Bonds were to become includable in gross income for purposes of federal income taxation, the Bonds would continue to remain outstanding until maturity unless earlier redeemed pursuant to optional or mandatory redemption or redemption upon prepayment of the Special Taxes. See "THE 2015 BONDS — Redemption."
-64-

IRS Audit of Tax-Exempt Bond Issues
The Internal Revenue Service (the "IRS") has initiated an expanded program for the auditing of tax-exempt bond issues, including both random and targeted audits. It is possible that the Bonds will be selected for audit by the IRS. It is also possible that the market value of such Bonds might be affected as a result of such an audit of such Bonds (or by an audit of similar bonds or securities).
Impact of Legislative Proposals, Clarifications of the Code and Court Decisions on Tax Exemption
Future legislative proposals, if enacted into law, clarification of the Code or court
decisions may cause interest on the Bonds to be subject, directly or indirectly, to federal income taxation or to be subject to or exempted from state income taxation, or otherwise prevent Bondowners from realizing the full current benefit of the tax status of such interest.
Secondary Market for Bonds
There can be no guarantee that there will be a secondary market for the Bonds or, if a
secondary market exists, that any Bonds can be sold for any particular price. Prices of bond issues for which a market is being made will depend upon then-prevailing circumstances. Such prices could be substantially different from the original purchase price.
No assurance can be given that the market price for the Bonds will not be affected by the
introduction or enactment of any future legislation (including without limitation amendments to the Internal Revenue Code), or changes in interpretation of the Internal Revenue Code, or any action of the Internal Revenue Service, including but not limited to the publication of proposed or final regulations, the issuance of rulings, the selection of the Bonds for audit examination, or the course or result of any Internal Revenue Service audit or examination of the Bonds or obligations that present similar tax issues as the Bonds.
-65-

CONSTITUTIONAL LIMITATIONS ON TAXATION AND APPROPRIATIONS Article XIIIA of the California Constitution, commonly known as "Proposition 13,"
provides that each county will levy the maximum ad valorem property tax permitted by Proposition 13 and will distribute the proceeds to local agencies in accordance with an allocation formula based in part on pre-Proposition 13 ad valorem property tax rates levied by local agencies.
Article XIIIA limits the maximum ad valorem tax on real property to 1% of "full cash
value," which is defined as the County Assessor’s valuation of real property as shown on the 1975-76 tax bill under full cash value, or, thereafter, the appraised value of real property when purchased, newly constructed, or a change in ownership has occurred after the 1975 assessment. The full cash value may be adjusted annually to reflect increases of no more than 2% per year or decreases in the consumer price index or comparable local data, or declining property value caused by damage, destruction or other factors.
Article XIIIA exempts from the 1% tax limitation any taxes to repay indebtedness
approved by the voters prior to July 1, 1978, and requires a vote of two-thirds of the qualified electorate to impose Special Taxes or any additional ad valorem, sales, or transaction taxes on real property. In addition, Article XIIIA requires the approval of two-thirds of all members of the State Legislature to change any State laws resulting in increased tax revenues. On June 3, 1986, California voters approved an amendment to Article XIIIA of the California Constitution to allow local governments and school districts to raise their property tax rates above the constitutionally mandated 1% ceiling for the purpose of paying off certain new general obligation debt issued for the acquisition or improvement of real property and approved by two-thirds of the votes cast by the qualified electorate. If any such voter-approved debt is issued, it may be on a parity with the lien of the Special Tax on the parcels within the District.
State and local government agencies in the State, and the State itself are subject to
annual appropriation limits, imposed by Article XIIIB of the State Constitution. Article XIIIB prohibits government agencies and the State from spending "appropriations subject to limitation" in excess of the appropriations limits imposed. "Appropriations subject to limitation" are authorizations to spend "proceeds of taxes," which consist of tax revenues, certain state subventions and certain other funds, including proceeds from regulatory licenses, user charges or other fees to the extent that such proceeds exceed the cost reasonably borne by such entity in providing the regulation, product or service. No limit is imposed on appropriations of funds which are not "proceeds of taxes" such as debt service on indebtedness existing or authorized before January 1, 1979, or subsequently authorized by the voters, appropriations required to comply with mandates of courts or the federal government, reasonable user charges or fees and certain other non-tax funds.
-66-

CONTINUING DISCLOSURE The Water District has covenanted for the benefit of owners of the 2015 Bonds to provide
certain financial information and operating data relating to the District by not later than the next April 1st after the end of the Water District’s fiscal year (presently June 30) in each year commencing with its report for the 2014-15 fiscal year (the "Water District Annual Report") and to provide notices of the occurrence of certain enumerated events. The Water District Annual Report and the notices of enumerated events will be filed with the Municipal Securities Rulemaking Board. These covenants have been made in order to assist the Underwriter in complying with Securities Exchange Commission Rule 15c2-12(b)(5).
In connection with prior bonds issued for the District in 2001, 2002, 2004 and 2005, the
Water District entered into a continuing disclosure obligation. For the last five years, reports were timely filed, except that the Water District did not file auditied financial statements for its 2014-15 fiscal year on a timely basis. In addition, the reports were filed by April 1st as required, but the obligation states that each report is to reflect information "as of December 31st of the prior year" and the reports state that they apply to the year ended June 30.
The Original Developer had entered into a continuing disclosure undertaking in
connection with the issuance of the 2001, 2002, 2004 and 2005 bonds for the District, however upon filing bankruptcy and the acquisition of the project by the Current Developer, such obligation to furnish developer information was not taken over by the Current Developer. In connection with the issuance of the 2014 Bonds, the Current Developer agreed to make information available to the Water District to be incorporated in the Water District Annual Report.
The specific nature of the information to be contained in the Water District Annual Report
or the notices of material events by the Water District is summarized in "APPENDIX G — FORM OF CONTINUING DISCLOSURE UNDERTAKING."
UNDERWRITING
The 2015 Bonds were purchased through negotiation by Westhoff, Cone & Holmstedt, on
its own behalf and as representative of Alamo Capital (the "Underwriter"). The Underwriter agreed to purchase the 2015 Bonds at a price of $7,034,669.60 (which is equal to the 7,260,000.00 par amount of the 2015 Bonds, less a net original issue discount of $105,540.40 less the Underwriter’s discount of $119,790.00). The initial public offering prices set forth on the cover page hereof may be changed by the Underwriter.
The Underwriter has entered into an agreement with Alamo Capital for retail distribution
of certain municipal securities offerings, at the original issue prices. Pursuant to said agreement, if applicable to the 2015 Bonds, the Underwriter will share a portion of its underwriting compensation with respect to the 2015 Bonds with Alamo Capital.
The Underwriter may offer and sell the 2015 Bonds to certain dealers and others at prices
lower than the offering prices stated on the inside cover page hereof. The offering prices may be changed from time to time by the Underwriter
-67-

LEGAL OPINION The validity of the 2015 Bonds and certain other legal matters are subject to the
approving opinion of Jones Hall, A Professional Law Corporation, San Francisco, California, Bond Counsel. A complete copy of the proposed form of Bond Counsel opinion is contained in APPENDIX F to this Official Statement, and the final opinion will be made available to registered owners of the 2015 Bonds at the time of delivery. Certain legal matters will also be passed upon by Jones Hall as Disclosure Counsel. The fees of Jones Hall are contingent upon the Bonds being issued. Certain legal matters will be passed upon for the Water District by Griffith & Masuda, A Professional Law Corporation, Turlock, California, as counsel to the Water District.
TAX MATTERS
In the opinion of Jones Hall, A Professional Law Corporation, San Francisco, California,
Bond Counsel, subject, however to the qualifications set forth below, under existing law, the interest on the 2015 Bonds is excluded from gross income for federal income tax purposes and such interest is not an item of tax preference for purposes of the federal alternative minimum tax imposed on individuals and corporations, provided, however, that, for the purpose of computing the alternative minimum tax imposed on corporations (as defined for federal income tax purposes), such interest is taken into account in determining certain income and earnings.
The opinions set forth in the preceding paragraph are subject to the condition that the
Water District comply with all requirements of the Internal Revenue Code of 1986 (the "Code") that must be satisfied subsequent to the issuance of the 2015 Bonds in order that such interest be, or continue to be, excluded from gross income for federal income tax purposes. The Water District has covenanted to comply with each such requirement. Failure to comply with certain of such requirements may cause the inclusion of such interest in gross income for federal income tax purposes to be retroactive to the date of issuance of the 2015 Bonds.
If the initial offering price to the public (excluding bond houses and brokers) at which a
2015 Bond is sold is less than the amount payable at maturity thereof, then such difference constitutes "original issue discount" for purposes of federal income taxes and State of California personal income taxes. If the initial offering price to the public (excluding bond houses and brokers) at which each 2015 Bond is sold is greater than the amount payable at maturity thereof, then such difference constitutes "original issue premium" for purposes of federal income taxes and State of California personal income taxes. De minimis original issue discount is disregarded.
Under the Code, original issue discount is treated as interest excluded from federal gross
income and exempt from State of California personal income taxes to the extent properly allocable to each owner thereof subject to the limitations described in the first paragraph of this section. The original issue discount accrues over the term to maturity of the 2015 Bond on the basis of a constant interest rate compounded on each interest or principal payment date (with straight-line interpolations between compounding dates). The amount of original issue discount accruing during each period is added to the adjusted basis of such 2015 Bond to determine taxable gain upon disposition (including sale, redemption, or payment on maturity) of such 2015 Bond. The Code contains certain provisions relating to the accrual of original issue discount in the case of purchasers of the 2015 Bonds who purchase the 2015 Bonds after the initial offering of a substantial amount of such maturity. Owners of such 2015 Bonds should consult their own tax advisors with respect to the tax consequences of ownership of 2015 Bonds with original issue discount, including the treatment of purchasers who do not purchase in the original offering, the allowance of a deduction for any loss on a sale or other disposition, and the treatment of accrued
-68-

original issue discount on such 2015 Bonds under federal individual and corporate alternative minimum taxes.
Under the Code, original issue premium is amortized on an annual basis over the term of
the 2015 Bond (said term being the shorter of the 2015 Bond’s maturity date or its call date). The amount of original issue premium amortized each year reduces the adjusted basis of the owner of the 2015 Bond for purposes of determining taxable gain or loss upon disposition. The amount of original issue premium on a 2015 Bond is amortized each year over the term to maturity of the 2015 Bond on the basis of a constant interest rate compounded on each interest or principal payment date (with straight-line interpolations between compounding dates). Amortized 2015 Bond premium is not deductible for federal income tax purposes. Owners of Premium 2015 Bonds, including purchasers who do not purchase in the original offering, should consult their own tax advisors with respect to State of California personal income tax and federal income tax consequences of owning such 2015 Bonds.
In the further opinion of Bond Counsel, interest on the 2015 Bonds is exempt from
California personal income taxes. Owners of the 2015 Bonds should also be aware that the ownership or disposition of, or
the accrual or receipt of interest on, the 2015 Bonds may have federal or state tax consequences other than as described above. Bond Counsel expresses no opinion regarding any federal or state tax consequences arising with respect to the 2015 Bonds other than as expressly described above.
RATINGS
The Water District has not applied to a rating agency for the assignment of a rating to the
2015 Bonds and does not contemplate applying for a rating.
NO LITIGATION At the time of delivery of and payment for the 2015 Bonds, the Counsel to the Water
District will deliver his opinion that to the best of its knowledge there is no action, suit, proceeding, inquiry or investigation at law or in equity before or by any court or regulatory agency pending against the Water District affecting its existence or the titles of its officers to office or seeking to restrain or to enjoin the issuance, sale or delivery of the 2015 Bonds, the application of the proceeds thereof in accordance with the Fiscal Agent Agreement, or the collection or application of the Special Tax to pay the principal of and interest on the 2015 Bonds, or in any way contesting or affecting the validity or enforceability of the 2015 Bonds, the Fiscal Agent Agreement or any action of the Water District contemplated by any of said documents, or in any way contesting the completeness or accuracy of this Official Statement or any amendment or supplement thereto, or contesting the powers of the Water District or its authority with respect to the 2015 Bonds or any action of the Water District contemplated by any of said documents.
-69-

The execution and delivery of this Official Statement by the Water District has been duly authorized by the Water District Board on behalf of the District.
WESTERN HILLS WATER DISTRICT By: /s/ Guillermo Marrero
President
-70-

APPENDIX A
WESTERN HILLS WATER DISTRICT DIABLO GRANDE COMMUNITY FACILITIES DISTRICT NO. 1
RATE AND METHOD OF APPORTIONMENT OF SPECIAL TAX
A-1

[THIS PAGE INTENTIONALLY LEFT BLANK]


[THIS PAGE INTENTIONALLY LEFT BLANK]

APPENDIX B
APPRAISAL OF CERTAIN PROPERTY IN THE DISTRICT

[THIS PAGE INTENTIONALLY LEFT BLANK]

Appraisal Report Western Hills Water District (Diablo Grande) Community Facilities District No. 1 Patterson, Stanislaus County, California
Date of Report: June 10, 2015
Prepared For: Mr. Guillermo Marrero, Director/President Western Hills Water District 9501 Morton Davis Drive Patterson, California 95363
Prepared By: Eric A. Segal, Appraiser Kevin K. Ziegenmeyer, MAI
3825 Atherton Road, Suite 500 | Rocklin, CA 95765 | Phone: 916.435.3883 | Fax: 916.435.4774
June 10, 2015 Mr. Guillermo Marrero, Director/President Western Hills Water District 9501 Morton Davis Drive Patterson, California 95363 RE: Western Hills Water District Diablo Grande
Community Facilities District No. 1 Patterson, Stanislaus County, California Dear Mr. Marrero: At your request and authorization, Seevers Jordan Ziegenmeyer has prepared an appraisal report and analyzed market data for the purpose of estimating the market value (fee simple estate) of certain undeveloped properties within the boundaries of the Western Hills Water District Diablo Grande Community Facilities District (CFD) No. 1, under the conditions and assumptions set forth in the attached report. The appraisal report has been conducted in accordance with appraisal standards and guidelines found in the Uniform Standards of Professional Appraisal Practice (USPAP) and the Appraisal Standards for Land Secured Financing published by the California Debt and Investment Advisory Commission (2004). This document is presented in an Appraisal Report Format, which is intended to comply with the reporting requirements set forth under Standards Rule 2-2(a) of the 2014-2015 edition of USPAP. The Western Hills Water District Diablo Grande Community Facilities District No. 1 encompasses approximately 2,250 acres of land to be developed with single- and multifamily residential housing, commercial uses, open space and recreational uses, and public facilities. Anticipated development within the CFD includes UP TO 2,354± single-family residential units and approximately 39 acres of commercial uses. There is also approximately 2,273 acres of undeveloped land (primarily open space) within the boundaries of the CFD not presently developable. The appraised properties comprise the undeveloped residential lots within the District not improved with a single-family residence, which total 300 separate Assessor’s parcels. The Diablo Grande master planned community is located in the southwestern portion of Stanislaus County, California, approximately eight miles southwest of the city of Patterson, west of Interstate 5, at the terminus of Diablo Grande Parkway and situated in a valley created by the Diablo Range. The various land use components contained within Diablo Grande – Phase 1, Units 1 through 5 include single-family and multifamily residential, commercial, winery, golf club and golf course, vineyards, public use and open space. It should be noted all the improvements financed by the Western Hills Water District Diablo Grande Community Facilities District No. 1 (series 2001, 2002, 2004, and 2005) are in place and available for use.

15-198
Mr. Guillermo Marrero June 10, 2015 Page 2 We have been requested to provide a cumulative, or aggregate, value estimate for the appraised properties for the individual ownership components of the subject, under the assumptions and conditions cited in the attached report. Primary among the assumptions is the value estimate is subject to the hypothetical condition any improvements to be financed by the Western Hills Water District Diablo Grande Community Facilities District No. 1 Special Tax Collections are in place. The value estimates assume a transfer would reflect a cash transaction or terms that are considered to be equivalent to cash. The estimates are also premised on an assumed sale after reasonable exposure in a competitive market under all conditions requisite to a fair sale, with buyer and seller each acting prudently, knowledgeably, for their own self-interest and assuming neither is under duress. The cumulative, or aggregate, value of the District accounts for the impact of the lien of the Special Tax securing the Western Hills Water District Diablo Grande Community Facilities District No. 1 Bonds. As a result of our analysis, it is our opinion the cumulative, or aggregate, value of the fee simple interest in the appraised properties, subject to the hypothetical condition any improvements to be financed by the Western Hills Water District Diablo Grande Community Facilities District No. 1 Special Tax Collections are in place, in accordance with the assumptions and conditions set forth in the attached document (please refer to pages 6 through 8), is:
FIFTY EIGHT MILLION FOUR HUNDRED NINETY TWO THOUSAND DOLLARS $58,492,000
Please see the Market Value by Assessor’s Parcel table in the Appendix for a description and breakdown of the value above by ownership and parcel. This letter must remain attached to the report, which contains 106 pages plus related tables, exhibits and Appendix, in order for the value opinion set forth herein to be considered valid. We hereby certify the subject properties have been inspected and we have impartially considered all data collected in the investigation. Further, we have no past, present or anticipated future interest in the property. The subject properties do not have any significant natural, cultural, recreational or scientific value. The appraiser certifies this appraisal assignment was not based on a requested minimum valuation, a specific valuation or the approval of a loan. Thank you for the opportunity to work with your office on this assignment. Sincerely,
Eric A. Segal, Appraiser Kevin Ziegenmeyer, MAI State Certification No.: AG026558 State Certification No.: AG013567 Expires: February 18, 2017 Expires: June 4, 2017 /jab
TABLE OF CONTENTS Summary of Important Facts and Conclusions 1 Introduction Client, Intended User and Intended Use of the Appraisal 3 Type and Definition of Value 3 Property Rights Appraised 3 Appraisal Report Format 3 Dates of Inspection, Value and Report 3 Scope of Work 4 Extraordinary Assumptions, Significant Factors and Hypothetical Conditions 6 General Assumptions and Limiting Conditions 7 Certification Statements 9 Subject Property Property History 11 Property Identification and Legal Data 13 Site Description 19 Subject Photographs 24 Market Area
Stanislaus County 28 Neighborhood 33 Residential Market Overview 37 Highest and Best Use 47
Valuation Analysis
Approaches to Value 50 Appraisal Methodology 53 Market Valuation 54 Component Value – Production-Oriented Residential Lots 54 Component Value – Estate Lots 70
Bulk Market Valuation – Master Developer Component 94 Summary and Conclusion 105 Exposure Time 106
Appendix A – Market Value by Assessor’s Parcel B – Remaining Development Costs C – Assessor’s Parcel Maps D – Readdressing/Reassigning Appraisal Reports E – Glossary of Terms F – Qualifications of Appraiser(s)

Seevers Jordan Ziegenmeyer 1
SUMMARY OF IMPORTANT FACTS AND CONCLUSIONS
Property Name: The appraised properties comprise the undeveloped residential lots within the boundaries of the Western Hills Water District Diablo Grande Community Facilities District No. 1 not improved with a single-family residence.
Property Location: The Diablo Grande master planned community is located in the southwestern portion of Stanislaus County, California, approximately eight miles southwest of the city of Patterson, west of Interstate 5, at the terminus of Diablo Grande Parkway and situated in a valley created by the Diablo Range.
Assessor’s Parcel Numbers/Ownership:
The appraised properties consist of 300 separate Assessor’s parcels, which are identified within the Appendix to this report (see Market Value by Assessor’s Parcel). A breakdown of the number of parcels under each ownership group (more than four parcels) is shown in the table below:
It is noted there are 428 additional parcels within Western Hills Water District Diablo Grande CFD No. 1 that have vertical improvements constructed and/or are not a part of this appraisal, such as golf course land, grazing land and open space areas.
Property Type/Current Use: Improved and unimproved residential lots
Zoning/Land Use: The various land components representing the subject property are zoned for single-family residential development. For a complete description of the governing zoning ordinances, please refer to the Property Identification and Legal Data section of this report.
Flood Zone: Zone X – Areas outside of the 100- and 500-year flood plains (per www.floodmaps.com, provided by Digital Media Services)
Earthquake Zone: According to the Seismic Safety Commission, the subject is located within Zone 3, which is assigned to areas of moderate seismic activity. The location within this zone does not prevent development. There are only two zones in California. Zone 4 is
Owner No. of Parcels
Civic Diablo Grande LLC 38Oak Valley Community Bank 5
Western Pacific Housing 118World International LLC 93
Other Individually Owned Parcels 46Total 300
Seevers Jordan Ziegenmeyer 2
assigned to areas of major faults. Zone 3 is assigned to areas with more moderate seismic activity. The subject is not located within a Fault-Rupture Hazard Zone (formerly referred to as an Alquist-Priolo Special Study Zone), as defined by Special Publication 42 (revised January 1994) of the California Department of Conservation, Division of Mines and Geology.
Highest and Best Use: Single-family residential development, as approved and proposed
Date of Inspection: May 16, 2015
Effective Date of Value: May 16, 2015
Date of Report: June 10, 2015
Property Rights Appraised: Fee simple estate
Conclusion of Cumulative, or Aggregate, Value:
$58,492,000 It should be noted the value presented above is subject to the general and extraordinary assumptions, hypothetical conditions and limiting conditions (please refer to pages 6 through 8) presented in the attached report.

Seevers Jordan Ziegenmeyer 3
CLIENT, INTENDED USER AND INTENDED USE
The client and intended user of the report is the Western Hills Water District. It is our understanding the report will be used for bond underwriting purposes.
APPRAISAL REPORT FORMAT
This document is an Appraisal Report, which is intended to comply with the reporting requirements set forth under Standards Rule 2-2(a) of the 2014-2015 edition of the Uniform Standards of Professional Appraisal Practice (USPAP).
TYPE AND DEFINITION OF VALUE
The purpose of this appraisal is to estimate the market value (fee simple estate), by ownership, and the cumulative, or aggregate, value of the appraised properties comprising a portion of the Western Hills Water District Diablo Grande Community Facilities District (CFD) No. 1, subject to the hypothetical condition any improvements to be financed by the CFD No. 1 Special Tax Collections are in place. Market value and aggregate value are defined as follows:
Market Value: The most probable price which a property should bring in a competitive and open market under all conditions requisite to a fair sale, the buyer and seller each acting prudently and knowledgeably, and assuming the price is not affected by undue stimulus. Implicit in this definition is the consummation of a sale as of a specified date and the passing of title from seller to buyer under conditions whereby:
(1) Buyer and seller are typically motivated;
(2) Both parties are well informed or well advised, and acting in what they
consider their own best interests;
(3) A reasonable time is allowed for exposure in the open market;
(4) Payment is made in terms of cash in U.S. dollars or in terms of financial arrangements comparable thereto; and
(5) The price represents the normal consideration for the property sold
unaffected by special or creative financing or sales concessions granted by anyone associated with the sale.1
1 Code of Federal Regulations, Title 12, Section 34.42 (55 Federal Register 34696, Aug. 24, 1990; as amended at 57 Federal Register 12202, Apr. 9, 1992; 59 Federal Register 29499, June 7, 1994).
Seevers Jordan Ziegenmeyer 4
PROPERTY RIGHTS APPRAISED The estimates of value derived in this report are for the fee simple estate. The definition of this real property interest is offered below.
Fee Simple Estate: absolute ownership unencumbered by any other interest or estate, subject only to the limitations imposed by the governmental powers of taxation, eminent domain, police power, and escheat.2
The rights appraised are also subject to the General and Extraordinary Assumptions and Limiting Conditions contained in this report and to any exceptions, encroachments, easements and rights-of-way recorded. The value estimates account for the impact of the lien of the Special Tax securing the Western Hills Water District Diablo Grande CFD No. 1 Bonds.
DATES OF INSPECTION, VALUE AND REPORT An inspection of the subject properties was completed on May 16, 2015, which represents the effective date of market value by ownership, and cumulative, or aggregate, value of the appraised properties. This appraisal report was completed and assembled on June 10, 2015.
SCOPE OF WORK This appraisal report has been prepared in accordance with the Uniform Standards of Professional Appraisal Practice (USPAP). This analysis is intended to be an “appraisal assignment,” as defined by USPAP; the intention is the appraisal service be performed in such a manner that the result of the analysis, opinions, or conclusion be that of a disinterested third party. Several legal and physical aspects of the subject property were researched and documented. A physical inspection of the property was completed and serves as the basis for the site description contained in this report. The sales history was verified by consulting public records. Various documents were provided for the appraisal, including developer’s budget and project maps. The zoning and entitlements, earthquake zone, flood zone and utilities were verified with applicable public agencies at the County of Stanislaus. Property tax information for the current tax year was obtained from the County of Stanislaus Treasurer-Tax Collector’s Office. Data relating to the subject’s neighborhood and surrounding market area were analyzed and documented. This information was obtained through personal inspections of portions of the neighborhood and market area; newspaper articles; real estate conferences; and interviews with
2 The Dictionary of Real Estate Appraisal, 5th ed. (Chicago: Appraisal Institute, 2010), 78.

Seevers Jordan Ziegenmeyer 5
various market participants, including property owners, property managers, brokers, developers and local government agencies. In this appraisal, the highest and best use of the subject property as though vacant was determined based on the four standard tests (legal permissibility, physical possibility, financial feasibility and maximum productivity). We have been requested to provide estimates of market value of the appraised properties. The sales comparison approach to value was used to determine the market value of each developable land use component comprising the subject property (production-oriented residential lots and estate lots). The data set and other market indicators was utilized to establish the incremental value difference between each of the lot groupings larger and smaller than the typical lot size used for analysis. A discounted cash flow analysis was relied upon in the valuation of the remaining lots held by the master developer. The cumulative, or aggregate, value of the appraised properties represents the sum of the value estimates concluded for each ownership interest, which is not equivalent to the market value of the District as a whole. This appraisal report has been conducted in accordance with appraisal standards and guidelines found in the Uniform Standards of Professional Appraisal Practice (USPAP) and the Appraisal Standards for Land Secured Financing published by the California Debt and Investment Advisory Commission (2004).
The individuals involved in the preparation of this appraisal include Kevin K. Ziegenmeyer, MAI, and Eric A. Segal, Appraiser. Mr. Segal 1) reviewed the subject property information provided by the owner/developer, 2) inspected the subject property, 3) collected and confirmed market data, 4) analyzed the market data and 5) prepared the draft report. Mr. Ziegenmeyer 1) inspected the subject property, 2) provided professional input and direction and 3) made any necessary revisions and/or amplifications to the draft report.
Seevers Jordan Ziegenmeyer 6
EXTRAORDINARY ASSUMPTIONS AND HYPOTHETICAL CONDITIONS It is noted the use of an extraordinary assumption or hypothetical condition can impact the results of an appraisal. Extraordinary Assumptions 1. It is assumed there are no adverse soil conditions, toxic substances or other environmental hazards
that may interfere or inhibit the development of the subject properties. 2. It is assumed all remaining infrastructure improvements, including those to be financed by the
Western Hills Water District Diablo Grande CFD No. 1 Bonds and those to be financed by the master developer, will be properly installed and available for use.
3. According to a representative for the master developer, approximately $350,000 has been
committed to construct the emergency communication equipment, which is required prior to issuing additional building permits beyond 500. It is specifically assumed the master developer and the County of Stanislaus will provide necessary fire suppression services for the project to allow for the continuation of development (issuance of building permits) within Diablo Grande.
4. The exact locations of the easements referenced in a preliminary title report were not provided to the
appraiser. The appraiser is not a surveyor nor qualified to determine the exact location of the referenced easements. It is assumed the easements noted in the referenced preliminary title report do not have an impact on the opinions of value as provided in this report. If, at some future date, these easements are determined to have a detrimental impact on value, the appraiser reserves the right to amend the opinion(s) of value. The opinions of value presented in this report are predicated on none of the items referenced in the preliminary title report having a detrimental impact upon the utility of the property as proposed, nor the opinions of value. If, at some future date, these exceptions are determined to have a detrimental impact on value, the appraiser reserves the right to amend the opinion(s) of value.
Hypothetical Conditions 1. The estimate of cumulative, or aggregate, value of the appraised properties comprising a portion of
the Western Hills Water District Diablo Grande CFD No. 1 is subject to a hypothetical condition. A hypothetical condition is defined by USPAP as “a condition, directly related to a specific assignment, which is contrary to what is known by the appraiser to exist on the effective date of the assignment results, but is used for the purpose of the analysis.” The hypothetical condition assumes certain infrastructure improvements to be financed by the Western Hills Water District Diablo Grande CFD No. 1 Special Tax Collections are in place and available for use.

Seevers Jordan Ziegenmeyer 7
GENERAL ASSUMPTIONS AND LIMITING CONDITIONS
1. No responsibility is assumed for the legal description provided or for matters pertaining to legal
or title considerations. Title to the property is assumed to be good and marketable unless otherwise stated.
2. No responsibility is assumed for matters of law or legal interpretation. 3. The property is appraised free and clear of any or all liens or encumbrances unless otherwise
stated. 4. The information and data furnished by others in preparation of this report is believed to be
reliable, but no warranty is given for its accuracy. 5. It is assumed there are no hidden or unapparent conditions of the property, subsoil, or structures
that render it more or less valuable. No responsibility is assumed for such conditions or for obtaining the engineering studies that may be required to discover them.
6. It is assumed the property is in full compliance with all applicable federal, state, and local
environmental regulations and laws unless the lack of compliance is stated, described, and considered in the appraisal report.
7. It is assumed the property conforms to all applicable zoning and use regulations and restrictions
unless nonconformity has been identified, described and considered in the appraisal report. 8. It is assumed all required licenses, certificates of occupancy, consents, and other legislative or
administrative authority from any local, state, or national government or private entity or organization have been or can be obtained or renewed for any use on which the value estimate contained in this report is based.
9. It is assumed the use of the land and improvements is confined within the boundaries or property
lines of the property described and there is no encroachment or trespass unless noted in the report.
10. Unless otherwise stated in this report, the existence of hazardous materials, which may or may
not be present on the property, was not observed by the appraiser. The appraiser has no knowledge of the existence of such materials on or in the property. The appraiser, however, is not qualified to detect such substances. The presence of substances such as asbestos, urea-formaldehyde foam insulation and other potentially hazardous materials may affect the value of the property. The value estimated is predicated on the assumption there is no such material on or in the property that would cause a loss in value. No responsibility is assumed for such conditions or for any expertise or engineering knowledge required to discover them. The intended user of this report is urged to retain an expert in this field, if desired.
11. The Americans with Disabilities Act (ADA) became effective January 26, 1992. I (we) have not
made a specific survey or analysis of this property to determine whether the physical aspects of the improvements meet the ADA accessibility guidelines. Since compliance matches each owner’s financial ability with the cost-to cure the property’s potential physical characteristics, the real estate appraiser cannot comment on compliance with ADA. A brief summary of the
Seevers Jordan Ziegenmeyer 8
subject’s physical aspects is included in this report. It in no way suggests ADA compliance by the current owner. Given that compliance can change with each owner’s financial ability to cure non-accessibility, the value of the subject does not consider possible non-compliance. Specific study of both the owner’s financial ability and the cost-to-cure any deficiencies would be needed for the Department of Justice to determine compliance.
12. The appraisal is to be considered in its entirety and use of only a portion thereof will render the
appraisal invalid. 13. Possession of this report or a copy thereof does not carry with it the right of publication nor may
it be used for any purpose by anyone other than the client without the previous written consent of Seevers Jordan Ziegenmeyer.
14. Neither all nor any part of the contents of this report (especially any conclusions as to value, the
identity of the appraiser, or the firm with which the appraiser is connected) shall be disseminated to the public through advertising, public relations, news, sales, or any other media without the prior written consent and approval of Seevers Jordan Ziegenmeyer. Seevers Jordan Ziegenmeyer authorizes the reproduction of this report for publication in the preliminary official statement and official statement for Bond financing purposes.
15. Acceptance and/or use of the appraisal report constitutes acceptance of all assumptions and
limiting conditions stated in this report. 16. An inspection of the subject properties revealed no apparent adverse easements, encroachments
or other conditions, which currently impact the subject. However, the exact locations of typical roadway and utility easements, or any additional easements, which would be referenced in a preliminary title report, were not provided to the appraiser. The appraiser is not a surveyor nor qualified to determine the exact location of easements. It is assumed typical easements do not have an impact on the opinion (s) of value as provided in this report. If, at some future date, these easements are determined to have a detrimental impact on value, the appraiser reserves the right to amend the opinion (s) of value.
17. This appraisal report is prepared for the exclusive use of the appraiser’s client. No third parties
are authorized to rely upon this report without the express consent of the appraiser. 18. The appraiser is not qualified to determine the existence of mold, the cause of mold, the type of
mold or whether mold might pose any risk to the property or its inhabitants. Additional inspection by a qualified professional is recommended.

Seevers Jordan Ziegenmeyer 9
CERTIFICATION STATEMENT I certify that, to the best of my knowledge and belief: The statements of fact contained in this report are true and correct. The reported analyses, opinions, and conclusions are limited only by the reported assumptions
and limiting conditions and are my personal, impartial, and unbiased professional analyses, opinions, and conclusions.
I have no present or prospective interest in the property that is the subject of this report and no
personal interest with respect to the parties involved. I have performed appraisal services regarding a portion of the properties that are the subject of
this report within the three-year period immediately preceding acceptance of this assignment. I have no bias with respect to the property that is the subject of this report or to the parties
involved with this assignment. My engagement in this assignment was not contingent upon developing or reporting
predetermined results. My compensation for completing this assignment is not contingent upon the development or
reporting of a predetermined value or direction in value that favors the cause of the client, the amount of the value opinion, the attainment of a stipulated result, or the occurrence of a subsequent event directly related to the intended use of this appraisal.
My analyses, opinions, and conclusions were developed, and this report has been prepared, in
conformity with the Uniform Standards of Professional Appraisal Practice. The reported analyses, opinions, and conclusions were developed, and this report has been
prepared, in conformity with the Code of Professional Ethics and Standards of Professional Appraisal Practice of the Appraisal Institute.
I have made a personal inspection of the property that is the subject of this report. The use of this report is subject to the requirements of the Appraisal Institute relating to review
by its duly authorized representatives. I certify that my State of California real estate appraiser license has never been revoked,
suspended, cancelled, or restricted. I have the knowledge and experience to complete this appraisal assignment. Please see the
Qualifications of Appraiser(s) portion of the Appendix to this report for additional information. As of the date of this report, I have completed the Standards and Ethics Education Requirement
of the Appraisal Institute for Associate Members.
June 10, 2015
Eric A. Segal, Appraiser DATE State Certification No.: AG026558 (February 18, 2017)
Seevers Jordan Ziegenmeyer 10
CERTIFICATION STATEMENT I certify that, to the best of my knowledge and belief: The statements of fact contained in this report are true and correct.
The reported analyses, opinions, and conclusions are limited only by the reported assumptions and limiting conditions and are my personal, impartial, and unbiased professional analyses, opinions, and conclusions.
I have no present or prospective interest in the property that is the subject of this report and no personal interest with respect to the parties involved.
I have performed no services, as an appraiser or in any other capacity, regarding the property that is the subject of this report within the three-year period immediately preceding acceptance of this assignment.
I have no bias with respect to the property that is the subject of this report or to the parties involved with this assignment.
My engagement in this assignment was not contingent upon developing or reporting predetermined results.
My compensation for completing this assignment is not contingent upon the development or reporting of a predetermined value or direction in value that favors the cause of the client, the amount of the value opinion, the attainment of a stipulated result, or the occurrence of a subsequent event directly related to the intended use of this appraisal.
My analyses, opinions, and conclusions were developed, and this report has been prepared, in conformity with the Uniform Standards of Professional Appraisal Practice.
The reported analyses, opinions, and conclusions were developed, and this report has been prepared, in conformity with the Code of Professional Ethics and Standards of Professional Appraisal Practice of the Appraisal Institute.
I have made an inspection of the property that is the subject of this report.
Eric A. Segal, Appraiser, provided significant real property appraisal assistance to the person signing this certification.
The use of this report is subject to the requirements of the Appraisal Institute relating to review by its duly authorized representatives.
I certify that my State of California real estate appraiser license has never been revoked, suspended, cancelled, or restricted.
I have the knowledge and experience to complete this appraisal assignment. Please see the Qualifications of Appraiser(s) portion of the Addenda to this report for additional information.
As of the date of this report, I have completed the continuing education program for Designated Members of the Appraisal Institute.
June 10, 2015
Kevin K. Ziegenmeyer, MAI DATE State Certification No.: AG013567 (Expires June 4, 2017)
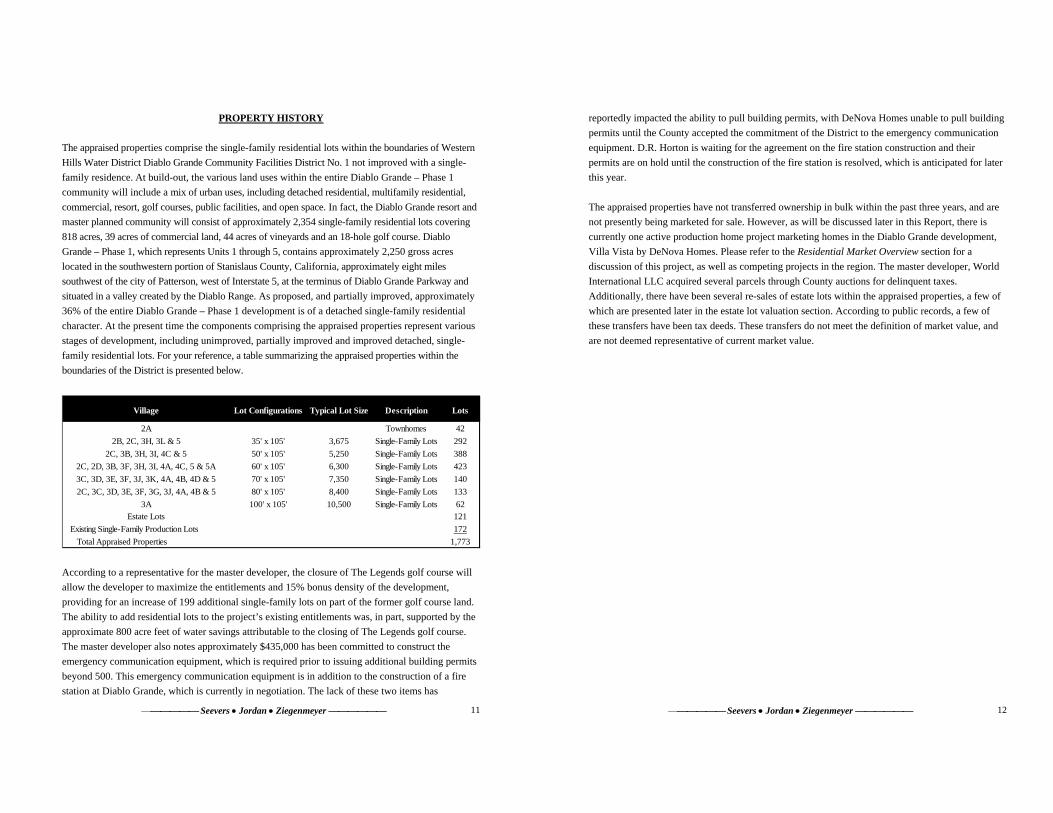
Seevers Jordan Ziegenmeyer 11
PROPERTY HISTORY The appraised properties comprise the single-family residential lots within the boundaries of Western Hills Water District Diablo Grande Community Facilities District No. 1 not improved with a single-family residence. At build-out, the various land uses within the entire Diablo Grande – Phase 1 community will include a mix of urban uses, including detached residential, multifamily residential, commercial, resort, golf courses, public facilities, and open space. In fact, the Diablo Grande resort and master planned community will consist of approximately 2,354 single-family residential lots covering 818 acres, 39 acres of commercial land, 44 acres of vineyards and an 18-hole golf course. Diablo Grande – Phase 1, which represents Units 1 through 5, contains approximately 2,250 gross acres located in the southwestern portion of Stanislaus County, California, approximately eight miles southwest of the city of Patterson, west of Interstate 5, at the terminus of Diablo Grande Parkway and situated in a valley created by the Diablo Range. As proposed, and partially improved, approximately 36% of the entire Diablo Grande – Phase 1 development is of a detached single-family residential character. At the present time the components comprising the appraised properties represent various stages of development, including unimproved, partially improved and improved detached, single-family residential lots. For your reference, a table summarizing the appraised properties within the boundaries of the District is presented below.
According to a representative for the master developer, the closure of The Legends golf course will allow the developer to maximize the entitlements and 15% bonus density of the development, providing for an increase of 199 additional single-family lots on part of the former golf course land. The ability to add residential lots to the project’s existing entitlements was, in part, supported by the approximate 800 acre feet of water savings attributable to the closing of The Legends golf course. The master developer also notes approximately $435,000 has been committed to construct the emergency communication equipment, which is required prior to issuing additional building permits beyond 500. This emergency communication equipment is in addition to the construction of a fire station at Diablo Grande, which is currently in negotiation. The lack of these two items has
Village Lot Configurations Typical Lot Size Description Lots
2A Townhomes 422B, 2C, 3H, 3L & 5 35' x 105' 3,675 Single-Family Lots 292
2C, 3B, 3H, 3I, 4C & 5 50' x 105' 5,250 Single-Family Lots 3882C, 2D, 3B, 3F, 3H, 3I, 4A, 4C, 5 & 5A 60' x 105' 6,300 Single-Family Lots 4233C, 3D, 3E, 3F, 3J, 3K, 4A, 4B, 4D & 5 70' x 105' 7,350 Single-Family Lots 1402C, 3C, 3D, 3E, 3F, 3G, 3J, 4A, 4B & 5 80' x 105' 8,400 Single-Family Lots 133
3A 100' x 105' 10,500 Single-Family Lots 62Estate Lots 121
Existing Single-Family Production Lots 172Total Appraised Properties 1,773
Seevers Jordan Ziegenmeyer 12
reportedly impacted the ability to pull building permits, with DeNova Homes unable to pull building permits until the County accepted the commitment of the District to the emergency communication equipment. D.R. Horton is waiting for the agreement on the fire station construction and their permits are on hold until the construction of the fire station is resolved, which is anticipated for later this year. The appraised properties have not transferred ownership in bulk within the past three years, and are not presently being marketed for sale. However, as will be discussed later in this Report, there is currently one active production home project marketing homes in the Diablo Grande development, Villa Vista by DeNova Homes. Please refer to the Residential Market Overview section for a discussion of this project, as well as competing projects in the region. The master developer, World International LLC acquired several parcels through County auctions for delinquent taxes. Additionally, there have been several re-sales of estate lots within the appraised properties, a few of which are presented later in the estate lot valuation section. According to public records, a few of these transfers have been tax deeds. These transfers do not meet the definition of market value, and are not deemed representative of current market value.

Seevers Jordan Ziegenmeyer 13
PROPERTY IDENTIFICATION AND LEGAL DATA
Location The appraised properties are located in the southwestern portion of Stanislaus County, California, approximately eight miles southwest of the city of Patterson, west of Interstate 5, at the terminus of Diablo Grande Parkway and situated in a valley created by the Diablo Range. Assessor’s Parcel Number/Ownership The subject property consists of 300 legally transferrable parcels comprising 1,691 single-family residential lots (existing and proposed), which are identified within the 2014/15 Tax Roll (Market
Value by Assessor’s Parcel) appended hereto. It is noted there are 428 additional parcels within Western Hills Water District Diablo Grande CFD No. 1 that have vertical improvements constructed and/or are not a part of this appraisal, such as golf course land, grazing land and open space areas that will ultimately support additional residential lots. It’s also worth noting there are 17 Assessor’s parcels that prepaid the Special Tax and are not a part of this appraisal. A breakdown of the appraised properties in the District is presented in the table below:
Legal Description A legal description of the appraised properties, which would be contained in a preliminary title report, was not provided for use in this analysis.
Village Lot Configurations Typical Lot Size Description Lots
2A Townhomes 422B, 2C, 3H, 3L & 5 35' x 105' 3,675 Single-Family Lots 292
2C, 3B, 3H, 3I, 4C & 5 50' x 105' 5,250 Single-Family Lots 3882C, 2D, 3B, 3F, 3H, 3I, 4A, 4C, 5 & 5A 60' x 105' 6,300 Single-Family Lots 4233C, 3D, 3E, 3F, 3J, 3K, 4A, 4B, 4D & 5 70' x 105' 7,350 Single-Family Lots 1402C, 3C, 3D, 3E, 3F, 3G, 3J, 4A, 4B & 5 80' x 105' 8,400 Single-Family Lots 133
3A 100' x 105' 10,500 Single-Family Lots 62Estate Lots 121
Existing Single-Family Production Lots 172Total Appraised Properties 1,773
Seevers Jordan Ziegenmeyer 14
Assessment and Tax Information Ad Valorem Taxes
The property tax system in California was amended in 1978 by Article XIII to the State Constitution, commonly referred to as Proposition 13. It provides for a limitation on ad valorem property taxes and for a procedure to establish the current taxable value of real property by reference to a base year value, which is then modified annually to reflect inflation (if any). Annual increases cannot exceed 2% per year. The base year was set at 1975-76, or any year thereafter in which the property is substantially improved or changes ownership. When either of these two conditions occur, the property is to be re-appraised at market value, which becomes the new base year assessed value. Proposition 13 also limits the maximum tax rate to 1% of the value of the property, exclusive of bonds and supplemental assessments. Bonded indebtedness approved prior to 1978 and any bonds subsequently approved by a two-thirds vote of the district, in which the property is located, can be added to the 1% tax rate. The existing ad valorem taxes are of nominal consequence in this appraisal, primarily due to the fact these taxes will be adjusted substantially as the remaining infrastructure and property improvements are completed and in consideration of the definition of market value employed in this appraisal, which assumes a sale of the appraised properties. The appraised properties are subject to a tax rate of 1.1903%. Special Taxes and Assessments
As referenced, the appraised properties are located within the boundaries of Western Hills Water District Diablo Grande CFD No. 1. The District includes single-family and multifamily residential land use components, commercial use parcels, undeveloped parcels and both golf course parcels (one golf course has been abandoned and is proposed for redevelopment with open space and residential lots). Each of these land uses are encumbered by Bonds associated with the CFD. The proceeds of the existing bonds were used by the Water District (Western Hills Water District) to acquire water, wastewater, drainage and related improvements of benefit to property within the District. Additionally, proceeds of the 2001 Bonds (initial issuance) were used, in part, to acquire, on behalf of the County, all or part of certain roadway improvements required as a condition of development within the District, including those roads known or to be known as Lower Oak Flat Road and Diablo Grande Parkway.

Seevers Jordan Ziegenmeyer 15
According to the CFD Tax Administration Report (Fiscal Year 2014-15), prepared by Goodwin Consulting Group, the annual special taxes applicable to the subject are as presented in the table below:
Land Use Maximum Annual Special Tax Rate Single-Family Residential Use
Estate Lots (3.0-acre minimum) $3,000 per unit 40,000 sf minimum lot size $3,000 per unit 20,000 sf minimum lot size $3,000 per unit 8,000 sf minimum lot size $2,400 per unit 6,000 sf minimum lot size $2,250 per unit 5,000 sf minimum lot size $2,100 per unit Patio Home – Detached residential $1,800 per unit
Multifamily Residential Use Townhouses $1,200 per unit Condominiums $900 per unit Apartments $900 per unit
Commercial Use Parcels Commercial Use $7,500 per acre Hotel Use $5,000 per acre Winery Use $3,600 per acre
Miscellaneous Parcels Golf Course $1,350 per acre Undeveloped Parcels $1,350 per acre
The appraised properties are also subject to a number of direct levies, which, in total, represent only nominal assessments. They include West Stanislaus Fire District, WSFPD Fire Suppression, Patterson Ambulance District and Turlock Mosquito Abatement. The bond indebtedness and these direct levies will be considered in the valuation of the subject property. Entitlement Status The Western Hills Water District Diablo Grande Community Facilities District No. 1 (“CFD”) contains approximately 2,250 gross acres of land. At build-out, the various property uses within the entire Diablo Grande resort and master planned development will include a mix of urban uses, including detached residential, multifamily residential, commercial, resort, golf courses, public facilities, and open space. Anticipated development within the CFD specifically includes more than 2,000 single-family residential units and approximately 39 acres of commercial uses. The Diablo Grande community represents a development that has undergone extensive planning and review. Consequently, significant changes to the underlying land uses are highly unlikely.
Seevers Jordan Ziegenmeyer 16
Land Use Summary
The various land use components contained within Diablo Grande – Phase 1, Units 1 through 5, are detailed in the table below.
Diablo Grande – Phase 1, Units 1 through 5 Component Description Acreage
Open Space & Recreation Hillside Area 498 Open Space & Recreation Creek Side Areas 297 Open Space & Recreation Parks 49 Open Space & Recreation Golf Courses 255 Open Space & Recreation Vineyards 44 Open Space & Recreation Ponds 22
Employment Hotel/Conference Center/Town Center 14 Employment Shopping Center 7 Employment Winery 3 Employment Golf Club 12 Employment Tennis Club 3
Single-Family Residential R-5 Single-Family Residential 44 Single-Family Residential R-8 Single-Family Residential 36 Single-Family Residential R-10 Single-Family Residential 345 Single-Family Residential R-20 Single-Family Residential 80 Single-Family Residential R-40 Single-Family Residential 98 Single-Family Residential Estate (3 ac. Minimum) 128 Single-Family Residential Patio Home Lots (4,500 sf) 13 Single-Family Residential Planned Development – Cottages 74 Multifamily Residential MF Residential – Town Center N/A
Public Facilities Water Treatment 18 Public Facilities Maintenance Center 4 Public Facilities Roads – Parkway 40 Public Facilities Roads – Others 147
Total 2,250 Source: Phasing Map Units 1 – 5, Thompson-Hysell Engineers (2005)
At the present time the numerous land use components comprising the subject of this appraisal represent unimproved and improved detached, single-family residential lots. There is also approximately 2,273 acres of undeveloped land (primarily open space) within the boundaries of Western Hills Water District Diablo Grande Community Facilities District No. 1 not presently developable.

Seevers Jordan Ziegenmeyer 17
General Plan Designation and Zoning The portion of the master planned community considered the subject of this appraisal assignment relates to that developable portion subject to the lien of the Special Tax securing the Western Hills Water District Diablo Grande Community Facilities District No. 1 Bonds not improved with a single-family residence. According to the Stanislaus County Planning Department, a PD – Planned Development land use designation covers the subject property. However, the various land uses included in the subject property are comprised of R-A – rural residential, R-1 – single-family residential and R-2 – medium density residential. Flood Zone The subject property is located within Flood Zone X, an area outside of the 100- and 500-year flood plains. The flood data is provided by Digital Media Services (www.floodmaps.com). The FEMA community/panel number is 060384-0725E, dated September 26, 2008. Earthquake Zone According to the Seismic Safety Commission the subject parcels are located within Zone 3, which is considered to be the lowest risk zone in California. There are only two zones in California. Zone 4 is assigned to areas of major faults. Zone 3 is assigned to areas with more moderate seismic activity. In addition, the subject is not located within a Fault-Rupture Hazard Zone (formerly referred to as an Alquist-Priolo Special Study Zone), as defined by Special Publication 42 (revised January 1994) of the California Department of Conservation, Division of Mines and Geology. Conditions of Title A preliminary title report was not provided for this analysis. It is assumed there are no adverse conditions on title. The appraiser assumes no negative title restrictions and accepts no responsibility for matters pertaining to title. Easements
An inspection of the subject property revealed no apparent adverse easements, encroachments or other conditions currently impacting the parcels. Please refer to a preliminary title report for information regarding potential easements, as the appraiser is not a surveyor nor qualified to determine the exact location of any easements. It is assumed that any easements noted in a preliminary title report do not have an impact on the opinion of value set forth in this report. If at some future date, any easements are determined to have a detrimental impact on value, the appraiser reserves the right to amend the opinion of value contained herein.
Seevers Jordan Ziegenmeyer 18
Assessor’s Parcel Maps A complete set of Assessor’s parcel maps encompassing the Western Hills Water District Diablo Grande Community Facilities District No. 1 are included in the Appendix to this report.

Seevers Jordan Ziegenmeyer 19
SITE DESCRIPTION The Western Hills Water District Diablo Grande Community Facilities District No. 1, which encumbers the Diablo Grande resort and master planned community, is located in the southwestern portion of Stanislaus County, California, approximately eight miles southwest of the City of Patterson, west of Interstate 5. Diablo Grande currently represents partially improved land proposed for a mix of urban uses, including detached residential, multifamily residential, commercial, hotel, golf courses, public facilities and open space. The appraised properties comprise the undeveloped residential lots within the District not improved with a single-family residence, which total 300 separate Assessor’s parcels. The subject property is further discussed as follows. Size and Shape: The Diablo Grande resort and master planned community is
irregular in shape and contains a gross land area of approximately 2,250 acres. There is also approximately 2,273 acres of undeveloped land (primarily open space) within the boundaries of Western Hills Water District Diablo Grande Community Facilities District No. 1 not presently developable.
Topography: The topography of the subject property varies from generally
level at the lower elevations to moderately sloping and steep terrain at the upper elevations.
Soil: A soils study of the Western Hills Water District Diablo
Grande Community Facilities District No. 1 was not provided for this analysis. This appraisal assumes the soil and subsoil conditions are suitable for development based on the existing development plan being implemented.
Adjacent Land Uses: North: Vacant land East: Vacant land South: Vacant land West: Vacant land Drainage: Drainage appears to be good, due to the proximity of Salado
Creek, which traverses the District. Offsite Improvements: There is one project entrance from Interstate 5 (Diablo Grande
Parkway). All four connector streets, including Legends South Parkway, Legends North Parkway and Copper Mountain Road, will either intersect or merge with the project’s primary route, Diablo Grande Parkway. Several interior residential streets will connect with any of the four aforementioned connector streets
Seevers Jordan Ziegenmeyer 20
to provide good access throughout the community. At this point, a portion of the off-site improvements, including Units 1 and 2, are installed.
Access: As indicated above, primary access to the subject property is
provided via one entrance and route, Diablo Grande Parkway, which connects with Interstate 5. At Interstate 5, Diablo Grande Parkway becomes Sperry Road, which provides direct access to the city of Patterson. As indicated previously, the subject’s detached residential properties will be accessible from proposed interior project streets, several of which already exist.
Utilities: Public utilities, including electricity, gas, water, and telephone
service, have been extended to the subject project. Public utilities serving Diablo Grande are as follows:
Water: Kern County Water Agency Sewer: City of Patterson Drainage: City of Patterson Electricity: Pacific Gas and Electric Gas: Propane (JS West) School District: Newman Crows Landing School District Fire District: County of Stanislaus Law Enforcement: County of Stanislaus Hazardous Waste: At the time of inspection, the appraiser did not observe the
existence of hazardous material, which may or may not be present on the properties. The appraiser has no knowledge of the existence of such materials on the properties. However, the appraiser is not qualified to detect such substances. The presence of potentially hazardous materials could affect the value of the properties. The value estimate is predicated on the assumption that there is no such material on or in the properties that would cause a loss in value. No responsibility is assumed for any such conditions or for any expertise or engineering knowledge required to discover them.
Functional Adequacy and Utility: The infrastructure of the master plan, from a conceptual
standpoint, has one entrance. The primary connector route originates at Interstate 5. This route, Diablo Grande Parkway, a circular roadway, provides adequate access to and from the project, and provides adequate access through the development, from which other roadways intersect. An interior street system will serve all of the various components of future development. Based upon this plan, overall functional utility is considered to be average.

Seevers Jordan Ziegenmeyer 21
Development Plan: The plan for approximately 2,250 acres is to develop a master-planned community consisting primarily of approximately 2,202 single-family homes on home sites that will generally range in size from 5,000 square feet to 40,000 square feet. Additionally, the Diablo Grande project will include a significant number of larger estate lots (3.0-acre minimum) and patio homes (3,300 to 4,500 square foot lots). Also included within the master planned community are proposed multifamily residential housing units that will be incorporated into the town center development. The balance of the community will be comprised of a mix of uses, including hotel/conference center, commercial, vineyard (existing) and winery, golf club (existing), tennis club, one 18-hole championship golf course (existing) and significant open spaces. The second 18-hole championship golf course (The Legends) was abandoned and will ultimately be utilized for both additional open space and residential lots (proposed lots).
Infrastructure Development: To deliver home sites, the developer is constructing a number of infrastructure improvements, including grading, drainage, sewer, water and roadways. According to the most recent infrastructure cost budget provided, remaining improvements total approximately $38,895,300, or $25,159 per lot for the remaining 1,546 unimproved residential lots held by the master developer. Construction fund proceeds from the previous refunding of the Western Hills Water District Diablo Grande CFD No. 1 Bonds over the next three years will finance an additional $4.5 million in infrastructure improvements, which will be considered in the valuation of the master developer component.
Grading: Mass grading on portions of the Diablo Grande project is
complete, as well as in-tracts for several of the villages. Drainage: Considering the topography of Diablo Grande, as well as the
proximity of Salado Creek, which traverses the project, drainage appears to be adequate.
Sewer: Sewage from the Diablo Grande project is treated by the
expanded wastewater treatment facility in the City of Patterson. Water: The subject property and other lands are within the boundaries
of the Western Hills Water District. At the request of the Western Hills Water District, a Community Facilities District was formed to fund capital improvements for the development of the Diablo Grande resort and master planned community. As part of those capital improvements, water transmission lines were installed to deliver necessary water service to the subject properties. According to the Official Statement for the Western Hills Water District Diablo Grande Community Facilities
Seevers Jordan Ziegenmeyer 22
District No. 1, “[a] permanent source of water is available to the subject property as identified by a Certificate of Transfer of Water dated June 5, 2000 between Kern County Water Agency and the Western Hills Water District, the Point of Delivery Agreement between the Department of Water Resources, State of California, and the Kern County Water Agency dated June 8, 2000, the agreement between the Department of Water Resources, State of California, The Kern County Water Agency and the Western Hills Water District for construction, operation and maintenance of the Western Hills Turnout, a permanent turnout within the California Aqueduct Right-of-Way dated June 8, 2000. These documents provide for the transfer from Kern County Water Agency to the Western Hills Water District of a long term and stable source of up to 8,000 acre feet per annum of annual water supply of Kern County Water Agency’s Pioneer Project water supply made available to the Water District by the Department of Water Resources by simultaneously exchanging Kern County Water Agency State Water Project water supply to the Western Hills Water District at the recently completed aqueduct turnout.”
Roads: The initial master developer constructed the major roadways
leading to the Diablo Grande resort and master planned community, which includes Lower Oak Flat Road and Diablo Grande Parkway, and has constructed a network of interior roadway segments to provide adequate access and circulation to many of the parcels that comprise the District. Additional roads will be constructed by the current master developer to facilitate the build-out of the Diablo Grande development.
Design Concept and Community Amenities: Design Concept: As previously indicated the entire Diablo Grande – Phase 1, as
proposed and partially improved, represents a resort and master planned community of 2,250 acres. The community was initially being developed around two 18-hole championship golf courses (The Ranch and The Legends West), however, one has been closed and will be re-used as additional open space and single-family residential lots, a 212-room resort hotel (proposed), winery and vineyard. Additionally, adjacent to the proposed hotel will be a shopping center and town center. Surrounding the golf course and climbing the surrounding hillsides will be approximately 2,354 single-family residences, which will include a number of custom homes. The various community and resort uses will be located at the center of the Diablo Grande – Phase 1 project.

Seevers Jordan Ziegenmeyer 23
The residential component of the Diablo Grande – Phase 1 project consists primarily of single-family residential home sites with varying lot sizes ranging from 3,675 square foot patio home lots to 10,500 square foot home sites. Custom/Estate lots range from approximately 0.5 acre to 9.13 acres. Design Guidelines and CC&Rs exist for the overall community.
Community Amenities: In addition to an 18-hole golf course (the second golf course
has been abandoned, as previously noted), at build-out Diablo Grande – Phase 1 will feature a swim and tennis center, equestrian center, picnic areas, children’s playground, town center, shopping center, resort hotel, as well as miles of hiking, walking, cycling and equestrian trails.
In addition to the Special Tax, a Homeowners Association (HOA) is collected from each residence, which is approximately $104 per month, as well as approximately $110 per month for the Western Hills Water District, which includes water, sewer and storm drain.
Conclusion: The configuration and size of Diablo Grande – Phase 1 are
considered adequate for residential and mixed-use development. While the project and the housing market stalled amidst the economic collapse in 2008, the historical demand for single-family product bodes well for this project over the long term and should ultimately increase the demand for the complementary land uses within this planned community. With new ownership and an aggressive marketing campaign, the Diablo Grande – Phase 1 master planned community should be competitive with other resort-style master planned communities in the Central Valley and foothill region, with the anticipation of capturing Bay Area commuters currently residing in Tracy, Manteca/Lathrop and Stockton.
Seevers Jordan Ziegenmeyer 24
SUBJECT PHOTOGRAPHS
Diablo Grande entrance
Looking north along Perrett Road (Estate Lots)
Easterly view from Perrett Road
Southerly view along Perrett Road
Southeasterly view from Perrett Road
Southerly view from Perrett Road

Seevers Jordan Ziegenmeyer 25
SUBJECT PHOTOGRAPHS
Subject Property – Estate Lots
Subject Property – Estate Lots
Looking north towards Griffiths Court
Subject Property – Estates Lots and golf course
Westerly view across Subject Property Subject Property
Seevers Jordan Ziegenmeyer 26
SUBJECT PHOTOGRAPHS
Subject Property
Diablo Grande Vineyards
Subject Property – Unimproved Lots
Subject Property
Southerly view along Oak Flat Road from Diablo Grande PArkway
Villa Vista Homes under construction along Fairway Drive

Seevers Jordan Ziegenmeyer 27
SUBJECT PHOTOGRAPHS
Looking south along Golf Canyon Drive – Villa Vista Subdivision
Looking north along Golf Canyon Drive – Villa Vista Subdivision
Estate Lots – Morton Davis Circle
Typical Estate Home
Seevers Jordan Ziegenmeyer 28
STANISLAUS COUNTY
Introduction Stanislaus County is located in the northern area of California’s San Joaquin Valley at the intersection of State Highway 99 and State Highway 132. It has always been known for its rich soil and abundant crops that stretch across the Central Valley from the foothills of the Sierra Nevada to the California Coastal Range. The county is located in the northern portion of the Central Valley, approximately 90 miles southeast of San Francisco, 75 miles south of Sacramento and 315 miles north of Los Angeles. The county encompasses approximately 1,521 square miles of primarily agricultural land. Stanislaus County’s climate is typical of the San Joaquin Valley, with a short rainy season from about December to April and a long dry season. It has an average rainfall of 12 inches per year. Modesto, the county seat of Stanislaus County, is geographically located in the central portion of the County. It is also known as a regional center for commerce in Stanislaus County. Population Stanislaus County has a population of over 524,000 and has experienced relatively slow growth over the past five years, with an average growth rate of 0.6% per year. The following table illustrates population trends for areas within the county over the past few years.

Seevers Jordan Ziegenmeyer 29
Transportation Several major highways, including Interstate 5 and Highway 99, two of California’s major north-south routes, intersect Stanislaus County. Highways 132, 108, and 120 are the east-west arteries running through the county. This highway system provides convenient and efficient means of shipping to all major markets. Much of Stanislaus County is served by the Santa Fe and Union Pacific Railroads. The Modesto & Empire Traction Company (M&ET) short-line interconnects the transcontinental lines and operates a modern intermodal facility in connection with the Santa Fe Railroad for heavy industrial users. Modesto City-County Airport offers service through Sky West. Approximately five flights each day connect with San Francisco’s direct, non-stop flights to all major hubs, such as Denver, Chicago, New York, Boston, Washington DC, Dallas, Minneapolis, Detroit, Pittsburg and Atlanta. Local charter service is available through Modesto Flight Center and Sky Trek Aviation. San Francisco, San Jose, Oakland and Sacramento airports are within 90 miles of Stanislaus County. The Port of Stockton, about 30 miles north of Stanislaus County, provides a deep-water port with direct access to the Pacific Ocean. Additionally, rail and truck transportation to and from the port is available. Over 90 interstate truck lines and over 100 contract carriers operate in the county. Overnight delivery is possible to all major locations in California. Employment & Economy The California Employment Development Department has reported the following employment data for Stanislaus County over the past several years.
POPULATION TRENDSCity 2008 2009 2010 2011 2012 2013 %/Yr
Ceres 44,103 44,738 45,179 45,538 45,801 46,320 1.0%Hughson 6,432 6,512 6,600 6,687 6,791 6,979 1.7%Modesto 200,941 201,331 201,911 201,713 202,852 205,987 0.5%Newman 10,029 10,183 10,208 10,475 10,554 10,643 1.2%Oakdale 19,777 20,231 20,557 20,779 20,922 21,234 1.5%Patterson 20,394 20,360 20,364 20,501 20,610 20,846 0.4%Riverbank 21,907 22,121 22,559 22,775 22,898 23,149 1.1%Turlock 67,420 67,619 68,279 68,813 69,290 69,888 0.7%Waterford 8,368 8,428 8,434 8,478 8,523 8,598 0.5%Unincorporated 110,018 109,703 109,912 110,485 111,098 110,480 0.1%
Total 509,389 511,226 514,003 516,244 519,339 524,124 0.6%
Source: California Department of Finance
Seevers Jordan Ziegenmeyer 30
The unemployment rate in Stanislaus County was 11.1% in May 2014, which compares to rates of 7.6% for California and 6.3% for the U.S. Most areas within the state and nation, including Stanislaus County, saw declining unemployment rates in 2004 through 2006, increases from 2007 to 2010, and declines in 2011-2013. Because the local economy has a strong agricultural base, seasonal swings in the area’s unemployment rate are tied to the agricultural growing season. County employment is typically strongest in the late summer months through the end of the harvest season, with unemployment peaking in the winter. Farm labor, food processing plants, packing plants and food distribution warehouses are all tied to the growing season. Stanislaus County has a diverse economy, with no one sector accounting for a majority of the employment in the region. The following chart indicates the percentage of total employment for each sector within the county.
As can be seen in the chart above, Stanislaus County’s largest employment sectors are Trade, Transportation and Utilities (which includes retail and wholesale trade); Government; Manufacturing; and Education and Health Services.
EMPLOYMENT TRENDS2008 2009 2010 2011 2012 2013
Labor Force 232,000 234,900 239,800 238,700 239,700 238,200Employment 206,500 197,700 198,300 198,800 203,600 207,300Job Growth (1,000) (8,800) 600 500 4,800 3,700Unemployment Rate 11.0% 15.8% 17.3% 16.7% 15.1% 13.0%
Source: California Employment Development Department
0.0% 5.0% 10.0% 15.0% 20.0% 25.0%
InformationOther Services
Financial ActivitiesNat Res/Min/Constr
AgricultureProf/Business ServicesLeisure & HospitalityEduc/Health Services
ManufacturingGovernment
Trade/Transp/Util
Source: California Employment Development Department
EMPLOYMENT BY SECTOR

Seevers Jordan Ziegenmeyer 31
Similar to the other counties that make up the Central Valley, or the San Joaquin Valley, Stanislaus County’s land is predominantly utilized for agriculture (nearly 80%). The main agricultural products in the region include milk, almonds, chickens, chicken eggs, cattle and calves, turkeys and walnuts. While agribusiness remains important to the economy of the region, other economic sectors have expanded over the past decade, including commercial, industrial, and service industries. This has provided a more diverse base of opportunity for the county’s labor force. In recent years, Stanislaus County has become a retail and medical center for the region, as well as the home to modern chemical-producing plants, metal products, electrical equipment, paper products and automotive parts. Stanislaus County’s major manufacturing employers and the employers’ products are listed in the following tables.
MAJOR MANUFACTURING EMPLOYERS Company Product Employees
E&J Gallo Winery Winery 3,181 Seneca Foods Fruit Products 2,200 Stanislaus Food Products Tomato Products 1,922 Foster Farms Poultry Processor 1,722 Del Monte Foods Fruit Products 1,700 ConAgra Foods Tomato & Bean Products 1,200 Bronco Wine Company Winery 834 Frito-Lay Snack Food Products 684 Racor Filtration Products 648 Foster Farms Dairy Dairy Products 628
Source: Stanislaus County Community Profile 2013-2014
MAJOR NON-MANUFACTURING EMPLOYERS Company Industry Employees
Stanislaus County County Government 3,990 Modesto City Schools Education District 3,113 Memorial Medical Center Healthcare 3,013 Turlock Unif. Sch. Dist. Education District 2,120 Doctors Medical Center Healthcare 1,984 Modesto Junior College Education Institution 1,643 Ceres Unif. Sch. Dist. Education District 1,561 Save Mart Supermarkets Retail Supermarket 1,503 Kaiser Permanente Healthcare 1,500 Wal-Mart Retailer 1,453
Source: Stanislaus County Community Profile 2010-2011 (Note: this data has not been included in subsequent years’ reports)
Seevers Jordan Ziegenmeyer 32
Household Income Median household income represents a broad statistical measure of well-being or standard of living in a community. The median income level divides households into two equal segments with one half of households earning less than the median and the other half earning more. The median income is considered to be a better indicator than the average household income as it is not dramatically affected by unusually high or low values. In the year 2012 (most recent data available from the U.S. Census Bureau), Stanislaus County’s median household income was $46,324, which was lower than the state of California’s median income of $58,322.
Recreation & Community Facilities Stanislaus County is located at the base of the Sierra Nevada foothills, just a few hours from Yosemite National Park. San Francisco, Lake Tahoe, Reno, Yosemite National Park, Los Angeles, the Napa Valley, Monterey Bay and historic towns of the Gold Rush era are all within a few hours by car. Within Stanislaus County itself there are 19 theatres, 48 parks, 3 municipal golf courses and 4 private country clubs. There are nearby lakes that offer swimming, boating and water sports. Mild weather makes most outdoor sports available year round. With picturesque Gold Rush-era towns dotting the foothills to the east and with the majestic Sierra Nevada beckoning skiers, backpackers, boaters and anglers, Stanislaus County offer residents many recreational options. Educational facilities in the county include 39 elementary schools, 5 junior high schools, 5 high schools, 2 continuation schools, various private and parochial schools, Modesto Junior College, Yosemite Community College District and the California State University, Stanislaus. Stanislaus State University, which offers bachelor and graduate degree programs, is located 10 miles south of Modesto. California State University, Stanislaus enrollment is about 6,000 students. Modesto Junior College is a community college that offers a variety of academic and vocational courses with enrollment of about 12,500 students. Conclusion Stanislaus County represents a growing region that was once dependent on agriculture but has transitioned into a more well-balanced economy. Business and industry recognize the economic opportunities the county has to offer, including a good transportation network, reasonable costs compared to other parts of California, and a productive workforce. Regional, national and international companies continue to locate and expand their businesses in Stanislaus County. Like most of the state and nation, the county experienced high unemployment and real estate market declines during the period of roughly 2008-2010. Employment conditions have shown some improvement in the county; however, unemployment remains somewhat high and the economic recovery period will likely be long and gradual.

Seevers Jordan Ziegenmeyer 33
NEIGHBORHOOD
Source: Google Maps
Introduction
This section of the report provides an analysis of the observable data that indicate patterns of growth, structure and/or change that may enhance or detract from property values. For the purpose of this analysis, a neighborhood is defined as “a group of complementary land uses; a congruous grouping of inhabitants, buildings or business enterprises.”3 Neighborhood Boundaries The boundaries of a neighborhood identify the physical area that influences the value of the subject property. These boundaries may coincide with observable changes in prevailing land use or occupant characteristics. Physical features such as the type of development, street patterns, terrain, vegetation and parcel size tend to identify neighborhoods. Roadways, waterways and changing elevations can also create neighborhood boundaries. The subject property is located within the Diablo Grande master planned community. The boundaries of the neighborhood generally coincide with Diablo Grande and are identified as the Diablo Grande Parkway to the east and the Diablo Canyon foothills to the north, west and south. 3 The Dictionary of Real Estate Appraisal, 5th ed. (Chicago: Appraisal Institute, 2010), 133.
Seevers Jordan Ziegenmeyer 34
Demographics According to the California Department of Finance, Patterson has a population of about 20,922 and has grown at an average rate of 0.6% per year over the past five years. The U.S. Census Bureau reports an average household size of 3.5 persons in Patterson, compared to 2.9 for California. Patterson has a homeownership rate of about 67% and a median household income of $55,016, slightly lower than California’s median of $60,185. All homes were constructed within the last 10 years. As of the 2010 Census, of the 385 total housing units, 179 were owner-occupied and 128 were renter-occupied and 78 were vacant. Of the 78 vacant housing units, 17.9% were for rent or rented and not occupied, 23.1% were for sale or sold and unoccupied, 29.5% were seasonal homes, 3.8% were migrant worker housing, and 25.6% were vacant for “other” reasons (likely in the foreclosure process). Transportation A network of interior roadways provides access throughout the Diablo Grande master planned community. The major arterial roadway is Diablo Grande Parkway, which extends northeast approximately eight miles before intersecting Interstate 5. Interstate 5 is a major north-south freeway that extends to Sacramento and Redding to the north, before continuing on into Oregon, Washington and eventually Canada. To the south, Interstate 5 provides access to the metropolitan areas of Los Angeles and San Diego, before terminating at the Mexico border. Land Uses The neighborhood is mostly single-family residential with golf/community uses. A map of major land uses is presented on the following page.

Seevers Jordan Ziegenmeyer 35
The entire Diablo Grande project, as proposed and partially improved, represents a resort and master planned community of 2,250 acres. The community was initially being developed around two 18-hole championship golf courses (The Ranch and The Legends West - existing), however, one course has been abandoned and will be reused as open space and future single-family homes, a proposed 212-room resort hotel, a proposed winery and existing vineyards (44 acres). Additionally, adjacent to the hotel will be a proposed shopping center and town center. At build-out, Diablo Grande – Phase 1 will include approximately 2,354 single-family residences (on approximately 790 acres), which will include significant custom home development. The various community and resort uses will be located at the center of the Diablo Grande – Phase 1 project. At the present time the single-family residential component of Diablo Grande – Phase 1 is at various stages of development, including unimproved, partially improved and improved detached, single-family residential land and residences, as well as land designated for commercial development. With the exception of the restaurant located within the clubhouse for the golf course, supporting commercial land uses have not yet been developed. It is not known when construction of the hotel/resort/spa will commence. It should be noted that Amazon recently constructed a regional distribution center in Patterson, which employs more than 500 people. With fewer than 200 finished lots in Patterson, job growth in
Custom Lots and Custom Homes
Production Homes built by Private Island Homes
Production Homes built by DR Horton
Clubhouse
Partially Improved Lots, owned by Private Island
Homes
Source: Google
The Villas by DeNova Homes
Seevers Jordan Ziegenmeyer 36
Patterson could lead to increased new home demand in Diablo Grande (at least until Patterson is able to deliver additional finished lots). Community Uses To date, one operating golf courses and the clubhouse is complete. Other community uses have not yet been constructed. Public educational services are provided by the Newman-Crows Landing School District, with schools located approximately 28 miles to the southeast in Newman. School buses pick up and drop off children in mornings and afternoons. Private schools are also located nearby. The Sacred Heart Catholic School (K-8) is located in Patterson, and St. Stanislaus Parich School (K-8) and Central Catholic High School (9-12) are located in Modesto. Turlock Christian Schools (Pre-school through 12) is located in Turlock. Currently, there are no churches or religious facilities within the community, and it is not known whether any are planned. The nearest churches are located within the city of Patterson. The nearest emergency room facilities are located in Tracy, Modesto and Turlock. Ambulance service is provided through Stanislaus County (911). Fire services are provided by the West Stanislaus County Fire Protection District, and law enforcement is provided by the Stanislaus County Sheriff’s Office. Conclusion The Diablo Grande neighborhood is developing. At the present time, community and commercial services necessary for a self-contained, well-balanced community are not available. However, commercial development is planned. As single-family residential development continues and more community and commercial services become available, the neighborhood will generate additional buyer interest. In the meantime, buyers will be attracted to Diablo Grande by its rural setting, resort-centered community and affordable prices. Overall, the characteristics support residential development. Residential land values in the neighborhood are stable to increasing in the near term.

Seevers Jordan Ziegenmeyer 37
RESIDENTIAL MARKET OVERVIEW Market Definition The neighborhood is characterized as a developing bedroom community and retirement area for Bay Area households. In the near term the subject would appeal to first-time and first-time move-up buyers from Patterson and Bay Area markets (commuters). The subject also would attract retirement, move-down buyers wanting a rural and recreational atmosphere but proximity to the Bay Area. Single-Family Building Permits Building permit data for Diablo Grande is not available. Building permit data for the city of Patterson, which is the closest urban area to the subject that captures similar buyers (as well as other buyer types), is shown below.
SINGLE-FAMILY BUILDING PERMITS – PATTERSON
Source: SOCDS Database
The number of single-family permits declined from 2006 through 2010. The declines were due to limited demand, not limited supply. Bay Area housing prices began increasing in 2011 and, as a result, some demand for homes in Patterson returned by 2012, and permit activity has increased since. Median Prices – New and Resale Prices Combined According to CoreLogic (formerly DataQuick), the median home price in Patterson for both new and resale homes was $285,000 in March 2015, which was up 21.5% year-over-year. The median price has fluctuated in recent months but the overall general trend has been upward.
Year Permits
2005 8992006 3072007 332008 42009 02010 02011 32012 232013 442014 29
10-Year Average 134
Seevers Jordan Ziegenmeyer 38
Comparisons can be made between the median price in Patterson and the nearby communities of Newman (Stanislaus County), Los Banos (Merced County), Tracy (San Joaquin County), Lathrop (San Joaquin County) Manteca (San Joaquin County) and Stockton (San Joaquin County). In March 2015, the median price in Patterson was $285,000, which was less than Tracy ($415,000), Lathrop ($336,500) and Manteca ($321,500), but more than Newman ($225,000), Los Banos ($217,000) and Stockton ($196,000). The median prices are correlated with distance from the Bay Area. Historical New Home Pricing and Sales A table and chart depicting the average pricing for active detached single-family residential projects in Patterson since the First Quarter of 2005 are provided on the following pages. This data, like much of the data presented in this section of the report, was collected by The Gregory Group, a firm that publishes new home prices and absorption statistics for most areas in California. As shown, there is no pricing data for 2010, 2011 and 2012 because there were no active projects in Patterson during this time period. In the First Quarter of 2014, DeNova Homes opened the Villa Vista subdivision in Diablo Grande, which was the first active subdivision in five years and is the only active subdivision in Patterson at the present time.

Seevers Jordan Ziegenmeyer 39
DETACHED PRICING AND INCENTIVES – PATTERSON
Source: The Gregory Group
QuarterAverage
Price
Net Average
PriceAverage Incentive
% Change Net Average
PriceAverage
Home SizeNumber of
Projects1Q 2005 $486,894 $484,648 $2,246 5.9% 2,616 182Q 2005 $494,164 $490,571 $3,593 1.2% 2,640 193Q 2005 $494,588 $491,156 $3,432 0.1% 2,609 194Q 2005 $504,949 $500,166 $4,783 1.8% 2,602 181Q 2006 $494,510 $486,154 $8,356 -2.8% 2,586 182Q 2006 $491,366 $469,031 $22,335 -3.5% 2,583 153Q 2006 $495,885 $469,169 $26,716 0.0% 2,593 174Q 2006 $487,657 $463,501 $24,156 -1.2% 2,580 161Q 2007 $479,291 $451,761 $27,530 -2.5% 2,570 142Q 2007 $481,755 $458,671 $23,084 1.5% 2,612 133Q 2007 $453,303 $413,586 $39,717 -9.8% 2,604 134Q 2007 $391,709 $387,361 $4,348 -6.3% 2,590 111Q 2008 $363,881 $357,554 $6,327 -7.7% 2,595 112Q 2008 $328,102 $320,032 $8,070 -10.5% 2,571 103Q 2008 $305,789 $297,227 $8,562 -7.1% 2,568 94Q 2008 $293,840 $283,890 $9,950 -4.5% 2,577 71Q 2009 $278,004 $268,061 $9,943 -5.6% 2,516 62Q 2009 $267,874 $261,874 $6,000 -2.3% 2,364 43Q 2009 $261,195 $253,973 $7,222 -3.0% 2,189 3
(no active projects in Patterson 2010-2012)
1Q 2013 $255,490 $255,490 $0 n/a 2,245 12Q 2013 $300,490 $300,490 $0 17.6% 2,245 13Q 2013 $300,490 $300,490 $0 0.0% 2,245 14Q 2013 $300,490 $300,490 $0 0.0% 2,245 11Q 2014 $325,400 $320,400 $5,000 6.6% 2,021 12Q 2014 $316,900 $311,900 $5,000 -2.7% 2,021 13Q 2014 $285,400 $280,400 $5,000 -10.1% 2,021 14Q 2014 $285,400 $280,400 $5,000 0.0% 2,021 11Q 2015 $285,400 $280,400 $5,000 0.0% 2,021 1
Seevers Jordan Ziegenmeyer 40
DETACHED PRICING AND INCENTIVES – PATTERSON
Source: The Gregory Group
At the Villa Vista project in Patterson, the average price was lowered from $316,900 in the Second Quarter of 2014 to $285,400 in the Third Quarter of 2014, where it has remained for the past three quarters. Though, it’s important to note the change in pricing is attributable to a change in marketing of the homes. According to the sales agent, the builder was offering an incentive to pay off the Western Hills Water District Diablo Grande Community Facilities District No. 1 Bonds as part of the closing costs. However, few buyers were receptive to the incentive and preferred to assume the Special Tax in lieu of a higher sales price, so the builder lowered the sales price of the homes and eliminated the Bond payoff incentive. Recent sales of new homes at Villa Vista have been averaging two contracts per week, according to the builder. Though, in the five quarters (through First Quarter 2015) that Villa Vista has been active, it has achieved 20 total sales, which equates to 4.0 sales per quarter and 1.3 sales per month. Absorption As noted, there is just one active project in Patterson. We have considered similar projects from Lathrop, Manteca and Stockton as indicators of achievable absorption for Diablo Grande. The map on the following page (which reflects the competitive areas) is followed by a table summarizing sales rates at active detached projects in these areas.
$0
$5,000
$10,000
$15,000
$20,000
$25,000
$30,000
$35,000
$40,000
$45,000
$200,000
$250,000
$300,000
$350,000
$400,000
$450,000
$500,000
$550,000
1Q 2
005
2Q 2
005
3Q 2
005
4Q 2
005
1Q 2
006
2Q 2
006
3Q 2
006
4Q 2
006
1Q 2
007
2Q 2
007
3Q 2
007
4Q 2
007
1Q 2
008
2Q 2
008
3Q 2
008
4Q 2
008
1Q 2
009
2Q 2
009
3Q 2
009
1Q 2
013
2Q 2
013
3Q 2
013
4Q 2
013
1Q 2
014
2Q 2
014
3Q 2
014
4Q 2
014
1Q 2
015
Ince
ntiv
es
Pric
ing
Average Price Net Average Price Average Incentive

Seevers Jordan Ziegenmeyer 41
COMPETITIVE AREAS
Seevers Jordan Ziegenmeyer 42
ABSORPTION RATES BY AREA AND PROJECT
Source: The Gregory Group
In Stockton, projects have averaged 4.1 sales per month over the last seven quarters; in Lathop, projects have averaged 2.5 sales per month; in Manteca, projects have averaged 5.0 sales per month. Absorption rates in Lathrop (at the newer River Islands master planned community and Mossdale Landing) have been strengthening over the past several quarters despite an increase in active projects, with 97 homes sold in the First Quarter 2015, with an average absorption rate of 4.6 sales per month. For Diablo Grande, where there is currently one active project, the average absorption rate has been 1.3 sales per month for the past five quarters, though absorption has been steadily increasing as the housing market continues to recover. As prices in Patterson and other markets
Project By Area BuilderAvg. Price(1Q 2015)
Avg. Home SF(1Q 2015)
Avg. Lot SF(1Q 2015)
1Q2015
4Q2014
3Q2014
2Q2014
1Q2014
4Q2013
3Q2013
Average Per
QuarterAverage
Per Month
StocktonAutumn Lane Caresco Homes $325,490 2,136 6,000 11 5 23 -- -- -- -- 13.0 4.3
Avalon KB Home $341,400 2,485 7,150 13 3 0 -- -- -- -- 5.3 1.8Northbrook Woodside Homes $296,790 1,907 6,000 12 19 9 14 14 14 13 13.6 4.5
Total 36 27 32 14 14 14 13No. of Active
Projects 3 3 3 1 1 1 1Quarterly Pro-Rata 12.0 9.0 10.7 14.0 14.0 14.0 13.0Monthly Pro-Rata 4.0 3.0 3.6 4.7 4.7 4.7 4.3
4.1 Avg. Monthly (Pro Rata)Lathrop
Crossroads Legacy Homes $314,240 1,859 4,000 2 3 10 1 9 3 6 4.9 1.6Drakes Bend DeNova Homes $363,233 2,172 5,000 19 12 -- -- -- -- -- 15.5 5.2Edgewater DeNova Homes $375,150 2,186 4,560 13 6 13 11 -- -- -- 10.8 3.6River Park Woodside Homes $376,790 2,612 4,950 25 4 5 8 4 -- -- 9.2 3.1River Walk Woodside Homes $352,240 2,227 5,100 7 5 0 -- -- -- -- 4.0 1.3
Waterpointe Van Daele Homes $447,990 3,214 6,500 15 16 9 4 -- -- -- 11.0 3.7Windrift Brookfield Residential $401,130 2,512 5,500 16 3 19 -- -- -- -- 12.7 4.2
Total 97 49 56 24 13 3 6No. of Active
Projects 7 7 6 4 2 1 1Quarterly Pro-Rata 13.9 7.0 9.3 6.0 6.5 3.0 6.0Monthly Pro-Rata 4.6 2.3 3.1 2.0 2.2 1.0 2.0
2.5 Avg. Monthly (Pro Rata)MantecaEnclave Woodside Homes $361,657 2,440 9,000 5 14 6 5 6 3 10 7.0 2.3
Oakwood Shores Lafferty Homes $439,286 2,972 9,000 3 -7 9 26 9 10 15 9.3 3.1Orchard Park Meritage Homes $411,276 2,966 7,800 27 0 22 30 0 12 -- 15.2 5.1Pomelo Grove Bright Homes $360,390 2,221 7,000 0 6 10 5 7 8 3 5.6 1.9
Raceway Collection Raymus Homes $360,323 2,191 5,500 35 -- -- -- -- -- -- 35.0 11.7Summit Collection Atherton Homes $423,419 2,701 8,000 2 -- -- -- -- -- -- 2.0 0.7
Summit -Union Ranch Atherton Homes $412,276 2,703 7,370 28 20 19 16 15 12 41 21.6 7.2Wildwood D.R. Horton Homes $387,490 2,765 6,000 21 7 18 9 -- -- -- 13.8 4.6
Woodbridge Del Webb $352,561 1,961 4,500 42 28 48 38 26 14 34 32.9 11.0
Total 163 68 132 129 63 59 103No. of Active
Projects 9 7 7 7 6 6 5Quarterly Pro-Rata 18.1 9.7 18.9 18.4 10.5 9.8 20.6Monthly Pro-Rata 6.0 3.2 6.3 6.1 3.5 3.3 6.9
5.0 Avg. Monthly (Pro Rata)PattersonVilla Vista DeNova Homes $285,400 2,020 6,000 7 6 3 -1 5 -- -- 4.0 1.3
Total 7 6 3 -1 5 N/A N/ANo. of Active
Projects 1 1 1 1 1 0 0Quarterly Pro-Rata 7.0 6.0 3.0 -1.0 5.0 N/A N/AMonthly Pro-Rata 2.3 2.0 1.0 -0.3 1.7 N/A N/A
1.3 Avg. Monthly (Pro Rata)

Seevers Jordan Ziegenmeyer 43
closer to the Bay Area continue to recover from the lows over the past several years, we anticipate increased demand for new homes in Diablo Grande, which will lead to strengthening absorption. Resale Pricing The following table provides a summary of the most recent re-sales in Diablo Grande. Specifically, this data includes sales between March 1 and May 20, 2015, for homes on lots containing at least 2,000 SF but less than 12,000 SF.
RE-SALES – DIABLO GRANDE (3/1/2015 – 5/20/2015)
Source: MetroList MLS
Historical data over a longer period (First Quarter 2009 through First Quarter 2015) for re-sales of single-family homes in Diablo Grande is presented on the following page, followed by a chart showing the trend in average price per square foot of living area.
AddressHome
Size (SF)Sale
PriceLast List
PriceSale Price
per SFSale %of List
YearBuilt
Days onMarket
LotSize (SF)
9069 Golf Canyon 1,776 $266,859 $272,900 $150 97.8% 2014 14 5,55420529 Sarazen Ln 1,932 $218,000 $233,500 $113 93.4% 2004 54 5,22720836 Shrub Oak Dr 2,541 $259,700 $264,900 $102 98.0% 2006 6 5,0009540 Sarazen Ct 2,392 $260,000 $269,900 $109 96.3% 2004 12 5,28020844 Shrub Oak Dr 2,752 $270,000 $258,000 $98 104.7% 2006 13 5,00020840 Shrub Oak Dr 3,165 $275,000 $278,000 $87 98.9% 2006 4 5,0009565 California Oak 2,752 $286,500 $305,000 $104 93.9% 2006 69 6,0208970 Sand Trap Ct 2,900 $305,000 $308,000 $105 99.0% 2006 289 5,66320777 Fairway Dr 2,828 $351,500 $354,900 $124 99.0% 2007 28 5,6639160 Panoz Ct 3,024 $439,900 $439,900 $145 100.0% 2004 25 11,326
Average 2,606 $293,246 $298,500 $114 98.1% 2006 51 5,973
Seevers Jordan Ziegenmeyer 44
RESALE HISTORY – DIABLO GRANDE
Source: MetroList MLS
QuarterEnding
TotalSales
Avg.Home Size
Avg. SalePrice
Avg. Price/Avg. SF
Avg. Dayson Market
Mar-09 4 2,351 $161,750 $69 98Jun-09 20 2,355 $133,458 $57 100Sep-09 16 2,363 $134,786 $57 28Dec-09 4 2,533 $156,500 $62 47Mar-10 3 2,350 $151,300 $64 6Jun-10 13 2,331 $142,231 $61 32Sep-10 9 2,319 $152,756 $66 64Dec-10 11 2,536 $168,941 $67 42Mar-11 9 2,211 $129,898 $59 62Jun-11 10 2,588 $156,802 $61 71Sep-11 9 2,653 $169,178 $64 44Dec-11 8 2,485 $156,012 $63 56Mar-12 10 2,373 $135,500 $57 58Jun-12 15 2,227 $159,170 $71 50Sep-12 8 2,812 $234,356 $83 32Dec-12 13 2,211 $172,821 $78 30Mar-13 9 2,275 $203,611 $89 46Jun-13 11 2,379 $244,945 $103 40Sep-13 9 2,339 $231,222 $99 31Dec-13 8 2,608 $303,144 $116 58Mar-14 4 2,343 $257,500 $110 28Jun-14 9 2,658 $323,306 $122 68Sep-14 10 2,444 $248,750 $102 74Dec-14 8 2,072 $233,761 $113 15Mar-15 10 2,509 $274,724 $109 57

Seevers Jordan Ziegenmeyer 45
RESALES – AVERAGE PRICE / AVERAGE SF
Source: MetroList MLS
As can be seen in the chart above, the average price per square foot of living area has been trending upward, with some leveling off seen in recent quarters. Sales volume has been fairly steady over the past couple of years, with 37 sales in 2013 and 31 sales in 2014. Conclusion The following are some key points about the local and regional housing market.
Throughout the regional area, new and resale prices have trended upward over the past 3-4 years.
Absorption rates in the Central Valley have strengthened in recent quarters as Bay Area prices have increased and buyers are looking for more affordable options.
There is only one active project marketing new homes in Patterson. This project has been open for five quarters and has achieved 1.3 sales per month on average.
Active projects in Stockton and Manteca have achieved sales rates of 4.1 and 5.0 sales per month, respectively, over the past seven quarters.
In the resale market in Diablo Grande, sales volume has been fairly steady for the past two years. The average price per square foot has been trending upward, with some leveling off in recent quarters.
The Patterson area is a secondary market that is connected to home affordability in the Bay Area. During periods of rising prices in the Bay Area, Patterson will likely enjoy stronger demand from
$50
$60
$70
$80
$90
$100
$110
$120
$130
Dec-08 Jan-10 Feb-11 Apr-12 May-13 Jun-14 Jul-15
Seevers Jordan Ziegenmeyer 46
buyers/workers priced out of the Bay Area market; and during periods of price declines, Patterson will be susceptible to periods of limited demand. Diablo Grande represents a longer commute for Bay Area workers than Patterson, but it offers more desirable recreational amenities and stronger community appeal, which helps offset the longer drive. Until supporting commercial services are constructed in Diablo Grande, Patterson will be a more attractive option for Bay Area commuters. As noted in the Neighborhood section of this report, Amazon recently constructed a regional distribution center in Patterson, which employs more than 500 people. Job growth in Patterson could lead to increased new home demand in Diablo Grande (at least until Patterson is able to deliver additional finished lots).

Seevers Jordan Ziegenmeyer 47
HIGHEST AND BEST USE ANALYSIS The term “highest and best use,” as used in this report, is defined as follows:
The reasonably probable and legal use of vacant land or an improved property that is physically possible, appropriately supported, financially feasible, and that results in the highest value. The four criteria the highest and best use must meet are legal permissibility, physical possibility, financial feasibility, and maximum productivity. Alternatively, the probable use of land or improved property – specific with respect to the user and timing of the use – that is adequately supported and results in the highest present value.4
Two analyses are typically required for highest and best use. The first analysis is highest and best use of the land as though vacant. The second analysis is the highest and best use of the land as improved, which is not applicable, since the appraised properties are vacant land. (Definitions of these terms are provided in the Glossary of Terms in the Appendix to this report.) Highest and Best Use as though Vacant In accordance with the definition of highest and best use, it is appropriate to analyze the subject as though vacant as it relates to legal permissibility, physical possibility, financial feasibility and maximum productivity. Legal Permissibility The legal factors influencing the highest and best use of the subject property are primarily government regulations such as zoning and building codes. The subject property represents approximately 2,250 gross acres tentatively approved for development, with portions containing final map approval. As proposed and approved, the subject property will include single- and multifamily residential housing, commercial uses, open space and public facilities. Anticipated development within the CFD includes 2,202 single-family residential units, 602 multifamily residential units and approximately 39 acres of commercial uses. The subject property, as proposed and partially improved, represents a resort and master planned community that has undergone extensive planning and review. Based on the difficulties in obtaining the subject’s existing approvals, it is doubtful any significant project changes would be allowed. Physical Possibility The physical and locational characteristics of the properties have been previously described in this report. In summary, the physical characteristics of the site, terrain and soils are suitable for the proposed uses.
4 The Dictionary of Real Estate Appraisal, 5th ed. (Chicago: Appraisal Institute, 2010), 93.
Seevers Jordan Ziegenmeyer 48
Location considerations include the compatibility of the subject’s proposed use(s) and location with respect to surrounding uses. As indicated previously, the subject represents a resort and master planned community, which has undergone extensive planning and review. The proposed development has been carefully designed to include an appropriate mix of land uses that are compatible with adjacent uses and uses throughout the master planned community. It should be noted at the time of inspection the appraiser did not observe the existence of hazardous material, which may or may not be present on the properties. The appraiser has no knowledge of the existence of such materials on the properties. However, the appraiser is not qualified to detect such substances. The presence of potentially hazardous materials could affect the value of the properties. The value estimate herein is predicated on the assumption there is no material on or in the properties that would cause a loss of value. No responsibility is assumed for any such conditions or for any expertise or engineering knowledge required to discover them. The client is urged to retain an expert in the field if desired. There are no known significant easements that would prohibit the development of the properties. Overall, the subject has locational characteristics, access and utilities, which support the subject’s intended uses. Financial Feasibility
The feasibility of the allowable uses is dependent on the supply and demand conditions, which influence the competitive position of each type of property use within the development. The demand for single-family development within the project will affect the timing and feasibility of other property uses within the development. The feasibility of single-family developments is dependent on the regional supply and demand conditions. Sales of new homes in Patterson, Stockton, Lathrop and Manteca have once again begun to improve after a prolonged period of contraction that began in 2008 during the past few years. These communities are serving as alternative housing destinations for commuters to the Bay Area region. Historically, the San Joaquin County cities of Stockton and Tracy have provided affordable residential developments for homebuyers seeking single-family residences outside the often-unaffordable Bay Area, which, in turn, has put pressure on the affordability of housing in those market areas, resulting in many homebuyers commuting to other areas seeking more affordable housing, including Patterson. Diablo Grande is located in a rural setting west of the city of Patterson in Stanislaus County. The developer is in the process of creating both a resort destination and master planned community of single- and multifamily residential units geared towards a wide range of potential buyers, including

Seevers Jordan Ziegenmeyer 49
retirees, telecommuters, upper-income homebuyers and first- and second-time move-up homebuyers. The development is centered on a proposed resort hotel, shopping center and town center, as well as existing vineyards and an 18-hole golf course. The community represents an upscale home-buying alternative to the relatively equidistant city of Stockton, and nearby Patterson. Further, Diablo Grande is attracting homebuyers from other Central Valley cities like Modesto and Turlock. Merchant builders have historically shown an interest in developing production-oriented projects on lots up to approximately one acre in size. As noted, Diablo Grande consists of various residential lot size categories ranging from 3,675 square feet to 10,500 square feet for smaller lots, and starting at 0.5 acre in size for custom/estate lots. The most financially feasible use of the subject’s lot categories less than one acre in size is production-oriented single-family residential development, while custom residential development is the most probable use of the estate lots. Maximum Productivity There is only one land use that is legally permissible, physically possible and financially feasible; to develop the subject property as single-family residential units. Conclusion of the Highest and Best Use – As Though Vacant Legal, physical, and market conditions have been analyzed to evaluate the highest and best use of the properties. The analysis is presented to evaluate the type of use(s) that will generate the greatest level of future benefits possible to the properties. The only use that meets the four criteria for determining the highest and best use is a well-balanced single-family residential development. The subject should be developed according to this land use designation. Based on this analysis, residential development is judged to be the subject’s highest and best use as vacant land. Probable Buyer The most probable buyer of the appraised properties is a combination of owner/users looking to acquire land for custom home development, a land speculator or merchant builder looking to acquire land for production home development.
Seevers Jordan Ziegenmeyer 50
APPROACHES TO VALUE The valuation process is a systematic procedure used in the valuation of real property.5 This process involves the investigation, organization and analysis of pertinent market data and other related factors that affect the market value of real estate. The market data is analyzed in terms of any one or all of the three traditional approaches to estimating real estate value. These are the cost, sales comparison, and income capitalization approaches. One additional analysis—a discounted cash flow analysis—is also applicable. Each approach to value is briefly discussed and defined as follows: Cost Approach The cost approach is based on the premise that no prudent buyer would pay more for a particular property than the cost to acquire a similar site and construct improvements of equivalent desirability and utility. Thus, this approach to value relates directly to the economic principle of substitution, as well as supply and demand. The cost approach is most applicable when valuing properties where the improvements are new or suffer only a minor amount of accrued depreciation, and is especially persuasive when the site value is well supported. The cost approach is also highly relevant when valuing special-purpose or specialty properties and other properties that are not frequently exchanged in the market. The definition of the cost approach is offered as follows:
A set of procedures through which a value indication is derived for the fee simple interest in a property by estimating the current cost to construct a reproduction of (or replacement for) the existing structure, including an entrepreneurial incentive, deducting depreciation from the total cost, and adding the estimated land value. Adjustments may then be made to the indicated fee simple value of the subject property to reflect the value of the property interest being appraised.6
Sales Comparison Approach The sales comparison approach is based on the premise that the value of a property is directly related to the prices being generated for comparable, competitive properties in the marketplace. Similar to the cost approach, the economic principles of substitution, as well as supply and demand are basic to the sales comparison approach. This approach has broad applicability and is particularly persuasive when there has been an adequate volume of recent, reliable transactions of similar properties that indicate value patterns or trends in the market. When sufficient data are available, this approach is the most direct and systematic approach to value estimation. Typically, the sales comparison approach is most pertinent when valuing land, single-family homes and small, owner-occupied commercial and office properties.
5 The Dictionary of Real Estate Appraisal, 5th ed. (Chicago: Appraisal Institute, 2010), 205. 6 The Dictionary of Real Estate Appraisal, 47.

Seevers Jordan Ziegenmeyer 51
The definition of the sales comparison approach is offered as follows:
The process of deriving a value indication for the subject property by comparing market information for similar properties with the property being appraised, identifying appropriate units of comparison, and making qualitative comparisons with or quantitative adjustments to the sale prices (or unit prices, as appropriate) of the comparable properties based on relevant, market-derived elements of comparison.7
Income Capitalization Approach The income capitalization approach is based on the premise that income-producing real estate is typically purchased as an investment. From an investor's point of view, the potential earning power of a property is the critical element affecting value. The concepts of anticipation and change, as they relate to supply and demand issues and substitution, are fundamental to this valuation approach. These concepts are important because the value of income-producing real estate is created by the expectation of benefits (income) to be derived in the future, which is subject to changes in market conditions. Value may be defined as the present worth of the rights to these future benefits. Within the income capitalization approach there are two basic techniques that can be utilized to estimate market value. These techniques of valuation are direct capitalization and yield capitalization.
Direct Capitalization: A method used to convert an estimate of a single year’s income expectancy into an indication of value in one direct step, either by dividing the net income estimate by an appropriate capitalization rate or by multiplying the income estimate by an appropriate factor. Direct capitalization employs capitalization rates and multipliers extracted or developed from market data. Only a single year’s income is used. Yield and value changes are implied but not identified.8 Yield Capitalization: A method used to convert future benefits into present value by 1) discounting each future benefit at an appropriate yield rate, or 2) developing an overall rate that explicitly reflects the investment’s income pattern, holding period, value change, and yield rate.9
The definition of the income capitalization approach is offered as follows:
A set of procedures through which an appraiser derives a value indication for an income-producing property by converting its anticipated benefits (cash flows and reversion) into property value. This conversion can be accomplished in two ways. One year’s income expectancy can be capitalized at a market-derived capitalization rate or at a capitalization rate that reflects a specified income pattern, return on investment, and change in the value of the investment. Alternatively, the annual cash flows for the holding period and the reversion can be discounted at a specified yield rate.10
7 The Dictionary of Real Estate Appraisal, 5th ed. (Chicago: Appraisal Institute, 2010), 175. 8 The Dictionary of Real Estate Appraisal, 58. 9 The Dictionary of Real Estate Appraisal, 211. 10 The Dictionary of Real Estate Appraisal, 99.
Seevers Jordan Ziegenmeyer 52
Discounted Cash Flow Analysis A discounted cash flow analysis is a procedure in which a discount rate is applied to a set of projected income streams and a reversion. The analyst specifies the quantity, variability, timing and duration of the income streams as well as the quantity and timing of the reversion and discounts each to its present value at a specified yield rate. DCF analysis can be applied with any yield capitalization technique and may be performed on either a lease-by-lease or aggregate basis.11 In the case of subdivision land, there is no reversion. The four main components of a discounted cash flow analysis are listed as follows: Revenue – the total gross income derived from the disposition of the subject components. Absorption Analysis – the time frame required to sell-off the components. Of primary
importance in this analysis is the allocation of the revenue over the absorption period – including the estimation of an appreciation factor (if any).
Expenses – the expenses associated with the sell-off of the components are calculated in this section – including administration, marketing and commission costs and property taxes.
Discount Rate – the appropriate discount rate is derived in this portion of the analysis employing a variety of data.
We utilize the discounted cash flow analysis (subdivision development method) to determine the market value of the property held by the master developer (World International LLC), in bulk.
11 The Dictionary of Real Estate Appraisal, 5th ed. (Chicago: Appraisal Institute, 2010), 59.

Seevers Jordan Ziegenmeyer 53
APPRAISAL METHODOLOGY
The market value of the appraised properties, by ownership, subject to the lien of the Special Tax securing the Western Hills Water District Diablo Grande Community Facilities District No. 1, will be estimated using the sales comparison approach to value. Since a substantial amount of the undeveloped residential lots (1,484) are held by a single ownership, World International LLC (the master developer), a discounted cash flow analysis (DCF) will be utilized to provide the market value, in bulk, of this ownership. In the sales comparison approach to value, the production-oriented residential lots will be compared to bulk lot sales in the Central Valley region. Similarly, the 121 estate lots will be valued using the recent sales of custom lots throughout the region. Under the discounted cash flow analysis, the expected revenue, absorption period, expenses and discount rate associated with the sell-off of the 1,484 lots will be utilized. A DCF analysis is a procedure in which a discount rate is applied to a projected revenue stream generated from the sale of individual components of a project. In this method of valuation, the appraiser specifies the quantity, variability, timing and duration of the revenue streams and discounts each to its present value at a specified yield rate.
Seevers Jordan Ziegenmeyer 54
MARKET VALUATION In order to estimate the market value of the subject’s developable residential lots, the sales comparison approach to value will be employed. The underlying premise of the sales comparison approach is the market value of a property is directly related to the price of comparable, competitive properties in the marketplace. In the sales comparison approach, the market value of the subject lots will be estimated by a comparison to similar properties that have recently sold, are listed for sale or are under contract. This approach is based on the economic principle of substitution. According to The Appraisal of Real Estate, 14th Edition (Chicago: Appraisal Institute, 2013), “The principle of substitution holds
that the value of property tends to be set by the cost of acquiring a substitute or alternative property
of similar utility and desirability within a reasonable amount of time.” The sales comparison approach is applicable when there are sufficient recent, reliable transactions to indicate value patterns or trends in the market. The proper application of this approach requires obtaining recent sales data for comparison with the subject property. In order to assemble the comparable sales, we searched public records and other data sources for leads, then confirmed the raw data obtained with parties directly related to the transactions (primarily brokers, buyers and sellers). COMPONENT VALUE PRODUCTION-ORIENTED RESIDENTIAL LOTS Consideration is given to factors such as property rights conveyed, financing, conditions of sale, and market appreciation or depreciation since the date of sale. Differences in physical characteristics, such as location, number of lots, typical lot size, lot premiums/discounts, site utility/topography and zoning/entitlements are considered in the analysis. On the following page is a table depicting the various lot size groupings comprising the residential lots within the District. For purposes of comparison, the District’s predominant, typical lot size of 6,300 square feet will form the basis of analysis, from which adjustments will be made for the varying lot size categories within the District.

Seevers Jordan Ziegenmeyer 55
In the collection of data for analysis, seven comparables have been identified as being representative of the market and it is believed the sales data collected is sufficient for comparison to the subject properties and pertinent to the valuation herein. The data from the comparable sales is summarized in the table on the next page, along with a location map, followed by detailed sales sheets and a discussion of adjustments necessary for comparison with the subject properties. For purposes of this analysis, the market data will be compared to the predominant production-oriented lot category within the District, the 6,300 square foot lots.
Village Lot Configurations Typical Lot Size Description Lots
2A Townhomes 422B, 2C, 3H, 3L & 5 35' x 105' 3,675 Single-Family Lots 292
2C, 3B, 3H, 3I, 4C & 5 50' x 105' 5,250 Single-Family Lots 3882C, 2D, 3B, 3F, 3H, 3I, 4A, 4C, 5 & 5A 60' x 105' 6,300 Single-Family Lots 4233C, 3D, 3E, 3F, 3J, 3K, 4A, 4B, 4D & 5 70' x 105' 7,350 Single-Family Lots 1402C, 3C, 3D, 3E, 3F, 3G, 3J, 4A, 4B & 5 80' x 105' 8,400 Single-Family Lots 133
3A 100' x 105' 10,500 Single-Family Lots 43
Seevers Jordan Ziegenmeyer 56
BULK LOT SALES SUMMARY
BULK LOT SALES MAP
Sale No. of Typical Lot Sale Sale Price Bonds Costs to Total ConsiderationNo. Location Date Lots Size (SF) Price Per Lot Per Lot Finish Per Lot
1 Drake's Bend at River Islands Aug-14 50 4,160 $3,500,000 $70,000 $29,453 $4,938 $104,391NWC Lakeside Drive & Commercial Street (nearly finished)Lathrop, San Joaquin County
2 Windrift at River Islands Dec-13 61 5,202 $4,575,000 $75,000 $33,237 $5,000 $113,237NEC Lakeside Drive & Commercial Street (nearly finished)Lathrop, San Joaquin County
3 Waterpoint at River Islands Dec-13 34 6,000 $2,618,000 $77,000 $33,237 $5,000 $115,237N/O Lakeside Drive at Upstream Drive (nearly finished)Lathrop, San Joaquin County
4 River Islands Dec-13 46 4,500 $3,460,000 $75,217 $33,237 $5,000 $113,454South Side of Lakeside Drive (nearly finished)Lathrop, San Joaquin County
5 Valley Crossings Apr-13 37 5,000 $2,874,900 $77,700 $0 $0 $77,700N/S of Warren Avenue, E/O Harlan Road (finished)Lathrop, San Joaquin County
6 Mossdale Landing North (portion) Mar-13 82 6,000 $6,278,409 $76,566 $27,583 $0 $104,149NWC Towne Center Drive & Golden Spike Trail (finished)Lathrop, San Joaquin County
7 Mountain House - Portion of Neighborhood G Aug-12 73 3,500 $5,005,000 $68,562 $13,764 $0 $82,326Moraga Street (finished)Mountain House, San Joaquin County

Seevers Jordan Ziegenmeyer 57
BULK LOT SALE 1 Property Identification
Project Name River Islands Location Northwest corner Lakeside Drive and Commercial
Street APN 213-310-14 (portion) City Lathrop County San Joaquin
Sale Data Grantor River Islands Development LLC Grantee DeNova Homes Contract Date N/A Closing Date August 8, 2014 Deed Book Page 78404 Confirmation Source Secondary source Property Rights Conveyed Fee Simple Conditions of Sale Market Financing Terms Cash Equivalent Canceled Contract Price $3,500,000 Annual Special Taxes per Lot $2,304
Land Data Zoning Single-family Topography Generally level Utilities All available Number of Lots 50 Land Area (Acres) N/A Density (Units per Acre) N/A Development Status at Sale Nearly finished Typical Lot Size (SF) 4,160
Indicators (per Lot) Sale Price $ 70,000 Bonds $ 29,453 Total Consideration $ 99,453 Site Development Costs $ 4,938 Permits and Fees $ 40,000
Remarks The comparable is the recent acquisition of 50 lots (first takedown) in nearly finished condition within the River Islands master planned community in Lathrop. The buyer, DeNova Homes, is marketing the lots under the Drake’s Bend at River Islands subdivision, with homes ranging from 1,886 to 2,450 square feet, with corresponding prices from $339,900 to $379,900, plus the assumption of bonds.
Seevers Jordan Ziegenmeyer 58
BULK LOT SALE 2 Property Identification
Project Name River Islands Location Northeast corner Lakeside Drive and Commercial
Street APN 213-380-01 thru -33; 213-390-01 thru -28 City Lathrop County San Joaquin
Sale Data Grantor River Islands Development LLC Grantee Brookfield Contract Date N/A Closing Date December 20, 2013 Deed Book Page 156627 Confirmation Source Secondary source Property Rights Conveyed Fee Simple Conditions of Sale Market Financing Terms Cash Equivalent Canceled Contract Price $4,575,000 Annual Special Taxes per Lot $2,600
Land Data Zoning Single-family Topography Generally level Utilities All available Number of Lots 61 Land Area (Acres) N/A Density (Units per Acre) N/A Development Status at Sale Nearly finished Typical Lot Size (SF) 6,000
Indicators (per Lot) Sale Price $ 75,000 Bonds $ 33,237 Total Consideration $108,237 Site Development Costs $ 5,000 Permits and Fees $ 40,000
Remarks The comparable is the sale of 61 nearly finished lots within the River Islands master planned community in Lathrop. The buyer, Brookfield Homes, is marketing the lots as part of the Windrift subdivision, with homes ranging from 2,100 to 2,800 square feet, with corresponding prices from $379,880 to $418,880, plus the assumption of bonds.

Seevers Jordan Ziegenmeyer 59
BULK LOT SALE 3 Property Identification
Project Name River Islands Location North of Lakeside Drive at Upstream Drive APN 213-400-01 thru -13; 213-410-01 thru -21 City Lathrop County San Joaquin
Sale Data Grantor River Islands Development LLC Grantee Van Daele Homes Contract Date N/A Closing Date December 27, 2013 Deed Book Page 160716 Confirmation Source Secondary source Property Rights Conveyed Fee Simple Conditions of Sale Market Financing Terms Cash Equivalent Canceled Contract Price $2,618,000 Annual Special Taxes per Lot $2,600
Land Data Zoning Single-family Topography Generally level Utilities All available Number of Lots 34 Land Area (Acres) N/A Density (Units per Acre) N/A Development Status at Sale Nearly finished Typical Lot Size (SF) 6,000
Indicators (per Lot) Sale Price $ 77,000 Bonds $ 33,237 Total Consideration $110,237 Site Development Costs $ 5,000 Permits and Fees $ 40,000
Remarks The comparable is the sale of 34 nearly finished lots within the River Islands master planned community in Lathrop. The buyer, Van Daele Homes, is marketing the lots as part of the Waterpointe subdivisions, with homes ranging from 2,859 to 3,601 square feet, with corresponding prices from $433,990 to $459,990, plus the assumption of bonds.
Seevers Jordan Ziegenmeyer 60
BULK LOT SALE 4 Property Identification
Project Name River Islands Location South side of Lakeside Drive APN 213-370-01 thru -46 City Lathrop County San Joaquin
Sale Data Grantor River Islands Development LLC Grantee DeNova Homes Contract Date September 2013 (renegotiated December 2013) Closing Date December 20, 2013 Deed Book Page 156633 Confirmation Source Broker; secondary source Property Rights Conveyed Fee Simple Conditions of Sale Market Financing Terms Cash Equivalent Canceled Contract Price $3,460,000 Annual Special Taxes per Lot $2,600
Land Data Zoning Single-family Topography Generally level Utilities All available Number of Lots 46 Land Area (Acres) N/A Density (Units per Acre) N/A Development Status at Sale Nearly finished Typical Lot Size (SF) 4,500
Indicators (per Lot) Sale Price $ 75,217 Bonds $ 33,237 Total Consideration $108,454 Site Development Costs $ 5,000 Permits and Fees $ 40,000
Remarks The pending sale is Phase 1 of a two phase takedown (Phase 2 is also 46 lots). The buyers initially went into contract in September 2013 for $90,217 per nearly finished lot, but renegotiated the price in December to $70,000 per lot for 30 standard lots and $85,000 per lot for 16 lakefront lots, with a weighted average lot price of $75,217. Costs to complete were reportedly $5,000 per lot.

Seevers Jordan Ziegenmeyer 61
BULK LOT SALE 5 Property Identification
Project Name Valley Crossing (portion) Location North side of Warren Avenue, east of Harlan
Road APN City Lathrop County San Joaquin County
Sale Data 196-760-01 et al Grantor KT Builders LLC Grantee Woodside 05N LP (Woodside Homes) Contract Date N/A Closing Date 4/10/2013 Deed Book Page 047181 Verification (Direct Party/Secondary/Public Records)
Secondary
Property Rights Conveyed Fee Simple Conditions of Sale Market Financing Terms Cash Equivalent Sale Price $2,874,900 Special Taxes per Lot $0 (at time of sale)
Land Data Zoning Single-family Topography Generally Level Utilities All available Number of Lots 37 Land Area (Acres) N/Av Density (Units per Acre) N/Av Development Status at Sale Finished Lots Typical Lot Size (SF) 5,000
Indicators Sale Price $ 77,700 Bonds $ 0 Total Consideration $ 77,700 Site Development Cost (Per Lot) $ 0 Permits and Fees (Per Lot) $ 30,000
Remarks This comparable represents the sale of 37 finished lots at an infill location in the northern area of Lathrop. The seller acquired the property in late 2012 for an undisclosed sum, as a short term investment.
Seevers Jordan Ziegenmeyer 62
BULK LOT SALE 6 Property Identification
Project Name Mossdale Landing North (portion) Location West side of Golden Spike Trail, south of McKee
Road APN 191-620-52 et al City Lathrop County San Joaquin County
Sale Data Grantor Lathrop 113 LP Grantee Woodside 05N LP (Woodside Homes) Contract Date N/A Closing Date 3/25/2013 Deed Book Page 38399 Verification (Direct Party/Secondary/Public Record)
Secondary
Property Rights Conveyed Fee Simple Conditions of Sale Market Financing Terms Cash Equivalent Sale Price $6,278,409 Special Taxes per Lot $858
Land Data Zoning Single-family Topography Generally level Utilities All available Number of Lots 82 Land Area (Acres) N/A Density (Units per Acre) N/A Development Status at Sale Finished Lots Typical Lot Size (SF) 6,000
Indicators (per Lot) Sale Price $ 76,566 Bonds $ 9,574 Total Consideration $ 86,140 Site Development Costs $ 0 Permits and Fees $ 30,000
Remarks This comparable represents the sale of 82 finished lots within the Mossdale Landing master planned community in Lathrop. The buyer, Woodside Homes, is marketing homes under the River Park subdivision, with homes ranging from 1,879 to 3,285 square feet, with corresponding prices from $335,990 to $420,990, plus the assumption of bonds.

Seevers Jordan Ziegenmeyer 63
BULK LOT SALE 7 Property Identification
Project Name Mountain House – Portion of Neighborhood G Location Moraga Street APN 256-030-01 thru -10, -29 thru -47; 256-050-09
thru -16, -45 thru -48; 256-060-33 thru -40; 256-070-01 thru 23
City Mountain House County San Joaquin
Sale Data Grantor Trimark Communities, LLC Grantee Lennar Homes of CA Contract Date N/A Closing Date August 8, 2012 Deed Book Page 100151 Confirmation Source Broker Property Rights Conveyed Fee Simple Conditions of Sale Market Financing Terms Cash Equivalent Canceled Contract Price $5,005,000 Annual Special Taxes per Lot $1,200
Land Data Zoning Single-family Topography Generally level Utilities All available Number of Lots 73 Land Area (Acres) N/A Density (Units per Acre) N/A Development Status at Sale Finished Typical Lot Size (SF) 3,500
Indicators (per Lot) Sale Price $ 68,562 Bonds $ 13,763 Total Consideration $ 82,325 Site Development Costs $ 0 Permits and Fees $ 26,000
Remarks The comparable is the August 2012 transfer of 73 finished lots in Mountain House with a typical lot size of 3,500 square feet.
Seevers Jordan Ziegenmeyer 64
Analysis and Conclusion The comparable transactions are adjusted based on the profile of the subject property with regard to categories that affect market value. For certain adjustments such as site development cost, permits and fees and Special Taxes, adjustments are made using actual or estimated (present value) dollar amounts. Other adjustments may be categories as either superior or inferior, with percentage adjustments applied accordingly. If a comparable has an attribute considered superior to that of the subject, it is adjusted downward to negate the effect the item has on the price of the comparable. The opposite is true of categories considered inferior to the subject. The adjustments are made in consideration of paired sales, the appraiser’s experience and knowledge and interviews with market participants. At a minimum, the appraiser considers the need to make adjustments for the following items:
Expenditures after Sale (i.e. site development costs (if any), permits and fees, bond encumbrance and atypical carrying costs such as Homeowner’s Association fees)
Property rights conveyed Financing terms Conditions of sale (motivation) Market conditions (time) Location Physical features
A detailed analysis involving the adjustment factors is presented below. Loaded Lot Analysis
Since each comparable has the same highest and best use as the subject property—near term single-family residential development—we apply adjustments for remaining site development costs (if any) and permits and fees on a dollar-for-dollar basis. That is, the comparables are analyzed on a loaded-lot-basis, where any remaining site development costs and permits and fees due at building permit are added to the lot price to yield a price that reflects the total consideration. After all other adjustments are applied (market conditions, physical characteristics, etc.), we deduct the subject’s remaining permits and fees to determine the subject’s lot value.
Expenditures After Sale For subdivision land, expenditures after sale typically include site development costs, permits and fees and bond encumbrance. For subdivisions where site development is complete and final subdivision map has recorded, adjustments for remaining site development costs do not apply.

Seevers Jordan Ziegenmeyer 65
Adjustments for Bond Encumbrance If applicable, we consider the remaining bond terms to estimate a remaining principal bond balance. While bond interest rates may vary somewhat, for approximation purposes, we utilized a 6% discount rate. The estimated bond encumbrances are added to the loaded lot prices on a dollar-for-dollar basis. Property Rights Conveyed In transactions of real property, the rights being conveyed vary widely and have a significant impact on the sales price. As previously noted, the opinion of value in this report is based on a fee simple estate, subject only to the limitations imposed by the governmental powers of taxation, eminent domain, police power and escheat, as well as non-detrimental easements, community facility districts and conditions, covenants and restrictions (CC&Rs). All the comparables represent fee simple estate transactions. Therefore, adjustments for property rights are not necessary. Financing Terms In analyzing the comparables, it is necessary to adjust for financing terms that differ from market terms. Typically, if the buyer retained third party financing (other than the seller) for the purpose of purchasing the property, a cash price is presumed and no adjustment is required. However, in instances where the seller provides financing as a debt instrument, a premium may have been paid by the buyer for below-market financing terms or a discount may have been demanded by the buyer if the financing terms were above market. The premium or discounted price must then be adjusted to a cash equivalent basis. The comparable sales were cash to the seller transactions and do not require adjustments. Conditions of Sale Adverse conditions of sale can account for a significant discrepancy from the sales price actually paid compared to that of the market. This discrepancy in price is generally attributed to the motivations of the buyer and the seller. Certain conditions of sale are considered to be non-market and may include the following:
a seller acting under duress, a lack of exposure to the open market, an inter-family or inter-business transaction for the sake of family or business interest, an unusual tax consideration, a premium paid for site assemblage, a sale at legal auction, or an eminent domain proceeding.
Seevers Jordan Ziegenmeyer 66
The comparables did not involve any non-market conditions of sale and do not require adjustments. Market Conditions Market conditions vary over time, but the date of this appraisal is for a specific point in time. In a dynamic economy – one that is undergoing changes in the value of the dollar, interest rates and economic growth or decline – extra attention needs to be paid to assess changing market conditions. Significant monthly changes in price levels can occur in several areas of a city, while prices in other areas remain relatively stable. Although the adjustment for market conditions is often referred to as a time adjustment, time is not the cause of the adjustment. The comparables represent transactions that occurred between August 2012 and August 2014. Lot prices have increased since the time period between August 2012 and April 2013. Upward adjustments are applied, accordingly. Physical Characteristics The physical characteristics of a property can impact the selling price. Those that may impact value include the following: Location Location adjustments are applied in consideration of area home prices, household income and other characteristics. The comparables are located in Lathrop and Mountain House. Comparables 1 through 6 are located in Lathrop, which is a considered slightly superior commuter market to the subject in terms of location, based on the most recent median home price statistics discussed in the Residential Market Overview section. Comparable 7 is located in Mountain House, which is superior to the subject in terms of its proximity to the Bay Area; thus, a downward adjustment is warranted. Community Appeal The subject is located within a master planned project with above average community appeal. Comparables 1 through 6 are typical suburban subdivisions, which are inferior to the subject and require upward adjustments. Comparable 7 is located in the Mountain House master planned community which is considered generally similar; thus, no adjustment is warranted. Number of Lots Generally, there is an inverse relationship between the number of lots and price per lot such that larger projects (with a greater number of lots) achieve a lower price per lot. However, market

Seevers Jordan Ziegenmeyer 67
participants indicate that projects of fewer than 20 lots are achieving discounts because of fewer buyers (merchant builders generally require at least this many lots to develop project synergy and offset model costs). All of the comparables contain similar lot counts to the subject (89 lots – typical) and do not require adjustments. Lot Size (Typical) Adjustments for differences in lot size between the comparables and subject are estimated by applying lot size adjustment factors to difference in lot size. We have considered paired sales to assist with the determination of a lot size adjustment factor, as well as market participant interviews. Topography/Site Utility Differences in contour, drainage, soil conditions, as well as project design, can affect the utility and, therefore, the market value of the properties. The subject property and comparables are planned for traditional single-family lots and all have average site utility. Adjustments for this factor do not apply. Lot Premiums/Discounts The subject and most of comparables are anticipated to achieve a similar level of lot premiums (cul-de-sac, corner, inverted corner). Comparable 4 features a number of lots with water (lake) frontage, which is anticipated to achieve premiums. This comparable is superior to the subject (on average) in this regard and requires a downward adjustment. Adjustment Grid The grid on the following page reflects the afore-discussed adjustments.
Seevers Jordan Ziegenmeyer 68
Conclusion of Lot Value The comparables reflect an unadjusted range of $68,562 to $77,700 per lot. On a loaded lot basis, and considering assumed bond debt, the comparables reflect a range of $107,700 to $155,237 per lot. With emphasis on the most recent bulk lot transactions and, in particular, Comparable 1, which is the most recent acquisition (first takedown) of nearly finished lots in the Central Valley, a loaded lot value of $140,000 is considered reasonable for the subject’s standard 6,300 square foot lots. Deducting the subject’s typical permits and fees due at building permit ($26,000 per lot) yields an underlying lot value of $114,000 per lot for the subject’s typical 6,300 square foot (60’ x 105’) lots. In the following table, adjustments for discrepancies in lot size are made to the above-concluded typical lot for each production lot size category within the District.
Elements of Comparison: Subject Sale 1 Sale 2 Sale 3 Sale 4 Sale 5 Sale 6 Sale 7Lot Price $70,000 $75,000 $77,000 $75,217 $77,700 $76,566 $68,562Remaining Site Development Costs $0 $4,938 $5,000 $5,000 $5,000 $0 $0 $0Permits and Fees $26,000 $40,000 $40,000 $40,000 $40,000 $30,000 $30,000 $26,000Loaded Lot Price Before Bonds $114,938 $120,000 $122,000 $120,217 $107,700 $106,566 $94,562Special Taxes $2,304 $2,600 $2,600 $2,600 $0 $2,472 $1,200 Years To Maturity (Approx) 25 25 25 25 0 19 20 Present Value at 6% $29,453 $33,237 $33,237 $33,237 $0 $27,583 $13,764Loaded Lot Price After Bonds $144,391 $153,237 $155,237 $153,454 $107,700 $134,149 $108,326Property Rights Conveyed Fee Simple Similar Similar Similar Similar Similar Similar Similar
Adjustment
Financing Terms Cash Equiv. Similar Similar Similar Similar Similar Similar SimilarAdjustment
Sale Conditions Market Similar Similar Similar Similar Similar Similar SimilarAdjustment
Market Conditions May-15 Aug-14 Dec-13 Dec-13 Dec-13 Apr-13 Mar-13 Aug-12Adjustment (Appraisal) Upward Upward Sig. Upward
Physical Characteristics:Location Diablo Grande Lathrop Lathrop Lathrop Lathrop Lathrop Lathrop Mtn. House
Adjustment Downward Downward Downward Downward Downward Downward Sig. Down
Community Appeal Good Inferior Inferior Inferior Inferior Inferior Inferior Similar Adjustment Sl. Upward Sl. Upward Sl. Upward Sl. Upward Sl. Upward Sl. Upward
Number of Lots 89 50 61 34 46 37 82 73Adjustment
Lot Size (Typical) 6,300 4,160 5,202 6,000 4,500 5,000 6,000 3,500Adjustment Upward Upward Upward Upward Sig. Upward
Topography/Site Utility Average Similar Similar Similar Similar Similar Similar SimilarAdjustment
Lot Premiums/Discounts Average Similar Similar Similar Superior Similar Similar SimilarAdjustment Downward
Summary of Adjustments Sl. Downward Sl. Downward Sl. Downward Sl. Downward Upward Upward UpwardAdjusted Loaded Lot Value < $144,391 < $153,237 ˂ $155,237 ˂ $153,454 > $107,700 > $134,149 > $108,326
Concluded Loaded Lot Value: $140,000Less: Permits and Fees ($26,000)Less: Remaining Site Development Costs $0Estimated Lot Indicator $114,000
ADJUSTMENT GRID - BULK LOT SALES
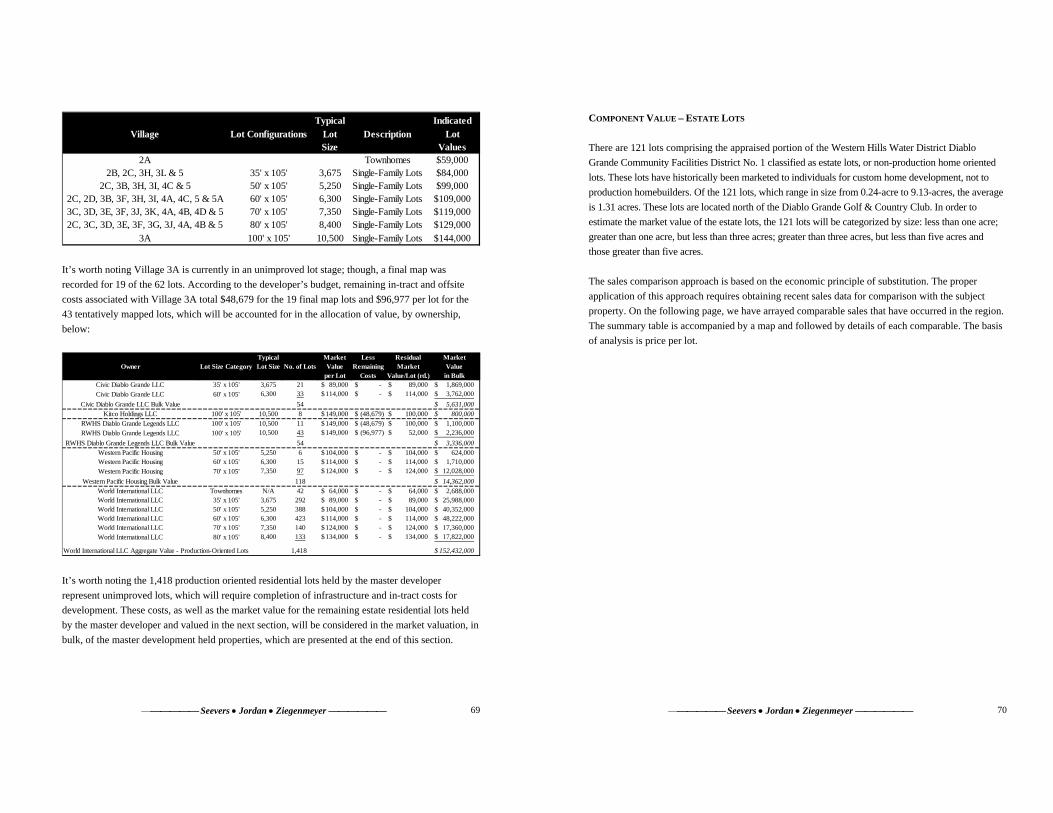
Seevers Jordan Ziegenmeyer 69
It’s worth noting Village 3A is currently in an unimproved lot stage; though, a final map was recorded for 19 of the 62 lots. According to the developer’s budget, remaining in-tract and offsite costs associated with Village 3A total $48,679 for the 19 final map lots and $96,977 per lot for the 43 tentatively mapped lots, which will be accounted for in the allocation of value, by ownership, below:
It’s worth noting the 1,418 production oriented residential lots held by the master developer represent unimproved lots, which will require completion of infrastructure and in-tract costs for development. These costs, as well as the market value for the remaining estate residential lots held by the master developer and valued in the next section, will be considered in the market valuation, in bulk, of the master development held properties, which are presented at the end of this section.
Typical IndicatedVillage Lot Configurations Lot Description Lot
Size Values2A Townhomes $59,000
2B, 2C, 3H, 3L & 5 35' x 105' 3,675 Single-Family Lots $84,0002C, 3B, 3H, 3I, 4C & 5 50' x 105' 5,250 Single-Family Lots $99,000
2C, 2D, 3B, 3F, 3H, 3I, 4A, 4C, 5 & 5A 60' x 105' 6,300 Single-Family Lots $109,0003C, 3D, 3E, 3F, 3J, 3K, 4A, 4B, 4D & 5 70' x 105' 7,350 Single-Family Lots $119,0002C, 3C, 3D, 3E, 3F, 3G, 3J, 4A, 4B & 5 80' x 105' 8,400 Single-Family Lots $129,000
3A 100' x 105' 10,500 Single-Family Lots $144,000
Typical Market Less Residual MarketOwner Lot Size Category Lot Size No. of Lots Value Remaining Market Value
per Lot Costs Value/Lot (rd.) in BulkCivic Diablo Grande LLC 35' x 105' 3,675 21 89,000$ -$ 89,000$ 1,869,000$ Civic Diablo Grande LLC 60' x 105' 6,300 33 114,000$ -$ 114,000$ 3,762,000$
Civic Diablo Grande LLC Bulk Value 54 5,631,000$ Kitco Holdings LLC 100' x 105' 10,500 8 149,000$ (48,679)$ 100,000$ 800,000$
RWHS Diablo Grande Legends LLC 100' x 105' 10,500 11 149,000$ (48,679)$ 100,000$ 1,100,000$ RWHS Diablo Grande Legends LLC 100' x 105' 10,500 43 149,000$ (96,977)$ 52,000$ 2,236,000$
RWHS Diablo Grande Legends LLC Bulk Value 54 3,336,000$ Western Pacific Housing 50' x 105' 5,250 6 104,000$ -$ 104,000$ 624,000$ Western Pacific Housing 60' x 105' 6,300 15 114,000$ -$ 114,000$ 1,710,000$ Western Pacific Housing 70' x 105' 7,350 97 124,000$ -$ 124,000$ 12,028,000$
Western Pacific Housing Bulk Value 118 14,362,000$ World International LLC Townhomes N/A 42 64,000$ -$ 64,000$ 2,688,000$ World International LLC 35' x 105' 3,675 292 89,000$ -$ 89,000$ 25,988,000$ World International LLC 50' x 105' 5,250 388 104,000$ -$ 104,000$ 40,352,000$ World International LLC 60' x 105' 6,300 423 114,000$ -$ 114,000$ 48,222,000$ World International LLC 70' x 105' 7,350 140 124,000$ -$ 124,000$ 17,360,000$ World International LLC 80' x 105' 8,400 133 134,000$ -$ 134,000$ 17,822,000$
World International LLC Aggregate Value - Production-Oriented Lots 1,418 152,432,000$
Seevers Jordan Ziegenmeyer 70
COMPONENT VALUE – ESTATE LOTS There are 121 lots comprising the appraised portion of the Western Hills Water District Diablo Grande Community Facilities District No. 1 classified as estate lots, or non-production home oriented lots. These lots have historically been marketed to individuals for custom home development, not to production homebuilders. Of the 121 lots, which range in size from 0.24-acre to 9.13-acres, the average is 1.31 acres. These lots are located north of the Diablo Grande Golf & Country Club. In order to estimate the market value of the estate lots, the 121 lots will be categorized by size: less than one acre; greater than one acre, but less than three acres; greater than three acres, but less than five acres and those greater than five acres. The sales comparison approach is based on the economic principle of substitution. The proper application of this approach requires obtaining recent sales data for comparison with the subject property. On the following page, we have arrayed comparable sales that have occurred in the region. The summary table is accompanied by a map and followed by details of each comparable. The basis of analysis is price per lot.

Seevers Jordan Ziegenmeyer 71
ESTATE LOT SALES SUMMARY
Property Sale Sale Land Area Price Bonds Total ConsiderationNo. Identification Date Price Acre/SF per Acre per Acre per Acre
1 545 Buena Tierra Drive Pending $235,000 0.57 $414,828 $0 $235,000Tracy, San Joaquin County 24,677 $0 $414,828APN: 246-040-02
2 10404 Fox Borough Court Apr-15 $279,000 0.64 $435,938 $0 $279,000Oakdale, Stanislaus County 27,878 $0 $435,938APN: 010-069-008
3 Lot 53, Goldsborough Circle Apr-15 $172,500 0.46 $373,134 $0 $172,500Oakdale, Stanislaus County 20,138 $0 $373,134APN: 010-076-010
4 Lot 26, Fox Borough Drive Feb-15 $180,000 0.46 $391,304 $0 $180,000Oakdale, Stanislaus County 20,038 $0 $391,304APN: 010-075-020
5 1012 Palm Avenue Jan-15 $149,950 0.38 $392,539 $0 $149,950Ripon, San Joaquin County 16,640 $0 $392,539APN: 259-670-38
6 2031 W. Lincoln Road Dec-14 $225,000 0.39 $575,889 $0 $225,000Stockton, San Joaquin County 17,019 $0 $575,889APN: 077-230-51
7 130 Opus One Court Dec-14 $240,000 2.92 $82,192 $0 $240,000El Dorado Hills, El Dorado County 127,195 $0 $82,192APN: 104-510-32-10
8 Perrett Road* Jul-14 $55,250 0.65 $85,394 $31,045 $86,295Patterson, Stanislaus County 28,183 $47,983 $133,377APN: 025-027-007
9 20641 Morton Davis Circle* Feb-14 $45,000 0.54 $83,333 $31,045 $76,045Patterson, Stanislaus County 23,522 $57,491 $140,824APN: 025-025-066
10 16485 Locust Avenue Nov-13 $150,000 3.67 $40,872 $0 $150,000Patterson, Stanislaus County 159,865 $0 $40,872APN: 048-009-034
11 20561 Morton Davis Circle* Listing $79,500 0.83 $95,783 $31,045 $110,545Patterson, Stanislaus County 36,155 $37,404 $133,187APN: 025-027-018
12 9341 Russ Court* Listing $45,000 0.49 $92,119 $31,045 $76,045Patterson, Stanislaus County 21,279 $63,552 $155,670APN: 025-025-018
13 Morton Davis Drive* Listing $125,000 0.57 $221,072 $31,045 $156,045Patterson, Stanislaus County 24,630 $54,905 $275,977APN: 025-026-021
* Diablo Grande
Seevers Jordan Ziegenmeyer 72
RESIDENTIAL (ESTATE) LOT SALES MAP
RESIDENTIAL (ESTATE) LOT SALES MAP (CENTRAL VALLEY)

Seevers Jordan Ziegenmeyer 73
LOT SALE 1
Property Identification Project Name N/A Location 545 Buena Tierra Drive APN 246-040-02 City Tracy County San Joaquin County
Sale Data Grantor Derriel D. Hayes et al Grantee N/A - Pending Contract Date May 1, 2015 Closing Date N/A Deed Book Page N/A Property Rights Conveyed Fee Simple Conditions of Sale Market Financing Terms Cash Equivalent Sale (List) Price $235,000 ($414,828 per acre) Confirmation Public records/MLS Annual Special Taxes per Lot $0
Land Data Zoning Residential Topography Level View Local Utilities All to site Land Area (Acres) 0.57
Remarks This residential lot is located in Tracy (San Joaquin County), just east of South Tracy Boulevard.The area is characterized by older estates and was listed for sale for $235,000.
Seevers Jordan Ziegenmeyer 74
LOT SALE 2
Property Identification Project Name Hillsborough Estates II Location 10404 Fox Borough Court APN 010-069-008 City Oakdale County Stanislaus County
Sale Data Grantor Reynaldo & Karen Wendt Grantee Steven M Benson & Shelly A Sabanovich Contract Date November 20, 2014 Closing Date April 17, 2015 Deed Book Page 28134 Property Rights Conveyed Fee Simple Conditions of Sale Market Financing Terms Cash Equivalent Sale Price $279,000 ($435,398 per acre) Confirmation Public records/MLS Annual Special Taxes per Lot $0
Land Data Zoning Residential Topography Level View Local Utilities All to site Land Area (Acres) 0.64
Remarks This estate lot is located in the Hillsborough Estates II subdivision in Oakdale, Stanislaus County. The property had been on the market for two months before going into contract in November 2014 for $279,000. This lot is located within a cul-de-sac and contains over ½-acre of land.

Seevers Jordan Ziegenmeyer 75
LOT SALE 3
Property Identification Project Name Hillsborough Estates II Location Lot 53, Goldsborough Circle APN 010-076-010 City Oakdale County Stanislaus County
Sale Data Grantor Steven M Benson Grantee Spencer McSherry Contract Date March 23, 2015 Closing Date April 7, 2015 Deed Book Page 24704 Property Rights Conveyed Fee Simple Conditions of Sale Market Financing Terms Cash Equivalent Sale Price $172,500 ($373,134 per acre) Confirmation Public records/MLS Annual Special Taxes per Lot $0
Land Data Zoning Residential Topography Level View Local Utilities All to site Land Area (Acres) 0.46
Remarks This estate lot is located in the Hillsborough Estates subdivision in Oakdale, Stanislaus County. The property had been on the market for 119 before going into contract in March 2015 for $172,500.
Seevers Jordan Ziegenmeyer 76
LOT SALE 4
Property Identification Project Name Hillsborough Estates II Location Lot 26, Fox Borough Drive APN 010-075-020 City Oakdale County Stanislaus County
Sale Data Grantor N/Av Grantee East West Invs. Contract Date January 31, 2015 Closing Date February 19, 2015 Deed Book Page 12012 Property Rights Conveyed Fee Simple Conditions of Sale Market Financing Terms Cash Equivalent Sale Price $180,000 ($391,304 per acre) Confirmation Public records/MLS Annual Special Taxes per Lot $0
Land Data Zoning Residential Topography Level View Local Utilities All to site Land Area (Acres) 0.46
Remarks This estate lot is located in the Hillsborough Estates II subdivision in Oakdale, Stanislaus County. The property had been on the market for nearly three years before going into contract in January 2015 for $180,000.

Seevers Jordan Ziegenmeyer 77
LOT SALE 5
Property Identification Project Name N/A Location 1012 Palm Avenue APN 259-670-38 City Ripon County San Joaquin County
Sale Data Grantor James & Tivie Downing Grantee Emerald Builders SG Inc. Contract Date January 17, 2015 Closing Date January 29, 2015 Deed Book Page 10398 Property Rights Conveyed Fee Simple Conditions of Sale Market Financing Terms Cash Equivalent Sale Price $149,950 ($392,539 per acre) Confirmation Public records/MLS Annual Special Taxes per Lot $0
Land Data Zoning Residential Topography Level View Local Utilities All to site Land Area (Acres) 0.38
Remarks This estate lot sold in January 2015 for $149,950 and is located in the city of Ripon, in San Joaquin County. The property was on the market for one day before going under contract.
Seevers Jordan Ziegenmeyer 78
LOT SALE 6
Property Identification Project Name N/A Location 2031 W. Lincoln Road APN 077-230-51 City Stockton County San Joaquin County
Sale Data Grantor Debra R. Wright Grantee Mathews R&D Family 2004 Trust Contract Date November 17, 2014 Closing Date December 5, 2014 Deed Book Page 123079 Property Rights Conveyed Fee Simple Conditions of Sale Market Financing Terms Cash Equivalent Sale Price $225,000 ($575,889 per acre) Confirmation Public records/MLS Annual Special Taxes per Lot $0
Land Data Zoning Residential Topography Level View Local Utilities All to site Land Area (Acres) 0.39
Remarks This comparable is the December 2014 sale of a 0.39-acre lot in Stockton within a gated, custom lot development. The property was on the market for 18 days before going under contract.

Seevers Jordan Ziegenmeyer 79
LOT SALE 7
Property Identification Project Name Chateau Montelana Location 130 Opus One Court APN 104-510-32-10 City El Dorado Hills County El Dorado County
Sale Data Grantor Joseph & Julie Rawlins Grantee Scott & Anthea Adair Contract Date N/A Closing Date December 15, 2014 Deed Book Page 51577 Property Rights Conveyed Fee Simple Conditions of Sale Market Financing Terms Cash Equivalent Sale Price $240,000 ($82,192 per acre) Confirmation Public records/MLS Annual Special Taxes per Lot $0
Land Data Zoning Residential Topography Level to sloping View American River Utilities All to site Land Area (Acres) 2.92
Remarks This comparable is the December 2014 resale of a 2.92-acre parcel in the Chateau Montelana subdivision in El Dorado County, above the South Fork of the American River. The property has all utilities available for residential development. The lot previously sold in June 2013 for $195,000.
Seevers Jordan Ziegenmeyer 80
LOT SALE 8
Property Identification Project Name Diablo Grande Location Perrett Road APN 025-027-007 City Patterson County Stanislaus County
Sale Data Grantor Grover Custom Builders Inc. Grantee Dan & Teresa Andersen Days on Market 7 Contract Date June 25, 2014 Closing Date July 8, 2014 Deed Book Page Pending Property Rights Conveyed Fee Simple Conditions of Sale Market Financing Terms Cash Equivalent Sale (List) Price $55,250 ($85,394 per acre) Confirmation Public records/MLS Annual Special Taxes per Lot $3,000
Land Data Zoning Residential Topography Sloping View Local Utilities In place Land Area (Acres) 0.647
Remarks This comparable is the sale of a 0.647-acre lot in Diablo Grande. The parcel sits above Perrett Road and offers local views with sloping terrain. The property was on the market for seven days.

Seevers Jordan Ziegenmeyer 81
LOT SALE 9
Property Identification Project Name Diablo Grande Location 20641 Morton Davis Circle APN 025-025-066 City Patterson County Stanislaus County
Sale Data Grantor Kenneth Helppie Grantee John R King Days on Market 111 Closing Date February 20, 2014 Deed Book Page 10702 Property Rights Conveyed Fee Simple Conditions of Sale Market Financing Terms Cash Equivalent Sale (List) Price $45,000 ($83,333 per acre) Confirmation Public records/MLS Annual Special Taxes per Lot $3,000
Land Data Zoning Residential Topography Level to sloping View Local Utilities In place Land Area (Acres) 0.54
Remarks This 0.54-acre lot in Diablo Grande sold in February 2014 for $45,000. The parcel sits above the Diablo Grande Golf & Country Club and offers local views with level to sloping terrain. The property was on the market for 111 days for $55,500.
Seevers Jordan Ziegenmeyer 82
LOT SALE 10
Property Identification Project Name N/A Location 16485 Locust Avenue APN 048-009-034 City Patterson County Stanislaus County
Sale Data Grantor Cose Living trust Grantee Rodolfo & Karen Alvarez Contract Date N/A Closing Date November 26, 2013 Deed Book Page 97357 Property Rights Conveyed Fee Simple Conditions of Sale Market Financing Terms Cash Equivalent Sale Price $150,000 ($40,872 per acre) Confirmation Public records/MLS Annual Special Taxes per Lot $0
Land Data Zoning Residential Topography Generally level View Local Utilities None Land Area (Acres) 3.67
Remarks This comparable is the sale of a 3.67-acre parcel in Patterson. The property sold with no water or sewer in place; though, existing estate homes flank both sides of the property. The property was on the market for just over 200 days and sold for the list price.

Seevers Jordan Ziegenmeyer 83
LOT SALE 11
Property Identification Project Name Diablo Grande Location 20561 Morton Davis Circle APN 025-027-018 City Patterson County Stanislaus County
Sale Data Grantor Terry Development Inc. Grantee N/A Days on Market 19 Closing Date N/A Deed Book Page N/A Property Rights Conveyed Fee Simple Conditions of Sale Market Financing Terms Cash Equivalent Sale (List) Price $79,500 ($95,783 per acre) Confirmation Public records/MLS Annual Special Taxes per Lot $3,000
Land Data Zoning Residential Topography Level to sloping View Local Utilities In place Land Area (Acres) 0.83
Remarks This 0.83-acre lot in Diablo Grande is listed for $79,500, plus the assumption of bonds ($31,045). The parcel offers local views with level to sloping terrain.
Seevers Jordan Ziegenmeyer 84
LOT SALE 12
Property Identification Project Name Diablo Grande Location 9341 Russ Court APN 025-025-018 City Patterson County Stanislaus County
Sale Data Grantor Carlos Tobaramaya Grantee N/A Days on Market 97 Closing Date N/A Deed Book Page N/A Property Rights Conveyed Fee Simple Conditions of Sale Market Financing Terms Cash Equivalent Sale (List) Price $45,000 ($92,119 per acre) Confirmation Public records/MLS Annual Special Taxes per Lot $3,000
Land Data Zoning Residential Topography Sloping View Local Utilities In place Land Area (Acres) 0.49
Remarks This lot in Diablo Grande has been on the market for 97 days. The seller acquired the lot in March 2013 for $30,000, plus the assumption of bonds ($31,045).

Seevers Jordan Ziegenmeyer 85
LOT SALE 13
Property Identification Project Name Diablo Grande Location Morton Davis Drive APN 025-026-021 City Patterson County Stanislaus County
Sale Data Grantor Ronald E. Cearley Grantee N/A Days on Market 187 Closing Date N/A Deed Book Page N/A Property Rights Conveyed Fee Simple Conditions of Sale Market Financing Terms Cash Equivalent Sale (List) Price $125,000 ($221,072 per acre) Confirmation Public records/MLS Annual Special Taxes per Lot $3,000
Land Data Zoning Residential Topography Sloping View Local Utilities In place Land Area (Acres) 0.57
Remarks This lot in Diablo Grande has been on the market for 187 days for a list price of $125,000. The lot is pie shaped and overlooks the golf course from an elevated lot position.
Seevers Jordan Ziegenmeyer 86
Analysis and Conclusion The comparable transactions are adjusted based on the profile of the subject property with regard to categories that affect market value. This report relies on quantitative adjustments. For certain adjustments such as site development cost and Special Taxes (if applicable), adjustments are made using actual or estimated (present value) dollar amounts. Other adjustments may be categories as either superior or inferior, with percentage adjustments applied accordingly. If a comparable has an attribute considered superior to that of the subject, it is adjusted downward to negate the effect the item has on the price of the comparable. The opposite is true of categories considered inferior to the subject. The adjustments are made in consideration of paired sales, the appraiser’s experience and knowledge and interviews with market participants. At a minimum, the appraiser considers the need to make adjustments for the following items:
Expenditures after Sale (atypical carrying costs such as Special Taxes) Property rights conveyed Financing terms Conditions of sale (motivation) Market conditions (time) Location Physical features
A detailed analysis involving the adjustment factors is presented below. Expenditures After Sale/Special Taxes Special Taxes vary between some of the comparables and the subject. Whether the comparables were purchased for investment or for speculative home construction, Special Taxes represent a significant holding cost. The subject is encumbered by the Western Hills Water District Diablo Grande Community Facilities District No. 1, as are Comparables 8, 9, 11, 12 and 13. The impact of the Bonds is considered in this analysis. Note that HOA fees between the comparables and subject can also vary. However, HOA fees are connected to the level of community amenities in each project, where higher fees generally provide some greater tangible benefit (such as a clubhouse, more common area landscaping, etc.) that contributes to higher sale prices. For this reason, we do not account for differences in HOA fees. Property Rights Conveyed In transactions of real property, the rights being conveyed vary widely and have a significant impact on the sales price. As previously noted, the opinion of value in this report is based on a fee simple estate, subject only to the limitations imposed by the governmental powers of taxation, eminent

Seevers Jordan Ziegenmeyer 87
domain, police power and escheat, as well as non-detrimental easements, community facility districts and conditions, covenants and restrictions (CC&Rs). All the comparables represent fee simple estate transactions. Therefore, adjustments for property rights are not necessary. Financing Terms In analyzing the comparables, it is necessary to adjust for financing terms that differ from market terms. Typically, if the buyer retained third party financing (other than the seller) for the purpose of purchasing the property, a cash price is presumed and no adjustment is required. However, in instances where the seller provides financing as a debt instrument, a premium may have been paid by the buyer for below-market financing terms or a discount may have been demanded by the buyer if the financing terms were above market. The premium or discounted price must then be adjusted to a cash equivalent basis. The comparable sales were cash to the seller transactions or cash equivalent transactions and do not require adjustments. Conditions of Sale Adverse conditions of sale can account for a significant discrepancy from the sales price actually paid compared to that of the market. This discrepancy in price is generally attributed to the motivations of the buyer and the seller. Certain conditions of sale are considered to be non-market and may include the following:
a seller acting under duress, a lack of exposure to the open market, an inter-family or inter-business transaction for the sake of family or business interest, an unusual tax consideration, a premium paid for site assemblage, a sale at legal auction, or an eminent domain proceeding.
All of the comparables were not known to involve any atypical conditions of sale and do not require adjustments. Comparables 11, 12 and 13 represent current listings and are adjusted downward for the typical negotiations between buyers and sellers. Market Conditions Market conditions vary over time, but the date of this appraisal is for a specific point in time. In a dynamic economy – one that is undergoing changes in the value of the dollar, interest rates and economic growth or decline – extra attention needs to be paid to assess changing market conditions. Significant monthly changes in price levels can occur in several areas of a city, while prices in other
Seevers Jordan Ziegenmeyer 88
areas remain relatively stable. Although the adjustment for market conditions is often referred to as a time adjustment, time is not the cause of the adjustment. As discussed in the Housing Market Overview, lot prices are increasing across the region as the market once again enters an expansionary residential period. Different areas of the Central Valley region are experiencing increases in prices at slightly different times and at different levels. After prices “corrected” to a stabilized level, lot pricing has been generally stable. Comparables 8 through 10, which transferred between November 2013 and July 2014, warrant upward adjustments for improving market conditions. The remaining comparables are either current listings, pending or recent transactions reflective of current market conditions. Physical Characteristics The physical characteristics of a property can impact the selling price. Those that may impact value include the following: Location Locational factors considered in this analysis include, but are not limited to, proximity to employment centers, amount of community facilities and economic/demographic characteristics. Comparables 8, 9, 11, 12 and 13 are properties located within the subject’s Diablo Grande master planned community; thus, no adjustments are warranted. Comparable 10 is located in Patterson and does not merit an adjustment for location. Comparable 7 is located in El Dorado Hills, which is generally considered substantially superior in terms of location and a downward adjustment is applied. Comparable 1 is located in Tracy, which is superior in terms of proximity to employment centers and supporting commercial and community services; thus, a downward adjustment is applied. Comparables 2, 3 and 4 are located in Oakdale (Stanislaus County), which is considered slightly superior to the subject in terms of supporting commercial and community services and receive downward adjustments. Comparables 5 and 6 are located in the cities of Ripon and Stockton (San Joaquin County), which also merit downward adjustments for superior location with respect to proximity to employment centers and supporting commercial and community services. Community Appeal The subject lots are located in the Diablo Grande community, which have good community appeal. Comparables 8, 9, 11, 12 and 13 are also located in Diablo Grande and share the same community appeal. Comparable 2 is located in Oakdale, adjacent to the Oakdale Golf and Country Club and is considered similar to the subject; thus, no adjustments are warranted. Similarly, Comparable 6 is located in an established area of Stockton, proximate to the Swenson Park golf course and Lincoln High School; no adjustment is necessary. Comparables 1, 3, 4, 5 and 10 are not located within

Seevers Jordan Ziegenmeyer 89
estate-oriented master planned communities and have below average community appeal compared to the subject. Comparable 7 is located in the Chateau Montelana subdivision in El Dorado Hills, which is considered generally similar to the subject under its current condition prior to build-out. Lot Position/View Amenity Most of the Comparables are similar to the typical subject lot. Comparable 10 is considered inferior when compared to the subject lots. Lot Size Differences in lot size between the comparables and subject are considered with respect to the categories of lots: less than one acre; greater than one acre, but less than three acres; greater than three acres, but less than five acres and those greater than five acres. In light of the rolling topography of the area and limitations of future building pads given the topography and wetlands or open space areas, minor differences in acreage between the comparables and subject do not require adjustment. Comparables with lot sizes within 0.5-acre do not require adjustment (this is generally supported by the data). In the overall value conclusion for each of the subject lot categories, an adjustment factor for the difference in lot size is considered and reflects the limited utility associated with land outside of the building pad area. Topography/Site Utility Differences in topography, shape of the parcel, trees, rock outcroppings, drainage or soil conditions can affect the utility and, therefore, the market value of residential lots. The primary site utility factor involving the subject is topography. All of the subject lots have generally sloping topography, with some containing steep topography, which limits the developable building pad. Comparables 1 through 6 and 10 have level topography (and site utility), which is considered superior to the subject lots. Utilities The subject lots have all utilities in place; whereas, a few of the Comparables lack utilities. Thus, upward adjustments are warranted. Adjustment Grid The grid on the following page reflects the afore-discussed adjustments.
Seevers Jordan Ziegenmeyer 90
Elem
ents
of C
ompa
rison
:Su
bjec
tSa
le 1
Sale
2Sa
le 3
Sale
4Sa
le 5
Sale
6Sa
le 7
Sale
8Sa
le 9
Sale
10
Sale
11
Sale
12
Sale
13
Lot P
rice
$235
,000
$279
,000
$172
,500
$180
,000
$149
,950
$225
,000
$240
,000
$55,
250
$45,
000
$150
,000
$79,
500
$45,
000
$125
,000
Spec
ial T
axes
$0$0
$0$0
$0$0
$0$3
1,04
5$3
1,04
5$0
$31,
045
$31,
045
$31,
045
Load
ed L
ot P
rice
Afte
r Bon
ds
$235
,000
$279
,000
$172
,500
$180
,000
$149
,950
$225
,000
$240
,000
$86,
295
$76,
045
$150
,000
$110
,545
$76,
045
$156
,045
Prop
erty
Righ
ts C
onve
yed
Fee
Sim
ple
Sim
ilar
Sim
ilar
Sim
ilar
Sim
ilar
Sim
ilar
Sim
ilar
Sim
ilar
Sim
ilar
Sim
ilar
Sim
ilar
Sim
ilar
Sim
ilar
Sim
ilar
Adj
ustm
ent
Fina
ncing
Ter
ms
Cas
h Eq
uiv.
Sim
ilar
Sim
ilar
Sim
ilar
Sim
ilar
Sim
ilar
Sim
ilar
Sim
ilar
Sim
ilar
Sim
ilar
Sim
ilar
Sim
ilar
Sim
ilar
Sim
ilar
Adj
ustm
ent
Sale
Con
ditio
nsM
arke
tPe
nding
Sim
ilar
Sim
ilar
Sim
ilar
Sim
ilar
Sim
ilar
Sim
ilar
Sim
ilar
Sim
ilar
Sim
ilar
Listi
ngLi
sting
Listi
ngA
djus
tmen
tSl
. Dow
nwar
dSl
. Dow
nwar
dSl
. Dow
nwar
dSl
. Dow
nwar
d
Mar
ket C
ondi
tions
May
-15
Pend
ingA
pr-1
5A
pr-1
5Fe
b-15
Jan-
15D
ec-1
4D
ec-1
4Ju
l-14
Feb-
14N
ov-1
3M
ay-1
5M
ay-1
5M
ay-1
5A
djus
tmen
t(A
ppra
isal)
Upw
ard
Upw
ard
Upw
ard
Phys
ical
Cha
ract
eris
tics:
Loca
tion
Diab
lo G
rand
eTr
acy
Oak
dale
Oak
dale
Oak
dale
Ripo
nSt
ockt
onEl
Dor
ado
Hills
Diab
lo G
rand
eD
iablo
Gra
nde
Patte
rson
Diab
lo G
rand
eD
iablo
Gra
nde
Diab
lo G
rand
eA
djus
tmen
tD
ownw
ard
Dow
nwar
dD
ownw
ard
Dow
nwar
dD
ownw
ard
Dow
nwar
dSi
g. D
own
Com
mun
ity A
ppea
lA
vera
geIn
ferio
rSi
mila
rIn
ferio
rIn
ferio
rIn
ferio
rSi
mila
rSi
mila
rSi
mila
rSi
mila
rIn
ferio
rSi
mila
rSi
mila
rSi
mila
r
Adj
ustm
ent
Upw
ard
Upw
ard
Upw
ard
Upw
ard
Upw
ard
Lot P
ositio
n/V
iew A
men
ityG
ood
Sim
ilar
Sim
ilar
Sim
ilar
Sim
ilar
Sim
ilar
Sim
ilar
Sim
ilar
Sim
ilar
Sim
ilar
Infe
rior
Sim
ilar
Sim
ilar
Sim
ilar
Adj
ustm
ent
Upw
ard
Lot S
ize (T
ypica
l)<1
; <3;
<5;
>5
0.57
0.64
0.46
0.46
0.38
0.39
2.92
0.65
0.54
3.67
0.83
0.49
0.57
Adj
ustm
ent
(acr
es)
Topo
grap
hy/S
ite U
tility
Slop
ingSu
perio
rSu
perio
rSu
perio
rSu
perio
rSu
perio
rSu
perio
rSi
mila
rSi
mila
rSi
mila
rSu
perio
rSi
mila
rSi
mila
rSi
mila
rA
djus
tmen
t(ty
pica
l)D
ownw
ard
Dow
nwar
dD
ownw
ard
Dow
nwar
dD
ownw
ard
Dow
nwar
dD
ownw
ard
Utili
ties
In P
lace
Sim
ilar
Sim
ilar
Non
eSi
mila
rSi
mila
rSi
mila
rSi
mila
rSi
mila
rSi
mila
rN
one
Sim
ilar
Sim
ilar
Sim
ilar
Adj
ustm
ent
Upw
ard
Upw
ard
Sum
mar
y of
Adj
ustm
ents
Dow
nwar
dD
ownw
ard
Dow
nwar
dD
ownw
ard
Dow
nwar
dD
ownw
ard
Sig.
Dow
nU
pwar
dU
pwar
dU
pwar
dSl
. Dow
nwar
dSl
. Dow
nwar
dSl
. Dow
nwar
dA
djus
ted
Load
ed L
ot V
alue
< $2
35,0
00< $
279,
000
< $1
72,5
00< $
180,
000
< $
149,
950
< $
225,
000
< $2
40,0
00> $
86,2
95> $
76,0
45>
$150
,000
≤ $
110,
545
< $7
6,04
5<
$156
,045
< 1
Acr
e<
3 A
cres
< 5
Acr
es>
5 A
cres
Con
clud
ed L
oade
d Lo
t Val
ue:
$90,
000
$135
,000
$175
,000
$200
,000
AD
JUST
ME
NT
GR
ID -
EST
AT
E L
OT
S

Seevers Jordan Ziegenmeyer 91
Conclusion Based on the data set, conclusions of market value for the subject’s estate lots, by category, is as follows:
The above value conclusions are applied to the 121 estate lots as follows:
Estate Lot Category Estate Lot Value
< 1 acre lots $90,000< 3 acre lots $135,000< 5 acre lots $175,000> 5 acre lots $200,000
Gross TaxableAPN Owner Name Description Appraised Value Acres Acres Lot Sq. Ft.
025-025-065 CAPITAL EQUITY MANAGEMENT GROUP INC Estate Lot $90,000 0.49 0.49 21,481025-025-019 ALVAREZ JACK Estate Lot $90,000 0.46 0.46 20,214025-028-012 ANDERSEN BRIAN & AMY Estate Lot $90,000 0.96 0.96 41,818025-025-003 BANK OF STOCKTON Estate Lot $90,000 0.51 0.51 22,111025-025-005 BANK OF STOCKTON Estate Lot $90,000 0.47 0.47 20,259025-025-029 BARSAMIAN ROBERT C & TRISHA A Estate Lot $90,000 0.46 0.46 20,113025-025-012 BRAR KAMALJIT Estate Lot $90,000 0.46 0.46 20,114025-025-014 BUI STEVE T Estate Lot $90,000 0.52 0.52 22,720025-025-027 CAO YANGLONG Estate Lot $90,000 0.46 0.46 20,072025-026-021 CEARLEY RONALD E Estate Lot $90,000 0.57 0.57 24,630025-027-003 CEARLEY RONALD E Estate Lot $135,000 2.82 2.82 122,839025-027-001 CHADINHA ABEL & PAULA M Estate Lot $175,000 3.34 3.34 145,490025-025-017 DEOL MANDEEP Estate Lot $90,000 0.47 0.47 20,435025-028-013 DIABLO GRANDE LTD PAR Estate Lot $135,000 1.36 1.36 59,242025-041-006 ENBOM BRIAN R & DIANE F Estate Lot $90,000 0.94 0.94 40,946025-027-002 GNESA HENRY A & JILL E Estate Lot $175,000 3.03 3.03 131,987025-027-007 ANDERSEN DAN & ANDERSON TERESA Estate Lot $90,000 0.63 0.63 27,564025-026-020 GURM MANDEEP S Estate Lot $90,000 0.66 0.66 28,659025-025-066 KING CHAD STEWART Estate Lot $90,000 0.55 0.55 23,892025-025-010 KAELEY PARAMDEEP Estate Lot $90,000 0.53 0.53 22,941025-026-022 KAMBOJ DILJIT S & KAUR SARBJIT Estate Lot $90,000 0.67 0.67 29,207025-025-013 KAUR RAJVIR Estate Lot $90,000 0.46 0.46 20,043025-025-008 LEE DANIEL Estate Lot $90,000 0.60 0.60 26,153025-025-002 MALSAM LAURIE Estate Lot $90,000 0.52 0.52 22,725025-025-030 MARTINS VALDERMIRO & EVA Estate Lot $90,000 0.49 0.49 21,505025-025-039 MASHHON HOSSEIN & MASOUMEH G Estate Lot $90,000 0.48 0.48 20,711025-025-015 MGOSY WILLY & LIM DOLORES Estate Lot $90,000 0.59 0.59 25,727025-025-038 WESTSIDE PROPERTY MANAGEMENT Estate Lot $90,000 0.51 0.51 22,111025-027-017 NY DIABLO GRANDE LLC Estate Lot $135,000 1.66 1.66 72,310025-023-003 OAK VALLEY COMMUNITY BANK Estate Lot $175,000 3.45 3.45 150,282025-023-004 OAK VALLEY COMMUNITY BANK Estate Lot $175,000 3.99 3.99 173,804025-023-005 OAK VALLEY COMMUNITY BANK Estate Lot $175,000 3.68 3.68 160,301025-023-006 OAK VALLEY COMMUNITY BANK Estate Lot $175,000 4.95 4.95 215,622025-023-007 OAK VALLEY COMMUNITY BANK Estate Lot $175,000 3.41 3.41 148,540
Seevers Jordan Ziegenmeyer 92
025-025-028 CALIFORNIA EQUITY MANAGEMENT GROUP, INC Estate Lot $90,000 0.46 0.46 20,212025-026-019 PAINE NANCY Estate Lot $90,000 0.66 0.66 28,780025-026-014 PENEYRA NESSIE V & JOVITA J Estate Lot $90,000 0.26 0.26 11,203025-026-026 PETERS MARK C Estate Lot $90,000 0.56 0.56 24,470025-025-057 FULLARD MARK Estate Lot $90,000 0.55 0.55 23,912025-025-058 TAYLOR WARREN & THERESA Estate Lot $90,000 0.46 0.46 20,095025-026-025 GPTJ HOLDINGS LLC Estate Lot $90,000 0.63 0.63 27,419025-027-021 SOUZA GEORGE J & MARLENE M Estate Lot $90,000 0.92 0.92 40,031025-027-018 TERRY DEVELOPMENT INC Estate Lot $90,000 0.83 0.83 36,155025-025-007 TITUS DEWAYNE Estate Lot $90,000 0.55 0.55 23,991025-025-018 TOBARAMAYA CARLOS Estate Lot $90,000 0.49 0.49 21,279025-026-028 TRIVEDI RITESH & SHEFALI Estate Lot $90,000 0.53 0.53 23,150025-026-009 WALKER MICHAEL S & BETH M Estate Lot $90,000 0.25 0.25 10,753025-026-010 WALKER MICHAEL S & BETH M Estate Lot $90,000 0.27 0.27 11,798025-025-004 WALT OXLEY ENTERPRISES INC Estate Lot $90,000 0.55 0.55 23,892025-025-067 FULLARD MARK Estate Lot $90,000 0.55 0.55 23,767025-041-007 WILLIAM BARRERA & LORRAINE LOPEZ Estate Lot $90,000 0.92 0.92 40,075025-042-016 DAVID GONZALEZ GARCIA Estate Lot $135,000 1.14 1.14 49,658025-023-009 WORLD INTERNATIONAL LLC Estate Lot $175,000 4.38 4.38 190,793025-023-010 WORLD INTERNATIONAL LLC Estate Lot $200,000 6.71 6.71 292,288025-025-001 WORLD INTERNATIONAL LLC Estate Lot $90,000 0.50 0.50 21,889025-025-006 WORLD INTERNATIONAL LLC Estate Lot $90,000 0.53 0.53 23,154025-025-034 WORLD INTERNATIONAL LLC Estate Lot $90,000 0.46 0.46 20,041025-025-047 WORLD INTERNATIONAL LLC Estate Lot $90,000 0.52 0.52 22,702025-025-049 WORLD INTERNATIONAL LLC Estate Lot $90,000 0.96 0.96 41,670025-025-051 WORLD INTERNATIONAL LLC Estate Lot $90,000 0.48 0.48 20,959025-025-053 WORLD INTERNATIONAL LLC Estate Lot $90,000 0.76 0.76 33,018025-025-054 WORLD INTERNATIONAL LLC Estate Lot $90,000 0.61 0.61 26,766025-025-055 WORLD INTERNATIONAL LLC Estate Lot $90,000 0.46 0.46 20,193025-025-056 WORLD INTERNATIONAL LLC Estate Lot $90,000 0.56 0.56 24,505025-025-059 WORLD INTERNATIONAL LLC Estate Lot $90,000 0.54 0.54 23,535025-025-060 WORLD INTERNATIONAL LLC Estate Lot $90,000 0.56 0.56 24,492025-025-061 WORLD INTERNATIONAL LLC Estate Lot $90,000 0.50 0.50 21,958025-025-062 WORLD INTERNATIONAL LLC Estate Lot $90,000 0.46 0.46 20,057025-025-063 WORLD INTERNATIONAL LLC Estate Lot $90,000 0.46 0.46 20,035025-025-064 WORLD INTERNATIONAL LLC Estate Lot $90,000 0.46 0.46 20,061025-025-068 WORLD INTERNATIONAL LLC Estate Lot $90,000 0.46 0.46 20,048025-027-008 WORLD INTERNATIONAL LLC Estate Lot $175,000 3.33 3.33 145,055025-027-012 WORLD INTERNATIONAL LLC Estate Lot $175,000 3.34 3.34 145,490025-027-013 WORLD INTERNATIONAL LLC Estate Lot $175,000 3.03 3.03 131,987025-027-015 WORLD INTERNATIONAL LLC Estate Lot $90,000 0.61 0.61 26,572025-027-016 WORLD INTERNATIONAL LLC Estate Lot $90,000 0.55 0.55 23,958025-028-007 WORLD INTERNATIONAL LLC Estate Lot $200,000 9.13 9.13 397,703025-028-008 WORLD INTERNATIONAL LLC Estate Lot $200,000 5.88 5.88 256,133025-028-009 WORLD INTERNATIONAL LLC Estate Lot $200,000 5.85 5.85 254,826025-028-011 WORLD INTERNATIONAL LLC Estate Lot $135,000 1.21 1.21 52,708025-028-014 WORLD INTERNATIONAL LLC Estate Lot $90,000 0.50 0.50 21,780025-028-015 WORLD INTERNATIONAL LLC Estate Lot $90,000 0.52 0.52 22,651025-028-016 WORLD INTERNATIONAL LLC Estate Lot $90,000 0.48 0.48 20,909025-028-017 WORLD INTERNATIONAL LLC Estate Lot $90,000 0.72 0.72 31,363025-028-018 WORLD INTERNATIONAL LLC Estate Lot $90,000 0.92 0.92 40,075025-028-019 WORLD INTERNATIONAL LLC Estate Lot $90,000 0.75 0.75 32,670025-028-020 WORLD INTERNATIONAL LLC Estate Lot $90,000 0.55 0.55 23,958025-028-021 WORLD INTERNATIONAL LLC Estate Lot $90,000 0.49 0.49 21,344025-028-022 WORLD INTERNATIONAL LLC Estate Lot $90,000 0.58 0.58 25,265025-028-023 WORLD INTERNATIONAL LLC Estate Lot $90,000 0.55 0.55 23,958025-028-024 WORLD INTERNATIONAL LLC Estate Lot $90,000 0.74 0.74 32,234025-028-025 WORLD INTERNATIONAL LLC Estate Lot $90,000 0.99 0.99 43,124025-028-026 WORLD INTERNATIONAL LLC Estate Lot $135,000 1.46 1.46 63,598025-041-001 WORLD INTERNATIONAL LLC Estate Lot $90,000 0.48 0.48 20,909025-041-002 WORLD INTERNATIONAL LLC Estate Lot $90,000 0.92 0.92 40,075025-041-003 WORLD INTERNATIONAL LLC Estate Lot $135,000 1.35 1.35 58,806025-041-004 WORLD INTERNATIONAL LLC Estate Lot $200,000 5.65 5.65 246,114

Seevers Jordan Ziegenmeyer 93
In light of the fact there are 66 estate lots held by the master developer, not including the production-oriented single-family lots previously valued, a discounted cash flow analysis will be used to determine the market value in bulk of the master developer (World International LLC) components.
025-041-005 WORLD INTERNATIONAL LLC Estate Lot $175,000 4.76 4.76 207,346025-041-009 WORLD INTERNATIONAL LLC Estate Lot $90,000 0.72 0.72 31,363025-041-010 WORLD INTERNATIONAL LLC Estate Lot $90,000 0.47 0.47 20,473025-041-011 WORLD INTERNATIONAL LLC Estate Lot $90,000 0.48 0.48 20,909025-042-004 WORLD INTERNATIONAL LLC Estate Lot $175,000 4.88 4.88 212,573025-042-005 WORLD INTERNATIONAL LLC Estate Lot $175,000 3.29 3.29 143,312025-042-006 WORLD INTERNATIONAL LLC Estate Lot $90,000 0.89 0.89 38,768025-042-007 WORLD INTERNATIONAL LLC Estate Lot $90,000 0.53 0.53 23,087025-042-008 WORLD INTERNATIONAL LLC Estate Lot $90,000 0.53 0.53 23,087025-042-009 WORLD INTERNATIONAL LLC Estate Lot $90,000 0.46 0.46 20,038025-042-010 WORLD INTERNATIONAL LLC Estate Lot $90,000 0.47 0.47 20,473025-042-011 WORLD INTERNATIONAL LLC Estate Lot $90,000 0.65 0.65 28,314025-042-012 WORLD INTERNATIONAL LLC Estate Lot $90,000 0.77 0.77 33,541025-042-013 WORLD INTERNATIONAL LLC Estate Lot $90,000 0.61 0.61 26,572025-042-014 WORLD INTERNATIONAL LLC Estate Lot $90,000 0.61 0.61 26,572025-042-015 WORLD INTERNATIONAL LLC Estate Lot $135,000 1.00 1.00 43,560025-042-017 WORLD INTERNATIONAL LLC Estate Lot $175,000 4.67 4.67 203,425025-042-018 WORLD INTERNATIONAL LLC Estate Lot $135,000 1.57 1.57 68,389025-042-019 WORLD INTERNATIONAL LLC Estate Lot $135,000 1.01 1.01 43,996025-042-020 WORLD INTERNATIONAL LLC Estate Lot $90,000 0.92 0.92 40,075025-042-021 WORLD INTERNATIONAL LLC Estate Lot $90,000 0.75 0.75 32,670025-026-008 WYATT JIM L & SANDRA Estate Lot $90,000 0.24 0.24 10,609025-026-027 YBARRA ANDREW G & FANNIE V Estate Lot $90,000 0.98 0.98 42,556025-041-008 ZERCOE STEVE Estate Lot $90,000 0.92 0.92 40,075
Seevers Jordan Ziegenmeyer 94
BULK MARKET VALUE – WORLD INTERNATIONAL LLC OWNERSHIP (MASTER DEVELOPER COMPONENT)
In this section, the market value of the World International LLC-owned portion of the District, in bulk, subject to the Lien of the Special Tax securing the Western Hills Water District Diablo Grande Community Facilities District No. 1 Bonds, will be estimated by employing the use of a discounted cash flow analysis; whereby, the expected revenue, absorption period, expenses and discount rate associated with the development and sell-off of the land will be taken into account. A discounted cash flow analysis is a procedure in which a discount rate is applied to a projected revenue stream generated from the sale of individual components of a project. In this method of valuation, the appraiser/analyst specifies the quantity, variability, timing and duration of the revenue streams and discounts each to its present value at a specified yield rate. The four main items of the discounted cash flow analysis are summarized as follows:
Revenue – the gross income is based on the individual component values.
Absorption Analysis – the time frame required for sell off. Of primary importance in this
analysis is the allocation of the revenue over the absorption period – including the estimation of an appreciation factor (if any).
Expenses – the expenses associated with the sell-off are calculated in this section – including
remaining in-tract and infrastructure costs, administration, marketing and commission costs, as well as taxes and special assessments.
Discount Rate – an appropriate discount rate is derived employing a variety of data.
Discussions of these four concepts begin below, with the discounted cash flow analysis offered at the end of this section. Revenue The individual component valuations of the 1,484 residential lots held by the master developer, which is depicted in the following table, comprises the revenue of the discounted cash flow analysis.

Seevers Jordan Ziegenmeyer 95
The market value of each lot was estimated in the previous valuation sections and is summarized in the table on the next page.
Village (Master Developer) Lot Configurations Typical Lot Size Description Lots Total
2A Townhomes 42 422B, 2C, 3H, 3L & 5 35' x 105' 3,675 Single-Family Lots 292
2C, 3B, 3H, 3I, 4C & 5 50' x 105' 5,250 Single-Family Lots 3882C, 2D, 3B, 3F, 3H, 3I, 4A, 4C, 5 & 5A 60' x 105' 6,300 Single-Family Lots 4233C, 3D, 3E, 3F, 3J, 3K, 4A, 4B, 4D & 5 70' x 105' 7,350 Single-Family Lots 1402C, 3C, 3D, 3E, 3F, 3G, 3J, 4A, 4B & 5 80' x 105' 8,400 Single-Family Lots 133 1,376
Estates 66 66Total (Master Developer) 1,484
Seevers Jordan Ziegenmeyer 96
Typical Lot Indicated TotalVillage/Estate Lot (Parcel) Lot Configurations Estate Lot Description Lots Bulk Lot Aggregate
Size (SF/AC) Values Values2A Townhomes 42 $64,000 $2,688,000
2B, 2C, 3H, 3L & 5 35' x 105' 3,675 Single-Family Lots 292 $89,000 $25,988,0002C, 3B, 3H, 3I, 4C & 5 50' x 105' 5,250 Single-Family Lots 388 $104,000 $40,352,000
2C, 2D, 3B, 3F, 3H, 3I, 4A, 4C, 5 & 5A 60' x 105' 6,300 Single-Family Lots 423 $114,000 $48,222,0003C, 3D, 3E, 3F, 3J, 3K, 4A, 4B, 4D & 5 70' x 105' 7,350 Single-Family Lots 140 $124,000 $17,360,0002C, 3C, 3D, 3E, 3F, 3G, 3J, 4A, 4B & 5 80' x 105' 8,400 Single-Family Lots 133 $134,000 $17,822,000
025-023-009 < 5 acre estate lot 4.38 Estate Lot 1 $175,000025-023-010 > 5 acre estate lot 6.71 Estate Lot 1 $200,000025-025-001 < 1 acre estate lot 0.50 Estate Lot 1 $90,000025-025-006 < 1 acre estate lot 0.53 Estate Lot 1 $90,000025-025-034 < 1 acre estate lot 0.46 Estate Lot 1 $90,000025-025-047 < 1 acre estate lot 0.52 Estate Lot 1 $90,000025-025-049 < 1 acre estate lot 0.96 Estate Lot 1 $90,000025-025-051 < 1 acre estate lot 0.48 Estate Lot 1 $90,000025-025-053 < 1 acre estate lot 0.76 Estate Lot 1 $90,000025-025-054 < 1 acre estate lot 0.61 Estate Lot 1 $90,000025-025-055 < 1 acre estate lot 0.46 Estate Lot 1 $90,000025-025-056 < 1 acre estate lot 0.56 Estate Lot 1 $90,000025-025-059 < 1 acre estate lot 0.54 Estate Lot 1 $90,000025-025-060 < 1 acre estate lot 0.56 Estate Lot 1 $90,000025-025-061 < 1 acre estate lot 0.50 Estate Lot 1 $90,000025-025-062 < 1 acre estate lot 0.46 Estate Lot 1 $90,000025-025-063 < 1 acre estate lot 0.46 Estate Lot 1 $90,000025-025-064 < 1 acre estate lot 0.46 Estate Lot 1 $90,000025-025-068 < 1 acre estate lot 0.46 Estate Lot 1 $90,000025-027-008 < 5 acre estate lot 3.33 Estate Lot 1 $175,000025-027-012 < 5 acre estate lot 3.34 Estate Lot 1 $175,000025-027-013 < 5 acre estate lot 3.03 Estate Lot 1 $175,000025-027-015 < 1 acre estate lot 0.61 Estate Lot 1 $90,000025-027-016 < 1 acre estate lot 0.55 Estate Lot 1 $90,000025-028-007 > 5 acre estate lot 9.13 Estate Lot 1 $200,000025-028-008 > 5 acre estate lot 5.88 Estate Lot 1 $200,000025-028-009 > 5 acre estate lot 5.85 Estate Lot 1 $200,000025-028-011 < 3 acre estate lot 1.21 Estate Lot 1 $135,000025-028-014 < 1 acre estate lot 0.50 Estate Lot 1 $90,000025-028-015 < 1 acre estate lot 0.52 Estate Lot 1 $90,000025-028-016 < 1 acre estate lot 0.48 Estate Lot 1 $90,000025-028-017 < 1 acre estate lot 0.72 Estate Lot 1 $90,000025-028-018 < 1 acre estate lot 0.92 Estate Lot 1 $90,000025-028-019 < 1 acre estate lot 0.75 Estate Lot 1 $90,000025-028-020 < 1 acre estate lot 0.55 Estate Lot 1 $90,000025-028-021 < 1 acre estate lot 0.49 Estate Lot 1 $90,000025-028-022 < 1 acre estate lot 0.58 Estate Lot 1 $90,000025-028-023 < 1 acre estate lot 0.55 Estate Lot 1 $90,000025-028-024 < 1 acre estate lot 0.74 Estate Lot 1 $90,000025-028-025 < 1 acre estate lot 0.99 Estate Lot 1 $90,000025-028-026 < 3 acre estate lot 1.46 Estate Lot 1 $135,000025-041-001 < 1 acre estate lot 0.48 Estate Lot 1 $90,000025-041-002 < 1 acre estate lot 0.92 Estate Lot 1 $90,000025-041-003 < 3 acre estate lot 1.35 Estate Lot 1 $135,000025-041-004 > 5 acre estate lot 5.65 Estate Lot 1 $200,000025-041-005 < 5 acre estate lot 4.76 Estate Lot 1 $175,000025-041-009 < 1 acre estate lot 0.72 Estate Lot 1 $90,000025-041-010 < 1 acre estate lot 0.47 Estate Lot 1 $90,000025-041-011 < 1 acre estate lot 0.48 Estate Lot 1 $90,000025-042-004 < 5 acre estate lot 4.88 Estate Lot 1 $175,000025-042-005 < 5 acre estate lot 3.29 Estate Lot 1 $175,000025-042-006 < 1 acre estate lot 0.89 Estate Lot 1 $90,000025-042-007 < 1 acre estate lot 0.53 Estate Lot 1 $90,000025-042-008 < 1 acre estate lot 0.53 Estate Lot 1 $90,000025-042-009 < 1 acre estate lot 0.46 Estate Lot 1 $90,000025-042-010 < 1 acre estate lot 0.47 Estate Lot 1 $90,000025-042-011 < 1 acre estate lot 0.65 Estate Lot 1 $90,000025-042-012 < 1 acre estate lot 0.77 Estate Lot 1 $90,000025-042-013 < 1 acre estate lot 0.61 Estate Lot 1 $90,000025-042-014 < 1 acre estate lot 0.61 Estate Lot 1 $90,000025-042-015 < 3 acre estate lot 1.00 Estate Lot 1 $135,000025-042-017 < 5 acre estate lot 4.67 Estate Lot 1 $175,000025-042-018 < 3 acre estate lot 1.57 Estate Lot 1 $135,000025-042-019 < 3 acre estate lot 1.01 Estate Lot 1 $135,000025-042-020 < 1 acre estate lot 0.92 Estate Lot 1 $90,000025-042-021 < 1 acre estate lot 0.75 Estate Lot 1 $90,000
Total Aggregate Value (master developer component) 1,484 $159,872,000

Seevers Jordan Ziegenmeyer 97
Absorption Analysis Absorption rates are best measured by looking at historic absorption rates for similar properties in the region. In developing an appropriate absorption period for the disposition of the subject’s parcels, we have considered historic absorption rates for similar properties and also attempted to consider the impacts of present market conditions, as well as the anticipated changes in the market. Real estate is cyclical in nature, and it is difficult to accurately forecast specific demand over a projected absorption period. In attempting to estimate the exposure time that would be required for the disposition of the production-oriented residential lots comprising the subject, both the historical exposure times and projected economic conditions are considered. A number of assumptions are made in the discounted cash flow analysis, not the least of which is the forecast of absorption, or disposition, of the various land use components comprising the subject property. It is common for surveys of market participants to reveal different estimations of anticipated absorption periods for the sell-off of multiple components comprising a master planned development, or large land holding, with some developers preferring to hasten the holding period in favor of mitigating exposures to fluctuations in market conditions; whereas, other developers prefer to manage the sell-off of the property over an extended period of time so as to minimize direct competition of product within the master planned project – most often associated with large residential developments. With 1,484 single-family residential lots, with limited activity during the past seven+ years, a managed disposition of the bulk lots to merchant builders over four years seems appropriate. While the project has remained relatively stagnant during the past several years of the housing market contraction, it is expected that as the housing market continues its recovery and appreciation in the primary market areas of the Bay Area, buyers will once again consider commuter options presented in the Central Valley. The subject property is a unique resort-oriented development and, according to the sales agent at the only active subdivision within Diablo Grande, the project is attracting buyers from throughout the Central Valley, including cities/communities along the Highway 99 corridor, and the South and East Bay Areas. Further, with increased development in the Keystone Business Park in Patterson, which houses international distributers like Amazon, and corresponding increases in employment, the subject property is likely to capture interest from potential buyers as experienced during the initial development period. We have also considered the long term absorption rates at similar custom (estate) lot projects in Northern California that target upper-income households. Lot sales at these projects are indicated in the table below.
Seevers Jordan Ziegenmeyer 98
Project & Location Survey Period Total Sales*
Sales Per Month
Comment
Promontory, Village 6, Phase 1 by AKT Development El Dorado Hills, Sacramento County, CA
October 2000 through June 2003 (20 months)
28 1.4 Rolling topography, lots of 1/3 acre, non-gated, resales excluded
Promontory, Village 6, Phase 2A by AKT Development El Dorado Hills, Sacramento County, CA
June 2003 through June 2005 (24 months)
34 1.4 Rolling topography, lots of 0.5 to 1.0 acre, gated, some lots with sale price of $1,000,000+, resales excluded
Copperidge in Saddle Creek by Castle & Cook Copperopolis, Calaveras County, CA
April 1996 through December 2000 (56 months)
114 2.0 Rolling topography, lots of 0.5 acre, non-gated golf course community, absorption indicated based on total project absorption period, resales excluded
The Knolls in Saddle Creek by Castle & Cook Copperopolis, Calaveras County, CA
March 2000 through October 2005 (67 months)
96 1.4 Rolling topography, lots of 0.5 acre, non-gated golf course community, absorption indicated based on total project absorption period, resales excluded
Greenhorn Greek Units 1 through 3 by Grupe Development Angels Camp, Calaveras County, CA
August 1995 through May 2004 (105 months)
316 3.1 Rolling topography, lots of 0.25 acre, non-gated golf course community, absorption indicated based on total project absorption period, resales excluded
Greenhorn Greek Units 4 by Resmark Angels Camp, Calaveras County, CA
December 2000 through September 2006 (69 months)
107 1.6 Rolling topography, lots of 0.25 acre, non-gated golf course community, absorption indicated based on total project absorption period, resales excluded
*Based on close of escrow. For custom home and lot construction, home pricing has not been as volatile as production pricing. Lot pricing generally increased significantly in 2012 as speculatively builders began acquiring lots for new construction. Home pricing for high end construction has been generally level since that time, with current levels significantly higher than 2009 and 2010. Over the next 12 months we project stable lot and home pricing, with pricing likely to increase slightly in subsequent years as the residential sector continues to expand and recover. The projects above suggest absorption rates between 1.4 and 3.1 units per month, with the upper end of the range indicative of two remote custom lot projects in Calaveras County, in the foothills of the Sierra Nevada mountain range, east of Stanislaus County. Absorption rates at four of the six projects above were calculated based on the total project absorption period and are useful indicators of long term absorption rates. As noted in the Estate Lot valuation section, several of the lots recently transferred were exposed for less than one month, suggesting, at the right price, there is still demand for custom lots in the market. Based on the survey above, it is estimated the subject’s estate lots could sell at a rate of approximately 1.5 per month, or approximately 48 months.

Seevers Jordan Ziegenmeyer 99
Market conditions in the area have been stabilizing and are experiencing recovery in some markets as discussed previously this report. The subject property has appeal as a resort-oriented master planned community with golf course and additional amenities planned. The remote location and distance from the employment centers of the East Bay area are tend to offset the positive characteristics of the development. Considering the disposition period concluded above, a total of four years, a modest appreciation rate commensurate with an anticipated inflation rate of 3% seems appropriate as the market continues its recovery and will be applied to the revenue components in this analysis. Expenses General and Administrative The general and administrative expense category covers the various administrative costs associated with managing the overall development. This would include management, legal and accounting fees and other professional services common to a development project. For purposes of this analysis, we have estimated this expense at 3% of the total gross sale proceeds. This expense is spread evenly over the entire sellout period. Marketing and Sales The costs associated with marketing, commissions and closing costs relative to the disposition of the subject’s components are estimated at 5% of the total gross sale proceeds. Although this rate is somewhat negotiable, it is consistent with current industry trends. Ad Valorem Taxes This appraisal is predicated on, and assumes, a sale of the appraised property in bulk. Interim ad valorem real estate taxes are based on a tax rate of 1.1903%. The total tax expense is gradually reduced over the absorption period, as the land components are sold off. Property taxes are increased by 2% per year. Special Taxes and Assessments As referenced, the appraised properties are located within the boundaries of Western Hills Water District Diablo Grande Community Facilities District No. 1. According to the CFD Tax Administration Report (Fiscal Year 2013-14), prepared by Goodwin Consulting Group (Dated December 18, 2013), the annual special taxes applicable to the subject are presented on the following page:
Seevers Jordan Ziegenmeyer 100
Land Use Maximum Annual Special Tax Rate Single-Family Residential Use
Estate Lots (3.0-acre minimum) $3,000 per unit 40,000 sf minimum lot size $3,000 per unit 20,000 sf minimum lot size $3,000 per unit 8,000 sf minimum lot size $2,400 per unit 6,000 sf minimum lot size $2,250 per unit 5,000 sf minimum lot size $2,100 per unit Patio Home – Detached residential $1,800 per unit
As parcels are sold off by the master developer, the Special Tax obligation will be assumed by the buyer. The purpose of this analysis is to estimate the market value of the underlying land, which serves as the collateral to the Bondholders. As components of the subject property are sold off in this analysis, the balance of the Special Tax obligations necessary to service the debt associated with the Western Hills Water District Diablo Grande Community Facilities District No. 1 Bonds are presumed to be collected from the new owners in the District. Remaining In-Tract and Infrastructure Costs
All of the master developer’s production-oriented single-family residential lots are in unimproved, or partially improved lot condition. According to the master developer’s representative, remaining in-tract costs for the 1,418 production-oriented residential lots total $58,433,948, or $39,376 per lot. Remaining infrastructure costs total $37,335,463, or $25,159 per lot. A copy of the budget is appended to this report. These costs will be considered in the valuation and phased commensurate with the disposition of the lots over the absorption period. It’s worth noting, however, $4.5 million in Special Tax Collections from the prior refunding of the Western Hills Water District Diablo Grande CFD No. 1 Bonds will be used towards the completion of additional infrastructure improvements over the next three years, or $1.5 million per year, which will be considered in the valuation analysis. Discount Rate The project yield rate is the rate of return on the total un-leveraged investment in a development, including both equity and debt. The leveraged yield rate is the rate of return to the “base” equity position when a portion of the development is financed. The “base” equity position represents the total equity contribution. The developer/builder may have funded all of the equity contribution, or a consortium of investors/builders as in a joint venture may fund it. Most surveys indicate that the threshold project yield requirement is about 20% to 30% for new home type projects. Instances in which project yields may be less than 20% often involve profit participation arrangements in master planned communities where the master developer limits the number of competing tracts.

Seevers Jordan Ziegenmeyer 101
According to a leading publication within the appraisal industry, the PwC Real Estate Investor Survey12, discount rates for land development projects ranged from 10.00% to 25.00%, with an average of 16.75% during the Fourth Quarter 2014, which is down 140 basis points (18.15%) from the Second Quarter 2014 (land survey completed every six months). These rates are free-and-clear of financing, are inclusive of developer’s profit, and assume entitlements are in place. Without entitlements in place, the PwC survey indicates certain investors increase the discount rate between 400 and 1,500 basis points (an average increase of 1,040 basis points). According to the data presented in the survey prepared by PwC, the majority of those respondents who use the discounted cash flow (DCF) method do so free and clear of financing. Additionally, the participants reflect a preference in including the developer’s profit in the discount rate, versus a separate line item for this factor. As such, the range of rates presented above is inclusive of the developer’s profit projection. The discount rates are based on a survey that includes residential, office, retail and industrial developments. Participants in the survey indicate the highest expected returns are on large-scale, unapproved developments. The low end of the range was extracted from projects where certain development risks had been lessened or eliminated. Several respondents indicate they expect slightly lower returns when approvals/entitlements are already in place. Excerpts from recent PwC surveys are copied below:
Looking ahead over the next 12 months, surveyed investors unanimously forecast property values in the national development land market to increase. Expected appreciation ranges up to 15.0% and average 5.0%. (Fourth Quarter 2014) As both the U.S. economy and the commercial real estate (CRE) industry’s fundamentals show continued signs of improvement, interest in CRE development has picked up across each main property sector – office, retail, industrial, apartments, and lodging. As a result, certain investors in the national development land market are looking to acquire new parcels, finish entitling owned tracts, and/or convert parcels into readied sites… For the first time in quite a while, our surveyed investors are unanimous in their expectations that values for development land will increase over the next 12 months… Appreciation ranges up to 10.0% and averages 3.6% – up quite a bit from six months ago when the average was 2.6%. (Second Quarter 2014) Survey results suggest that investors anticipate commercial real estate (CRE) fundamentals to continue to improve, opening up diverse development land opportunities across all property types… The outlook for development improved for the second straight year. In addition, and perhaps more importantly, the average outlook for development is considered “fair” – an improvement from two years ago when the average outlook was “modestly poor…” The improvement in the development outlook does not mean that the CRE industry will be flooded with new supply in the near future and that vast opportunities exist for development land
12 PwC Real Estate Investor Survey, PricewaterhouseCoopers, 4th Quarter 2014, Volume 27, Number 4.
Seevers Jordan Ziegenmeyer 102
investors. “Some markets still have a significant inventory of land with entitlements and some with partial infrastructure that will move forward with development first, so we still need to be patient,” says an investor, who suggests looking for opportunities in metros where sustainable job growth exists. Another strategizes to “find the right land location and then wait for buyers to show up.” (Fourth Quarter 2013) Improvements to the U.S. housing market and domestic economy have sparked increased interest in commercial real estate (CRE) development as many investors note that a growing number of developers are talking about and planning new projects. “The market is certainly improving in specific areas and specific submarkets,” says an investor. Nevertheless, patience is a key word among many development land investors since the recovery in the CRE industry is occurring very slowly in many areas. “It’s all about timing, and you need to be in the right market at the right time,” shares another. (Second Quarter 2013)
Although there are signs of improvements in this property sector, investors stress that it mostly relates to the amount of activity rather than improvements in pricing. “It is still a buyers’ market,” says a participant. For now, some development land investors advise owners to “hold onto their land and wait for markets to really come back…” A growing interest in new development caused both the average and high and low ranges of the discount rate to decline for the national land development market over the past six months. (Fourth Quarter 2012)
Information for a developing in-house database of project yield rates is presented in the following table.
Data Yield / IRR ExpectationsSource (Inclusive of Profit)
PwC Real Estate Investor Survey -Fourth Quarter 2014 (updated semi-annually)
Range of 10.0% to 25.0%, with an average of 16.75%, inclusive of profit and assuming entitlements in place, for land development (national average)
Josh Roden - Meritage (2013) 20% to 25% for entitled lotsJeb Elmore - Lewis Operating Corp (2013) 18% to 25%. Longer term, higher risk projects on higher side of the range, shorter
term, lower risk projects on the lower side of the range. Long term speculation properties (10 to 20 years out) often closer to 30%.
Greg Ackerman - Pulte (2010) 18% minimum, 20% targetChris Downey - Hon Development Minimum IRR of 20-25%; for an 8 to 10 year cash flow, mid to upper 20% rangeGary Gorian - Dale Poe Development 25% IRR for land development is typical (no entitlements); slightly higher for
properties with significant infrastructure costsDavid Pitts - Newhall Land and Farming 20% to 30% IRR for land development deals on an unleveraged basisMark Palkowitsh - MSP California, LLC 35% for large land deals from raw unentitled to tentative map stage, unleveraged or
leveraged. 25% to 30% from tentative map to pad sales to merchant builders, unleveraged
Rick Nieman - GFC 18% to 22% for land with some entitlements, unleveraged. 30% for raw unentitled Lin Stinson - Providence Realty Group Low 20% range yield rate required to attract capital to longer-term land holdingsDan Boyd - ESE Land Company Merchant builder yield requirements in the 20% range for traditionally financed tract
developments. Larger land holdings would require 25% to 30%. Environmentally challenged or politically risky development could well run in excess of 35%.
Tulare Windmill Ventures, LLC 10% discount rate excluding profit for single-family subdivisionsDavid Jacobsen - Ridgecrest Homes 10% to 40% for single-family residential subdivisions with 1-2 year development
timelinesMike Grant - Premier Homes 15% to 20% IRRLyle McCullogh - California Pacific Homes No less than 20% IRR for land development, either entitled or unentitledRoy Robertson - Ekotec 20% to 30% for an unentitled property; the lower end of the range would reflect
those properties close to tentative mapsGordon MacKenzie - Brookfield Development No less than 30% when typical entitlement risk exists

Seevers Jordan Ziegenmeyer 103
The expected and reported IRR requirements relate to properties consisting of unimproved land. The condition of the subject as finished lots and partially finished lots is superior (less risk) in comparison to the properties referred to by the survey respondents; however, the subject’s risk is upwardly influenced by its outlying market location, move-up market segment and significant lot premium revenue (which can dissipate significantly in periods of market decline). Based on the preceding discussion and developer surveys, we have concluded a discount rate (IRR) of 22.0% for the market valuation of the components held by the master developer, which includes both improved and unimproved residential lots, given the duration of the absorption period (four years). Conclusion The discounted cash flow on the following page incorporates the preceding factors in estimating the market of the World International LLC-owned portion of the District, in bulk. The discounted cash flow analysis is calculated on an annual basis, with the components selling out over a four year period.
Seevers Jordan Ziegenmeyer 104
Assumptions:
Village Typical Lot Total Lots Value Lot Conclusion HOLDING COSTS AND GENERAL EXPENSES
2A Townhomes 42 $64,000 2,688,000$ General and Administrative (% sales) 3.0%2B, 2C, 3H, 3L & 5 3,675 292 $89,000 25,988,000$ Marketing and Sales 5.0%2C, 3B, 3H, 3I, 4C & 5 5,250 388 $104,000 40,352,000$ First year annual taxes per Bulk Lot: $2752C, 2D, 3B, 3F, 3H, 3I, 4A, 4C, 5 & 5A 6,300 423 $114,000 48,222,000$ First year annual taxes per Estate Lot: $2883C, 3D, 3E, 3F, 3J, 3K, 4A, 4B, 4D & 5 7,350 140 $124,000 17,360,000$ Avg. Annual Special Taxes (Bulk Lots): $2,1172C, 3C, 3D, 3E, 3F, 3G, 3J, 4A, 4B & 5 8,400 133 $134,000 17,822,000$ Annual Special Taxes (Estate Lots): $3,000Total Production-Oriented Lots 1,418 $107,498 152,432,000$ Remaining In-Tract Costs: $58,433,948
Remaining Infrastructure Costs: $37,335,463Estate Lots 66 $112,727 7,440,000$
Aggregate Retail Value/Sales Revenue 1,484 $107,730 159,872,000$ DISCOUNT RATE (IRR) 22%
Income and Expense Analysis:
Period (One Period = 1 year) 1 2 3 4 TotalSales (Production Lots): 300 340 375 403 1,418
Inventory (Production Lots): 1,118 778 403 0Sales (Estate Lots): 18 18 18 12 66
Inventory (Estate Lots): 48 30 12 0
Appreciation/Inflation: 3.0% 6.0% 9.0% 12.0%
Total Sales Revenue 35,306,810$ 40,893,074$ 46,151,469$ 50,035,300$ 172,386,653$
ExpensesGeneral and Administrative (1,292,900)$ (1,292,900)$ (1,292,900)$ (1,292,900)$ (5,171,600)$ Marketing and Sales (1,765,340)$ (2,044,654)$ (2,307,573)$ (2,501,765)$ (8,619,333)$ Ad Valorem Taxes (409,106)$ (321,389)$ (222,668)$ (114,320)$ (1,067,483)$ Special Taxes (3,199,950)$ (2,510,841)$ (1,737,050)$ (889,164)$ (8,337,004)$ Remaining In-Tract Costs (12,362,612)$ (14,010,961)$ (15,453,265)$ (16,607,109)$ (58,433,948)$ Remaining Infrastructure Costs (7,898,899)$ (8,952,086)$ (9,873,624)$ (10,610,854)$ (37,335,463)$ Prior Bond Fund Proceeds (Offset) 1,500,000$ 1,500,000$ 1,500,000$ -$ 4,500,000$
Total Expenses (25,428,808)$ (27,632,829)$ (29,387,081)$ (32,016,112)$ (114,464,830)$
NET INCOME 9,878,002$ 13,260,245$ 16,764,388$ 18,019,188$ 57,921,823$
Present Value Factor 0.81967 0.67186 0.55071 0.45140
Discounted Cash Flow 8,096,723$ 8,909,060$ 9,232,264$ 8,133,845$ 34,371,892$
Net Present Value 34,371,892$
CONCLUSION OF VALUE BY DISCOUNTED CASH FLOW ANALYSIS (RD) 34,370,000$

Seevers Jordan Ziegenmeyer 105
SUMMARY AND CONCLUSION The purpose of this appraisal is to provide the market values, by ownership, of the appraised properties, subject to the Lien of the Special Tax securing the Western Hills Water District Diablo Grande Community Facilities District No. 1 Bonds (fee simple estate), as of May 16, 2015. The appraised properties represent the undeveloped residential lots situated within the boundaries of the District no improved with a single-family residence. The Diablo Grande master planned community is located in the southwestern portion of Stanislaus County, California, approximately eight miles southwest of the city of Patterson, west of Interstate 5, at the terminus of Diablo Grande Parkway and situated in a valley created by the Diablo Range. The cumulative, or aggregate, value of the appraised properties is estimated herein in accordance with the definitions, certifications, assumptions and conditions set forth in the attached document (please refer to pages 6 through 8). Primary among the assumptions is the value estimate is subject to the hypothetical condition any improvements to be financed by the Western Hills Water District Diablo Grande Community Facilities District No. 1 Special Tax Collections are in place. As a result of our analysis, it is our opinion the cumulative, or aggregate, value of the appraised properties (please see Market Value by Assessor’s Parcel list in the Appendix to this report), as of May 16, 2015, is:
FIFTY EIGHT MILLION FOUR HUNDRED NINETY TWO THOUSAND DOLLARS $58,492,000
The value estimates assume a transfer that reflects a cash transaction or terms considered to be equivalent to cash. The estimate is also premised on an assumed sale after reasonable exposure in a competitive market under all conditions requisite to a fair sale, with buyer and seller each acting prudently, knowledgeably, for their own self interest and assuming neither is under duress.
Seevers Jordan Ziegenmeyer 106
EXPOSURE TIME Exposure time is the period a property interest would have been offered on the market prior to the hypothetical consummation of a sale at market value on the effective date of the appraisal. Marketing time reflects the time it might take to sell an interest in real property at its estimated market value during the period immediately after the effective date of the appraisal. Exposure time and marketing time may or may not be similar depending on whether market activity in the immediate future continues in the same manner as in the immediate past. Indications of the exposure time associated with a market value estimate are provided by the marketing times of sale comparables, interviews with participants in the market, and analysis of general economic conditions. Estimation of a future marketing time is more difficult, requiring forecasting and analysis of trends. The exposure time is estimated for the subject property below. As described above, exposure time is defined as the length of time a property interest would have been offered on the market prior to the hypothetical consummation of a sale at market value on the effective date of the appraisal. It is a retrospective estimate of time based on an analysis of past events assuming a competitive and open market. The residential land market throughout the Central Valley region has shown signs of recovery. A transfer of residential land has typically occurred within 12 months of exposure. Given the size of the subject properties, and the condition of the market, it is expected that if appropriately priced, the exposure time for the subject properties, assuming the properties (by ownership) are not marketed concurrently, would likely be in line with the high end of the range, or approximately 12 months.

2014
-15
Gro
ss
Tax
able
L
otA
PNO
wne
r (A
s of A
pril
1, 2
015)
Lan
d U
se D
escr
iptio
nIm
pr. V
alue
Lan
d V
alue
Tot
al V
alue
Lan
d U
seA
ppra
ised
Val
ueA
ssig
ned
Val
ueA
crea
geA
crea
geSq
. Ft.
025-
005-
009-
000
WO
RLD
INTE
RN
ATI
ON
AL
LLC
All
Rem
aini
ng L
ots/
Land
Hel
d B
y W
orld
Inte
rnat
iona
l LLC
15,7
56$
25
8,42
0$
274,
176
$
O
rigin
al P
arce
l34
,370
,000
$
34,3
70,0
00$
984.
628
0.0
002
5-01
0-01
6-00
0W
OR
LD IN
TER
NA
TIO
NA
L LL
CEx
empt
50,0
16$
50
,016
$
Exem
pt19
0.0
0.0
002
5-01
1-01
2-00
0W
OR
LD IN
TER
NA
TIO
NA
L LL
CEx
empt
31,5
87$
31
,587
$
Exem
pt12
0.0
0.0
002
5-01
5-01
1-00
0W
OR
LD IN
TER
NA
TIO
NA
L LL
CEx
empt
13,1
60$
13
,160
$
Exem
pt50
.00.
00
025-
021-
001-
000
KO
LDIN
G K
ELLY
R &
OA
NA
LSi
ngle
Fam
ily24
0,00
0$
20,0
00$
26
0,00
0$
Sing
le F
amily
260,
000
$
0.
00.
05,
803
025-
021-
002-
000
BR
EWST
ER IR
ENE
LIN
DLE
YSi
ngle
Fam
ily94
,061
$
41,8
04$
13
5,86
5$
Sing
le F
amily
135,
865
$
0.
00.
05,
112
025-
021-
003-
000
DO
UG
HER
TY B
RIA
N S
& P
HY
LIS
ASi
ngle
Fam
ily16
3,97
9$
41,8
04$
20
5,78
3$
Sing
le F
amily
205,
783
$
0.
00.
04,
985
025-
021-
004-
000
SCO
FIEL
D R
OB
ERT
AD
AM
& A
ND
REA
NIC
OLE
Sing
le F
amily
254,
000
$
20
,000
$
274,
000
$
Si
ngle
Fam
ily27
4,00
0$
0.0
0.0
6,37
702
5-02
1-00
5-00
0A
LFA
NO
PH
ILIP
M &
MA
RY
ESi
ngle
Fam
ily16
3,94
0$
20,4
92$
18
4,43
2$
Sing
le F
amily
184,
432
$
0.
00.
07,
302
025-
021-
006-
000
HA
YN
ES C
HR
ISTO
PHER
& C
HER
REL
LESi
ngle
Fam
ily23
9,50
0$
20,0
00$
25
9,50
0$
Sing
le F
amily
259,
500
$
0.
00.
06,
056
025-
021-
007-
000
HO
OK
CH
AR
LES
M &
KU
SUM
APr
epai
d12
5,51
7$
20,4
92$
14
6,00
9$
Prep
aid
0.0
0.0
5,10
702
5-02
1-00
8-00
0H
OR
NE
EDW
AR
D JR
Sing
le F
amily
112,
350
$
41
,804
$
154,
154
$
Si
ngle
Fam
ily15
4,15
4$
0.0
0.0
5,12
002
5-02
1-00
9-00
0C
OV
OLO
MIC
HA
EL R
Sing
le F
amily
260,
175
$
20
,090
$
280,
265
$
Si
ngle
Fam
ily28
0,26
5$
0.0
0.0
5,13
302
5-02
1-01
0-00
0H
AR
RIS
PA
UL
E &
YV
ON
NE
VSi
ngle
Fam
ily25
4,00
0$
20,0
00$
27
4,00
0$
Sing
le F
amily
274,
000
$
0.
00.
05,
146
025-
021-
011-
000
RU
SSEL
L R
OB
ERT
J & B
AR
BA
RA
Sing
le F
amily
185,
000
$
20
,000
$
205,
000
$
Si
ngle
Fam
ily20
5,00
0$
0.0
0.0
5,15
902
5-02
1-01
2-00
0H
AA
CK
KEN
NET
H W
& S
USA
N S
Sing
le F
amily
239,
500
$
20
,000
$
259,
500
$
Si
ngle
Fam
ily25
9,50
0$
0.0
0.0
5,17
202
5-02
1-01
3-00
0B
ATH
KE
RA
YM
ON
D G
ERO
LD &
DO
RO
THY
JEA
NSi
ngle
Fam
ily26
9,00
0$
20,0
00$
28
9,00
0$
Sing
le F
amily
289,
000
$
0.
00.
06,
254
025-
021-
014-
000
RIC
E B
RIA
N L
& M
AR
ION
LSi
ngle
Fam
ily13
9,71
5$
63,0
28$
20
2,74
3$
Sing
le F
amily
202,
743
$
0.
00.
06,
432
025-
021-
015-
000
RO
DR
IGU
EZ R
AM
ON
P &
BLA
NC
A E
Sing
le F
amily
76,6
84$
52
,524
$
129,
208
$
Si
ngle
Fam
ily12
9,20
8$
0.0
0.0
5,60
902
5-02
1-01
6-00
0A
TWA
L JA
SWIN
DER
& S
HA
MIN
DER
Sing
le F
amily
74,5
84$
52
,524
$
127,
108
$
Si
ngle
Fam
ily12
7,10
8$
0.0
0.0
4,94
702
5-02
1-01
7-00
0R
OH
LFS
RO
NA
LDSi
ngle
Fam
ily24
1,00
0$
20,0
00$
26
1,00
0$
Sing
le F
amily
261,
000
$
0.
00.
06,
087
025-
021-
018-
000
BR
OW
N G
RO
VER
L &
AD
INIA
Sing
le F
amily
100,
033
$
52
,647
$
152,
680
$
Si
ngle
Fam
ily15
2,68
0$
0.0
0.0
5,65
802
5-02
1-01
9-00
0H
ALL
BA
RR
Y S
Sing
le F
amily
94,0
61$
41
,804
$
135,
865
$
Si
ngle
Fam
ily13
5,86
5$
0.0
0.0
5,70
502
5-02
1-02
0-00
0M
AR
TIN
S V
ALD
EMIR
O S
OU
SASi
ngle
Fam
ily25
1,50
0$
20,0
00$
27
1,50
0$
Sing
le F
amily
271,
500
$
0.
00.
05,
752
025-
021-
021-
000
GA
RC
IA C
AR
LOS
LSi
ngle
Fam
ily26
9,00
0$
20,0
00$
28
9,00
0$
Sing
le F
amily
289,
000
$
0.
00.
05,
798
025-
021-
022-
000
VA
RG
AS
CA
RLO
S D
Sing
le F
amily
183,
000
$
20
,000
$
203,
000
$
Si
ngle
Fam
ily20
3,00
0$
0.0
0.0
5,84
502
5-02
1-02
3-00
0SO
TELO
DA
VID
& L
YN
NE
Sing
le F
amily
261,
180
$
25
,113
$
286,
293
$
Si
ngle
Fam
ily28
6,29
3$
0.0
0.0
5,89
102
5-02
1-02
4-00
0R
EID
DA
VID
Sing
le F
amily
115,
522
$
20
,090
$
135,
612
$
Si
ngle
Fam
ily13
5,61
2$
0.0
0.0
5,93
802
5-02
1-02
5-00
0R
OJA
S G
AR
Y E
& M
ON
ICA
LSi
ngle
Fam
ily18
0,70
2$
63,0
28$
24
3,73
0$
Sing
le F
amily
243,
730
$
0.
00.
05,
948
025-
021-
026-
000
MA
RC
OU
X R
ICH
AR
D A
LLEN
Sing
le F
amily
254,
000
$
20
,000
$
274,
000
$
Si
ngle
Fam
ily27
4,00
0$
0.0
0.0
5,34
702
5-02
1-02
7-00
0D
ESA
NTI
S G
AR
Y &
SH
EILA
Sing
le F
amily
239,
500
$
20
,000
$
259,
500
$
Si
ngle
Fam
ily25
9,50
0$
0.0
0.0
5,96
902
5-02
1-02
8-00
0B
RO
WN
FIEL
D D
ENN
ISSi
ngle
Fam
ily22
3,19
0$
20,0
90$
24
3,28
0$
Sing
le F
amily
243,
280
$
0.
00.
08,
470
025-
021-
029-
000
PER
EZ JO
SE L
SR
& L
IVIE
Sing
le F
amily
96,8
72$
52
,647
$
149,
519
$
Si
ngle
Fam
ily14
9,51
9$
0.0
0.0
6,74
602
5-02
1-03
0-00
0PE
RC
Y G
AR
YSi
ngle
Fam
ily10
2,42
1$
36,5
79$
13
9,00
0$
Sing
le F
amily
139,
000
$
0.
00.
05,
280
025-
021-
031-
000
WIL
SON
ED
WA
RD
JSi
ngle
Fam
ily25
3,14
4$
20,0
90$
27
3,23
4$
Sing
le F
amily
273,
234
$
0.
00.
05,
098
025-
021-
032-
000
MO
REI
RA
MIK
E &
NU
BIA
SSi
ngle
Fam
ily96
,150
$
41,8
04$
13
7,95
4$
Sing
le F
amily
137,
954
$
0.
00.
05,
521
025-
021-
033-
000
HIL
L G
LEN
N &
CH
AR
LEN
ESi
ngle
Fam
ily10
9,73
7$
41,8
04$
15
1,54
1$
Sing
le F
amily
151,
541
$
0.
00.
05,
641
025-
021-
034-
000
TRIP
P SH
EREE
D &
BR
IAN
GSi
ngle
Fam
ily86
,139
$
52,5
24$
13
8,66
3$
Sing
le F
amily
138,
663
$
0.
00.
05,
641
025-
021-
035-
000
HA
GG
ERTY
KEN
NET
H A
& M
ILLE
R D
ON
NA
LSi
ngle
Fam
ily18
3,00
0$
20,0
00$
20
3,00
0$
Sing
le F
amily
203,
000
$
0.
00.
05,
641
025-
021-
036-
000
CH
AN
JOH
N K
& E
MM
ILY
CSi
ngle
Fam
ily25
4,00
0$
20,0
00$
27
4,00
0$
Sing
le F
amily
274,
000
$
0.
00.
05,
641
025-
021-
037-
000
NA
VA
RR
ETE
BA
LDEM
AR
Sing
le F
amily
192,
000
$
20
,000
$
212,
000
$
Si
ngle
Fam
ily21
2,00
0$
0.0
0.0
5,64
102
5-02
1-03
8-00
0R
EIC
HEL
DER
FER
CA
RLA
Sing
le F
amily
269,
000
$
20
,000
$
289,
000
$
Si
ngle
Fam
ily28
9,00
0$
0.0
0.0
5,64
202
5-02
1-03
9-00
0A
ZEV
EDO
STE
VE
ASi
ngle
Fam
ily18
3,00
0$
20,0
00$
20
3,00
0$
Sing
le F
amily
203,
000
$
0.
00.
05,
649
025-
021-
040-
000
TRA
N P
AU
LSi
ngle
Fam
ily15
2,68
2$
42,1
19$
19
4,80
1$
Sing
le F
amily
194,
801
$
0.
00.
06,
146
025-
021-
041-
000
SOU
ZA JO
HN
CH
AR
LES
Sing
le F
amily
99,7
95$
52
,524
$
152,
319
$
Si
ngle
Fam
ily15
2,31
9$
0.0
0.0
5,75
002
5-02
1-04
2-00
0H
OU
STO
N F
ON
DA
JSi
ngle
Fam
ily26
6,10
2$
20,0
90$
28
6,19
2$
Sing
le F
amily
286,
192
$
0.
00.
05,
459
025-
021-
043-
000
DY
K B
ERT
J VA
N &
ASH
LEE
VA
NSi
ngle
Fam
ily13
5,25
1$
20,4
92$
15
5,74
3$
Sing
le F
amily
155,
743
$
0.
00.
05,
370
025-
021-
044-
000
DA
RTE
Z R
ENEE
& K
ENSi
ngle
Fam
ily12
2,55
2$
20,0
90$
14
2,64
2$
Sing
le F
amily
142,
642
$
0.
00.
05,
281
025-
021-
045-
000
FAW
NS
VIC
TOR
IASi
ngle
Fam
ily26
9,00
0$
20,0
00$
28
9,00
0$
Sing
le F
amily
289,
000
$
0.
00.
06,
070
025-
021-
046-
000
MU
RPH
Y JA
MES
PSi
ngle
Fam
ily18
3,00
0$
20,0
00$
20
3,00
0$
Sing
le F
amily
203,
000
$
0.
00.
07,
189
025-
021-
047-
000
KO
RTH
MA
RK
D &
CA
RR
IE L
Sing
le F
amily
68,2
80$
52
,524
$
120,
804
$
Si
ngle
Fam
ily12
0,80
4$
0.0
0.0
6,15
902
5-02
1-04
8-00
0W
AN
G Z
UC
HU
N &
LIU
DA
ND
AN
Sing
le F
amily
143,
649
$
20
,090
$
163,
739
$
Si
ngle
Fam
ily16
3,73
9$
0.0
0.0
5,64
302
5-02
1-04
9-00
0H
OR
N A
LVIN
& G
UER
RA
TH
ERES
ASi
ngle
Fam
ily13
9,63
1$
20,0
90$
15
9,72
1$
Sing
le F
amily
159,
721
$
0.
00.
05,
922
025-
021-
050-
000
JOH
NSO
N M
AR
TIN
G &
DEO
LIN
DA
ASi
ngle
Fam
ily10
3,99
8$
52,5
24$
15
6,52
2$
Sing
le F
amily
156,
522
$
0.
00.
06,
170
025-
021-
051-
000
KH
UU
JOH
N &
TR
AN
LA
N A
NH
TSi
ngle
Fam
ily13
0,12
8$
20,4
92$
15
0,62
0$
Sing
le F
amily
150,
620
$
0.
00.
05,
357
025-
021-
052-
000
DIA
BLO
GR
AN
DE
RES
IDEN
TIA
L A
SSO
CEx
empt
Exem
pt0.
00.
00
025-
022-
001-
000
MIL
LAR
DEB
RA
JSi
ngle
Fam
ily18
9,61
3$
78,7
86$
26
8,39
9$
Sing
le F
amily
268,
399
$
0.
00.
013
,232
025-
022-
002-
000
WEN
NEK
AM
P M
AR
VIN
RIC
HA
RD
Sing
le F
amily
300,
500
$
25
,000
$
325,
500
$
Si
ngle
Fam
ily32
5,50
0$
0.0
0.0
12,8
8902
5-02
2-00
3-00
0A
NK
LAM
MA
RK
& D
ON
NA
Sing
le F
amily
266,
000
$
25
,000
$
291,
000
$
Si
ngle
Fam
ily29
1,00
0$
0.0
0.0
12,3
8602
5-02
2-00
4-00
0C
INFI
O K
AR
ENSi
ngle
Fam
ily24
2,18
6$
63,1
78$
30
5,36
4$
Sing
le F
amily
305,
364
$
0.
00.
013
,151
025-
022-
005-
000
DA
VIS
JULI
E A
NN
Sing
le F
amily
318,
000
$
25
,000
$
343,
000
$
Si
ngle
Fam
ily34
3,00
0$
0.0
0.0
13,3
7302
5-02
2-00
6-00
0D
AV
IS M
ERLE
GEN
ESi
ngle
Fam
ily13
3,93
7$
78,7
86$
21
2,72
3$
Sing
le F
amily
212,
723
$
0.
00.
013
,740
025-
022-
007-
000
AA
TIO
RO
NA
LD &
CH
RIS
TIN
ASi
ngle
Fam
ily29
5,58
7$
69,6
46$
36
5,23
3$
Sing
le F
amily
365,
233
$
0.
00.
013
,951
025-
022-
008-
000
WO
RLD
INTE
RN
ATI
ON
AL
LLC
Sing
le F
amily
136,
563
$
78
,786
$
215,
349
$
Si
ngle
Fam
ily21
5,34
9$
0.0
0.0
14,1
65
MA
RK
ET
VA
LU
E B
Y A
SSE
SSO
R'S
PA
RC
EL
Wes
tern
Hill
s Wat
er D
istr
ict
Com
mun
ity F
acili
ties D
istr
ict N
o. 1
(Dia
blo
Gra
nde)
FY 2
014-
15 P
arce
l Inf
orm
atio
n Ass
esse
d V
alue
s
1 of
12
2014
-15
Gro
ss
Tax
able
L
otA
PNO
wne
r (A
s of A
pril
1, 2
015)
Lan
d U
se D
escr
iptio
nIm
pr. V
alue
Lan
d V
alue
Tot
al V
alue
Lan
d U
seA
ppra
ised
Val
ueA
ssig
ned
Val
ueA
crea
geA
crea
geSq
. Ft.
Ass
esse
d V
alue
s
025-
022-
009-
000
GU
AR
AN
TY H
OLD
ING
S O
F C
ALI
FOR
NIA
INC
Sing
le F
amily
279,
000
$
25
,000
$
304,
000
$
Si
ngle
Fam
ily30
4,00
0$
0.0
0.0
13,0
2002
5-02
2-01
0-00
0PO
MET
TA C
HA
DSi
ngle
Fam
ily22
5,01
6$
69,6
46$
29
4,66
2$
Sing
le F
amily
294,
662
$
0.
00.
011
,271
025-
022-
011-
000
BED
WEL
L W
ILLI
AM
D &
JEA
NN
ETTE
Sing
le F
amily
321,
452
$
25
,113
$
346,
565
$
Si
ngle
Fam
ily34
6,56
5$
0.0
0.0
10,7
7802
5-02
2-01
2-00
0R
AM
OS
DO
UG
LAS
E &
FR
AN
CIS
CA
TSi
ngle
Fam
ily21
0,09
7$
78,7
86$
28
8,88
3$
Sing
le F
amily
288,
883
$
0.
00.
011
,785
025-
022-
013-
000
MC
LA
UG
HLI
N E
DW
AR
D F
III &
CO
LLEE
N M
Sing
le F
amily
346,
000
$
25
,000
$
371,
000
$
Si
ngle
Fam
ily37
1,00
0$
0.0
0.0
12,4
1202
5-02
2-01
4-00
0FE
RN
AN
DES
AN
TON
IOSi
ngle
Fam
ily12
6,05
8$
78,7
86$
20
4,84
4$
Sing
le F
amily
204,
844
$
0.
00.
011
,267
025-
022-
015-
000
GA
RC
IA C
AR
MEN
MSi
ngle
Fam
ily20
0,64
3$
68,2
80$
26
8,92
3$
Sing
le F
amily
268,
923
$
0.
00.
013
,126
025-
022-
016-
000
ATW
AL
JASW
IND
ER &
SH
AM
IND
ERSi
ngle
Fam
ily17
9,00
8$
47,3
82$
22
6,39
0$
Sing
le F
amily
226,
390
$
0.
00.
013
,236
025-
022-
017-
000
FRY
PA
UL
HSi
ngle
Fam
ily10
5,57
3$
78,7
86$
18
4,35
9$
Sing
le F
amily
184,
359
$
0.
00.
013
,358
025-
022-
018-
000
FOW
LER
FR
EDER
ICK
J &
SH
ERR
Y L
Sing
le F
amily
205,
331
$
47
,382
$
252,
713
$
Si
ngle
Fam
ily25
2,71
3$
0.0
0.0
12,5
8502
5-02
2-01
9-00
0B
LAK
ES D
AV
ID L
& M
IRA
ND
ASi
ngle
Fam
ily19
1,64
3$
78,9
72$
27
0,61
5$
Sing
le F
amily
270,
615
$
0.
00.
012
,825
025-
022-
020-
000
HA
YES
JOH
N R
& M
ILLI
CEN
T E
Sing
le F
amily
236,
066
$
25
,113
$
261,
179
$
Si
ngle
Fam
ily26
1,17
9$
0.0
0.0
12,9
1202
5-02
2-02
1-00
0H
AR
T D
AIM
ON
DSi
ngle
Fam
ily30
0,50
0$
25,0
00$
32
5,50
0$
Sing
le F
amily
325,
500
$
0.
00.
016
,173
025-
022-
022-
000
SCO
TLA
ND
REG
INA
EV
A &
STE
VEN
JAC
KSi
ngle
Fam
ily14
2,15
2$
78,9
72$
22
1,12
4$
Sing
le F
amily
221,
124
$
0.
00.
016
,846
025-
022-
023-
000
THO
MA
S LE
SLIE
REX
Sing
le F
amily
240,
788
$
25
,615
$
266,
403
$
Pr
epai
d0.
00.
013
,874
025-
022-
024-
000
PAR
JAN
SH
IKH
AR
Sing
le F
amily
169,
064
$
25
,615
$
194,
679
$
Si
ngle
Fam
ily19
4,67
9$
0.0
0.0
13,7
8002
5-02
2-02
5-00
0M
UR
PHY
TH
OM
AS
J & D
ON
NA
LSi
ngle
Fam
ily32
1,00
0$
25,0
00$
34
6,00
0$
Sing
le F
amily
346,
000
$
0.
00.
015
,000
025-
022-
026-
000
MIL
LER
KEN
NET
H D
Sing
le F
amily
337,
000
$
25
,000
$
362,
000
$
Si
ngle
Fam
ily36
2,00
0$
0.0
0.0
12,1
7702
5-02
2-02
7-00
0C
HA
N A
NTH
ON
Y &
HO
MA
ESi
ngle
Fam
ily21
1,00
9$
47,0
30$
25
8,03
9$
Sing
le F
amily
258,
039
$
0.
00.
010
,946
025-
022-
028-
000
GIR
AR
D C
LIFF
OR
D J
& G
AIL
ASi
ngle
Fam
ily22
9,92
7$
31,3
53$
26
1,28
0$
Sing
le F
amily
261,
280
$
0.
00.
012
,059
025-
022-
029-
000
GO
OD
EILL
STE
PHEN
W &
AN
GEL
INA
Sing
le F
amily
215,
172
$
30
,738
$
245,
910
$
Si
ngle
Fam
ily24
5,91
0$
0.0
0.0
13,5
9702
5-02
2-03
0-00
0K
ITA
JIM
A H
ENR
Y &
BET
TYSi
ngle
Fam
ily16
2,82
5$
68,2
80$
23
1,10
5$
Sing
le F
amily
231,
105
$
0.
00.
013
,742
025-
022-
031-
000
BR
AZI
L LO
RA
Sing
le F
amily
246,
011
$
25
,113
$
271,
124
$
Si
ngle
Fam
ily27
1,12
4$
0.0
0.0
13,1
0702
5-02
2-03
2-00
0H
AR
PER
TIM
OTH
Y J
& L
IND
A J
Sing
le F
amily
262,
123
$
47
,382
$
309,
505
$
Si
ngle
Fam
ily30
9,50
5$
0.0
0.0
13,5
5402
5-02
2-03
3-00
0TR
AD
E D
AN
IEL
L &
SH
ERR
Y L
Sing
le F
amily
142,
340
$
78
,786
$
221,
126
$
Si
ngle
Fam
ily22
1,12
6$
0.0
0.0
13,1
2002
5-02
2-03
4-00
0TR
AD
E D
AN
IEL
L &
SH
ERR
Y L
Sing
le F
amily
300,
500
$
25
,000
$
325,
500
$
Si
ngle
Fam
ily32
5,50
0$
0.0
0.0
11,5
3102
5-02
2-03
5-00
0C
AST
RO
SA
MSO
NSi
ngle
Fam
ily17
8,58
4$
63,0
28$
24
1,61
2$
Sing
le F
amily
241,
612
$
0.
00.
010
,443
025-
022-
036-
000
RO
SE T
INA
Sing
le F
amily
199,
593
$
68
,280
$
267,
873
$
Si
ngle
Fam
ily26
7,87
3$
0.0
0.0
10,8
2202
5-02
2-03
7-00
0C
HR
ISTE
NSE
N M
AR
KSi
ngle
Fam
ily17
8,00
6$
78,7
86$
25
6,79
2$
Sing
le F
amily
256,
792
$
0.
00.
010
,264
025-
022-
038-
000
DIA
BLO
GR
AN
DE
RES
IDEN
TIA
L A
SSO
CEx
empt
Exem
pt0.
00.
00
025-
022-
039-
000
DIA
BLO
GR
AN
DE
RES
IDEN
TIA
L A
SSO
CEx
empt
Exem
pt0.
00.
00
025-
023-
002-
000
WO
RLD
INTE
RN
ATI
ON
AL
LLC
Exem
ptEx
empt
0.0
0.0
002
5-02
3-00
3-00
0O
AK
VA
LLEY
CO
MM
UN
ITY
BA
NK
Esta
te L
ot75
,000
$
75,0
00$
Si
ngle
Fam
ily17
5,00
0$
17
5,00
0$
0.0
0.0
150,
282
025-
023-
004-
000
OA
K V
ALL
EY C
OM
MU
NIT
Y B
AN
KEs
tate
Lot
75,0
00$
75
,000
$
Sing
le F
amily
175,
000
$
175,
000
$
0.
00.
017
3,80
402
5-02
3-00
5-00
0O
AK
VA
LLEY
CO
MM
UN
ITY
BA
NK
Esta
te L
ot75
,000
$
75,0
00$
Si
ngle
Fam
ily17
5,00
0$
17
5,00
0$
0.0
0.0
160,
301
025-
023-
006-
000
OA
K V
ALL
EY C
OM
MU
NIT
Y B
AN
KEs
tate
Lot
75,0
00$
75
,000
$
Sing
le F
amily
175,
000
$
175,
000
$
0.
00.
021
5,62
202
5-02
3-00
7-00
0O
AK
VA
LLEY
CO
MM
UN
ITY
BA
NK
Esta
te L
ot75
,000
$
75,0
00$
Si
ngle
Fam
ily17
5,00
0$
17
5,00
0$
0.0
0.0
148,
540
025-
023-
008-
000
WO
RLD
INTE
RN
ATI
ON
AL
LLC
Exem
ptEx
empt
0.0
0.0
002
5-02
3-00
9-00
0W
OR
LD IN
TER
NA
TIO
NA
L LL
CEs
tate
Lot
(inc
lude
d in
Mas
ter D
evel
oper
bul
k va
lue)
36,8
53$
36
,853
$
Sing
le F
amily
-$
0.0
0.0
190,
793
025-
023-
010-
000
WO
RLD
INTE
RN
ATI
ON
AL
LLC
Esta
te L
ot (i
nclu
ded
in M
aste
r Dev
elop
er b
ulk
valu
e)36
,853
$
36,8
53$
Si
ngle
Fam
ily-
$
0.
00.
029
2,28
802
5-02
3-02
2-00
0D
IAB
LO G
RA
ND
E R
ESID
ENTI
AL
ASS
OC
Exem
ptEx
empt
0.0
0.0
002
5-02
3-02
8-00
0D
IAB
LO G
RA
ND
E R
ESID
ENTI
AL
ASS
OC
Exem
ptEx
empt
0.0
0.0
002
5-02
4-00
1-00
0M
IRA
MO
NTE
S ED
UA
RD
OSi
ngle
Fam
ily47
9,00
0$
60,0
00$
53
9,00
0$
Sing
le F
amily
539,
000
$
0.
00.
012
,928
025-
024-
002-
000
ZALI
NSK
I JEF
FER
SON
RSi
ngle
Fam
ily28
7,00
0$
25,0
00$
31
2,00
0$
Sing
le F
amily
312,
000
$
0.
00.
013
,985
025-
024-
003-
000
HES
SE JO
HN
H &
MIC
HEL
E M
Sing
le F
amily
266,
000
$
25
,000
$
291,
000
$
Si
ngle
Fam
ily29
1,00
0$
0.0
0.0
12,3
1402
5-02
4-00
4-00
0B
UEH
NER
KY
LE &
LES
LIE
Sing
le F
amily
169,
531
$
78
,972
$
248,
503
$
Si
ngle
Fam
ily24
8,50
3$
0.0
0.0
10,7
5302
5-02
4-00
5-00
0B
ERR
Y W
ILLI
AM
KSi
ngle
Fam
ily24
7,41
6$
47,6
30$
29
5,04
6$
Sing
le F
amily
295,
046
$
0.
00.
010
,295
025-
024-
006-
000
OST
RO
FSK
Y M
ATT
HEW
ASi
ngle
Fam
ily33
0,00
0$
25,0
00$
35
5,00
0$
Sing
le F
amily
355,
000
$
0.
00.
011
,257
025-
024-
007-
000
TREL
OA
R T
IM &
ER
INSi
ngle
Fam
ily24
1,08
9$
25,1
13$
26
6,20
2$
Sing
le F
amily
266,
202
$
0.
00.
010
,952
025-
024-
008-
000
GO
OD
EILL
AN
THO
NY
Sing
le F
amily
275,
243
$
25
,113
$
300,
356
$
Si
ngle
Fam
ily30
0,35
6$
0.0
0.0
11,5
5002
5-02
4-00
9-00
0FA
UST
GR
EGO
RY
ASi
ngle
Fam
ily27
6,24
8$
25,1
13$
30
1,36
1$
Sing
le F
amily
301,
361
$
0.
00.
013
,810
025-
024-
010-
000
IVY
BA
RR
Y &
MO
NIQ
UE
Sing
le F
amily
240,
788
$
35
,862
$
276,
650
$
Si
ngle
Fam
ily27
6,65
0$
0.0
0.0
12,3
1702
5-02
4-01
1-00
0W
HIT
NEY
JEFF
REY
A &
KA
THR
YN
MSi
ngle
Fam
ily30
1,36
2$
25,1
13$
32
6,47
5$
Sing
le F
amily
326,
475
$
0.
00.
010
,829
025-
024-
012-
000
SAU
ND
ERS
MIC
HA
EL &
B V
ICTO
RIA
Sing
le F
amily
126,
119
$
49
,583
$
175,
702
$
Si
ngle
Fam
ily17
5,70
2$
0.0
0.0
10,7
8802
5-02
4-01
3-00
0FI
LLPO
T R
AN
DA
LL W
AY
NE
Sing
le F
amily
318,
000
$
25
,000
$
343,
000
$
Si
ngle
Fam
ily34
3,00
0$
0.0
0.0
10,7
8802
5-02
4-01
4-00
0G
OA
D W
AY
NE
GSi
ngle
Fam
ily31
0,00
0$
60,0
00$
37
0,00
0$
Sing
le F
amily
370,
000
$
0.
00.
010
,788
025-
024-
015-
000
LIST
ER JA
MES
E &
AR
AN
DA
LIS
TER
RO
SA I
Sing
le F
amily
295,
247
$
39
,192
$
334,
439
$
Si
ngle
Fam
ily33
4,43
9$
0.0
0.0
11,5
7902
5-02
4-01
6-00
0D
IAB
LO G
RA
ND
E R
ESID
ENTI
AL
ASS
OC
Exem
ptEx
empt
0.0
0.0
002
5-02
4-01
7-00
0D
IAB
LO G
RA
ND
E R
ESID
ENTI
AL
ASS
OC
Exem
ptEx
empt
0.0
0.0
002
5-02
5-00
1-00
0W
OR
LD IN
TER
NA
TIO
NA
L LL
CEs
tate
Lot
(inc
lude
d in
Mas
ter D
evel
oper
bul
k va
lue)
31,5
87$
31
,587
$
Sing
le F
amily
-$
0.0
0.0
21,8
8902
5-02
5-00
2-00
0M
ALS
AM
LA
UR
IEEs
tate
Lot
50,0
00$
50
,000
$
Sing
le F
amily
90,0
00$
90,0
00$
0.
00.
022
,725
025-
025-
003-
000
CA
PITA
L EQ
UIT
Y M
AN
AG
EMEN
T G
RO
UP
INC
Esta
te L
ot20
,902
$
20,9
02$
Si
ngle
Fam
ily90
,000
$
90
,000
$
0.0
0.0
22,1
1102
5-02
5-00
4-00
0W
ALT
OX
LEY
EN
TER
PRIS
ES IN
CEs
tate
Lot
50,0
00$
50
,000
$
Sing
le F
amily
90,0
00$
90,0
00$
0.
00.
023
,892
025-
025-
005-
000
CA
LIFO
RN
IA E
QU
ITY
MA
NA
GEM
ENT
GR
OU
P, IN
CEs
tate
Lot
20,9
02$
20
,902
$
Sing
le F
amily
90,0
00$
90,0
00$
0.
00.
020
,259
025-
025-
006-
000
WO
RLD
INTE
RN
ATI
ON
AL
LLC
Esta
te L
ot (i
nclu
ded
in M
aste
r Dev
elop
er b
ulk
valu
e)31
,587
$
31,5
87$
Si
ngle
Fam
ily-
$
0.
00.
023
,154
025-
025-
007-
000
TITU
S D
EWA
YN
EEs
tate
Lot
20,9
02$
20
,902
$
Sing
le F
amily
90,0
00$
90,0
00$
0.
00.
023
,991
025-
025-
008-
000
LEE
DA
NIE
LEs
tate
Lot
53,2
40$
53
,240
$
Sing
le F
amily
90,0
00$
90,0
00$
0.
00.
026
,153
025-
025-
009-
000
PAR
JAN
SH
IKH
AR
& P
RA
NEE
TISi
ngle
Fam
ily28
9,57
1$
105,
298
$
39
4,86
9$
Sing
le F
amily
394,
869
$
0.
00.
023
,573
025-
025-
010-
000
KA
ELEY
PA
RA
MD
EEP
Esta
te L
ot50
,000
$
50,0
00$
Si
ngle
Fam
ily90
,000
$
90
,000
$
0.0
0.0
22,9
4102
5-02
5-01
1-00
0W
INTE
RS
DER
EK C
HA
RLE
SSi
ngle
Fam
ily27
1,73
2$
31,3
53$
30
3,08
5$
Sing
le F
amily
303,
085
$
0.
00.
020
,521
2 of
12

2014
-15
Gro
ss
Tax
able
L
otA
PNO
wne
r (A
s of A
pril
1, 2
015)
Lan
d U
se D
escr
iptio
nIm
pr. V
alue
Lan
d V
alue
Tot
al V
alue
Lan
d U
seA
ppra
ised
Val
ueA
ssig
ned
Val
ueA
crea
geA
crea
geSq
. Ft.
Ass
esse
d V
alue
s
025-
025-
012-
000
BR
AR
KA
MA
LJIT
Esta
te L
ot50
,000
$
50,0
00$
Si
ngle
Fam
ily90
,000
$
90
,000
$
0.0
0.0
20,1
1402
5-02
5-01
3-00
0K
AU
R R
AJV
IREs
tate
Lot
50,0
00$
50
,000
$
Sing
le F
amily
90,0
00$
90,0
00$
0.
00.
020
,043
025-
025-
014-
000
BU
I STE
VE
TEs
tate
Lot
50,0
00$
50
,000
$
Sing
le F
amily
90,0
00$
90,0
00$
0.
00.
022
,720
025-
025-
015-
000
MG
OSY
WIL
LY &
LIM
DO
LOR
ESEs
tate
Lot
50,0
00$
50
,000
$
Sing
le F
amily
90,0
00$
90,0
00$
0.
00.
025
,727
025-
025-
016-
000
SUB
IDO
GIL
BER
T M
Sing
le F
amily
247,
452
$
94
,767
$
342,
219
$
Si
ngle
Fam
ily34
2,21
9$
0.0
0.0
20,0
3102
5-02
5-01
7-00
0D
EOL
MA
ND
EEP
Esta
te L
ot50
,000
$
50,0
00$
Si
ngle
Fam
ily90
,000
$
90
,000
$
0.0
0.0
20,4
3502
5-02
5-01
8-00
0TO
BA
RA
MA
YA
CA
RLO
SEs
tate
Lot
39,1
77$
39
,177
$
Sing
le F
amily
90,0
00$
90,0
00$
0.
00.
021
,279
025-
025-
019-
000
ALV
AR
EZ JA
CK
Esta
te L
ot50
,000
$
50,0
00$
Si
ngle
Fam
ily90
,000
$
90
,000
$
0.0
0.0
20,2
1402
5-02
5-02
0-00
0TI
TUS
DEW
AY
NE
& C
LAU
DIA
Sing
le F
amily
457,
263
$
68
,442
$
525,
705
$
Si
ngle
Fam
ily52
5,70
5$
0.0
0.0
20,8
6002
5-02
5-02
1-00
0M
END
ON
CA
DEB
RA
& D
ON
ALD
Sing
le F
amily
317,
635
$
30
,738
$
348,
373
$
Si
ngle
Fam
ily34
8,37
3$
0.0
0.0
20,1
1502
5-02
5-02
2-00
0B
RO
WN
ING
CR
YST
AL
Sing
le F
amily
405,
000
$
30
,000
$
435,
000
$
Si
ngle
Fam
ily43
5,00
0$
0.0
0.0
20,0
5902
5-02
5-02
3-00
0M
UN
RO
SH
AN
E JO
SEPH
Sing
le F
amily
366,
000
$
30
,000
$
396,
000
$
Si
ngle
Fam
ily39
6,00
0$
0.0
0.0
20,0
3602
5-02
5-02
4-00
0G
RA
YC
AR
JOSE
PH &
EM
ON
Sing
le F
amily
152,
321
$
15
2,32
1$
304,
642
$
Si
ngle
Fam
ily30
4,64
2$
0.0
0.0
20,0
7202
5-02
5-02
5-00
0PE
REZ
JOSE
L &
LIV
IESi
ngle
Fam
ily26
7,87
5$
94,5
44$
36
2,41
9$
Sing
le F
amily
362,
419
$
0.
00.
022
,511
025-
025-
026-
000
CA
O Y
AN
GLO
NG
Sing
le F
amily
532,
406
$
50
,227
$
582,
633
$
Si
ngle
Fam
ily58
2,63
3$
0.0
0.0
20,1
6602
5-02
5-02
7-00
0C
AO
YA
NG
LON
GEs
tate
Lot
50,2
27$
50
,227
$
Sing
le F
amily
90,0
00$
90,0
00$
0.
00.
020
,072
025-
025-
028-
000
CA
LIFO
RN
IA E
QU
ITY
MA
NA
GEM
ENT
GR
OU
P, IN
CEs
tate
Lot
50,0
00$
50
,000
$
Sing
le F
amily
90,0
00$
90,0
00$
0.
00.
020
,212
025-
025-
029-
000
BA
RSA
MIA
N R
OB
ERT
C &
TR
ISH
A A
Esta
te L
ot50
,000
$
50,0
00$
Si
ngle
Fam
ily90
,000
$
90
,000
$
0.0
0.0
20,1
1302
5-02
5-03
0-00
0M
AR
TIN
S V
ALD
ERM
IRO
& E
VA
Esta
te L
ot50
,000
$
50,0
00$
Si
ngle
Fam
ily90
,000
$
90
,000
$
0.0
0.0
21,5
0502
5-02
5-03
3-00
0D
HO
ND
MA
NO
J J &
MIT
ASi
ngle
Fam
ily40
5,33
1$
30,1
36$
43
5,46
7$
Sing
le F
amily
435,
467
$
0.
00.
020
,895
025-
025-
034-
000
WO
RLD
INTE
RN
ATI
ON
AL
LLC
Esta
te L
ot (i
nclu
ded
in M
aste
r Dev
elop
er b
ulk
valu
e)31
,587
$
31,5
87$
Si
ngle
Fam
ily-
$
0.
00.
020
,041
025-
025-
035-
000
BO
OS
EDW
AR
D A
III &
SH
AR
I LSi
ngle
Fam
ily29
0,31
2$
30,1
36$
32
0,44
8$
Sing
le F
amily
320,
448
$
0.
00.
020
,498
025-
025-
036-
000
THIE
RSC
H U
LRIC
H A
& F
ELEC
IASi
ngle
Fam
ily29
7,14
2$
30,7
38$
32
7,88
0$
Sing
le F
amily
327,
880
$
0.
00.
020
,061
025-
025-
037-
000
GO
RIT
SKA
IA A
NN
A V
Sing
le F
amily
296,
339
$
30
,136
$
326,
475
$
Si
ngle
Fam
ily32
6,47
5$
0.0
0.0
25,1
5502
5-02
5-03
8-00
0W
ESTS
IDE
PRO
PER
TY M
AN
AG
EMEN
TEs
tate
Lot
10,2
46$
10
,246
$
Sing
le F
amily
90,0
00$
90,0
00$
0.
00.
022
,111
025-
025-
039-
000
MA
SHH
ON
HO
SSEI
N &
MA
SOU
MEH
GEs
tate
Lot
50,0
00$
50
,000
$
Sing
le F
amily
90,0
00$
90,0
00$
0.
00.
020
,711
025-
025-
040-
000
JOH
NSO
N M
AR
TIN
G &
JUD
Y A
Sing
le F
amily
295,
000
$
30
,000
$
325,
000
$
Si
ngle
Fam
ily32
5,00
0$
0.0
0.0
20,2
9102
5-02
5-04
1-00
0D
IAB
LO G
RA
ND
E R
ESID
ENTI
AL
ASS
OC
Exem
ptEx
empt
0.0
0.0
002
5-02
5-04
2-00
0LA
RA
MIC
HA
ELEx
empt
Exem
pt0.
00.
00
025-
025-
043-
000
DIA
BLO
GR
AN
DE
RES
IDEN
TIA
L A
SSO
CEx
empt
Exem
pt0.
00.
00
025-
025-
046-
000
DIA
BLO
GR
AN
DE
RES
IDEN
TIA
L A
SSO
CEx
empt
Exem
pt0.
00.
00
025-
025-
047-
000
WO
RLD
INTE
RN
ATI
ON
AL
LLC
Esta
te L
ot (i
nclu
ded
in M
aste
r Dev
elop
er b
ulk
valu
e)31
,587
$
31,5
87$
Si
ngle
Fam
ily-
$
0.
00.
022
,702
025-
025-
048-
000
CH
AV
EZ R
ICK
E &
LO
RI R
Sing
le F
amily
425,
221
$
46
,108
$
471,
329
$
Si
ngle
Fam
ily47
1,32
9$
0.0
0.0
40,0
2502
5-02
5-04
9-00
0W
OR
LD IN
TER
NA
TIO
NA
L LL
CEs
tate
Lot
(inc
lude
d in
Mas
ter D
evel
oper
bul
k va
lue)
31,5
87$
31
,587
$
Sing
le F
amily
-$
0.0
0.0
41,6
7002
5-02
5-05
0-00
0M
END
OZA
RU
BEN
A &
LO
RR
AIN
E D
Prep
aid
432,
246
$
78
,972
$
511,
218
$
Pr
epai
d0.
00.
025
,089
025-
025-
051-
000
WO
RLD
INTE
RN
ATI
ON
AL
LLC
Esta
te L
ot (i
nclu
ded
in M
aste
r Dev
elop
er b
ulk
valu
e)31
,587
$
31,5
87$
Si
ngle
Fam
ily-
$
0.
00.
020
,959
025-
025-
052-
000
MA
RK
S H
ENR
Y W
& JO
AN
N L
Sing
le F
amily
367,
000
$
35
,000
$
402,
000
$
Si
ngle
Fam
ily40
2,00
0$
0.0
0.0
39,0
2502
5-02
5-05
3-00
0W
OR
LD IN
TER
NA
TIO
NA
L LL
CEs
tate
Lot
(inc
lude
d in
Mas
ter D
evel
oper
bul
k va
lue)
31,5
87$
31
,587
$
Sing
le F
amily
-$
0.0
0.0
33,0
1802
5-02
5-05
4-00
0W
OR
LD IN
TER
NA
TIO
NA
L LL
CEs
tate
Lot
(inc
lude
d in
Mas
ter D
evel
oper
bul
k va
lue)
31,5
87$
31
,587
$
Sing
le F
amily
-$
0.0
0.0
26,7
6602
5-02
5-05
5-00
0W
OR
LD IN
TER
NA
TIO
NA
L LL
CEs
tate
Lot
(inc
lude
d in
Mas
ter D
evel
oper
bul
k va
lue)
31,5
87$
31
,587
$
Sing
le F
amily
-$
0.0
0.0
20,1
9302
5-02
5-05
6-00
0W
OR
LD IN
TER
NA
TIO
NA
L LL
CEs
tate
Lot
(inc
lude
d in
Mas
ter D
evel
oper
bul
k va
lue)
31,5
87$
31
,587
$
Sing
le F
amily
-$
0.0
0.0
24,5
0502
5-02
5-05
7-00
0FU
LLA
RD
MA
RK
Esta
te L
ot55
,000
$
55,0
00$
Si
ngle
Fam
ily90
,000
$
90
,000
$
0.0
0.0
23,9
1202
5-02
5-05
8-00
0TA
YLO
R W
AR
REN
& T
HER
ESA
Esta
te L
ot55
,249
$
55,2
49$
Si
ngle
Fam
ily90
,000
$
90
,000
$
0.0
0.0
20,0
9502
5-02
5-05
9-00
0W
OR
LD IN
TER
NA
TIO
NA
L LL
CEs
tate
Lot
(inc
lude
d in
Mas
ter D
evel
oper
bul
k va
lue)
31,5
87$
31
,587
$
Sing
le F
amily
-$
0.0
0.0
23,5
3502
5-02
5-06
0-00
0W
OR
LD IN
TER
NA
TIO
NA
L LL
CEs
tate
Lot
(inc
lude
d in
Mas
ter D
evel
oper
bul
k va
lue)
31,5
87$
31
,587
$
Sing
le F
amily
-$
0.0
0.0
24,4
9202
5-02
5-06
1-00
0W
OR
LD IN
TER
NA
TIO
NA
L LL
CEs
tate
Lot
(inc
lude
d in
Mas
ter D
evel
oper
bul
k va
lue)
31,5
87$
31
,587
$
Sing
le F
amily
-$
0.0
0.0
21,9
5802
5-02
5-06
2-00
0W
OR
LD IN
TER
NA
TIO
NA
L LL
CEs
tate
Lot
(inc
lude
d in
Mas
ter D
evel
oper
bul
k va
lue)
31,5
87$
31
,587
$
Sing
le F
amily
-$
0.0
0.0
20,0
5702
5-02
5-06
3-00
0W
OR
LD IN
TER
NA
TIO
NA
L LL
CEs
tate
Lot
(inc
lude
d in
Mas
ter D
evel
oper
bul
k va
lue)
31,5
87$
31
,587
$
Sing
le F
amily
-$
0.0
0.0
20,0
3502
5-02
5-06
4-00
0W
OR
LD IN
TER
NA
TIO
NA
L LL
CEs
tate
Lot
(inc
lude
d in
Mas
ter D
evel
oper
bul
k va
lue)
31,5
87$
31
,587
$
Sing
le F
amily
-$
0.0
0.0
20,0
6102
5-02
5-06
5-00
0C
API
TAL
EQU
ITY
MA
NA
GEM
ENT
GR
OU
P IN
CEs
tate
Lot
50,0
00$
50
,000
$
Sing
le F
amily
90,0
00$
90,0
00$
0.
00.
021
,481
025-
025-
066-
000
KIN
G C
HA
D S
TEW
AR
TEs
tate
Lot
50,0
00$
50
,000
$
Sing
le F
amily
90,0
00$
90,0
00$
0.
00.
023
,892
025-
025-
067-
000
FULL
AR
D M
AR
KEs
tate
Lot
48,7
20$
48
,720
$
Sing
le F
amily
90,0
00$
90,0
00$
0.
00.
023
,767
025-
025-
068-
000
WO
RLD
INTE
RN
ATI
ON
AL
LLC
Esta
te L
ot (i
nclu
ded
in M
aste
r Dev
elop
er b
ulk
valu
e)31
,587
$
31,5
87$
Si
ngle
Fam
ily-
$
0.
00.
020
,048
025-
025-
069-
000
WES
TSID
E PR
OPE
RTY
MA
NA
GEM
ENT
Sing
le F
amily
519,
996
$
52
,256
$
572,
252
$
Si
ngle
Fam
ily57
2,25
2$
0.0
0.0
40,9
4602
5-02
6-00
1-00
0V
ALE
NTI
NE
VA
NES
SA &
JOSE
PHSi
ngle
Fam
ily42
1,90
6$
30,1
36$
45
2,04
2$
Sing
le F
amily
452,
042
$
0.
00.
020
,782
025-
026-
002-
000
BO
RR
ELLI
GA
RR
ETT
& K
ATI
ESi
ngle
Fam
ily22
3,75
5$
105,
048
$
32
8,80
3$
Sing
le F
amily
328,
803
$
0.
00.
020
,911
025-
026-
003-
000
RO
SE D
AV
ID &
NA
JAT
Sing
le F
amily
265,
167
$
62
,947
$
328,
114
$
Si
ngle
Fam
ily32
8,11
4$
0.0
0.0
22,2
6902
5-02
6-00
4-00
0H
UG
GER
KU
RT
JSi
ngle
Fam
ily23
6,36
1$
78,7
86$
31
5,14
7$
Sing
le F
amily
315,
147
$
0.
00.
025
,187
025-
026-
005-
000
CO
NFO
RTI
DO
MIN
IC L
& JA
NIC
E P
Sing
le F
amily
353,
500
$
30
,000
$
383,
500
$
Si
ngle
Fam
ily38
3,50
0$
0.0
0.0
22,0
9802
5-02
6-00
6-00
0R
AM
OS
JOH
N &
BR
END
ASi
ngle
Fam
ily35
7,16
8$
94,5
44$
45
1,71
2$
Prep
aid
0.0
0.0
23,0
6602
5-02
6-00
7-00
0SW
IDER
SKI P
AU
L J S
R &
VA
LER
IE J
MSi
ngle
Fam
ily25
6,13
6$
94,5
44$
35
0,68
0$
Sing
le F
amily
350,
680
$
0.
00.
022
,136
025-
026-
008-
000
WY
ATT
JIM
LEs
tate
Lot
25,0
00$
25
,000
$
Sing
le F
amily
90,0
00$
90,0
00$
0.
00.
010
,609
025-
026-
009-
000
WA
LKER
MIC
HA
EL S
& B
ETH
MEs
tate
Lot
25,0
00$
25
,000
$
Sing
le F
amily
90,0
00$
90,0
00$
0.
00.
010
,753
025-
026-
010-
000
WA
LKER
MIC
HA
EL S
& B
ETH
MEs
tate
Lot
25,0
00$
25
,000
$
Sing
le F
amily
90,0
00$
90,0
00$
0.
00.
011
,798
025-
026-
011-
000
LUN
D JA
SON
& A
MY
Sing
le F
amily
632,
500
$
50
,000
$
682,
500
$
Si
ngle
Fam
ily68
2,50
0$
0.0
0.0
11,4
3002
5-02
6-01
2-00
0PE
NA
FLO
RID
A C
AR
LOS
JR &
CH
AR
INA
CSi
ngle
Fam
ily46
0,50
0$
30,0
00$
49
0,50
0$
Sing
le F
amily
490,
500
$
0.
00.
014
,325
025-
026-
013-
000
FRED
ERIC
K JO
HN
L &
KA
THLE
EN L
Sing
le F
amily
261,
000
$
30
,000
$
291,
000
$
Si
ngle
Fam
ily29
1,00
0$
0.0
0.0
12,8
4102
5-02
6-01
4-00
0PE
NEY
RA
NES
SIE
V &
JOV
ITA
JEs
tate
Lot
25,0
00$
25
,000
$
Sing
le F
amily
90,0
00$
90,0
00$
0.
00.
011
,203
025-
026-
015-
000
JOH
NSO
N M
AR
TIN
G &
DEO
LIN
DA
ASi
ngle
Fam
ily41
2,00
0$
30,0
00$
44
2,00
0$
Sing
le F
amily
442,
000
$
0.
00.
022
,913
025-
026-
016-
000
WY
ATT
JIM
LSi
ngle
Fam
ily37
4,00
0$
30,0
00$
40
4,00
0$
Sing
le F
amily
404,
000
$
0.
00.
020
,972
3 of
12
2014
-15
Gro
ss
Tax
able
L
otA
PNO
wne
r (A
s of A
pril
1, 2
015)
Lan
d U
se D
escr
iptio
nIm
pr. V
alue
Lan
d V
alue
Tot
al V
alue
Lan
d U
seA
ppra
ised
Val
ueA
ssig
ned
Val
ueA
crea
geA
crea
geSq
. Ft.
Ass
esse
d V
alue
s
025-
026-
017-
000
FEN
TON
DA
NIE
L E
& P
ATR
ICIA
MSi
ngle
Fam
ily34
3,50
0$
30,0
00$
37
3,50
0$
Sing
le F
amily
373,
500
$
0.
00.
026
,498
025-
026-
018-
000
DO
MIN
GU
EZ R
AY
& A
LMA
Sing
le F
amily
246,
866
$
94
,544
$
341,
410
$
Si
ngle
Fam
ily34
1,41
0$
0.0
0.0
26,4
3802
5-02
6-01
9-00
0PA
INE
NA
NC
YEs
tate
Lot
18,8
12$
18
,812
$
Sing
le F
amily
90,0
00$
90,0
00$
0.
00.
028
,780
025-
026-
020-
000
GU
RM
MA
ND
EEP
SEs
tate
Lot
50,0
00$
50
,000
$
Sing
le F
amily
90,0
00$
90,0
00$
0.
00.
028
,659
025-
026-
021-
000
CEA
RLE
Y R
ON
ALD
EEs
tate
Lot
25,7
96$
25
,796
$
Sing
le F
amily
90,0
00$
90,0
00$
0.
00.
024
,630
025-
026-
022-
000
KA
MB
OJ D
ILJI
T S
& K
AU
R S
AR
BJI
TEs
tate
Lot
50,0
00$
50
,000
$
Sing
le F
amily
90,0
00$
90,0
00$
0.
00.
029
,207
025-
026-
023-
000
MA
RC
OTT
E ST
EVEN
J JR
& A
NG
ELA
NSi
ngle
Fam
ily35
3,00
0$
35,0
00$
38
8,00
0$
Sing
le F
amily
388,
000
$
0.
00.
032
,339
025-
026-
024-
000
LOM
AN
TO P
ETER
MIC
HA
ELSi
ngle
Fam
ily32
1,45
2$
30,1
36$
35
1,58
8$
Sing
le F
amily
351,
588
$
0.
00.
024
,014
025-
026-
025-
000
GPT
J HO
LDIN
GS
LLC
Esta
te L
ot47
,382
$
47,3
82$
Si
ngle
Fam
ily90
,000
$
90
,000
$
0.0
0.0
27,4
1902
5-02
6-02
6-00
0PE
TER
S M
AR
K C
Esta
te L
ot50
,000
$
50,0
00$
Si
ngle
Fam
ily90
,000
$
90
,000
$
0.0
0.0
24,4
7002
5-02
6-02
7-00
0Y
BA
RR
A A
ND
REW
G &
FA
NN
IE V
Esta
te L
ot23
,515
$
23,5
15$
Si
ngle
Fam
ily90
,000
$
90
,000
$
0.0
0.0
42,5
5602
5-02
6-02
8-00
0TR
IVED
I RIT
ESH
& S
HEF
ALI
Esta
te L
ot9,
040
$
9,04
0$
Sing
le F
amily
90,0
00$
90,0
00$
0.
00.
023
,150
025-
026-
029-
000
DIA
BLO
GR
AN
DE
RES
IDEN
TIA
L A
SSO
CEx
empt
Exem
pt0.
00.
00
025-
027-
001-
000
CH
AD
INH
A A
BEL
M &
PA
ULA
MEs
tate
Lot
75,0
00$
75
,000
$
Sing
le F
amily
175,
000
$
175,
000
$
3.
30.
014
5,49
002
5-02
7-00
2-00
0G
NES
A H
ENR
Y A
& JI
LL E
Esta
te L
ot75
,000
$
75,0
00$
Si
ngle
Fam
ily17
5,00
0$
17
5,00
0$
3.0
0.0
131,
987
025-
027-
003-
000
CEA
RLE
Y R
ON
ALD
EEs
tate
Lot
75,0
00$
75
,000
$
Sing
le F
amily
135,
000
$
135,
000
$
2.
80.
012
2,83
902
5-02
7-00
7-00
0A
ND
ERSE
N D
AN
& A
ND
ERSO
N T
ERES
AEs
tate
Lot
50,0
00$
50
,000
$
Sing
le F
amily
90,0
00$
90,0
00$
0.
00.
027
,564
025-
027-
008-
000
WO
RLD
INTE
RN
ATI
ON
AL
LLC
Esta
te L
ot (i
nclu
ded
in M
aste
r Dev
elop
er b
ulk
valu
e)31
,587
$
31,5
87$
Si
ngle
Fam
ily-
$
3.
30.
014
5,05
502
5-02
7-01
0-00
0D
IAB
LO G
RA
ND
E R
ESID
ENTI
AL
ASS
OC
Exem
ptEx
empt
0.0
0.0
002
5-02
7-01
1-00
0D
IAB
LO G
RA
ND
E R
ESID
ENTI
AL
ASS
OC
Exem
ptEx
empt
0.0
0.0
002
5-02
7-01
2-00
0W
OR
LD IN
TER
NA
TIO
NA
L LL
CEs
tate
Lot
(inc
lude
d in
Mas
ter D
evel
oper
bul
k va
lue)
31,5
14$
31
,514
$
Sing
le F
amily
-$
3.3
0.0
145,
490
025-
027-
013-
000
WO
RLD
INTE
RN
ATI
ON
AL
LLC
Esta
te L
ot (i
nclu
ded
in M
aste
r Dev
elop
er b
ulk
valu
e)31
,514
$
31,5
14$
Si
ngle
Fam
ily-
$
3.
00.
013
1,98
702
5-02
7-01
4-00
0C
RU
Z SA
NTI
AG
O &
JULI
E A
Sing
le F
amily
384,
341
$
57
,913
$
442,
254
$
Si
ngle
Fam
ily44
2,25
4$
0.7
0.0
30,4
9202
5-02
7-01
5-00
0W
OR
LD IN
TER
NA
TIO
NA
L LL
CEs
tate
Lot
(inc
lude
d in
Mas
ter D
evel
oper
bul
k va
lue)
31,5
14$
31
,514
$
Sing
le F
amily
-$
0.6
0.0
26,5
7202
5-02
7-01
6-00
0W
OR
LD IN
TER
NA
TIO
NA
L LL
CEs
tate
Lot
(inc
lude
d in
Mas
ter D
evel
oper
bul
k va
lue)
31,5
14$
31
,514
$
Sing
le F
amily
-$
0.6
0.0
23,9
5802
5-02
7-01
7-00
0N
Y D
IAB
LO G
RA
ND
E LL
CEs
tate
Lot
60,0
00$
60
,000
$
Sing
le F
amily
135,
000
$
135,
000
$
1.
70.
072
,310
025-
027-
018-
000
TER
RY
DEV
ELO
PMEN
T IN
CEs
tate
Lot
50,0
00$
50
,000
$
Sing
le F
amily
90,0
00$
90,0
00$
0.
80.
036
,155
025-
027-
021-
000
SOU
ZA G
EOR
GE
J & M
AR
LEN
E M
Esta
te L
ot16
,394
$
16,3
94$
Si
ngle
Fam
ily90
,000
$
90
,000
$
0.0
0.0
40,0
3102
5-02
7-02
2-00
0ST
AR
R P
AR
TNER
S LL
CSi
ngle
Fam
ily40
1,81
6$
45,2
04$
44
7,02
0$
Sing
le F
amily
447,
020
$
1.
00.
041
,818
025-
028-
003-
000
DIA
BLO
GR
AN
DE
RES
IDEN
TIA
L A
SSO
CEx
empt
Exem
pt0.
00.
00
025-
028-
007-
000
WO
RLD
INTE
RN
ATI
ON
AL
LLC
Esta
te L
ot (i
nclu
ded
in M
aste
r Dev
elop
er b
ulk
valu
e)42
,119
$
42,1
19$
Si
ngle
Fam
ily-
$
9.
10.
039
7,70
302
5-02
8-00
8-00
0W
OR
LD IN
TER
NA
TIO
NA
L LL
CEs
tate
Lot
(inc
lude
d in
Mas
ter D
evel
oper
bul
k va
lue)
36,8
53$
36
,853
$
Sing
le F
amily
-$
5.9
0.0
256,
133
025-
028-
009-
000
WO
RLD
INTE
RN
ATI
ON
AL
LLC
Esta
te L
ot (i
nclu
ded
in M
aste
r Dev
elop
er b
ulk
valu
e)36
,766
$
36,7
66$
Si
ngle
Fam
ily-
$
5.
90.
025
4,82
602
5-02
8-01
0-00
0FR
Y L
AU
REN
CE
S &
MIC
HEL
E A
Sing
le F
amily
463,
315
$
78
,972
$
542,
287
$
Si
ngle
Fam
ily54
2,28
7$
1.1
0.0
48,3
5202
5-02
8-01
1-00
0W
OR
LD IN
TER
NA
TIO
NA
L LL
CEs
tate
Lot
(inc
lude
d in
Mas
ter D
evel
oper
bul
k va
lue)
31,5
14$
31
,514
$
Sing
le F
amily
-$
1.2
0.0
52,7
0802
5-02
8-01
2-00
0A
ND
ERSE
N B
RIA
N &
AM
YEs
tate
Lot
50,0
00$
50
,000
$
Sing
le F
amily
90,0
00$
90,0
00$
1.
00.
041
,818
025-
028-
013-
000
DIA
BLO
GR
AN
DE
LTD
PA
REs
tate
Lot
58,6
01$
58
,601
$
Sing
le F
amily
135,
000
$
135,
000
$
1.
40.
059
,242
025-
028-
014-
000
WO
RLD
INTE
RN
ATI
ON
AL
LLC
Esta
te L
ot (i
nclu
ded
in M
aste
r Dev
elop
er b
ulk
valu
e)31
,514
$
31,5
14$
Si
ngle
Fam
ily-
$
0.
50.
021
,780
025-
028-
015-
000
WO
RLD
INTE
RN
ATI
ON
AL
LLC
Esta
te L
ot (i
nclu
ded
in M
aste
r Dev
elop
er b
ulk
valu
e)31
,514
$
31,5
14$
Si
ngle
Fam
ily-
$
0.
50.
022
,651
025-
028-
016-
000
WO
RLD
INTE
RN
ATI
ON
AL
LLC
Esta
te L
ot (i
nclu
ded
in M
aste
r Dev
elop
er b
ulk
valu
e)31
,514
$
31,5
14$
Si
ngle
Fam
ily-
$
0.
50.
020
,909
025-
028-
017-
000
WO
RLD
INTE
RN
ATI
ON
AL
LLC
Esta
te L
ot (i
nclu
ded
in M
aste
r Dev
elop
er b
ulk
valu
e)31
,514
$
31,5
14$
Si
ngle
Fam
ily-
$
0.
70.
031
,363
025-
028-
018-
000
WO
RLD
INTE
RN
ATI
ON
AL
LLC
Esta
te L
ot (i
nclu
ded
in M
aste
r Dev
elop
er b
ulk
valu
e)31
,514
$
31,5
14$
Si
ngle
Fam
ily-
$
0.
90.
040
,075
025-
028-
019-
000
WO
RLD
INTE
RN
ATI
ON
AL
LLC
Esta
te L
ot (i
nclu
ded
in M
aste
r Dev
elop
er b
ulk
valu
e)31
,514
$
31,5
14$
Si
ngle
Fam
ily-
$
0.
80.
032
,670
025-
028-
020-
000
WO
RLD
INTE
RN
ATI
ON
AL
LLC
Esta
te L
ot (i
nclu
ded
in M
aste
r Dev
elop
er b
ulk
valu
e)31
,514
$
31,5
14$
Si
ngle
Fam
ily-
$
0.
60.
023
,958
025-
028-
021-
000
WO
RLD
INTE
RN
ATI
ON
AL
LLC
Esta
te L
ot (i
nclu
ded
in M
aste
r Dev
elop
er b
ulk
valu
e)31
,514
$
31,5
14$
Si
ngle
Fam
ily-
$
0.
50.
021
,344
025-
028-
022-
000
WO
RLD
INTE
RN
ATI
ON
AL
LLC
Esta
te L
ot (i
nclu
ded
in M
aste
r Dev
elop
er b
ulk
valu
e)31
,514
$
31,5
14$
Si
ngle
Fam
ily-
$
0.
60.
025
,265
025-
028-
023-
000
WO
RLD
INTE
RN
ATI
ON
AL
LLC
Esta
te L
ot (i
nclu
ded
in M
aste
r Dev
elop
er b
ulk
valu
e)31
,514
$
31,5
14$
Si
ngle
Fam
ily-
$
0.
60.
023
,958
025-
028-
024-
000
WO
RLD
INTE
RN
ATI
ON
AL
LLC
Esta
te L
ot (i
nclu
ded
in M
aste
r Dev
elop
er b
ulk
valu
e)31
,587
$
31,5
87$
Si
ngle
Fam
ily-
$
0.
70.
032
,234
025-
028-
025-
000
WO
RLD
INTE
RN
ATI
ON
AL
LLC
Esta
te L
ot (i
nclu
ded
in M
aste
r Dev
elop
er b
ulk
valu
e)31
,587
$
31,5
87$
Si
ngle
Fam
ily-
$
1.
00.
043
,124
025-
028-
026-
000
WO
RLD
INTE
RN
ATI
ON
AL
LLC
Esta
te L
ot (i
nclu
ded
in M
aste
r Dev
elop
er b
ulk
valu
e)31
,587
$
31,5
87$
Si
ngle
Fam
ily-
$
1.
50.
063
,598
025-
028-
027-
000
RU
OSS
JEFF
REY
SC
OTT
& E
MIL
Y E
LIZA
BET
HSi
ngle
Fam
ily40
0,13
6$
89,5
03$
48
9,63
9$
Sing
le F
amily
489,
639
$
1.
10.
046
,174
025-
029-
001-
000
RO
DR
IGU
EZ A
BEL
AR
DO
& R
ON
ISi
ngle
Fam
ily16
1,99
4$
41,8
04$
20
3,79
8$
Sing
le F
amily
203,
798
$
0.
00.
05,
781
025-
029-
002-
000
BLA
CK
GLE
NN
& L
OR
ISi
ngle
Fam
ily24
6,11
2$
30,1
36$
27
6,24
8$
Sing
le F
amily
276,
248
$
0.
00.
06,
206
025-
029-
003-
000
MIL
LAR
DEB
RA
JSi
ngle
Fam
ily18
2,00
0$
20,0
00$
20
2,00
0$
Sing
le F
amily
202,
000
$
0.
00.
07,
563
025-
029-
004-
000
BEC
KLE
R JE
FFR
EY A
& S
USA
N M
Sing
le F
amily
183,
000
$
20
,000
$
203,
000
$
Si
ngle
Fam
ily20
3,00
0$
0.0
0.0
7,75
402
5-02
9-00
5-00
0B
AK
ER L
IND
ASi
ngle
Fam
ily26
1,18
0$
20,0
90$
28
1,27
0$
Sing
le F
amily
281,
270
$
0.
00.
05,
581
025-
029-
006-
000
AG
AN
AD
AR
MA
ND
O S
Sing
le F
amily
135,
866
$
41
,804
$
177,
670
$
Si
ngle
Fam
ily17
7,67
0$
0.0
0.0
5,01
802
5-02
9-00
7-00
0C
ERN
Y L
AU
REN
Sing
le F
amily
135,
612
$
20
,090
$
155,
702
$
Si
ngle
Fam
ily15
5,70
2$
0.0
0.0
5,25
802
5-02
9-00
8-00
0K
AM
EL A
YM
AN
Sing
le F
amily
110,
562
$
42
,119
$
152,
681
$
Si
ngle
Fam
ily15
2,68
1$
0.0
0.0
4,92
202
5-02
9-00
9-00
0N
EMET
H D
ESID
ERIU
S S
F &
PA
TRIC
IA R
Sing
le F
amily
97,6
94$
63
,028
$
160,
722
$
Si
ngle
Fam
ily16
0,72
2$
0.0
0.0
5,36
902
5-02
9-01
0-00
0PE
REZ
RO
BER
T &
VA
NES
SA M
Sing
le F
amily
162,
825
$
68
,280
$
231,
105
$
Si
ngle
Fam
ily23
1,10
5$
0.0
0.0
5,70
402
5-02
9-01
1-00
0N
AV
AR
RO
AM
AD
OR
Sing
le F
amily
103,
191
$
42
,119
$
145,
310
$
Si
ngle
Fam
ily14
5,31
0$
0.0
0.0
5,92
602
5-02
9-01
2-00
0W
HIT
E H
AM
ISI M
Sing
le F
amily
170,
771
$
25
,113
$
195,
884
$
Si
ngle
Fam
ily19
5,88
4$
0.0
0.0
6,14
302
5-02
9-01
3-00
0PA
INE
NA
NC
Y R
OSA
NN
ASi
ngle
Fam
ily23
9,50
0$
20,0
00$
25
9,50
0$
Sing
le F
amily
259,
500
$
0.
00.
05,
555
025-
029-
014-
000
RIC
HA
RD
SON
DA
VID
ASi
ngle
Fam
ily16
0,72
5$
63,0
28$
22
3,75
3$
Sing
le F
amily
223,
753
$
0.
00.
06,
493
025-
029-
015-
000
LIN
DSE
Y M
ATT
HEW
& N
ATA
LIE
Sing
le F
amily
91,3
91$
52
,524
$
143,
915
$
Si
ngle
Fam
ily14
3,91
5$
0.0
0.0
5,97
802
5-02
9-01
6-00
0ER
ICK
SON
JESS
E G
& A
DR
IAN
NE
Sing
le F
amily
138,
345
$
14
,631
$
152,
976
$
Si
ngle
Fam
ily15
2,97
6$
0.0
0.0
7,45
602
5-02
9-01
7-00
0SW
ISH
ER M
AR
CU
S A
& N
ICO
LE A
Sing
le F
amily
185,
000
$
20
,000
$
205,
000
$
Si
ngle
Fam
ily20
5,00
0$
0.0
0.0
5,60
202
5-02
9-01
8-00
0W
HIT
E JA
CK
D &
AM
Y E
Sing
le F
amily
158,
817
$
20
,492
$
179,
309
$
Si
ngle
Fam
ily17
9,30
9$
0.0
0.0
5,61
902
5-02
9-01
9-00
0EQ
UIT
Y T
RU
ST C
OM
PAN
Y C
UST
OD
IAN
Sing
le F
amily
115,
827
$
52
,647
$
168,
474
$
Si
ngle
Fam
ily16
8,47
4$
0.0
0.0
5,58
0
4 of
12

2014
-15
Gro
ss
Tax
able
L
otA
PNO
wne
r (A
s of A
pril
1, 2
015)
Lan
d U
se D
escr
iptio
nIm
pr. V
alue
Lan
d V
alue
Tot
al V
alue
Lan
d U
seA
ppra
ised
Val
ueA
ssig
ned
Val
ueA
crea
geA
crea
geSq
. Ft.
Ass
esse
d V
alue
s
025-
029-
020-
000
AR
AB
ZAI F
AR
DIN
Sing
le F
amily
180,
817
$
20
,090
$
200,
907
$
Si
ngle
Fam
ily20
0,90
7$
0.0
0.0
5,48
502
5-02
9-02
1-00
0C
HEN
HA
N &
QI X
IAO
NIN
GSi
ngle
Fam
ily13
0,59
0$
20,0
90$
15
0,68
0$
Sing
le F
amily
150,
680
$
0.
00.
05,
390
025-
029-
022-
000
ELO
LA JA
MES
& E
RIN
Sing
le F
amily
261,
682
$
20
,090
$
281,
772
$
Si
ngle
Fam
ily28
1,77
2$
0.0
0.0
4,96
502
5-02
9-02
3-00
0M
AR
TIN
STE
PHEN
LSi
ngle
Fam
ily63
,028
$
52,5
24$
11
5,55
2$
Sing
le F
amily
115,
552
$
0.
00.
05,
371
025-
029-
024-
000
DO
TSO
N N
ICH
OLE
Sing
le F
amily
133,
202
$
20
,492
$
153,
694
$
Si
ngle
Fam
ily15
3,69
4$
0.0
0.0
5,04
202
5-02
9-02
5-00
0R
OD
RIG
UEZ
JEN
NIE
Sing
le F
amily
113,
529
$
20
,492
$
134,
021
$
Si
ngle
Fam
ily13
4,02
1$
0.0
0.0
4,73
802
5-02
9-02
6-00
0R
UEL
AS
FER
NA
ND
OSi
ngle
Fam
ily12
0,80
5$
52,5
24$
17
3,32
9$
Sing
le F
amily
173,
329
$
0.
00.
04,
738
025-
029-
027-
000
BR
OW
NFI
ELD
DEN
NIS
Sing
le F
amily
123,
558
$
20
,090
$
143,
648
$
Si
ngle
Fam
ily14
3,64
8$
0.0
0.0
4,61
602
5-02
9-02
8-00
0G
OM
EZ L
UIS
AN
TON
IOSi
ngle
Fam
ily18
0,81
7$
20,0
90$
20
0,90
7$
Sing
le F
amily
200,
907
$
0.
00.
04,
356
025-
029-
029-
000
SAM
SON
VIC
TOR
INO
CSi
ngle
Fam
ily23
0,00
0$
20,0
00$
25
0,00
0$
Sing
le F
amily
250,
000
$
0.
00.
04,
602
025-
029-
030-
000
PER
EZ JU
LISS
ASi
ngle
Fam
ily13
5,86
6$
41,8
04$
17
7,67
0$
Sing
le F
amily
177,
670
$
0.
00.
08,
328
025-
029-
031-
000
LEM
US
ALB
ERTO
Sing
le F
amily
229,
000
$
20
,000
$
249,
000
$
Si
ngle
Fam
ily24
9,00
0$
0.0
0.0
4,59
202
5-02
9-03
2-00
0M
ASO
N R
OB
ERT
WA
YN
ESi
ngle
Fam
ily15
5,72
2$
20,9
02$
17
6,62
4$
Sing
le F
amily
176,
624
$
0.
00.
04,
458
025-
029-
033-
000
JEN
SEN
DA
VID
C &
MA
RLE
NE
RSi
ngle
Fam
ily10
7,58
6$
20,4
92$
12
8,07
8$
Sing
le F
amily
128,
078
$
0.
00.
04,
692
025-
029-
034-
000
OLA
LIA
LU
ZVIM
IND
A S
AN
DO
VA
LSi
ngle
Fam
ily25
4,00
0$
20,0
00$
27
4,00
0$
Sing
le F
amily
274,
000
$
0.
00.
04,
830
025-
029-
035-
000
CH
AV
ES C
ALL
IE J
Sing
le F
amily
94,2
66$
40
,985
$
135,
251
$
Si
ngle
Fam
ily13
5,25
1$
0.0
0.0
4,96
802
5-02
9-03
6-00
0H
ERN
AEZ
-GA
RZA
MA
RG
AR
ITA
Sing
le F
amily
239,
500
$
20
,000
$
259,
500
$
Si
ngle
Fam
ily25
9,50
0$
0.0
0.0
4,96
802
5-02
9-03
7-00
0SI
ERR
A JO
HN
MSi
ngle
Fam
ily26
6,50
0$
20,0
00$
28
6,50
0$
Sing
le F
amily
286,
500
$
0.
00.
04,
979
025-
029-
038-
000
WIT
HER
S C
HA
RLE
S &
ESM
ERA
LDA
Sing
le F
amily
233,
000
$
20
,000
$
253,
000
$
Si
ngle
Fam
ily25
3,00
0$
0.0
0.0
6,52
302
5-02
9-03
9-00
0D
HA
LIW
AL
SHA
MSH
ERPr
epai
d12
3,32
4$
31,3
53$
15
4,67
7$
Prep
aid
0.0
0.0
7,60
202
5-02
9-04
0-00
0LT
D D
EVEL
OPM
ENT
INC
Sing
le F
amily
229,
000
$
20
,000
$
249,
000
$
Si
ngle
Fam
ily24
9,00
0$
0.0
0.0
6,45
902
5-02
9-04
1-00
0W
ON
G A
MEL
IA O
I CH
ING
Sing
le F
amily
106,
245
$
42
,119
$
148,
364
$
Si
ngle
Fam
ily14
8,36
4$
0.0
0.0
6,53
502
5-02
9-04
2-00
0M
ILLE
R D
AV
ID W
Sing
le F
amily
183,
000
$
20
,000
$
203,
000
$
Si
ngle
Fam
ily20
3,00
0$
0.0
0.0
8,77
702
5-02
9-04
3-00
0M
EDIN
A R
AFA
EL &
JOK
AB
EDSi
ngle
Fam
ily12
9,08
3$
20,0
90$
14
9,17
3$
Sing
le F
amily
149,
173
$
0.
00.
07,
123
025-
029-
044-
000
VA
SON
CH
RIS
TIN
ESi
ngle
Fam
ily18
3,00
0$
20,0
00$
20
3,00
0$
Sing
le F
amily
203,
000
$
0.
00.
06,
444
025-
029-
045-
000
ATW
AL
JASW
IND
ER &
SH
AM
IND
ERSi
ngle
Fam
ily10
0,03
3$
52,6
47$
15
2,68
0$
Sing
le F
amily
152,
680
$
0.
00.
05,
197
025-
029-
046-
000
CO
X C
LAR
ENC
E L
JR &
EV
ELY
N H
Sing
le F
amily
126,
029
$
20
,492
$
146,
521
$
Si
ngle
Fam
ily14
6,52
1$
0.0
0.0
4,60
402
5-02
9-04
7-00
0M
AR
INO
S LA
UR
A L
Sing
le F
amily
143,
448
$
20
,492
$
163,
940
$
Si
ngle
Fam
ily16
3,94
0$
0.0
0.0
5,22
102
5-02
9-04
8-00
0D
IAB
LO G
RA
ND
E R
ESID
ENTI
AL
ASS
NEx
empt
Exem
pt0.
00.
00
025-
029-
049-
000
DIA
BLO
GR
AN
DE
RES
IDEN
TIA
L A
SSN
Exem
ptEx
empt
0.0
0.0
002
5-02
9-05
0-00
0D
IAB
LO G
RA
ND
E R
ESID
ENTI
AL
ASS
OC
Exem
ptEx
empt
0.0
0.0
002
5-02
9-05
1-00
0D
IAB
LO G
RA
ND
E R
ESID
ENTI
AL
ASS
OC
Exem
ptEx
empt
0.0
0.0
002
5-03
0-00
1-00
0B
UTC
HER
MIC
HA
EL D
& E
ILEE
NSi
ngle
Fam
ily19
1,00
0$
20,0
00$
21
1,00
0$
Sing
le F
amily
211,
000
$
0.
00.
07,
387
025-
030-
002-
000
DE
PAU
W S
HEL
BY
MSi
ngle
Fam
ily13
1,31
1$
52,5
24$
18
3,83
5$
Sing
le F
amily
183,
835
$
0.
00.
07,
102
025-
030-
003-
000
REY
ES E
DW
AR
D F
Sing
le F
amily
210,
953
$
20
,090
$
231,
043
$
Si
ngle
Fam
ily23
1,04
3$
0.0
0.0
7,15
502
5-03
0-00
4-00
0Y
AJK
O K
ENN
ETH
& M
AU
REE
NSi
ngle
Fam
ily82
,289
$
52,6
47$
13
4,93
6$
Sing
le F
amily
134,
936
$
0.
00.
06,
446
025-
030-
005-
000
MIL
TON
KA
YZE
LLSi
ngle
Fam
ily25
1,00
0$
20,0
00$
27
1,00
0$
Sing
le F
amily
271,
000
$
0.
00.
06,
189
025-
030-
006-
000
OU
DO
MPH
AN
H V
ICTO
R &
VIC
TOR
IASi
ngle
Fam
ily15
2,68
2$
52,6
47$
20
5,32
9$
Sing
le F
amily
205,
329
$
0.
00.
05,
962
025-
030-
007-
000
PAD
RO
N D
IAN
ASi
ngle
Fam
ily12
2,27
8$
20,9
02$
14
3,18
0$
Sing
le F
amily
143,
180
$
0.
00.
06,
026
025-
030-
008-
000
MIX
EY JO
HN
B &
KA
REN
MSi
ngle
Fam
ily19
6,44
1$
63,0
28$
25
9,46
9$
Sing
le F
amily
259,
469
$
0.
00.
06,
228
025-
030-
009-
000
SHEP
PER
D JA
MES
& Y
VO
NN
E E
Sing
le F
amily
255,
500
$
20
,000
$
275,
500
$
Si
ngle
Fam
ily27
5,50
0$
0.0
0.0
6,54
102
5-03
0-01
0-00
0C
HA
VEZ
CIR
ILO
Sing
le F
amily
200,
908
$
20
,090
$
220,
998
$
Si
ngle
Fam
ily22
0,99
8$
0.0
0.0
6,02
002
5-03
0-01
1-00
0G
OLD
SBER
RY
MIC
HA
EL &
SU
SAN
Sing
le F
amily
280,
500
$
20
,000
$
300,
500
$
Si
ngle
Fam
ily30
0,50
0$
0.0
0.0
5,84
402
5-03
0-01
2-00
0B
RA
H K
IRA
NJE
ET K
AU
RSi
ngle
Fam
ily25
1,00
0$
20,0
00$
27
1,00
0$
Sing
le F
amily
271,
000
$
0.
00.
07,
018
025-
030-
013-
000
WES
TER
N P
AC
IFIC
HO
USI
NG
Impr
oved
Sin
gle
Fam
ily R
esid
entia
l Lot
50'
x 1
05' T
ypic
al L
ot30
,000
$
30,0
00$
Si
ngle
Fam
ily10
4,00
0$
10
4,00
0$
0.0
0.0
16,2
8602
5-03
0-01
4-00
0W
ESTE
RN
PA
CIF
IC H
OU
SIN
GIm
prov
ed S
ingl
e Fa
mily
Res
iden
tial L
ot 5
0' x
105
' Typ
ical
Lot
25,0
00$
25
,000
$
Sing
le F
amily
104,
000
$
104,
000
$
0.
00.
08,
096
025-
030-
015-
000
WES
TER
N P
AC
IFIC
HO
USI
NG
Impr
oved
Sin
gle
Fam
ily R
esid
entia
l Lot
50'
x 1
05' T
ypic
al L
ot25
,000
$
25,0
00$
Si
ngle
Fam
ily10
4,00
0$
10
4,00
0$
0.0
0.0
6,60
002
5-03
0-01
6-00
0O
NA
DO
MIN
AD
OR
LSi
ngle
Fam
ily23
9,50
0$
20,0
00$
25
9,50
0$
Sing
le F
amily
259,
500
$
0.
00.
06,
777
025-
030-
017-
000
AH
UJA
DH
AR
AM
& S
AN
TOSH
Sing
le F
amily
260,
000
$
20
,000
$
280,
000
$
Si
ngle
Fam
ily28
0,00
0$
0.0
0.0
6,81
102
5-03
0-01
8-00
0A
HER
N T
HO
MA
S G
& B
EVER
LYSi
ngle
Fam
ily27
7,00
0$
20,0
00$
29
7,00
0$
Sing
le F
amily
297,
000
$
0.
00.
07,
656
025-
030-
019-
000
GA
RC
IA C
AR
OL
JSi
ngle
Fam
ily23
9,50
0$
20,0
00$
25
9,50
0$
Sing
le F
amily
259,
500
$
0.
00.
06,
656
025-
030-
020-
000
GA
LOTT
A M
ICH
AEL
J SR
Sing
le F
amily
260,
000
$
20
,000
$
280,
000
$
Si
ngle
Fam
ily28
0,00
0$
0.0
0.0
8,51
502
5-03
0-02
1-00
0JA
VA
DI T
OU
RA
JSi
ngle
Fam
ily19
9,80
3$
20,4
92$
22
0,29
5$
Sing
le F
amily
220,
295
$
0.
00.
011
,494
025-
030-
022-
000
SUN
DB
ERG
KEN
NET
H &
PR
ISC
ILLA
Sing
le F
amily
270,
000
$
20
,000
$
290,
000
$
Si
ngle
Fam
ily29
0,00
0$
0.0
0.0
6,36
802
5-03
0-02
3-00
0M
ELLO
-MA
RTI
NEZ
VIC
KI L
& C
AR
LOS
Sing
le F
amily
152,
669
$
20
,492
$
173,
161
$
Si
ngle
Fam
ily17
3,16
1$
0.0
0.0
5,42
602
5-03
0-02
4-00
0B
AU
TIST
A F
RA
NK
Sing
le F
amily
179,
310
$
20
,492
$
199,
802
$
Si
ngle
Fam
ily19
9,80
2$
0.0
0.0
5,50
002
5-03
0-02
5-00
0G
ILL
HA
RR
Y &
AN
NA
Sing
le F
amily
220,
000
$
20
,000
$
240,
000
$
Si
ngle
Fam
ily24
0,00
0$
0.0
0.0
5,50
002
5-03
0-02
6-00
0O
RR
IS D
AV
ID &
JON
ISi
ngle
Fam
ily12
3,11
5$
41,8
04$
16
4,91
9$
Sing
le F
amily
164,
919
$
0.
00.
05,
500
025-
030-
027-
000
HEN
WO
OD
CO
RY
Sing
le F
amily
246,
112
$
20
,090
$
266,
202
$
Si
ngle
Fam
ily26
6,20
2$
0.0
0.0
5,50
002
5-03
0-02
8-00
0W
HIT
LOW
JAN
INE
MSi
ngle
Fam
ily15
3,10
9$
41,8
04$
19
4,91
3$
Sing
le F
amily
194,
913
$
0.
00.
05,
500
025-
030-
029-
000
ELO
LA S
TEV
ENSi
ngle
Fam
ily25
8,16
6$
20,0
90$
27
8,25
6$
Sing
le F
amily
278,
256
$
0.
00.
05,
500
025-
030-
030-
000
NU
SOM
RO
BER
TSi
ngle
Fam
ily15
9,67
3$
52,5
24$
21
2,19
7$
Sing
le F
amily
212,
197
$
0.
00.
05,
608
025-
030-
031-
000
TULL
ER G
REG
OR
Y A
Sing
le F
amily
117,
932
$
52
,647
$
170,
579
$
Si
ngle
Fam
ily17
0,57
9$
0.0
0.0
5,93
202
5-03
0-03
2-00
0B
REL
AN
D T
ERR
Y &
YIN
YIN
G L
Sing
le F
amily
148,
930
$
41
,804
$
190,
734
$
Si
ngle
Fam
ily19
0,73
4$
0.0
0.0
5,81
102
5-03
0-03
3-00
0M
OTA
S H
ERM
ENEG
ILD
OSi
ngle
Fam
ily27
7,00
0$
20,0
00$
29
7,00
0$
Sing
le F
amily
297,
000
$
0.
00.
05,
674
025-
030-
034-
000
YA
NG
LIN
& G
AO
MIN
Sing
le F
amily
260,
000
$
20
,000
$
280,
000
$
Si
ngle
Fam
ily28
0,00
0$
0.0
0.0
5,86
602
5-03
0-03
5-00
0M
ITC
HEL
L PE
TER
S &
ILZE
GSi
ngle
Fam
ily14
7,06
8$
52,5
24$
19
9,59
2$
Sing
le F
amily
199,
592
$
0.
00.
05,
883
025-
030-
036-
000
ASC
ENC
IO E
NR
IQU
E &
GLO
RIA
Sing
le F
amily
277,
000
$
20
,000
$
297,
000
$
Si
ngle
Fam
ily29
7,00
0$
0.0
0.0
5,78
502
5-03
0-03
7-00
0ST
ON
E M
AR
SHA
LL &
SU
SAN
Prep
aid
119,
935
$
52
,647
$
172,
582
$
Pr
epai
d0.
00.
06,
543
025-
030-
038-
000
WA
TTS
AN
DR
E TY
REL
L &
STE
PHA
NIE
DSi
ngle
Fam
ily16
3,03
8$
41,8
04$
20
4,84
2$
Sing
le F
amily
204,
842
$
0.
00.
07,
235
5 of
12
2014
-15
Gro
ss
Tax
able
L
otA
PNO
wne
r (A
s of A
pril
1, 2
015)
Lan
d U
se D
escr
iptio
nIm
pr. V
alue
Lan
d V
alue
Tot
al V
alue
Lan
d U
seA
ppra
ised
Val
ueA
ssig
ned
Val
ueA
crea
geA
crea
geSq
. Ft.
Ass
esse
d V
alue
s
025-
030-
039-
000
HA
RR
IS JO
SEPH
A &
CH
AR
ITO
ASi
ngle
Fam
ily20
3,41
9$
20,0
90$
22
3,50
9$
Sing
le F
amily
223,
509
$
0.
00.
07,
444
025-
030-
040-
000
MO
SBY
MER
RIT
T C
& C
AR
ITA
DSi
ngle
Fam
ily94
,544
$
52,5
24$
14
7,06
8$
Sing
le F
amily
147,
068
$
0.
00.
07,
590
025-
030-
041-
000
LEG
OU
RD
FR
AN
CK
M &
CA
THY
LSi
ngle
Fam
ily15
1,26
9$
63,0
28$
21
4,29
7$
Sing
le F
amily
214,
297
$
0.
00.
08,
676
025-
030-
042-
000
HO
NG
KY
UN
G C
& M
AG
GIE
YO
UN
G H
UI
Sing
le F
amily
106,
098
$
52
,524
$
158,
622
$
Si
ngle
Fam
ily15
8,62
2$
0.0
0.0
6,17
302
5-03
0-04
3-00
0FI
NTO
N A
DA
M &
JILL
IAN
Sing
le F
amily
129,
209
$
52
,524
$
181,
733
$
Si
ngle
Fam
ily18
1,73
3$
0.0
0.0
5,00
002
5-03
0-04
4-00
0H
ILL
MA
RK
& K
ATH
LEEN
Sing
le F
amily
89,5
03$
52
,647
$
142,
150
$
Si
ngle
Fam
ily14
2,15
0$
0.0
0.0
5,00
002
5-03
0-04
5-00
0ZH
AO
ZH
I VIA
OSi
ngle
Fam
ily12
8,07
8$
20,4
92$
14
8,57
0$
Sing
le F
amily
148,
570
$
0.
00.
05,
000
025-
030-
046-
000
SHEK
FR
AN
K &
TU
YIB
EISi
ngle
Fam
ily11
0,56
2$
42,1
19$
15
2,68
1$
Sing
le F
amily
152,
681
$
0.
00.
05,
942
025-
030-
047-
000
CO
OPE
R N
EIL
Sing
le F
amily
142,
152
$
52
,647
$
194,
799
$
Si
ngle
Fam
ily19
4,79
9$
0.0
0.0
6,97
302
5-03
0-04
8-00
0G
EOR
GE
DO
RIA
N A
Sing
le F
amily
168,
477
$
42
,119
$
210,
596
$
Si
ngle
Fam
ily21
0,59
6$
0.0
0.0
5,60
002
5-03
0-04
9-00
0G
RA
Y H
AR
LAN
DSi
ngle
Fam
ily10
9,73
7$
41,8
04$
15
1,54
1$
Sing
le F
amily
151,
541
$
0.
00.
05,
600
025-
030-
050-
000
RU
GG
IER
O R
ICH
AR
D A
Sing
le F
amily
115,
554
$
52
,524
$
168,
078
$
Si
ngle
Fam
ily16
8,07
8$
0.0
0.0
5,60
002
5-03
0-05
1-00
0A
CH
ETA
RO
SALI
ND
A &
SA
NTI
AG
OSi
ngle
Fam
ily28
0,50
0$
20,0
00$
30
0,50
0$
Sing
le F
amily
300,
500
$
0.
00.
06,
634
025-
030-
052-
000
MA
RU
YA
MA
FR
AN
K H
Sing
le F
amily
238,
500
$
20
,000
$
258,
500
$
Si
ngle
Fam
ily25
8,50
0$
0.0
0.0
5,91
702
5-03
0-05
3-00
0K
ALS
KA
NC
HA
NSi
ngle
Fam
ily12
0,18
9$
41,8
04$
16
1,99
3$
Sing
le F
amily
161,
993
$
0.
00.
05,
004
025-
030-
054-
000
POR
TER
SU
CK
OW
DIA
NA
Sing
le F
amily
280,
500
$
20
,000
$
300,
500
$
Si
ngle
Fam
ily30
0,50
0$
0.0
0.0
5,00
002
5-03
0-05
5-00
0JA
MES
LER
OY
Sing
le F
amily
179,
812
$
20
,090
$
199,
902
$
Si
ngle
Fam
ily19
9,90
2$
0.0
0.0
5,00
202
5-03
0-05
6-00
0A
NG
GEO
RG
E &
YA
O JU
DY
RIV
ERA
Sing
le F
amily
95,1
05$
41
,804
$
136,
909
$
Si
ngle
Fam
ily13
6,90
9$
0.0
0.0
5,76
502
5-03
0-05
7-00
0D
EE JO
HN
ESi
ngle
Fam
ily12
9,19
4$
20,9
02$
15
0,09
6$
Sing
le F
amily
150,
096
$
0.
00.
06,
725
025-
030-
058-
000
AB
AY
AN
DEN
NIS
P &
ELO
ISA
NSi
ngle
Fam
ily19
1,00
0$
20,0
00$
21
1,00
0$
Sing
le F
amily
211,
000
$
0.
00.
05,
600
025-
030-
059-
000
HO
RN
E JR
ED
WA
RD
Sing
le F
amily
137,
955
$
20
,902
$
158,
857
$
Si
ngle
Fam
ily15
8,85
7$
0.0
0.0
5,60
002
5-03
0-06
0-00
0M
ESA
RU
DY
R &
MA
RC
IASi
ngle
Fam
ily19
1,00
0$
20,0
00$
21
1,00
0$
Sing
le F
amily
211,
000
$
0.
00.
05,
632
025-
030-
061-
000
GO
RD
ON
ED
WA
RD
C &
LA
UR
A L
Sing
le F
amily
287,
500
$
20
,000
$
307,
500
$
Si
ngle
Fam
ily30
7,50
0$
0.0
0.0
7,10
602
5-03
0-06
2-00
0B
ERK
EY W
ILLI
AM
& L
ELIA
Sing
le F
amily
193,
000
$
20
,000
$
213,
000
$
Si
ngle
Fam
ily21
3,00
0$
0.0
0.0
7,64
802
5-03
0-06
3-00
0W
ESTE
RN
PA
CIF
IC H
OU
SIN
GIm
prov
ed S
ingl
e Fa
mily
Res
iden
tial L
ot 5
0' x
105
' Typ
ical
Lot
25,0
00$
25
,000
$
Sing
le F
amily
104,
000
$
104,
000
$
0.
00.
05,
000
025-
030-
064-
000
WES
TER
N P
AC
IFIC
HO
USI
NG
Impr
oved
Sin
gle
Fam
ily R
esid
entia
l Lot
50'
x 1
05' T
ypic
al L
ot25
,000
$
25,0
00$
Si
ngle
Fam
ily10
4,00
0$
10
4,00
0$
0.0
0.0
5,00
802
5-03
0-06
5-00
0W
ESTE
RN
PA
CIF
IC H
OU
SIN
GIm
prov
ed S
ingl
e Fa
mily
Res
iden
tial L
ot 5
0' x
105
' Typ
ical
Lot
25,0
00$
25
,000
$
Sing
le F
amily
104,
000
$
104,
000
$
0.
00.
05,
226
025-
030-
066-
000
MED
RA
NO
LO
RR
AIN
E J
Sing
le F
amily
191,
000
$
20
,000
$
211,
000
$
Si
ngle
Fam
ily21
1,00
0$
0.0
0.0
7,70
902
5-03
0-06
7-00
0D
IAB
LO G
RA
ND
E R
ESID
ENTI
AL
ASS
NEx
empt
Exem
pt0.
00.
00
025-
030-
068-
000
DIA
BLO
GR
AN
DE
CO
MM
ERC
IAL
ASS
OC
Exem
ptEx
empt
0.0
0.0
002
5-03
1-00
1-00
0LI
NC
OLN
BR
YA
NSi
ngle
Fam
ily73
,708
$
31,5
87$
10
5,29
5$
Sing
le F
amily
105,
295
$
0.
00.
04,
049
025-
031-
002-
000
MA
RTI
NEZ
MA
RSH
ALL
JRSi
ngle
Fam
ily13
2,59
9$
20,0
90$
15
2,68
9$
Sing
le F
amily
152,
689
$
0.
00.
04,
050
025-
031-
003-
000
GO
LEZ
JILL
ENE
MSi
ngle
Fam
ily11
5,78
3$
20,4
92$
13
6,27
5$
Sing
le F
amily
136,
275
$
0.
00.
04,
440
025-
031-
004-
000
SIM
ENSO
N L
AW
REN
CE
WSi
ngle
Fam
ily84
,038
$
31,5
14$
11
5,55
2$
Sing
le F
amily
115,
552
$
0.
00.
03,
932
025-
031-
005-
000
SALA
IS M
IGU
ELSi
ngle
Fam
ily53
,049
$
31,5
14$
84
,563
$
Sing
le F
amily
84,5
63$
0.
00.
04,
052
025-
031-
006-
000
DA
HLI
N S
TAN
LEY
ASi
ngle
Fam
ily10
5,29
8$
26,3
22$
13
1,62
0$
Sing
le F
amily
131,
620
$
0.
00.
05,
001
025-
031-
007-
000
DA
VIS
JULI
ESi
ngle
Fam
ily10
8,61
0$
25,6
15$
13
4,22
5$
Sing
le F
amily
134,
225
$
0.
00.
05,
330
025-
031-
008-
000
DES
AI K
AM
AL
V &
NEH
ASi
ngle
Fam
ily14
5,65
8$
20,0
90$
16
5,74
8$
Sing
le F
amily
165,
748
$
0.
00.
03,
472
025-
031-
009-
000
RIE
BEL
WIL
LIA
M &
CH
ERY
LSi
ngle
Fam
ily16
2,00
0$
20,0
00$
18
2,00
0$
Sing
le F
amily
182,
000
$
0.
00.
04,
032
025-
031-
010-
000
BLA
CK
RO
BER
T J
Sing
le F
amily
243,
000
$
20
,000
$
263,
000
$
Si
ngle
Fam
ily26
3,00
0$
0.0
0.0
4,39
002
5-03
1-01
1-00
0D
AV
IS JU
LIE
Sing
le F
amily
190,
000
$
20
,000
$
210,
000
$
Si
ngle
Fam
ily21
0,00
0$
0.0
0.0
6,24
102
5-03
1-01
2-00
0V
ERM
A R
OH
IT &
KA
UR
HA
RPR
EET
Sing
le F
amily
173,
500
$
20
,000
$
193,
500
$
Si
ngle
Fam
ily19
3,50
0$
0.0
0.0
4,65
302
5-03
1-01
3-00
0PE
NSA
MIC
HA
ELSi
ngle
Fam
ily17
3,50
0$
20,0
00$
19
3,50
0$
Sing
le F
amily
193,
500
$
0.
00.
04,
849
025-
031-
014-
000
ATW
AL
JASW
IND
ER &
SA
MIN
DER
Sing
le F
amily
85,3
85$
20
,090
$
105,
475
$
Si
ngle
Fam
ily10
5,47
5$
0.0
0.0
4,02
002
5-03
1-01
5-00
0FE
RN
AN
DEZ
BEN
ITO
& N
OLA
RSi
ngle
Fam
ily19
0,00
0$
20,0
00$
21
0,00
0$
Sing
le F
amily
210,
000
$
0.
00.
03,
920
025-
031-
016-
000
CA
RD
INA
LE P
AU
L &
CA
RID
AD
Sing
le F
amily
173,
500
$
20
,000
$
193,
500
$
Si
ngle
Fam
ily19
3,50
0$
0.0
0.0
3,12
002
5-03
1-01
7-00
0A
LBR
ECH
T A
NN
Sing
le F
amily
162,
000
$
20
,000
$
182,
000
$
Si
ngle
Fam
ily18
2,00
0$
0.0
0.0
3,60
002
5-03
1-01
8-00
0M
YR
ICK
ASH
LEY
Sing
le F
amily
190,
000
$
20
,000
$
210,
000
$
Si
ngle
Fam
ily21
0,00
0$
0.0
0.0
3,92
002
5-03
1-01
9-00
0D
ON
G C
HEN
HA
O &
BA
I CH
UN
YIN
GSi
ngle
Fam
ily17
3,50
0$
20,0
00$
19
3,50
0$
Sing
le F
amily
193,
500
$
0.
00.
03,
100
025-
031-
020-
000
ERIC
KSO
N R
OG
ER D
Sing
le F
amily
80,3
63$
20
,090
$
100,
453
$
Si
ngle
Fam
ily10
0,45
3$
0.0
0.0
3,60
002
5-03
1-02
1-00
0SH
AIK
NA
ZEER
& S
HA
RM
ILA
BEG
UM
Sing
le F
amily
176,
000
$
20
,000
$
196,
000
$
Si
ngle
Fam
ily19
6,00
0$
0.0
0.0
3,92
002
5-03
1-02
2-00
0A
TWA
L JA
SWIN
DER
& S
HA
MIN
DER
Sing
le F
amily
90,9
10$
20
,090
$
111,
000
$
Si
ngle
Fam
ily11
1,00
0$
0.0
0.0
4,55
602
5-03
1-02
3-00
0SA
YED
I-R
ASH
TI H
ILD
A F
Sing
le F
amily
167,
758
$
20
,090
$
187,
848
$
Si
ngle
Fam
ily18
7,84
8$
0.0
0.0
4,33
802
5-03
1-02
4-00
0G
RA
CE
JOH
N P
JR &
CA
RO
L A
Sing
le F
amily
144,
500
$
20
,000
$
164,
500
$
Si
ngle
Fam
ily16
4,50
0$
0.0
0.0
4,37
202
5-03
1-02
5-00
0EL
WIS
HA
HI S
AN
A A
Sing
le F
amily
170,
000
$
20
,000
$
190,
000
$
Si
ngle
Fam
ily19
0,00
0$
0.0
0.0
4,26
802
5-03
1-02
6-00
0FA
RIA
DA
RLI
NO
& C
HR
ISTI
NE
Sing
le F
amily
144,
500
$
20
,000
$
164,
500
$
Si
ngle
Fam
ily16
4,50
0$
0.0
0.0
5,39
002
5-03
1-02
7-00
0H
OG
AN
CO
LTO
N B
Sing
le F
amily
89,4
92$
26
,128
$
115,
620
$
Si
ngle
Fam
ily11
5,62
0$
0.0
0.0
6,12
802
5-03
1-02
8-00
0A
NC
HET
A M
AR
CEL
INO
ISi
ngle
Fam
ily14
4,50
0$
20,0
00$
16
4,50
0$
Sing
le F
amily
164,
500
$
0.
00.
04,
741
025-
031-
029-
000
VA
NN
OR
SDEL
L V
ALE
RIE
RSi
ngle
Fam
ily11
0,49
9$
20,0
90$
13
0,58
9$
Sing
le F
amily
130,
589
$
0.
00.
04,
156
025-
031-
030-
000
SYTO
NO
RM
AN
& F
ON
AC
IER
ED
ITH
A T
Sing
le F
amily
73,7
08$
31
,587
$
105,
295
$
Si
ngle
Fam
ily10
5,29
5$
0.0
0.0
7,02
002
5-03
1-03
1-00
0LE
WIS
DO
NA
LD C
& S
CH
NEI
DER
ELL
ENSi
ngle
Fam
ily97
,339
$
20,4
92$
11
7,83
1$
Sing
le F
amily
117,
831
$
0.
00.
05,
526
025-
031-
032-
000
EDW
AR
DS
LEIL
AN
I JEA
NSi
ngle
Fam
ily10
7,58
6$
20,4
92$
12
8,07
8$
Sing
le F
amily
128,
078
$
0.
00.
04,
535
025-
031-
033-
000
KA
POO
R N
EER
USi
ngle
Fam
ily88
,259
$
20,9
02$
10
9,16
1$
Sing
le F
amily
109,
161
$
0.
00.
04,
757
025-
031-
034-
000
ZHA
NG
BU
SH B
AO
-XIN
GSi
ngle
Fam
ily86
,870
$
26,3
22$
11
3,19
2$
Sing
le F
amily
113,
192
$
0.
00.
05,
428
025-
031-
035-
000
CH
AV
ES D
AV
ID S
Sing
le F
amily
97,4
40$
20
,090
$
117,
530
$
Si
ngle
Fam
ily11
7,53
0$
0.0
0.0
6,97
002
5-03
1-03
6-00
0W
ON
G A
MEL
IA O
CSi
ngle
Fam
ily18
0,00
0$
20,0
00$
20
0,00
0$
Sing
le F
amily
200,
000
$
0.
00.
05,
111
025-
031-
037-
000
GH
EZZI
JEFF
REY
ASi
ngle
Fam
ily94
,715
$
31,5
87$
12
6,30
2$
Sing
le F
amily
126,
302
$
0.
00.
04,
985
025-
031-
038-
000
CO
FFEY
MIC
HA
EL J
& IR
AID
ASi
ngle
Fam
ily14
5,00
0$
20,0
00$
16
5,00
0$
Sing
le F
amily
165,
000
$
0.
00.
04,
643
025-
031-
039-
000
MO
RSA
Y T
AM
BA
Sing
le F
amily
173,
500
$
20
,000
$
193,
500
$
Si
ngle
Fam
ily19
3,50
0$
0.0
0.0
3,08
402
5-03
1-04
0-00
0G
RU
ND
Y K
ATH
LEEN
Sing
le F
amily
161,
500
$
20
,000
$
181,
500
$
Si
ngle
Fam
ily18
1,50
0$
0.0
0.0
4,84
3
6 of
12

2014
-15
Gro
ss
Tax
able
L
otA
PNO
wne
r (A
s of A
pril
1, 2
015)
Lan
d U
se D
escr
iptio
nIm
pr. V
alue
Lan
d V
alue
Tot
al V
alue
Lan
d U
seA
ppra
ised
Val
ueA
ssig
ned
Val
ueA
crea
geA
crea
geSq
. Ft.
Ass
esse
d V
alue
s
025-
031-
041-
000
PIZA
NO
PA
UL
VSi
ngle
Fam
ily16
1,50
0$
20,0
00$
18
1,50
0$
Sing
le F
amily
181,
500
$
0.
00.
05,
545
025-
031-
042-
000
DEL
DO
N L
ERO
Y JR
Sing
le F
amily
121,
092
$
31
,587
$
152,
679
$
Pr
epai
d0.
00.
03,
328
025-
031-
043-
000
REE
D P
HIL
IP C
HA
RLE
SSi
ngle
Fam
ily16
2,00
0$
20,0
00$
18
2,00
0$
Sing
le F
amily
182,
000
$
0.
00.
03,
653
025-
031-
044-
000
JPM
OR
GA
N C
HA
SE B
AN
K N
ASi
ngle
Fam
ily97
,440
$
20,0
90$
11
7,53
0$
Sing
le F
amily
117,
530
$
0.
00.
03,
653
025-
031-
045-
000
TITU
S D
EWA
YN
ESi
ngle
Fam
ily41
,064
$
31,5
87$
72
,651
$
Sing
le F
amily
72,6
51$
0.
00.
02,
948
025-
031-
046-
000
LOPE
Z C
HR
ISTI
NA
ASi
ngle
Fam
ily64
,079
$
31,5
14$
95
,593
$
Sing
le F
amily
95,5
93$
0.
00.
03,
419
025-
031-
047-
000
VEG
A H
ECTO
RSi
ngle
Fam
ily88
,835
$
26,1
28$
11
4,96
3$
Sing
le F
amily
114,
963
$
0.
00.
03,
948
025-
031-
048-
000
HO
RTO
N G
RIS
ELD
A &
BA
SIL
ESi
ngle
Fam
ily89
,503
$
26,3
22$
11
5,82
5$
Sing
le F
amily
115,
825
$
0.
00.
03,
917
025-
031-
049-
000
LI L
AU
REN
Sing
le F
amily
81,9
70$
20
,492
$
102,
462
$
Si
ngle
Fam
ily10
2,46
2$
0.0
0.0
5,02
102
5-03
1-05
0-00
0R
OU
TT L
AV
ON
NA
ESi
ngle
Fam
ily81
,970
$
25,6
15$
10
7,58
5$
Sing
le F
amily
107,
585
$
0.
00.
04,
452
025-
031-
051-
000
DIA
BLO
GR
AN
DE
RES
IDEN
TIA
L A
SSO
CIA
TIO
NEx
empt
Exem
pt0.
00.
00
025-
031-
052-
000
DIA
BLO
GR
AN
DE
RES
IDEN
TIA
L A
SSO
CEx
empt
Exem
pt0.
00.
00
025-
031-
053-
000
DIA
BLO
GR
AN
DE
CO
MM
ERC
IAL
ASS
OC
Exem
ptEx
empt
0.0
0.0
002
5-03
2-00
1-00
0PE
RR
Y R
OB
ERT
DSi
ngle
Fam
ily86
,068
$
20,4
92$
10
6,56
0$
Sing
le F
amily
106,
560
$
0.
00.
03,
100
025-
032-
002-
000
CU
NN
ING
HA
M R
AC
HEL
LE L
EBLA
NC
Sing
le F
amily
84,2
38$
26
,322
$
110,
560
$
Si
ngle
Fam
ily11
0,56
0$
0.0
0.0
3,60
002
5-03
2-00
3-00
0H
OR
NE
EDW
AR
D JR
Sing
le F
amily
113,
917
$
20
,902
$
134,
819
$
Si
ngle
Fam
ily13
4,81
9$
0.0
0.0
3,92
002
5-03
2-00
4-00
0M
UR
RA
Y C
RA
IG V
& A
NG
ELA
DA
WN
Sing
le F
amily
149,
676
$
20
,090
$
169,
766
$
Si
ngle
Fam
ily16
9,76
6$
0.0
0.0
3,10
002
5-03
2-00
5-00
0SP
AR
KS
ALE
XA
ND
RA
Sing
le F
amily
105,
286
$
31
,587
$
136,
873
$
Si
ngle
Fam
ily13
6,87
3$
0.0
0.0
3,60
002
5-03
2-00
6-00
0W
AR
D JO
SEPH
& JA
CQ
UEL
YN
Sing
le F
amily
130,
042
$
31
,587
$
161,
629
$
Si
ngle
Fam
ily16
1,62
9$
0.0
0.0
3,92
002
5-03
2-00
7-00
0C
IVIC
DIA
BLO
GR
AN
DE
LLC
Impr
oved
Sin
gle
Fam
ily R
esid
entia
l Lot
35'
x 1
05' T
ypic
al L
ot15
,793
$
15,7
93$
Si
ngle
Fam
ily89
,000
$
89
,000
$
0.0
0.0
3,92
002
5-03
2-00
8-00
0C
IVIC
DIA
BLO
GR
AN
DE
LLC
Impr
oved
Sin
gle
Fam
ily R
esid
entia
l Lot
35'
x 1
05' T
ypic
al L
ot15
,793
$
15,7
93$
Si
ngle
Fam
ily89
,000
$
89
,000
$
0.0
0.0
4,40
102
5-03
2-00
9-00
0C
IVIC
DIA
BLO
GR
AN
DE
LLC
Impr
oved
Sin
gle
Fam
ily R
esid
entia
l Lot
35'
x 1
05' T
ypic
al L
ot15
,793
$
15,7
93$
Si
ngle
Fam
ily89
,000
$
89
,000
$
0.0
0.0
5,28
802
5-03
2-01
0-00
0C
IVIC
DIA
BLO
GR
AN
DE
LLC
Impr
oved
Sin
gle
Fam
ily R
esid
entia
l Lot
35'
x 1
05' T
ypic
al L
ot15
,793
$
15,7
93$
Si
ngle
Fam
ily89
,000
$
89
,000
$
0.0
0.0
6,16
102
5-03
2-01
1-00
0C
IVIC
DIA
BLO
GR
AN
DE
LLC
Impr
oved
Sin
gle
Fam
ily R
esid
entia
l Lot
35'
x 1
05' T
ypic
al L
ot15
,793
$
15,7
93$
Si
ngle
Fam
ily89
,000
$
89
,000
$
0.0
0.0
3,31
902
5-03
2-01
2-00
0C
IVIC
DIA
BLO
GR
AN
DE
LLC
Impr
oved
Sin
gle
Fam
ily R
esid
entia
l Lot
35'
x 1
05' T
ypic
al L
ot15
,793
$
15,7
93$
Si
ngle
Fam
ily89
,000
$
89
,000
$
0.0
0.0
3,64
202
5-03
2-01
3-00
0C
IVIC
DIA
BLO
GR
AN
DE
LLC
Impr
oved
Sin
gle
Fam
ily R
esid
entia
l Lot
35'
x 1
05' T
ypic
al L
ot15
,793
$
15,7
93$
Si
ngle
Fam
ily89
,000
$
89
,000
$
0.0
0.0
4,37
002
5-03
2-01
4-00
0M
ATT
HEW
S K
INSL
EY M
Sing
le F
amily
185,
000
$
20
,000
$
205,
000
$
Si
ngle
Fam
ily20
5,00
0$
0.0
0.0
3,31
802
5-03
2-01
5-00
0SA
HA
K M
UH
IBU
LLA
HSi
ngle
Fam
ily14
8,67
1$
20,0
90$
16
8,76
1$
Sing
le F
amily
168,
761
$
0.
00.
03,
641
025-
032-
016-
000
RA
MER
DA
VID
WSi
ngle
Fam
ily19
0,00
0$
20,0
00$
21
0,00
0$
Sing
le F
amily
210,
000
$
0.
00.
03,
965
025-
032-
017-
000
CA
CH
OLA
AN
AST
AC
IASi
ngle
Fam
ily17
3,50
0$
20,0
00$
19
3,50
0$
Sing
le F
amily
193,
500
$
0.
00.
05,
268
025-
032-
018-
000
DEL
DO
N L
E R
OY
JRPr
epai
d84
,238
$
31,5
87$
11
5,82
5$
Prep
aid
0.0
0.0
4,55
502
5-03
2-01
9-00
0M
AC
WIL
LIA
MS
JASO
N &
NO
ELLE
Sing
le F
amily
161,
500
$
20
,000
$
181,
500
$
Si
ngle
Fam
ily18
1,50
0$
0.0
0.0
4,49
002
5-03
2-02
0-00
0C
IVIC
DIA
BLO
GR
AN
DE
LLC
Impr
oved
Sin
gle
Fam
ily R
esid
entia
l Lot
35'
x 1
05' T
ypic
al L
ot15
,793
$
15,7
93$
Si
ngle
Fam
ily89
,000
$
89
,000
$
0.0
0.0
4,89
002
5-03
2-02
1-00
0C
IVIC
DIA
BLO
GR
AN
DE
LLC
Impr
oved
Sin
gle
Fam
ily R
esid
entia
l Lot
35'
x 1
05' T
ypic
al L
ot15
,793
$
15,7
93$
Si
ngle
Fam
ily89
,000
$
89
,000
$
0.0
0.0
4,15
502
5-03
2-02
2-00
0C
IVIC
DIA
BLO
GR
AN
DE
LLC
Impr
oved
Sin
gle
Fam
ily R
esid
entia
l Lot
35'
x 1
05' T
ypic
al L
ot15
,793
$
15,7
93$
Si
ngle
Fam
ily89
,000
$
89
,000
$
0.0
0.0
5,29
602
5-03
2-02
3-00
0C
IVIC
DIA
BLO
GR
AN
DE
LLC
Impr
oved
Sin
gle
Fam
ily R
esid
entia
l Lot
35'
x 1
05' T
ypic
al L
ot15
,793
$
15,7
93$
Si
ngle
Fam
ily89
,000
$
89
,000
$
0.0
0.0
5,96
502
5-03
2-02
4-00
0PE
REA
NO
EMI M
Sing
le F
amily
94,7
67$
31
,587
$
126,
354
$
Si
ngle
Fam
ily12
6,35
4$
0.0
0.0
5,59
002
5-03
2-02
5-00
0H
AIY
AN
LU
Sing
le F
amily
109,
619
$
31
,587
$
141,
206
$
Si
ngle
Fam
ily14
1,20
6$
0.0
0.0
3,97
002
5-03
2-02
6-00
0ZI
ALC
ITA
WIL
FRED
V &
ELI
ZAB
ETH
AN
N L
Sing
le F
amily
100,
033
$
31
,587
$
131,
620
$
Si
ngle
Fam
ily13
1,62
0$
0.0
0.0
4,74
002
5-03
2-02
7-00
0M
IKR
UT
EVA
ISi
ngle
Fam
ily17
0,00
0$
20,0
00$
19
0,00
0$
Sing
le F
amily
190,
000
$
0.
00.
04,
154
025-
032-
028-
000
CH
AN
PA
MEL
A C
Sing
le F
amily
161,
500
$
20
,000
$
181,
500
$
Si
ngle
Fam
ily18
1,50
0$
0.0
0.0
5,08
302
5-03
2-02
9-00
0G
OD
WIN
JOSE
PH &
EIL
EEN
Sing
le F
amily
161,
500
$
20
,000
$
181,
500
$
Si
ngle
Fam
ily18
1,50
0$
0.0
0.0
5,83
702
5-03
2-03
0-00
0ID
C R
ENTA
LS L
LCSi
ngle
Fam
ily87
,093
$
20,4
92$
10
7,58
5$
Sing
le F
amily
107,
585
$
0.
00.
03,
608
025-
032-
031-
000
GO
LDSB
ERR
Y M
ICH
AEL
& S
USA
NSi
ngle
Fam
ily85
,385
$
20,0
90$
10
5,47
5$
Sing
le F
amily
105,
475
$
0.
00.
03,
960
025-
032-
032-
000
ESPA
RZA
EM
ILIO
Sing
le F
amily
162,
000
$
20
,000
$
182,
000
$
Si
ngle
Fam
ily18
2,00
0$
0.0
0.0
3,96
002
5-03
2-03
3-00
0EN
RIQ
UEZ
VIN
CEN
TSi
ngle
Fam
ily11
5,82
7$
31,5
87$
14
7,41
4$
Sing
le F
amily
147,
414
$
0.
00.
03,
344
025-
032-
034-
000
FAZE
KA
S LA
UR
ASi
ngle
Fam
ily78
,972
$
31,5
87$
11
0,55
9$
Sing
le F
amily
110,
559
$
0.
00.
04,
762
025-
032-
035-
000
LUN
D JA
SON
ESi
ngle
Fam
ily83
,609
$
26,1
28$
10
9,73
7$
Sing
le F
amily
109,
737
$
0.
00.
02,
948
025-
032-
036-
000
NIC
OLA
U T
IMO
THY
& JE
NN
IFER
Sing
le F
amily
65,2
84$
31
,587
$
96,8
71$
Si
ngle
Fam
ily96
,871
$
0.0
0.0
4,45
502
5-03
2-03
7-00
0M
ESQ
UIT
E M
ATT
HEW
& JA
NE
Sing
le F
amily
87,0
93$
20
,492
$
107,
585
$
Si
ngle
Fam
ily10
7,58
5$
0.0
0.0
4,96
502
5-03
2-03
8-00
0LI
LA
UR
ENSi
ngle
Fam
ily69
,162
$
20,4
92$
89
,654
$
Sing
le F
amily
89,6
54$
0.
00.
03,
285
025-
032-
039-
000
YA
NG
LIN
& G
AO
MIN
Sing
le F
amily
93,0
08$
20
,090
$
113,
098
$
Si
ngle
Fam
ily11
3,09
8$
0.0
0.0
5,30
702
5-03
2-04
0-00
0ES
TRA
DA
RO
MU
LO &
GLO
RIA
Sing
le F
amily
105,
298
$
26
,322
$
131,
620
$
Si
ngle
Fam
ily13
1,62
0$
0.0
0.0
5,77
402
5-03
2-04
1-00
0B
AC
ALS
O A
RTU
RO
& S
AA
VED
RA
MA
RIE
LSi
ngle
Fam
ily81
,519
$
26,1
28$
10
7,64
7$
Sing
le F
amily
107,
647
$
0.
00.
02,
993
025-
032-
042-
000
BR
OW
N D
ALE
Sing
le F
amily
73,1
81$
31
,587
$
104,
768
$
Si
ngle
Fam
ily10
4,76
8$
0.0
0.0
4,78
302
5-03
2-04
3-00
0TH
OR
PE JA
MES
G &
AM
Y L
Sing
le F
amily
100,
033
$
26
,322
$
126,
355
$
Si
ngle
Fam
ily12
6,35
5$
0.0
0.0
7,06
202
5-03
2-04
4-00
0LL
OY
D S
HIR
LEY
Sing
le F
amily
52,5
24$
31
,514
$
84,0
38$
Si
ngle
Fam
ily84
,038
$
0.0
0.0
7,79
402
5-03
2-04
5-00
0D
IAB
LO G
RA
ND
E R
ESID
ENTI
AL
ASS
OC
Exem
ptEx
empt
0.0
0.0
002
5-03
2-04
6-00
0D
IAB
LO G
RA
ND
E R
ESID
ENTI
AL
ASS
OC
Exem
ptEx
empt
0.0
0.0
002
5-03
2-04
7-00
0C
IVIC
DIA
BLO
GR
AN
DE
LLC
Exem
ptEx
empt
0.0
0.0
002
5-03
3-00
1-00
0LU
ND
JASO
N E
Sing
le F
amily
68,4
42$
31
,587
$
100,
029
$
Si
ngle
Fam
ily10
0,02
9$
0.0
0.0
4,93
702
5-03
3-00
2-00
0PA
SHC
HEN
KO
VA
L &
GU
CH
EK O
LGA
Sing
le F
amily
185,
000
$
20
,000
$
205,
000
$
Si
ngle
Fam
ily20
5,00
0$
0.0
0.0
5,18
302
5-03
3-00
3-00
0LE
WIS
KEE
NA
NSi
ngle
Fam
ily16
2,00
0$
20,0
00$
18
2,00
0$
Sing
le F
amily
182,
000
$
0.
00.
03,
408
025-
033-
004-
000
GA
LLI S
EAN
Sing
le F
amily
115,
827
$
31
,587
$
147,
414
$
Si
ngle
Fam
ily14
7,41
4$
0.0
0.0
5,17
802
5-03
3-00
5-00
0EL
LER
BY
KA
REN
LEE
& R
OB
ERT
JAM
ESSi
ngle
Fam
ily18
5,00
0$
20,0
00$
20
5,00
0$
Sing
le F
amily
205,
000
$
0.
00.
03,
302
025-
033-
006-
000
FUSE
LIER
DA
REK
Sing
le F
amily
121,
618
$
26
,322
$
147,
940
$
Si
ngle
Fam
ily14
7,94
0$
0.0
0.0
4,71
102
5-03
3-00
7-00
0PI
RO
RA
MSO
NSi
ngle
Fam
ily48
,435
$
31,5
87$
80
,022
$
Sing
le F
amily
80,0
22$
0.
00.
05,
494
025-
033-
008-
000
MO
RA
LES
NO
EL A
Sing
le F
amily
162,
000
$
20
,000
$
182,
000
$
Si
ngle
Fam
ily18
2,00
0$
0.0
0.0
3,57
102
5-03
3-00
9-00
0SE
NG
SO
PHO
RN
Sing
le F
amily
182,
000
$
20
,000
$
202,
000
$
Si
ngle
Fam
ily20
2,00
0$
0.0
0.0
8,09
902
5-03
3-01
0-00
0A
VIL
A E
DW
AR
D W
JR &
DEB
OR
AH
Sing
le F
amily
73,5
34$
31
,514
$
105,
048
$
Si
ngle
Fam
ily10
5,04
8$
0.0
0.0
6,76
5
7 of
12
2014
-15
Gro
ss
Tax
able
L
otA
PNO
wne
r (A
s of A
pril
1, 2
015)
Lan
d U
se D
escr
iptio
nIm
pr. V
alue
Lan
d V
alue
Tot
al V
alue
Lan
d U
seA
ppra
ised
Val
ueA
ssig
ned
Val
ueA
crea
geA
crea
geSq
. Ft.
Ass
esse
d V
alue
s
025-
033-
011-
000
CO
SE D
AR
LEN
E A
Sing
le F
amily
138,
224
$
42
,859
$
181,
083
$
Si
ngle
Fam
ily18
1,08
3$
0.0
0.0
5,27
702
5-03
3-01
2-00
0M
AU
RIN
O P
AB
LOSi
ngle
Fam
ily81
,604
$
31,5
87$
11
3,19
1$
Sing
le F
amily
113,
191
$
0.
00.
04,
608
025-
033-
013-
000
PIC
HA
RD
O JU
AN
A M
AR
IASi
ngle
Fam
ily73
,708
$
31,5
87$
10
5,29
5$
Sing
le F
amily
105,
295
$
0.
00.
06,
501
025-
033-
014-
000
BY
RO
N W
INST
ON
ASi
ngle
Fam
ily17
3,50
0$
20,0
00$
19
3,50
0$
Sing
le F
amily
193,
500
$
0.
00.
03,
683
025-
033-
015-
000
VEL
A B
REN
TON
Sing
le F
amily
115,
783
$
20
,492
$
136,
275
$
Si
ngle
Fam
ily13
6,27
5$
0.0
0.0
4,24
502
5-03
3-01
6-00
0C
OU
SIN
S B
RA
ND
ON
& M
AR
ISH
ASi
ngle
Fam
ily13
5,51
4$
31,5
14$
16
7,02
8$
Sing
le F
amily
167,
028
$
0.
00.
04,
606
025-
033-
017-
000
CIV
IC D
IAB
LO G
RA
ND
E LL
CIm
prov
ed S
ingl
e Fa
mily
Res
iden
tial L
ot 3
5' x
105
' Typ
ical
Lot
15,7
93$
15
,793
$
Sing
le F
amily
89,0
00$
89,0
00$
0.
00.
03,
756
025-
033-
018-
000
CIV
IC D
IAB
LO G
RA
ND
E LL
CIm
prov
ed S
ingl
e Fa
mily
Res
iden
tial L
ot 3
5' x
105
' Typ
ical
Lot
15,7
93$
15
,793
$
Sing
le F
amily
89,0
00$
89,0
00$
0.
00.
03,
545
025-
033-
019-
000
CIV
IC D
IAB
LO G
RA
ND
E LL
CIm
prov
ed S
ingl
e Fa
mily
Res
iden
tial L
ot 3
5' x
105
' Typ
ical
Lot
15,7
93$
15
,793
$
Sing
le F
amily
89,0
00$
89,0
00$
0.
00.
04,
566
025-
033-
020-
000
FAR
AC
A D
AV
ID &
DEE
LAY
NE
Sing
le F
amily
114,
758
$
20
,492
$
135,
250
$
Si
ngle
Fam
ily13
5,25
0$
0.0
0.0
3,47
302
5-03
3-02
1-00
0EN
CH
ILL
DA
RLE
NE
Sing
le F
amily
121,
092
$
31
,587
$
152,
679
$
Si
ngle
Fam
ily15
2,67
9$
0.0
0.0
3,91
402
5-03
3-02
2-00
0JO
HN
SON
LIN
DA
LO
W &
STE
VEN
PA
UL
Sing
le F
amily
179,
008
$
31
,587
$
210,
595
$
Si
ngle
Fam
ily21
0,59
5$
0.0
0.0
5,95
802
5-03
3-02
3-00
0O
H E
UN
ICE
ASi
ngle
Fam
ily11
0,56
2$
31,5
87$
14
2,14
9$
Sing
le F
amily
142,
149
$
0.
00.
05,
156
025-
033-
024-
000
YA
NG
LIN
& G
AO
MIN
Sing
le F
amily
92,5
86$
20
,090
$
112,
676
$
Si
ngle
Fam
ily11
2,67
6$
0.0
0.0
5,18
202
5-03
3-02
5-00
0C
IVIC
DIA
BLO
GR
AN
DE
LLC
Impr
oved
Sin
gle
Fam
ily R
esid
entia
l Lot
35'
x 1
05' T
ypic
al L
ot15
,793
$
15,7
93$
Si
ngle
Fam
ily89
,000
$
89
,000
$
0.0
0.0
4,15
102
5-03
3-02
6-00
0C
IVIC
DIA
BLO
GR
AN
DE
LLC
Impr
oved
Sin
gle
Fam
ily R
esid
entia
l Lot
35'
x 1
05' T
ypic
al L
ot15
,793
$
15,7
93$
Si
ngle
Fam
ily89
,000
$
89
,000
$
0.0
0.0
4,60
002
5-03
3-02
7-00
0C
IVIC
DIA
BLO
GR
AN
DE
LLC
Impr
oved
Sin
gle
Fam
ily R
esid
entia
l Lot
35'
x 1
05' T
ypic
al L
ot15
,793
$
15,7
93$
Si
ngle
Fam
ily89
,000
$
89
,000
$
0.0
0.0
4,28
802
5-03
3-02
8-00
0C
IVIC
DIA
BLO
GR
AN
DE
LLC
Impr
oved
Sin
gle
Fam
ily R
esid
entia
l Lot
35'
x 1
05' T
ypic
al L
ot15
,793
$
15,7
93$
Si
ngle
Fam
ily89
,000
$
89
,000
$
0.0
0.0
4,77
302
5-03
3-02
9-00
0G
OLD
SBER
RY
MIC
HA
EL &
SU
SAN
Sing
le F
amily
84,2
38$
31
,587
$
115,
825
$
Si
ngle
Fam
ily11
5,82
5$
0.0
0.0
4,69
102
5-03
3-03
0-00
0C
OTT
ER R
HET
T &
DES
IREE
Sing
le F
amily
94,7
67$
26
,322
$
121,
089
$
Si
ngle
Fam
ily12
1,08
9$
0.0
0.0
4,55
602
5-03
3-03
1-00
0FO
PPIA
NO
AN
DR
EA JE
AN
Sing
le F
amily
168,
000
$
20
,000
$
188,
000
$
Si
ngle
Fam
ily18
8,00
0$
0.0
0.0
4,41
102
5-03
3-03
2-00
0M
AR
LEY
KA
THR
YN
DA
WN
Sing
le F
amily
88,8
35$
26
,128
$
114,
963
$
Si
ngle
Fam
ily11
4,96
3$
0.0
0.0
4,05
002
5-03
3-03
3-00
0M
ENG
E ST
EVE
& L
IND
A L
Sing
le F
amily
170,
000
$
20
,000
$
190,
000
$
Si
ngle
Fam
ily19
0,00
0$
0.0
0.0
3,96
102
5-03
3-03
4-00
0C
IVIC
DIA
BLO
GR
AN
DE
LLC
Impr
oved
Sin
gle
Fam
ily R
esid
entia
l Lot
35'
x 1
05' T
ypic
al L
ot15
,793
$
15,7
93$
Si
ngle
Fam
ily89
,000
$
89
,000
$
0.0
0.0
4,62
002
5-03
3-03
5-00
0C
IVIC
DIA
BLO
GR
AN
DE
LLC
Impr
oved
Sin
gle
Fam
ily R
esid
entia
l Lot
35'
x 1
05' T
ypic
al L
ot15
,793
$
15,7
93$
Si
ngle
Fam
ily89
,000
$
89
,000
$
0.0
0.0
4,05
002
5-03
3-03
6-00
0C
IVIC
DIA
BLO
GR
AN
DE
LLC
Impr
oved
Sin
gle
Fam
ily R
esid
entia
l Lot
35'
x 1
05' T
ypic
al L
ot15
,793
$
15,7
93$
Si
ngle
Fam
ily89
,000
$
89
,000
$
0.0
0.0
3,73
102
5-03
3-03
7-00
0D
IAB
LO G
RA
ND
E R
ESID
ENTI
AL
ASS
OC
Exem
ptEx
empt
0.0
0.0
002
5-03
3-03
8-00
0D
IAB
LO G
RA
ND
E R
ESID
ENTI
AL
ASS
OC
IATI
ON
Exem
ptEx
empt
0.0
0.0
002
5-03
3-03
9-00
0D
IAB
LO G
RA
ND
E R
ESID
ENTI
AL
ASS
OC
Exem
ptEx
empt
0.0
0.0
002
5-03
3-04
0-00
0D
IAB
LO G
RA
ND
E C
OM
MER
CIA
L A
SSO
CEx
empt
Exem
pt0.
00.
00
025-
034-
001-
000
WES
TER
N P
AC
IFIC
HO
USI
NG
Impr
oved
Sin
gle
Fam
ily R
esid
entia
l Lot
60'
x 1
05' T
ypic
al L
ot25
,000
$
25,0
00$
Si
ngle
Fam
ily11
4,00
0$
11
4,00
0$
0.0
0.0
23,1
4202
5-03
4-00
2-00
0W
ESTE
RN
PA
CIF
IC H
OU
SIN
GIm
prov
ed S
ingl
e Fa
mily
Res
iden
tial L
ot 6
0' x
105
' Typ
ical
Lot
25,0
00$
25
,000
$
Sing
le F
amily
114,
000
$
114,
000
$
0.
00.
011
,381
025-
034-
003-
000
WES
TER
N P
AC
IFIC
HO
USI
NG
Impr
oved
Sin
gle
Fam
ily R
esid
entia
l Lot
60'
x 1
05' T
ypic
al L
ot25
,000
$
25,0
00$
Si
ngle
Fam
ily11
4,00
0$
11
4,00
0$
0.0
0.0
6,60
002
5-03
4-00
4-00
0W
ESTE
RN
PA
CIF
IC H
OU
SIN
GIm
prov
ed S
ingl
e Fa
mily
Res
iden
tial L
ot 6
0' x
105
' Typ
ical
Lot
25,0
00$
25
,000
$
Sing
le F
amily
114,
000
$
114,
000
$
0.
00.
06,
600
025-
034-
005-
000
WES
TER
N P
AC
IFIC
HO
USI
NG
Impr
oved
Sin
gle
Fam
ily R
esid
entia
l Lot
60'
x 1
05' T
ypic
al L
ot25
,000
$
25,0
00$
Si
ngle
Fam
ily11
4,00
0$
11
4,00
0$
0.0
0.0
6,60
002
5-03
4-00
6-00
0W
ESTE
RN
PA
CIF
IC H
OU
SIN
GIm
prov
ed S
ingl
e Fa
mily
Res
iden
tial L
ot 6
0' x
105
' Typ
ical
Lot
25,0
00$
25
,000
$
Sing
le F
amily
114,
000
$
114,
000
$
0.
00.
06,
543
025-
034-
007-
000
WES
TER
N P
AC
IFIC
HO
USI
NG
Impr
oved
Sin
gle
Fam
ily R
esid
entia
l Lot
60'
x 1
05' T
ypic
al L
ot25
,000
$
25,0
00$
Si
ngle
Fam
ily11
4,00
0$
11
4,00
0$
0.0
0.0
12,1
6502
5-03
4-00
8-00
0W
ESTE
RN
PA
CIF
IC H
OU
SIN
GIm
prov
ed S
ingl
e Fa
mily
Res
iden
tial L
ot 6
0' x
105
' Typ
ical
Lot
25,0
00$
25
,000
$
Sing
le F
amily
114,
000
$
114,
000
$
0.
00.
08,
490
025-
034-
009-
000
WES
TER
N P
AC
IFIC
HO
USI
NG
Impr
oved
Sin
gle
Fam
ily R
esid
entia
l Lot
60'
x 1
05' T
ypic
al L
ot25
,000
$
25,0
00$
Si
ngle
Fam
ily11
4,00
0$
11
4,00
0$
0.0
0.0
7,55
402
5-03
4-01
0-00
0W
ESTE
RN
PA
CIF
IC H
OU
SIN
GIm
prov
ed S
ingl
e Fa
mily
Res
iden
tial L
ot 6
0' x
105
' Typ
ical
Lot
25,0
00$
25
,000
$
Sing
le F
amily
114,
000
$
114,
000
$
0.
00.
05,
943
025-
034-
011-
000
WES
TER
N P
AC
IFIC
HO
USI
NG
Impr
oved
Sin
gle
Fam
ily R
esid
entia
l Lot
60'
x 1
05' T
ypic
al L
ot25
,000
$
25,0
00$
Si
ngle
Fam
ily11
4,00
0$
11
4,00
0$
0.0
0.0
6,93
502
5-03
4-01
2-00
0W
ESTE
RN
PA
CIF
IC H
OU
SIN
GIm
prov
ed S
ingl
e Fa
mily
Res
iden
tial L
ot 6
0' x
105
' Typ
ical
Lot
25,0
00$
25
,000
$
Sing
le F
amily
114,
000
$
114,
000
$
0.
00.
06,
927
025-
034-
013-
000
WES
TER
N P
AC
IFIC
HO
USI
NG
Impr
oved
Sin
gle
Fam
ily R
esid
entia
l Lot
60'
x 1
05' T
ypic
al L
ot25
,000
$
25,0
00$
Si
ngle
Fam
ily11
4,00
0$
11
4,00
0$
0.0
0.0
6,62
202
5-03
4-01
4-00
0W
ESTE
RN
PA
CIF
IC H
OU
SIN
GIm
prov
ed S
ingl
e Fa
mily
Res
iden
tial L
ot 6
0' x
105
' Typ
ical
Lot
25,0
00$
25
,000
$
Sing
le F
amily
114,
000
$
114,
000
$
0.
00.
06,
293
025-
034-
015-
000
WES
TER
N P
AC
IFIC
HO
USI
NG
Impr
oved
Sin
gle
Fam
ily R
esid
entia
l Lot
60'
x 1
05' T
ypic
al L
ot25
,000
$
25,0
00$
Si
ngle
Fam
ily11
4,00
0$
11
4,00
0$
0.0
0.0
7,07
302
5-03
4-01
6-00
0W
ESTE
RN
PA
CIF
IC H
OU
SIN
GEx
empt
Exem
pt0.
00.
00
025-
034-
017-
000
WES
TER
N P
AC
IFIC
HO
USI
NG
Exem
ptEx
empt
0.0
0.0
002
5-03
4-01
8-00
0W
ESTE
RN
PA
CIF
IC H
OU
SIN
GEx
empt
Exem
pt0.
00.
00
025-
034-
019-
000
WES
TER
N P
AC
IFIC
HO
USI
NG
Exem
ptEx
empt
0.0
0.0
002
5-03
4-02
0-00
0W
ESTE
RN
PA
CIF
IC H
OU
SIN
GEx
empt
Exem
pt0.
00.
00
025-
034-
021-
000
WES
TER
N P
AC
IFIC
HO
USI
NG
Exem
ptEx
empt
0.0
0.0
002
5-03
5-00
1-00
0W
ESTE
RN
PA
CIF
IC H
OU
SIN
GIm
prov
ed S
ingl
e Fa
mily
Res
iden
tial L
ot 7
0' x
105
' Typ
ical
Lot
25,0
00$
25
,000
$
Sing
le F
amily
124,
000
$
124,
000
$
0.
00.
05,
005
025-
035-
002-
000
WES
TER
N P
AC
IFIC
HO
USI
NG
Impr
oved
Sin
gle
Fam
ily R
esid
entia
l Lot
70'
x 1
05' T
ypic
al L
ot25
,000
$
25,0
00$
Si
ngle
Fam
ily12
4,00
0$
12
4,00
0$
0.0
0.0
5,00
202
5-03
5-00
3-00
0W
ESTE
RN
PA
CIF
IC H
OU
SIN
GIm
prov
ed S
ingl
e Fa
mily
Res
iden
tial L
ot 7
0' x
105
' Typ
ical
Lot
25,0
00$
25
,000
$
Sing
le F
amily
124,
000
$
124,
000
$
0.
00.
05,
033
025-
035-
004-
000
WES
TER
N P
AC
IFIC
HO
USI
NG
Impr
oved
Sin
gle
Fam
ily R
esid
entia
l Lot
70'
x 1
05' T
ypic
al L
ot25
,000
$
25,0
00$
Si
ngle
Fam
ily12
4,00
0$
12
4,00
0$
0.0
0.0
5,10
902
5-03
5-00
5-00
0W
ESTE
RN
PA
CIF
IC H
OU
SIN
GIm
prov
ed S
ingl
e Fa
mily
Res
iden
tial L
ot 7
0' x
105
' Typ
ical
Lot
25,0
00$
25
,000
$
Sing
le F
amily
124,
000
$
124,
000
$
0.
00.
05,
294
025-
035-
006-
000
WES
TER
N P
AC
IFIC
HO
USI
NG
Impr
oved
Sin
gle
Fam
ily R
esid
entia
l Lot
70'
x 1
05' T
ypic
al L
ot25
,000
$
25,0
00$
Si
ngle
Fam
ily12
4,00
0$
12
4,00
0$
0.0
0.0
5,79
402
5-03
5-00
7-00
0W
ESTE
RN
PA
CIF
IC H
OU
SIN
GIm
prov
ed S
ingl
e Fa
mily
Res
iden
tial L
ot 7
0' x
105
' Typ
ical
Lot
25,0
00$
25
,000
$
Sing
le F
amily
124,
000
$
124,
000
$
0.
00.
06,
139
025-
035-
008-
000
WES
TER
N P
AC
IFIC
HO
USI
NG
Impr
oved
Sin
gle
Fam
ily R
esid
entia
l Lot
70'
x 1
05' T
ypic
al L
ot25
,000
$
25,0
00$
Si
ngle
Fam
ily12
4,00
0$
12
4,00
0$
0.0
0.0
6,00
602
5-03
5-00
9-00
0W
ESTE
RN
PA
CIF
IC H
OU
SIN
GIm
prov
ed S
ingl
e Fa
mily
Res
iden
tial L
ot 7
0' x
105
' Typ
ical
Lot
25,0
00$
25
,000
$
Sing
le F
amily
124,
000
$
124,
000
$
0.
00.
06,
484
025-
035-
010-
000
WES
TER
N P
AC
IFIC
HO
USI
NG
Impr
oved
Sin
gle
Fam
ily R
esid
entia
l Lot
70'
x 1
05' T
ypic
al L
ot25
,000
$
25,0
00$
Si
ngle
Fam
ily12
4,00
0$
12
4,00
0$
0.0
0.0
6,40
202
5-03
5-01
1-00
0W
ESTE
RN
PA
CIF
IC H
OU
SIN
GIm
prov
ed S
ingl
e Fa
mily
Res
iden
tial L
ot 7
0' x
105
' Typ
ical
Lot
25,0
00$
25
,000
$
Sing
le F
amily
124,
000
$
124,
000
$
0.
00.
06,
644
025-
035-
012-
000
WES
TER
N P
AC
IFIC
HO
USI
NG
Impr
oved
Sin
gle
Fam
ily R
esid
entia
l Lot
70'
x 1
05' T
ypic
al L
ot25
,000
$
25,0
00$
Si
ngle
Fam
ily12
4,00
0$
12
4,00
0$
0.0
0.0
6,29
502
5-03
5-01
3-00
0W
ESTE
RN
PA
CIF
IC H
OU
SIN
GIm
prov
ed S
ingl
e Fa
mily
Res
iden
tial L
ot 7
0' x
105
' Typ
ical
Lot
25,0
00$
25
,000
$
Sing
le F
amily
124,
000
$
124,
000
$
0.
00.
013
,273
025-
035-
014-
000
WES
TER
N P
AC
IFIC
HO
USI
NG
Impr
oved
Sin
gle
Fam
ily R
esid
entia
l Lot
70'
x 1
05' T
ypic
al L
ot30
,000
$
30,0
00$
Si
ngle
Fam
ily12
4,00
0$
12
4,00
0$
0.0
0.0
18,1
8102
5-03
5-01
5-00
0W
ESTE
RN
PA
CIF
IC H
OU
SIN
GIm
prov
ed S
ingl
e Fa
mily
Res
iden
tial L
ot 7
0' x
105
' Typ
ical
Lot
25,0
00$
25
,000
$
Sing
le F
amily
124,
000
$
124,
000
$
0.
00.
011
,916
025-
035-
016-
000
WES
TER
N P
AC
IFIC
HO
USI
NG
Impr
oved
Sin
gle
Fam
ily R
esid
entia
l Lot
70'
x 1
05' T
ypic
al L
ot25
,000
$
25,0
00$
Si
ngle
Fam
ily12
4,00
0$
12
4,00
0$
0.0
0.0
6,53
002
5-03
5-01
7-00
0W
ESTE
RN
PA
CIF
IC H
OU
SIN
GIm
prov
ed S
ingl
e Fa
mily
Res
iden
tial L
ot 7
0' x
105
' Typ
ical
Lot
25,0
00$
25
,000
$
Sing
le F
amily
124,
000
$
124,
000
$
0.
00.
05,
837
025-
035-
018-
000
WES
TER
N P
AC
IFIC
HO
USI
NG
Impr
oved
Sin
gle
Fam
ily R
esid
entia
l Lot
70'
x 1
05' T
ypic
al L
ot25
,000
$
25,0
00$
Si
ngle
Fam
ily12
4,00
0$
12
4,00
0$
0.0
0.0
5,84
002
5-03
5-01
9-00
0W
ESTE
RN
PA
CIF
IC H
OU
SIN
GIm
prov
ed S
ingl
e Fa
mily
Res
iden
tial L
ot 7
0' x
105
' Typ
ical
Lot
25,0
00$
25
,000
$
Sing
le F
amily
124,
000
$
124,
000
$
0.
00.
06,
274
8 of
12

2014
-15
Gro
ss
Tax
able
L
otA
PNO
wne
r (A
s of A
pril
1, 2
015)
Lan
d U
se D
escr
iptio
nIm
pr. V
alue
Lan
d V
alue
Tot
al V
alue
Lan
d U
seA
ppra
ised
Val
ueA
ssig
ned
Val
ueA
crea
geA
crea
geSq
. Ft.
Ass
esse
d V
alue
s
025-
035-
020-
000
WES
TER
N P
AC
IFIC
HO
USI
NG
Impr
oved
Sin
gle
Fam
ily R
esid
entia
l Lot
70'
x 1
05' T
ypic
al L
ot25
,000
$
25,0
00$
Si
ngle
Fam
ily12
4,00
0$
12
4,00
0$
0.0
0.0
6,32
902
5-03
5-02
1-00
0W
ESTE
RN
PA
CIF
IC H
OU
SIN
GIm
prov
ed S
ingl
e Fa
mily
Res
iden
tial L
ot 7
0' x
105
' Typ
ical
Lot
25,0
00$
25
,000
$
Sing
le F
amily
124,
000
$
124,
000
$
0.
00.
06,
829
025-
035-
022-
000
WES
TER
N P
AC
IFIC
HO
USI
NG
Impr
oved
Sin
gle
Fam
ily R
esid
entia
l Lot
70'
x 1
05' T
ypic
al L
ot25
,000
$
25,0
00$
Si
ngle
Fam
ily12
4,00
0$
12
4,00
0$
0.0
0.0
6,28
302
5-03
5-02
3-00
0W
ESTE
RN
PA
CIF
IC H
OU
SIN
GIm
prov
ed S
ingl
e Fa
mily
Res
iden
tial L
ot 7
0' x
105
' Typ
ical
Lot
25,0
00$
25
,000
$
Sing
le F
amily
124,
000
$
124,
000
$
0.
00.
06,
328
025-
035-
024-
000
WES
TER
N P
AC
IFIC
HO
USI
NG
Impr
oved
Sin
gle
Fam
ily R
esid
entia
l Lot
70'
x 1
05' T
ypic
al L
ot25
,000
$
25,0
00$
Si
ngle
Fam
ily12
4,00
0$
12
4,00
0$
0.0
0.0
6,37
002
5-03
5-02
5-00
0W
ESTE
RN
PA
CIF
IC H
OU
SIN
GIm
prov
ed S
ingl
e Fa
mily
Res
iden
tial L
ot 7
0' x
105
' Typ
ical
Lot
25,0
00$
25
,000
$
Sing
le F
amily
124,
000
$
124,
000
$
0.
00.
06,
359
025-
035-
026-
000
WES
TER
N P
AC
IFIC
HO
USI
NG
Impr
oved
Sin
gle
Fam
ily R
esid
entia
l Lot
70'
x 1
05' T
ypic
al L
ot25
,000
$
25,0
00$
Si
ngle
Fam
ily12
4,00
0$
12
4,00
0$
0.0
0.0
5,92
302
5-03
5-02
7-00
0W
ESTE
RN
PA
CIF
IC H
OU
SIN
GIm
prov
ed S
ingl
e Fa
mily
Res
iden
tial L
ot 7
0' x
105
' Typ
ical
Lot
25,0
00$
25
,000
$
Sing
le F
amily
124,
000
$
124,
000
$
0.
00.
05,
400
025-
035-
028-
000
WES
TER
N P
AC
IFIC
HO
USI
NG
Impr
oved
Sin
gle
Fam
ily R
esid
entia
l Lot
70'
x 1
05' T
ypic
al L
ot25
,000
$
25,0
00$
Si
ngle
Fam
ily12
4,00
0$
12
4,00
0$
0.0
0.0
5,40
002
5-03
5-02
9-00
0W
ESTE
RN
PA
CIF
IC H
OU
SIN
GIm
prov
ed S
ingl
e Fa
mily
Res
iden
tial L
ot 7
0' x
105
' Typ
ical
Lot
25,0
00$
25
,000
$
Sing
le F
amily
124,
000
$
124,
000
$
0.
00.
05,
400
025-
035-
030-
000
WES
TER
N P
AC
IFIC
HO
USI
NG
Impr
oved
Sin
gle
Fam
ily R
esid
entia
l Lot
70'
x 1
05' T
ypic
al L
ot25
,000
$
25,0
00$
Si
ngle
Fam
ily12
4,00
0$
12
4,00
0$
0.0
0.0
5,87
402
5-03
5-03
1-00
0W
ESTE
RN
PA
CIF
IC H
OU
SIN
GIm
prov
ed S
ingl
e Fa
mily
Res
iden
tial L
ot 7
0' x
105
' Typ
ical
Lot
25,0
00$
25
,000
$
Sing
le F
amily
124,
000
$
124,
000
$
0.
00.
010
,930
025-
035-
032-
000
WES
TER
N P
AC
IFIC
HO
USI
NG
Impr
oved
Sin
gle
Fam
ily R
esid
entia
l Lot
70'
x 1
05' T
ypic
al L
ot25
,000
$
25,0
00$
Si
ngle
Fam
ily12
4,00
0$
12
4,00
0$
0.0
0.0
9,05
802
5-03
5-03
3-00
0W
ESTE
RN
PA
CIF
IC H
OU
SIN
GIm
prov
ed S
ingl
e Fa
mily
Res
iden
tial L
ot 7
0' x
105
' Typ
ical
Lot
25,0
00$
25
,000
$
Sing
le F
amily
124,
000
$
124,
000
$
0.
00.
08,
894
025-
035-
034-
000
WES
TER
N P
AC
IFIC
HO
USI
NG
Impr
oved
Sin
gle
Fam
ily R
esid
entia
l Lot
70'
x 1
05' T
ypic
al L
ot25
,000
$
25,0
00$
Si
ngle
Fam
ily12
4,00
0$
12
4,00
0$
0.0
0.0
8,86
202
5-03
5-03
5-00
0W
ESTE
RN
PA
CIF
IC H
OU
SIN
GIm
prov
ed S
ingl
e Fa
mily
Res
iden
tial L
ot 7
0' x
105
' Typ
ical
Lot
25,0
00$
25
,000
$
Sing
le F
amily
124,
000
$
124,
000
$
0.
00.
08,
614
025-
035-
036-
000
WES
TER
N P
AC
IFIC
HO
USI
NG
Impr
oved
Sin
gle
Fam
ily R
esid
entia
l Lot
70'
x 1
05' T
ypic
al L
ot25
,000
$
25,0
00$
Si
ngle
Fam
ily12
4,00
0$
12
4,00
0$
0.0
0.0
8,17
002
5-03
5-03
7-00
0W
ESTE
RN
PA
CIF
IC H
OU
SIN
GIm
prov
ed S
ingl
e Fa
mily
Res
iden
tial L
ot 7
0' x
105
' Typ
ical
Lot
25,0
00$
25
,000
$
Sing
le F
amily
124,
000
$
124,
000
$
0.
00.
07,
462
025-
035-
038-
000
WES
TER
N P
AC
IFIC
HO
USI
NG
Impr
oved
Sin
gle
Fam
ily R
esid
entia
l Lot
70'
x 1
05' T
ypic
al L
ot25
,000
$
25,0
00$
Si
ngle
Fam
ily12
4,00
0$
12
4,00
0$
0.0
0.0
6,56
202
5-03
5-03
9-00
0W
ESTE
RN
PA
CIF
IC H
OU
SIN
GIm
prov
ed S
ingl
e Fa
mily
Res
iden
tial L
ot 7
0' x
105
' Typ
ical
Lot
25,0
00$
25
,000
$
Sing
le F
amily
124,
000
$
124,
000
$
0.
00.
05,
600
025-
035-
040-
000
WES
TER
N P
AC
IFIC
HO
USI
NG
Impr
oved
Sin
gle
Fam
ily R
esid
entia
l Lot
70'
x 1
05' T
ypic
al L
ot25
,000
$
25,0
00$
Si
ngle
Fam
ily12
4,00
0$
12
4,00
0$
0.0
0.0
5,93
902
5-03
5-04
1-00
0W
ESTE
RN
PA
CIF
IC H
OU
SIN
GIm
prov
ed S
ingl
e Fa
mily
Res
iden
tial L
ot 7
0' x
105
' Typ
ical
Lot
25,0
00$
25
,000
$
Sing
le F
amily
124,
000
$
124,
000
$
0.
00.
07,
533
025-
035-
042-
000
WES
TER
N P
AC
IFIC
HO
USI
NG
Impr
oved
Sin
gle
Fam
ily R
esid
entia
l Lot
70'
x 1
05' T
ypic
al L
ot25
,000
$
25,0
00$
Si
ngle
Fam
ily12
4,00
0$
12
4,00
0$
0.0
0.0
7,35
002
5-03
5-04
3-00
0W
ESTE
RN
PA
CIF
IC H
OU
SIN
GIm
prov
ed S
ingl
e Fa
mily
Res
iden
tial L
ot 7
0' x
105
' Typ
ical
Lot
25,0
00$
25
,000
$
Sing
le F
amily
124,
000
$
124,
000
$
0.
00.
07,
350
025-
035-
044-
000
WES
TER
N P
AC
IFIC
HO
USI
NG
Impr
oved
Sin
gle
Fam
ily R
esid
entia
l Lot
70'
x 1
05' T
ypic
al L
ot25
,000
$
25,0
00$
Si
ngle
Fam
ily12
4,00
0$
12
4,00
0$
0.0
0.0
7,79
702
5-03
5-04
5-00
0W
ESTE
RN
PA
CIF
IC H
OU
SIN
GEx
empt
Exem
pt0.
00.
00
025-
036-
001-
000
WES
TER
N P
AC
IFIC
HO
USI
NG
Impr
oved
Sin
gle
Fam
ily R
esid
entia
l Lot
70'
x 1
05' T
ypic
al L
ot25
,000
$
25,0
00$
Si
ngle
Fam
ily12
4,00
0$
12
4,00
0$
0.0
0.0
9,11
402
5-03
6-00
2-00
0W
ESTE
RN
PA
CIF
IC H
OU
SIN
GIm
prov
ed S
ingl
e Fa
mily
Res
iden
tial L
ot 7
0' x
105
' Typ
ical
Lot
25,0
00$
25
,000
$
Sing
le F
amily
124,
000
$
124,
000
$
0.
00.
07,
979
025-
036-
003-
000
WES
TER
N P
AC
IFIC
HO
USI
NG
Impr
oved
Sin
gle
Fam
ily R
esid
entia
l Lot
70'
x 1
05' T
ypic
al L
ot25
,000
$
25,0
00$
Si
ngle
Fam
ily12
4,00
0$
12
4,00
0$
0.0
0.0
8,14
402
5-03
6-00
4-00
0W
ESTE
RN
PA
CIF
IC H
OU
SIN
GIm
prov
ed S
ingl
e Fa
mily
Res
iden
tial L
ot 7
0' x
105
' Typ
ical
Lot
25,0
00$
25
,000
$
Sing
le F
amily
124,
000
$
124,
000
$
0.
00.
08,
863
025-
036-
005-
000
WES
TER
N P
AC
IFIC
HO
USI
NG
Impr
oved
Sin
gle
Fam
ily R
esid
entia
l Lot
70'
x 1
05' T
ypic
al L
ot25
,000
$
25,0
00$
Si
ngle
Fam
ily12
4,00
0$
12
4,00
0$
0.0
0.0
8,92
202
5-03
6-00
6-00
0W
ESTE
RN
PA
CIF
IC H
OU
SIN
GIm
prov
ed S
ingl
e Fa
mily
Res
iden
tial L
ot 7
0' x
105
' Typ
ical
Lot
25,0
00$
25
,000
$
Sing
le F
amily
124,
000
$
124,
000
$
0.
00.
011
,275
025-
036-
007-
000
WES
TER
N P
AC
IFIC
HO
USI
NG
Impr
oved
Sin
gle
Fam
ily R
esid
entia
l Lot
70'
x 1
05' T
ypic
al L
ot25
,000
$
25,0
00$
Si
ngle
Fam
ily12
4,00
0$
12
4,00
0$
0.0
0.0
10,0
2702
5-03
6-00
8-00
0W
ESTE
RN
PA
CIF
IC H
OU
SIN
GIm
prov
ed S
ingl
e Fa
mily
Res
iden
tial L
ot 7
0' x
105
' Typ
ical
Lot
25,0
00$
25
,000
$
Sing
le F
amily
124,
000
$
124,
000
$
0.
00.
09,
335
025-
036-
009-
000
WES
TER
N P
AC
IFIC
HO
USI
NG
Impr
oved
Sin
gle
Fam
ily R
esid
entia
l Lot
70'
x 1
05' T
ypic
al L
ot25
,000
$
25,0
00$
Si
ngle
Fam
ily12
4,00
0$
12
4,00
0$
0.0
0.0
9,15
902
5-03
6-01
0-00
0W
ESTE
RN
PA
CIF
IC H
OU
SIN
GIm
prov
ed S
ingl
e Fa
mily
Res
iden
tial L
ot 7
0' x
105
' Typ
ical
Lot
25,0
00$
25
,000
$
Sing
le F
amily
124,
000
$
124,
000
$
0.
00.
09,
141
025-
036-
011-
000
WES
TER
N P
AC
IFIC
HO
USI
NG
Impr
oved
Sin
gle
Fam
ily R
esid
entia
l Lot
70'
x 1
05' T
ypic
al L
ot25
,000
$
25,0
00$
Si
ngle
Fam
ily12
4,00
0$
12
4,00
0$
0.0
0.0
9,05
002
5-03
6-01
2-00
0W
ESTE
RN
PA
CIF
IC H
OU
SIN
GIm
prov
ed S
ingl
e Fa
mily
Res
iden
tial L
ot 7
0' x
105
' Typ
ical
Lot
25,0
00$
25
,000
$
Sing
le F
amily
124,
000
$
124,
000
$
0.
00.
08,
885
025-
036-
013-
000
WES
TER
N P
AC
IFIC
HO
USI
NG
Impr
oved
Sin
gle
Fam
ily R
esid
entia
l Lot
70'
x 1
05' T
ypic
al L
ot25
,000
$
25,0
00$
Si
ngle
Fam
ily12
4,00
0$
12
4,00
0$
0.0
0.0
8,64
502
5-03
6-01
4-00
0W
ESTE
RN
PA
CIF
IC H
OU
SIN
GIm
prov
ed S
ingl
e Fa
mily
Res
iden
tial L
ot 7
0' x
105
' Typ
ical
Lot
25,0
00$
25
,000
$
Sing
le F
amily
124,
000
$
124,
000
$
0.
00.
08,
330
025-
036-
015-
000
WES
TER
N P
AC
IFIC
HO
USI
NG
Impr
oved
Sin
gle
Fam
ily R
esid
entia
l Lot
70'
x 1
05' T
ypic
al L
ot25
,000
$
25,0
00$
Si
ngle
Fam
ily12
4,00
0$
12
4,00
0$
0.0
0.0
9,10
302
5-03
6-01
6-00
0W
ESTE
RN
PA
CIF
IC H
OU
SIN
GIm
prov
ed S
ingl
e Fa
mily
Res
iden
tial L
ot 7
0' x
105
' Typ
ical
Lot
25,0
00$
25
,000
$
Sing
le F
amily
124,
000
$
124,
000
$
0.
00.
08,
310
025-
036-
017-
000
WES
TER
N P
AC
IFIC
HO
USI
NG
Impr
oved
Sin
gle
Fam
ily R
esid
entia
l Lot
70'
x 1
05' T
ypic
al L
ot25
,000
$
25,0
00$
Si
ngle
Fam
ily12
4,00
0$
12
4,00
0$
0.0
0.0
7,57
402
5-03
6-01
8-00
0W
ESTE
RN
PA
CIF
IC H
OU
SIN
GIm
prov
ed S
ingl
e Fa
mily
Res
iden
tial L
ot 7
0' x
105
' Typ
ical
Lot
25,0
00$
25
,000
$
Sing
le F
amily
124,
000
$
124,
000
$
0.
00.
07,
302
025-
036-
019-
000
WES
TER
N P
AC
IFIC
HO
USI
NG
Impr
oved
Sin
gle
Fam
ily R
esid
entia
l Lot
70'
x 1
05' T
ypic
al L
ot25
,000
$
25,0
00$
Si
ngle
Fam
ily12
4,00
0$
12
4,00
0$
0.0
0.0
7,03
002
5-03
6-02
0-00
0W
ESTE
RN
PA
CIF
IC H
OU
SIN
GIm
prov
ed S
ingl
e Fa
mily
Res
iden
tial L
ot 7
0' x
105
' Typ
ical
Lot
25,0
00$
25
,000
$
Sing
le F
amily
124,
000
$
124,
000
$
0.
00.
06,
628
025-
036-
021-
000
WES
TER
N P
AC
IFIC
HO
USI
NG
Impr
oved
Sin
gle
Fam
ily R
esid
entia
l Lot
70'
x 1
05' T
ypic
al L
ot25
,000
$
25,0
00$
Si
ngle
Fam
ily12
4,00
0$
12
4,00
0$
0.0
0.0
6,36
702
5-03
6-02
2-00
0W
ESTE
RN
PA
CIF
IC H
OU
SIN
GIm
prov
ed S
ingl
e Fa
mily
Res
iden
tial L
ot 7
0' x
105
' Typ
ical
Lot
25,0
00$
25
,000
$
Sing
le F
amily
124,
000
$
124,
000
$
0.
00.
06,
105
025-
036-
023-
000
WES
TER
N P
AC
IFIC
HO
USI
NG
Impr
oved
Sin
gle
Fam
ily R
esid
entia
l Lot
70'
x 1
05' T
ypic
al L
ot25
,000
$
25,0
00$
Si
ngle
Fam
ily12
4,00
0$
12
4,00
0$
0.0
0.0
5,81
902
5-03
6-02
4-00
0W
ESTE
RN
PA
CIF
IC H
OU
SIN
GIm
prov
ed S
ingl
e Fa
mily
Res
iden
tial L
ot 7
0' x
105
' Typ
ical
Lot
25,0
00$
25
,000
$
Sing
le F
amily
124,
000
$
124,
000
$
0.
00.
05,
315
025-
036-
025-
000
WES
TER
N P
AC
IFIC
HO
USI
NG
Impr
oved
Sin
gle
Fam
ily R
esid
entia
l Lot
70'
x 1
05' T
ypic
al L
ot25
,000
$
25,0
00$
Si
ngle
Fam
ily12
4,00
0$
12
4,00
0$
0.0
0.0
11,3
7502
5-03
6-02
6-00
0W
ESTE
RN
PA
CIF
IC H
OU
SIN
GIm
prov
ed S
ingl
e Fa
mily
Res
iden
tial L
ot 7
0' x
105
' Typ
ical
Lot
25,0
00$
25
,000
$
Sing
le F
amily
124,
000
$
124,
000
$
0.
00.
08,
384
025-
036-
027-
000
WES
TER
N P
AC
IFIC
HO
USI
NG
Impr
oved
Sin
gle
Fam
ily R
esid
entia
l Lot
70'
x 1
05' T
ypic
al L
ot25
,000
$
25,0
00$
Si
ngle
Fam
ily12
4,00
0$
12
4,00
0$
0.0
0.0
5,20
002
5-03
6-02
8-00
0W
ESTE
RN
PA
CIF
IC H
OU
SIN
GIm
prov
ed S
ingl
e Fa
mily
Res
iden
tial L
ot 7
0' x
105
' Typ
ical
Lot
25,0
00$
25
,000
$
Sing
le F
amily
124,
000
$
124,
000
$
0.
00.
05,
200
025-
036-
029-
000
WES
TER
N P
AC
IFIC
HO
USI
NG
Impr
oved
Sin
gle
Fam
ily R
esid
entia
l Lot
70'
x 1
05' T
ypic
al L
ot25
,000
$
25,0
00$
Si
ngle
Fam
ily12
4,00
0$
12
4,00
0$
0.0
0.0
5,37
202
5-03
6-03
0-00
0W
ESTE
RN
PA
CIF
IC H
OU
SIN
GIm
prov
ed S
ingl
e Fa
mily
Res
iden
tial L
ot 7
0' x
105
' Typ
ical
Lot
25,0
00$
25
,000
$
Sing
le F
amily
124,
000
$
124,
000
$
0.
00.
06,
362
025-
036-
031-
000
WES
TER
N P
AC
IFIC
HO
USI
NG
Impr
oved
Sin
gle
Fam
ily R
esid
entia
l Lot
70'
x 1
05' T
ypic
al L
ot25
,000
$
25,0
00$
Si
ngle
Fam
ily12
4,00
0$
12
4,00
0$
0.0
0.0
6,57
502
5-03
6-03
2-00
0W
ESTE
RN
PA
CIF
IC H
OU
SIN
GIm
prov
ed S
ingl
e Fa
mily
Res
iden
tial L
ot 7
0' x
105
' Typ
ical
Lot
25,0
00$
25
,000
$
Sing
le F
amily
124,
000
$
124,
000
$
0.
00.
06,
626
025-
036-
033-
000
WES
TER
N P
AC
IFIC
HO
USI
NG
Impr
oved
Sin
gle
Fam
ily R
esid
entia
l Lot
70'
x 1
05' T
ypic
al L
ot25
,000
$
25,0
00$
Si
ngle
Fam
ily12
4,00
0$
12
4,00
0$
0.0
0.0
6,37
302
5-03
6-03
4-00
0W
ESTE
RN
PA
CIF
IC H
OU
SIN
GIm
prov
ed S
ingl
e Fa
mily
Res
iden
tial L
ot 7
0' x
105
' Typ
ical
Lot
25,0
00$
25
,000
$
Sing
le F
amily
124,
000
$
124,
000
$
0.
00.
05,
426
025-
036-
035-
000
WES
TER
N P
AC
IFIC
HO
USI
NG
Exem
ptEx
empt
0.0
0.0
002
5-03
6-03
6-00
0W
ESTE
RN
PA
CIF
IC H
OU
SIN
GEx
empt
Exem
pt0.
00.
00
025-
037-
001-
000
WES
TER
N P
AC
IFIC
HO
USI
NG
Impr
oved
Sin
gle
Fam
ily R
esid
entia
l Lot
70'
x 1
05' T
ypic
al L
ot25
,000
$
25,0
00$
Si
ngle
Fam
ily12
4,00
0$
12
4,00
0$
0.0
0.0
8,42
302
5-03
7-00
2-00
0W
ESTE
RN
PA
CIF
IC H
OU
SIN
GIm
prov
ed S
ingl
e Fa
mily
Res
iden
tial L
ot 7
0' x
105
' Typ
ical
Lot
25,0
00$
25
,000
$
Sing
le F
amily
124,
000
$
124,
000
$
0.
00.
06,
927
025-
037-
003-
000
WES
TER
N P
AC
IFIC
HO
USI
NG
Impr
oved
Sin
gle
Fam
ily R
esid
entia
l Lot
70'
x 1
05' T
ypic
al L
ot25
,000
$
25,0
00$
Si
ngle
Fam
ily12
4,00
0$
12
4,00
0$
0.0
0.0
6,47
002
5-03
7-00
4-00
0W
ESTE
RN
PA
CIF
IC H
OU
SIN
GIm
prov
ed S
ingl
e Fa
mily
Res
iden
tial L
ot 7
0' x
105
' Typ
ical
Lot
25,0
00$
25
,000
$
Sing
le F
amily
124,
000
$
124,
000
$
0.
00.
07,
314
025-
037-
005-
000
WES
TER
N P
AC
IFIC
HO
USI
NG
Impr
oved
Sin
gle
Fam
ily R
esid
entia
l Lot
70'
x 1
05' T
ypic
al L
ot25
,000
$
25,0
00$
Si
ngle
Fam
ily12
4,00
0$
12
4,00
0$
0.0
0.0
7,40
402
5-03
7-00
6-00
0W
ESTE
RN
PA
CIF
IC H
OU
SIN
GIm
prov
ed S
ingl
e Fa
mily
Res
iden
tial L
ot 7
0' x
105
' Typ
ical
Lot
25,0
00$
25
,000
$
Sing
le F
amily
124,
000
$
124,
000
$
0.
00.
07,
898
025-
037-
007-
000
WES
TER
N P
AC
IFIC
HO
USI
NG
Impr
oved
Sin
gle
Fam
ily R
esid
entia
l Lot
70'
x 1
05' T
ypic
al L
ot25
,000
$
25,0
00$
Si
ngle
Fam
ily12
4,00
0$
12
4,00
0$
0.0
0.0
7,92
202
5-03
7-00
8-00
0W
ESTE
RN
PA
CIF
IC H
OU
SIN
GIm
prov
ed S
ingl
e Fa
mily
Res
iden
tial L
ot 7
0' x
105
' Typ
ical
Lot
25,0
00$
25
,000
$
Sing
le F
amily
124,
000
$
124,
000
$
0.
00.
07,
454
9 of
12
2014
-15
Gro
ss
Tax
able
L
otA
PNO
wne
r (A
s of A
pril
1, 2
015)
Lan
d U
se D
escr
iptio
nIm
pr. V
alue
Lan
d V
alue
Tot
al V
alue
Lan
d U
seA
ppra
ised
Val
ueA
ssig
ned
Val
ueA
crea
geA
crea
geSq
. Ft.
Ass
esse
d V
alue
s
025-
037-
009-
000
WES
TER
N P
AC
IFIC
HO
USI
NG
Impr
oved
Sin
gle
Fam
ily R
esid
entia
l Lot
70'
x 1
05' T
ypic
al L
ot25
,000
$
25,0
00$
Si
ngle
Fam
ily12
4,00
0$
12
4,00
0$
0.0
0.0
6,23
802
5-03
7-01
0-00
0W
ESTE
RN
PA
CIF
IC H
OU
SIN
GIm
prov
ed S
ingl
e Fa
mily
Res
iden
tial L
ot 7
0' x
105
' Typ
ical
Lot
25,0
00$
25
,000
$
Sing
le F
amily
124,
000
$
124,
000
$
0.
00.
09,
513
025-
037-
011-
000
WES
TER
N P
AC
IFIC
HO
USI
NG
Impr
oved
Sin
gle
Fam
ily R
esid
entia
l Lot
70'
x 1
05' T
ypic
al L
ot25
,000
$
25,0
00$
Si
ngle
Fam
ily12
4,00
0$
12
4,00
0$
0.0
0.0
10,2
2802
5-03
7-01
2-00
0W
ESTE
RN
PA
CIF
IC H
OU
SIN
GIm
prov
ed S
ingl
e Fa
mily
Res
iden
tial L
ot 7
0' x
105
' Typ
ical
Lot
30,0
00$
30
,000
$
Sing
le F
amily
124,
000
$
124,
000
$
0.
00.
017
,196
025-
037-
013-
000
WES
TER
N P
AC
IFIC
HO
USI
NG
Impr
oved
Sin
gle
Fam
ily R
esid
entia
l Lot
70'
x 1
05' T
ypic
al L
ot25
,000
$
25,0
00$
Si
ngle
Fam
ily12
4,00
0$
12
4,00
0$
0.0
0.0
10,1
7402
5-03
7-01
4-00
0W
ESTE
RN
PA
CIF
IC H
OU
SIN
GIm
prov
ed S
ingl
e Fa
mily
Res
iden
tial L
ot 7
0' x
105
' Typ
ical
Lot
25,0
00$
25
,000
$
Sing
le F
amily
124,
000
$
124,
000
$
0.
00.
09,
007
025-
037-
015-
000
WES
TER
N P
AC
IFIC
HO
USI
NG
Impr
oved
Sin
gle
Fam
ily R
esid
entia
l Lot
70'
x 1
05' T
ypic
al L
ot25
,000
$
25,0
00$
Si
ngle
Fam
ily12
4,00
0$
12
4,00
0$
0.0
0.0
7,77
802
5-03
7-01
6-00
0W
ESTE
RN
PA
CIF
IC H
OU
SIN
GIm
prov
ed S
ingl
e Fa
mily
Res
iden
tial L
ot 7
0' x
105
' Typ
ical
Lot
25,0
00$
25
,000
$
Sing
le F
amily
124,
000
$
124,
000
$
0.
00.
07,
740
025-
037-
017-
000
WES
TER
N P
AC
IFIC
HO
USI
NG
Impr
oved
Sin
gle
Fam
ily R
esid
entia
l Lot
70'
x 1
05' T
ypic
al L
ot25
,000
$
25,0
00$
Si
ngle
Fam
ily12
4,00
0$
12
4,00
0$
0.0
0.0
7,65
402
5-03
7-01
8-00
0W
ESTE
RN
PA
CIF
IC H
OU
SIN
GIm
prov
ed S
ingl
e Fa
mily
Res
iden
tial L
ot 7
0' x
105
' Typ
ical
Lot
25,0
00$
25
,000
$
Sing
le F
amily
124,
000
$
124,
000
$
0.
00.
07,
213
025-
037-
019-
000
WES
TER
N P
AC
IFIC
HO
USI
NG
Impr
oved
Sin
gle
Fam
ily R
esid
entia
l Lot
70'
x 1
05' T
ypic
al L
ot25
,000
$
25,0
00$
Si
ngle
Fam
ily12
4,00
0$
12
4,00
0$
0.0
0.0
9,18
702
5-03
7-02
0-00
0W
ESTE
RN
PA
CIF
IC H
OU
SIN
GEx
empt
Exem
pt0.
00.
00
025-
038-
001-
000
WO
RLD
INTE
RN
ATI
ON
AL
LLC
Gol
f39
4,87
0$
253,
243
$
64
8,11
3$
Gol
f64
8,11
3$
48.1
48.1
002
5-03
8-00
2-00
0PA
CIF
IC B
LUE
LLC
Win
ery
200,
000
$
20
0,00
0$
Win
ery
200,
000
$
10
.710
.70
025-
038-
003-
000
DIA
BLO
GR
AN
DE
RES
IDEN
TIA
L A
SSO
CEx
empt
Exem
pt0.
00.
00
025-
039-
002-
000
WO
RLD
INTE
RN
ATI
ON
AL
LLC
Exem
ptEx
empt
0.0
0.0
002
5-03
9-00
3-00
0W
OR
LD IN
TER
NA
TIO
NA
L LL
CEx
empt
Exem
pt0.
00.
00
025-
039-
008-
000
DIA
BLO
GR
AN
DE
CO
MM
ERC
IAL
ASS
OC
Exem
ptEx
empt
0.0
0.0
002
5-03
9-00
9-00
0D
IAB
LO G
RA
ND
E C
OM
MER
CIA
L A
SSO
CEx
empt
Exem
pt0.
00.
00
025-
039-
010-
000
DIA
BLO
GR
AN
DE
CO
MM
ERC
IAL
ASS
OC
Exem
ptEx
empt
0.0
0.0
002
5-03
9-01
2-00
0W
OR
LD IN
TER
NA
TIO
NA
L LL
CD
iabl
o R
ange
- gr
azin
g la
nd/o
pen
spac
e1,
026,
665
$
1,49
5,24
8$
2,
521,
913
$
U
ndev
elop
ed2,
521,
913
$
1,24
2.4
843.
50
025-
040-
001-
000
WO
RLD
INTE
RN
ATI
ON
AL
LLC
Gol
f1,
568,
091
$
212,
703
$
2,
962,
920
$
G
olf
2,96
2,92
0$
40
.440
.40
025-
040-
002-
000
DIA
BLO
GR
AN
DE
CO
MM
ERC
IAL
ASS
OC
Exem
ptEx
empt
0.0
0.0
002
5-04
0-00
3-00
0W
OR
LD IN
TER
NA
TIO
NA
L LL
CH
otel
287,
466
$
28
7,46
6$
Hot
el28
7,46
6$
13.7
13.7
002
5-04
0-00
4-00
0W
OR
LD IN
TER
NA
TIO
NA
L LL
CEx
empt
Exem
pt0.
00.
00
025-
040-
005-
000
WO
RLD
INTE
RN
ATI
ON
AL
LLC
Und
evel
oped
314,
316
$
20
7,96
4$
537,
020
$
U
ndev
elop
ed53
7,02
0$
54.0
54.0
002
5-04
0-00
6-00
0W
ESTE
RN
PA
CIF
IC H
OU
SIN
GEx
empt
Exem
pt0.
00.
00
025-
040-
008-
000
DIA
BLO
GR
AN
DE
CO
MM
ERC
IAL
ASS
OC
Exem
ptEx
empt
0.0
0.0
002
5-04
0-00
9-00
0W
OR
LD IN
TER
NA
TIO
NA
L LL
CEx
empt
Exem
pt0.
00.
00
025-
040-
010-
000
WO
RLD
INTE
RN
ATI
ON
AL
LLC
Exem
ptEx
empt
1.2
0.0
002
5-04
0-01
1-00
0W
OR
LD IN
TER
NA
TIO
NA
L LL
CEx
empt
Exem
pt1.
50.
00
025-
040-
012-
000
WO
RLD
INTE
RN
ATI
ON
AL
LLC
Phas
e 1,
Vill
age
5 - 2
24 P
rodu
ctio
n-O
rient
ed S
FR L
ots
65,1
30$
65
,130
$
Und
evel
oped
-$
3.1
3.1
002
5-04
0-01
3-00
0W
OR
LD IN
TER
NA
TIO
NA
L LL
CPh
ase
1, V
illag
e 5
- 224
Pro
duct
ion-
Orie
nted
SFR
Lot
s24
7,91
6$
247,
916
$
U
ndev
elop
ed-
$
39
.539
.50
025-
040-
014-
000
WO
RLD
INTE
RN
ATI
ON
AL
LLC
Exem
pt10
,002
$
10,0
02$
Ex
empt
38.5
0.0
002
5-04
0-01
5-00
0W
OR
LD IN
TER
NA
TIO
NA
L LL
CEx
empt
Exem
pt0.
70.
00
025-
041-
001-
000
WO
RLD
INTE
RN
ATI
ON
AL
LLC
Esta
te L
ot (i
nclu
ded
in M
aste
r Dev
elop
er b
ulk
valu
e)31
,587
$
31,5
87$
Si
ngle
Fam
ily-
$
0.
50.
020
,909
025-
041-
002-
000
WO
RLD
INTE
RN
ATI
ON
AL
LLC
Esta
te L
ot (i
nclu
ded
in M
aste
r Dev
elop
er b
ulk
valu
e)31
,587
$
31,5
87$
Si
ngle
Fam
ily-
$
0.
90.
040
,075
025-
041-
003-
000
WO
RLD
INTE
RN
ATI
ON
AL
LLC
Esta
te L
ot (i
nclu
ded
in M
aste
r Dev
elop
er b
ulk
valu
e)31
,587
$
31,5
87$
Si
ngle
Fam
ily-
$
1.
40.
058
,806
025-
041-
004-
000
WO
RLD
INTE
RN
ATI
ON
AL
LLC
Esta
te L
ot (i
nclu
ded
in M
aste
r Dev
elop
er b
ulk
valu
e)36
,853
$
36,8
53$
Si
ngle
Fam
ily-
$
5.
70.
024
6,11
402
5-04
1-00
5-00
0W
OR
LD IN
TER
NA
TIO
NA
L LL
CEs
tate
Lot
(inc
lude
d in
Mas
ter D
evel
oper
bul
k va
lue)
31,5
87$
31
,587
$
Sing
le F
amily
-$
4.8
0.0
207,
346
025-
041-
006-
000
ENB
OM
BR
IAN
R &
DIA
NE
FEs
tate
Lot
50,0
00$
50
,000
$
Sing
le F
amily
90,0
00$
90,0
00$
0.
90.
040
,946
025-
041-
007-
000
WIL
LIA
M B
AR
RER
A &
LO
RR
AIN
E LO
PEZ
Esta
te L
ot50
,000
$
50,0
00$
Si
ngle
Fam
ily90
,000
$
90
,000
$
0.9
0.0
40,0
7502
5-04
1-00
8-00
0ZE
RC
OE
STEV
EEs
tate
Lot
50,0
00$
50
,000
$
Sing
le F
amily
90,0
00$
90,0
00$
0.
90.
040
,075
025-
041-
009-
000
WO
RLD
INTE
RN
ATI
ON
AL
LLC
Esta
te L
ot (i
nclu
ded
in M
aste
r Dev
elop
er b
ulk
valu
e)31
,587
$
31,5
87$
Si
ngle
Fam
ily-
$
0.
70.
031
,363
025-
041-
010-
000
WO
RLD
INTE
RN
ATI
ON
AL
LLC
Esta
te L
ot (i
nclu
ded
in M
aste
r Dev
elop
er b
ulk
valu
e)31
,587
$
31,5
87$
Si
ngle
Fam
ily-
$
0.
50.
020
,473
025-
041-
011-
000
WO
RLD
INTE
RN
ATI
ON
AL
LLC
Esta
te L
ot (i
nclu
ded
in M
aste
r Dev
elop
er b
ulk
valu
e)31
,587
$
31,5
87$
Si
ngle
Fam
ily-
$
0.
50.
020
,909
025-
041-
012-
000
DIA
BLO
GR
AN
DE
RES
IDEN
TIA
L A
SSO
CEx
empt
Exem
pt0.
00.
00
025-
042-
002-
000
DIA
BLO
GR
AN
DE
RES
IDEN
TIA
L A
SSO
CEx
empt
Exem
pt0.
00.
00
025-
042-
003-
000
DIA
BLO
GR
AN
DE
RES
IDEN
TIA
L A
SSO
CEx
empt
Exem
pt0.
00.
00
025-
042-
004-
000
WO
RLD
INTE
RN
ATI
ON
AL
LLC
Esta
te L
ot (i
nclu
ded
in M
aste
r Dev
elop
er b
ulk
valu
e)31
,514
$
31,5
14$
Si
ngle
Fam
ily-
$
4.
90.
021
2,57
302
5-04
2-00
5-00
0W
OR
LD IN
TER
NA
TIO
NA
L LL
CEs
tate
Lot
(inc
lude
d in
Mas
ter D
evel
oper
bul
k va
lue)
31,5
87$
31
,587
$
Sing
le F
amily
-$
3.3
0.0
143,
312
025-
042-
006-
000
WO
RLD
INTE
RN
ATI
ON
AL
LLC
Esta
te L
ot (i
nclu
ded
in M
aste
r Dev
elop
er b
ulk
valu
e)31
,514
$
31,5
14$
Si
ngle
Fam
ily-
$
0.
90.
038
,768
025-
042-
007-
000
WO
RLD
INTE
RN
ATI
ON
AL
LLC
Esta
te L
ot (i
nclu
ded
in M
aste
r Dev
elop
er b
ulk
valu
e)31
,514
$
31,5
14$
Si
ngle
Fam
ily-
$
0.
50.
023
,087
025-
042-
008-
000
WO
RLD
INTE
RN
ATI
ON
AL
LLC
Esta
te L
ot (i
nclu
ded
in M
aste
r Dev
elop
er b
ulk
valu
e)31
,587
$
31,5
87$
Si
ngle
Fam
ily-
$
0.
50.
023
,087
025-
042-
009-
000
WO
RLD
INTE
RN
ATI
ON
AL
LLC
Esta
te L
ot (i
nclu
ded
in M
aste
r Dev
elop
er b
ulk
valu
e)31
,587
$
31,5
87$
Si
ngle
Fam
ily-
$
0.
50.
020
,038
025-
042-
010-
000
WO
RLD
INTE
RN
ATI
ON
AL
LLC
Esta
te L
ot (i
nclu
ded
in M
aste
r Dev
elop
er b
ulk
valu
e)31
,514
$
31,5
14$
Si
ngle
Fam
ily-
$
0.
50.
020
,473
025-
042-
011-
000
WO
RLD
INTE
RN
ATI
ON
AL
LLC
Esta
te L
ot (i
nclu
ded
in M
aste
r Dev
elop
er b
ulk
valu
e)31
,587
$
31,5
87$
Si
ngle
Fam
ily-
$
0.
70.
028
,314
025-
042-
012-
000
WO
RLD
INTE
RN
ATI
ON
AL
LLC
Esta
te L
ot (i
nclu
ded
in M
aste
r Dev
elop
er b
ulk
valu
e)31
,587
$
31,5
87$
Si
ngle
Fam
ily-
$
0.
80.
033
,541
025-
042-
013-
000
WO
RLD
INTE
RN
ATI
ON
AL
LLC
Esta
te L
ot (i
nclu
ded
in M
aste
r Dev
elop
er b
ulk
valu
e)31
,514
$
31,5
14$
Si
ngle
Fam
ily-
$
0.
60.
026
,572
025-
042-
014-
000
WO
RLD
INTE
RN
ATI
ON
AL
LLC
Esta
te L
ot (i
nclu
ded
in M
aste
r Dev
elop
er b
ulk
valu
e)31
,514
$
31,5
14$
Si
ngle
Fam
ily-
$
0.
60.
026
,572
025-
042-
015-
000
WO
RLD
INTE
RN
ATI
ON
AL
LLC
Esta
te L
ot (i
nclu
ded
in M
aste
r Dev
elop
er b
ulk
valu
e)31
,514
$
31,5
14$
Si
ngle
Fam
ily-
$
1.
00.
043
,560
025-
042-
016-
000
DA
VID
GO
NZA
LEZ
GA
RC
IAEs
tate
Lot
50,0
00$
50
,000
$
Sing
le F
amily
135,
000
$
135,
000
$
1.
10.
049
,658
025-
042-
017-
000
WO
RLD
INTE
RN
ATI
ON
AL
LLC
Esta
te L
ot (i
nclu
ded
in M
aste
r Dev
elop
er b
ulk
valu
e)31
,587
$
31,5
87$
Si
ngle
Fam
ily-
$
4.
70.
020
3,42
502
5-04
2-01
8-00
0W
OR
LD IN
TER
NA
TIO
NA
L LL
CEs
tate
Lot
(inc
lude
d in
Mas
ter D
evel
oper
bul
k va
lue)
31,5
14$
31
,514
$
Sing
le F
amily
-$
1.6
0.0
68,3
8902
5-04
2-01
9-00
0W
OR
LD IN
TER
NA
TIO
NA
L LL
CEs
tate
Lot
(inc
lude
d in
Mas
ter D
evel
oper
bul
k va
lue)
31,5
87$
31
,587
$
Sing
le F
amily
-$
1.0
0.0
43,9
9602
5-04
2-02
0-00
0W
OR
LD IN
TER
NA
TIO
NA
L LL
CEs
tate
Lot
(inc
lude
d in
Mas
ter D
evel
oper
bul
k va
lue)
31,5
14$
31
,514
$
Sing
le F
amily
-$
0.9
0.0
40,0
7502
5-04
2-02
1-00
0W
OR
LD IN
TER
NA
TIO
NA
L LL
CEs
tate
Lot
(inc
lude
d in
Mas
ter D
evel
oper
bul
k va
lue)
31,5
14$
31
,514
$
Sing
le F
amily
-$
0.8
0.0
32,6
7002
5-04
3-00
1-00
0SZ
CZE
RB
IN S
AN
DR
A A
Sing
le F
amily
205,
500
$
20
,000
$
225,
500
$
Si
ngle
Fam
ily22
5,50
0$
0.0
0.0
8,63
802
5-04
3-00
2-00
0TI
LTO
N S
HA
LIC
E M
AR
IKSi
ngle
Fam
ily27
1,22
5$
20,0
90$
29
1,31
5$
Sing
le F
amily
291,
315
$
0.
00.
06,
673
025-
043-
003-
000
RU
DN
ICK
A K
ATA
RZY
NA
MSi
ngle
Fam
ily14
0,04
6$
52,6
47$
19
2,69
3$
Sing
le F
amily
192,
693
$
0.
00.
05,
745
10 o
f 12

2014
-15
Gro
ss
Tax
able
L
otA
PNO
wne
r (A
s of A
pril
1, 2
015)
Lan
d U
se D
escr
iptio
nIm
pr. V
alue
Lan
d V
alue
Tot
al V
alue
Lan
d U
seA
ppra
ised
Val
ueA
ssig
ned
Val
ueA
crea
geA
crea
geSq
. Ft.
Ass
esse
d V
alue
s
025-
043-
004-
000
WIL
LIA
MS
JER
ALD
& D
AR
LEN
ESi
ngle
Fam
ily33
6,52
0$
50,2
27$
38
6,74
7$
Sing
le F
amily
386,
747
$
0.
00.
08,
103
025-
043-
005-
000
CA
LLA
HA
N D
AN
IEL
J & C
ON
STA
NC
E L
Sing
le F
amily
210,
049
$
20
,492
$
230,
541
$
Si
ngle
Fam
ily23
0,54
1$
0.0
0.0
6,65
102
5-04
3-00
6-00
0B
LAC
K JA
MES
WIL
LIA
MSi
ngle
Fam
ily19
6,88
9$
20,0
90$
21
6,97
9$
Sing
le F
amily
216,
979
$
0.
00.
05,
308
025-
043-
007-
000
HA
NSO
N T
HO
MA
S J
Sing
le F
amily
161,
994
$
20
,902
$
182,
896
$
Si
ngle
Fam
ily18
2,89
6$
0.0
0.0
6,46
202
5-04
3-00
8-00
0C
AR
UA
L EM
ILIA
BSi
ngle
Fam
ily13
5,76
0$
20,9
02$
15
6,66
2$
Sing
le F
amily
156,
662
$
0.
00.
06,
048
025-
043-
009-
000
SALL
AS-
IVIE
NO
REE
NSi
ngle
Fam
ily25
4,00
0$
20,0
00$
27
4,00
0$
Sing
le F
amily
274,
000
$
0.
00.
05,
718
025-
043-
010-
000
GO
NZA
LEZ
MA
RTH
A E
AG
UIL
AR
Sing
le F
amily
184,
835
$
20
,090
$
204,
925
$
Si
ngle
Fam
ily20
4,92
5$
0.0
0.0
5,76
402
5-04
3-01
1-00
0R
OC
CA
FR
AN
K JO
SEPH
& P
ATR
ICIA
AN
NSi
ngle
Fam
ily25
4,00
0$
20,0
00$
27
4,00
0$
Sing
le F
amily
274,
000
$
0.
00.
07,
038
025-
043-
012-
000
GA
RC
IA E
NR
IQU
ESi
ngle
Fam
ily20
5,50
0$
20,0
00$
22
5,50
0$
Sing
le F
amily
225,
500
$
0.
00.
09,
489
025-
043-
013-
000
LAW
REN
CE
JOH
N A
LLEN
& A
NN
ETTE
MA
RIE
Sing
le F
amily
170,
088
$
20
,492
$
190,
580
$
Si
ngle
Fam
ily19
0,58
0$
0.0
0.0
6,55
502
5-04
3-01
4-00
0SI
NG
H B
HU
PIN
DER
Sing
le F
amily
171,
921
$
20
,902
$
192,
823
$
Si
ngle
Fam
ily19
2,82
3$
0.0
0.0
6,50
202
5-04
3-01
5-00
0M
EDEI
RO
S LI
ON
EL &
EV
ASi
ngle
Fam
ily11
0,56
2$
52,6
47$
16
3,20
9$
Sing
le F
amily
163,
209
$
0.
00.
05,
624
025-
043-
016-
000
CO
RTE
S A
DR
IAN
ASi
ngle
Fam
ily13
9,52
3$
20,9
02$
16
0,42
5$
Sing
le F
amily
160,
425
$
0.
00.
06,
549
025-
043-
017-
000
LEE
CA
LLIN
& C
AR
OLY
NSi
ngle
Fam
ily20
5,50
0$
20,0
00$
22
5,50
0$
Sing
le F
amily
225,
500
$
0.
00.
010
,007
025-
043-
018-
000
DIA
BLO
GR
AN
DE
RES
IDEN
TIA
L A
SSO
CEx
empt
Exem
pt0.
00.
00
025-
043-
019-
000
DIA
BLO
GR
AN
DE
RES
IDEN
TIA
L A
SSO
CEx
empt
Exem
pt0.
00.
00
025-
043-
020-
000
DIA
BLO
GR
AN
DE
RES
IDEN
TIA
L A
SSO
CEx
empt
Exem
pt0.
00.
00
025-
043-
021-
000
DIA
BLO
GR
AN
DE
RES
IDEN
TIA
L A
SSO
CEx
empt
Exem
pt0.
00.
00
025-
043-
022-
000
DIA
BLO
GR
AN
DE
CO
MM
ERC
IAL
ASS
OC
Exem
ptEx
empt
0.0
0.0
002
5-04
4-00
1-00
0PO
MET
TA C
HA
D A
Sing
le F
amily
214,
971
$
20
,090
$
235,
061
$
Si
ngle
Fam
ily23
5,06
1$
0.0
0.0
6,85
702
5-04
4-00
2-00
0U
NIO
N S
TREE
T M
OR
TGA
GE
INC
Sing
le F
amily
141,
399
$
40
,985
$
182,
384
$
Si
ngle
Fam
ily18
2,38
4$
0.0
0.0
5,17
402
5-04
4-00
3-00
0TE
DJA
SU
HA
RLI
& G
RA
CE
KSi
ngle
Fam
ily26
6,50
0$
20,0
00$
28
6,50
0$
Sing
le F
amily
286,
500
$
0.
00.
05,
274
025-
044-
004-
000
SMIT
H JA
MES
A &
ELV
A H
Sing
le F
amily
257,
000
$
20
,000
$
277,
000
$
Si
ngle
Fam
ily27
7,00
0$
0.0
0.0
5,53
802
5-04
4-00
5-00
0G
REE
NW
ELL
KIM
BER
LY &
AN
THO
NY
WSi
ngle
Fam
ily25
4,00
0$
20,0
00$
27
4,00
0$
Sing
le F
amily
274,
000
$
0.
00.
04,
873
025-
044-
006-
000
MA
TTH
EWS
EUG
ENIE
AN
NSi
ngle
Fam
ily28
0,00
0$
20,0
00$
30
0,00
0$
Sing
le F
amily
300,
000
$
0.
00.
07,
281
025-
044-
007-
000
MEA
D D
AV
ID L
& K
AY
E L
Sing
le F
amily
254,
000
$
20
,000
$
274,
000
$
Si
ngle
Fam
ily27
4,00
0$
0.0
0.0
8,43
202
5-04
4-00
8-00
0R
OQ
UE
CA
RLO
S A
& G
ILLI
AN
KSi
ngle
Fam
ily17
9,31
0$
20,4
92$
19
9,80
2$
Sing
le F
amily
199,
802
$
0.
00.
06,
399
025-
044-
009-
000
BA
ND
ON
G W
ILLI
E &
RA
NI
Sing
le F
amily
266,
500
$
20
,000
$
286,
500
$
Si
ngle
Fam
ily28
6,50
0$
0.0
0.0
6,31
202
5-04
4-01
0-00
0A
LLD
RED
GE
KIM
LSi
ngle
Fam
ily19
2,21
8$
20,0
90$
21
2,30
8$
Sing
le F
amily
212,
308
$
0.
00.
05,
000
025-
044-
011-
000
SIN
GH
CH
AR
AN
& H
AR
DIP
KSi
ngle
Fam
ily24
1,00
0$
20,0
00$
26
1,00
0$
Sing
le F
amily
261,
000
$
0.
00.
06,
398
025-
044-
012-
000
LIO
TAR
D JE
FFR
EY L
& T
EVA
NO
DSi
ngle
Fam
ily13
6,78
8$
20,4
92$
15
7,28
0$
Sing
le F
amily
157,
280
$
0.
00.
07,
233
025-
044-
013-
000
EHLE
R A
LAN
& JA
NET
Sing
le F
amily
140,
886
$
20
,492
$
161,
378
$
Si
ngle
Fam
ily16
1,37
8$
0.0
0.0
6,31
502
5-04
4-01
4-00
0R
AU
CH
WIL
LIA
M JO
HN
JR &
TER
ESA
AN
NSi
ngle
Fam
ily19
5,48
3$
20,4
92$
21
5,97
5$
Sing
le F
amily
215,
975
$
0.
00.
06,
159
025-
044-
015-
000
BO
WER
S M
AR
HA
ULT
GR
EGG
& V
ICTO
RIA
LO
MA
Sing
le F
amily
194,
679
$
20
,492
$
215,
171
$
Si
ngle
Fam
ily21
5,17
1$
0.0
0.0
6,14
802
5-04
4-01
6-00
0C
HA
NEY
CA
SSA
ND
RA
SU
MM
ERS
Sing
le F
amily
115,
000
$
10
,451
$
125,
451
$
Pr
epai
d0.
00.
06,
130
025-
044-
017-
000
CO
STA
JAR
ED M
& N
INA
MSi
ngle
Fam
ily10
0,00
0$
10,4
51$
11
0,45
1$
Sing
le F
amily
110,
451
$
0.
00.
05,
964
025-
044-
018-
000
CA
STO
REN
A A
MY
Sing
le F
amily
115,
000
$
10
,451
$
125,
451
$
Si
ngle
Fam
ily12
5,45
1$
0.0
0.0
5,65
202
5-04
4-01
9-00
0C
IVIC
DIA
BLO
GR
AN
DE
LLC
Sing
le F
amily
100,
000
$
10
,451
$
110,
451
$
Si
ngle
Fam
ily11
0,45
1$
0.0
0.0
6,07
202
5-04
4-02
0-00
0M
CLE
OD
ALB
AIm
prov
ed S
ingl
e Fa
mily
Res
iden
tial L
ot 6
0' x
105
' Typ
ical
Lot
10,4
51$
10
,451
$
Prep
aid
0.0
0.0
6,03
702
5-04
4-02
1-00
0C
RO
WLE
Y P
ATR
ICK
CIm
prov
ed S
ingl
e Fa
mily
Res
iden
tial L
ot 6
0' x
105
' Typ
ical
Lot
10,4
51$
10
,451
$
Sing
le F
amily
114,
000
$
114,
000
$
0.
00.
06,
070
025-
044-
022-
000
CIV
IC D
IAB
LO G
RA
ND
E LL
CIm
prov
ed S
ingl
e Fa
mily
Res
iden
tial L
ot 6
0' x
105
' Typ
ical
Lot
10,4
51$
10
,451
$
Prep
aid
0.0
0.0
6,24
302
5-04
4-02
3-00
0M
EAD
OW
CR
EEK
GR
OU
P LL
CIm
prov
ed S
ingl
e Fa
mily
Res
iden
tial L
ot 6
0' x
105
' Typ
ical
Lot
10,4
51$
10
,451
$
Prep
aid
0.0
0.0
6,53
102
5-04
4-02
4-00
0LA
W R
OB
ERT
FIm
prov
ed S
ingl
e Fa
mily
Res
iden
tial L
ot 6
0' x
105
' Typ
ical
Lot
10,4
51$
10
,451
$
Prep
aid
0.0
0.0
5,86
402
5-04
4-02
5-00
0R
OM
ERO
ED
MO
ND
JESU
S &
ATH
ZIR
I GA
BR
IELA
Impr
oved
Sin
gle
Fam
ily R
esid
entia
l Lot
60'
x 1
05' T
ypic
al L
ot10
,451
$
10,4
51$
Si
ngle
Fam
ily11
4,00
0$
11
4,00
0$
0.0
0.0
8,86
702
5-04
4-02
6-00
0C
IVIC
DIA
BLO
GR
AN
DE
LLC
Impr
oved
Sin
gle
Fam
ily R
esid
entia
l Lot
60'
x 1
05' T
ypic
al L
ot10
,451
$
10,4
51$
Pr
epai
d0.
00.
06,
724
025-
044-
027-
000
CIV
IC D
IAB
LO G
RA
ND
E LL
CIm
prov
ed S
ingl
e Fa
mily
Res
iden
tial L
ot 6
0' x
105
' Typ
ical
Lot
10,4
51$
10
,451
$
Prep
aid
0.0
0.0
6,84
302
5-04
4-02
8-00
0C
IVIC
DIA
BLO
GR
AN
DE
LLC
Impr
oved
Sin
gle
Fam
ily R
esid
entia
l Lot
60'
x 1
05' T
ypic
al L
ot10
,451
$
10,4
51$
Pr
epai
d0.
00.
05,
553
025-
044-
029-
000
CIV
IC D
IAB
LO G
RA
ND
E LL
CIm
prov
ed S
ingl
e Fa
mily
Res
iden
tial L
ot 6
0' x
105
' Typ
ical
Lot
10,4
51$
10
,451
$
Prep
aid
0.0
0.0
5,59
002
5-04
4-03
0-00
0C
IVIC
DIA
BLO
GR
AN
DE
LLC
Impr
oved
Sin
gle
Fam
ily R
esid
entia
l Lot
60'
x 1
05' T
ypic
al L
ot10
,451
$
10,4
51$
Si
ngle
Fam
ily11
4,00
0$
11
4,00
0$
0.0
0.0
5,54
702
5-04
4-03
1-00
0C
IVIC
DIA
BLO
GR
AN
DE
LLC
Impr
oved
Sin
gle
Fam
ily R
esid
entia
l Lot
60'
x 1
05' T
ypic
al L
ot10
,451
$
10,4
51$
Si
ngle
Fam
ily11
4,00
0$
11
4,00
0$
0.0
0.0
5,64
602
5-04
4-03
2-00
0C
IVIC
DIA
BLO
GR
AN
DE
LLC
Impr
oved
Sin
gle
Fam
ily R
esid
entia
l Lot
60'
x 1
05' T
ypic
al L
ot10
,451
$
10,4
51$
Si
ngle
Fam
ily11
4,00
0$
11
4,00
0$
0.0
0.0
5,74
402
5-04
4-03
3-00
0C
IVIC
DIA
BLO
GR
AN
DE
LLC
Impr
oved
Sin
gle
Fam
ily R
esid
entia
l Lot
60'
x 1
05' T
ypic
al L
ot10
,451
$
10,4
51$
Si
ngle
Fam
ily11
4,00
0$
11
4,00
0$
0.0
0.0
5,88
502
5-04
4-03
4-00
0C
IVIC
DIA
BLO
GR
AN
DE
LLC
Impr
oved
Sin
gle
Fam
ily R
esid
entia
l Lot
60'
x 1
05' T
ypic
al L
ot10
,451
$
10,4
51$
Si
ngle
Fam
ily11
4,00
0$
11
4,00
0$
0.0
0.0
5,79
202
5-04
4-03
5-00
0C
IVIC
DIA
BLO
GR
AN
DE
LLC
Impr
oved
Sin
gle
Fam
ily R
esid
entia
l Lot
60'
x 1
05' T
ypic
al L
ot10
,451
$
10,4
51$
Si
ngle
Fam
ily11
4,00
0$
11
4,00
0$
0.0
0.0
6,31
802
5-04
4-03
6-00
0C
IVIC
DIA
BLO
GR
AN
DE
LLC
Impr
oved
Sin
gle
Fam
ily R
esid
entia
l Lot
60'
x 1
05' T
ypic
al L
ot10
,451
$
10,4
51$
Si
ngle
Fam
ily11
4,00
0$
11
4,00
0$
0.0
0.0
6,34
502
5-04
4-03
7-00
0C
IVIC
DIA
BLO
GR
AN
DE
LLC
Impr
oved
Sin
gle
Fam
ily R
esid
entia
l Lot
60'
x 1
05' T
ypic
al L
ot10
,451
$
10,4
51$
Si
ngle
Fam
ily11
4,00
0$
11
4,00
0$
0.0
0.0
6,39
802
5-04
4-03
8-00
0C
IVIC
DIA
BLO
GR
AN
DE
LLC
Impr
oved
Sin
gle
Fam
ily R
esid
entia
l Lot
60'
x 1
05' T
ypic
al L
ot10
,451
$
10,4
51$
Si
ngle
Fam
ily11
4,00
0$
11
4,00
0$
0.0
0.0
6,37
002
5-04
4-03
9-00
0C
IVIC
DIA
BLO
GR
AN
DE
LLC
Sing
le F
amily
130,
000
$
10
,451
$
140,
451
$
Si
ngle
Fam
ily14
0,45
1$
0.0
0.0
6,12
902
5-04
4-04
0-00
0C
IVIC
DIA
BLO
GR
AN
DE
LLC
Sing
le F
amily
130,
000
$
10
,451
$
140,
451
$
Si
ngle
Fam
ily14
0,45
1$
0.0
0.0
6,33
002
5-04
4-04
1-00
0C
IVIC
DIA
BLO
GR
AN
DE
LLC
Impr
oved
Sin
gle
Fam
ily R
esid
entia
l Lot
60'
x 1
05' T
ypic
al L
ot10
,451
$
10,4
51$
Si
ngle
Fam
ily11
4,00
0$
11
4,00
0$
0.0
0.0
6,64
002
5-04
4-04
2-00
0M
ENG
CH
UN
HU
ASi
ngle
Fam
ily16
8,39
4$
20,2
46$
18
8,64
0$
Sing
le F
amily
188,
640
$
0.
00.
08,
126
025-
044-
043-
000
DIA
BLO
GR
AN
DE
RES
IDEN
TIA
L A
SSO
CEx
empt
Exem
pt0.
00.
00
025-
044-
044-
000
DIA
BLO
GR
AN
DE
RES
IDEN
TIA
L A
SSO
CEx
empt
Exem
pt0.
00.
00
025-
044-
045-
000
DIA
BLO
GR
AN
DE
PAR
Exem
ptEx
empt
0.0
0.0
002
5-04
4-04
6-00
0D
IAB
LO G
RA
ND
E C
OM
MER
CIA
L A
SSO
CEx
empt
Exem
pt0.
00.
00
025-
045-
001-
000
CIV
IC D
IAB
LO G
RA
ND
E LL
CIm
prov
ed S
ingl
e Fa
mily
Res
iden
tial L
ot 6
0' x
105
' Typ
ical
Lot
10,4
51$
10
,451
$
Sing
le F
amily
114,
000
$
114,
000
$
0.
00.
06,
727
025-
045-
002-
000
CIV
IC D
IAB
LO G
RA
ND
E LL
CIm
prov
ed S
ingl
e Fa
mily
Res
iden
tial L
ot 6
0' x
105
' Typ
ical
Lot
10,4
51$
10
,451
$
Sing
le F
amily
114,
000
$
114,
000
$
0.
00.
05,
910
025-
045-
003-
000
CIV
IC D
IAB
LO G
RA
ND
E LL
CIm
prov
ed S
ingl
e Fa
mily
Res
iden
tial L
ot 6
0' x
105
' Typ
ical
Lot
10,4
51$
10
,451
$
Sing
le F
amily
114,
000
$
114,
000
$
0.
00.
06,
188
025-
045-
004-
000
CIV
IC D
IAB
LO G
RA
ND
E LL
CIm
prov
ed S
ingl
e Fa
mily
Res
iden
tial L
ot 6
0' x
105
' Typ
ical
Lot
10,4
51$
10
,451
$
Sing
le F
amily
114,
000
$
114,
000
$
0.
00.
06,
900
025-
045-
005-
000
RIS
SAN
EN A
LVA
R R
& JO
ELLE
N S
Sing
le F
amily
268,
000
$
20
,000
$
288,
000
$
Si
ngle
Fam
ily28
8,00
0$
0.0
0.0
5,44
8
11 o
f 12
2014
-15
Gro
ss
Tax
able
L
otA
PNO
wne
r (A
s of A
pril
1, 2
015)
Lan
d U
se D
escr
iptio
nIm
pr. V
alue
Lan
d V
alue
Tot
al V
alue
Lan
d U
seA
ppra
ised
Val
ueA
ssig
ned
Val
ueA
crea
geA
crea
geSq
. Ft.
Ass
esse
d V
alue
s
025-
045-
006-
000
VA
LLA
DO
REY
NA
LDO
& D
AW
NSi
ngle
Fam
ily14
4,22
6$
20,9
02$
16
5,12
8$
Sing
le F
amily
165,
128
$
0.
00.
05,
460
025-
045-
007-
000
JPM
OR
GA
N C
HA
SE B
AN
K N
ASi
ngle
Fam
ily26
6,50
0$
20,0
00$
28
6,50
0$
Sing
le F
amily
286,
500
$
0.
00.
05,
793
025-
045-
008-
000
GA
RC
INES
LY
ND
ON
& B
ERN
ALY
NSi
ngle
Fam
ily20
6,00
0$
20,0
00$
22
6,00
0$
Sing
le F
amily
226,
000
$
0.
00.
09,
950
025-
045-
009-
000
PAN
GA
NIB
AN
CO
RA
ZON
Sing
le F
amily
255,
500
$
20
,000
$
275,
500
$
Si
ngle
Fam
ily27
5,50
0$
0.0
0.0
9,00
602
5-04
5-01
0-00
0C
HR
ISTI
AN
GR
EGO
RY
RO
GER
Sing
le F
amily
122,
955
$
20
,492
$
143,
447
$
Si
ngle
Fam
ily14
3,44
7$
0.0
0.0
5,87
002
5-04
5-01
1-00
0TA
YLO
R B
RA
D D
Sing
le F
amily
257,
000
$
20
,000
$
277,
000
$
Si
ngle
Fam
ily27
7,00
0$
0.0
0.0
5,19
602
5-04
5-01
2-00
0B
UR
T R
OB
ERT
W &
KA
THLE
EN A
Sing
le F
amily
204,
582
$
41
,804
$
246,
386
$
Si
ngle
Fam
ily24
6,38
6$
0.0
0.0
8,03
702
5-04
5-01
3-00
0O
LIV
ER M
ICH
AEL
W &
MA
RY
JAN
ESi
ngle
Fam
ily13
8,22
2$
20,4
92$
15
8,71
4$
Sing
le F
amily
158,
714
$
0.
00.
07,
145
025-
045-
014-
000
CO
STA
CH
RIS
TOPH
ER S
& L
ISA
GSi
ngle
Fam
ily20
5,50
0$
20,0
00$
22
5,50
0$
Sing
le F
amily
225,
500
$
0.
00.
06,
297
025-
045-
015-
000
SOLO
RIO
JOSE
ASi
ngle
Fam
ily14
1,39
9$
20,4
92$
16
1,89
1$
Sing
le F
amily
161,
891
$
0.
00.
06,
044
025-
045-
016-
000
AG
UIL
AR
CA
RLO
S F
JRSi
ngle
Fam
ily14
3,20
6$
42,1
19$
18
5,32
5$
Sing
le F
amily
185,
325
$
0.
00.
09,
304
025-
045-
017-
000
DEL
GA
DO
JOSE
LSi
ngle
Fam
ily10
5,55
7$
41,8
04$
14
7,36
1$
Sing
le F
amily
147,
361
$
0.
00.
09,
503
025-
045-
018-
000
SEEF
ELD
T C
HA
RLE
S E
& G
EOR
GET
TESi
ngle
Fam
ily14
7,41
8$
42,1
19$
18
9,53
7$
Sing
le F
amily
189,
537
$
0.
00.
05,
774
025-
045-
019-
000
RO
CC
A JO
SEPH
O &
BA
RB
AR
A A
Sing
le F
amily
217,
221
$
30
,738
$
247,
959
$
Si
ngle
Fam
ily24
7,95
9$
0.0
0.0
4,92
102
5-04
5-02
0-00
0D
AV
IES
RO
NA
LD &
MA
RY
Sing
le F
amily
167,
219
$
41
,804
$
209,
023
$
Si
ngle
Fam
ily20
9,02
3$
0.0
0.0
5,06
402
5-04
5-02
1-00
0A
DA
MS
JON
ATH
AN
DA
NIE
L &
DIA
NE
GSi
ngle
Fam
ily28
2,50
0$
20,0
00$
30
2,50
0$
Sing
le F
amily
302,
500
$
0.
00.
05,
086
025-
045-
022-
000
WO
RR
ELL
MIC
HA
EL &
AM
Y L
Sing
le F
amily
194,
679
$
25
,615
$
220,
294
$
Si
ngle
Fam
ily22
0,29
4$
0.0
0.0
5,38
102
5-04
5-02
3-00
0M
EDEI
RO
S LI
ON
EL JR
& E
VA
MSi
ngle
Fam
ily15
4,69
1$
52,6
47$
20
7,33
8$
Sing
le F
amily
207,
338
$
0.
00.
05,
525
025-
045-
024-
000
PER
EZ M
AR
K T
JRSi
ngle
Fam
ily12
7,89
5$
42,1
19$
17
0,01
4$
Sing
le F
amily
170,
014
$
0.
00.
05,
525
025-
045-
025-
000
RO
CC
A JO
AN
Sing
le F
amily
254,
000
$
20
,000
$
274,
000
$
Si
ngle
Fam
ily27
4,00
0$
0.0
0.0
5,52
502
5-04
5-02
6-00
0M
OR
GA
N B
RA
ND
ON
RO
BER
T C
AST
LESi
ngle
Fam
ily14
6,52
6$
41,8
04$
18
8,33
0$
Sing
le F
amily
188,
330
$
0.
00.
05,
525
025-
045-
027-
000
RO
WE
DO
UG
LAS
G &
CO
NN
IE R
Sing
le F
amily
257,
000
$
20
,000
$
277,
000
$
Si
ngle
Fam
ily27
7,00
0$
0.0
0.0
5,49
602
5-04
5-02
8-00
0K
ELLY
RO
NA
LD C
Sing
le F
amily
255,
500
$
20
,000
$
275,
500
$
Si
ngle
Fam
ily27
5,50
0$
0.0
0.0
5,41
702
5-04
5-02
9-00
0B
AR
RIO
ZO
IA A
Sing
le F
amily
206,
000
$
20
,000
$
226,
000
$
Si
ngle
Fam
ily22
6,00
0$
0.0
0.0
5,66
002
5-04
5-03
0-00
0H
OW
ELL
GER
ALD
W &
JOH
NN
ASi
ngle
Fam
ily25
7,00
0$
20,0
00$
27
7,00
0$
Sing
le F
amily
277,
000
$
0.
00.
05,
540
025-
045-
031-
000
FAR
IA D
AR
LIN
O &
CH
RIS
TIN
ESi
ngle
Fam
ily14
2,63
7$
42,1
19$
18
4,75
6$
Sing
le F
amily
184,
756
$
0.
00.
08,
574
025-
045-
032-
000
CIV
IC D
IAB
LO G
RA
ND
E LL
CIm
prov
ed S
ingl
e Fa
mily
Res
iden
tial L
ot 6
0' x
105
' Typ
ical
Lot
10,4
51$
10
,451
$
Sing
le F
amily
114,
000
$
114,
000
$
0.
00.
06,
052
025-
045-
033-
000
CIV
IC D
IAB
LO G
RA
ND
E LL
CIm
prov
ed S
ingl
e Fa
mily
Res
iden
tial L
ot 6
0' x
105
' Typ
ical
Lot
10,4
51$
10
,451
$
Sing
le F
amily
114,
000
$
114,
000
$
0.
00.
06,
803
025-
045-
034-
000
DEL
A C
RU
Z C
HA
RLE
EN A
Sing
le F
amily
200,
315
$
40
,985
$
241,
300
$
Si
ngle
Fam
ily24
1,30
0$
0.0
0.0
6,77
702
5-04
5-03
5-00
0A
VA
NC
ENA
IGN
AC
IO M
& JU
DY
BSi
ngle
Fam
ily26
2,30
5$
30,7
38$
29
3,04
3$
Sing
le F
amily
293,
043
$
0.
00.
06,
432
025-
045-
036-
000
RIG
GA
LL M
ERED
YD
D IA
N &
MA
RY
AN
NE
Sing
le F
amily
249,
497
$
25
,615
$
275,
112
$
Si
ngle
Fam
ily27
5,11
2$
0.0
0.0
5,74
802
5-04
5-03
7-00
0C
IVIC
DIA
BLO
GR
AN
DE
LLC
Impr
oved
Sin
gle
Fam
ily R
esid
entia
l Lot
60'
x 1
05' T
ypic
al L
ot10
,451
$
10,4
51$
Si
ngle
Fam
ily11
4,00
0$
11
4,00
0$
0.0
0.0
5,54
802
5-04
5-03
8-00
0D
IAB
LO G
RA
ND
E R
ESID
ENTI
AL
ASS
OC
Exem
ptEx
empt
0.0
0.0
002
5-04
5-03
9-00
0D
IAB
LO G
RA
ND
E R
ESID
ENTI
AL
ASS
OC
Exem
ptEx
empt
0.0
0.0
002
5-04
5-04
0-00
0D
IAB
LO G
RA
ND
E C
OM
MER
CIA
L A
SSO
CEx
empt
Exem
pt0.
00.
00
025-
046-
001-
000
WO
RLD
INTE
RN
ATI
ON
AL
LLC
Dia
blo
Ran
ge -
graz
ing
land
/ope
n sp
ace
394,
870
$
73
4,98
7$
1,12
9,85
7$
Und
evel
oped
1,12
9,85
7$
48
2.0
327.
30
025-
046-
004-
000
WO
RLD
INTE
RN
ATI
ON
AL
LLC
Dia
blo
Ran
ge -
graz
ing
land
/ope
n sp
ace
710,
768
$
82
8,14
9$
1,53
8,91
7$
Und
evel
oped
1,53
8,91
7$
74
3.0
504.
50
025-
047-
001-
000
WO
RLD
INTE
RN
ATI
ON
AL
LLC
Dia
blo
Ran
ge -
graz
ing
land
/ope
n sp
ace
668,
648
$
55
7,03
1$
1,22
5,67
9$
Und
evel
oped
1,22
5,67
9$
54
9.0
372.
70
025-
048-
001-
000
WO
RLD
INTE
RN
ATI
ON
AL
LLC
Phas
e 1,
Vill
ages
4B
& 4
D -
16 P
rodu
ctio
n-O
rient
ed S
FR L
ots
51,5
95$
51
,595
$
Und
evel
oped
-$
8.4
8.4
002
5-04
8-00
2-00
0D
IAB
LO G
RA
ND
E R
ESID
ENTI
AL
ASS
OC
Exem
ptEx
empt
0.0
0.0
002
5-04
9-00
1-00
0PA
CIF
IC B
LUE
LLC
Und
evel
oped
610,
757
$
61
0,75
7$
Und
evel
oped
610,
757
$
50
.750
.70
025-
050-
001-
000
WO
RLD
INTE
RN
ATI
ON
AL
LLC
Uni
mpr
oved
Sin
gle
Fam
ily L
ot -
Vill
age
3A (1
)25
,000
$
25,0
00$
Si
ngle
Fam
ily-
$
0.
00.
010
,055
025-
050-
002-
000
WO
RLD
INTE
RN
ATI
ON
AL
LLC
Uni
mpr
oved
Sin
gle
Fam
ily L
ot -
Vill
age
3A (1
)25
,000
$
25,0
00$
Si
ngle
Fam
ily-
$
0.
00.
011
,197
025-
050-
003-
000
WO
RLD
INTE
RN
ATI
ON
AL
LLC
Uni
mpr
oved
Sin
gle
Fam
ily L
ot -
Vill
age
3A (1
)30
,000
$
30,0
00$
Si
ngle
Fam
ily-
$
0.
00.
013
,105
025-
050-
004-
000
WO
RLD
INTE
RN
ATI
ON
AL
LLC
Uni
mpr
oved
Sin
gle
Fam
ily L
ot -
Vill
age
3A (1
)30
,000
$
30,0
00$
Si
ngle
Fam
ily-
$
0.
00.
013
,867
025-
050-
005-
000
WO
RLD
INTE
RN
ATI
ON
AL
LLC
Uni
mpr
oved
Sin
gle
Fam
ily L
ot -
Vill
age
3A (1
)25
,000
$
25,0
00$
Si
ngle
Fam
ily-
$
0.
00.
012
,125
025-
050-
006-
000
WO
RLD
INTE
RN
ATI
ON
AL
LLC
Uni
mpr
oved
Sin
gle
Fam
ily L
ot -
Vill
age
3A (1
)28
,000
$
28,0
00$
Si
ngle
Fam
ily-
$
0.
00.
011
,588
025-
050-
007-
000
WO
RLD
INTE
RN
ATI
ON
AL
LLC
Uni
mpr
oved
Sin
gle
Fam
ily L
ot -
Vill
age
3A (1
)28
,000
$
28,0
00$
Si
ngle
Fam
ily-
$
0.
00.
012
,344
025-
050-
008-
000
WO
RLD
INTE
RN
ATI
ON
AL
LLC
Uni
mpr
oved
Sin
gle
Fam
ily L
ot -
Vill
age
3A (1
)30
,000
$
30,0
00$
Si
ngle
Fam
ily-
$
0.
00.
013
,270
025-
050-
009-
000
WO
RLD
INTE
RN
ATI
ON
AL
LLC
Uni
mpr
oved
Sin
gle
Fam
ily L
ot -
Vill
age
3A (1
)30
,000
$
30,0
00$
Si
ngle
Fam
ily-
$
0.
00.
013
,837
025-
050-
010-
000
WO
RLD
INTE
RN
ATI
ON
AL
LLC
Uni
mpr
oved
Sin
gle
Fam
ily L
ot -
Vill
age
3A (1
)28
,000
$
28,0
00$
Si
ngle
Fam
ily-
$
0.
00.
011
,750
025-
050-
011-
000
WO
RLD
INTE
RN
ATI
ON
AL
LLC
Uni
mpr
oved
Sin
gle
Fam
ily L
ot -
Vill
age
3A (1
)30
,000
$
30,0
00$
Si
ngle
Fam
ily-
$
0.
00.
015
,037
025-
050-
012-
000
WO
RLD
INTE
RN
ATI
ON
AL
LLC
Uni
mpr
oved
Sin
gle
Fam
ily L
ot -
Vill
age
3A (1
)30
,000
$
30,0
00$
Si
ngle
Fam
ily-
$
0.
00.
013
,753
025-
050-
013-
000
WO
RLD
INTE
RN
ATI
ON
AL
LLC
Uni
mpr
oved
Sin
gle
Fam
ily L
ot -
Vill
age
3A (1
)50
,000
$
50,0
00$
Si
ngle
Fam
ily-
$
0.
00.
020
,307
025-
050-
014-
000
RW
HS
DIA
BLO
GR
AN
DE
LEG
END
S LL
CEx
empt
Exem
pt0.
00.
00
025-
050-
015-
000
RW
HS
DIA
BLO
GR
AN
DE
HO
MEO
WN
ER A
SSO
CEx
empt
Exem
pt0.
00.
00
025-
050-
016-
000
RW
HS
DIA
BLO
GR
AN
DE
HO
MEO
WN
ER A
SSO
CEx
empt
Exem
pt0.
00.
00
025-
050-
017-
000
RW
HS
DIA
BLO
GR
AN
DE
HO
MEO
WN
ER A
SSO
CEx
empt
Exem
pt0.
00.
00
025-
051-
001-
000
WO
RLD
INTE
RN
ATI
ON
AL
LLC
Uni
mpr
oved
Sin
gle
Fam
ily L
ot -
Vill
age
3A (1
)30
,000
$
30,0
00$
Si
ngle
Fam
ily-
$
0.
00.
014
,338
025-
051-
002-
000
WO
RLD
INTE
RN
ATI
ON
AL
LLC
Uni
mpr
oved
Sin
gle
Fam
ily L
ot -
Vill
age
3A (1
)25
,000
$
25,0
00$
Si
ngle
Fam
ily-
$
0.
00.
011
,700
025-
051-
003-
000
WO
RLD
INTE
RN
ATI
ON
AL
LLC
Uni
mpr
oved
Sin
gle
Fam
ily L
ot -
Vill
age
3A (1
)30
,000
$
30,0
00$
Si
ngle
Fam
ily-
$
0.
00.
013
,582
025-
051-
004-
000
WO
RLD
INTE
RN
ATI
ON
AL
LLC
Uni
mpr
oved
Sin
gle
Fam
ily L
ot -
Vill
age
3A (1
)30
,000
$
30,0
00$
Si
ngle
Fam
ily-
$
0.
00.
015
,988
025-
051-
005-
000
WO
RLD
INTE
RN
ATI
ON
AL
LLC
Uni
mpr
oved
Sin
gle
Fam
ily L
ot -
Vill
age
3A (1
)25
,000
$
25,0
00$
Si
ngle
Fam
ily-
$
0.
00.
010
,830
025-
051-
006-
000
WO
RLD
INTE
RN
ATI
ON
AL
LLC
Uni
mpr
oved
Sin
gle
Fam
ily L
ot -
Vill
age
3A (1
)25
,000
$
25,0
00$
Si
ngle
Fam
ily-
$
0.
00.
011
,598
025-
051-
007-
000
WO
RLD
INTE
RN
ATI
ON
AL
LLC
Phas
e 1,
Vill
age
3A -
43 U
nim
prov
ed S
ingl
e-Fa
mily
Lot
s40
0,00
0$
400,
000
$
U
ndev
elop
ed-
$
18
.018
.00
025-
051-
008-
000
RW
HS
DIA
BLO
GR
AN
DE
HO
MEO
WN
ER A
SSO
CEx
empt
Exem
pt0.
00.
00
025-
052-
001-
000
WO
RLD
INTE
RN
ATI
ON
AL
LLC
Phas
e 1,
Vill
age
3F -
82 P
rodu
ctio
n-O
rinet
ed S
FR L
ots
424,
920
$
42
4,92
0$
Und
evel
oped
-$
51.3
51.3
0To
tals
85,8
58,6
88$
29,6
21,5
62$
116,
677,
116
$ 58
,492
,000
$
4,84
3.0
2,66
5.8
11,8
54,2
16
12 o
f 12


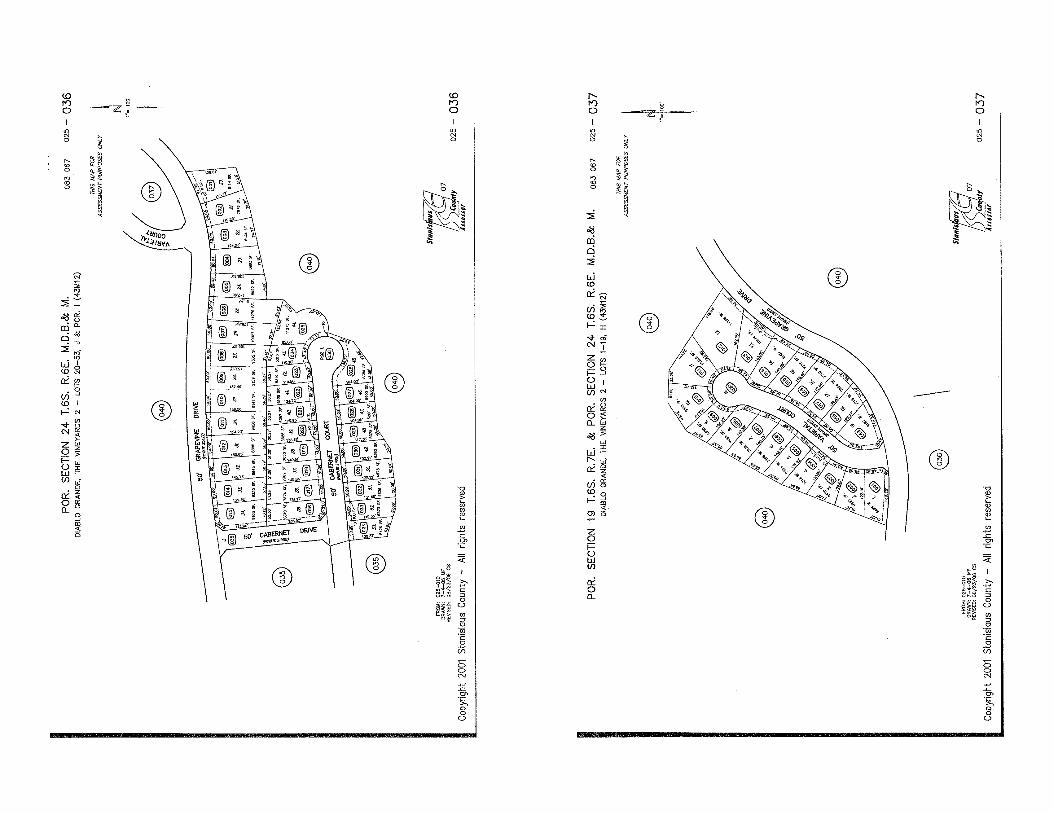


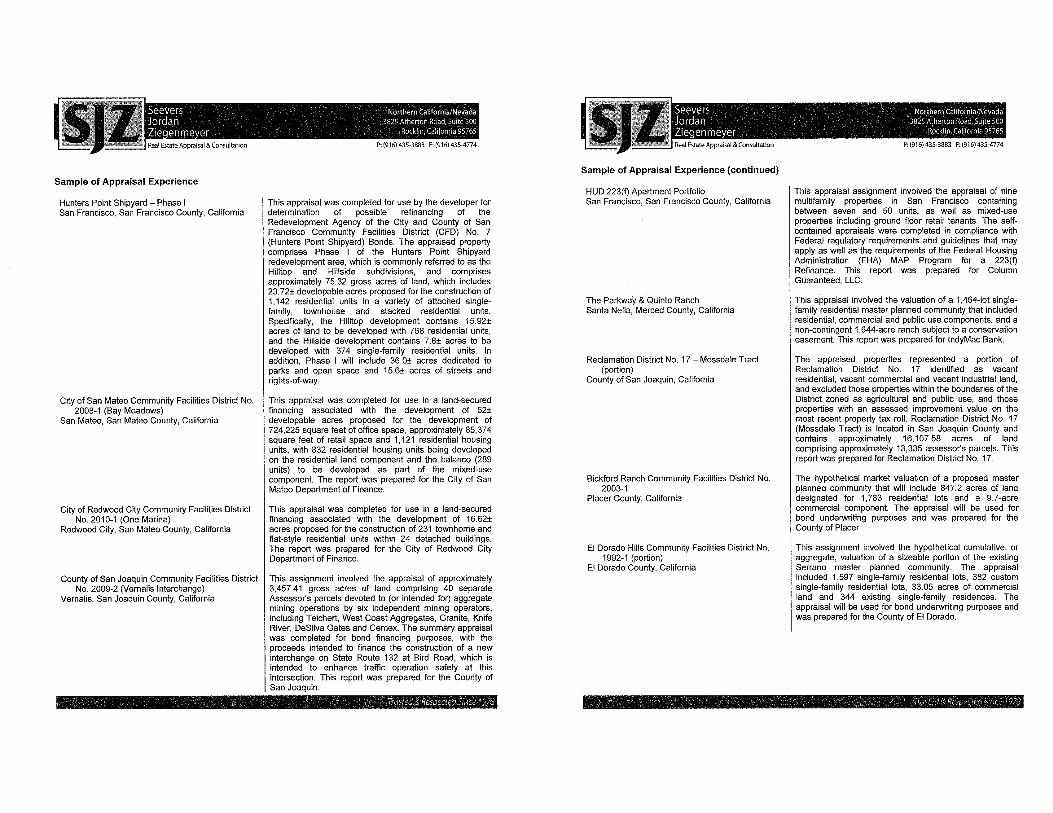


APPENDIX C
MARKET ASSESSMENT AND ANALYSIS REPORT
C-1

[THIS PAGE INTENTIONALLY LEFT BLANK]

June 2015 | Western Hills Water District Diablo Grande CFD No. 1 Diablo Grande in Stanislaus County, CA
MARKET ASSESSMENT AND ANALYSIS “Diablo Grande” in Patterson, California
Master Plan Community Assessment and Future Product Planning

June 2015 | Western Hills Water District Diablo Grande CFD No. 1 Diablo Grande in Stanislaus County, CA 2
BACKGROUND: As part of its due diligence efforts, Western Hills Water District Diablo Grande CFD No. 1 has commissioned Meyers Research, LLC to perform this analysis related to the Diablo Grande property in Patterson, California located within the western area of the Modesto metropolitan area (Stanislaus County). As planned, the Western Hills Water District Diablo Grande CFD No. 1 (“District”) will include approximately 2,312 single family residential uses, 42 multifamily residential units, and approximately 39 acres of commercial uses—735 lots currently exist with 420+/- existing homes, as well as custom lots and 33+/- recently completed and actively selling new homes. This an update to previous studies completed for Laurus Corporation in June 2013 and July 2014. OBJECTIVE: The objective of this assignment is to assess the market opportunity for an additional +/-1,619 home sites at Diablo Grande lots controlled by the Laurus Corporation. This report update details residential product, pricing and absorption for the entirety of the District master plan both in today’s market (June 2015), moving forward to market entry (estimated 2016/2017) and throughout the potential buildout of the community. CONTACT INFORMATION: This analysis was prepared by Meyers Research, LLC. It has been commissioned by Western Hills Water District Diablo Grande CFD No. 1. Tim Sullivan, Practice Leader, served as the Project Director and oversaw all aspects of this assignment. Shaun McCutcheon, Senior Manager, served as the Project Manager and conducted the day-to-day operations of the analysis. Follow-up questions should be directed to us at: 420 Stevens Avenue, Suite 120 Solana Beach, CA 92075 858.381.4388
Background and Objectives
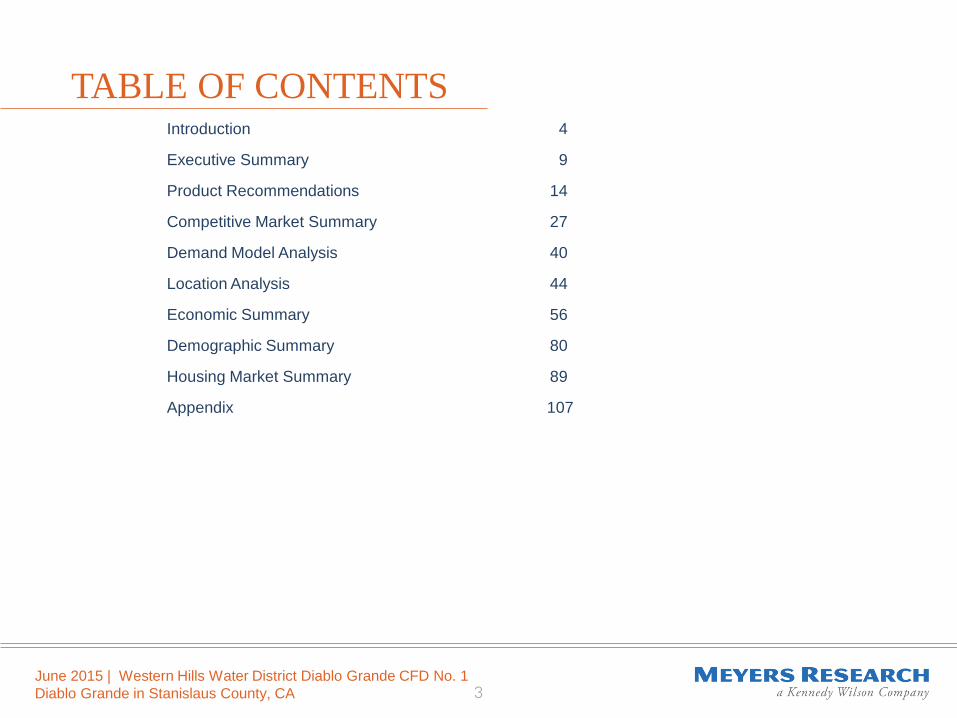
June 2015 | Western Hills Water District Diablo Grande CFD No. 1 Diablo Grande in Stanislaus County, CA 3
TABLE OF CONTENTS Introduction 4
Executive Summary 9
Product Recommendations 14
Competitive Market Summary 27
Demand Model Analysis 40
Location Analysis 44
Economic Summary 56
Demographic Summary 80
Housing Market Summary 89
Appendix 107

June 2015 | Western Hills Water District Diablo Grande CFD No. 1 Diablo Grande in Stanislaus County, CA 4
The Western Hills Water District Diablo Grande CFD No. 1 (the “District”) is evaluating the market opportunity for Diablo Grande, an existing, amenitized master planned community located in unincorporated Stanislaus County about 30 miles west of downtown Modesto. The community includes an 18-hole golf course, a 20,000 square foot clubhouse including golf pro shop, lockers, bar and grill, tennis courts, outdoor pool and meeting space as well as guard gated entry. The golf course was completed in the 1990s and new home sales and lot sales began in 2004. The most current plan accounts for over +/-2,300 total residential units; additional phases are planned to develop over a longer time horizon. Ultimately the vision is for a single, cohesive master planned community. Product and pricing recommendations included in this analysis are based on the most recent revised land plan for the District (approximately 1,619 planned home sites to be developed). The Diablo Grande site offers a number of competitive advantages that enhance the project’s opportunity compared to big picture market conditions. The community is planned to include a combination of diverse housing product and price points that should enhance its appeal to a wide array of buyer profiles and increase absorption. Master planned community options are limited in the region and none offer the amenity package of Diablo Grande, with golf, a clubhouse and countryside mountain views. Nestled in the hills in the western Stanislaus County, this community is situated above the Tule Fog line that negatively effects much of the Central Valley housing stock, making Diablo Grande one of the best housing options in the valley to offer clear and sunny days most of the year. The Development is accessed by Diablo Grande Parkway, a dedicated off-ramp from the I-5 Freeway across from the growing city of Patterson. The scenic seven mile drive winds through the virgin ranchlands and orchards. Residents feel a sense of home as soon as they exit the freeway, with the scenic open space feeling like a natural extension of the open space that embraces Diablo Grande and continues within the District. The community is 15 minutes away from regional retail facilities such as a 50,000 square foot Save Mart grocery store, 158,000 square foot Super Wal-Mart, CVS drugstore, Starbucks, and others. Patterson continues to grow with the recent opening of Grainger’s 820,000 square foot distribution center, Amazon’s 1,000,000+ square foot fulfillment center, and a 1.5 million square foot Restoration Hardware distribution center is under development. CVS operates an 807,000 square foot distribution center and Kohl's has a 400,700 square foot facility as well. The state Enterprise Zone is expected to continue to draw more companies and increase the local employment base. Many Bay Area residents are accustomed to relatively long commutes, and there are a number of employment bases within one hour from Diablo Grande, including Stockton, Modesto and Livermore-Pleasanton-Dublin. There are a limited number of master planned communities within this one hour commute - Mountain House is the primary example. Diablo Grande has a price advantage over Mountain House and communities to the west in Livermore-Pleasanton-Dublin, and has advantages in terms of quality / value (better amenities, views etc.) over several new home options in Stockton and Modesto. Our research indicates that the Subject Property represents a favorable long-term development opportunity for Western Hills Water District Diablo Grande CFD No. 1. Housing and economic conditions in the region are showing measured improvements over the past three years, and indicators are poised for further improvement. Meyers Research anticipates that new home sales, housing prices and employment levels all will show continued improvements and should continue to grow over the next several years. Residential lot prices are experiencing healthy gains and builders are running out of desirable areas / communities in which to buy lots. Water supply is also likely to restrict the opportunity in the future for the development of new home product, in terms of new master plans (with golf in particular). Given the improving market, it would be logical for Diablo Grande to start lot sales this year (2015) with product estimated to enter the market by 2016. This analysis provides perspective on current and anticipated future housing market and economic and demographic conditions in the region and surrounding markets, and the opportunity for Diablo Grande within the context of the evolving market. The section that follows provides perspective on the factors that are likely to influence the development opportunity at Diablo Grande going forward and how the region is expected to evolve in the coming years.
Introduction

June 2015 | Western Hills Water District Diablo Grande CFD No. 1 Diablo Grande in Stanislaus County, CA 5
Subject Property Location
Source: Bing Maps; MapPoint
Diablo Grande is located in the western portion of Stanislaus County, seven miles west of Patterson and Interstate 5. The community is proximate to Modesto to the east, Stockton to the north, the Tri-Valley area (Pleasanton, Livermore and Dublin), and San Jose/ greater Bay Area to the west.
Diablo Grande
90 Minutes
45 Minutes
60 Minutes
50 Minutes

June 2015 | Western Hills Water District Diablo Grande CFD No. 1 Diablo Grande in Stanislaus County, CA 6
Diablo Grande Site Plan and Lot Sizes
Source: AECOM
The entire Diablo Grande community encompasses a total of 29,500 acres. Currently there are 420 homes built on the 735 final mapped lots (including custom home lots), and DeNova Homes is currently selling 33 homes at their Villa Vista community (opened January 2014). D.R. Horton also owns existing mapped lots. Proposed lot sizes include townhomes, alley-loaded product, and conventional single family homes on lots ranging from 50’x80’ to 75’x110’. The purpose of this assignment is to address the buildout of the North Area and South Area, shown on the image to the left, totaling an additional +/- 1,619 lots.
Custom Lots
Clubhouse/ Pool/ Tennis

June 2015 | Western Hills Water District Diablo Grande CFD No. 1 Diablo Grande in Stanislaus County, CA 7
Diablo Grande Parcels and Lot Size Mix
Source: AECOM
The proposed North Area and South Area parcels are labeled to the right, and their corresponding unit count is detailed on the table below. There are a total of 13 parcels comprising 1,363 units in the South Area, and a single parcel of 256 lots in the North Area.
Custom Lots
Clubhouse/ Pool/ Tennis

June 2015 | Western Hills Water District Diablo Grande CFD No. 1 Diablo Grande in Stanislaus County, CA 8
Diablo Grande Includes Golf, Amenities and Open Space Diablo Grande offers an 18-hole, par 72 championship golf course. The Ranch Course was designed by award winning architect Dennis Griffith—this tournament-style course has been rated as one of the top Northern California courses by "Golf Today" magazine. The community includes a 20,000 square foot clubhouse including golf pro shop, lockers, bar and grill, tennis courts, outdoor pool and meeting space, as well as guard gated entry. A second course, The Legends was also built but closed in Spring 2014 due to the drought and water conservation efforts. The proposed Western Hills Water District Diablo Grande CFD No. 1 includes the redevelopment of this course into additional housing, amenities and open space.

June 2015 | Western Hills Water District Diablo Grande CFD No. 1 Diablo Grande in Stanislaus County, CA 9
Executive Summary “Western Hills Water District Diablo Grande CFD No. 1 ” in Patterson, California Master Plan Community Assessment and Future Product Planning

June 2015 | Western Hills Water District Diablo Grande CFD No. 1 Diablo Grande in Stanislaus County, CA 10
Key Findings Diablo Grande represents an opportunity to re-launch a large-scale, golf / outdoor recreation oriented, well amenitized master plan community in an attractive setting. The following summarizes our key findings:
• Meyers Research generally concurs with the Diablo Grande District plan and its seven distinct product lines spanning each of the various parcel densities at Diablo Grande: five conventional single family detached lines, one attached townhome product line, and one alley loaded product.
• Single family product represent the majority of the supply and demand in the greater Modesto market, both currently and historically. Approximately 83% of the product offered in Diablo Grande will be within the product lines as described above.
• The recommended base prices for Diablo Grande appear reasonably positioned above stand-alone communities in nearby Patterson, as well as other areas in the greater Modesto area.
• Pricing for the single family homes is consistent with DeNova's recent sales.
• Pricing is generally consistent to slightly below sales in Manteca and Tracy and is positioned well below Mountain House on a base price comparison.
• Pricing is generally at or below all market comparables in order to make Diablo Grande’s competitive on a monthly payment basis.
• Because of relatively high homeowners association fees and combined tax rate at Diablo Grande, the recommended base prices are generally positioned in the middle of the market compared to other actively selling communities in the greater Modesto market on a monthly payment basis, higher than stand-alone product in Patterson and Modesto, similar to Manteca and Lathrop, and lower than Mountain House and Tracy.
• Targeting absorption rates ranging from 2.5 sales per month for 75-foot wide single family homes to 3.5 sales per month for the least expensive attached homes appears reasonable given the current competitive sales environment.
• Pricing and absorption are based on Meyers' assumption that Diablo Grande and its future builder partners will build at least to a similar specification level as the existing product within Diablo Grande and that additional community amenities will be improved and incorporated.
June 2015 | Western Hills Water District Diablo Grande CFD No. 1 Diablo Grande in Stanislaus County, CA 11
Diablo Grande Offers a Well Segmented Master Plan in an Attractive Setting The following summarizes the community vision for new residential development at Diablo Grande:
• Quality and Value: The vision for Diablo Grande is that of a product diverse, amenitized master plan that is a “step above” most communities in northern California. Regional demographics reflect the some families with incomes that are higher than typical for the metro area and suggest an opportunity to offer new homes in an environment that is superior to new home communities in the region (the likes of which include Woodbridge, River Islands and Mountain House, although Mountain House benefits heavily from Bay Area commuter demand). We anticipate that Diablo Grande can re-launch increased new product lines to drive new home sales by offering product appealing to a wide variety of buyer profiles in the market today including younger families, a substantial number of move-up buyers and empty-nesters/active adults in a separate enclave or with product targeted specifically to those buyers.
• Setting and Location: The site offers the natural beauty of the California foothills, including rolling hills, vegetation and impressive mountain views. Consider that over five million square feet of new distribution centers will have been built by the end of the year (including Amazon.com) in Patterson, indicating the local employment base is rapidly growing. This is a notable positive for the Subject. The key challenge to overcome will be in re-building a broader base of buyers, since the site is a 45 minute drive from Modesto and a 60 to 90 minute drive from the key job bases in the Tri-Valley area, Oakland and San Jose.
• Segmentation: Amenitized master plans are limited in the local market (primarily Mountain House, River Islands and the age-restricted Woodbridge). These communities typically attract a mix of families, empty nesters, and retirees. Buyers include a strong mix of primary and some second homebuyers—it is estimated that 80% to 90% of existing homeowners in Diablo Grande are primary residents. Our recommendations for the Subject Property effectively target these key buyer segments, with empty nesters and retirees being obvious short term opportunities.
• Master Plan Advantage: Master planned communities are large scale developments that typically include a wide array of real estate product, diverse amenities and multiple commercial uses (such as offices, shopping centers and hotels). The concept is that a “place” can be created where different lifestyle options are offered and a central environment is established. Starting with such trend setters as Columbia in Maryland, The Woodlands in Texas and Mission Viejo and Irvine in California in the 1970s, and followed by The Villages in Florida and Valencia in northern Los Angeles County in the 1980s, master plans defined a clear path to establishing value and creating a magnet for the home buying public. Master plans have became synonymous with great schools, expansive parks and open space, safer investments, and recreational opportunities that command a price premium over the competition. The master planned environment of Diablo Grande gives it a true competitive advantage in the local and regional market. Further, going forward we anticipate a reduction in the creation of new master planned communities—particularly with golf—given the difficulty to assemble and entitle land, combined with significant upfront costs required to execute the plan. This presents a notable advantage.

June 2015 | Western Hills Water District Diablo Grande CFD No. 1 Diablo Grande in Stanislaus County, CA 12
Diablo Grande Offers a Well Segmented Master Plan in an Attractive Setting • Existing Infrastructure: Diablo Grande has a number of features that provide the foundation for the master plan to continue new home
sales, an existing golf course and a new water pumping facility that can accommodate up to 5,000 homes. It also has extensive open space which is a major amenity for all buyer types. It is our understanding that the community clubhouse will undergo a renovation soon, which will further enhance the marketability of the community.
• Timing Advantage: Home values and lot values have increased significantly in the surrounding areas (including the Bay Area) in the past year, which ultimately impacts the demand for further out locations such as Diablo Grande.
• Regional Perspective: Diablo Grande is located in the Modesto MSA, but will likely attract a portion of buyers from outside this area. The community will be influenced by the economic trends and housing market conditions in surrounding MSAs--the Stockton, Oakland, and San Jose MSAs are viable areas from which Diablo Grande will draw demand from. The Oakland and San Jose MSAs are characterized by a solid job base and job growth, a concentration of higher paying jobs, relatively high incomes ($75,000 - $95,000 median), and relatively high home prices (median resale prices of $700,000+). Diablo Grande may be seen as an affordable option and an excellent value for the Oakland and San Jose MSA buyer. See the Economic and Demographic Summary and Housing Market Summary sections of this report.

June 2015 | Western Hills Water District Diablo Grande CFD No. 1 Diablo Grande in Stanislaus County, CA 13
Diablo Grande Offers Buyers an Excellent Value Compared to the TriValley Area The TriValley area (Livermore, Pleasanton, Dublin) is a key region from which Diablo Grande is well positioned to draw buyers. This area is a 60 minute drive from Diablo Grande—which is not an unreasonable commute time in the Bay Area—and is characterized by high incomes, favorable job growth, low unemployment rate and relatively high home prices. All of these factors make Diablo Grande an excellent value for those working in the TriValley area. Consider the following economic and housing market indicators for Livermore, Pleasanton and Dublin.
• Job Growth is Favorable and the Unemployment Rate is Low: Livermore, Pleasanton and Dublin have all rebounded sharply over the past three plus years to replacing and exceeding the job losses from 2009 to 2010. Livermore, with 3,100 new jobs in 2014 and 600 new net jobs this year currently has an unemployment rate of 3.0%, which is the lowest it has been since 2006. Pleasanton has also rebounded well over the past few years, with 500 new net jobs thus far in 2015 and a total job base of 36,000 employees. The unemployment rate is very favorable and at its lowest point since 2008 at 3.5%. Dublin job growth spiked in 2014 with 8,900 jobs added. The unemployment is at its lowest rate since 2006 at 2.6% as of April 2015.
• Median Household Incomes are Relatively High: Median household incomes in the TriValley area are relatively high when compared to Patterson and Stanislaus County. Livermore’s median household income is currently $104,580 and is projected to reach $112,121 by 2020, a 7.2% increase. Incomes are higher in Pleasanton, at $117,122 currently, and are projected to increase to $132,989 by 2020. Dublin median incomes are at $120,590 and are projected to reach $138,354 by 2020.
• Population Growth is Evident: Livermore, Pleasanton and Dublin are all projected to see noticeable population increases over the next five years. The Livermore population is estimated at 83,737 as of 2015, and is projected to reach 88,107 by 2020; households are estimated at 30,162 currently, and are projected to grow at 1.1% annually over the next five years. The Pleasanton population is estimated at 73,549, and is projected to reach 77,995 by 2020; Pleasanton households are estimated at 26,333 and are projected to grow at 1.2% annually over the next five years. Dublin’s population is estimated at 56,287 currently, and is projected to grow the most over the next five years, reaching 65,923 by 2020; Dublin households are estimated at 18,393 currently, and are projected to grow at 3.6% annually through 2020, the fastest growth rate in the TriValley area.
• Home Prices are Relatively High and Rising in the TriValley Area: Over the past 24 months, single family detached home prices have increased over $163,000 in the Tri Valley area from $669,583 to $833,000, a 24.4% increase. While home prices have increased in Stanislaus County and Patterson (Zip Code 95363) over the same time period as well, an increase of 43.3% in Stanislaus County and 47.6% in Patterson still only results in prices of $229,917 and $252,750, respectively, which remain significantly lower. Total price per square foot in the TriValley area has increased to $397/SF, triple the amount of Patterson ($111/SF) and Stanislaus County ($135/SF). Patterson is clearly a more affordable living option, allowing buyers to purchase larger homes for a fraction of the price.

June 2015 | Western Hills Water District Diablo Grande CFD No. 1 Diablo Grande in Stanislaus County, CA 14
Product Recommendations “Western Hills Water District Diablo Grande CFD No. 1 ” in Patterson, California Master Plan Community Assessment and Future Product Planning

June 2015 | Western Hills Water District Diablo Grande CFD No. 1 Diablo Grande in Stanislaus County, CA 15
This section provides product and pricing recommendations for Diablo Grande as of June 2015. Lot counts and parcel densities are per Laurus Corporation and AECOM. The proposed product and price points for each residential parcel are per Meyers Research and are based on our familiarity and assessment of the site its locational opportunities and challenges, and Western Hills Water District Diablo Grande CFD No. 1’s maintenance / execution of additional amenities to enhance the community. Price points and absorption are based on a review of actively selling communities in the local market today with particular attention paid to other cohesive master planned communities such as Mountain House and River Islands. These communities, and our experience with master planned community product planning nationwide, are used as a benchmark for product and pricing at Diablo Grande. In reality, the Subject will be built out over a series of years and the market will evolve over that time period. The prices that are stated in this report today will not be the prices that the project achieves when home sales begin. Similarly, we expect that per project absorption rates will improve over time above where the market is today given improving new home sales conditions and decreasing lot opportunities in this region. This analysis offers perspective on how prices and absorption could change over the next several years during these market changes. Western Hills Water District Diablo Grande CFD No. 1’s vision for the Subject, with Meyers Research’ support, is that of a well amenitized, golf oriented master planned community appealing to a wide variety of buyer profiles in the market today including younger families, maturing families, a substantial number of move-up buyers and empty-nesters/active adults in a separate enclave or with product targeted specifically to those buyers. While this analysis positions Diablo Grande with the context of the conventional housing market in the region, we recognize that the immediate scenic location, amenities and golf course enable Diablo Grande to perform at or above existing communities in the local market, particularly in terms of pricing. Further, there is an opportunity to attract a regional base of buyers with appropriate product creation and pricing.
Product, Pricing and Absorption Analysis Overview

June 2015 | Western Hills Water District Diablo Grande CFD No. 1 Diablo Grande in Stanislaus County, CA 16
The Subject’s recommended unit sizes, pricing and absorption estimates are summarized below. Meyers generally concurs with the Diablo Grande District plan and its seven distinct product lines spanning each of the various parcel densities at Diablo Grande: five conventional single-family detached, one attached townhome product one alley loaded product (with limited unit count). Our research shows that single family product on lots that range from 40’ to 70’ wide are where the majority of the supply and demand are in the greater Modesto market, both currently and historically. Approximately 83% of the product offered at the Subject will be within these product types and lot widths. The recommended base prices for the Subject appear reasonably positioned above stand alone communities in nearby Patterson, as well as other areas in the Modesto MSA. Pricing for the SFR 50’ homes is consistent with what DeNova selling at today in Diablo Grande (on 55’ wide lots, but experiencing relatively slow sales). Pricing is generally consistent-to-slightly below Manteca and Tracy, and is positioned well below Mountain House on a base price comparison. Our base pricing is generally at or below all market comparables, in order to make Diablo Grande competitive on a monthly payment basis. Because of relatively high HOA fees and combined tax rate (base tax rate and Mello Roos fees) at Diablo Grande, on a monthly payment basis, the recommended base prices are generally positioned in the middle of the market when compared to other actively selling communities in the greater Modesto market—higher than stand alone product in Patterson and Modesto, similar to Manteca and Lathrop, and lower than Mountain house and Tracy (which offer a shorter commute time to Bay Area markets). Targeting absorption rates ranging from 2.5 sales per month for 75’ wide single family homes to 3.5 sales per month for the most inexpensive attached homes appears reasonable given the current competitive landscape. Pricing and absorption are based on Meyers assumption that Western Hills Water District Diablo Grande CFD No. 1 and its future builder partners will build at least to a similar specification level as the existing product within Diablo Grande, and that additional community amenities will be improved/incorporated.
Diablo Grande Offers a Wide Range of Unit Sizes and Price Points
BASE PRICE NET BASE PRICE $ ASSUMPTIONS AVERAGE PRICE
Project/Subdivision Type Configuration # of Units Est % of Total Units
Average Unit Size
Base Price $/SFPrice
ImpactingIncentives
Net Base Price
$/SF Options Premiums Average Price
$/SF Estimated Sales / Month
Diablo Grande - Townhomes Townhomes - 132 8% 1,350 $197,500 $146 $0 $197,500 $146 $15,000 $2,500 $215,000 $159 3.50
Diablo Grande - Alley 40' Single Family 2,800 40 2% 1,700 $245,000 $144 $0 $245,000 $144 $15,000 $2,500 $262,500 $154 3.50
Diablo Grande - SFD1 50' Single Family 4,000 142 9% 2,100 $285,000 $136 $0 $285,000 $136 $20,000 $5,000 $310,000 $148 3.00
Diablo Grande - SFD2 50' Single Family 5,000 385 24% 2,301 $310,052 $135 $0 $310,052 $135 $20,000 $5,000 $335,052 $146 3.00
Diablo Grande - SFD3 60' Single Family 6,000 290 18% 2,500 $331,250 $133 $0 $331,250 $133 $25,000 $7,500 $363,750 $146 3.00
Diablo Grande - SFD4 60' Single Family 6,600 489 30% 2,801 $367,566 $131 $0 $367,566 $131 $25,000 $7,500 $400,066 $143 3.00
Diablo Grande - SFD5 75' Single Family 8,250 141 9% 3,304 $417,730 $126 $0 $417,730 $126 $35,000 $12,500 $465,230 $141 2.50
1,619 100% 2,465 $327,617 $134 $0 $327,617 $134 $23,181 $6,590 $357,389 $146 3.0COMMUNITY SUMMARY

June 2015 | Western Hills Water District Diablo Grande CFD No. 1 Diablo Grande in Stanislaus County, CA 17
The full summary details the estimated tax rate, HOA dues, incentives, premiums and options/upgrades by series for this report. Variations in these estimates may result in changes to the base price of the home. The unit size ranges and price ranges represent our market-tested recommendations for each lot product type. Actual square footages may be refined once actual builders commit to the project and implement their actual floorplans.
Subject Property Full Pricing Detail
COMMUNITY SPECIFICS FLOORPLANS RECOMMENDATIONSSubject Property Name Builder Name Mo Base Incentives Net Base Net Base Assumptions Total Payment Assumptions 80.0%Location Master Plan Size Sales Base Price/ Total / All Off Price Price ($ Price/ Options / Estimated Total Price/ Monthly Base Addl Tax 4.5%Product Details Sales Summary Mix SF Pace Price SF Incentives Of Home Impacting) SF Upgrades Premiums Price SF HOA Tax Rate Assess. Mo. Pmt.
Diablo Grande - Townhomes Builder TBD 66 1,100 3.5 $180,000 $164 ($5,000) $0 $180,000 $164 $15,000 $2,500 $197,500 $180 $190 1.25% $187.50 $1,384Patterson Diablo Grande 66 1,600 $215,000 $134 ($5,000) $0 $215,000 $134 $15,000 $2,500 $232,500 $145 $190 1.25% $187.50 $1,562Product: Townhomes Total Units: 132Configuration: - Units Sold: 0Lot Dimensions: ATT 3 Months Sold: 0
Units Remaining: 132% Remaining: 100%
Summary Statistics: 1,350 3.5 $197,500 $146 ($5,000) $0 $197,500 $146 $15,000 $2,500 $215,000 $159 $190 1.25% $188 $1,473
Diablo Grande - Alley 40' Builder TBD 20 1,400 3.5 $225,000 $161 ($5,000) $0 $225,000 $161 $15,000 $2,500 $242,500 $173 $190 1.25% $187.50 $1,613Patterson Diablo Grande 20 2,000 $265,000 $133 ($5,000) $0 $265,000 $133 $15,000 $2,500 $282,500 $141 $190 1.25% $187.50 $1,817Product: Single Family Total Units: 40Configuration: 2,800 Units Sold: 0Lot Dimensions: 40x70 3 Months Sold: 0
Units Remaining: 40% Remaining: 100%
Summary Statistics: 1,700 3.5 $245,000 $144 ($5,000) $0 $245,000 $144 $15,000 $2,500 $262,500 $154 $190 1.25% $188 $1,715
Diablo Grande - SFD1 50' Builder TBD 71 1,800 3.0 $265,000 $147 ($5,000) $0 $265,000 $147 $20,000 $5,000 $290,000 $161 $170 1.25% $187.50 $1,835Patterson Diablo Grande 71 2,400 $305,000 $127 ($5,000) $0 $305,000 $127 $20,000 $5,000 $330,000 $138 $170 1.25% $187.50 $2,039Product: Single Family Total Units: 142Configuration: 4,000 Units Sold: 0Lot Dimensions: 50x80 3 Months Sold: 0
Units Remaining: 142% Remaining: 100%
Summary Statistics: 2,100 3.0 $285,000 $136 ($5,000) $0 $285,000 $136 $20,000 $5,000 $310,000 $148 $170 1.25% $188 $1,937
Diablo Grande - SFD2 50' Builder TBD 192 2,000 3.0 $290,000 $145 ($5,000) $0 $290,000 $145 $20,000 $5,000 $315,000 $158 $170 1.25% $187.50 $1,962Patterson Diablo Grande 193 2,600 $330,000 $127 ($5,000) $0 $330,000 $127 $20,000 $5,000 $355,000 $137 $170 1.25% $187.50 $2,166Product: Single Family Total Units: 385Configuration: 5,000 Units Sold: 0Lot Dimensions: 50x100 3 Months Sold: 0
Units Remaining: 385% Remaining: 100%
Summary Statistics: 2,301 3.0 $310,052 $135 ($5,000) $0 $310,052 $135 $20,000 $5,000 $335,052 $146 $170 1.25% $188 $2,065

June 2015 | Western Hills Water District Diablo Grande CFD No. 1 Diablo Grande in Stanislaus County, CA 18
Subject Property Full Pricing Detail (continued) COMMUNITY SPECIFICS FLOORPLANS RECOMMENDATIONS
Subject Property Name Builder Name Mo Base Incentives Net Base Net Base Assumptions Total Payment Assumptions 80.0%Location Master Plan Size Sales Base Price/ Total / All Off Price Price ($ Price/ Options / Estimated Total Price/ Monthly Base Addl Tax 4.5%Product Details Sales Summary Mix SF Pace Price SF Incentives Of Home Impacting) SF Upgrades Premiums Price SF HOA Tax Rate Assess. Mo. Pmt.
Diablo Grande - SFD3 60' Builder TBD 145 2,100 3.0 $305,000 $145 ($5,000) $0 $305,000 $145 $25,000 $7,500 $337,500 $161 $170 1.25% $187.50 $2,077Patterson Diablo Grande 145 2,900 $357,500 $123 ($5,000) $0 $357,500 $123 $25,000 $7,500 $390,000 $134 $170 1.25% $187.50 $2,345Product: Single Family Total Units: 290Configuration: 6,000 Units Sold: 0Lot Dimensions: 60x100 3 Months Sold: 0Includes North Neighborhood Units Remaining: 290
% Remaining: 100%
Summary Statistics: 2,500 3.0 $331,250 $133 ($5,000) $0 $331,250 $133 $25,000 $7,500 $363,750 $146 $170 1.25% $188 $2,211
Diablo Grande - SFD4 60' Builder TBD 244 2,300 3.0 $335,000 $146 ($5,000) $0 $335,000 $146 $25,000 $7,500 $367,500 $160 $170 1.25% $187.50 $2,230Patterson Diablo Grande 245 3,300 $400,000 $121 ($5,000) $0 $400,000 $121 $25,000 $7,500 $432,500 $131 $170 1.25% $187.50 $2,561Product: Single Family Total Units: 489Configuration: 6,600 Units Sold: 0Lot Dimensions: 60x110 3 Months Sold: 0
Units Remaining: 489Includes North Neighborhood % Remaining: 100%
Summary Statistics: 2,801 3.0 $367,566 $131 ($5,000) $0 $367,566 $131 $25,000 $7,500 $400,066 $143 $170 1.25% $188 $2,396
Diablo Grande - SFD5 75' Builder TBD 70 2,800 2.5 $385,000 $138 ($5,000) $0 $385,000 $138 $35,000 $12,500 $432,500 $154 $170 1.25% $187.50 $2,561Patterson Diablo Grande 71 3,800 $450,000 $118 ($5,000) $0 $450,000 $118 $35,000 $12,500 $497,500 $131 $170 1.25% $187.50 $2,892Product: Single Family Total Units: 141Configuration: 8,250 Units Sold: 0Lot Dimensions: 75x110 3 Months Sold: 0
Units Remaining: 141% Remaining: 100%
Summary Statistics: 3,304 2.5 $417,730 $126 ($5,000) $0 $417,730 $126 $35,000 $12,500 $465,230 $141 $170 1.25% $188 $2,728

June 2015 | Western Hills Water District Diablo Grande CFD No. 1 Diablo Grande in Stanislaus County, CA 19
67
103
68
104
43
9 3 3 0 0 9 18
$0
$100,000
$200,000
$300,000
$400,000
$500,000
$600,000
0
20
40
60
80
100
120
2004
2005
2006
2007
2008
2009
2010
2011
2012
2013
2014
2015
Med
ian
Pric
e
Sale
s Vo
lum
e
Source: DataQuick, DeNova Homes
Until 2014 Diablo Grande had not had new home sales activity since 2011. At the peak in 2005 through 2007, new home sales reached 100 sales per year. DeNova has introduced a 5,600 square foot lot subdivision which has nine reported sales in 2014 and 18 sales in 2015. Base pricing currently ranges from $271,500 to $304,900. While it would appear this community is underperforming, consider that the greater master plan has not yet restarted and DeNova is not necessarily a builder with a wide marketing reach. Pricing for this community is consistent with our recommended prices for similar sized product on similar lots. Once the master plan is officially re-released to the market with multiple builders with multiple marketing efforts are implemented we will see the full sales capabilities of Diablo Grande. Note: data is for production home sales only. Does not reflect custom lot sales.
Diablo Grande Has Yet to Find its Full Sales Potential
Meyers Research Average Price:
$357,389
2014/2015 sales and pricing as per DeNova’s Villa Vista community.
Development of Diablo Grande, CA2004 2005 2006 2007 2008 2009 2010 2011 2012 2013 2014 2015
Annual New Home Sales 67 103 68 104 43 9 3 3 0 0 9 18 Prior Year Change n/a 53.7% -34.0% 52.9% -58.7% -79.1% -66.7% 0.0% -- -- n/a 100.0%Median New Home Sales Price $353,500 $505,500 $430,500 $347,350 $282,000 $136,000 $105,000 $195,000 -- -- $303,900 $266,700 Prior Year Change n/a 43.0% -14.8% -19.3% -18.8% -51.8% -22.8% 85.7% -- -- n/a -12.2%
New Home History

June 2015 | Western Hills Water District Diablo Grande CFD No. 1 Diablo Grande in Stanislaus County, CA 20
From today until an estimated timeframe the community could open for sale (+/-2016) and throughout the community’s sell out we would expect appreciation at Diablo Grande. Over the next five years it is reasonable to anticipate continued appreciation through 2015 (+/-4%) and as the economy continues to stabilize and the market gains strength we forecast an increase of 6.0% in 2016, 4.0% in 2017, 4.0% in 2018 and 3.0% in 2019. Note: average prices for each year reflect year end.
The Community Should See Price Appreciation in the Coming Years
2015 2016 2017 2018 2019
Project/Subdivision Type Configuration # of Units Average Price 4.0% 6.0% 5.0% 4.0% 3.0%
Diablo Grande - Townhomes ATT - 132 $215,000 $223,600 $237,016 $248,867 $258,821 $266,586
Diablo Grande - Alley 40' Single Family 2,800 40 $262,500 $273,000 $289,380 $303,849 $316,003 $325,483
Diablo Grande - SFD1 50' Single Family 4,000 142 $310,000 $322,400 $341,744 $358,831 $373,184 $384,380
Diablo Grande - SFD2 50' Single Family 5,000 385 $335,052 $348,454 $369,361 $387,829 $403,343 $415,443
Diablo Grande - SFD3 60' Single Family 6,000 290 $363,750 $378,300 $400,998 $421,048 $437,890 $451,027
Diablo Grande - SFD4 60' Single Family 6,600 489 $400,066 $416,069 $441,033 $463,085 $481,608 $496,057
Diablo Grande - SFD5 75' Single Family 8,250 141 $465,230 $483,840 $512,870 $538,514 $560,054 $576,856
1,619 $357,389 $371,684 $393,985 $413,685 $430,232 $443,139COMMUNITY SUMMARY
TOTAL PRICE APPRECIATION SCHEDULE

June 2015 | Western Hills Water District Diablo Grande CFD No. 1 Diablo Grande in Stanislaus County, CA 21
2015 2016 2017 2018 2019 2020 2021 2022 2023 2024 2025 2026 2027
Project/Subdivision Type Configuration # of Units SALES PACE 0.0% 0.0% 0.0% 0.0% 0.0% 0.0% 0.0% 0.0% 0.0% 0.0% 0.0% 0.0% 0.0%
Diablo Grande - Townhomes ATT - 132 3.5 3.5 3.5 3.5 3.5 3.5 3.5 3.5 3.5 3.5 3.5 3.5 3.5 3.5
Diablo Grande - Alley 40' Single Family 2,800 40 3.5 3.5 3.5 3.5 3.5 3.5 3.5 3.5 3.5 3.5 3.5 3.5 3.5 3.5
Diablo Grande - SFD1 50' Single Family 4,000 142 3.0 3.0 3.0 3.0 3.0 3.0 3.0 3.0 3.0 3.0 3.0 3.0 3.0 3.0
Diablo Grande - SFD2 50' Single Family 5,000 385 3.0 3.0 3.0 3.0 3.0 3.0 3.0 3.0 3.0 3.0 3.0 3.0 3.0 3.0
Diablo Grande - SFD3 60' Single Family 6,000 290 3.0 3.0 3.0 3.0 3.0 3.0 3.0 3.0 3.0 3.0 3.0 3.0 3.0 3.0
Diablo Grande - SFD4 60' Single Family 6,600 489 3.0 3.0 3.0 3.0 3.0 3.0 3.0 3.0 3.0 3.0 3.0 3.0 3.0 3.0
Diablo Grande - SFD5 75' Single Family 8,250 141 2.5 2.5 2.5 2.5 2.5 2.5 2.5 2.5 2.5 2.5 2.5 2.5 2.5 2.5
1,619 3.0 3.0 3.0 3.0 3.0 3.0 3.0 3.0 3.0 3.0 3.0 3.0 3.0 3.0
Project/Subdivision Type Configuration # of Units Avg Yr/Pace 2015 2016 2017 2018 2019 2020 2021 2022 2023 2024 2025 2026 2027
Diablo Grande - Townhomes ATT - 132 33 21 42 42 27
Diablo Grande - Alley 40' Single Family 2,800 40 40 40
Diablo Grande - SFD1 50' Single Family 4,000 142 28 18 36 36 36 16
Diablo Grande - SFD2 50' Single Family 5,000 385 34 18 36 36 36 36 36 36 36 36 36 34 9
Diablo Grande - SFD3 60' Single Family 6,000 290 36 36 36 36 36 36 36 36 36 2
Diablo Grande - SFD4 60' Single Family 6,600 489 42 18 36 36 36 36 72 72 39 36 36 36 36
Diablo Grande - SFD5 75' Single Family 8,250 141 30 30 30 30 30 21
1,619 244 0 75 150 150 171 164 174 174 141 138 129 106 47
4 4 4 5 5 5 5 4 4 4 3 3NUMBER OF ACTIVE PROJECTS
COMMUNITY SUMMARY
COMMUNITY SUMMARY
ABSORPTION APPRECIATION SCHEDULE
HYPOTHETICAL COMMUNITY SELL OUT
Our per-project absorption pace and hypothetical build out schedule are detailed below. We do not assume increased an absorption schedule over time for any single product line, given the multiple product lines to be offered concurrently (four to five active projects at any given time).
Community Absorption Yields Build Out Over +/-11 Years
Assumes two SFD4 60’ wide projects selling concurrently

June 2015 | Western Hills Water District Diablo Grande CFD No. 1 Diablo Grande in Stanislaus County, CA 22
75
150 150
171 164
174 174
141 138 129
106
47
0
20
40
60
80
100
120
140
160
180
2016 2017 2018 2019 2020 2021 2022 2023 2024 2025 2026 2027
Tota
l Num
ber o
f Uni
ts
Diablo Grande’s Sell Out Could Follow the Traditional Sales “Bell Curve” The following chart represents annual new home sales at Diablo Grande based on the conceptual build-out. We believe it is possible for the project to reach sales levels that meet and exceed historical peak sales at Diablo Grande, provided that the project can deliver multiple product lines and is able to enhance marketing efforts and create improvements/ additions to community amenities. The peak years of our absorption schedule reach +/-175 units per year – higher than the historical norm, but lower than other master plans in the competitive market such as Mountain House (338 average annual closings and 203 sales in 2014).
Diablo Grande new home sales reached over 100 sales in 2005 and 2007. This level of demand may be understated, as sales agents report that finished lot supply was not sufficient to meet demand at that time, and sales could have been potentially higher.
Market Perspective: Mountain House Sales
Average 2003 to 2014: 338 2014 Sales: 203

June 2015 | Western Hills Water District Diablo Grande CFD No. 1 Diablo Grande in Stanislaus County, CA 23
402
477 502
692
557
285
149 83
117
333 261
203
0
100
200
300
400
500
600
700
2003 2004 2005 2006 2007 2008 2009 2010 2011 2012 2013 2014
Tota
l Clo
sing
s Mountain House Historical Absorption Shows MPC Potential (and the Most Current Real Estate Cycle)
The following chart represents historical annual new home sales at Mountain House, a key master plan comparable in Tracy. At its peak, Mountain House had 692 annual sales in 2006. The average annual closings is 338 per year and Mountain House had 203 closings in 2014. Homes sales and closings may be understated going forward, as there is limited finished lot supply and builders are limiting the release of lots. While we recognize that Mountain House is better situated to attract commuter buyers than Diablo Grande (30+ minutes closer to the Bay Area), our recommended absorption for Diablo Grande is reasonable when compared to annual closings at Mountain House.
Diablo Grande Recommended Absorption (2016+):
75 to 174 Sales per Year.
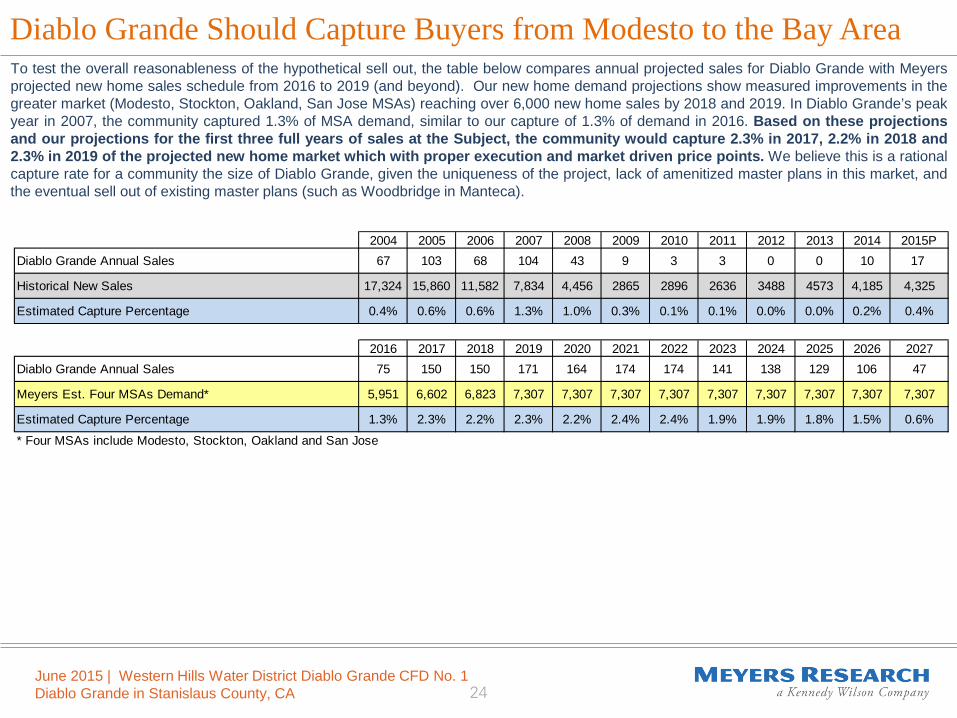
June 2015 | Western Hills Water District Diablo Grande CFD No. 1 Diablo Grande in Stanislaus County, CA 24
To test the overall reasonableness of the hypothetical sell out, the table below compares annual projected sales for Diablo Grande with Meyers projected new home sales schedule from 2016 to 2019 (and beyond). Our new home demand projections show measured improvements in the greater market (Modesto, Stockton, Oakland, San Jose MSAs) reaching over 6,000 new home sales by 2018 and 2019. In Diablo Grande’s peak year in 2007, the community captured 1.3% of MSA demand, similar to our capture of 1.3% of demand in 2016. Based on these projections and our projections for the first three full years of sales at the Subject, the community would capture 2.3% in 2017, 2.2% in 2018 and 2.3% in 2019 of the projected new home market which with proper execution and market driven price points. We believe this is a rational capture rate for a community the size of Diablo Grande, given the uniqueness of the project, lack of amenitized master plans in this market, and the eventual sell out of existing master plans (such as Woodbridge in Manteca).
Diablo Grande Should Capture Buyers from Modesto to the Bay Area
2004 2005 2006 2007 2008 2009 2010 2011 2012 2013 2014 2015PDiablo Grande Annual Sales 67 103 68 104 43 9 3 3 0 0 10 17
Historical New Sales 17,324 15,860 11,582 7,834 4,456 2865 2896 2636 3488 4573 4,185 4,325
Estimated Capture Percentage 0.4% 0.6% 0.6% 1.3% 1.0% 0.3% 0.1% 0.1% 0.0% 0.0% 0.2% 0.4%
2016 2017 2018 2019 2020 2021 2022 2023 2024 2025 2026 2027Diablo Grande Annual Sales 75 150 150 171 164 174 174 141 138 129 106 47
Meyers Est. Four MSAs Demand* 5,951 6,602 6,823 7,307 7,307 7,307 7,307 7,307 7,307 7,307 7,307 7,307
Estimated Capture Percentage 1.3% 2.3% 2.2% 2.3% 2.2% 2.4% 2.4% 1.9% 1.9% 1.8% 1.5% 0.6%* Four MSAs include Modesto, Stockton, Oakland and San Jose
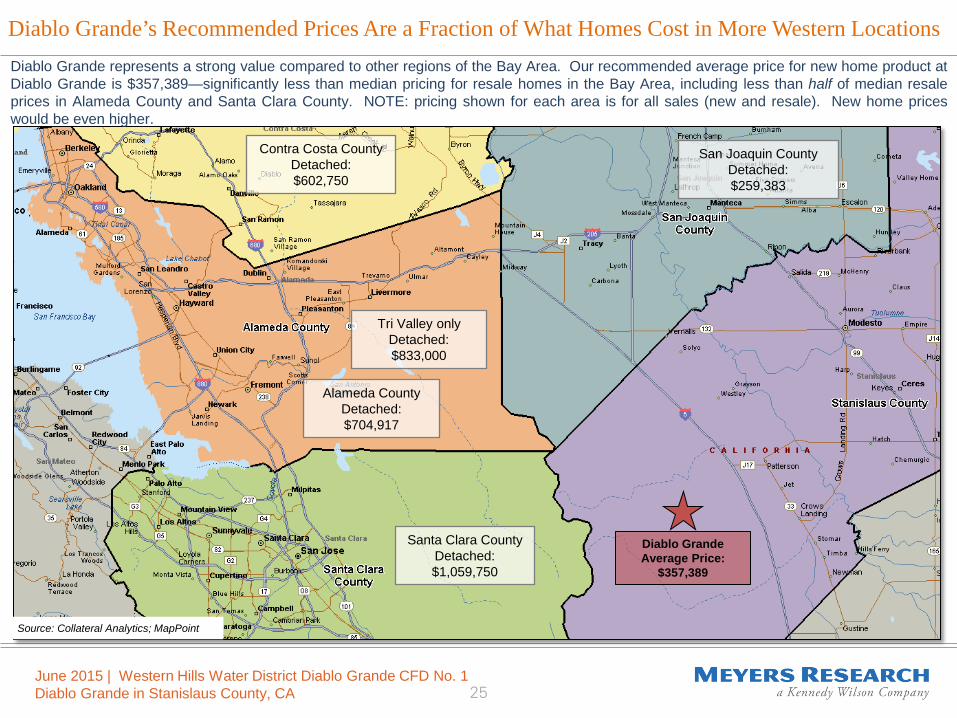
June 2015 | Western Hills Water District Diablo Grande CFD No. 1 Diablo Grande in Stanislaus County, CA 25
Diablo Grande’s Recommended Prices Are a Fraction of What Homes Cost in More Western Locations
Source: Collateral Analytics; MapPoint
Diablo Grande represents a strong value compared to other regions of the Bay Area. Our recommended average price for new home product at Diablo Grande is $357,389—significantly less than median pricing for resale homes in the Bay Area, including less than half of median resale prices in Alameda County and Santa Clara County. NOTE: pricing shown for each area is for all sales (new and resale). New home prices would be even higher.
Diablo Grande Average Price:
$357,389
Santa Clara County Detached: $1,059,750
Alameda County Detached: $704,917
Contra Costa County Detached: $602,750
Tri Valley only Detached: $833,000
San Joaquin County Detached: $259,383

June 2015 | Western Hills Water District Diablo Grande CFD No. 1 Diablo Grande in Stanislaus County, CA 26
BASE PRICE NET BASE PRICE $ ASSUMPTIONS AVERAGE PRICE FINISHED LOT LAND RESIDUAL
Project/Subdivision Type Configuration # of Units Est % of Total Units
Average Unit Size
Base Price $/SFPrice
ImpactingIncentives
Net Base Price
$/SF Options Premiums Average Price
$/SF Estimated Sales / Month
Lot to Home Value
Lot Price Price / Front Foot
Diablo Grande - Townhomes Townhomes - 132 8% 1,350 $197,500 $146 $0 $197,500 $146 $15,000 $2,500 $215,000 $159 3.50 34.2% $68,425 $2,281
Diablo Grande - Alley 40' Single Family 2,800 40 2% 1,700 $245,000 $144 $0 $245,000 $144 $15,000 $2,500 $262,500 $154 3.50 32.5% $80,438 $2,011
Diablo Grande - SFD1 50' Single Family 4,000 142 9% 2,100 $285,000 $136 $0 $285,000 $136 $20,000 $5,000 $310,000 $148 3.00 30.8% $89,450 $1,789
Diablo Grande - SFD2 50' Single Family 5,000 385 24% 2,301 $310,052 $135 $0 $310,052 $135 $20,000 $5,000 $335,052 $146 3.00 30.1% $94,814 $1,896
Diablo Grande - SFD3 60' Single Family 6,000 290 18% 2,500 $331,250 $133 $0 $331,250 $133 $25,000 $7,500 $363,750 $146 3.00 30.3% $102,806 $1,713
Diablo Grande - SFD4 60' Single Family 6,600 489 30% 2,801 $367,566 $131 $0 $367,566 $131 $25,000 $7,500 $400,066 $143 3.00 29.3% $109,985 $1,833
Diablo Grande - SFD5 75' Single Family 8,250 141 9% 3,304 $417,730 $126 $0 $417,730 $126 $35,000 $12,500 $465,230 $141 2.50 29.1% $125,122 $1,668
1,619 100% 2,465 $327,617 $134 $0 $327,617 $134 $23,181 $6,590 $357,389 $146 3.0 30.1% $100,490 $1,823COMMUNITY SUMMARY
Finished Lot Land Residual Analysis For each of the product lines we conducted a static land residual analysis of the recommended base prices plus premiums to test implied lot prices. This exercise results in an overall community lot price average of +/-$100,000 per lot, equating to 30.1% lot to home value ratio and approximately $1,823 per front foot. See Appendix for detailed lot residual analysis for each product type.
Hard costs for this analysis were estimated at $60.00 for single family detached product and townhomes. Builder profit was estimated at 12%. Interviews with local real estate professionals confirm these inputs are reasonable. Modifications to these or other inputs in the land residual model will change the lot prices estimated above.

June 2015 | Western Hills Water District Diablo Grande CFD No. 1 Diablo Grande in Stanislaus County, CA 27
Competitive Market Summary “Western Hills Water District Diablo Grande CFD No. 1 ” in Patterson, California Master Plan Community Assessment and Future Product Planning

June 2015 | Western Hills Water District Diablo Grande CFD No. 1 Diablo Grande in Stanislaus County, CA 28
$150,000
$200,000
$250,000
$300,000
$350,000
$400,000
$450,000
$500,000
$550,000
1,000 1,500 2,000 2,500 3,000 3,500 4,000
Tota
l Pric
e / C
lose
d Pr
ice
Unit Size (Square Feet)
Diablo Grande - Townhomes - ATT, Builder TBD, 3.5 sls per mo
Diablo Grande - Alley 40' - 2,800 sq ft, Builder TBD, 3.5 sls per mo
Diablo Grande - SFD1 50' - 4,000 sq ft, Builder TBD, 3.0 sls per mo
Diablo Grande - SFD2 50' - 5,000 sq ft, Builder TBD, 3.0 sls per mo
Diablo Grande - SFD3 60' - 6,000 sq ft, Builder TBD, 3.0 sls per mo
Diablo Grande - SFD4 60' - 6,600 sq ft, Builder TBD, 3.0 sls per mo
Diablo Grande - SFD5 75' - 8,250 sq ft, Builder TBD, 2.5 sls per mo
Diablo Grande (New Sales, 12 Months)
Diablo Grande (Resales, 12 Months)
Linear (Diablo Grande (New Sales, 12 Months))
Linear (Diablo Grande (Resales, 12 Months))
Source: Meyers Research
Diablo Grande’s recommended total prices (base plus premiums and options/upgrades) are reasonably priced above most existing resales in Diablo Grande given its new construction and the vision for improvements to be made to the community, and similar to the new homes at Villa Vista (in blue). Further, pricing is still reasonably within established values for the area.
Competitive Positioning At Upper End of Diablo Grande Sales
Resales above $400,000 are on large lots (11,000 to 34,000 square feet)

June 2015 | Western Hills Water District Diablo Grande CFD No. 1 Diablo Grande in Stanislaus County, CA 29
The recommended base prices for the Subject appear reasonably positioned vs DeNova’s Villa Vista community in Diablo Grande. Further prices are near price levels for stand alone communities in other Modesto locations (Keyes and Riverbend). Base prices are generally below Manteca, and well below Tracy and Mountain House on a base price comparison.
Base Price Positioning at Bottom of Greater Modesto Market
$150,000
$200,000
$250,000
$300,000
$350,000
$400,000
$450,000
$500,000
$550,000
$600,000
$650,000
$700,000
$750,000
1,000 1,500 2,000 2,500 3,000 3,500 4,000 4,500
Tota
l Pric
e
Unit Size (Square Feet)
Diablo Grande - Townhomes - ATT, Builder TBD, 3.5 sls per moDiablo Grande - Alley 40' - 2,800 sq ft, Builder TBD, 3.5 sls per moDiablo Grande - SFD1 50' - 4,000 sq ft, Builder TBD, 3.0 sls per moDiablo Grande - SFD2 50' - 5,000 sq ft, Builder TBD, 3.0 sls per moDiablo Grande - SFD3 60' - 6,000 sq ft, Builder TBD, 3.0 sls per moDiablo Grande - SFD4 60' - 6,600 sq ft, Builder TBD, 3.0 sls per moDiablo Grande - SFD5 75' - 8,250 sq ft, Builder TBD, 2.5 sls per moVilla Vista 55' - 6,050 sq ft, DeNova, 0.9/0.7 sls per moIvy Terrace TH - ATT, Adroit, 1.5/1.5 sls per moCornerstone - 3,000 sq ft, KB Home, 3.3/5.3 sls per moThe Corners at Eastgate - 3,800 sq ft, Kiper, 1.7/1.3 sls per moBelmont at Bridle Ridge 58' - 6,380 sq ft, JKB Living, 2.3/4.0 sls per moSavannah 35' - 3,500 sq ft, Signature, 5.2/6.3 sls per moSpring Hill Estates - 4,000 sq ft, Richmond American, 4.5/10.0 sls per moHeritage at Hansen Village 50' - 5,000 sq ft, Woodside, 6.0/9.0 sls per moSundance 55' - 5,225 sq ft, TriPointe, NEW/NEW sls per moUmbria 65' - 6,500 sq ft, Shea, 6.1/6.0 sls per moMaplewood 50' - 5,000 sq ft, William Lyon, 3.1/4.0 sls per moThe Falls at Yosemite Vista 52' - 5,200 sq ft, Bright, 1.2/2.3 sls per moVentana 55' - 5,500 sq ft, TriPointe, 2.7/4.0 sls per moStarflower 60' - 6,000 sq ft, Standard Pacific, New/NEW sls per moTrinity Lane Duplexes - ATT, Pulte, 3.6/3.7 sls per moRiver Walk at Mossdale Landing 50' - 5,000 sq ft, Woodside, 6.4/6.0 sls per moRiver Park at Mossdale Landing 60' - 6,000 sq ft, Woodside, 3.5/9.3 sls per moWindrift at River Islands 55' - 5,500 sq ft, Brookfield, 5.4/8.0 sls per moEdgewater at River Islands 60' - 6,000 sq ft, DeNova, 4.3/5.7 sls per moWaterpointe at River Islands 70' - 9,100 sq ft, Van Deale, 5.4/6.0 sls per moDrake's Bend at River Islands 40' - 4,000 sq ft, DeNova, 6.0/6.0 sls per moPomelo Grove 61' - 6,100 sq ft, Bright, 3.6/2.3 sls per moSummit Collection 67' - 7,370 sq ft, Atherton, 4.4/5.3 sls per moOrchard Park 60' - 6,900 sq ft, Meritage, 7.7/8.3 sls per moBella Vista at Oakwood Shores 50' - 5,000 sq ft, Lafferty, 2.3/1.7 sls per moBella Lago at Oakwood Shores 60' - 6,000 sq ft, Lafferty, 1.7/1.3 sls per moThe Enclave at Oakwood Shores 62' - 6,200 sq ft, Woodside, 2.2/1.7 sls per moClassics @ Woodbridge 46' - 4,600 sq ft, Del Webb, 2.7/4.0 sls per moPremiere @ Woodbridge 55' - 5,500 sq ft, Del Webb, 3.5/4.0 sls per moEstates @ Woodbridge 75' - 7,500 sq ft, Del Webb, 2.7/4.0 sls per mo
Source: Meyers Research; Individual Community Sales Offices Absorption = Historical/3 Month
Diablo Grande (Subject) Patterson/ Diablo Grande
Modesto (Ceres/ Riverbank/ Oakdale) Mountain House
Tracy Lathrop - Mossdale Landing
Lathrop - River Islands Manteca
Manteca - Oakwood Shores Woodbridge (Active Adult)

June 2015 | Western Hills Water District Diablo Grande CFD No. 1 Diablo Grande in Stanislaus County, CA 30
Total Price Positioning at Bottom of Greater Modesto Market Total prices (base plus premiums, options and upgrades) are similar to the price positioning comparison on the previous page.
$150,000
$200,000
$250,000
$300,000
$350,000
$400,000
$450,000
$500,000
$550,000
$600,000
$650,000
$700,000
$750,000
1,000 1,500 2,000 2,500 3,000 3,500 4,000 4,500
Tota
l Pric
e
Unit Size (Square Feet)
Diablo Grande - Townhomes - ATT, Builder TBD, 3.5 sls per moDiablo Grande - Alley 40' - 2,800 sq ft, Builder TBD, 3.5 sls per moDiablo Grande - SFD1 50' - 4,000 sq ft, Builder TBD, 3.0 sls per moDiablo Grande - SFD2 50' - 5,000 sq ft, Builder TBD, 3.0 sls per moDiablo Grande - SFD3 60' - 6,000 sq ft, Builder TBD, 3.0 sls per moDiablo Grande - SFD4 60' - 6,600 sq ft, Builder TBD, 3.0 sls per moDiablo Grande - SFD5 75' - 8,250 sq ft, Builder TBD, 2.5 sls per moVilla Vista 55' - 6,050 sq ft, DeNova, 0.9/0.7 sls per moIvy Terrace TH - ATT, Adroit, 1.5/1.5 sls per moCornerstone - 3,000 sq ft, KB Home, 3.3/5.3 sls per moThe Corners at Eastgate - 3,800 sq ft, Kiper, 1.7/1.3 sls per moBelmont at Bridle Ridge 58' - 6,380 sq ft, JKB Living, 2.3/4.0 sls per moSavannah 35' - 3,500 sq ft, Signature, 5.2/6.3 sls per moSpring Hill Estates - 4,000 sq ft, Richmond American, 4.5/10.0 sls per moHeritage at Hansen Village 50' - 5,000 sq ft, Woodside, 6.0/9.0 sls per moSundance 55' - 5,225 sq ft, TriPointe, NEW/NEW sls per moUmbria 65' - 6,500 sq ft, Shea, 6.1/6.0 sls per moMaplewood 50' - 5,000 sq ft, William Lyon, 3.1/4.0 sls per moThe Falls at Yosemite Vista 52' - 5,200 sq ft, Bright, 1.2/2.3 sls per moVentana 55' - 5,500 sq ft, TriPointe, 2.7/4.0 sls per moStarflower 60' - 6,000 sq ft, Standard Pacific, New/NEW sls per moTrinity Lane Duplexes - ATT, Pulte, 3.6/3.7 sls per moRiver Walk at Mossdale Landing 50' - 5,000 sq ft, Woodside, 6.4/6.0 sls per moRiver Park at Mossdale Landing 60' - 6,000 sq ft, Woodside, 3.5/9.3 sls per moWindrift at River Islands 55' - 5,500 sq ft, Brookfield, 5.4/8.0 sls per moEdgewater at River Islands 60' - 6,000 sq ft, DeNova, 4.3/5.7 sls per moWaterpointe at River Islands 70' - 9,100 sq ft, Van Deale, 5.4/6.0 sls per moDrake's Bend at River Islands 40' - 4,000 sq ft, DeNova, 6.0/6.0 sls per moPomelo Grove 61' - 6,100 sq ft, Bright, 3.6/2.3 sls per moSummit Collection 67' - 7,370 sq ft, Atherton, 4.4/5.3 sls per moOrchard Park 60' - 6,900 sq ft, Meritage, 7.7/8.3 sls per moBella Vista at Oakwood Shores 50' - 5,000 sq ft, Lafferty, 2.3/1.7 sls per moBella Lago at Oakwood Shores 60' - 6,000 sq ft, Lafferty, 1.7/1.3 sls per moThe Enclave at Oakwood Shores 62' - 6,200 sq ft, Woodside, 2.2/1.7 sls per moClassics @ Woodbridge 46' - 4,600 sq ft, Del Webb, 2.7/4.0 sls per moPremiere @ Woodbridge 55' - 5,500 sq ft, Del Webb, 3.5/4.0 sls per moEstates @ Woodbridge 75' - 7,500 sq ft, Del Webb, 2.7/4.0 sls per mo
Source: Meyers Research; Individual Community Sales Offices Absorption = Historical/3 Month
Diablo Grande (Subject) Patterson/ Diablo Grande
Modesto (Ceres/ Riverbank/ Oakdale) Mountain House
Tracy Lathrop - Mossdale Landing
Lathrop - River Islands Manteca
Manteca - Oakwood Shores Woodbridge (Active Adult)

June 2015 | Western Hills Water District Diablo Grande CFD No. 1 Diablo Grande in Stanislaus County, CA 31
Monthly Payment in the Middle of Greater Modesto Market Because of relatively high HOA fees and combined tax rate (base tax rate and Mello Roos fees) at Diablo Grande, on a monthly payment basis, the recommended base prices are generally positioned in the middle of the market when compared to other actively selling communities in the greater Modesto market—higher than stand alone product in Patterson and Modesto, similar to Manteca and Lathrop, and lower than Mountain house and Tracy (which offer a shorter commute time to Bay Area markets).
$1,000
$1,200
$1,400
$1,600
$1,800
$2,000
$2,200
$2,400
$2,600
$2,800
$3,000
$3,200
$3,400
$3,600
$3,800
$4,000
$4,200
1,000 1,500 2,000 2,500 3,000 3,500 4,000 4,500
Estim
ated
Mon
thly
Pay
men
t
Unit Size (Square Feet)
Diablo Grande - Townhomes - ATT, Builder TBD, 3.5 sls per moDiablo Grande - Alley 40' - 2,800 sq ft, Builder TBD, 3.5 sls per moDiablo Grande - SFD1 50' - 4,000 sq ft, Builder TBD, 3.0 sls per moDiablo Grande - SFD2 50' - 5,000 sq ft, Builder TBD, 3.0 sls per moDiablo Grande - SFD3 60' - 6,000 sq ft, Builder TBD, 3.0 sls per moDiablo Grande - SFD4 60' - 6,600 sq ft, Builder TBD, 3.0 sls per moDiablo Grande - SFD5 75' - 8,250 sq ft, Builder TBD, 2.5 sls per moVilla Vista 55' - 6,050 sq ft, DeNova, 0.9/0.7 sls per moIvy Terrace TH - ATT, Adroit, 1.5/1.5 sls per moCornerstone - 3,000 sq ft, KB Home, 3.3/5.3 sls per moThe Corners at Eastgate - 3,800 sq ft, Kiper, 1.7/1.3 sls per moBelmont at Bridle Ridge 58' - 6,380 sq ft, JKB Living, 2.3/4.0 sls per moSavannah 35' - 3,500 sq ft, Signature, 5.2/6.3 sls per moSpring Hill Estates - 4,000 sq ft, Richmond American, 4.5/10.0 sls per moHeritage at Hansen Village 50' - 5,000 sq ft, Woodside, 6.0/9.0 sls per moSundance 55' - 5,225 sq ft, TriPointe, NEW/NEW sls per moUmbria 65' - 6,500 sq ft, Shea, 6.1/6.0 sls per moMaplewood 50' - 5,000 sq ft, William Lyon, 3.1/4.0 sls per moThe Falls at Yosemite Vista 52' - 5,200 sq ft, Bright, 1.2/2.3 sls per moVentana 55' - 5,500 sq ft, TriPointe, 2.7/4.0 sls per moStarflower 60' - 6,000 sq ft, Standard Pacific, New/NEW sls per moTrinity Lane Duplexes - ATT, Pulte, 3.6/3.7 sls per moRiver Walk at Mossdale Landing 50' - 5,000 sq ft, Woodside, 6.4/6.0 sls per moRiver Park at Mossdale Landing 60' - 6,000 sq ft, Woodside, 3.5/9.3 sls per moWindrift at River Islands 55' - 5,500 sq ft, Brookfield, 5.4/8.0 sls per moEdgewater at River Islands 60' - 6,000 sq ft, DeNova, 4.3/5.7 sls per moWaterpointe at River Islands 70' - 9,100 sq ft, Van Deale, 5.4/6.0 sls per moDrake's Bend at River Islands 40' - 4,000 sq ft, DeNova, 6.0/6.0 sls per moPomelo Grove 61' - 6,100 sq ft, Bright, 3.6/2.3 sls per moSummit Collection 67' - 7,370 sq ft, Atherton, 4.4/5.3 sls per moOrchard Park 60' - 6,900 sq ft, Meritage, 7.7/8.3 sls per moBella Vista at Oakwood Shores 50' - 5,000 sq ft, Lafferty, 2.3/1.7 sls per moBella Lago at Oakwood Shores 60' - 6,000 sq ft, Lafferty, 1.7/1.3 sls per moThe Enclave at Oakwood Shores 62' - 6,200 sq ft, Woodside, 2.2/1.7 sls per moClassics @ Woodbridge 46' - 4,600 sq ft, Del Webb, 2.7/4.0 sls per moPremiere @ Woodbridge 55' - 5,500 sq ft, Del Webb, 3.5/4.0 sls per moEstates @ Woodbridge 75' - 7,500 sq ft, Del Webb, 2.7/4.0 sls per mo
Source: Meyers Research; Individual Community Sales Offices Absorption = Historical/3 Month
Diablo Grande (Subject) Patterson/ Diablo Grande
Modesto (Ceres/ Riverbank/ Oakdale) Mountain House
Tracy Lathrop - Mossdale Landing
Lathrop - River Islands Manteca
Manteca - Oakwood Shores Woodbridge (Active Adult)

June 2015 | Western Hills Water District Diablo Grande CFD No. 1 Diablo Grande in Stanislaus County, CA 32
Elasticity of Demand Varies From 1.0 to 10.0 Sales Per Month The chart below depicts the sensitivity of average price as it relates to sales pace among competitive projects, on an overall basis (blue) and in recent months (green). Our recommended sales paces per product line at Diablo Grande (black) are at or slightly below the trend line of comparables’ sales paces. This is a reasonable absorption strategy considering the price points targeted at Diablo Grande.
0.0
2.0
4.0
6.0
8.0
10.0
12.0
$150,000 $200,000 $250,000 $300,000 $350,000 $400,000 $450,000 $500,000 $550,000 $600,000
Sale
s Pe
r Mon
th
Average Net Base Price
Diablo Grande - Townhomes - ATT, Builder TBD, 3.5 sls per mo
Diablo Grande - Alley 40' - 2,800 sq ft, Builder TBD, 3.5 sls per mo
Diablo Grande - SFD1 50' - 4,000 sq ft, Builder TBD, 3.0 sls per mo
Diablo Grande - SFD2 50' - 5,000 sq ft, Builder TBD, 3.0 sls per mo
Diablo Grande - SFD3 60' - 6,000 sq ft, Builder TBD, 3.0 sls per mo
Diablo Grande - SFD4 60' - 6,600 sq ft, Builder TBD, 3.0 sls per mo
Diablo Grande - SFD5 75' - 8,250 sq ft, Builder TBD, 2.5 sls per mo
Competitive Market - Historical Sales Pace
Competitive Market - Past 3 Months Sales Pace
Source: Meyers Research; Individual Community Sales Offices

33 June 2014 | Diablo Grande Existing Sales - Overview
Diablo Grande New Home and Existing Homes Sales Detail YEARBUILT SQ. FT. LOT
SIZESALEDATE PRICE YEAR
BUILT SQ. FT. LOTSIZE
SALEDATE PRICE
2014 2,265 6,130 3/31/2014 $336,900 2004 2,893 22,269 5/6/2015 $405,1002014 1,776 5,964 10/27/2014 $279,900 2004 3,495 25,155 6/12/2014 $310,0002014 2,497 5,652 1/27/2014 $339,900 2004 2,685 6,377 8/25/2014 $259,0002014 2,497 6,037 4/12/2014 $349,900 2004 2,601 13,597 6/9/2014 $340,0002014 1,776 6,070 10/31/2014 $279,900 2004 2,601 13,120 3/25/2015 $375,0002014 2,497 6,243 8/30/2014 $344,900 2004 3,024 11,531 4/10/2015 $440,0002014 1,776 6,531 4/6/2014 $303,900 2004 2,392 5,280 4/7/2015 $260,0002014 2,265 5,864 9/23/2014 $303,900 2004 2,685 5,658 7/25/2014 $270,0002014 1,776 8,867 10/22/2014 $276,900 2004 2,685 6,070 4/10/2015 $347,5002015 1,776 6,072 2/2/2015 $276,900 2004 1,932 5,281 4/1/2015 $218,0002015 1,776 6,724 1/19/2015 $264,900 2004 1,932 5,922 8/25/2014 $200,0002015 2,497 6,843 2/7/2015 $317,900 2004 2,517 5,370 8/20/2014 $258,0002015 1,776 5,553 1/24/2015 $262,900 2004 2,685 5,616 2/24/2015 $250,0002015 2,265 5,590 1/3/2015 $298,900 2004 2,517 6,056 12/16/2014 $267,0002015 1,776 6,727 4/4/2015 $253,500 2005 2,824 34,339 10/21/2014 $410,0002015 2,265 5,910 5/10/2015 $289,500 2005 2,878 25,187 3/25/2015 $286,0002015 1,776 6,188 3/14/2015 $253,500 2005 2,168 4,738 1/27/2015 $220,0002015 2,265 6,900 3/1/2015 $290,900 2005 2,517 6,535 12/23/2014 $259,0002015 2,497 6,052 1/5/2015 $306,886 2006 1,797 7,062 10/27/2014 $205,0002015 1,776 6,803 3/14/2015 $268,500 2006 1,797 4,965 9/2/2014 $195,0002015 1,776 5,548 2/28/2015 $248,500 2006 3,827 23,573 12/11/2014 $500,0002015 1,776 5,547 4/25/2015 $259,500 2006 2,468 5,774 6/25/2014 $240,0002015 1,776 5,744 4/11/2015 $259,500 2006 2,036 4,049 12/2/2014 $217,5002015 1,776 5,792 5/16/2015 $262,500 2006 1,565 4,452 12/11/2014 $194,5002015 2,265 6,398 5/10/2015 $294,900 2006 2,752 6,020 5/11/2015 $286,5002015 1,776 6,370 5/23/2015 $260,500 2006 2,828 5,764 3/11/2015 $305,0002015 2,265 6,640 5/22/2015 $309,500 2006 2,494 5,866 9/25/2014 $258,000
2006 2,010 7,590 10/29/2014 $230,0002006 2,752 5,000 8/20/2014 $253,0002006 2,508 5,000 3/16/2015 $260,0002006 3,165 5,000 3/4/2015 $275,0002006 2,752 5,600 9/16/2014 $253,0002007 2,715 5,774 6/17/2014 $193,5002007 1,802 3,960 9/9/2014 $199,0002007 2,715 4,921 8/7/2014 $341,0002007 2,036 3,100 10/22/2014 $185,0002007 2,828 5,525 3/9/2015 $351,5002007 2,494 5,426 12/30/2014 $258,0002007 2,508 6,368 2/27/2015 $286,0002008 1,802 3,600 4/4/2015 $181,0002008 2,828 6,399 11/3/2014 $290,000
Minimum: 1,776 5,547 $248,500 Minimum: 1,565 3,100 $181,000Maximum: 2,497 8,867 $349,900 Maximum: 3,827 34,339 $500,000Average: 2,036 6,250 $288,714 Average: 2,525 8,509 $276,393Median: 1,776 6,072 $279,900 Median: 2,601 5,774 $259,000
Diablo Grande (Resales, 12 Months)Diablo Grande (New Sales, 12 Months)

June 2015 | Western Hills Water District Diablo Grande CFD No. 1 Diablo Grande in Stanislaus County, CA 34
Comparables Floorplan Summary COMMUNITY SPECIFICS AND SALES PACE FLOORPLAN SUMMARY COMPETITIVE MARKET PRICING SUMMARY
Project Name Builder Name Base Current Incentives Net Base Net Base Typical Total Monthly Payment Inputs 80.0%Location Master Plan Size Base Price/ Price Options / Closing $ / Price ($ Price/ Options / Total Price/ Monthly Base Addl 4.5%Product Details Sales Summary SF Bed Bath Level Pkg Price Sq. Ft. Reduction Upgrades Other Reduction) Sq. Ft. Upgrades Premiums Price SF HOA Tax Taxes Mo.Pmt.
Villa Vista 55' DeNova 1,776 3 2.0 1 2 $271,500 $153 $0 ($5,000) ($5,000) $271,500 $153 $7,500 $5,000 $284,000 $160 $170 1.25% 0.79% $1,805Patterson Diablo Grande 2,265 4 2.5 2 3 $304,900 $135 $0 ($5,000) ($5,000) $304,900 $135 $7,500 $5,000 $317,400 $140 $170 1.25% 0.71% $1,975Product: Single Family Total Units: 33 #N/A #### #### #### #### #N/A #N/A #N/A #N/A #N/A #N/A #N/A #N/A #N/A #N/A #N/A #N/A #N/A #N/A #N/AConfiguration: 6,050 Units Sold: 27 #N/A #### #### #### #### #N/A #N/A #N/A #N/A #N/A #N/A #N/A #N/A #N/A #N/A #N/A #N/A #N/A #N/A #N/ALot Dimensions: 55x110 3 Months Sold: 3 #N/A #### #### #### #### #N/A #N/A #N/A #N/A #N/A #N/A #N/A #N/A #N/A #N/A #N/A #N/A #N/A #N/A #N/ASales Open Date: Jan-14 Units Remaining: 29 #N/A #### #### #### #### #N/A #N/A #N/A #N/A #N/A #N/A #N/A #N/A #N/A #N/A #N/A #N/A #N/A #N/A #N/AOverall Sales Rate: 0.9 % Remaining: 88% #N/A #### #### #### #### #N/A #N/A #N/A #N/A #N/A #N/A #N/A #N/A #N/A #N/A #N/A #N/A #N/A #N/A #N/A3 Mon. Sales Rate: 0.7 - #N/A #### #### #### #### #N/A #N/A #N/A #N/A #N/A #N/A #N/A #N/A #N/A #N/A #N/A #N/A #N/A #N/A #N/A
Totals/Averages: 2,021 $288,200 $143 $0 ($5,000) ($5,000) $288,200 $143 $7,500 $5,000 $300,700 $149 $170 1.25% 0.75% $1,890
Ivy Terrace TH Adroit 1,002 2 1.0 1 0 $211,977 $212 $0 $0 ($1,000) $211,977 $212 $2,000 $0 $213,977 $214 $133 1.10% 0.00% $1,196Patterson - 1,179 2 2.0 1 0 $217,977 $185 $0 $0 ($1,000) $217,977 $185 $2,000 $0 $219,977 $187 $133 1.10% 0.00% $1,226Product: Stacked Flats Total Units: 60 1,308 3 2.0 1 0 $226,977 $174 $0 $0 ($1,000) $226,977 $174 $2,000 $0 $228,977 $175 $133 1.10% 0.00% $1,271Configuration: ATT Units Sold: 3 #N/A #### #### #### #### #N/A #N/A #N/A #N/A #N/A #N/A #N/A #N/A #N/A #N/A #N/A #N/A #N/A #N/A #N/A
ATT 3 Months Sold: 3 #N/A #### #### #### #### #N/A #N/A #N/A #N/A #N/A #N/A #N/A #N/A #N/A #N/A #N/A #N/A #N/A #N/A #N/ASales Open Date: Apr-15 Units Remaining: 57 #N/A #### #### #### #### #N/A #N/A #N/A #N/A #N/A #N/A #N/A #N/A #N/A #N/A #N/A #N/A #N/A #N/A #N/AOverall Sales Rate: 1.5 % Remaining: 95% #N/A #### #### #### #### #N/A #N/A #N/A #N/A #N/A #N/A #N/A #N/A #N/A #N/A #N/A #N/A #N/A #N/A #N/A3 Mon. Sales Rate: 1.5 - #N/A #### #### #### #### #N/A #N/A #N/A #N/A #N/A #N/A #N/A #N/A #N/A #N/A #N/A #N/A #N/A #N/A #N/A
Totals/Averages: 1,163 $218,977 $188 $0 $0 ($1,000) $218,977 $188 $2,000 $0 $220,977 $190 $133 1.10% 0.00% $1,231
Cornerstone KB Home 1,772 3 2.5 2 2 $268,500 $152 $0 $0 $0 $268,500 $152 $17,500 $3,000 $289,000 $163 $125 1.25% 0.00% $1,597Riverbank - 1,860 3 3.0 2 2 $278,000 $149 $0 $0 $0 $278,000 $149 $17,500 $3,000 $298,500 $160 $125 1.25% 0.00% $1,646Product: Single Family Total Units: 115 1,998 3 2.5 2 2 $275,500 $138 $0 $0 $0 $275,500 $138 $17,500 $3,000 $296,000 $148 $125 1.25% 0.00% $1,633Configuration: 3,000 Units Sold: 40 2,169 3 3.0 2 2 $300,000 $138 $0 $0 $0 $300,000 $138 $17,500 $3,000 $320,500 $148 $125 1.25% 0.00% $1,758
- 3 Months Sold: 16 #N/A #### #### #### #### #N/A #N/A #N/A #N/A #N/A #N/A #N/A #N/A #N/A #N/A #N/A #N/A #N/A #N/A #N/ASales Open Date: May-14 Units Remaining: 75 #N/A #### #### #### #### #N/A #N/A #N/A #N/A #N/A #N/A #N/A #N/A #N/A #N/A #N/A #N/A #N/A #N/A #N/AOverall Sales Rate: 3.3 % Remaining: 65% #N/A #### #### #### #### #N/A #N/A #N/A #N/A #N/A #N/A #N/A #N/A #N/A #N/A #N/A #N/A #N/A #N/A #N/A3 Mon. Sales Rate: 5.3 - #N/A #### #### #### #### #N/A #N/A #N/A #N/A #N/A #N/A #N/A #N/A #N/A #N/A #N/A #N/A #N/A #N/A #N/A
Totals/Averages: 1,950 $280,500 $144 $0 $0 $0 $280,500 $144 $17,500 $3,000 $301,000 $154 $125 1.25% 0.00% $1,659
The Corners at Eastgate Kiper 2,033 4 2.5 2 2 $306,660 $151 $0 $0 ($3,000) $306,660 $151 $0 $2,500 $309,160 $152 $0 1.25% 0.00% $1,575Ceres - 2,250 4 3.0 2 2 $311,699 $139 $0 $0 ($3,000) $311,699 $139 $0 $2,500 $314,199 $140 $0 1.25% 0.00% $1,601Product: Single Family Total Units: 18 #N/A #### #### #### #### #N/A #N/A #N/A #N/A #N/A #N/A #N/A #N/A #N/A #N/A #N/A #N/A #N/A #N/A #N/AConfiguration: 3,800 Units Sold: 14 #N/A #### #### #### #### #N/A #N/A #N/A #N/A #N/A #N/A #N/A #N/A #N/A #N/A #N/A #N/A #N/A #N/A #N/A
- 3 Months Sold: 4 #N/A #### #### #### #### #N/A #N/A #N/A #N/A #N/A #N/A #N/A #N/A #N/A #N/A #N/A #N/A #N/A #N/A #N/ASales Open Date: Sep-14 Units Remaining: 4 #N/A #### #### #### #### #N/A #N/A #N/A #N/A #N/A #N/A #N/A #N/A #N/A #N/A #N/A #N/A #N/A #N/A #N/AOverall Sales Rate: 1.7 % Remaining: 22% #N/A #### #### #### #### #N/A #N/A #N/A #N/A #N/A #N/A #N/A #N/A #N/A #N/A #N/A #N/A #N/A #N/A #N/A3 Mon. Sales Rate: 1.3 - #N/A #### #### #### #### #N/A #N/A #N/A #N/A #N/A #N/A #N/A #N/A #N/A #N/A #N/A #N/A #N/A #N/A #N/A
Totals/Averages: 2,142 $309,180 $144 $0 $0 ($3,000) $309,180 $144 $0 $2,500 $311,680 $146 $0 1.25% 0.00% $1,588
Belmont at Bridle Ridge 58' JKB Living 1,754 3 2.0 1 2 $296,000 $169 $0 $0 $0 $296,000 $169 $6,500 $3,000 $305,500 $174 $0 1.10% 0.18% $1,564Oakdale - 1,918 4 2.0 1 2 $310,000 $162 $0 $0 $0 $310,000 $162 $6,500 $3,000 $319,500 $167 $0 1.10% 0.17% $1,634Product: Single Family Total Units: 100 1,919 3 2.0 1 2 $305,000 $159 $0 $0 $0 $305,000 $159 $6,500 $3,000 $314,500 $164 $0 1.10% 0.17% $1,609Configuration: 6,380 Units Sold: 38 1,960 3 2.0 1 2 $307,000 $157 $0 $0 $0 $307,000 $157 $6,500 $3,000 $316,500 $161 $0 1.10% 0.17% $1,619Lot Dimensions: 58x110 3 Months Sold: 12 2,055 4 2.5 2 2 $320,000 $156 $0 $0 $0 $320,000 $156 $6,500 $3,000 $329,500 $160 $0 1.10% 0.17% $1,683Sales Open Date: Jan-14 Units Remaining: 62 2,281 3 3.0 2 2 $336,000 $147 $0 $0 $0 $336,000 $147 $6,500 $3,000 $345,500 $151 $0 1.10% 0.16% $1,763Overall Sales Rate: 2.3 % Remaining: 62% 2,291 4 2.0 1 2 $323,000 $141 $0 $0 $0 $323,000 $141 $6,500 $3,000 $332,500 $145 $0 1.10% 0.17% $1,6983 Mon. Sales Rate: 4.0 - 2,333 3 3.0 2 2 $342,000 $147 $0 $0 $0 $342,000 $147 $6,500 $3,000 $351,500 $151 $0 1.10% 0.16% $1,793
2,368 4 2.5 2 2 $342,000 $144 $0 $0 $0 $342,000 $144 $6,500 $3,000 $351,500 $148 $0 1.10% 0.16% $1,7932,609 3 3.0 1 2 $352,000 $135 $0 $0 $0 $352,000 $135 $6,500 $3,000 $361,500 $139 $0 1.10% 0.15% $1,843
Totals/Averages: 2,149 $323,300 $150 $0 $0 $0 $323,300 $150 $6,500 $3,000 $332,800 $155 $0 1.10% 0.17% $1,700

June 2015 | Western Hills Water District Diablo Grande CFD No. 1 Diablo Grande in Stanislaus County, CA 35
Comparables Floorplan Summary COMMUNITY SPECIFICS AND SALES PACE FLOORPLAN SUMMARY COMPETITIVE MARKET PRICING SUMMARY
Project Name Builder Name Base Current Incentives Net Base Net Base Typical Total Monthly Payment Inputs 80.0%Location Master Plan Size Base Price/ Price Options / Closing $ / Price ($ Price/ Options / Total Price/ Monthly Base Addl 4.5%Product Details Sales Summary SF Bed Bath Level Pkg Price Sq. Ft. Reduction Upgrades Other Reduction) Sq. Ft. Upgrades Premiums Price SF HOA Tax Taxes Mo.Pmt.
Maplewood 50' William Lyon 1,820 3 2.5 2 2 $452,336 $249 $0 $0 ($5,000) $452,336 $249 $20,000 $1,000 $473,336 $260 $0 1.07% 0.00% $2,341Tracy - 2,878 4 3.0 2 2 $529,342 $184 $0 $0 ($5,000) $529,342 $184 $20,000 $1,000 $550,342 $191 $0 1.07% 0.00% $2,722Product: Single Family Total Units: 59 3,092 4 3.0 2 2 $535,083 $173 $0 $0 ($5,000) $535,083 $173 $20,000 $1,000 $556,083 $180 $0 1.07% 0.00% $2,750Configuration: 5,000 Units Sold: 26 3,324 5 3.0 2 2 $543,657 $164 $0 $0 ($5,000) $543,657 $164 $20,000 $1,000 $564,657 $170 $0 1.07% 0.00% $2,792Lot Dimensions: 50x100 3 Months Sold: 12 #N/A #### #### #### #### #N/A #N/A #N/A #N/A #N/A #N/A #N/A #N/A #N/A #N/A #N/A #N/A #N/A #N/A #N/ASales Open Date: Sep-14 Units Remaining: 33 #N/A #### #### #### #### #N/A #N/A #N/A #N/A #N/A #N/A #N/A #N/A #N/A #N/A #N/A #N/A #N/A #N/A #N/AOverall Sales Rate: 3.1 % Remaining: 56% #N/A #### #### #### #### #N/A #N/A #N/A #N/A #N/A #N/A #N/A #N/A #N/A #N/A #N/A #N/A #N/A #N/A #N/A3 Mon. Sales Rate: 4.0 - #N/A #### #### #### #### #N/A #N/A #N/A #N/A #N/A #N/A #N/A #N/A #N/A #N/A #N/A #N/A #N/A #N/A #N/A
Totals/Averages: 2,779 $515,105 $185 $0 $0 ($5,000) $515,105 $185 $20,000 $1,000 $536,105 $193 $0 1.07% 0.00% $2,651
The Falls at Yosemite Vista 52' Bright 2,173 4 3.0 1 2 $462,345 $213 $0 ($5,000) ($3,500) $462,345 $213 $15,000 $8,000 $485,345 $223 $0 1.36% 0.00% $2,517Tracy Yosemite Vista 2,356 4 3.5 2 2 $495,500 $210 $0 ($5,000) ($3,500) $495,500 $210 $15,000 $8,000 $518,500 $220 $0 1.36% 0.00% $2,689Product: Single Family Total Units: 166 2,902 4 4.0 2 2 $528,500 $182 $0 ($5,000) ($3,500) $528,500 $182 $15,000 $8,000 $551,500 $190 $0 1.36% 0.00% $2,861Configuration: 5,200 Units Sold: 136 #N/A #### #### #### #### #N/A #N/A #N/A #N/A #N/A #N/A #N/A #N/A #N/A #N/A #N/A #N/A #N/A #N/A #N/ALot Dimensions: 52x100 3 Months Sold: 7 #N/A #### #### #### #### #N/A #N/A #N/A #N/A #N/A #N/A #N/A #N/A #N/A #N/A #N/A #N/A #N/A #N/A #N/ASales Open Date: Feb-06 Units Remaining: 30 #N/A #### #### #### #### #N/A #N/A #N/A #N/A #N/A #N/A #N/A #N/A #N/A #N/A #N/A #N/A #N/A #N/A #N/AOverall Sales Rate: 1.2 % Remaining: 18% #N/A #### #### #### #### #N/A #N/A #N/A #N/A #N/A #N/A #N/A #N/A #N/A #N/A #N/A #N/A #N/A #N/A #N/A3 Mon. Sales Rate: 2.3 - #N/A #### #### #### #### #N/A #N/A #N/A #N/A #N/A #N/A #N/A #N/A #N/A #N/A #N/A #N/A #N/A #N/A #N/A
Totals/Averages: 2,477 $495,448 $200 $0 ($5,000) ($3,500) $495,448 $200 $15,000 $8,000 $518,448 $209 $0 1.36% 0.00% $2,689
Ventana 55' TriPointe 2,000 3 2.5 1 2 $437,900 $219 $0 $0 ($2,500) $437,900 $219 $20,000 $0 $457,900 $229 $0 1.10% 0.00% $2,276Tracy - 2,465 4 3.0 1 2 $495,900 $201 $0 $0 ($2,500) $495,900 $201 $20,000 $0 $515,900 $209 $0 1.10% 0.00% $2,564Product: Single Family Total Units: 59 2,641 3 3.0 2 2 $495,900 $188 $0 $0 ($2,500) $495,900 $188 $20,000 $0 $515,900 $195 $0 1.10% 0.00% $2,564Configuration: 5,500 Units Sold: 15 2,800 4 3.0 2 2 $512,900 $183 $0 $0 ($2,500) $512,900 $183 $20,000 $0 $532,900 $190 $0 1.10% 0.00% $2,649Lot Dimensions: 55x100 3 Months Sold: 12 2,892 4 3.0 2 3 $525,900 $182 $0 $0 ($2,500) $525,900 $182 $20,000 $0 $545,900 $189 $0 1.10% 0.00% $2,713Sales Open Date: Dec-14 Units Remaining: 44 3,274 4 3.5 2 2 $545,900 $167 $0 $0 ($2,500) $545,900 $167 $20,000 $0 $565,900 $173 $0 1.10% 0.00% $2,813Overall Sales Rate: 2.7 % Remaining: 75% #N/A #### #### #### #### #N/A #N/A #N/A #N/A #N/A #N/A #N/A #N/A #N/A #N/A #N/A #N/A #N/A #N/A #N/A3 Mon. Sales Rate: 4.0 - #N/A #### #### #### #### #N/A #N/A #N/A #N/A #N/A #N/A #N/A #N/A #N/A #N/A #N/A #N/A #N/A #N/A #N/A
Totals/Averages: 2,679 $502,400 $188 $0 $0 ($2,500) $502,400 $188 $20,000 $0 $522,400 $195 $0 1.10% 0.00% $2,596
Starflower 60' Standard Pacific 2,111 3 2.5 1 2 $495,000 $234 $0 ($5,000) ($5,000) $495,000 $234 $15,000 $5,000 $515,000 $244 $0 1.07% 0.04% $2,566Tracy - 2,486 4 3.0 2 2 $499,000 $201 $0 ($5,000) ($5,000) $499,000 $201 $15,000 $5,000 $519,000 $209 $0 1.07% 0.04% $2,586Product: Single Family Total Units: 69 2,612 4 3.5 2 2 $535,000 $205 $0 ($5,000) ($5,000) $535,000 $205 $15,000 $5,000 $555,000 $212 $0 1.07% 0.04% $2,764Configuration: 6,000 Units Sold: 58 #N/A #### #### #### #### #N/A #N/A #N/A #N/A #N/A #N/A #N/A #N/A #N/A #N/A #N/A #N/A #N/A #N/A #N/ALot Dimensions: 60x100 3 Months Sold: 6 #N/A #### #### #### #### #N/A #N/A #N/A #N/A #N/A #N/A #N/A #N/A #N/A #N/A #N/A #N/A #N/A #N/A #N/ASales Open Date: Jun-13 Units Remaining: 11 #N/A #### #### #### #### #N/A #N/A #N/A #N/A #N/A #N/A #N/A #N/A #N/A #N/A #N/A #N/A #N/A #N/A #N/AOverall Sales Rate: New % Remaining: 16% #N/A #### #### #### #### #N/A #N/A #N/A #N/A #N/A #N/A #N/A #N/A #N/A #N/A #N/A #N/A #N/A #N/A #N/A3 Mon. Sales Rate: NEW - #N/A #### #### #### #### #N/A #N/A #N/A #N/A #N/A #N/A #N/A #N/A #N/A #N/A #N/A #N/A #N/A #N/A #N/A
Totals/Averages: 2,403 $509,667 $212 $0 ($5,000) ($5,000) $509,667 $212 $15,000 $5,000 $529,667 $220 $0 1.07% 0.04% $2,638
Trinity Lane Duplexes Pulte 1,599 3 2.5 2 2 $384,990 $241 $0 ($5,000) ($5,000) $384,990 $241 $10,000 $5,000 $399,990 $250 $97 1.40% 0.00% $2,185Tracy - 1,909 3 2.5 2 2 $389,990 $204 $0 ($5,000) ($5,000) $389,990 $204 $10,000 $5,000 $404,990 $212 $97 1.40% 0.00% $2,211Product: Townhomes Total Units: 60 1,978 3 2.5 2 2 $389,990 $197 $0 ($5,000) ($5,000) $389,990 $197 $10,000 $5,000 $404,990 $205 $97 1.40% 0.00% $2,211Configuration: ATT Units Sold: 11 2,067 4 3.0 2 2 $399,990 $194 $0 ($5,000) ($5,000) $399,990 $194 $10,000 $5,000 $414,990 $201 $97 1.40% 0.00% $2,263
ATT 3 Months Sold: 11 #N/A #### #### #### #### #N/A #N/A #N/A #N/A #N/A #N/A #N/A #N/A #N/A #N/A #N/A #N/A #N/A #N/A #N/ASales Open Date: Mar-15 Units Remaining: 49 #N/A #### #### #### #### #N/A #N/A #N/A #N/A #N/A #N/A #N/A #N/A #N/A #N/A #N/A #N/A #N/A #N/A #N/AOverall Sales Rate: 3.6 % Remaining: 82% #N/A #### #### #### #### #N/A #N/A #N/A #N/A #N/A #N/A #N/A #N/A #N/A #N/A #N/A #N/A #N/A #N/A #N/A3 Mon. Sales Rate: 3.7 - #N/A #### #### #### #### #N/A #N/A #N/A #N/A #N/A #N/A #N/A #N/A #N/A #N/A #N/A #N/A #N/A #N/A #N/A
Totals/Averages: 1,888 $391,240 $207 $0 ($5,000) ($5,000) $391,240 $207 $10,000 $5,000 $406,240 $215 $97 1.40% 0.00% $2,218

June 2015 | Western Hills Water District Diablo Grande CFD No. 1 Diablo Grande in Stanislaus County, CA 36
Comparables Floorplan Summary COMMUNITY SPECIFICS AND SALES PACE FLOORPLAN SUMMARY COMPETITIVE MARKET PRICING SUMMARY
Project Name Builder Name Base Current Incentives Net Base Net Base Typical Total Monthly Payment Inputs 80.0%Location Master Plan Size Base Price/ Price Options / Closing $ / Price ($ Price/ Options / Total Price/ Monthly Base Addl 4.5%Product Details Sales Summary SF Bed Bath Level Pkg Price Sq. Ft. Reduction Upgrades Other Reduction) Sq. Ft. Upgrades Premiums Price SF HOA Tax Taxes Mo.Pmt.
River Walk at Mossdale Landing 50' Woodside 1,656 2 2.0 1 2 $323,990 $196 $0 $0 ($5,000) $323,990 $196 $15,000 $5,000 $343,990 $208 $0 1.80% 0.00% $1,910Lathrop Mossdale Landing 2,192 3 3.0 2 2 $355,990 $162 $0 $0 ($5,000) $355,990 $162 $15,000 $5,000 $375,990 $172 $0 1.80% 0.00% $2,088Product: Single Family Total Units: 52 2,352 3 2.5 2 2 $363,990 $155 $0 $0 ($5,000) $363,990 $155 $15,000 $5,000 $383,990 $163 $0 1.80% 0.00% $2,132Configuration: 5,000 Units Sold: 27 2,706 3 3.0 2 2 $396,990 $147 $0 $0 ($5,000) $396,990 $147 $15,000 $5,000 $416,990 $154 $0 1.80% 0.00% $2,316Lot Dimensions: 50x100 3 Months Sold: 18 #N/A #### #### #### #### #N/A #N/A #N/A #N/A #N/A #N/A #N/A #N/A #N/A #N/A #N/A #N/A #N/A #N/A #N/ASales Open Date: Jan-15 Units Remaining: 25 #N/A #### #### #### #### #N/A #N/A #N/A #N/A #N/A #N/A #N/A #N/A #N/A #N/A #N/A #N/A #N/A #N/A #N/AOverall Sales Rate: 6.4 % Remaining: 48% #N/A #### #### #### #### #N/A #N/A #N/A #N/A #N/A #N/A #N/A #N/A #N/A #N/A #N/A #N/A #N/A #N/A #N/A3 Mon. Sales Rate: 6.0 - #N/A #### #### #### #### #N/A #N/A #N/A #N/A #N/A #N/A #N/A #N/A #N/A #N/A #N/A #N/A #N/A #N/A #N/A
Totals/Averages: 2,227 $360,240 $162 $0 $0 ($5,000) $360,240 $162 $15,000 $5,000 $380,240 $171 $0 1.80% 0.00% $2,112
River Park at Mossdale Landing 60' Woodside 1,879 3 2.0 1 2 $344,990 $184 $0 $0 ($5,000) $344,990 $184 $10,000 $1,500 $356,490 $190 $0 1.80% 0.00% $1,980Lathrop Mossdale Landing 2,372 3 2.0 1 2 $375,990 $159 $0 $0 ($5,000) $375,990 $159 $10,000 $1,500 $387,490 $163 $0 1.80% 0.00% $2,152Product: Single Family Total Units: 146 2,581 3 2.5 2 2 $373,990 $145 $0 $0 ($5,000) $373,990 $145 $10,000 $1,500 $385,490 $149 $0 1.80% 0.00% $2,141Configuration: 6,000 Units Sold: 57 2,945 3 2.5 2 2 $403,990 $137 $0 $0 ($5,000) $403,990 $137 $10,000 $1,500 $415,490 $141 $0 1.80% 0.00% $2,307Lot Dimensions: 60x100 3 Months Sold: 28 3,285 4 3.5 2 2 $429,990 $131 $0 $0 ($5,000) $429,990 $131 $10,000 $1,500 $441,490 $134 $0 1.80% 0.00% $2,452Sales Open Date: Jan-14 Units Remaining: 89 #N/A #### #### #### #### #N/A #N/A #N/A #N/A #N/A #N/A #N/A #N/A #N/A #N/A #N/A #N/A #N/A #N/A #N/AOverall Sales Rate: 3.5 % Remaining: 61% #N/A #### #### #### #### #N/A #N/A #N/A #N/A #N/A #N/A #N/A #N/A #N/A #N/A #N/A #N/A #N/A #N/A #N/A3 Mon. Sales Rate: 9.3 - #N/A #### #### #### #### #N/A #N/A #N/A #N/A #N/A #N/A #N/A #N/A #N/A #N/A #N/A #N/A #N/A #N/A #N/A
Totals/Averages: 2,612 $385,790 $148 $0 $0 ($5,000) $385,790 $148 $10,000 $1,500 $397,290 $152 $0 1.80% 0.00% $2,206
Windrift at River Islands 55' Brookfield 2,100 3 2.5 1 2 $396,350 $189 $0 $0 ($5,000) $396,350 $189 $17,500 $0 $413,850 $197 $0 1.80% 0.00% $2,298Lathrop - River Islands River Islands 2,561 4 3.0 2 2 $430,310 $168 $0 $0 ($5,000) $430,310 $168 $17,500 $0 $447,810 $175 $0 1.80% 0.00% $2,487Product: Single Family Total Units: 121 2,590 5 3.0 2 3 $420,580 $162 $0 $0 ($5,000) $420,580 $162 $17,500 $0 $438,080 $169 $0 1.80% 0.00% $2,433Configuration: 5,500 Units Sold: 54 2,800 5 3.0 2 3 $432,880 $155 $0 $0 ($5,000) $432,880 $155 $17,500 $0 $450,380 $161 $0 1.80% 0.00% $2,501Lot Dimensions: 55x100 3 Months Sold: 24 #N/A #### #### #### #### #N/A #N/A #N/A #N/A #N/A #N/A #N/A #N/A #N/A #N/A #N/A #N/A #N/A #N/A #N/ASales Open Date: Aug-14 Units Remaining: 67 #N/A #### #### #### #### #N/A #N/A #N/A #N/A #N/A #N/A #N/A #N/A #N/A #N/A #N/A #N/A #N/A #N/A #N/AOverall Sales Rate: 5.4 % Remaining: 55% #N/A #### #### #### #### #N/A #N/A #N/A #N/A #N/A #N/A #N/A #N/A #N/A #N/A #N/A #N/A #N/A #N/A #N/A3 Mon. Sales Rate: 8.0 - #N/A #### #### #### #### #N/A #N/A #N/A #N/A #N/A #N/A #N/A #N/A #N/A #N/A #N/A #N/A #N/A #N/A #N/A
Totals/Averages: 2,513 $420,030 $167 $0 $0 ($5,000) $420,030 $167 $17,500 $0 $437,530 $174 $0 1.80% 0.00% $2,430
Edgewater at River Islands 60' DeNova 1,841 3 3.0 1 2 $407,900 $222 $0 $0 ($5,000) $407,900 $222 $10,000 $30,000 $447,900 $243 $0 1.80% 0.00% $2,487Lathrop - River Islands River Islands 2,032 3 2.5 2 2 $393,900 $194 $0 $0 ($5,000) $393,900 $194 $10,000 $30,000 $433,900 $214 $0 1.80% 0.00% $2,410Product: Single Family Total Units: 92 2,304 3 3.0 2 2 $410,500 $178 $0 $0 ($5,000) $410,500 $178 $10,000 $30,000 $450,500 $196 $0 1.80% 0.00% $2,502Configuration: 6,000 Units Sold: 54 2,568 4 3.0 2 2 $423,500 $165 $0 $0 ($5,000) $423,500 $165 $10,000 $30,000 $463,500 $180 $0 1.80% 0.00% $2,574Lot Dimensions: 60x100 3 Months Sold: 17 #N/A #### #### #### #### #N/A #N/A #N/A #N/A #N/A #N/A #N/A #N/A #N/A #N/A #N/A #N/A #N/A #N/A #N/ASales Open Date: May-14 Units Remaining: 38 #N/A #### #### #### #### #N/A #N/A #N/A #N/A #N/A #N/A #N/A #N/A #N/A #N/A #N/A #N/A #N/A #N/A #N/AOverall Sales Rate: 4.3 % Remaining: 41% #N/A #### #### #### #### #N/A #N/A #N/A #N/A #N/A #N/A #N/A #N/A #N/A #N/A #N/A #N/A #N/A #N/A #N/A3 Mon. Sales Rate: 5.7 - #N/A #### #### #### #### #N/A #N/A #N/A #N/A #N/A #N/A #N/A #N/A #N/A #N/A #N/A #N/A #N/A #N/A #N/A
Totals/Averages: 2,186 $408,950 $187 $0 $0 ($5,000) $408,950 $187 $10,000 $30,000 $448,950 $205 $0 1.80% 0.00% $2,493
Waterpointe at River Islands 70' Van Deale 2,859 5 4.5 2 3 $441,990 $155 $0 ($2,500) ($2,500) $441,990 $155 $35,000 $10,000 $486,990 $170 $0 1.80% 0.00% $2,704Lathrop - River Islands River Islands 3,148 4 4.5 2 3 $487,990 $155 $0 ($2,500) ($2,500) $487,990 $155 $35,000 $10,000 $532,990 $169 $0 1.80% 0.00% $2,960Product: Single Family Total Units: 68 3,601 5 4.5 2 3T $603,004 $167 $0 ($2,500) ($2,500) $603,004 $167 $35,000 $10,000 $648,004 $180 $0 1.80% 0.00% $3,599Configuration: 9,100 Units Sold: 57 #N/A #### #### #### #### #N/A #N/A #N/A #N/A #N/A #N/A #N/A #N/A #N/A #N/A #N/A #N/A #N/A #N/A #N/ALot Dimensions: 70x130 3 Months Sold: 18 #N/A #### #### #### #### #N/A #N/A #N/A #N/A #N/A #N/A #N/A #N/A #N/A #N/A #N/A #N/A #N/A #N/A #N/ASales Open Date: Jul-14 Units Remaining: 11 #N/A #### #### #### #### #N/A #N/A #N/A #N/A #N/A #N/A #N/A #N/A #N/A #N/A #N/A #N/A #N/A #N/A #N/AOverall Sales Rate: 5.4 % Remaining: 16% #N/A #### #### #### #### #N/A #N/A #N/A #N/A #N/A #N/A #N/A #N/A #N/A #N/A #N/A #N/A #N/A #N/A #N/A3 Mon. Sales Rate: 6.0 - #N/A #### #### #### #### #N/A #N/A #N/A #N/A #N/A #N/A #N/A #N/A #N/A #N/A #N/A #N/A #N/A #N/A #N/A
Totals/Averages: 3,203 $510,995 $160 $0 ($2,500) ($2,500) $510,995 $160 $35,000 $10,000 $555,995 $174 $0 1.80% 0.00% $3,088

June 2015 | Western Hills Water District Diablo Grande CFD No. 1 Diablo Grande in Stanislaus County, CA 37
Comparables Floorplan Summary COMMUNITY SPECIFICS AND SALES PACE FLOORPLAN SUMMARY COMPETITIVE MARKET PRICING SUMMARY
Project Name Builder Name Base Current Incentives Net Base Net Base Typical Total Monthly Payment Inputs 80.0%Location Master Plan Size Base Price/ Price Options / Closing $ / Price ($ Price/ Options / Total Price/ Monthly Base Addl 4.5%Product Details Sales Summary SF Bed Bath Level Pkg Price Sq. Ft. Reduction Upgrades Other Reduction) Sq. Ft. Upgrades Premiums Price SF HOA Tax Taxes Mo.Pmt.
Drake's Bend at River Islands 40' DeNova 1,886 3 2.5 2 2 $353,900 $188 $0 $0 ($5,000) $353,900 $188 $12,500 $500 $366,900 $195 $0 1.80% 0.00% $2,038Lathrop - River Islands River Islands 2,182 4 3.0 2 2 $370,900 $170 $0 $0 ($5,000) $370,900 $170 $12,500 $500 $383,900 $176 $0 1.80% 0.00% $2,132Product: Single Family Total Units: 104 2,450 4 3.0 2 2 $402,500 $164 $0 $0 ($5,000) $402,500 $164 $12,500 $500 $415,500 $170 $0 1.80% 0.00% $2,307Configuration: 4,000 Units Sold: 40 #N/A #### #### #### #### #N/A #N/A #N/A #N/A #N/A #N/A #N/A #N/A #N/A #N/A #N/A #N/A #N/A #N/A #N/ALot Dimensions: 40x100 3 Months Sold: 18 #N/A #### #### #### #### #N/A #N/A #N/A #N/A #N/A #N/A #N/A #N/A #N/A #N/A #N/A #N/A #N/A #N/A #N/ASales Open Date: Nov-14 Units Remaining: 64 #N/A #### #### #### #### #N/A #N/A #N/A #N/A #N/A #N/A #N/A #N/A #N/A #N/A #N/A #N/A #N/A #N/A #N/AOverall Sales Rate: 6.0 % Remaining: 62% #N/A #### #### #### #### #N/A #N/A #N/A #N/A #N/A #N/A #N/A #N/A #N/A #N/A #N/A #N/A #N/A #N/A #N/A3 Mon. Sales Rate: 6.0 - #N/A #### #### #### #### #N/A #N/A #N/A #N/A #N/A #N/A #N/A #N/A #N/A #N/A #N/A #N/A #N/A #N/A #N/A
Totals/Averages: 2,173 $375,767 $173 $0 $0 ($5,000) $375,767 $173 $12,500 $500 $388,767 $179 $0 1.80% 0.00% $2,159
Pomelo Grove 61' Bright 2,071 3 2.0 1 2 $375,190 $181 $0 $0 $0 $375,190 $181 $8,000 $1,500 $384,690 $186 $0 1.40% 0.00% $2,008Manteca - 2,173 3 2.5 1 2 $382,000 $176 $0 $0 $0 $382,000 $176 $8,000 $1,500 $391,500 $180 $0 1.40% 0.00% $2,044Product: Single Family Total Units: 152 2,356 4 3.5 2 2 $396,000 $168 $0 $0 $0 $396,000 $168 $8,000 $1,500 $405,500 $172 $0 1.40% 0.00% $2,117Configuration: 6,100 Units Sold: 152 2,902 4 4.0 2 2 $414,990 $143 $0 $0 $0 $414,990 $143 $8,000 $1,500 $424,490 $146 $0 1.40% 0.00% $2,216Lot Dimensions: 61x100 3 Months Sold: 7 #N/A #### #### #### #### #N/A #N/A #N/A #N/A #N/A #N/A #N/A #N/A #N/A #N/A #N/A #N/A #N/A #N/A #N/ASales Open Date: Dec-11 Units Remaining: 0 #N/A #### #### #### #### #N/A #N/A #N/A #N/A #N/A #N/A #N/A #N/A #N/A #N/A #N/A #N/A #N/A #N/A #N/AOverall Sales Rate: 3.6 % Remaining: 0% #N/A #### #### #### #### #N/A #N/A #N/A #N/A #N/A #N/A #N/A #N/A #N/A #N/A #N/A #N/A #N/A #N/A #N/A3 Mon. Sales Rate: 2.3 - #N/A #### #### #### #### #N/A #N/A #N/A #N/A #N/A #N/A #N/A #N/A #N/A #N/A #N/A #N/A #N/A #N/A #N/A
Totals/Averages: 2,376 $392,045 $165 $0 $0 $0 $392,045 $165 $8,000 $1,500 $401,545 $169 $0 1.40% 0.00% $2,096
Summit Collection 67' Atherton 1,877 2 2.0 1 2 $353,990 $189 $0 ($10,000) ($10,000) $353,990 $189 $30,000 $3,000 $386,990 $206 $0 1.40% 0.00% $2,020Manteca Union Ranch 2,128 3 2.5 1 2 $401,990 $189 $0 ($10,000) ($10,000) $401,990 $189 $30,000 $3,000 $434,990 $204 $0 1.40% 0.00% $2,271Product: Single Family Total Units: 315 2,334 4 3.0 1 2 $413,990 $177 $0 ($10,000) ($10,000) $413,990 $177 $30,000 $3,000 $446,990 $192 $0 1.40% 0.00% $2,333Configuration: 7,370 Units Sold: 307 2,477 3 3.0 1 2 $418,990 $169 $0 ($10,000) ($10,000) $418,990 $169 $30,000 $3,000 $451,990 $182 $0 1.40% 0.00% $2,359Lot Dimensions: 67x110 3 Months Sold: 16 2,835 3 3.0 1 3 $446,990 $158 $0 ($10,000) ($10,000) $446,990 $158 $30,000 $3,000 $479,990 $169 $0 1.40% 0.00% $2,506Sales Open Date: Aug-09 Units Remaining: 8 3,412 5 4.5 2 3 $461,990 $135 $0 ($10,000) ($10,000) $461,990 $135 $30,000 $3,000 $494,990 $145 $0 1.40% 0.00% $2,584Overall Sales Rate: 4.4 % Remaining: 3% 3,844 4 4.5 2 3 $492,990 $128 $0 ($10,000) ($10,000) $492,990 $128 $30,000 $3,000 $525,990 $137 $0 1.40% 0.00% $2,7463 Mon. Sales Rate: 5.3 - #N/A #### #### #### #### #N/A #N/A #N/A #N/A #N/A #N/A #N/A #N/A #N/A #N/A #N/A #N/A #N/A #N/A #N/A
Totals/Averages: 2,701 $427,276 $158 $0 ($10,000) ($10,000) $427,276 $158 $30,000 $3,000 $460,276 $170 $0 1.40% 0.00% $2,403
Orchard Park 60' Meritage 2,278 3 2.0 1 3 $383,990 $169 $0 ($19,200) ($4,000) $383,990 $169 $35,000 $2,500 $421,490 $185 $0 1.07% 0.00% $2,084Manteca - 2,401 3 2.5 2 2 $387,990 $162 $0 ($19,400) ($4,000) $387,990 $162 $35,000 $2,500 $425,490 $177 $0 1.07% 0.00% $2,104Product: Single Family Total Units: 275 2,630 4 3.0 2 3 $397,990 $151 $0 ($19,900) ($4,000) $397,990 $151 $35,000 $2,500 $435,490 $166 $0 1.07% 0.00% $2,154Configuration: 6,900 Units Sold: 146 2,660 4 3.5 1 3 $404,990 $152 $0 ($20,250) ($4,000) $404,990 $152 $35,000 $2,500 $442,490 $166 $0 1.07% 0.00% $2,188Lot Dimensions: 60x120 3 Months Sold: 25 2,927 4 3.5 2 3 $413,990 $141 $0 ($20,700) ($4,000) $413,990 $141 $35,000 $2,500 $451,490 $154 $0 1.07% 0.00% $2,233Sales Open Date: Nov-13 Units Remaining: 129 3,046 4 2.5 1 3 $431,990 $142 $0 ($21,600) ($4,000) $431,990 $142 $35,000 $2,500 $469,490 $154 $0 1.07% 0.00% $2,322Overall Sales Rate: 7.7 % Remaining: 47% 3,085 4 3.0 2 3 $423,990 $137 $0 ($21,200) ($4,000) $423,990 $137 $35,000 $2,500 $461,490 $150 $0 1.07% 0.00% $2,2823 Mon. Sales Rate: 8.3 - 3,439 4 3.0 2 3 $443,990 $129 $0 ($22,200) ($4,000) $443,990 $129 $35,000 $2,500 $481,490 $140 $0 1.07% 0.00% $2,381
3,743 4 3.0 2 3 $458,990 $123 $0 ($22,950) ($4,000) $458,990 $123 $35,000 $2,500 $496,490 $133 $0 1.07% 0.00% $2,455
Totals/Averages: 2,912 $416,434 $143 $0 ($20,822) ($4,000) $416,434 $143 $35,000 $2,500 $453,934 $156 $0 1.07% 0.00% $2,245
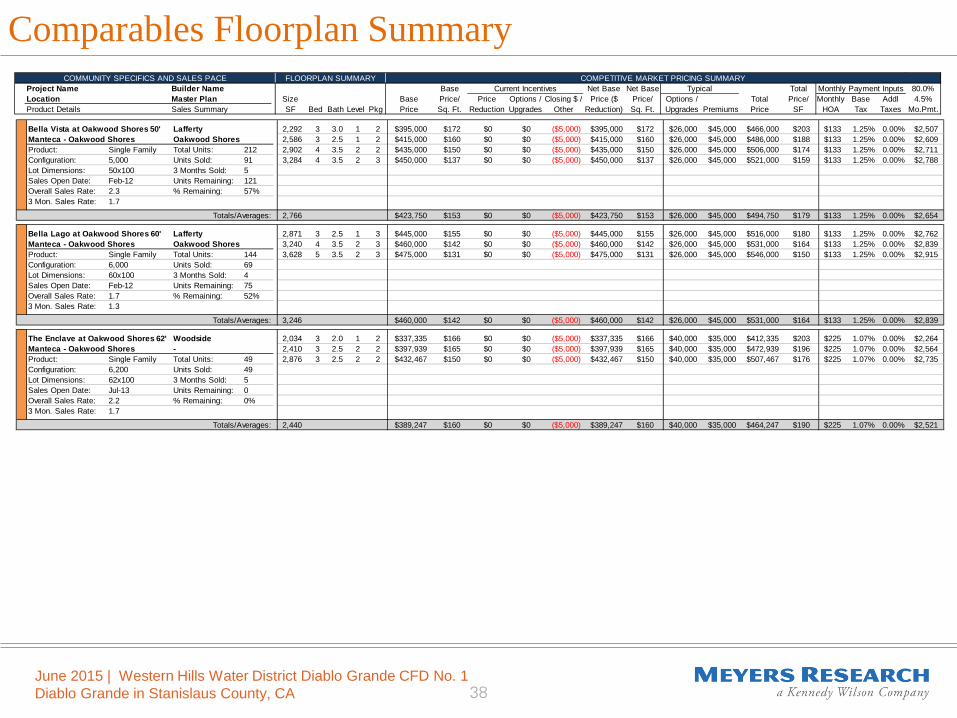
June 2015 | Western Hills Water District Diablo Grande CFD No. 1 Diablo Grande in Stanislaus County, CA 38
Comparables Floorplan Summary COMMUNITY SPECIFICS AND SALES PACE FLOORPLAN SUMMARY COMPETITIVE MARKET PRICING SUMMARY
Project Name Builder Name Base Current Incentives Net Base Net Base Typical Total Monthly Payment Inputs 80.0%Location Master Plan Size Base Price/ Price Options / Closing $ / Price ($ Price/ Options / Total Price/ Monthly Base Addl 4.5%Product Details Sales Summary SF Bed Bath Level Pkg Price Sq. Ft. Reduction Upgrades Other Reduction) Sq. Ft. Upgrades Premiums Price SF HOA Tax Taxes Mo.Pmt.
Bella Vista at Oakwood Shores 50' Lafferty 2,292 3 3.0 1 2 $395,000 $172 $0 $0 ($5,000) $395,000 $172 $26,000 $45,000 $466,000 $203 $133 1.25% 0.00% $2,507Manteca - Oakwood Shores Oakwood Shores 2,586 3 2.5 1 2 $415,000 $160 $0 $0 ($5,000) $415,000 $160 $26,000 $45,000 $486,000 $188 $133 1.25% 0.00% $2,609Product: Single Family Total Units: 212 2,902 4 3.5 2 2 $435,000 $150 $0 $0 ($5,000) $435,000 $150 $26,000 $45,000 $506,000 $174 $133 1.25% 0.00% $2,711Configuration: 5,000 Units Sold: 91 3,284 4 3.5 2 3 $450,000 $137 $0 $0 ($5,000) $450,000 $137 $26,000 $45,000 $521,000 $159 $133 1.25% 0.00% $2,788Lot Dimensions: 50x100 3 Months Sold: 5 #N/A #### #### #### #### #N/A #N/A #N/A #N/A #N/A #N/A #N/A #N/A #N/A #N/A #N/A #N/A #N/A #N/A #N/ASales Open Date: Feb-12 Units Remaining: 121 #N/A #### #### #### #### #N/A #N/A #N/A #N/A #N/A #N/A #N/A #N/A #N/A #N/A #N/A #N/A #N/A #N/A #N/AOverall Sales Rate: 2.3 % Remaining: 57% #N/A #### #### #### #### #N/A #N/A #N/A #N/A #N/A #N/A #N/A #N/A #N/A #N/A #N/A #N/A #N/A #N/A #N/A3 Mon. Sales Rate: 1.7 - #N/A #### #### #### #### #N/A #N/A #N/A #N/A #N/A #N/A #N/A #N/A #N/A #N/A #N/A #N/A #N/A #N/A #N/A
Totals/Averages: 2,766 $423,750 $153 $0 $0 ($5,000) $423,750 $153 $26,000 $45,000 $494,750 $179 $133 1.25% 0.00% $2,654
Bella Lago at Oakwood Shores 60' Lafferty 2,871 3 2.5 1 3 $445,000 $155 $0 $0 ($5,000) $445,000 $155 $26,000 $45,000 $516,000 $180 $133 1.25% 0.00% $2,762Manteca - Oakwood Shores Oakwood Shores 3,240 4 3.5 2 3 $460,000 $142 $0 $0 ($5,000) $460,000 $142 $26,000 $45,000 $531,000 $164 $133 1.25% 0.00% $2,839Product: Single Family Total Units: 144 3,628 5 3.5 2 3 $475,000 $131 $0 $0 ($5,000) $475,000 $131 $26,000 $45,000 $546,000 $150 $133 1.25% 0.00% $2,915Configuration: 6,000 Units Sold: 69 #N/A #### #### #### #### #N/A #N/A #N/A #N/A #N/A #N/A #N/A #N/A #N/A #N/A #N/A #N/A #N/A #N/A #N/ALot Dimensions: 60x100 3 Months Sold: 4 #N/A #### #### #### #### #N/A #N/A #N/A #N/A #N/A #N/A #N/A #N/A #N/A #N/A #N/A #N/A #N/A #N/A #N/ASales Open Date: Feb-12 Units Remaining: 75 #N/A #### #### #### #### #N/A #N/A #N/A #N/A #N/A #N/A #N/A #N/A #N/A #N/A #N/A #N/A #N/A #N/A #N/AOverall Sales Rate: 1.7 % Remaining: 52% #N/A #### #### #### #### #N/A #N/A #N/A #N/A #N/A #N/A #N/A #N/A #N/A #N/A #N/A #N/A #N/A #N/A #N/A3 Mon. Sales Rate: 1.3 - #N/A #### #### #### #### #N/A #N/A #N/A #N/A #N/A #N/A #N/A #N/A #N/A #N/A #N/A #N/A #N/A #N/A #N/A
Totals/Averages: 3,246 $460,000 $142 $0 $0 ($5,000) $460,000 $142 $26,000 $45,000 $531,000 $164 $133 1.25% 0.00% $2,839
The Enclave at Oakwood Shores 62' Woodside 2,034 3 2.0 1 2 $337,335 $166 $0 $0 ($5,000) $337,335 $166 $40,000 $35,000 $412,335 $203 $225 1.07% 0.00% $2,264Manteca - Oakwood Shores - 2,410 3 2.5 2 2 $397,939 $165 $0 $0 ($5,000) $397,939 $165 $40,000 $35,000 $472,939 $196 $225 1.07% 0.00% $2,564Product: Single Family Total Units: 49 2,876 3 2.5 2 2 $432,467 $150 $0 $0 ($5,000) $432,467 $150 $40,000 $35,000 $507,467 $176 $225 1.07% 0.00% $2,735Configuration: 6,200 Units Sold: 49 #N/A #### #### #### #### #N/A #N/A #N/A #N/A #N/A #N/A #N/A #N/A #N/A #N/A #N/A #N/A #N/A #N/A #N/ALot Dimensions: 62x100 3 Months Sold: 5 #N/A #### #### #### #### #N/A #N/A #N/A #N/A #N/A #N/A #N/A #N/A #N/A #N/A #N/A #N/A #N/A #N/A #N/ASales Open Date: Jul-13 Units Remaining: 0 #N/A #### #### #### #### #N/A #N/A #N/A #N/A #N/A #N/A #N/A #N/A #N/A #N/A #N/A #N/A #N/A #N/A #N/AOverall Sales Rate: 2.2 % Remaining: 0% #N/A #### #### #### #### #N/A #N/A #N/A #N/A #N/A #N/A #N/A #N/A #N/A #N/A #N/A #N/A #N/A #N/A #N/A3 Mon. Sales Rate: 1.7 - #N/A #### #### #### #### #N/A #N/A #N/A #N/A #N/A #N/A #N/A #N/A #N/A #N/A #N/A #N/A #N/A #N/A #N/A
Totals/Averages: 2,440 $389,247 $160 $0 $0 ($5,000) $389,247 $160 $40,000 $35,000 $464,247 $190 $225 1.07% 0.00% $2,521

June 2015 | Western Hills Water District Diablo Grande CFD No. 1 Diablo Grande in Stanislaus County, CA 39
Comparables Floorplan Summary COMMUNITY SPECIFICS AND SALES PACE FLOORPLAN SUMMARY COMPETITIVE MARKET PRICING SUMMARY
Project Name Builder Name Base Current Incentives Net Base Net Base Typical Total Monthly Payment Inputs 80.0%Location Master Plan Size Base Price/ Price Options / Closing $ / Price ($ Price/ Options / Total Price/ Monthly Base Addl 4.5%Product Details Sales Summary SF Bed Bath Level Pkg Price Sq. Ft. Reduction Upgrades Other Reduction) Sq. Ft. Upgrades Premiums Price SF HOA Tax Taxes Mo.Pmt.
Classics @ Woodbridge 46' Del Webb 1,329 2 2.0 1 2 $295,990 $223 $0 $0 ($3,000) $295,990 $223 $30,000 $5,000 $330,990 $249 $155 1.06% 0.00% $1,789Woodbridge Woodbridge 1,635 2 2.0 1 2 $315,900 $193 $0 $0 ($3,000) $315,900 $193 $30,000 $5,000 $350,900 $215 $155 1.06% 0.00% $1,887Product: Single Family Total Units: 428 #N/A #### #### #### #### #N/A #N/A #N/A #N/A #N/A #N/A #N/A #N/A #N/A #N/A #N/A #N/A #N/A #N/A #N/AConfiguration: 4,600 Units Sold: 289 #N/A #### #### #### #### #N/A #N/A #N/A #N/A #N/A #N/A #N/A #N/A #N/A #N/A #N/A #N/A #N/A #N/A #N/ALot Dimensions: 46x100 3 Months Sold: 12 #N/A #### #### #### #### #N/A #N/A #N/A #N/A #N/A #N/A #N/A #N/A #N/A #N/A #N/A #N/A #N/A #N/A #N/ASales Open Date: Aug-06 Units Remaining: 139 #N/A #### #### #### #### #N/A #N/A #N/A #N/A #N/A #N/A #N/A #N/A #N/A #N/A #N/A #N/A #N/A #N/A #N/AOverall Sales Rate: 2.7 % Remaining: 32% #N/A #### #### #### #### #N/A #N/A #N/A #N/A #N/A #N/A #N/A #N/A #N/A #N/A #N/A #N/A #N/A #N/A #N/A3 Mon. Sales Rate: 4.0 - #N/A #### #### #### #### #N/A #N/A #N/A #N/A #N/A #N/A #N/A #N/A #N/A #N/A #N/A #N/A #N/A #N/A #N/A
Totals/Averages: 1,482 $305,945 $206 $0 $0 ($3,000) $305,945 $206 $30,000 $5,000 $340,945 $230 $155 1.06% 0.00% $1,838
Premiere @ Woodbridge 55' Del Webb 1,841 2 2.0 1 2 $345,990 $188 $0 $0 ($4,000) $345,990 $188 $35,000 $10,000 $390,990 $212 $155 1.06% 0.00% $2,085Woodbridge Woodbridge 1,912 3 2.0 1 2 $351,990 $184 $0 $0 ($4,000) $351,990 $184 $35,000 $10,000 $396,990 $208 $155 1.06% 0.00% $2,115Product: Single Family Total Units: 570 #N/A #### #### #### #### #N/A #N/A #N/A #N/A #N/A #N/A #N/A #N/A #N/A #N/A #N/A #N/A #N/A #N/A #N/AConfiguration: 5,500 Units Sold: 363 #N/A #### #### #### #### #N/A #N/A #N/A #N/A #N/A #N/A #N/A #N/A #N/A #N/A #N/A #N/A #N/A #N/A #N/ALot Dimensions: 55x100 3 Months Sold: 12 #N/A #### #### #### #### #N/A #N/A #N/A #N/A #N/A #N/A #N/A #N/A #N/A #N/A #N/A #N/A #N/A #N/A #N/ASales Open Date: Aug-06 Units Remaining: 207 #N/A #### #### #### #### #N/A #N/A #N/A #N/A #N/A #N/A #N/A #N/A #N/A #N/A #N/A #N/A #N/A #N/A #N/AOverall Sales Rate: 3.5 % Remaining: 36% #N/A #### #### #### #### #N/A #N/A #N/A #N/A #N/A #N/A #N/A #N/A #N/A #N/A #N/A #N/A #N/A #N/A #N/A3 Mon. Sales Rate: 4.0 - #N/A #### #### #### #### #N/A #N/A #N/A #N/A #N/A #N/A #N/A #N/A #N/A #N/A #N/A #N/A #N/A #N/A #N/A
Totals/Averages: 1,877 $348,990 $186 $0 $0 ($4,000) $348,990 $186 $35,000 $10,000 $393,990 $210 $155 1.06% 0.00% $2,100
Estates @ Woodbridge 75' Del Webb 2,019 3 2.0 1 2 $372,990 $185 $0 $0 ($5,000) $372,990 $185 $40,000 $15,000 $427,990 $212 $155 1.06% 0.00% $2,268Woodbridge Woodbridge 2,379 2 2.0 1 2 $392,990 $165 $0 $0 ($5,000) $392,990 $165 $40,000 $15,000 $447,990 $188 $155 1.06% 0.00% $2,367Product: Single Family Total Units: 428 2,618 2 2.5 1 3 $405,990 $155 $0 $0 ($5,000) $405,990 $155 $40,000 $15,000 $460,990 $176 $155 1.06% 0.00% $2,431Configuration: 7,500 Units Sold: 288 #N/A #### #### #### #### #N/A #N/A #N/A #N/A #N/A #N/A #N/A #N/A #N/A #N/A #N/A #N/A #N/A #N/A #N/ALot Dimensions: 75x100 3 Months Sold: 12 #N/A #### #### #### #### #N/A #N/A #N/A #N/A #N/A #N/A #N/A #N/A #N/A #N/A #N/A #N/A #N/A #N/A #N/ASales Open Date: Aug-06 Units Remaining: 140 #N/A #### #### #### #### #N/A #N/A #N/A #N/A #N/A #N/A #N/A #N/A #N/A #N/A #N/A #N/A #N/A #N/A #N/AOverall Sales Rate: 2.7 % Remaining: 33% #N/A #### #### #### #### #N/A #N/A #N/A #N/A #N/A #N/A #N/A #N/A #N/A #N/A #N/A #N/A #N/A #N/A #N/A3 Mon. Sales Rate: 4.0 - #N/A #### #### #### #### #N/A #N/A #N/A #N/A #N/A #N/A #N/A #N/A #N/A #N/A #N/A #N/A #N/A #N/A #N/A
Totals/Averages: 2,339 $390,657 $167 $0 $0 ($5,000) $390,657 $167 $40,000 $15,000 $445,657 $191 $155 1.06% 0.00% $2,355
June 2015 | Western Hills Water District Diablo Grande CFD No. 1 Diablo Grande in Stanislaus County, CA 40
Demand Model Analysis “Western Hills Water District Diablo Grande CFD No. 1 ” in Patterson, California Master Plan Community Assessment and Future Product Planning

June 2015 | Western Hills Water District Diablo Grande CFD No. 1 Diablo Grande in Stanislaus County, CA 41
Based on the Meyers Research demand model we anticipate steady annual increases in new home sales over the next five years approaching demand for 260+ new homes in 2015 and reaching 500+/- new home sales annually from 2017 to 2019.
Modesto MSA New Home Demand Model (2015 to 2019)
Based on MSA incomes and housing affordability, there will be demand for a wide range of new home product perfect for an amenitized master planned community with various parcels sizes, price points and product types. Today the $200,000 to $300,000 price band would capture the greatest market share but this shifts upward over the next five years.
The MSA/County is on pace for 450 to 500 new building permits this year suggesting the 2014
demand estimates are reasonable.
0100200300400500600700800
2015 2016 2017 2018 2019
319
461 557
629 727
Hypothetical New Home Demand by Year
020406080
100120140160180200
2015 2016 2017 2018 2019
Hypothetical New Home Demand by Price Point $125k to $175k $175k to $275k $275k to $400k $400k to $600k $600k to $800k $800k+

June 2015 | Western Hills Water District Diablo Grande CFD No. 1 Diablo Grande in Stanislaus County, CA 42
With more than 1,600 units planned, Diablo Grande will need to attract move-up buyers, families of all kinds, retirees and move down buyers. All of these life stages / age segments will hold a notable amount of new home demand in greater Modesto throughout the Subject’s buildout.
Modesto MSA New Home Demand Model by Age and Life Stage
020406080
100120140160180
2015 2016 2017 2018 2019
Hypothetical New Home Demand by Year and Age Under 25 25 to 34 35 to 44 45 to 54 55 to 64 65 to 74 75 & Older
0
20
40
60
80
100
120
140
160
2015 2016 2017 2018 2019
Hypothetical New Home Demand by Year and LifeStage Young Families Growing Families Mature Families Couples <45 Singles Empty Nester Retirees

June 2015 | Western Hills Water District Diablo Grande CFD No. 1 Diablo Grande in Stanislaus County, CA 43
Modesto MSA New Home Demand Model (2015 to 2019) Annual Household Income Range
Income RangeHouseholds
% of Total Households
Home PricePurchase Range*
% of AnnualDemand
Under 25 25 to 34 35 to 44 45 to 54 55 to 64 65 to 74 75 & Older Young Families
Growing Families
Mature Families
Couples <45
Singles Empty Nester
Retirees
Income $35,000 - $49,999 25,883 15.0% $125,000 to $175,000 58 18.3% 3 11 11 11 10 8 6 9 7 6 6 8 9 14Income $50,000 - $74,999 31,453 18.2% $175,000 to $275,000 76 23.7% 2 14 14 17 14 10 4 11 10 9 8 11 13 14Income $75,000 - $99,999 21,652 12.5% $275,000 to $400,000 65 20.5% 1 12 14 16 13 6 3 10 10 8 7 9 12 9Income $100,000 - $149,999 21,896 12.7% $400,000 to $600,000 76 24.0% 1 12 18 20 16 6 2 11 12 10 8 11 16 9Income $150,000 - $199,999 7,169 4.2% $600,000 to $800,000 26 8.0% 0 3 5 8 6 2 1 3 4 4 2 3 6 3Income $200,000 + 4,860 2.8% $800,000 + 17 5.4% 0 2 4 5 4 2 1 2 3 2 1 2 4 3Total Demand ($35K+) 112,912 65.4% $125,000 + - 319 100.0% 8 54 66 76 63 35 17 46 46 39 32 45 60 52
Demand by Age and Income (Absolute Numbers) Demand by LifeStage (Absolute Numbers)Annual Household Income Range
Income RangeHouseholds
% of Total Households
Home PricePurchase Range*
% of AnnualDemand
Under 25 25 to 34 35 to 44 45 to 54 55 to 64 65 to 74 75 & Older Young Families
Growing Families
Mature Families
Couples <45
Singles Empty Nester
Retirees
Income $35,000 - $49,999 26,173 14.8% $125,000 to $175,000 82 17.7% 3 16 15 14 13 11 8 12 9 8 9 11 12 20Income $50,000 - $74,999 32,117 18.2% $175,000 to $275,000 107 23.2% 3 21 20 23 20 15 6 16 14 12 11 15 19 21Income $75,000 - $99,999 23,193 13.1% $275,000 to $400,000 97 21.1% 2 18 20 23 19 10 5 15 14 12 10 14 18 15Income $100,000 - $149,999 22,906 13.0% $400,000 to $600,000 111 24.0% 2 18 27 27 24 10 4 17 17 14 11 16 22 13Income $150,000 - $199,999 7,814 4.4% $600,000 to $800,000 39 8.4% 0 5 8 12 9 4 1 5 6 6 3 5 9 5Income $200,000 + 5,156 2.9% $800,000 + 26 5.5% 0 2 6 6 7 3 1 3 4 4 2 3 6 4Total Demand ($35K+) 117,359 66.5% $125,000 + - 461 100.0% 11 80 95 106 91 53 25 67 65 55 47 64 86 78
Demand by Age and Income (Absolute Numbers) Demand by LifeStage (Absolute Numbers)Annual Household Income Range
Income RangeHouseholds
% of Total Households
Home PricePurchase Range*
% of AnnualDemand
Under 25 25 to 34 35 to 44 45 to 54 55 to 64 65 to 74 75 & Older Young Families
Growing Families
Mature Families
Couples <45
Singles Empty Nester
Retirees
Income $35,000 - $49,999 26,379 14.6% $125,000 to $175,000 96 17.1% 4 19 17 16 16 14 10 14 11 9 11 13 14 24Income $50,000 - $74,999 32,691 18.2% $175,000 to $275,000 127 22.8% 4 25 24 25 23 18 7 19 16 13 14 18 22 25Income $75,000 - $99,999 24,716 13.7% $275,000 to $400,000 120 21.6% 2 23 25 28 23 13 6 18 17 14 13 17 22 19Income $100,000 - $149,999 23,875 13.3% $400,000 to $600,000 134 24.1% 2 22 33 32 28 12 5 21 21 17 14 19 27 17Income $150,000 - $199,999 8,458 4.7% $600,000 to $800,000 49 8.7% 0 6 10 15 11 5 2 6 8 7 4 6 11 7Income $200,000 + 5,446 3.0% $800,000 + 31 5.6% 0 3 7 8 8 4 1 4 5 4 2 4 7 6Total Demand ($35K+) 121,565 67.5% $125,000 + - 557 100.0% 13 98 116 123 110 66 31 82 77 64 57 77 102 97
Demand by Age and Income (Absolute Numbers) Demand by LifeStage (Absolute Numbers)Annual Household Income Range
Income RangeHouseholds
% of Total Households
Home PricePurchase Range*
% of AnnualDemand
Under 25 25 to 34 35 to 44 45 to 54 55 to 64 65 to 74 75 & Older Young Families
Growing Families
Mature Families
Couples <45
Singles Empty Nester
Retirees
Income $35,000 - $49,999 26,421 14.5% $125,000 to $175,000 105 16.6% 4 21 19 16 17 15 12 16 12 9 12 15 15 27Income $50,000 - $74,999 33,074 18.1% $175,000 to $275,000 140 22.3% 4 28 26 27 26 20 8 21 17 15 15 20 23 29Income $75,000 - $99,999 26,131 14.3% $275,000 to $400,000 139 22.1% 3 27 29 31 27 16 7 21 19 16 15 20 25 23Income $100,000 - $149,999 24,724 13.5% $400,000 to $600,000 152 24.2% 2 26 37 35 32 14 6 24 23 19 16 22 30 20Income $150,000 - $199,999 9,070 5.0% $600,000 to $800,000 57 9.1% 1 7 12 17 13 6 2 7 9 8 5 7 12 8Income $200,000 + 5,711 3.1% $800,000 + 36 5.7% 0 4 8 8 9 5 1 4 5 5 3 4 8 7Total Demand ($35K+) 125,131 68.5% $125,000 + - 629 100.0% 14 113 132 134 124 77 37 93 85 71 65 87 114 114
Demand by Age and Income (Absolute Numbers) Demand by LifeStage (Absolute Numbers)Annual Household Income Range
Income RangeHouseholds
% of Total Households
Home PricePurchase Range*
% of AnnualDemand
Under 25 25 to 34 35 to 44 45 to 54 55 to 64 65 to 74 75 & Older Young Families
Growing Families
Mature Families
Couples <45
Singles Empty Nester
Retirees
Income $35,000 - $49,999 26,414 14.3% $125,000 to $175,000 117 16.1% 5 24 21 17 19 18 13 18 13 10 13 16 17 31Income $50,000 - $74,999 33,402 18.1% $175,000 to $275,000 159 21.8% 5 32 30 29 29 24 10 24 19 16 17 22 26 34Income $75,000 - $99,999 27,533 14.9% $275,000 to $400,000 164 22.6% 3 33 34 35 32 19 9 25 22 18 18 23 29 28Income $100,000 - $149,999 25,546 13.8% $400,000 to $600,000 176 24.2% 2 30 44 39 37 17 7 28 26 21 19 25 34 24Income $150,000 - $199,999 9,681 5.2% $600,000 to $800,000 68 9.4% 1 9 14 19 15 7 3 9 11 10 6 9 15 10Income $200,000 + 5,972 3.2% $800,000 + 42 5.8% 0 4 10 9 11 6 2 5 6 5 3 5 9 8Total Demand ($35K+) 128,547 69.6% $125,000 + - 727 100.0% 16 132 153 149 143 92 44 109 97 80 76 101 130 136
*Home Price Purchase Range Assumptions:1) 10% down payment for incomes up to $100,000; 20% down payment for all incomes over $100,0002) 4.25% mortgage rate and a 30-year note.3) Monthly housing payment (principal interest, taxes 1.25%, & HOA $50/month) set at 24.3% (per 2013 American Community Survey)4) Low-end of price range matches low-end of income range and vice versa
Demand by LifeStage (Absolute Numbers)
2016 Demand by Home Price Range2016 Demand
2015 Demand by Home Price Range2015 Demand
Demand by Age and Income (Absolute Numbers)
2017 Demand by Home Price Range2017 Demand
2018 Demand by Home Price Range2018 Demand
2019 Demand by Home Price Range2019 Demand

June 2015 | Western Hills Water District Diablo Grande CFD No. 1 Diablo Grande in Stanislaus County, CA 44
Location Analysis “Western Hills Water District Diablo Grande CFD No. 1 ” in Patterson, California Master Plan Community Assessment and Future Product Planning

June 2015 | Western Hills Water District Diablo Grande CFD No. 1 Diablo Grande in Stanislaus County, CA 45
Location Analysis - Introduction This section highlights the locational opportunities associated with Diablo Grande. This section provides details regarding the project’s proximity to employment, retail and health care as well as perspective on local area schools. Diablo Grande sets a new standard for housing development in greater Modesto, as there is no similar community in the region. Consider the following:
• The location and setting of Diablo Grande is very attractive. The valley surrounding the community is populated with creeks, canyons,
native wildlife, oak trees, wine vineyards and golden hillsides.
• Recreation options are abundant within Diablo Grande and the surrounding area. In addition to the Ranch Course golf course, the community offers a number of outdoor activities including hiking, biking, tennis and horseback riding. Community amenities include a clubhouse with a bar/ grill, pool and outdoor lounge area which further enhance the community. It is our understanding that the clubhouse is to undergo a renovation prior to the launch of the District’s lot offerings.
• Current location challenges include a lack of retail options within Diablo Grande, limited retail in Patterson, and distant health care facilities in Modesto.
• Proximity to employment is limited, and the community is at a disadvantage to master plans such as Mountain House, which commands
relatively high price points (over $400,000) and is able to draw from a vast buyer pool of commuters from the Bay Area. Diablo Grande will need to draw from a more local buyer segment, as a daily commute to the Bay Area is not realistic for most residents. This challenge can be mitigated by stressing the value associated with Diablo Grande, in terms offering excellent amenities and golf course living at a fraction of the price of a similar community, were it to exist in the Bay Area.

June 2015 | Western Hills Water District Diablo Grande CFD No. 1 Diablo Grande in Stanislaus County, CA 46
Subject Site Summary Attribute Opportunities Challenges Meyers
Conclusion
Location Diablo Grande offers an attractive residential location offering elevation, topography, and nearby mountain views . The valley setting is populated with creeks, canyons, native wildlife, oak trees, wine vineyards and golden hillsides.
The site is over 30 minutes drive to employment centers in central Modesto, 60 minutes to Livermore/ Dublin, and is 90 minutes to the Bay Area. Retail/commercial uses are still quite limited in this area.
Good
Site Access The subject is accessible from Interstate 5 via the Sperry Avenue exit. It is then a 7-mile drive west along Diablo Grande parkway to the site.
While access to the I-5 freeway is relatively easy, the seven+ mile distance is relatively far. There is no access to Diablo Grande from the west, and no direct connection to the San Jose MSA aside from slow, winding mountain roads.
Fair/ Good
Employment
Diablo Grande is located proximate to various agriculture processing plants in greater Modesto, including Gallo Winery, Seneca Foods and Del Monte Foods. Patterson continues to grow with the recent opening of Grainger’s 820,000 sq. ft. distribution center, Amazon’s 1,000,000+ sq. ft. fulfillment center, and an additional 1,500,000 sq. ft. is also underway for a Restoration Hardware distribution center. CVS operates an 807,000 sq. ft. distribution center and Kohl's has a 400,700 sq. ft. facility as well. The state Enterprise Zone is expected to continue to draw more companies and increase the local employment base. Additionally, new developments such as the West Ridge Business Park offer build to suit opportunities for Distribution/ Warehouse space of over 1 million square feet.
There are no employment concentrations within the immediate area of Diablo Grande. The nearest employment concentrations are at least ten miles from the site. This represents a disadvantage to master plans such as Mountain House, which is within a more reasonable commute to employment nodes in the East Bay and San Jose.
Fair/ Good
Schools Diablo Grande residents attend Newman-Crows Landing Unified Schools. Despite the relatively low ranking of the Newman-Crows Landing Unified District, the elementary school that serves Diablo Grange—Bonita Elementary—scores relatively high.
Newman-Crows Landing Unified ranks relatively low as compared to other school districts in Stanislaus County. Lammersville Joint Unified School district serves Mountain House residents and is ranked relatively high. Households that value school districts may favor a Mountain House home purchase over Diablo Grande, while families with elementary school age children may choose Diablo Grande based on the reputation of the assigned elementary school.
Elementary: Very Good
Middle/ High:
Below Average
Retail and Recreation
Recreation uses are abundant within Diablo Grande, including hiking, biking, tennis, and horseback riding in addition to the acclaimed golf course. Retail services including grocer, general merchandise and restaurants are concentrated in Patterson.
The Diablo Grande community lacks a community fitness center, a feature that exists in other comparable master planned communities (such as Woodbridge) and other golf/ country club communities in greater Modesto. Retail and commercial uses are limited in the immediate area. There are no retail services within Diablo Grande, and it is a ten mile drive to any services.
Recreation: Excellent
Retail:
Average
Health Care The closest hospitals to Diablo Grande are in Modesto, including Memorial Medical Center and Kindred Hospital, and Tracy Hospital in Tracy.
The Modesto and Tracy hospitals are over 30 minutes away. It is possible that a medical facility could emerge in the long term in the local area/ Patterson, but there are no immediate plans for such a facility.
Below Average

June 2015 | Western Hills Water District Diablo Grande CFD No. 1 Diablo Grande in Stanislaus County, CA 47
Subject Property Location
Source: Bing Maps
Diablo Grande is located in the western portion of Stanislaus County, 9 miles west of Patterson and Interstate 5. The community is proximate to Modesto to the east, Stockton to the north, and San Jose/ greater Bay Area to the west.
Diablo Grande
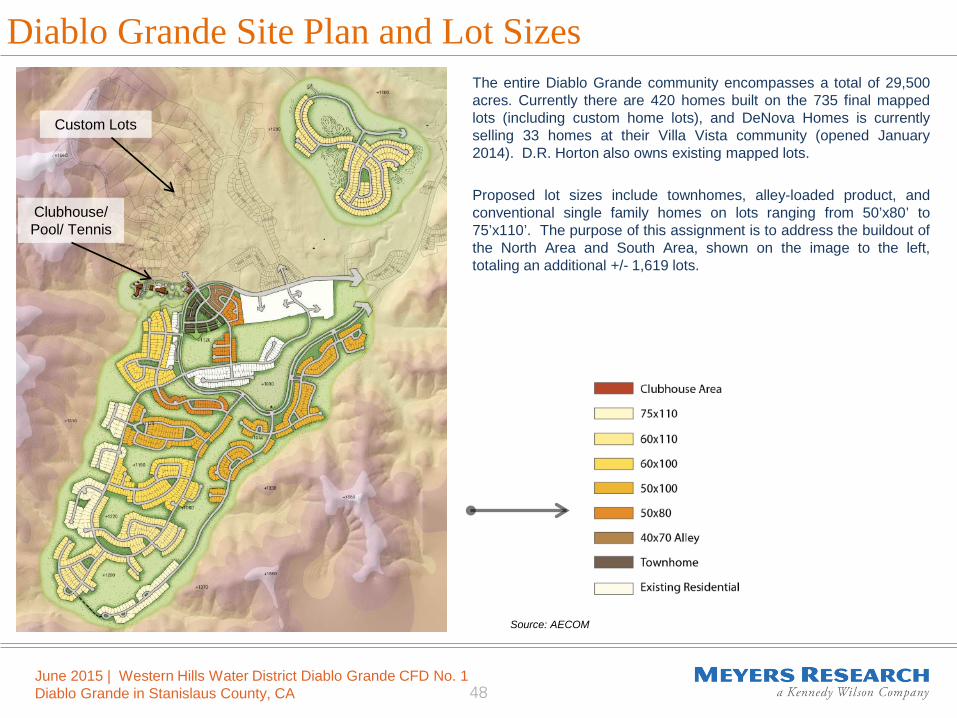
June 2015 | Western Hills Water District Diablo Grande CFD No. 1 Diablo Grande in Stanislaus County, CA 48
Diablo Grande Site Plan and Lot Sizes
Source: AECOM
The entire Diablo Grande community encompasses a total of 29,500 acres. Currently there are 420 homes built on the 735 final mapped lots (including custom home lots), and DeNova Homes is currently selling 33 homes at their Villa Vista community (opened January 2014). D.R. Horton also owns existing mapped lots. Proposed lot sizes include townhomes, alley-loaded product, and conventional single family homes on lots ranging from 50’x80’ to 75’x110’. The purpose of this assignment is to address the buildout of the North Area and South Area, shown on the image to the left, totaling an additional +/- 1,619 lots.
Custom Lots
Clubhouse/ Pool/ Tennis
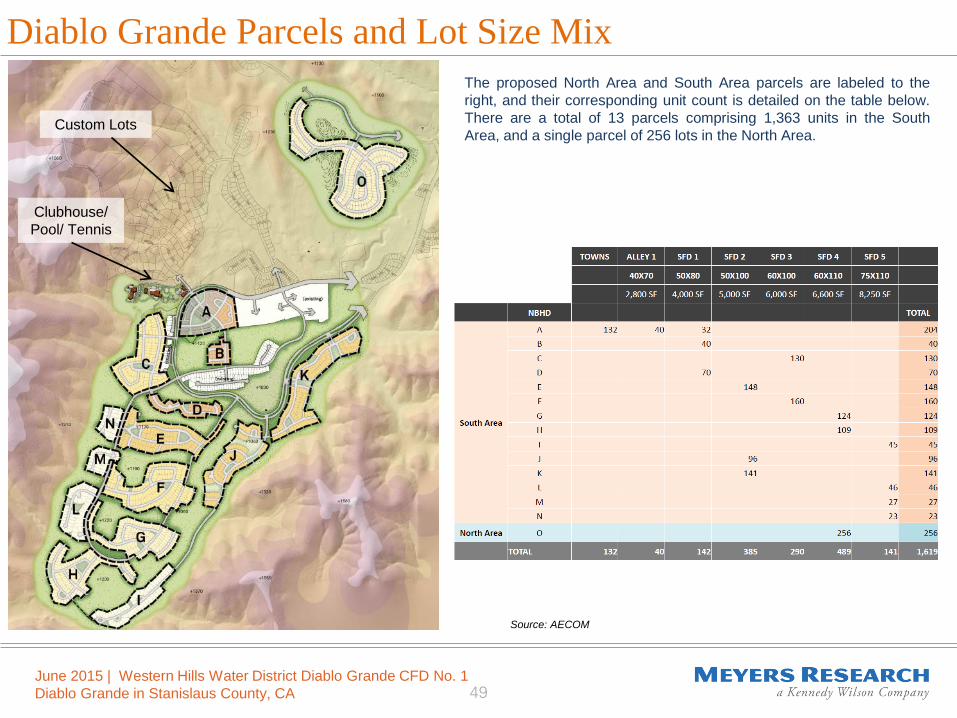
June 2015 | Western Hills Water District Diablo Grande CFD No. 1 Diablo Grande in Stanislaus County, CA 49
Diablo Grande Parcels and Lot Size Mix
Source: AECOM
The proposed North Area and South Area parcels are labeled to the right, and their corresponding unit count is detailed on the table below. There are a total of 13 parcels comprising 1,363 units in the South Area, and a single parcel of 256 lots in the North Area.
Custom Lots
Clubhouse/ Pool/ Tennis

June 2015 | Western Hills Water District Diablo Grande CFD No. 1 Diablo Grande in Stanislaus County, CA 50
Diablo Grande is within a 15-minute drive to Interstate 5 and retail services in Patterson. Downtown Modesto and Tracy/ Manteca represent a 30 to 45 minute drive; San Jose and the East Bay are within a 60 to 90 minute drive from Diablo Grande.
Drive-Time Map (w/ Employment by Zip Code Overlay)
Source: US Census Bureau; MapPoint
30-min
60-min
EMPLOYEES BY ZIP CODE
90-min
45-min

June 2015 | Western Hills Water District Diablo Grande CFD No. 1 Diablo Grande in Stanislaus County, CA 51
Local Area Top Employers Include Agriculture, Distribution
Sources: MapPoint; City of Patterson
Major employers in Stanislaus County include food processing facilities associated with the agricultural industry in the Central Valley. Patterson benefits from a new Amazon.com distribution facility (1,000+ employees) as well as a new Grainger facility (150+ employees) located in Patterson. CVS operates an 807,000 square foot distribution center and Kohl's has a 400,700 sq. ft. facility as well. Finally, Restoration Hardware is scheduled to open its 1,500,000 million sq. ft. distribution center in the coming months. The state Enterprise Zone is expected to continue to draw more companies and increase the local employment base. Additionally, new developments such as the West Ridge Business Park offer build to suit opportunities for Distribution/ Warehouse space of over 1 million square feet.

June 2015 | Western Hills Water District Diablo Grande CFD No. 1 Diablo Grande in Stanislaus County, CA 52
Diablo Grande does not offer any retail services within the community, aside from a bar and restaurant within the existing clubhouse. Diablo Grande currently must drive 10 miles to Patterson for such services. Patterson offers a 158,000 square foot Wal-Mart for general merchandise and grocery uses, a 50,000 square foot Save Mart supermarket, True Value hardware, CVS drugstore, and various fast food/ restaurant establishments.
Local Commercial Services Include Grocery and General Merchandise
Source: Bing Maps and Google Earth Pro
Patterson Marketplace
Patterson Plaza
Diablo Grande 10+/- Miles from Retail
True Value Center
Villa Del Lago
PATTERSON MARKETPLACESave MartMcDonalds
Radio ShackDollar Tree
Sherwin WilliamsSubway
SupercutsMountain Mike's Pizza
Baskin RobbinsInline and Pad Retail
TRUE VALUE SHOPPING CENTERTrue Value Hardware
Century 21Valley Smile DentalChinese RestaurantMexican Restaurant
Furniture StoreChillaberries
Papa Murphy's PizzaInline and Pad Retail
PATTERSON PLAZAWal Mart
CVSFast FoodPad Retail
VILLA DEL LAGOBest Western
Denny'sArco
Jack In The BoxKFC
El Rosal RestaurantStarbucks
Lamppost PizzaInline and Pad Retail

June 2015 | Western Hills Water District Diablo Grande CFD No. 1 Diablo Grande in Stanislaus County, CA 53
Despite its proximity to the city of Patterson, Diablo Grande residents attend Newman-Crows Landing Unified Schools. This school district is one of the more underperforming districts in the County and API scores went down in 2013. However, it should be noted that the elementary school assigned to Diablo Grande has very high scores (see following page).
School Performance – 2013 API Scores
Source: California Department of Education
COUNTY DISTRICT 2013 2012 Growth 2013 RankPARADISE ELEMENTARY 882 855 27 1KNIGHTS FERRY ELEMENTARY 878 854 24 2GRATTON ELEMENTARY 866 897 -31 3HICKMAN COMMUNITY CHARTER 859 853 6 4VALLEY HOME JOINT ELEMENTARY 858 850 8 5SYLVAN UNION ELEMENTARY 831 837 -6 6HART-RANSOM UNION ELEMENTARY 816 828 -12 7STANISLAUS UNION ELEMENTARY 815 804 11 8OAKDALE JOINT UNIFIED 807 806 1 9SHILOH ELEMENTARY 805 833 -28 10HUGHSON UNIFIED 803 802 1 11EMPIRE UNION ELEMENTARY 798 803 -5 12SALIDA UNION ELEMENTARY 793 799 -6 13KEYES UNION 789 781 8 14ROBERTS FERRY UNION ELEMENTARY 782 822 -40 15CERES UNIFIED 781 782 -1 16TURLOCK UNIFIED 779 782 -3 17WATERFORD UNIFIED 776 776 0 18CHATOM UNION 770 766 4 19MODESTO CITY HIGH 756 755 1 20MODESTO CITY ELEMENTARY 744 752 -8 21PATTERSON JOINT UNIFIED 734 747 -13 22RIVERBANK UNIFIED 726 743 -17 23NEWMAN-CROWS LANDING UNIFIED 722 746 -24 24STANISLAUS COUNTY OFFICE OF ED 481 445 36 25
STANISALUS COUNTY SCHOOL DISTRICTS

June 2015 | Western Hills Water District Diablo Grande CFD No. 1 Diablo Grande in Stanislaus County, CA 54
Bonita Elementary School is the assigned elementary school to Diablo Grande, and scores very favorably in terms of API score, ranking third out of 89 elementary schools in Stanislaus County. The greatschools.org rating is also very good (8 out of 10 score), and the average of all subject test scores (77 out of 100) is ranked fifth highest among all schools.
Assigned Elementary School Among Top Schools in the County
Elementary School Name DistrictGreat Schools
Rating API ScoreAverage
Score Elementary School Name DistrictGreat Schools
RatingAPI
ScoreAverage
ScoreLakew ood Elementary School Modesto City Elementary 10 930 84Aspire University Charter School Sylvan Union Elementary 9 915 78 Dennis G. Earl Elementary School Turlock Unif ied 5 802 59Bonita Elementary School Newman-Crows Landing Unified 8 903 77 Hart-Ransom Academic Charter School Hart-Ransom Union Elementary 5 799 52Paradise Charter School Paradise Elementary 8 901 76 Osborn Tw o-Way Immersion Academy Turlock Unif ied 5 798 59Walnut Elementary Education Center Turlock Unif ied 8 882 72 Shiloh Charter School Shiloh Elementary 4 796 42Knights Ferry Elementary School Knights Ferry Elementary 9 878 83 Hughson Elementary School Hughson Unif ied School District 5 794 50Whitmore Charter School Of Art & TechnoCeres Unif ied School District 7 867 69 Keyes Elementary School Keyes Union 5 785 56Sierra View Elementary School Oakdale Joint Unif ied 8 866 77 Don Pedro Elementary School Ceres Unif ied School District 5 783 54Aspire Summit Charter Academy Ceres Unif ied School District 7 859 69 Elihu Beard Elementary School Modesto City Elementary 5 783 57Mary Ann Sanders Elementary School Sylvan Union Elementary 7 858 71 John Fremont Elementary School Modesto City Elementary 5 783 52Valley Home Elementary School Valley Home Joint Elementary 6 858 72 Denair Elementary School Denair Unif ied 4 782 57Sonoma Elementary School Modesto City Elementary 7 857 70 Woodrow Elementary School Sylvan Union Elementary 5 782 59Westport Elementary School Ceres Unif ied School District 7 857 69 Northmead Elementary School Patterson Joint Unif ied 4 779 53Enslen Elementary School Modesto City Elementary 7 852 63 Casw ell Elementary School Ceres Unif ied School District 4 776 48Hickman Elementary School Hickman Community Charter 7 851 70 Walter White Elementary School Ceres Unif ied School District 4 776 58Hickman Charter School Hickman Community Charter 7 846 66 Connecting Waters Charter School Waterford Unif ied School District 5 775 55Mary Lou Dieterich Elementary School Stanislaus Union Elementary 7 843 71 Dena Boer School Salida Union Elementary 4 775 55Standiford Elementary School Sylvan Union Elementary 7 843 72 George Eisenhut Elementary School Stanislaus Union Elementary 3 771 46Agnes M. Baptist Elementary School Stanislaus Union Elementary 7 841 66 Las Palmas Elementary School Patterson Joint Unif ied 4 771 49Coleman F. Brow n Elementary School Sylvan Union Elementary 6 841 68 Great Valley Academy Stanislaus County Office Of Education 5 770 55Fair Oaks Elementary School Oakdale Joint Unif ied 6 840 67 Walter M. Brow n Elementary School Turlock Unif ied 4 768 48Orchard Elementary School Sylvan Union Elementary 7 839 66 Grayson Charter School Patterson Joint Unif ied 3 765 48Sinclear Elementary School Ceres Unif ied School District 6 839 66 Richard M. Moon Primary School Waterford Unif ied School District 4 764 42Alice N. Stroud Elementary School Empire Union Elementary 7 838 67 Catherine Everett Elementary School Modesto City Elementary 3 759 41Magnolia Elementary School Oakdale Joint Unif ied 6 837 64 Capistrano Elementary School Empire Union Elementary 3 758 51Cloverland Elementary School Oakdale Joint Unif ied 6 836 65 Chatom Elementary School Chatom Union 3 756 45Apricot Valley Elementary School Patterson Joint Unif ied 6 834 64 Josephine Chrysler Elementary School Stanislaus Union Elementary 2 753 41Stanislaus Elementary School Stanislaus Union Elementary 6 834 63 Fairview Elementary School Modesto City Elementary 3 750 43Bernard L. Hughes Elementary School Empire Union Elementary 6 833 60 John Muir Elementary School Modesto City Elementary 4 750 50Samuel Vaughn Elementary School Ceres Unif ied School District 6 832 61 Lucille Whitehead Intermediate School Waterford Unif ied School District 3 745 47Sherw ood Elementary School Sylvan Union Elementary 6 832 65 Robertson Road Elementary School Modesto City Elementary 3 745 43Freedom Elementary School Sylvan Union Elementary 7 831 65 Von Renner Elementary School New man-Crow s Landing Unif ied 2 738 45La Rosa Elementary School Ceres Unif ied School District 6 831 55 Walnut Grove Elementary School Patterson Joint Unif ied 3 737 44Sandra Tovar Medeiros Elementary SchooTurlock Unif ied 6 829 61 Hunt Elementary School New man-Crow s Landing Unif ied 4 733 44Crossroads Elementary School Sylvan Union Elementary 7 828 68 Empire Elementary School Empire Union Elementary 4 726 35Fox Road Elementary School Hughson Unif ied School District 5 828 63 Riverbank Language Academy Riverbank Unif ied 2 725 37Keyes To Learning Charter School Keyes Union 7 826 59 Salida Elementary School Salida Union Elementary 2 722 42Shiloh Elementary School Shiloh Elementary 4 825 59 California Avenue Elementary School Riverbank Unif ied 3 721 45Gratton Elementary School Gratton Elementary - 824 83 Cunningham Elementary School Turlock Unif ied 2 718 40Hart-Ransom Elementary School Hart-Ransom Union Elementary 6 821 68 Wilson Elementary School Modesto City Elementary 2 714 32Stockard Coffee Elementary School Sylvan Union Elementary 7 820 67 Burbank Elementary School Modesto City Elementary 2 713 40Joel J. Hidahl Elementary School Ceres Unif ied School District 5 816 61 Mesa Verde Elementary School Riverbank Unif ied 2 712 37Rose Avenue Elementary School Modesto City Elementary 5 816 56 Crow ell Elementary School Turlock Unif ied 2 708 38Sisk Elementary School Salida Union Elementary 5 814 62 Franklin Elementary School Modesto City Elementary 1 708 32Christine Sipherd Elementary School Empire Union Elementary 5 809 58 Orville Wright Elementary School Modesto City Elementary 1 708 34Sylvan Elementary School Sylvan Union Elementary 6 809 62 Harriette Kirschen Elementary School Modesto City Elementary 2 705 35Virginia Parks Elementary School Ceres Unif ied School District 6 808 57 Tuolumne Elementary School Modesto City Elementary 2 705 36Roberts Ferry Union Elementary School Roberts Ferry Union Elementary 5 807 62 El Vista Elementary School Modesto City Elementary 2 692 31William Garrison Elementary School Modesto City Elementary 4 807 51 Bret Harte Elementary School Modesto City Elementary 1 689 33Carroll Fow ler Elementary School Ceres Unif ied School District 5 806 59 Wakefield Elementary School Turlock Unif ied 1 685 34Alberta Martone Elementary School Modesto City Elementary 5 803 59 James Marshall Elementary School Modesto City Elementary 2 679 32Julien Elementary School Turlock Unif ied 5 803 55 Shackelford Elementary School Modesto City Elementary 1 666 28M. Robert Adkison Elementary School Ceres Unif ied School District 5 803 54 Source: Stanislaus County Schools, greatschools.org

June 2015 | Western Hills Water District Diablo Grande CFD No. 1 Diablo Grande in Stanislaus County, CA 55
Assigned High School Has Average Scores
High School Name DistrictGreat Schools
Rating APIAverage
Score
Keyes To Learning Charter School Keyes Union 7 826 61James C. Enochs High School Modesto City High 8 821 78Whitmore Charter High School Ceres Unif ied School District 8 809 76Hughson High School Hughson Unif ied School District 8 807 72Waterford High School Waterford Unif ied School District 8 807 67Oakdale High School Oakdale Joint Unif ied 8 798 75Fred C. Beyer High School Modesto City High 8 790 74Turlock High School Turlock Unif ied 8 781 76John H. Pitman High School Turlock Unif ied 7 779 72Joseph A. Gregori High School Modesto City High 6 779 70Ceres High School Ceres Unif ied School District 6 778 58Connecting Waters Charter School Waterford Unif ied School District 5 775 60Central Valley High School Ceres Unif ied School District 5 769 58Valley Charter High School Stanislaus County Office Of Education 7 766 48Denair High School Denair Unif ied 5 755 42Modesto High School Modesto City High 6 747 72Thomas Dow ney High School Modesto City High 5 743 48Riverbank High School Riverbank Unif ied 5 741 52Peter Johansen High School Modesto City High 5 725 59Patterson High School Patterson Joint Unif ied 4 715 57Grace M. Davis High School Modesto City High 5 706 48Orestimba High School Newman-Crows Landing Unified 5 706 47Oakdale Charter High School Oakdale Joint Unif ied 4 667 57Denair Charter Academy Denair Unif ied - 579 22Argus High (Continuation) School Ceres Unif ied School District - 574 31Del Puerto High School Patterson Joint Unif ied - 557 28East Stanislaus High School Oakdale Joint Unif ied - 554 3Stanislaus County Special Education School Stanislaus County Office Of Education 1 551 17Valley Oak Junior And Senior High School Oakdale Joint Unif ied - 535 26Robert Elliott Alternative Education Center Modesto City High - 517 7Adelante High School Riverbank Unif ied - 500 20John B. Allard School Stanislaus County Office Of Education - 494 9Endeavor Alternative School Ceres Unif ied School District 2 486 23West Side Valley High (Continuation) School New man-Crow s Landing Unif ied School District - 486 5Roselaw n High School Turlock Unif ied - 483 35Petersen Alternative Center For Education Stanislaus County Office Of Education - 463 13
Orestimba High School is the assigned elementary school to Diablo Grande, and has mediocre scores in terms of API score, ranking 22 out of 36 high schools in Stanislaus County. The greatschools.org rating is average (5 out of 10 score), and the average of all subject test scores (47 out of 100) is also ranked 22 out of 36 high schools.

June 2015 | Western Hills Water District Diablo Grande CFD No. 1 Diablo Grande in Stanislaus County, CA 56
Economic Summary “Western Hills Water District Diablo Grande CFD No. 1 ” in Patterson, California Master Plan Community Assessment and Future Product Planning

June 2015 | Western Hills Water District Diablo Grande CFD No. 1 Diablo Grande in Stanislaus County, CA 57
Economic Summary – Location Map
Source: MapPoint
This section highlights the key economic indicators of the greater Bay Area and Central Valley from which Diablo Grande is well positioned to draw buyers from. These areas include the Modesto MSA, Stockton MSA, Oakland MSA (includes the TriValley Area, Pleasanton-Livermore-Dublin) and the San Jose MSA.
Diablo Grande
Tri Valley Area (Livermore,
Pleasanton, Dublin)

June 2015 | Western Hills Water District Diablo Grande CFD No. 1 Diablo Grande in Stanislaus County, CA 58
Livermore has rebounded sharply over the past three plus years to replace and exceed the job losses during 2009/ 2010, with 3,100 new net jobs in 2014—the largest growth level in recent history—and a total job base of 44,300 employees. The unemployment rate is at its lowest point since 2006, at 3.0% currently.
City of Livermore, CA Employment Trends
Livermore, CA - Ten Year History2003 2004 2005 2006 2007 2008 2009 2010 2011 2012 2013 2014 Apr 2015
Total 39,600 39,200 39,000 39,300 39,800 39,800 38,100 37,800 38,400 39,500 40,600 43,700 44,300 Prior Year Change (900) (400) (200) 300 500 0 (1,700) (300) 600 1,100 1,100 3,100 600 Annual % Change -2.2% -1.0% -0.5% 0.8% 1.3% 0.0% -4.3% -0.8% 1.6% 2.9% 2.8% 7.6% 1.4%Unemployment Rate 4.4% 3.8% 3.3% 2.8% 3.0% 4.0% 6.9% 7.4% 6.8% 5.9% 4.8% 4.0% 3.0%
Non Farm Employment0
-1,0
00
-900
-400
-200
300
500
0
-1,7
00
-300
600 1,
100
1,10
0
3,10
0
600
0.0%
1.0%
2.0%
3.0%
4.0%
5.0%
6.0%
7.0%
8.0%
-2,000
-1,000
0
1,000
2,000
3,000
4,000
2001 2002 2003 2004 2005 2006 2007 2008 2009 2010 2011 2012 2013 2014 Apr2015
Une
mpl
oym
ent R
ate
Annu
al G
row
th
Source: California EDD

June 2015 | Western Hills Water District Diablo Grande CFD No. 1 Diablo Grande in Stanislaus County, CA 59
City of Pleasanton, CA Employment Trends Pleasanton has also rebounded extremely well over the past three plus years to replace and exceed the job losses during 2009 / 2010, with 500 new net jobs in 2015 to-date and a total job base of 35,800 employees. The unemployment rate is very favorable and at its lowest point since 2008 at 3.5%.
Pleasanton, CA - Ten Year History2003 2004 2005 2006 2007 2008 2009 2010 2011 2012 2013 2014 Apr 2015
Total 34,500 34,200 34,100 34,300 34,700 34,700 33,300 33,000 33,500 34,500 35,400 35,300 35,800 Prior Year Change (800) (300) (100) 200 400 0 (1,400) (300) 500 1,000 900 (100) 500 Annual % Change -2.3% -0.9% -0.3% 0.6% 1.2% 0.0% -4.0% -0.9% 1.5% 3.0% 2.6% -0.3% 1.4%Unemployment Rate 3.4% 2.9% 2.5% 2.2% 2.3% 3.1% 5.3% 5.8% 5.3% 4.5% 3.7% 4.6% 3.5%
Non Farm Employment0
-900
-800
-300
-100
200 40
0
0
-1,4
00
-300
500
1,00
0
900
-100
500
0.0%
1.0%
2.0%
3.0%
4.0%
5.0%
6.0%
7.0%
-1,500
-1,000
-500
0
500
1,000
1,500
2001 2002 2003 2004 2005 2006 2007 2008 2009 2010 2011 2012 2013 2014 Apr2015
Une
mpl
oym
ent R
ate
Annu
al G
row
th
Source: California EDD

June 2015 | Western Hills Water District Diablo Grande CFD No. 1 Diablo Grande in Stanislaus County, CA 60
City of Dublin, CA Employment Trends Dublin job growth spiked in 2014 with 8,900 jobs added. The unemployment is at its lowest rate since 2006 at 2.6% as of April 2015.
Dublin, CA - Ten Year History2003 2004 2005 2006 2007 2008 2009 2010 2011 2012 2013 2014 Apr 2015
Total 14,900 14,700 14,700 14,800 15,000 15,000 14,300 14,200 14,400 14,800 15,200 24,100 24,400 Prior Year Change (300) (200) 0 100 200 0 (700) (100) 200 400 400 8,900 300 Annual % Change -2.0% -1.3% 0.0% 0.7% 1.4% 0.0% -4.7% -0.7% 1.4% 2.8% 2.7% 58.6% 1.2%Unemployment Rate 4.1% 3.5% 3.1% 2.6% 2.8% 3.7% 6.4% 6.9% 6.3% 5.5% 4.5% 3.7% 2.8%
Non Farm Employment0
-400
-300
-200
0 100
200
0
-700
-100
200
400
400
8,90
0
300
0.0%
1.0%
2.0%
3.0%
4.0%
5.0%
6.0%
7.0%
8.0%
-2,000
0
2,000
4,000
6,000
8,000
10,000
2001 2002 2003 2004 2005 2006 2007 2008 2009 2010 2011 2012 2013 2014 Apr2015
Une
mpl
oym
ent R
ate
Annu
al G
row
th
Source: California EDD

61 June 2014 | Diablo Grande Existing Sales - Overview
The Modesto, CA MSA suffered net job losses from 2008 through 2011, and began to rebound in 2012. The MSA added 2,710 jobs in 2014, an increase of 1.7%, following a 2.9% rise in 2013. Total non-farm employment is projected to continue increasing over the next five years, reaching 162,490 jobs in 2015 and over 170,000 by 2019. With these recent employment gains, the unemployment rate has declined from a peak of 17.2% in 2010 to 11.4% in 2014, and is projected to decrease significantly to 6.4% by 2018.
Modesto, CA MSA Employment Trends
Modesto, CA Metropolitan Statistical Area - Ten Year History Five-Year Forecast*
2005 2006 2007 2008 2009 2010 2011 2012 2013 2014 2015F 2016F 2017F 2018F 2019F
Non-Farm Employment 161,300 162,340 162,910 159,740 150,300 149,690 148,870 152,050 156,450 159,160 162,490 165,710 168,070 169,760 170,820
Prior Year Change 4,670 1,040 570 (3,170) (9,440) (610) (820) 3,180 4,400 2,710 3,330 3,220 2,360 1,690 1,060
Annual % Change 3.0% 0.6% 0.4% -1.9% -5.9% -0.4% -0.5% 2.1% 2.9% 1.7% 2.1% 2.0% 1.4% 1.0% 0.6%
Unemployment Rate 8.5% 8.0% 8.7% 11.0% 15.8% 17.2% 16.7% 15.1% 13.0% 11.4% 9.0% 7.5% 6.7% 6.4% 6.5%
Employment History& Forecasts
0.0%
2.0%
4.0%
6.0%
8.0%
10.0%
12.0%
14.0%
16.0%
18.0%
20.0%
-10,000
-8,000
-6,000
-4,000
-2,000
0
2,000
4,000
6,000
8,000
1993
1994
1995
1996
1997
1998
1999
2000
2001
2002
2003
2004
2005
2006
2007
2008
2009
2010
2011
2012
2013
2014
2015
2016
2017
2018
2019
Une
mpl
oym
ent R
ate
Annu
al N
on-F
arm
Em
ploy
men
t Gro
wth
Source: Economy.com

62 June 2014 | Diablo Grande Existing Sales - Overview
Excluding agriculture, a primary source of new jobs in the Modesto MSA over the past 12 months has been in the Education and Health Services category, with 700 jobs added, as well as the high-paying Professional and Business Services sector, with 600 jobs added.
Modesto, CA MSA Employment Growth by Sector
High Income Sectors Other Sectors
Financial Activities Information Professional and Business Services
Construction & Mining
Education & Health Services
Government Leisure & Hospitality Manufacturing Other Services Trade, Transp. and Utilities
Current Month 5,300 800 14,000 7,100 29,300 26,200 16,300 19,100 5,200 37,600
Same Month Previous Year 5,400 900 13,400 6,600 28,600 26,000 16,100 19,000 5,400 37,200
12-Month Growth -100 -100 600 500 700 200 200 100 -200 400
Employment by Sector
-300
-200
-100
0
100
200
300
400
500
600
700
800
Financial Activities Information Professional andBusiness Services
Construction &Mining
Education & HealthServices
Government Leisure & Hospitality Manufacturing Other Services Trade, Transp. andUtilities
Annu
al N
on-F
arm
Em
ploy
men
t Gro
wth
Source: Economy.com

63 June 2014 | Diablo Grande Existing Sales - Overview
Modesto, CA MSA E/P Ratio The E/P Ratio is based on employment growth versus building permits. An E/P Ratio over 1.0 means more jobs are being added than homes being built. Ratios over 1.0 indicate an opportunity to introduce new homes to the market. Similar to other parts of the state, the Modesto E/P Ratio has recovered since being negative from 2008 through 2011. However, with a jump in employment and a just a small increase in building permits has the E/P ratio at the highest level in recent history at 13.79 in 2013 and 6.09 in 2014—it is projected that the E/P ratio will stabilize at lower levels in the coming years.
Modesto, CA Metropolitan Statistical Area - Ten Year History Economy.com Five-Year Forecast
2005 2006 2007 2008 2009 2010 2011 2012 2013 2014 2015F 2016F 2017F 2018F 2019F
Non-Farm Employment 161,300 162,340 162,910 159,740 150,300 149,690 148,870 152,050 156,450 159,160 162,490 165,710 168,070 169,760 170,820
Prior Year Change 4,670 1,040 570 (3,170) (9,440) (610) (820) 3,180 4,400 2,710 3,330 3,220 2,360 1,690 1,060
Building Permits 4,525 2,644 1,865 481 364 292 164 285 319 445 2,192 3,815 4,188 4,202 3,987
Employment/Housing 1.03 0.39 0.31 -6.59 -25.93 -2.09 -5.00 11.16 13.79 6.09 1.52 0.84 0.56 0.40 0.27
Employment/Housing History& Forecasts
-30.0
-25.0
-20.0
-15.0
-10.0
-5.0
0.0
5.0
10.0
15.0
20.0
-12,000
-10,000
-8,000
-6,000
-4,000
-2,000
0
2,000
4,000
6,000
8,000
1993
1994
1995
1996
1997
1998
1999
2000
2001
2002
2003
2004
2005
2006
2007
2008
2009
2010
2011
2012
2013
2014
2015
F
2016
F
2017
F
2018
F
2019
F
E/P
Rat
io
Annu
al N
on-F
arm
Em
ploy
men
t Gro
wth
Source: Economy.com

64 June 2014 | Diablo Grande Existing Sales - Overview
The affordability index depicts whether or not a family earning the median income can carry the interest and principal payments on a median-priced home. An index value of 100 indicates that a typical household has just enough income to qualify for an 80% mortgage for a median-priced home. Therefore higher the score, the more affordable the area. The affordability index dropped in the Modesto MSA in 2014 to 128.8, from 159.3 in 2013. Affordability is expected to continue declining over the next several years, as rising mortgage rates and higher home prices impact affordability. Nevertheless, over the next five years, the affordability index is projected to stay near 100 and well above the low point of 59.5 in 2006, making Modesto an affordable area of California.
Modesto, CA MSA Affordability Index
Modesto, CA Metropolitan Statistical Area - Ten Year History Economy.com Five-Year Forecast
2005 2006 2007 2008 2009 2010 2011 2012 2013 2014 2015F 2016F 2017F 2018F 2019F
Affordability Index 67.6 59.5 68.8 117.7 186.9 181.3 195.8 204.3 159.3 128.8 114.4 101.5 96.0 97.7 98.2
Affordability Indexw/ Forecasts
0.0
50.0
100.0
150.0
200.0
250.0
1993
1994
1995
1996
1997
1998
1999
2000
2001
2002
2003
2004
2005
2006
2007
2008
2009
2010
2011
2012
2013
2014
2015
F
2016
F
2017
F
2018
F
2019
F
Affo
rdab
ility
Inde
x
Source: Economy.com

65 June 2014 | Diablo Grande Existing Sales - Overview
San Francisco-Oakland-Fremont MSA Employment Trends After hitting 10.3% unemployment, the highest in recent history, the San Francisco-Oakland-Fremont MSA added over 240,000 jobs since 2011 and regaining every job lost during the recession. Job growth is projected to remain very strong, adding nearly that same amount over the next five years. This certainly will impact home prices in the greater area as people are drawn towards these new employment opportunities.
San Francisco-Oakland-Fremont, CA Metropolitan Statistical Area - Ten Year History Five-Year Forecast*
2005 2006 2007 2008 2009 2010 2011 2012 2013 2014 2015F 2016F 2017F 2018F 2019F
Non-Farm Employment 2,001,840 2,035,190 2,061,010 2,058,790 1,947,570 1,917,580 1,949,510 2,024,520 2,104,610 2,160,860 2,231,880 2,296,270 2,338,420 2,364,040 2,379,650
Prior Year Change 17,000 33,350 25,820 (2,220) (111,220) (29,990) 31,930 75,010 80,090 56,250 71,020 64,390 42,150 25,620 15,610
Annual % Change 0.9% 1.7% 1.3% -0.1% -5.4% -1.5% 1.7% 3.8% 4.0% 2.7% 3.3% 2.9% 1.8% 1.1% 0.7%
Unemployment Rate 4.9% 4.2% 4.4% 5.7% 9.6% 10.3% 9.4% 8.0% 6.6% 5.4% 4.9% 4.7% 4.6% 4.5% 4.5%
Employment History& Forecasts
0.0%
2.0%
4.0%
6.0%
8.0%
10.0%
12.0%
-150,000
-100,000
-50,000
0
50,000
100,000
1993
1994
1995
1996
1997
1998
1999
2000
2001
2002
2003
2004
2005
2006
2007
2008
2009
2010
2011
2012
2013
2014
2015
2016
2017
2018
2019
Une
mpl
oym
ent R
ate
Annu
al N
on-F
arm
Em
ploy
men
t Gro
wth
Source: Economy.com
66 June 2014 | Diablo Grande Existing Sales - Overview
San Francisco-Oakland-Fremont MSA Employment Growth by Sector A primary source of new jobs in the San Francisco-Oakland-Fremont MSA over the past 12 months was in the high-income Professional and Business Services sector, adding 26,600 over the past year. Additional positive growth is evident in the Education and Health Services sector, Leisure and Hospitality Sector and the Trade, Transportation and Utilities sectors.
High Income Sectors Other Sectors
Financial Activities Information Professional and Business Services
Construction & Mining
Education & Health Services
Government Leisure & Hospitality Manufacturing Other Services Trade, Transp. and Utilities
Current Month 124,000 77,600 453,300 101,800 328,000 304,900 255,100 120,000 81,700 368,700
Same Month Previous Year 125,900 73,900 426,700 96,700 320,900 301,800 244,000 118,000 79,800 361,500
12-Month Growth -1,900 3,700 26,600 5,100 7,100 3,100 11,100 2,000 1,900 7,200
Employment by Sector
-5,000
0
5,000
10,000
15,000
20,000
25,000
30,000
Financial Activities Information Professional andBusiness Services
Construction &Mining
Education & HealthServices
Government Leisure & Hospitality Manufacturing Other Services Trade, Transp. andUtilities
Annu
al N
on-F
arm
Em
ploy
men
t Gro
wth
Source: Economy.com

67 June 2014 | Diablo Grande Existing Sales - Overview
San Francisco-Oakland-Fremont MSA E/P Ratio The San Francisco-Oakland-Fremont MSA has historically had a high E/P ratio, with the exception of 2009-2010 when more than 140,000 jobs were lost. Pent-up demand for housing due to strong job creation the past four years has resulted in an unusually high E/P ratio which could impact neighboring real estate markets outside of the MSA—the E/P ratio is expected to remain strong going forward.
San Francisco-Oakland-Fremont, CA Metropolitan Statistical Area - Ten Year History Economy.com Five-Year Forecast
2005 2006 2007 2008 2009 2010 2011 2012 2013 2014 2015F 2016F 2017F 2018F 2019F
Non-Farm Employment 2,001,840 2,035,190 2,061,010 2,058,790 1,947,570 1,917,580 1,949,510 2,024,520 2,104,610 2,160,860 2,231,880 2,296,270 2,338,420 2,364,040 2,379,650
Prior Year Change 17,000 33,350 25,820 (2,220) (111,220) (29,990) 31,930 75,010 80,090 56,250 71,020 64,390 42,150 25,620 15,610
Building Permits 14,883 14,483 10,560 7,555 3,550 4,621 5,783 9,163 10,922 9,834 11,884 12,226 9,858 8,539 8,261
Employment/Housing 1.14 2.30 2.45 -0.29 -31.33 -6.49 5.52 8.19 7.33 5.72 5.98 5.27 4.28 3.00 1.89
Employment/Housing History& Forecasts
-35.0
-30.0
-25.0
-20.0
-15.0
-10.0
-5.0
0.0
5.0
10.0
15.0
-150,000
-100,000
-50,000
0
50,000
100,000
1993
1994
1995
1996
1997
1998
1999
2000
2001
2002
2003
2004
2005
2006
2007
2008
2009
2010
2011
2012
2013
2014
2015
F
2016
F
2017
F
2018
F
2019
F
E/P
Rat
io
Annu
al N
on-F
arm
Em
ploy
men
t Gro
wth
Source: Economy.com

68 June 2014 | Diablo Grande Existing Sales - Overview
San Francisco-Oakland-Fremont MSA Building Permit Trends Total residential building permit activity in the San Francisco-Oakland-Fremont MSA decreased by 10.0% in 2014, driven mainly be a decline in multifamily (apartment) permits. Single family permits are well below historical averages and have been stable at 3,000+/- annual permits for three consecutive years. Single family opportunities are scarce as densities and prices are increasing. Other MSAs in the area may be able to attract buyers looking for new, single family homes in the immediate future.
San Francisco-Oakland-Fremont, CA Metropolitan Statistical Area - Ten Year History Economy.com Five-Year Forecast
2005 2006 2007 2008 2009 2010 2011 2012 2013 2014 2015F 2016F 2017F 2018F 2019F
Total Building Permits 14,883 14,483 10,560 7,555 3,550 4,621 5,783 9,163 10,922 9,834 11,884 12,226 9,858 8,539 8,261
Annual % Change -2.3% -2.7% -27.1% -28.5% -53.0% 30.2% 25.1% 58.4% 19.2% -10.0% 20.9% 2.9% -19.4% -13.4% -3.3%
SFD Building Permits 8,102 5,900 5,055 2,359 2,271 2,118 1,923 3,095 3,659 3,681 4,384 6,149 5,911 5,857 5,721
Annual % Change 1.5% -27.2% -14.3% -53.3% -3.7% -6.7% -9.2% 60.9% 18.2% 0.6% 19.1% 40.3% -3.9% -0.9% -2.3%
MF Building Permits 6,781 8,583 5,505 5,196 1,279 2,503 3,860 6,068 7,263 6,153 7,500 6,077 3,946 2,683 2,540
Annual % Change -6.5% 26.6% -35.9% -5.6% -75.4% 95.7% 54.2% 57.2% 19.7% -15.3% 21.9% -19.0% -35.1% -32.0% -5.3%
Residential Building Permit History & Forecasts
0
2,000
4,000
6,000
8,000
10,000
12,000
14,000
16,000
1993
1994
1995
1996
1997
1998
1999
2000
2001
2002
2003
2004
2005
2006
2007
2008
2009
2010
2011
2012
2013
2014
2015
F
2016
F
2017
F
2018
F
2019
F
Res
iden
tial B
uild
ing
Perm
its
MF Building Permits SFD Building PermitsSource: Economy.com

69 June 2014 | Diablo Grande Existing Sales - Overview
The San Francisco-Oakland-Fremont MSA has notoriously been one of the least affordable areas in the United States. Despite affordability nearly reaching 100 in 2012, (indicating a household earing a median income can carry the interest and principal payments on a median-priced home) the affordability index is declining sharply as home prices rapidly increase. Households earning a median income and are looking to purchase a new home will likely have to look outside the MSA.
San Francisco-Oakland-Fremont MSA Affordability Index
San Francisco-Oakland-Fremont, CA Metropolitan Statistical Area - Ten Year History Economy.com Five-Year Forecast
2005 2006 2007 2008 2009 2010 2011 2012 2013 2014 2015F 2016F 2017F 2018F 2019F
Affordability Index 52.4 47.7 47.7 66.4 92.8 86.4 96.8 97.9 79.3 64.8 61.6 57.4 55.5 56.3 55.8
Affordability Indexw/ Forecasts
0.0
20.0
40.0
60.0
80.0
100.0
120.0
1993
1994
1995
1996
1997
1998
1999
2000
2001
2002
2003
2004
2005
2006
2007
2008
2009
2010
2011
2012
2013
2014
2015
F
2016
F
2017
F
2018
F
2019
F
Affo
rdab
ility
Inde
x
Source: Economy.com

70 June 2014 | Diablo Grande Existing Sales - Overview
Stockton, CA MSA Employment Trends The Stockton MSA experienced net job losses from 2008 through 2011, but has since rebounded with three years of strengthening job growth in 2012 through 2014. The MSA added 4,250 jobs in 2014, an increase of 2.1%, after a 3.2% rise in 2013. Total non-farm employment is projected to reach 210,600 jobs in 2015 and 222,750 by 2019. The unemployment rate has declined steadily from a peak of 17.3% in 2010 to a rate of 11.1% last year. Unemployment is projected to continue decreasing over the next five years to 8.1% by 2018.
Stockton, CA Metropolitan Statistical Area - Ten Year History Five-Year Forecast*
2005 2006 2007 2008 2009 2010 2011 2012 2013 2014 2015F 2016F 2017F 2018F 2019F
Non-Farm Employment 208,580 211,930 214,710 209,420 197,700 191,160 190,570 194,580 200,830 205,080 210,600 216,340 219,580 221,500 222,750
Prior Year Change 5,320 3,350 2,780 (5,290) (11,720) (6,540) (590) 4,010 6,250 4,250 5,520 5,740 3,240 1,920 1,250
Annual % Change 2.6% 1.6% 1.3% -2.5% -5.6% -3.3% -0.3% 2.1% 3.2% 2.1% 2.7% 2.7% 1.5% 0.9% 0.6%
Unemployment Rate 7.9% 7.4% 8.1% 10.4% 15.3% 17.3% 16.8% 15.0% 12.9% 11.1% 9.5% 8.7% 8.3% 8.1% 8.1%
Employment History& Forecasts
0.0%
2.0%
4.0%
6.0%
8.0%
10.0%
12.0%
14.0%
16.0%
18.0%
20.0%
-15,000
-10,000
-5,000
0
5,000
10,000
1993
1994
1995
1996
1997
1998
1999
2000
2001
2002
2003
2004
2005
2006
2007
2008
2009
2010
2011
2012
2013
2014
2015
2016
2017
2018
2019
Une
mpl
oym
ent R
ate
Annu
al N
on-F
arm
Em
ploy
men
t Gro
wth
Source: Economy.com
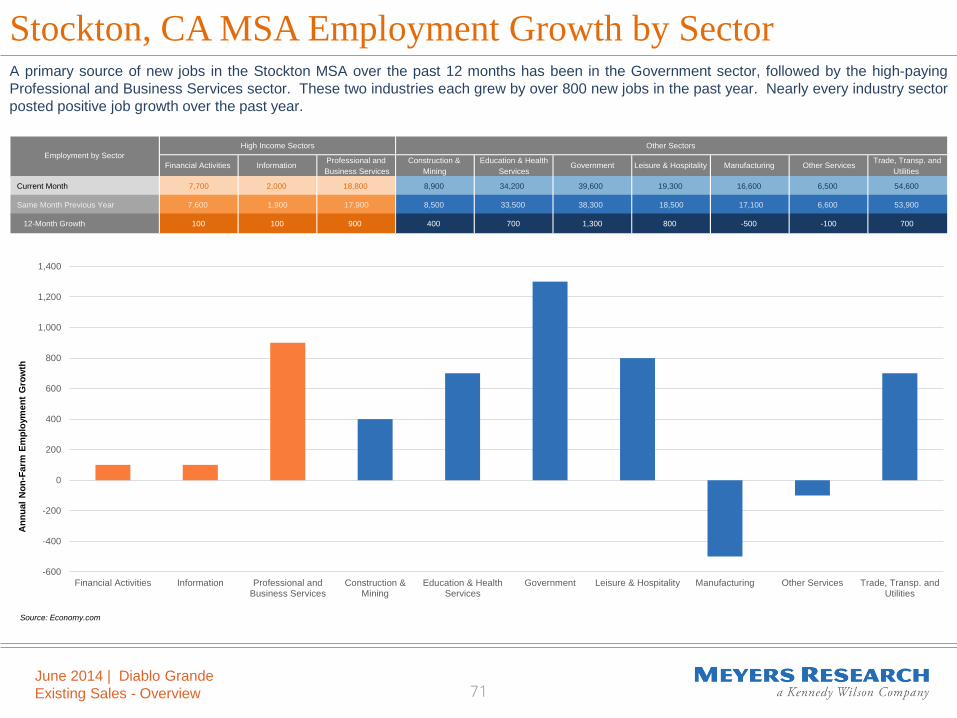
71 June 2014 | Diablo Grande Existing Sales - Overview
Stockton, CA MSA Employment Growth by Sector A primary source of new jobs in the Stockton MSA over the past 12 months has been in the Government sector, followed by the high-paying Professional and Business Services sector. These two industries each grew by over 800 new jobs in the past year. Nearly every industry sector posted positive job growth over the past year.
High Income Sectors Other Sectors
Financial Activities Information Professional and Business Services
Construction & Mining
Education & Health Services
Government Leisure & Hospitality Manufacturing Other Services Trade, Transp. and Utilities
Current Month 7,700 2,000 18,800 8,900 34,200 39,600 19,300 16,600 6,500 54,600
Same Month Previous Year 7,600 1,900 17,900 8,500 33,500 38,300 18,500 17,100 6,600 53,900
12-Month Growth 100 100 900 400 700 1,300 800 -500 -100 700
Employment by Sector
-600
-400
-200
0
200
400
600
800
1,000
1,200
1,400
Financial Activities Information Professional andBusiness Services
Construction &Mining
Education & HealthServices
Government Leisure & Hospitality Manufacturing Other Services Trade, Transp. andUtilities
Annu
al N
on-F
arm
Em
ploy
men
t Gro
wth
Source: Economy.com

72 June 2014 | Diablo Grande Existing Sales - Overview
Stockton, CA MSA E/P Ratio The Stockton MSA E/P Ratio has recovered since being negative from 2008 through 2011, with the current ratio of 3.39 indicating solid pent-up demand for housing due to job creation—it is projected that the E/P ratio will stabilize at lower levels in the coming years.
Stockton, CA Metropolitan Statistical Area - Ten Year History Economy.com Five-Year Forecast
2005 2006 2007 2008 2009 2010 2011 2012 2013 2014 2015F 2016F 2017F 2018F 2019F
Non-Farm Employment 208,580 211,930 214,710 209,420 197,700 191,160 190,570 194,580 200,830 205,080 210,600 216,340 219,580 221,500 222,750
Prior Year Change 5,320 3,350 2,780 (5,290) (11,720) (6,540) (590) 4,010 6,250 4,250 5,520 5,740 3,240 1,920 1,250
Building Permits 5,869 3,652 2,426 819 792 813 933 1,006 1,134 1,253 3,752 4,811 4,592 4,363 4,181
Employment/Housing 0.91 0.92 1.15 -6.46 -14.80 -8.04 -0.63 3.99 5.51 3.39 1.47 1.19 0.71 0.44 0.30
Employment/Housing History& Forecasts
-20.0
-15.0
-10.0
-5.0
0.0
5.0
10.0
-15,000
-10,000
-5,000
0
5,000
10,000
1993
1994
1995
1996
1997
1998
1999
2000
2001
2002
2003
2004
2005
2006
2007
2008
2009
2010
2011
2012
2013
2014
2015
F
2016
F
2017
F
2018
F
2019
F
E/P
Rat
io
Annu
al N
on-F
arm
Em
ploy
men
t Gro
wth
Source: Economy.com

73 June 2014 | Diablo Grande Existing Sales - Overview
Stockton, CA MSA Building Permit Trends Total residential building permit activity in the Stockton MSA increased by 10.5% in 2014, reaching over 1,250 permits for the year. Single family permit activity has experienced consistent growth since 2012, increasing by 16.5% this past year. Due to expected strong permit activity for single-family homes, total permits are projected to double in 2015, and top 4,000 by 2016, the highest in recent history.
0
1,000
2,000
3,000
4,000
5,000
6,000
7,000
8,000
1993
1994
1995
1996
1997
1998
1999
2000
2001
2002
2003
2004
2005
2006
2007
2008
2009
2010
2011
2012
2013
2014
2015
F
2016
F
2017
F
2018
F
2019
F
Res
iden
tial B
uild
ing
Perm
its
MF Building Permits SFD Building PermitsSource: Economy.com
Stockton, CA Metropolitan Statistical Area - Ten Year History Economy.com Five-Year Forecast
2005 2006 2007 2008 2009 2010 2011 2012 2013 2014 2015F 2016F 2017F 2018F 2019F
Total Building Permits 5,869 3,652 2,426 819 792 813 933 1,006 1,134 1,253 3,752 4,811 4,592 4,363 4,181
Annual % Change -12.7% -37.8% -33.6% -66.2% -3.3% 2.7% 14.8% 7.8% 12.7% 10.5% 199.4% 28.2% -4.6% -5.0% -4.2%
SFD Building Permits 5,684 3,461 2,201 765 792 801 781 1,006 1,062 1,238 3,669 4,736 4,550 4,339 4,159
Annual % Change -8.7% -39.1% -36.4% -65.2% 3.5% 1.1% -2.5% 28.8% 5.6% 16.5% 196.5% 29.1% -3.9% -4.6% -4.2%
MF Building Permits 185 191 225 54 0 12 152 0 72 16 82 75 42 24 23
Annual % Change -62.6% 3.2% 17.8% -76.0% -100.0% 1166.7% -100.0% -78.3% 427.9% -8.9% -44.4% -42.6% -4.4%
Residential Building Permit History & Forecasts

74 June 2014 | Diablo Grande Existing Sales - Overview
The affordability index dropped in the Stockton MSA in 2014 to 126.3, from 156.0 in 2013. Affordability is expected to continue declining over the next several years, as rising mortgage rates and higher home prices take a toll on affordability. Nevertheless, over the next five years, the affordability index is projected to stay near 100.0 and well above the low point of 57.2 in 2006, with the Stockton MSA continuing to provide an affordable housing market for Northern California.
Stockton, CA MSA Affordability Index
Stockton, CA Metropolitan Statistical Area - Ten Year History Economy.com Five-Year Forecast
2005 2006 2007 2008 2009 2010 2011 2012 2013 2014 2015F 2016F 2017F 2018F 2019F
Affordability Index 62.3 57.2 70.0 121.8 183.9 171.7 181.2 194.2 156.0 126.3 111.0 100.3 96.8 99.1 99.5
Affordability Indexw/ Forecasts
0.0
50.0
100.0
150.0
200.0
250.0
1993
1994
1995
1996
1997
1998
1999
2000
2001
2002
2003
2004
2005
2006
2007
2008
2009
2010
2011
2012
2013
2014
2015
F
2016
F
2017
F
2018
F
2019
F
Affo
rdab
ility
Inde
x
Source: Economy.com
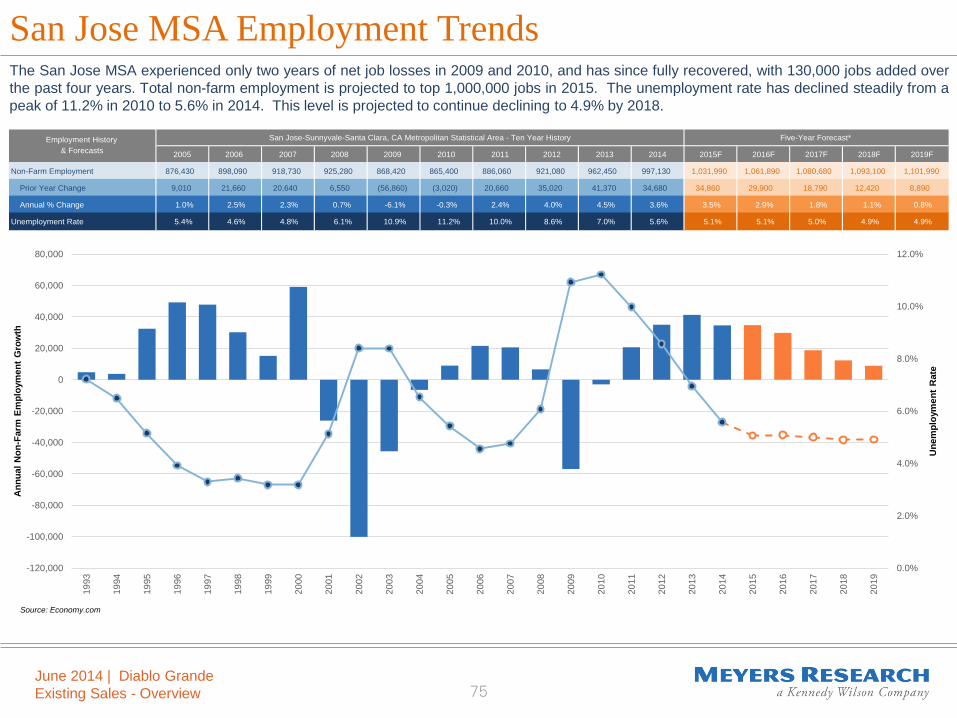
75 June 2014 | Diablo Grande Existing Sales - Overview
San Jose MSA Employment Trends The San Jose MSA experienced only two years of net job losses in 2009 and 2010, and has since fully recovered, with 130,000 jobs added over the past four years. Total non-farm employment is projected to top 1,000,000 jobs in 2015. The unemployment rate has declined steadily from a peak of 11.2% in 2010 to 5.6% in 2014. This level is projected to continue declining to 4.9% by 2018.
San Jose-Sunnyvale-Santa Clara, CA Metropolitan Statistical Area - Ten Year History Five-Year Forecast*
2005 2006 2007 2008 2009 2010 2011 2012 2013 2014 2015F 2016F 2017F 2018F 2019F
Non-Farm Employment 876,430 898,090 918,730 925,280 868,420 865,400 886,060 921,080 962,450 997,130 1,031,990 1,061,890 1,080,680 1,093,100 1,101,990
Prior Year Change 9,010 21,660 20,640 6,550 (56,860) (3,020) 20,660 35,020 41,370 34,680 34,860 29,900 18,790 12,420 8,890
Annual % Change 1.0% 2.5% 2.3% 0.7% -6.1% -0.3% 2.4% 4.0% 4.5% 3.6% 3.5% 2.9% 1.8% 1.1% 0.8%
Unemployment Rate 5.4% 4.6% 4.8% 6.1% 10.9% 11.2% 10.0% 8.6% 7.0% 5.6% 5.1% 5.1% 5.0% 4.9% 4.9%
Employment History& Forecasts
0.0%
2.0%
4.0%
6.0%
8.0%
10.0%
12.0%
-120,000
-100,000
-80,000
-60,000
-40,000
-20,000
0
20,000
40,000
60,000
80,000
1993
1994
1995
1996
1997
1998
1999
2000
2001
2002
2003
2004
2005
2006
2007
2008
2009
2010
2011
2012
2013
2014
2015
2016
2017
2018
2019
Une
mpl
oym
ent R
ate
Annu
al N
on-F
arm
Em
ploy
men
t Gro
wth
Source: Economy.com

76 June 2014 | Diablo Grande Existing Sales - Overview
San Jose MSA Employment Growth by Sector A primary source of new jobs in the San Jose MSA over the past 12 months was in the high-income Professional and Business Services and Information sectors. These industries grew by a combined 20,000 new jobs in the past year, while none of the employment sectors experienced a decline.
High Income Sectors Other Sectors
Financial Activities Information Professional and Business Services
Construction & Mining
Education & Health Services
Government Leisure & Hospitality Manufacturing Other Services Trade, Transp. and Utilities
Current Month 35,200 69,000 205,900 39,800 155,900 97,300 91,000 163,100 24,500 145,200
Same Month Previous Year 33,200 60,700 194,300 39,500 149,900 95,700 87,400 159,300 25,300 142,300
12-Month Growth 2,000 8,300 11,600 300 6,000 1,600 3,600 3,800 -800 2,900
Employment by Sector
-2,000
0
2,000
4,000
6,000
8,000
10,000
12,000
Financial Activities Information Professional andBusiness Services
Construction &Mining
Education & HealthServices
Government Leisure & Hospitality Manufacturing Other Services Trade, Transp. andUtilities
Annu
al N
on-F
arm
Em
ploy
men
t Gro
wth
Source: Economy.com

77 June 2014 | Diablo Grande Existing Sales - Overview
San Jose MSA E/P Ratio The San Jose MSA E/P Ratio has recovered since drop in employment in 2009 and 2010, with a ratio of 3.48 in 2014 indicating strong pent-up demand for housing due to job creation. With job growth significantly outpacing the new home market, there will be a solid demand for affordable housing in the greater region as prices continue to rise in places like San Jose.
San Jose-Sunnyvale-Santa Clara, CA Metropolitan Statistical Area - Ten Year History Economy.com Five-Year Forecast
2005 2006 2007 2008 2009 2010 2011 2012 2013 2014 2015F 2016F 2017F 2018F 2019F
Non-Farm Employment 876,430 898,090 918,730 925,280 868,420 865,400 886,060 921,080 962,450 997,130 1,031,990 1,061,890 1,080,680 1,093,100 1,101,990
Prior Year Change 9,010 21,660 20,640 6,550 (56,860) (3,020) 20,660 35,020 41,370 34,680 34,860 29,900 18,790 12,420 8,890
Building Permits 5,736 6,150 4,194 3,490 1,094 4,179 3,097 5,532 7,764 9,964 8,839 8,721 6,798 6,116 6,265
Employment/Housing 1.57 3.52 4.92 1.88 -51.97 -0.72 6.67 6.33 5.33 3.48 3.94 3.43 2.76 2.03 1.42
Employment/Housing History& Forecasts
-60.0
-50.0
-40.0
-30.0
-20.0
-10.0
0.0
10.0
20.0
-120,000
-100,000
-80,000
-60,000
-40,000
-20,000
0
20,000
40,000
60,000
80,000
1993
1994
1995
1996
1997
1998
1999
2000
2001
2002
2003
2004
2005
2006
2007
2008
2009
2010
2011
2012
2013
2014
2015
F
2016
F
2017
F
2018
F
2019
F
E/P
Rat
io
Annu
al N
on-F
arm
Em
ploy
men
t Gro
wth
Source: Economy.com

78 June 2014 | Diablo Grande Existing Sales - Overview
San Jose MSA Building Permit Trends Total residential building permit activity in the San Jose MSA increased by 28.3% in 2014, reaching 9,900 permits for the year, the most since 2003. Multi-family permit activity experienced strong growth, with multi-family permits up 38.2% from the previous year, while single family permits were stable at 1,800 permits (limited by land supply constraints). Single-family permits are projected to increase by +/-30% in 2015 and 2016.
San Jose-Sunnyvale-Santa Clara, CA Metropolitan Statistical Area - Ten Year History Economy.com Five-Year Forecast
2005 2006 2007 2008 2009 2010 2011 2012 2013 2014 2015F 2016F 2017F 2018F 2019F
Total Building Permits 5,736 6,150 4,194 3,490 1,094 4,179 3,097 5,532 7,764 9,964 8,839 8,721 6,798 6,116 6,265
Annual % Change 4.4% 7.2% -31.8% -16.8% -68.7% 282.0% -25.9% 78.6% 40.3% 28.3% -11.3% -1.3% -22.1% -10.0% 2.4%
SFD Building Permits 2,416 2,151 1,955 958 642 861 1,002 1,501 1,870 1,817 2,379 3,061 3,102 3,147 3,133
Annual % Change -13.3% -11.0% -9.1% -51.0% -33.0% 34.1% 16.4% 49.8% 24.6% -2.9% 31.0% 28.6% 1.4% 1.4% -0.4%
MF Building Permits 3,320 3,999 2,239 2,532 452 3,318 2,095 4,031 5,894 8,147 6,459 5,661 3,696 2,968 3,132
Annual % Change 22.7% 20.5% -44.0% 13.1% -82.1% 634.1% -36.9% 92.4% 46.2% 38.2% -20.7% -12.4% -34.7% -19.7% 5.5%
Residential Building Permit History & Forecasts
0
1,000
2,000
3,000
4,000
5,000
6,000
7,000
8,000
9,000
10,000
1993
1994
1995
1996
1997
1998
1999
2000
2001
2002
2003
2004
2005
2006
2007
2008
2009
2010
2011
2012
2013
2014
2015
F
2016
F
2017
F
2018
F
2019
F
Res
iden
tial B
uild
ing
Perm
its
MF Building Permits SFD Building PermitsSource: Economy.com

79 June 2014 | Diablo Grande Existing Sales - Overview
The affordability index dropped in the San Jose MSA in 2014 to 67.6, from 76.3 in 2013. Affordability is expected to continue declining over the next several years, as rising interest rates and increasing home prices take a toll on affordability. Households earning the median income could either stay renters or turn to housing outside of San Jose and Santa Clara County for more affordable options. The more affordable nearby areas in Stanislaus County such as Patterson/ Diablo Grande could be an alternative to the high cost of living in San Jose.
San Jose MSA Affordability Index
San Jose-Sunnyvale-Santa Clara, CA Metropolitan Statistical Area - Ten Year History Economy.com Five-Year Forecast
2005 2006 2007 2008 2009 2010 2011 2012 2013 2014 2015F 2016F 2017F 2018F 2019F
Affordability Index 51.7 46.9 45.9 61.6 88.0 80.0 90.0 91.8 76.3 67.6 62.5 57.9 56.5 58.6 59.4
Affordability Indexw/ Forecasts
0.0
10.0
20.0
30.0
40.0
50.0
60.0
70.0
80.0
90.0
100.0
1993
1994
1995
1996
1997
1998
1999
2000
2001
2002
2003
2004
2005
2006
2007
2008
2009
2010
2011
2012
2013
2014
2015
F
2016
F
2017
F
2018
F
2019
F
Affo
rdab
ility
Inde
x
Source: Economy.com

June 2015 | Western Hills Water District Diablo Grande CFD No. 1 Diablo Grande in Stanislaus County, CA 80
Demographic Summary “Western Hills Water District Diablo Grande CFD No. 1 ” in Patterson, California Master Plan Community Assessment and Future Product Planning

June 2015 | Western Hills Water District Diablo Grande CFD No. 1 Diablo Grande in Stanislaus County, CA 81
Demographic Summaries – Location Map
Source: MapPoint
This section highlights the key demographics of Stanislaus County, the 95363 zip code (which includes Diablo Grande), the City of Patterson, as well as, the surrounding counties and the Tri Valley area.
Diablo Grande
Tri Valley Area (Livermore,
Pleasanton, Dublin)

June 2015 | Western Hills Water District Diablo Grande CFD No. 1 Diablo Grande in Stanislaus County, CA 82
The areas with relatively high incomes are to the west of Diablo Grande, in San Jose and the Bay Area (90 +/- minutes from the Site). The area surrounding Diablo Grande exhibit mid-range incomes, consistent with areas such as Tracy, Manteca and Oakdale. Central areas of Modesto typically have slightly lower incomes than Diablo Grande.
Median Income Heat Map
Source: ESRI; MapPoint
$150k
$75k
$35k
Diablo Grande

83 June 2014 | Diablo Grande Existing Sales - Overview
- -- - - - -- - - - --- -- - - - -- - - - --
- -- - - - -- - - - --
- -- - - - -- - - - --- -- - - - -- - - - --- -- - - - -- - - - --
- -- - - - -- - - - --
- -- - - - -- - - - --- -- - - - -- - - - --
- Source: ESRI -
0.0%0.1%0.2%0.3%0.4%0.5%0.6%0.7%
0
500
1,000
1,500
2,000
2,500
3,000
Stanislaus County City of Patterson,CA
Zip Code 95363
Total Population (2015 - 2020)
Annual Change % Annual Growth
20.022.024.026.028.030.032.034.036.0
Stanislaus County City of Patterson, CA Zip Code 95363
Median Age (2015)
2.82.93.03.13.23.33.43.53.63.7
Stanislaus County City of Patterson, CA Zip Code 95363
Avg. HH. Size (2015)
0.0%
0.1%
0.2%
0.3%
0.4%
0.5%
0.6%
0100200300400500600700800900
Stanislaus County City of Patterson,CA
Zip Code 95363
Households (2015 - 2020)
Annual Change % Annual Growth
These graphs indicate that the County and City of Patterson is anticipated to grow at a faster pace than the zip code. ESRI may not take into account the restart of a community like Diablo Grande. The zip code currently has a lower median age and higher average household size than the greater City and County suggesting the local Diablo Grande area has historically attracted younger families. With the addition of single-story product at the Subject we would anticipate the median age to shift upward as Diablo Grande builds out.
Stanislaus County vs. City of Patterson vs. Zip Code 95363

84 June 2014 | Diablo Grande Existing Sales - Overview
- -- - - - -- - - - --- -- - - - -- - - - --
- -- - - - -- - - - --
- -- - - - -- - - - --- -- - - - -- - - - --- -- - - - -- - - - --
- -- - - - -- - - - --
- -- - - - -- - - - --- -- - - - -- - - - --
- Source: ESRI -
$0$10,000$20,000$30,000$40,000$50,000$60,000$70,000$80,000
Stanislaus County City of Patterson, CA Zip Code 95363
HH. Income (2015)
2015 2020
$0$50,000
$100,000$150,000$200,000$250,000$300,000$350,000$400,000$450,000
Stanislaus County City of Patterson, CA Zip Code 95363
Net Worth (2015)
Median Average
0.0%
5.0%
10.0%
15.0%
20.0%
25.0%
30.0%
Stanislaus County City of Patterson, CA Zip Code 95363
Educational Attainment - Bachelor's or Higher (2015)
0.0%
10.0%
20.0%
30.0%
40.0%
50.0%
60.0%
Stanislaus County City of Patterson, CA Zip Code 95363
Occupation (2015)
White Collar Services Blue Collar
Incomes in the City of Patterson and Subject’s 95363 zip code are higher than the greater county suggesting it is a desirable location within the county. Given the concentration of manufacturing employment in Patterson, education levels are generally lower in the local area as are white-collar occupations.
Stanislaus County vs. City of Patterson vs. Zip Code 95363: Income, Net Worth, Education and Occupation

85 June 2014 | Diablo Grande Existing Sales - Overview
- -- - - - -- - - - --- -- - - - -- - - - --
- -- - - - -- - - - --
- -- - - - -- - - - --- -- - - - -- - - - --- -- - - - -- - - - --
- -- - - - -- - - - --
- -- - - - -- - - - --- -- - - - -- - - - --
- Source: ESRI -
0.0%0.5%1.0%1.5%2.0%2.5%3.0%3.5%4.0%
0500
1,0001,5002,0002,5003,0003,5004,000
StanislausCounty
Zip Code95363
TriValleyArea
Dublin Pleasanton Livermore
Total Population (2015 - 2020)
Annual Change % Annual Growth
20.0
25.0
30.0
35.0
40.0
45.0
StanislausCounty
Zip Code95363
TriValleyArea
Dublin Pleasanton Livermore
Median Age (2015)
0.00.51.01.52.02.53.03.54.0
StanislausCounty
Zip Code95363
TriValleyArea
Dublin Pleasanton Livermore
Avg. HH. Size (2015)
0.0%0.5%1.0%1.5%2.0%2.5%3.0%3.5%4.0%
0200400600800
1,0001,2001,400
StanislausCounty
Zip Code95363
TriValleyArea
Dublin Pleasanton Livermore
Households (2015 - 2020)
Annual Change % Annual Growth
Spearheaded by Dublin (one of the fastest growing cities in the state), the TriValley Area is projected to grow at a faster pace than Stanislaus County and the immediate local Diablo Grande area. This growth should further push housing prices. The median age in the TriValley is higher and average household size is smaller suggesting a higher percentage of older, wealthier households.
Local Areas vs. The TriValley Area

86 June 2014 | Diablo Grande Existing Sales - Overview
- -- - - - -- - - - --- -- - - - -- - - - --
- -- - - - -- - - - --
- -- - - - -- - - - --- -- - - - -- - - - --- -- - - - -- - - - --
- -- - - - -- - - - --
- -- - - - -- - - - --- -- - - - -- - - - --
- Source: ESRI -
$0$20,000$40,000$60,000$80,000
$100,000$120,000$140,000$160,000
StanislausCounty
Zip Code95363
TriValleyArea
Dublin Pleasanton Livermore
HH. Income (2015)
2015 2020
$0$200,000$400,000$600,000$800,000
$1,000,000$1,200,000$1,400,000
StanislausCounty
Zip Code95363
TriValleyArea
Dublin Pleasanton Livermore
Net Worth (2015)
Median Average
0.0%
10.0%
20.0%
30.0%
40.0%
50.0%
60.0%
70.0%
StanislausCounty
Zip Code95363
TriValleyArea
Dublin Pleasanton Livermore
Educational Attainment - Bachelor's or Higher (2015)
0.0%10.0%20.0%30.0%40.0%50.0%60.0%70.0%80.0%90.0%
StanislausCounty
Zip Code95363
TriValleyArea
Dublin Pleasanton Livermore
Occupation (2015)
White Collar Services Blue Collar
Incomes and Net Worth in the TriValley Area are much higher than Stanislaus County and the 95363 zip code. Further, there is a much higher percentage of residents with bachelor’s degrees and white collar jobs. As home prices continue to rise in the TriValley Area, even households making the average income will struggle to afford a home pushing them outside to more attainably priced areas.
Local Areas vs. Tri Valley: Income, Net Worth, Education and Occupation

87 June 2014 | Diablo Grande Existing Sales - Overview
- -- - - - -- - - - --- -- - - - -- - - - --
- -- - - - -- - - - --
- -- - - - -- - - - --- -- - - - -- - - - --- -- - - - -- - - - --
- -- - - - -- - - - --
- -- - - - -- - - - --- -- - - - -- - - - --
- Source: ESRI -
0.0%0.2%0.4%0.6%0.8%1.0%1.2%1.4%
0
5,000
10,000
15,000
20,000
25,000
StanislausCounty
Zip Code95363
San JoaquinCounty
AlamedaCounty
Santa ClaraCounty
Total Population (2015 - 2020)
Annual Change % Annual Growth
20.022.024.026.028.030.032.034.036.038.040.0
StanislausCounty
Zip Code95363
San JoaquinCounty
AlamedaCounty
Santa ClaraCounty
Median Age (2015)
0.00.51.01.52.02.53.03.54.0
StanislausCounty
Zip Code95363
San JoaquinCounty
AlamedaCounty
Santa ClaraCounty
Avg. HH. Size (2015)
0.0%0.2%0.4%0.6%0.8%1.0%1.2%1.4%
01,0002,0003,0004,0005,0006,0007,0008,0009,000
StanislausCounty
Zip Code95363
San JoaquinCounty
AlamedaCounty
Santa ClaraCounty
Households (2015 - 2020)
Annual Change % Annual Growth
The surrounding counties are projected to grow at a faster pace than Stanislaus County and the immediate local Diablo Grande area. Further, the median age in Alameda and Santa Clara counties is higher and average household size is smaller suggesting a higher percentage of older, wealthier households.
Local Areas vs. Surrounding Counties

88 June 2014 | Diablo Grande Existing Sales - Overview
- -- - - - -- - - - --- -- - - - -- - - - --
- -- - - - -- - - - --
- -- - - - -- - - - --- -- - - - -- - - - --- -- - - - -- - - - --
- -- - - - -- - - - --
- -- - - - -- - - - --- -- - - - -- - - - --
- Source: ESRI -
$0
$20,000
$40,000
$60,000
$80,000
$100,000
$120,000
StanislausCounty
Zip Code95363
San JoaquinCounty
AlamedaCounty
Santa ClaraCounty
HH. Income (2015)
2015 2020
$0$100,000$200,000$300,000$400,000$500,000$600,000$700,000$800,000$900,000
$1,000,000
StanislausCounty
Zip Code95363
San JoaquinCounty
AlamedaCounty
Santa ClaraCounty
Net Worth (2015)
Median Average
0.0%
10.0%
20.0%
30.0%
40.0%
50.0%
60.0%
StanislausCounty
Zip Code95363
San JoaquinCounty
AlamedaCounty
Santa ClaraCounty
Educational Attainment - Bachelor's or Higher (2015)
0.0%10.0%20.0%30.0%40.0%50.0%60.0%70.0%80.0%
StanislausCounty
Zip Code95363
San JoaquinCounty
AlamedaCounty
Santa ClaraCounty
Occupation (2015)
White Collar Services Blue Collar
Comparing the local area to the surrounding counties, incomes and net worth are lower in Stanislaus and the Subject zip code compared to Alameda County and Santa Clara County. There is also a difference in educational attainment and occupation type.
Local Areas vs. Surrounding Counties: Income, Net Worth, Education and Occupation

June 2015 | Western Hills Water District Diablo Grande CFD No. 1 Diablo Grande in Stanislaus County, CA 89
Housing Market Summary “Western Hills Water District Diablo Grande CFD No. 1 ” in Patterson, California Master Plan Community Assessment and Future Product Planning

June 2015 | Western Hills Water District Diablo Grande CFD No. 1 Diablo Grande in Stanislaus County, CA 90
Demographic Summaries – Location Map
Source: MapPoint
This section highlights the key housing market statistics for Diablo Grande, Stanislaus County, the city of Patterson (95363 zip code), surrounding counties and the Tri Valley area.
Diablo Grande
Tri Valley Area (Livermore,
Pleasanton, Dublin)
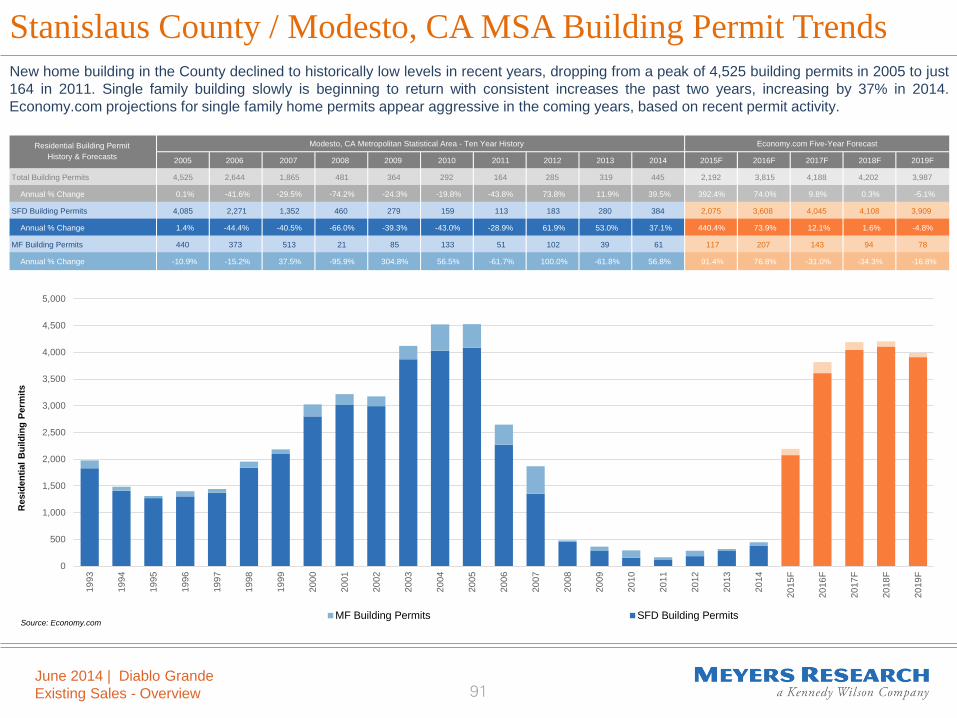
91 June 2014 | Diablo Grande Existing Sales - Overview
0
500
1,000
1,500
2,000
2,500
3,000
3,500
4,000
4,500
5,000
1993
1994
1995
1996
1997
1998
1999
2000
2001
2002
2003
2004
2005
2006
2007
2008
2009
2010
2011
2012
2013
2014
2015
F
2016
F
2017
F
2018
F
2019
F
Res
iden
tial B
uild
ing
Perm
its
MF Building Permits SFD Building PermitsSource: Economy.com
Stanislaus County / Modesto, CA MSA Building Permit Trends New home building in the County declined to historically low levels in recent years, dropping from a peak of 4,525 building permits in 2005 to just 164 in 2011. Single family building slowly is beginning to return with consistent increases the past two years, increasing by 37% in 2014. Economy.com projections for single family home permits appear aggressive in the coming years, based on recent permit activity.
Modesto, CA Metropolitan Statistical Area - Ten Year History Economy.com Five-Year Forecast
2005 2006 2007 2008 2009 2010 2011 2012 2013 2014 2015F 2016F 2017F 2018F 2019F
Total Building Permits 4,525 2,644 1,865 481 364 292 164 285 319 445 2,192 3,815 4,188 4,202 3,987
Annual % Change 0.1% -41.6% -29.5% -74.2% -24.3% -19.8% -43.8% 73.8% 11.9% 39.5% 392.4% 74.0% 9.8% 0.3% -5.1%
SFD Building Permits 4,085 2,271 1,352 460 279 159 113 183 280 384 2,075 3,608 4,045 4,108 3,909
Annual % Change 1.4% -44.4% -40.5% -66.0% -39.3% -43.0% -28.9% 61.9% 53.0% 37.1% 440.4% 73.9% 12.1% 1.6% -4.8%
MF Building Permits 440 373 513 21 85 133 51 102 39 61 117 207 143 94 78
Annual % Change -10.9% -15.2% 37.5% -95.9% 304.8% 56.5% -61.7% 100.0% -61.8% 56.8% 91.4% 76.8% -31.0% -34.3% -16.8%
Residential Building Permit History & Forecasts

92 June 2014 | Diablo Grande Existing Sales - Overview
City of Patterson, CA Building Permit Trends After an unusually high peak of 899 new home building permits issued in 2005, the new home market virtually disappeared from Patterson, with no issuances in 2009 or 2010 and just 3 in 2011. While new home building is far from the 2005 peak, there were increases over the past three years, a promising sign for a returning new home market.
City of Patterson, CA2004 2005 2006 2007 2008 2009 2010 2011 2012 2013 2014
Total Building Permits 231 899 307 33 12 0 0 3 44 128 70 Annual % Change 13.2% 289.2% -65.9% -89.3% -63.6% -100.0% -- -- 666.7% 91.3% 2.3%SFD Building Permits 231 899 307 33 4 0 0 3 42 48 62 Annual % Change 13.2% 289.2% -65.9% -89.3% -87.9% -100.0% -- -- 1300.0% 14.3% 29.2%MF Building Permits 0 0 0 0 8 0 0 0 2 80 8 Annual % Change -- -- -- -- -- -100.0% -- -- -- -- --
Residenital Building Permit History
0
100
200
300
400
500
600
700
800
900
1,000
1992
1993
1994
1995
1996
1997
1998
1999
2000
2001
2002
2003
2004
2005
2006
2007
2008
2009
2010
2011
2012
2013
Source: SOCDS

93 June 2014 | Diablo Grande Existing Sales - Overview
7,807
13,381
5,725
305
1,373
345
0
200
400
600
800
1,000
1,200
1,400
1,600
0
2,000
4,000
6,000
8,000
10,000
12,000
14,000
12/0
03/
016/
019/
0112
/01
3/02
6/02
9/02
12/0
23/
036/
039/
0312
/03
3/04
6/04
9/04
12/0
43/
056/
059/
0512
/05
3/06
6/06
9/06
12/0
63/
076/
079/
0712
/07
3/08
6/08
9/08
12/0
83/
096/
099/
0912
/09
3/10
6/10
9/10
12/1
03/
116/
119/
1112
/11
3/12
6/12
9/12
12/1
23/
136/
139/
1312
/13
3/14
6/14
9/14
12/1
43/
15
Stan
isla
us C
ount
y
Rolling 12-Month Total Single Family Detached Sales
Stanislaus County City of Patterson
Source: Collateral Analytics
City
of P
atte
rson
Single family detached home sales in both Stanislaus County and Patterson have been on the decline since 2010. This is verification of the consistent price increases over the same time period (see the following page).
Stanislaus County vs. Patterson, CA (Zip Code 95363) SFD Sales

94 June 2014 | Diablo Grande Existing Sales - Overview
$140,917
$142,000
$402,583
$229,917
$505,750
$252,750
$100,000
$150,000
$200,000
$250,000
$300,000
$350,000
$400,000
$450,000
$500,000
$550,000
12/0
03/
016/
019/
0112
/01
3/02
6/02
9/02
12/0
23/
036/
039/
0312
/03
3/04
6/04
9/04
12/0
43/
056/
059/
0512
/05
3/06
6/06
9/06
12/0
63/
076/
079/
0712
/07
3/08
6/08
9/08
12/0
83/
096/
099/
0912
/09
3/10
6/10
9/10
12/1
03/
116/
119/
1112
/11
3/12
6/12
9/12
12/1
23/
136/
139/
1312
/13
3/14
6/14
9/14
12/1
43/
15
Rolling 12-Month Total Single Family Detached Price
Stanislaus County City of Patterson
Source: Collateral Analytics
After several months of small decreases or little change in single family detached homes price, there have been consistent monthly increases in Stanislaus County and Patterson. Prices have increased steadily (+/-$70,000 in Stanislaus County and +/-$100,000 in Patterson) since June of 2012. Note: Pricing if for all sales (new & resale). New homes will achieve a premium.
Stanislaus County vs. Patterson, CA (Zip Code 95363) SFD Price

95 June 2014 | Diablo Grande Existing Sales - Overview
$86
$84
$225
$135
$203
$111
$50
$75
$100
$125
$150
$175
$200
$225
$250
12/0
03/
016/
019/
0112
/01
3/02
6/02
9/02
12/0
23/
036/
039/
0312
/03
3/04
6/04
9/04
12/0
43/
056/
059/
0512
/05
3/06
6/06
9/06
12/0
63/
076/
079/
0712
/07
3/08
6/08
9/08
12/0
83/
096/
099/
0912
/09
3/10
6/10
9/10
12/1
03/
116/
119/
1112
/11
3/12
6/12
9/12
12/1
23/
136/
139/
1312
/13
3/14
6/14
9/14
12/1
43/
15
Rolling 12-Month Total Single Family Detached Price per Square Foot
Stanislaus County City of Patterson
Source: Collateral Analytics
Despite higher home prices compared to Stanislaus County, price per square foot values are generally lower in the City of Patterson. Buyers looking for larger homes could be drawn to Patterson in order to find the best value.
Stanislaus County vs. Patterson, CA (Zip Code 95363) SFD Price per Square Foot
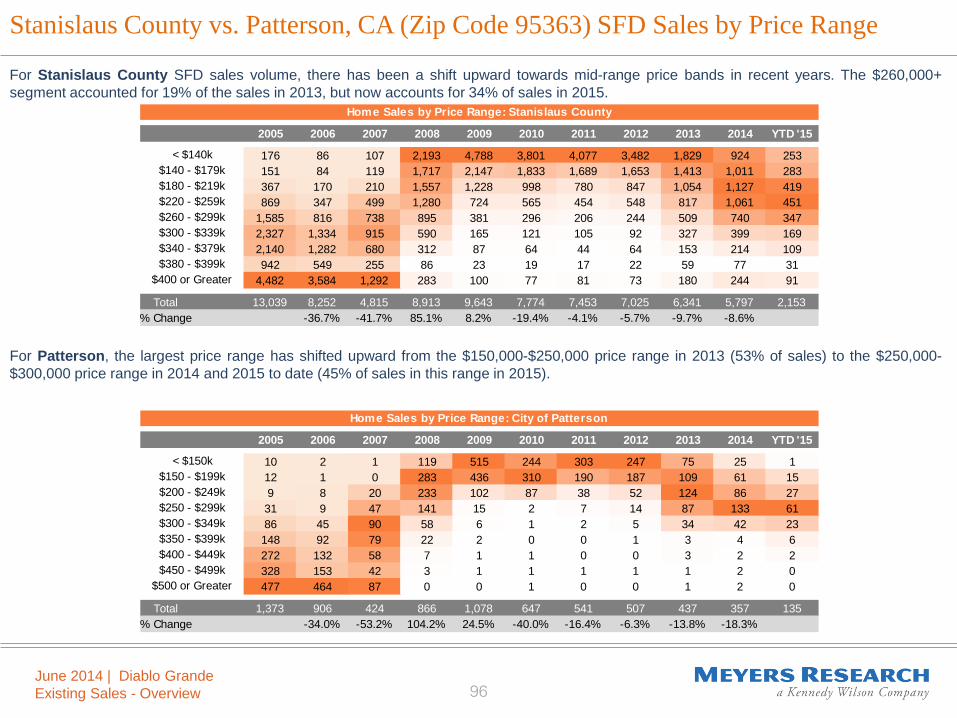
96 June 2014 | Diablo Grande Existing Sales - Overview
For Stanislaus County SFD sales volume, there has been a shift upward towards mid-range price bands in recent years. The $260,000+ segment accounted for 19% of the sales in 2013, but now accounts for 34% of sales in 2015. For Patterson, the largest price range has shifted upward from the $150,000-$250,000 price range in 2013 (53% of sales) to the $250,000-$300,000 price range in 2014 and 2015 to date (45% of sales in this range in 2015).
Stanislaus County vs. Patterson, CA (Zip Code 95363) SFD Sales by Price Range
Home Sales by Price Range: Stanislaus County
2005 2006 2007 2008 2009 2010 2011 2012 2013 2014 YTD '15
176 86 107 2,193 4,788 3,801 4,077 3,482 1,829 924 253151 84 119 1,717 2,147 1,833 1,689 1,653 1,413 1,011 283367 170 210 1,557 1,228 998 780 847 1,054 1,127 419869 347 499 1,280 724 565 454 548 817 1,061 451
1,585 816 738 895 381 296 206 244 509 740 3472,327 1,334 915 590 165 121 105 92 327 399 1692,140 1,282 680 312 87 64 44 64 153 214 109942 549 255 86 23 19 17 22 59 77 31
4,482 3,584 1,292 283 100 77 81 73 180 244 91
Total 13,039 8,252 4,815 8,913 9,643 7,774 7,453 7,025 6,341 5,797 2,153% Change -36.7% -41.7% 85.1% 8.2% -19.4% -4.1% -5.7% -9.7% -8.6%
< $140k$140 - $179k$180 - $219k$220 - $259k$260 - $299k$300 - $339k$340 - $379k$380 - $399k
$400 or Greater
Home Sales by Price Range: City of Patterson
2005 2006 2007 2008 2009 2010 2011 2012 2013 2014 YTD '15
10 2 1 119 515 244 303 247 75 25 112 1 0 283 436 310 190 187 109 61 159 8 20 233 102 87 38 52 124 86 2731 9 47 141 15 2 7 14 87 133 6186 45 90 58 6 1 2 5 34 42 23148 92 79 22 2 0 0 1 3 4 6272 132 58 7 1 1 0 0 3 2 2328 153 42 3 1 1 1 1 1 2 0477 464 87 0 0 1 0 0 1 2 0
Total 1,373 906 424 866 1,078 647 541 507 437 357 135% Change -34.0% -53.2% 104.2% 24.5% -40.0% -16.4% -6.3% -13.8% -18.3%
< $150k$150 - $199k$200 - $249k$250 - $299k$300 - $349k$350 - $399k$400 - $449k$450 - $499k
$500 or Greater

97 June 2014 | Diablo Grande Existing Sales - Overview
Home values in San Joaquin County have increased the City of Patterson and remain above Stanislaus County. Overall, home prices remain well below the 2006 peak, but have increased significantly over the past two years.
Stanislaus County vs. Patterson, CA (Zip Code 95363) vs. San Joaquin County SFD Price
$176,250
$140,917
$142,000
$460,750
$259,583
$402,583
$229,917
$505,750
$252,750
$100,000
$150,000
$200,000
$250,000
$300,000
$350,000
$400,000
$450,000
$500,000
$550,000
12/0
03/
016/
019/
0112
/01
3/02
6/02
9/02
12/0
23/
036/
039/
0312
/03
3/04
6/04
9/04
12/0
43/
056/
059/
0512
/05
3/06
6/06
9/06
12/0
63/
076/
079/
0712
/07
3/08
6/08
9/08
12/0
83/
096/
099/
0912
/09
3/10
6/10
9/10
12/1
03/
116/
119/
1112
/11
3/12
6/12
9/12
12/1
23/
136/
139/
1312
/13
3/14
6/14
9/14
12/1
43/
15
Rolling 12-Month Total Single Family Detached Price
San Joaquin County Stanislaus County City of Patterson
Source: Collateral Analytics

98 June 2014 | Diablo Grande Existing Sales - Overview
$100
$86
$84
$243
$143
$225
$135
$203
$111
$50
$75
$100
$125
$150
$175
$200
$225
$250
12/0
03/
016/
019/
0112
/01
3/02
6/02
9/02
12/0
23/
036/
039/
0312
/03
3/04
6/04
9/04
12/0
43/
056/
059/
0512
/05
3/06
6/06
9/06
12/0
63/
076/
079/
0712
/07
3/08
6/08
9/08
12/0
83/
096/
099/
0912
/09
3/10
6/10
9/10
12/1
03/
116/
119/
1112
/11
3/12
6/12
9/12
12/1
23/
136/
139/
1312
/13
3/14
6/14
9/14
12/1
43/
15
Rolling 12-Month Total Single Family Detached Price per Square Foot
San Joaquin County Stanislaus County City of Patterson
Source: Collateral Analytics
Following absolute prices, San Joaquin County’s price per square foot values are well above Stanislaus County and the City of Patterson. The average price per square foot of single family homes in all areas studied has been increasing for the past three years.
Stanislaus County vs. Patterson, CA (Zip Code 95363) vs. San Joaquin County SFD Price per Square Foot

99 June 2014 | Diablo Grande Existing Sales - Overview
$388,917
$140,917
$142,000
$720,917 $704,917
$402,583
$229,917
$505,750
$252,750
$100,000
$200,000
$300,000
$400,000
$500,000
$600,000
$700,000
$800,000
12/0
03/
016/
019/
0112
/01
3/02
6/02
9/02
12/0
23/
036/
039/
0312
/03
3/04
6/04
9/04
12/0
43/
056/
059/
0512
/05
3/06
6/06
9/06
12/0
63/
076/
079/
0712
/07
3/08
6/08
9/08
12/0
83/
096/
099/
0912
/09
3/10
6/10
9/10
12/1
03/
116/
119/
1112
/11
3/12
6/12
9/12
12/1
23/
136/
139/
1312
/13
3/14
6/14
9/14
12/1
43/
15
Rolling 12-Month Total Single Family Detached Price
Alameda County Stanislaus County City of Patterson
Source: Collateral Analytics
Home prices in the more urban Alameda County to the west are significantly higher than Stanislaus County and Patterson. Prices in Alameda have also been increasing at a faster pace than the other two geographies, increasing by 12% in the past year. High price points in Alameda County will drive buyers to more affordable locations east, possibly to Patterson and to a complete community like Diablo Grande.
Stanislaus County vs. Patterson, CA (Zip Code 95363) vs. Alameda County SFD Price

100 June 2014 | Diablo Grande Existing Sales - Overview
$222
$86
$84
$428 $412
$225
$135
$203
$111
$50
$100
$150
$200
$250
$300
$350
$400
$450
12/0
03/
016/
019/
0112
/01
3/02
6/02
9/02
12/0
23/
036/
039/
0312
/03
3/04
6/04
9/04
12/0
43/
056/
059/
0512
/05
3/06
6/06
9/06
12/0
63/
076/
079/
0712
/07
3/08
6/08
9/08
12/0
83/
096/
099/
0912
/09
3/10
6/10
9/10
12/1
03/
116/
119/
1112
/11
3/12
6/12
9/12
12/1
23/
136/
139/
1312
/13
3/14
6/14
9/14
12/1
43/
15
Rolling 12-Month Total Single Family Detached Price per Square Foot
Alameda County Stanislaus County City of Patterson
Source: Collateral Analytics
Following absolute prices, the SFD price per square foot in Alameda County is significantly higher than both Stanislaus County and the city of Patterson. While the average price per square foot of single family homes in all areas studied has been increasing for the past three years, Alameda County has greatly outpaced Stanislaus County and Patterson, creating an opportunity to capture buyers who have been priced out of a home in the area.
Stanislaus County vs. Patterson, CA (Zip Code 95363) vs. Alameda County SFD Price per Square Foot
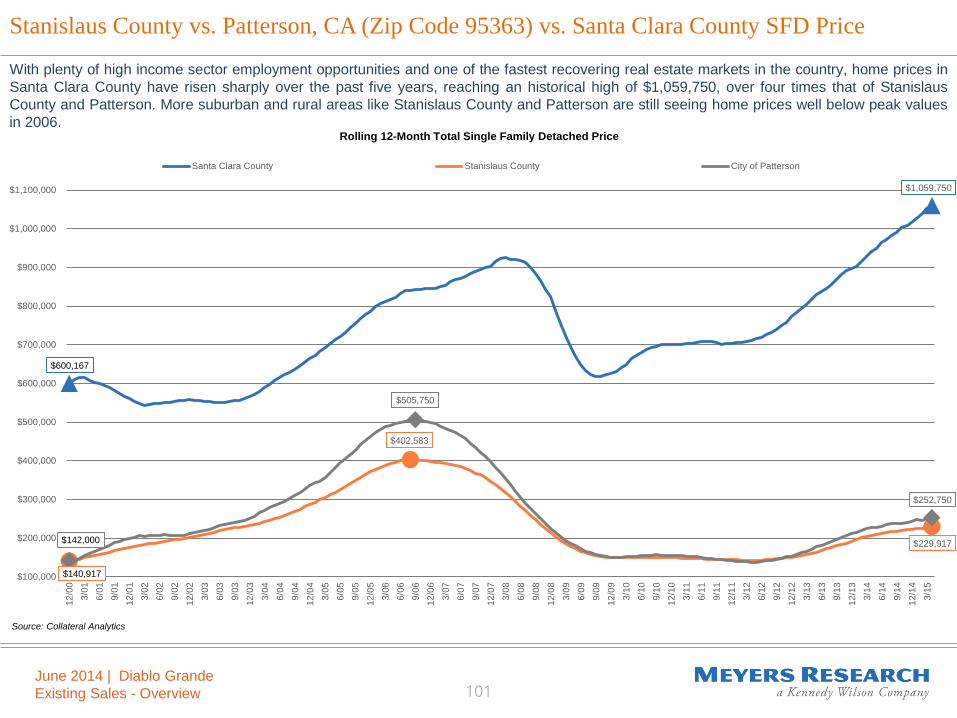
101 June 2014 | Diablo Grande Existing Sales - Overview
$600,167
$140,917
$142,000
$1,059,750
$402,583
$229,917
$505,750
$252,750
$100,000
$200,000
$300,000
$400,000
$500,000
$600,000
$700,000
$800,000
$900,000
$1,000,000
$1,100,000
12/0
03/
016/
019/
0112
/01
3/02
6/02
9/02
12/0
23/
036/
039/
0312
/03
3/04
6/04
9/04
12/0
43/
056/
059/
0512
/05
3/06
6/06
9/06
12/0
63/
076/
079/
0712
/07
3/08
6/08
9/08
12/0
83/
096/
099/
0912
/09
3/10
6/10
9/10
12/1
03/
116/
119/
1112
/11
3/12
6/12
9/12
12/1
23/
136/
139/
1312
/13
3/14
6/14
9/14
12/1
43/
15
Rolling 12-Month Total Single Family Detached Price
Santa Clara County Stanislaus County City of Patterson
Source: Collateral Analytics
With plenty of high income sector employment opportunities and one of the fastest recovering real estate markets in the country, home prices in Santa Clara County have risen sharply over the past five years, reaching an historical high of $1,059,750, over four times that of Stanislaus County and Patterson. More suburban and rural areas like Stanislaus County and Patterson are still seeing home prices well below peak values in 2006.
Stanislaus County vs. Patterson, CA (Zip Code 95363) vs. Santa Clara County SFD Price

102 June 2014 | Diablo Grande Existing Sales - Overview
$311
$86
$84
$582
$225
$135 $203
$111
$0
$50
$100
$150
$200
$250
$300
$350
$400
$450
$500
$550
$600
12/0
03/
016/
019/
0112
/01
3/02
6/02
9/02
12/0
23/
036/
039/
0312
/03
3/04
6/04
9/04
12/0
43/
056/
059/
0512
/05
3/06
6/06
9/06
12/0
63/
076/
079/
0712
/07
3/08
6/08
9/08
12/0
83/
096/
099/
0912
/09
3/10
6/10
9/10
12/1
03/
116/
119/
1112
/11
3/12
6/12
9/12
12/1
23/
136/
139/
1312
/13
3/14
6/14
9/14
12/1
43/
15
Rolling 12-Month Total Single Family Detached Price per Square Foot
Santa Clara County Stanislaus County City of Patterson
Source: Collateral Analytics
The price per square foot of a single family detached home in Santa Clara County is more than four times as high as that of Stanislaus County and over five times that of the City of Patterson. Buyers looking for larger homes have to opportunity to pay a fraction of the price in Stanislaus County and Patterson.
Stanislaus County vs. Patterson, CA (Zip Code 95363) vs. Santa Clara County SFD Price per Square Foot

103 June 2014 | Diablo Grande Existing Sales - Overview
$349,750
$140,917
$142,000
$703,583
$602,750
$402,583
$229,917
$505,750
$252,750
$100,000
$200,000
$300,000
$400,000
$500,000
$600,000
$700,000
$800,000
12/0
03/
016/
019/
0112
/01
3/02
6/02
9/02
12/0
23/
036/
039/
0312
/03
3/04
6/04
9/04
12/0
43/
056/
059/
0512
/05
3/06
6/06
9/06
12/0
63/
076/
079/
0712
/07
3/08
6/08
9/08
12/0
83/
096/
099/
0912
/09
3/10
6/10
9/10
12/1
03/
116/
119/
1112
/11
3/12
6/12
9/12
12/1
23/
136/
139/
1312
/13
3/14
6/14
9/14
12/1
43/
15
Rolling 12-Month Total Single Family Detached Price
Contra Costa County Stanislaus County City of Patterson
Source: Collateral Analytics
While home prices are slightly lower in Contra Costa County than other San Francisco Bay area counties such as Alameda County and Santa Clara County, prices are still more than double that of Stanislaus County and the City of Patterson. Despite the distance to large employment hubs such as Oakland, San Jose and San Francisco, the affordability of homes in these areas create a distinct advantage over other communities.
Stanislaus County vs. Patterson, CA (Zip Code 95363) vs. Contra Costa County SFD Price

104 June 2014 | Diablo Grande Existing Sales - Overview
$177
$86
$84
$359
$305
$225
$135
$203
$111
$50
$100
$150
$200
$250
$300
$350
$400
12/0
03/
016/
019/
0112
/01
3/02
6/02
9/02
12/0
23/
036/
039/
0312
/03
3/04
6/04
9/04
12/0
43/
056/
059/
0512
/05
3/06
6/06
9/06
12/0
63/
076/
079/
0712
/07
3/08
6/08
9/08
12/0
83/
096/
099/
0912
/09
3/10
6/10
9/10
12/1
03/
116/
119/
1112
/11
3/12
6/12
9/12
12/1
23/
136/
139/
1312
/13
3/14
6/14
9/14
12/1
43/
15
Rolling 12-Month Total Single Family Detached Price per Square Foot
Contra Costa County Stanislaus County City of Patterson
Source: Collateral Analytics
Price per square foot in Contra Costa County has risen sharply over the past three years, nearly double the values from the same period in 2012. Comparatively, prices in Patterson have risen $41/SF and just $39/SF in Stanislaus County. Buyers who are quickly being priced out of areas closer to the San Francisco Bay could look to communities like Patterson as a more affordable alternative.
Stanislaus County vs. Patterson, CA (Zip Code 95363) vs. Contra Costa County SFD Price per Square Foot

105 June 2014 | Diablo Grande Existing Sales - Overview
$490,167
$140,917
$142,000
$871,083
$833,000
$402,583
$229,917
$505,750
$252,750
$100,000
$200,000
$300,000
$400,000
$500,000
$600,000
$700,000
$800,000
$900,000
12/0
03/
016/
019/
0112
/01
3/02
6/02
9/02
12/0
23/
036/
039/
0312
/03
3/04
6/04
9/04
12/0
43/
056/
059/
0512
/05
3/06
6/06
9/06
12/0
63/
076/
079/
0712
/07
3/08
6/08
9/08
12/0
83/
096/
099/
0912
/09
3/10
6/10
9/10
12/1
03/
116/
119/
1112
/11
3/12
6/12
9/12
12/1
23/
136/
139/
1312
/13
3/14
6/14
9/14
12/1
43/
15
Rolling 12-Month Total Single Family Detached Price
TriValley Area Stanislaus County City of Patterson
Source: Collateral Analytics
The TriValley area (Dublin, Pleasanton, and Livermore) is an area closer to the San Francisco Bay area with significant new home activity. Buyers have better access to transportation, employment, shopping and other benefits of living closer to major cities. Prices as such are well above that of Stanislaus County and Patterson. Diablo Grande has the potential to pull buyers working in this area, especially based on the relative affordability.
Stanislaus County vs. Patterson, CA (Zip Code 95363) vs. TriValley Area SFD Price

106 June 2014 | Diablo Grande Existing Sales - Overview
$230
$86
$84
$408 $397
$225
$135
$203
$111
$0
$50
$100
$150
$200
$250
$300
$350
$400
$450
12/0
03/
016/
019/
0112
/01
3/02
6/02
9/02
12/0
23/
036/
039/
0312
/03
3/04
6/04
9/04
12/0
43/
056/
059/
0512
/05
3/06
6/06
9/06
12/0
63/
076/
079/
0712
/07
3/08
6/08
9/08
12/0
83/
096/
099/
0912
/09
3/10
6/10
9/10
12/1
03/
116/
119/
1112
/11
3/12
6/12
9/12
12/1
23/
136/
139/
1312
/13
3/14
6/14
9/14
12/1
43/
15
Rolling 12-Month Total Single Family Detached Price per Square Foot
TriValley Area Stanislaus County City of Patterson
Source: Collateral Analytics
Like much of the Bay Area, home values have increased significantly in the TriValley area, increasing by over $100/SF in three years. Buyers will be able to purchase a home for a third of the price per square foot in Patterson compared to the TriValley area.
Stanislaus County vs. Patterson, CA (Zip Code 95363) vs. Tri Valley Area SFD Price per Square Foot
June 2015 | Western Hills Water District Diablo Grande CFD No. 1 Diablo Grande in Stanislaus County, CA 107
Appendix: Land Residuals “Western Hills Water District Diablo Grande CFD No. 1 ” in Patterson, California Master Plan Community Assessment and Future Product Planning
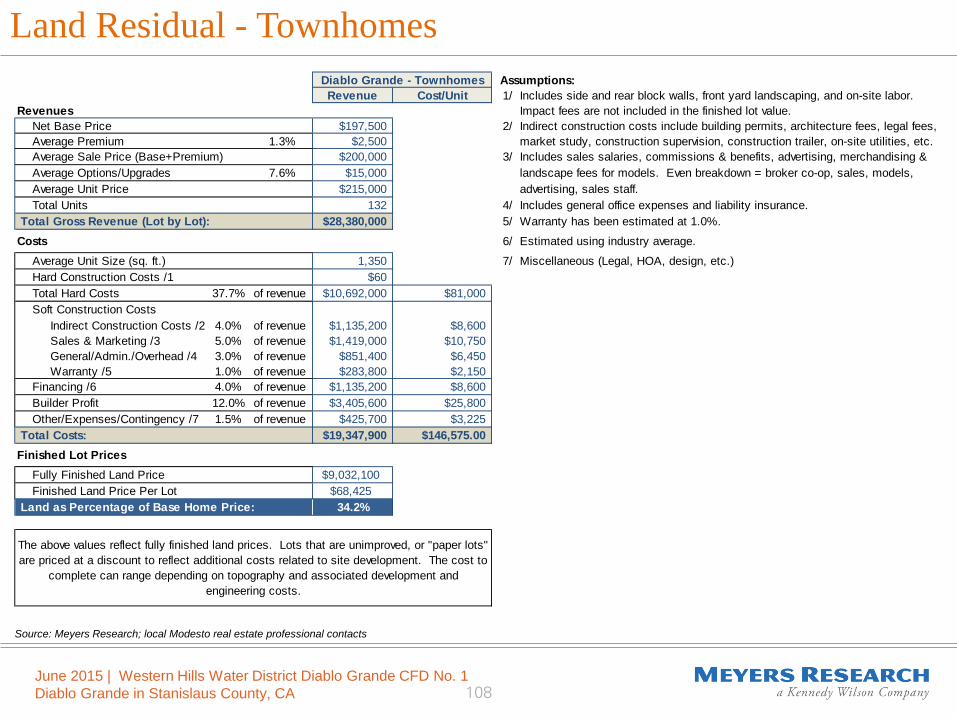
June 2015 | Western Hills Water District Diablo Grande CFD No. 1 Diablo Grande in Stanislaus County, CA 108
Land Residual - Townhomes
Source: Meyers Research; local Modesto real estate professional contacts
Diablo Grande - Townhomes Assumptions:Revenue Cost/Unit 1/ Includes side and rear block walls, front yard landscaping, and on-site labor.
Revenues Impact fees are not included in the finished lot value.Net Base Price $197,500 2/ Indirect construction costs include building permits, architecture fees, legal fees, Average Premium 1.3% $2,500 market study, construction supervision, construction trailer, on-site utilities, etc.Average Sale Price (Base+Premium) $200,000 3/ Includes sales salaries, commissions & benefits, advertising, merchandising & Average Options/Upgrades 7.6% $15,000 landscape fees for models. Even breakdown = broker co-op, sales, models, Average Unit Price $215,000 advertising, sales staff.Total Units 132 4/ Includes general office expenses and liability insurance.
Total Gross Revenue (Lot by Lot): $28,380,000 5/ Warranty has been estimated at 1.0%.Costs 6/ Estimated using industry average.
Average Unit Size (sq. ft.) 1,350 7/ Miscellaneous (Legal, HOA, design, etc.) Hard Construction Costs /1 $60Total Hard Costs 37.7% of revenue $10,692,000 $81,000Soft Construction Costs Indirect Construction Costs /2 4.0% of revenue $1,135,200 $8,600 Sales & Marketing /3 5.0% of revenue $1,419,000 $10,750 General/Admin./Overhead /4 3.0% of revenue $851,400 $6,450 Warranty /5 1.0% of revenue $283,800 $2,150Financing /6 4.0% of revenue $1,135,200 $8,600Builder Profit 12.0% of revenue $3,405,600 $25,800Other/Expenses/Contingency /7 1.5% of revenue $425,700 $3,225
Total Costs: $19,347,900 $146,575.00Finished Lot Prices
Fully Finished Land Price $9,032,100Finished Land Price Per Lot $68,425
Land as Percentage of Base Home Price: 34.2%
The above values reflect fully finished land prices. Lots that are unimproved, or "paper lots" are priced at a discount to reflect additional costs related to site development. The cost to
complete can range depending on topography and associated development and engineering costs.

June 2015 | Western Hills Water District Diablo Grande CFD No. 1 Diablo Grande in Stanislaus County, CA 109
Land Residual – Alley Load 40’ Wide
Source: Meyers Research; local Modesto real estate professional contacts
Diablo Grande - Alley 40' Assumptions:Revenue Cost/Unit 1/ Includes side and rear block walls, front yard landscaping, and on-site labor.
Revenues Impact fees are not included in the finished lot value.Net Base Price $245,000 2/ Indirect construction costs include building permits, architecture fees, legal fees, Average Premium 1.0% $2,500 market study, construction supervision, construction trailer, on-site utilities, etc.Average Sale Price (Base+Premium) $247,500 3/ Includes sales salaries, commissions & benefits, advertising, merchandising & Average Options/Upgrades 6.1% $15,000 landscape fees for models. Even breakdown = broker co-op, sales, models, Average Unit Price $262,500 advertising, sales staff.Total Units 40 4/ Includes general office expenses and liability insurance.
Total Gross Revenue (Lot by Lot): $10,500,000 5/ Warranty has been estimated at 1.0%.Costs 6/ Estimated using industry average.
Average Unit Size (sq. ft.) 1,700 7/ Miscellaneous (Legal, HOA, design, etc.) Hard Construction Costs /1 $60Total Hard Costs 38.9% of revenue $4,080,000 $102,000Soft Construction Costs Indirect Construction Costs /2 4.0% of revenue $420,000 $10,500 Sales & Marketing /3 5.0% of revenue $525,000 $13,125 General/Admin./Overhead /4 3.0% of revenue $315,000 $7,875 Warranty /5 1.0% of revenue $105,000 $2,625Financing /6 4.0% of revenue $420,000 $10,500Builder Profit 12.0% of revenue $1,260,000 $31,500Other/Expenses/Contingency /7 1.5% of revenue $157,500 $3,938
Total Costs: $7,282,500 $182,062.50Finished Lot Prices
Fully Finished Land Price $3,217,500Finished Land Price Per Lot $80,438
Land as Percentage of Base Home Price: 32.5%
The above values reflect fully finished land prices. Lots that are unimproved, or "paper lots" are priced at a discount to reflect additional costs related to site development.
The cost to complete can range depending on topography and associated development and engineering costs.

June 2015 | Western Hills Water District Diablo Grande CFD No. 1 Diablo Grande in Stanislaus County, CA 110
Land Residual – Single Family 1 (50’ Wide)
Source: Meyers Research; local Modesto real estate professional contacts
Diablo Grande - SFD1 50' Assumptions:Revenue Cost/Unit 1/ Includes side and rear block walls, front yard landscaping, and on-site labor.
Revenues Impact fees are not included in the finished lot value.Net Base Price $285,000 2/ Indirect construction costs include building permits, architecture fees, legal fees, Average Premium 1.8% $5,000 market study, construction supervision, construction trailer, on-site utilities, etc.Average Sale Price (Base+Premium) $290,000 3/ Includes sales salaries, commissions & benefits, advertising, merchandising & Average Options/Upgrades 7.0% $20,000 landscape fees for models. Even breakdown = broker co-op, sales, models, Average Unit Price $310,000 advertising, sales staff.Total Units 142 4/ Includes general office expenses and liability insurance.
Total Gross Revenue (Lot by Lot): $44,020,000 5/ Warranty has been estimated at 1.0%.Costs 6/ Estimated using industry average.
Average Unit Size (sq. ft.) 2,100 7/ Miscellaneous (Legal, HOA, design, etc.) Hard Construction Costs /1 $60Total Hard Costs 40.6% of revenue $17,892,000 $126,000Soft Construction Costs Indirect Construction Costs /2 4.0% of revenue $1,760,800 $12,400 Sales & Marketing /3 5.0% of revenue $2,201,000 $15,500 General/Admin./Overhead /4 3.0% of revenue $1,320,600 $9,300 Warranty /5 1.0% of revenue $440,200 $3,100Financing /6 4.0% of revenue $1,760,800 $12,400Builder Profit 12.0% of revenue $5,282,400 $37,200Other/Expenses/Contingency /7 1.5% of revenue $660,300 $4,650
Total Costs: $31,318,100 $220,550.00Finished Lot Prices
Fully Finished Land Price $12,701,900Finished Land Price Per Lot $89,450
Land as Percentage of Base Home Price: 30.8%
The above values reflect fully finished land prices. Lots that are unimproved, or "paper lots" are priced at a discount to reflect additional costs related to site development.
The cost to complete can range depending on topography and associated development and engineering costs.

June 2015 | Western Hills Water District Diablo Grande CFD No. 1 Diablo Grande in Stanislaus County, CA 111
Land Residual – Single Family 2 (50’ Wide)
Source: Meyers Research; local Modesto real estate professional contacts
Diablo Grande - SFD2 50' Assumptions:Revenue Cost/Unit 1/ Includes side and rear block walls, front yard landscaping, and on-site labor.
Revenues Impact fees are not included in the finished lot value.Net Base Price $310,052 2/ Indirect construction costs include building permits, architecture fees, legal fees, Average Premium 1.6% $5,000 market study, construction supervision, construction trailer, on-site utilities, etc.Average Sale Price (Base+Premium) $315,052 3/ Includes sales salaries, commissions & benefits, advertising, merchandising & Average Options/Upgrades 6.5% $20,000 landscape fees for models. Even breakdown = broker co-op, sales, models, Average Unit Price $335,052 advertising, sales staff.Total Units 385 4/ Includes general office expenses and liability insurance.
Total Gross Revenue (Lot by Lot): $128,995,000 5/ Warranty has been estimated at 1.0%.Costs 6/ Estimated using industry average.
Average Unit Size (sq. ft.) 2,301 7/ Miscellaneous (Legal, HOA, design, etc.) Hard Construction Costs /1 $60Total Hard Costs 41.2% of revenue $53,148,000 $138,047Soft Construction Costs Indirect Construction Costs /2 4.0% of revenue $5,159,800 $13,402 Sales & Marketing /3 5.0% of revenue $6,449,750 $16,753 General/Admin./Overhead /4 3.0% of revenue $3,869,850 $10,052 Warranty /5 1.0% of revenue $1,289,950 $3,351Financing /6 4.0% of revenue $5,159,800 $13,402Builder Profit 12.0% of revenue $15,479,400 $40,206Other/Expenses/Contingency /7 1.5% of revenue $1,934,925 $5,026
Total Costs: $92,491,475 $240,237.60Finished Lot Prices
Fully Finished Land Price $36,503,525Finished Land Price Per Lot $94,814
Land as Percentage of Base Home Price: 30.1%
The above values reflect fully finished land prices. Lots that are unimproved, or "paper lots" are priced at a discount to reflect additional costs related to site development.
The cost to complete can range depending on topography and associated development and engineering costs.

June 2015 | Western Hills Water District Diablo Grande CFD No. 1 Diablo Grande in Stanislaus County, CA 112
Land Residual – Single Family 3 (60’ Wide)
Source: Meyers Research; local Modesto real estate professional contacts
Diablo Grande - SFD3 60' Assumptions:Revenue Cost/Unit 1/ Includes side and rear block walls, front yard landscaping, and on-site labor.
Revenues Impact fees are not included in the finished lot value.Net Base Price $331,250 2/ Indirect construction costs include building permits, architecture fees, legal fees, Average Premium 2.3% $7,500 market study, construction supervision, construction trailer, on-site utilities, etc.Average Sale Price (Base+Premium) $338,750 3/ Includes sales salaries, commissions & benefits, advertising, merchandising & Average Options/Upgrades 7.5% $25,000 landscape fees for models. Even breakdown = broker co-op, sales, models, Average Unit Price $363,750 advertising, sales staff.Total Units 290 4/ Includes general office expenses and liability insurance.
Total Gross Revenue (Lot by Lot): $105,487,500 5/ Warranty has been estimated at 1.0%.Costs 6/ Estimated using industry average.
Average Unit Size (sq. ft.) 2,500 7/ Miscellaneous (Legal, HOA, design, etc.) Hard Construction Costs /1 $60Total Hard Costs 41.2% of revenue $43,500,000 $150,000Soft Construction Costs Indirect Construction Costs /2 4.0% of revenue $4,219,500 $14,550 Sales & Marketing /3 5.0% of revenue $5,274,375 $18,188 General/Admin./Overhead /4 3.0% of revenue $3,164,625 $10,913 Warranty /5 1.0% of revenue $1,054,875 $3,638Financing /6 4.0% of revenue $4,219,500 $14,550Builder Profit 12.0% of revenue $12,658,500 $43,650Other/Expenses/Contingency /7 1.5% of revenue $1,582,313 $5,456
Total Costs: $75,673,688 $260,943.75Finished Lot Prices
Fully Finished Land Price $29,813,813Finished Land Price Per Lot $102,806
Land as Percentage of Base Home Price: 30.3%
The above values reflect fully finished land prices. Lots that are unimproved, or "paper lots" are priced at a discount to reflect additional costs related to site development.
The cost to complete can range depending on topography and associated development and engineering costs.

June 2015 | Western Hills Water District Diablo Grande CFD No. 1 Diablo Grande in Stanislaus County, CA 113
Land Residual – Single Family 4 (60’ Wide)
Source: Meyers Research; local Modesto real estate professional contacts
Diablo Grande - SFD4 60' Assumptions:Revenue Cost/Unit 1/ Includes side and rear block walls, front yard landscaping, and on-site labor.
Revenues Impact fees are not included in the finished lot value.Net Base Price $367,566 2/ Indirect construction costs include building permits, architecture fees, legal fees, Average Premium 2.0% $7,500 market study, construction supervision, construction trailer, on-site utilities, etc.Average Sale Price (Base+Premium) $375,066 3/ Includes sales salaries, commissions & benefits, advertising, merchandising & Average Options/Upgrades 6.8% $25,000 landscape fees for models. Even breakdown = broker co-op, sales, models, Average Unit Price $400,066 advertising, sales staff.Total Units 489 4/ Includes general office expenses and liability insurance.
Total Gross Revenue (Lot by Lot): $195,632,500 5/ Warranty has been estimated at 1.0%.Costs 6/ Estimated using industry average.
Average Unit Size (sq. ft.) 2,801 7/ Miscellaneous (Legal, HOA, design, etc.) Hard Construction Costs /1 $60Total Hard Costs 42.0% of revenue $82,182,000 $168,061Soft Construction Costs Indirect Construction Costs /2 4.0% of revenue $7,825,300 $16,003 Sales & Marketing /3 5.0% of revenue $9,781,625 $20,003 General/Admin./Overhead /4 3.0% of revenue $5,868,975 $12,002 Warranty /5 1.0% of revenue $1,956,325 $4,001Financing /6 4.0% of revenue $7,825,300 $16,003Builder Profit 12.0% of revenue $23,475,900 $48,008Other/Expenses/Contingency /7 1.5% of revenue $2,934,488 $6,001
Total Costs: $141,849,913 $290,081.62Finished Lot Prices
Fully Finished Land Price $53,782,588Finished Land Price Per Lot $109,985
Land as Percentage of Base Home Price: 29.3%
The above values reflect fully finished land prices. Lots that are unimproved, or "paper lots" are priced at a discount to reflect additional costs related to site development.
The cost to complete can range depending on topography and associated development and engineering costs.

June 2015 | Western Hills Water District Diablo Grande CFD No. 1 Diablo Grande in Stanislaus County, CA 114
Land Residual – Single Family 5 (75’ Wide)
Source: Meyers Research; local Modesto real estate professional contacts
Diablo Grande - SFD5 75' Assumptions:Revenue Cost/Unit 1/ Includes side and rear block walls, front yard landscaping, and on-site labor.
Revenues Impact fees are not included in the finished lot value.Net Base Price $417,730 2/ Indirect construction costs include building permits, architecture fees, legal fees, Average Premium 3.0% $12,500 market study, construction supervision, construction trailer, on-site utilities, etc.Average Sale Price (Base+Premium) $430,230 3/ Includes sales salaries, commissions & benefits, advertising, merchandising & Average Options/Upgrades 8.4% $35,000 landscape fees for models. Even breakdown = broker co-op, sales, models, Average Unit Price $465,230 advertising, sales staff.Total Units 141 4/ Includes general office expenses and liability insurance.
Total Gross Revenue (Lot by Lot): $65,597,500 5/ Warranty has been estimated at 1.0%.Costs 6/ Estimated using industry average.
Average Unit Size (sq. ft.) 3,304 7/ Miscellaneous (Legal, HOA, design, etc.) Hard Construction Costs /1 $60Total Hard Costs 42.6% of revenue $27,948,000 $198,213Soft Construction Costs Indirect Construction Costs /2 4.0% of revenue $2,623,900 $18,609 Sales & Marketing /3 5.0% of revenue $3,279,875 $23,262 General/Admin./Overhead /4 3.0% of revenue $1,967,925 $13,957 Warranty /5 1.0% of revenue $655,975 $4,652Financing /6 4.0% of revenue $2,623,900 $18,609Builder Profit 12.0% of revenue $7,871,700 $55,828Other/Expenses/Contingency /7 1.5% of revenue $983,963 $6,978
Total Costs: $47,955,238 $340,108.07Finished Lot Prices
Fully Finished Land Price $17,642,263Finished Land Price Per Lot $125,122
Land as Percentage of Base Home Price: 29.1%
The above values reflect fully finished land prices. Lots that are unimproved, or "paper lots" are priced at a discount to reflect additional costs related to site development.
The cost to complete can range depending on topography and associated development and engineering costs.

June 2015 | Western Hills Water District Diablo Grande CFD No. 1 Diablo Grande in Stanislaus County, CA
MARKET ASSESSMENT AND ANALYSIS “Diablo Grande” in Patterson, California
Master Plan Community Assessment and Future Product Planning

[THIS PAGE INTENTIONALLY LEFT BLANK]

D-1
APPENDIX D
SUMMARY OF CERTAIN PROVISIONS OF THE FISCAL AGENT AGREEMENT
The following summary of the Fiscal Agent Agreement is a summary only and does not purport to be a complete statement of the contents thereof. Reference is made to the Fiscal Agent Agreement for the complete terms thereof.
Definitions
“2014 Bonds” means the Western Hills Water District Diablo Grande Community
Facilities District No. 1 Special Tax Refunding Bonds, Series 2014. “2015 Bonds” means the Western Hills Water District Diablo Grande Community
Facilities District No. 1 Special Tax Refunding Bonds, Series 2015. "Acquisition Agreement" means the Acquisition Agreement, dated as of August 1, 2001
and the supplements thereto dated as of December 1, 2002, May 1, 2004, and January 1, 2005 and entered into by and between the Water District and the Master Developer, and any amendments thereto.
"Act" means the Mello-Roos Community Facilities Act of 1982, as amended, being
Sections 53311 et seq. of the California Government Code. “Additional Bonds” means any series of bonds other than the 2014 Bonds and 2015
Bonds issued pursuant to the Fiscal Agent Agreement. "Administrative Expenses" means any or all of the following: the fees and expenses of
the Fiscal Agent (including any fees or expenses of its counsel), the expenses of the Water District in carrying out its duties under the Fiscal Agent Agreement (including, but not limited to, the levying and collection of the Special Taxes, and the foreclosure of the liens of delinquent Special Taxes) including the fees and expenses of its counsel, an allocable share of the salaries of Water District staff directly related thereto and a proportionate amount of Water District general administrative overhead related thereto, any amounts paid by the Water District from its general funds pursuant to the Fiscal Agent Agreement, and all other costs and expenses of the Water District or the Fiscal Agent incurred in connection with the issuance and administration of the Bonds and/or the discharge of their respective duties under the Fiscal Agent Agreement (including, but not limited to, the calculation of the levy of the Special Taxes, foreclosures with respect to delinquent taxes, and the calculation of amounts subject to rebate to the United States) and, in the case of the Water District, in any way related to the administration of the District. Administrative Expenses shall include any such expenses incurred in prior years but not yet paid, and any advances of funds by the Water District under the Fiscal Agent Agreement.
"Annual Debt Service" means, for each Bond Year, the sum of (i) the interest due on the
Outstanding Bonds in such Bond Year, assuming that the Outstanding Bonds are retired as scheduled, and (ii) the principal amount of the Outstanding Bonds including any mandatory sinking fund payments due in such Bond Year.

D-2
"Authorized Officer" means the Water District Treasurer, President or any other officer or employee authorized by the Board of Directors of the Water District or by an Authorized Officer to undertake the action referenced in this Agreement as required to be undertaken by an Authorized Officer.
"Bond Counsel" means any attorney or firm of attorneys acceptable to the Water District
and nationally recognized for expertise in rendering opinions as to the legality and tax-exempt status of securities issued by public entities.
"Bond Year" means each twelve-month period beginning on September 2 in any year
and extending to the next succeeding September 1, both dates inclusive; except that the first Bond Year shall begin on the Closing Date and end on September 1, 2004.
“Bonds” means the Western Hills Water District Diablo Grande Community Facilities
District No. 1 Special Tax Bonds of any series at any time Outstanding under the Fiscal Agent Agreement or any Supplemental Agreement.
"Business Day" means any day other than (i) a Saturday or a Sunday or (ii) a day on
which banking institutions in the state in which the Principal Office of the Fiscal Agent is located are authorized or obligated by law or executive order to be closed.
"CDIAC" means the California Debt and Investment Advisory Commission of the office of
the State Treasurer of the State of California or any successor agency or bureau thereto. "Closing Date" means the date upon which there is a physical delivery of the Bonds in
exchange for the amount representing the purchase price of the Bonds by the Original Purchaser.
"Code" means the Internal Revenue Code of 1986 as in effect on the date of issuance of
the Bonds or (except as otherwise referenced herein) as it may be amended to apply to obligations issued on the date of issuance of the Bonds, together with applicable temporary and final regulations promulgated, and applicable official public guidance published, under the Code.
"Cost of Issuance" means items of expense payable or reimbursable directly or indirectly by the Water District and related to the authorization, sale and issuance of the Bonds, which items of expense shall include, but not be limited to, printing costs, costs of reproducing and binding documents, closing costs, filing and recording fees, initial fees, expenses and charges of the Fiscal Agent including its first annual administration fee, expenses incurred by the Water District in connection with the issuance of the Bonds, financial advisor fees, Bond (underwriter's) discount or underwriting fee, legal fees and charges, including bond counsel, charges for execution, transportation and safekeeping of the Bonds and other costs, charges and fees in connection with the foregoing.
"DTC" means the Depository Trust Company, New York, New York, and its successors
and assigns. "Debt Service" means the scheduled amount of interest and amortization of principal
payable on the Bonds during the period of computation, excluding amounts scheduled during such period which relate to principal which has been retired before the beginning of such period.

D-3
"Debt Service Account" means the account of the Special Tax Fund by that name established by the Fiscal Agent.
"District" means the Western Hills Water District Diablo Grande Community Facilities
District No. 1 formed pursuant to the Resolution of Formation. "Fair Market Value" means the price at which a willing buyer would purchase the
investment from a willing seller in a bona fide, arm's length transaction (determined as of the date the contract to purchase or sell the investment becomes binding) if the investment is traded on an established securities market (within the meaning of Section 1273 of the Code) and, otherwise, the term "Fair Market Value" means the acquisition price in a bona fide arm's length transaction (as referenced above) if (i) the investment is a certificate of deposit that is acquired in accordance with applicable regulations under the Code, (ii) the investment is an agreement with specifically negotiated withdrawal or reinvestment provisions and a specifically negotiated interest rate (for example, a guaranteed investment contract, a forward supply contract or other investment agreement) that is acquired in accordance with applicable regulations under the Code, (iii) the investment is a United States Treasury Security—State and Local Government Series that is acquired in accordance with applicable regulations of the United States Bureau of Public Debt, or (iv) the investment is the Local Agency Investment Fund of the State of California, but only if at all times during which the investment is held its yield is reasonably expected to be equal to or greater than the yield on a reasonably comparable direct obligation of the United States.
"Federal Securities" means any of the following which are non-callable and which at the
time of investment are legal investments under the laws of the State of California for funds held by the Fiscal Agent (the Fiscal Agent entitled to rely upon investment direction from the Water District as a certification that such investment constitutes a legal investment).
(i) Direct general obligations of the United States of America (including
obligations issued or held in book-entry form on the books of the United States Department of the Treasury) and obligations, the payment of principal of and interest on which are directly or indirectly guaranteed by the United States of America, including, without limitation, such of the foregoing which are commonly referred to as "stripped" obligations and coupons; or
(ii) Any of the following obligations of the following agencies of the United States of America: (i) direct obligations of the Export-Import Bank, (ii) certificates of beneficial ownership issued by the Farmers Home Administration, (iii) participation certificates issued by the General Services Administration, (iv) mortgage-backed bonds or passthrough obligations issued and guaranteed by the Government National Mortgage Association, (v) project notes issued by the United States Department of Housing and Urban Development, and (vi) public housing notes and bonds guaranteed by the United States of America. "Fiscal Agent" means the Fiscal Agent appointed by the Water District and acting as an
independent fiscal agent with the duties and powers herein provided, its successors and assigns, and any other corporation or association which may at any time be substituted in its place, as provided in the Fiscal Agent Agreement.
"Fiscal Agent Agreement" means the Fiscal Agent Agreement dated as of July 1, 2001,
the First Supplement to Fiscal Agent Agreement dated as of December 1, 2002, the Second

D-4
Supplement to Fiscal Agent Agreement dated as of May 1, 2004, the Third Supplement to Fiscal Agent Agreement dated as of January 1, 2005, and the Fourth Supplemental Agreement to Fiscal Agent Agreement dated as of August 1, 2014 by and between the Water District and the Fiscal Agent, and the Fifth Supplemental Agreement to Fiscal Agent Agreement dated as of July 1, 2015, as it may be amended or supplemented from time to time by any Supplemental Agreement.
"Fiscal Year" means the twelve-month period extending from July 1 in a calendar year to
June 30 of the succeeding year, both dates inclusive. "Information Services" means Financial Information, Inc 's "Daily Called Bond Service,"
30 Montgomery Street, 10th Floor, Jersey City, New Jersey 07302, Attention Editor; Kenny Information Services' "Called Bond Service," 65 Broadway, 16th Floor, New York, New York 10064; Moody's Investors Service "Municipal and Government," 5250 77 Center Drive, Charlotte, North Carolina 28217, Attention Municipal News Reports; Standard & Poor's Ratings Services "Called Bond Record," 25 Broadway, 3rd Floor, New York, New York 10004; and, in accordance with then current guidelines of the Securities and Exchange Commission, such other addresses and/or such services providing information with respect to called bonds as the Water District may designate in an Officer's Certificate delivered to the Fiscal Agent.
"Interest Payment Dates" means, (i) with respect to the 2014 Bonds, March 1 and
September 1 of each year, commencing with March 1, 2015, and (ii) with respect to the 2015 Bonds, March 1 and September 1 of each year, commencing March 1, 2016.
“Master Developer” means Diablo Grande Limited Partnership, a California limited
partnership. "Maximum Annual Debt Service" means the largest Annual Debt Service for any Bond
Year after the calculation is made through the final maturity date of any Outstanding Bonds. "Officer's Certificate" means a written certificate of the Water District signed by an
Authorized Officer of the Water District. "Ordinance" means any ordinance of the Water District levying the Special Taxes. "Original Purchaser" means the first purchaser of the Bonds from the Water District. "Outstanding," when used as of any particular time with reference to Bonds, means
(subject to the provisions of the Fiscal Agent Agreement) all Bonds except (i) Bonds theretofore canceled by the Fiscal Agent or surrendered to the Fiscal Agent for cancellation; (ii) Bonds paid or deemed to have been paid within the meaning of the Fiscal Agent Agreement; and (iii) Bonds in lieu of or in substitution for which other Bonds shall have been authorized, executed, issued and delivered by the Water District pursuant to the Fiscal Agent Agreement or any Supplemental Agreement.
"Owner" or "Bondowner" means any person who shall be the registered owner of any
Outstanding Bond.
"Permitted Investments" means any of the following, to the extent that they are lawful investments for Water District funds at the time of investment, and are acquired at Fair Market

D-5
Value (the Fiscal Agent entitled to rely upon investment direction from the Water District as a certification that such investment constitutes a legal investment):
(i) Federal Securities;
(ii) any of following obligations of federal agencies not guaranteed by the
United States of America: (a) debentures issued by the Federal Housing Administration; (b) participation certificates or senior debt obligations of the Federal Home Loan Mortgage Corporation or Farm Credit Banks (consisting of Federal Land Banks, Federal Intermediate Credit Banks or Banks for Cooperatives); (c) bonds or debentures of the Federal Home Loan Bank Board established under the Federal Home Loan Bank Act, bonds of any federal home loan bank established under said act and stocks, bonds, debentures, participations and other obligations of or issued by the Federal National Mortgage Association, the Student Loan Marketing Association, the Government National Mortgage Association and the Federal Home Loan Mortgage Corporation; and bonds, notes or other obligations issued or assumed by the International Bank for Reconstruction and Development;
(iii) interest-bearing demand or time deposits (including certificates of deposit) in federal or State of California chartered banks (including the Fiscal Agent), provided that (a) in the case of a savings and loan association, such demand or time deposits shall be fully insured by the Federal Deposit Insurance Corporation, or the unsecured obligations of such savings and loan association shall be rated in one of the top two rating categories by a nationally recognized rating service, and (b) in the case of a bank, such demand or time deposits shall be fully insured by the Federal Deposit Insurance Corporation, or the unsecured obligations of such bank (or the unsecured obligations of the parent bank holding company of which such bank is the lead bank) shall be rated in one of the top two rating categories by a nationally recognized rating service;
(iv) repurchase agreements with a registered broker/dealer subject to the Securities Investors' Protection Corporation Liquidation in the event of insolvency, or any commercial bank provided that: (a) the unsecured obligations of such bank shall be rated in one of the top two rating categories by a nationally recognized rating service, or such bank shall be the lead bank of a banking holding company whose unsecured obligations are rated in one of the top two rating categories by a nationally recognized rating service; (b) the most recent reported combined capital, surplus and undivided profits of such bank shall be not less than $100 million; (c) the repurchase obligation under any such repurchase obligation shall be required to be performed in not more than thirty (30) days; (d) the entity holding such securities as described in clause (c) shall have a pledged first security interest therein for the benefit of the Fiscal Agent under the California Commercial Code or pursuant to the book-entry procedures described by 31 C.F.R. 306.1 et seq. or 31 C.F.R. 350.0 et seq. and are rated in one of the top two rating categories by a nationally recognized rating service;
(v) bankers acceptances endorsed and guaranteed by banks described in clause (iv) above;
(vi) obligations, the interest on which is exempt from federal income taxation under Section 103 of the Code and which are rated in the one of the top two rating categories by a nationally recognized rating service;

D-6
(vii) money market funds which invest solely in Federal Securities or in
obligations described in the preceding clause (ii) of this definition, or money market funds which are rated in the highest rating category by Standard & Poor's Ratings Services or Moody's Investor Service, including funds which are managed or maintained by the Fiscal Agent;
(viii) units of a taxable government money market portfolio comprised solely of obligations listed in (i) or (iv) above;
(ix) any investment which is a legal investment for proceeds of the Bonds at the time of the execution of such agreement, and which investment is made pursuant to an agreement between the Water District or the Fiscal Agent or any successor Fiscal Agent and a financial institution or governmental body whose long term debt obligations are rated in one of the top two rating categories by a nationally recognized rating service;
(x) commercial paper of "prime" quality of the highest ranking or of the highest letter and numerical rating as provided for by Moody's Investors Service, or Standard and Poor's Corporation, of issuing corporations that are organized and operating within the United States and having total assets in excess of five hundred million dollars ($500,000,000) and having an "AA" or higher rating for the issuer's debentures, other than commercial paper, as provided for by Moody's Investors Service or Standard and Poor's Corporation, and provided that purchases of eligible commercial paper may not exceed 180 days maturity nor represent more than 10 percent of the outstanding paper of an issuing corporation;
(xi) any general obligation of a bank or insurance company whose long term debt obligations are rated in one of the two highest rating categories of a national rating service;
(xii) shares in a common law trust established pursuant to Title 1, Division 7, Charter 5 of the Government Code of the State which invests exclusively in investments permitted by Section 53635 of Title 5, Division 2, Chapter 4 of the Government Code of the State, as it may be amended;
(xiii) shares in the California Asset Management Program; or (xiv) any other lawful investment for Water District funds.
"Principal Office" means the corporate trust office of the Fiscal Agent in San Francisco,
California, or such other or additional offices as may be designated by the Fiscal Agent. "Project" means the acquisitions and improvements described in the Resolution of
Intention. "Record Date" means the fifteenth (15th) day of the month next preceding the month of
the applicable Interest Payment Date. "Regulations" means temporary and permanent regulations promulgated under the
Code.

D-7
"Reserve Fund Credit Instrument" means a surety bond issued by an insurance
company rated in the highest rating category by Standard & Poor's and Moody's. "Reserve Requirement" means an amount equal to the lesser of (a) Maximum Annual
Debt Service on the Outstanding Bonds, (b) 125% of average annual Debt Service, or (c) ten percent (10%) of the total proceeds of the Bonds deposited under the Fiscal Agent Agreement.
"Resolution of Formation" means Resolution No. 2000-06, adopted by the Board of Directors of the Water District on September 24, 2000, establishing the District for the purpose of providing for the financing of certain public facilities in and for such District.
"Resolution of Intention" means Resolution No. 2000-03, adopted by the Board of
Directors of the Water District on August 24, 2000. "Securities Depositories" means The Depository Trust Company, 711 Stewart Avenue,
Garden City, New York 11530, Fax-(516) 227-4039 or 4190; Midwest Securities Trust Company, Capital Structures-Call Notification, 440 South LaSalle Street, Chicago, Illinois 60605, Fax-(312) 663-2343; Philadelphia Depository Trust Company, Reorganization Division, 1900 Market Street, Philadelphia, Pennsylvania 19103, Attention Bond Department, Dex-(215) 496-5058; and, in accordance with then current guidelines of the Securities and Exchange Commission, such other addresses and/or such other securities depositories as the Water District may designate in an Officer's Certificate delivered to the Fiscal Agent.
"Special Tax Revenues" means the proceeds of the Special Taxes received by the
Water District, including all scheduled payments and delinquent payments thereof, interest and penalties thereon and proceeds of the redemption or sale of property sold as a result of foreclosure of the lien of the Special Taxes.
"Special Taxes" means the special taxes levied within the District pursuant to the Act,
the Ordinance and the Fiscal Agent Agreement. "Supplemental Agreement" means an agreement the execution of which is authorized by
a resolution which has been duly adopted by the Water District under the Act and which agreement is amendatory of or supplemental to the Fiscal Agent Agreement, but only if and to the extent that such agreement is specifically authorized under the Fiscal Agent Agreement.
"Treasurer" means the duly acting Treasurer of the Water District or if the Water District
has no Treasurer, the President of the Water District or such employee of the Water District as the Board of Directors of the Water District authorizes to act in place of the Treasurer for purposes of administration of the Bonds.
“Water District” means the Western Hills Water District a water district duly organized and existing under Division 13, Sections 34000-38501 of the California Water Code, and any successor thereto.

D-8
Special Tax Revenues; Flow of Funds Pledge of Special Tax Revenues. All of the Special Tax Revenues and all moneys
deposited in the Bond Fund, the Reserve Fund and, until disbursed as provided in the Fiscal Agent Agreement, in the Special Tax Fund are pledged to secure the repayment of the Bonds. Such pledge shall constitute a first lien on the Special Tax Revenues and said amounts. The Special Tax Revenues and all moneys deposited in such funds (except as otherwise provided in the Fiscal Agent Agreement) are dedicated in their entirety to the payment of the principal of, and interest and any premium on, the Bonds as provided in the Fiscal Agent Agreement and in the Act until all of the Bonds have been paid and retired or until moneys or Defeasance Obligations have been set aside irrevocably for that purpose in accordance with the Fiscal Agent Agreement. Amounts in the Costs of Issuance Fund are not pledged to the repayment of the Bonds.
Special Tax Fund
Establishment of Special Tax Fund. There is established under the Fiscal Agent
Agreement as separate funds to be held by the Fiscal Agent, (i) the Diablo Grande Community Facilities District No. 1 Special Tax Bonds, Series 2014, Special Tax Fund, and (ii) the Diablo Grande Community Facilities District No. 1 Special Tax Bonds, Series 2015, Special Tax Fund, to the credit of which the Water District shall forward to the Fiscal Agent for deposit, promptly upon receipt, all Special Tax Revenues received by the Water District and any amounts required by the Fiscal Agent Agreement to be deposited therein. Within the Special Tax Fund, the Fiscal Agent will establish and maintain two accounts: (a) the Debt Service Account, to the credit of which the Fiscal Agent shall deposit, immediately upon receipt, all Special Tax Revenues, and (b) the Surplus Account, to the credit of which the shall deposit deposit, immediately upon receipt, surplus Special Tax Revenues, as described below. Moneys in the Special Tax Fund will be disbursed as provided below and, pending any disbursement, will be subject to a lien in favor of the Owners of the Bonds.
All Special Tax Revenues shall be deposited in the Debt Service Account upon receipt.
No later than ten (10) Business Days prior to each Interest Payment Date, the Fiscal Agent shall withdraw from the Debt Service Account of the Special Tax Fund and transfer (i) to the Reserve Fund, an amount which when added to the amount then on deposit therein is equal to the Reserve Requirement, and (ii) to the Bond Fund an amount, taking into account any amounts then on deposit in the Bond Fund such that the amount in the Bond Fund equals the principal, premium, if any, and interest due on the Bonds on the next Interest Payment Date. At such time as deposits to the Debt Service Account equal the principal, premium if any, and interest becoming due on the Bonds for the current Bond Year and the amount needed to restore the Reserve Fund balance to the Reserve Requirement, the amount in the Debt Service Account in excess of such amount may, at the discretion of and upon the request of, the Water District, be transferred to the Surplus Account, which shall occur on or after September 15th of each year. If there has been no levy for pay-as-you-go expenditures it is unlikely there will be amounts to be transferred to the Surplus Account.
From time to time, the Water District may cause withdrawal from the Surplus Account of
the Special Tax Fund amounts needed to pay costs of the Project or incidental expenses of the District authorized under the Act. Moneys in the Surplus Account may, at the Water District's discretion, also be used to pay the principal of, premium, if any, and interest on the Bonds or to replenish the Reserve Fund to the amount of the Reserve Requirement.

D-9
Moneys in the Surplus Account will be held in trust by the Fiscal Agent for the benefit of the Water District and the Owners of the Bonds, is required to be disbursed as provided above, and, pending any disbursements, shall be subject to a lien in favor of the Owners of the Bonds.
Bond Fund
Establishment of the Bond Fund. There is established under the Fiscal Agent Agreement
as a separate fund to be held by the Fiscal Agent the Diablo Grande Community Facilities District No. 1 Special Tax Bonds Bond Fund, to the credit of which deposits shall be made as required by the Fiscal Agent Agreement or the Act. Moneys in the Bond Fund shall be held in trust by the Fiscal Agent for the benefit of the Owners of the Bonds, shall be disbursed for the payment of the principal of, and interest and any premium on, the Bonds as provided below, and, pending such disbursement, shall be subject to a lien in favor of the Owners of the Bonds.
Disbursements. On each Interest Payment Date, the Fiscal Agent shall withdraw from
the Bond Fund and pay to the Owners of the Bonds the principal of, and interest and any premium, then due and payable on the Bonds, including any amounts due on the Bonds by reason of the sinking payments set forth in the Fiscal Agent Agreement or any redemption of the Bonds pursuant to the Fiscal Agent Agreement.
In the event that amounts in the Bond Fund are insufficient to pay regularly scheduled
payments of principal of and interest on the Bonds, the Fiscal Agent shall withdraw from the Reserve Fund to the extent of any funds therein, the amount of such insufficiency, and the Fiscal Agent shall provide written notice to the Treasurer of the amounts so withdrawn from the Reserve Fund. Amounts so withdrawn from the Reserve Fund shall be deposited in the Bond Fund.
If, after the foregoing transfer, there are insufficient funds in the Bond Fund to make the
payments provided for to pay regularly scheduled payments of principal of and interest on the Bonds, the Fiscal Agent shall apply the available funds first to the payment of interest on the Bonds, then to the payment of principal due on the Bonds other than by reason of sinking payments, and then to payment of principal due on the Bonds by reason of sinking payments. Any sinking payment not made as scheduled shall be added to the sinking payment to be made on the next sinking payment date.
Deficiency. If at any time it appears to the Fiscal Agent that there is a danger of
deficiency in the Bond Fund and that the Fiscal Agent may be unable to pay regularly scheduled debt service on the Bonds in a timely manner, the Fiscal Agent shall report to the Treasurer such fact. The Water District covenants to increase the levy of the Special Taxes in the next Fiscal Year (subject to the maximum amount authorized by the Resolution of Formation) in accordance with the procedures set forth in the Act for the purpose of curing Bond Fund deficiencies.
Reserve Fund
There is established in the Fiscal Agent Agreement as a separate fund to be held by the
Fiscal Agent the Diablo Grande Community Facilities District No. 1 Special Tax Bonds Reserve Fund. In lieu of funding the Reserve Fund with cash or in replacement thereof, the Reserve Fund may be funded with a Reserve Fund Credit Instrument. Moneys in the Reserve Fund shall be held in trust by the Fiscal Agent for the benefit of the Owners of the Bonds as a reserve for

D-10
the payment of principal of, and interest on, the Bonds and shall be subject to a lien in favor of the Owners of the Bonds.
Use of Fund. Except as otherwise provided in the Fiscal Agent Agreement, all amounts
deposited in the Reserve Fund shall be used and withdrawn by the Fiscal Agent solely for the purpose of making transfers to the Bond Fund in the event of any deficiency at any time in the Bond Fund of the amount then required for payment of the principal of, and interest on, the Bonds. Whenever transfer is made from the Reserve Fund to the Bond Fund due to a deficiency in the Bond Fund, the Fiscal Agent shall provide written notice thereof to the Treasurer.
Transfer of Excess of Reserve Requirement. Whenever, on the Business Day prior to
any Interest Payment Date, the amount in the Reserve Fund exceeds the then applicable Reserve Requirement, the Fiscal Agent shall transfer an amount equal to the excess from the Reserve Fund to the Bond Fund to be used for the payment of the principal of and interest on the Bonds.
Transfer for Rebate Purposes. Investment earnings on amounts in the Reserve Fund
may be withdrawn from the Reserve Fund for purposes of making payment to the federal government to comply with rebate requirements.
Transfer When Balance Exceeds Outstanding Bonds. Whenever the balance in the
Reserve Fund exceeds the amount required to redeem or pay the Outstanding Bonds, including interest accrued to the date of payment or redemption and after making premium, if any, due upon redemption, and make any transfer required under the Fiscal Agent Agreement and upon receipt of an Officer's Certificate directing it to do so, the Fiscal Agent shall transfer the amount in the Reserve Fund to the Bond Fund to be applied, on the next succeeding Interest Payment Date to the payment and redemption of all of the Outstanding Bonds. In the event that the amount so transferred from the Reserve Fund to the Bond Fund exceeds the amount required to pay and redeem the Outstanding Bonds, the balance in the Reserve Fund shall be transferred to the Water District, after payment of any amounts due the Fiscal Agent, to be used for any lawful purpose of the Water District.
Improvement Fund
Establishment of Improvement Fund. There is established in the Fiscal Agent
Agreement as a separate fund to be held by the Fiscal Agent, the Diablo Grande Community Facilities District No. 1 Special Tax Bonds Improvement Fund and created within the Improvement Fund, separate account sdesignated as the “2014 Improvements Account” and the “2015 Improvements Account” of the Improvement Fund, which accounts are established for purposes of accounting for the use and disposition of 2014 Bond and 2015 Bond proceeds directed to the Improvement Fund to the credit of which a deposit shall be made as required by the Fiscal Agent Agreement. Moneys in the Improvement Fund shall be held in trust by the Fiscal Agent and shall be disbursed as provided in the Fiscal Agent Agreement for the payment or reimbursement of costs of the Project.
Procedure for Disbursement. Disbursements from the Improvement Fund shall be made
as determined by the Treasurer for the payment the costs of the Project, including for costs of acquisition of portions of the Project in accordance with the Acquisition Agreement.

D-11
Investment. Moneys in the Improvement Fund and the accounts established thereunder shall be invested and deposited in accordance with the Fiscal Agent Agreement. Interest earnings and profits from the investment of amounts in the Improvement Fund shall be retained by the Fiscal Agent in the Improvement Fund to be used for the purposes of the Improvement Fund.
Closing of Fund. Upon the filing of an Officer's Certificate stating that the portion of the
Project to be financed from the Improvement Fund and the accounts established thereunder has been completed and that all costs of such portion of the Improvements have been paid or are not required to be paid from the Improvement Fund, the Fiscal Agent shall transfer the amount, if any, remaining in the Improvement Fund to the Bond Fund for application to the payment of principal of and interest on the Bonds in accordance with the Fiscal Agent Agreement and the Improvement Fund shall be closed.
Costs of Issuance Fund
Establishment of Costs of Issuance Fund. There is established under the Fiscal Agent
Agreement as a separate fund to be held by the Fiscal Agent, the Diablo Grande Community Facilities District No. 1 Special Tax Bonds Costs of Issuance Fund. Moneys in the Costs of Issuance Fund shall be held in trust by the Fiscal Agent and shall be disbursed for the payment or reimbursement of Costs of Issuance.
Disbursement. Amounts in the Costs of Issuance Fund shall be disbursed from time to
time to pay Costs of Issuance, as set forth in a requisition containing respective amounts to be paid to the designated payees, signed by the Treasurer or a designee thereof and delivered to the Fiscal Agent. The Fiscal Agent shall maintain the Costs of Issuance Fund for a period of six months, from the Closing Date and then shall transfer any moneys remaining therein, including any investment earnings thereon, to the Treasurer for deposit by the Treasurer in the Special Tax Fund. Thereafter, every invoice received by the Fiscal Agent shall be submitted to the Treasurer for payment from amounts on deposit in the Special Tax Fund.
Certain Covenants of the Water District
Punctual Payment. The Water District will punctually pay or cause to be paid the
principal of, and interest and any premium on, the Bonds when and as due in strict conformity with the terms of the Fiscal Agent Agreement, and it will faithfully observe and perform all of the conditions covenants and requirements of the Fiscal Agent Agreement and all Supplemental Agreements and of the Bonds.
Limited Obligation. The Bonds are limited obligations of the Water District on behalf of
the District and are payable solely from and secured solely by the Special Tax Revenues and the amounts in the Bond Fund, the Reserve Fund and the Special Tax Fund created under the Fiscal Agent Agreement.
Extension of Time for Payment. In order to prevent any accumulation of claims for
interest after maturity, the Water District shall not, directly or indirectly, extend or consent to the extension of the time for the payment of any claim for interest on any of the Bonds and shall not, directly or indirectly, be a party to the approval of any such arrangement by purchasing or funding said claims for interest or in any other manner. In case any such claim for interest shall be extended or funded, whether or not with the consent of the Water District, such claim for interest so extended or funded shall not be entitled, in case of default under the Fiscal Agent

D-12
Agreement, to the benefits of the Fiscal Agent Agreement, except subject to the prior payment in full of the principal of all of the Bonds then Outstanding and of all claims for interest which shall not have been so extended or funded.
Against Encumbrances. The Water District will not encumber, pledge or place any
charge or lien upon any of the Special Tax Revenues or other amounts pledged to the Bonds superior to or on a parity with the pledge and lien herein created for the benefit of the Bonds, except as permitted by the Fiscal Agent Agreement.
Books and Accounts. The Water District will keep, or cause to be kept, proper books of
record and accounts, separate from all other records and accounts of the Water District, in which complete and correct entries shall be made of all transactions relating to the expenditure of amounts disbursed from the Special Tax Fund and to the Special Tax Revenues. Such books of record and accounts shall at all times during business hours be subject to the inspection of the Fiscal Agent and the Owners of not less than ten percent (10%) of the principal amount of the Bonds then Outstanding, or their representatives duly authorized in writing.
Protection of Security and Rights of Owners. The Water District will preserve and
protect the security of the Bonds and the rights of the Owners, and will warrant and defend their rights against all claims and demands of all persons. From and after the delivery of any of the Bonds by the Water District, the Bonds shall be incontestable by the Water District.
Compliance with Law; Completion of Project. The Water District will comply with all
applicable provisions of the Act and the law in completing the acquisition and construction of the Project; provided that the Water District shall have no obligation to advance any funds to complete the Project in excess of the amounts available therefor in the Improvement Fund.
Collection of Special Tax Revenues. The Water District shall comply with all
requirements of the Act so as to assure the timely collection of Special Tax Revenues, including without limitation, the enforcement of delinquent Special Taxes. On or within five (5) Business Days of each June 1, the Fiscal Agent shall provide the Treasurer with a notice stating the amount then on deposit in the Bond Fund and the Reserve Fund. The receipt of such notice by the Treasurer shall in no way affect the obligations of the Treasurer under the following two paragraphs. Upon receipt of such notice, the Treasurer shall communicate with the Treasurer to ascertain the relevant parcels on which the Special Taxes are to be levied, taking into account any parcel splits during the preceding and then current year.
The Water District shall effect the levy of the Special Taxes each Fiscal Year in
accordance with the Ordinance such that the computation of the levy is complete before the final date on which County Auditor will accept the transmission of the Special Tax amounts for the parcels within the District for inclusion on the next secured real property tax roll. Upon the completion of the computation of the amounts of the levy, the Water District shall prepare or cause to be prepared, and shall transmit to the Treasurer, such data as the County Auditor requires to include the levy of the Special Taxes on the next secured real property tax roll.
The Water District shall fix and levy the amount of Special Taxes within the District
required for the payment of principal of and interest on any outstanding Bonds of the District becoming due and payable during the ensuing year, including any necessary replenishment or expenditure of the Reserve Fund for the Bonds and an amount estimated to be sufficient to pay the Administrative Expenses during such year, all in accordance with the rate and method of apportionment of the Special Taxes for the District and the Ordinance. In any event, the Special

D-13
Taxes so levied shall not exceed the authorized amounts as provided in the proceedings pursuant to the Resolution of Formation.
No Arbitrage. The Water District shall not take, or permit or suffer to be taken by the
Fiscal Agent or otherwise, any action with respect to the gross proceeds of the Bonds which if such action had been reasonably expected to have been taken, or had been deliberately and intentionally taken, on the Closing Date would have caused the Bonds to be "arbitrage bonds" within the meaning of Section 148 of the Code and Regulations.
Maintenance of Tax-Exemption. The Water District shall take all actions necessary to
assure the exclusion of interest on the Bonds from the gross income of the Owners of the Bonds to the same extent as such interest is permitted to be excluded from gross income under the Code as in effect on the date of issuance of the Bonds.
Additional Bonds
In addition to the Bonds, the Water District may, by a Supplemental Agreement,
authorize the issuance additional Bonds, payable from Special Taxes and secured, unless otherwise provided in the Supplemental Agreement, by the Special Tax Revenues equally and ratably with Bonds previously issued, but only upon compliance by the Water District with the requirements set forth in the Supplemental Agreement, and subject to certain conditions, which include the following:
(i) No default in the Bonds shall have occurred and then be continuing.
(ii) The Supplemental Agreement providing for the issuance of the Additional
Bonds shall specify the purpose for which such Additional Bonds is being issued, which shall be one or more of the following:
(A) to provide moneys needed to construct and acquire the Facilities, by depositing into the Improvement Fund the proceeds of such Additional Bonds to be so applied, or
(B) to refund all or part of the Bonds or Additional Bonds then
Outstanding, by depositing in trust with the Fiscal Agent, moneys or Federal Securities in the amount necessary to discharge all liability of the Water District with respect to the bonds to be refunded as provided in Section 9.03.
(iii) The Supplemental Fiscal Agent Agreement providing for the issuance of
such Series shall also require that there be deposited into a subaccount in the Reserve Fund, forthwith upon the receipt of the proceeds of the sale of such Series, an amount at least equal to the Reserve Requirement with respect to the Outstanding Bonds of the Series to which it relates. Said deposit may be made from the proceeds of the sale of such Series or by the Water District or from both such sources, as provided in the Supplemental Fiscal Agent Agreement.
(iv) The Bonds of such Series shall be payable as to principal on September
1 in each year in which principal becomes due, and shall be payable as to interest semiannually on March 1 and September 1, except that the first installment of interest may be payable on either March 1 or September 1 and shall be for a period not longer than six (6) months.

D-14
(v) Fixed serial maturities or Sinking Fund Payments, or any combination
thereof, shall be established in amounts sufficient to provide for the retirement of all of the Bonds of such Series on or before their respective maturity dates.
(vi) The aggregate principal amount of all additional Series of Bonds plus the
2014 Bonds and 2015 Bonds shall not exceed the total amount of Bonds authorized to be issued.
(vii) After giving effect to the issuance of such Series of Bonds:
(A) Projected Special Taxes plus projected investment earnings on
amounts held in the Reserve Fund to be transferred to the Special Tax Fund pursuant to the terms of this Fiscal Agent Agreement for each Fiscal Year are equal to or greater than one hundred ten percent (110%) of maximum Debt Service for the next Fiscal Year; provided that such projection of investment earnings on amounts held in the Reserve Fund may assume an investment rate equal to the passbook savings rate available to the Water District at the time of determination; and
(B) The aggregate value of all parcels in the District subject to the
Special Tax, including then existing improvements and any facilities to be constructed or acquired with the proceeds of the proposed series of Bonds, as determined by an MAI appraisal or, in the alternative, the assessed value of all such parcels and improvements thereon (and improvements to be financed from proceeds of the Bonds proposed to be issued) as shown on the then current County tax roll, or by a combination of both methods is at least 3.00 times the sum of (i) the aggregate principal amount of all Bonds then outstanding plus (ii) the aggregate principal amount of the series of Bonds proposed to be issued, plus (iii) the aggregate principal amount of any bonds then outstanding and payable from assessments which are a lien against property in the District, plus (iv) a portion of the aggregate principal amount of all Mello-Roos bonds, other than Bonds then outstanding, and payable at least partially from special taxes to be levied on parcels of land subject to the Special Tax within the District (the "Other Mello-Roos Bonds") equal to the aggregate principal amount of the Other Mello-Roos Bonds multiplied by a fraction, the numerator of which is the amount of special taxes levied for the Other Mello-Roos Bonds on parcels of land within the District subject to the Special Tax, and the denominator of which is the total amount of special taxes levied for the Other Mello-Roos Bonds on all parcels of land subject to the Special Tax against which the special taxes are levied to pay the Other Mello-Roos Bonds (such fraction to be determined based upon the special taxes which could be levied the year in which maximum annual debt service on the Other Mello-Roos Bonds occurs), based upon information from the most recent available fiscal year.
Notwithstanding the above requirements, if there shall have deposited
with the Fiscal Agent cash or a letter of credit meeting the requirements of the Fiscal Agent Agreement in an amount (the “Letter of Credit Amount”) equal to the shortfall in the valuation of the property in the District to meet the value-to-lien requirement set forth in the preceding paragraph, the Letter of Credit Amount shall be excluded from the debt computation under this subsection (ii). Any

D-15
such letter of credit deposited with the Fiscal Agent shall remain in effect, and the Letter of Credit Amount shall not be reduced or the letter of credit thereafter terminated, until satisfaction of the preceding paragraphs of this subsection (B) with respect to the amount by which the letter of credit is proposed to be reduced, or with respect to the Letter of Credit Amount in connection with the proposed termination of the letter of credit.
Investments; Disposition of Investment Proceeds
Deposit and Investment of Moneys in Funds. Moneys in any fund or account created
or established by the Fiscal Agent Agreement and held by the Fiscal Agent shall be invested by the Fiscal Agent in Permitted Investments, as directed pursuant to an Officer’s Certificate filed with the Fiscal Agent at least two Business Days in advance of the making of such investments.
The Fiscal Agent or the Treasurer, as applicable, shall sell or present for redemption,
any investment security whenever it shall be necessary to provide moneys to meet any required payment, transfer, withdrawal or disbursement from the fund or account to which such investment security is credited and neither the Fiscal Agent nor the Treasurer shall be liable or responsible for any loss resulting from the acquisition or disposition of such investment security in accordance with the Fiscal Agent Agreement.
Rebate of Excess Investment Earnings to the United States. The Water District
covenants to calculate and rebate to the federal government, in accordance with the Regulations, excess investment earnings to the extent required by Section 148(f) of the Code. The Water District shall notify the Fiscal Agent of any amounts determined to be due to the federal government, and the Fiscal Agent shall, upon receipt of an Officer's Certificate of the Water District, withdraw such amounts from the Reserve Fund pursuant to the Fiscal Agent Agreement, and pay such amounts to the federal government as required by the Code and the Regulations. In the event of any shortfall in amounts available to make such payments, the Fiscal Agent shall notify the Treasurer in writing of the amount of the shortfall and the Treasurer shall make such payment from any amounts available in the Special Tax Fund.
The Fiscal Agent
Removal or Resignation of Fiscal Agent. The Water District may remove the Fiscal
Agent initially appointed, and any successor thereto, and may appoint a successor or successors thereto, but any such successor shall be a bank or trust company having a combined capital (exclusive of borrowed capital) and surplus of at least Fifty Million Dollars ($50,000,000) including, for such purpose, the combined capital and surplus of any parent holding company, and subject to supervision or examination by federal or state authority.
The Fiscal Agent may at any time resign by giving written notice to the Water District and
by giving to the Owners notice by mail of such resignation. Upon receiving notice of such resignation, the Water District shall promptly appoint a successor Fiscal Agent by an instrument in writing. Any resignation or removal of the Fiscal Agent shall become effective upon acceptance of appointment by the successor Fiscal Agent.
If no appointment of a successor Fiscal Agent has be made within thirty (30) days after
the Fiscal Agent has given to the Water District written notice or after a vacancy in the office of the Fiscal Agent shall have occurred by reason of its inability to act, the Fiscal Agent or any Bondowner may apply to any court of competent jurisdiction to appoint a successor Fiscal

D-16
Agent. Said court may thereupon, after such notice, if any, as such court may deem proper, appoint a successor Fiscal Agent.
Modification or Amendment of Fiscal Agent Agreement
The Fiscal Agent Agreement and the rights and obligations of the Water District and of
the Owners of the Bonds may be modified or amended at any time by a Supplemental Agreement pursuant to the affirmative vote at a meeting of Owners, or with the written consent without a meeting, of the Owners of at least sixty percent (60%) in aggregate principal amount of the Bonds then Outstanding, exclusive of Bonds disqualified as provided in the Fiscal Agent Agreement. No such modification or amendment shall (i) extend the maturity of any Bond or reduce the interest rate thereon, or otherwise alter or impair the obligation of the Water District to pay the principal of, and the interest and any premium on, any Bond, without the express consent of the Owner of such Bond, or (ii) permit the creation by the Water District of any pledge or lien upon the Special Taxes superior to or on a parity with the pledge and lien created for the benefit of the Bonds (except as otherwise permitted by the Act, the laws of the State of California or the Fiscal Agent Agreement), or reduce the percentage of Bonds required for the amendment hereof. No such amendment may modify any of the rights or obligations of the Fiscal Agent without its written consent.
The Fiscal Agent Agreement and the rights and obligations of the Water District and of
the Owners may also be modified or amended at any time by a Supplemental Agreement, without the consent of any Owners, only to the extent permitted by law and only for any one or more of the following purposes:
(A) to add to the covenants and agreements of the Water District in the Fiscal
Agent Agreement contained, other covenants and agreements thereafter to be observed, or to limit or surrender any right or power in the Fiscal Agent Agreement reserved to or conferred upon the Water District;
(B) to make modifications not adversely affecting any outstanding series of Bonds of the Water District in any material respect;
(C) to make such provisions for the purpose of curing any ambiguity, or of curing, correcting or supplementing any defective provision contained in the Fiscal Agent Agreement, or in regard to questions arising under the Fiscal Agent Agreement, as the Water District and the Fiscal Agent may deem necessary or desirable, and which shall not adversely affect the rights of the Owners of the Bonds;
(D) to make such additions, deletions or modifications as may be necessary or desirable to assure compliance with Section 148 of the Code relating to required rebate of excess investment earnings to the United States or otherwise as may be necessary to assure exclusion from gross income for federal income tax purposes of interest on the Bonds or to conform with the Regulations. Procedure for Amendment with Written Consent of Owners. The Water District and the
Fiscal Agent may at any time enter into a Supplemental Agreement amending the provisions of the Bonds or of the Fiscal Agent Agreement or any Supplemental Agreement, to the extent that such amendment is permitted by the Fiscal Agent Agreement. A copy of such Supplemental Agreement, together with a request to Owners for their consent thereto, if such consent is required, shall be mailed by first class mail, by the Fiscal Agent to each Owner of Bonds

D-17
Outstanding, but failure to mail copies of such Supplemental Agreement and request shall not affect the validity of the Supplemental Agreement when assented to as in the Fiscal Agent Agreement.
If consent of the Owners is required, such Supplemental Agreement shall not become
effective unless there shall be filed with the Fiscal Agent the written consents of the Owners of at least sixty percent (60%) in aggregate principal amount of the Bonds then Outstanding (exclusive of Bonds disqualified as provided in the Fiscal Agent Agreement) and a notice shall have been mailed as provided in the Fiscal Agent Agreement.
Miscellaneous
Discharge of Agreement. If the Water District has paid and discharged the entire
indebtedness on all or any portion of the Bonds Outstanding in any one or more of the following ways:
(A) by well and truly paying or causing to be paid the principal of, and interest
and any premium on, such Bonds Outstanding, as and when the same become due and payable;
(B) by depositing with the Fiscal Agent, in trust, at or before maturity, money which, together with (in the event that all of the Bonds are to be defeased) the amounts then on deposit in the funds and accounts provided for in the Fiscal Agent Agreement, is fully sufficient to pay such Bonds Outstanding, including all principal, interest and redemption premiums, or;
(C) by irrevocably depositing with the Fiscal Agent, in trust, cash and Federal Securities in such amount as the Water District shall determine as confirmed by an independent certified public accountant will, together with the interest to accrue thereon and (in the event that all of the Bonds are to be defeased) moneys then on deposit in the fund and accounts provided for in the Fiscal Agent Agreement, be fully sufficient to pay and discharge the indebtedness on such Bonds (including all principal, interest and redemption premiums) at or before their respective maturity dates; and if such Bonds are to be redeemed prior to the maturity thereof notice of such
redemption has been given as in the Fiscal Agent Agreement provided or provision satisfactory to the Fiscal Agent has been made for the giving of such notice, then, at the election of the Water District, and notwithstanding that any Bonds shall not have been surrendered for payment, the pledge of the Special Taxes and other funds provided for in the Fiscal Agent Agreement and all other obligations of the Water District under the Fiscal Agent Agreement with respect to such Bonds Outstanding shall cease and terminate, except only the obligations of the Water District with respect to maintenance of the tax exemption of the Bonds and to pay or cause to be paid to the Owners of the Bonds not so surrendered and paid all sums due thereon and all amounts owing to the Fiscal Agent; and thereafter Special Taxes shall not be payable to the Fiscal Agent.
Any funds thereafter held by the Fiscal Agent upon payments of all fees and expenses of
the Fiscal Agent, which are not required for said purpose, shall be paid over to the Water District.

D-18
Execution of Documents and Proof of Ownership by Owners. Any request, declaration or other instrument which the Fiscal Agent Agreement may require or permit to be executed by Owners may be in one or more instruments of similar tenor, and shall be executed by Owners in person or by their attorneys appointed in writing.
Except as otherwise expressly provided in the Fiscal Agent Agreement, the fact and date
of the execution by any Owner or his attorney of such request, consent, declaration or other instrument, or of such writing appointing such attorney, may be proved by the certificate of any notary public or other officer authorized to take acknowledgments of deeds to be recorded in the state in which he purports to act, that the person signing such request, declaration or other instrument or writing acknowledged to him the execution thereof, or by an affidavit of a witness of such execution, duly sworn to before such notary public or other officer.
Except as otherwise expressly provided in the Fiscal Agent Agreement, the ownership of
registered Bonds and the amount, maturity, number and date of holding the same shall be proved by the registry books.
Any request, consent, declaration or other instrument or writing of the Owner of any
Bond shall bind all future Owners of such Bond in respect of anything done or suffered to be done by the Water District or the Fiscal Agent in good faith and in accordance therewith.
Waiver of Personal Liability. No member, officer, agent or employee of the Water
District shall be individually or personally liable for the payment of the principal of, or interest or any premium on, the Bonds; but nothing herein contained shall relieve any such member, officer, agent or employee from the performance of any official duty provided by law.

APPENDIX E
SELECTED DEMOGRAPHIC DATA
General The District is situated in an unincorporated area of Stanislaus County, in the Diablo
mountain range on the western rim of the San Joaquin Valley. Located approximately nine miles southwest of the City of Patterson, approximately 45 miles east of the City of San Jose, directly off Interstate Highway 5. In addition, the District lies about 60 minutes driving time (or over 90 minutes at commute hours) to employment centers in Pleasanton, Livermore, Dublin and San Ramon just west of and accessible from Interstate 5 to Interstate 580. The Developer expects to market property in the District primarily to two target areas: (i) residents in the Patterson area who commute to work into the Tri-Valley area, and (ii) residents in the Tri-Valley/San Francisco Bay area who will purchase a home in the District as a second/vacation home. Accordingly, certain general demographic information is presented below regarding both the Tri-Valley/San Francisco Bay area and the Patterson/Stanislaus County area.
The area that is locally known as the "Tri-Valley Area" includes San Ramon, Alamo,
Blackhawk, Danville and Diablo (in Contra Costa County) and Dublin, Livermore, Pleasanton and Sunol (in Alameda County). Over the past several years the San Ramon/Danville area has experienced rapid and steady growth. While Danville has remained residential and rural in character, San Ramon and other neighboring cities, such as Concord, Pleasanton and Walnut Creek, have developed significant job centers including major commercial and light industry business parks, all within easy commuting distance. In addition, the Livermore/Pleasanton area has experienced significant new growth in population as well as development in commercial sectors.
The County of Stanislaus is located approximately 90 minutes southeast from both the
City of San Francisco and Silicon Valley. The City of Patterson is a city in Stanislaus County, located off Interstate 5. It is 27 miles southeast of Tracy and is part of the Modesto Metropolitan Statistical Area. Patterson is known as the "Apricot Capital of the World"; the town holds an annual Apricot Fiesta to celebrate with many drinks, food, desserts and games. The City of Patterson is a fast-growing community, strategically located in the northwestern part of the San Joaquin Valley, near Interstate 5, and close to the San Francisco Bay Area, the state capital of Sacramento. It is the myriad of recreational outdoor opportunities of the Sierra Nevada Mountains to the east. The city derives much of its economic vitality from agriculture, food processing, and distribution. It is also home to a rapidly expanding business park adjacent to Interstate 5. The City of Patterson is also noted for its numerous trees, especially its palm-lined thoroughfares.
With a population exceeding 203,000, Modesto is the largest city in, and the seat of,
Stanislaus County. Centrally located on Highway 99, Modesto is easily accessible from throughout California. West of the valley and over the coastal mountain range lies the San Francisco Bay Area, a 90-minute drive from Modesto. Eastward are the foothills that house the famed Mother Lode gold country and lead to the majestic Sierra Nevada mountain range and Yosemite National Park. Modesto is located in the heart of one of the greatest agricultural areas of our nation - the San Joaquin Valley. Dairy products, almonds, apricots, melons, tomatoes, wine grapes, peaches, walnuts and poultry products are some of its top commodities.
E-1
The County of San Joaquin is one of California’s original counties and was created at the time of statehood in 1850. The County covers an area of approximately 1,436 square miles, consisting of 1,399 square miles of land and 27 square miles of water. The County of San Joaquin is adjacent to Stanislaus County to the south and southeast, Alameda and Contra Costa Counties to the west, Sacramento County to the north, Amador County to the northeast, Calaveras County to the east and a corner of Santa Clara County to the southwest. Major highways in San Joaquin County include: Interstate 5, Interstate 205, Interstate 580, State Route 99, State Route 4 (Crosstown Freeway/California Delta Highway) and State Route 120. The San Joaquin Regional Transit District provides bus service within the City of Stockton in addition to routes throughout the County of San Joaquin and commuter routes to Livermore, Pleasanton, Sacramento and Santa Clara County. The Stockton Metropolitan Airport serves the San Joaquin Valley with passenger and air freight facilities.
Population
Population estimates are shown below for Patterson, Tracy, Stockton, Livermore, Dublin, and Pleasanton, the Counties of Stanislaus and San Joaquin and the State of California, as of January 1 for the years 2011 through 2015.
TRI-VALLEY AREA
Population
2011 2012 2013 2014 2015 Patterson 20,501 20,610 20,802 20,979 21,094 Tracy 83,242 83,562 84,466 84,937 85,296 Stockton 292,897 294,545 297,757 299,878 306,999 Livermore 81,547 82,295 83,404 84,815 85,990 Dublin 46,207 46,730 49,932 53,430 55,844 Pleasanton 70,537 71,178 71,939 73,028 74,850 Stanislaus County 516,244 519,350 523,038 528,157 532,297 San Joaquin County 689,160 692,997 701,745 708,678 719,511 State of California 37,427,946 37,668,804 37,984,138 38,357,121 38,714,725 Source: California State Department of Finance; Demographic Research.
Employment and Industry
The unemployment rate in the Stanislaus County was 10.4 percent in March 2015, down
from a revised 10.7 percent in February 2015, and below the year-ago estimate of 13.2 percent. This compares with an unadjusted unemployment rate of 6.5 percent for California and 5.6 percent for the nation during the same period.
E-2

MODESTO MSA (Stanislaus County)
Civilian Labor Force, Employment and Unemployment; Employment by Industry (Annual Averages)
2010 2011 2012 2013 2014 Civilian Labor Force (1) 242,900 242,000 242,300 241,700 241,400 Employment 201,800 202,100 206,100 210,400 214,400 Unemployment 41,100 39,900 36,100 31,200 27,100 Unemployment Rate 16.9% 16.5% 14.9% 12.9% 11.2% Wage and Salary Employment: (2) Agriculture 12,900 12,900 13,400 14,100 14,000 Mining, Logging, and Construction 5,900 5,800 6,300 7,000 7,300 Manufacturing 20,700 20,700 20,700 20,900 20,800 Wholesale Trade 5,900 5,800 5,800 5,900 6,000 Retail Trade 19,500 20,000 20,800 21,500 21,800 Transportation, Warehousing & Utilities 6,200 6,400 6,800 7,100 7,200 Information 1,200 1,100 1,000 900 900 Financial Activities 5,500 5,400 5,400 5,400 5,400 Professional & Business Services 12,500 12,200 12,800 13,400 14,000 Educational & Health Services 26,700 26,700 27,200 28,800 30,100 Leisure & Hospitality 14,600 14,500 14,900 15,800 16,900 Other Services 5,100 4,900 4,900 5,000 5,300 Federal Government 1,000 900 900 800 800 State Government 1,700 1,800 1,800 1,800 1,900 Local Government 23,600 23,000 22,700 22,900 23,300 Total, All Industries 162,700 162,000 165,400 171,100 175,700
(1) Labor force data is by place of residence; includes self-employed individuals, unpaid family workers, household domestic
workers, and workers on strike. (2) Industry employment is by place of work; excludes self-employed individuals, unpaid family workers, household domestic
workers, and workers on strike. (3) Totals may not add due to rounding. Source: State of California Employment Development Department.
E-3

STANISLAUS COUNTY Major Employers (As of April 2015)
Employer Name Location Industry Andre Champagne Cellars Modesto Wineries (Mfrs) California State University Turlock Schools-Universities & Colleges Academic Carlo Rossi Winery Modesto Wineries (Mfrs) Community Services Agency Not Available Government Offices-County Con Agra Foods Inc Oakdale Canning (Mfrs) Copperidge Winery Modesto Beverages (Whls) Cvs Caremark Distribution Ctr Patterson Distribution Centers (Whls) Del Monte Foods Modesto Canning (Mfrs) Doctors Medical Ctr Modesto Hospitals E & J Gallo Winery Modesto Wineries (Mfrs) Ecco Domani Winery Modesto Wineries (Mfrs) Emanuel Medical Ctr Turlock Hospitals Fairbanks Cellars Not Available Wineries (Mfrs) Foster Farms Turlock Poultry Processing Plants (Mfrs) Frito-Lay Inc Modesto Potato Chips (Whls) Hornsby's Pub Draft Cider Ltd Not Available Beverages (Whls) Memorial Medical Ctr Modesto Hospitals Modesto Bee Modesto Newspapers (Publishers/Mfrs) Oak Valley Hospital District Oakdale Hospitals Peter Vella Winery Modesto Wineries (Mfrs) Stanislaus Cnty Community Svc Turlock Government Offices-County Stanislaus County Community Modesto Government Offices-County Stanislaus County Welfare Dept Modesto County Government-Social/Human Resources Women Infants Child Prgm-W I C Modesto Health Services Zabaco Winery Modesto Wineries (Mfrs) Source: State of California Employment Development Department; extracted from America’s Labor Market Information System Employer Database, 2015 2nd Edition.
E-4

The City is included in the Stockton-Lodi Metropolitan Statistical Area ("MSA"), which includes all of San Joaquin County. The unemployment rate in the San Joaquin County was 9.5 percent in March 2015, down from a revised 10.1 percent in February 2015, and below the year-ago estimate of 12.4 percent. This compares with an unadjusted unemployment rate of 6.5 percent for California and 5.6 percent for the nation during the same period.
The following table summarizes the annual average civilian labor force, employment and
unemployment in the County for the calendar years 2010 through 2014.
STOCKTON-LODI METROPOLITAN STATISTICAL AREA (MSA) (San Joaquin County)
Civilian Labor Force, Employment and Unemployment (Annual Averages)
2010 2011 2012 2013 2014 Civilian Labor Force (1) 311,200 311,000 311,300 311,300 310,700 Employment 259,800 260,600 266,400 272,800 277,600 Unemployment 51,400 50,300 44,900 38,600 33,100 Unemployment Rate 16.5% 16.2% 14.4% 12.4% 10.7% Wage and Salary Employment: (2) Agriculture 15,700 15,500 15,700 16,100 15,900 Mining and Logging 100 100 100 100 100 Construction 7,600 7,400 7,600 8,800 8,900 Manufacturing 17,600 18,000 17,800 17,900 18,600 Wholesale Trade 10,000 10,200 10,800 11,100 11,300 Retail Trade 23,700 24,200 24,900 25,600 26,000 Transportation, Warehousing & Utilities 13,800 14,500 14,900 15,200 15,700 Information 2,100 2,100 2,100 2,100 2,100 Financial Activities 7,700 7,500 7,500 7,600 7,500 Professional & Business Services 15,400 15,200 16,600 17,400 17,900 Educational & Health Services 32,300 32,500 33,100 34,900 35,900 Leisure & Hospitality 16,100 16,300 17,000 18,200 19,100 Other Services 6,500 6,300 6,500 6,600 6,900 Federal Government 4,300 4,000 3,900 3,500 3,200 State Government 3,900 3,800 3,600 4,300 5,800 Local Government 29,900 28,700 28,600 29,300 29,800 Total, All Industries 206,900 206,200 210,700 218,700 224,600
(1) Labor force data is by place of residence; includes self-employed individuals, unpaid family workers, household domestic
workers, and workers on strike. (2) Industry employment is by place of work; excludes self-employed individuals, unpaid family workers, household domestic
workers, and workers on strike. (3) Totals may not add due to rounding. Source: State of California Employment Development Department.
E-5

SAN JOAQUIN COUNTY Major Employers (As of April 2015)
Employer Name Location Industry All Trade Handyman Mgmt Llc Tracy Handyman Services B & B Ranch Linden Ranches Blue Shield of California Lodi Insurance Dameron Hospital Assn Stockton Hospitals Deuel Vocational Institution Tracy City Govt-Correctional Institutions Division of Juvenile Justice Stockton State Govt-Correctional Institutions Foster Care Svc Stockton County Government-Social/Human Resources Inland Flying Svc Stockton Aircraft Servicing & Maintenance Jc Penney Distribution Ctr Lathrop Distribution Centers (Whls) Leprino Foods Co Tracy Cheese Processors (Mfrs) Lodi Memorial Hospital Lodi Hospitals Lodi Memorial Hospital Lodi Hospitals Morada Produce Co Stockton Fruits & Vegetables-Growers & Shippers North California Youth Ctr Not Available Police Departments O-G Packing & Cold Storage Co Stockton Fruits & Vegetables-Growers & Shippers Pacific Coast Producers Lodi Canning (Mfrs) Prima Frutta Packing Inc Linden Fruit & Produce Packers Safeway Distribution Warehouse Tracy Distribution Centers (Whls) San Joaquin County Human Svc Stockton County Government-Social/Human Resources San Joaquin General Hospital French Camp Hospitals St Joseph's Cancer Ctr Stockton Cancer Treatment Centers University of the Pacific Stockton Schools-Universities & Colleges Academic Walmart Supercenter Stockton Department Stores Waste Management Lodi Consultants-Business NEC Whirlpool Corp Stockton Appliances-Household-Major-Man Source: State of California Employment Development Department; extracted from America’s Labor Market Information System Employer Database, 2015 2nd Edition.
E-6

Retail Sales
A summary of historic taxable sales within the City of Patterson during the past five
years in which data is available is shown in the following table. Total taxable sales during calendar year 2013 in the City of Patterson were reported to be $282,444,000 a 42% increase under the total taxable sales of $199,533,000 reported during calendar year 2012. Annual data for calendar year 2014 is not yet available.
CITY OF PATTERSON Taxable Transactions
(Dollars In Thousands)
Number of Permits
Taxable Transactions
Number of Permits
Taxable Transactions
2009 166 $89,334 233 $108,254 2010 182 97,143 248 117,785 2011 181 108,235 246 132,107 2012 174 114,678 246 199,533 2013 195 144,173 265 282,444
Source: California State Board of Equalization A summary of historic taxable sales within the City of Tracy during the past five years in
which data is available is shown in the following table. Total taxable sales during calendar year 2013 in the City of Tracy were reported to be $1,339,394,000 a 12% increase under the total taxable sales of $1,199,306,000 reported during calendar year 2012. Annual data for calendar year 2014 is not yet available.
CITY OF TRACY
Taxable Retail Sales Number of Permits and Valuation of Taxable Transactions
(Dollars in Thousands)
Retail Stores Total All Outlets
Number of Permits
Taxable Transactions
Number of Permits
Taxable Transactions
2009 909 $752,864 1,338 $878,925 2010 961 829,188 1,382 928,740 2011 950 943,829 1,365 1,056,404 2012 930 1,030,595 1,320 1,199,306 2013 972 1,139,346 1,382 1,339,394
Source: State Board of Equalization.
E-7

A summary of historic taxable sales within the City of Stockton during the past five years in which data is available is shown in the following table. Total taxable sales during calendar year 2013 in the City of Stockton were reported to be $3,393,791,000 a 2% increase under the total taxable sales of $3,316,162,000 reported during calendar year 2012. Annual data for calendar year 2014 is not yet available.
CITY OF STOCKTON Taxable Retail Sales
Number of Permits and Valuation of Taxable Transactions Calendar Years 2009 through 2013
(Dollars in Thousands)
Retail Stores Total All Outlets
Number of Permits
Taxable Transactions
Number of Permits
Taxable Transactions
2009 3,351 $2,209,264 4,874 $2,844,988 2010 3,511 2,248,782 5,051 2,867,407 2011 3,427 2,397,288 4,956 3,133,324 2012 3,611 2,500,195 5,110 3,316,162 2013 3,741 2,590,622 5,204 3,393,791
Source: State Board of Equalization. A summary of historic taxable sales within the City of Dublin during the past five years in
which data is available is shown in the following table. Total taxable sales during calendar year 2013 in the City of Dublin were reported to be $1,518,125,000, a 6% increase under the total taxable sales of $1,436,142,000 reported during calendar year 2012. Annual data for calendar year 2014 is not yet available.
CITY OF DUBLIN
Taxable Transactions (Dollars In Thousands)
Retail Stores Total All Outlets
Number of Permits
Taxable Transactions
Number of Permits
Taxable Transactions
2009 653 $880,638 994 $1,020,068 2010 682 932,814 1,031 1,121,559 2011 678 1,042,872 1,033 1,241,228 2012 716 1,213,278 1,071 1,436,142 2013 746 1,261,933 1,099 1,518,125
Source: State Board of Equalization.
E-8

A summary of historic taxable sales within the City of Pleasanton during the past five years in which data is available is shown in the following table. Total taxable sales during calendar year 2013 in the City of Pleasanton were reported to be $1,894,143,000 a 6% increase over the total taxable sales of $1,779,335,000 reported during calendar year 2012. Annual data for calendar year 2014 is not yet available.
CITY OF PLEASANTON Taxable Transactions
(Dollars In Thousands)
Retail Stores Total All Outlets Number
of Permits Taxable
Transactions Number
of Permits Taxable
Transactions 2009 1,751 $1,087,655 2,661 $1,541,099 2010 1,810 1,144,898 2,722 1,652,586 2011 1,765 1,191,633 2,646 1,715,384 2012 1,859 1,245,151 2,752 1,779,335 2013 2,060 1,304,218 2,982 1,894,143
Source: California State Board of Equalization, Taxable Sales in California (Sales & Use Tax). A summary of historic taxable sales within the City of Livermore during the past five
years in which data is available is shown in the following table. Total taxable sales during calendar year 2013 in the City of Livermore were reported to be $2,055,757,000, a 9% increase over the total taxable sales of $1,893,475,000 reported during calendar year 2012. Annual data for calendar year 2014 is not yet available.
CITY OF LIVERMORE Taxable Transactions
Number Of Permits And Valuation Of Taxable Transactions (Dollars In Thousands)
Retail Stores Total All Outlets
Number
of Permits
Taxable
Transactions
Number
of Permits
Taxable
Transactions 2009 1,232 $810,255 2,177 $1,575,305 2010 1,316 854,906 2,262 1,630,560 2011 1,251 962,681 2,190 1,816,943 2012 1,310 1,128,509 2,235 1,893,475 2013 1,476 1,425,790 2,427 2,055,757
Source: California State Board of Equalization, Taxable Sales in California (Sales & Use Tax).
E-9

A summary of historic taxable sales within Stanislaus County during the past five years in which data is available is shown in the following table. Total taxable sales during the calendar year 2013 in Stanislaus County were reported to be $7,639,992,000, a 6% increase over the total taxable sales of $7,178,273,000 reported during calendar year 2012.
STANISLAUS COUNTY Taxable Transactions
(Dollars in Thousands)
Retail Stores Total All Outlets Number
of Permits Taxable
Transactions Number
of Permits Taxable
Transactions 2009 6,364 $3,925,638 9,644 $5,847,057 2010 6,612 4,112,697 9,881 6,098,614 2011 6,521 4,934,011 9,717 6,662,466 2012 6,649 4,709,642 9,761 7,178,273 2013 6,741 4,998,626 9,757 7,639,992 Source: State Board of Equalization.
A summary of historic taxable sales within San Joaquin County during the past five years in
which data is available is shown in the following table. Total taxable sales during the calendar year 2013 in the San Joaquin County were reported to be $9,466,015,000 a 5% increase over the total taxable sales of $9,010,930,000 reported during calendar year 2012.
SAN JOAQUIN COUNTY
Taxable Retail Sales Number of Permits and Valuation of Taxable Transactions
(Dollars in Thousands)
Retail Stores Total All Outlets
Number of Permits
Taxable Transactions
Number of Permits
Taxable Transactions
2009 8,203 4,974,437 12,297 7,260,073 2010 8,534 5,213,982 12,633 7,602,090 2011 8,337 5,740,948 12,450 8,426,952 2012 8,542 6,124,321 12,613 9,010,930 2013 8,754 6,519,537 12,752 9,466,015
Source: State Board of Equalization.
E-10

Building Activity
The following chart shows the total number of residential building permits issued Patterson, Tracy, Stockton, Livermore, Dublin, and Pleasanton, and the Counties of Stanislaus and San Joaquin, the value of those permits and the value of non-residential permits, for each of the last five calendar years for which data is available, from calendar years 2010 through 2014. Annual figures are not yet available for calendar year 2015.
CITY OF PATTERSON
Total Building Permit Valuations (Valuations In Thousands)
2010 2011 2012 2013 2014
Permit Valuation New Single-family $0.0 303.8 $2,358.3 $2,046.5 $645.5 New Multi-family 0.0 0.0 0.0 $0.0 0.0 Res. Alterations/Additions 1,624.1 1,272.5 8,695.3 $683.5 496.74
Total Residential 1,624.1 1,576.3 11,053.6 $2,729.9 1,142.24
New Commercial $0.0 $0.0 4,420.8 $1,624.0 793.8 New Industrial 0.0 0.0 68,286.3 18.4 0.0 New Other 612.8 0.0 53.0 4,748.3 $2,704.0 Com. Alterations/Additions 15,270.0 9,748.2 4,646.1 842.0 2,426.6
Total Nonresidential 15,882.8 9,748.2 77,406.2 7,232.7 5,924.4
New Dwelling Units Single Family 0 3 21 17 3 Multiple Family 0 0 0 0 0 TOTAL 0 0 0 17 3
Source: Construction Industry Research Board, Building Permit Summary.
CITY OF TRACY
Building Permit Activity For Calendar Years 2010 through 2014
(Dollars in Thousands)
2010 2011 2012 2013 2014 Permit Valuation New Single-family $4,549.0 $2,951.8 $5,317.5 $20,057.9 $44,538.3 New Multi-family 0.0 0.0 0.0 0.0 0.0 Res. Alterations/Additions 1,914.9 2,042.1 1,734.5 1,402.9 44,884.6
Total Residential 6,464.0 4,993.9 7,052.0 21,460.8 89,422.9 New Commercial 13,184.4 213.6 98,007.0 2,378.8 2,354.3 New Industrial 0.0 0.0 0.0 0.0 0.0 New Other 1,234.8 52.7 4,200.0 4,395.6 $2,363.6 Com. Alterations/Additions 16,082.3 30,056.6 6,029.0 18,458.5 18,846.3
Total Nonresidential $30,501.5 $30,322.9 108,236.0 25,232.9 23,564.21 New Dwelling Units Single Family 18 11 20 67 135 Multiple Family 0 0 0 0 0 TOTAL 18 11 20 67 135
Source: Construction Industry Research Board, Building Permit Summary
E-11
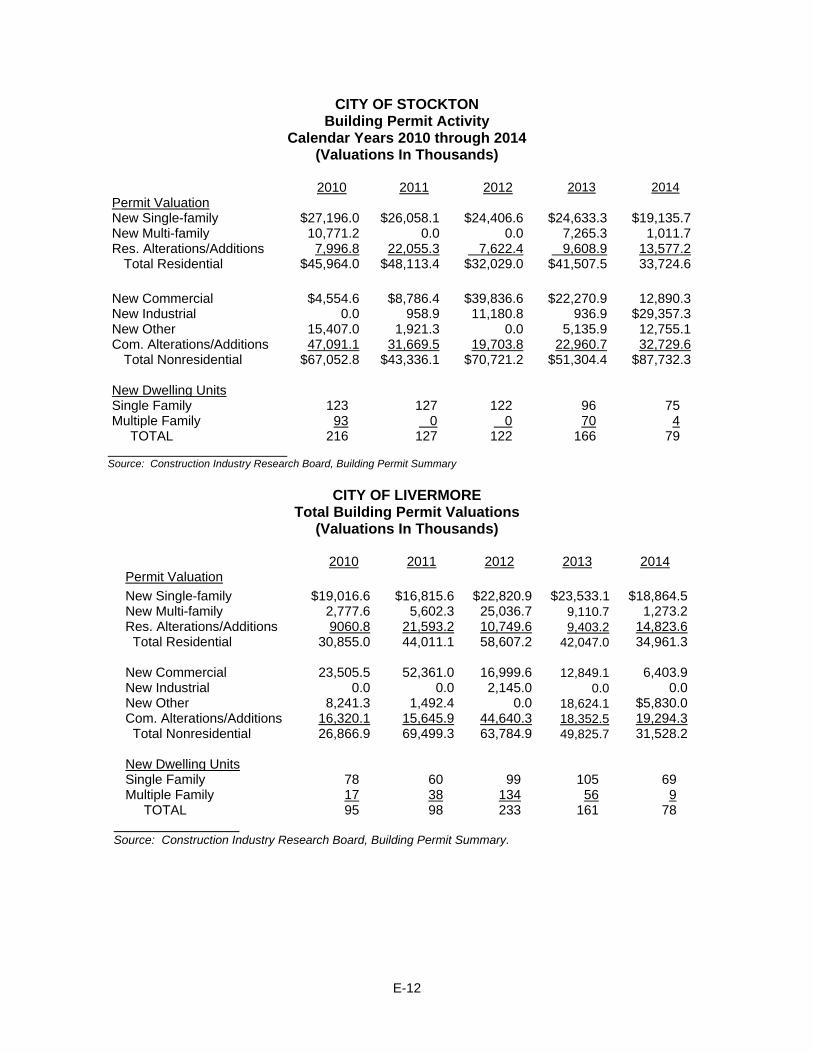
CITY OF STOCKTON Building Permit Activity
Calendar Years 2010 through 2014 (Valuations In Thousands)
2010 2011 2012 2013 2014 Permit Valuation New Single-family $27,196.0 $26,058.1 $24,406.6 $24,633.3 $19,135.7 New Multi-family 10,771.2 0.0 0.0 7,265.3 1,011.7 Res. Alterations/Additions 7,996.8 22,055.3 7,622.4 9,608.9 13,577.2
Total Residential $45,964.0 $48,113.4 $32,029.0 $41,507.5 33,724.6
New Commercial $4,554.6 $8,786.4 $39,836.6 $22,270.9 12,890.3 New Industrial 0.0 958.9 11,180.8 936.9 $29,357.3 New Other 15,407.0 1,921.3 0.0 5,135.9 12,755.1 Com. Alterations/Additions 47,091.1 31,669.5 19,703.8 22,960.7 32,729.6
Total Nonresidential $67,052.8 $43,336.1 $70,721.2 $51,304.4 $87,732.3 New Dwelling Units Single Family 123 127 122 96 75 Multiple Family 93 0 0 70 4 TOTAL 216 127 122 166 79
Source: Construction Industry Research Board, Building Permit Summary
CITY OF LIVERMORE
Total Building Permit Valuations (Valuations In Thousands)
2010 2011 2012 2013 2014
Permit Valuation New Single-family $19,016.6 $16,815.6 $22,820.9 $23,533.1 $18,864.5 New Multi-family 2,777.6 5,602.3 25,036.7 9,110.7 1,273.2 Res. Alterations/Additions 9060.8 21,593.2 10,749.6 9,403.2 14,823.6 Total Residential 30,855.0 44,011.1 58,607.2 42,047.0 34,961.3
New Commercial 23,505.5 52,361.0 16,999.6 12,849.1 6,403.9 New Industrial 0.0 0.0 2,145.0 0.0 0.0 New Other 8,241.3 1,492.4 0.0 18,624.1 $5,830.0 Com. Alterations/Additions 16,320.1 15,645.9 44,640.3 18,352.5 19,294.3 Total Nonresidential 26,866.9 69,499.3 63,784.9 49,825.7 31,528.2
New Dwelling Units Single Family 78 60 99 105 69 Multiple Family 17 38 134 56 9 TOTAL 95 98 233 161 78
Source: Construction Industry Research Board, Building Permit Summary.
E-12

CITY OF DUBLIN
Total Building Permit Valuations (Valuations In Thousands)
2010 2011 2012 2013 2014
Permit Valuation New Single-family $89,974.8 $124,160.6 $214,736.6 $256,827.4 $199,190.9 New Multi-family 39,950.1 143,327.4 108,683.9 $12,662.4 156,240.1 Res. Alterations/Additions 13,364.6 10,785.8 2,414.4 $3,889.5 7,873.4 Total Residential 143,291.8 278,273.8 325,834.9 $273,379.3 363,304.4
New Commercial 3,050.0 15,377.6 3,986.7 6,687.6 $16,385.0 New Industrial 0.0 0.0 134.0 0.0 0.0 New Other 4,455.2 1,834.7 416.7 3,616.7 16,670.6 Com. Alterations/Additions 29,775.5 13,223.9 2,721.1 25,390.7 24,777.0 Total Nonresidential 31,165.8 30,436.2 7,258.5 35,695.0 57,832.6
New Dwelling Units Single Family 228 276 586 634 481 Multiple Family 116 543 368 34 698 TOTAL 344 819 954 668 1,179
Source: Construction Industry Research Board, Building Permit Summary.
CITY OF PLEASANTON
Total Building Permit Valuations (Valuations In Thousands)
2010 2011 2012 2013 2014
Permit Valuation New Single-family $17,955.7 $17,723.1 $24,739.7 $45,271.0 $36,265.0 New Multi-family 0.0 0.0 75,463.5 $56,157.0 42,023.6 Res. Alterations/Additions 12,471.1 17,882.2 7,057.6 $12,981.1 $22,426.2 Total Residential 30,426.8 35,605.3 107,260.8 $114,409.0 100,714.8
New Commercial 0.0 10,196.2 12,612.0 0.0 2,976.0 New Industrial 0.0 12,085.7 0.0 0.0 0.0 New Other 6,467.9 105.0 0.0 0.0 2,976.0 Com. Alterations/Additions 24,983.1 35,406.3 34,904.1 0.0 14,103.6 Total Nonresidential 31,451.0 57,793.2 47,516.1 0.0 20,055.6
New Dwelling Units Single Family 46 43 53 147 75 Multiple Family 0 0 303 297 225 TOTAL 46 43 356 444 300
Source: Construction Industry Research Board, Building Permit Summary.
E-13

STANISLAUS COUNTY Total Building Permit Valuations
(Valuations in Thousands)
I. 2010 2011 2012 2013 2014 Permit Valuation New Single-family $31,155.8 $27,045.5 $33,625.6 $64,015.4 $91,762.8 New Multi-family 5,174.4 4,851.5 16,767.5 3,362.9 7,700.0 Res. Alterations/Additions 30,936.7 38,240.1 43,827.0 27,737.5 $37,921.7
Total Residential 67,267.0 70,137.1 94,220.1 95,115.8 137,384.6
New Commercial 18,152.6 24,572.2 51,846.1 66,570.6 74,161.9 New Industrial 5,827.0 4,229.0 84,187.5 10,668.9 22,626.8 New Other 50,943.9 4,329.8 10,750.1 20,898.0 41,116.2 Com. Alterations/Additions 70,646.6 61,010.4 49,916.6 72,028.7 63,065.1
Total Nonresidential 145,570.1 94,141.4 196,700.3 170,166.2 $200,970.0 New Dwelling Units Single Family 176 136 167 292 389 Multiple Family 68 51 116 41 50 TOTAL 244 187 283 333 439 Source: Construction Industry Research Board, Building Permit Summary.
SAN JOAQUIN COUNTY
Building Permit Valuation (Valuations in Thousands)
2010 2011 2012 2013 2014
Permit Valuation New Single-family $166,223.0 $159,012.2 $130,632.5 $264,761.1 $318,760.2 New Multi-family 15,426.9 14,853.1 0.0 7,601.9 4,726.9 Res. Alterations/Additions 28,058.7 48,093.6 6,861.2 28,764.8 78,511.0 Total Residential 209,708.7 221,958.9 137,493.7 301,127.8 $401,998.0
New Commercial 31,521.9 45,422.2 176,179.0 $158,299.3 42,976.5 New Industrial 1,333.0 9,669.3 13,126.8 1,141.9 $29,357.3 New Other 40,130.0 4,709.7 4,200.0 21,462.7 $ 41,819.6 Com. Alterations/Additions 100,108.9 108,216.9 65,989.4 79,145.2 89,630.8 Total Nonresidential $173,093.8 $168,018.1 259,495.2 $260,049.1 203,784.2
New Dwelling Units Single Family 801 728 457 1,062 1,214 Multiple Family 157 152 0 74 19 TOTAL 958 880 457 1,136 1,233 Source: Construction Industry Research Board, Building Permit Summary.
E-14

Effective Buying Income
"Effective Buying Income" is defined as personal income less personal tax and nontax payments, a number often referred to as "disposable" or "after-tax" income. Personal income is the aggregate of wages and salaries, other labor-related income (such as employer contributions to private pension funds), proprietor's income, rental income (which includes imputed rental income of owner-occupants of non-farm dwellings), dividends paid by corporations, interest income from all sources, and transfer payments (such as pensions and welfare assistance). Deducted from this total are personal taxes (federal, state and local), nontax payments (fines, fees, penalties, etc.) and personal contributions to social insurance. According to U.S. government definitions, the resultant figure is commonly known as "disposable personal income."
The table on the following page summarizes the total effective buying income for the
County, the State and the United States for the period 2010 through 2014.
E-15

Effective Buying Income As of January 1, 2010 through 2014
Year
Area
Total Effective Buying Income (000’s Omitted)
Median Household Effective Buying Income
2010 City of Patterson 254,090 43,264 City of Tracy 1,713,418 $62,219 City of Stockton 4,346,983 36,336 City of Livermore 2,398,055 70,331 City of Pleasanton 2,655,145 83,430
City of Dublin $ 1,490,823 $76,300 Stanislaus County 8,315,378 40,486 San Joaquin County 11,425,114 42,086
California 801,393,028 47,177 United States 6,365,020,076 41,368
2011 City of Patterson 253,595 42,250 City of Tracy $ 1,716,623 $62,085 City of Stockton 4,119,228 35,913 City of Livermore 2,415,195 70,004 City of Pleasanton 2,663,055 82,584
City of Dublin $ 1,470,853 $79,098 Stanislaus County 8,473,994 40,355 San Joaquin County 11,534,632 42,000
California 814,578,458 47,062 United States 6,438,704,664 41,253
2012 City of Patterson 310,385 45,186 City of Tracy $ 1,646,643 $56,079 City of Stockton 4,346,255 37,189 City of Livermore 2,888,325 75,176 City of Pleasanton 3,200,600 84,608
City of Dublin $ 1,669,493 $82,308 Stanislaus County 8,213,148 39,104 San Joaquin County 11,964,855 43,204
California 858,676,636 48,340 United States 6,982,757,379 43,715
2013 City of Patterson 344,000 47,950 City of Tracy $ 1,731,160 $58,300 City of Stockton 4,471,413 38,548 City of Livermore 2,881,053 75,927 City of Pleasanton 3,064,005 86,291 City of Dublin 1,719,630 84,244 Stanislaus County 8,164,105 38,183 San Joaquin County 11,964,855 43,204 California 858,676,636 48,340 United States 6,982,757,379 43,715
2014 City of Patterson 336,550 46,639 City of Tracy 1,785,568 60,154 City of Stockton 4,569,848 38,987 City of Livermore 3,184,843 80,237 City of Pleasanton 3,287,665 90,651 City of Dublin 1,896,895 87,311 Stanislaus County 8,644,033 40,665 San Joaquin County 12,381,905 44,235 California 901,189,699 50,072 United States 7,357,153,421 45,448
Source: Source: The Nielsen Company (US), Inc.
E-16

APPENDIX F
FORM OF OPINION OF BOND COUNSEL
Board of Directors Western Hills Water District P.O. Box 655 Patterson, California 95363
OPINION: $7,260,000 Western Hills Water District Diablo Grande Community Facilities District No. 1 Special Tax Refunding Bonds Series 2015
Members of the Water District Board:
We have acted as bond counsel in connection with the issuance by the Western Hills Water District (the "Water District") of $7,260,000 Western Hills Water District Diablo Grande Community Facilities District No. 1 Special Tax Refunding Bonds Series 2015 (the "Bonds"), pursuant to the Mello-Roos Community Facilities Act of 1982, as amended, constituting Section 53311, et seq. of the California Government Code (the "Act") and a Fiscal Agent Agreement dated as of August 1, 2001, a Supplement No. 1 to Fiscal Agent Agreement dated as of December 1, 2002, a Supplement No. 2 to Fiscal Agent Agreement dated as of May 1, 2004, a Supplement No. 3 to Fiscal Agent Agreement dated as of January 1, 2005, a Supplement No. 4 to Fiscal Agent Agreement dated as of July 1, 2014 and a Supplement No. 5 to Fiscal Agent Agreement dated as of July 1, 2015 (collectively, the "Fiscal Agent Agreement") by and between the Water District on behalf of the Western Hills Water District Diablo Grande Community Facilities District No. 1 and The Bank of New York Trust Company, N.A. We have examined the law and such certified proceedings and other papers as we deem necessary to render this opinion.
As to questions of fact material to our opinion, we have relied upon representations of the Water District contained in the Fiscal Agent Agreement, and in the certified proceedings and other certifications of public officials furnished to us, without undertaking to verify the same by independent investigation.
Based upon the foregoing, we are of the opinion, under existing law, as follows:
1. The Water District is duly created and validly existing as a water district underDivision 13, Sections 34000-38501 of the California Water Code, with the power to adopt the resolution authorizing the issuance of the Bonds, enter into the Fiscal Agent Agreement, and perform the agreements on its part contained therein and issue the Bonds.
2. The Bonds have been duly authorized, executed and delivered by the WaterDistrict and are valid and binding limited obligations of the Water District, payable solely from the sources provided therefor in the Fiscal Agent Agreement.
F-1
Members of the Water District Board Western Hills Water District Page 2
3. The Fiscal Agent Agreement has been duly entered into by the Water District andconstitutes a valid and binding obligation of the Water District enforceable upon the Water District.
4. Pursuant to the Act, the Fiscal Agent Agreement creates a valid lien on the fundspledged by the Fiscal Agent Agreement.
5. The interest on the Bonds is excluded from gross income for federal income taxpurposes and is not an item of tax preference for purposes of the federal alternative minimum tax imposed on individuals and corporations; it should be noted, however, that, for the purpose of computing the alternative minimum tax imposed on corporations (as defined for federal income tax purposes), such interest is taken into account in determining certain income and earnings. The opinion set forth in the preceding sentence is subject to the condition that the Water District comply with all requirements of the Internal Revenue Code of 1986 that must be satisfied subsequent to the issuance of the Bonds in order that such interest thereon be, or continue to be, excluded from gross income for federal income tax purposes. The Water District has covenanted to comply with each such requirements. Failure to comply with certain of such requirements may cause the inclusion of interest on the Bonds in gross income for federal income tax purposes to be retroactive to the date of issuance of the Bonds. We express no opinion regarding other federal tax consequences arising with respect to the Bonds.
6. The interest on the Bonds is exempt from personal income taxation imposed bythe State of California.
The rights of the owners of the Bonds and the enforceability of the Bonds and the Fiscal Agent Agreement may be subject to bankruptcy, insolvency, reorganization, moratorium and other similar laws affecting creditors’ rights heretofore or hereafter enacted and may also be subject to the exercise of judicial discretion in appropriate cases.
Respectfully submitted,
F-2

APPENDIX G
FORM OF CONTINUING DISCLOSURE UNDERTAKING
CONTINUING DISCLOSURE AGREEMENT
THIS CONTINUING DISCLOSURE AGREEMENT (the "Disclosure Agreement") is dated as of July 15, 2015, is by and among the Western Hills Water District, a public body, corporate and politic, organized and existing under and by virtue of the laws of the State of California (the "Issuer" or the "Water District"), and Goodwin Consulting Group, Inc., Sacramento, California, in its capacity as Dissemination Agent (the "Dissemination Agent"). The Bonds are being issued pursuant to a Fiscal Agent Agreement, dated as of August 1, 2001, as amended and supplemented by a Supplemental Agreement No. 1 to Fiscal Agent Agreement dated as of December 1, 2002, a Supplemental Agreement No. 2 to Fiscal Agent Agreement dated as of May 1, 2004, a Supplemental Agreement No. 3 to Fiscal Agent Agreement dated as of January 1, 2005, a Supplemental Agreement No. 4 to Fiscal Agent Agreement, dated as of July 1, 2014 and a Supplemental Agreement No. 5 to Fiscal Agent Agreement, dated as of July 1, 2015 (together, the "Fiscal Agent Agreement"), between The Bank of New York Mellon Trust Company, N.A., as fiscal agent, and the Water District. The Water District hereby covenants and agrees as follows:
Section 1. Purpose of the Disclosure Agreement. This Disclosure Agreement is being executed and delivered by the Water District for the benefit of the holders and beneficial owners of the Bonds and in order to assist the Participating Underwriter in complying with S.E.C. Rule 15c2-12(b)(5).
Section 2. Definitions. In addition to the definitions set forth above and in the Fiscal Agent Agreement, which apply to any capitalized term used in this Disclosure Agreement unless otherwise defined in this Section, the following capitalized terms shall have the following meanings:
"Annual Report" means any Annual Report provided by the Water District pursuant to, and as described in, Sections 3 and 4 of this Disclosure Agreement.
"Annual Report Date" means the date that is nine months after the end of the Water District's fiscal year (currently April 1 based on the Water District’s fiscal year end of June 30).
"Dissemination Agent" means Goodwin Consulting Group, Inc., or any successor Dissemination Agent designated in writing by the Water District and which has filed with the Water District a written acceptance of such designation.
"Listed Events" means any of the events listed in Section 5(a) of this Disclosure Agreement.
"MSRB" means the Municipal Securities Rulemaking Board, which has been designated by the Securities and Exchange Commission as the sole repository of disclosure information for purposes of the Rule.
G-1

"Official Statement" means the final official statement dated June 16, 2015, executed by the Water District in connection with the issuance of the Bonds.
"Participating Underwriter" means Westhoff, Cone & Holmstedt, the original underwriter of the Bonds required to comply with the Rule in connection with offering of the Bonds.
"Rule" means Rule 15c2-12(b)(5) adopted by the Securities and Exchange Commission under the Securities Exchange Act of 1934, as it may be amended from time to time.
Section 3. Provision of Annual Reports.
(a) The Water District shall, or shall cause the Dissemination Agent to, not later than the Annual Report Date, commencing April 1, 2016, with the report for the 2014-2015 fiscal year, provide to the MSRB, in an electronic format as prescribed by the MSRB, an Annual Report that is consistent with the requirements of Section 4 of this Disclosure Agreement. Not later than 15 Business Days prior to the Annual Report Date, the Water District shall provide the Annual Report to the Dissemination Agent (if other than the Water District). If by 15 Business Days prior to the Annual Report Date the Dissemination Agent (if other than the Water District) has not received a copy of the Annual Report, the Dissemination Agent shall contact the Water District to determine if the Water District is in compliance with the previous sentence. The Annual Report may be submitted as a single document or as separate documents comprising a package, and may include by reference other information as provided in Section 4 of this Disclosure Agreement; provided that the audited financial statements of the Water District may be submitted separately from the balance of the Annual Report, and later than the Annual Report Date, if not available by that date. If the Water District’s fiscal year changes, it shall give notice of such change in the same manner as for a Listed Event under Section 5(c). The Water District shall provide a written certification with each Annual Report furnished to the Dissemination Agent to the effect that such Annual Report constitutes the Annual Report required to be furnished by the Water District hereunder.
(b) If the Water District does not provide, or cause the Dissemination Agent to provide, an Annual Report by the Annual Report Date as required in subsection (a) above, the Dissemination Agent shall provide to the MSRB, in an electronic format as prescribed by the MSRB, a notice in substantially the form attached as Exhibit A.
(c) The Dissemination Agent shall:
(i) determine each year prior to the Annual Report Date the then-applicable rules and electronic format prescribed by the MSRB for the filing of annual continuing disclosure reports; and
(ii) if the Dissemination Agent is other than the Water District, file a report with the Water District and the Participating Underwriter certifying that the Annual Report has been provided pursuant to this Disclosure Agreement, and stating the date it was provided.
Section 4. Content of Annual Reports. The Water District's Annual Report shall contain or incorporate by reference the following documents and information:
(a) Audited Financial Statements prepared in accordance with generally accepted accounting principles as promulgated to apply to governmental
G-2

entities from time to time by the Governmental Accounting Standards Board. If the Issuer's audited financial statements are not available by the time the Annual Report is required to be filed pursuant to Section 3(a), the Annual Report shall contain unaudited financial statements in a format similar to the financial statements contained in the final Official Statement, and the audited financial statements shall be filed in the same manner as the Annual Report when they become available. This submission should be made with the following caveat:
THE WATER DISTRICT'S ANNUAL FINANCIAL STATEMENT IS PROVIDED SOLELY TO COMPLY WITH THE SECURITIES EXCHANGE COMMISSION STAFF’S INTERPRETATION OF RULE 15C2-12. NO FUNDS OR ASSETS OF THE WATER DISTRICT (OTHER THAN THE PROCEEDS OF THE SPECIAL TAXES LEVIED FOR THE DISTRICT AND SECURING THE BONDS) ARE REQUIRED TO BE USED TO PAY DEBT SERVICE ON THE BONDS AND THE WATER DISTRICT IS NOT OBLIGATED TO ADVANCE AVAILABLE FUNDS FROM THE WATER DISTRICT TREASURY TO COVER ANY DELINQUENCIES. INVESTORS SHOULD NOT RELY ON THE FINANCIAL CONDITION OF THE WATER DISTRICT IN EVALUATING WHETHER TO BUY, HOLD OR SELL THE BONDS.
(b) The following additional items:
(1) Principal amount of 2015 Bonds outstanding.
(2) Balance in the improvement fund or construction account.
(3) Balance in debt service reserve fund, and statement of the reserve fund requirement. Statement of projected reserve fund draw, if any.
(4) Balance in other funds and accounts held by Issuer or fiscal agent related to the 2015 Bonds.
(5) Additional debt authorized by the Water District and payable from or secured by assessments or special taxes with respect to property within the District.
(6) The Special Tax levy, collections, the delinquency rate, total amount of delinquencies, number of parcels delinquent in payment and delinquencies per parcel.
(7) Notwithstanding the June 30th reporting date for the Annual Report, the following information shall be reported as of the last day of the month immediately preceding the date of the Annual Report rather than as of June 30th. Identity of each delinquent taxpayer responsible for 5 percent or more of total special tax/assessment levied, and the following information: assessor parcel number, assessed value of applicable properties, amount of Special Tax levied, amount delinquent by parcel number and status of foreclosure proceedings. If any foreclosure has been completed, summary of results of foreclosure sales or transfers.
(8) Most recently available assessed value of all parcels subject to the special tax or assessment.
G-3

(9) List of landowners and assessor's parcel number of parcels subject to 20 percent or more of the Special Tax levy including the following information: development status to the extent shown in Water District records, land use classification, assessed value (land and improvements). (c) For so long as there is any owner of property in the District whose
properties in the District collectively represent 20% or more of the Special Taxes, the following information regarding the status of development in the District:
(1) Significant amendments to land use entitlements. (2) Status of any legislative, administrative and judicial challenges to
the construction of the development known to the Issuer.
(3) Assessed valuation of property shown on County Assessor's tax rolls with no "improvements" value in the District for the current (as of the date of the report) fiscal year.
(4) List of landowners (as shown County Assessor's tax roll) and
assessor's parcel number(s) of parcels held by owners whose properties collectively represent 10% or more of the Special Taxes for the current (as of the date of the report) fiscal year.
(5) Number of building permits issued by the County for property in
the District for the reported fiscal year.
(d) In addition to any of the information expressly required to be provided under paragraphs (a), (b) and (c) of this Section, the Issuer shall provide such further information, if any, as may be necessary to make the specifically required statements, in the light of the circumstances under which they are made, not misleading. Any or all of the items listed above may be included by specific reference to other
documents, including official statements of debt issues of the Water District or related public entities, which are available to the public on the MSRB’s Internet web site or filed with the Securities and Exchange Commission. The Water District shall clearly identify each such other document so included by reference.
Section 5. Reporting of Listed Events. (a) The Water District shall give, or cause to be given, notice of the occurrence of
any of the following Listed Events with respect to the Bonds:
(1) Principal and interest payment delinquencies. (2) Non-payment related defaults, if material. (3) Unscheduled draws on debt service reserves reflecting financial
difficulties. (4) Unscheduled draws on credit enhancements reflecting financial
difficulties.
G-4

(5) Substitution of credit or liquidity providers, or their failure to perform. (6) Adverse tax opinions, the issuance by the Internal Revenue Service of
proposed or final determinations of taxability, Notices of Proposed Issue (IRS Form 5701-TEB) or other material notices or determinations with respect to the tax status of the Bonds, or other material events affecting the tax status of the Bonds.
(7) Modifications to rights of security holders, if material. (8) Bond calls, if material, and tender offers. (9) Defeasances. (10) Release, substitution, or sale of property securing repayment of the
securities, if material. (11) Rating changes. (12) Bankruptcy, insolvency, receivership or similar event of the Water District. (13) The consummation of a merger, consolidation, or acquisition involving the
Water District, or the sale of all or substantially all of the assets of the Water District (other than in the ordinary course of business), the entry into a definitive agreement to undertake such an action, or the termination of a definitive agreement relating to any such actions, other than pursuant to its terms, if material.
(14) Appointment of a successor or additional Fiscal Agent or the change of
name of the Fiscal Agent, if material.
(b) Whenever the Water District obtains knowledge of the occurrence of a Listed Event, the Water District shall, or shall cause the Dissemination Agent (if not the Water District) to, file a notice of such occurrence with the MSRB, in an electronic format as prescribed by the MSRB, in a timely manner not in excess of 10 business days after the occurrence of the Listed Event. Notwithstanding the foregoing, notice of Listed Events described in subsections (a)(8) and (9) above need not be given under this subsection any earlier than the notice (if any) of the underlying event is given to holders of affected Bonds under the Fiscal Agent Agreement.
(c) The Water District acknowledges that the events described in subparagraphs
(a)(2), (a)(7), (a)(8) (if the event is a bond call), (a)(10), (a)(13), and (a)(14) of this Section 5 contain the qualifier "if material" and that subparagraph (a)(6) also contains the qualifier "material" with respect to certain notices, determinations or other events affecting the tax status of the Bonds. The Water District shall cause a notice to be filed as set forth in paragraph (b) above with respect to any such event only to the extent that it determines the event’s occurrence is material for purposes of U.S. federal securities law. Whenever the Water District obtains knowledge of the occurrence of any of these Listed Events, the Water District will as soon as possible determine if such event would be material under applicable federal securities law. If such event is determined to be material, the Water District will cause a notice to be filed as set forth in paragraph (b) above.
G-5

(d) For purposes of this Disclosure Agreement, any event described in paragraph
(a)(12) above is considered to occur when any of the following occur: the appointment of a receiver, fiscal agent, or similar officer for the Water District in a proceeding under the United States Bankruptcy Code or in any other proceeding under state or federal law in which a court or governmental authority has assumed jurisdiction over substantially all of the assets or business of the Water District, or if such jurisdiction has been assumed by leaving the existing governing body and officials or officers in possession but subject to the supervision and orders of a court or governmental authority, or the entry of an order confirming a plan of reorganization, arrangement, or liquidation by a court or governmental authority having supervision or jurisdiction over substantially all of the assets or business of the Water District.
Section 6. Identifying Information for Filings with the MSRB. All documents provided to
the MSRB under the Disclosure Agreement shall be accompanied by identifying information as prescribed by the MSRB.
Section 7. Termination of Reporting Obligation. The Water District's obligations under
this Disclosure Agreement shall terminate upon the legal defeasance, prior redemption or payment in full of all of the Bonds. If such termination occurs prior to the final maturity of the Bonds, the Water District shall give notice of such termination in the same manner as for a Listed Event under Section 5(c).
Section 8. Dissemination Agent. The Water District may, from time to time, appoint or
engage a Dissemination Agent to assist it in carrying out its obligations under this Disclosure Agreement, and may discharge any such Agent, with or without appointing a successor Dissemination Agent.
Section 9. Amendment; Waiver. Notwithstanding any other provision of this Disclosure
Agreement, the Water District may amend this Disclosure Agreement, and any provision of this Disclosure Agreement may be waived, provided that the following conditions are satisfied:
(a) if the amendment or waiver relates to the provisions of Sections 3(a), 4 or 5(a), it
may only be made in connection with a change in circumstances that arises from a change in legal requirements, change in law, or change in the identity, nature, or status of an obligated person with respect to the Bonds, or type of business conducted;
(b) the undertakings herein, as proposed to be amended or waived, would, in the
opinion of nationally recognized bond counsel, have complied with the requirements of the Rule at the time of the primary offering of the Bonds, after taking into account any amendments or interpretations of the Rule, as well as any change in circumstances; and
(c) the proposed amendment or waiver either (i) is approved by holders of the Bonds
in the manner provided in the Fiscal Agent Agreement for amendments to the Fiscal Agent Agreement with the consent of holders, or (ii) does not, in the opinion of the Fiscal Agent or nationally recognized bond counsel, materially impair the interests of the holders or beneficial owners of the Bonds.
If the annual financial information or operating data to be provided in the Annual Report
is amended pursuant to the provisions hereof, the first annual financial information filed pursuant hereto containing the amended operating data or financial information shall explain, in
G-6

narrative form, the reasons for the amendment and the impact of the change in the type of operating data or financial information being provided.
If an amendment is made to the undertaking specifying the accounting principles to be
followed in preparing financial statements, the annual financial information for the year in which the change is made shall present a comparison between the financial statements or information prepared on the basis of the new accounting principles and those prepared on the basis of the former accounting principles. The comparison shall include a qualitative discussion of the differences in the accounting principles and the impact of the change in the accounting principles on the presentation of the financial information, in order to provide information to investors to enable them to evaluate the ability of the Water District to meet its obligations. To the extent reasonably feasible, the comparison shall be quantitative. A notice of the change in the accounting principles shall be filed in the same manner as for a Listed Event under Section 5(c).
Section 10. Additional Information. Nothing in this Disclosure Agreement shall be
deemed to prevent the Water District from disseminating any other information, using the means of dissemination set forth in this Disclosure Agreement or any other means of communication, or including any other information in any Annual Report or notice of occurrence of a Listed Event, in addition to that which is required by this Disclosure Agreement. If the Water District chooses to include any information in any Annual Report or notice of occurrence of a Listed Event in addition to that which is specifically required by this Disclosure Agreement, the Water District shall have no obligation under this Disclosure Agreement to update such information or include it in any future Annual Report or notice of occurrence of a Listed Event.
Section 11. Default. In the event of a failure of the Water District to comply with any
provision of this Disclosure Agreement, the Participating Underwriter or any holder or beneficial owner of the Bonds may take such actions as may be necessary and appropriate, including seeking mandate or specific performance by court order, to cause the Water District to comply with its obligations under this Disclosure Agreement. A default under this Disclosure Agreement shall not be deemed an Event of Default under the Fiscal Agent Agreement, and the sole remedy under this Disclosure Agreement in the event of any failure of the Water District to comply with this Disclosure Agreement shall be an action to compel performance.
Section 12. Duties, Immunities and Liabilities of Dissemination Agent. The
Dissemination Agent shall have only such duties as are specifically set forth in this Disclosure Agreement, and the Water District agrees to indemnify and save the Dissemination Agent, its officers, directors, employees and agents, harmless against any loss, expense and liabilities which it may incur arising out of or in the exercise or performance of its powers and duties hereunder, including the costs and expenses (including attorneys fees) of defending against any claim of liability, but excluding liabilities due to the Dissemination Agent's negligence or willful misconduct. The Dissemination Agent shall have no duty or obligation to review any information provided to it hereunder and shall not be deemed to be acting in any fiduciary capacity District for the Water District, the Trustee, the Bond owners or any other party. The obligations of the Water District under this Section shall survive resignation or removal of the Dissemination Agent and payment of the Bonds.
Section 13. Beneficiaries. This Disclosure Agreement shall inure solely to the benefit of
the Water District, the Trustee, the Dissemination Agent, the Participating Underwriter and holders and beneficial owners from time to time of the Bonds, and shall create no rights in any other person or entity.
G-7
Section 14. Counterparts. This Disclosure Agreement may be executed in several
counterparts, each of which shall be regarded as an original, and all of which shall constitute one and the same instrument.
IN WITNESS WHEREOF, the parties hereto have executed this Disclosure Agreement
as of the date first above written.
WESTERN HILLS WATER DISTRICT, for and on behalf of Western Hills Water District Diablo Grande Community Facilities District No. 1 By:
Authorized Officer
GOODWIN CONSULTING GROUP, INC., as Dissemination Agent By:
Authorized Officer
G-8

EXHIBIT A
NOTICE TO REPOSITORIES OF FAILURE TO FILE ANNUAL REPORT
Name of Issuer: Western Hills Water District
Name of Bond Issue: $7,260,000 Western Hills Water District Diablo Grande Community Facilities District No. 1 Special Tax Refunding Bonds Series 2015
Date of Issuance: _________
NOTICE IS HEREBY GIVEN that the Western Hills Water District (the "Water District")
on behalf of Western Hills Water District Diablo Grande Community Facilities District No. 1 has not provided an Annual Report with respect to the above-named Bonds as required by the Fiscal Agent Agreement, dated as of August 1, 2001, as amended and supplemented by a Supplemental Agreement No. 1 to Fiscal Agent Agreement dated as of December 1, 2002, a Supplemental Agreement No. 2 to Fiscal Agent Agreement dated as of May 1, 2004, a Supplemental Agreement No. 3 to Fiscal Agent Agreement dated as of January 1, 2005, a Supplemental Agreement No. 4 to Fiscal Agent Agreement dated as of August 1, 2014 and a Supplemental Agreement No. 5 to Fiscal Agent Agreement dated as of July 1, 2015 by and between the Water District and The Bank of New York Melon, N.A., as Fiscal Agent. The Water District anticipates that the Annual Report will be filed by _____________.
Dated: _______________
GOODWIN CONSULTING GROUP, INC., as Dissemination Agent, on behalf of Western Hills Water District Diablo Grande Community Facilities District No. 1 By:
Authorized Officer
cc: Western Hills Water District
G-9

[THIS PAGE INTENTIONALLY LEFT BLANK]

APPENDIX H
BOOK-ENTRY SYSTEM
The following description of the Depository Trust Company ("DTC"), the procedures and
record keeping with respect to beneficial ownership interests in the Bonds, payment of principal, interest and other payments on the Bonds (herein, the "Securities") to DTC Participants or Beneficial Owners, confirmation and transfer of beneficial ownership interest in the Securities and other related transactions by and between DTC, the DTC Participants and the Beneficial Owners is based solely on information provided by DTC. Accordingly, no representations can be made concerning these matters and neither the DTC Participants nor the Beneficial Owners should rely on the foregoing information with respect to such matters, but should instead confirm the same with DTC or the DTC Participants, as the case may be.
Neither the issuer of the Securities (the "Issuer") nor the trustee, fiscal agent or paying
agent appointed with respect to the Securities (the "Agent") takes any responsibility for the information contained in this Appendix.
No assurances can be given that DTC, DTC Participants or Indirect Participants will
distribute to the Beneficial Owners (a) payments of interest, principal or premium, if any, with respect to the Securities, (b) certificates representing ownership interest in or other confirmation or ownership interest in the Securities, or (c) redemption or other notices sent to DTC or Cede & Co., its nominee, as the registered owner of the Securities, or that they will so do on a timely basis, or that DTC, DTC Participants or DTC Indirect Participants will act in the manner described in this Appendix. The current "Rules" applicable to DTC are on file with the Securities and Exchange Commission and the current "Procedures" of DTC to be followed in dealing with DTC Participants are on file with DTC.
1. The Depository Trust Company ("DTC"), New York, NY, will act as securities
depository for the securities (the "Securities"). The Securities will be issued as fully-registered securities registered in the name of Cede & Co. (DTC’s partnership nominee) or such other name as may be requested by an authorized representative of DTC. One fully-registered Security certificate will be issued for each issue of the Securities, each in the aggregate principal amount of such issue, and will be deposited with DTC. If, however, the aggregate principal amount of any issue exceeds $500 million, one certificate will be issued with respect to each $500 million of principal amount, and an additional certificate will be issued with respect to any remaining principal amount of such issue.
2. DTC, the world’s largest securities depository, is a limited-purpose trust company
organized under the New York Banking Law, a "banking organization" within the meaning of the New York Banking Law, a member of the Federal Reserve System, a "clearing corporation" within the meaning of the New York Uniform Commercial Code, and a "clearing agency" registered pursuant to the provisions of Section 17A of the Securities Exchange Act of 1934. DTC holds and provides asset servicing for over 3.5 million issues of U.S. and non-U.S. equity issues, corporate and municipal debt issues, and money market instruments (from over 100 countries) that DTC’s participants ("Direct Participants") deposit with DTC. DTC also facilitates the post-trade settlement among Direct Participants of sales and other securities transactions in deposited securities, through electronic computerized book-entry transfers and pledges between Direct Participants’ accounts. This eliminates the need for physical movement of securities certificates. Direct Participants include both U.S. and non-U.S. securities brokers and
H-1
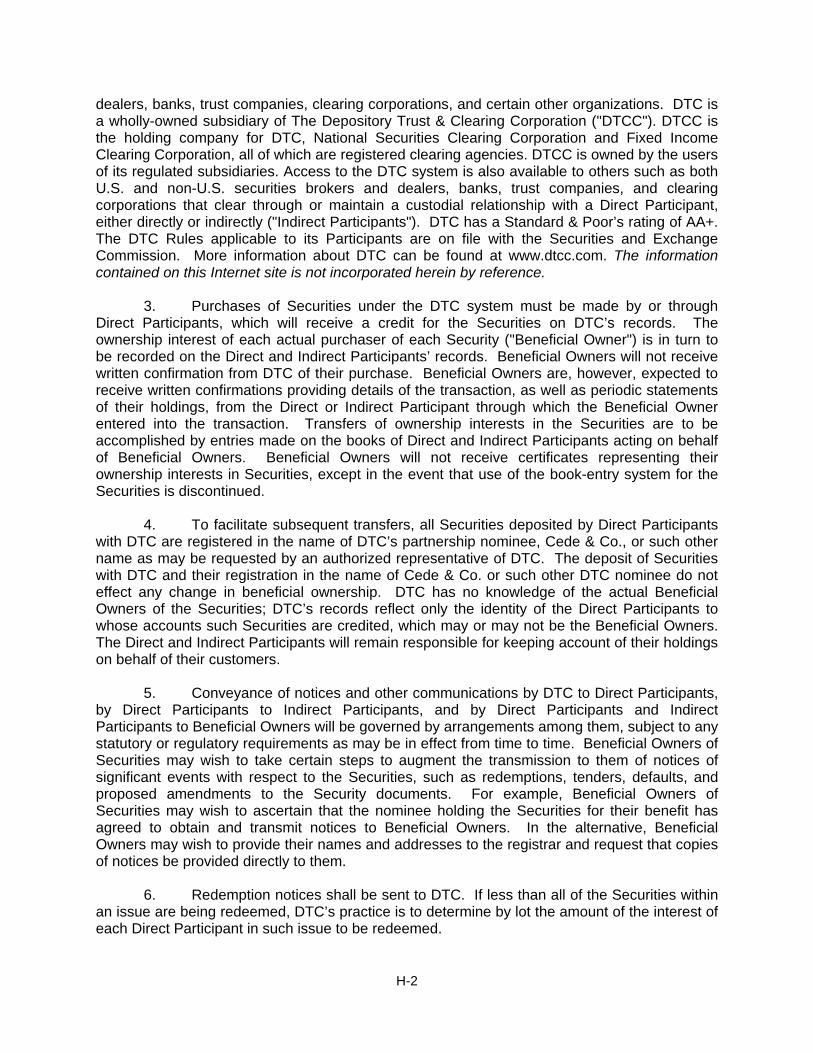
dealers, banks, trust companies, clearing corporations, and certain other organizations. DTC is a wholly-owned subsidiary of The Depository Trust & Clearing Corporation ("DTCC"). DTCC is the holding company for DTC, National Securities Clearing Corporation and Fixed Income Clearing Corporation, all of which are registered clearing agencies. DTCC is owned by the users of its regulated subsidiaries. Access to the DTC system is also available to others such as both U.S. and non-U.S. securities brokers and dealers, banks, trust companies, and clearing corporations that clear through or maintain a custodial relationship with a Direct Participant, either directly or indirectly ("Indirect Participants"). DTC has a Standard & Poor’s rating of AA+. The DTC Rules applicable to its Participants are on file with the Securities and Exchange Commission. More information about DTC can be found at www.dtcc.com. The information contained on this Internet site is not incorporated herein by reference.
3. Purchases of Securities under the DTC system must be made by or through
Direct Participants, which will receive a credit for the Securities on DTC’s records. The ownership interest of each actual purchaser of each Security ("Beneficial Owner") is in turn to be recorded on the Direct and Indirect Participants’ records. Beneficial Owners will not receive written confirmation from DTC of their purchase. Beneficial Owners are, however, expected to receive written confirmations providing details of the transaction, as well as periodic statements of their holdings, from the Direct or Indirect Participant through which the Beneficial Owner entered into the transaction. Transfers of ownership interests in the Securities are to be accomplished by entries made on the books of Direct and Indirect Participants acting on behalf of Beneficial Owners. Beneficial Owners will not receive certificates representing their ownership interests in Securities, except in the event that use of the book-entry system for the Securities is discontinued.
4. To facilitate subsequent transfers, all Securities deposited by Direct Participants
with DTC are registered in the name of DTC’s partnership nominee, Cede & Co., or such other name as may be requested by an authorized representative of DTC. The deposit of Securities with DTC and their registration in the name of Cede & Co. or such other DTC nominee do not effect any change in beneficial ownership. DTC has no knowledge of the actual Beneficial Owners of the Securities; DTC’s records reflect only the identity of the Direct Participants to whose accounts such Securities are credited, which may or may not be the Beneficial Owners. The Direct and Indirect Participants will remain responsible for keeping account of their holdings on behalf of their customers.
5. Conveyance of notices and other communications by DTC to Direct Participants,
by Direct Participants to Indirect Participants, and by Direct Participants and Indirect Participants to Beneficial Owners will be governed by arrangements among them, subject to any statutory or regulatory requirements as may be in effect from time to time. Beneficial Owners of Securities may wish to take certain steps to augment the transmission to them of notices of significant events with respect to the Securities, such as redemptions, tenders, defaults, and proposed amendments to the Security documents. For example, Beneficial Owners of Securities may wish to ascertain that the nominee holding the Securities for their benefit has agreed to obtain and transmit notices to Beneficial Owners. In the alternative, Beneficial Owners may wish to provide their names and addresses to the registrar and request that copies of notices be provided directly to them.
6. Redemption notices shall be sent to DTC. If less than all of the Securities within
an issue are being redeemed, DTC’s practice is to determine by lot the amount of the interest of each Direct Participant in such issue to be redeemed.
H-2
7. Neither DTC nor Cede & Co. (nor any other DTC nominee) will consent or vote with respect to Securities unless authorized by a Direct Participant in accordance with DTC’s MMI Procedures. Under its usual procedures, DTC mails an Omnibus Proxy to Issuer as soon as possible after the record date. The Omnibus Proxy assigns Cede & Co.’s consenting or voting rights to those Direct Participants to whose accounts Securities are credited on the record date (identified in a listing attached to the Omnibus Proxy).
8. Redemption proceeds, distributions, and dividend payments on the Securities will
be made to Cede & Co., or such other nominee as may be requested by an authorized representative of DTC. DTC’s practice is to credit Direct Participants’ accounts upon DTC’s receipt of funds and corresponding detail information from Issuer or Agent, on payable date in accordance with their respective holdings shown on DTC’s records. Payments by Participants to Beneficial Owners will be governed by standing instructions and customary practices, as is the case with securities held for the accounts of customers in bearer form or registered in "street name," and will be the responsibility of such Participant and not of DTC, Agent, or Issuer, subject to any statutory or regulatory requirements as may be in effect from time to time. Payment of redemption proceeds, distributions, and dividend payments to Cede & Co. (or such other nominee as may be requested by an authorized representative of DTC) is the responsibility of Issuer or Agent, disbursement of such payments to Direct Participants will be the responsibility of DTC, and disbursement of such payments to the Beneficial Owners will be the responsibility of Direct and Indirect Participants.
9. DTC may discontinue providing its services as depository with respect to the
Securities at any time by giving reasonable notice to Issuer or Agent. Under such circumstances, in the event that a successor depository is not obtained, Security certificates are required to be printed and delivered.
10. Issuer may decide to discontinue use of the system of book-entry-only transfers
through DTC (or a successor securities depository). In that event, Security certificates will be printed and delivered to DTC.
11. The information in this section concerning DTC and DTC’s book-entry system
has been obtained from sources that Issuer believes to be reliable, but Issuer takes no responsibility for the accuracy thereof.
H-3

[THIS PAGE INTENTIONALLY LEFT BLANK]