OFFICIAL STATEMENT - State of Nevada
292
OFFICIAL STATEMENT $292,600,000 State of Nevada Highway Revenue (Motor Vehicle Fuel Tax) Improvement and Refunding Bonds Series 2016
-
Upload
khangminh22 -
Category
Documents
-
view
1 -
download
0
Transcript of OFFICIAL STATEMENT - State of Nevada

OFFICIAL STATEMENT
$292,600,000
State of NevadaHighway Revenue
(Motor Vehicle Fuel Tax)Improvement and Refunding Bonds
Series 2016

[THIS PAGE HAS BEEN INTENTIONALLY LEFT BLANK]

In the opinion of Sherman & Howard L.L.C., Bond Counsel to the State of Nevada, assuming continuous compliance with certaincovenants described herein, interest on the Series 2016 Bonds is excluded from gross income under federal income tax lawspursuant to Section 103 of the Internal Revenue Code of 1986, as amended to the date of delivery of the Series 2016 Bonds (the“Tax Code”), and is excluded from alternative minimum taxable income as defined in Section 55(b)(2) of the Tax Code exceptthat such interest is required to be included in calculating the “adjusted current earnings” adjustment applicable to corporationsfor purposes of computing the alternative minimum taxable income of corporations. See “TAX MATTERS — Federal TaxMatters” in Part I of this Official Statement. The Series 2016 Bonds, their transfer and the income therefrom are free andexempt from taxation by the State or any subdivision thereof, except for the tax on estates imposed pursuant to Chapter 375A ofNRS and the tax on generation skipping transfers imposed pursuant to Chapter 375B of the NRS. See “TAX MATTERS — StateTax Exemption” in Part I of this Official Statement.
NEW ISSUE – BOOK-ENTRY ONLY
$292,600,000State of Nevada
Highway Revenue(Motor Vehicle Fuel Tax)
Improvement and Refunding BondsSeries 2016
DATED: Date of Delivery DUE: December 1, on the dates shown on the inside cover
Interest on the above-captioned Series 2016 Bonds is payable on June 1 and December 1 of each year, commencingDecember 1, 2016. Series 2016 Bonds may be purchased in book-entry form only, in the principal amount of $5,000 or anyintegral multiple thereof. See “APPENDIX C — BOOK-ENTRY ONLY SYSTEM” in Part I of this Official Statement.
The Series 2016 Bonds or portions thereof maturing on or after December 1, 2026, are subject to optional redemptionprior to maturity on and after June 1, 2026, as set forth herein.
The Series 2016 Bonds are issued pursuant to a bond resolution of the State Board of Finance adopted on November10, 2015 (the “Bond Resolution”). The Bond Resolution provides that the Series 2016 Bonds shall be payable from any federalaid eligible for the payment of the principal of and interest on the Series 2016 Bonds and from the proceeds of the motor vehiclefuel taxes imposed and collected pursuant to the Fuel Tax Act and credited to the State Highway Fund (the “Gross PledgedRevenues”).
The Series 2016 Bonds are special obligations of the State, payable and collectible solely out of the Gross PledgedRevenues. Bondholders may not look to any general or other fund for payment except the special funds pledged underthe Bond Resolution. The Series 2016 Bonds do not constitute an indebtedness or a debt within the meaning of anyconstitutional or statutory provision or limitation, and the Series 2016 Bonds shall not be considered or held to be generalobligations of the State. The State does not pledge its full faith and credit for the payment of the Series 2016 Bonds. See“DESCRIPTION OF THE SERIES 2016 BONDS — Security for the Series 2016 Bonds” in Part I of this Official Statement.
For maturity dates, principal amounts, interest rates, yields and CUSIP numbers of the Series 2016 Bonds, see theinside cover of this Official Statement.
The Series 2016 Bonds are offered when, as and if issued by the State and accepted by the underwriter subject to theapproval of legality and certain other legal matters by Sherman & Howard L.L.C., Bond Counsel and to certain other conditions.Certain legal matters will be passed upon by Nixon Peabody LLP, as Disclosure Counsel to the State. The Series 2016 Bonds areexpected to be available for book-entry delivery on or about March 9, 2016.
This page contains certain information for quick reference only. It is not a summary of this issue. Investors must readthe entire Official Statement to obtain information essential to the making of an informed investment decision.
Official Statement Dated: February 17, 2016.
RATINGSFitch: AA+Moody’s: Aa2Standard & Poor’s: AAASee “RATINGS” in Part I of thisOfficial Statement

State of NevadaHighway Revenue
(Motor Vehicle Fuel Tax)Improvement and Refunding Bonds
Series 2016
Maturity Date(December 1)
PrincipalAmount
InterestRate Yield
CUSIP†
Number
2017 $ 5,905,000 5.000% 0.550% 641480HP62018 6,205,000 5.000 0.670 641480HQ42019 1,270,000 5.000 0.810 641480HR22020 12,800,000 5.000 0.920 641480HS02021 11,965,000 5.000 1.070 641480HT82022 12,585,000 5.000 1.260 641480HU52023 13,220,000 5.000 1.480 641480HV32024 27,315,000 5.000 1.660 641480HW12025 28,705,000 5.000 1.800 641480HX92026 32,155,000 5.000 1.910c 641480HY72027 44,560,000 5.000 2.000c 641480HZ42028 46,790,000 5.000 2.100c 641480JA72029 49,125,000 3.000 2.670c 641480JB5
† A registered trademark of the American Bankers Association. The CUSIP numbers listed above are being provided solely for the convenienceof Bondholders only at the time of issuance of the Bonds. The State makes no representation with respect to such numbers nor undertakes anyresponsibility for their accuracy now or at any time in the future. The CUSIP number is subject to being changed after the issuance of theBonds.
C Priced to June 1, 2026 par call date.

STATE OF NEVADABrian Sandoval, Governor
Mark Hutchison, Lieutenant GovernorBarbara K. Cegavske, Secretary of State
Daniel M. Schwartz, State TreasurerRonald L. Knecht, State Controller
Adam Paul Laxalt, Attorney General
FINANCIAL ADVISORSHobbs, Ong & Associates, Inc.3900 Paradise Road, Suite 152
Las Vegas, Nevada 89169(702) 733-7223
Public Financial Management, Inc.50 California Street, Suite 2300San Francisco, California 94111
(415) 982-5544
BOND COUNSELSherman & Howard L.L.C.
50 West Liberty Street, Suite 1000Reno, Nevada 89501
(775) 323-1980
DISCLOSURE COUNSELNixon Peabody LLP
555 W. 5th Street, 46th FloorLos Angeles, California
(213) 629-6000
REGISTRAR, PAYING AGENT AND ESCROW AGENTU.S. Bank National Association
101 North First Avenue, Suite 1600Phoenix, Arizona 85003
(800) 934-6802
No dealer, broker, salesperson or other person has been authorized by the State of Nevada (the “State”) togive any information or to make any representations other than as contained in this Official Statement and, if givenor made, such other information or representations must not be relied upon as having been authorized by the State orthe successful bidders for the Series 2016 Bonds. This Official Statement does not constitute an offer to sell or asolicitation of an offer to buy, nor shall there be any sale of the Series 2016 Bonds by any person, in any jurisdictionin which it is unlawful for such person to make such offer, solicitation or sale.
Any information, estimates and expressions of opinion herein are subject to change without notice; andneither the delivery of this Official Statement nor any sale made hereunder shall, under any circumstances, createany implication that there has been no material change in the affairs of the State since the date hereof.
The information set forth herein has been furnished by the State and includes information obtained fromother sources. Such other sources are believed to be reliable, but the information derived from such sources is notguaranteed as to accuracy or completeness. The information and expressions of opinion herein are subject to changewithout notice and neither the delivery of this Official Statement nor any sale made hereunder shall, under anycircumstances, create any implication that there has been no change in the affairs of the State since the date hereof.Such information and expressions of opinion are made for the purpose of providing information to prospectiveinvestors and are not to be used for any other purpose or relied on by any other person.
This Official Statement contains statements which, to the extent they are not recitations of historical fact,constitute “forward-looking statements”. In this respect, the words “estimate”, “project”, “anticipate”, “expect”,“intend”, “believe”, and similar expressions are intended to identify forward-looking statements. A number ofimportant factors affecting the State’s financial results could cause actual results to differ materially from thosestated in the forward-looking statements. The presentation of information, including tables of receipts from taxesand other revenues, is intended to show recent historic information and is not intended to indicate future orcontinuing trends in the financial position or other affairs of the State. No representation is made that pastexperience, as it might be shown by such financial and other information, will necessarily continue or be repeated inthe future.
In connection with this offering the purchasers may over allot or effect transactions that stabilize ormaintain the market prices of the Series 2016 Bonds offered hereby at levels above that which might otherwiseprevail in the open market. Such stabilizing, if commenced, may be discontinued at any time.
THESE SECURITIES HAVE NOT BEEN RECOMMENDED BY ANY FEDERAL OR STATESECURITIES COMMISSION OR REGULATORY AUTHORITY. FURTHERMORE, THE FOREGOINGAUTHORITIES HAVE NOT CONFIRMED THE ACCURACY OR DETERMINED THE ADEQUACY OF THISDOCUMENT. ANY REPRESENTATION TO THE CONTRARY IS A CRIMINAL OFFENSE.
- i -
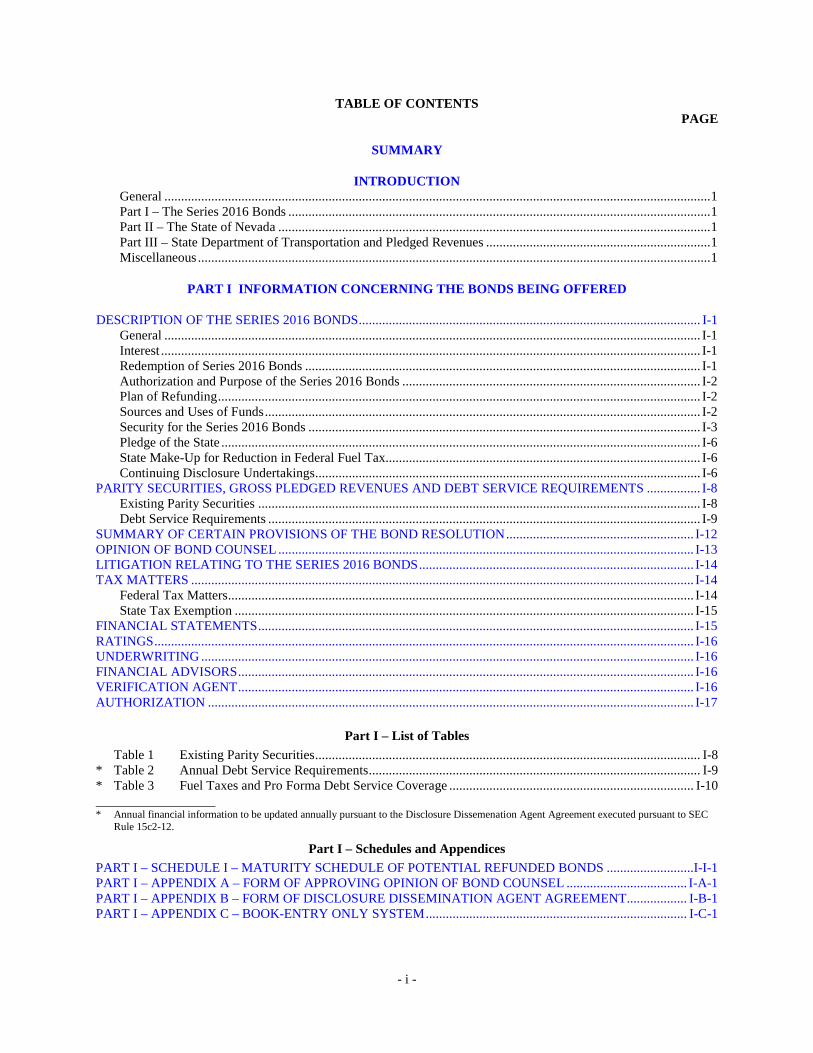
TABLE OF CONTENTSPAGE
SUMMARY
INTRODUCTIONGeneral ...................................................................................................................................................................1Part I – The Series 2016 Bonds ..............................................................................................................................1Part II – The State of Nevada .................................................................................................................................1Part III – State Department of Transportation and Pledged Revenues ...................................................................1Miscellaneous .........................................................................................................................................................1
PART I INFORMATION CONCERNING THE BONDS BEING OFFERED
DESCRIPTION OF THE SERIES 2016 BONDS...................................................................................................... I-1General ................................................................................................................................................................ I-1Interest ................................................................................................................................................................. I-1Redemption of Series 2016 Bonds ...................................................................................................................... I-1Authorization and Purpose of the Series 2016 Bonds ......................................................................................... I-2Plan of Refunding................................................................................................................................................ I-2Sources and Uses of Funds.................................................................................................................................. I-2Security for the Series 2016 Bonds ..................................................................................................................... I-3Pledge of the State ............................................................................................................................................... I-6State Make-Up for Reduction in Federal Fuel Tax.............................................................................................. I-6Continuing Disclosure Undertakings................................................................................................................... I-6
PARITY SECURITIES, GROSS PLEDGED REVENUES AND DEBT SERVICE REQUIREMENTS ................ I-8Existing Parity Securities .................................................................................................................................... I-8Debt Service Requirements ................................................................................................................................. I-9
SUMMARY OF CERTAIN PROVISIONS OF THE BOND RESOLUTION........................................................ I-12OPINION OF BOND COUNSEL ............................................................................................................................ I-13LITIGATION RELATING TO THE SERIES 2016 BONDS.................................................................................. I-14TAX MATTERS ...................................................................................................................................................... I-14
Federal Tax Matters........................................................................................................................................... I-14State Tax Exemption ......................................................................................................................................... I-15
FINANCIAL STATEMENTS.................................................................................................................................. I-15RATINGS................................................................................................................................................................. I-16UNDERWRITING ................................................................................................................................................... I-16FINANCIAL ADVISORS........................................................................................................................................ I-16VERIFICATION AGENT........................................................................................................................................ I-16AUTHORIZATION ................................................................................................................................................. I-17
Part I – List of Tables
Table 1 Existing Parity Securities................................................................................................................... I-8* Table 2 Annual Debt Service Requirements................................................................................................... I-9* Table 3 Fuel Taxes and Pro Forma Debt Service Coverage ......................................................................... I-10
* Annual financial information to be updated annually pursuant to the Disclosure Dissemenation Agent Agreement executed pursuant to SECRule 15c2-12.
Part I – Schedules and Appendices
PART I – SCHEDULE I – MATURITY SCHEDULE OF POTENTIAL REFUNDED BONDS ..........................I-I-1PART I – APPENDIX A – FORM OF APPROVING OPINION OF BOND COUNSEL .................................... I-A-1PART I – APPENDIX B – FORM OF DISCLOSURE DISSEMINATION AGENT AGREEMENT.................. I-B-1PART I – APPENDIX C – BOOK-ENTRY ONLY SYSTEM.............................................................................. I-C-1
- ii -
PART II – INFORMATION CONCERNING THE STATE OF NEVADA
GOVERNMENT STRUCTURE ...............................................................................................................................II-1ECONOMIC AND DEMOGRAPHIC INFORMATION .........................................................................................II-2
General ...............................................................................................................................................................II-2Population and Age Distribution ........................................................................................................................II-2Income................................................................................................................................................................II-3Employment .......................................................................................................................................................II-4Educational Attainment ......................................................................................................................................II-5Sales and Use Tax .............................................................................................................................................II-6Gaming and Tourism..........................................................................................................................................II-6Transportation ....................................................................................................................................................II-8Economic Development .....................................................................................................................................II-9Federal Activities .............................................................................................................................................II-10Mining ..............................................................................................................................................................II-11Electric Utilities................................................................................................................................................II-12Water ................................................................................................................................................................II-12State Litigation .................................................................................................................................................II-14
Part II – List of Tables
Table 1 Nevada Population by County..............................................................................................................II-2Table 2 Age Distribution...................................................................................................................................II-2Table 3 Per Capita Personal Income Groups.....................................................................................................II-3Table 4 Median Household Income ..................................................................................................................II-3Table 5 Percent of Households by Income Groups ...........................................................................................II-4Table 6 Average Annual Labor Force Summary ..............................................................................................II-4Table 7 Average Establishment – Based Industrial Employment by Calendar Year ........................................II-5Table 8 Educational Attainment........................................................................................................................II-5Table 9 Transactions Taxable Under the Nevada Sales and Use Tax Laws......................................................II-6Table 10 Gross Taxable Gaming Revenues and Total Gaming Taxes ................................................................II-6Table 11 Visitor Volume and room Occupancy Rate Las Vegas Metropolitan Area, Nevada ...........................II-7Table 12 Visitor Volume and room Occupancy Rate Washoe County, Nevada .................................................II-8Table 13 Convention and Visitors Authority Room Tax Revenue......................................................................II-8Table 14 Mineral Production.............................................................................................................................II-12Table 15 Mineral Production (By Weight)........................................................................................................II-12
PART III – INFORMATION CONCERNING THE STATE DEPARTMENT OF TRANSPORTATIONREVENUES PLEDGED TO SECURE THE BONDS
AND RELATED MATTERS
NEVADA DEPARTMENT OF TRANSPORTATION...........................................................................................III-1NDOT Responsibilities .....................................................................................................................................III-1NDOT Governance............................................................................................................................................III-1NDOT Staff .......................................................................................................................................................III-1
THE STATE HIGHWAY SYSTEM........................................................................................................................III-2Overview ...........................................................................................................................................................III-2NDOT-Maintained Roads .................................................................................................................................III-2
SUPPORT FOR STATE HIGHWAY SYSTEM .....................................................................................................III-5Federal Aid Highway System............................................................................................................................III-5Other Improved Roads ......................................................................................................................................III-6Unimproved Roads............................................................................................................................................III-6
NDOT PLANNING AND CURRENT PROGRAMS..............................................................................................III-6Statewide Transportation Planning (Annual Work Program)............................................................................III-6Statewide Transportation Improvement Program..............................................................................................III-6Pioneer Program................................................................................................................................................III-8

- iii -
Project NEON....................................................................................................................................................III-8OVERVIEW OF FUNDING FOR STATE HIGHWAYS .......................................................................................III-9
State Highway Fund ..........................................................................................................................................III-9Transportation Funding in General....................................................................................................................III-9Federal Highway Funding in General................................................................................................................III-9State Transportation Funding in General.........................................................................................................III-10State Make-Up for Reduction in Federal Fuel Tax..........................................................................................III-10
STATE FUNDING.................................................................................................................................................III-10Fuel Taxes .......................................................................................................................................................III-10Other Taxes and Fees ......................................................................................................................................III-12Revenue Source Derived From Counties ........................................................................................................III-16
FEDERAL TRANSPORTATION FUNDING.......................................................................................................III-17MAP-21 and the FAST Act .............................................................................................................................III-17Federal Aid to Pay the Bonds ..........................................................................................................................III-19
REVENUES AND EXPENDITURES OF STATE HIGHWAY ACTIVITIES.....................................................III-20REVENUES PLEDGED TO SECURE SERIES 2016 BONDS AND PARITY SECURITIES............................III-21
Gross Pledge Revenues ...................................................................................................................................III-22Direct Distributions and Other Exclusions ......................................................................................................III-22Highway Improvement Revenue Bonds..........................................................................................................III-22
Part III – List of Tables
Table 1 Miles of Improved Roads by County ..................................................................................................III-3Table 2 Vehicle Miles of Travel by County.....................................................................................................III-4Table 3 Truck Miles of Travel .........................................................................................................................III-5Table 4 State Highway System Mileage ..........................................................................................................III-6Table 5 Special Fuel Tax Distribution ...........................................................................................................III-11Table 6 State Gasoline Tax Revenue .............................................................................................................III-12Table 7 Vehicle Registration Rates ................................................................................................................III-14Table 8 Vehicle Permit Fees ..........................................................................................................................III-14Table 9 State Motor Vehicle Fund Taxes, Licenses, and Fees Revenue ........................................................III-15Table 10 State Motor Vehicle Taxes Deposited to State Highway Fund Derived from the Motor
Vehicle Fund .....................................................................................................................................III-15Table 11 Highway Fund Federal-Aid Revenue for Highways by Phase..........................................................III-19Table 12 Highway Fund Federal-Aid Apportionments ....................................................................................III-19Table 13 Total State Highway Revenue...........................................................................................................III-20Table 14 State Highway Expenditures and Disbursements..............................................................................III-21Table 15 NDOT Expenditures by Activity.......................................................................................................III-21Table 16 NDOT Expenditures by Appropriation .............................................................................................III-21
Part III – Appendix A – State of Nevada History of State Highway Fund Revenues, Expendituresand Changes in Fund Balances.................................................................................... III-A-1
Appendix B – State of Nevada Comprehensive Annual Financial Report for FY 2015 ......... III B-1

- i -
SUMMARY
This summary is not a complete description of the Series 2016 Bonds and does not contain all of the informationyou should consider before making any investment decision with respect to the Series 2016 Bonds. Prospectivepurchasers of Series 2016 Bonds should read the more detailed information appearing in this Official Statement fora complete understanding about the offering and the terms of security and sources of payment for the Series 2016Bonds.
THE BONDS
Bonds Offered ....................................................State of Nevada Highway Revenue (Motor Vehicle Fuel Tax) Improvementand Refunding Bonds Series 2016 (the “Series 2016 Bonds”)
Interest Payment Dates ................................June 1 and December 1, commencing December 1, 2016
Redemption Provisions................................The Series 2016 Bonds, or portions thereof in Authorized Denominations (asdefined under “DESCRIPTION OF THE SERIES 2016 BONDS” in Part Iof this Official Statement), maturing on or after December 1, 2026, will besubject to optional redemption prior to their respective maturities, at theoption of the State of Nevada (the “State”), on and after June 1, 2026, inwhole or in part at any time, from any maturities selected by the State and bylot within a maturity, at a redemption price equal to 100% of the principalamount of each Series 2016 Bond, or portion thereof to be redeemed, plusaccrued interest thereon to the redemption date.
PURPOSE
Purpose............................................................The Series 2016 Bonds are being issued by the State to refund certainoutstanding bonds, to fund State highway construction projects, and to paycosts of issuance of the Series 2016 Bonds.
SECURITY AND SOURCES OP PAYMENT FOR THE BONDS
Gross Pledged Revenues................................The Series 2016 Bonds are payable from and secured by Gross PledgedRevenues, which consist of the proceeds of State excise taxes on motorvehicle fuel and special fuel (defined as any combustible gas or liquid usedfor the generation of power for the propulsion of motor vehicles) credited ortransferred to the State Highway Fund pursuant to the Fuel Tax Act (asdefined in Part III of this Official Statement) and credited to the StateHighway Fund and any federal aid eligible for the payment of the principalof and interest on the Series 2016 Bonds. The Bond Resolution excludesfrom Gross Pledged Revenues certain fuel tax proceeds not collectedbecause of exempt sales and other exempt transactions, any tax proceeds notcollected because of the dealers’ collections and handling fee, tax proceedsfor making refunds, motor vehicle fuel tax proceeds paid on fuel used inwatercraft for recreational purposes, tax proceeds imposed and collected andrequired to be distributed to the counties in the State, tax proceeds derivedfrom motor vehicle fuel used in aircraft, and fuel taxes in an amountrequired to pay the costs of administration for the collection of any excisetax on gasoline or other motor vehicle fuel, subject to the limitation of notexceeding 1% of the total proceeds so collected.
The State also has other bonds secured on a parity with the Series 2016Bonds outstanding and may issue additional parity bonds in the future.
See “DESCRIPTION OF THE SERIES 2016 BONDS - Security for theSeries 2016 Bonds” in Part I of this Official Statement for additionalinformation regarding the security for the Series 2016 Bonds.

- 1 -
OFFICIAL STATEMENT
OF THE STATE OF NEVADA
RELATING TO THE ISSUE AND SALE OF
$292,600,000HIGHWAY REVENUE
(MOTOR VEHICLE FUEL TAX)IMPROVEMENT AND REFUNDING BONDS
SERIES 2016
INTRODUCTION
General
This Official Statement of the State of Nevada (the “State”), including the cover page, the inside coverpages, schedules and appendices, is provided for the purpose of setting forth information in connection with the saleof the State’s Highway Revenue (Motor Vehicle Fuel Tax) Bonds Series 2016 (the “Series 2016 Bonds”).
This Official Statement consists of the cover pages and all prefatory material prior to this introduction, thisintroduction, and Part I (including all schedules and appendices thereto), Part II and Part III (including the appendixthereto).
Part I – The Series 2016 Bonds
Part I sets forth information concerning the Series 2016 Bonds, including the payment and redemptionprovisions, the basis of their authorization and their purposes, the security for the Series 2016 Bonds, the federalincome tax treatment of the interest on the Series 2016 Bonds, and certain other matters.
Part II – The State of Nevada
Part II sets forth certain information relating to the State, including certain financial information relating tothe State, and certain economic and demographic information.
Part III – State Department of Transportation and Pledged Revenues
Part III sets forth certain information relating to the State Department of Transportation (sometimesreferred to herein as “NDOT”), the various revenue sources pledged as security for the Series 2016 Bonds, andrelated matters.
Miscellaneous
Potential investors should review this entire Official Statement. The Official Statement speaks only as ofits date, and the information contained herein is subject to change. Brief descriptions of the State, the Series 2016Bonds, the State Department of Transportation, and the State documents authorizing the Series 2016 Bonds (the“Bond Resolution”) are included in this Official Statement. All references herein to the Series 2016 Bonds and theBond Resolution and other documents referred to herein are qualified in their entirety by reference to suchdocuments and all capitalized terms used herein, which are not defined, have the meanings given such terms as setforth in the Bond Resolution.
So far as any statements made in this Official Statement involve matters of opinion, assumptions,projections, anticipated events or estimates, whether or not expressly stated, they are set forth as such and not aspresentations of fact, and actual results may differ substantially from those set forth herein. Neither this OfficialStatement nor any statement that may have been made verbally or in writing is to be construed as a contract with thepurchasers or subsequent owners of the Series 2016 Bonds.

- 2 -
The summaries of certain provisions of the Series 2016 Bonds, the State statutes, the Bond Resolution andother documents referred to in this Official Statement do not purport to be complete and reference is made to each ofthem for a complete statement of their provisions.
A wide variety of other information, including financial information, concerning the State and the StateDepartment of Transportation is available from State agencies, State agency publications and State agency websites.No such information is a part of or incorporated into this Official Statement.
[THE BALANCE OF THIS PAGE HAS BEEN INTENTIONALLY LEFT BLANK]

I-1
PART I
INFORMATION CONCERNING THE BONDS BEING OFFERED
DESCRIPTION OF THE SERIES 2016 BONDS
General
The Series 2016 Bonds will be dated the date of delivery and will mature on the dates and in the principalamounts set forth on the inside cover of this Official Statement. The Series 2016 Bonds will be registered in thename of Cede & Co., as nominee of The Depository Trust Company (“DTC”), which will act as securitiesdepository for the Series 2016 Bonds. Beneficial interests in the Series 2016 Bonds may be purchased in book-entryform only, in denominations of $5,000 or any integral multiple thereof (“Authorized Denominations”). Purchasersof Series 2016 Bonds will not receive certificates representing their ownership interest in the Series 2016 Bondspurchased. The record date for the payment of interest on the Series 2016 Bonds (the “Regular Record Date”) is theclose of business on the 15th day of the calendar month preceding an interest payment date. Interest will be paid byU.S. Bank National Association, Paying Agent and Registrar (the “Paying Agent” and “Registrar”), on the interestpayment date (or if such day is not a business day, on the next succeeding business day) to DTC or its nominee asregistered owner of the Series 2016 Bonds. Disbursement of interest, principal and redemption payments is theresponsibility of DTC. So long as Cede & Co., as nominee of DTC, is the registered owner of the Series 2016Bonds, references in this Official Statement to the registered owners of the Series 2016 Bonds will mean Cede &Co., and will not mean the beneficial owners. See “APPENDIX C — BOOK-ENTRY ONLY SYSTEM” in Part Iof this Official Statement.
Interest
Interest on the Series 2016 Bonds is payable on the dates and at the interest rates shown on the inside coverpage of this Official Statement calculated on the basis of a 360-day year of twelve 30-day months.
Redemption of Series 2016 Bonds
Optional Redemption
The Series 2016 Bonds, or portions thereof in Authorized Denominations, maturing on or afterDecember 1, 2026, will be subject to optional redemption prior to their respective maturities, at the option of theState, on and after June 1, 2026, in whole or in part at any time, from any maturities selected by the State and by lotwithin a maturity, at a redemption price equal to 100% of the principal amount of each Series 2016 Bond, or portionthereof to be redeemed, plus accrued interest thereon to the redemption date.
Notice of Redemption
Notice of redemption of any Series 2016 Bonds will be given by the Registrar by electronic mail as long asCede & Co. or a nominee of a successor depository is the owner of the Series 2016 Bonds, and otherwise by first-class, postage prepaid mail, at least 30 days but not more than 60 days prior to the redemption date, to DTC, as theregistered owner of the Series 2016 Bonds, and electronically to the Municipal Securities Rulemaking Board via itsElectronic Municipal Market Access System (“MSRB”), and as otherwise provided in the Bond Resolution. Thenotice will identify the Series 2016 Bonds or portions thereof to be redeemed, specify the redemption date, and statethat on the redemption date the principal amount thereof, accrued interest and premium, if any, thereon will becomedue and payable at the principal office of the Paying Agent, or such other office as may be designated by the PayingAgent, and that after the redemption date, no further interest will accrue on the principal of any Series 2016 Bondcalled for redemption. Failure to give such notice as described above to the MSRB or DTC, or any defect therein,shall not affect the validity of the proceedings for the redemption of any other Series 2016 Bond called forredemption.

I-2
Any notice of redemption may contain a statement that the redemption is conditional upon the receipt bythe Paying Agent of funds on or before the date fixed for redemption sufficient to pay the redemption price of theSeries 2016 Bonds so called for redemption, and that if such funds are not available, such redemption shall becanceled by written notice to the owners of the Series 2016 Bonds called for redemption in the same manner as theoriginal redemption notice was given.
Authorization and Purpose of the Series 2016 Bonds
The Series 2016 Bonds are being issued by the State to refund the outstanding State of Nevada, HighwayImprovement Revenue (Motor Vehicle Fuel Tax) Bonds, Series 2006 (the “2006 Bonds”) identified in Schedule I ofthis Part I, to refund the outstanding State of Nevada, Highway Improvement Revenue (Motor Vehicle Fuel Tax)Bonds, Series 2008 (the “2008 Bonds”) identified in Schedule I of this Part I, to fund State highway constructionprojects, and to pay costs of issuance of the Series 2016 Bonds. The Series 2016 Bonds are being issued pursuant tothe Constitution and laws of the State, including particularly Chapters 365 and 366, Nevada Revised Statutes (the“Fuel Tax Act”); Chapter 408, Nevada Revised Statutes (the “Project Act”); Sections 349.150 to 349.364, inclusive,Nevada Revised Statutes (the “State Securities Law”); and Chapter 348, Nevada Revised Statutes; and a BondResolution titled “2015 Highway Revenue Bond Resolution” adopted by the State of Nevada Board of Finance (the“Board”) on November 10, 2015 (the “Bond Resolution”). A copy of the Bond Resolution is on file in the office ofthe secretary of the Board in Carson City, Nevada, for public inspection.
Plan of Refunding
A portion of the proceeds of the sale of the Series 2016 Bonds and other lawfully available moneys will beset aside in an irrevocable escrow account, established with U.S. Bank National Association, as escrow agent (the“Escrow Agent”), to refund the outstanding 2006 Bonds and 2008 Bonds described in Schedule I to Part I of thisOfficial Statement. Amounts held by the Escrow Agent will be invested in obligations of, or obligationsunconditionally guaranteed by, the United States, that in each case are not callable for redemption prior to theirmaturities except at the option of the holder thereof.
The tables in Schedule I to Part I of this Official Statement describe the maturity dates, outstandingaggregate par amounts, coupons, CUSIP numbers, redemption dates and redemption prices of the 2006 Bonds andthe 2008 Bonds which will be refunded (collectively, the “Refunded Bonds”). The Refunded Bonds will be paid onthe redemption dates and at the redemption prices shown in the tables in Schedule I.
Sources and Uses of Funds
The sources and uses of the proceeds of the Series 2016 Bonds are approximately as follows:
SOURCESPrincipal Amount of Series 2016 Bonds $292,600,000.00Net Premium 63,714,074.45
Debt Service Fund for 2006 Bonds and 2008 Bonds 2,150,225.00
TOTAL SOURCES $358,464,299.45
USESConstruction Account $199,995,000.00Refunding Escrow 156,654,009.70
Costs of Issuance(1) 1,815,289.75
TOTAL USES $358,464,299.45
________________________(1) Represents legal and financing fees, printing costs, rating fees, underwriter’s discount and other miscellaneous
expenses relating to the issuance of the Series 2016 Bonds.

I-3
Security for the Series 2016 Bonds
Gross Pledged Revenues
The Bond Resolution provides that the Series 2016 Bonds shall be payable from any federal aid eligible forthe payment of the principal of and interest on the Series 2016 Bonds and from the proceeds of the motor vehicleFuel Taxes (as defined in Part III of this Official Statement) imposed and collected pursuant to the Fuel Tax Act andcredited to the State Highway Fund (as defined in Part III of this Official Statement) for the payment of principal ofand interest on the Series 2016 Bonds (the “Gross Pledged Revenues”). The Bond Resolution excludes from GrossPledged Revenues certain fuel tax proceeds not collected because of exempt sales and other exempt transactions,any tax proceeds not collected because of the dealers’ collections and handling fee, tax proceeds for making refunds,motor vehicle fuel tax proceeds paid on fuel used in watercraft for recreational purposes, tax proceeds imposed andcollected and required to be distributed to the counties in the State, tax proceeds derived from motor vehicle fuelused in aircraft, and fuel taxes in an amount required to pay the costs of administration for the collection of anyexcise tax on gasoline or other motor vehicle fuel, subject to the limitation of not exceeding 1% of the total proceedsso collected (such exclusions being herein the “Direct Distributions and Other Exclusions”). For a more detailedsummary of the Gross Pledged Revenues and the Direct Distributions and Other Exclusions, see “REVENUESPLEDGED TO SECURE SERIES 2016 BONDS AND PARITY SECURITIES” in Part III of this OfficialStatement. For a more detailed summary of the pledge created by the Bond Resolution, see “SUMMARY OFCERTAIN PROVISIONS OF THE BOND RESOLUTION” in this Part I of this Official Statement.
Limited Obligation of State
The Series 2016 Bonds are payable and collectible solely out of the Gross Pledged Revenues. The holdersof Series 2016 Bonds may not look to any general or other fund for the payment of the Bond Requirements, exceptthe Gross Pledged Revenues. The Series 2016 Bonds do not constitute an indebtedness or a debt within the meaningof any constitutional or statutory provision or limitation; and the Series 2016 Bonds are not general obligations ofthe State, but constitute its special obligations. The Series 2016 Bonds are not secured by an encumbrance,mortgage or other pledge of property of the State, except the Gross Pledged Revenues and any other moneyspledged for the payment of the Series 2016 Bonds.
Existing Parity Securities
The State currently has five series of highway improvement revenue bonds outstanding in the aggregateprincipal amount of $440,540,000, all of which are secured by the Gross Pledged Revenues (the “Existing ParitySecurities”). Each series of Existing Parity Securities was authorized and issued pursuant to a bond resolutionadopted by the Board that is substantially similar to the Bond Resolution authorizing the Series 2016 Bonds.Existing Parity Securities (and Additional Parity Securities, described below, if and when issued) are secured by theGross Pledged Revenues on a parity with the Series 2016 Bonds, without priority or preference. For a summary ofExisting Parity Securities issued and outstanding see Table 1 in this Part I of this Official Statement.
Additional Parity Securities
The Bond Resolution permits the issuance by the State of additional bonds or other additional securities(“Additional Parity Securities”) payable from the Gross Pledged Revenues and constituting a lien thereon on a paritywith, but not prior or superior to, the lien thereon of the Series 2016 Bonds and the Existing Parity Securities.Existing Parity Securities, the Series 2016 Bonds and Additional Parity Securities are referred to herein as “ParitySecurities”. The Bond Resolution also permits the issuance of bonds or other securities refunding all or a part of theSeries 2016 Bonds, or that are subordinate to the Parity Securities.
The State currently anticipates issuing approximately $365 million of Additional Parity Securities (notincluding the Series 2016 Bonds) through 2018, including approximately $185 million in 2017. The timing andamount of Additional Parity Securities may change.

I-4
Prior to the issuance of Additional Parity Securities (other than refunding securities, which are summarizedbelow), the following conditions must be satisfied:
(i) Absence of Default. At the time of the adoption of the resolution authorizing the issuance of theAdditional Parity Securities, the State shall not be in default in making any required paymentswith respect to any Parity Securities.
(ii) Historic Earnings Test. The Gross Pledged Revenues (but excluding any federal aid included asGross Pledged Revenues) derived for the last fiscal year for which audited Gross PledgedRevenues are available immediately preceding the date of the issuance of the Additional ParitySecurities proposed to be issued shall have been sufficient to pay an amount at least equal to 300%of the combined maximum annual principal and interest requirements to be paid during any oneBond Year of the Outstanding Series 2016 Bonds, any Existing Parity Securities and theAdditional Parity Securities proposed to be issued (excluding any reserves therefor), except asotherwise expressly provided in the Bond Resolution.
(iii) Adjustment of Gross Pledged Revenues. In any computation of such earnings tests as to whetheror not Additional Parity Securities may be issued as provided in the preceding paragraph, theamount of the Gross Pledged Revenues for the next preceding fiscal year shall be decreased andmay be increased by the amount of loss or gain estimated by the Treasurer, the Controller or anIndependent Accountant resulting from any change in the Fuel Tax proceeds and constituting allor a part of the Gross Pledged Revenues, whether a change in the amount periodically paid pergallon, or the portions of the collections thereof credited to the Gross Pledged Revenues, ormodifications to the Direct Distributions and Other Exclusions, or otherwise, during the nextpreceding fiscal year, as if the schedule of such modified Fuel Tax proceeds had been in effectduring the entire next preceding fiscal year, if such change shall have been made by the State priorto such computation of the designated earnings test but made in the same fiscal year in which suchcomputation is made or in the next preceding fiscal year.
(iv) Reduction of Annual Requirements. The respective annual Bond Requirements (including theamount of any prior redemption premiums due on any prior redemption date as of which the Stateshall have called or shall have obligated itself to call for prior redemption by a call of securities forpayment if the securities are subject to call for prior redemption) shall be reduced to the extentsuch Bond Requirements are scheduled to be paid in each of the respective fiscal years withmoneys held in trust or in escrow for that purpose by any trust bank within or without the State,including the known minimum yield from any investment in Federal Securities.
As used in the Bond Resolution, the following terms have the meanings set forth below:
“Bond Requirements” means the principal of, the interest on and any prior redemption premiums due inconnection with the Series 2016 Bonds and any other additional bonds or other additional securities payable fromthe Gross Pledged Revenues, or such part of such other bonds or other securities pertaining to those revenues as maybe designated, as such principal, any such premiums, and such interest become due.
“Direct Distributions and Other Exclusions” means the distributions and other exclusions of revenues fromthe Gross Pledged Proceeds resulting from exempt sales and other exempt transactions, allowances for the dealers’collections and handling fee, refunds, exemption of proceeds pertaining to fuel used in watercraft for recreationalpurposes or in aircraft, Fuel Taxes imposed and collected for the benefit of counties and certain politicalsubdivisions therein, and administration costs of collecting certain Fuel Taxes, as more specifically delineated in theBond Resolution.
“Federal Securities” means bills, certificates of indebtedness, notes, bonds or similar securities which aredirect obligations of, or the principal and interest of which securities are unconditionally guaranteed by, the UnitedStates, or securities which are direct obligations of, or the principal and interest of which securities are conditionallyor unconditionally guaranteed by the Federal Government, or other securities of the Federal Government, or otherobligations the payment of which is fully secured by a pledge of any such securities.

I-5
Issuance of Refunding Securities
Parity Securities (including the Series 2016 Bonds) may be refunded only if such Parity Securities at thetime or times of their required surrender for their payment shall then mature or shall be then callable for priorredemption for the purpose of refunding them at the State’s option upon proper call, unless the owner or owners ofall Parity Securities of the issue consent to such surrender and payment, regardless of whether the priority of the lienfor the payment of any refunding securities on the Gross Pledged Revenues is changed (except as otherwiseprovided in the Bond Resolution). If only a part of the Outstanding Parity Securities of any issue or issues payablefrom the Gross Pledged Revenues is refunded, then such securities must not be refunded without the consent of theowner or owners of the unrefunded portion of such securities unless:
(i) Requirements Not Increased. The refunding bonds or other refunding securities do not increasefor any Bond Year the aggregate principal and interest requirements evidenced by such refundingsecurities and by the Outstanding securities not refunded on and prior to the last maturity date orlast Redemption Date, if any, whichever time is earlier, of such unrefunded securities, and unlessthe lien of any refunding bonds or other refunding securities on the Gross Pledged Revenues is notraised to a higher priority than the lien thereon of the Bonds or other securities thereby refunded;or
(ii) Subordinate Lien. The lien on any Gross Pledged Revenues for the payment of the refundingsecurities is subordinate to each such lien for the payment of any securities not refunded; or
(iii) Historic Earnings Test. The refunding bonds are issued in compliance with the requirementssummarized under the heading “Additional Parity Securities” above, but excluding from anycomputation thereunder the bonds or other securities to be refunded and redeemed and which shallforthwith upon the issuance of the refunding bonds be no longer Outstanding.
Subordinate Securities Permitted
The Bond Resolution permits the State to issue additional bonds or other additional securities payable fromthe Gross Pledged Revenues and having a lien on the Gross Pledged Revenues that is junior to the lien thereonsecuring the Series 2016 Bonds and other Parity Securities.
Priority of Application of Gross Pledged Revenues
As long as any of the Series 2016 Bonds remain Outstanding, the Bond Resolution requires that duringeach fiscal year the Gross Pledged Revenues shall be administered, the money pertaining thereto shall be applied inthe order of priority, and payments shall be made from the Gross Pledged Revenues as follows:
First, from the Gross Pledged Revenues, there shall be credited to the Bond Fund and any bondfunds created by resolutions authorizing the issuance of any Parity Securities, monthly, commencing on thefirst day of the month immediately succeeding the delivery of the Parity Securities, an amount in equalmonthly installments necessary, together with any other money from time to time available therefor fromwhatever source, to pay the next maturing installments of principal and interest due on the OutstandingParity Securities. The moneys credited to the Bond Fund shall be used to pay the Bond Requirements ofthe Outstanding Parity Securities.
Second, after payment of the amounts required to be made first as set forth above, amountsrequired to be transferred to the Rebate Account for purposes of compliance with the Internal RevenueCode shall be so transferred.
Third, after payment of the amounts required to be made first and second as set forth above,amounts may be used for payments required to be made with respect to subordinate securities payable fromthe Gross Pledged Revenues.

I-6
After the transfers described above are made, any remaining Gross Pledged Revenues may be used in anyfiscal year for any one or any combination of lawful purposes, as the Board or the Director may from time to timedetermine.
Pledge of the State
Pursuant to State law, the faith of the State is pledged that the Project Act, the Fuel Tax Act, the StateSecurities Law, any other law supplemental or otherwise pertaining to the Bond Act, and any other act concerningthe Series 2016 Bonds or other State securities, Fuel Taxes or the Gross Pledged Revenues, or any combination ofsuch securities, such taxes and such revenues, shall not be repealed nor amended or otherwise directly or indirectlymodified in such manner as to impair adversely the Series 2016 Bonds or any other outstanding State securities,until all such securities have been discharged in full or provision for their payment and redemption has been fullymade.
State Make-Up for Reduction in Federal Fuel Tax
Under current State law, if the tax collected by the Federal Government relating to motor vehicle fuel isreduced or discontinued in whole or in part, the State’s motor vehicle fuel tax will increase in an amount equal to theamount by which the federal tax is reduced. This provision, if triggered by federal reductions in the fuel tax, wouldprovide an additional source of revenues to the State Highway Fund comprising Gross Pledged Revenues securingthe Series 2016 Bonds.
Continuing Disclosure Undertakings
The State has agreed to certain covenants relating to compliance with Rule 15c2-12 promulgated by theSecurities and Exchange Commission (the “SEC”) pursuant to the Securities Exchange Act of 1934, as amended(“SEC Rule 15c2-12”). The State has designated Digital Assurance Certification, L.L.C. (“DAC”) as itsdissemination agent. See Appendix B of this Part I for the form of Disclosure Dissemination Agent Agreement to beentered into by the State with respect to the Bonds.
In connection with other bonds issued by the State, the State has entered into similar continuous disclosureundertakings pursuant to which the State agrees to provide and file annual financial information and notices ofspecified material events with respect to the applicable bonds. In addition, in connection with various current andadvance refundings, the State has designated the applicable paying agent for the bonds to be defeased or redeemedas its representative for purposes of filing notices of defeasance or redemption with the MSRB.
The State became aware that an annual report filing for the fiscal year ended June 30, 2009, due by March31, 2010, for Nevada Municipal Bond Bank Project Nos. 57-64 Series June 1, 1997B was not on file with the MSRB(the annual report filings for the prior and subsequent fiscal years were properly filed). The State made asupplemental filing to remedy the omission. The State believes that the omission of the filing in 2010 was due toeither a clerical error in the filing process or the result of a change in CUSIP number that was not properly recorded.
The State generally offers multiple series of bonds through a single official statement and enters intocontinuing disclosure arrangements through a single agreement that is applicable to all series of bonds offered underthe applicable official statement. In certain instances, one or more series of bonds is secured by revenues that are notavailable as security for the other series of bonds offered pursuant to the same offering document. It has come to theState’s attention that in several financings a continuing disclosure obligation may be applicable to an issue of bondsfor which it is not intended, and that is not secured by the revenues with respect to which continuing disclosureinformation is required. The State has become aware of a limited number of instances of failure to update certaintables, none of which the State believes to be material because the tables update revenue sources that are notavailable for payment of the issue of bonds for which an update was not provided.

I-7
With respect to the State’s Motor Vehicle Fuel Tax Revenue Bonds, the State learned that while annualreports were filed for fiscal years ended June 30, 2008 and 2009, updates of certain tables1 were omitted from theannual report. The affected bonds are no longer outstanding.
With respect to the State’s General Obligation (Limited Tax) Bonds (Nevada Municipal Bond Bank ProjectNos. R-9A, R-9B, R-9C, R-10, R-11 and R-12) Series 2005F and General Obligation (Limited Tax) (RevenueSupported) Water Refunding Bonds, Series 2005H, notices of redemption of bonds to occur on July 1, 2015 werenot on file with the MSRB until June 24, 2015 and July 9, 2015, respectively.
The Office of the State Treasurer believes that, except as set forth above, during the past five years theState has complied in all material respects with any prior written continuing disclosure undertaking pursuant to SECRule 15c2-12.
[THE BALANCE OF THIS PAGE HAS BEEN INTENTIONALLY LEFT BLANK]
1 These tables were regarding the Public Employees’ Retirement System of Nevada (“PERS”). Such informationis currently included in State general obligation bond offering documents, but not in offering documents forHighway Revenue (Motor Vehicle Fuel Tax) Bonds, which are not secured by a State general obligation pledge
I-8
PARITY SECURITIES, GROSS PLEDGED REVENUES AND DEBT SERVICE REQUIREMENTS
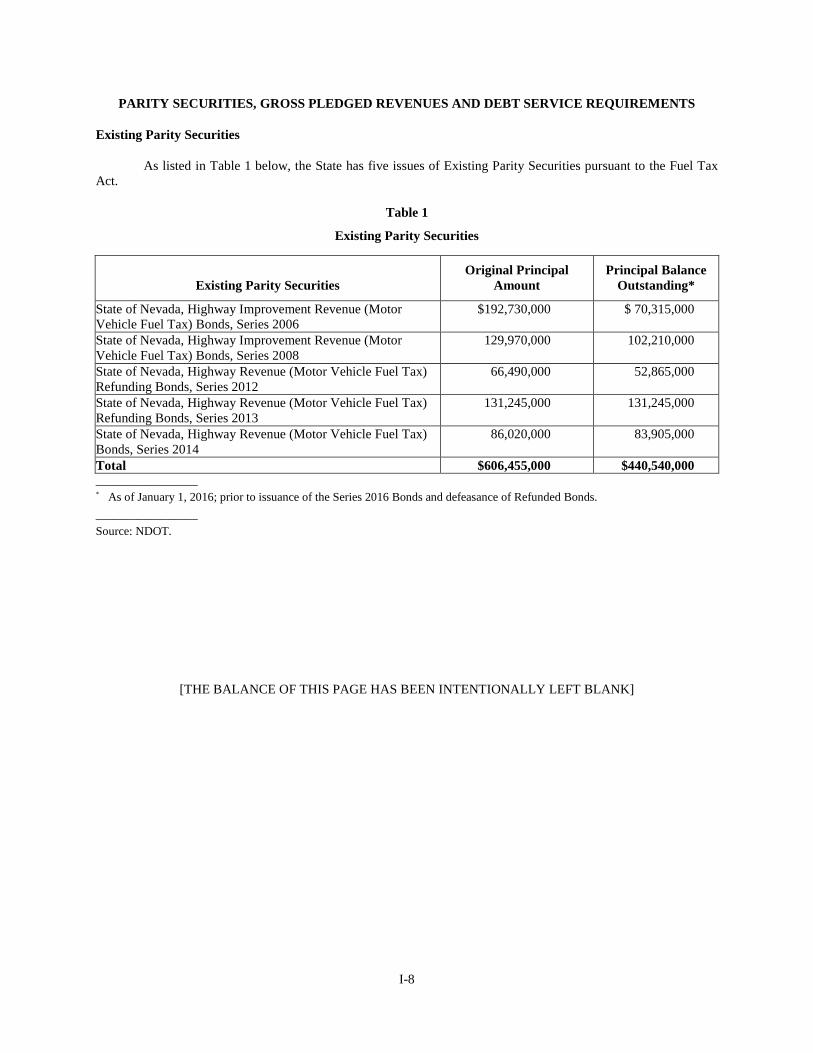
Existing Parity Securities
As listed in Table 1 below, the State has five issues of Existing Parity Securities pursuant to the Fuel TaxAct.
Table 1
Existing Parity Securities
Existing Parity SecuritiesOriginal Principal
AmountPrincipal Balance
Outstanding*
State of Nevada, Highway Improvement Revenue (MotorVehicle Fuel Tax) Bonds, Series 2006
$192,730,000 $ 70,315,000
State of Nevada, Highway Improvement Revenue (MotorVehicle Fuel Tax) Bonds, Series 2008
129,970,000 102,210,000
State of Nevada, Highway Revenue (Motor Vehicle Fuel Tax)Refunding Bonds, Series 2012
66,490,000 52,865,000
State of Nevada, Highway Revenue (Motor Vehicle Fuel Tax)Refunding Bonds, Series 2013
131,245,000 131,245,000
State of Nevada, Highway Revenue (Motor Vehicle Fuel Tax)Bonds, Series 2014
86,020,000 83,905,000
Total $606,455,000 $440,540,000_________________* As of January 1, 2016; prior to issuance of the Series 2016 Bonds and defeasance of Refunded Bonds.
_________________
Source: NDOT.
[THE BALANCE OF THIS PAGE HAS BEEN INTENTIONALLY LEFT BLANK]

I-9
Debt Service Requirements
The following table lists the debt service requirements for the $440,540,000 outstanding principal amountof Existing Parity Securities.
Table 2
Annual Debt Service Requirements(As of January 1, 2016)
Bond YearEnded
December 1
Principal of andInterest on ExistingParity Securities(1)
2016 $ 68,782,4752017 68,672,4252018 68,678,4252019 60,106,8752020 62,565,8502021 38,470,3752022 38,466,8752023 38,467,3252024 38,467,3252025 38,462,1252026 25,688,050Total $546,828,125
_________________(1) Does not give effect to issuance of the Series 2016
Bonds or defeasance of Refunded Bonds.
_________________Source: NDOT.
[THE BALANCE OF THIS PAGE HAS BEEN INTENTIONALLY LEFT BLANK]

I-10
The following Table 3 reports Fuel Taxes included in Gross Pledged Revenues for the five fiscal yearsended June 30, 2015, and pro forma debt service coverage on Existing Parity Securities Outstanding.
Table 3
Fuel Taxes and Pro Forma Debt Service Coverage (1)
(000 omitted)
2011 2012 2013 2014 2015
Gas Tax $186,165 $185,171 $185,651 $187,784 $193,392Special Fuel Tax 78,534 79,198 80,913 79,094 81,120Total Fuel Taxes (2)(4) $264,699 $264,369 $266,564 $266,878 $274,512
Coverage of Maximum AnnualDebt Service (3)
3.29 3.29 4.25 3.88 3.99
(1) Calculated using Fuel Taxes only. Does not include any debt service coverage from federal aid funds discussed under “FEDERALTRANSPORTATION FUNDING” in Part III of this Official Statement. Fuel Taxes are for fiscal years ended June 30.
(2) Fuel Taxes constituting Gross Pledged Revenues do not include “Direct Distributions and Other Exclusions” consisting of tax proceeds thatare not collected because of exempt sales and other exempt transactions, dealers’ collection and handling fees, tax proceeds to be used forrefunds, motor vehicle fuel tax proceeds paid on fuel used in watercraft for recreational purposes, tax proceeds distributed to counties, taxproceeds derived from motor vehicle fuel used in aircraft; and the costs of administration for the collection of excise taxes on gasoline orother motor vehicle fuel (subject to a limitation of not exceeding 1% of the total proceeds so collected).
(3) Based on scheduled debt service on the Existing Parity Securities and assuming no other debt outstanding. Maximum Annual Debt Serviceon Existing Parity Securities is $80,454,000 for 2011, $80,254,000 for 2012, $62,657,000 for 2013, $68,782,475 for 2014 and $68,782,475for 2015. Maximum Annual Debt Service on Existing Parity Securities is determined based on bond years (each bond year ending onDecember 1).
(4) Appendix A to Part III of this Official Statement consists of a State of Nevada History of State Highway Fund Revenues, Expenditures andChanges in Fund Balances for the five fiscal years ended June 30, 2015. The line item “Other Taxes” in that presentation includes the FuelTaxes. “Other Taxes” also includes debits that reduce the total amounts reported as “Other Taxes” to amounts less than the amounts of FuelTaxes reported in this table.
_________________
Source: NDOT.
Gross Pledged Revenues include federal aid eligible for the payment of the principal of and interest on theParity Securities. Receipts by the State of federal aid revenues eligible for debt service from Fiscal Years 2011through 2015 were as follows:
FiscalYear
Federal Aid Eligible forDebt Service(in millions)
2011 $53.902012 48.302013 50.602014 53.402015 39.24
_________________
Source: NDOT.
The amount of federal aid eligible for the payment of the principal of and interest on the Parity Securities isbased on the annual principal debt service payment and the federal reimbursement percentage. The amount offederal aid eligible for the payment of the principal of and interest on the Parity Securities decreased in 2015 due toa lower principal debt service payment than the previous years. NDOT’s federal participation percentage istypically 95% due to the high percentage of federally owned land in the State (i.e., approximately 80% of the State).

I-11
It should be noted that the portion of federal aid revenues that is eligible to be used to pay debt service,while being included within Gross Pledged Revenues, is not included when performing the debt service coveragecalculation required by the Bond Resolution as a condition of the issuance of Additional Parity Securities.
Gross Pledged Revenues consist of the proceeds of motor vehicle Fuel Taxes imposed and collectedpursuant to the Fuel Tax Act and credited to the State Highway Fund and any federal aid eligible for the payment ofthe principal of and interest on the Series 2016 Bonds. The table below shows Gross Pledged Revenues for the fivefiscal years ended June 30, 2015:
Gross Pledged Revenues(000 omitted)
2011 2012 2013 2014 2015
Gas Tax $186,165 $185,171 $185,651 $187,784 $193,392Special Fuel Tax 78,534 79,198 80,913 79,094 81,120Federal Aid Eligible for DebtService 53,900 48,300 50,600 53,400 39,240Total Fuel Taxes $318,599 $312,669 $317,164 $320,278 $313,752
_________________
Source: NDOT.
[THE BALANCE OF THIS PAGE HAS BEEN INTENTIONALLY LEFT BLANK]

I-12
SUMMARY OF CERTAIN PROVISIONS OF THE BOND RESOLUTION
The Bond Resolution. The Bond Resolution includes the form, terms and conditions of the Series 2016Bonds, the manner and terms of their issuance, the manner of their execution, the method of their payment, thesecurity therefor and other matters.
The Bond Fund. The Board has created a separate account to be held in trust by the State and designated asthe “State of Nevada, Highway Parity Revenue Bonds, Gross Pledged Revenues Interest and Bond RetirementFund” (the “Bond Fund”). The Bond Resolution requires that monthly deposits be made to the Bond Fund fromGross Pledged Revenues in equal installments as necessary to pay the next maturing installments of principal andinterest on the Series 2016 Bonds and any Parity Securities. Money in the Bond Fund is required to be transferred tothe Paying Agent to pay debt service on the Series 2016 Bonds and any Parity Securities as debt service becomesdue.
Gross Pledged Revenues each month in excess of the amounts required to be deposited in the Bond Fundthat month are required by the Bond Resolution to be applied as described under the heading “DESCRIPTION OFTHE SERIES 2016 BONDS — Security for the Series 2016 Bonds — Priority of Application of Gross PledgedRevenues” in Part I of this Official Statement.
Amounts held in the Bond Fund will be accounted for in the State Treasury as a separate trust account inone or more bank accounts as determined by the State Board of Finance or the State Treasurer. Any moneys thereinnot needed for immediate use may be invested by the State Treasurer in investments permitted under State law.Investment earnings on the Bond Fund will be credited to the State Highway Fund.
Bonds Outstanding. In the Bond Resolution, the term “Outstanding” means, when used with reference tothe Series 2016 Bonds or any other designated securities and as of any particular date, all the Series 2016 Bonds orany such other securities payable from the Gross Pledged Revenues, in any manner theretofore and thereupon beingexecuted and delivered:
(i) Except any Series 2016 Bond or other security canceled by the State, or otherwise on the State’sbehalf, at or before such date;
(ii) Except any Series 2016 Bond or other security for the payment or the redemption of whichmoneys at least equal to its Bond Requirements to the date of its maturity or any RedemptionDate, whichever date is earlier, if any, shall have theretofore been deposited with a trust bank inescrow or in trust for that purpose, as provided in the Bond Resolution hereof or any similarsection of the resolution pursuant to which such other securities were issued (see “Defeasance”below); and
(iii) Except any Series 2016 Bond or other security in lieu of or in substitution for which another Series2016 Bond or other security shall have been executed and delivered pursuant to the sections of theBond Resolution relating to bond transfers.
Covenants of the State; Amendment of the Bond Resolution. The Bond Resolution sets forth covenants ofthe State, including a promise to impose and collect the Fuel Tax Proceeds and to preserve and protect the pledge ofthe Gross Pledged Revenues. The covenants also include a promise not to repeal or amend or modify Nevada law soas to impair adversely the Series 2016 Bonds.
Amendments to the Bond Resolution. The Bond Resolution can be amended with the written consent of theinsurer of the Series 2016 Bonds, if any, or the owners of record of at least 66% in aggregate principal amount of theoutstanding Series 2016 Bonds, but no amendment may, without the consent of all Series 2016 Bond owners ofrecord adversely affected thereby, change Series 2016 Bond maturity or redemption provisions, reduce the principalamount of any Series 2016 Bond or the rate of interest thereon, create a lien upon or a pledge of revenues rankingprior to the lien of or to the pledge created by the Bond Resolution, reduce the bondholder consent requirements ofthe Bond Resolution, establish priorities as between Series 2016 Bonds or materially and prejudicially modify or

I-13
otherwise materially and prejudicially affect the rights or privileges of the record owners of less than all of theoutstanding Series 2016 Bonds. Each bond resolution authorizing an issue of Existing Parity Securities hassubstantially the same amendment provisions, but applicable to the issue of Existing Parity Securities authorized andissued pursuant to such bond resolution.
Defeasance. When all Bond Requirements of a Series 2016 Bond or any other securities of any other issuepayable from the Gross Pledged Revenues have been duly paid, the pledge and lien and all obligations under theBond Resolution as to that Series 2016 Bond or other security shall thereby be discharged and the Series 2016 Bondor other security shall no longer be deemed to be Outstanding within the meaning of the Bond Resolution. Thereshall be deemed to be such due payment if the State, acting by and through the Board, has placed in escrow or intrust with a trust bank exercising trust powers, an amount sufficient (including the known minimum yield availablefor such purpose from Federal Securities in which such amount wholly or in part may be initially invested) to meetall Bond Requirements of the Series 2016 Bond or other security as such requirements become due to the fixedmaturity of the Series 2016 Bond or other security or to any Redemption Date or Redemption Dates as of which theState shall have exercised or shall have obligated itself to exercise its prior redemption option by a call of the Series2016 Bond or security for payment if the securities are subject to a call for prior redemption. The Federal Securitiesshall become due prior to the respective times on which the proceeds thereof shall be needed, in accordance with aschedule established and agreed upon between the State and such bank at the time of the creation of the escrow ortrust, or the Federal Securities shall be subject to redemption at the option of the owner thereof to assure suchavailability as so needed to meet such schedule. If at any time the State has so placed in escrow or trust an amountsufficient to pay designated Bond Requirements of the Series 2016 Bond or security constituting less than all of theBond Requirements of the Series 2016 Bond or security becoming due on and before their respective due dates,whether the fixed maturity dates of the Series 2016 Bonds or security or any such Redemption Date pertaining to thesecurities, such designated Bond Requirements shall be deemed paid and discharged under the Bond Resolution.The term “Federal Securities” shall include only bills, certificates of indebtedness, notes, bonds or similar securitieswhich are direct obligations of, or the principal of and interest on which securities are unconditionally guaranteedby, the United States which are not callable at the option of the issuer thereof.
Events of Default; Remedies. The Bond Resolution includes various events of default, includingnonpayment of debt service. No provision is made for acceleration of maturity of the Series 2016 Bonds upondefault. Upon the happening and continuance of any of the events of default set forth in the Bond Resolution, theOwner or Owners of not less than 10% in aggregate principal amount of the Series 2016 Bonds then Outstanding,including, without limitation, a trustee or trustees therefor, may proceed against the State and its agents, officers andemployees to protect and to enforce the rights of any Owner of Series 2016 Bonds under the Bond Resolution bymandamus or by other suit, action or special proceedings in equity or at law, in any court of competent jurisdiction,either for the appointment of a receiver or for the specific performance of any covenant or agreement set forth in theBond Resolution or in an award of execution of any power granted in the Bond Resolution for the enforcement ofany proper, legal or equitable remedy as such Owner or Owners may deem most effectual to protect and to enforcetheir rights, or to enjoin any act or thing which may be unlawful or in violation of any right of any Owner of anySeries 2016 Bond, or to require the State to act as if it were the trustee of an express trust, or any combination ofsuch remedies. All such proceedings at law or in equity shall be instituted, had and maintained for the equal benefitof all Owners of the Series 2016 Bonds then Outstanding.
OPINION OF BOND COUNSEL
The validity of the Series 2016 Bonds is to be approved by Bond Counsel, whose approving opinion will bedelivered with the Series 2016 Bonds. A copy of the proposed text of the approving opinion of Bond Counsel is setforth in Appendix A to Part I of this Official Statement.
I-14
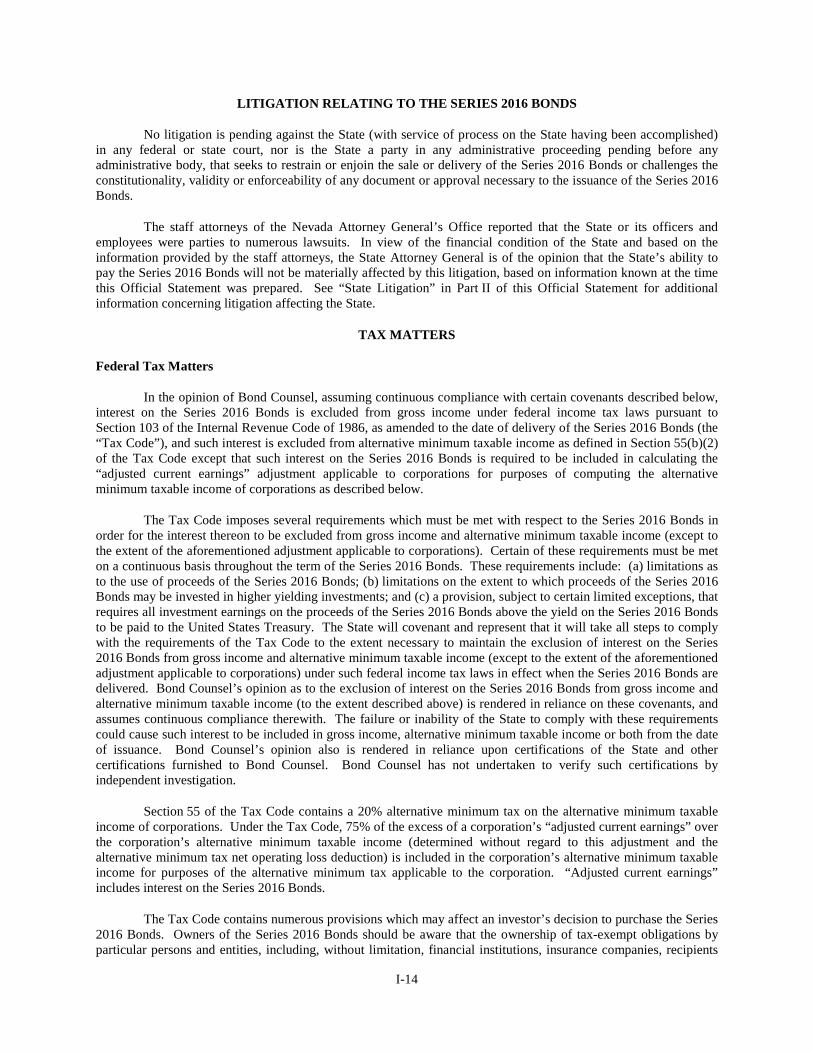
LITIGATION RELATING TO THE SERIES 2016 BONDS
No litigation is pending against the State (with service of process on the State having been accomplished)in any federal or state court, nor is the State a party in any administrative proceeding pending before anyadministrative body, that seeks to restrain or enjoin the sale or delivery of the Series 2016 Bonds or challenges theconstitutionality, validity or enforceability of any document or approval necessary to the issuance of the Series 2016Bonds.
The staff attorneys of the Nevada Attorney General’s Office reported that the State or its officers andemployees were parties to numerous lawsuits. In view of the financial condition of the State and based on theinformation provided by the staff attorneys, the State Attorney General is of the opinion that the State’s ability topay the Series 2016 Bonds will not be materially affected by this litigation, based on information known at the timethis Official Statement was prepared. See “State Litigation” in Part II of this Official Statement for additionalinformation concerning litigation affecting the State.
TAX MATTERS
Federal Tax Matters
In the opinion of Bond Counsel, assuming continuous compliance with certain covenants described below,interest on the Series 2016 Bonds is excluded from gross income under federal income tax laws pursuant toSection 103 of the Internal Revenue Code of 1986, as amended to the date of delivery of the Series 2016 Bonds (the“Tax Code”), and such interest is excluded from alternative minimum taxable income as defined in Section 55(b)(2)of the Tax Code except that such interest on the Series 2016 Bonds is required to be included in calculating the“adjusted current earnings” adjustment applicable to corporations for purposes of computing the alternativeminimum taxable income of corporations as described below.
The Tax Code imposes several requirements which must be met with respect to the Series 2016 Bonds inorder for the interest thereon to be excluded from gross income and alternative minimum taxable income (except tothe extent of the aforementioned adjustment applicable to corporations). Certain of these requirements must be meton a continuous basis throughout the term of the Series 2016 Bonds. These requirements include: (a) limitations asto the use of proceeds of the Series 2016 Bonds; (b) limitations on the extent to which proceeds of the Series 2016Bonds may be invested in higher yielding investments; and (c) a provision, subject to certain limited exceptions, thatrequires all investment earnings on the proceeds of the Series 2016 Bonds above the yield on the Series 2016 Bondsto be paid to the United States Treasury. The State will covenant and represent that it will take all steps to complywith the requirements of the Tax Code to the extent necessary to maintain the exclusion of interest on the Series2016 Bonds from gross income and alternative minimum taxable income (except to the extent of the aforementionedadjustment applicable to corporations) under such federal income tax laws in effect when the Series 2016 Bonds aredelivered. Bond Counsel’s opinion as to the exclusion of interest on the Series 2016 Bonds from gross income andalternative minimum taxable income (to the extent described above) is rendered in reliance on these covenants, andassumes continuous compliance therewith. The failure or inability of the State to comply with these requirementscould cause such interest to be included in gross income, alternative minimum taxable income or both from the dateof issuance. Bond Counsel’s opinion also is rendered in reliance upon certifications of the State and othercertifications furnished to Bond Counsel. Bond Counsel has not undertaken to verify such certifications byindependent investigation.
Section 55 of the Tax Code contains a 20% alternative minimum tax on the alternative minimum taxableincome of corporations. Under the Tax Code, 75% of the excess of a corporation’s “adjusted current earnings” overthe corporation’s alternative minimum taxable income (determined without regard to this adjustment and thealternative minimum tax net operating loss deduction) is included in the corporation’s alternative minimum taxableincome for purposes of the alternative minimum tax applicable to the corporation. “Adjusted current earnings”includes interest on the Series 2016 Bonds.
The Tax Code contains numerous provisions which may affect an investor’s decision to purchase the Series2016 Bonds. Owners of the Series 2016 Bonds should be aware that the ownership of tax-exempt obligations byparticular persons and entities, including, without limitation, financial institutions, insurance companies, recipients

I-15
of Social Security or Railroad Retirement benefits, taxpayers who may be deemed to have incurred or continuedindebtedness to purchase or carry tax-exempt obligations, foreign corporations doing business in the United Statesand certain “subchapter S” corporations may result in adverse federal and state tax consequences. UnderSection 3406 of the Tax Code, backup withholding may be imposed on payments on the Series 2016 Bonds made toany owner who fails to provide certain required information, including an accurate taxpayer identification number,to certain persons required to collect such information pursuant to the Tax Code. Backup withholding may also beapplied if the owner underreports “reportable payments” (including interest and dividends) as defined inSection 3406, or fails to provide a certificate that the owner is not subject to backup withholding in circumstanceswhere such a certificate is required by the Tax Code. Bond Counsel’s opinion relates only to the exclusion ofinterest on the Series 2016 Bonds from gross income and alternative minimum taxable income as described aboveand will state that no opinion is expressed regarding other federal tax consequences arising from the receipt oraccrual of interest on or ownership of the Series 2016 Bonds. Owners of the Series 2016 Bonds should consult theirown tax advisors as to the applicability of these consequences.
The opinions expressed by Bond Counsel are based on existing law as of the delivery date of the Series2016 Bonds. No opinion is expressed as of any subsequent date nor is any opinion expressed with respect topending or proposed legislation. Amendments to the federal or state tax laws may be pending now or could beproposed in the future that, if enacted into law, could adversely affect the value of the Series 2016 Bonds, theexclusion of interest on the Series 2016 Bonds from gross income or alternative minimum taxable income or bothfrom the date of issuance of the Series 2016 Bonds or any other date, or that could result in other adverse taxconsequences. In addition, future court actions or regulatory decisions could affect the tax treatment or market valueof the Series 2016 Bonds. Owners of the Series 2016 Bonds are advised to consult with their own tax advisors withrespect to such matters.
The Internal Revenue Service (the “Service”) has an ongoing program of auditing tax-exempt obligationsto determine whether, in the view of the Service, interest on such tax-exempt obligations is includable in the grossincome of the owners thereof for federal income tax purposes. No assurances can be given as to whether or not theService will commence an audit of the Series 2016 Bonds. If an audit is commenced, the market value of the Series2016 Bonds may be adversely affected. Under current audit procedures, the Service will treat the State as thetaxpayer and the Series 2016 Bond owners may have no right to participate in such procedures. The State hascovenanted not to take any action that would cause the interest on the Series 2016 Bonds to lose its exclusion fromgross income for federal income tax purposes or lose its exclusion from alternative minimum taxable income exceptto the extent described above for the owners thereof for federal income tax purposes. None of the State, thefinancial advisors, any initial purchaser, Bond Counsel or Disclosure Counsel is responsible for paying orreimbursing any Series 2016 Bond owner with respect to any audit or litigation costs relating to the Series 2016Bonds.
State Tax Exemption
The Series 2016 Bonds, their transfer, and the income therefrom are free and exempt from taxation by theState or any subdivision thereof except for the tax on estates imposed pursuant to Chapter 375A of NRS and the taxon generation-skipping transfers imposed pursuant to Chapter 375B of NRS.
FINANCIAL STATEMENTS
The Series 2016 Bonds are not general obligations of the State. The State financial information that isdiscussed in this paragraph is provided to investors solely as background information concerning the State. TheComprehensive Annual Financial Report of the State of Nevada for the fiscal year ended June 30, 2015 are includedas Appendix B to Part III of this Official Statement.
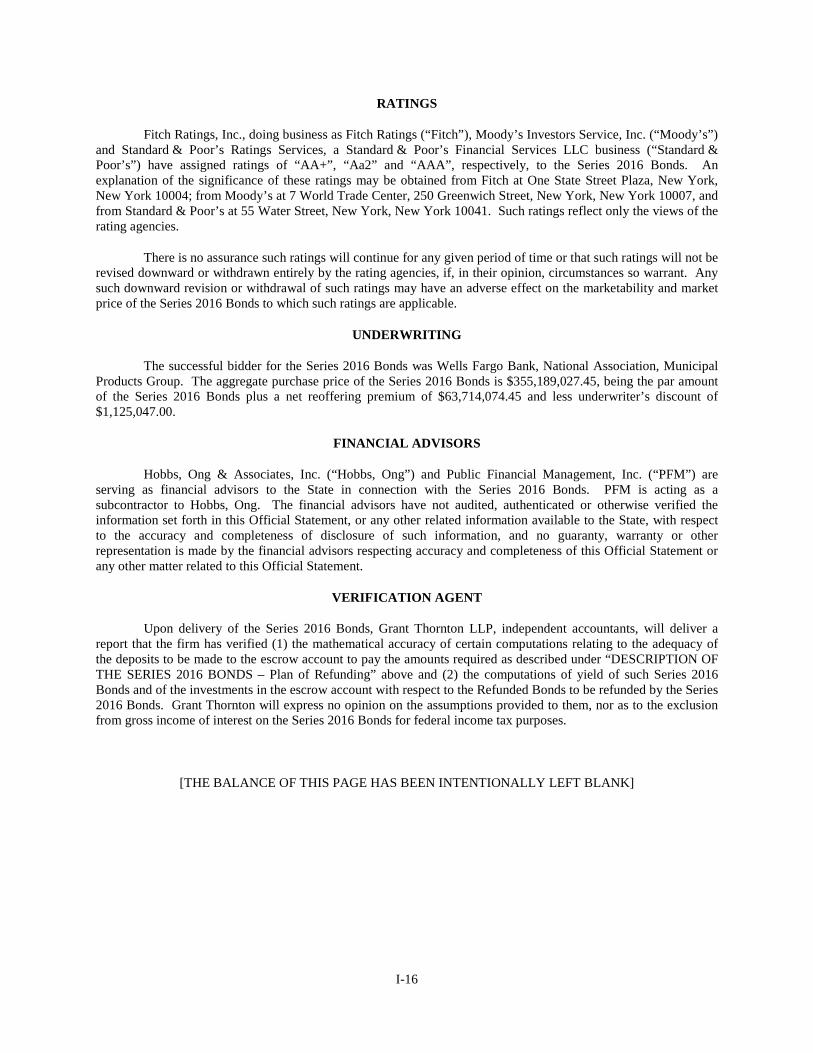
I-16
RATINGS
Fitch Ratings, Inc., doing business as Fitch Ratings (“Fitch”), Moody’s Investors Service, Inc. (“Moody’s”)and Standard & Poor’s Ratings Services, a Standard & Poor’s Financial Services LLC business (“Standard &Poor’s”) have assigned ratings of “AA+”, “Aa2” and “AAA”, respectively, to the Series 2016 Bonds. Anexplanation of the significance of these ratings may be obtained from Fitch at One State Street Plaza, New York,New York 10004; from Moody’s at 7 World Trade Center, 250 Greenwich Street, New York, New York 10007, andfrom Standard & Poor’s at 55 Water Street, New York, New York 10041. Such ratings reflect only the views of therating agencies.
There is no assurance such ratings will continue for any given period of time or that such ratings will not berevised downward or withdrawn entirely by the rating agencies, if, in their opinion, circumstances so warrant. Anysuch downward revision or withdrawal of such ratings may have an adverse effect on the marketability and marketprice of the Series 2016 Bonds to which such ratings are applicable.
UNDERWRITING
The successful bidder for the Series 2016 Bonds was Wells Fargo Bank, National Association, MunicipalProducts Group. The aggregate purchase price of the Series 2016 Bonds is $355,189,027.45, being the par amountof the Series 2016 Bonds plus a net reoffering premium of $63,714,074.45 and less underwriter’s discount of$1,125,047.00.
FINANCIAL ADVISORS
Hobbs, Ong & Associates, Inc. (“Hobbs, Ong”) and Public Financial Management, Inc. (“PFM”) areserving as financial advisors to the State in connection with the Series 2016 Bonds. PFM is acting as asubcontractor to Hobbs, Ong. The financial advisors have not audited, authenticated or otherwise verified theinformation set forth in this Official Statement, or any other related information available to the State, with respectto the accuracy and completeness of disclosure of such information, and no guaranty, warranty or otherrepresentation is made by the financial advisors respecting accuracy and completeness of this Official Statement orany other matter related to this Official Statement.
VERIFICATION AGENT
Upon delivery of the Series 2016 Bonds, Grant Thornton LLP, independent accountants, will deliver areport that the firm has verified (1) the mathematical accuracy of certain computations relating to the adequacy ofthe deposits to be made to the escrow account to pay the amounts required as described under “DESCRIPTION OFTHE SERIES 2016 BONDS – Plan of Refunding” above and (2) the computations of yield of such Series 2016Bonds and of the investments in the escrow account with respect to the Refunded Bonds to be refunded by the Series2016 Bonds. Grant Thornton will express no opinion on the assumptions provided to them, nor as to the exclusionfrom gross income of interest on the Series 2016 Bonds for federal income tax purposes.
[THE BALANCE OF THIS PAGE HAS BEEN INTENTIONALLY LEFT BLANK]

I-17
AUTHORIZATION
This Official Statement and its use in connection with the offering and sale of the Series 2016 Bonds havebeen duly authorized by the State.
STATE OF NEVADA
/s/ Daniel M. SchwartzState Treasurer

[THIS PAGE HAS BEEN INTENTIONALLY LEFT BLANK]

Schedule I-I-1
SCHEDULE I
MATURITY SCHEDULE OF POTENTIAL REFUNDED BONDS
A portion of the proceeds of the Series 2016 Bonds will be used to refund all or a portion of the followingbonds:
Highway Improvement Revenue(Motor Vehicle Fuel Tax) Bonds
Series 2006
Maturity Date(December 1)
OutstandingAggregate
Par Amount CouponCUSIP No.
(641480) Redemption DateRedemption
Price2017 $ 9,530,000 5.000% EL8 12/1/2016 100%2018 10,015,000 5.000 EM6 12/1/2016 1002024 13,420,000 3.500 ET1 12/1/2016 1002025 13,895,000 3.500 EU8 12/1/2016 1002026 14,390,000 3.500 EV6 12/1/2016 100
Highway Improvement Revenue(Motor Vehicle Fuel Tax) Bonds
Series 2008
Maturity Date(December 1)
OutstandingAggregate
Par Amount CouponCUSIP No.
(641480) Redemption DateRedemption
Price2018 $ 9,390,000 5.000% FR4 6/1/2018 100%2019 7,340,000 4.125 FS2 6/1/2018 1002020 21,570,000 4.250 FT0 6/1/2018 1002021 8,390,000 5.000 FU7 6/1/2018 1002022 8,825,000 5.000 FV5 6/1/2018 1002023 9,275,000 5.000 FW3 6/1/2018 1002024 9,750,000 5.000 FX1 6/1/2018 1002025 10,255,000 5.000 FY9 6/1/2018 100

APPENDIX A
FORM OF APPROVING OPINION OF BOND COUNSEL

[THIS PAGE HAS BEEN INTENTIONALLY LEFT BLANK]

I-A-1
FORM OF APPROVING OPINION OF BOND COUNSEL
State of NevadaCapitol Building101 N. Carson, No. 4Carson City, Nevada 89701
$292,600,000State of Nevada
Highway Revenue(Motor Vehicle Fuel Tax)
Improvement and Refunding BondsSeries 2016
Ladies and Gentlemen:
We have acted as bond counsel to the State of Nevada (the “State”) in connection with the issuance of its“State of Nevada, Highway Revenue (Motor Vehicle Fuel Tax) Improvement and Refunding Bonds, Series 2016” inthe aggregate principal amount of $292,600,000 (the “Bonds”) pursuant to an authorizing resolution adopted andapproved by the State Board of Finance on November 10, 2015 (the “Bond Resolution”). In such capacity, we haveexamined the State’s certified proceedings and such other documents and such law of the State and of the UnitedStates of America as we have deemed necessary to render this opinion letter. Capitalized terms not otherwisedefined herein shall have the meanings ascribed to them in the Bond Resolution.
Regarding questions of fact material to our opinions, we have relied upon the State’s certified proceedingsand other representations and certifications of public officials and others furnished to us without undertaking toverify the same by independent investigation.
Based upon such examination, it is our opinion as bond counsel that:
1. The Bonds constitute valid and binding, special, limited obligations of the State payable solelyfrom the Gross Pledged Revenues and from funds and accounts pledged therefor under the Bond Resolution.
2. The Bond Resolution creates a valid lien on the Gross Pledged Revenues and on the Bond Fundpledged therein for the security of the Bonds on a parity with the lien thereon of any Parity Securities heretofore andhereafter issued. Except as described in this paragraph, we express no opinion regarding the priority of the lien onthe Gross Pledged Revenues or on the Bond Fund created by the Bond Resolution.
3. Interest on the Bonds is excluded from gross income under federal income tax laws pursuant toSection 103 of the Internal Revenue Code of 1986, as amended to the date hereof (the “Tax Code”), and interest onthe Bonds is excluded from alternative minimum taxable income as defined in Section 55(b)(2) of the Tax Codeexcept that such interest is required to be included in calculating the adjusted current earnings adjustment applicableto corporations for purposes of computing the alternative minimum taxable income of corporations. The opinionsexpressed in this paragraph assume continuous compliance with the covenants and continued accuracy of therepresentations contained in the State’s certified proceedings and in certain other documents and certain othercertifications furnished to us.
4. Under laws of the State in effect as of the date hereof, the Bonds, their transfer and the incometherefrom are free and exempt from taxation by the State or any subdivision thereof, except for the tax on estatesimposed pursuant to Chapter 375A of NRS and the tax on generation-skipping transfers imposed pursuant toChapter 375B of NRS.
I-A-2
The opinions expressed in this opinion letter are subject to the following:
The obligations of the State pursuant to the Bonds and the Bond Resolution are subject to the application ofequitable principles, to the reasonable exercise in the future by the State and its governmental bodies of the policepower inherent in the sovereignty of the State and to the exercise by the United States of America of the powersdelegated to it by the Federal Constitution, including without limitation, bankruptcy powers.
In expressing the opinions above, we are relying in part on a report of independent certified publicaccountants verifying (i) the mathematical computations of the adequacy of the maturing principal amounts of andinterest on the investments and moneys included in the Escrow Account to pay when due, at stated maturity or uponprior redemption, all principal of, any prior redemption premiums, and interest on the Refunded Bonds and (ii) themathematical calculations of the yield of the Bonds and the yield of certain investments made with the proceeds ofthe Bonds and other moneys deposited in the Escrow Account.
In this opinion letter rendered in our capacity as bond counsel, we are opining only upon those matters setforth herein, and we are not passing upon the accuracy, adequacy or completeness of the Official Statement or anyother statements made in connection with any offer or sale of the Bonds or upon any federal or state taxconsequences arising from the receipt or accrual of interest on or the ownership or disposition of the Bonds, exceptthose specifically addressed herein.
This opinion letter is rendered as of the date hereof and we assume no obligation to revise or supplementthis opinion letter to reflect any facts or circumstances that may hereafter come to our attention or any changes inlaw that may hereafter occur.
Respectfully submitted,

APPENDIX B
FORM OF DISCLOSURE DISSEMINATION AGENT AGREEMENT

[THIS PAGE HAS BEEN INTENTIONALLY LEFT BLANK]
I-B-1
FORM OF DISCLOSURE DISSEMINATION AGENT AGREEMENT
This Disclosure Dissemination Agent Agreement (this “Disclosure Agreement”), dated as ofMarch 9, 2016, is executed and delivered by the State of Nevada (the “Issuer”) and Digital Assurance Certification,L.L.C., as exclusive Disclosure Dissemination Agent (the “Disclosure Dissemination Agent” or “DAC”) for thebenefit of the Holders (hereinafter defined) of the Bonds (hereinafter defined) in order to provide certain continuingdisclosure with respect to the Bonds in accordance with Rule 15c2-12 of the United States Securities and ExchangeCommission under the Securities Exchange Act of 1934, as the same may be amended from time to time (the“Rule”).
The services provided under this Disclosure Agreement solely relate to the execution of instructionsreceived from the Issuer through use of the DAC system and do not constitute “advice” within the meaning of theDodd-Frank Wall Street Reform and Consumer Protection Act (the “Act”). DAC will not provide any advice orrecommendation to the Issuer or anyone on the Issuer’s behalf regarding the “issuance of municipal securities” orany “municipal financial product” as defined in the Act and nothing in this Disclosure Agreement shall beinterpreted to the contrary.
SECTION 1. Definitions. Capitalized terms not otherwise defined in this Disclosure Agreement shallhave the meaning assigned in the Rule or, to the extent not in conflict with the Rule, in the Official Statement(hereinafter defined). The capitalized terms shall have the following meanings:
“Annual Filing Date” means the date, set in Section 2(a) and Section 2(f), by which the Annual Report is tobe filed with the MSRB.
“Annual Financial Information” means annual financial information as such term is used in paragraph(b)(5)(i) of the Rule and specified in Section 3(a) of this Disclosure Agreement.
“Annual Report” means an Annual Report described in and consistent with Section 3 of this DisclosureAgreement.
“Audited Financial Statements” means the financial statements (if any) of the Issuer for the prior fiscalyear, certified by an independent auditor as prepared in accordance with generally accepted accountingprinciples or otherwise, as such term is used in paragraph (b)(5)(i) of the Rule and specified in Section 3(b)of this Disclosure Agreement.
“Bonds” means the bonds as listed on the attached Exhibit A, with the CUSIP numbers relating thereto.
“Certification” means a written certification of compliance signed by the Disclosure Representative statingthat the Annual Report, Audited Financial Statements, Notice Event notice, Failure to File Event notice,Voluntary Event Disclosure or Voluntary Financial Disclosure delivered to the Disclosure DisseminationAgent is the Annual Report, Audited Financial Statements, Notice Event notice, Failure to File Eventnotice required to be, or the Voluntary Event Disclosure or Voluntary Financial Disclosure elected by theIssuer to be, submitted to the MSRB under this Disclosure Agreement. A Certification shall accompanyeach such document submitted to the Disclosure Dissemination Agent by the Issuer and include the fullname of the Bonds and the CUSIP numbers for all Bonds to which the document applies.
“CUSIP number” means, with respect to any Bonds, the 9-character CUSIP number (the nine characterscomprising a combination of digits and letters) relating to such Bonds.
“Disclosure Dissemination Agent” means Digital Assurance Certification, L.L.C, acting in its capacity asDisclosure Dissemination Agent hereunder, or any successor Disclosure Dissemination Agent designated inwriting by the Issuer pursuant to Section 9 hereof.

I-B-2
“Disclosure Representative” means the Treasurer of the Issuer or his or her designee, or such other personas the Issuer shall designate in writing to the Disclosure Dissemination Agent from time to time as theperson responsible for providing Information to the Disclosure Dissemination Agent.
“Failure to File Event” means the Issuer’s failure to file an Annual Report on or before the Annual FilingDate.
“Force Majeure Event” means: (i) acts of God, war, or terrorist action; (ii) failure or shut-down of theElectronic Municipal Market Access system maintained by the MSRB; or (iii) to the extent beyond theDisclosure Dissemination Agent’s reasonable control, interruptions in telecommunications or utilitiesservices, failure, malfunction or error of any telecommunications, computer or other electrical, mechanicalor technological application, service or system, computer virus, interruptions in Internet service ortelephone service (including due to a virus, electrical delivery problem or similar occurrence) that affectInternet users generally, or in the local area in which the Disclosure Dissemination Agent or the MSRB islocated, or acts of any government, regulatory or any other competent authority the effect of which is toprohibit the Disclosure Dissemination Agent from performance of its obligations under this DisclosureAgreement.
“Holder” means any person (i) having the power, directly or indirectly, to vote or consent with respect to,or to dispose of ownership of, any Bonds (including persons holding Bonds through nominees, depositoriesor other intermediaries) or (ii) treated as the owner of any Bonds for federal income tax purposes.
“Information” means, collectively, the Annual Reports, the Audited Financial Statements (if any), theNotice Event notices, the Failure to File Event notices, the Voluntary Event Disclosures and the VoluntaryFinancial Disclosures.
“MSRB” means the Municipal Securities Rulemaking Board established pursuant to Section 15B(b)(1) ofthe Securities Exchange Act of 1934.
“Notice Event” means any of the events enumerated in paragraph (b)(5)(i)(C) of the Rule and listed inSection 4(a) of this Disclosure Agreement.
“Obligated Person” means any person, including the Issuer, who is either generally or through anenterprise, fund, or account of such person committed by contract or other arrangement to support paymentof all, or part of the obligations on the Bonds (other than providers of municipal bond insurance, letters ofcredit, or other liquidity facilities) and who, if other than the Issuer, is identified in this DisclosureAgreement as an Obligated Person.
“Official Statement” means that Official Statement prepared by the Issuer in connection with the Bondslisted on Exhibit A.
“Paying Agent” means the paying agent for the Bonds designated by the Issuer, and its successors andassigns.
“Voluntary Event Disclosure” means information of the category specified in any of subsections (e)(vi)(1)through (e)(vi)(11) of Section 2 of this Disclosure Agreement that is accompanied by a Certification of theDisclosure Representative containing the information prescribed by Section 7(a) of this DisclosureAgreement.
“Voluntary Financial Disclosure” means information of the category specified in any of subsections(e)(vii)(1) through (e)(vii)(9) of Section 2 of this Disclosure Agreement that is accompanied by aCertification of the Disclosure Representative containing the information prescribed by Section 7(b) of thisDisclosure Agreement.

I-B-3
SECTION 2. Provision of Annual Reports and Other Disclosures.
(a) The Issuer shall provide, annually, an electronic copy of the Annual Report and Certification tothe Disclosure Dissemination Agent not later than the Annual Filing Date. Promptly upon receipt of an electroniccopy of the Annual Report and the Certification, the Disclosure Dissemination Agent shall provide an AnnualReport to the MSRB not later than March 31 after the end of each fiscal year of the Issuer, commencing with thefiscal year ending June 30, 2016. Such date and each anniversary thereof is the Annual Filing Date. The AnnualReport may be submitted as a single document or as separate documents comprising a package, and may cross-reference other information as provided in Section 3 of this Disclosure Agreement.
(b) If on the fifteenth (15th) day prior to the Annual Filing Date, the Disclosure Dissemination Agenthas not received a copy of the Annual Report and Certification, the Disclosure Dissemination Agent shall contactthe Disclosure Representative by telephone and in writing (which may be by e-mail) to remind the Issuer of itsundertaking to provide the Annual Report pursuant to Section 2(a). Upon such reminder, the DisclosureRepresentative shall either (i) provide the Disclosure Dissemination Agent with an electronic copy of the AnnualReport and the Certification no later than two (2) business days prior to the Annual Filing Date, or (ii) instruct theDisclosure Dissemination Agent in writing that the Issuer will not be able to file the Annual Report within the timerequired under this Disclosure Agreement, state the date by which the Annual Report for such year will be providedand instruct the Disclosure Dissemination Agent that a Failure to File Event has occurred and to immediately send anotice to the MSRB in substantially the form attached as Exhibit B (with the appropriate CUSIP numbers for theaffected Bonds).
(c) If the Disclosure Dissemination Agent has not received an Annual Report and Certification by3:00 p.m. Pacific time on the Annual Filing Date (or, if such Annual Filing Date falls on a Saturday, Sunday orholiday, then the first business day thereafter) for the Annual Report, a Failure to File Event shall have occurred andthe Issuer irrevocably directs the Disclosure Dissemination Agent to immediately send a notice to the MSRB insubstantially the form attached as Exhibit B (with the appropriate CUSIP numbers for the affected Bonds), withoutreference to the anticipated filing date for the Annual Report.
(d) If Audited Financial Statements of the Issuer are prepared but not available prior to the AnnualFiling Date, the Issuer shall, when the Audited Financial Statements are available, provide in a timely manner anelectronic copy to the Disclosure Dissemination Agent, accompanied by a Certification, together with a copy for theTrustee, for filing with the MSRB.
(e) The Disclosure Dissemination Agent shall:
(i) verify the filing specifications of the MSRB each year prior to the Annual Filing Date;
(ii) upon receipt, promptly file each Annual Report received under Sections 2(a) and 2(b)with the MSRB;
(iii) upon receipt, promptly file each Audited Financial Statement received under Section 2(d)with the MSRB;
(iv) upon receipt, promptly file the text of each Notice Event received under Sections 4(a) and4(b)(ii) with the MSRB, identifying the Notice Event as instructed by the Issuer pursuantto Section 4(a) or 4(b)(ii) (being any of the categories set forth below) when filingpursuant to Section 4(c) of this Disclosure Agreement:
1. “Principal and interest payment delinquencies;”
2. “Non-Payment related defaults, if material;”
3. “Unscheduled draws on debt service reserves reflecting financial difficulties;”

I-B-4
4. “Unscheduled draws on credit enhancements reflecting financial difficulties;”
5. “Substitution of credit or liquidity providers, or their failure to perform;”
6. “Adverse tax opinions, the issuance by the Internal Revenue Service of proposedor final determinations of taxability, Notices of Proposed Issue (IRS Form 5701-TEB) or other material notices or determinations with respect to the tax status ofthe Bonds, or other material events affecting the tax status of the Bonds.”
7. “Modifications to rights of securities holders, if material;”
8. “Bond calls, if material;”
9. “Defeasances;”
10. “Release, substitution, or sale of property securing repayment of the securities, ifmaterial;”
11. “Rating changes;”
12. “Tender offers;”
13. “Bankruptcy, insolvency, receivership or similar event of an Obligated Person;”
14. “Merger, consolidation, or acquisition of an Obligated Person, if material;” and
15. “Appointment of a successor or additional trustee, or the change of name of atrustee, if material;”
(v) upon receipt (or irrevocable direction pursuant to Section 2(c) of this DisclosureAgreement, as applicable), promptly file a completed copy of Exhibit B to this DisclosureAgreement (with the appropriate CUSIP numbers for the affected Bonds) with theMSRB, identifying the filing as “Failure to provide annual financial information asrequired” when filing pursuant to Section 2(b)(ii) or Section 2(c) of this DisclosureAgreement;
(vi) upon receipt, promptly file the text of each Voluntary Event Disclosure received underSection 7(a) with the MSRB, identifying the Voluntary Event Disclosure as instructed bythe Issuer pursuant to Section 7(a) (being any of the categories set forth below) whenfiling pursuant to Section 7(a) of this Disclosure Agreement:
1. “amendment to continuing disclosure undertaking;”
2. “change in Obligated Person;”
3. “notice to investors pursuant to bond documents;”
4. “certain communications from the Internal Revenue Service;”
5. “secondary market purchases;”
6. “bid for auction rate or other securities;”
7. “capital or other financing plan;”
I-B-5
8. “litigation/enforcement action;”
9. “change of tender agent, remarketing agent, or other on-going party;”
10. “derivative or other similar transaction;” and
11. “other event-based disclosures;”
(vii) upon receipt, promptly file the text of each Voluntary Financial Disclosure receivedunder Section 7(b) with the MSRB, identifying the Voluntary Financial Disclosure asinstructed by the Issuer pursuant to Section 7(b) (being any of the categories set forthbelow) when filing pursuant to Section 7(b) of this Disclosure Agreement:
1. “quarterly/monthly financial information;”
2. “change in fiscal year/timing of annual disclosure;”
3. “change in accounting standard;”
4. “interim/additional financial information/operating data;”
5. “budget;”
6. “investment/debt/financial policy;”
7. “information provided to rating agency, credit/liquidity provider or other thirdparty;”
8. “consultant reports;” and
9. “other financial/operating data.”
(viii) provide the Issuer evidence of the filings of each of the above when made, which shall beby means of the DAC system, for so long as DAC is the Disclosure Dissemination Agentunder this Disclosure Agreement.
(f) The Issuer may adjust the Annual Filing Date upon change of its fiscal year by providing writtennotice of such change and the new Annual Filing Date to the Disclosure Dissemination Agent, Trustee (if any) andthe MSRB, provided that the period between the existing Annual Filing Date and new Annual Filing Date shall notexceed one year.
(g) Any Information received by the Disclosure Dissemination Agent before 6:00 p.m. Eastern timeon any business day that it is required to file with the MSRB pursuant to the terms of this Disclosure Agreement andthat is accompanied by a Certification and all other information required by the terms of this Disclosure Agreementwill be filed by the Disclosure Dissemination Agent with the MSRB no later than 11:59 p.m. Eastern time on thesame business day; provided, however, the Disclosure Dissemination Agent shall have no liability for any delay infiling with the MSRB if such delay is caused by a Force Majeure Event provided that the Disclosure DisseminationAgent uses reasonable efforts to make any such filing as soon as possible.
(h) The Paying Agent may deliver notices of redemption or defeasance of Bonds to the DisclosureDissemination Agent on behalf of the Issuer for filing pursuant to Section 4. Upon receipt of any such notice, theDisclosure Dissemination Agent shall promptly file the text of such notice with the MSRB in accordance with thisDisclosure Agreement.

I-B-6
SECTION 3. Content of Annual Reports.
(a) Each Annual Report shall contain Annual Financial Information with respect to the Issuer,including Audited Financial Statements, if available, and information of the type included in the tables marked withan asterisk in the lists of tables set forth in the Table of Contents pages of the Official Statement.
(b) Audited Financial Statements shall be prepared in accordance with generally accepted accountingprinciples (“GAAP”). If audited financial statements are not available, then, unaudited financial statements,prepared in accordance with GAAP as described in the Official Statement will be included in the Annual Report.Audited Financial Statements (if any) will be provided pursuant to Section 2(d).
Any or all of the items listed above may be included by specific reference to other documents, includingofficial statements of debt issues with respect to which the Issuer is an Obligated Person, which have beenpreviously filed with the Securities and Exchange Commission or available to the public on the MSRB Internetwebsite. If the document incorporated by reference is a final official statement, it must be available from theMSRB. The Issuer will clearly identify each such document so incorporated by reference.
Any Annual Financial Information containing modified operating data or financial information is requiredto explain, in narrative form, the reasons for the modification and the impact of the change in the type of operatingdata or financial information being provided.
SECTION 4. Reporting of Notice Events.
(a) The occurrence of any of the following events with respect to the Bonds constitutes a NoticeEvent:
1. Principal and interest payment delinquencies;
2. Non-payment related defaults, if material;
3. Unscheduled draws on debt service reserves reflecting financial difficulties;
4. Unscheduled draws on credit enhancements reflecting financial difficulties;
5. Substitution of credit or liquidity providers, or their failure to perform;
6. Adverse tax opinions, the issuance by the Internal Revenue Service of proposedor final determinations of taxability, Notices of Proposed Issue (IRS Form 5701-TEB) or other material notices or determinations with respect to the tax status ofthe Bonds, or other material events affecting the tax status of the Bonds;
7. Modifications to rights of Bond holders, if material;
8. Bond calls, if material, and tender offers;
9. Defeasances;
10. Release, substitution, or sale of property securing repayment of the Bonds, ifmaterial;
11. Rating changes;
12. Bankruptcy, insolvency, receivership or similar event of the Obligated Person;
I-B-7
Note to subsection (a)(12) of this Section 4: For the purposes of the eventdescribed in subsection (a)(12) of this Section 4, the event is considered to occurwhen any of the following occur: the appointment of a receiver, fiscal agent orsimilar officer for an Obligated Person in a proceeding under the U.S.Bankruptcy Code or in any other proceeding under state or federal law in whicha court or governmental authority has assumed jurisdiction over substantially allof the assets or business of the Obligated Person, or if such jurisdiction has beenassumed by leaving the existing governing body and officials or officers inpossession but subject to the supervision and orders of a court or governmentalauthority, or the entry of an order confirming a plan of reorganization,arrangement or liquidation by a court or governmental authority havingsupervision or jurisdiction over substantially all of the assets or business of theObligated Person.
13. The consummation of a merger, consolidation, or acquisition involving anObligated Person or the sale of all or substantially all of the assets of theObligated Person, other than in the ordinary course of business, the entry into adefinitive agreement to undertake such an action or the termination of adefinitive agreement relating to any such actions, other than pursuant to itsterms, if material; and
14. Appointment of a successor or additional trustee or the change of name of atrustee, if material.
The Issuer (or the Paying Agent on behalf of the Issuer pursuant to Section 2(h)) shall, in a timely mannernot in excess of ten business days after its occurrence, notify the Disclosure Dissemination Agent in writing of theoccurrence of a Notice Event. Such notice shall instruct the Disclosure Dissemination Agent to report theoccurrence pursuant to subsection (c) and shall be accompanied by a Certification. Such notice or Certification shallidentify the Notice Event that has occurred (which shall be any of the categories set forth in Section 2(e)(iv) of thisDisclosure Agreement), include the text of the disclosure that the Issuer desires to make, contain the writtenauthorization of the Issuer for the Disclosure Dissemination Agent to disseminate such information, and identify thedate the Issuer desires for the Disclosure Dissemination Agent to disseminate the information (provided that suchdate is not later than the tenth business day after the occurrence of the Notice Event).
(b) The Disclosure Dissemination Agent is under no obligation to notify the Issuer or the DisclosureRepresentative of an event that may constitute a Notice Event. In the event the Disclosure Dissemination Agent sonotifies the Disclosure Representative, the Disclosure Representative will within two business days of receipt ofsuch notice (but in any event not later than the tenth business day after the occurrence of the Notice Event, if theIssuer determines that a Notice Event has occurred), instruct the Disclosure Dissemination Agent that (i) a NoticeEvent has not occurred and no filing is to be made or (ii) a Notice Event has occurred and the DisclosureDissemination Agent is to report the occurrence pursuant to subsection (c) of this Section 4, together with aCertification. Such Certification shall identify the Notice Event that has occurred (which shall be any of thecategories set forth in Section 2(e)(iv) of this Disclosure Agreement), include the text of the disclosure that theIssuer desires to make, contain the written authorization of the Issuer for the Disclosure Dissemination Agent todisseminate such information, and identify the date the Issuer desires for the Disclosure Dissemination Agent todisseminate the information (provided that such date is not later than the tenth business day after the occurrence ofthe Notice Event).
(c) If the Disclosure Dissemination Agent has been instructed by the Issuer (or by the Paying Agenton behalf of the Issuer pursuant to Section 2(h)) as prescribed in subsection (a) or (b)(ii) of this Section 4 to reportthe occurrence of a Notice Event, the Disclosure Dissemination Agent shall promptly file a notice of suchoccurrence with the MSRB in accordance with Section 2(e)(iv) hereof. The Disclosure Dissemination Agent shallpromptly deliver to the Disclosure Representative (and Paying Agent with respect to notices filed at the PayingAgent’s direction pursuant to Section 2(h)) evidence of confirmation of such filing with the MSRB.

I-B-8
SECTION 5. CUSIP Numbers. Whenever providing information to the Disclosure DisseminationAgent, including but not limited to Annual Reports, documents incorporated by reference to the Annual Reports,Audited Financial Statements, Notice Event notices, Failure to File Event notices, Voluntary Event Disclosures andVoluntary Financial Disclosures, the Issuer shall indicate the full name of the Bonds and the CUSIP numbers for theBonds as to which the provided information relates.
SECTION 6. Additional Disclosure Obligations. The Issuer acknowledges and understands that otherstate and federal laws, including but not limited to the Securities Act of 1933 and Rule 10b-5 promulgated under theSecurities Exchange Act of 1934, may apply to the Issuer, and that the failure of the Disclosure DisseminationAgent to so advise the Issuer shall not constitute a breach by the Disclosure Dissemination Agent of any of its dutiesand responsibilities under this Disclosure Agreement. The Issuer acknowledges and understands that the duties ofthe Disclosure Dissemination Agent relate exclusively to execution of the mechanical tasks of disseminatinginformation as described in this Disclosure Agreement.
SECTION 7. Voluntary Filings.
(a) The Issuer may instruct the Disclosure Dissemination Agent to file a Voluntary Event Disclosurewith the MSRB from time to time pursuant to a Certification of the Disclosure Representative. Such Certificationshall identify the Voluntary Event Disclosure (which shall be any of the categories set forth in Section 2(e)(vi) ofthis Disclosure Agreement), include the text of the disclosure that the Issuer desires to make, contain the writtenauthorization of the Issuer for the Disclosure Dissemination Agent to disseminate such information, and identify thedate the Issuer desires for the Disclosure Dissemination Agent to disseminate the information. If the DisclosureDissemination Agent has been instructed by the Issuer as prescribed in this Section 7(a) to file a Voluntary EventDisclosure, the Disclosure Dissemination Agent shall promptly file such Voluntary Event Disclosure with theMSRB in accordance with Section 2(e)(vi) hereof.
(b) The Issuer may instruct the Disclosure Dissemination Agent to file a Voluntary FinancialDisclosure with the MSRB from time to time pursuant to a Certification of the Disclosure Representative. SuchCertification shall identify the Voluntary Financial Disclosure (which shall be any of the categories set forth inSection 2(e)(vii) of this Disclosure Agreement), include the text of the disclosure that the Issuer desires to make,contain the written authorization of the Issuer for the Disclosure Dissemination Agent to disseminate suchinformation, and identify the date the Issuer desires for the Disclosure Dissemination Agent to disseminate theinformation. If the Disclosure Dissemination Agent has been instructed by the Issuer as prescribed in thisSection 7(b) to file a Voluntary Financial Disclosure, the Disclosure Dissemination Agent shall promptly file suchVoluntary Financial Disclosure with the MSRB in accordance with Section 2(e)(vii) hereof.
(c) The parties hereto acknowledge that the Issuer is not obligated pursuant to the terms of thisDisclosure Agreement to file any Voluntary Event Disclosure pursuant to Section 7(a) hereof or any VoluntaryFinancial Disclosure pursuant to Section 7(b) hereof.
(d) Nothing in this Disclosure Agreement shall be deemed to prevent the Issuer from disseminatingany other information through the Disclosure Dissemination Agent using the means of dissemination set forth in thisDisclosure Agreement or including any other information in any Annual Report, Audited Financial Statements,Notice Event notice, Failure to File Event notice, Voluntary Event Disclosure or Voluntary Financial Disclosure, inaddition to that required by this Disclosure Agreement. If the Issuer chooses to include any information in anyAnnual Report, Audited Financial Statements, Notice Event notice, Failure to File Event notice, Voluntary EventDisclosure or Voluntary Financial Disclosure in addition to that which is specifically required by this DisclosureAgreement, the Issuer shall have no obligation under this Disclosure Agreement to update such information orinclude it in any future Annual Report, Audited Financial Statements, Notice Event notice, Failure to File Eventnotice, Voluntary Event Disclosure or Voluntary Financial Disclosure.
SECTION 8. Termination of Reporting Obligation. The obligations of the Issuer and the DisclosureDissemination Agent under this Disclosure Agreement shall terminate with respect to an issue of the Bonds upon thelegal defeasance, prior redemption or payment in full of all of the Bonds of such issue, when the Issuer is no longeran Obligated Person, or upon delivery by the Disclosure Representative to the Disclosure Dissemination Agent of anopinion of nationally recognized bond counsel to the effect that continuing disclosure is no longer required.

I-B-9
SECTION 9. Disclosure Dissemination Agent. The Issuer has appointed Digital AssuranceCertification, L.L.C. as exclusive Disclosure Dissemination Agent under this Disclosure Agreement. The Issuermay, upon thirty days written notice to the Disclosure Dissemination Agent and the Trustee, replace or appoint asuccessor Disclosure Dissemination Agent. Upon termination of DAC’s services as Disclosure DisseminationAgent, whether by notice of the Issuer or DAC, the Issuer agrees to appoint a successor Disclosure DisseminationAgent or, alternately, agrees to assume all responsibilities of Disclosure Dissemination Agent under this DisclosureAgreement for the benefit of the Holders of the Bonds. Notwithstanding any replacement or appointment of asuccessor, the Issuer shall remain liable, until payment in full, for any and all sums owed and payable to theDisclosure Dissemination Agent. The Disclosure Dissemination Agent may resign at any time by providing thirtydays’ prior written notice to the Issuer.
SECTION 10. Remedies in Event of Default. In the event of a failure of the Issuer or the DisclosureDissemination Agent to comply with any provision of this Disclosure Agreement, the Holders’ rights to enforce theprovisions of this Disclosure Agreement shall be limited solely to a right, by action in mandamus or for specificperformance, to compel performance of the parties’ obligation under this Disclosure Agreement. Any failure by aparty to perform in accordance with this Disclosure Agreement shall not constitute a default on the Bonds or underany other document relating to the Bonds, and all rights and remedies shall be limited to those expressly statedherein.
SECTION 11. Duties, Immunities and Liabilities of Disclosure Dissemination Agent.
(a) The Disclosure Dissemination Agent shall have only such duties as are specifically set forth in thisDisclosure Agreement. The Disclosure Dissemination Agent’s obligation to deliver the information at the times andwith the contents described herein shall be limited to the extent the Issuer has provided such information to theDisclosure Dissemination Agent as required by this Disclosure Agreement. The Disclosure Dissemination Agentshall have no duty with respect to the content of any disclosures or notice made pursuant to the terms hereof. TheDisclosure Dissemination Agent shall have no duty or obligation to review or verify any Information or any otherinformation, disclosures or notices provided to it by the Issuer and shall not be deemed to be acting in any fiduciarycapacity for the Issuer, the Holders of the Bonds or any other party. The Disclosure Dissemination Agent shall haveno responsibility for the Issuer’s failure to report to the Disclosure Dissemination Agent a Notice Event or a duty todetermine the materiality thereof. The Disclosure Dissemination Agent shall have no duty to determine, or liabilityfor failing to determine, whether the Issuer has complied with this Disclosure Agreement. The DisclosureDissemination Agent may conclusively rely upon certifications of the Issuer at all times.
The obligations of the Issuer under this Section shall survive resignation or removal of the Disclosure DisseminationAgent and defeasance, redemption or payment of the Bonds.
(b) The Disclosure Dissemination Agent may, from time to time, consult with legal counsel (either in-house or external) of its own choosing in the event of any disagreement or controversy, or question or doubt as tothe construction of any of the provisions hereof or its respective duties hereunder, and shall not incur any liabilityand shall be fully protected in acting in good faith upon the advice of such legal counsel. The reasonable fees andexpenses of such counsel shall be payable by the Issuer.
(c) All documents, reports, notices, statements, information and other materials provided to theMSRB under this Disclosure Agreement shall be provided in an electronic format and accompanied by identifyinginformation as prescribed by the MSRB.
SECTION 12. Amendment; Waiver. Notwithstanding any other provision of this DisclosureAgreement, the Issuer and the Disclosure Dissemination Agent may amend this Disclosure Agreement and anyprovision of this Disclosure Agreement may be waived, if such amendment or waiver is supported by an opinion ofcounsel expert in federal securities laws acceptable to both the Issuer and the Disclosure Dissemination Agent to theeffect that such amendment or waiver does not materially impair the interests of Holders of the Bonds and wouldnot, in and of itself, cause the undertakings herein to violate the Rule if such amendment or waiver had beeneffective on the date hereof but taking into account any subsequent change in or official interpretation of the Rule;provided neither the Issuer nor the Disclosure Dissemination Agent shall be obligated to agree to any amendmentmodifying their respective duties or obligations without their consent thereto.

I-B-10
Notwithstanding the preceding paragraph, the Disclosure Dissemination Agent shall have the right to adoptamendments to this Disclosure Agreement necessary to comply with modifications to and interpretations of theprovisions of the Rule as announced by the Securities and Exchange Commission from time to time by giving notless than 20 days prior written notice of the intent to do so together with a copy of the proposed amendment to theIssuer. No such amendment shall become effective if the Issuer shall, within 10 days following the giving of suchnotice, send a notice to the Disclosure Dissemination Agent in writing that it objects to such amendment.
SECTION 13. Beneficiaries. This Disclosure Agreement shall inure solely to the benefit of the Issuer,the Trustee of the Bonds, the Disclosure Dissemination Agent, the underwriter, and the Holders from time to time ofthe Bonds, and shall create no rights in any other person or entity.
SECTION 14. Governing Law. This Disclosure Agreement and the rights and obligations of the partieshereto shall be governed by, and construed according to, the laws of the State of Nevada. The DisclosureDissemination Agent consents to the jurisdiction of the Nevada district courts for enforcement of this DisclosureAgreement.
SECTION 15. Counterparts. This Disclosure Agreement may be executed in several counterparts, eachof which shall be an original and all of which shall constitute but one and the same instrument.
[Signature page follows]

I-B-11
The Disclosure Dissemination Agent and the Issuer have caused this Disclosure Dissemination AgentAgreement to be executed, on the date first written above, by their respective officers duly authorized.
DIGITAL ASSURANCE CERTIFICATION,L.L.C., as Disclosure Dissemination Agent
By:Name:Title:
STATE OF NEVADAas Issuer
By:Name: Daniel M. SchwartzTitle: State Treasurer

I-B-12
EXHIBIT ANAME AND CUSIP NUMBERS OF BONDS
$292,600,000STATE OF NEVADA
HIGHWAY REVENUE (MOTOR VEHICLE FUEL TAX)IMPROVEMENT AND REFUNDING BONDS
SERIES 2016
Base CUSIP: 641480
Maturity Date(December 1)
PrincipalAmount
InterestRate
CUSIPSuffix
2017 $ 5,905,000 5.000% HP62018 6,205,000 5.000 HQ42019 1,270,000 5.000 HR22020 12,800,000 5.000 HS02021 11,965,000 5.000 HT82022 12,585,000 5.000 HU52023 13,220,000 5.000 HV32024 27,315,000 5.000 HW12025 28,705,000 5.000 HX92026 32,155,000 5.000 HY72027 44,560,000 5.000 HZ42028 46,790,000 5.000 JA72029 49,125,000 3.000 JB5

I-B-13
EXHIBIT BNOTICE TO MSRB OF FAILURE TO FILE ANNUAL REPORT
Issuer: State of Nevada
Name of Bond Issue: Highway Revenue (Motor Vehicle Fuel Tax) Improvement andRefunding Bonds Series 2016
Date of Issuance: March 9, 2016
NOTICE IS HEREBY GIVEN that the Issuer has not provided an Annual Report with respect to the above-named Bonds as required by the Disclosure Dissemination Agent Agreement between the Issuer and DigitalAssurance Certification, L.L.C., as Disclosure Dissemination Agent. The Issuer has notified the DisclosureDissemination Agent that it anticipates that the Annual Report will be filed by ____________.
Dated:
Digital Assurance Certification, L.L.C., as DisclosureDissemination Agent, on behalf of the Issuer
cc: IssuerObligated Person

I-C-1
APPENDIX C
BOOK-ENTRY ONLY SYSTEM
The information contained in this Appendix has been extracted from a document prepared by DTC,entitled “SAMPLE OFFERING DOCUMENT LANGUAGE DESCRIBING BOOK-ENTRY-ONLYISSUANCE.”
The Depository Trust Company (“DTC”), New York, NY, will act as securities depository for the Bonds.The Bonds will be issued as fully-registered Bonds registered in the name of Cede & Co. (DTC’s partnershipnominee) or such other name as may be requested by an authorized representative of DTC. One fully-registeredBond certificate will be issued for each maturity of each series of Bonds, in the aggregate principal amount thereof,and will be deposited with DTC.
DTC, the world’s largest securities depository, is a limited-purpose trust company organized under the NewYork Banking Law, a “banking organization” within the meaning of the New York Banking Law, a member of theFederal Reserve System, a “clearing corporation” within the meaning of the New York Uniform Commercial Code,and a “clearing agency” registered pursuant to the provisions of Section 17A of the Securities Exchange Act of1934. DTC holds and provides asset servicing for over 3.5 million issues of U.S. and non-U.S. equity issues,corporate and municipal debt issues, and money market instruments (from over 100 countries) that DTC’sparticipants (“Direct Participants”) deposit with DTC. DTC also facilitates the post-trade settlement among DirectParticipants of sales and other securities transactions in deposited securities through electronic computerized book-entry transfers and pledges between Direct Participants’ accounts. This eliminates the need for physical movementof securities certificates. Direct Participants include both U.S. and non-U.S. securities brokers and dealers, banks,trust companies, clearing corporations, and certain other organizations. DTC is a wholly-owned subsidiary of TheDepository Trust & Clearing Corporation (“DTCC”). DTCC is the holding company for DTC, National SecuritiesClearing Corporation and Fixed Income Clearing Corporation, all of which are registered clearing agencies. DTCCis owned by the users of its regulated subsidiaries. Access to the DTC system is also available to others such as bothU.S. and non-U.S. securities brokers and dealers, banks, trust companies, and clearing corporations that clearthrough or maintain a custodial relationship with a Direct Participant, either directly or indirectly (“IndirectParticipants”). DTC has a Standard & Poor’s rating of AA+. The DTC Rules applicable to its Participants are onfile with the Securities and Exchange Commission. More information about DTC can be found at www.dtcc.com.
Purchases of Bonds under the DTC system must be made by or through Direct Participants, which willreceive a credit for the Bonds on DTC’s records. The ownership interest of each actual purchaser of each Bond(“Beneficial Owner”) is in turn to be recorded on the Direct and Indirect Participants’ records. Beneficial Ownerswill not receive written confirmation from DTC of their purchase. Beneficial Owners are, however, expected toreceive written confirmations providing details of the transaction, as well as periodic statements of their holdings,from the Direct or Indirect Participant through which the Beneficial Owner entered into the transaction. Transfers ofownership interests in the Bonds are to be accomplished by entries made on the books of Direct and IndirectParticipants acting on behalf of Beneficial Owners. Beneficial Owners will not receive certificates representingtheir ownership interests in Bonds, except in the event that use of the book-entry system for the Bonds isdiscontinued.
To facilitate subsequent transfers, all Bonds deposited by Direct Participants with DTC are registered in thename of DTC’s partnership nominee, Cede & Co., or such other name as may be requested by an authorizedrepresentative of DTC. The deposit of Bonds with DTC and their registration in the name of Cede & Co. or suchother DTC nominee do not effect any change in beneficial ownership. DTC has no knowledge of the actualBeneficial Owners of the Bonds; DTC’s records reflect only the identity of the Direct Participants to whose accountssuch Bonds are credited, which may or may not be the Beneficial Owners. The Direct and Indirect Participants willremain responsible for keeping account of their holdings on behalf of their customers.
Conveyance of notices and other communications by DTC to Direct Participants, by Direct Participants toIndirect Participants, and by Direct Participants and Indirect Participants to Beneficial Owners will be governed byarrangements among them, subject to any statutory or regulatory requirements as may be in effect from time to time.Beneficial Owners of Bonds may wish to take certain steps to augment the transmission to them of notices of

I-C-2
significant events with respect to the Bonds, such as redemptions, tenders, defaults, and proposed amendments to theBond documents. For example, Beneficial Owners of Bonds may wish to ascertain that the nominee holding theBonds for their benefit has agreed to obtain and transmit notices to Beneficial Owners. In the alternative, BeneficialOwners may wish to provide their names and addresses to the registrar and request that copies of notices beprovided directly to them.
Redemption notices shall be sent to DTC. If less than all of the Bonds within an issue are being redeemed,DTC’s practice is to determine by lot the amount of the interest of each Direct Participant in the Bonds to beredeemed.
Neither DTC nor Cede & Co. (nor any other DTC nominee) will consent or vote with respect to Bondsunless authorized by a Direct Participant in accordance with MMI Procedures. Under its usual procedures, DTCmails an Omnibus Proxy to the State as soon as possible after the record date. The Omnibus Proxy assigns Cede &Co.’s consenting or voting rights to those Direct Participants to whose accounts Bonds are credited on the recorddate (identified in a listing attached to the Omnibus Proxy).
Principal, interest and redemption proceeds on the Bonds will be made to Cede & Co., or such othernominee as may be requested by an authorized representative of DTC. DTC’s practice is to credit DirectParticipants’ accounts upon DTC’s receipt of funds and corresponding detail information from the State or thePaying Agent, on payable date in accordance with their respective holdings shown on DTC’s records. Payments byParticipants to Beneficial Owners will be governed by standing instructions and customary practices, as is the casewith securities held for the accounts of customers in bearer form or registered in “street name,” and will be theresponsibility of such Participant and not of DTC nor its nominee, the Paying Agent, or the State, subject to anystatutory or regulatory requirements as may be in effect from time to time. Payment of principal, interest orredemption proceeds to Cede & Co. (or such other nominee as may be requested by an authorized representative ofDTC) is the responsibility of the State or the Paying Agent, disbursement of such payments to Direct Participantswill be the responsibility of DTC, and disbursement of such payments to the Beneficial Owners will be theresponsibility of Direct and Indirect Participants.
DTC may discontinue providing its services as depository with respect to the Bonds at any time by givingreasonable notice to the State or the Paying Agent. Under such circumstances, in the event that a successordepository is not obtained, Bonds are required to be printed and delivered.
The State may decide to discontinue use of the system of book-entry-only transfers through DTC (or asuccessor securities depository). In that event, Bonds will be printed and delivered to DTC.
The information in this section concerning DTC and DTC’s book-entry system has been obtained fromsources that the State believes to be reliable, but the State takes no responsibility for the accuracy thereof. Theinformation contained in the website referred to in the preceding material or in any other website referred to thereinis not incorporated by reference in this Official Statement.
[THE BALANCE OF THIS PAGE HAS BEEN INTENTIONALLY LEFT BLANK]

PART II
INFORMATION CONCERNING THE STATE OF NEVADA
Part II of this Official Statement contains information concerning the State, and supplements theinformation contained in the other parts of this Official Statement. This Official Statement, including the cover, theinside cover pages, Part I and the schedules and appendices thereto, this Part II, Part III and the appendices thereto,and any financial statements expressly incorporated herein by reference, should be read in its entirety.

- i -
Table Of Contents
Page
GOVERNMENT STRUCTURE ...............................................................................................................................II-1ECONOMIC AND DEMOGRAPHIC INFORMATION .........................................................................................II-2
General ...............................................................................................................................................................II-2Population and Age Distribution ........................................................................................................................II-2Income................................................................................................................................................................II-3Employment .......................................................................................................................................................II-4Educational Attainment ......................................................................................................................................II-5Sales and Use Tax ..............................................................................................................................................II-6Gaming and Tourism..........................................................................................................................................II-6Transportation ....................................................................................................................................................II-8Economic Development .....................................................................................................................................II-9Federal Activities .............................................................................................................................................II-10Mining ..............................................................................................................................................................II-11Electric Utilities................................................................................................................................................II-12Water ................................................................................................................................................................II-12State Litigation .................................................................................................................................................II-14
Part II – List of Tables
Table 1 Nevada Population by County .......................................................................................................... II-2Table 2 Age Distribution................................................................................................................................ II-2Table 3 Per Capita Personal Income Groups.................................................................................................. II-3Table 4 Median Household Income ............................................................................................................... II-3Table 5 Percent of Households by Income Groups ........................................................................................ II-4Table 6 Average Annual Labor Force Summary ........................................................................................... II-4Table 7 Average Establishment - Based Industrial Employment by Calendar Year...................................... II-5Table 8 Educational Attainment..................................................................................................................... II-5Table 9 Transactions Taxable Under the Nevada Sales and Use Tax Laws .................................................. II-6Table 10 Gross Taxable Gaming Revenues and Total Gaming Taxes............................................................. II-6Table 11 Visitor Volume and Room Occupancy Rate Las Vegas Metropolitan Area, Nevada ....................... II-7Table 12 Visitor Volume and Room Occupancy Rate Washoe County, Nevada ............................................ II-8Table 13 Convention and Visitors Authority Room Tax Revenue .................................................................. II-8Table 14 Mineral Production ......................................................................................................................... II-12Table 15 Mineral Production (By Weight) .................................................................................................... II-12

II-1
GOVERNMENT STRUCTURE
Nevada’s Constitution was approved in 1864 and has been amended from time to time. The Constitutionprovides for three branches of government: legislative, executive and judicial. The legislative branch is made up ofa Senate and an Assembly. State Senators are elected for four-year terms, and members of the State Assembly areelected for two-year terms.
The State Legislature convenes biennially in odd-numbered years. The most recent regular (78th) bienniallegislative session convened on February 2, 2015 and adjourned on June 1, 2015. Special sessions of the StateLegislature may be convened by the Governor by proclamation or by the State Legislature by a petition specifyingthe business to be transacted in the session and signed by two-thirds of the legislators of each house. Most recently,the State Legislature held a special session from December 16 – 19, 2015.
There are 21 Senators and 42 members of the Assembly. Nevada’s elected Constitutional officers are theGovernor, Lieutenant Governor, Secretary of State, Treasurer, Controller, and Attorney General, all of whom areelected for four-year terms. All Constitutional officers are limited to two terms. Supreme Court justices are electedon a non-partisan ballot for six-year terms.
Following are the State’s Constitutional officers:
Office Name
PoliticalParty
AffiliationTerm First
Commenced Term Expires
Governor Brian Sandoval Republican 2011 2019Lieutenant Governor Mark Hutchison Republican 2015 2019Secretary of State Barbara K. Cegavske Republican 2015 2019Treasurer Daniel M. Schwartz Republican 2015 2019Controller Ronald L. Knecht Republican 2015 2019Attorney General Adam Paul Laxalt Republican 2015 2019
The Board of Finance, consisting of the Governor, the Treasurer, the Controller, and two additionalmembers appointed by the Governor, may issue and redeem securities on behalf of the State, when authorized bylaw, as provided in NRS Sections 349.150 through 349.364.
County governments in Nevada are managed by boards of county commissioners or the equivalent. Thereare 17 counties in the State. Cities are governed by general acts, and 13 of the cities are also governed by specialcharters granted by the State Legislature.
Representation in the United States Congress is by two Senators and four Representatives.
As of December 1, 2015, there were approximately 17,470 permanent and non-permanent (emergency,provisional and temporary) full-time equivalent State employees excluding employees of the Nevada System ofHigher Education, courts and legislature. The State does not have collective bargaining agreements with employeeunions. As of January 1, 2015, approximately 3,265 State employees were members of voluntary employee/labororganizations that represent the interests of their members. The State considers its relations with its employees to besatisfactory.

II-2
ECONOMIC AND DEMOGRAPHIC INFORMATION
General
This portion of Part II of this Official Statement contains general information concerning the economic anddemographic conditions in the State. It is provided so that prospective investors will be aware of factors that mayaffect future development and growth within the State. The information presented was obtained from the sourcesindicated, and the State does not guarantee or make any representation as to the accuracy or completeness of the datapresented.
Population and Age Distribution
Nevada’s population increased from 1,201,833 residents in 1990 to 1,998,257 residents in 2000 and to2,724,634 residents in 2010, an increase of approximately 66% between 1990 and 2000 and approximately 127%between 1990 and 2010. In 2014, Nevada’s population increased by 1.5% from the previous year. Historical andestimated State population figures, by county, are shown in the following table:
Table 1Nevada Population by County
1990 2000 2010 2011 2012 2013 2014Carson City 40,443 53,095 55,850 56,066 55,441 54,668 53,969Churchill 17,938 26,247 26,360 25,136 25,238 25,322 25,103Clark 741,459 1,425,723 1,968,831 1,967,722 1,988,195 2,031,723 2,069,450Douglas 27,637 43,101 49,242 47,661 48,015 48,478 48,553Elko 33,530 50,756 52,097 49,861 51,771 53,384 53,358Esmeralda 1,344 1513 1,145 825 860 858 926Eureka 1,547 1,847 1,609 1,994 2,011 2,024 1,903Humboldt 12,844 18,149 18,364 17,135 17,384 17,457 17,388Lander 6,266 6,822 5,992 5,988 6,221 6,343 6,560Lincoln 3,775 4,420 4,631 5,284 5,100 5,020 5,004Lyon 20,001 37,393 52,334 52,443 52,245 52,960 53,344Mineral 6,475 6,270 4,471 4,601 4,679 4,662 4,584Nye 17,781 35,924 45,459 44,513 44,292 44,749 45,456Pershing 4,336 7,458 7,133 6,847 7,013 6,882 6,714Storey 2,526 3,897 4,234 4,123 4,103 4,017 3,974Washoe 254,667 333,566 417,379 421,593 442,704 432,324 436,797
White Pine 9,264 10,650 9,503 10,002 9,945 10,095 10,218
Nevada Total 1,201,833 2,066,831 2,724,634 2,721,794 2,750,217 2,800,967 2,843,301________________________
Source: 1990 and 2000: U.S. Bureau of the Census; 2010-2014: Nevada State Demographer.
The following table sets forth a comparative age distribution profile for Clark County, Washoe County, theState and the United States:
Table 2Age Distribution
Percent of Population
AgeClark
CountyWashoeCounty State United States
14 and under 19.9% 18.5% 19.4% 19.1%15-24 12.9 13.6 13.0 13.825-34 14.8 14.4 14.3 13.535-54 27.7 25.7 27.1 26.455 and older 24.9 27.8 26.2 27.1
________________________
Source: U.S. Census Bureau, 2014 American Community Survey 1-Year Estimates.

II-3
Income
The following table sets forth annual per capita personal income levels of the Las Vegas-Paradise MSA(which consists of Clark County), the Reno-Sparks MSA (which consists of Washoe County and Storey County),the State and the United States:
Table 3Per Capita Personal Income Groups
YearLas Vegas-
Paradise MSAReno-Sparks
MSA State United States2010 $36,057 $41,216 $36,918 $40,2772011 36,488 43,030 37,745 42,4532012 38,713 43,048 39,436 44,2662013 38,091 44,280 39,223 44,4382014 39,533 46,120 40,742 46,049
________________________
Source: U.S. Department of Commerce, Bureau of Economic Analysis.
The following tables depict Median Household Income and Percent of Households by Income Groups forClark County, Washoe County, the State and the United States.
Table 4Median Household Income
Year Clark County Washoe County State United States
2010 $51,437 $50,556 $51,001 $50,0462011 48,215 50,733 48,927 50,5022012 49,546 49,026 49,760 51,3712013 51,057 53,588 51,230 52,2502014 51,214 52,618 51,450 53,657
________________________
Source: U.S. Census Bureau, 2014 American Community Survey 1-Year Estimates.
[THE BALANCE OF THIS PAGE HAS BEEN INTENTIONALLY LEFT BLANK]

II-4
Table 5Percent of Households by Income Groups
Income GroupClark CountyHouseholds
Washoe CountyHouseholds State Households
United StatesHouseholds
Under $25,000 22.1% 23.7% 22.3% 23.1%$25,000-$34,999 11.4 9.6 11.2 10.0$35,000-$49,999 15.1 13.8 15.0 13.5$50,000 and Over 51.3 52.8 51.5 53.4
________________________
Source: U.S. Census Bureau, 2014 American Community Survey 1-Year Estimates.
Employment
The following tables set forth labor force and employment statistics for the State. The State experiencedhigh rates of unemployment beginning in 2008 and continuing through 2012. In July 2010, the State’sunemployment rate reached a high of 13.7%. As of December 31, 2015, the State’s unemployment rate was 6.8%.
Table 6(1)
Average Annual Labor Force Summary
Calendar Year 2010 2011 2012 2013 2014 2015Total Labor Force 1,358,579 1,373,663 1,378,362 1,384,462 1,394,599 1,420,404Unemployed 183,804 179,602 153,946 132,137 108,125 96,625Unemployment Rate(2) 13.5% 13.1% 11.2% 9.5% 7.8% 6.8%Total Employment(3) 1,174,774 1,194,061 1,224,415 1,252,326 1,286,474 1,323,779
(1) Based on non-seasonally adjusted information as of December 2015. Subject to revision as additional information becomesavailable.
(2) According to the U.S. Department of Labor, Bureau of Labor Statistics, the U.S. average unemployment rates for the years2010 through 2014 were 9.6%, 8.9%, 8.1%, 7.4% and 6.2% respectively.
(3) Adjusted by census relationships to reflect number of persons by place of residence.________________________
Source: State of Nevada - Department of Employment, Training and Rehabilitation.
[THE BALANCE OF THIS PAGE HAS BEEN INTENTIONALLY LEFT BLANK]

II-5
Table 7(1)
Average Establishment-Based Industrial Employment by Calendar Year(Estimates in Thousands)
NAICS Classification(2) 2010 2011 2012 2013 2014 2015Natural Resources and Mining 12.2 14.0 15.5 15.2 14.4 13.5Construction 59.3 52.2 52.0 56.8 62.8 68.5Manufacturing 37.9 38.3 39.2 40.5 41.6 42.0Trade (wholesale and retail) 160.1 161.3 164.9 168.3 173.3 174.8Transportation, Warehousing and Utilities 50.0 51.4 53.2 53.9 56.9 59.0
Information 12.5 12.6 12.7 12.9 13.6 13.8Financial Activities 52.9 52.5 54.4 56.8 57.2 57.1Professional and Business Services 135.7 139.7 144.7 149.9 155.7 160.2Education and Health Services 101.5 105.4 108.5 111.6 116.2 122.0Leisure and Hospitality (casinos excluded) 122.3 126.8 130.7 137.5 144.8 156.1Casino Hotels and Gaming 186.7 188.8 186.5 186.4 191.9 195.8
Other Services 32.9 32.4 33.3 33.5 34.8 36.0Government 153.8 150.3 149.4 151.0 152.3 154.1
Total all industries 1,117.8 1,125.7 1,144.8 1,174.3 1,215.3 1,252.8
(1) Based on non-seasonally adjusted CES information as of December 2015. Subject to revision as additional informationbecomes available. Totals may not add due to rounding.
(2) Reflects employment by place of work. Does not necessarily coincide with labor force concept. Includes multiplejobholders.
________________________
Source: Nevada Department of Employment, Training and Rehabilitation.
Educational Attainment
The following table sets forth educational attainment statistics for the State.
Table 8Educational Attainment
(Civilian Labor Force Aged 25 and Older)
Nevada state-wideEducational Attainment Level Male Female Total(1)
Total population 49.7% 50.3% 100.0%Not a high school graduate 15.1 14.7 14.9High school graduate (including equivalency) 28.5 27.8 28.2Some college or associate degree 33.0 34.7 33.8Bachelor’s degree 15.1 15.3 15.2Graduate or Professional Degree 8.3 7.5 7.9
(1) Totals may not add exactly due to rounding.__________________________
Source: U.S. Census, 2014 American Community Survey 1-Year Estimates.
[THE BALANCE OF THIS PAGE HAS BEEN INTENTIONALLY LEFT BLANK]

II-6
Sales and Use Tax
Aggregate sales and use taxes imposed in Nevada’s counties range from 6.85% to 8.1% (Clark County).The State General Fund’s share (2%) is a major source of revenue for the State’s General Fund. Clark County andWashoe County are the major sources of taxable sales revenue in the State. The following table presents a record oftaxable sales in the State:
Table 9(1)
Transactions Taxable Under the Nevada Sales and Use Tax Laws
Fiscal YearEnded June 30
TaxableSales
PercentageChange
2011 $39,935,010,577 5.73%2012 42,954,750,131 7.562013 45,203,408,413 5.232014 47,440,345,167 4.952015 50,347,535,951 6.13
July – Oct 2014 16,413,268,784 --July – Oct 2015 17,267,720,332 5.20
(1) Subject to change.________________________
Source: State of Nevada - Department of Taxation.
Gaming and Tourism
The economy of Nevada is largely dependent upon a tourism industry based upon legalized gaming andrelated forms of entertainment. The industry represents a significant source of revenues to the State, county andlocal jurisdictions in which gaming companies operate. For two of the past four fiscal years (2012 to 2015), grosstaxable gaming revenue has increased. However, for four of the past five fiscal years (2011 to 2015), state gamingcollections from all sources have experienced increases with a modest decline in 2015. During prior fiscal years, theincreases in gaming win have been driven primarily by increased convention attendance and visitation on the LasVegas Strip in addition to record win amounts in baccarat. However, in 2015, the increases in gaming win weredriven by markets outside of the Las Vegas Strip. The following table represents a record of gross taxable gamingrevenues in the State and total State gaming taxes and fees collected.
Table 10(1)
Gross Taxable Gaming Revenues and Total Gaming Taxes
Fiscal Year Gross Taxable Gaming Revenue(2) State Gaming Collection(3)
Ended June 30 State Total % Change State Total % Change2011 $9,836,451,902 1.74% $853,455,347 2.91%2012 9,770,060,305 -0.67 864,621,791 1.312013 10,208,523,998 4.49 892,106,457 3.182014 10,208,208,433 -0.003 912,371,316 2.272015 10,511,301,026 2.97 909,857,085 -0.28
July – Oct 2014 $3,520,811,868 -- $262,561,417 --July – Oct 2015 $3,439,456,945 -2.31 $273,214,420 4.06
(1) The figures shown are subject to adjustments due to amended tax filings, fines and penalties.(2) The total of all sums received as winnings less only the total of all sums paid out as losses (before operating expenses).(3) Based upon the taxable revenues generated in the previous month. Cash receipts of the State from all sources relating to
gaming (General Fund and other revenues) including percentage license fees, quarterly flat license fees, annual license fees,casino entertainment taxes, annual slot machine taxes, penalties, advance fees, and miscellaneous collections. A portion ofcollections is deposited to the State funds other than the State’s General Fund.
________________________
Source: State of Nevada - Gaming Control Board.

II-7
Gaming Is a Highly Regulated Industry. The five-member Nevada Gaming Commission and the three-member Nevada Gaming Control Board, both appointed by the Governor, investigate and approve all licenses,establish operating rules, monitor the activities of licensed establishments and collect State gaming fees and taxes.In addition to the State, local governments also license, levy taxes and regulate gaming establishments and licensees.The laws, regulations and ordinances of both state and local governments regulate the licensing, operations andfinancial stability of the businesses as well as the background and character of the owners, managers, and personswith financial interests in the gaming.
The Gaming Industry Is Highly Competitive. Prior to the 1980s, Nevada was the only state with legalizedcasino gaming, although some forms of gaming, such as pari-mutuel horse, dog and jai alai betting, existed in otherstates. A significant proliferation of casino and other forms of gaming has occurred outside of Nevada, bothnationally and internationally, in recent years. According to the American Gaming Association, today there are 40states that have some form of legalized electronic gaming device, including traditional slot machines, video pokerand bingo at Indian casinos, commercial casinos, racetrack casinos, and/or bars, restaurants or other licensedestablishments (“non-casino devices”). These include 24 states with commercial casinos, 14 with racetrack casinos,and 28 with tribal casinos, and seven have non-casino devices. Additionally, tribal gaming in the State of Californiaaccounts for the highest Native American gaming revenue of any state within the United States. Gaming continuesto expand into foreign countries as well. Nevada no longer enjoys a near-monopoly on the United States gamingmarket as it did historically. Competition from casino gaming, state-run lotteries and other forms of gaming willlikely continue to increase in the future. The impact of such expansion and proliferation upon Nevada’s gamingeconomy is uncertain.
Information relating to the occupancy rates of hotels is not available on a state-wide basis. Thisinformation is generally only available for Clark County (Las Vegas) and for Washoe County (Reno and Sparks) asprovided in the following tables:
Table 11Visitor Volume and Room Occupancy Rate
Las Vegas Metropolitan Area, Nevada
Calendar YearTotal Visitor
Volume
Number ofHotel/Motel Rooms
AvailableHotel/Motel
Occupancy Rate(1)National
Occupancy Rate(2)
2010 37,335,436 148,935 80.4% 57.6%2011 38,928,708 150,161 83.8 60.12012 39,727,022 150,481 84.4 61.42013 39,668,221 150,593 84.3 62.32014 41,126,512 150,544 86.8 --2015 42,312,216(3) 149,213 87.7 --
(1) The sample size for this survey represents approximately 75% of the total hotel/motel rooms available.(2) Source: PwC Hospitality Directions: May 2015(3) Represents a 2.9% increase from the January – December 2014 period.________________________
Source: Las Vegas Convention and Visitors Authority.
[THE BALANCE OF THIS PAGE HAS BEEN INTENTIONALLY LEFT BLANK]
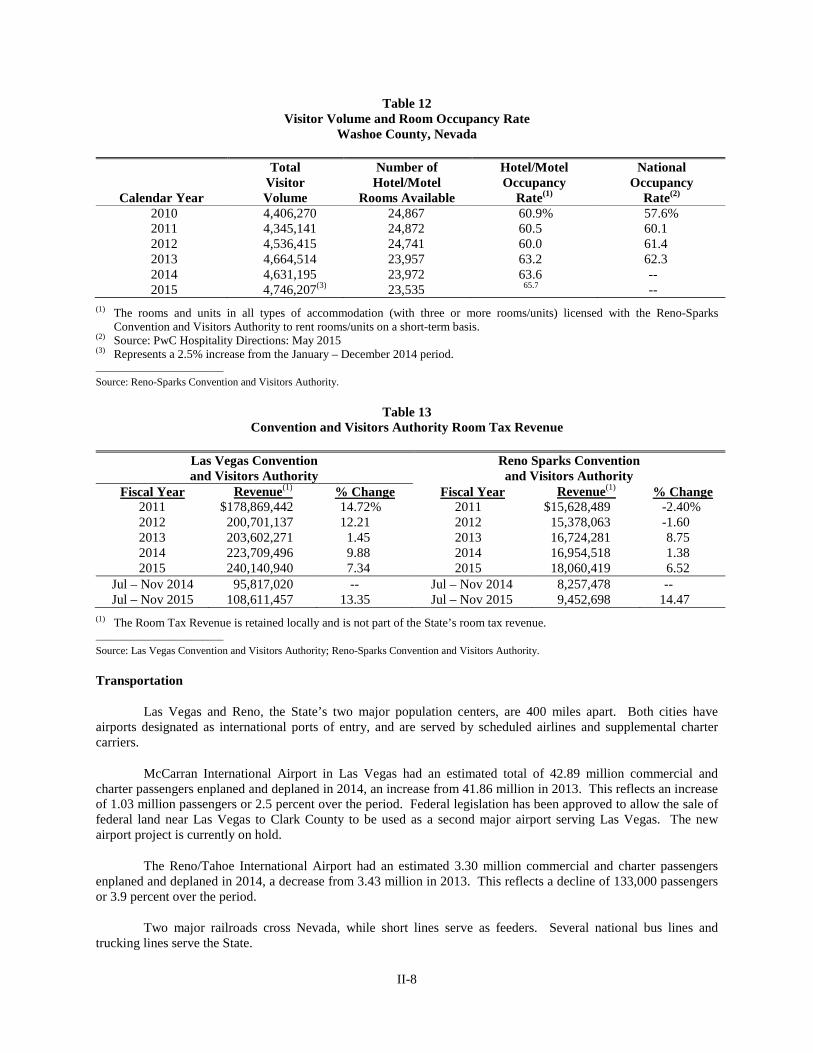
II-8
Table 12Visitor Volume and Room Occupancy Rate
Washoe County, Nevada
Calendar Year
TotalVisitorVolume
Number ofHotel/Motel
Rooms Available
Hotel/MotelOccupancy
Rate(1)
NationalOccupancy
Rate(2)
2010 4,406,270 24,867 60.9% 57.6%2011 4,345,141 24,872 60.5 60.12012 4,536,415 24,741 60.0 61.42013 4,664,514 23,957 63.2 62.32014 4,631,195 23,972 63.6 --2015 4,746,207(3) 23,535 65.7 --
(1) The rooms and units in all types of accommodation (with three or more rooms/units) licensed with the Reno-SparksConvention and Visitors Authority to rent rooms/units on a short-term basis.
(2) Source: PwC Hospitality Directions: May 2015(3) Represents a 2.5% increase from the January – December 2014 period.________________________
Source: Reno-Sparks Convention and Visitors Authority.
Table 13Convention and Visitors Authority Room Tax Revenue
Las Vegas Conventionand Visitors Authority
Reno Sparks Conventionand Visitors Authority
Fiscal Year Revenue(1) % Change Fiscal Year Revenue(1) % Change2011 $178,869,442 14.72% 2011 $15,628,489 -2.40%2012 200,701,137 12.21 2012 15,378,063 -1.602013 203,602,271 1.45 2013 16,724,281 8.752014 223,709,496 9.88 2014 16,954,518 1.382015 240,140,940 7.34 2015 18,060,419 6.52
Jul – Nov 2014 95,817,020 -- Jul – Nov 2014 8,257,478 --Jul – Nov 2015 108,611,457 13.35 Jul – Nov 2015 9,452,698 14.47
(1) The Room Tax Revenue is retained locally and is not part of the State’s room tax revenue.________________________
Source: Las Vegas Convention and Visitors Authority; Reno-Sparks Convention and Visitors Authority.
Transportation
Las Vegas and Reno, the State’s two major population centers, are 400 miles apart. Both cities haveairports designated as international ports of entry, and are served by scheduled airlines and supplemental chartercarriers.
McCarran International Airport in Las Vegas had an estimated total of 42.89 million commercial andcharter passengers enplaned and deplaned in 2014, an increase from 41.86 million in 2013. This reflects an increaseof 1.03 million passengers or 2.5 percent over the period. Federal legislation has been approved to allow the sale offederal land near Las Vegas to Clark County to be used as a second major airport serving Las Vegas. The newairport project is currently on hold.
The Reno/Tahoe International Airport had an estimated 3.30 million commercial and charter passengersenplaned and deplaned in 2014, a decrease from 3.43 million in 2013. This reflects a decline of 133,000 passengersor 3.9 percent over the period.
Two major railroads cross Nevada, while short lines serve as feeders. Several national bus lines andtrucking lines serve the State.

II-9
There are nine federal highways in Nevada, three of which are part of the interstate system. Interstate 15,connecting Salt Lake City and San Diego, passes through Las Vegas and provides convenient access to the LosAngeles area. Interstate 80 connects with the San Francisco Bay area and the Reno-Sparks area. Interstate 580connects Reno and Carson City. NDOT is partnering with Arizona Department of Transportation to plan aninterstate (Interstate 11) link between Las Vegas and Phoenix, with the potential of extending north to Canada andsouth to Mexico. For more information regarding Interstate 11, see “SUPPORT FOR STATE HIGHWAYSYSTEM – Federal Aid Highway System” in Part III of this Official Statement.
U.S. Highways 95 and 93 are major routes north from Las Vegas, through Fallon and Ely, Nevada,respectively. South of Las Vegas, U.S. 95 extends to the Mexican border, generally following the Colorado River,and U.S. 93 crosses into Arizona.
Nevada is less than one day’s drive to more than 40 million consumers and five major U.S. ports servingthe Pacific Rim. Northern Nevada is at the center of the western region, with 11 states and 53 million people onlyone day’s drive away. Southern Nevada is just hours away from the Southern California markets and within 2-daydelivery of nearly every state west of the Mississippi River.
Economic Development
The Nevada Governor’s Office of Economic Development (“GOED”) promotes a robust, diversified andprosperous economy in Nevada, stimulates business expansion and retention, encourages entrepreneurial enterprise,attracts new businesses, and facilitates community development. GOED is assisted by Regional DevelopmentAuthorities across the State when a business chooses to locate or expand within their respective region.
GOED has seven industry focal areas:
Aerospace & Defense
Health & Medical Services
Information Technology
Manufacturing & Logistics
Mining
Natural Resource Technologies
Tourism, Hospitality & Gaming
Additionally, GOED is advancing the development of emerging industry clusters that center on watertechnology innovation, unmanned aerial systems, and advanced manufacturing. Nevada’s ability to grow itsindustries is dependent upon a trained workforce, and GOED plays an important role in ensuring that industrydemand is matched with an educated, skilled, and available workforce.
GOED is able to offer incentives to qualifying companies, following Board approval, to create jobs andalleviate some costs associated with expanding or relocating in the State. GOED’s incentives include: Sales and UseTax Abatement; Modified Business Tax Abatement; Personal Property Tax Abatement; Real Property TaxAbatement for Recycling; Data Center Abatement; Aviation Parts Abatement; Train Employees Now grant; and theSilver State Works Hiring Incentive.
GOED’s International Trade Division facilitates export growth, increases foreign direct investment, recruitsforeign expansion, and expands higher education partnerships. Nevada has established high-level partnerships withgovernment officials and industry associations in the People’s Republic of China, the Republic of Korea, Mexico,Brazil, Canada, Israel, Poland, Germany, United Kingdom, Ireland, and Italy.
GOED is the umbrella organization for the Nevada Film Office which provides assistance to the local andnational television and film production community.
II-10
The Procurement Technical Assistance Center Procurement Outreach Program is housed in GOED andworks to simplify the process of contracting with all levels of government.
The Rural Community and Economic Development Division in GOED promotes and facilitates communitydevelopment throughout rural Nevada. The Division administers the State and Small Cities CommunityDevelopment Block Grant Program which aids in the development of suitable living conditions, increases the supplyof decent housing, and helps create economic opportunities in the rural parts of the State.
In 2014 the State’s economic development efforts resulted in approximately $12 billion of recently oranticipated business investment in the State, 14,700 new jobs and the arrival or expansion of 97 companies. Amongthe most noteworthy of these is the Tesla Gigafactory.
The Tesla Gigafactory is currently under construction and is expected to be completed in 2017, at a cost ofapproximately $5 billion. The factory is being built to construct the lithium-ion batteries that are used to powerTesla electric motor cars at reduced production costs. Employment is estimated to reach approximately 6,500employees when the facility is in full operation.
Notable economic development activity in 2015 includes Faraday Future and the Switch Data Center.
Faraday Future is a next-generation electric car manufacturing company that has committed to build a $1.4billion, 3 million square foot manufacturing plant in North Las Vegas. This facility is expected to result in 4,500full-time jobs when fully built-out and employ 3,000 construction and installation workers until that time.Production is expected to begin in 2017.
Switch is a developer and operator of colocation data centers, most of which are located in the State.Switch has committed to invest approximately $3 billion in constructing a new 3 million square foot data centercampus on approximately 1,000 acres of land near Reno. This facility is part of an expanding data center presence inthe state that includes Rackspace, eBay, and Apple.
Among its other economic development activities, the GOED created and also oversees the Battle BornGrowth Escalator, Nevada’s State venture capital program (under the auspices of State Small Business CreditInitiative). This program invests in early stage, high-growth Nevada enterprises in the following sectors: aerospaceand defense, agriculture, energy, health care, IT, logistics and operations, manufacturing, mining, tourism andgaming and water.
The State was selected by the FAA as one of six test site locations for flying Unmanned Aerial Systems.
Federal Activities
Operations and facilities of the federal government in the State have been significant, beginning withHoover Dam in the 1930s, an Army Air Force gunnery school (which later became Nellis Air Force Base) duringWorld War II, and the subsequent creation of the Nevada National Security Site (formerly the Nevada Test Site).Currently, the following major federal activities are located in the State.
Hoover Dam. Hoover Dam, operated by the Bureau of Reclamation, is a multiple-purpose development.The dam controls floods and stores water for irrigation, municipal and industrial uses, hydroelectric powergeneration, and recreation. Hoover Dam is one of the world’s largest hydroelectric installations with a capacity ofmore than 2,000 megawatts. Hoover Dam also is a major tourist attraction in Clark County.
Nellis Air Force Base. Nellis Air Force Base, a part of the U.S. Air Force Air Combat Command, islocated adjacent to the City of Las Vegas. The base itself covers more than 14,000 acres of land, while the total landarea occupied by Nellis Air Force Base and its ranges is over three million acres. The base hosts numerous militaryprograms as well as civilian workers. It is the home base of the “Thunderbirds,” the world famous air demonstrationsquadron.

II-11
Nevada National Security Site. The Nevada National Security Site (“NNSS”) was established in 1950 asthe nation’s proving ground for nuclear weapons testing. In recent years, under the direction of the NNSS NevadaSite Office of the U.S. Department of Energy (“DOE”), NNSS use has diversified into many other areas such ashazardous chemical spill testing, emergency response training, conventional weapons testing, and wastemanagement projects that can best be conducted in this remote desert area. NNSS has been designated as anEnvironmental Research Park where scientists and students can conduct research on environmental issues. Located65 miles north of Las Vegas, the NNSS is a massive outdoor laboratory and national experimental center. NNSScomprises approximately 1,350 square miles, surrounded by thousands of additional acres of land withdrawn fromthe public domain for use as a protected wildlife range and for a military gunnery range, creating an unpopulatedarea of approximately 5,470 square miles. Federal employees and independent contractors are employed at NNSS.
Yucca Mountain. The federal government formerly planned to use Yucca Mountain (locatedapproximately 90 miles northwest of Las Vegas in Nye County) as a national nuclear repository for high-level wasteand spent fuel from nuclear power plants around the country. The U.S. Department of Energy submitted in 2008 alicense application to the U.S. Nuclear Regulatory Commission (the “NRC”) seeking authorization to construct thenuclear waste and spent fuel repository, but the NRC suspended its review. Following various challenges, in 2013the D.C. Circuit Court of Appeals ordered the NRC to resume the statutory license review process unless Congressdeclares otherwise through legislation or until appropriated funds are depleted. While NRC review of the YuccaMountain application continues, there are significant hurdles to its approval, strong opposition to the project, and
lack of federal funding. The status of the proposed nuclear repository at Yucca Mountain remains uncertain.
Mining
Nevada is called the “Silver State” because of the vast quantities of silver mined from the Comstock Lodein the 19th Century. Today, Nevada’s mining industry production consists of metals, industrial minerals, oil andgas, and geothermal energy. The total value of mineral production (excluding oil, gas and geothermal) in Nevadareached $7.1 billion in 2014. Gold is the primary source of mining revenue which reached $6.3 billion in 2014.Nevada leads the nation in gold production.
Oil and natural gas exploration activity continues in Nevada. During 2014, the total net oil produced was316,426 barrels. There are no commercial sales of natural gas in Nevada; however, small quantities are producedand used to fuel oil production facilities on lease sites.
Gross geothermal energy production totaled 2.7 million megawatt-hours in 2014 from 22 electricalgenerating plants.
According to the Department of Employment, Training and Rehabilitation, in 2014, there was an averageof 14,413 people employed in the mining industry at an average annual salary of $88,634.
[THE BALANCE OF THIS PAGE HAS BEEN INTENTIONALLY LEFT BLANK]
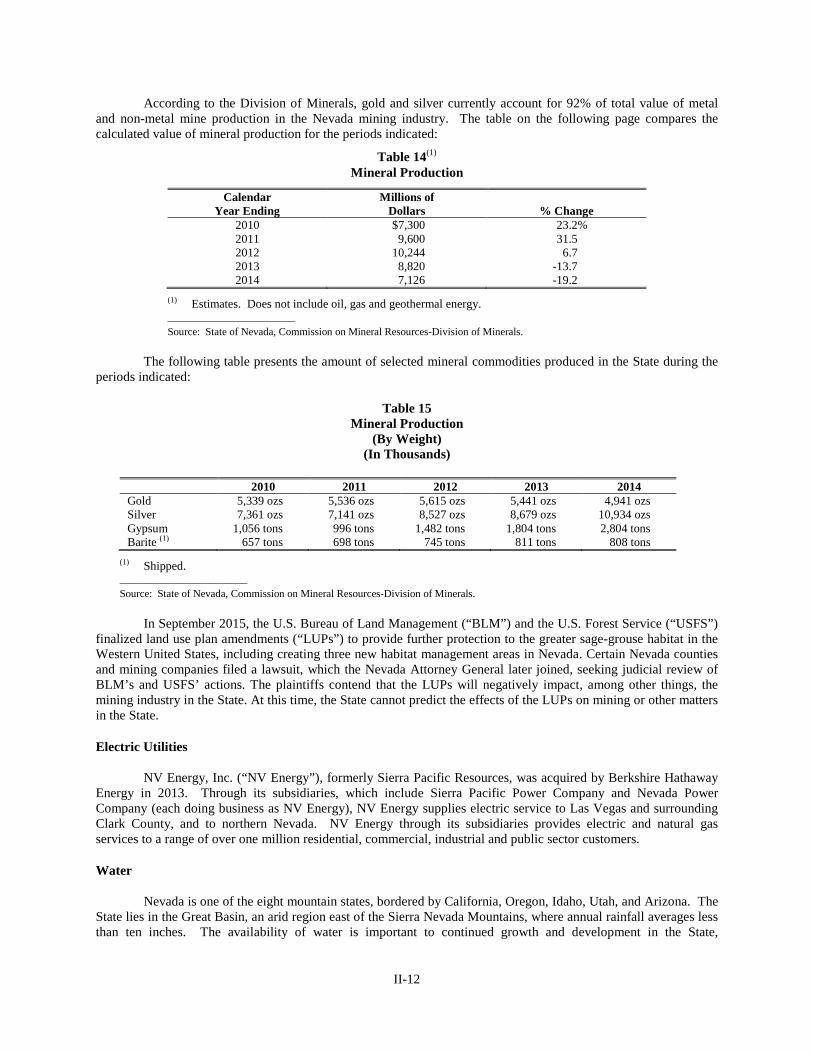
II-12
According to the Division of Minerals, gold and silver currently account for 92% of total value of metaland non-metal mine production in the Nevada mining industry. The table on the following page compares thecalculated value of mineral production for the periods indicated:
Table 14(1)
Mineral Production
CalendarYear Ending
Millions ofDollars % Change
2010 $7,300 23.2%2011 9,600 31.52012 10,244 6.72013 8,820 -13.72014 7,126 -19.2
(1) Estimates. Does not include oil, gas and geothermal energy.________________________
Source: State of Nevada, Commission on Mineral Resources-Division of Minerals.
The following table presents the amount of selected mineral commodities produced in the State during theperiods indicated:
Table 15Mineral Production
(By Weight)(In Thousands)
2010 2011 2012 2013 2014Gold 5,339 ozs 5,536 ozs 5,615 ozs 5,441 ozs 4,941 ozsSilver 7,361 ozs 7,141 ozs 8,527 ozs 8,679 ozs 10,934 ozsGypsum 1,056 tons 996 tons 1,482 tons 1,804 tons 2,804 tonsBarite (1) 657 tons 698 tons 745 tons 811 tons 808 tons
(1) Shipped.________________________
Source: State of Nevada, Commission on Mineral Resources-Division of Minerals.
In September 2015, the U.S. Bureau of Land Management (“BLM”) and the U.S. Forest Service (“USFS”)finalized land use plan amendments (“LUPs”) to provide further protection to the greater sage-grouse habitat in theWestern United States, including creating three new habitat management areas in Nevada. Certain Nevada countiesand mining companies filed a lawsuit, which the Nevada Attorney General later joined, seeking judicial review ofBLM’s and USFS’ actions. The plaintiffs contend that the LUPs will negatively impact, among other things, themining industry in the State. At this time, the State cannot predict the effects of the LUPs on mining or other mattersin the State.
Electric Utilities
NV Energy, Inc. (“NV Energy”), formerly Sierra Pacific Resources, was acquired by Berkshire HathawayEnergy in 2013. Through its subsidiaries, which include Sierra Pacific Power Company and Nevada PowerCompany (each doing business as NV Energy), NV Energy supplies electric service to Las Vegas and surroundingClark County, and to northern Nevada. NV Energy through its subsidiaries provides electric and natural gasservices to a range of over one million residential, commercial, industrial and public sector customers.
Water
Nevada is one of the eight mountain states, bordered by California, Oregon, Idaho, Utah, and Arizona. TheState lies in the Great Basin, an arid region east of the Sierra Nevada Mountains, where annual rainfall averages lessthan ten inches. The availability of water is important to continued growth and development in the State,

II-13
particularly in its two most populous counties, Clark County and Washoe County. The water providers for thosetwo counties are briefly discussed below.
On January 16, 2014, the U.S. Department of Agriculture (“USDA”) announced the designation of ninecounties in Nevada, including Clark County and Washoe County, as primary natural disaster areas due to ongoingdrought conditions. Qualified farm operators in these areas and certain contiguous areas may be eligible for low-interest emergency loans from the USDA. The State cannot predict the duration of the drought or the effects of thedrought on the State.
Clark County
The major water purveyors in Clark County are the Big Bend Water District; the cities of Boulder City,Henderson, and North Las Vegas; the Las Vegas Valley Water District (“LVVWD”); and Nellis Air Force Base.The LVVWD provides water service to the City of Las Vegas, the unincorporated urban areas of Clark County,Jean, Kyle Canyon, Blue Diamond, and Searchlight. The Big Bend Water District, operated by the LVVWD, servesthe Town of Laughlin, and the Coyote Springs Water Resources District, operated by the LVVWD, serves thecommunity within the Coyote Spring valley. In addition, the Virgin Valley Water District serves the City ofMesquite and surrounding area, and the Moapa Valley Water District serves Logandale, Overton, Moapa andGlendale.
The Southern Nevada Water Authority (“SNWA”) was established to address water issues on a regionalbasis rather than an individual purveyor basis. The members of the SNWA include the cities of Boulder City,Henderson, Las Vegas and North Las Vegas, the Big Bend Water District, Clark County Water Reclamation District(formerly Clark County Sanitation District), and the LVVWD. The SNWA works collaboratively with its memberagencies to manage regional water facilities; address water resource management and water conservation on aregional basis; manage and develop additional water supplies for Southern Nevada; and expand and enhanceregional treatment and delivery capabilities. The LVVWD provides the management and staff for the SNWA.
In addition to aggressive water conservation measures, the SNWA developed and maintains acomprehensive Water Resource Plan to manage current and future resources available to the Las Vegas Valley. Theplan, which was first adopted in 1996, is reviewed annually and updated as needed. The Water Resource Planprovides a demand projection for Southern Nevada and outlines a portfolio of water resource options to meetprojected water demands over a 50-year planning horizon. This portfolio approach enables the SNWA to quicklyrespond to changing conditions. The portfolio of resources as described in the SNWA Water Resource Planincludes Nevada’s 300,000 acre-foot per year (“AFY”) Colorado River apportionment and associated return-flowcredits; Las Vegas Valley and in-state groundwater; flood control, domestic and intentionally created surplus water(intentionally created surplus water is divided into four categories: tributary, imported, system efficiency andextraordinary conservation); water resources banked in the Las Vegas Valley and the states of Arizona andCalifornia; wastewater reuse; and other current and future supplies.
While the Colorado River Basin continues to experience drought conditions, the SNWA has acquired and isdeveloping new water resources that will be managed in tandem with Colorado River supplies. These resources,paired with expected conservation gains, are designated to enable the SNWA to meet current and projected waterdemands over the long-term planning horizon. In 2015, the SNWA updated its Water Resource Plan to outline theSNWA’s approach to meeting demands during declared shortages in light of new rules and agreements. Responsemeasures include the use of Intentionally Created Surplus, banked resources, shortage-sharing agreements andheightened conservation measures. The SNWA also continues to work with the other Colorado River Basin states toidentify and explore options for long-term augmentation of Colorado River resources.
Washoe County
The primary source of water for Washoe County is the Truckee River, which flows from Lake Tahoe toPyramid Lake (approximately 120 miles). Underground water and individual private wells augment the river watersupply, particularly in the unincorporated areas of Washoe County.

II-14
Regional planning of water resources in certain portions of Washoe County is the responsibility of theNorthern Nevada Water Planning Commission (the “Planning Commission”) and the Western Regional WaterCommission (the “Regional Commission”). The Regional Commission is governed by a Board of Trusteescomprising representatives of the City of Reno, the City of Sparks, Washoe County, the Truckee Meadows WaterAuthority, the Truckee Meadows Water Reclamation Facility, and the Sun Valley General Improvement District.The Planning Commission is comprised of members from Public Works for the City of Reno, Public Works for theCity of Sparks, Community Services Department for Washoe County, the General Manager of the Sun ValleyGeneral Improvement District, two representatives from the Truckee Meadows Water Authority, the TruckeeMeadows Water Reclamation Facility, Pyramid Lake Paiute Tribe, the Nature Conservancy, Truckee MeadowsFlood Management, and various other members.
On January 14, 2011, the Regional Commission adopted the 2011-2030 Comprehensive Regional WaterManagement Plan (the “Comprehensive Plan”) developed by the Planning Commission for the relevant planningarea, covering such matters as supply of municipal and industrial water; quality of water; sanitary sewerage;treatment of sewage; drainage of storm waters and control of floods. The Comprehensive Plan addresses suchmatters as the problems and needs of the planning area; the providers of service; alternatives to reduce demand orincrease water supply; identifying and providing for existing and future sources of water needed to meet present andfuture needs; priorities and general location for additional major facilities needed to provide services; programs tomitigate drought, conserve water and otherwise manage water; and other matters related to water supply, planningand conservation. Any facility of “regional significance” associated with water supply, wastewater treatment andstormwater drainage must be recognized in the Comprehensive Plan or presented for review by the PlanningCommission and possible amendment to the Comprehensive Plan by approval of the Regional Commission.
The Truckee Meadows Water Authority (“TMWA”), a joint powers authority composed of the City ofReno, the City of Sparks and Washoe County, provides water service to the cities of Reno and Sparks, and WashoeCounty. On January 1, 2015 TMWA merged with the Washoe County water utility and the South Truckee MeadowsGeneral Improvement District (“STMGID”). Total services increased from approximately 94,000 to 120,000 waterservices. Portions of Washoe County are served either by special districts, private companies and/or private wells.TMWA has developed a Water Resource Plan and Water Facility Plan to address the water needs of its service areathrough 2030.
State Litigation
The staff attorneys of the State Attorney General’s Office reported that the State or its officers andemployees were parties to numerous lawsuits, in addition to those described below. In view of the financialcondition of the State and based on the information provided by the staff attorneys, the State Attorney General is ofthe opinion that the State’s ability to pay the Series 2016 Bonds will not be materially affected by this litigation,based on information known at the time this Official Statement was prepared.
Several of the actions pending against the State are based upon the State’s (or its agents’) negligence or tortliability in which the State must be named as a party defendant. However, there is a statutory limit to the State’sliability of $50,000 per claim for causes of action arising before October 1, 2007, which has increased to $75,000per claim effective for causes of action arising on or after October 1, 2007 and to $100,000 for causes of actionarising on or after October 1, 2011. Buildings and contents are self-insured to $100,000 for property loss withcommercial insurance purchased to cover excess above this amount.
The State and/or its officers and employees are parties to a number of lawsuits that have been filed underthe federal civil rights statutes. The State is statutorily required to indemnify its officers and employees held liablefor damages for acts or omissions on the part of its officers and employees occurring in the course of their publicemployment. Several causes of action may be filed against the State based on alleged civil rights violations by itsofficers and employees. The statutory limit of tort liability (discussed above) does not apply in federal civil rights,federal discrimination and certain employment cases. Accordingly, the potential liability of the State isunascertainable at the present time.
2003 Non-Participating Manufacturers Adjustment arbitration proceeding relating to nationwide TobaccoMaster Settlement Agreement (MSA). The State is involved in a nationwide arbitration with a group of tobacco

II-15
companies, the Participating Manufacturers, over the tobacco Master Settlement Agreement (MSA), which the Statesigned along with 46 other states in 1998. The Participating Manufacturers have alleged that the State has failed todiligently enforce the provisions of NRS 370A (Qualifying Statute) as contemplated by the Master SettlementAgreement. As a result, in January 2009, the Nevada Supreme Court ordered the State to arbitrate its dispute withthe Participating Manufacturers. The State’s potential liability is up to the total amount of the MSA payment forcalendar year 2003 which is approximately $44 million. Additional arbitrations for the succeeding calendar yearswere anticipated with a similar dollar amount at risk. The State entered into a settlement with the ParticipatingManufacturers, reflected in an agreed term sheet, in December 2012. The agreement has not yet been finalized in aformal settlement agreement, but it is anticipated that the settlement will be duly formalized. The settlementresolves the dispute for calendar 2003 and reaches subsequent years through 2014. Although not yet finalized in aformal agreement, the settlement has resulted in a release of funds by the Participating Manufacturers that increasedrevenue received by the state under the MSA for 2013. The settlement terms will reduce revenue from the MSA foryears 2014 through 2018.
K-Kel, Inc., dba Spearmint Rhino Gentlemen’s Club, et al. v. Dept. of Taxation, et al., Case No. A648894,is a State district court action, through a petition for judicial review, challenging application of the statute imposingNevada’s Live Entertainment statute on grounds of constitutionality and seeking a refund of taxes paid, plus interest.In prior proceedings, the Nevada Supreme Court affirmed district court’s rulings finding Nevada’s LiveEntertainment Tax facially valid and determining that an as-applied challenge could only be brought through apetition for judicial review. Taxpayers petition for certiorari to the United States Supreme Court was denied. Whatremains is Taxpayers’ petition for judicial review of the denial of its as-applied challenge by the Nevada TaxCommission, which is pending before the Eighth Judicial District Court of the State of Nevada. That challengecontends the Live Entertainment Tax is unconstitutional as it is applied to the particular Taxpayers. It is estimatedthat, if Taxpayers prevail, the refund claim alone could exceed $87 million.
Southern California Edison sought a $36 million refund of use taxes paid arguing that coal used to produceelectricity was not taxable. The issue in this matter is similar to Sierra Pacific Power, above. Since the initialrequest, the refund sought in this matter, including interest has increased to in excess of $111 million. At thehearing that was held in late 2008, Southern California Edison’s refund request was denied by the Nevada TaxCommission. Trial de novo was held in the First Judicial District on January 21-31, 2014. On December 15, 2014,based on the Nevada Supreme Court’s decision in Sierra Pacific Power, above, the District Court determined thatSouthern California Edison was not entitled to a refund. The District Court’s Decision is on appeal to the NevadaSupreme Court.
Village League v. State Board, CV-03-06922. Pursuant to an order of the Nevada Supreme Court that theState Board of Equalization provide taxpayers statewide the opportunity to testify regarding equalization, the StateBoard has made a decision denying certain Incline Village residential property owners’ request that values for theproperties receive a rollback to 2002 values for tax years 2003-2004, 2004-2005 and 2005-2006, ordering insteadthat the Washoe County Assessor reappraise said properties without using certain disapproved methodologies. Theproperty owners sought and were denied judicial review and have appealed to the Nevada Supreme Court. If theproperty owners were to prevail on appeal, it would be anticipated that they would be granted a refund in excess of$10 million.
City of Fernley v. State of Nevada. The City of Fernley is suing the State alleging that the manner in whichthe revenue from certain taxes is divided among local governments violates the Federal and State Constitutions. Thecomplaint does not request a specific dollar amount; however, the dollar amounts at issue may exceed $10 million.As the relief involves potential redistribution of revenues among local governments, it is unclear whether, werejudgment awarded to the City, it would involve a loss of revenues to the State. The District Court has granted theState’s motion for summary judgment. That decision is currently on appeal to the Nevada Supreme Court.
Nassiri, Fred, adv. NDOT. NDOT previously settled an eminent domain action with Nassiri. Settlementincluded transfer by NDOT of other property to Nassiri. Nassiri filed an action asserting inverse condemnation,breach of contract, breach of the implied covenant of good faith and fair dealing, and rescission, based on actions(subsequently taken) by NDOT, specifically development of an overpass that blocked view of the property from thefreeway, thereby allegedly impairing the property. The inverse condemnation claim has been dismissed. Nassiri’sclaim is in excess of $40 million.

II-16
Wykoff Newberg Corp., adv. State of Nevada (NDOT). The State, through NDOT, brought a condemnationproceeding against Wykoff to acquire property for widening I-15 between Tropicana and Blue Diamond. NDOTinitially valued compensation due Wykoff at $1,290,000, but Wykoff demanded $10 million. The parties reached atentative settlement for the amount of $2,990,000 (NDOT’s initial valuation plus $1,700,000), but a dispute over theconditions of the settlement has prevented it from being finalized. NDOT has brought a pending motion to enforcethe settlement.
Morrison v. Quest et al. The widow of deceased former boxer Tommy Morrison is suing the Nevada StateAthletic Commission, the former Executive Director Marc Ratner and the former Chairman of the Medical AdvisoryBoard, Dr. Margaret Goodman (along with a lab and its director who are represented by a private attorney) for $110million for alleged negligence surrounding a lab test performed in order for him to participate in a 1996 bout, andalleged statements made in 2007.
This matter was filed in July 2014 in the Federal District Court in Las Vegas, Nevada. An initial motion todismiss was granted in part and denied in part. Plaintiff then filed an amended complaint, which the State hasmoved to dismiss and is awaiting a hearing or decision on this motion.
Walden et al. v. Nevada Department of Corrections. This is a Fair Labor Standard Act collective action onbehalf of all State of Nevada Department of Corrections correctional officers (1,729 officers) under sections 206 and207 of 29 U.S.C. § 201 et seq. for alleged failure to pay for preliminary and postliminary duties leading to pay andovertime violations. It also includes a pendant contract and Nevada Constitution claim for same styled as a classaction. Plaintiffs seek to recover straight time and overtime for up to one hour each day worked for each officer forthe statutory period of two years, plus an additional year and double damages for alleged intentional violation of thefederal law. The contract claim seeks to recover 6 years of damages. The preliminary and postliminary activitiesalleged to be non-compensated include checking in with the shift supervisor, obtaining keys or handcuffs, walkingto the post within the prison, relieving the employee already at the post including exchange of pertinent information,and then the reverse at the end of the shift. The collective class has been conditionally certified, with 2,963 eligiblemembers, and approximately 500 joining the lawsuit. Plaintiffs have not provided any calculation of damages todate. If Plaintiffs are successful in proving all of their claims, the back wages and overtime for three years couldgive rise to a claim of $11.5 Million Dollars, possibly doubled to $23 Million Dollars. This case is currently stayedto explore mediation.
There are a number of other actions affecting the State, but the State estimates that its potential liability forany single action not described above will not exceed $10 million.
[THE BALANCE OF THIS PAGE HAS BEEN INTENTIONALLY LEFT BLANK]

[THIS PAGE HAS BEEN INTENTIONALLY LEFT BLANK]

PART III
INFORMATION CONCERNING THE STATE DEPARTMENT OF TRANSPORTATION, REVENUESPLEDGED TO SECURE THE BONDS AND RELATED MATTERS
Part III of this Official Statement contains information concerning the State Department of Transportation,revenues pledged to secure the Series 2016 Bonds, Parity Securities issued and outstanding, and related information.This Part III supplements the information contained in the other parts of this Official Statement. This OfficialStatement, including the cover, the inside cover pages, Part I and the schedules and appendices thereto, Part II, thisPart III and the appendices hereto, and any financial statements expressly incorporated herein by reference, shouldbe read in its entirety.

[THIS PAGE HAS BEEN INTENTIONALLY LEFT BLANK]

Table of Contents
Page
i
NEVADA DEPARTMENT OF TRANSPORTATION.......................................................................................... III-1
NDOT Responsibilities .................................................................................................................................... III-1NDOT Governance........................................................................................................................................... III-1NDOT Staff ...................................................................................................................................................... III-1
THE STATE HIGHWAY SYSTEM....................................................................................................................... III-2
Overview .......................................................................................................................................................... III-2NDOT-Maintained Roads ................................................................................................................................ III-2
SUPPORT FOR STATE HIGHWAY SYSTEM .................................................................................................... III-5
Federal Aid Highway System........................................................................................................................... III-5Other Improved Roads ..................................................................................................................................... III-6Unimproved Roads........................................................................................................................................... III-6
NDOT PLANNING AND CURRENT PROGRAMS............................................................................................. III-6
Statewide Transportation Planning (Annual Work Program)........................................................................... III-6Statewide Transportation Improvement Program............................................................................................. III-6Pioneer Program ............................................................................................................................................... III-8Project NEON................................................................................................................................................... III-8
OVERVIEW OF FUNDING FOR STATE HIGHWAYS ...................................................................................... III-9
State Highway Fund ......................................................................................................................................... III-9Transportation Funding in General................................................................................................................... III-9Federal Highway Funding in General............................................................................................................... III-9State Transportation Funding in General........................................................................................................ III-10State Make-Up for Reduction in Federal Fuel Tax......................................................................................... III-10
STATE FUNDING................................................................................................................................................ III-10
Fuel Taxes ...................................................................................................................................................... III-10Other Taxes and Fees ..................................................................................................................................... III-12Revenue Source Derived From Counties ....................................................................................................... III-16
FEDERAL TRANSPORTATION FUNDING...................................................................................................... III-17
MAP-21 and the FAST Act ............................................................................................................................ III-17Federal Aid to Pay the Bonds ......................................................................................................................... III-19
REVENUES AND EXPENDITURES OF STATE HIGHWAY ACTIVITIES.................................................... III-20
REVENUES PLEDGED TO SECURE SERIES 2016 BONDS AND PARITY SECURITIES........................... III-21
Gross Pledged Revenues ................................................................................................................................ III-22Direct Distributions and Other Exclusions ..................................................................................................... III-22Highway Improvement Revenue Bonds......................................................................................................... III-22

- ii -
Part III – List of Tables
Table 1 Miles of Improved Roads by County ..................................................................................................III-3Table 2 Vehicle Miles of Travel by County.....................................................................................................III-4Table 3 Truck Miles of Travel .........................................................................................................................III-5Table 4 State Highway System Mileage ..........................................................................................................III-6Table 5 Special Fuel Tax Distribution ...........................................................................................................III-11Table 6 State Gasoline Tax Revenue .............................................................................................................III-12Table 7 Vehicle Registration Rates ................................................................................................................III-14Table 8 Vehicle Permit Fees ..........................................................................................................................III-14Table 9 State Motor Vehicle Fund Taxes, Licenses, and Fees Revenue ........................................................III-15Table 10 State Motor Vehicle Taxes Deposited to State Highway Fund Derived from the Motor
Vehicle Fund .....................................................................................................................................III-15Table 11 Highway Fund Federal-Aid Revenue for Highways by Phase..........................................................III-19Table 12 Highway Fund Federal-Aid Apportionments ....................................................................................III-19Table 13 Total State Highway Revenue...........................................................................................................III-20Table 14 State Highway Expenditures and Disbursements..............................................................................III-21Table 15 NDOT Expenditures by Activity.......................................................................................................III-21Table 16 NDOT Expenditures by Appropriation .............................................................................................III-21
Part III - Appendix A - State of Nevada History of State Highway Fund Revenues, Expendituresand Changes in Fund Balances....................................................................................................... III-A-1
Appendix B - State of Nevada Comprehensive Annual Financial Report for FY 2015 .......... III-B-1

III-1
NEVADA DEPARTMENT OF TRANSPORTATION
NDOT Responsibilities
The Nevada Department of Transportation (“NDOT”) supervises the planning, construction, improvementand maintenance of the State’s highway system. NDOT is responsible for the planning, construction, operation andmaintenance of approximately 5,400 miles of highway and over 1,100 bridges.
NDOT Governance
NDOT is administered by a seven-member Board of Directors (the “State Transportation Board”),consisting of the Governor, the Lieutenant Governor and the State Controller, each of whom serves ex officio, andfour members who are appointed by the Governor. The appointed members serve four-year terms. The Governorserves as Chairman of the State Transportation Board. NDOT is headed by a Director who is appointed by the StateTransportation Board. NDOT currently has an annual operating budget of approximately $800 million and managesapproximately 1,750 employees.
NDOT Staff
The State Transportation Board appoints the Director of NDOT. The Director in turn appoints subordinateofficers and employees of NDOT. Following are the key executives of NDOT:
Rudy Malfabon, P.E. is the Director of NDOT. He has worked for NDOT for more than 27 years. AsDirector, he is responsible for the daily operations of NDOT. Previously, Mr. Malfabon was NDOT’s DeputyDirector for Southern Nevada. Mr. Malfabon is a graduate civil engineer from the University of Nevada, Reno, andis a registered professional engineer in the states of Nevada and Washington.
Bill Hoffman, P.E. is the Deputy Director of NDOT. He is responsible for assisting the Director in thedaily operations of NDOT. Mr. Hoffman began his employment with NDOT in 1991 as an Engineering Technicianin District 2. Since then, he has served in a variety of positions within NDOT, including the roles of Chief of theMaintenance and Operations Division and Assistant Director, Engineering. Mr. Hoffman holds a bachelor’s degreein sports marketing from the University of Wyoming and a bachelor’s degree in civil engineering from theUniversity of Nevada, Reno and is a registered professional engineer in the State.
Tracy Larkin-Thomason is the Deputy Director for Southern Nevada. Ms. Larkin-Thomason has morethan 26 years of transportation experience and has held positions in the areas of planning, operations, maintenanceengineering, traffic engineering, structural design, and roadway civil engineering. As Deputy Director for SouthernNevada, Ms. Larkin-Thomason seeks to improve communication, coordination and customer service with localagency partners, elected officials and the general public. Ms. Larkin-Thomason has a Bachelor of Science degree incivil engineering from the University of Nevada, Reno, and is a licensed civil engineer in the State. She is alsocertified as an ITE Professional Traffic Operations Engineer and a Nevada Certified Public Manager.
David Gaskin, P.E. is Deputy Director of NDOT’s statewide Stormwater Management Program.Mr. Gaskin oversees environmental programs, including policy, regulatory and education efforts to managestormwater involving state roads and transportation facilities in accordance with state and federal laws. He alsoworks closely with other agencies to help preserve clarity and reduce pollution in the stormwater and other waterrunoff from roads and road projects. Mr. Gaskin has more than 22 years of experience managing environmentalprograms at the Nevada Division of Environmental Protection. He also worked to construct and operate large solarpower plants in the Mojave Desert and was an officer in the U.S. Navy. Mr. Gaskin is a registered professionalmechanical engineer and holds a degree in astronautics from the Massachusetts Institute of Technology (MIT).
John Terry, P.E. is the Assistant Director of Engineering/Chief Engineer. He is in charge of NDOT’s pre-construction engineering sections including Project Management, Design, Bridge, Environmental, Location, andRight-of-Way. Mr. Terry supervises six groups within NDOT, representing more than 300 engineering and right-of-way professionals responsible for developing all engineering work necessary in delivering design plans and

III-2
specifications used in the construction of NDOT projects. He worked for NDOT in Carson City in the RoadwayDesign, Structures, Hydraulics, and Traffic Divisions. After 12 years in the private sector, Mr. Terry returned toNDOT in 2002 as a senior project manager and assistant chief project manager. He has a Bachelor of Sciencedegree in civil engineering from Union College and is a registered professional engineer in the State.
Reid Kaiser, P.E. is the NDOT’s Assistant Director of Operations and is responsible for the Construction,Materials, Equipment, Traffic Operations and Maintenance and Asset Management divisions. He is responsible foradministering the construction program, implementing strategies for pavement preservation, keeping the NDOTfleet mobile and managing traffic operations. Mr. Kaiser holds a Bachelor’s degree in Construction EngineeringManagement from Oregon State University and is a registered professional engineer in Nevada and California. Hebegan his career with NDOT as a rotational engineer and has served as Assistant Resident Engineer, ResidentEngineer, Assistant District Engineer, Assistant Chief Construction Engineer and Chief Materials Engineer. Havingworked 25 years in construction and materials at Headquarters and District 2, Mr. Kaiser has constructed over $100million in construction projects, implemented asphalt pavement specifications for NDOT, and served on AASHTO’ssub-committee on Materials.
Sondra Rosenberg, PTP is the Assistant Director of Planning and is responsible for the ProgramDevelopment, Multimodal Planning, Performance Analysis, Research, Roadway Systems, Safety Engineering,Traffic Information and Southern Nevada Planning Divisions within NDOT. Ms. Rosenberg has a Bachelor’s ofScience degree in Physics from the University of Rochester and a Master of Science degree in TransportationTechnology and Policy from the University of California, Davis. She is a certified Professional TransportationPlanner and is active in the Northern Nevada Section of the American Planning Association. Ms. Rosenberg hasworked at NDOT since 2008 and prior to that she was a transportation planner for Fehr & Peers, a consulting firm.As the Federal Programs Manager in NDOT Planning, Sondra managed the 1-15 Mobility Alliance and the 1-11 &Intermountain West Corridor Study. She effectively built coalitions that consisted of neighboring state DOTsMetropolitan Planning Organizations, economic development councils, chambers of commerce, businesses andvarious other stakeholders.
Robert Nellis is the Assistant Director of Administration and is responsible for the Financial Management,Accounting, Administrative Services and Information Services Divisions within NDOT. Mr. Nellis has 20 years ofexperience in private sector real estate development, business management, public land management, and energyprogram management. He has been with the State since 2004 and was head of the State Land Office in the Divisionof State Lands for five years.
THE STATE HIGHWAY SYSTEM
Overview
The State highway system consists of approximately 5,400 centerline miles, which includes the federal-aidhighway system and other improved roads. The federal-aid highway system is more fully described below under theheading “SUPPORT FOR STATE HIGHWAY SYSTEM — Federal Aid Highway System” in this Part III. A well-functioning State highway system is key to the State’s economy, and improvements to the system will be needed tosupport future economic development and diversification efforts. The State’s population increased from 1,201,833residents in 1990 to 1,998,257 residents in 2000 and to 2,724,634 residents in 2010, an increase of approximately66% between 1990 and 2000 and approximately 127% between 1990 and 2010. This growth has resulted insignificantly increased highway usage during that period. The State’s location results in a large proportion ofcommercial truck use, including high usage by trucks having an origin and destination outside the State. NDOTprojects significant growth in both commercial and non-commercial road usage.
NDOT-Maintained Roads
NDOT is responsible for constructing, operating and maintaining approximately 20 percent of all roads(measured in miles) in the State. These roads are referred to herein as the state-maintained system (the “State-Maintained System”). The State-Maintained System carries approximately 49 percent of the total vehicle miles oftravel. The remaining 51 percent of vehicle miles traveled is on systems maintained by county, city or othergovernmental agencies. While the State-Maintained System represents only 20 percent of total road miles, the

III-3
State-Maintained System also carries approximately 70 percent of all truck traffic and 68 percent of the heavy trucktraffic. Vehicle miles of travel on all roads in the State increased from 14 billion in 1995 to 25.4 billion in 2014.
Table 1 illustrates the number of miles of improved roads in the State by county, within and outside theState-Maintained System, based on the most recent data available (2014).
Table 1Miles of Improved Roads by County
__________________
Source: NDOT.
998
2,092
79
1,074
2,745
324
659
2,777
1,192
1,001
906
469
1,286
273
5,552
512
271
410
358
20
213
576
206
248
354
280
344
195
237
717
105
762
341
31
0 1,000 2,000 3,000 4,000 5,000 6,000
W HIT EP IN E
W AS HO E
S T O R EY
P ER S HIN G
N YE
M IN ER AL
L YO N
L IN CO L N
L AN DER
HU M BO L DT
EU R EKA
ES M ER AL DA
EL KO
DO U GL AS
CL A R K
CHU R CHIL L
CAR S O N CIT Y
M IL ES O FIM P R O VED R O A D BY CO U N T Y
N DO T M AIN T AIN ED
L O CAL L Y M AIN T AIN ED

III-4
Table 2 illustrates the number of vehicle miles traveled in the State by county, within and outside the State-Maintained System, based on the most recent data available (2014).
Table 2Vehicle Miles of Travel by County
(million miles traveled)
__________________
Source: NDOT.
41
1,409
28
24
312
11
75
28
27
70
20
18
184
78
10,527
55
171
123
2,129
11
233
431
109
350
99
102
276
116
89
606
350
6,887
249
196
0 2,000 4,000 6,000 8,000 10,000 12,000
W HIT EP IN E
W AS HO E
S T O R EY
P ER S HIN G
N YE
M IN ER AL
L YO N
L IN CO L N
L AN DER
HU M BO L DT
EU R EKA
ES M ER AL DA
EL KO
DO U GL AS
CL A R K
CHU R CHIL L
CAR S O N CIT Y
VEHICL EM IL ES O FT R AVEL BY CO U N T Y(IN M IL L IO N S O FVEHICL EM IL ES T R AVEL ED)
N DO T M AIN T AIN ED
L O CAL L Y M AIN T AIN ED

III-5
Table 3 illustrates the numbers of truck miles traveled in the State.
Table 3Truck Miles of Travel
__________________Source: NDOT.
SUPPORT FOR STATE HIGHWAY SYSTEM
Federal Aid Highway System
The federal-aid highway system is classified as the National Highway System (the “NHS”) routes and theSurface Transportation Program (the “STP”) roads. The NHS within the State consists of all interstate routes, mostprincipal arterials, the defense strategic highway network, and strategic connectors, including 589 miles of interstatehighways (I-15 and I-80) and 1,811 miles of other NHS routes (US 95, US 50, US 395, US 6, US 93, McCarranBoulevard in Reno and Tropicana Avenue in Las Vegas). The STP within the State consists of 2,393 miles of roadsthat are functionally classified as principal arterials, minor arterials, major collectors, and urban collectors. See“FEDERAL TRANSPORTATION FUNDING” in this Part III for a discussion of various programs of federalassistance for highways in general, and “REVENUES AND EXPENDITURES OF STATE HIGHWAYACTIVITIES” in this Part III for amounts of federal assistance for the State Highway Fund.
NDOT is partnering with Arizona Department of Transportation to plan an interstate (Interstate 11) linkbetween Las Vegas and Phoenix, with the potential of extending north to Canada and south to Mexico. NDOT andthe Regional Transportation Commission of Southern Nevada (RTC) are constructing portions of Interstate 11 nearBoulder City known as the Boulder City Bypass. The construction of the Boulder City Bypass is expected to becomplete in 2018. In November of 2013, NDOT was made aware of the potential presence of naturally occurringasbestos in the area of the Boulder City Bypass. In order to reduce exposure to naturally occurring asbestos duringconstruction, specific mitigation measures have been developed to minimize the naturally occurring asbestos frombecoming airborne during construction.
0
500
1,000
1,500
2,000
2,500
2005 2006 2007 2008 2009 2010 2011 2012 2013 2014
Tru
ck
Miles
(In
Millio
ns)
Year
Truck Miles Of Travel
NDOT Maintained Locally Maintained

III-6
Other Improved Roads
There are 604 miles of other improved roads on the State highway system, including local and ruralcollectors, access frontage and state park roads. Other improved roads that are not part of the NHS or STP areclassified mainly as local or rural minor collectors. These roads serve as access roads to the NHS and STP and donot qualify for federal aid but receive support from the State’s gas tax distribution. Responsibility for maintainingthese roads is divided among NDOT, cities and counties.
Unimproved Roads
The balance of the roads in the State is classified as unimproved roads. Unimproved roads are local roadsand are not regularly maintained. Unimproved roads do not qualify for federal aid, are not maintained by NDOT,and are not entitled to receive gas tax receipts to fund costs of their construction, operation or maintenance.
The following table sets forth the aggregate mileage of highways in the State by responsibility for maintaining andeligibility for federal funding.
Table 4State Highway System Mileage
NDOTMaintained
LocallyMaintained
StatewideTotal
Federal AidNHS 2,400 154 2,554STP 2,393 7,936 10,329
Subtotal 4,793 8,090 12,883Non-Federal AidOther Improved 604 14,275 14,879Unimproved 0 15,053 15,053
Subtotal 604 29,328 29,932
Total 5,397 37,418 42,815__________________Source: NDOT.
NDOT PLANNING AND CURRENT PROGRAMS
Statewide Transportation Planning (Annual Work Program)
The Annual Work Program (“AWP”) is a compilation of NDOT’s short range (two to three years) and longrange (four to ten years) elements of various transportation projects and includes projects pursued during each fiscalyear. Pursuant to Nevada Revised Statutes (“NRS”) Section 408.203, the Director of NDOT is required to submit acomprehensive report of highway construction and maintenance projects for the next ten years to the StateLegislative Counsel Bureau, a projects report for the next three years to the Legislative Counsel Bureau in everyeven-numbered year, and a progress report regarding NDOT’s 12-year plan for highway resurfacing to the StateLegislature in every odd-numbered year.
Statewide Transportation Improvement Program
The Statewide Transportation Improvement Program (the “STIP”) consists of capital and non-capitaltransportation projects supported by United States Code Title 23 (Highways) and the Federal Transit Act funding.The STIP is administered by NDOT. Annually, the NDOT develops a STIP, including a four-year list of federallyfunded and regionally significant non-federally funded transportation projects and programs consistent with thegoals and strategies of the statewide transportation plan. Projects in non-attainment areas must conform with theState Implementation Plan prior to being included in a STIP.

III-7
The STIP is developed in cooperation with the State’s Metropolitan Planning Organizations (the “MPO”)and local government agencies. An MPO is designated for each urbanized area with a population of more than50,000. The Regional Transportation Commission (the “RTC”) of Southern Nevada, the RTC of Washoe County,the Carson Area MPO (each designated by the US Census Bureau) and the Tahoe MPO (designated throughCongressional actions) are the State’s MPOs. The STIP also includes all regionally significant transportationprojects in the Transportation Management Areas (the “TMAs”) regardless of funding sources. TMAs are urbanizedareas with a population of more than 200,000 and are certified at least once every three years.
Highway Safety Improvement Program (the “HSIP”)
The HSIP was established in fiscal year 2006 as a core program with separate funding to significantlyreduce traffic fatalities and serious injuries on all public roads. Each year NDOT utilizes a percentage of the FederalSafety Program funding to upgrade and maintain the statewide crash database, develop and implement safetymanagement systems, develop strategic plans, evaluate safety engineering software and receive training in new andeffective methods of traffic safety engineering. Up to $21 million annually is allocated for HSIP programs.
For information regarding the effects of the FAST Act (as defined below) on the HSIP, see “FEDERALTRANSPORTATION FUNDING – MAP-21 and the FAST Act” in this Part III.
State Highway Preservation
The NDOT maintains approximately 5,400 miles of highways, which carry approximately 49 percent of theState’s traffic and 68 percent of the heavy trucks. NDOT’s goal is to continue to maintain the State’s interstatesystem and high volume roads at a high level of serviceability by applying timely overlays and reconstructinginferior segments; continue to maintain the State’s non-interstate principal arterials, minor arterials, and othermoderate volume roads at a modest to high level of serviceability by applying timely overlays and reconstructinginferior segments; and improve low volume roads and maintain them at a limited, but acceptable, level ofserviceability. In Fiscal Year 2015, NDOT spent $116 million on maintenance and preservation.
Interstate Maintenance Program
The Interstate Maintenance Program was initiated to ensure that the Interstate Highway System is maintained on anongoing basis. The purpose of the program is to maintain a reasonably high level of serviceability on the roads,while optimizing available funding and minimizing risks to the traveling public. Unobligated InterstateConstruction authorization balances are used to fund these projects.
Nevada Bridge Program
In 2012, President Obama signed into law the Moving Ahead for Progress in the 21st Century Act (“MAP-21”). MAP-21 eliminated the Federal Highway Bridge Program (HBP) funding category. Without a specificfunding category for bridges, NDOT has targeted $10,000,000 annually in funding for the Nevada Bridge Program.Bridge Inspection operations cost about $2,000,000 annually and MAP-21 requires NDOT to allocate $2.1 millionto replacement and rehabilitation for bridges on locally maintained roads.
On December 4, 2015, President Obama signed into law the Fixing Americas Surface Transportation Act(the “FAST Act”). The FAST Act increases overall funding for the STP, which has been converted to a block grantprogram known as the Surface Transportation Block Grant Program (“STBGP”). While the FAST Act also expandsfunding for bridges off of the NHS, NDOT has not yet determined the impact of the FAST Act on the NevadaBridge Program.
For more information regarding MAP-21 and the FAST Act, see “FEDERAL TRANSPORTATIONFUNDING – MAP-21 and the FAST Act” in this Part III.
III-8
Transportation Enhancement Program
The Transportation Enhancement Program (the “TEP”) was established by Congress as part of theInternational Surface Transportation Efficiency Act of 1991 (“ISTEA”) and was continued under the TransportationEquity Act for the 21st Century Act (“TEA-21”). In 2005, TEP was included in the Safe, Accountable, Flexible,Efficient Transportation Equity Act: A Legacy for Users (“SAFETEA-LU”). MAP-21 created the TransportationAlternatives program encompassing most activities funded under the TEP. The TEP includes projects such aspedestrian and bicycle facilities, landscaping and other scenic beautification, historic preservation, and rehabilitationand operation of historic transportation structures. FAST Act modifications to the TEP include changing how theTEP will be funded from a percentage of annual apportionments to a set annual amount. The FAST Act alsoexpands eligible recipients for funds to include nonprofits responsible for administration of local transportationsafety programs and requires annual reports from state and local planning organizations on the number ofproject applications and awards.
For more information regarding MAP-21 and the FAST Act, see “FEDERAL TRANSPORTATIONFUNDING – MAP-21 and the FAST Act” in this Part III.
Pioneer Program
A modern transportation system is essential to the State’s ability to attract visitors, move people and goods,improve quality of life for its residents, and provide beneficial family-wage jobs. The State is committed tosearching for innovative delivery and funding strategies to keep up with the transportation needs of the State’sexpanded population. In 2011, the State Transportation Board authorized NDOT to explore innovative financingand construction methods to help solve the State’s growing transportation and congestion problems. In response,NDOT created the Pioneer Program to assess and implement public-private partnerships designed to ensure promptdelivery of needed projects and to provide a more efficient transportation system.
Public-private partnerships allow the state to leverage limited public funds and utilize private capital tofinance, design, build, operate, and/or maintain needed transportation improvements that could not otherwise befunded. These partnerships usually include the greater assumption of risk by the private partner, rather thantaxpayers, along with specified responsibilities, performance and quality assurances to the taxpayer. While eachentity shares in the risks and rewards, the involved government partner maintains control and ownership of theproject and sets the standards under which the private partner must build, maintain and possibly operate the facility.
The goals of the Pioneer Program are as follows: (1) keep the State competitive and moving; (2) enhancethe State’s standard of living and economic vitality by increasing mobility for commuters, visitors, transit, andeconomic commerce; (3) reduce congestion on heavily-traveled State transportation corridors; (4) deliver projectsfaster and with greater cost certainty throughout the state, thus promoting rural economies and job-boostingdevelopment; (5) improve safety by unlocking gridlocked roadways; (6) improve air quality by reducing the numberof idling vehicles stuck in traffic; (7) enhance express transit, vanpool, and rideshare opportunities in applicableareas; and (8) generate revenue and leverage limited public funds to potentially fund other needed transportationimprovements in the State.
Project NEON
Project NEON is a significant project in Las Vegas consisting of improving the capacity, operations andsafety of a section of Interstate 15 (I-15) and major street connections from south of the Sahara Avenue/I-15interchange to the I-15/US 95/I-515 interchange known as the Spaghetti Bowl. NDOT began preliminary studies in2003 and received federal environmental approval in late 2010. Preliminary engineering advanced thereafter, withNDOT commencing right-of-way acquisition in 2011.
After evaluation of the procurement alternatives for Project NEON, NDOT has elected to procure ProjectNEON as a Design Build Project to be financed using highway revenue bonds, including the Series 2016 Bonds.The Design Build Contract has been awarded to Kiewit Infrastructure West Co. in the amount of $559,370.303. TheState anticipates issuing approximately $365 million of Additional Parity Securities (not including the Series 2016
III-9
Bonds) through 2018, including approximately $185 million in 2017, to fund, among other projects, Project NEON.The timing and amount of Additional Parity Securities may change.
OVERVIEW OF FUNDING FOR STATE HIGHWAYS
State highways maintained by NDOT are financed with dedicated highway-user revenue and federal funds.No State General Fund (general tax) revenue is normally used. Under the State’s Constitution, the proceeds fromthe imposition of any license or registration fee and other charges with respect to the operation of any motor vehicleupon any public highway in the State and the proceeds from the imposition of any excise tax on gasoline or othervehicle fuel shall, except costs of administration, be used exclusively for the construction, maintenance, and repairof the public highways of the State. The provisions of that section of the State Constitution do not apply to theproceeds of any tax imposed upon motor vehicles by the State Legislature in lieu of an ad valorem tax.
State Highway Fund
The State Highway Fund was created by State law as a special revenue fund to account for the receipt andexpenditure of dedicated highway-user revenues. State law requires that, subject to certain exceptions, the proceedsfrom the imposition of any (1) license or registration fee and other charges with respect to the operation of anymotor vehicle upon any public highway or city, town or county road in the State and (2) excise tax on gasoline orother motor vehicle fuel must be deposited in the State Highway Fund. Amounts in the State Highway Fund mustbe used, except for costs of administering the collection thereof, exclusively for the administration, construction,reconstruction, improvement and maintenance of the highways provided for under State law. Cost of administrationfor the collection of the excise tax on gasoline or other motor vehicle fuel may not exceed 1% of the proceedscollected. Costs of administration for the collection of license or registration fees for motor vehicles may not exceed22% of the proceeds collected. The cap on costs of administration was modified with the passage of Senate Bill 502during the 2015 legislative session. This bill temporarily modifies the cap to 27% during the implementation,upgrade, and maintenance of a new information technology platform used by the Department of Motor Vehicles(“DMV”) through fiscal year 2020. The impact of this change is estimated to be approximately $13 million perfiscal year in terms of revenues available for NDOT use. Amounts received by the State from the federalgovernment for acquiring, constructing, repairing or improving any highway in the State are also deposited in theState Highway Fund.
Transportation Funding in General
Funding for highways within the State is derived from a number of sources, including federal, state andlocal sources. State and federal highway funds are derived from motor vehicle license and registration fees, drivers’license fees, and motor vehicle fuel taxes, which are deposited in the State Highway Fund. NDOT is the majorrecipient of amounts in the State Highway Fund. See Appendix A to this Part III for historical financial informationabout the State Highway Fund. The bonds described in this Official Statement are payable out of Gross PledgedRevenues that are accounted for in the State Highway Fund. See “DESCRIPTION OF THE SERIES 2016BONDS — Security for the Series 2016 Bonds — Gross Pledged Revenues” in Part I of this Official Statement.
Federal Highway Funding in General
A significant amount of funding for State highway purposes is received from the federal government.Federal highway funds are derived from fuel tax and highway-user fees and are allocated by Congress to the statesunder federal transportation statutes enacted from time to time and annual appropriations bills. Federal funds areavailable only for reimbursement of expenditures on approved projects and are normally paid to the State weekly.Federal aid is not available for routine maintenance, administration, or other non-project related costs. To beeligible for federal funds, the State must, among other requirements, pay five to twenty-five percent of the project’scosts. Federal funds received by the State for highway projects are required to be deposited in the State HighwayFund and a portion of such funds are included in Gross Pledged Revenues available to be transferred to the BondFund. See “DESCRIPTION OF THE SERIES 2016 BONDS — Security for the Series 2016 Bonds — GrossPledged Revenues” and “PARITY SECURITIES, GROSS PLEDGED REVENUES AND DEBT SERVICEREQUIREMENTS – Debt Service Requirements” in Part I of this Official Statement.

III-10
Federal funding for State surface transportation programs is currently authorized by the FAST Act, whichprovides authorization for federal funding of the surface transportation programs through September 30, 2020. See“FEDERAL TRANSPORTATION FUNDING — MAP-21 and the FAST Act”. No assurances can be made thatthe level of future federal funding will be maintained at levels of historical federal funding, or that the State will beeligible to receive all of those funds that have been appropriated by Congress and are available for the State. Federalhighway funds that have been allocated to states but have not been obligated by a state, and which are subject tolapse in the current federal fiscal year, are available for redistribution to other states. NDOT has consistentlyobligated all of the Federal Highway Funds that have been allocated to it in each federal fiscal year, and becomeeligible for and received additional federal funds through this reallocation process. See “DESCRIPTION OF THESERIES 2016 BONDS — Security for the Series 2016 Bonds — Gross Pledged Revenues” in Part I of this OfficialStatement.
State Transportation Funding in General
Under State law, the proceeds from the imposition of any license or registration fee and other charges withrespect to the operation of any motor vehicle upon any public highway in the State and the proceeds from theimposition of any excise tax on gasoline or other vehicle fuel shall, except costs of administration, be deposited inthe State Highway Fund and be used exclusively for the construction, maintenance, and repair of the publichighways of the State. For summaries of the various fuel taxes and other fees and charges that are collected anddeposited in the State Highway Fund, see “STATE FUNDING — Fuel Taxes” and “STATE FUNDING — OtherTaxes and Fees” in this Part III.
State Make-Up for Reduction in Federal Fuel Tax
Under current State law, if the tax collected by the federal government relating to motor vehicle fuel isreduced or discontinued in whole or in part, the State’s motor vehicle fuel tax will increase in an amount equal to theamount by which the federal tax is reduced.
STATE FUNDING
Fuel Taxes
The primary source of funds to pay the Parity Securities, including the Series 2016 Bonds, is State excisetaxes on motor vehicle fuel and special fuel (defined as any combustible gas or liquid used for the generation ofpower for the propulsion of motor vehicles) credited or transferred to the State Highway Fund (collectively, the“Fuel Taxes”) pursuant to various State statutes imposing such taxes (the “Fuel Tax Act”). The State Board ofFinance has determined in the Bond Resolution that the net proceeds of the Fuel Taxes are sufficient to pay debtservice on the Series 2016 Bonds.
The State’s Fuel Taxes are imposed pursuant to various sections of State law. A portion of the receiptsfrom the Fuel Taxes are earmarked for NDOT purposes, and certain receipts are earmarked for apportionment to thecounties and for other purposes. The Statewide (State and county mandatory) tax on gasoline is 24.75 cents pergallon (not including the 0.055 cents per gallon tax on imported gasoline). Receipts from these Fuel Taxes areallocated as follows:
(1) 17.65 cents per gallon is deposited to the State Highway Fund for NDOT purposes;
(2) 6.35 cents per gallon is allocated to the counties; and
(3) 0.75 cents is deposited in the Cleaning Up Petroleum Discharges Fund.
In addition to the foregoing, the State imposes a 0.055 cents per gallon inspection fee for importedgasoline, which is deposited in the General Fund.

III-11
The State imposes a diesel fuel tax of 27.0 cents per gallon (not including the 0.75 cents allocated forpetroleum clean-up). Fuel taxes are also imposed on compressed natural gas, liquefied petroleum gas and water-phased hydrocarbon fuel for motor vehicles, but nearly all of the State’s Fuel Tax proceeds are derived from thetaxes on gasoline and diesel fuel. The following table sets forth the tax distribution for diesel fuel and for propanegas and methane gas used as motor fuels.
Table 5Special Fuel Tax Distribution
(Cents per Gallon)
Fuel
StateHighway
FundPetroleumClean-up
Diesel 27.0 0.75Propane 22.0Methane 21.0
__________________Source: NDOT.
State law specifies that additional Fuel Taxes will be imposed to the extent federal taxes on these motorvehicle fuels are reduced or discontinued in whole or in part. See “OVERVIEW OF FUNDING FOR STATEHIGHWAYS — State Make-Up for Reduction in Federal Fuel Tax” in this Part III.
Counties are permitted by State law to impose an additional fuel tax up to a maximum of 9.0 cents pergallon. These amounts are permitted to be indexed for inflation. This discretionary tax has been imposed at the rateof 9.0 cents per gallon by the counties of Carson City, Churchill, Clark, Eureka, Elko, Humboldt, Lander, Lyon,Mineral, Pershing, Washoe and White Pine; and at the rate of 4.0 cents per gallon by the counties of Douglas,Esmeralda, Lincoln, Nye and Storey. The 2015 State Legislature approved AB 191 allowing counties to index fueltax to inflation. In November of 2016, voters in each county, except Washoe, will decide whether to imposeindexing in their county. If approved, NDOT will receive additional revenue to fund highway projects in thecounties where the revenue is generated.
Dealers are required by State law to collect the Fuel Taxes and report and pay at the end of the calendarmonth the tax liability incurred on fuel sales during the preceding calendar month.
The following table sets forth the State fuel tax revenues by source for the fiscal years ending June 30,2011 through 2015.
[THE BALANCE OF THIS PAGE HAS BEEN INTENTIONALLY LEFT BLANK]

III-12
Table 6State Gasoline Tax Revenue
(Administered by the Department of Motor Vehicles)(Millions of Dollars)
FiscalYear
State GasTax (to
HighwayFund)
MandatoryCounty Gas
Tax
OptionalCounty Gas
Tax
CountyIndex on
MotorFuel Tax
Jet FuelTax
PetroleumClean Up
Fees Other(1) Total(2)
2011 $186.2 $66.9 $92.6 $18.1 $11.4 $12.3 $5.0 $392.32012 185.2 66.6 92.0 19.7 11.5 12.7 4.8 392.52013 185.7 66.8 92.5 25.6 15.1 12.7 4.7 403.02014 187.8 67.5 94.0 44.1 14.2 12.9 4.3 424.92015 193.4 69.5 96.6 89.9 14.4 13.0 5.3 482.2
(1) Includes Petroleum Inspection Fees, Aviation Fuel Tax, and other Gasoline Tax distributions.(2) Totals may not add up due to rounding.__________________
Source: NDOT and DMV.
Factors over which the State has no control which might adversely affect Fuel Tax receipts include, but arenot limited to, reduction in supplies of motor vehicle fuels, government restrictions on the sale or use of motorvehicle fuels, voluntary conservation, increased cost, reduced fuel consumption of certain vehicles, utilization ofvehicles not propelled by such fuels (including, but limited to, electric vehicles), restrictions on the use of motorvehicles because of environmental concerns and societal changes regarding car ownership and use.
Other Taxes and Fees
The State Highway Fund receives revenues from a number of other State sources, which are summarizedbelow. These revenues are not included in Gross Pledged Revenues, but are generally available for NDOTpurposes.
Governmental Services Tax
A governmental services tax is imposed on motorists for the privilege of operating any vehicle on thepublic highways of the State. Such tax is imposed in lieu of all taxes based on value and levied for state or localpurpose on such vehicles. The annual amount of the basic governmental services tax throughout the State is 4.0cents on each $1 of valuation of the vehicle as determined by the DMV. An optional supplemental rate of 1% of avehicle’s depreciated assessed valuation is taxed in Clark, Churchill, and White Pine counties.
The distribution of the governmental services tax is dependent on where the taxes are paid or collected. Forvehicles registered at a DMV office, 94% is distributed to local governments and 6% to the State Highway Fund as acollection commission. For vehicles registered at a County Assessor’s office, 99% is distributed to localgovernments and the State Highway Fund receives 1%. Local governments use the funds primarily for schools andcurrent debt service. Supplemental Government Services Tax is an additional fee for vehicles in Clark, Churchilland White Pine counties. The funds are returned to those counties to be used for road construction and othergovernmental functions of such county.
As a result of passage of SB483 by the 2015 State Legislature, the State Highway Fund will be receiving anadditional tax on the registration of vehicles. This tax is expected to bring an additional $30 million into the StateHighway Fund in Fiscal Year 2017 and an additional $61 million per year thereafter.

III-13
Driver’s License Fees
Driver’s licenses issued by the State are renewable every four years. The current rates for obtaining adriver’s license are as follows: $23.50 for operating passenger cars; $18.50 for persons 65 years old or older; $5.50for a motorcycle endorsement; and $108.00 for operating commercial vehicles.
Title Fees
The State charges a one-time title fee of $29.25 for all vehicles (new title).
[THE BALANCE OF THIS PAGE HAS BEEN INTENTIONALLY LEFT BLANK]

III-14
Vehicle Registration
The following table shows the current annual registration rates for vehicles by type and weight.
Table 7Vehicle Registration Rates
Type of Vehicle Registration Cost
Automobiles, RV’s and Motor Homes $33
Motorcycles $39
Travel Trailers $27
Trucks, Truck Tractors, or Buses less than 6,000 lbs. DGVW* $33
Trucks, Truck Tractors, or Buses between 6,000 and 8,499 lbs. DGVW* $38
Trucks, Truck Tractors, or Buses between 8,500 and 10,000 lbs. DGVW* $48
Per 1,000 lbs. for units between 10,001 and 26,000 lbs. DGVW* $12
Per 1,000 lbs. for motor-carrier units between 26,001 and 80,000 lbs. DGVW*(maximum fee is $1,360). Interstate motor-carriers prorate this fee and payonly on the percentage of miles driven in the State.
$17
* Declared Gross Vehicle Weight.
__________________Source: NDOT.
Permit Fees
The following table shows the current annual permit fee for various types of vehicles by weight.
Table 8Vehicle Permit Fees
Vehicle Type/Size of Load Permit Fees
Per 1,000 lbs. exceeding 80,000 lbs. for reducible-load units between 80,000and 129,000 lbs. DGVW* (maximum fee is $2,940)
$60
For overlength vehicles (longer than 70 feet) carrying reducible loads notexceeding 80,000 lbs. DGVW*
$10
For non-reducible loads carried on over legal-size or weight vehicles. $60
* Declared Gross Vehicle Weight.
__________________Source: NDOT.

III-15
Table 9State Motor Vehicle Fund Taxes, Licenses, and Fees Revenue
(Administered by the Department of Motor Vehicles)(Millions of Dollars)
Fiscal Year
State MotorVehicle Taxes(to Highway
Fund)
County TaxesLicenses and
FeesSales Tax
Collections
GeneralFund
AllocationOther
Revenue(1) Total(2)
2011 $232.7 $267.6 $24.1 $61.5 $ 63.5 $649.42012 236.6 261.2 25.3 62.4 75.2 660.62013 238.5 266.8 27.7 63.5 47.7 644.12014 246.0 287.0 29.5 62.3 93.8 718.52015 257.8 314.6 35.4 62.9 106.1 776.8
(1) Other revenue includes special fuel inflation index and DMV fees and commissions.(2) Totals may not add up due to rounding._________________________
Source: NDOT.
Table 10State Motor Vehicle Taxes Deposited to State Highway Fund Derived from the Motor Vehicle Fund
(Millions of Dollars)
Fiscal YearSpecial Fuel
Taxes(1)Motor-Carrier
Fees Registration FeesDriver’s License
Fees Total(2)
2011 $78.5 $37.6 $98.0 $18.6 $232.72012 79.2 38.5 99.8 19.0 236.62013 80.9 36.7 102.1 18.7 238.52014 79.1 39.0 104.7 23.1 246.02015 81.1 40.2 110.3 26.2 257.8
(1) Special fuel includes diesel fuel, propane, natural gas, and water-phased hydrocarbon emulsions.(2) Totals may not add up due to rounding._________________________
Source: NDOT.
Additional Excise Tax
The 2015 State Legislature approved AB 175 imposing an excise tax on the use of a digital network orsoftware application to connect a passenger with a driver. The first $5 million collected each biennium will becredited to the State Highway Fund.
[THE BALANCE OF THIS PAGE HAS BEEN INTENTIONALLY LEFT BLANK]

III-16
Revenue Source Derived From Counties
Prior to the adoption of Assembly Bill 595 (“A.B. 595”) during the 2007 Legislative Session, counties werepermitted to impose, in addition to other permissible property taxes, an ad valorem tax on all taxable property in thecounty at a rate not to exceed 5.0 cents per $100 of the assessed valuation of the county. A.B. 595 requires, withincounties with a population of 100,000 or more, that proceeds of this tax be distributed among the county, cities andtowns based on a specified formula, with a portion of this tax allocated to and deposited in the State Highway Fund.This provides a dedicated source of funding for the State Highway Fund which was not available prior to FY 2009.A.B. 595 allocates the proceeds of the tax among the county, cities and towns and the State Highway Fund asfollows:
Fiscal YearPortion Retained by
County, Cities, and Towns
Portion Deposited inState Highway Fund
for Projects within the County
2009 88% 12%2010 76 242011 64 362012 52 48
2013 andthereafter
40 60
__________________Source: NDOT.
Actual revenues received by the NDOT related to ad valorem tax on property are as follows:
Fiscal Year Washoe Co. Clark Co. Total
2009 $ 885,000 $ 3,882,000 $ 4,767,000
2010 1,745,000 10,090,000 11,835,000
2011 2,368,000 10,953,000 13,321,000
2012 2,888,000 10,651,000 13,539,000
2013 3,424,000 16,057,000 19,481,000
2014 3,632,000 15,379,000 19,011,000
2015 3,693,000 16,449,000 20,142,000
$18,635,000 $83,461,000 $102,096,000_________________________Source: NDOT.
Proceeds of this tax from a county deposited in the State Highway Fund must be used exclusively forprojects within that county, and may not be used to reduce or supplant the amount or percentage of money thatwould otherwise be available from the State Highway Fund for projects in that county. Receipts from this tax arenot included in Gross Pledged Revenues.
[THE BALANCE OF THIS PAGE HAS BEEN INTENTIONALLY LEFT BLANK]

III-17
FEDERAL TRANSPORTATION FUNDING
Fuel taxes and other highway-user revenues collected by the federal government are placed in the FederalHighway Trust Fund. Congress allocates these funds to the states pursuant to provisions in multi-year highwayfunding authorization acts. The State receives approximately $1.00 in federal highway funds (as a combination ofboth apportioned funds and earmarked funds) for every dollar contributed to the Federal Highway Trust Fund. Inrecent years, fuel taxes and other highway user revenues have not been sufficient to provide funding to states atauthorized levels and Congress has appropriated other funds to cover the shortfall.
MAP-21 and the FAST Act
MAP-21
On July 6, 2012, President Obama signed into law the Moving Ahead for Progress in the 21st Century Act(“MAP-21”). At the time of its enactment, MAP-21 was the first long-term highway authorization enacted since2005. MAP-21 established authorization for federal funding of surface transportation programs and allocation ofsuch funding among the states and territories for the federal fiscal years ending September 30, 2013 and 2014.
Funding levels under MAP-21 were generally maintained at FY 2012 levels, with minor adjustments forinflation. MAP-21 also extended the imposition of fuel taxes and other highway-user taxes, generally at the ratesthat were in place when the legislation was enacted, through September 30, 2016.
More information regarding MAP-21 can be found at: http://www.fhwa.dot.gov/map21/summaryinfo.cfm.Information on this website is not incorporated by reference in this Official Statement.
FAST Act
The FAST Act provides $305 billion of transportation funding through September 30, 2020, extends fueltaxes and other highway user taxes through September 30, 2022 and provides additional funding for the HighwayTrust Fund to address shortfalls in the Highway Trust Fund. The FAST Act will provide every state a 5.1 percentincrease in formula funds in Federal Fiscal Year 2016. This is followed by annual increases ranging from 2.1percent in Federal Fiscal Year 2017 to 2.4 percent in Federal Fiscal Year 2020, increases that are anticipated toapproximately offset the effect of projected inflation during such years. The FAST Act allocates $1.9 billion to theState for transportation projects over five years, or roughly $385 million annually. For the five year period, this is a$170 million total increase above prior funding levels to the State.
The FAST Act retains the highway program structure created pursuant to MAP-21 with some majoradditions or changes.
National Highway Performance Program (NHPP)
The FAST Act will add two permissible uses for NHPP funds: to pay subsidy and administrative costs forTransportation Infrastructure Finance and Innovation Act (TIFIA) program projects and for improvements to bridgesthat are not on the NHS.
Surface Transportation
The FAST Act rewrites the list of uses eligible for STP funds and increases the ways that STP funds can beused for local roads and rural minor collectors. The STBGP still requires that a fraction of program funds bedistributed within each state on the basis of population, and the fraction subject to this requirement grows from 50percent in 2015 under the existing STP program to 55 percent in FY 2020 and FY 2021. See “NDOT PLANNINGAND CURRENT PROGRAMS – Statewide Transportation Improvement Program – Nevada Bridge Program” forinformation relating to FAST Act changes to the STP.
III-18
Congestion Mitigation & Air Quality (CMAQ) Program
The CMAQ program provides a flexible funding source to state and local governments for transportationprojects and programs to help meet the requirements of the Clean Air Act. The FAST Act makes only a fewchanges to the CMAQ program: CMAQ funds can be used not only for attainment of ambient air quality standards,but also to maintain standards in an attainment area; the diesel retrofit program is expanded to include port-relatedoff-road equipment and vehicles; and it provides for certain exemptions for low-population-density states. TheCMAQ program receives the same share of formula funds as applied under MAP-21.
Highway Safety Improvement Program (HSIP)
The FAST Act ends the ability of states to shift funds designated for infrastructure safety projects tobehavioral or educational activities, which is supposed to ensure resources remain in construction-related programs.The FAST Act also designates several new safety improvements eligible for funding, including vehicle-to-infrastructure communication and roadway improvements that provide separation between pedestrians and motorvehicles.
Transportation Alternatives
See “NDOT PLANNING AND CURRENT PROGRAMS – Statewide Transportation ImprovementProgram – Transportation Enhancement Program” for information relating to FAST Act changes to theTransportation Alternatives Program.
The FAST Act’s two new initiatives are the National Freight Program, which funds freight-related highwayimprovements, and the Nationally Significant Freight and Highway Projects Program, which funds projects intendedto improve the movement of both freight and people, increase competitiveness, reduce bottlenecks, and improveintermodal connectivity.
More information regarding the FAST Act can be found at: https://www.transportation.gov/fastact.Information on this website is not incorporated by reference in this Official Statement.
[THE BALANCE OF THIS PAGE HAS BEEN INTENTIONALLY LEFT BLANK]

III-19
Table 11Highway Fund Federal-Aid Revenue for Highways by Phase
(Millions of Dollars)
Fiscal YearPlanning and
ResearchRight of
WayPreliminaryEngineering
Constructionand
ConstructionEngineering
Transit andRail
MiscellaneousFederalFunding
TotalFederal Aid
forHighways
2011 $ 8.4 $14.1 $21.1 $322.1 $ 8.0 $0.5 $374.22012 9.2 18.7 34.1 393.7 10.7 0.1 466.72013 12.8 29.4 19.2 281.3 8.1 0.0 350.82014 14.2 32.6 21.1 256.8 5.9 0.1 330.82015 10.3 59.6 17.0 214.4 7.4 0.0 308.7
Note: Federal-Aid revenue is received on a reimbursement basis and typically is from prior year apportionments. Consequently, the Federal-aid revenue shown will not match the Federal-aid apportionments, shown in Table 12, in a given year. Totals may not add up due torounding.
_________________________
Source: NDOT.
Table 12Highway Fund Federal-Aid Apportionments
(Millions of Dollars)
Under SAFETEA-LU
FiscalYear
InterstateMaintenance
NationalHighwaySystem
Congestion/Air Quality
SurfaceTransportation
Program Other(1) ARRA Total(2)
2009 $50.0 $72.9 $18.3 $ 47.6 $96.8 $201.0 $486.6
2010 77.1 84.3 35.8 111.2 84.0 392.4
2011 82.2 93.6 28.4 82.5 43.2 329.9
2012 79.8 88.6 32.8 82.1 46.8 330.2
Under MAP-21(3)
Fiscal Year
NationalHighway
PerformanceProgram
Congestion/Air Quality
SurfaceTransportation
Program Other(1) Total(2)
2013 $182.0 $31.3 $86.4 $44.4 $344.0
2014 187.2 41.4 88.7 37.7 355.0
2015 187.2 42.6 88.7 44.5 363.0
(1) Other includes Planning, Bridge Replacement, Advance Right of Way, High Priority, Forest Highway Funds, and EarmarkedFunds, if any.
(2) Totals may not add up due to rounding.(3) MAP-21 reallocated/combined program funds, therefore, cannot be compared to SAFETEA-LU programs. Amounts include a
0.2% across-the-board rescission.__________________
Source: NDOT.
Federal Aid to Pay the Bonds
Federal law pertaining to highway systems (23 United States Code Annotated Section 122) permits theUnited States Secretary of Transportation to reimburse the State for the retirement of a portion of the principal of,

III-20
interest on, costs of issuance, costs of insurance and any other costs incidental to the sale of the Series 2016 Bonds ifbond proceeds are used for an “eligible project.” Reimbursement for the Series 2016 Bonds may be sought by theState from the federal government to the extent the Series 2016 Bond proceeds are used for an eligible project. Anyfunds received as reimbursement will be Gross Pledged Revenues and credited to the State Highway Fund and, ifnecessary, transferred to the Bond Fund and applied as described under the heading “DESCRIPTION OF THESERIES 2016 BONDS — Security for the Series 2016 Bonds — Priority of Application of Gross PledgedRevenues” in Part I of this Official Statement. No assurance can be given that federal reimbursement will occurbecause reimbursement is dependent upon both the appropriation of funds by Congress and the completion of theeligible project in accordance with federal requirements. Information about federal aid included in Gross PledgedRevenues in the last five fiscal years is included under the heading “PARITY SECURITIES, GROSS PLEDGEDREVENUES AND DEBT SERVICE REQUIREMENTS – Existing Parity Securities” in Part I of this OfficialStatement.
Federal law provides that the eligibility of the Series 2016 Bonds for reimbursement shall not constitute acommitment, guarantee or obligation on the part of the United States to provide for payment of debt service on theSeries 2016 Bonds or create any right of a bondholder or other third party against the United States for payment ofthe Series 2016 Bonds.
REVENUES AND EXPENDITURES OF STATE HIGHWAY ACTIVITIES
The following tables set forth revenues of and expenditures from the State Highway activities.
Table 13Total State Highway Revenue(1)
(Administered by NDOT)(Millions of Dollars)
Fiscal YearFederal-AidRevenue(2)
State Gasand Motor
Vehicle Revenue Other Sources(3) Bond Proceeds Total(4)
2011 $374.2 $418.8 $291.2 -- $1,084.22012 466.7 421.7 150.7 -- 1,039.12013 350.8 424.1 134.1 -- 909.02014 330.8 433.8 119.9 100.0 984.52015 308.7 451.1 101.3 -- 861.2
(1) Total revenue is net of collection costs of the Highway Fund.(2) The Federal-Aid Revenue shown includes monies for highways, transit, aviation, and other programs.(3) “Other Sources” includes interest income, cooperative construction reimbursement, DMV and Department of Public Safety authorized
revenue, A.B. 595 revenue, and miscellaneous sales and reimbursements.(4) Totals may not add up due to rounding.__________________Source: NDOT.

III-21
Table 14State Highway Expenditures and Disbursements
(Millions of Dollars)
FiscalYear
Transfersto otherAgencies
DMVExpenditures
DPS(1)
Expenditures
BondPrincipal and
InterestNDOT
Expenditures Total2011 $4.4 $90.2 $77.0 $84.2 $807.2 $1,063.12012 4.3 89.7 76.1 80.5 924.8 1,175.42013 4.2 85.5 76.5 79.8 661.0 906.92014 5.4 90.9 78.7 70.1 533.3 778.42015 8.3 90.4 74.9 67.8 628.9 870.3
(1) DPS stands for Department of Public Safety (includes Nevada Highway Patrol). Totals may not add up due to rounding.__________________
Source: NDOT.
Table 15NDOT Expenditures by Activity
(Millions of Dollars)
FiscalYear
Administrativeand
Support Services
Maintenanceand
EquipmentConstruction
and EngineeringTotal NDOT
Expenditures*
2011 $44.2 $111.7 $651.4 $807.22012 43.8 132.9 748.1 924.82013 40.5 113.8 506.7 661.02014 50.7 115.0 367.5 533.32015 47.5 109.2 472.2 628.9
* Totals may not add up due to rounding.__________________Source: NDOT.
Table 16NDOT Expenditures by Appropriation
(Millions of Dollars)
FiscalYear Salaries Travel Operating Equipment
CapitalImprovements Total*
2011 $125.8 $2.1 $59.8 $3.2 $616.3 $807.22012 120.4 2.2 61.9 3.7 736.7 924.82013 123.8 1.9 60.8 4.9 469.7 661.02014 123.3 1.9 61.0 4.6 342.5 533.32015 119.2 1.8 59.9 6.5 441.4 628.9
* Totals may not add up due to rounding.__________________Source: NDOT.
REVENUES PLEDGED TO SECURE SERIES 2016 BONDS AND PARITY SECURITIES
The State Constitution (Article 9, Section 5) provides that the proceeds from the imposition of any excisetax on gasoline or other motor vehicle fuel shall, except costs of administration, be used exclusively for theconstruction, maintenance, and repair of the public highways of the State. The State has determined that the use ofFuel Taxes to pay the Parity Securities is permitted by this provision.

III-22
The foregoing constitutional provision further provides that, excluding administrative costs, revenuesreceived from taxes levied on any gasoline or other vehicle fuel, license or registration fee shall be used exclusivelyfor the construction of, maintenance, and repair of the public highways of the State. Accordingly, the majority ofthe State Highway Fund, which derives its funds from Article 9, Section 5 numerated sources, finances the activitiesof NDOT. However, the DMV and the Department of Public Safety are also partially funded by appropriationsfrom the State Highway Fund. Other appropriations or transfers from the Highway Fund for administrative servicesprovided to NDOT include the Department of Administration, the Attorney General’s Office, the Public WorksBoard, and the Transportation Services Authority.
The Bond Resolution provides that State laws concerning the Fuel Taxes or the Gross Pledged Revenuesmay not be repealed or amended or otherwise directly or indirectly modified in such manner as to impair adverselythe Series 2016 Bonds or any other Outstanding State securities until all such securities have been discharged in fullor provision for their payment and redemption has been fully made.
Gross Pledged Revenues
The Bond Resolution provides that the Series 2016 Bonds shall be payable from any federal aid eligible forthe payment of the principal of and interest on the Series 2016 Bonds and from the proceeds of the motor vehiclefuel taxes imposed and collected pursuant to the Fuel Tax Act and credited to the State Highway Fund for thepayment of principal of and interest on the Series 2016 Bonds (the “Gross Pledged Revenues”). Gross PledgedRevenues includes the fuel taxes and special fuel taxes described under the headings “STATE FUNDING — FuelTaxes”, “STATE FUNDING — Other Taxes and Fees” and a portion of the federal aid discussed under “FEDERALTRANSPORTATION FUNDING — Federal Aid to Pay the Bonds” in this Part III. Historic amounts of federal aideligible for debt service are included under “PARITY SECURITIES, GROSS PLEDGED REVENUES AND DEBTSERVICE REQUIREMENTS – Debt Service Requirements” in Part I. Gross Pledged Revenues does not includethe Direct Distributions and Other Exclusions described below.
Direct Distributions and Other Exclusions
The Bond Resolution excludes from Gross Pledged Revenues certain fuel tax proceeds not collectedbecause of exempt sales and other exempt transactions; any tax proceeds not collected because of the dealers’collection and handling fee; tax proceeds for making refunds; motor vehicle fuel tax proceeds paid on fuel used inwatercraft for recreational purposes; tax proceeds imposed and collected and required to be distributed to thecounties in the State; tax proceeds derived from motor vehicle fuel used in aircraft; and fuel taxes in an amountrequired to pay the costs of administration for the collection of any excise tax on gasoline or other motor vehiclefuel, subject to the limitation of not exceeding 1% of the total proceeds so collected (such exclusions being hereinthe “Direct Distributions and Other Exclusions”).
Highway Improvement Revenue Bonds
Pursuant to NRS 408.273 (the “Project Act”); chapter 365 and chapter 366 of the NRS (collectively, the“Fuel Tax Act”) and the Bond Resolution adopted by State Board of Finance, the State, acting by and through theState Board of Finance, is authorized to issue highway improvement revenue bonds known as “HighwayImprovement Revenue Bonds.” As such, pursuant to the Project Act and the request submitted by the StateTransportation Board, the State Board of Finance is authorized to issue revenue bonds to provide funds to pay forthe cost of construction, maintenance and repair of public highways of the State. The State has issued $606 millionin bonds since 2006 primarily for the construction of six “Super Projects”: US-95 widening in Las Vegas,I-515/Beltway Interchange in Henderson, Hoover Dam Bypass, I-580 Reno to Carson Freeway, Carson CityFreeway, and Project NEON. Currently, the State has approximately $441 million of highway revenue bonds(referred to herein as Existing Parity Securities) outstanding. The State anticipates issuing approximately $365million of Additional Parity Securities (not including the Series 2016 Bonds) through 2018, including approximately$185 million in 2017. The timing and amount of Additional Parity Securities may change. See “DESCRIPTIONOF THE SERIES 2016 BONDS – Security for the Series 2016 Bonds – Existing Parity Securities” and “—Additional Parity Securities” and “PARITY SECURITIES, GROSS PLEDGED REVENUES AND DEBTSERVICE REQUIREMENTS – Existing Parity Securities.”

[THIS PAGE HAS BEEN INTENTIONALLY LEFT BLANK]

III-A-1
APPENDIX A
State of NevadaHistory of State Highway Fund Revenues,
Expenditures and Changes in Fund Balances(000’s omitted)
2011 2012 2013 2014 2015
Revenues:
Intergovernmental $564,571 $527,123 $375,228 $337,794 $315,819
Other taxes (1) 218,898 197,412 206,233 237,925 227,372
Licenses, fees and permits 171,406 181,307 183,328 194,200 206,476
Sales and charges for services 13,184 13,934 13,860 15,446 15,891
Interest and investment income 854 3,034 650 (1,975) 3,208
Other 13,074 21,911 33,618 16,364 14,497
Total revenues 981,987 944,721 812,917 799,754 783,263
Expenditures:
Current:
General government - - -
Law, justice and public safety 151,334 151,312 149,803 159,597 158,936
Transportation 751,647 846,335 578,231 452,820 635,049
Intergovernmental 58,721 80,450 87,244 78,361
Debt Service: (2)
Principal 104 53 - -
Interest 7 2 2 2
Total expenditures 961,813 1,078,152 815,280 690,780 793,985
Excess (deficiency) of revenues overexpenditures
20,174 (133,431) (2,363) 108,974 (10,722)
Other Financing Sources (Uses):
Proceeds from sale of bonds - - - 100,019
Proceeds from sale of capital assets - - - 61 61
Operating transfers in 6,473 6,470 4,806 3972 3,809
Operating transfers out (9,066) (7,161) (7,494) (8,276) (12,974)
Total other financing sources (uses) (2,593) (691) (2,688) 95,776 (9,104)
Excess deficiency of revenues and otherfinancing sources over expendituresand other financing uses
17,581 (134,122) (5,051) 204,750 (19,826)
Fund balances, July 1 270,599 288,180 154,058 149,007 353,757
Fund balances, June 30 $288,180 $154,058 $149,007 $353,757 $333,931
__________________(1) This line item includes the Fuel Taxes reported in the table under “STATE FUNDING - Fuel Taxes” in this Part III.(2) This does not refer to debt service on the Parity Securities, but to debt service payments on other Highway Fund obligations.__________________
Source: NDOT.

III-B-1
APPENDIX B
State of NevadaComprehensive Annual Financial Report for FY 2015

Comprehensive
Annual
Financial
Report
for the Fiscal YearEnded June 30, 2015
Ron Knecht, MS, JD, PE(CA)State Controller
State of Nevada


Ron Knecht, MS, JD & PE(CA)
State ControllerRon Knecht, an economist, financial and policy analyst, Professional Mechanical Engineer (registered in California), and law-school graduate, became Controller January 5, 2015. As Controller, he also serves on Nevada’s Board of Finance, Executive Branch Audit Committee and Department of Transportation Board of Directors.
Before being elected Controller, he divided 44 working years between public service and entrepreneurial small business, all in managerial and senior professional positions. He’s been a founder, executive or director for 12 firms, charities, community-service and public-interest groups.
In previous jobs, he testified extensively as an expert witness. In 2012-14, 1986-2001 and 1976-78, he was a consultant and business executive. In 2001-12, he was a senior economist at Nevada’s Public Utilities Commission. He held principal economics, finance, technology and policy positions in 1978-86 at California’s Energy and Public Utilities Commissions.
In 2009-13 he co-taught about ten two-day seminars for SNL Financial on utility finance, cost of capital, and economic and policy issues for regulators, professionals, managers, executives and securities analysts. In 1973-77, he was a Research Associate and Research Engineer at the University of Illinois. In 1972-73 he was Assistant City Engineer in Urbana, Illinois.
Ron was elected to the Board of Regents of the Nevada System of Higher Education in 2006 and re-elected in 2012. For two years, he chaired the Budget & Finance Committee and was Vice-chair another year; he chaired the Audit Committee for two years; and for seven years he was very active on the Investment and Major Projects Committee, which oversees $1-billion of endowment and operating funds. He served on four other committees and on institutional presidential selection and performance-review committees, chairing two of them. Ron was elected to the Nevada Assembly for 2002-04, representing Carson City and Washoe City.
With some scholarship support, he worked his way through undergraduate and early graduate studies at the University of Illinois (BA, Liberal Arts & Sciences; mathematics major; physics & chemistry minor; 1971). Spending most of his working career in San Francisco and Silicon Valley, he paid his way at Stanford University (MS, Engineering Economic Systems; 1989) and the University of San Francisco (JD; 1995) by working full time. He’s been a columnist for various print and on-line papers, and has taught part-time at two colleges.
The most important things in Ron’s life are his wife, Kathy, their teenage daughter Karyn, and Ron and Kathy’s mothers and families. Raised in a small Midwestern town, he’s always been active in a wide range of athletics and outdoor activities -- a competitive distance runner in high school and college. He enjoys ballet, modern dance, symphony, opera, rock & roll, country & western, theater and film, and he collects baseball cards and pursues other hobbies.

2
6
18 20
22 25 26
29 30 33 34
36 37
3839
41
88 91 92
94
98 99
100104
108110
i x xi xii
Independent Auditor’s Report.........................................................................................................................................................Management’s Discussion and Analysis..........................................................................................................................................
Basic Financial Statements Government-Wide Financial Statements Statement of Net Position................................................................................................................................................... Statement of Activities........................................................................................................................................................ Fund Financial Statements Balance Sheet - Governmental Funds............................................................................................................................. Reconciliation of the Governmental Funds Balance Sheet to the Statement of Net Position.......................... Statement of Revenues, Expenditures and Changes in Fund Balances - Governmental Funds......................... Reconciliation of Revenues, Expenditures and Changes in Fund Balances of Governmental Funds to the Statement of Activities.................................................................................................................................................. Statement of Net Position - Proprietary Funds............................................................................................................ Statement of Revenues, Expenses and Changes in Fund Net Position - Proprietary Funds............................... Statement of Cash Flows - Proprietary Funds............................................................................................................... Statement of Fiduciary Net Position - Fiduciary Funds............................................................................................... Statement of Changes in Fiduciary Net Position - Fiduciary Funds.......................................................................... Combining Statement of Net Position - Discretely Presented Component Units................................................ Combining Statement of Activities - Discretely Presented Component Units...................................................... Notes to the Financial Statements.............................................................................................................................................
Required Supplementary Information Budgetary Comparison Schedule - General Fund and Major Special Revenue Funds........................................... Notes to Required Supplementary Information - Budgetary Reporting.................................................................. Pension Plan Information.................................................................................................................................................... Schedule of Infrastructure Condition and Maintenance Data.................................................................................... Combining Statements and Schedules Nonmajor Governmental Funds Combining Balance Sheet................................................................................................................................................... Combining Statement of Revenues, Expenditures and Changes in Fund Balances............................................... Nonmajor Special Revenue Funds Combining Balance Sheet.............................................................................................................................................. Combining Statement of Revenues, Expenditures and Changes in Fund Balances.......................................... Other Nonmajor Governmental Funds Combining Balance Sheet............................................................................................................................................... Combining Statement of Revenues, Expenditures and Changes in Fund Balances...........................................
Letter of Transmittal................................................................................................................................................................. Constitutional Officers............................................................................................................................................................. Organizational Chart................................................................................................................................................................. GFOA Certificate of Achievement.........................................................................................................................................
Table of Contents
NEVADA
Introductory Section
Financial Section

Table 1 - Net Position by Component.............................................................................................................................................Table 2 - Changes in Net Position........................................................................................................................................................Table 3 - Fund Balances of Governmental Funds...........................................................................................................................Table 4 - Changes in Fund Balances of Governmental Funds........................................................................................................Table 5 - Taxable Sales by County......................................................................................................................................................Table 6 - Principal Sales Tax Payers by Business Type.....................................................................................................................Table 7 - Ratios of Outstanding Debt by Type..................................................................................................................................Table 8 - Ratios of General Bonded Debt Outstanding..................................................................................................................Table 9 - Legal Debt Margin Information.....................................................................................................................................................Table 10 - Pledged Revenue Coverage................................................................................................................................................Table 11 - Demographic and Economic Statistics.............................................................................................................................Table 12 - Principal Employers.............................................................................................................................................................Table 13 - School Enrollment...............................................................................................................................................................Table 14 - Full-time Equivalent State Government Employees by Function.................................................................................Table 15 - Operating Indicators by Function........................................................................................................................................Table 16 - Capital Asset Statistics by Function....................................................................................................................................
Schedule of Total Uses - Budget and Actual, Non-GAAP Budgetary Basis - All General Fund Budgets...................
Schedule of Total Uses - Budget and Actual, Non-GAAP Budgetary Basis - All Special Revenue Fund Budgets... Schedule of Sources - Budget and Actual, Non-GAAP Budgetary Basis - All Nonmajor Special Revenue Fund Budgets... Nonmajor Enterprise Funds Combining Statement of Net Position.................................................................................................................................... Combining Statement of Revenues, Expenses and Changes in Fund Net Position...................................................... Combining Statement of Cash Flows...................................................................................................................................... Internal Service Funds Combining Statement of Net Position.................................................................................................................................... Combining Statement of Revenues, Expenses and Changes in Fund Net Position....................................................... Combining Statement of Cash Flows...................................................................................................................................... Fiduciary Funds Combining Statement of Fiduciary Net Position–Pension and Other Employee Benefit Trust, Investment Trust and Private–Purpose Trust Funds................................................................................................................................... Combining Statement of Changes in Fiduciary Net Position–Pension and Other Employee Benefit Trust, Investment Trust and Private–Purpose Trust Funds......................................................................................................................... Combining Statement of Fiduciary Assets and Liabilites–Agency Funds........................................................................ Combining Statement of Changes in Assets and Liabilities - Agency Funds...................................................................
Compliance Section
Statistical Section
Financial Section (continued) 112 121 124
128 130 132
136 138 140
144 146 148 150
Independent Auditor’s Report on Internal Control over Financial Reporting and on Compliance and Other Matters...
154 154 156 156 158 158 159 160 161 162 163 164 165 165 166 168
170
NEVADA

i
RON KNECHT, MS, JD, PE(CA)
State Controller
JAMES W. SMACK Chief Deputy Controller
GEOFFREY LAWRENCE
Assistant Controller
STATE OF NEVADA
OFFICE OF THE STATE CONTROLLER
Grant Sawyer State Office Building 555 E. Washington Avenue, Suite 4300
Las Vegas, Nevada 89101-1071 (702) 486-3895
Fax (702) 486-3896
State Capitol 101 N. Carson Street, Suite 5 Carson City, NV 89701-4786
(775) 684-5750 Fax (775) 684-5696 www.controller.nv.gov
December 21, 2015 To the Citizens, Governor and Legislators of the State of Nevada: In accordance with Nevada Revised Statutes (NRS) 227.110 and the State Accounting Procedures Law (NRS 353.291 through 353.3245), I am pleased to present the State of Nevada Comprehensive Annual Financial Report (CAFR) for the fiscal year ended June 30, 2015. The objective of this Report is to provide a clear picture of the government as a single, unified entity, in addition to traditional fund-based financial statements.
Introduction to the Report Responsibility: The Controller’s Office prepares the State of Nevada CAFR and is responsible for the accuracy, completeness, and fairness of the presentation, including disclosures. To the best of our knowledge and belief, the information contained in the State of Nevada CAFR is accurate in all material respects and is reported in a manner that fairly presents the financial position and results of operations of the State’s primary government and the component units for which it is financially accountable. Additionally, this report includes all disclosures necessary to enable the reader to gain a reasonable understanding of Nevada’s financial activities. U.S. Generally Accepted Accounting Principles: As required by State Accounting Procedures Law, this report has been prepared in accordance with U.S. generally accepted accounting principles (GAAP), applicable to State and Local Governments as established by the Governmental Accounting Standards Board (GASB). The State also voluntarily follows the recommendations of the Government Finance Officers Association (GFOA) for the contents of government financial reports and participates in the GFOA’s review program for the Certificate of Achievement for Excellence in Financial Reporting. Internal Control Structure: The State of Nevada has established a comprehensive internal control framework designed to both safeguard the government’s assets against loss from unauthorized use or theft, and to properly record and adequately document transactions. As a result, the transactions can be compiled into the presentation of the State’s financial statements in conformity with U.S. GAAP. Since the cost of internal controls should not outweigh their benefits, the State’s comprehensive framework of internal controls has been designed to provide reasonable, rather than absolute, assurance that the financial statements will be free from material misstatement. Many of our essential control features are decentralized. Hence, the State relies upon the controls in place within its various departments and agencies. NRS 353A.025 requires the heads of agencies to review their internal controls on a periodic basis to determine if the agency is in compliance with the Uniform System of Internal Accounting and Administrative Controls adopted pursuant to NRS 353A.020. On or prior to July 1 of even-numbered years, agencies are required to report the status of their internal controls to the Department of Administration. Independent Auditors: The independent accounting firm of Eide Bailly LLP has audited the accompanying financial statements in accordance with generally accepted governmental auditing standards. Their opinion appears in the Financial Section of this publication. The goal of the independent audit is to provide reasonable assurance that the financial statements of the State of Nevada are free of material misstatement. We received an unqualified

ii
opinion on the basic financial statements for this fiscal year. The independent audit of the financial statements of the State of Nevada is part of a broader, federally mandated Single Audit designed to meet the special needs of federal grantor agencies. The standards governing Single Audit engagements require the independent auditor to report not only on the fair presentation of the financial statements, but also on the audited government’s internal controls and compliance with legal requirements, with special emphasis on internal controls and legal requirements involving the financial statements. This report can be found in the Compliance Section of the CAFR, and in the State of Nevada’s separately issued Single Audit Report. Management’s Discussion and Analysis: U.S. generally accepted accounting principles require management to provide a narrative introduction, overview and analysis to accompany the basic financial statements in the form of Management’s Discussion and Analysis (MD&A). This letter of transmittal is designed to complement the MD&A and should be read in conjunction with it.
Profile of Government
Background: The Nevada Territory was carved out of the Utah Territory by Congress in 1861 and its boundaries were subsequently expanded eastward in 1862 and eastward and southward in 1866. In 1864, Nevada was granted statehood after transmitting its newly ratified constitution to Congress in the longest and costliest transmission by telegraph in history. This allowed statehood to be conferred on October 31, just days ahead of the November 8 presidential election at a time President Lincoln thought he might need Nevada's electoral votes to secure reelection. The Great Basin Desert dominates the Nevada landscape, with the Sierra Nevada Mountains to the west and the Rocky Mountains to the east. Federal agencies own and control more than 80 percent of Nevada’s 70,264,320 acres, meaning most of Nevada's land area is restricted from use and development by private citizens. Local governments are also unable to collect property taxes on these lands to sustain vital public services, although they do receive less valuable Payments in Lieu of Taxes from the federal government. Due greatly to the shortage of land available for citizens, more than 90% of our 2.8 million residents are squeezed into one of two distinct population centers: the Reno/Sparks/Carson City area near Lake Tahoe and Clark County at the southeast tip, separated by 450 miles. Nevadans enjoy the absence of a personal income tax but labor under a variety of indirect taxes that are assessed on businesses and thus passed onto consumers in the form of higher prices and to workers in the form of suppressed wage and employment growth. Nevada has offered a continuous legal market for gaming since 1935, allowing that industry to thrive in the state while also financing a significant share of public services. The State operates under a constitution that provides for a full range of services, including education, health and social services, highway maintenance and construction, law enforcement, public safety, business regulation, and resource development. Reporting Entity: The State of Nevada, as described in Note 1 to the basic financial statements, is the reporting entity for this CAFR, which conforms to the requirements of GASB Statement No. 14 as amended by GASB Statement No. 61. The accounting and reporting principles reflected in these statements are based primarily upon the fundamental concept that publicly elected officials are accountable to their constituents, and that financial statements should emphasize primary government and permit financial statement users to distinguish between the state and its component units. The primary government includes the Public Employees’, Legislators’ and Judicial Retirement Systems, and the Nevada Real Property Corporation. The State Legislature sets statutorily the parameters within which these entities operate. The Nevada System of Higher Education, Colorado River Commission, and Nevada Capital Investment Corporation are shown separately as legally separate component units.
Financial Information Debt Management: The State Constitution limits the aggregate principal amount of the general obligation debt to two percent of the total reported assessed property value of the State. Additional disclosures regarding the State’s long-term obligations are provided in the notes to the basic financial statements.

iii
Long-Term Financial Planning and Financial Policies: State law (NRS 353.205) requires a balanced budget. The Governor must submit a proposed budget for the Executive Branch to the State Legislature before each regular session, which convenes every odd-numbered year. Spending levels under this Executive Budget proposal may not exceed the amounts that existed during the biennial budget period that began July 1, 1975, adjusted for population growth and inflation. However, the Legislature enacts the budget through passage of the General Appropriations Act and the Authorized Expenditures Act and the legislatively approved budget is not constrained by this growth limitation. Once passed and signed, the budget becomes the State’s financial plan for the next two fiscal years. In accordance with State statute, The Economic Forum, comprised of private economic and financial experts appointed by the Legislature and the Governor, sets the General Fund revenue forecasts which are binding on the budget. If revenues fall below those originally anticipated during the course of the fiscal year, the Governor must revise the budget to ensure that State appropriations do not exceed revenues. If the revisions exceed thresholds specified in NRS 353.220, they must be submitted to the Legislative Interim Finance Committee for approval.
Economic Outlook
Economic outlook discussions in reports like this one are typically based on business-cycle analyses. That approach is based on assuming there are no salient long-term developments -- or “secular trends” -- to disrupt the cyclical outlook. As we show, important secular trends have been developing over decades and have already wrought profound changes in the U.S. and Nevada economies -- and substantially changed the outlook. We discuss trends in four areas, followed by a synthesis of these trends for the long-term U.S. economic outlook, concluding with Nevada-specific considerations. More outlook discussion is posted on the Controller’s web site, controller.nv.gov. Below, we show first that the size, scope and reach of government have long been excessive relative to our economy, yet still growing; that has resulted in an increasingly substantial drag on economic growth. For decades this burden was offset by three growth-inducing factors: 1) demographic and labor-force participation trends; 2) increasing debt levels; and 3) rapid growth in emerging economies, plus globalization (increasing trade and foreign domestic investment). Unfortunately, trends in all three areas have reversed. So, for the foreseeable future, economic growth will be suppressed perhaps even from current 2% real annual rates (or 1% per person per year). Government Overreach: The size, scope and reach of American government – including spending, taxing, borrowing, regulation, monetary and credit-allocation policy, and other intervention – long ago exceeded levels that promote the public interest in maximum economic growth and fairness. These excesses at federal, state and local levels have increasingly slowed growth and will continue to do so unless they are reined in. Economists now understand that economic growth and thus aggregate human wellbeing levels are determined more by the economic, political and social institutions, practices and policies of a society than by geographic, infrastructure, resources and other earlier development-theory factors. The rule of law, limited government with separation of powers, personal liberty and individual rights, strong property rights and high levels of economic freedom are essential for growth. As detailed on the Controller’s web site, empirical literature – research based on real economic data – supports and quantifies theory suggesting that there’s an optimal range of government spending that maximizes economic growth. There are classically defined public goods that are most efficiently provided by government and there are market failures that justify regulation and other intervention, but excess spending, scope and reach of the public sector diverts efficient private investment and consumption, and it is a drag on growth. While there are uncertainties and debate about the levels of public spending relative to the economy that maximize growth, the best evidence shows that the U.S. passed those levels by the 1960s and has increased government excess to the present time. The chart below of public spending over time as a percentage of the U.S. economy vividly illustrates this point. The excess growth has not been limited to the federal government; state and local spending have grown even faster in relative terms. Nevada’s local-government and total public-sector spending have grown particularly fast. Nationally, increasing government intervention in health care has driven up its cost and its share of the economy relative to optimal levels and has thereby contributed to slowing of economic growth.
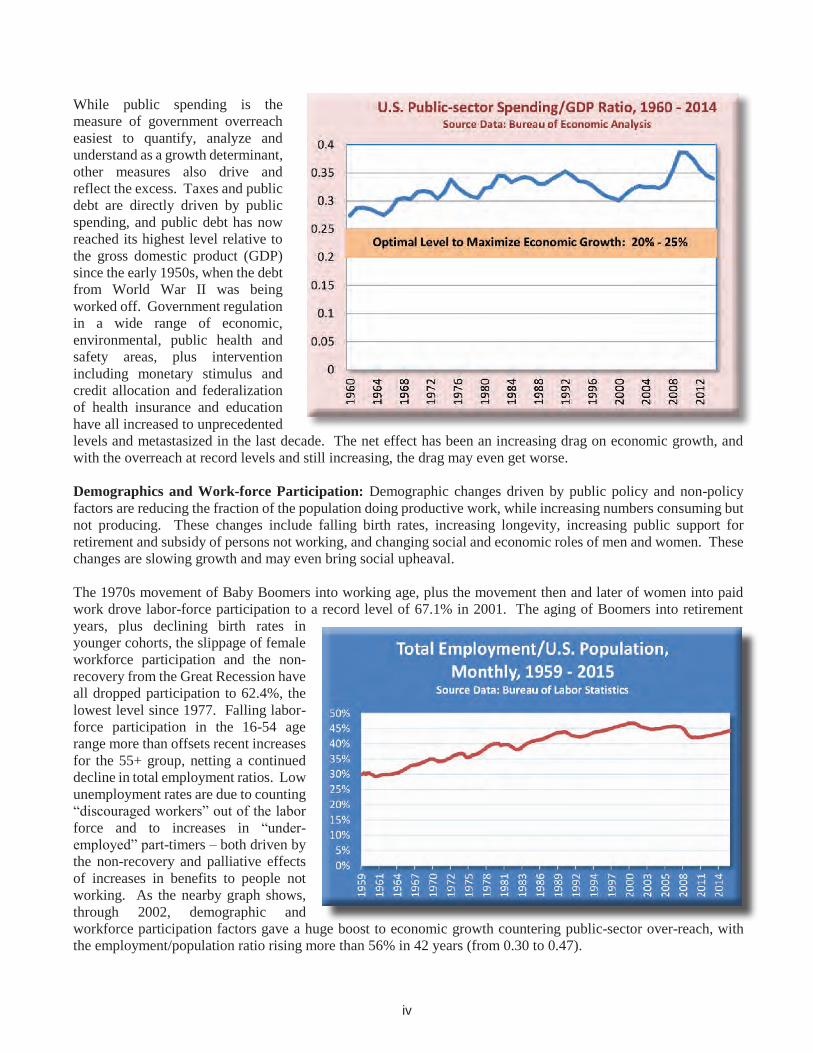
iv
While public spending is the measure of government overreach easiest to quantify, analyze and understand as a growth determinant, other measures also drive and reflect the excess. Taxes and public debt are directly driven by public spending, and public debt has now reached its highest level relative to the gross domestic product (GDP) since the early 1950s, when the debt from World War II was being worked off. Government regulation in a wide range of economic, environmental, public health and safety areas, plus intervention including monetary stimulus and credit allocation and federalization of health insurance and education have all increased to unprecedented levels and metastasized in the last decade. The net effect has been an increasing drag on economic growth, and with the overreach at record levels and still increasing, the drag may even get worse.
Demographics and Work-force Participation: Demographic changes driven by public policy and non-policy factors are reducing the fraction of the population doing productive work, while increasing numbers consuming but not producing. These changes include falling birth rates, increasing longevity, increasing public support for retirement and subsidy of persons not working, and changing social and economic roles of men and women. These changes are slowing growth and may even bring social upheaval.
The 1970s movement of Baby Boomers into working age, plus the movement then and later of women into paid work drove labor-force participation to a record level of 67.1% in 2001. The aging of Boomers into retirement years, plus declining birth rates in younger cohorts, the slippage of female workforce participation and the non-recovery from the Great Recession have all dropped participation to 62.4%, the lowest level since 1977. Falling labor-force participation in the 16-54 age range more than offsets recent increases for the 55+ group, netting a continued decline in total employment ratios. Low unemployment rates are due to counting “discouraged workers” out of the labor force and to increases in “under-employed” part-timers – both driven by the non-recovery and palliative effects of increases in benefits to people not working. As the nearby graph shows, through 2002, demographic and workforce participation factors gave a huge boost to economic growth countering public-sector over-reach, with the employment/population ratio rising more than 56% in 42 years (from 0.30 to 0.47).

v
However, since 2002, these factors have reinforced the increasing drag from government excess that depresses growth. The movement of the large Boomer cohort into retirement began in 2011 and will accelerate and then continue for 20 more years. Because retirement age and support policies were set when longevity was lower and health of people over 60 was less robust, U.S. dependent/producer ratios will continue to rise relative to what they would be under market incentives. So, total-factor productivity and thus the economy will continue to grow slowly. The burden on productive cohorts will increase, especially with slow income growth, leading perhaps to social upheaval in the absence of significantly increased legal immigration. Slow economic growth and low interest rates and other rates of return on investment will challenge retirement funding and exacerbate all these problems.
Debt in All Sectors and Net Saving and Investment: Total debt levels relative to the U.S. economy increased hugely until the financial crash and Great Recession of 2007-09. As shown in the nearby graph of total American debt as a percentage of the economy, they have retrenched only mildly since then, leaving an excess-leverage overhang that may not be receding. All debt sectors are involved: government at all levels; business; and households (mortgage, auto, student and consumer loans, etc.). Monetary and credit-allocation policy drove much of the metastasis, especially in the decade ending 2008, providing artificial and unsustainable temporary stimulus to growth. It also produced mal-investment, and that problem plus deleveraging have already contributed to weak business earnings and anemic economic growth; it will continue to do so for the foreseeable future. The resulting
sustained low interest rates have destroyed much economic wealth and damaged institutional retirement and endowment investors and savers.
Total U.S. debt/GDP ratios in 2014 were twice their 1984 levels, despite retrenchment following the financial crash and Great Recession. Consumer debt growth was driven mainly by federal mortgage lending policies, causing the housing bubble and subsequent collapse. Business debt grew in finance and large corporate stock buybacks, mergers and acquisitions, meaning there is now perhaps an equity bubble. Federal government total debt/GDP ratios have more than doubled as fiscal and monetary policy have been used to try to ameliorate the negative growth
effects of a wide range of public policies. Further retrenchment from current debt levels is needed to restore the economy, so demand for capital and interest rates and investment returns will remain low, as will economic growth.
International Economic Growth, Trade and Investment: Until the Great Recession, long-term growth of the world and developing economies, especially China, was more rapid than in the U.S. and other advanced nations. Driven by and contributing to 1) increasing globalization, 2) trade and 3) foreign direct investment in the U.S., this growth increased U.S. economic growth by lowering costs to American consumers and businesses and spurring more efficient investment and production by domestic and foreign businesses.
Since 2007, trade increases have lagged world economic growth. Growth in China and other developing nations has slowed, further depressing American growth. The three factors above that now retard U.S. economic growth are even worse in other major economies, advanced and developing. While this makes our economy the “cleanest dirty shirt in the laundry pile” for investors, it also means the global trade and investment cavalry will not be ridingto our rescue. The world economy will no longer spur U.S. economic growth as it did before the Great Recession.

vi
The problems of excess and still growing size, reach and scope of government are worse in every other major economy than in the U.S., as shown in the nearby chart. So are demographic problems of low birth rates and labor force participation plus increased aging. So, Europe (the only other comparably-sized economy) and Japan continue to struggle as they long have done with very low growth. China has grown hugely into the second-largest national economy, but the command-and-control methods that remain even after its liberalization have yielded massive mal-investment and debt growth. Due to mal-investment, persistent low consumer demand and the recently eased one-child policy, an historically awful policy mistake and human tragedy, China is headed for ever lower and possibly negative growth. All other economies are too small to make a significant difference to U.S. growth.
Total debt worldwide is now about 5.6 times what it was 20 years ago, while the world economy is only 2.8 times its prior size, meaning debt/GDP ratios have doubled in only two decades. That increase is likely unsustainable even with increasing development and globalization, leading to future retrenchment. Europe is now following Japan and the U.S. into monetary and credit-allocation overreach, and Italy and others (possibly including Japan and China) soon may face Reinhart/Rogoff excess debt levels (debt above 90% of GDP leading to financial collapse). Birth rates being an inverse function of women’s education and wealth levels explains much of the world demographic problem, but in India and Africa they are dropping even faster than education and income indicate.
Upshot: Continued Slow Economic Growth: All four mutually reinforcing problems discussed above have already produced the poorest recession recovery on record, with real growth of about 2% annually – or, adjusting for population increase, real per-person growth of about 1%. With none of these factors abating (and perhaps increasing), the most reasonable outlook is economic and productivity growth at recent anemic rates or even lower. The nearby chart of rolling ten-year growth rates shows that U.S. economic growth has long been declining due to these factors and has collapsed to record sustained low levels since 2008. Growth at 1% per person per year sounds only slightly lower than historic 2.5% levels, but the compounding impact is huge: Average human
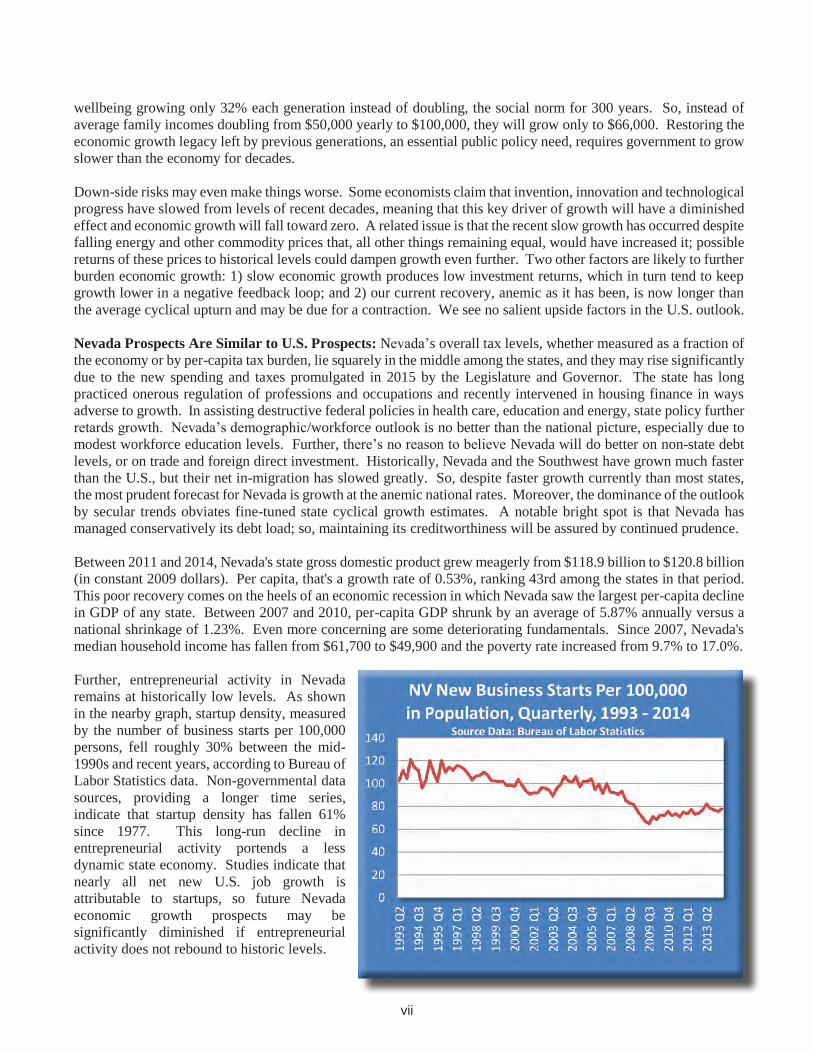
vii
wellbeing growing only 32% each generation instead of doubling, the social norm for 300 years. So, instead of average family incomes doubling from $50,000 yearly to $100,000, they will grow only to $66,000. Restoring the economic growth legacy left by previous generations, an essential public policy need, requires government to grow slower than the economy for decades.
Down-side risks may even make things worse. Some economists claim that invention, innovation and technological progress have slowed from levels of recent decades, meaning that this key driver of growth will have a diminished effect and economic growth will fall toward zero. A related issue is that the recent slow growth has occurred despite falling energy and other commodity prices that, all other things remaining equal, would have increased it; possible returns of these prices to historical levels could dampen growth even further. Two other factors are likely to further burden economic growth: 1) slow economic growth produces low investment returns, which in turn tend to keep growth lower in a negative feedback loop; and 2) our current recovery, anemic as it has been, is now longer than the average cyclical upturn and may be due for a contraction. We see no salient upside factors in the U.S. outlook.
Nevada Prospects Are Similar to U.S. Prospects: Nevada’s overall tax levels, whether measured as a fraction of the economy or by per-capita tax burden, lie squarely in the middle among the states, and they may rise significantly due to the new spending and taxes promulgated in 2015 by the Legislature and Governor. The state has long practiced onerous regulation of professions and occupations and recently intervened in housing finance in ways adverse to growth. In assisting destructive federal policies in health care, education and energy, state policy further retards growth. Nevada’s demographic/workforce outlook is no better than the national picture, especially due to modest workforce education levels. Further, there’s no reason to believe Nevada will do better on non-state debt levels, or on trade and foreign direct investment. Historically, Nevada and the Southwest have grown much faster than the U.S., but their net in-migration has slowed greatly. So, despite faster growth currently than most states, the most prudent forecast for Nevada is growth at the anemic national rates. Moreover, the dominance of the outlook by secular trends obviates fine-tuned state cyclical growth estimates. A notable bright spot is that Nevada has managed conservatively its debt load; so, maintaining its creditworthiness will be assured by continued prudence.
Between 2011 and 2014, Nevada's state gross domestic product grew meagerly from $118.9 billion to $120.8 billion (in constant 2009 dollars). Per capita, that's a growth rate of 0.53%, ranking 43rd among the states in that period. This poor recovery comes on the heels of an economic recession in which Nevada saw the largest per-capita decline in GDP of any state. Between 2007 and 2010, per-capita GDP shrunk by an average of 5.87% annually versus a national shrinkage of 1.23%. Even more concerning are some deteriorating fundamentals. Since 2007, Nevada's median household income has fallen from $61,700 to $49,900 and the poverty rate increased from 9.7% to 17.0%.
Further, entrepreneurial activity in Nevada remains at historically low levels. As shown in the nearby graph, startup density, measured by the number of business starts per 100,000 persons, fell roughly 30% between the mid-1990s and recent years, according to Bureau of Labor Statistics data. Non-governmental data sources, providing a longer time series,indicate that startup density has fallen 61% since 1977. This long-run decline in entrepreneurial activity portends a less dynamic state economy. Studies indicate that nearly all net new U.S. job growth is attributable to startups, so future Nevada economic growth prospects may be significantly diminished if entrepreneurial activity does not rebound to historic levels.

viii
In sum: Government at all levels has long been so big, yet still growing relative to our economy, that it increasingly consumes our time, energy and productivity, crowds out private entrepreneurship and business spending and investment, and thereby stifles economic growth. Until 2002, falling birth rates plus Baby Boomers and women entering the workforce greatly mitigated this problem. Sustained low birth rates leading to small working-age cohorts, plus somewhat falling rates of workforce participation by women and by men ages 16-54, have lately decreased the fraction of the population working and the producer/dependent ratios that fed earlier growth. Increasing debt levels relative to the economy, which were mainly driven by policy far into unsustainable territory, promoted growth until the financial crash. Mild retrenchment during the non-recovery has not worked off the overhang; so, slow growth of non-government debt demand will add to the drag on growth. Rapid growth of developing economies, plus faster growth of trade and foreign domestic investment also helped greatly until 2009. Growth most places has slowed since then because the government overreach, demographic and workforce participation and debt problems are worse in other major economies; plus, trade is now growing slower than the world economy. The most reasonable expectation is that these world trends will continue, not improve, despite (or even due to) low commodity and energy prices. Hence, all four fundamental factors are now driving U.S. economic growth down from the current 2% annual real levels (1% per person), and human wellbeing will grow much slower in the future than in the last 300 years. The increasing time since the Great Recession also suggests cyclical factors may stunt growth in coming years. Nevada is not exempt from this unfortunate outlook: Its public-sector metastasis has been greater and is continuing; other demographic, debt and international trade and investment factors do not portend improvement from the national economic outlook. Nevada’s creditworthiness is a single bright spot. However, low economic growth will yield low expected investment returns, greatly challenging management of the state’s retirement and endowment funds.
Major State Initiatives
Business Growth: In 2008-10, the number of business closures in Nevada exceeded business starts. This trend has been reversed since 2011. The state's economic development strategy, however, has focused mainly on the relocation of large firms from other states and new plant locations in Nevada instead of promoting domestic entrepreneurship. Notable recent announcements in this area include the location of a battery manufacturing plant for Tesla Motors in northwest Nevada using a $1.2 billion tax incentive package; also, location of a Faraday Future auto manufacturing plant in southern Nevada, aided by a $335 million package of tax incentives and infrastructure grants. The state has a Catalyst Fund offering cash payments to businesses locating or expanding in Nevada, plus an array of tax credits and abatements. The numbers of companies to receive state assistance have increased dramatically in recent years, from 29 in 2009 to 113 in 2013 and 71 through the first three quarters of 2015. It is unclear that this is the best approach in face of a long-term decline in domestic entrepreneurship. This concern was expressed by SRI International and the Brookings Institution in a draft economic development plan for Nevada. "Winning a relocation," the contractors assert, "might make the headlines, but as research...shows, job gains and losses are overwhelmingly driven by intra-state business dynamics rather than the between-state movement of firms." In light of this observation, it may be advisable to promote native entrepreneurship through the educational curricula and by lowering barriers to entry for new firms into the marketplace, such as those imposed through occupational and other licensing requirements that are often more strenuous in Nevada than elsewhere. Resource Development: Coeur Mining, Inc. is working to expand its mining operations near Lovelock, Nevada with production scheduled for 2017. A draft environmental impact statement was completed in October 2015 and is expected to be finalized in early 2016. The expansion would increase authorized surface disturbance of the existing operation by 231 acres. The 2015 legislature increased the Modified Business Tax rate facing mining companies to 2.0% while increasing the rate for other nonfinancial firms to 1.475%. The change is estimated to raise the cost of MBT facing mining companies to $17.4 million per annum. In addition, the current prepayment requirement for the Net Proceeds of Minerals Tax was removed beginning FY17, helping the industry.

ix
Education: Student performance in Nevada K-12 schools lies in the middle-to-lower range among five adjacent states, despite higher per-student spending levels than three out of five of them. Nationally and internationally, student performance is not statistically correlated with spending. However, while again increasing K-12 spending greatly, the 2015 Legislature enacted the nation's most expansive school choice program. Beginning in FY16, every child enrolled in a Nevada public school may request an Education Savings Account (ESA) that can be used to finance a customized educational curriculum for the child. ESA funds can be used to pay for private tuition, tutoring, online courses or materials. Students who apply and meet eligibility criteria will receive at least $5,139 deposited annually into their ESA. However, there are pending legal challenges to the program. Health and Human Services: Medicaid enrollment grew to 580,852 in September 2015, nearly double the 332,560 of just two years earlier. In 2013 the Legislature and Governor expanded Medicaid eligibility criteria, pursuant to the federal Affordable Care Act, making all individuals with incomes up to 138% of the federal poverty level eligible, including single, childless, able-bodied adults. This expansion, plus tax penalties under the Act for failing to procure health insurance, have been direct causes of enrollment growth. Expected rapid enrollment growth will create challenges for Nevada in the near future. While the Act provided federal funding to cover the entire cost of coverage for newly eligible persons in 2016, this federal support begins to decline in 2017 to 90% of coverage costs by 2020. Given federal budget constraints, this percentage may continue to decline after 2020, shifting the cost of this coverage to states, and it could impose significant financial burdens on their budgets. The additional cost to Nevada taxpayers of optional and mandated coverage expansions has been estimated by independent sources at up to $5.4 billion cumulatively by 2023. This cost burden will either displace existing priorities for state spending, result in tax increases beyond those enacted by the 2015 Legislature, or both. Transportation: The Nevada Department of Transportation (NDOT) completed one major project in September 2014. The I-15 South Cactus Avenue Interchange in Southern Nevada was finished within budget and ahead of schedule. No other major projects were completed in Fiscal Year 2015. Nevada is beginning work on major transportation projects expected to be completed in coming years, including the massive Project Neon in Las Vegas and the USA Parkway in northwestern Nevada. These will be followed by the I-11 corridor developments between those two areas, and the state is developing a comprehensive freight plan. NDOT project schedules are contingent on the availability of funding, which is likely to be aided significantly by recent passage of the federal FAST Act.
Awards and Acknowledgments GFOA Certificate of Achievement: The GFOA awarded a Certificate of Achievement for Excellence in Financial Reporting to the State of Nevada for its CAFR for the fiscal year ended June 30, 2014. To be awarded a Certificate of Achievement, a government must publish an easily readable and efficiently organized CAFR that satisfies both generally accepted accounting principles and applicable legal requirements. A copy of the GFOA Certificate of Achievement is included in the Introductory Section of the CAFR. A Certificate of Achievement is valid for only a one-year period. We believe that this current CAFR continues to meet the requirements of Certificate of Achievement Program, and we are submitting it to the GFOA to determine its eligibility for another certificate. Acknowledgments and Conclusion: This report would not have been possible without the hard work, dedication and professionalism of my staff and the cooperation and assistance from all State agencies, Executive, Legislature and Judiciary. I sincerely appreciate the efforts of all the individuals involved, especially the Controller’s Office staff. We are committed to advancing accountability, continuity and efficiency in the State’s financial operations. Sincerely,
Ronald L. Knecht, MS, JD & PE(CA) Nevada State Controller

x
Brian SandovalGovernor Barbara Cegavske
Secretary of StateMark Hutchison
Lieutenant Governor
Ron KnechtController
Dan SchwartzTreasurer
Adam Paul LaxaltAttorney General
State of Nevada Constitutional Officers

xi
Citizens
Executive BranchJudicial Branch Legislative Branch
Governor *
Lieutenant Governor * Secretary of State *
Treasurer * Controller *
Attorney General *
Universities and Colleges *Supreme Court *
District Courts *
Justices’ Courts *
Municipal Courts *
Senate * Assembly *
Administration
Agriculture
Business and Industry
Colorado River Commission
Conservation and Natural Resources
Corrections
Tourism and Cultural Affairs
Education
Employment, Training and Rehabilitation
Gaming
Health and Human Services
Military
Motor Vehicles
Public Employees’ Benefits
Public Employees’ Retirement
Public Safety
Public Utilities Commission
Taxation
Transportation
Veterans’ Services
Wildlife
* Elected Officials
Organizational Chart
Miscellaneous Boards and Commissions

xii

1
Financial Section
Nevada Cattle DrivePhotos: Kevin Bell

www.eidebai l ly.com5441 Kietzke Ln., Ste. 150 | Reno, NV 89511-2094 | T 775.689.9100 | F 775.689.9299 | EOE
Independent Auditor’s Report
The Honorable Ronald Knecht, MS, JD & PE State ControllerCarson City, Nevada
Report on the Financial StatementsWe have audited the accompanying financial statements of the governmental activities, the business-type activities, the aggregate discretely presented component units, each major fund, and the aggregate remaining fund information of the State of Nevada, as of and for the year ended June 30, 2015, and the related notes to the financial statements, which collectively comprise the State’s basic financial statements as listed in the table of contents.
Management’s Responsibility for the Financial StatementsManagement is responsible for the preparation and fair presentation of these financial statements in accordance with accounting principles generally accepted in the United States of America; this includes the design, implementation, and maintenance of internal control relevant to the preparation and fair presentation of financial statements that are free from material misstatement, whether due to fraud or error.
Auditor’s ResponsibilityOur responsibility is to express opinions on these financial statements based on our audit. We did not audit the financial statements of the following:
the financial statements of the Housing Division, which is both a major fund and 38.55 percent of the assets and deferred outflows of resources, 25.96 percent of net position, and 3.88 percent of the revenues of the business-type activities;
the financial statements of the Nevada System of Higher Education and the Colorado River Commission, both of which are discretely presented component units and represent more than 99 percent of assets and deferred outflows of resources, net position, and revenues of the discretely presented component units;
the financial statements of the Self Insurance and Insurance Premiums Internal Service Funds which, in the aggregate, represent less than one percent of the assets and deferred outflows of resources and the net position, and 3.57 percent of the revenues of the aggregate remaining fund information;
the financial statements of the Pension Trust Funds and the Other Employee Benefit Trust Fund – State Retirees’ Fund, which in the aggregate represent 65.41 percent of the assets and deferred outflows of resources, 66.73 percent of the net position and 31.81 percent of the revenues of the aggregate remaining fund information;

3
the financial statements of the Nevada College Savings Plan – Private Purpose Trust Fund, which represent 29.49 percent of the assets and deferred outflows of resources, 30.50 percent of the net position and 45.39 percent of the revenues of the aggregate remaining fund information;
the financial statements of the Retirement Benefits Investment Fund – Investment Trust Fund,which represent less than one percent of the assets and deferred outflows of resources, net position and revenues of the aggregate remaining fund information;
the financial statements of the Division of Museums and History Dedicated Trust Fund, which represent less than one percent of the assets and deferred outflows of resources, fund balance and revenues of the aggregate remaining fund information.
Those statements were audited by other auditors whose reports have been furnished to us, and our opinion, insofar as it relates to the amounts included for the above-mentioned funds and entities, is basedsolely on the reports of the other auditors. We conducted our audit in accordance with auditing standards generally accepted in the United States of America and the standards applicable to financial audits contained in Government Auditing Standards, issued by the Comptroller General of the United States. Those standards require that we plan and perform the audit to obtain reasonable assurance about whether the financial statements are free of material misstatement. The financial statements of the Division of Museums and History Dedicated Trust Fund, the Pension Trust Funds, the Insurance Premiums Internal Service Fund and the Retirement Benefits Investment Fund were not audited in accordance with Government Auditing Standards.
An audit involves performing procedures to obtain audit evidence about the amounts and disclosures in the financial statements. The procedures selected depend on the auditor’s judgment, including the assessment of the risks of material misstatement of the financial statements, whether due to fraud or error. In making those risk assessments, the auditor considers internal control relevant to the entity’s preparation and fair presentation of the financial statements in order to design audit procedures that are appropriate in the circumstances, but not for the purpose of expressing an opinion on the effectiveness of the entity’s internal control. Accordingly, we express no such opinion. An audit also includes evaluating the appropriateness of accounting policies used and the reasonableness of significant accounting estimates made by management, as well as evaluating the overall presentation of the financial statements.
We believe that the audit evidence we have obtained, and the reports of other auditors, is sufficient and appropriate to provide a basis for our audit opinions.
OpinionsIn our opinion, based on our audit and the reports of other auditors, the financial statements referred to above present fairly, in all material respects, the respective financial position of the governmental activities, the business-type activities, the aggregate discretely presented component units, each major fund, and the aggregate remaining fund information of the State of Nevada, as of June 30, 2015, and the respective changes in financial position and, where applicable, cash flows thereof for the year then ended in conformity with accounting principles generally accepted in the United States of America.
Change in Accounting PrincipleAs described in Notes 1 and 17 to the financial statements, the State of Nevada adopted the provisions of GASB Statement No. 68, Accounting and Financial Reporting for Pensions and GASB Statement No. 71, Pension Transition for Contributions Made Subsequent to the Measurement Date, which has resulted in a restatement of the net position as of July 1, 2014. Our opinions are not modified with respect to this matter.

4
Correction of ErrorAs discussed in Note 17 to the financial statements, an error occurred in the determination of the amortization period on refunding loss during the fiscal years 2005 through 2014, which was discoveredby management during the current year. Accordingly, amounts for amortization on refunding loss have resulted in a restatement of net position/fund balances as of July 1, 2014. Our opinions are not modified with respect to this matter.
Other Matters
Required Supplementary InformationAccounting principles generally accepted in the United States of America require that the management’s discussion and analysis on pages 6 through 16, the budgetary comparison information, the notes to required supplementary information-budgetary reporting, the schedule of funding progress, the schedule of infrastructure condition and maintenance data, and the pension plan information collectively presented on pages 88 through 94 be presented to supplement the basic financial statements. Such information, although not a part of the basic financial statements, is required by the Governmental Accounting Standards Board, who considers it to be an essential part of financial reporting for placing the basic financial statements in an appropriate operational, economic, or historical context. We and the other auditors have applied certain limited procedures to the required supplementary information in accordance with auditing standards generally accepted in the United States of America, which consisted of inquiries of management about the methods of preparing the information and comparing the information for consistency with management’s responses to our inquiries, the basic financial statements, and other knowledge we obtained during our audit of the basic financial statements. We do not express an opinion or provide any assurance on the information because the limited procedures do not provide us with sufficient evidence to express an opinion or provide any assurance.
Other InformationOur audit was conducted for the purpose of forming opinions on the financial statements that collectively comprise the State of Nevada’s basic financial statements. The introductory section, combiningstatements and schedules, and statistical section are presented for purposes of additional analysis and are not a required part of the basic financial statements.
The combining statements and schedules are the responsibility of management and were derived from and relate directly to the underlying accounting and other records used to prepare the basic financial statements. Such information has been subjected to the auditing procedures applied in the audit of thebasic financial statements and certain additional procedures, including comparing and reconciling such information directly to the underlying accounting and other records used to prepare the basic financial statements or to the basic financial statements themselves, and other additional procedures in accordance with auditing standards generally accepted in the United States of America by us and other auditors. Inour opinion, based on our audit, the procedures performed as described above, and the reports of the other auditors, the combining statements and schedules are fairly stated in all material respects in relation to the basic financial statements as a whole.
The introductory and statistical sections have not been subjected to the auditing procedures applied in the audit of the basic financial statements and, accordingly, we do not express an opinion or provide any assurance on them.
Other Reporting Required by Government Auditing StandardsIn accordance with Government Auditing Standards, we have also issued our report dated December 21,2015, on our consideration of the State of Nevada’s internal control over financial reporting and on our tests of its compliance with certain provisions of laws, regulations, contracts, and grant agreements and

5
other matters. The purpose of that report is to describe the scope of our testing of internal control over financial reporting and compliance and the results of that testing, and not to provide an opinion on the internal control over financial reporting or on compliance. That report is an integral part of an audit performed in accordance with Government Auditing Standards in considering the State’s internal control over financial reporting and compliance.
Reno, NevadaDecember 21, 2015

6
ManageMent’s Discussion anD analysis
State of Nevada management provides this discussion and analysis of the State of Nevada’s Comprehensive Annual Financial Report (CAFR) for readers of the State’s financial statements. This narrative overview and analysis of the financial activities of the State of Nevada is for the fiscal year ended June 30, 2015. Readers should consider this information in conjunction with the additional information furnished in the letter of transmittal.
HigHligHtsGovernment-wide:Net Position – The assets and deferred outflows of resources of the State exceeded liabilities and deferred inflows of resources by $4.4 billion (reported as net position). Of the $4.4 billion in net position, $1.6 billion was restricted and not available to meet the State’s general obligations. Also unavailable to meet the State’s general obligations is $4.9 billion net investment in capital assets.
As a result of implementing GASB 68 Accounting and Financial Reporting for Pensions, the State recorded $182.2 million deferred outflows of resources, $1.7 billion net pension liability, and $503.4 million deferred inflows of resources for the primary government. The State’s total net position decreased by $1.4 billion or 24.2% over the prior year, of which $2.0 billion is a decrease to beginning unrestricted net position due to the implementation of GASB 68. Net position of governmental activities decreased by $1.8 billion or 32.6%. Net position of business-type activities increased by $364.7 million or 96.2%
Fund-level:At the close of the current fiscal year, the State’s governmental funds reported combined ending fund balances of $1.6 billion, a decrease of $144.2 million from the prior year. Of the ending fund balance, $949.2 million is available for spending and $613.8 million is not in spendable form, primarily municipal securities and permanent fund principal. The spendable portion consists of: $607.1 million restricted to expenditures for specific purposes such as transportation, health and human services, law, justice and public safety, and capital projects; $547.2 million committed to expenditures for specific purposes such as servicing bonds payable, health and education development, and environmental protection; and a negative $205.1 million unassigned, in the General Fund. The reasons for the negative unassigned fund balance are disclosed in the Financial Analysis of the State’s Funds section below.
The State’s enterprise funds reported combined ending net position of $744.4 million, an increase of $365.5 million from the prior year, of which $36.6 million is a decrease to beginning net position as a result of implementing GASB 68, Accounting and Financial Reporting for Pensions. The remaining increases in net position consist of $347.6 million in the Unemployment Compensation Fund, $35.3 million in the Water Projects Loans Fund, and $9.8 million in the Higher Education Tuition Trust Fund. Of the combined ending net position, $88.8 million represents the net position-unrestricted of which $109.8 million is from the Unemployment Compensation Fund and a deficit of $20.8 million is from the non-major enterprise funds.
The State’s fiduciary funds reported combined ending net position of $51.5 billion, an increase of $2.6 billion from the prior year. This increase is due primarily to the increases in contributions, interest, dividends and change in the fair value of investments in the Pension Trust Funds and Private Purpose Trust Funds.
Long-term Debt (government-wide):The State’s total bonds payable and certificates of participation payable decreased by $280.7 million or 7.4% from $3.8 billion in fiscal year 2014 to $3.5 billion in fiscal year 2015.
overview of tHe financial stateMents
This discussion and analysis is an introduction to the State of Nevada’s basic financial statements which are comprised of three components: 1) government-wide financial statements, 2) fund financial statements, and 3) notes to the financial statements. The Comprehensive Annual Financial Report also contains other supplementary information in addition to the basic financial statements.
Government-wide Financial Statements:The government-wide financial statements are designed to provide readers with a broad overview of the State of Nevada’s finances in a manner similar to the private sector. They take into account all revenues and expenses connected with the fiscal year regardless of when cash is received or paid. The government-wide financial statements include the following two statements:

7
The statement of net position presents all of the State’s assets, liabilities, and deferred outflows/inflows of resources with the difference being reported as “net position.” The statement combines and consolidates all of the State’s current financial resources with capital assets and long-term obligations. Over time, increases and decreases in net position measure whether the State’s financial position is improving or deteriorating.
The statement of activities presents information showing how the State’s net position changed during the most recent fiscal year. The statement reveals how much it costs the State to provide its various services, and whether the services cover their own costs through user fees, charges, grants, or are financed with taxes and other general revenues. All changes in net position are reported as soon as the underlying event occurs, regardless of the timing of cash flows. Therefore, some revenue and expenses reported in this statement will not result in cash flows until future fiscal periods (e.g., uncollected taxes earned and unused leave).
Both government-wide statements above report three types of activities:
Governmental Activities – Taxes and intergovernmental revenues primarily support these activities. Most services normally associated with State government fall into this category, including general government, health and social services, education, law, justice and public safety, regulation of business, transportation, recreation and resource development, interest on long-term debt and unallocated depreciation.
Business-type Activities – These activities are intended to recover all, or a significant portion, of the costs of the activities by charging fees to customers. The Housing Division and Unemployment Compensation are examples of the State’s business-type activities.
Discretely Presented Component Units – Discrete component units are legally separate organizations for which their relationship with the primary government meets selected criteria. The State has three discretely presented component units – the Nevada System of Higher Education, the Colorado River Commission and the Nevada Capital Investment Corporation. Complete financial statements of the individual component units can be obtained from their respective administrative offices.
Fund Financial Statements:A fund is an accounting entity consisting of a set of self-balancing accounts to track funding sources and spending for a particular purpose. The State’s funds are broken down into three types:
Governmental funds – Most of the State’s basic services are reported in governmental funds. These funds focus on short-term outflows and inflows of expendable resources as well as balances left at the end of the fiscal year available to finance future activities. These funds are reported using the flow of current financial resources measurement focus and the modified accrual basis of accounting.
The governmental fund financial statements focus on major funds and provide additional information that is not provided in the government-wide financial statements. It is useful to compare the information presented for governmental funds with similar information presented for governmental activities in the government-wide financial statements. By doing so, readers may better understand the long-term impact of the government’s near-term financing decisions. A reconciliation is provided between the governmental fund statements and the governmental activities in the government-wide financial statements.
Proprietary funds – When the State charges customers for the services it provides, whether to outside customers (enterprise funds) or to other State agencies (internal service funds), the services are generally reported in the proprietary funds. Proprietary funds apply the accrual basis of accounting utilized by private sector businesses, and there is a reconciliation between the government-wide financial statement business-type activities and the enterprise fund financial statements. Because internal service fund operations primarily benefit governmental funds, they are included with the governmental activities in the government-wide financial statements.
Fiduciary funds – These funds are used to account for resources held for the benefit of parties outside the state government. For instance, the State acts as a trustee or fiduciary for its employee pension plans, and it is also responsible for other assets that, because of a trust arrangement, can be used only for the trust beneficiaries. Fiduciary funds are reported using the accrual basis of accounting. The government-wide statements exclude fiduciary fund activities and balances because these assets are restricted in purpose and do not represent discretionary assets of the State to finance its operations.
Notes to the Financial Statements:The notes to the financial statements provide additional information that is essential to a full understanding of the data provided in both the government-wide and fund financial statements.

8
Required Supplementary Information:The required supplementary information includes budgetary comparison schedules for the General Fund and major special revenue funds, along with notes and a reconciliation of the statutory and U.S. generally accepted accounting principles (GAAP) fund balances at fiscal year-end. This section also includes a schedule of pension plan information and a schedule of infrastructure condition and maintenance data.
Other Supplementary Information:Other supplementary information includes combining financial statements for non-major governmental, non-major enterprise, all internal service and all fiduciary funds. The non-major funds are added together, by fund type, and presented in single columns in the basic financial statements. Other supplementary information contains budgetary schedules of total uses for the General Fund and special revenue fund budgets, as well as a schedule of sources for non-major special revenue fund budgets.
governMent-wiDe financial analysis
The State’s overall financial position and operations for the fiscal years ended June 30, 2015 and 2014 for the primary government are summarized in the following statements based on the information included in the government-wide financial statements.
Net Position:As noted earlier, net position may serve over time as a useful indicator of a government’s financial position. The State’s combined net position (governmental and business-type activities) decreased to $4.4 billion at the end of 2015, compared with $5.8 billion at the end of the previous year.
The largest portion of the State’s net position ($4.9 billion or 111.5%) reflects its investment in capital assets such as land, buildings, improvements other than buildings, equipment, software costs, construction in progress, infrastructure and rights-of-way, less any related debt still outstanding that was used to acquire those assets. The State uses these capital assets to provide services to its citizens; consequently, these assets are not available for future spending. Although the State’s investment in its capital assets is reported net of related debt, it should be noted that the resources needed to repay this debt must be provided from other sources, since the capital assets themselves cannot be used to liquidate these liabilities.
An additional portion of the State’s net position ($1.6 billion or 37.1%) represents resources that are subject to external restrictions on how they may be used. At the close of the fiscal year, the State reported an unrestricted net position deficit of $2.1 billion or (48.6%) as compared to a $348.3 million deficit in the prior year.
TotalChange
2015 2014* 2015 2014* 2015 2014* 2015-2014AssetsCurrent and other assets 3,637,061$ 3,604,390$ 2,163,799$ 1,918,000$ 5,800,860$ 5,522,390$ 278,470$ Net capital assets 6,200,840 6,020,493 12,517 12,321 6,213,357 6,032,814 180,543 Total assets 9,837,901 9,624,883 2,176,316 1,930,321 12,014,217 11,555,204 459,013Total deferred outflows of resources 244,857 13,978 4,562 1,612 249,419 15,590 233,829LiabilitiesCurrent liabilities 1,612,110 1,513,414 69,068 69,382 1,681,178 1,582,796 98,382Long-term liabilities 4,327,379 2,710,278 1,358,862 1,483,298 5,686,241 4,193,576 1,492,665 Total liabilities 5,939,489 4,223,692 1,427,930 1,552,680 7,367,419 5,776,372 1,591,047Total deferred inflows of resources 495,015 704 9,041 - 504,056 704 503,352Net PositionNet investment in capital assets 4,895,213 4,672,738 3,791 3,434 4,899,004 4,676,172 222,832Restricted 976,650 866,071 651,863 599,806 1,628,513 1,465,877 162,636Unrestricted (deficit) (2,223,609) (124,344) 88,253 (223,987) (2,135,356) (348,331) (1,787,025) Total net position 3,648,254$ 5,414,465$ 743,907$ 379,253$ 4,392,161$ 5,793,718$ (1,401,557)$
* The 2014 amounts presented here have not been restated for the implementation of GASB 68 for pensions and other adjustments.
State of Nevada's Net Position-Primary Government(expressed in thousands)
Governmental Business-typeActivities Activities Total

9
The unrestricted deficit net position in governmental activities increased by $2.1 billion from a deficit of $124.3 million to a total deficit of $2.2 billion. This is primarily due to the implementation of GASB 68, Accounting and Financial Reporting for Pensions which recorded a decrease to beginning net position of governmental activities of $2.0 billion. Other changes in governmental activities were a result of several factors, including a decrease in the unrestricted fund balance of the General Fund of $64.3 million and an increase of $11.9 million in deferred inflows of resources for unavailable revenue recognized as revenue in the government-wide statement of net activities. Of the $11.9 million increase in deferred inflows of resources for unavailable revenue, approximately $7.9 million is from taxes and $1.0 million is from rebates for health and social services. In business-type activities the unrestricted net position increased by $312.2 million from a deficit of $224.0 million to a net position of $88.2 million. The increase is primarily due to an increase in the net position of the Unemployment Compensation Fund in the amount of $347.6 million.
Changes in Net Position:Total government-wide revenues increased by $1.2 billion during the current year. The increase in revenues is a result of several factors, including increases of $800.2 million in federal funding, $163.4 million in other taxes, $75.3 million in sales and use taxes and $70.7 million in other revenues. Other general revenue tax increases include $44.6 million in insurance premium taxes and $30.8 million in modified business taxes. Program revenues from charges for services increased by $52.4 million compared to the prior year.
TotalChange
2015 2014* 2015 2014* 2015 2014* 2015-2014Revenues Program revenues Charges for services 828,977$ 767,186$ 111,885$ 121,264$ 940,862$ 888,450$ 52,412$ Operating grants and contributions 4,337,546 3,416,382 75,716 196,653 4,413,262 3,613,035 800,227 Capital grants and contributions 10,385 9,349 - - 10,385 9,349 1,036 General revenues Sales and use taxes 1,160,968 1,085,656 - - 1,160,968 1,085,656 75,312 Gaming taxes 906,382 922,999 - - 906,382 922,999 (16,617) Modified business taxes 413,749 382,976 - - 413,749 382,976 30,773 Insurance premium taxes 301,226 256,587 - - 301,226 256,587 44,639 Property and transfer taxes 219,189 209,784 - - 219,189 209,784 9,405 Motor and special fuel taxes 277,305 269,544 - - 277,305 269,544 7,761 Other taxes 833,958 688,399 555,187 537,372 1,389,145 1,225,771 163,374 Investment earnings 14,780 5,462 - - 14,780 5,462 9,318 Other 231,043 160,298 - - 231,043 160,298 70,745
Total Revenues 9,535,508 8,174,622 742,788 855,289 10,278,296 9,029,911 1,248,385Expenses General government 280,465 202,620 - - 280,465 202,620 77,845 Health and social services 4,887,130 3,784,055 - - 4,887,130 3,784,055 1,103,075 Education - K to 12 1,892,519 1,830,605 - - 1,892,519 1,830,605 61,914 Education - higher education 490,407 495,893 - - 490,407 495,893 (5,486) Law, justice and public safety 695,023 662,330 - - 695,023 662,330 32,693 Regulation of business 259,106 303,020 - - 259,106 303,020 (43,914) Transportation 462,386 327,519 - - 462,386 327,519 134,867 Recreation and resource development 145,000 139,188 - - 145,000 139,188 5,812 Interest on long-term debt 94,987 121,224 - - 94,987 121,224 (26,237) Unallocated depreciation 2,137 2,150 - - 2,137 2,150 (13) Unemployment insurance - - 380,166 552,246 380,166 552,246 (172,080) Housing - - 23,442 31,954 23,442 31,954 (8,512) Water loans - - 6,372 7,837 6,372 7,837 (1,465) Workers' compensation and safety - - 27,644 26,715 27,644 26,715 929 Higher education tuition - - 25,768 21,325 25,768 21,325 4,443 Other - - 30,263 32,944 30,263 32,944 (2,681)Total Expenses 9,209,160 7,868,604 493,655 673,021 9,702,815 8,541,625 1,161,190 Change in net position before contributions to permanent funds, special items and transfers 326,348 306,018 249,133 182,268 575,481 488,286 87,195 Contributions to permanent fund 9,038 5,908 - - 9,038 5,908 3,130 Special item - Settlement - - 5,000 330 5,000 330 4,670 Transfers (147,100) 6,689 147,100 (6,689) - - -Change in net position 188,286 318,615 401,233 175,909 589,519 494,524 94,995
Net position - beginning of year 5,414,465 5,095,850 379,253 203,344 5,793,718 5,299,194 494,524 Adjustment to beginning net position (1,954,497) - (36,579) - (1,991,076) - (1,991,076)Net position - end of year 3,648,254$ 5,414,465$ 743,907$ 379,253$ 4,392,161$ 5,793,718$ (1,401,557)$
* The 2014 amounts presented here have not been restated for the implementation of GASB 68 for pensions or other adjustments.
Changes in State of Nevada's Net Position-Primary Government(expressed in thousands)
Governmental Business-typeActivities Activities Total

10
Health and social services 4,887,130 53.07% 53%Education - K to 12 1,892,519 20.55% 21%Education - higher education 490,407 5.33% 5%Law, justice 695,023 7.55% 8%Transportation 462,386 5.02% 5%Other 781,695 8.49% 8%Total 9,209,160 100% 100%
Health and social services
53%
Education - K to 12 21%
Education - higher education
5%
Law, justice 8%
Transportation 5%
Other 8%
Charges for services 828,977 8.69% 9%Grants and contributions 4,347,931 45.60% 46%Taxes 4,112,777 43.13% 43%Investment earnings and other 245,205 2.57% 2%Total 9,534,890 100% 100%
Charges for services
9%
Grants and contributions
46% Taxes 43%
Investment earnings and
other 2%
Expenses RevenuesGeneral government 280,465$ 176,063$ Health and social services 4,887,130 3,765,983Education - K to 12 1,892,519 266,873Education - higher education 490,407 -Law, justice 695,023 341,215Regulation 259,106 216,890Transportation 462,386 323,124Recreation 145,000 85,531
Total 9,112,036$ 5,175,679$
Revenues and Expenses by Function: Governmental Activities(expressed in thousands)
Governmental activities – The current year net position increased by $188.3 million. Approximately 43.1% of the total revenue came from taxes, while 45.6% was in the form of grants and contributions (including federal aid). Charges for various goods and services provided 8.7% of the total revenues (see chart below). The State’s governmental activities expenses cover a range of services and the largest expenses were 53.1% for health and social services and 20.6% for K to 12 education (see chart below). In 2015, governmental activities expenses exceeded program revenues, resulting in the use of $4.0 billion in general revenues, which were generated to support the government.
The following chart depicts the governmental activities revenues for the fiscal year:
The following chart depicts the governmental activities expenses for the fiscal year:
The following table depicts the total program revenues and expenses for each function of governmental activities:
Business-type activities – The current year net position increased by $401.2 million. Approximately 74.7% of the total revenue came from taxes, while 10.2% was in the form of grants and contributions (including federal aid). Charges for various goods and services provided 15.1% of the total revenues (see chart below). The State’s business-type activities expenses cover a range of services. The largest expenses were 77.0% for unemployment compensation (see chart below). In 2015, business-type activities expenses exceeded program revenues by $306.1 million. Of this amount, unemployment compensation was the largest, with net expenses of $365.3 million, resulting in the use of general revenues generated by and restricted to the Unemployment Compensation Fund.

11
Unemployment compensation 380,166 77.0% 77%Housing 23,442 4.7% 5%Water loans 6,372 1.3% 1%Other 30,263 6.1% 6%Workers compensation & safety 27,643 5.6% 6%Higher education tuition 25,768 5.2% 5%Total 493,654 100% 100%
Unemployment compensation
77%
Housing 5%
Water loans 1%
Other 6%
Workers compensation
& safety 6%
Higher education
tuition 5%
Expenses RevenuesUnemployment compensation 380,166$ 14,877$ Housing 23,442 28,841Water loans 6,372 42,775Workers' compensation 27,644 38,540Higher education tuition 25,768 28,261Other 30,263 34,307
Total 493,655$ 187,601$
Revenues and Expenses by Function: Business-type Activities(expressed in thousands)
Charges for services 111,885 15.06% 15%Grants and contributions 75,716 10.19% 10%Taxes and other 555,187 74.74% 75%Total 742,788 100% 100%
Charges for services
15%
Grants and contributions
10%
Taxes 75%
The following chart depicts the business-type activities revenues for the fiscal year:
The following chart depicts the business-type activities expenses for the fiscal year:
The following table depicts the total program revenues and expenses for each function for business-type activities:
The State’s overall financial position declined over the past year, primarily due to the implementation of GASB 68, Accounting and Financial Reporting for Pensions, which resulted in a $2.0 billion decrease to beginning net position. However, current year operations resulted in a $188.3 million increase in the net position of the governmental activities and a $401.2 million increase in the net position of the business-type activities. Nevada continues to recover at a slow pace. Key economic indicators from the State’s sales and other taxes continue to show positive growth. Tax revenues for governmental activities increased in the current fiscal year $296.8 million or 7.8% compared to an increase of $79.0 million or 2.1% in the prior fiscal year. In addition, intergovernmental revenues for governmental activities increased $921.2 million primarily due to Medicaid receipts. In the Highway Fund, intergovernmental revenues decreased $22.0 million primarily due to a decrease in federal aid, while motor and special vehicle taxes increased $10.3 million and driver’s license and motor carrier fees increased $12.3 million.

12
Amount Percent Amount Percent Amount PercentGaming taxes, fees and licenses 894,805$ 11.3% 913,960$ 13.5% (19,155)$ -2.1%Sales taxes 1,161,893 14.6% 1,081,735 15.9% 80,158 7.4%Modified business taxes 411,914 5.2% 384,886 5.7% 27,028 7.0%Insurance premium taxes 292,665 3.7% 263,532 3.9% 29,133 11.1%Property and transfer taxes 67,696 0.9% 63,528 0.9% 4,168 6.6%Motor and special fuel taxes 2,466 0.0% 2,671 0.0% (205) -7.7%Other taxes 574,185 7.2% 544,436 8.0% 29,749 5.5%Intergovernmental 4,081,581 51.3% 3,118,097 46.0% 963,484 30.9%Licenses, fees and permits 305,079 3.8% 289,652 4.3% 15,427 5.3%Sales and charges for services 70,877 0.9% 58,016 0.9% 12,861 22.2%Interest and investment income (337) 0.0% 9,913 0.1% (10,250) -103.4%Other revenues 87,208 1.1% 53,555 0.8% 33,653 62.8% Total revenues 7,950,032$ 100.0% 6,783,981$ 100.0% 1,166,051$ 17.2%
General Fund Revenues (expressed in thousands)
2015 2014 Increase (Decrease)
financial analysis of tHe state’s funDs
Governmental Funds:As of the end of the current fiscal year, the State’s governmental funds reported combined ending fund balances of $1.6 billion, a decrease of $144.2 million from the prior year. Of these total ending fund balances, $613.8 million or 39.3% is nonspendable, either due to its form or legal constraints, and $607.1 million or 38.8% is restricted for specific programs by external constraints, constitutional provisions, or contractual obligations. An additional $547.2 million or 35.0% of total fund balance has been committed to specific purposes. Committed amounts cannot be used for any other purpose unless approved by the Legislature. At the end of the fiscal year there is no committed fund balance for fiscal emergency. NRS 353.288 provides for the Account to Stabilize the Operation of the State Government (Stabilization Account) in the State General Fund. Additions to the stabilization account are triggered at the end of a fiscal year if the General Fund unrestricted fund balance (budgetary basis) exceeds 7% of General Fund operating appropriations, in which case forty percent of the excess is deposited to the Stabilization Account. Expenditures may occur only if actual revenues for the biennium fall short by 5% or more from anticipated revenues, or if the Legislature and Governor declare that a fiscal emergency exists. During the fiscal year, actual revenues for the biennium fell short by 5% or more from anticipated revenues and a transfer in the amount of $28.1 million was made from the Stabilization Account to the General Fund for unrestricted State General Fund use. The remaining negative $205.1 million or (13.1%) of fund balance is unassigned. The major funds are discussed more fully below.
The General Fund is the chief operating fund of the State. At the end of the current fiscal year, the total General Fund fund balance was $207.3 million compared to $274.8 million in the prior fiscal year. The fund balance decreased from operations by $67.6 million or 24.6% during the current fiscal year. Reasons for this decrease are discussed in further detail below. The negative unassigned fund balance of $205.1 million is mostly due to an accrual for Medicaid expenditures and for unearned gaming taxes and mining taxes already collected and budgeted but not yet recognized as revenues.
The following schedule presents a summary of revenues of the General Fund for the fiscal years ended June 30, 2015 and 2014 (expressed in thousands). Other financing sources are not included.
The total General Fund revenues increased $1.2 billion or 17.2%. The largest increases in revenue sources were $963.5 million or 30.9% in intergovernmental revenues, $80.2 million or 7.4% in sales taxes, $33.7 million or 62.8% in other revenues, $29.7 million or 5.5% in other taxes, and $29.1 million or 11.1% in insurance premium taxes. Intergovernmental revenues primarily increased by $912.2 million in receipts for Medicaid, $60.7 million in receipts for food stamps, and $27.1 million in receipts for county revenues. The largest decline in revenue sources was $19.2 million or 2.1% in gaming taxes and $10.3 million or 103.4% in interest and investment income. In other revenues, unclaimed property revenues increased by $7.5 million primarily due to a one time receipt by public safety of $4 million, and $19.7 million of settlement income was recorded in the current year.
The following schedule presents a summary of expenditures by function of the General Fund for the fiscal years ended June 30, 2015 and 2014 (expressed in thousands). Other financing uses are not included.

13
Amount Percent Amount Percent Amount PercentGeneral government 128,236$ 1.6% 113,896$ 1.6% 14,340$ 12.6%Health and social services 4,766,687 59.1% 3,683,368 52.8% 1,083,319 29.4%Education - K to 12 1,891,259 23.4% 1,830,511 26.3% 60,748 3.3%Education - higher education 486,937 6.0% 485,893 7.0% 1,044 0.2%Law, justice and public safety 450,754 5.6% 459,481 6.6% (8,727) -1.9%Regulation of business 233,072 2.9% 279,899 4.0% (46,827) -16.7%Recreation, resource development 113,164 1.4% 115,949 1.7% (2,785) -2.4%Debt service 3,251 0.0% 3,716 0.0% (465) -12.5% Total expenditures 8,073,360$ 100.0% 6,972,713$ 100.0% 1,100,647$ 15.8%
Note: Fiscal year 2014 revised to reclassify Intergovernmental expenditures to function.
General Fund Expenditures (expressed in thousands)
2015 2014 Increase (Decrease)
The total General Fund expenditures increased 15.8%. The largest increases in expenditures were $1.1 billion or 29.4% in health and social services expenditures, $60.7 million or 3.3% in K to 12 education, and $14.3 million or 12.6% in general government. Health and social services expenditures increased due to expansion of the Medicaid program. The largest decrease was $46.8 million or 16.7% of expenditures for the regulation of business primarily due to a decrease in a one-time settlement of $49.0 million received in 2014 for the Home Means Nevada Program.
The State Highway Fund is a special revenue fund used to account for the maintenance, regulation and construction of public highways and is funded through vehicle fuel taxes, federal funds, other charges and bond revenue. The fund balance decreased $19.8 million or 5.6% during the current fiscal year compared to a 137.4% increase in the prior year. This was primarily due to an increase in transportation expenditures of $105.5 million or 19.9%. Expenditures increased as spending for three major road construction projects, Project NEON, USA Parkway and the Boulder City Bypass, increased. Intergovernmental revenues decreased by $22.0 million primarily due to a $21.5 million decrease in federal aid. The 50.6% decrease in other taxes is due to the Legislative allocation to the General Fund of $21.9 million in Motor Vehicle Government Services tax commissions and penalties previously allocated to the Highway Fund. The nonspendable fund balance is $16.3 million, the restricted fund balance is $307.3 million and the committed fund balance is $10.3 million.
The Municipal Bond Bank Fund is a special revenue fund used to account for revenues and expenditures associated with buying local government bonds with proceeds of State general obligation bonds. The fund balance decreased by $26.7 million during the current fiscal year, which is a 10.5% decrease from the prior year. This decrease was primarily due to the refunding of local government bonds.
The Permanent School Fund is a permanent fund used to account for certain property and the proceeds derived from such property, escheated estates, and all fines collected under penal laws of the State, which become permanent assets of the fund. All earnings on the assets are to be used for education. The fund balance increased by $9.2 million during the current fiscal year, which is a 2.8% increase from the prior year. This increase is primarily due to $3.0 million increase in land sales. Proprietary Funds:The State’s proprietary funds provide the same type of information found in the government-wide financial statements, but in more detail. Proprietary funds are comprised of two types: enterprise funds and internal service funds. Enterprise funds are used when goods or services are provided primarily to parties outside of the State while internal service funds are used when goods or services are provided primarily to State agencies.
Enterprise Funds – There are four major enterprise funds: Housing Division Fund, Unemployment Compensation Fund, Water Projects Loans Fund and the Higher Education Tuition Trust Fund. The combined net position of the four major funds is $723.3 million, the net position of the nonmajor enterprise funds is $21.1 million and the total combined net position of all enterprise funds is $744.4 million. The combined net position of all enterprise funds increased by $365.5 million in 2015, of which $36.6 million is a decrease to beginning net position due to the implementation of GASB 68, Accounting and Financial Reporting for Pensions. The major enterprise funds are discussed below:
The Housing Division Fund was created for the purpose of making available additional funds to assist private enterprise and governmental agencies in providing safe and sanitary housing facilities and provides low interest loans for first-time homebuyers with low or moderate incomes. The net position increased by $2.9 million or 1.5%, of which $2.7 million is a decrease to beginning net position due to the implementation of GASB 68, Accounting and Financial Reporting for Pensions, resulting in an ending net position of $193.1 million. Revenues from interest on loans decreased by 7.4% due to loan delinquencies reflecting Nevada’s high and continuing unemployment and foreclosure rate, along with a reduction in interest and investment income of 8.2%. Operating expenses decreased primarily due to few programs closed in the multi-family programs and decreased loan servicing and program expenses and bond program expense.

14
The Unemployment Compensation Fund accounts for the payment of unemployment compensation benefits to unemployed State citizens. The net position increased by $347.6 million during the current fiscal year, which is a 146.2% increase from the prior year, resulting in an ending net position of $109.8 million. This increase in net position is primarily due to operating revenues exceeding expenses by $194.0 million and a transfer of $161.6 million from the Unemployment Comp Bond Fund for special bond contributions assessed on employers for payment of principal and interest on Unemployment Compensation Bonds. During fiscal year 2015, $369.7 million of unemployment compensation benefits was paid to unemployed State citizens compared to $536.8 million paid in fiscal year 2014, representing a 31.1% decrease in claims expense.
The Water Projects Loans Fund issues loans to governmental and private entities for two programs: Safe Drinking Water and Water Pollution Control. The federal EPA matches the State’s bond proceeds to make loans to governmental entities; only federal funds are loaned to private entities. The net position increased by $34.6 million during the current fiscal year, of which $.7 million is a decrease to beginning net position due to the implementation of GASB 68, Accounting and Financial Reporting for Pensions, for a final net position of $367.3 million, which is a 10.4% increase from the prior year.
The Higher Education Tuition Trust Fund provides a simple and convenient way for Nevada families to save for a college education through the advance payment of tuition. A purchaser enters into a contract for the future payment of tuition for a specified beneficiary. The contract benefits are based on in-state rates for Nevada public colleges, but can be used towards costs at any accredited, nonprofit, private or out-of-state college. The Trust Fund completed its seventeenth enrollment period during the fiscal year with 977 new enrollments. The net position increased $9.6 million or 22.1% during the current fiscal year, of which $.2 million is a decrease to beginning net position due to the implementation of GASB 68, Accounting and Financial Reporting for Pensions. During the fiscal year the fund was forgiven an advance from the General Fund resulting in an increase to net position of $5.0 million.
Internal Service Funds – The internal service funds charge State agencies for goods and services such as building maintenance, purchasing, printing, insurance, data processing and fleet services in order to recover the costs of the goods or services. Rates charged to State agencies for the operations of internal service funds are adjusted in following years to offset gains and losses. Because these are allocations of costs to other funds, they are not included separately in the government-wide financial statements but are eliminated and reclassified as either governmental activities or business-type activities. In 2015, total internal service fund net position decreased by $80.6 million, of which $51.1 million is a decrease to beginning net position due to the implementation of GASB 68, Accounting and Financial Reporting for Pensions, for a final net position of $5.2 million. The two largest funds are:
The Self-Insurance Fund accounts for group health, life and disability insurance for State employees and retirees and certain other public employees. Net position decreased by $34.7 million or 30.2% during the current fiscal year, of which $3.1 million is a decrease to beginning net position due to the implementation of GASB 68, Accounting and Financial Reporting for Pensions, for a final net position of $80.0 million. The remaining decrease was caused primarily by a 5.4% decrease in insurance premium income and a 17.5% increase in claims expense.
The Insurance Premiums Fund accounts for general, civil (tort), auto and property casualty liabilities of State agencies. The net position deficit decreased by $3.4 million or 6.2% during the current fiscal year, of which $1.0 million is a decrease to beginning net position due to the implementation of GASB 68, Accounting and Financial Reporting for Pensions, resulting in a total deficit of $50.8 million. The remaining deficit decrease is the result of an increase in net premium income of 6.0% and a decrease of 9.0% in claims expense.
analysis of general funD BuDget variations
The General Fund budgetary revenues and other financing sources were $664.6 million or 6.8% less than the final budget, primarily because actual intergovernmental revenues received were less than the final budgeted amount. Intergovernmental revenues represent federal grants, and there are timing differences arising from when grants are awarded, received and spent. The final budget can include grant revenue for the entire grant period, whereas the actual amount recorded represents grant revenue received in the current year.
The net increase in the General Fund expenditures and other uses budget from original to final was $1.3 billion. Some of the differences originate because the original budget consists only of those budgets subject to legislative approval through the General Appropriations Act and the Authorizations Bill. The non-executive budgets, not subject to legislative approval, only require approval by the Budget Division and if approved after July 1, are considered to be revisions. Increases due to the non-executive budgets approved after July 1 and increased estimated receipts were approximately $1.3 billion.

15
I II III IV V
State Policy-minimum percentage 70% 65% 60% 40% 10%
Actual results of 2014 condition assessment 84% 71% 62% 33% 7%Actual results of 2012 condition assessment 84% 85% 84% 32% 9%Actual results of 2011 condition assessment 56% 79% 67% 30% 9%
2014 2012 2011
State Policy-maximum percentage 10% 10% 10%
Actual results condition assessment 4% 4% 4%
Percentage of substandard bridges
Condition Level of the Roadways
Percentage of roadways with an IRI of less than 80
Condition Level of the Bridges
Category
capital assets anD DeBt aDMinistration
Capital Assets:The State’s capital assets for governmental and business-type activities as of June 30, 2015 amount to $7.4 billion, net of accumulated depreciation of $1.2 billion, leaving a net book value of $6.2 billion. This investment in capital assets includes land, buildings, improvements other than buildings, equipment, software costs, infrastructure, rights-of-way, and construction in progress. Infrastructure assets are items that are normally immovable, such as roads and bridges.
As allowed by GASB Statement No. 34, the State has adopted an alternative process for recording depreciation expense on selected infrastructure assets. Under this alternative method, referred to as the modified approach, the State expenses certain maintenance and preservation costs and does not report depreciation expense on infrastructure. Utilization of this approach requires the State to: 1) commit to maintaining and preserving affected assets at or above a condition level established by the State; 2) maintain an inventory of the assets and perform periodic condition assessments to ensure that the condition level is being maintained; and 3) make annual estimates of the amounts that must be expended to maintain and preserve assets at the predetermined condition levels. To monitor the condition of the roadways the State uses the International Roughness Index (IRI). The State has set a policy that it will maintain a certain percentage of each category of its roadways with an IRI of less than 80 and will also maintain its bridges so that not more than 10% are structurally deficient or functionally obsolete. The most recent condition assessment shows a decline in the condition level of the roadways. However, the results of the three most recent condition assessments provide reasonable assurance that the condition level of the roadways is being preserved above, or approximately at, the condition level established. The following table shows the State’s policy and the condition level of the roadways and bridges:
The estimated amount necessary to maintain and preserve infrastructure assets at target condition levels exceeded the actual amounts of expense incurred for fiscal year 2015 by $56.4 million. Even though actual spending for maintenance and preservation of infrastructure assets fell below estimates, condition levels are expected to approximately meet or exceed the target condition levels for the roadway category. Additional information on the State’s infrastructure can be found in the Schedule of Infrastructure Condition and Maintenance Data in the Required Supplementary Information section to the financial statements.
To keep pace with the demands of the population, the State also has a substantial capital projects program. The following is a summary of major projects in progress or completed during 2015 (expressed in millions):

16
General Obligation University System Projects Bonds 3/10/2015A 78,335$ General Obligation Capital Improvement and Cultural Affairs Refunding Bonds 3/10/2015B 192,950 General Obligation Natural Resources and Refunding Bonds 3/10/2015C 20,320 General Obligation Natural Resources and Refunding Bonds Marlette Lake 3/10/2015C 1,020 Housing Multi-Unit Henderson Family 08/15/2013 5,691 Housing Multi-Unit Agate Avenue 11/27/2013 9,643 Housing Multi-Unit Landsman Gardens 12/12/2013 5,170 Housing Single-Family Bonds 2014 Issue A 04/01/2015 40,000 Housing Multi-Family Summerhill 04/29/2015 11,000 Housing Multi-Family Agate Avenue II 12/12/2014 55
Expended byJune 30, 2015 Total Budget
Healthcare Reform Software 45.2$ 45.2$ Unemployment Insurance Software Development 29.1 40.4 New Readiness Center North Las Vegas 29.4 35.8 Field Maintenance Shop Facility - LV Readiness Center 23.9 26.9 Elko County Readiness Center 15.9 16.6 Southern Nevada Veterans' Cemetery Expansion 8.3 11.4 NDOT Integrated Right of Way Software 8.2 9.4 Energy Retrofit Projects 5.3 6.2 Las Vegas Springs Preserve Museum 5.6 5.6 Southern Desert CC Finish Core Expansion 4.9 5.0
The total increase in the State’s capital assets for the primary government for the current fiscal year was $299.1 million. This increase included current expenditures to purchase capital assets and completed projects from construction in progress. Depreciation charges for the year totaled $75.6 million.
Additional information on the State’s capital assets can be found in Note 7 to the financial statements.
Debt Administration:As of year-end, the State had $3.5 billion in bonds and certificates of participation outstanding, compared to $3.8 billion last year, a decrease of $280.7 million or 7.4% during the current fiscal year. This decrease was due primarily to the payment of principal on debt.
The most current bond ratings from Fitch, Moody’s Investor Service and Standard and Poor’s were AA+, Aa2 and AA, respectively. These ratings are an indication of high quality obligations and a reflection of sound financial management. The Constitution of the State limits the aggregate principal amount of the general obligation debt to 2% of the total reported assessed property value of the State.
New bonds issued during the 2015 fiscal year were (expressed in thousands):
Additional information on the State’s long-term debt obligations can be found in Note 9 to the financial statements and in the Statistical Section.
Requests for InformationThis financial report is designed to provide a general overview of the State of Nevada’s finances. Questions concerning any of the information provided in this report or requests for additional financial information should be addressed to: State of Nevada, Office of the State Controller, 101 N. Carson Street, Suite 5, Carson City, NV 89701 or visit our website at: www.controller.nv.gov.

17
Basic Financial Section
Burning ManPhotos: Dana Wilson
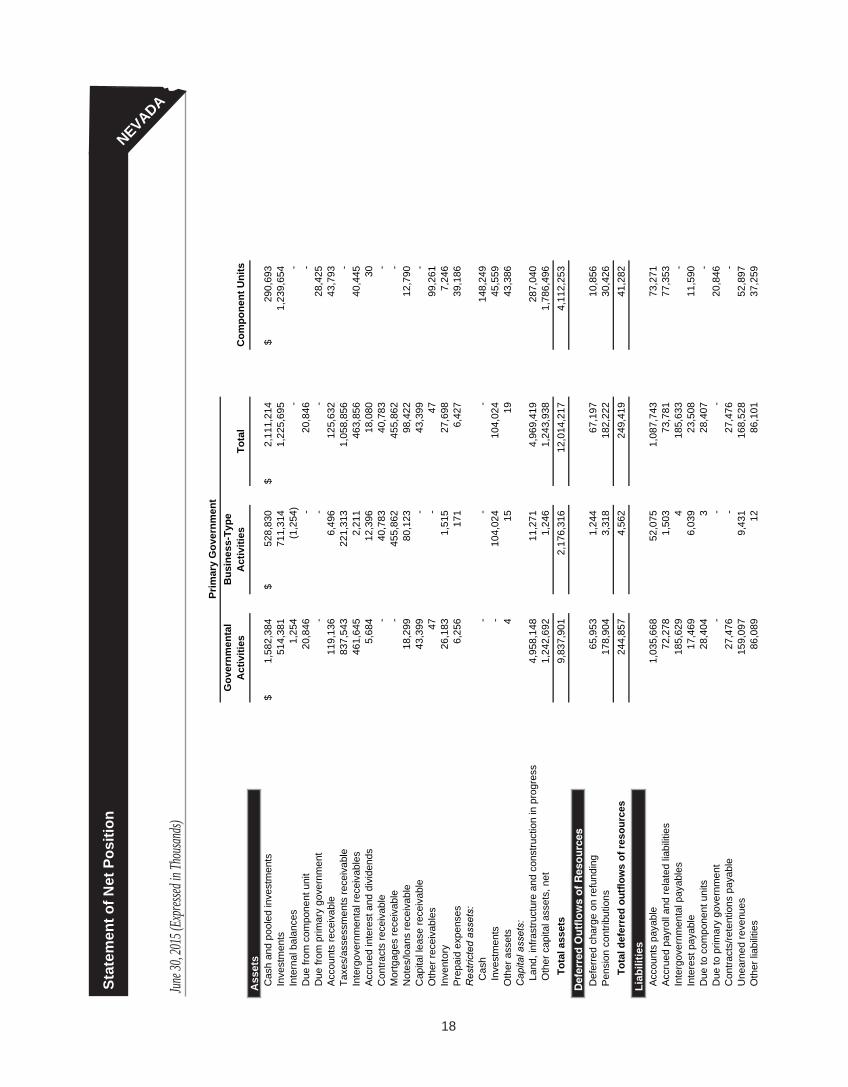
NEVADA
Gov
ernm
enta
l A
ctiv
ities
Bus
ines
s-Ty
pe
Act
iviti
esTo
tal
Com
pone
nt U
nits
Ass
ets
Cas
h an
d po
oled
inve
stm
ents
1,58
2,38
4$
528,
830
$
2,
111,
214
$
29
0,69
3$
Inve
stm
ents
514,
381
711,
314
1,22
5,69
51,
239,
654
Inte
rnal
bal
ance
s1,
254
(1,2
54)
--
Due
from
com
pone
nt u
nit
20,8
46-
20,8
46-
Due
from
prim
ary
gove
rnm
ent
--
-28
,425
Acc
ount
s re
ceiv
able
119,
136
6,49
612
5,63
243
,793
Taxe
s/as
sess
men
ts re
ceiv
able
837,
543
221,
313
1,05
8,85
6-
Inte
rgov
ernm
enta
l rec
eiva
bles
461,
645
2,21
146
3,85
640
,445
Acc
rued
inte
rest
and
div
iden
ds5,
684
12,3
9618
,080
30C
ontra
cts
rece
ivab
le-
40,7
8340
,783
-M
ortg
ages
rece
ivab
le-
455,
862
455,
862
-N
otes
/loan
s re
ceiv
able
18,2
9980
,123
98,4
2212
,790
Cap
ital l
ease
rece
ivab
le43
,399
-43
,399
-O
ther
rece
ivab
les
47-
4799
,261
Inve
ntor
y26
,183
1,51
527
,698
7,24
6P
repa
id e
xpen
ses
6,25
617
16,
427
39,1
86R
estri
cted
ass
ets:
Cas
h-
--
148,
249
Inv
estm
ents
-10
4,02
410
4,02
445
,559
Oth
er a
sset
s4
1519
43,3
86C
apita
l ass
ets:
Lan
d, in
frast
ruct
ure
and
cons
truct
ion
in p
rogr
ess
4,95
8,14
811
,271
4,96
9,41
928
7,04
0 O
ther
cap
ital a
sset
s, n
et1,
242,
692
1,24
61,
243,
938
1,78
6,49
6
Tot
al a
sset
s9,
837,
901
2,17
6,31
612
,014
,217
4,11
2,25
3
Def
erre
d O
utflo
ws
of R
esou
rces
Def
erre
d ch
arge
on
refu
ndin
g65
,953
1,24
467
,197
10,8
56P
ensi
on c
ontri
butio
ns17
8,90
43,
318
182,
222
30,4
26
Tot
al d
efer
red
outfl
ows
of re
sour
ces
244,
857
4,56
224
9,41
941
,282
Liab
ilitie
sA
ccou
nts
paya
ble
1,03
5,66
852
,075
1,08
7,74
373
,271
Acc
rued
pay
roll
and
rela
ted
liabi
litie
s72
,278
1,50
373
,781
77,3
53In
terg
over
nmen
tal p
ayab
les
185,
629
418
5,63
3-
Inte
rest
pay
able
17,4
696,
039
23,5
0811
,590
Due
to c
ompo
nent
uni
ts28
,404
328
,407
-D
ue to
prim
ary
gove
rnm
ent
--
-20
,846
Con
tract
s/re
tent
ions
pay
able
27,4
76-
27,4
76-
Une
arne
d re
venu
es15
9,09
79,
431
168,
528
52,8
97O
ther
liab
ilitie
s86
,089
1286
,101
37,2
59
Prim
ary
Gov
ernm
ent
Sta
tem
ent o
f Net
Pos
ition
Ass
ets
June
30, 2
015 (
Expr
essed
in Th
ousa
nds)
Liab
ilitie
s
18
Def
erre
d O
utflo
ws
of R
esou
rces

Long
-term
liab
ilitie
s: P
ortio
n du
e or
pay
able
with
in o
ne y
ear:
Res
erve
for l
osse
s77
,371
-77
,371
- O
blig
atio
ns u
nder
cap
ital l
ease
s2,
649
-2,
649
3,22
8 C
ompe
nsat
ed a
bsen
ces
61,6
741,
255
62,9
2932
,868
Ben
efits
pay
able
-17
,710
17,7
10-
Bon
ds p
ayab
le33
7,03
717
4,57
251
1,60
931
,452
Cer
tific
ates
of p
artic
ipat
ion
paya
ble
2,94
6-
2,94
6-
Por
tion
due
or p
ayab
le a
fter o
ne y
ear:
Fed
eral
adv
ance
s-
-8,
205
Res
erve
for l
osse
s48
,026
-48
,026
- O
blig
atio
ns u
nder
cap
ital l
ease
s20
,177
-20
,177
43,0
48 N
et p
ensi
on o
blig
atio
n1,
714,
657
31,5
841,
746,
241
297,
838
Com
pens
ated
abs
ence
s37
,357
753
38,1
1017
,751
Ben
efits
pay
able
-18
1,68
118
1,68
1-
Bon
ds p
ayab
le1,
933,
758
950,
347
2,88
4,10
556
8,73
2 C
ertif
icat
es o
f par
ticip
atio
n pa
yabl
e91
,709
-91
,709
- D
ue to
com
pone
nt u
nit
18-
18-
Une
arne
d re
venu
e-
--
61,0
59 A
rbitr
age
reba
te li
abili
ty-
961
961
-
Tot
al li
abili
ties
5,93
9,48
91,
427,
930
7,36
7,41
91,
337,
397
Def
erre
d In
flow
s of
Res
ourc
esP
ensi
on re
late
d am
ount
s49
4,39
09,
041
503,
431
85,5
82Ta
xes
6-
6-
Fine
s an
d fo
rfeitu
res
619
-61
9-
Don
atio
ns-
--
11,6
69Le
ase
reve
nue
--
-4,
119
T
otal
def
erre
d in
flow
s of
reso
urce
s49
5,01
59,
041
504,
056
101,
370
Net
Pos
ition
Net
inve
stm
ent i
n ca
pita
l ass
ets
4,89
5,21
33,
791
4,89
9,00
41,
560,
248
Res
trict
ed fo
r: S
ecur
ity o
f out
stan
ding
obl
igat
ions
-19
2,38
519
2,38
5-
Wor
kers
' com
pens
atio
n-
38,4
8238
,482
- T
uitio
n co
ntra
ct b
enef
its-
52,9
9652
,996
- C
apita
l pro
ject
s52
7-
527
102,
384
Deb
t ser
vice
28,4
72-
28,4
7221
,711
Edu
catio
n - K
to 1
264
5-
645
836
Edu
catio
n - h
ighe
r edu
catio
n11
,366
-11
,366
- T
rans
porta
tion
252,
376
-25
2,37
6-
Rec
reat
ion
and
reso
urce
dev
elop
men
t56
,354
367,
998
424,
352
- L
aw, j
ustic
e an
d pu
blic
saf
ety
46,2
08-
46,2
08-
Hea
lth a
nd s
ocia
l ser
vice
s23
2,31
0-
232,
310
- R
egul
atio
n of
bus
ines
s13
,872
213
,874
- S
chol
arsh
ips
--
-41
9,48
1 L
oans
--
-8,
188
Ope
ratio
ns a
nd m
aint
enan
ce-
--
713
Res
earc
h an
d de
velo
pmen
t-
--
9,53
8 O
ther
pur
pose
s44
7-
447
2,17
0 F
unds
hel
d as
per
man
ent i
nves
tmen
ts:
N
onex
pend
able
334,
052
-33
4,05
237
8,78
6
Exp
enda
ble
21-
21-
Unr
estri
cted
(def
icit)
(2,2
23,6
09)
88,2
53(2
,135
,356
)21
0,71
3
Tot
al n
et p
ositi
on3,
648,
254
$
74
3,90
7$
4,39
2,16
1$
2,71
4,76
8$
The
note
s to
the
finan
cial
sta
tem
ents
are
an
inte
gral
par
t of t
his
stat
emen
t.
Net
Pos
ition
19
Def
erre
d In
flow
s of
Res
ourc
es

NEVADA
Expe
nses
Cha
rges
for
Serv
ices
Ope
ratin
g G
rant
s an
d C
ontr
ibut
ions
Cap
ital
Gra
nts
and
Con
trib
utio
nsG
over
nmen
tal
Act
iviti
esB
usin
ess-
type
A
ctiv
ities
Tota
lC
ompo
nent
U
nits
Func
tions
/Pro
gram
s
Pr
imar
y go
vern
men
t
Gov
ernm
enta
l act
iviti
es:
G
ener
al g
over
nmen
t28
0,46
5$
17
2,46
8$
3,
595
$
-
$
(104
,402
)$
-
$
(104
,402
)$
-$
Hea
lth a
nd s
ocia
l ser
vice
s4,
887,
130
222,
917
3,54
3,06
6-
(1,1
21,1
47)
-(1
,121
,147
)-
E
duca
tion
- K to
12
1,89
2,51
92,
547
264,
326
-(1
,625
,646
)-
(1,6
25,6
46)
-
Edu
catio
n - h
ighe
r edu
catio
n49
0,40
7-
--
(490
,407
)-
(490
,407
)-
L
aw, j
ustic
e an
d pu
blic
saf
ety
695,
023
295,
582
43,5
772,
056
(353
,808
)-
(353
,808
)-
R
egul
atio
n of
bus
ines
s25
9,10
673
,929
142,
961
-(4
2,21
6)-
(42,
216)
-
Tra
nspo
rtatio
n46
2,38
614
,388
300,
775
7,96
1(1
39,2
62)
-(1
39,2
62)
-
Rec
reat
ion
and
reso
urce
dev
elop
men
t14
5,00
047
,146
38,0
1736
8(5
9,46
9)-
(59,
469)
-
Int
eres
t on
long
-term
deb
t94
,987
-1,
229
-(9
3,75
8)-
(93,
758)
-
Una
lloca
ted
depr
ecia
tion
2,13
7-
--
(2,1
37)
-(2
,137
)-
Tot
al g
over
nmen
tal a
ctiv
ities
9,20
9,16
082
8,97
74,
337,
546
10,3
85(4
,032
,252
)-
(4,0
32,2
52)
-
Bus
ines
s-ty
pe a
ctiv
ities
:
Une
mpl
oym
ent i
nsur
ance
380,
166
1,75
313
,124
--
(365
,289
)(3
65,2
89)
-
Hou
sing
23,4
4217
,058
11,7
83-
-5,
399
5,39
9-
W
ater
loan
s6,
372
8,23
334
,542
--
36,4
0336
,403
-
Wor
kers
' com
pens
atio
n an
d sa
fety
27,6
4434
,804
3,73
6-
-10
,896
10,8
96-
H
ighe
r edu
catio
n tu
ition
25,7
6818
,643
9,61
8-
-2,
493
2,49
3-
O
ther
30,2
6331
,394
2,91
3-
-4,
044
4,04
4-
Tot
al b
usin
ess-
type
act
iviti
es49
3,65
511
1,88
575
,716
--
(306
,054
)(3
06,0
54)
-
To
tal p
rimar
y go
vern
men
t9,
702,
815
$
94
0,86
2$
4,
413,
262
$
10
,385
$
(4,0
32,2
52)
(306
,054
)(4
,338
,306
)-
To
tal c
ompo
nent
uni
ts1,
692,
545
$
69
0,53
6$
46
5,48
8$
80
,973
$
--
-(4
55,5
48)
Prog
ram
Rev
enue
sN
et (E
xpen
ses)
Rev
enue
s an
d C
hang
es in
Net
Pos
ition
Prim
ary
Gov
ernm
ent
Sta
tem
ent o
f Act
iviti
es
For t
he F
iscal
Year
End
ed Ju
ne 30
, 201
5 (Ex
press
ed in
Thou
sand
s)
20
Func
tions
/Pro
gram
s
Pri
mar
y G
over
nmen
t

21
876,
636
-87
6,63
6-
1,03
2,52
9-
1,03
2,52
9-
413,
749
-41
3,74
9-
301,
226
-30
1,22
6-
67,6
96-
67,6
96-
2,46
6-
2,46
6-
378,
627
300
378,
927
-
-55
4,88
755
4,88
7-
128,
439
-12
8,43
9-
29,7
46-
29,7
46-
150,
480
-15
0,48
0-
139,
417
-13
9,41
7-
67,8
15-
67,8
15-
51,6
21-
51,6
21-
34,8
35-
34,8
35-
12,0
75-
12,0
75-
246,
277
-24
6,27
7-
207,
024
-20
7,02
4-
20,2
09-
20,2
09-
3,53
2-
3,53
2-
618
-61
8-
41,2
57-
41,2
57-
14,7
80-
14,7
8011
,918
137,
546
-13
7,54
64,
501
9,03
8-
9,03
829
,980
--
-48
6,96
9-
5,00
05,
000
-(1
47,1
00)
147,
100
--
4,22
0,53
870
7,28
74,
927,
825
533,
368
188,
286
401,
233
589,
519
77,8
203,
459,
968
342,
674
3,80
2,64
22,
636,
948
3,64
8,25
4$
743,
907
$
4,39
2,16
1$
2,
714,
768
$
The
note
s to
the
finan
cial
sta
tem
ents
are
an
inte
gral
par
t of t
his
stat
emen
t.
Gam
ing
G
ener
al re
venu
es:
T
axes
:
Oth
er ta
xes
Sal
es a
nd u
se
M
odifi
ed b
usin
ess
Insu
ranc
e pr
emiu
m
P
rope
rty a
nd tr
ansf
er
M
otor
and
spe
cial
fuel
Oth
er
Res
trict
ed fo
r une
mpl
oym
ent c
ompe
nsat
ion:
Oth
er ta
xes
R
estri
cted
for e
duca
tiona
l pur
pose
s:
S
ales
and
use
taxe
s
G
amin
g ta
xes
Oth
er ta
xes
R
estri
cted
for d
ebt s
ervi
ce p
urpo
ses:
Pro
perty
and
tran
sfer
taxe
s
M
otor
and
spe
cial
fuel
taxe
s
O
ther
R
estri
cted
for r
ecre
atio
n an
d re
sour
ce d
evel
opm
ent p
urpo
ses:
Oth
er ta
xes
R
estri
cted
for h
ealth
and
soc
ial s
ervi
ces
purp
oses
:
P
rope
rty a
nd tr
ansf
er ta
xes
C
ontri
butio
ns to
per
man
ent f
unds
R
estri
cted
for t
rans
porta
tion
purp
oses
:
M
otor
and
spe
cial
fuel
taxe
s
O
ther
taxe
s
Res
trict
ed fo
r reg
ulat
ion
of b
usin
ess:
Oth
er ta
xes
Oth
er
Set
tlem
ent i
ncom
e
Unr
estri
cted
inve
stm
ent e
arni
ngs
O
ther
gen
eral
reve
nues
N
et p
ositi
on -
endi
ng
P
aym
ents
from
Sta
te o
f Nev
ada
S
peci
al it
em -
adva
nce
forg
iven
ess
Tr
ansf
ers
T
otal
gen
eral
reve
nues
, spe
cial
item
s, a
nd tr
ansf
ers
Cha
nge
in n
et p
ositi
on
Net
pos
ition
- be
ginn
ing
(as
rest
ated
)

22
General Fund State Highway Municipal Bond BankAssetsCash and pooled investments: Cash with treasurer 564,653,170$ 353,092,911$ 3,990$ Cash in custody of other officials 5,461,534 175,023 -Investments 14,559,620 - 227,845,000Receivables: Accounts receivable 51,909,256 1,282,372 - Taxes receivable 800,026,990 36,772,317 - Intergovernmental receivables 428,837,934 19,792,917 - Accrued interest and dividends 2,665,805 - 1,209,767 Notes/loans receivable 18,213,727 - - Other receivables 15,830 - -Due from other funds 22,320,748 5,485,413 865Due from fiduciary funds 363,079 - -Due from component units 320,400 - -Inventory 9,193,024 16,258,950 -Advances to other funds 2,798,055 - -Prepaid items 5,979,393 70,541 - Total assets 1,927,318,565$ 432,930,444$ 229,059,622$
LiabilitiesAccounts payable and accruals: Accounts payable 453,136,442$ 21,856,844$ -$ Accrued payroll and related liabilities 50,832,041 16,422,079 - Intergovernmental payables 158,651,962 25,244,751 - Contracts/retentions payable 93,795 20,544,135 -Due to other funds 28,998,269 7,063,120 4,367Due to fiduciary funds 532,097,647 1,650,439 -Due to component units 9,400,823 1,531,959 -Unearned revenues 157,188,264 271,830 -Other liabilities 81,729,911 2,107,389 -
Total liabilities 1,472,129,154 96,692,546 4,367Deferred Inflows of ResourcesUnavailable revenue: Taxes 84,099,141 128,780 - Intergovernmental 137,675,307 - - Licenses, fees and permits 3,634,164 - - Sales and charges for services 9,817,630 339,365 - Settlement income - - - Interest 255,114 142,205 185,404 Other 11,794,945 1,696,778 -Taxes 6,374 - -Fines and forfeitures 619,403 - -
Total deferred inflows of resources 247,902,078 2,307,128 185,404
Fund BalancesNonspendable 35,134,296 16,329,491 227,845,000Restricted 62,113,980 307,297,550 -Committed 315,130,956 10,303,729 1,024,851Unassigned (205,091,899) - -
Total fund balances 207,287,333 333,930,770 228,869,851
Total liabilities, deferred inflows of resources and fund balances 1,927,318,565$ 432,930,444$ 229,059,622$
The notes to the financial statements are an integral part of this statement.
Balance SheetGovernmental Funds
June 30, 2015
Assets
Liabilities
Fund Balances
Deferred Inflows of Resources

NEVADA
23
Permanent School Fund
Other Governmental Funds
Total Governmental Funds
17,234,148$ 386,924,096$ 1,321,908,315$ 23,657,094 60,543,755 89,837,406
270,401,879 1,574,376 514,380,875
2,035 61,056,654 114,250,317- 743,194 837,542,501
2,646,511 7,122,168 458,399,530734,184 1,074,607 5,684,363
- - 18,213,727- 30,822 46,652
42,275 25,502,384 53,351,685- 1,015,944 1,379,023
20,496,002 60 20,816,462- 455,333 25,907,307- 753,183 3,551,238- 13,670 6,063,604
335,214,128$ 546,810,246$ 3,471,333,005$
-$ 9,062,321$ 484,055,607$ - 3,056,551 70,310,671- 1,684,247 185,580,960- 6,838,156 27,476,086
1,283,720 25,025,647 62,375,123- 18,682 533,766,768- 17,470,963 28,403,745- 1,338,978 158,799,072
306,344 1,945,039 86,088,683
1,590,064 66,440,584 1,636,856,715
- - 84,227,921- - 137,675,307- - 3,634,164- 5,172 10,162,167- 20,469,114 20,469,114
5,651 112,257 700,631660 443,397 13,935,780
- - 6,374- - 619,403
6,311 21,029,940 271,430,861
333,617,753 902,714 613,829,254- 237,695,687 607,107,217- 220,741,321 547,200,857- - (205,091,899)
333,617,753 459,339,722 1,563,045,429
335,214,128$ 546,810,246$ 3,471,333,005$

24
Saddle-Trained Wild Horse & Burro Inmate Training and Adoption Program

25
NEVADA
Reconciliation of the Governmental Funds Balance Sheet to the Statement of Net Position
June 30, 2015
Total fund balances - governmental funds 1,563,045,429$
Amounts reported for governmental activities in the statement of net position are differentbecause:
Capital assets used in governmental activities are not financial resources and thereforeare not reported in the funds. These assets consist of:
Land 149,678,677$ Construction in progress 199,374,971 Infrastructure assets 3,965,219,441 Rights-of-way 642,842,133 Buildings 1,679,307,924 Improvements other than buildings 124,408,559 Furniture and equipment 352,599,737 Software costs 168,677,262 Accumulated depreciation/amortization (1,105,312,183) Total capital assets 6,176,796,521
Some of the State's revenues collected after year-end are not available soon enoughto pay for the current period's expenditures and, therefore, are reported as unavailabledeferred inflows of resources in the funds. 270,805,084
Intergovernmental receivable not providing current resources. 221,045
Capital lease receivable from discretely presented component unit is not reported in thegovernmental funds. 43,398,670
Internal service funds are used by management to charge the costs of certain activitiesto individual funds. The assets, deferred outflows of resources, liabilities, and deferredinflows of resources of the internal service funds are included in governmental activitiesin the statement of net position. 5,670,697
The loss on early retirement of debt is reported as a deferred outflow of resources onthe statement of net position and is amortized over the original remaining life of the olddebt, or the life of the new debt, whichever is less. 65,953,215
Deferred outflow of resources related to pensions are not reported in the governmentalfunds. 174,232,897
Deferred inflow of resources related to pensions are not reported in the governmental funds. (481,696,535)
Certain liabilities for settlement agreements are not due and payable in the current periodand therefore are not reported in the funds. (5,022,608)
Some liabilities are not due and payable in the current period and therefore are not reported in the funds. Those liabilities consist of:
Net pension obligation (1,670,300,939) Bonds payable (2,265,545,232) Accrued interest on bonds (17,468,621) Certificates of participation (94,654,904) Capital leases (21,487,191) Compensated absences (95,693,591) Total long-term liabilities (4,165,150,478)
Net position of governmental activities 3,648,253,937$
The notes to the financial statements are an integral part of this statement.
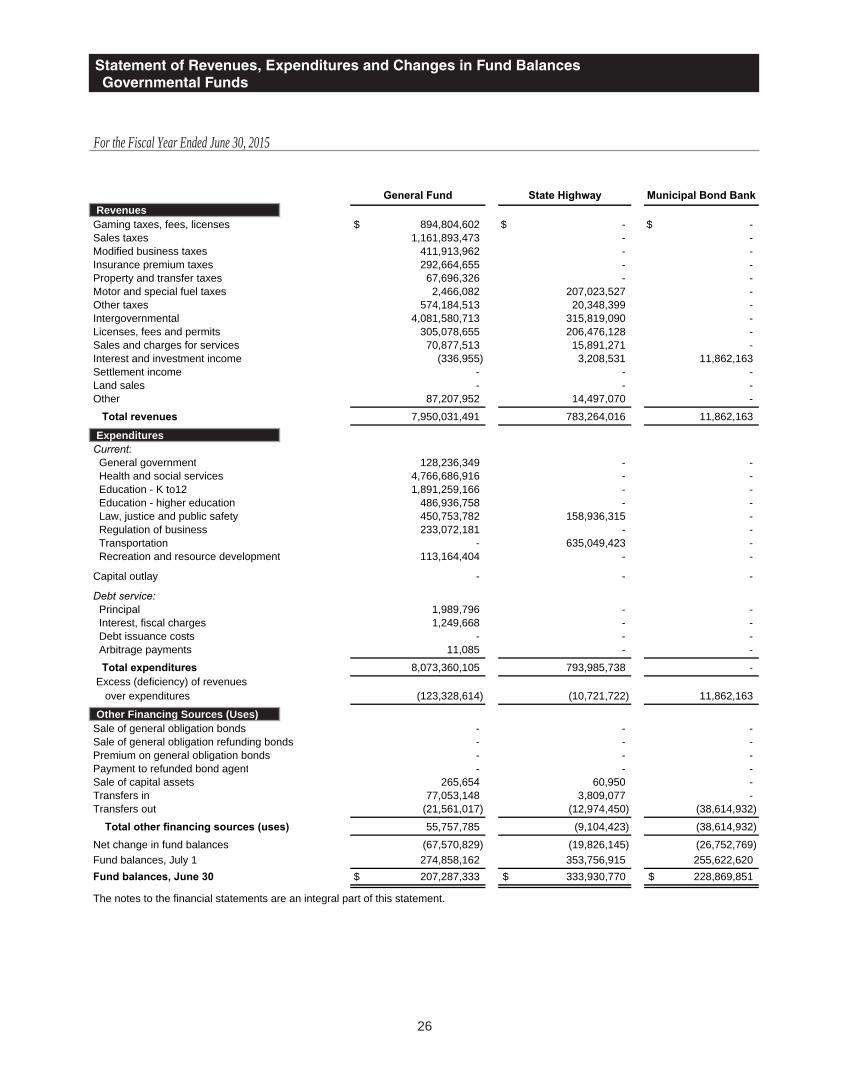
26
General Fund State Highway Municipal Bond BankRevenuesGaming taxes, fees, licenses 894,804,602$ -$ -$ Sales taxes 1,161,893,473 - -Modified business taxes 411,913,962 - -Insurance premium taxes 292,664,655 - -Property and transfer taxes 67,696,326 - -Motor and special fuel taxes 2,466,082 207,023,527 -Other taxes 574,184,513 20,348,399 -Intergovernmental 4,081,580,713 315,819,090 -Licenses, fees and permits 305,078,655 206,476,128 -Sales and charges for services 70,877,513 15,891,271 -Interest and investment income (336,955) 3,208,531 11,862,163Settlement income - - -Land sales - - -Other 87,207,952 14,497,070 -
Total revenues 7,950,031,491 783,264,016 11,862,163
ExpendituresCurrent: General government 128,236,349 - - Health and social services 4,766,686,916 - - Education - K to12 1,891,259,166 - - Education - higher education 486,936,758 - - Law, justice and public safety 450,753,782 158,936,315 - Regulation of business 233,072,181 - - Transportation - 635,049,423 - Recreation and resource development 113,164,404 - -
Capital outlay - - -
Debt service: Principal 1,989,796 - - Interest, fiscal charges 1,249,668 - - Debt issuance costs - - - Arbitrage payments 11,085 - -
Total expenditures 8,073,360,105 793,985,738 - Excess (deficiency) of revenues over expenditures (123,328,614) (10,721,722) 11,862,163
Other Financing Sources (Uses)Sale of general obligation bonds - - -Sale of general obligation refunding bonds - - -Premium on general obligation bonds - - -Payment to refunded bond agent - - -Sale of capital assets 265,654 60,950 -Transfers in 77,053,148 3,809,077 -Transfers out (21,561,017) (12,974,450) (38,614,932)
Total other financing sources (uses) 55,757,785 (9,104,423) (38,614,932)
Net change in fund balances (67,570,829) (19,826,145) (26,752,769)Fund balances, July 1 274,858,162 353,756,915 255,622,620Fund balances, June 30 207,287,333$ 333,930,770$ 228,869,851$
The notes to the financial statements are an integral part of this statement.
Revenues
Expenditures
Statement of Revenues, Expenditures and Changes in Fund BalancesGovernmental Funds
For the Fiscal Year Ended June 30, 2015
Other Financing Sources (Uses)
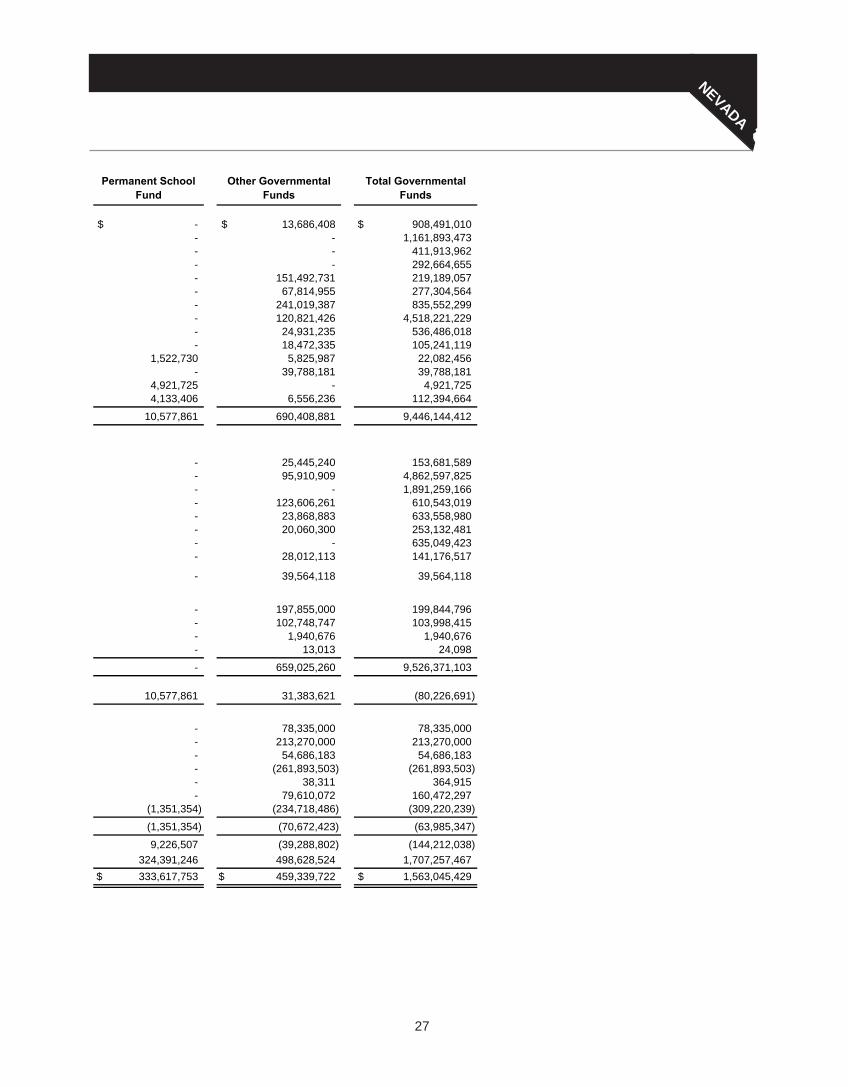
NEVADA
27
Permanent School Fund
Other Governmental Funds
Total Governmental Funds
-$ 13,686,408$ 908,491,010$ - - 1,161,893,473- - 411,913,962- - 292,664,655- 151,492,731 219,189,057- 67,814,955 277,304,564- 241,019,387 835,552,299- 120,821,426 4,518,221,229- 24,931,235 536,486,018- 18,472,335 105,241,119
1,522,730 5,825,987 22,082,456- 39,788,181 39,788,181
4,921,725 - 4,921,7254,133,406 6,556,236 112,394,664
10,577,861 690,408,881 9,446,144,412
- 25,445,240 153,681,589- 95,910,909 4,862,597,825- - 1,891,259,166- 123,606,261 610,543,019- 23,868,883 633,558,980- 20,060,300 253,132,481- - 635,049,423- 28,012,113 141,176,517
- 39,564,118 39,564,118
- 197,855,000 199,844,796- 102,748,747 103,998,415- 1,940,676 1,940,676- 13,013 24,098
- 659,025,260 9,526,371,103
10,577,861 31,383,621 (80,226,691)
- 78,335,000 78,335,000- 213,270,000 213,270,000- 54,686,183 54,686,183- (261,893,503) (261,893,503)- 38,311 364,915- 79,610,072 160,472,297
(1,351,354) (234,718,486) (309,220,239)
(1,351,354) (70,672,423) (63,985,347)
9,226,507 (39,288,802) (144,212,038)324,391,246 498,628,524 1,707,257,467333,617,753$ 459,339,722$ 1,563,045,429$

28
Kayakers on Lake MeadToursim and Cultural Affairs
Kayaking East Fork of the Carson River, NVToursim and Cultural Affairs

29
NEVADA
Reconciliation of Revenues, Expenditures, and Changes in Fund Balances of Governmental Funds to the Statement of Activities
For the Fiscal Year Ended June 30, 2015
Net change in fund balances - total governmental funds (144,212,038)$ Amounts reported for governmental activities in the statement of activities are different because:
Capital outlays are reported as expenditures in governmental funds. However, in thestatement of activities, the cost of capital assets is allocated over their estimated usefullives as depreciation expense. In the current period, the amounts are:
Capital outlay 256,676,438$ Depreciation expense (69,578,515) Excess of capital outlay over depreciation expense 187,097,923
Debt proceeds provide current financial resources to governmental funds; however, issuingdebt increases long-term liabilities in the statement of net assets. In the current period,proceeds were received from:
Bonds issued (78,335,000) Refunding bonds issued (213,270,000) Premiums on debt issued (54,686,183) Total bond proceeds (346,291,183)
Repayment of long-term debt is reported as an expenditure in governmental funds, but therepayment reduces long-term liabilities in the statement of net position. In the current year, these amounts consist of:
Bond principal retirement 194,821,677 Certficates of participation retirement 2,520,000 Payments to the bond refunding agent 261,893,503 Capital lease payments 1,761,450 Total long-term debt repayment 460,996,630
Internal service funds are used to charge the costs of certain activities to individual funds.The change in net position of the internal service funds is reported with governmental activities. (28,725,554)
Because some revenues will not be collected for several months after the State's fiscal yearend, they are not considered "available" and are not reported as revenues in the governmentalfunds. Unavailable deferred inflows of resources changed by this amount. 51,367,087
In the statement of activities, the gain or loss on the sale of assets is reported, whereas in thegovernmental funds, only the proceeds from the sale increase financial resources. Thus, thethe change in net assets differs from the change in fund balance by the cost of the asset sold. (812,147)
Governmental funds reported an expenditure for construction costs related to an assetrecorded as a capital lease receivable in the statement of net position. 38,857,952
Amortization of deferred loss on early retirement of debt is reported as an expense for thestatement of activities. (7,639,217)
Amortization of premiums on bonds and certificates of participation is reported as a reductionof interest expense for the statement of activities. 18,191,042
Some items reported in the statement of activities do not require the use of current financialresources and therefore are not reported as expenditures in governmental funds. Theseactivities consist of the net change in:
Pension costs, net (36,373,044) Accrued interest payable (1,978,710) Compensated absences (1,883,173) Settlement agreement liability (309,224) Total additional expenditures (40,544,151)
Change in net position of governmental activities 188,286,344$
The notes to the financial statements are an integral part of this statement.

30
HousingDivision
UnemploymentCompensation
WaterProjectsLoans
HigherEducation
Tuition Trust
OtherEnterprise
Funds
TotalEnterprise
Funds
InternalServiceFunds
AssetsCurrent assets:Cash and pooled investments: Cash with treasurer 560,612$ -$ 121,054,094$ 1,231,465$ 57,178,537$ 180,024,708$ 170,638,091$ Cash in custody of other officials 494,878 347,749,410 - 342,622 218,721 348,805,631 -Investments 47,541,052 - - 210,156,888 - 257,697,940 -Receivables: Accounts receivable - - - - 6,486,391 6,486,391 614,164 Assessments receivable - 221,312,799 - - 250 221,313,049 - Intergovernmental receivables - - 1,588,332 - 623,261 2,211,593 3,024,364 Contracts receivable - - - 9,154,365 - 9,154,365 - Mortgages receivable 24,438,022 - - - - 24,438,022 - Accrued interest and dividends 8,282,869 - 3,838,588 274,342 - 12,395,799 - Notes/loans receivable - - - - - - 5,000Due from other funds 92,155 1,771,296 294,142 11,893 1,129,178 3,298,664 10,876,231Due from fiduciary funds - - - - 9,712 9,712 2,892,703Due from component units - - - - - - 29,983Inventory - - - - 1,515,351 1,515,351 275,320Prepaid items - - - - 170,669 170,669 192,270Restricted assets: Investments 72,745,528 - - - - 72,745,528 - Total current assets 154,155,116 570,833,505 126,775,156 221,171,575 67,332,070 1,140,267,422 188,548,126Noncurrent assets:Investments 172,350,479 - 281,266,051 - - 453,616,530 -Receivables: Contracts receivable - - - 31,628,789 - 31,628,789 - Mortgages receivable 431,423,652 - - - - 431,423,652 - Notes/loans receivable 51,000,000 - 29,122,925 - - 80,122,925 80,000Restricted assets: Investments 31,278,244 - - - - 31,278,244 -Other assets - - - - 15,000 15,000 4,445Capital assets: Land - - - - 567,812 567,812 1,032,737 Buildings - - - - 3,388,840 3,388,840 20,392,485 Improvements other than buildings - - - - 630,647 630,647 3,839,621 Furniture and equipment 333,847 - 35,280 173,374 5,361,964 5,904,465 54,339,679 Software costs - - - - - - 15,323,810 Construction in progress - - - - 10,703,713 10,703,713 - Less accumulated depreciation/ amortization (40,484) - (35,280) (66,240) (8,536,000) (8,678,004) (70,884,399) Total noncurrent assets 686,345,738 - 310,388,976 31,735,923 12,131,976 1,040,602,613 24,128,378 Total assets 840,500,854 570,833,505 437,164,132 252,907,498 79,464,046 2,180,870,035 212,676,504
Deferred Outflows of ResourcesDeferred charge on refunding - - 1,149,516 - 94,412 1,243,928 -Pension contributions 244,235 - 65,024 17,885 2,990,399 3,317,543 4,671,415 Total deferred outflows of resources 244,235 - 1,214,540 17,885 3,084,811 4,561,471 4,671,415
Enterprise Funds
Assets
Statement of Net PositionProprietary Funds
June 30, 2015
Deferred Outflows of Resources

NEVADA
31
HousingDivision
UnemploymentCompensation
WaterProjectsLoans
HigherEducation
Tuition Trust
OtherEnterprise
Funds
TotalEnterprise
Funds
InternalServiceFunds
Enterprise Funds
LiabilitiesCurrent liabilities:Accounts payable and accruals: Accounts payable 41,880,967$ 8,598,234$ 78,085$ 115,753$ 1,327,404$ 52,000,443$ 8,809,263$ Accrued payroll and related liabilities 114,963 - 23,700 12,234 1,352,270 1,503,167 1,967,164 Interest payable 3,240,575 1,664,221 1,090,013 - 44,315 6,039,124 - Intergovernmental payables - - - - 4,198 4,198 47,986Bank overdraft - - - - - - 4,000,485Due to other funds 9,933 1,651,340 210,660 58,513 1,896,656 3,827,102 1,324,355Due to fiduciary funds - - 17,216 - 57,256 74,472 13,723Due to component units - - - 3,432 - 3,432 17,858Unearned revenues - - - - 9,430,943 9,430,943 298,605Other liabilities - - - - 12,050 12,050 -Short-term portion of long-term liabilities: Reserve for losses - - - - - - 77,370,730 Compensated absences 90,586 - 22,592 14,959 1,127,243 1,255,380 1,916,338 Benefits payable - - - 17,709,553 - 17,709,553 - Bonds payable 19,129,752 144,125,825 11,087,457 - 229,358 174,572,392 513,323 Obligations under capital leases - - - - - - 689,650 Total current liabilities 64,466,776 156,039,620 12,529,723 17,914,444 15,481,693 266,432,256 96,969,480Noncurrent liabilities:Advances from funds - - - - 227,370 227,370 3,323,868Reserve for losses - - - - - - 48,026,180Net pension obligation 2,325,157 - 619,039 170,271 28,469,084 31,583,551 44,356,202Compensated absences 78,045 - 9,787 6,695 658,368 752,895 1,421,268Benefits payable - - - 181,681,853 - 181,681,853 -Bonds payable 580,097,475 303,986,583 57,765,488 - 8,496,953 950,346,499 4,736,249Obligations under capital leases - - - - - - 648,976Arbitrage rebate liability - 960,702 - - - 960,702 - Total noncurrent liabilities 582,500,677 304,947,285 58,394,314 181,858,819 37,851,775 1,165,552,870 102,512,743 Total liabilities 646,967,453 460,986,905 70,924,037 199,773,263 53,333,468 1,431,985,126 199,482,223
Deferred Inflows of ResourcesPension related amounts 665,591 - 177,204 48,741 8,149,460 9,040,996 12,693,021
Net PositionNet investment in capital assets 293,363 - - 107,134 3,390,665 3,791,162 17,572,206Restricted for: Tuition contract benefits - - - 52,996,245 - 52,996,245 - Security of outstanding obligations 192,385,342 - - - - 192,385,342 - Workers' compensation - - - - 38,481,574 38,481,574 - Revolving loans - - 367,998,489 - - 367,998,489 - Regulation of business - - - - 2,000 2,000 -Unrestricted (deficit) 433,340 109,846,600 (721,058) - (20,808,310) 88,750,572 (12,399,531) Total net position 193,112,045$ 109,846,600$ 367,277,431$ 53,103,379$ 21,065,929$ 744,405,384 5,172,675$
Adjustment to report the cumulative internal balance for the net effect of the activity between the internal service funds and the enterprise funds over time. (498,022) Net position of business-type activities 743,907,362$
The notes to the financial statements are an integral part of this statement.
Liabilities
Net Position
(Continued)
Deferred Inflows of Resources

32
Nevada Off-Road Racing

33
NEVADA
Housing Division
Unemployment Compensation
Water Projects Loans
Higher Education
Tuition Trust
Other Enterprise
FundsTotal Enterprise
FundsInternal
Service FundsOperating RevenuesNet premium income -$ -$ -$ -$ -$ -$ 342,126,396$ Sales - - - 18,513,649 6,463,385 24,977,034 2,433,621Assessments - 554,886,641 - - 300,596 555,187,237 -Charges for services - - 10,000 129,100 13,088,151 13,227,251 45,408,563Rental income - - - - 106,100 106,100 19,759,959Interest income on loans/notes 11,416,757 - 8,214,051 - - 19,630,808 -Federal government - 7,033,800 32,671,789 - - 39,705,589 -Licenses, fees and permits - - - - 38,600,781 38,600,781 -Fines - - - - 3,436,200 3,436,200 -Other 5,641,274 1,753,478 8,487 - 4,503,162 11,906,401 483,571 Total operating revenues 17,058,031 563,673,919 40,904,327 18,642,749 66,498,375 706,777,401 410,212,110
Operating ExpensesSalaries and benefits 2,077,349 - 409,543 179,083 34,480,116 37,146,091 35,893,681Operating 1,886,123 - 3,798,097 458,166 13,235,147 19,377,533 39,667,600Claims and benefits expense - 369,719,188 - 25,106,514 5,884,877 400,710,579 233,113,660Interest on bonds payable 15,148,926 - 2,150,652 - - 17,299,578 -Materials or supplies used - - - - 2,876,291 2,876,291 726,042Servicers' fees 79,058 - - - - 79,058 -Depreciation 40,484 - - 18,035 310,251 368,770 5,651,528Insurance premiums - - - - - - 127,842,405 Total operating expenses 19,231,940 369,719,188 6,358,292 25,761,798 56,786,682 477,857,900 442,894,916
Operating income (loss) (2,173,909) 193,954,731 34,546,035 (7,119,049) 9,711,693 228,919,501 (32,682,806)
Nonoperating Revenues (Expenses)Interest and investment income 7,709,618 6,089,679 1,869,984 9,618,430 1,401,989 26,689,700 3,147,466Interest expense - (10,056,842) - - (381,198) (10,438,040) (4,848)Bond issuance costs - - - - (12,300) (12,300) -Federal grant revenue 4,073,608 - - - 5,247,223 9,320,831 -Federal grant expense (4,148,654) - - - - (4,148,654) -Gain (loss) on disposal of assets - - - - - - (1,641,476)Arbitrage rebate - (389,638) - - - (389,638) - Total nonoperating revenues (expenses) 7,634,572 (4,356,801) 1,869,984 9,618,430 6,255,714 21,021,899 1,501,142Income (loss) before transfers 5,460,663 189,597,930 36,416,019 2,499,381 15,967,407 249,941,400 (31,181,664)
Special Items and TransfersSpecial item - advance forgiveness - - - 5,000,000 - 5,000,000 -Transfers in 156,743 161,607,667 - 2,323,143 15,326 164,102,879 1,739,361Transfers out - (3,575,976) (1,107,916) - (12,319,274) (17,003,166) (91,132)
Change in net position 5,617,406 347,629,621 35,308,103 9,822,524 3,663,459 402,041,113 (29,533,435)Net position, July 1 (as restated) 187,494,639 (237,783,021) 331,969,328 43,280,855 17,402,470 34,706,110
Net position, June 30 193,112,045$ 109,846,600$ 367,277,431$ 53,103,379$ 21,065,929$ 5,172,675$
Adjustment for the net effect of the current year activity between the internal service funds and the enterprise funds. (807,882) Change in net position of business-type activities 401,233,231$
The notes to the financial statements are an integral part of this statement.
Enterprise Funds
Operating Revenues
Operating Expenses
Statement of Revenues, Expenses and Changes in Fund Net PositionProprietary Funds
For the Fiscal Year Ended June 30, 2015
Nonoperating Revenues (Expenses)
Special Items and Transfers

34
Statement of Cash FlowsProprietary Funds
For the Fiscal Year Ended June 30, 2015
Water Higher Other InternalHousing Unemployment Projects Education Enterprise ServiceDivision Compensation Loans Tuition Trust Funds Totals Funds
Cash flows from operating activitiesReceipts from customers and users 22,371,570$ 535,278,199$ 18,487$ 16,874,727$ 79,000,444$ 653,543,427$ 52,461,818$ Receipts for interfund services provided 15,613 1,945,201 - 11,913 3,293,391 5,266,118 265,580,408 Receipts from component units - - - - - - 71,305,951 Receipts of principal on loans/notes 49,213,663 - - - - 49,213,663 5,000 Receipts of interest on loans/notes 5,373,939 - - - - 5,373,939 - Receipts from federal government - 7,033,800 31,693,502 - - 38,727,302 - Payments to suppliers, other governments and beneficiaries (2,364,995) (371,068,830) (3,648,628) (5,174,545) (40,937,860) (423,194,858) (367,337,142)Payments to employees (1,738,658) - (390,187) (167,797) (34,312,150) (36,608,792) (34,325,177) Payments for interfund services (2,739,510) - (120,200) (148,371) (7,652,904) (10,660,985) (19,296,340) Payments to component units - - - (5,975,152) (3,914) (5,979,066) (179,083) Purchase of loans and notes (36,475,631) - - - - (36,475,631) -
Net cash provided by (used for) operating activities 33,655,991 173,188,370 27,552,974 5,420,775 (612,993) 239,205,117 (31,784,565)
Cash flows from noncapital financing activitiesGrant receipts 4,073,608 - - - 4,871,351 8,944,959 - Advances from federal government - - - 2,323,143 - 2,323,143 - Proceeds from sale of bonds 72,211,717 - - - - 72,211,717 - Transfers and advances from other funds 156,743 163,374,691 - - 15,326 163,546,760 1,754,158 Principal paid on noncapital debt (80,778,767) (138,590,000) (9,505,000) - - (228,873,767) - Interest paid on noncapital debt (15,493,765) (24,784,691) (2,745,396) - - (43,023,852) - Transfers and advances to other funds - (2,420,047) (1,181,533) - (12,659,151) (16,260,731) (278,632) Payments to other governments and organizations (4,223,700) - - - - (4,223,700) -
Net cash provided by (used for) noncapital financing activities (24,054,164) (2,420,047) (13,431,929) 2,323,143 (7,772,474) (45,355,471) 1,475,526
Cash flows from capital and related financing activitiesProceeds from capital debt - - - - 1,020,000 1,020,000 - Proceeds from sale of capital assets - - - - - - 130,607 Purchase of capital assets - - - - (145,381) (145,381) (6,025,981) Principal paid on capital debt - - - - (1,190,670) (1,190,670) (1,480,332) Interest paid on capital debt - - - - (461,454) (461,454) (4,848) Issue costs - - - - (12,300) (12,300) - Payments on construction projects - - - - (365,639) (365,639) - Net cash provided by (used for) capital and related financing activities - - - - (1,155,444) (1,155,444) (7,380,554)
Cash flows from investing activitiesProceeds from sale of investments 462,104,497 - - 43,399,906 - 505,504,403 - Receipts of principal on loans/notes - - 25,201,006 - - 25,201,006 - Purchase of investments (478,464,428) - - (57,693,595) - (536,158,023) - Purchase of loans and notes - - (30,238,353) - - (30,238,353) - Interest, dividends and gains (losses) 6,651,812 6,089,679 10,325,741 5,819,438 1,479,751 30,366,421 3,329,151
Net cash provided by (used for) investing activities (9,708,119) 6,089,679 5,288,394 (8,474,251) 1,479,751 (5,324,546) 3,329,151
Net increase (decrease) in cash (106,292) 176,858,002 19,409,439 (730,333) (8,061,160) 187,369,656 (34,360,442) Cash and cash equivalents, July 1 1,161,782 170,891,408 101,644,655 2,304,420 65,458,418 341,460,683 204,998,533
Cash and cash equivalents, June 30 1,055,490 $ 347,749,410 $ 121,054,094 $ 1,574,087 $ 57,397,258 $ 528,830,339 $ 170,638,091 $
Enterprise Funds

NEVADA
35
Water Higher Other InternalHousing Unemployment Projects Education Enterprise ServiceDivision Compensation Loans Tuition Trust Funds Totals Funds
Enterprise Funds
Reconciliation of operating income (loss) to net cash provided by (used for) operating activitiesOperating income (loss) (2,173,909)$ 193,954,731 $ 34,546,035 $ (7,119,049)$ 9,711,693 $ 228,919,501 $ (32,949,806)$
Adjustments to reconcile operating income (loss) to net cash provided by (used for) operating activitiesDepreciation 40,484 - - 18,035 310,251 368,770 5,651,528 Interest on loans - - (8,214,051) - - (8,214,051) - Interest on bonds payable 15,148,926 - 2,150,652 - - 17,299,578 - Decrease (increase) in loans and notes receivable 6,056,125 - - - - 6,056,125 5,000 Decrease (increase) in accrued interest and receivables (244,298) (19,416,719) (978,287) (1,756,109) 1,096,179 (21,299,234) (7,219,507) Decrease (increase) in inventory, deferred charges, other assets - - 3,724 1,490 (14,340) (9,126) 324,318 Decrease (increase) in deferred outflows of resources (2,228) - (5,016) (2,123) (37,148) (46,515) 180,180 Increase (decrease) in accounts payable, accruals, other liabilities 14,773,887 (1,349,642) 34,740 14,274,357 (12,350,184) 15,383,158 14,782,401 Increase (decrease) in unearned revenues - - - - (27,405) (27,405) (13,641,909) Increase (decrease) in net pension liability (608,587) - (162,027) (44,567) (7,451,499) (8,266,680) (11,609,791) Increase (decrease) in deferred inflows of resources 665,591 - 177,204 48,741 8,149,460 9,040,996 12,693,021 Other adjustments - - - - - - -
Total adjustments 35,829,900 (20,766,361) (6,993,061) 12,539,824 (10,324,686) 10,285,616 1,165,241
Net cash provided by (used for) operating activities 33,655,991 $ 173,188,370 $ 27,552,974 $ 5,420,775 $ (612,993)$ 239,205,117 $ (31,784,565)$
Noncash investing, capital and financing activitiesIncrease (decrease) in fair value of investments -$ -$ -$ 3,943,350$ -$ 3,943,350$ -$
The notes to the financial statements are an integral part of this statement.
(Continued)

36
NEVADA
Pension and Other Employee Benefit
Trust FundsInvestment Trust
FundsPrivate-Purpose Trust
Funds Agency FundsAssetsCash and pooled investments: Cash with treasurer 4,971,859$ 10,612$ 6,597,414$ 80,717,201$ Cash in custody of other officials 264,618,864 7,011,215 17,282,677 31,150,816
Investments: Investments 1,296,388 943,863,634 15,857,000,441 222,312,599 Fixed income securities 9,478,773,231 - - - Marketable equity securities 14,671,703,489 - - - International securities 7,327,360,685 - - - Real estate 1,454,303,113 - - - Alternative investments 1,319,000,149 - - -
Collateral on loaned securities 373,833,323 - - -
Receivables: Accounts receivable - 8,734 84,858 - Accrued interest and dividends 91,621,113 2,310,336 3,488,328 - Taxes receivable - - - 58,334,065 Trades pending settlement 129,463,466 - 3,976,716 - Intergovernmental receivables 102,308,751 - 89,585 20,178 Contributions receivable - - 12,857,154 - Other receivables 194,495 - - 99,064
Due from other funds 122,332 17,351 172,939 533,542,341Due from fiduciary funds 19,306,997 - - 13,319,888Due from component unit 1,488,231 - - 2,263,225Other assets 3,633,781 - - -Furniture and equipment 40,412,280 - 48,222 -Accumulated depreciation (36,462,089) - (48,222) - Total assets 35,247,950,458 953,221,882 15,901,550,112 941,759,377
LiabilitiesAccounts payable and accruals: Accounts payable 10,454,250 107,744 2,863,597 - Accrued payroll and related liabilities - - 714 80,001 Intergovernmental payables - 33,588 8,591 595,511,978 Redemptions payable - - 5,789,195 - Trades pending settlement 141,195,584 2,490,065 12,905,426 -
Bank overdraft - - 3,061,000 -Obligations under securities lending 373,833,323 - - -Due to other funds 2,892,703 40,361 1,348,374 -Due to fiduciary funds - - 26,840 32,600,045Other liabilities: Deposits - - - 308,465,127 Other liabilities 178,709 - - 5,102,226 Total liabilities 528,554,569 2,671,758 26,003,737 941,759,377
Net positionRestricted for: Employees' pension benefits 34,714,399,697 - - - OPEB benefits 4,996,192 - - - Pool participants - 950,550,124 - - Individuals - - 15,875,546,375 - Total net position 34,719,395,889$ 950,550,124$ 15,875,546,375$ -$
The notes to the financial statements are an integral part of this statement.
Statement of Fiduciary Net PositionFiduciary Funds
June 30, 2015
Assets
Liabilities
Net Position
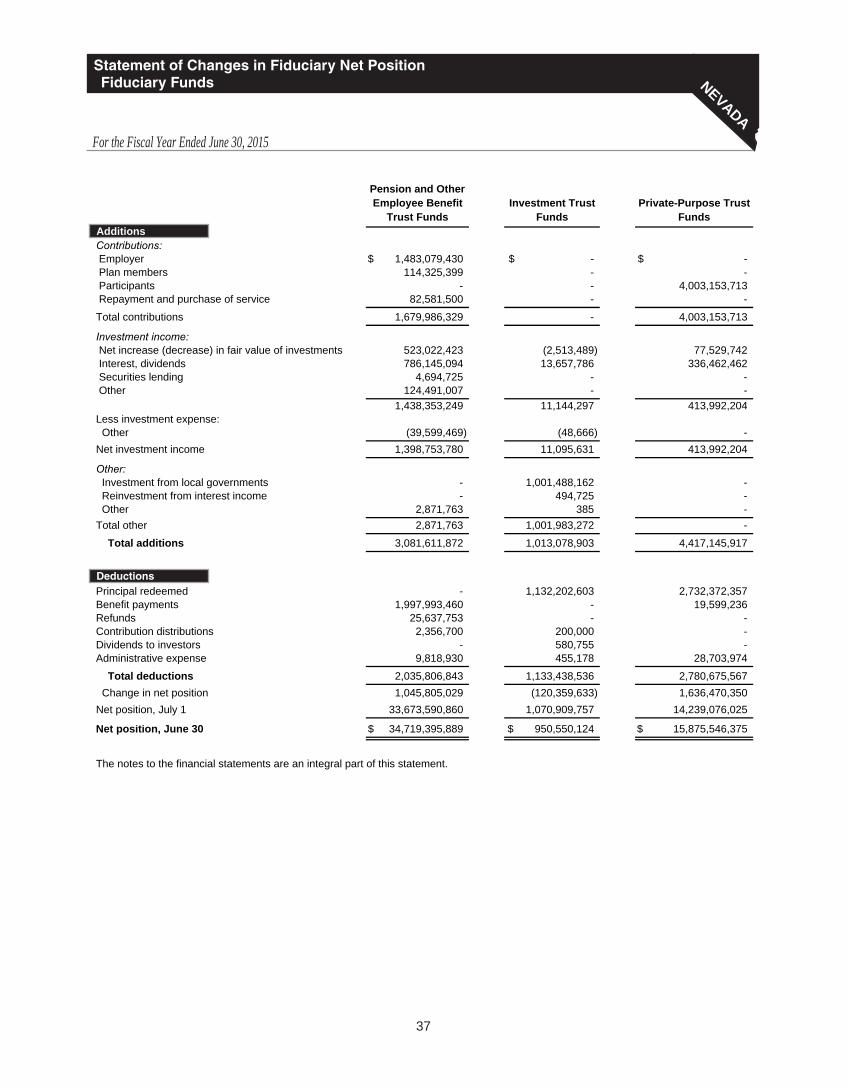
37
NEVADA
Pension and Other Employee Benefit
Trust FundsInvestment Trust
FundsPrivate-Purpose Trust
FundsAdditionsContributions: Employer 1,483,079,430$ -$ -$ Plan members 114,325,399 - - Participants - - 4,003,153,713 Repayment and purchase of service 82,581,500 - -
Total contributions 1,679,986,329 - 4,003,153,713
Investment income: Net increase (decrease) in fair value of investments 523,022,423 (2,513,489) 77,529,742 Interest, dividends 786,145,094 13,657,786 336,462,462 Securities lending 4,694,725 - - Other 124,491,007 - -
1,438,353,249 11,144,297 413,992,204Less investment expense: Other (39,599,469) (48,666) -Net investment income 1,398,753,780 11,095,631 413,992,204
Other: Investment from local governments - 1,001,488,162 - Reinvestment from interest income - 494,725 - Other 2,871,763 385 -Total other 2,871,763 1,001,983,272 -
Total additions 3,081,611,872 1,013,078,903 4,417,145,917
DeductionsPrincipal redeemed - 1,132,202,603 2,732,372,357Benefit payments 1,997,993,460 - 19,599,236Refunds 25,637,753 - -Contribution distributions 2,356,700 200,000 -Dividends to investors - 580,755 -Administrative expense 9,818,930 455,178 28,703,974
Total deductions 2,035,806,843 1,133,438,536 2,780,675,567 Change in net position 1,045,805,029 (120,359,633) 1,636,470,350Net position, July 1 33,673,590,860 1,070,909,757 14,239,076,025
Net position, June 30 34,719,395,889$ 950,550,124$ 15,875,546,375$
The notes to the financial statements are an integral part of this statement.
Statement of Changes in Fiduciary Net PositionFiduciary Funds
For the Fiscal Year Ended June 30, 2015
Additions
Deductions
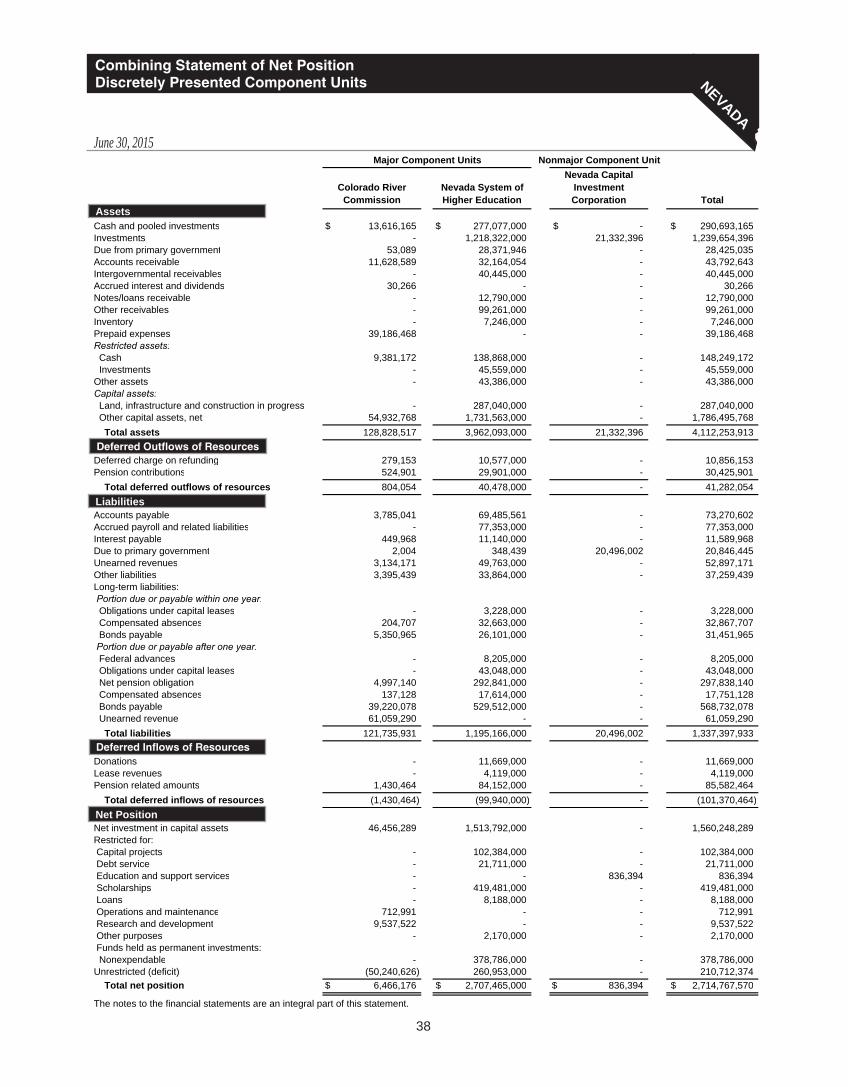
38
NEVADA
Nonmajor Component Unit
Colorado River Commission
Nevada System of Higher Education
Nevada Capital Investment Corporation Total
AssetsCash and pooled investments 13,616,165$ 277,077,000$ -$ 290,693,165$ Investments - 1,218,322,000 21,332,396 1,239,654,396Due from primary government 53,089 28,371,946 - 28,425,035Accounts receivable 11,628,589 32,164,054 - 43,792,643Intergovernmental receivables - 40,445,000 - 40,445,000Accrued interest and dividends 30,266 - - 30,266Notes/loans receivable - 12,790,000 - 12,790,000Other receivables - 99,261,000 - 99,261,000Inventory - 7,246,000 - 7,246,000Prepaid expenses 39,186,468 - - 39,186,468Restricted assets: Cash 9,381,172 138,868,000 - 148,249,172 Investments - 45,559,000 - 45,559,000Other assets - 43,386,000 - 43,386,000Capital assets: Land, infrastructure and construction in progress - 287,040,000 - 287,040,000 Other capital assets, net 54,932,768 1,731,563,000 - 1,786,495,768 Total assets 128,828,517 3,962,093,000 21,332,396 4,112,253,913
Deferred Outflows of ResourcesDeferred charge on refunding 279,153 10,577,000 - 10,856,153Pension contributions 524,901 29,901,000 - 30,425,901 Total deferred outflows of resources 804,054 40,478,000 - 41,282,054
LiabilitiesAccounts payable 3,785,041 69,485,561 - 73,270,602Accrued payroll and related liabilities - 77,353,000 - 77,353,000Interest payable 449,968 11,140,000 - 11,589,968Due to primary government 2,004 348,439 20,496,002 20,846,445Unearned revenues 3,134,171 49,763,000 - 52,897,171Other liabilities 3,395,439 33,864,000 - 37,259,439Long-term liabilities: Portion due or payable within one year: Obligations under capital leases - 3,228,000 - 3,228,000 Compensated absences 204,707 32,663,000 - 32,867,707 Bonds payable 5,350,965 26,101,000 - 31,451,965 Portion due or payable after one year: Federal advances - 8,205,000 - 8,205,000 Obligations under capital leases - 43,048,000 - 43,048,000 Net pension obligation 4,997,140 292,841,000 - 297,838,140 Compensated absences 137,128 17,614,000 - 17,751,128 Bonds payable 39,220,078 529,512,000 - 568,732,078 Unearned revenue 61,059,290 - - 61,059,290 Total liabilities 121,735,931 1,195,166,000 20,496,002 1,337,397,933
Deferred Inflows of ResourcesDonations - 11,669,000 - 11,669,000Lease revenues - 4,119,000 - 4,119,000Pension related amounts 1,430,464 84,152,000 - 85,582,464 Total deferred inflows of resources (1,430,464) (99,940,000) - (101,370,464)
Net PositionNet investment in capital assets 46,456,289 1,513,792,000 - 1,560,248,289Restricted for: Capital projects - 102,384,000 - 102,384,000 Debt service - 21,711,000 - 21,711,000 Education and support services - - 836,394 836,394 Scholarships - 419,481,000 - 419,481,000 Loans - 8,188,000 - 8,188,000 Operations and maintenance 712,991 - - 712,991 Research and development 9,537,522 - - 9,537,522 Other purposes - 2,170,000 - 2,170,000 Funds held as permanent investments: Nonexpendable - 378,786,000 - 378,786,000Unrestricted (deficit) (50,240,626) 260,953,000 - 210,712,374 Total net position 6,466,176$ 2,707,465,000$ 836,394$ 2,714,767,570$
The notes to the financial statements are an integral part of this statement.
Major Component Units
Combining Statement of Net PositionDiscretely Presented Component Units
June 30, 2015
Assets
Liabilities
Net Position
Deferred Outflows of Resources
Deferred Inflows of Resources

39
NEVADA
Combining Statement of ActivitiesDiscretely Presented Component Units
For the Fiscal Year Ended June 30, 2015
Nonmajor Component Unit
Colorado River Commission
Nevada System of Higher Education
Nevada Capital Investment Corporation Total
Expenses 60,629,349$ 1,631,681,000$ 235,224$ 1,692,545,573$
Program revenues Charges for services 58,282,239 632,254,000 - 690,536,239 Operating grants and contributions - 465,488,000 - 465,488,000 Capital grants and contributions - 80,973,000 - 80,973,000
Total program revenues 58,282,239 1,178,715,000 - 1,236,997,239
General revenues Unrestricted investment earnings 374,175 10,817,000 726,947 11,918,122 Other general revenues 67,653 4,433,000 - 4,500,653 Contributions to permanent funds - 29,980,000 - 29,980,000 Payments from State of Nevada - 486,969,000 - 486,969,000
Total general revenues 441,828 532,199,000 726,947 533,367,775
Change in net position (1,905,282) 79,233,000 491,723 77,819,441
Net position, July 1 (as restated) 8,371,458 2,628,232,000 344,671 2,636,948,129Net position, June 30 6,466,176$ 2,707,465,000$ 836,394$ 2,714,767,570$
The notes to the financial statements are an integral part of this statement.
Major Component Units
Expenses
Program Revenues
General Revenues

40
ATV Rider at Sand Mountain Near Fallon, NV
Winnemucca Sand Dunes
Winnemucca Sand Dunes

41
Notes to Financial StatementsFor the Fiscal Year Ended June 30, 2015 NEVADA
Note 1 - Summary of Significant Accounting Policies………………………….......................................….
Note 2 - Budgetary and Legal Compliance……………………………..……....…........…………......…
Note 3 - Deposits and Investments……………………………….....…………............………......……
Note 4 - Receivables…………………………..................................................…………….....………
Note 5 - Interfund Transactions………………….……...........................................…….............…..…
Note 6 - Restricted Assets………………......….……...........................................……..............…..…
Note 7 - Capital Assets…………………........……….......................................……...………....……
Note 8 - Capital Lease Receivable.……....................................……....………………….........………
Note 9 - Long-Term Obligations………....................................……....………………….........………
Note 10 - Pensions and Other Employee Benefits……………….................................................................
Note 11 - Risk Management……………………...............................……....……….....…………....…
Note 12 - Fund Balances and Net Position.............................................................................................…
Note 13 - Principal Tax Revenues……………….……..........................................……..........….......…
Note 14 - Works of Art and Historical Treasures…….........................................................….…….......…
Note 15 - Commitments and Contingencies………………………..................................…….......…...…
Note 16 - Subsequent Events……………...............................................................…………........……
Note 17 - Accounting Changes and Restatements............................…….....................................................
42
48
49
56
57
60
60
62
62
68
77
78
80
81
82
84
84
Index

42
Notes to Financial StatementsFor the Fiscal Year Ended June 30, 2015 NEVADANote 1 - Summary of Significant Accounting Policies
The accompanying financial statements of the State of Nevada (the State) have been prepared in conformity with accounting principles generally accepted in the United States of Ameri-ca (GAAP), as prescribed by the Governmental Accounting Standards Board (GASB). GASB is the accepted standard setting body for establishing governmental accounting and financial reporting principles.
A. Description of Government-wide Financial State-mentsThe Government-wide Financial Statements, which consist of the Statement of Net Position and the Statement of Activities, report information on all non-fiduciary activities of the prima-ry government and its component units. All fiduciary activi-ties, including component units that are fiduciary in nature, are reported only in the fund financial statements. Primary government activities are distinguished between govern-mental and business-type activities. Governmental activi-ties generally are financed through taxes, intergovernmental revenues, and other non-exchange revenues. Business-type activities are financed in whole or in part by fees charged to external parties for goods or services. The primary govern-ment is reported separately from certain legally separate component units for which the primary government is finan-cially accountable.
B. Reporting EntityFor financial reporting purposes, the State’s reporting enti-ty includes the “primary government” and its “component units.” The primary government includes all funds, depart-ments, agencies, and those authorities that are considered an integral part of the State’s activities. Component units are legally separate organizations for which the State’s elected officials are financially accountable. The State’s component units have a June 30 year-end.
The GASB has set forth criteria to be considered in determin-ing financial accountability. These criteria include appoint-ing a voting majority of an organization’s governing body and either: 1) the ability of the State to impose its will on that organization; or 2) the potential for the organization to provide specific financial benefits to, or impose specific finan-cial burdens on the State. When the State does not appoint a voting majority of an organization’s governing body, GASB requires inclusion in the reporting entity based on financial accountability if: 1) the organization is both fiscally depen-dent on the State and there is the potential for the organization to provide specific financial benefits to, or impose specific financial burdens on the State; or 2) it would be misleading to exclude the organization.
Fiduciary Component Units: The following fiduciary component units are legally separate from the State. The State is financially accountable for these organizations since it appoints the voting majority of the boards and is able to impose its will on them through the ability to remove appoint-ed members of the organization’s governing board. Since these component units are fiduciary in nature, they are includ-ed only in the fund financial statements with the primary
government’s fiduciary funds. Therefore, these component units are excluded from the government-wide financial state-ments.
The Public Employees’ Retirement System (PERS), the Legislators’ Retirement System (LRS) and the Judicial Retirement System (JRS) are administered by a seven-member board appointed by the Governor. PERS is the administrator of a cost-sharing, multiple-employer, defined benefit public employees’ retirement system established to provide a reasonable base income to qualified employ-ees who have been employed by a public employer and whose earning capacities have been removed or substan-tially impaired by age or disability. LRS is the administra-tor of a single-employer public employees’ defined benefit retirement system established to provide a reasonable base income to Legislators at retirement. JRS is the adminis-trator of an agent multiple-employer public employees’ defined benefit retirement system established to provide a reasonable base income to justices of the Supreme Court, district judges, municipal court judges, and justices of the peace at retirement.
The Retirement Benefits Investment Fund (RBIF) was created for the sole purpose of providing an investment vehicle for monies belonging to either the State or local government other post employment benefit trust funds. RBIF is administered by the Retirement Benefits Invest-ment Board, which consists of the same members as the Public Employees’ Retirement Board.
Blended Component Unit: The Nevada Real Property Corporation (NRPC) is a legally separate organization. The State is financially accountable for NRPC since it appoints the board of directors, and NRPC provides a financial benefit to the State by providing financing services. NRPC was incor-porated to finance certain construction projects which include office buildings, a transitional residential facility and a ware-house, all financed by the issuance of certificates of participa-tion. Upon completion of construction, the NRPC leases the facilities to the State. Since the NRPC provides financing services solely to the State, these financial transactions are reported as part of the primary government using the blended method.
Discretely Presented Component Units: A component unit should be included in the reporting entity financial statements using the discrete presentation method if the component unit’s governing body is not substantively the same as the govern-ing body of the primary government, the component unit does not provide services entirely or almost entirely to the primary government, and the component unit’s total debt outstand-ing is not expected to be repaid entirely or almost entirely with resources of the primary government. The following discretely presented component units meet these criteria and are reported in a separate column in the government-wide financial statements to emphasize they are legally separate from the State.

43
Notes to Financial StatementsFor the Fiscal Year Ended June 30, 2015 NEVADA
(Note 1 Continued)
The Nevada System of Higher Education (NSHE) is a legally separate organization consisting of the institu-tions of public higher education in Nevada, the NSHE Administration entity, and their component units. NSHE is governed by a Board of Regents elected by the voters. NSHE is considered to be fiscally dependent on the primary government since the State can modify and approve their budgets. In addition, NSHE imposes a financial burden on the primary government since the State provides finan-cial support to NSHE through annual operating and capital appropriations.
The Colorado River Commission (CRC) is a legally sepa-rate organization responsible for managing Nevada’s inter-ests in the water and power resources available from the Colorado River. It is governed by seven commissioners, a majority of whom are appointed by the State: four are appointed by the Governor and three are appointed by the board of directors of the Southern Nevada Water Authority. The State is financially accountable for CRC since bonds issued by the CRC are backed by the full faith and credit of the State of Nevada, which creates the potential for a finan-cial burden to the State. CRC provides services to citizens through the distribution and sale of electric power.
The Nevada Capital Investment Corporation (NCIC) is a legally separate organization whose board of directors consists of the State Treasurer, who serves as the chair; five members that are appointed by the primary govern-ment; and the Chancellor of NSHE, or his designee. Up to five additional members of the board may be chosen who are direct investors of the corporation. The NCIC is an independent corporation for public benefit, the general purpose of which is to act as a limited partner, shareholder or member to provide private equity funding to businesses located in or seeking to locate in Nevada, and engage in certain industries. The amount invested in the NCIC is not to exceed $50 million from the State Permanent School Fund. The State is financially accountable for NCIC since it is able to impose its will through veto power by the State Treasurer.
Complete financial statements for each of the individual component units, with the exception of the Nevada Real Prop-erty Corporation, which has no other financial activity than that described above, may be obtained at that organization’s administrative offices:
Public Employees’ Retirement SystemCarson City, NV
Legislators’ Retirement SystemCarson City, NV
Judicial Retirement SystemCarson City, NV
Retirement Benefits Investment FundCarson City, NV
Nevada System of Higher Education Reno, NV
Colorado River CommissionLas Vegas, NV
Nevada Capital Investment CorporationCarson City, NV
Related Organizations: The Governor is responsible for appointing the members of many boards and commissions. The State’s accountability for these entities does not extend beyond making the appointments and thus these entities are excluded from this report. The State does not exercise finan-cial or administrative control over the excluded boards and commissions.
C. Basis of PresentationGovernment-Wide Financial Statements: While separate government-wide and fund financial statements are presented, they are interrelated. On the government-wide financial state-ments, the governmental activities column incorporates data from governmental funds and internal service funds, while business-type activities incorporate data from the govern-ment’s enterprise funds. Separate fund financial statements are provided for governmental funds, proprietary funds, and fiduciary funds, even though the latter are excluded from the government-wide financial statements. As discussed earli-er, the State has three discretely presented component units which are shown in a single column in the government-wide financial statements.
In general, the effect of interfund activity has been removed from the government-wide financial statements. Overhead costs have been removed to minimize the double counting of internal activities, but interfund services provided and used have been retained, as their elimination would distort the measurement of the cost of individual functional activi-ties. Internal activities of a reimbursement type nature reduce the expenses of the reimbursed programs. Certain central-ized costs have been included as part of the program expens-es reported for the various functions and activities. The net amount of interfund receivables and payables between govern-mental activities and business-type activities are reported as internal balances on the government-wide statement of net position. The net amount of transfers between governmental activities and business-type activities are reported as transfers on the government-wide statement of activities.
Fund Financial Statements: The fund financial statements provide information about the government’s funds, including its fiduciary and blended component units. Separate financial statements are provided for governmental funds, proprietary funds, and fiduciary funds, even though the latter are exclud-ed from the government-wide statements. Major individual governmental and enterprise funds are reported as separate columns in the fund financial statements. All remaining governmental and enterprise funds are aggregated and report-ed as non-major funds.
The State reports the following major governmental funds:
General Fund – this is the State’s primary operating fund. It accounts for all financial resources of the general government except those required to be accounted for in another fund.
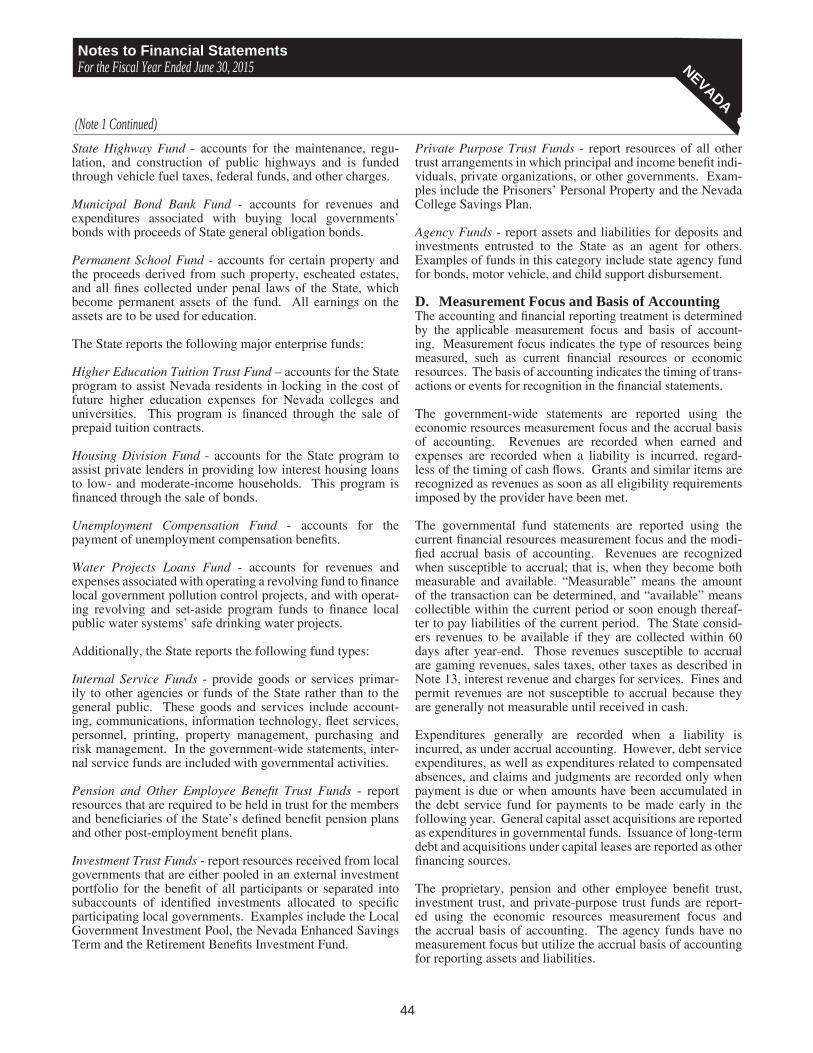
44
Notes to Financial StatementsFor the Fiscal Year Ended June 30, 2015 NEVADA
(Note 1 Continued)
State Highway Fund - accounts for the maintenance, regu-lation, and construction of public highways and is funded through vehicle fuel taxes, federal funds, and other charges.
Municipal Bond Bank Fund - accounts for revenues and expenditures associated with buying local governments’ bonds with proceeds of State general obligation bonds.
Permanent School Fund - accounts for certain property and the proceeds derived from such property, escheated estates, and all fines collected under penal laws of the State, which become permanent assets of the fund. All earnings on the assets are to be used for education.
The State reports the following major enterprise funds:
Higher Education Tuition Trust Fund – accounts for the State program to assist Nevada residents in locking in the cost of future higher education expenses for Nevada colleges and universities. This program is financed through the sale of prepaid tuition contracts.
Housing Division Fund - accounts for the State program to assist private lenders in providing low interest housing loans to low- and moderate-income households. This program is financed through the sale of bonds.
Unemployment Compensation Fund - accounts for the payment of unemployment compensation benefits.
Water Projects Loans Fund - accounts for revenues and expenses associated with operating a revolving fund to finance local government pollution control projects, and with operat-ing revolving and set-aside program funds to finance local public water systems’ safe drinking water projects.
Additionally, the State reports the following fund types:
Internal Service Funds - provide goods or services primar-ily to other agencies or funds of the State rather than to the general public. These goods and services include account-ing, communications, information technology, fleet services, personnel, printing, property management, purchasing and risk management. In the government-wide statements, inter-nal service funds are included with governmental activities.
Pension and Other Employee Benefit Trust Funds - report resources that are required to be held in trust for the members and beneficiaries of the State’s defined benefit pension plans and other post-employment benefit plans.
Investment Trust Funds - report resources received from local governments that are either pooled in an external investment portfolio for the benefit of all participants or separated into subaccounts of identified investments allocated to specific participating local governments. Examples include the Local Government Investment Pool, the Nevada Enhanced Savings Term and the Retirement Benefits Investment Fund.
Private Purpose Trust Funds - report resources of all other trust arrangements in which principal and income benefit indi-viduals, private organizations, or other governments. Exam-ples include the Prisoners’ Personal Property and the Nevada College Savings Plan.
Agency Funds - report assets and liabilities for deposits and investments entrusted to the State as an agent for others. Examples of funds in this category include state agency fund for bonds, motor vehicle, and child support disbursement.
D. Measurement Focus and Basis of AccountingThe accounting and financial reporting treatment is determined by the applicable measurement focus and basis of account-ing. Measurement focus indicates the type of resources being measured, such as current financial resources or economic resources. The basis of accounting indicates the timing of trans-actions or events for recognition in the financial statements.
The government-wide statements are reported using the economic resources measurement focus and the accrual basis of accounting. Revenues are recorded when earned and expenses are recorded when a liability is incurred, regard-less of the timing of cash flows. Grants and similar items are recognized as revenues as soon as all eligibility requirements imposed by the provider have been met.
The governmental fund statements are reported using the current financial resources measurement focus and the modi-fied accrual basis of accounting. Revenues are recognized when susceptible to accrual; that is, when they become both measurable and available. “Measurable” means the amount of the transaction can be determined, and “available” means collectible within the current period or soon enough thereaf-ter to pay liabilities of the current period. The State consid-ers revenues to be available if they are collected within 60 days after year-end. Those revenues susceptible to accrual are gaming revenues, sales taxes, other taxes as described in Note 13, interest revenue and charges for services. Fines and permit revenues are not susceptible to accrual because they are generally not measurable until received in cash.
Expenditures generally are recorded when a liability is incurred, as under accrual accounting. However, debt service expenditures, as well as expenditures related to compensated absences, and claims and judgments are recorded only when payment is due or when amounts have been accumulated in the debt service fund for payments to be made early in the following year. General capital asset acquisitions are reported as expenditures in governmental funds. Issuance of long-term debt and acquisitions under capital leases are reported as other financing sources.
The proprietary, pension and other employee benefit trust, investment trust, and private-purpose trust funds are report-ed using the economic resources measurement focus and the accrual basis of accounting. The agency funds have no measurement focus but utilize the accrual basis of accounting for reporting assets and liabilities.

45
Notes to Financial StatementsFor the Fiscal Year Ended June 30, 2015 NEVADA
(Note 1 Continued)
E. Assets,Liabilities,DeferredOutflows/InflowsofResourcesandNetPosition/FundBalanceCash and Pooled Investments - The State Treasurer manages a cash pool where all temporary surplus cash is invested. These investments are reported on the Statement of Net Position and Balance Sheet as cash and pooled investments. Earnings from these pooled investments are credited to the General Fund and certain other funds that have specific statutory authority to receive a prorated share based on daily cash balances. Also included in this category is cash held by departments in petty cash funds and in bank accounts outside the Treasurer’s cash management pool. The operations and investments of the cash pool are described in Note 3.
Cash and cash equivalents are defined as bank accounts, petty cash, money market demand accounts and certificates of deposit with original maturities of three months or less. Cash and cash equivalents are reported in the Statement of Cash Flows for proprietary fund types.
Investments - Investments are stated at fair value. Fair value is defined as the price at which an asset passes from a will-ing seller to a willing buyer. It is assumed that both buyer and seller are rational and have a reasonable knowledge of relevant facts. Short-term investments are generally reported at cost, which approximates fair value, except for the short-term investments of the Nevada College Savings Plan that are valued at amortized cost, which approximates fair value. Securities, traded on a national or international exchange, are valued at the last reported sale price of the day. International securities prices incorporate end-of-day exchange rates. The fair value of real estate investments is based on estimated current value, and MAI (Member Appraisal Institute) inde-pendent appraisals. Investments that do not have an estab-lished market are reported at estimated fair value.
The Local Government Investment Pool, the Nevada Enhanced Savings Term Investment Trust and the Retirement Benefits Investment Fund are reported as investment trust funds. The investments of the Local Government Investment Pool and the Nevada Enhanced Savings Term Investment Trust are subject to the general limitations of NRS 355.170. The investments of the Retirement Benefits Investment Fund are governed by the prudent person standard, as set forth by NRS 286.682. Security transactions are accounted for on the trade date (the date the order to buy or sell is executed). Inter-est income is determined on an accrual basis with discounts earned and premiums paid being amortized. Realized gains and losses, if any, on sales of securities are calculated using the amortized cost basis at the date of sale. The fair value of the position in the pool is the same as the value of the pool shares. The Bank of New York Mellon is the custodian and transfer agent for the Local Government Investment Pool, the Nevada Enhanced Savings Term Investment Trust and the Retirement Benefits Investment Fund.
Derivatives are generally valued at quoted market value. Under the circumstance where quoted market values are not considered to be readily available, such derivatives are report-
ed at estimated fair value and the methods and significant assumptions used are described in Note 3D. Investments are discussed further in Note 3.
Receivables - Receivables represent amounts due to the State at June 30, which will be collected sometime in the future. In the government-wide financial statements, a correspond-ing amount is recorded as revenue. In the governmental fund financial statements, the portions considered “available” (i.e., received by the State within approximately 60 days after year-end) are recorded as revenue; the remainder is recorded as deferred inflows of resources, unavailable revenue. Receiv-ables in proprietary fund types have arisen in the ordinary course of business. All receivables are shown net of an allowance for uncollectible accounts. Significant receivable balances not expected to be collected within one year are presented in Note 4.
Interfund Transactions - The State has two types of interfund transactions:
1. Services rendered and employee benefit contributions are accounted for as revenues, expenditures/expenses in the funds involved.
2. Operating appropriations and subsidies are accounted for as transfers in the funds involved.
Due from/due to other funds and transfers are presented in Note 5.
Inventories – In general, inventories in governmental funds are recorded as expenditures when purchased; however, certain inventories in the General Fund, the Highway Fund, and nonmajor governmental funds are recorded as expendi-tures at the time individual inventory items are consumed. Inventories are stated at cost on the first-in, first-out basis. Inventory items in the governmental funds are offset by nonspendable fund balance to indicate that they will not be converted to cash.
Prepaid Items – Prepaid items reflect payments for costs applicable to future accounting periods and are recorded in both government-wide and fund financial statements. The cost of prepaid items is recorded as expenditures/expenses when consumed rather than when purchased. Prepaid items in the governmental funds are offset by nonspendable fund balance to indicate that they will not be converted to cash.
Advances to Other Funds - Long-term interfund advances are recorded by the advancing fund as a receivable. These amounts are reported in the nonspendable fund balance in the General Fund to maintain the accountability and to disclose properly the amount available for appropriation. In other governmental funds this amount will be reported in restricted, committed, or assigned fund balances. Repayments are cred-ited to the receivable and corresponding reductions are made in the appropriate fund balance. A summary of interfund advances is presented in Note 5.
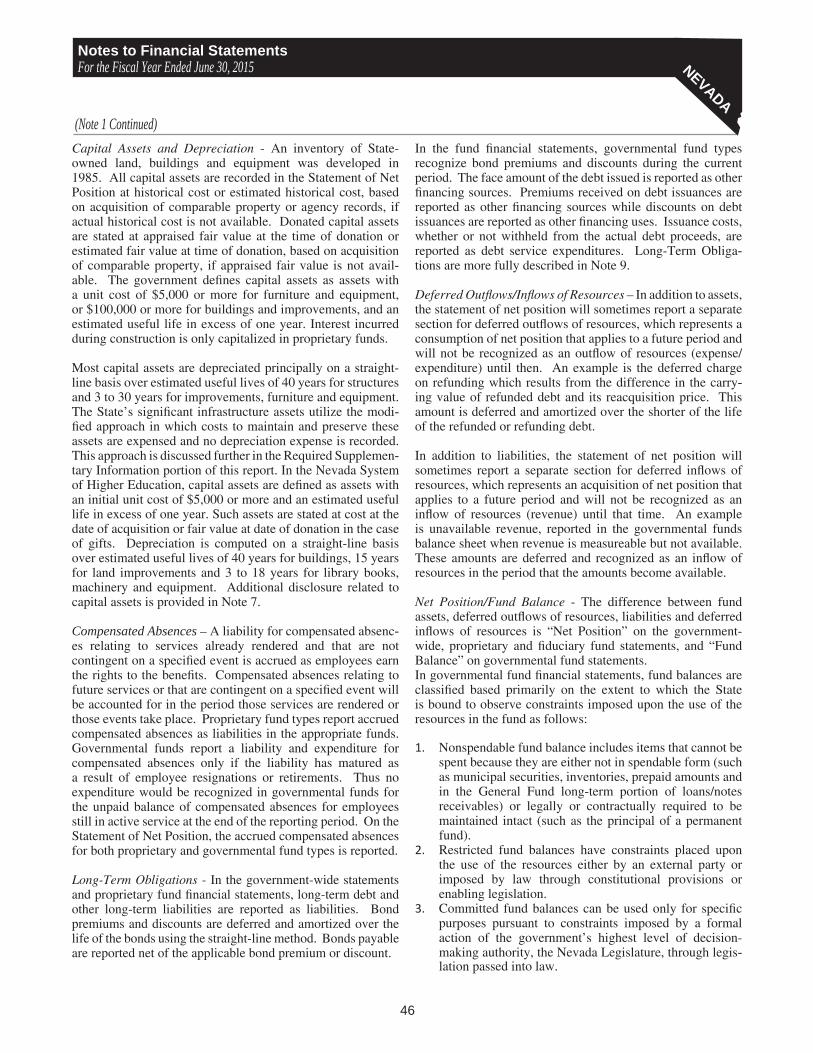
46
Notes to Financial StatementsFor the Fiscal Year Ended June 30, 2015 NEVADA
(Note 1 Continued)
Capital Assets and Depreciation - An inventory of State-owned land, buildings and equipment was developed in 1985. All capital assets are recorded in the Statement of Net Position at historical cost or estimated historical cost, based on acquisition of comparable property or agency records, if actual historical cost is not available. Donated capital assets are stated at appraised fair value at the time of donation or estimated fair value at time of donation, based on acquisition of comparable property, if appraised fair value is not avail-able. The government defines capital assets as assets with a unit cost of $5,000 or more for furniture and equipment, or $100,000 or more for buildings and improvements, and an estimated useful life in excess of one year. Interest incurred during construction is only capitalized in proprietary funds.
Most capital assets are depreciated principally on a straight-line basis over estimated useful lives of 40 years for structures and 3 to 30 years for improvements, furniture and equipment. The State’s significant infrastructure assets utilize the modi-fied approach in which costs to maintain and preserve these assets are expensed and no depreciation expense is recorded. This approach is discussed further in the Required Supplemen-tary Information portion of this report. In the Nevada System of Higher Education, capital assets are defined as assets with an initial unit cost of $5,000 or more and an estimated useful life in excess of one year. Such assets are stated at cost at the date of acquisition or fair value at date of donation in the case of gifts. Depreciation is computed on a straight-line basis over estimated useful lives of 40 years for buildings, 15 years for land improvements and 3 to 18 years for library books, machinery and equipment. Additional disclosure related to capital assets is provided in Note 7.
Compensated Absences – A liability for compensated absenc-es relating to services already rendered and that are not contingent on a specified event is accrued as employees earn the rights to the benefits. Compensated absences relating to future services or that are contingent on a specified event will be accounted for in the period those services are rendered or those events take place. Proprietary fund types report accrued compensated absences as liabilities in the appropriate funds. Governmental funds report a liability and expenditure for compensated absences only if the liability has matured as a result of employee resignations or retirements. Thus no expenditure would be recognized in governmental funds for the unpaid balance of compensated absences for employees still in active service at the end of the reporting period. On the Statement of Net Position, the accrued compensated absences for both proprietary and governmental fund types is reported.
Long-Term Obligations - In the government-wide statements and proprietary fund financial statements, long-term debt and other long-term liabilities are reported as liabilities. Bond premiums and discounts are deferred and amortized over the life of the bonds using the straight-line method. Bonds payable are reported net of the applicable bond premium or discount.
In the fund financial statements, governmental fund types recognize bond premiums and discounts during the current period. The face amount of the debt issued is reported as other financing sources. Premiums received on debt issuances are reported as other financing sources while discounts on debt issuances are reported as other financing uses. Issuance costs, whether or not withheld from the actual debt proceeds, are reported as debt service expenditures. Long-Term Obliga-tions are more fully described in Note 9.
Deferred Outflows/Inflows of Resources – In addition to assets, the statement of net position will sometimes report a separate section for deferred outflows of resources, which represents a consumption of net position that applies to a future period and will not be recognized as an outflow of resources (expense/expenditure) until then. An example is the deferred charge on refunding which results from the difference in the carry-ing value of refunded debt and its reacquisition price. This amount is deferred and amortized over the shorter of the life of the refunded or refunding debt.
In addition to liabilities, the statement of net position will sometimes report a separate section for deferred inflows of resources, which represents an acquisition of net position that applies to a future period and will not be recognized as an inflow of resources (revenue) until that time. An example is unavailable revenue, reported in the governmental funds balance sheet when revenue is measureable but not available. These amounts are deferred and recognized as an inflow of resources in the period that the amounts become available.
Net Position/Fund Balance - The difference between fund assets, deferred outflows of resources, liabilities and deferred inflows of resources is “Net Position” on the government-wide, proprietary and fiduciary fund statements, and “Fund Balance” on governmental fund statements.In governmental fund financial statements, fund balances are classified based primarily on the extent to which the State is bound to observe constraints imposed upon the use of the resources in the fund as follows:
1. Nonspendable fund balance includes items that cannot be spent because they are either not in spendable form (such as municipal securities, inventories, prepaid amounts and in the General Fund long-term portion of loans/notes receivables) or legally or contractually required to be maintained intact (such as the principal of a permanent fund).
2. Restricted fund balances have constraints placed upon the use of the resources either by an external party or imposed by law through constitutional provisions or enabling legislation.
3. Committed fund balances can be used only for specific purposes pursuant to constraints imposed by a formal action of the government’s highest level of decision-making authority, the Nevada Legislature, through legis-lation passed into law.

47
Notes to Financial StatementsFor the Fiscal Year Ended June 30, 2015 NEVADA
(Note 1 Continued)
4. Assigned fund balance includes amounts that are constrained by the government’s intent to be used for a specific purpose, but are neither restricted nor committed. Assignments of fund balance are created by the executive branch.
5. Unassigned fund balance is the residual amount of the General Fund not included in the four categories above. Also, any deficit fund balances within the other govern-mental fund types are reported as unassigned.
Each fund has been analyzed for proper classification of fund balance. Funds are created by the Legislature and money is authorized to be transferred to the fund for a particular purpose. Balances in the Legislatively created funds are at least committed, and may be further restricted depending on whether there is an external party, constitutional provision, or enabling legislation constraint involved. Note 12 provides a disaggregation of governmental fund balances, nonspendable, restricted, committed, and unassigned.
Net Position/Fund Balance Flow Assumptions - The State’s policy is to spend restricted amounts first when an expendi-ture/expense is incurred for purposes for which both restricted and unrestricted resources are available. Therefore, restricted net position/fund balance is depleted before using unrestricted net position/fund balance. In governmental funds, when an expenditure is incurred for purposes for which amounts in any of the unrestricted fund balance classifications could be used, the assumed order of spending is first committed, assigned and then unassigned.
Minimum Fund Balance Policy - NRS 353.213(3) requires that the proposed budget for each fiscal year of the biennium provide for a reserve of not less than 5% or more than 10% of the total of all proposed appropriations from the State General Fund for the operation of all departments, institutions and agencies of the State and authorized expenditures from the State General Fund for the regulation of gaming for that fiscal year.
Stabilization Arrangement – NRS 353.288 provides for the Account to Stabilize the Operation of the State Government (Stabilization Account) in the State General Fund. Addi-tions to the stabilization arrangement are triggered at the end of a fiscal year if the General Fund unrestricted fund balance (budgetary basis) exceeds 7% of General Fund operating appropriations. Forty percent of the excess is deposited to the Stabilization Account, and is classified on the balance sheet as committed for fiscal emergency. Expenditures may occur only if actual revenues for the biennium fall short by 5% or more from anticipated revenues, or if the Legislature and Governor declare that a fiscal emergency exists. The balance in the Stabilization Account committed for fiscal emergency at June 30, 2015 is $0.
Pensions – For purposes of measuring the net pension liabil-ity and deferred outflows/inflows of resources related to pensions, and pension expense, information about the fidu-ciary net position of the PERS, LRS and JRS and additions to/deductions from the plans fiduciary net position have been determined on the same basis as they are reported by PERS, LRS and JRS. For this purpose, benefit payments (includ-ing refunds of employee contributions) are recognized when due and payable in accordance with the benefit terms. Invest-ments are reported at fair value.
F. RevenuesandExpenditures/ExpensesProgram Revenues - In the government-wide statement of activities, program revenues include: 1) charges to custom-ers or applicants who purchase, use or directly benefit from goods, services or privileges provided by a given function, and 2) grants and contributions that are restricted to meeting the operational or capital requirements of a particular func-tion. Taxes and other items not meeting the definition of program revenues are instead reported as general revenues.
Property Taxes – Property taxes are recognized as revenues in the year for which they are levied. Property taxes are levied July 1 on property values assessed by the prior January 1. Property tax billings are payable in quarterly installments on the third Monday in August and the first Monday in October, January and March, after which time the bill is delinquent.
Grants – The State participates in various federal award programs which are received in both cash and noncash forms. Grants and other entitlements are recognized as revenues when all eligibility requirements are met, including any time requirements, and the amount is received within 60 days after year-end. Federal reimbursement type grants are recog-nized as revenue when the qualifying expenditures have been incurred and all other eligibility requirements have been met, and the amount is received within 60 days after year-end. Certain grants have matching requirements in which the State must contribute a proportionate share of the total costs of a program. Use of grant resources is conditioned upon compli-ance with terms of the grant agreements and applicable federal regulations, which include subjecting grants to financial and compliance audits.
Proprietary Funds Operating and Nonoperating Revenues and Expenses - Proprietary funds distinguish operating reve-nues and expenses from nonoperating items. Operating reve-nues and expenses generally result from providing services and producing and delivering goods in connection with a proprietary fund’s principal, ongoing operations. All reve-nues and expenses not meeting this definition are reported as nonoperating revenues and expenses.

48
Notes to Financial StatementsFor the Fiscal Year Ended June 30, 2015 NEVADA Note 2 - Budgetary and Legal Compliance
Budgetary Process and ControlThe Governor must submit his proposed budget for the Exec-utive Branch to the State Legislature not later than 14 calen-dar days before each regular session, which convenes every odd-numbered year. The presented budget spans the next two fiscal years and contains the detailed budgetary estimates of revenues and expenditures. The Legislature enacts the budget through passage of the General Appropriations Act, which allows expenditures from unrestricted revenues, and the Authorized Expenditures Act, which allows expenditures from revenues collected for specific purposes. Once passed and signed, the budget becomes the State’s financial plan for the next two fiscal years.
The legal level of budgetary control, the level at which appro-priations are approved and the level at which over-expenditure of appropriations or transfers of appropriated amounts may not occur without Legislative action, is at the total program level within each department or agency.
Limited budgetary revisions may be made without Legisla-tive action through the following management/administrative procedures. After obtaining the approval of the Governor, or his designee, the Budget Director, Legislative Interim Finance Committee (LIFC) approval is required of those revisions in excess of $30,000 which have the effect, when taken into consideration with all other changes during the fiscal year, of increasing or decreasing any legislatively approved expendi-ture level by 10% or $75,000, whichever is less. Revisions not exceeding this threshold require only Budget Director approval. The LIFC approval is not equivalent to governing body approval, as total appropriations for a program may not be increased except as follows. The Legislature appropri-ates limited funds to the Contingency Account, in the Gener-al Fund, which may be allocated to programs by the LIFC upon recommendation of the Board of Examiners. Alloca-tions totaling $7,020,833 were made in the 2015 fiscal year.
Unencumbered appropriations lapse at the end of each fiscal year unless specific authority to carry forward is granted in the Appropriations Act. Unexpended authorized resources, under the Authorized Expenditures Act, are carried forward for expenditure in the next fiscal period.
Budgets are legally adopted for the General Fund and Special Revenue Funds, except for the Nevada Real Property Corpo-ration special revenue fund. In addition, certain activity within such funds may be unbudgeted. The State’s budget is prepared principally on a modified accrual basis with the following exceptions:
1. Cash placed in petty cash funds or outside bank accounts is considered expended for budgetary purposes.
2. Advances to other funds are considered expenditures. Repayments of such advances are considered revenues.
3. Certain assets, such as prepaid items, are considered expended for budgetary purposes. Inventory is an expen-diture for budgetary purposes. Certain unearned revenue is considered revenue for budgetary purposes.
4. Expenditures are only recognized if the liability is liqui-dated within 45 days after the fiscal year end.
5. Revenue from grants is only recognized when it is received in cash.
6. Encumbrances for goods or services not received by fiscal year end are considered an expenditure of the current period if received and paid within 45 days.
The Budgetary Comparison Schedule is presented as Required Supplementary Information (RSI) in this report. Actual amounts in this schedule are presented on a budgetary basis. Because this basis differs from accounting principles general-ly accepted in the United States of America (GAAP), a recon-ciliation between the budgetary and GAAP basis is presented in the RSI.

49
Notes to Financial StatementsFor the Fiscal Year Ended June 30, 2015 NEVADANote 3 - Deposits and Investments
The Nevada Revised Statutes (NRS) and Nevada Administrative Code, as well as procedures approved by the State Board of Finance, govern deposits and investing activi-ties for the primary government and its discretely presented component units which are not expressly required by law to be received and kept by another party. NRS 226.110(3) further requires that the Office of the State Treasurer shall establish the policies to be followed in the investment of money of the State of Nevada.
A. DepositsPrimary Government, Private Purpose Trust, Pension and Other Employee Benefit Trust, and Investment Trust Funds - The State minimizes its custodial credit risk by legislation establishing a program to monitor a collateral pool for public deposits. Custodial credit risk for deposits is the risk that in the event of a bank failure, the State’s deposits may not be recovered. The NRS direct the Office of the State Treasurer to deposit funds into any state, or national bank, credit union or savings and loan association covered by federal deposi-tory insurance. For those deposits over and above the federal depository insurance maximum balance, sufficient collateral must be held by the financial institution to protect the State of Nevada against loss. The pooled collateral for deposits program maintains a 102% pledged collateral for all public deposits. As of June 30, 2015, the bank balance of the primary government, private purpose trust, pension and other employee benefit trust, and investment trust funds totaled $466,916,664, of which $38,328,077 was uncollateralized and uninsured.
Component Units - Cash and cash equivalents of the Nevada System of Higher Education (NSHE) are stated at cost, which approximates market, and consist of deposits in money market funds, which are not federally insured, and cash in the bank. At June 30, 2015 NSHE’s deposits in money market funds totaled $209,659,000 and cash in bank was $6,019,000. Of these balances, $250,000 are covered by the Federal Depository Insurance Corporation (FDIC); the remaining deposits are uncollateralized and uninsured.
B. InvestmentsNRS 355.140 details the types of securities in which the State may invest. In general, authorized investments include: certif-icates of deposit, asset-backed securities, bankers’ acceptanc-es and commercial paper, collateralized mortgage obligations, corporate notes, municipal bonds, money market mutual funds whose policies meet the criteria set forth in the statute, United States treasury securities, and specific securities implicitly guaranteed by the federal government. Additionally, the State may invest in limited types of repurchase agreements; however, statutes generally prohibit the State from entering into reverse-repurchase agreements. The State’s Permanent
School Fund is further limited by statute as to the types of investments in which it may invest (NRS 355.060). Cash and Investments are also discussed in Note 1 under Assets, Liabilities, Deferred Outflows/Inflows of Resources and Net Position/Fund Balance.
The State Board of Finance reviews the State’s investment policies at least every four months. The Board is comprised of the Governor, the State Controller, the State Treasurer and two members appointed by the governor, one of which must be actively engaged in commercial banking in the State.
Investments held in the Local Government Investment Pool (LGIP), Retirement Benefits Investment Fund (RBIF), and Nevada Enhanced Savings Term (NVEST) are specifically identifiable investment securities and are included in the following tables. LGIP, RBIF, and NVEST are investment trust funds and discussed further in Note 1, Assets, Liabilities, Deferred Outflows/Inflows of Resources and Net Position/Fund Balance. LGIP and NVEST are governed by the Nevada State Board of Finance and administered by the Nevada State Treasurer. Complete financial statements for LGIP and NVEST may be obtained from the State Treasurer’s Office, 101 N. Carson Street, Suite 4, Carson City, NV 89701. RBIF is administered by the Retirement Benefits Investment Board. The audited financial statements of RBIF may be obtained from the Public Employees’ Retirement System, 693 West Nye Lane, Carson City, Nevada 89703.
InterestRateRisk: Interest rate risk is the risk that chang-es in interest rates will adversely affect the fair value of an investment. Primary Government, Private Purpose Trust, Pension and Other Employee Benefit Trust, and Investment Trust Funds - The State minimizes interest rate risk by maintaining an effective duration of less than 1.5 years and holding at least 25% of the portfolio’s total market value in securities with a maturity of 12 months or less. However, the benchmark used by the State Treasurer to determine whether competi-tive market yields are being achieved is the 90 day U.S. Treasury Bill’s average over the previous three month period (Rolling 90 day T-Bill). Investment policies for the pension and other employee benefit trust funds authorize all securities within the Barclays Aggregate Index benchmark. If securi-ties are purchased outside the Barclays U.S. Treasury Index, they must be of investment grade rating by at least two of the following: Moody’s, Standard & Poor’s or Fitch (BBB- or better by Standard & Poor’s/Fitch, Baa3 or better by Moody’s) except those issued or guaranteed by the U.S. Government or its agencies. The following table provides information about the interest rate risks associated with the State’s investments as of June 30, 2015 (expressed in thousands):

50
Notes to Financial StatementsFor the Fiscal Year Ended June 30, 2015 NEVADA
(Note 3 Continued)
The Nevada College Savings Plan, a private purpose trust, currently has no formal investment policy with regard to interest rate risk for the investments. The mutual funds held by Vanguard, USAA, Upromise, and Putnam have various maturities from 35 days to 12.7 years and are not included in the table above.
Component Units – The Nevada System of Higher Education’s (NSHE) policy for reducing its exposure to interest rate risk is to have an average investment life of at least two years for fixed income securities within both the endowment and oper-ating investment pools. With regard to the trusts included in endowment investments, NSHE is not the trustee of these investments and, therefore, currently has no policies with regard to interest rate risk for these investments. Investments having interest rate risk are principally invested in mutual funds and private commingled funds. The following table provides the segmented time distribution for these invest-ments at June 30, 2015 (expressed in thousands):
CreditRisk: Credit risk is the risk that an issuer or other counterparty to an investment will not fulfill its obligations to the State of Nevada.
Primary Government, Private Purpose Trust, Pension and Other Employee Benefit Trust, and Investment Trust Funds - NRS 355.140, the State Treasurer’s investment policy, and investment policies of the pension and other employee bene-fit trust and investment trust funds all address credit risk. A summary of the policies is presented as follows:
• Commercial paper, Negotiable Certificates of Deposit, and Bankers’ Acceptances are rated by a nationally recognized rating service as “A-1,” “P-1” or its equiva-lent, or better,
• Notes, bonds and other unconditional obligations issued by corporations in the U.S. and municipal bonds (effec-tive September 2011) are rated by a nationally recognized rating service as “A” or its equivalent, or better,
• Money market mutual funds are SEC registered 2(A)7 and rated by a nationally recognized rating service as “AAA” or its equivalent,
• Collateralized mortgage obligations and asset-backed securities are rated by a nationally recognized rating service as “AAA” or its equivalent,
• Repurchase agreements with banks or registered broker-dealers provided the agreement is collateralized by 102% with U.S. Treasuries or U.S. government agency securi-ties on a delivery basis.
In addition to the above provisions, investment policies for the pension and other employee benefit trust funds allow investment in corporate bonds, assets-related instruments, and foreign debt issued in the U.S. rated by at least two of the following: Moody’s, Standard & Poor’s, or Fitch (BBB- or better by Standard & Poor’s/Fitch, Baa3 or better by Moody’s). The Nevada College Savings Plan, a private purpose trust, currently has no formal investment policy with regard to credit risk for the investments. Investments having credit risk are included in the table below.
The State’s investments as of June 30, 2015 were rated by Standard & Poor’s and/or an equivalent national rating organi-zation, and the ratings are presented below using the Standard & Poor’s rating scale (at fair value, expressed in thousands):
Fair Value Less Than 1 1-5 6-10 More Than 10U. S. Treasury securities 9,549,208$ 41,280$ 6,523,597$ 1,714,046$ 1,270,285$ Negotiable certificate of deposit 15,003 15,003 - - - U. S. agencies 1,828,816 925,497 629,439 18,067 255,813 Mutual funds 245,200 245,200 - - - Asset backed corporate securities 134,141 490 66,790 59,171 7,690 Corporate bonds and notes 264,971 96,847 151,137 4,669 12,318 Commercial paper 364,652 364,652 - - - Fixed income securities 671 671 - - - International investments 300 - - - 300 Municipal bonds 546,642 21,585 21,342 110,576 393,139 Investment agreements 541 - - - 541 Other short-term investments 366,785 366,785 - - - Collateralized mortgage obligations 13,529 - - - 13,529 Other investments 153 153 - - - Total 13,330,612$ 2,078,163$ 7,392,305$ 1,906,529$ 1,953,615$
Maturities in Years
Less than 1 year 213,121$ 1 to 5 years 157,440 6 to 10 years 143,578 More than 10 years - Total 514,139$

51
Notes to Financial StatementsFor the Fiscal Year Ended June 30, 2015 NEVADA
(Note 3 Continued)
AAA AA A BBB BB B VMIG1 UnratedU.S. agencies 39,881$ 1,571,412$ -$ -$ -$ -$ -$ -$ Mutual funds - - - - - - - 15,579,562 Asset backed corporate securities 25,693 93,358 568 1,901 633 251 - 2,005 Corporate bonds and notes 2,675 76,841 162,203 9,852 2,563 416 - 400 Commerical paper - - 224,656 - - - - - Fixed income securities - - - - - - - 119 International investments - - - 300 - - - - Municipal bonds - 546,642 - - - - - - Investment agreements - - 390 151 - - - - Other short-term investments 85,598 19,304 79,963 - - - 34,293 233,225 Collateralized mortgage obligations 7,079 - - - - - - - Total 160,926$ 2,307,557$ 467,780$ 12,204$ 3,196$ 667$ 34,293$ 15,815,311$
Quality Rating
Component Unit – The NSHE’s policy for reducing its expo-sure to credit risk is to maintain a weighted average credit rating of AA or better, and never below A, for investments with credit risk within both the endowment and operating invest-ment pools. With regard to the trusts included in endowment investments, NSHE is not the trustee of these investments and therefore, it currently has no policies with regard to credit risk for these investments. The credit risk profile for NSHE operating and endowment investments at June 30, 2015 is as follows (at fair value, expressed in thousands):
Concentration of Credit Risk: Concentration of credit risk is the risk of loss that may be attributed to the magni-tude of a government’s investment in a single issuer. The NRS 355.140, 355.060, and the State Treasurer’s investment policy limit the investing in any one issuer to 5% of the total par value of the portfolio, with the exception of the Housing Division and the Investment Trust Funds. At June 30, 2015, the following investments exceeded 5% of the Primary Government and Investment Trust Funds’ total investments (expressed in thousands):
At June 30, 2015, the following investments exceeded 5% of the Higher Education Tuition Trust’s total investments (expressed in thousands):
The Housing Division currently places no limit on the amount it may invest in any one issuer provided their ratings are in the highest two general rating categories. However, the Housing Division monitors rating changes on all issuers. If warrant-ed, more concentrated investments may have to be diluted to alternative investment providers. As of June 30, 2015, the Housing Division’s investments in Fannie Mae and Ginnie Mae are 4.66% and 54.85% respectively, of the Housing Division’s total investments. The Fannie Mae and Ginnie Mae investments are in mortgage backed securities matched to the interest rate and maturity of the underlying bonds. Because such investments are matched to concomitant liabilities, the Housing Division is less concerned about a concentration risk on these investments.
Component Unit - The Nevada Capital Investment Corporation (NCIC) owns 99% equity interest in Silver State Opportunities Fund LLC (SSOF), a Nevada limited liability company, for the purpose of obtaining income. At June 30, 2015 the invest-ment in equity interest of SSOF exceeded 5% of NCIC’s total investments.
ForeignCurrencyRisk: Foreign currency risk is the risk that changes in exchange rates will adversely affect the fair value of an investment or deposit.
UnratedMutual funds publicly traded 652,271$ Partnerships 91,163 Endowment cash/cash equivalents 3,462 Trust(s) 5,512 Private commingled funds 40,433 Total 792,841$
Fair Value PercentagePrimary government
Federal Home Loan Bank 671,999$ 20.35%So Nevada Water Authority 173,520 5.26%
Investment Trust FundsFederal Home Loan Bank 137,939 13.28%
Fair Value PercentageFederal Home Loan Mortgage Corp- Asset-Backed Mortgage Security 14,165$ 6.74%

52
Notes to Financial StatementsFor the Fiscal Year Ended June 30, 2015 NEVADA
(Note 3 Continued)
Primary Government, Pension and Other Employee Benefit Trust Funds, and Investment Trust Funds - The primary govern-ment does not have a policy regarding foreign currency risk; however, the State Treasurer’s office does not have any deposits or investments in foreign currency. The PERS, LRS, JRS, and RBIF do have foreign currency policies for deposit and invest-ments, which may be used for portfolio diversification and hedging. Highly speculative positions in currency are not permitted. LRS and JRS had no exposure to foreign currency risk as of June 30, 2015. The following table summarizes the pension and investment trust funds’ exposure to foreign currency risk in U.S. dollars as of June 30, 2015 (expressed in thousands):
EquityPending
Transactions Cash TotalAustralian Dollar 455,632$ -$ 901$ 456,533$ British Pound Sterling 1,349,356 3,300 3,529 1,356,185 Danish Krone 110,741 - - 110,741 Euro 2,009,787 (800) 1,120 2,010,107 Hong Kong Dollar 217,038 - 3,406 220,444 Israeli Shekel 39,969 - 202 40,171 Japanese Yen 1,524,287 (6,600) 7,833 1,525,520 Norwegian Krone 8,367 100 101 8,568 Polish Zloty 42,694 - 400 43,094 Singapore Dollar 93,519 - 1,904 95,423 Swedish Krona 195,699 - 10 195,709 Swiss Franc 614,226 - 100 614,326 Total 6,661,315$ (4,000)$ 19,506$ 6,676,821$
Currency by Investment and Fair Value
Currency at Fair ValueBritish Pound 1$ Japenese Yen 4 Taiwan Dollar 9 Swedish Krona 4 Swiss Franc 2 Total 20$
Private Purpose Trust Fund - The Nevada College Savings Plan, a private purpose trust, currently has no formal invest-ment policy with regard to foreign currency risk for the invest-ments. The Plan consists of Vanguard College Savings Plan, USAA College Savings Plan, Upromise College Fund Plan, and Putnam for America Plan which all state that there are certain inherent risks involved when investing in internation-al securities through mutual funds that are not present with investments in domestic securities, such as foreign currency exchange rate fluctuations, adverse political and economic developments, natural disasters and possible prevention or delay of currency exchange due to foreign governmental laws or restrictions. The investments held in Putnam for America Plan consist of the portfolios managed and sponsored by Putnam Investment Management, Putnam Mutual Funds, and non-Putnam Mutual Funds. Both mutual funds pose no foreign currency risk. The following table summarizes foreign currency risk for the GAA portfolios in U.S. dollars as of June 30, 2015 (expressed in thousands):
Component Unit - The NSHE does not directly invest in foreign currency investments and is therefore not subject to foreign currency risk. However, it has $210,058,000 in mutu-al funds in both the operating and endowment pools that are primarily invested in international equities at June 30, 2015.
C. Securities LendingPrimary Government and Investment Trust Funds - NRS 355.135 authorizes the State Treasurer to lend securities from the investment portfolio of the State if collateral received from the borrower is at least 102% of market value of the underlying securities and the value of the securities borrowed is determined on a daily basis. There were no securities on loan at June 30, 2015 (excluding PERS).
Public Employees’ Retirement System (PERS) – The system also maintains a securities lending program under the authority of the “prudent person” standard of NRS 286.682. Securities loaned under this program consist of U.S. Treasury Obligations, corporate fixed income securities, international fixed income securities, equity securities, and international equity securities. Collateral received consists of cash and securities issued by the U.S. Government, its agencies or instrumentalities. Collateral received for the lending of U.S. securities must equal at least 102% of market value, plus accrued interest in the case of fixed income securities. Collateral received for the lending of international securities must equal at least 105% of market value, plus accrued inter-est in the case of fixed income securities.
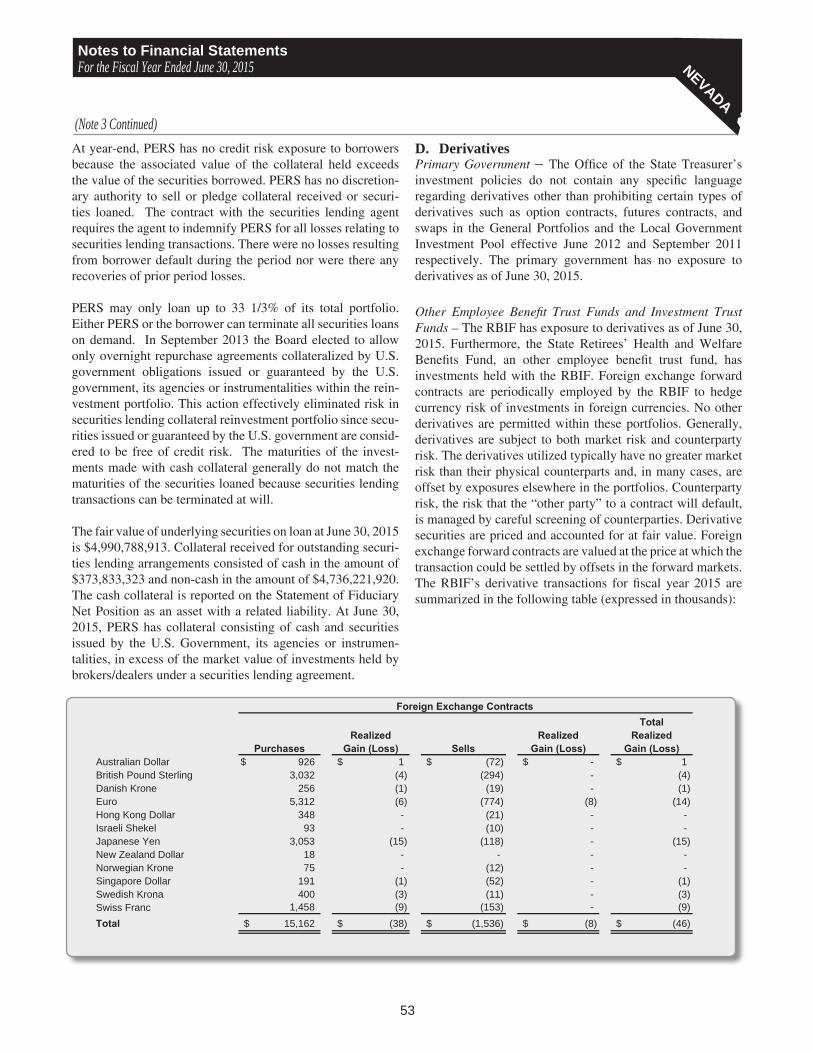
53
Notes to Financial StatementsFor the Fiscal Year Ended June 30, 2015 NEVADA
(Note 3 Continued)
At year-end, PERS has no credit risk exposure to borrowers because the associated value of the collateral held exceeds the value of the securities borrowed. PERS has no discretion-ary authority to sell or pledge collateral received or securi-ties loaned. The contract with the securities lending agent requires the agent to indemnify PERS for all losses relating to securities lending transactions. There were no losses resulting from borrower default during the period nor were there any recoveries of prior period losses.
PERS may only loan up to 33 1/3% of its total portfolio. Either PERS or the borrower can terminate all securities loans on demand. In September 2013 the Board elected to allow only overnight repurchase agreements collateralized by U.S. government obligations issued or guaranteed by the U.S. government, its agencies or instrumentalities within the rein-vestment portfolio. This action effectively eliminated risk in securities lending collateral reinvestment portfolio since secu-rities issued or guaranteed by the U.S. government are consid-ered to be free of credit risk. The maturities of the invest-ments made with cash collateral generally do not match the maturities of the securities loaned because securities lending transactions can be terminated at will.
The fair value of underlying securities on loan at June 30, 2015 is $4,990,788,913. Collateral received for outstanding securi-ties lending arrangements consisted of cash in the amount of $373,833,323 and non-cash in the amount of $4,736,221,920. The cash collateral is reported on the Statement of Fiduciary Net Position as an asset with a related liability. At June 30, 2015, PERS has collateral consisting of cash and securities issued by the U.S. Government, its agencies or instrumen-talities, in excess of the market value of investments held by brokers/dealers under a securities lending agreement.
D. DerivativesPrimary Government – The Office of the State Treasurer’s investment policies do not contain any specific language regarding derivatives other than prohibiting certain types of derivatives such as option contracts, futures contracts, and swaps in the General Portfolios and the Local Government Investment Pool effective June 2012 and September 2011 respectively. The primary government has no exposure to derivatives as of June 30, 2015.
Other Employee Benefit Trust Funds and Investment Trust Funds – The RBIF has exposure to derivatives as of June 30, 2015. Furthermore, the State Retirees’ Health and Welfare Benefits Fund, an other employee benefit trust fund, has investments held with the RBIF. Foreign exchange forward contracts are periodically employed by the RBIF to hedge currency risk of investments in foreign currencies. No other derivatives are permitted within these portfolios. Generally, derivatives are subject to both market risk and counterparty risk. The derivatives utilized typically have no greater market risk than their physical counterparts and, in many cases, are offset by exposures elsewhere in the portfolios. Counterparty risk, the risk that the “other party” to a contract will default, is managed by careful screening of counterparties. Derivative securities are priced and accounted for at fair value. Foreign exchange forward contracts are valued at the price at which the transaction could be settled by offsets in the forward markets. The RBIF’s derivative transactions for fiscal year 2015 are summarized in the following table (expressed in thousands):
PurchasesRealized
Gain (Loss) SellsRealized
Gain (Loss)
Total Realized
Gain (Loss)Australian Dollar 926$ 1$ (72)$ -$ 1$ British Pound Sterling 3,032 (4) (294) - (4)Danish Krone 256 (1) (19) - (1)Euro 5,312 (6) (774) (8) (14)Hong Kong Dollar 348 - (21) - -Israeli Shekel 93 - (10) - -Japanese Yen 3,053 (15) (118) - (15)New Zealand Dollar 18 - - - -Norwegian Krone 75 - (12) - -Singapore Dollar 191 (1) (52) - (1)Swedish Krona 400 (3) (11) - (3)Swiss Franc 1,458 (9) (153) - (9)Total 15,162$ (38)$ (1,536)$ (8)$ (46)$
Foreign Exchange Contracts

54
Notes to Financial StatementsFor the Fiscal Year Ended June 30, 2015 NEVADA
(Note 3 Continued)
Private Purpose Trust Fund – Certain investments in the Nevada College Savings Plan are managed by Putnam Investment Management through Putnam sponsored portfolios (the Portfolios) and mutual funds. The Portfolios use five types of deriva-tives: futures contracts, forward currency contracts, total return swap contracts, interest rate swap contracts, and credit default contracts. Currently, there is no written investment policy with regard to derivatives for the Portfolios. All five types of deriva-tives are considered investments. The fair value amount in the table below represents the unrealized appreciation (depreciation) from derivative instruments and is reported in the Statement of Fiduciary Net Position. The net increase (decrease) in fair value is reported as investment income on the Statement of Changes in Fiduciary Net Position. The Portfolios’ investment deriva-tive instruments as of June 30, 2015, and changes in fair value for the year then ended are summarized in the following table (expressed in thousands):
Contracts/ Notional Amounts Fair Value
Change in Fair Value
Forward Currency Contracts, net 41,086$ (65)$ 116$ CC Interest Rate Swap Contracts, gross 7,151$ 13 (15) OTC Total Return Swap Contracts, gross 16,464$ (27) (21) OTC Credit Default Contracts, gross 1,700$ 14 (19) CC Credit Default Contracts, gross 8,285$ (67) (315) Futures Contracts, gross 100 82 51 Total (50)$ (203)$
The Portfolios use futures contracts to manage interest rate risk, gain exposure to interest rates, manage prepayment risk, equitize cash, and manage exposure to market risk. The poten-tial risk is that the change in value of futures contracts may not correspond to the change in value of the managed instru-ments. In addition, losses may arise from changes in the value of the underlying instruments if there is an illiquid secondary market for the contracts, if interest or exchange rates move unexpectedly, or if the counterparty to the contract is unable to perform. Futures contracts are valued at the quoted daily settlement prices established by the exchange on which they trade. Risks may exceed amounts recognized on the Statement of Fiduciary Net Position. The Portfolios and the broker agree to exchange an amount of cash equal to the daily fluctuation in the value of the futures contract. Such receipts or payments are known as “variation margin.”
The Portfolios buy and sell forward currency contracts, which are agreements between two parties to buy and sell curren-cies at a set price on a future date. These contracts are used to manage foreign exchange risk and to gain exposure on currency. The contract is marked to market daily using current forward currency exchange rates supplied by a quotation service. The Portfolios may be exposed to risk if the value of currency changes unfavorably, if the counterparties to the contracts are unable to meet the terms of their contracts or if the Portfolios are unable to enter into a closing position. Risk of loss may exceed amounts recognized on the Statement of Fiduciary Net Position.
The Portfolios entered into OTC total return swap contracts, which are arrangements to exchange a market linked return for a periodic payment, both based on a notional principal amount, to manage sector exposure, manage exposure to specific sectors or industries, manage exposure to specific securi-ties, to gain exposure to basket of securities, to gain exposure to specific markets or countries. To the extent that the total return of the security, index or other financial measure under-lying the transaction exceeds or falls short of the offsetting interest rate obligation, the Portfolios will receive a payment from or make a payment to the counterparty. OTC total return swap contracts are marked to market daily based upon quota-tions from an independent pricing service or market makers. The Portfolios could be exposed to credit or market risk due to unfavorable changes in the fluctuation of interest rates or the price of the underlying security or index, the possibility that there is no liquid market for these agreements or that the counterparty may default on its obligation to perform. The Portfolios’ maximum risk of loss from counterparty risk is the fair value of the contract. This risk may be mitigated by having a master netting arrangement between the Portfolios and the counterparty. Risk of loss may exceed amounts recognized on the Statement of Fiduciary Net Position.
The Portfolios entered into OTC and/or centrally cleared interest rate swap contracts to manage interest rate risk and to gain exposure on interest. OTC and centrally cleared interest rate swap contracts are marked to market daily based upon quotations from an independent pricing service or market makers. The Portfolios could be exposed to credit or market

55
Notes to Financial StatementsFor the Fiscal Year Ended June 30, 2015 NEVADA
(Note 3 Continued)
risk due to unfavorable changes in the fluctuation of interest rates or if the counterparty defaults, in the case of OTC inter-est rate contracts, or the central clearing agency or a clearing member defaults, in the case of centrally cleared interest rate swap contracts, on its respective obligation to perform. This risk may be mitigated for OTC interest rate swap contracts by having a master netting arrangement between the Portfolios and the counterparty and for centrally cleared interest rate swap contracts through the daily exchange of variation margin. There is minimal counterparty risk with respect to centrally cleared interest rate swap contracts due to the clear-inghouse guarantee fund and other resources that are available in the event of a clearing member default. Risk of loss may exceed amounts recognized on the Statement of Fiduciary Net Position.
The Portfolios entered into OTC and/or centrally cleared cred-it default contracts to manage credit risk and market risk, and gain exposure on individual names and/or baskets of securi-ties. In an OTC and centrally cleared credit default contracts, the protection buyer typically makes a periodic stream of payments to a counterparty, the protection seller, in exchange for the right to receive a contingent payment upon the occur-rence of a credit event on the reference obligation or all other equally ranked obligations of the reference entity. Credit events are contract specific but may include bankruptcy, failure to pay, restructuring and obligation acceleration. The OTC and centrally cleared credit default contracts are marked to market daily based upon quotations from an independent pricing service or market makers. In addition to bearing the risk that the credit event will occur, the Portfolios could be exposed to market risk due to unfavorable changes in interest rates or in the price of the underlying security or index or the possibility that it may be unable to close out its position at the same time or at the same price as if it had purchased the underlying reference obligations. In certain circumstances,
the Portfolios may enter into offsetting OTC and centrally cleared credit default contracts which could mitigate their risk of loss. Risk of loss may exceed amounts recognized on the Statement of Fiduciary Net Position. The Portfolios’ maxi-mum risk of loss from counterparty risk, either as the protec-tion seller or as the protection buyer, is the fair value of the contract. This risk may be mitigated for OTC credit default contracts by having a master netting arrangement between the Portfolios and the counterparty and for centrally cleared credit default contracts through the daily exchange of the variation margin. Counterparty risk is further mitigated with respect to centrally cleared credit default contracts due to the clearing-house guarantee fund and other resources that are available in the event of a clearing member default. Where the Portfolios are a seller of protection, the maximum potential amount of future payments it may be required to make is equal to the notional amount.
Derivative instruments held by the Portfolios were not indi-vidually rated by a ratings agency for the reporting period. As of June 30, 2015, OTC derivative counterparties had ratings that were either greater than or equivalent to long-term ratings of Baa1/BBB and short-term ratings of P-2/A-2. Centrally cleared contracts are not considered brokered contracts and have mitigated risks. With futures, there is minimal counter-party credit risk to the Portfolios since futures are exchange traded and the exchange’s clearinghouse, as counterparty to all exchange traded futures, guarantees the futures against default.
Derivative instruments are subject to interest rate risk. Prices of longer term maturities generally change more in response to interest rate changes than the prices of shorter term maturi-ties. The following table provides information about the inter-est rate risks associated with the types of investment deriva-tive instruments as of June 30, 2015 (expressed in thousands):
Less than 1 1-5 6-10 Greater than 10 TotalForward Currency Contracts (65)$ -$ -$ -$ (65)$ CC Interest Rate Swap Contracts - 10 4 (1) 13 OTC Total Return Swap Contracts (27) - - - (27) OTC Credit Default Contracts - - - 14 14 CC Credit Default Contracts - (67) - - (67) Futures Contracts 82 - - - 82 Total (10)$ (57)$ 4$ 13$ (50)$
Maturities in Years

56
Notes to Financial StatementsFor the Fiscal Year Ended June 30, 2015 NEVADA
PermanentGeneral School Fund Total
As shown on financial statements:Intergovernmental receivables 428,838$ 2,647$ 431,485$ Notes/loans receivable 18,214 - 18,214 Due from Component Unit 320 20,496 20,816
Total 447,372$ 23,143$ 470,515$ Classified:
Current portion 421,245$ 2,647$ 423,892$ Noncurrent portion:
Intergovernmental receivables 8,963 - 8,963 Notes/loans receivable 17,164 - 17,164 Due from Component Unit - 20,496 20,496 Total noncurrent portion 26,127 20,496 46,623 Total 447,372$ 23,143$ 470,515$
Major Funds
Note 4 - Receivables
Receivable balances are disaggregated by type and presented separately in the financial statements. Significant receivable balances not expected to be collected within one year and not already classified in the fund financials are presented below (expressed in thousands):
Not included in the receivable balances are amounts considered to be uncollectible. In the governmental funds, uncollectible taxes receivable are estimated at $31.9 million, and uncollectible accounts receivable are estimated at $103.5 million. The proprietary funds have $31.9 million in uncollectible accounts receivable of which $9.0 million are from uninsured employers’ fines and penalties, and $11.0 million are from unemployment contributions and benefit overpayments.
Fair ValueAustralian Dollar (35)$ Brazilian Real 1 British Pound 32 Canadian Dollar (85) Chilean Peso (3) Euro (2) Hungarian Forint (2) Indian Rupee 2 Israeli Shekel (3) Japanese Yen 17 Mexican Peso (24) New Zealand Dollar 46 Norwegian Krone (5) Philippines Peso (2) Polish Zloty 3 Singapore Dollar 7 Swedish Krona (11) Swiss Franc (1) Total (65)$
Forward currency contracts are subject to foreign currency risk. The following table provides information about the forward currency contracts as of June 30, 2015 (expressed in thousands):
The audited financial statements of Putnam 529 for America may be obtained from Putnam Investment Management, One Post Office Square, Boston, MA 02109.
(Note 3 Continued)

57
Notes to Financial StatementsFor the Fiscal Year Ended June 30, 2015 NEVADANote 5 - Interfund Transactions
NonmajorGeneral Governmental Total
Advances ToNonmajor enterprise 227$ -$ 227$ Internal service 2,571 753 3,324 Total other funds 2,798$ 753$ 3,551$
Advances From
State Municipal Permanent Nonmajor TotalGeneral Highway Bond Bank School Governmental Governmental
Due FromMajor Governmental Funds:
General -$ 2,546$ 1$ 42$ 16,262$ 18,851$ State Highway 5,363 - - - 211 5,574 Municipal Bond Bank 4 - - - - 4 Permanent School Fund 1,284 - - - - 1,284
Nonmajor governmental 12,911 2,782 - - 7,227 22,920 Total Governmental 19,562 5,328 1 42 23,700 48,633 Major Enterprise Funds:
Housing Division - - - - - - Unemployment Comp - - - - 1,651 1,651 Water Projects Loans 209 - - - - 209 Higher Ed Tuition Trust 55 - - - - 55
Nonmajor enterprise 1,751 6 - - - 1,757 Total Enterprise 2,015 6 - - 1,651 3,672 Internal Service 744 152 - - 151 1,047
Total other funds 22,321$ 5,486$ 1$ 42$ 25,502$ 53,352$
Fiduciary 363$ -$ -$ -$ 1,016$ 1,379$ Component Units:
Colorado River Commission -$ -$ -$ -$ -$ -$ Nevada System of Higher Education 320 - - - - 320 Nevada Capital Investment Corporation - - - 20,496 - 20,496
Total Component Units 320$ -$ -$ 20,496$ -$ 20,816$
Due To
Major Governmental Funds
A. InterfundAdvancesA summary of interfund advances at June 30, 2015, follows (expressed in thousands):
Interfund advances are the portions of interfund balances that are not expected to be repaid within one year. The interfund balances that are expected to be repaid within one year are shown in the Due From/Due To summary below.
Advances are generally made to finance capital expenditures or as a loan for operating purposes.
B. DueFrom/DueToOtherFundsandComponentUnitsA summary of due from and due to other funds and component units at June 30, 2015, is shown below (expressed in thousands):
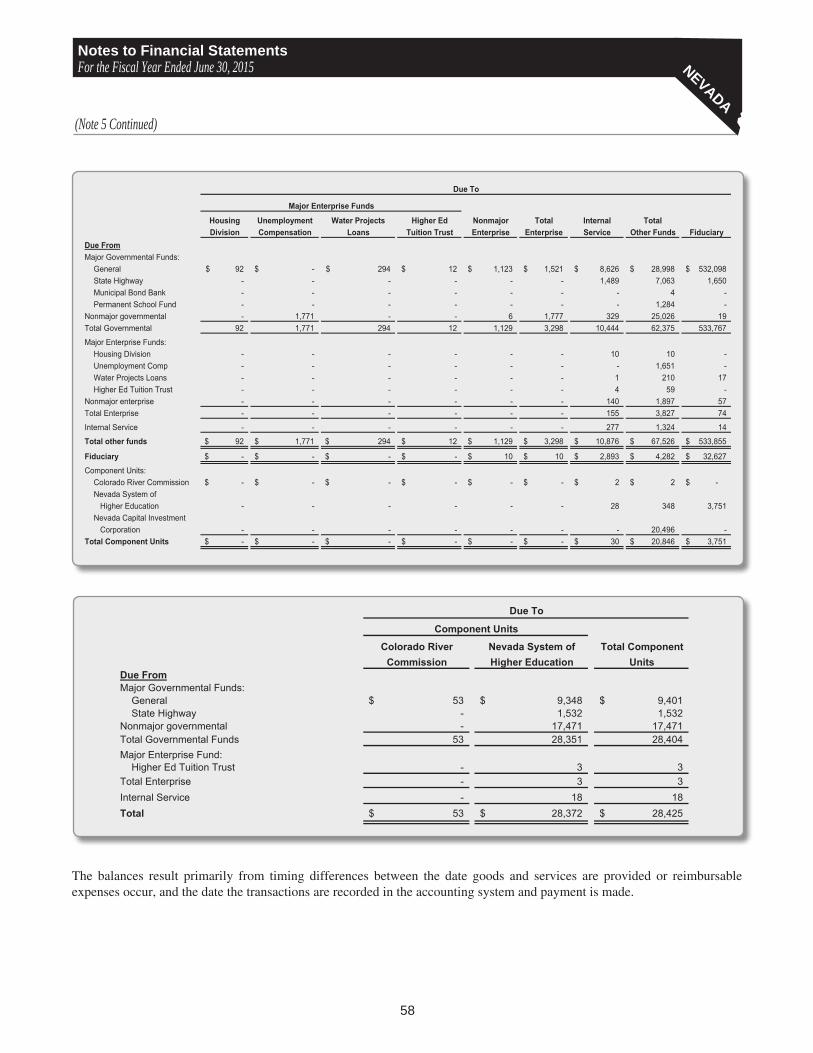
58
Notes to Financial StatementsFor the Fiscal Year Ended June 30, 2015 NEVADA
(Note 5 Continued)
Housing Unemployment Water Projects Higher Ed Nonmajor Total Internal TotalDivision Compensation Loans Tuition Trust Enterprise Enterprise Service Other Funds Fiduciary
Due FromMajor Governmental Funds:
General 92$ -$ 294$ 12$ 1,123$ 1,521$ 8,626$ 28,998$ 532,098$ State Highway - - - - - - 1,489 7,063 1,650 Municipal Bond Bank - - - - - - - 4 - Permanent School Fund - - - - - - - 1,284 -
Nonmajor governmental - 1,771 - - 6 1,777 329 25,026 19 Total Governmental 92 1,771 294 12 1,129 3,298 10,444 62,375 533,767
Major Enterprise Funds:Housing Division - - - - - - 10 10 - Unemployment Comp - - - - - - - 1,651 - Water Projects Loans - - - - - - 1 210 17 Higher Ed Tuition Trust - - - - - - 4 59 -
Nonmajor enterprise - - - - - - 140 1,897 57 Total Enterprise - - - - - - 155 3,827 74
Internal Service - - - - - - 277 1,324 14
Total other funds 92$ 1,771$ 294$ 12$ 1,129$ 3,298$ 10,876$ 67,526$ 533,855$
Fiduciary -$ -$ -$ -$ 10$ 10$ 2,893$ 4,282$ 32,627$
Component Units:Colorado River Commission -$ -$ -$ -$ -$ -$ 2$ 2$ -$ Nevada System of Higher Education - - - - - - 28 348 3,751 Nevada Capital Investment Corporation - - - - - - - 20,496 -
Total Component Units -$ -$ -$ -$ -$ -$ 30$ 20,846$ 3,751$
Due To
Major Enterprise Funds
Colorado River Nevada System of Total ComponentCommission Higher Education Units
Due FromMajor Governmental Funds:
General 53$ 9,348$ 9,401$ State Highway - 1,532 1,532
Nonmajor governmental - 17,471 17,471 Total Governmental Funds 53 28,351 28,404 Major Enterprise Fund:
Higher Ed Tuition Trust - 3 3 Total Enterprise - 3 3 Internal Service - 18 18 Total 53$ 28,372$ 28,425$
Due To
Component Units
The balances result primarily from timing differences between the date goods and services are provided or reimbursable expenses occur, and the date the transactions are recorded in the accounting system and payment is made.

59
Notes to Financial StatementsFor the Fiscal Year Ended June 30, 2015 NEVADA
(Note 5 Continued)
State Municipal Permanent Nonmajor TotalGeneral Highway Bond Bank School Governmental Governmental
Transfers In/FromMajor Governmental Funds:
General -$ 8,022$ 4$ 1,351$ 54,244$ 63,621$ State Highway 1,021 - - - 2,766 3,787
Nonmajor governmental 16,808 4,465 38,611 - 16,100 75,984 Total Governmental 17,829 12,487 38,615 1,351 73,110 143,392 Major Enterprise Funds:
Housing 157 - - - - 157 Unemployment Comp - - - - 161,608 161,608 Higher Ed Tuition Trust 2,323 - - - - 2,323
Nonmajor enterprise - - - - 1 1 Total Enterprise 2,480 - - - 161,609 164,089
Internal Service 1,252 487 - - - 1,739
Total other funds 21,561$ 12,974$ 38,615$ 1,351$ 234,719$ 309,220$
Major Governmental Funds
Transfers Out/To
Unemployment Water Projects Nonmajor Total Internal TotalCompensation Loans Enterprise Enterprise Service Other Funds
Transfers In/FromMajor Governmental Funds:
General -$ 1,108$ 12,305$ 13,413$ 19$ 77,053$ State Highway - - - - 22 3,809
Nonmajor governmental 3,576 - - 3,576 50 79,610 Total Governmental 3,576 1,108 12,305 16,989 91 160,472 Major Enterprise Funds:
Housing - - - - - 157 Unemployment Comp - - - - - 161,608 Higher Ed Tuition Trust - - - - - 2,323
Nonmajor enterprise - - 14 14 - 15 Total Enterprise - - 14 14 - 164,103
Internal Service - - - - - 1,739 Total other funds 3,576$ 1,108$ 12,319$ 17,003$ 91$ 326,314$
Transfers Out/To
Major Enterprise Fund
C. TransfersFrom/TransfersToOtherFundsA summary of transfers between funds for the year ended June 30, 2015, is shown below (expressed in thousands):
The general purpose for transfers is to move monies from funds required by statute to collect them to the funds required by statute or budget to expend them, and to move monies collected for debt service purposes to the debt service fund required to make the payment.
In addition, the Nevada Legislature approved appropriations for the support of the Nevada System of Higher Education (NSHE), a component unit. Net payments to NSHE of $487 million are reported as Education-higher education expenses/expenditures in the Statement of Activities and in the Statement of Revenues, Expenditures, and Changes in Fund Balances – Governmental Funds. A corresponding amount is reported as general revenue of NSHE in the Statement of Activities.

60
Notes to Financial StatementsFor the Fiscal Year Ended June 30, 2015 NEVADA
Note 7 - Capital Assets
Beginning EndingBalance Increases Decreases Balance
Governmental activities:Capital assets, not being depreciated
Land 150,606$ 105$ -$ 150,711$ Construction in progress 186,824 52,842 (40,291) 199,375 Infrastructure 3,808,689 156,531 - 3,965,220 Rights-of-way 620,528 22,343 (29) 642,842
Total capital assets, not being depreciated 4,766,647 231,821 (40,320) 4,958,148 Capital assets, being depreciated/amortized
Buildings 1,663,982 35,718 - 1,699,700 Improvements other than buildings 123,781 4,467 - 128,248 Furniture and equipment 399,887 25,771 (18,718) 406,940 Software costs 183,384 732 (115) 184,001
Total capital assets, being depreciated/amortized 2,371,034 66,688 (18,833) 2,418,889
Less accumulated depreciation/amortization for:Buildings (547,313) (43,521) - (590,834) Improvements other than buildings (81,781) (3,866) - (85,647) Furniture and equipment (331,487) (22,919) 16,141 (338,265) Software costs (156,607) (4,924) 80 (161,451)
Total accumulated depreciation/amortization (1,117,188) (75,230) 16,221 (1,176,197)
Total capital assets, being depreciated/amortized, net 1,253,846 (8,542) (2,612) 1,242,692 Governmental activities capital assets, net 6,020,493$ 223,279$ (42,932)$ 6,200,840$
Business-type activities:Capital assets, not being depreciated
Land 568$ -$ -$ 568$ Construction in progress 10,283 420 - 10,703
Total capital assets, not being depreciated 10,851 420 - 11,271
Capital assets, being depreciatedBuildings 3,389 - - 3,389 Improvements other than buildings 631 - - 631 Furniture and equipment 6,288 145 (529) 5,904
Total capital assets, being depreciated 10,308 145 (529) 9,924
Less accumulated depreciation for:Buildings (2,827) (103) - (2,930) Improvements other than buildings (572) - - (572) Furniture and equipment (5,439) (266) 529 (5,176)
Total accumulated depreciation (8,838) (369) 529 (8,678) Total capital assets, being depreciated, net 1,470 (224) - 1,246
Business-type activities capital assets, net 12,321$ 196$ -$ 12,517$
Note 6 - Restricted Assets
Primary Government
Business-Type Activities
Component Units
Restricted:Cash -$ 148,249$ Investments 104,024 45,559 Total 104,024$ 193,808$
Restricted for:Debt service 104,024$ 4,039$ Construction - 138,868Other purposes - 50,901 Total 104,024$ 193,808$
Capital asset activity of the primary government for the year ended June 30, 2015, was as follows (expressed in thousands):
Various debt service, operation and maintenance, capital improvement and construction (acquisition) funding require-ments of bond covenants, and trust indentures are recorded as restricted assets on the Statement of Net Position. The com-ponents of restricted assets at June 30, 2015 are as follows (expressed in thousands):

61
Notes to Financial StatementsFor the Fiscal Year Ended June 30, 2015 NEVADA
(Note 7 Continued)
Governmental activities:General government 4,021$ Education, support services 833Health, social services 11,108Law, justice, public safety 33,196Recreation, resource development 5,693Transportation 10,036Regulation of business 2,554Unallocated 2,137Depreciation and amortization on capital assets held by the State's internal service funds is charged to the various functions based on their use of the assets 5,652 Total depreciation/amortization expense - governmental activities 75,230$
Business-type activities:Enterprise 369$ Total depreciation expense - business-type activities 369$
Beginning EndingBalance Increases Decreases Balance
Nevada System of Higher Education:Capital assets, not being depreciated
Construction in progress 52,612$ 148,371$ (28,265)$ 172,718$ Land 83,953 17,188 - 101,141 Collections 12,967 216 (2) 13,181
Total capital assets, not being depreciated 149,532 165,775 (28,267) 287,040 Capital assets, being depreciated
Buildings 2,362,648 30,554 (1,490) 2,391,712 Land and improvements 119,488 12,628 (3,147) 128,969 Machinery and equipment 346,789 24,420 (12,340) 358,869 Intangibles 42,851 1,359 (138) 44,072 Library books and media 118,996 2,299 (685) 120,610
Total capital assets, being depreciated 2,990,772 71,260 (17,800) 3,044,232 Less accumulated depreciation for:
Buildings (757,849) (58,265) 9 (816,105) Land and improvements (93,589) (4,220) 1,325 (96,484) Machinery and equipment (250,732) (25,165) 13,815 (262,082) Intangibles (19,526) (4,195) 264 (23,457) Library books and media (112,300) (3,065) 824 (114,541)
Total accumulated depreciation (1,233,996) (94,910) 16,237 (1,312,669) Total capital assets, being depreciated, net 1,756,776 (23,650) (1,563) 1,731,563
Nevada System of Higher Education activity capital assets, net 1,906,308$ 142,125$ (29,830)$ 2,018,603$
Included in the table above are three Department of Correction facilities that have been closed and are idle, with a carrying value of $12.2 million.
Current period depreciation and amortization expense was charged to functions of the primary government as follows (expressed in thousands):
Capital asset activity of the Nevada System of Higher Education for the year ended June 30, 2015, was as follows (expressed in thousands):

62
Notes to Financial StatementsFor the Fiscal Year Ended June 30, 2015 NEVADA
Beginning Ending Due WithinBalance Additions Reductions Balance One Year
Governmental activities:Bonds payable:
General obligation bonds 1,703,840$ 291,605$ (387,515)$ 1,607,930$ 272,915$ Special obligation bonds 527,450 - (41,310) 486,140 45,600
Subtotal 2,231,290 291,605 (428,825) 2,094,070 318,515 Issuance premiums (discounts) 146,792 54,686 (24,753) 176,725 18,522
Total bonds payable 2,378,082 346,291 (453,578) 2,270,795 337,037
Certificates of participation 94,455 - (2,520) 91,935 2,710 Issuance premiums (discounts) 2,956 (236) 2,720 236
Total certificates of participation 97,411 - (2,756) 94,655 2,946
Other Governmental long-term activities:Obligations under capital leases 25,094 - (2,268) 22,826 2,649 Compensated absences obligations 97,126 78,104 (76,199) 99,031 61,674
Total other governmental long-term activities 122,220 78,104 (78,467) 121,857 64,323 Governmental activities long-term obligations 2,597,713$ 424,395$ (534,801)$ 2,487,307$ 404,306$
Business-type activities:Bonds payable:
General obligation bonds 83,025$ 1,020$ (10,675)$ 73,370$ 10,590$ Special obligation bonds 1,156,634 71,559 (219,335) 1,008,858 150,271
Subtotal 1,239,659 72,579 (230,010) 1,082,228 160,861 Issuance premiums (discounts) 55,914 663 (13,886) 42,691 13,711
Total bonds payable 1,295,573 73,242 (243,896) 1,124,919 174,572 Compensated absences obligations 2,001 1,553 (1,546) 2,008 1,255 Arbitrage rebate liability 571 390 - 961 - Tuition benefits payable 185,153 23,161 (8,923) 199,391 17,710
Business-type activities long-term obligations 1,483,298$ 98,346$ (254,365)$ 1,327,279$ 193,537$
Note 8 - Capital Lease Receivable
Note 9 - Long-Term Obligations
A. ChangesinLong-TermLiabilitiesThe following is a summary of changes in long-term obligations of the primary government for the fiscal year ended June 30, 2015 (expressed in thousands):
The General Fund and special revenue funds typically liquidate the capital lease obligations. The compensated absence obliga-tions are typically liquidated by the General Fund and State Highway Fund incurring the related salaries and wages costs. The debt service funds typically liquidate the arbitrage obligations.
B. Bonds PayableThe State issues general obligation bonds for the acquisition, construction and improvement of major capital facilities; buying local governments’ bonds in the municipal bond bank fund; loans to municipalities for water projects; protection of natu-ral resources; cultural affairs projects; the construction, reconstruction, improvement and maintenance of highways; and for refunding purposes. General obligation bonds are direct obligations and pledge the full faith and credit of the State.
Special obligation highway improvement revenue bonds provide funds for property acquisition and construction of highway projects. Special obligation unemployment compensation bonds are to repay the Federal Unemployment Advance as benefits paid significantly exceeded employer assessment during the national economic downturn. Special obligation housing bonds in the aggregate have a debt limit of $5 billion and are used for housing loans or to purchase mortgage loans having both fixed and variable interest rates. Special obligation bonds are payable solely from gross pledged revenues and are not general obligations of the State.
The State, as lessor, entered into a lease purchase agree-ment in fiscal year 2014 with the Nevada System of Higher Education (NSHE), a discretely presented component unit, as lessee. The agreement is to finance a building construction project at the Nevada State College. Construction is sched-uled for completion in fiscal year 2016, and at the end of the lease, title to the buildings transfers to NSHE. As discussed in Note 9G, the construction is being financed by Lease Revenue Certificates of Participation Series 2013. Proceeds from the certificates of participation are used to pay the capitalized interest during the construction period, and NSHE will begin
making capital lease principal and interest payments starting in fiscal year 2016.
For the fiscal year ended June 30, 2015, a capital lease receiv-able has been recorded by the primary government in the amount of $43,398,670, which represents the certificate of participation proceeds remitted to NSHE for construction of the buildings. Upon completion of the buildings in fiscal year 2016, the full amount of the minimum lease payments receiv-able will be recorded.

63
Notes to Financial StatementsFor the Fiscal Year Ended June 30, 2015 NEVADA
Interest Original PrincipalRates Amount Outstanding
Governmental activities:General obligation bonds:
Subject to Constitutional Debt Limitation .25-7.0% 1,616,210$ 1,123,490$ Exempt from Constitutional Debt Limitation 2.0-6.0% 740,940 484,440
Special obligation bonds:Exempt from Constitutional Debt Limitation- Highway Improvement Revenue Bonds 2.5-5.0% 797,900 486,140 Subtotal 3,155,050 2,094,070
Issuance premiums (discounts) 273,009 176,725 Governmental activities bonds payable 3,428,059 2,270,795
Business-type activities:General obligation bonds:
Exempt from Constitutional Debt Limitation 1.75-5.1% 103,755 73,370 Special obligation bonds:
Unemployment Compensation Bonds 2.0-5.0% 548,900 410,310 Housing Bonds *.20-6.95% 815,870 598,548 Subtotal 1,468,525 1,082,228
Issuance premiums (discounts) 67,435 42,691 Business-type activities bonds payable 1,535,960 1,124,919
Total bonds payable 4,964,019$ 3,395,714$
*Many Housing bonds have variable rates of interest. The tax exempt bonds track the SIFMA Indexwhile the federally taxable debt tracks the one-month LIBOR Index.
Year EndingJune 30 Principal Interest Principal Interest
2016 318,515$ 87,526$ 160,861$ 35,851$ 2017 157,920 81,012 179,224 28,867 2018 166,800 75,681 145,852 20,413 2019 156,065 65,697 18,883 15,110 2020 164,460 59,584 18,798 61,381
2021-2025 749,915 180,142 92,267 60,401 2026-2030 346,620 31,258 97,963 42,813 2031-2035 33,035 1,940 144,556 28,997 2036-2040 740 12 157,930 14,160 2041-2045 - - 55,752 3,830 2046-2050 - - 10,142 566
Total 2,094,070$ 582,852$ 1,082,228$ 312,389$
Governmental Activities Business-Type Activities
(Note 9 Continued)
Debt limitation (2% of total assessed valuation) 2,028,293$ Less : Bonds and leases payable as of June 30, 2015, subject to limitation (1,127,220)
Remaining debt capacity 901,073$
General obligation bonds and special obligation bonds of the primary government outstanding at June 30, 2015 are comprised of the following (expressed in thousands):
Debt service requirements (principal and interest) for all long-term bonds and notes outstanding at June 30, 2015, of the primary government are summarized in the table following (expressed in thousands):
C. Constitutional Debt LimitationsSection 3, Article 9, of the State Constitution (as amended) limits the aggregate principal amount of the State’s public debt to two percent (2%) of the assessed valuation of the State. Exempt from this limitation are debts authorized by the Legislature that are incurred for the protection and preserva-tion of, or for obtaining the benefits of, any property or natural resources within the State. At June 30, 2015, the debt limitation and its unused portion are computed as follows (expressed in thousands):

64
Notes to Financial StatementsFor the Fiscal Year Ended June 30, 2015 NEVADA
(Note 9 Continued)
Issue Description:Refunding
AmountRefunded Amount
Cash Flow Gain (Loss)
Present Value Gain
General obligation bonds:Capital Improvement and Cultural Affairs Refunding Bonds Series 2015B 239,133$ 212,725$ 26,998$ 22,503$ Natural Resources Refunding Bonds Series 2015C 23,795 21,730 3,506 2,578
Total 262,928$ 234,455$ 30,504$ 25,081$
Year Ending Governmental June 30 Activities
2016 3,625$ 2017 3,6932018 3,1572019 3,2412020 3,069
2021-2025 10,955Total minimum lease payments 27,740Less: amount representing interest (4,914)Obligations under capital leases 22,826$
D. NevadaMunicipalBondBankGeneral obligation bonds have been issued through the Nevada Municipal Bond Bank, a special revenue fund, as authorized by NRS 350A. These bonds are subject to statutory limitation of $1.8 billion and are exempt from the Constitutional Debt Limitation. Proceeds from the bonds are used to purchase validly issued general obligation bonds of the State’s local govern-ments to finance projects related to natural resources. The State anticipates that the debt service revenue it receives from the participating local governments will be sufficient to pay the debt service requirements of the State bonds as they become due. Fourteen projects were funded through the Nevada Municipal Bond Bank as of June 30, 2015, and total investments in local governments amounted to $227,845,000.
E. Refunded Debt and RedemptionsDuring the fiscal year 2015, the State of Nevada refunded $234,455,000 in general obligation, limited tax, bonds related to capi-tal improvement and cultural affairs, and natural resources by issuing refunding bonds with a total par amount of $214,290,000 at a $46,243,124 premium. Proceeds from refunding bonds were used to refund certain outstanding State general obligation bonds to realize debt service savings. The refunding decreased the aggregate debt service payments by $30,503,586 with an economic or present value gain of $25,080,713. The reacquisition price exceeded the carrying amount of the old debt causing a deferred accounting loss of $21,663,779. This amount is being reported as a deferred outflow of resources and amortized as an adjustment to interest expense over the life of the refunded debt or the refunding debt, whichever is shorter. The impact of the refunding issues is presented in the following table (expressed in thousands):
In current and prior years, the State defeased certain general obligations and other bonds by placing the proceeds of new bonds and other monies in an irrevocable trust to provide for all future debt service payments on the old bonds. Accordingly, the trust account assets and the liability for the defeased bonds are not included in the State’s financial statements. The total outstanding amount of defeased issues at June 30, 2015 is $507,165,068.
F. Capital LeasesThe State has entered into various agreements for the lease of equipment and improvement of buildings. Assets of the primary government acquired under such leases at June 30, 2015, include equipment with a historical cost of $3,133,420 with accu-mulated depreciation of $1,528,165 and building improvements of $27,810,128 with accumulated depreciation of $5,149,544.
For all capital leases of the primary government, the gross minimum lease payments and the present value of the net minimum lease payments as of June 30, 2015 follow (expressed in thousands):

65
Notes to Financial StatementsFor the Fiscal Year Ended June 30, 2015 NEVADA
(Note 9 Continued)
Year EndingJune 30 Principal Interest
2016 2,710$ 4,242$ 2017 3,845 4,132 2018 4,080 3,957 2019 2,960 3,805 2020 3,160 3,676
2021-2025 18,140 16,027 2026-2030 22,200 11,334 2031-2035 12,945 6,996 2036-2040 12,685 4,228 2041-2043 9,210 936
Total 91,935$ 59,333$
APV of the future tuition obligation $199,391Net position available 252,495
126.63%Net position as a percentage of tuition benefits obligation
Universities Community Colleges2016-17 4.00% 4.00%2017-18 4.00% 4.00%2018-19 4.00% 4.00%2019-20 and later 5.75% 5.50%
G. CertificatesofParticipationIn fiscal year 2010, the NRPC, a blended component unit, issued $7,900,000 of General Obligation Certificates of Participation series 2009 at 5.0-5.125% interest to prepay the remaining outstanding balance of the 1999 issue of the Nevada Real Property Corporation. The original 1999 issue of $15,000,000 was to finance the acquisition, construc-tion, installation and equipping of a secured juvenile treat-ment facility. The 2009 issue is a direct general obligation of the State to which the full faith and credit of the State is pledged. The State is required to make payments from gener-al (ad valorem) taxes in the Consolidated Bond Interest and Redemption debt service fund that approximate the interest and principal payments made by trustees to certificate holders.
In fiscal year 2014, the NRPC issued $35,785,000 of Lease Revenue Refunding Certificates of Participation Series 2013 at 3.0-5.0% interest to refund the outstanding balances of Lease Revenue Certificates of Participation Series 2004 and 2004B, which were to finance the acquisition and construction of the State’s Capitol Complex Building 1 and Casa Grande Projects respectively.
In fiscal year 2014, the NRPC issued $50,445,000 of new Lease Revenue Certificates of Participation Series 2013 at 4.0-5.0% interest to finance the State’s Nevada State College Project. The Project is leased to the Nevada System of Higher Education (NSHE), the State’s discretely presented component unit, upon the completion of the construction (in fiscal year 2016) pursuant to a Lease Purchase Agreement. Meanwhile, the NRPC entered into a Ground Lease with respect to the real property on which the Project is located.
In fiscal year 2007, the NRPC issued $5,760,000 of Lease Revenue Certificates of Participation Series 2006 at 4.0-5.0% interest to finance the design and construction of a ware-house addition to the Legislative Counsel Bureau’s existing State Printing Office building in Carson City and resurfacing of the exterior of the existing building, together with related improvements on the premises.
Under the lease revenue certificates of participation financ-ing arrangements, the certificates are not general obligations of the State and are not backed by the faith and credit or the taxing power of the State. The State’s obligation to pay base rent and make other payments to the trustee under the financ-ing leases is subject to appropriation by the State. In the event that the State does not make a sufficient appropriation with respect to a Lease Purchase Agreement, that Lease Purchase Agreement will terminate. Currently, only the payment of principal and interest on the Series 2006 is being guaranteed by an insurance policy.
The following schedule presents future certificates of partici-pation payments as of June 30, 2015 (expressed in thousands):
H. TuitionBenefitsPayableThe Higher Education Tuition Trust Fund, an enterprise fund, reports benefits payable as shown in Section A based upon the actuarial present value (APV) of the future tuition obligations and administrative expenses that will be paid in future years. The present value calculation includes the effects of project-ed tuition and fee increases and termination of contracts as follows (expressed in thousands):
The actuarial valuation used an investment yield assumption of 6.00% per year and tuition growth assumptions as follows:
I. ArbitrageRebateRequirementThe Tax Reform Act of 1986 imposes a rebate requirement with respect to some bonds issued by the State. Under this requirement, an amount equal to the sum of (a) the excess of the aggregate amount earned on all investments (other than certain specified exceptions) over the amount that would have been earned if all investments were invested at a rate equal to the yield on the bonds, and (b) any income earned on the excess described in (a) must be rebated to the United States Treasury, in order for the interest on the bonds to be excluded from gross income for federal income tax purposes. In accor-dance with the Internal Revenue Service Regulations, arbi-trage rebate liability has been calculated as of June 30, 2015, and changes for the fiscal year then ended are presented in Section A of this note.

66
Notes to Financial StatementsFor the Fiscal Year Ended June 30, 2015 NEVADA
(Note 9 Continued)
J. Conduit Debt ObligationsThe State has issued Industrial Revenue Bonds to provide financial assistance to private-sector entities for the acquisi-tion and construction of commercial facilities deemed to be in the public interest. During the 2013 session, the Nevada Legislature enacted the Charter School Financing Law, which authorizes the issuance of Charter School Bonds and other obligations to finance the acquisition, construction, improve-ment, maintenance or furnishing of land, buildings and facili-ties for Charter Schools in the State of Nevada. The above two types of bonds are secured by the properties financed and are payable solely from payments received on the underly-ing mortgage loans. The State is not obligated in any manner for the repayment of the bonds. Accordingly, the bonds are not reported as liabilities in the accompanying financial state-ments. As of June 30, 2015, there are seven series of Industrial Revenue Bonds and one series of Charter School Bonds outstanding, with an aggregate principal amount payable of $635,249,449.
K. Pledged RevenuePledged motor vehicle and special fuel tax - The State has pledged a portion of future motor vehicle fuel and special fuel tax revenues as well as federal aid for eligible projects to repay the Highway Improvement Revenue Bonds that were issued for highway construction projects and property acqui-sition purposes. As of June 30, 2015, the outstanding balance of Highway Improvement Revenue and Refunding bonds is $486,140,000. The total of principal and interest remaining on the bonds is $603,661,863 payable through December 2026. Upon completion of eligible projects, federal aid of $330,361,808 is expected to be received in fiscal year 2016. For the current year, principal and interest paid was $65,654,768 and total motor vehicle fuel and special fuel tax revenues were $274,838,482.
Pledged future lease rental payments – With respect to each series of Lease Revenue Certificates of Participation, the NRPC, a blended component unit, has pledged its rights, title and interest in the applicable Ground Lease and Lease Purchase Agreement to the Trustee (including the right to receive payments of base rent and other payments). As of June 30, 2015, the outstanding balance of Lease Revenue Certificates of Participation is $88,205,000. The total of prin-cipal and interest remaining on the certificates is $147,251,150 payable through June 2043. In fiscal year 2015, principal and interest of $5,523,306 was paid, which includes the interest payment of $2,432,775 paid entirely by the excess certifi-cate proceeds during the construction period for the State’s Nevada State College Project as discussed in Section G of this note and Note 8. As of June 30, 2015, $12,441,732 was held by the trustee for the benefit of the bondholders. Building rent
of $3,000,000 is expected to be collected in fiscal year 2016, which, along with assets held by the trustee, will be used to pay the fiscal year 2016 debt service principal and interest of $5,614,156.
Pledged additional assessments of unemployment contri-butions - The State has pledged additional assessments on unemployment contributions (special bond contributions), the proceeds derived from the sale of bonds, and related invest-ment earnings to repay $548,900,000 of Unemployment Compensation Fund Special Revenue Bonds issued on November 6, 2013. The revenue bonds were issued for the purposes of repaying the Federal Unemployment Advance that occurred during the last recession and funding a deposit to the Nevada UITF Account to avoid the need for further advances. Pursuant to NRS 612.6132, special bond contri-butions must be established at levels sufficient to pay debt service on the bonds. As of June 30, 2015, the outstanding balance of the bonds is $410,310,000. The total principal and interest remaining on the bonds is $446,170,075 payable through June 2018. In fiscal year 2015, principal and interest of $161,949,950 was paid. As of June 30, 2015, $47,993,921 was held by the trustee for the benefit of the bondholders. Special bond contributions of $199,746,044 are expected to be collected in fiscal year 2016, which, along with assets held by the trustee, will be used to pay the fiscal year 2016 debt service principal and interest of $150,045,950.
Pledged Nevada Housing Division program funds - The single-family bonds are payable from, and secured by, a pledge of the proceeds derived from the sale of bonds; the rights and interest of the Housing Division in all mortgage loans purchased under the various bond certificates; reve-nues which primarily include mortgage repayments and the net income, if any, derived as a result of foreclosure or other action taken in the event of a default on such a mortgage loan; curtailments, consisting generally of all amounts representing monthly principal payments with respect to mortgage loans which are received in advance of the scheduled amortization thereof; and all earnings realized by the investment of monies in all funds and accounts as well as all funds and accounts created by the various bond certificates. The multi-unit bonds are payable from, and secured by, a pledge of the proceeds derived from the sale of bonds; all earnings realized from the investment of bond proceeds; after permanent financing, all revenues received from the develop-ment including housing assistance and rental payments made by tenants, notes receivable collateralized by deeds of trust and the rights to FHA insurance, draws on bank letters of credit, private mortgage and hazard insurance and condemna-tion proceeds.

67
Notes to Financial StatementsFor the Fiscal Year Ended June 30, 2015 NEVADA
(Note 9 Continued)
Year Ending June 30 Amount2016 3,318$ 2017 4,1302018 3,8242019 3,5202020 3,520
2021-2025 17,5952026-2030 10,793
Total minimum lease payments 46,700Less: amount representing interest (424)Obligations under capital leases 46,276$
Year Ending June 30 Principal Interest
2016 26,037$ 23,967$ 2017 33,908 22,881 2018 24,460 21,811 2019 24,867 20,849 2020 26,076 19,823
2021-2025 124,227 83,004 2026-2030 111,866 57,092 2031-2035 109,756 32,047 2036-2040 53,607 10,231 2041-2045 20,546 1,819
Total 555,350$ 293,524$
Beginning Ending Due WithinBalance Additions Reductions Balance One Year
Bonds and notes payable 488,691$ 103,255$ (72,301)$ 519,645$ 23,425$ Issuance premiums (discounts) 30,038 9,892 (4,225) 35,705 2,612 Total bonds payable 518,729 113,147 (76,526) 555,350 26,037
Obligations under capital leases 2,451 44,722 (897) 46,276 3,228 Compensated absences obligations 47,830 32,953 (30,667) 50,116 32,663 Total 569,010$ 190,822$ (108,090)$ 651,742 61,928 Discretely presented component units of the NSHE: Compensated absences 161 - Long-term debt 263 64 Total 652,166$ 61,992$
Substantially all program fund assets are pledged in trust for the benefit of the bondholders. Nevada Housing Division issues a stand-alone financial report that includes financial statements and required supplemental information. The Report may be obtained from Nevada Housing Division, 1535 Old Hot Springs Road, Suite 50, Carson City, NV 89706.
L. Component Unit ObligationsNevada System of Higher Education (NSHE) – Bonds, notes, capital leases and compensated absences payable by NSHE at June 30, 2015, and the changes for the year then ended, consist of the following (expressed in thousands):
Tuition and fees, auxiliary enterprises’ revenue and certain other revenue as defined in the bond indentures secure the revenue bonds.
The following table presents annual principal and interest payments for bonds and notes payable outstanding by NSHE at June 30, 2015 (expressed in thousands):
Future net minimum rental payments which are required under the capital leases by NSHE for the years ending June 30 are as follows (expressed in thousands):

68
Notes to Financial StatementsFor the Fiscal Year Ended June 30, 2015 NEVADA
Note 10 - Pensions and Other Employee Benefits
Beginning Ending Due WithinBalance Additions Reductions Balance One Year
Bonds payable:General obligation bonds 95,885$ -$ (51,905)$ 43,980$ 4,785$ Issuance premiums (discounts) 2,081 - (1,490) 591 566
Total bonds payable 97,966 - (53,395) 44,571 5,351
Compensated absences obligations 339 191 (188) 342 205 Total 98,305$ 191$ (53,583)$ 44,913$ 5,556$
Year Ending June 30 Principal Interest2016 4,785$ 1,690$ 2017 5,015 1,465 2018 5,970 1,208 2019 730 1,063 2020 740 1,050
2021-2025 3,975 4,958 2026-2030 4,655 4,258 2031-2035 5,610 3,266 2036-2040 6,580 1,960 2041-2044 5,920 516
Total 43,980$ 21,434$
(Note 9 Continued)
Colorado River Commission (CRC) – Bonds and compensated absences payable by CRC at June 30, 2015, and the changes for the year then ended, consist of the following (expressed in thousands):
Scheduled maturities for bonds payable by CRC for the years ending June 30 are as follows (expressed in thousands):
The aggregate pension related amounts for the primary gov-ernment consist of a net pension liability of $1,746,240,692, deferred outflows of resources of $182,221,855, deferred inflows of resources of $503,430,552 and pension expense of $221,281,891. The State’s defined benefit pension plans are described in detail below. A. Public Employees’ Retirement System of NevadaPlan Description – The Public Employees’ Retirement Sys-tem (PERS) was established in 1947 by the Nevada Legis-lature and is governed by the Public Employees’ Retirement Board whose seven members are appointed by the governor. PERS administers a cost-sharing multiple-employer defined benefit pension plan that covers qualified State employees and employees of participating local government entities in the State. Any government employer in the State may elect to have its regular and police/fire employees covered by PERS. The cost to administer the plan is financed through the con-tributions and investment earnings of the plan. PERS issues a publicly available financial report that includes financial statements and the required supplementary information for the System. That report may be obtained on the PERS website at www.nvpers.org.
Pension Benefits – Benefits provided to participants or their beneficiaries include retirement, disability, and survivor benefits. Benefits are determined by the number of years of accredited service at the time of retirement and the member’s highest average compensation in any 36 consecutive months, with special provisions for members entering the System on or after January 1, 2010. Members become fully vested as to benefits upon completion of 5 years of service. Unreduced benefits are available, depending upon when the member entered the System, as follows:
Before January 1, 2010 On or after January 1, 2010Age 65 with 5 years of service Age 65 with 5 years of serviceAge 60 with 10 years of service Age 62 with 10 years of serviceAny age with 30 years of service Any age with 30 years of service
Before January 1, 2010 On or after January 1, 2010Age 65 with 5 years of service Age 65 with 5 years of serviceAge 55 with 10 years of service Age 60 with 10 years of serviceAge 50 with 20 years of service Age 50 with 20 years of serviceAny age with 25 years of service Any age with 30 years of service
Regular Members
Police/Fire Members
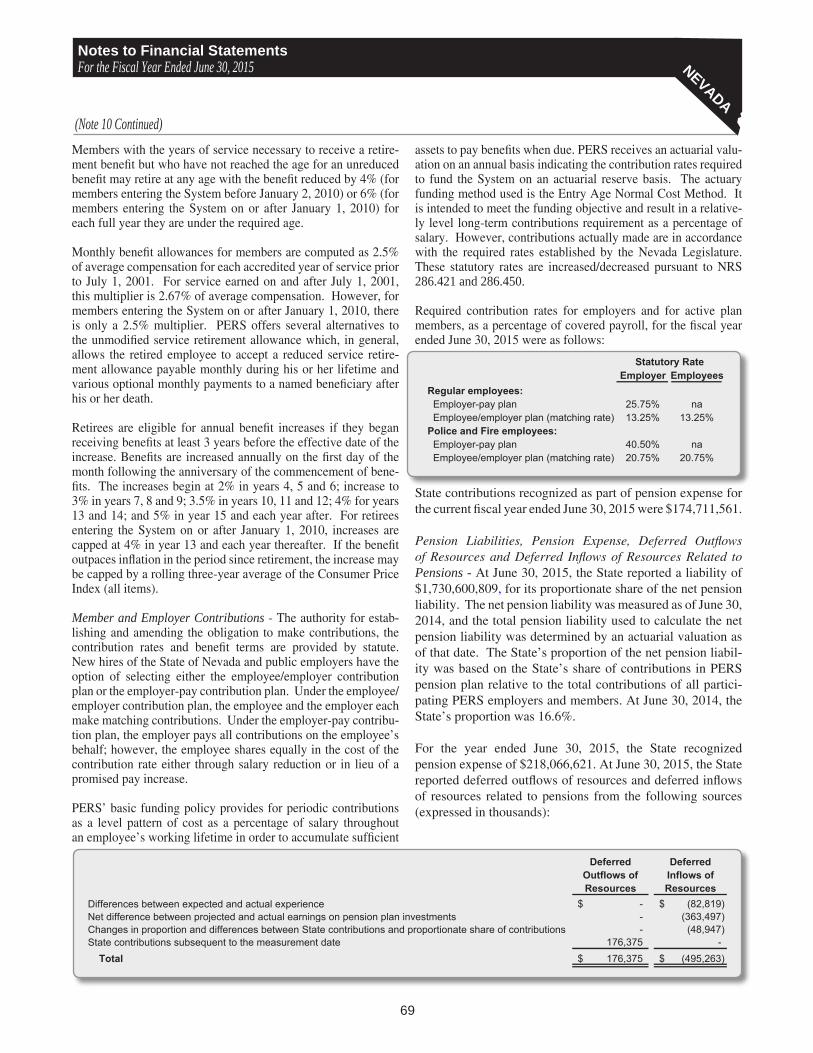
69
Notes to Financial StatementsFor the Fiscal Year Ended June 30, 2015 NEVADA
(Note 10 Continued)
Members with the years of service necessary to receive a retire-ment benefit but who have not reached the age for an unreduced benefit may retire at any age with the benefit reduced by 4% (for members entering the System before January 2, 2010) or 6% (for members entering the System on or after January 1, 2010) for each full year they are under the required age.
Monthly benefit allowances for members are computed as 2.5% of average compensation for each accredited year of service prior to July 1, 2001. For service earned on and after July 1, 2001, this multiplier is 2.67% of average compensation. However, for members entering the System on or after January 1, 2010, there is only a 2.5% multiplier. PERS offers several alternatives to the unmodified service retirement allowance which, in general, allows the retired employee to accept a reduced service retire-ment allowance payable monthly during his or her lifetime and various optional monthly payments to a named beneficiary after his or her death.
Retirees are eligible for annual benefit increases if they began receiving benefits at least 3 years before the effective date of the increase. Benefits are increased annually on the first day of the month following the anniversary of the commencement of bene-fits. The increases begin at 2% in years 4, 5 and 6; increase to 3% in years 7, 8 and 9; 3.5% in years 10, 11 and 12; 4% for years 13 and 14; and 5% in year 15 and each year after. For retirees entering the System on or after January 1, 2010, increases are capped at 4% in year 13 and each year thereafter. If the benefit outpaces inflation in the period since retirement, the increase may be capped by a rolling three-year average of the Consumer Price Index (all items).
Member and Employer Contributions - The authority for estab-lishing and amending the obligation to make contributions, the contribution rates and benefit terms are provided by statute. New hires of the State of Nevada and public employers have the option of selecting either the employee/employer contribution plan or the employer-pay contribution plan. Under the employee/employer contribution plan, the employee and the employer each make matching contributions. Under the employer-pay contribu-tion plan, the employer pays all contributions on the employee’s behalf; however, the employee shares equally in the cost of the contribution rate either through salary reduction or in lieu of a promised pay increase.
PERS’ basic funding policy provides for periodic contributions as a level pattern of cost as a percentage of salary throughout an employee’s working lifetime in order to accumulate sufficient
assets to pay benefits when due. PERS receives an actuarial valu-ation on an annual basis indicating the contribution rates required to fund the System on an actuarial reserve basis. The actuary funding method used is the Entry Age Normal Cost Method. It is intended to meet the funding objective and result in a relative-ly level long-term contributions requirement as a percentage of salary. However, contributions actually made are in accordance with the required rates established by the Nevada Legislature. These statutory rates are increased/decreased pursuant to NRS 286.421 and 286.450.
Required contribution rates for employers and for active plan members, as a percentage of covered payroll, for the fiscal year ended June 30, 2015 were as follows:
State contributions recognized as part of pension expense for the current fiscal year ended June 30, 2015 were $174,711,561.
Pension Liabilities, Pension Expense, Deferred Outflows of Resources and Deferred Inflows of Resources Related to Pensions - At June 30, 2015, the State reported a liability of $1,730,600,809, for its proportionate share of the net pension liability. The net pension liability was measured as of June 30, 2014, and the total pension liability used to calculate the net pension liability was determined by an actuarial valuation as of that date. The State’s proportion of the net pension liabil-ity was based on the State’s share of contributions in PERS pension plan relative to the total contributions of all partici-pating PERS employers and members. At June 30, 2014, the State’s proportion was 16.6%.
For the year ended June 30, 2015, the State recognized pension expense of $218,066,621. At June 30, 2015, the State reported deferred outflows of resources and deferred inflows of resources related to pensions from the following sources (expressed in thousands):
Employer EmployeesRegular employees: Employer-pay plan 25.75% na Employee/employer plan (matching rate) 13.25% 13.25%Police and Fire employees: Employer-pay plan 40.50% na Employee/employer plan (matching rate) 20.75% 20.75%
Statutory Rate
Deferred Outflows of Resources
Deferred Inflows of Resources
Differences between expected and actual experience -$ (82,819)$ Net difference between projected and actual earnings on pension plan investments - (363,497) Changes in proportion and differences between State contributions and proportionate share of contributions - (48,947) State contributions subsequent to the measurement date 176,375 - Total 176,375$ (495,263)$

70
Notes to Financial StatementsFor the Fiscal Year Ended June 30, 2015 NEVADA
(Note 10 Continued)
Deferred outflows of resources of $176,375,195 for contribu-tions subsequent to the measurement date will be recognized as a reduction of the net pension liability in the year ended June 30, 2016.
The average of the expected remaining service lives of all employees that are provided with pensions through PERS (active and inactive employees) determined at July 1, 2013 (the beginning of the measurement period ended June 30, 2014) is 6.7 years.
Other amounts reported as deferred outflows of resources and deferred inflows of resources related to pensions will be recog-nized in pension expense as follows (expressed in thousands):
Actuarial Assumptions – The State’s net pension liability was measured as of June 30, 2014, and the total pension liability used to calculate the net pension liability was determined by an actuarial valuation as of that date. The total pension liabil-ity was determined using the following actuarial assumptions, applied to all periods included in the measurement:
Mortality rates were based on the RP-2000 Combined Healthy Mortality Table projected to 2013 with Scale AA, set back one year for females (no age setback for males) for regular members and set forward one year for police/fire members. Mortality rates for disabled members were based on the RP-2000 Disabled Retiree Mortality Table projected to 2013 with Scale AA, set forward three years.
Actuarial assumptions used in the June 30, 2014 valuation were based on the results of the actuarial experience review completed in 2013.
Investment Policy -The PERS Board evaluates and estab-lishes the investment portfolio target asset allocations and the expected real rates of return (expected returns, net of invest-ment expenses and inflation) for each asset class. The Board reviews these asset allocations and capital market expecta-tions annually. The System’s target asset allocations and current long-term geometric expected real rates of return for each asset class included in the fund’s investment portfolio as of June 30, 2014, are included in the following table:
Discount Rate – The discount rate used to measure the total pension liability was 8% as of June 30, 2014. The projec-tion of cash flows used to determine the discount rate assumed plan contributions will be made in amounts consistent with statutory provisions and recognizing the plan’s current fund-ing policy and cost-sharing mechanism between employ-ers and members. For this purpose, all contributions that are intended to fund benefits for all plan members and their bene-ficiaries are included, except that projected contributions that are intended to fund the service costs for future plan members and their beneficiaries are not included.
Sensitivity of the Proportionate Share of the Net Pension Liability to Changes in the Discount Rate – The following pres-ents the State’s proportionate share of the net pension liability at June 30, 2014 calculated using the discount rate of 8%, as well as what the State’s proportionate share of the net pension liability would be if it were calculated using a discount rate that is 1-percentage-point lower (7%) or 1-percentage-point higher (9%) than the current rate (expressed in thousands):
Pension Plan fiduciary net position – Detailed information about the pension plan’s fiduciary net position is available in the separately issued PERS’ report.
Payables to the pension plan – At June 30, 2015, the State reported payables to the defined benefit pension plan of
Year Ended June 30:2016 (116,963)$ 2017 (116,963) 2018 (116,964) 2019 (116,964) 2020 (16,123) Thereafter (11,286)
Inflation rate: 3.50%
Payroll growth: 5.00%, including inflation
Investment rate of return: 8.00%
Productivity pay increase: 0.75%
Projected salary increases: Regular: 4.60% to 9.75%, depending on service
Police/Fire: 5.25% to 14.50%, depending on service
Rates include inflation and productivity increasesConsumer price index: 3.50%
Other assumptions: Same as those used in the June 30, 2014 funding actuarial valuation
Asset ClassTarget
Allocation
Long-term Geometric
Expected Real Rate of Return
Domestic equity 42% 5.50%International equity 18% 5.75%Domestic fixed income 30% 0.25%Private markets 10% 6.80%
1% Decrease in Discount Rate (7%)
Discount Rate (8%)
1% Increase in Discount Rate (9%)
Net pension liability 2,691,274$ 1,730,601$ 932,037$

71
Notes to Financial StatementsFor the Fiscal Year Ended June 30, 2015 NEVADA
(Note 10 Continued)
$13,391,837 for legally required employer contributions which had been withheld from employee wages but not yet remitted to PERS. B. Legislators’ Retirement System of NevadaPlan Description – The Legislators’ Retirement System (LRS) is a single-employer defined benefit pension plan established in 1967 by the Nevada Legislature (NRS 218C) and is governed by the Public Employees’ Retirement Board whose seven members are appointed by the governor. All State Legislators are members. LRS issues a publicly available financial report that includes financial statements and the required supplemen-tary information for the System. LRS’ financial report may be obtained from the Public Employees’ Retirement System, 693 West Nye Lane, Carson City, Nevada 89703.
Employee membership data related to the LRS pension plan, as of June 30, 2014:
Pension Benefits – Benefits are determined by the number of years of accredited service at the time of retirement. Service years include the entire election term whether or not the Legis-lature is in session. Benefits payments to which participants may be entitled under the plan include pension and survivor benefits. Monthly benefit allowances are $25 for each year of service up to 30 years.
If a Legislator is newly elected after July 1, 1985, they must have at least 10 years of service, be age 60, and no longer be a Legislator in order to retire without benefit reduction. If a Legislator is no longer serving and has at least 10 years of service but is under the age of 60, they can elect to wait to receive their benefit until the age of 60 or begin receiving a reduced benefit prior to the age of 60. The minimum require-ment for an unreduced benefit for a Legislator elected prior to July 1, 1985, is 8 years of accredited service at age 60.
Members are eligible for benefit increases based on their effective date of membership. For members with an effec-tive date of membership before January 1, 2010, the lesser of: (a) 2% per year following the third anniversary of the commencement of benefits, 3% per year following the sixth anniversary, 3.5% per year following the ninth anniversary, 4% per year following the twelfth anniversary and 5% per year following the fourteenth anniversary, or (b) the average percentage increase in the Consumer Price Index (or other
Board approved index) for the three preceding years. In any event, a member’s benefit must be increased by the percent-ages in (a) if it has not been increased at a rate greater than or equal to the average of the Consumer Price Index (CPI) (All items) (or other Board approved index) for the period between retirement and the date of increase. For members with an effective date of membership on or after January 1, 2010, same as above, except the increases in paragraph (a) do not exceed 4% per year. For future retirees, those hired prior to 2010 are assumed to reach the cap after 24 years of retirement. Those hired in 2010 or later are assumed to reach the cap after 39 years of retirement. Underlying all of these assumptions is that CPI will grow over time at a rate of 3.5% per year.
Member and Employer Contributions - The Legislator contri-bution of 15% of compensation is paid by the Legislator only when the Legislature is in session, as required by statute. The Legislature holds sessions every two years. Prior to 1985, the employee contributions were matched by the employer. The 1985 Legislators’ Retirement Act includes NRS 218C.390(2) which states, “The Director of the Legislative Counsel Bureau shall pay to the Board from the Legislative Fund an amount as the contribution of the State of Nevada as employer which is actuarially determined to be sufficient to provide the System with enough money to pay all benefits for which the System will be liable.” The Legislature appropriated $426,702 for fiscal years 2013 and 2014, which is the required State contri-bution as determined by the actuary. This amount was paid by the State of Nevada to the Legislative fund during fiscal 2013, of which $213,351 (half) was recognized as employer contri-butions in the fiscal year 2013, and the other half recognized as employer contributions in fiscal year 2014.
State contributions recognized as part of pension expense for the fiscal year ended June 30, 2015 were $213,351.
LRS’ basic funding policy provides for contributions by the State based on a biennial actuarial valuation prepared per NRS 281C.390(2). The Actuarially Determined Employ-ers’ Contribution (ADEC) includes the employer’s normal cost and a provision for amortizing the Unfunded Actuarial Accrued Liability (UAAL). LRS receives an actuarial valu-ation on a biennial basis. Effective with the January 1, 2009 valuation, the UAAL is amortized as a level dollar amount over a declining amortization period of 20 years. Any increases or decreases in the UAAL that arise in future years will be amortized over separate 20-year periods. In addition, the Actuarial Value of Assets (AVA) was limited to not less than 75% or greater than 125% of market value. The actuarial funding method used is the Entry Age Normal Cost Method.
Retirees and beneficiaries currently receiving benefits 79Inactive vested members 11Inactive non-vested members 21Active members 40 Total 151

72
Notes to Financial StatementsFor the Fiscal Year Ended June 30, 2015 NEVADA
(Note 10 Continued)
Pension Liabilities, Pension Expense, Deferred Outflows of Resources and Deferred Inflows of Resources Related to Pensions – At June 30, 2015, The State reported a liability of $658,424, for its proportionate share of the net pension liability. The net pension liability was measured as of June 30, 2014, and the total pension liability used to calculate the net pension liability was determined by an actuarial valuation as of that date.
For the year ended June 30, 2015, the State recognized pension expense of $9,154. At June 30, 2015, the State reported deferred outflows of resources and deferred inflows of resources related to pensions from the following sources (expressed in thousands):
Deferred Outflows of Resources
Deferred Inflows of Resources
Net difference between projected and actual earnings on pension plan investments -$ (375)$ State contributions subsequent to the measurement date 312 - Total 312$ (375)$
Deferred outflows of resources of $311,710 for contributions subsequent to the measurement date will be recognized as a reduction of the net pension liability in the year ended June 30, 2016.
The average of the expected remaining service lives of all employees that are provided with pensions through LRS determined at July 1, 2013 (beginning of the measurement period ended June 30, 2014) is 1.32 years.
Other amounts reported as deferred outflows of resources and deferred inflows of resources related to pensions will be recog-nized in pension expense as follows (expressed in thousands):
Year Ended June 30:2016 (94)$ 2017 (94) 2018 (94) 2019 (93) 2020 - Thereafter -
2014Total pension liabilityService cost 37$ Interest 428 Benefit payments, including refunds (494)
Net change in total pension liability (29) Total pension liability - beginning 5,560 Total pension liability - ending (a) 5,531$
Plan fiduciary net positionContributions - employer 213$ Contributions - employee 27 Net investment income 804 Benefit payments, including refunds (494) Administrative expense (46) Other 46
Net change in plan fiduciary net position 550 Plan fiduciary net position - beginning 4,323 Plan fiduciary net position - ending (b) 4,873$
Net pension liability - ending (a) - (b) 658$ Plan fiduciary net position as a percentage of total pension liability 88%Covered-employee payroll N/ANet pension liability as a percentage of covered-employee payroll N/A
The following table presents the changes in the net pension liability for LRS for the year ended June 30, 2014 (expressed in thousands):
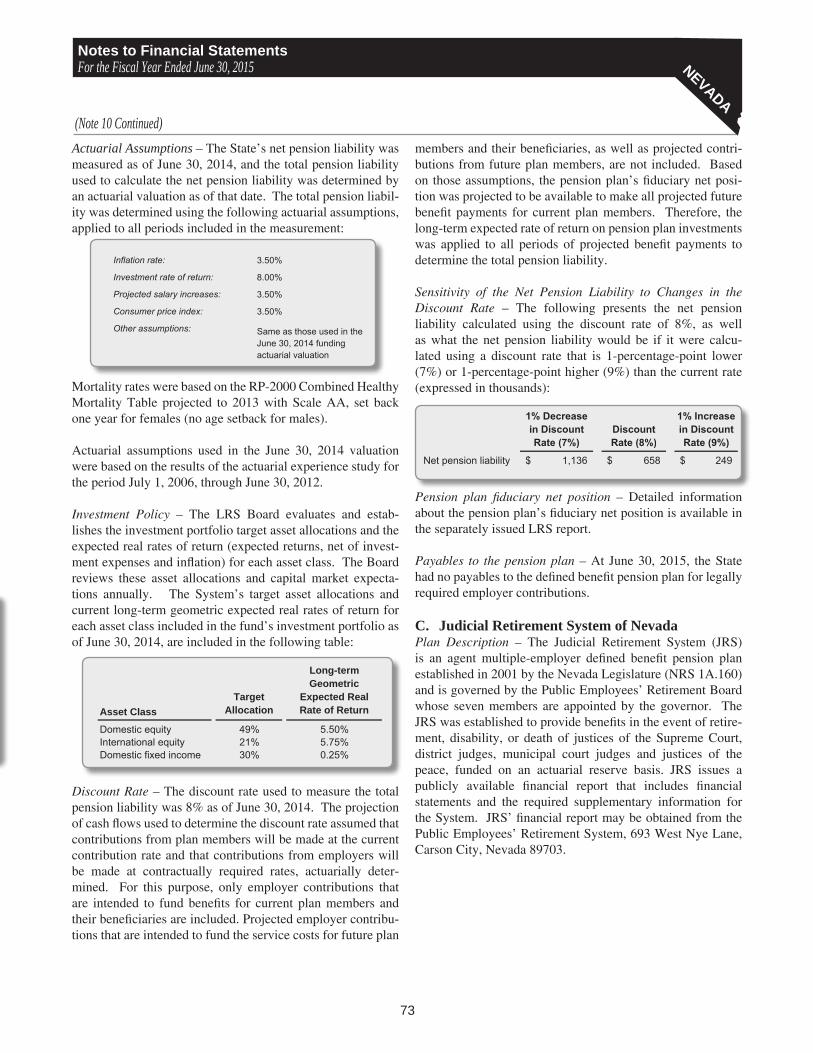
73
Notes to Financial StatementsFor the Fiscal Year Ended June 30, 2015 NEVADA
(Note 10 Continued)
Actuarial Assumptions – The State’s net pension liability was measured as of June 30, 2014, and the total pension liability used to calculate the net pension liability was determined by an actuarial valuation as of that date. The total pension liabil-ity was determined using the following actuarial assumptions, applied to all periods included in the measurement:
Mortality rates were based on the RP-2000 Combined Healthy Mortality Table projected to 2013 with Scale AA, set back one year for females (no age setback for males).
Actuarial assumptions used in the June 30, 2014 valuation were based on the results of the actuarial experience study for the period July 1, 2006, through June 30, 2012.
Investment Policy – The LRS Board evaluates and estab-lishes the investment portfolio target asset allocations and the expected real rates of return (expected returns, net of invest-ment expenses and inflation) for each asset class. The Board reviews these asset allocations and capital market expecta-tions annually. The System’s target asset allocations and current long-term geometric expected real rates of return for each asset class included in the fund’s investment portfolio as of June 30, 2014, are included in the following table:
Discount Rate – The discount rate used to measure the total pension liability was 8% as of June 30, 2014. The projection of cash flows used to determine the discount rate assumed that contributions from plan members will be made at the current contribution rate and that contributions from employers will be made at contractually required rates, actuarially deter-mined. For this purpose, only employer contributions that are intended to fund benefits for current plan members and their beneficiaries are included. Projected employer contribu-tions that are intended to fund the service costs for future plan
members and their beneficiaries, as well as projected contri-butions from future plan members, are not included. Based on those assumptions, the pension plan’s fiduciary net posi-tion was projected to be available to make all projected future benefit payments for current plan members. Therefore, the long-term expected rate of return on pension plan investments was applied to all periods of projected benefit payments to determine the total pension liability.
Sensitivity of the Net Pension Liability to Changes in the Discount Rate – The following presents the net pension liability calculated using the discount rate of 8%, as well as what the net pension liability would be if it were calcu-lated using a discount rate that is 1-percentage-point lower (7%) or 1-percentage-point higher (9%) than the current rate (expressed in thousands):
Pension plan fiduciary net position – Detailed information about the pension plan’s fiduciary net position is available in the separately issued LRS report.
Payables to the pension plan – At June 30, 2015, the State had no payables to the defined benefit pension plan for legally required employer contributions.
C. Judicial Retirement System of NevadaPlan Description – The Judicial Retirement System (JRS) is an agent multiple-employer defined benefit pension plan established in 2001 by the Nevada Legislature (NRS 1A.160) and is governed by the Public Employees’ Retirement Board whose seven members are appointed by the governor. The JRS was established to provide benefits in the event of retire-ment, disability, or death of justices of the Supreme Court, district judges, municipal court judges and justices of the peace, funded on an actuarial reserve basis. JRS issues a publicly available financial report that includes financial statements and the required supplementary information for the System. JRS’ financial report may be obtained from the Public Employees’ Retirement System, 693 West Nye Lane, Carson City, Nevada 89703.
Inflation rate: 3.50%
Investment rate of return: 8.00%
Projected salary increases: 3.50%
Consumer price index: 3.50%
Other assumptions: Same as those used in the June 30, 2014 funding actuarial valuation
Asset ClassTarget
Allocation
Long-term Geometric
Expected Real Rate of Return
Domestic equity 49% 5.50%International equity 21% 5.75%Domestic fixed income 30% 0.25%
1% Decrease in Discount Rate (7%)
Discount Rate (8%)
1% Increase in Discount Rate (9%)
Net pension liability 1,136$ 658$ 249$

74
Notes to Financial StatementsFor the Fiscal Year Ended June 30, 2015 NEVADA(Note 10 Continued)
Employee membership data related to the JRS pension plan, as of June 30, 2014:
Pension Benefits - Benefits are paid according to vari-ous options contained in pertinent statutes, dependent upon whether a member was serving as a Supreme Court justice or district judge before November 5, 2002. Retiring members who were serving as a judge before November 5, 2002 may select among the two benefit options below. Retiring members who began serving as a justice or judge on or after November 5, 2002 may select only the first option below.
Option 1 - 2003 Benefit Plan: Benefits, as required by statute, are computed at 3.4091% per year of accredited service at the time of retirement, to a maximum of 75%, times the member’s highest average compensation in any 36 consecutive months. Benefit payments to which participants may be entitled under the plan include pension benefits, disability benefits and survi-vor benefits.
Option 2 – Previous Benefit Plan: Retiring members who were serving as a Supreme Court justice or district judge prior to November 5, 2002 may select the following benefit: Benefit payments are computed at 4.1666% for each year of service, up to a total maximum of 22 years, times the member’s compensation for their last year of service.
Members who retired under the Previous Benefit Plan (plan in effect before November 5, 2002) and are appointed as senior judges can earn service credit while receiving their pension payments. They are eligible to have their benefit recalculated each time they earn an additional year of service credit.
Members of the System become fully vested after five years of service. A member of the System is eligible for retire-ment at age 65 with five years of service, at age 60 with ten years of service, or at any age with 30 years of service. For those members who were serving as a Supreme Court justice or district judge prior to November 5, 2002, and selected the second benefit option, eligibility for retirement is at age 60 with five years of service.
Member and Employer Contributions – The JRS is an employer-paid plan and there is no contribution from active members. The participating employers submit the percentage of compensation determined by the actuary to pay the normal costs and administrative expenses. Annually, the participating employers pay to the JRS an amount on the unfunded liability which is actuarially determined to be sufficient to enable the JRS to pay all current benefits for which the JRS is liable.
JRS’ basic funding policy provides for contributions by the participating employers based on an actuarial valuation prepared per Nevada Revised Statute (NRS 1A.180(1)). The amount of the annual contribution required to fund the System is comprised of a normal cost payment and a payment on the Unfunded Actuarial Accrued Liability (UAAL). Effective January 1, 2009, UAAL is amortized over a year-by-year closed amortization period as a level percent of pay (3% payroll growth assumed) where each amortization period will be set at 30 years for State judges (Supreme Court justices and district judges) and 20 years for each non-state agency. Any increases or decreases in UAAL that arise in future years will be amortized over separate 30-year periods for state judges and 20-year periods for non-state judges. The actuarial fund-ing method used is the Entry Age Normal Cost Method.
The required annual actuarially determined contribution to fund the System at June 30, 2015 was $5,266,488 and the actual contribution made was $5,534,949.
Pension Liability, Pension Expense, Deferred Outflows of Resources and Deferred Inflows of Resources Related to Pensions – At June 30, 2015, The State reported a liability of $14,981,459 for its net pension liability for the JRS pension plan. The net pension liability was measured as of June 30, 2014, and the total pension liability used to calculate the net pension liability was determined by an actuarial valuation as of that date. The State’s net pension liability was based on an individual basis and based on the plan provisions and benefit accrual rates applicable to that individual.
For the year ended June 30, 2015, the State recognized pension expense of $3,206,116. At June 30, 2015, the State reported deferred outflows of resources and deferred inflows of resources related to pensions from the following sources (expressed in thousands):
Retirees and beneficiaries currently receiving benefits 59Inactive vested members 4Active members 109 Total 172
Deferred Outflows of Resources
Deferred Inflows of Resources
Differences between expected and actual experience -$ (1,954)$ Net difference between projected and actual earnings on pension plan investments - (5,839) State contributions subsequent to the measurement date 5,535 - Total 5,535$ (7,793)$

75
Notes to Financial StatementsFor the Fiscal Year Ended June 30, 2015 NEVADA
Deferred outflows of resources of $5,534,949 for contribu-tions subsequent to the measurement date will be recognized as a reduction of the net pension liability in the year ended June 30, 2016.
The average of the expected remaining service lives of all members that are provided with pensions through JRS deter-mined at July 1, 2013 (beginning of measurement period ended June 30, 2014) is 5.22 years.
Other amounts reported as deferred outflows of resources and deferred inflows of resources related to pensions will be recog-nized in pension expense as follows (expressed in thousands):
Year Ended June 30:2016 (1,923)$ 2017 (1,923) 2018 (1,923) 2019 (1,923) 2020 (101) Thereafter -
The following table presents the changes in the net pension liability for JRS for the year ended June 30, 2014 (expressed in thousands):
2014Total pension liabilityService cost 3,411$ Interest 8,367 Differences between expected and actual experience (2,666) Benefit payments, including refunds (4,295) Other 990 Net change in total pension liability 5,807 Total pension liability - beginning 102,823 Total pension liability - ending (a) 108,630$
Plan fiduciary net positionContributions - employer 6,002$ Net investment income 14,252 Benefit payments, including refunds (4,295) Administrative expense (83) Other 990 Net change in plan fiduciary net position 16,866 Plan fiduciary net position - beginning 75,247 Plan fiduciary net position - ending (b) 92,113$
Net pension liability - ending (a) - (b) 16,517$ Plan fiduciary net position as a percentage of total pension liability 85%Covered-employee payroll (measurement as of end of fiscal year) 18,934$ Net pension liability as a percentage of covered-employee payroll 87%
Actuarial Assumptions – The State’s net pension liability was measured as of June 30, 2014, and the total pension liability used to calculate the net pension liability was determined by an actuarial valuation as of that date. The total pension liabil-ity was determined using the following actuarial assumptions, applied to all periods included in the measurement:
Mortality rates were based on the RP-2000 Combined Healthy Mortality Table projected to 2013 with Scale AA, set back one year for females (no age setback for males).
The actuarial assumptions used in the June 30, 2014 valuation were based on the results of an actuarial experience study for the period July 1, 2006, through June 30, 2012.
Investment Policy – The JRS Board evaluates and establish-es the investment portfolio target asset allocations and the expected real rates of return (expected returns, net of invest-ment expenses and inflation) for each asset class. The Board reviews these asset allocations and capital market expecta-tions annually. The System’s target asset allocations and current long-term geometric expected real rates of return for each asset class included in the fund’s investment portfolio as of June 30, 2014, are included in the following table:
Inflation rate: 3.50%
Investment rate of return: 8.00%
Projected salary increases: 3.00% - 8.00% varies by service
Consumer price index: 3.50%
Other assumptions: Same as those used in the June 30, 2014 funding actuarial valuation
Asset ClassTarget
Allocation
Long-term Geometric
Expected Real Rate of Return
Domestic equity 49% 5.50%International equity 21% 5.75%Domestic fixed income 30% 0.25%
(Note 10 Continued)

76
Notes to Financial StatementsFor the Fiscal Year Ended June 30, 2015 NEVADA
Discount Rate – The discount rate used to measure the total pension liability was 8% as of June 30, 2014. The projection of cash flows used to determine the discount rate assumed that employer contributions will be made monthly at the current contribution rate and the payment to amortize the unfunded actuarial liability is assumed to be paid at the end of the year for State and monthly for non-state agencies. Based on those assumptions, the pension plan’s fiduciary net position was projected to be available to make all projected future benefit payments for current plan members. Therefore, the long-term expected rate of return on pension plan investments was applied to all periods of projected benefit payments to deter-mine the total pension liability.
Sensitivity of the Net Pension Liability to Changes in the Discount Rate – The following presents the State’s propor-tionate share of the net pension liability using the discount rate of 8%, as well as what the net pension liability would be if it were calculated using a discount rate that is 1-percentage-point lower (7%) or 1-percentage-point higher (9%) than the current rate (expressed in thousands):
Pension Plan fiduciary net position – Detailed information about the pension plan’s fiduciary net position is available in the separately issued LRS report.
Payables to the pension plan – At June 30, 2015, the State reported payables to the defined benefit pension plan of $276,087 for legally required employer contributions not yet remitted to JRS.
D. OtherPostemploymentBenefitsPlan Description – The State Retirees’ Health and Welfare Benefits Fund, Public Employees’ Benefits Program (“PEBP”) of the State of Nevada (“Retirees’ Fund”) was created in 2007 by the Nevada Legislature to account for the financial assets designated to offset the portion of current and future costs of health and welfare benefits paid on behalf of state retirees. NRS 287.0436 established the Retirees’ Fund as an irrevo-cable trust fund for the purpose of providing retirement bene-fits other than pensions. The Retirees’ Fund is a multiple-employer cost-sharing defined postemployment benefit plan administered by the Board of the Public Employees’ Benefits Program of the State of Nevada. The Retirees’ Fund provides benefits other than pensions to eligible retirees and their dependents through the payment of subsidies to the PEBP. PEBP administers a group health and life insurance program for covered employees, both active and retired, of the State, and certain other participating public employers within the State of Nevada. NAC 287.530 establishes the benefit upon
the retiree. All Nevada public employees who retire with at least five years of public service and who have State service are eligible to receive benefits from the Retirees’ Fund. State service is defined as employment with any Nevada State agen-cy, the Nevada System of Higher Education and any State Board or Commission. A portion of the monthly premiums are deducted from pension checks and paid to the PEBP. The cost varies depending on which health plan the retiree choos-es, as well as the amount of subsidy they receive. The Retirees’ Fund issues a stand-alone financial report that includes financial statements and required supplementary information. The State reports the Retirees’ Fund as a trust fund. The Retirees’ Fund financial report may be obtained from Public Employees’ Benefits Program, 901 South Stewart Street, Suite 1001, Carson City, NV 89701.
Summary of Significant Accounting Policies - The financial statements of the Retirees’ Fund have been prepared using the accrual basis of accounting and the economic resources measurement focus. Employer contributions are recognized when due and the employer has made a formal commitment to provide the contributions. Benefits and refunds are recog-nized when due and payable in accordance with the terms of the plan. The Retirees’ Fund does not receive member contributions.
Method Used to Value Investments – Investments are reported at fair value, which is defined as the price at which an asset passes from a willing seller to a willing buyer. Investments are held with the Retirement Benefits Investment Fund (RBIF), which values participants’ shares according to the contribu-tions of each entity, and accordingly, earnings and expenses are allocated to each entity in proportion to the participants’ share in the RBIF.
Contributions and Funding Policy - NRS 287.046 establishes a subsidy to pay an amount toward the cost of the premium or contribution for the persons retired from the State. Contribu-tions to the Retirees’ Fund are paid by the State of Nevada through an assessment of actual payroll paid by each State entity. For the period from July 1, 2014 through June 30, 2015 the rate assessed was 2.663% of annual covered payroll. The assessment is based on an amount provided by the Legis-lature each biennium in session law. For the year ended June 30, 2015, the State, its component units, State Boards and Commissions, and other participating public employers contributed $37,758,981 to the plan, which is 100% of the contractually required contribution. For the years ended June 30, 2014 and 2013 the State, its component units, State Boards and Commissions, and other participating public employers contributed $32,697,856, and $36,686,124, respectively, to the plan, which equaled 100% of the contractually required contribution each year.
1% Decrease in Discount Rate (7%)
Discount Rate (8%)
1% Increase in Discount Rate (9%)
Net pension liability 26,255$ 14,981$ 5,434$
(Note 10 Continued)
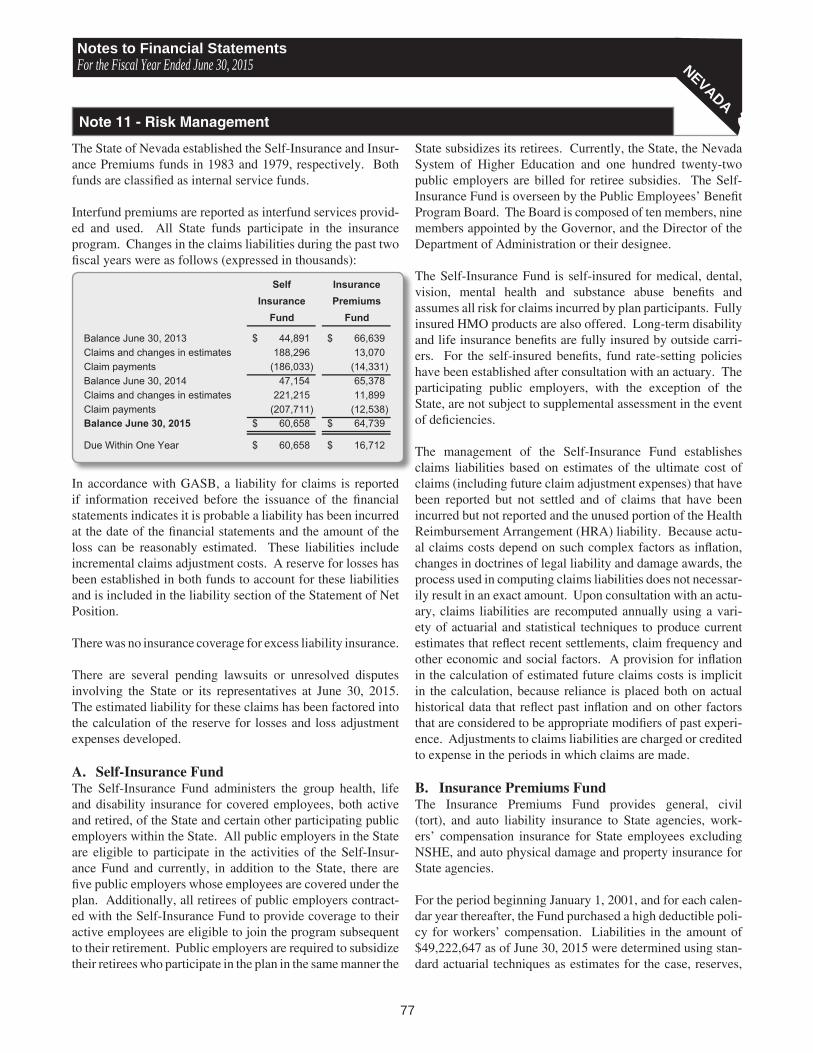
77
Notes to Financial StatementsFor the Fiscal Year Ended June 30, 2015 NEVADANote 11 - Risk Management
Self InsuranceInsurance Premiums
Fund Fund
Balance June 30, 2013 44,891$ 66,639$ Claims and changes in estimates 188,296 13,070Claim payments (186,033) (14,331)Balance June 30, 2014 47,154 65,378 Claims and changes in estimates 221,215 11,899Claim payments (207,711) (12,538)Balance June 30, 2015 60,658$ 64,739$
Due Within One Year 60,658$ 16,712$
The State of Nevada established the Self-Insurance and Insur-ance Premiums funds in 1983 and 1979, respectively. Both funds are classified as internal service funds.
Interfund premiums are reported as interfund services provid-ed and used. All State funds participate in the insurance program. Changes in the claims liabilities during the past two fiscal years were as follows (expressed in thousands):
In accordance with GASB, a liability for claims is reported if information received before the issuance of the financial statements indicates it is probable a liability has been incurred at the date of the financial statements and the amount of the loss can be reasonably estimated. These liabilities include incremental claims adjustment costs. A reserve for losses has been established in both funds to account for these liabilities and is included in the liability section of the Statement of Net Position.
There was no insurance coverage for excess liability insurance.
There are several pending lawsuits or unresolved disputes involving the State or its representatives at June 30, 2015. The estimated liability for these claims has been factored into the calculation of the reserve for losses and loss adjustment expenses developed.
A. Self-InsuranceFundThe Self-Insurance Fund administers the group health, life and disability insurance for covered employees, both active and retired, of the State and certain other participating public employers within the State. All public employers in the State are eligible to participate in the activities of the Self-Insur-ance Fund and currently, in addition to the State, there are five public employers whose employees are covered under the plan. Additionally, all retirees of public employers contract-ed with the Self-Insurance Fund to provide coverage to their active employees are eligible to join the program subsequent to their retirement. Public employers are required to subsidize their retirees who participate in the plan in the same manner the
State subsidizes its retirees. Currently, the State, the Nevada System of Higher Education and one hundred twenty-two public employers are billed for retiree subsidies. The Self-Insurance Fund is overseen by the Public Employees’ Benefit Program Board. The Board is composed of ten members, nine members appointed by the Governor, and the Director of the Department of Administration or their designee.
The Self-Insurance Fund is self-insured for medical, dental, vision, mental health and substance abuse benefits and assumes all risk for claims incurred by plan participants. Fully insured HMO products are also offered. Long-term disability and life insurance benefits are fully insured by outside carri-ers. For the self-insured benefits, fund rate-setting policies have been established after consultation with an actuary. The participating public employers, with the exception of the State, are not subject to supplemental assessment in the event of deficiencies.
The management of the Self-Insurance Fund establishes claims liabilities based on estimates of the ultimate cost of claims (including future claim adjustment expenses) that have been reported but not settled and of claims that have been incurred but not reported and the unused portion of the Health Reimbursement Arrangement (HRA) liability. Because actu-al claims costs depend on such complex factors as inflation, changes in doctrines of legal liability and damage awards, the process used in computing claims liabilities does not necessar-ily result in an exact amount. Upon consultation with an actu-ary, claims liabilities are recomputed annually using a vari-ety of actuarial and statistical techniques to produce current estimates that reflect recent settlements, claim frequency and other economic and social factors. A provision for inflation in the calculation of estimated future claims costs is implicit in the calculation, because reliance is placed both on actual historical data that reflect past inflation and on other factors that are considered to be appropriate modifiers of past experi-ence. Adjustments to claims liabilities are charged or credited to expense in the periods in which claims are made.
B. InsurancePremiumsFundThe Insurance Premiums Fund provides general, civil (tort), and auto liability insurance to State agencies, work-ers’ compensation insurance for State employees excluding NSHE, and auto physical damage and property insurance for State agencies.
For the period beginning January 1, 2001, and for each calen-dar year thereafter, the Fund purchased a high deductible poli-cy for workers’ compensation. Liabilities in the amount of $49,222,647 as of June 30, 2015 were determined using stan-dard actuarial techniques as estimates for the case, reserves,

78
Notes to Financial StatementsFor the Fiscal Year Ended June 30, 2015 NEVADA
(Note 11 Continued)
Note 12 - Fund Balances and Net Position
incurred but not reported losses and allocated loss adjustment expenses under the plan as of June 30, 2015.
The Fund is financed by the State. The State has a maxi-mum exposure of $50,000 through October 1, 2007, $75,000 through October 1, 2011 and $100,000 thereafter for each general liability claim, with the exception of claims that are filed in other jurisdictions, namely, federal court. Those claims filed in federal court are not subject to the limit. Per State statute, if, as the result of future general liability or cata-strophic losses, fund resources are exhausted, coverage is first provided by the reserve for statutory contingency account and would then revert to the General Fund.
The Fund is fully self-insured for general, civil and vehicle liability. The Fund is also self-insured for comprehensive and collision loss to automobiles, self-insured to $250,000 for property loss with commercial insurance purchased to cover the excess above this amount, and commercially insured for losses to boilers and machinery and certain other risks.
At June 30, 2015, incurred but not reported claims liability for general, civil and auto liability insurance is based upon stan-dard actuarial techniques, which take into account financial data, loss experience of other self-insurance programs and the insurance industry, the development of known claims, esti-mates of the cost of reported claims, incurred but not reported claims, and allocated loss adjustment expenses. The incurred but not reported claims liability for property casualty insur-ance is based upon the estimated cost to replace damaged property. The liability for estimated losses from reported and unreported claims in excess of the amounts paid for the
workers’ compensation policies is determined using standard actuarial techniques, which take into account claims history and loss development factors for similar entities. This liability is further adjusted for a non-working escrow deposit on-hand with the insurer which is restricted for use as collateral against future losses and a loss fund on-hand with the insurer that is restricted for payment of claims. Incurred but not reported claims liabilities are included in the reserve for losses.
The State is contingently liable for the cost of post retirement heart and lung disease benefits payable under the Nevada Occupational Disease Act. Any fireman or police officer that satisfies the five-year employment period requirement under this act is eligible for coverage under Workers’ Compensation for heart and lung disease. A range of estimated losses from $5,101,500 to $18,117,600 for heart disease and $6,096,400 for lung disease have been determined using standard actuari-al techniques. Due to the high degree of uncertainty surround-ing this coverage, no accrual for these losses is reflected in the financial statements.
At June 30, 2015 total liabilities exceeded total assets by $50,818,771. The Fund is liable for approximately $51,000,000 as of June 30, 2015 in potential claims settle-ments, which have yet to be funded through premium contri-butions. As NRS 331.187 provides that if money in the Fund is insufficient to pay a tort claim, the claim is to be paid from the reserve for statutory contingency account, and, as manage-ment assesses premiums to cover current claims payments, management believes that this provides the opportunity for the Fund to satisfy these liabilities.
A. Net Position-Restricted by Enabling LegislationThe government-wide statement of net position reports $1,628,514,265 of net position-restricted for the primary government, of which $222,664,490 is restricted by enabling legislation.
B. Governmental Fund Balances Governmental fund balances are classified as nonspendable, restricted, committed, assigned and/or unassigned based primarily on the extent to which the State is bound to observe constraints imposed on the use of the resources of the fund. A summary of governmental fund balances at June 30, 2015, is shown below (expressed in thousands):
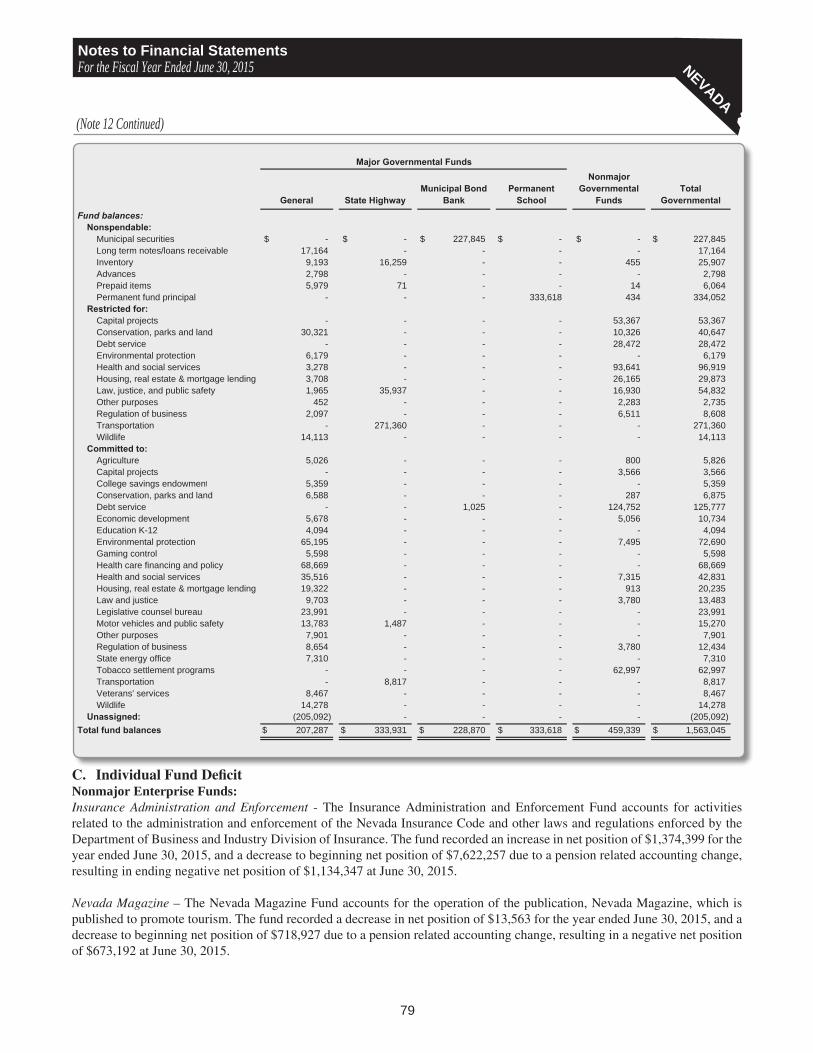
79
Notes to Financial StatementsFor the Fiscal Year Ended June 30, 2015 NEVADA(Note 12 Continued)
General State HighwayMunicipal Bond
BankPermanent
School
Nonmajor Governmental
FundsTotal
GovernmentalFund balances:
Nonspendable:Municipal securities -$ -$ 227,845$ -$ -$ 227,845$ Long term notes/loans receivable 17,164 - - - - 17,164 Inventory 9,193 16,259 - - 455 25,907 Advances 2,798 - - - - 2,798 Prepaid items 5,979 71 - - 14 6,064 Permanent fund principal - - - 333,618 434 334,052
Restricted for:Capital projects - - - - 53,367 53,367 Conservation, parks and land 30,321 - - - 10,326 40,647 Debt service - - - - 28,472 28,472 Environmental protection 6,179 - - - - 6,179 Health and social services 3,278 - - - 93,641 96,919 Housing, real estate & mortgage lending 3,708 - - - 26,165 29,873 Law, justice, and public safety 1,965 35,937 - - 16,930 54,832 Other purposes 452 - - - 2,283 2,735 Regulation of business 2,097 - - - 6,511 8,608 Transportation - 271,360 - - - 271,360 Wildlife 14,113 - - - - 14,113
Committed to:Agriculture 5,026 - - - 800 5,826 Capital projects - - - - 3,566 3,566 College savings endowment 5,359 - - - - 5,359 Conservation, parks and land 6,588 - - - 287 6,875 Debt service - - 1,025 - 124,752 125,777 Economic development 5,678 - - - 5,056 10,734 Education K-12 4,094 - - - - 4,094 Environmental protection 65,195 - - - 7,495 72,690 Gaming control 5,598 - - - - 5,598 Health care financing and policy 68,669 - - - - 68,669 Health and social services 35,516 - - - 7,315 42,831 Housing, real estate & mortgage lending 19,322 - - - 913 20,235 Law and justice 9,703 - - - 3,780 13,483 Legislative counsel bureau 23,991 - - - - 23,991 Motor vehicles and public safety 13,783 1,487 - - - 15,270 Other purposes 7,901 - - - - 7,901 Regulation of business 8,654 - - - 3,780 12,434 State energy office 7,310 - - - - 7,310 Tobacco settlement programs - - - - 62,997 62,997 Transportation - 8,817 - - - 8,817 Veterans' services 8,467 - - - - 8,467 Wildlife 14,278 - - - - 14,278
Unassigned: (205,092) - - - - (205,092) Total fund balances 207,287$ 333,931$ 228,870$ 333,618$ 459,339$ 1,563,045$
Major Governmental Funds
C. IndividualFundDeficitNonmajor Enterprise Funds:Insurance Administration and Enforcement - The Insurance Administration and Enforcement Fund accounts for activities related to the administration and enforcement of the Nevada Insurance Code and other laws and regulations enforced by the Department of Business and Industry Division of Insurance. The fund recorded an increase in net position of $1,374,399 for the year ended June 30, 2015, and a decrease to beginning net position of $7,622,257 due to a pension related accounting change, resulting in ending negative net position of $1,134,347 at June 30, 2015.
Nevada Magazine – The Nevada Magazine Fund accounts for the operation of the publication, Nevada Magazine, which is published to promote tourism. The fund recorded a decrease in net position of $13,563 for the year ended June 30, 2015, and a decrease to beginning net position of $718,927 due to a pension related accounting change, resulting in a negative net position of $673,192 at June 30, 2015.

80
Notes to Financial StatementsFor the Fiscal Year Ended June 30, 2015 NEVADA
InternalServiceFunds:Buildings and Grounds – The Buildings and Grounds Fund accounts for the maintenance, housekeeping and security of most State buildings. The fund recorded a decrease in net position of $552,839 for the year ended June 30, 2015, and a decrease to beginning net position of $7,488,379 due to a pension related accounting change, resulting in a negative net position of $3,587,258 at June 30, 2015.
Communications – The Communications Fund accounts for the operation of mail services for State agencies in Carson City, Reno, Las Vegas and Elko. The fund recorded a decrease in net position of $114,807 for the year ended June 30, 2015, and a decrease to beginning net position of $1,427,700 due to a pension related accounting change, resulting in a negative net position of $353,006 at June 30, 2015.
Insurance Premiums – The Insurance Premiums Fund allo-cates the cost of fidelity insurance, property insurance and workers’ compensation insurance to State agencies. The fund recorded an increase in net position of $4,310,814 for the year ended June 30, 2015, and a decrease to beginning net posi-tion of $952,778 due to a pension related accounting change, resulting in negative net position of $50,818,771 at June 30, 2015.
Administrative Services – The Administrative Services Fund provides administrative and accounting services to various divisions of the Department of Administration. The fund recorded an increase in net position of $68,477 for the year
ended June 30, 2015, and a decrease to beginning net position of $2,982,036 due to a pension related accounting change, resulting in negative net position of $2,641,754 at June 30, 2015.
Personnel – The Personnel Fund accounts for the costs of administering the State personnel system. The fund record-ed a decrease in net position of $628,247 for the year ended June 30, 2015, and a decrease to beginning net position of $7,569,551 due to a pension related accounting change, result-ing in negative net position of $7,592,483 at June 30, 2015.
Purchasing – The Purchasing Fund provides purchasing ser-vices to State agencies and other governmental units. The fund recorded an increase in net position of $9,635 for the year ended June 30, 2015, and a decrease to beginning net position of $3,191,045 due to a pension related accounting change, resulting in negative net position of $3,036,451 at June 30, 2015.
Information Services – The Information Services Fund ac-counts for designing, programming, and maintaining data processing software and also operating the State’s central computer facility, radio communication and telecommunica-tion systems. The fund recorded a decrease in net position of $2,437,341 for the year ended June 30, 2015, and a decrease to beginning net position of $22,203,298 due to a pension re-lated accounting change, resulting in negative net position of $15,219,501 at June 30, 2015.
(Note 12 Continued)
Note 13 - Principal Tax Revenues
The principal taxing authorities for the State of Nevada are the Nevada Tax Commission and the Nevada Gaming Com-mission.
The Nevada Tax Commission was created under NRS 360.010 and is the taxing and collecting authority for most non-gaming taxes. The following are the primary non-gaming tax revenues:
Sales and Use Taxes are imposed at a minimum rate of 6.85%, with county and local option up to an additional 1.25%, on all taxable sales and taxable items of use. The State receives tax revenue of 2% of total sales with the bal-ance distributed to local governmental entities and school districts.
Modified Business Tax is imposed at different rates for businesses and financial institutions. If the sum of all the wages paid by the employer exceeds $85,000 for the cal-endar quarter, the tax is 1.17% of the amounts the wages
exceed $85,000. Modified Business Tax is imposed on financial institutions at 2% on gross wages paid by the employer during the calendar quarter. There is an allow-able deduction from the gross wages for amounts paid by the employer for qualified health insurance or a qualified health benefit plan.
Insurance Premium Tax is imposed at 3.5% on insurance premiums written in Nevada. A “Home Office Credit” is given to insurance companies with home or regional of-fices in Nevada, but not to exceed 80% of the taxes due.
Motor Vehicle Fuel Tax is levied at 24.805 cents per gallon on gasoline and gasohol sales. 17.65 cents of the tax goes to the State Highway Fund, .75 cents goes to the Clean-ing Up Petroleum Discharges Fund, .055 cents goes to the General Fund and the remaining 6.35 cents goes to the counties. The counties have an option to levy up to an ad-ditional 9 cents per gallon.

81
Notes to Financial StatementsFor the Fiscal Year Ended June 30, 2015 NEVADA
Note 14 - Works of Art and Historical Treasures
(Note 13 Continued)
The State possesses certain works of art, historical treasures, and similar assets that are not included in the capital assets shown in Note 7. The mission of the Lost City Museum in Overton is to study, preserve, and protect prehistoric Pueblo sites found in the Moapa Valley and adjacent areas and to interpret these sites through exhibits and public programs. In Reno, the Nevada Historical Society exhibits and maintains a large number of historical collections preserving the cultural heritage of Nevada. These collections are divided into four sections: library, manuscripts, photography, and museum. The Nevada State Museum in Carson City collects, preserves, and documents three general types of collections: anthropol-ogy, history, and natural history as it relates to Nevada and the Great Basin. The mission of the Nevada State Museum, Las Vegas, is to inspire and educate a diverse public about the history and natural history of Nevada. Its major collec-tions include transportation, mining, and tourism as well as daily artifacts such as clothing, historical correspondence, business records, and photography. The Nevada State Rail-road Museum, which is located in Carson City, is dedicated to educating visitors and the community through the collection,
preservation and interpretation of objects directly related to railroads and railroading in Nevada. The East Ely Depot Museum, located in the historic Nevada Northern Railroad Depot building, exhibits artifacts, documents, and photo-graphs of early Eastern Nevada mining and railroad transpor-tation. The Nevada Arts Council with locations in Carson City and Las Vegas exhibits artwork. Its mission is to enrich the cultural life of the State and make excellence in the arts acces-sible to all Nevadans.
These collections are not capitalized by the State because they are:
• Held for public exhibition, education or research in furtherance of public service, rather than financial gain,
• Protected, kept unencumbered, cared for and preserved, and
• Subject to an organizational policy that requires the proceeds from sales of collection items to be used to acquire other items for collections.
Other Sources of tax revenues include: Cigarette Tax, Controlled Substance Tax, Jet Fuel, Liquor Tax, Live En-tertainment Tax (non-gaming establishments), Lodging Tax, Business License Fees, Motor Carrier Fees, Motor Vehicle Registration Fees, Net Proceeds of Minerals Tax, Property Tax, Real Property Transfer Tax, Short-Term Lessor Fees and Tire Tax.
The Nevada Gaming Commission was created under NRS 463.022 and is charged with collecting State gaming taxes and fees. The following sources account for gaming tax revenues:
Percentage Fees are the largest of several State levies on gaming. They are based upon gross revenue and are col-lected monthly. The fee is applied on a graduated basis at the following monthly rates: 3.5% of the first $50,000 of gross revenue; 4.5% of the next $84,000 of gross revenue; and 6.75% of the gross revenue in excess of $134,000.
Live Entertainment Taxes are imposed at 10% of all amounts paid for admission, food, merchandise or refresh-ment, while the establishment is providing entertainment in facilities with less than occupancy/seating of 7,500. A 5% rate is imposed for facilities with at least 7,500 occu-pancy/seating.
Flat Fee Collections are levied on the number of gambling games and slot machines operated. Licensees pay fees at variable rates on the number of gaming devices operated per quarter.
Other Sources of gaming tax revenues include: Unre-deemed Slot Machine Wagering Vouchers, Annual State Slot Machine Taxes, Annual License Fees and Miscella-neous Collections, which consists of penalties and fines, manufacturer’s, distributor’s and slot route operator’s fees, advance payments, race wire fees, pari-mutuel wagering tax and other nominal miscellaneous items.

82
Notes to Financial StatementsFor the Fiscal Year Ended June 30, 2015 NEVADANote 15 - Commitments and Contingencies
A. Primary GovernmentLawsuits - The State Attorney General’s Office reported that the State of Nevada or its officers and employees were parties to numerous lawsuits, in addition to those described below. In view of the financial condition of the State, the State Attorney General is of the opinion that the State’s financial condition will not be materially affected by this litigation, based on infor-mation known at this time.
Several of the actions pending against the State are based upon the State’s (or its agents’) alleged negligence in which the State must be named as a party defendant. However, there is a statutory limit to the State’s liability of $50,000 per cause of action through October 1, 2007 and $75,000 per cause of action through October 1, 2011 and $100,000 per cause of action thereafter. Such limitation does not apply to federal actions such as civil rights actions under 42 U.S.C. Section 1983 brought under federal law or to actions in other states. Building and contents are insured on a blanket replacement cost basis for all risk except certain specified exclusions.
The State and/or its officers and employees are parties to a number of lawsuits filed under the federal civil rights statutes. However, the State is statutorily required to indemnify its offi-cers and employees held liable in damages for acts or omis-sions on the part of its officers and employees occurring in the course of their public employment. Several claims may thus be filed against the State based on alleged civil rights viola-tions by its officers and employees. Since the statutory limit of liability (discussed above) does not apply in federal civil rights cases, the potential liability of the State is not ascertainable at the present time. Currently, the State is involved in several actions alleging federal civil rights violations that could result in substantial liability to the State.
The State is litigating vigorously a Fair Labor Standards Act action brought by correctional officers against the State of Nevada’s Department of Corrections, for back wages and over-time pay. The plaintiffs have yet to provide their actual damage amount. If the plaintiffs are successful in obtaining certification and in proving all of their claims, the back wages and overtime pay for three years could result in liability of $28.1 million or more.
In litigation filed against the Department of Taxation (DOT), the plaintiff is seeking a declaration that the Live Entertainment Tax is unconstitutional on its face and that they do not have to pay the tax. The Live Entertainment Tax is collected by the DOT as well as the Gaming Control Board. The Gaming Control Board’s collection of the Live Entertainment Tax has not been challenged. Should a refund be granted, the estimated amount to date is $128.6 million. However, if the tax is found to be uncon-stitutional on its face, the statute may be completely stricken.
The Department of Taxation has litigated vigorously two lawsuits of like nature against utility companies. The lawsuits arose out of claims for the refund of $253.0 million in use tax paid, plus interest, on coal purchased out of the state and used
in Nevada. The companies claim the use tax is unconstitutional. The State won both cases in the Nevada Supreme Court and the 1st Judicial District Court. The utility companies have yet to appeal. The use tax distribution is shared between the State, counties and local governments. If the utility companies appeal and are successful, the State’s exposure upon a potentially unfavorable outcome is $45.3 million.
The Nevada Department of Transportation (NDOT) in an inverse condemnation case is taking a parcel for the I-15 road improvement project known as Project NEON, in Las Vegas. The landowner filed its preemptory claim against NDOT in hope to recover attorney fees. NDOT filed a motion to dismiss. There is a reasonable possibility of an unfavorable outcome for NDOT in the amount of $6.6 million, before federal participation.
PERS - The Public Employees’ Retirement System (PERS) has entered into investment funding commitments related to private markets to fund an additional $1,073.3 million at some future date.
Leases- The State is obligated by leases for buildings and equip-ment accounted for as operating leases. Operating leases do not give rise to property rights as capital leases do. Therefore, the results of the lease agreements are not reflected in the Statement of Net Position. Primary government lease expense for the year ended June 30, 2015 amounted to $37.0 million. The following is the primary government’s schedule of future minimum rental payments required under operating leases that have initial or remaining noncancelable lease terms in excess of one year as of June 30, 2015 (expressed in thousands):
Federal Grants - The State receives significant financial assis-tance from the federal government in the form of grants and entitlements, which are generally conditioned upon compli-ance with terms and conditions of the grant agreements and applicable federal regulations, including the expenditure of the resources for eligible purposes. Substantially all grants are subject to financial and compliance audits by federal agencies. Any disallowance as a result of these audits could become a liability of the State. As of June 30, 2015, the State is unable to estimate the amount, if any, of expenditures that may be disal-lowed, although the State expects such amounts, if any, to be immaterial.
Rebate Arbitrage - The Federal Tax Reform Act of 1986 imposes a rebate requirement with respect to some bonds
For the YearEnding June 30 Amount
2016 29,195$ 2017 24,9262018 19,5042019 15,4632020 11,572
2021-2025 30,3452026-2030 4,5782031-2035 235
Total 135,818$
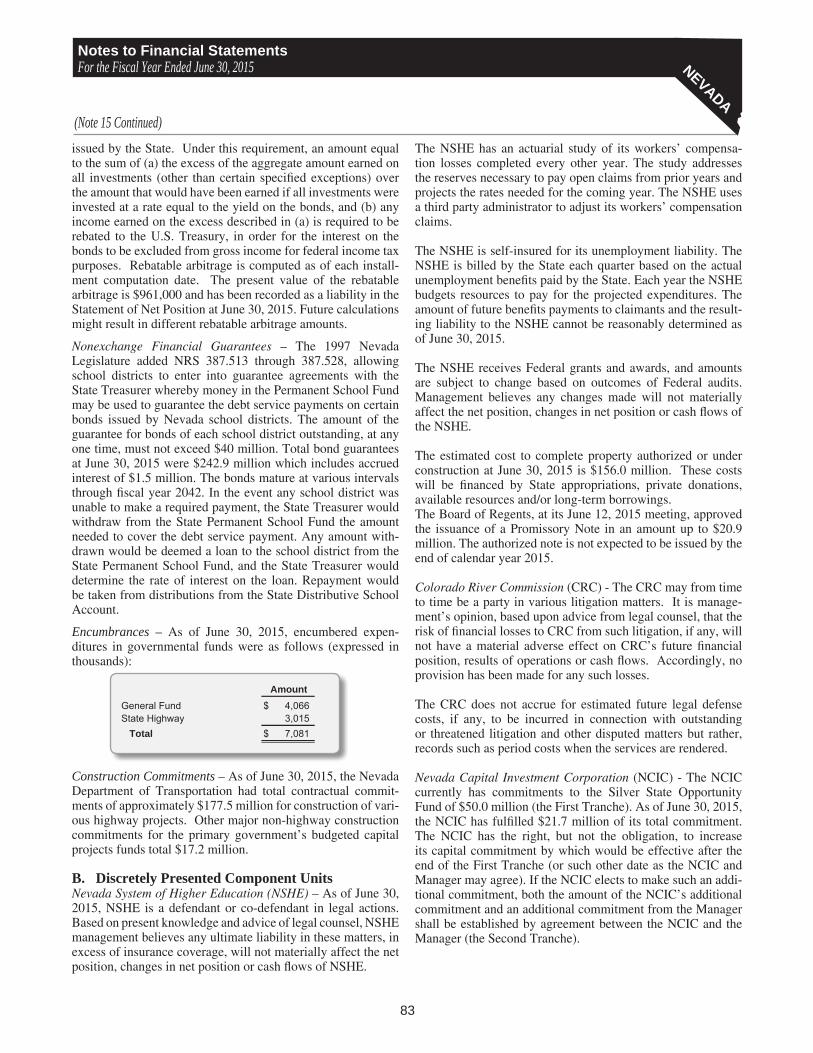
83
Notes to Financial StatementsFor the Fiscal Year Ended June 30, 2015 NEVADA
(Note 15 Continued)
issued by the State. Under this requirement, an amount equal to the sum of (a) the excess of the aggregate amount earned on all investments (other than certain specified exceptions) over the amount that would have been earned if all investments were invested at a rate equal to the yield on the bonds, and (b) any income earned on the excess described in (a) is required to be rebated to the U.S. Treasury, in order for the interest on the bonds to be excluded from gross income for federal income tax purposes. Rebatable arbitrage is computed as of each install-ment computation date. The present value of the rebatable arbitrage is $961,000 and has been recorded as a liability in the Statement of Net Position at June 30, 2015. Future calculations might result in different rebatable arbitrage amounts.
Nonexchange Financial Guarantees – The 1997 Nevada Legislature added NRS 387.513 through 387.528, allowing school districts to enter into guarantee agreements with the State Treasurer whereby money in the Permanent School Fund may be used to guarantee the debt service payments on certain bonds issued by Nevada school districts. The amount of the guarantee for bonds of each school district outstanding, at any one time, must not exceed $40 million. Total bond guarantees at June 30, 2015 were $242.9 million which includes accrued interest of $1.5 million. The bonds mature at various intervals through fiscal year 2042. In the event any school district was unable to make a required payment, the State Treasurer would withdraw from the State Permanent School Fund the amount needed to cover the debt service payment. Any amount with-drawn would be deemed a loan to the school district from the State Permanent School Fund, and the State Treasurer would determine the rate of interest on the loan. Repayment would be taken from distributions from the State Distributive School Account.
Encumbrances – As of June 30, 2015, encumbered expen-ditures in governmental funds were as follows (expressed in thousands):
Construction Commitments – As of June 30, 2015, the Nevada Department of Transportation had total contractual commit-ments of approximately $177.5 million for construction of vari-ous highway projects. Other major non-highway construction commitments for the primary government’s budgeted capital projects funds total $17.2 million.
B. Discretely Presented Component UnitsNevada System of Higher Education (NSHE) – As of June 30, 2015, NSHE is a defendant or co-defendant in legal actions. Based on present knowledge and advice of legal counsel, NSHE management believes any ultimate liability in these matters, in excess of insurance coverage, will not materially affect the net position, changes in net position or cash flows of NSHE.
The NSHE has an actuarial study of its workers’ compensa-tion losses completed every other year. The study addresses the reserves necessary to pay open claims from prior years and projects the rates needed for the coming year. The NSHE uses a third party administrator to adjust its workers’ compensation claims.
The NSHE is self-insured for its unemployment liability. The NSHE is billed by the State each quarter based on the actual unemployment benefits paid by the State. Each year the NSHE budgets resources to pay for the projected expenditures. The amount of future benefits payments to claimants and the result-ing liability to the NSHE cannot be reasonably determined as of June 30, 2015.
The NSHE receives Federal grants and awards, and amounts are subject to change based on outcomes of Federal audits. Management believes any changes made will not materially affect the net position, changes in net position or cash flows of the NSHE.
The estimated cost to complete property authorized or under construction at June 30, 2015 is $156.0 million. These costs will be financed by State appropriations, private donations, available resources and/or long-term borrowings.The Board of Regents, at its June 12, 2015 meeting, approved the issuance of a Promissory Note in an amount up to $20.9 million. The authorized note is not expected to be issued by the end of calendar year 2015.
Colorado River Commission (CRC) - The CRC may from time to time be a party in various litigation matters. It is manage-ment’s opinion, based upon advice from legal counsel, that the risk of financial losses to CRC from such litigation, if any, will not have a material adverse effect on CRC’s future financial position, results of operations or cash flows. Accordingly, no provision has been made for any such losses.
The CRC does not accrue for estimated future legal defense costs, if any, to be incurred in connection with outstanding or threatened litigation and other disputed matters but rather, records such as period costs when the services are rendered.
Nevada Capital Investment Corporation (NCIC) - The NCIC currently has commitments to the Silver State Opportunity Fund of $50.0 million (the First Tranche). As of June 30, 2015, the NCIC has fulfilled $21.7 million of its total commitment. The NCIC has the right, but not the obligation, to increase its capital commitment by which would be effective after the end of the First Tranche (or such other date as the NCIC and Manager may agree). If the NCIC elects to make such an addi-tional commitment, both the amount of the NCIC’s additional commitment and an additional commitment from the Manager shall be established by agreement between the NCIC and the Manager (the Second Tranche).
AmountGeneral Fund 4,066$ State Highway 3,015 Total 7,081$

84
Notes to Financial StatementsFor the Fiscal Year Ended June 30, 2015 NEVADANote 16 - Subsequent Events
A. Primary GovernmentBonds – On October 14, 2015, the State issued $339,030,000 in General Obligation Bonds. The bonds were issued primar-ily to finance various capital improvement projects including: construction of a new Department of Motor Vehicle Service Office, improvements for publicly owned water systems and to finance property acquisition and renovations by the Divi-sion of State Parks. Bonds were also issued to finance or refi-nance loans to certain local governments within the State for water and sewer projects and to provide State matching funds for the State’s Safe Drinking Water Revolving Fund Program.
B. Discretely Presented Component UnitsNevada System of Higher Education – The Board of Regents, at its October 23, 2015 meeting, authorized the formation of DRI-Tennessee, a nonprofit organization that will be reported as a component unit of the System once operations commence.
C. New Accounting PronouncementIn February 2015, the GASB issued Statement No. 72, Fair Value Measurement and Application (GASB 72), which addresses accounting and financial reporting issues related to fair value measurements. GASB 72 provides guidance for determining a fair value measurement for financial report-ing purposes in addition to providing guidance for applying fair value to certain investments and disclosures related to all
fair value measurement. GASB 72 is effective for fiscal years beginning after June 15, 2015. The anticipated impact of this pronouncement is uncertain at this time.
In June 2015, the GASB issued Statement No. 73, Accounting and Financial Reporting for Pensions and Related Assets that are not Within the Scope of GASB Statement 68, and Amend-ments to Certain Provisions of GASB Statements 67 and 68 (GASB 73), which improves the usefulness of information about pensions included in the general purpose external finan-cial reports of state and local governments for making deci-sions and assessing accountability. GASB 73 is effective for fiscal years beginning after June 15, 2015. The anticipated impact of this pronouncement is uncertain at this time.
In June 2015, the GASB issued Statement No. 75, Accounting and Financial Reporting for Postemployment Benefits other than Pensions (GASB 75), which improves accounting and financial reporting by state and local governments for postem-ployment benefits other than pensions (other postemployment benefits or OPEB). It also improves information provided by state and local governmental employers about financial support of OPEB that is provided by other entities. GASB 75 is effective for fiscal years beginning after June 15, 2017. The anticipated impact of this pronouncement is uncertain at this time.
Note 17 - Accounting Changes and Restatements
Governmental Business-typeActivities Activities
Net position at June 30, 2014 as previously reported 5,414,465$ 379,253$ Net pension liability as of June 30, 2013 (2,169,389) (39,850) Deferred outflows of resources related to contributions made during the year ended June 30, 2014 176,883 3,271 Debt refunding loss amortization 38,009 -
Net position at June 30, 2014 as restated 3,459,968$ 342,674$
A. Primary GovernmentThe State implemented GASB Statement No. 68, Accounting and Financial Reporting for Pensions and GASB Statement No. 71, Pension Transition for Contributions Made Subsequent to the Measurement Date, in the current year. Accordingly, the fis-cal year 2015 financial statements have been adjusted with a prior year restatement of the beginning net position to retroactively report the beginning net pension liability and deferred outflows of resources related to contributions made during the year ended June 30, 2014.
In addition, a prior period adjustment was made to correct the amortization period on refunding losses.
The following table shows the changes to the beginning net position as of July 1, 2014 for the primary government (expressed in thousands):

85
Notes to Financial StatementsFor the Fiscal Year Ended June 30, 2015 NEVADA
Colorado River Nevada System ofCommission Higher Education
Net position at June 30, 2014 as previously reported 7,816$ 2,968,196$ Net pension liability as of June 30, 2013 (6,305) (369,489) Deferred outflows of resources related to contributions made during the year ended June 30, 2014 527 29,192 Donated capital assets in fiscal year 2002 951 - Unearned revenue on refunded portion of the 2005i bonds 907 - Unrecorded revenue in fiscal years 2013 and 2014 4,475 - Contributions receivable - 333
Net position at June 30, 2014 as restated 8,371$ 2,628,232$
The following table shows the changes to the beginning net position as of July 1, 2014 for the proprietary funds (expressed in thousands):
B. Discretely Presented Component UnitsThe Colorado River Commission and the Nevada System of Higher Education implemented GASB Statement No. 68, Ac-counting and Financial Reporting for Pensions and GASB Statement No. 71, Pension Transition for Contributions Made Subsequent to the Measurement Date, in the current year. Accordingly, the fiscal year 2015 financial statements have been adjusted with a prior year restatement of the beginning net position to retroactively report the beginning net pension liability and deferred outflows of resources related to contributions made during the year ended June 30, 2014.
During fiscal year 2015, the Colorado River Commission discovered capital assets originally constructed by a third party and donated to the Commission in 2002 had not been properly recorded. The cost basis of the assets is $12,555,784 and an adjust-ment to capital assets was made to the prior period for that amount. Corresponding increases to accumulated depreciation, unearned revenue and net position were recorded on the proprietary fund financial statements.
In addition, the Colorado River Commission determined in the current year that the previously refunded portion of the 2005i bonds in 2012 should have been recorded as unearned revenue and therefore, a prior period adjustment was recorded to increase unearned revenue and net position, and decrease the payable to customers on the proprietary fund financial statements.
Lastly, the Colorado River Commission prior year net position was determined to be understated as a result of unrecorded revenue in fiscal years 2013 and 2014; therefore, a prior period adjustment increasing net position and decreasing the payable to customers was recorded on the proprietary fund financial statements.
The following table shows the changes to the beginning net position as of July 1, 2014 (expressed in thousands):
(Note 17 Continued)
Housing Division
Water Projects Loans
Higher Education
Tuition Trust
Nonmajor Enterprise
Funds
Internal Service Funds
Net position at June 30, 2014 as previously reported 190,186$ 332,690$ 43,480$ 50,370$ 85,821$ Net pension liability as of June 30, 2013 (2,933) (781) (215) (35,921) (55,966) Deferred outflows of resources related to contributions made during the year ended June 30, 2014 242 60 16 2,953 4,851
Net position at June 30, 2014 as restated 187,495$ 331,969$ 43,281$ 17,402$ 34,706$
Major Enterprise Funds

86
April 12, 2014, Las Vegas, Nevada:Manny Pacquiao wins a 12-round unanimous decision over Timothy Bradley to earn the WBO World Welterweight belt at the MGM Grand Garden Arena.
Photo Credits: Chris Farina Top Rank (no other credit allowed) copyright 2014

87
RequiRed SupplementaRy infoRmation
May 2, 2015, Las Vegas, Nevada: Floyd Mayweather wins a 12-round unanimous decision over Manny Pacquiao at the MGM Grand Garden Arena
Photo Credits : Chris Farina Top Rank (no other credit allowed) copyright 2015

88
Original Budget Final Budget ActualVariance with Final
Budget
SOURCES OF FINANCIAL RESOURCESFund balances, July 1 579,982,174$ 579,982,174$ 579,982,174$ -$
Revenues: Sales taxes 1,023,194,100 1,037,822,100 1,033,453,997 (4,368,103) Gaming taxes, fees, licenses 908,293,432 865,810,133 878,143,350 12,333,217 Intergovernmental 2,798,126,345 3,830,366,049 3,350,672,190 (479,693,859) Other taxes 1,458,385,149 1,463,514,033 1,487,350,493 23,836,460 Sales, charges for services 248,153,992 265,107,631 256,195,055 (8,912,576) Licenses, fees and permits 589,799,146 633,993,495 625,655,497 (8,337,998) Interest 8,831,334 10,033,227 2,586,910 (7,446,317) Other 305,935,227 383,437,222 337,641,337 (45,795,885)
Other financing sources: Transfers 528,491,375 728,352,462 580,601,887 (147,750,575) Reversions from other funds - - 1,496,463 1,496,463
Total sources 8,449,192,274 9,798,418,526 9,133,779,353 (664,639,173)
USES OF FINANCIAL RESOURCESExpenditures and encumbrances: Elected officials 153,088,564 141,940,023 113,349,962 28,590,061 Legislative and judicial 84,566,581 87,299,449 61,707,097 25,592,352 Finance and administration 76,676,025 81,733,333 61,594,658 20,138,675 Education - K to 12 2,035,502,964 2,158,321,781 2,061,755,614 96,566,167 Education - higher education 756,471,241 791,256,985 779,462,075 11,794,910 Human services 4,070,314,718 5,054,036,030 4,493,345,234 560,690,796 Commerce and industry 330,282,985 348,142,939 268,781,463 79,361,476 Public safety 405,551,942 435,902,358 368,517,075 67,385,283 Infrastructure 314,660,716 378,769,271 169,523,688 209,245,583 Special purpose agencies 57,559,447 110,089,838 72,058,973 38,030,865Other financing uses: Transfers to other funds 31,350,818 49,320,818 49,320,818 - Reversions to other funds - - 1,501,844 (1,501,844)Projected reversions (49,712,029) (49,712,029) - (49,712,029)
Total uses 8,266,313,972 9,587,100,796 8,500,918,501 1,086,182,295
Fund balances, June 30 182,878,302$ 211,317,730$ 632,860,852$ 421,543,122$
General Fund
Sources of Financial Resources
For the Fiscal Year Ended June 30, 2015
Budgetary Comparison ScheduleGeneral Fund and Major Special Revenue Funds
Uses of Financial Resources

89
NEVADA
Original Budget Final Budget Actual
Variance with Final
BudgetOriginal Budget Final Budget Actual
Variance with Final Budget
333,445,914$ 333,445,914$ 333,445,914$ -$ 2,211$ 2,211$ 2,211$ -$
- - - - - - - -- - - - - - - -
322,400,309 361,043,338 312,263,094 (48,780,244) - - - -262,642,984 287,538,489 295,189,486 7,650,997 - - - -15,970,750 18,282,540 18,507,328 224,788 - - - -
184,028,988 188,281,192 206,555,537 18,274,345 - - - -202,814 384,305 1,461,123 1,076,818 16,501,819 16,501,819 10,837,721 (5,664,098)
37,220,420 38,417,389 18,445,274 (19,972,115) - - 4,925,000 4,925,000
8,105,093 12,786,769 11,327,920 (1,458,849) - - - -- - - - - - - -
1,164,017,272 1,240,179,936 1,197,195,676 (42,984,260) 16,504,030 16,504,030 15,764,932 (739,098)
- - - - - - - -- - - - - - - -- - - - - - - -- - - - - - - -- - - - - - - -- - - - - - - -- - - - - - - -
190,061,565 209,381,434 173,622,906 35,758,528 - - - -694,706,319 806,722,664 629,575,377 177,147,287 - - - -
- - - - - - - -
72,016,009 76,481,109 76,481,109 - 16,501,819 16,504,030 15,764,932 739,098- - 154,736 (154,736) - - - -
(46,302,875) (76,302,875) - (76,302,875) - - - -
910,481,018 1,016,282,332 879,834,128 136,448,204 16,501,819 16,504,030 15,764,932 739,098
253,536,254$ 223,897,604$ 317,361,548$ 93,463,944$ 2,211$ -$ -$ -$
State Highway Fund Municipal Bond Bank

90
Pension Plan Information

NEVADA
91
Total fund balance (budgetary basis) 632,861$ Restricted funds (398,117)
Unrestricted fund balance (budgetary basis) 234,744$
General State MunicipalFund Highway Bond Bank
Fund balances (budgetary basis) June 30, 2015 632,861$ 317,362$ -$ Adjustments:Basis differences: Petty cash or outside bank accounts 5,526 175 -
Investments not recorded on the budgetary basis 14,560 - 227,845 Accrual of certain other receivables 239,435 1,423 1,025 Inventory 9,193 16,329 -
Advances to other funds 3,050 - -
Accrual of certain accounts payable and other liabilities (428,148) (4,085) -
Unearned revenues (147,457) - -
Deferred inflows - unavailable (137,927) - - Encumbrances 4,065 3,015 -
Other (1,411) (288) - Perspective differences: Special revenue fund reclassified to General Fund for GAAP purposes 13,540 - -
Fund balances (GAAP basis) June 30, 2015 207,287$ 333,931$ 228,870$
For the Fiscal Year Ended June 30, 2015
Notes to Required Supplementary InformationBudgetary Reporting
The accompanying Budgetary Comparison Schedule – General Fund and Major Special Revenue Funds presents both the origi-nal and the final legally adopted budgets, as well as actual data on a budgetary basis. (Note 2 of the basic financial statements identifies the budgeting process and control.)
The original budget is adopted through passage of the General Appropriations Act, which allows for expenditures from unre-stricted revenues, while the Authorized Expenditures Act allows for expenditures from revenues collected for specific purposes (restricted revenues). For programs financed from restricted revenues, spending authorization is generally contingent upon recognition of the related revenue. Reductions of spending authority occur if revenues fall short of estimates. If revenues exceed the estimate, supplemental appropriations are required before the additional resources can be spent.
Generally Accepted Accounting Principles (GAAP) require that the final legal budget be reflected in the “final budget” column. Therefore, updated revenue estimates available for appropriations as of August 19 are reported instead of the amounts disclosed in the original budget. The August 19, 2015 date is used because this is the date for which the Legislative Interim Finance Committee affected the last changes to the fiscal year ended June 30, 2015 budget as permitted by NRS 353.220.
Since the budgetary and GAAP presentations of actual data differ, a reconciliation of ending fund balances is presented below (expressed in thousands):
Total fund balance on the budgetary basis in the General Fund at June 30, 2015, is composed of both restricted funds, which are not available for appropriation, and unrestricted funds as follows (expressed in thousands):

92
For the Fiscal Year Ended June 30, 2015
Pension Plan Information
2015 2014 2013 2012 2011 2010 2009 2008 2007 2006Statutorily required contribtutions 176,579$ 174,712$ 162,484$ 163,219$ 160,959$ 164,630$ 153,768$ 146,754$ 136,270$ 129,981$ Contributions in relation to the statutorialy required contribution 176,579 174,712 162,484 163,219 160,959 164,630 153,768 146,754 136,270 129,981 Contribution (deficiency) excess - - - - - - - - - - Covered-employee payroll 874,098 872,316 855,179 859,047 946,818 968,412 961,050 917,213 851,688 859,873 Contributions as a percentage of covered employee payroll 20% 20% 19% 19% 17% 17% 16% 16% 16% 15%
A. Multiple-employerCostSharingPlanThe following schedule presents the State’s (primary government’s) proportionate share of the net pension liability for the Public Employees’ Retirement System at June 30, 2014 (expressed in thousands):
The following schedule presents a ten year history of the State’s (primary government’s) contributions to the Public Employ-ees’ Retirement System (expressed in thousands):
B. Single-employer PlanThe following schedule presents the changes in the net pension liability for the Legislators’ Retirement System for the year ended June 30, 2014 (expressed in thousands):
2014State's proportion of the net pension liability 16.6%State's proportionate share of the net pension liability 1,730,601$ State's covered-employee payroll 872,316$ State's proportionate share of the net pension liability as a percentage of its covered-employee payroll 198%Plan fiduciary net position as a percentage of the total pension liability 76%Note: This schedule requires ten years of information to be presented. However, until ten years of data is available, only those years for whichinformation is available will be presented.
2014Total pension liabilityService cost 37$ Interest 428 Benefit payments, including refunds (494)
Net change in total pension liability (29) Total pension liability - beginning 5,560 Total pension liability - ending (a) 5,531$
Plan fiduciary net positionContributions - employer 213$ Contributions - employee 27 Net investment income 804 Benefit payments, including refunds (494) Administrative expense (46) Other 46
Net change in plan fiduciary net position 550 Plan fiduciary net position - beginning 4,323 Plan fiduciary net position - ending (b) 4,873$
Net pension liability - ending (a) - (b) 658$ Plan fiduciary net position as a percentage of total pension liability 88%Covered-employee payroll N/ANet pension liability as a percentage of covered-employee payroll N/ANote: This schedule requires ten years of information to be presented. However, until ten years of data is is available, onlythose years for which information is available will be presented

93
The following schedule presents the State’s (primary government’s) contributions to the Legislators’ Retirement System (ex-pressed in thousands):
C. Agent Multiple-employer PlanThe following schedule presents the changes in the net pension liability for the Judicial Retirement System for the year ended June 30, 2014 (expressed in thousands):
2015Statutorily required contribtutions 312$ Contributions in relation to the statutorily required contribution 312$ Contribution (deficiency) excess -$ Covered-employee payroll N/AContributions as a percentage of covered-employee payroll N/ANote: This schedule requires ten years of information to be presented. However, until ten years of data is available, onlythose years for which information is available will be presented
2015Actuarially determined contribution 5,266$ Contributions in relation to the actuarially determined contribution 5,535$ Contribution (deficiency) excess 269$ Covered-employee payroll 17,132$ Contributions as a percentage of covered-employee payroll 32%Note: This schedule requires ten years of information to be presented. However, until ten years of data isavailable, only those years for which information is available will be presented
The following schedule presents the State’s (primary government’s) contributions to the Judicial Retirement System (expressed in thousands):
2014Total pension liabilityService cost 3,411$ Interest 8,367 Differences between expected and actual experience (2,666) Benefit payments, including refunds (4,295) Other 990
Net change in total pension liability 5,807 Total pension liability - beginning 102,823 Total pension liability - ending (a) 108,630$
Plan fiduciary net positionContributions - employer 6,002$ Net investment income 14,252 Benefit payments, including refunds (4,295) Administrative expense (83) Other 990
Net change in plan fiduciary net position 16,866 Plan fiduciary net position - beginning 75,247 Plan fiduciary net position - ending (b) 92,113$
Net pension liability - ending (a) - (b) 16,517$ Plan fiduciary net position as a percentage of total pension liability 85%Covered-employee payroll (measurement as of end of fiscal year) 18,934$ Net pension liability as a percentage of covered-employee payroll 87%Note: This schedule requires ten years of information to be presented. However, until ten years of data isavailable, only those years for which information is available will be presented.
Notes to Required Supplementary Information – actuarial assumptions used in calculating the actuarially determined contribu-tions can be found in Note 10C.
(Continued)

NEVADA
94
For the Fiscal Year Ended June 30, 2015
Schedule of Infrastructure Condition and Maintenance Data
I II III IV V
State Policy-minimum percentage 70% 65% 60% 40% 10%
Actual results of 2014 condition assessment 84% 71% 62% 33% 7%Actual results of 2012 condition assessment 84% 85% 84% 32% 9%Actual results of 2011 condition assessment 56% 79% 67% 30% 9%
Condition Level of the RoadwaysPercentage of roadways with an IRI of less than 80
Category
2015 2014 2013 2012 2011Estimated 386,093$ 433,338$ 402,650$ 322,210$ 490,910$
Actual 329,677 360,904 325,313 304,333 404,871
Maintenance and Preservation Costs(Expressed in Thousands)
2014 2012 2011State Policy-maximum percentage 10% 10% 10%
Actual results condition assessment 4% 4% 4%
Percentage of substandard bridgesCondition Level of the Bridges
The State has adopted the modified approach for reporting infrastructure assets defined as a single roadway network that includes bridges. Bridges are not considered a subsystem as they are included in the cost of road construction. Under this approach, the State expenses certain maintenance and preservation costs and does not report depreciation expense. The single roadway network accounted for under the modified approach includes the combination of approximately 5,400 centerline miles of roads and approximately 1,150 bridges.
The State manages its roadway network by dividing the roadway system into five categories based on the traffic load. The categories range from category I, representing the busiest roadways and interstates, to category V, representing the least busy rural routes with an average daily traffic of less than 400 vehicles. To monitor the condition of the roadways the State uses the International Roughness Index (IRI). IRI measures the cumulative deviation from a smooth surface. The lower the IRI value, the better the condition of the roadway. The State has set a policy to maintain a certain percentage of each category of its road-ways with an IRI of less than 80. Considering the results of all three condition assessments together, they provide reasonable assurance that the condition level of the roadways is being preserved above, or approximately at, the condition level established for categories I, II and III. The condition level for categories IV and V, which are non-national highways and the least busy rural roads, are below the State’s minimum percentage. On January 5, 2015 the Pavement and Bridge Condition Notice of Proposed Rulemaking was released by the Federal Highway Administration (FHWA). The State may align its goals for condition assess-ments to be consistent with the FHWA guidance if the proposed rules are enacted. The current condition assessment would meet its roadway condition level policy goals under the proposed rules. The State has set a policy to maintain its bridges so that not more than 10 percent are structurally deficient or functionally obsolete. The following tables show the State’s policy and the condition level of the roadways and bridges.
The following table shows the State’s estimate of spending necessary to preserve and maintain the roadway network at, or above, the established condition level and the actual amount spent during the past five fiscal years.
Maintenance and preservation costs are primarily funded with highway user revenue, fuel taxes, vehicle registration and license fees. The funding level for maintenance and preservation costs is affected by the amount of taxes and fees collected and the amount appropriated for construction of new roadways.

95
Combining Statements and Schedules

96
Nonmajor Governmental FundsNoNmajor Special reveNue FuNdSEmployment Security Accounts for the administration of employment training programs (NRS 612.607), unemployment compensation claims (NRS 612.605), and employment security laws (NRS 612.615).
Unemployment Comp Bond Fund Accounts for special bond contributions assessed on employers for the purpose of retiring the bonds in the Unemployment Compensation Fund (NRS 612.613)
Regulatory Accounts for receipts and expenditures related to enforcement of regulations on manufactured housing (NRS 489.491), enforcement of regulations pursuant to dairy products (NRS 584.053), legal judgments against real estate licensees (NRS 645.842), regulation of public utilities (NRS 703.147), and regulation of taxicabs (NRS 706.8825).
Higher Education Capital Construction Accounts for the first $5,000,000 and 20% of the remaining annual slot machine tax, which is designated for capital construction and payment of principal and interest of construction bonds for higher education (NRS 463.385).
Cleaning Up Petroleum Discharges Accounts for fees collected and claims paid related to the use, storage or discharge of petroleum (NRS 590.830).
Hospital Care to Indigent Persons Accounts for taxes levied to provide care to indigent persons hospitalized from motor vehicle accidents, and for taxes received and payments to counties for supplemental medical assistance to indigent persons (NRS 428.175).
Tourism Promotion Accounts for room taxes and other monies designated for the support of the Commission on Tourism (NRS 231.250).
Offenders’ Store Accounts for operations of the general merchandise stores and snack bars used by offenders. Earnings, except interest, must be expended for the welfare and benefit of all offenders (NRS 209.221).
Tobacco Settlement Accounts for proceeds from settlement agreements with and civil actions against manufacturers of tobacco products, forty percent of which is allocated to the Millennium Scholarship fund for the purpose of increasing the number of State residents who enroll in and attend a university or community college of the Nevada System of Higher Education (NRS 396.926), and sixty percent of which is allocated to the Healthy Nevada fund (NRS 439.620) for the purpose of assisting Nevada residents in obtaining and maintaining good health.
Attorney General Settlement Accounts for receipts from the National Mortgage Settlement for purposes of foreclosure relief and housing programs.
Gift Accounts for gifts and grants received by the Department of Conservation and Natural Resources (NRS 232.070), the Department of Wildlife (NRS 501.3585), the State Board of Education (NRS 385.095), the State Library and Archives (NRS 378.090), the Division of State Parks (NRS 407.075), the Rehabilitation Division of the Department of Employment, Training and Rehabilitation (NRS 232.960), and the Department of Health and Human Services (NRS 232.355).
Natural Resources Accounts for grants to publicly owned water systems for water conservation and capital improvements (NRS 349.952).
NV Real Property Corp General Fund Accounts for the general fund activity of the Nevada Real Property Corporation, a blended component unit incorporated to finance certain construction projects.
Miscellaneous Accounts for receipts and expenditures related to compensation of victims of crime (NRS 217.260); fees related to private investigators and recoveries for unfair trade practices (NRS 228.096); prosecution of racketeering (NRS 207.415); and the office of advocate for customers of public utilities (NRS 228.310). It also accounts for private money received by the Division of Museums and History for the Dedicated Trust Fund (NRS 381.0031; receipts for the care of sites for the disposal of radioactive waste (NRS 459.231); and fees collected from owners of mobile home parks to provide mobile home lot rent assistance to low-income mobile home owners (NRS 118B.215).

97
NoNmajor debt Service FuNdSConsolidated Bond Interest and Redemption Fund Accumulates monies for the payment of leases and of principal and interest on general obligation bonds of the State (NRS 349.090).
Highway Revenue Bonds Accumulates monies for the payment of principal and interest on highway revenue bonds of the State (NRS 349.300).
NoNmajor capital projectS FuNdSParks Capital Project Construction Accounts for the parks improvements program for the Division of State Parks of the Department of Conservation and Natural Resources (NRS 407.065).
Capital Improvement Program - Motor Vehicle Accounts for capital improvement projects for the Department of Motor Vehicles and Public Safety (NRS 341.146).
Capital Improvement Program - Human Resources Accounts for capital improvement projects for the Department of Health and Human Services (NRS 341.146).
Capital Improvement Program - University System Accounts for capital improvement projects for the Nevada System of Higher Education (NRS 341.146).
Capital Improvement Program - General State Government Accounts for capital improvement projects for general government (NRS 341.146).
Capital Improvement Program - Prison System Accounts for capital improvement projects for the Department of Corrections (NRS 341.146).
Capital Improvement Program - Military Accounts for capital improvement projects for the Department of Military (NRS 341.146).
Capital Improvement Program - Wildlife Accounts for capital improvement projects for the Department of Wildlife (NRS 341.146).
NoNmajor permaNeNt FuNdHenry Wood Christmas Fund Accounts for the bequest of the late Henry Wood to provide Christmas gifts to orphans.

98
NEVADA
Special Revenue
FundsDebt Service
Funds
Capital Projects Funds
Henry Wood Christmas Permanent
Fund
Total Nonmajor Governmental
FundsAssetsCash and pooled investments: Cash with treasurer 187,123,503$ 143,843,935$ 55,905,445$ 51,213$ 386,924,096$ Cash in custody of other officials 60,543,755 - - - 60,543,755
Investments 1,574,376 - - - 1,574,376
Receivables: Accounts receivable 61,056,654 - - - 61,056,654 Taxes receivable 743,194 - - - 743,194 Intergovernmental receivables 6,130,523 798,354 193,291 - 7,122,168 Accrued interest and dividends 2,208 1,072,399 - - 1,074,607 Other receivables - - 30,822 - 30,822
Due from other funds 15,626,454 3,028,068 6,847,737 125 25,502,384Due from fiduciary funds 1,015,944 - - - 1,015,944Due from component units 60 - - - 60Inventory 455,333 - - - 455,333Advances to other funds - 753,183 - - 753,183Prepaid items 13,670 - - - 13,670 Total assets 334,285,674$ 149,495,939$ 62,977,295$ 51,338$ 546,810,246$
LiabilitiesAccounts payable and accruals: Accounts payable 8,959,617$ 24,822$ 77,882$ -$ 9,062,321$ Accrued payroll and related liabilities 3,056,551 - - - 3,056,551 Intergovernmental payables 1,548,984 - 135,263 - 1,684,247
Contracts payable - - 6,191,723 - 6,191,723Retention payable - - 646,433 - 646,433Due to other funds 22,179,629 202,162 2,643,673 183 25,025,647Due to fiduciary funds 18,682 - - - 18,682Due to component units 9,756,749 - 7,714,214 - 17,470,963Unearned revenues 1,338,978 - - - 1,338,978Other liabilities 1,945,039 - - - 1,945,039
Total liabilities 48,804,229 226,984 17,409,188 183 66,440,584
Deferred Inflows of ResourcesUnavailable revenue: Sales and charges for services 5,172 - - - 5,172 Settlement income 20,469,114 - - - 20,469,114 Interest 51,538 60,296 406 17 112,257 Other 443,397 - - - 443,397
Total deferred inflows of resources 20,969,221 60,296 406 17 21,029,940
Fund BalancesNonspendable 872,714 - - 30,000 902,714Restricted 167,200,765 28,472,293 42,001,491 21,138 237,695,687Committed 96,438,745 120,736,366 3,566,210 - 220,741,321 Total fund balances 264,512,224 149,208,659 45,567,701 51,138 459,339,722, , , , , , , Total liabilities, deferred inflows of resources and fund balances 334,285,674$ 149,495,939$ 62,977,295$ 51,338$ 546,810,246$
Combining Balance SheetNonmajor Governmental Funds
June 30, 2015
Assets
Liabilities
Fund Balances
Deferred Inflows of Resources

99
NEVADA
Special Revenue Funds
Debt Service Funds
Capital Projects Funds
Henry Wood Christmas Permanent
Fund
Total Nonmajor
Governmental Funds
RevenuesGaming taxes, fees, licenses 13,686,408$ -$ -$ -$ 13,686,408$ Property and transfer taxes 12,075,458 139,417,273 - - 151,492,731Motor and special fuel taxes - 67,814,955 - - 67,814,955Other taxes 241,019,387 - - - 241,019,387Intergovernmental 77,186,240 42,046,487 1,588,699 - 120,821,426Licenses, fees and permits 24,931,235 - - - 24,931,235Sales and charges for services 18,171,422 300,913 - - 18,472,335Interest and investment income 3,279,615 2,545,442 4 926 5,825,987Settlement income 39,788,181 - - - 39,788,181Other 6,144,464 - 411,772 - 6,556,236
Total revenues 436,282,410 252,125,070 2,000,475 926 690,408,881
ExpendituresCurrent: General government 25,046,557 398,683 - - 25,445,240 Health and social services 95,910,909 - - - 95,910,909 Education - higher education 37,361,625 86,244,636 - - 123,606,261 Law, justice and public safety 23,868,883 - - - 23,868,883 Regulation of business 20,060,300 - - - 20,060,300 Recreation, resource development 28,012,113 - - - 28,012,113
Capital outlay - - 39,564,118 - 39,564,118
Debt service: Principal - 197,855,000 - - 197,855,000 Interest, fiscal charges 375 102,748,372 - - 102,748,747 Debt issuance costs - 1,940,676 - - 1,940,676 Arbitrage payments 13,013 - - - 13,013 Total expenditures 230,273,775 389,187,367 39,564,118 - 659,025,260 Excess (deficiency) of revenues over expenditures 206,008,635 (137,062,297) (37,563,643) 926 31,383,621
Other Financing Sources (Uses)Sale of general obligation bonds - 78,335,000 - - 78,335,000Sale of general obligation refunding bonds - 213,270,000 - - 213,270,000Premium on general obligation bonds - 54,686,183 - - 54,686,183Payment to refunded bond agent - (261,893,503) - - (261,893,503)Sale of capital assets 38,311 - - - 38,311Transfers in 14,618,102 56,706,936 8,285,034 - 79,610,072Transfers out (232,735,724) (1,583) (1,980,996) (183) (234,718,486)
Total other financing sources (uses) (218,079,311) 141,103,033 6,304,038 (183) (70,672,423)Net change in fund balances (12,070,676) 4,040,736 (31,259,605) 743 (39,288,802)Fund balances, July 1 276,582,900 145,167,923 76,827,306 50,395 498,628,524Fund balances, June 30 264,512,224$ 149,208,659$ 45,567,701$ 51,138$ 459,339,722$
Combining Statement of Revenues, Expenditures and Changes in Fund BalancesNonmajor Governmental Funds
For the Fiscal Year Ended June 30, 2015
Revenues
Expenditures
Other Financing Sources (Uses)
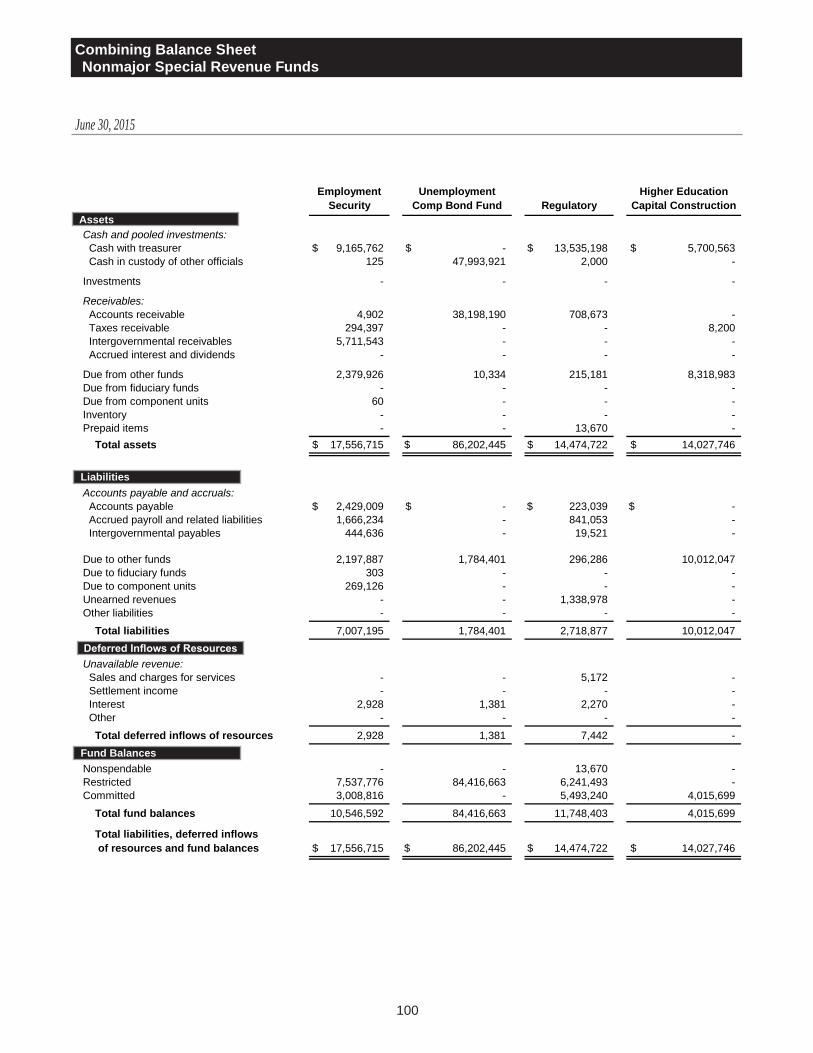
100
Employment Security
Unemployment Comp Bond Fund Regulatory
Higher Education Capital Construction
AssetsCash and pooled investments: Cash with treasurer 9,165,762$ -$ 13,535,198$ 5,700,563$ Cash in custody of other officials 125 47,993,921 2,000 -
Investments - - - -
Receivables: Accounts receivable 4,902 38,198,190 708,673 - Taxes receivable 294,397 - - 8,200 Intergovernmental receivables 5,711,543 - - - Accrued interest and dividends - - - -
Due from other funds 2,379,926 10,334 215,181 8,318,983Due from fiduciary funds - - - -Due from component units 60 - - -Inventory - - - -Prepaid items - - 13,670 - Total assets 17,556,715$ 86,202,445$ 14,474,722$ 14,027,746$
LiabilitiesAccounts payable and accruals: Accounts payable 2,429,009$ -$ 223,039$ -$ Accrued payroll and related liabilities 1,666,234 - 841,053 - Intergovernmental payables 444,636 - 19,521 -
Due to other funds 2,197,887 1,784,401 296,286 10,012,047Due to fiduciary funds 303 - - -Due to component units 269,126 - - -Unearned revenues - - 1,338,978 -Other liabilities - - - -
Total liabilities 7,007,195 1,784,401 2,718,877 10,012,047
Deferred Inflows of ResourcesUnavailable revenue: Sales and charges for services - - 5,172 - Settlement income - - - - Interest 2,928 1,381 2,270 - Other - - - -
Total deferred inflows of resources 2,928 1,381 7,442 -
Fund BalancesNonspendable - - 13,670 -Restricted 7,537,776 84,416,663 6,241,493 -Committed 3,008,816 - 5,493,240 4,015,699
Total fund balances 10,546,592 84,416,663 11,748,403 4,015,699
Total liabilities, deferred inflows of resources and fund balances 17,556,715$ 86,202,445$ 14,474,722$ 14,027,746$
Combining Balance SheetNonmajor Special Revenue Funds
June 30, 2015
Assets
Liabilities
Fund Balances
Deferred Inflows of Resources
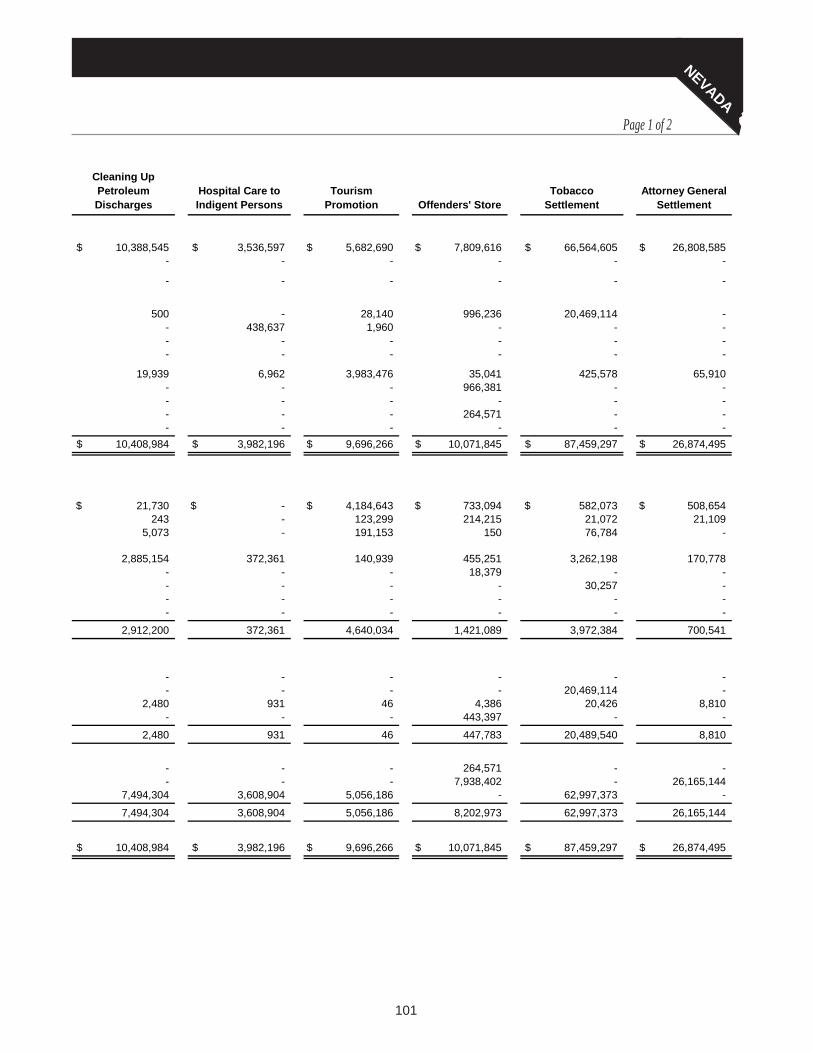
101
NEVADAPage 1 of 2
Cleaning Up Petroleum Discharges
Hospital Care to Indigent Persons
Tourism Promotion Offenders' Store
Tobacco Settlement
Attorney General Settlement
10,388,545$ 3,536,597$ 5,682,690$ 7,809,616$ 66,564,605$ 26,808,585$ - - - - - -
- - - - - -
500 - 28,140 996,236 20,469,114 -- 438,637 1,960 - - -- - - - - -- - - - - -
19,939 6,962 3,983,476 35,041 425,578 65,910- - - 966,381 - -- - - - - -- - - 264,571 - -- - - - - -
10,408,984$ 3,982,196$ 9,696,266$ 10,071,845$ 87,459,297$ 26,874,495$
21,730$ -$ 4,184,643$ 733,094$ 582,073$ 508,654$ 243 - 123,299 214,215 21,072 21,109
5,073 - 191,153 150 76,784 -
2,885,154 372,361 140,939 455,251 3,262,198 170,778- - - 18,379 - -- - - - 30,257 -- - - - - -- - - - - -
2,912,200 372,361 4,640,034 1,421,089 3,972,384 700,541
- - - - - -- - - - 20,469,114 -
2,480 931 46 4,386 20,426 8,810- - - 443,397 - -
2,480 931 46 447,783 20,489,540 8,810
- - - 264,571 - -- - - 7,938,402 - 26,165,144
7,494,304 3,608,904 5,056,186 - 62,997,373 -
7,494,304 3,608,904 5,056,186 8,202,973 62,997,373 26,165,144
10,408,984$ 3,982,196$ 9,696,266$ 10,071,845$ 87,459,297$ 26,874,495$

102
NEVADA
GiftNatural
Resources
NV Real Property Corp General Fund Miscellaneous
Total Nonmajor Special
Revenue Funds
AssetsCash and pooled investments: Cash with treasurer 2,365,738$ 11,044,297$ 665,453$ 23,855,854$ 187,123,503$ Cash in custody of other officials 9,248 - 12,441,732 96,729 60,543,755
Investments 255,072 - - 1,319,304 1,574,376
Receivables: Accounts receivable 1,580 - - 649,319 61,056,654 Taxes receivable - - - - 743,194 Intergovernmental receivables - 60,280 - 358,700 6,130,523 Accrued interest and dividends 2,208 - - - 2,208
Due from other funds 106,722 27,112 1,049 30,241 15,626,454Due from fiduciary funds - - - 49,563 1,015,944Due from component units - - - - 60Inventory - - - 190,762 455,333Prepaid items - - - - 13,670 Total assets 2,740,568$ 11,131,689$ 13,108,234$ 26,550,472$ 334,285,674$
LiabilitiesAccounts payable and accruals: Accounts payable 10,902$ 41,300$ -$ 225,173$ 8,959,617$ Accrued payroll and related liabilities - - - 169,326 3,056,551 Intergovernmental payables - 811,490 - 177 1,548,984
Due to other funds - 86,588 - 515,739 22,179,629Due to fiduciary funds - - - - 18,682Due to component units - - 1,742,366 7,715,000 9,756,749Unearned revenues - - - - 1,338,978Other liabilities - - - 1,945,039 1,945,039
Total liabilities 10,902 939,378 1,742,366 10,570,454 48,804,229
Deferred Inflows of ResourcesUnavailable revenue: Sales and charges for services - - - - 5,172 Settlement income - - - - 20,469,114 Interest 723 3,624 140 3,393 51,538 Other - - - - 443,397
Total deferred inflows of resources 723 3,624 140 3,393 20,969,221
Fund BalancesNonspendable - - - 594,473 872,714Restricted 2,441,906 10,188,687 11,365,728 10,904,966 167,200,765Committed 287,037 - - 4,477,186 96,438,745
Total fund balances 2,728,943 10,188,687 11,365,728 15,976,625 264,512,224
Total liabilities, deferred inflows of resources and fund balances 2,740,568$ 11,131,689$ 13,108,234$ 26,550,472$ 334,285,674$
Combining Balance SheetNonmajor Special Revenue Funds
June 30, 2015 Page 2 of 2
Assets
Liabilities
Fund Balances
Deferred Inflows of Resources

103

104
Employment SecurityUnemployment
Comp Bond Fund Regulatory
Higher Education Capital
ConstructionRevenuesGaming taxes, fees, licenses -$ -$ -$ 13,686,408$ Property and transfer taxes - - - -Other taxes 12,559,194 191,535,563 61,378 -Intergovernmental 70,446,609 - 587,571 -Licenses, fees and permits 308,655 - 19,316,209 -Sales and charges for services 610,000 - 2,135 -Interest and investment income 220,185 12,678 126,416 -Settlement income - - - -Other 1,065 - 428,364 -
Total revenues 84,145,708 191,548,241 20,522,073 13,686,408
ExpendituresCurrent: General government - - - - Health and social services 87,926,825 - - - Education - higher education - - - 5,000,000 Law, justice and public safety - - - - Regulation of business - - 19,130,436 - Recreation, resource development - - - -
Debt service: Interest - - 50 325 Arbitrage payments - - - -
Total expenditures 87,926,825 - 19,130,486 5,000,325 Excess (deficiency) of revenues over expenditures (3,781,117) 191,548,241 1,391,587 8,686,083
Other Financing Sources (Uses)Sale of capital assets 4,116 - 31,495 -Transfers in 5,572,470 - 259,237 -Transfers out (3,209,142) (162,362,267) (500,659) (11,689,375)
Total other financing sources (uses) 2,367,444 (162,362,267) (209,927) (11,689,375)Net change in fund balances (1,413,673) 29,185,974 1,181,660 (3,003,292)Fund balances, July 1 11,960,265 55,230,689 10,566,743 7,018,991Fund balances, June 30 10,546,592$ 84,416,663$ 11,748,403$ 4,015,699$
Combining Statement of Revenues, Expenditures and Changes in Fund BalancesNonmajor Special Revenue Funds
Revenues
Expenditures
For the Fiscal Year Ended June 30, 2015
Other Financing Sources (Uses)

105
NEVADAPage 1 of 2
Cleaning Up Petroleum Discharges
Hospital Care to Indigent Persons
Tourism Promotion Offenders' Store
Tobacco Settlement
Attorney General Settlement
-$ -$ -$ -$ -$ -$ - 12,075,458 - - - -
12,982,804 - 20,471,650 - - -- 3,577,750 - - - -
413,300 - 50,815 - - -- - - 16,913,962 - -
186,331 193,757 693 176,772 1,297,013 574,103- - - - 39,788,181 -- - 6,754 12,583 14,420 -
13,582,435 15,846,965 20,529,912 17,103,317 41,099,614 574,103
- - - - 25,019,987 -- 60,000 - - 7,739,938 -- - - - - -- - - 11,798,369 - 2,887,920- - - - - -
8,899,332 - 14,137,120 - - -
- - - - - -- - - - - -
8,899,332 60,000 14,137,120 11,798,369 32,759,925 2,887,920
4,683,103 15,786,965 6,392,792 5,304,948 8,339,689 (2,313,817)
- - - - - -- - 145,174 - 7,937,798 -
(4,531,423) (11,987,932) (5,992,141) (2,195,890) (22,270,792) (1,493,610)
(4,531,423) (11,987,932) (5,846,967) (2,195,890) (14,332,994) (1,493,610)151,680 3,799,033 545,825 3,109,058 (5,993,305) (3,807,427)
7,342,624 (190,129) 4,510,361 5,093,915 68,990,678 29,972,5717,494,304$ 3,608,904$ 5,056,186$ 8,202,973$ 62,997,373$ 26,165,144$

106
NEVADA
GiftNatural
Resources
NV Real Property Corp General Fund Miscellaneous
Total Nonmajor Special Revenue
FundsRevenuesGaming taxes, fees, licenses -$ -$ -$ -$ 13,686,408$ Property and transfer taxes - - - - 12,075,458Other taxes - - - 3,408,798 241,019,387Intergovernmental - 170,901 - 2,403,409 77,186,240Licenses, fees and permits - - - 4,842,256 24,931,235Sales and charges for services - - - 645,325 18,171,422Interest and investment income 53,511 269,177 13,814 155,165 3,279,615Settlement income - - - - 39,788,181Other 397,274 - 2,983,476 2,300,528 6,144,464
Total revenues 450,785 440,078 2,997,290 13,755,481 436,282,410
ExpendituresCurrent: General government 25,544 - 1,026 - 25,046,557 Health and social services 92,776 - - 91,370 95,910,909 Education - higher education - - 32,361,625 - 37,361,625 Law, justice and public safety - - - 9,182,594 23,868,883 Regulation of business - - - 929,864 20,060,300 Recreation, resource development 307,801 4,667,860 - - 28,012,113
Debt service: Interest - - - - 375 Arbitrage payments - 13,013 - - 13,013
Total expenditures 426,121 4,680,873 32,362,651 10,203,828 230,273,775 Excess (deficiency) of revenues over expenditures 24,664 (4,240,795) (29,365,361) 3,551,653 206,008,635
Other Financing Sources (Uses)Sale of capital assets - - - 2,700 38,311Transfers in 104,127 - - 599,296 14,618,102Transfers out - (316,631) (5,523,307) (662,555) (232,735,724)
Total other financing sources (uses) 104,127 (316,631) (5,523,307) (60,559) (218,079,311)Net change in fund balances 128,791 (4,557,426) (34,888,668) 3,491,094 (12,070,676)Fund balances, July 1 2,600,152 14,746,113 46,254,396 12,485,531 276,582,900Fund balances, June 30 2,728,943$ 10,188,687$ 11,365,728$ 15,976,625$ 264,512,224$
Combining Statement of Revenues, Expenditures and Changes in Fund BalancesNonmajor Special Revenue Funds
Revenues
Expenditures
For the Fiscal Year Ended June 30, 2015
Other Financing Sources (Uses)
Page 2 of 2

107

108
Consolidated Bond Interest
and Redemption
Highway Revenue Bonds Total
Parks Capital Project
ConstructionCIP Motor
VehicleAssetsCash and pooled investments: Cash with treasurer 115,371,642$ 28,472,293$ 143,843,935$ 433,301$ 222,274$ Receivables: Intergovernmental receivables 798,354 - 798,354 - - Accrued interest and dividends 1,072,399 - 1,072,399 - - Other receivables - - - - -Due from other funds 3,028,068 - 3,028,068 14,197 195,719Advances to other funds 753,183 - 753,183 - - Total assets 121,023,646$ 28,472,293$ 149,495,939$ 447,498$ 417,993$
LiabilitiesAccounts payable and accruals: Accounts payable 24,822$ -$ 24,822$ 1,525$ 31,736$ Intergovernmental payables - - - - -Contracts payable - - - 7,143 146,616Retentions payable - - - - 51,647Due to other funds 202,162 - 202,162 438,830 17,367Due to component units - - - - -
Total liabilities 226,984 - 226,984 447,498 247,366
Deferred Inflows of ResourcesUnavailable revenue: Interest 60,296 - 60,296 - -
Total deferred inflows of resources 60,296 - 60,296 - -
Fund BalancesRestricted - 28,472,293 28,472,293 - -Committed 120,736,366 - 120,736,366 - 170,627
Total fund balances 120,736,366 28,472,293 149,208,659 - 170,627
Total liabilities, deferred inflows of resources and fund balances 121,023,646$ 28,472,293$ 149,495,939$ 447,498$ 417,993$
Debt Service Funds Capital Projects Funds
Combining Balance SheetOther Nonmajor Governmental Funds
Assets
June 30, 2015
Liabilities
Fund Balances
Deferred Inflows of Resources

109
NEVADA
CIP Human Resources
CIP University System
CIP General State Government
CIP Prison System CIP Military CIP Wildlife Total
2,579$ 3,150,818$ 21,468,754$ 22,439,836$ 7,990,593$ 197,290$ 55,905,445$
- - - 145,382 - 47,909 193,291- - - - - - -- - 30,822 - - - 30,822- 5,003,038 1,333,576 390 171,588 129,229 6,847,737- - - - - - -
2,579$ 8,153,856$ 22,833,152$ 22,585,608$ 8,162,181$ 374,428$ 62,977,295$
-$ 1,325$ 14,646$ 14,114$ 3,820$ 10,716$ 77,882$ - - 23,212 - 97,787 14,264 135,263- 405,127 3,229,848 1,352,658 871,366 178,965 6,191,723- 2,307 273,120 274,991 44,368 - 646,433
2,579 30,477 413,095 1,155,143 586,182 - 2,643,673- 7,714,214 - - - - 7,714,214
2,579 8,153,450 3,953,921 2,796,906 1,603,523 203,945 17,409,188
- 406 - - - - 406
- 406 - - - - 406
- - 16,791,965 19,423,649 5,615,394 170,483 42,001,491- - 2,087,266 365,053 943,264 - 3,566,210
- - 18,879,231 19,788,702 6,558,658 170,483 45,567,701
2,579$ 8,153,856$ 22,833,152$ 22,585,608$ 8,162,181$ 374,428$ 62,977,295$
Capital Projects Funds

110
Consolidated Bond Interest
and Redemption
Highway Revenue Bonds Total
Parks Capital Project
ConstructionCIP Motor
VehicleRevenuesProperty and transfer taxes 139,417,273$ -$ 139,417,273$ -$ -$ Motor and special fuel taxes - 67,814,955 67,814,955 - -Intergovernmental 42,046,487 - 42,046,487 32,011 -Sales and charges for services 300,913 - 300,913 - -Interest and investment income 2,545,442 - 2,545,442 4 -Other - - - - -
Total revenues 184,310,115 67,814,955 252,125,070 32,015 -
ExpendituresCurrent: General government 398,683 - 398,683 - - Education - higher education 86,244,636 - 86,244,636 - -Capital outlay - - - 311,697 3,608,761
Debt service: Principal 156,545,000 41,310,000 197,855,000 - - Interest 78,403,604 24,344,768 102,748,372 - - Debt issuance costs 1,940,676 - 1,940,676 - -
Total expenditures 323,532,599 65,654,768 389,187,367 311,697 3,608,761 Excess (deficiency) of revenues over expenditures (139,222,484) 2,160,187 (137,062,297) (279,682) (3,608,761)
Other Financing Sources (Uses)Sale of general obligation bonds 78,335,000 - 78,335,000 - -Sale of general obligation refunding bonds 213,270,000 - 213,270,000 - -Premium on general obligation bonds 54,686,183 - 54,686,183 - -Payment to refunded bond agent (261,893,503) - (261,893,503) - -Transfers in 56,706,936 - 56,706,936 229,031 3,557,114Transfers out (1,583) - (1,583) - -
Total other financing sources (uses) 141,103,033 - 141,103,033 229,031 3,557,114Net change in fund balances 1,880,549 2,160,187 4,040,736 (50,651) (51,647)Fund balances, July 1 118,855,817 26,312,106 145,167,923 50,651 222,274Fund balances, June 30 120,736,366$ 28,472,293$ 149,208,659$ -$ 170,627$
Debt Service Funds Capital Projects Funds
Combining Statement of Revenues, Expenditures and Changes in Fund BalancesOther Nonmajor Governmental Funds
Revenues
Expenditures
For the Fiscal Year Ended June 30, 2015
Other Financing Sources (Uses)

111
NEVADA
CIP Human Resources
CIP University System
CIP General State
GovernmentCIP Prison
System CIP Military CIP Wildlife Total
-$ -$ -$ -$ -$ -$ -$ - - - - - - -- - - 309,928 587,969 658,791 1,588,699- - - - - - -- - - - - - 4- - 400,174 - 11,598 - 411,772
- - 400,174 309,928 599,567 658,791 2,000,475
- - - - - - -- - - - - - -
1,105 - 15,993,455 12,836,015 5,322,391 1,490,694 39,564,118
- - - - - - -- - - - - - -- - - - - - -
1,105 - 15,993,455 12,836,015 5,322,391 1,490,694 39,564,118
(1,105) - (15,593,281) (12,526,087) (4,722,824) (831,903) (37,563,643)
- - - - - - -- - - - - - -- - - - - - -- - - - - - -- - 2,495,014 - 1,109,498 894,377 8,285,034
(2,579) - (377,188) (1,056,037) (545,192) - (1,980,996)
(2,579) - 2,117,826 (1,056,037) 564,306 894,377 6,304,038(3,684) - (13,475,455) (13,582,124) (4,158,518) 62,474 (31,259,605)3,684 - 32,354,686 33,370,826 10,717,176 108,009 76,827,306
-$ -$ 18,879,231$ 19,788,702$ 6,558,658$ 170,483$ 45,567,701$
Capital Projects Funds

112
Final Budget Actual Variance
GENERAL FUND UNBUDGETED ACTIVITY/REFUNDS -$ 7,571,098$ (7,571,098)$ ELECTED OFFICIALSOffice of the Governor 2,370,083 2,227,170 142,913Governor's Mansion Maintenance 385,591 308,496 77,095Governor's Washington Office 259,433 259,433 -Ethics Commission 813,824 677,529 136,295High Level Nuclear Waste 1,838,728 1,439,557 399,171Governor's Office Energy Conservation 1,821,093 1,631,941 189,152Renewable Energy/Energy Efficiency Loan Program 2,620,596 1,347,471 1,273,125Renewable Energy 10,031,253 1,531,224 8,500,029Lieutenant Governor 520,366 511,608 8,758Attorney General Administrative Account 27,027,352 26,363,939 663,413Attorney General Extradition Coordinator 730,977 633,086 97,891Attorney General Special Fund 2,543,738 1,523,524 1,020,214Attorney General Workers' Compensation Fraud 3,930,922 3,376,185 554,737Attorney General Crime Prevention 281,725 274,389 7,336Attorney General Medicaid Fraud 3,506,706 1,897,754 1,608,952Attorney General Violence Against Women Grants 4,531,357 2,318,752 2,212,605Attorney General Council For Prosecuting Attorneys 390,197 174,147 216,050Attorney General Victims of Domestic Violence 537,833 284,947 252,886Private Investigators Licensing Board 1,602,609 1,365,609 237,000Secretary of State 15,801,527 14,697,053 1,104,474Secretary of State HAVA Elections Account 2,787,043 928,709 1,858,334Secretary of State Advisory Committee Gift 61 - 61Secretary of State Notary Training 281,090 110,851 170,239Securities Forfeiture Account 1,682,403 1,503,062 179,341State Treasurer 2,579,122 2,456,115 123,007Silicosis and Disabled Pensions 108,806 34,999 73,807Nevada College Savings Trust 4,133,251 3,787,570 345,681Endowment Account 12,388,245 7,232,267 5,155,978College Savings Private Entity 83,419 - 83,419Unclaimed Property 2,310,891 1,853,527 457,364Controller's Office 4,960,942 4,431,864 529,078Debt Recovery 1,017,734 106,078 911,656Rainy Day 28,061,106 28,061,106 -
141,940,023 113,349,962 28,590,061LEGISLATIVE - JUDICIALJudicial BranchAdministrative Office of the Courts 5,183,815 3,123,888 2,059,927Judicial Programs and Services Division 1,158,768 993,663 165,105Uniform System of Judicial Records 3,658,428 1,267,393 2,391,035Judicial Education 1,725,124 895,211 829,913Court of Appeals 997,088 875,978 121,110State Judicial Elected Officials 21,709,600 21,386,793 322,807Judicial Support, Governance and Special Events 1,021,039 377,489 643,550Judicial Retirement System State Share 2,061,891 2,061,891 -Supreme Court 11,589,598 11,226,458 363,140Specialty Courts 7,549,907 5,436,480 2,113,427Senior Justice and Senior Judge Program 1,491,981 1,389,701 102,280Judicial Selection 30,432 27,719 2,713Foreclosure Mediation Program 2,285,974 1,415,972 870,002Law Library Gift Fund 76,729 7,090 69,639Law Library 1,659,970 1,604,422 55,548Judicial Discipline 643,129 550,968 92,161Legislative BranchInterim Finance Committee 15,701,127 7,050,272 8,650,855Disaster Relief 8,748,511 2,015,709 6,732,802So Nevada Community Project Fund 6,338 - 6,338
87,299,449 61,707,097 25,592,352
General Fund Unbudgeted Activity/RefundsElected Officials
Schedule of Total Uses - Budget and Actual, Non-GAAP Budgetary BasisAll General Fund Budgets
For the Fiscal Year Ended June 30, 2015 Page 1 of 9
Legislative–Judicial

113
NEVADA
Final Budget Actual Variance
FINANCE AND ADMINISTRATIONDepartment of AdministrationConstruction Education Account 249,792$ 165,360$ 84,432$ Commission For Women 1,504 - 1,504State Archives 1,184,792 1,148,540 36,252NSLA - IPS Equipment/Software 36,330 4,618 31,712Nevada State Library 4,986,028 4,538,567 447,461Nevada State Library - CLAN 436,490 303,247 133,243Special Appropriations 1,234,691 515,718 718,973Judicial College/Juvenile and Family Justice 130,430 130,430 -Budget and Planning 4,667,926 4,362,510 305,416Internal Audit 1,259,557 1,240,723 18,834Graffiti Reward Fund 11,521 - 11,521Merit Award Board 1,100 418 682Roof Maintenance Reserve 736,787 92,750 644,037Public Works Division Administration 858,577 857,745 832Public Works Division 270,927 267,144 3,783Public Works Inspection 3,711,799 3,578,118 133,681Public Works Retention Payment 3,127 391 2,736Building Official Admin 3,124,514 657,223 2,467,291State Unemployment Compensation 4,884,508 1,603,922 3,280,586Hearings and Appeals 4,637,614 4,290,590 347,024General Fund Salary Adjustment 16,021,435 247,404 15,774,031Stale Claims 2,343,895 399,453 1,944,442Emergency Fund 222,814 42,973 179,841Statutory Contingency 3,375,841 3,292,620 83,221Department of TaxationDepartment of Taxation 27,341,334 26,283,096 1,058,238
81,733,333 54,023,560 27,709,773EDUCATION K-12Department of EducationDistributive School Account 1,486,852,731 1,475,722,426 11,130,305Educator Effectiveness 170,000 165,946 4,054School Remediation 114,568,246 112,615,194 1,953,052State Supplemental School Support 151,133,653 150,556,077 577,576Education State Programs 6,068,916 5,852,923 215,993Educational Trust Fund 563,279 88,899 474,380Career and Technical Education 12,601,522 10,139,014 2,462,508Gear Up 7,541,588 4,175,066 3,366,522Gear Up Scholarship Trust 10,065,057 1,331,091 8,733,966Continuing Education 7,483,222 6,085,149 1,398,073Proficiency Testing 6,697,029 5,371,030 1,325,999Other State Education Programs 30,849,418 30,225,272 624,146Account for Health Education of Minors 550 - 550Education Technology Trust 20,400 19,328 1,072Professional Licensing and Testing 2,978,252 1,524,393 1,453,859Discretionary Grants - Unrestricted 524,421 315,982 208,439Public Charter School Loan Program 704,998 527,227 177,771Discretionary Grants - Restricted 30,326,929 17,104,167 13,222,762Elementary and Secondary Ed - Title I 126,349,524 111,721,957 14,627,567Elementary and Secondary Ed Titles II, V & VI 46,786,815 30,492,761 16,294,054Individuals with Disabilities (IDEA) 90,888,929 80,194,599 10,694,330Education Staffing Services 1,908,298 1,908,297 1Education Support Services 3,983,060 2,445,373 1,537,687Incentives for Licensed Educational Personnel 9,619,234 5,992,661 3,626,573Student Indemnification Account 1,562,621 1,181,531 381,090State Public Charter School Authority 7,632,466 5,564,156 2,068,310Commission on Postsecondary Education 440,623 435,095 5,528
2,158,321,781 2,061,755,614 96,566,167
Page 2 of 9
Finance and Administration
Education K-12

114
Final Budget Actual Variance
HIGHER EDUCATIONNevada System of Higher EducationSpecial Projects 3,418,603$ 1,535,787$ 1,882,816$ Education for Dependent Children 45,422 - 45,422University of Nevada - Reno 178,888,666 178,254,028 634,638School of Medical Sciences 37,179,365 36,771,755 407,610Intercollegiate Athletics UNR 4,972,752 4,972,475 277Statewide Programs - UNR 7,699,493 7,698,256 1,237University System Administration 4,429,850 4,429,836 14University of Nevada Las Vegas 238,459,818 237,871,905 587,913Intercollegiate Athletics UNLV 7,049,245 7,049,245 -Agricultural Experiment Station 6,540,550 6,540,550 -Cooperative Extension Service 5,426,727 5,136,805 289,922System Computing Center 16,870,709 16,870,709 -UNLV Law School 12,569,066 11,875,808 693,258National Direct Student Loan Program 35,793 35,793 -University Press 406,989 406,989 -Statewide Programs - UNLV 2,866,667 2,866,667 -Business Center North 1,829,353 1,829,353 -Business Center South 1,642,847 1,642,847 -Anatomical Gift Account 393,912 70,000 323,912UNLV Dental School 15,629,761 15,494,960 134,801Collegiate License Plate Account 407,353 - 407,353Nevada State College at Henderson 19,732,683 19,010,552 722,131College of Southern Nevada 133,803,128 131,488,034 2,315,094NSHE Performance Funding Pool 27,174 - 27,174Laboratory and Research 1,502,862 1,502,862 -Great Basin College 16,409,317 16,203,455 205,862Desert Research Institute 7,674,943 7,674,943 -Western Nevada College 19,827,722 18,127,897 1,699,825Truckee Meadows Community College 43,986,540 42,877,763 1,108,777WICHE Loan and Stipend 1,191,567 884,693 306,874WICHE Administration 338,108 338,108 -
791,256,985 779,462,075 11,794,910HUMAN SERVICESDirector's OfficeDHR Administration 1,535,669 1,441,517 94,152Grants Management Unit 28,450,805 26,739,848 1,710,957Prevention/Treatment of Problem Gambling 2,046,153 1,677,062 369,091IDEA Part C Compliance 3,972,105 3,521,480 450,625Developmental Disabilities 668,635 638,348 30,287Victims of Human Trafficking 58,628 - 58,628Public Defender 3,684,296 3,607,615 76,681Consumer Health Assistance 1,359,625 1,204,916 154,709DHR Children's Trust Account 1,026,089 636,465 389,624UPL Holding Account 6,517,000 2,781,023 3,735,977Aging and Disability Services DivisionEarly Intervention Services 37,031,631 32,279,231 4,752,400Family Preservation Program 2,859,604 2,731,696 127,908Rural Regional Center 15,768,714 15,196,960 571,754Desert Regional Center 104,219,632 101,905,679 2,313,953Sierra Regional Center 36,523,403 34,453,884 2,069,519Aging Federal Programs and Administration 31,101,764 22,362,508 8,739,256Disability Services 31,869,753 25,153,975 6,715,778Division of Health Care Financing and PolicyIntergovernmental Transfer Program 190,335,847 109,063,422 81,272,425Health Care Financing and Policy 171,390,569 150,785,383 20,605,186Increased Quality of Nursing Care 32,204,514 29,999,786 2,204,728Nevada Check-Up Program 47,873,554 46,113,964 1,759,590Nevada Medicaid 3,233,979,480 2,975,550,583 258,428,897
Human Services
Schedule of Total Uses - Budget and Actual, Non-GAAP Budgetary BasisAll General Fund Budgets
For the Fiscal Year Ended June 30, 2015 Page 3 of 9
Higher Education

115
NEVADAPage 4 of 9
Final Budget Actual Variance
Division of Public and Behavioral HealthRadiological Health 4,980,345$ 2,884,432$ 2,095,913$ Cancer Control Registry 1,378,437 913,889 464,548HHS - SAPTA 22,535,761 18,486,908 4,048,853Health Statistics and Planning 2,630,012 1,333,613 1,296,399Consumer Protection 2,460,591 1,674,443 786,148So NV Adult Mental Health Services 87,960,647 77,724,434 10,236,213No NV Adult Mental Health Services 30,628,970 28,056,411 2,572,559Behavioral Health Information System 2,776,970 2,428,617 348,353Behavioral Health Administration 11,720,574 8,163,288 3,557,286Facility for the Mental Offender 10,750,375 10,480,488 269,887Alcohol Tax Program 1,459,371 1,099,999 359,372Rural Clinics 13,305,360 13,072,408 232,952Immunization Program 9,214,674 7,416,495 1,798,179Marijuana Health Registry 5,682,309 2,710,260 2,972,049WIC Food Supplement 78,237,592 65,709,886 12,527,706Communicable Diseases 17,956,284 15,819,879 2,136,405Health Facilities 17,602,564 8,850,843 8,751,721Health Facilities-Admin Penalty 321,166 155,805 165,361Public Health Preparedness Program 12,900,547 9,920,059 2,980,488Biostatistics and Epidemiology 5,562,570 4,809,555 753,015Chronic Disease 8,603,352 7,261,146 1,342,206Maternal Child Health Services 11,329,313 9,114,429 2,214,884Office of State Health Administration 6,076,580 4,118,432 1,958,148Community Health Services 3,753,347 3,055,881 697,466Emergency Medical Services 1,052,338 836,660 215,678Child Care Services 1,596,943 1,256,753 340,190Division of Welfare and Supportive ServicesWelfare Administration 80,644,722 70,665,268 9,979,454Temp Assistance for Needy Families 53,327,698 50,111,778 3,215,920Assistance to Aged and Blind 8,998,285 8,998,285 -Welfare Field Services 102,514,283 94,764,461 7,749,822Child Support Enforcement Program 20,304,608 13,780,929 6,523,679Collection and Distribution Account 41,032,899 20,863,450 20,169,449Child Care Assistance and Development 39,268,474 34,254,121 5,014,353Energy Assistance - Welfare 22,659,924 21,368,169 1,291,755Division of Child and Family ServicesCommunity Juvenile Justice Programs 4,509,816 3,071,209 1,438,607Washoe County Integration 36,550,340 30,553,716 5,996,624Clark County Child Welfare 95,668,619 90,121,460 5,547,159UNITY/SACWIS 5,761,288 5,306,928 454,360Children, Youth and Family Administration 23,031,291 18,309,771 4,721,520Youth Alternative Placement 4,191,465 4,191,464 1Juvenile Correctional Facility 4,764,659 4,126,399 638,260Caliente Youth Center 8,225,684 7,907,353 318,331Victims of Domestic Violence 3,479,385 2,634,751 844,634Rural Child Welfare 21,999,852 18,745,409 3,254,443Transition from Foster Care 2,140,836 509,502 1,631,334Review of Death of Children 396,413 64,044 332,369Nevada Youth Training Center 7,266,973 6,668,392 598,581Youth Parole Services 5,711,725 5,282,424 429,301Farm Account - Youth Training Center 11,650 - 11,650No NV Child and Adolescent Services 8,586,161 8,224,031 362,130So NV Child and Adolescent Services 26,246,838 23,312,778 2,934,060Department of Employment, Training and RehabilitationBlind Business Enterprise Program 5,645,993 1,216,735 4,429,258Services to the Blind 4,293,032 3,583,527 709,505Vocational Rehabilitation 17,814,814 15,366,594 2,448,220Rehabilitation Administration 1,438,916 1,170,173 268,743Disability Adjudication 16,982,500 13,392,657 3,589,843Office of Equal Rights 1,446,237 1,354,881 91,356

116
Final Budget Actual Variance
DETR Administrative Services 6,151,533$ 5,091,355$ 1,060,178$ Research and Analysis 2,915,662 2,432,701 482,961Information Develoment and Processing 13,098,993 10,700,161 2,398,832
5,054,036,030 4,493,345,234 560,690,796COMMERCE AND INDUSTRYOffice of Economic DevelopmentGovernor's Office of Economic Development 8,985,092 8,889,633 95,459Motion Pictures 979,827 539,602 440,225Rural Community Development 2,457,016 1,944,270 512,746NV SSBCI Program 7,315,358 3,947,917 3,367,441Nevada Catalyst Fund 11,585,940 8,271,000 3,314,940GOED Nevada Knowledge Fund 9,230,672 7,118,999 2,111,673Small Business and Procurement 581,717 551,605 30,112Commission on Mineral ResourcesMinerals 3,106,781 2,127,148 979,633Bond Reclamation 5,493,130 437,324 5,055,806Department of AgricultureNevada Beef Council 288,609 240,716 47,893Commodity Food Program 16,382,352 13,405,695 2,976,657Nutrition Education Programs 133,633,211 129,342,599 4,290,612Weed Abatement and Control 100,396 - 100,396Plant Health and Quarantine Services 446,579 429,229 17,350Agriculture Research and Promotion 121,341 1,508 119,833Agricultural Registration/Enforcement 4,701,217 3,138,323 1,562,894Livestock Inspection 1,591,209 1,322,069 269,140Agriculture License Plates 33,145 23,164 9,981Veterinary Medical Services 1,199,979 1,113,301 86,678Consumer Equitibility 3,526,116 2,103,118 1,422,998Pest, Plant Disease and Noxious Weed 868,636 672,476 196,160Junior Agricultural Loan Program 254,845 - 254,845Agriculture Administration 2,771,614 2,696,118 75,496Rangeland Resources Commission 268,520 82,448 186,072Rangeland Grasshopper and Morman Cricket 409,460 72,131 337,329Predatory Animal and Rodent Control 1,122,224 860,836 261,388Department of Tourism and Cultural AffairsLost City Museum 430,687 413,531 17,156LV Springs Preserve Museum Dev 429,298 409,397 19,901Nevada Historical Society 593,624 479,243 114,381Nevada State Museum 1,622,949 1,552,806 70,143Museums and History Administration 365,467 362,058 3,409Nevada State Museum, Las Vegas 1,515,687 1,408,756 106,931State Railroad Museums 1,295,015 1,157,868 137,147Nevada Humanities 50,000 50,000 -Nevada Arts Council 2,087,518 1,995,078 92,440Indian Commission 256,688 248,468 8,220Gaming Control BoardGaming Control Board 43,103,935 38,378,700 4,725,235Gaming Control Federal Forfeiture 630,635 1,447 629,188Gaming Control - Forfeiture Account 561,004 - 561,004Gaming Control - Other State Forfeiture 505,440 - 505,440Federal Forfeiture Treasury 6,039,116 196,757 5,842,359Gaming Commission 412,148 363,441 48,707Department of Business and IndustryBusiness and Industry Administration 4,320,830 3,905,544 415,286New Market Performance Guarantee 6,250,000 1,000,000 5,250,000Industrial Development Bonds 619,140 26,836 592,304Special Housing Assistance 2,497,934 149,104 2,348,830Low Income Housing Trust Fund 20,577,762 5,148,903 15,428,859DOE Weatherization 6,797,684 4,834,482 1,963,202Employee Management Relations 707,881 362,038 345,843Common Interest Communities 3,799,934 1,767,375 2,032,559
Schedule of Total Uses - Budget and Actual, Non-GAAP Budgetary BasisAll General Fund Budgets
For the Fiscal Year Ended June 30, 2015 Page 5 of 9
Commerce and Industry
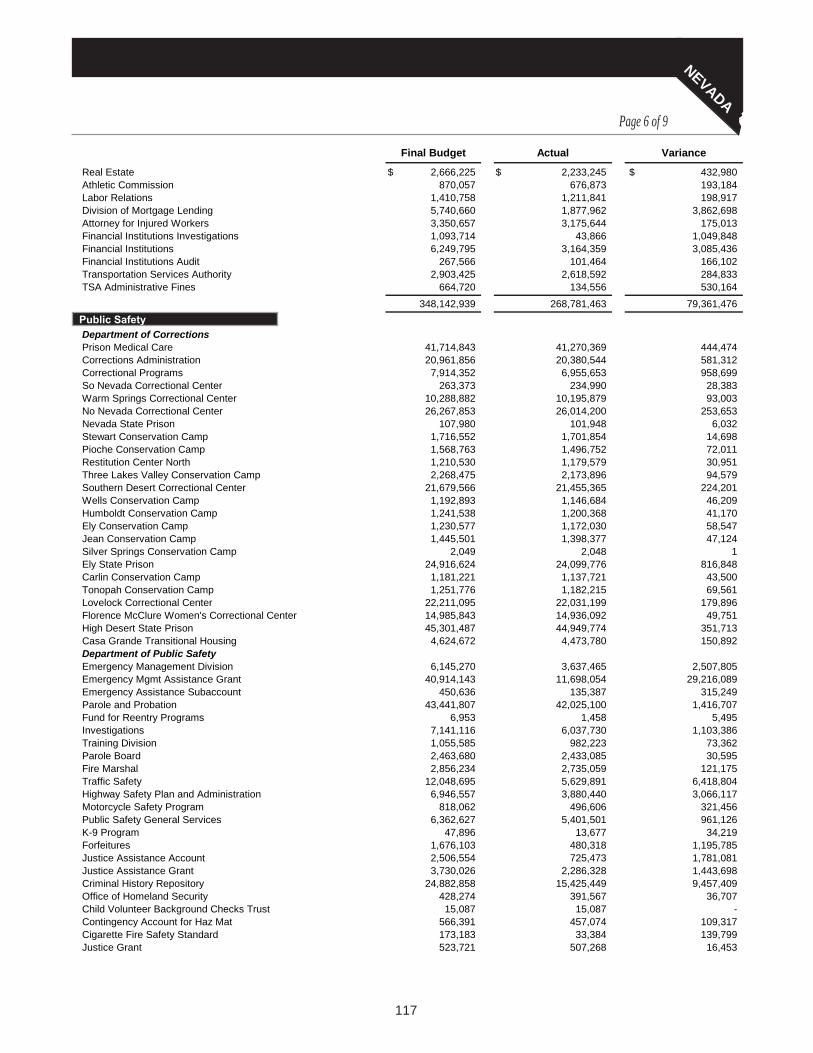
117
NEVADA
Final Budget Actual Variance
Real Estate 2,666,225$ 2,233,245$ 432,980$ Athletic Commission 870,057 676,873 193,184Labor Relations 1,410,758 1,211,841 198,917Division of Mortgage Lending 5,740,660 1,877,962 3,862,698Attorney for Injured Workers 3,350,657 3,175,644 175,013Financial Institutions Investigations 1,093,714 43,866 1,049,848Financial Institutions 6,249,795 3,164,359 3,085,436Financial Institutions Audit 267,566 101,464 166,102Transportation Services Authority 2,903,425 2,618,592 284,833TSA Administrative Fines 664,720 134,556 530,164
348,142,939 268,781,463 79,361,476PUBLIC SAFETYDepartment of CorrectionsPrison Medical Care 41,714,843 41,270,369 444,474Corrections Administration 20,961,856 20,380,544 581,312Correctional Programs 7,914,352 6,955,653 958,699So Nevada Correctional Center 263,373 234,990 28,383Warm Springs Correctional Center 10,288,882 10,195,879 93,003No Nevada Correctional Center 26,267,853 26,014,200 253,653Nevada State Prison 107,980 101,948 6,032Stewart Conservation Camp 1,716,552 1,701,854 14,698Pioche Conservation Camp 1,568,763 1,496,752 72,011Restitution Center North 1,210,530 1,179,579 30,951Three Lakes Valley Conservation Camp 2,268,475 2,173,896 94,579Southern Desert Correctional Center 21,679,566 21,455,365 224,201Wells Conservation Camp 1,192,893 1,146,684 46,209Humboldt Conservation Camp 1,241,538 1,200,368 41,170Ely Conservation Camp 1,230,577 1,172,030 58,547Jean Conservation Camp 1,445,501 1,398,377 47,124Silver Springs Conservation Camp 2,049 2,048 1Ely State Prison 24,916,624 24,099,776 816,848Carlin Conservation Camp 1,181,221 1,137,721 43,500Tonopah Conservation Camp 1,251,776 1,182,215 69,561Lovelock Correctional Center 22,211,095 22,031,199 179,896Florence McClure Women's Correctional Center 14,985,843 14,936,092 49,751High Desert State Prison 45,301,487 44,949,774 351,713Casa Grande Transitional Housing 4,624,672 4,473,780 150,892Department of Public SafetyEmergency Management Division 6,145,270 3,637,465 2,507,805Emergency Mgmt Assistance Grant 40,914,143 11,698,054 29,216,089Emergency Assistance Subaccount 450,636 135,387 315,249Parole and Probation 43,441,807 42,025,100 1,416,707Fund for Reentry Programs 6,953 1,458 5,495Investigations 7,141,116 6,037,730 1,103,386Training Division 1,055,585 982,223 73,362Parole Board 2,463,680 2,433,085 30,595Fire Marshal 2,856,234 2,735,059 121,175Traffic Safety 12,048,695 5,629,891 6,418,804Highway Safety Plan and Administration 6,946,557 3,880,440 3,066,117Motorcycle Safety Program 818,062 496,606 321,456Public Safety General Services 6,362,627 5,401,501 961,126K-9 Program 47,896 13,677 34,219Forfeitures 1,676,103 480,318 1,195,785Justice Assistance Account 2,506,554 725,473 1,781,081Justice Assistance Grant 3,730,026 2,286,328 1,443,698Criminal History Repository 24,882,858 15,425,449 9,457,409Office of Homeland Security 428,274 391,567 36,707Child Volunteer Background Checks Trust 15,087 15,087 -Contingency Account for Haz Mat 566,391 457,074 109,317Cigarette Fire Safety Standard 173,183 33,384 139,799Justice Grant 523,721 507,268 16,453
Public Safety
Page 6 of 9

118
Final Budget Actual Variance
Dignitary Protection 1,077,905$ 944,414$ 133,491$ Department of Motor VehiclesMotor Vehicle Pollution Control 11,834,662 9,483,818 2,350,844Peace Officers Standards and Training 2,240,032 1,768,126 471,906
435,902,358 368,517,075 67,385,283INFRASTRUCTUREDepartment of WildlifeConservation Education 2,545,548 2,301,768 243,780Law Enforcement 7,226,573 6,492,284 734,289Game Management 5,555,683 4,857,588 698,095Fisheries Management 8,223,629 6,702,855 1,520,774Diversity 2,575,328 2,436,137 139,191Habitat 7,057,882 5,691,898 1,365,984Wildlife Director's Office 3,683,248 3,452,540 230,708Wildlife Operations 8,249,868 7,391,417 858,451Wildlife Heritage Account 8,156,898 486,885 7,670,013Wildlife Fund 33,687,075 19,476,697 14,210,378Wildlife Habitat Enhancements 6,904,316 361,653 6,542,663Department of Conservation and Natural ResourcesState Environmental Commission 414,656 206,071 208,585Natural Resources Administration 1,167,462 1,056,421 111,041Conservation and Natural Resources Gift 214,187 - 214,187NV State Parks/Cultural Resources Endowment 510,000 - 510,000Water Resources Legal Cost 2,503,614 173,601 2,330,013Tahoe Regional Planning Agency 14,796,760 1,526,553 13,270,207Conservation Districts 588,764 521,024 67,740Cultural Resource Program 993,224 385,161 608,063Historic Preservation and Archives 1,613,298 1,325,727 287,571Comstock Historic District 171,837 168,835 3,002Comstock Historical District Gifts 40,167 18,825 21,342Parks Federal Grant Programs 6,624,415 1,829,418 4,794,997State Parks 12,368,877 9,849,035 2,519,842State Parks Interpretive and Educational Program 925,381 527,091 398,290Maintenance of State Parks 2,286,483 473,279 1,813,204State Parks Facility and Grounds Maintenance 14,857,235 138,425 14,718,810Coyote Srings Groundwater Basin 36,601 869 35,732Flood Control Revenue Fund 241,070 22 241,048USGS Co-Op 673,107 527,328 145,779Groundwater Recharge Projects 314,149 60,349 253,800Water Right Surveyors 70,368 9,657 60,711Well Driller's Licenses 40,491 15,057 25,434Water Resources 11,224,452 5,833,256 5,391,196Water Resources Cooperative Project 2,722,414 494,036 2,228,378State Engineer Revenue 324,169 156,576 167,593Little Humboldt River 141,719 21,609 120,110Quinn River Distribution 70,127 2,598 67,529Water Studies 277,000 - 277,000Adjudication Emergency 15,946 203 15,743Steptoe Valley Water Basin 30,021 2,403 27,618Diamond Valley Ground Water 45,137 8,659 36,478Lake Valley Ground Water Basin 38,109 1,235 36,874Middle Reese River Ground Water Basin 35,841 3,033 32,808Dixie Creek/10 Mi Ground Water 16,696 2,288 14,408Churchill Valley Ground Water 19,047 3,207 15,840Colorado River Valley 17,258 - 17,258Washoe Valley Ground Water 17,854 5,398 12,456Amargosa Valley Ground Water 24,691 6,486 18,205Las Vegas Basin Water District 4,398,757 1,446,353 2,952,404San Emidio Desert Ground Water Basin 6,895 1,900 4,995Hualapai Flat Ground Water Basin 10,872 102 10,770Pine Forest Valley Water Basin 7,574 - 7,574
Infrastructure
Schedule of Total Uses - Budget and Actual, Non-GAAP Budgetary BasisAll General Fund Budgets
For the Fiscal Year Ended June 30, 2015 Page 7 of 9

119
NEVADAPage 8 of 9
Final Budget Actual Variance
Kings River Valley Water Basin 12,288$ -$ 12,288$ Desert Valley Water Basin 5,430 - 5,430Silver State Valley Water Basin 7,937 - 7,937Quinn River Valley Water Basin 12,101 - 12,101Kobeh Valley Groundwater Basin 6,186 - 6,186Mary's River Water Basin 5,229 - 5,229Lamoille Valley Water Basin 3,878 - 3,878Huntington Valley Water Basin 3,909 - 3,909Elko Segment Water Basin 12,366 - 12,366Mary's Creek Area Water Basin 4,000 - 4,000Pine Valley Water Basin 5,735 - 5,735Winnemucca Segment Water Basin 5,122 - 5,122Fernley Area Water Basin 3,000 73 2,927Tracy Segment Water Basin 2,000 - 2,000Spanish Springs Valley Water Basin 3,000 - 3,000Lake Tahoe Water Basin 5,800 - 5,800Truckee Cyn Segment Water Basin 3,000 45 2,955Carson Desert Water Basin 3,000 - 3,000Buena Vista Valley Water Basin 3,481 - 3,481Muddy River Surface Water 26,552 12,384 14,168Pahranagat Lake 84,109 42,586 41,523Pahrump Artesian Basin 202,539 32,361 170,178Boulder Flat Ground Water 131,541 21,489 110,052Dayton Valley Ground Water 24,944 8,107 16,837Mason Valley Ground Water 170,555 115,722 54,833Humboldt Water District 401,832 256,699 145,133Water District Revenue Fund 3,727,144 3,697,144 30,000Smith Valley Artesian Basin 55,528 34,830 20,698Currant Creek 5,251 - 5,251Duckwater Creek 53,323 13,833 39,490Paradise Valley Ground Water 55,775 15,387 40,388Upper White River 8,966 3,163 5,803Muddy River Springs 19,883 2,828 17,055Kingston Creek 7,917 699 7,218Warm Springs/Winnemucca Creek 18,502 3,261 15,241Eagle Valley 86,617 5,918 80,699Carson Valley Ground Water 53,355 9,127 44,228Fish Lake Valley Artesian 23,688 5,893 17,795Carico Creek 431 191 240Lemmon Valley 63,489 6,285 57,204Truckee Meadows/Sun Valley 150,248 19,976 130,272Antelope Valley Ground Water Basin 17,998 2,931 15,067Warm Springs Ground Water 36,493 8,196 28,297Lower Moapa Valley Groundwater 12,251 324 11,927Honey Lake Valley 22,449 1,933 20,516Whirlwind Valley 12,290 410 11,880Crescent Water Groundwater 30,834 9,752 21,082Pumpernickel Valley 6,224 2,545 3,679Clovers Area Groundwater 50,493 5,610 44,883Cold Springs Valley 28,678 1,099 27,579Imlay Ground Water 7,252 991 6,261Kelly Creek Ground Water 43,709 6,661 37,048Lower Reese River Valley 31,676 1,736 29,940Maggie Creek 55,202 10,016 45,186North Fork Ground Water 27,421 4,635 22,786Pleasant Valley 8,207 1,183 7,024Forestry 15,102,480 8,819,180 6,283,300Forest Fire Suppression/Emergency Response 8,890,174 4,838,833 4,051,341Forestry Conservation Camps 10,305,207 9,049,308 1,255,899Forestry Inter-Gov Agreements 2,942,659 2,238,581 704,078Wildland Fire Protection Program 3,242,536 967,125 2,275,411
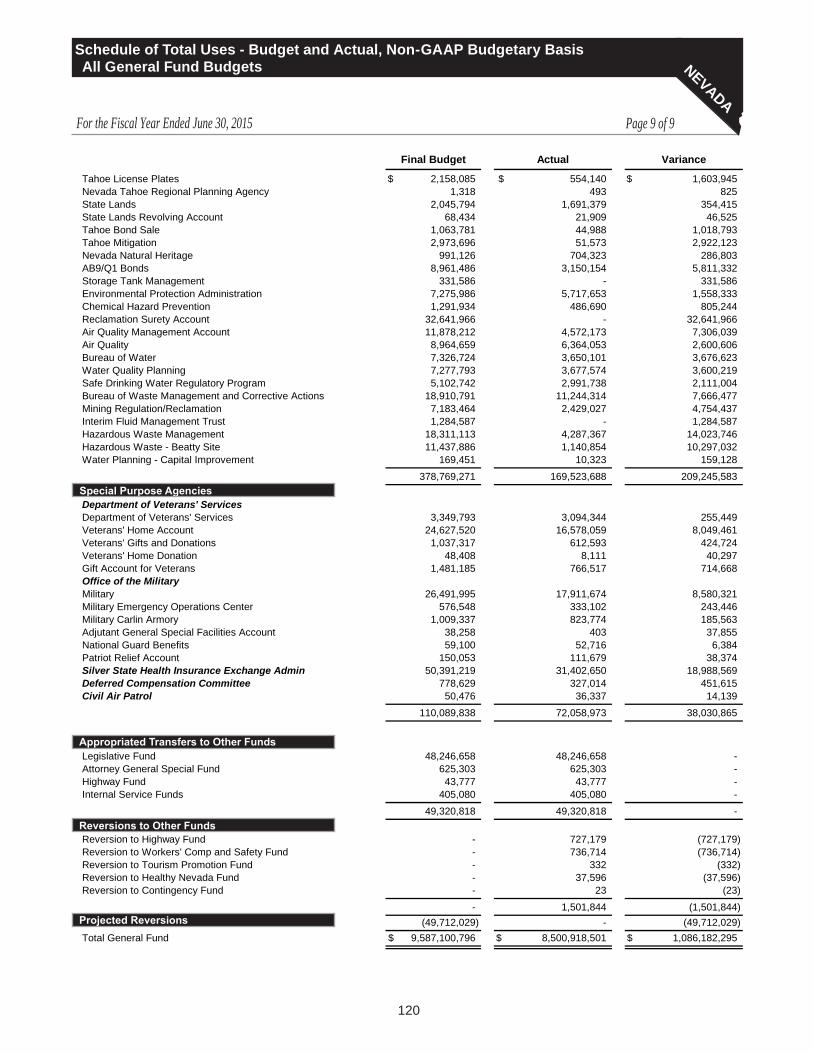
120
NEVADA
Final Budget Actual Variance
Tahoe License Plates 2,158,085$ 554,140$ 1,603,945$ Nevada Tahoe Regional Planning Agency 1,318 493 825State Lands 2,045,794 1,691,379 354,415State Lands Revolving Account 68,434 21,909 46,525Tahoe Bond Sale 1,063,781 44,988 1,018,793Tahoe Mitigation 2,973,696 51,573 2,922,123Nevada Natural Heritage 991,126 704,323 286,803AB9/Q1 Bonds 8,961,486 3,150,154 5,811,332Storage Tank Management 331,586 - 331,586Environmental Protection Administration 7,275,986 5,717,653 1,558,333Chemical Hazard Prevention 1,291,934 486,690 805,244Reclamation Surety Account 32,641,966 - 32,641,966Air Quality Management Account 11,878,212 4,572,173 7,306,039Air Quality 8,964,659 6,364,053 2,600,606Bureau of Water 7,326,724 3,650,101 3,676,623Water Quality Planning 7,277,793 3,677,574 3,600,219Safe Drinking Water Regulatory Program 5,102,742 2,991,738 2,111,004Bureau of Waste Management and Corrective Actions 18,910,791 11,244,314 7,666,477Mining Regulation/Reclamation 7,183,464 2,429,027 4,754,437Interim Fluid Management Trust 1,284,587 - 1,284,587Hazardous Waste Management 18,311,113 4,287,367 14,023,746Hazardous Waste - Beatty Site 11,437,886 1,140,854 10,297,032Water Planning - Capital Improvement 169,451 10,323 159,128
378,769,271 169,523,688 209,245,583SPECIAL PURPOSE AGENCIESDepartment of Veterans' ServicesDepartment of Veterans' Services 3,349,793 3,094,344 255,449Veterans' Home Account 24,627,520 16,578,059 8,049,461Veterans' Gifts and Donations 1,037,317 612,593 424,724Veterans' Home Donation 48,408 8,111 40,297Gift Account for Veterans 1,481,185 766,517 714,668Office of the MilitaryMilitary 26,491,995 17,911,674 8,580,321Military Emergency Operations Center 576,548 333,102 243,446Military Carlin Armory 1,009,337 823,774 185,563Adjutant General Special Facilities Account 38,258 403 37,855National Guard Benefits 59,100 52,716 6,384Patriot Relief Account 150,053 111,679 38,374Silver State Health Insurance Exchange Admin 50,391,219 31,402,650 18,988,569Deferred Compensation Committee 778,629 327,014 451,615Civil Air Patrol 50,476 36,337 14,139
110,089,838 72,058,973 38,030,865
APPROPRIATED TRANSFERS TO OTHER FUNDSLegislative Fund 48,246,658 48,246,658 -Attorney General Special Fund 625,303 625,303 -Highway Fund 43,777 43,777 -Internal Service Funds 405,080 405,080 -
49,320,818 49,320,818 -REVERSIONS TO OTHER FUNDSReversion to Highway Fund - 727,179 (727,179)Reversion to Workers' Comp and Safety Fund - 736,714 (736,714)Reversion to Tourism Promotion Fund - 332 (332)Reversion to Healthy Nevada Fund - 37,596 (37,596)Reversion to Contingency Fund - 23 (23)
- 1,501,844 (1,501,844)PROJECTED REVERSIONS (49,712,029) - (49,712,029)Total General Fund 9,587,100,796$ 8,500,918,501$ 1,086,182,295$
Schedule of Total Uses - Budget and Actual, Non-GAAP Budgetary BasisAll General Fund Budgets
For the Fiscal Year Ended June 30, 2015 Page 9 of 9
Appropriated Transfers to Other Funds
Reversions to Other Funds
Projected Reversions
Special Purpose Agencies
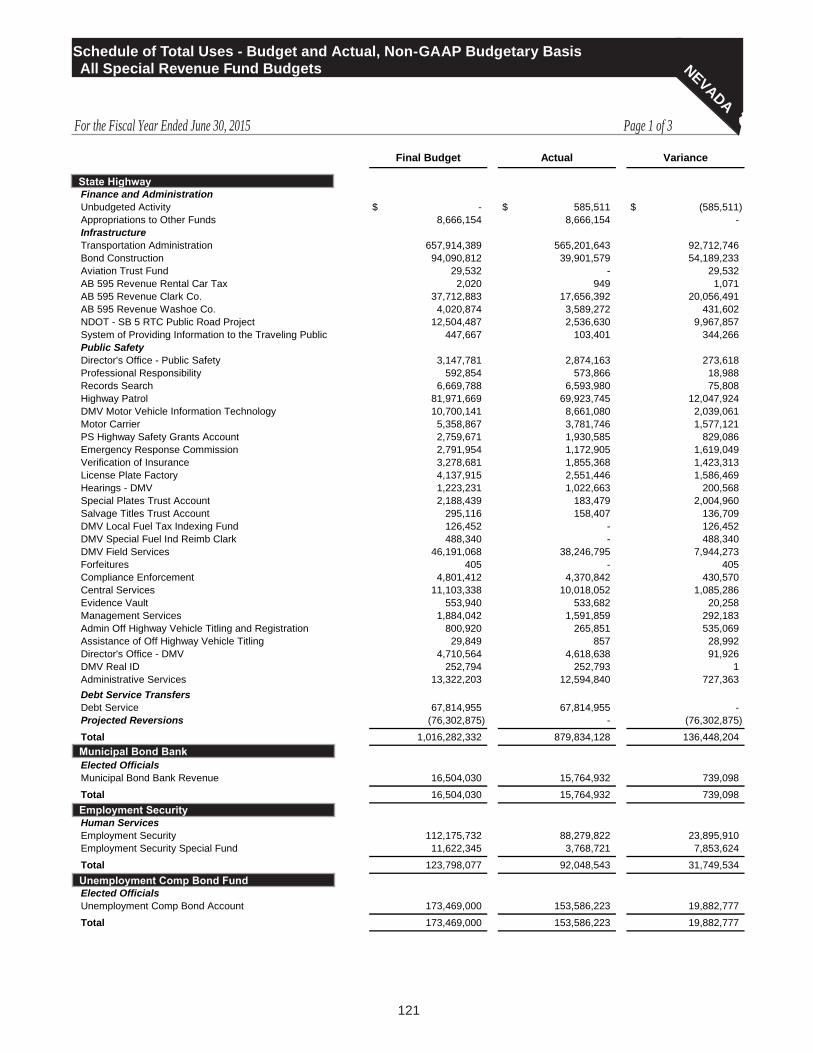
121
NEVADA
Final Budget Actual Variance
STATE HIGHWAYFinance and AdministrationUnbudgeted Activity -$ 585,511$ (585,511)$ Appropriations to Other Funds 8,666,154 8,666,154 -InfrastructureTransportation Administration 657,914,389 565,201,643 92,712,746Bond Construction 94,090,812 39,901,579 54,189,233Aviation Trust Fund 29,532 - 29,532AB 595 Revenue Rental Car Tax 2,020 949 1,071AB 595 Revenue Clark Co. 37,712,883 17,656,392 20,056,491AB 595 Revenue Washoe Co. 4,020,874 3,589,272 431,602NDOT - SB 5 RTC Public Road Project 12,504,487 2,536,630 9,967,857System of Providing Information to the Traveling Public 447,667 103,401 344,266Public SafetyDirector's Office - Public Safety 3,147,781 2,874,163 273,618Professional Responsibility 592,854 573,866 18,988Records Search 6,669,788 6,593,980 75,808Highway Patrol 81,971,669 69,923,745 12,047,924DMV Motor Vehicle Information Technology 10,700,141 8,661,080 2,039,061Motor Carrier 5,358,867 3,781,746 1,577,121PS Highway Safety Grants Account 2,759,671 1,930,585 829,086Emergency Response Commission 2,791,954 1,172,905 1,619,049Verification of Insurance 3,278,681 1,855,368 1,423,313License Plate Factory 4,137,915 2,551,446 1,586,469Hearings - DMV 1,223,231 1,022,663 200,568Special Plates Trust Account 2,188,439 183,479 2,004,960Salvage Titles Trust Account 295,116 158,407 136,709DMV Local Fuel Tax Indexing Fund 126,452 - 126,452DMV Special Fuel Ind Reimb Clark 488,340 - 488,340DMV Field Services 46,191,068 38,246,795 7,944,273Forfeitures 405 - 405Compliance Enforcement 4,801,412 4,370,842 430,570Central Services 11,103,338 10,018,052 1,085,286Evidence Vault 553,940 533,682 20,258Management Services 1,884,042 1,591,859 292,183Admin Off Highway Vehicle Titling and Registration 800,920 265,851 535,069Assistance of Off Highway Vehicle Titling 29,849 857 28,992Director's Office - DMV 4,710,564 4,618,638 91,926DMV Real ID 252,794 252,793 1Administrative Services 13,322,203 12,594,840 727,363Debt Service TransfersDebt Service 67,814,955 67,814,955 -Projected Reversions (76,302,875) - (76,302,875)
Total 1,016,282,332 879,834,128 136,448,204MUNICIPAL BOND BANKElected OfficialsMunicipal Bond Bank Revenue 16,504,030 15,764,932 739,098
Total 16,504,030 15,764,932 739,098EMPLOYMENT SECURITYHuman ServicesEmployment Security 112,175,732 88,279,822 23,895,910Employment Security Special Fund 11,622,345 3,768,721 7,853,624
Total 123,798,077 92,048,543 31,749,534UNEMPLOYMENT COMP BOND FUNDElected OfficialsUnemployment Comp Bond Account 173,469,000 153,586,223 19,882,777
Total 173,469,000 153,586,223 19,882,777
State Highway
Municipal Bond Bank
Schedule of Total Uses - Budget and Actual, Non-GAAP Budgetary BasisAll Special Revenue Fund Budgets
For the Fiscal Year Ended June 30, 2015 Page 1 of 3
Employment Security
Unemployment Comp Bond Fund

122
Final Budget Actual Variance
REGULATORYCommerce and IndustryManufactured Housing 1,688,491$ 860,980$ 827,511$ Real Estate Education and Research 1,144,611 528,639 615,972Real Estate Recovery 507,000 197,323 309,677Mobile Home Parks 359,026 162,591 196,435Mfg Housing-Education/Recovery 333,453 50,518 282,935Regulatory Fund 14,612,966 10,503,047 4,109,919Administrative Fines 122,700 122,700 -Taxicab Authority 11,067,934 6,102,999 4,964,935Dairy Commission 1,876,325 1,013,071 863,254
Total 31,712,506 19,541,868 12,170,638HIGHER EDUCATION CAPITAL CONSTRUCTIONFinance and AdministrationHigher Education Capital Construction 5,000,000 5,000,000 -Higher Education Special Construction 9,189,700 9,189,700 -
Total 14,189,700 14,189,700 -CLEANING UP PETROLEUM DISCHARGESInfrastructurePetroleum Clean-Up Trust Fund 21,762,007 13,430,756 8,331,251
Total 21,762,007 13,430,756 8,331,251HOSPITAL CARE TO INDIGENT PERSONSFinance and AdministrationSupplemental Fund - Indigents 19,223,037 12,047,932 7,175,105
Total 19,223,037 12,047,932 7,175,105TOURISM PROMOTIONCommerce and IndustryTourism Development 225,550 188,000 37,550Commission on Tourism 25,032,467 20,018,980 5,013,487
Total 25,258,017 20,206,980 5,051,037OFFENDERS' STOREPublic SafetyOffenders' Store Fund 21,374,711 13,656,755 7,717,956Inmate Welfare Account 5,177,829 3,498,808 1,679,021
Total 26,552,540 17,155,563 9,396,977TOBACCO SETTLEMENTElected OfficialsMillennium Scholarship Fund 48,800,758 24,662,556 24,138,202Millennium Scholarship Administration 374,750 337,798 36,952Guinn Memorial Millennium Scholarship Fund 442,339 9,000 433,339Trust Fund for Healthy Nevada 67,937,351 29,376,648 38,560,703MSA Compliance Administration 975,493 631,287 344,206Human ServicesTobacco Settlement Program 5,429,581 5,030,895 398,686Senior RX and Disability RX 5,048,144 3,201,523 1,846,621Healthy Nevada Fund Administration 9,032,561 - 9,032,561
Total 138,040,977 63,249,707 74,791,270ATTORNEY GENERAL SETTLEMENTPublic SafetyNational Settlement Administration 30,566,018 4,378,454 26,187,564
Total 30,566,018 4,378,454 26,187,564GIFTEducationEducation Gift Fund 21,000 - 21,000Library and Archives Gift Fund 645,203 25,545 619,658
Regulatory
Schedule of Total Uses - Budget and Actual, Non-GAAP Budgetary BasisAll Special Revenue Fund Budgets
For the Fiscal Year Ended June 30, 2015 Page 2 of 3
Cleaning Up Petroleum Discharges
Tourism Promotion
Offenders’ Store
Tobacco Settlement
Hospital Care to Indigent Persons
Attorney General Settlement
Gift
Higher Education Capital Construction

123
NEVADA
Final Budget Actual Variance
Human ServicesRural Services Gift Account 12,622$ -$ 12,622$ SNAMHS Gift Fund 29,198 - 29,198Health Division Gifts 36,911 34,865 2,046Aging Services Gift 55,709 700 55,009CBS Washoe Gift Fund 23,023 - 23,023Indian Commission Gift Acct 72,531 6,802 65,729Hospital Gift Fund 236,550 - 236,550SRC Gift Fund 10,831 - 10,831NV Equal Rights Commission Gift Fund 9,441 2,181 7,260Blind Gift Fund 401,063 10,000 391,063Welfare Gift Fund 9,887 - 9,887Rehabilitation Gift Fund 36,804 10,220 26,584Henry Woods Christmas Fund 598 - 598Nevada Children's Gift Account 592,808 10,000 582,808CYC Gift Fund 3,296 800 2,496Youth Training Center Gift Fund 40,453 - 40,453DRC Gift Fund 8,678 - 8,678InfrastructureWildlife Trust Account 625,917 231,251 394,666Park Gift and Grants 316,712 76,551 240,161
Total 3,189,235 408,915 2,780,320NATURAL RESOURCESInfrastructureGrants To Water Purveyors 130,273 - 130,273Erosion Control Bond Q12 694,416 145,296 549,120Protect Lake Tahoe 14,961,005 4,852,209 10,108,796
Total 15,785,694 4,997,505 10,788,189MISCELLANEOUSElected OfficialsRacketeering-Prosecution Account 125 - 125Consumer Advocate 6,265,886 3,273,874 2,992,012Unfair Trade Practices 750,000 264,639 485,361Commerce and IndustryLot Rent Trust Subsidy 637,907 368,460 269,447Museums and History Board Trust 23,275 17,272 6,003Museums Administrator Trust 38,997 23,284 15,713Nevada Historical Society Trust 297,123 72,065 225,058Nevada State Museum Trust 656,297 368,743 287,554Nevada Railroad Museum Trust 314,131 212,212 101,919Lost City Museum Trust 127,390 97,296 30,094LV Museum and Historical Society Trust 134,350 65,038 69,312Human ServicesRadioactive Material Disposal 1,244,610 598,411 646,199Finance and AdministrationVictims of Crime 16,322,524 5,833,184 10,489,340
Total 26,812,615 11,194,478 15,618,137LEGISLATIVE (Non-GAAP Fund)Legislative BranchNevada Legislative Interim 633,802 535,664 98,138Legislative Counsel Bureau 57,278,173 45,573,345 11,704,828Audit Contingency Account 361,766 333,457 28,309
Total 58,273,741 46,442,466 11,831,275Total Special Revenue Funds 1,741,419,526$ 1,368,478,150$ 372,941,376$
Page 3 of 3
Natural Resources
Miscellaneous
Legislative (Non-GAAP Fund)

124
Final Budget Actual Variance Final Budget Actual Variance
Fund balances, July 1 13,200,672$ 13,200,672$ -$ -$ -$ -$
Revenues: Federal 92,547,991 72,443,812 (20,104,179) - - - Other taxes - - - 173,394,000 153,567,476 (19,826,524) Sales and charges for services 1,017,991 613,291 (404,700) - - - Licenses, fees and permits 340,000 308,655 (31,345) - - - Interest 17,433 35,451 18,018 75,000 18,748 (56,252) Other 14,916,701 14,678,569 (238,132) - - -Other financing sources: Transfer from other funds 1,757,289 1,241,894 (515,395) - - -Total sources 123,798,077$ 102,522,344$ (21,275,733)$ 173,469,000$ 153,586,224$ (19,882,776)$
Fund balances, July 1 10,477,910$ 10,477,910$ -$ -$ -$ -$
Revenues: Gaming taxes, fees, licenses - - - 13,686,409 13,686,409 - Federal 446,806 601,652 154,846 - - - Other taxes 11,920,918 11,559,448 (361,470) - - - Sales, charges for services 5,642,894 5,571,570 (71,324) - - - Licenses, fees and permits 2,387,813 2,248,599 (139,214) - - - Interest 19,651 26,017 6,366 - - - Other 429,851 489,007 59,156 - - -Other financing sources: Transfer from other funds 386,663 413,466 26,803 - - -Total sources 31,712,506$ 31,387,669$ (324,837)$ 13,686,409$ 13,686,409$ -$
Fund balances, July 1 7,512,007$ 7,512,007$ -$ -$ -$ -$
Revenues: Other taxes 13,500,000 12,982,804 (517,196) 19,077,445 12,075,458 (7,001,987) Intergovernmental - - - - 3,499,750 3,499,750 Licenses, fees and permits 550,000 413,300 (136,700) - - - Interest 100,000 28,360 (71,640) 31,592 7,230 (24,362) Other 100,000 - (100,000) 114,000 78,000 (36,000)Total sources 21,762,007$ 20,936,471$ (825,536)$ 19,223,037$ 15,660,438$ (3,562,599)$
Fund balances, July 1 4,493,337$ 4,493,337$ -$ 4,803,851$ 4,803,851$ -$
Revenues: Other taxes 20,588,026 20,469,690 (118,336) - - - Sales, charges for services - - - 17,058,372 16,914,774 (143,598) Licenses, fees and permits 50,815 50,815 - - - - Interest - 495 495 29,488 26,283 (3,205) Other 10,012 6,754 (3,258) 423,595 496,892 73,297Other financing sources: Transfer from other funds 115,827 245,174 129,347 4,237,234 2,880,000 (1,357,234)Total sources 25,258,017$ 25,266,265$ 8,248$ 26,552,540$ 25,121,800$ (1,430,740)$
Schedule of Sources - Budget and Actual, Non-GAAP Budgetary BasisAll Nonmajor Special Revenue Fund Budgets
For the Fiscal Year Ended June 30, 2015
Employment Security Unemployment Compensation Bond
Regulatory Higher Education Capital Construction
Cleaning Up Petroleum Discharges Hospital Care to Indigent Persons
Tourism Promotion Offenders’ Store

125
NEVADA
Final Budget Actual Variance Final Budget Actual Variance
Fund balances, July 1 70,147,469$ 70,147,469$ -$ 30,448,672$ 30,448,672$ -$
Revenues: Interest 152,502 186,561 34,059 117,346 117,346 - Other 40,255,970 39,802,601 (453,369) - - -Other financing sources: Transfer from other funds 27,485,036 16,170,216 (11,314,820) - - -Total sources 138,040,977$ 126,306,847$ (11,734,130)$ 30,566,018$ 30,566,018$ -$
Fund balances, July 1 2,356,556$ 2,356,556$ -$ 14,980,785$ 14,980,785$ -$
Revenues: Federal - - - 631,257 170,901 (460,356) Interest 24,182 8,589 (15,593) 171,652 43,413 (128,239) Other 804,253 405,797 (398,456) 2,000 - (2,000)Other financing sources: Transfer from other funds 4,244 104,127 99,883 - - -Total sources 3,189,235$ 2,875,069$ (314,166)$ 15,785,694$ 15,195,099$ (590,595)$
Fund balances, July 1 10,910,320$ 10,910,320$ -$ 7,926,470$ 7,926,470$ -$
Revenues: Federal 3,281,526 2,403,409 (878,117) - - - Other taxes 2,906,531 2,897,918 (8,613) - - - Sales, charges for services 694,804 700,971 6,167 997,200 946,142 (51,058) Licenses, fees and permits 5,175,327 4,627,783 (547,544) 190,000 213,210 23,210 Interest 18,238 35,159 16,921 - - - Other 5,100,566 4,312,830 (787,736) 364,268 365,879 1,611Other financing sources: Transfer from other funds 725,303 725,303 - 48,795,803 48,782,503 (13,300)Total sources 28,812,615$ 26,613,693$ (2,198,922)$ 58,273,741$ 58,234,204$ (39,537)$
Fund balances, July 1 177,258,049$ 177,258,049$ -$
Revenues: Gaming taxes, fees, licenses 13,686,409 13,686,409 - Federal 96,907,580 75,619,774 (21,287,806) Other taxes 241,386,920 213,552,794 (27,834,126) Sales, charges for services 25,411,261 24,746,748 (664,513) Intergovernmental - 3,499,750 3,499,750 Licenses, fees and permits 8,693,955 7,862,362 (831,593) Interest 757,084 533,652 (223,432) Other 62,521,216 60,636,329 (1,884,887)Other financing sources: Transfer from other funds 83,507,399 70,562,683 (12,944,716)Total sources 710,129,873$ 647,958,550$ (62,171,323)$
Tobacco Settlement Attorney General Settlement
Gift Natural Resources
Miscellaneous Legislative (Non-GAAP Fund)
Total Nonmajor Special Revenue Funds
(Continued)

126

127
Nonmajor Enterprise FundsWorkers’ Compensation and Safety Records assessments on insurers for compensation of injured workers and administration of regulations for employee safety (NRS 616A.425), assesses self-insurers to pay claims against insolvent self-insured employers (NRS 616B.309), accounts for compensation benefits to physically impaired employees from a subsequent injury in the course of employment (NRS 616B.554, 616B.575, 616B.584), and accounts for injury claims of employees of uninsured employers (NRS 616A.430).
Insurance Administration and Enforcement Accounts for activities related to the administration and enforcement of the Nevada Insurance Code and other laws and regulations enforced by the Department of Business and Industry Division of Insurance (NRS 680C.100).
Gaming Investigative Accounts for activities related to investigations of gaming license applicants (NRS 463.331).
Forestry Nurseries Accounts for the self-supporting operation of State nurseries, which propagate, maintain and distribute plants for conservation purposes (NRS 528.100).
Prison Industry Accounts for a self-supporting program of job training through the employment of inmates in farming and manufacturing (NRS 209.189).
Nevada Magazine Accounts for the operation of the publication, Nevada Magazine, which is published to promote tourism (NRS 231.290).
Marlette Lake Water System Accounts for the costs of operating the State-owned Marlette Lake Water System. The system serves the State Buildings and Grounds Division and portions of Carson City and Storey County (NRS 331.180).

128
Workers' Compensation and Safety
Insurance Admin and Enforcement
Gaming Investigative Forestry Nurseries
AssetsCurrent assets:Cash and pooled investments: Cash with treasurer 35,201,792$ 6,903,468$ 10,919,649$ 464,255$ Cash in custody of other officials 250 - 218,271 100Receivables: Accounts receivable 5,544,629 277,585 98,406 5,981 Assessments receivable - 250 - - Intergovernmental receivables 292,114 75,034 - -Due from other funds 946,722 25,499 997 42,131Due from fiduciary funds - - - -Inventory - - - 190,061Prepaid items - 157,219 4,392 - Total current assets 41,985,507 7,439,055 11,241,715 702,528Noncurrent assets:Receivables:Other assets - - - -Capital assets: Land - - - - Buildings - - - - Improvements other than buildings - - - - Furniture and equipment 2,414,920 220,621 163,726 60,965 Construction in progress - - - - Less accumulated depreciation (2,199,916) (194,805) (163,726) (60,965) Total noncurrent assets 215,004 25,816 - - Total assets 42,200,511 7,464,871 11,241,715 702,528
Deferred Outflows of ResourcesDeferred charge on refunding - - - -Pension contributions 1,936,722 693,942 - 16,424 Total deferred outflows of resources 1,936,722 693,942 - 16,424
LiabilitiesCurrent liabilities:Accounts payable and accruals: Accounts payable 926,727 92,135 39,800 3,886 Accrued payroll and related liabilities 898,639 321,242 - 9,094 Interest payable - - - - Intergovernmental payables 3,586 - 224 -Due to other funds 85,398 36,822 1,727,562 22,582Due to fiduciary funds 3 - - 548Unearned revenues - - 9,222,129 -Other liabilities - - - -Short-term portion of long-term liabilities: Compensated absences 749,749 245,080 - 4,777 Bonds payable - - - - Total current liabilities 2,664,102 695,279 10,989,715 40,887Noncurrent liabilities:Advances from general fund - - - 227,370Net pension obligation 18,437,910 6,606,436 - 156,359Compensated absences 441,569 100,310 - 1,146Bonds payable - - - - Total noncurrent liabilities 18,879,479 6,706,746 - 384,875 Total liabilities 21,543,581 7,402,025 10,989,715 425,762
Deferred Inflows of ResourcesPension related amounts 5,277,971 1,891,135 - 44,759 Total deferred inflows of resources 5,277,971 1,891,135 - 44,759
Net PositionNet investment in capital assets 215,004 25,816 - -Restricted for workers' compensation 38,481,574 - - -Restricted for regulation of business - - 2,000 -Unrestricted (deficit) (21,380,897) (1,160,163) 250,000 248,431 Total net position 17,315,681$ (1,134,347)$ 252,000$ 248,431$
Combining Statement of Net Position Nonmajor Enterprise Funds
June 30, 2015
Assets
Net Position
Deferred Outflows of Resources
Liabilities
Deferred Inflows of Resources

129
NEVADA
Prison Industry Nevada MagazineMarlette Lake Water System Total
2,777,827$ 164,771$ 746,775$ 57,178,537$ 100 - - 218,721
469,863 89,927 - 6,486,391- - - 250
176,982 - 79,131 623,261109,595 4,211 23 1,129,178
9,712 - - 9,7121,293,404 31,886 - 1,515,351
- 9,058 - 170,6694,837,483 299,853 825,929 67,332,070
15,000 - - 15,000
153,140 - 414,672 567,8122,890,227 - 498,613 3,388,840
- - 630,647 630,6471,037,007 - 1,464,725 5,361,964
- - 10,703,713 10,703,713(3,411,231) - (2,505,357) (8,536,000)
684,143 - 11,207,013 12,131,9765,521,626 299,853 12,032,942 79,464,046
- - 94,412 94,412249,010 65,905 28,396 2,990,399249,010 65,905 122,808 3,084,811
171,933 33,856 59,067 1,327,40480,514 33,764 9,017 1,352,270
- - 44,315 44,31530 - 358 4,198
16,505 5,322 2,465 1,896,65656,705 - - 57,25673,507 135,307 - 9,430,94310,000 - 2,050 12,050
91,664 19,086 16,887 1,127,243- - 229,358 229,358
500,858 227,335 363,517 15,481,693
- - - 227,3702,370,618 627,430 270,331 28,469,084
104,021 4,579 6,743 658,368- - 8,496,953 8,496,953
2,474,639 632,009 8,774,027 37,851,7752,975,497 859,344 9,137,544 53,333,468
678,605 179,606 77,384 8,149,460678,605 179,606 77,384 8,149,460
669,143 - 2,480,702 3,390,665- - - 38,481,574- - - 2,000
1,447,391 (673,192) 460,120 (20,808,310)2,116,534$ (673,192)$ 2,940,822$ 21,065,929$
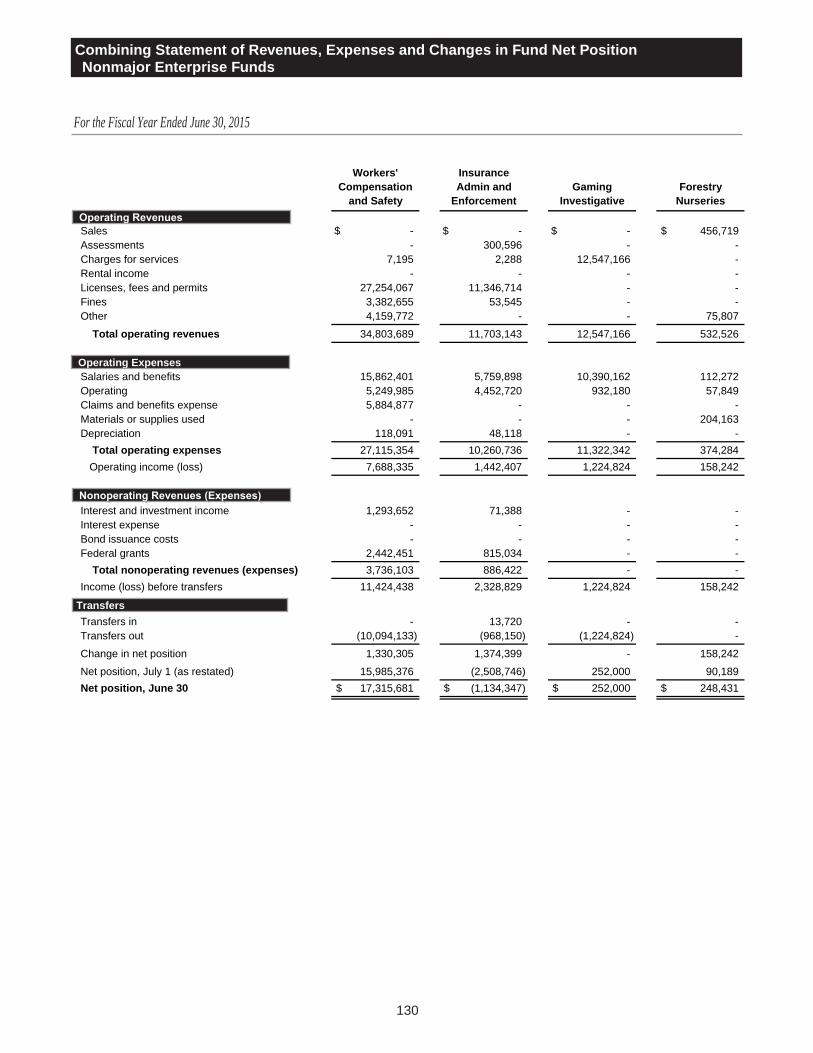
130
Workers' Compensation
and Safety
Insurance Admin and
EnforcementGaming
InvestigativeForestry
NurseriesOperating RevenuesSales -$ -$ -$ 456,719$ Assessments - 300,596 - -Charges for services 7,195 2,288 12,547,166 -Rental income - - - -Licenses, fees and permits 27,254,067 11,346,714 - -Fines 3,382,655 53,545 - -Other 4,159,772 - - 75,807
Total operating revenues 34,803,689 11,703,143 12,547,166 532,526
Operating ExpensesSalaries and benefits 15,862,401 5,759,898 10,390,162 112,272Operating 5,249,985 4,452,720 932,180 57,849Claims and benefits expense 5,884,877 - - -Materials or supplies used - - - 204,163Depreciation 118,091 48,118 - - Total operating expenses 27,115,354 10,260,736 11,322,342 374,284 Operating income (loss) 7,688,335 1,442,407 1,224,824 158,242
Nonoperating Revenues (Expenses)Interest and investment income 1,293,652 71,388 - -Interest expense - - - -Bond issuance costs - - - -Federal grants 2,442,451 815,034 - - Total nonoperating revenues (expenses) 3,736,103 886,422 - -Income (loss) before transfers 11,424,438 2,328,829 1,224,824 158,242
TransfersTransfers in - 13,720 - -Transfers out (10,094,133) (968,150) (1,224,824) -
Change in net position 1,330,305 1,374,399 - 158,242
Net position, July 1 (as restated) 15,985,376 (2,508,746) 252,000 90,189Net position, June 30 17,315,681$ (1,134,347)$ 252,000$ 248,431$
Combining Statement of Revenues, Expenses and Changes in Fund Net PositionNonmajor Enterprise Funds
For the Fiscal Year Ended June 30, 2015
Operating Revenues
Operating Expenses
Nonoperating Revenues (Expenses)
Transfers

131
NEVADA
Prison Industry Nevada MagazineMarlette Lake Water System Total
4,111,807$ 1,011,446$ 883,413$ 6,463,385$ - - - 300,596
531,502 - - 13,088,151106,100 - - 106,100
- - - 38,600,781- - - 3,436,200
110,715 11,680 145,188 4,503,162
4,860,124 1,023,126 1,028,601 66,498,375
1,595,484 570,469 189,430 34,480,1162,113,590 169,669 259,154 13,235,147
- - - 5,884,8772,375,577 296,551 - 2,876,291
113,266 - 30,776 310,2516,197,917 1,036,689 479,360 56,786,682
(1,337,793) (13,563) 549,241 9,711,693
36,949 - - 1,401,989- - (381,198) (381,198)- - (12,300) (12,300)
1,989,738 - - 5,247,2232,026,687 - (393,498) 6,255,714
688,894 (13,563) 155,743 15,967,407
- - 1,606 15,326(32,167) - - (12,319,274)
656,727 (13,563) 157,349 3,663,459
1,459,807 (659,629) 2,783,473 17,402,4702,116,534$ (673,192)$ 2,940,822$ 21,065,929$
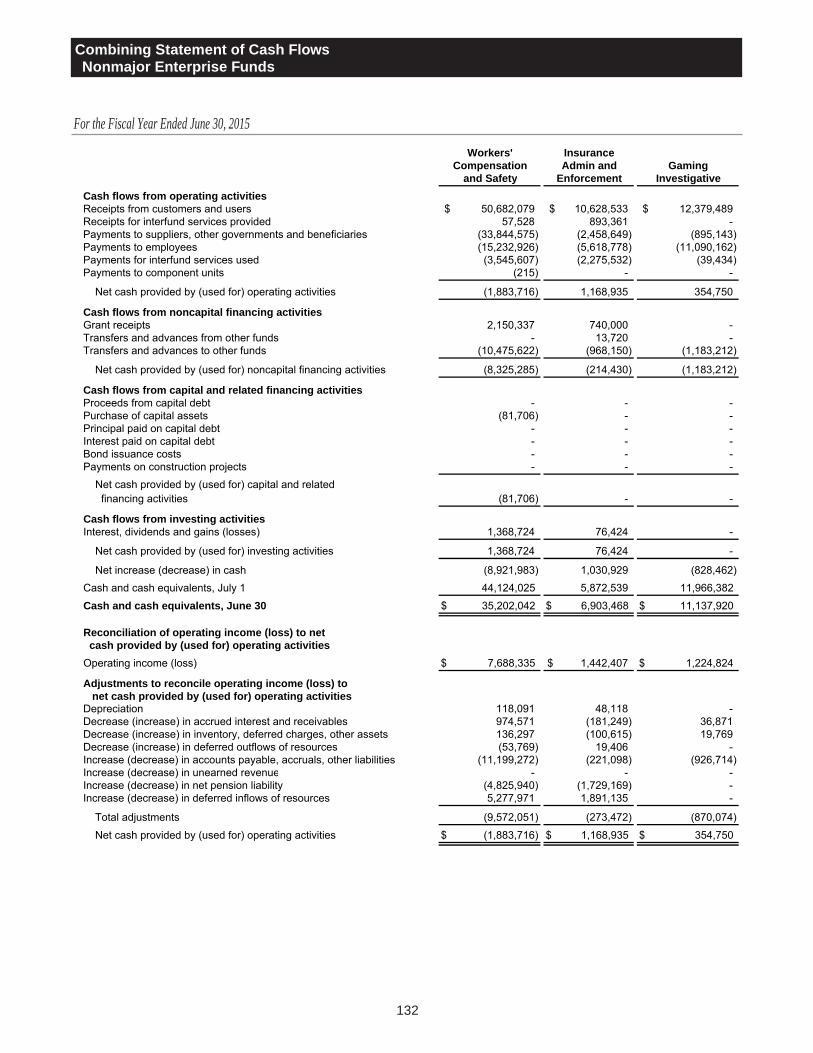
132
Combining Statement of Cash FlowsNonmajor Enterprise Funds
For the Fiscal Year Ended June 30, 2015
Workers' InsuranceCompensation Admin and Gaming
and Safety Enforcement InvestigativeCash flows from operating activitiesReceipts from customers and users 50,682,079$ 10,628,533$ 12,379,489$ Receipts for interfund services provided 57,528 893,361 - Payments to suppliers, other governments and beneficiaries (33,844,575) (2,458,649) (895,143) Payments to employees (15,232,926) (5,618,778) (11,090,162) Payments for interfund services used (3,545,607) (2,275,532) (39,434) Payments to component units (215) - -
Net cash provided by (used for) operating activities (1,883,716) 1,168,935 354,750
Cash flows from noncapital financing activitiesGrant receipts 2,150,337 740,000 - Transfers and advances from other funds - 13,720 - Transfers and advances to other funds (10,475,622) (968,150) (1,183,212)
Net cash provided by (used for) noncapital financing activities (8,325,285) (214,430) (1,183,212)
Cash flows from capital and related financing activitiesProceeds from capital debt - - - Purchase of capital assets (81,706) - - Principal paid on capital debt - - - Interest paid on capital debt - - - Bond issuance costs - - - Payments on construction projects - - - Net cash provided by (used for) capital and related financing activities (81,706) - -
Cash flows from investing activitiesInterest, dividends and gains (losses) 1,368,724 76,424 -
Net cash provided by (used for) investing activities 1,368,724 76,424 -
Net increase (decrease) in cash (8,921,983) 1,030,929 (828,462) Cash and cash equivalents, July 1 44,124,025 5,872,539 11,966,382
Cash and cash equivalents, June 30 35,202,042 $ 6,903,468 $ 11,137,920 $
Reconciliation of operating income (loss) to net cash provided by (used for) operating activitiesOperating income (loss) 7,688,335 $ 1,442,407$ 1,224,824 $
Adjustments to reconcile operating income (loss) to net cash provided by (used for) operating activitiesDepreciation 118,091 48,118 - Decrease (increase) in accrued interest and receivables 974,571 (181,249) 36,871 Decrease (increase) in inventory, deferred charges, other assets 136,297 (100,615) 19,769 Decrease (increase) in deferred outflows of resources (53,769) 19,406 - Increase (decrease) in accounts payable, accruals, other liabilities (11,199,272) (221,098) (926,714) Increase (decrease) in unearned revenue - - - Increase (decrease) in net pension liability (4,825,940) (1,729,169) - Increase (decrease) in deferred inflows of resources 5,277,971 1,891,135 -
Total adjustments (9,572,051) (273,472) (870,074)
Net cash provided by (used for) operating activities (1,883,716)$ 1,168,935 $ 354,750 $

133
NEVADA
Forestry Prison Nevada Marlette LakeNurseries Industry Magazine Water System Total
223,263$ 3,364,633$ 694,094$ 1,028,353$ 79,000,444$ 371,293 1,651,728 319,481 - 3,293,391
(247,895) (2,939,699) (410,153) (141,746) (40,937,860) (115,697) (1,538,625) (539,632) (176,330) (34,312,150) (22,440) (1,663,427) (42,087) (64,377) (7,652,904)
- (185) - (3,514) (3,914)
208,524 (1,125,575) 21,703 642,386 (612,993)
- 1,981,014 - - 4,871,351 - - - 1,606 15,326 - (32,167) - - (12,659,151)
- 1,948,847 - 1,606 (7,772,474)
- - - 1,020,000 1,020,000 - (63,675) - - (145,381)
(20,670) - - (1,170,000) (1,190,670) - - - (461,454) (461,454) - - - (12,300) (12,300) - - - (365,639) (365,639)
(20,670) (63,675) - (989,393) (1,155,444)
- 34,603 - - 1,479,751
- 34,603 - - 1,479,751
187,854 794,200 21,703 (345,401) (8,061,160) 276,501 1,983,727 143,068 1,092,176 65,458,418
464,355 $ 2,777,927 $ 164,771 $ 746,775 $ 57,397,258 $
158,242 $ (1,337,793)$ (13,563)$ 549,241 $ 9,711,693 $
- 113,266 - 30,776 310,251 54,939 193,441 17,854 (248) 1,096,179
571 (97,974) 26,122 1,490 (14,340) (1,585) (7,696) 6,821 (325) (37,148) (7,477) (46,938) (3,509) 54,824 (12,350,184)
- - (27,405) - (27,405) (40,925) (620,486) (164,223) (70,756) (7,451,499) 44,759 678,605 179,606 77,384 8,149,460
50,282 212,218 35,266 93,145 (10,324,686)
208,524 $ (1,125,575)$ 21,703 $ 642,386 $ (612,993)$

134

135
Internal Service FundsSelf-Insurance Accounts for self-insured group life, accident and health insurance plans for State and other government employees (NRS 287.0435).
Buildings and Grounds Accounts for the maintenance, housekeeping and security of most State buildings (NRS 331.101).
Fleet Services Accounts for the operations of the State vehicle fleet (NRS 336.110).
Communications Accounts for the operation of mail services for State agencies in Carson City, Reno, Las Vegas and Elko (NRS 378.143).
Insurance Premiums Allocates the costs of fidelity insurance, property insurance and workers’ compensation insurance to State agencies (NRS 331.187).
Administrative Services Provides administrative and accounting services to various divisions of the Department of Administration (NRS 232.219).
Personnel Accounts for the costs of administering the State personnel system. Operations are financed by assessments charged to user agencies (NRS 284.110).
Purchasing Provides purchasing services to State agencies and other governmental units. The operation is financed by an administrative charge on purchase orders and warehouse orders (NRS 333.120).
Information Services Accounts for designing, programming, and maintaining data processing software and also operating the State’s central computer facility, radio communication and telecommunication systems (NRS 242.211).
Printing Accounts for the operation of the State printing facilities (NRS 344.090).
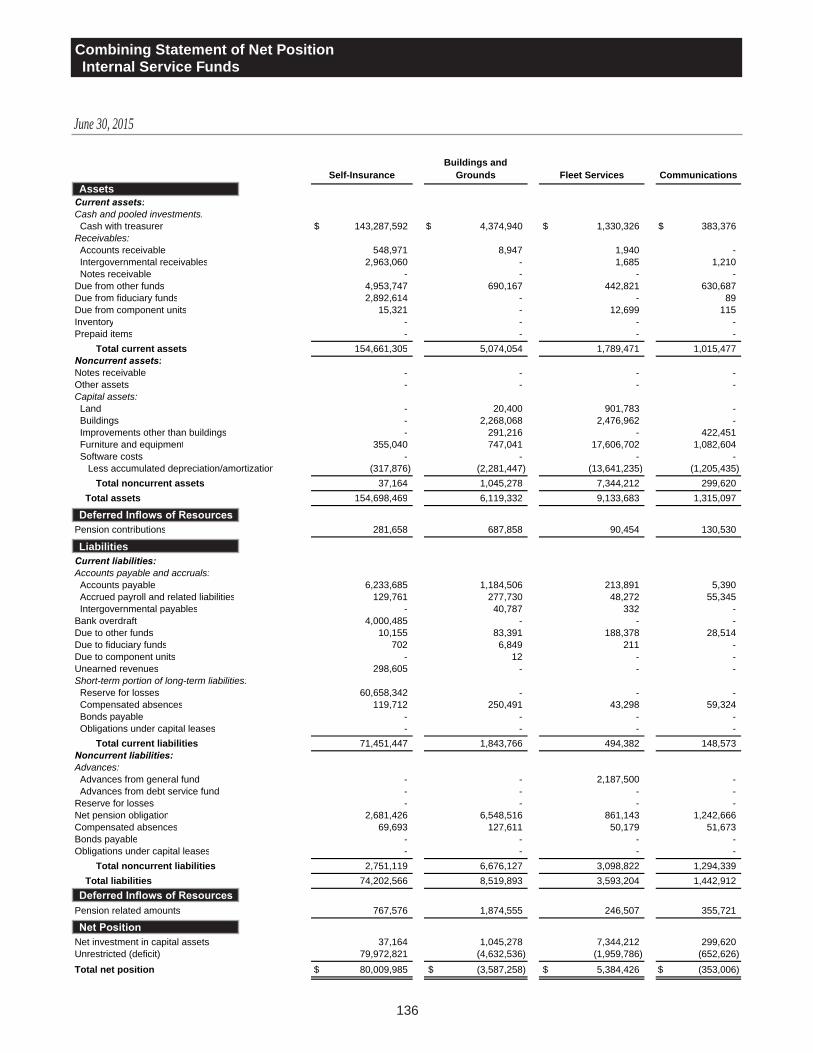
136
Self-InsuranceBuildings and
Grounds Fleet Services CommunicationsAssetsCurrent assets:Cash and pooled investments: Cash with treasurer 143,287,592$ 4,374,940$ 1,330,326$ 383,376$ Receivables: Accounts receivable 548,971 8,947 1,940 - Intergovernmental receivables 2,963,060 - 1,685 1,210 Notes receivable - - - -Due from other funds 4,953,747 690,167 442,821 630,687Due from fiduciary funds 2,892,614 - - 89Due from component units 15,321 - 12,699 115Inventory - - - -Prepaid items - - - - Total current assets 154,661,305 5,074,054 1,789,471 1,015,477Noncurrent assets:Notes receivable - - - -Other assets - - - -Capital assets: Land - 20,400 901,783 - Buildings - 2,268,068 2,476,962 - Improvements other than buildings - 291,216 - 422,451 Furniture and equipment 355,040 747,041 17,606,702 1,082,604 Software costs - - - - Less accumulated depreciation/amortization (317,876) (2,281,447) (13,641,235) (1,205,435) Total noncurrent assets 37,164 1,045,278 7,344,212 299,620 Total assets 154,698,469 6,119,332 9,133,683 1,315,097
Deferred Outflows of ResourcesPension contributions 281,658 687,858 90,454 130,530
LiabilitiesCurrent liabilities:Accounts payable and accruals: Accounts payable 6,233,685 1,184,506 213,891 5,390 Accrued payroll and related liabilities 129,761 277,730 48,272 55,345 Intergovernmental payables - 40,787 332 -Bank overdraft 4,000,485 - - -Due to other funds 10,155 83,391 188,378 28,514Due to fiduciary funds 702 6,849 211 -Due to component units - 12 - -Unearned revenues 298,605 - - -Short-term portion of long-term liabilities: Reserve for losses 60,658,342 - - - Compensated absences 119,712 250,491 43,298 59,324 Bonds payable - - - - Obligations under capital leases - - - - Total current liabilities 71,451,447 1,843,766 494,382 148,573Noncurrent liabilities:Advances: Advances from general fund - - 2,187,500 - Advances from debt service fund - - - -Reserve for losses - - - -Net pension obligation 2,681,426 6,548,516 861,143 1,242,666Compensated absences 69,693 127,611 50,179 51,673Bonds payable - - - -Obligations under capital leases - - - - Total noncurrent liabilities 2,751,119 6,676,127 3,098,822 1,294,339 Total liabilities 74,202,566 8,519,893 3,593,204 1,442,912
Deferred Inflows of ResourcesPension related amounts 767,576 1,874,555 246,507 355,721
Net PositionNet investment in capital assets 37,164 1,045,278 7,344,212 299,620Unrestricted (deficit) 79,972,821 (4,632,536) (1,959,786) (652,626)Total net position 80,009,985$ (3,587,258)$ 5,384,426$ (353,006)$
Combining Statement of Net PositionInternal Service Funds
Assets
Liabilities
June 30, 2015
Net Position
Deferred Inflows of Resources
Deferred Inflows of Resources

137
NEVADA
Insurance Premiums
Administrative Services Personnel Purchasing
Information Services Printing Total
14,073,447$ 731,023$ 1,331,102$ 499,017$ 3,526,532$ 1,100,736$ 170,638,091$
574 - - - 13,828 39,904 614,164- - - 25 58,384 - 3,024,364
5,000 - - - - - 5,0001,201,701 - 3,127 39 2,641,859 312,083 10,876,231
- - - - - - 2,892,70344 - - - 1,804 - 29,983
- - - - - 275,320 275,320186,992 - 5,278 - - - 192,270
15,467,758 731,023 1,339,507 499,081 6,242,407 1,728,043 188,548,126
80,000 - - - - - 80,000- - - - 4,445 - 4,445
- - - 95,554 15,000 - 1,032,737- - - 140,000 14,762,838 744,617 20,392,485- - - - - 3,125,954 3,839,621
36,877 52,240 161,062 152,380 30,274,863 3,870,870 54,339,679- - 15,323,810 - - - 15,323,810
(32,848) (52,064) (15,465,166) (292,380) (32,601,561) (4,994,387) (70,884,399)84,029 176 19,706 95,554 12,455,585 2,747,054 24,128,378
15,551,787 731,199 1,359,213 594,635 18,697,992 4,475,097 212,676,504
86,662 273,054 688,134 290,536 2,021,811 120,718 4,671,415
514,998 4,112 39,730 14,508 586,526 11,917 8,809,26347,720 113,641 294,380 109,233 816,543 74,539 1,967,164
- - - 35 6,832 - 47,986- - - - - - 4,000,485
16,323 14,446 318,140 21,201 636,659 7,148 1,324,355- - - - 12 5,949 13,723
17,846 - - - - - 17,858- - - - - - 298,605
16,712,388 - - - - - 77,370,73036,206 113,260 311,541 115,483 792,676 74,347 1,916,338
- - - - 513,323 - 513,323- - - - 689,650 - 689,650
17,345,481 245,459 963,791 260,460 4,042,221 173,900 96,969,480
- - - - 383,185 - 2,570,685- - - - 753,183 - 753,183
48,026,180 - - - - - 48,026,180825,038 2,599,515 6,551,158 2,765,945 19,247,972 1,032,823 44,356,20224,348 56,905 249,570 103,448 617,661 70,180 1,421,268
- - - - 4,736,249 - 4,736,249- - - - 648,976 - 648,976
48,875,566 2,656,420 6,800,728 2,869,393 26,387,226 1,103,003 102,512,74366,221,047 2,901,879 7,764,519 3,129,853 30,429,447 1,276,903 199,482,223
236,173 744,128 1,875,311 791,769 5,509,857 291,424 12,693,021
4,029 176 19,706 95,554 5,979,413 2,747,054 17,572,206(50,822,800) (2,641,930) (7,612,189) (3,132,005) (21,198,914) 280,434 (12,399,531)(50,818,771)$ (2,641,754)$ (7,592,483)$ (3,036,451)$ (15,219,501)$ 3,027,488$ 5,172,675$

138
Self-InsuranceBuildings and
Grounds Fleet Services CommunicationsOperating RevenuesNet premium income 318,205,286$ -$ -$ -$ Sales - - - -Charges for services - 1,234,060 59,288 6,687,280Rental income - 14,676,028 4,880,387 -Other 282,212 60,967 - - Total operating revenues 318,487,498 15,971,055 4,939,675 6,687,280
Operating ExpensesSalaries and benefits 2,175,236 5,459,454 887,607 1,037,026Operating 6,999,305 10,945,964 2,099,234 5,727,903Claims expense 221,214,737 - - -Materials or supplies used - - 261,241 -Depreciation 19,751 121,174 1,348,252 37,158Insurance premiums 122,796,623 - - - Total operating expenses 353,205,652 16,526,592 4,596,334 6,802,087 Operating income (loss) (34,718,154) (555,537) 343,341 (114,807)Nonoperating Revenues (Expenses)Interest and investment income 3,147,036 - - -Interest expense - - - -Gain (loss) on disposal of assets - 2,366 122,876 - Total nonoperating revenues (expenses) 3,147,036 2,366 122,876 -Income (loss) before transfers (31,571,118) (553,171) 466,217 (114,807)TransfersTransfers in - 332 891,319 -Transfers out - - - -Change in net position (31,571,118) (552,839) 1,357,536 (114,807)
Net position, July 1 (as restated) 111,581,103 (3,034,419) 4,026,890 (238,199)
Net position, June 30 80,009,985$ (3,587,258)$ 5,384,426$ (353,006)$
Combining Statement of Revenues, Expenses and Changes in Fund Net Position Internal Service Funds
Operating Revenues
Operating Expenses
For the Fiscal Year Ended June 30, 2015
Nonoperating Revenues (Expenses)
Transfers

139
NEVADA
Insurance Premiums
Administrative Services Personnel Purchasing
Information Services Printing Total
23,921,110$ -$ -$ -$ -$ -$ 342,126,396$ - - - - - 2,433,621 2,433,621- 2,469,094 7,323,870 2,691,102 24,943,869 - 45,408,563- - - - 203,544 - 19,759,959
93,632 - 31,553 24 1,174 14,009 483,57124,014,742 2,469,094 7,355,423 2,691,126 25,148,587 2,447,630 410,212,110
693,647 2,085,743 5,099,655 1,955,841 15,141,401 1,358,071 35,893,6812,015,206 313,856 2,873,540 725,334 7,479,029 488,229 39,667,600
11,898,923 - - - - - 233,113,660- - - - - 464,801 726,042
800 1,018 10,475 316 3,841,230 271,354 5,651,5285,045,782 - - - - - 127,842,405
19,654,358 2,400,617 7,983,670 2,681,491 26,461,660 2,582,455 442,894,9164,360,384 68,477 (628,247) 9,635 (1,313,073) (134,825) (32,682,806)
430 - - - - - 3,147,466- - - - (4,848) - (4,848)- - - - (1,766,718) - (1,641,476)
430 - - - (1,771,566) - 1,501,1424,360,814 68,477 (628,247) 9,635 (3,084,639) (134,825) (31,181,664)
- - - - 688,430 159,280 1,739,361(50,000) - - - (41,132) - (91,132)
4,310,814 68,477 (628,247) 9,635 (2,437,341) 24,455 (29,533,435)
(55,129,585) (2,710,231) (6,964,236) (3,046,086) (12,782,160) 3,003,033 34,706,110
(50,818,771)$ (2,641,754)$ (7,592,483)$ (3,036,451)$ (15,219,501)$ 3,027,488$ 5,172,675$

140
Combining Statement of Cash FlowsInternal Service Funds
For the Fiscal Year Ended June 30, 2015
Self- Buildings FleetInsurance and Grounds Services Communications
Cash flows from operating activitiesReceipts from customers and users 51,278,488$ 22,690$ 1,393$ 9,533$ Receipts for interfund services provided 176,065,722 15,816,414 4,814,503 6,679,147 Receipts from component units 70,719,703 - 90,489 5,293 Receipts of principal on loans and notes - - - - Payments to suppliers, other governments and beneficiaries (334,667,160) (8,781,093) (1,369,951) (5,319,670) Payments to employees (2,085,929) (5,324,056) (848,587) (983,396) Payments for interfund services used (1,189,570) (1,925,345) (894,533) (400,411) Payments to component units - (156) - -
Net cash provided by (used for) operating activities (39,878,746) (191,546) 1,793,314 (9,504)
Cash flows from noncapital financing activitiesTransfers and advances from other funds - 77,910 761,976 - Transfers and advances to other funds - - (187,500) -
Net cash provided by (used for) noncapital financing activities - 77,910 574,476 -
Cash flows from capital and related financing activitiesProceeds from sale of capital assets - 2,366 128,241 - Purchase of capital assets (5,160) (42,729) (2,074,403) (11,435) Principal paid on capital debt - - - - Interest paid on capital debt - - - - Net cash provided by (used for) capital and related financing activities (5,160) (40,363) (1,946,162) (11,435)
Cash flows from investing activitiesInterest, dividends and gains (losses) 3,328,721 - - -
Net cash provided by (used for) investing activities 3,328,721 - - -
Net increase (decrease) in cash (36,555,185) (153,999) 421,628 (20,939) Cash and cash equivalents, July 1 179,842,777 4,528,939 908,698 404,315
Cash and cash equivalents, June 30 143,287,592 $ 4,374,940 $ 1,330,326 $ 383,376 $
Reconciliation of operating income (loss) to net cash provided by (used for) operating activitiesOperating income (loss) (34,718,154)$ (555,537)$ 343,341 $ (114,807)$
Adjustments to reconcile operating income (loss) to net cash provided by (used for) operating activitiesDepreciation 19,751 121,174 1,348,252 37,158 Decrease (increase) in loans and notes receivable - - - - Decrease (increase) in accrued interest and receivables (6,781,676) (131,951) (33,290) 6,268 Decrease (increase) in inventory, deferred charges, other assets 22,344 58,094 9,682 13,406 Decrease (increase) in deferred outflows of resources 164 86,287 (8,411) 9,691 Increase (decrease) in accounts payable, accruals, other liabilities 15,154,995 69,840 112,628 8,314 Increase (decrease) in unearned revenue (13,641,909) - - - Increase (decrease) in net pension liability (701,837) (1,714,008) (225,395) (325,255) Increase (decrease) in deferred inflows of resources 767,576 1,874,555 246,507 355,721
Total adjustments (5,160,592) 363,991 1,449,973 105,303
Net cash provided by (used for) operating activities (39,878,746)$ (191,546)$ 1,793,314 $ (9,504)$
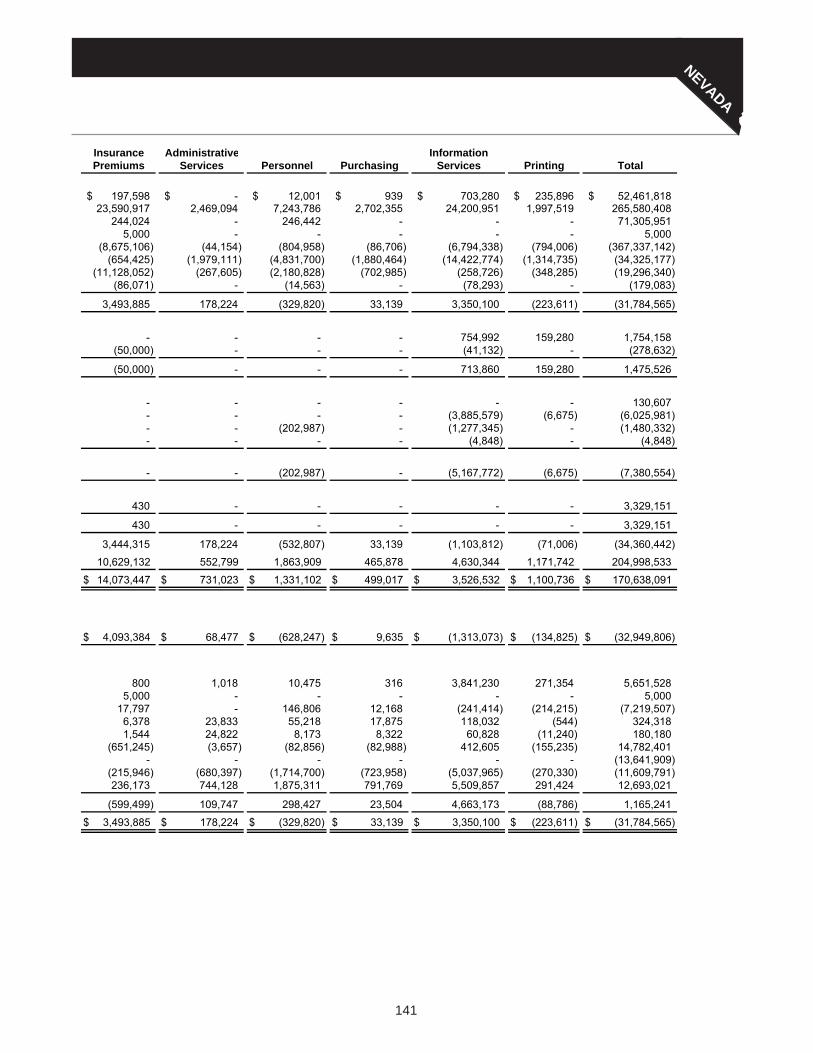
141
NEVADA
Insurance Administrative InformationPremiums Services Personnel Purchasing Services Printing Total
197,598$ -$ 12,001$ 939$ 703,280$ 235,896$ 52,461,818$ 23,590,917 2,469,094 7,243,786 2,702,355 24,200,951 1,997,519 265,580,408
244,024 - 246,442 - - - 71,305,951 5,000 - - - - - 5,000
(8,675,106) (44,154) (804,958) (86,706) (6,794,338) (794,006) (367,337,142) (654,425) (1,979,111) (4,831,700) (1,880,464) (14,422,774) (1,314,735) (34,325,177)
(11,128,052) (267,605) (2,180,828) (702,985) (258,726) (348,285) (19,296,340) (86,071) - (14,563) - (78,293) - (179,083)
3,493,885 178,224 (329,820) 33,139 3,350,100 (223,611) (31,784,565)
- - - - 754,992 159,280 1,754,158 (50,000) - - - (41,132) - (278,632)
(50,000) - - - 713,860 159,280 1,475,526
- - - - - - 130,607 - - - - (3,885,579) (6,675) (6,025,981) - - (202,987) - (1,277,345) - (1,480,332) - - - - (4,848) - (4,848)
- - (202,987) - (5,167,772) (6,675) (7,380,554)
430 - - - - - 3,329,151
430 - - - - - 3,329,151
3,444,315 178,224 (532,807) 33,139 (1,103,812) (71,006) (34,360,442) 10,629,132 552,799 1,863,909 465,878 4,630,344 1,171,742 204,998,533
14,073,447 $ 731,023 $ 1,331,102 $ 499,017 $ 3,526,532 $ 1,100,736 $ 170,638,091 $
4,093,384 $ 68,477 $ (628,247)$ 9,635 $ (1,313,073)$ (134,825)$ (32,949,806)$
800 1,018 10,475 316 3,841,230 271,354 5,651,528 5,000 - - - - - 5,000
17,797 - 146,806 12,168 (241,414) (214,215) (7,219,507) 6,378 23,833 55,218 17,875 118,032 (544) 324,318 1,544 24,822 8,173 8,322 60,828 (11,240) 180,180
(651,245) (3,657) (82,856) (82,988) 412,605 (155,235) 14,782,401 - - - - - - (13,641,909)
(215,946) (680,397) (1,714,700) (723,958) (5,037,965) (270,330) (11,609,791) 236,173 744,128 1,875,311 791,769 5,509,857 291,424 12,693,021
(599,499) 109,747 298,427 23,504 4,663,173 (88,786) 1,165,241
3,493,885 $ 178,224 $ (329,820)$ 33,139 $ 3,350,100 $ (223,611)$ (31,784,565)$

142

143
Fiduciary FundsPension and Other Employee Benefit TrustPublic Employees’ Retirement Accounts for the operations of the Public Employees’ Retirement System which provides income benefits to qualified public employees (NRS 286.220).
Legislators’ Retirement Accounts for the operations of the Legislators’ Retirement System (NRS 218.2375).
Judicial Retirement Accounts for the operations of the Judicial Retirement System which provides benefits for justices of the Supreme Court and district judges (NRS 1A.160).
State Retirees’ Fund Accounts for the assets accumulated and the payments made for other postemployment benefits provided to current and future State retirees. Administered as a defined benefit Other Postemployment Benefit Plan (OPEB). Funding comes from employer contributions and investment earnings (NRS 287.0436).
Investment TrustLocal Government Investment Pool Accounts for investment funds received from local governments and pooled to obtain greater interest earnings (NRS 355.167).
Nevada Enhanced Savings Term Accounts for the establishment of one or more separate subaccounts for identified investments that are made for and allocated to specific participating local governments (NRS 355.165).
Retirement Benefits Investment Fund Accounts for investment of contributions made by participating entities to support financing of other post employment benefits at some time in the future (NRS 355.220).
Private Purpose TrustPrisoners’ Personal Property Accounts for personal property held in trust for prisoners pending their release (NRS 209.241).
Nevada College Savings Plan Accounts for participant contributions used to pay for future college expenses (NRS 353B.340).
AgencyIntergovernmental Accounts for taxes and fees, such as sales and use, property tax and motor vehicle privilege tax, collected by the Department of Taxation on behalf of local governments (NRS 353.254).
State Agency Fund for Bonds Accounts for surety bonds and deposits held by the State (NRS 353.251).
Motor Vehicle Accounts for taxes and fees collected by the Department of Motor Vehicles pending distribution to counties (NRS 482.180).
Child Support Disbursement Accounts for the centralized collection and disbursement of child support payments in accordance with 42 U.S.C. Sec. 654b (NRS 425.363).
Child Welfare Trust Accounts for survivor benefits held in trust for children receiving welfare services (NRS 432.037).
Restitution Trust Accounts for money received from parolees making restitution (NRS 213.126).
State Payroll Accounts for payment of payroll and payroll deductions such as income tax withholding, insurance deductions, credit union deductions, etc. (NRS 227.130).

144
PublicEmployees'Retirement
Legislators'Retirement
JudicialRetirement
OtherEmployee
Benefit Trust Fund - State
Retirees' Fund TotalAssetsCash and pooled investments: Cash with treasurer -$ -$ -$ 4,971,859$ 4,971,859$ Cash in custody of other officials 264,196,276 65,098 357,490 - 264,618,864
Investments: Investments - - - 1,296,388 1,296,388 Fixed income securities 9,449,725,984 1,369,342 27,677,905 - 9,478,773,231 Marketable equity securities 14,600,247,164 3,362,231 68,094,094 - 14,671,703,489 International securities 7,324,919,557 115,609 2,325,519 - 7,327,360,685 Real estate 1,454,303,113 - - - 1,454,303,113 Alternative investments 1,319,000,149 - - - 1,319,000,149
Collateral on loaned securities 373,833,323 - - - 373,833,323
Receivables: Accounts receivable - - - - - Accrued interest and dividends 91,334,239 9,755 277,119 - 91,621,113 Trades pending settlement 129,448,044 15,086 336 - 129,463,466 Intergovernmental receivables 101,981,995 - 316,760 9,996 102,308,751 Contributions receivable - - - - - Other receivables - - 194,495 - 194,495
Due from other funds - - - 122,332 122,332Due from fiduciary funds 19,306,997 - - - 19,306,997Due from component units - - - 1,488,231 1,488,231Other assets 3,633,781 - - - 3,633,781Furniture and equipment 40,412,280 - - - 40,412,280Accumulated depreciation (36,462,089) - - - (36,462,089)
Total assets 35,135,880,813 4,937,121 99,243,718 7,888,806 35,247,950,458
LiabilitiesAccounts payable and accruals: Accounts payable 10,447,810 1,874 4,566 - 10,454,250 Intergovernmental payables - - - - - Redemptions payable - - - - - Trades pending settlement 140,879,407 21,724 294,453 - 141,195,584
Bank overdraft - - - - -Obligations under securities lending 373,833,323 - - - 373,833,323Due to other funds 89 - - 2,892,614 2,892,703Due to fiduciary funds - - - - -Other liabilities - 178,709 - - 178,709
Total liabilities 525,160,629 202,307 299,019 2,892,614 528,554,569
Net positionRestricted for: Employees' pension benefits 34,610,720,184 4,734,814 98,944,699 - 34,714,399,697 OPEB benefits - - - 4,996,192 4,996,192 Pool participants - - - - - Individuals - - - - -Total net position 34,610,720,184$ 4,734,814$ 98,944,699$ 4,996,192$ 34,719,395,889$
Pension Trust Funds
Combining Statement of Fiduciary Net PositionPension and Other Employee Benefit Trust, Investment Trust and Private–Purpose Trust Funds
Assets
Liabilities
June 30, 2015
Net Position

145
NEVADA
LocalGovernmentInvestment
Pool
NevadaEnhanced
Savings Term
RetirementBenefits
InvestmentFund Total
Prisoners'PersonalProperty
Nevada College Savings Plan Total
-$ 10,612$ -$ 10,612$ 6,597,414$ -$ 6,597,414$- - 7,011,215 7,011,215 - 17,282,677 17,282,677
406,997,401 253,988,957 282,877,276 943,863,634 - 15,857,000,441 15,857,000,441- - - - - - -- - - - - - -- - - - - - -- - - - - - -- - - - - - -
- - - - - - -
- 8,734 - 8,734 84,858 - 84,858222,200 463,108 1,625,028 2,310,336 - 3,488,328 3,488,328
- - - - - 3,976,716 3,976,716- - - - 89,585 - 89,585- - - - - 12,857,154 12,857,154- - - - - - -
17,216 135 - 17,351 172,939 - 172,939- - - - - - -- - - - - - -- - - - - - -- - - - 48,222 - 48,222- - - - (48,222) - (48,222)
407,236,817 254,471,546 291,513,519 953,221,882 6,944,796 15,894,605,316 15,901,550,112
- 78,166 29,578 107,744 118,991 2,745,320 2,864,31133,588 - - 33,588 8,591 - 8,591
- - - - - 5,789,195 5,789,195- - 2,490,065 2,490,065 - 12,905,426 12,905,426
- - - - - 3,061,000 3,061,000- - - - - - -
9,743 30,618 - 40,361 1,348,374 - 1,348,374- - - - 26,840 - 26,840- - - - - - -
43,331 108,784 2,519,643 2,671,758 1,502,796 24,500,941 26,003,737
- - - - - - -- - - - - - -
407,193,486 254,362,762 288,993,876 950,550,124 - - -- - - - 5,442,000 15,870,104,375 15,875,546,375
407,193,486$ 254,362,762$ 288,993,876$ 950,550,124$ 5,442,000$ 15,870,104,375$ 15,875,546,375$
Private Purpose Trust FundsInvestment Trust Funds

146
Public Employees' Retirement
Legislators' Retirement
Judicial Retirement
Other Employee
Benefit Trust Fund - State
Retirees' Fund TotalAdditionsContributions: Employer 1,436,652,815$ 155,855$ 8,511,779$ 37,758,981$ 1,483,079,430$ Plan members 114,302,545 22,854 - - 114,325,399 Participants - - - - - Repayment and purchase of service 82,485,688 - 95,812 - 82,581,500
Total contributions 1,633,441,048 178,709 8,607,591 37,758,981 1,679,986,329
Investment income: Net increase (decrease) in fair value of investments 520,754,925 124,110 2,111,876 31,512 523,022,423 Interest, dividends 784,929,413 56,352 1,114,177 45,152 786,145,094 Securities lending 4,694,725 - - - 4,694,725 Other 124,491,007 - - - 124,491,007
1,434,870,070 180,462 3,226,053 76,664 1,438,353,249Less investment expense: Other (39,577,974) (1,096) (19,994) (405) (39,599,469)Net investment income 1,395,292,096 179,366 3,206,059 76,259 1,398,753,780
Other: Investment from local governments - - - - - Reinvestment from interest income - - - - - Other 2,786,066 85,697 - - 2,871,763Total other 2,786,066 85,697 - - 2,871,763
Total additions 3,031,519,210 443,772 11,813,650 37,835,240 3,081,611,872
DeductionsPrincipal redeemed - - - - -Benefit payments 1,958,237,104 497,304 4,896,513 34,362,539 1,997,993,460Refunds 25,637,753 - - - 25,637,753Contribution distributions 2,356,700 - - - 2,356,700Dividends to investors - - - - -Administrative expense 9,648,626 84,654 85,650 - 9,818,930 Total deductions 1,995,880,183 581,958 4,982,163 34,362,539 2,035,806,843
Change in net position 1,035,639,027 (138,186) 6,831,487 3,472,701 1,045,805,029Net position, July 1 33,575,081,157 4,873,000 92,113,212 1,523,491 33,673,590,860Net position, June 30 34,610,720,184$ 4,734,814$ 98,944,699$ 4,996,192$ 34,719,395,889$
Pension Trust Funds
Combining Statement of Changes in Fiduciary Net PositionPension and Other Employee Benefit Trust, Investment Trust and Private–Purpose Trust Funds
Additions
Deductions
For the Fiscal Year Ended June 30, 2015

147
NEVADA
Local Government
Investment Pool
Nevada Enhanced
Savings Term
Retirement Benefits
Investment Fund Total
Prisoners' Personal Property
Nevada College Savings Plan Total
-$ -$ -$ -$ -$ -$ -$ - - - - - - -- - - - 19,711,461 3,983,442,252 4,003,153,713- - - - - - -
- - - - 19,711,461 3,983,442,252 4,003,153,713
38,394 (4,518,778) 1,966,895 (2,513,489) - 77,529,742 77,529,742608,160 6,625,742 6,423,884 13,657,786 - 336,462,462 336,462,462
- - - - - - -- - - - - - -
646,554 2,106,964 8,390,779 11,144,297 - 413,992,204 413,992,204
- - (48,666) (48,666) - - -646,554 2,106,964 8,342,113 11,095,631 - 413,992,204 413,992,204
948,724,944 7,849,718 44,913,500 1,001,488,162 - - -494,725 - - 494,725 - - -
- - 385 385 - - -949,219,669 7,849,718 44,913,885 1,001,983,272 - - -
949,866,223 9,956,682 53,255,998 1,013,078,903 19,711,461 4,397,434,456 4,417,145,917
969,947,250 162,255,353 - 1,132,202,603 - 2,732,372,357 2,732,372,357- - - - 19,599,236 - 19,599,236- - - - - - -- - 200,000 200,000 - - -
580,755 - - 580,755 - - -27,405 394,188 33,585 455,178 - 28,703,974 28,703,974
970,555,410 162,649,541 233,585 1,133,438,536 19,599,236 2,761,076,331 2,780,675,567
(20,689,187) (152,692,859) 53,022,413 (120,359,633) 112,225 1,636,358,125 1,636,470,350427,882,673 407,055,621 235,971,463 1,070,909,757 5,329,775 14,233,746,250 14,239,076,025407,193,486$ 254,362,762$ 288,993,876$ 950,550,124$ 5,442,000$ 15,870,104,375$ 15,875,546,375$
Private Purpose Trust FundsInvestment Trust Funds

148
IntergovernmentalState Agency Fund
for Bonds Motor VehicleChild Support Disbursement
AssetsCash and pooled investments: Cash with treasurer 11,207,370$ 23,385,174$ 34,478,187$ -$ Cash in custody of other officials - 21,839,680 6,103,919 3,207,217
Investments - 222,312,599 - -
Receivables: Taxes receivable 10,255,493 - 48,078,572 - Intergovernmental receivables - - - - Other receivables - - 99,064 -
Due from other funds 492,659,580 33,221,865 453,417 -Due from fiduciary funds 13,293,048 - 1,101 -Due from component units - - - -Prepaid items - - - - Total assets 527,415,491$ 300,759,318$ 89,214,260$ 3,207,217$
LiabilitiesAccounts payable and accruals: Accrued payroll and related liabilities -$ -$ -$ -$ Intergovernmental payables 527,415,491 - 68,096,487 -
Due to fiduciary funds - - 13,293,048 -Other liabilities: Deposits - 300,759,318 7,705,809 - Other liabilities - - 118,916 3,207,217 Total liabilities 527,415,491$ 300,759,318$ 89,214,260$ 3,207,217$
Assets
Liabilities
Combining Statement of Fiduciary Assets and LiabilitiesAgency Funds
June 30, 2015
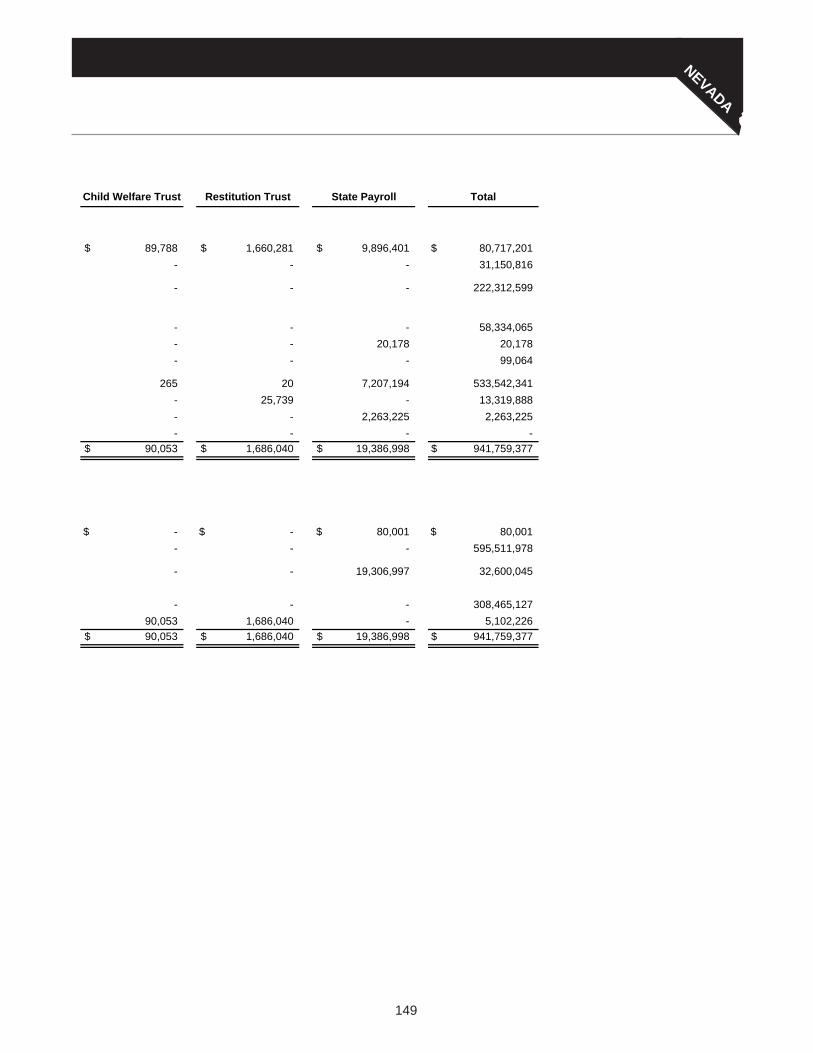
149
NEVADA
Child Welfare Trust Restitution Trust State Payroll Total
89,788$ 1,660,281$ 9,896,401$ 80,717,201$ - - - 31,150,816
- - - 222,312,599
- - - 58,334,065- - 20,178 20,178- - - 99,064
265 20 7,207,194 533,542,341- 25,739 - 13,319,888- - 2,263,225 2,263,225- - - -
90,053$ 1,686,040$ 19,386,998$ 941,759,377$
-$ -$ 80,001$ 80,001$ - - - 595,511,978
- - 19,306,997 32,600,045
- - - 308,465,12790,053 1,686,040 - 5,102,22690,053$ 1,686,040$ 19,386,998$ 941,759,377$
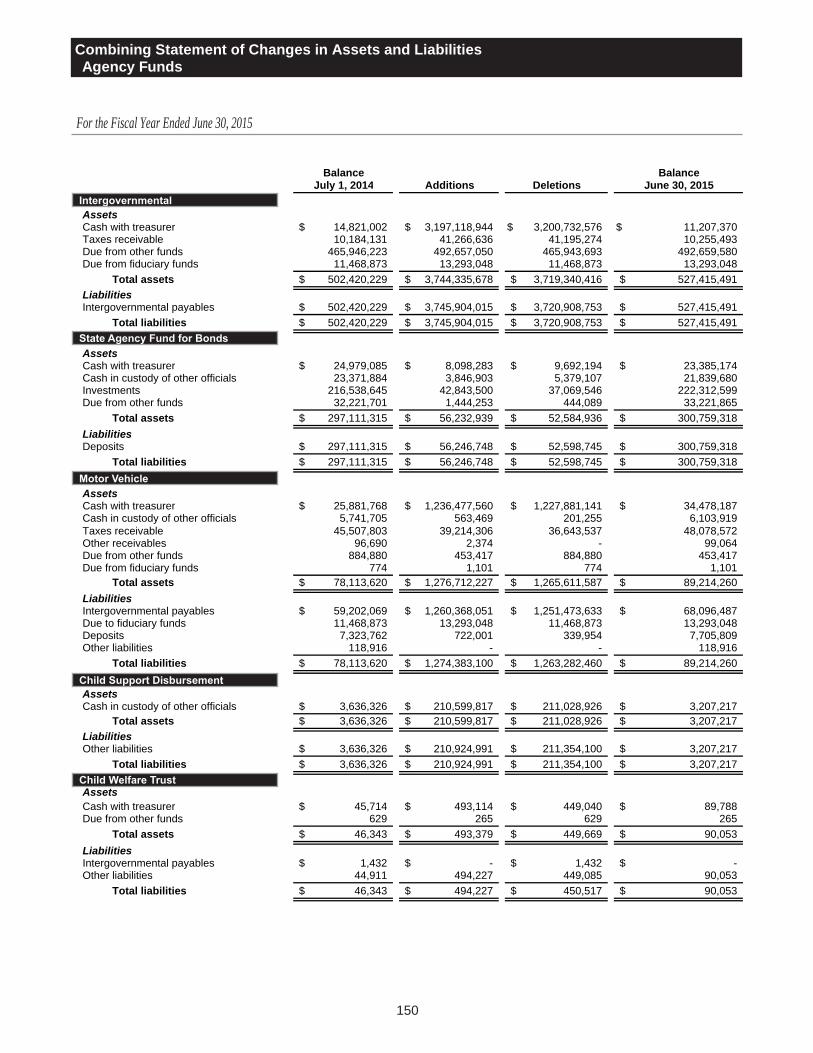
150
Balance BalanceJuly 1, 2014 Additions Deletions June 30, 2015
IntergovernmentalAssetsCash with treasurer 14,821,002$ 3,197,118,944$ 3,200,732,576$ 11,207,370$ Taxes receivable 10,184,131 41,266,636 41,195,274 10,255,493 Due from other funds 465,946,223 492,657,050 465,943,693 492,659,580 Due from fiduciary funds 11,468,873 13,293,048 11,468,873 13,293,048 Total assets 502,420,229$ 3,744,335,678$ 3,719,340,416$ 527,415,491$ LiabilitiesIntergovernmental payables 502,420,229$ 3,745,904,015$ 3,720,908,753$ 527,415,491$ Total liabilities 502,420,229$ 3,745,904,015$ 3,720,908,753$ 527,415,491$ State Agency Fund for BondsAssetsCash with treasurer 24,979,085$ 8,098,283$ 9,692,194$ 23,385,174$ Cash in custody of other officials 23,371,884 3,846,903 5,379,107 21,839,680 Investments 216,538,645 42,843,500 37,069,546 222,312,599 Due from other funds 32,221,701 1,444,253 444,089 33,221,865 Total assets 297,111,315$ 56,232,939$ 52,584,936$ 300,759,318$ LiabilitiesDeposits 297,111,315$ 56,246,748$ 52,598,745$ 300,759,318$ Total liabilities 297,111,315$ 56,246,748$ 52,598,745$ 300,759,318$ Motor VehicleAssetsCash with treasurer 25,881,768$ 1,236,477,560$ 1,227,881,141$ 34,478,187$ Cash in custody of other officials 5,741,705 563,469 201,255 6,103,919 Taxes receivable 45,507,803 39,214,306 36,643,537 48,078,572 Other receivables 96,690 2,374 - 99,064 Due from other funds 884,880 453,417 884,880 453,417 Due from fiduciary funds 774 1,101 774 1,101 Total assets 78,113,620$ 1,276,712,227$ 1,265,611,587$ 89,214,260$ LiabilitiesIntergovernmental payables 59,202,069$ 1,260,368,051$ 1,251,473,633$ 68,096,487$ Due to fiduciary funds 11,468,873 13,293,048 11,468,873 13,293,048 Deposits 7,323,762 722,001 339,954 7,705,809 Other liabilities 118,916 - - 118,916 Total liabilities 78,113,620$ 1,274,383,100$ 1,263,282,460$ 89,214,260$ Child Support DisbursementAssets Cash in custody of other officials 3,636,326$ 210,599,817$ 211,028,926$ 3,207,217$ Total assets 3,636,326$ 210,599,817$ 211,028,926$ 3,207,217$ LiabilitiesOther liabilities 3,636,326$ 210,924,991$ 211,354,100$ 3,207,217$ Total liabilities 3,636,326$ 210,924,991$ 211,354,100$ 3,207,217$ Child Welfare TrustAssetsCash with treasurer 45,714$ 493,114$ 449,040$ 89,788$ Due from other funds 629 265 629 265 Total assets 46,343$ 493,379$ 449,669$ 90,053$ LiabilitiesIntergovernmental payables 1,432$ -$ 1,432$ -$ Other liabilities 44,911 494,227 449,085 90,053 Total liabilities 46,343$ 494,227$ 450,517$ 90,053$
Intergovernmental
State Agency Fund for Bonds
Combining Statement of Changes in Assets and LiabilitiesAgency Funds
For the Fiscal Year Ended June 30, 2015
Motor Vehicle
Child Support Disbursement
Child Welfare Trust

151
NEVADA
Balance BalanceJuly 1, 2014 Additions Deletions June 30, 2015
Restitution Trust Assets Cash with treasurer 1,392,695$ 3,291,605$ 3,024,019$ 1,660,281$ Due from other funds 100 20 100 20 Due from fiduciary funds 24,742 25,739 24,742 25,739 Total assets 1,417,537$ 3,317,364$ 3,048,861$ 1,686,040$ LiabilitiesOther liabilities 1,417,537$ 3,170,822$ 2,902,319$ 1,686,040$ Total liabilities 1,417,537$ 3,170,822$ 2,902,319$ 1,686,040$ State PayrollAssetsCash with treasurer 19,358,207$ 707,245,964$ 716,707,770$ 9,896,401$ Intergovernmental receivables 16,521 20,178 16,521 20,178 Due from other funds 2,510,192 7,207,194 2,510,192 7,207,194 Due from fiduciary funds 41,991 - 41,991 - Due from component unit 1,202,326 2,263,225 1,202,326 2,263,225 Total assets 23,129,237$ 716,736,561$ 720,478,800$ 19,386,998$ LiabilitiesAccrued payroll and related liabilities 1,025,191$ 374,245,785$ 375,190,975$ 80,001$ Due to fiduciary funds 19,120,277 252,694,321 252,507,601 19,306,997 Deposits 2,983,769 90,093,743 93,077,512 - Total liabilities 23,129,237$ 717,033,849$ 720,776,088$ 19,386,998$ Totals - All Agency FundsAssetsCash with treasurer 86,478,471$ 5,152,725,470$ 5,158,486,740$ 80,717,201$ Cash in custody of other officials 32,749,915 215,010,189 216,609,288 31,150,816 Investments 216,538,645 42,843,500 37,069,546 222,312,599 Taxes receivable 55,691,934 80,480,942 77,838,811 58,334,065 Intergovernmental receivables 16,521 20,178 16,521 20,178 Other receivables 96,690 2,374 - 99,064 Due from other funds 501,563,725 501,762,199 469,783,583 533,542,341 Due from fiduciary funds 11,536,380 13,319,888 11,536,380 13,319,888 Due from component unit 1,202,326 2,263,225 1,202,326 2,263,225 Total assets 905,874,607$ 6,008,427,965$ 5,972,543,195$ 941,759,377$ LiabilitiesAccrued payroll and related liabilities 1,025,191$ 374,245,785$ 375,190,975$ 80,001$ Intergovernmental payables 561,623,730 5,006,272,066 4,972,383,818 595,511,978 Due to fiduciary funds 30,589,150 265,987,369 263,976,474 32,600,045 Deposits 307,418,846 147,062,492 146,016,211 308,465,127 Other liabilities 5,217,690 214,590,040 214,705,504 5,102,226 Total liabilities 905,874,607$ 6,008,157,752$ 5,972,272,982$ 941,759,377$
Restitution Trust
State Payroll
Totals - All Agency Funds
(Continued)
152
Wildhorse StateRecreation Area
Heli Skiing Ruby Mountains
Spooner SummitLake Tahoe

153
This part of the State of Nevada’s comprehensive annual financial report presents detailed information as a context for understanding what the information in the financial statements, note disclosures, and required supplementary information says about the government’s overall financial health.
Tables Pages
Financial Trends
These tables contain trend information to help the reader understand how the government’s financial performance and well-being have changed over time.
revenue caPaciTy
These tables contain information to help the reader assess the government’s most significant revenue source, taxable sales.
debT caPaciTy
These tables present information to help the reader assess the affordability of the government’s current levels of outstanding debt and the government’s ability to issue additional debt in the future.
demograPhic and economic inFormaTion
These tables offer demographic and economic indicators to help the reader understand the environment within which the government’s financial activities take place.
oPeraTing inFormaTion
These tables contain service and infrastructure data to help the reader understand how the information in the government’s financial report relates to the services the government provides and the activities it performs.
Sources: Unless otherwise noted, the information in these tables is derived from the comprehensive annual financial report of the relevant year.
154
158
159
163
166
Statistical Section

154
NEVADA
Last
Ten
Fis
cal Y
ears
, (A
ccru
al B
asis
of A
ccou
ntin
g, E
xpre
ssed
in T
hous
ands
)
Tabl
e 2
- Cha
nges
in N
et P
ositi
on
Last
Ten
Fis
cal Y
ears
, (A
ccru
al B
asis
of A
ccou
ntin
g, E
xpre
ssed
in T
hous
ands
)
Tabl
e 1
- Net
Pos
ition
by
Com
pone
nt
Gov
ernm
enta
l Act
iviti
es20
0620
0720
0820
0920
1020
1120
1220
1320
1420
15
Net
inve
stm
ent i
n ca
pita
l ass
ets
3,44
5,62
9$
3,
486,
155
$
3,52
2,17
7$
3,
492,
205
$
3,62
2,78
7$
3,
875,
141
$
4,01
7,14
7$
4,
357,
735
$
4,67
2,73
8$
4,
895,
213
$
R
estri
cted
675,
966
613,
375
697,
168
702,
743
683,
526
749,
818
700,
341
741,
250
866,
071
976,
650
U
nres
trict
ed (d
efic
it)50
4,54
162
3,78
728
9,12
3(2
36,9
12)
(224
,799
)(2
76,9
24)
(59,
069)
(3,1
35)
(124
,344
)(2
,223
,609
)To
tal g
over
nmen
tal a
ctiv
ities
net
pos
ition
4,62
6,13
6$
4,
723,
317
$
4,50
8,46
8$
3,
958,
036
$
4,08
1,51
4$
4,
348,
035
$
4,65
8,41
9$
5,
095,
850
$
5,41
4,46
5$
3,
648,
254
$
Bus
ines
s-ty
pe A
ctiv
itie s
N
et in
vest
men
t in
capi
tal a
sset
s2,
824
$
2,78
3$
3,
393
$
3,28
6$
3,
615
$
3,12
0$
3,
076
$
3,42
2$
3,
434
$
3,79
1$
Res
trict
ed1,
143,
248
1,29
3,73
71,
297,
613
819,
348
464,
346
503,
090
538,
143
560,
410
599,
806
651,
863
U
nres
trict
ed (d
efic
it)6,
428
9,44
110
,206
(5,4
66)
(303
,705
)(5
58,2
65)
(544
,418
)(3
60,4
88)
(223
,987
)88
,253
Tota
l bus
ines
s-ty
pe a
ctiv
ities
net
pos
ition
1,15
2,50
0$
1,
305,
961
$
1,31
1,21
2$
81
7,16
8$
164,
256
$
(5
2,05
5)$
(3,1
99)
$
203,
344
$
37
9,25
3$
743,
907
$
Pr
imar
y G
over
nmen
t
Net
inve
stm
ent i
n ca
pita
l ass
ets
3,44
8,45
3$
3,
488,
938
$
3,52
5,57
0$
3,
495,
491
$
3,62
6,40
2$
3,
878,
261
$
4,02
0,22
3$
4,
361,
157
$
4,67
6,17
2$
4,
899,
004
$
R
estri
cted
1,81
9,21
41,
907,
112
1,99
4,78
11,
522,
091
1,14
7,87
21,
252,
908
1,23
8,48
41,
301,
660
1,46
5,87
71,
628,
513
U
nres
trict
ed (d
efic
it)51
0,96
963
3,22
829
9,32
9(2
42,3
78)
(528
,504
)(8
35,1
89)
(603
,487
)(3
63,6
23)
(348
,331
)(2
,135
,356
)To
tal p
rimar
y go
vern
men
t net
pos
ition
5,77
8,63
6$
6,
029,
278
$
5,81
9,68
0$
4,
775,
204
$
4,24
5,77
0$
4,
295,
980
$
4,65
5,22
0$
5,
299,
194
$
5,79
3,71
8$
4,
392,
161
$
2006
2007
2008
2009
2010
2011
2012
2013
2014
2015
Expe
nses
Gov
ernm
enta
l act
iviti
es:
G
ener
al g
over
nmen
t34
9,22
4$
42
1,29
1$
439,
682
$
389,
943
$
37
5,21
9$
334,
616
$
24
0,41
7$
229,
136
$
20
2,62
0$
280,
465
$
Hea
lth a
nd s
ocia
l ser
vice
s 2,
198,
551
2,34
0,88
42,
454,
843
2,66
7,41
93,
017,
013
3,20
9,23
73,
250,
926
3,46
4,33
43,
784,
055
4,88
7,13
0
Edu
catio
n - K
to 1
2 (b
)1,
261,
533
1,54
7,37
81,
663,
725
1,77
0,62
71,
810,
353
1,81
8,86
91,
794,
579
1,81
2,99
21,
830,
605
1,89
2,51
9
Edu
catio
n - h
ighe
r edu
catio
n (b
)56
8,70
370
7,24
871
8,00
670
4,78
962
0,57
057
4,66
748
6,32
047
7,85
249
5,89
349
0,40
7
Law
, jus
tice
and
publ
ic s
afet
y57
8,04
962
4,14
965
0,65
768
7,41
069
0,10
466
7,59
864
6,70
165
7,72
866
2,33
069
5,02
3
Reg
ulat
ion
of b
usin
ess
101,
857
104,
385
114,
786
118,
086
100,
380
122,
679
101,
687
85,6
8830
3,02
025
9,10
6
Tran
spor
tatio
n50
8,56
968
0,28
157
6,81
576
2,61
064
4,97
663
0,65
780
1,79
750
5,35
432
7,51
946
2,38
6
Rec
reat
ion
and
reso
urce
dev
elop
men
t15
6,93
317
3,03
716
7,62
716
5,74
116
1,04
815
3,40
413
8,59
913
4,57
813
9,18
814
5,00
0
Inte
rest
on
long
-term
deb
t13
2,96
915
0,48
614
6,31
213
8,30
413
2,23
812
8,60
612
2,08
010
6,12
612
1,22
494
,987
U
nallo
cate
d de
prec
iatio
n1,
513
720
992
976
1,44
81,
402
1,75
52,
023
2,15
02,
137
Tota
l gov
ernm
enta
l act
iviti
es e
xpen
ses
5,85
7,90
16,
749,
859
6,93
3,44
57,
405,
905
7,55
3,34
97,
641,
735
7,58
4,86
17,
475,
811
7,86
8,60
49,
209,
160
Bus
ines
s-ty
pe a
ctiv
ities
:
Une
mpl
oym
ent i
nsur
ance
239,
232
296,
784
439,
632
1,33
6,04
32,
233,
382
1,76
7,63
21,
286,
839
867,
600
552,
246
380,
166
H
ousi
ng45
,397
46,1
5243
,953
44,3
8257
,342
83,4
6750
,979
34,2
4731
,954
23,4
42
Wat
er lo
ans
8,22
67,
885
6,83
66,
218
14,6
9716
,476
8,24
98,
942
7,83
76,
372
W
orke
rs' c
ompe
nsat
ion
and
safe
ty23
,991
25,3
8126
,258
26,8
0126
,084
29,6
4227
,706
28,6
8526
,715
27,6
44
Hig
her e
duca
tion
tuiti
on18
,940
10,5
048,
109
13,1
0314
,051
18,9
5926
,067
25,0
8121
,325
25,7
68
Oth
er15
,601
16,4
2420
,496
16,9
6723
,175
28,9
0526
,187
32,1
0732
,944
30,2
63To
tal b
usin
ess-
type
act
iviti
es e
xpen
ses
351,
387
403,
130
545,
284
1,44
3,51
42,
368,
731
1,94
5,08
11,
426,
027
996,
662
673,
021
493,
655
Tota
l prim
ary
gove
rnm
ent e
xpen
ses
6,20
9,28
8$
7,15
2,98
9$
7,47
8,72
9$
8,84
9,41
9$
9,92
2,08
0$
9,58
6,81
6$
9,01
0,88
8$
8,47
2,47
3$
8,54
1,62
5$
9,70
2,81
5$

155
Prog
ram
Rev
enue
sG
over
nmen
tal a
ctiv
ities
:
Cha
rges
for s
ervi
ces:
Gen
eral
gov
ernm
ent
226,
191
$
254,
947
$
25
4,19
8$
28
1,99
7$
285,
927
$
30
1,85
6$
183,
278
$
18
0,16
9$
174,
265
$
17
2,46
8$
Hea
lth a
nd s
ocia
l ser
vice
s13
8,67
512
5,91
514
7,78
514
1,47
313
1,40
815
6,69
821
2,73
021
2,31
017
2,45
922
2,91
7
La
w, j
ustic
e an
d pu
blic
saf
ety
242,
262
256,
015
257,
355
252,
755
236,
004
234,
385
253,
431
267,
060
273,
895
295,
582
Oth
er16
2,02
814
8,95
913
5,03
411
8,66
814
3,68
917
7,34
214
5,11
612
8,12
614
6,56
713
8,01
0
Ope
ratin
g gr
ants
and
con
tribu
tions
1,84
8,09
12,
025,
361
1,98
2,31
52,
544,
032
3,14
1,98
63,
050,
092
3,09
1,55
63,
116,
377
3,41
6,38
24,
337,
546
C
apita
l gra
nts
and
cont
ribut
ions
27,0
8016
,010
21,8
7119
,608
56,7
1916
4,71
173
,749
56,0
039,
349
10,3
85To
tal g
over
nmen
tal a
ctiv
ities
pro
gram
reve
nues
2,64
4,32
72,
827,
207
2,79
8,55
83,
358,
533
3,99
5,73
34,
085,
084
3,95
9,86
03,
960,
045
4,19
2,91
75,
176,
908
Bus
ines
s-ty
pe a
ctiv
ities
:
Cha
rges
for s
ervi
ces:
Une
mpl
oym
ent i
nsur
ance
--
-1,
460
1,66
91,
587
1,54
41,
556
1,39
31,
753
Hou
sing
33,5
8932
,372
30,7
2126
,604
23,6
9321
,385
20,1
0519
,840
16,0
0317
,058
Wat
er lo
ans
6,48
49,
907
8,97
88,
648
8,40
98,
370
8,37
18,
873
8,92
48,
233
Wor
kers
' com
pens
atio
n an
d sa
fety
25,5
9336
,037
35,6
3238
,955
30,1
4435
,071
37,9
4634
,322
40,6
7134
,804
Hig
her e
duca
tion
tuiti
on (
a)9,
032
6,04
44,
405
6,22
28,
222
9,28
414
,065
20,0
7422
,063
18,6
43
O
ther
24,0
3524
,652
31,8
4429
,504
23,3
5230
,854
25,8
5632
,358
32,2
1031
,394
O
pera
ting
gran
ts a
nd c
ontri
butio
ns (
a)10
2,65
893
,578
83,9
8251
9,40
11,
327,
044
1,24
2,75
484
8,58
550
3,96
019
6,65
375
,716
Tota
l bus
ines
s-ty
pe a
ctiv
ities
pro
gram
reve
nues
201,
391
202,
590
195,
562
630,
794
1,42
2,53
31,
349,
305
956,
472
620,
983
317,
917
187,
601
Tota
l prim
ary
gove
rnm
ent p
rogr
am re
venu
es2,
845,
718
$
3,
029,
797
$
2,99
4,12
0$
3,98
9,32
7$
5,
418,
266
$
5,43
4,38
9$
4,91
6,33
2$
4,
581,
028
$
4,51
0,83
4$
5,
364,
509
$
Net
(Exp
ense
)/Rev
enue
Gov
ernm
enta
l act
iviti
es(3
,213
,574
)$
(3
,922
,652
)$
(4
,134
,887
)$
(4
,047
,372
)$
(3
,557
,616
)$
(3
,556
,651
)$
(3
,625
,001
)$
(3
,515
,766
)$
(3
,675
,687
)$
(4
,032
,252
)$
B
usin
ess-
type
act
iviti
es(1
49,9
96)
(200
,540
)(3
49,7
22)
(812
,720
)(9
46,1
98)
(595
,776
)(4
69,5
55)
(375
,679
)(3
55,1
04)
(306
,054
)To
tal p
rimar
y go
vern
men
t net
exp
ense
(3,3
63,5
70)
$
(4,1
23,1
92)
$
(4,4
84,6
09)
$
(4,8
60,0
92)
$
(4,5
03,8
14)
$
(4,1
52,4
27)
$
(4,0
94,5
56)
$
(3,8
91,4
45)
$
(4,0
30,7
91)
$
(4,3
38,3
06)
$
Gen
eral
Rev
enue
s an
d O
ther
Cha
nges
in N
et P
ositi
onG
over
nmen
tal a
ctiv
ities
:
Sal
es a
nd u
se ta
xes
1,09
7,93
9$
1,14
9,45
6$
1,
101,
741
$
94
3,78
7$
870,
474
$
93
1,91
1$
967,
374
$
1,
027,
124
$
1,08
5,65
6$
1,
160,
968
$
G
amin
g ta
xes
1,00
3,11
11,
029,
044
1,01
1,50
688
3,05
484
4,47
085
0,02
188
4,92
890
1,08
592
2,99
990
6,38
2
Mod
ified
bus
ines
s ta
xes
255,
252
282,
729
297,
161
281,
605
381,
300
378,
971
373,
156
386,
928
382,
976
413,
749
In
sura
nce
prem
ium
taxe
s23
8,29
726
1,37
825
6,84
724
1,25
223
3,28
023
3,33
423
8,08
325
2,19
525
6,58
730
1,22
6
Pro
perty
and
tran
sfer
taxe
s31
8,94
129
6,49
828
0,89
627
8,88
126
6,87
823
1,75
821
5,64
921
5,21
120
9,78
421
9,18
8
Mot
or a
nd s
peci
al fu
el ta
xes
297,
383
300,
182
297,
087
272,
614
268,
554
267,
649
267,
181
269,
232
269,
544
277,
305
O
ther
taxe
s39
8,46
042
7,10
942
5,25
040
7,46
964
2,97
968
8,75
269
6,43
168
5,65
068
8,39
983
3,96
0
Inve
stm
ent e
arni
ngs
87,7
2914
3,01
310
5,07
59,
026
(1,2
46)
(4,1
82)
(11,
543)
2,89
25,
462
14,7
80
Oth
er86
,371
99,4
7611
6,08
214
8,32
114
6,87
921
4,27
730
0,43
022
9,73
316
0,29
823
1,04
2
Con
tribu
tions
to p
erm
anen
t fun
d76
,553
12,2
088,
801
7,01
98,
165
6,63
76,
705
5,37
65,
908
9,03
8
Spe
cial
item
(2
76,7
73)
--
--
--
--
-
Tran
sfer
s31
,373
18,7
4019
,592
23,9
1219
,361
24,0
44(3
,009
)(2
2,22
9)6,
689
(147
,100
)To
tal g
over
nmen
tal a
ctiv
ities
3,61
4,63
64,
019,
833
3,92
0,03
83,
496,
940
3,68
1,09
43,
823,
172
3,93
5,38
53,
953,
197
3,99
4,30
24,
220,
538
Bus
ines
s-ty
pe a
ctiv
ities
:
Oth
er ta
xes
365,
598
372,
741
374,
565
342,
588
314,
657
403,
509
515,
402
565,
925
537,
372
555,
187
O
ther
--
--
--
-21
2-
-
Spe
cial
item
-
--
--
--
-33
05,
000
Tr
ansf
ers
(31,
373)
(18,
740)
(19,
592)
(23,
912)
(19,
361)
(24,
044)
3,00
922
,229
(6,6
89)
147,
100
Tota
l bus
ines
s-ty
pe a
ctiv
ities
334,
225
354,
001
354,
973
318,
676
295,
296
379,
465
518,
411
588,
366
531,
013
707,
287
Tota
l prim
ary
gove
rnm
ent
3,94
8,86
1$
4,37
3,83
4$
4,
275,
011
$
3,
815,
616
$
3,97
6,39
0$
4,
202,
637
$
4,
453,
796
$
4,54
1,56
3$
4,
525,
315
$
4,92
7,82
5$
Cha
nge
in N
et P
ositi
onG
over
nmen
tal a
ctiv
ities
401,
062
$
97,1
81$
(2
14,8
49)
$
(5
50,4
32)
$
12
3,47
8$
266,
521
$
31
0,38
4$
437,
431
$
31
8,61
5$
188,
286
$
B
usin
ess-
type
act
iviti
es18
4,22
915
3,46
15,
251
(494
,044
)(6
50,9
02)
(216
,311
)48
,856
212,
687
175,
909
401,
233
Tota
l prim
ary
gove
rnm
ent
585,
291
$
250,
642
$
(2
09,5
98)
$
(1
,044
,476
)$
(5
27,4
24)
$
50
,210
$
359,
240
$
65
0,11
8$
494,
524
$
58
9,51
9$
(a) R
evis
ed fi
gure
s fo
r yea
rs 2
006-
2013
(b) B
egin
ning
with
fisc
al y
ear 2
015,
edu
catio
nal e
xpen
ditu
res
are
repo
rted
sepa
rate
ly fo
r K to
12
and
high
er e
duca
tion;
acc
ordi
ngly
, fis
cal y
ears
200
6 th
roug
h 20
14 h
ave
been
revi
sed
to re
port
thes
e se
para
tely

156
NEVADA
Last
Ten
Fis
cal Y
ears
, (M
odifi
ed A
ccru
al B
asis
of A
ccou
ntin
g, E
xpre
ssed
in T
hous
ands
)
Tabl
e 4
- Cha
nges
in F
und
Bal
ance
s of
Gov
ernm
enta
l Fun
ds
Tab
le 3
- Fu
nd B
alan
ces
of G
over
nmen
tal F
unds
Last
Ten
Fis
cal Y
ears
, (M
odifi
ed A
ccru
al B
asis
of A
ccou
ntin
g, E
xpre
ssed
in T
hous
ands
)
2006
2007
2008
2009
2010
2011
2012
2013
2014
2015
Gen
eral
Fun
d
Res
erve
d35
,336
$
17
,585
$
15
,088
$
13
,512
$
12
,463
$
-
$
-
$
-
$
-
$
-
$
Unr
eser
ved
486,
160
427,
506
384,
663
179,
310
222,
095
-
-
-
-
-
Non
spen
dabl
e-
-
-
-
-
18,4
56
23,8
01
33,1
13
39,2
55
35,1
34
R
estri
cted
-
-
-
-
-
73
,687
61
,049
59
,359
65
,342
62
,114
Com
mitt
ed-
-
-
-
-
270,
568
281,
751
345,
248
306,
050
315,
131
U
nass
igne
d-
-
-
-
-
(115
,965
)
(9
6,27
2)
(66,
701)
(1
35,7
89)
(205
,092
)
To
tal G
ener
al fu
nd52
1,49
6$
445,
091
$
39
9,75
1$
192,
822
$
23
4,55
8$
246,
746
$
27
0,32
9$
371,
019
$
27
4,85
8$
207,
287
$
All
Oth
er G
over
nmen
tal F
unds
R
eser
ved
1,00
4,40
7$
1,
244,
430
$
1,31
1,02
4$
94
7,71
9$
1,07
8,04
5$
-
$
-
$
-
$
-
$
-
$
Unr
eser
ved,
repo
rted
in:
Spe
cial
reve
nue
fund
s1,
038,
753
77
1,88
7
40
3,71
5
39
6,52
0
20
3,46
6
-
-
-
-
-
Cap
ital p
roje
cts
fund
s39
,365
87
,057
17
,402
73
,892
59
,944
-
-
-
-
-
Per
man
ent f
unds
21
22
22
20
20
-
-
-
-
-
Non
spen
dabl
e-
-
-
-
-
607,
134
614,
697
604,
111
599,
746
578,
695
R
estri
cted
-
-
-
-
-
41
4,04
0
27
6,66
6
32
4,47
3
59
7,38
9
54
4,99
3
Com
mitt
ed-
-
-
-
-
188,
796
212,
311
245,
888
235,
265
232,
070
U
nass
igne
d-
-
-
-
-
(191
)
-
-
-
-
To
tal a
ll ot
her g
over
nmen
tal f
unds
2,08
2,54
6$
2,
103,
396
$
1,73
2,16
3$
1,
418,
151
$
1,34
1,47
5$
1,
209,
779
$
1,10
3,67
4$
1,
174,
472
$
1,43
2,40
0$
1,
355,
758
$
Not
e: G
AS
B S
tate
men
t 54
chan
ged
the
pres
enta
tion
of fu
nd b
alan
ce c
ateg
orie
s an
d cl
assi
ficat
ions
beg
inni
ng in
fisc
al y
ear 2
011.
2006
2007
2008
2009
2010
2011
2012
2013
2014
2015
Revenues
Gam
ing
taxe
s, fe
es, l
icen
ses
1,00
3,11
1$
1,
028,
663
$
1,00
8,51
6$
88
0,57
3$
842,
359
$
84
9,73
3$
884,
331
$
89
6,68
5$
927,
824
$
90
8,49
1$
Sal
es ta
xes
1,09
9,48
3
1,
132,
418
1,08
8,02
4
95
3,11
2
870,
539
92
5,89
9
965,
060
1,
024,
624
1,08
1,73
5
1,
161,
893
Mod
ified
bus
ines
s ta
xes
255,
252
27
8,95
3
284,
600
27
7,51
6
385,
110
38
1,90
1
369,
661
38
6,61
0
384,
886
41
1,91
4
Insu
ranc
e pr
emiu
m ta
xes
238,
297
25
9,27
5
256,
693
23
8,52
4
233,
906
23
4,83
1
236,
787
24
8,51
2
263,
532
29
2,66
5
Pro
perty
and
tran
sfer
taxe
s 31
8,94
1
296,
498
28
0,89
5
278,
881
26
6,87
8
231,
758
21
5,64
9
215,
211
20
9,78
4
219,
189
M
otor
and
spe
cial
fuel
taxe
s29
7,38
3
300,
182
29
7,08
8
272,
614
26
8,55
4
267,
649
26
7,18
1
269,
232
26
9,54
3
277,
305
O
ther
taxe
s34
3,29
2
373,
436
37
2,65
2
387,
449
62
0,54
3
664,
427
65
7,13
8
685,
948
69
2,19
2
835,
552
In
terg
over
nmen
tal
1,97
2,79
9
2,
108,
916
2,05
8,07
1
2,
672,
751
3,27
3,26
6
3,
372,
565
3,33
5,55
8
3,
340,
627
3,55
2,32
7
4,
518,
221
Lice
nses
, fee
s an
d pe
rmits
422,
934
42
9,50
1
432,
729
41
9,51
4
452,
838
49
7,84
7
490,
240
48
7,12
3
508,
401
53
6,48
6
Sal
es a
nd c
harg
es fo
r ser
vice
s80
,134
97
,408
95
,407
85
,401
84
,422
81
,923
85
,211
87
,595
90
,322
10
5,24
1
Inte
rest
and
inve
stm
ent i
ncom
e15
2,80
1
239,
651
18
5,00
6
44,8
31
37,8
55
31,8
53
22,5
99
23,4
96
25,3
97
22,0
82
Set
tlem
ent i
ncom
e35
,685
37
,351
45
,976
50
,062
41
,963
39
,517
40
,291
14
7,07
1
40,1
20
39,7
88
Land
sal
es71
,231
5,
756
2,50
3
66
3
965
56
0
397
63
2
1,93
3
4,
922
Oth
er88
,006
91
,086
10
5,47
5
141,
808
11
2,72
8
143,
461
16
0,92
1
151,
708
83
,277
11
2,39
5
Tota
l rev
enue
s6,
379,
349
6,67
9,09
4
6,
513,
635
6,70
3,69
9
7,
491,
926
7,72
3,92
4
7,
731,
024
7,96
5,07
4
8,
131,
273
9,44
6,14
4

157
Expe
nditu
res
Gen
eral
gov
ernm
ent
183,
194
23
0,01
1
21
2,65
9
16
6,90
9
13
7,99
4
14
1,36
6
134,
889
143,
135
112,
757
153,
682
Hea
lth a
nd s
ocia
l ser
vice
s2,
060,
371
2,22
0,21
2
2,29
8,23
9
2,51
0,53
0
2,83
3,20
5
3,00
9,38
6
3,
096,
457
3,
264,
884
3,
593,
828
4,
862,
598
E
duca
tion
and
supp
ort s
ervi
ces
(c)
39,0
21
39,2
57
45,2
40
57,8
15
57,1
96
53,7
96
53,9
59
53,1
19
30,8
45
-
E
duca
tion
- K to
12
(c)
-
-
-
-
-
-
-
-
-
1,
891,
259
E
duca
tion
- hig
her e
duca
tion
(c)
-
-
-
-
-
-
-
-
-
61
0,54
3
La
w, j
ustic
e an
d pu
blic
saf
ety
530,
247
58
3,60
1
61
7,15
1
62
8,50
0
63
3,89
0
60
9,23
0
604,
364
595,
649
622,
066
633,
559
Reg
ulat
ion
of b
usin
ess
95,4
67
100,
119
104,
844
105,
631
107,
145
109,
928
91
,792
80
,594
29
3,43
8
25
3,13
2
Tr
ansp
orta
tion
706,
543
77
6,85
2
61
2,49
3
74
7,42
5
69
1,93
1
75
1,64
7
846,
335
578,
231
452,
821
635,
049
Rec
reat
ion
and
reso
urce
dev
elop
men
t13
4,84
1
144,
245
166,
347
135,
272
130,
800
129,
770
12
5,80
9
12
1,33
0
13
2,68
2
14
1,17
7
In
terg
over
nmen
tal (
b)2,
104,
075
2,50
2,22
2
2,63
4,97
6
2,70
6,02
5
2,70
4,69
0
2,71
6,15
7
2,
569,
693
2,
592,
985
2,
638,
028
-
Cap
ital o
utla
y11
4,22
6
71,9
99
167,
959
176,
599
59,5
20
41,1
05
34,2
22
61,3
30
29,7
41
39,5
64
Deb
t ser
vice
:
Prin
cipa
l29
6,77
1
348,
072
424,
971
183,
976
176,
982
194,
920
17
1,00
4
16
3,88
9
16
6,02
1
19
9,84
5
Inte
rest
, fis
cal c
harg
es12
0,68
3
137,
972
143,
181
145,
169
140,
495
135,
842
12
5,97
8
11
6,18
3
10
6,87
1
10
3,99
8
Deb
t iss
uanc
e co
sts
1,11
6
3,
167
2,
440
2,
080
1,
734
1,
300
1,79
5
1,90
1
2,28
2
1,94
1
A
rbitr
age
paym
ent
74
-
-
-
-
-
22
180
730
24
Tota
l exp
endi
ture
s6,
386,
629
7,15
7,72
9
7,
430,
500
7,56
5,93
1
7,
675,
582
7,89
4,44
7
7,
856,
319
7,77
3,41
0
8,
182,
110
9,52
6,37
1
E
xces
s (d
efic
ienc
y) o
f rev
enue
s o
ver (
unde
r) e
xpen
ditu
res
(7,2
80)
(478
,635
)
(9
16,8
65)
(862
,232
)
(1
83,6
56)
(170
,523
)
(1
25,2
95)
191,
664
(50,
837)
(80,
227)
Oth
er F
inan
cing
Sou
rces
(Use
s)C
apita
l lea
ses
4,14
3
8,
487
2,
926
20
18
,209
40
8
-
-
-
-
Sal
e of
gen
eral
obl
igat
ion
bond
s23
1,62
3
387,
155
448,
379
300,
384
109,
244
22,6
55
42,0
20
-
14
1,04
5
78
,335
S
ale
of g
ener
al o
blig
atio
n re
fund
ing
bond
s-
118,
346
-
-
33,7
46
117,
415
24
3,08
0
35
3,47
0
4,
125
21
3,27
0
P
rem
ium
on
gene
ral o
blig
atio
n bo
nds
9,70
3
17
,635
17
,861
18
,494
3,
928
13
,172
40
,530
52
,780
21
,012
54
,686
P
aym
ent t
o re
fund
ed b
ond
agen
t-
(122
,039
)
-
-
(3
5,67
7)
(1
28,5
29)
(279
,916
)
(4
04,1
78)
(4,4
25)
(2
61,8
93)
Sal
e of
cer
tific
ates
of p
artic
ipat
ion
-
5,
760
-
-
-
-
-
-
50
,445
-
Sal
e of
refu
ndin
g ce
rtific
ates
of p
artic
ipat
ion
-
-
-
-
7,90
0
-
-
-
35
,785
-
Pre
miu
m (d
isco
unt)
on c
ertif
icat
es o
f par
ticip
atio
n-
(78)
-
-
74
3
-
-
-
2,79
4
-
P
aym
ent t
o re
fund
ed c
ertif
icat
es o
f
parti
cipa
tion
agen
t-
-
-
-
(8
,466
)
-
-
-
(4
2,79
9)
-
Sal
e of
cap
ital a
sset
s16
6
646
11,4
89
684
92
89
103
99
335
365
Tran
sfer
s in
380,
858
58
7,13
7
76
3,98
8
47
6,14
7
35
8,11
3
22
1,16
7
156,
037
194,
136
192,
193
160,
472
Tran
sfer
s ou
t(3
49,0
50)
(579
,970
)
(7
44,3
50)
(454
,439
)
(3
39,1
16)
(195
,362
)
(1
59,0
81)
(216
,483
)
(1
87,9
07)
(309
,220
)
To
tal o
ther
fina
ncin
g so
urce
s (u
ses)
277,
443
42
3,07
9
50
0,29
3
34
1,29
0
14
8,71
6
51
,015
42
,773
(2
0,17
6)
21
2,60
3
(6
3,98
5)
Sp
ecia
l Ite
mO
ne-ti
me
tax
reba
te(2
76,7
73)
-
-
-
-
-
-
-
-
-
Net
cha
nge
in fu
nd b
alan
ces
(6,6
10)
$
(55,
556)
$
(4
16,5
72)
$
(5
20,9
42)
$
(3
4,94
0)$
(119
,508
)$
(82,
522)
$
17
1,48
8$
161,
766
$
(1
44,2
12)
$
Tota
l exp
endi
ture
s6,
386,
629
$
7,15
7,72
9 $
7,
430,
500
$
7,56
5,93
1 $
7,
675,
582
$
7,89
4,44
7 $
7,
856,
319
$
7,77
3,41
0$
8,
182,
110
$
9,52
6,37
1$
Le
ss: C
apita
lized
ass
ets
incl
uded
in th
e
func
tiona
l cat
egor
ies
387,
287
24
5,03
2
29
5,92
6
22
7,81
2
20
9,12
3
24
5,79
0
221,
991
232,
772
271,
655
252,
136
Tota
l non
capi
tal e
xpen
ditu
res
5,99
9,34
2$
6,
912,
697
$
7,13
4,57
4$
7,
338,
119
$
7,46
6,45
9$
7,
648,
657
$
7,63
4,32
8$
7,
540,
638
$
7,91
0,45
5$
9,
274,
235
$
Deb
t ser
vice
(prin
cipa
l and
inte
rest
) as
a
perc
enta
ge o
f non
capi
tal
ex
pend
iture
s (a
)6.
96%
7.03
%7.
96%
4.49
%4.
25%
4.32
%3.
89%
3.71
%3.
45%
3.28
%
(b) B
egin
ninn
g w
ith fi
scal
yea
r 201
5, in
terg
over
nmen
tal e
xpen
ditu
res
are
clas
sifie
d by
func
tiona
l exp
endi
ture
s.(c
) Beg
inni
nng
with
fisc
al y
ear 2
015,
edu
catio
nal e
xpen
ditu
res
are
repo
rted
sepa
rate
ly fo
r K to
12
and
high
er e
duca
tion.
(a) T
he p
erce
ntag
es h
ave
been
revi
sed
for f
isca
l yea
rs 2
006
thro
ugh
2010
to o
nly
incl
ude
debt
ser
vice
prin
icip
al a
nd in
tere
st in
the
calc
ulat
ion.

158
NEVADA
Tabl
e 6
- Pri
ncip
al S
ales
Tax
Pay
ers
by B
usin
ess
Type
Cur
rent
Yea
r an
d N
ine
Yea
rs A
go,
(Exp
ress
ed in
Tho
usan
ds)
Last
Ten
Fis
cal Y
ears
, (E
xpre
ssed
in T
hous
ands
)
Tab
le 5
- Ta
xabl
e S
ales
by
Cou
nty 20
0620
0720
0820
0920
1020
1120
1220
1320
1420
15Ta
xabl
e Sa
les
by C
ount
y:
Car
son
City
$1,0
21,2
1099
1,89
3$
919,
266
$
76
1,37
9$
678,
626
$
73
5,16
1$
756,
079
$
779,
297
$
804,
368
$
892,
530
$
C
hurc
hill
331,
338
306,
426
29
4,41
1
321,
713
25
1,25
7
249,
112
32
0,18
8
387,
570
25
2,67
5
283,
497
C
lark
35,6
04,3
92
36
,262
,388
35
,930
,374
31
,378
,242
27
,969
,288
29
,046
,720
31,0
80,8
81
32,5
66,6
65
35,0
40,8
92
37,4
97,0
74
Dou
glas
815,
590
765,
218
69
1,60
9
584,
679
53
7,18
7
532,
984
55
7,66
0
592,
823
59
9,62
3
653,
187
E
lko
1,02
9,76
3
1,
193,
449
1,14
8,37
9
1,
101,
164
1,09
3,15
8
1,
477,
347
1,54
5,69
1
1,
595,
351
1,42
6,13
3
1,
437,
625
Esm
eral
da8,
598
16
,523
12
,645
9,
226
6,55
1
11
,832
20,3
99
19
,806
16,8
26
18
,193
Eur
eka
315,
450
501,
077
32
8,50
5
285,
942
26
6,35
6
304,
276
36
7,34
0
370,
492
31
5,75
6
260,
130
H
umbo
ldt
483,
366
474,
811
50
8,71
3
498,
791
53
3,66
7
748,
153
74
0,65
6
921,
112
78
0,77
4
577,
537
La
nder
170,
539
280,
378
22
8,21
3
264,
109
22
0,34
8
249,
321
44
3,45
8
440,
677
30
2,69
1
308,
198
Li
ncol
n31
,529
15,3
98
26,9
67
25,2
57
25,8
71
33,1
16
50
,417
30,0
55
29
,501
28,9
55
Ly
on44
1,89
6
37
5,52
3
385,
591
34
0,28
4
290,
241
30
0,84
3
346,
511
30
5,52
5
356,
890
39
6,52
5
Min
eral
33,4
45
35
,679
38
,843
37
,247
36
,280
42
,181
57,6
96
66
,463
62,6
61
74
,178
Nye
522,
296
540,
377
47
3,29
1
427,
505
39
7,57
0
466,
836
49
8,13
0
832,
077
62
4,76
1
497,
920
P
ersh
ing
62,9
92
68
,332
67
,279
62
,892
65
,681
78
,096
106,
443
96
,442
94,6
33
82
,473
Sto
rey
109,
411
204,
717
12
1,24
4
59,5
78
48,2
99
61,8
63
70
,859
77,7
29
10
8,43
4
246,
041
W
asho
e7,
245,
525
7,20
2,64
1
6,
823,
701
5,70
7,79
1
5,
176,
982
5,28
2,93
5
5,
522,
605
5,82
4,72
6
6,
370,
685
6,81
7,58
9
W
hite
Pin
e17
5,14
7
19
2,87
7
197,
818
22
0,81
5
174,
705
31
4,23
5
469,
737
29
6,59
8
253,
042
27
5,88
4
Tota
l48
,402
,487
$
49,4
27,7
07$
48
,196
,849
$
42,0
86,6
14$
37
,772
,067
$
39,9
35,0
11$
42
,954
,750
$
45,2
03,4
08$
47
,440
,345
$
50,3
47,5
36$
The
Sta
te re
ceiv
es a
por
tion
of s
ales
taxe
s at
a ra
te o
f 2%
on
taxa
ble
sale
s.So
urce
: D
epar
tmen
t of T
axat
ion
Taxa
ble
Perc
enta
ge o
f Ta
xTa
xabl
e Pe
rcen
tage
of
Tax
Sale
sTo
tal T
axab
le S
ales
Liab
ility
Sale
sTo
tal T
axab
le S
ales
Liab
ility
Bus
ines
s Ty
pe:
Food
ser
vice
s an
d dr
inki
ng p
lace
s8,
547,
579
$
17
.6%
170,
952
$
11,1
26,1
23$
22
.1%
222,
523
$
Mot
or v
ehic
le a
nd p
arts
dea
lers
6,63
7,76
0
13.7
%13
2,75
5
5,85
9,34
7
11
.6%
117,
187
G
ener
al m
erch
andi
se s
tore
s4,
091,
513
8.
4%81
,830
4,47
1,39
9
8.
9%89
,428
Clo
thin
g an
d cl
othi
ng a
cces
sorie
s st
ores
2,29
5,11
4
4.7%
45,9
02
4,
028,
614
8.0%
80,5
72
M
erch
ant w
hole
sale
rs, d
urab
le g
oods
3,47
6,21
1
7.2%
69,5
24
3,
350,
522
6.7%
67,0
10
B
uild
ing
mat
eria
l, ga
rden
equ
ipm
ent,
supp
lies
3,47
2,45
4
7.1%
69,4
49
2,
026,
768
4.0%
40,5
35
Fo
od a
nd b
ever
age
stor
es1,
607,
134
3.
3%32
,143
1,69
4,62
1
3.
4%33
,893
Ren
tal a
nd le
asin
g se
rvic
es-
--
1,63
1,10
8
3.
2%32
,622
Ele
ctro
nics
and
app
lianc
e st
ores
-
-
-
1,
556,
844
3.1%
31,1
37
M
isce
llane
ous
reta
il4,
842,
993
10
.0%
96,8
60
1,
035,
644
2.1%
20,7
13
Fu
rnitu
re a
nd h
ome
furn
ishi
ngs
stor
es2,
639,
849
5.
4%52
,797
-
--
Adm
inis
trativ
e an
d su
ppor
t ser
vice
s1,
439,
884
3.
0%28
,798
-
--
Tota
l39
,050
,491
$
80
.4%
781,
010
$
36,7
80,9
90$
73.1
%73
5,62
0$
Sour
ce:
Dep
artm
ent o
f Tax
atio
nN
ote:
Due
to c
onfid
entia
lity
issu
es, t
he n
ames
of t
he te
n la
rges
t rev
enue
pay
ers
are
not a
vaila
ble.
Th
e ca
tego
ries
pres
ente
d ar
e in
tend
ed to
pro
vide
alte
rnat
ive
info
rmat
ion
rega
rdin
g th
e so
urce
of t
he S
tate
's re
venu
e.
2006
48,5
81,0
96
2015
50,3
47,5
36
Fisc
al Y
ear 2
006
Fisc
al Y
ear 2
015
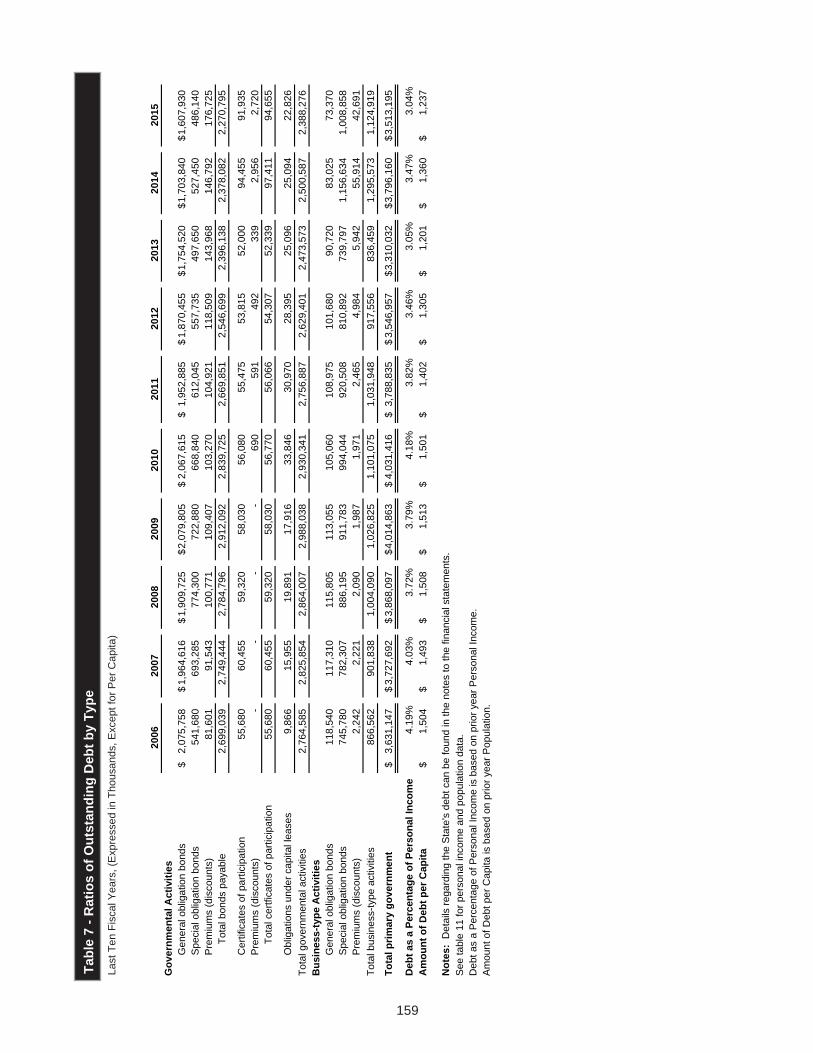
159
Last
Ten
Fis
cal Y
ears
, (E
xpre
ssed
in T
hous
ands
, Exc
ept f
or P
er C
apita
)
Tabl
e 7
- Rat
ios
of O
utst
andi
ng D
ebt b
y Ty
pe
2006
2007
2008
2009
2010
2011
2012
2013
2014
2015
Gov
ernm
enta
l Act
iviti
es
G
ener
al o
blig
atio
n bo
nds
2,07
5,75
8$
1,
964,
616
$ 1,
909,
725
$ 2,
079,
805
$ 2,
067,
615
$ 1,
952,
885
$
1,87
0,45
5$
1,75
4,52
0$
1,70
3,84
0$
1,60
7,93
0$
Spe
cial
obl
igat
ion
bond
s54
1,68
069
3,28
577
4,30
072
2,88
066
8,84
061
2,04
555
7,73
549
7,65
052
7,45
048
6,14
0P
rem
ium
s (d
isco
unts
)81
,601
91,5
4310
0,77
110
9,40
710
3,27
010
4,92
111
8,50
914
3,96
814
6,79
217
6,72
5
Tot
al b
onds
pay
able
2,69
9,03
92,
749,
444
2,78
4,79
62,
912,
092
2,83
9,72
52,
669,
851
2,54
6,69
92,
396,
138
2,37
8,08
22,
270,
795
Cer
tific
ates
of p
artic
ipat
ion
55,6
8060
,455
59,3
2058
,030
56,0
8055
,475
53,8
1552
,000
94,4
5591
,935
Pre
miu
ms
(dis
coun
ts)
--
--
690
591
492
339
2,95
62,
720
T
otal
cer
tfica
tes
of p
artic
ipat
ion
55,6
8060
,455
59,3
2058
,030
56,7
7056
,066
54,3
0752
,339
97,4
1194
,655
Obl
igat
ions
und
er c
apita
l lea
ses
9,86
615
,955
19,8
9117
,916
33,8
4630
,970
28,3
9525
,096
25,0
9422
,826
Tota
l gov
ernm
enta
l act
iviti
es2,
764,
585
2,82
5,85
42,
864,
007
2,98
8,03
82,
930,
341
2,75
6,88
72,
629,
401
2,47
3,57
32,
500,
587
2,38
8,27
6B
usin
ess-
type
Act
iviti
esG
ener
al o
blig
atio
n bo
nds
118,
540
117,
310
115,
805
113,
055
105,
060
108,
975
101,
680
90,7
2083
,025
73,3
70S
peci
al o
blig
atio
n bo
nds
745,
780
782,
307
886,
195
911,
783
994,
044
920,
508
810,
892
739,
797
1,15
6,63
41,
008,
858
Pre
miu
ms
(dis
coun
ts)
2,24
22,
221
2,09
01,
987
1,97
12,
465
4,98
45,
942
55,9
1442
,691
Tota
l bus
ines
s-ty
pe a
ctiv
ities
866,
562
901,
838
1,00
4,09
01,
026,
825
1,10
1,07
51,
031,
948
917,
556
836,
459
1,29
5,57
31,
124,
919
Tota
l prim
ary
gove
rnm
ent
3,63
1,14
7$
3,
727,
692
$ 3,
868,
097
$ 4,
014,
863
$ 4,
031,
416
$ 3,
788,
835
$
3,54
6,95
7$
3,31
0,03
2$
3,79
6,16
0$
3,51
3,19
5$
Deb
t as
a Pe
rcen
tage
of P
erso
nal I
ncom
e4.
19%
4.03
%3.
72%
3.79
%4.
18%
3.82
%3.
46%
3.05
%3.
47%
3.04
%A
mou
nt o
f Deb
t per
Cap
ita1,
504
$
1,49
3$
1,
508
$
1,51
3$
1,
501
$
1,40
2$
1,
305
$
1,20
1$
1,
360
$
1,23
7$
Not
es:
Det
ails
rega
rdin
g th
e S
tate
's d
ebt c
an b
e fo
und
in th
e no
tes
to th
e fin
anci
al s
tate
men
ts.
See
tabl
e 11
for p
erso
nal i
ncom
e an
d po
pula
tion
data
.D
ebt a
s a
Per
cent
age
of P
erso
nal I
ncom
e is
bas
ed o
n pr
ior y
ear P
erso
nal I
ncom
e.A
mou
nt o
f Deb
t per
Cap
ita is
bas
ed o
n pr
ior y
ear P
opul
atio
n.

160
NEVADA
Last
Ten
Fis
cal Y
ears
, (E
xpre
ssed
in T
hous
ands
, Exc
ept f
or P
er C
apita
)
Tabl
e 8
- Rat
ios
of G
ener
al B
onde
d D
ebt O
utst
andi
ng
2006
2007
2008
2009
2010
2011
2012
2013
2014
2015
Gov
ernm
enta
l act
iviti
es:
Gen
eral
obl
igat
ion
bond
s2,
075,
758
$
1,
964,
616
$
1,
909,
725
$
2,
079,
805
$
2,
067,
615
$
1,
952,
885
$
1,
870,
455
$
1,
754,
520
$
1,
703,
840
$
1,
607,
930
$
P
rem
ium
s (d
isco
unts
)42
,449
49,1
6556
,770
69,9
50
68
,356
74,5
51
86
,292
96,9
09
92
,714
129,
441
S
ubto
tal
2,11
8,20
72,
013,
781
1,96
6,49
5
2,14
9,75
5
2,13
5,97
1
2,02
7,43
6
1,95
6,74
7
1,85
1,42
9
1,79
6,55
4
1,73
7,37
1
Cer
tific
ates
of p
artic
ipat
ion
11,6
95
10
,940
10
,155
9,33
5
7,90
0
7,90
0
6,93
5
5,92
0
4,85
5
3,73
0
Pre
miu
ms
(dis
coun
ts)
--
-
-
689
591
492
394
295
197
S
ubto
tal
11,6
9510
,940
10,1
55
9,
335
8,
589
8,
491
7,
427
6,
314
5,
150
3,
927
Bus
ines
s-ty
pe a
ctiv
ities
:G
ener
al o
blig
atio
n bo
nds
118,
540
117,
310
115,
805
113,
055
105,
060
108,
975
10
1,68
0
90
,720
83,0
25
73
,370
Pre
miu
ms
(dis
coun
ts)
2,24
22,
221
2,09
0
1,98
7
1,82
2
2,33
8
4,87
0
5,85
3
5,09
1
4,20
9
S
ubto
tal
120,
782
119,
531
117,
895
115,
042
106,
882
111,
313
106,
550
96,5
7388
,116
77,5
79
Tota
l gen
eral
bon
ded
debt
2,25
0,68
4$
2,14
4,25
2$
2,09
4,54
5$
2,27
4,13
2$
2,25
1,44
2$
2,14
7,24
0$
2,07
0,72
4$
1,95
4,31
6$
1,88
9,82
0$
1,81
8,87
7$
Act
ual T
axab
le P
rope
rty
Val
ue
245,
075,
283
$ 32
7,14
0,47
3$
38
3,57
1,01
3$
410,
130,
698
$ 34
1,88
6,42
3$
264,
840,
276
$ 24
6,39
1,22
0$
234,
900,
598
$ 23
9,04
8,32
8$
260,
130,
702
$
Perc
enta
ge o
f Act
ual T
axab
le V
alue
of P
rope
rty
(b)
0.92
%0.
66%
0.55
%0.
55%
0.66
%0.
81%
0.84
%0.
83%
0.79
%0.
70%
Deb
t Per
Cap
ita (
a) (b
) 93
2$
85
9$
817
$
857
$
839
$
794
$
762
$
709
$
677
$
641
$
Not
e: D
etai
ls re
gard
ing
the
Sta
te's
out
stan
ding
deb
t can
be
foun
d in
the
note
s to
the
finan
cial
sta
tem
ents
.O
nly
the
gene
ral o
blig
atio
n ce
rtific
ates
of p
artic
ipat
ion
subj
ect t
o th
e de
bt li
mita
tion
are
incl
uded
abo
ve.
(a)
See
Tab
le 1
1 fo
r pop
ulat
ion
data
.(b
) R
evis
ed fo
r fis
cal y
ears
200
6 th
roug
h 20
14 to
exc
lude
spe
cial
obl
igat
ion
bond
s.
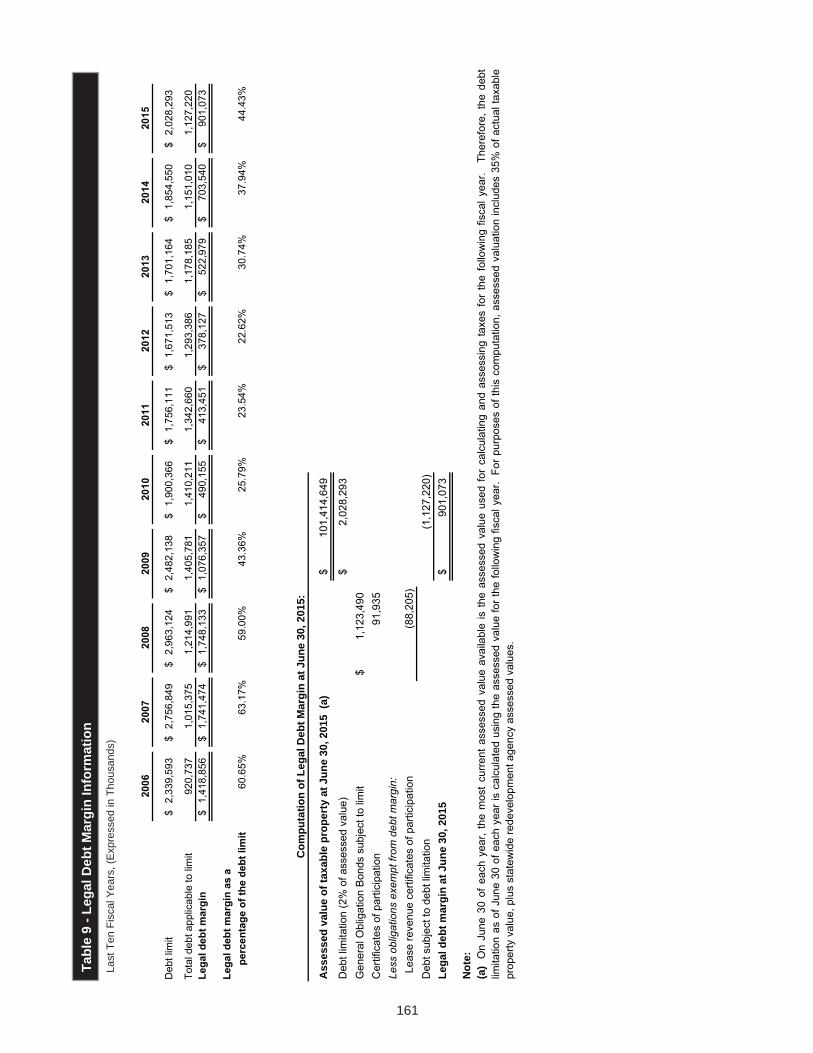
161
Last
Ten
Fis
cal Y
ears
, (E
xpre
ssed
in T
hous
ands
)
Tab
le 9
- Le
gal D
ebt M
argi
n In
form
atio
n
2006
2007
2008
2009
2010
2011
2012
2013
2014
2015
Deb
t lim
it2,
339,
593
$
2,75
6,84
9$
2,
963,
124
$
2,48
2,13
8$
1,
900,
366
$
1,75
6,11
1$
1,
671,
513
$
1,70
1,16
4$
1,
854,
550
$
2,02
8,29
3$
Tota
l deb
t app
licab
le to
lim
it92
0,73
7
1,01
5,37
5
1,
214,
991
1,40
5,78
1
1,
410,
211
1,34
2,66
0
1,
293,
386
1,17
8,18
5
1,
151,
010
1,12
7,22
0
Le
gal d
ebt m
argi
n1,
418,
856
$
1,74
1,47
4$
1,
748,
133
$
1,07
6,35
7$
49
0,15
5$
413,
451
$
37
8,12
7$
522,
979
$
70
3,54
0$
901,
073
$
Lega
l deb
t mar
gin
as a
per
cent
age
of th
e de
bt li
mit
60.6
5%63
.17%
59.0
0%43
.36%
25.7
9%23
.54%
22.6
2%30
.74%
37.9
4%44
.43%
.Ass
esse
d va
lue
of ta
xabl
e pr
oper
ty a
t Jun
e 30
, 201
5 (a
)10
1,41
4,64
9$
Deb
t lim
itatio
n (2
% o
f ass
esse
d va
lue)
2,02
8,29
3$
G
ener
al O
blig
atio
n B
onds
sub
ject
to li
mit
1,12
3,49
0$
C
ertif
icat
es o
f par
ticip
atio
n91
,935
Less
obl
igat
ions
exe
mpt
from
deb
t mar
gin:
L
ease
reve
nue
certi
ficat
es o
f par
ticip
atio
n(8
8,20
5)
D
ebt s
ubje
ct to
deb
t lim
itatio
n(1
,127
,220
)
Le
gal d
ebt m
argi
n at
Jun
e 30
, 201
590
1,07
3$
Not
e:
Com
puta
tion
of L
egal
Deb
t Mar
gin
at J
une
30, 2
015:
(a)
On
June
30of
each
year
,th
em
ost
curr
enta
sses
sed
valu
eav
aila
ble
isth
eas
sess
edva
lue
used
for
calc
ulat
ing
and
asse
ssin
gta
xes
for
the
follo
win
gfis
caly
ear.
Ther
efor
e,th
ede
btlim
itatio
nas
ofJu
ne30
ofea
chye
aris
calc
ulat
edus
ing
the
asse
ssed
valu
efo
rthe
follo
win
gfis
caly
ear.
Forp
urpo
ses
ofth
isco
mpu
tatio
n,as
sess
edva
luat
ion
incl
udes
35%
ofac
tual
taxa
ble
prop
erty
val
ue, p
lus
stat
ewid
e re
deve
lopm
ent a
genc
y as
sess
ed v
alue
s.

162
NEVADA
Last
Ten
Fis
cal Y
ears
, (E
xpre
ssed
in T
hous
ands
)
Tabl
e 10
- P
ledg
ed R
even
ue C
over
age
2006
2007
2008
2009
2010
2011
2012
2013
2014
2015
Hig
hway
Impr
ovem
ent R
even
ue B
onds
R
even
ue -
fuel
taxe
s29
4,34
8$
297,
142
$
29
3,94
1$
269,
479
$
26
5,48
7$
264,
699
$
264,
369
$
266,
564
$
266,
872
$
274,
838
$
D
ebt s
ervi
ce
Prin
cipa
l30
,710
$
41
,125
$
48
,955
$
51
,420
$
54
,040
$
56
,795
$
12
0,80
0$
19
1,33
0$
56
,220
$
41
,310
$
Inte
rest
23,7
39
30,1
06
32,7
27
37,1
57
33,8
76
31,1
36
28,4
50
25
,011
22,4
22
24
,345
To
tal
54
,449
$
71
,231
$
81
,682
$
88
,577
$
87
,916
$
87
,931
$
14
9,25
0$
21
6,34
1$
78
,642
$
65
,655
$
C
over
age
(c)
5.41
4.17
3.60
3.04
3.02
3.01
1.77
1.23
3.39
4.19
Une
mpl
oym
ent C
ompe
nsat
ion
Bon
dsR
even
ue -
spec
ial b
ond
co
ntrib
utio
ns-
$
-$
-
$
-$
-
$
-$
-
$
-$
58
,003
$
19
1,54
8$
Deb
t ser
vice
P
rinci
pal
-$
-
$
-$
-
$
-$
-
$
-$
-
$
-$
13
8,59
0$
Inte
rest
-
-
-
-
-
-
-
-
13,6
44
23
,360
To
tal
-
$
-$
-
$
-$
-
$
-$
-
$
-$
13
,644
$
16
1,95
0$
Cov
erag
e (c
)N
/AN
/AN
/AN
/AN
/AN
/AN
/AN
/A4.
251.
18
Mor
tgag
e R
even
ue B
onds
Rev
enue
(a)
435,
332
$
35
5,32
8$
12
9,28
6$
70
,051
$
42
,123
$
12
6,95
7$
10
9,19
4$
83
,366
$
10
0,72
9$
58
,737
$
E
xpen
ses
(b)
6,72
0
4,
595
4,
368
5,
277
6,
548
7,
610
15
,751
8,86
7
9,48
1
4,04
3
Net
ava
ilabl
e re
venu
es42
8,61
2$
350,
733
$
12
4,91
8$
64,7
74$
35,5
75$
119,
347
$
93,4
43$
74,4
99$
91,2
48$
54,6
94$
Deb
t ser
vice
P
rinci
pal (
d)13
6,18
6$
51,0
03$
37,8
97$
33,5
92$
67,0
79$
132,
536
$
157,
962
$
71,0
95$
151,
432
$
80,7
45$
In
tere
st38
,644
37
,002
38
,051
36
,354
33
,236
29
,111
26
,444
23,2
26
17
,882
15,1
49
Tota
l
174,
830
$
88
,005
$
75
,948
$
69
,946
$
10
0,31
5$
161,
647
$
184,
406
$
94,3
21$
169,
314
$
95,8
94$
Cov
erag
e (c
)2.
453.
991.
640.
930.
360.
740.
510.
790.
540.
57
Leas
e R
even
ue C
ertif
icat
es o
f Par
ticip
atio
nR
even
ue -
leas
e re
nt (n
et)
900
$
2,
088
$
2,86
7$
1,
614
$
2,96
1$
3,
045
$
2,
878
$
2,
972
$
4,
098
$
2,
996
$
Ass
ets
- hel
d by
the
trust
ee (e
)4,
926
4,71
2
4,94
8
4,77
9
4,83
7
4,64
3
4,70
9
4,55
8
46,9
02
12
,442
To
tal
5,82
6$
6,
800
$
7,81
5$
6,
393
$
7,79
8$
7,
688
$
7,58
7$
7,
530
$
51,0
00$
15,4
38$
Deb
t ser
vice
P
rinci
pal
-$
23
0$
350
$
47
0$
515
$
60
5$
69
5$
80
0$
1,
795
$
1,
395
$
In
tere
st2,
021
2,15
0
2,25
6
2,24
5
2,22
9
2,21
2
2,18
8
2,16
3
3,41
8
4,12
8
Tota
l
2,02
1$
2,
380
$
2,60
6$
2,
715
$
2,74
4$
2,
817
$
2,88
3$
2,
963
$
5,21
3$
5,
523
$
Cov
erag
e (c
)2.
882.
863.
002.
352.
842.
732.
632.
549.
782.
80N
otes
: D
etai
ls re
gard
ing
the
Sta
te's
out
stan
ding
deb
t can
be
foun
d in
the
note
s to
the
finan
cial
sta
tem
ents
.(a
) Con
sist
s of
inte
rest
and
inve
stm
ent i
ncom
e an
d pr
inci
pal c
olle
ctio
ns o
f the
Hou
sing
Div
isio
n E
nter
pris
e Fu
nd.
(b) C
onsi
sts
of o
pera
ting
expe
nses
, non
oper
atin
g ex
pens
es a
nd tr
ansf
ers
out l
ess
inte
rest
exp
ense
and
dep
reci
atio
n.(c
) Cov
erag
e eq
uals
net
ava
ilabl
e re
venu
es d
ivid
ed b
y to
tal d
ebt s
ervi
ce.
(d) P
rinci
pal p
aid
on m
ortg
age
reve
nue
bond
s is
upd
ated
for y
ears
201
0 an
d 20
11.
Ther
e is
no
chan
ge to
cov
erag
e ra
tio.
(e) A
sset
s - h
eld
by th
e tru
stee
are
the
com
bina
tion
of a
dditi
onal
leas
e re
nt, i
nves
tmen
t inc
ome,
and
bon
d pr
ocee
ds.

163
Last
Ten
Cal
enda
r Y
ears
Tab
le 1
1 - D
emog
raph
ic a
nd E
cono
mic
Sta
tistic
s
2005
2006
2007
2008
2009
2010
2011
2012
2013
2014
Popu
latio
n
Nev
ada
(a)
2,41
4,80
72,
495,
529
2,56
5,38
22,
653,
630
2,68
4,66
52,
703,
230
2,71
8,58
62,
755,
245
2,79
1,49
42,
839,
099
P
erce
ntag
e ch
ange
3.5%
3.3%
2.8%
3.4%
1.2%
0.7%
0.6%
1.3%
1.3%
1.7%
U
nite
d S
tate
s (a
)29
6,41
0,40
429
9,39
8,48
430
1,62
1,15
730
4,09
3,96
630
6,77
1,52
930
9,32
6,29
531
1,72
1,63
231
4,11
2,07
831
6,49
7,53
131
8,85
7,05
6
Per
cent
age
chan
ge0.
9%1.
0%0.
7%0.
8%0.
9%0.
8%0.
8%0.
8%0.
8%0.
7%
Tota
l Per
sona
l Inc
ome
N
evad
a (in
mill
ions
) (a
)86
,650
$
92,5
57$
10
3,84
7$
105,
824
$
96
,430
$
99,0
92$
10
2,61
2$
108,
657
$
10
9,49
0$
115,
672
$
Per
cent
age
chan
ge9.
9%6.
8%12
.2%
1.9%
-8.9
%2.
8%3.
6%5.
9%0.
8%5.
6%
Uni
ted
Sta
tes
(in m
illio
ns)
(a)
10,2
51,6
39$
10,8
60,9
17$
11,6
45,8
82$
12,4
51,6
60$
11,8
52,7
15$
12,4
17,6
59$
13,2
33,4
36$
13,9
04,4
85$
14,0
64,4
68$
14,6
83,1
47$
P
erce
ntag
e ch
ange
5.6%
5.9%
7.2%
6.9%
-4.8
%4.
8%6.
6%5.
1%1.
2%4.
4%
Per C
apita
Per
sona
l Inc
ome
N
evad
a (a
)35
,883
$
37,0
89$
40
,480
$
39,8
79$
35
,919
$
36,6
57$
37
,745
$
39,4
36$
39
,223
$
40,7
42$
Per
cent
age
chan
ge6.
2%3.
4%9.
1%-1
.5%
-9.9
%2.
1%3.
0%4.
5%-0
.5%
3.9%
U
nite
d S
tate
s (a
)34
,586
$
36,2
76$
38
,611
$
40,9
47$
38
,637
$
40,1
44$
42
,453
$
44,2
66$
44
,438
$
46,0
49$
Per
cent
age
chan
ge4.
6%4.
9%6.
4%6.
1%-5
.6%
3.9%
5.8%
4.3%
0.4%
3.6%
Labo
r For
ce a
nd E
mpl
oym
ent
N
evad
a La
bor F
orce
1,21
8,52
51,
295,
085
1,33
5,85
21,
373,
462
1,36
9,89
11,
350,
309
1,38
5,87
21,
378,
876
1,37
2,86
21,
393,
639
Une
mpl
oyed
49,0
0254
,217
64,3
8091
,450
161,
270
200,
772
187,
732
152,
468
135,
071
107,
856
Une
mpl
oym
ent R
ate
4.0%
4.2%
4.8%
6.7%
11.8
%14
.9%
13.5
%11
.1%
9.8%
7.7%
U
nite
d S
tate
s La
bor F
orce
149,
320,
000
151,
428,
000
153,
124,
000
154,
287,
000
154,
142,
000
153,
889,
000
153,
617,
000
154,
975,
000
155,
389,
000
155,
922,
000
Une
mpl
oyed
7,59
1,00
07,
001,
000
7,07
8,00
08,
924,
000
14,2
65,0
0014
,825
,000
13,7
47,0
0012
,506
,000
11,4
60,0
009,
617,
000
Une
mpl
oym
ent R
ate
5.1%
4.6%
4.6%
5.8%
9.3%
9.6%
8.9%
8.1%
7.4%
6.2%
Sour
ces:
U.S
. Dep
artm
ent o
f Com
mer
ce, B
urea
u of
Eco
nom
ic A
naly
sis;
Nev
ada
Dep
artm
ent o
f Em
ploy
men
t, Tr
aini
ng, a
nd R
ehab
ilita
tion
Not
e: T
otal
per
sona
l inc
ome
is c
ompo
sed
of w
ages
and
sal
arie
s, p
ropr
ieto
rs' i
ncom
e, p
erso
nal i
nter
est a
nd d
ivid
end
inco
me,
rent
al in
com
e, a
nd p
erso
nal c
urre
nt tr
ansf
er re
ceip
ts, l
ess
cont
ribut
ions
for g
over
nmen
t soc
ial i
nsur
ance
. P
er c
apita
per
sona
l inc
ome
is c
alcu
late
d by
div
idin
g to
tal p
erso
nal i
ncom
e by
pop
ulat
ion.
(a) R
evis
ed e
stim
ates
for 2
011
thro
ugh
2013

164
NEVADA
Cur
rent
Yea
r an
d N
ine
Yea
rs A
go
Tabl
e 12
- P
rinc
ipal
Em
ploy
ers
Perc
enta
ge o
f Tot
al
Perc
enta
ge o
f Tot
al
Empl
oyee
sR
ank
Stat
e Em
ploy
men
tEm
ploy
ees
Ran
kSt
ate
Empl
oym
ent
Empl
oyer
:C
lark
Cou
nty
Sch
ool D
istri
ct30
,000
- 39
,999
1 2.
87%
30,0
00 -
39,9
991
2.51
%S
tate
of N
evad
a20
,000
- 29
,999
2 2.
05%
20,0
00 -
29,9
992
1.79
%W
asho
e C
ount
y S
choo
l Dis
trict
8,00
0 - 8
,499
6 0.
68%
8,50
0 - 8
,999
3 0.
63%
Cla
rk C
ount
y9,
000
- 9,4
994
0.76
%8,
500
- 8,9
994
0.63
%W
ynn
Las
Veg
as9,
000
- 9,4
995
0.76
%8,
000
- 8,4
995
0.59
%B
ella
gio,
LLC
9,50
0 - 9
,999
3 0.
80%
8,00
0 - 8
,499
6 0.
59%
MG
M G
rand
Hot
el/C
asin
o8,
000
- 8,4
997
0.68
%8,
000
- 8,4
997
0.59
%A
ria R
esor
t & C
asin
o, L
LC-
--
7,50
0 - 7
,999
8 0.
56%
Man
dala
y B
ay R
esor
t & C
asin
o8,
000
- 8,4
998
0.68
%7,
000
- 7,4
999
0.52
%C
aesa
r's P
alac
e4,
500
- 4,9
9910
0.
39%
6,00
0 - 6
,499
10
0.45
%M
irage
Cas
ino-
Hot
el5,
500
- 5,9
999
0.47
%-
-To
tal
111,
500
- 135
,490
10.1
4%11
1,50
0 - 1
35,4
908.
86%
Sour
ces:
Nev
ada
Dep
artm
ent o
f Em
ploy
men
t, Tr
aini
ng, a
nd R
ehab
ilita
tion
and
Nev
ada
Dep
artm
ent o
f Adm
inis
tratio
n
Not
e: P
erce
ntag
e of
tota
l sta
te e
mpl
oym
ent i
s ba
sed
on th
e m
idpo
ints
in th
e ra
nges
giv
en.
Cal
enda
r Yea
r 200
5C
alen
dar Y
ear 2
014
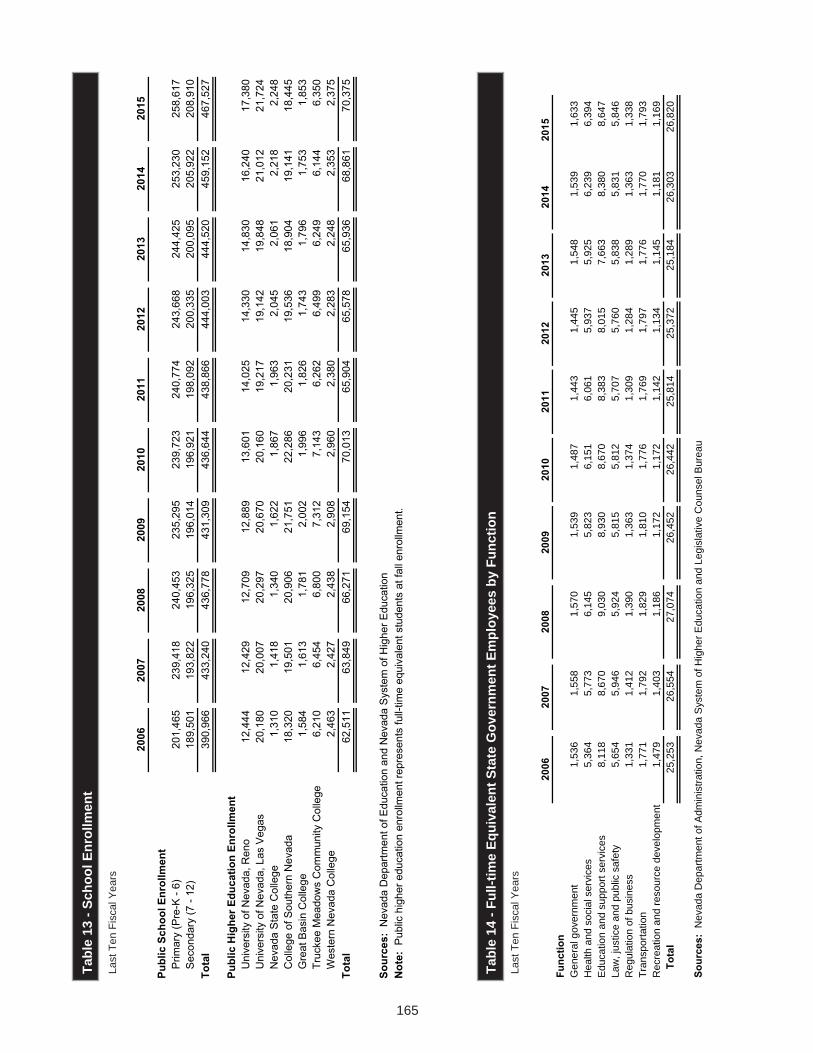
165
Last
Ten
Fis
cal Y
ears
Tab
le 1
3 - S
choo
l Enr
ollm
ent
Tabl
e 14
- Fu
ll-tim
e E
quiv
alen
t Sta
te G
over
nmen
t Em
ploy
ees
by F
unct
ion
Last
Ten
Fis
cal Y
ears
2006
2007
2008
2009
2010
2011
2012
2013
2014
2015
Func
tion
Gen
eral
gov
ernm
ent
1,53
61,
558
1,57
01,
539
1,48
71,
443
1,44
51,
548
1,53
91,
633
Hea
lth a
nd s
ocia
l ser
vice
s5,
364
5,77
36,
145
5,82
36,
151
6,06
15,
937
5,92
56,
239
6,39
4E
duca
tion
and
supp
ort s
ervi
ces
8,11
88,
670
9,03
08,
930
8,67
08,
383
8,01
57,
663
8,38
08,
647
Law
, jus
tice
and
publ
ic s
afet
y5,
654
5,94
65,
924
5,81
55,
812
5,70
75,
760
5,83
85,
831
5,84
6R
egul
atio
n of
bus
ines
s1,
331
1,41
21,
390
1,36
31,
374
1,30
91,
284
1,28
91,
363
1,33
8Tr
ansp
orta
tion
1,77
11,
792
1,82
91,
810
1,77
61,
769
1,79
71,
776
1,77
01,
793
Rec
reat
ion
and
reso
urce
dev
elop
men
t1,
479
1,40
31,
186
1,17
21,
172
1,14
21,
134
1,14
51,
181
1,16
9
Tota
l25
,253
26,5
5427
,074
26,4
5226
,442
25,8
1425
,372
25,1
8426
,303
26,8
20
Sour
ces:
Nev
ada
Dep
artm
ent o
f Adm
inis
tratio
n, N
evad
a S
yste
m o
f Hig
her E
duca
tion
and
Legi
slat
ive
Cou
nsel
Bur
eau
2006
2007
2008
2009
2010
2011
2012
2013
2014
2015
Publ
ic S
choo
l Enr
ollm
ent
Prim
ary
(Pre
-K -
6)20
1,46
523
9,41
824
0,45
323
5,29
523
9,72
324
0,77
424
3,66
824
4,42
525
3,23
025
8,61
7S
econ
dary
(7 -
12)
189,
501
193,
822
196,
325
196,
014
196,
921
198,
092
200,
335
200,
095
205,
922
208,
910
Tota
l39
0,96
643
3,24
043
6,77
843
1,30
943
6,64
443
8,86
644
4,00
344
4,52
045
9,15
246
7,52
7
Publ
ic H
ighe
r Edu
catio
n En
rollm
ent
12,4
4412
,429
12,7
0912
,889
13,6
0114
,025
14,3
3014
,830
16,2
4017
,380
20,1
8020
,007
20,2
9720
,670
20,1
6019
,217
19,1
4219
,848
21,0
1221
,724
Nev
ada
Sta
te C
olle
ge
1,31
01,
418
1,34
01,
622
1,86
71,
963
2,04
52,
061
2,21
82,
248
Col
lege
of S
outh
ern
Nev
ada
18,3
2019
,501
20,9
0621
,751
22,2
8620
,231
19,5
3618
,904
19,1
4118
,445
Gre
at B
asin
Col
lege
1,58
41,
613
1,78
12,
002
1,99
61,
826
1,74
31,
796
1,75
31,
853
Truc
kee
Mea
dow
s C
omm
unity
Col
lege
6,21
06,
454
6,80
07,
312
7,14
36,
262
6,49
96,
249
6,14
46,
350
Wes
tern
Nev
ada
Col
lege
2,46
32,
427
2,43
82,
908
2,96
02,
380
2,28
32,
248
2,35
32,
375
Tota
l62
,511
63,8
4966
,271
69,1
5470
,013
65,9
0465
,578
65,9
3668
,861
70,3
75
Sour
ces:
Nev
ada
Dep
artm
ent o
f Edu
catio
n an
d N
evad
a S
yste
m o
f Hig
her E
duca
tion
Not
e: P
ublic
hig
her e
duca
tion
enro
llmen
t rep
rese
nts
full-
time
equi
vale
nt s
tude
nts
at fa
ll en
rollm
ent.
Uni
vers
ity o
f Nev
ada,
Ren
oU
nive
rsity
of N
evad
a, L
as V
egas
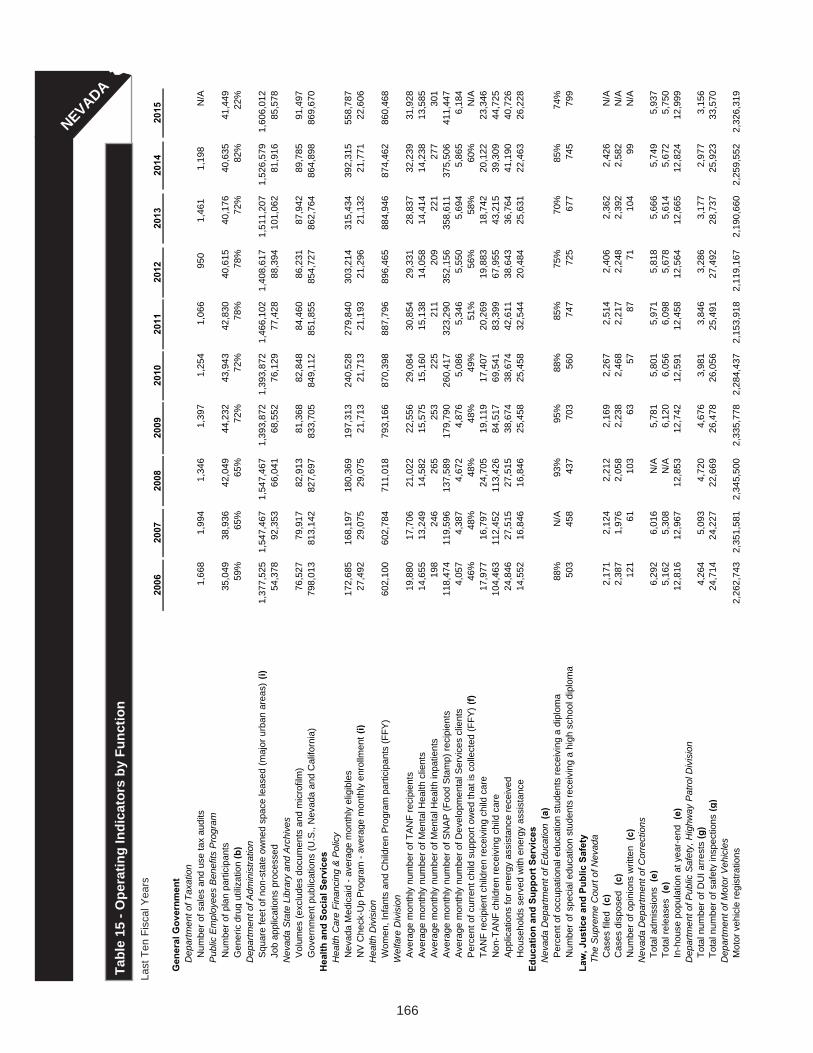
166
NEVADA
Last
Ten
Fis
cal Y
ears
Tabl
e 15
- O
pera
ting
Indi
cato
rs b
y Fu
nctio
n
2006
2007
2008
2009
2010
2011
2012
2013
2014
2015
Gen
eral
Gov
ernm
ent
Dep
artm
ent o
f Tax
atio
nN
umbe
r of s
ales
and
use
tax
audi
ts1,
668
1,99
41,
346
1,39
71,
254
1,06
695
0
1,
461
1,
198
N/A
Pub
lic E
mpl
oyee
s B
enef
its P
rogr
am
Num
ber o
f pla
n pa
rtici
pant
s35
,049
38,9
3642
,049
44,2
3243
,943
42,8
3040
,615
40,1
7640
,635
41,4
49G
ener
ic d
rug
utili
zatio
n (b
)59
%65
%65
%72
%72
%78
%78
%72
%82
%22
%D
epar
tmen
t of A
dmin
istra
tion
Squ
are
feet
of n
on-s
tate
ow
ned
spac
e le
ased
(maj
or u
rban
are
as)
(i)1,
377,
525
1,54
7,46
71,
547,
467
1,39
3,87
21,
393,
872
1,46
6,10
21,
408,
617
1,51
1,20
71,
526,
579
1,60
6,01
2Jo
b ap
plic
atio
ns p
roce
ssed
54,3
7892
,353
66,0
4168
,552
76,1
2977
,428
88,3
9410
1,06
281
,916
85,5
78N
evad
a S
tate
Lib
rary
and
Arc
hive
sV
olum
es (e
xclu
des
docu
men
ts a
nd m
icro
film
)76
,527
79,9
1782
,913
81,3
6882
,848
84,4
6086
,231
87,9
4289
,785
91,4
97G
over
nmen
t pub
licat
ions
(U.S
., N
evad
a an
d C
alifo
rnia
)79
8,01
381
3,14
282
7,69
783
3,70
584
9,11
285
1,85
585
4,72
786
2,76
486
4,89
886
9,67
0H
ealth
and
Soc
ial S
ervi
ces
Hea
lth C
are
Fina
ncin
g &
Pol
icy
Nev
ada
Med
icai
d - a
vera
ge m
onth
ly e
ligib
les
172,
685
168,
197
180,
369
197,
313
240,
528
279,
840
303,
214
315,
434
392,
315
558,
787
NV
Che
ck-U
p P
rogr
am -
aver
age
mon
thly
enr
ollm
ent (
i)27
,492
29,0
7529
,075
21,7
1321
,713
21,1
9321
,296
21,1
3221
,771
22,6
06H
ealth
Div
isio
nW
omen
, Inf
ants
and
Chi
ldre
n P
rogr
am p
artic
ipan
ts (F
FY)
602,
100
602,
784
711,
018
793,
166
870,
398
887,
796
896,
465
884,
946
874,
462
860,
468
Wel
fare
Div
isio
nA
vera
ge m
onth
ly n
umbe
r of T
AN
F re
cipi
ents
19,8
8017
,706
21,0
2222
,556
29,0
8430
,854
29,3
3128
,837
32,2
3931
,928
Ave
rage
mon
thly
num
ber o
f Men
tal H
ealth
clie
nts
14,6
5513
,249
14,5
8215
,575
15,1
6015
,138
14,0
5814
,414
14,2
3813
,585
Ave
rage
mon
thly
num
ber o
f Men
tal H
ealth
inpa
tient
s19
824
626
525
322
521
120
922
127
730
1A
vera
ge m
onth
ly n
umbe
r of S
NA
P (F
ood
Sta
mp)
reci
pien
ts11
8,47
411
9,59
613
7,58
917
9,79
026
0,41
732
3,29
035
2,15
635
8,61
137
5,50
641
1,44
7A
vera
ge m
onth
ly n
umbe
r of D
evel
opm
enta
l Ser
vice
s cl
ient
s4,
057
4,38
74,
672
4,87
65,
086
5,34
65,
550
5,69
45,
865
6,18
4P
erce
nt o
f cur
rent
chi
ld s
uppo
rt ow
ed th
at is
col
lect
ed (F
FY) (
f) 46
%48
%48
%48
%49
%51
%56
%58
%60
%N
/ATA
NF
reci
pien
t chi
ldre
n re
ceiv
ing
child
car
e17
,977
16,7
9724
,705
19,1
1917
,407
20,2
6919
,883
18,7
4220
,122
23,3
46N
on-T
AN
F ch
ildre
n re
ceiv
ing
child
car
e10
4,46
311
2,45
211
3,42
684
,517
69,5
4183
,399
67,9
5543
,215
39,3
0944
,725
App
licat
ions
for e
nerg
y as
sist
ance
rece
ived
24,8
4627
,515
27,5
1538
,674
38,6
7442
,611
38,6
4336
,764
41,1
9040
,726
Hou
seho
lds
serv
ed w
ith e
nerg
y as
sist
ance
14
,552
16,8
4616
,846
25,4
5825
,458
32,5
4420
,484
25,6
3122
,463
26,2
28Ed
ucat
ion
and
Supp
ort S
ervi
ces
Nev
ada
Dep
artm
ent o
f Edu
catio
n (a
)P
erce
nt o
f occ
upat
iona
l edu
catio
n st
uden
ts re
ceiv
ing
a di
plom
a88
%N
/A93
%95
%88
%85
%75
%70
%85
%74
%N
umbe
r of s
peci
al e
duca
tion
stud
ents
rece
ivin
g a
high
sch
ool d
iplo
ma
503
458
437
703
560
747
725
677
745
799
Law
, Jus
tice
and
Publ
ic S
afet
yTh
e S
upre
me
Cou
rt of
Nev
ada
Cas
es fi
led
(c)
2,17
12,
124
2,21
22,
169
2,26
72,
514
2,40
62,
362
2,42
6N
/AC
ases
dis
pose
d (c
)2,
387
1,97
62,
058
2,23
82,
468
2,21
72,
248
2,39
22,
582
N/A
Num
ber o
f opi
nion
s w
ritte
n (c
)12
161
103
6357
8771
104
99N
/AN
evad
a D
epar
tmen
t of C
orre
ctio
ns
Tota
l adm
issi
ons
(e)
6,29
26,
016
N/A
5,78
15,
801
5,97
15,
818
5,66
65,
749
5,93
7To
tal r
elea
ses
(e)
5,16
25,
308
N/A
6,12
06,
056
6,09
85,
678
5,61
45,
672
5,75
0In
-hou
se p
opul
atio
n at
yea
r-en
d (e
)12
,816
12,9
6712
,853
12,7
4212
,591
12,4
5812
,564
12,6
6512
,824
12,9
99D
epar
tmen
t of P
ublic
Saf
ety,
Hig
hway
Pat
rol D
ivis
ion
Tota
l num
ber o
f DU
I arr
ests
(g)
4,26
45,
093
4,72
04,
676
3,98
13,
846
3,28
63,
177
2,97
73,
156
Tota
l num
ber o
f saf
ety
insp
ectio
ns (g
)24
,714
24,2
2722
,669
26,4
7826
,056
25,4
9127
,492
28,7
3725
,923
33,5
70D
epar
tmen
t of M
otor
Veh
icle
s M
otor
veh
icle
regi
stra
tions
2,26
2,74
32,
351,
581
2,34
5,50
02,
335,
778
2,28
4,43
72,
153,
918
2,11
9,16
72,
190,
660
2,25
9,55
22,
326,
319

167
Reg
ulat
ion
of B
usin
ess
Nev
ada
Dep
artm
ent o
f Agr
icul
ture
Num
ber o
f mea
ls s
erve
d in
the
Chi
ldre
n &
Adu
lt Fo
od C
are
Pro
gram
(i)
4,25
6,70
13,
093,
889
3,09
3,88
94,
330,
289
4,33
0,28
94,
063,
461
4,59
2,26
64,
724,
529
4,80
0,38
64,
527,
435
Per
cent
of K
-12
stud
ents
par
ticip
atin
g in
the
Nat
'l S
choo
l Lun
ch P
rogr
am (b
) (j)
41%
43%
43%
42%
42%
47%
52%
54%
54%
54%
Nev
ada
Gam
ing
Com
mis
sion
Lice
nses
issu
ed &
act
ive
at fi
scal
yea
r-en
d2,
924
2,96
12,
933
2,88
22,
827
2,87
52,
859
2,93
32,
981
2,96
1Li
cens
ed d
evic
es a
t fis
cal y
ear-
end:
G
ames
6,23
26,
133
6,13
56,
019
5,98
55,
948
5,88
75,
676
5,73
15,
818
Ta
bles
1,09
81,
102
1,00
11,
063
1,13
21,
070
1,01
690
284
887
1
Slo
ts20
7,56
920
2,36
219
8,08
019
4,18
019
0,13
519
0,21
718
4,15
017
9,77
617
6,07
317
4,54
8D
epar
tmen
t of B
usin
ess
and
Indu
stry
U
nits
of a
fford
able
hou
sin g
pro
duce
d (b
) (i)
236
403
403
792
792
773
592
727
1,11
784
8Ta
xica
b A
utho
rity
notic
es o
f vio
latio
n is
sued
3,
290
3,12
94,
066
4,29
23,
474
3,45
33,
128
4,41
93,
306
3,67
2Ta
xica
b A
utho
rity
vehi
cle
insp
ectio
ns m
ade
6,62
76,
486
7,02
57,
507
7,47
17,
165
7,69
36,
849
7,37
49,
210
Num
ber o
f wor
ksite
saf
ety
& h
ealth
insp
ectio
ns2,
594
2,39
92,
566
2,83
52,
040
1,22
31,
322
1,27
21,
659
1,13
1N
umbe
r of b
oile
r and
ele
vato
r ins
pect
ions
20,6
0618
,323
19,2
3321
,200
16,3
8219
,701
14,8
9014
,564
13,0
6112
,306
Insu
ranc
e lic
ense
and
rene
wal
app
licat
ions
pro
cess
ed (
b) (i
)41
,646
44,7
6544
,765
39,0
6539
,065
42,5
0642
,748
41,3
8266
,763
51,0
06Tr
ansp
orta
tion
Nev
ada
Dep
artm
ent o
f Tra
nspo
rtatio
n M
iles
of h
i ghw
ays
- ru
ral
(e)
4,74
14,
757
4,73
64,
802
4,78
24,
782
4,75
04,
726
4,72
64,
735
Mile
s of
hi g
hway
s -
urba
n (e
)65
866
566
261
861
861
863
365
466
766
2R
ecre
atio
n an
d R
esou
rce
Dev
elop
men
tC
omm
issi
on o
n To
uris
m
Inqu
iries
from
adv
ertis
ing
cam
paig
n (d
)16
2,59
230
1,22
341
7,26
936
3,67
719
6,05
819
9,47
122
2,19
716
2,11
731
,998
23,5
42To
uris
m w
eb s
ite v
isito
rs (
d)1,
405,
972
1,95
1,19
33,
459,
745
1,68
5,23
72,
056,
349
2,42
4,56
72,
422,
893
1,24
9,03
01,
226,
380
708,
795
Com
mis
sion
on
Eco
nom
ic D
evel
opm
ent
Num
ber o
f pro
ject
s re
ques
ting
Com
mun
ity D
evel
opm
ent B
lock
Gra
nts
5742
3721
4628
4235
4036
Num
ber o
f pro
ject
s fu
nded
2727
2620
3824
3127
2420
Dep
artm
ent o
f Con
serv
atio
n an
d N
atur
al R
esou
rces
P
erce
nt o
f hum
an c
ause
d w
ildla
nd fi
res
in N
DF'
s ju
risdi
ctio
n in
vest
igat
ed
97%
100%
100%
100%
100%
100%
100%
100%
100%
100%
Num
ber o
f Sta
te P
ark
user
s (h
)3,
215,
606
3,34
3,05
33,
004,
037
3,15
0,69
33,
008,
942
3,03
0,36
43,
093,
257
3,04
6,04
92,
999,
315
3,02
8,85
9
N/A
= n
ot a
vaila
ble
Not
es:
(j) D
ata
from
Exe
cutiv
e B
udge
t prio
r to
2012
(e) D
ata
prio
r to
2009
was
bas
ed o
n ca
lend
ar y
ear.
(f) R
evis
ed fi
gure
s fo
r 200
7, 2
008,
201
0, 2
011
(g) R
evis
ed fi
gure
s fo
r 201
1, 2
012
(h) 2
006
thro
ugh
2011
dat
a ba
sed
on c
alen
dar y
ear.
201
2 th
roug
h 20
15 d
ata
is fi
scal
yea
r.(i)
Dat
a fro
m E
xecu
tive
Bud
get p
rior t
o 20
11
Sour
ces:
Nev
ada
Dep
artm
ents
of T
axat
ion,
Adm
inis
tratio
n, H
ealth
and
Hum
an S
ervi
ces,
Edu
catio
n, A
gric
ultu
re, C
orre
ctio
ns, M
otor
Veh
icle
s, P
ublic
Saf
ety,
Tra
nspo
rtatio
n, B
usin
ess
and
Indu
stry
, Con
serv
atio
n an
d N
atur
al R
esou
rces
; Sup
rem
e C
ourt
of N
evad
a; N
evad
a G
amin
g C
omm
issi
on a
nd C
ontro
l Boa
rd; P
ublic
Em
ploy
ees
Ben
efit
Pro
gram
; Sta
te o
f Nev
ada
Exe
cutiv
e B
udge
ts.
(a) S
ee ta
ble
13 fo
r pub
lic s
choo
l enr
ollm
ent.
(b) T
he E
xecu
tive
Bud
get i
s pr
epar
ed b
ienn
ially
, and
act
ual f
igur
es a
re o
nly
avai
labl
e fo
r the
bas
e ye
ar (e
ven
num
bere
d ye
ars)
. B
ase
year
figu
res
have
bee
n us
ed fo
r odd
num
bere
d ye
ars
in th
is ta
ble.
(c) D
ata
base
d on
cal
enda
r yea
r.(d
) Rev
ised
figu
res
prov
ided
by
Com
mis
sion
on
Tour
ism
for 2
006
and
2009
.

168
NEVADA
Last
Ten
Fis
cal Y
ears
Tabl
e 16
- C
apita
l Ass
et S
tatis
tics
by F
unct
ion
2006
2007
2008
2009
2010
2011
2012
2013
2014
2015
Gen
eral
Gov
ernm
ent
Sta
te o
wne
d of
fice
spac
e (s
quar
e fe
et)
214,
747
215,
867
201,
688
201,
688
202,
229
214,
611
219,
927
215,
416
213,
896
213,
896
Veh
icle
s (m
otor
poo
l)82
479
084
985
182
879
877
577
786
590
9H
ealth
and
Soc
ial S
ervi
ces
Sta
te o
wne
d of
fice
spac
e (s
quar
e fe
et)
122,
415
52,6
2633
,093
33,3
4470
,939
70,7
7064
,506
68,6
4868
,648
68,6
48M
enta
l hea
lth c
ente
rs5
55
55
55
55
5V
eter
ans'
hom
e1
11
11
11
11
1Y
outh
cor
rect
iona
l cen
ters
33
33
22
22
33
Veh
icle
s24
124
022
523
221
919
318
316
715
514
7Ed
ucat
ion
and
Supp
ort S
ervi
ces
Sta
te o
wne
d of
fice
spac
e (s
quar
e fe
et)
28,2
0028
,200
28,2
0027
,949
28,0
3128
,200
28,2
0028
,200
28,2
0028
,200
Num
ber o
f Sta
te m
useu
ms
77
77
77
77
77
Sta
te li
brar
y1
11
11
11
11
1La
w, J
ustic
e an
d Pu
blic
Saf
ety
Sta
te o
wne
d of
fice
spac
e (s
quar
e fe
et)
550,
648
540,
125
596,
564
596,
564
646,
446
646,
223
645,
775
645,
322
645,
322
645,
322
Sup
rem
e C
ourt
build
ing
11
11
11
11
11
Dep
artm
ent o
f Cor
rect
ions
faci
litie
s21
2119
2020
2019
1919
19V
ehic
les
1,09
11,
067
1,17
21,
217
1,19
91,
161
1,19
11,
118
1,12
81,
088
Reg
ulat
ion
of B
usin
ess
Sta
te o
wne
d of
fice
spac
e (s
quar
e fe
et)
107,
547
107,
547
107,
547
107,
547
106,
027
102,
038
102,
478
102,
245
103,
765
103,
765
Veh
icle
s27
928
529
229
332
326
325
324
225
924
9Tr
ansp
orta
tion
Sta
te o
wne
d of
fice
spac
e (s
quar
e fe
et)
184,
988
251,
658
251,
658
251,
658
258,
056
280,
728
273,
327
308,
532
308,
532
337,
094
ND
OT
lane
mile
s13
,087
13,1
3113
,137
13,0
5513
,055
13,0
5513
,368
13,6
1313
,622
13,6
28N
DO
T br
idge
s1,
025
1,04
51,
092
1,09
21,
092
1,10
91,
116
1,10
11,
154
1,16
4N
DO
T ve
hicl
es87
286
490
182
662
553
862
863
363
163
9N
DO
T he
avy
equi
pmen
t1,
875
1,90
01,
913
1,88
62,
033
2,05
81,
943
1,93
11,
918
1,92
6N
DO
T m
aint
enan
ce s
tatio
ns (s
taffe
d)41
5148
4545
4242
4244
44R
ecre
atio
n an
d R
esou
rce
Dev
elop
men
tS
tate
ow
ned
offic
e sp
ace
(squ
are
feet
)14
6,98
213
7,35
313
9,87
413
9,87
414
0,99
814
2,63
814
2,14
014
3,15
014
3,15
014
3,15
0N
umbe
r of S
tate
Par
ks26
2425
2424
2424
2423
23A
cres
of S
tate
Par
ks13
2,80
013
2,80
013
2,11
714
5,75
014
5,75
014
5,75
014
5,74
514
5,76
014
6,22
514
6,22
5N
umbe
r of F
ish
Hat
cher
ies
44
44
44
44
44
Wild
life
Man
agem
ent A
reas
1111
1111
1111
1111
1111
Acr
es o
f Wild
life
Man
agem
ent A
reas
117,
959
117,
959
117,
959
116,
888
118,
993
118,
993
120,
254
121,
086
119,
212
119,
212
Veh
icle
s99
880
381
185
491
980
579
779
082
685
0
Sour
ces:
Nev
ada
Atto
rney
Gen
eral
's O
ffice
; Nev
ada
Dep
artm
ents
of A
dmin
istra
tion,
Con
serv
atio
n an
d N
atur
al R
esou
rces
, Tou
rism
and
Cul
tura
l Affa
irs, H
ealth
& H
uman
Ser
vice
s,
Tran
spor
tatio
n an
d W
ildlif
e

169
Compliance Section
Cyclists explore Bloody Shins TrailWinnemucca, NV
www.eidebai l ly.com5441 Kietzke Ln., Ste. 150 | Reno, NV 89511-2094 | T 775.689.9100 | F 775.689.9299 | EOE
Independent Auditor’s Report on Internal Control over Financial Reporting and onCompliance and Other Matters Based on an Audit of Financial Statements
Performed in Accordance with Government Auditing Standards
The Honorable Ronald Knecht, MS, JD & PE State ControllerCarson City, Nevada
We have audited, in accordance with the auditing standards generally accepted in the United States of America and the standards applicable to financial audits contained in Government Auditing Standardsissued by the Comptroller General of the United States, the financial statements of the governmental activities, the business-type activities, the aggregate discretely presented component units, each major fund, and the aggregate remaining fund information of the State of Nevada, as of and for the year ended June 30, 2015, and the related notes to the financial statements, which collectively comprise the State of Nevada’s basic financial statements, and have issued our report thereon dated December 21, 2015. Our report includes a reference to other auditors who audited the financial statements of the Nevada System of Higher Education and the Colorado River Commission, discretely presented component units; the Housing Division Enterprise Fund, the Self Insurance and Insurance Premiums Internal Service Funds, the Pension Trust Funds and the Other Employee Benefit Trust Fund – State Retirees’ Fund, the Nevada College Savings Plan – Private Purpose Trust Fund, the Retirement Benefits Investment Fund – Investment Trust Fund, and the Division of Museums and History Dedicated Trust Fund, as described in our report on the State of Nevada’s financial statements. This report does not include the results of the other auditors’ testing of internal control over financial reporting or compliance and other matters that are reported on separately by some of those auditors. The financial statements of the Division of Museums and History Dedicated Trust Fund, the Pension Trust Funds, the Insurance Premiums Internal ServiceFund and the Retirement Benefits Investment Trust Fund were not audited in accordance with Government Auditing Standards.
Internal Control Over Financial ReportingIn planning and performing our audit of the financial statements, we considered the State of Nevada’s internal control over financial reporting (internal control) to determine the audit procedures that are appropriate in the circumstances for the purpose of expressing our opinions on the financial statements, but not for the purpose of expressing an opinion on the effectiveness of the State of Nevada’s internal control. Accordingly, we do not express an opinion on the effectiveness of the State of Nevada’s internal control.
A deficiency in internal control exists when the design or operation of a control does not allow management or employees, in the normal course of performing their assigned functions, to prevent, or detect and correct misstatements on a timely basis. A material weakness is a deficiency, or combination of deficiencies, in internal control such that there is a reasonable possibility that a material misstatement of the entity’s financial statements will not be prevented, or detected and corrected on a timely basis. Asignificant deficiency is a deficiency, or a combination of deficiencies, in internal control that is less severe than a material weakness, yet important enough to merit attention by those charged with governance.

171
2011 Ornament
Our consideration of internal control was for the limited purpose described in the preceding paragraph and was not designed to identify all deficiencies in internal control that might be material weaknesses or significant deficiencies and therefore, material weaknesses or significant deficiencies may exist that were not identified. Given these limitations, during our audit we did not identify any deficiencies in internal control that we consider to be material weaknesses. We did identify certain deficiencies in internal control, described in the accompanying schedule of findings and responses as Findings 2015-A and 2015-B that we consider to be significant deficiencies.
Compliance and Other MattersAs part of obtaining reasonable assurance about whether the State of Nevada’s financial statements are free of material misstatement, we performed tests of its compliance with certain provisions of laws, regulations, contracts and grant agreements, noncompliance with which could have a direct and material effect on the determination of financial statement amounts. However, providing an opinion on compliance with those provisions was not an objective of our audit and, accordingly, we do not express such an opinion. The results of our tests disclosed no instances of noncompliance or other matters that are required to be reported under Government Auditing Standards.
The State of Nevada’s Response to FindingsThe State of Nevada’s responses to the findings identified in our audit are described in the accompanying schedule of findings and responses. The State of Nevada’s responses were not subjected to the auditing procedures applied in the audit of the financial statements and, accordingly, we express no opinion on them.
Purpose of this ReportThe purpose of this report is solely to describe the scope of our testing of internal control and compliance and the results of that testing, and not to provide an opinion on the effectiveness of the State of Nevada’sinternal control or on compliance. This report is an integral part of an audit performed in accordance with Government Auditing Standards in considering the State of Nevada’s internal control and compliance. Accordingly, this communication is not suitable for any other purpose.
Reno, NevadaDecember 21, 2015

172
STATE OF NEVADASCHEDULE OF FINDINGS AND RESPONSES
FOR THE YEAR ENDED JUNE 30, 2015
Findings Relating to the Financial Statements Reported in Accordance with GAGAS:
Finding 2015-A
Significant deficiency
Criteria and Condition: Management is responsible for establishing and maintaining an effective system of internal control over financial reporting. Properly reporting the gain/loss on refunding transactions is a key component of effective internal control over financial reporting.
A prior period adjustment of approximately $38,000,000 was required to correct the amortization of the gain/loss on the refunding of certain bonds. The State of Nevada amortized the gain/loss on refunding transactions over the shorter of the life of the old debt or the life of the new debt, as required. Because it was the State of Nevada’s policy to refund debt on the first available call date, the State of Nevada calculated the life of the old debt as ending on the call date. However, during the year, the State of Nevada became aware of a recently issued Question and Answer that clarified that the life of the old debt should run through the original end date of the issue.
Effect: In prior years, net position in the government wide financial statements was understated by approximately $38,000,000 and amortization expense was overstated by a like amount.
Cause: The State of Nevada calculated the life of the old debt as ending on the call date of the issue, rather than on the end date of the original issue.
Recommendation: We recommend the State of Nevada enhance internal controls to ensure the correct end date is used when recording amortization of gain/loss on refunding transactions.
Views of Responsible Officials and planned corrective action: The State of Nevada Controller’s office is in agreement that
the internal controls need to be enhanced to ensure the correct end date is used for amortization of gain/loss on refunding transactions. This has already been implemented by the Controller’s office, both with the identification and correction of the error, and with updating procedures to

173
calculate the life of the old debt by using the original end date of the issue.

174174
STATE OF NEVADASCHEDULE OF FINDINGS AND RESPONSES
FOR THE YEAR ENDED JUNE 30, 2015
Findings Relating to the Financial Statements Reported in Accordance with GAGAS:
Finding 2015-B
Significant deficiency
Criteria and Condition: Management is responsible for establishing and maintaining an effective system of internal control over financial reporting. Properly capitalizing assets in the government-wide financial statements is a key component of effective internal control over financial reporting.
A journal entry was required to properly report a capital asset addition during the year. Land in the approximate amount of $10,000,000 was recorded as an asset in 2012 and inadvertently recorded again in 2015 as part of the completed project.
Effect: Capital assets were overstated before the adjustment.
Cause: The State of Nevada Controller’s office did not have adequate review procedures over multi-year construction projects to identify that an asset had been previously recorded.
Recommendation: We recommend the State of Nevada enhance review procedures over multi-year construction projects to ensure all components in the project are capitalized only once.
Views of Responsible Officials and planned corrective action: The State of Nevada Controller’s office is in agreement with
the need for enhanced review procedures over multi-year construction projects. Therefore, additional procedures will be added to the review process in order to ensure that all components of multi-year construction projects are properly capitalized.