1H-13C CPMAS andT2 Relaxation Solid-State NMR Measurements of Melamine-Based Polycondensed Chemical...
11
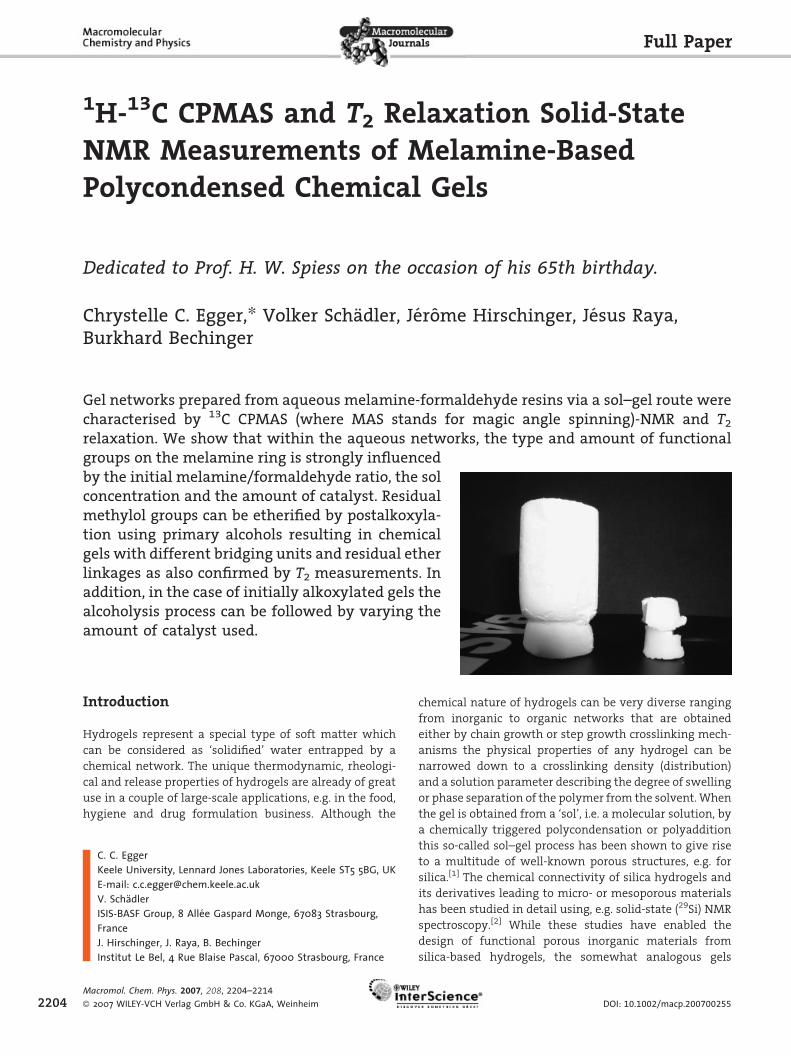
1 H- 13 C CPMAS and T 2 Relaxation Solid-State NMR Measurements of Melamine-Based Polycondensed Chemical Gels Dedicated to Prof. H. W. Spiess on the occasion of his 65th birthday. Chrystelle C. Egger, * Volker Scha ¨dler, Je ´ro ˆme Hirschinger, Je ´sus Raya, Burkhard Bechinger Introduction Hydrogels represent a special type of soft matter which can be considered as ‘solidified’ water entrapped by a chemical network. The unique thermodynamic, rheologi- cal and release properties of hydrogels are already of great use in a couple of large-scale applications, e.g. in the food, hygiene and drug formulation business. Although the chemical nature of hydrogels can be very diverse ranging from inorganic to organic networks that are obtained either by chain growth or step growth crosslinking mech- anisms the physical properties of any hydrogel can be narrowed down to a crosslinking density (distribution) and a solution parameter describing the degree of swelling or phase separation of the polymer from the solvent. When the gel is obtained from a ‘sol’, i.e. a molecular solution, by a chemically triggered polycondensation or polyaddition this so-called sol–gel process has been shown to give rise to a multitude of well-known porous structures, e.g. for silica. [1] The chemical connectivity of silica hydrogels and its derivatives leading to micro- or mesoporous materials has been studied in detail using, e.g. solid-state ( 29 Si) NMR spectroscopy. [2] While these studies have enabled the design of functional porous inorganic materials from silica-based hydrogels, the somewhat analogous gels Full Paper Gel networks prepared from aqueous melamine-formaldehyde resins via a sol–gel route were characterised by 13 C CPMAS (where MAS stands for magic angle spinning)-NMR and T 2 relaxation. We show that within the aqueous networks, the type and amount of functional groups on the melamine ring is strongly influenced by the initial melamine/formaldehyde ratio, the sol concentration and the amount of catalyst. Residual methylol groups can be etherified by postalkoxyla- tion using primary alcohols resulting in chemical gels with different bridging units and residual ether linkages as also confirmed by T 2 measurements. In addition, in the case of initially alkoxylated gels the alcoholysis process can be followed by varying the amount of catalyst used. C. C. Egger Keele University, Lennard Jones Laboratories, Keele ST5 5BG, UK E-mail: [email protected] V. Scha ¨dler ISIS-BASF Group, 8 Alle ´e Gaspard Monge, 67083 Strasbourg, France J. Hirschinger, J. Raya, B. Bechinger Institut Le Bel, 4 Rue Blaise Pascal, 67000 Strasbourg, France 2204 Macromol. Chem. Phys. 2007, 208, 2204–2214 ß 2007 WILEY-VCH Verlag GmbH & Co. KGaA, Weinheim DOI: 10.1002/macp.200700255
-
Upload
independent -
Category
Documents
-
view
0 -
download
0
Transcript of 1H-13C CPMAS andT2 Relaxation Solid-State NMR Measurements of Melamine-Based Polycondensed Chemical...
Full Paper
2204
1H-13C CPMAS and T2 Relaxation Solid-StateNMR Measurements of Melamine-BasedPolycondensed Chemical Gels
Dedicated to Prof. H. W. Spiess on the occasion of his 65th birthday.
Chrystelle C. Egger,* Volker Schadler, Jerome Hirschinger, Jesus Raya,Burkhard Bechinger
Gel networks prepared from aqueous melamine-formaldehyde resins via a sol–gel route werecharacterised by 13C CPMAS (where MAS stands for magic angle spinning)-NMR and T2
relaxation. We show that within the aqueous networks, the type and amount of functionalgroups on the melamine ring is strongly influencedby the initial melamine/formaldehyde ratio, the solconcentration and the amount of catalyst. Residualmethylol groups can be etherified by postalkoxyla-tion using primary alcohols resulting in chemicalgels with different bridging units and residual etherlinkages as also confirmed by T2 measurements. Inaddition, in the case of initially alkoxylated gels thealcoholysis process can be followed by varying theamount of catalyst used.
Introduction
Hydrogels represent a special type of soft matter which
can be considered as ‘solidified’ water entrapped by a
chemical network. The unique thermodynamic, rheologi-
cal and release properties of hydrogels are already of great
use in a couple of large-scale applications, e.g. in the food,
hygiene and drug formulation business. Although the
C. C. EggerKeele University, Lennard Jones Laboratories, Keele ST5 5BG, UKE-mail: [email protected]. SchadlerISIS-BASF Group, 8 Allee Gaspard Monge, 67083 Strasbourg,FranceJ. Hirschinger, J. Raya, B. BechingerInstitut Le Bel, 4 Rue Blaise Pascal, 67000 Strasbourg, France
Macromol. Chem. Phys. 2007, 208, 2204–2214
� 2007 WILEY-VCH Verlag GmbH & Co. KGaA, Weinheim
chemical nature of hydrogels can be very diverse ranging
from inorganic to organic networks that are obtained
either by chain growth or step growth crosslinking mech-
anisms the physical properties of any hydrogel can be
narrowed down to a crosslinking density (distribution)
and a solution parameter describing the degree of swelling
or phase separation of the polymer from the solvent. When
the gel is obtained from a ‘sol’, i.e. a molecular solution, by
a chemically triggered polycondensation or polyaddition
this so-called sol–gel process has been shown to give rise
to a multitude of well-known porous structures, e.g. for
silica.[1] The chemical connectivity of silica hydrogels and
its derivatives leading to micro- or mesoporous materials
has been studied in detail using, e.g. solid-state (29Si) NMR
spectroscopy.[2] While these studies have enabled the
design of functional porous inorganic materials from
silica-based hydrogels, the somewhat analogous gels
DOI: 10.1002/macp.200700255
1H-13C CPMAS and T2 Relaxation Solid-State NMR Measurements . . .
obtained via chemical polycondensation of organic pre-
cursors is much less understood. Organic hydrogels syn-
thesised by reacting phenolic and amino resins in water
have been largely used to produce aerogels and xerogels;[3]
particular phenol-based hydrogels and their corresponding
aerogels currently enjoy a renaissance as such aerogels can
be further carbonised to produce nanoporous carbon (e.g.
to be used as electrodes).[4] In contrast to the vast number
of potential applications of such organogels and their pre-
cursors, there is a striking lack of understanding concern-
ing their structure and dynamics. Here, we present a first
comprehensive solid-state NMR study which aims at char-
acterising the structure and dynamics of model melamine-
formaldehyde chemically formed hydrogels. First of all,
the study of melamine hydrogels helps to better under-
stand the mechanism of the organic sol–gel process but
also shows the potential for further gel modifications
that lead to improved properties. Chemical modification of
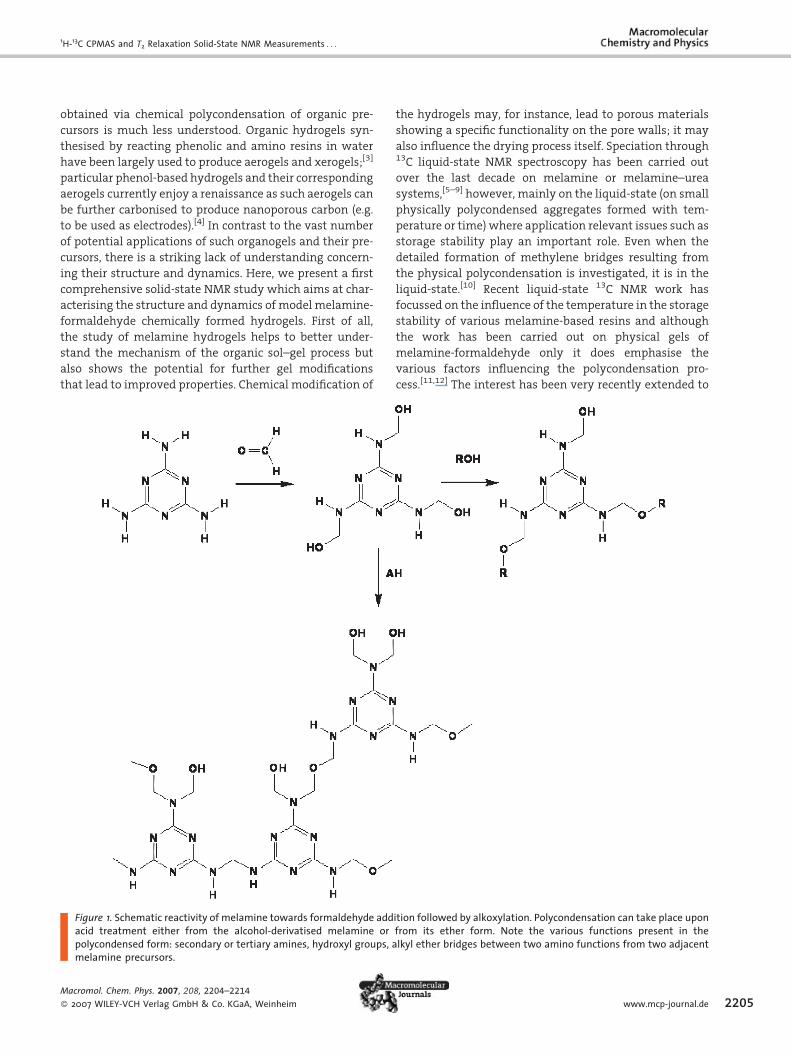
Figure 1. Schematic reactivity of melamine towards formaldehyde addacid treatment either from the alcohol-derivatised melamine orpolycondensed form: secondary or tertiary amines, hydroxyl groups, amelamine precursors.
Macromol. Chem. Phys. 2007, 208, 2204–2214
� 2007 WILEY-VCH Verlag GmbH & Co. KGaA, Weinheim
the hydrogels may, for instance, lead to porous materials
showing a specific functionality on the pore walls; it may
also influence the drying process itself. Speciation through13C liquid-state NMR spectroscopy has been carried out
over the last decade on melamine or melamine–urea
systems,[5–9] however, mainly on the liquid-state (on small
physically polycondensed aggregates formed with tem-
perature or time) where application relevant issues such as
storage stability play an important role. Even when the
detailed formation of methylene bridges resulting from
the physical polycondensation is investigated, it is in the
liquid-state.[10] Recent liquid-state 13C NMR work has
focussed on the influence of the temperature in the storage
stability of various melamine-based resins and although
the work has been carried out on physical gels of
melamine-formaldehyde only it does emphasise the
various factors influencing the polycondensation pro-
cess.[11,12] The interest has been very recently extended to
ition followed by alkoxylation. Polycondensation can take place uponfrom its ether form. Note the various functions present in thelkyl ether bridges between two amino functions from two adjacent
www.mcp-journal.de 2205
C. C. Egger, V. Schadler, J. Hirschinger, J. Raya, B. Bechinger
2206
colloidal melamine–urea-formaldehyde resins.[13–16] Solid-
state multinuclear NMR (1H, 15N and 13C)[17,18] or relaxation
experiments[19] have also been carried out on physically
precipitated phases but not on macroscopic chemical
hydrogels. So far, very little is reported about the chemical
connectivity and functionalities in the gel state.[20] Here
we employ 13C magic angle spinning (MAS) NMR spectros-
copy to characterise different gels as obtained chemically
from melamine-formaldehyde resins. In 13C NMR spectros-
copy under MAS, the line broadening of the NMR signal as
typically observed for strong gels is reduced by averaging
the anisotropy of the dipolar coupling. Using this tech-
nique, species of distinct chemical shift within the gel can
be distinguished as synthesised under well-defined poly-
merisation conditions.[21] Other NMR works can sometime
be carried out, such as diffusion measurements coupled
to relaxation experiments, when the rate of release of a
component in a complex aqueous structure such as cement
is targeted.[22]
In Figure 1, the formation of melamine-formaldehyde
resins via the addition of formaldehyde under basic
conditions is shown. The resins can be further alkoxylated
via acid catalysis either (i) by adding alcohols or (ii) by
condensing the methylol groups to form crosslinks
between the melamine rings. More details about the
chemistry of such melamine resins are described in the
literature.[23–25]
From the mechanistic scheme presented in Figure 1,
it becomes easy to realise that the degree of catalysed
polycondensation will be greatly influenced by the ratio
melamine/formaldehyde, but also the ratio melamine-
formaldehyde/catalyst (catalyst¼ acid) and the degree of
hydrolysis of the ether functions into alcohol. Although the
degree of polycondensation can be measured indirectly
(e.g. gel stiffness), the solid-state NMR technique is a very
Table 1. Experimental parameters for the 11 MFGs studied, prepaformaldehyde are given in molar ratio, melamine-formaldehyde to a
MFG1a MFG1b MFG
MF no. 1 1
M:F (moles) 1:1.51 1:1.51 1
[MF] wt.-% 16.8 18.9 1
Initial MF/Ac (weight) 2 2
Post-treatment – – 5 wt.-%
MFG3a MFG3
MF no. 3 3
M:F:1-butanol (moles) 1:5:5 1:5:5
[MF] wt.-% 25 17.5
Initial MF/Ac (weight) 18 18
Macromol. Chem. Phys. 2007, 208, 2204–2214
� 2007 WILEY-VCH Verlag GmbH & Co. KGaA, Weinheim
suited technique as it not only gives the amount of
crosslinking, but it also gives information about the type
and amount of functions left in the gel for further reactions
or curing. In addition, results from spin–spin relaxation
measurements give good estimation of the water mobility
within the gels and add onto the 1H-13C CPMAS experi-
ments.
In this work, we study model melamine-formaldehyde
gels (MFG) with 1H-13C CPMAS and T2 relaxation measure-
ments. We investigate the influence of the formaldehyde
content, the catalyst content, the alkoxylation step and
also the influence of the post-treatment step, on both the
structure and the dynamics of various MFGs.
Experimental Part
Synthesis of the Gels
Three different types of melamine-formaldehyde resins have been
used in this work: (i) MF1 with a ratio melamine-to-formaldehyde
equal to 1:1.51 and (ii) MF2 with ratio 1:3.15 and (iii) MF3 the
methylol functions of which being fully etherified by 1-butanol.
All resins were provided by BASF Aktiengesellschaft and used
without further purification. MF1 and MF2 have been dissolved
in water using a homogeniser of the Ultra-Turrax type. When
starting with MF1 or MF2 resins, gels have been prepared by
adding a given amount of formic acid to a propylene vial
containing a melamine-formaldehyde solution. The vial is then
placed in a water bath at 60 8C for 3 h and kept at room
temperature thereafter until further NMR measurements are
carried out. Instead, MF3 is dissolved into methyl ethyl ketone
(MEK) and hydrochloric acid is used as the catalyst. Post-
treatments on gels prepared from MF1 and MF2 consist of
dipping the gels into a 5 wt.-% solution of 1-butanol with pH
stabilised to about 2–3 using formic acid, at 80 8C for 2 h. The
synthesis details are summarised in Table 1.
red from 3 different melamine-formaldehyde resins (melamine/cid is a mass ratio).
1a-PT MFG2a MFG2b MFG2a-PT
1 2 2 2
:1.51 1:3.15 1:3.15 1:3.15
6.8 17.0 17.0 17.0
2 2 1.5 2
1-butanol – – 5 wt.-% 1-butanol
b MFG3c MFG3d MFG3e
3 3 3
1:5:5 1:5:5 1:5:5
25 25 25
5 10 15
DOI: 10.1002/macp.200700255

1H-13C CPMAS and T2 Relaxation Solid-State NMR Measurements . . .
Solid-State NMR Measurements
The spectra showed below have been recorded on a Bruker Avance
300 spectrometer operating at 300.133 MHz (7.05 T), equipped
with a 4 mm double resonance MAS probe (1H-X, X ranging from15N to 31P). A Bruker Cooling Unit was used to keep the
temperature at 300 K (0.1 K error). Each sample was introduced
into a 4 mm HRMAS ZrO2 rotor fitted with a 50 mL cylindrical
insert. For all MAS NMR experiments, samples were spun at 6 kHz.
The Hartmann-Hahn conditions for all 13C CP/MAS spectra were as
follows: n1(13C)¼50 kHz, n1(1H)¼56 kHz, n1(1H decoupling)¼80 kHz, contact time¼ 2 ms, recycle time¼ 5 s. Although the signal
intensities observed in 1H-13C CPMAS NMR spectra are not quanti-
tative due to the dependence of magnetisation transfer on the
dynamics, environment and functional groups involved, it is here,
however, possible to compare spectra quantitatively against one
another since acquisition parameters have been kept constant
amongst all experiments. 13C spectral deconvolutions and curve
fittings were carried out using TopSpin 2.0 (Bruker) using a
Simplex algorithm with a line shape composition of 50% Gaussian
and Lorentzian contributions, respectively. A typical 13C CPMAS
Figure 2. A typical 13C CPMAS NMR spectrum for a nonalkoxylated MFcontributions: (i) the aromatic carbon nuclei from the triazine ring (150methylol/methoxy bridges (60–80 ppm) or the methylene bridges (40these two regions are also given for MFG2a.
Macromol. Chem. Phys. 2007, 208, 2204–2214
� 2007 WILEY-VCH Verlag GmbH & Co. KGaA, Weinheim
spectrum along with the deconvolution result is displayed in
Figure 2.
Peak assignments are essentially based on previous liquid-state
work,[5–12] but also occasionally on solid-state work available in
the literature.[17,18,20] As indicated in Figure 2, the peaks in the
150–175 ppm region correspond to the aromatic carbons of the
triazine ring. The 40–80 ppm region divides into two parts: (i)
60–80 ppm corresponding to carbon atoms present in methoxy
functions and (ii) 40–60 ppm corresponding to carbon atoms in
methylene units. Within each region, due to the broadness of the
peaks, peak assignment cannot be categorical and various func-
tions are sometimes possible. The amplitude of the 13C signals
stemming from the triazine ring (150–175 ppm) have been used to
normalise the spectra such that a quantitative comparison of the
signal intensities in the 40–80 ppm region becomes possible
(the acquisition parameters are the same for all 1H-13C CP/MAS
experiments). However, due to the fact that only amplitudes and
not signal areas are used to normalise the spectra, spectra
comparison still remains approximate. The amplitude factors are
given in Table 2 under the gel names and are relative to the gel
which has its amplitude set to 1, along with the deconvolution
G (here MFG2a), along with the assignments of the two main signal–175 ppm), (ii) the aliphatic carbon nuclei (40–80 ppm) with either the–60 ppm). Result of the 13C spectral deconvolution and curve fitting of
www.mcp-journal.de 2207
C. C. Egger, V. Schadler, J. Hirschinger, J. Raya, B. Bechinger
Table2.
Expe
rimen
tal13
Cch
emic
alsh
iftsf
orM
FG1a
ndM
FG2-
type
gels
alon
gw
ithth
ein
tegr
alfo
reac
hde
conv
olut
edpe
akgi
ven
perr
egio
n(15
0–17
0pp
m,4
0–80
ppm
).As
sign
men
tsar
eal
sogi
ven
and
refe
rto
the
liter
atur
e.
Carbontype
13Cch
emicalsh
ifts
(deconvolution%)
ppm
MFG
1a
1
MFG
1b
T1.3665a)
MFG
1a-PT
T1.5665
MFG
2a
T0.10811
MFG
2b
T6.2621
MFG
2a-PT
T53.5854
Tri
azi
ne
rin
gb
)
ArC
–N
H2
16
7.8
(22
)1
67
.9(1
9)
17
1.5
(6)
16
9.2
(13
)1
66
.9(1
3)
16
9.9
(35
)
ArC
–N
H(C
H2O
–R
)1
65
.5(5
0)
16
5.4
(52
)1
67
.6(6
2)
16
7.6
(65
)1
65
.6(5
3)
16
7.9
(49
)
ArC
–N
(CH
2O
–R
) 21
57
.9(2
7)
15
7.9
(28
)1
60
.4(3
1)
15
9.1
(22
)1
57
.3(3
3)
16
1.5
(16
)
–C
H2O
–
–N
(R1)C
H2O
CH
2–
N(R
2)–
––
–7
3.6
(33
)–
–
–N
(R)–
CH
2O
Ho
r–
N(R
)–C
H2O
CH
2–
NH
––
––
71
.8(3
8)
–
–N
H–
CH
2O
Ho
r–
N(C
H2O
H) 2
or
–N
H–
CH
2O
–C
H2O
H–
––
66
.8(3
)6
5.3
(2)
–
–C
H2–
–N
(R1)–
CH
2–
N(R
2)–
––
58
.9(3
7)
––
–N
H–
CH
2–
N(C
H2)–
[5]
53
.9(5
9)
55
.8(3
2)
55
.2(1
9.5
)5
6.1
(63
)5
4.6
(60
)5
6.0
(80
)
–N
H–
CH
2–
N(C
H2)–
[10
]–
51
.6(2
4)
50
.3(4
4)
––
50
.5(2
0)
–N
H–
CH
2–
NH
–4
7.5
(41
)4
7.5
(44
)–
––
–
Sha
rp
1-B
uta
no
l–
––
––
64
.4
36
.4
21
.1
15
.8
a) M
FG1
bT
1.3
66
5:
am
pli
tud
efa
cto
rfr
om
MFG
1b
toM
FG1
a;
b) A
rCst
an
ds
for
aro
ma
tic
carb
on
sfr
om
the
tria
zin
eri
ng
.
2208Macromol. Chem. Phys. 2007, 208, 2204–2214
� 2007 WILEY-VCH Verlag GmbH & Co. KGaA, Weinheim DOI: 10.1002/macp.200700255
1H-13C CPMAS and T2 Relaxation Solid-State NMR Measurements . . .
results for each gel, distinct for each region of the spectrum (the
triazine region between 155 and 175 ppm and the functions
carried by the triazine ring between 40 and 80 ppm). In the case of
nonalkoxylated materials, the chemical shifts of the aromatic
carbons follow the rule that the more substituted the amine
function it carries, the smaller the chemical shift (from 168 to
164 ppm).[6] In the case of the MF3-based material, both the solvent
and the pH are different and consequently affect the 13C chemical
shifts. The solvent and pH effects are discussed in the text.
T2 relaxation measurements have been performed at 300 K
using a Hahn echo pulse sequence with echo times varying
from 5� 10�6 to 0.1 s. Fits for relaxations curves followed an
exponential decay and also used a Simplex algorithm. The T2 value
of bulk water measured under the same conditions is 250 ms.
Results and Discussion
1H-13C: CPMAS
Formaldehyde acts as a crosslinker between melamine
units (see Figure 1) as its addition to the melamine ring
creates alcohol (methylol) functions which can then
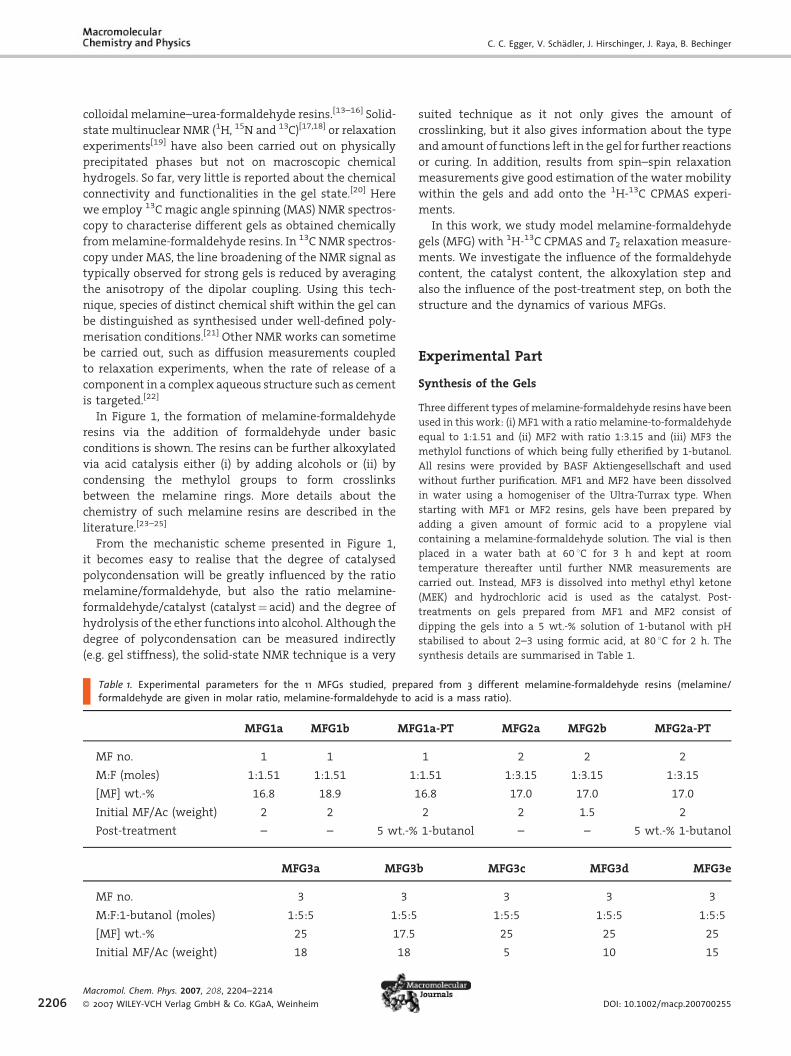
Figure 3. 1H-13C CPMAS spectra of gels prepared with nonalkylatedresins (MF1 or MF2). Top: Influence of the formaldehyde content,MFG1a and MFG2a; middle: Influence of the acid content, MFG2aand MFG2b; bottom: Influence of the resin concentration, MFG1aand MFG1b. Compared spectra have been normalised to thestrongest peak of MFG1a or MFG2a.
Macromol. Chem. Phys. 2007, 208, 2204–2214
� 2007 WILEY-VCH Verlag GmbH & Co. KGaA, Weinheim
undergo polycondensation, the degree of which will
impact the density and robustness of the final gels. In
order to study the influence of the formaldehyde content
on the chemical structures of the resulting products, two
different gels (MFG1a and MFG2a) have been synthesised
using nonalkoxylated resins which have a ratio of
melamine-to-formaldehyde differing by a factor of 2 while
keeping constant the relative amount of formic acid used
to catalyse the reaction (see details in Table 1). The
resulting 1H-13C CPMAS spectra of the two gels are shown
in Figure 3 (top). Apart from the small chemical shift
between the two spectra (�1.4 ppm) which could be
attributed to slight pH variation, there are two main
differences between the two spectra: (i) the 56.1 ppm peak
for MFG2a is stronger than that at 53.9 ppm for MFG1a
and (ii) two extra peaks at 73.6 and 66.8 ppm appear on the
MFG2a spectrum. From the results gathered in Table 2, it
appears that after normalisation to the strongest peak in
the MFG1a spectrum, the peak at 56.1 ppm for MFG2a is
�7 times stronger than that of MFG1a (this factor seems
smaller if one looks at the spectra, which is due to the fact
that only amplitudes and not areas have been used to
normalise the spectra), which suggests more methylene
bridges [–NH–CH2–N(CH2)–] in the case of higher formal-
dehyde content in the resin (MFG2a). Furthermore, there is
less nonreacted ArC–NH2 in MFG2a than in MFG1a (13.0
and 22.2%, respectively) and there is no detectable –NH–
CH2–NH– signal in MFG2a (no peak at 47 ppm) suggesting
a relatively high degree of substitution on the triazine
ring, which is in complete agreement with the presence of
more crosslinkers in MFG2a than in MFG1a. More
importantly, the two extra peaks in MFG2a are assigned
to –N(R1)CH2OCH2–N(R2)– (73.6 ppm) and to various
possible methoxyamine groups (66.8 ppm) clearly show-
ing the presence of methoxy bridges or N-methylol
functions in the case of the high-formaldehyde content
gel which do not exist in MFG1a. This result obtained in
the solid-state of chemical hydrogels is in perfect agree-
ment with that previously found in the liquid-state with
physical gels.[17]
Similarly, the influence of acid content has been studied
on both resin types. The resulting 1H-13C CPMAS are given
in Figure 3 (middle) for MF2-based materials and the same
conclusions can be derived from MF1-based materials
(data not shown). A slight variation in acidity (MF/Ac¼ 2
compared to¼ 1.5) greatly affects the intensity of the
peaks at 73.6–71.8 and 66.8–65.3 ppm (amplitude differ-
ence varying around 5–7 following a normalisation based
on signal intensity). The triazine region differs between
both spectra, thus matching of intensity for normalisation
is not sufficient: indeed it seems that the area for the signal
correlated to the triazine ring for MFG2a is larger than
that of MFG2b. Consequently, any quantification on the
40–80 ppm region is risky and cannot be attempted.
www.mcp-journal.de 2209
C. C. Egger, V. Schadler, J. Hirschinger, J. Raya, B. Bechinger
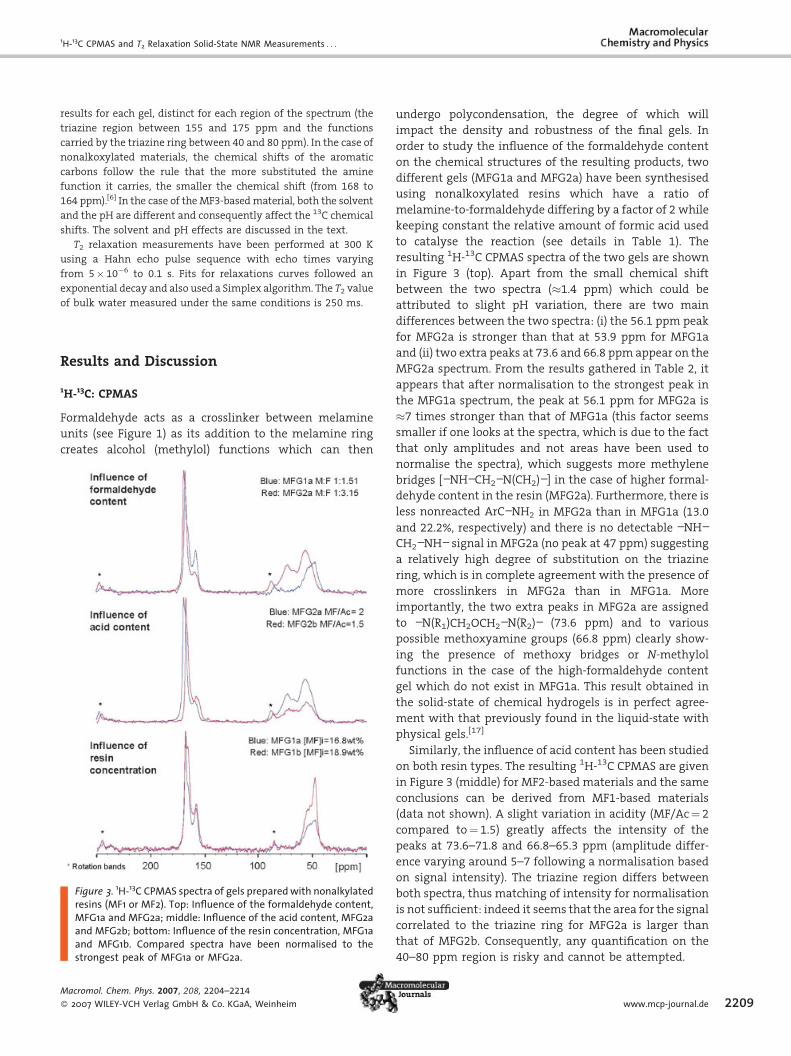
Figure 5. 1H-13C CPMAS spectra of gels prepared with alkylatedresins (MF3). Top: Influence of the resin concentration, MFG3a andMFG3b; bottom: Influence of the acid content, MFG3c, MFG3d andMFG3e. Compared spectra have been normalised to the strongestpeak of MFG3a or MFG3c. For MFG3c, conclusive assignment ofthe sharp peaks is not possible as they are very weak.
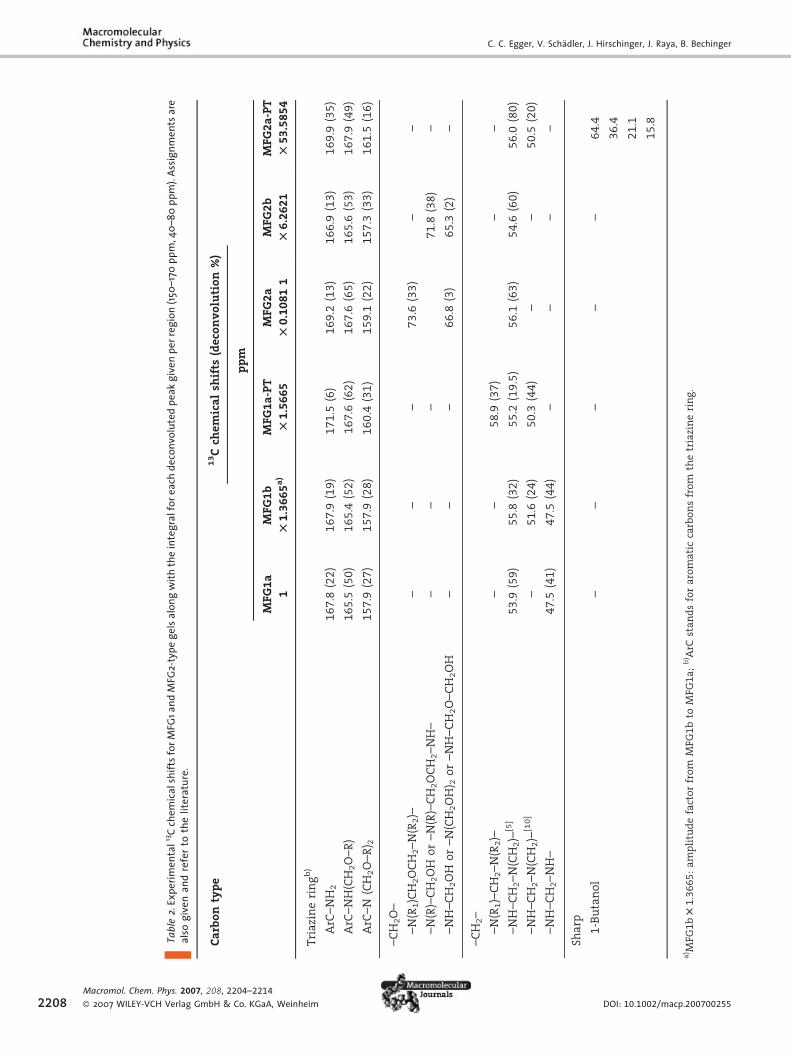
Figure 4. 1H-13C CPMAS spectra of gels prepared with nonalkylatedresins (MF1 or MF2) before and after post-treatment with a 5 wt.-%1-butanol solution. Top: on a low-formaldehyde content resinMFG1a and MFG1a-PT; bottom: on a high-formaldehyde contentresin MFG2a and MFG2a-PT. Compared spectra have been normal-ised to the strongest peak of MFG1a or MFG2a.
2210
The influence of the resin concentration on the final gel
has also been investigated and the spectra of two gels
MFG1a and MFG1b prepared using MF1 at 16.8 and
18.9 wt.-%, respectively, (MF/Ac¼ 2) are displayed in
Figure 3 (bottom). The relative amount of each type of
carbon within the triazine ring is very similar in both cases
(Table 1) and so are the relative amounts of the different
methylene units [compare 58.7 and 41.2% against
(32.1þ 24.3) and 43.6]. However, when compared to the
triazine intensities there are 1.3 times more –NH–CH2–
N(CH2)– units in MFG1b than in MFG1a, clearly showing
that an increase in the resin concentration favours
cocondensation between melamine units.
Two samples MFG1a and MFG2a have been post-treated
chemically with 1-butanol (see the Experimental Part for
detail) in order to tackle possibilities of gel postgrafting.
The resulting 1H-13C CPMAS spectra are shown in Figure 4,
and the first noticeable feature is that both the aromatic
and the aliphatic part of the MFG1a spectrum remain
almost unchanged after treatment with 1-butanol, whereas
in the case of MFG2a sharp peaks appear in the 0–70 ppm
region. These signals are indicative of more mobiles
species when compared to the rest of gel. As the spectrum
was obtained by crosspolarisation the latter cannot be
from sites exhibiting isotropic motions and therefore is
part of the gel phase rather than unconnected freely
moving molecules. The peaks at 64.4/36.4/21.1/15.8 ppm
are a clear signature of 1-butanol whereas the signal
emerging at 33.8 ppm is from the background (the noisy
Macromol. Chem. Phys. 2007, 208, 2204–2214
� 2007 WILEY-VCH Verlag GmbH & Co. KGaA, Weinheim
background is unfortunately due to a lack of material for
this particular experiment). The width at half height of
the sharp peaks varies approximately from 40 to 70 Hz,
suggesting rather mobile species. According to these
results, it seems that the presence of either N-methylol
functions or methoxy bridges within MFG2a have allowed
the n-1-butanol to react with the polymeric network,
which was not possible with MFG1a.
The 1H-13C CPMAS spectra of various gels prepared with
MF3 (melamine-formaldehyde resin almost completely
etherified with 1-butanol) under different conditions (acid
content or resin concentration) are presented in Figure 5. It
is interesting to note that the spectrum of the post-treated
gel is very similar to that prepared with MF3 [clearly
seen in Figure 5 (top)], which corroborates the grafting of
1-butanol molecules inside the gel MFG2a. Extra sharp
peaks at 7.5/28.8/36.3/207.8 ppm are also present, char-
acteristic of MEK, utilised here as the solvent to dissolve
the MF3 resin. Hence, that implies that solvent molecules,
in equilibrium with their enol-tautomer have reacted with
the melamine-based gel, suggesting a higher reactivity of
melamine units towards MEK than themselves. The MF3
resin is initially almost entirely capped with 1-butanol
and probably stays so since the acid content is rather
DOI: 10.1002/macp.200700255
1H-13C CPMAS and T2 Relaxation Solid-State NMR Measurements . . .
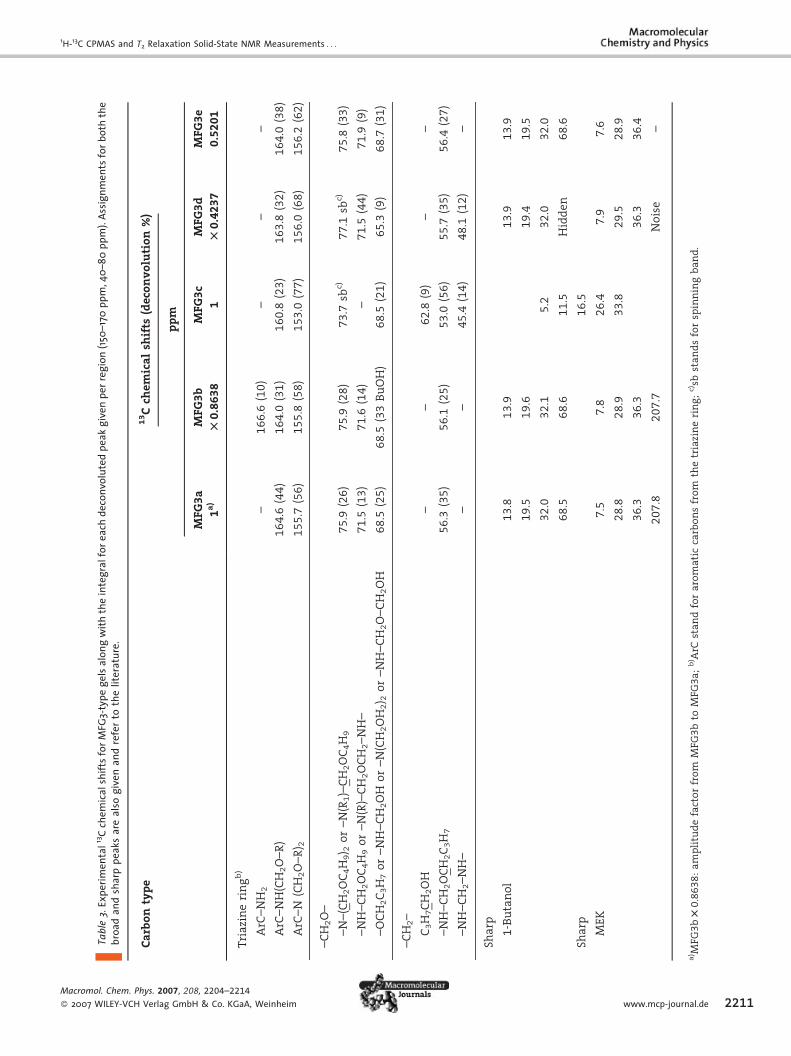
Table3.
Expe
rimen
tal13
Cch
emic
alsh
iftsf
orM
FG3-
type
gels
alon
gw
ithth
ein
tegr
alfo
reac
hde
conv
olut
edpe
akgi
ven
perr
egio
n(15
0–17
0pp
m,4
0–80
ppm
).As
sign
men
tsfo
rbot
hth
ebr
oad
and
shar
ppe
aks
are
also
give
nan
dre
fer
toth
elit
erat
ure.
Carbontype
13Cch
emicalsh
ifts
(deconvolution%)
ppm
MFG
3a
1a)
MFG
3b
T0.8638
MFG
3c
1
MFG
3d
T0.4237
MFG
3e
0.5201
Tri
azi
ne
rin
gb
)
ArC
–N
H2
–1
66
.6(1
0)
––
–
ArC
–N
H(C
H2O
–R
)1
64
.6(4
4)
16
4.0
(31
)1
60
.8(2
3)
16
3.8
(32
)1
64
.0(3
8)
ArC
–N
(CH
2O
–R
) 21
55
.7(5
6)
15
5.8
(58
)1
53
.0(7
7)
15
6.0
(68
)1
56
.2(6
2)
–C
H2O
–
–N
–( C
H2O
C4H
9) 2
or
–N
(R1)–
CH
2O
C4H
97
5.9
(26
)7
5.9
(28
)7
3.7
sbc)
77
.1sb
c)7
5.8
(33
)
–N
H–
CH
2O
C4H
9o
r–
N(R
)–C
H2O
CH
2–
NH
–7
1.5
(13
)7
1.6
(14
)–
71
.5(4
4)
71
.9(9
)
–O
CH
2C
3H
7o
r–
NH
–C
H2O
Ho
r–
N(C
H2O
H2) 2
or
–N
H–
CH
2O
–C
H2O
H6
8.5
(25
)6
8.5
(33
Bu
OH
)6
8.5
(21
)6
5.3
(9)
68
.7(3
1)
–C
H2–
C3H
7C
H2O
H–
–6
2.8
(9)
––
–N
H–
CH
2O
CH
2C
3H
75
6.3
(35
)5
6.1
(25
)5
3.0
(56
)5
5.7
(35
)5
6.4
(27
)
–N
H–
CH
2–
NH
––
–4
5.4
(14
)4
8.1
(12
)–
Sha
rp
1-B
uta
no
l1
3.8
13
.91
3.9
13
.9
19
.51
9.6
19
.41
9.5
32
.03
2.1
5.2
32
.03
2.0
68
.56
8.6
11
.5H
idd
en6
8.6
Sha
rp1
6.5
ME
K7
.57
.82
6.4
7.9
7.6
28
.82
8.9
33
.82
9.5
28
.9
36
.33
6.3
36
.33
6.4
20
7.8
20
7.7
No
ise
–
a) M
FG3
bT
0.8
63
8:
am
pli
tud
efa
cto
rfr
om
MFG
3b
toM
FG3
a;
b) A
rCst
an
dfo
ra
rom
ati
cca
rbo
ns
fro
mth
etr
iazi
ne
rin
g;
c)sb
sta
nd
sfo
rsp
inn
ing
ba
nd
.
Macromol. Chem. Phys. 2007, 208, 2204–2214
� 2007 WILEY-VCH Verlag GmbH & Co. KGaA, Weinheim www.mcp-journal.de 2211
C. C. Egger, V. Schadler, J. Hirschinger, J. Raya, B. Bechinger
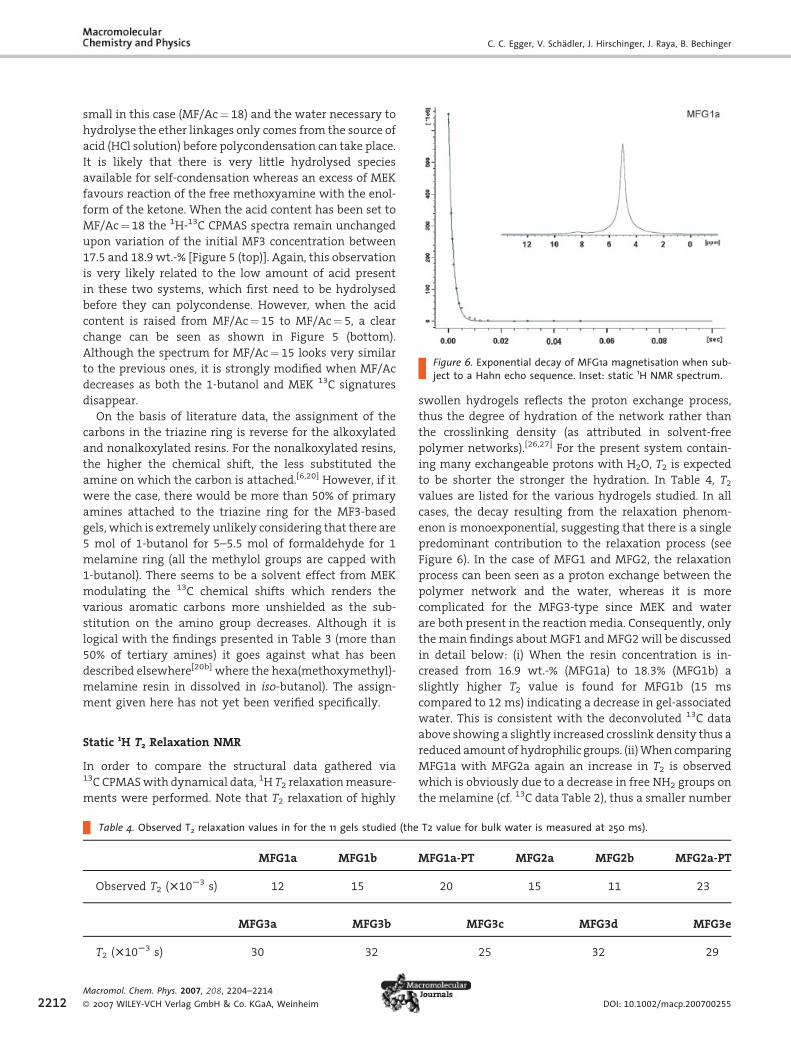
Figure 6. Exponential decay of MFG1a magnetisation when sub-ject to a Hahn echo sequence. Inset: static 1H NMR spectrum.
2212
small in this case (MF/Ac¼ 18) and the water necessary to
hydrolyse the ether linkages only comes from the source of
acid (HCl solution) before polycondensation can take place.
It is likely that there is very little hydrolysed species
available for self-condensation whereas an excess of MEK
favours reaction of the free methoxyamine with the enol-
form of the ketone. When the acid content has been set to
MF/Ac¼ 18 the 1H-13C CPMAS spectra remain unchanged
upon variation of the initial MF3 concentration between
17.5 and 18.9 wt.-% [Figure 5 (top)]. Again, this observation
is very likely related to the low amount of acid present
in these two systems, which first need to be hydrolysed
before they can polycondense. However, when the acid
content is raised from MF/Ac¼ 15 to MF/Ac¼ 5, a clear
change can be seen as shown in Figure 5 (bottom).
Although the spectrum for MF/Ac¼ 15 looks very similar
to the previous ones, it is strongly modified when MF/Ac
decreases as both the 1-butanol and MEK 13C signatures
disappear.
On the basis of literature data, the assignment of the
carbons in the triazine ring is reverse for the alkoxylated
and nonalkoxylated resins. For the nonalkoxylated resins,
the higher the chemical shift, the less substituted the
amine on which the carbon is attached.[6,20] However, if it
were the case, there would be more than 50% of primary
amines attached to the triazine ring for the MF3-based
gels, which is extremely unlikely considering that there are
5 mol of 1-butanol for 5–5.5 mol of formaldehyde for 1
melamine ring (all the methylol groups are capped with
1-butanol). There seems to be a solvent effect from MEK
modulating the 13C chemical shifts which renders the
various aromatic carbons more unshielded as the sub-
stitution on the amino group decreases. Although it is
logical with the findings presented in Table 3 (more than
50% of tertiary amines) it goes against what has been
described elsewhere[20b] where the hexa(methoxymethyl)-
melamine resin in dissolved in iso-butanol). The assign-
ment given here has not yet been verified specifically.
Static 1H T2 Relaxation NMR
In order to compare the structural data gathered via13C CPMAS with dynamical data, 1H T2 relaxation measure-
ments were performed. Note that T2 relaxation of highly
Table 4. Observed T2 relaxation values in for the 11 gels studied (the
MFG1a MFG1b
Observed T2 (T10S3 s) 12 15
MFG3a MFG3b
T2 (T10S3 s) 30 32
Macromol. Chem. Phys. 2007, 208, 2204–2214
� 2007 WILEY-VCH Verlag GmbH & Co. KGaA, Weinheim
swollen hydrogels reflects the proton exchange process,
thus the degree of hydration of the network rather than
the crosslinking density (as attributed in solvent-free
polymer networks).[26,27] For the present system contain-
ing many exchangeable protons with H2O, T2 is expected
to be shorter the stronger the hydration. In Table 4, T2
values are listed for the various hydrogels studied. In all
cases, the decay resulting from the relaxation phenom-
enon is monoexponential, suggesting that there is a single
predominant contribution to the relaxation process (see
Figure 6). In the case of MFG1 and MFG2, the relaxation
process can been seen as a proton exchange between the
polymer network and the water, whereas it is more
complicated for the MFG3-type since MEK and water
are both present in the reaction media. Consequently, only
the main findings about MGF1 and MFG2 will be discussed
in detail below: (i) When the resin concentration is in-
creased from 16.9 wt.-% (MFG1a) to 18.3% (MFG1b) a
slightly higher T2 value is found for MFG1b (15 ms
compared to 12 ms) indicating a decrease in gel-associated
water. This is consistent with the deconvoluted 13C data
above showing a slightly increased crosslink density thus a
reduced amount of hydrophilic groups. (ii) When comparing
MFG1a with MFG2a again an increase in T2 is observed
which is obviously due to a decrease in free NH2 groups on
the melamine (cf. 13C data Table 2), thus a smaller number
T2 value for bulk water is measured at 250 ms).
MFG1a-PT MFG2a MFG2b MFG2a-PT
20 15 11 23
MFG3c MFG3d MFG3e
25 32 29
DOI: 10.1002/macp.200700255
1H-13C CPMAS and T2 Relaxation Solid-State NMR Measurements . . .
of exchangeable protons. (iii) The influence of catalyst is
tested by comparing the T2 values of 15 and 11 ms for a
resin/acid ratio of 2 and 1.5 for MFG2a and MFG2b, re-
spectively. This suggests that at higher amounts of catalyst
(MFG2b) a slightly lower crosslink density is achieved,
reflected by an increase in the amount of gel-associated
water (hydrophilic swelling) in agreement with mechan-
ical observations. (iv) Finally, when T2 of the butoxylated
gels MFG1a-PT and MFG2a-PT is compared with T2 of the
respective samples without post- treatment a slightly
higher water mobility is found for the ‘hydrophobised’
samples (20–23 ms against 11–15 ms). Again, this can be
attributed to a reduced amount of proton-exchangeable
groups as a result of the etherification. T2 values of the
MFG3 specimens are all very similar (around 25–32 ms)
and slightly larger than that from MFG1 and MFG2 gels.
Semiquantitative estimations of T2 values of 1H from
water associated with the polymer backbone is possible if
one considers the protons from water in exchange with
that of the polymer (the exchangeable protons), in addition
to the water molecules H-bonded to the network (the
interfacial water) and finally the bulk water not affected
by the network.[26] Per melamine-formaldehyde motif the
number of exchangeable protons can be estimated to be
about 0–3 (exchangeable protons left on the amino groups
after polycondensation) and interfacial protons are about
30–36 in number (considering the number of donor and
acceptor centres in the motif, and also that two water
molecules have been shown to reorient anisotropically per
hydroxyl group of a carbohydrate[27]). Consequently, the
proportion of gel-associated water protons would roughly
be about 30–35% for MFG1 or MFG2. Then, the contribu-
tion of both the H-bonded and exchangeable protons to the
observed T2 value can be estimated using a similar ap-
proach to ref.[26] [Equation (6)], knowing that the bulk
water relaxes in 250 ms under the same conditions.
The estimates are of a few milliseconds only. These
results show that the observed relaxation rate is largely
dominated by the gel-associated water and that small
changes in the composition of the chemical gels will affect
the observed relaxation process.
Conclusion
This work gives a comprehensive study of a model organic
chemical hydrogel based on melamine-formaldehyde
chemistry. It aims at gaining insights about the chem-
istry of the gels formed by acid catalysis of melamine-
formaldehyde resins and is based on 13C CPMAS and T2
relaxation NMR experiments. When varying the formal-
dehyde or acid content, the nature of the resin is modified,
and despite the complexity of the systems studied, we find
Macromol. Chem. Phys. 2007, 208, 2204–2214
� 2007 WILEY-VCH Verlag GmbH & Co. KGaA, Weinheim
interesting features. Indeed, we show that (i) the content of
formaldehyde influences the type of bridging units present
in the gel, (ii) the amount of acid affects the gel crosslink-
ing density and degree of hydration, (iii) the initial type of
resin used impacts on the nature of the final material. We
also demonstrate that the type of bridges present in the
MFG specimens is of great importance when carrying
out postmodification reactions. Our study corroborates
the previous literature on physical gels of melamine-
formaldehyde resins but beyond that it lays out a real
potential in chemically designing hydrogels with tailored
properties (e.g. polarity, possibility of further postgrafting,
stability of the network upon drying), opening for instance
a new route towards organic hierarchical porous materials.
Acknowledgements: Dr. Marc Fricke and Dr. Vijay Raman arewarmly thanked for useful discussions and for their help inpreparing and modifying the hydrogels.
Received: May 8, 2007; Revised: July 20, 2007; Accepted: July 24,2007; DOI: 10.1002/macp.200700255
Keywords: hydrogels; melamine; solid-state NMR
[1] R. K. Iler, ‘‘The Chemistry of Silica’’, Wiley, New York 1979.[2] J. D. Epping, B. F. Chmelka, Curr. Opin. Coll. Interf. Sci. 2006, 11,
81.[3] R. W. Pekala, J. Mater. Sci. 1989, 24, 3221.[4] S. A. Al-Muhtaseb, J. A. Ritter, Adv. Mater. 2003, 15, 1001.[5] B. Tomita, C.-Y. Hse, Mokuzai Gakkaishi 1995, 41, 490.[6] P. Ramachandran, R. P. Subrayan, F. N. Jones, J. Appl. Polym.
Sci. 1996, 62, 1237.[7] L. A. Panangama, A. Pizzi, J. Appl. Polym. Sci. 1996, 59,
2055.[8] A. T. Mercer, A. Pizzi, J. Appl. Polym. Sci. 1996, 61, 1697.[9] B. Y. No, M. G. Kim, J. Appl. Polym. Sci. 2004, 93, 2559.
[10] M. L. Sheepers, P. J. Adriaensens, J. M. Gelan, R. A. Carleer,D. J. Vanderzande, N. K. de Vries, P. M. Brandts, J. Polym. Sci.1995, 33, 915.
[11] S. Jahromi, Macromol. Chem. Phys. 1999, 200, 2230.[12] S. Jahromi, Polymer 1999, 40, 5103.[13] J. Mijatovic, W. H. Binder, F. Kubel, W. Kantner, Macromol.
Symp. 2002, 181, 373.[14] M. Zanetti, A. Pizzi, J. Appl. Polym. Sci. 2004, 91, 2690.[15] A. Pizzi, B. George, M. Zanetti, J. Appl. Polym. Sci. 2005, 96,
655.[16] A. Despres, A. Pizzi, J. Appl. Polym. Sci. 2006, 100, 1406.[17] J. R. Ebdon, B. J. Hunt, W. T. S. O’Rourke, J. Parkin, Br. Polym. J.
1988, 20, 327.[18] A. S. Angelatos, M. I. Burgar, N. Dunlop, F. Separovic, J. Appl.
Polym. Sci. 2004, 91, 3504.[19] S. Jahromi, V. Litvinov, E. Gelade, J. Appl. Polym. Sci. 1999, 37,
3307.
www.mcp-journal.de 2213

C. C. Egger, V. Schadler, J. Hirschinger, J. Raya, B. Bechinger
2214
[20] [20a] M. Andreis, J. L. Kroenig, M. Gupta, S. Ramesh, J. Polym.Sci. 1995, 1449; [20b] M. Andreis, J. L. Kroenig, M. Gupta,S. Ramesh, J. Polym. Sci. 1995, 1461.
[21] K. J. Rao, S. Prabakar, ‘‘Magnetic Resonance Current Trends’’,C. L. Khetrapal, G. Govil, Eds., Springer-Verlag, Berlin 1991,p. 243.
[22] K. Friedemann, F. Stallmach, J. Karger, Cem. Concr. Res. 2006,36, 817.
[23] W. J. Blank, J. Coating. Technol. 1979, 51, 61.
Macromol. Chem. Phys. 2007, 208, 2204–2214
� 2007 WILEY-VCH Verlag GmbH & Co. KGaA, Weinheim
[24] F. N. Jones, G. Chu, U. Samaraweera, Prog. Org. Coat. 1994, 24,189.
[25] G. L. Nelson, C. E. Hoyle, R. F. Storey, Proceedings of the 15thWater-Born and Higher-Solids Coatings Symposium NewOrleans, Louisiana 1988, p. 33.
[26] R. Barbieri, M. Quaglia, M. Delfini, E. Brosio, Polymer 1998, 39,1059.
[27] B. P. Hills, C. Cano, P. S. Belton, Macromolecules 1991, 24,2944.
DOI: 10.1002/macp.200700255


![Conversion of Hyperpolarized [1-13C]Pyruvate in Breast ...](https://static.fdokumen.com/doc/165x107/6328a69be491bcb36c0bdd22/conversion-of-hyperpolarized-1-13cpyruvate-in-breast-.jpg)