1-s2 0-S0048969708004191-main
11
Detecting urbanization effects on surface and subsurface thermal environment — A case study of Osaka Shaopeng Huang a, ⁎ , Makoto Taniguchi b , Makoto Yamano c , Chung-ho Wang d a Department of Geological Sciences, University of Michigan, Ann Arbor, Michigan 48109-1005, USA b Research Institute for Humanity and Nature, 457-4 Motoyama, Kamigamo, Kita-ku, Kyoto, 603-8047, Japan c Earthquake Research Institute, University of Tokyo, 1-1-1 Yayoi Bunkyo-ku, Tokyo, 113-0032, Japan d Institute of Earth Sciences, Academia Sinica, P.O.B. 1-55, Taipei Nanking, 11529, Taiwan, ROC ARTICLE INFO ABSTRACT Available online 2 June 2008 Tremendous efforts have been devoted to improve our understanding of the anthropogenic effects on the atmospheric temperature change. In comparison, little has been done in the study of the human impacts on the subsurface thermal environment. The objective of this study is to analyze surface air temperature records and borehole subsurface temperature records for a better understanding of the urban heat island effects across the ground surface. The annual surface air temperature time series from six meteorological stations and six deep borehole temperature profiles of high qualities show that Osaka has been undergoing excess warming since late 19th century. The mean warming rate in Osaka surface air temperature is about 2.0 °C/100a over the period from 1883 to 2006, at least half of which can be attributed to the urban heat island effects. However, this surface air temperature warming is not as strong as the ground warming recorded in the subsurface temperature profiles. The surface temperature anomaly from the Osaka meteorological record can only account for part of the temperature anomaly recorded in the borehole temperature profiles. Surface air temperature is conventionally measured around 1.5 m above the ground; whereas borehole temperatures are measured from rocks in the subsurface. Heat conduction in the subsurface is much less efficient than the heat convection of the air above the ground surface. Therefore, the anthropogenic thermal impacts on the subsurface can be more persistent and profound than the impacts on the atmosphere. This study suggests that the surface air temperature records alone might underestimate the full extent of urban heat island effects on the subsurface environment. © 2008 Elsevier B.V. All rights reserved. Keywords: Surface air temperature Diurnal temperature range Borehole temperature Urban heat island effects Subsurface thermal environment 1. Introduction 20th century global warming is well documented in the instrumental record (Brohan et al., 2006) and a wide range of proxies including borehole temperatures (e.g., Huang, 2004). It has been recognized that anthropogenic forcing is at least partially responsible for the recent warming (IPCC, 2007). The human influences on climate change are particularly significant in urban areas. Urbanization alters the thermal properties of the land, changes the energy budget at the ground surface, changes the surrounding atmospheric circulation characteristics, gen- erates a great amount of anthropogenic waste heat, and leads to a series of changes in the urban environmental system. The impacts of urbanization on the thermal environment are generally termed as urban heat island effects. Those effects mostly originate near the ground surface and first result in surface temperature anomalies. The anomalous urban ground surface temperature anomalies will unavoidably propagate both upward into the atmosphere (Jones et al., 1990; Kalnay and Cai, 2003; Kim and Baik, 2004; Zhou et al., 2004; Brazel et al., SCIENCE OF THE TOTAL ENVIRONMENT 407 (2009) 3142 – 3152 ⁎ Corresponding author. E-mail address: [email protected] (S. Huang). 0048-9697/$ – see front matter © 2008 Elsevier B.V. All rights reserved. doi:10.1016/j.scitotenv.2008.04.019 available at www.sciencedirect.com www.elsevier.com/locate/scitotenv
Transcript of 1-s2 0-S0048969708004191-main

S C I E N C E O F T H E T O T A L E N V I R O N M E N T 4 0 7 ( 2 0 0 9 ) 3 1 4 2 – 3 1 5 2
ava i l ab l e a t www.sc i enced i rec t . com
www.e l sev i e r. com/ loca te / sc i to tenv
Detecting urbanization effects on surface and subsurfacethermal environment — A case study of Osaka
Shaopeng Huanga,⁎, Makoto Taniguchib, Makoto Yamanoc, Chung-ho Wangd
aDepartment of Geological Sciences, University of Michigan, Ann Arbor, Michigan 48109-1005, USAbResearch Institute for Humanity and Nature, 457-4 Motoyama, Kamigamo, Kita-ku, Kyoto, 603-8047, JapancEarthquake Research Institute, University of Tokyo, 1-1-1 Yayoi Bunkyo-ku, Tokyo, 113-0032, JapandInstitute of Earth Sciences, Academia Sinica, P.O.B. 1-55, Taipei Nanking, 11529, Taiwan, ROC
A R T I C L E I N F O
⁎ Corresponding author.E-mail address: [email protected] (S. H
0048-9697/$ – see front matter © 2008 Elsevidoi:10.1016/j.scitotenv.2008.04.019
A B S T R A C T
Available online 2 June 2008
Tremendous efforts have been devoted to improve our understanding of the anthropogeniceffects on the atmospheric temperature change. In comparison, little has been done in the studyof the human impacts on the subsurface thermal environment. The objective of this study is toanalyze surfaceair temperature recordsandborehole subsurface temperature records for abetterunderstanding of the urban heat island effects across the ground surface. The annual surface airtemperature time series from six meteorological stations and six deep borehole temperatureprofiles of high qualities show that Osaka has been undergoing excess warming since late 19thcentury. The mean warming rate in Osaka surface air temperature is about 2.0 °C/100a over theperiod from 1883 to 2006, at least half of which can be attributed to the urban heat island effects.However, this surface air temperaturewarming is not as strong as the groundwarming recordedin the subsurface temperature profiles. The surface temperature anomaly from the Osakameteorological record can only account for part of the temperature anomaly recorded in theborehole temperature profiles. Surface air temperature is conventionallymeasured around 1.5mabove the ground; whereas borehole temperatures are measured from rocks in the subsurface.Heat conduction in the subsurface ismuch less efficient than theheat convectionof the air abovethegroundsurface.Therefore, theanthropogenic thermal impactson thesubsurfacecanbemorepersistent and profound than the impacts on the atmosphere. This study suggests that thesurface air temperature records alone might underestimate the full extent of urban heat islandeffects on the subsurface environment.© 2008 Elsevier B.V. All rights reserved.
Keywords:Surface air temperatureDiurnal temperature rangeBorehole temperatureUrban heat island effectsSubsurface thermal environment
1. Introduction
20th century global warming is well documented in theinstrumental record (Brohan et al., 2006) and a wide range ofproxies including borehole temperatures (e.g., Huang, 2004). Ithas been recognized that anthropogenic forcing is at leastpartially responsible for the recent warming (IPCC, 2007). Thehuman influencesonclimate changeare particularly significantinurbanareas. Urbanization alters the thermal properties of theland, changes the energy budget at the ground surface, changes
uang).
er B.V. All rights reserved
the surrounding atmospheric circulation characteristics, gen-erates a great amount of anthropogenicwasteheat, and leads toa series of changes in the urban environmental system.
The impacts of urbanizationon the thermalenvironmentaregenerally termed as urban heat island effects. Those effectsmostly originate near the ground surface and first result insurface temperature anomalies. The anomalous urban groundsurface temperature anomalies will unavoidably propagateboth upward into the atmosphere (Jones et al., 1990; Kalnayand Cai, 2003; Kim and Baik, 2004; Zhou et al., 2004; Brazel et al.,
.

3143S C I E N C E O F T H E T O T A L E N V I R O N M E N T 4 0 7 ( 2 0 0 9 ) 3 1 4 2 – 3 1 5 2
2007; Liu et al., 2007; Stathopoulou and Cartalis, 2007) anddownward into the subsurface (Bodri and Cermak, 1999;Changnon, 1999; Baker and Baker, 2002; Ferguson and Wood-bury, 2004; Taniguchi et al., 2005).
With the increasing trend in urbanization worldwide,tremendous efforts have been devoted to improve our under-standing of the urban heat island effects. However, most of theresearch efforts so far have been focused on the atmosphericaspects of theurbanheat islandeffects (Jones et al., 1990;Kalnayand Cai, 2003; Peterson, 2003; Trenberth, 2004; Zhou et al., 2004;Brohan et al., 2006; Parker, 2006; Jenerette et al., 2007). Theurbanheat island effects on the subsurface temperature and theirenvironmental consequences are poorly understood.
The objective of this study is to analyze meteorologicalrecords and surface temperature data for the detection of theurbanization effects on the thermal environment across theground surface in Osaka metropolitan area in Japan.
Osaka is the second largest metropolis in the country andhas a population growing from 8.67 million in 1985 to8.82 million in 2006 (http://www.citypopulation.de/). Weanalyze the trends in the annual mean temperature, themean maximum and minimum temperatures, and the meandiurnal temperature range recorded in 6 meteorologicalstations around Osaka. We use a high quality subset ofborehole temperature data reported in two previous studies(Taniguchi and Uemura, 2005; Taniguchi et al., 2005) to detectthe subsurface warming in Osaka. We calculate the transientimpacts of the urban annual time series on subsurfacetemperature distribution, and compare the calculated subsur-face temperatures to the borehole measurements.
Although borehole temperatures can be used for a recon-structionof surface temperaturehistory (e.g., Huanget al., 2000),climate reconstruction is the focus of thepaper byYamanoet al.(this issue) in this special issue. Readers interested in climatereconstruction basedonborehole temperatures fromOsaka andseveral other Asian cities are referred to Yamano et al. (thisissue) for additional information and results.
This study is part of an on-going effort of the multi-disciplinary research project “Human impacts on urbansubsurface environment” which has Tokyo, Osaka, Bangkok,Seoul, Taipei, Manila, and Jakarta as its target research areas.
2. Meteorological records
In addition to the surface air temperature time series from theOsaka meteorological station, we select meteorologicalrecords from two urban stations (Kyoto and Kobe) and onesuburban station (Nara) around Osaka, and two rural stations(Tsurugisan and Ibukiyama) in more remote areas for thisstudy (Fig. 1). All the selected meteorological stations are themember stations of the Global Historical Climatological Net-work (GHCN) (Peterson and Vose, 1997).
The Osaka meteorological observatory is located in thedowntown area of the Osaka city. The Kyoto, Kobe, and Narastations are the GHCN stations closest to Osaka, locatedrespectively in the northern Kyoto city, the shore area of theKobe city, and the hilly area of the Nara city. The two ruralstations selected for comparison are the rural stations closestto Osaka among the 167 Japanese meteorological stations
included in the GHCN. Unfortunately, there are no other ruralstations in the GHCN that are located within the immediatevicinity of the Osaka metropolitan area.
For this study, we analyze the trends in annual meantemperature, annual mean maximum temperature, annualmean minimum temperature, and the diurnal temperaturerange for the selected stations. Themonthlymean temperature,mean maximum temperature, and mean minimum tempera-ture time series of the selected GHCN stations are available atthe Japan Meteorological Agency (JMA) website http://www.data.jma.go.jp/obd/stats/data/en/smp/index.html. Thesemeteorological records have been aggregated to generatecorresponding annual time series. We further derived theannual mean diurnal temperature range time series from theaggregated annual maximum andminimum records.
All of the four urban/suburban stations are still in activeservice and have annual data up to 2006 by the time of thisstudy. The Osaka time series started in 1883, and the Kyotorecord started two years earlier in 1881. However, both of thetwo rural stations have been out of service since 2001. Thetemporal lengths covered by the selected meteorologicalrecords range from 52 years (Nara) to 125 years (Kyoto). All ofthe selected meteorological records show overall warmingtrends in the annual mean temperature, maximum tempera-ture, and minimum temperature time series over theirobservation periods (Fig. 2).
The Osaka station shows a warming trend of 1.99 °C/100aover the 124 year period from 1883 to 2006, more than triplethe 20th century global warming rate 0.6 °C/100a (IPCC, 2001).The anomalous urban warming is consistently recorded in therecords from the nearby urban/suburban stations, of whichthe warming rates are 2.24 °C/100a for Kyoto, 1.45 °C/100a forKobe, and 1.96 °C/100a for Nara, respectively. In comparison,the warming rates recorded in the two rural stations are morediverse. Over its 55-year life span, the Tsurugisan stationshowed a warming rate of 0.47 °C/100a which is slightly lowerthan the global average; whereas the 82-year Ibukiyamarecord showed a 1.60 °C/100a warming rate that is muchgreater than the global average.
To reduce the ambiguity of comparing records of differenttemporal lengths, we have also analyzed the records over the1954–2000 period covered by all of the 6 selected stations. Thetrends derived from the records over the entire observationperiods and over the 1954–2000 common-period are summar-ized in Table 1 for comparison. Amore vigorous yet consistenturban warming trend and a more moderate yet diverse ruralwarming are reconfirmed by the common-period dataanalysis.
The change in the diurnal temperature range appears to beanother important indicator of urban heat island effects inthis region. In both entire-period and common-period ana-lyses, Osaka and the other two urban stations show adecreasing trend in the diurnal temperature range, apparentlydue to nighttime warming being more significant thandaytime warming in urban areas (Kalnay and Cai, 2003; Zhouet al., 2004). In contrast, the trends in the diurnal temperaturerange for the two rural stations are mild over their entireobservation periods, and positive over the 1954–2000 period(Table 1). In these two rural sites, the nighttime (minimumtemperature) warming trends are comparable to or less
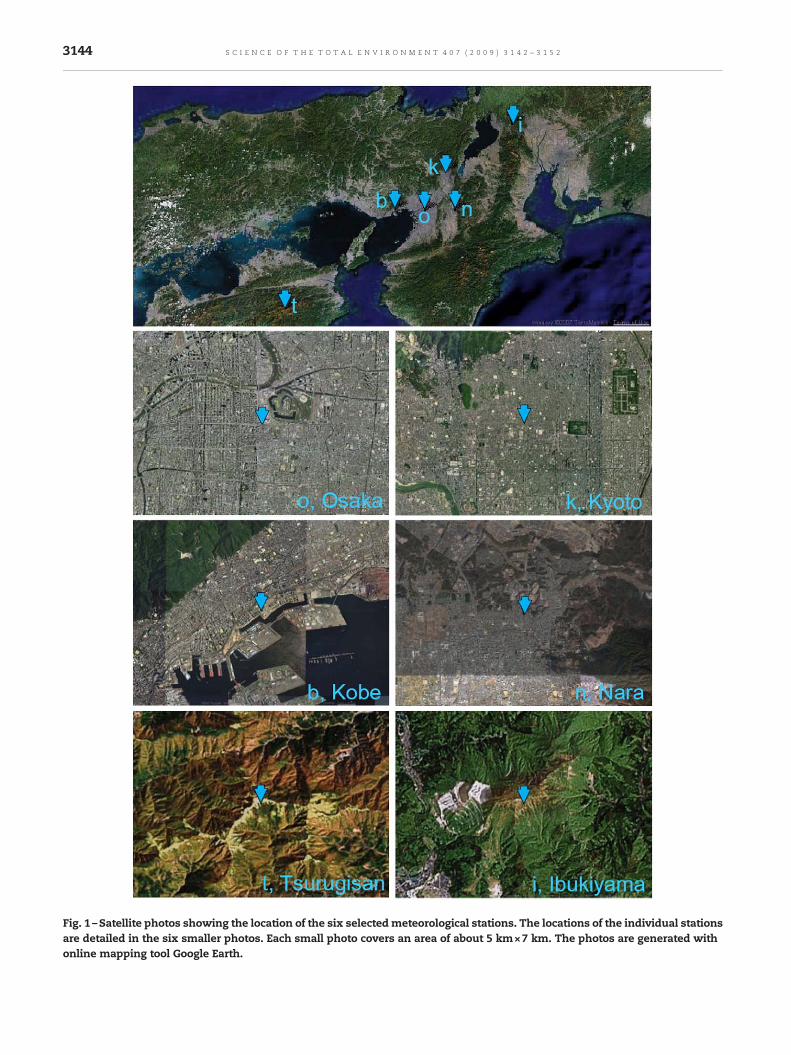
Fig. 1 –Satellite photos showing the location of the six selectedmeteorological stations. The locations of the individual stationsare detailed in the six smaller photos. Each small photo covers an area of about 5 km×7 km. The photos are generated withonline mapping tool Google Earth.
3144 S C I E N C E O F T H E T O T A L E N V I R O N M E N T 4 0 7 ( 2 0 0 9 ) 3 1 4 2 – 3 1 5 2

Fig. 2 –The annual mean (green dot), maximum (purple diamond), minimum (blue cross), and annual temperature range (redtriangle) time series and the linear regression trends for the selected meteorological stations. The equations for the trend linesare shownwith the same color scheme. The meteorological data were retrieved from the JapanMeteorological Agency websiteat http://www.data.jma.go.jp/obd/stats/data/en/smp/index.html. (For interpretation of the references to color in this figurelegend, the reader is referred to the web version of this article.)
3145S C I E N C E O F T H E T O T A L E N V I R O N M E N T 4 0 7 ( 2 0 0 9 ) 3 1 4 2 – 3 1 5 2
significant than the daytime (maximum temperature) warm-ing trends.
The record from the Nara station embraces a strongwarming trend in the annual mean temperature that is
similar to the urban stations and a positive trend in thediurnal temperature range that is characteristic of the tworural stations. The Nara station is classified in the GHCNinventory as an urban station based on the population of Nara

Table 1 – Characteristics of the selected meteorological records.
Stationname
Setting Latitude Longitude Periodcovered
Trends (°C/100a) over entireobservation period
Trends (°C/100a) over the1954–2000 period
North East Mean Max Min Range Mean Max Min Range
Osaka Urban 34°40.9′ 135°31.1′ 1883–2006 1.99 1.35 2.71 −1.36 2.90 1.58 4.17 −2.59Kyoto Urban 35°0.9′ 135°43.9′ 1881–2006 2.24 0.94 3.55 −2.61 2.43 0.68 3.25 −2.57Kobe Urban 34°41.8′ 135°12.7′ 1897–2006 1.45 0.66 1.95 −1.29 1.81 1.49 1.57 −0.08Nara Suburban 34°41.6′ 135°49.6′ 1954–2006 1.96 1.93 1.43 0.50 1.81 1.69 1.13 0.55Tsurugisan Rural 33°51.2′ 134°5.8′ 1946–2000 0.47 0.71 0.11 0.41 0.18 0.89 −0.33 1.22Ibukiyama Rural 35°25′ 136°24.4′ 1919–2000 1.60 1.72 1.88 −0.17 1.62 1.95 0.89 1.06
3146 S C I E N C E O F T H E T O T A L E N V I R O N M E N T 4 0 7 ( 2 0 0 9 ) 3 1 4 2 – 3 1 5 2
city it is associated with. The GHCN uses a tripartiteclassification of stations by population, with less than 10,000as Rural, 10,000 to 50,000 as Small Townandover 50,000 asUrban.The city of Nara has a population of over 300,000. However, incontrast to Osaka, Kyoto, and Kobe, the Nara meteorologicalstation is not within an urban center. We reclassify Nara stationas suburban for its location in thehilly areanear themarginof thecity (see Fig. 1). The positive trend in the diurnal temperaturerange is consistent with this reclassification.
3. Borehole data
The six boreholes fromwhich temperature measurements areanalyzed in this study are located within the denselypopulated Osaka urban area (Fig. 3). Osaka city occupies anarea of 220 km2 of the 1600 km2 Osaka alluvial plain which isopen to the Osaka Bay to the west, and surrounded byHokuetsu and RokkoMountains to the north, IkomaMountainto the east, and Izumi Mountain to the south. The plain iscovered by Pleistocene Osaka group and the later sediments toa thickness over 600 m in the central part of the plain. Theunderlying bedrocks of the Osaka plain are Mesozoic volcanicrocks and granites. All the boreholes were drilled at least20 years ago in the Quaternary sedimentary rocks.
The borehole temperature profiles (Fig. 4) used in thisanalysis are selected from the borehole temperatures mea-sured during the field campaign from August to October 2003.Subsurface temperatures from these boreholes were mea-sured at 1 m intervals with a logger of 0.01 K accuracy.Additional information regarding the geological settings of theborehole sites and the technical aspects of the temperaturemeasurements can be found in Taniguchi and Uemura (2005).
In principle, the distribution of temperature in the subsur-face is controlled in part by the heat flowing from deep interiorof Earth, and in part by the temperature history at the groundsurface (Cermak et al., 1992; Huang et al., 2000; Pollack andHuang, 2000; Harris andChapman, 2001; Smerdon et al., 2006). Ifthe surface temperature never changes, the distribution of thesubsurface temperature would be a linear function of depthwith the geothermal gradient as its slope (Fig. 5). However, if thesurface temperature changes with time, the distribution of thesubsurface temperature would depart from linearity. A pro-gressive cooling at the ground surface would result in atemperature profile bending towards lower temperature asillustrated in Fig. 5 in blue. Conversely, a warming at the groundsurfacewould forcea temperatureprofile tobowtowardshighertemperature at shallow depths (red curve in Fig. 5).
In the field, however, subsurface temperature is alsosubject to other perturbations related to site-specific environ-mental settings including land cover, land use, and ground-water movement (Pollack and Huang, 2000; Goto et al., 2005;Taniguchi and Uemura, 2005; Bartlett et al., 2006). 6 out of the34 borehole temperature profiles obtained by Taniguchiproject team over the 2003 field campaign (Taniguchi andUemura, 2005) in Osaka meet the basic data requirements forthe objective of detecting urban heat island effects.
Borehole drilling is very expensive and is generally unafford-able to researchers from an academic institution. Temperaturelogging for scientific research has to relymostly on the boreholesdrilled for industrial or civil purposes. As such, many boreholetemperature measurements from undesired settings may be notuseful to the specific research purpose due to high level of noise.
The boreholes available for logging in Osaka at the time aregroundwater monitoring wells. Many borehole temperaturedata are excluded from the analysis of this study due to severeperturbations from groundwater flows (Taniguchi and Uemura,2005;Taniguchi et al., 2005). Temperature changesat thegroundsurface can only impose smooth transient perturbations to thesubsurface temperature field. However, groundwater flows cancause both smoothandabrupt changes to a temperature profile.In our borehole data selection, an abrupt change is taken as anidentifier of ground water perturbation.
Another factor leading to the rejection of some boreholetemperature profiles is the borehole depth. Temperature mea-surements from shallowboreholeswould not allow separation ofthe steady steady-state geothermal gradient from the climate/urbanization related transient components. In this study,weonlyuse temperature profiles that extend to the depth of 180 m.
Although the temperature profiles selected for this studycompriseahighqualitysubsetof theOsakaboreholedataarchive,theyarenot freeofnon-climateperturbations, asevidenced in theirregular variation in the profiles. Nevertheless, the level of thenoise is much lower than the transient signals in the selectedprofiles. All six profiles bend towards higher temperature atshallower depths, a clear signature of ground warming in Osaka.
4. Urban heat island effects in surface airtemperature
A wide range of the urbanization effects in surface airtemperature have been reported by different groups, fromnegligible (Peterson, 2003; Parker, 2004; Peterson and Owen,2005; Parker, 2006) to very significant (Kato, 1996; Kalnay andCai, 2003; Li et al., 2004; Zhou et al., 2004; Kalnay et al., 2006).

Fig. 3 –Satellite photos showing the location of the six selected boreholes. The location of the Osaka (o), Kobe (b), and Nara (n)meteorological stations are shownon the topmap for reference. The locations of the individual borehole sites are detailed in thefive smaller photos. Each small photo covers an area of about 5 km×7 km. The photos are generated with online mapping toolGoogle Earth.
3147S C I E N C E O F T H E T O T A L E N V I R O N M E N T 4 0 7 ( 2 0 0 9 ) 3 1 4 2 – 3 1 5 2

Fig. 4 –Temperature - depth profiles selected for this study.Included in the legend labels are the borehole ID numbersfollowed by borehole names and logging dates.
Fig. 5 –Scheme illustrating the distribution of subsurfacetemperature controlled in part by geothermal gradient (G)and ground surface temperature condition. (For interpreta-tion of the references to color in this figure legend, the readeris referred to the web version of this article.)
3148 S C I E N C E O F T H E T O T A L E N V I R O N M E N T 4 0 7 ( 2 0 0 9 ) 3 1 4 2 – 3 1 5 2
The Osaka station documented a strong warming trend ofabout 2.0 °C/100a over the period from 1883 to 2006, and 2.9 °C/100a over the 1954–2000 period, much greater than the 20thcentury global warming rate 0.6 °C/100a (IPCC, 2001). Theanomalousurbanwarming is consistently recorded in the recordsfrom the nearby urban/suburban Kyoto, Kobe, and Nara stations.This excess warming rate in Osaka and its surrounding urbanareas is also substantially greater than the regional warming rateestimated by the Japan Meteorological Agency (JMA).
The JMA carefully selected 17 meteorological stationsacross the country that are considered not to have beenmuch influencedbyurbanization andhave continuous recordsfor the regional climate trend. The mean surface temperaturein Japan is estimated to have been rising at a rate of about1.06 °C per 100 years since 1898 (JMA, 2006). This Japaneseregional mean is close to the average of the warming trends ofthe two rural stations Tsurugisan and Ibukiyama, despite thatthe warming rates of these two stations are more diverse.
The JMA (JMA, 2006) cautions that its regional estimatemight be not entirely free of urbanization perturbation. Basedon the records from the urban stations around Osaka and theJMA regional estimate, a conservative estimate of the urbanheat island effects in Osaka would be in the range of 1–2 °C/100a. This estimate agrees in general with the early analysis ofKato (1996). Based on principal component score analysis ofmonthly mean temperature data for the period from 1920 to1992 from 51 meteorological stations in Japan, Kato suggeststhat the maximum urban effects with a population of over100,000 in 1993 were 1.0–2.5 °C/100a in Japan (Kato, 1996).
It is worthy of pointing out that climate change is nothomogenous, temporally and spatially. Based on land-onlymeteorological records, for example, Huang (2006a,b) show thaton a global scale, the 20th century warming comprised twowarming phases and a slightly cooling transition phase, with thefirstwarming phase over the earlier four decades and the secondwarming phase started in around the beginning of the 1970s.However, ona continental scale, a two-phasewarmingwasmoretypical ofNorthAmerica, Europe, andAfrica thanAsia, Australia,andSouthAmerica (see Fig. 1 ofHuang, 2006b). Themeansurfaceair temperature appeared to be flat over the first half of the 20thcentury in Asia. Among the three long long-term urban records
analyzed in this study,Osaka andKobe shownosignificant trendover the firsthalf of the20thcentury,which is consistentwith theAsian continental record. However, due to the shortage of long-term rural records for comparison, it is unclear at this pointwhether the missing of an early 20th century warming phase ischaracteristic of rural areas as well.
In addition to the warming rate substantially greater than theglobal and regionalmeans, the urban heat island effects in Osakaappear to be reflected in a decreasing trend in the diurnaltemperature range, as opposed to an increasing trend in the ruralareas. The overall decreasing rate of 1.36 °C/100a in the diurnalrange for the entire observation period and 2.59 °C/100a for thelater half of the 20th century also exceed the global mean of0.84 °C/100a (Easterling et al., 1997) and the rates inmany areas inAsia-Pacific region (Zhou et al., 2004; Griffiths et al., 2005).
The diurnal temperature range is an important climateparameter widely used in the study of urbanization effects(Easterling et al., 1997; Kalnay and Cai, 2003; Braganza et al.,2004; Zhou et al., 2004; Sun et al., 2006). Land use and landcover associated with roads and buildings tend to enhancedaytime storage and nighttime release of thermal energy.Therefore, the diurnal temperature range is commonlyexpected to decrease with urbanization.
It should be pointed out, however, that the spatial and tem-poral variations in the diurnal temperature range in the studyareas are not always coherent. For examples, superimposed onthe long-term decreasing trends are decadal increasing trends inthe Osaka and Kyoto series. Moreover, given a significantly de-creasing trend in the urban areas, it seems logical to expect thediurnal temperature range to be greater in rural areas than inurbanareas. But this isnot the case for themeteorological recordswe analyzed in this study. Fig. 2 shows that the diurnal tempe-rature ranges at the two rural sites are consistently smaller thanthe diurnal temperature ranges at the four urban/suburban sites.Over the 1954–2000 common-period, the average diurnal tem-perature ranges for the two rural stations are 5.58 (Ibukiyama)and 6.44 (Tsurugisan) °C, as opposed to the 8.1 (Osaka), 9.34(Kyoto), 7.54 (Kobe), and 9.96 (Nara) °C for the urban/suburbanstations.The relationshipbetween thediurnal temperature rangeand urbanization process in Osaka remains to be furtherinvestigated.

3149S C I E N C E O F T H E T O T A L E N V I R O N M E N T 4 0 7 ( 2 0 0 9 ) 3 1 4 2 – 3 1 5 2
5. Air warming and ground warming
Both meteorological record and borehole temperature datashow an on-going warming trend in Osaka which is expect-able. However, when we compare the synthetic temperatureprofiles projected from the Osaka annual surface air tempera-ture time series to the actual borehole temperature profiles,we also see discrepancies.
For a comparison of the meteorological projection and bore-hole observation, we first used the Shen and Beck functionalspace inversionmethod (ShenandBeck, 1991, 1992) toprocess theborehole data for the best estimates of the steady-state geother-mal gradient and surface temperature for each of the boreholes(Table 2).
The functional Space inversion method of Shen and Beck(1991, 1992) allows for incorporation of a priori information forthe ground surface temperature history, subsurface tempera-ture distribution, thermal physical properties, and the steadysteady-state basal heat flow (Shen et al., 1995). In addition tothe measured borehole temperatures, the a priori informationwe incorporated in the estimation of the steady steady-statecomponents include a regional thermal gradient of 0.034 K/m(Taniguchi and Uemura, 2005) and a terrestrial heat flow of85 mW/m2.
We then assumed that the ground surface temperature can beapproximated by the surface air temperature (Harris and Chap-man, 1997; Smerdon et al., 2004; Huang, 2006a) and calculated thetransient subsurface temperature anomalies that the Osakasurface air temperature series can be responsible for.
Temperature variation over time t at the ground surfaceimposes a downward-propagating transient perturbation to thesteady-state background temperature field. In a semi-infinitesolid medium, the subsurface transient temperature anomalyΔTz at a given depth z due to a temperature anomaly history onthe surface T0(t) is given by (Carslaw and Jaeger, 1959)
DTz =z
2ffiffiffiffiffiffipa
pZ
T0 tð Þt−3=2e−z2= 4atð Þdt;
where α is thermal diffusivity which is assumed to be0.8×10−6 m2/s, and the surface temperature anomaly T0(t) isreferred to the pre-1900 mean of the Osaka meteorologicalrecord. The calculated subsurface temperature anomaliesare superimposed on to the estimated steady-state compo-nents to synthesize the calculated temperature profiles.
We note that the calculation of the transient perturbationsfrom a surface temperature time series is dependant on thechoice of the initial temperature or the pre-observational
Table 2 – Estimated steady-sate components of the selected bo
BoreholeID
Boreholename
Latitude
North
1 Niwakubo2-3 34° 43′ 48″2 Minato2-B 34° 39′ 27″3 Sakai2 34° 34′ 39″4 Sakai3 34° 34′ 39″5 Izumiotu 34° 30′ 16″6 Kishiwada3 34° 28′ 30″
mean (Harris and Chapman, 1997). In this analysis the pre-1900 mean is taken as the initial temperature for two majorreasons: it is the best estimate we can get from themeteorological data available; and it is consistent with ourfocus on the borehole data down to the depth of 180 m.
We reiterate that the objective of this study is to detectpossible effects of urbanization on thermal environmentthrough comparative analyses of meteorological and boreholetemperature records. Given that the Osaka meteorological timeseries started in 1883 and that the transient perturbations of aground surface temperature history over the past one and aquarter centuries or so are expected to be confined within thedepth of 150m,we zoomon the borehole temperatures down toa depth of 180 m. A slightly greater cutoff depth of the boreholedata is to allow for the determination of the quasi steady state.
Fig. 6 shows that the subsurface temperature anomalycalculated from the meteorological record is substantiallysmaller than the groundwarming documented in the boreholetemperature profiles in Osaka. Given that the meteorologicalobservatory and the boreholes are all located within the urbanarea and that the daily mean temperature rarely falls belowfrozen point in Osaka, the discrepancy cannot be attributed tosnow cover effect (Chapman et al., 2004; Bartlett et al., 2005;Smerdon et al., 2006). Instead, the apparent discrepancybetween the meteorological and borehole records could becharacteristic of an urban thermal environment.
As noted earlier, the anthropogenic urban warmth mainlyoriginates on the ground surface and propagates upward to theatmosphere and downward to the earth. The so called surface airtemperature fromameteorological observatory is conventionallyrecorded at a height of around 1.5m above the ground surface. Ameteorological observatory is usually located in an open spacewhereair can floweasily. Theair flowaround theobservatory canprevent themeasuring instruments from feeling the full extent ofwarming on the ground surface. This could explain partially thatalthough the assembles of the surface air temperatures atregional and global scales include numerous urban records,they are not substantially contained by urban heat island effects,according to theworldwide andUSdata analyses (Peterson, 2003;Brohan et al., 2006; Parker, 2006).
On the contrary, borehole temperatures are measurementsof temperatures of rocks in the subsurface. It has long beenrecognized that the intensity of urban heat island effectsdecreases with increasing wind speed [e.g., see Arnfield, 2003for a review]. The influence of the large scale wind decreasesto zero at the ground surface. The heat transfer below theground surface is dominated by conduction which is ordersless efficient than air convection above the surface. Therefore,
rehole temperature profiles.
Longitude Geothermalgradient(°C/100m)
Surfacetemperature
(°C)East
135° 34′ 00″ 2.72 15.12135° 26′ 56″ 3.57 15.99135° 27′ 27″ 3.98 16.20135° 27′ 27″ 4.49 15.28135° 24′ 37″ 2.69 14.46135° 24′ 37″ 2.89 16.07

Fig. 6 –Comparison of the hypothetic temperature profilesprojected from the Osaka meteorological time series (dashedpurple curves) and the observed temperature profiles (solidred curves). Shown in green lines are the quasi-steady satetemperatures. The profiles are offset to avoid overlaps. (Forinterpretation of the references to color in this figure legend,the reader is referred to the web version of this article.)
3150 S C I E N C E O F T H E T O T A L E N V I R O N M E N T 4 0 7 ( 2 0 0 9 ) 3 1 4 2 – 3 1 5 2
the urban heat island effects could be more persistent andprofound in the subsurface than in the atmosphere.
6. Conclusions
The analysis of the meteorological records from the six GHCNstations aroundOsaka shows that there is a strongwarming inthe annual mean temperature and a decreasing trend in thediurnal temperature range in the urban areas, as opposed to amore moderate warming and an increasing trend in thediurnal range in rural areas. This general characterization ismore obvious in the trends derived from the period from 1954–2000 commonly covered by all six stations. Themeanwarmingrate in Osaka surface air temperature is about 2.0 °C/100a overthe period from 1883 to 2006 and 2.6 °C/100a from 1954 to 2000.Based on the comparison of the urban and regional trends, it isestimated that the urbanheat island effects are responsible forat least half of the observed surface air warming.
The overall diurnal temperature range in Osaka–Kyoto–Kobe urban areas has decreased considerably over the pastcentury. However, the spatial and temporal variations in thediurnal temperature range in the study areas are not alwayscoherent. There are increasing trends of decadal scales super-imposed on the long long-term decreasing trends in the Osakaand Kyoto diurnal temperature range records. Additionally,the fact that the diurnal temperature range is greater in urbanareas than in rural areas seems to contradict the decreasingtrend characteristic of urban stations. The relationshipbetween the diurnal temperature range and the urbanizationprocess in Osaka remains to be further investigated.
Six deep borehole temperature profiles obtained within theurban area of Osaka, a high quality subset of the borehole data
used in the two previous studies (Taniguchi andUemura, 2005;Taniguchi et al., 2005), are selected for the inspection of theurban heat island effects on the subsurface thermal environ-ment. All these borehole profiles comprise positive transienttemperature component at shallower depths that can beattributed to an on-going land warming in Osaka.
Both meteorological records and borehole data showstrong positive temperature anomalies in Osaka. However,the urban warming in Osaka recorded in the subsurfacetemperature profiles is significantly greater than what isrecorded in the near surface air temperature time series. Theair flow around a meteorological observatory might haveprevented the measuring instrument from recording the fullextent of anthropogenic warmth in the Osaka urban areas.
Surface air temperature is conventionally measured at aheight of around 1.5 m above the ground while boreholetemperatures are measured from rocks in the subsurface. Thedominating heat transport mechanism in the subsurface is heatconduction,which ismuch less efficient than theheat convectionof the air above the ground surface. Therefore, the anthropogenicthermal impacts on the subsurface are more persistent andprofound than the impacts on the atmosphere. This studysuggests that the surface air temperature records alone mightunderestimate the extent of urban heat island effects.
Temperature is a fundamental parameter controllingvarious physical, chemical, and geological processes. Thesubsurface urban heat island can adversely impact a city'secosystem, air quality, public health, energy demand, andmetropolitan infrastructure costs. Recent studies of Knorret al. (2005) and Knorr et al. (2007) on the possible effect ofwarming of soil on the microorganisms illustrates theimportance of a better understanding of subsurface thermalenvironment.With the world wide urbanization growing at anunprecedented pace, there is an urgent need to improve ourunderstanding of the subsurface urban heat island and itsenvironmental, social, and economical consequences.
Acknowledgements
The project “Human impacts on urban subsurface environ-ment” is sponsored by the Research Institute for Humanityand Nature in Kyoto. Huang is supported in part by the NOAAClimate Change Data and Detection Program (AwardNA07OAR4310059) and the Knowledge Innovation Programof the Chinese Academy of Sciences (Award KZCX2-YW-BR-03). This study is benefited from the constructive commentfrom Henry Pollack. The authors thank Drs. Vladimir Cermakand Robert Harris for their constructive comments that helpedto improve the quality of this paper.
R E F E R E N C E S
Arnfield AJ. Two decades of urban climate research: a review ofturbulence, exchanges of energy and water, and the urban heatisland. Int J Climatol 2003;23:1–26.
Baker JM, Baker DG. Long-term ground heat flux and heat storageat a mid-latitude site. Clim Change 2002;54:295–303.

3151S C I E N C E O F T H E T O T A L E N V I R O N M E N T 4 0 7 ( 2 0 0 9 ) 3 1 4 2 – 3 1 5 2
Bartlett MG, Chapman DS, Harris RN. Snow effect on NorthAmerican ground temperatures, 1950–2002. J Geophys ResEarth Surf 2005;110.
Bartlett MG, Chapman DS, Harris RN. A decade of ground-airtemperature tracking at Emigrant Pass Observatory, Utah.J Climate 2006;19:3722–31.
Bodri L, Cermak V. Climate change of the last millennium inferredfrom borehole temperatures: regional patterns of climaticchanges in the Czech Republic — Part III. Glob Planet Change1999;21:225–35.
Braganza K, Karoly DJ, Arblaster JM. Diurnal temperature range asan index of global climate change during the twentiethcentury. Geophys Res Lett 2004:31.
Brazel A, Gober P, Lee SJ, Grossman-Clarke S, Zehnder J,Hedquist B, et al. Determinants of changes in the regionalurban heat island in metropolitan Phoenix (Arizona, USA)between 1990 and 2004. Clim Res 2007;33:171–82.
Brohan P, Kennedy JJ, Harris I, Tett SFB, Jones PD. Uncertaintyestimates in regional and global observed temperature changes:a new data set from 1850. J Geophys Res Atmos 2006:111.
Carslaw HS, Jaeger JC. Conduction of Heat in Solids. New York:Oxford Univ. Press; 1959.
Cermak V, Bodri L, Safanda J. Underground temperature-fields andchanging climate — evidence from Cuba. Glob Planet Change1992;97:325–37.
Changnon SA. A rare long record of deep soil temperatures definestemporal temperature changes and an urban heat island. ClimChange 1999;42:531–8.
Chapman DS, Bartlett MG, Harris RN. Comment on “Ground vs.surface air temperature trends: Implications for borehole surfacetemperature reconstructions” by M.E. Mann and G. Schmidt.Geophys Res Lett 2004:31.
EasterlingDR,HortonB, JonesPD,PetersonTC,KarlTR,ParkerDE, et al.Maximum andminimum temperature trends for the globe.Science 1997;277:364–7.
Ferguson G, Woodbury AD. Subsurface heat flow in an urbanenvironment. J Geophys Research-Solid Earth 2004:109.
Goto S, Hamamoto H, Yamano M. Climatic and environmentalchanges at southeastern coast of Lake Biwa over past3000 years, inferred from borehole temperature data. PhysEarth Planet Inter 2005;152:314–25.
Griffiths GM, Chambers LE, Haylock MR, Manton MJ, Nicholls N,Baek HJ, et al. Change in mean temperature as a predictor ofextreme temperature change in the Asia-Pacific region. Int JClimatol 2005;25:1301–30.
Harris RN, Chapman DS. Borehole temperatures and a baseline for20th-century global warming estimates. Science 1997;275:1618–21.
Harris RN, Chapman DS. Mid-Latitude (30 degrees–60 degrees N)climatic warming inferred by combining borehole temperatureswith surface air temperatures. Geophys. Res. Lett.2001;28:747–50.
Huang S. Land warming as part of global warming. Eos. Trans AmGeophys Union 2006a;87:477–80.
Huang SP. 1851–2004 annual heat budget of the continentallandmasses. Geophys Res Lett 2006b:33.
Huang SP. Merging information from different resources for newinsights into climate change in the past and future. GeophysRes Lett 2004:31.
Huang SP, Pollack HN, Shen PY. Temperature trends ever the pastfive centuries reconstructed from borehole temperatures.Nature 2000;403:756–8.
IPCC. Climate Change. In: Houghton JT, Ding Y, Griggs DJ,Noguer M, Linden PJvd, Dai X, et al, editors. The ScientificBasis: Contribution of Working Group I to the Third Assess-ment Report of the Intergovernmental Panel on ClimateChange. Cambridge, U.K.; New York: Cambridge UniversityPress; 2001.
IPCC. Climate Change. The physical science basis. In: SolomonS, Qin D, Manning M, Chen Z, Marquis M, Averyt KB, et al,
editors. Contribution of Working Group I to the fourthassessment report of the intergovernmental panel onclimate change. Cambridge, U.K.; New York: CambridgeUniversity Press; 2007. p. 996.
Jenerette GD, Harlan SL, Brazel A, Jones N, Larsen L, Stefanov WL.Regional relationships between surface temperature, vegeta-tion, and human settlement in a rapidly urbanizing ecosystem.Landsc Ecol 2007;22:353–65.
JMA. Climate Change Monitoring Report. Japan MeteorologicalAgency, Tokyo, Japan; 2005.
Jones PD, GroismanPY, CoughlanM, PlummerN,WangWC,Karl TR.Assessment of urbanization effects in time-series of surface air-temperature over land. Nature 1990;347:169–72.
Kalnay E, Cai M. Impact of urbanization and land-use change onclimate. Nature 2003;423:528–31.
Kalnay E, Cai M, Li H, Tobin J. Estimation of the impact of land-surface forcings on temperature trends in eastern UnitedStates. J Geophys Res Atmos 2006:111.
Kato H. A statistical method for separating urban effect trendsfrom observed temperature data and its application toJapanese temperature records. J Meteorol Soc Jpn1996;74:639–53.
Kim YH, Baik JJ. Daily maximum urban heat island intensity inlarge cities of Korea. Theor Appl Climatol 2004;79:151–64.
Knorr W, Gobron N, Scholze M, Kaminski T, Schnur R, Pinty B.Impact of terrestrial biosphere carbon exchanges on theanomalous CO2 increase in 2002–2003. Geophys Res Lett2007:34.
KnorrW, Prentice IC, House JI, Holland EA. Long-term sensitivity ofsoil carbon turnover to warming. Nature 2005;433:298–301.
Li Q, Zhang H, Liu X, Huang J. Urban heat island effect on annualmean temperature during the last 50 years in China. TheorAppl Climatol 2004;79:165–74.
Liu W, Ji C, Zhong J, Jiang X, Zheng Z. Temporal characteristics ofthe Beijing urban heat island. Theor Appl Climatol2007;87:213–21.
Parker DE. Climate — large-scale warming is not urban. Nature2004;432:290-290.
Parker DE. A demonstration that large-scale warming is not urban.J Clim 2006;19:2882–95.
Peterson TC. Assessment of urban versus rural in situ surfacetemperatures in the contiguous United States: no differencefound. J Clim 2003;16:2941–59.
Peterson TC, Owen TW. Urban heat island assessment: metadataare important. J Clim 2005;18:2637–46.
Peterson TC, Vose RS. An overview of the global historicalclimatology network temperature database. Bull Am MeteorolSoc 1997;78:2837–49.
Pollack HN, Huang SP. Climate reconstruction from subsurfacetemperatures. Annu Rev Earth Planet Sci. 2000;28:339–65.
Shen PY, Beck AE. Least-squares inversion of borehole tempera-ture-measurements in functional space. J Geophys Res SolidEarth 1991;96:19965–79.
Shen PY, Beck AE. Paleoclimate change and heat-flow densityinferred from temperature data in the superior province ofthe Canadian shield. Glob Planet Change 1992;98:143–65.
Shen PY, Pollack HN, Huang S, Wang K. Effects of subsurfaceheterogeneity on the inference of climate-change fromborehole temperature data — model studies and fieldexamples from Canada. J Geophys Res Solid Earth1995;100:6383–96.
Smerdon JE, Pollack HN, Cermak V, Enz JW, Kresl M, Safanda J, etal. Air–ground temperature coupling and subsurface propa-gation of annual temperature signals. J Geophys Res Atmos2004:109.
Smerdon JE, Pollack HN, Cermak V, Enz JW, Kresl M, Safanda J,et al. Daily, seasonal, and annual relationships between airand subsurface temperatures. J Geophys Res Atmos2006:111.

3152 S C I E N C E O F T H E T O T A L E N V I R O N M E N T 4 0 7 ( 2 0 0 9 ) 3 1 4 2 – 3 1 5 2
Stathopoulou M, Cartalis C. Daytime urban heat islands fromLandsat ETM+ and Corine land cover data: an application tomajor cities in Greece. Sol Energy 2007;81:358–68.
Sun DL, Pinker RT, Kafatos M. Diurnal temperature range over theUnited States: a satellite view. Geophys Res Lett 2006:33.
Taniguchi M, Uemura T. Effects of urbanization and groundwaterflow on the subsurface temperature in Osaka, Japan. PhysEarth Planet Inter 2005;152:305–13.
Taniguchi M, Uemura T, Sakura Y. Effects of urbanization andgroundwater flow on subsurface temperature in three mega-cities in Japan. J Geophys Eng 2005;2:320–5.
Trenberth KE. Climatology — rural land-use change and climate.Nature 2004;427:213-213.
Zhou LM, Dickinson RE, Tian YH, Fang JY, Li QX, Kaufmann RK, et al.Evidence for a significanturbanizationeffect onclimate inChina.Proc Natl Acad Sci US Am 2004;101:9540–4.