Main project
72
CHAPTER ONE 1.0 Introduction This chapter represents the following subtopics of chapter one in the following order; background to the study, statement of the problem, research objectives , research questions, significance of the study, research limitations, scope of the study and conceptual framework. It is the section that lays the section of the foundation of the study. 1.1 Background to the study Exchange rate exposure is becoming an increasingly important issue in international financial management. Exchange rate fluctuations are a major source of risk for multinational corporations. To mitigate exchange rate uncertainty, it has been claimed that hedging; not only financial hedging, but also operational hedging can protect companies from unexpected movements of exchange rates (Allayannis, Ihrig, and Weston (2000)). Corporate hedging refers to the use of off-balance-sheet instruments and on-balance-sheet strategy (Nance (1993)). Firms that are exposed to exchange rate risk can actively reduce currency risk by two ways. On the one hand, firms can hedge exchange rate risk by financial hedging, entering into derivatives contracts, such as forwards, futures or 1
-
Upload
independent -
Category
Documents
-
view
0 -
download
0
Transcript of Main project
CHAPTER ONE
1.0 Introduction
This chapter represents the following subtopics of chapter one in
the following order; background to the study, statement of the
problem, research objectives , research questions, significance of
the study, research limitations, scope of the study and conceptual
framework. It is the section that lays the section of the
foundation of the study.
1.1 Background to the study
Exchange rate exposure is becoming an increasingly important issue
in international financial management. Exchange rate fluctuations
are a major source of risk for multinational corporations. To
mitigate exchange rate uncertainty, it has been claimed that
hedging; not only financial hedging, but also operational hedging
can protect companies from unexpected movements of exchange rates
(Allayannis, Ihrig, and Weston (2000)). Corporate hedging refers to
the use of off-balance-sheet instruments and on-balance-sheet
strategy (Nance (1993)). Firms that are exposed to exchange rate
risk can actively reduce currency risk by two ways. On the one
hand, firms can hedge exchange rate risk by financial hedging,
entering into derivatives contracts, such as forwards, futures or
1
options. The hedging with these off-balance-sheet contracts has a
negative effect on exchange rate exposure. On the other hand, firms
can reduce their exposure through on-balance-sheet hedging. Firms
can move factories to its sales markets and as a result revenues
and expenses are incurred in the same currency. This is also called
operational hedging, which has a negative effect on exchange rate
exposure.
1.1.1 What Is Foreign Exchange Rate Exposure
The exchange rate is the price of one country’s currency in terms
of another currency and it is one of the most important prices in
the open economy. It is a well-known fact that after the breakdown
of the Bretton Woods System of fixed exchange rates in 1973,
exchange rate volatility has increased dramatically and
unpredictably. For example, exchange rates are typically four times
as volatile as interest rates and ten times as volatile as
inflation rates.
It is widely believed that exchange rate movements should affect
the value of a firm. A multinational corporation (MNC) with
subsidiaries in foreign locations, an exporter or importer
concentrating on international trade or even a firm that has no
direct international activities will be affected by the exchange
rate fluctuations.
2
The general concept of exchange rate exposure refers to the degree
to which a company is affected by exchange rate changes. A number
of theoretical papers have investigated the possible sources of
exchange rate exposure. For example, Dumas (1978), Adler and Dumas
(1980), and Hodder (1982) have defined economic exposure to
exchange rate movements as the regression coefficient of the real
value of a firm on the exchange rate across states of nature. As
Adler and Dumas (1984) point out, from the viewpoint of U.S.
investors, exposure is the regression coefficient or, if there are
many currencies, the vector of partial regression coefficients,
when an asset’s dollar price is regressed on exchange rates. From
the viewpoint of the firm and its managers, exposure is a
statistical quantity rather than a (projected) accounting number.
The regression coefficient concept of exposure provides a single
comprehensive measure that summarizes the sensitivity of the whole
firm, to all the various ways in which exchange rate changes can
affect it. Once exposure is so measured it can, for purposes of
managerial control, be decomposed into distinct components. The
decomposition can produce the counterparts of translation and
transaction exposure as part of the total exposure. Neither parts
should be ignored or hedged alone
3
Based on the impact of exchange rate changes on a firm, there are
mainly two types of exchange rate exposure – accounting exposure,
and transaction exposure
Accounting exposure, also known as translation exposure, refers to
the changes in income statement items and the book value of balance
sheet assets and liabilities that are caused by an exchange rate
change. More specifically, it arises from the need, for the purpose
of reporting and consolidation, to convert the financial statements
of foreign operations from the local currencies involved to the
home currency.
Transaction exposure results from transactions that give rise to
known, contractually binding future foreign-currency-denominated
cash inflows or outflow. Since the transaction will result in a
future foreign currency cash inflow or outflow, any change in the
exchange rate between the time the transaction is entered into and
the time it is settled in cash will lead to a change in the
domestic currency amount of cash inflow or outflow.
1.1.2 Corporate Hedging
Corporate hedging refers to the use of off-balance-sheet
instruments such as forwards, futures, swaps and options to reduce
the volatility of firm value (Nance (1993)).
4

Managing foreign exchange exposure is now an important aspect of
corporate risk management.
Hedging a particular currency exposure means establishing an
offsetting currency position such that whatever is lost or gained
on the original currency exposure is exactly offset by a
corresponding foreign currency gain or loss on the currency
Exchange rate exposure is becoming an increasingly important issue
in international financial management. Exchange rate fluctuations
are a major source of risk for multinational corporations. To
mitigate exchange rate uncertainty, it has been claimed that
hedging, not only financial hedging, but also operational hedging
can protect companies from unexpected movements of exchange rates
(Allayannis, Ihrig, and Weston (2000)).
Firms that are exposed to exchange rate risk can actively reduce
currency risk by two ways. On the one hand, firms can hedge
exchange rate risk by financial hedging, entering into derivatives
contracts, such as forwards, futures or options. The hedging with
these off-balance-sheet contracts has a negative effect on exchange
rate exposure. On the other hand, firms can reduce their exposure
through on-balance-sheet hedging. Firms can move factories to its
sales markets and as a result revenues and expenses are incurred in
the same currency. This is also called operational hedging, which
has a negative effect on exchange rate exposure.5

According to the classic Modigliani and Miller theory, financial
risk management is irrelevant to the firm. Investors can hedge on
their own by holding well-diversified portfolios. Optimal hedging
theories, however, suggest that a firm’s hedging activities affect
the extent to which the firm is exposed to exchange rate movements.
In a world of market imperfections, firms have incentives to employ
derivative instruments to hedge against exchange rate risk.
Extensive use of derivatives as hedging instruments should diminish
a firm’s exposure.
.
1.2 Problem statement
Previous researches have tried to uncover the impact of financial
derivatives’ use on exchange rate exposure by using a series of
variables that existing studies find to be important in explaining
a firm’s hedging policy to proxy for financial hedging. For
example, He and Ng (1998) relate the exchange rate exposure to the
level of its export ratio and variables that are proxies for its
hedging needs. For the past few decades, the effectiveness of
currency hedging has been studied by a number of papers providing
empirical results of both US and European countries. In addition to
Allayannis and Ofek’s (2001) study indicating that the use of
foreign currency derivatives can significantly reduce the exchange
rate exposure of US firms, jong, Ligterink and Macrae (2002) take a6

look at Dutch firms. They found that financial hedging by using
derivative has no significant effects on the exchange exposure,
which is in contrast to their hypothesis. In line with theory, they
find that exchange rate exposure is significantly reduced through
operational hedging by producing in factories abroad. Nydahl (2001)
has also studied the Swedish firms and found that the foreign
exchange exposure is negatively related to the use of currency
derivatives
These abovementioned results are only applied to the US and
European countries, few studies thus far have examined the hedging
effects of firms in African countries.
Kenya has witnessed local companies operating in various
countries. Furthermore there are extraordinary high portion of MNCs
that are significantly exposed to exchange rate risk. In this light
the researcher will seek to answer the question, does hedging
effectively reduce these exchange rate exposures? In this study, we
will examine the hedging effectiveness on companies trading in the
stock exchange.
While most studies have examined firms’ financial hedging, few
studies have examined firms’ operational hedging. Diversifying
operations in different countries is a very important way to
eliminate exchange rate risk. However, it is difficult to measure
operational hedging. Jong, Ligterink and Macrae (2002) gather the7
operational hedging information through a tailor-made questionnaire
by asking the firms directly to indicate what percentage of total
exposure the firm hedges through its operation. They find that
operational hedging has significant negative effect on exchange
rate exposure for a sample of Dutch firms. Allayannis, Ihrig, and
Weston (2000) develop several measures of geographic dispersion
that proxy for the use of operational hedging strategies, they find
that geographic dispersion through the location of subsidiaries
across multiple countries or regions does not reduce exchange rate
exposure.
This study will aim at investigating both financial and operational
hedging in the risk management strategies of multinational
corporations.
Moreover, as the use of the foreign currency derivatives for
financial hedging has grown dramatically in the past two decades, I
take a further step to examine the determinants of the use of
derivatives.
While these tests reveal the factors that prompt corporations to
hedge, they do not answer the question of what determines the
extent of hedging.
1.3 General objectives
8
To investigate the various financial and operating hedging
strategies and / or tools on foreign exchange rate exposure and how
such strategies impact on firms’ value.
Specific objectives of this study.
1. To examine the effectiveness of financial hedging on exchange
rate exposure.
2. To determine the effect of operating hedging on exchange rate
exposure.
3. To determine how each strategy contributes to the risk
management of eliminating exchange rate exposure and improving
firm value.
4. To examine the effectiveness of derivatives use on firm market
value.
1.4 Empirical Questions of This Study
1. Can financial hedging reduce the exchange rate exposure of
multinational corporations and what determines the use of
foreign currency derivatives by corporations?
2. Can operational hedging reduce the exchange rate exposure of
multinational corporations and what determines the use of
foreign currency derivatives by corporations?
3. Do exchange rate movements affect firm value? Is exchange rate
exposure significant for the multinational corporations?
4. Does hedging affect firms’ market value?9

1.5 Justification of the study
While there are an increasing number of studies providing evidence
that firms that hedge fit the profile of one theory or another, no
study have addressed the question of whether there is a direct
relation between hedging and firm value. The study will try to find
out which hedging strategies that a firm can use to increase its
value.
Empirical examination of hedging theories has been difficult. Many
previous papers have been unable to uncover the impact of financial
derivatives’ use on exchange rate exposure due to unavailability of
data on hedging instruments. Most of the earlier studies used
survey data to examine why firms use derivatives. For example,
Nancy, Smith and Smithson (1993) use survey data to compare
characteristics of firms that actively hedge with those that do
not.
IFRS 7 requires firms to disclose information on financial
instruments with off-balance sheet risk (e.g., futures, forwards,
options and swaps) with effect from January 1 2009. With the
availability of derivative data, the effect of the use of
derivatives on foreign exchange exposure can be easily examined
using a sample of Kenya multinationals. I will use detailed
10

derivative data to examine whether firms use foreign currency
derivatives for hedging or for speculative purposes.
1.6 Significance of the research.
The study will have the following benefits which will justify why
it need to be undertaken.
Multinationals corporations; There has been a sharp increase in
foreign investment in Kenya. Multi-national and transnational
corporations are playing increasingly important roles in Kenyan
business. The researches will benefits companies quoted in the NSE
with subsidiaries in foreign countries.
Firms that have foreign involvement; Kenyan corporate units are
also engaging in a much wider range of cross border transactions
with different countries and products. Kenyan firms have also been
more active in raising financial resources abroad. All these
developments combine to give a boost to cross-currency cash flows,
involving different currencies and different countries. The
corporate enterprises in India are increasingly alive to the need
for organised fund management and for the application of innovative
hedging techniques for protecting themselves against attendant
risks. Derivatives are the tools that facilitate trading in risk.11
Importers and exporters will understand the effect of international
dynamics on the local economy
The foreign exchange market is still evolving and corporate
enterprises are going through the movements in transition from a
passive to an active role in risk management. There is no organized
information available on how the corporate enterprises in India are
facing this challenge. It is in this context that a review of the
perceptions and concerns of the corporates, in relation to
derivatives and of their initiatives in tuning the organisational
set up to acquire and adopt the requisite skills in risk
management, assumes significance. Appropriate policy and other
measures can then be taken to accelerate the process of further
development of foreign exchange market and also upgrade foreign
exchange risk management (FERM) with higher professionalism and
increased effectiveness.
The liberalisation of the kenyan economy started in 1991.Demand and
supply conditions now govern the exchange rates in our foreign
exchange market. A fast developing economy has to cope with a
multitude of changes, ranging from individual and institutional
preferences to changes in technology, in economic policies, in
regulations etc. Besides, there are changes arising from external
trade and capital account interactions. These generate a variety of
risks, which have to be managed.12
1.7 Scope of the study
The study may not be wholly relied upon in determining similar
cases in the future as factors triggering the foreign exchange
reactions changes from time to time.
-Secondly, other factors that affect the stock market have not been
included and their effect on this study is therefore not
established empirically. As such an element of error cannot be
ruled out.
-The study is based on estimates and forecasts which may have a
significant variation from the actual results.
13

CHAPTER TWO
2.0 Literature review
A number of empirical researches have examined the question of how
firms deal with the foreign exchange risk. Usually, firms utilize
two different ways to hedge the exchange rate risk. One is a
financial hedge through financial market instruments, such as
exchange rate derivatives or foreign currency debt, and the other
is an operational hedge through the operational setup of the
exporting firm. To effectively manage long-term exchange rate
risks, firms should built operational hedging strategies in
addition to widely used financial hedging strategies. Most studies
focus on currency hedging1. These studies analyze the relationship
between operational hedging and financial hedging and show the
14

effectiveness of both strategies by conducting empirical analysis
based on firms' stock return
2.1 Operational hedging
Real options are referred to as operational hedging mechanisms in
the operations management literature. Operational hedging has been
studied in a variety of fields - operations management, finance,
strategy and international business. In all fields, operational
hedging is discussed in conjunction with financial hedging, and
mostly analyzed in a multinational context. The existence of risks
that can only be managed operationally (Triantis 2000) means that
operational hedging constitutes an important part of firm-level risk
management programs: Empirical investigations (Allayannis et al.
2001, Pantzalis et al. 2001) clearly demonstrate that firms do use
operational hedges in managing their risks.
The finance literature has used the term “operational hedging” in
the last decade with increasing frequency. It is always discussed in
conjunction with its financial counterpart, financial hedging. In
the finance literature, operational hedging is the course of action
that hedges the firm’s risk exposure by means of non-financial
instruments, particularly through operational activities.
15
2.12 Operational hedging strategies.
Similar to the operations management literature, operational
flexibility is the major operational hedging strategy discussed in
the finance literature. Finance research underlines the value-
enhancing capability of this kind of flexibility by referring to
its real option features. Even in a risk-neutral setting, creating
real option features in an existing investment increases value by
providing flexibility in the decision-making process. Since most of
the papers are in the context of multinational corporations,
operational flexibility in the form of switching production or
sourcing locations is the most prevalent type of operational
hedging strategy.
In addition to operational flexibility, geographical
diversification is discussed as another operational hedging
strategy in a multinational context. Geographical diversification
is aligning the costs and revenues of a firm so that they are
exposed to the same risks. Domestic firms selling to foreign
markets can ensure that their production costs and sales revenues
are exposed to the same exchange rate uncertainties by opening a
production facility in these markets. As in the case of operational
flexibility, firms reduce their downside exposures to exchange rate
risks by eliminating the negative effect of appreciated local16
currency (in the form of higher production costs). However,
different from operational flexibility, firms also sacrifice the
gains in the upside by forgoing the positive effect of depreciated
currency (in the form of lower production costs). Therefore,
geographical diversification reduces the total variability of cash
flows.
Chowdry and Howe (1999) consider opening a production facility in a
foreign market as the operational hedging strategy of multinational
firms without differentiating between geographical diversification
and operational flexibility. They analyze the conditions under
which firms engage in financial and operational hedging strategies
with respect to exchange rate and demand risks. They state that by
having plants in several countries, multinationals can align their
costs and revenues besides shifting production among these
locations. They argue that the facility location decision is
considered to be an operational hedging strategy only when firms
are concerned with the variability of their operating profits.
Hommel (2003) considers geographical diversification and
operational flexibility in the form of a real switching option as
two separate operational hedging strategies. He investigates the
incentives of firms to hedge currency risk with financial and
operational (there, “operative”) means in a multinational context.
The hedging motivation is introduced through a minimum profit17
constraint such that firms have incentives to hedge their payoffs
to satisfy this constraint. He argues that operational flexibility
is employed as a hedging device when the exchange rate and demand
volatility are sufficiently large (in that case the minimum profit
constraint is violated); otherwise it serves as a value driver to
enhance expected profits.
These papers emphasize that because operational flexibility can be
used for a purely value-enhancement motive, it is considered to be
an operational hedging strategy only when there is a risk hedging
motive for employing it. Generally speaking, operational actions
are considered to be operational hedges if they are taken in order
to reduce a risk measure of concern. In particular, if firms care
about downside risk (e.g. having a minimum profit constraint),
then operational hedges mitigate risk through a reduction in the
downside exposure.
If variance of the payoffs is the risk measure under consideration
(e.g. having a convex tax schedule), then operational hedges
mitigate risk through a reduction in variance.
In empirical research in risk management, operational hedging
strategies are always studied in conjunction with financial
derivatives in an exchange rate or commodity setting. Geographical
diversification and operational flexibility are the operational
hedging strategies implemented through different operational18

decisions. This field mainly investigates the substitutability or
complementarities of operational and financial hedging instruments
and tests whether firms use risk management activities under
different risk management motives.
Fok et al. (1997) consider locating production facilities in major
foreign markets to minimize foreign exchange rate exposure, and
choosing a technology to minimize exposure to commodity price risk
to be production-originated hedging instruments of multinational
firms. Although the term “operational hedging” is not used, the
former is simply geographical diversification whereas the latter is
similar to a product differentiation strategy (Miller 1998), which
is a type of operational flexibility.
In a multinational context, Allayannis et al. (2001) proxy the
operational hedging of multinationals by the level of geographic
dispersion (the location of subsidiaries across multiple countries
or regions) without differentiating between geographical
diversification and operational flexibility. They investigate both
financial and operational exchange rate risk management strategies
of firms, and demonstrate how much each strategy contributes to the
overall goal of mitigating risk and improving shareholder value.
In a similar framework, Doukas and Padmanabhan (2002) consider the
intangible assets of firms to be operational hedging devices with
respect to political risks. The authors argue that by having high19
levels of intangible assets, firms can compensate the loss due to
the political interruption of a host government using their other
assets (for example, in other countries). Observe that high levels
of intangible assets provide flexibility in terms of shifting
resources among countries or businesses; this is another form of
operational flexibility.
In a commodity setting, Petersen and Thiagarajan (2000) focus on
gold mining firms. These firms, by adjusting their mining strategies
as a function of gold price, create cost structures that positively
correlate with the price of gold. Operational flexibility, created
by the ability to adjust cost structures, is their operational
hedging strategy, and creates a natural hedge against gold price
exposure.
Carter et al. (2003) define operational hedging strategies as a
combination of production and marketing strategies across the firm’s
operating units developed to manage long-term exposures. Other than
geographical diversification, they discuss real option type
operational hedging strategies such as shifting sourcing or
production, exploiting growth-options, having pricing flexibility
and abandoning foreign markets. Observe that all of these strategies
are again types of operational flexibility.
In the international business literature, Pantzalis et al. (2001)
define operational hedging as the firm’s operational decisions20
(related to marketing, production, sourcing, plant location,
treasury) that are best suited to managing the exchange rate
exposure on the firm’s competitive position across markets. Without
using the term “geographical diversification,” they consider the
shifting of production to offset price changes with local cost
changes to be an operational hedging strategy. As another
operational hedging strategy, they describe the operational
flexibility of multinationals in the form of shifting production and
transferring resources within their network.
Research in the strategy field provides a more comprehensive and
complete discussion of diversification and operational flexibility
from different perspectives. Diversification is defined as having
different lines of business through mergers and joint ventures
(Wang and Lim 2003), of which geographical diversification is one
type.
Kogut (1985) analyzes diversification and operational flexibility
as risk management tools of multinationals. He examines how
operational flexibility and diversification change the risk
profiles of firms. He argues that an operational decision (the
sourcing policy in this case) can create three different types of
risk profile: speculative, hedged and flexible. The speculative
profile is betting on one site mainly to benefit from economies of
scale in operations. By matching the exchange rate exposure on the21

cost side with that on the profit side, the firm can create a
hedged risk profile. This approach corresponds to the geographical
diversification strategy discussed in the finance literature.
Finally, a flexible risk profile created through operational
flexibility permits the firm to exploit uncertainties by creating
real options. Operational flexibility creates both arbitrage
(exploitation of differences between markets such as production
switching) and leverage (enhancing strategic position such as
increased bargaining power in negotiations with local governments)
opportunities for multinationals.
Miller (1998) says that strategic hedges, which he defines as real
options, can be used to hedge corporate downside risk. He discusses
operational flexibility and diversification as strategic hedges:
Similar to operational flexibility, diversification is claimed to
have real option benefits. In particular, diversification into new
product or geographic markets has an option value through creating
growth options (Kogut 1991, Kogut and Kulatilaka 1994). Other than
aligning costs and revenues, by opening a production facility in a
foreign country, firms can exploit being in that market by the cost
effectiveness of launching new products in the same market. Under
operational flexibility, Miller lists developing in-house capacity
to produce inputs when a firm has negative exposure to input
prices, vertical integration of a key supplier when the firm faces22
the price risk of a non-commodity input, reducing the price
elasticity of demand through product differentiation, and
increasing customer brand loyalty and switching costs when the firm
faces price competition.
2.2 Financial hedging
Financial approach involves the usage of various financial
instruments, such as forward or futures contracts, options, and
swaps. The goal of financial hedging is to increase value by
minimizing the variance of the net cash flows. Financial
instruments are considered to be an appropriate tool for minimizing
the risk from near-term exposures that have predetermined future
cash flows and can be relatively easily quantified (Srinivasulu
1981, Lessard 1986, Bodnar et al. 1995). The potential of the
financial instruments to manage operating exposure to exchange rate
changes is limited due to the broader scope of exposure, its longer
time horizon and existing uncertainty in the underlying cash flows
in addition to the exchange rate uncertainty. The elements of
operating exposure affect all parts of the company and therefore
cannot be exclusively look upon as a financial phenomenon. For
example, financial means become irrelevant hedging mechanisms when
changes in the exchange rates alter the competitive position of the
company or results in loss of various business opportunities.23
According to the risk management literature, management of the
operating exposure should be based on the strategic coordination of
the activities in company’s financial and operational areas. The
strategic financial approach to the management of the operating
exposure is based on the proper choice of the financing base and
may involve the choice of alternative credit lines in different
currencies or even in different countries
CHAPTER THREE
3.0 RESEARCH METHODOLOGY
3.1 Introduction
This chapter will cover in details the different methods that the
researcher will use to carry out the research and acquire data, the
target population for the study, sample and sampling procedure and
design, description of research instruments, description of data
collection procedure and tools to be used in data analysis.
24

3.2 Research Design
This study adopts a descriptive research design. This is a method
of collecting data by interviewing or administering a questionnaire
to sample of individuals (Orodho, 2003). In order to archive the
objectives of the study, the questionnaires were designed with the
intention of answering the research questions. Descriptive research
design is systematic, empirical inquiry into which the researcher
does not have direct control of independent valuables as their
manifestation have already occurred or because they reflecting the
state of happenings and qualify the obtained findings through the
use of qualitative analysis (Mugenda And Mugenda 1999). It means
considering such basic questions as what, how, when, when and where
about a given phenomenon.
3.3 Target Population
The target population is the financial managers and treasury
managers of selected companies listed in the NSE. The Nairobi
stock exchange has 58 companies listed (CMA annual report2011).
Such companies are distributed across the following industry
portfolios or segments;
Agricultural
Automobiles and accessories
Banking 25

Commercial and services
Construction and allied
Energy and petroleum
Insurance
investment
Manufacturing and allied
Telecommunication and technology
Due to the specialized nature of this study, and how it relates to
a specific market segment, the study selected such companies that
have foreign subsidiaries, engage on export and import or are
concentrating on international trade. As such the population
covered two department of the companies analysed below.
Table 1 population size
Department No of
companies
% of companies
Finance
department
58 50%
Treasury
department
58 50%
Total 116 100%
3.4 Sample and sampling procedure
This represented the number of respondent that will be selected by
26
the applied sampling technique and issued with questionnaires. In
this study, Simple random sampling will be applied to select
financial managers and corporate treasures to represent each
industry portfolios. This is a sampling technique where each member
of the population has an equal chance of being selected.
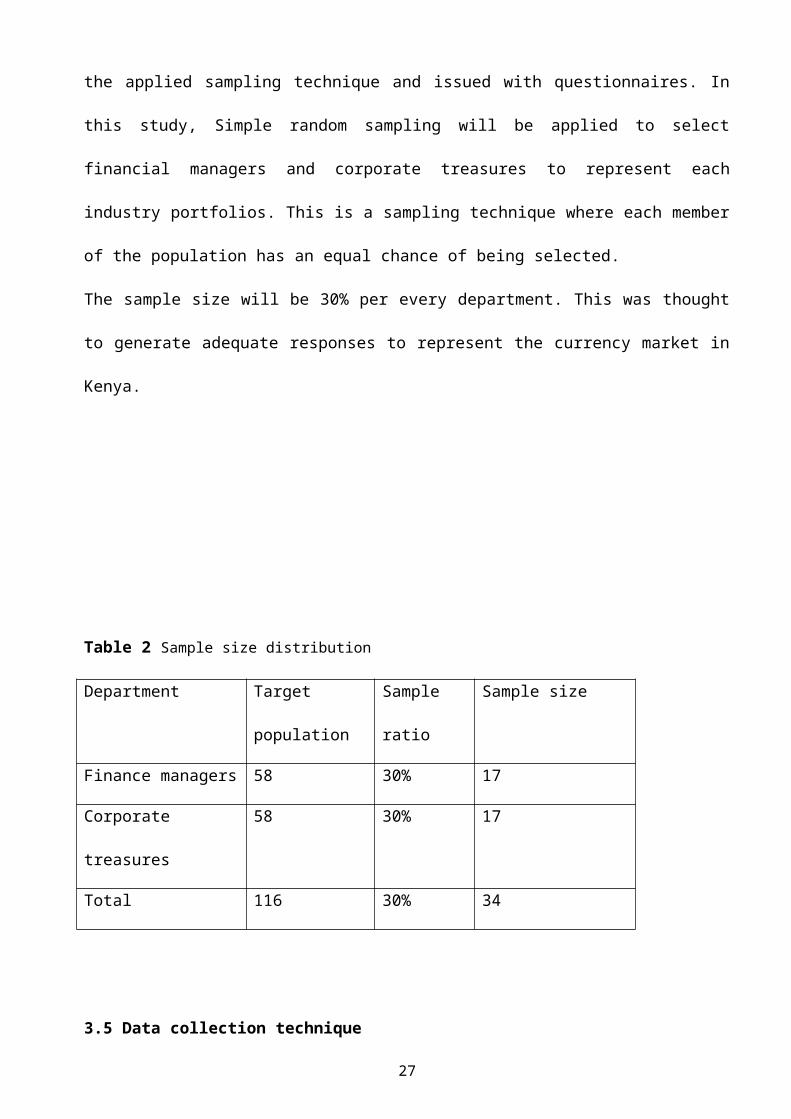
The sample size will be 30% per every department. This was thought
to generate adequate responses to represent the currency market in
Kenya.
Table 2 Sample size distribution
Department Target
population
Sample
ratio
Sample size
Finance managers 58 30% 17
Corporate
treasures
58 30% 17
Total 116 30% 34
3.5 Data collection technique
27

The method of data collection will be done using both primary and
secondary data. Primary data will be collected by use of
questionnaires. Operational hedging information will be gathered
through tailor-made questionnaires by asking the firm directly to
indicate what percentage of total exposure the firm hedges through
it operations.
Secondary data will be collected from the following sources; -The
companies published financial statements which give information on
financial instruments with off-balance-sheet risk. This will help
to estimate exposure for the period from 2009 to 2011, the
historical data on the exchange rates of the Kenya shilling against
the dollar will be obtained from: www.exchange-
rates.org/ history /KES/ USD /G . The rates of the Kenya shilling to the
dollar were obtained for the same period. Data regarding individual
firms’ stock prices, market index as measured by 20-share NSE Index
are obtained from NSE database. Exchange rate and trade volume data
to construct trade-weighted exchange rate will be obtained from
IFS.
3.5.1 Data collection Instruments
This comprise of questionnaires being the main instruments of use.
The questionnaires were sent to corporate treasurers and financial
managers to source data on firms’ hedging policies and their use of28
derivatives. The vast majority of questions in the survey were of
the open ended and close ended variety. The survey was designed in
this way to maximize the response rate while eliciting the
information of greatest interest. The main part of the
questionnaires required firms to indicate whether they hedged and
if so whether they used derivatives instruments for hedging. There
was also a section requiring firms to provide their motives for
hedging.
To examine the determinants of derivative use, i employ a series of
financial valuables which are obtained from Worldscope database.
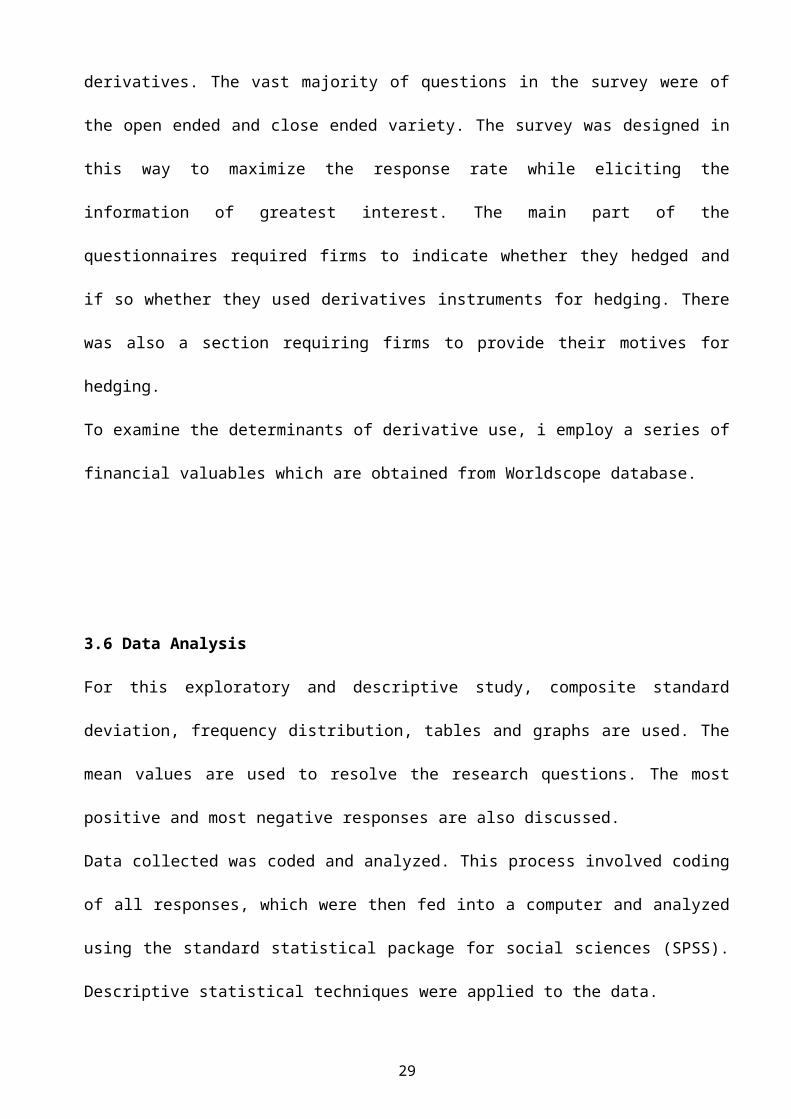
3.6 Data Analysis
For this exploratory and descriptive study, composite standard
deviation, frequency distribution, tables and graphs are used. The
mean values are used to resolve the research questions. The most
positive and most negative responses are also discussed.
Data collected was coded and analyzed. This process involved coding
of all responses, which were then fed into a computer and analyzed
using the standard statistical package for social sciences (SPSS).
Descriptive statistical techniques were applied to the data.
29
This involved reducing the accumulated data into a manageable size
by looking at mean, averages, percentages and patterns that the
data had produced. This involved applying statistical and
descriptive techniques to the data and exploring various
relationships. It also involved viewing for consistent results that
could be interpreted and linked to answer the research questions.
This analysis was able to generate adequate results on the research
questions leading to conclusive results. The results are presented
in form of tables, figures and graphs in the next chapter.
CHAPTER FOUR
4.0 PRESENTATION OF THE FINDINGS AND INTERPRETATION
4.1 INTRODUCTION
The results of the data analysis and the findings are presented in
this chapter. The presentation is inform of graphs, and tables.
Fourty questionnaires were administered through emails that were
30
sent out to finance managers and corporate treasurers who were
expected to answer and elaborate on their knowledge of foreign
exchange exposure and how they hedge the exchange rate risks. The
responders were called and asked to fill out the questionnaires and
email them back with the answers. Persuasion by phone calls was
used to encourage all responders to answer the questions and return
the results to the researcher. Out of the 40 dealers questioned, 40
responded. This gave a response rate of 100% on the questionnaires
administered. The data collected was coded and analyzed. The
analysis involved the use of frequencies, percentages and mean
scores.
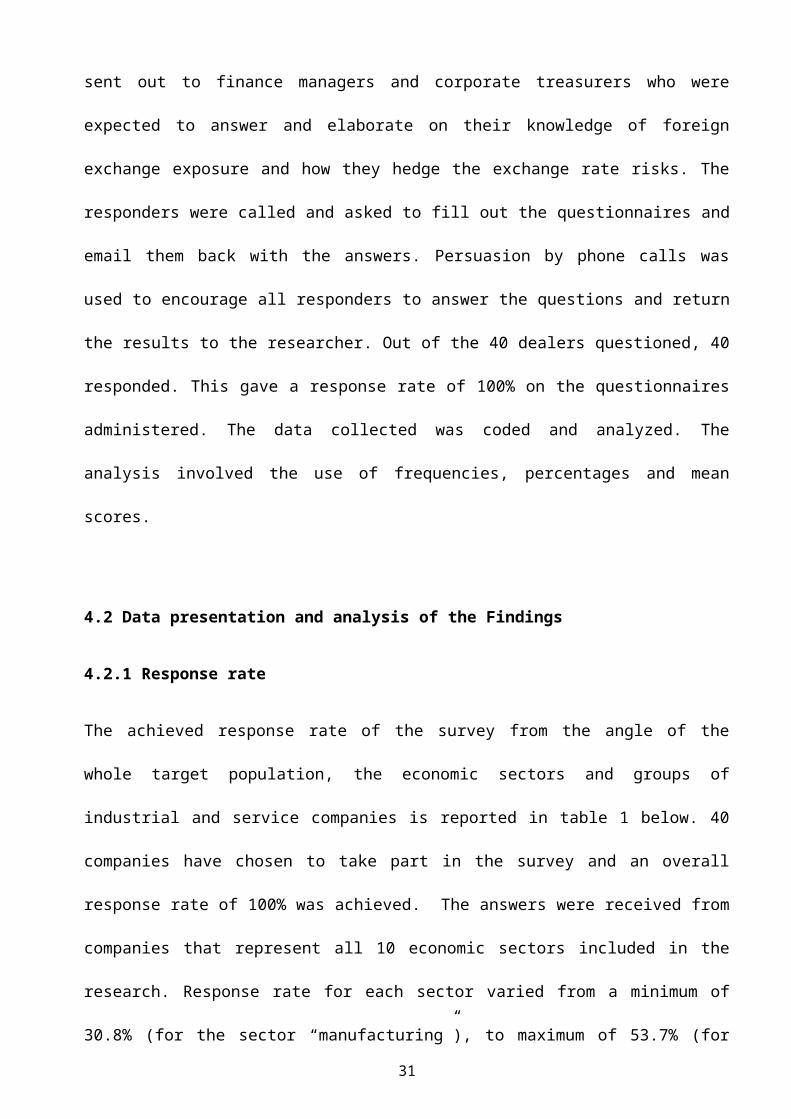
4.2 Data presentation and analysis of the Findings
4.2.1 Response rate
The achieved response rate of the survey from the angle of the
whole target population, the economic sectors and groups of
industrial and service companies is reported in table 1 below. 40
companies have chosen to take part in the survey and an overall
response rate of 100% was achieved. The answers were received from
companies that represent all 10 economic sectors included in the
research. Response rate for each sector varied from a minimum of
30.8% (for the sector “manufacturing”), to maximum of 53.7% (for
31
the sector banking, commercial service and agricultural), 53% of
the answers were received from the companies defined as service
group companies and 47% from the companies define as individuals.
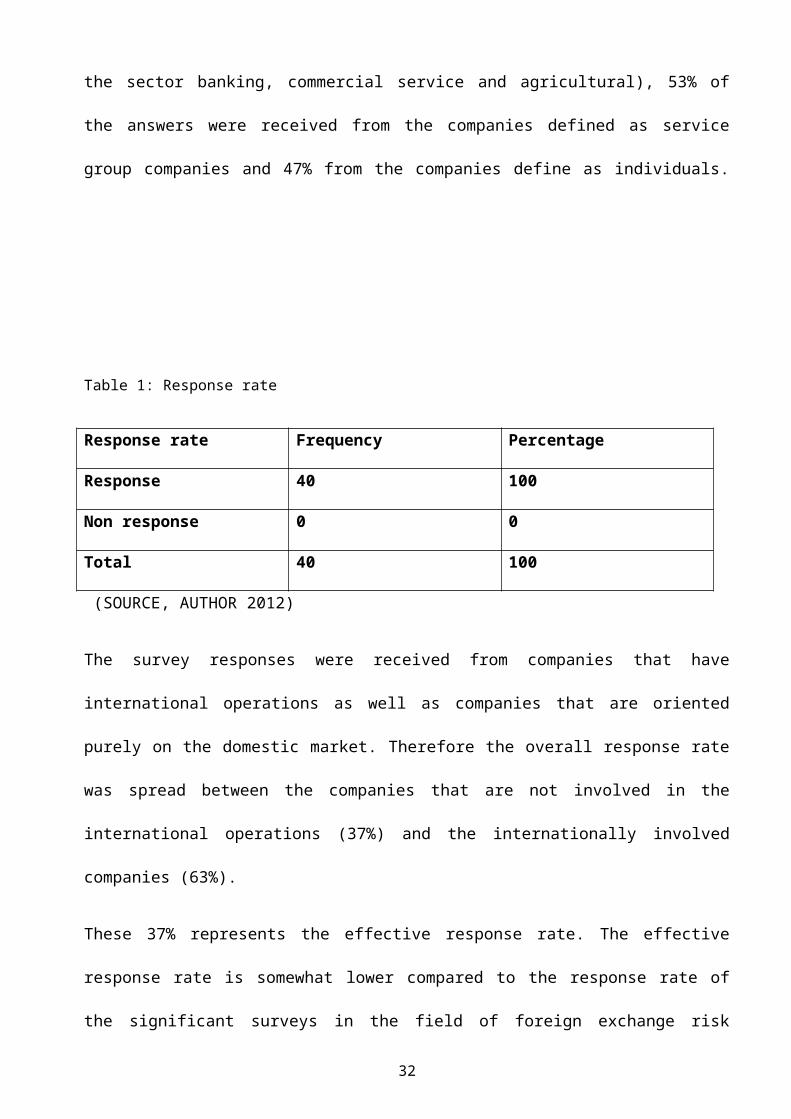
Table 1: Response rate
Response rate Frequency Percentage
Response 40 100
Non response 0 0
Total 40 100
(SOURCE, AUTHOR 2012)
The survey responses were received from companies that have
international operations as well as companies that are oriented
purely on the domestic market. Therefore the overall response rate
was spread between the companies that are not involved in the
international operations (37%) and the internationally involved
companies (63%).
These 37% represents the effective response rate. The effective
response rate is somewhat lower compared to the response rate of
the significant surveys in the field of foreign exchange risk
32
management. However the 40 companies that were contacted for the
purpose of the survey included both companies that are and are not
involved into international activities and only those companies
that have international operations are of interests to this study.
Excluding not internationally involve companies from the target
group would significantly improve the effective response rate.
Otherwise, the number of the responding companies tat are
internationally involve is significant for conducting statistical
calculations an generalizing the results of the survey. Therefore
we conclude that the survey response is quite satisfactory.
4.2.2 The Company’s ability to implement natural hedges in
their practice
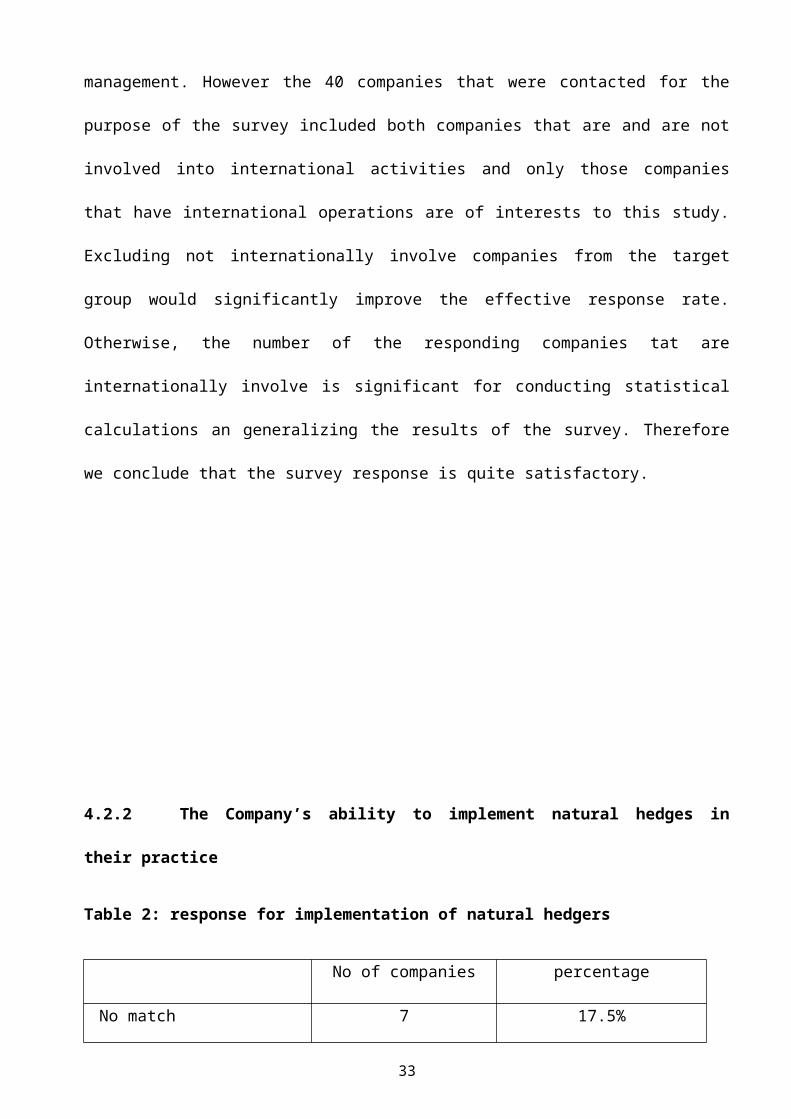
Table 2: response for implementation of natural hedgers
No of companies percentage
No match 7 17.5%
33
Relatively low match 5 12.5%
Match to some degree 15 37.5%
Relatively high match 9 22.5%
Complete match 4 10%
40 100%
Figure 1; implementation of natural hedgers
The majority of the companies (37.6%) have a certain match between
currencies in which their operating revenues and costs are
denominated. And overall 87.1 % of the companies have at least some
match in the currencies since only 12.9% of the companies answered
that they have no match in the currencies at all. This 12.9% is
probably equal to that group of companies that have production or
sourcing in the country with one particular currency.
34
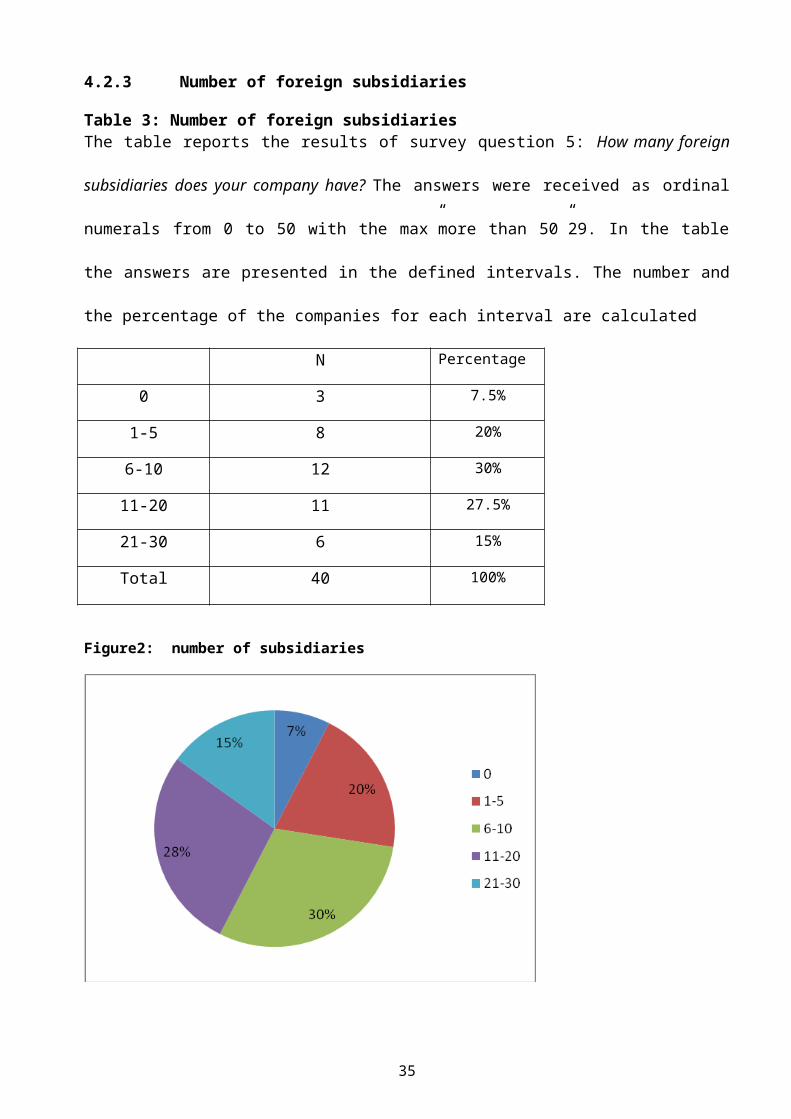
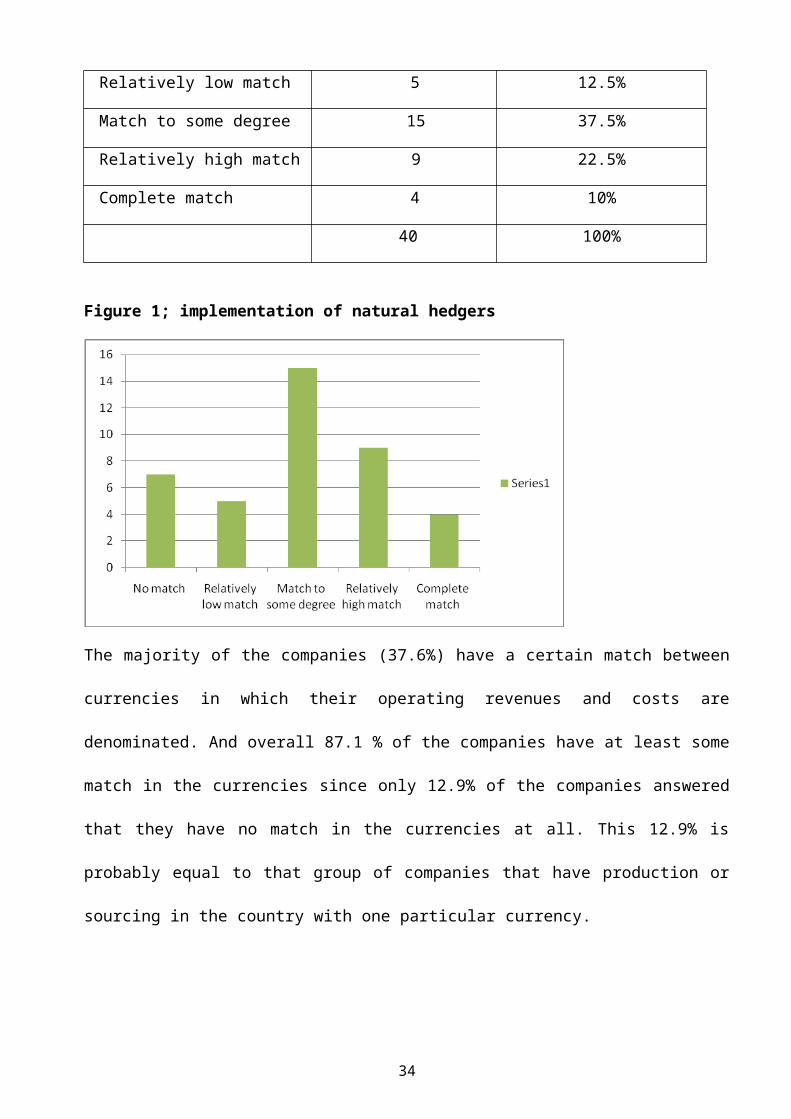
4.2.3 Number of foreign subsidiaries
Table 3: Number of foreign subsidiariesThe table reports the results of survey question 5: How many foreign
subsidiaries does your company have? The answers were received as ordinal
numerals from 0 to 50 with the max”more than 50”29. In the table
the answers are presented in the defined intervals. The number and
the percentage of the companies for each interval are calculated
Figure2: number of subsidiaries
35
N Percentage
0 3 7.5%
1-5 8 20%
6-10 12 30%
11-20 11 27.5%
21-30 6 15%
Total 40 100%
Almost 35% of the companies do not have foreign subsidiaries abroad
indicating that a “physical” presence in foreign countries is not a
necessary condition for the companies to be involved in
international activities. The majority of the companies (45.7%),
however, have between 1 and 5 subsidiaries abroad. About 58% of the
companies have from 1 to 10 subsidiaries abroad. On average the
companies have 3.4 subsidiaries abroad.
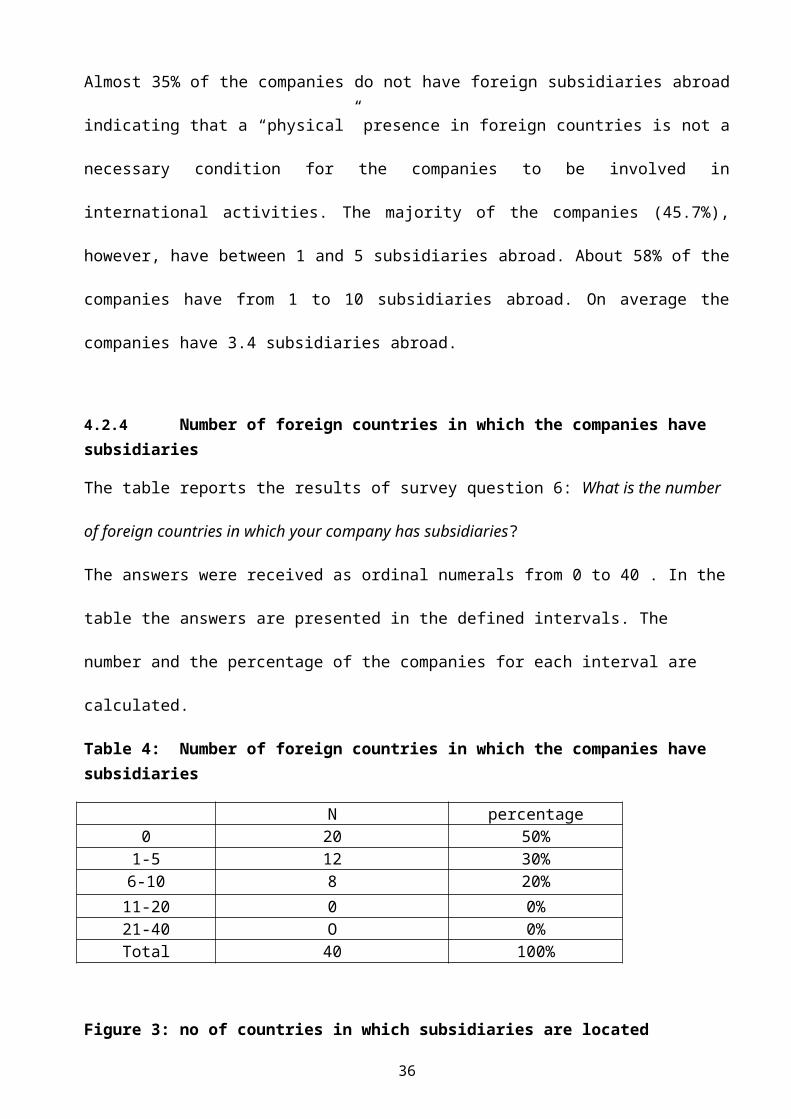
4.2.4 Number of foreign countries in which the companies have subsidiaries
The table reports the results of survey question 6: What is the number
of foreign countries in which your company has subsidiaries?
The answers were received as ordinal numerals from 0 to 40 . In the
table the answers are presented in the defined intervals. The
number and the percentage of the companies for each interval are
calculated.
Table 4: Number of foreign countries in which the companies have subsidiaries
Figure 3: no of countries in which subsidiaries are located
36
N percentage0 20 50%
1-5 12 30%6-10 8 20%11-20 0 0%21-40 O 0%Total 40 100%
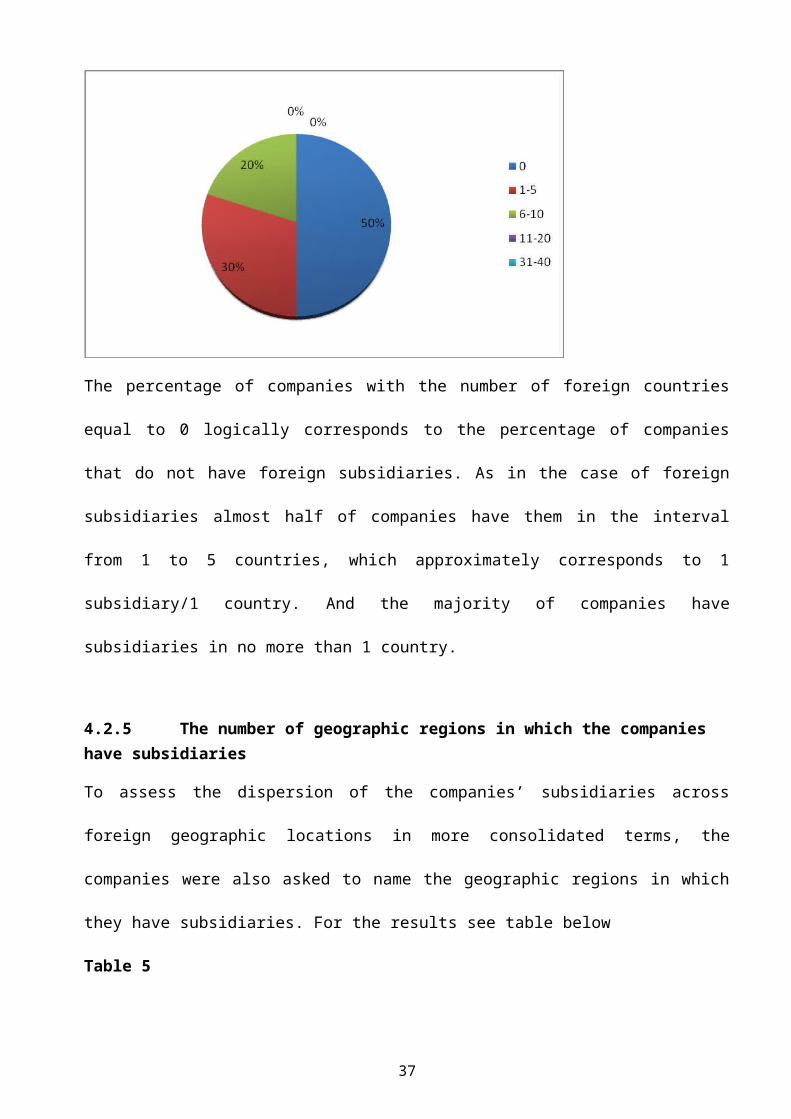
The percentage of companies with the number of foreign countries
equal to 0 logically corresponds to the percentage of companies
that do not have foreign subsidiaries. As in the case of foreign
subsidiaries almost half of companies have them in the interval
from 1 to 5 countries, which approximately corresponds to 1
subsidiary/1 country. And the majority of companies have
subsidiaries in no more than 1 country.
4.2.5 The number of geographic regions in which the companies have subsidiaries
To assess the dispersion of the companies’ subsidiaries across
foreign geographic locations in more consolidated terms, the
companies were also asked to name the geographic regions in which
they have subsidiaries. For the results see table below
Table 5
37
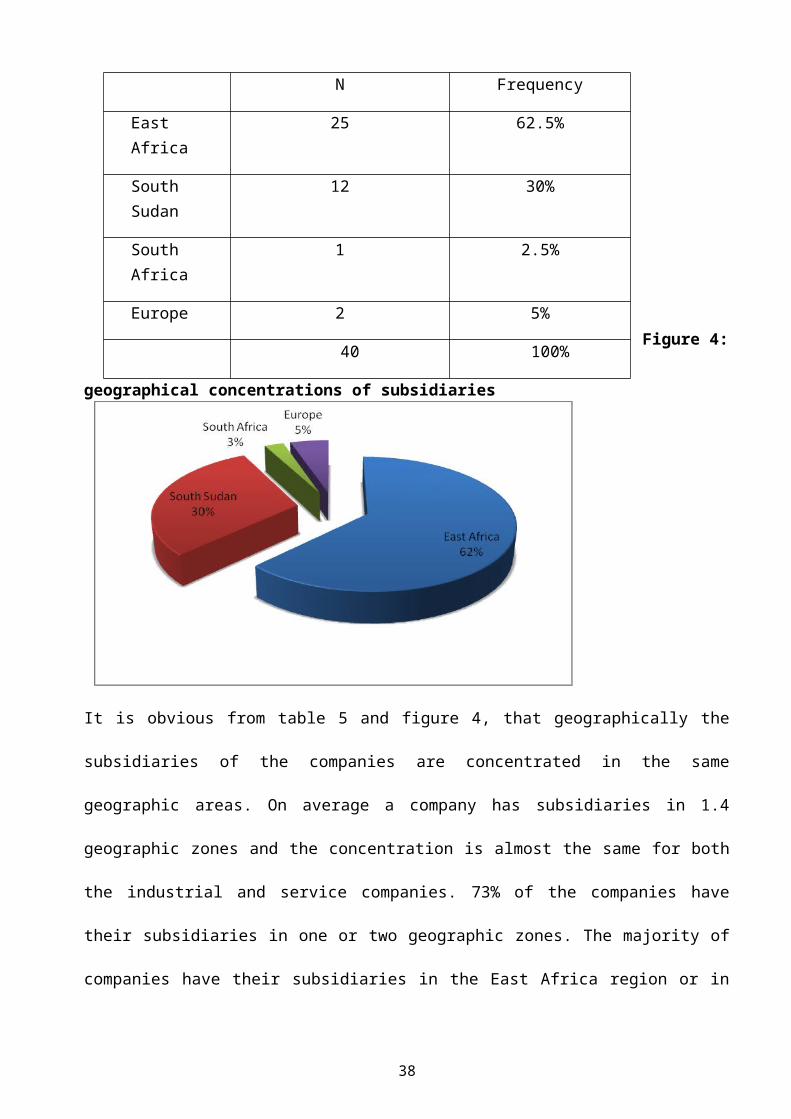
Figure 4:
geographical concentrations of subsidiaries
It is obvious from table 5 and figure 4, that geographically the
subsidiaries of the companies are concentrated in the same
geographic areas. On average a company has subsidiaries in 1.4
geographic zones and the concentration is almost the same for both
the industrial and service companies. 73% of the companies have
their subsidiaries in one or two geographic zones. The majority of
companies have their subsidiaries in the East Africa region or in
38
N Frequency
East Africa
25 62.5%
South Sudan
12 30%
South Africa
1 2.5%
Europe 2 5%
40 100%
south Sudan. The third most popular location is the US and Canada
followed by the South Africa.
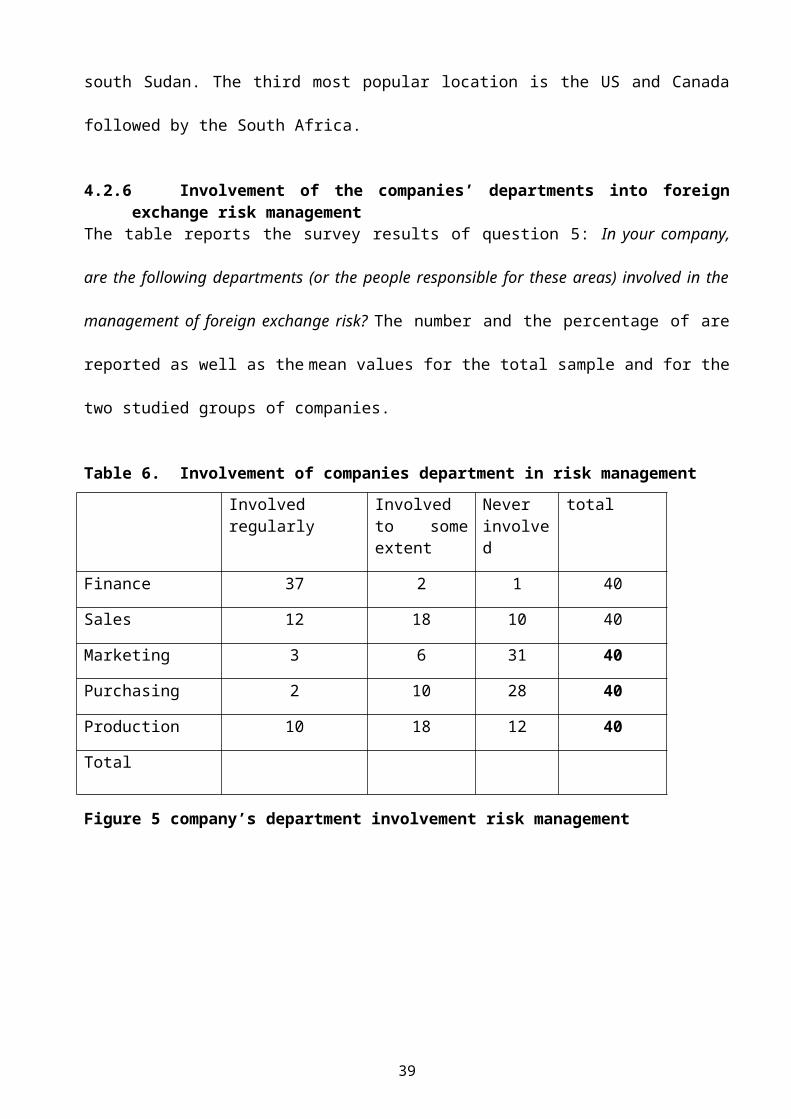
4.2.6 Involvement of the companies’ departments into foreignexchange risk management
The table reports the survey results of question 5: In your company,
are the following departments (or the people responsible for these areas) involved in the
management of foreign exchange risk? The number and the percentage of are
reported as well as the mean values for the total sample and for the
two studied groups of companies.
Table 6. Involvement of companies department in risk management
Figure 5 company’s department involvement risk management
39
Involvedregularly
Involvedto someextent
Neverinvolved
total
Finance 37 2 1 40
Sales 12 18 10 40
Marketing 3 6 31 40
Purchasing 2 10 28 40
Production 10 18 12 40
Total
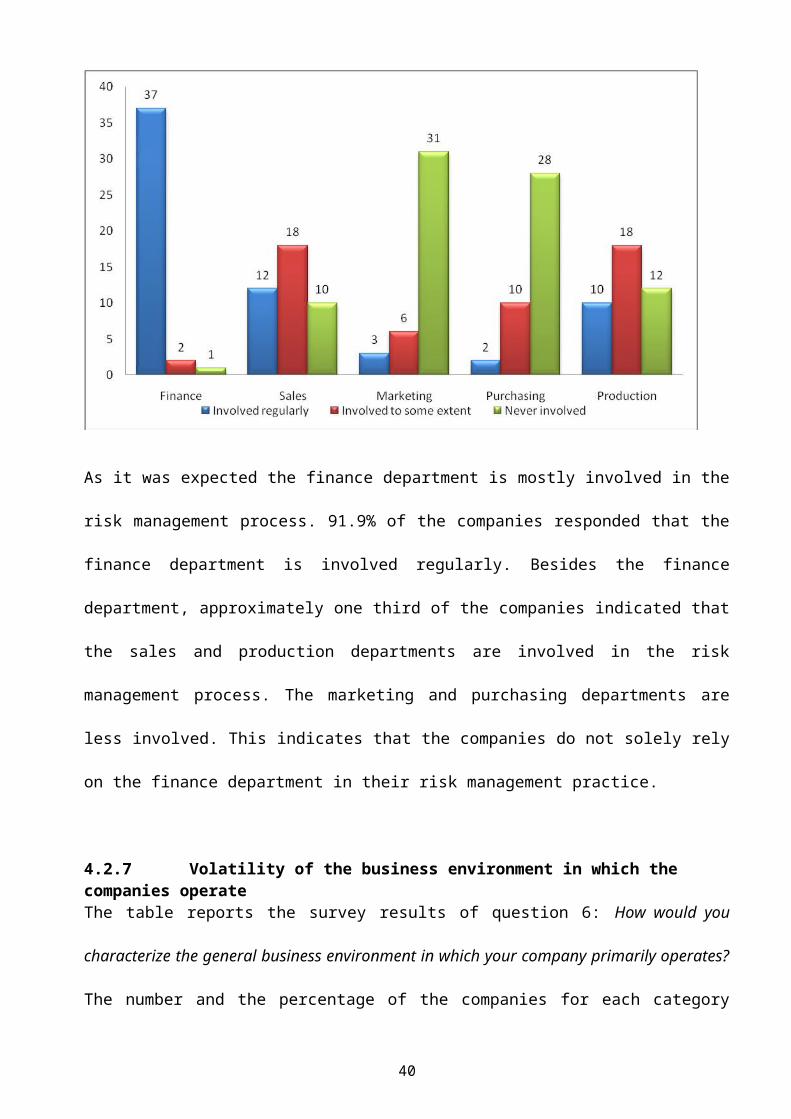
As it was expected the finance department is mostly involved in the
risk management process. 91.9% of the companies responded that the
finance department is involved regularly. Besides the finance
department, approximately one third of the companies indicated that
the sales and production departments are involved in the risk
management process. The marketing and purchasing departments are
less involved. This indicates that the companies do not solely rely
on the finance department in their risk management practice.
4.2.7 Volatility of the business environment in which the companies operate The table reports the survey results of question 6: How would you
characterize the general business environment in which your company primarily operates?
The number and the percentage of the companies for each category
40
are reported as well as the mean values for the total sample and for
the two studied groups of companies
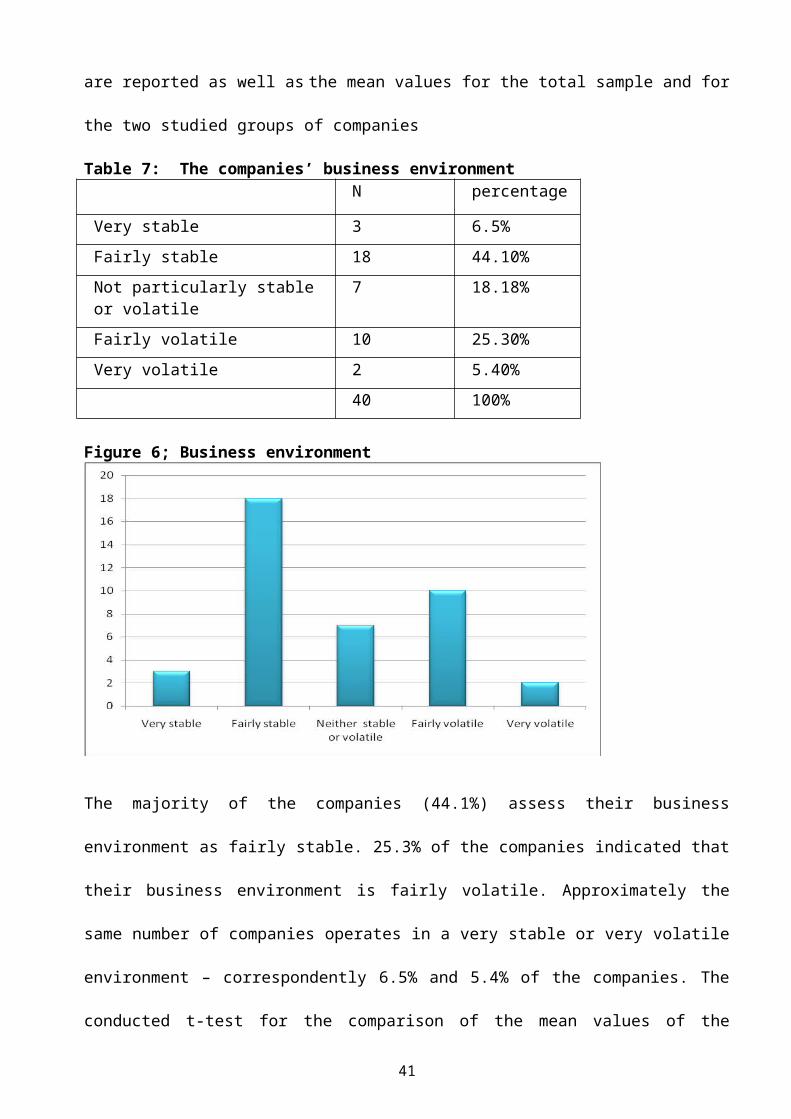
Table 7: The companies’ business environment N percentage
Very stable 3 6.5%Fairly stable 18 44.10%Not particularly stable or volatile
7 18.18%
Fairly volatile 10 25.30%Very volatile 2 5.40%
40 100%
Figure 6; Business environment
The majority of the companies (44.1%) assess their business
environment as fairly stable. 25.3% of the companies indicated that
their business environment is fairly volatile. Approximately the
same number of companies operates in a very stable or very volatile
environment – correspondently 6.5% and 5.4% of the companies. The
conducted t-test for the comparison of the mean values of the
41
indicator for the industrial and service groups showed that there
is statistically significant difference, though at a 10% level.
Thus, on average the industrials on average operate in more stable
environment than the service companies.
4.2.8 Company’s general attitude to the foreign exchange risk
management
The table reports the survey results of question 22: If you think about
the general attitude of your company to foreign exchange risk management, which of the
following statements would best describe it? The number and the percentage of
the companies for each category are reported as well as the mean
values for the total sample and for the two studied groups of
companies.
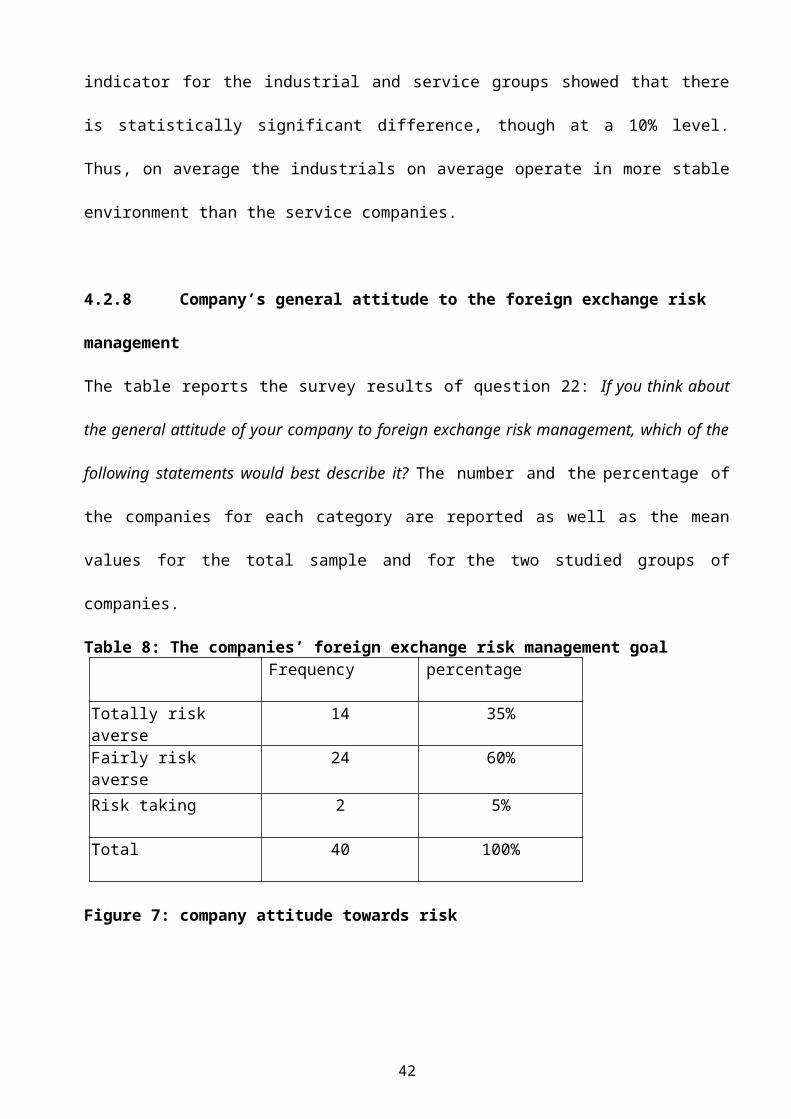
Table 8: The companies’ foreign exchange risk management goalFrequency percentage
Totally risk averse
14 35%
Fairly risk averse
24 60%
Risk taking 2 5%
Total 40 100%
Figure 7: company attitude towards risk
42
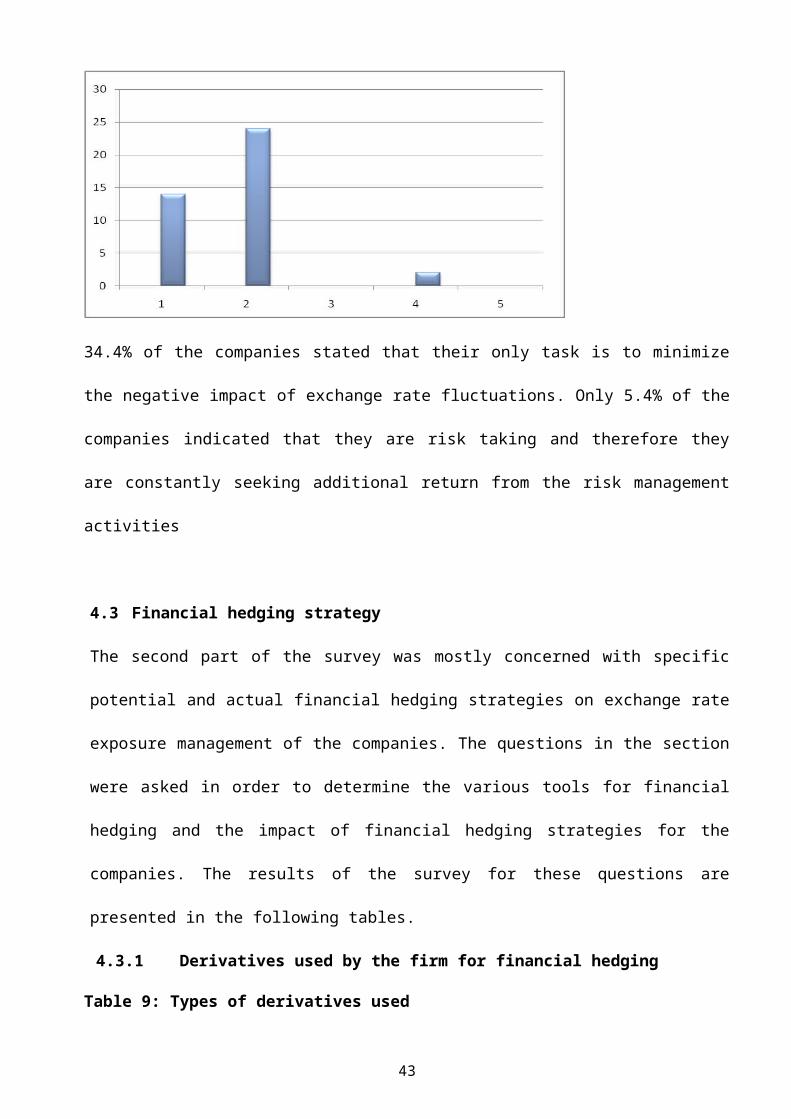
34.4% of the companies stated that their only task is to minimize
the negative impact of exchange rate fluctuations. Only 5.4% of the
companies indicated that they are risk taking and therefore they
are constantly seeking additional return from the risk management
activities
4.3 Financial hedging strategy
The second part of the survey was mostly concerned with specific
potential and actual financial hedging strategies on exchange rate
exposure management of the companies. The questions in the section
were asked in order to determine the various tools for financial
hedging and the impact of financial hedging strategies for the
companies. The results of the survey for these questions are
presented in the following tables.
4.3.1 Derivatives used by the firm for financial hedging
Table 9: Types of derivatives used
43
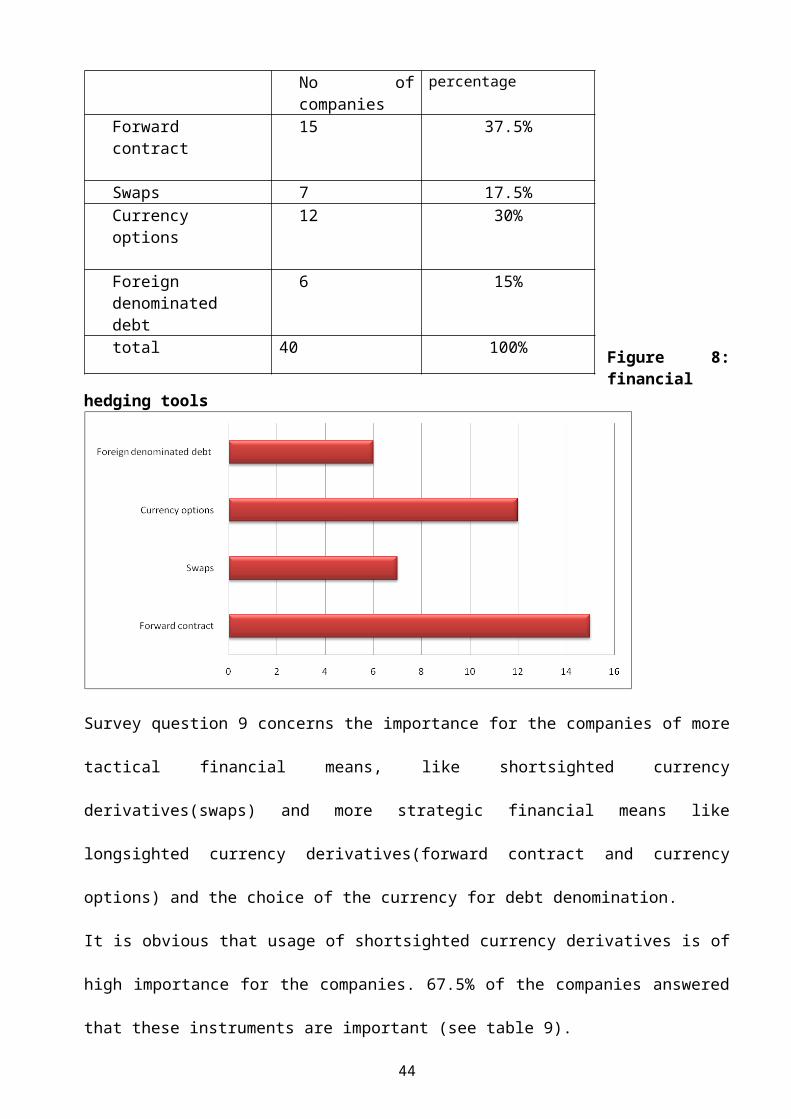
Figure 8:financial
hedging tools
Survey question 9 concerns the importance for the companies of more
tactical financial means, like shortsighted currency
derivatives(swaps) and more strategic financial means like
longsighted currency derivatives(forward contract and currency
options) and the choice of the currency for debt denomination.
It is obvious that usage of shortsighted currency derivatives is of
high importance for the companies. 67.5% of the companies answered
that these instruments are important (see table 9).
44
No ofcompanies
percentage
Forwardcontract
15 37.5%
Swaps 7 17.5%Currencyoptions
12 30%
Foreigndenominateddebt
6 15%
total 40 100%

On the second place ranked after its importance for the companies
to manage their foreign exchange risk is the choice of swaps. For
30% of companies this tool is at least somewhat important.
So, we can see that most of the companies would choose tactical
financial instruments when managing foreign exchange exposure. In
the case when they will need to apply a more strategically oriented
approach they would rather choose longsighted currency derivatives
instead of foreign debt.
4.3.2 The impact of shortsighted currency derivatives (Forwardcontracts, options)
Table 10
Impact 1
Strongly Agree
2Agree
3Disagree
4StronglyDisagree
5Can’t
Tell
To reduce corporate taxliability
8 24 6 1 1
Lowers the probability of firmencountering financial distress.
17 20 3 0 0
Derivatives reduces volatilityin accounting earnings
13 25 1 0 1
Reduced volatility in cash flowsand earnings in imperfect market
12 26 2 0 0
Increase firms market price inthe presence of agency betweenshareholders and bondholders
8 20 5 4 3
Protect against downside riskand allow upside appreciation
17 19 4 0 0
45
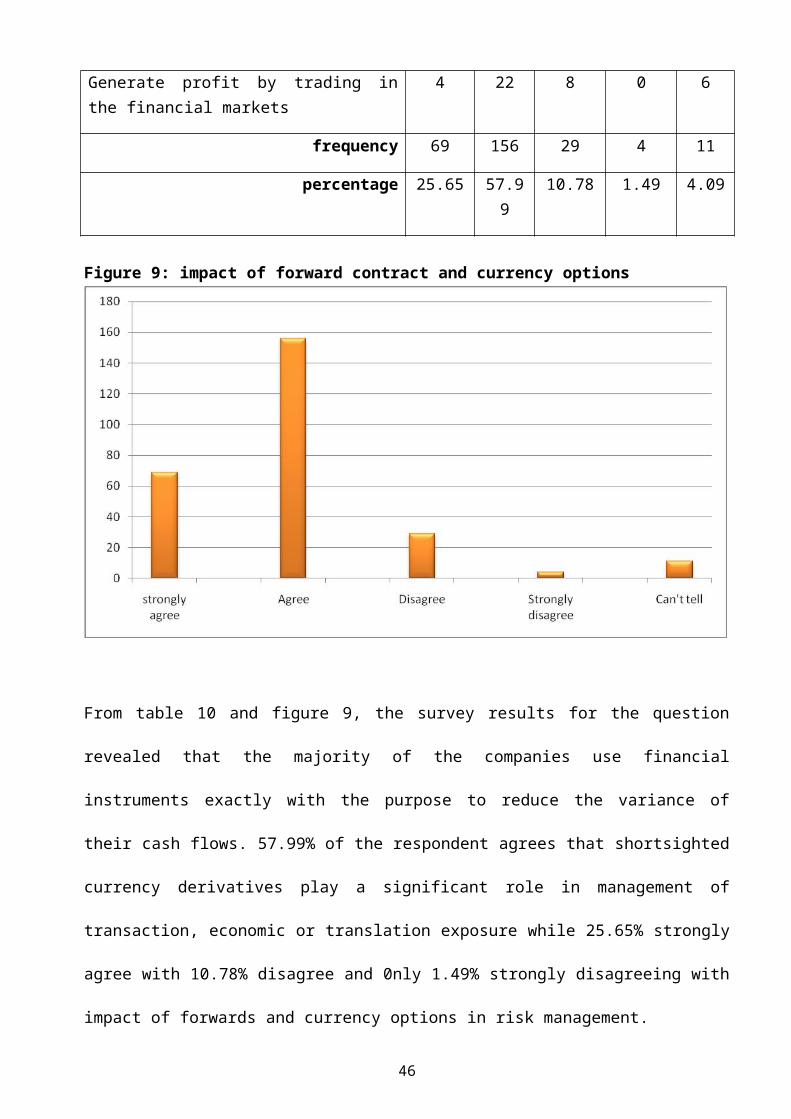
Generate profit by trading inthe financial markets
4 22 8 0 6
frequency 69 156 29 4 11
percentage 25.65 57.99
10.78 1.49 4.09
Figure 9: impact of forward contract and currency options
From table 10 and figure 9, the survey results for the question
revealed that the majority of the companies use financial
instruments exactly with the purpose to reduce the variance of
their cash flows. 57.99% of the respondent agrees that shortsighted
currency derivatives play a significant role in management of
transaction, economic or translation exposure while 25.65% strongly
agree with 10.78% disagree and 0nly 1.49% strongly disagreeing with
impact of forwards and currency options in risk management.
46

4.3.3 Impact of use of longsighted currency derivatives(swaps) as hedging tools
Table 11: impact of swaps
1 2 3 4 5
Minimize the costs of foreignconversion while protecting againstexchange rate risk.
21 15 2 1 1
Minimise risk & maximise certaintyof revenue & costs & activelymanage risks in order to makeprofit contribution
18 21 1 0 0
Increase firm value in the presenceof financial distress costs
21 14 2 2 1
reduced volatility in interest rate 19 17 1 0 0
reduce financial distress costs 21 15 2 1 1
Give companies a better match between liabilities and revenue
19 17 1 0 3
Ensures certainty of receipt of 17 22 1 0 0
47
foreign monies
To achieve better lending rates 25 15 0 0 0
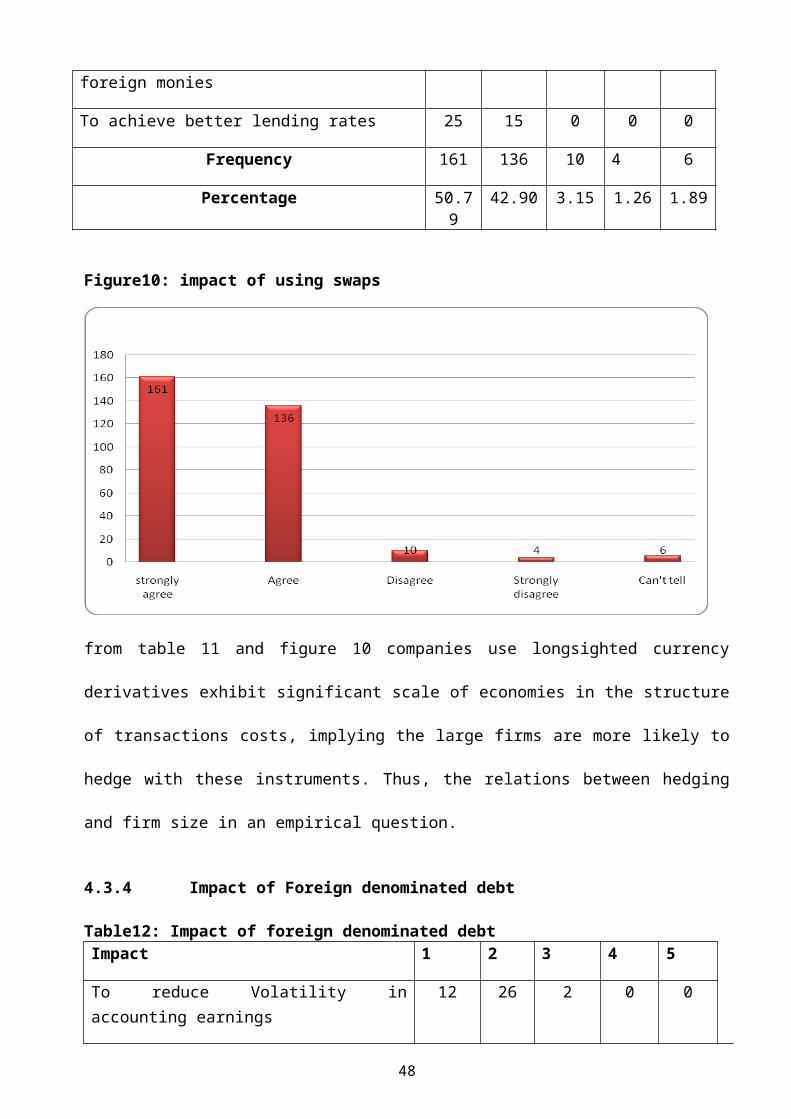
Frequency 161 136 10 4 6
Percentage 50.79
42.90 3.15 1.26 1.89
Figure10: impact of using swaps
from table 11 and figure 10 companies use longsighted currency
derivatives exhibit significant scale of economies in the structure
of transactions costs, implying the large firms are more likely to
hedge with these instruments. Thus, the relations between hedging
and firm size in an empirical question.
4.3.4 Impact of Foreign denominated debt
Table12: Impact of foreign denominated debtImpact 1 2 3 4 5
To reduce Volatility inaccounting earnings
12 26 2 0 0
48

Volatility in cash flows 10 19 7 2 2
Generate additional returns andenhance the profitability of thetreasury activity.
12 17 8 2 1
Reduce funding costs/ make thebest use of borrowingopportunities
17 20 3 0 0
Financial price risk hedging 14 18 6 2 0
To hedge translation exposure 17 18 6 2 0
To hedge transaction exposure 13 22 3 0 2
Frequency 95 140 34 6 5
Percentage 33.93%
50% 12.14%
2.14%
1.79%
Figure 11: Impact of foreign denominated debt
Table 12 and figure 11 findings shows that debt denominated in
foreign currency are used to reduce the probability that a firm
encounters financial distress by reducing the variability of firm
49
value, and thereby reduces the expected costs of financial
distress.
4.4 OPERATIONAL HEDGING
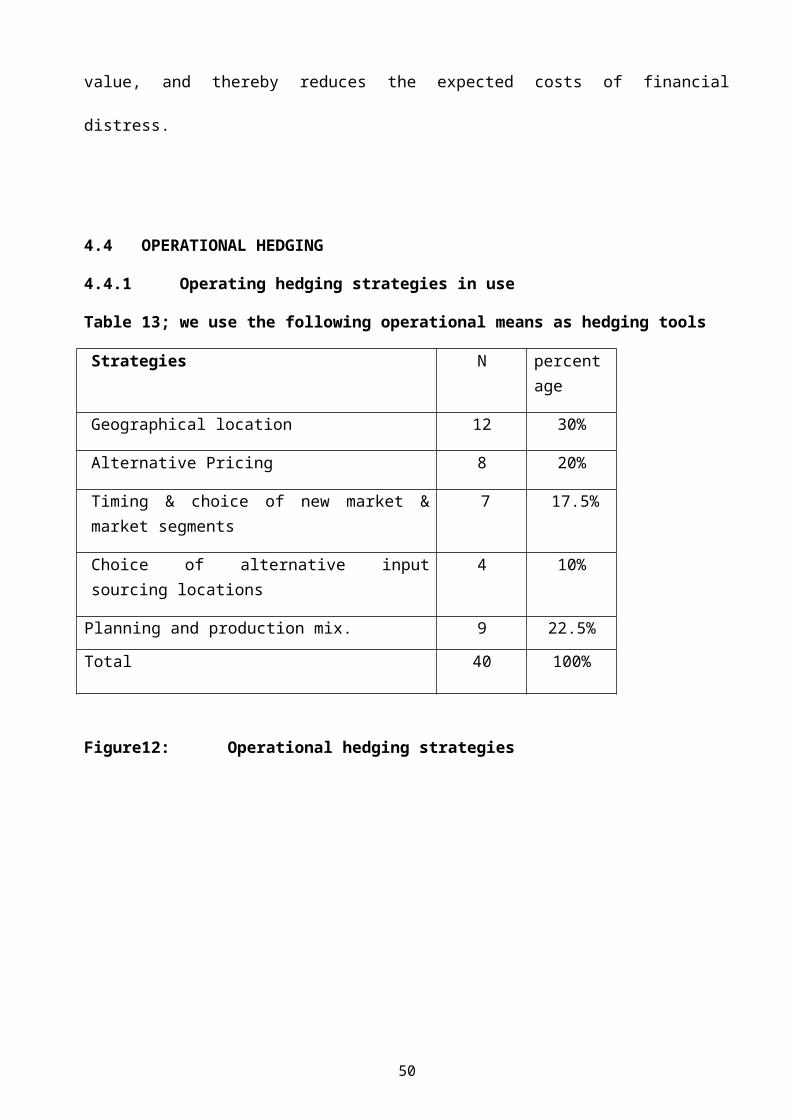
4.4.1 Operating hedging strategies in use
Table 13; we use the following operational means as hedging tools
Strategies N percentage
Geographical location 12 30%
Alternative Pricing 8 20%
Timing & choice of new market &market segments
7 17.5%
Choice of alternative inputsourcing locations
4 10%
Planning and production mix. 9 22.5%
Total 40 100%
Figure12: Operational hedging strategies
50
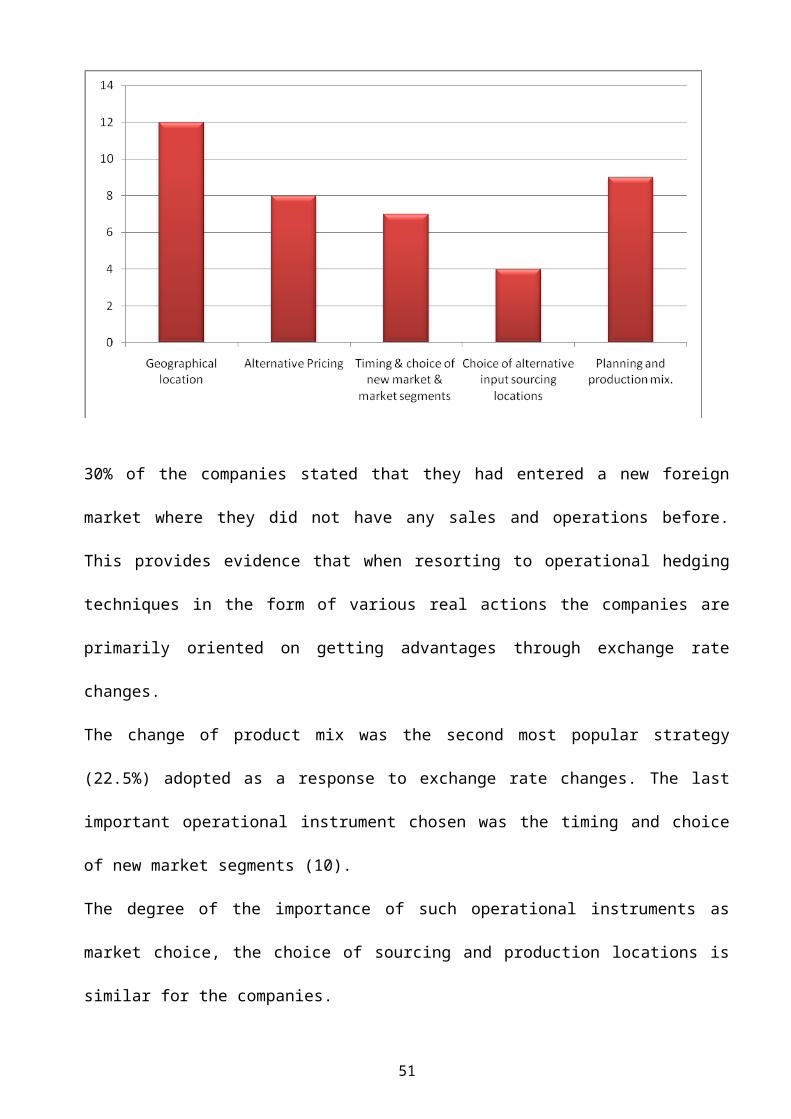
30% of the companies stated that they had entered a new foreign
market where they did not have any sales and operations before.
This provides evidence that when resorting to operational hedging
techniques in the form of various real actions the companies are
primarily oriented on getting advantages through exchange rate
changes.
The change of product mix was the second most popular strategy
(22.5%) adopted as a response to exchange rate changes. The last
important operational instrument chosen was the timing and choice
of new market segments (10).
The degree of the importance of such operational instruments as
market choice, the choice of sourcing and production locations is
similar for the companies.
51
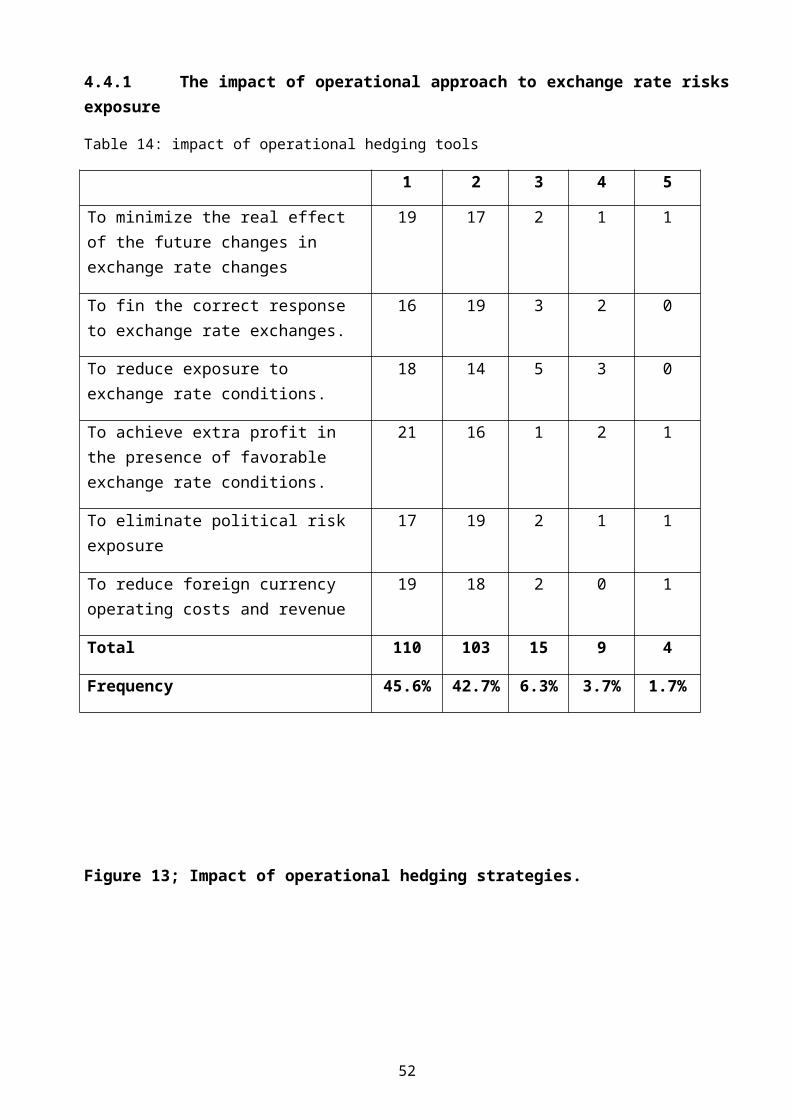
4.4.1 The impact of operational approach to exchange rate risksexposure
Table 14: impact of operational hedging tools
1 2 3 4 5
To minimize the real effect of the future changes in exchange rate changes
19 17 2 1 1
To fin the correct response to exchange rate exchanges.
16 19 3 2 0
To reduce exposure to exchange rate conditions.
18 14 5 3 0
To achieve extra profit in the presence of favorable exchange rate conditions.
21 16 1 2 1
To eliminate political risk exposure
17 19 2 1 1
To reduce foreign currency operating costs and revenue
19 18 2 0 1
Total 110 103 15 9 4
Frequency 45.6% 42.7% 6.3% 3.7% 1.7%
Figure 13; Impact of operational hedging strategies.
52

Table 14 and figure 13 findings shows that majority of the above
are likely impact of operational hedging strategy. 45.6% and 42.7%
strongly agree that operating strategies minimses volatility on
cash flow by minimizing the real effect of the future company
exposure to exchange risks.
4.4.2 The importance of operational meansThe table report survey results of question 14: in order to manage
the impact of exchange rate fluctuations on your company’s
operating cash flows or competitive position, how important are the
following operational means for your company?
1 2 3 4 5
Product mix choice 18 4 11 6 1
Market choice 14 6 8 9 3
Production locations 16 4 10 8 2
Pricing strategy 10 3 5 14 8
53
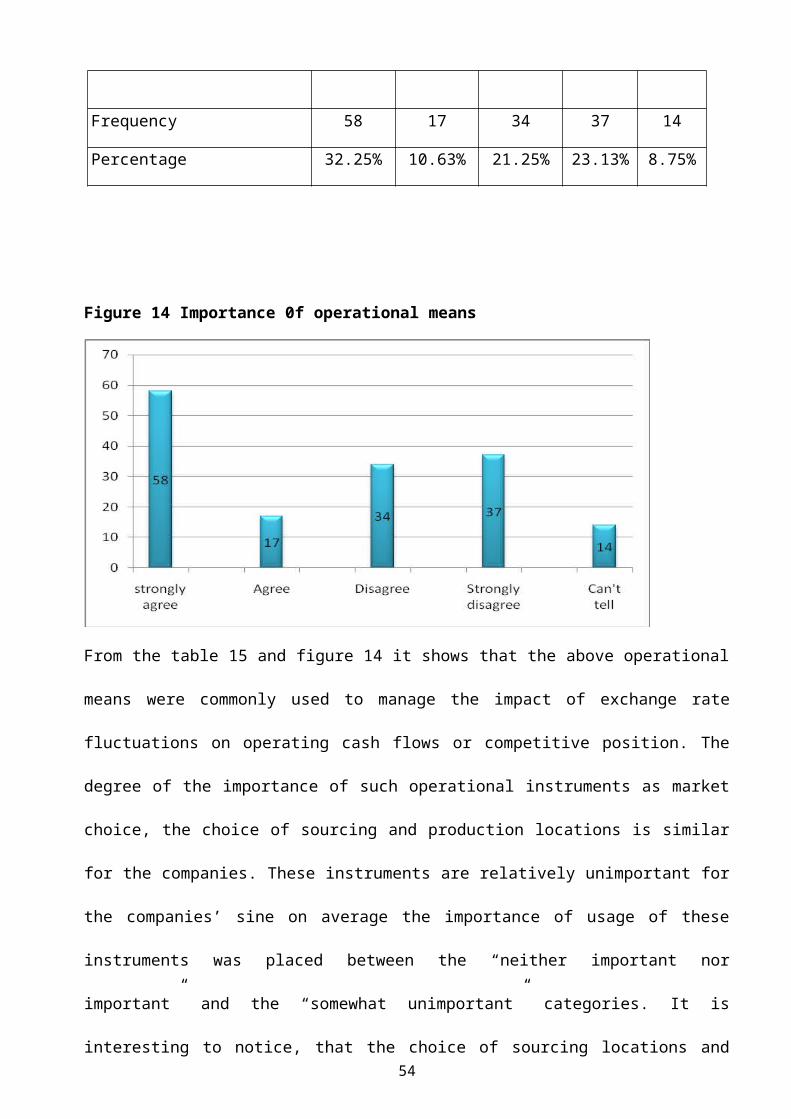
Frequency 58 17 34 37 14
Percentage 32.25% 10.63% 21.25% 23.13% 8.75%
Figure 14 Importance 0f operational means
From the table 15 and figure 14 it shows that the above operational
means were commonly used to manage the impact of exchange rate
fluctuations on operating cash flows or competitive position. The
degree of the importance of such operational instruments as market
choice, the choice of sourcing and production locations is similar
for the companies. These instruments are relatively unimportant for
the companies’ sine on average the importance of usage of these
instruments was placed between the “neither important nor
important” and the “somewhat unimportant” categories. It is
interesting to notice, that the choice of sourcing locations and54

the production location was not as important for the companies as
one would assume, since three is a wide spread assumption that
companies will always look for “cheaper” sourcing or production
locations. Furthermore, the industrial companies’ choice of
sourcing locations was slightly more important that it was for the
service companies.
4.5 Effectiveness of hedging strategies on firm’s value
The survey results for the previous questions indicate that in
general the companies tend to name various financial hedging means
as more important than operational means. However, from those
results it is difficult to conclude something concrete about the
importance between financial and operational means. For this
purpose the companies were directly asked to define the importance
between the financial and operational means for their management of
the operating foreign exchange exposure.
4.5.1 Relative importance of financial or operational means.
Table 16 importance of financial or operational hedging strategy
Frequency Percentage
Financial means are much more important(1)
5 12.9%
Financial means are more important(2)
9 23.7%
Financial and operational means are 12 29.6%
55
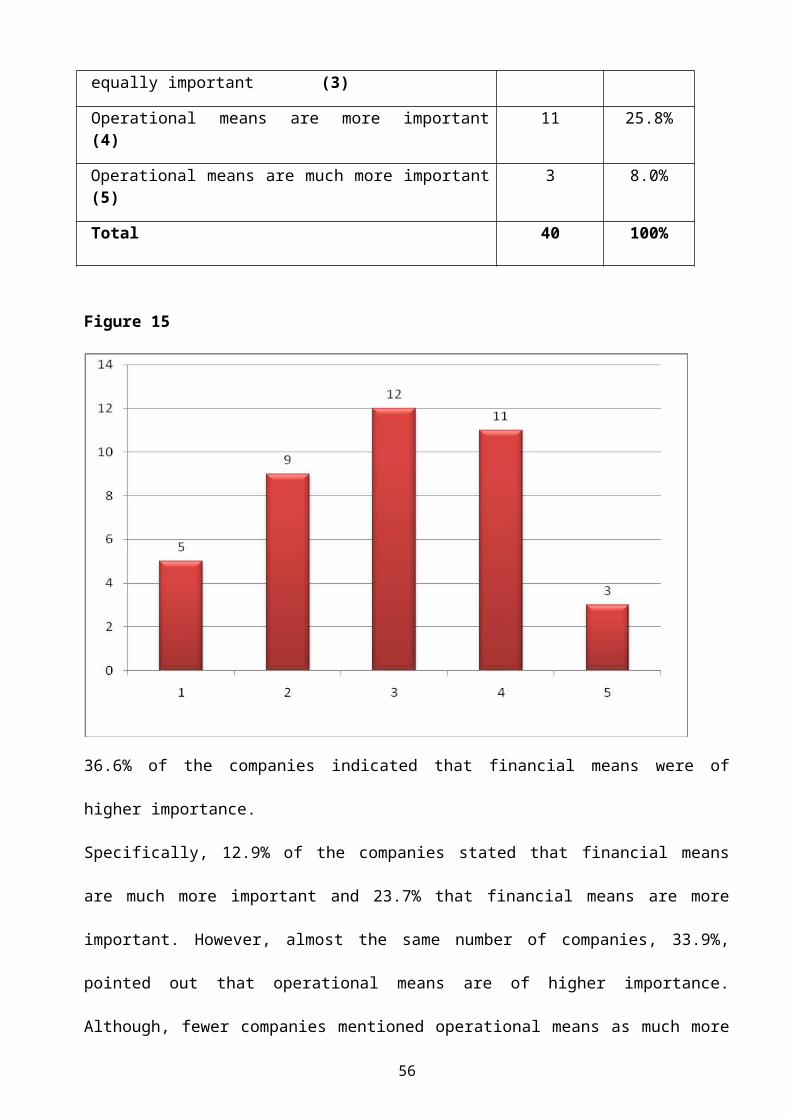
equally important (3)
Operational means are more important(4)
11 25.8%
Operational means are much more important(5)
3 8.0%
Total 40 100%
Figure 15
36.6% of the companies indicated that financial means were of
higher importance.
Specifically, 12.9% of the companies stated that financial means
are much more important and 23.7% that financial means are more
important. However, almost the same number of companies, 33.9%,
pointed out that operational means are of higher importance.
Although, fewer companies mentioned operational means as much more
56
important compared to the number of companies that mentioned
financial means as much more important. Despite the fact that the
majority of the companies were inclined to pick one of the risk
management approaches, financial or operational, the most
interesting results was that the most frequently chosen category
was category 3 “financial and operational means are equally
important”. Thus the results of the survey provide a clear
indication that both financial and operational means are at the
same level of importance for the companies.
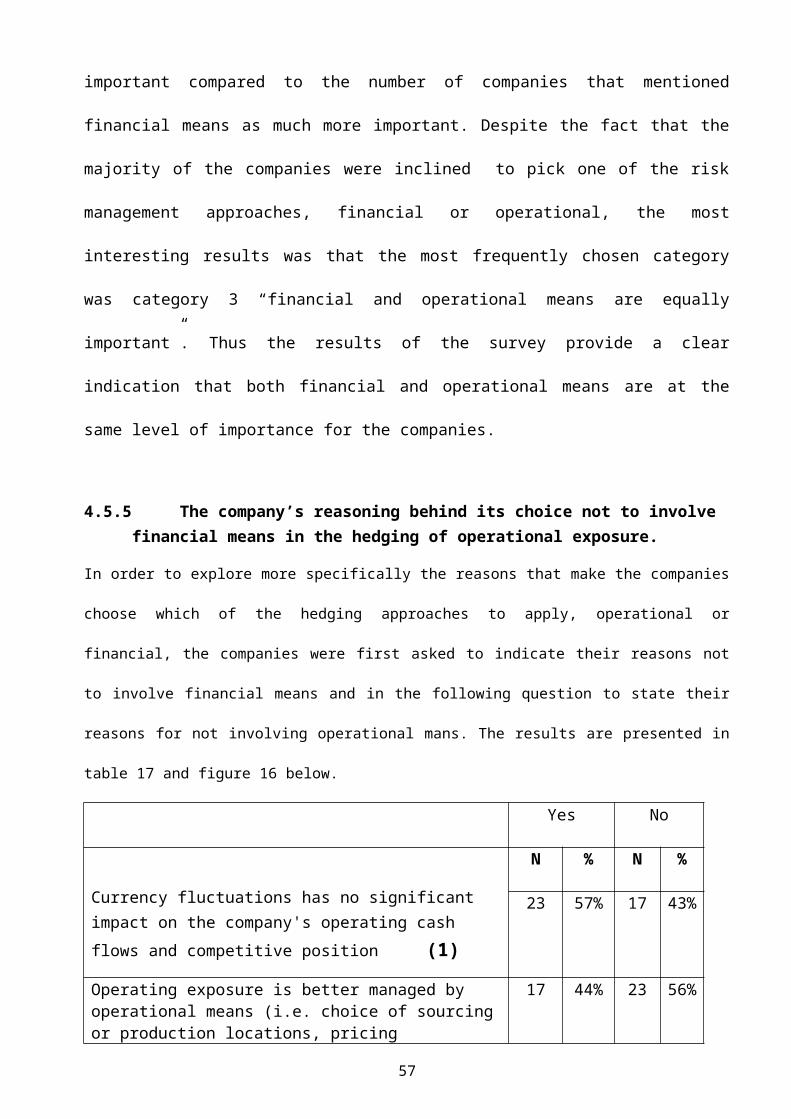
4.5.5 The company’s reasoning behind its choice not to involve financial means in the hedging of operational exposure.
In order to explore more specifically the reasons that make the companies
choose which of the hedging approaches to apply, operational or
financial, the companies were first asked to indicate their reasons not
to involve financial means and in the following question to state their
reasons for not involving operational mans. The results are presented in
table 17 and figure 16 below.
Yes No
Currency fluctuations has no significant impact on the company's operating cash flows and competitive position (1)
N % N %
23 57% 17 43%
Operating exposure is better managed by operational means (i.e. choice of sourcingor production locations, pricing
17 44% 23 56%
57
strategy etc) (2)Operating exposure cannot be quantified properly in order to be hedged by financial means (3)
14 35% 26 65%
The cost of hedging by financial means aretoo high (4)
15 38% 25 62%
Lack of knowledge and expertise of operating exposure (5)
8 19% 32 81%
The management of the company believes that in the long run positive and negative exchange rate changes cancel each other out. (6)
14 35% 26 65%
The proper financial instruments are not available on the market. (7)
5 13% 35 87%
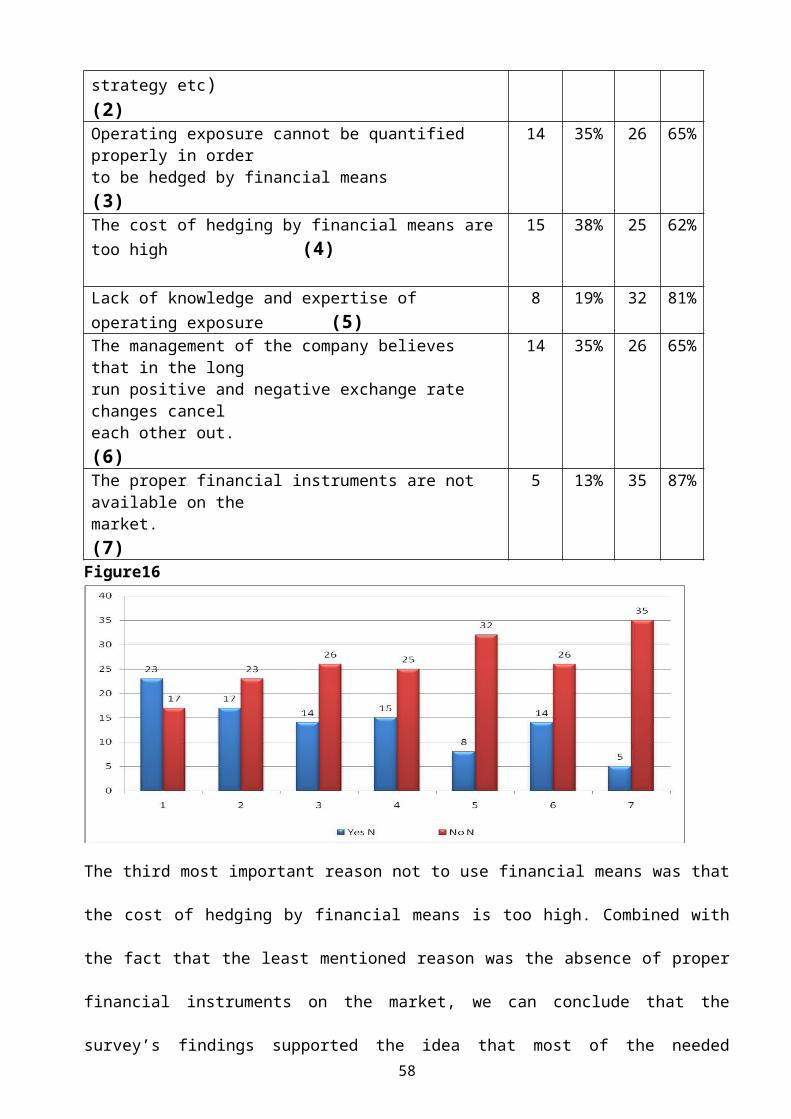
Figure16
The third most important reason not to use financial means was that
the cost of hedging by financial means is too high. Combined with
the fact that the least mentioned reason was the absence of proper
financial instruments on the market, we can conclude that the
survey’s findings supported the idea that most of the needed58

financial instruments can be found on the market but in some cases,
especially in the long run, their usage will be very costly for the
companies.
As in the case of financial means, when the influence of exchange
rate changes on the company’s operating cash flows is
insignificant, the company’s does no resort to risk management
actions. That is why the reason was chosen as the primary reason by
companies. (See table 18 below)
Table 18: the company’s reasoning behind its choice not to involve
operational means in the hedging operating exposure.
Yes No
Currency fluctuations has no significant impact on the company's operating cash flows and competitive position (1)
N % N %
21 51% 19 49%
Operating exposure is better managed by operational means (i.e. choice of sourcingor production locations, pricingstrategy etc) (2)
19 49% 21 51%
The cost of hedging by financial means aretoo high (3)
14 35% 26 65%
Operational exposure cannot be quantified properly in order to hedge by financial means. (4)
13 34% 27 66%
The management of the company believes that in the long run positive and negative exchange rate changes cancel each other out.
11 28% 29 72%
59

(5)Lack of knowledge and expertise of operating exposure (6)
8 21% 32 79%
Figure 17
Again, the evidence was found that in the case when companies chose
not to use operational means the first explanation would be that
the exposure could be better managed by financial means. Based
solely on the results of question 16 and 17, we cannot affirm if
the companies consider the financial and operational hedging
options as complements or substitutes to each other.
60
CHAPTER FIVE
5.0 SUMMARY OF MAJOR FINDINGS, CONCLUSIONS AND RECOMMEDATIONS.
5.1 IntroductionIn this chapter, the findings of the study are given. The chapter
is arranged as follows: introduction, summary of major findings,
answers to rsearch questions, recommendations, limitations and
suggested area of further research.
5.2 summary of major findings.
5.3 Conclusions
The present study complements the existing risk management
literature by providing empirical evidence on the strategic foreign
exchange risk management practice by companies quoted in the
Nairobi Stock Exchange. The empirical data obtained from the
conducted survey supports the fact that interactions between
operational and financial strategies are seen as being complements
to each other. One third of the responding companies’ directly
stated that operational or financial means are equally important in
the management of foreign exchange operating exposure.61
Further more, the companies indicated that the second most
important reason for not involving financial means into the risk
management of operating exposure is that the exposure can be
managed by the means of various operational strategies. Operational
flexibility was named as the most popular operational hedging
strategy used by the companies. When it comes to the adoption by
the companies various real actions as a response to foreign
exchange rate fluctuations, the majority of the companies consider
a shift of supplier to foreign locations where it became cheaper to
source due to exchange rate changes.
Among the company specific factors that explain the importance and
application of financial and operational hedging approaches the
measures of multinationality and foreign exposure are undoubtedly
significant as explanatory factors for the importance and
application of hedging strategies. Besides these measures, on the
aggregate level the measures of profitability and growth
opportunities, the company’s risk objective and the involvement of
the operational and financial department in the risk management
process are also significant factors in explaining the importance
of operational hedges and the size of the company, its capital
structure and the involvement of he operational and financial
departments are important as an explanation of the importance of
financial means.62
As in the case of the importance of financial and operational
approaches, the measures of multinationality and foreign exchange
exposure are also the most significant factors that explain the
companies’ actual and potential involvement in real action
strategies and the usage of shortsighted and longsighted financial
means. Risk management objectives and involvement of both financial
and operational departments were important factors in explaining
the actual real options strategies adopted by the companies as a
response t exchange rate changes. Additionally, the presented
growth opportunities are explanatory factors for the possible real
options strategies undertaken by the companies and company’s size
is significant for explaining the usage of shortsighted financial
means.
5.4 Suggestion for further research.
The research looked at only companies’ listed in the Nairobi stock
Exchange. Further research is also desirable that can provide
comparable empirical study on small and medium sized companies
which are not quoted. Analysis on ales aggregate level, like an
analysis of companies from the same industry would be advantageous
and a study with follow-up interviews or case study on the topic
would also be relevant.
63
5.5 Limitation of study
There are some limitations to the presented research. Despite the
attempt design objective and precise questions one can argue about
a certain degree of subjectivity in some of the survey questions.
This is one of the possible reasons that some of the regression
results were not robust when the regressions were estimated on the
restricted sample of companies. Generally, the limitations of the
research do not make the results less valuable for the desion
making process. However, the results should be interpreted with a
certain degree of prudence.
List of references
Aabo, T. and Simkins B.J., 2005, “Interaction between real options
and financial hedging: fact or fiction in managerial decision-
making”, Review of Financial Economics 14, pp.
353 – 369.
Adler, M. and Dumas, B., 1984, “Exposure to currency risk:
definition and measurement”. Financial Management, 13(2), pp. 41-
50.
Aggarwal, R. and Soenen, L., 1989, “Managing persistent real
changes in currency values: the roles of multinational operating
64
strategies”, Columbia Journal of World Business, vol. 24, 3, pp.
60-67
Allayannis, G., Ihrig, J. and Weston, J.P., 2001, “Exchange-Rate
Hedging: Financial versus Operational Strategies”, AEA Papers and
Proceedings, may, pp. 391 – 395.
Allen, L. and Pantzalis, C., 1996. “Valuation of the operating
flexibility of multinational
corporations”. Journal of International Business Studies, 27, pp.
633–653.
Andersen, T.M., Dalim, B., Linderoth, H., 2006, ”The Danish
Economy, An International Perspective”, 2nd Edition, DJOF
Publishing Copenhagen.
Bartram, S., Dufey, G. and Frenkel, M.R., 2005, “A primer on the
exposure of nonfinancial corporations to foreign exchange rate
risks”. Journal of Multinational Financial Management 15, pp. 394-
413.
Belk, P.A. and Edelshain D. J., 1997, “Foreign Exchange Rate
Management – The Paradox”. Managerial Finance 23, pp. 5-24.
Belk, P.A. and Glaum, M., 1990, “The Management of Foreign Exchange
Risk in UK
Multinationsl: An Empirical Investigation”, Accounting and Business
Research, 21,81, pp. 3-13
65
Bodnar, G.M. and Gentry, W.M., 1993, “Exchange rate exposure and
industry characteristics: evidence from Canada, Japan and the USA”.
Journal of International Money and Finance 12, pp. 29-45.
Bodnar, G.M., Hayt, G.S. and Marston, R.C., 1998. Wharton Survey of
Financial Risk Management by US Non-Financial Firms. Financial
Management 27, pp. 70-91.
Booth, L. and Rotenberg, W., 1990, “Assessing Foreign Exchange
Exposure: Theory and Application Using Canadian Firms” Journal of
International Financial Management and Accounting 2, 1, pp. 1 – 22.
Bradley, K. and Moles, P., 2002, “Managing Strategic Exchange Rate
Exposures: Evidence from UK firms”. Managerial Finance 28, pp. 28 -
41
Capel, J., 1997, “A Real Options Approach to Economic Exposure
Management”. Journal of International Financial Management and
Accounting 8, 2, pp. 87-113.
Carter, D. A., Pantzalis, C. and Simkins, B., 2003, “Asymmetric
exposure to foreign exchange risk: Financial and real options
hedges implemented by U.S. multinational corporations”. Proceedings
from the 7th Annual International Conference on Real
Options: Theory Meets Practice. Washington, D.C.
Choi, J.J. and Kim, Y.C., 2003, “The Asian exposure of U.S. firms:
Operational and risk 68 Management Strategies”. Pacific-Basin
Finance Journal 11, pp. 121-138.66
Chowdhry, B. abd Howe, J.T.B., 1999, “Corporate risk management for
multinational corporations: financial and operational hedging
policies”. European Finance Review 2, pp. 229-246
Driouchi, T., Battisti, G. and Bennett, D., 2006, “Downsize Risk
Implications of Multinationality and Real options” Proceedings from
the 10th Annual International Conference on Real Options: Theory
Meets Practice, New-York City, USA, June 14-17
Faseruk, A. and Mishara, D.R., 2008, “An examination of US dollar
risk management by Canadian non-financial firms”. Management
Research News, vol. 31, 8, pp. 570-581
Flood, E. and Lessard, D.R., 1986, “On the measurement of
operating exposure to exchange rates: conceptual approach ”.
Financial management, spring, pp. 25-36.
Froot, K. A., Scharfstein, D. S. and Stein, J. C., 1993. “Risk
Management: Coordinating Corporate Investment and Financing
Policies”. The Journal of Finance 48, 5, pp. 1629- 1658
Froot, K.A., Scharfstein, D. S. and Stein, J.C., 1994. “A framework
for Risk Management”. Harvard Business Review, nov.-dec., pp. 91 –
102.
Géczy, C., Minton, B. A., Schrand, C., 1997, “Why Firms Use
Currency Derivatives.”
The Journal of Finance, 52, 4, September , p. 1323-1354.
67

Glaum, M., 1990, “Strategic Management of Exchange Rate Risks”.
Long Range
Planning 23, 4, pp. 65 – 72.
Hakkarainen, A., Joseph, N., Kasanen, E. and Puttonen, V., 1998.
“The Foreign Exchange Exposure Management Practices of Finnish
Industrial Firms” Journal of International Financial Management and
Accounting 9, 1, pp. 34 – 57.
Hair, J., Babin, B., Money, A. and Samouel, P., ”Essentials on
Business Research Methods”. Wiley, US., 2003.
Hau, H., 1999, “Comment on “ Corporate risk management for
multinational corporations: financial and operational hedging
policies”, European Finance Review 2, pp. 247-249
Hollensen, S., 2007, “Global marketing: a decision-oriented
approach”, N.Y., Prentice Hall/Financial times, 714 p.
Hommel, U., 2003, ”Financial versus operative hedging of currency
risk”. Global Finance Journal 14, pp. 1-18
Joseph, N.L., 2000, “The choice of hedging techniques and the
characteristics of UK industrial firms”. Journal of Multinational
Financial Management 10, pp. 161-184.
Kato,I. and Uctum, M., 2008, “Choice of exchange rate regime and
currency zones”. International Review of Economics and Finance, 17,
pp. 436 – 456.
68
Kogut, B. and Kulatilaka, N., 1994, “Operating Flexibility, Global
Manufacturing, and the Option Value of a Multinational Network”.
Management Science 40, 1, pp. 123-139.
Kuhn, J., 2007, Corporate Risk Management and Hedging Practice by
Medium-sized Companies in Denmark”, Master thesis, Aarhus School of
Business.69
Lessard, D.R. 1986, “Financial and Global Competition” in
Completion in Global industries, ed. M.Porter, Harvard Business
Press, Boston, Massachusetts
Loderer, C. and Pichler, K., 2000, “Firms, do you know your
currency risk exposure? Survey results”. Journal of Empirical
Finance, 7, pp. 317 – 344.
Marshall, A. P., 2000, “Foreign Exchange Rate Management in UK,
USA and Asia Pacific multinational companies”. Journal of
Multinational Financial Management 10, pp. 185 – 211.
Martin, A. D. and Mauer, L. J., 2003, “Transaction versus economic
exposure: which has greater cash flow consequences?” International
Review of Economics and Finance 12, pp. 437 – 449.
Mello, A. S., Parsons, J.E. and Triantis, A. J., 1995, “An
Integrated Model of multinational flexibility and financial
hedging”. Journal of International Economics 39, pp. 27-51.
Miller, K. D., 1998, “Economic exposure and integrated risk
management”, Strategic Management Journal, 19, 5, 497-514 pp.69
Moffett, M.H. and Karlsen, J. K., 1994, “Managing Foreign Exchange
Rate Exposure”. Journal of International Financial Management and
Accounting 5, 2, pp. 157 – 175.
Nance, D. R., Smith, C. W., Smithson, C. W., 1993, “On the
Determinants of Corporate Hedging”. The Journal of Finance, 48, 1,
March, p. 267-284
Pantzalis, C., Simkins, B.J. and Laux, P.A., 2001, “Operational
Hedges and the Foreign Exchange Exposure of U.S. Multinational
Corporations”. Journal of International Business Studies, 32, 4,
pp. 793 – 812.
Rangan, S., 1998. Do Multinationals operate Flexibly? Theory and
evidence. Journal of International Business Studies 29,2, pp. 217-
237
Srinivasulu, S. L., 1981, “Strategic response to Foreign Exchange
Risks” Columbia Journal of World Business, spring, pp. 13-22
Triantis, A., 2005, “Realizing the potential of real options: Does
theory meet practice?” Journal of applied corporate finance 17, 2,
pp. 8-16.
Trigeorgis, L., 1993, “Real Options and Interactions with Financial
Flexibility”. Financial
Management, autumn, pp. 202-224
70

APPENDIX A
LETTER OF INTRODUCTION TO RESPONDENT
Dear Sir/Madam,
I am a student at KCA University Nairobi, pursuing a degree in
Bachelor of Commerce (finance option). I am conducting a research
on impact of hedging foreign currency exposure. My objective is to
71
broaden the pool of knowledge about the use of various hedging
tools in Kenya and their significance on firm’s value.
To do this I require to collect data from financial managers and/
or treasury managers on the subject. Your help in the following few
questions, which will take a few of your minutes, will make areal
contribution to the accuracy and success of this study.
Your reply will be treated in strict confidence and will be
available only to my supervisor and me. Any publications will only
be statistical totals.
Your assistance will be greatly appreciated.
Regards,
Joseph M. Chege
72