1-s2 0-S0001691814000274-main
10
Association between individual differences in non-symbolic number acuity and math performance: A meta-analysis Qixuan Chen, Jingguang Li ⁎ State Key Laboratory of Cognitive Neuroscience and Learning, Beijing Normal University, Beijing 100875, China abstract article info Article history: Received 5 June 2013 Received in revised form 15 January 2014 Accepted 28 January 2014 Available online 26 February 2014 PsycINFO classification: 2340 Cognitive processes 3550 Academic Learning & Achievement Keywords: Number acuity Math performance Meta-analysis Individual differences Many recent studies have examined the association between number acuity, which is the ability to rapidly and non-symbolically estimate the quantity of items appearing in a scene, and symbolic math performance. However, various contradictory results have been reported. To comprehensively evaluate the association between number acuity and symbolic math performance, we conduct a meta-analysis to synthesize the results observed in previ- ous studies. First, a meta-analysis of cross-sectional studies (36 samples, N = 4705) revealed a significant posi- tive correlation between these skills (r = 0.20, 95% CI = [0.14, 0.26]); the association remained after considering other potential moderators (e.g., whether general cognitive abilities were controlled). Moreover, a meta-analysis of longitudinal studies revealed 1) that number acuity may prospectively predict later math performance (r = 0.24, 95% CI = [0.11, 0.37]; 6 samples) and 2) that number acuity is retrospectively correlated to early math per- formance as well (r = 0.17, 95% CI = [0.07, 0.26]; 5 samples). In summary, these pieces of evidence demonstrate a moderate but statistically significant association between number acuity and math performance. Based on the estimated effect sizes, power analyses were conducted, which suggested that many previous studies were under- powered due to small sample sizes. This may account for the disparity between findings in the literature, at least in part. Finally, the theoretical and practical implications of our meta-analytic findings are presented, and future research questions are discussed. © 2014 Elsevier B.V. All rights reserved. 1. Introduction Humans use their intuitive sense of quantity to guide a variety of everyday life decisions. For example, we may quickly compare the num- ber of people in one group to that in another group without verbally counting. This intuitive skill, number acuity, is already present in human infants (McCrink & Wynn, 2004; Xu & Spelke, 2000), has been observed in non-human animals (Brannon, Cantlon, & Terrace, 2006; Flombaum, Junge, & Hauser, 2005), and is widespread across different cultures (Pica, Lemer, Izard, & Dehaene, 2004). Based on these pieces of evidence, researchers believe that this intuitive skill is rooted in a mental system that non-symbolically represents approximate numbers, and this skill has been referred to as the “number sense” (Dehaene, 1997). Unlike nonhuman animals, humans in various societies use num- bers in a formal symbolic number system, i.e., mathematics. Although symbolic and non-symbolic numerical representations differ in many aspects, various recent studies have explored the link between them. In this paper, we aimed to evaluate the existing evidence regarding the relationship between non-symbolic and symbolic numerical repre- sentations via meta-analytic methods. 1.1. Number acuity Number acuity is often operationally defined as performance in non- symbolic number comparison or arithmetic tasks. In the non-symbolic comparison task (Halberda, Mazzocco & Feigenson, 2008), participants were asked to compare the quantities of two different item arrays (e.g., dots) and to choose the more numerous array. The two arrays could be 1) intermixed and simultaneously presented (i.e., the intermixed design); 2) presented separately and simultaneously (i.e., the paired de- sign); or 3) successively presented (i.e., the sequential design) (Price, Palmer, Battista, & Ansari, 2012). The difficulty of making such a com- parison is generally controlled by changing the ratio between the ar- rays. For instance, distinguishing 14 versus 12 dots is more difficult than distinguishing 14 versus 7 dots. In addition, number acuity can also be measured using a non-symbolic number arithmetic task. In this task, participants are often shown three successively presented ar- rays and are asked to judge whether the sum or difference of the quan- tities of the first two arrays is larger than the quantity of the third array (Barth, La Mont, Lipton, Dehaene, Kanwisher and Spelke, 2006; Gilmore, McCarthy, & Spelke, 2010). Many studies have consistently found that the performance on non-symbolic comparison or arithmetic tasks follows Weber's law (e.g., Halberda & Feigenson, 2008; Whalen, Gallistel, & Gelman, 1999), i.e., the subjective differences in the quantities of two item arrays are proportional to the objective differences in their quantities. Therefore, Acta Psychologica 148 (2014) 163–172 ⁎ Corresponding author. Tel.: +86 18600030984. E-mail address: [email protected] (J. Li). 0001-6918/$ – see front matter © 2014 Elsevier B.V. All rights reserved. http://dx.doi.org/10.1016/j.actpsy.2014.01.016 Contents lists available at ScienceDirect Acta Psychologica journal homepage: www.elsevier.com/ locate/actpsy
Transcript of 1-s2 0-S0001691814000274-main
Acta Psychologica 148 (2014) 163–172
Contents lists available at ScienceDirect
Acta Psychologica
j ourna l homepage: www.e lsev ie r .com/ locate /actpsy
Association between individual differences in non-symbolic numberacuity and math performance: A meta-analysis
Qixuan Chen, Jingguang Li ⁎State Key Laboratory of Cognitive Neuroscience and Learning, Beijing Normal University, Beijing 100875, China
⁎ Corresponding author. Tel.: +86 18600030984.E-mail address: [email protected] (J. Li).
0001-6918/$ – see front matter © 2014 Elsevier B.V. All rihttp://dx.doi.org/10.1016/j.actpsy.2014.01.016
a b s t r a c t
a r t i c l e i n f oArticle history:Received 5 June 2013Received in revised form 15 January 2014Accepted 28 January 2014Available online 26 February 2014
PsycINFO classification:2340 Cognitive processes3550 Academic Learning & Achievement
Keywords:Number acuityMath performanceMeta-analysisIndividual differences
Many recent studies have examined the association between number acuity, which is the ability to rapidly andnon-symbolically estimate the quantity of items appearing in a scene, and symbolicmath performance. However,various contradictory results have been reported. To comprehensively evaluate the association between numberacuity and symbolic math performance, we conduct a meta-analysis to synthesize the results observed in previ-ous studies. First, a meta-analysis of cross-sectional studies (36 samples, N = 4705) revealed a significant posi-tive correlation between these skills (r= 0.20, 95% CI= [0.14, 0.26]); the association remained after consideringother potential moderators (e.g., whether general cognitive abilities were controlled).Moreover, ameta-analysisof longitudinal studies revealed 1) that number acuity may prospectively predict later math performance (r =0.24, 95% CI= [0.11, 0.37]; 6 samples) and 2) that number acuity is retrospectively correlated to early math per-formance aswell (r= 0.17, 95% CI= [0.07, 0.26]; 5 samples). In summary, these pieces of evidence demonstratea moderate but statistically significant association between number acuity and math performance. Based on theestimated effect sizes, power analyseswere conducted,which suggested thatmany previous studieswere under-powered due to small sample sizes. This may account for the disparity between findings in the literature, at leastin part. Finally, the theoretical and practical implications of our meta-analytic findings are presented, and futureresearch questions are discussed.
© 2014 Elsevier B.V. All rights reserved.
1. Introduction
Humans use their intuitive sense of quantity to guide a variety ofeveryday life decisions. For example, wemay quickly compare the num-ber of people in one group to that in another group without verballycounting. This intuitive skill, number acuity, is already present inhuman infants (McCrink & Wynn, 2004; Xu & Spelke, 2000), has beenobserved in non-human animals (Brannon, Cantlon, & Terrace, 2006;Flombaum, Junge, & Hauser, 2005), and is widespread across differentcultures (Pica, Lemer, Izard, & Dehaene, 2004). Based on these piecesof evidence, researchers believe that this intuitive skill is rooted in amental system that non-symbolically represents approximate numbers,and this skill has been referred to as the “number sense” (Dehaene,1997). Unlike nonhuman animals, humans in various societies use num-bers in a formal symbolic number system, i.e., mathematics. Althoughsymbolic and non-symbolic numerical representations differ in manyaspects, various recent studies have explored the link between them.In this paper, we aimed to evaluate the existing evidence regardingthe relationship between non-symbolic and symbolic numerical repre-sentations via meta-analytic methods.
ghts reserved.
1.1. Number acuity
Number acuity is often operationally defined as performance in non-symbolic number comparison or arithmetic tasks. In the non-symboliccomparison task (Halberda, Mazzocco & Feigenson, 2008), participantswere asked to compare the quantities of two different item arrays(e.g., dots) and to choose the more numerous array. The two arrayscould be 1) intermixed and simultaneously presented (i.e., the intermixeddesign); 2) presented separately and simultaneously (i.e., the pairedde-sign); or 3) successively presented (i.e., the sequential design) (Price,Palmer, Battista, & Ansari, 2012). The difficulty of making such a com-parison is generally controlled by changing the ratio between the ar-rays. For instance, distinguishing 14 versus 12 dots is more difficultthan distinguishing 14 versus 7 dots. In addition, number acuity canalso be measured using a non-symbolic number arithmetic task. Inthis task, participants are often shown three successively presented ar-rays and are asked to judge whether the sum or difference of the quan-tities of the first two arrays is larger than the quantity of the third array(Barth, La Mont, Lipton, Dehaene, Kanwisher and Spelke, 2006;Gilmore, McCarthy, & Spelke, 2010).
Many studies have consistently found that the performance onnon-symbolic comparison or arithmetic tasks follows Weber's law(e.g., Halberda & Feigenson, 2008; Whalen, Gallistel, & Gelman, 1999),i.e., the subjective differences in the quantities of two item arrays areproportional to the objective differences in their quantities. Therefore,
164 Q. Chen, J. Li / Acta Psychologica 148 (2014) 163–172
number acuity is best indexed byWeber's fraction (w), the smallest nu-merical change to an array that can be detected. The value ofw is equalto the difference between the quantities of two arrays divided by thequantity of the smaller array. For instance, if one person's most accurateand reliable performance involves distinguishing 10 dots from 8 dots,the Weber fraction of her/his performance is 0.25 [w = (10 − 8) ∕ 8 =0.25]. Moreover, studies have found that number acuity increases withage. In typical development, number acuity sharply increases in infancyand early childhood, and continues to gradually increase until 30 yearsof age (Halberda & Feigenson, 2008; Halberda, Ly, Wilmer, Naiman, &Germine, 2012). The averagew for numerateWestern adults is estimat-ed to be 0.11 (Halberda et al., 2008); however, studies have found largeindividual differences in number acuity (Halberda et al., 2008, 2012).
1.2. The link between number acuity and symbolic math performance
In addition to understanding the mental representations of numberacuity, recent studies have begun to explore the relationship betweennumber acuity and symbolic math performance. Researchers have pro-posed several hypotheses to describe this relationship. One such hy-pothesis is that better number acuity improves people's ability tolearn math. One piece of evidence supporting this hypothesis is thatyoung children without access to arithmetic instruction have beenfound to successfully perform symbolic addition and subtraction tasks;their performances also appeared to demonstrate several critical signa-tures of non-symbolic number representation (Gilmore, McCarthy, &Spelke, 2007). Therefore, researchers have speculated that the develop-ment of arithmetic abilities is partly built on children's number acuity.Moreover, another piece of supporting evidence is that training innon-symbolic arithmetic tasks can improve participants' performanceon symbolic arithmetic tasks (Park & Brannon, 2013). However, anothertraining study did not find a significant increase in symbolic math per-formance after a game-based training involving non-symbolic numbercomparison, estimation and calculation (Obersteiner, Reiss, & Ufer,2013). A second hypothesis states that math learning may shape num-ber acuity. This hypothesis is supported by recent studies comparing in-dividuals with and without access to school (Nys, Ventura, Fernandes,Querido, & Leybaert, 2013; Piazza, Pica, Izard, Spelke, & Dehaene,2013). Specifically, individuals with access to school demonstratedbetter performance in a non-symbolic number comparison task thanindividuals without access to school. This effect may be true not onlyin Western cultures (Nys et al., 2013; but see Zebian & Ansari, 2012for a null result) but also in a remote Amazonian culture (Piazza et al.,2013). The third hypothesis states that number acuity is simplyindependent of symbolic math performance (Butterworth, 2010;Lyons, Ansari, & Beilock, 2012). Butterworth (2010) argued that it is un-clear how non-symbolic number representation is in accordance withbasic principles of arithmetic reasoning. For example, non-symbolicnumerosities may be represented logarithmically (i.e., according toWeber's law), whichmakes it difficult to use non-symbolic number rep-resentation in symbolic addition and subtraction.
To some extent, it appears that all three hypotheses are plausible.However, none of the hypotheses has been supported by conclusive ex-perimental evidence. At present, a good starting point is to test the cor-relation between number acuity and symbolic math performance.Specifically, because correlation is a premise of causation, the causalrole of number acuity in math performance (or vice versa) would pre-dict a correlation between individual differences in these two variables(Underwood, 1975;Wilmer, 2008). For this purpose,many studies haveexamined the correlation between number acuity and symbolic mathperformance (see De Smedt, Noël, Gilmore, & Ansari, 2013; Feigenson,Libertus, & Halberda, 2013 for narrative reviews). Specifically, a positivecorrelation between these variables would support the first two hy-potheses (although it would not completely validate them given thatcorrelation does not imply causation), and a lack of a significant correla-tion may lend some support to the third hypothesis. Additionally,
examining the association between number acuity and symbolic mathperformance may have practical implications. Because math is one ofthemost essential aspects in science, engineering, technology, and busi-ness, identifying the factors that underlie individual differences in mathperformance is meaningful. If these factors are indeed correlated andadditional future convincing evidence supports the hypothesis statingthat number acuity causally influences math performance, educatorsmay develop programs to improve math ability through number acuitytraining (Wilson & Dehaene, 2007). In summary, examining the associ-ation between number acuity and math performance is both theoreti-cally and practically valuable.
Indeed, the first correlational study of number acuity and math per-formance has found that performance on a non-symbolic comparisontask at 14 years of age is strongly correlated with (i.e., correlationcoefficient is approximately 0.4 to 0.5) school math performance fromkindergarten to sixth grade (Halberda et al., 2008). However, subse-quent replication studies have reported rather mixed results. A numberof studies have confirmed the association between number acuityand math performance (Gilmore et al., 2010; Libertus, Feigenson, &Halberda, 2011; Libertus, Odic, & Halberda, 2012), whereas someother studies have failed to detect a positive association betweenthese factors (e.g., Holloway & Ansari, 2009; Kolkman, Kroesbergen, &Leseman, 2013; Price et al., 2012). In addition, several studies suggestthat the association between number acuity and math performanceis dependent on various potential moderators. For instance, Inglis,Attridge, Batchelor, and Gilmore (2011) have proposed that the associ-ation may exist only in children and not in adults. Similarly, Bonny andLourenco (2013) have proposed that the association is non-linear anddependent on participants' math ability.
The contradictory findings in the literature may lead to two generaltypes of speculation. First, the pattern of inconsistency in the findingsbetween studies is thought to be due to potential moderators. However,a narrative review, which included existing relevant studies, did notidentify any particular moderators that would account for the inconsis-tent findings previously reported (De Smedt et al., 2013). Second, thelack of a clear pattern in the findings of studies examining the relation-ship between number acuity and math performance casts doubt onwhether these factors are causally related. Rather, this may suggestthat number acuity is irrelevant or plays only a trivial role in math per-formance; in either of these cases, measuring number acuity may nothave any particular practical significance for math learning.
1.3. Study rationale
Before jumping to a conclusion about the contradictory findings, webelieve that a quantitative meta-analytical review of existing empiricalstudies is necessary. The meta-analysis technique has two distinctmethodological advantages over narrative reviews. First, single studiesmay lack sufficient statistical power to detect an association betweennumber acuity and math performance that may be subtle. A meta-analysis may overcome this problem by cumulating participants acrossmultiple samples. Second, meta-analytic techniques may be able toidentify potential moderators that may underlie the inconsistency ob-served in the findings of previous studies. Specifically, several potentialmoderators have not been comprehensively evaluated in prior research.First, whether such an association is specific to the numerical domainremains unclear. Specifically, the association between number acuityandmath performancemayno longer be significant if the individual dif-ferences in general cognitive abilities are controlled. This question is im-portant andhas been examined often in individual studies (e.g., Gilmoreet al., 2010; Halberda et al., 2008); however, a comprehensive meta-analysis is warranted. Second, as proposed by Inglis et al. (2011), agemay affect the association between number acuity and math perfor-mance. Third, the task formats used to measure number acuity acrossstudies are highly variable (Price et al., 2012). Therefore, it is necessaryto examinewhether the association is restricted to specific task formats.

1 Soltész, Szücs, and Szücs (2010) did not report results from single measures of num-ber acuity; therefore, we used a composite measure of number acuity based on the factoranalysis of various accuracy-based indicators.
165Q. Chen, J. Li / Acta Psychologica 148 (2014) 163–172
Fourth, although number acuity wasmostly indexed by two highly cor-related indices,w or overall accuracy (e.g., r= 0.95, Lindskog,Winman,Juslin, & Poom, 2013), number acuity was sometimes indirectly indexedby the numerical distance effect (NDE), i.e., the performance difference(difference score or slope) in response time between large (10 versus 5)and small (10 versus 9) numerical distances separating two item arrays(e.g., Holloway & Ansari, 2009). As proposed by Lindskog et al. (2013),the association may not exist when number acuity is scored usingNDE because the size of the NDE might be an inappropriate index ofnon-symbolic numerical precision. In summary, narrative reviews donot systematically code themethodological differences between studiesand statistically evaluate them; therefore narrative reviews are not ap-propriate for identifying these moderating factors.
For these reasons, we performed a meta-analytic evaluation of theprevious studies that have reported a correlation between number acu-ity andmath performance. Specifically,we documented two types of ev-idence. First, we documented the extensive cross-sectional correlationalevidence. We assessed whether people who have better number acuityare more likely to be more successful at learning math than their peerswith worse number acuity. Second, we documented longitudinal evi-dence, which is somewhat more informative regarding causal directionthan cross-sectional evidence. It is possible that if one variable mea-sured at an earlier time point is correlated with another variable mea-sured at a later time point, the results may be used to establish thedirectionality in possible causal models. Specifically, we addressed twodifferent types of questions using longitudinal data. First, does betternumber acuity precede better math performance (i.e., evidenced viaprospective data)? Second, does better math performance precede bet-ter number acuity (i.e., evidenced via retrospective data)? If numberacuity has a causal effect on math learning, a positive correlation is ex-pected to be observed using prospective data. Similarly, if math learningcan shape number acuity, a positive correlation is expected be observedusing retrospective data.
We address cross-sectional and longitudinal empirical evidence inorder. Based on the evidence reviewed, we propose a potential causeof the inconsistency in the findings of the current literature. Finally,we discuss the implications of themeta-analytic findings, and future re-search questions generated by this review.
2. Evaluation of cross-sectional studies
We first conducted a meta-analysis to estimate the strength of theassociation between number acuity and math performance based onprevious cross-sectional studies.We then investigated potential moder-ators of this association.
2.1. Methods
2.1.1. Literature searchTo identify studies that were appropriate for meta-analysis, we
searched PubMed, Google Scholar, and the ProQuest Dissertations andTheses database for all studies that were available up to November 1,2013 that examined the association between number acuity and mathperformance. The following terms were included in the search: numberacuity, number sense, approximate number system, numerical cogni-tion, non-symbolic number comparison, non-symbolic number addi-tion, math ability, and math achievement. In addition, we identifiedadditional relevant studies from the references in the studies and liter-ature reviews initially identified by our search.
2.1.2. Inclusion and data extraction criteriaCross-sectional studies that used non-symbolic comparison and/or
addition tasks to measure number acuity were included in the analyses.Data were extracted independently by two authors of the present studyand then were cross-checked for accuracy. One data point (i.e., effect
size) was extracted from each sample, and the data were extracted ac-cording to the criteria detailed below.
(1) Scoring procedures for number acuity. In the included studies(36 independent samples), researchers used several different ways toindex number acuity when calculating the correlation between thisskill and math performance. Some studies quantified number acuity asoverall accuracy (21 samples, 58% of all samples) or average responsetime (RT, 9 samples, 25%) across all trials in a task. Other studies quan-tified number acuity asWeber fraction (w, 17 samples, 47%) by psycho-physics modeling (e.g., Halberda & Feigenson, 2008), based on theaccuracies of all different numerical distances separating two item ar-rays. In addition, a small portion of studies quantified number acuityas NDE (8 samples, 22%), the performance difference in RT betweenlarge and small numerical distances (Holloway & Ansari, 2009).
Because overall accuracy andwwere used inmost studies (i.e., 32 ofthe 36 samples used at least one of these scoring procedures, 89%) andwere highly correlated, our meta-analysis used results that were pri-marily based on these two indices. In addition, because w is generallyconsidered to be a more precise measure of number acuity relative tooverall accuracy (Halberda et al., 2008), w was preferred if more thanone index was used.1 Finally, four samples only contained NDE-basedresults; unless otherwise noted, these results were entered into themeta-analysis as well.
(2) Measures of math performance. In some cases, studies usedmore than one test to index math performance (e.g., Castronovo &Göbel, 2012; Gilmore et al., 2010; Sasanguie, Göbel, Moll, Smets, &Reynvoet, 2013). If one test more comprehensively captured math per-formance than other tests, the results based on the single comprehen-sive test were preferred (e.g., school grades in math). If multiple testswere used to index different facets of math performance separately(e.g., addition and subtraction) and multiple correlation coefficientswere reported, the averaged correlation coefficients were entered intothe meta-analysis.
(3) Studies using covariates. If studies reported both zero-order cor-relations and partial correlations after partialling out variance related toother constructs (e.g., IQ and language achievement), we used the latterbecause it is more likely to reflect the true association between numberacuity and math performance. Similarly, if more than one analysis con-trolled for covariates, the analysis that regressed out most of the covar-iates was preferred.
(4) Transformation of the correlation coefficient. First, the directionof the correlation coefficient was adjusted for consistency across all ofthe included studies. Specifically, positive correlation coefficients weretaken to indicate that better number acuity was associated with bettermath performance. Second, if the coefficient of determination (i.e., R2)was reported in a regression analysis (e.g., DeWind & Brannon, 2012;Fuhs & McNeil, 2013; Libertus et al., 2011), we calculated the squareroot of R2 to index the magnitude of the association.
For each study, the following information was extracted: the effectsize of the association (i.e., correlation coefficients), the number of par-ticipants, the participants' age, the sex ratio (proportions of females),the indices and task formats used to measure number acuity, the mea-sures of math performance, and the variables that were controlled.
2.1.3. Data analysisWe conducted the meta-analysis using the Metafor package in R
(Viechtbauer, 2010). The correlation coefficients that were extractedfrom the included studies were used as the measure of the effect size.Because of the heterogeneous nature of these studies (e.g., children ver-sus adults; differences in the tasks used to measure number acuity andmath performance), the weighted effect size and 95% confidence inter-val (95% CI) were generated via a random-effects analysis framework
3 Price et al. (2012) used three differentmethods to present stimuli in the non-symbolicnumber comparison task (i.e., intermixed, paired, and sequential presentation) and re-
166 Q. Chen, J. Li / Acta Psychologica 148 (2014) 163–172
using the DerSimonian–Laird estimators (DerSimonian & Laird, 1986). Inthismodel, between-study heterogeneity is proposed to result frombothrandom variation and effects from individual studies. The random-effects model is generally more conservative (i.e., has a wider CI) thanthe fixed-effects model that assumes that between-study heterogeneityresults from random variation only. In addition, the Z test was used toexamine the statistical significance of the weighted effect size.
Publication bias, the tendency to publish positive results rather thannon-significant results, was assessed and corrected in multiple steps.First, itwas visually evaluated using a funnel plot of all of the studies, de-fined by the effect sizes on the horizontal axis and the study sizes(indexed by the standard error of the effect size within each study) onthe vertical axis. When no publication bias exists, the two sides of thefunnel plot should be mirror images of each other (Sutton, Abrams,Jones, Sheldon, & Song, 2000). Egger's test and Begg's testwere then ap-plied to statistically test the asymmetry of the funnel plot. Because onetest may be more sensitive to specific situations than the other test, weused a conservative criterion: if either test detected a statistically signif-icant publication bias, we considered the included studies to be biased.Third, if a publication bias existed, a “trim and fill”method was used toadjust themeta-analysis by filling in studies thatwouldmake the funnelplot symmetrical (Duval & Tweedie, 2000). After imputing, the symmet-ric studies provided a more accurate estimation of the effect size.
In addition, a sensitivity analysis was applied to examine whetherthe inclusion of a particular study had a significant effect on the overallweighted effect size. That is, studies were removed one at a time to ex-amine whether the pooled effect size remained statistically significant.Finally, we examined the potential influence of moderators on the asso-ciation between number acuity and math performance using a meta-regression analysis. Specifically, sample-level moderators (e.g., adultsversus children) were coded as covariates in the random-effectsmodel testing the association.
2.2. Results
2.2.1. Overall analysisThirty-one studies,2 which comprised 36 independent samples (see
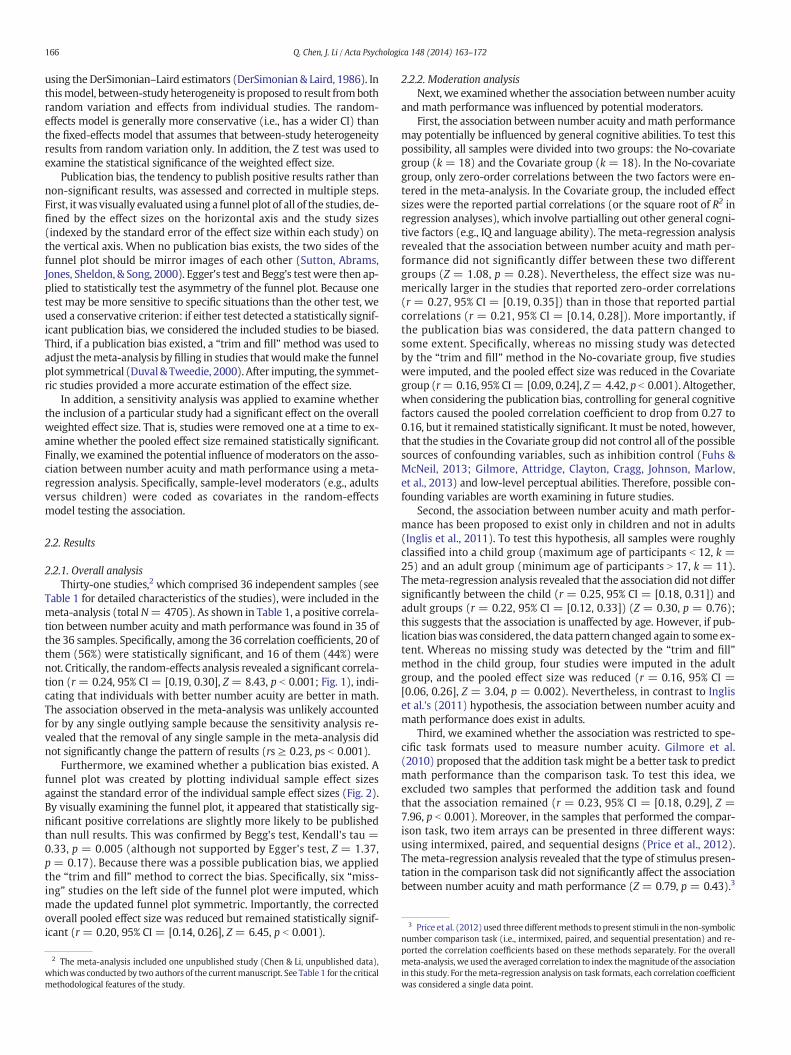
Table 1 for detailed characteristics of the studies), were included in themeta-analysis (total N= 4705). As shown in Table 1, a positive correla-tion between number acuity and math performance was found in 35 ofthe 36 samples. Specifically, among the 36 correlation coefficients, 20 ofthem (56%) were statistically significant, and 16 of them (44%) werenot. Critically, the random-effects analysis revealed a significant correla-tion (r = 0.24, 95% CI = [0.19, 0.30], Z = 8.43, p b 0.001; Fig. 1), indi-cating that individuals with better number acuity are better in math.The association observed in the meta-analysis was unlikely accountedfor by any single outlying sample because the sensitivity analysis re-vealed that the removal of any single sample in the meta-analysis didnot significantly change the pattern of results (rs ≥ 0.23, ps b 0.001).
Furthermore, we examined whether a publication bias existed. Afunnel plot was created by plotting individual sample effect sizesagainst the standard error of the individual sample effect sizes (Fig. 2).By visually examining the funnel plot, it appeared that statistically sig-nificant positive correlations are slightly more likely to be publishedthan null results. This was confirmed by Begg's test, Kendall's tau =0.33, p = 0.005 (although not supported by Egger's test, Z = 1.37,p = 0.17). Because there was a possible publication bias, we appliedthe “trim and fill” method to correct the bias. Specifically, six “miss-ing” studies on the left side of the funnel plot were imputed, whichmade the updated funnel plot symmetric. Importantly, the correctedoverall pooled effect size was reduced but remained statistically signif-icant (r = 0.20, 95% CI = [0.14, 0.26], Z = 6.45, p b 0.001).
2 The meta-analysis included one unpublished study (Chen & Li, unpublished data),whichwas conducted by two authors of the currentmanuscript. See Table 1 for the criticalmethodological features of the study.
2.2.2. Moderation analysisNext, we examinedwhether the association between number acuity
and math performance was influenced by potential moderators.First, the association between number acuity andmath performance
may potentially be influenced by general cognitive abilities. To test thispossibility, all samples were divided into two groups: the No-covariategroup (k = 18) and the Covariate group (k = 18). In the No-covariategroup, only zero-order correlations between the two factors were en-tered in the meta-analysis. In the Covariate group, the included effectsizes were the reported partial correlations (or the square root of R2 inregression analyses), which involve partialling out other general cogni-tive factors (e.g., IQ and language ability). The meta-regression analysisrevealed that the association between number acuity and math per-formance did not significantly differ between these two differentgroups (Z = 1.08, p = 0.28). Nevertheless, the effect size was nu-merically larger in the studies that reported zero-order correlations(r = 0.27, 95% CI = [0.19, 0.35]) than in those that reported partialcorrelations (r = 0.21, 95% CI = [0.14, 0.28]). More importantly, ifthe publication bias was considered, the data pattern changed tosome extent. Specifically, whereas no missing study was detectedby the “trim and fill” method in the No-covariate group, five studieswere imputed, and the pooled effect size was reduced in the Covariategroup (r= 0.16, 95% CI= [0.09, 0.24], Z= 4.42, p b 0.001). Altogether,when considering the publication bias, controlling for general cognitivefactors caused the pooled correlation coefficient to drop from 0.27 to0.16, but it remained statistically significant. It must be noted, however,that the studies in the Covariate group did not control all of the possiblesources of confounding variables, such as inhibition control (Fuhs &McNeil, 2013; Gilmore, Attridge, Clayton, Cragg, Johnson, Marlow,et al., 2013) and low-level perceptual abilities. Therefore, possible con-founding variables are worth examining in future studies.
Second, the association between number acuity and math perfor-mance has been proposed to exist only in children and not in adults(Inglis et al., 2011). To test this hypothesis, all samples were roughlyclassified into a child group (maximum age of participants b 12, k =25) and an adult group (minimum age of participants N 17, k = 11).Themeta-regression analysis revealed that the association did not differsignificantly between the child (r = 0.25, 95% CI = [0.18, 0.31]) andadult groups (r = 0.22, 95% CI = [0.12, 0.33]) (Z = 0.30, p = 0.76);this suggests that the association is unaffected by age. However, if pub-lication biaswas considered, the data pattern changed again to someex-tent. Whereas no missing study was detected by the “trim and fill”method in the child group, four studies were imputed in the adultgroup, and the pooled effect size was reduced (r = 0.16, 95% CI =[0.06, 0.26], Z = 3.04, p = 0.002). Nevertheless, in contrast to Ingliset al.'s (2011) hypothesis, the association between number acuity andmath performance does exist in adults.
Third, we examined whether the association was restricted to spe-cific task formats used to measure number acuity. Gilmore et al.(2010) proposed that the addition taskmight be a better task to predictmath performance than the comparison task. To test this idea, weexcluded two samples that performed the addition task and foundthat the association remained (r = 0.23, 95% CI = [0.18, 0.29], Z =7.96, p b 0.001). Moreover, in the samples that performed the compar-ison task, two item arrays can be presented in three different ways:using intermixed, paired, and sequential designs (Price et al., 2012).Themeta-regression analysis revealed that the type of stimulus presen-tation in the comparison task did not significantly affect the associationbetween number acuity and math performance (Z = 0.79, p = 0.43).3
ported the correlation coefficients based on these methods separately. For the overallmeta-analysis, we used the averaged correlation to index themagnitude of the associationin this study. For themeta-regression analysis on task formats, each correlation coefficientwas considered a single data point.
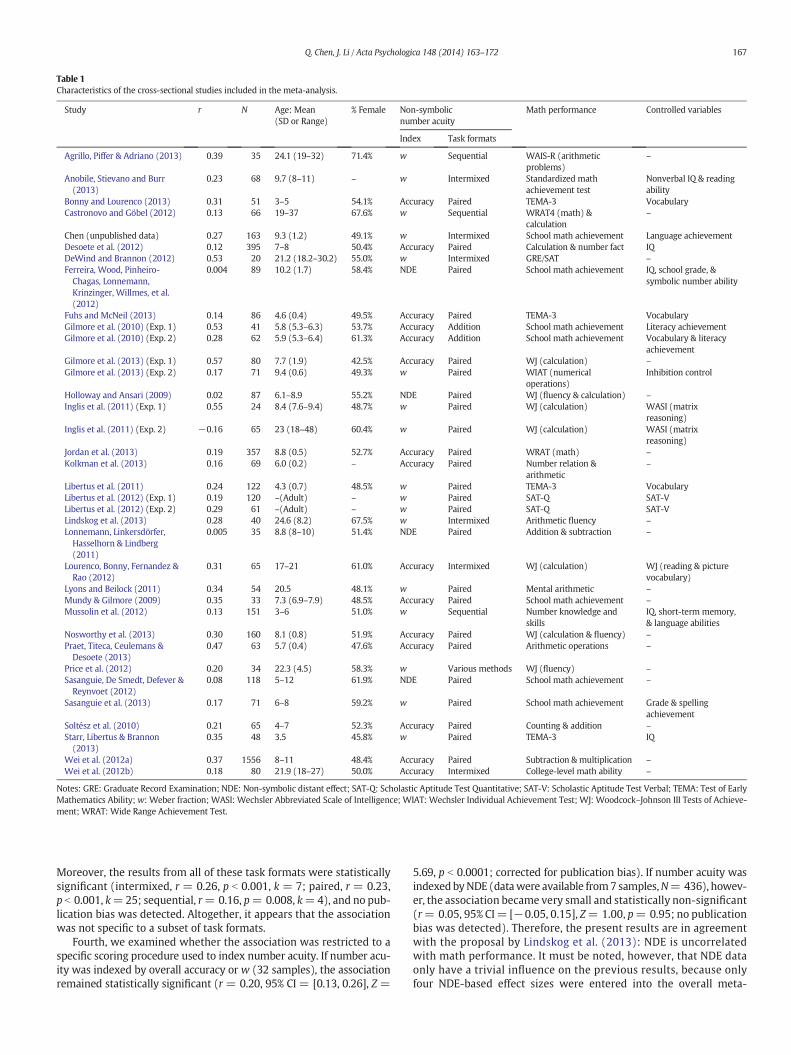
Table 1Characteristics of the cross-sectional studies included in the meta-analysis.
Study r N Age: Mean(SD or Range)
% Female Non-symbolicnumber acuity
Math performance Controlled variables
Index Task formats
Agrillo, Piffer & Adriano (2013) 0.39 35 24.1 (19–32) 71.4% w Sequential WAIS-R (arithmeticproblems)
–
Anobile, Stievano and Burr(2013)
0.23 68 9.7 (8–11) – w Intermixed Standardized mathachievement test
Nonverbal IQ & readingability
Bonny and Lourenco (2013) 0.31 51 3–5 54.1% Accuracy Paired TEMA-3 VocabularyCastronovo and Göbel (2012) 0.13 66 19–37 67.6% w Sequential WRAT4 (math) &
calculation–
Chen (unpublished data) 0.27 163 9.3 (1.2) 49.1% w Intermixed School math achievement Language achievementDesoete et al. (2012) 0.12 395 7–8 50.4% Accuracy Paired Calculation & number fact IQDeWind and Brannon (2012) 0.53 20 21.2 (18.2–30.2) 55.0% w Intermixed GRE/SAT –
Ferreira, Wood, Pinheiro-Chagas, Lonnemann,Krinzinger, Willmes, et al.(2012)
0.004 89 10.2 (1.7) 58.4% NDE Paired School math achievement IQ, school grade, &symbolic number ability
Fuhs and McNeil (2013) 0.14 86 4.6 (0.4) 49.5% Accuracy Paired TEMA-3 VocabularyGilmore et al. (2010) (Exp. 1) 0.53 41 5.8 (5.3–6.3) 53.7% Accuracy Addition School math achievement Literacy achievementGilmore et al. (2010) (Exp. 2) 0.28 62 5.9 (5.3–6.4) 61.3% Accuracy Addition School math achievement Vocabulary & literacy
achievementGilmore et al. (2013) (Exp. 1) 0.57 80 7.7 (1.9) 42.5% Accuracy Paired WJ (calculation) –
Gilmore et al. (2013) (Exp. 2) 0.17 71 9.4 (0.6) 49.3% w Paired WIAT (numericaloperations)
Inhibition control
Holloway and Ansari (2009) 0.02 87 6.1–8.9 55.2% NDE Paired WJ (fluency & calculation) –
Inglis et al. (2011) (Exp. 1) 0.55 24 8.4 (7.6–9.4) 48.7% w Paired WJ (calculation) WASI (matrixreasoning)
Inglis et al. (2011) (Exp. 2) −0.16 65 23 (18–48) 60.4% w Paired WJ (calculation) WASI (matrixreasoning)
Jordan et al. (2013) 0.19 357 8.8 (0.5) 52.7% Accuracy Paired WRAT (math) –
Kolkman et al. (2013) 0.16 69 6.0 (0.2) – Accuracy Paired Number relation &arithmetic
–
Libertus et al. (2011) 0.24 122 4.3 (0.7) 48.5% w Paired TEMA-3 VocabularyLibertus et al. (2012) (Exp. 1) 0.19 120 –(Adult) – w Paired SAT-Q SAT-VLibertus et al. (2012) (Exp. 2) 0.29 61 –(Adult) – w Paired SAT-Q SAT-VLindskog et al. (2013) 0.28 40 24.6 (8.2) 67.5% w Intermixed Arithmetic fluency –
Lonnemann, Linkersdörfer,Hasselhorn & Lindberg(2011)
0.005 35 8.8 (8–10) 51.4% NDE Paired Addition & subtraction –
Lourenco, Bonny, Fernandez &Rao (2012)
0.31 65 17–21 61.0% Accuracy Intermixed WJ (calculation) WJ (reading & picturevocabulary)
Lyons and Beilock (2011) 0.34 54 20.5 48.1% w Paired Mental arithmetic –
Mundy & Gilmore (2009) 0.35 33 7.3 (6.9–7.9) 48.5% Accuracy Paired School math achievement –
Mussolin et al. (2012) 0.13 151 3–6 51.0% w Sequential Number knowledge andskills
IQ, short-term memory,& language abilities
Nosworthy et al. (2013) 0.30 160 8.1 (0.8) 51.9% Accuracy Paired WJ (calculation & fluency) –
Praet, Titeca, Ceulemans &Desoete (2013)
0.47 63 5.7 (0.4) 47.6% Accuracy Paired Arithmetic operations –
Price et al. (2012) 0.20 34 22.3 (4.5) 58.3% w Various methods WJ (fluency) –
Sasanguie, De Smedt, Defever &Reynvoet (2012)
0.08 118 5–12 61.9% NDE Paired School math achievement –
Sasanguie et al. (2013) 0.17 71 6–8 59.2% w Paired School math achievement Grade & spellingachievement
Soltész et al. (2010) 0.21 65 4–7 52.3% Accuracy Paired Counting & addition –
Starr, Libertus & Brannon(2013)
0.35 48 3.5 45.8% w Paired TEMA-3 IQ
Wei et al. (2012a) 0.37 1556 8–11 48.4% Accuracy Paired Subtraction & multiplication –
Wei et al. (2012b) 0.18 80 21.9 (18–27) 50.0% Accuracy Intermixed College-level math ability –
Notes: GRE: Graduate Record Examination; NDE: Non-symbolic distant effect; SAT-Q: Scholastic Aptitude Test Quantitative; SAT-V: Scholastic Aptitude Test Verbal; TEMA: Test of EarlyMathematics Ability; w: Weber fraction; WASI: Wechsler Abbreviated Scale of Intelligence; WIAT: Wechsler Individual Achievement Test; WJ: Woodcock–Johnson III Tests of Achieve-ment; WRAT: Wide Range Achievement Test.
167Q. Chen, J. Li / Acta Psychologica 148 (2014) 163–172
Moreover, the results from all of these task formats were statisticallysignificant (intermixed, r = 0.26, p b 0.001, k = 7; paired, r = 0.23,p b 0.001, k=25; sequential, r= 0.16, p= 0.008, k=4), and no pub-lication bias was detected. Altogether, it appears that the associationwas not specific to a subset of task formats.
Fourth, we examined whether the association was restricted to aspecific scoring procedure used to index number acuity. If number acu-ity was indexed by overall accuracy or w (32 samples), the associationremained statistically significant (r = 0.20, 95% CI = [0.13, 0.26], Z =
5.69, p b 0.0001; corrected for publication bias). If number acuity wasindexedbyNDE (datawere available from7 samples,N= 436), howev-er, the association became very small and statistically non-significant(r= 0.05, 95% CI= [−0.05, 0.15], Z= 1.00, p= 0.95; no publicationbias was detected). Therefore, the present results are in agreementwith the proposal by Lindskog et al. (2013): NDE is uncorrelatedwith math performance. It must be noted, however, that NDE dataonly have a trivial influence on the previous results, because onlyfour NDE-based effect sizes were entered into the overall meta-
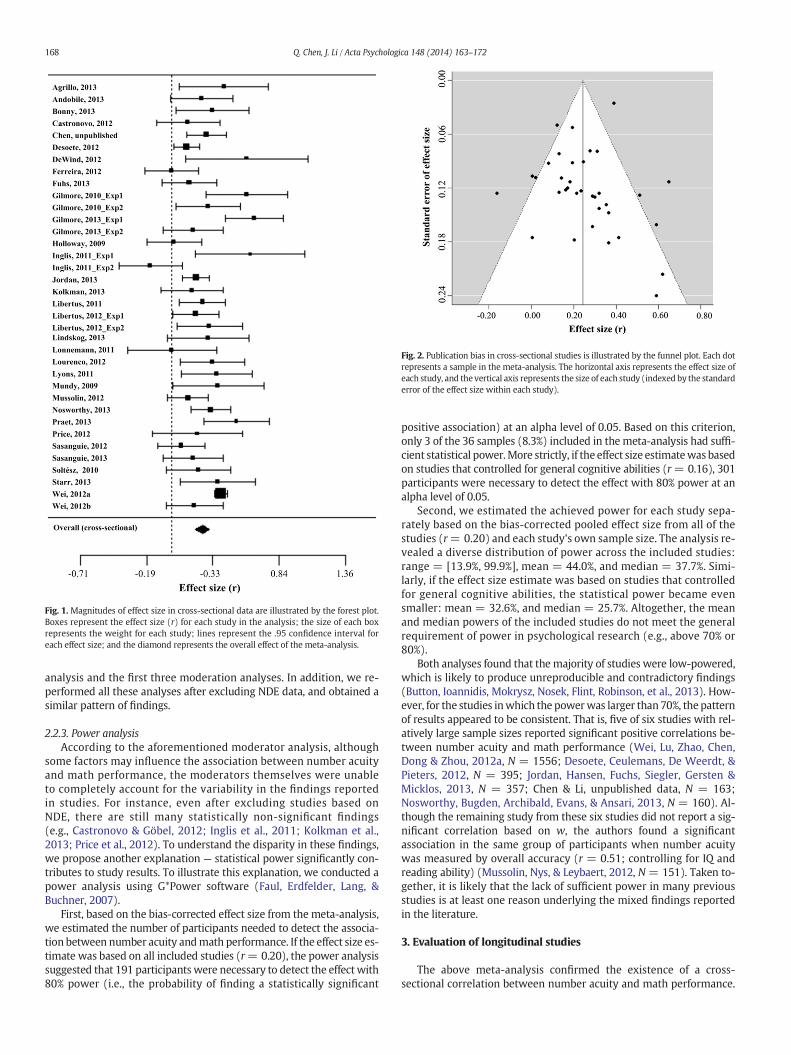
Fig. 1. Magnitudes of effect size in cross-sectional data are illustrated by the forest plot.Boxes represent the effect size (r) for each study in the analysis; the size of each boxrepresents the weight for each study; lines represent the .95 confidence interval foreach effect size; and the diamond represents the overall effect of the meta-analysis.
Fig. 2. Publication bias in cross-sectional studies is illustrated by the funnel plot. Each dotrepresents a sample in the meta-analysis. The horizontal axis represents the effect size ofeach study, and the vertical axis represents the size of each study (indexed by the standarderror of the effect size within each study).
168 Q. Chen, J. Li / Acta Psychologica 148 (2014) 163–172
analysis and the first three moderation analyses. In addition, we re-performed all these analyses after excluding NDE data, and obtained asimilar pattern of findings.
2.2.3. Power analysisAccording to the aforementioned moderator analysis, although
some factors may influence the association between number acuityand math performance, the moderators themselves were unableto completely account for the variability in the findings reportedin studies. For instance, even after excluding studies based onNDE, there are still many statistically non-significant findings(e.g., Castronovo & Göbel, 2012; Inglis et al., 2011; Kolkman et al.,2013; Price et al., 2012). To understand the disparity in these findings,we propose another explanation — statistical power significantly con-tributes to study results. To illustrate this explanation, we conducted apower analysis using G*Power software (Faul, Erdfelder, Lang, &Buchner, 2007).
First, based on the bias-corrected effect size from the meta-analysis,we estimated the number of participants needed to detect the associa-tion between number acuity andmath performance. If the effect size es-timate was based on all included studies (r= 0.20), the power analysissuggested that 191 participants were necessary to detect the effect with80% power (i.e., the probability of finding a statistically significant
positive association) at an alpha level of 0.05. Based on this criterion,only 3 of the 36 samples (8.3%) included in the meta-analysis had suffi-cient statistical power.More strictly, if the effect size estimatewas basedon studies that controlled for general cognitive abilities (r= 0.16), 301participants were necessary to detect the effect with 80% power at analpha level of 0.05.
Second, we estimated the achieved power for each study sepa-rately based on the bias-corrected pooled effect size from all of thestudies (r= 0.20) and each study's own sample size. The analysis re-vealed a diverse distribution of power across the included studies:range = [13.9%, 99.9%], mean = 44.0%, and median = 37.7%. Simi-larly, if the effect size estimate was based on studies that controlledfor general cognitive abilities, the statistical power became evensmaller: mean = 32.6%, and median = 25.7%. Altogether, the meanand median powers of the included studies do not meet the generalrequirement of power in psychological research (e.g., above 70% or80%).
Both analyses found that themajority of studies were low-powered,which is likely to produce unreproducible and contradictory findings(Button, Ioannidis, Mokrysz, Nosek, Flint, Robinson, et al., 2013). How-ever, for the studies inwhich the powerwas larger than70%, the patternof results appeared to be consistent. That is, five of six studies with rel-atively large sample sizes reported significant positive correlations be-tween number acuity and math performance (Wei, Lu, Zhao, Chen,Dong & Zhou, 2012a, N = 1556; Desoete, Ceulemans, De Weerdt, &Pieters, 2012, N = 395; Jordan, Hansen, Fuchs, Siegler, Gersten &Micklos, 2013, N = 357; Chen & Li, unpublished data, N = 163;Nosworthy, Bugden, Archibald, Evans, & Ansari, 2013, N = 160). Al-though the remaining study from these six studies did not report a sig-nificant correlation based on w, the authors found a significantassociation in the same group of participants when number acuitywas measured by overall accuracy (r = 0.51; controlling for IQ andreading ability) (Mussolin, Nys, & Leybaert, 2012, N = 151). Taken to-gether, it is likely that the lack of sufficient power in many previousstudies is at least one reason underlying the mixed findings reportedin the literature.
3. Evaluation of longitudinal studies
The above meta-analysis confirmed the existence of a cross-sectional correlation between number acuity and math performance.
169Q. Chen, J. Li / Acta Psychologica 148 (2014) 163–172
We then evaluated longitudinal investigations of this association. Com-pared with the large number of cross-sectional studies, the number oflongitudinal studies (8 studies, 11 samples) is very small. However, itis still worthwhile to synthesize evidence from longitudinal studies be-cause longitudinal data may provide answers for different types of re-search questions. Specifically, researchers have suggested two types ofquestions that can be answered longitudinally. First, can number acuitymeasured at an earlier time point predict math performance at a latertime point (i.e., via prospective studies)? Second, is number acuitymea-sured at a later time point associated withmath performance at an ear-lier time point (i.e., via retrospective studies)? Following the samecriterion and procedure used for the meta-analysis of the cross-sectional studies, we separately evaluated the evidence from prospec-tive and retrospective longitudinal studies. Because the number of stud-ies included in this analysis was very small, we did not performmoderator analyses as in the evaluation of cross-sectional studies. It isworth noting, however, that most longitudinal studies share commonmethodological features: 1) eight of eleven correlation coefficientswere reported as the partial correlation observed after controlling forother general cognitive factors; 2) eight of eleven samples containedchild participants only; and 3) number acuitywas indexed byoverall ac-curacy or w in all samples.
Six studies consisting of a total of 714 child participants across six in-dependent samples reported prospective data4 (Table 2, top panel; Fig.3a.). The random-effects model revealed a significant correlation be-tween number acuity and math performance (r = 0.25, 95% CI =[0.12, 0.39], Z = 3.37, p = 0.0007). Moreover, Egger's test revealedthe existence of a publication bias (Z = 2.18, p = 0.03) (Begg's test:Kendall's tau = 0.33, p = 0.58). After correcting for the publicationbias using the “trim and fill”method, the strength of the association be-came smaller but remained significant (r = 0.24, 95% CI = [0.11,0.37], Z = 2.56, p b 0.001).
Four studies consisting of a total of 11,609 participants across five in-dependent samples reported retrospective data5 (Table 2, bottompanel; Fig. 3b). The random-effects model revealed a significant cor-relation between number acuity and math performance (r = 0.23,95% CI = [0.14, 0.32], Z= 5.09, p b 0.0001). In addition, a trend of pub-lication bias was detected by Egger's test (Z= 1.95, p= 0.051) but notby Begg's test (Kendall's tau = 0.40, p = 0.48). After correcting for thepublication bias with the “trim and fill”method, the strength of the cor-relation became smaller but remained significant (r = 0.17, 95% CI =[0.07, 0.26], Z = 3.44, p b 0.001).
In summary, number acuity not only prospectively predicts latermath performance but also can be retrospectively predicted by earliermath performance. Furthermore, the magnitude of the bias-correctedeffect sizes in longitudinal studies (prospective data, r = 0.24; retro-spective data, r = 0.17) approximated that in cross-sectional studies(r = 0.20). However, given the limited number of longitudinal studies
4 In Starr, queryLibertus and Brannon (2010), number acuity was measured by a nu-merical change detection task, which was different from the non-symbolic comparisonor arithmetic tasks used in other studies. In this task, greater preference (i.e., increasedviewing time) for numerically changed arrays of dots indicated better number acuity. Be-cause previous studies havedemonstrated that thedetection of numerical change can cap-ture non-symbolic number processing well (e.g., Libertus & Brannon, 2010; Piazza,Izard, Pinel, LeBihan & Dehaene, 2004), Starr et al.'s study was included in the meta-analysis.
5 Halberda et al. (2012) asked participants to report “howwell they performed relativeto their peers in a variety of school subjects (e.g., math, science, and writing)”. Most par-ticipants (70%) aged more than 22 years may have already completed school. Therefore,self-reports from these participants may mainly retrospectively reflect their math perfor-mance in their early school years. Consequently, we categorized this study as retrospec-tive. However, a minority of their participants (who were younger than 22 years old)may have been concurrently enrolled in schoolwhile participating in the study; therefore,the study may also contain a small amount of cross-sectional data. Nevertheless, a secondmeta-analysiswas conducted to determinewhether categorizing the results fromyoungerparticipants (age ≤ 22) as cross-sectional and the results from older participants (ageN 22) as retrospective affected our findings; the second meta-analysis revealed a similarpattern of results.
included, the estimated effect sizes using these studies may be inaccu-rate. Nevertheless, we still estimated the achieved power for each longi-tudinal study separately based on the bias-corrected pooled effect size.A power analysis revealed that the power of the longitudinal studieswas inadequate (mean = 55.3%, median = 42.3%).
4. Discussion
In this study, we aimed to document the association between num-ber acuity and symbolic math performance. Although previous investi-gations have provided contradictory results regarding the correlation,our meta-analysis confirmed the existence of such an association notonly in cross-sectional data but also in longitudinal data. Moreover,we systematically evaluated the influence of several potential modera-tors and found that none of these factors can fully explain the inconsis-tent findings reported in the current literature. Importantly, poweranalyses suggest that most previous studies did not test a sufficientnumber of participants and thus were apparently underpowered. It iswell known in behavioral science that low power may reduce the repli-cability of results (e.g., Button et al., 2013). Consequently, the lack ofpower in many previous studies may be at least one key factor account-ing for the contradictory findings in the current literature. In the follow-ing section, we consider the theoretical and practical implications of theresults of the present meta-analysis, and outline the empirical researchdirections that are necessary to address the remaining issues.
The presence of an association is one premise of more advancedrelationships (e.g., causal or mediating relationships). Therefore, confir-mation of a true association between number acuity and math perfor-mance provides a promising starting point to test theories regardingthe relationship between these two factors. Besides the cross-sectionaldata, the longitudinal data provide additional hints for the causal direc-tion in the relationship between number acuity andmath performance.If number acuity can causally influencemath learning, number acuity atan earlier age is expected to be associated with math performance at alater age. Similarly, if math learning can shape the development of num-ber acuity, math performance at an earlier age is expected to be associ-ated with number acuity at a later age. Interestingly, these results wereseparately observed in the prospective and retrospective data, respec-tively. Therefore, currently, both hypotheses regarding the causal direc-tion of the association between number acuity and math performancecannot be rejected. It must be considered that the participants in all oftheprospective studieswere either infants or kindergarteners; this indi-cates that the participants were unlikely to have received formal mathinstruction. Therefore, the correlation observed in prospective studieslikely indicates that non-symbolic number representation plays a causalrole in the acquisition of math knowledge and skills, at least in earlychildhood. However, there may be bidirectional influences of numberacuity and symbolic math performance through development.
Although the association between number acuity and math perfor-mance is statistically significant, an intriguing question regardingwhether this association is of practical significance remains (Kirk,1996). In other words, is this result useful in real education settings?Although the seminal study by Halberda and his colleagues (2008) re-ported a large overlapping of variance between number acuity andmath performance (R squared is approximately 20% when controllingfor general cognitive factors; N = 64), subsequent replication studiesseldom reported such a large effect size. Indeed, our meta-analysis sug-gested that number acuity only explains a numerically moderate por-tion (~4%) of the total variance of math performance. However, suchan effect size is still statistically reasonable, because math performanceis likely influenced by many other domain-specific (e.g., counting abili-ty) and domain-general factors (e.g., language, general intelligence, andacademic motivation). For example, a recent large (N= 70,000+) lon-gitudinal study found that general intelligence at 11 years of age ex-plained 48% of the variance in school math achievement at 16 years ofage (Deary, Strand, Smith, & Fernandes, 2007). To further understand

Fig. 3.Magnitudes of effect size in longitudinal data are illustrated by the forest plot. a) Prospective studies, in which number acuity wasmeasured at an earlier time point and math per-formancewasmeasured at a later time point; b) Retrospective studies, inwhichmath performancewasmeasured at an earlier time point and number acuitywasmeasured at a later timepoint. Boxes represent the effect size (r) for each study in the analysis; the size of each box represents theweight for each study; lines represent the .95 confidence interval for each effectsize; and the diamond represents the overall effect of the meta-analysis.
170 Q. Chen, J. Li / Acta Psychologica 148 (2014) 163–172
the practical significance of the association between number acuity andmath performance, we compared the effect size of this association withthe effect sizes of correlations between math performance and otherwell-known contributing factors. According to prior meta-analyses, al-though the number acuity contributes less to math performance thanmath anxiety (Ma, 1999; r = 0.27) and socioeconomic status (Sirin,2005; r= 0.35), the effect size of number acuity is similar to that of at-titude toward mathematics (Ma & Kishor, 1997; r= 0.12) and parentalinvolvement (Fan&Chen, 2001; r= 0.18). Based on these comparisons,we believe that the association between number acuity andmath learn-ing is practically meaningful. Specifically, researchers and educatorscould measure number acuity in addition to other contributing factors
Table 2Characteristics of the longitudinal studies included in the meta-analysis.
Study r N Age: Mean (SD) %Female
No
T1 T2 T3 Ind
Perspective studiesDesoete et al. (2012) 0.12 395 5–6 T1 + 1 T1 + 2 50.4% Ac
Kolkman et al. (2013) 0.10 69 4.1(0.3)
5.1(0.3)
6.0(0.2)
– Ac
Libertus, Feigenson &Halberda (2013)
0.33 122 4.2(0.7)
4.8(0.7)
– 47.9% w
Mazzocco, Feigenson &Halberda (2012a)
0.53 17 4.1(0.4)
6.7(0.4)
– 41.2% Ac
Praet et al. (2013) 0.34 63 5.7(0.4)
T1 + 1 – 47.6% Ac
Starr et al. (2013) 0.35 48 0.5 3.5 45.8% w
Retrospective studiesDesoete et al. (2012) 0.10 395 6–7 7–8 – 50.4% Ac
Halberda et al. (2008) 0.41 64 8 14 – 50.0% w
Halberda et al. (2012) (Exp. 1) 0.17 10548 – 11–85 – – w
Halberda et al. (20120 (Exp. 2) 0.22 458 – 11–85 – – wLibertus et al. (2013) 0.41 144 4.2
(0.7)4.8(0.7)
47.9% w
Notes:1. Abbreviations: SAT-Q: Scholastic Aptitude Test Quantitative; SAT-V: Scholastic Aptitude Tes2. Kolkman et al. (2013)measured number acuity twice at T1 and T2, andDesoete et al. (2013)mcorrelation coefficients for different time intervals, and the averaged correlation coefficients w
(e.g., working memory and IQ) and make predictions about anindividual's math ability (e.g., to assist in the early detection of mathlearning difficulties). However, given that the effect size of number acu-ity is not large, number acuity alone is not sufficient tomake educationaldecisions.
In summary, the association between number acuity and math per-formance is not only theoreticallymeaningful but also practically signif-icant. However, there are still several relevant gaps in the literature. Inthe following section, we describe additional research directions thatare necessary to fill these gaps.
First, correlational evidence alone cannot conclusively identify thecausal direction of the association between number acuity and math
n-symbolic number acuity Math performance Controlled variables
ex Task formats
curacy (t1) Paired Calculation &numberfact (t2 & t3)
IQ
curacy (T1& T2) Paired Number relation &arithmetic (T3)
–
(T1) Paired TEMA-3 (T2) TEMA-3 (T1) & vocabulary
curacy (T1) Paired TEMA-3 (T2) IQ & rapid naming
curacy (T1) Paired Arithmeticoperations(T2)
–
(T1) Changedetection
TEMA-3 (T2) IQ
curacy (T2) Paired Calculation &numberfact (T1)
IQ
(T2) Intermixed TEMA-2 (T1) IQ, rapid naming, &variouscontrols
& RT (T2) Intermixed Self-reported mathability (T1)
School performance
& RT (T2) Intermixed SAT-Q (T1) SAT-V(T2) Paired TEMA-3 (T1) –
t Verbal; TEMA: Test of Early Mathematics Ability;w: Weber fraction.easuredmath performance twice at T2 and T3. Therefore, these two studies reported two
ere entered into the meta-analysis for each of them.
6 References marked with an asterisk indicate studies included in the meta-analysis.
171Q. Chen, J. Li / Acta Psychologica 148 (2014) 163–172
performance or exclude the possibility of third variables. To explorepossible causal directions, training experiments are paramount, butsuch evidence is very limited. On the one hand, only two studies havetrained human's number acuity (Obersteiner et al., 2013; Park &Brannon, 2013), and only one of these studies reported that this trainingcan improve symbolic math performance (Park & Brannon, 2013). Fur-thermore, in Park and Brannon's study, the training and test tasks werenon-symbolic and symbolic arithmetic (i.e., addition & subtraction)tasks, respectively. Therefore, it remains unclear whether the trainingfacilitates representation of non-symbolic numerosities, or if it ismerelyrelated to shared cognitive processes between symbolic and non-symbolic mental arithmetic tasks (e.g., shift of attention). To distinguishthese two possibilities, future research may use the non-symbolic com-parison task as a training task, which examines the pure training effectof number acuity and excludes the influence of processes involvingmental arithmetic. On the other hand, three studies have examinedwhether access to school can improve number acuity (Nys et al., 2013;Piazza et al., 2013; Zebian & Ansari, 2012), and two of these studies re-ported positive results (Nys et al., 2013; Piazza et al., 2013). However, allof these studies are quasi-experimental; the comparison groups werenot randomly selected. Therefore, significant training effects may havebeen accounted for by other between-group differences. To addressthis issue, randomized controlled experiments are needed in future re-search. Finally, because number acuity is only moderately correlatedwith math performance, extensive training and/or large sample sizesmay be necessary to detect true but subtle training effects.
Even if the causal direction between number acuity and math per-formance can be confirmed, there is still a need to explore the proxi-mate mechanism underlying the association. This question is difficultbecause the representation of non-symbolic and symbolic numbersdiffers fundamentally (Butterworth, 2010). Nevertheless, there areseveral potential possibilities underlying the association that are notmutually exclusive. It is possible that better number acuitymay help es-tablish academic interest and confidence inmath learning in early child-hood, which eventually facilitates the development of math abilities(Halberda et al., 2012; Libertus et al., 2011). Both experimental and cor-relational studies can directly measure learning activities and/or inter-est in math and empirically examine this hypothesis. It is also possiblethat ordinal but not cardinal representations (i.e., “how much”) ofnon-symbolic numbers are linked to math performance. Specifically,the order sense of approximate numbers might be transferred andused to understand symbolic order relationships, which may facilitatemastery of symbolic math abilities. This idea is empirically supportedby Lyons and Beilock (2011), who suggested that the number orderingability mediates the relationship between number acuity and adults' ar-ithmetic competence via analysis of the mediating effects of individualdifferences. Given that the sample size in Lyons and Beilock (N = 54)was small, these results require further replication. A third possibilityis that number acuity may be improved by several outcomes of mathlearning, such as the increased salience of numerical properties overthe other characteristics of objects and experience and familiarity withnumbers (Nys et al., 2013). To test this hypothesis, the salience and fa-miliarity of numerical information can be directly measured in futurestudies.
Revealing the effect size of the association between number acuityandmath performancemay also shed light on the etiology ofmath learn-ing difficulties, including dyscalculia (i.e., a specific arithmetic learningdisability). Recent studies of whether poor number acuity is associatedwith dyscalculia remain similarly controversial (see Butterworth, 2010and Butterworth, Varma, & Laurillard, 2011, for reviews). Whereassome studies have found positive associations between poor numberacuity and dyscalculia (e.g., Mazzocco, Feigenson, & Halberda, 2012b;Piazza et al., 2010), other studies have not observed any significantdifferences (e.g., Iuculano, Tang, Hall, & Butterworth, 2008; Rousselle& Noël, 2007). These conflicting findings may also partly stem from in-sufficient sample sizes in multiple studies. Future studies using
adequate methodologies (e.g., large sample size) are needed to furtherexplore the reasons underlying the inconsistency in these findings.
Acknowledgment
We thank Jia Liu, Yiying Song, Shuang Guo, Yajun Zhao, and twoanonymous reviewers for their invaluable comments on an early ver-sion of the manuscript. We also thank several study authors who en-tered into personal communications that helped us make the studymore comprehensive.
References6
*Agrillo, C., Piffer, L., & Adriano, A. (2013). Individual differences in non-symbolic numer-ical abilities predict mathematical achievements but contradict ATOM. Behavioral andBrain Functions, 9(1), 26.
*Anobile, G., Stievano, P., & Burr, D. C. (2013). Visual sustained attention and numerositysensitivity correlate with math achievement in children. Journal of Experimental ChildPsychology, 116(2), 380–391.
Barth, H., La Mont, K., Lipton, J., Dehaene, S., Kanwisher, N., & Spelke, E. (2006).Non-symbolic arithmetic in adults and young children. Cognition, 98(3), 199–222.
*Bonny, J.W., & Lourenco, S. F. (2013). The approximate number system and its relation toearly math achievement: Evidence from the preschool years. Journal of ExperimentalChild Psychology, 114(3), 375–388.
Brannon, E. M., Cantlon, J. F., & Terrace, H. S. (2006). The role of reference points in ordinalnumerical comparisons by rhesus macaques (Macaca mulatta). Journal ofExperimental Psychology, 32(2), 120–134.
Butterworth, B. (2010). Foundational numerical capacities and the origins of dyscalculia.Trends in Cognitive Sciences, 14(12), 534–541.
Butterworth, B., Varma, S., & Laurillard, D. (2011). Dyscalculia: From brain to education.Science, 332(6033), 1049–1053.
Button, K. S., Ioannidis, J. P., Mokrysz, C., Nosek, B.A., Flint, J., Robinson, E. S., et al. (2013).Power failure: Why small sample size undermines the reliability of neuroscience.Nature Reviews Neuroscience, 14(5), 365–376.
*Castronovo, J., & Göbel, S. M. (2012). Impact of highmathematics education on the num-ber sense. PLoS One, 7(4), e33832.
*De Smedt, B., Noël, M. P., Gilmore, C., & Ansari, D. (2013). How do symbolic andnon-symbolic numerical magnitude processing relate to individual differences inchildren's mathematical skills? A review of evidence from brain and behavior.Trends in Neuroscience and Education, 2(2), 48–55.
Deary, I. J., Strand, S., Smith, P., & Fernandes, C. (2007). Intelligence and educationalachievement. Intelligence, 35(1), 13–21.
Dehaene, S. (1997). The number sense: How the mind creates mathematics. Oxford Univer-sity Press.
DerSimonian, R., & Laird, N. (1986). Meta-analysis in clinical trials. Controlled ClinicalTrials, 7(3), 177–188.
*Desoete, A., Ceulemans, A., DeWeerdt, F., & Pieters, S. (2012). Can we predict mathemat-ical learning disabilities from symbolic and non-symbolic comparison tasks in kinder-garten? Findings from a longitudinal study. British Journal of Educational Psychology,82(1), 64–81.
*DeWind, N. K., & Brannon, E. M. (2012). Malleability of the approximate number system:Effects of feedback and training. Frontiers in Human Neuroscience, 6(68), 1–10.
Duval, S., & Tweedie, R. (2000). Trim and fill: A simple funnel-plot based method of test-ing and adjusting for publication bias in meta-analysis. Biometrics, 56(2), 455–463.
Fan, X., & Chen, M. (2001). Parental involvement and students' academic achievement: Ameta-analysis. Educational Psychology Review, 13(1), 1–22.
Faul, F., Erdfelder, E., Lang, A. G., & Buchner, A. (2007). G* Power 3: A flexible statisticalpower analysis program for the social, behavioral, and biomedical sciences.Behavior Research Methods, 39(2), 175–191.
*Feigenson, L., Libertus, M. E., & Halberda, J. (2013). Links between the intuitive sense ofnumber and formal mathematics ability. Child Development Perspectives, 7(2), 74–79.
*Ferreira, F. D. O., Wood, G., Pinheiro-Chagas, P., Lonnemann, J., Krinzinger, H., Willmes, K.,et al. (2012). Explaining school mathematics performance from symbolic and non-symbolic magnitude processing: Similarities and differences between typical andlow-achieving children. Psychology & Neuroscience, 5(1), 37–46.
Flombaum, J. I., Junge, J. A., & Hauser, M.D. (2005). Rhesus monkeys (Macaca mulatta)spontaneously compute addition operations over large numbers. Cognition, 97(3),315–325.
*Fuhs, M. W., & McNeil, N. M. (2013). ANS acuity and mathematics ability in preschoolersfrom low-income homes: contributions of inhibitory control. Developmental Science,16(1), 136–148.
*Gilmore, C., Attridge, N., Clayton, S., Cragg, L., Johnson, S., Marlow, N., et al. (2013). Indi-vidual differences in inhibitory control, not non-verbal number acuity, correlate withmathematics achievement. PLoS One, 8(6), e67374.
*Gilmore, C. K., McCarthy, S. E., & Spelke, E. S. (2007). Symbolic arithmetic knowledgewithout instruction. Nature, 447(7144), 589–591.
*Gilmore, C. K., McCarthy, S. E., & Spelke, E. S. (2010). Non-symbolic arithmetic abilitiesand mathematics achievement in the first year of formal schooling. Cognition,115(3), 394–406.
172 Q. Chen, J. Li / Acta Psychologica 148 (2014) 163–172
*Halberda, J., Ly, R., Wilmer, J. B., Naiman, D. Q., & Germine, L. (2012). Number senseacross the lifespan as revealed by a massive Internet-based sample. Proceedings ofthe National Academy of Sciences, 109(28), 11116–11120.
*Halberda, J., Mazzocco, M. M., & Feigenson, L. (2008). Individual differences in nonverbalnumber acuity correlate with maths achievement. Nature, 455(7213), 665–668.
Halberda, J., & Feigenson, L. (2008). Developmental change in the acuity of the “numbersense”: The approximate number system in 3-, 4-, 5-, and 6-year-olds and adults.Developmental Psychology, 44(5), 1457–1465.
*Holloway, I. D., & Ansari, D. (2009). Mapping numerical magnitudes onto symbols: Thenumerical distance effect and individual differences in children's mathematicsachievement. Journal of Experimental Child Psychology, 103(1), 17–29.
*Inglis, M., Attridge, N., Batchelor, S., & Gilmore, C. (2011). Non-verbal number acuity cor-relates with symbolic mathematics achievement: But only in children. PsychonomicBulletin & Review, 18(6), 1222–1229.
Iuculano, T., Tang, J., Hall, C. W., & Butterworth, B. (2008). Core information processingdeficits in developmental dyscalculia and low numeracy. Developmental Science,11(5), 669–680.
*Jordan, N. C., Hansen, N., Fuchs, L. S., Siegler, R. S., Gersten, R., & Micklos, D. (2013). De-velopmental predictors of fraction concepts and procedures. Journal of ExperimentalChild Psychology, 116(1), 45–58.
Kirk, R. E. (1996). Practical significance: A concept whose time has come. Educational andPsychological Measurement, 56(5), 746–759.
*Kolkman, M. E., Kroesbergen, E. H., & Leseman, P. P. (2013). Early numerical develop-ment and the role of non-symbolic and symbolic skills. Learning and Instruction, 25,95–103.
*Libertus, M. E., Feigenson, L., & Halberda, J. (2011). Preschool acuity of the approximatenumber system correlates with school math ability. Developmental Science, 14(6),1292–1300.
*Libertus, M. E., Feigenson, L., & Halberda, J. (2013). Is approximate number precisiona stable predictor of math ability? Learning and Individual Differences, 25,126–133.
*Libertus, M. E., Odic, D., & Halberda, J. (2012). Intuitive sense of number correlates withmath scores on college-entrance examination. Acta Psychologica, 141(3), 373–379.
Libertus, M. E., & Brannon, E. M. (2010). Stable individual differences in number discrim-ination in infancy. Developmental Science, 13(6), 900–906.
*Lindskog, M., Winman, A., Juslin, P., & Poom, L. (2013). Measuring acuity of the approx-imate number system reliably and validly: The evaluation of an adaptive test proce-dure. Frontiers in Psychology, 4, 510.
*Lonnemann, J., Linkersdörfer, J., Hasselhorn, M., & Lindberg, S. (2011). Symbolic andnon-symbolic distance effects in children and their connection with arithmetic skills.Journal of Neurolinguistics, 24(5), 583–591.
*Lourenco, S. F., Bonny, J. W., Fernandez, E. P., & Rao, S. (2012). Nonsymbolic number andcumulative area representations contribute shared and unique variance to symbolicmath competence. Proceedings of the National Academy of Sciences of the UnitedStates of America, 109(46), 18737–18742.
*Lyons, I. M., & Beilock, S. L. (2011). Numerical ordering ability mediates the relation be-tween number-sense and arithmetic competence. Cognition, 121(2), 256–261.
Lyons, I. M., Ansari, D., & Beilock, S. L. (2012). Symbolic estrangement: Evidence against astrong association between numerical symbols and the quantities they represent.Journal of Experimental Psychology: General, 141(4), 635–641.
Ma, X. (1999). A meta-analysis of the relationship between anxiety toward mathematicsand achievement in mathematics. Journal for Research in Mathematics Education,30(5), 520–540.
Ma, X., & Kishor, N. (1997). Assessing the relationship between attitude toward mathe-matics and achievement in mathematics: A meta-analysis. Journal for Research inMathematics Education, 28(1), 26–47.
*Mazzocco, M. M., Feigenson, L., & Halberda, J. (2012a). Preschoolers' precision of the ap-proximate number system predicts later school mathematics performance. PLoS One,6(9), e23749.
*Mazzocco, M. M., Feigenson, L., & Halberda, J. (2012b). Impaired acuity of the approxi-mate number system underlies mathematical learning disability (dyscalculia). ChildDevelopment, 82(4), 1224–1237.
McCrink, K., & Wynn, K. (2004). Large-number addition and subtraction by 9-month-oldinfants. Psychological Science, 15(11), 776–781.
*Mundy, E., & Gilmore, C. K. (2009). Children's mapping between symbolic and nonsym-bolic representations of number. Journal of Experimental Child Psychology, 103(4),490–502.
*Mussolin, C., Nys, J., & Leybaert, J. (2012). Relationships between approximate numbersystem acuity and early symbolic number abilities. Trends in Neuroscience andEducation, 1(1), 21–31.
*Nosworthy, N., Bugden, S., Archibald, L., Evans, B., & Ansari, D. (2013). A two-minutepaper-and-pencil test of symbolic and nonsymbolic numerical magnitude processingexplains variability in primary school children's arithmetic competence. PLoS One,8(7), e67918.
Nys, J., Ventura, P., Fernandes, T., Querido, L., & Leybaert, J. (2013). Does math educationmodify the approximate number system? A comparison of schooled and unschooledadults. Trends in Neuroscience and Education, 2(1), 13–22.
Obersteiner, A., Reiss, K., & Ufer, S. (2013). How training on exact or approximate mentalrepresentations of number can enhance first-grade students' basic number process-ing and arithmetic skills. Learning and Instruction, 23, 125–135.
Park, J., & Brannon, E. M. (2013). Training the approximate number system improvesmath proficiency. Psychological Science, 24(10), 2013–2019.
Piazza, M., Facoetti, A., Trussardi, A. N., Berteletti, I., Conte, S., Lucangeli, D., et al. (2010).Developmental trajectory of number acuity reveals a severe impairment in develop-mental dyscalculia. Cognition, 116(1), 33–41.
Piazza, M., Izard, V., Pinel, P., LeBihan, D., & Dehaene, S. (2004). Tuning curves for approx-imate numerosity in the human parietal cortex. Neuron, 44(3), 547–555.
Piazza, M., Pica, P., Izard, V., Spelke, E. S., & Dehaene, S. (2013). Education enhances theacuity of the nonverbal approximate number system. Psychological Science, 24(6),1037–1043.
Pica, P., Lemer, C., Izard, V., & Dehaene, S. (2004). Exact and approximate arithmetic in anAmazonian indigene group. Science, 306(5695), 499–503.
*Praet, M., Titeca, D., Ceulemans, A., & Desoete, A. (2013). Language in the prediction ofarithmetics in kindergarten and grade 1. Learning and Individual Differences, 27,90–96.
*Price, G. R., Palmer, D., Battista, C., & Ansari, D. (2012). Nonsymbolic numerical magni-tude comparison: Reliability and validity of different task variants and outcomemea-sures, and their relationship to arithmetic achievement in adults. Acta Psychologica,140(1), 50–57.
Rousselle, L., & Noël, M. P. (2007). Basic numerical skills in children with mathematicslearning disabilities: A comparison of symbolic vs non-symbolic number magnitudeprocessing. Cognition, 102(3), 361–395.
*Sasanguie, D., De Smedt, B., Defever, E., & Reynvoet, B. (2012). Association between basicnumerical abilities and mathematics achievement. British Journal of DevelopmentalPsychology, 30(2), 344–357.
*Sasanguie, D., Göbel, S. M., Moll, K., Smets, K., & Reynvoet, B. (2013). Approximate num-ber sense, symbolic number processing, or number–space mappings: What underliesmathematics achievement? Journal of Experimental Child Psychology, 114(3),418–431.
Sirin, S. R. (2005). Socioeconomic status and academic achievement: A meta-analytic re-view of research. Review of Educational Research, 75(3), 417–453.
*Soltész, F., Szücs, D., & Szücs, L. (2010). Relationships between magnitude representa-tion, counting and memory in 4-to 7-year-old children: A developmental study.Behavioral and Brain Functions, 6(1), 13.
Starr, A., Libertus, M., & Brannon, E. M. (2013). Number sense in infancy predicts mathe-matical abilities in childhood. Proceedings of the National Academy of Science, http://dx.doi.org/10.1073/pnas.1302751110.
Sutton, A. J., Abrams, K. R., Jones, D. R., Sheldon, T. A., & Song, F. (2000). Methods formeta-analysis in medical research. New York: John Wiley & Sons.
Underwood, B. J. (1975). Individual differences as a crucible in theory construction.American Psychologist, 2, 128–134.
Viechtbauer,W. (2010). Conducting meta-analyses in R with themetafor package. Journalof Statistical Software, 36(3), 1–48.
*Wei, W., Lu, H., Zhao, H., Chen, C., Dong, Q., & Zhou, X. (2012a). Gender differences inchildren's arithmetic performance are accounted for by gender differences in lan-guage abilities. Psychological Science, 23(3), 320–330.
*Wei, W., Yuan, H., Chen, C., & Zhou, X. (2012b). Cognitive correlates of performance inadvanced mathematics. British Journal of Educational Psychology, 82(1), 157–181.
Whalen, J., Gallistel, C. R., & Gelman, R. (1999). Nonverbal counting in humans: Thepsychophysics of number representation. Psychological Science, 10(2), 130–137.
Wilmer, J. B. (2008). How to use individual differences to isolate functional organization,biology, and utility of visual functions; with illustrative proposals for stereopsis.Spatial Vision, 21(6), 561–579.
Wilson, A. J., & Dehaene, S. (2007). Number sense and developmental dyscalculia. HumanBehavior, Learning, and the Developing Brain: Atypical Development, 212–238.
Xu, F., & Spelke, E. S. (2000). Large number discrimination in 6-month-old infants.Cognition, 74(1), B1–B11.
Zebian, S., & Ansari, D. (2012). Differences between literates and illiterates on symbolicbut not nonsymbolic numerical magnitude processing. Psychonomic Bulletin &Review, 19(1), 93–100.