1-s2 0-027795369500125Q-main
10
Pergamon 0277-9536(95)00125-5 Sot'. Sci. Med. Vol. 41, No. 10, pp. 1349-1358, 1995 Copyright c, 1995 ElsevierScience Ltd Printed in Great Britain. All rights reserved 0277-9536/95 $9.50+ 0.00 THE SWEDISH SF-36 HEALTH SURVEY--I. EVALUATION OF DATA QUALITY, SCALING ASSUMPTIONS, RELIABILITY AND CONSTRUCT VALIDITY ACROSS GENERAL POPULATIONS IN SWEDEN MARIANNE SULLIVAN, I* JAN KARLSSON I and JOHN E. WARE JR 2 IThe Health Care Research Unit/Department of Internal Medicine, Sahlgrenska University Hospital and University of G6teborg, S-41345 G6teborg, Sweden and 2The Health Institute, New England Medical Center, Boston, MA 02111, U.S.A. Abstract--We document the applicability of the SF-36 Health Survey, which was translated into Swedish using methods later adopted by the International Quality of Life Assessment (IQOLA) Project procedures. To test its appropriateness for use in Sweden, it was administered through mail-out/mail- back questionnaires in seven general population studies with an average response rate of 68%. The 8930 respondents varied by gender (48.2% men), age (range 15-93 years, mean age 42.7), marital status, education, socio-economic status, and geographical area. Psychometric methods used in the evaluation of the SF-36 in the U.S. were replicated. Over 90 % of respondents had complete items for each of the eight SF-36 scales, although more missing data were observed for subjects 75 years and over. Scale scores could be computed for the vast majority of respondents (95% and over); slightly fewer in the oldest subgroup. Item-internal consistency was consistently high across socio-demographic subgroups and the eight scales. Most reliability estimates exceeded the 0.80 level. The highest reliability was observed for the Bodily Pain Scale where all subgroups met the 0.90 level recommended for individual comparisons; coefficients at or above 0.90 were also observed in most subgroups for the Physical Functioning Scale. Tests of scaling assumptions including hypothesized item groupings, which reflect the construct validity of scales, were consistently favorable across subgroups, although lower rates were noted in the oldest age group. In conclusion, these studies have yielded empirical evidence supporting the feasibility of a non-English language reproduction of the SF-36 Health Survey. The Swedish SF-36 is ready for further evaluation. Key words--health status, SF-36 Health Survey, cross-cultural evaluation, psychometrics, validity, general population A major challenge faces those who develop and those who use the new self-report measures of health status in clinical research. They must estab- lish tests of reliability and validity that can be use- fully applied across countries and cultures. This includes tests of the assumptions underlying the construction and scoring of scales, such as the tests described here. The expected relationships among the different domains of health-related quality of life, and their association to clinical parameters, should also be clarified through cross-cultural evaluations. The International Quality of Life Assessment (IQOLA) Project represents a significant-develop- ment towards this end. IQOLA is a 4-year project to translate and adapt the widely used SF-36 Health Survey in up to 15 countries [1]. The project will validate, norm and document SF-36 surveys as required for their use in multi-national clinical trials and other international studies of health outcomes. *Author for correspondence. While standardized questionnaires that measure the patient's point of view have been used in research for decades, their length and complexity have prevented their widespread dissemination [2]. The SF-36 was constructed to provide a brief alternative for use in health policy evaluations, gen- eral population surveys, clinical research and prac- tice, and other applications involving diverse populations [3]. The goal of constructing the eight SF-36 scales was to achieve comprehensiveness, i.e. representation of multi-dimensional health concepts and measurement of the full range of health states, including levels of well-being and personal evalu- ations of health. Precision relative to other measures, and validity in relation to psychometric and clinical criteria were important prerequisites [4]. U.S. studies have shown that the SF-36 scales have clinical validity for purposes of distinguishing patients with and without a chronic condition, dis- criminating between groups known to differ in medical and psychiatric conditions, discriminating levels of severity within a medical diagnosis, and 1349
-
Upload
independent -
Category
Documents
-
view
3 -
download
0
Transcript of 1-s2 0-027795369500125Q-main

Pergamon 0277-9536(95)00125-5
Sot'. Sci. Med. Vol. 41, No. 10, pp. 1349-1358, 1995 Copyright c, 1995 Elsevier Science Ltd
Printed in Great Britain. All rights reserved 0277-9536/95 $9.50 + 0.00
THE SWEDISH SF-36 HEALTH SURVEY--I. EVALUATION OF DATA QUALITY, SCALING ASSUMPTIONS,
RELIABILITY AND CONSTRUCT VALIDITY ACROSS GENERAL POPULATIONS IN SWEDEN
M A R I A N N E S U L L I V A N , I* J A N K A R L S S O N I and J O H N E. W A R E JR 2
IThe Health Care Research Unit/Department of Internal Medicine, Sahlgrenska University Hospital and University of G6teborg, S-41345 G6teborg, Sweden and 2The Health Institute, New England
Medical Center, Boston, MA 02111, U.S.A.
Abstract--We document the applicability of the SF-36 Health Survey, which was translated into Swedish using methods later adopted by the International Quality of Life Assessment (IQOLA) Project procedures. To test its appropriateness for use in Sweden, it was administered through mail-out/mail- back questionnaires in seven general population studies with an average response rate of 68%. The 8930 respondents varied by gender (48.2% men), age (range 15-93 years, mean age 42.7), marital status, education, socio-economic status, and geographical area. Psychometric methods used in the evaluation of the SF-36 in the U.S. were replicated. Over 90 % of respondents had complete items for each of the eight SF-36 scales, although more missing data were observed for subjects 75 years and over. Scale scores could be computed for the vast majority of respondents (95% and over); slightly fewer in the oldest subgroup. Item-internal consistency was consistently high across socio-demographic subgroups and the eight scales. Most reliability estimates exceeded the 0.80 level. The highest reliability was observed for the Bodily Pain Scale where all subgroups met the 0.90 level recommended for individual comparisons; coefficients at or above 0.90 were also observed in most subgroups for the Physical Functioning Scale. Tests of scaling assumptions including hypothesized item groupings, which reflect the construct validity of scales, were consistently favorable across subgroups, although lower rates were noted in the oldest age group. In conclusion, these studies have yielded empirical evidence supporting the feasibility of a non-English language reproduction of the SF-36 Health Survey. The Swedish SF-36 is ready for further evaluation.
Key words--health status, SF-36 Health Survey, cross-cultural evaluation, psychometrics, validity, general population
A major challenge faces those who develop and those who use the new self-report measures of health status in clinical research. They must estab- lish tests of reliability and validity that can be use- fully applied across countries and cultures. This includes tests of the assumptions underlying the construction and scoring of scales, such as the tests described here. The expected relationships among the different domains of health-related quality of life, and their association to clinical parameters, should also be clarified through cross-cultural evaluations.
The International Quality of Life Assessment ( IQOLA) Project represents a significant-develop- ment towards this end. IQOLA is a 4-year project to translate and adapt the widely used SF-36 Health Survey in up to 15 countries [1]. The project will validate, norm and document SF-36 surveys as required for their use in multi-national clinical trials and other international studies of health outcomes.
*Author for correspondence.
While standardized questionnaires that measure the patient 's point of view have been used in research for decades, their length and complexity have prevented their widespread dissemination [2]. The SF-36 was constructed to provide a brief alternative for use in health policy evaluations, gen- eral populat ion surveys, clinical research and prac- tice, and other applications involving diverse populations [3]. The goal of constructing the eight SF-36 scales was to achieve comprehensiveness, i.e. representation of multi-dimensional health concepts and measurement of the full range of health states, including levels of well-being and personal evalu- ations of health. Precision relative to other measures, and validity in relation to psychometric and clinical criteria were important prerequisites [4]. U.S. studies have shown that the SF-36 scales have clinical validity for purposes of distinguishing patients with and without a chronic condition, dis- criminating between groups known to differ in medical and psychiatric conditions, discriminating levels of severity within a medical diagnosis, and
1349

1350 Marianne Sullivan et al.
Independent forward translations
Health promoti~on officer S t a t i S t ~ ~ o g i s t s
Pooled Swedish version
Backtranslation
Iterative comparisons: original version and backtranslated version
Pilot studies: l. Health promotion groups 2. Clinical groups
Evaluation of response patterns
Swedish test version
Health surveys in Sweden
Crosseultural comparative data analysis, Sweden and the US.
Fig. 1. Adaptation of the SF-36 Health Survey to Swedish conditions according to a translation-back- translation procedure (pre-IQOLA Project).
Scientific leader
reflecting changes in health-related quality of life associated with changes in disease severity [5]. Useful information about the performance of the U.S. SF-36 adapted for British use includes feasi- bility, reliability, and applicability across diverse general populations [6, 7] and patient groups [8]. The purpose of the present paper is to demonstrate data quality, scaling properties, reliability, and con- struct validity of the SF-36 Health Survey in the Swedish general population.
METHODS
Translation and pilot testing o f the Swedish SF-36
The translation-backtranslation procedure (Fig. I) was completed in 1990 prior to the inception of the IQOLA Project. Six translators, in addition to the scientific leader, provided independent forward translations. An experienced translator, who had participated in earlier adaptations of several instru- ments (e.g. the Sickness Impact Profile) at the Health Care Research Unit, provided the indepen- dent translation from Swedish to English. After iterative evaluations of the Swedish content, an agreed-upon test version was designed. A few examples were changed to reflect common Swedish activities, e.g. "walks in the forest or gardening" were used to describe moderately strenuous activi- ties instead of "bowling or playing golf". "Walking more than two kilometers" was considered the best approximation of "walking more than a mile".
"Walking a couple of hundred meters" and "walking a hundred meters" were considered equiv- alent to "walking several blocks" and "walking one block", respectively (cf. British SF-36, [9]).
Pilot studies, conducted during 1990 and 1991 included self-selected participants in health pro- motion programs (n=262) and mixed groups of chronically ill and disabled (n = 75). Feasibility, re- sponse rate, data quality, and reliability estimates were satisfactory. The self-selected group comprised subjects in good health and, accordingly, their score distributions were skewed with most subjects scor- ing at the better health levels. The patient group often reported multiple diagnoses or handicaps and scored, as expected, lowest on scales representing physical functioning, pain and general health. No question was perceived difficult to answer or upset- ting. However, a rewording of role limitation items from "work or housework" to the original phrase "work or other regular daily activities" was necess- ary. In 1991-1992, the difficulty and quality of the translation were evaluated for each item using the IQOLA Project procedures, and a satisfactory result for the Swedish version was declared in 1992 ([10], Bullinger et al. for the IQOLA Project team, forth- coming).
General design o f the population studies
For proper psychometric evaluation and stan- dardization of Swedish norms, population studies were performed in different communities: urban-

The Swedish SF-36 Health Survey 1351
Table I. The Swedish SF-36 Health Survey. Target population, sample size, response rate and demography for general Swedish popu- lation 1991-1992
Residence* Middle-sized Urban- Suburban in
Small town Rural Total county town Small town suburban G6teborg (Skf) (Tnm) (Hid) (Mnl) (Kgv) (Gbg) (Lvg)
Target population (n) 765 1900 4816 2200 1475 996 993 Sample size (hi 542 1220 3582 1412 878 645 651 Response rate (%) 70.8% 64.2% 74.4% 64.2% 59.5% 64.8 65.6 Age range 15 26 20-65 18 75 16--85 16~84 20--93 19-74 Mean age 18.9 38.0 44.4 42.5 43.7 49.1 41.0 Male/female 50/50 51/49 48/52 46/54 45/55 49/51 51/49
*Skf-Skellefte~, small town, young sample; Tnm=Tanum, rural, general; Hid = Halland, total county, general; Mnl - M61ndal, middle- sized town, general; Kgv-Kung~ilv, small town, general; Gbg=G6teborg, urban-suburban, general; Lvg~L6vg~irdet, urban- suburban, problem area of G6teborg, general.
suburban, middle-size and small town, and rural areas. Elderly and young persons from all socio- economic classes were represented. Seven surveys following the same general procedure were per- formed via mail-out/mail-back questionnaires in 1991 and 1992. Information to participants about the purpose of the survey, the confidentiality of data management, and the freedom to refuse par- ticipation were emphasized.
Certain steps were followed to ensure an optimal response rate: (a) information about the studies was communicated to people in the community through the media (newspaper, local radio and/or TV), (b) included in the survey packet were a cover letter, signed by community representatives, urging people to participate, and a present (a bathing ticket, a pen etc.), (c) at least one reminder was sent approxi- mately 14 days after the first mailing, and (d) a data manager was made available (name and phone number) for inquiries. The Health Care Research Unit had authorized permission to create data files and store personal information for research pur- poses.
Our total normative sample included a middle- sized town (Mln), known from the official statistics to be among the most representative towns of Sweden (Statistics Sweden, R. Svensson, personal communication), a total county (Hid) known as the healthiest part of Sweden, the city of G6teborg (Gbg) known as the least healthy part, a problem area of G6teborg (Lvg), a young, small town sample (Ski), and an additional small town (Kgv) and rural (Tnm) population completed the data set (Official Statistics of Sweden, 1991 and 1992). Target populations, sample sizes, response rates, and demographics are presented in Table 1.
Response rates (Table 1) varied from around 60% (small town sample) to almost 75% (total county), with a mean rate of 68%. Differences in response rates depended more on the amount of resources available for data collection than on the willingness of the subjects. The study of young per- sons employed two reminders and incentives (tickets for swimming-pool and fitness test) after return of questionnaires, thus achieving an above
average response rate (70.4%). The survey with the highest response rate (total county, 74.4%), included an extra round of mailing after two months.
The urban-suburban population studies, as defined in Table 1, were performed by the regional office of the National Bureau of Statistics. Their routine procedures included a telephone interview of a random sample of non-respondents. Analysis of these two surveys considered gender, age, and district. Despite a slight over-representation of men among the responders, very similar percentages for different age groups and districts ensured broad representativeness.
Questionnaire
The first part of the questionnaire contained the SF-36, which groups 36 items into eight multi-item scales (Table 2) including physical functioning, role limitations due to physical problems, bodily pain, general health perceptions, vitality, social function- ing, role limitations due to emotional problems, and mental health. A further single item concerns reported health transition over the past year [3]. For each question raw scores were coded, recali- brated in two instances, summed, and transformed into a scale from 0 (worst possible health state measured) to 100 (best possible health state) follow- ing the standard SF-36 scoring algorithms [5]. As in earlier studies of the SF-36, scale scores were com- puted if one-half or more of the items within a scale were answered by the respondent, i.e. a person- specific mean score was calculated based on the non-missing items [5].
Additional questions included smoking, alcohol use, perception of food habits and body weight, work-related distress, leisure/recreation habits; glo- bal ratings of satisfaction with work, living arrange- ments, financial situation, leisure, family and social relations, health, and overall life situation; and a varying number of questions about sickness and health care utilization. A set of common socio- demographic questions was posed at the end of the booklet. In this paper, common variables of all population studies were used for subgroup analysis:

1352 Marianne Sullivan et al.
Table 2. Item frequency distribution in percent and percent missing data (n = 8930)
Item frequency distribution* % in each category Missing data Scale ltemt 1 2 3 4 5 6 (%)
Physical functioning (PF) 1 17.9 32.5 49.6 :~ 4.8
Role physical (RP)
Bodily pain (BP)
General health (GH)
Vitality (VT)'
Social functioning (SF)
Role emotional (RE)
Mental health (MH)
Reported health transition (TRAN)
2 4.9 16.7 78.5 4.0 3 5.1 15.4 79.5 4.1 4 6,2 15.1 78.7 4.2 5 1,9 7.9 90.2 5.7 6 5.9 16.2 77.9 4.1 7 6.5 11.1 82.4 4.4 8 2.6 5.9 91.5 7.1 9 1.8 4.0 94.2 7.5
10 1.8 5.9 92.3 4.6 1 13.0 87.0 5.0 2 22.1 77.9 4.8 3 14.4 85.6 5.6 4 17.0 83.0 4.5 1 1.6 6.0 20.0 13.0 20.0 39.5 I. 1 2 1.9 5.2 11.9 20.2 22.4 38.3 2.8 1 3.2 14.5 30.5 29.4 22.4 1.0 2 1.9 3.8 8.7 16.8 68.8 3.8 3 6.9 7.2 8.6 28.8 48.4 3.5 4 3.9 6.3 25.7 14.9 49. I 4.5 5 7.2 9.1 9.0 38.1 36.6 3.7 1 5.5 7.8 13.6 14.0 40.0 19.1 3.2 2 6.7 10.2 14.9 19.5 32.9 15.7 3.5 3 2.5 3.7 6.4 10.8 28. I 48.5 3.7 4 4.5 6.7 12.2 20.5 40.0 16.0 3.0 1 1.4 3.4 7.4 14.9 72.9 1.5 2 1.6 2.9 8.0 14.3 73.2 1.8 1 10.5 89.5 5.0 2 19.6 80.4 5.0 3 12.8 87,2 5.3 l 1.0 1,5 3.7 6.6 21.0 66.2 3.4 2 1.0 1,3 2.5 4.6 13.4 77.2 3.8 3 4.4 6.9 10.2 10.9 38.6 29.0 3.3 4 1.3 2.0 4.3 8.8 31.5 52.0 3.4 5 4.2 9.2 12.1 14.5 38.6 21.3 3.5
2.0 9.2 74.1 9.4 5.3 0.9
*A higher value reflects better health for all items. tltem content is given elsewhere [4, 5]. :~Not applicable.
gender, age, education level, socio-economic status, marital status, and residence.
Statistical analysis
Beyond documentation of data quality and stan- dard reliability estimates (Cronbach's alpha), psy- chometric testing was performed to confirm empirically that the groupings of items were repli- cated as hypothesized [11]. We replicated the evalu- ation performed in the U.S. for the original SF-36 [4]. It included: (a) completeness of data, both at an item and scale level; (b) tests of scaling assumptions underlying the summated-rating method including distribution of item responses, equivalence of item means and standard deviations, and item-internal consistency; (c) item-discriminant validity and scal- ing success rates; (d) estimation of internal-consist- ency reliability for each scale; and (e) descriptive statistics for scale scores.
Details of evaluation standards have been described along with the rules that were used in the U.S. study [4]. In brief, high and consistent corre- lation was assumed between an item and its own scale, and significantly lower associations between
that item and all other scales. Correlations were corrected for overlap, i.e. the correlation of an item with the sum of the other items in the same scale was computed. The 0.40 standard for item-internal consistency was applied. Scaling successes required item-scale correlations to be two standard errors higher with its own scale in comparison with all other scales. A reliability coefficient of 0.70 was considered acceptable on the group level and 0.90 for individual comparisons [11, 12]. Important fea- tures of score distributions included floor and ceil- ing effects, i.e. percentage of subjects with worst and best possible score, respectively, as explained elsewhere [4].
The focus of our paper was comparative, i.e. to determine the quality of the Swedish SF-36, using standards and results from the original evaluations. First, we hypothesized that Swedish results for data completeness, scaling assumptions, reliability, and construct validity would reach the same levels as those in the U.S. evaluations. Secondly, we expected less favorable data quality for elderly, less educated, and those with lower socio-economic status, as observed in the U.S. [4].

The Swedish SF-36 Health Survey 1353
Table 3. Item means and standard deviations and correlations between SF-36 items and hypothesized scales (n = 8930)
SF-36 Scales Scale Item Mean SD PF RP BP GH Vq" SF RE MH
Physical functioning (PF) I 2.34 0.75 0.,~* 0.50 0.49 0.52 0.39 0.31 0.26 0.24 2 2.76 0.52 0.80 0.59 0.49 0.52 0.42 0.39 0.33 0.29 3 2.76 0.52 0.73 0,53 0.47 0.47 0.39 0.35 0.30 0.28 4 2.75 0.55 0.78 0,49 0.41 0.49 0.39 0.35 0.29 0.27 5 2.89 0.36 0.74 0,40 0.32 0.37 0.30 0.30 0.27 0.22 6 2.74 0.54 0.73 0.46 0.43 0.44 0.34 0.29 0.27 0.22 7 2.78 0.54 0.78 0,53 0.42 0.46 0.38 0.34 0.32 0.26 8 2.90 0.37 0.75 0.41 0.31 0.37 0.30 0.32 0.26 0.22 9 2.92 0.31 0.66 0.34 0.26 0.30 0.24 0.27 0.23 0.19
10 2.91 0.33 0.61 0.36 0.29 0.32 0,26 0.29 0.22 0.22
Role physical (RP) I 1.88 0.33 0.50 0.73 0.44 0.41 0.39 0,41 0.43 0.28 2 1.79 0.41 0.48 0.69 0.47 0.49 0.49 0.45 0.49 0.36 3 1.86 0.35 0.55 0.77 0.49 0.46 0.41 0.41 0.38 0.28 4 1.83 0.37 0.58 0.77 0.53 0.51 0.45 0.43 0.40 0.31
Bodily pain (BP) 1 4.65 1.39 0.48 0.50 0.88 0.55 0.52 0.41 0.30 0,36 2 4.76 1.30 0.54 0.59 0.88 0.58 0.56 0.47 0.36 0.40
General health (GH) I 3.56 1.07 0.51 0.49 0.55 0.69 0.59 0.44 035 0,45 2 4.48 0.91 0.33 0.34 0.36 0.57 0.42 0.39 0,31 0.38 3 4.06 1.20 0.46 0.43 0.42 0.68 0.49 0.42 0,34 0.41 4 4.02 1.14 0.39 0.35 0.38 0.55 0.44 0.32 0.28 0.35 5 3.89 1.19 0.53 0.53 0.57 0.79 0.66 0.52 0.41 0,53
Vitality (VT) 1 4.34 1.39 0.46 0.51 0.54 0.63 0.75 0.57 0.46 0.64 2 4.11 1.43 0.37 0.43 0.45 0.57 0.72 0.54 0.46 0.69 3 5.06 1.24 0.36 0.38 0.43 0.50 0.60 0.47 0.37 0.51 4 4.35 1.29 0.33 0.38 0,44 0.51 0.71 0,49 0.38 0.56
Social functioning (SF) 1 4.56 0.86 0.37 0.44 0.41 0.48 0.56 0.71 0.53 0.62 2 4.57 0.85 0.40 0.47 0.43 0.51 0.59 0.71 050 0.63
Role emotional (RE) I 1.90 0.30 0.35 0.48 0.30 0.37 0.40 0.47 0.65 0.45 2 1.81 0.39 0.30 0.43 0.31 0.40 0.47 0.49 0.66 0.51 3 1.87 0.33 0.26 0,35 0.25 0.32 0.40 0,44 0.61 0.45
Mental health (MH) 1 5.45 0.97 0,23 0.26 0.29 0.40 0.47 0,52 0.44 0.66 2 5.61 0.90 0,25 0.28 0.28 0.39 0.50 0.57 0,47 0.66 3 4.61 1.38 0,29 0.33 0.36 0.49 0.67 0.57 0.48 0.75 4 5.25 1.03 0,23 0.27 0.31 0.41 0.58 0.57 0.46 0.72 5 4.40 1.38 0~28 0.32 0.34 0.50 0,66 0.54 0.44 0.71
Reported health transition (TRAN) 3.08 0.68 0.21 0.22 0.21 0.24 0.26 0.22 0.17 0.20
*Bolded entries denote correlations corrected for overlap; desired level > 0.40. Standard error of the correlation matrix = 0.01.
RESULTS
Subject characteristics
Major socio-demographic characteristics are given in Table 1. Although the randomly selected subjects were not stratified by age or sex, an almost equal gender distribution was obtained (48.2% men) and, apart from the younger sample (Ski), the age range was wide (15-93 years, mean age 42.7). The sex and age distributions, and the proportions with mandatory (9 years) vs higher education grade, married or co-habitating vs all others, and gainfully employed vs all others, matched Swedish popu- lation levels (Official Statistics of Sweden, 1991 and 1992).
Completeness of data
The item frequency distribution in percentages, and the percent of persons missing each of the 36 items, are presented in Table 2. Missing value rates were low, ranging from 0.9% (TRAN) to 7.5% (PF9) and averaging 3.8%. In comparison, rates
*Tables not shown are available upon request from the author.
evaluated in the U.S. patient data base, ranged from a low of 1.1% (GH1) to a high of 5.9% (PF1), and averaged 3.9%. Interesting differences emerged in missing value rates between the U.S. and Sweden. First, a very low rate of missing values was noted for questions where response choices fol- lowed in a vertical sequence (BP1 and 2, GHI , SFI and 2, and TRAN). This was more pronounced in the Swedish than the U.S. sample. Secondly, the physical function questions, which were ordered as a Guttman scale (PF4-5, PF7-9), showed higher missing value rates for the last items in the sequence (Table 2; 5.7%, 7.1%, and 7.5% for PF5, 8 and 9 respectively). This phenomenon was not present in the U.S. sample.
Very high percentages of items that were com- plete were seen for the combined sample, ranging from 89.5% (PF) to 97.4% (SF) and these com- pared well with the U.S. patient sample (table not shown*). As in the U.S. evaluation, the Physical Functioning scale had a slightly lower rate of com- plete items because of its length (10 items) and its composition (Table 2). A slight drop in percent complete items could be seen by age, as expected.

1354 Marianne Sullivan et al.
Table 4. Results of item sealing tests and reliability estimates (n = 8930)
Scale
Range of item correlations item scaling tests
Item- Item- Scaling internal discriminant Success/ success
k* consistencyt validity:~ total§ (%)
Scale
Reliabilityll
Physical functioning 10 0.58-0.80 0.19-0.59 80/80 Role physical 4 0.69-0.77 0.28-0.58 32/32 Bodily pain 2 0.88 0.304).59 16/16 General health 5 0.55-0.79 0.28-0.66 40/40 Vitality 4 0.60-0.75 0.33-0.69 32/32 Social functioning 2 0.71 0.37-0.63 16/16 Role emotional 3 0.61-0.66 0.25-0.51 24/24 Mental health 5 0.664).75 0.23-0.67 40/40
100 100 100 100 100 100 100 100
0.91 0.88 0.93 0.84 0.85 0.83 0.79 0.87
*Number of items and number of item-internal consistency tests per scale. tCorrelations between items and hypothesized scale corrected for overlap. :~Correlations between items and other scales. §Number of hypothesized significantly higher/total number of correlations I llnternal-consistency reliability (Cronbach's alpha).
The drop was comparable with the U.S. sample for the Bodily Pain and Social Functioning scales, in which questions and response choices are presented in a vertical sequence; however, for all other scales a lower percentage completed was seen in our oldest subgroups. Those with only mandatory education level had somewhat lower percent of complete items in all scales but Bodily Pain and Social Functioning, where the difference was minor (1%). The same tendency was seen when the gainfully employed individuals were compared with all others. The "all others" comprised homemakers, unemployed, students, persons with a disability or retirement pension, persons on sick-leave, etc. No such trend was seen for married/co-habitating vs all others or for males vs females, except for a 2% lower rate in the General Health scale for women. Differences in data completeness by residence were seen; the highest percentages were in the small town, young sample (Skf, 95.8-98.2%), and the lowest were in the urban-suburban areas (Lvg and Gbg, 86.9o/o - 97.5%).
The percentage of subjects for whom scale scores were computable were consistently high (above 90%), matching the U.S. values, except for lower percentages in five scales for subjects 75 years of age and older (MH, RE, VT, RP and GH, ranging from 81.1% to 85%; table not shown).
Summated-rating scaling assumptions
The distribution of responses is presented in Table 2 for the combined sample. All values for each item were observed but item distributions were skewed with more subjects giving favorable re- sponse choices, as expected for general populations. A less positively skewed distribution was seen for items in scales that assess well-being (GH, VT and MH) and items reflecting high physical capacity (e.g. PF1).
As shown in Table 3 for the combined sample, item means were comparable across items in the same scale, as were most standard deviations. A noteworthy departure was seen for the most favor-
able Physical Functioning item (PFI), which had a lower mean value and a higher standard deviation than other items in scale, as would be expected in general populations.
Table 3 also presents the matrix of item-scale correlations which was analyzed to test hypoth- esized item groupings corresponding to scales. Significantly higher item-scale correlations (corrected for overlap) were seen throughout the matrix for the hypothesized scale vs all other scales. The pattern compared well with that of the U.S. sample. The median item-scale correlation for each of the six multi-item scales was very high, ranging from 0.65 for Role-Emotional to 0.75 for Role- Physical. All items exceeded greatly the 0.40 stan- dard for item-internal consistency (Tables 3 and 4).
The item-scale correlations for PF1 and PFI0 were at the lower end compared with the other eight items in the scale; they are included to measure the extremes of the Physical Functioning scale, top and bottom, respectively. General Health items representing susceptibility (GH2) and resist- ance to illness (GH4) had lower item-scale corre- lations than the other three General Health items. However, in the U.S. matrix GH4 and GH5 had substantially lower values (0.44 and 0.38, respect- ively).
Item-internal consistency evaluation was repli- cated across subgroups (table not shown). Item- scale correlations were roughly equal and substan- tial in magnitude across both subgroups and scales with few exceptions. The Social Functioning scale was lower in the youngest and oldest groups, and the Role-Physical, Role-Emotional and Mental Health scales showed somewhat lower correlations in the youngest. The 0.40 standard for item-internal consistency was achieved throughout.
ltem-discriminant validity and scaling success rates
Table 4 summarizes results of scaling tests of item discriminant validity based on the matrix in Table 3. For the combined sample, perfect scaling success rates were achieved across all scales. For

The Swedish SF-36 Health Survey 1355
subgroups, the average scaling s u c c e s s r a t e was high (94.6-100%; table not shown), except for the elderly (78.2%). Most rates exceeded 90% across all eight SF-36 scales. In the urban-suburban sample (Gbg), the Vitality scale reached a somewhat lower level than usual, 81.3%, because two items also corre- lated substantially with the Mental Health scale. As expected, scaling success rates were lower in the smallest subgroup (age group 75 and over, n = 233) because of a larger standard error of the correlation matrix. Three scales performed poorly in the oldest age group: Social Functioning, General Health, and Vitality.
Reliability of scale scores
Internal-consistency reliability estimates for the eight SF-36 scales are presented in Table 4 for the combined sample. Each of the scales exceeded the 0.70 level recommended for group comparisons, ranging from 0.79 for Role-Emotional to 0.93 for Bodily Pain. The recommended standard of 0.90 for individual comparisons was met for Physical Functioning and Bodily Pain, while Role-Physical and Mental Health scales came close to the desired level.
Analyses of internal-consistency coefficients for subgroups revealed some variation in reliability (range = 0.64-0.95; table not shown). Only three coefficients fell below 0.70, however, two of them in the young sample (Skf; SF and RE scales), and one in the old age group (SF scale). The Bodily Pain and Physical Functioning scales were the strongest across all subgroups.
Descriptive statistics for scales
Important features of score distributions are pre- sented in Table 5. The full range of 0-100 was observed for all scales in the combined sample. The median exceeded the mean for all scales, as expected in relatively well population samples. Negative skewness was substantial, indicating distri- butions with respondents scoring towards the posi- tive end of the scales. The least negatively skewed scales were Bodily Pain and the bipolar scales Vitality, General Health, and Mental Health.
In a general population sample the number scor- ing at the lowest level (floor effects) should be negli- gible. This assumption was confirmed for all scales. Similarly, as anticipated for a generally well popu- lation, the percent scoring at the ceiling (highest level) was high for the functional limitations scales. The bipolar scales Vitality, General Health, and Mental Health showed wider score distributions; only 7.3%, 13.5%, and 16.1%, respectively, scored perfectly.
Analyses of the percentage of respondents at the floor and ceiling for each subgroup across all scales showed predictable variations by age (table not shown). The heaviest floor effect was observed among the oldest for Role-Physical and Role- Emotional (35.5% and 23.6%, respectively). The best score distribution, i.e. negligible floor effects and low percentages at ceiling for all subgroups, was noted for the Vitality scale. In general, ceiling effects for Bodily Pain and the functional limi- tations scales were more frequent among men, the young and middle-aged, the well-educated, and the gainfully employed. For the well-being scales, Mental Health and Vitality, the percentages at ceil- ing were somewhat higher in the older age groups and in the group with only mandatory education. Results for marital status were inconsistent; married or co-habitating individuals had a higher ceiling effect for Social Functioning, Role-Emotional, and Mental Health scales, while those who were single, divorced or widowed showed a higher percentage at ceiling for the Physical Functioning scale. No con- sistent pattern was seen regarding residence, apart from the small town, young sample. There were lower ceiling effects for urban-suburban samples (Gbg, Lvg) across all scales, although for Bodily Pain the difference was negligible.
Summary of trends' in results
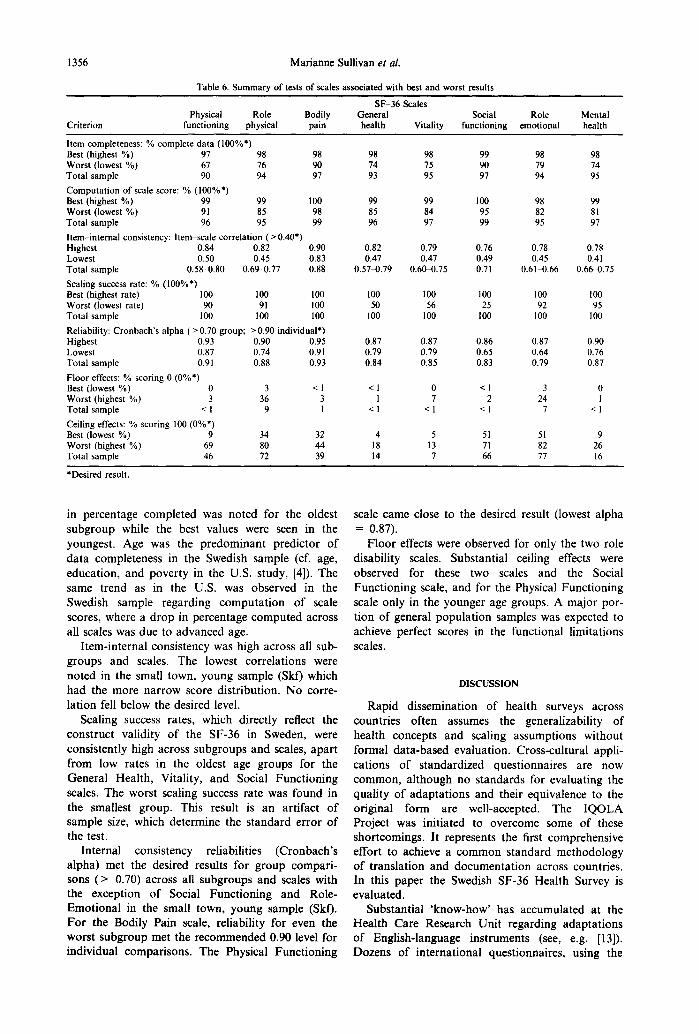
Table 6 summarizes trends in results across scales for selected criterion, desired result, and observed results for the SF-36 scales are shown. We present values for the best and worst subgroup as well as the total sample results.
The vast majority of subgroups had complete items within each of the eight scales. The only drop
Table 5. Descriptive statistics and features of score distributions for SF-36 (n - 8930)
Physical Role Bodily General Vitality Social Role Mental functioning physical pain health functioning emotional health
Items 10 4 2 5 4 2 3 5 Levels 21 5 11 21 21 9 4 26
Mean 87.9 83.2 74.8 75.8 68.8 88.6 85.7 80.9 CI* 87.5-88.3 82.5-83.8 74.3-75.4 75.4-76.3 "" 68.3-69.3 88.2 89.0 85.0 86.3 80.5-81.3 Median 95.0 100.0 84.0 82.0 75.0 100.0 100.0 88.0 Range (~100 O-100 0-100 0-100 0-100 0100 0-100 0-100 SD 19.6 31.8 26.1 22.2 22.8 20.3 29.2 18.9 % Floort 0.3 8.9 1.0 0.2 0.8 0.6 6.6 0.2 % Ceilingt 45.9 72.2 39.1 13.5 7.3 66.1 76.6 16.1
*95% confidence interval, tPercentage of subjects with worst and best possible score, respectively.
1356 Marianne Sullivan et aL
Table 6. Summary of tests of scales associated with best and worst results
SF-36 Scales Physical Role Bodily General Social Role Mental
Criterion functioning physical pain health Vitality functioning emotional health
Item completeness: % complete data (100%*) Best (highest %) 97 98 98 98 98 99 98 98 Worst (lowest %) 67 76 90 74 75 90 79 74 Total sample 90 94 97 93 95 97 94 95 Computation of scale score: % 000%*) Best (highest %) 99 99 100 99 99 100 98 99 Worst (lowest %) 91 85 98 85 84 95 82 81 Total sample 96 95 99 96 97 99 95 97 Item-internal consistency: Item scale correlation ( > 0.40*) Highest 0.84 0.82 0.90 0.82 0.79 0.76 0.78 0.78 Lowest 0.50 0.45 0.83 0.47 0.47 0.49 0.45 0.4 I Total sample 0.58-0.80 0.69-0.77 0 .88 0.57-0.79 0.60~.75 0.71 0.61-0.66 0.66-0.75 Scaling success rate: % (100%*) Best (highest rate) 100 100 100 100 100 100 100 100 Worst (lowest rate) 90 91 100 50 56 25 92 95 Total sample 100 100 100 100 100 100 100 100 Reliability: Cronbach's alpha (>0.70 group; >0.90 individual*) Highest 0.93 0.90 0.95 0.87 0.87 0.86 0.87 0.90 Lowest 0.87 0.74 0.91 0.79 0.79 0.65 0.64 0.76 Total sample 0.91 0.88 0.93 0.84 0.85 0.83 0.79 0.87 Floor effects: % scoring 0 (0%*) Best (lowest %) 0 3 < 1 < 1 0 < 1 3 0 Worst (highest %) 3 36 3 1 7 2 24 I Total sample < 1 9 1 < 1 < 1 < I 7 < 1 Ceiling effects: % scoring 100 (0%*) Best (lowest %) 9 34 32 4 5 51 51 9 Worst (highest %) 69 80 44 18 13 71 82 26 Total sample 46 72 39 14 7 66 77 16
*Desired result.
in percentage completed was noted for the oldest subgroup while the best values were seen in the youngest. Age was the p r edom i nan t predic tor of da ta completeness in the Swedish sample (cf. age, educat ion, and pover ty in the U.S. study, [4]). The same trend as in the U.S. was observed in the Swedish sample regarding compu ta t i on of scale scores, where a d rop in percentage computed across all scales was due to advanced age.
I tem-internal consistency was high across all sub- groups and scales. The lowest correlat ions were noted in the small town, young sample (Skf) which had the more nar row score dis t r ibut ion. No corre- lat ion fell below the desired level.
Scaling success rates, which directly reflect the const ruct validity of the SF-36 in Sweden, were consistently high across subgroups and scales, apar t f rom low rates in the oldest age groups for the Genera l Heal th, Vitality, and Social Func t ion ing scales. The worst scaling success rate was found in the smallest group. This result is an art ifact of sample size, which determine the s tandard error of the test.
In terna l consistency reliabilities (Cronbach ' s a lpha) met the desired results for group compari - sons ( > 0.70) across all subgroups and scales with the exception of Social Func t ion ing and Role- Emot iona l in the small town, young sample (Skf). Fo r the Bodily Pain scale, reliability for even the worst subgroup met the r ecommended 0.90 level for individual compar isons . The Physical Func t ion ing
scale came close to the desired result (lowest a lpha = 0.87).
F loor effects were observed for only the two role disabili ty scales. Substant ia l ceiling effects were observed for these two scales and the Social Func t ion ing scale, and for the Physical Func t ion ing scale only in the younger age groups. A major por- t ion of general popu la t ion samples was expected to achieve perfect scores in the funct ional l imitat ions scales.
DISCUSSION
Rapid disseminat ion of heal th surveys across countr ies often assumes the generalizabili ty of heal th concepts and scaling assumpt ions wi thout formal da ta -based evaluat ion. Cross-cultural appli- cat ions of s tandardized quest ionnaires are now common , a l though no s tandards for evaluat ing the quali ty of adap ta t ions and their equivalence to the original form are well-accepted. The I Q O L A Project was init iated to overcome some of these shor tcomings. It represents the first comprehensive effort to achieve a c o m m o n s tandard methodology of t rans la t ion and documen ta t ion across countries. In this paper the Swedish SF-36 Heal th Survey is evaluated.
Substant ia l ' know-how' has accumulated at the Heal th Care Research Uni t regarding adap ta t ions of English-language ins t ruments (see, e.g. [13]). Dozens of in te rna t ional quest ionnaires , using the

The Swedish SF-36 Health Survey 1357
same general forward-backward translation pro- cedure as in this study (Fig. 1), have been evaluated and documented. The SF-36 is now available as another option for use in Sweden.
The basic generic concepts measured by the SF- 36 Health Survey seem relevant to the Swedish so- ciety. The quality ratings of the Swedish translation, which included clarity, common language use, and conceptual equivalence, were considered satisfac- tory. The latter criterion, which asks if the adap- tation captures the concept measured in the original version, was also judged by the principal developer of the measure. Through extensive pilot testing and examination of data from our general population studies and, at a later stage, application of the IQOLA Project evaluation procedure, we were able to finalize the content of the Swedish SF-36 in 1992.
Population studies were performed in different communities for proper psychometric evaluation of scaling assumptions and scoring algorithms, and for standardization of Swedish norms. Normative data are essential to allow detailed comparisons and score interpretations across diverse patient popu- lations and outcomes assessments. Our SF-36 data base comprised surveys from seven general Swedish populations. Representativeness was achieved across gender, age (15 years and over), socio-economic class, and area of living. The best and worst areas regarding health status in the community, as judged by official statistics, were included. The structure of the Swedish society was considered well represented through the substantial portion (around 75%) of small town/rural areas (Table 1). The surveys fol- lowed a common procedure for studies with sparse resources--mail-out/mail-back questionnaires. As expected from earlier experiences at the National Bureau of Statistics we received a response rate of around two-thirds, which was considered satisfac- tory.
The comparative information on the Swedish SF- 36 vs the original U.S. measure was concerned with psychometric properties. Descriptive statistics were not comparable between samples (general Swedish populations vs patient groups in the U.S.).
Response patterns of the Swedish SF-36 followed the hypothesized general picture also observed in the U.S. evaluation. High and consistent data qual- ity across socio-demographic characteristics seems reassuring. The slight drop in data quality noted for the oldest subgroup (75 years and over) was expected. The low item-discriminant validity (lower success rate) for this group was influenced by the higher standard error in the item-scale correlation matrix, due to the small number of subjects (n = 233). Data quality may be improved among the elderly by using personal administration instead of mailed questionnaires.
The minimum desirable reliability of a question- naire will continue to be debatable [11, 12]. The im-
plications of differences in reliability are being studied [5, 14]. The homogeneity of the sample, as well as many technical aspects of the questionnaire itself, such as the number of questions included and the scale construction technique, ought to be con- sidered. The degree of acceptable reliability varies considerably with the purpose for which the ques- tionnaire is to be used. For example, a reliability estimate of 0.50, sometimes considered acceptable for group comparisons, is probably too low; and the more conservative limit of 0.70 would be more acceptable. This higher standard is especially im- portant to control when short multi-item scales are used. The limit of 0.70 was exceeded or approxi- mated (three coefficients came close to 0.70) across all subgroups and scale analyses in this paper. Most values were above the 0.80 level beyond which cor- relations are attenuated very little by measurement errors [11]. Several scales met, or came close to, the reliability standard of 0.90 for individual compari- sons. This result was in agreement with the U.S. findings. Finally, a particular reliability coefficient should be compared with the general level of coeffi- cients reported for similar measures of the same concept [12]. Using this criterion, the alpha coeffi- cients presented here seem as high as would be an- ticipated for other measures of these and similar health concepts [15, 16].
In conclusion, there is satisfactory empirical evi- dence that the SF-36 proved feasible and reliable in a non-English speaking country. Its clinical validity is currently being evaluated within population stu- dies of women [17] and the elderly [18]. Among others, an ongoing clinical trial of cancer patients undergoing palliative treatment will include head- to-head comparisons between the SF-36 and other measures, i.e. European Organization for Research and Treatment of Cancer, Core Quality of Life Questionnaire (EORTC QLQ-C30, [19]), Sickness Impact Profile (SIP, [20]), Hospital Anxiety and Depression scale (HAD, [21]), and Mood Adjective Check List (MACL, [22]).
The Swedish version of the SF-36 is now avail- able with a manual that includes norms and in- terpretation guidelines [23]. This opens the way for a number of important applications for assessing outcomes of a variety of interventions in primary health care, community health programs, and in clinical research.
Acknowledgements- The authors gratefully acknowledge: Bj6rn Wettergren, MD, Community Medicine Unit, Bohuslandstinget; Ingemar Norling, PhD, Department of Social Work, University of G6teborg; Amir Baigi, Epidemiologist, Community Medicine Unit, Landstinget Halland; and Bertil Marklund, MD, Department of Primary Health Care, University of G6teborg, for excel- lent assistance in organizing field studies, data collection and coding. Without the help and devotion of these people a research effort of this magnitude could not have bee accomplished. Barbara Gandek, MS, San Keller, PhD, and Sharon Wood-Dauphinee, PhD are acknowledged for

1358 Marianne Sullivan et al.
their helpful review of the manuscript. We are sincerely grateful to the numerous funding boards for their gener- ous financial support and for giving us extraordinary working conditions with this cross-cultural research pro- ject. In particular, we thank the International Quality of Life Assessment (IQOLA) Project and its primary spon- sors, Glaxo Research Institute and Schering-Plough Corporation. [Supported in parts by grants from The Swedish Council for Social Research (90-0111:2), The Medical Faculty, University of Gfteborg, Local Community Medicine Authorities, The Swedish Association of Local Authorities, Glaxo Sweden, and by grants to the International Quality of Life Assessment (IQOLA) Project from Glaxo and Schering-Plough Corporation.]
REFERENCES
1. Aaronson N.K., Aquadro C., Alonso J. et al. International quality of life assessment (IQOLA) project. Quality Life Res. 1, 349, 1992.
2. Patrick D.L. and Bergner M. Measurement of health status in the 1990s. Ann. Rev. publ. Hlth 11, 165, 1990.
3. Ware J.E. and Sherbourne C.D. The MOS 36-item short-form health survey (SF-36): I. Conceptual fra- mework and item selection. Med. Care 30, 473, 1992.
4. McHorney C.A., Ware J.E. and Rachel J.F. The MOS-item short-form health survey (SF-36): III. Tests of data quality, scaling assumptions, and reliability across diverse patient groups. Med. Care 32, 40, 1994.
5. Ware J.E., Snow K.K., Kosinski M. and Gandek B. SF-36 Health Survey. Manual and Interpretation Guide. New England Medical Center, Boston, 1993.
6. Brazier J.E., Harper R. and Jones N.M.B. et al. Validating the SF-36 health survey questionnaire: new outcome measure for primary care. Br. med. J. 305, 160, 1992.
7. Jenkinson C., Coulter A. and Wright L. Short form 36 (SF 36) health survey questionnaire: normative data for adults of working age. Br. med. J. 306, 1437, 1993.
8. Garratt A.M., Ruta D.A., Abdalla N.I., Buckingham J.K. and Russell I.T. The SF 36 health survey ques- tionnaire: an outcome measure suitable for routine use within the NHS? Br. Med. J. 306, 1440, 1993.
9. Ware J.E. Measuring patients' views: the optimum outcome measure. SF 36: a valid, reliable assessment of health from the patient's point of view. Br. med. J. 306, 1429, 1993.
10. Sullivan M. Livskvalitetsm/itning. Nytt generellt och nytt tum6rspecifikt formul/ir f6r utv/irdering och planering presenteras. Ldkartidningen 91, 1340, 1994.
(Quality of Life Assessment: a new generic and new tumor-specific questionnaire are announced to pro- mote reliable quality of life assessments in medical care. J. Swed. Med. Assoc., English summary).
11. Nunnally J.C. Psychometric Theory. 2nd edn. McGraw-Hill, New York, 1978.
12. Helmstadter G.C. Principles of Psychological Measurement. Appleton-Century Crofts, New York, 1964.
13. Sullivan M., Ahlm~n M., Archenholtz B. and Svensson G. Measuring health in rheumatic disorders by means of a Swedish version of the Sickness Impact Profile. Results from a population study. Scand. J. Rheumatol. 15, 193, 1986.
14. McHorney C.A., Ware J.E., Rogers W. et al. The val- idity and relative precision of MOS short- and long- form health status scales and Dartmouth COOP Charts: Results from the Medical Outcomes Study. Med. Care 30, MS253, 1992.
15. McDowell I. and Newell C. Measuring Health: ,4 Guide to Rating Scales and Questionnaires. Oxford University Press, Oxford, 1987.
16. Walker S.R. and Rosser R.M. Quality of Life Assessment: Key Issues in the 1990s. Kluwer Academic Publishers, Dordrecht, 1993.
17. Bengtsson C., Gredmark T., Hallberg L. et al. The population study of women in Gothenburg, 1980-81. The third phase of a longitudinal study. Scand. J. Soc. Med. 17, 141, 1989.
18. Steen B. and Djurfelt H. The gerontological and geria- tric population studies in Gothenburg, Sweden. Eur. J. Geriatrics Interdisc. Res. Aging 26, 163, 1993.
19. Aaronson N.K., Ahmedzai S., Bergman B. et al. The European Organization for Research and Treatment of Cancer QLQ-C30: A quality-of-life instrument for use in international clinical trials in oncology. J. Natl Cancer Inst. 85, 365, 1993.
20. Bergner M., Bobbitt R.A., Carter W.B. and Gilson B.S. The Sickness Impact Profile: development in final revision of a health status measure. Med. Care 19, 787, 1981.
21. Zigmond A.S. and Snaith R.P. The Hospital Anxiety and Depression scale. Acta Psychiatr. Scand. 67, 361, 1983.
22. Persson L.-O. and Sj6berg L. Mood and somatic symptoms. J. Psychosom. Res. 31, 499, 1987.
23. Sullivan M., Karlsson J. and Ware J.E. Hdlsoenkdt SF-36. Svensk Manual och Tolkningsguide (SF-36 Health Survey. Swedish Manual and Interpretation Guide, English abstract). Sahlgrenska University Hospital, G6teborg, 1994.