1-s2 0-S092540051201430X-main
8
Sensors and Actuators B 178 (2013) 371–378 Contents lists available at SciVerse ScienceDirect Sensors and Actuators B: Chemical journa l h o mepage: www.elsevier.com/locate/snb Localized surface plasmon resonance-optical sensors based on radiolytically synthesized silver nanoparticles for estimation of uric acid Nilanjal Misra a , Virendra Kumar a,∗ , Lalit Borde b , Lalit Varshney a a Radiation Technology Development Division, Bhabha Atomic Research Centre, Trombay, Mumbai 400 085, India b Department of Biological Sciences, Tata Institute of Fundamental Research, Mumbai 400 005, India a r t i c l e i n f o Article history: Received 7 November 2012 Received in revised form 22 December 2012 Accepted 30 December 2012 Available online xxx Keywords: Localized surface plasmon resonance Silver nanoparticles Biosensor Gamma radiolysis Uric acid a b s t r a c t The quantitative determination of trace levels of uric acid has potential applications in the medical field. In this work, a simple colorimetric estimation of uric acid based on localized surface plasmon resonance (LSPR) band of polyvinyl pyrrolidone-capped-silver nanoparticles (PVP-Ag-NPs) is described. PVP-Ag-NPs were synthesized via gamma radiolytic route, thereby, avoiding the use of any external chemical reduc- ing agent. These nanoparticles were characterized using UV–visible spectrophotometry, transmission electron microscopy (TEM), atomic force microscopy (AFM) and particle size analyzer (PSA). The silver nanoparticles prepared by this method were found to be of spherical shape with diameters 5.1 ± 1.6 nm. Radiation synthesized silver nanoparticles were then used as LSPR-based optical chemical sensors for detection and estimation of uric acid concentrations in human serum and bovine serum samples. The effect of PVP molecular weight on the uric acid detection efficiency of the system was also studied. It was observed that low molecular weight PVP (40 kD) gave better results as biosensor for uric acid estimation. © 2013 Elsevier B.V. All rights reserved. 1. Introduction Uric acid represents the major catabolite of purine breakdown in humans. The normal concentration of uric acid in blood samples is reported to be in the range 150–420 M [1]. High levels of uric acid in the blood (hyperuricemia or Lesch–Nyhan syndrome) are linked with gout and other conditions including increased alcohol consumption, obesity, diabetes, high cholesterol, high blood pres- sure, kidney disease, and heart disease [2,3]. On the other hand, abnormally low uric acid levels are symptoms of diseases, such as multiple sclerosis [1]. Hence estimation of uric acid in blood can be used as a diagnostic tool for monitoring a large number of diseases. Furthermore, uric acid is an antioxidant in human adult plasma and is involved in various pathological changes [4]. In view of this, numerous techniques have been developed over the years for detection and estimation of uric acid levels, which include enzy- matic methods [5], spectrophotometry [6,7] electroanalysis [8], high performance liquid chromatography [9], fluorimetry [10,11] and chemiluminescence [12]. In recent years, the use of metal nanoparticles as analytical and bioanalytical sensors has been receiving significant atten- tion because of their unusual optical, electronic, and chemical ∗ Corresponding author. Tel.: +91 22 25595689/4763; fax: +91 22 25505151. E-mail addresses: [email protected], [email protected] (V. Kumar). properties [13–17]. Large numbers of methods have been devel- oped for the fabrication of metal nanoparticles. However, the major disadvantages in most of the methods include use of external reduc- ing chemicals, poor control over nanoparticle size distribution, and the poor dispersion of the nanoparticles in the polymer host [18]. Gamma radiolytic method has emerged as an efficient alternative technique for fast and one step synthesis of uniformly dispersed metal nanoparticles [19–21]. This method is unique because it is a room temperature process and the reaction system is devoid of any external chemical reducing agents. The reducing radicals gen- erated in situ during radiolysis of water, such as e aq − and H • , are utilized to reduce metal ion precursors to metal in zero-valent state. These metal atoms coalesce to form metal nanoparticles of desired sizes controlled by the stabilizing agent. These nanoparticles can, therefore, be effectively employed as biosensors with minimum probability of interference from external additives. The use of a biocompatible polymer, such as poly(N-vinyl-2-pyrrolidone) as the capping agent [22,23] further enhances their viability to detect biologically relevant molecules without disturbing the natural environment of the biological samples in which the estimation is usually done. LSPR-based optical chemical sensors and biosensors are the appropriate, simplified, cheap and rapid alternative to more sophis- ticated detection techniques. The LSPR wavelength is extremely sensitive to the local environment around the nanoparticles, which facilitates their use as sensing devices [24]. In particular, this property can be utilized for highly sensitive detection of target 0925-4005/$ – see front matter © 2013 Elsevier B.V. All rights reserved. http://dx.doi.org/10.1016/j.snb.2012.12.110
Transcript of 1-s2 0-S092540051201430X-main
Ls
Na
b
a
ARR2AA
KLSBGU
1
iialcsaacdpofmha
at
0h
Sensors and Actuators B 178 (2013) 371– 378
Contents lists available at SciVerse ScienceDirect
Sensors and Actuators B: Chemical
journa l h o mepage: www.elsev ier .com/ locate /snb
ocalized surface plasmon resonance-optical sensors based on radiolyticallyynthesized silver nanoparticles for estimation of uric acid
ilanjal Misraa, Virendra Kumara,∗, Lalit Bordeb, Lalit Varshneya
Radiation Technology Development Division, Bhabha Atomic Research Centre, Trombay, Mumbai 400 085, IndiaDepartment of Biological Sciences, Tata Institute of Fundamental Research, Mumbai 400 005, India
r t i c l e i n f o
rticle history:eceived 7 November 2012eceived in revised form2 December 2012ccepted 30 December 2012vailable online xxx
a b s t r a c t
The quantitative determination of trace levels of uric acid has potential applications in the medical field.In this work, a simple colorimetric estimation of uric acid based on localized surface plasmon resonance(LSPR) band of polyvinyl pyrrolidone-capped-silver nanoparticles (PVP-Ag-NPs) is described. PVP-Ag-NPswere synthesized via gamma radiolytic route, thereby, avoiding the use of any external chemical reduc-ing agent. These nanoparticles were characterized using UV–visible spectrophotometry, transmissionelectron microscopy (TEM), atomic force microscopy (AFM) and particle size analyzer (PSA). The silver
eywords:ocalized surface plasmon resonanceilver nanoparticlesiosensoramma radiolysisric acid
nanoparticles prepared by this method were found to be of spherical shape with diameters 5.1 ± 1.6 nm.Radiation synthesized silver nanoparticles were then used as LSPR-based optical chemical sensors fordetection and estimation of uric acid concentrations in human serum and bovine serum samples. Theeffect of PVP molecular weight on the uric acid detection efficiency of the system was also studied.It was observed that low molecular weight PVP (40 kD) gave better results as biosensor for uric acidestimation.
. Introduction
Uric acid represents the major catabolite of purine breakdownn humans. The normal concentration of uric acid in blood sampless reported to be in the range 150–420 �M [1]. High levels of uriccid in the blood (hyperuricemia or Lesch–Nyhan syndrome) areinked with gout and other conditions including increased alcoholonsumption, obesity, diabetes, high cholesterol, high blood pres-ure, kidney disease, and heart disease [2,3]. On the other hand,bnormally low uric acid levels are symptoms of diseases, suchs multiple sclerosis [1]. Hence estimation of uric acid in bloodan be used as a diagnostic tool for monitoring a large number ofiseases. Furthermore, uric acid is an antioxidant in human adultlasma and is involved in various pathological changes [4]. In viewf this, numerous techniques have been developed over the yearsor detection and estimation of uric acid levels, which include enzy-
atic methods [5], spectrophotometry [6,7] electroanalysis [8],igh performance liquid chromatography [9], fluorimetry [10,11]nd chemiluminescence [12].
In recent years, the use of metal nanoparticles as analyticalnd bioanalytical sensors has been receiving significant atten-ion because of their unusual optical, electronic, and chemical
∗ Corresponding author. Tel.: +91 22 25595689/4763; fax: +91 22 25505151.E-mail addresses: [email protected], [email protected] (V. Kumar).
925-4005/$ – see front matter © 2013 Elsevier B.V. All rights reserved.ttp://dx.doi.org/10.1016/j.snb.2012.12.110
© 2013 Elsevier B.V. All rights reserved.
properties [13–17]. Large numbers of methods have been devel-oped for the fabrication of metal nanoparticles. However, the majordisadvantages in most of the methods include use of external reduc-ing chemicals, poor control over nanoparticle size distribution, andthe poor dispersion of the nanoparticles in the polymer host [18].Gamma radiolytic method has emerged as an efficient alternativetechnique for fast and one step synthesis of uniformly dispersedmetal nanoparticles [19–21]. This method is unique because it isa room temperature process and the reaction system is devoid ofany external chemical reducing agents. The reducing radicals gen-erated in situ during radiolysis of water, such as eaq
− and H•, areutilized to reduce metal ion precursors to metal in zero-valent state.These metal atoms coalesce to form metal nanoparticles of desiredsizes controlled by the stabilizing agent. These nanoparticles can,therefore, be effectively employed as biosensors with minimumprobability of interference from external additives. The use of abiocompatible polymer, such as poly(N-vinyl-2-pyrrolidone) as thecapping agent [22,23] further enhances their viability to detectbiologically relevant molecules without disturbing the naturalenvironment of the biological samples in which the estimation isusually done.
LSPR-based optical chemical sensors and biosensors are theappropriate, simplified, cheap and rapid alternative to more sophis-
ticated detection techniques. The LSPR wavelength is extremelysensitive to the local environment around the nanoparticles, whichfacilitates their use as sensing devices [24]. In particular, thisproperty can be utilized for highly sensitive detection of target
372 N. Misra et al. / Sensors and Actuat
300 40 0 50 0 60 0 70 0 80 0
0.0
0.2
0.4
0.6
0.8
1.0
1.2
1.4 f
Ab
s.
Wav elength (nm)
a
Fig. 1. Absorption spectra of aqueous PVP-Ag-NPs solution obtained at differentradiation doses: (a) 1.0 kGy, (b) 1.3 kGy, (c) 1.6 kGy, (d) 2.0 kGy, (e) 2.3 kGy, (f)2
mepseuo
ttthdSdsiia
2
2
twPt3Awspgdpci−
When an aqueous solution containing AgI, PVP (mol. wt. = 40 kD)and 2-propanol is purged with N2 and subjected to gamma
.5 kGy.
olecules in biomedical and environmental applications. Fillippot al. [24] have reported the development of localized surfacelasmon resonance-based optical biosensors using polymer coatedilver nanoparticles for the detection of hydrogen peroxide. In ourarlier work, estimation of hydrogen peroxide has been reportedsing radiolytically synthesized gold nanoparticles in presence of-phenylenediamine [25].
To the best of our knowledge, we report herein for the firstime, gamma radiolytically synthesized PVP-Ag-NPs for the detec-ion of uric acid in biological samples. The technique is based onhe catalytic oxidation and degradation of silver nanoparticles byydrogen peroxide, which is generated in situ during enzymaticegradation of uric acid in presence of enzyme uricase [26–30].pherical silver nanoparticles were synthesized via gamma irra-iation of precursor silver ions in presence of PVP, which waspecifically chosen as the capping and stabilizing agent because ofts water solubility, good stabilizing capability and biodegradabil-ty. The method was successfully employed for estimation of uriccid concentration in bovine and human serum samples.
. Experimental
.1. Materials
Aqueous solutions were prepared using deionized water (resis-ivity = 18 M� cm). Silver nitrate (99.9%) and 2-propanol (AR grade)ere procured from S.D. Fine Chemicals Ltd., Mumbai, India.
oly(N-vinyl-2-pyrrolidone) (PVP) (Sigma Aldrich, Germany) ofhree different molecular weights, namely, 40 kD, 160 kD and60 kD were used as capping agents. Uric acid SigmaUltra (Sigmaldrich, Germany, ≥99%) and Uricase (Sigma Aldrich, Germany)ere used as received. Disodium hydrogen phosphate and potas-
ium dihydrogen phosphate, used for buffer preparation, wereurchased from Thomas and Baker Chemicals, India. Prior to use,lassware was cleaned with aquaregia and thoroughly rinsed witheionized water. A 5 mM stock solution of uric acid in 20 mMhosphate buffer (pH 7.4) was prepared by heating at 90 ◦C. Uri-ase solution with concentration of 0.137 mg mL−1 was prepared
n phosphate buffer for further use. Serum samples were stored at4 ◦C and incubated in a water bath at 37 ◦C prior to use.ors B 178 (2013) 371– 378
2.2. Instrumentation
The UV–vis absorption spectra were recorded on a UV–visspectrophotometer (Evolution 300, Thermoelectron, UK) in thewavelength region of 250–800 nm with resolution of 1 nm.
Transmission electron microscopy (TEM) was performed on anenergy filtering transmission electron microscope (EF-TEM, LIBRA120, Carl Zeiss) with an accelerating voltage of 120 kV in order todetermine the shape and size of the nanoparticles. For the mea-surement of TEM, silver nanoparticles were deposited on a carboncoated copper grid by placing dilute silver nanoparticles solutionon it and drying in a laminar flow hood. Particle size distributions ofthe Ag nanoparticles were obtained by performing image analysison TEM images using the Visilog 6.3 software (Noesis).
AFM measurements were performed using an NT-MDT solvermodel P47 instrument (Russia) with 50 �m scanner head and sili-con nitride tip in contact mode. The sample for AFM measurementwas prepared by depositing a dilute solution of silver nanoparticleson a glass slide and allowing it to dry in a laminar flow hood.
The hydrodynamic diameter of Ag nanoparticles was measuredusing particle size analyzer (VASCO 3, Cordouan, France). For theanalysis, 0.5 mL of dilute silver nanoparticle solution was placed onthe glass base, the laser count rate adjusted to approximately 2000counts per second and the acquisition was performed for 4 min inthe continuous mode at 25 ◦C.
Zeta potential of the samples was determined using a MalvernZetasizer nano ZS. 1.5 mL of the sample was taken in the transparentcell for carrying out the zeta potential measurements at pH 7.4.
2.3. Preparation of PVP capped Ag nanoparticles
PVP-Ag-NPs were prepared by gamma radiolytic route using60Co gamma chamber (GC 5000, BRIT, India) having a radiation doserate of 2.47 kGy h−1 determined using Fricke dosimetry [31]. Anaqueous solution containing 4 × 10⁻⁴ mol dm−3 AgI, 1.0% PVP (w/v)and 0.2 mol dm−3 2-propanol was purged with N2 and irradiated fora target absorbed dose. In this study, PVP capping agent with molec-ular weight of 40 kD was used, unless and otherwise mentioned.The formation of Ag nanoparticles was indicated by developmentof bright yellow color and the saturation gamma radiation dose wasdetermined by spectroscopic monitoring.
2.4. Estimation of uric acid
For estimation of uric acid, 0.2 mL of 0.137 mg mL−1 of uricasestock solution and different volumes of a known concentration ofuric acid solution were taken in 25 mL conical flasks and diluted to6.25 mL. The resultant mixtures were allowed to stand for 20 min.Subsequently, 3.75 mL of 4 × 10⁻⁴ mol dm−3 Ag nanoparticles solu-tion (in terms of AgI, assuming complete reduction of the precursorion) were added to each of the mixtures to make the total volumeof 10 mL. The reaction mixtures were allowed to stand for another60 min and the UV–visible spectra were recorded in the wavelengthrange 250–650 nm. A calibration curve was established by plottingthe absorbance at �max as a function of uric acid concentration, fromwhich the concentrations of uric acid in the unknown samples wereestimated.
3. Results and discussions
3.1. Formation of Ag nanoparticles
radiation, radiolysis of water takes place. As a result, reactive tran-sient species, namely, eaq
−, H•, •OH, etc., are generated (Eq. (1)).

N. Misra et al. / Sensors and Actuators B 178 (2013) 371– 378 373
F 40 kDr EM imi
2•
tp2s
•
A
A
A
ig. 2. TEM analysis of Ag nanoparticles prepared using PVP of molecular weight
esult of TEM image-a, (c) particle size distribution histogram of TEM image-a, (d) Tmage-d, (f) particle size distribution histogram of TEM image-d.
-propanol present in the reaction medium reacts with H• andOH to give 2-propyl radical, a mild reducing agent (Eq. (2)). Athe same time the oxidizing radical •OH gets eliminated in therocess. The reducing species present in the system viz. eaq
− and-propyl radical reduce the metal ion (AgI) to metal in zero valenttate (Ag0)(Eq.(3) and Eq. (4)).
γ-radia tion
(1)
OH/H• + (CH3)2CH OH → (CH3)2C• OH + H2O/H2 (2)
gI + eaq− → Ag0 (3)
gI + (CH3)2C• OH → Ag0 + (CH3)2C O + H+ (4)
After formation of Ag0, coalescence step leads to formation ofg nanoparticles in presence of PVP as a capping and stabilizing
: (a) TEM image before addition of uric acid-uricase system, (b) image processingage after addition of uric acid-uricase system, (e) image processing result of TEM
agent. PVP contains functional groups like >C O and >N– groups,which facilitates its anchorage to metal nanoparticles and restrictsthe uncontrolled growth of nanoparticles via encapsulation by thelong polymer chains.
3.2. Characterization of Ag nanoparticles
Fig. 1 shows the UV–visible spectra of silver nanoparticlessolution as a function of radiation dose. Ag nanoparticles showcharacteristic surface plasmon resonance (SPR) band at around400 nm. The yield of Ag nanoparticles, manifested by intensity of
characteristic SPR band of Ag nanoparticles, increases with increasein absorbed radiation dose till all precursor AgI ions are exhausted.The saturation dose for reduction of 4 × 10⁻⁴ mol dm−3 AgI wasfound to be 2.3 kGy.
374 N. Misra et al. / Sensors and Actuators B 178 (2013) 371– 378
cpsocm
3
e7vioarttIstbaLait
sa0Tpe
FaP
260 28 0 30 0 32 0 34 0 36 0
0.00
0.02
0.04
0.06
0.08
0.10
0.12
0.14
0.16
0.18
Ab
s.
Wavel ength(nm)
a
b
c
d
e
the nanoparticles [36]. This is also evident from the TEM images ofPVP-Ag-NPs recorded before and after addition of uric acid-uricasesystem (Fig. 2a and d). While the control (PVP-Ag-NPs) exhibited an
Fig. 3. Enzymatic degradation of uric acid in presence of uricase.
Fig. 2a shows the TEM image of the freshly prepared PVP-apped-Ag nanoparticles. Image analysis of the TEM image-2a waserformed using Visilog 6.3 software and presented in Fig. 2b. Theize distribution of the nano-particles in the form of histogrambtained after image analysis is shown in Fig. 2c. Ag nanoparti-les stabilized by PVP were found to be spherical in shape havingean diameter of 5.1 nm with standard deviation ±1.6 nm.
.3. PVP-Ag-NPs as LSPR-based uric acid sensor
Uric acid undergoes enzymatic degradation in presence ofnzyme uricase under optimum assay conditions of 37 ◦C and pH.4, as shown in scheme presented in Fig. 3. This pH is also rele-ant because it represents the physiological pH of biological fluids,.e., urine or blood serum. Hydrogen peroxide is generated as onef the reaction products, which is known to be a strong oxidizinggent. Hydrogen peroxide causes oxidation of silver nanoparticlesesulting in a decrease in intensity of the SPR band. Fig. 4 showshe changes in the LSPR optical characteristics of PVP-Ag-NPs withime after the introduction of uric acid and uricase into the system.t was observed that with increasing time, the bright yellow color ofilver nanoparticles gradually faded and the solution turned almostransparent, which was manifested by the gradual decrease in SPRand intensity with time. The relationship between absorbancend time is illustrated in Fig. 4 inset. In order to confirm that theSPR absorbance change was caused only in the presence of uriccid, phosphate buffer and deionized water alone were separatelyntroduced into the nanoparticle solution and the spectra moni-ored with time; no spectral change was observed in either case.
As mentioned in Section 2.4, for the evaluation of PVP-Ag-NPsolution as a uric acid biosensor, different concentrations of uriccid (10–100 �M) were taken in 25 mL conical flasks and 0.2 mL of
−1
.137 mg mL uricase stock solution was added to each of them.he resultant mixtures were diluted to 6.25 mL with 20 mM phos-hate buffer and incubated at 37 ◦C for 20 min. The course of thenzymatic reaction was followed by monitoring the absorbance300 40 0 50 0 60 0 70 0
0.0
0.2
0.4
0.6
0.8
1.0
1.2
1.4
1.6
1.8
0 10 20 30 40 50 60
0.9
1.0
1.1
1.2
1.3
1.4
1.5
1.6
1.7
Abs.
time (min)
Ab
s.
Wavel ength (nm)
a
b
c
d
e
ig. 4. Absorption spectra of PVP-Ag-NPs solution in presence of 50 �M uric acidfter (a) 0 min, (b) 5 min, (c) 20 min, (d) 45 min, (e) 60 min. Inset: Absorbance ofVP-Ag-NPs solution containing uric acid as a function of time.
Fig. 5. Absorption spectra of 20 �M uric acid solution in presence of uricase after(a) 0 min, (b) 5 min, (c) 10 min, (d) 15 min, (e) 20 min.
peak of uric acid, whose intensity decreases with time (Fig. 5). Sub-sequently, 3.75 mL of 4.0 × 10⁻⁴ mol dm−3Ag nanoparticle solution(final concentration being 1.5 × 10⁻⁴ mol dm−3) was added to eachof the flasks and the mixtures allowed to stand at room temper-ature for another 60 min. The UV–visible spectra were recordedthereafter in the wavelength range 250–650 nm. Fig. 6 shows thevariation in LSPR band of the PVP-Ag-NPs with increasing concen-tration of uric acid. It was observed that intensity of the LSPR banddecreases gradually with increase in uric acid concentration. Thedecrease was accompanied by a slight red shift in the absorptionmaxima of the band, which is attributed to the partial oxidation ofnano-Ag [32–35]. The shift in �max might also be due to the slightaggregation caused by the destruction of the PVP shell stabilizingthe nanoparticles followed by decrease in the distance between
average particle size of 5.1 ± 1.6 nm, those in presence of uric acid
300 40 0 50 0 60 0 70 0 80 0
0.0
0.2
0.4
0.6
0.8
1.0
1.2
1.4
1.6
0 10 20 30 40 50
0.9
1.0
1.1
1.2
1.3
1.4
1.5
Abs.
Uric acid (μM)
Ab
s.
Wavel ength(nm)
a
b
c
d
e
f
Fig. 6. Absorption spectra of PVP-Ag-NPs solution (PVP, mol. wt. = 40 kD) in pres-ence of different concentration of uric acid, after 60 min: (a) 0 �M, (b) 10 �M,(c) 20 �M, (d) 30 �M, (e) 40 �M, (f) 50 �M. Inset: Linear plot of absorbanceof PVP-Ag-NPs vs uric acid concentration (R2 = 0.9964), uric acid concentrationrange = 0–5 × 10⁻⁵ mol dm−3.
N. Misra et al. / Sensors and Actuators B 178 (2013) 371– 378 375
F addit
wsdp
utagdotp
mctpdTcastsztibootststPwco
3
sSt
ter. The volume of the filtrate was made up to the original volumeusing 20 mM phosphate buffer and divided into two parts of 1 mLeach. The first part of the filtrate was subjected to the uric acid esti-mation protocol using PVP-Ag-NPs sensor system, as described in
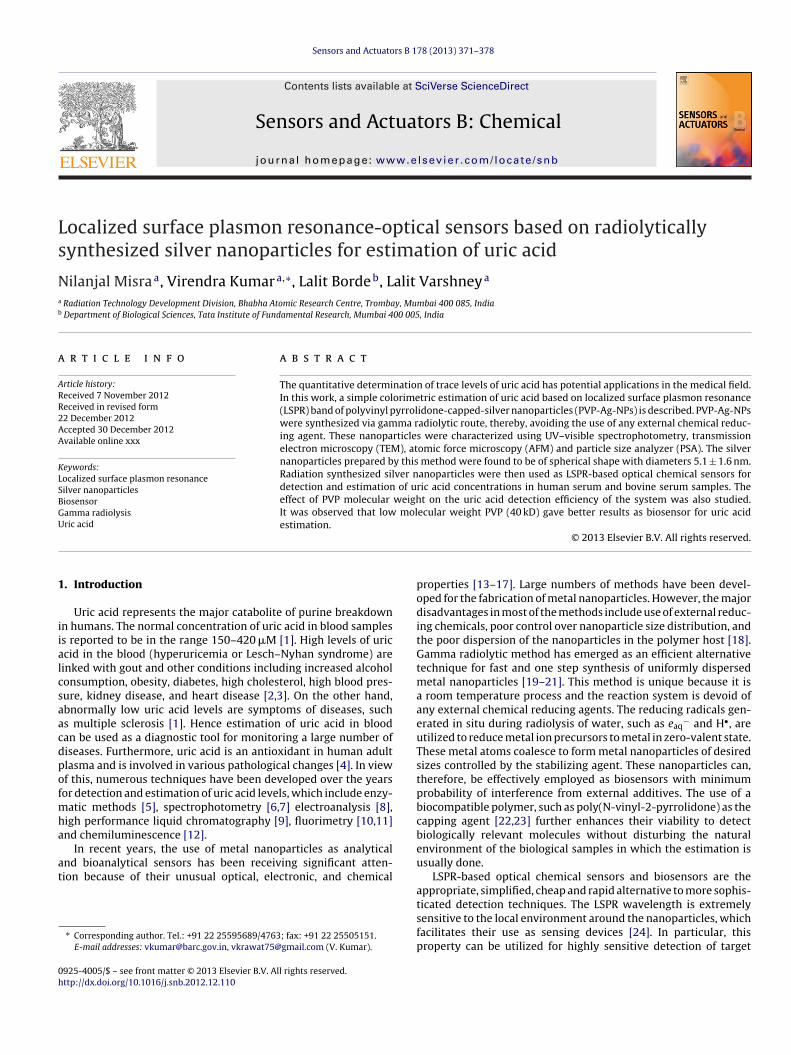
ig. 7. AFM images of PVP-Ag-NPs prepared using PVP (mol. wt. = 40 kD): (a) before
ere found to have bigger particle size of 15.4 ± 4.6 nm. Particleize analyzer data also reveals an increase in average hydrodynamiciameter of the PVP-Ag-NPs after addition of 20 �M uric acid inresence of uricase.
AFM analysis was carried out to study the effect of addition ofric acid-uricase system to the PVP-Ag-NPs. Fig. 7a and b presenthe AFM images of PVP-Ag-NPs before and after addition of uriccid-uricase system. Introduction of uric acid and subsequenteneration of hydrogen peroxide in the medium resulted in partialecomposition of the polymer layer leading to the aggregationf the Ag colloids, which is evident from bigger particle size andhe blurring of the boundaries existing between the individualarticles.
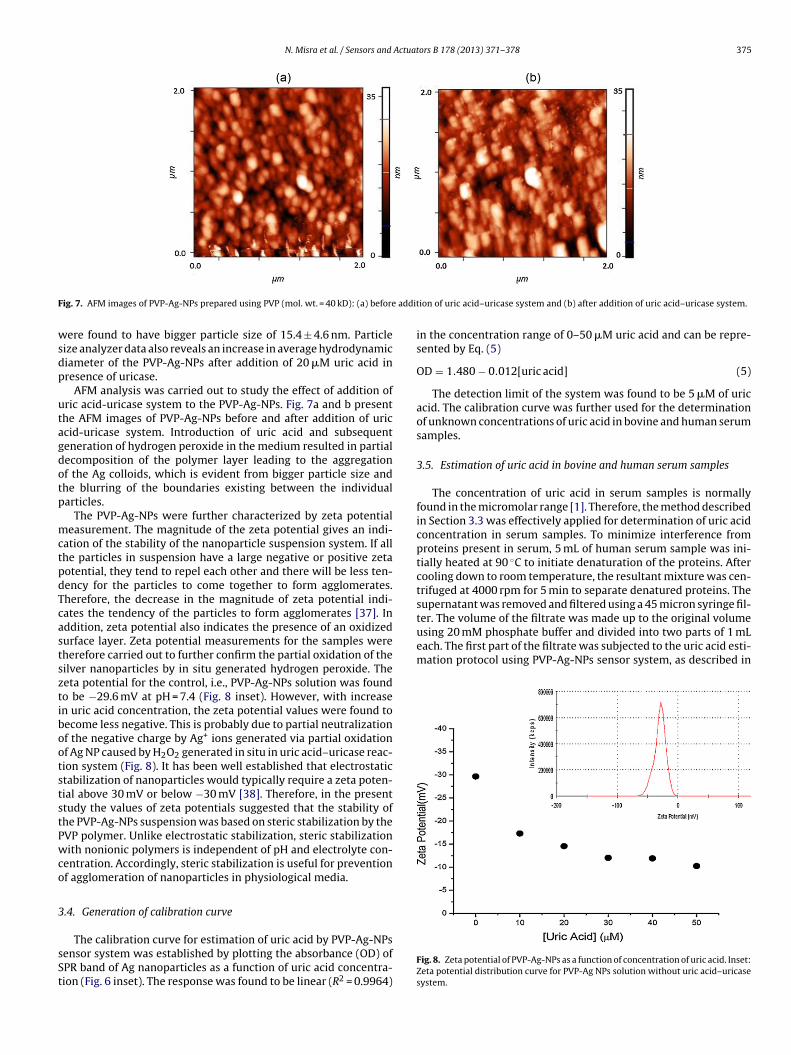
The PVP-Ag-NPs were further characterized by zeta potentialeasurement. The magnitude of the zeta potential gives an indi-
ation of the stability of the nanoparticle suspension system. If allhe particles in suspension have a large negative or positive zetaotential, they tend to repel each other and there will be less ten-ency for the particles to come together to form agglomerates.herefore, the decrease in the magnitude of zeta potential indi-ates the tendency of the particles to form agglomerates [37]. Inddition, zeta potential also indicates the presence of an oxidizedurface layer. Zeta potential measurements for the samples wereherefore carried out to further confirm the partial oxidation of theilver nanoparticles by in situ generated hydrogen peroxide. Theeta potential for the control, i.e., PVP-Ag-NPs solution was foundo be −29.6 mV at pH = 7.4 (Fig. 8 inset). However, with increasen uric acid concentration, the zeta potential values were found toecome less negative. This is probably due to partial neutralizationf the negative charge by Ag+ ions generated via partial oxidationf Ag NP caused by H2O2 generated in situ in uric acid–uricase reac-ion system (Fig. 8). It has been well established that electrostatictabilization of nanoparticles would typically require a zeta poten-ial above 30 mV or below −30 mV [38]. Therefore, in the presenttudy the values of zeta potentials suggested that the stability ofhe PVP-Ag-NPs suspension was based on steric stabilization by theVP polymer. Unlike electrostatic stabilization, steric stabilizationith nonionic polymers is independent of pH and electrolyte con-
entration. Accordingly, steric stabilization is useful for preventionf agglomeration of nanoparticles in physiological media.
.4. Generation of calibration curve
The calibration curve for estimation of uric acid by PVP-Ag-NPsensor system was established by plotting the absorbance (OD) ofPR band of Ag nanoparticles as a function of uric acid concentra-ion (Fig. 6 inset). The response was found to be linear (R2 = 0.9964)
ion of uric acid–uricase system and (b) after addition of uric acid–uricase system.
in the concentration range of 0–50 �M uric acid and can be repre-sented by Eq. (5)
OD = 1.480 − 0.012[uric acid] (5)
The detection limit of the system was found to be 5 �M of uricacid. The calibration curve was further used for the determinationof unknown concentrations of uric acid in bovine and human serumsamples.
3.5. Estimation of uric acid in bovine and human serum samples
The concentration of uric acid in serum samples is normallyfound in the micromolar range [1]. Therefore, the method describedin Section 3.3 was effectively applied for determination of uric acidconcentration in serum samples. To minimize interference fromproteins present in serum, 5 mL of human serum sample was ini-tially heated at 90 ◦C to initiate denaturation of the proteins. Aftercooling down to room temperature, the resultant mixture was cen-trifuged at 4000 rpm for 5 min to separate denatured proteins. Thesupernatant was removed and filtered using a 45 micron syringe fil-
Fig. 8. Zeta potential of PVP-Ag-NPs as a function of concentration of uric acid. Inset:Zeta potential distribution curve for PVP-Ag NPs solution without uric acid–uricasesystem.

376 N. Misra et al. / Sensors and Actuators B 178 (2013) 371– 378
Table 1Determination of uric acid in human serum samples using proposed method and comparison method; results of one sample T-test and one way ANOVA F-test.
Sample (human serum) Uric acid concentration (�M) One sample t-testt(˛ = 0.05, n = 5)
One way ANOVAF-test
Other methoda Proposed methodb p F
HS-1 185 180 ± 4.4 −2.54 0.97 0.001HS-2 153 149 ± 4.1 −2.18HS-3 243 248 ± 4.9 +2.28
Sioibcrpcion
aedPmHetopb
oh(oScdl
mtat
3P
s4mtwdwstou
300 40 0 50 0 60 0 70 0
0.0
0.2
0.4
0.6
0.8
1.0
1.2
1.4
1.6
10 20 30 40 501.30
1.32
1.34
1.36
1.38
1.40
1.42
1.44
1.46
1.48
1.50
Abs.
Uric acid (μM)
Ab
s.
Wav elength (nm)
a
e
Fig. 9. Absorption spectra of PVP-Ag-NPs solution (PVP, mol. wt. = 160 kD) in pres-ence of different concentration of uric acid, after 60 min: (a) 0 �M, (b) 10 �M,
with PVP of molecular weight 360 kD as the capping agent (datanot shown). The calibration plots for PVP-Ag sensor systems withhigher molecular weight PVP were found to exhibit poor linearity
250 30 0 35 0 40 0 45 0 50 0 55 0 60 0 65 0 70 0
0.0
0.2
0.4
0.6
0.8
1.0
1.2
1.4
1.6
1.8
10 20 30 40 50
0.9
1.0
1.1
1.2
1.3
1.4
1.5
1.6
1.7
Abs.
Uric Acid (μM)
Ab
s.
Wav elen gth (nm)
a
b
c
d
e
a Other method: QuantiChrom Uric Acid Assay Kit (DIUA-250).b Average ± standard deviation (for 5 determinations).
ection 2.4. The second part of the filtrate was diluted 10 times andts UV–visible spectrum was recorded for background correctionf the SPR band of the sample. The same procedure was adoptedn case of bovine serum sample. The concentrations of uric acid inoth human and bovine serum samples were estimated from thealibration plot (Fig. 6 inset). The interference of ions, such as chlo-ides, sulphates, chlorides and sulphates in the uric acid estimationrocess may be ignored in this case where the silver nanoparti-les have been sterically stabilized using PVP, as the effect of theons on the LSPR band of Ag-NPs becomes prominent only in casef electrostatically stabilized systems, such as citrate stabilized Aganoparticles [39,40].
For comparison purpose, a commercial colorimetric uric acidssay kit (Quantichrom Uric Acid Assay Kit-DIUA-250) was used tostimate the uric acid in the samples under similar reaction con-itions. Table 1 presents the results obtained from the proposedVP-Ag-NPs biosensor and those obtained from the comparisonethod for three different human serum samples (HS-1, HS-2 andS-3). A one sample T-test was performed to test the null hypoth-sis and the results are presented in Table 1. The absolute values ofhe estimated t were lower than the critical t value ( = 0.05, df = 4)f 2.776, which suggested that the results obtained using the pro-osed method, were not significantly different from those obtainedy the comparison procedure at a 95% confidence level.
A one-way ANOVA F-test was also performed on the resultsbtained from proposed method and comparison method for threeuman serum samples in order to check the null hypothesisTable 1). In this case, Fcrit(1,4) = 7.71 at = 0.05. The p and F valuesbtained from the ANOVA F-test were 0.97 and 0.001, respectively.ince p > and F < Fcrit, it can be concluded that the uric acid con-entration estimated by our proposed method is not significantlyifferent from that obtained with the comparison method at 95%
evel of significance.The concentration of uric acid in bovine serum sample was esti-
ated to be 181 ± 3.7 �M (average ± standard deviation) by usinghe proposed method. This was also found to be in reasonably goodgreement with the measured value of 190 �M determined usinghe commercial kit method.
.6. Effect of PVP molecular weight on sensing properties ofVP-Ag-NPs system
The experiments discussed earlier had been carried out usingilver nanoparticles synthesized using PVP of molecular weight0 kD as the capping agent. In order to study the effect of PVPolecular weight on the sensor properties of PVP-Ag-NPs sys-
em, similar experiments were conducted using PVP of moleculareights 160 kD and 360 kD. For higher molecular weight PVPs,ecrease in absorbance with increase in uric acid concentrationas found to be very low for low uric acid concentrations, when the
pectra were recorded after 60 min (Fig. 9). However, on recordinghe spectra again after 8 h, significant decrease in absorbance wasbserved for the system where PVP of molecular weight 160 kD wassed as the capping agent (Fig. 10); though no change in spectral
(c) 20 �M, (d) 30 �M, (e) 40 �M, (f) 50 �M. Inset: Linear plot of absorbanceof PVP-Ag-NPs vs uric acid concentration (R2 = 0.8826), uric acid concentrationrange = 0–5 × 10⁻⁵ mol dm−3.
characteristics was observed after 8 h in case of PVP-Ag system
Fig. 10. Absorption spectra of PVP-Ag-NPs solution (PVP, mol. wt. = 160 kD) inpresence of different concentration of uric acid, after 8 h: (a) 0 �M, (b) 10 �M,(c) 20 �M, (d) 30 �M, (e) 40 �M, (f) 50 �M. Inset: Linear plot of absorbanceof PVP-Ag-NPs vs uric acid concentration (R2 = 0.9679), uric acid concentrationrange = 0–5 × 10⁻⁵ mol dm−3.
Actuat
ai0rvmwwe(aior
4
bobdhLt5wslttnrmrhit
A
tJ
R
[
[
[
[
[
[
[
[
[
[
[
[
[
[
[
[
[
[
[
[
[
[
[
[
[
N. Misra et al. / Sensors and
s compared to that with PVP of molecular weight 40 kD (Fig. 6nset, Fig. 9 inset). R2 values were found to be 0.9964, 0.8826 and.7730 for PVP with molecular weights 40 kD, 160 kD and 360 kD,espectively. This implies that the oxidation and degradation of sil-er nanoparticles became progressively slower when PVP of higherolecular weights was used as capping agents. High moleculareight PVPs (160 kD and 360 kD) have longer polymeric chains,hich wrap around the Ag clusters and effectively shield them from
xternal oxidizing agents. However, lower molecular weight PVP40 kDa) has comparatively shorter polymeric chains and hence itsbility to stabilize Ag clusters is also less. Therefore, Ag in such casess more accessible to hydrogen peroxide, which causes significantxidation of the Ag atoms present on the surface of the clusters,esulting in a decrease in the absorbance of the SPR band.
. Conclusions
A novel biosensor based on PVP-Ag-NPs has been developedy gamma radiolytic method, and demonstrated for estimationf uric acid in biological samples. No external reducing agent haseen used in this method. A colorimetric method based on oxi-ation of PVP stabilized Ag nanoparticles by in situ generatedydrogen peroxide has been developed for estimation of uric acid.inear range of detection of uric acid by this technique was foundo be 0 to 5 × 10⁻⁵ mol dm−3 with minimum detection limit of
× 10−6 mol dm−3. The molecular weight of the capping agent PVPas found to play a crucial role in the efficacy of the PVP-Ag-NPs
ystem as a sensor for uric acid estimation; lower the molecu-ar weight of PVP, faster and better the response towards sensinghe uric acid. Further, this method was also effectively employedo determine concentration of uric acid in actual biological fluids,amely bovine and human serum samples. T-tests and F-test car-ied out on the analysis results demonstrated that the proposedethod offers reasonably good accuracy and precision in case of
eal samples. This novel detection method using nano-materialsas potential applications in medical and environmental monitor-
ng as a simplified, low cost biosensor for uric acid estimation inhe micro-molar range.
cknowledgments
Authors sincerely thank R.K. Singhal, BARC, India for zeta poten-ial measurements, V. Sudarsan, BARC, India for AFM analysis anderome Pulpytel, UPMC, Paris, France for TEM image analysis.
eferences
[1] E. Miller, J. Kedziora, Effect of whole body cryotherapy on uric acid con-centration in plasma of multiple sclerosis patients, International Review ofAllergology and Clinical Immunology 17 (2011) 20–23.
[2] G. Wurzner, J.C. Gerster, A. Chiolero, M. Maillard, C.L. Fallab-Stubi, H.R. Brunner,M. Burnier, Comparative effects of losartan and irbesartan on serum uric acid inhypertensive patients with hyperuricemia and gout, Journal of Hypertension19 (2001) 1855–1860.
[3] L. Tan, G.M. Yang, P. Wang, Z.Y. Xie, H.P. Bai, X.X. Lu, Y.H. Yang, Directdetermination of uric acid based on Pd nanoparticles electrodepositing ontoanatase-type TiO2 nanoparticles/chitsan film-modified electrode, AnalyticalLetters 41 (2008) 2860–2876.
[4] R.N. Goyal, V.K. Gupta, A. Sangal, N. Bachheti, Voltammetric determination ofuric acid at a fullerene-C60-modified glassy carbone electrode, Electroanalysis17 (2005) 2217–2223.
[5] Y.N. Ni, D.X. Cao, S. Kokt, Simultaneous enzymatic kinetic determination of pes-ticides, carbaryl, and phoxim, with the aid of chemometrics, Analytica ChimicaActa 588 (2007) 131–139.
[6] H. Dubois, B. Delvoux, V. Ehrhardt, H. Greiling, An enzymatic assay for uric acidin serum and urine compared with HPLC, Journal of Clinical Chemistry and
Clinical Biochemistry 27 (1989) 151–156.[7] T. Yamaguchi, K. Hasegawa, S. Kamino, K. Iyachi, H. Tominaga, Y. Fujita, Spec-trophotometric determination of uric acid based on fading of o-hydroxyhydro-quinonephthalein–palladium(II)–hexadecyltrimethylammonium complex,Analytical Sciences 23 (2007) 223–226.
[
[
ors B 178 (2013) 371– 378 377
[8] R.T. Kachoosangi, C.E. Banks, R.G. Compton, Simultaneous determination of uricacid and ascorbic acid using edge plane pyrolytic graphite electrode, Electro-analysis 18 (2006) 741–747.
[9] N. Cooper, R. Khosravan, C. Erdmann, J. Fiene, J.W. Lee, Quantification of uricacid, xanthine, and hypoxanthine in human serum by HPLC for pharmacody-namic studies, Journal of Chromatography B 837 (2006) 1–10.
10] D.M. Amunson, M. Zhou, Fluorometric method for the enzymatic determina-tion of cholesterol, Journal of Biochemical and Biophysical Methods 38 (1999)43–52.
11] J. Galbán, Y. Andreu, M.J. Almenara, S. de Marcos, J.R. Castillo, Direct deter-mination of uric acid in serum by a fluorometric-enzymatic method based onuricase, Talanta 54 (2001) 847–854.
12] D. Yao, A.G. Vlessidis, N.P. Evmiridis, Microdialysis sampling and monitoring ofuric acid in vivo by a chemiluminescence reaction and an enzyme on immobi-lized chitosan support membrane, Analytica Chimica Acta 478 (2003) 23–30.
13] S. Schultz, D. Smith, J. Mock, D. Schultz, Single-target molecule detection withnonbleaching multicolor optical immunolabels, Proceedings of the NationalAcademy of Sciences of the United States of America 97 (2000) 996–1001.
14] T. Taton, C. Mirkin, R. Letsinger, Scanometric DNA array detection withnanoparticle probes, Science 289 (2000) 1757–1760.
15] J. Yguerabide, E. Yguerabide, Light-scattering submicroscopic particles ashighly fluorescent analogs and their use as tracer labels in clinical and bio-logical applications. II. Experimental characterization, Analytical Biochemistry262 (1998) 157–176.
16] G.V. Ramesh, S. Porel, T.P. Radhakrishnan, Polymer thin films embeddedwith in situ grown metal nanoparticles, Chemical Society Reviews 38 (2009)2646–2656.
17] W. Fritzsche, H. Porwal, A. Wiegand, S. Bornmann, J.M. Kohler, In-situ formationof Ag containing nanoparticles in thin polymer films, Nanostructured Materials10 (1998) 89–97.
18] S.S. Gasaymeh, S. Radiman, L.Y. Heng, E. Saion, G.H.M. Saeed, Synthesis andcharacterization of silver/polyvinylpyrrolidone (Ag/PVP) nanoparticles usinggamma irradiation techniques, African Physical Review 4 (2010) 31–41.
19] S. Choi, S. Lee, Y. Hwang, K. Lee, H. Kang, Interaction between the surface ofthe silver nanoparticles prepared by gamma irradiation and organic moleculescontaining thiol group, Radiation Physics and Chemistry 67 (2003) 517–521.
20] S. Choi, H.G. Park, Surface-enhanced Raman scattering (SERS) spectra of sodiumbenzoate and 4-picoline in Ag colloids prepared by gamma irradiation, AppliedSurface Science 243 (2005) 76–81.
21] S.S. Gasaymeh, S. Radiman, L.Y. Heng, E. Saion, G.H.M. Saeed, Synthesis andcharacterization of silver/polyvinylpyrrolidone (Ag/PVP) nanoparticles usinggamma irradiation techniques, American Journal of Applied Science 7 (2010)892–901.
22] Y. Borodko, S.E. Habas, M. Koebel, P. Yang, H. Frei, G.A. Somorjai, Pro-bing the interaction of poly(vinylpyrrolidone) with platinum nanocrystalsby UV-Raman and FTIR, Journal of Physical Chemistry B 110 (2006)23052–23059.
23] H. Wang, X. Qiao, J. Chen, X. Wang, S. Ding, Mechanisms of PVP in the prepa-ration of silver nanoparticles, Materials Chemistry and Physics 94 (2005)449–453.
24] E. Filippo, A. Serra, D. Manno, Poly(vinyl alcohol) capped silver nanoparticles aslocalized surface plasmon resonance-based hydrogen peroxide sensor, Sensorsand Actuators B 138 (2009) 625–630.
25] N. Misra, J. Biswal, A. Gupta, J.K. Sainis, S. Sabharwal, Gamma radiation inducedsynthesis of gold nanoparticles in aqueous polyvinyl pyrolidone solution andits application for H2O2 estimation, Radiation Physics and Chemistry 81 (2012)195–200.
26] T. Pal, D.S. Maity, A. Ganguly, Silver-gelatin method for determination of inor-ganic peroxides in alkaline solution, Talanta 35 (1988) 658–660.
27] Y. Zhao, X. Yang, W. Lu, H. Liao, F. Liao, Uricase based methods for determinationof uric acid in serum, Mikrochimica Acta 164 (2009) 1–6.
28] G.T. Sanders, A.J. Pasman, F.J. Hoek, Determination of uric acid with uricase andperoxidase [J], Clinica Chimica Acta 101 (1980) 299–303.
29] D.W. Moss, Methodological principles in the enzymatic determination of sub-strates illustrated by the measurement of uric acid, Clinica Chimica Acta 105(1980) 351–360.
30] S.M.U. Ali, N.H. Alvi, Z. Ibupoto, O. Nur, M. Willander, B. Danielsson, Selectivepotentiometric determination of uric acid with uricase immobilized on ZnOnanowires, Sensors and Actuators B 152 (2011) 241–247.
31] W.L. McLaughlin, A.K. Boyd, K.N. Chadwick, J.C. McDonald, A. Miller (Eds.),Dosimetry for Radiation Processing, Taylor and Francis, London, 1980.
32] C. Lok, C. Ho, R. Chen, Q. He, W. Yu, H. Sun, P. Tam, J. Chiu, C. Che, Silvernanoparticles: partial oxidation and antibacterial activities, Journal of Biologi-cal Inorganic Chemistry 12 (2007) 527–534.
33] A. Henglein, Colloidal silver nanoparticles: photochemical preparation andinteraction with O2, CCl4 and some metal ions, Chemistry of Materials 10 (1998)444–450.
34] A. Henglein, Physiochemical properties of small metal particles in solu-tion: microelectrode reactions, chemisorptions, composite metal particlesand the atom-to-metal transition, Journal of Physical Chemistry 97 (1993)5457–5471.
35] X. Li, J.J. Lenhart, H.W. Walker, Dissolution-accompanied aggregation kineticsof silver nanoparticles, Langmuir 26 (2010) 16690–16698.
36] P. Vasileva, B. Donkova, I. Karadjova, C. Dushkin, Synthesis of starch stabilizedsilver nanoparticles and their application as a surface plasmon resonance basedsensor of hydrogen peroxide, Colloids and Surfaces A 382 (2011) 203–210.

3 Actuat
[
[
[
[
B
NAfca
78 N. Misra et al. / Sensors and
37] G.M. Dougherty, K.A. Rose, J.B.H. Tok, S.S. Pannu, F.Y.S. Chuang, M.Y. Sha, G.Chakarova, S.G. Penn, The zeta potential of surface functionalized metallicnanorod particles in aqueous solution, Electrophoresis 29 (2007) 1131–1139.
38] P. Bihari, M. Vippola, S. Schultes, M. Praetner, A.G. Khandoga, C.A. Reichel, C.Coester, T. Tuomi, M. Rehberg, F. Krombach, Optimized dispersion of nanopar-ticles for biological in vitro and in vivo studies, Particle and Fibre Toxicology 5(2008) 1–14.
39] M. Tejamaya, I. Romer, R.C. Merrifield, J.R. Lead, Stability of citrate, PVP, and PEGcoated silver nanoparticles in ecotoxicology media, Environmental Science andTechnology 46 (2012) 7011–7017.
40] A.M.E. Badawy, T.P. Luxton, R.G. Silva, K.G. Scheckel, M.T. Suidan, T.M. Tolay-mat, Impact of environment conditions (pH, ionic strength, and electrolytetype) on the surface charge and aggregation of silver nanoparticles suspensions,Environmental Science and Technology 44 (2010) 1260–1266.
iographies
ilanjal Misra joined Radiation Technology Development Division (RTDD), Bhabhatomic Research Centre (BARC) in 2010 after completing his M.Sc. in Chemistry
rom IIT Delhi, India in 2009. He is presently working as Scientific Officer-C. Hisurrent field of interest covers design and development of nano-materials for sensorpplications and nanocomposites for biomedical and industrial applications.
ors B 178 (2013) 371– 378
Dr. Virendra Kumar after completing his M.Sc. in Chemistry from IIT Roorkee,India in 1998, joined RTDD, BARC in 1999. He obtained his Ph.D. in 2004 from Uni-versity of Mumbai. He carried out his post-doctoral research during 2007–2009in Université Pierre et Marie Curie, Paris, France on plasma processing of poly-mers and nano-materials for biomedical applications. He is presently working asScientific Officer-F. His current research interest includes nano-materials basedsensor, radiation cured high performance inorganic/organic hybrid nanocompos-ite coatings, radiation grafting and plasma processing of polymers for biomedicalapplications.
Lalit Borde after completing his Diploma in Electronics Engineering in 2004from St. Xavier’s Technical Institute, Mumbai, joined Department of BiologicalSciences, Tata Institute of Fundamental Research, Mumbai in 2005 as Scien-tific Assistant. His research interests include characterization of nanomaterialsusing various aspects of the TEM microscopy, such as Cryo Electron Microscopy,Energy Filtered Electron Microscopy, Electron Energy Loss Spectroscopy Imaging(EELS).
Dr. Lalit Varshney joined BARC in 1982 after completing M.Sc. in Chemistry in 1981
from University of Delhi. He obtained his Ph.D. in 1990 from University of Mum-bai, India. Presently, he is working as Head, RTDD, BARC, India and Professor, HomiBhabha National Institute (HBNI), India. He is currently engaged in the developmentof advanced polymeric materials for medical and environmental applications usingradiation technology.