1. FORM I 2. FORM IA - Environmental Clearance
62
SRI KOLLIPARA VASUDEVA RAO AND SRI KOLLIPARA JOGA RAO Survey No. 245/2, Kanuru, Penamaluru, Krishna District, Andhra Pradesh 1. FORM I 2. FORM IA Submitted By Sri Kollipara Vasudeva Rao & Sri Kollipara Joga Rao, Flat no. 601, Ganga Block, Dollfine Estates, Kamayyathopu, Kanuru, Vijayawada - 520007 Andhra Pradesh Studies & Documented By M/s Team Labs and Consultants B-115, 116, 117 & 509, Annapurna Block, Aditya Enclave, Ameerpet, Hyderabad- 500 038 Phone: 91-040-23748555/616 Fax : 91-040-23748666 e-mail: [email protected] SUBMITTED TO STATE LEVEL ENVIRONMENT IMPACT ASSESSMENT AUTHORITY, ANDHRA PRADESH GOVERNMENT OF INDIA
-
Upload
khangminh22 -
Category
Documents
-
view
0 -
download
0
Transcript of 1. FORM I 2. FORM IA - Environmental Clearance

SRI KOLLIPARA VASUDEVA RAO AND SRI KOLLIPARA JOGA RAO
Survey No. 245/2, Kanuru, Penamaluru, Krishna District, Andhra Pradesh
1. FORM I
2. FORM IA
Submitted By Sri Kollipara Vasudeva Rao & Sri Kollipara Joga Rao, Flat no. 601, Ganga Block, Dollfine Estates, Kamayyathopu, Kanuru, Vijayawada - 520007 Andhra Pradesh
Studies & Documented By M/s Team Labs and Consultants B-115, 116, 117 & 509, Annapurna Block, Aditya Enclave, Ameerpet, Hyderabad- 500 038 Phone: 91-040-23748555/616 Fax : 91-040-23748666 e-mail: [email protected]
SUBMITTED TO STATE LEVEL ENVIRONMENT IMPACT ASSESSMENT AUTHORITY,
ANDHRA PRADESH GOVERNMENT OF INDIA
FI - 1
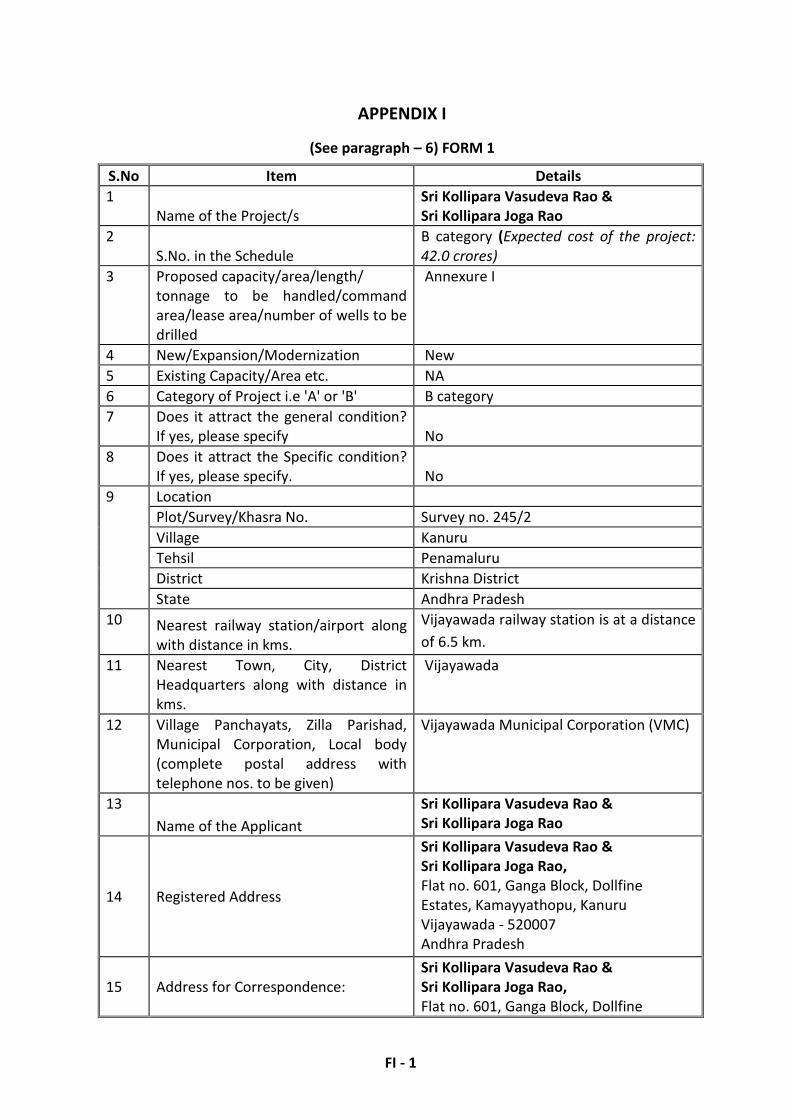
APPENDIX I
(See paragraph – 6) FORM 1
S.No Item Details
1
Name of the Project/s
Sri Kollipara Vasudeva Rao &
Sri Kollipara Joga Rao
2
S.No. in the Schedule
B category (Expected cost of the project:
42.0 crores)
3 Proposed capacity/area/length/
tonnage to be handled/command
area/lease area/number of wells to be
drilled
Annexure I
4 New/Expansion/Modernization New
5 Existing Capacity/Area etc. NA
6 Category of Project i.e 'A' or 'B' B category
7 Does it attract the general condition?
If yes, please specify No
8 Does it attract the Specific condition?
If yes, please specify. No
9 Location
Plot/Survey/Khasra No. Survey no. 245/2
Village Kanuru
Tehsil Penamaluru
District Krishna District
State Andhra Pradesh
10 Nearest railway station/airport along
with distance in kms.
Vijayawada railway station is at a distance
of 6.5 km.
11 Nearest Town, City, District
Headquarters along with distance in
kms.
Vijayawada
12 Village Panchayats, Zilla Parishad,
Municipal Corporation, Local body
(complete postal address with
telephone nos. to be given)
Vijayawada Municipal Corporation (VMC)
13
Name of the Applicant
Sri Kollipara Vasudeva Rao &
Sri Kollipara Joga Rao
14 Registered Address
Sri Kollipara Vasudeva Rao &
Sri Kollipara Joga Rao,
Flat no. 601, Ganga Block, Dollfine
Estates, Kamayyathopu, Kanuru
Vijayawada - 520007
Andhra Pradesh
15 Address for Correspondence:
Sri Kollipara Vasudeva Rao &
Sri Kollipara Joga Rao,
Flat no. 601, Ganga Block, Dollfine

FI - 2
S.No Item Details
Estates, Kamayyathopu, Kanuru
Vijayawada - 520007
Andhra Pradesh
Name
Sri Kollipara Vasudeva Rao &
Sri Kollipara Joga Rao
Designation(Owner/Partner/CEO) Owners
Address Sri Kollipara Vasudeva Rao &
Sri Kollipara Joga Rao,
Flat no. 601, Ganga Block, Dollfine
Estates, Kamayyathopu, Kanuru
Vijayawada – 520007, Andhra Pradesh
Pin Code 520007
E-mail [email protected]
Telephone Number (M) 9100155444
Fax No.
16 Details of alternative Sites examined,
if any. Location of these sites should
be shown on a topo sheet.
Village-District-State
NA
17 Interlinked Projects No
18 Whether separate application of
interlinked project has been
submitted?
19 If yes, date of submission
20 If no, reason
21 Whether the proposal involves
approval/clearance under: if yes,
details of the same and their status to
be given.
(a) The Forest (Conservation) Act,
1980? (b) The Wildlife
(Protection) Act, 1972 ? (c)
The C.R.Z Notification, 1991 ?
No
22 Whether there is any Government
Order/Policy relevant/relating to the
site?
No
23 Forest land involved (hectares) No
24 Whether there is any location pending
against the project and /or land in
which the project is propose to be set
up?
(a) Name of the Court
(b) Case No
(c) Orders/directions of the Court, if
any and its relevance with the
proposed project.
No

FI - 3
(II) Activity
1. Construction, operation or decommissioning of the Project involving actions, which
will cause physical changes in the locality (topography, land use, changes in water
bodies, etc.)
S.No Information/Checklist confirmation Yes/No
Details thereof (with
approximate quantities /rates,
wherever possible) with source
of information data
1.1 Permanent or temporary change in
land use, land cover or topography
including increase in intensity of
land use (with respect to local land
use plan)
Yes The site area is located in
Vijayawada Guntur Tenali
Mangalagiri Urban Development
Authority. The present land use
is Residential and Commercial.
Presently the land is barren and
is not used for any productive
purpose. The proposed project
shall enhance the land cover.
1.2 Clearance of existing land, vegetation
and buildings?
No The land is barren containing
mainly shrubs and bushes. The
same shall be cleared.
1.3 Creation of new land uses?
No The present land use is
Residential and Commercial.
1.4 Pre-construction investigations e.g.
bore houses, soil testing?
Yes Bore holes shall be drilled for
ground water abstraction,
subject to the permission from
the State Ground Water
Authority
1.5 Construction works?
Yes The project is a construction of
Residential and commercial
project.
1.6 Demolition works? No
1.7 Temporary sites used for construction
works or housing of construction
workers?
No Labor shall be employed from
the local areas, hence no
labour/construction camps are
proposed.
1.8 Above ground buildings, structures or
earthworks including linear
structures, cut and fill or excavations
No Built up Area: Annexure I Cut
and Fill quantity: Annexure II
1.9 Underground works including mining
or tunneling?
No
1.10 Reclamation works? No
1.11 Dredging? No
1.12 Offshore structures? No

FI - 4
S.No Information/Checklist confirmation Yes/No
Details thereof (with
approximate quantities /rates,
wherever possible) with source
of information data
1.13 Production and manufacturing
processes?
No Residential and Commercial
construction project.
1.14 Facilities for storage of goods or
materials?
Yes Construction materials like
cement, steel, sand, paints,
aggregate etc shall be stored on
site. The cement and paints are
stored indoor, while the
remaining is stored out doors.
1.15 Facilities for treatment or disposal of
solid waste or liquid effluents?
Yes The wastewater shall be treated
and reused for flushing and on
land irrigation purpose. The
excess treated water if any shall
be let out into sewer lines. The
water balance, water recycling
quantities and the design
details of sewage treatment
plant are presented in Annexure
–III
The Municipal solid waste shall
be collected and the collected
Municipal solid waste shall be
sent to Municipal solid waste
management facility. The
Municipal solid waste
management plan is enclosed in
Annexure – IV.
1.16 Facilities for long term housing of
operational workers?
No Required labour shall be drawn
from neighboring areas/ villages.
1.17 New road, rail or sea traffic during
construction or operation?
No
1.18 New road, rail, air waterborne or
other transport infrastructure
including new or altered routes and
stations, ports, airports etc?
No
1.19 Closure or diversion of existing
transport routes or infrastructure
leading to changes in traffic
movements?
No
1.20 New or diverted transmission lines
or pipelines?
No
1.21 Impoundment, damming, culverting,
realignment or other changes to the
No The local hydrology shall be
considered while designing the

FI - 5
S.No Information/Checklist confirmation Yes/No
Details thereof (with
approximate quantities /rates,
wherever possible) with source
of information data
hydrology of watercourses or
aquifers?
storm water drains.
1.22 Stream crossings? No
1.23 Abstraction or transfers of water
form ground or surface waters?
Yes The domestic water requirement
during occupation shall be
drawn from Panchayat, shall be
used during construction.
1.24 Changes in water bodies or the land
surface affecting drainage or run-off?
No The proposed storm water
drains shall consider increased
run off due to the project and
shall be provided with sufficient
number of collection sumps and
rainwater harvesting structures.
1.25 Transport of personnel or materials
for construction, operation or
decommissioning?
Yes Trucks shall be used for
transporting the materials.
1.26 Long-term dismantling or
decommissioning or restoration
works?
No
1.27 Ongoing activity during
decommissioning which could have
an impact on the environment?
No
1.28 Influx of people to an area in either
temporarily or permanently?
Yes The local area is developing at a
faster pace due to
industrialization and Residential
development in the surrounding
areas.
1.29 Introduction of alien species? No
1.30 Loss of native species or genetic
diversity?
No
1.31 Any other actions? No

FI - 6
2. Use of Natural resources for construction or operation of the Project (such as land,
water, materials or energy, especially any resources which are non-renewable or in
short supply):
S.No Information/checklist confirmation Yes/No
Details thereof (with
approximate quantities /rates,
wherever possible) with
source of information data
2.1 Land especially undeveloped or
agricultural land (ha)
Yes Undeveloped land of 0.7219 ha
2.2 Water (expected source &
competing users) unit: KLD
Yes Vijayawada Municipal
Corporation (VMC). Water
requirement during occupation
is 108.1 KLD. During
construction the water
requirement is 50 KLD.
2.3 Minerals (MT) No
2.4 Construction material – stone,
aggregates, sand / soil (expected
source – MT)
Yes Annexure – V: Lead distances
of construction materials.
Annexure – VI: Quantity of
construction material
requirement.
2.5 Forests and timber (source – MT) Yes Local authorized Suppliers
2.6 Energy including electricity and
fuels (source, competing users)
Unit: fuel (MT), energy (MW)
Yes DG sets and construction
equipment shall be used during
construction, which shall use
mainly HSD as fuel. The
energy requirement during
occupation is presented in
Annexure – VII. DG sets (5 X
250 kVA) shall be used during
occupation in the event of
power shut down by
APTRANSCO to provide power
for lifts, street lighting,
common lighting and Effluent
treatment plants.
2.7 Any other natural resources (use
appropriate standard units)
No

FI - 7
3. Use, storage, transport, handling or production of substances or materials, which
could be harmful to human health or the environment or raise concerns about actual
or perceived risks to human health.
S.No Information/Checklist confirmation Yes/No
Details thereof (with
approximate quantities/rates,
wherever possible) with source
of information data
3.1 Use of substances or materials, which
are hazardous (as per MSIHC rules) to
human health or the environment
(flora, fauna, and water supplies)
No Hazardous materials used are;
HSD, Paints etc.
3.2 Changes in occurrence of disease or
affect disease vectors (e.g. insect or
water borne diseases)
No
3.3 Affect the welfare of people e.g. by
changing living conditions?
Yes The project shall provide housing
facility for 118 families and 526
employees.
3.4 Vulnerable groups of people who could
be affected by the project e.g. hospital
patients, children, the elderly etc.,
No
3.5 Any other causes
No

FI - 8
4. Production of solid wastes during construction or operation or decommissioning
(MT/month)
S.No Information/Checklist confirmation Yes/No
Details thereof (with
approximate quantities/rates,
wherever possible) with
source of information data
4.1 Spoil, overburden or mine wastes No
4.2 Municipal waste (domestic and or
Residential wastes)
Yes 576 kg/day
4.3 Hazardous wastes (as per Hazardous
Waste Management Rules)
Yes Used oil: 190 l/year
Used Batteries: 10 nos. /year
4.4 Other industrial process wastes No
4.5 Surplus product No
4.6 Sewage sludge or other sludge from
effluent treatment
Yes 5 - kg/day sludge from STP shall
be reused as manure.
4.7 Construction or demolition wastes Yes
4.8 Redundant machinery or equipment No
4.9 Contaminated soils or other
materials
No
4.10 Agricultural wastes No
4.11 Other solid wastes No

FI - 9
5.0 Release of pollutants or any hazardous, toxic or noxious substances to air (Kg/hr)
S.No. Information/Checklist confirmation Yes/No
Details thereof (with
approximate quantities/rates,
wherever possible) with source
of information data
5.1 Emissions from combustion of fossil
fuels from stationary or mobile
sources
Yes Emissions from DG sets,
operated only during load shut
down by APTRANSCO. Emissions
quantities are presented in
Annexure – VIII.
5.2 Emissions from production processes No Cooking and vehicular transport
are the other sources of
emission.
5.3 Emissions from materials handling
including storage or transport
No
5.4 Emissions from construction activities
including plant and equipment
Yes Construction equipment and DG
sets which mainly use HSD, as
fuel shall generate emissions.
5.5 Dust or odours from handling of
materials including construction
materials, sewage and waste
No
5.6 Emissions from incineration of waste No
5.7 Emissions from burning of waste in
open air (e.g. slash materials,
construction debris)
No
5.8 Emissions from any other sources
No

FI - 10
6.0 Generation of Noise and Vibration, and Emissions of Light and Heat:
S.No. Information/Checklist
confirmation Yes/No
Details thereof (with approximate
quantities/rates, wherever
possible) with source of
information data with source of
information data
6.1 From operation of equipment e.g.
engines, ventilation plant,
crushers
Yes Construction activity and the
construction equipment are the
main sources of noise and vibration
during construction. While there
are no major sources of noise
during occupation phase.
6.2 From industrial or similar
processes
No
6.3 From construction or demolition Yes
6.4 From blasting or piling No No blasting activity envisaged.
6.5 From construction or operational
traffic
Yes There will be an increase in the
traffic density, which shall increase
the noise levels of the area both
during construction and occupation
phases.
6.6 From lighting or cooling systems No
6.7 From any other sources No

FI - 11
7. Risks of contamination of land or water from releases of pollutants into the
ground or into sewers, surface waters, groundwater, coastal waters or the sea:
S.No. Information/Checklist confirmation Yes/No
Details thereof (with
approximate quantities/rates,
wherever possible) with source
of information data
7.1 From handling, storage, use or
spillage of hazardous materials
No Used batteries and waste oil
shall be stored separately and
shall not lead to contamination
of land during normal operation.
7.2 From discharge of sewage or other
effluents to water or the land
(expected mode and place of
discharge)
No The sewage shall be treated to
achieve the standards prescribed
by MoE&F during operation
phase. While the discharges
from temporary toilets during
construction shall be sent to
septic tank followed by soak pit.
7.3 By deposition of pollutants emitted
to air into the land or into water
No The project shall not emit
substantial quantities of
pollutants to have an impact on
the air quality.
7.4 From any other sources No
7.5 Is there a risk of long term build up of
pollutants in the environment from
these sources?
No

FI - 12
8. Risk of accidents during construction or operation of the Project, which could affect
human health or the environment
S.No. Information/Checklist confirmation Yes/No
Details thereof (with
approximate quantities/ rates,
wherever possible) with source
of information data
8.1 From explosions, spillages, fires etc
from storage, handling, use or
production of hazardous substances
No Precautionary measures shall be
adopted. Fire plan shall be put
in place before occupation of
the property.
8.2 From any other causes
No
8.3 Could the project be affected by
natural disasters causing
environmental damage (e.g. floods,
earthquakes, landslides, cloudburst
etc)?
No The site is located at a higher
elevation and the seismic zone
for the project area is Zone II,
which is considered safe
FI - 13
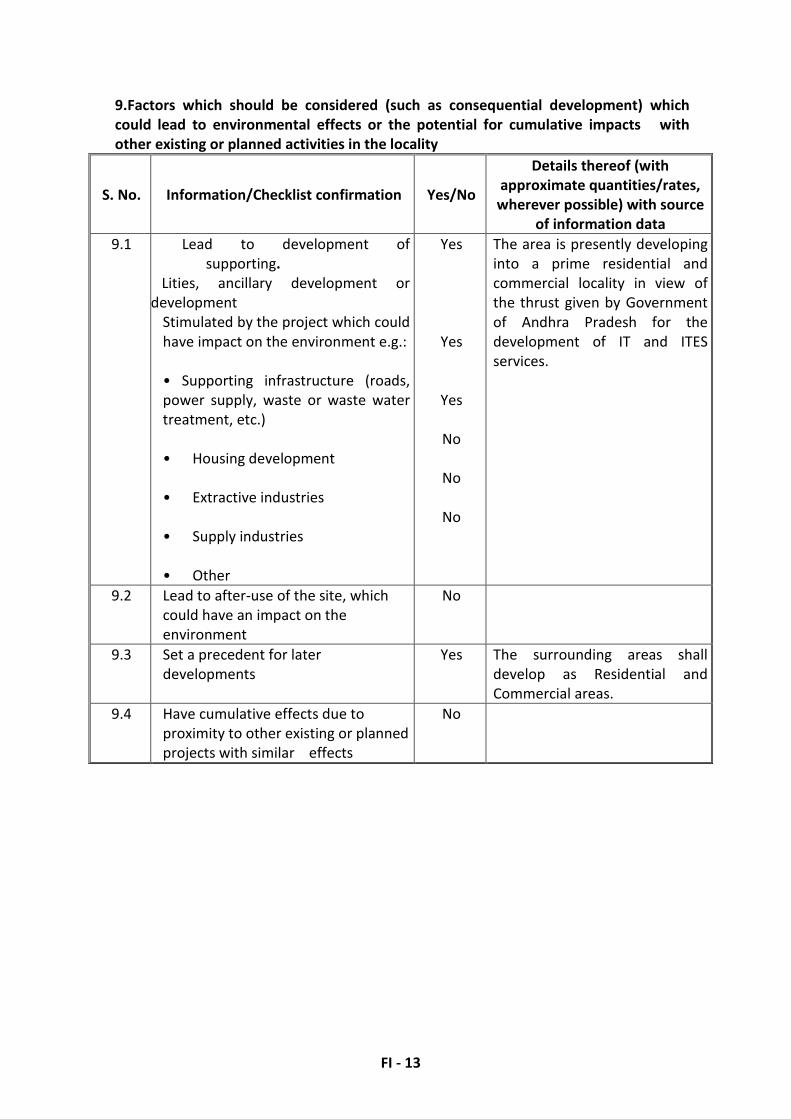
9.Factors which should be considered (such as consequential development) which
could lead to environmental effects or the potential for cumulative impacts with
other existing or planned activities in the locality
S. No. Information/Checklist confirmation Yes/No
Details thereof (with
approximate quantities/rates,
wherever possible) with source
of information data
9.1 Lead to development of
supporting.
Lities, ancillary development or
development
Stimulated by the project which could
have impact on the environment e.g.:
• Supporting infrastructure (roads,
power supply, waste or waste water
treatment, etc.)
• Housing development
• Extractive industries
• Supply industries
• Other
Yes
Yes
Yes
No
No
No
The area is presently developing
into a prime residential and
commercial locality in view of
the thrust given by Government
of Andhra Pradesh for the
development of IT and ITES
services.
9.2 Lead to after-use of the site, which
could have an impact on the
environment
No
9.3 Set a precedent for later
developments
Yes The surrounding areas shall
develop as Residential and
Commercial areas.
9.4 Have cumulative effects due to
proximity to other existing or planned
projects with similar effects
No

FI - 14
(III) Environmental Sensitivity
S.No Areas Name/
Identity
Aerial distance (within 15
km.) Proposed project
location boundary
1 Areas protected under international
conventions, national or local legislation
for their ecological, landscape, cultural or
other related value
No
2 Areas which are important or sensitive for
ecological reasons - Wetlands,
watercourses or other water bodies,
coastal zone, biospheres, mountains,
forests
No
3 Areas used by protected, important or
sensitive species of flora or fauna for
breeding, nesting, foraging, resting, over
wintering, migration
No
4 Inland, coastal, marine or underground
waters
No
5 State, National boundaries No
6 Routes or facilities used by the public for
access to recreation or other tourist, pilgrim
areas
No
7 Defense installations No
8 Densely populated or built-up area Yes The area is developing into a
densely populated area
9 Areas occupied by sensitive man-made land
uses (hospitals, schools, places of worship,
community facilities)
Yes Hospitals, Schools, Places of
worship and community
facilities are located in the
project impact area.
10 Areas containing important, high quality or
scarce resources. (Ground water resources,
surface resources forestry, agriculture,
fisheries, tourism, minerals)
No
11 Areas already subjected to pollution or
environmental damage. (Those where
existing legal environmental standards are
exceeded)
No
12 Areas susceptible to natural hazard which
could cause the project to present
environmental problems (Earthquakes,
subsidence, landslides, erosion, flooding or
extreme or adverse climatic conditions)
No
FI - 15
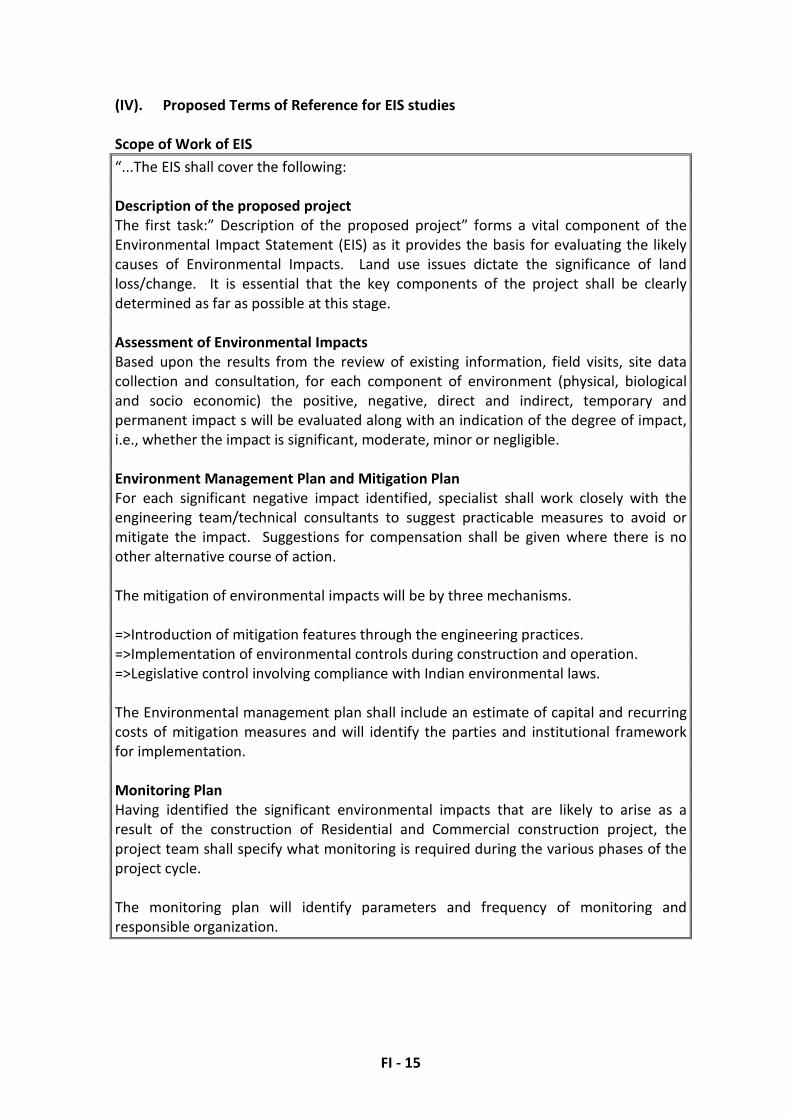
(IV). Proposed Terms of Reference for EIS studies
Scope of Work of EIS
“...The EIS shall cover the following:
Description of the proposed project
The first task:” Description of the proposed project” forms a vital component of the
Environmental Impact Statement (EIS) as it provides the basis for evaluating the likely
causes of Environmental Impacts. Land use issues dictate the significance of land
loss/change. It is essential that the key components of the project shall be clearly
determined as far as possible at this stage.
Assessment of Environmental Impacts
Based upon the results from the review of existing information, field visits, site data
collection and consultation, for each component of environment (physical, biological
and socio economic) the positive, negative, direct and indirect, temporary and
permanent impact s will be evaluated along with an indication of the degree of impact,
i.e., whether the impact is significant, moderate, minor or negligible.
Environment Management Plan and Mitigation Plan
For each significant negative impact identified, specialist shall work closely with the
engineering team/technical consultants to suggest practicable measures to avoid or
mitigate the impact. Suggestions for compensation shall be given where there is no
other alternative course of action.
The mitigation of environmental impacts will be by three mechanisms.
=>Introduction of mitigation features through the engineering practices.
=>Implementation of environmental controls during construction and operation.
=>Legislative control involving compliance with Indian environmental laws.
The Environmental management plan shall include an estimate of capital and recurring
costs of mitigation measures and will identify the parties and institutional framework
for implementation.
Monitoring Plan
Having identified the significant environmental impacts that are likely to arise as a
result of the construction of Residential and Commercial construction project, the
project team shall specify what monitoring is required during the various phases of the
project cycle.
The monitoring plan will identify parameters and frequency of monitoring and
responsible organization.
FI - 16
A - 1
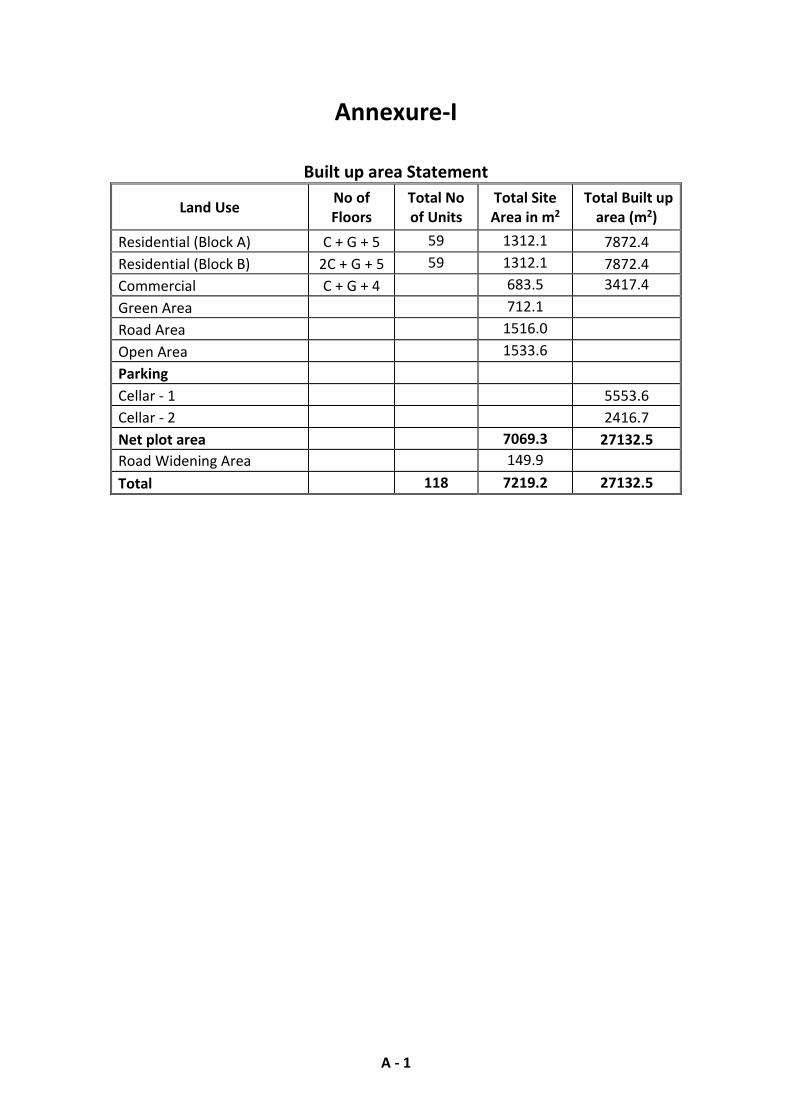
Annexure-I
Built up area Statement
Land Use No of
Floors
Total No
of Units
Total Site
Area in m2
Total Built up
area (m2)
Residential (Block A) C + G + 5 59 1312.1 7872.4
Residential (Block B) 2C + G + 5 59 1312.1 7872.4
Commercial C + G + 4 683.5 3417.4
Green Area 712.1
Road Area 1516.0
Open Area 1533.6
Parking
Cellar - 1 5553.6
Cellar - 2 2416.7
Net plot area 7069.3 27132.5
Road Widening Area 149.9
Total 118 7219.2 27132.5

A - 2
Annexure-II
Earth Work Quantities
S.No Area Qty. of fill (m3) Qty. of cut (m3) Surplus fill (m3) Surplus cut (m3)
1 Site 5775 5775 --- ---

A - 3
Annexure-III
Water Requirement of the Project
Land Use No. of
Units
No. of
Persons/
unit
Water
requirement per
person in l *
Total Water
Requirement in
KLD
Residential 118 5 135 79.7
Visitors 2 15 3.5
Retail 30 6 45 8.1
Visitors 220 15 3.3
Office 300 45 13.5
TOTAL 108.1
*Water requirement as per NBC
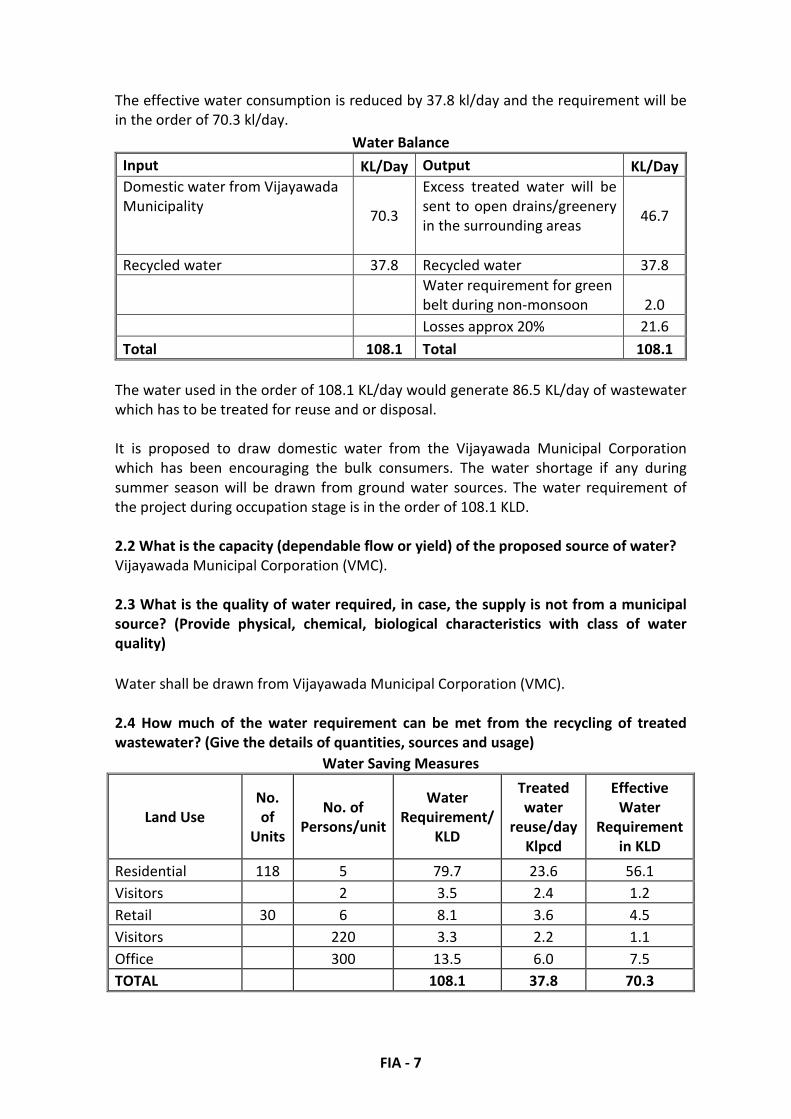
Water Saving Measures
Land Use
No.
of
Units
No. of
Persons/unit
Water
Requirement/
KLD
Treated
water
reuse/day
Klpcd
Effective
Water
Requirement
in KLD
Residential 118 5 79.7 23.6 56.1
Visitors 2 3.5 2.4 1.2
Retail 30 6 8.1 3.6 4.5
Visitors 220 3.3 2.2 1.1
Office 300 13.5 6.0 7.5
TOTAL 108.1 37.8 70.3
The effective water consumption is reduced by 37.8 kl/day and the requirement will be in
the order of 70.3 kl/day.
Water Balance
Input KL/Day Output KL/Day
Domestic water from Vijayawada
Municipality 70.3
Excess treated water will be
sent to open drains/greenery
in the surrounding areas
46.7
Recycled water 37.8 Recycled water 37.8
Water requirement for green
belt during non-monsoon 2.0
Losses approx 20% 21.6
Total 108.1 Total 108.1
The water used in the order of 108.1 KL/day would generate 86.5 KL/day of wastewater
which has to be treated for reuse and or disposal.

A - 4
Sewage treatment plant based on Fluidized Aerobic Bio Reactor (FAB) technology
PROCESS DESCRIPTION:
The raw sewage will be collected in a collection sump and pumped to mechanical bar screen
chamber for removal of large floating matter followed by grit removal in Grit Chamber. The
raw sewage will then be collected in an equalization tank for homogenization of hydraulic
load. The tank contents will be kept in suspension by means of course bubble serration
through pipe grid. The equalization tank, with air flow indicator for continuous monitoring
of air supply to the tank in order to avoid septic conditions, will be covered from top (RCC or
FRP) to avoid nuisance. The equalized effluent will then be pumped to two Fluidized
Aerobic Bio Reactors (FAB) in series where BOD/COD reduction can be achieved by virtue of
aerobic microbial activities. The oxygen required will be supplied through coarse air bubble
diffusers. The bio-solids formed in the biological process will be separated in the down
stream Tube Settler. The clear supernatant will gravitate to the chlorine contact tank where
sodium hypochlorite will be dosed for disinfection of treated water prior to disposal.
The biological sludge generated in the FAB and settled in the tube settlers will be collected
in a sludge sump and then pumped to sludge drying bed for de watering. The dried sludge
will then be disposed off suitably as manure. The schematics of the process are shown. The
two main components of the treatment system viz. The FAB reactor and tube settler are
described in the following sections.
Fluidized Aerobic Bio Reactor (FAB)
Conventional effluent treatment plants are large sized, power intensive and require a lot of
monitoring. Scarcity of open space and rising land a power costs have forced the industries
to look ourfor space saving, compact and efficient treatment options. This has led to the
development attached growth processes where the bio mass is retained within the aeration
tank obviating the need for recycle. These plants are not only compact but also user
friendly. The endeavor to have a continuously operating, no-clogging biofilm reactor with
no need for back washing, low head-loss and high specific biofilm surface area culminated
in the most advanced technology of aerobic biological fluidized bed treatment where the
biofilm (biomass) grows on small carrier elements that move along with the water in the
reactor. The movement is normally caused by aeration in the aerobic version of the reactor.
The reactor combines all the advantages and best features of Trickling filters, Rotating
biological contractors, activated sludge process and submerged fixed film reactors while
eliminating the drawbacks of these systems. The plants are more compact and more energy
efficient.
The Fluidized Aerobic Bio Reactor (FAB) consists of a tank in any shape filled up with small
carrier elements. The elements are made up of special grade PVC or polypropylene of
controlled density (shown in plate). For media of specific gravity 0.92-0.96 the overall
density could be expected to increase up to 9.5% when full of biomass such that they can
fluidize using an aeration device. A biofilm develops on the elements, which move along the
effluent in the reactor. The movement within the reactor is generated by providing aeration
with the help of diffusers placed at the bottom of the reactor. Then thin biofilm on the
elements enables the bacteria to act upon the biodegradable matter in the effluent and

A - 5
reduce the BOD/COD content in the presence of oxygen available from the air that is used
for fluidization.
Characteristics of Waste water
Parameter Quantity in mg/l
PH 6 – 7
Total Suspended Solids 300
BOD 150
COD 350
Design of the unit
Basic data
Flow : 86.5 KLD
Capacity : 100 m3
Peak factor : 3.5
Peak flow Q peak : 300 m3/day
Influent BOD : 200 mg/lit
Influent Suspended Solids : 200 mg/lit
Influent COD : 350 mg/lit
Effluent BOD : 30 mg/lit
Effluent COD : 200 mg/lit
Effluent Suspended Solids : 100 mg/lit
1. Bar Screen Chamber
Average flow : 0.0015 m3/sec
Peak factor : 3.5
Peak flow : 0.005 m3/sec
Velocity at peak flow : 0.75 m/Sec
Effective area of screen Required
At average flow : 0.005 m2
At Peak flow : 0.0075 m2
Provide Effective area of screen : 0.0075 m2
Considering the bar of dia. 10 mm(w) and clear spacing of 20 mm (b)
Overall area required : 0.011 m2
Considering screen depth as : 0.022 m Consider 0.5 m
Number of clear spacing : 0.3
Number of bars : 1 Consider 3 Nos.
Hence Provide 5 bars
Provide a screen of 0.5 m X 0.5 m at an inclination of sin 600. In a screen channel of one
meter (1 m) length.

A - 6
2. Grit Chamber:
The flow from the bar screen chamber is let into the Grit Chamber of minimum 2 hours
capacity. This tank is provided to even out the flow variation, and to provide a continuous
feed into the secondary biological treatment units.
Peak flow Q : 0.005 m3/sec
Providing a flow through velocity of 0.30 m/sec
Cross sectional area of Channel (0.004/0.3) : 0.016 m2
Surface area of channel (0.004/0.03) : 0.38 m2
Assuming depth d : 0.2 m
Width of channel (0.013/0.2) : 0.08 m (say 0.2m)
Length of channel (0.30/0.06) : 4. 5 m (say 4.5 m)
Provide two channels each of 0.2 m wide and 4.5 m long with depth of waste water 0.2 m.
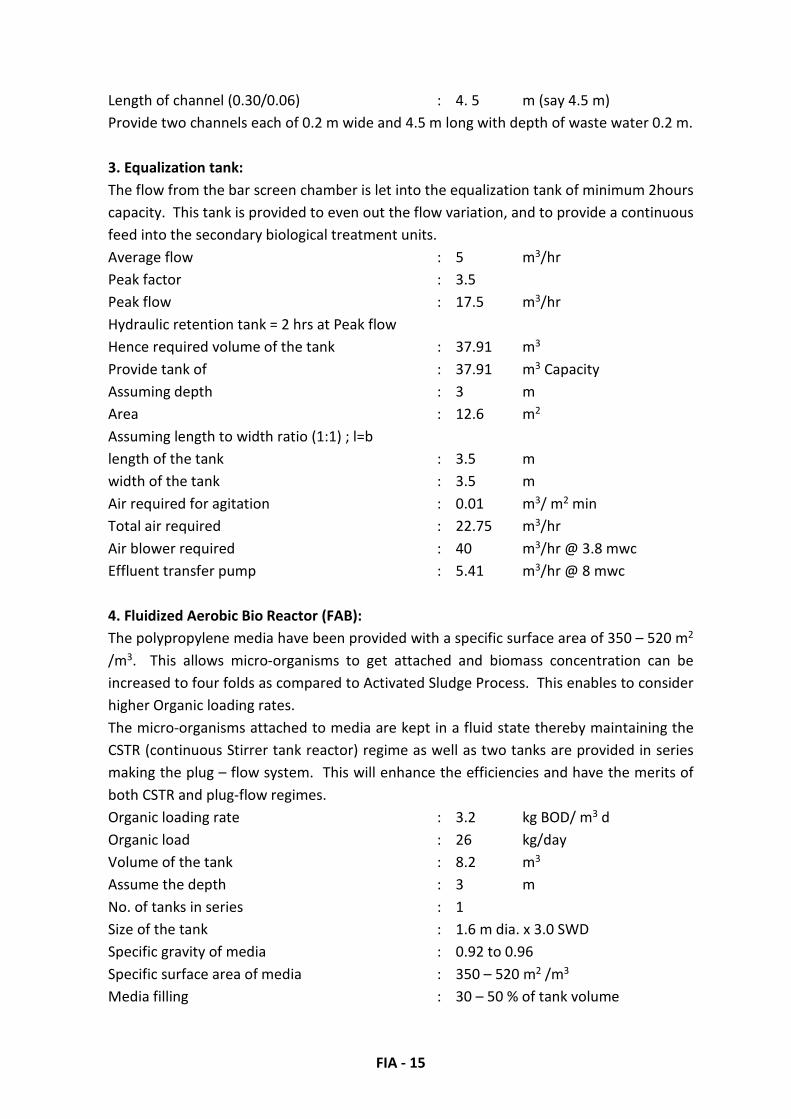
3. Equalization tank:
The flow from the bar screen chamber is let into the equalization tank of minimum 2hours
capacity. This tank is provided to even out the flow variation, and to provide a continuous
feed into the secondary biological treatment units.
Average flow : 5 m3/hr
Peak factor : 3.5
Peak flow : 17.5 m3/hr
Hydraulic retention tank = 2 hrs at Peak flow
Hence required volume of the tank : 37.91 m3
Provide tank of : 37.91 m3 Capacity
Assuming depth : 3 m
Area : 12.6 m2
Assuming length to width ratio (1:1) ; l=b
length of the tank : 3.5 m
width of the tank : 3.5 m
Air required for agitation : 0.01 m3/ m2 min
Total air required : 22.75 m3/hr
Air blower required : 40 m3/hr @ 3.8 mwc
Effluent transfer pump : 5.41 m3/hr @ 8 mwc
4. Fluidized Aerobic Bio Reactor (FAB):
The polypropylene media have been provided with a specific surface area of 350 – 520 m2
/m3. This allows micro-organisms to get attached and biomass concentration can be
increased to four folds as compared to Activated Sludge Process. This enables to consider
higher Organic loading rates.
The micro-organisms attached to media are kept in a fluid state thereby maintaining the
CSTR (continuous Stirrer tank reactor) regime as well as two tanks are provided in series

A - 7
making the plug – flow system. This will enhance the efficiencies and have the merits of
both CSTR and plug-flow regimes.
Organic loading rate : 3.2 kg BOD/ m3 d
Organic load : 26 kg/day
Volume of the tank : 8.2 m3
Assume the depth : 3 m
No. of tanks in series : 1
Size of the tank : 1.6 m dia. x 3.0 SWD
Specific gravity of media : 0.92 to 0.96
Specific surface area of media : 350 – 520 m2 /m3
Media filling : 30 – 50 % of tank volume
Oxygen required : 2 kg / kg BOD
Oxygen in air : 23%
Specific gravity of air @ 30 deg. : 1.65
Aeration : Coarse bubble
Oxygen transfer efficiency : 12%
Air required : 51.82 m3/hr
Air blower required : 80 m3/hr @ 6.5 m wc
5.Tube settler
Surface loading rate : 48 m2 /m3 d
Surface area required : 2.7 m2
Tank size : 3.0 m x 6.0 m x 2.7 m SWD With 55
deg. hopper bottom
Tube Modules : 3.0m x 6.0 m x 0.6 m ht.
Tube inclination : 60 deg.
Settling area for 60 deg slope : 11 m2 /m3
Cross sectional area of tubes : 120 mm x 44 mm Hexagonal
Hydraulic radius : 1/61 cm (1.5 cm)
Shape factor : 0.6 – 0.7 for media settleable solids
6. Pre-Filtration tank
The flow from each individual settling tank i.e., the supernatant liquid is let into the
respective Pre-Filtration Tank, which has a minimum 1.5 hours holding capacity. This tank
is provided to hold the treated effluent and give an even flow to the pressure sand filter.
Average flow : 5 m3/hr
Peak factor : 2 m3/hr
Peak flow : 10 m3/hr
Provide min 1.5 hours holding capacity.
Hence required volume of the tank : 16.25 m3

A - 8
7. Pressure Sand Filter:
Vertical down flow type with graded/sand bed under drain plate with polysterene strains.
Flow : 100 m3/day
Rate of filtration assumed as : 10 m3/m2/hr
Requirement of treated water for usage in 20 hrs : 6.5 m3/hr
Dia. of filter of 1 nos. : 950 mm
Provide pressure sand filter of 950 mm dia. and 1100 mm HOS with sand as media layer,
under drain pipe, laterals face piping etc for each stream.
8. Activated Carbon Filter:
Vertical down flow type with graded/sand bed under drain plate with polysterene strains.
Flow : 100 m3/day
Rate of filtration assumed as : 10 m3/m2/hr
Requirement of treated water for usage in 20 hrs : 6.5 m3/hr
Dia of filter of 1 nos. : 950 mm
Provide pressure sand filter of 950 mm dia. and 1100 mm HOS with sand as media layer,
under drain pipe, laterals face piping etc for each stream.
9.Final Treated Water Holding Tank
It is always preferred to provide one final holding tank of minimum one day holding
capacity, so that the treated effluents can be stored and used back for gardening or other
tertiary purposes.
Capacity: 100 m3
9.Ultraviolet Disinfection:
UV applied to low turbidity water is a highly effective means of disinfection. UV is not
harmful to aquatic organisms in the receiving water. UV light kills viruses, Vegetative- and
spore-forming bacteria, algae and yeasts. No chemicals are added to the wastewater to
change the pH, conductivity, odor or taste to create possible toxic compounds. UV
treatment has a few moving parts to adjust or wear out.
10. Sludge Filter Press:
The biomass in the aeration tank stabilizes BOD in wastewater by consuming the organic
matter in the wastewater. The metabolic activity results in growth of the biomass
population in the Fluidized Aerobic Bio Reactor (FAB). Sludge holding tank has been
provided with filter press for dewatering sludge. The filtrate drains off through the media,
which is again let into equalization tank.

A - 9
The dewatered sludge is collected in trays, which can be used as manure in the garden.
No. of plates : 24
Size of plates : 600 mm X 600 mm
Plate moc (material of construction) : PP (poly propline)
Type of operation : Hydraulic
Power pack capacity : 2 HP
The filtrate drains off through the media, which is again let into equalization tank. The
dewatered sludge is collected in trays, which can be used as manure in the garden.
Characteristics of Treated Waste water
Parameter Quantity in mg/l
pH 7 – 8
Total Suspended Solids 20
BOD 20
COD 50
Disposal of Treated Wastewater: The treated water shall be treated and reused for flushing
the toilets and on land irrigation. Excess treated water shall be utilized for HVAC/disposal in
Open drains/ development of greenery in the surrounding areas

A - 10
SE
WA
GE
TR
EA
TM
EN
T P
LA
NT
FLU
IDIZ
ED
AE
RO
BIC
BIO
RE
AC
TO
R T
EC
HN
OLO
GY
(FA
B)
Slu
dg
e D
ew
ate
rin
g
Sy
ste
m
EQ
T
TAN
K
AC
F
Ba
r S
cre
en
/ G
rit
Ch
am
be
r
Ra
w S
ew
ag
e
Ov
erf
low
Fil
ter
Fe
ed
Pu
mp
(1W
+1
S)
Slu
dg
e
Dis
po
sal
SLU
DG
E
HO
LDIN
G T
AN
K
CLA
RIF
IED
WA
TE
R
TAN
K
FAB
RE
AC
TO
R
(Pa
cka
ge
un
it)
TU
BE
Se
ttle
rs
PS
F
TR
EA
TE
D
WA
TE
R
TAN
KUV
To R
eu
se
Op
en
dra
ins/
Exce
ss t
rea
ted
wa
ter
sha
ll b
e u
tili
zed
fo
r d
ev
elo
pm
en
t o
f
gre
en
ery
in t
he
su
rro
un
din
g a
rea
s

A - 11
Annexure-IV
MUNICIPAL SOLID WASTE MANAGEMENT PLAN
Maintenance
Department
Maintenance
Department
Biodegradable
waste
Non-Biodegradable
Waste
Authorized Agency
of Local BodyAuthorized Agency
of Local Body
Main Collection
point/Segregation
Point
Main Collection
point/Segregation
Point
Local Body
Segregation at Source
Maintenance
Department
Domestic
Hazardous Wastes
Authorized Agency
of Local Body
Main Collection
point/Segregation
Point
Local Body Local Body
Maintenance
Department
e - Waste
Authorized Agency
of Local Body
Storage Area
Local Body
Segregation at each residence into bio-degradable, non bio- degradable and domestic
hazardous wastes. Facilitation by owners co-operative to dispose recyclable waste to
Authorized Waste Pickers / Authorized Recyclers. Balance segregated waste given to
Authorized Agency of Local Body for disposal.
A - 12
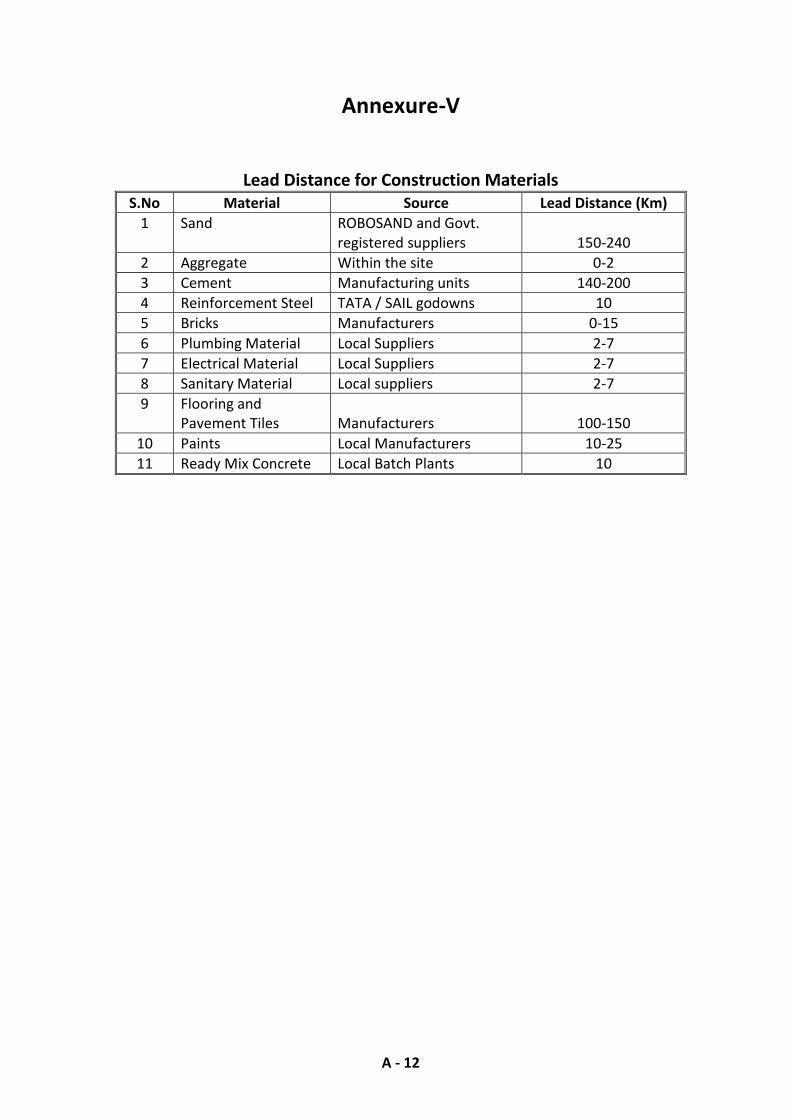
Annexure-V
Lead Distance for Construction Materials
S.No Material Source Lead Distance (Km)
1 Sand ROBOSAND and Govt.
registered suppliers 150-240
2 Aggregate Within the site 0-2
3 Cement Manufacturing units 140-200
4 Reinforcement Steel TATA / SAIL godowns 10
5 Bricks Manufacturers 0-15
6 Plumbing Material Local Suppliers 2-7
7 Electrical Material Local Suppliers 2-7
8 Sanitary Material Local suppliers 2-7
9 Flooring and
Pavement Tiles Manufacturers 100-150
10 Paints Local Manufacturers 10-25
11 Ready Mix Concrete Local Batch Plants 10

A - 13
Annexure-VI
Material Consumption for Project
Units
BUA per
unit in
(m2)
Total
Ready Mix
Concrete
(m3)
Total
Cement
(bags)
Total
Sand
(m3)
Total
Aggre
gate
(m3)
Total
Water
(m3)
Total
Brick
(nos.) x
1000
Total
Reinfor
cement
steel
( MT)
Total BUA 27133 11124 25233 10582 1167 6566 3147 624
Total 27133 11124 25233 10582 1167 6566 3147 624
A - 14
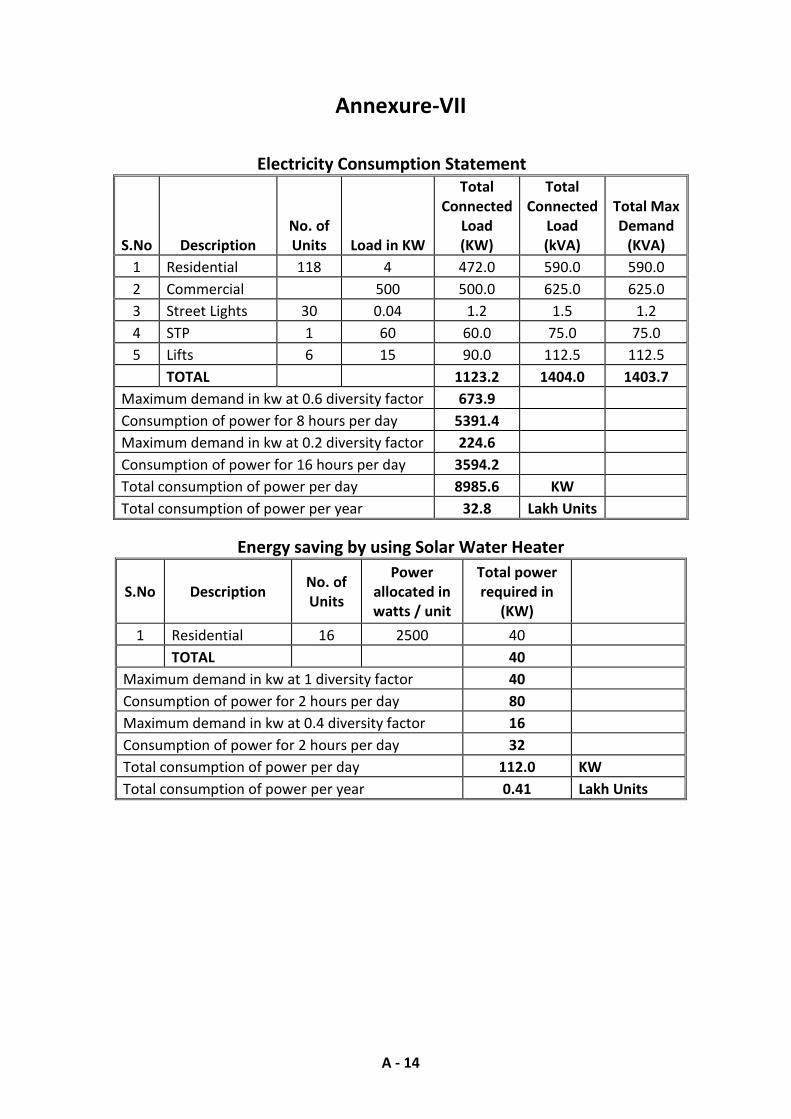
Annexure-VII
Electricity Consumption Statement
S.No Description
No. of
Units Load in KW
Total
Connected
Load
(KW)
Total
Connected
Load
(kVA)
Total Max
Demand
(KVA)
1 Residential 118 4 472.0 590.0 590.0
2 Commercial 500 500.0 625.0 625.0
3 Street Lights 30 0.04 1.2 1.5 1.2
4 STP 1 60 60.0 75.0 75.0
5 Lifts 6 15 90.0 112.5 112.5
TOTAL 1123.2 1404.0 1403.7
Maximum demand in kw at 0.6 diversity factor 673.9
Consumption of power for 8 hours per day 5391.4
Maximum demand in kw at 0.2 diversity factor 224.6
Consumption of power for 16 hours per day 3594.2
Total consumption of power per day 8985.6 KW
Total consumption of power per year 32.8 Lakh Units
Energy saving by using Solar Water Heater
S.No Description No. of
Units
Power
allocated in
watts / unit
Total power
required in
(KW)
1 Residential 16 2500 40
TOTAL 40
Maximum demand in kw at 1 diversity factor 40
Consumption of power for 2 hours per day 80
Maximum demand in kw at 0.4 diversity factor 16
Consumption of power for 2 hours per day 32
Total consumption of power per day 112.0 KW
Total consumption of power per year 0.41 Lakh Units

A - 15
Energy saving by using Solar Street Lights
S.No Description No. of
Units
Power
allocated in
watts / unit
Total power
required in
(KW)
1 Street lights 10 40 0.4
TOTAL 0.4
Maximum demand in kw at 0.6 diversity factor 0.2
Consumption of power for 8 hours per day 2
Maximum demand in kw at full load 0.4
Consumption of power for 4 hours per day 2
Total consumption of power per day 3.5 KW
Total consumption of power per year 0.01 Lakh Units
saving with Solar Heater and Street Lighting 0.42 Lakh Units
Electrical Power savings using CFL/LED for lighting
S.No Description Area in
m2
Power
allocated in
watts / unit
Total power
required in
(KW)
1
Residential and
Commercial 11290 20 226
2 Common & Utilities 7970 2.5 20
TOTAL 246
Maximum demand in kw at 0.9 diversity factor 221
Consumption of power for 12 hours per day 2654
Total consumption of power per day 2653.8 KW
Total consumption of power per year 9.69 Lakh Units
Savings in power using CFL 2.91 Lakh Units
Savings in Electrical Power Consumption – SUMMARY
S.No Description With
CFL/LED
With Solar
Heater and
Street
Lighting
Total
Consumption
lakh units
Total Saving
1 Savings in lakh
kwh units 2.91 0.42
32.80
3.33
2 Savings in
percentage (%) 8.86 1.29 10.1

A - 16
Annexure-VIII
Details of DG Set emissions
Name of
Stack
Stack
Height (m)
Dia of
stack
at top
(m)
Temp. of
exhaust
gases (0C)
Exit
Velocity
(m/sec)
Pollutant
Emission Rate (µg/m3)
PM SO2 NOx
250 kVA X
5 nos. 3.2 0.2 225 8.5 60 105 160
FIA - 1
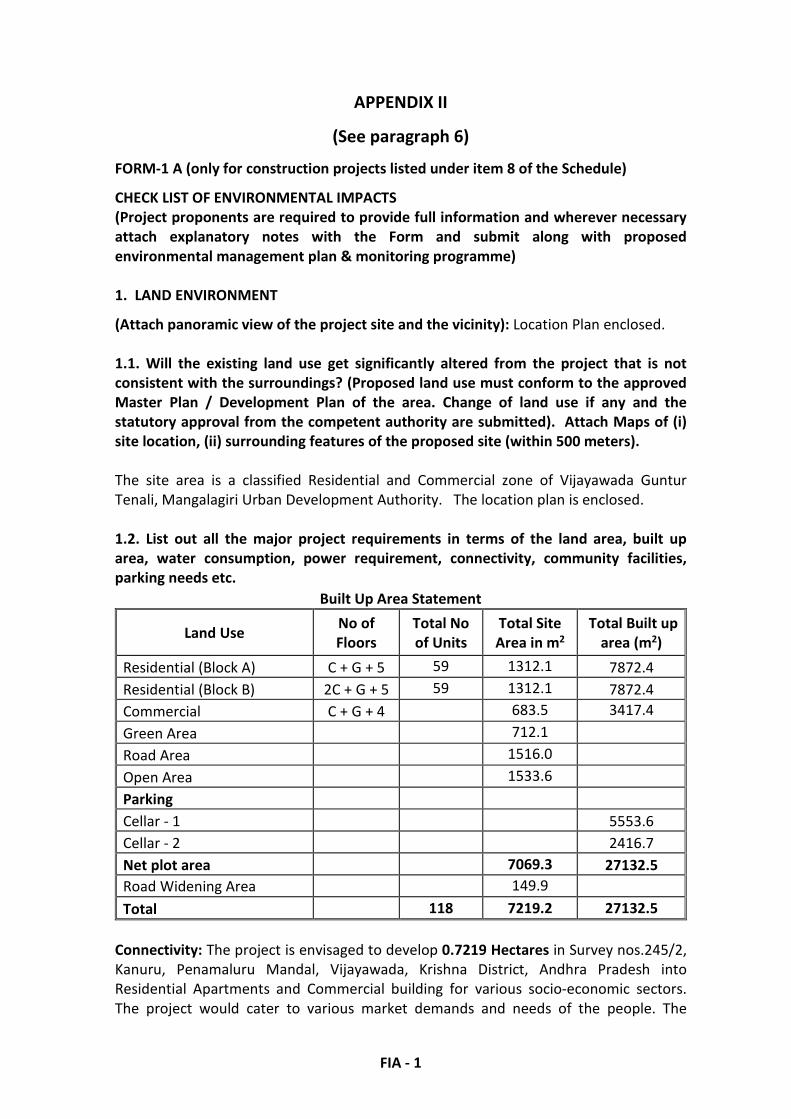
APPENDIX II
(See paragraph 6)
FORM-1 A (only for construction projects listed under item 8 of the Schedule)
CHECK LIST OF ENVIRONMENTAL IMPACTS
(Project proponents are required to provide full information and wherever necessary
attach explanatory notes with the Form and submit along with proposed
environmental management plan & monitoring programme)
1. LAND ENVIRONMENT
(Attach panoramic view of the project site and the vicinity): Location Plan enclosed.
1.1. Will the existing land use get significantly altered from the project that is not
consistent with the surroundings? (Proposed land use must conform to the approved
Master Plan / Development Plan of the area. Change of land use if any and the
statutory approval from the competent authority are submitted). Attach Maps of (i)
site location, (ii) surrounding features of the proposed site (within 500 meters).
The site area is a classified Residential and Commercial zone of Vijayawada Guntur
Tenali, Mangalagiri Urban Development Authority. The location plan is enclosed.
1.2. List out all the major project requirements in terms of the land area, built up
area, water consumption, power requirement, connectivity, community facilities,
parking needs etc.
Built Up Area Statement
Land Use No of
Floors
Total No
of Units
Total Site
Area in m2
Total Built up
area (m2)
Residential (Block A) C + G + 5 59 1312.1 7872.4
Residential (Block B) 2C + G + 5 59 1312.1 7872.4
Commercial C + G + 4 683.5 3417.4
Green Area 712.1
Road Area 1516.0
Open Area 1533.6
Parking
Cellar - 1 5553.6
Cellar - 2 2416.7
Net plot area 7069.3 27132.5
Road Widening Area 149.9
Total 118 7219.2 27132.5
Connectivity: The project is envisaged to develop 0.7219 Hectares in Survey nos.245/2,
Kanuru, Penamaluru Mandal, Vijayawada, Krishna District, Andhra Pradesh into
Residential Apartments and Commercial building for various socio-economic sectors.
The project would cater to various market demands and needs of the people. The

FIA - 2
project site is surrounded by residential building in all the directions. An existing 45 m
wide road (NH-9) in south direction known as Mahatma Gandhi Road connecting
Vijayawada–Machilipatnam. Vijayawada railway station is at a distance of 6.5 km.
WATER CONSUMPTION:
Water Requirement of the Project
Land Use No. of
Units
No. of
Persons/
unit
Water
requirement per
person in l *
Total Water
Requirement in
KLD
Residential 118 5 135 79.7
Visitors 2 15 3.5
Retail 30 6 45 8.1
Visitors 220 15 3.3
Office 300 45 13.5
TOTAL 108.1
*Water requirement as per NBC
Water Saving Measures
Land Use
No.
of
Units
No. of
Persons/unit
Water
Requirement/
KLD
Treated
water
reuse/day
Klpcd
Effective
Water
Requirement
in KLD
Residential 118 5 79.7 23.6 56.1
Visitors 2 3.5 2.4 1.2
Retail 30 6 8.1 3.6 4.5
Visitors 220 3.3 2.2 1.1
Office 300 13.5 6.0 7.5
TOTAL 108.1 37.8 70.3
The effective water consumption is reduced by 37.8 kl/day and the requirement will be
in the order of 70.3 kl/day.
Water Balance
Input KL/Day Output KL/Day
Domestic water from Vijayawada
Municipality 70.3
Excess treated water will be
sent to open drains/greenery
in the surrounding areas
46.7
Recycled water 37.8 Recycled water 37.8
Water requirement for green
belt during non-monsoon 2.0
Losses approx 20% 21.6
Total 108.1 Total 108.1
The water used in the order of 108.1 KL/day would generate 86.5 KL/day of wastewater
which has to be treated for reuse and or disposal.

FIA - 3
Parking Space Provision of the Project
Floor No. of units 4 - Wheeler 2 - Wheeler
Cellar-1 118 238 125
Cellar-2
Total 118 238 125
Parking Details: Commercial Residential Total
Required Parking as per GO 168,
Go AP & GO 119, Go AP 1127.7 33.0% 1731.9 22.0% 2859.7
Parking Area Provided 7970.4
Required Parking as per MoEF
& NBC 188
Parking Provided 238
Amenities Proposed
Amenity Description or Nos.
Green Area 712.1 m2
DG sets 5 X 250 kVA
Sewage Treatment Plant 1
POWER REQUIRMENT:
Electricity Consumption Statement
S.No Description
No. of
Units Load in KW
Total
Connected
Load
(KW)
Total
Connected
Load
(kVA)
Total Max
Demand
(KVA)
1 Residential 118 4 472.0 590.0 590.0
2 Commercial 500 500.0 625.0 625.0
3 Street Lights 30 0.04 1.2 1.5 1.2
4 STP 1 60 60.0 75.0 75.0
5 Lifts 6 15 90.0 112.5 112.5
TOTAL 1123.2 1404.0 1403.7
Maximum demand in kw at 0.6 diversity factor 673.9
Consumption of power for 8 hours per day 5391.4
Maximum demand in kw at 0.2 diversity factor 224.6
Consumption of power for 16 hours per day 3594.2
Total consumption of power per day 8985.6 KW
Total consumption of power per year 32.8 Lakh Units

FIA - 4
Energy Saving by using Solar Water Heater
S.No Description No. of
Units
Power
allocated in
watts / unit
Total power
required in
(KW)
1 Residential 16 2500 40
TOTAL 40
Maximum demand in kw at 1 diversity factor 40
Consumption of power for 2 hours per day 80
Maximum demand in kw at 0.4 diversity factor 16
Consumption of power for 2 hours per day 32
Total consumption of power per day 112.0 KW
Total consumption of power per year 0.41 Lakh Units
Energy saving by using Solar Street Lights
S.No Description No. of
Units
Power
allocated in
watts / unit
Total power
required in
(KW)
1 Street lights 10 40 0.4
TOTAL 0.4
Maximum demand in kw at 0.6 diversity factor 0.2
Consumption of power for 8 hours per day 2
Maximum demand in kw at full load 0.4
Consumption of power for 4 hours per day 2
Total consumption of power per day 3.5 KW
Total consumption of power per year 0.01 Lakh Units
saving with Solar Heater and Street Lighting 0.42 Lakh Units
Electrical Power savings using CFL / LED for lighting
S.No Description Area in
m2
Power
allocated in
watts / unit
Total power
required in
(KW)
1
Residential and
Commercial 11290 20 226
2 Common & Utilities 7970 2.5 20
TOTAL 246
Maximum demand in kw at 0.9 diversity factor 221
Consumption of power for 12 hours per day 2654
Total consumption of power per day 2653.8 KW
Total consumption of power per year 9.69 Lakh Units
Savings in power using CFL 2.91 Lakh Units

FIA - 5
Savings in Electrical Power Consumption – SUMMARY
S.No Description With
CFL/LED
With Solar
Heater and
Street Lighting
Total
Consumption
lakh units
Total Saving
1 Savings in lakh
kwh units 2.91 0.42
32.80
3.33
2 Savings in
percentage (%) 8.86 1.29 10.1
1.3. What are the likely impacts of the proposed activity on the existing facilities
adjacent to the proposed site? (Such as open spaces, community facilities, details of
the existing land use and disturbance to the local ecology).
The local area is developed as residential and commercial construction activities of a
number of housing/commercial complexes are going on. No major impact on the local
ecology is anticipated.
1.4. Will there are any significant land disturbance resulting in erosion, subsidence &
instability? (Details of soil type, slope analysis, vulnerability to subsidence, Seismicity
etc may be given).
a. Soil type: clayey or clay loams
b. Slope analysis:
c. Vulnerability to Subsidence: No subsidence is anticipated in plain terrain areas.
d. Seismicity: The site area is classified as Zone II as per the IMD.
1.5. Will the proposal involve alteration of natural drainage systems? (Give details on
a contour map showing the natural drainage near the proposed project site)
No, the site area is 7219.2 m2 only, and forms part of Krishna river drainage.
1.6. What are the quantities of earthwork involved in the construction activity
cutting, filling, reclamation etc. (Give details of the quantities of earthwork involved,
transport of fill materials from outside the site etc.)
Earth Work Quantities
S.No Area Qty of fill (m3) Qty of cut
(m3)
Surplus fill
(m3)
Surplus cut
(m3)
1 Site 5775 5775 --- ---
1.7 Give details regarding water supply, waste handling etc during the construction
period.
The water requirement during construction shall be drawn from either ground water or
treated sewage from treatment plants from other occupied areas, surrounding the
project. The maximum expected drawl of ground water would be in the order of 50 KLD
during construction.
Construction debris like cement, sand, RCC, Aggregate, steel etc. are the waste
generation during construction and these waste materials are used for road
development.

FIA - 6
1.8. Will the low lying areas & wetlands get altered? (Provide details of how low lying
and wetlands are getting modified from the proposed activity)
-NO-
1.9. Whether construction debris & waste during construction cause health hazard?
(Give quantities of various types of wastes generated during construction including
the construction labour and the means of disposal).
Construction Debris
The construction debris consists of various types of materials. The construction debris
will be in both hazardous and non-hazardous categories. The hazardous debris consists
of empty containers of adhesives, thinners, paints, and petroleum products. These
empty containers will be sold to authorize recycling agencies. The non hazardous
wastes contain recyclable debris like iron and other metal, glass, plastics, cartons of
paper, wood etc. These wastes will be sent for reuse/recycle. The waste percentage will
be in the order of 2%. Construction debris containing bricks, demolished RCC will be
used for land filling in the place of subgrade.
2. WATER ENVIRONMENT
2.1. Give the total quantity of water requirement for the proposed project with the
breakup of requirements for various uses. How will the water requirement met? State
the sources & quantities and furnish a water balance statement.
Water Requirement of the Project
Land Use No. of
Units
No. of
Persons/
unit
Water
requirement per
person in l *
Total Water
Requirement
in KLD
Residential 118 5 135 79.7
Visitors 2 15 3.5
Retail 30 6 45 8.1
Visitors 220 15 3.3
Office 300 45 13.5
TOTAL 108.1
*Water requirement as per NBC
Water Saving Measures
Land Use
No.
of
Units
No. of
Persons/unit
Water
Requirement/
KLD
Treated
water
reuse/day
Klpcd
Effective
Water
Requirement
in KLD
Residential 118 5 79.7 23.6 56.1
Visitors 2 3.5 2.4 1.2
Retail 30 6 8.1 3.6 4.5
Visitors 220 3.3 2.2 1.1
Office 300 13.5 6.0 7.5
TOTAL 108.1 37.8 70.3
FIA - 7
The effective water consumption is reduced by 37.8 kl/day and the requirement will be
in the order of 70.3 kl/day.
Water Balance
Input KL/Day Output KL/Day
Domestic water from Vijayawada
Municipality 70.3
Excess treated water will be
sent to open drains/greenery
in the surrounding areas
46.7
Recycled water 37.8 Recycled water 37.8
Water requirement for green
belt during non-monsoon 2.0
Losses approx 20% 21.6
Total 108.1 Total 108.1
The water used in the order of 108.1 KL/day would generate 86.5 KL/day of wastewater
which has to be treated for reuse and or disposal.
It is proposed to draw domestic water from the Vijayawada Municipal Corporation
which has been encouraging the bulk consumers. The water shortage if any during
summer season will be drawn from ground water sources. The water requirement of
the project during occupation stage is in the order of 108.1 KLD.
2.2 What is the capacity (dependable flow or yield) of the proposed source of water?
Vijayawada Municipal Corporation (VMC).
2.3 What is the quality of water required, in case, the supply is not from a municipal
source? (Provide physical, chemical, biological characteristics with class of water
quality)
Water shall be drawn from Vijayawada Municipal Corporation (VMC).
2.4 How much of the water requirement can be met from the recycling of treated
wastewater? (Give the details of quantities, sources and usage)
Water Saving Measures
Land Use
No.
of
Units
No. of
Persons/unit
Water
Requirement/
KLD
Treated
water
reuse/day
Klpcd
Effective
Water
Requirement
in KLD
Residential 118 5 79.7 23.6 56.1
Visitors 2 3.5 2.4 1.2
Retail 30 6 8.1 3.6 4.5
Visitors 220 3.3 2.2 1.1
Office 300 13.5 6.0 7.5
TOTAL 108.1 37.8 70.3

FIA - 8
The effective water consumption is reduced by 37.8 kl/day and the requirement will be
in the order of 70.3 kl/day.
2.5. Will there be diversion of water from other users? (Please assess the impacts of
the project on other existing uses and quantities of consumption)
NO, the required water shall be drawn from Village panchayat, during non-availability of
water, water shall be drawn from ground sources.
2.6 What is the incremental pollution load from wastewater generated from the
proposed activity? (Give details of the quantities and composition of wastewater
generated from the proposed activity)
Characteristics of Waste water
Parameter Quantity in mg/l
PH 6 – 7
Total Suspended Solids 400 – 600
BOD 200 – 300
COD 450 – 500
The treated water shall be used for toilet flushing and for green belt development for
the greening of site. The unused excess treated wastewater shall be sent to municipal
open drains. The quantity of sewage expected is in the order of 86.5 KL/day.
2.7. Give details of the water requirements met from water harvesting? Furnish
details of the facilities created.
The storm water drain would also ensure that the sedimentation does not occur, as
rainwater harvesting structures will also help in controlling the sedimentation. The
rainwater harvesting system proposed would enhance the water retention and
increases the water table. The drainage would in effect reduce the runoff and increase
the percolation. The gradient of the channel will be maintained throughout its length so
that water does not pond within it. Flows will be maintained at velocities that will scour
the channel of debris. For instance, runoff velocities should not be less than 1 m/s nor
should they exceed 3 m/s. Based on the catchment area, potential inflows and rainfall
intensity determine the drain size so as to minimize damage resulting from high
intensity storms. Energy dissipaters such as drop structures will be provided along the
channel where runoff velocities may become excessive. The overflow from the storm
water drains at rainwater harvesting structures shall be provided with an overflow
channel to drain into the roadside plantation which will act as a bios wale. The typical
cross section is presented below.

FIA - 9
2.8. What would be the impact of the land use changes occurring due to the proposed
project on the runoff characteristics (quantitative as well as qualitative) of the area in
the post construction phase on a long term basis? Would it aggravate the problems of
flooding or water logging in any way?
The impact of housing project on physiography is a function of the terrain of the area. It
is most drastically altered in case of hilly terrain or where extensive cut-and-fill
operations are involved. The project area has a rocky terrain and the design stage
deliberations have ensured that the major contours are not disturbed. However the
physiography impact will be significant and non-reversible, as the contours of the area
will be disturbed. The cut and fill operations may cause air pollution, clogging of drains
and solid waste for disposal. The design stage has optimized the cut and fill operations
and the excess cut material is minimum and the same shall be reused for the
construction purposes.
The project will have a positive impact on the soils and soil quality as housing project
will have landscaping and the soils will be protected due to conservation.

FIA - 10
During the occupation stage, compaction will not occur, and the compaction if any will
be restricted to road ROW. And the road ROW compaction cannot be said to be an
impact of the operation stage as the pavement itself is a function of compacted base
and sub base.
During the occupation stage, soil pollution due to garbage dumping at unauthorized
locations may have temporary negative impact leading contamination of soil. The
accidental spills or leaks are also a low probability incident.
The other major impact will be due to the increased run off and may have negative
impact on the receiving body if the same is not properly managed. Impacts due to
surface runoff include increased soil erosion and local flooding or water logging. Hence
the project will be designed with adequate storm water drains and cross drainage
structures. The housing activity will be provided with a Sewage treatment plant to treat
the domestic wastewater and necessary infrastructure will be provided for the safe
disposal of domestic wastes to protect the water bodies.
2.9. What are the impacts of the proposal on the ground water? (Will there be tapping
of ground water; give the details of ground water table, recharging capacity, and
approvals obtained from competent authority, if any)
Ground water shall be used as a secondary source during non-availability of water from
VMC. The ground water table is at a depth of 10m to 15m. State ground water board
is approached for necessary permission.
2.10. What precautions/measures are taken to prevent the run-off from construction
activities polluting land & aquifers? (Give details of quantities and the measures taken
to avoid the adverse impacts)
Construction activity is taken up only during non-monsoon season. There are no major
drains in the site. All material dumps shall be located away from the natural drains.
Storm water drains shall be constructed before the construction of the buildings.
2.11. How is the storm water from within the site managed? (State the provisions
made to avoid flooding of the area, details of the drainage facilities
Provided along with a site layout indication contour levels)
Storm water drains will be provided all over the site to meet the expected increase in
the runoff during rainy seasons due to the impervious nature of the roads and other
paved areas. It is proposed to maintain the levels as much as possible before letting
storm water into side drains of main road.
Based on the catchment area, potential inflows and rainfall intensity determine the
drain size so as to minimize damage resulting from high intensity storms. Energy
dissipaters such as drop structures will be provided along the channel where runoff
velocities may become excessive. The overflow from the storm water drains at
rainwater harvesting structures shall be provided with an overflow channel to drain into
the roadside plantation, which will act as a bioswale.

FIA - 11
Storm water drains: Conservation of water resource is most important aspect of the
project during construction and occupation phases. Storm water drainage planning,
domestic water planning and sewerage transfer and sewage treatment planning are
most essential.
Storm water sumps will be provided to meet the expected increase in the runoff during
rainy seasons due to the impervious nature of the Roof, roads and other paved areas.
The site is uneven and it is proposed to maintain the levels as much as possible, hence
storm water outlets from the site are anticipated. The expected runoff is calculated for
the design of the storm water runoff and presented in following table.
CALCULATION FOR STORM WATER DRAIN:
Quantity of storm water:
(a) Without project:
Area of Catchment, ‘A’ : 0.7069 Ha
Run off Coefficient, ‘C’ : 0.6
Maximum intensity of rainfall, ‘I’ : 100 mm/hr
Therefore Q : 0.118 m3/sec
(b) With project: :
Area for catchment for roof and road : 0.482 Ha
Area of Catchment, ‘A’ : 0482 Ha
Run off Coefficient, ‘C’ : 0.9
Maximum intensity of rainfall, ‘I’ : 40 mm/hr
Therefore Q = : 0.048 m3/sec
Area for catchment for open areas : 0.225 Ha
Run off Coefficient, ‘C’ : 0.6
Maximum intensity of rainfall, ‘I’ : 100 mm/hr
Therefore Q = : 0.037 m3/sec
Total Discharge : 0.086 m3/sec
But, Discharge, Q = A/V :
Where, :
A= Area of the Drain, :
V= Max. Permissible Velocity : 6
m/sec for concrete
drain
Area of drain, ‘A’ = Q/V : 0.014 m2
Taking depth of drain as 0.6 m at the starting
point : 0.6
Width of drain = Area/depth = 0.024 m 24 mm
Width of the drain is to taken 24 mm and depth varies according to the slope of ground.

FIA - 12
Strom Water Runoff
Land
Use
Area in
hectares
Vol./hr
after
developm
ent C=0.8
Vol./hr
before
developm
ent C=0.6
Difference
in
Discharges
Remarks
Roof
Area 0.33 264.6 198.5 66.2
Stored in 3 sumps of
25 m3 capacity and
used for domestic
purpose
Road
Area 0.15 121.3 91.0 30.3 21 nos. of RWH pits
are provided of size
1.2m x 1.2m x 1.5 m Open
Area 0.22 67.4 134.7 -67.4
TOTAL 0.71 29.1
* C=0.3 after development of greenery
The roof waters are channeled through storm water drains which are connected with
water harvesting pits. Storm water from the roof tops will be directed to intermediate
rainwater harvesting pits (21 Nos.) to be provided (as per VMDA norms) at a rate of 1
each at a distance of 50 m, which in turn will be directed to 3 Nos. bigger rainwater
harvesting structures at the corner of the plot area.
2.12. Will the deployment of construction laborers particularly in the peak period lead
to unsanitary conditions around the project site (Justify with proper explanation)
No, Temporary toilet facilities shall be provided and the same shall be connected to
septic tank followed by soak pit.
2.13 What on-site facilities are provided for the collection, treatment & safe disposal
of sewage? (Give details of the quantities of wastewater generation, treatment
capacities with technology & facilities for recycling and disposal)
The project site shall be provided with appropriate plumbing for transfer of sewage to
the sewage treatment plant. The total quantity of sewage anticipated is in the order
of 86.5 KLD. The flow diagram of the Sewage treatment plant is presented in following
figure.
Sewage treatment plant based on Fluidized Aerobic Bio Reactor (FAB) technology
PROCESS DESCRIPTION:
The raw sewage will be collected in a collection sump and pumped to mechanical bar
screen chamber for removal of large floating matter followed by grit removal in Grit
Chamber. The raw sewage will then be collected in an equalization tank for
homogenization of hydraulic load. The tank contents will be kept in suspension by
means of course bubble serration through pipe grid. The equalization tank, with air
flow indicator for continuous monitoring of air supply to the tank in order to avoid
septic conditions, will be covered from top (RCC or FRP) to avoid nuisance. The
equalized effluent will then be pumped to two Fluidized Aerobic Bio Reactors (FAB) in
series where BOD/COD reduction can be achieved by virtue of aerobic microbial
activities. The oxygen required will be supplied through coarse air bubble diffusers.
The bio-solids formed in the biological process will be separated in the down stream

FIA - 13
Tube Settler. The clear supernatant will gravitate to the chlorine contact tank where
sodium hypochlorite will be dosed for disinfection of treated water prior to disposal.
The biological sludge generated in the FAB and settled in the tube settlers will be
collected in a sludge sump and then pumped to sludge drying bed for de watering. The
dried sludge will then be disposed off suitably as manure. The schematics of the
process are shown. The two main components of the treatment system viz. The FAB
reactor and tube settler are described in the following sections.
Fluidized Aerobic Bio Reactor (FAB)
Conventional effluent treatment plants are large sized, power intensive and require a
lot of monitoring. Scarcity of open space and rising land a power costs have forced the
industries to look ourfor space saving, compact and efficient treatment options. This
has led to the development attached growth processes where the bio mass is retained
within the aeration tank obviating the need for recycle. These plants are not only
compact but also user friendly. The endeavor to have a continuously operating, no-
clogging biofilm reactor with no need for back washing, low head-loss and high specific
biofilm surface area culminated in the most advanced technology of aerobic biological
fluidized bed treatment where the biofilm (biomass) grows on small carrier elements
that move along with the water in the reactor. The movement is normally caused by
aeration in the aerobic version of the reactor.
The reactor combines all the advantages and best features of Trickling filters, Rotating
biological contractors, activated sludge process and submerged fixed film reactors while
eliminating the drawbacks of these systems. The plants are more compact and more
energy efficient.
The Fluidized Aerobic Bio Reactor (FAB) consists of a tank in any shape filled up with
small carrier elements. The elements are made up of special grade PVC or
polypropylene of controlled density (shown in plate). For media of specific gravity 0.92-
0.96 the overall density could be expected to increase up to 9.5% when full of biomass
such that they can fluidize using an aeration device. A biofilm develops on the
elements, which move along the effluent in the reactor. The movement within the
reactor is generated by providing aeration with the help of diffusers placed at the
bottom of the reactor. Then thin biofilm on the elements enables the bacteria to act
upon the biodegradable matter in the effluent and reduce the BOD/COD content in the
presence of oxygen available from the air that is used for fluidization.
Characteristics of Waste water
Parameter Quantity in mg/l
PH 6 – 7
Total Suspended Solids 300
BOD 150
COD 350

FIA - 14
Design of the unit
Basic data
Flow : 86.5 KLD
Capacity : 100 m3
Peak factor : 3.5
Peak flow Q peak : 300 m3/day
Influent BOD : 200 mg/lit
Influent Suspended Solids : 200 mg/lit
Influent COD : 350 mg/lit
Effluent BOD : 30 mg/lit
Effluent COD : 200 mg/lit
Effluent Suspended Solids : 100 mg/lit
1. Bar Screen Chamber
Average flow : 0.0015 m3/sec
Peak factor : 3.5
Peak flow : 0.005 m3/sec
Velocity at peak flow : 0.75 m/Sec
Effective area of screen Required
At average flow : 0.005 m2
At Peak flow : 0.0075 m2
Provide Effective area of screen : 0.0075 m2
Considering the bar of dia. 10 mm(w) and clear spacing of 20 mm (b)
Overall area required : 0.011 m2
Considering screen depth as : 0.022 m Consider 0.5 m
Number of clear spacing : 0.3
Number of bars : 1 Consider 3 Nos.
Hence Provide 5 bars
Provide a screen of 0.5 m X 0.5 m at an inclination of sin 600. In a screen channel of one
meter (1 m) length.
2. Grit Chamber :
The flow from the bar screen chamber is let into the Grit Chamber of minimum 2 hours
capacity. This tank is provided to even out the flow variation, and to provide a continuous
feed into the secondary biological treatment units.
Peak flow Q : 0.005 m3/sec
Providing a flow through velocity of 0.30 m/sec
Cross sectional area of Channel (0.004/0.3) : 0.016 m2
Surface area of channel (0.004/0.03) : 0.38 m2
Assuming depth d : 0.2 m
Width of channel (0.013/0.2) : 0.08 m (say 0.2m)
FIA - 15
Length of channel (0.30/0.06) : 4. 5 m (say 4.5 m)
Provide two channels each of 0.2 m wide and 4.5 m long with depth of waste water 0.2 m.
3. Equalization tank:
The flow from the bar screen chamber is let into the equalization tank of minimum 2hours
capacity. This tank is provided to even out the flow variation, and to provide a continuous
feed into the secondary biological treatment units.
Average flow : 5 m3/hr
Peak factor : 3.5
Peak flow : 17.5 m3/hr
Hydraulic retention tank = 2 hrs at Peak flow
Hence required volume of the tank : 37.91 m3
Provide tank of : 37.91 m3 Capacity
Assuming depth : 3 m
Area : 12.6 m2
Assuming length to width ratio (1:1) ; l=b
length of the tank : 3.5 m
width of the tank : 3.5 m
Air required for agitation : 0.01 m3/ m2 min
Total air required : 22.75 m3/hr
Air blower required : 40 m3/hr @ 3.8 mwc
Effluent transfer pump : 5.41 m3/hr @ 8 mwc
4. Fluidized Aerobic Bio Reactor (FAB):
The polypropylene media have been provided with a specific surface area of 350 – 520 m2
/m3. This allows micro-organisms to get attached and biomass concentration can be
increased to four folds as compared to Activated Sludge Process. This enables to consider
higher Organic loading rates.
The micro-organisms attached to media are kept in a fluid state thereby maintaining the
CSTR (continuous Stirrer tank reactor) regime as well as two tanks are provided in series
making the plug – flow system. This will enhance the efficiencies and have the merits of
both CSTR and plug-flow regimes.
Organic loading rate : 3.2 kg BOD/ m3 d
Organic load : 26 kg/day
Volume of the tank : 8.2 m3
Assume the depth : 3 m
No. of tanks in series : 1
Size of the tank : 1.6 m dia. x 3.0 SWD
Specific gravity of media : 0.92 to 0.96
Specific surface area of media : 350 – 520 m2 /m3
Media filling : 30 – 50 % of tank volume

FIA - 16
Oxygen required : 2 kg / kg BOD
Oxygen in air : 23%
Specific gravity of air @ 30 deg. : 1.65
Aeration : Coarse bubble
Oxygen transfer efficiency : 12%
Air required : 51.82 m3/hr
Air blower required : 80 m3/hr @ 6.5 m wc
5.Tube settler
Surface loading rate : 48 m2 /m3 d
Surface area required : 2.7 m2
Tank size : 3.0 m x 6.0 m x 2.7 m SWD With 55
deg. hopper bottom
Tube Modules : 3.0m x 6.0 m x 0.6 m ht.
Tube inclination : 60 deg.
Settling area for 60 deg slope : 11 m2 /m3
Cross sectional area of tubes : 120 mm x 44 mm Hexagonal
Hydraulic radius : 1/61 cm (1.5 cm)
Shape factor : 0.6 – 0.7 for media settleable solids
6. Pre Filtration tank
The flow from the each individual settling tank i.e., the supernatant liquid is let into the
respective Pre-Filtration Tank, which has a minimum 1.5 hours holding capacity. This tank
is provided to hold the treated effluent and give an even flow to the pressure sand filter.
Average flow : 5 m3/hr
Peak factor : 2 m3/hr
Peak flow : 10 m3/hr
Provide min 1.5 hours holding capacity.
Hence required volume of the tank : 16.25 m3
7. Pressure Sand Filter:
Vertical down flow type with graded/sand bed under drain plate with polysterene strains.
Flow : 100 m3/day
Rate of filtration assumed as : 10 m3/m2/hr
Requirement of treated water for usage in 20 hrs : 6.5 m3/hr
Dia. of filter of 1 nos. : 950 mm
Provide pressure sand filter of 950 mm dia. and 1100 mm HOS with sand as media layer,
under drain pipe, laterals face piping etc for each stream.
8. Activated Carbon Filter:
Vertical down flow type with graded/sand bed under drain plate with polysterene strains.

FIA - 17
Flow : 100 m3/day
Rate of filtration assumed as : 10 m3/m2/hr
Requirement of treated water for usage in 20 hrs : 6.5 m3/hr
Dia of filter of 1 nos. : 950 mm
Provide pressure sand filter of 950 mm dia. and 1100 mm HOS with sand as media layer,
under drain pipe, laterals face piping etc for each stream.
9.Final Treated Water Holding Tank
It is always preferred to provide one final holding tank of minimum one day holding
capacity, so that the treated effluents can be stored and used back for gardening or other
tertiary purposes.
Capacity: 100 m3
9.Ultraviolet Disinfection:
UV applied to low turbidity water is a highly effective means of disinfection. UV is not
harmful to aquatic organisms in the receiving water. UV light kills viruses, Vegetative- and
spore-forming bacteria, algae and yeasts. No chemicals are added to the wastewater to
change the pH, conductivity, odor or taste to create possible toxic compounds. UV
treatment has a few moving parts to adjust or wear out.
10. Sludge Filter Press:
The biomass in the aeration tank stabilizes BOD in wastewater by consuming the organic
matter in the wastewater. The metabolic activity results in growth of the biomass
population in the Fluidized Aerobic Bio Reactor (FAB). Sludge holding tank has been
provided with filter press for dewatering sludge. The filtrate drains off through the media,
which is again let into equalization tank.
The dewatered sludge is collected in trays, which can be used as manure in the garden.
No. of plates : 24
Size of plates : 600 mm X 600 mm
Plate moc (material of construction) : PP (poly propline)
Type of operation : Hydraulic
Power pack capacity : 2 HP
The filtrate drains off through the media, which is again let into equalization tank. The
dewatered sludge is collected in trays, which can be used as manure in the garden.
Characteristics of Treated Waste water
Parameter Quantity in mg/l
pH 7.3
Total Suspended Solids 20
BOD 10
COD 50
Disposal of Treated Wastewater: The treated water shall be treated and reused for
flushing the toilets and on land irrigation. Excess treated water shall be utilized for
HVAC/disposal in Open drains/ development of greenery in the surrounding areas
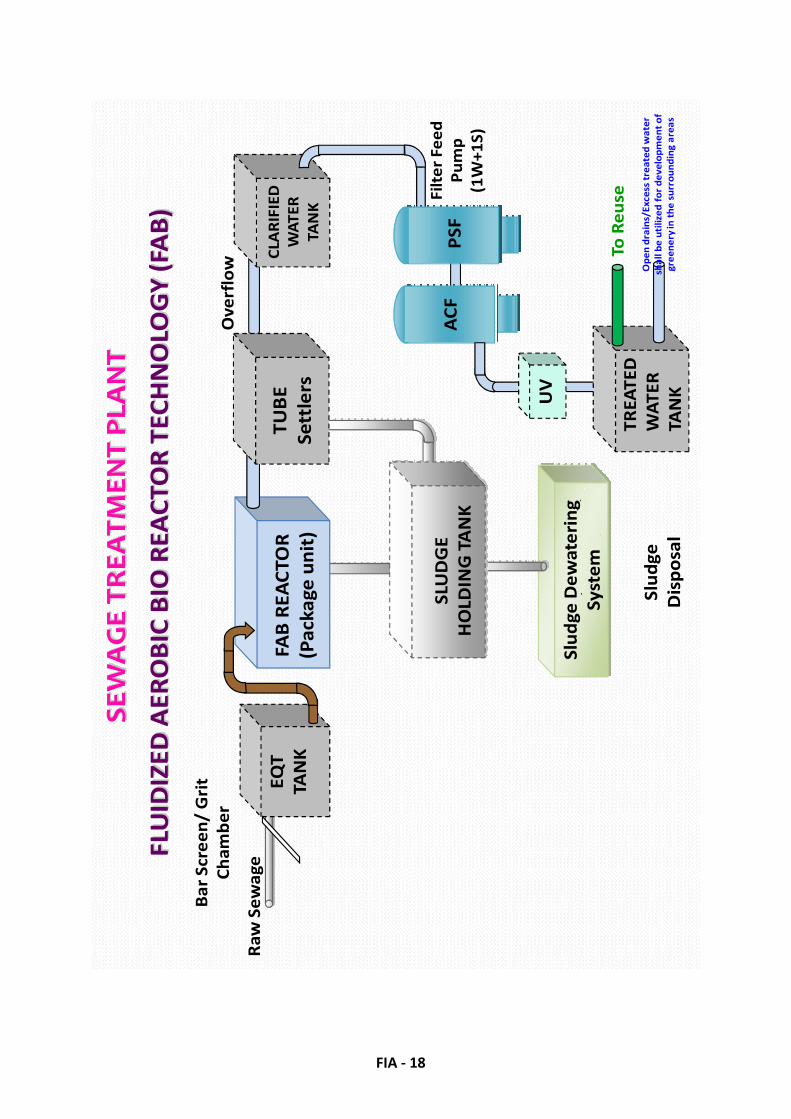
FIA - 18
SE
WA
GE
TR
EA
TM
EN
T P
LA
NT
FLU
IDIZ
ED
AE
RO
BIC
BIO
RE
AC
TO
R T
EC
HN
OLO
GY
(FA
B)
Slu
dg
e D
ew
ate
rin
g
Sy
ste
m
EQ
T
TAN
K
AC
F
Ba
r S
cre
en
/ G
rit
Ch
am
be
r
Ra
w S
ew
ag
e
Ov
erf
low
Fil
ter
Fe
ed
Pu
mp
(1W
+1
S)
Slu
dg
e
Dis
po
sal
SLU
DG
E
HO
LD
ING
TA
NK
CLA
RIF
IED
WA
TE
R
TA
NK
FAB
RE
AC
TO
R
(Pa
cka
ge
un
it)
TU
BE
Se
ttle
rs
PS
F
TR
EA
TE
D
WA
TE
R
TAN
KUV
To R
eu
se
Op
en
dra
ins/
Exce
ss t
rea
ted
wa
ter
sha
ll b
e u
tili
zed
fo
r d
ev
elo
pm
en
t o
f
gre
en
ery
in t
he
su
rro
un
din
g a
rea
s
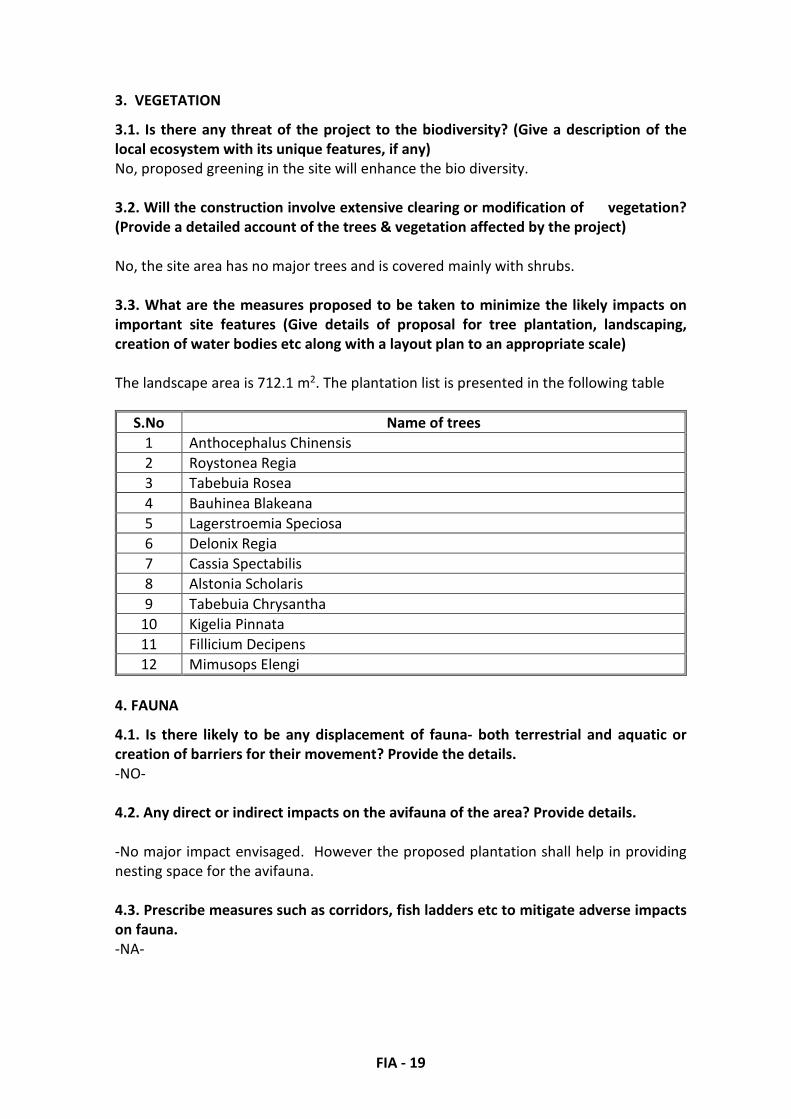
FIA - 19
3. VEGETATION
3.1. Is there any threat of the project to the biodiversity? (Give a description of the
local ecosystem with its unique features, if any)
No, proposed greening in the site will enhance the bio diversity.
3.2. Will the construction involve extensive clearing or modification of vegetation?
(Provide a detailed account of the trees & vegetation affected by the project)
No, the site area has no major trees and is covered mainly with shrubs.
3.3. What are the measures proposed to be taken to minimize the likely impacts on
important site features (Give details of proposal for tree plantation, landscaping,
creation of water bodies etc along with a layout plan to an appropriate scale)
The landscape area is 712.1 m2. The plantation list is presented in the following table
S.No Name of trees
1 Anthocephalus Chinensis
2 Roystonea Regia
3 Tabebuia Rosea
4 Bauhinea Blakeana
5 Lagerstroemia Speciosa
6 Delonix Regia
7 Cassia Spectabilis
8 Alstonia Scholaris
9 Tabebuia Chrysantha
10 Kigelia Pinnata
11 Fillicium Decipens
12 Mimusops Elengi
4. FAUNA
4.1. Is there likely to be any displacement of fauna- both terrestrial and aquatic or
creation of barriers for their movement? Provide the details.
-NO-
4.2. Any direct or indirect impacts on the avifauna of the area? Provide details.
-No major impact envisaged. However the proposed plantation shall help in providing
nesting space for the avifauna.
4.3. Prescribe measures such as corridors, fish ladders etc to mitigate adverse impacts
on fauna.
-NA-
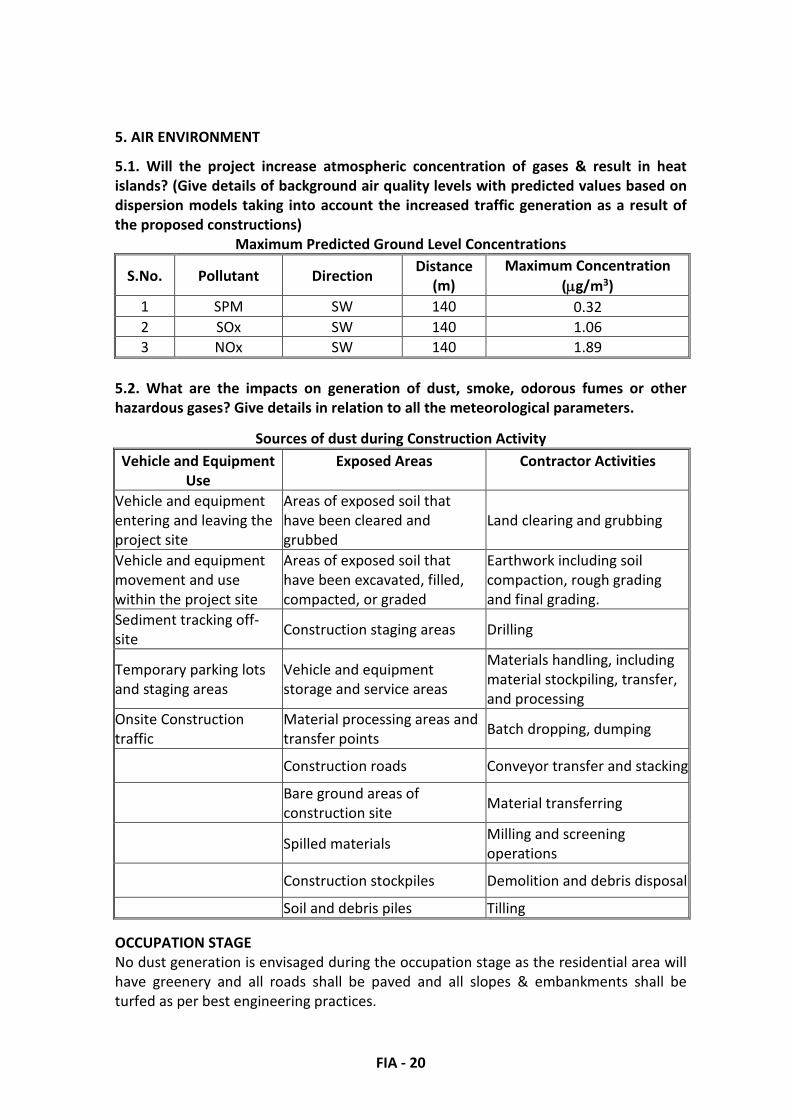
FIA - 20
5. AIR ENVIRONMENT
5.1. Will the project increase atmospheric concentration of gases & result in heat
islands? (Give details of background air quality levels with predicted values based on
dispersion models taking into account the increased traffic generation as a result of
the proposed constructions)
Maximum Predicted Ground Level Concentrations
S.No. Pollutant Direction Distance
(m)
Maximum Concentration
(g/m3)
1 SPM SW 140 0.32
2 SOx SW 140 1.06
3 NOx SW 140 1.89
5.2. What are the impacts on generation of dust, smoke, odorous fumes or other
hazardous gases? Give details in relation to all the meteorological parameters.
Sources of dust during Construction Activity
Vehicle and Equipment
Use
Exposed Areas Contractor Activities
Vehicle and equipment
entering and leaving the
project site
Areas of exposed soil that
have been cleared and
grubbed
Land clearing and grubbing
Vehicle and equipment
movement and use
within the project site
Areas of exposed soil that
have been excavated, filled,
compacted, or graded
Earthwork including soil
compaction, rough grading
and final grading.
Sediment tracking off-
site Construction staging areas Drilling
Temporary parking lots
and staging areas
Vehicle and equipment
storage and service areas
Materials handling, including
material stockpiling, transfer,
and processing
Onsite Construction
traffic
Material processing areas and
transfer points Batch dropping, dumping
Construction roads Conveyor transfer and stacking
Bare ground areas of
construction site Material transferring
Spilled materials Milling and screening
operations
Construction stockpiles Demolition and debris disposal
Soil and debris piles Tilling
OCCUPATION STAGE
No dust generation is envisaged during the occupation stage as the residential area will
have greenery and all roads shall be paved and all slopes & embankments shall be
turfed as per best engineering practices.

FIA - 21
5.3. Will the proposal create shortage of parking space for vehicles? Furnish details of
the present level of transport infrastructure and measures proposed for improvement
including the traffic management at the entry & exit to the project site.
Parking Space Provision of the Project
Floor No. of units 4 - Wheeler 2 - Wheeler
Cellar-1 118 238 125
Cellar-2
Total 118 238 125
Parking Details: Commercial Residential Total
Required Parking as per GO 168,
Go AP & GO 119, Go AP 1127.7 33.0% 1731.9 22.0% 2859.7
Parking Area Provided 7970.4
Required Parking as per MoEF
& NBC 188
Parking Provided 238
Circulation Plan:
Ground Floor Driveway: 7.0 m
No. of cellar: 2
No. of Ramps: 3 - 1 way
Width of Ramp: 5.4 m
Slope of Ramp: 1 in 8
Cellar floor Driveway: 4.5 m
No. of Lifts :12
Capacity of each Lift: 10 - 20 Pax.
Connecting Road: 45 m ROW
Volume/Capacity Ratio
Road Existing
volume,
PCU/hr
Maximum
capacity,
PCU/hr
Volume/
Capacity
Los,
performance
NH – 9 1778 3600 0.494 “C” Good
Modified Los & Performance
Road
Existing
volume,
PCU/hr
Existing
volume/
Capacity
Additional
volume
Modified
Volume
Modified
Volume/
Capacity
Modified
Los &
perfor
mance
NH – 9 1778 0.494 27 1805 0.501
“C”
Good
FIA - 22
5.4. Provide details of the movement patterns with internal roads, bicycle tracks,
pedestrian pathways, footpaths etc., with areas under each category.
-NA-
5.5. Will there be significant increase in traffic noise & vibrations? Give details of the
sources and the measures proposed for mitigation of the above.
There shall be an increase in the traffic density by 27 nos. of vehicles.
5.6. What will be the impact of DG sets & other equipment on noise levels & vibration
in & ambient air quality around the project site? Provide details.
DG sets shall be provided with acoustic enclosures. The emissions from the DG sets are
released at 3.2 m height above the roof level.
6. AESTHETICS
6.1. Will the proposed constructions in any way result in the obstruction of a view,
scenic amenity or landscapes? Are these considerations taken into account by the
proponents?
-NO-
6.2. Will there be any adverse impacts from new constructions on the existing
structures? What are the considerations taken into account?
-No adverse impacts are anticipated-
6.3. Whether there are any local considerations of urban form & urban design
influencing the design criteria? They may be explicitly spelt out.
The layout plan is on the basis of Development rules prescribed by Vijayawada Guntur
Tenali, Mangalagiri Urban Development Authority (VGTMUDA).
6.4. Are there any anthropological or archaeological sites or artefacts nearby? State if
any other significant features in the vicinity of the proposed site have been
considered.
-NO-
7. SOCIO-ECONOMIC ASPECTS
7.1. Will the proposal result in any changes to the demographic structure of local
population? Provide the details.
-NO- The population distribution is presented in the following table.
7.2 Give details of the existing social infrastructure around the proposed project.
The proposed project is Residential Apartment and Commercial building project
Bus Stops: 1.0 km from site
Railway station: 6.5 Km from site
7.3. Will the project cause adverse effects on local communities, disturbance to
sacred sites or other cultural values? What are the safeguards proposed?
-NO-
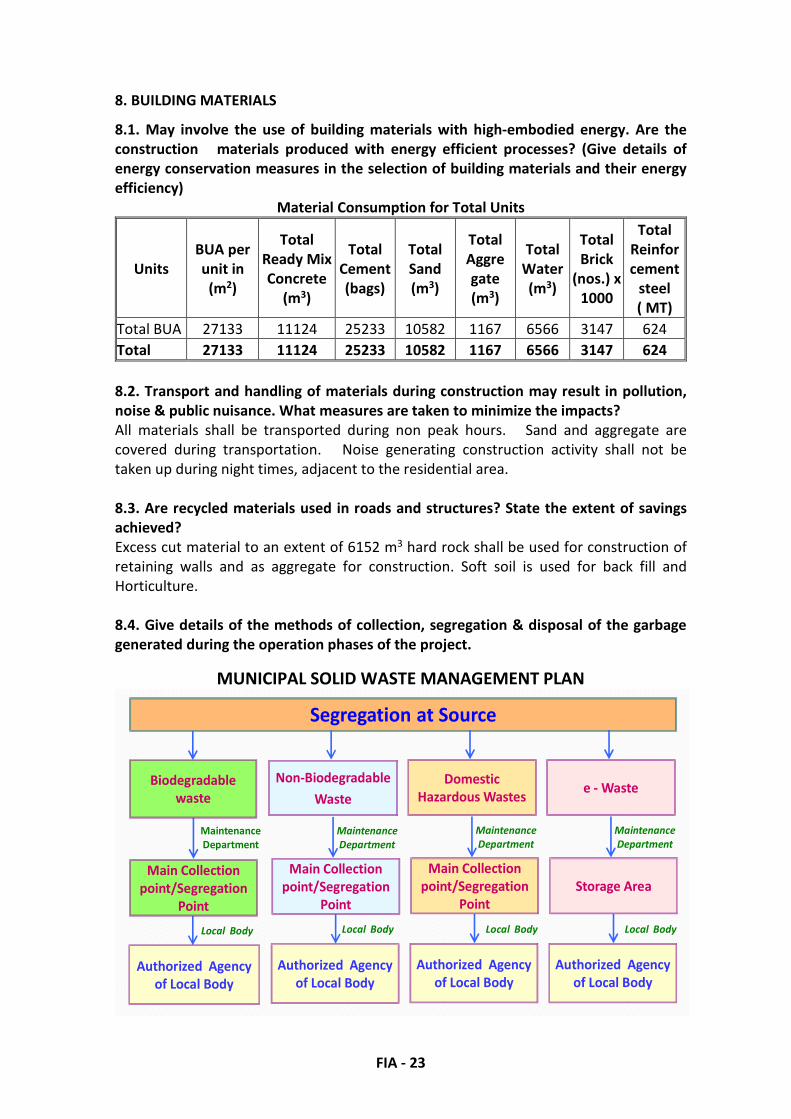
FIA - 23
8. BUILDING MATERIALS
8.1. May involve the use of building materials with high-embodied energy. Are the
construction materials produced with energy efficient processes? (Give details of
energy conservation measures in the selection of building materials and their energy
efficiency)
Material Consumption for Total Units
Units
BUA per
unit in
(m2)
Total
Ready Mix
Concrete
(m3)
Total
Cement
(bags)
Total
Sand
(m3)
Total
Aggre
gate
(m3)
Total
Water
(m3)
Total
Brick
(nos.) x
1000
Total
Reinfor
cement
steel
( MT)
Total BUA 27133 11124 25233 10582 1167 6566 3147 624
Total 27133 11124 25233 10582 1167 6566 3147 624
8.2. Transport and handling of materials during construction may result in pollution,
noise & public nuisance. What measures are taken to minimize the impacts?
All materials shall be transported during non peak hours. Sand and aggregate are
covered during transportation. Noise generating construction activity shall not be
taken up during night times, adjacent to the residential area.
8.3. Are recycled materials used in roads and structures? State the extent of savings
achieved?
Excess cut material to an extent of 6152 m3 hard rock shall be used for construction of
retaining walls and as aggregate for construction. Soft soil is used for back fill and
Horticulture.
8.4. Give details of the methods of collection, segregation & disposal of the garbage
generated during the operation phases of the project.
MUNICIPAL SOLID WASTE MANAGEMENT PLAN
Maintenance
Department
Maintenance
Department
Biodegradable
waste
Non-Biodegradable
Waste
Authorized Agency
of Local BodyAuthorized Agency
of Local Body
Main Collection
point/Segregation
Point
Main Collection
point/Segregation
Point
Local Body
Segregation at Source
Maintenance
Department
Domestic
Hazardous Wastes
Authorized Agency
of Local Body
Main Collection
point/Segregation
Point
Local Body Local Body
Maintenance
Department
e - Waste
Authorized Agency
of Local Body
Storage Area
Local Body
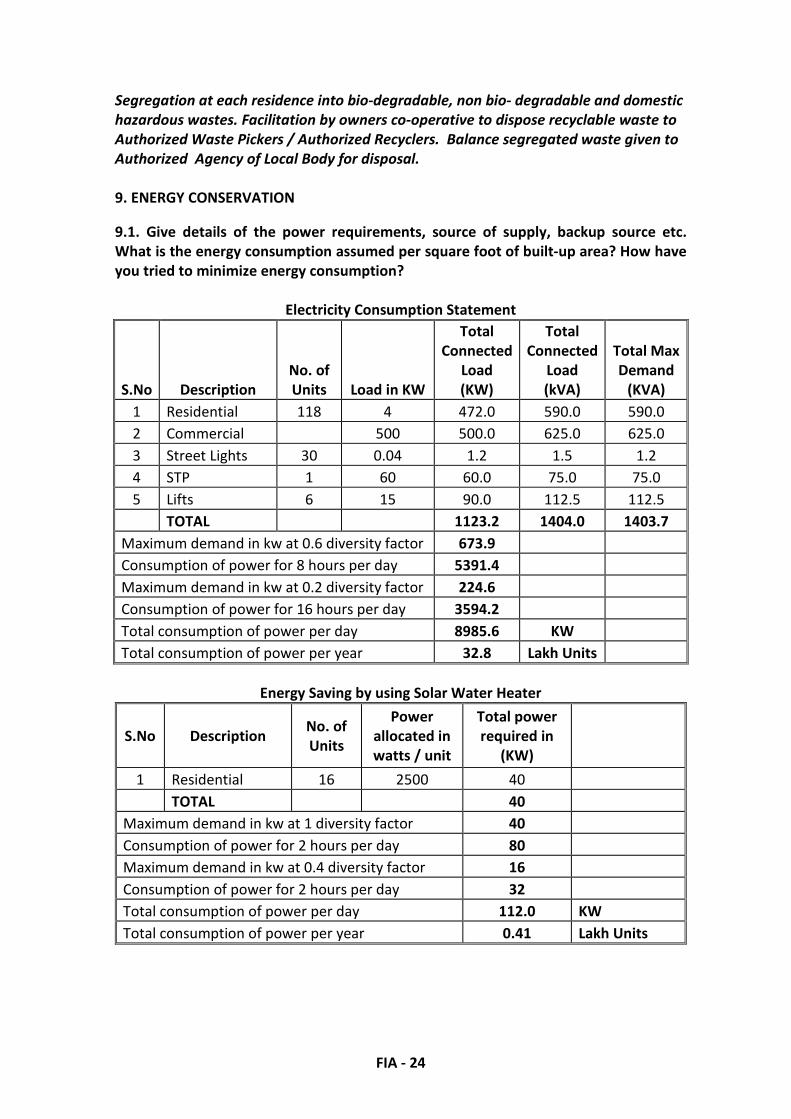
FIA - 24
Segregation at each residence into bio-degradable, non bio- degradable and domestic
hazardous wastes. Facilitation by owners co-operative to dispose recyclable waste to
Authorized Waste Pickers / Authorized Recyclers. Balance segregated waste given to
Authorized Agency of Local Body for disposal.
9. ENERGY CONSERVATION
9.1. Give details of the power requirements, source of supply, backup source etc.
What is the energy consumption assumed per square foot of built-up area? How have
you tried to minimize energy consumption?
Electricity Consumption Statement
S.No Description
No. of
Units Load in KW
Total
Connected
Load
(KW)
Total
Connected
Load
(kVA)
Total Max
Demand
(KVA)
1 Residential 118 4 472.0 590.0 590.0
2 Commercial 500 500.0 625.0 625.0
3 Street Lights 30 0.04 1.2 1.5 1.2
4 STP 1 60 60.0 75.0 75.0
5 Lifts 6 15 90.0 112.5 112.5
TOTAL 1123.2 1404.0 1403.7
Maximum demand in kw at 0.6 diversity factor 673.9
Consumption of power for 8 hours per day 5391.4
Maximum demand in kw at 0.2 diversity factor 224.6
Consumption of power for 16 hours per day 3594.2
Total consumption of power per day 8985.6 KW
Total consumption of power per year 32.8 Lakh Units
Energy Saving by using Solar Water Heater
S.No Description No. of
Units
Power
allocated in
watts / unit
Total power
required in
(KW)
1 Residential 16 2500 40
TOTAL 40
Maximum demand in kw at 1 diversity factor 40
Consumption of power for 2 hours per day 80
Maximum demand in kw at 0.4 diversity factor 16
Consumption of power for 2 hours per day 32
Total consumption of power per day 112.0 KW
Total consumption of power per year 0.41 Lakh Units
LO
CA
L B
OD
IES
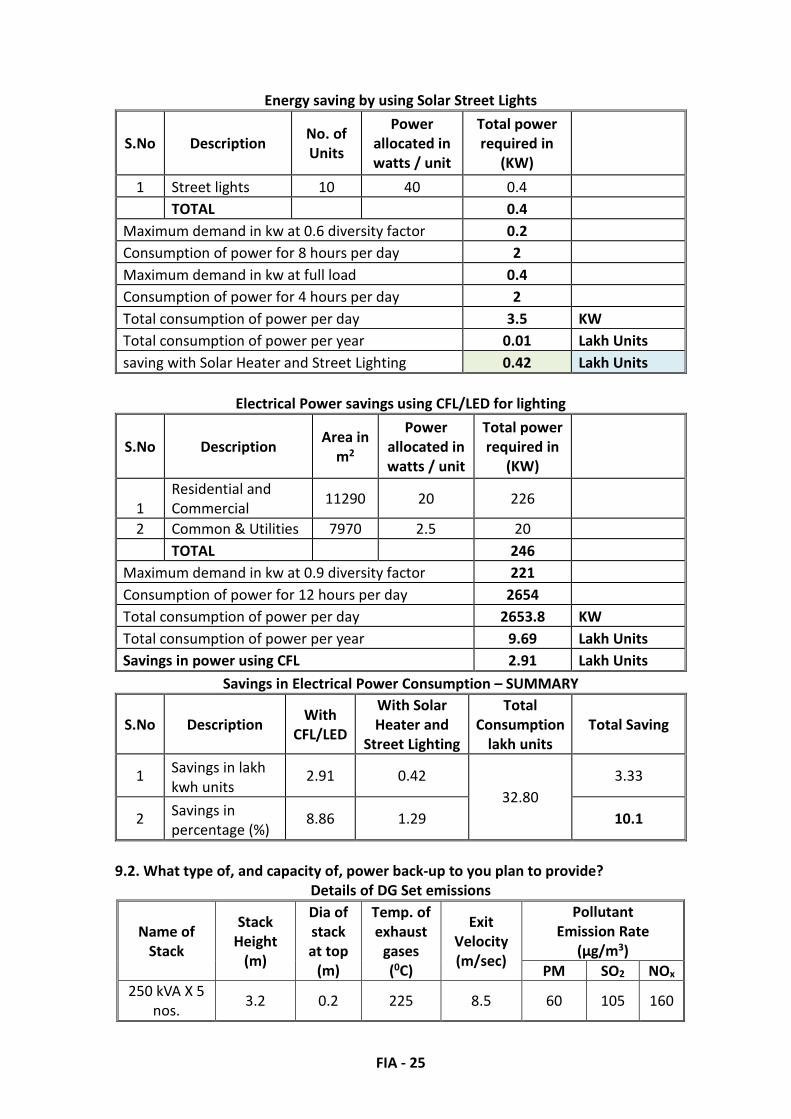
FIA - 25
Energy saving by using Solar Street Lights
S.No Description No. of
Units
Power
allocated in
watts / unit
Total power
required in
(KW)
1 Street lights 10 40 0.4
TOTAL 0.4
Maximum demand in kw at 0.6 diversity factor 0.2
Consumption of power for 8 hours per day 2
Maximum demand in kw at full load 0.4
Consumption of power for 4 hours per day 2
Total consumption of power per day 3.5 KW
Total consumption of power per year 0.01 Lakh Units
saving with Solar Heater and Street Lighting 0.42 Lakh Units
Electrical Power savings using CFL/LED for lighting
S.No Description Area in
m2
Power
allocated in
watts / unit
Total power
required in
(KW)
1
Residential and
Commercial 11290 20 226
2 Common & Utilities 7970 2.5 20
TOTAL 246
Maximum demand in kw at 0.9 diversity factor 221
Consumption of power for 12 hours per day 2654
Total consumption of power per day 2653.8 KW
Total consumption of power per year 9.69 Lakh Units
Savings in power using CFL 2.91 Lakh Units
Savings in Electrical Power Consumption – SUMMARY
S.No Description With
CFL/LED
With Solar
Heater and
Street Lighting
Total
Consumption
lakh units
Total Saving
1 Savings in lakh
kwh units 2.91 0.42
32.80
3.33
2 Savings in
percentage (%) 8.86 1.29 10.1
9.2. What type of, and capacity of, power back-up to you plan to provide?
Details of DG Set emissions
Name of
Stack
Stack
Height
(m)
Dia of
stack
at top
(m)
Temp. of
exhaust
gases
(0C)
Exit
Velocity
(m/sec)
Pollutant
Emission Rate
(µg/m3)
PM SO2 NOx
250 kVA X 5
nos. 3.2 0.2 225 8.5 60 105 160

FIA - 26
9.3. What are the characteristics of the glass you plan to use? Provide specifications of
its characteristics related to both short wave and long wave radiation?
The façade is not made of glass, and the glass requirement is only for windows. The
glass characteristics are presented as follows;
Characteristics of Glass utilized.
Normal Anti-firing type
Seethrough(SE) Non-
seethrough(NS) SE NS
Nominal thickness 6 8 10 6 10 9.8 9.8
Structure
Out glass FL3 FL4 FL5 G3 G5 PWN 6.8 GWN 6.8
vacuum 0.2 0.2 0.2 0.2 0.2 0.2 0.2
In glass Low-E 3 Low-E 4 Low-E 5 Low-E 3 Low-E 3 Low-E 3 Low-E 3
Visible TL (%) 75.5 74.6 73.8 75.5 73.8 72.4 72.4
RL (%) 15.9 15.8 15.6 15.9 15.6 16.8 16.8
Solar
TS (%) 62.6 60.1 57.8 62.6 57.8 56.9 56.9
RS (%) 14.1 13.6 13.2 14.1 13.2 14.2 14.2
AS (%) 23.3 26.3 29.0 23.3 29.0 28.9 28.9
Solar heat gain 0.76 0.74 0.72 0.69 0.66 0.69 0.63
Thermal
insulation
(W/m2K)
(kcal/m2hr
C)
1.5 1.5 1.5 1.5 1.5 1.5 1.5
1.3 1.3 1.3 1.3 1.3 1.3 1.3
Sound reduction
(JIS grade) 30 30 30 30 30 35 35
Maximum size(mm)
Minimum size(mm)
2,400 x 1,350
350 x 200
1,800 x1,200
350 x 200
L M
350 x 200
9.4. What passive solar architectural features are being used in the building? Illustrate
the applications made in the proposed project.
The width to height ratio between the blocks is around 1:1.5 which is achieved
as per the development control rules.
All window openings is provided with chajjas depth as specified by the design
standards (around 300mm)
The full height openings have been designed for better lighting in the
apartments units. For climatic considerations, all these openings are placed next
to a balcony/sit out space, which acts as a buffer by eliminating the direct
lighting and thereby avoiding heat ingress.
Use of Large fenestrations in buildings reduces the use of mechanical light
energy during daytime thereby reducing the energy consumption.
9.5. Does the layout of streets & buildings maximize the potential for solar energy
devices? Have you considered the use of street lighting, emergency lighting and solar
hot water systems for use in the building complex? Substantiate with details.
Solar power shall be used for external lightning (street lightning, landscape, basement,
etc.).
FIA - 27
9.6. Is shading effectively used to reduce cooling/heating loads? What principles have
been used to maximize the shading of Walls on the East and the West and the Roof?
How much energy saving has been effected?
Yes, the block is aligned north and south to maximize the shading.
9.7. Do the structures use energy-efficient space conditioning, lighting and mechanical
systems? Provide technical details. Provide details of the transformers and motor
efficiencies, lighting intensity and air-conditioning load assumptions? Are you using
CFC and HCFC free chillers? Provide specifications.
Building Materials
1) The building materials chosen for the blocks are as per the recommendations of
the climatic standards.
2) To achieve the maximum energy value, a balance between the availability of
building materials locally and skilled labourers is achieved.
3) Burnt brickwork with fly ash for the walling and plastering reduces the thermal
penetration by 20-30%.
4) The RCC roof is covered with Brickbat concrete and terracotta weather tiles,
which reduces the heat penetration by 18%.
Colour of Facades
1) The colour choice for the buildings uses a maximum of white surface (nearly
84%). This increases the solar reflectivity factor.
2) Emittance factor for white surfaces is around 90% compared to coloured surface
(20-60%)
3) 16% of wall area uses earthen colours and this space has longer thermal storage
in the walls. This creates a comfortable temperature at nights due to the thicker
walls designed.
4) Heat Absorbance of the brick used for building is around 50%.
5) The roof of the units (if not covered with terrace garden) is painted white to
have a maximum reflectivity.
6) The R-factor (resistance factor) for the roof with brickbats and white painted is
nearly 40% more as compared to the recommended standards.
9.8. What are the likely effects of the building activity in altering the microclimates?
Provide a self-assessment on the likely impacts of the proposed construction on
creation of heat island & inversion effects?
Green Roofs
Green roofs are an attractive roofing option that can reduce urban heat islands by
providing shade and through evapotranspiration, the release of water from plants to
the surrounding air. The benefits of green roofs include:
Reduce sewage system loads by assimilating large amounts of rainwater.
Absorb air pollution, collect airborne particulates, and store carbon.
Protect underlying roof material by eliminating exposure to the sun's ultraviolet
(UV) radiation and extreme daily temperature fluctuations.
Serve as living environments that provide habitats for birds and other small
animals.

FIA - 28
Offer an attractive alternative to traditional roofs, addressing growing concerns
about urban quality of life.
Reduce noise transfer from the outdoors.
Insulate a building from extreme temperatures, mainly by keeping the building
interior cool in the summer.
9.9. What are the thermal characteristics of the building envelope? (a) Roof (b)
External walls and (c) Fenestration? Give details of the material used and the U-values
or the R-values of the individual components.
S. No. Components U - value
1 Walls 2.44
2 Roofs 3.35
3 Floors 1.13
4 Windows 5.67
9.10. What precautions & safety measures are proposed against fire hazards? Furnish
details of emergency plans.
-NA-
9.11. If you are using glass as wall material provides details and specifications
including emissivity and thermal characteristics.
-No-
9.12. What is the rate of air infiltration into the building? Provide details of how you
are mitigating the effects of infiltration.
4 A changes = 4.
9.13. To what extent the non-conventional energy technologies are utilized in the
overall energy consumption? Provide details of the renewable energy technologies
used.
-Nil-
10. ENVIRONMENT MANAGEMENT PLAN
The Environment Management Plan would consist of all mitigation measures for each
item wise activity to be undertaken during the construction, operation and the entire
life cycle to minimize adverse environmental impacts as a result of the activities of
the project. It would also delineate the environmental monitoring plan for compliance
of various environmental regulations. It will state the steps to be taken in case of
emergency such as accidents at the site including fire.
Furnished in EIS/EMP report

SRI KOLLIPARA VASUDEVA RAO AND SRI KOLLIPARA JOGA RAO
Survey No. 245/2, Kanuru, Penamaluru, Krishna District, Andhra Pradesh
Studies and Documentation by: M/s Team Labs and Consultants B-115, 116,117 & 509, Annapurna Block, Aditya Enclave, Ameerpet, Hyderabad- 500 038 Phone: 91-040-23748555/616 Fax : 91-040-23748666 e-mail: [email protected]


![Colec]ia PLURAL](https://static.fdokumen.com/doc/165x107/63165d23c32ab5e46f0dbd8a/colecia-plural.jpg)