Achieving Treatment Outcome With DPP4i for Diabetic Patient "Efficacy Beyond Sugar Control”
75
Achieving Treatment Outcome With DPP4i for Diabetic Patient “Efficacy Beyond Sugar Control” 1
-
Upload
suharti-wairagya -
Category
Health & Medicine
-
view
903 -
download
1
Transcript of Achieving Treatment Outcome With DPP4i for Diabetic Patient "Efficacy Beyond Sugar Control”
Achieving Treatment Outcome
With DPP4i for Diabetic Patient
“Efficacy Beyond Sugar
Control”
1
Riwayat Hidup :
Nama : Dr Eddy Supriadi, Sp.PD, FINASIM
Tempat/ Tgl. Lahir : Jakarta, 19 Feb 1968
Pendidikan : Dokter FKUI 1993, Penyakit Dalam
FKUI 2006
Tempat Kerja : RS Dr H. MARZOEKI MAHDI
Pengalaman :
- Inspire Diabetes Program. PERKENI Indonesia-
STENO Denmark. Jakarta 2013.
- Workshop and Symposium on the Diabetic Foot.
Noordwijkerhout, The Netherlands, 2011
- dll.
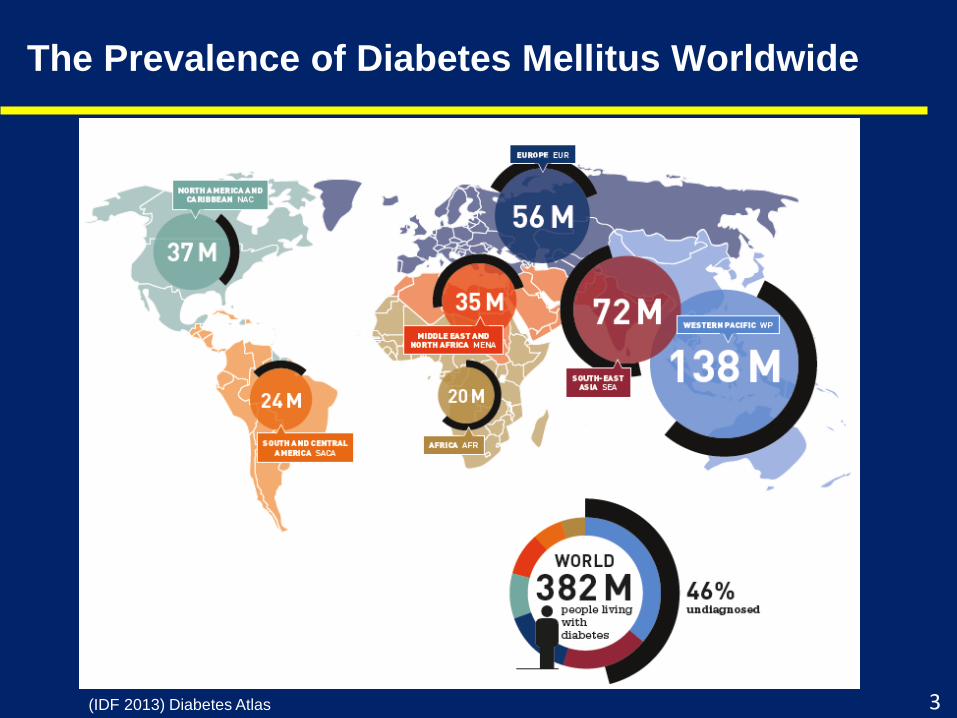
The Prevalence of Diabetes Mellitus Worldwide
(IDF 2013) Diabetes Atlas 3
PART I
DIABETES UPDATE
4
ADA Diabetes Care 2015
5
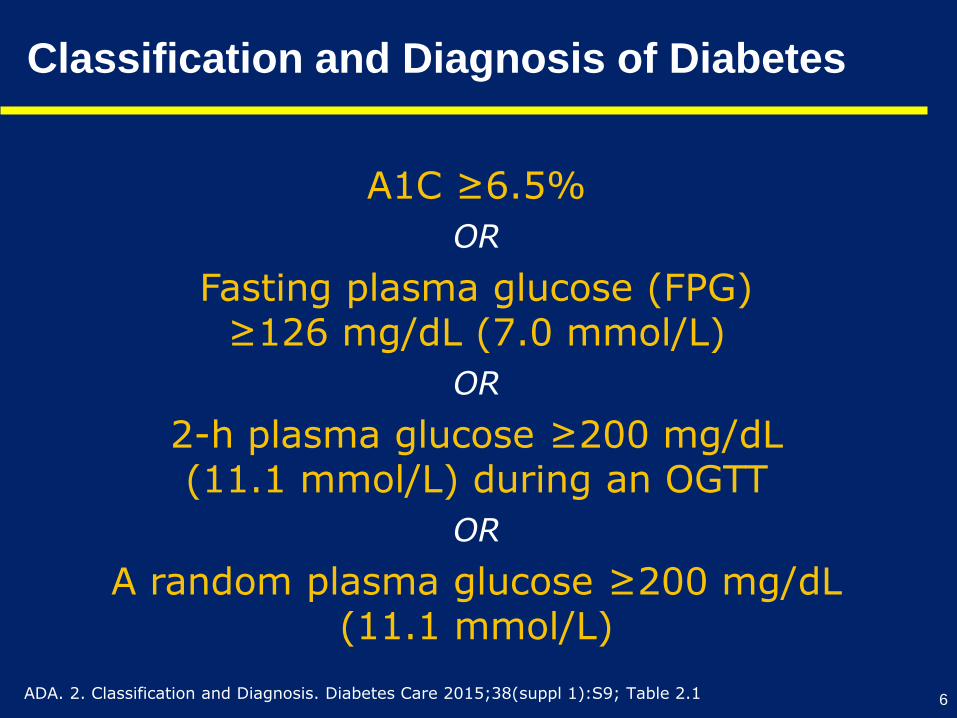
Classification and Diagnosis of Diabetes
6
A1C ≥6.5%
OR
Fasting plasma glucose (FPG)≥126 mg/dL (7.0 mmol/L)
OR
2-h plasma glucose ≥200 mg/dL(11.1 mmol/L) during an OGTT
OR
A random plasma glucose ≥200 mg/dL(11.1 mmol/L)
ADA. 2. Classification and Diagnosis. Diabetes Care 2015;38(suppl 1):S9; Table 2.1
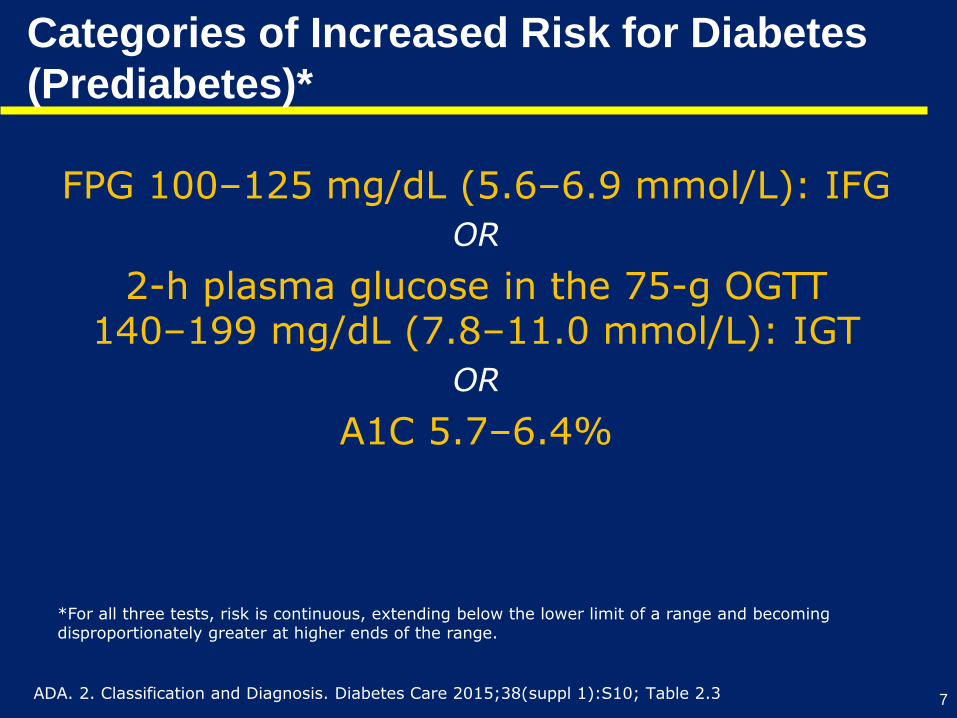
Categories of Increased Risk for Diabetes
(Prediabetes)*
7
FPG 100–125 mg/dL (5.6–6.9 mmol/L): IFG
OR
2-h plasma glucose in the 75-g OGTT140–199 mg/dL (7.8–11.0 mmol/L): IGT
OR
A1C 5.7–6.4%
*For all three tests, risk is continuous, extending below the lower limit of a range and becoming disproportionately greater at higher ends of the range.
ADA. 2. Classification and Diagnosis. Diabetes Care 2015;38(suppl 1):S10; Table 2.3
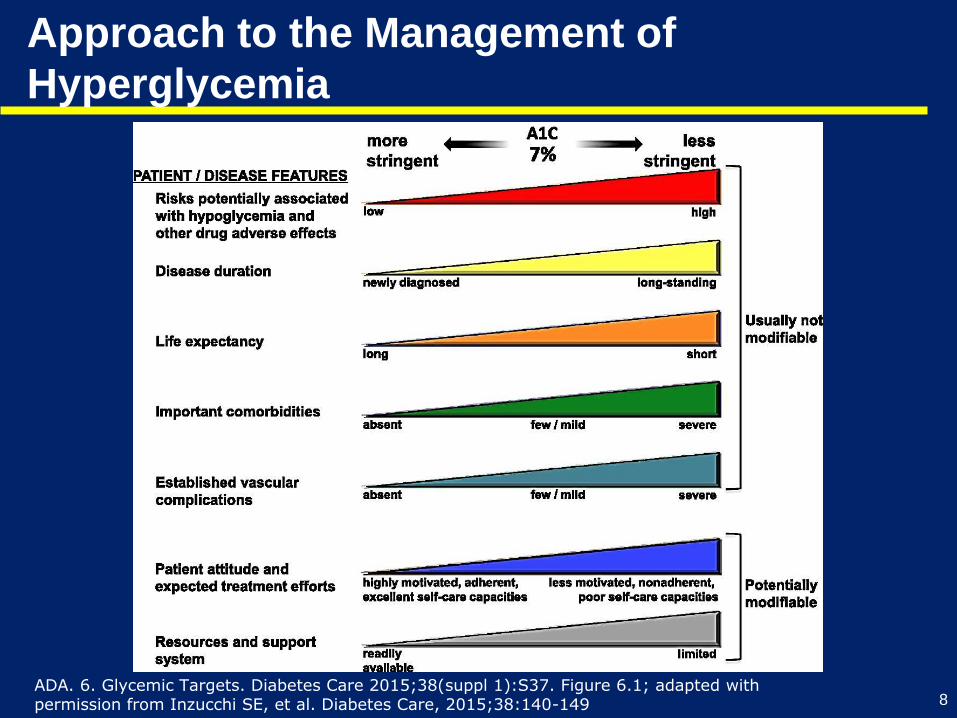
Approach to the Management of
Hyperglycemia
8ADA. 6. Glycemic Targets. Diabetes Care 2015;38(suppl 1):S37. Figure 6.1; adapted with permission from Inzucchi SE, et al. Diabetes Care, 2015;38:140-149
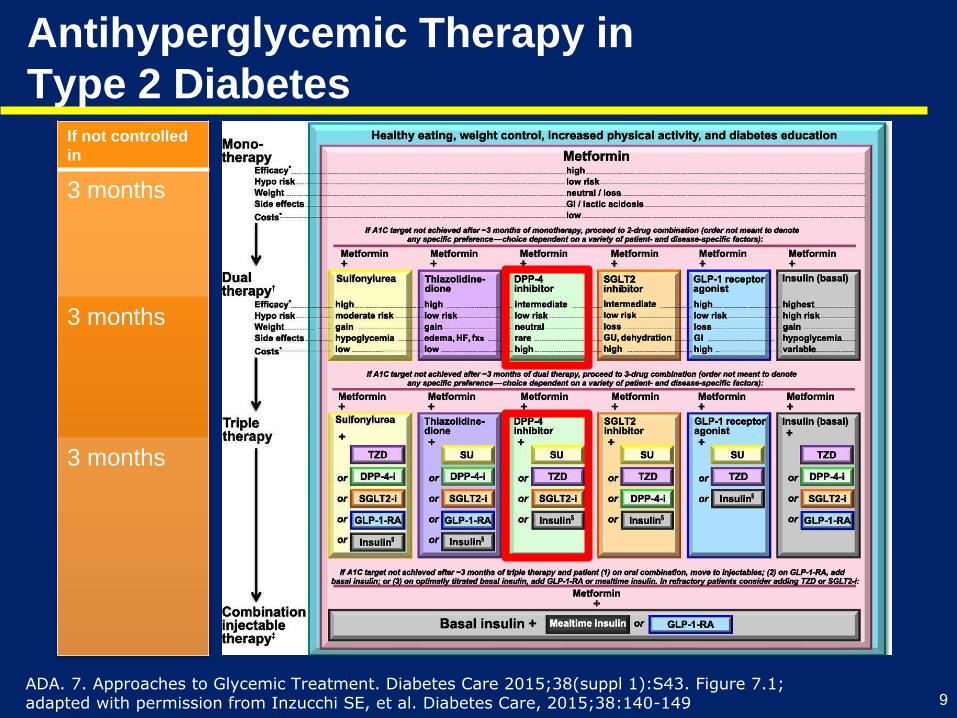
Antihyperglycemic Therapy in
Type 2 Diabetes
9
If not controlled
in
3 months
3 months
3 months
ADA. 7. Approaches to Glycemic Treatment. Diabetes Care 2015;38(suppl 1):S43. Figure 7.1; adapted with permission from Inzucchi SE, et al. Diabetes Care, 2015;38:140-149

PERKENI 2015
10
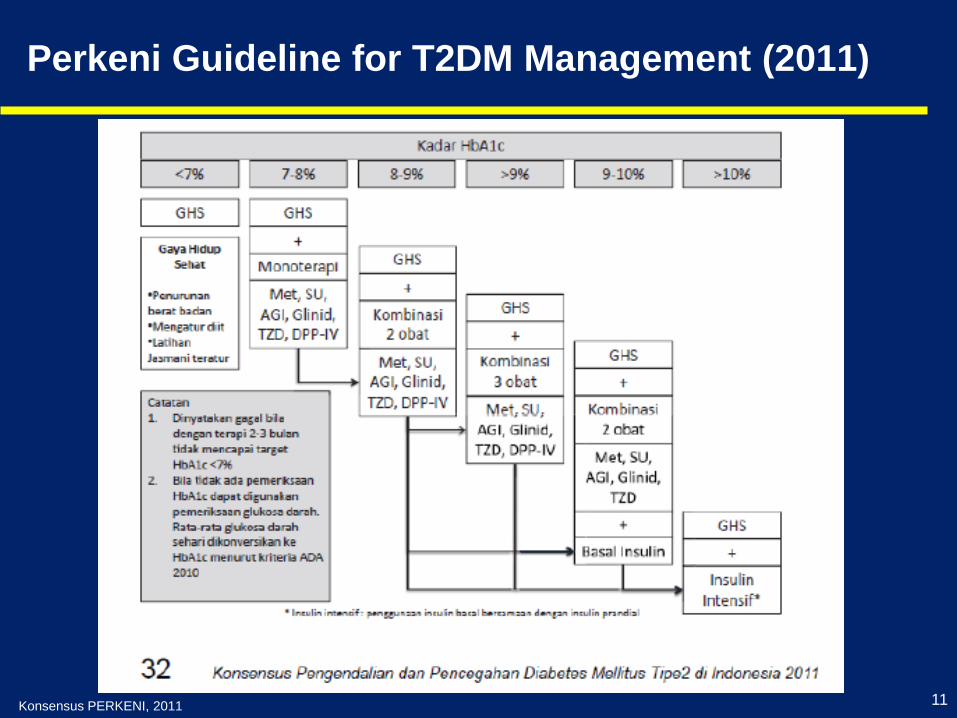
Konsensus PERKENI, 2011
Perkeni Guideline for T2DM Management (2011)
11
PART II
Incretins and DPP-4
Inhibition
12
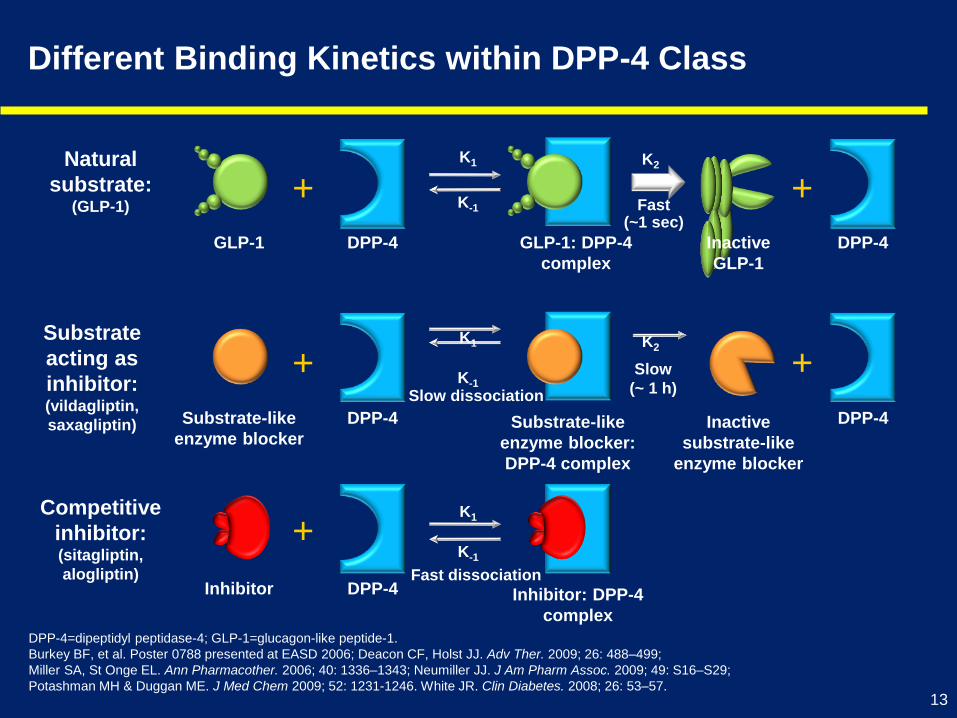
Different Binding Kinetics within DPP-4 Class
Natural
substrate:(GLP-1)
GLP-1
+
DPP-4
K-1
K1
GLP-1: DPP-4
complex
K2
Fast(~1 sec)
DPP-4Inactive
GLP-1
+
DPP-4=dipeptidyl peptidase-4; GLP-1=glucagon-like peptide-1.
Burkey BF, et al. Poster 0788 presented at EASD 2006; Deacon CF, Holst JJ. Adv Ther. 2009; 26: 488–499;
Miller SA, St Onge EL. Ann Pharmacother. 2006; 40: 1336–1343; Neumiller JJ. J Am Pharm Assoc. 2009; 49: S16–S29;
Potashman MH & Duggan ME. J Med Chem 2009; 52: 1231-1246. White JR. Clin Diabetes. 2008; 26: 53–57.
Substrate
acting as
inhibitor:(vildagliptin,
saxagliptin) Substrate-like
enzyme blocker
+
DPP-4
K-1
K1
Substrate-like
enzyme blocker:
DPP-4 complex
K2
Slow
(~ 1 h)
DPP-4Inactive
substrate-like
enzyme blocker
+Slow dissociation
Inhibitor
+
DPP-4
K-1
K1
Inhibitor: DPP-4
complex
Competitive
inhibitor:(sitagliptin,
alogliptin) Fast dissociation
13
DPP-4=dipeptidyl peptidase-4; GLP-1=glucagon-like peptide-1. Burkey BF, et al. Poster 0788 presented at EASD 2006; Deacon CF, Holst JJ. Adv Ther.
2009; 26: 488–499; Miller SA, St Onge EL. Ann Pharmacother. 2006; 40: 1336–1343; Neumiller JJ. J Am Pharm Assoc. 2009; 49: S16–S29; Potashman
MH, Duggan ME. J Med Chem 2009; 52: 1231–1246; White JR. Clin Diabetes. 2008; 26: 53–57.
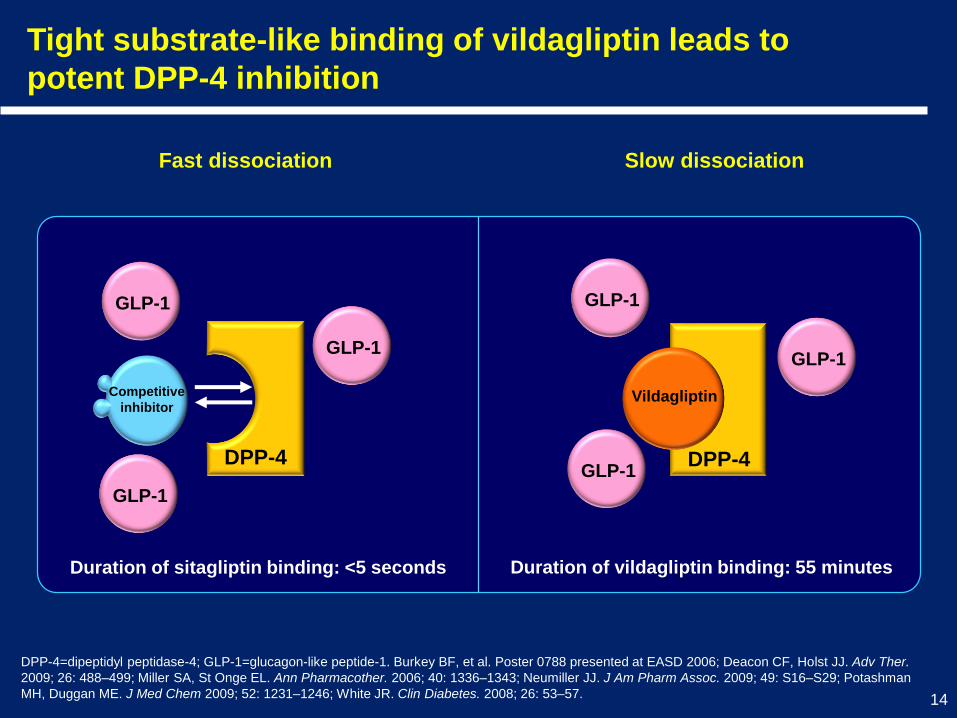
Fast dissociation Slow dissociation
GLP-1
GLP-1
GLP-1
DPP-4
Competitive
inhibitor
GLP-1
GLP-1
GLP-1DPP-4
Vildagliptin
Tight substrate-like binding of vildagliptin leads to
potent DPP-4 inhibition
Duration of sitagliptin binding: <5 seconds Duration of vildagliptin binding: 55 minutes
14
0
20
40
60
80
100
120
-2 -1 0 1 2 3 4 5 6 7 8 9 10 11 12 13 14 15 16
Vildagliptin 50 mg twice daily
Sitagliptin 100 mg once daily
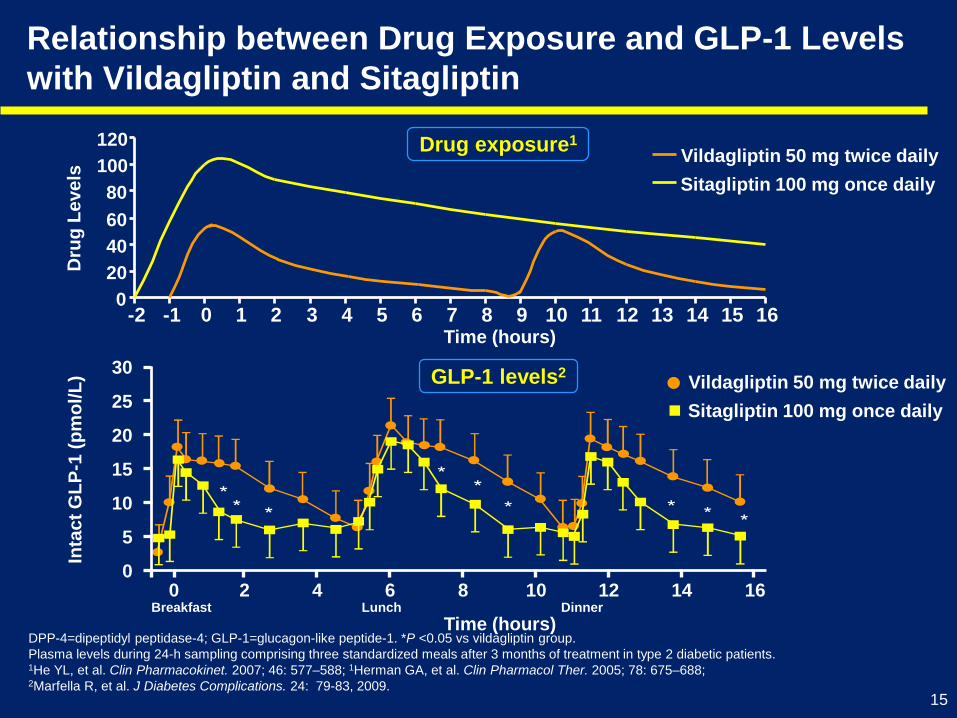
Relationship between Drug Exposure and GLP-1 Levels
with Vildagliptin and SitagliptinD
rug
Le
ve
ls
Drug exposure1
DPP-4=dipeptidyl peptidase-4; GLP-1=glucagon-like peptide-1. *P <0.05 vs vildagliptin group.
Plasma levels during 24-h sampling comprising three standardized meals after 3 months of treatment in type 2 diabetic patients. 1He YL, et al. Clin Pharmacokinet. 2007; 46: 577–588; 1Herman GA, et al. Clin Pharmacol Ther. 2005; 78: 675–688; 2Marfella R, et al. J Diabetes Complications. 24: 79-83, 2009.
Inta
ct
GL
P-1
(p
mo
l/L
)
Time (hours)
0 2 4 6 8 10 12 14 160
5
10
15
20
25
30
Breakfast Lunch Dinner
Vildagliptin 50 mg twice daily
Sitagliptin 100 mg once daily
Time (hours)
GLP-1 levels2
15
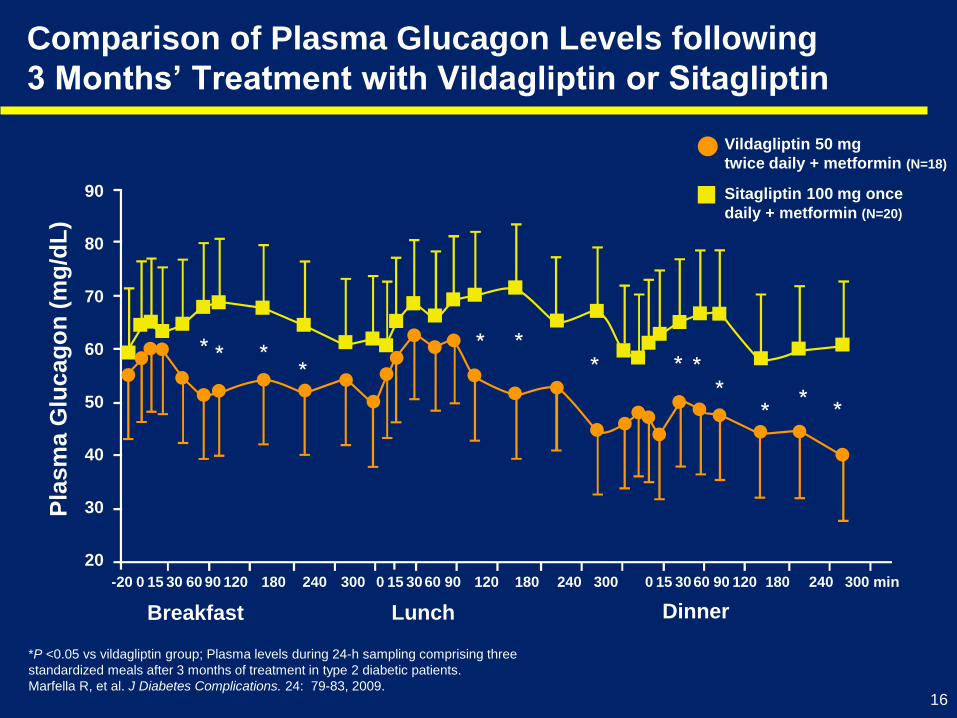
Comparison of Plasma Glucagon Levels following
3 Months’ Treatment with Vildagliptin or Sitagliptin
Sitagliptin 100 mg once
daily + metformin (N=20)
Vildagliptin 50 mg
twice daily + metformin (N=18)
*P <0.05 vs vildagliptin group; Plasma levels during 24-h sampling comprising three
standardized meals after 3 months of treatment in type 2 diabetic patients.
Marfella R, et al. J Diabetes Complications. 24: 79-83, 2009.
90
80
70
60
50
40
30
20
Breakfast Lunch Dinner
Pla
sm
a G
lucag
on
(m
g/d
L)
-20 0 15 30 60 90 120 180 240 300 0 15 3060 90 120 180 240 300 0 15 3060 90 120 180 240 300 min
16
Dysglycaemia of Diabetes
Vascular complications in diabetes are mainly or partly dependent
on dysglycaemia
2 components:
• Sustained chronic hyperglycaemia
• Acute glucose fluctuations
Both component lead to diabetes complication through:
• Excessive protein glycation
• Activation of oxidative stress
Monnier L et al. J Diabetes Sci Technol 2008;2:1094-1100 17
Glycaemic variability
Glycaemic variability – an important parameter
used to resolve potential clinical problems in
diabetic patients
Acts as independent risk factor for diabetic
complications, although HbA1c values were
intensely treated
Zaccardi F et al. J Diabetes Sci Technol 2008;2:1061-5 18
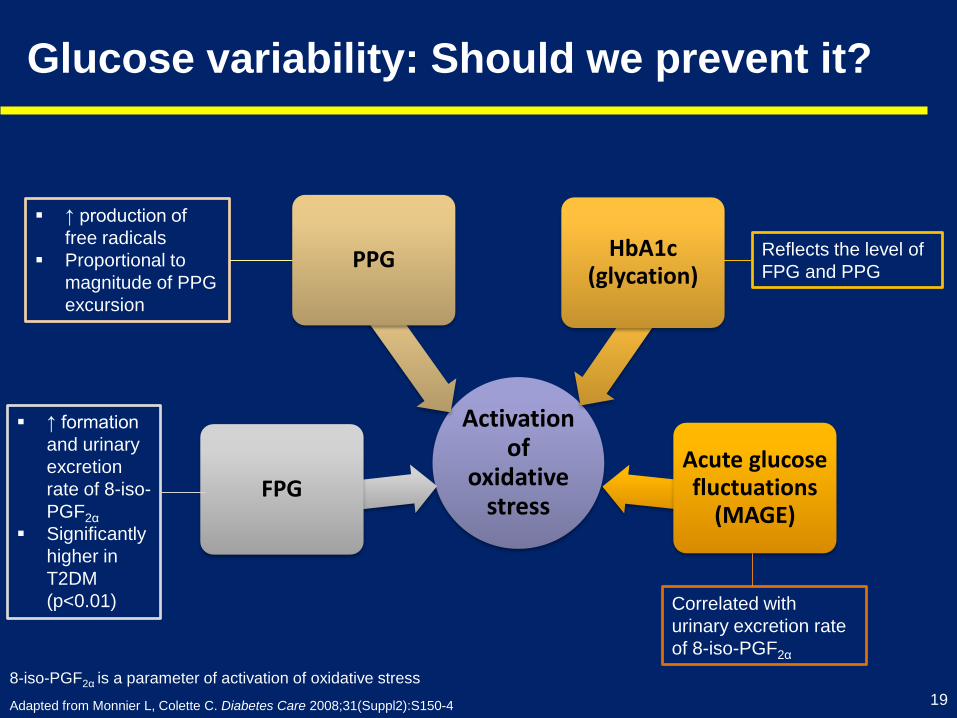
Glucose variability: Should we prevent it?
Activation of
oxidative stress
FPG
PPG HbA1c (glycation)
Acute glucose fluctuations
(MAGE)
Adapted from Monnier L, Colette C. Diabetes Care 2008;31(Suppl2):S150-4
Correlated with
urinary excretion rate
of 8-iso-PGF2α
Reflects the level of
FPG and PPG
↑ production of
free radicals
Proportional to
magnitude of PPG
excursion
↑ formation
and urinary
excretion
rate of 8-iso-
PGF2α
Significantly
higher in
T2DM
(p<0.01)
8-iso-PGF2α is a parameter of activation of oxidative stress
19
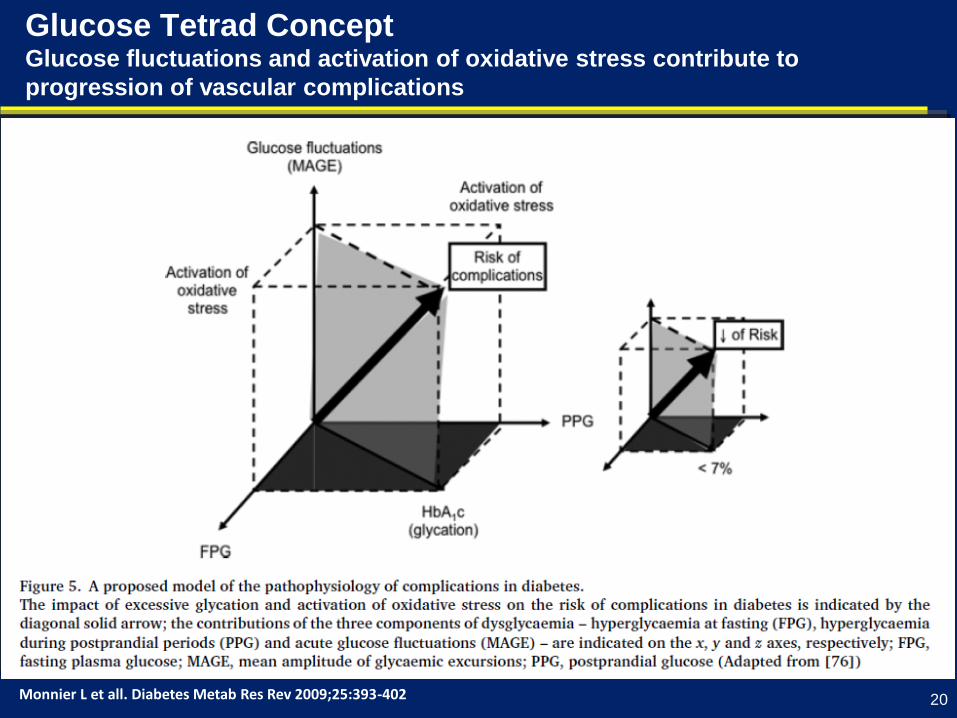
Glucose Tetrad ConceptGlucose fluctuations and activation of oxidative stress contribute to
progression of vascular complications
Monnier L et all. Diabetes Metab Res Rev 2009;25:393-402 20
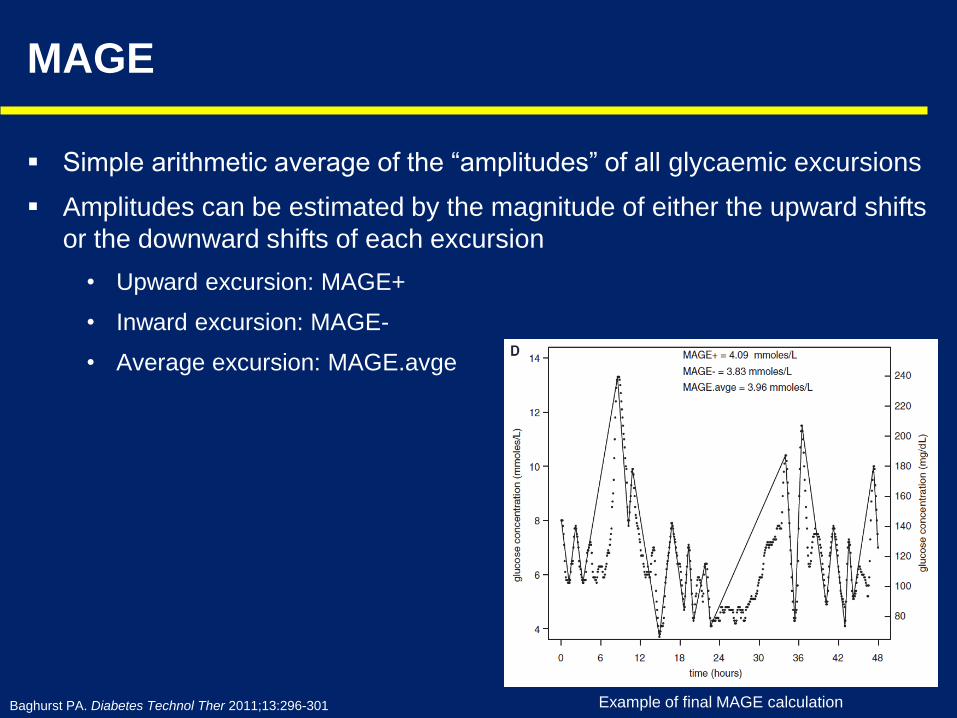
MAGE
Simple arithmetic average of the “amplitudes” of all glycaemic excursions
Amplitudes can be estimated by the magnitude of either the upward shifts
or the downward shifts of each excursion
• Upward excursion: MAGE+
• Inward excursion: MAGE-
• Average excursion: MAGE.avge
Baghurst PA. Diabetes Technol Ther 2011;13:296-301 Example of final MAGE calculation
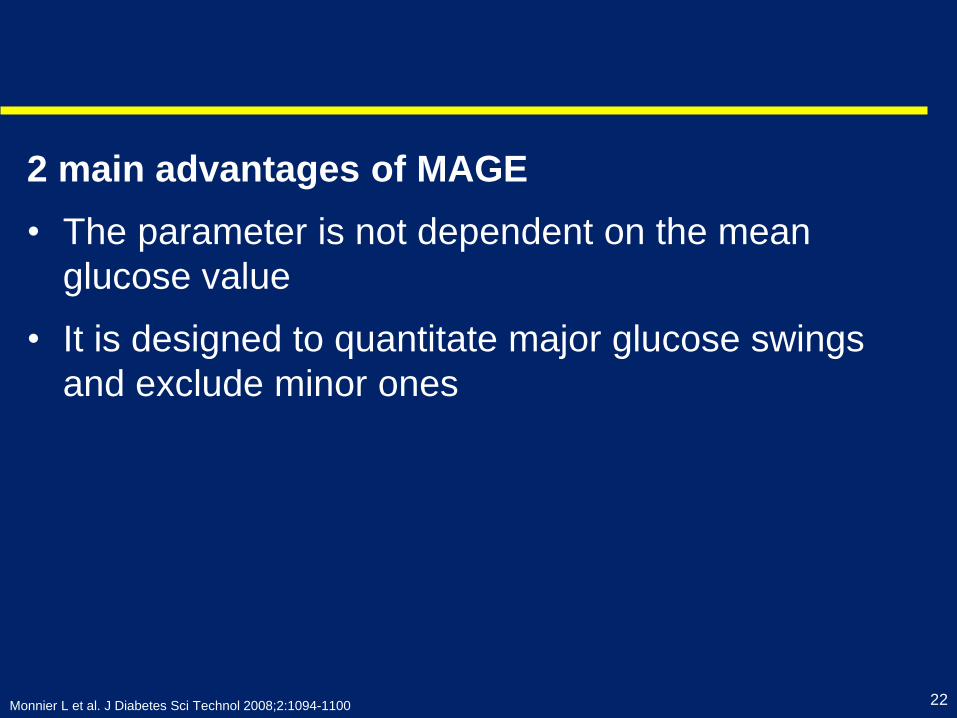
2 main advantages of MAGE
• The parameter is not dependent on the mean
glucose value
• It is designed to quantitate major glucose swings
and exclude minor ones
Monnier L et al. J Diabetes Sci Technol 2008;2:1094-1100 22
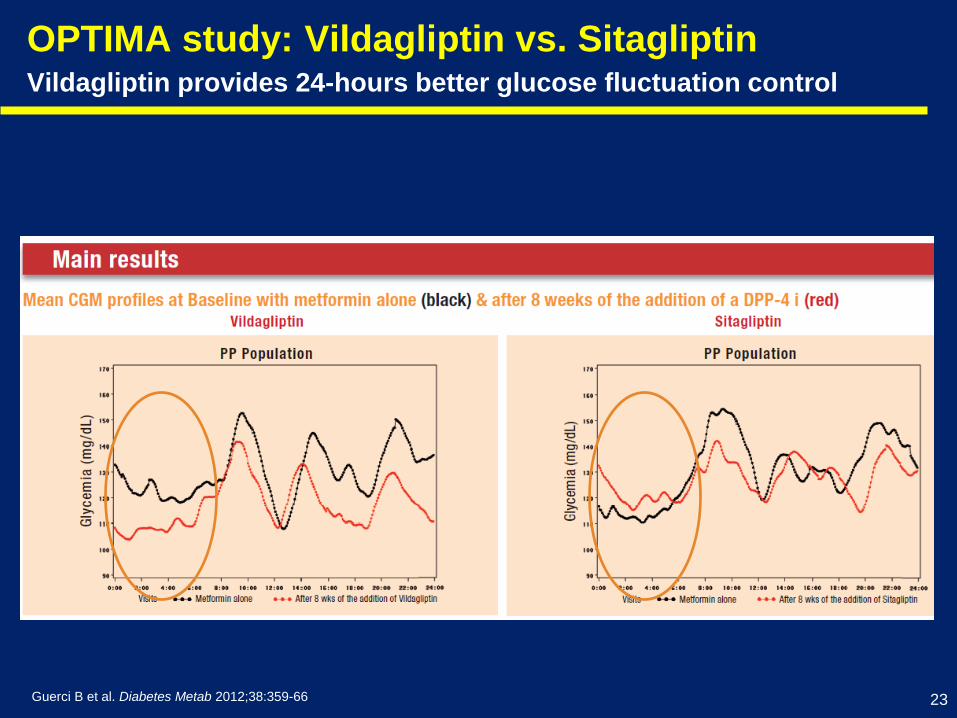
OPTIMA study: Vildagliptin vs. SitagliptinVildagliptin provides 24-hours better glucose fluctuation control
Guerci B et al. Diabetes Metab 2012;38:359-66 23
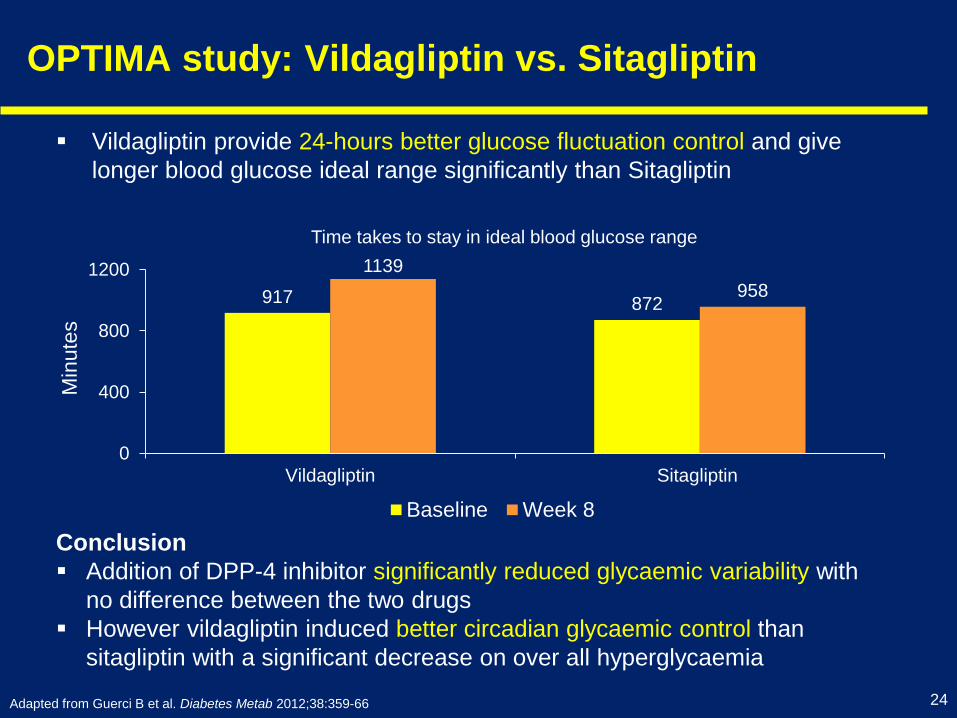
OPTIMA study: Vildagliptin vs. Sitagliptin
917 872
1139
958
0
400
800
1200
Vildagliptin Sitagliptin
Baseline Week 8
Vildagliptin provide 24-hours better glucose fluctuation control and give
longer blood glucose ideal range significantly than Sitagliptin
Min
ute
s
Adapted from Guerci B et al. Diabetes Metab 2012;38:359-66
Conclusion
Addition of DPP-4 inhibitor significantly reduced glycaemic variability with
no difference between the two drugs
However vildagliptin induced better circadian glycaemic control than
sitagliptin with a significant decrease on over all hyperglycaemia
Time takes to stay in ideal blood glucose range
24
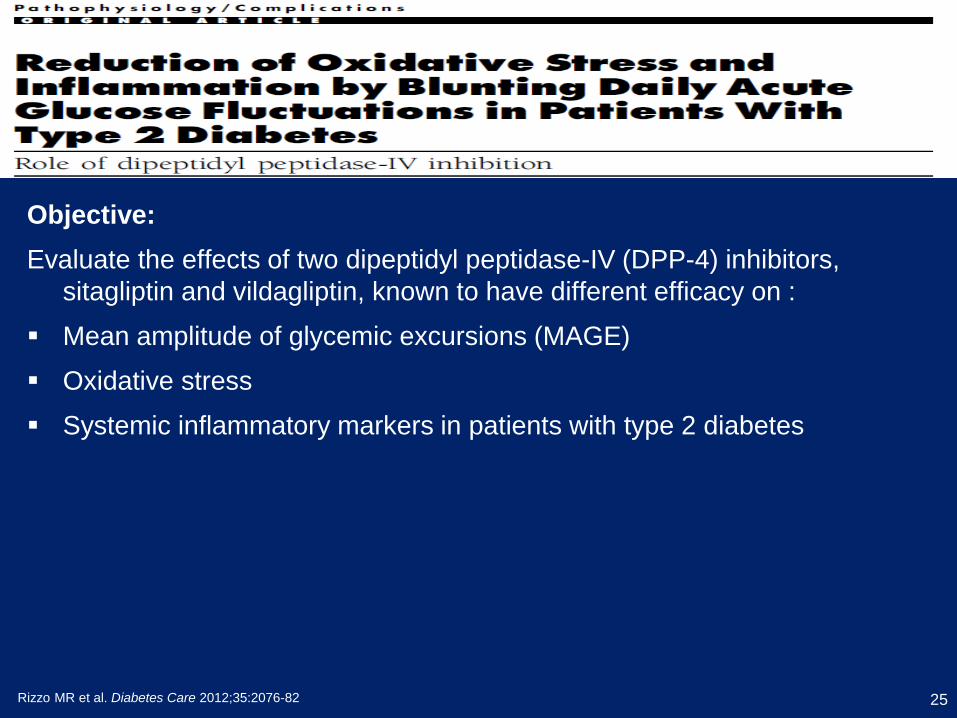
Objective:
Evaluate the effects of two dipeptidyl peptidase-IV (DPP-4) inhibitors,
sitagliptin and vildagliptin, known to have different efficacy on :
Mean amplitude of glycemic excursions (MAGE)
Oxidative stress
Systemic inflammatory markers in patients with type 2 diabetes
Rizzo MR et al. Diabetes Care 2012;35:2076-82 25
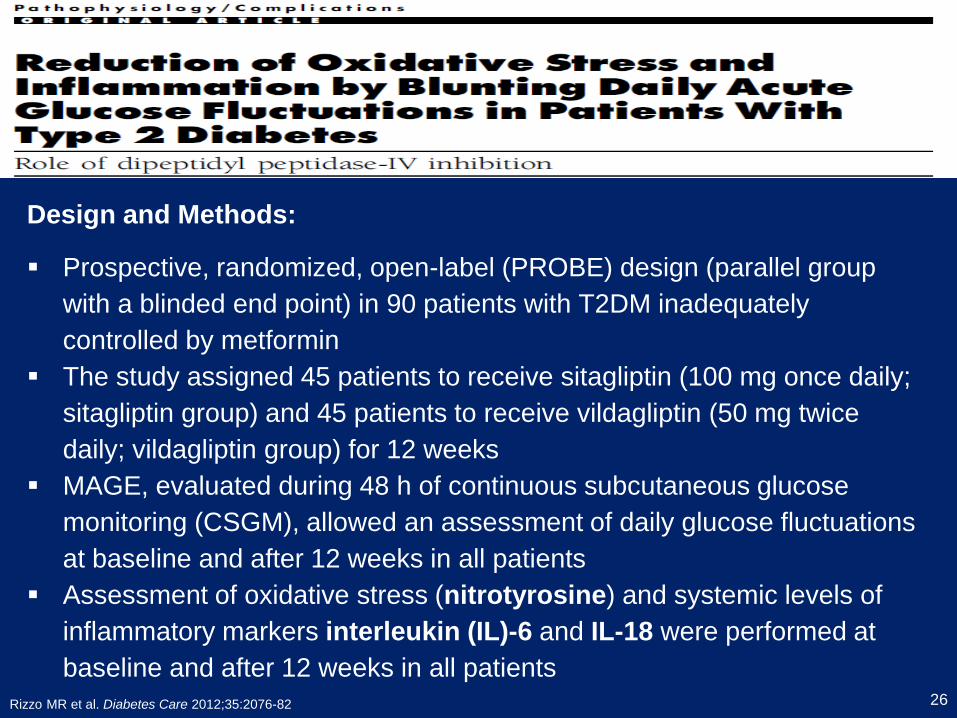
Design and Methods:
Prospective, randomized, open-label (PROBE) design (parallel group
with a blinded end point) in 90 patients with T2DM inadequately
controlled by metformin
The study assigned 45 patients to receive sitagliptin (100 mg once daily;
sitagliptin group) and 45 patients to receive vildagliptin (50 mg twice
daily; vildagliptin group) for 12 weeks
MAGE, evaluated during 48 h of continuous subcutaneous glucose
monitoring (CSGM), allowed an assessment of daily glucose fluctuations
at baseline and after 12 weeks in all patients
Assessment of oxidative stress (nitrotyrosine) and systemic levels of
inflammatory markers interleukin (IL)-6 and IL-18 were performed at
baseline and after 12 weeks in all patients
Rizzo MR et al. Diabetes Care 2012;35:2076-82 26
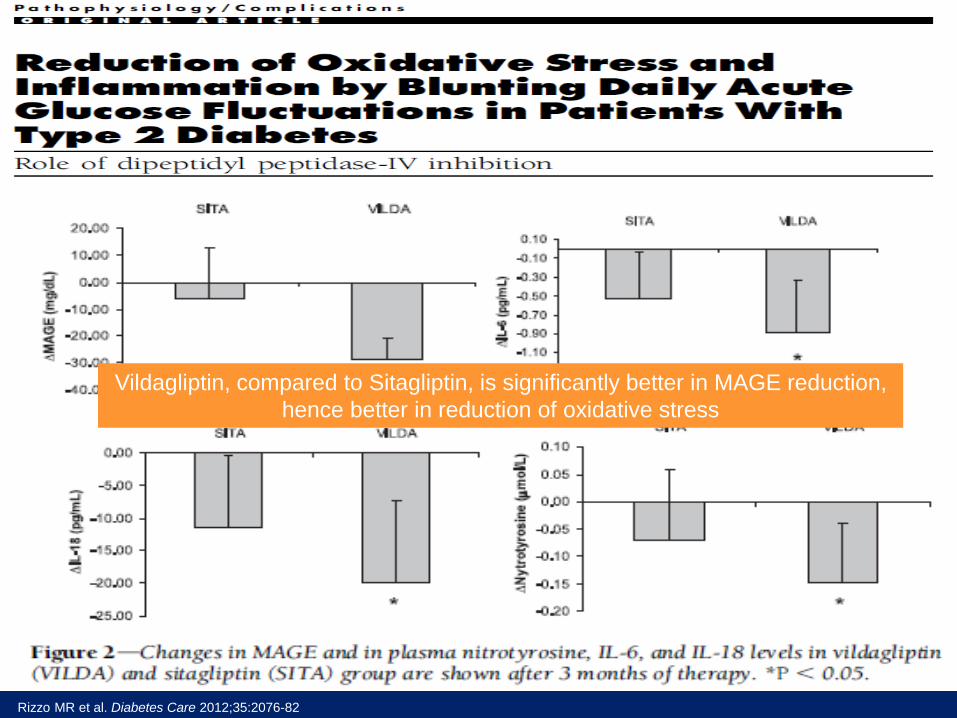
Vildagliptin, compared to Sitagliptin, is significantly better in MAGE reduction,
hence better in reduction of oxidative stress
Rizzo MR et al. Diabetes Care 2012;35:2076-82
Conclusion:
MAGE reduction is associated with reduction of oxidative stress and
markers of systemic inflammation in type 2 diabetic patients.
These effects were greater in the vildagliptin group than in the sitagliptin
group
Rizzo MR et al. Diabetes Care 2012;35:2076-82 28
PART III
Vildagliptin Concept In
T2DM Therapy
29
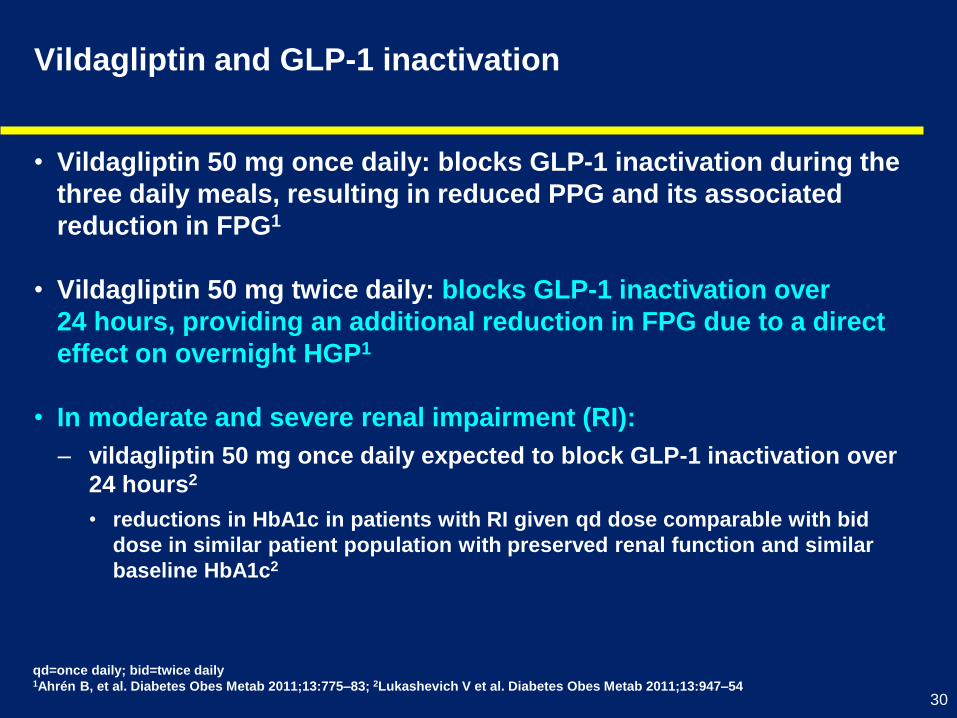
Vildagliptin and GLP-1 inactivation
• Vildagliptin 50 mg once daily: blocks GLP-1 inactivation during the
three daily meals, resulting in reduced PPG and its associated
reduction in FPG1
• Vildagliptin 50 mg twice daily: blocks GLP-1 inactivation over
24 hours, providing an additional reduction in FPG due to a direct
effect on overnight HGP1
• In moderate and severe renal impairment (RI):
‒ vildagliptin 50 mg once daily expected to block GLP-1 inactivation over
24 hours2
• reductions in HbA1c in patients with RI given qd dose comparable with bid
dose in similar patient population with preserved renal function and similar
baseline HbA1c2
qd=once daily; bid=twice daily1Ahrén B, et al. Diabetes Obes Metab 2011;13:775–83; 2Lukashevich V et al. Diabetes Obes Metab 2011;13:947–54
30
REAL WORD EFFECTIVENESS DATA
31
32
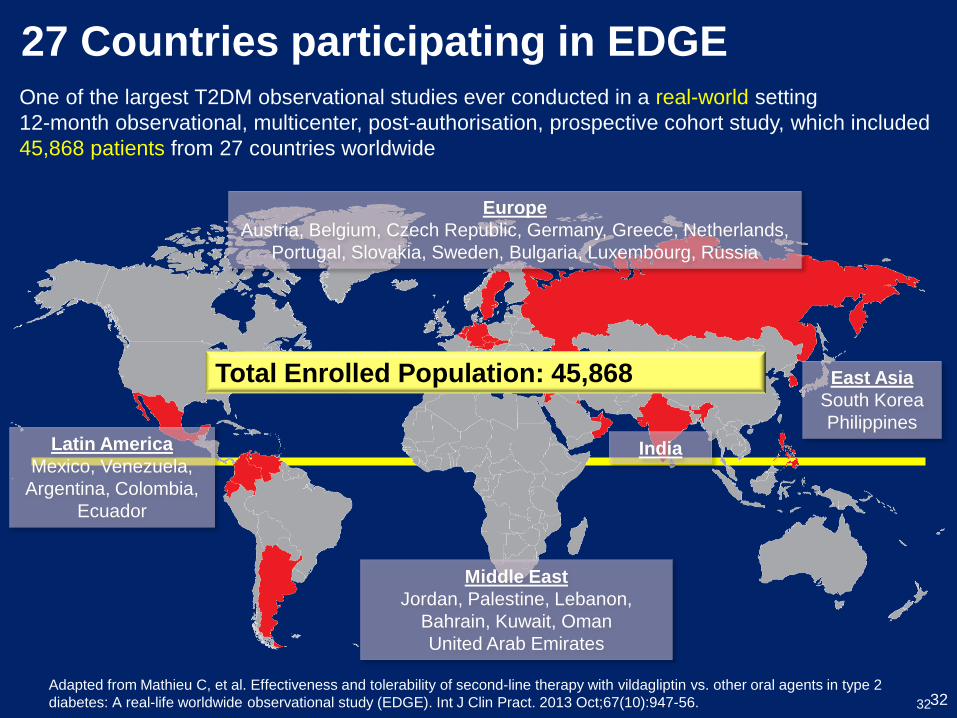
Europe
Austria, Belgium, Czech Republic, Germany, Greece, Netherlands,
Portugal, Slovakia, Sweden, Bulgaria, Luxembourg, Russia
Latin America
Mexico, Venezuela,
Argentina, Colombia,
Ecuador
Middle East
Jordan, Palestine, Lebanon,
Bahrain, Kuwait, Oman
United Arab Emirates
India
East Asia
South Korea
Philippines
27 Countries participating in EDGE
32
Total Enrolled Population: 45,868
Adapted from Mathieu C, et al. Effectiveness and tolerability of second-line therapy with vildagliptin vs. other oral agents in type 2
diabetes: A real-life worldwide observational study (EDGE). Int J Clin Pract. 2013 Oct;67(10):947-56.
One of the largest T2DM observational studies ever conducted in a real-world setting
12-month observational, multicenter, post-authorisation, prospective cohort study, which included
45,868 patients from 27 countries worldwide
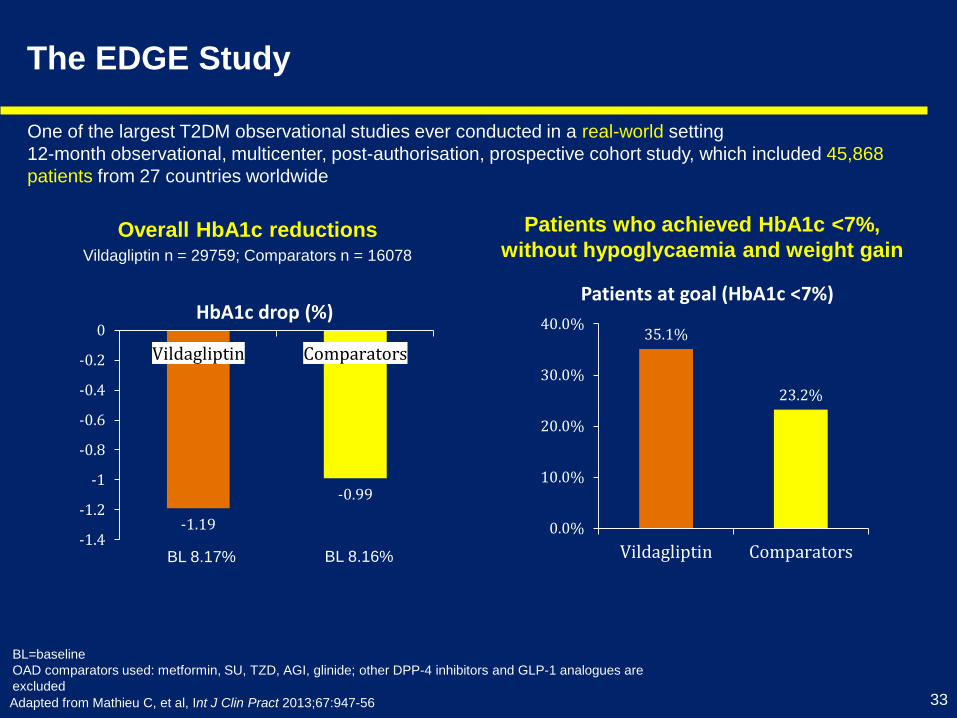
Overall HbA1c reductions Patients who achieved HbA1c <7%,
without hypoglycaemia and weight gain
The EDGE Study
35.1%
23.2%
0.0%
10.0%
20.0%
30.0%
40.0%
Vildagliptin Comparators
Patients at goal (HbA1c <7%)
-1.19
-0.99
-1.4
-1.2
-1
-0.8
-0.6
-0.4
-0.2
0
Vildagliptin Comparators
HbA1c drop (%)
Vildagliptin n = 29759; Comparators n = 16078
BL 8.17% BL 8.16%
Adapted from Mathieu C, et al, Int J Clin Pract 2013;67:947-56
BL=baseline
OAD comparators used: metformin, SU, TZD, AGI, glinide; other DPP-4 inhibitors and GLP-1 analogues are
excluded
One of the largest T2DM observational studies ever conducted in a real-world setting
12-month observational, multicenter, post-authorisation, prospective cohort study, which included 45,868
patients from 27 countries worldwide
33
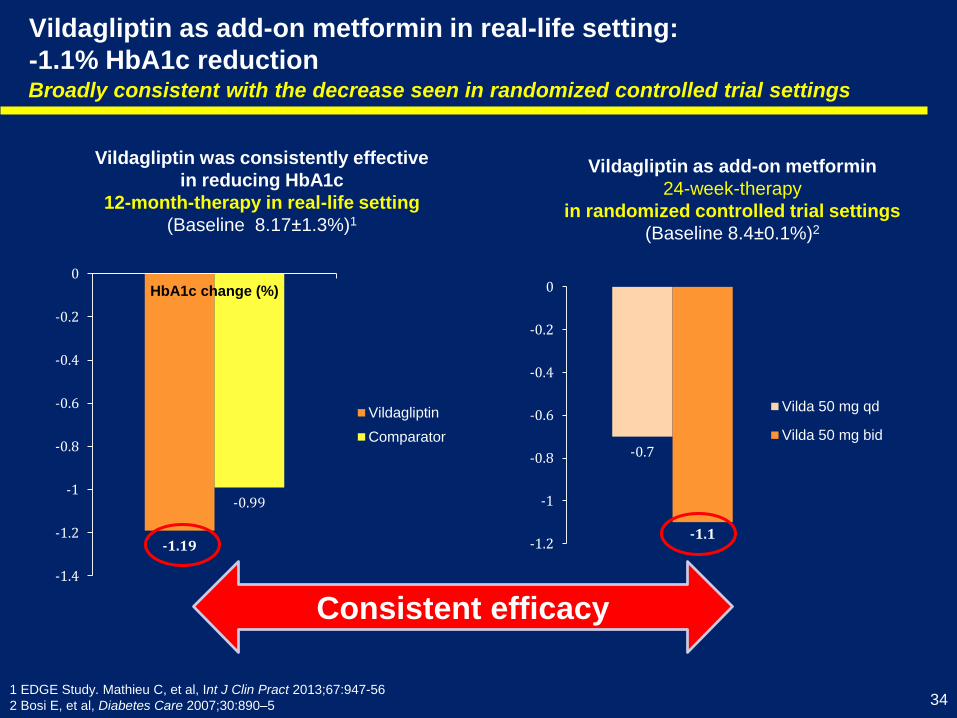
Vildagliptin as add-on metformin in real-life setting:
-1.1% HbA1c reductionBroadly consistent with the decrease seen in randomized controlled trial settings
-1.19
-0.99
-1.4
-1.2
-1
-0.8
-0.6
-0.4
-0.2
0HbA1c change (%)
Vildagliptin
Comparator
Vildagliptin was consistently effective
in reducing HbA1c
12-month-therapy in real-life setting
(Baseline 8.17±1.3%)1
-0.7
-1.1-1.2
-1
-0.8
-0.6
-0.4
-0.2
0
Vilda 50 mg qd
Vilda 50 mg bid
Vildagliptin as add-on metformin
24-week-therapy
in randomized controlled trial settings
(Baseline 8.4±0.1%)2
Consistent efficacy
1 EDGE Study. Mathieu C, et al, Int J Clin Pract 2013;67:947-56
2 Bosi E, et al, Diabetes Care 2007;30:890–5 34
EDGE study Conclusion
In conclusion, EDGE demonstrated in a real-life setting
that T2DM patients in whom second-line oral glucose-
lowering therapy is initiated:
• vildagliptin can succeed in lowering HbA1c to < 7%,
(without weight gain, hypoglycaemia or peripheral
oedema) in a higher proportion than comparator OADs
• No differences in the reported number of AEs or SAEs
between Vildagliptin and comparator OAD.
• This information is consistent with data from RCTs with
vildagliptin
35
36
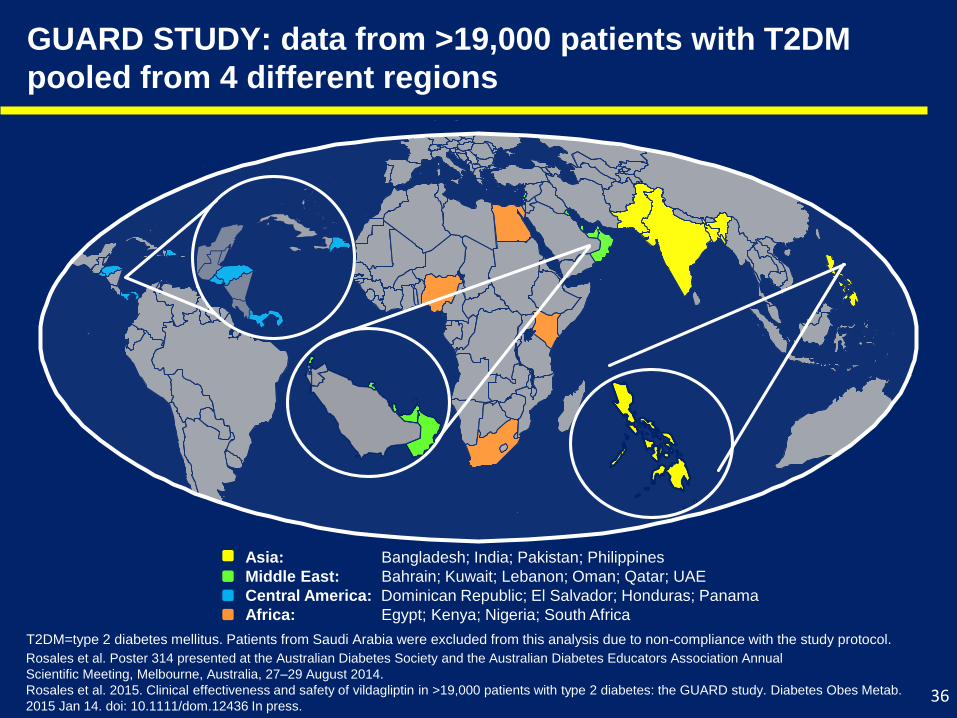
GUARD STUDY: data from >19,000 patients with T2DM
pooled from 4 different regions
Asia: Bangladesh; India; Pakistan; Philippines
Middle East: Bahrain; Kuwait; Lebanon; Oman; Qatar; UAE
Central America: Dominican Republic; El Salvador; Honduras; Panama
Africa: Egypt; Kenya; Nigeria; South Africa
T2DM=type 2 diabetes mellitus. Patients from Saudi Arabia were excluded from this analysis due to non-compliance with the study protocol.
Rosales et al. Poster 314 presented at the Australian Diabetes Society and the Australian Diabetes Educators Association Annual
Scientific Meeting, Melbourne, Australia, 27–29 August 2014.
Rosales et al. 2015. Clinical effectiveness and safety of vildagliptin in >19,000 patients with type 2 diabetes: the GUARD study. Diabetes Obes Metab.
2015 Jan 14. doi: 10.1111/dom.12436 In press.
Adapted from Rosales et al. 2015. Clinical effectiveness and safety of vildagliptin in >19,000 patients with type 2 diabetes: the GUARD study. Diabetes
Obes Metab. 2015 Jan 14. doi: 10.1111/dom.12436 In press.
Adapted from Rosales et al. Poster 314 presented at the Australian Diabetes Society and the Australian Diabetes Educators Association Annual
Scientific Meeting, Melbourne, Australia, 27–29 August 2014.
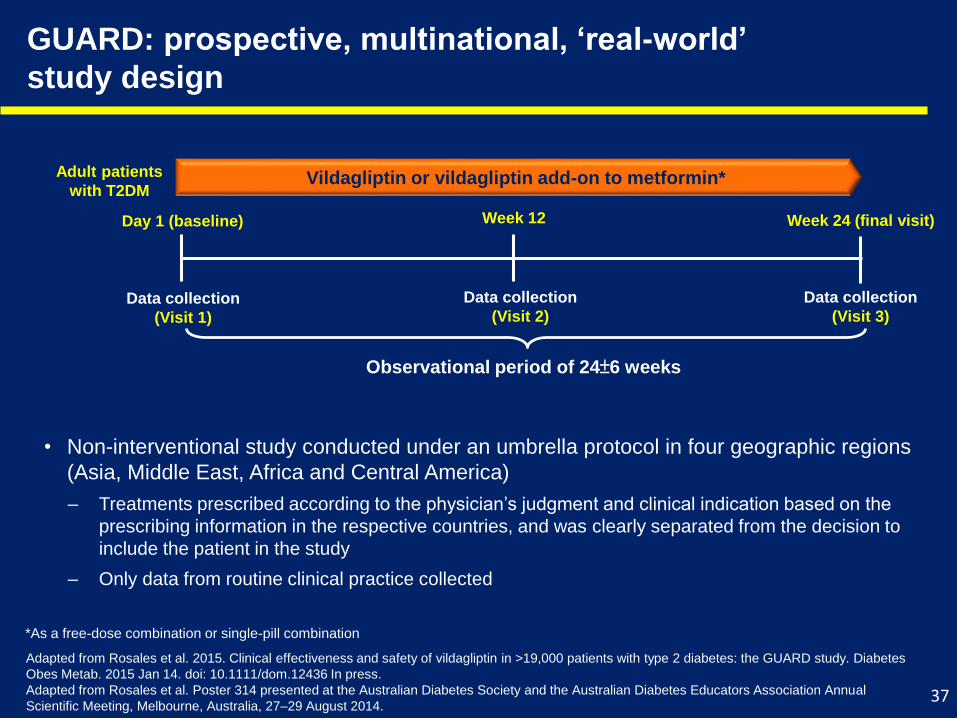
GUARD: prospective, multinational, ‘real-world’
study design
*As a free-dose combination or single-pill combination
Vildagliptin or vildagliptin add-on to metformin*
Data collection
(Visit 3)
Data collection
(Visit 2)Data collection
(Visit 1)
Observational period of 24±6 weeks
Adult patients
with T2DM
Day 1 (baseline) Week 24 (final visit)Week 12
• Non-interventional study conducted under an umbrella protocol in four geographic regions
(Asia, Middle East, Africa and Central America)
‒ Treatments prescribed according to the physician’s judgment and clinical indication based on the
prescribing information in the respective countries, and was clearly separated from the decision to
include the patient in the study
‒ Only data from routine clinical practice collected
37
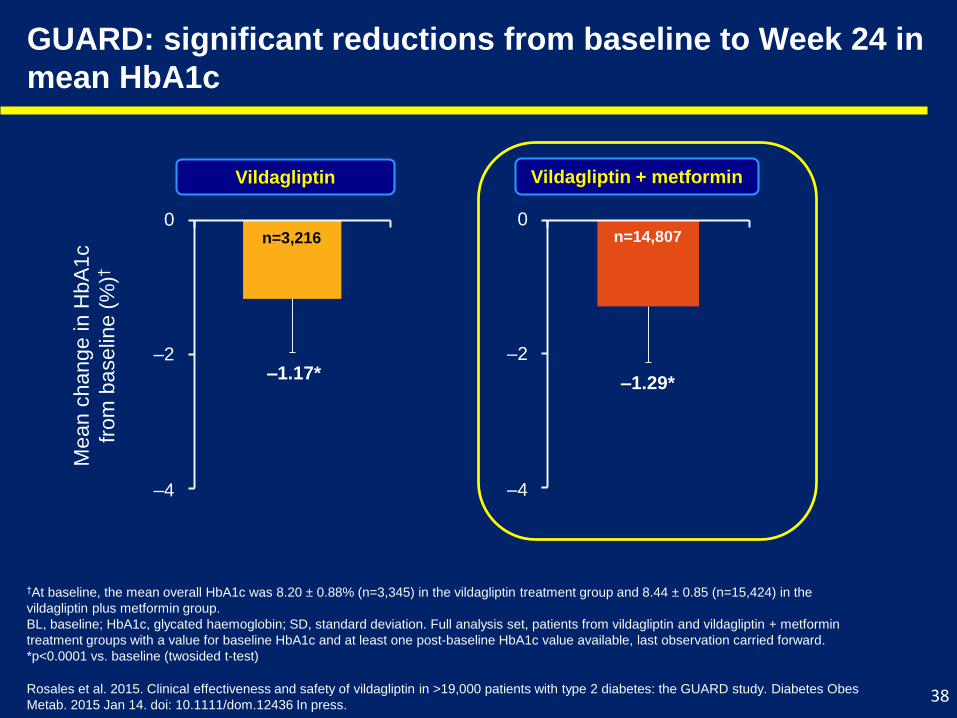
GUARD: significant reductions from baseline to Week 24 in
mean HbA1c
–1.29*–1.17*
†At baseline, the mean overall HbA1c was 8.20 ± 0.88% (n=3,345) in the vildagliptin treatment group and 8.44 ± 0.85 (n=15,424) in the
vildagliptin plus metformin group.
BL, baseline; HbA1c, glycated haemoglobin; SD, standard deviation. Full analysis set, patients from vildagliptin and vildagliptin + metformin
treatment groups with a value for baseline HbA1c and at least one post-baseline HbA1c value available, last observation carried forward.
*p<0.0001 vs. baseline (twosided t-test)
Rosales et al. 2015. Clinical effectiveness and safety of vildagliptin in >19,000 patients with type 2 diabetes: the GUARD study. Diabetes Obes
Metab. 2015 Jan 14. doi: 10.1111/dom.12436 In press.
Mea
n c
ha
ng
e in H
bA
1c
from
baselin
e (
%)†
Vildagliptin Vildagliptin + metformin
0
–2
–4
0
–2
–4
n=3,216 n=14,807
38
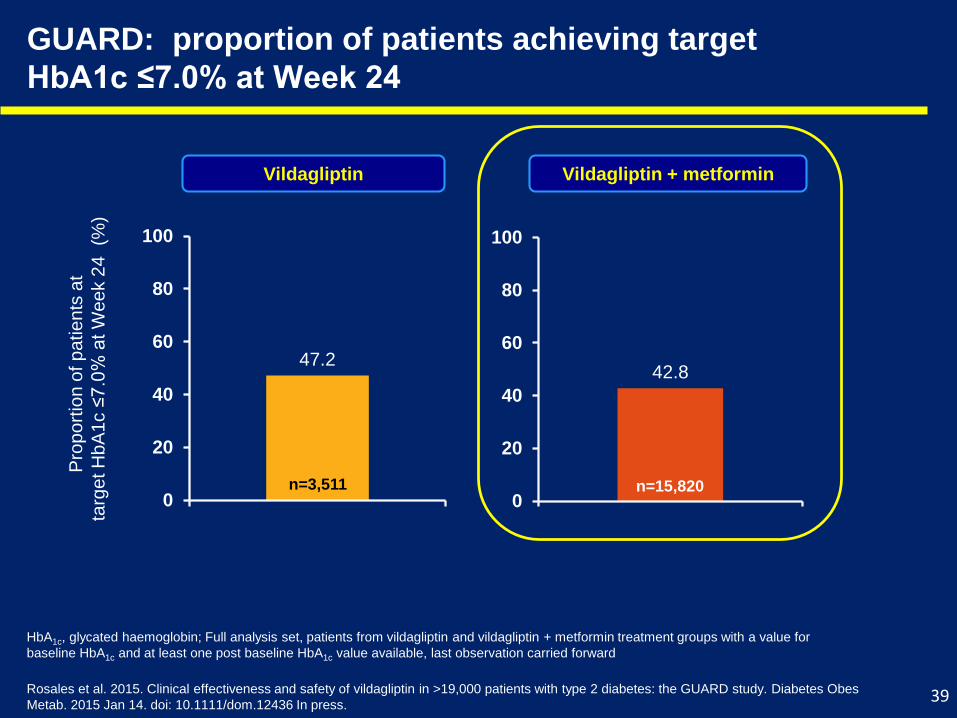
GUARD: proportion of patients achieving target
HbA1c ≤7.0% at Week 24
47.2
0
20
40
60
80
100
42.8
0
20
40
60
80
100
Vildagliptin Vildagliptin + metformin
Pro
po
rtio
n o
f p
atie
nts
at
targ
etH
bA
1c ≤
7.0
% a
tW
ee
k 2
4
(%)
HbA1c, glycated haemoglobin; Full analysis set, patients from vildagliptin and vildagliptin + metformin treatment groups with a value for
baseline HbA1c and at least one post baseline HbA1c value available, last observation carried forward
n=3,511 n=15,820
Rosales et al. 2015. Clinical effectiveness and safety of vildagliptin in >19,000 patients with type 2 diabetes: the GUARD study. Diabetes Obes
Metab. 2015 Jan 14. doi: 10.1111/dom.12436 In press.39
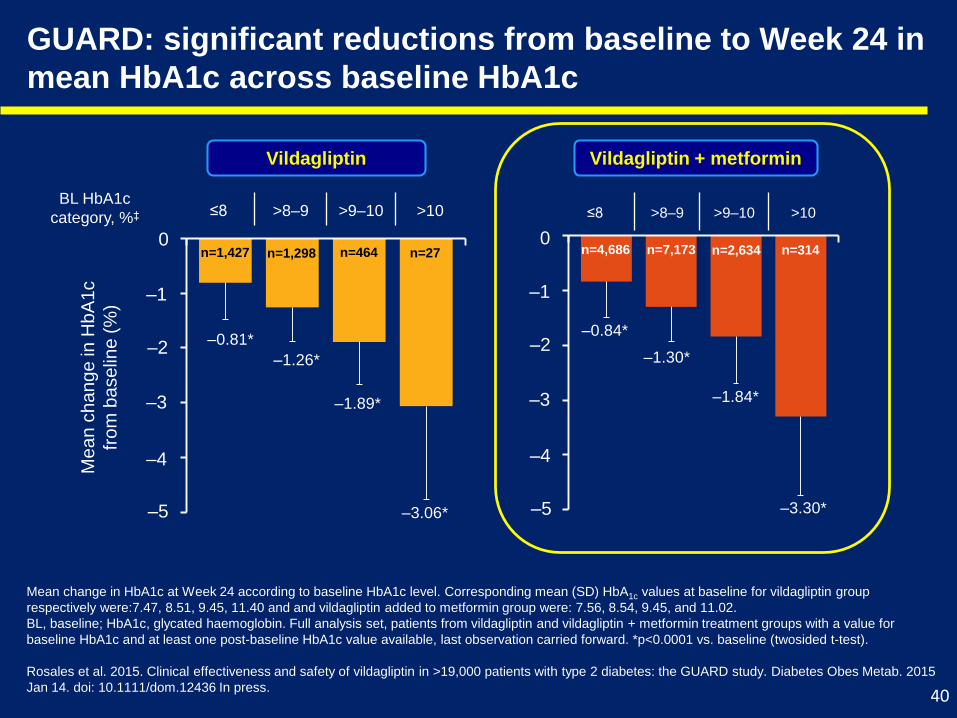
GUARD: significant reductions from baseline to Week 24 in
mean HbA1c across baseline HbA1c
Vildagliptin Vildagliptin + metformin
–3.06*
–0.81*
–1.89*
–1.26*
–3.30*
–0.84*
–1.30*
–1.84*
–1
–3
–5
–1
–3
–5
≤8 >8–9 >9–10 >10BL HbA1c
category, %‡
Me
an
ch
an
ge
in H
bA
1c
fro
m b
ase
line
(%
)
Mean change in HbA1c at Week 24 according to baseline HbA1c level. Corresponding mean (SD) HbA1c values at baseline for vildagliptin group
respectively were:7.47, 8.51, 9.45, 11.40 and and vildagliptin added to metformin group were: 7.56, 8.54, 9.45, and 11.02.
BL, baseline; HbA1c, glycated haemoglobin. Full analysis set, patients from vildagliptin and vildagliptin + metformin treatment groups with a value for
baseline HbA1c and at least one post-baseline HbA1c value available, last observation carried forward. *p<0.0001 vs. baseline (twosided t-test).
Rosales et al. 2015. Clinical effectiveness and safety of vildagliptin in >19,000 patients with type 2 diabetes: the GUARD study. Diabetes Obes Metab. 2015
Jan 14. doi: 10.1111/dom.12436 In press.
n=1,427 n=1,298 n=464 n=27 n=4,686 n=7,173 n=2,634 n=314
≤8 >8–9 >9–10 >10
–2
–4
00
–2
–4
40
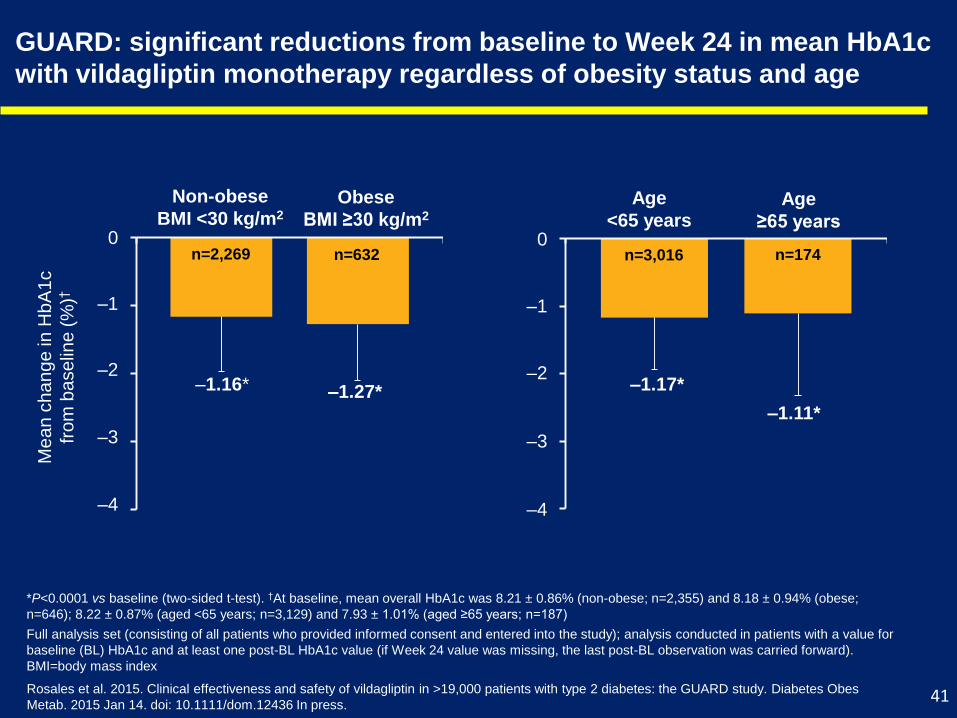
GUARD: significant reductions from baseline to Week 24 in mean HbA1c
with vildagliptin monotherapy regardless of obesity status and age
Me
an
ch
an
ge
in H
bA
1c
fro
m b
ase
line
(%
)†
*P<0.0001 vs baseline (two-sided t-test). †At baseline, mean overall HbA1c was 8.21 ± 0.86% (non-obese; n=2,355) and 8.18 ± 0.94% (obese;
n=646); 8.22 ± 0.87% (aged <65 years; n=3,129) and 7.93 ± 1.01% (aged ≥65 years; n=187)
Full analysis set (consisting of all patients who provided informed consent and entered into the study); analysis conducted in patients with a value for
baseline (BL) HbA1c and at least one post-BL HbA1c value (if Week 24 value was missing, the last post-BL observation was carried forward).
BMI=body mass index
n=2,269 n=632
–1.16*
0
–1
–2
–3
–4
–1.27* –1.17*
0
–1
–2
–3
–4
–1.11*
n=3,016 n=174
Non-obese
BMI <30 kg/m2
Obese
BMI ≥30 kg/m2
Age
<65 yearsAge
≥65 years
41Rosales et al. 2015. Clinical effectiveness and safety of vildagliptin in >19,000 patients with type 2 diabetes: the GUARD study. Diabetes Obes
Metab. 2015 Jan 14. doi: 10.1111/dom.12436 In press.
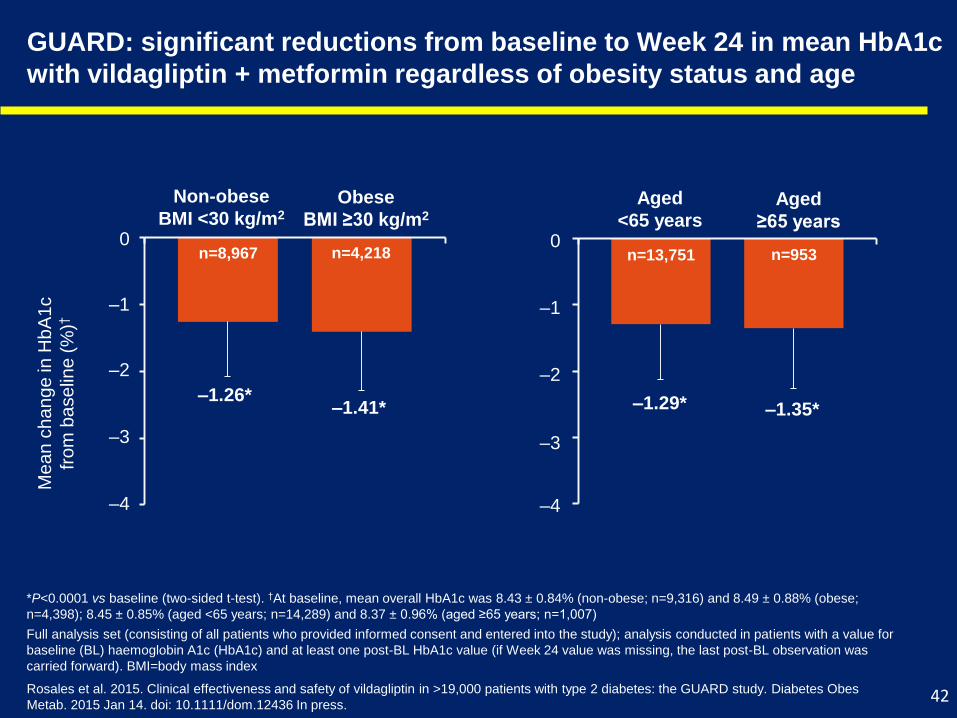
GUARD: significant reductions from baseline to Week 24 in mean HbA1c
with vildagliptin + metformin regardless of obesity status and age
Me
an
ch
an
ge
in H
bA
1c
fro
m b
ase
line
(%
)†
*P<0.0001 vs baseline (two-sided t-test). †At baseline, mean overall HbA1c was 8.43 ± 0.84% (non-obese; n=9,316) and 8.49 ± 0.88% (obese;
n=4,398); 8.45 ± 0.85% (aged <65 years; n=14,289) and 8.37 ± 0.96% (aged ≥65 years; n=1,007)
Full analysis set (consisting of all patients who provided informed consent and entered into the study); analysis conducted in patients with a value for
baseline (BL) haemoglobin A1c (HbA1c) and at least one post-BL HbA1c value (if Week 24 value was missing, the last post-BL observation was
carried forward). BMI=body mass index
Non-obese
BMI <30 kg/m2
Obese
BMI ≥30 kg/m2
Aged
<65 yearsAged
≥65 years
–1.26*
0
–1
–2
–3
–4
–1.41* –1.29*
0
–1
–2
–3
–4
–1.35*
n=13,751 n=953n=8,967 n=4,218
42Rosales et al. 2015. Clinical effectiveness and safety of vildagliptin in >19,000 patients with type 2 diabetes: the GUARD study. Diabetes Obes
Metab. 2015 Jan 14. doi: 10.1111/dom.12436 In press.
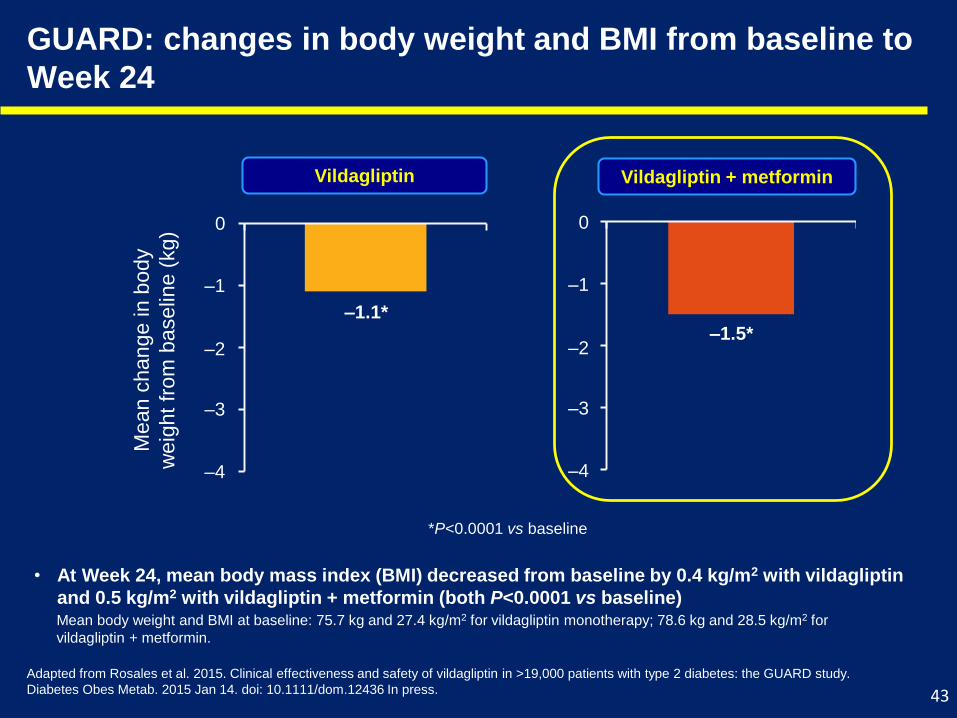
GUARD: changes in body weight and BMI from baseline to
Week 24
Mean c
hange in b
ody
weig
ht
from
baselin
e (
kg)
Vildagliptin Vildagliptin + metformin
–1.1*–1.5*
Mean body weight and BMI at baseline: 75.7 kg and 27.4 kg/m2 for vildagliptin monotherapy; 78.6 kg and 28.5 kg/m2 for
vildagliptin + metformin.
• At Week 24, mean body mass index (BMI) decreased from baseline by 0.4 kg/m2 with vildagliptin
and 0.5 kg/m2 with vildagliptin + metformin (both P<0.0001 vs baseline)
0
–1
–2
–3
–4
0
–1
–2
–3
–4
Adapted from Rosales et al. 2015. Clinical effectiveness and safety of vildagliptin in >19,000 patients with type 2 diabetes: the GUARD study.
Diabetes Obes Metab. 2015 Jan 14. doi: 10.1111/dom.12436 In press. 43
*P<0.0001 vs baseline
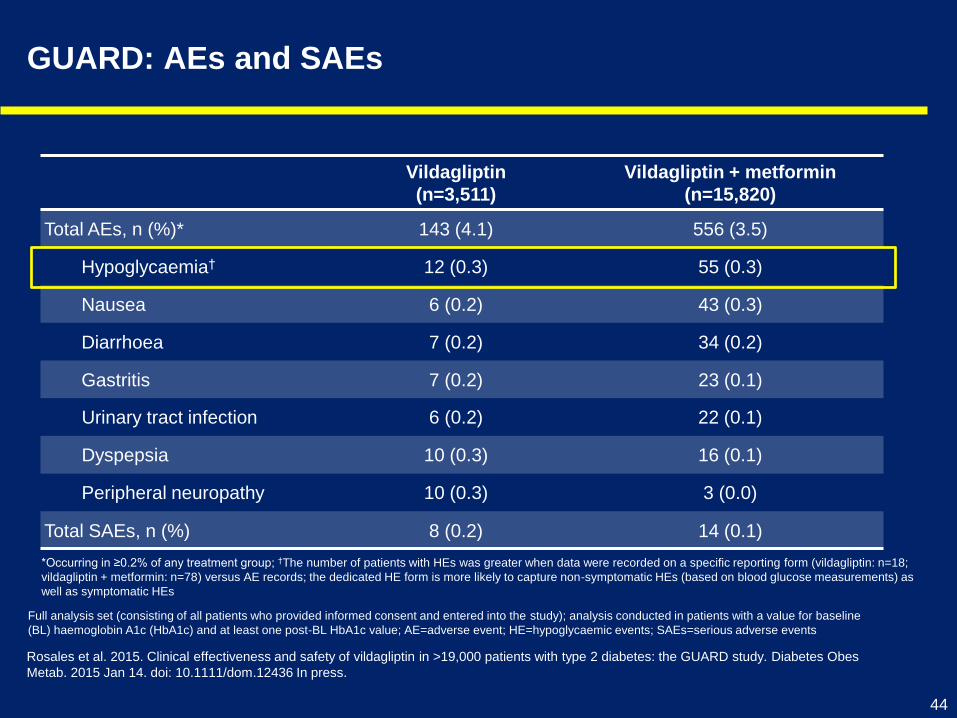
GUARD: AEs and SAEs
44
Vildagliptin
(n=3,511)
Vildagliptin + metformin
(n=15,820)
Total AEs, n (%)* 143 (4.1) 556 (3.5)
Hypoglycaemia† 12 (0.3) 55 (0.3)
Nausea 6 (0.2) 43 (0.3)
Diarrhoea 7 (0.2) 34 (0.2)
Gastritis 7 (0.2) 23 (0.1)
Urinary tract infection 6 (0.2) 22 (0.1)
Dyspepsia 10 (0.3) 16 (0.1)
Peripheral neuropathy 10 (0.3) 3 (0.0)
Total SAEs, n (%) 8 (0.2) 14 (0.1)
*Occurring in ≥0.2% of any treatment group; †The number of patients with HEs was greater when data were recorded on a specific reporting form (vildagliptin: n=18;
vildagliptin + metformin: n=78) versus AE records; the dedicated HE form is more likely to capture non-symptomatic HEs (based on blood glucose measurements) as
well as symptomatic HEs
Full analysis set (consisting of all patients who provided informed consent and entered into the study); analysis conducted in patients with a value for baseline
(BL) haemoglobin A1c (HbA1c) and at least one post-BL HbA1c value; AE=adverse event; HE=hypoglycaemic events; SAEs=serious adverse events
Rosales et al. 2015. Clinical effectiveness and safety of vildagliptin in >19,000 patients with type 2 diabetes: the GUARD study. Diabetes Obes
Metab. 2015 Jan 14. doi: 10.1111/dom.12436 In press.
GUARD was a large prospective study assessing vildagliptin with/without
metformin in a real-world setting: more than 19,000 patients with T2DM were
pooled across Asia, Middle East, Central America and Africa
Vildagliptin with/without metformin was associated with statistically significant
and clinically relevant HbA1c reductions from baseline
This effect was observed irrespective of patient age or obesity status and was
seen across baseline HbA1c categories
Vildagliptin without/without metformin was generally well tolerated
Overall, the findings from the real-world GUARD study are generally consistent
with other real-world studies and interventional controlled clinical trials with
vildagliptin with/without metformin
GUARD study: conclusions
45
Rosales et al. 2015. Clinical effectiveness and safety of vildagliptin in >19,000 patients with type 2 diabetes: the GUARD study. Diabetes Obes
Metab. 2015 Jan 14. doi: 10.1111/dom.12436 In press.
Safety and Efficacy Profile in
T2DM Patiens With Moderate and
Severe Renal Impairment
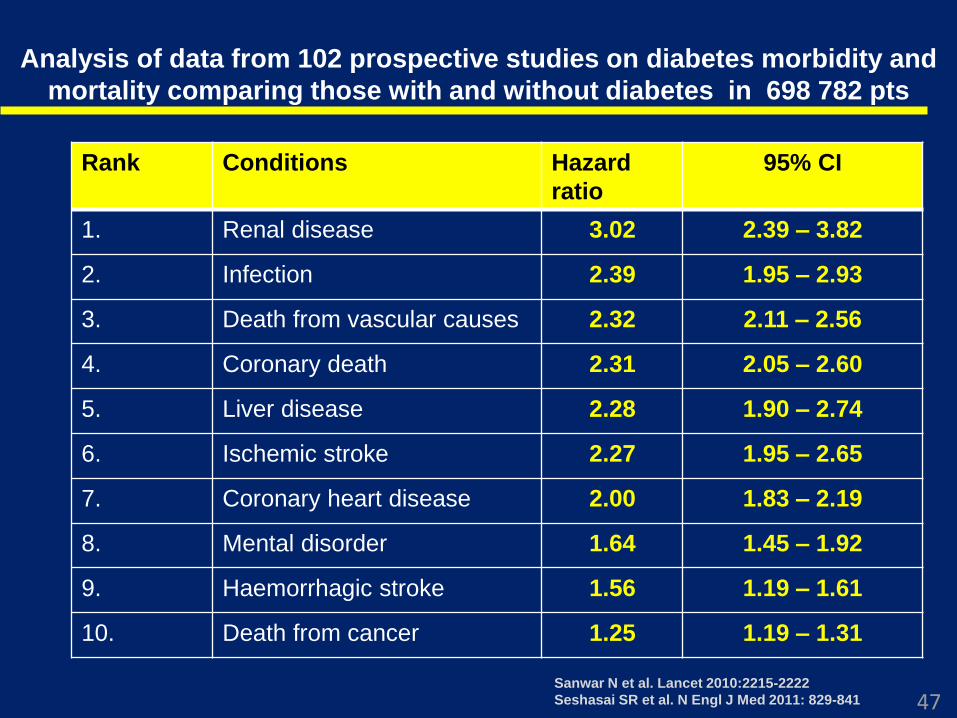
Analysis of data from 102 prospective studies on diabetes morbidity and
mortality comparing those with and without diabetes in 698 782 pts
Rank Conditions Hazard
ratio
95% CI
1. Renal disease 3.02 2.39 – 3.82
2. Infection 2.39 1.95 – 2.93
3. Death from vascular causes 2.32 2.11 – 2.56
4. Coronary death 2.31 2.05 – 2.60
5. Liver disease 2.28 1.90 – 2.74
6. Ischemic stroke 2.27 1.95 – 2.65
7. Coronary heart disease 2.00 1.83 – 2.19
8. Mental disorder 1.64 1.45 – 1.92
9. Haemorrhagic stroke 1.56 1.19 – 1.61
10. Death from cancer 1.25 1.19 – 1.31
Sanwar N et al. Lancet 2010:2215-2222
Seshasai SR et al. N Engl J Med 2011: 829-841 47
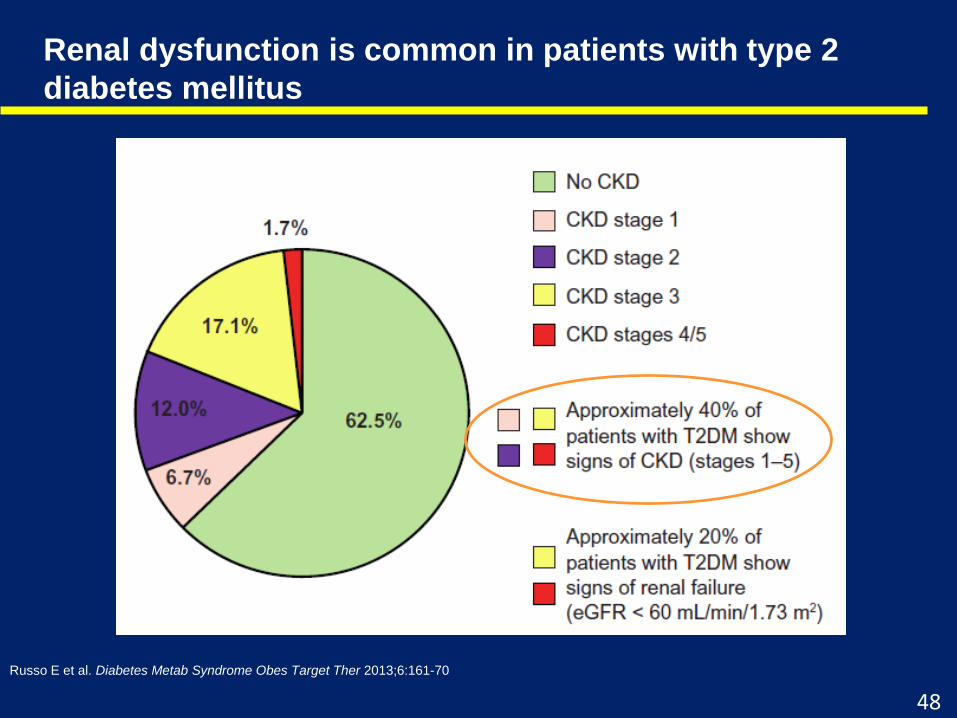
Renal dysfunction is common in patients with type 2
diabetes mellitus
Russo E et al. Diabetes Metab Syndrome Obes Target Ther 2013;6:161-70
48
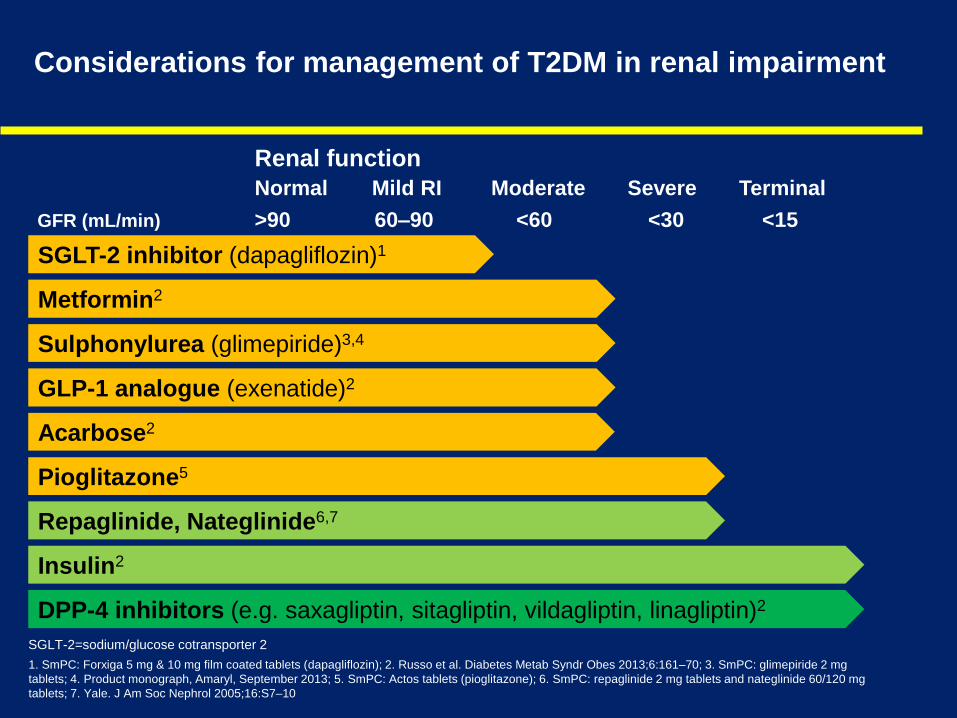
Considerations for management of T2DM in renal impairment
GLP-1 analogue (exenatide)2
Metformin2
Sulphonylurea (glimepiride)3,4
Pioglitazone5
DPP-4 inhibitors (e.g. saxagliptin, sitagliptin, vildagliptin, linagliptin)2
Repaglinide, Nateglinide6,7
Insulin2
Acarbose2
SGLT-2 inhibitor (dapagliflozin)1
1. SmPC: Forxiga 5 mg & 10 mg film coated tablets (dapagliflozin); 2. Russo et al. Diabetes Metab Syndr Obes 2013;6:161–70; 3. SmPC: glimepiride 2 mg
tablets; 4. Product monograph, Amaryl, September 2013; 5. SmPC: Actos tablets (pioglitazone); 6. SmPC: repaglinide 2 mg tablets and nateglinide 60/120 mg
tablets; 7. Yale. J Am Soc Nephrol 2005;16:S7–10
Renal function
Normal Mild RI Moderate Severe Terminal
GFR (mL/min) >90 60–90 <60 <30 <15
SGLT-2=sodium/glucose cotransporter 2
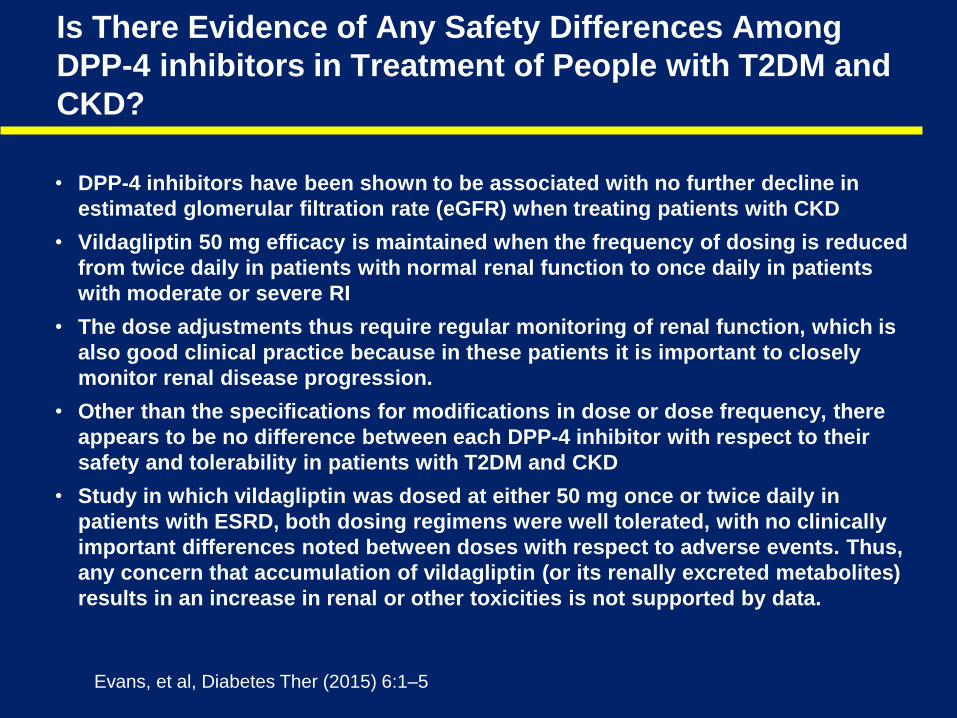
Is There Evidence of Any Safety Differences Among
DPP-4 inhibitors in Treatment of People with T2DM and
CKD?
• DPP-4 inhibitors have been shown to be associated with no further decline in
estimated glomerular filtration rate (eGFR) when treating patients with CKD
• Vildagliptin 50 mg efficacy is maintained when the frequency of dosing is reduced
from twice daily in patients with normal renal function to once daily in patients
with moderate or severe RI
• The dose adjustments thus require regular monitoring of renal function, which is
also good clinical practice because in these patients it is important to closely
monitor renal disease progression.
• Other than the specifications for modifications in dose or dose frequency, there
appears to be no difference between each DPP-4 inhibitor with respect to their
safety and tolerability in patients with T2DM and CKD
• Study in which vildagliptin was dosed at either 50 mg once or twice daily in
patients with ESRD, both dosing regimens were well tolerated, with no clinically
important differences noted between doses with respect to adverse events. Thus,
any concern that accumulation of vildagliptin (or its renally excreted metabolites)
results in an increase in renal or other toxicities is not supported by data.
Evans, et al, Diabetes Ther (2015) 6:1–5
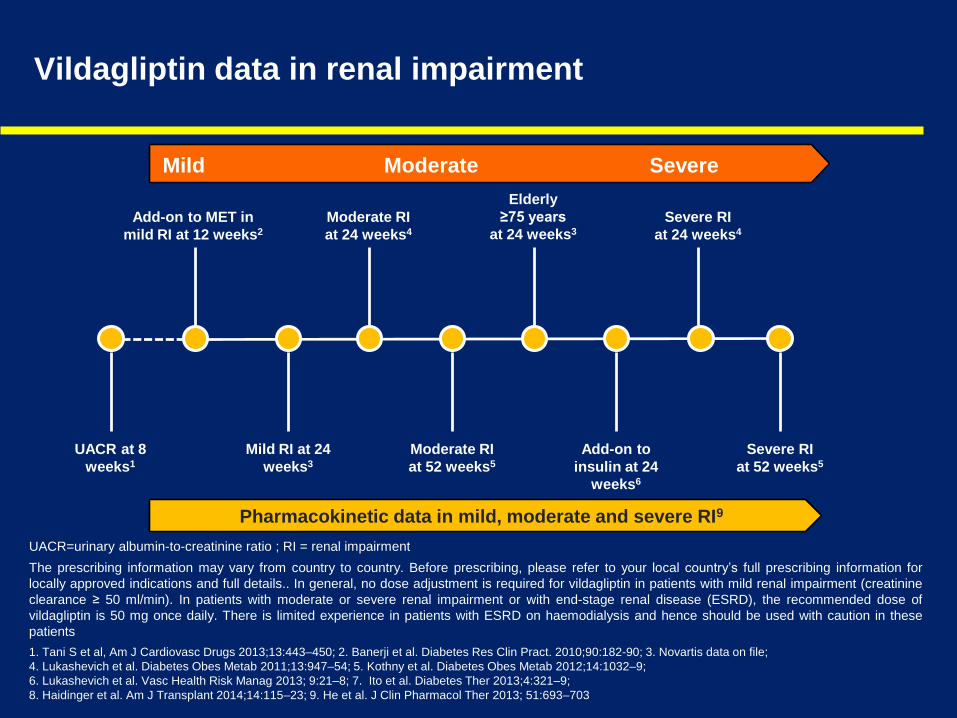
Vildagliptin data in renal impairment
UACR=urinary albumin-to-creatinine ratio ; RI = renal impairment
The prescribing information may vary from country to country. Before prescribing, please refer to your local country’s full prescribing information for
locally approved indications and full details.. In general, no dose adjustment is required for vildagliptin in patients with mild renal impairment (creatinine
clearance ≥ 50 ml/min). In patients with moderate or severe renal impairment or with end-stage renal disease (ESRD), the recommended dose of
vildagliptin is 50 mg once daily. There is limited experience in patients with ESRD on haemodialysis and hence should be used with caution in these
patients
1. Tani S et al, Am J Cardiovasc Drugs 2013;13:443–450; 2. Banerji et al. Diabetes Res Clin Pract. 2010;90:182-90; 3. Novartis data on file;
4. Lukashevich et al. Diabetes Obes Metab 2011;13:947–54; 5. Kothny et al. Diabetes Obes Metab 2012;14:1032–9;
6. Lukashevich et al. Vasc Health Risk Manag 2013; 9:21–8; 7. Ito et al. Diabetes Ther 2013;4:321–9;
8. Haidinger et al. Am J Transplant 2014;14:115–23; 9. He et al. J Clin Pharmacol Ther 2013; 51:693–703
Mild Moderate Severe
Pharmacokinetic data in mild, moderate and severe RI9
UACR at 8
weeks1
Mild RI at 24
weeks3
Add-on to MET in
mild RI at 12 weeks2
Moderate RI
at 24 weeks4
Moderate RI
at 52 weeks5
Elderly
≥75 years
at 24 weeks3
Severe RI
at 24 weeks4
Add-on to
insulin at 24
weeks6
Severe RI
at 52 weeks5
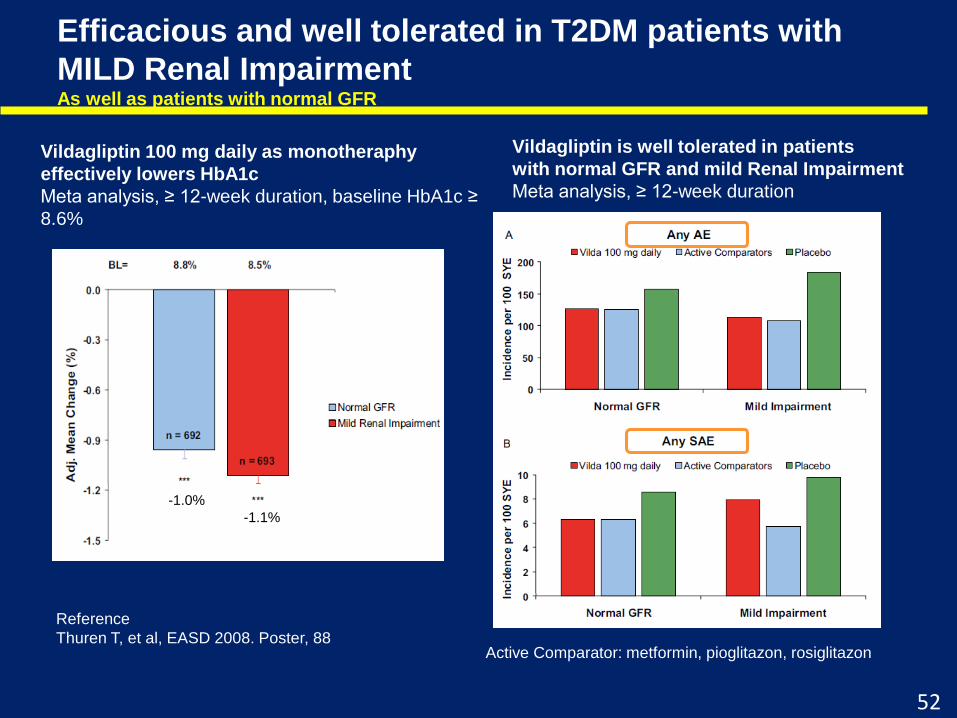
Efficacious and well tolerated in T2DM patients with
MILD Renal Impairment As well as patients with normal GFR
Vildagliptin 100 mg daily as monotheraphy
effectively lowers HbA1c
Meta analysis, ≥ 12-week duration, baseline HbA1c ≥
8.6%
Vildagliptin is well tolerated in patients
with normal GFR and mild Renal Impairment
Meta analysis, ≥ 12-week duration
Reference
Thuren T, et al, EASD 2008. Poster, 88
52
Active Comparator: metformin, pioglitazon, rosiglitazon
-1.1%
-1.0%
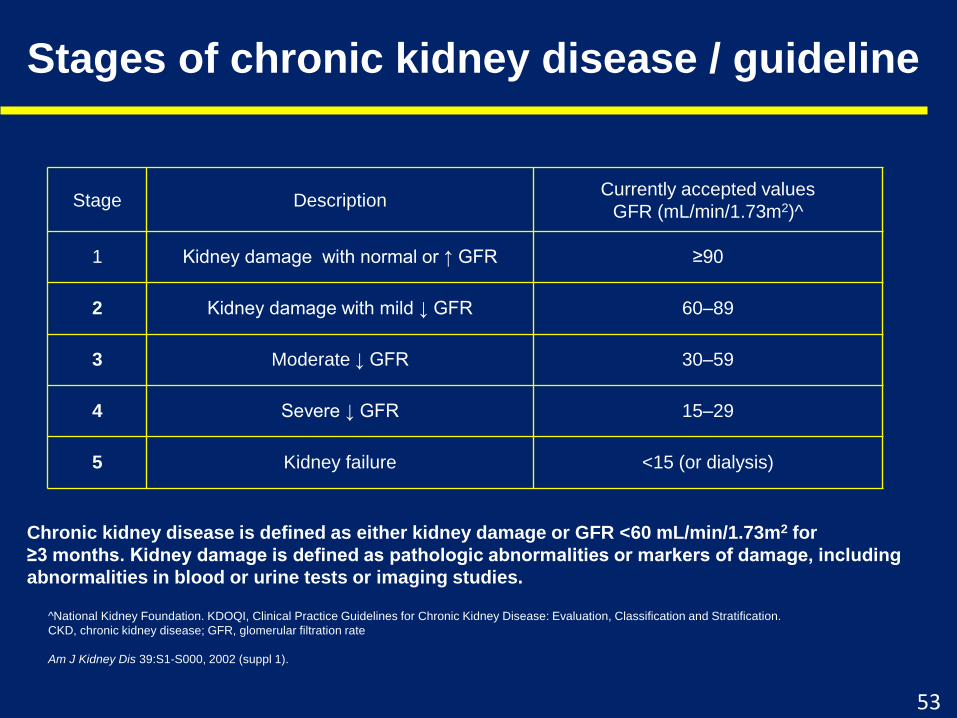
Stages of chronic kidney disease / guideline
Chronic kidney disease is defined as either kidney damage or GFR <60 mL/min/1.73m2 for
≥3 months. Kidney damage is defined as pathologic abnormalities or markers of damage, including
abnormalities in blood or urine tests or imaging studies.
Stage DescriptionCurrently accepted values
GFR (mL/min/1.73m2)^
1 Kidney damage with normal or ↑ GFR ≥90
2 Kidney damage with mild ↓ GFR 60–89
3 Moderate ↓ GFR 30–59
4 Severe ↓ GFR 15–29
5 Kidney failure <15 (or dialysis)
^National Kidney Foundation. KDOQI, Clinical Practice Guidelines for Chronic Kidney Disease: Evaluation, Classification and Stratification.
CKD, chronic kidney disease; GFR, glomerular filtration rate
Am J Kidney Dis 39:S1-S000, 2002 (suppl 1).
53
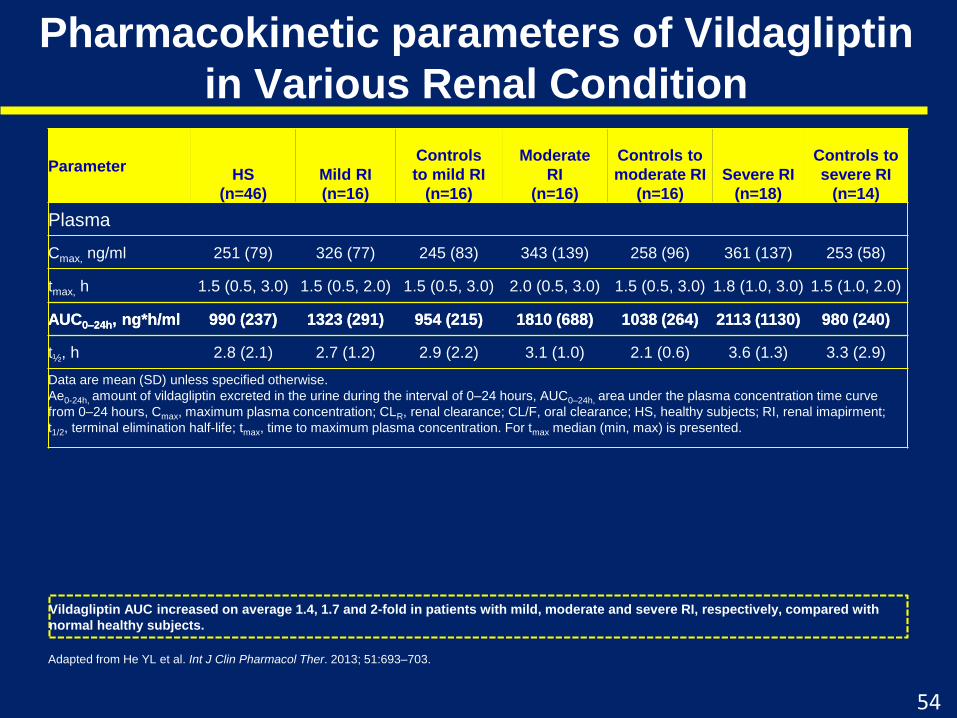
Pharmacokinetic parameters of Vildagliptin
in Various Renal Condition
Adapted from He YL et al. Int J Clin Pharmacol Ther. 2013; 51:693–703.
ParameterHS
(n=46)
Mild RI
(n=16)
Controls
to mild RI
(n=16)
Moderate
RI
(n=16)
Controls to
moderate RI
(n=16)
Severe RI
(n=18)
Controls to
severe RI
(n=14)
Plasma
Cmax, ng/ml 251 (79) 326 (77) 245 (83) 343 (139) 258 (96) 361 (137) 253 (58)
tmax, h 1.5 (0.5, 3.0) 1.5 (0.5, 2.0) 1.5 (0.5, 3.0) 2.0 (0.5, 3.0) 1.5 (0.5, 3.0) 1.8 (1.0, 3.0) 1.5 (1.0, 2.0)
AUC0–24h, ng*h/ml 990 (237) 1323 (291) 954 (215) 1810 (688) 1038 (264) 2113 (1130) 980 (240)
t½, h 2.8 (2.1) 2.7 (1.2) 2.9 (2.2) 3.1 (1.0) 2.1 (0.6) 3.6 (1.3) 3.3 (2.9)
Data are mean (SD) unless specified otherwise.
Ae0-24h, amount of vildagliptin excreted in the urine during the interval of 0–24 hours, AUC0–24h, area under the plasma concentration time curve
from 0–24 hours, Cmax, maximum plasma concentration; CLR, renal clearance; CL/F, oral clearance; HS, healthy subjects; RI, renal imapirment;
t1/2, terminal elimination half-life; tmax, time to maximum plasma concentration. For tmax median (min, max) is presented.
Vildagliptin AUC increased on average 1.4, 1.7 and 2-fold in patients with mild, moderate and severe RI, respectively, compared with
normal healthy subjects.
AUC0–24h, ng*h/ml 990 (237) 1323 (291) 954 (215) 1810 (688) 1038 (264) 2113 (1130) 980 (240)
54
Conclusions
• The pharmacokinetic results from this study indicate that no dose adjustment for
vildagliptin is necessary in patients with mild RI (50 mg bid).
• In patients with moderate or severe RI, vildagliptin 50 mg qd is considered
appropriate and recommended.
bid, twice daily; qd, once daily; RI, renal impairment
He YL et al. Int J Clin Pharmacol Ther. 2013; 51:693–703.
55
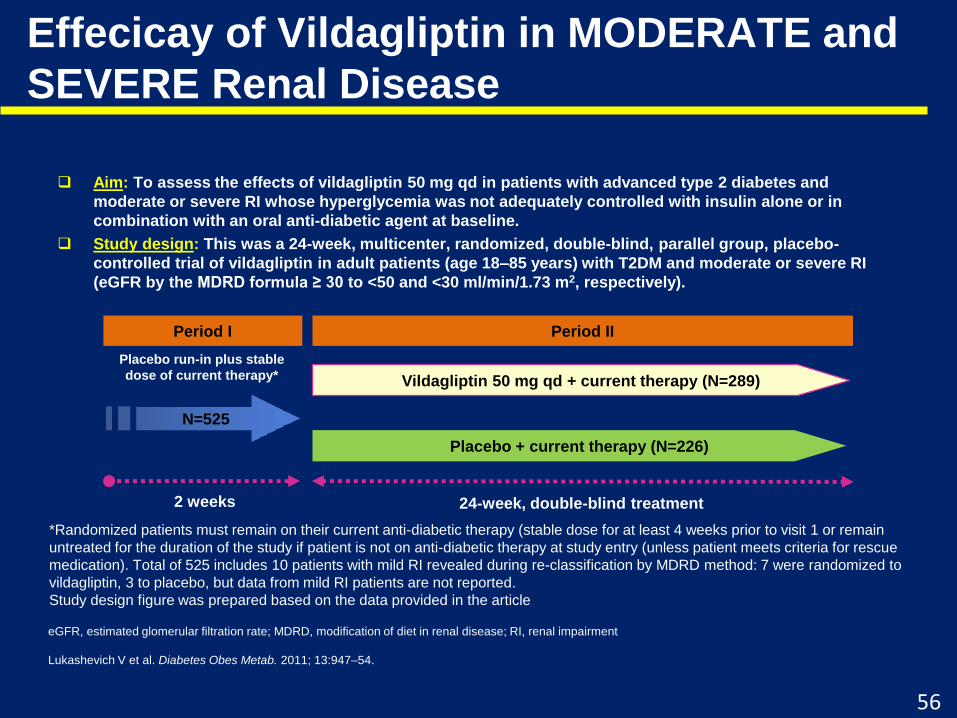
Aim: To assess the effects of vildagliptin 50 mg qd in patients with advanced type 2 diabetes and
moderate or severe RI whose hyperglycemia was not adequately controlled with insulin alone or in
combination with an oral anti-diabetic agent at baseline.
Study design: This was a 24-week, multicenter, randomized, double-blind, parallel group, placebo-
controlled trial of vildagliptin in adult patients (age 18–85 years) with T2DM and moderate or severe RI
(eGFR by the MDRD formula ≥ 30 to <50 and <30 ml/min/1.73 m2, respectively).
Effecicay of Vildagliptin in MODERATE and
SEVERE Renal Disease
eGFR, estimated glomerular filtration rate; MDRD, modification of diet in renal disease; RI, renal impairment
Lukashevich V et al. Diabetes Obes Metab. 2011; 13:947–54.
Placebo + current therapy (N=226)
N=525
Vildagliptin 50 mg qd + current therapy (N=289)
Placebo run-in plus stable
dose of current therapy*
Period I Period II
24-week, double-blind treatment2 weeks
*Randomized patients must remain on their current anti-diabetic therapy (stable dose for at least 4 weeks prior to visit 1 or remain
untreated for the duration of the study if patient is not on anti-diabetic therapy at study entry (unless patient meets criteria for rescue
medication). Total of 525 includes 10 patients with mild RI revealed during re-classification by MDRD method: 7 were randomized to
vildagliptin, 3 to placebo, but data from mild RI patients are not reported.
Study design figure was prepared based on the data provided in the article
56
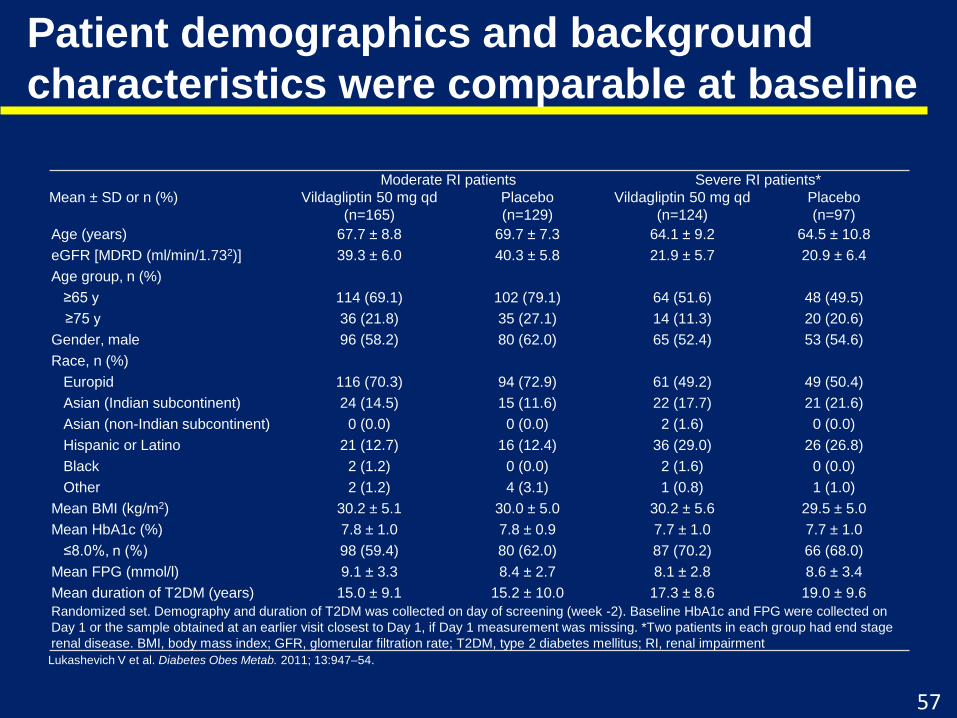
Patient demographics and background
characteristics were comparable at baseline
Mean ± SD or n (%)
Moderate RI patients Severe RI patients*
Vildagliptin 50 mg qd
(n=165)
Placebo
(n=129)
Vildagliptin 50 mg qd
(n=124)
Placebo
(n=97)
Age (years) 67.7 ± 8.8 69.7 ± 7.3 64.1 ± 9.2 64.5 ± 10.8
eGFR [MDRD (ml/min/1.732)] 39.3 ± 6.0 40.3 ± 5.8 21.9 ± 5.7 20.9 ± 6.4
Age group, n (%)
≥65 y 114 (69.1) 102 (79.1) 64 (51.6) 48 (49.5)
≥75 y 36 (21.8) 35 (27.1) 14 (11.3) 20 (20.6)
Gender, male 96 (58.2) 80 (62.0) 65 (52.4) 53 (54.6)
Race, n (%)
Europid 116 (70.3) 94 (72.9) 61 (49.2) 49 (50.4)
Asian (Indian subcontinent) 24 (14.5) 15 (11.6) 22 (17.7) 21 (21.6)
Asian (non-Indian subcontinent) 0 (0.0) 0 (0.0) 2 (1.6) 0 (0.0)
Hispanic or Latino 21 (12.7) 16 (12.4) 36 (29.0) 26 (26.8)
Black 2 (1.2) 0 (0.0) 2 (1.6) 0 (0.0)
Other 2 (1.2) 4 (3.1) 1 (0.8) 1 (1.0)
Mean BMI (kg/m2) 30.2 ± 5.1 30.0 ± 5.0 30.2 ± 5.6 29.5 ± 5.0
Mean HbA1c (%) 7.8 ± 1.0 7.8 ± 0.9 7.7 ± 1.0 7.7 ± 1.0
≤8.0%, n (%) 98 (59.4) 80 (62.0) 87 (70.2) 66 (68.0)
Mean FPG (mmol/l) 9.1 ± 3.3 8.4 ± 2.7 8.1 ± 2.8 8.6 ± 3.4
Mean duration of T2DM (years) 15.0 ± 9.1 15.2 ± 10.0 17.3 ± 8.6 19.0 ± 9.6
Randomized set. Demography and duration of T2DM was collected on day of screening (week -2). Baseline HbA1c and FPG were collected on
Day 1 or the sample obtained at an earlier visit closest to Day 1, if Day 1 measurement was missing. *Two patients in each group had end stage
renal disease. BMI, body mass index; GFR, glomerular filtration rate; T2DM, type 2 diabetes mellitus; RI, renal impairment
Lukashevich V et al. Diabetes Obes Metab. 2011; 13:947–54.
57
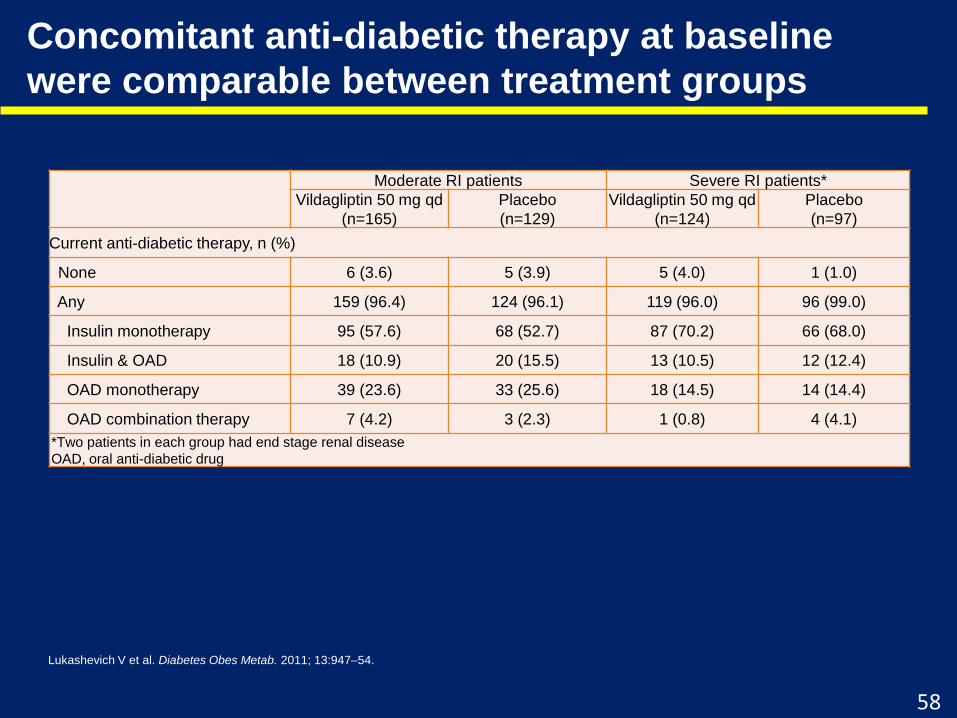
Concomitant anti-diabetic therapy at baseline
were comparable between treatment groups
Moderate RI patients Severe RI patients*
Vildagliptin 50 mg qd
(n=165)
Placebo
(n=129)
Vildagliptin 50 mg qd
(n=124)
Placebo
(n=97)
Current anti-diabetic therapy, n (%)
None 6 (3.6) 5 (3.9) 5 (4.0) 1 (1.0)
Any 159 (96.4) 124 (96.1) 119 (96.0) 96 (99.0)
Insulin monotherapy 95 (57.6) 68 (52.7) 87 (70.2) 66 (68.0)
Insulin & OAD 18 (10.9) 20 (15.5) 13 (10.5) 12 (12.4)
OAD monotherapy 39 (23.6) 33 (25.6) 18 (14.5) 14 (14.4)
OAD combination therapy 7 (4.2) 3 (2.3) 1 (0.8) 4 (4.1)
*Two patients in each group had end stage renal disease
OAD, oral anti-diabetic drug
Lukashevich V et al. Diabetes Obes Metab. 2011; 13:947–54.
58
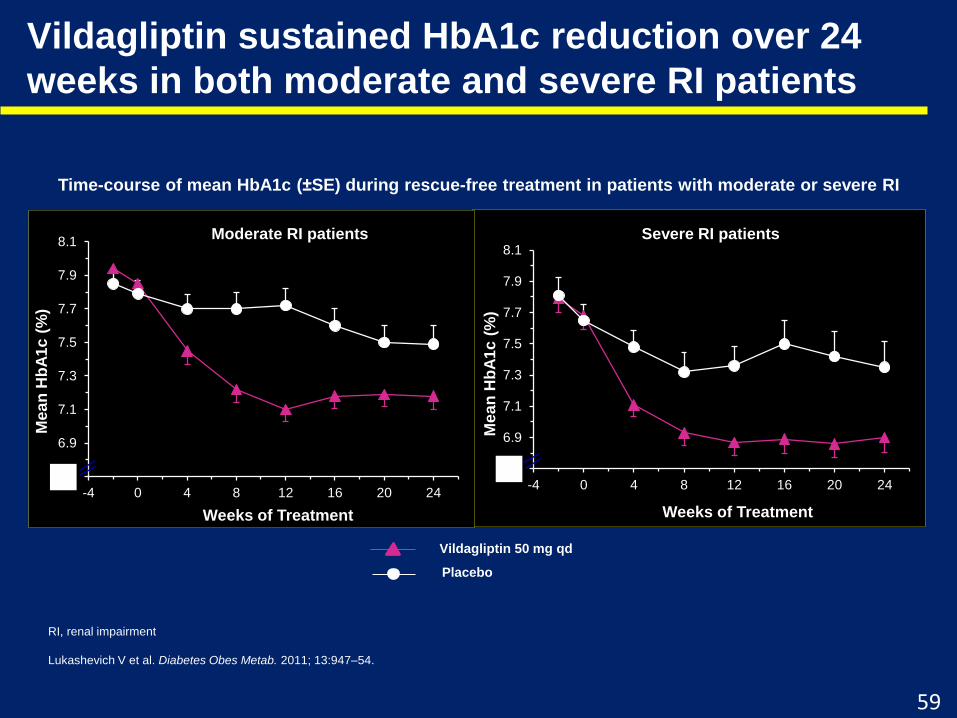
Vildagliptin sustained HbA1c reduction over 24
weeks in both moderate and severe RI patients
RI, renal impairment
Lukashevich V et al. Diabetes Obes Metab. 2011; 13:947–54.
Time-course of mean HbA1c (±SE) during rescue-free treatment in patients with moderate or severe RI
6.7
6.9
7.1
7.3
7.5
7.7
7.9
8.1
-4 0 4 8 12 16 20 24M
ea
n H
bA
1c
(%
)
Weeks of Treatment
Vildagliptin 50 mg qd
Placebo
Moderate RI patients Severe RI patients
6.7
6.9
7.1
7.3
7.5
7.7
7.9
8.1
-4 0 4 8 12 16 20 24
Me
an
Hb
A1
c (
%)
Weeks of Treatment
00
Moderate RI patients
59
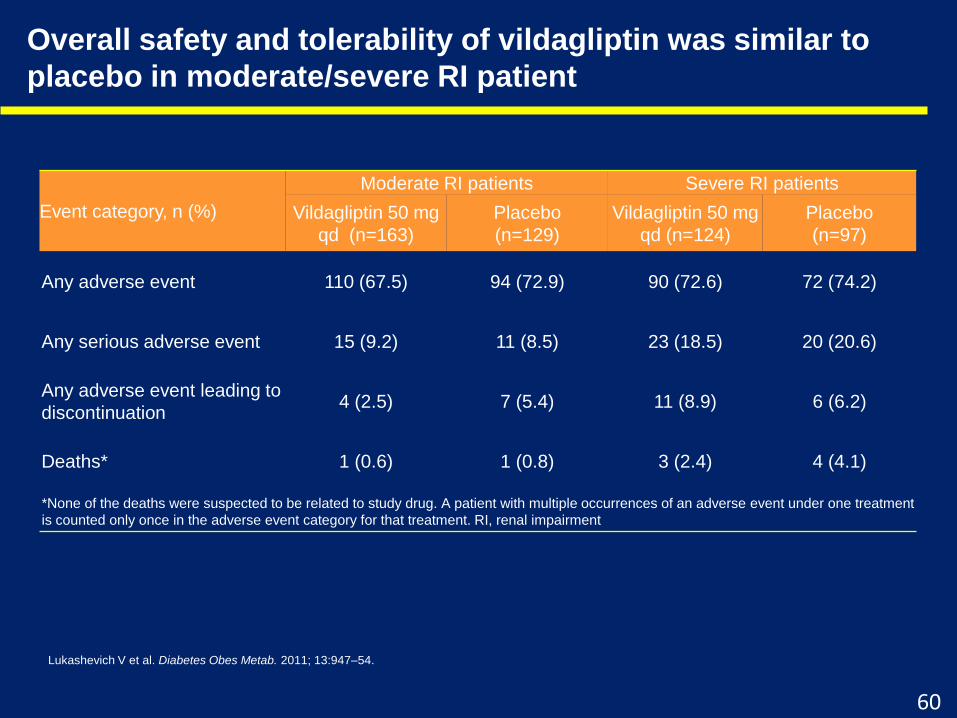
Overall safety and tolerability of vildagliptin was similar to
placebo in moderate/severe RI patient
Event category, n (%)
Moderate RI patients Severe RI patients
Vildagliptin 50 mg
qd (n=163)
Placebo
(n=129)
Vildagliptin 50 mg
qd (n=124)
Placebo
(n=97)
Any adverse event 110 (67.5) 94 (72.9) 90 (72.6) 72 (74.2)
Any serious adverse event 15 (9.2) 11 (8.5) 23 (18.5) 20 (20.6)
Any adverse event leading to
discontinuation4 (2.5) 7 (5.4) 11 (8.9) 6 (6.2)
Deaths* 1 (0.6) 1 (0.8) 3 (2.4) 4 (4.1)
*None of the deaths were suspected to be related to study drug. A patient with multiple occurrences of an adverse event under one treatment
is counted only once in the adverse event category for that treatment. RI, renal impairment
Lukashevich V et al. Diabetes Obes Metab. 2011; 13:947–54.
60
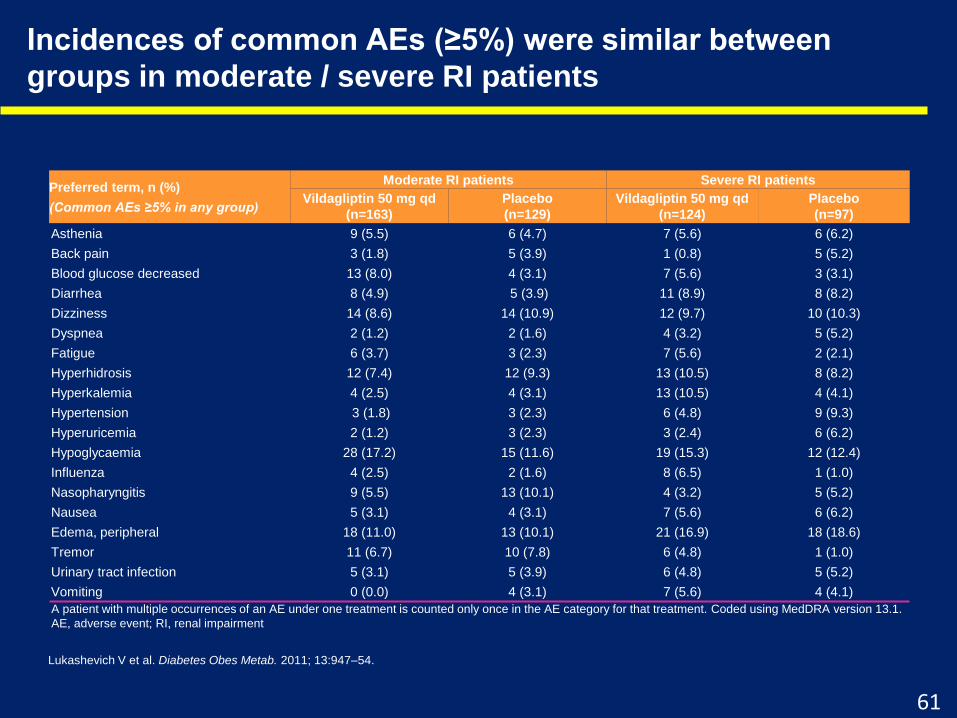
Incidences of common AEs (≥5%) were similar between
groups in moderate / severe RI patients
Preferred term, n (%)
(Common AEs ≥5% in any group)
Moderate RI patients Severe RI patients
Vildagliptin 50 mg qd
(n=163)
Placebo
(n=129)
Vildagliptin 50 mg qd
(n=124)
Placebo
(n=97)
Asthenia 9 (5.5) 6 (4.7) 7 (5.6) 6 (6.2)
Back pain 3 (1.8) 5 (3.9) 1 (0.8) 5 (5.2)
Blood glucose decreased 13 (8.0) 4 (3.1) 7 (5.6) 3 (3.1)
Diarrhea 8 (4.9) 5 (3.9) 11 (8.9) 8 (8.2)
Dizziness 14 (8.6) 14 (10.9) 12 (9.7) 10 (10.3)
Dyspnea 2 (1.2) 2 (1.6) 4 (3.2) 5 (5.2)
Fatigue 6 (3.7) 3 (2.3) 7 (5.6) 2 (2.1)
Hyperhidrosis 12 (7.4) 12 (9.3) 13 (10.5) 8 (8.2)
Hyperkalemia 4 (2.5) 4 (3.1) 13 (10.5) 4 (4.1)
Hypertension 3 (1.8) 3 (2.3) 6 (4.8) 9 (9.3)
Hyperuricemia 2 (1.2) 3 (2.3) 3 (2.4) 6 (6.2)
Hypoglycaemia 28 (17.2) 15 (11.6) 19 (15.3) 12 (12.4)
Influenza 4 (2.5) 2 (1.6) 8 (6.5) 1 (1.0)
Nasopharyngitis 9 (5.5) 13 (10.1) 4 (3.2) 5 (5.2)
Nausea 5 (3.1) 4 (3.1) 7 (5.6) 6 (6.2)
Edema, peripheral 18 (11.0) 13 (10.1) 21 (16.9) 18 (18.6)
Tremor 11 (6.7) 10 (7.8) 6 (4.8) 1 (1.0)
Urinary tract infection 5 (3.1) 5 (3.9) 6 (4.8) 5 (5.2)
Vomiting 0 (0.0) 4 (3.1) 7 (5.6) 4 (4.1)
A patient with multiple occurrences of an AE under one treatment is counted only once in the AE category for that treatment. Coded using MedDRA version 13.1.
AE, adverse event; RI, renal impairment
Lukashevich V et al. Diabetes Obes Metab. 2011; 13:947–54.
61
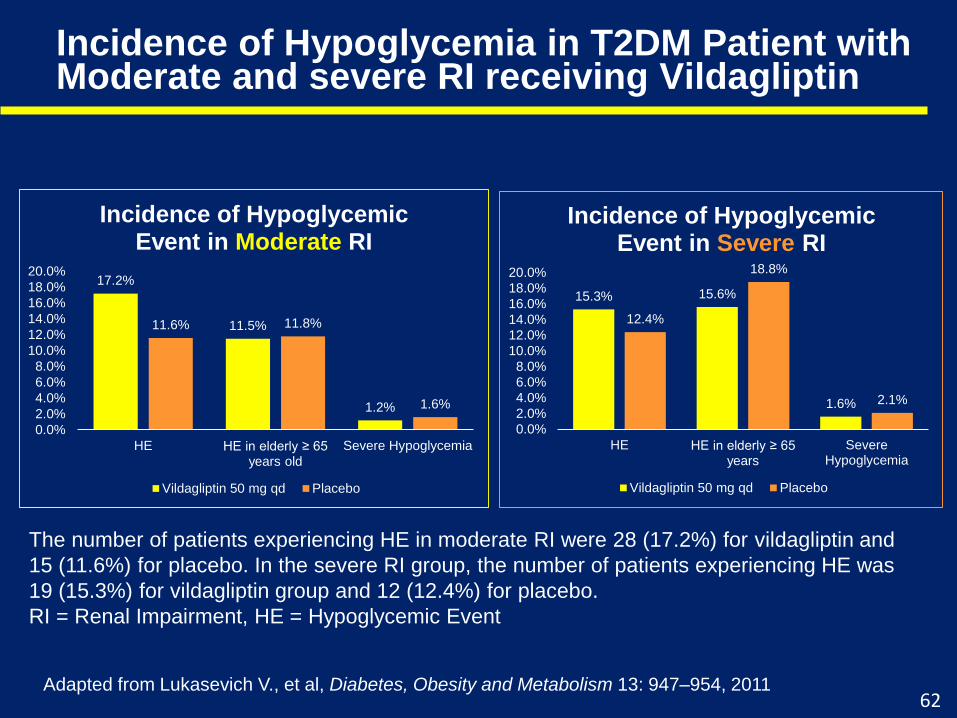
Incidence of Hypoglycemia in T2DM Patient with Moderate and severe RI receiving Vildagliptin
62Adapted from Lukasevich V., et al, Diabetes, Obesity and Metabolism 13: 947–954, 2011
15.3% 15.6%
1.6%
12.4%
18.8%
2.1%
0.0%
2.0%
4.0%
6.0%
8.0%
10.0%
12.0%
14.0%
16.0%
18.0%
20.0%
HE HE in elderly ≥ 65 years
SevereHypoglycemia
Incidence of Hypoglycemic Event in Severe RI
Vildagliptin 50 mg qd Placebo
The number of patients experiencing HE in moderate RI were 28 (17.2%) for vildagliptin and
15 (11.6%) for placebo. In the severe RI group, the number of patients experiencing HE was
19 (15.3%) for vildagliptin group and 12 (12.4%) for placebo.
RI = Renal Impairment, HE = Hypoglycemic Event
17.2%
11.5%
1.2%
11.6% 11.8%
1.6%
0.0%
2.0%
4.0%
6.0%
8.0%
10.0%
12.0%
14.0%
16.0%
18.0%
20.0%
HE HE in elderly ≥ 65 years old
Severe Hypoglycemia
Incidence of Hypoglycemic Event in Moderate RI
Vildagliptin 50 mg qd Placebo
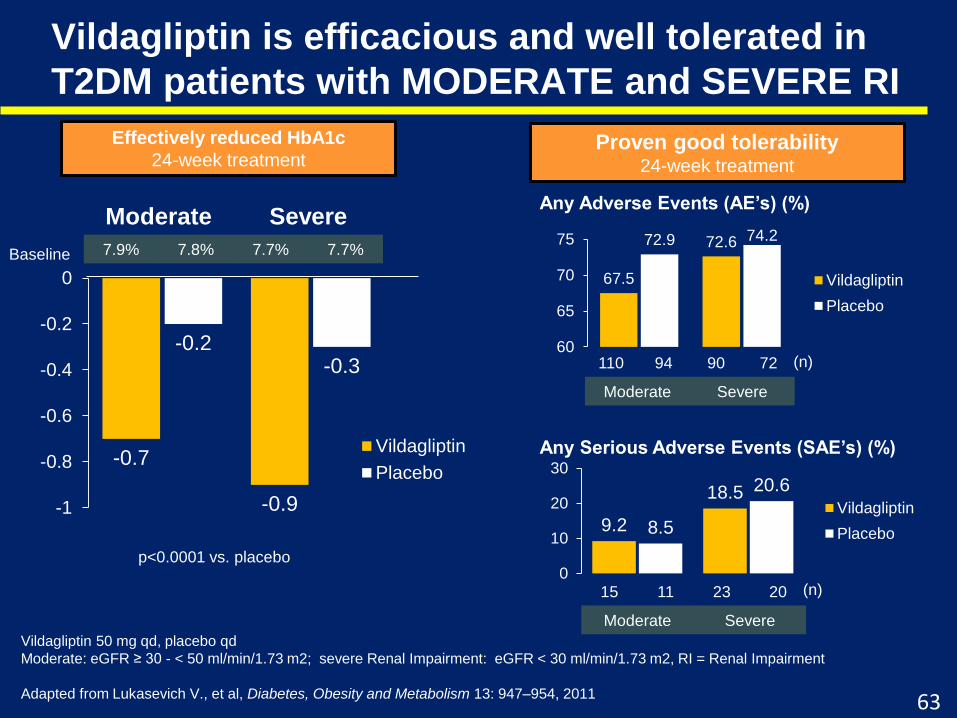
Vildagliptin is efficacious and well tolerated in
T2DM patients with MODERATE and SEVERE RI
-0.7
-0.9
-0.2-0.3
-1
-0.8
-0.6
-0.4
-0.2
0
Vildagliptin
Placebo
Effectively reduced HbA1c
24-week treatment
67.5
72.672.9 74.2
60
65
70
75
Vildagliptin
Placebo
Proven good tolerability24-week treatment
Any Serious Adverse Events (SAE’s) (%)
9.2
18.5
8.5
20.6
0
10
20
30
Vildagliptin
Placebo
Any Adverse Events (AE’s) (%)
Vildagliptin 50 mg qd, placebo qd
Moderate: eGFR ≥ 30 - < 50 ml/min/1.73 m2; severe Renal Impairment: eGFR < 30 ml/min/1.73 m2, RI = Renal Impairment
Adapted from Lukasevich V., et al, Diabetes, Obesity and Metabolism 13: 947–954, 2011 63
Moderate Severe
7.9% 7.8% 7.7% 7.7%Baseline
p<0.0001 vs. placebo
110 94 90 72
Moderate Severe
15 11 23 20
Moderate Severe
(n)
(n)
Conclusions
• Treatment with vildagliptin (50 mg qd) added to ongoing anti-diabetic therapy was
well-tolerated, with a safety profile comparable to placebo.
• In patients with moderate or severe RI, vildagliptin added to current therapy elicited
robust improvements in glycemic control with HbA1c reductions of ∼0.7% (from
baseline 7.9% in moderate RI) and ∼0.9% (from baseline of 7.7% in severe RI).
• It may be concluded that vildagliptin treatment is well-tolerated and effective in
patients with T2DM and moderate or severe RI and did not cause deterioration of
renal function.
RI, renal impairment; T2DM, type 2 diabetes mellitus
Lukashevich V et al. Diabetes Obes Metab. 2011; 13:947–54.
64
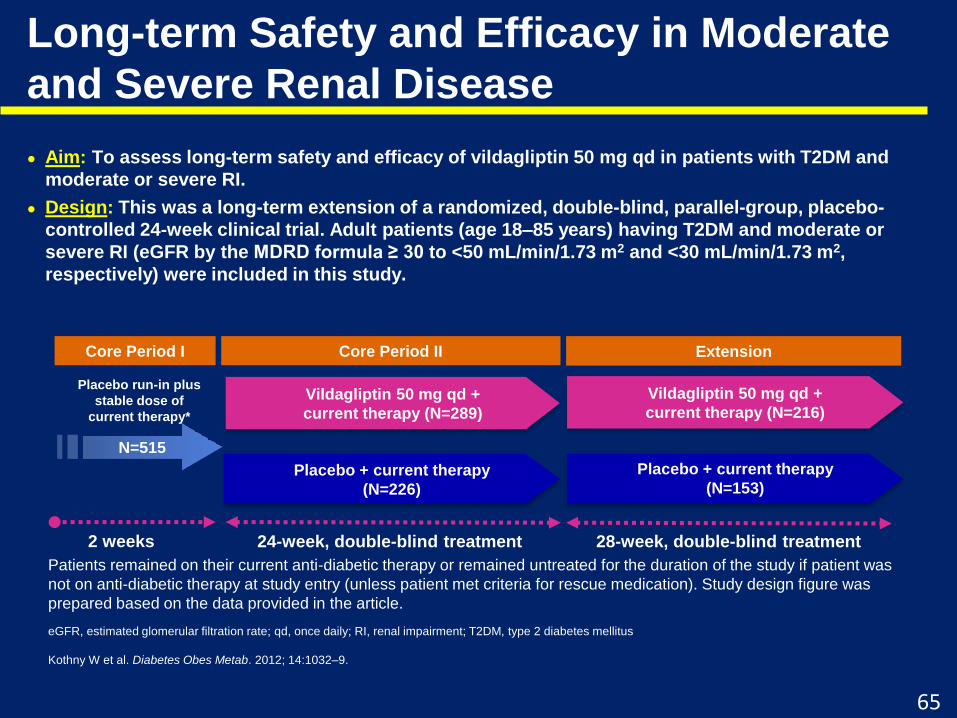
Long-term Safety and Efficacy in Moderate
and Severe Renal Disease
● Aim: To assess long-term safety and efficacy of vildagliptin 50 mg qd in patients with T2DM and
moderate or severe RI.
● Design: This was a long-term extension of a randomized, double-blind, parallel-group, placebo-
controlled 24-week clinical trial. Adult patients (age 18–85 years) having T2DM and moderate or
severe RI (eGFR by the MDRD formula ≥ 30 to <50 mL/min/1.73 m2 and <30 mL/min/1.73 m2,
respectively) were included in this study.
N=515
Placebo + current therapy
(N=226)
Placebo + current therapy
(N=153)
Vildagliptin 50 mg qd +
current therapy (N=216)
Placebo run-in plus
stable dose of
current therapy*
2 weeks 24-week, double-blind treatment 28-week, double-blind treatment
Vildagliptin 50 mg qd +
current therapy (N=289)
Core Period I Core Period II Extension
Patients remained on their current anti-diabetic therapy or remained untreated for the duration of the study if patient was
not on anti-diabetic therapy at study entry (unless patient met criteria for rescue medication). Study design figure was
prepared based on the data provided in the article.
eGFR, estimated glomerular filtration rate; qd, once daily; RI, renal impairment; T2DM, type 2 diabetes mellitus
Kothny W et al. Diabetes Obes Metab. 2012; 14:1032–9.
65
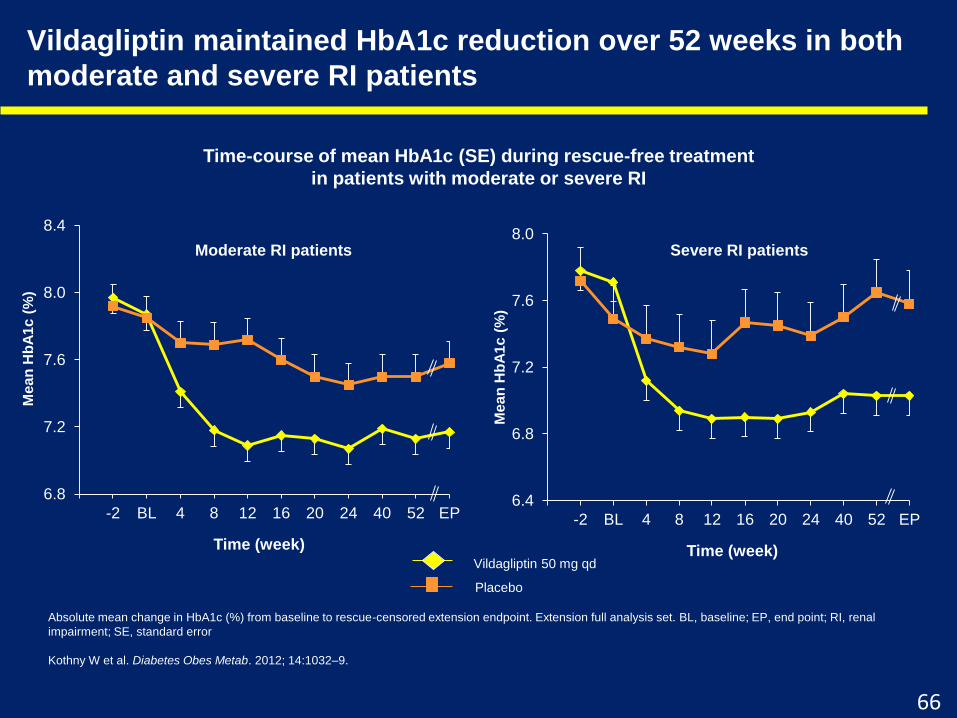
Time-course of mean HbA1c (SE) during rescue-free treatment
in patients with moderate or severe RI
Vildagliptin maintained HbA1c reduction over 52 weeks in both
moderate and severe RI patients
6.8
7.2
7.6
8.0
8.4
-2 BL 4 8 12 16 20 24 40 52 EP
Me
an
Hb
A1
c (
%)
Time (week)
6.4
6.8
7.2
7.6
8.0
-2 BL 4 8 12 16 20 24 40 52 EP
Me
an
Hb
A1
c (
%)
Time (week)
Moderate RI patients Severe RI patients
Vildagliptin 50 mg qd
Placebo
Absolute mean change in HbA1c (%) from baseline to rescue-censored extension endpoint. Extension full analysis set. BL, baseline; EP, end point; RI, renal
impairment; SE, standard error
Kothny W et al. Diabetes Obes Metab. 2012; 14:1032–9.
66
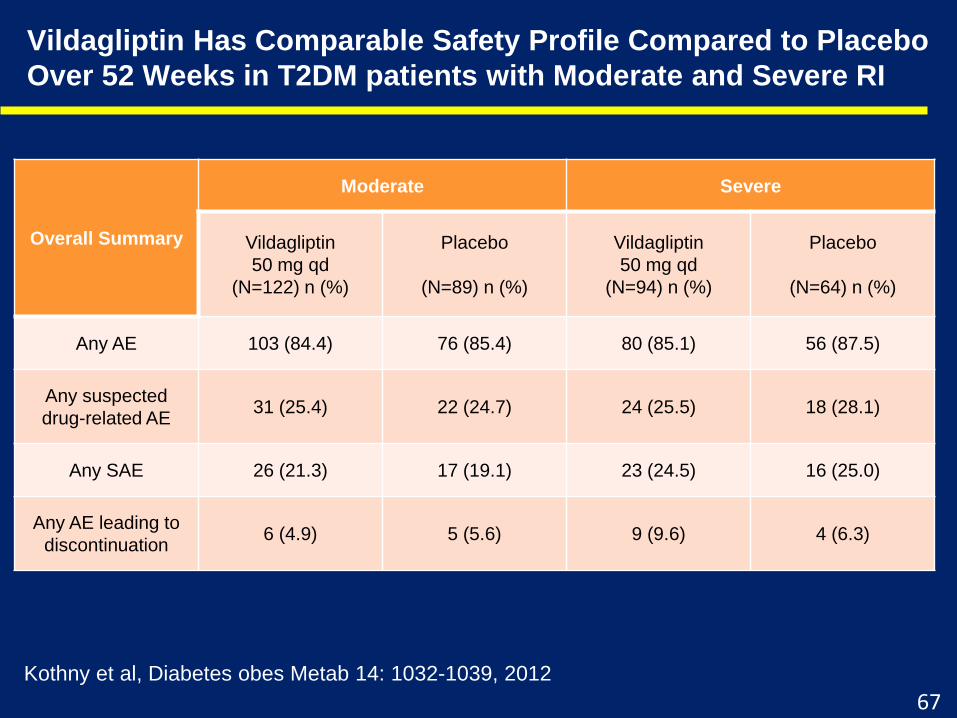
Vildagliptin Has Comparable Safety Profile Compared to Placebo
Over 52 Weeks in T2DM patients with Moderate and Severe RI
Overall Summary
Moderate Severe
Vildagliptin
50 mg qd
(N=122) n (%)
Placebo
(N=89) n (%)
Vildagliptin
50 mg qd
(N=94) n (%)
Placebo
(N=64) n (%)
Any AE 103 (84.4) 76 (85.4) 80 (85.1) 56 (87.5)
Any suspected
drug-related AE31 (25.4) 22 (24.7) 24 (25.5) 18 (28.1)
Any SAE 26 (21.3) 17 (19.1) 23 (24.5) 16 (25.0)
Any AE leading to
discontinuation6 (4.9) 5 (5.6) 9 (9.6) 4 (6.3)
67Kothny et al, Diabetes obes Metab 14: 1032-1039, 2012
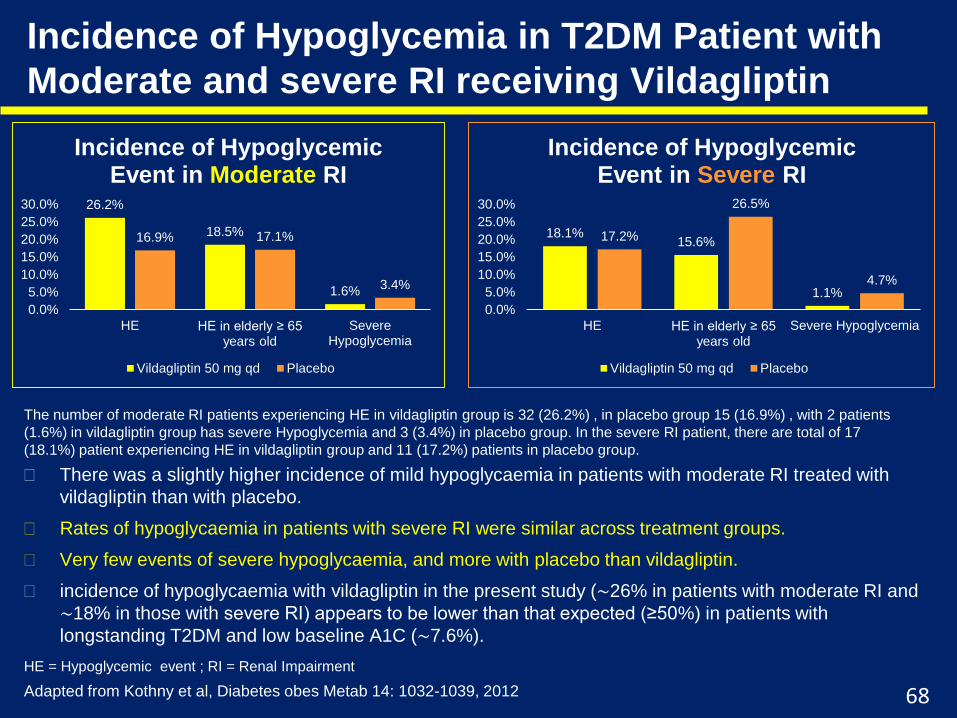
Incidence of Hypoglycemia in T2DM Patient with
Moderate and severe RI receiving Vildagliptin
There was a slightly higher incidence of mild hypoglycaemia in patients with moderate RI treated with
vildagliptin than with placebo.
Rates of hypoglycaemia in patients with severe RI were similar across treatment groups.
Very few events of severe hypoglycaemia, and more with placebo than vildagliptin.
incidence of hypoglycaemia with vildagliptin in the present study (∼26% in patients with moderate RI and
∼18% in those with severe RI) appears to be lower than that expected (≥50%) in patients with
longstanding T2DM and low baseline A1C (∼7.6%).
68
26.2%
18.5%
1.6%
16.9% 17.1%
3.4%
0.0%
5.0%
10.0%
15.0%
20.0%
25.0%
30.0%
HE HE in elderly ≥ 65 years old
SevereHypoglycemia
Incidence of Hypoglycemic Event in Moderate RI
Vildagliptin 50 mg qd Placebo
18.1%15.6%
1.1%
17.2%
26.5%
4.7%
0.0%
5.0%
10.0%
15.0%
20.0%
25.0%
30.0%
HE HE in elderly ≥ 65 years old
Severe Hypoglycemia
Incidence of Hypoglycemic Event in Severe RI
Vildagliptin 50 mg qd Placebo
Adapted from Kothny et al, Diabetes obes Metab 14: 1032-1039, 2012
The number of moderate RI patients experiencing HE in vildagliptin group is 32 (26.2%) , in placebo group 15 (16.9%) , with 2 patients
(1.6%) in vildagliptin group has severe Hypoglycemia and 3 (3.4%) in placebo group. In the severe RI patient, there are total of 17
(18.1%) patient experiencing HE in vildagliptin group and 11 (17.2%) patients in placebo group.
HE = Hypoglycemic event ; RI = Renal Impairment
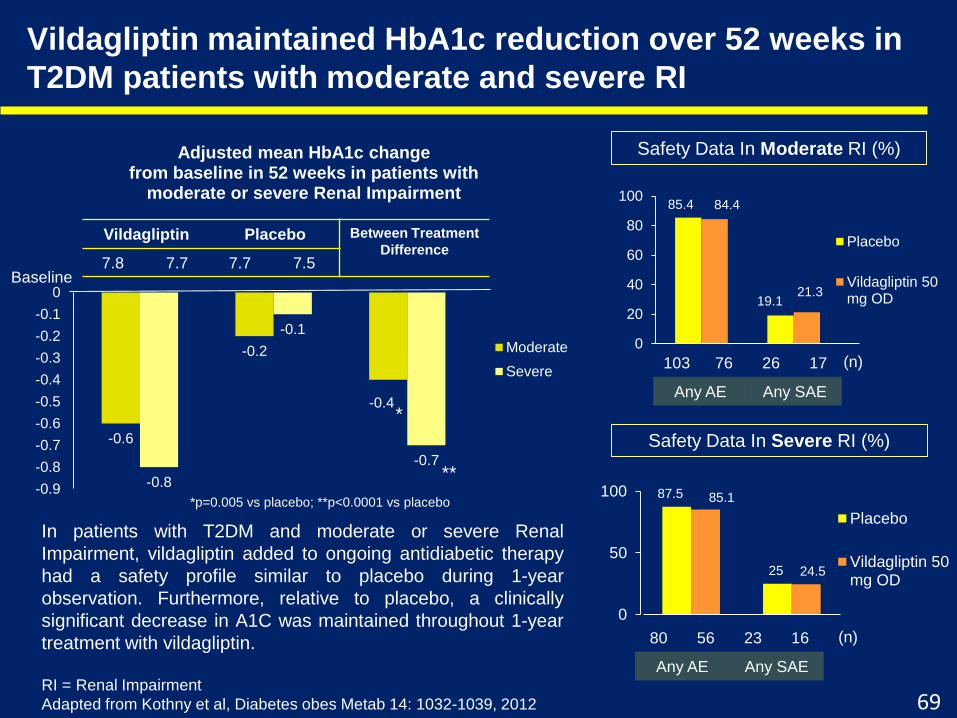
Vildagliptin maintained HbA1c reduction over 52 weeks in
T2DM patients with moderate and severe RI
85.4
19.1
84.4
21.3
0
20
40
60
80
100
Placebo
Vildagliptin 50mg OD
Safety Data In Moderate RI (%)
Safety Data In Severe RI (%)
87.5
25
85.1
24.5
0
50
100
Placebo
Vildagliptin 50mg OD
-0.6
-0.2
-0.4
-0.8
-0.1
-0.7
-0.9
-0.8
-0.7
-0.6
-0.5
-0.4
-0.3
-0.2
-0.1
0
Adjusted mean HbA1c change from baseline in 52 weeks in patients with
moderate or severe Renal Impairment
Moderate
Severe
In patients with T2DM and moderate or severe Renal
Impairment, vildagliptin added to ongoing antidiabetic therapy
had a safety profile similar to placebo during 1-year
observation. Furthermore, relative to placebo, a clinically
significant decrease in A1C was maintained throughout 1-year
treatment with vildagliptin.
RI = Renal Impairment
Adapted from Kothny et al, Diabetes obes Metab 14: 1032-1039, 2012 69
103 76 26 17
Any AE Any SAE
(n)
(n)80 56 23 16
Any AE Any SAE
Vildagliptin Placebo Between Treatment
Difference7.8 7.7 7.7 7.5
Baseline
*p=0.005 vs placebo; **p<0.0001 vs placebo
*
**
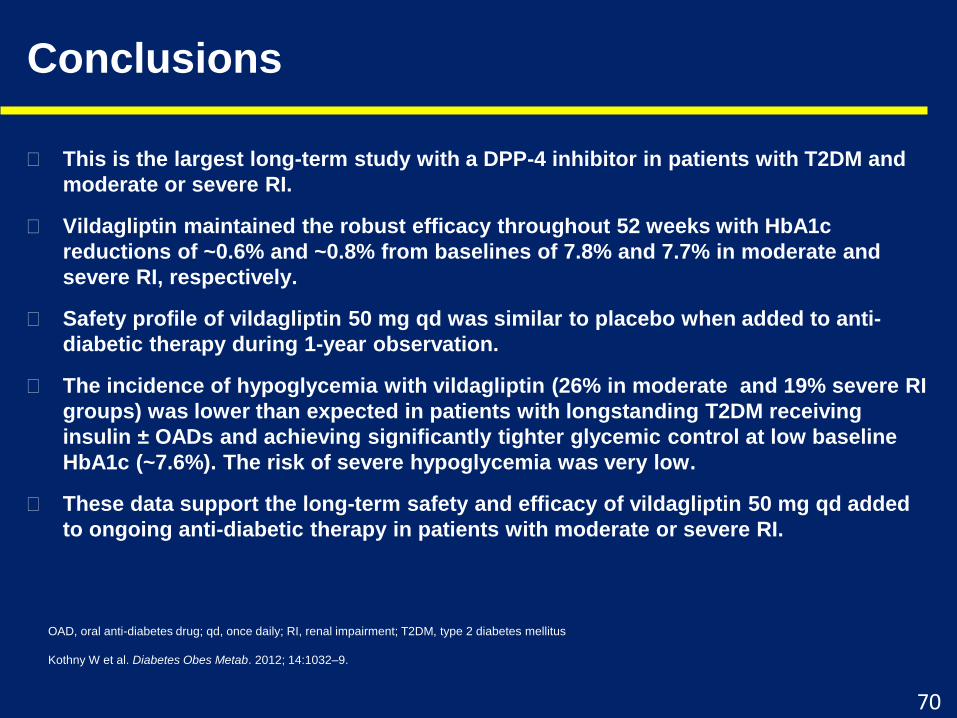
Conclusions
This is the largest long-term study with a DPP-4 inhibitor in patients with T2DM and
moderate or severe RI.
Vildagliptin maintained the robust efficacy throughout 52 weeks with HbA1c
reductions of ~0.6% and ~0.8% from baselines of 7.8% and 7.7% in moderate and
severe RI, respectively.
Safety profile of vildagliptin 50 mg qd was similar to placebo when added to anti-
diabetic therapy during 1-year observation.
The incidence of hypoglycemia with vildagliptin (26% in moderate and 19% severe RI
groups) was lower than expected in patients with longstanding T2DM receiving
insulin ± OADs and achieving significantly tighter glycemic control at low baseline
HbA1c (~7.6%). The risk of severe hypoglycemia was very low.
These data support the long-term safety and efficacy of vildagliptin 50 mg qd added
to ongoing anti-diabetic therapy in patients with moderate or severe RI.
OAD, oral anti-diabetes drug; qd, once daily; RI, renal impairment; T2DM, type 2 diabetes mellitus
Kothny W et al. Diabetes Obes Metab. 2012; 14:1032–9.
70

Thank You
71

72

73

74
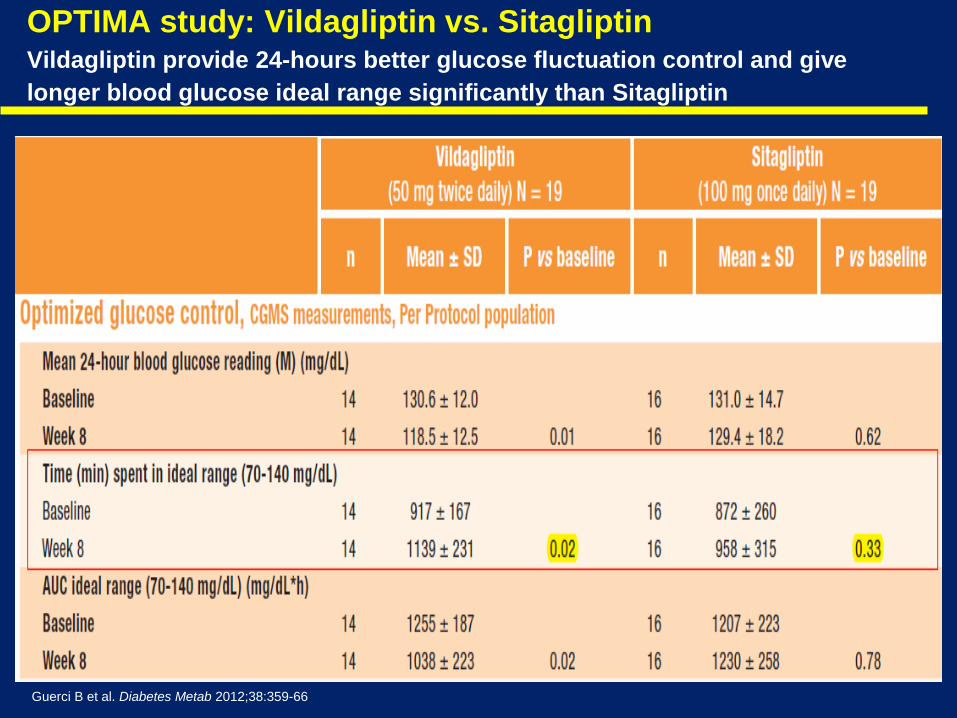
OPTIMA study: Vildagliptin vs. SitagliptinVildagliptin provide 24-hours better glucose fluctuation control and give
longer blood glucose ideal range significantly than Sitagliptin
Guerci B et al. Diabetes Metab 2012;38:359-66