YOUTH EMPLOYMENT REPORT IN INDONESIA an update
68
1 YOUTH EMPLOYMENT REPORT IN INDONESIA an update
-
Upload
khangminh22 -
Category
Documents
-
view
0 -
download
0
Transcript of YOUTH EMPLOYMENT REPORT IN INDONESIA an update

1
YOUTH EMPLOYMENTREPORT IN INDONESIA
an update
2
Copyright@International Labour Organization 2004
First published 2004
Publications of the International Labour Office enjoy copyright under Protocol 2 of the Universal Copyright Convention.Nevertheless, short excerpts from them may be reproduced without authorization, on condition that the source is indicated. Forrights of reproduction or translation, application should be made to the Publications Bureau (Rights and Permissions), InternationalLabour Office, CH-1211 Geneva 22, Switzerland. The International Labour Office welcomes such applications.
Libraries, institutions and other users registered in the United Kingdom with the Copyright Licensing Agency, 90 Tottenham CourtRoad, London W1T 4LP [Fax: (+44) (0)20 7631 5500; email: [email protected]], in the United States with the Copyright ClearanceCenter, 222 Rosewood Drive, Danvers, MA 01923 [Fax: (+1) (978) 750 4470; email: [email protected]] or in other countrieswith associated Reproduction Rights Organizations, may make photocopies in accordance with the licences issued to them for thispurpose.
ILOKantor Perburuhan Internasional, 2004“Laporan Mengenai Tenaga Kerja Muda di Indonesia: data terbaru”Judul Bahasa Inggris: ”Youth Employment Report in Indonesia: an update”ISBN 92-2-016123-0
The designations employed in ILO publications, which are in conformity with United Nations practice, and the presentation ofmaterial therein do not imply the expression of any opinion whatsoever on the part of the International Labour Office concerningthe legal status of any country, area or territory or of its authorities, or concerning the delimitation of its frontiers.
The responsibility for opinions expressed in signed articles, studies and other contributions rests solely with their authors, andpublication does not constitute an endorsement by the International Labour Office of the opinions expressed in them.
Reference to names of firms and commercial products and processes does not imply their endorsement by the InternationalLabour Office, and any failure to mention a particular firm, commercial product or process is not a sign of disapproval.
ILO publications can be obtained through major booksellers or ILO local offices in many countries, or direct from ILO Publications,International Labour Office, CH-1211 Geneva 22, Switzerland or from the ILO Office in Jakarta, Menara Thamrin, Level 22, Jl. MHThamrin Kav. 3, Jakarta 10250. Catalogues or lists of new publications are available free of charge from the above address, or byemail: [email protected] ; [email protected].
Visit our website: www.ilo.org/publns ; www.un.or.id/ilo
Printed in Jakarta, Indonesia
3
Youth unemployment is one of the most serious issues facing Indonesia today. It is a tragedy for theyoung women and men concerned and for the nation. It is an enormous waste of the talents and skills ofthe new generation.
There is a need to find new opportunities for decent and productive work for the young people ofIndonesia. Without such opportunities, many young people will not be able to realize their potential.
To address this challenge, the Government of Indonesia, under the leadership of the CoordinatingMinistry of Economic Affairs, volunteered in 2002 to be one of the ten “lead” countries of the YouthEmployment Network. This was followed by the establishment, by Ministerial decree, of the IndonesiaYouth Employment Network (I-YEN) and the development of a national Youth Employment ActionPlan. The Action Plan was prepared by the I-YEN following consultations with interested persons andgroups and was launched by the Vice President of the Republic on International Youth Day, 12 August2004.
Some of the key policy recommendations highlighted in the Action Plan include making educationaffordable for the poor, developing a national skills qualification framework, strengthening the networkof vocational education and training centres of excellence and incorporating youth employment goalsinto macro economic policy. The recommendations also include developing new opportunities in emergingsectors, mobilizing business for action, making it easier for young people to start and run businesses,mobilizing private sector support for young entrepreneurs, and developing linkage support programsbetween large and small enterprises.
Of course it is an important step to develop an Action Plan – but that is only the start of the job!More important is the commitment to implementation and willingness to put energy and resources intotranslating “good concepts into practical action”. This will require a strong partnership betweengovernment, the business community, employers and workers organizations, together with communityorganizations and others. It also needs the active support and involvement of young people.
The present publication has been prepared as part of a technical cooperation project on Addressingthe Challenges of Youth Employment in Indonesia (INS/02/50M/NET) which is funded by the Governmentof the Netherlands. The report aims to raise awareness about youth employment issues in Indonesia andsupport for programs to address these issues. It updates an earlier report on Youth Employment in Indonesiawhich was published in 2002. That report sought to identify the dimensions of the youth employmentchallenge in Indonesia and to detail some of the preliminary work undertaken in gaining inputs andsupport for a national action program on youth employment.
Foreword

4
The new report is the result of collaboration between the ILO and the Institute for Economic andSocial Research, Faculty of Economics, University of Indonesia. It is divided into three chapters. Thefirst chapter provides an overview of the current demographic situation of youth in Indonesia, andprovides statistics relating to the youth population, education, and employment. The data show themagnitude of the youth employment challenge in Indonesia, including the gender dimension. The secondchapter deals with poverty and youth. The ILO involvement in the Poverty Reduction Strategy (PRSP)process in Indonesia has taught us much about the links between youth poverty and the lack of employmentopportunities. The report deals with various aspects of youth poverty – income, access to basic educationand health services, vulnerability and powerlessness. The final chapter of the report examines youthentrepreneurship issues, including the problems young people face in starting and expanding their ownbusinesses.
We thank all those involved in the preparation of this report, both from the University of Indonesiaand the ILO. We hope that the report will assist the Government of Indonesia, and its partners, in theefforts to create more and better job opportunities for the young people of Indonesia.
Alan BoultonDirectorILO Jakarta OfficeOctober 2004

5
This is the Output-2 (Final Report) of YOUTH EMPLOYMENT REPORT IN INDONESIA,which is conducted by Institute for Economic and Social Research Faculty of Economics University ofIndonesia (LPEM FEUI) in corporation with The International Labor Office (ILO).
On behalf of Institute for Economic and Social Research Faculty of Economics University ofIndonesia and our staff, we would like to appreciate The International Labor Office (ILO), for giving usthe opportunity to conduct this study
Jakarta, December 2003Institute for Economic and Social ResearchFaculty of Economics University of Indonesia(LPEM FEUI)
Dr. Muh. Chatib BasriAssociate Director for Economics and Policy Research
Preface

6
7
Foreword iii
Preface v
Table of Content vii
List of Table and Figure ix
INTRODUCTION 1
Background 1Report Content 2Chapter 1: Overview of the Demographic Situation of Youth in Indonesia 2Chapter 2: Poverty and Youth 2Chapter 3: Youth Entrepreneurship 2
CHAPTER 1: OVERVIEW OF THE DEMOGRAPHIC SITUATIONOF YOUTH IN INDONESIA 4
Introduction 4Youth Population 4
Age and Gender 7Education 10Ethnic Groups, Residence and Mobility 14
Youth Employment 19Youth Labor Force Participation Rate 19Employment to Population Ratio 21Employment by Status 23Employment by Field of Work 25Unemployment 26Unemployment by Gender 27Unemployment by Level of Schooling 28Percentage of Unemployed Youth to Total Unemployment 30Underemployment 31Wages and Salary of Youth Employment 34Social Consequences of Young Unemployment 36
Summary 38
Table of Content
8
CHAPTER 2: POVERTY AND YOUTH 40
Introduction 40Overview of Indonesian Poverty Profile 41Poverty Profile of Young People 46
Education 48Consumption Pattern 5Employment by Work Status 5Employment by Field of Work 5
Conclusion 53
CHAPTER 3: YOUTH ENTREPRENEURSHIP 54Introduction 54Profile of Youth Entrepreneurship 55
Rural and Urban 57Gender 59Education 60Self Employment by Field of Work 62
Challenges of Youth Entrepreunership
BIBLIOGRAPHY 67
9
Table1.1. Indonesian Population Projection 2000-2005 (In Thousands Of People) 5
Table 1.2. Indonesian Youth As Percentage Of Total Population, 1971-2002 5
Table 1.3. Indonesian Youth As Percentage Of Total Population By LocationAnd Gender, 1971-2002 5
Table 1.4. Youth And Adult Labor Force Participation Rate andUnemployment Rate 1971-2002 5
Figure 1.1. Youth Population As Percentage Of Total Population 5
Table 1.5. Percentage Of Indonesian Population By Age Group And Gender 1971-2002 5
Table 1.6. Percentage Distribution Of Youth Population
(15-24 Years) By Educational Attainment 1971-2002 5
Table 1.7. Percentage Distribution Of Youth Population (15-24 Years) By EducationalAttainment And Gender 1971-2002 5
Figure 1.2. Youth School Enrolment Ratio By Location, 1971-2002 5
Figure 1.3. Youth School Enrolment Ratio By Gender, 1971-2002 5
Table 1.8 Percentage Distribution Of Youth Population
(15-24 Years) By Ethnic Group, 1980-2000 5
Figure 1.4. Percentage Of Indonesian Youth Population
(15-24 Years) By Location, 1971-2002 5
Figure 1. 5. Growth Rate Of Youth (15-24 Years) Population By Location, 1971-2002 5
Table 1.9 Percentage Of Youth By Migration Status, 1980-2000 5
Table 1.10 Percentage Indonesia Total Population Status By Migration Status, 1980-2000 5
Table 1.11 Percentage Indonesia Inter-regional Lifetime Migration Stream, 2000 15
Figure 1.6. Rural Labor Force Participation Rate By Age Group, 1971-2002 5
Figure 1.7. Urban Labor Force Participation Rate By Age Group, 1971-2002 5
Figure 1.8. Youth (15-24 Year) Labor Force Participation Rate By Gender, 1971-2000 5
Figure 1.9. Youth (15-24 Years) Employment To Population Ratio By Gender, 1971-2002 5
daftar tabel dan figur

10
Figure 1.10. Youth (15-24 Years) Employment To Population Ratio By Location, 1971-2002 5
Figure 1.11. Youth (15-24 Years) Employment By Status, 1971-2002 5
Figure 1.12. Percentage Of Adult (Over 25 Years) Employment By Status, 1971-2002 5
Table 1.12 Percentage Of Youth (15-24 Years) Employment By Field Of Work 1985-2002 5
Table 1.13 Percentage Distribution Of Adult (>24 Years) Employmentby Field Of Work, 1985-2002 5
Figure 1.13. Youth (15-24 Years) Unemployment Rate By Location, 1971-2002 5
Figure 1.14 Youth (15-24 Years) Unemployment Rate By Gender, 1971-2002 5
Table 1.14 Percentage Of Youth (15-24 Years) Unemployment RateBy Level Of Schooling, 1985-2002 5
Table 1.15 Percentage Of Adult (>24 Years) Unemployment RateBy Level Of Schooling, 1985-2002 5
Figure 1.15. Unemployed Youth (15-24 Years) As Percentage Of Total Unemployment(>15 Years), 1971-2002 5
Figure 1.16. Youth Underemployment As Percentage Of Total EmployedBy Age Group, 1985-2002 5
Figure 1.17. Youth Underemployment As Percentage Of Total EmployedBy Status, 1985-2002 5
Table 1.16. Youth (15-24 Years) Underemployment As Percentage Of Total EmployedBy Educational Attainment, 1985-2002 5
Table 1.17. Percentage Of Youth Employment (15-24 Years) And Adult Employment(>25 Years) By Level Of Monthly Wages/Salaries/Income 5
Figure 1.18. Percentage Of In-patient Youth For Drugs Abuse CasesBy Age Group, 1995-1998 5
Figure 1.19 Percentage Of Additional Prisoners By Age Groups 5
Table 1.18. Material Lost, Action, Victims Caused By Student FightingIn Jakarta, 1997-2001 5
Table 2.1. Poverty Indicators For Indonesia, 1990-2002 5
Table 2.2. Profile Of The Poor And Non-poor In Indonesia (%), 2002 5
Figure 2.1. Percentage Of Poor People By Age, 1996-2002 5
Table 2.3. Employment Profile Of The Poor And Non-poor In Indonesia (%), 2002 5
Figure 2.2. Average Monthly Expenditure Of Poor And Non-poor, 996-2002 5
Table 2.4. Percentage Of Poor Young People By Location And Gender, 1996-2002 5
Figure 2.3. Number Of Poor And Non Poor Young People, 1996-2002 5
Figure 2.3. Number Of Poor Young People By Location, 1996-2002 5

11
Table 2.5. Percentage Of Poor Young People By Location And Education Level, 2002 5
Figure 2.4. Percentage Of Poor Young People By Education Level, 2002 5
Table 2.6. Percentage Of Poor Young People By Work Status And Location, 2002 5
Figure 2.5. Percentage Of Monthly Average Expenditure For Poor Young People, 2002 5
Figure2.6. Employment To Population Ratio For Poor Young PeopleBy Location, 1996-2002 50
Table 2.7. Percentage Of Poor Young People By Field Of Work, 1996-2002 5
Table 2.8. Percentage Of Poor Young People By Field Of Work And Location, 2002 5
Figure 3.1. Percentage Of Self-employed Workers, 1997-2002 5
Table 3.1. Percentage Of Worker By Work Status, 1997-2002 5
Table 3.2. Self-employed Workers By Age, 1997-2002 5
Ffigure 3.2. Composition Of Young Self Employed In Rural Area, 2002 5
Figure 3.3. Composition Of Young Self Employed In Urban Area, 2002 5
Figure 3.4. Percentage Of Young Self Employed By Field Of Work, 1997-2002 5
Figure 3.5 Percentage of Young Self Employed by Field of Work, 1997-2002 5
Figure 3.6 Percentage of Young Self Employed by Education, 2002 5
Figure 3.7 Percentage of Young Self Employed by Education and Location, 2002
Table 3.3. Percentage Of Young Self Employed By Field Of Work, 1997-2002 5
Figure 3.8. Percentage of Young Self-Employer by Field of Work and Location, 2002

12
13
BackgroundBackgroundBackgroundBackgroundBackground
In general, youth employment and unemployment are highly sensitive to variations in the labormarket and overall economic conditions.1 As such, during times of crisis, like in Indonesia, the youthemployment tends to be hardest hit, since they are lacking of adaptive capacity like skills and capital.Strategies for dealing with unemployment must necessarily take into account a process that make certainpopulation groups more vulnerable to unemployment than others. It is important to determine the specificpatterns and features of the youth (un)employment situation in Indonesia, relating to these vulnerablegroups and developing means and awareness to contain them.
The ILO report in 2002 has given a good picture of youth employment situation in Indonesia. Thereport will be more comprehensive if it is not only covered statistical analysis but also cover policy-oriented analysis. The study presented here would update data and intensify the analysis in the report.Moreover, two things could be added to further complement the existing report, which are an analysis of“Poverty and Youth” and an analysis of “Youth Entrepreneurship”. This is because of two majorgovernment policy initiated in the coming years would relate to the two issues. As such, relating youthemployment with the two issues could save resources and give greater impact.2
Report ContentReport ContentReport ContentReport ContentReport Content
The report will be based on the report of ILO on the Youth and Employment in Indonesia, 2002.Basically, the contents would be similar with updated data and issues. The first chapter will elaboratedemographic situation youth employment; the second chapter will describe condition of youth andpoverty; while the last chapter will present analysis on youth entrepreneurship.
Mostly the data used for the analysis would be secondary data from SUSENAS, the census, andother relevant and recent statistical sources such as PODES. The analysis would also include an issueand policy-oriented analysis, with emphasis on employability, youth entrepreneurship, gender equality,and job creation.
Introduction
1 IOE Programme of Action on Youth Employment, Enhancing Youth Employment: Employers’ Actions (Draft Programme) Geneva,June 1998.
2 The paper by Soeprobo (2002) published by ILO and ILO report on youth employment in Solomon Island (2002) provide a morecomplete analysis on youth employment. However, as the target group of ILO’s report on Indonesia is the government, the items onthe report could be shortened so that it could still be readable by the government or general public.
14
The contents of the draft report here are still very preliminary and have not comprehensively analysisthe data. However, the report has given broad picture on the topic mention above. The topic on youthentrepreneurship has not been covered here, and will be presented in the final report.
The detail topics covered in the report are explained as the followings.
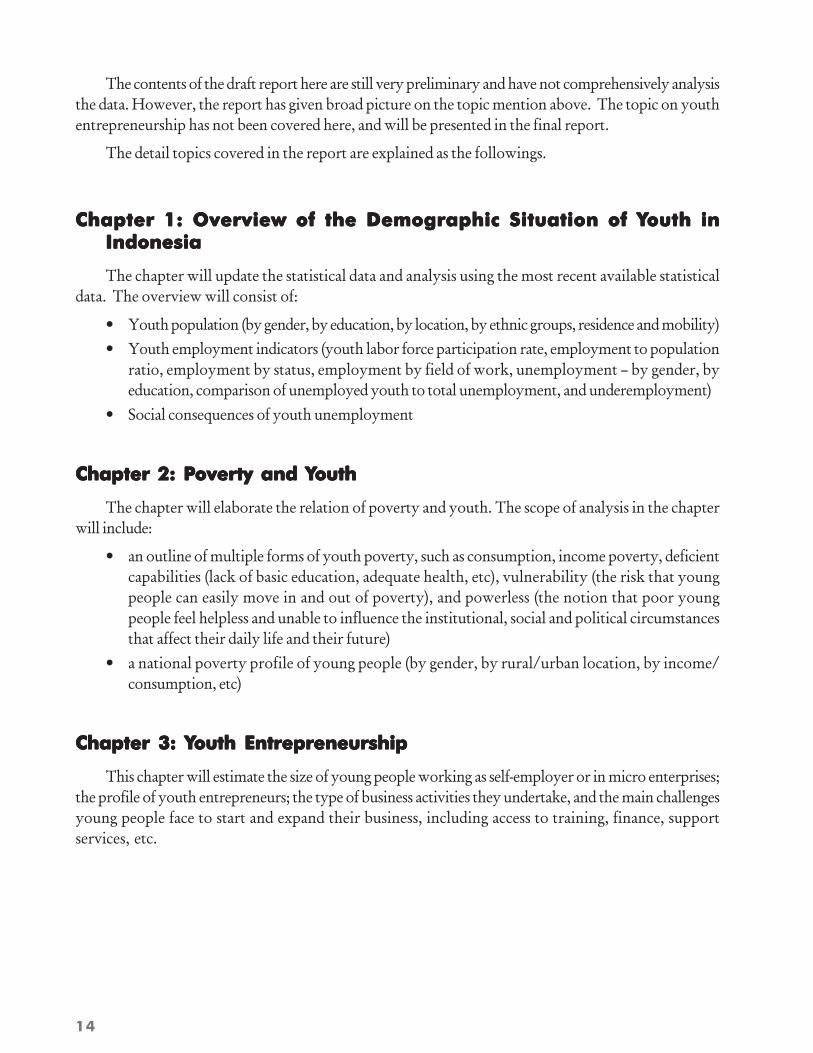
Chapter 1: Overview of the Demographic Situation of YChapter 1: Overview of the Demographic Situation of YChapter 1: Overview of the Demographic Situation of YChapter 1: Overview of the Demographic Situation of YChapter 1: Overview of the Demographic Situation of Youth inouth inouth inouth inouth inIndonesiaIndonesiaIndonesiaIndonesiaIndonesia
The chapter will update the statistical data and analysis using the most recent available statisticaldata. The overview will consist of:
• Youth population (by gender, by education, by location, by ethnic groups, residence and mobility)• Youth employment indicators (youth labor force participation rate, employment to population
ratio, employment by status, employment by field of work, unemployment – by gender, byeducation, comparison of unemployed youth to total unemployment, and underemployment)
• Social consequences of youth unemployment
Chapter 2: PChapter 2: PChapter 2: PChapter 2: PChapter 2: Poverty and Yoverty and Yoverty and Yoverty and Yoverty and Youthouthouthouthouth
The chapter will elaborate the relation of poverty and youth. The scope of analysis in the chapterwill include:
• an outline of multiple forms of youth poverty, such as consumption, income poverty, deficientcapabilities (lack of basic education, adequate health, etc), vulnerability (the risk that youngpeople can easily move in and out of poverty), and powerless (the notion that poor youngpeople feel helpless and unable to influence the institutional, social and political circumstancesthat affect their daily life and their future)
• a national poverty profile of young people (by gender, by rural/urban location, by income/consumption, etc)
Chapter 3: YChapter 3: YChapter 3: YChapter 3: YChapter 3: Youth Entrepreneurshipouth Entrepreneurshipouth Entrepreneurshipouth Entrepreneurshipouth Entrepreneurship
This chapter will estimate the size of young people working as self-employer or in micro enterprises;the profile of youth entrepreneurs; the type of business activities they undertake, and the main challengesyoung people face to start and expand their business, including access to training, finance, supportservices, etc.
15
IntroductionIntroductionIntroductionIntroductionIntroduction
In order to fully understand the situation of youth in the Indonesia labor force, this chapter presentdemographic and employment information. Specific reference is made to youth population statistic,educational and employment issues, migration and the social consequences of youth unemployment.
YYYYYouth Pouth Pouth Pouth Pouth Populationopulationopulationopulationopulation
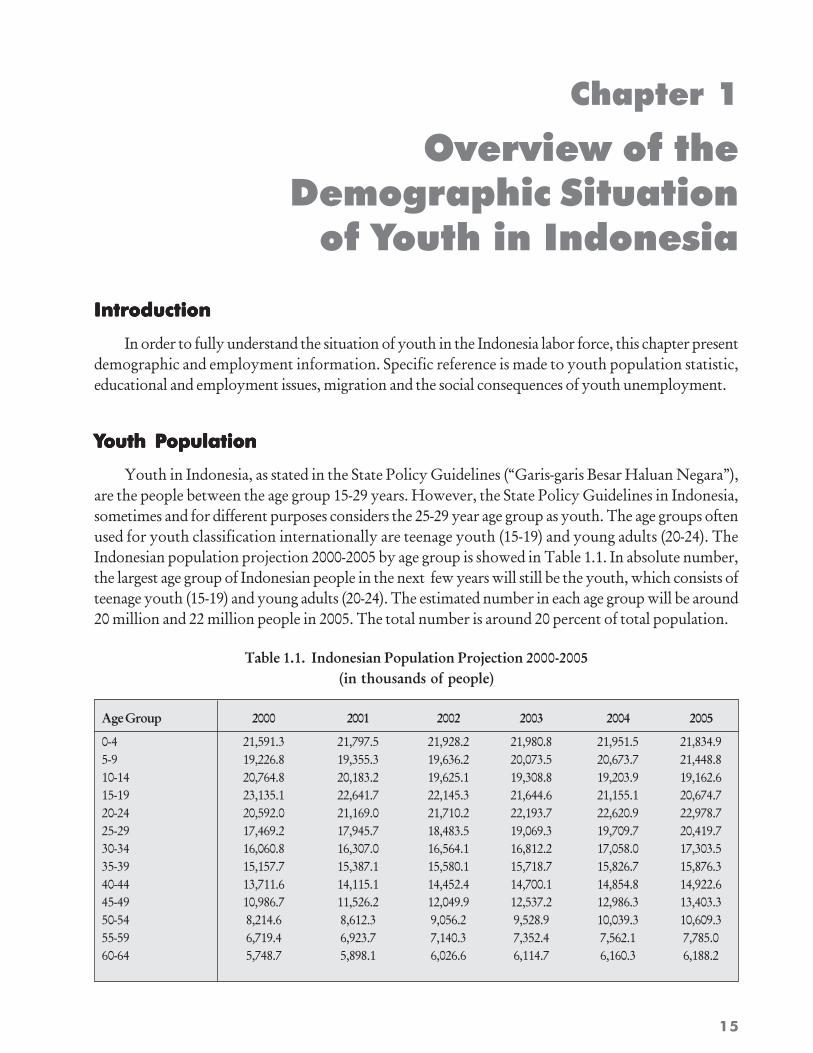
Youth in Indonesia, as stated in the State Policy Guidelines (“Garis-garis Besar Haluan Negara”),are the people between the age group 15-29 years. However, the State Policy Guidelines in Indonesia,sometimes and for different purposes considers the 25-29 year age group as youth. The age groups oftenused for youth classification internationally are teenage youth (15-19) and young adults (20-24). TheIndonesian population projection 2000-2005 by age group is showed in Table 1.1. In absolute number,the largest age group of Indonesian people in the next few years will still be the youth, which consists ofteenage youth (15-19) and young adults (20-24). The estimated number in each age group will be around20 million and 22 million people in 2005. The total number is around 20 percent of total population.
Table 1.1. Indonesian Population Projection 2000-2005(in thousands of people)
Age Group 2000 2001 2002 2003 2004 2005
0-4 21,591.3 21,797.5 21,928.2 21,980.8 21,951.5 21,834.95-9 19,226.8 19,355.3 19,636.2 20,073.5 20,673.7 21,448.810-14 20,764.8 20,183.2 19,625.1 19,308.8 19,203.9 19,162.615-19 23,135.1 22,641.7 22,145.3 21,644.6 21,155.1 20,674.720-24 20,592.0 21,169.0 21,710.2 22,193.7 22,620.9 22,978.725-29 17,469.2 17,945.7 18,483.5 19,069.3 19,709.7 20,419.730-34 16,060.8 16,307.0 16,564.1 16,812.2 17,058.0 17,303.535-39 15,157.7 15,387.1 15,580.1 15,718.7 15,826.7 15,876.340-44 13,711.6 14,115.1 14,452.4 14,700.1 14,854.8 14,922.645-49 10,986.7 11,526.2 12,049.9 12,537.2 12,986.3 13,403.350-54 8,214.6 8,612.3 9,056.2 9,528.9 10,039.3 10,609.355-59 6,719.4 6,923.7 7,140.3 7,352.4 7,562.1 7,785.060-64 5,748.7 5,898.1 6,026.6 6,114.7 6,160.3 6,188.2
Chapter 1
Overview of theDemographic Situation
of Youth in Indonesia
16
Total Number of 15-19 Population
15-19 years asPercentage of Total
Population
Total Number of 20-24Population
20-24 years asPercentage of Total
Population
65-69 4,483.6 4,685.7 4,855.3 4,972.0 5,035.5 5,059.970-74 2,838.2 2,975.9 3,131.8 3,300.6 3,455.7 3,660.975+ 2,845.8 3,055.3 3,227.7 3,340.2 3,388.5 3,386.3
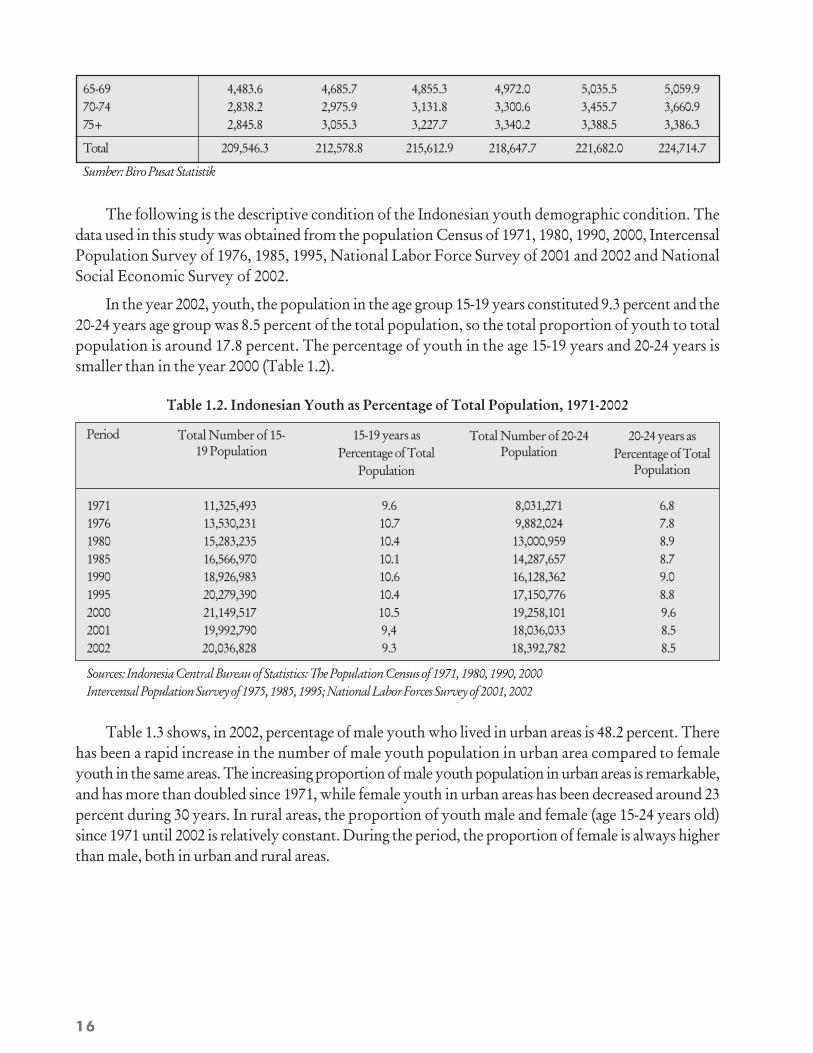
Total 209,546.3 212,578.8 215,612.9 218,647.7 221,682.0 224,714.7
Sumber: Biro Pusat Statistik
The following is the descriptive condition of the Indonesian youth demographic condition. Thedata used in this study was obtained from the population Census of 1971, 1980, 1990, 2000, IntercensalPopulation Survey of 1976, 1985, 1995, National Labor Force Survey of 2001 and 2002 and NationalSocial Economic Survey of 2002.
In the year 2002, youth, the population in the age group 15-19 years constituted 9.3 percent and the20-24 years age group was 8.5 percent of the total population, so the total proportion of youth to totalpopulation is around 17.8 percent. The percentage of youth in the age 15-19 years and 20-24 years issmaller than in the year 2000 (Table 1.2).
Table 1.2. Indonesian Youth as Percentage of Total Population, 1971-2002
Period
1971 11,325,493 9.6 8,031,271 6.81976 13,530,231 10.7 9,882,024 7.81980 15,283,235 10.4 13,000,959 8.91985 16,566,970 10.1 14,287,657 8.71990 18,926,983 10.6 16,128,362 9.01995 20,279,390 10.4 17,150,776 8.82000 21,149,517 10.5 19,258,101 9.62001 19,992,790 9,4 18,036,033 8.52002 20,036,828 9.3 18,392,782 8.5
Sources: Indonesia Central Bureau of Statistics: The Population Census of 1971, 1980, 1990, 2000Intercensal Population Survey of 1975, 1985, 1995; National Labor Forces Survey of 2001, 2002
Table 1.3 shows, in 2002, percentage of male youth who lived in urban areas is 48.2 percent. Therehas been a rapid increase in the number of male youth population in urban area compared to femaleyouth in the same areas. The increasing proportion of male youth population in urban areas is remarkable,and has more than doubled since 1971, while female youth in urban areas has been decreased around 23percent during 30 years. In rural areas, the proportion of youth male and female (age 15-24 years old)since 1971 until 2002 is relatively constant. During the period, the proportion of female is always higherthan male, both in urban and rural areas.
17
Labor ForceParticipation Rate
UnemploymentRate
Period
Labor ForceParticipation Rate
UnemploymentRate
Youth (15-24) Adult (>25)
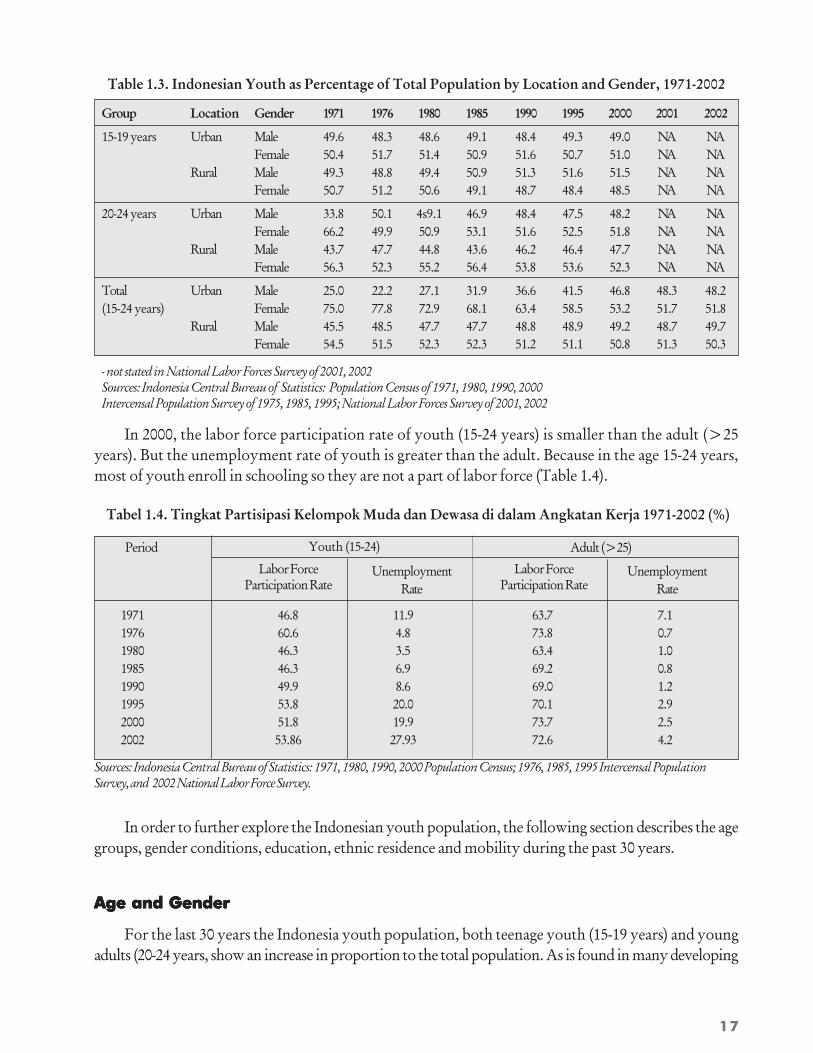
Table 1.3. Indonesian Youth as Percentage of Total Population by Location and Gender, 1971-2002
Group Location Gender 1971 1976 1980 1985 1990 1995 2000 2001 2002
15-19 years Urban Male 49.6 48.3 48.6 49.1 48.4 49.3 49.0 NA NAFemale 50.4 51.7 51.4 50.9 51.6 50.7 51.0 NA NA
Rural Male 49.3 48.8 49.4 50.9 51.3 51.6 51.5 NA NAFemale 50.7 51.2 50.6 49.1 48.7 48.4 48.5 NA NA
20-24 years Urban Male 33.8 50.1 4s9.1 46.9 48.4 47.5 48.2 NA NAFemale 66.2 49.9 50.9 53.1 51.6 52.5 51.8 NA NA
Rural Male 43.7 47.7 44.8 43.6 46.2 46.4 47.7 NA NAFemale 56.3 52.3 55.2 56.4 53.8 53.6 52.3 NA NA
Total Urban Male 25.0 22.2 27.1 31.9 36.6 41.5 46.8 48.3 48.2(15-24 years) Female 75.0 77.8 72.9 68.1 63.4 58.5 53.2 51.7 51.8
Rural Male 45.5 48.5 47.7 47.7 48.8 48.9 49.2 48.7 49.7 Female 54.5 51.5 52.3 52.3 51.2 51.1 50.8 51.3 50.3
- not stated in National Labor Forces Survey of 2001, 2002Sources: Indonesia Central Bureau of Statistics: Population Census of 1971, 1980, 1990, 2000Intercensal Population Survey of 1975, 1985, 1995; National Labor Forces Survey of 2001, 2002
In 2000, the labor force participation rate of youth (15-24 years) is smaller than the adult (>25years). But the unemployment rate of youth is greater than the adult. Because in the age 15-24 years,most of youth enroll in schooling so they are not a part of labor force (Table 1.4).
Tabel 1.4. Tingkat Partisipasi Kelompok Muda dan Dewasa di dalam Angkatan Kerja 1971-2002 (%)
1971 46.8 11.9 63.7 7.11976 60.6 4.8 73.8 0.71980 46.3 3.5 63.4 1.01985 46.3 6.9 69.2 0.81990 49.9 8.6 69.0 1.21995 53.8 20.0 70.1 2.92000 51.8 19.9 73.7 2.52002 53.86 27.93 72.6 4.2
Sources: Indonesia Central Bureau of Statistics: 1971, 1980, 1990, 2000 Population Census; 1976, 1985, 1995 Intercensal PopulationSurvey, and 2002 National Labor Force Survey.
In order to further explore the Indonesian youth population, the following section describes the agegroups, gender conditions, education, ethnic residence and mobility during the past 30 years.
Age and GenderAge and GenderAge and GenderAge and GenderAge and Gender
For the last 30 years the Indonesia youth population, both teenage youth (15-19 years) and youngadults (20-24 years, show an increase in proportion to the total population. As is found in many developing

18
countries and characterized by a big proportion being young population (15-24 years). The Indonesiandata confirms a youth domination being around 18 percent of the total population. Thus, special attentionis deserved because this population is expected to be nation’s future in human resources. Below is agraphic presentation of the youth population as a percentage of the total population.
Figure 1.1. Youth Population as Percentage of Total Population
Over the last 30 years, the Indonesian female youth shows a slightly larger number than male.During 1971-2002, it can be observed from the percentage of population by gender, for all youth agegroup, that female proportion is always higher than male. But in 2002, the proportion of the femalebecomes smaller than a year before. The exception applies to the 15-19 age group that shows a changefrom female domination in 1971 to 1980 to male domination during 1985-2002 (Table 1.5).
Table 1.5. Percentage of Indonesian Population by Age Group and Gender 1971-2002
Periode Gender Age Total ( > 0 )
15-19 years 20-24 years 15-24 years
1971 Male 49.3 44.9 47.5 49.3Female 50.7 55.2 52.5 50.7
1976 Male 48.7 48.3 48.5 49.5Female 51.3 51.7 51.5 50.5
1980 Male 49.2 45.9 47.7 49.7Female 50.8 54.0 52.3 50.3
1985 Male 50.3 44.7 47.7 49.8Female 49.7 55.3 52.3 50.2
1990 Male 50.3 47.0 48.8 49.9Female 49.7 52.9 51.2 50.1
1995 Male 50.7 46.9 48.9 49.8Female 49.3 53.1 51.1 50.2
Sources: Indonesia Central Bureau of Statistics: 1971, 1980, 1990, 2000 Population Census; 1976, 1985,1995 Intercensal Population Survey, and 2001, 2002 National Labor Force Survey.
0.00
5.00
10.00
15.00
20.00
25.00
1971 1976 1980 1985 1990 1995 2000 2001 2002
Year
%
15-19
20-24
15-24
19
2000 Male 50.4 48.0 49.2 50.2Female 49.6 52.0 50.8 49.8
2001 Male 51.0 46.2 48.7 49.5Female 49.0 53.8 51.3 50.5
2002 Male 51.9 47.3 49.7 49.7Female 48.1 52.7 50.3 50.3
Sources: Indonesia Central Bureau of Statistics: 1971, 1980, 1990, 2000 Population Census; 1976, 1985, 1995 Intercensal PopulationSurvey, and 2001, 2002 National Labor Force Survey.
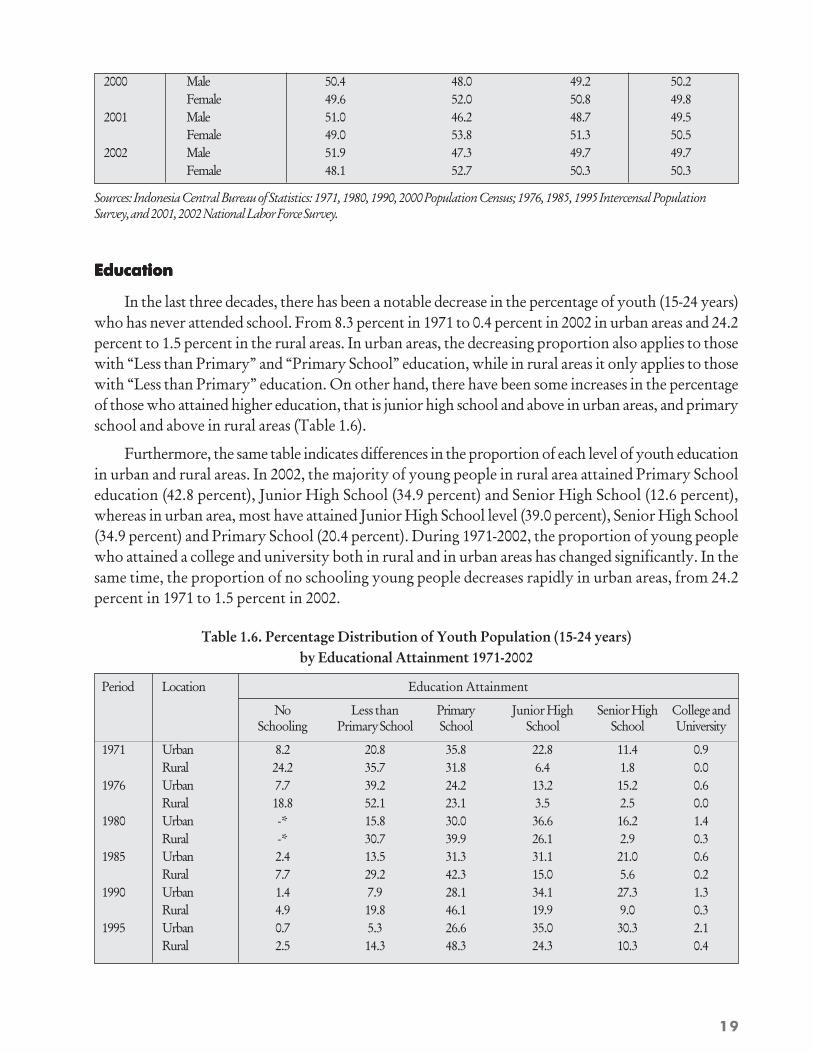
EducationEducationEducationEducationEducation
In the last three decades, there has been a notable decrease in the percentage of youth (15-24 years)who has never attended school. From 8.3 percent in 1971 to 0.4 percent in 2002 in urban areas and 24.2percent to 1.5 percent in the rural areas. In urban areas, the decreasing proportion also applies to thosewith “Less than Primary” and “Primary School” education, while in rural areas it only applies to thosewith “Less than Primary” education. On other hand, there have been some increases in the percentageof those who attained higher education, that is junior high school and above in urban areas, and primaryschool and above in rural areas (Table 1.6).
Furthermore, the same table indicates differences in the proportion of each level of youth educationin urban and rural areas. In 2002, the majority of young people in rural area attained Primary Schooleducation (42.8 percent), Junior High School (34.9 percent) and Senior High School (12.6 percent),whereas in urban area, most have attained Junior High School level (39.0 percent), Senior High School(34.9 percent) and Primary School (20.4 percent). During 1971-2002, the proportion of young peoplewho attained a college and university both in rural and in urban areas has changed significantly. In thesame time, the proportion of no schooling young people decreases rapidly in urban areas, from 24.2percent in 1971 to 1.5 percent in 2002.
Table 1.6. Percentage Distribution of Youth Population (15-24 years)by Educational Attainment 1971-2002
Period Location Education Attainment
No Less than Primary Junior High Senior High College andSchooling Primary School School School School University
1971 Urban 8.2 20.8 35.8 22.8 11.4 0.9Rural 24.2 35.7 31.8 6.4 1.8 0.0
1976 Urban 7.7 39.2 24.2 13.2 15.2 0.6Rural 18.8 52.1 23.1 3.5 2.5 0.0
1980 Urban -* 15.8 30.0 36.6 16.2 1.4Rural -* 30.7 39.9 26.1 2.9 0.3
1985 Urban 2.4 13.5 31.3 31.1 21.0 0.6Rural 7.7 29.2 42.3 15.0 5.6 0.2
1990 Urban 1.4 7.9 28.1 34.1 27.3 1.3Rural 4.9 19.8 46.1 19.9 9.0 0.3
1995 Urban 0.7 5.3 26.6 35.0 30.3 2.1Rural 2.5 14.3 48.3 24.3 10.3 0.4
20
2000 Urban 0.5 3.1 22.1 37.9 34.3 2.3Rural 1.6 7.7 44.5 33.1 12.6 0.5
2001 Urban 0.4 3.2 20.5 37.6 35.7 1.6Rural 1.4 8.0 43.3 34.6 12.2 0.4
2002 Urban 0.4 2.9 20.4 39.0 34.9 2.5Rural 1.5 7.6 42.8 34.9 12.6 0.5
-* The Central Body of Statistics publication of the Population Census 1980 does not contain the data for the categorySources: Indonesia Central Bureau of Statistics: Population Census of 1971, 1980, 1990, 2000Intercensal Population Survey of 1975, 1985, 1995; National Labor Forces Survey of 2001, 2002
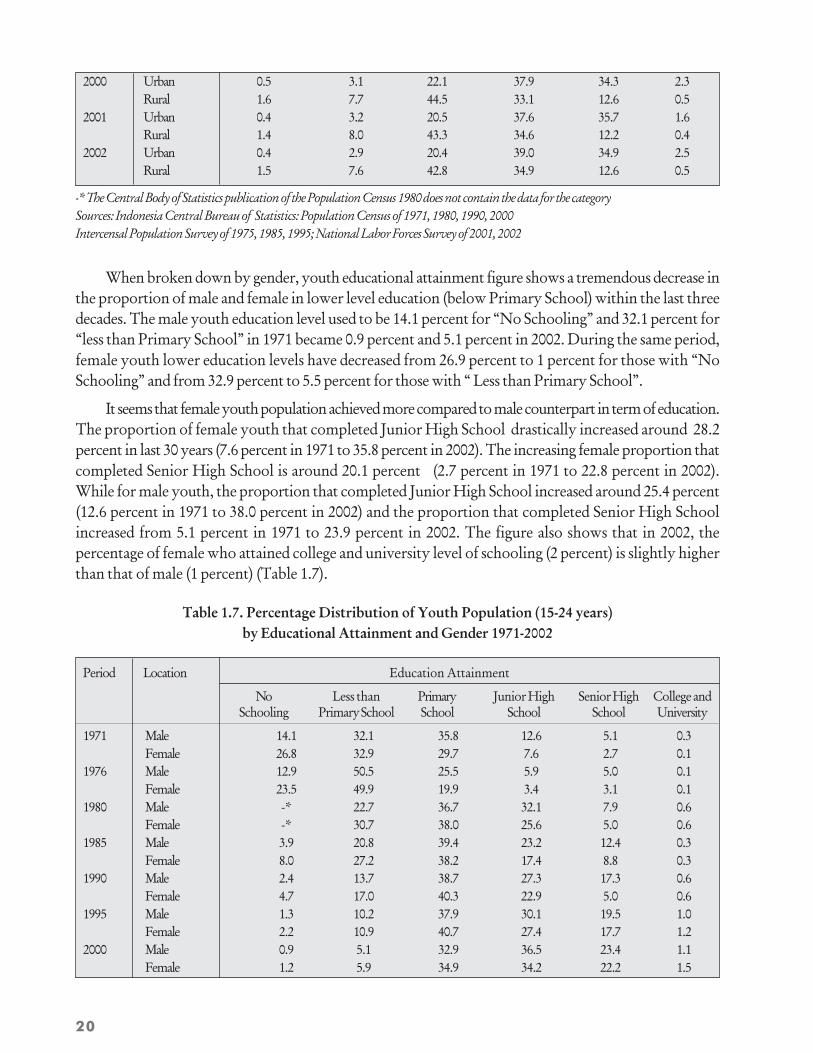
When broken down by gender, youth educational attainment figure shows a tremendous decrease inthe proportion of male and female in lower level education (below Primary School) within the last threedecades. The male youth education level used to be 14.1 percent for “No Schooling” and 32.1 percent for“less than Primary School” in 1971 became 0.9 percent and 5.1 percent in 2002. During the same period,female youth lower education levels have decreased from 26.9 percent to 1 percent for those with “NoSchooling” and from 32.9 percent to 5.5 percent for those with “ Less than Primary School”.
It seems that female youth population achieved more compared to male counterpart in term of education.The proportion of female youth that completed Junior High School drastically increased around 28.2percent in last 30 years (7.6 percent in 1971 to 35.8 percent in 2002). The increasing female proportion thatcompleted Senior High School is around 20.1 percent (2.7 percent in 1971 to 22.8 percent in 2002).While for male youth, the proportion that completed Junior High School increased around 25.4 percent(12.6 percent in 1971 to 38.0 percent in 2002) and the proportion that completed Senior High Schoolincreased from 5.1 percent in 1971 to 23.9 percent in 2002. The figure also shows that in 2002, thepercentage of female who attained college and university level of schooling (2 percent) is slightly higherthan that of male (1 percent) (Table 1.7).
Table 1.7. Percentage Distribution of Youth Population (15-24 years)by Educational Attainment and Gender 1971-2002
Period Location Education Attainment
No Less than Primary Junior High Senior High College andSchooling Primary School School School School University
1971 Male 14.1 32.1 35.8 12.6 5.1 0.3Female 26.8 32.9 29.7 7.6 2.7 0.1
1976 Male 12.9 50.5 25.5 5.9 5.0 0.1Female 23.5 49.9 19.9 3.4 3.1 0.1
1980 Male -* 22.7 36.7 32.1 7.9 0.6Female -* 30.7 38.0 25.6 5.0 0.6
1985 Male 3.9 20.8 39.4 23.2 12.4 0.3Female 8.0 27.2 38.2 17.4 8.8 0.3
1990 Male 2.4 13.7 38.7 27.3 17.3 0.6Female 4.7 17.0 40.3 22.9 5.0 0.6
1995 Male 1.3 10.2 37.9 30.1 19.5 1.0Female 2.2 10.9 40.7 27.4 17.7 1.2
2000 Male 0.9 5.1 32.9 36.5 23.4 1.1Female 1.2 5.9 34.9 34.2 22.2 1.5
21
2001 Male 0.8 5.6 31.0 37.3 24.2 1.1Female 1.0 5.8 33.6 34.8 23.0 1.8
2002 Male 0.9 5.1 31.0 38.0 23.9 1.0Female 1.0 5.5 33.0 35.8 22.8 2.0
-* The Central Body of Statistics publication of the Population Census 1980 does not contain the data for the categorySources: Indonesia Central Bureau of Statistics: Population Census of 1971, 1980, 1990, 2000Intercensal Population Survey of 1975, 1985, 1995; National Labor Forces Survey of 2001, 2002
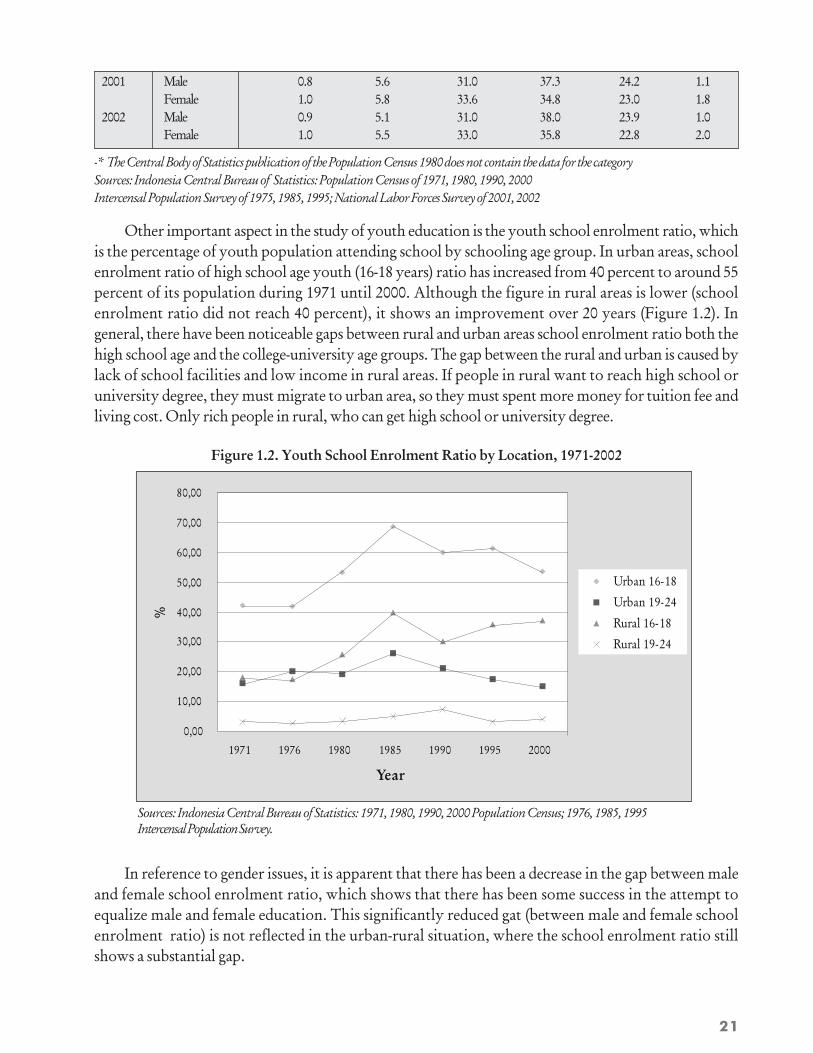
Other important aspect in the study of youth education is the youth school enrolment ratio, whichis the percentage of youth population attending school by schooling age group. In urban areas, schoolenrolment ratio of high school age youth (16-18 years) ratio has increased from 40 percent to around 55percent of its population during 1971 until 2000. Although the figure in rural areas is lower (schoolenrolment ratio did not reach 40 percent), it shows an improvement over 20 years (Figure 1.2). Ingeneral, there have been noticeable gaps between rural and urban areas school enrolment ratio both thehigh school age and the college-university age groups. The gap between the rural and urban is caused bylack of school facilities and low income in rural areas. If people in rural want to reach high school oruniversity degree, they must migrate to urban area, so they must spent more money for tuition fee andliving cost. Only rich people in rural, who can get high school or university degree.
Figure 1.2. Youth School Enrolment Ratio by Location, 1971-2002
0,00
10,00
20,00
30,00
40,00
50,00
60,00
70,00
80,00
1971 1976 1980 1985 1990 1995 2000
Year
%
Urban 16-18
Urban 19-24
Rural 16-18
Rural 19-24
Sources: Indonesia Central Bureau of Statistics: 1971, 1980, 1990, 2000 Population Census; 1976, 1985, 1995Intercensal Population Survey.
In reference to gender issues, it is apparent that there has been a decrease in the gap between maleand female school enrolment ratio, which shows that there has been some success in the attempt toequalize male and female education. This significantly reduced gat (between male and female schoolenrolment ratio) is not reflected in the urban-rural situation, where the school enrolment ratio stillshows a substantial gap.

22
It has been suggested that the increase in the number of educated female youth could affect decisionswhether to actively participate in the economy or not. The potentiality of joining the labor market is alsoevident in a study by the Indonesian Institute of Science, and which suggests that a possible reason forthis phenomena, is the increase in the acceptance of female workers in urban areas (Tirtosudarmo,1994)
On the other hand, the data also indicates that the highest school enrolment ratio of both male andfemale youth forms only 40 to 50 percent (1985 and 1995 for 16-18 years age group) (Figure 1.3). Thefigure for the 19-24 group age is much lower, never having reached 20 percent over the last 30 years. Asyouth education tends to equalize in gender, it does not seem to be happening regionally. (urban or rural)
Figure 1.3. Youth School Enrolment Ratio by Gender, 1971-2002
Ethnic Groups, Residence and MobilityEthnic Groups, Residence and MobilityEthnic Groups, Residence and MobilityEthnic Groups, Residence and MobilityEthnic Groups, Residence and Mobility
Table 1.8 shows the information on the language used daily by the youth. From the table, most ofyouth live in rural areas, although the proportion is decreasing. Simultaneously, the proportion of youthfrom various ethnic groups who live in urban areas has been increasing as indicated from 1980 to 2000.Table 1.8 shows that in 1980 almost 80 percent of Javanese youth lived in rural areas, but in 2000 about55 percent were living in rural areas. The decreasing Javanese youth population who lived in rural areasis caused by a massive urbanization and transmigration during last two decades.
In 1990 and 1995, the Minang ethnic group, (originally from the Western side of Sumatera Island)had the largest proportion (35.8 and 47.5 percent) of native ethnic youth living in urban areas. But in2000, the Minang ethnic groups are the second largest. In 1980 this figure was only 24 percent. TheMinangs, widely known for their culture of mobility, could be found in many regions in Indonesia, andwere mostly involved in trade activities. In 2000, Buginese ethnic group and Madurese had the largest
Sources: Indonesia Central Bureau of Statistics: 1971, 1980, 1990, 2000 Population Census; 1976, 1985,1995 Intercensal Population Survey.
0.00
10.00
20.00
30.00
40.00
50.00
60.00
1971 1976 1980 1985 1990 1995 2000
Year
%
Male 16-18
Male 19-24
Female 16-18
Female 19-24
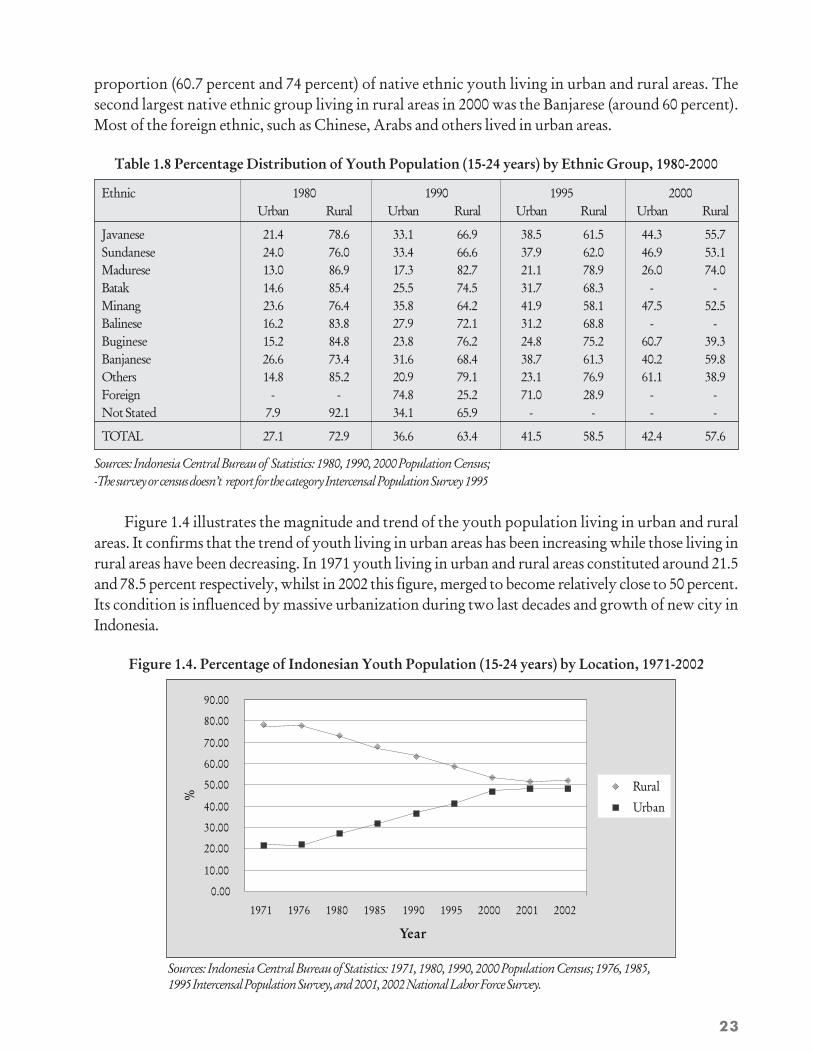
23
proportion (60.7 percent and 74 percent) of native ethnic youth living in urban and rural areas. Thesecond largest native ethnic group living in rural areas in 2000 was the Banjarese (around 60 percent).Most of the foreign ethnic, such as Chinese, Arabs and others lived in urban areas.
Table 1.8 Percentage Distribution of Youth Population (15-24 years) by Ethnic Group, 1980-2000
Ethnic 1980 1990 1995 2000Urban Rural Urban Rural Urban Rural Urban Rural
Javanese 21.4 78.6 33.1 66.9 38.5 61.5 44.3 55.7Sundanese 24.0 76.0 33.4 66.6 37.9 62.0 46.9 53.1Madurese 13.0 86.9 17.3 82.7 21.1 78.9 26.0 74.0Batak 14.6 85.4 25.5 74.5 31.7 68.3 - -Minang 23.6 76.4 35.8 64.2 41.9 58.1 47.5 52.5Balinese 16.2 83.8 27.9 72.1 31.2 68.8 - -Buginese 15.2 84.8 23.8 76.2 24.8 75.2 60.7 39.3Banjanese 26.6 73.4 31.6 68.4 38.7 61.3 40.2 59.8Others 14.8 85.2 20.9 79.1 23.1 76.9 61.1 38.9Foreign - - 74.8 25.2 71.0 28.9 - -Not Stated 7.9 92.1 34.1 65.9 - - - -
TOTAL 27.1 72.9 36.6 63.4 41.5 58.5 42.4 57.6
Sources: Indonesia Central Bureau of Statistics: 1980, 1990, 2000 Population Census;-The survey or census doesn’t report for the category Intercensal Population Survey 1995
Figure 1.4 illustrates the magnitude and trend of the youth population living in urban and ruralareas. It confirms that the trend of youth living in urban areas has been increasing while those living inrural areas have been decreasing. In 1971 youth living in urban and rural areas constituted around 21.5and 78.5 percent respectively, whilst in 2002 this figure, merged to become relatively close to 50 percent.Its condition is influenced by massive urbanization during two last decades and growth of new city inIndonesia.
Figure 1.4. Percentage of Indonesian Youth Population (15-24 years) by Location, 1971-2002
0.00
10.00
20.00
30.00
40.00
50.00
60.00
70.00
80.00
90.00
1971 1976 1980 1985 1990 1995 2000 2001 2002
Year
%
Rural
Urban
Sources: Indonesia Central Bureau of Statistics: 1971, 1980, 1990, 2000 Population Census; 1976, 1985,1995 Intercensal Population Survey, and 2001, 2002 National Labor Force Survey.
24
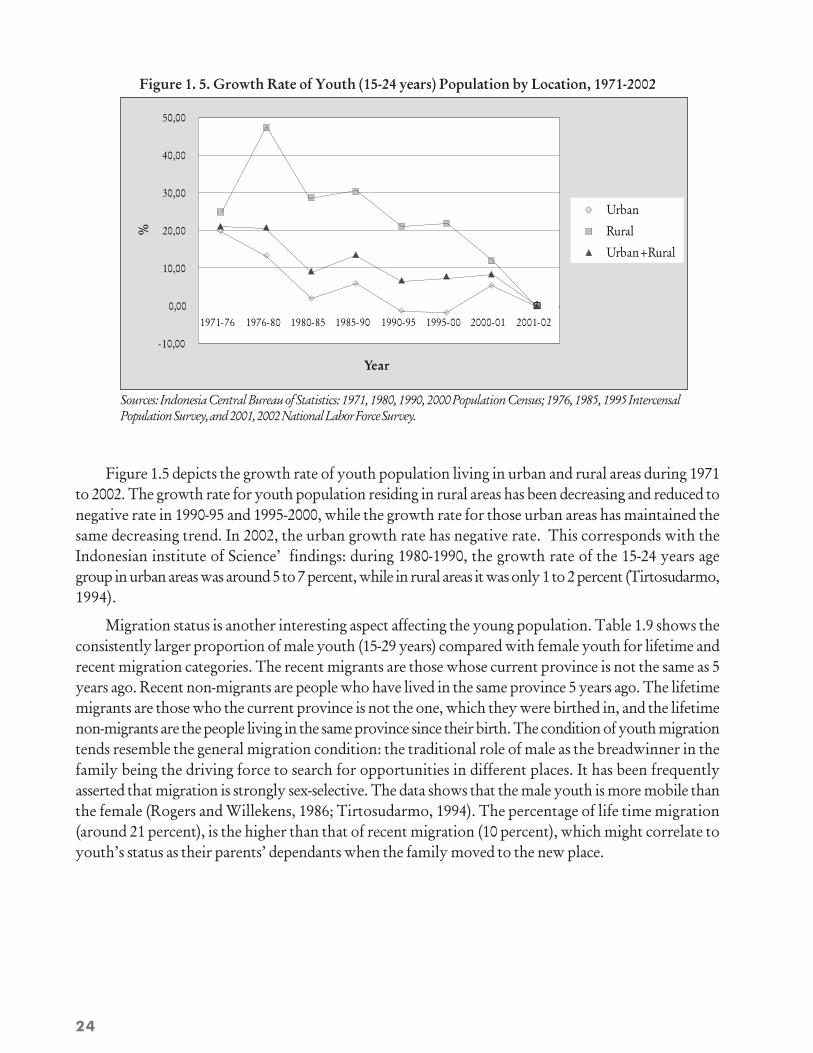
Figure 1. 5. Growth Rate of Youth (15-24 years) Population by Location, 1971-2002
-10,00
0,00
10,00
20,00
30,00
40,00
50,00
1971-76 1976-80 1980-85 1985-90 1990-95 1995-00 2000-01 2001-02
Year
%
Urban
Rural
Urban+Rural
Sources: Indonesia Central Bureau of Statistics: 1971, 1980, 1990, 2000 Population Census; 1976, 1985, 1995 IntercensalPopulation Survey, and 2001, 2002 National Labor Force Survey.
Figure 1.5 depicts the growth rate of youth population living in urban and rural areas during 1971to 2002. The growth rate for youth population residing in rural areas has been decreasing and reduced tonegative rate in 1990-95 and 1995-2000, while the growth rate for those urban areas has maintained thesame decreasing trend. In 2002, the urban growth rate has negative rate. This corresponds with theIndonesian institute of Science’ findings: during 1980-1990, the growth rate of the 15-24 years agegroup in urban areas was around 5 to 7 percent, while in rural areas it was only 1 to 2 percent (Tirtosudarmo,1994).
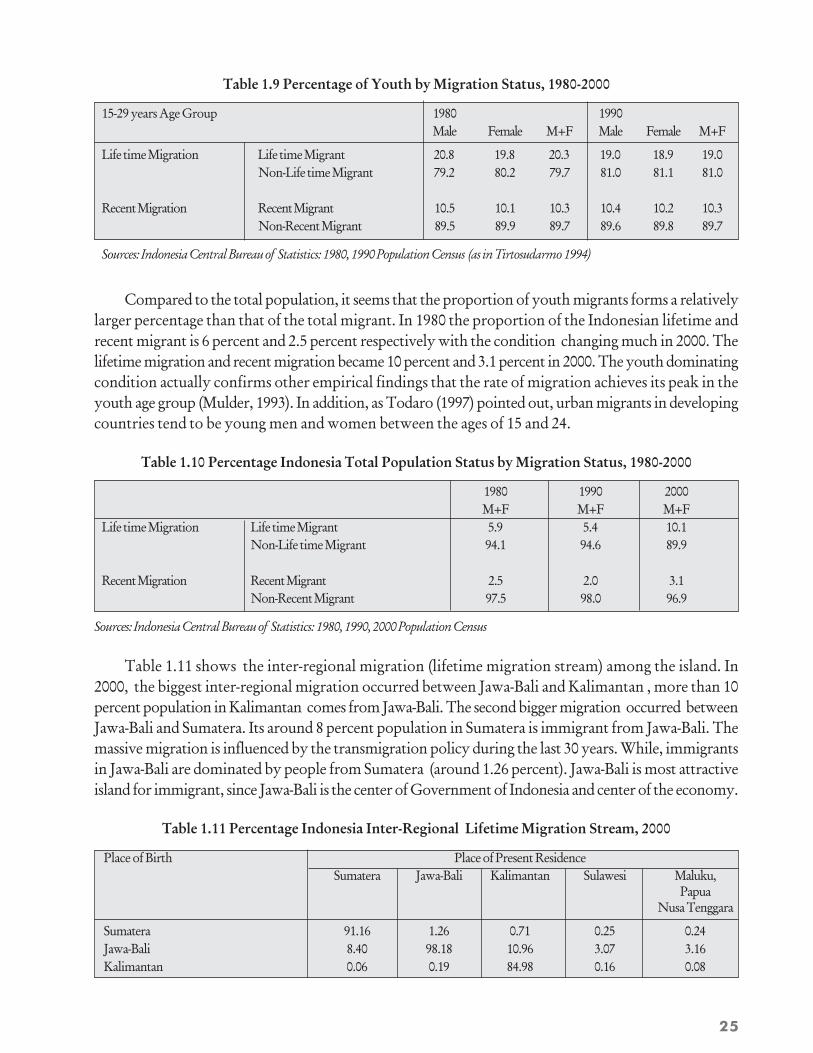
Migration status is another interesting aspect affecting the young population. Table 1.9 shows theconsistently larger proportion of male youth (15-29 years) compared with female youth for lifetime andrecent migration categories. The recent migrants are those whose current province is not the same as 5years ago. Recent non-migrants are people who have lived in the same province 5 years ago. The lifetimemigrants are those who the current province is not the one, which they were birthed in, and the lifetimenon-migrants are the people living in the same province since their birth. The condition of youth migrationtends resemble the general migration condition: the traditional role of male as the breadwinner in thefamily being the driving force to search for opportunities in different places. It has been frequentlyasserted that migration is strongly sex-selective. The data shows that the male youth is more mobile thanthe female (Rogers and Willekens, 1986; Tirtosudarmo, 1994). The percentage of life time migration(around 21 percent), is the higher than that of recent migration (10 percent), which might correlate toyouth’s status as their parents’ dependants when the family moved to the new place.
25
Table 1.9 Percentage of Youth by Migration Status, 1980-2000
15-29 years Age Group 1980 1990Male Female M+F Male Female M+F
Life time Migration Life time Migrant 20.8 19.8 20.3 19.0 18.9 19.0Non-Life time Migrant 79.2 80.2 79.7 81.0 81.1 81.0
Recent Migration Recent Migrant 10.5 10.1 10.3 10.4 10.2 10.3
Non-Recent Migrant 89.5 89.9 89.7 89.6 89.8 89.7
Sources: Indonesia Central Bureau of Statistics: 1980, 1990 Population Census (as in Tirtosudarmo 1994)
Compared to the total population, it seems that the proportion of youth migrants forms a relativelylarger percentage than that of the total migrant. In 1980 the proportion of the Indonesian lifetime andrecent migrant is 6 percent and 2.5 percent respectively with the condition changing much in 2000. Thelifetime migration and recent migration became 10 percent and 3.1 percent in 2000. The youth dominatingcondition actually confirms other empirical findings that the rate of migration achieves its peak in theyouth age group (Mulder, 1993). In addition, as Todaro (1997) pointed out, urban migrants in developingcountries tend to be young men and women between the ages of 15 and 24.
Table 1.10 Percentage Indonesia Total Population Status by Migration Status, 1980-2000
1980 1990 2000M+F M+F M+F
Life time Migration Life time Migrant 5.9 5.4 10.1Non-Life time Migrant 94.1 94.6 89.9
Recent Migration Recent Migrant 2.5 2.0 3.1
Non-Recent Migrant 97.5 98.0 96.9
Sources: Indonesia Central Bureau of Statistics: 1980, 1990, 2000 Population Census
Table 1.11 shows the inter-regional migration (lifetime migration stream) among the island. In2000, the biggest inter-regional migration occurred between Jawa-Bali and Kalimantan , more than 10percent population in Kalimantan comes from Jawa-Bali. The second bigger migration occurred betweenJawa-Bali and Sumatera. Its around 8 percent population in Sumatera is immigrant from Jawa-Bali. Themassive migration is influenced by the transmigration policy during the last 30 years. While, immigrantsin Jawa-Bali are dominated by people from Sumatera (around 1.26 percent). Jawa-Bali is most attractiveisland for immigrant, since Jawa-Bali is the center of Government of Indonesia and center of the economy.
Table 1.11 Percentage Indonesia Inter-Regional Lifetime Migration Stream, 2000
Place of Birth Place of Present ResidenceSumatera Jawa-Bali Kalimantan Sulawesi Maluku,
PapuaNusa Tenggara
Sumatera 91.16 1.26 0.71 0.25 0.24Jawa-Bali 8.40 98.18 10.96 3.07 3.16Kalimantan 0.06 0.19 84.98 0.16 0.08

26
Sulawesi 0.28 0.18 2.63 95.46 1.40Maluku, PapuaNusa Tenggara 0.07 0.16 0.66 0.98 94.82 Not Stated/Foreign 0.02 0.03 0.06 0.09 0.30Total 100 100 100 100 100
Sources: Indonesia Central Bureau of Statistics: 2000 Population Census
YYYYYouth Employmentouth Employmentouth Employmentouth Employmentouth Employment
YYYYYouth Labor Force Pouth Labor Force Pouth Labor Force Pouth Labor Force Pouth Labor Force Participation Ratearticipation Ratearticipation Ratearticipation Ratearticipation Rate
Generally, over the last 30 years, the Indonesian youth labor force participation rate has beenincreasing, both in rural and urban areas, and in all youth age groups. As can be seen in Figure 1.6, ineach period more than 40 percent of rural youth and related age groups participated actively in economy.This also applied in urban areas except for teenage youth (15-19 years) whose labor force participationrate comprised about 30 percent (Figure 1.7). These facts should be of significant concern, for whenthey are expected to stay in school, those teenagers have already been working or looking for work.
The difference of labor force participation rate between rural and urban teenage youth (the formersbeing beginner) is supposed to correspond with the difference in the rural and urban school enrolmentratio. It seems that the explanation for lower labor force participation rate of urban teenage youth is theirstaying-in-school status. The older age group (25-29 years) in Figure 1. 6 and 7 show a higher ratecompared with the younger age group, (for both rural and urban areas) whilst the 15-24 age group isbetween the two. In 2000, these age groups reached a magnitude of around 70 percent of participationin the economy, both in urban and rural areas.
Figure 1.6. Rural Labor Force Participation Rate by Age Group, 1971-2002
0.00
10.00
20.00
30.00
40.00
50.00
60.00
70.00
80.00
1971 1976 1980 1985 1990 1995 2000 2001 2002
Year
%
15-19
20-24
15-24
Sources: Indonesia Central Bureau of Statistics: 1971, 1980, 1990, 2000 Population Census; 1976, 1985, 1995Intercensal Population Survey, and 2001, 2002 National Labor Force Survey
27
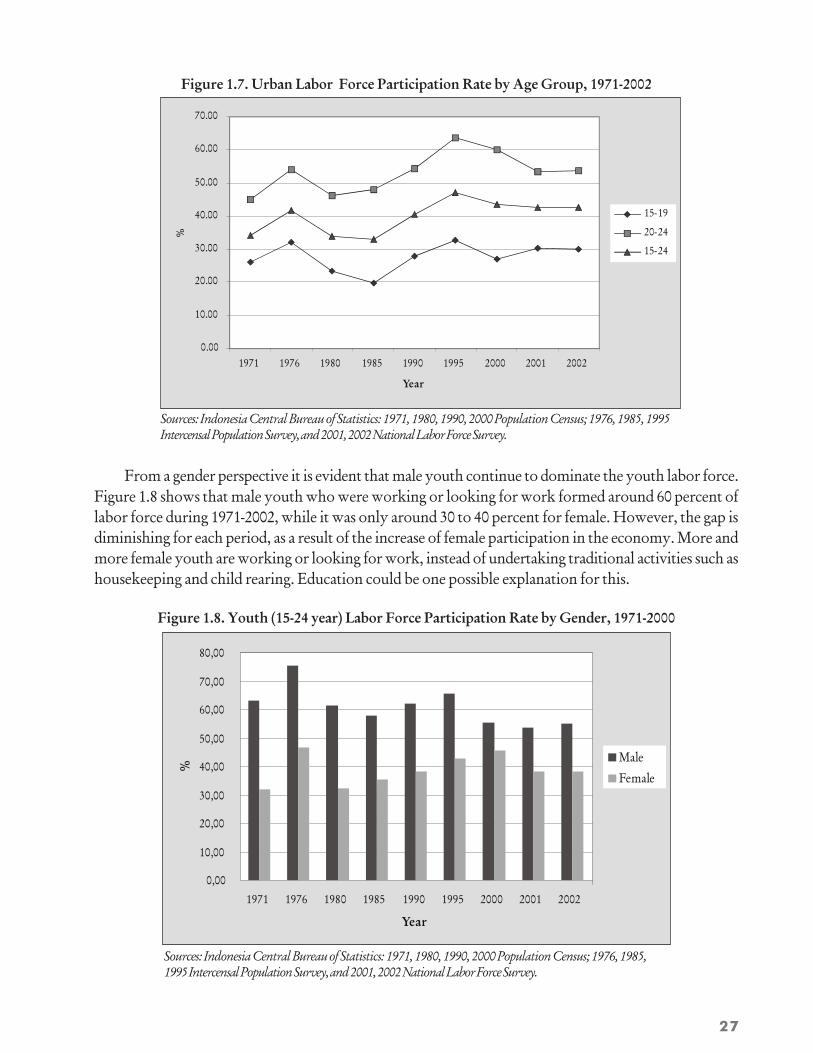
Figure 1.7. Urban Labor Force Participation Rate by Age Group, 1971-2002
0.00
10.00
20.00
30.00
40.00
50.00
60.00
70.00
1971 1976 1980 1985 1990 1995 2000 2001 2002
Year
%
15-19
20-24
15-24
Sources: Indonesia Central Bureau of Statistics: 1971, 1980, 1990, 2000 Population Census; 1976, 1985, 1995Intercensal Population Survey, and 2001, 2002 National Labor Force Survey.
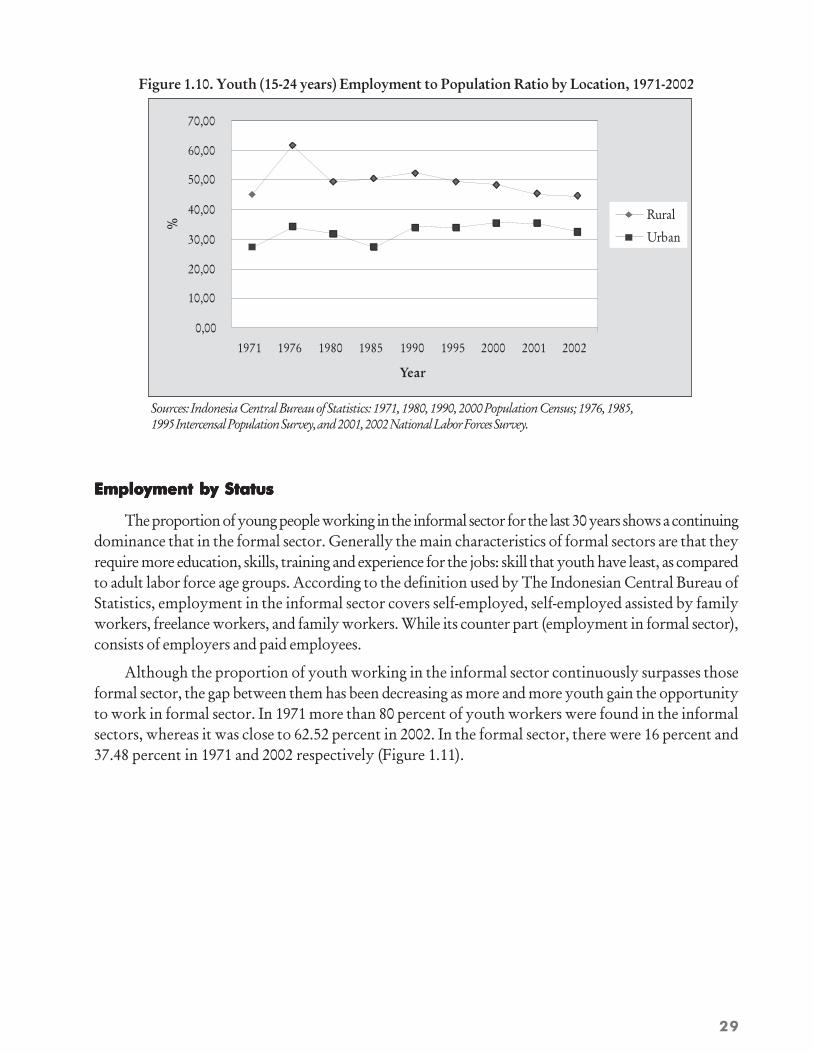
From a gender perspective it is evident that male youth continue to dominate the youth labor force.Figure 1.8 shows that male youth who were working or looking for work formed around 60 percent oflabor force during 1971-2002, while it was only around 30 to 40 percent for female. However, the gap isdiminishing for each period, as a result of the increase of female participation in the economy. More andmore female youth are working or looking for work, instead of undertaking traditional activities such ashousekeeping and child rearing. Education could be one possible explanation for this.
Figure 1.8. Youth (15-24 year) Labor Force Participation Rate by Gender, 1971-2000
0,00
10,00
20,00
30,00
40,00
50,00
60,00
70,00
80,00
1971 1976 1980 1985 1990 1995 2000 2001 2002
Year
%
Male
Female
Sources: Indonesia Central Bureau of Statistics: 1971, 1980, 1990, 2000 Population Census; 1976, 1985,1995 Intercensal Population Survey, and 2001, 2002 National Labor Force Survey.

28
Employment to Population RatioEmployment to Population RatioEmployment to Population RatioEmployment to Population RatioEmployment to Population Ratio
Employment to population ratio may indicate the employability of a potentially productivepopulation. For youth, the ratio is develop through a comparison of all employed youth (15-24) to thetotal number of respective age groups of the population. As in Puguh et.al. (2000), the ratio indicatesthe extent to which the population is involved in labor market activities. The result indicates that around50 per-cent of male youth were employed during the period of study, while there were only about 30per-cent of female youth employed.
There is a tendency of decrease in terms of the gap of male and female youth employment topopulation ratio during the last five years. As observed in Figure 1.9, the ratios for male and female arerelatively constant, not having changed drastically in the last two decades. This constant employmentratio to population ratio of youth age groups could reflect the demand for youth labor in the market. Butas the youth labor force participation in the work world continues to expand, this situation might explainthe growing portion of those who are looking for work. Lack of education and experience could bereason for that situation. In 2000 the gap between male and female is so close, but in 2001 and 2002 thegap becomes larger than 2000.
Figure 1.9. Youth (15-24 years) Employment to Population Ratio by Gender, 1971-2002
0,00
10,00
20,00
30,00
40,00
50,00
60,00
70,00
80,00
1971 1976 1980 1985 1990 1995 2000 2001 2002
Year
%
Male
Female
Sources: Indonesia Central Bureau of Statistics: 1971, 1980, 1990, 2000 Population Census; 1976, 1985, 1995Intercensal Population Survey, and 2001, 2002 National Labor Force Survey.
The youth employment to the population ratio by Location, as observed in Figure 1. 10, also showsa relatively stable trend for last twenty years. The ratio for rural, which comprises 50 per-cent, surpassedthat for urban by 10 to 20 percent. In 2001 and 2002, the gap between rural and urban areas becomessmaller.
29
Figure 1.10. Youth (15-24 years) Employment to Population Ratio by Location, 1971-2002
Sources: Indonesia Central Bureau of Statistics: 1971, 1980, 1990, 2000 Population Census; 1976, 1985,1995 Intercensal Population Survey, and 2001, 2002 National Labor Forces Survey.
Employment by StatusEmployment by StatusEmployment by StatusEmployment by StatusEmployment by Status
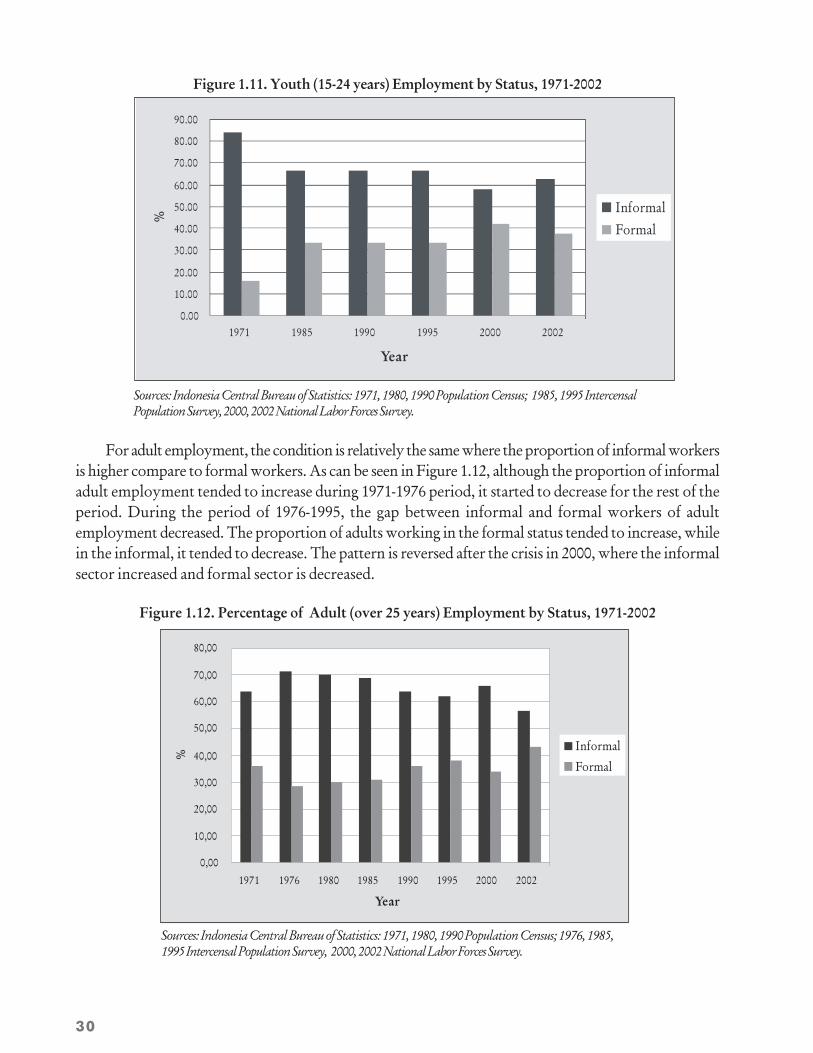
The proportion of young people working in the informal sector for the last 30 years shows a continuingdominance that in the formal sector. Generally the main characteristics of formal sectors are that theyrequire more education, skills, training and experience for the jobs: skill that youth have least, as comparedto adult labor force age groups. According to the definition used by The Indonesian Central Bureau ofStatistics, employment in the informal sector covers self-employed, self-employed assisted by familyworkers, freelance workers, and family workers. While its counter part (employment in formal sector),consists of employers and paid employees.
Although the proportion of youth working in the informal sector continuously surpasses thoseformal sector, the gap between them has been decreasing as more and more youth gain the opportunityto work in formal sector. In 1971 more than 80 percent of youth workers were found in the informalsectors, whereas it was close to 62.52 percent in 2002. In the formal sector, there were 16 percent and37.48 percent in 1971 and 2002 respectively (Figure 1.11).
0,00
10,00
20,00
30,00
40,00
50,00
60,00
70,00
1971 1976 1980 1985 1990 1995 2000 2001 2002
Year
%
Rural
Urban
30
Figure 1.11. Youth (15-24 years) Employment by Status, 1971-2002
Sources: Indonesia Central Bureau of Statistics: 1971, 1980, 1990 Population Census; 1985, 1995 IntercensalPopulation Survey, 2000, 2002 National Labor Forces Survey.
Sources: Indonesia Central Bureau of Statistics: 1971, 1980, 1990 Population Census; 1976, 1985,1995 Intercensal Population Survey, 2000, 2002 National Labor Forces Survey.
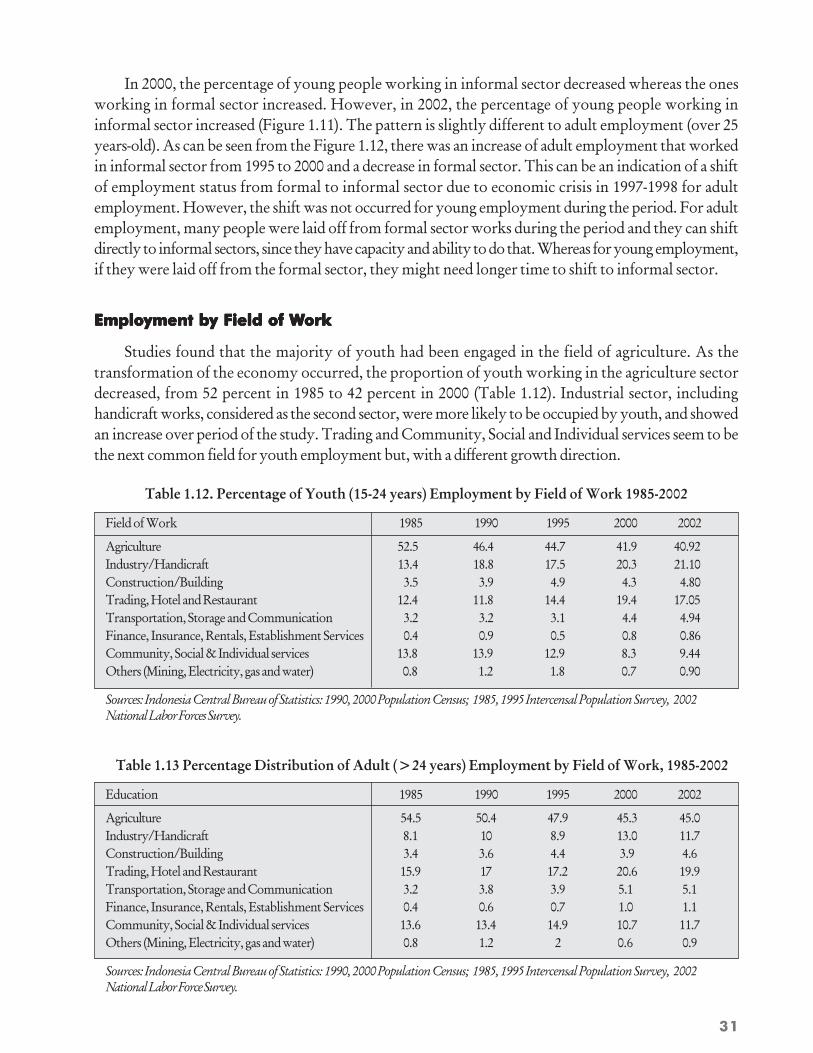
For adult employment, the condition is relatively the same where the proportion of informal workersis higher compare to formal workers. As can be seen in Figure 1.12, although the proportion of informaladult employment tended to increase during 1971-1976 period, it started to decrease for the rest of theperiod. During the period of 1976-1995, the gap between informal and formal workers of adultemployment decreased. The proportion of adults working in the formal status tended to increase, whilein the informal, it tended to decrease. The pattern is reversed after the crisis in 2000, where the informalsector increased and formal sector is decreased.
Figure 1.12. Percentage of Adult (over 25 years) Employment by Status, 1971-2002
0.00
10.00
20.00
30.00
40.00
50.00
60.00
70.00
80.00
90.00
1971 1985 1990 1995 2000 2002
Year
%
InformalFormal
0,00
10,00
20,00
30,00
40,00
50,00
60,00
70,00
80,00
1971 1976 1980 1985 1990 1995 2000 2002
Year
%
Informal
Formal
31
In 2000, the percentage of young people working in informal sector decreased whereas the onesworking in formal sector increased. However, in 2002, the percentage of young people working ininformal sector increased (Figure 1.11). The pattern is slightly different to adult employment (over 25years-old). As can be seen from the Figure 1.12, there was an increase of adult employment that workedin informal sector from 1995 to 2000 and a decrease in formal sector. This can be an indication of a shiftof employment status from formal to informal sector due to economic crisis in 1997-1998 for adultemployment. However, the shift was not occurred for young employment during the period. For adultemployment, many people were laid off from formal sector works during the period and they can shiftdirectly to informal sectors, since they have capacity and ability to do that. Whereas for young employment,if they were laid off from the formal sector, they might need longer time to shift to informal sector.
Employment by Field of WEmployment by Field of WEmployment by Field of WEmployment by Field of WEmployment by Field of Workorkorkorkork
Studies found that the majority of youth had been engaged in the field of agriculture. As thetransformation of the economy occurred, the proportion of youth working in the agriculture sectordecreased, from 52 percent in 1985 to 42 percent in 2000 (Table 1.12). Industrial sector, includinghandicraft works, considered as the second sector, were more likely to be occupied by youth, and showedan increase over period of the study. Trading and Community, Social and Individual services seem to bethe next common field for youth employment but, with a different growth direction.
Table 1.12. Percentage of Youth (15-24 years) Employment by Field of Work 1985-2002
Field of Work 1985 1990 1995 2000 2002
Agriculture 52.5 46.4 44.7 41.9 40.92Industry/Handicraft 13.4 18.8 17.5 20.3 21.10Construction/Building 3.5 3.9 4.9 4.3 4.80Trading, Hotel and Restaurant 12.4 11.8 14.4 19.4 17.05Transportation, Storage and Communication 3.2 3.2 3.1 4.4 4.94Finance, Insurance, Rentals, Establishment Services 0.4 0.9 0.5 0.8 0.86Community, Social & Individual services 13.8 13.9 12.9 8.3 9.44Others (Mining, Electricity, gas and water) 0.8 1.2 1.8 0.7 0.90
Sources: Indonesia Central Bureau of Statistics: 1990, 2000 Population Census; 1985, 1995 Intercensal Population Survey, 2002National Labor Forces Survey.
Table 1.13 Percentage Distribution of Adult (>24 years) Employment by Field of Work, 1985-2002
Education 1985 1990 1995 2000 2002
Agriculture 54.5 50.4 47.9 45.3 45.0Industry/Handicraft 8.1 10 8.9 13.0 11.7Construction/Building 3.4 3.6 4.4 3.9 4.6Trading, Hotel and Restaurant 15.9 17 17.2 20.6 19.9Transportation, Storage and Communication 3.2 3.8 3.9 5.1 5.1Finance, Insurance, Rentals, Establishment Services 0.4 0.6 0.7 1.0 1.1Community, Social & Individual services 13.6 13.4 14.9 10.7 11.7Others (Mining, Electricity, gas and water) 0.8 1.2 2 0.6 0.9
Sources: Indonesia Central Bureau of Statistics: 1990, 2000 Population Census; 1985, 1995 Intercensal Population Survey, 2002National Labor Force Survey.
32
UnemploymentUnemploymentUnemploymentUnemploymentUnemployment
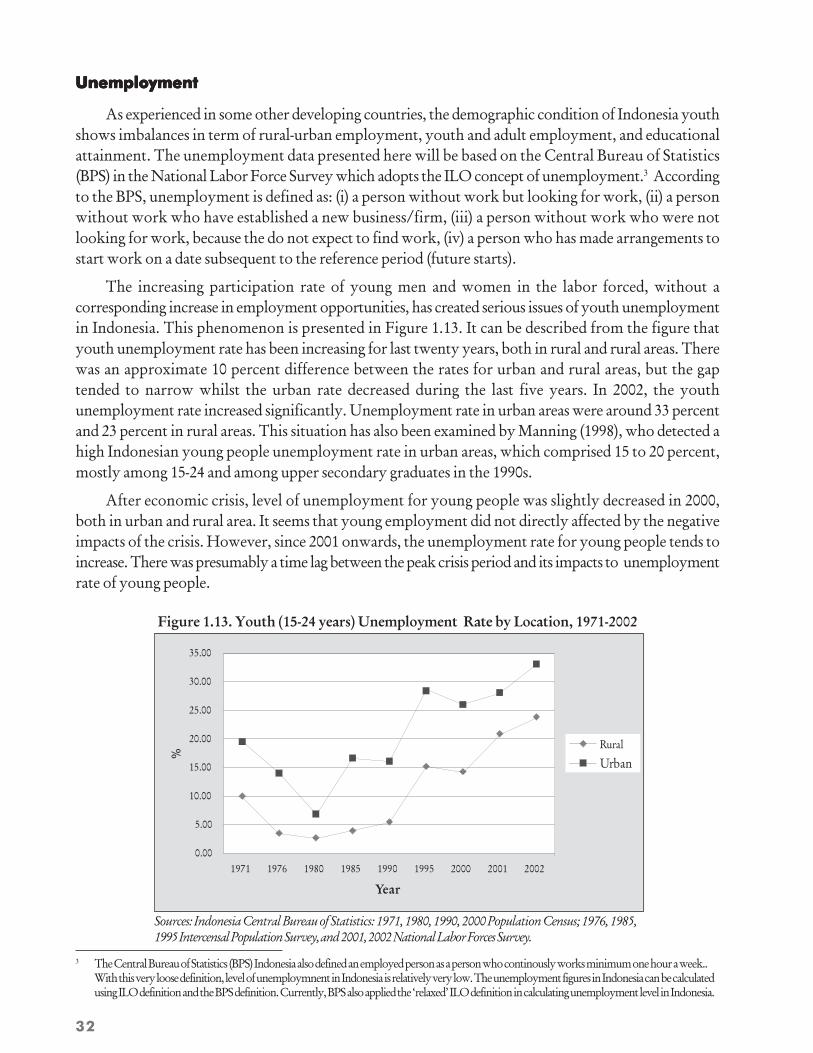
As experienced in some other developing countries, the demographic condition of Indonesia youthshows imbalances in term of rural-urban employment, youth and adult employment, and educationalattainment. The unemployment data presented here will be based on the Central Bureau of Statistics(BPS) in the National Labor Force Survey which adopts the ILO concept of unemployment.3 Accordingto the BPS, unemployment is defined as: (i) a person without work but looking for work, (ii) a personwithout work who have established a new business/firm, (iii) a person without work who were notlooking for work, because the do not expect to find work, (iv) a person who has made arrangements tostart work on a date subsequent to the reference period (future starts).
The increasing participation rate of young men and women in the labor forced, without acorresponding increase in employment opportunities, has created serious issues of youth unemploymentin Indonesia. This phenomenon is presented in Figure 1.13. It can be described from the figure thatyouth unemployment rate has been increasing for last twenty years, both in rural and rural areas. Therewas an approximate 10 percent difference between the rates for urban and rural areas, but the gaptended to narrow whilst the urban rate decreased during the last five years. In 2002, the youthunemployment rate increased significantly. Unemployment rate in urban areas were around 33 percentand 23 percent in rural areas. This situation has also been examined by Manning (1998), who detected ahigh Indonesian young people unemployment rate in urban areas, which comprised 15 to 20 percent,mostly among 15-24 and among upper secondary graduates in the 1990s.
After economic crisis, level of unemployment for young people was slightly decreased in 2000,both in urban and rural area. It seems that young employment did not directly affected by the negativeimpacts of the crisis. However, since 2001 onwards, the unemployment rate for young people tends toincrease. There was presumably a time lag between the peak crisis period and its impacts to unemploymentrate of young people.
Figure 1.13. Youth (15-24 years) Unemployment Rate by Location, 1971-2002
3 The Central Bureau of Statistics (BPS) Indonesia also defined an employed person as a person who continously works minimum one hour a week..With this very loose definition, level of unemploymnent in Indonesia is relatively very low. The unemployment figures in Indonesia can be calculatedusing ILO definition and the BPS definition. Currently, BPS also applied the ‘relaxed’ ILO definition in calculating unemployment level in Indonesia.
0.00
5.00
10.00
15.00
20.00
25.00
30.00
35.00
1971 1976 1980 1985 1990 1995 2000 2001 2002
Year
%
Rural
Urban
Sources: Indonesia Central Bureau of Statistics: 1971, 1980, 1990, 2000 Population Census; 1976, 1985,1995 Intercensal Population Survey, and 2001, 2002 National Labor Forces Survey.
33
Unemployment by GenderUnemployment by GenderUnemployment by GenderUnemployment by GenderUnemployment by Gender
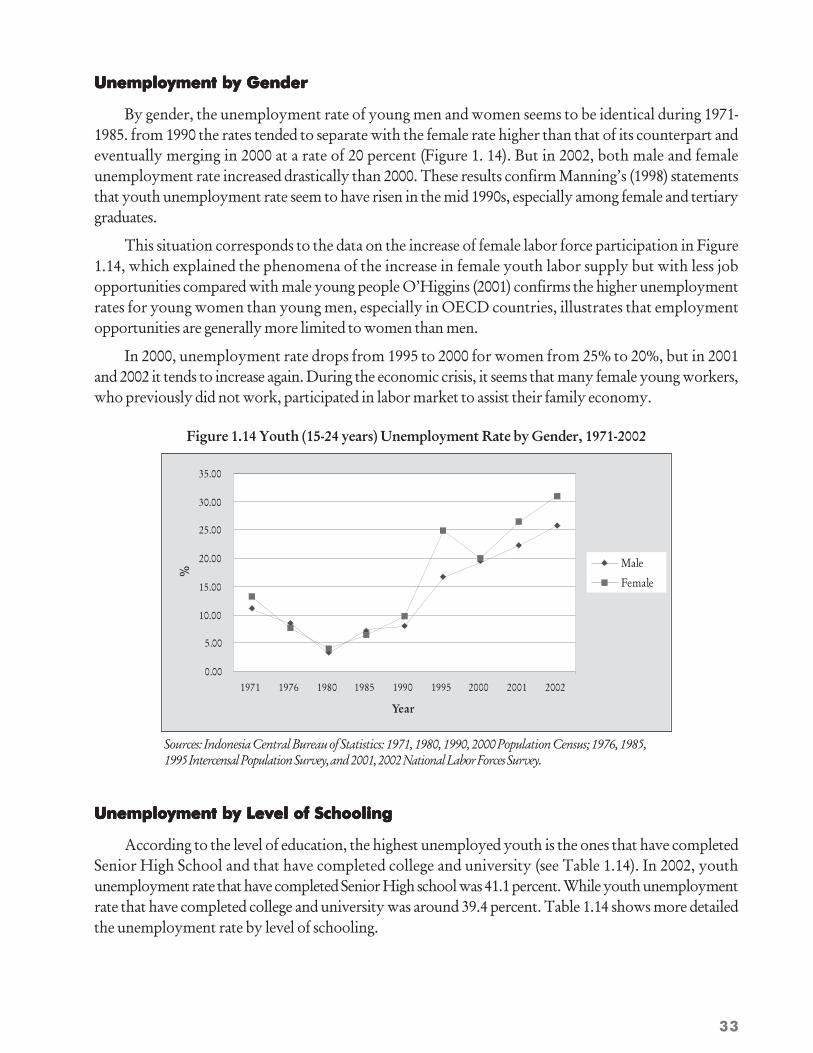
By gender, the unemployment rate of young men and women seems to be identical during 1971-1985. from 1990 the rates tended to separate with the female rate higher than that of its counterpart andeventually merging in 2000 at a rate of 20 percent (Figure 1. 14). But in 2002, both male and femaleunemployment rate increased drastically than 2000. These results confirm Manning’s (1998) statementsthat youth unemployment rate seem to have risen in the mid 1990s, especially among female and tertiarygraduates.
This situation corresponds to the data on the increase of female labor force participation in Figure1.14, which explained the phenomena of the increase in female youth labor supply but with less jobopportunities compared with male young people O’Higgins (2001) confirms the higher unemploymentrates for young women than young men, especially in OECD countries, illustrates that employmentopportunities are generally more limited to women than men.
In 2000, unemployment rate drops from 1995 to 2000 for women from 25% to 20%, but in 2001and 2002 it tends to increase again. During the economic crisis, it seems that many female young workers,who previously did not work, participated in labor market to assist their family economy.
Figure 1.14 Youth (15-24 years) Unemployment Rate by Gender, 1971-2002
0.00
5.00
10.00
15.00
20.00
25.00
30.00
35.00
1971 1976 1980 1985 1990 1995 2000 2001 2002
Year
%
Male
Female
Sources: Indonesia Central Bureau of Statistics: 1971, 1980, 1990, 2000 Population Census; 1976, 1985,1995 Intercensal Population Survey, and 2001, 2002 National Labor Forces Survey.
Unemployment by Level of SchoolingUnemployment by Level of SchoolingUnemployment by Level of SchoolingUnemployment by Level of SchoolingUnemployment by Level of Schooling
According to the level of education, the highest unemployed youth is the ones that have completedSenior High School and that have completed college and university (see Table 1.14). In 2002, youthunemployment rate that have completed Senior High school was 41.1 percent. While youth unemploymentrate that have completed college and university was around 39.4 percent. Table 1.14 shows more detailedthe unemployment rate by level of schooling.

34
Table 1.14 Percentage of Youth (15-24 years) Unemployment Rate by Level of Schooling, 1985-2002
Education 1985 1990 1995 2000 2002
No Schooling 1.2 2.2 - 3.9 15.1Less Than Primary School 1.9 2.5 7.6 7.4 18.7Primary School 3.3 3.1 9.6 12.4 21.9Junior High School 9.8 7.8 16.6 18.2 28.0Senior High School 31.1 27.3 33.6 33.9 41.1College and University 20.5 31.4 40.8 35.8 39.4Total per-age group 6.9 8.7 20.0 16.2 29.0
Sources: Indonesia Central Bureau of Statistics: 1990, 2000 Population Census; 1985, 1995 Intercensal Population Survey, and 2000,2002 National Labor Forces Survey.
Table 1.15 Percentage of Adult (>24 years) Unemployment Rate by Level of Schooling, 1985-2002
Education 1985 1990 1995 2000 2002
No Schooling 0.5 0.8 - 0.4 3.8Less Than Primary School 0.9 0.8 2.3 1.8 4.0Primary School 1.1 0.9 2.8 2.4 3.7Junior High School 4.3 3.3 5.5 8.6 5.0Senior High School 7 7.8 12.3 12.4 7.6College and University 11.3 17.2 23.1 20.9 8.0Total per-age group 2.2 3.3 7.1 7.6 4.9
Sources: Indonesia Central Bureau of Statistics: 1990, 2000 Population Census; 1985, 1995 Intercensal Population Survey, and 2000,2002 National Labor Forces Survey.
Unemployment rates among young people with a higher-level of education remain high, and have atendency to increase further. This situation indicates that there are a large proportion of youth jobseekers with higher education. Unemployment amongst highly educated youth is evident with newgraduates looking for work for first time (Tirtosudarmo 1994). The youth (15-24 years) unemploymentrate amongst Junior High School graduates ranges from 9.8 percent in 1985 to 18.2 percent in 2000(Table 1.14). For High School and College and University graduates the rate fluctuated from 31.1 to 33.9percent and 20.5 to 35.8 percent respectively.
These figures indicate a high unemployment rate for educated youth, but as O’Higgins (2001)suggest, even if there is a high unemployment rate concentrated amongst the highly educated, there aresome consistencies results:
• The Labor Force Participation Rate tends to increase with the level of education and competitionin labor market is more aggressive for higher of education.
• Educational levels for urban and rural areas of the Indonesian population have been increasingrapidly over the past 30 years.
• Although the unemployment rates seem to be higher amongst the more educated youth, theabsolute total number is less than that of the lower educated.
Research conducted by Ministry of Manpower Republic of Indonesia (1999) collected data fromgeneral and vocational high school graduates. The results revealed that the school graduates were facingthree main difficulties when looking for work. These were: competition among job seekers (41.4 percent),
35
unmatched education (16.6 percent), limited skills (12.8 percent). Having these constraints meant thatyoung people needed to short cut the system in order to obtain employment. This is consolidated byproportion of high school graduates who found employment without tests (40 percent of the totalnumber employed).
Furthermore, results indicate that the information sources on the availability of employment rangesfrom relatives (47 percent), employee of the company (20 percent), and the company itself (14.9 percent).Application letters are obtained either directly from the company (67.7 percent) or through relatives(16.6 percent).
PPPPPercentage of Unemployed Yercentage of Unemployed Yercentage of Unemployed Yercentage of Unemployed Yercentage of Unemployed Youth to Touth to Touth to Touth to Touth to Total Unemploymentotal Unemploymentotal Unemploymentotal Unemploymentotal Unemployment
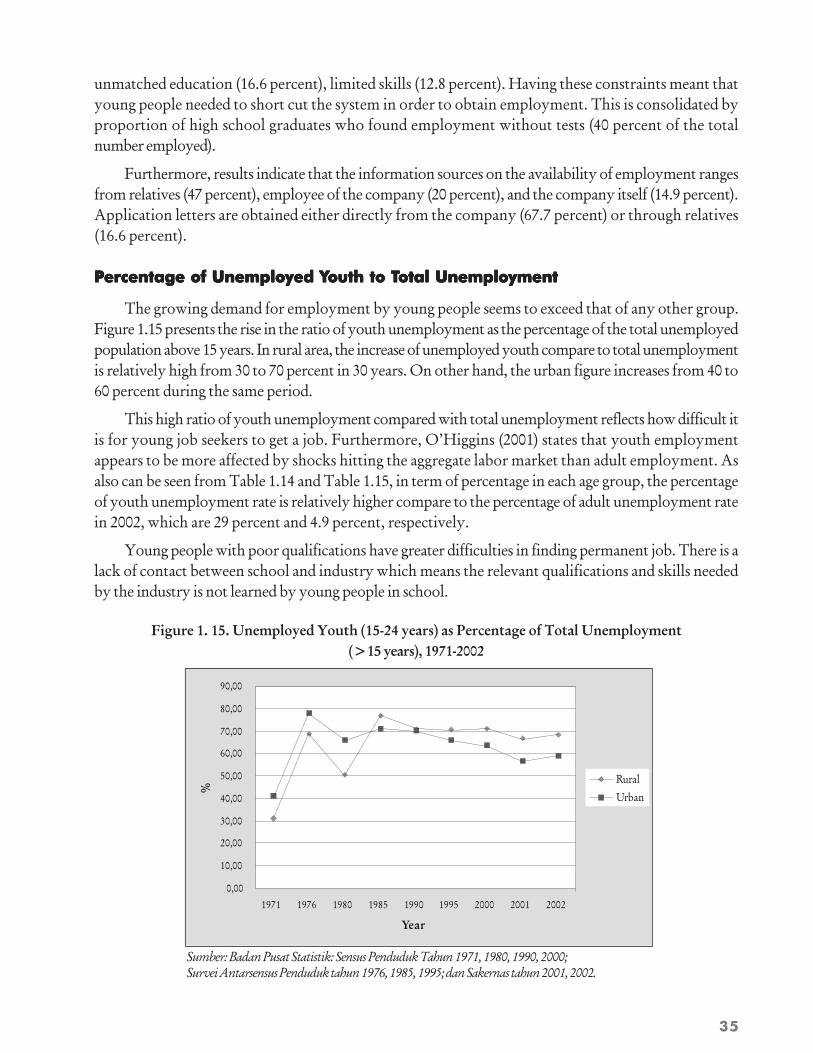
The growing demand for employment by young people seems to exceed that of any other group.Figure 1.15 presents the rise in the ratio of youth unemployment as the percentage of the total unemployedpopulation above 15 years. In rural area, the increase of unemployed youth compare to total unemploymentis relatively high from 30 to 70 percent in 30 years. On other hand, the urban figure increases from 40 to60 percent during the same period.
This high ratio of youth unemployment compared with total unemployment reflects how difficult itis for young job seekers to get a job. Furthermore, O’Higgins (2001) states that youth employmentappears to be more affected by shocks hitting the aggregate labor market than adult employment. Asalso can be seen from Table 1.14 and Table 1.15, in term of percentage in each age group, the percentageof youth unemployment rate is relatively higher compare to the percentage of adult unemployment ratein 2002, which are 29 percent and 4.9 percent, respectively.
Young people with poor qualifications have greater difficulties in finding permanent job. There is alack of contact between school and industry which means the relevant qualifications and skills neededby the industry is not learned by young people in school.
Figure 1. 15. Unemployed Youth (15-24 years) as Percentage of Total Unemployment(>15 years), 1971-2002
0,00
10,00
20,00
30,00
40,00
50,00
60,00
70,00
80,00
90,00
1971 1976 1980 1985 1990 1995 2000 2001 2002
Year
%
Rural
Urban
Sumber: Badan Pusat Statistik: Sensus Penduduk Tahun 1971, 1980, 1990, 2000;Survei Antarsensus Penduduk tahun 1976, 1985, 1995; dan Sakernas tahun 2001, 2002.
36
UnderemploymentUnderemploymentUnderemploymentUnderemploymentUnderemployment
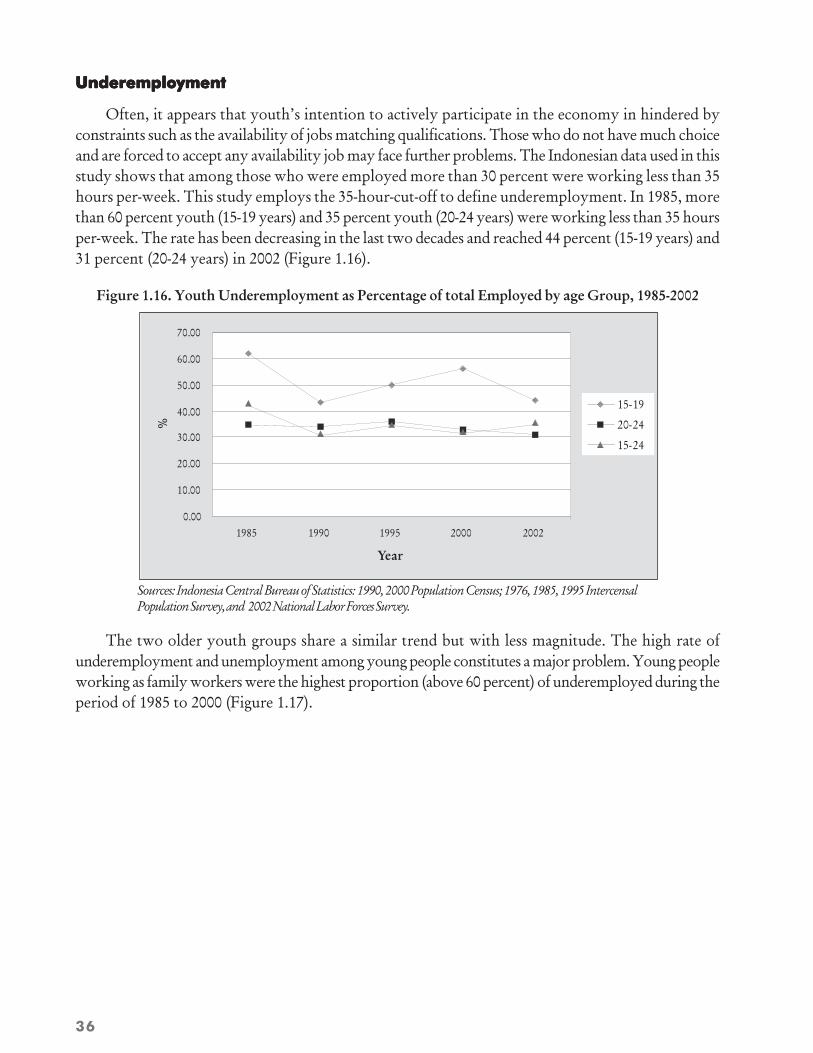
Often, it appears that youth’s intention to actively participate in the economy in hindered byconstraints such as the availability of jobs matching qualifications. Those who do not have much choiceand are forced to accept any availability job may face further problems. The Indonesian data used in thisstudy shows that among those who were employed more than 30 percent were working less than 35hours per-week. This study employs the 35-hour-cut-off to define underemployment. In 1985, morethan 60 percent youth (15-19 years) and 35 percent youth (20-24 years) were working less than 35 hoursper-week. The rate has been decreasing in the last two decades and reached 44 percent (15-19 years) and31 percent (20-24 years) in 2002 (Figure 1.16).
Figure 1.16. Youth Underemployment as Percentage of total Employed by age Group, 1985-2002
0.00
10.00
20.00
30.00
40.00
50.00
60.00
70.00
1985 1990 1995 2000 2002
Year
%
15-19
20-24
15-24
Sources: Indonesia Central Bureau of Statistics: 1990, 2000 Population Census; 1976, 1985, 1995 IntercensalPopulation Survey, and 2002 National Labor Forces Survey.
The two older youth groups share a similar trend but with less magnitude. The high rate ofunderemployment and unemployment among young people constitutes a major problem. Young peopleworking as family workers were the highest proportion (above 60 percent) of underemployed during theperiod of 1985 to 2000 (Figure 1.17).

37
Figure 1.17. Youth Underemployment as Percentage of total Employed by Status, 1985-2002
0.00
10.00
20.00
30.00
40.00
50.00
60.00
70.00
80.00
1985 1990 1995 2000 2002
Year
%Own AccountWorkerEmployer
Employee
Family workers
Sources: Indonesia Central Bureau of Statistics: 1990, 2000 Population Census; 1976, 1985, 1995 IntercensalPopulation Survey, and 2002 National Labor Forces Survey.
While the category of worker status decreased during the 15 years of observation, those who workedas an employer increased during 1995-2002. However, youth with employee status constituted the lowestproportion of underemployed, which decreased from 20 percent in 1985 to slightly above 13 percent in2002.
The higher the level of schooling, the lower the proportion of youth underemployment. Those whohave never gone to school constitute the highest proportion of underemployment in each year ofobservation except in 1985, however, there was a decline in terms of the proportion of higher andmiddle level educated youth being underemployed. Table 1. 16 shows that the higher level of schooling,the lower the proportion of youth underemployment. Those who have never gone to school constitutethe highest proportion of underemployment in each year of observation except in 1985; however, therewas a decline in terms of the proportion of higher and middle level educated youth beingunderemployment. In 1985, around 41 percent of youth worker with college and university educationwere underemployed whereas 20 percent of them still underemployed in 2000.
Table 1.16. Youth (15-24 years) Underemployment as Percentage of Total Employed by EducationalAttainment, 1985-2002
Education 1985 1990 1995 2000 2002
No Schooling 57,4 42,5 - 58.6 55,96Less Than Primary School 44,9 38,6 48,8 44.7 46,30Primary School 53,3 35,6 46,1 43.2 36,61Junior High School 60,9 28,3 43,7 39.0 27,95Senior High School 43,2 27,9 27,8 24.6 18,62College and University 41,1 35,8 30,6 19.7 22,52
Sources: Indonesia Central Bureau of Statistics: 1990, 2000 Population Census; 1985, 1995 Intercensal Population Survey, and 2002National Labor Forces Survey.
38
WWWWWages and Salary of Yages and Salary of Yages and Salary of Yages and Salary of Yages and Salary of Youth Employmentouth Employmentouth Employmentouth Employmentouth Employment
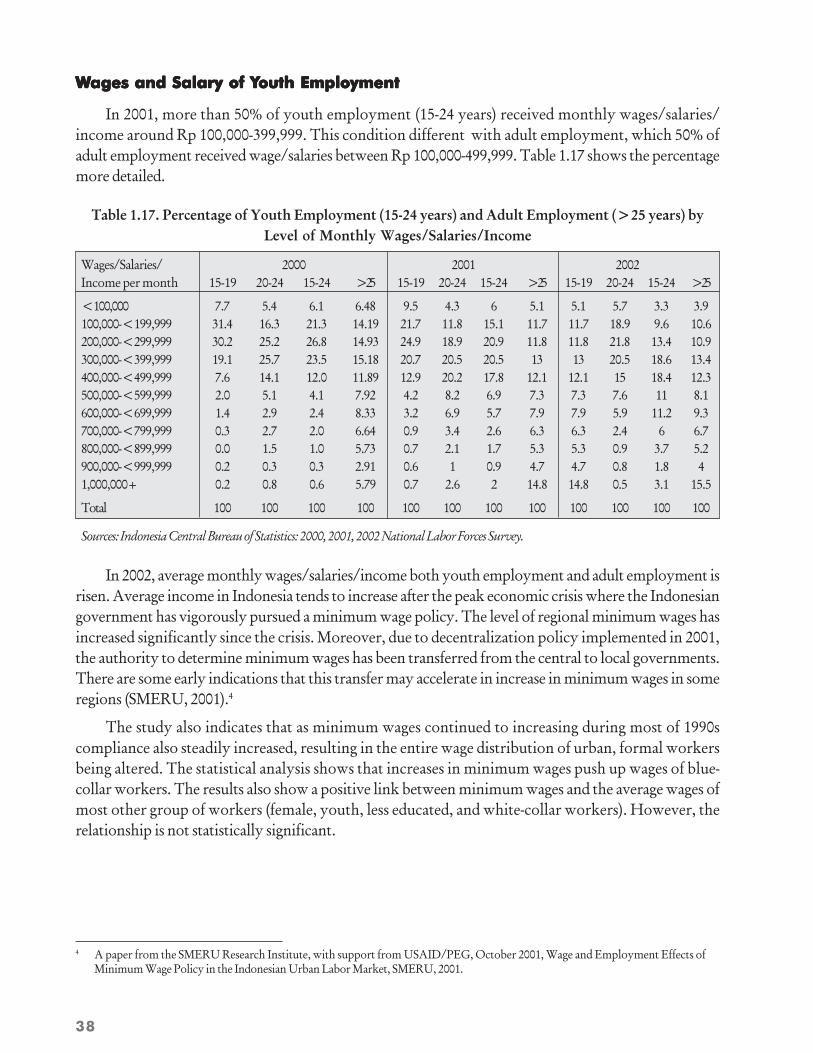
In 2001, more than 50% of youth employment (15-24 years) received monthly wages/salaries/income around Rp 100,000-399,999. This condition different with adult employment, which 50% ofadult employment received wage/salaries between Rp 100,000-499,999. Table 1.17 shows the percentagemore detailed.
Table 1.17. Percentage of Youth Employment (15-24 years) and Adult Employment (>25 years) byLevel of Monthly Wages/Salaries/Income
Wages/Salaries/ 2000 2001 2002Income per month 15-19 20-24 15-24 >25 15-19 20-24 15-24 >25 15-19 20-24 15-24 >25
<100,000 7.7 5.4 6.1 6.48 9.5 4.3 6 5.1 5.1 5.7 3.3 3.9100,000-<199,999 31.4 16.3 21.3 14.19 21.7 11.8 15.1 11.7 11.7 18.9 9.6 10.6200,000-<299,999 30.2 25.2 26.8 14.93 24.9 18.9 20.9 11.8 11.8 21.8 13.4 10.9300,000-<399,999 19.1 25.7 23.5 15.18 20.7 20.5 20.5 13 13 20.5 18.6 13.4400,000-<499,999 7.6 14.1 12.0 11.89 12.9 20.2 17.8 12.1 12.1 15 18.4 12.3500,000-<599,999 2.0 5.1 4.1 7.92 4.2 8.2 6.9 7.3 7.3 7.6 11 8.1600,000-<699,999 1.4 2.9 2.4 8.33 3.2 6.9 5.7 7.9 7.9 5.9 11.2 9.3700,000-<799,999 0.3 2.7 2.0 6.64 0.9 3.4 2.6 6.3 6.3 2.4 6 6.7800,000-<899,999 0.0 1.5 1.0 5.73 0.7 2.1 1.7 5.3 5.3 0.9 3.7 5.2900,000-<999,999 0.2 0.3 0.3 2.91 0.6 1 0.9 4.7 4.7 0.8 1.8 41,000,000+ 0.2 0.8 0.6 5.79 0.7 2.6 2 14.8 14.8 0.5 3.1 15.5
Total 100 100 100 100 100 100 100 100 100 100 100 100
Sources: Indonesia Central Bureau of Statistics: 2000, 2001, 2002 National Labor Forces Survey.
In 2002, average monthly wages/salaries/income both youth employment and adult employment isrisen. Average income in Indonesia tends to increase after the peak economic crisis where the Indonesiangovernment has vigorously pursued a minimum wage policy. The level of regional minimum wages hasincreased significantly since the crisis. Moreover, due to decentralization policy implemented in 2001,the authority to determine minimum wages has been transferred from the central to local governments.There are some early indications that this transfer may accelerate in increase in minimum wages in someregions (SMERU, 2001).4
The study also indicates that as minimum wages continued to increasing during most of 1990scompliance also steadily increased, resulting in the entire wage distribution of urban, formal workersbeing altered. The statistical analysis shows that increases in minimum wages push up wages of blue-collar workers. The results also show a positive link between minimum wages and the average wages ofmost other group of workers (female, youth, less educated, and white-collar workers). However, therelationship is not statistically significant.
4 A paper from the SMERU Research Institute, with support from USAID/PEG, October 2001, Wage and Employment Effects ofMinimum Wage Policy in the Indonesian Urban Labor Market, SMERU, 2001.
39
Social Consequences of YSocial Consequences of YSocial Consequences of YSocial Consequences of YSocial Consequences of Young Unemploymentoung Unemploymentoung Unemploymentoung Unemploymentoung Unemployment
The lack of job availability and excessive supply of youth labor are resulted a youth unemployment,and underemployment. An increase in the youth unemployment rate could aggravate the situation wherethere are many existing youngsters who have been unsuccessful in their job search. Those trapped insuch a disadvantage situation may seek another way to exercise their potential and there is no guaranteeit would not be manipulated toward unhealthy and socially unacceptable activities.
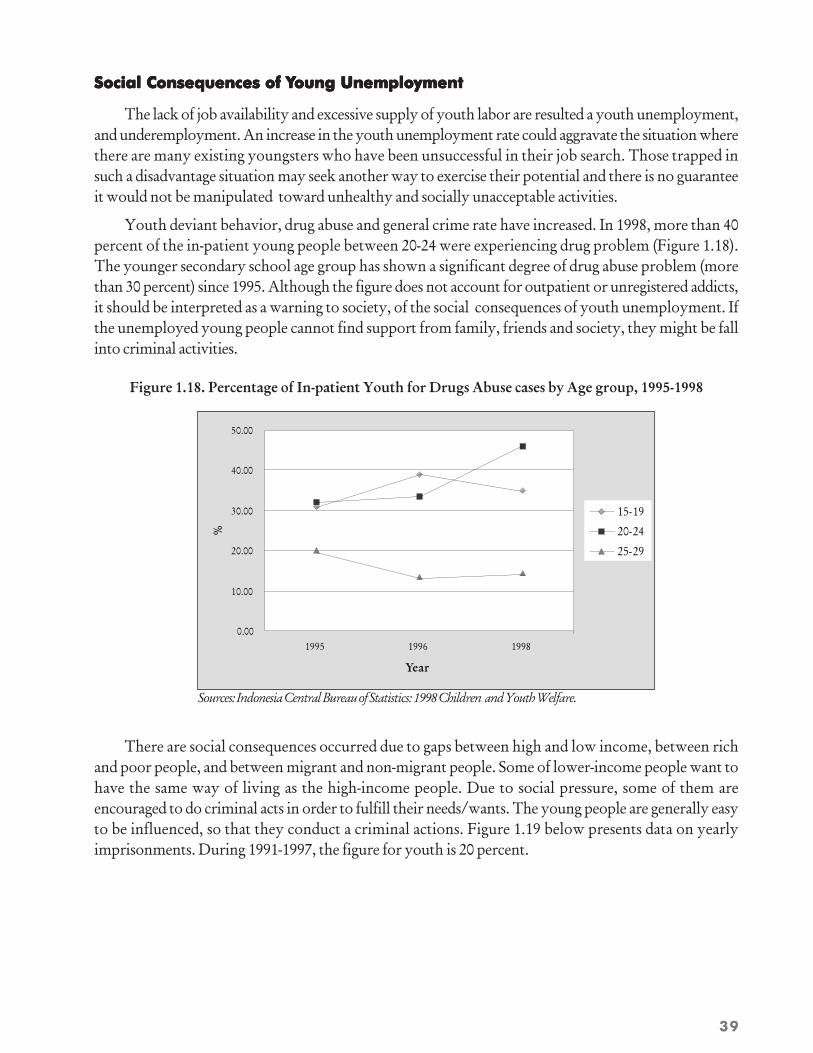
Youth deviant behavior, drug abuse and general crime rate have increased. In 1998, more than 40percent of the in-patient young people between 20-24 were experiencing drug problem (Figure 1.18).The younger secondary school age group has shown a significant degree of drug abuse problem (morethan 30 percent) since 1995. Although the figure does not account for outpatient or unregistered addicts,it should be interpreted as a warning to society, of the social consequences of youth unemployment. Ifthe unemployed young people cannot find support from family, friends and society, they might be fallinto criminal activities.
Figure 1.18. Percentage of In-patient Youth for Drugs Abuse cases by Age group, 1995-1998
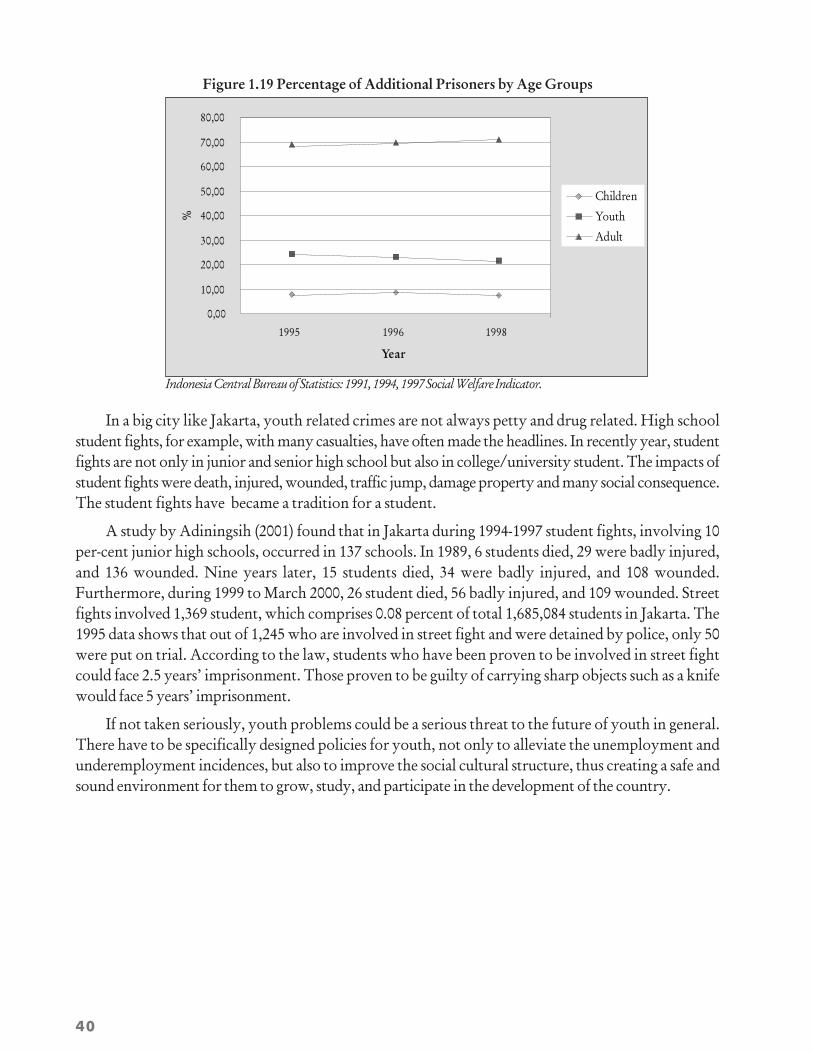
There are social consequences occurred due to gaps between high and low income, between richand poor people, and between migrant and non-migrant people. Some of lower-income people want tohave the same way of living as the high-income people. Due to social pressure, some of them areencouraged to do criminal acts in order to fulfill their needs/wants. The young people are generally easyto be influenced, so that they conduct a criminal actions. Figure 1.19 below presents data on yearlyimprisonments. During 1991-1997, the figure for youth is 20 percent.
0.00
10.00
20.00
30.00
40.00
50.00
1995 1996 1998
Year
%
15-19
20-24
25-29
Sources: Indonesia Central Bureau of Statistics: 1998 Children and Youth Welfare.
40
Figure 1.19 Percentage of Additional Prisoners by Age Groups
0,00
10,00
20,00
30,00
40,00
50,00
60,00
70,00
80,00
1995 1996 1998
Year
%Children
Youth
Adult
Indonesia Central Bureau of Statistics: 1991, 1994, 1997 Social Welfare Indicator.
In a big city like Jakarta, youth related crimes are not always petty and drug related. High schoolstudent fights, for example, with many casualties, have often made the headlines. In recently year, studentfights are not only in junior and senior high school but also in college/university student. The impacts ofstudent fights were death, injured, wounded, traffic jump, damage property and many social consequence.The student fights have became a tradition for a student.
A study by Adiningsih (2001) found that in Jakarta during 1994-1997 student fights, involving 10per-cent junior high schools, occurred in 137 schools. In 1989, 6 students died, 29 were badly injured,and 136 wounded. Nine years later, 15 students died, 34 were badly injured, and 108 wounded.Furthermore, during 1999 to March 2000, 26 student died, 56 badly injured, and 109 wounded. Streetfights involved 1,369 student, which comprises 0.08 percent of total 1,685,084 students in Jakarta. The1995 data shows that out of 1,245 who are involved in street fight and were detained by police, only 50were put on trial. According to the law, students who have been proven to be involved in street fightcould face 2.5 years’ imprisonment. Those proven to be guilty of carrying sharp objects such as a knifewould face 5 years’ imprisonment.
If not taken seriously, youth problems could be a serious threat to the future of youth in general.There have to be specifically designed policies for youth, not only to alleviate the unemployment andunderemployment incidences, but also to improve the social cultural structure, thus creating a safe andsound environment for them to grow, study, and participate in the development of the country.
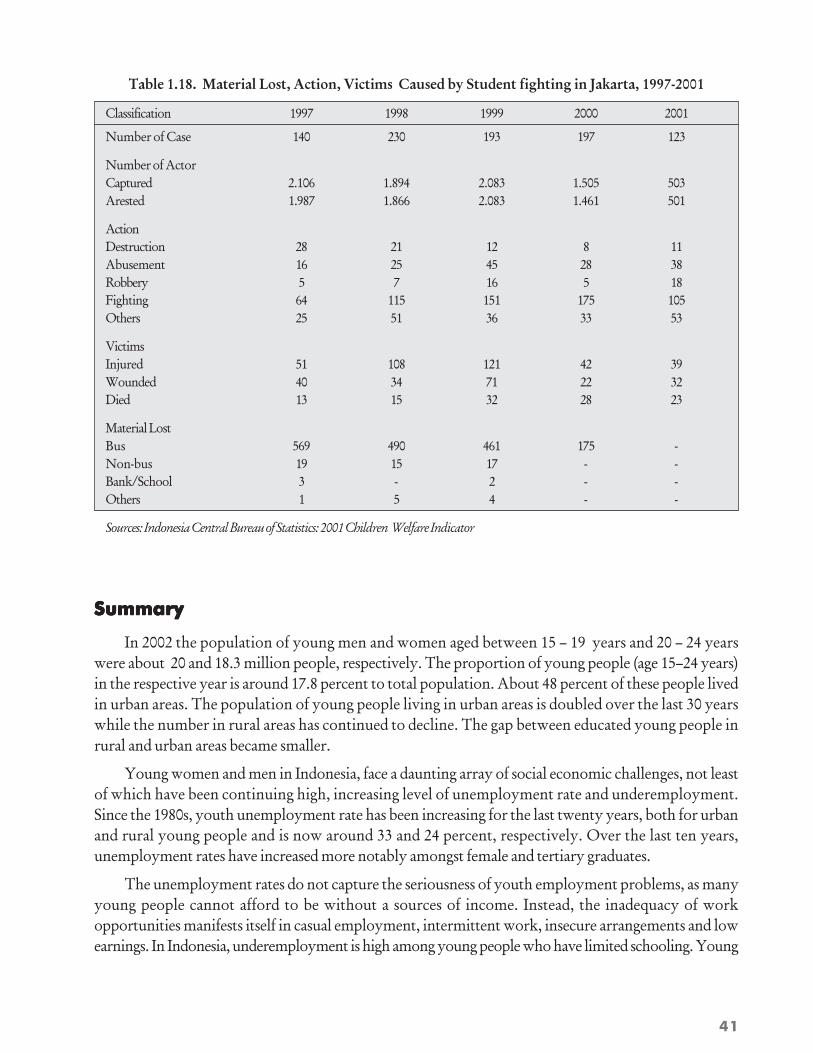
41
Table 1.18. Material Lost, Action, Victims Caused by Student fighting in Jakarta, 1997-2001
Classification 1997 1998 1999 2000 2001
Number of Case 140 230 193 197 123
Number of Actor Captured 2.106 1.894 2.083 1.505 503Arested 1.987 1.866 2.083 1.461 501
Action Destruction 28 21 12 8 11Abusement 16 25 45 28 38Robbery 5 7 16 5 18Fighting 64 115 151 175 105Others 25 51 36 33 53
Victims Injured 51 108 121 42 39Wounded 40 34 71 22 32Died 13 15 32 28 23
Material Lost Bus 569 490 461 175 -Non-bus 19 15 17 - -Bank/School 3 - 2 - -Others 1 5 4 - -
Sources: Indonesia Central Bureau of Statistics: 2001 Children Welfare Indicator
SummarySummarySummarySummarySummary
In 2002 the population of young men and women aged between 15 – 19 years and 20 – 24 yearswere about 20 and 18.3 million people, respectively. The proportion of young people (age 15–24 years)in the respective year is around 17.8 percent to total population. About 48 percent of these people livedin urban areas. The population of young people living in urban areas is doubled over the last 30 yearswhile the number in rural areas has continued to decline. The gap between educated young people inrural and urban areas became smaller.
Young women and men in Indonesia, face a daunting array of social economic challenges, not leastof which have been continuing high, increasing level of unemployment rate and underemployment.Since the 1980s, youth unemployment rate has been increasing for the last twenty years, both for urbanand rural young people and is now around 33 and 24 percent, respectively. Over the last ten years,unemployment rates have increased more notably amongst female and tertiary graduates.
The unemployment rates do not capture the seriousness of youth employment problems, as manyyoung people cannot afford to be without a sources of income. Instead, the inadequacy of workopportunities manifests itself in casual employment, intermittent work, insecure arrangements and lowearnings. In Indonesia, underemployment is high among young people who have limited schooling. Young

42
people working as family workers are the highest proportion (around 40%) of underemployed people inIndonesia. Its condition is better than in 2000, the underemployed of young family worker is around60%.
Youth unemployment and underemployment perpetuate a vicious cycle of poverty and exclusion.Youth joblessness and income disparity among people are linked to personal and social problem such ashealth, crime, vandalism and drugs. Not only is this a disheartening but it also contributes to the loss ofthe creative talents of young people who otherwise would be making innovative contributions to thelabor force and society.
43
IntroductionIntroductionIntroductionIntroductionIntroduction
According to a research report by SMERU5 for every 10 percent increase in real minimum wages,there will be more than a one percent reduction in total employment, controlling for other factors affectingemployment, such as economic growth and growth in the working population. Significantly, the negativeeffects of minimum wage legislation is greatest for those groups that are most vulnerable to changes inlabor market conditions such as females, youth workers, and less educated workers, which make up thebulk of those employed in both the formal and informal sectors. As such, the crisis brings about twomajor impacts on youth employment, unemployment and lowered wage. Both would lead to an increaseof poverty among the youth.
The chapter will provide characteristics of disadvantage youth and its relationship with povertyprofile. It will describe condition of poor people based on several characteristics, such as location,gender, education, consumption pattern, and employment. The description presented here will focus toyoung people, which are people at the age 15 to 24 years old.
In exploring poverty and labor data in Indonesia, there are some limitations encountered. Thecommonly database used to analyze social economic condition and poverty is the National SocialEconomic Survey (SUSENAS) which is conducted every three years by the BPS. On the other hands,statistical data for labor market and employment is National Labor Force Survey (SAKERNAS) that isannually conducted.
In general, to measure poverty level of a country, it is calculated number of people that live underpoverty line. There are several definitions of poverty lines that can be used to calculate poverty indicatorsin Indonesia, which are: from the Indonesian Central Bureau of Statistics (BPS), LPEM FEUI, and theWorld Bank. The calculation here uses the BPS poverty lines for 1996, 1999, and 2002. The povertylines basically are calculated using the consumption module in the SUSENAS data, so that the povertylines reflect the minimum monthly average consumption per person.6 The poverty lines are presented inTable 2.1.
Chapter 2
Poverty and Youth
5 A paper from the SMERU Research Institute, with support from USAID/PEG, October 2001, Wage and Employment Effects ofMinimum Wage Policy in the Indonesian Urban Labor Market, SMERU, 2001.
6 LPEM FEUI has done research concerning the measurement of poverty lines in Indonesia and number of poverty using differentmethods of poverty lines, which were: “Menghitung Kembali Tingkat Kemiskinan di Indonesia 1990-1999” (Re-calculating PovertyLevel in Indonesia 1990-1999), LPEM FEUI, unpublished research paper, 2000; “The Indonesian Poverty Profile”, unpublishedresearch paper, 2001.
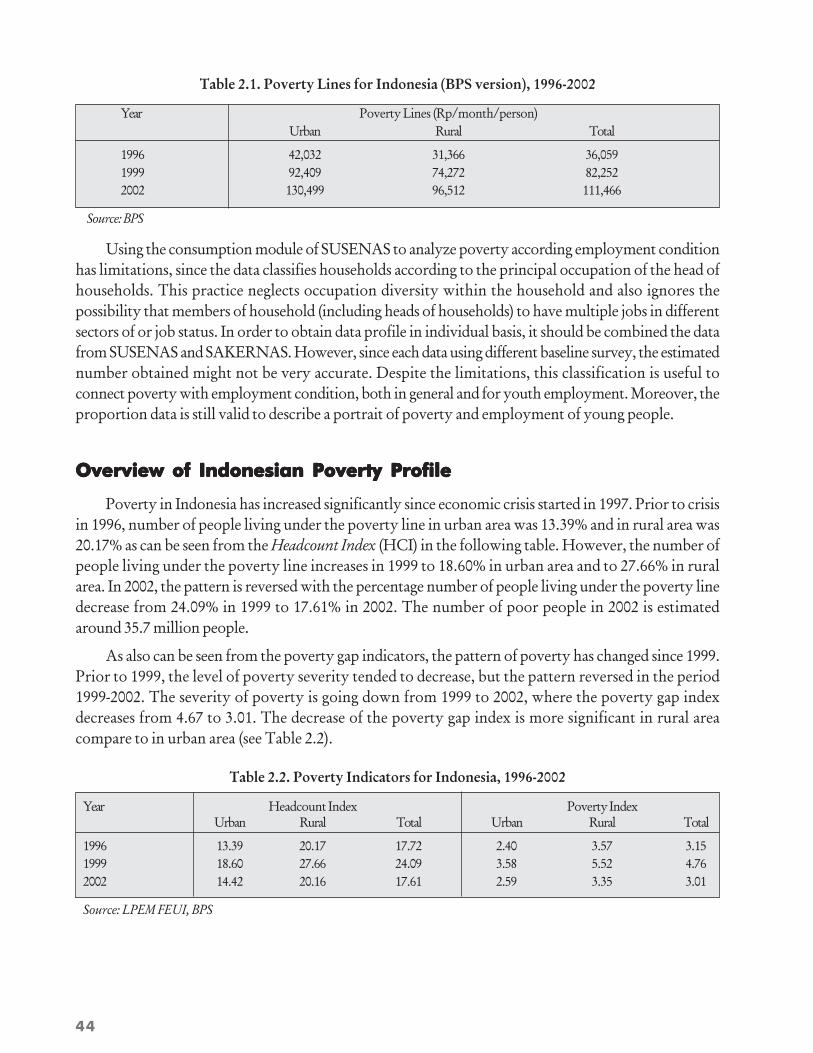
44
Table 2.1. Poverty Lines for Indonesia (BPS version), 1996-2002
Year Poverty Lines (Rp/month/person)Urban Rural Total
1996 42,032 31,366 36,0591999 92,409 74,272 82,2522002 130,499 96,512 111,466
Source: BPS
Using the consumption module of SUSENAS to analyze poverty according employment conditionhas limitations, since the data classifies households according to the principal occupation of the head ofhouseholds. This practice neglects occupation diversity within the household and also ignores thepossibility that members of household (including heads of households) to have multiple jobs in differentsectors of or job status. In order to obtain data profile in individual basis, it should be combined the datafrom SUSENAS and SAKERNAS. However, since each data using different baseline survey, the estimatednumber obtained might not be very accurate. Despite the limitations, this classification is useful toconnect poverty with employment condition, both in general and for youth employment. Moreover, theproportion data is still valid to describe a portrait of poverty and employment of young people.
Overview of Indonesian Poverty ProfileOverview of Indonesian Poverty ProfileOverview of Indonesian Poverty ProfileOverview of Indonesian Poverty ProfileOverview of Indonesian Poverty Profile
Poverty in Indonesia has increased significantly since economic crisis started in 1997. Prior to crisisin 1996, number of people living under the poverty line in urban area was 13.39% and in rural area was20.17% as can be seen from the Headcount Index (HCI) in the following table. However, the number ofpeople living under the poverty line increases in 1999 to 18.60% in urban area and to 27.66% in ruralarea. In 2002, the pattern is reversed with the percentage number of people living under the poverty linedecrease from 24.09% in 1999 to 17.61% in 2002. The number of poor people in 2002 is estimatedaround 35.7 million people.
As also can be seen from the poverty gap indicators, the pattern of poverty has changed since 1999.Prior to 1999, the level of poverty severity tended to decrease, but the pattern reversed in the period1999-2002. The severity of poverty is going down from 1999 to 2002, where the poverty gap indexdecreases from 4.67 to 3.01. The decrease of the poverty gap index is more significant in rural areacompare to in urban area (see Table 2.2).
Table 2.2. Poverty Indicators for Indonesia, 1996-2002
Year Headcount Index Poverty IndexUrban Rural Total Urban Rural Total
1996 13.39 20.17 17.72 2.40 3.57 3.151999 18.60 27.66 24.09 3.58 5.52 4.762002 14.42 20.16 17.61 2.59 3.35 3.01
Source: LPEM FEUI, BPS

45
Based on age classification, the percentage of poor people in the age bracket of 15 to 24 year-oldwas 16.6% in 1996 and rose to 18.1% in 1999 and 2002. As can be seen in Figure 2.1, the highestproportion of poor people was in the age under 10 year-old, followed by age range 30-44 year-old andage range 10-14 year-old. The pattern remains the same from the period 1996 to 2002. In all ageclassification, the number of poor people increases in 1999 compare to 1996. However, the numberdecreases in 2002. This reflected impacts of economic crisis in 1999. Compare to population of youngpeople in 2002 (age 15-24 year-old), which was about 38 million people; there was 21.3% of youngpeople living under the poverty line.
Figure 2.1. Percentage of Poor People by Age, 1996-2002
Looking closely to the 2002 data, the profile of poor people compare to the non-poor in Indonesiais illustrating in Table 2.3. The proportion of male and female is relatively the same, both in urban andrural area, for poor and non-poor people. By education level, the percentage of people that completedhigher level of education (senior high school, college and university) is higher for the non-poor peoplewho live in urban area compare to other groups. Meanwhile for the poor, the percentage of people witheducation level elementary school (completed or not) is relatively high which is nearly 60%. Thepercentage is higher in rural area compare to in urban area.
Table 2.3. Profile of the Poor and Non-Poor in Indonesia (%), 2002
Non Poor Poor All Urban Rural Total Urban Rural Total Urban Rural Total
Age classification< 10 17.4 18.7 18.1 22.4 24.4 23.6 18.4 20.1 19.310-14 9.0 10.3 9.7 12.3 13.3 12.9 9.7 11.0 10.415-19 10.1 9.4 9.8 11.6 10.0 10.6 10.4 9.5 9.920-24 10.3 8.2 9.2 8.5 6.9 7.5 10.0 7.9 8.825-29 9.7 8.5 9.0 7.0 6.7 6.8 9.1 8.0 8.530-44 24.0 22.1 23.0 20.3 20.6 20.5 23.3 21.8 22.545-59 12.7 14.0 13.4 10.7 11.0 10.9 12.3 13.3 12.9
Sumber: SUSENAS 1996-2002
0
2,000
4,000
6,000
8,000
10,000
12,000
14,000
16,000
< 10 10-14 15-19 20-24 25-29 30-44 45-59 <= 60
Age classfication
thou
sand
peo
ple
1996 1999 2002
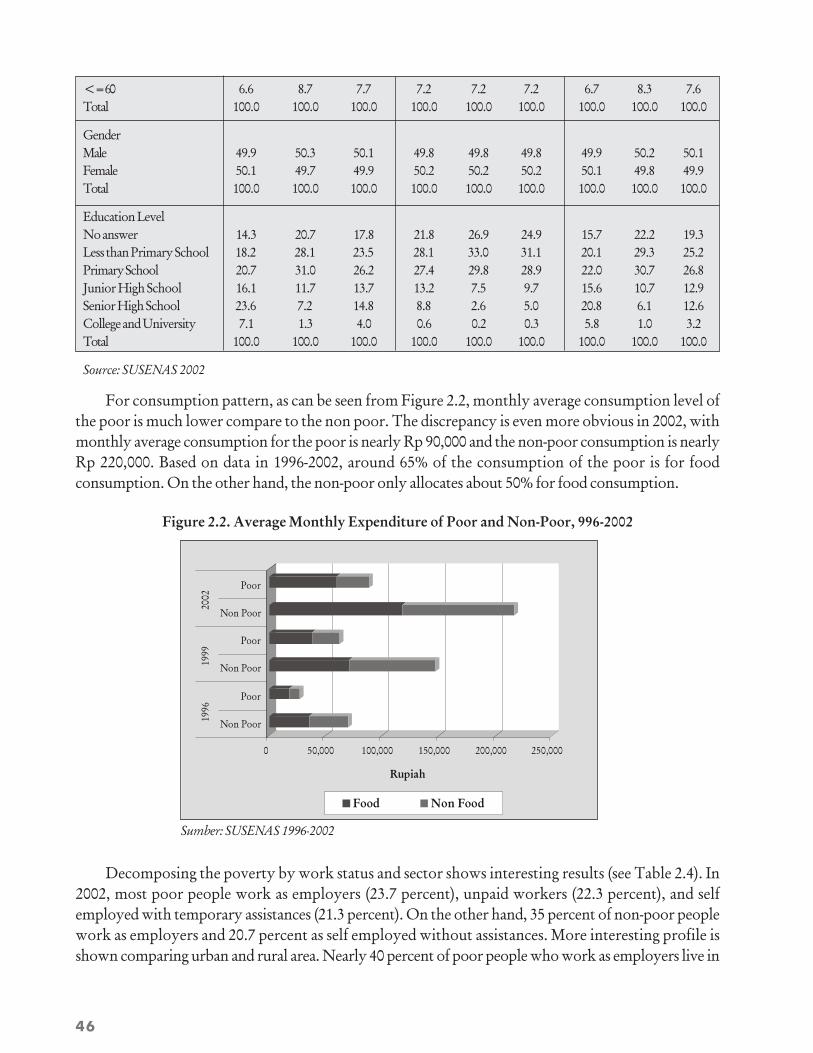
46
<= 60 6.6 8.7 7.7 7.2 7.2 7.2 6.7 8.3 7.6Total 100.0 100.0 100.0 100.0 100.0 100.0 100.0 100.0 100.0
GenderMale 49.9 50.3 50.1 49.8 49.8 49.8 49.9 50.2 50.1Female 50.1 49.7 49.9 50.2 50.2 50.2 50.1 49.8 49.9Total 100.0 100.0 100.0 100.0 100.0 100.0 100.0 100.0 100.0
Education LevelNo answer 14.3 20.7 17.8 21.8 26.9 24.9 15.7 22.2 19.3Less than Primary School 18.2 28.1 23.5 28.1 33.0 31.1 20.1 29.3 25.2Primary School 20.7 31.0 26.2 27.4 29.8 28.9 22.0 30.7 26.8Junior High School 16.1 11.7 13.7 13.2 7.5 9.7 15.6 10.7 12.9Senior High School 23.6 7.2 14.8 8.8 2.6 5.0 20.8 6.1 12.6College and University 7.1 1.3 4.0 0.6 0.2 0.3 5.8 1.0 3.2Total 100.0 100.0 100.0 100.0 100.0 100.0 100.0 100.0 100.0
Source: SUSENAS 2002
For consumption pattern, as can be seen from Figure 2.2, monthly average consumption level ofthe poor is much lower compare to the non poor. The discrepancy is even more obvious in 2002, withmonthly average consumption for the poor is nearly Rp 90,000 and the non-poor consumption is nearlyRp 220,000. Based on data in 1996-2002, around 65% of the consumption of the poor is for foodconsumption. On the other hand, the non-poor only allocates about 50% for food consumption.
Figure 2.2. Average Monthly Expenditure of Poor and Non-Poor, 996-2002
Decomposing the poverty by work status and sector shows interesting results (see Table 2.4). In2002, most poor people work as employers (23.7 percent), unpaid workers (22.3 percent), and selfemployed with temporary assistances (21.3 percent). On the other hand, 35 percent of non-poor peoplework as employers and 20.7 percent as self employed without assistances. More interesting profile isshown comparing urban and rural area. Nearly 40 percent of poor people who work as employers live in
Sumber: SUSENAS 1996-2002
0 50,000 100,000 150,000 200,000 250,000
Rupiah
Non Poor
Poor
Non Poor
Poor
Non Poor
Poor
1996
1999
2002
Food Non Food
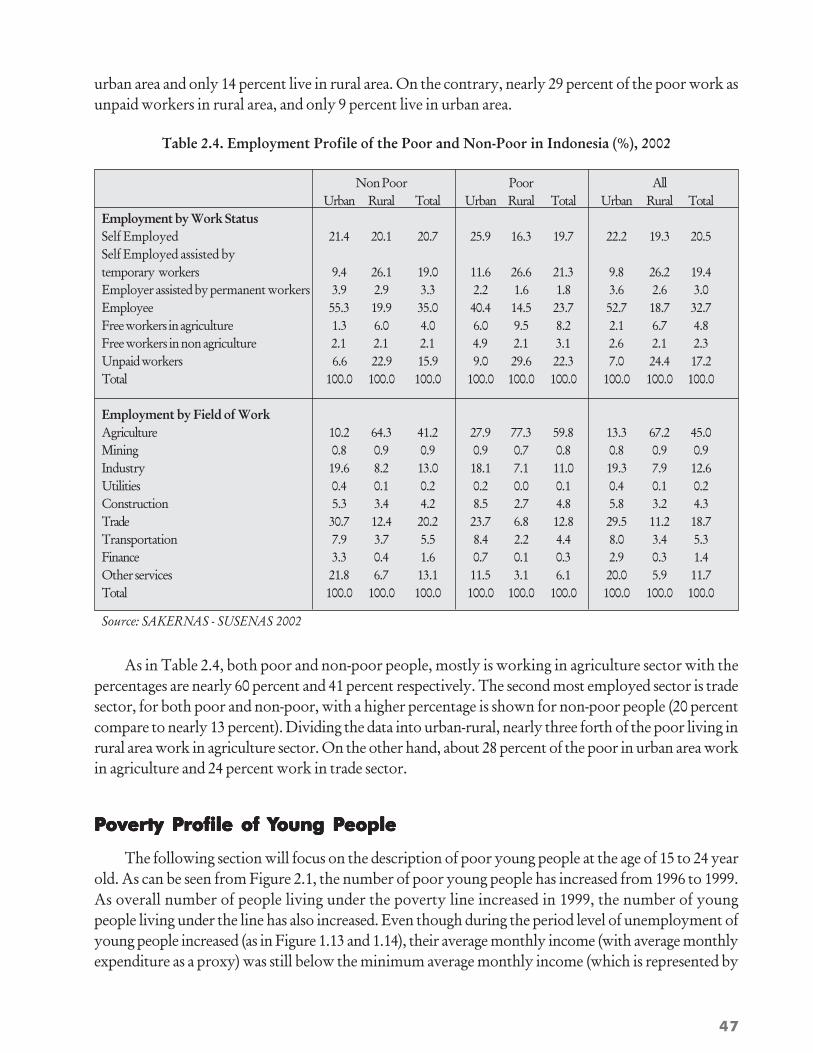
47
urban area and only 14 percent live in rural area. On the contrary, nearly 29 percent of the poor work asunpaid workers in rural area, and only 9 percent live in urban area.
Table 2.4. Employment Profile of the Poor and Non-Poor in Indonesia (%), 2002
Non Poor Poor All Urban Rural Total Urban Rural Total Urban Rural TotalEmployment by Work Status Self Employed 21.4 20.1 20.7 25.9 16.3 19.7 22.2 19.3 20.5Self Employed assisted bytemporary workers 9.4 26.1 19.0 11.6 26.6 21.3 9.8 26.2 19.4Employer assisted by permanent workers 3.9 2.9 3.3 2.2 1.6 1.8 3.6 2.6 3.0Employee 55.3 19.9 35.0 40.4 14.5 23.7 52.7 18.7 32.7Free workers in agriculture 1.3 6.0 4.0 6.0 9.5 8.2 2.1 6.7 4.8Free workers in non agriculture 2.1 2.1 2.1 4.9 2.1 3.1 2.6 2.1 2.3Unpaid workers 6.6 22.9 15.9 9.0 29.6 22.3 7.0 24.4 17.2Total 100.0 100.0 100.0 100.0 100.0 100.0 100.0 100.0 100.0 Employment by Field of Work Agriculture 10.2 64.3 41.2 27.9 77.3 59.8 13.3 67.2 45.0Mining 0.8 0.9 0.9 0.9 0.7 0.8 0.8 0.9 0.9Industry 19.6 8.2 13.0 18.1 7.1 11.0 19.3 7.9 12.6Utilities 0.4 0.1 0.2 0.2 0.0 0.1 0.4 0.1 0.2Construction 5.3 3.4 4.2 8.5 2.7 4.8 5.8 3.2 4.3Trade 30.7 12.4 20.2 23.7 6.8 12.8 29.5 11.2 18.7Transportation 7.9 3.7 5.5 8.4 2.2 4.4 8.0 3.4 5.3Finance 3.3 0.4 1.6 0.7 0.1 0.3 2.9 0.3 1.4Other services 21.8 6.7 13.1 11.5 3.1 6.1 20.0 5.9 11.7Total 100.0 100.0 100.0 100.0 100.0 100.0 100.0 100.0 100.0
Source: SAKERNAS - SUSENAS 2002
As in Table 2.4, both poor and non-poor people, mostly is working in agriculture sector with thepercentages are nearly 60 percent and 41 percent respectively. The second most employed sector is tradesector, for both poor and non-poor, with a higher percentage is shown for non-poor people (20 percentcompare to nearly 13 percent). Dividing the data into urban-rural, nearly three forth of the poor living inrural area work in agriculture sector. On the other hand, about 28 percent of the poor in urban area workin agriculture and 24 percent work in trade sector.
PPPPPoverty Profile of Yoverty Profile of Yoverty Profile of Yoverty Profile of Yoverty Profile of Young Poung Poung Poung Poung Peopleeopleeopleeopleeople
The following section will focus on the description of poor young people at the age of 15 to 24 yearold. As can be seen from Figure 2.1, the number of poor young people has increased from 1996 to 1999.As overall number of people living under the poverty line increased in 1999, the number of youngpeople living under the line has also increased. Even though during the period level of unemployment ofyoung people increased (as in Figure 1.13 and 1.14), their average monthly income (with average monthlyexpenditure as a proxy) was still below the minimum average monthly income (which is represented by
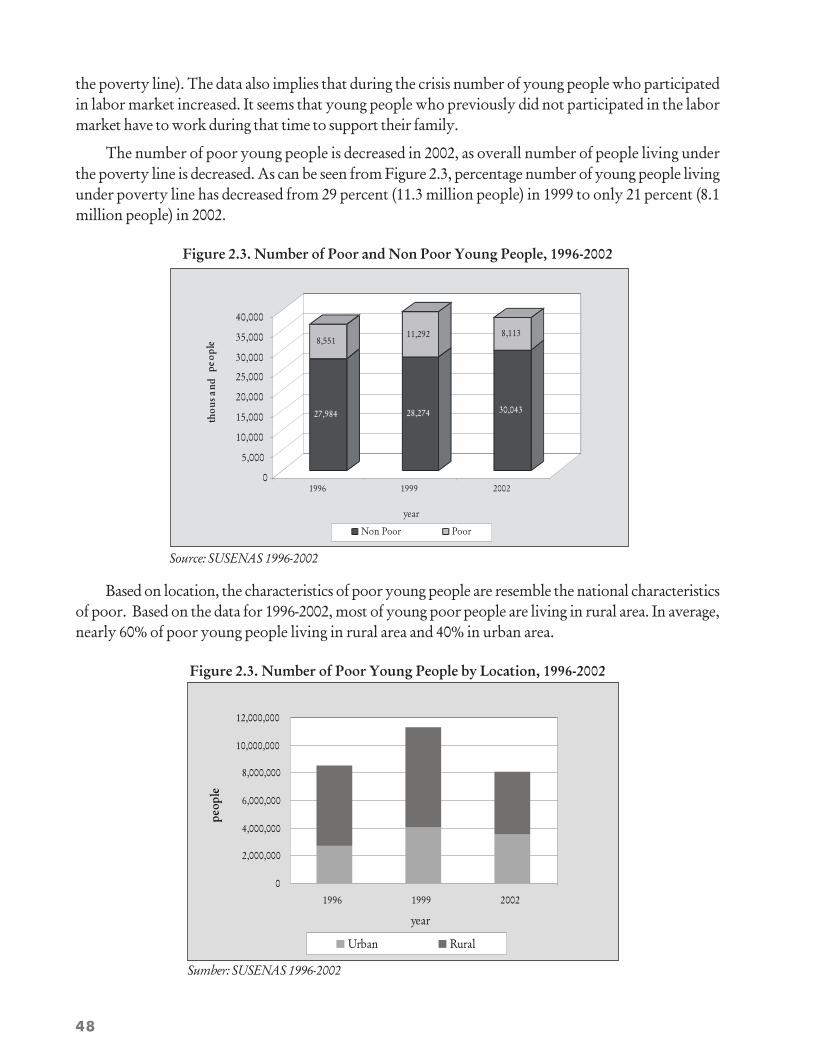
48
the poverty line). The data also implies that during the crisis number of young people who participatedin labor market increased. It seems that young people who previously did not participated in the labormarket have to work during that time to support their family.
The number of poor young people is decreased in 2002, as overall number of people living underthe poverty line is decreased. As can be seen from Figure 2.3, percentage number of young people livingunder poverty line has decreased from 29 percent (11.3 million people) in 1999 to only 21 percent (8.1million people) in 2002.
Figure 2.3. Number of Poor and Non Poor Young People, 1996-2002
Based on location, the characteristics of poor young people are resemble the national characteristicsof poor. Based on the data for 1996-2002, most of young poor people are living in rural area. In average,nearly 60% of poor young people living in rural area and 40% in urban area.
Figure 2.3. Number of Poor Young People by Location, 1996-2002
27,984
8,551
28,274
11,292
30,043
8,113
0
5,000
10,000
15,000
20,000
25,000
30,000
35,000
40,000
thou
sand
peop
le
1996 1999 2002
year
Non Poor Poor
Source: SUSENAS 1996-2002
0
2,000,000
4,000,000
6,000,000
8,000,000
10,000,000
12,000,000
1996 1999 2002
year
peop
le
Urban Rural
Sumber: SUSENAS 1996-2002
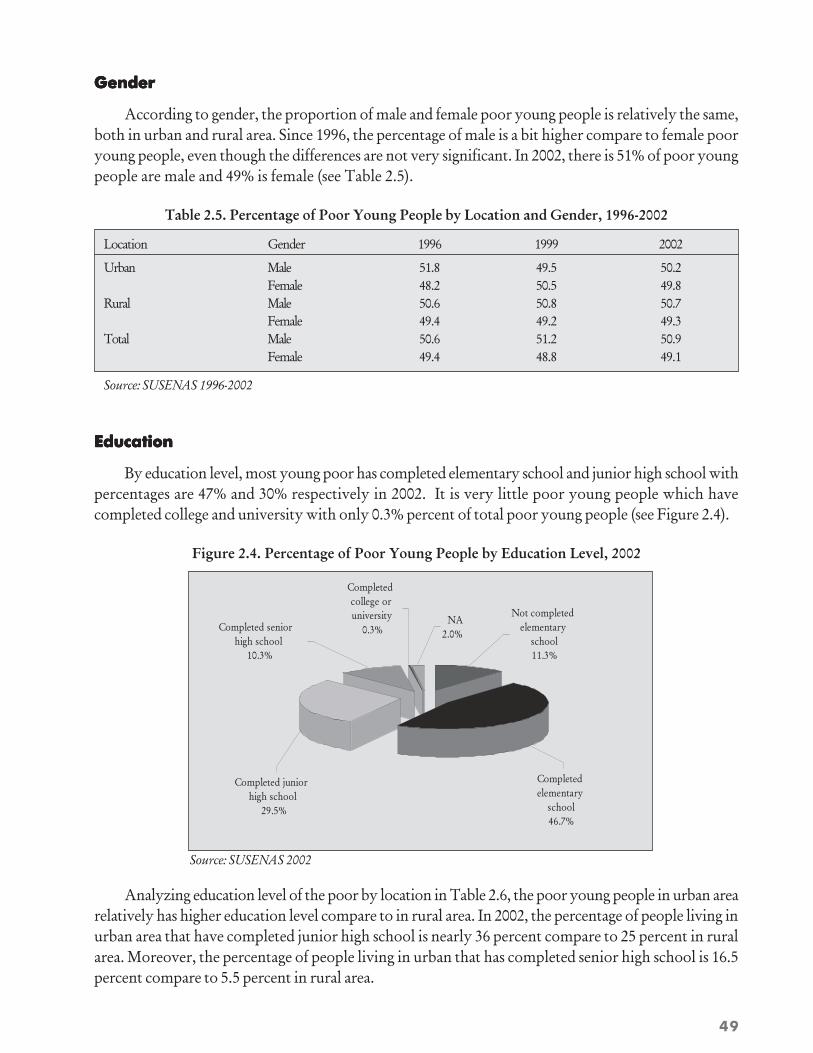
49
GenderGenderGenderGenderGender
According to gender, the proportion of male and female poor young people is relatively the same,both in urban and rural area. Since 1996, the percentage of male is a bit higher compare to female pooryoung people, even though the differences are not very significant. In 2002, there is 51% of poor youngpeople are male and 49% is female (see Table 2.5).
Table 2.5. Percentage of Poor Young People by Location and Gender, 1996-2002
Location Gender 1996 1999 2002
Urban Male 51.8 49.5 50.2 Female 48.2 50.5 49.8Rural Male 50.6 50.8 50.7 Female 49.4 49.2 49.3Total Male 50.6 51.2 50.9 Female 49.4 48.8 49.1
Source: SUSENAS 1996-2002
EducationEducationEducationEducationEducation
By education level, most young poor has completed elementary school and junior high school withpercentages are 47% and 30% respectively in 2002. It is very little poor young people which havecompleted college and university with only 0.3% percent of total poor young people (see Figure 2.4).
Figure 2.4. Percentage of Poor Young People by Education Level, 2002
Completed elementary
school46.7%
Not completed elementary
school11.3%
NA2.0%
Completed senior high school
10.3%
Completed college or university
0.3%
Completed junior high school
29.5%
Source: SUSENAS 2002
Analyzing education level of the poor by location in Table 2.6, the poor young people in urban arearelatively has higher education level compare to in rural area. In 2002, the percentage of people living inurban area that have completed junior high school is nearly 36 percent compare to 25 percent in ruralarea. Moreover, the percentage of people living in urban that has completed senior high school is 16.5percent compare to 5.5 percent in rural area.
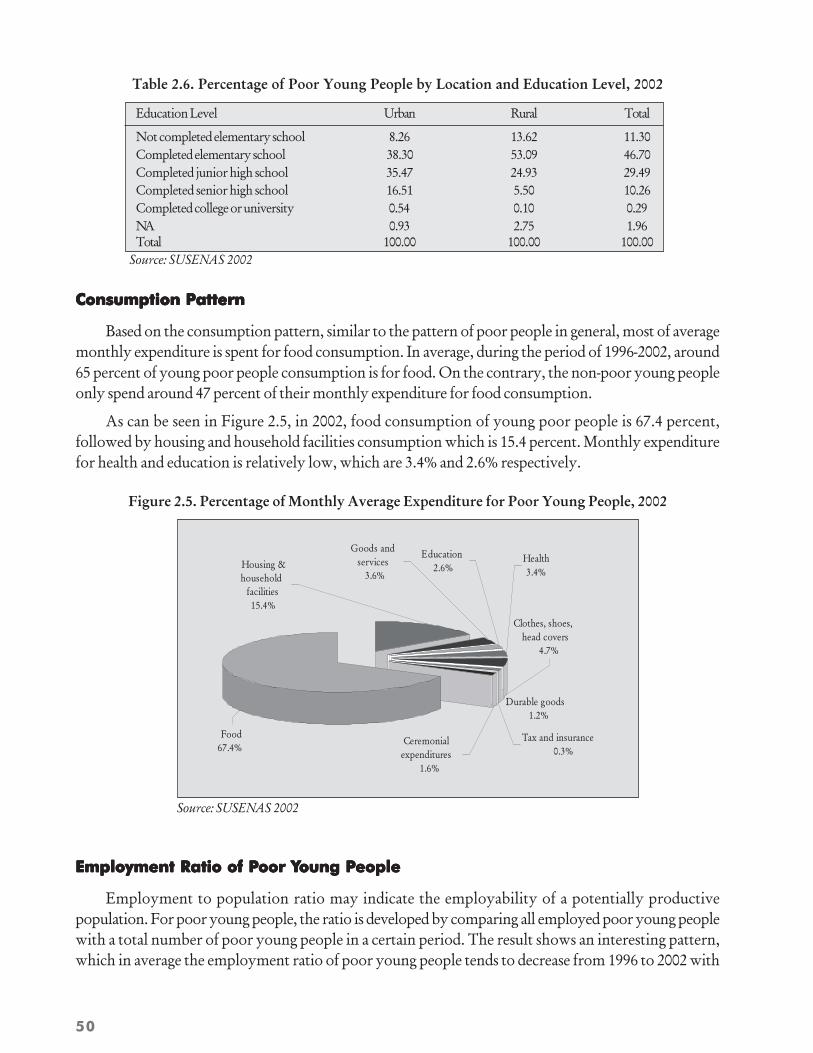
50
Table 2.6. Percentage of Poor Young People by Location and Education Level, 2002
Education Level Urban Rural Total
Not completed elementary school 8.26 13.62 11.30Completed elementary school 38.30 53.09 46.70Completed junior high school 35.47 24.93 29.49Completed senior high school 16.51 5.50 10.26Completed college or university 0.54 0.10 0.29NA 0.93 2.75 1.96Total 100.00 100.00 100.00
Source: SUSENAS 2002
Consumption PatternConsumption PatternConsumption PatternConsumption PatternConsumption Pattern
Based on the consumption pattern, similar to the pattern of poor people in general, most of averagemonthly expenditure is spent for food consumption. In average, during the period of 1996-2002, around65 percent of young poor people consumption is for food. On the contrary, the non-poor young peopleonly spend around 47 percent of their monthly expenditure for food consumption.
As can be seen in Figure 2.5, in 2002, food consumption of young poor people is 67.4 percent,followed by housing and household facilities consumption which is 15.4 percent. Monthly expenditurefor health and education is relatively low, which are 3.4% and 2.6% respectively.
Figure 2.5. Percentage of Monthly Average Expenditure for Poor Young People, 2002
Employment Ratio of PEmployment Ratio of PEmployment Ratio of PEmployment Ratio of PEmployment Ratio of Poor Yoor Yoor Yoor Yoor Young Poung Poung Poung Poung Peopleeopleeopleeopleeople
Employment to population ratio may indicate the employability of a potentially productivepopulation. For poor young people, the ratio is developed by comparing all employed poor young peoplewith a total number of poor young people in a certain period. The result shows an interesting pattern,which in average the employment ratio of poor young people tends to decrease from 1996 to 2002 with
Durable goods1.2%
Food67.4%
Tax and insurance0.3%
Ceremonial expenditures
1.6%
Clothes, shoes, head covers
4.7%
Education2.6%
Health3.4%
Goods and services
3.6%Housing & household
facilities15.4%
Source: SUSENAS 2002
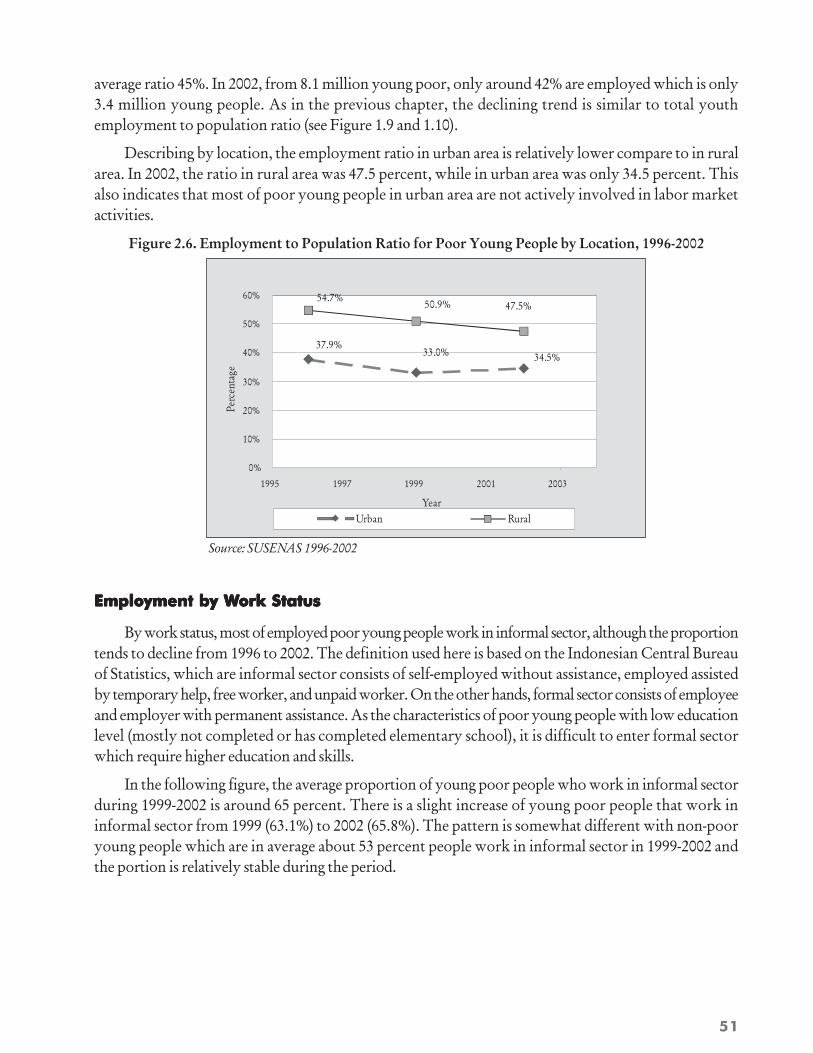
51
average ratio 45%. In 2002, from 8.1 million young poor, only around 42% are employed which is only3.4 million young people. As in the previous chapter, the declining trend is similar to total youthemployment to population ratio (see Figure 1.9 and 1.10).
Describing by location, the employment ratio in urban area is relatively lower compare to in ruralarea. In 2002, the ratio in rural area was 47.5 percent, while in urban area was only 34.5 percent. Thisalso indicates that most of poor young people in urban area are not actively involved in labor marketactivities.
Figure 2.6. Employment to Population Ratio for Poor Young People by Location, 1996-2002
Employment by WEmployment by WEmployment by WEmployment by WEmployment by Work Statusork Statusork Statusork Statusork Status
By work status, most of employed poor young people work in informal sector, although the proportiontends to decline from 1996 to 2002. The definition used here is based on the Indonesian Central Bureauof Statistics, which are informal sector consists of self-employed without assistance, employed assistedby temporary help, free worker, and unpaid worker. On the other hands, formal sector consists of employeeand employer with permanent assistance. As the characteristics of poor young people with low educationlevel (mostly not completed or has completed elementary school), it is difficult to enter formal sectorwhich require higher education and skills.
In the following figure, the average proportion of young poor people who work in informal sectorduring 1999-2002 is around 65 percent. There is a slight increase of young poor people that work ininformal sector from 1999 (63.1%) to 2002 (65.8%). The pattern is somewhat different with non-pooryoung people which are in average about 53 percent people work in informal sector in 1999-2002 andthe portion is relatively stable during the period.
Source: SUSENAS 1996-2002
34.5%37.9%
33.0%
47.5%54.7% 50.9%
0%
10%
20%
30%
40%
50%
60%
1995 1997 1999 2001 2003
Year
Perc
enta
ge
Urban Rural

52
Figure 2.7. Percentage of Poor Young People by Work Status, 1999-2002
If we look into more details, in 2002, most poor young people work as employee and unpaid worker,with percentage 33.4 percent and 39.23% to total young poor respectively (Table 2.7). Comparing theprofile of poor people in general, this proportion shows the similar pattern. According to location, pooryoung people who work as employees in urban area comprise 58% of total working poor young people.On the other hands, in rural area, 52.3% of total working poor young people work as unpaid workers.The data shows an indication that in rural area which is dominated by agricultural sector, most of youngpeople living under the poverty line work as unpaid workers.
Table 2.7. Percentage of Poor Young People by Work Status and Location, 2002
Work Status Urban Rural Total
Self Employed without assistance 13.27 9.61 10.91Self Employed with temporary assistance 2.40 6.35 4.94Self Employed with permanent assistance 1.23 0.68 0.87Employee 58.02 19.76 33.38Free worker in agriculture 3.79 8.73 6.97Free worker in non agriculture 5.79 2.57 3.72Unpaid worker 15.51 52.30 39.21Total 100.00 100.00 100.00
Source: SAKERNAS & SUSENAS 2002
Employment by Field of WEmployment by Field of WEmployment by Field of WEmployment by Field of WEmployment by Field of Workorkorkorkork
As majority of youth employment work in the field of agriculture, the working poor young peopleshow a similar pattern. More than 50 percent of employed poor young people are working in agriculturefrom 1996 to 2002. The next largest sectors where most poor young people engaged are industry andtrade with average percentage around 16 percent and 11 percent respectively for the period 1996-2002(Table 2.8).
Source: SUSENAS 1996-2002

53
Table 2.8. Percentage of Poor Young People by Field of Work, 1996-2002
Field of Work Non Poor Poor1996 1999 2002 1996 1999 2002
Agriculture 38.00 38.23 37.67 58.14 56.80 54.81Mining 0.92 0.83 1.05 0.91 0.84 0.77Industry 19.02 18.53 21.64 15.72 15.98 16.69Utilities 0.40 0.27 0.13 0.24 0.08 0.05Construction 5.28 3.83 4.08 5.54 4.09 5.50Trade 16.20 19.96 18.31 9.12 11.81 12.71Transportation 4.18 4.71 5.17 2.58 3.45 3.84Finance 0.73 0.77 1.25 0.17 0.29 0.32Other services 15.27 12.88 10.69 7.59 6.66 5.31Total 100.00 100.00 100.00 100.00 100.00 100.00
Source: SAKERNAS & SUSENAS 1996-2002
Looking closer to the 2002 data, most of poor young people in urban area are working in industryand trade, followed by agriculture sector. On the other hand, in rural area 74 of poor young people areworking in agriculture. Again, the profile here is similar to the overall poverty profile as describe in theprevious section.
Tabel 2.9. Persentase Orang Muda Miskin menurut Bidang Pekerjaan dan Tempat, 2002
Field of Work Urban Rural Total
Agriculture 19.98 74.00 54.81Mining 0.91 0.69 0.77Industry 29.45 9.65 16.69Utilities 0.08 0.04 0.05Construction 9.36 3.37 5.50Trade 24.19 6.39 12.71Transportation 6.50 2.38 3.84Finance 0.74 0.08 0.32Other services 8.79 3.40 5.31Total 100.00 100.00 100.00
Source: SAKERNAS & SUSENAS 2002
ConclusionConclusionConclusionConclusionConclusion
The data shows that the number of poor young people has increased significantly from 1996 to1999 as the overall number of poor people increased during the period. However, in 2002 number ofpoor decreased and so as number of poor young people. The percentage number of young people livingunder poverty line has decreased from 29 percent in 1999 to only 21 percent in 2002.
The profile of poor young people is parallel to the profile of poor people in general. Most of pooryoung people are living in rural area, have a low education level (which is mostly no more than elementaryschool), and spend majority of their monthly expenditure of consumption.
54
From employment point of view, the employment ratio of poor young people tends to decreasefrom 1996 to 2002. In 2002, from 8.1 million young poor, only around 42 are employed which is only 3.4million young people. The employment ratio in urban area is relatively lower compare to in rural area.This indicates that most of poor young people in urban area are not actively involved in labor marketactivities.
Most of employed poor young people work in informal sector, although the proportion tends todecline from 1996 to 2002. As the characteristics of poor young people with low education level, it isdifficult to enter formal sector which require higher education and skills. More than 50 percent of employedpoor young people are working in agriculture from 1996 to 2002. The next largest sectors where mostpoor young people engaged are industry and trade with average percentage around 16 percent and 11percent respectively for the period 1996-2002.
55
IntroductionIntroductionIntroductionIntroductionIntroduction
Entrepreneurship is one option for young people to participate in labor market and to make a living.In Indonesia, the portion of youth employment works in informal sector is relatively high, which is inaverage nearly 65% during the period of 1990-2002. Moreover, nearly 20 percent of youth employmentswork as self-employers, which consist of self-employers without assistances, self-employers with temporaryassistances, and self-employers with permanent assistances. In addition, empirical evidence suggeststhat most less educated youth work in informal sector as entrepreneurs since they do not have adequateeducation level to enter formal works.7 The figures indicate that being entrepreneurs is one option foryoung people to have a decent work.
Young people starting their own businesses are likely to experience a range of problems. Eventhough entrepreneurship does not require high level of education, it requires certain skills. Many ofthese problems apply to anyone starting a new enterprise but some problems are related to the youthfulage of the entrepreneur. Young people are likely to have limited business networks and contacts comparedwith older people. One fundamental problem is the inability to secure start-up funds leading to undercapitalization (starting a business without enough funds). Other problems commonly encountered aremanaging cash flow, especially dealing with bad debts and late payments; and coping with stress, especiallywithout the support of friends who understand the demands of self-employment. Once under way,problems can arise with managing the expansion of the business such as working out how to employ theright staff and managing other people for the first time.
As entrepreneurship can be one option to alleviate unemployment for young people, it is encouragedthat governments, the private sector, non-government agencies and local communities can, each in theirown way, promote efforts to support young people starting up enterprises.
This chapter will estimate the size of young people working as self-employer or in micro enterprises;the profile of youth entrepreneurs; the type of business activities they undertake, and the main challengesyoung people face to start and expand their business. The database used is the SAKERNAS from theCentral Bureau of Statistics (BPS) for time period of 1997-2002.
Profile Of YProfile Of YProfile Of YProfile Of YProfile Of Youth Entrepreneurshipouth Entrepreneurshipouth Entrepreneurshipouth Entrepreneurshipouth Entrepreneurship
The size of entrepreneur can be estimated from the number of employment by work status. In thisanalysis, the definition of entrepreneur is people who are self-employed without assistance, self-employed
Chapter 3
Youth Entrepreneurship
7 Gyorgy Sziraczki and Annemarie Reerink, “School-to-work Transition in Indonesia, ILO, 2003.
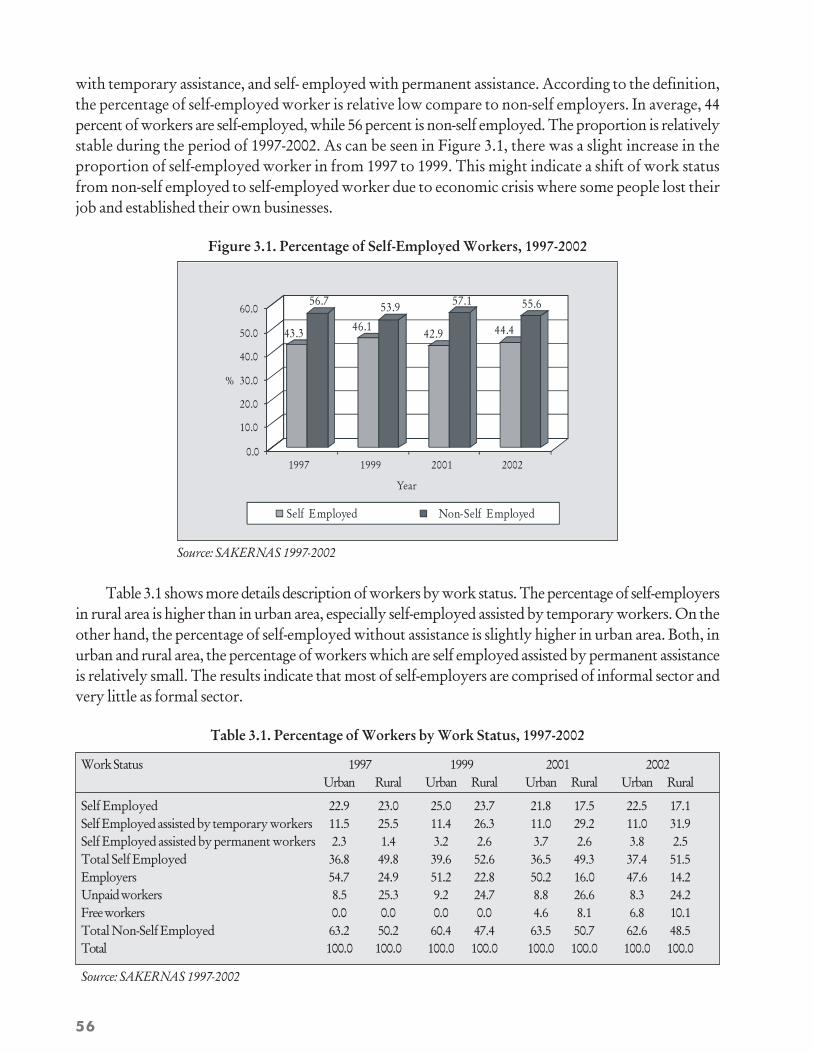
56
with temporary assistance, and self- employed with permanent assistance. According to the definition,the percentage of self-employed worker is relative low compare to non-self employers. In average, 44percent of workers are self-employed, while 56 percent is non-self employed. The proportion is relativelystable during the period of 1997-2002. As can be seen in Figure 3.1, there was a slight increase in theproportion of self-employed worker in from 1997 to 1999. This might indicate a shift of work statusfrom non-self employed to self-employed worker due to economic crisis where some people lost theirjob and established their own businesses.
Figure 3.1. Percentage of Self-Employed Workers, 1997-2002
Table 3.1 shows more details description of workers by work status. The percentage of self-employersin rural area is higher than in urban area, especially self-employed assisted by temporary workers. On theother hand, the percentage of self-employed without assistance is slightly higher in urban area. Both, inurban and rural area, the percentage of workers which are self employed assisted by permanent assistanceis relatively small. The results indicate that most of self-employers are comprised of informal sector andvery little as formal sector.
Table 3.1. Percentage of Workers by Work Status, 1997-2002
Work Status 1997 1999 2001 2002Urban Rural Urban Rural Urban Rural Urban Rural
Self Employed 22.9 23.0 25.0 23.7 21.8 17.5 22.5 17.1Self Employed assisted by temporary workers 11.5 25.5 11.4 26.3 11.0 29.2 11.0 31.9Self Employed assisted by permanent workers 2.3 1.4 3.2 2.6 3.7 2.6 3.8 2.5Total Self Employed 36.8 49.8 39.6 52.6 36.5 49.3 37.4 51.5Employers 54.7 24.9 51.2 22.8 50.2 16.0 47.6 14.2Unpaid workers 8.5 25.3 9.2 24.7 8.8 26.6 8.3 24.2Free workers 0.0 0.0 0.0 0.0 4.6 8.1 6.8 10.1Total Non-Self Employed 63.2 50.2 60.4 47.4 63.5 50.7 62.6 48.5Total 100.0 100.0 100.0 100.0 100.0 100.0 100.0 100.0
Source: SAKERNAS 1997-2002
43.3
56.7
46.1
53.9
42.9
57.1
44.4
55.6
0.0
10.0
20.0
30.0
40.0
50.0
60.0
%
1997 1999 2001 2002
Year
Self Employed Non-Self Employed
Source: SAKERNAS 1997-2002
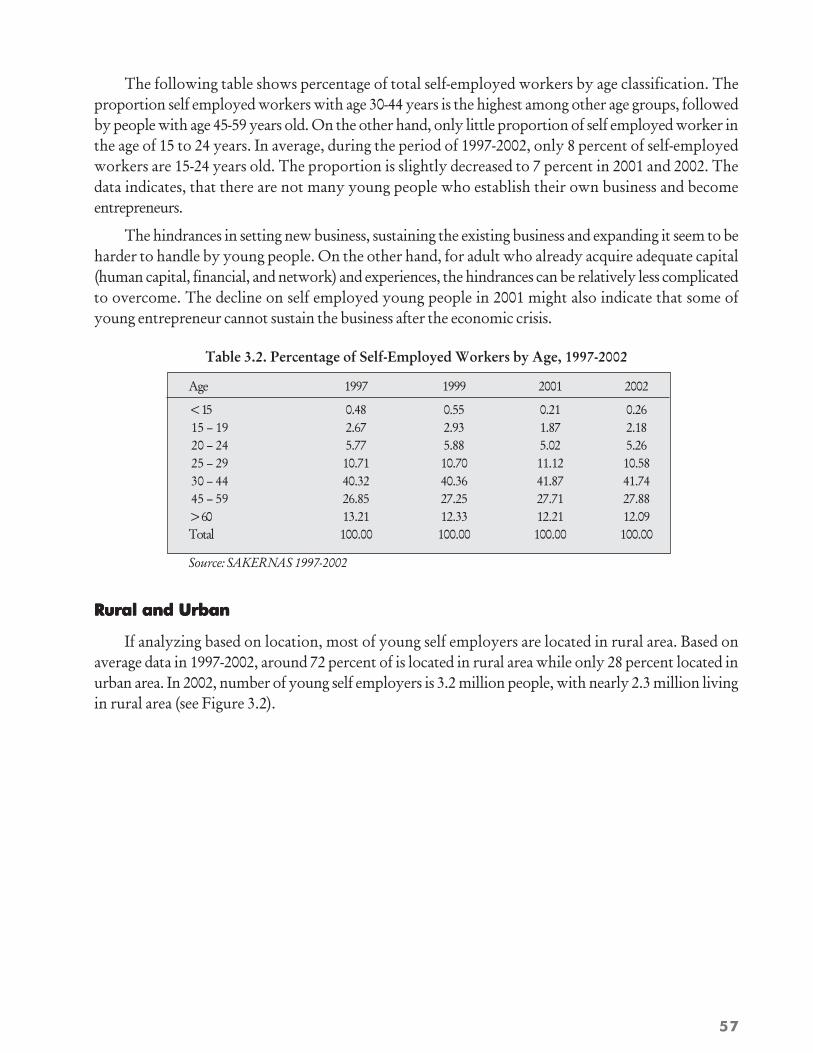
57
The following table shows percentage of total self-employed workers by age classification. Theproportion self employed workers with age 30-44 years is the highest among other age groups, followedby people with age 45-59 years old. On the other hand, only little proportion of self employed worker inthe age of 15 to 24 years. In average, during the period of 1997-2002, only 8 percent of self-employedworkers are 15-24 years old. The proportion is slightly decreased to 7 percent in 2001 and 2002. Thedata indicates, that there are not many young people who establish their own business and becomeentrepreneurs.
The hindrances in setting new business, sustaining the existing business and expanding it seem to beharder to handle by young people. On the other hand, for adult who already acquire adequate capital(human capital, financial, and network) and experiences, the hindrances can be relatively less complicatedto overcome. The decline on self employed young people in 2001 might also indicate that some ofyoung entrepreneur cannot sustain the business after the economic crisis.
Table 3.2. Percentage of Self-Employed Workers by Age, 1997-2002
Age 1997 1999 2001 2002
< 15 0.48 0.55 0.21 0.26 15 – 19 2.67 2.93 1.87 2.18 20 – 24 5.77 5.88 5.02 5.26 25 – 29 10.71 10.70 11.12 10.58 30 – 44 40.32 40.36 41.87 41.74 45 – 59 26.85 27.25 27.71 27.88> 60 13.21 12.33 12.21 12.09Total 100.00 100.00 100.00 100.00
Source: SAKERNAS 1997-2002
Rural and UrbanRural and UrbanRural and UrbanRural and UrbanRural and Urban
If analyzing based on location, most of young self employers are located in rural area. Based onaverage data in 1997-2002, around 72 percent of is located in rural area while only 28 percent located inurban area. In 2002, number of young self employers is 3.2 million people, with nearly 2.3 million livingin rural area (see Figure 3.2).
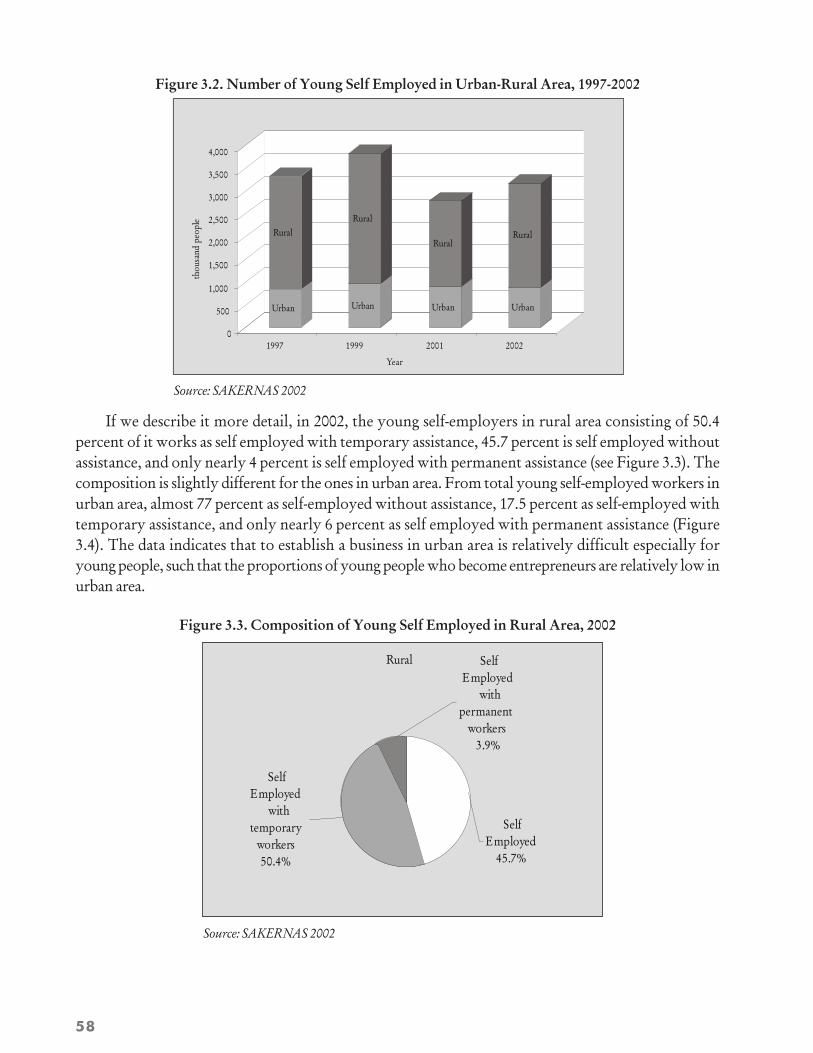
58
Rural Self
Employed with
permanent workers
3.9%
Self Employed
45.7%
Self Employed
withtemporary
workers50.4%
Figure 3.2. Number of Young Self Employed in Urban-Rural Area, 1997-2002
Source: SAKERNAS 2002
If we describe it more detail, in 2002, the young self-employers in rural area consisting of 50.4percent of it works as self employed with temporary assistance, 45.7 percent is self employed withoutassistance, and only nearly 4 percent is self employed with permanent assistance (see Figure 3.3). Thecomposition is slightly different for the ones in urban area. From total young self-employed workers inurban area, almost 77 percent as self-employed without assistance, 17.5 percent as self-employed withtemporary assistance, and only nearly 6 percent as self employed with permanent assistance (Figure3.4). The data indicates that to establish a business in urban area is relatively difficult especially foryoung people, such that the proportions of young people who become entrepreneurs are relatively low inurban area.
Figure 3.3. Composition of Young Self Employed in Rural Area, 2002
Source: SAKERNAS 2002
Urban
Rural
Urban
Rural
Urban
Rural
Urban
Rural
0
500
1,000
1,500
2,000
2,500
3,000
3,500
4,000
thou
sand
peo
ple
1997 1999 2001 2002
Year

59
Figure 3.4. Composition of Young Self Employed in Urban Area, 2002
Source: SAKERNAS 2002
In line with the national picture, there is very little percentage of self-employers which categorizedas self employed with permanent assistance. In order to establish business in formal sector, which is selfemployed with permanent assistance is not preferable, both in urban and rural area. There are somepossible explanations for this, among others is the cost of constructing and doing business in formalsector is relatively higher compare to informal sector. By hiring permanent workers, the business islegally obliged ed by many government regulations and requirements, such as wages and other fringebenefits for workers, taxes and other levies. Hence, the entrepreneurs must have adequate financialcapital to establish a formal business. These are hard requirements, not only for young entrepreneurs butalso for adult ones. Moreover, self-employed with permanent assistances as a formal sector job usuallyrequires higher qualification on formal education.
Interestingly, there is a significant difference between the proportion of young people as self-employedwithout assistance and as self-employed with temporary assistance in rural and urban area. Most ofyoung self-employers in rural area hire temporary assistances, while in urban area most of them workswithout assistances. In rural area, where the majority of people working in agriculture sector and manyof them living nearby to their family and relatives, the self-employers can utilize unpaid family workersto assist the business which presumably related to agriculture. On the other hand, in urban area wheremost people work in industry and trade sector, to hire temporary assistance is more expensive anddifficult, especially for those who do not have closed relations or networks. Hence, the proportion ofyoung self-employers in urban area is relatively higher.
GenderGenderGenderGenderGender
According to gender classification, during the period 1997-2002, the proportion of young malepeople who become self-employers is significantly higher compare to young female who become self-employers. In average, there are 70 percent of self-employers are male. As describe in Chapter 1, eventhe male youth continue to dominate the youth labor force, the gap between male and female youth
Urban
Self Employed
76.7%
Self Employed
withtemporary workers17.5%
Self Employed
with permanent
workers5.8%
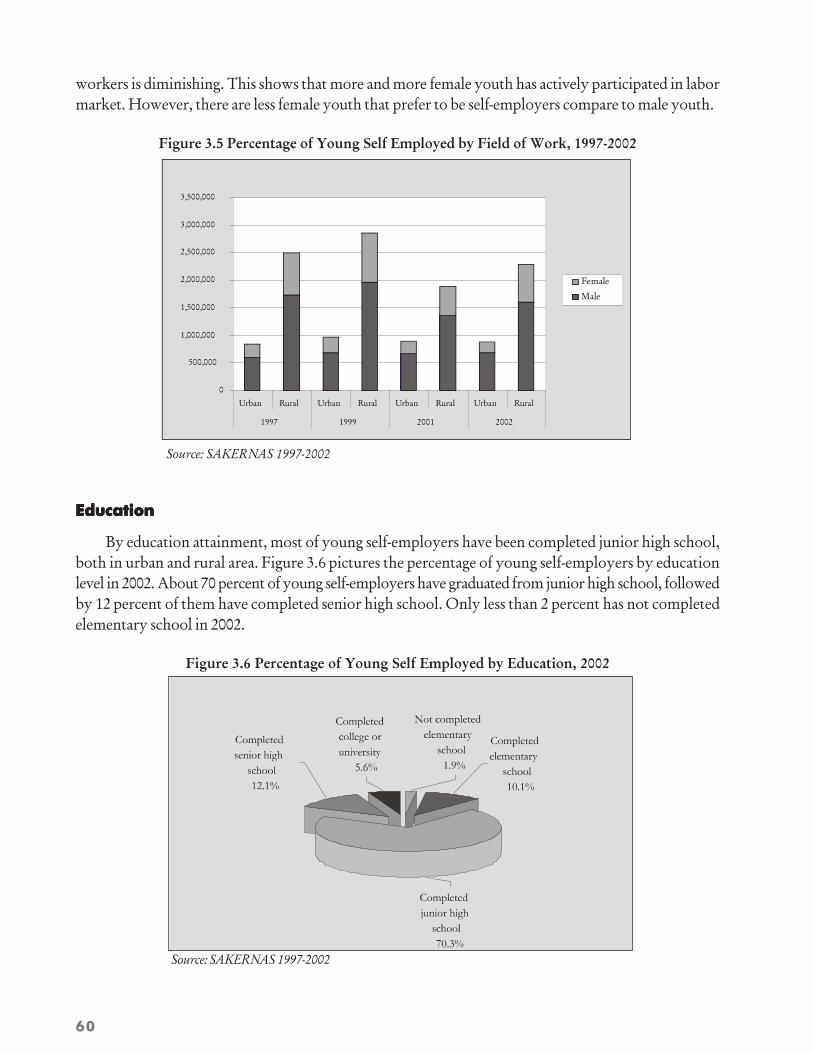
60
workers is diminishing. This shows that more and more female youth has actively participated in labormarket. However, there are less female youth that prefer to be self-employers compare to male youth.
Figure 3.5 Percentage of Young Self Employed by Field of Work, 1997-2002
Source: SAKERNAS 1997-2002
EducationEducationEducationEducationEducation
By education attainment, most of young self-employers have been completed junior high school,both in urban and rural area. Figure 3.6 pictures the percentage of young self-employers by educationlevel in 2002. About 70 percent of young self-employers have graduated from junior high school, followedby 12 percent of them have completed senior high school. Only less than 2 percent has not completedelementary school in 2002.
Figure 3.6 Percentage of Young Self Employed by Education, 2002
Source: SAKERNAS 1997-2002
0
500,000
1,000,000
1,500,000
2,000,000
2,500,000
3,000,000
3,500,000
Urban Rural Urban Rural Urban Rural Urban Rural
1997 1999 2001 2002
Female
Male
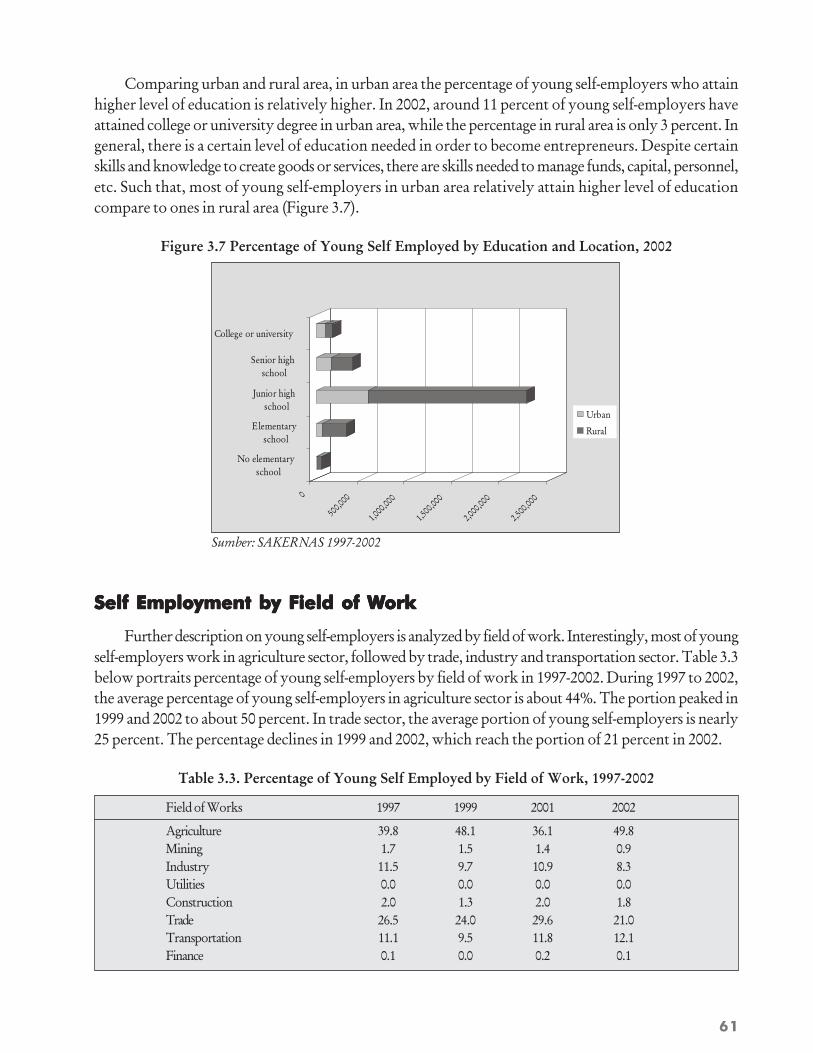
61
Comparing urban and rural area, in urban area the percentage of young self-employers who attainhigher level of education is relatively higher. In 2002, around 11 percent of young self-employers haveattained college or university degree in urban area, while the percentage in rural area is only 3 percent. Ingeneral, there is a certain level of education needed in order to become entrepreneurs. Despite certainskills and knowledge to create goods or services, there are skills needed to manage funds, capital, personnel,etc. Such that, most of young self-employers in urban area relatively attain higher level of educationcompare to ones in rural area (Figure 3.7).
Figure 3.7 Percentage of Young Self Employed by Education and Location, 2002
Sumber: SAKERNAS 1997-2002
Self Employment by Field of WSelf Employment by Field of WSelf Employment by Field of WSelf Employment by Field of WSelf Employment by Field of Workorkorkorkork
Further description on young self-employers is analyzed by field of work. Interestingly, most of youngself-employers work in agriculture sector, followed by trade, industry and transportation sector. Table 3.3below portraits percentage of young self-employers by field of work in 1997-2002. During 1997 to 2002,the average percentage of young self-employers in agriculture sector is about 44%. The portion peaked in1999 and 2002 to about 50 percent. In trade sector, the average portion of young self-employers is nearly25 percent. The percentage declines in 1999 and 2002, which reach the portion of 21 percent in 2002.
Table 3.3. Percentage of Young Self Employed by Field of Work, 1997-2002
Field of Works 1997 1999 2001 2002
Agriculture 39.8 48.1 36.1 49.8Mining 1.7 1.5 1.4 0.9Industry 11.5 9.7 10.9 8.3Utilities 0.0 0.0 0.0 0.0Construction 2.0 1.3 2.0 1.8Trade 26.5 24.0 29.6 21.0Transportation 11.1 9.5 11.8 12.1Finance 0.1 0.0 0.2 0.1
0
500,0
00
1,000
,000
1,500
,000
2,000
,000
2,500
,000
No elementary school
Elementary school
Junior high school
Senior high school
College or university
Urban
Rural

62
Other services 7.3 5.8 8.0 5.9Total 100.0 100.0 100.0 100.0
Source: SAKERNAS 1997-2002
Comparing between urban and rural area, there are significant different of youth self-employersaccording the field of work. In urban area, majority of youth self-employers is in trade sector, whileagriculture sector dominated youth self-employers in rural area. As can be seen from Figure 3.6 below, in2002, in urban area there is 41 percent of youth self-employers in trade sector and 21 percent intransportation sector. On the other hand, in rural area, there is 64 percent of youth self-employers inagriculture sector, and only 13 percent in trade sector.
Figure 3.8. Percentage of Young Self-Employer by Field of Work and Location, 2002
Source: SAKERNAS 1997-2002
Challenges of YChallenges of YChallenges of YChallenges of YChallenges of Youth Entrepreunershipouth Entrepreunershipouth Entrepreunershipouth Entrepreunershipouth Entrepreunership
Entering the labor market for the first time is usually a difficult stage in most people lives. Based onqualitative discussion presented in the previous ILO report (2002), there are employment barriers,hindrances and constraints that experienced by Indonesian young people in entering labor market. Theseranged from limited job opportunities, aggressive competition, and the influences of collusion, corruptionand nepotism.
On the other hand, finding decent jobs, especially in formal sector, is not an easy option for youngpeople, especially for those with low education level. Main obstacles in finding decent jobs experiencedby young people are inadequate education/skills, no work experiences, and not enough jobs available.Most of young people get information about jobs from informal networks, advertisements, privateemployment agents, and public employment services.
As in the ILO report (2003),8 young people were asked how they had looked for jobs before findingtheir first employment. The most frequently mentioned method was the use of informal networks (friends
0%
10%
20%
30%
40%
50%
60%
70%
Urban Rural
Agriculture
Mining
Industry
Utilities
Construction
Trade
Transport
Finance
Other services
8 Gyorgy Sziraczki and Annemarie Reerink, « School-to-Work Transition in Indonesia », ILO Report, edited version 31th October 2003.
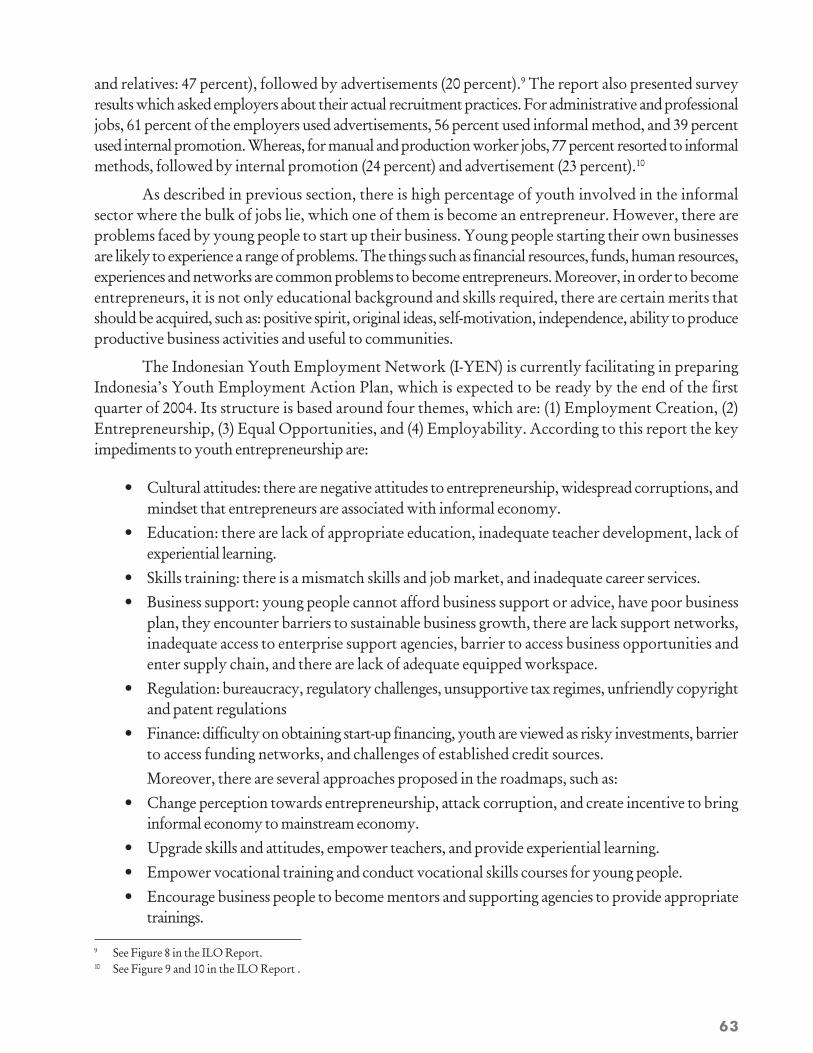
63
and relatives: 47 percent), followed by advertisements (20 percent).9 The report also presented surveyresults which asked employers about their actual recruitment practices. For administrative and professionaljobs, 61 percent of the employers used advertisements, 56 percent used informal method, and 39 percentused internal promotion. Whereas, for manual and production worker jobs, 77 percent resorted to informalmethods, followed by internal promotion (24 percent) and advertisement (23 percent).10
As described in previous section, there is high percentage of youth involved in the informalsector where the bulk of jobs lie, which one of them is become an entrepreneur. However, there areproblems faced by young people to start up their business. Young people starting their own businessesare likely to experience a range of problems. The things such as financial resources, funds, human resources,experiences and networks are common problems to become entrepreneurs. Moreover, in order to becomeentrepreneurs, it is not only educational background and skills required, there are certain merits thatshould be acquired, such as: positive spirit, original ideas, self-motivation, independence, ability to produceproductive business activities and useful to communities.
The Indonesian Youth Employment Network (I-YEN) is currently facilitating in preparingIndonesia’s Youth Employment Action Plan, which is expected to be ready by the end of the firstquarter of 2004. Its structure is based around four themes, which are: (1) Employment Creation, (2)Entrepreneurship, (3) Equal Opportunities, and (4) Employability. According to this report the keyimpediments to youth entrepreneurship are:
• Cultural attitudes: there are negative attitudes to entrepreneurship, widespread corruptions, andmindset that entrepreneurs are associated with informal economy.
• Education: there are lack of appropriate education, inadequate teacher development, lack ofexperiential learning.
• Skills training: there is a mismatch skills and job market, and inadequate career services.• Business support: young people cannot afford business support or advice, have poor business
plan, they encounter barriers to sustainable business growth, there are lack support networks,inadequate access to enterprise support agencies, barrier to access business opportunities andenter supply chain, and there are lack of adequate equipped workspace.
• Regulation: bureaucracy, regulatory challenges, unsupportive tax regimes, unfriendly copyrightand patent regulations
• Finance: difficulty on obtaining start-up financing, youth are viewed as risky investments, barrierto access funding networks, and challenges of established credit sources.Moreover, there are several approaches proposed in the roadmaps, such as:
• Change perception towards entrepreneurship, attack corruption, and create incentive to bringinformal economy to mainstream economy.
• Upgrade skills and attitudes, empower teachers, and provide experiential learning.• Empower vocational training and conduct vocational skills courses for young people.• Encourage business people to become mentors and supporting agencies to provide appropriate
trainings.
9 See Figure 8 in the ILO Report.10 See Figure 9 and 10 in the ILO Report .
64
• Ease the regulatory environment and bureaucracy for business sector, especially for youngentrepreneurs.
• And, the most important is to enlarge access of funds for young new entrepreneurs.
According to ILO (2003)11 , young people needs a better labor market information and targetedtraining program. The vast majority of self-employed would like to receive entrepreneurial training andcapital to turn their business into viable ventures, which grow and create value and jobs. Greater socialand economic encouragements to build a culture of entrepreneurship and prompt assistance for youngpeople who show a strong intention to become entrepreneurs are also required in order to create financiallyviable small enterprises that can potentially employ additional young workers.
There are several policies implemented by the Ministry of Manpower in order to developentrepreneurship. One of these policies is called Tenaga Kerja Mandiri Professional (TKPMP), whichmeans a Young Professional Entrepreneur Development (YPED) – Supriadi (2000). This policyimplemented as business creation programs by motivating the people who have commitment. The potentialtarget of the program are young educated people who have talent, spirit of entrepreneurship andcommitment to be entrepreneur; young people with family business background or has a business facilitiesand own potential to create a business; and drop out of school and village community who are willing toimprove their life and income in rural areas.
Entrepreneurship is one way to alleviate unemployment and provide job opportunities for youngpeople. Entrepreneurship program is one alternative employment creating opportunity. The governmentcan develop several programs for different level of education, locations, with cooperation with the thirdparties. The government roles are needed to bridge the gap of potential young entrepreneurs and basicneeds for entrepreneurship, such as: (i) improving technical and entrepreneurship managerial skill foryouth work force; (ii) improving the capability to be self-reliant and self-sustained in creating anddeveloping a productive economic activity; and (iii) creating small productive business for young educatedwhich offers employment opportunity for others.
11 Ibid
65
daftar pustaka
Adiningsih, Neni Utama. 2001, August 25th. Media Indonesia” Anakku Sayang, Mengapa Tawuran? 11Tahun Ratifikasi Hak Anak” (My Dear Children, Why Street Fights? 11 years of Child Rights ConventionRatification). Jakarta.
Badan Kesejahteraan Sosial Nasional (National Social Welfare Board). 2000. Pedoman Dasar KarangTaruna dan Forum Komunikasi Karang Taruna (Basic Guidance for “Karang Taruna” and its CommunicationForum). Jakarta.
Badan Koordinasi Penanggulangan Kemiskinan Republik Indonesia and SMERU Research Institute.2001. Paket Informasi Dasar Penanggulangan Kemiskinan. Jakarta.
Badan Pusat Statistics (BPS) Indonesia – Indonesia Central Bureau of Statistics. Population of Indonesia:1971, 1976, 1980, 1985, 1990, 1995, 2000. Jakarta.
_______.Children and Youth Welfare Indicators 1998. Jakarta._______.Children Welfare Indicators 1994, 1999,2001. Jakarta._______.National Social Economic Survey (SUSENAS): 1996,1999, 2000, 2001,2002. Jakarta._______.National Labor Force Survey (SAKERNAS): 1996,1995, 2000, 2001, 2002. Jakarta._______.Social Welfare Indicator: 2000, 2001, 2002. Jakarta._______.Youth Statistics: 1985, 1995, 2000. Jakarta.Cartherwood, Vince. 1985. Young People, Education and Employment. New Zealand Planning Council.
Wellington.Departemen Tenaga Kerja Republik Indonesia (Ministry of Manpower Republic of Indonesia).
1995. Penelitian Penyediaan Ekspor Jasa Tenaga Kerja (Research on Labor Export Supply Service). Jakarta._______.1996. Pedoman Penyelenggaraan Pelatihan (Training Module). Jakarta._______.1999. Pedoman Pembinaan Lembaga Pelatihan Kerja Swasta (Guidance for Private Work Training
Institutions). Jakarta._______.1999. Penelitian Penelusuran Lulusan SMU dan SMK di Pasar Kerja (Tracer Research of General
and Vacation High School Graduates in the Labor Market). Jakarta._______.2000. Situasi Tenaga Kerja dan Kesempatan Kerja di Indonesia: Suatu Tinjauan yang Dilaksanakan
pada tahun 1998/1999 (Situation of Labor Force and Employment in Indonesia: An Observation Conductedin the year 1998/1999). Jakarta.
_____________________________________________. 2000. Perencanaan Tenaga Kerja Nasional(National Labor force Planning). Jakarta.
Economic and Social Committee of the European Communities. 1983. Youth Employment. Brussels.

66
European Foundation for the Improvement of Living and Working Conditions. 1990. The Path ofYoung People Towards Autonomy: Report of A Seminar. Luxemburg.
International Labor Organization (ILO). 2002. Youth Employment in Indonesia. ILO Jakarta Office._______. June 1998. ILO Programme of Action on Youth Employment, Enhancing Youth Employment: Employers
Actions (Draft Programme). Geneva._______.December 2003. I-YEN Roadmap for Youth Entrepreneurship. ILO-LPEM-FEUI. Jakarta.LPEM FEUI. 2000. Menghitung Kembali Tingkat Kemiskinan di Indonesia 1990-1999.. Unpublished
Research Report. Jakarta._______. 2001. The Indonesian Poverty Profile. Unpublished Research Report. Jakarta._______. 2002. Analisis Peringkat Pemerintah Daerah dalam Menanggulangi Kemiskinan. Unpublished
Research Report. Jakarta.SMERU Research Institute (with support from USAID/PEG). October 2001. Wage and Employment
Effects of Minimum Wage Policy in the Indonesian Urban Labor Market. Jakarta.Supriadi. 2000. Program on Employment Creation and Income Generation. The Indonesian Ministry of
Manpower. Jakarta.Sziraczki, Gyorgy and Annemarie Reerink. October 2003. School-to-Work Transition. ILO-Jakarta.

67

68