
劉怡維Yi-Wei Liu 清華大學物理系Laser spectroscopy of Lamb ...
38
The size of the Proton 劉怡維 Yi-Wei Liu 清華大學物理系 Laser spectroscopy of Lamb Shift of muonic hydrogen
-
Upload
khangminh22 -
Category
Documents
-
view
3 -
download
0
Transcript of 劉怡維Yi-Wei Liu 清華大學物理系Laser spectroscopy of Lamb ...

The size of the Proton
劉怡維Yi-Wei Liu清華大學物理系
Laser spectroscopy of Lamb Shift of muonic hydrogen
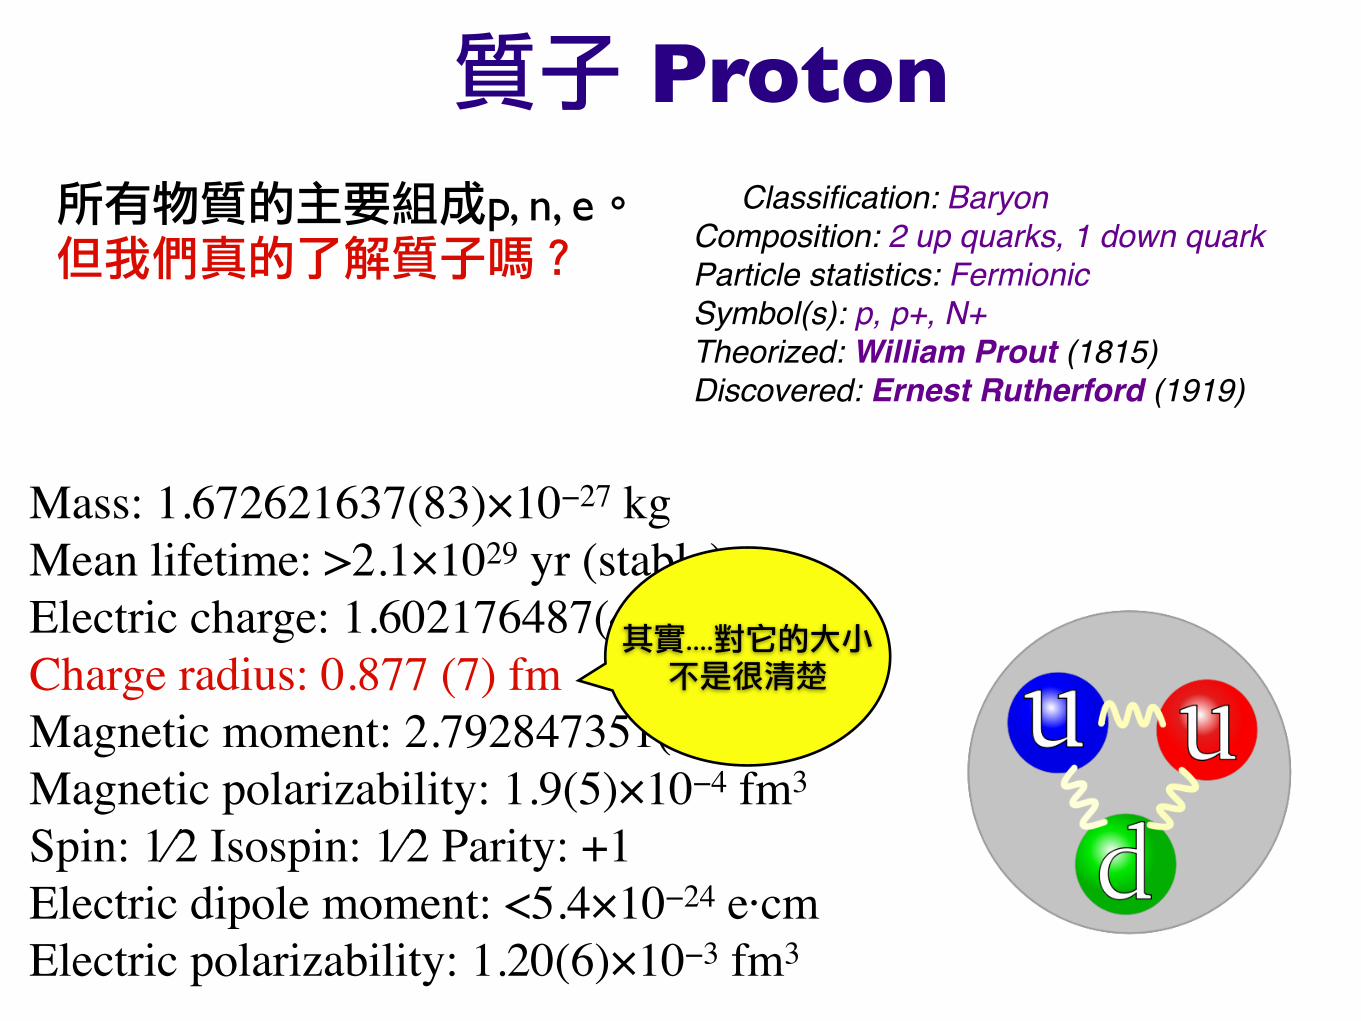
質子 Proton 所有物質的主要組成p, n, e。但我們真的了解質子嗎?
Classification: Baryon Composition: 2 up quarks, 1 down quark Particle statistics: Fermionic Symbol(s): p, p+, N+ Theorized: William Prout (1815) Discovered: Ernest Rutherford (1919)
Mass: 1.672621637(83)×10−27 kgMean lifetime: >2.1×1029 yr (stable) Electric charge: 1.602176487(40)×10−19 CCharge radius: 0.877 (7) fmMagnetic moment: 2.792847351(28) μN Magnetic polarizability: 1.9(5)×10−4 fm3 Spin: 1⁄2 Isospin: 1⁄2 Parity: +1Electric dipole moment: <5.4×10⁻²⁴ e·cm Electric polarizability: 1.20(6)×10−3 fm3
其實....對它的大小不是很清楚
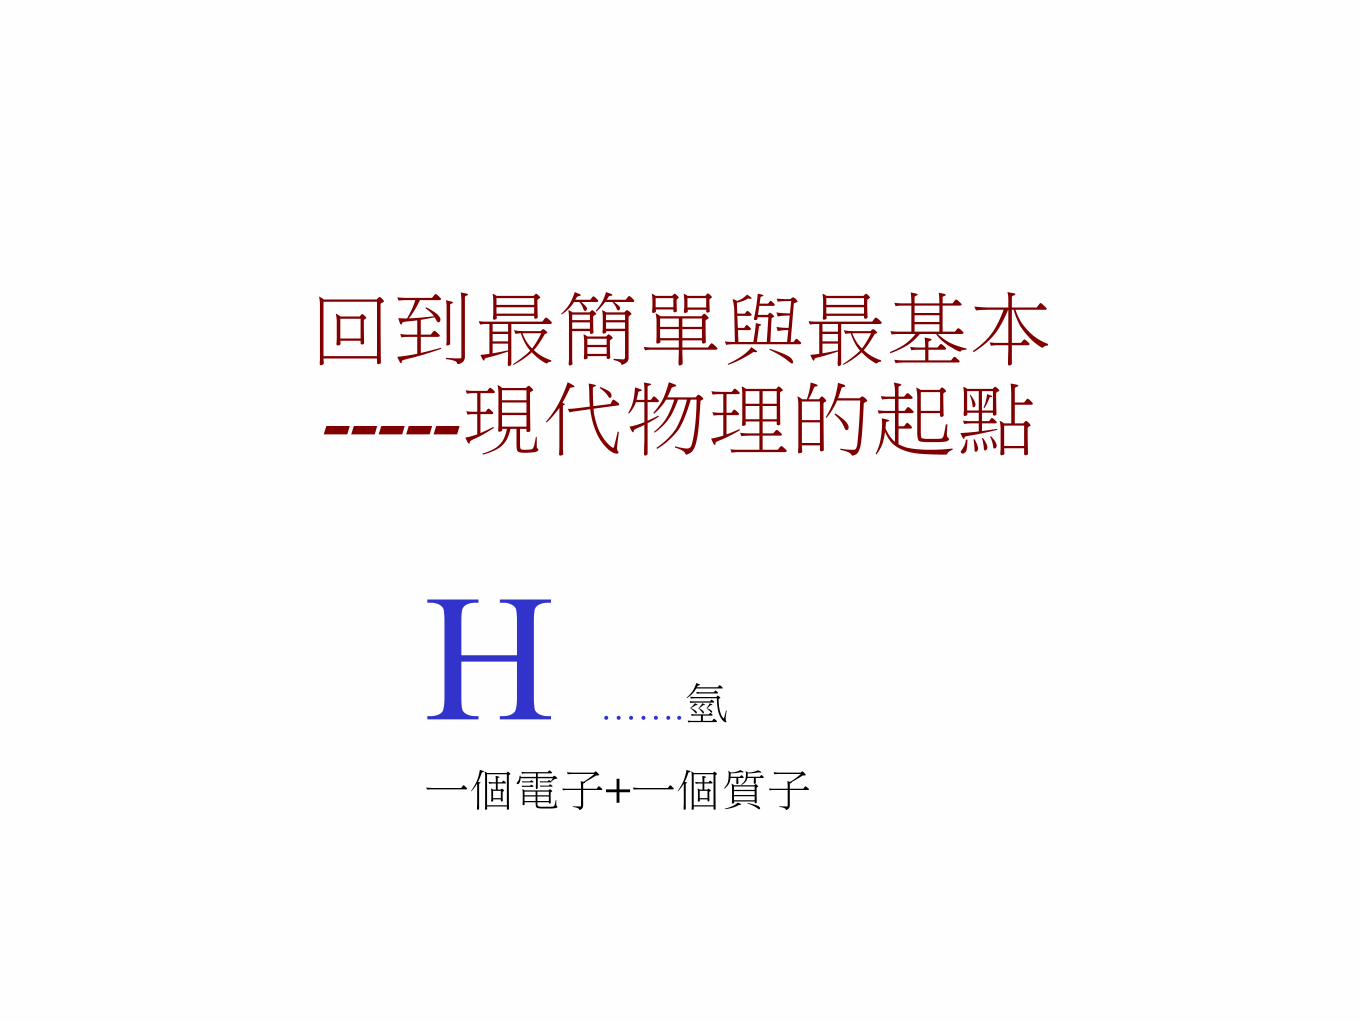
回到最簡單與最基本-----現代物理的起點
H …….氫
一個電子+一個質子
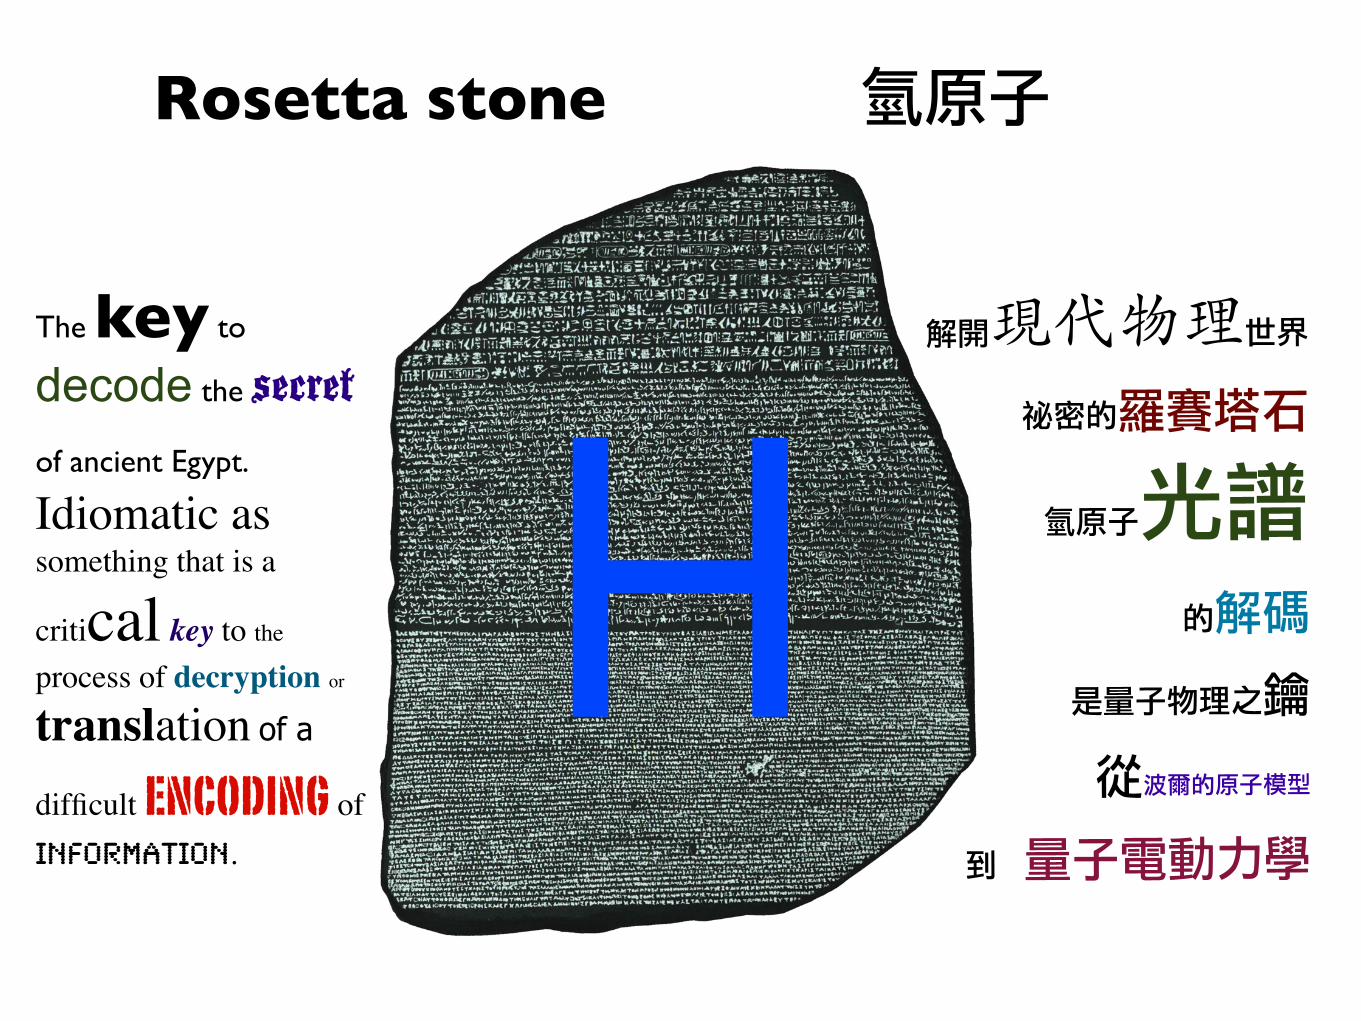
Rosetta stone
The key to
decode the secret of ancient Egypt. Idiomatic as something that is a
critical key to the process of decryption or translation of a
difficult encoding of information.
氫原子
解開現代物理世界
祕密的羅賽塔石
氫原子光譜的解碼
是量子物理之鑰
從波爾的原子模型
到 量子電動力學
H
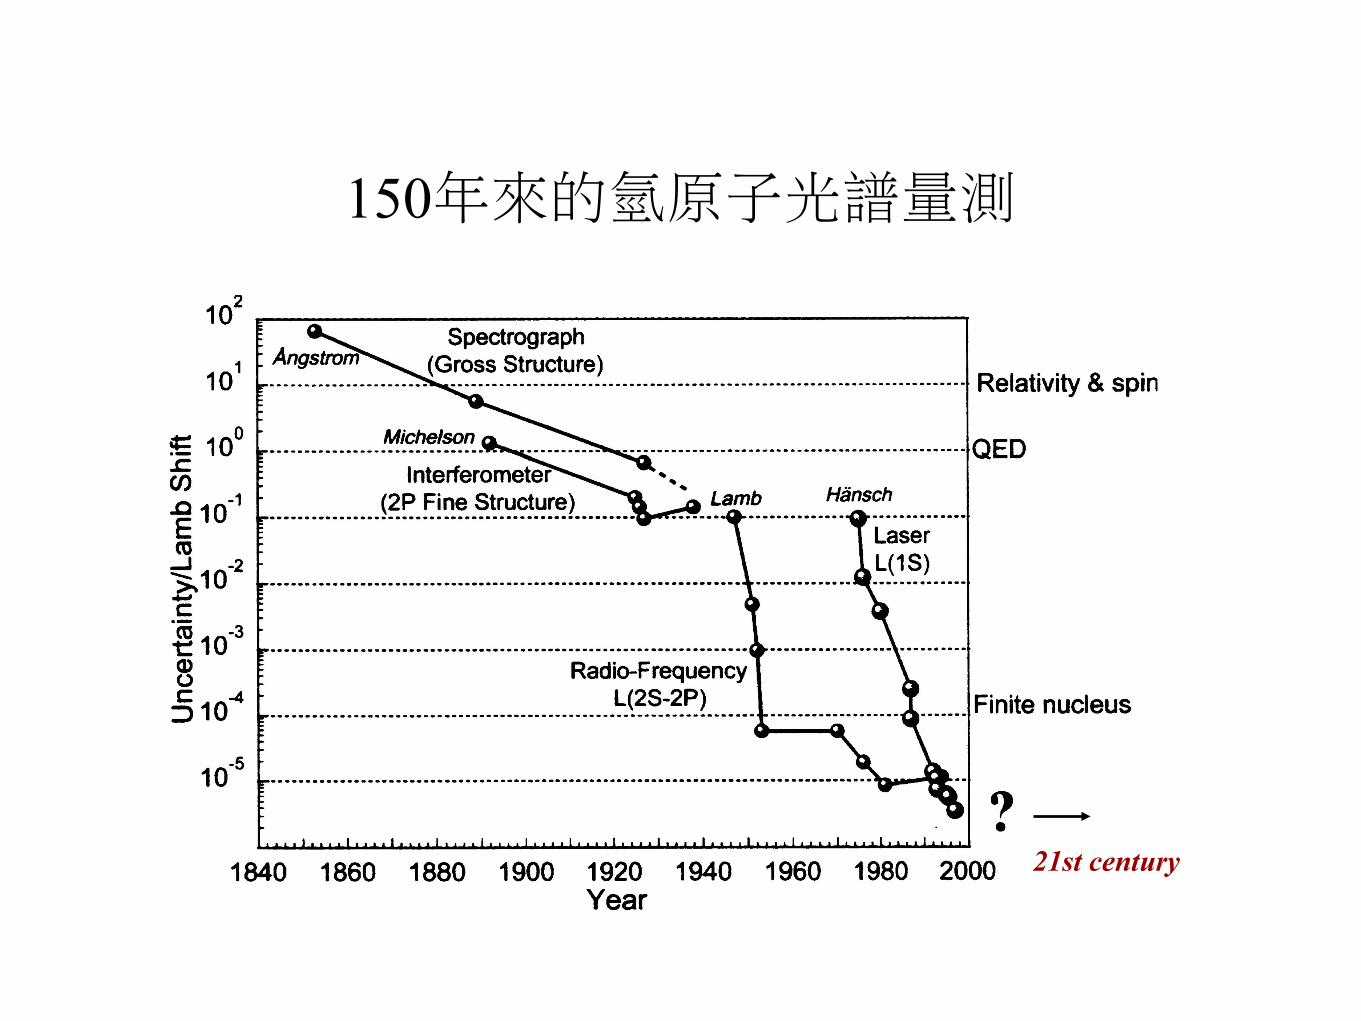
150年來的氫原子光譜量測
21st century
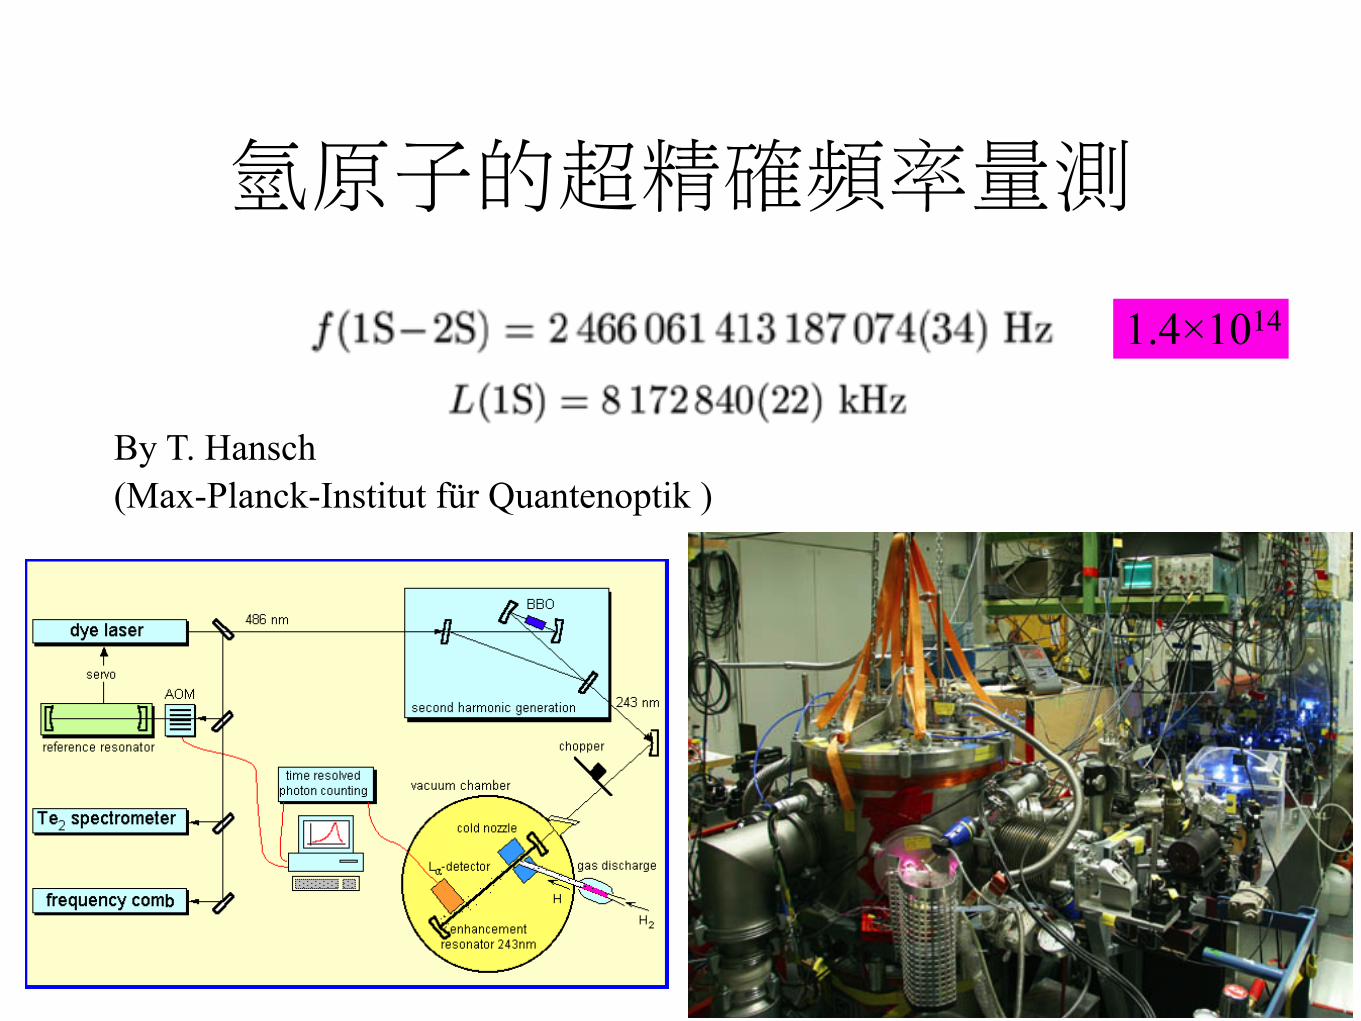
氫原子的超精確頻率量測
By T. Hansch (Max-Planck-Institut für Quantenoptik )
1.4×10¹⁴
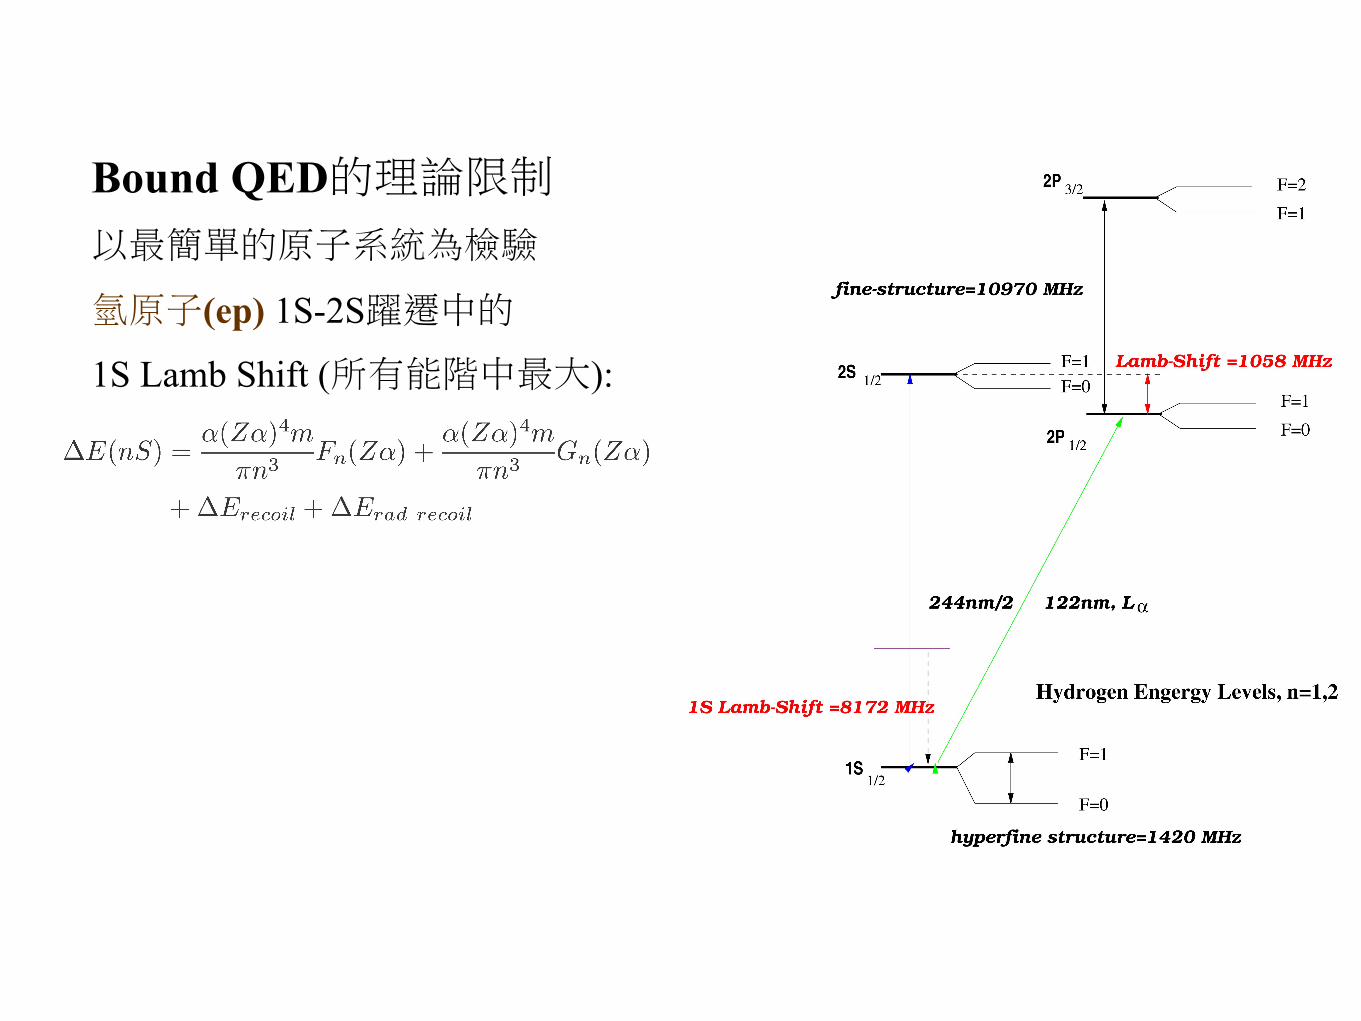
Bound QED的理論限制以最簡單的原子系統為檢驗
氫原子(ep) 1S-2S躍遷中的
1S Lamb Shift (所有能階中最大):
目前理論的極限所在
不確定的 <r2 >
(質子的電荷分布半徑)
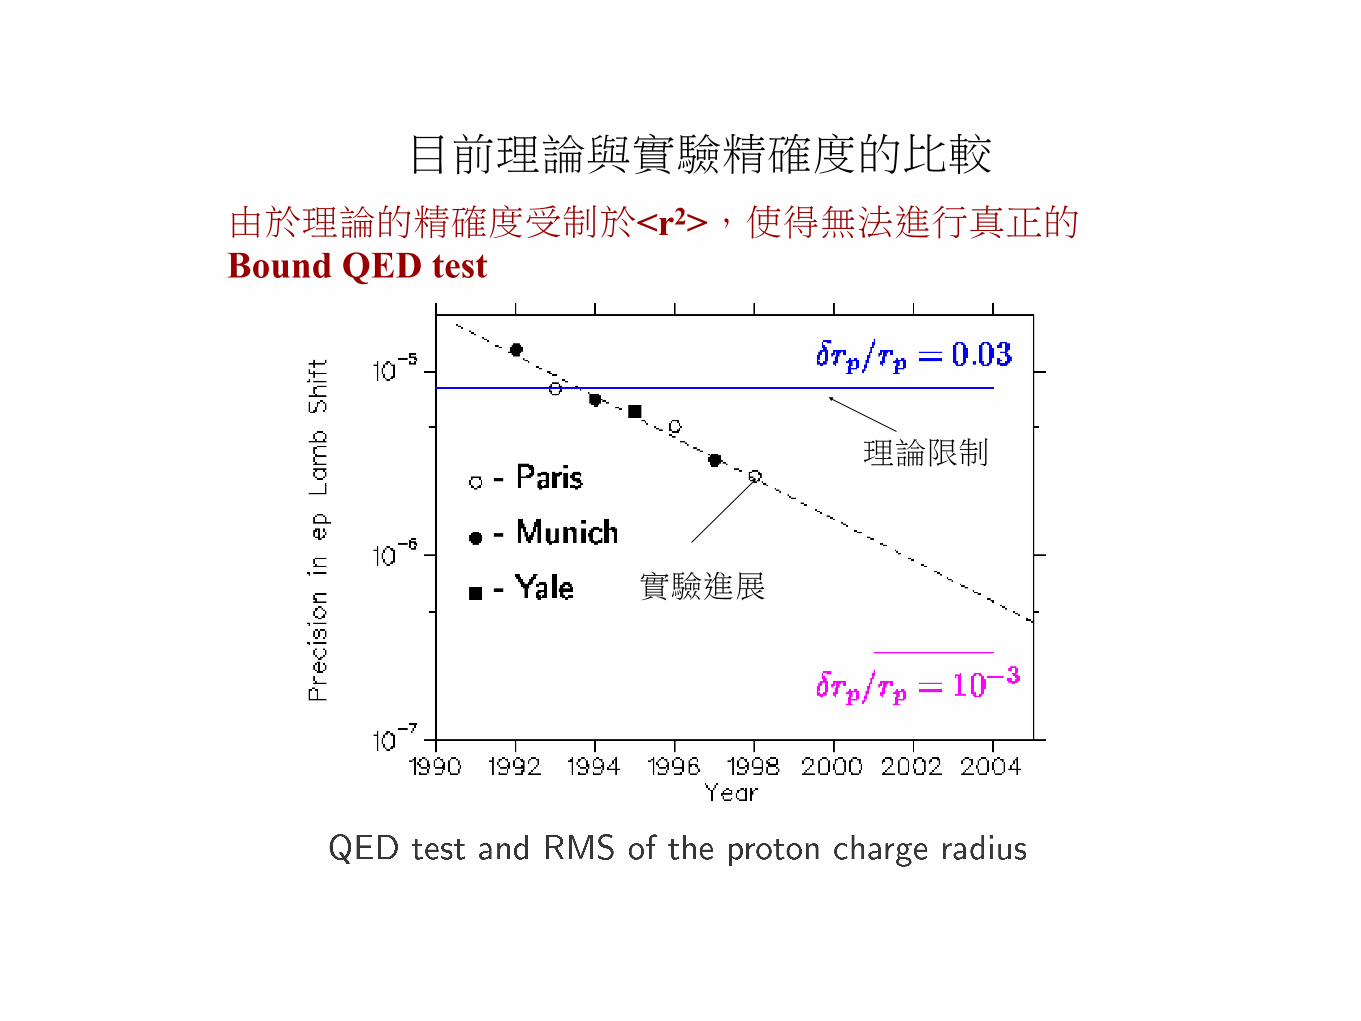
目前理論與實驗精確度的比較
由於理論的精確度受制於<r2>,使得無法進行真正的Bound QED test
實驗進展
理論限制
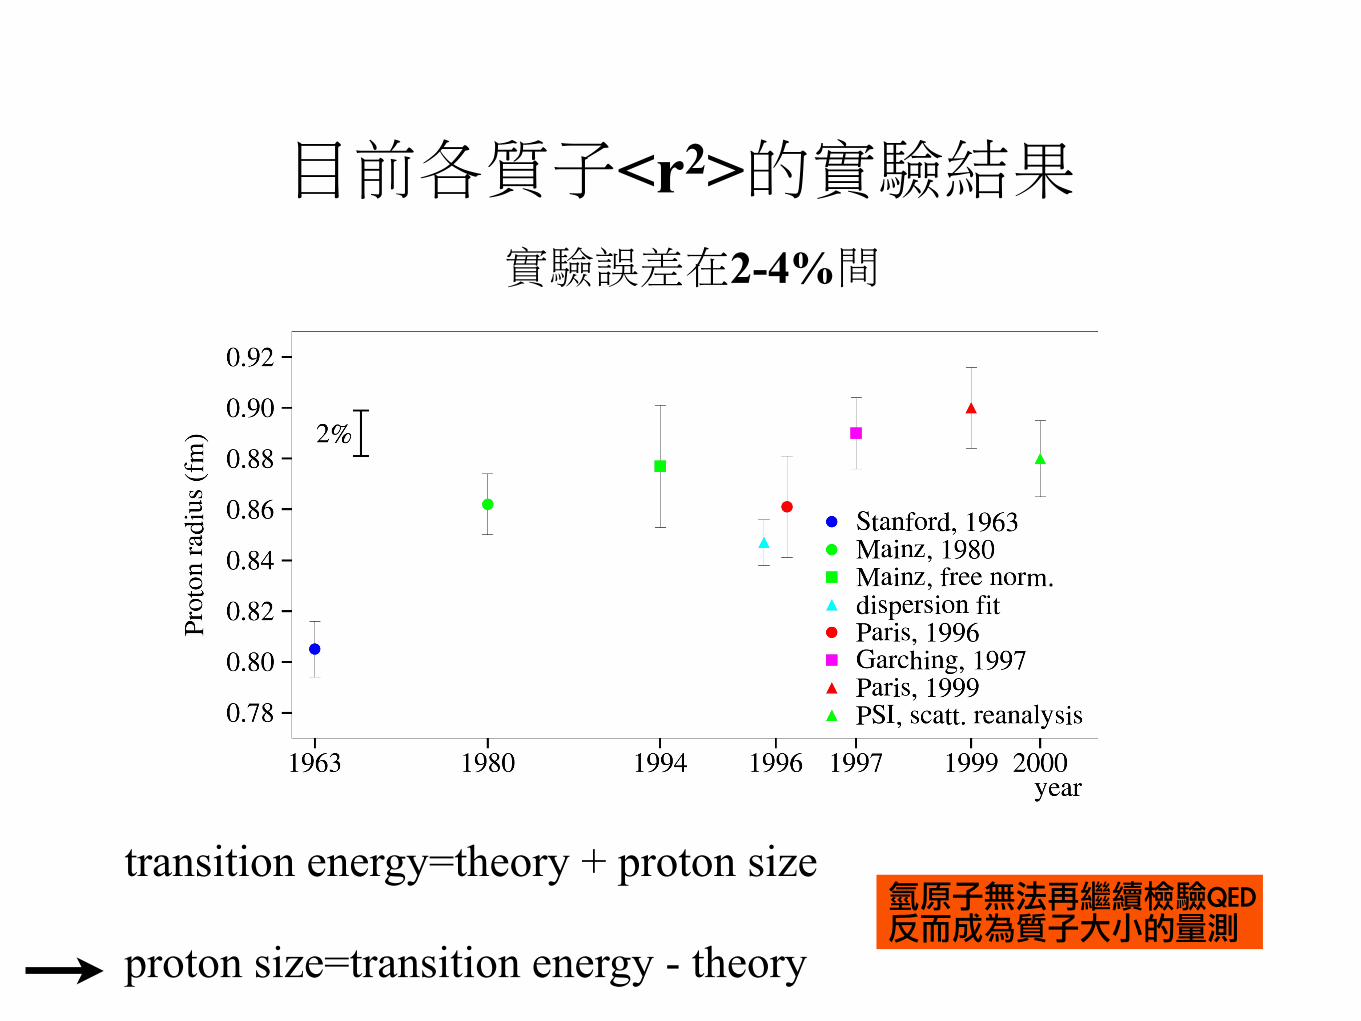
目前各質子<r2>的實驗結果實驗誤差在2-4%間
transition energy=theory + proton size
proton size=transition energy - theory氫原子無法再繼續檢驗QED反而成為質子大小的量測

Few possible strategies to go around the finite size effect
• Purely leptonic system :me、 e+e- muonium 1s-2s : muon mass problem (2000, PRL)
positronium 1s-2s :Second order Doppler effect (1993, S. Chu)
• Measuring the proton size muonic hydrogen spectroscopy
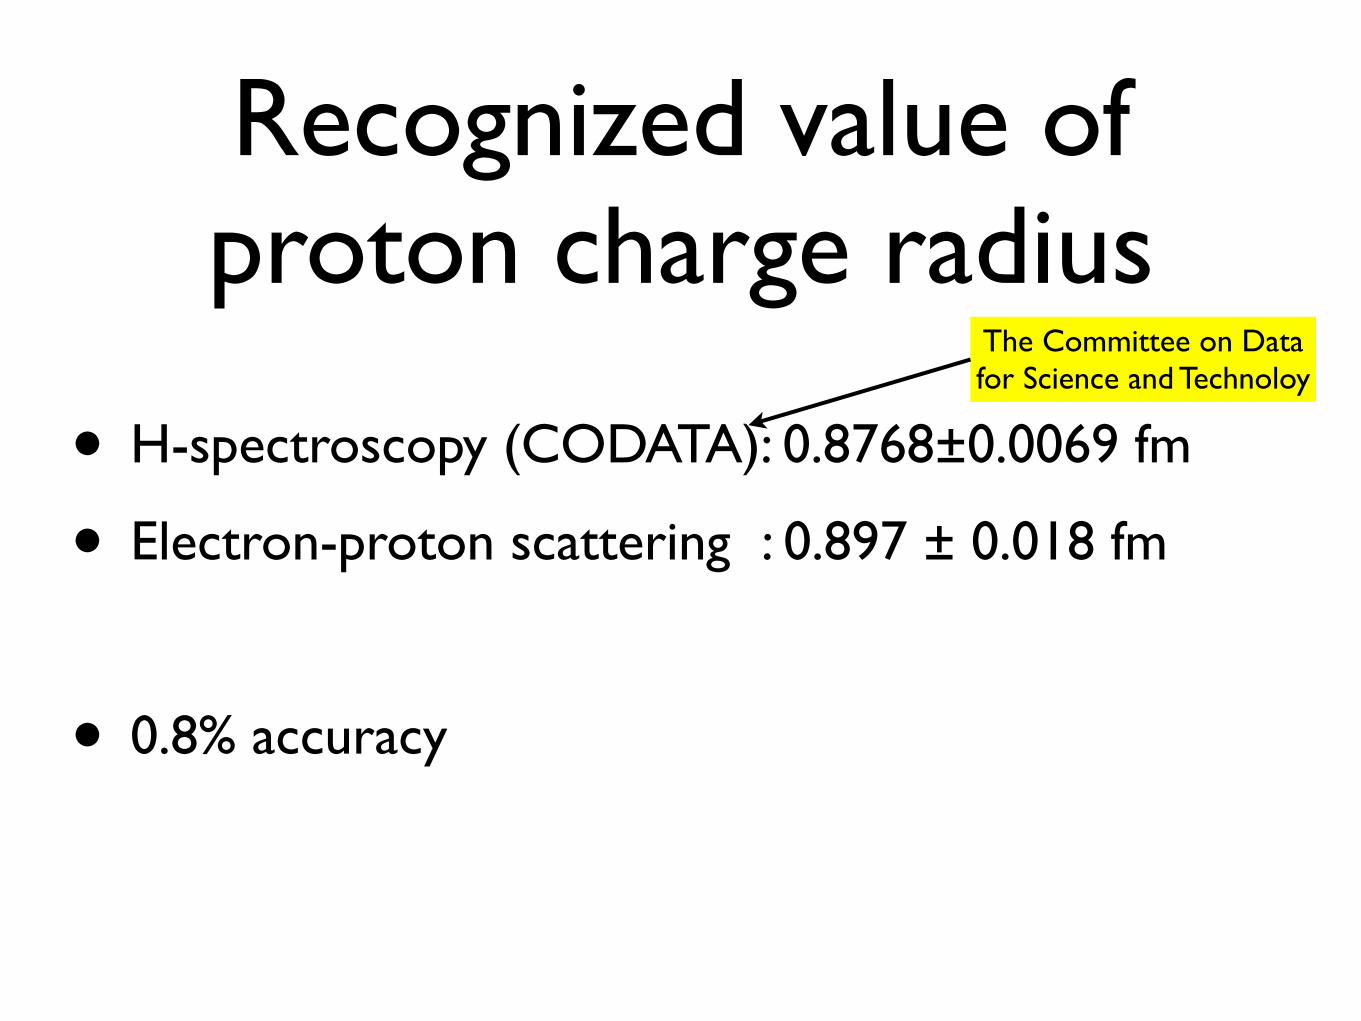
Recognized value of proton charge radius
• H-spectroscopy (CODATA): 0.8768±0.0069 fm
• Electron-proton scattering : 0.897 ± 0.018 fm
• 0.8% accuracy
The Committee on Data for Science and Technoloy
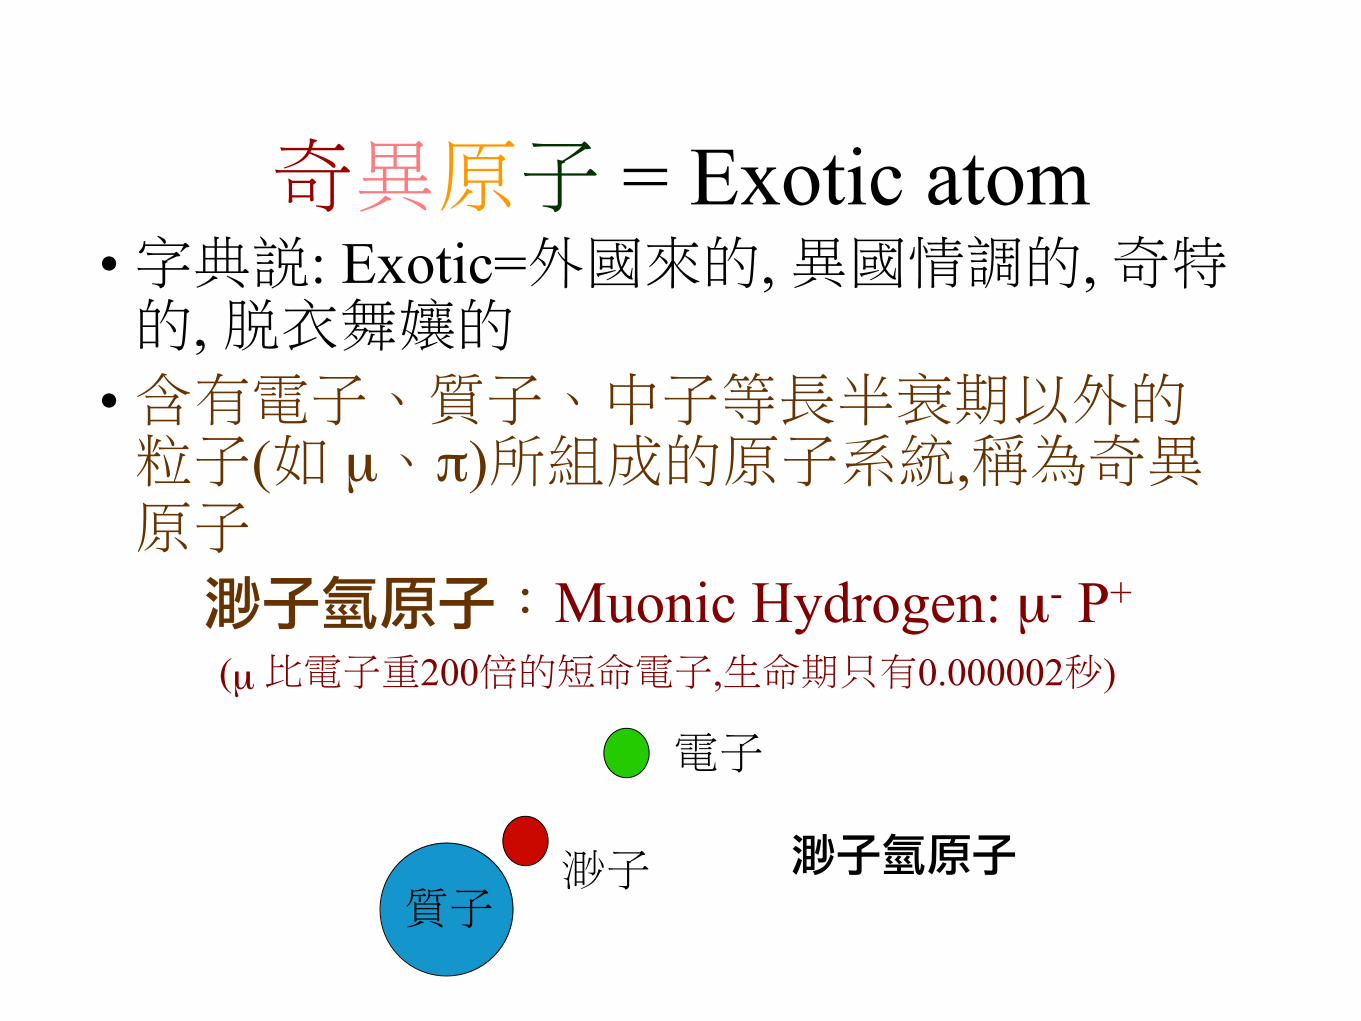
奇異原子 = Exotic atom•字典說: Exotic=外國來的, 異國情調的, 奇特的, 脫衣舞孃的
•含有電子、質子、中子等長半衰期以外的粒子(如 µ、π)所組成的原子系統,稱為奇異原子渺子氫原子:Muonic Hydrogen: µ- P+
(µ 比電子重200倍的短命電子,生命期只有0.000002秒)
質子
電子
氫原子渺子渺子
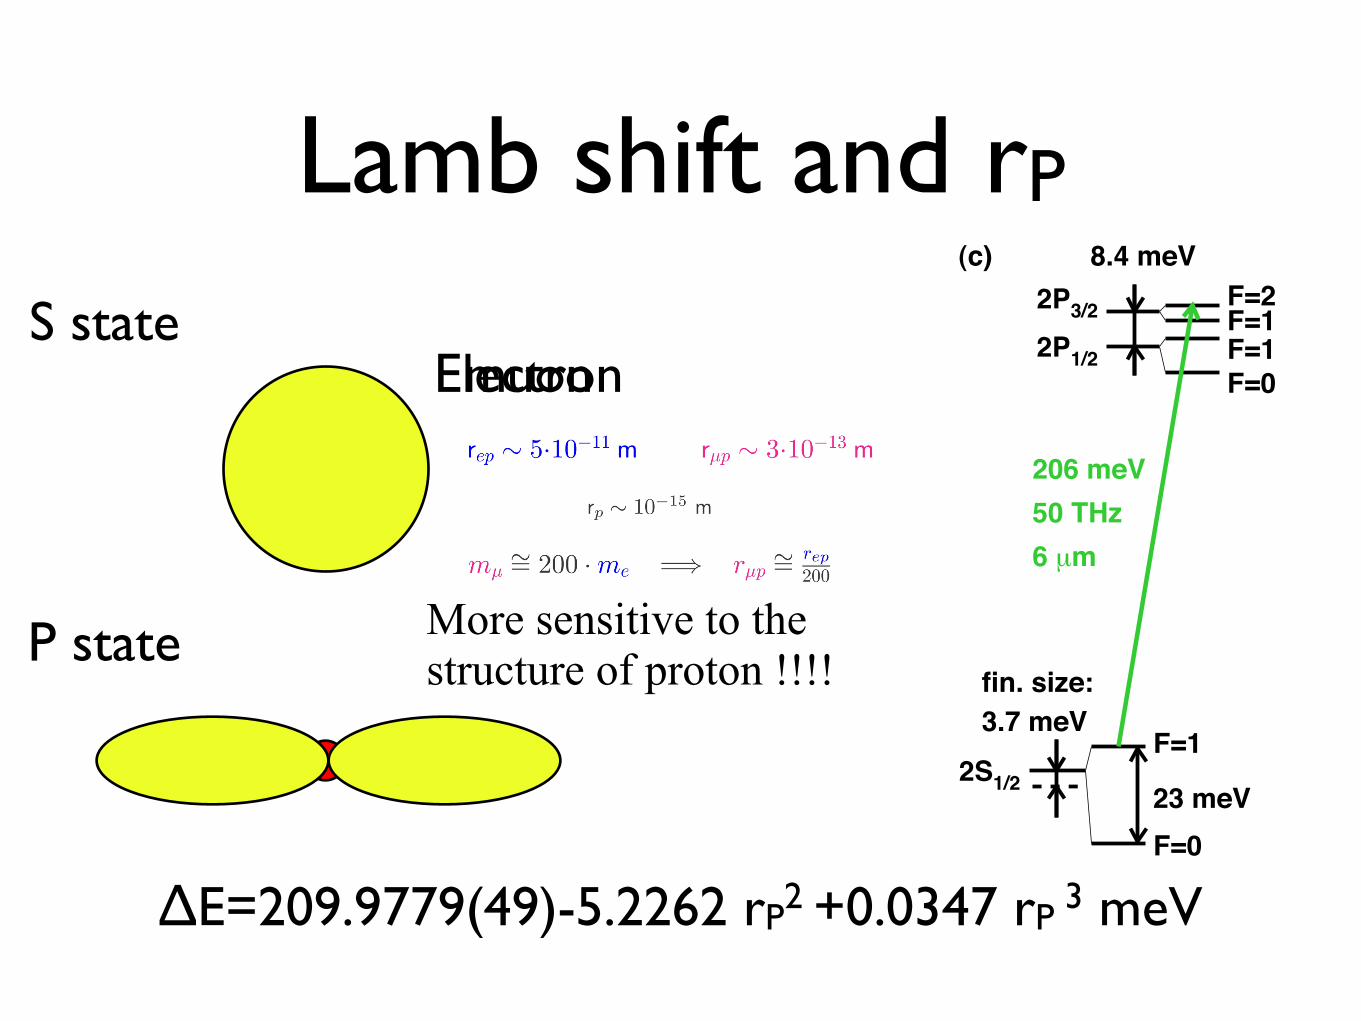
Lamb shift and rP
2S1/2
2P1/2
2P3/2
F=0
F=0
F=1
F=2
F=1 F=1
23 meV
8.4 meV
3.7 meV
fin. size:
206 meV
50 THz
6 µm
1S
2S
2PLaser
(K!)
2 keV X-ray
(a)
(b)
(c)
1S
2S2P
n~ 14
1%
2 keV X-ray
(K!, K
", K
# )
99%
Figure 1: (a) About 99% of the muons proceed directly to
the 1S ground state during the muonic cascade, emitting
“prompt” K-series X-rays (blue in Fig. 4). 1% remain in
the metastable 2S state. (b) The µp(2S) atoms are illu-minated by a laser pulse at “delayed” times (red region
in Fig. 4). If the laser is on resonance, delayed K! X-
rays are observed. (c) Vacuum polarization dominates the
Lamb shift in µp. The proton’s finite size effect is large.
vacuum polarization which shifts the 2S binding energy
towards more negative values (Fig. 1(b)). Its uncertainty
of 0.005meV is dominated by the proton polarizability
term13 of 0.015(4)meV. The µp fine and hyperfine split-tings (due to spin-orbit and spin-spin interactions) are an
order of magnitude smaller than the Lamb shift (Fig. 1(c)).
The second and third terms in Eq. (1) are the finite size
contributions. They amount to 1.8% of !E, two ordersof magnitude more than for H.
For more than forty years the µp Lamb shift has beenconsidered one of the fundamental experiments in atomic
spectroscopy, but only recent progress in muon beams
and laser technology made such an experiment feasible.
We report on the first successful measurement of the µpLamb shift. The energy difference between the 2SF=1
1/2
and 2PF=23/2 states of µp atoms has been determined by
means of pulsed laser spectroscopy at wavelengths around
6.01µm. This transition was chosen because it gives thelargest signal of all six allowed optical 2S-2P transitions.
All transitions are spectrally well separated. Data were
also taken for another 2S-2P transition in µp which willbe reported elsewhere.
The experiment has been performed at the !E5 beam-
PM PM
PM
!
!2
H Target
µ$
3
2
Laser pulse
e
10 cm
2
1
1
ExB
eS
S Multipass cavity
Figure 2: Muons entering the final stage of the muon
beam line pass two stacks of ultra-thin Carbon foils (S1,
S2). The realeased electrons are separated from the slower
muons by "E ! "B drift and are detected in plastic scintil-
lators read out by photo multiplier tubes (PM). The muon
stop volume is evenly illuminated by the laser light using
a multipass cavity.
line of the proton accelerator at the Paul Scherrer Insti-
tute (PSI) in Switzerland. We have built a new beam line
for low-energy negative muons (" 5 keV kinetic energy)which yields an order of magnitude more muon stops in a
small low-density gas volume than a conventional muon
beam18, 19. Slow µ! enter a 5 Tesla solenoid (sketched in
Fig. 2 and described in the methods section) and are de-
tected in two transmission muon detectors, generating a
trigger for the pulsed laser system.
The muons are stopped in H2 gas at 1 hPa, whereby
highly excited µp atoms (n # 14) are formed20. Most ofthese deexcite quickly to the 1S-ground state21, but "1%populate the long-lived 2S-state22 (Fig. 1 (a)). A short
laser pulse with a wavelength tunable around # # 6 µmenters the mirror cavity surrounding the target gas volume,
about 0.9 µs after the muon stop. 2S$ 2P transitions are
induced on resonance (Fig. 1 (b)), immediately followed
by 2P$ 1S deexcitation via emission of a 1.9 keV X-ray
(lifetime $2P = 8.5 ps). A resonance curve is obtainedby measuring at different laser wavelengths the number
of 1.9 keV X-rays which occur in time-coincidence with
the laser pulse. The laser fluence of 6mJ/cm2 results in a
2S-2P transition probability on resonance of about 30%.
The lifetime of the µp 2S-state $2S is crucial for this
experiment. In the absence of collisions $2S would be
equal to the muon lifetime of 2.2µs. In H2 gas, however,
the 2S-state is collisionally quenched, and $2S # 1µs atourH2 gas pressure of 1 hPa
22. This pressure is a trade-off
between maximizing $2S and minimizing the muon stop
volume (length"1/pressure) and therefore the laser pulse
energy required to drive the 2S-2P transition.
The design of the laser (see Fig. 3 and the meth-
ods section) is dictated by the need for tunable light
2
S state
P state
Electronmuon
More sensitive to the structure of proton !!!!
∆E=209.9779(49)-5.2262 rP2 +0.0347 rP 3 meV

14
渺子比電子重兩百倍,更靠近質子兩百倍,能更敏銳地偵測到質子的大小。
1/200
為甚麼是渺子氫原子?

PrincipleCascade and detection mechanism μ-
n=14
2S2P
1S
2keV X-ray
cw TiSa laserYb:YAG thin!disk laser
9 mJ 9 mJ
Oscillator200 W
500 W
43 mJ
Wavemeter
Raman cell
7 mJ
µ
Verdi
Amplifier
5 W
FP
1030 nmOscillator
Amplifier
1030 nm 200 W
500 W
I / Cs2SHG
23 mJ515 nm23 mJ 1.5 mJ
µ6 m cavity
cw TiSa708 nm400 mW
43 mJ
SHG
SHG
H O20.25 mJ
6 m6 m
TiSa Amp.
TiSa Osc.
708 nm, 15 mJ
20 m
µµ
!
Ge!filter
monitoring
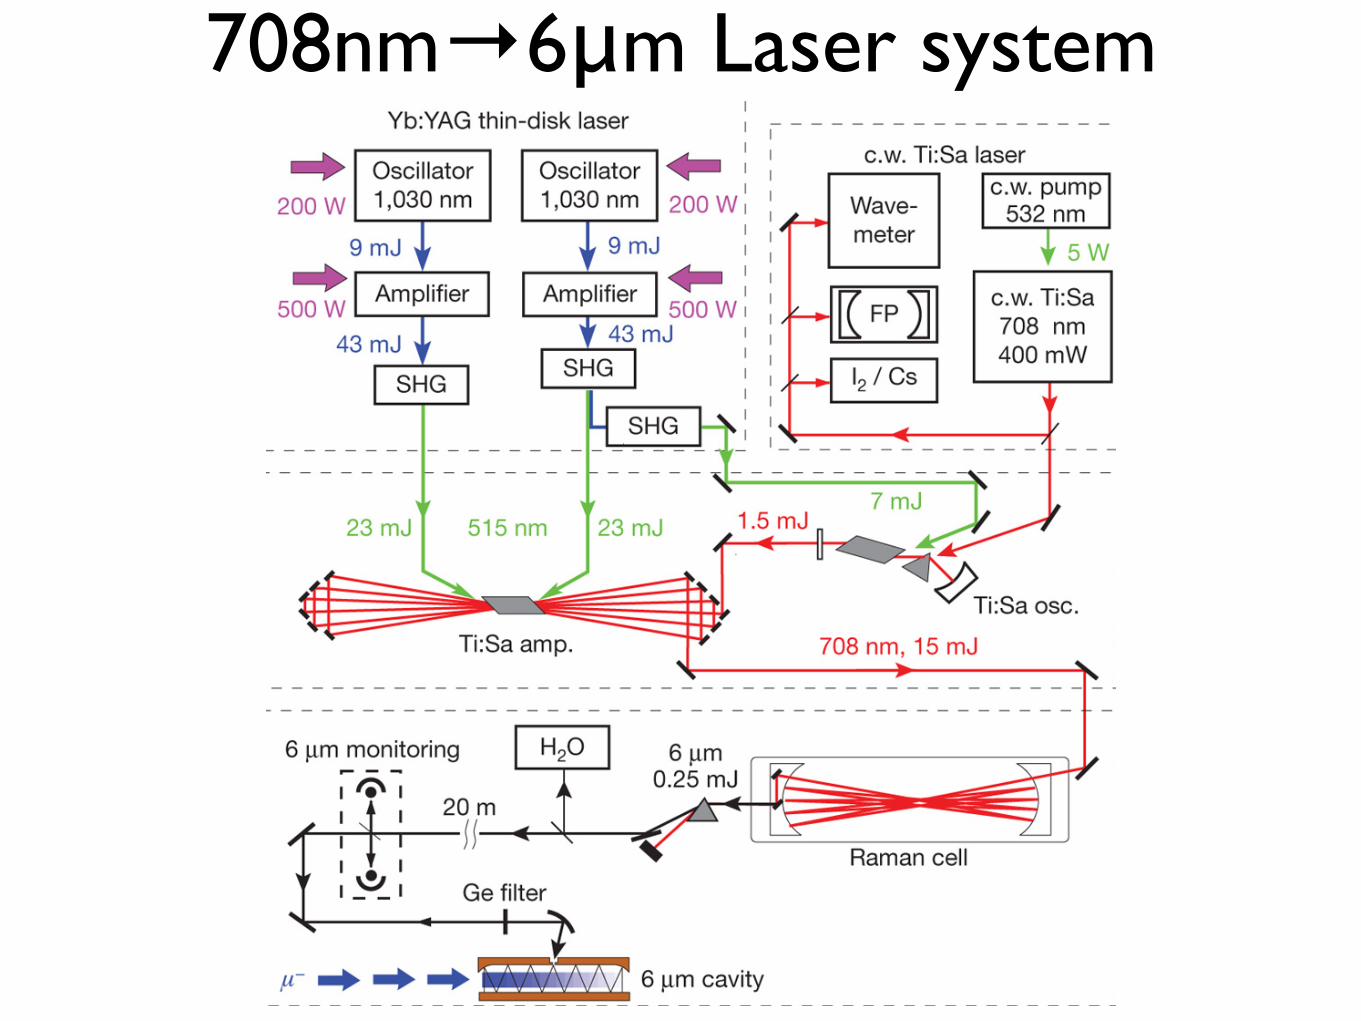
Figure 3: Laser system. The cw light of the Ti:sapphire
(TiSa) ring laser is used to seed the pulsed TiSa oscillator.
A detected muon triggers the Yb:YAG disc lasers. After
second harmonic generation (SHG), this light pumps the
pulsed TiSa which emits 5 ns short pulses at the wave-
length given by the cw TiSa laser. These short pulses
are shifted to the required ! ! 6µm via three sequen-
tial Stokes shifts in the Raman cell. Frequency calibration
is always performed at ! = 6µm.
output within "2S after a random trigger by an incom-
ing muon with a rate of about 400Hz. The cw light at
! ! 708 nm of a tunable Ti:sapphire (TiSa) laser is pulse-amplified by frequency-doubled light from a cw-pumped
Yb:YAG disk laser23, 24. The cw TiSa laser is locked to a
Fabry-Perot cavity (FP) with a free spectral range (FSR)
of 1497.332(3)MHz. The pulsed light25, 26 is shifted to
! ! 6µm by three sequential vibrational Stokes shifts in
a Raman cell27 filled with H2.
Tuning the cw TiSa at ! ! 708 nm by a frequency dif-ference !# results in the same !# detuning of the 6µmlight after the Raman cell. During the search of the res-
onance we scanned the laser in steps of typically 6 FSR
! 9GHz, not to miss the 18.6GHz wide resonance line.The final resonance scan was performed in steps of 2 FSR.
For the absolute frequency calibrationwe recorded several
absorption spectra of water at ! ! 6 µm, thereby elimi-nating possible systematic shifts originating from the TiSa
laser or the Raman process. By H2O absorption we also
eve
nts
in
25 n
s
0
50
100
150
200
-0.5 0 0.5 1 1.5 2 2.5 3 3.5 41
10
210
310
410
510 events
610!1.32
s]µtime [-0.5 0 0.5 1 1.5 2 2.5 3
0
50
100
150
200
-0.5 0 0.5 1 1.5 2 2.5 3 3.5 41
10
210
310
410
510 events
610!1.02
Figure 4: Summed X-ray time spectra recorded on reso-
nance (top) and off resonance (bottom). The insets show
the same data. The laser light illuminates the muonic
atoms in the laser time window t " [0.887, 0.962] µs in-dicated in red. The “prompt” X-rays are marked in blue
(see text and Fig. 1).
determined the laser bandwidth of (1.75 ± 0.25) GHz at6µm.
For every laser frequency, an accumulated time spec-
trum of K! events is recorded using large-area avalanche
photo-diodes28 (LAAPDs). Their time and (relative) en-
ergy resolution for 1.9 keV X-rays is 35 ns and 25% (full-
width at half maximum), respectively. The resulting X-
ray time spectra are shown for laser frequencies on and
off resonance in Fig. 4. The large “prompt” peak contains
the # 99% of the muons which do not form metastable
µp(2S) atoms and proceed directly to the 1S ground state(Fig. 1(a)). This peak helps to normalize the data for each
laser wavelength to the number of µp atoms formed, e.g.,due to varying measurement times per laser frequency.
The 75 ns long laser time window, in which the laser in-
duced K! events are expected, is indicated in Fig. 4. We
have recorded a rate of 7 events per hour in the laser
time window when on resonance. The background of
about 1 event/hour originates mainly from falsely iden-
tified muon-decay electrons and effects related to delayed
muon transfer to target walls.
Figure 5 shows the measured 2S $ 2P resonance
curve. It is obtained by plotting the number of K! events
recorded in the laser time window, normalized to the num-
ber of events in the prompt peak, as a function of the laser
frequency. In total we have measured 550 events on res-
onance, where we expect 155 background events. The
3
cw TiSa laserYb:YAG thin!disk laser
9 mJ 9 mJ
Oscillator200 W
500 W
43 mJ
Wavemeter
Raman cell
7 mJ
µ
Verdi
Amplifier
5 W
FP
1030 nmOscillator
Amplifier
1030 nm 200 W
500 W
I / Cs2SHG
23 mJ515 nm23 mJ 1.5 mJ
µ6 m cavity
cw TiSa708 nm400 mW
43 mJ
SHG
SHG
H O20.25 mJ
6 m6 m
TiSa Amp.
TiSa Osc.
708 nm, 15 mJ
20 m
µµ
!
Ge!filter
monitoring
Figure 3: Laser system. The cw light of the Ti:sapphire
(TiSa) ring laser is used to seed the pulsed TiSa oscillator.
A detected muon triggers the Yb:YAG disc lasers. After
second harmonic generation (SHG), this light pumps the
pulsed TiSa which emits 5 ns short pulses at the wave-
length given by the cw TiSa laser. These short pulses
are shifted to the required ! ! 6µm via three sequen-
tial Stokes shifts in the Raman cell. Frequency calibration
is always performed at ! = 6µm.
output within "2S after a random trigger by an incom-
ing muon with a rate of about 400Hz. The cw light at
! ! 708 nm of a tunable Ti:sapphire (TiSa) laser is pulse-amplified by frequency-doubled light from a cw-pumped
Yb:YAG disk laser23, 24. The cw TiSa laser is locked to a
Fabry-Perot cavity (FP) with a free spectral range (FSR)
of 1497.332(3)MHz. The pulsed light25, 26 is shifted to
! ! 6µm by three sequential vibrational Stokes shifts in
a Raman cell27 filled with H2.
Tuning the cw TiSa at ! ! 708 nm by a frequency dif-ference !# results in the same !# detuning of the 6µmlight after the Raman cell. During the search of the res-
onance we scanned the laser in steps of typically 6 FSR
! 9GHz, not to miss the 18.6GHz wide resonance line.The final resonance scan was performed in steps of 2 FSR.
For the absolute frequency calibrationwe recorded several
absorption spectra of water at ! ! 6 µm, thereby elimi-nating possible systematic shifts originating from the TiSa
laser or the Raman process. By H2O absorption we also
even
ts in
25 n
s
0
50
100
150
200
-0.5 0 0.5 1 1.5 2 2.5 3 3.5 41
10
210
310
410
510 events
610!1.32
s]µtime [-0.5 0 0.5 1 1.5 2 2.5 3
0
50
100
150
200
-0.5 0 0.5 1 1.5 2 2.5 3 3.5 41
10
210
310
410
510 events
610!1.02
Figure 4: Summed X-ray time spectra recorded on reso-
nance (top) and off resonance (bottom). The insets show
the same data. The laser light illuminates the muonic
atoms in the laser time window t " [0.887, 0.962] µs in-dicated in red. The “prompt” X-rays are marked in blue
(see text and Fig. 1).
determined the laser bandwidth of (1.75 ± 0.25) GHz at6µm.
For every laser frequency, an accumulated time spec-
trum of K! events is recorded using large-area avalanche
photo-diodes28 (LAAPDs). Their time and (relative) en-
ergy resolution for 1.9 keV X-rays is 35 ns and 25% (full-
width at half maximum), respectively. The resulting X-
ray time spectra are shown for laser frequencies on and
off resonance in Fig. 4. The large “prompt” peak contains
the # 99% of the muons which do not form metastable
µp(2S) atoms and proceed directly to the 1S ground state(Fig. 1(a)). This peak helps to normalize the data for each
laser wavelength to the number of µp atoms formed, e.g.,due to varying measurement times per laser frequency.
The 75 ns long laser time window, in which the laser in-
duced K! events are expected, is indicated in Fig. 4. We
have recorded a rate of 7 events per hour in the laser
time window when on resonance. The background of
about 1 event/hour originates mainly from falsely iden-
tified muon-decay electrons and effects related to delayed
muon transfer to target walls.
Figure 5 shows the measured 2S $ 2P resonance
curve. It is obtained by plotting the number of K! events
recorded in the laser time window, normalized to the num-
ber of events in the prompt peak, as a function of the laser
frequency. In total we have measured 550 events on res-
onance, where we expect 155 background events. The
3
99%1%
6μm2keV X-ray
Signal!!!
Prompt X-ray
delay X-ray
Hydrogen

Two major technical challenges
• Muonic hydrogen: Produce slow muon that can stop in low pressure hydrogen gas.
• Light source: 6μm laser source, powerful, well-controlled frequency, triggered on demand.
<5keV
1 hPa
0.2 mJ
Δt<1µs

Experimental hall


Generation of Cold muonic hydrogen

Interaction region
2S1/2
2P1/2
2P3/2
F=0
F=0
F=1
F=2
F=1 F=1
23 meV
8.4 meV
3.7 meV
fin. size:
206 meV
50 THz
6 µm
1S
2S
2PLaser
(K!)
2 keV X-ray
(a)
(b)
(c)
1S
2S2P
n~ 14
1%
2 keV X-ray
(K!, K
", K
# )
99%
Figure 1: (a) About 99% of the muons proceed directly to
the 1S ground state during the muonic cascade, emitting
“prompt” K-series X-rays (blue in Fig. 4). 1% remain in
the metastable 2S state. (b) The µp(2S) atoms are illu-minated by a laser pulse at “delayed” times (red region
in Fig. 4). If the laser is on resonance, delayed K! X-
rays are observed. (c) Vacuum polarization dominates the
Lamb shift in µp. The proton’s finite size effect is large.
vacuum polarization which shifts the 2S binding energy
towards more negative values (Fig. 1(b)). Its uncertainty
of 0.005meV is dominated by the proton polarizability
term13 of 0.015(4)meV. The µp fine and hyperfine split-tings (due to spin-orbit and spin-spin interactions) are an
order of magnitude smaller than the Lamb shift (Fig. 1(c)).
The second and third terms in Eq. (1) are the finite size
contributions. They amount to 1.8% of !E, two ordersof magnitude more than for H.
For more than forty years the µp Lamb shift has beenconsidered one of the fundamental experiments in atomic
spectroscopy, but only recent progress in muon beams
and laser technology made such an experiment feasible.
We report on the first successful measurement of the µpLamb shift. The energy difference between the 2SF=1
1/2
and 2PF=23/2 states of µp atoms has been determined by
means of pulsed laser spectroscopy at wavelengths around
6.01µm. This transition was chosen because it gives thelargest signal of all six allowed optical 2S-2P transitions.
All transitions are spectrally well separated. Data were
also taken for another 2S-2P transition in µp which willbe reported elsewhere.
The experiment has been performed at the !E5 beam-
PM PM
PM
!
!2
H Target
µ$
3
2
Laser pulse
e
10 cm
2
1
1
ExB
eS
S Multipass cavity
Figure 2: Muons entering the final stage of the muon
beam line pass two stacks of ultra-thin Carbon foils (S1,
S2). The realeased electrons are separated from the slower
muons by "E ! "B drift and are detected in plastic scintil-
lators read out by photo multiplier tubes (PM). The muon
stop volume is evenly illuminated by the laser light using
a multipass cavity.
line of the proton accelerator at the Paul Scherrer Insti-
tute (PSI) in Switzerland. We have built a new beam line
for low-energy negative muons (" 5 keV kinetic energy)which yields an order of magnitude more muon stops in a
small low-density gas volume than a conventional muon
beam18, 19. Slow µ! enter a 5 Tesla solenoid (sketched in
Fig. 2 and described in the methods section) and are de-
tected in two transmission muon detectors, generating a
trigger for the pulsed laser system.
The muons are stopped in H2 gas at 1 hPa, whereby
highly excited µp atoms (n # 14) are formed20. Most ofthese deexcite quickly to the 1S-ground state21, but "1%populate the long-lived 2S-state22 (Fig. 1 (a)). A short
laser pulse with a wavelength tunable around # # 6 µmenters the mirror cavity surrounding the target gas volume,
about 0.9 µs after the muon stop. 2S$ 2P transitions are
induced on resonance (Fig. 1 (b)), immediately followed
by 2P$ 1S deexcitation via emission of a 1.9 keV X-ray
(lifetime $2P = 8.5 ps). A resonance curve is obtainedby measuring at different laser wavelengths the number
of 1.9 keV X-rays which occur in time-coincidence with
the laser pulse. The laser fluence of 6mJ/cm2 results in a
2S-2P transition probability on resonance of about 30%.
The lifetime of the µp 2S-state $2S is crucial for this
experiment. In the absence of collisions $2S would be
equal to the muon lifetime of 2.2µs. In H2 gas, however,
the 2S-state is collisionally quenched, and $2S # 1µs atourH2 gas pressure of 1 hPa
22. This pressure is a trade-off
between maximizing $2S and minimizing the muon stop
volume (length"1/pressure) and therefore the laser pulse
energy required to drive the 2S-2P transition.
The design of the laser (see Fig. 3 and the meth-
ods section) is dictated by the need for tunable light
2
708nm→6μm Laser system

Replay the MOMENT...

Results
laser frequency [THz]49.75 49.8 49.85 49.9 49.95
]-4
de
lay
ed
/ p
rom
pt
ev
en
ts [
10
0
1
2
3
4
5
6
7
e-p scattering
CODATA-06 our value
O2H
calib.
Figure 5: Resonance. Number of events in the laser time
window normalized to the number of “prompt” events as a
function of the laser frequency. The fit is a Lorentzian on
top of a flat background. The predictions for the line po-
sition using the proton radius from CODATA1 or electron
scattering10 are indicated. One of the calibration measure-
ments using water absorption is also shown.
fit to the data is a Lorentzian resonance line on top of a
flat background. All four parameters (Lorentzian ampli-
tude, position and width, as well as background ampli-
tude) were varied freely.
We obtain a centroid position of 49881.88 ± 0.70(stat) GHz. The resulting width is 18.0 ± 2.2GHz, whichcompares well with the expected value of 21 ± 1 GHz re-sulting from the laser bandwidth and Doppler- and power-
broadening of the natural line width of 18.6 GHz. The
resulting background amplitude agrees with the one ob-
tained by a fit to data recorded without laser (not shown).
An elaborate line shape model, where the Lorentzian is
corrected for the laser pulse energies which have been
recorded for each laser shot, gives the same result. We
obtain a chi-square value of !2 = 28.1 for 28 degrees offreedom (dof). A fit of a flat line, assuming no resonance,
gives !2 = 283 for 31 dof, making this resonance line16" significant.
The systematic uncertainty of our measurement is
300MHz. It originates exclusively from our laser wave-
length calibration procedure. We have calibrated our line
position in 21 measurements of 5 different water vapor
absorption lines in the range # = 5.49 . . .6.01µm. Thepositions of these water lines are known to an absolute
precision of 1MHz from the HITRAN database29, 30. The
measured relative spacing between the 5 lines agrees with
the tabulated ones. One such measurement of a water va-
por absorption line is shown in Fig. 5. Our quoted un-
certainty of 300MHz comes from pulse to pulse fluctua-
tions and a broadening effect occurring in the Raman pro-
cess. The FSR of the reference FP does not contribute,
since the FSR is known better than 3 kHz and the whole
scanned range is within 70 FSR from the water line. Other
systematic corrections we have considered are Zeeman
shift in the 5 Tesla field (< 30MHz), AC and DC Starkshifts(< 1MHz), Doppler shift (< 1MHz) and pressureshift (< 2MHz). All these effects are small due to thesmall size of the µp atom.
The centroid position of the 2SF=11/2 ! 2PF=2
3/2 is
49881.88 ± 0.76GHz, where the uncertainty is the
quadratic sum of the statistical (0.70GHz) and the sys-
tematic (0.30GHz) uncertainties. This frequency cor-
responds to an energy of !E2P!2S = 206.2949 ±
0.0032meV. From Eq. 1 we deduce an rms proton chargeradius of rp=0.84091(36)(57)fm where the first and sec-
ond uncertainties originate from the experimental uncer-
tainty of 0.76GHz and the uncertainty in the first term in
Eq. 1, respectively. Theory, and here mainly the proton
polarizability term, limits the accuracy on rp to 8" 10!4.
Our experimental precision would suffice to deduce rp to
a relative uncertainty of 4 " 10!4.
This new value of the proton radius
rp=0.84091(68) fm is 10 times more precise than the
previous world average1, but it disagrees strongly with
the values in literature: 5.2" deviation from CODATA
value1 which is inferred mainly from H spectroscopy, and
3.1" from the value extracted from e-p scattering9, 10.
The origin of this large discrepancy is not known. If it
comes from theory in µp, a term as large as 0.32meV
(1.6"10!3 of the total Lamb shift) must be missing. It
is quite improbable that a term of such magnitude might
have been forgotten. If the theory used to extract rp from
muonic hydrogen is correct, then the problem comes
from hydrogen spectroscopic experiments or from the
calculation of the Lamb shifts in H.
If, on the other hand, the Lamb shift calculations for
µp and H atoms are assumed to be correct, a new valueof the Rydberg constant R" is obtained. Combining the
precisely measured H(1S-2S) interval2 with the H(1S)-
and H(2S)-Lamb shifts calculated with our rp and the
new value of the fine structure constant31 gives R" =10973731.568150(16)m!1 [1.5 ppt]. This is !113 kHz/cor 5.2" away from the CODATA value1, but 4.6 times
more precise.
To conclude, spectrocopy in hydrogenic atoms contin-
4
49881.88±0.76GHz2S1/2 (F=1)→2P3/2 (F=2):rp=0.84184(36)(56) fm

experiment is now known as the Lamb shift. QED has made predictions of remarkable pre-cision and was the prototype of field theories that followed, but its mathematical foundation is not secure and experimental verification is still being actively pursued.
Pohl and co-workers1 at the Paul Scherrer Institute (PSI) in Switzerland have measured the Lamb shift in muonic hydrogen. In muonic hydrogen, the electron has been replaced by a negative muon — a similar particle of the same charge but 207 times heavier and unstable. The muon’s larger mass gives muonic hydrogen a smaller atomic size and allows a much larger interaction with the proton, allowing the pro-ton structure to be probed more accurately than by using hydrogen. This experiment has long been suggested as likely to give significant improvement in measurement uncertainty, but that has not been achieved until now because of considerable experimental difficulties.
At the PSI, an intense source of muons is available. Pulses of muons are stopped in hydrogen gas and some produce muonic
hydrogen, a small proportion of which is in a relatively long-lived (metastable) state — with a lifetime of around one microsecond. Within this lifetime, the muonic hydrogen is subjected to an intense laser pulse (Fig. 1), and if cor-rectly tuned, this pulse will induce a transition to an upper state separated in energy from the initial metastable state by the Lamb shift. This transition is detected through the emission of X-ray photons as the upper state decays rap-idly to the ground state. Detection in a narrow time window distinguishes these laser-induced X-rays from the background X-rays, from other unwanted states produced and from muon decays. Varying the tuning of the laser frequency over many repetitions of the muonic hydrogen and laser interaction allows highly accurate measurement of the transition energy, from which the proton size can be calculated.
Previously, measurements of proton size have been made directly by scattering elec-trons from protons, and indirectly by spectros-copy of atomic hydrogen. Electron-scattering results are complex to analyse and the data are
inconsistent. However, the available data have been analysed by Sick5 to give a global result. Data from hydrogen spectroscopy have been compiled and combined with the electron-scattering data in the 2006 CODATA review6. Pohl and colleagues’ new result1 is significantly different, by five standard deviations, from the result of a combination of these previous methods (Fig. 2).
The source of this discrepancy is currently unknown. The electron scattering is the most direct method, but the interpretation of the data is open to question. In both hydrogen and muonic hydrogen spectroscopy, long, detailed QED calculations are required to produce a proton size from the experimental data. Pohl et al. have detailed more than 30 terms in the derivation of the equation linking their transi-tion-energy measurement to the proton size. In calculations of this complexity, the possibility of error always exists with a magnitude that is hard to determine. In hydrogen spectroscopy, different transitions have been measured to allow the proton size and the related Rydberg constant to be extracted. In hydrogen, unlike in the muonic hydrogen reported here, these require measurement to a small fraction of the experimental transition spectral linewidth, and so details of the transition must be modelled to a high degree of accuracy — again, a possible source of error.
The discrepancy is most likely to be resolved through future work on hydrogen, muonic hydrogen, muonic deuterium and similar ‘simple atomic systems’7 — that is, systems of two bound particles. The simplicity of these systems, and hence their accessibility to calcu-lation, allows physics to be probed, with dif-ferent systems emphasizing different aspects of the physics. The hydrogen atom is the best-known two-body system. Others under study — including muonium (a bound antimuon and an electron) and positronium (a positron and an electron) — probe the QED of systems with-out nuclei. The helium ion (an !-particle and an electron) and antihydrogen (an antiproton and an antielectron) offer further insight into fundamental physics.
If experimental discrepancies are confirmed rather than errors being found, high-accuracy work such as that by Pohl and colleagues, not the high-energy collisions of giant accelerators, may have seen beyond the standard model of particle physics. Jeff Flowers is at the National Physical Laboratory, Teddington, Middlesex TW11 0LW, UK.e-mail: [email protected]
1. Pohl, R. et al. Nature 466, 213–216 (2010).2. Rigden, J. S. Hydrogen: The Essential Element (Harvard Univ.
Press, 2002).3. Lamb, W. E. Jr & Retherford, R. C. Phys. Rev. 72, 241–243
(1947).4. Dyson, F. J. Phys. Rev. 75, 486–502 (1949).5. Sick, I. Phys. Lett. B 576, 62–67 (2003).6. Mohr, P. J., Taylor, B. N. & Newell, D. B. Rev. Mod. Phys. 80,
633–730 (2008).7. Flowers, J. L., Margolis, H. S. & Klein, H. A. Contemp. Phys.
45, 123–145 (2004).
Figure 2 | Size of the proton.!A comparison of the results of different methods used to measure the proton size is shown: electron scattering5, hydrogen spectroscopy, the combination of these (both from the CODATA 2006 review6), and Pohl and colleagues’ new measurement1 derived from muonic hydrogen spectroscopy. The bars indicate an uncertainty of one standard deviation. The discrepancy of about five standard deviations between the muonic hydrogen result and the CODATA result, which summarizes all previous work, is clear.
Figure 1 | Part of the laser system of the muonic-hydrogen apparatus used by Pohl and colleagues1.
F. RE
ISER
& A
. AN
TOG
NIN
I, PA
UL-
SCH
ERRE
R-IN
ST.
196
NATURE|Vol 466|8 July 2010NEWS & VIEWS
© 20 Macmillan Publishers Limited. All rights reserved10
變小的質子
• 新數值 0.84184 fm<0.8768 fm, 小了4%
10-15m
0.00000000000000084184 公尺
精確度到達了, 尚未被研究過的極小世界
雖然不大, 確影響深遠

CODATA experimental inputs
The MPQ result in Eq. !66" and Table XII for!H!1S1/2–2S1/2" was provided by Udem !2006" ofthe MPQ group. It follows from the measuredvalue !H!1S1/2–2S1/2"=2 466 061 102 474.851!34" kHz#1.4"10!14$ obtained for the !1S,F=1,mF= ±1"! !2S,F!=1,mF! = ±1" transition frequency !Fischer etal., 2004a, 2004b; Hänsch et al., 2005" by using the wellknown 1S and 2S hyperfine splittings !Ramsey, 1990;Kolachevsky et al., 2004" to convert it to the frequencycorresponding to the hyperfine centroid.
3. Nuclear radii
The theoretical expressions for the finite nuclear sizecorrection to the energy levels of hydrogen H and deu-terium D !see Sec. IV.A.1.h" are functions of the bound-state nuclear rms charge radius of the proton Rp and ofthe deuteron Rd. These values are treated as variables inthe adjustment, so the transition frequency data, to-gether with theory, determine values for the radii. Theradii are also determined by elastic electron-proton scat-tering data in the case of Rp and from elastic electron-deuteron scattering data in the case of Rd. These inde-pendently determined values are used as additionalinformation on the radii. There have been no new re-sults during the last four years and thus we take as input
data for these two radii the values used in the 2002 ad-justment,
Rp = 0.895!18" fm, !67"
Rd = 2.130!10" fm. !68"
The result for Rp is due to Sick !2003" #see also Sick!2007"$. The result for Rd is that given in Sec. III.B.7 ofCODATA-98 based on the analysis of Sick and Traut-mann !1998".
An experiment currently underway to measure theLamb shift in muonic hydrogen may eventually providea significantly improved value of Rp and hence an im-proved value of R# !Nebel et al., 2007".
B. Antiprotonic helium transition frequencies and Ar(e)
The antiprotonic helium atom is a three-body systemconsisting of a 4He or 3He nucleus, an antiproton, andan electron, denoted by p̄He+. Even though the Bohrradius for the antiproton in the field of the nucleus isabout 1836 times smaller than the electron Bohr radius,in the highly excited states studied experimentally, theaverage orbital radius of the antiproton is comparable tothe electron Bohr radius, giving rise to relatively long-
TABLE XII. Summary of measured transition frequencies ! considered in the present work for the determination of the Rydbergconstant R# !H is hydrogen and D is deuterium".
Authors Laboratory Frequency interval!s"Reported value
!! /kHz"Rel. stand.uncert. ur
Fischer et al., 2004a, 2004b MPQ !H!1S1/2–2S1/2" 2 466 061 413 187.074!34" 1.4"10!14
Weitz et al., 1995 MPQ !H!2S1/2–4S1/2"! 14!H!1S1/2–2S1/2" 4 797 338!10" 2.1"10!6
!H!2S1/2–4D5/2"! 14!H!1S1/2–2S1/2" 6 490 144!24" 3.7"10!6
!D!2S1/2–4S1/2"! 14!D!1S1/2–2S1/2" 4 801 693!20" 4.2"10!6
!D!2S1/2–4D5/2"! 14!D!1S1/2–2S1/2" 6 494 841!41" 6.3"10!6
Huber et al., 1998 MPQ !D!1S1/2–2S1/2"!!H!1S1/2–2S1/2" 670 994 334.64!15" 2.2"10!10
de Beauvoir et al., 1997 LKB/SYRTE !H!2S1/2–8S1/2" 770 649 350 012.0!8.6" 1.1"10!11
!H!2S1/2–8D3/2" 770 649 504 450.0!8.3" 1.1"10!11
!H!2S1/2–8D5/2" 770 649 561 584.2!6.4" 8.3"10!12
!D!2S1/2–8S1/2" 770 859 041 245.7!6.9" 8.9"10!12
!D!2S1/2–8D3/2" 770 859 195 701.8!6.3" 8.2"10!12
!D!2S1/2–8D5/2" 770 859 252 849.5!5.9" 7.7"10!12
Schwob et al., 1999, 2001 LKB/SYRTE !H!2S1/2–12D3/2" 799 191 710 472.7!9.4" 1.2"10!11
!H!2S1/2–12D5/2" 799 191 727 403.7!7.0" 8.7"10!12
!D!2S1/2–12D3/2" 799 409 168 038.0!8.6" 1.1"10!11
!D!2S1/2–12D5/2" 799 409 184 966.8!6.8" 8.5"10!12
Bourzeix et al., 1996 LKB !H!2S1/2–6S1/2"! 14!H!1S1/2–3S1/2" 4 197 604!21" 4.9"10!6
!H!2S1/2–6D5/2"! 14!H!1S1/2–3S1/2" 4 699 099!10" 2.2"10!6
Berkeland et al., 1995 Yale !H!2S1/2–4P1/2"! 14!H!1S1/2–2S1/2" 4 664 269!15" 3.2"10!6
!H!2S1/2–4P3/2"! 14!H!1S1/2–2S1/2" 6 035 373!10" 1.7"10!6
Hagley and Pipkin, 1994 Harvard !H!2S1/2–2P3/2" 9 911 200!12" 1.2"10!6
Lundeen and Pipkin, 1986 Harvard !H!2P1/2–2S1/2" 1 057 845.0!9.0" 8.5"10!6
Newton et al., 1979 U. Sussex !H!2P1/2–2S1/2" 1 057 862!20" 1.9"10!5
647Mohr, Taylor, and Newell: CODATA recommended values of the fundamental …
Rev. Mod. Phys., Vol. 80, No. 2, April–June 2008
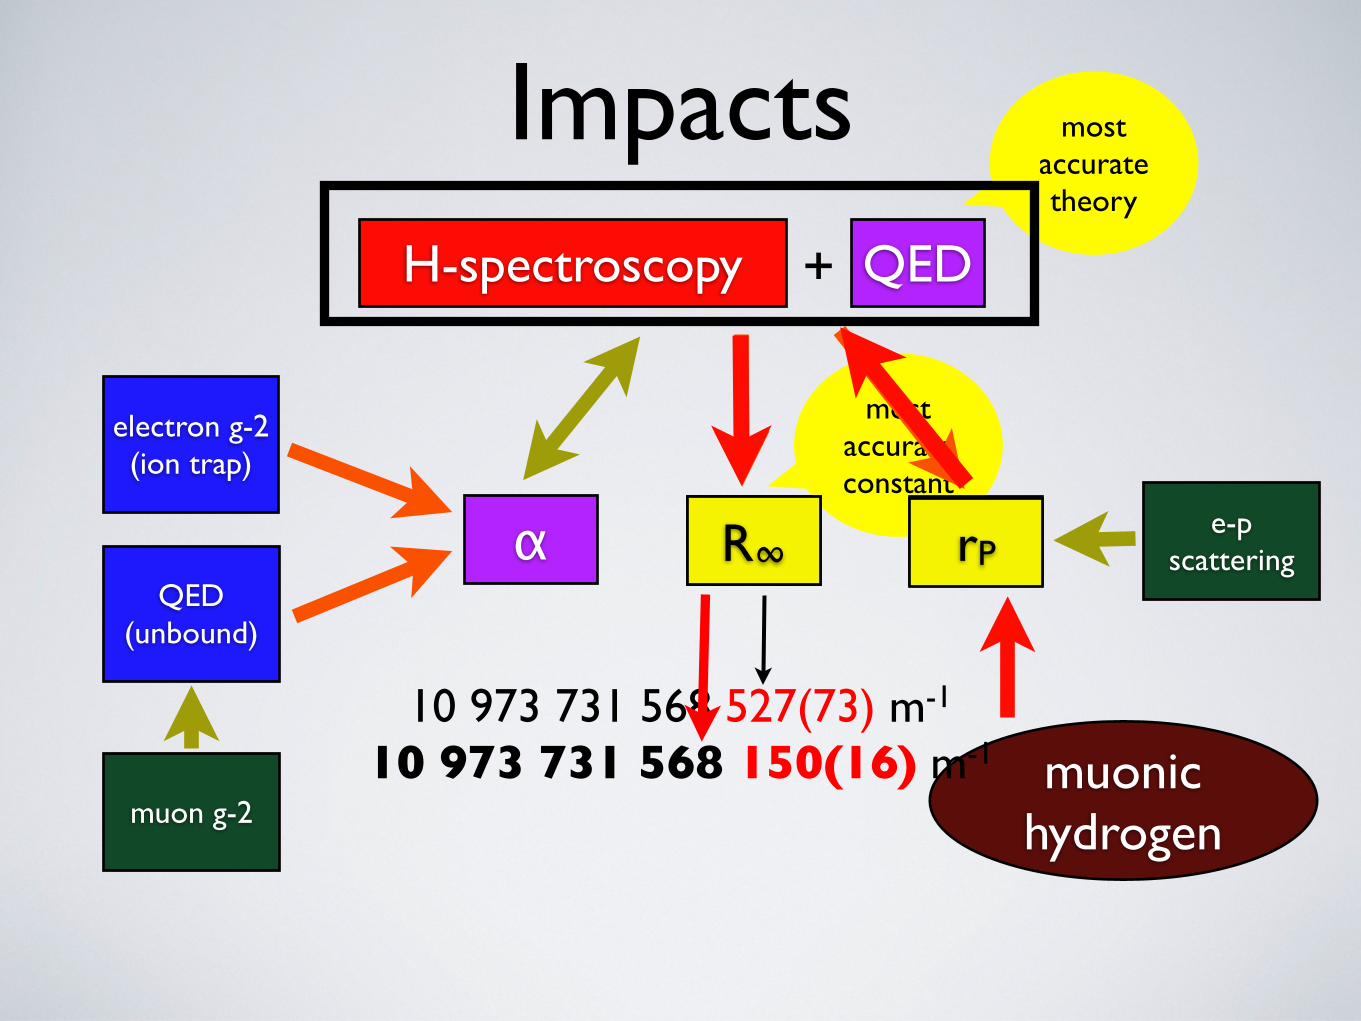
most accurate constant
ImpactsH-spectroscopy QED
α R∞ rPQED
(unbound)
electron g-2(ion trap)
muon g-2
e-p scattering
muonic hydrogen
most accurate theory
+
10 973 731 568 527(73) m-1
10 973 731 568 150(16) m-1
rPR∞

Implications
• Is QED wrong???
• Physics in very small scale (am 10-18, zm 10-21)???
• Unexplored μ-p or e-p interaction???
Some possible routes to the puzzle:
Now, we have a big trouble in atomic physics
Is there any sign shown in the past ?
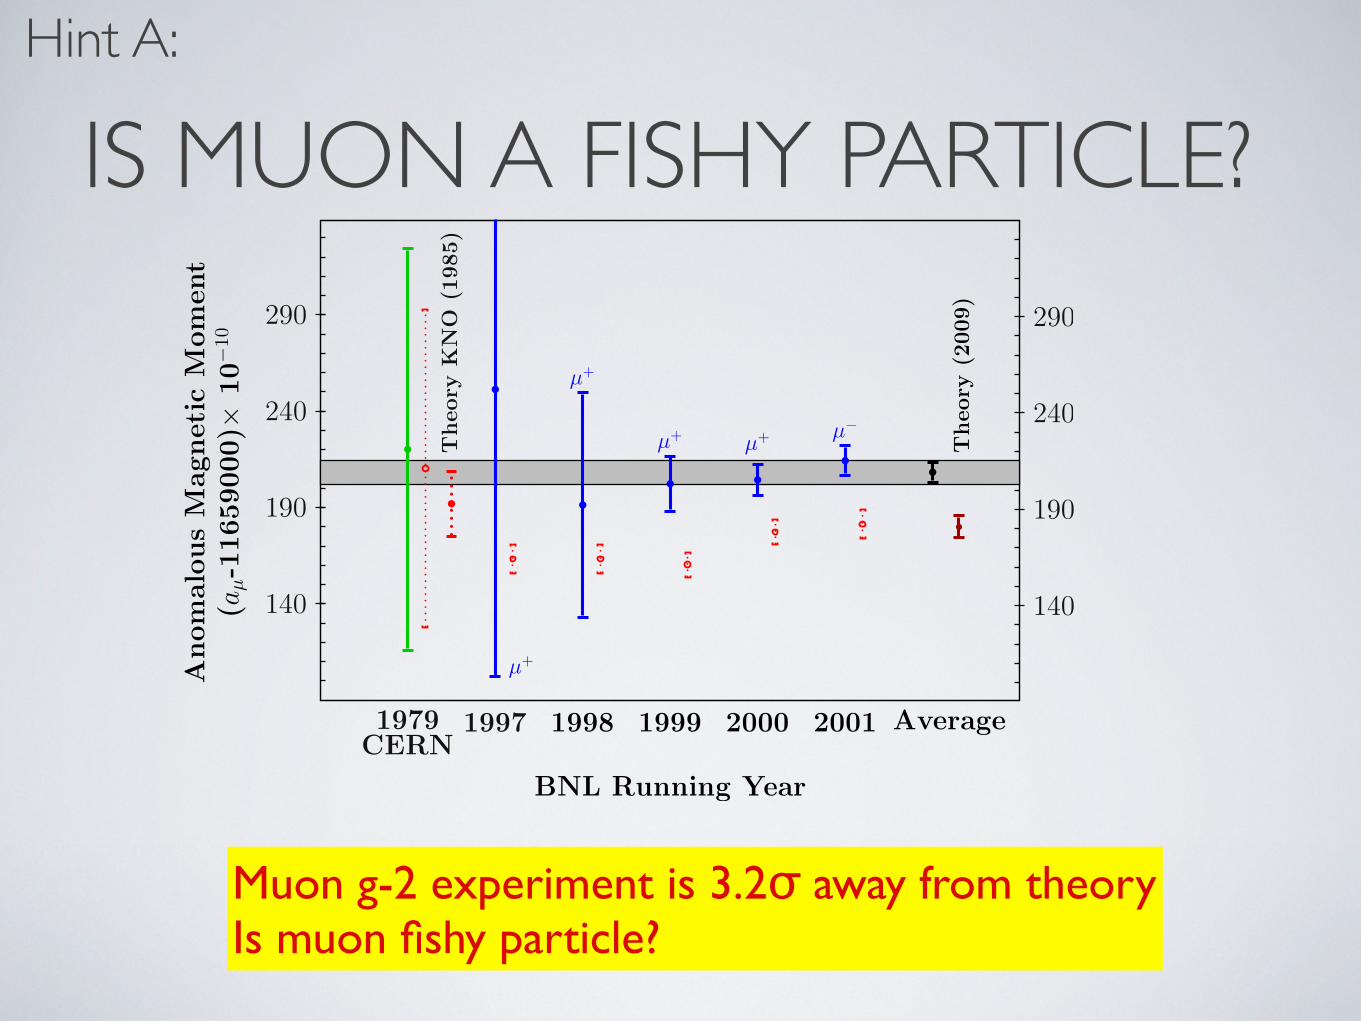
16 F. Jegerlehner, A. Nyffeler / Physics Reports 477 (2009) 1–110
Fig. 7. Results for the individual E821 measurements, together with the new world average and the theoretical prediction. The CERN result is showntogether with the theoretical prediction by Kinoshita et al. 1985, at about the time when the E821 project was proposed.The dotted vertical bars indicatethe theory values quoted by the experiments.
3. QED prediction of g ! 2
Any precise theoretical prediction requires a precise knowledge of the fundamental parameters. In QED these are thefine structure constant ! and the lepton masses. As the leading order result is !
2" and since we want to determine a# withvery high precision, the most important basic parameter for calculating aµ is the fine structure constant. Its most precisevalue is determined using of the electron anomalous magnetic moment
aexpe = 0.00115965218073(28)(0.24 ppb), (42)
which very recently [105,106] has been obtained with extreme precision. Confronting the experimental value with thetheoretical prediction as a series in ! (see Section 3.2 below) determines [107,108,106]
!!1(ae) = 137.035999084(51)(0.37 ppb). (43)
This new value has an uncertainty 20 times smaller than any preceding independent determination of ! and we will use itthroughout in the calculation of aµ.
Starting at 2-loops, higher order corrections include contributions from lepton loops in which different leptons cancirculate and results depend on the corresponding mass ratios. Whenever needed, we will use the following values forthe muon–electron and muon–tau mass ratios, and lepton masses [37,38,103,104]
mµ/me = 206.7682838(54), mµ/m$ = 0.0594592(97),me = 0.5109989918(44) MeV, mµ = 105.6583692(94) MeV, m$ = 1776.99(29) MeV.
(44)
The primary determination of the electron and muon masses come from measuring the ratio with respect to the mass of anucleus and the masses are obtained in atomic mass units (amu). Therefore the ratios are known more precisely, than thenumbers we get by inserting lepton masses given in MeV. In fact, the conversion factor to MeV is more uncertain than themass of the electron and muon in amu.
Note that the mass-dependent contributions in fact differ for ae, aµ and a$ , such that lepton universality is broken:ae "= aµ "= a$ .
More SM parameters will be needed for the evaluation of weak and hadronic contributions. We have collected themin Appendix together with known polylogarithmic functions needed for the representation of analytic results of the QEDcalculations.
Until recently the electron anomaly ae and, until before the advent of the Brookhaven muon g ! 2 measurements,also aµ were considered to provide the most clean and precise tests of QED. In fact the by far largest contribution tothe anomalous magnetic moment is of pure QED origin, and with the new determination of ae by the Harvard electrong ! 2 experiment [105,106] ae together with its QED prediction [108] allows for the most precise determination of theelectromagnetic fine structure constant. The dominance of just one type of interaction in the electromagnetic vertex of theleptons, historically, was very important for the development of QFT andQED, as it allowed one to test QED as amodel theoryunder simple unambiguous conditions. How important such experimental tests werewemay learn from the fact that it tookabout 20 years from the invention of QED (Dirac 1928 [ge = 2]) until the first reliable results could be established (Schwinger1948 [a(2)
e = !/2" ]) after a covariant formulation and renormalization was understood and settled in its main aspects.When the precision of experiments improved, the QED part by itself became a big challenge for theorists, because higher
order corrections are sizable, and as the order of perturbation theory increases, the complexity of the calculations grows
IS MUON A FISHY PARTICLE?
Muon g-2 experiment is 3.2σ away from theoryIs muon fishy particle?
Hint A:
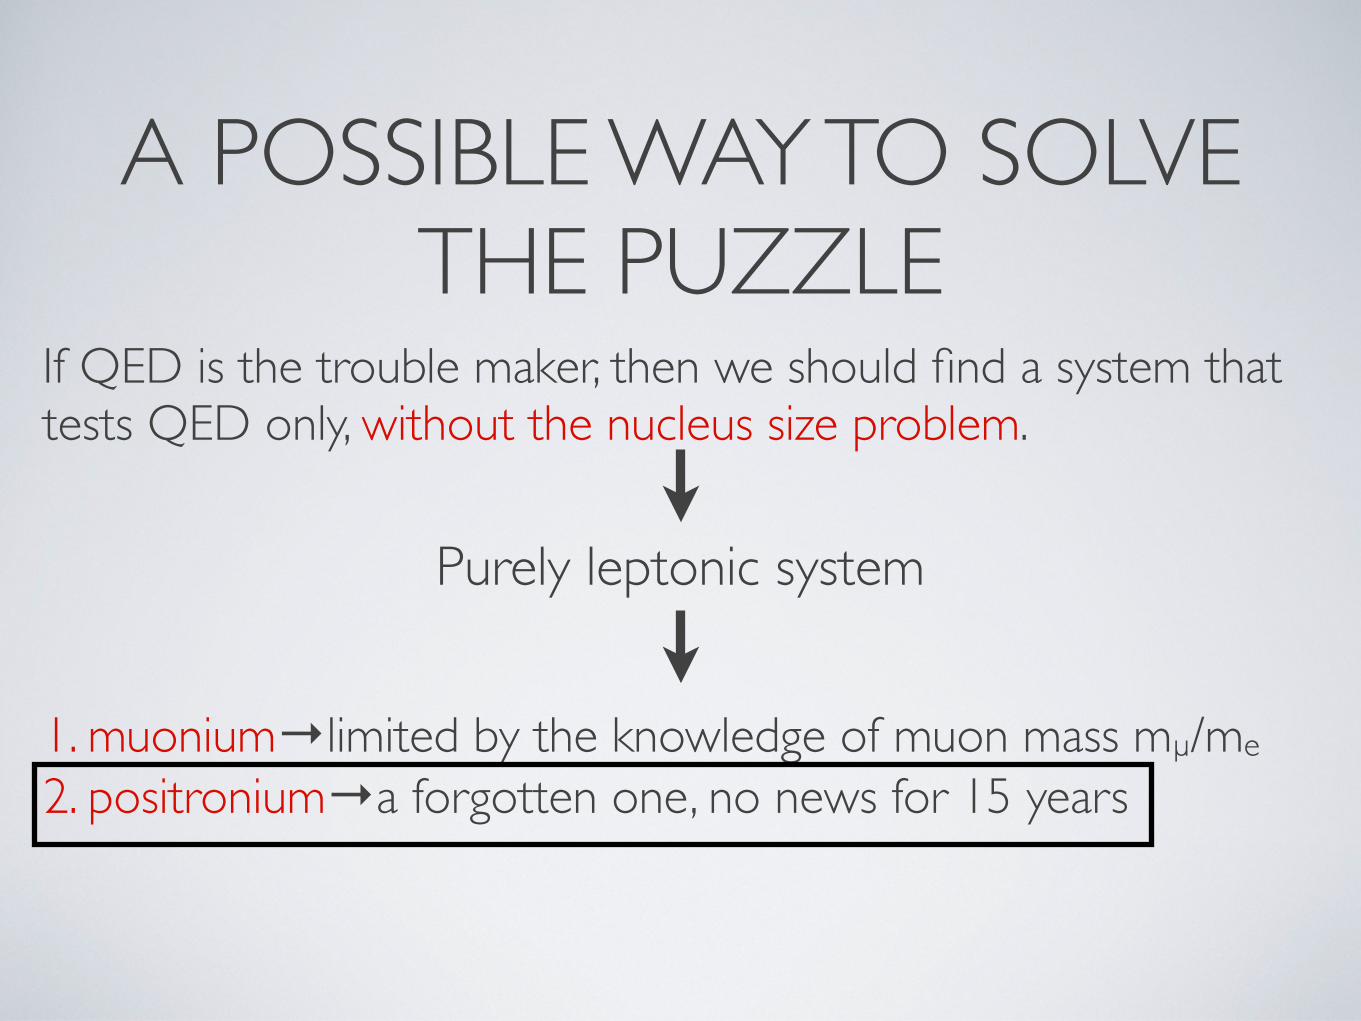
A POSSIBLE WAY TO SOLVE THE PUZZLE
If QED is the trouble maker, then we should find a system that tests QED only, without the nucleus size problem.
Purely leptonic system
1. muonium→limited by the knowledge of muon mass mµ/me
2. positronium→a forgotten one, no news for 15 years
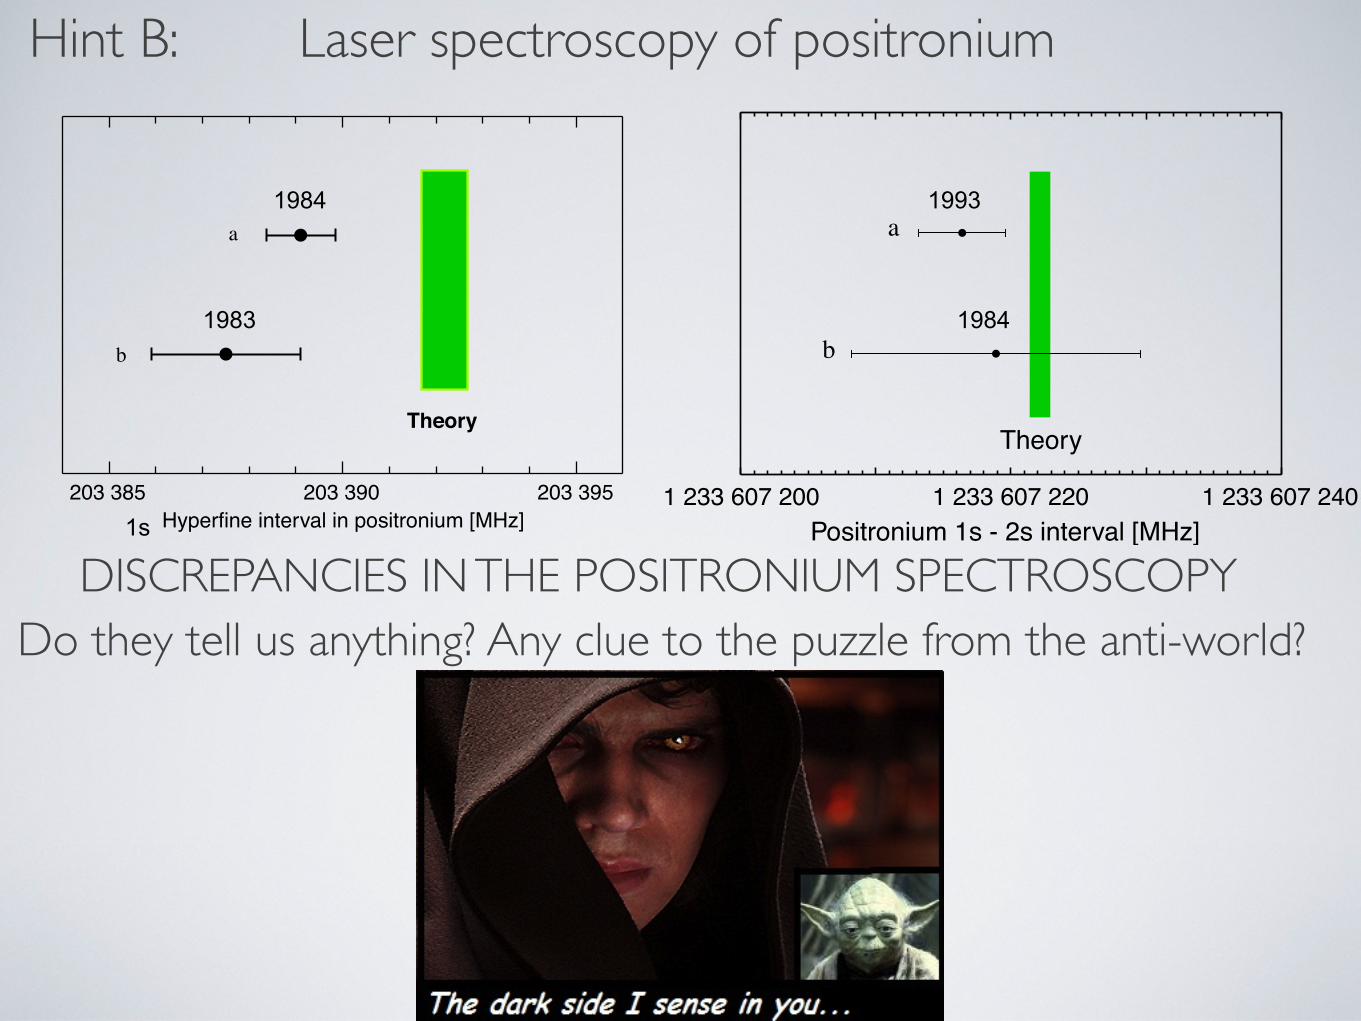
Savely G. Karshenboim / Physics Reports 422 (2005) 1–63 35
Hyperfine interval in positronium [MHz]
a
b
Theory
203 385 203 390 203 395
Fig. 23. The hyperfine splitting in the ground state of positronium. TheYale experiment (a) was performed in 1984 [170] and the Brandeis one (b)
in 1975 [171].
Table 13
Theory of the 1S hyperfine interval in positronium
Term Fractional contribution !E (MHz) References
EF !4mc2 1.000 000 0 204 386.6
QED1 !5mc2 !0.004 919 6 !1 005.5QED2 !6mc2 0.000 057 7 11.8 [184]
QED3 !7mc2 !0.000 006 1(22) !1.2(6) [61,149,150,185]
Total 0.995 132 1(22) 203 391.7(6)
The numerical results are presented for the frequency E/h. The calculation of the second-order terms was completed in Ref. [184] (for other
important contributions see [174,201] and references therein. The leading logarithmic contributions of the third order were found in [61], while the
next-to-leading logarithmic terms were achieved in [149,150,185]. The uncertainty is presented following [168,169].
as well as for the HFS and the lifetime calculations. Actually, the uncertainty of the calculations of the recoil effects
determines the entire theoretical uncertainty for the most wanted spectroscopic characteristics in positronium.
The equality ofm/M to unity leads to another important feature of positronium tests for the bound state QED. Since the
corrections of interest are enhanced (m/M is not a suppressing factor any longer), the fractional accuracy for successful
high-precision tests is now relatively low. As a result, in contrast to hydrogen, the interpretation of the measurements
of the 1S–2S interval does not crucially involve knowledge of the Rydberg constant with high accuracy. A study of
the hyperfine interval does not require a value of the fine structure constant ! with high accuracy as it is in muonium.Since m/M = 1, it is unnecessary to determine a mass ratio m/M and a ratio of magnetic moments of the electron
and nucleus, i.e., positronium,8 in an additional experiment. In other words, positronium offers several high-precision
tests of bound state QED without any need to determine values of any fundamental or phenomenological constant with
high accuracy.
The HFS interval has been determined experimentally with the highest absolute accuracy among other positronium
transitions. Present experimental data for the positronium hyperfine interval together with the theoretical result are
depicted in Fig. 23. The theoretical status for the positronium hyperfine interval in the 1S state is presented in detail in
Table 13. The dominant source of the uncertainty is the third-order corrections for positronium (!E(QED3)), which
are known only in the logarithmic approximation. The diagrams under question are related to radiative-recoil and recoil
8 One may wonder what should happen if the CPT symmetry is broken andme/me and "e/"e are not exactly equal to unity. In principle, certainfeatures of positronium might be sensitive to such a violation, however, special experiments with selective sensitivity to this effect would be needed.
It is also clear, that such a CPT violation should show itself not just as a small mismatch in masses and magnetic moments, but as incorrectness of
the basic equations (e.g., the Dirac equation).
DISCREPANCIES IN THE POSITRONIUM SPECTROSCOPYDo they tell us anything? Any clue to the puzzle from the anti-world?
36 Savely G. Karshenboim / Physics Reports 422 (2005) 1–63
Positronium 1s - 2s interval [MHz]
a
b
Theory
1 233 607 200 1 233 607 220 1 233 607 240
Fig. 24. Determination of the 13S1–23S1 interval in positronium. The references here are: a is for [172] and b is for [173].
Table 14
Theory of the 13S1–23S1 interval in positronium
Term !E (MHz)
!2mc2 1 233 690 735.1
!4mc2 !82 005.6!5mc2 !1 501.4!6mc2 !7.1, [174]!7mc2 1.2(6), [175,200]
Total 1 233 607 222.2(6)
The corrections !E are presented in the energy units, while their numerical values are given in the frequency units for E/h.
corrections, and they are the same as those responsible for the uncertainty of muonium hyperfine interval (!(Z!)2m/M
and (Z!)3m/M) [61,168,114] (see the previous section for detail). The fourth-order recoil terms of theory of heavy
atoms become the third-order corrections in positronium.
Studies of the spectrum and decay rates of positronium provide us with a number of strong tests of bound state
QED, some of which are among the most accurate. Some theoretical predictions from Table 12 can be compared with
accurate experimental data, a review of which can be found in [166]. The most accurately measured spectroscopic data
are related to the ground state HFS (see Fig. 23) and to the 1S–2S interval (see Fig. 24 and Table 14). There are some
minor discrepancies between experimental and theoretical data.
The experimental situation with the orthopositronium decay (see Fig. 25) had been not acceptable for a while but
it has been recently improved [182]. The problem was a significant inconsistency of various experiments and long-
standing strong discrepancy between theory and the most accurate experimental data. The data presented in Fig. 25
include most recent vacuum results from Tokyo [183] andAnnArbor [182] which are in a good agreement with theory
(see Table 15). The original gas result fromAnnArbor (data point c in Fig. 25) is corrected (data point d) according to
the preliminary analysis in [166] but that is not a final result. Further examination is in progress and it seems that the
final uncertainty will be bigger [179].
For the parapositronium decay theory and experiment are in perfect agreement (see Figs. 26 and 27). Most of
positronium decay experiments were reviewed in Refs. [166,167].
These two papers also review experiments on the fine structure in positronium performed at 23S1–2P intervals which
were less accurate than experiments at 1S HFS and 1S–2S intervals. Data on the fine structure are not as accurate as
the results related to the 1S hyperfine splitting and the 1S–2S interval but the progress is possible [166] (Fig. 28).
To conclude the section, let us discuss briefly the theory of the positronium decay rates and energy levels and
in particular the uncertainty of their calculations. We collected all theoretical predictions in Table 12. The results
were published and presented in different compilations. What we would like to emphasize here is our estimation of
uncertainty.
1s
1983
1984 1993
1984
Hint B: Laser spectroscopy of positronium
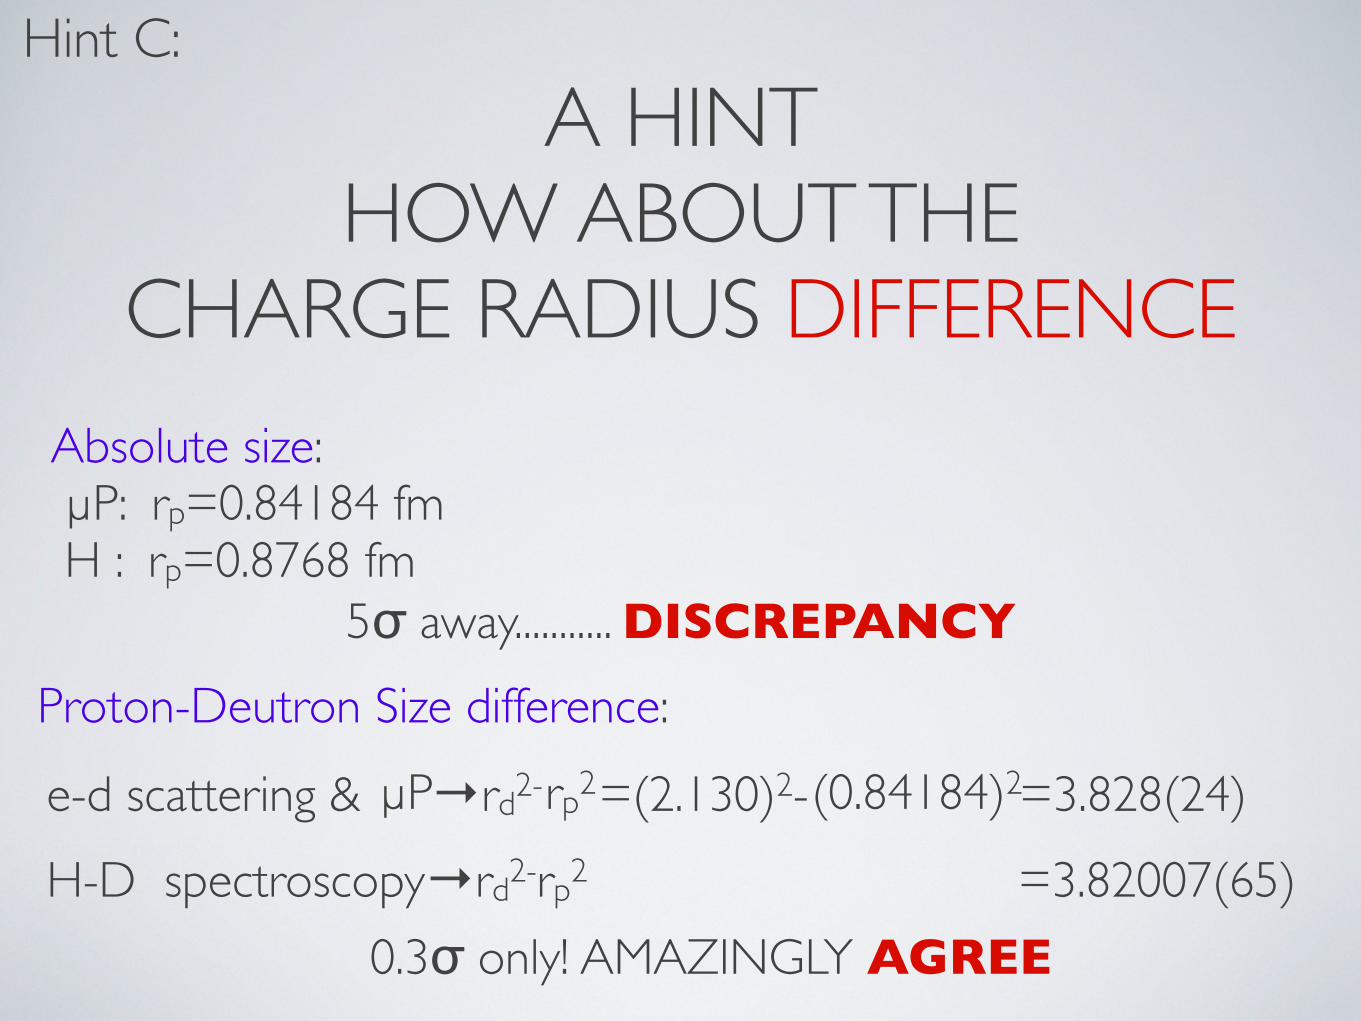
A HINT HOW ABOUT THE
CHARGE RADIUS DIFFERENCE
e-d scattering & →rd2- =(2.130)2- =3.828(24)
Absolute size: µP: rp=0.84184 fm H : rp=0.8768 fm
5σ away........... DISCREPANCY
Proton-Deutron Size difference:
µP rp2 (0.84184)2
H-D spectroscopy→rd2-rp2 =3.82007(65)
0.3σ only! AMAZINGLY AGREE
Hint C:
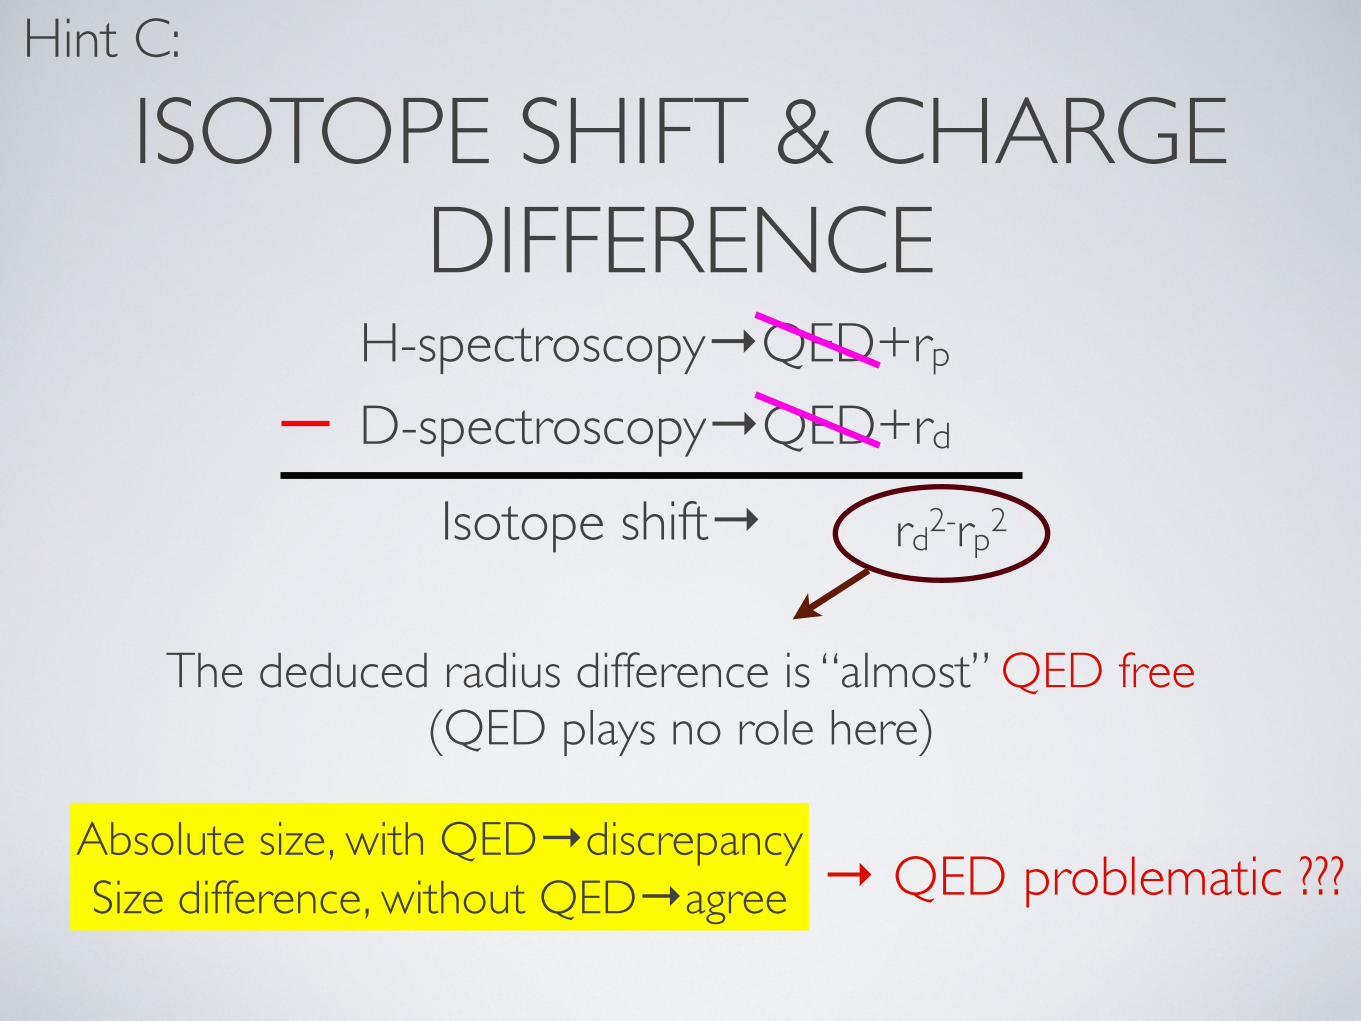
ISOTOPE SHIFT & CHARGE DIFFERENCE
The deduced radius difference is “almost” QED free(QED plays no role here)
H-spectroscopy→QED+rp
D-spectroscopy→QED+rd
rd2-rp2
Absolute size, with QED→discrepancySize difference, without QED→agree → QED problematic ???
Hint C:
Isotope shift→

Future of the experiment• Analysis other hyperfine transitions and
muonic Deuterium.
• muonic helium (μHe+) experiment (approved project, take data in 2013)
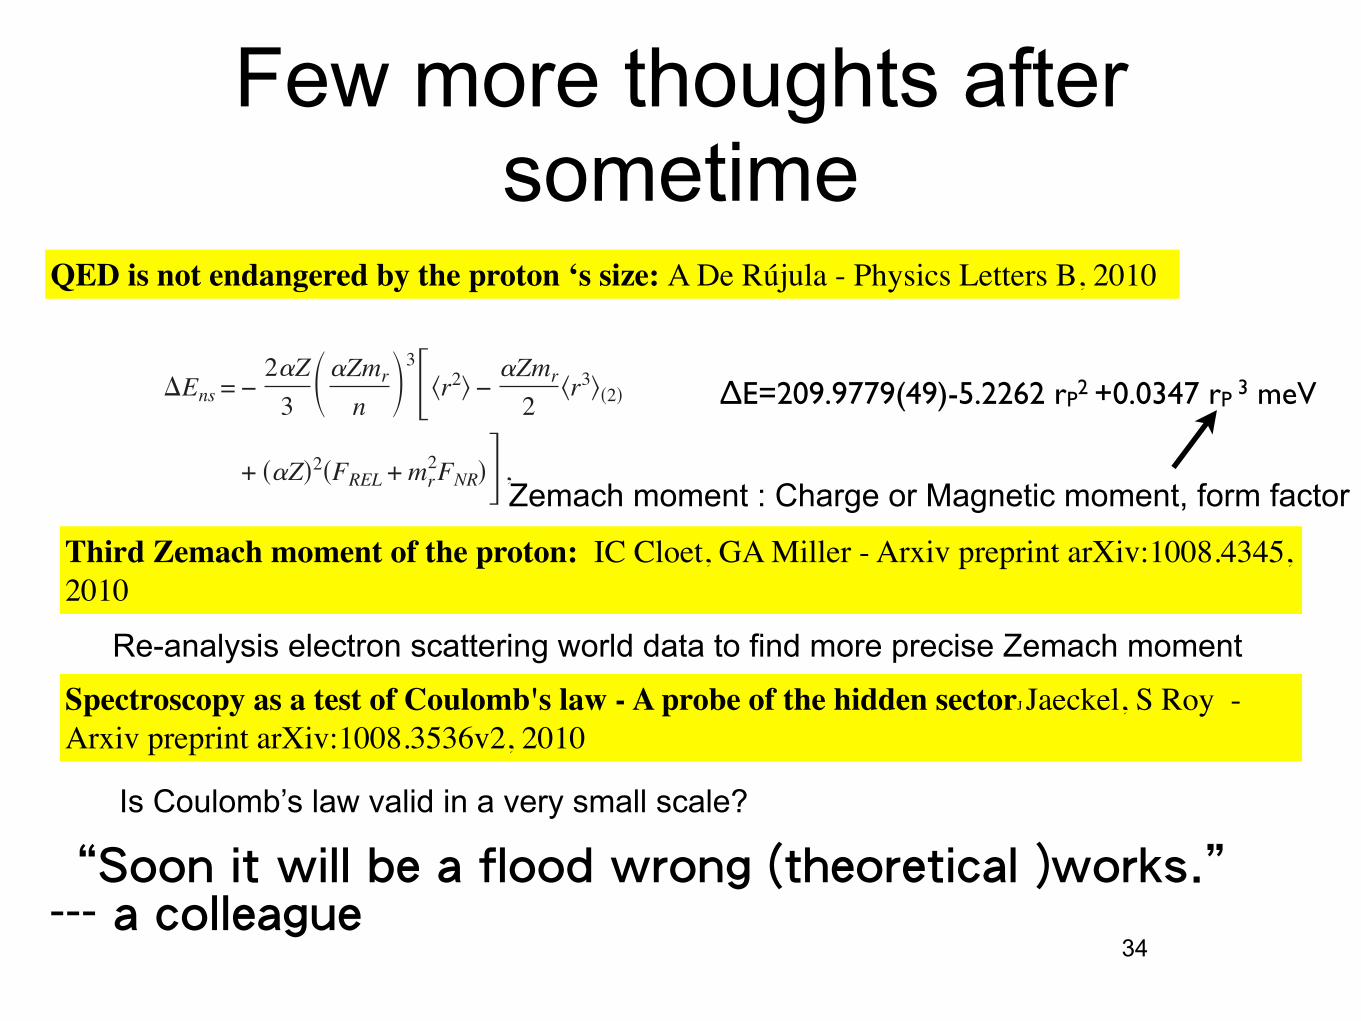
Few more thoughts after sometime
34
∆E=209.9779(49)-5.2262 rP2 +0.0347 rP 3 meV
potential to the 2p-2s transition is reduced by 0.0081 meVwith a proton radius of 0.862 fm !17" and by 0.0085 meVwith a proton radius of 0.880 fm !18". This result is consis-tent with the number given in !10" !Eq. #266$". More recentvalues for the proton radius have been given by Sick !19"#0.895±0.018 fm$ and in the newest CODATA compilation!20" #0.875±0.007 fm$.The numerical values given below were calculated as the
expectation value of the Uehling potential using point
Coulomb-Dirac wave functions with reduced mass.
Point nucleus Rp=0.875 fm
2p1/2-2s1/2 2p3/2-2s1/2 2p1/2-2s1/2 2p3/2-2s1/2
Uehling 205.0282 205.0332 205.0199 205.0250
Kaellen-
Sabry
1.50814 1.50818 1.50807 1.50811
The effect of finite proton size calculated here can be
parametrized as !0.0109%r2&. However, higher iterations canchange these results. For a very crude estimate, one can scale
previous results for helium !5" and assume that the ratio ofnonperturbative to perturbative contributions was the same,
giving a contribution of 0.175 meV.
The contributions due to two and three iterations have
been calculated by !8,23", respectively, giving a total of0.151 meV. An additional higher iteration including finite
size and vacuum polarization is given in Ref. !8" !Eqs. #66$and #67$" and Ref. !10" !Eqs. #264$ and #268$". These amountto !0.0164%r2&. The best way to calculate this would be anaccurate numerical solution of the Dirac equation in the com-
bined Coulomb plus Uehling potential.
The mixed muon-electron vacuum polarization correction
was recalculated and gave the same result as obtained
previously: namely, 0.000 07 meV !10,21".The Wichmann-Kroll !22" contribution was calculated us-
ing the parametrization for the potential given in !1". Theresult obtained #!0.001 03 meV$ is consistent with that
given in !10", but not with that given in !8".The equivalent potential for the virtual Delbrück effect
was recomputed from the Fourier transform given in !11,1".The resulting potential was checked by reproducing previ-
ously calculated results for the 2s-2p transition in muonic
helium and the 3d-2p transitions in muonic Mg and Si. The
result for hydrogen is +#0.001 35±0.000 15$ meV. As in thecase of muonic helium, this contribution very nearly cancels
the Wichmann-Kroll contribution. The contribution corre-
sponding to three photons to the muon and one to the proton
should be analogous to the light-by-light contribution to the
muon anomalous moment; to my knowledge, the corre-
sponding contribution to the muon form factor has
never been calculated. It will be comparable to the
other light-by-light contributions. For an estimate, the cor-
rection to the Lamb shift due to the contribution to the
anomalous magnetic moment was calculated; it amounts to
#!$0.000 02 meV; the contribution to the muon form factor
is one of the most significant unknown corrections.
The sixth-order vacuum polarization corrections to the
Lamb shift in muonic hydrogen have been calculated by Ki-
noshita and Nio !23". Their result for the 2p-2s transition is
"E#6$ = 0.120045##Z$2mr'#
$(3 ) 0.00761 meV.
It is entirely possible that the as-yet uncalculated light-by-
light contribution will give a comparable contribution.
The hadronic vacuum polarization contribution has been
estimated by a number of authors !10,24,25". It amounts toabout 0.012 meV. One point that should not be forgotten
about the hadronic VP correction is the fact that the sum rule
or dispersion relation that everyone #including myself$ useddoes not take into account the fact that the proton #nucleus$can in principle interact strongly with the hadrons in the
virtual hadron loop. This is irrelevant for the anomalous
magnetic moment but probably not for muonic atoms. An
estimation of this effect appears to be extremely difficult and
could easily change the correction by up to 50%. Eides et al.
!10" point out that the graph related to hadronic vacuumpolarization can also contriibute to the measured value of the
nuclear charge distribution #and polarizability$. It is not easyto determine where the contribution should be assigned.
III. FINITE NUCLEAR SIZE AND NUCLEAR
POLARIZATION
The main contribution due to finite nuclear size has been
given analytically to order ##Z$6 by Friar !26". The mainresult is
"Ens = !2#Z
3'#Zmr
n(3*%r2& !
#Zmr
2%r3$
+ ##Z$2#FREL + mr2FNR$+ , #5$
where %r2& is the mean-square radius of the proton. Formuonic hydrogen, the coefficient of %r2& is
5.1975 #meV fm!2$, giving an energy shift #for the leadingterm$ of 3.862±0.108 meV if the proton rms radius is
0.862±0.012 fm. The shift is 4.163±0.188 meV if the pro-
ton rms radius is 0.895±0.018 fm, and 3.979±0.076 meV if
the proton rms radius of 0.875±0.007 fm.
The second term in Eq. #5$ contributes !0.0232 meV fora dipole form factor and !0.0212 meV for a Gaussian formfactor. The parameters were fitted to the proton rms radius.
This can be written as !0.0347%r2&3/2 or 0.0317%r2&3/2, re-spectively. This differs slightly from the value given by Pa-
chucki !9". The model dependence introduces an uncertaintyof about %0.002 meV. The remaining terms contribute
0.00046 meV. This estimate includes all of the terms given in
!26", while other authors !9" give only some of them. Clearlythe neglected terms are not negligible. There is also a con-
tribution of !3&10!6 meV to the binding energy of the 2p1/2level and a recoil correction of 0.012 meV to the binding
energy of the 2s level.
As mentioned previously, the finite-size contri-
butions to vacuum polarization can be parametrized as
E. BORIE PHYSICAL REVIEW A 71, 032508 #2005$
032508-2
Zemach moment : Charge or Magnetic moment, form factor
Third Zemach moment of the proton: IC Cloet, GA Miller - Arxiv preprint arXiv:1008.4345, 2010
QED is not endangered by the proton ‘s size: A De Rújula - Physics Letters B, 2010
Re-analysis electron scattering world data to find more precise Zemach moment
Spectroscopy as a test of Coulomb's law - A probe of the hidden sectorJ Jaeckel, S Roy - Arxiv preprint arXiv:1008.3536v2, 2010
Is Coulomb’s law valid in a very small scale?
“Soon it will be a flood wrong (theoretical )works.” --- a colleague
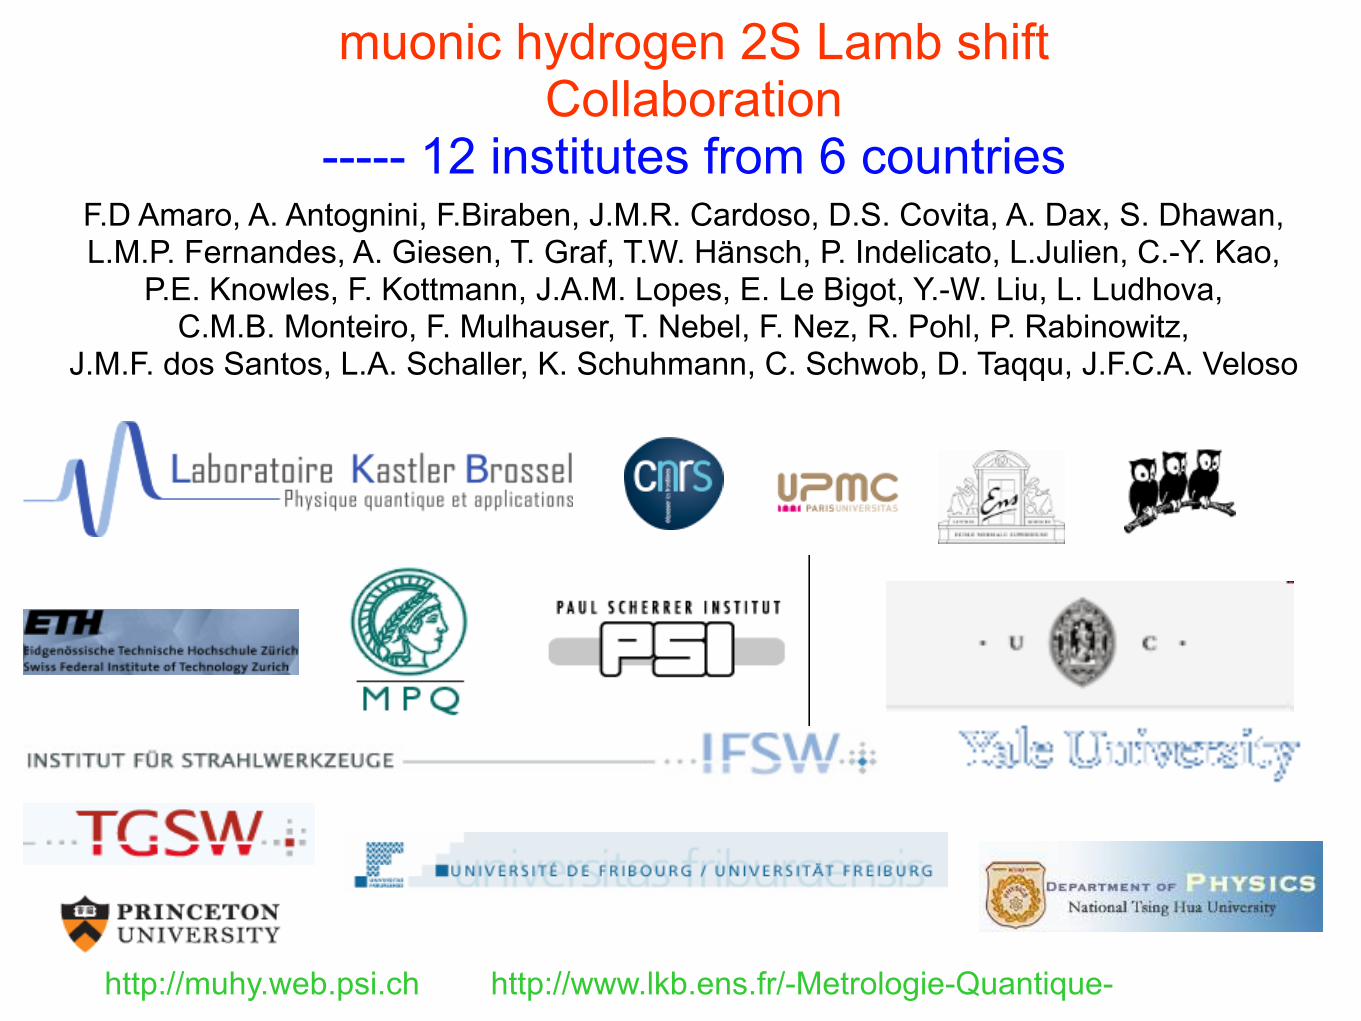
muonic hydrogen 2S Lamb shiftCollaboration
----- 12 institutes from 6 countriesF.D Amaro, A. Antognini, F.Biraben, J.M.R. Cardoso, D.S. Covita, A. Dax, S. Dhawan,L.M.P. Fernandes, A. Giesen, T. Graf, T.W. Hänsch, P. Indelicato, L.Julien, C.-Y. Kao,
P.E. Knowles, F. Kottmann, J.A.M. Lopes, E. Le Bigot, Y.-W. Liu, L. Ludhova, C.M.B. Monteiro, F. Mulhauser, T. Nebel, F. Nez, R. Pohl, P. Rabinowitz,
J.M.F. dos Santos, L.A. Schaller, K. Schuhmann, C. Schwob, D. Taqqu, J.F.C.A. Veloso
http://muhy.web.psi.ch http://www.lkb.ens.fr/-Metrologie-Quantique-

Proton Size Investigators thank you for your attention


感謝
•國家科學委員會的經費支持,特別是國際合作處的台瑞雙邊合作協議。
•清華大學校方以及物理系的長期支持。
38