japanese_invasion_7jan2015.pdf - Yi Lu
47
Once an Enemy, Forever an Enemy? The Long-run Impact of the Japanese Invasion of China from 1937 to 1945 on Trade and Investment Yi Che, a Julan Du, b* Yi Lu, c and Zhigang Tao d a Antai College of Economics & Management, Shanghai Jiao Tong University, Shanghai, China; Email: [email protected]. b Department of Economics, Chinese University of Hong Kong, Shatin, N.T., Hong Kong; Email: [email protected]. c Department of Economics, National University of Singapore, AS2 #06-02, 1 Arts Link, Singapore 117570; Email: [email protected]. d School of Business, University of Hong Kong, Pokfulam Road, Hong Kong; Email: [email protected]. Revised: January 2015 Abstract In this study, we exploit one of the most important conflicts of the 20th century between what are currently the world’s second and third largest economies, that is, the Japanese invasion of China from 1937 to 1945, to investigate the long- term impact of conflicts between countries on cross-border trade and investment. ∗ Corresponding author: Julan Du, Department of Economics, Chinese University of Hong Kong, Shatin, N.T., Hong Kong; Tel: 852-3943-8008; Email: [email protected] or [email protected]. 1 *Manuscript Click here to view linked References
-
Upload
khangminh22 -
Category
Documents
-
view
3 -
download
0
Transcript of japanese_invasion_7jan2015.pdf - Yi Lu

Once an Enemy, Forever an Enemy? The Long-run
Impact of the Japanese Invasion of China from 1937
to 1945 on Trade and Investment
Yi Che,a Julan Du,b∗Yi Lu,c and Zhigang Taod
a Antai College of Economics & Management,
Shanghai Jiao Tong University, Shanghai, China;
Email: [email protected].
b Department of Economics, Chinese University of Hong Kong,
Shatin, N.T., Hong Kong; Email: [email protected].
c Department of Economics, National University of Singapore,
AS2 #06-02, 1 Arts Link, Singapore 117570; Email: [email protected].
d School of Business, University of Hong Kong,
Pokfulam Road, Hong Kong; Email: [email protected].
Revised: January 2015
Abstract
In this study, we exploit one of the most important conflicts of the 20th century
between what are currently the world’s second and third largest economies, that
is, the Japanese invasion of China from 1937 to 1945, to investigate the long-
term impact of conflicts between countries on cross-border trade and investment.
∗Corresponding author: Julan Du, Department of Economics, Chinese University of Hong Kong,Shatin, N.T., Hong Kong; Tel: 852-3943-8008; Email: [email protected] or [email protected].
1
*ManuscriptClick here to view linked References

We find that Japanese multinationals are less likely to invest in Chinese regions
that suffered greater civilian casualties during the Japanese invasion, and these
regions also trade less with Japan. Our study shows that historical animosity
still influences international trade and investment, despite the trend toward an
increasingly globalized world.
Keywords: Sino-Japanese War; Trade and Investment; Difference-in-Differences
Estimation
JEL Codes: F1; D74; F21; F23
2

1 Introduction
We are living in an increasingly globalized world with substantial cross-border trade and
investment due to the dramatic reduction in trade barriers and advancements in com-
munications technology and logistics. Yet we have also witnessed continuous conflicts
between countries, some of which are even referred to as a clash of civilizations (Hunting-
ton, 1996). There is little understanding of whether these conflicts and their legacies have
long-term impacts on cross-border trade and investment. In this study, we exploit one of
the most important conflicts of the 20th century between the current world’s second and
third largest economies, the Japanese invasion of China from 1937 to 1945, to investigate
its long-run impacts on contemporary trade and investment between these two countries.
The eight-year Japanese invasion caused tremendous damage to China in terms of
civilian and military casualties and property losses. More importantly, even seven decades
after the end of the war, the two countries have not reached any reconciliation. The
lingering war memories, ongoing territorial rows, and repeated disputes over Japan’s war
responsibility might well cast shadows on current bilateral economic relations. Taking
advantage of the fairly large degree of variation in war losses across Chinese regions1
due to the country’s vast size, we use the percentage of civilian casualties caused by
the Japanese invasion (the number of civilians who suffered minor wounds, sustained
major wounds, or died due to the Japanese invasion in a region, divided by its pre-war
total population) to capture the severity of the damage caused by the Japanese invasion
across Chinese regions. The outcome variables in our study concern the direct investment
made by Japanese multinationals across Chinese regions and the bilateral trade between
Chinese regions and Japan.
To identify the long-run impacts that the Japanese invasion of China has had on con-
temporary trade and investment between these two countries, we employ the difference-in-
differences (DD) estimation method. Specifically, our identification strategy is to compare
both the Japanese investment in a Chinese region and the trade between this region and
1Regions here refer to province-level administrative units in China. Specifically, there are 22 provinces,4 municipalities directly under the supervision of the central government, and 5 minority autonomousregions.
3

Japan with the corresponding values of other foreign countries, and then examine the
variations in these differences across Chinese regions that suffered different degrees of
civilian casualties from the Japanese invasion.
In those Chinese regions that suffered greater civilian casualties, Japanese multina-
tionals were late in making direct investments, launched a smaller number of enterprises,
and invested a smaller amount. Specifically, a one-percentage-point decrease in the ratio
of civilian casualties would cause the number of direct investment projects from Japan
to increase by 7.9%, the contemporary investment from Japan in 2001 to increase by
23.3%, the accumulated investment from Japan until 2001 to increase by 16.3%, and the
investment from Japan to enter half a year earlier.
Those Chinese regions hit harder in the Japanese invasion imported less from Japan,
although their exports to Japan were much less affected or even unaffected. Hence, they
have less aggregate trade with Japan at present. Specifically, a one-percentage-point
decrease in the ratio of civilian casualties would, in a single year of 2001, cause China’s
imports from Japan to increase by 14.7%, and its total trade with Japan to increase by
15.9%. Obviously, if viewed with a longer time horizon, the cumulative losses caused
by war legacies in trade value from 1945 (the end of the Japanese invasion), especially
1978 (China’s adoption of open-door policy), to 2001 and beyond, should reach a large
amount. A similar conclusion also applies to the cumulative loss of the Japanese direct
investment in China.
It is noteworthy that our results are robust to the use of an alternative estimation
strategy (i.e., Poisson pseudo maximum likelihood estimation by Santos Silva and Ten-
reyro, 2006) to deal with zero investment or zero trade value.
In our empirical analysis, the use of the DD method allows us to eliminate all of the
differences (such as regional capacity for economic development, distance to the coast,
access to transport facilities, wage costs, education levels, etc.) across Chinese regions
that may be correlated with civilian casualties and outcome variables, and to remove
all of the differences (such as institutional quality, cultural affinity with China, language
distance to China, market size, etc.) across foreign countries that may also affect civilian
4

casualties and outcome variables. Therefore, in our opinion, the long-term impacts of
war casualties most likely stem from the war-induced chronic psychological conditions (or
sequelae) reflected in the deep-seated animosity and estrangement between the Chinese
and the Japanese. Indeed, two recent papers show that personal feelings have significant
effects on trade among countries. Guiso, Sapienza, and Zingales (2009) find that bilateral
trust has a substantial impact on trade and investment within Europe, whereas Michael
and Zhi (2010) show that the negative attitude between France and the U.S. significantly
affected their bilateral trade relation from 2002 to 2003.
To support our conjecture, in Section 5.3, we present evidence using data from the
Survey of Global Views conducted by the Chicago Council on Global Affairs in 2006.
Specifically, we find that in regions with more civilian casualties caused by the Japanese
invasion, the Chinese residents contemporarily have on average a lower level of trust
toward the Japanese. They are more likely to hold a negative view of the role of Japan
in Asia, want Japan to have a smaller influence in the world, and urge Japan to consider
China’s interests in formulating its foreign policy. Similarly, we find that in regions with
higher civilian casualties, there is a higher percentage of Chinese residents who hold the
view that Japan practices unfair trade with China.
Our study sheds new light on the long-term impacts of conflicts and wars on for-
eign direct investment. It also contributes to an emerging line of literature examining
the effects of conflicts on bilateral trade (Blomberg and Hess, 2006; Martin, Mayer, and
Thoenig, 2008; Glick and Taylor, 2010).2 Our study differs from this literature by using
cross-region (instead of cross-country) data to examine the long-run (instead of short-
run) impact of one major war (instead of multiple and different types of conflicts).3 We
demonstrate how war memories intensified by a lack of reconciliation over war respon-
2There are studies examining the effects of conflicts on other outcome variables, such as population(Davis and Weinstein, 2002), the poverty trap (Miguel and Roland, 2011), and development (Przeworski,Alvarez, Cheibub, and Limongi, 2000).
3Felbermayr and Groschl (2013) find that the historical Union-Confederacy border in the UnitedStates lowers the contemporary trade between U.S. states across the border by about 13%. They attributethis border effect to the Civil War, which took place 150 years ago. Their study is similar to ours in thatboth examine the long-term effects of historical conflicts. However, our study differs by using a directmeasure of the war damage caused by the Japanese invasion of China and examining the long-termeffects on direct investment as well as trade between Japan and China’s regions.
5

sibility can add to distrust and cast a shadow over current bilateral economic relations.
This paper also contributes to the international economics literature by being one of the
few studies examining the non-economic determinants of trade. One recent exception is
Head, Mayer, and Ries (2010) who study the effect of independence on post-colonial trade
using cross-country data, whereas we examine war’s effects on trade using within-country
and cross-region data.
The rest of this paper is organized as follows. The historical background of the Sino-
Japanese war of 1937-1945 is provided in Section 2. The data are described in Section
3, and our identification strategy is discussed in Section 4. The empirical findings are
presented in Section 5, and Section 6 concludes the paper.
2 Historical Background
The Marco Polo Bridge Incident on July 7, 1937 marked the beginning of a total war
between China and Japan. By 1941, Japan had occupied much of northern and coastal
China. After the Japanese attack on Pearl Harbor in 1941, the war became a major
front of the Pacific War in World War II, and lingered until August 1945 when Japan
surrendered.
The eight-year Japanese invasion resulted in tremendous losses sustained by the Chi-
nese people. Official Chinese statistics put China’s civilian and military casualties at 20
million dead and 15 million wounded during the 1937-45 period.4 Most Western histo-
rians agree that the total number of casualties was at least 20 million.5 The war also
wreaked havoc on the Chinese economy. The property losses suffered by the Chinese
were estimated to be US$383 billion based on the currency exchange rate in July 1937,
roughly 50 times the GDP of Japan at that time.6
Although the civilian casualties caused by the Japanese military invasion were widespread
in China, there was still a fairly large degree of variation in war atrocities across regions
4See “Remember Role in Ending Fascist War”. Chinadaily.com.cn, Aug 15, 2005.5See “Nuclear Power: The End of the War Against Japan”, by Duncan Anderson, bbc.co.uk/history,
Feb. 17, 2011.6See Ho Ying-chin (1979), Who Actually Fought the Sino-Japanese War 1937-1945?, Lee Ming Co.,
Inc.
6

owing to the country’s vast size. Figure 1 shows the geographic distribution of civilian
casualties across China, with the darker color representing more severe civilian casualties
(i.e., higher percentages of civilian casualties in total population; see Section 3 for details
on the data sources and the construction of this measure). Clearly, civilian casualties
were concentrated in China’s central corridor, starting in Shanxi all the way down to
Guangxi and passing through Henan, Hubei, Hunan, and Jiangxi. This was because of
the strategic intention of the Japanese army to build a supply line for its war in the
Pacific Ocean (so-called Operation Ichi-Go).7 The central corridor regions also suffered
the most because they formed the boundary between the Chinese resistance regions and
the Japanese occupied regions where conflicts occurred frequently. In contrast, there
were far fewer casualties in coastal regions, except in the case of Jiangsu where the no-
torious Nanking Massacre took place. Western China (consisting of Chinese resistance
areas) suffered primarily from the Japanese bombing, but the casualties were much less
severe. This large variation in war damage provides an ideal setting for us to identify the
invasion’s effect on Japan and China’s contemporary trade and investment.
3 Data
Most of the data we use in this study come from three sources. The first one is the
Survey of Foreign-invested Enterprises conducted by the National Bureau of Statistics
of China in 2001, from which we collect information on multinationals (the location of
investment in China, the identity of FDI source countries/areas,8 the year each foreign-
invested enterprise was established, the amount of capital investment (i.e., investment
in equity capital, other long-term capital, short-term capital, etc.) made by foreign
investors in each foreign-invested enterprise in 2001, and the cumulative amount of capital
investment made by foreign investors in each foreign-invested enterprise until 20019), and
aggregate the information for each of China’s FDI source countries/areas. Totally 109
7For more information, see http://en.wikipedia.org/wiki/Operation Ichi-Go.8The word “area” refers to a non-sovereign dependent area. For brevity, we call it an area to distin-
guish it from a sovereign state, which is referred to as a “country”.9Foreign investors often do not make the entire capital investment up front at the establishment of
foreign-invested enterprises, but rather make or even increase capital investment over time.
7

countries/areas had invested in China until 2001, and they constitute the whole sample
upon which our main analysis is based. Our results still hold when we exclude FDI from
Hong Kong, Macau and Taiwan (known for the possibility of the so-called round-trip
FDI), from tax-haven countries/areas, and/or from South Korea (as quite many Koreans
were drafted into the Japanese army and participated in the invasion of China in World
War II).
The second data source is the 2001 China Customs Data, from which we collect
information on each Chinese region’s total exports to and imports from each of China’s
trade partners. Totally 227 countries/areas have active trade relations with China, and
our results hold when we exclude trade with Hong Kong and Macau (known for their
trade intermediary roles), with tax-haven countries/areas, and/or with South Korea.
The last data source includes A History of the Investigation of China’s Losses during
World War II (Chi, 1987)10 and Statistical Abstract of the Republic of China, from which
we collect information on the number of civilians who suffered minor or major wounds
or died as a result of the Japanese invasion and the regional pre-war total population,
respectively.11
To capture variations in the severity of war damage and its persistent influence across
Chinese regions, we use Civilian Casualties (measured as the ratio of civilian casualties
to the regional pre-war population in 1936).12 Civilian casualties are expected to be
particularly powerful in capturing the war damage and the psychological sequelae of the
war. Unlike property losses, the negative effects of human casualties are often irreversible
10The data, which were initially collected by the Commission on the Investigation of China’s WarLosses set up by the government of the Republic of China after the war for the purpose of civil claimsfor war reparation from Japan and subsequently compiled by Chi (1987), are considered to be the mostreliable source on war losses.
11Note that the three northeastern regions of China, Helongjiang, Jilin and Liaoning, are not includedin the analysis. This is because the data source does not cover these regions, which were occupiedby the Japanese much earlier (1931) than the rest of China (1937), and were subject to a much lessconfrontational invasion strategy (the hijack and then installation of the last emperor of the Qing dynastyas the puppet ruler of these three regions, collectively called Manchuria) compared with the rest of China.
12A caveat for this data set is that, according to the administrative divisions in the war period,Shanghai was counted geographically as part of Jiangsu province, while Beijing and Tianjin were treatedas part of Hebei. We set the value of Civilian Casualties for Beijing and Tianjian to be the same as thatfor Hebei. However, as Shanghai is historically an immigrant city, we first use the 2000 population censusto find the composition of Shanghai residents in terms of the Chinese regions they originally came from,and then calculate a weighted average value for Shanghai. Our regression results remain qualitativelythe same if these three cities are excluded from the analysis.
8

and long-lasting. Furthermore, Chinese civilians often have extended family relations and
social networks in the local areas, most of whom remain in the region from one generation
to another. Injury or death among family members and friends during the war could have
generated long-term memories from one generation to another, resulting in unfavorable
attitudes toward Japan.
Table 1 lists the values of the key variables in our analysis, i.e., trade values (total
trade, total imports, and total exports) between each region in China and Japan in 2001,
direct investment by Japanese multinationals (number of existing enterprises in 2001,
capital investment made in 2001, and accumulated capital investment until 2001) in
each Chinese region, civilian casualties caused by the Japanese invasion in each Chinese
region, and the distance between each Chinese region and Japan (measured as the distance
between the regional capital city and Tokyo, Japan).
In Figures 2 and 3a-3c, we present, respectively, the unadjusted correlation across
Chinese regions between civilian casualties and the proportion of the number of Japanese-
invested firms in the total number of foreign-invested enterprises operating in 2001, the
share of a region’s trade value with Japan in its total foreign trade value, the fraction
of a region’s import value from Japan in its total import value, and the percentage of
a region’s export value to Japan in its total export value. For the share of the number
of Japanese-invested enterprises and the percentage of a Chinese region’s imports from
Japan in its total imports, we do find some negative correlations between them and
civilian casualties, but there appears to be no relation at all between civilian casualties
and China’s exports to Japan, leading to a muted negative relation between civilian
casualties and China’s total trade value with Japan. These unadjusted correlation plots,
however, may not reveal the true long-run impacts of the Japanese invasion of China on
the direct investment by Japanese multinationals and the Sino-Japanese bilateral trade,
due to the lack of control for some observed or unobserved variables that obviously affect
civilian casualties, investment from Japanese multinationals or Sino-Japanese trade. For
example, Chinese regions that are farther away from Japan were less likely to be invaded
by the Japanese in the 1930s-1940s, and they are also less likely to be invested in by the
9

Japanese multinationals and less likely to trade with Japan at present. Meanwhile, the
Japanese could have encountered more stalwart civilian resistance (and hence caused more
civilian casualties) in regions with a tradition of xenophobia, which also adversely affects
the contemporary FDI location choice and the Sino-Japanese bilateral trade. These
two factors could significantly and simultaneously affect the relations between civilian
casualties and Sino-Japanese bilateral economic relations. For the first possible factor,
more distant regions had fewer war casualties and thus have less trade with and investment
from Japan today, which might lead to a positive association between trade/investment
and casualties. For the second factor, regions with more xenophobia suffered more war
casualties and thus have less trade and investment today. Hence, a negative relationship
is expected. Thus, these two factors may affect the relations between civilian casualties
and Sino-Japanese trade and investment in opposite directions, so that the unadjusted
correlations only produce a blurred picture. In the next section, we discuss our strategy
for identifying the long-run impacts of Japan’s invasion of China on the direct investment
made by Japanese multinationals and Sino-Japanese bilateral trade.
4 Identification
Our identification strategy is to compare both the Japanese investment in a Chinese
region and the trade between this region and Japan with the corresponding values of
other foreign countries with the same Chinese region, and then examine such differences
across Chinese regions that suffered different civilian casualties from the Japanese invasion
(i.e., essentially a DD estimation strategy). Specifically, the estimation specification is
yrf = λr + ξf + γdrf + βzr · Japanf + εrf , (1)
where r and f are the indices for Chinese regions and foreign countries, respectively;
drf is the logarithm of physical distance between Chinese region r and foreign country f
(measured by the distance between the capital city of Chinese region r and the capital city
of foreign country f); zr is the percentage of civilian casualties caused by the Japanese
10

invasion in region r; Japanf is an indicator variable that takes the value of 1 if the country
is Japan and 0 otherwise; and εrf is the error term.13 Standard errors are clustered
at the region level to deal with any possible heteroskedasticity and serial correlation
problems (Bertrand, Duflo, and Mullainathan, 2004). Meanwhile, as the number of
regions is only 28, there could be a concern that too few clusters may lead to estimated
residuals being systematically too close to zero compared with the true error terms,
resulting in an overrejection of the null hypothesis. To address this potential concern, we
also report the standard error calculated using the percentile-t cluster bootstrap method
developed by Cameron, Gelbach, and Miller (2008) for improved statistical inference with
few clusters.14
Our outcome variables, yrf , are about the investment made by multinationals from
foreign country f in Chinese region r, and the trade between foreign country f and Chi-
nese region r. For investment outcomes, we use the total number of enterprises invested
by foreign country f in Chinese region r that were still operating in 2001 (in logarithm),
the value of capital investment made by investors from foreign country f in these en-
terprises in Chinese region r in 2001 (in logarithm), the value of accumulated capital
investment made by investors from foreign country f in these enterprises in Chinese re-
gion r until 2001 (in logarithm), and the calendar year when the first investment from
foreign country f took place in Chinese region r. For trade outcomes, we examine the
total trade value between Chinese region r and foreign country f , the value of imports
by Chinese region r from foreign country f , and the value of exports by Chinese region
r to foreign country f (all in 2001 and in logarithm).
The inclusion of fixed effects for Chinese regions (λr) eliminates all the differences
(such as regional capacity for economic development, distance to the coast, access to
transport facilities, wage costs, education levels, etc.) across Chinese regions that may
be correlated with civilian casualties and outcome variables. Meanwhile, the inclusion
13Note that zr and Japanf are absorbed by region (λr) and country (ξf ) fixed effects, respectively,and hence do not appear in the estimation equation.
14This method, most emphasized by theoretical econometricians and statisticians, provides asymptoticrefinement, and can lead to considerable improvement (see Cameron, Gelbach, and Miller, 2008, fordetails).
11

of fixed effects for foreign countries (ξf) controls for all foreign country characteristics
(such as institutional quality, cultural affinity with China, language distance to China,
market size, etc.) that may also affect civilian casualties and outcome variables. The
double difference, conditional on the bilateral physical distance, then yields an unbiased
estimation of β.
As some foreign countries did not invest in or trade with some regions in China,
our dataset contains some zero observations. One potential concern with our estimation
strategy is that Equation (1) essentially excludes zero investment and zero trade values,
which may lead to a sample selection bias. To deal with this issue, we, in a robustness
check, adopt the Poisson pseudo maximum likelihood estimation (PPMLE) by Santos
Silva and Tenreyro (2006).
As an illustration of our DD estimation, we use the added variable plot method to
present the adjusted correlations (i.e., the ones conditional on the physical distance drf ,
fixed effects for Chinese regions λr, and fixed effects for foreign countries ξf) between
the interaction term of civilian casualties and the Japan indicator variable and the four
investment/trade outcome variables for the subsample of two foreign countries, Japan
and the U.S., in Appendix Figure A1/Figures A2a-A2c, respectively.15 Both Japan and
the U.S. are among China’s largest trade partners and share similarities in many aspects
except the historical invasion of China. We control for distance because geographical
proximity may facilitate trade and investment flows. For the total number of foreign
invested firms, total trade value, and total import value, we do find negative correlations
between them and the interaction term of civilian casualties and the Japan indicator
variable, but it is less clear for total export value. In the next section, we report the
regression results based on the whole sample of all foreign countries to further corroborate
these findings.
15Specifically, the Y-axis variables are the residue from the regressions of the concerned invest-ment/trade outcomes on the physical distance drf , fixed effects for Chinese regions λr, and fixed effectsfor foreign countries ξf . The X-axis variable is the residue from the regression of civilian causalties onthe same set of regressors. In practice, we use the STATA code, avplot.
12

5 Empirical Results
5.1 Investment
The benchmark regression results regarding the impacts of the Japanese invasion on the
investment by Japanese multinationals (via Equation (1) for the outcome variables about
investment) are reported in Table 2. It is found that, for all four of the measures of direct
investment in Chinese regions (the total number of foreign-invested enterprises existing
in 2001, the value of investment made in 2001, the value of accumulated investment
until 2001, and the year when the first direct investment took place), Civilian Casual-
ties*Japan Indicator has statistically significant estimated coefficients, which are negative
in Columns 1-3 and positive in Column 4. The use of the percentile-t cluster bootstrap
method increases the magnitude of the estimated standard errors slightly in Columns
1-3, but does not reduce the statistical significance of the estimated coefficients. It even
lowers the estimated standard error and raises the statistical significance of the estimated
coefficient of Civilian Casualties*Japan Indicator in Column 4. These results imply that
the Chinese regions that suffered more war casualties in the 1930s-1940s accommodated
less Japanese investment, i.e., fewer direct investment projects from Japan, a smaller
amount of investment from Japan in 2001, a smaller value of accumulated investment
from Japan until 2001, and late timing in receiving direct investment from Japan.
Moreover, the control variable (the distance between a Chinese region and a foreign
country) produces consistent and intuitive results, i.e., foreign multinationals prefer to
invest in Chinese regions that are geographically closer to their home countries.
In terms of economic significance, a one-percentage-point decrease in the ratio of
civilian casualties would increase the number of Japanese-invested enterprises existing in
2001 by 7.9%, the value of contemporary capital investment made by Japanese investors
in these enterprises in 2001 by 23.3%, the value of accumulated capital investment made
by Japanese investors in these enterprises until 2001 by 16.3%, and cause the first direct
investment project from Japan to enter half a year earlier. To gauge the overall impact
of the war damage on investment, for each region in China, we calculate the increase
13

in the value of capital investment from Japan if there had been no such war (i.e., for
each region in China, we set the value of civilian casualties to zero).16 Taken together
(see the Appendix Table for details), the war legacies caused a total loss of 1, 244 direct
investment projects from Japan in 2001, US$1 billion in contemporary capital investment
from Japan in 2001, and US$4.6 billion in accumulated capital investment from Japan
until 2001.
To address the concern of zeros, in Table 3, we use the PPMLE method by Santos
Silva and Tenreyro (2006) to re-estimate Equation (1) by including observations of ze-
ros in the regressions. We still find negative and statistically significant impacts of the
Japanese invasion on the investment made by Japanese multinationals, suggesting that
the sample selection issue caused by zero investment would not change our conclusion.
Interestingly, the magnitudes of the impacts obtained using the PPMLE estimation for
the amount of contemporary capital investment and the amount of accumulated invest-
ment are even larger than those obtained earlier, implying that the zeros problem mainly
causes a downward bias of the magnitude of our estimated coefficients, and thus actually
underestimates the effects of civilian casualties.
5.2 Trade
The regression results for the impacts of the Japanese invasion on the contemporary trade
between Chinese regions and Japan (via Equation (1) for the outcome variables about
trade) are reported in Table 4. It is found that, for all three of the measures of trade
(total trade value, total import value, and total export value), Civilian Casualties*Japan
Indicator has negative estimated coefficients (Columns 1-3) and is statistically significant
for total trade and total imports (Columns 1 and 2, respectively). Our results imply that
Chinese regions hit harder in the Japanese invasion imported less from Japan, although
their exports to Japan were not statistically significantly affected. Consequently, the
16For example, if there were no Japanese invasion, the percentage of civilian casualties in Hubeiprovince would drop from 5.08% to zero; hence, the number of direct investment projects from Japan inHubei province would increase by 5.08 ∗ 0.079 or 40.13%. Given that the number of direct investmentprojects from Japan in Hubei province in 2001 was 119, it implies an increase of 47.8 direct investmentprojects.
14

harder-hit regions have significantly less aggregate trade with Japan at present. The con-
trasting results of the impacts of civilian casualties on imports and exports are consistent
with and reinforce to some extent the proposed mechanisms of the long-run impacts of
Japan’s invasion of China, which are discussed in detail in Section 5.3.
Moreover, the control variable (the distance between a Chinese region and a foreign
country) produces outcomes that are consistent with the gravity model, i.e., foreign
countries prefer to trade with Chinese regions that are geographically closer to them.
In terms of economic significance, a one-percentage-point decrease in the ratio of
civilian casualties would cause China’s imports from Japan to increase by 14.7%, and
its total trade with Japan to increase by 15.9%. To gauge the overall impact of the
war damage on bilateral trade, for each region in China, we calculate the increase in the
value of trade with Japan if there had been no such war (i.e., for each region in China,
we set the value of civilian casualties to zero). Taken together (see the Appendix Table
for details), in a single year of 2001, the war legacies resulted in a total loss of US$10
billion in China’s imports from Japan and a total loss of US$21.9 billion in trade value
between China and Japan. Even if we take into account the facts that there had been a
long period of suspended or sluggish trade between China and the West before 1978 and
the expansion of China’s trade capacity has accelerated only since 1978, the war-legacy-
induced trade losses in the post-war period are still expected to have been accumulated
to a much higher level. Hence, in view of the cumulative losses in trade value from the
end of the Japanese invasion in 1945, (especially since 1978), to 2001 and beyond, the
Japanese invasion of China has caused a far greater loss of trade between China and
Japan.
Our estimated trade losses due to the war damage are in line with the findings reported
in the literature. For example, Felbermayr and Groschl (2013) report a decrease of 13%
in trade between states across the historical Union-Confederacy border (where the Civil
War took place about 150 years ago) in the United States. Using a cross-country data
set on wars dating back to 1870, Glick and Taylor (2010) find that trade falls by as
much as 21% eight years after the cessation of wars. Drawing on a large data set of
15

military conflicts over the 1950-2000 period, Martin, Mayer, and Thoenig (2008) uncover
a decrease of 22% in trade due to military conflicts.
To address the issue of zero trade, in Table 5, we present the results from the PPMLE
estimations. Consistently, we find that the Japanese invasion had negative and statis-
tically significant effects on all three trade measures, i.e., total value of trade between
China and Japan, import value from Japan, and export value to Japan, despite rather
significant drops in the magnitude. Meanwhile, consistent with our earlier findings, the
magnitude of these effects is found to be much larger for the imports from Japan than
for the exports to Japan. These results further reinforce our previous findings that the
Japanese invasion of China from 1937 to 1945 continues to damage contemporary Sino-
Japanese trade relations, and that most of the damage results from reduced imports from
Japan.
5.3 Discussion
Our analysis demonstrates that the Japanese invasion of China exerts negative effects on
the current Japanese investment in China and the Sino-Japanese bilateral trade. There
are various a priori reasons for war damage to deter trade and foreign investment. For
example, the destruction of physical infrastructure, transportation facilities, and pro-
duction capacity, the loss of human life and human capital, and the damage of natural
environments can all undermine regional capacity for socioeconomic development. If so,
trade and investment relations with foreign countries other than Japan would also be
adversely affected. Our analysis focusing on the differences between Japan and other
foreign countries in the same regions demonstrates that the long-term impacts of war
damage are specific to Japan. Hence, in our opinion, the most plausible interpretation is
that the war created long-lasting war memories and chronic psychological conditions such
as lack of trust and an unfavorable attitude of the Chinese toward the Japanese, which
is particularly exacerbated by the Chinese public’s perception of Japan’s lack of sincere
remorse for the war crimes committed (e.g., the whitewashing of war crimes in Japanese
history textbooks and the political visits of top Japanese government officials to the Ya-
16

sukuni Shrine which enshrines Japan’s war dead, including convicted war criminals), and
the rising nationalism tolerated by the Chinese government.
To shed light on whether war casualties gauge the intensity of war-induced psycholog-
ical sequelae or war memories, we use data from the Survey of Global Views conducted
by the Chicago Council on Global Affairs on July 10-21, 2006. The Chinese sample of the
survey, to which we have access, uses a multi-stage stratified random sampling method.
First, ten regions were chosen according to their geographic location and their human
development index. Second, the number of individuals to be surveyed in each region was
determined in accordance with the proportion of the region’s population in the national
population on the basis of the 2005 national census, and the sample was weighted to
represent the urban-rural resident composition in the 2005 census, which indicated that
43% of people lived in cities or towns and 57% lived in villages. Finally, individuals were
randomly surveyed.17 As one of the regions was in northeast China, for which we do
not have war casualty data, our following analysis focuses on the remaining nine regions
(Beijing, Guangdong, Hebei, Henan, Hubei, Sichuan, Xinjiang, Yunnan, and Zhejiang)
with a total number of 1,964 individuals. The survey assesses separately the degree to
which Chinese residents’ attitudes toward Japan and toward the U.S. are favorable on
various issues. In this type of survey, the U.S. often serves as a benchmark, which also
provides a good platform for us to conduct DD analyses.
There are a number of relevant survey questions that can be grouped into three types.
The first type is about the trust the contemporary Chinese place in Japan. Specifically,
the question asks how much Chinese people trust Japan to act responsibly in the world.
The same question is applied to the U.S. The multiple choices for the answer are 1 (not at
all), 2 (not very much), 3 (somewhat), and 4 (a great deal), with a higher value indicating
a higher degree of trust.
The second category of questions concerns three other indicators of the general opin-
ions of the Chinese toward Japan. One question asks surveyees whether a foreign country
is playing a positive or negative role in resolving the key problems facing Asia. The same
17We would like to thank Professor Donglin Han of Renmin University of China for sharing the datawith us.
17

question is asked separately for Japan and for the U.S. We construct an indicator variable
that takes a value of one if a surveyee thinks that a foreign country plays a negative role.
In another question, surveyees are asked to indicate on a 10-point scale how much influ-
ence they want a foreign country to have in the world, with a higher value corresponding
to a higher degree of preference and positive attitude. The question is asked separately
for Japan and for the U.S. In a third question, surveyees are asked how much they think
a foreign country takes the interests of China into account when making foreign policy
decisions. The question is asked separately for Japan and for the U.S. The multiple
choices for the answer are 1 (not at all), 2 (not very much), 3 (somewhat), and 4 (a great
deal), with a higher value indicating a higher degree of positive attitude.
The third type of question is about the bilateral economic relations. The survey asks
Chinese citizens whether a foreign country practices fair or unfair trade with China. The
question is asked separately for Japan and for the U.S. We construct an indicator variable
that takes a value of one if a foreign country is regarded as conducting unfair trade with
China.
We first employ the added variable plot method to present the adjusted correlations
(i.e., the ones conditional on the physical distance drf ,18 fixed effects for Chinese regions
λr, and fixed effects for foreign countries ξf)19 between the interaction term of civilian
casualties and the Japan indicator and the indicators of the Chinese people’s attitude
toward a foreign country. The individual-level responses regarding the attitude toward
a foreign country are aggregated to the region level as the average responses of regional
residents or the proportion of regional residents that hold a certain view. The region-level
responses to the questions for Japan and for the U.S. are treated as distinct observations
in the pooled sample in generating the added variable plot.
As shown in Figure 4a, the contemporary Chinese residents in regions with more
18Physical distance is controlled because it may affect the extent of a region’s exposure to or exchangewith Japan or the U.S., which in turn helps shape the attitudes of the regional residents toward Japanor the U.S., even if the direction of the effect is unclear ex ante.
19We control for fixed effects for foreign countries because foreign countries have different character-istics, such as cultural differences from China, which may affect the attitudes of Chinese people towardthem. Meanwhile, different regions in China may also have different characteristics, such as the varia-tions in the culture of openness and the degree of engaging in foreign relations, which may affect theattitudes of regional residents toward foreigners.
18

civilian casualties have on average a lower level of trust in the belief that Japan acts
responsibly in the world. Regarding the questions in the second category, in regions with
higher civilian casualties, we observe (1) a larger proportion of Chinese residents to have a
negative view of Japan’s role in resolving Asian issues (Figure 4b), (2) regional residents,
on average, would want Japan to have a smaller influence in the world (Figure 4c); and
(3) a lower average degree of agreement with the view that Japan takes China’s interests
into account when making its foreign policy decisions (Figure 4d). The above results lend
support to our aforementioned argument that the war has created chronic psychological
conditions such as a lack of trust and unfavorable attitudes of the Chinese toward the
Japanese.
In terms of bilateral economic relations, in regions with higher civilian casualties, a
larger proportion of Chinese residents hold the view that Japan practices unfair trade with
China (Figure 4e). This provides more direct support to our claim that war memories
and psychological sequelae undermine bilateral economic relations.
To further corroborate our findings in the aforementioned figures, we conduct a re-
gression analysis. The sample combines individual responses to the questions regarding
attitudes toward Japan with those regarding attitudes toward the U.S. We conduct our
regression analysis on the basis of individual-level responses. Specifically, the estimation
specification is
yirf = λi + ξf + γdrf + βzr · Japanf + (Xi · Japanf )′
θ + (Wr · Japanf )′
ψ + εirf , (2)
where yirf measures the attitudes of individual i located in region r for foreign country f
(the five measures used in Figures 4a-4e); λi is the individual fixed effects, controlling for
all of the individual characteristics that shape the attitudes of regional residents toward
foreign countries in general, which are represented by the attitudes toward the U.S.;20
ξf is the fixed effects for foreign countries; drf is the distance between Chinese region r
and foreign country f ; zr is the percentage of civilian casualties in region r caused by the
20Given that the survey is a cross-sectional dataset, λi also controls for all of the regional characteristicsthat shape the attitudes of regional residents toward foreign countries in general.
19

Japanese invasion; Japanf is an indicator variable that takes a value of one if the foreign
country is Japan and zero if it is the U.S.. Thus, zr · Japanf captures the impact of war
casualties on individuals’ attitudes toward Japan that differ from those toward the U.S.
The prevalent anti-Japanese sentiment in China may be affected by other regional and
individual characteristics.21 We therefore include Xi, a vector of individual characteristics
(including gender, age, education, urban residency, and income), and Wr, a vector of
regional characteristics (including GDP, population, the percentage of the population
with college degrees, railway density, and land area). The interaction terms (Xi · Japanf )
and (Wr · Japanf ) capture how these individual and regional characteristics can affect
the Chinese residents’ attitude toward Japan in a different manner than that toward the
U.S.22
Inspired by several existing survey studies,23 we think some sociocultural factors can
potentially help shape the Chinese people’s view of Japan, including (1) the social learning
of war memories passed on from older generations, media, etc.; (2) information contained
in the propaganda conducted by Chinese media, movies, TV dramas, etc.; (3) the degree
of exposure to Japanese culture and society; and (4) the degree of contact with the
Japanese people. The regional characteristics variables can reflect these factors to some
degree. For example, a higher ratio of civilian casualties intensifies war memories. The
exposure to Japanese culture and the frequency of contact with Japanese tourists and
business people may be larger for a region that is closer to Japan, larger in size (land
area, GDP size, and population) and has better transportation infrastructure (railway
density).24 Also, for instance, a region with a larger fraction of college degree holders may
21For information on the anti-Japanese sentiment in China, one may refer to Il Hyun Cho and Seo-HyunPark, “Anti-Chinese and Anti-Japanese Sentiments in East Asia: The Politics of Opinion, Distrust, andPrejudice”, The Chinese Journal of International Politics, 4(3): 265-90, 2011, and various news reportssuch as “Anti-Japan Sentiment Gains Strength in China”, Time, September 2010.
22To improve the efficiency, we estimate Equation (2) in a first-difference manner (that eliminatesindividual indicator variables λi), i.e.,
yirf = ξ + γdrf + βzr +X′
iθ +W′
rψ + εirf ,
where yirf ≡ yir,Japan − yir,US ; ξ ≡ ξJapan − ξUS ; drf ≡ dr,Japan − dr,US ; and εirf ≡ εir,Japan − εir,US .23For example, Lu Deping conducted a survey of college students in Tsinghua University, Renmin
University of China, and China Youth University for Political Science in Beijing on their view of Japanin 2001. Later, Sha Sha conducted a survey and social-psychological study of the college students’ viewof Japan in Xiamen University in Fujian province in 2008.
24In addition, to a large degree, the victim mentality, i.e., an excessive and persistent sense of being
20
be more likely to exhibit independent thinking that is less affected by media propaganda.
Individual characteristics can also play a role.25 Males and females may respond
differently to media propaganda. Older people may have more intense war memories
than younger people. More educated individuals and people with higher income status
may be less affected by media propaganda. Urban residents may have more exposure to
the Japanese culture and people, media propaganda, and mass protests against Japan
than rural residents, which in turn shapes their opinions of Japan.
Because there are only nine regions, we report the standard errors calculated using
the percentile-t cluster bootstrap method developed by Cameron, Gelbach, and Miller
(2008) for improved statistical inference with fewer clusters.
The regression results of Equation (2) are reported in Table 6. We find that Civilian
Casualties*Japan Indicator has statistically significant estimated coefficients for all five
of the measures of individual feelings or opinions (Columns 1-5), showing that individuals
from regions with higher civilian casualties have more unfavorable opinions about Japan.
This is consistent with the findings in Figures 4a-4e. These results reinforce our argument
that the negative impacts of the Japanese invasion of China on contemporary investment
from Japan and Sino-Japanese bilateral trade is most likely due to the lack of trust and
unfavorable attitude of the Chinese toward the Japanese as a result of war memories.26
Moreover, in unreported results, we find that some regional and individual charac-
teristics affect people’s attitudes toward Japan to some degree, but the results are not
consistently significant. For instance, older people, urban residents, and females tend
to have a more negative view of Japan. Residents in regions with a larger population
victimized by neighboring countries after wars and border disputes, is often closely associated with thepopular notion of narrow-mindedness of small town or small country mentality, which may be less intensefor a larger region in various size measures.
25Earlier studies detect the effects of individual characteristics on the sequelae of war. For example,under a similar setting, Schnurr et al. (2004) identify various risk factors for the development of post-traumatic stress disorder (PTSD) among Vietnam veterans in the U.S. They find that individuals withhigh school degrees or college education, higher socioeconomic status, etc. were less likely to suffer fromPTSD. (see Schnurr PP, Lunney CA, and Sengupta A (2004) “Risk Factors for the Development VersusMaintenance of Posttraumatic Stress Disorder”, Journal of Trauma Stress, 17 (2): 85-95.)
26In spirit, our findings are in line with those of Nunn and Wantchekon (2011), who show that thetransatlantic and Indian Ocean slave trades affected cultural norms, beliefs, and values, and in turnshaped the current differences in trust levels within Africa. Our work, however, emphasizes how warmemories cultivate interstate animosity and mistrust, rather than people’s values and trust levels ingeneral.
21
and land area, a higher fraction of college graduates, and a higher railway density tend
to have a more positive view of Japan, probably because the residents there have more
contact with the Japanese people and culture, and are less affected by propaganda.
Similarly, the more salient impacts of war casualties on China’s imports from Japan
compared to China’s exports to Japan can also be understood in the context of war-
induced psychological sequelae. Although the majority of the public in each country
have a negative opinion of the other country, the Japanese are mainly concerned with
China’s military buildup, whereas the Chinese antipathy toward Japan is primarily rooted
in war memories.27 As the victims of the Japanese invasion, the Chinese people have a
strong sense of animosity about the apparent lack of remorse on the Japanese side for the
war atrocities. Understandably, the Chinese exhibit more frequent open expressions of
hostility and animosity toward Japan (e.g., frequent showing of movies or TV dramas with
brutal Japanese soldiers in World War II, and hostile expressions toward Japan on the
Internet and through other media outlets), whereas there are fewer open expressions of
hostility toward the Chinese in Japan. Moreover, in recent decades, when events aroused
public indignation, there were large-scale protests and even violent attacks on Japanese
people, stores, and goods in China.28 Because it is much easier to identify the imports
from Japan in China than the exports to Japan, the former are believed to be subject
to much more intense social pressure and higher political risks, which might adversely
affect imports more than exports. This asymmetric pattern reinforces our claim that war
memories and public discontent in China are the main reasons that war casualties exert
long-term impacts on the current Sino-Japanese economic relationship.
6 Conclusion
Whether conflicts adversely affect international trade and investment is a crucial issue in
this increasingly globalized world. Several studies focus on the reduction in trade flows in
the immediate years following the wars and how fast trade value recovers. Nevertheless,
27See “Publics of Asian Powers Hold Negative Views of One Another”, Pew Research Global AttitudesProject, Sep. 21, 2006.
28See “History Overshadows Present, Future Japan-China Relations”, The Japan Times, Jan. 1, 2014.
22

it is equally important to understand whether past conflicts among countries generate
long-term war memories that affect their contemporary trade and investment, in terms of
both the absolute and relative levels. Whether historical conflicts cause current economic
exchange to fall short of the level that could have been reached had there been no war-
induced animosity is an intriguing question. In this study, we utilize the Japanese invasion
of China from 1937 to 1945 to examine this issue. The fact that these two countries have
not reached reconciliation over the war makes this massive conflict an ideal setting to
analyze the long-term adverse impacts of the war.
We collect data on the percentage of civilian casualties in Chinese regions as a mea-
sure of the severity of war damage and hence the intensity of war-induced psychological
sequelae generated by the Japanese invasion. To identify the long-run impacts of the
war on contemporary trade and investment between these two countries, we employ a
difference-in-differences estimation. Our analyses based on the 2001 foreign-invested en-
terprises data and the 2001 China Customs data show that Chinese regions with larger
war casualties have attracted less investment from Japanese multinationals and engaged
in less trade with Japan, particularly imports from Japan. By linking civilian casualties
with the attitudes of current Chinese residents toward Japan, we demonstrate that the
long-term impacts of the Japanese invasion on the current bilateral economic relations
work primarily through the lack of trust and unfavorable opinions of the Chinese people
about the Japanese. Our study shows that historical animosity still matters in interna-
tional trade and investment, despite the trend toward an increasingly globalized world. If
the Chinese and the Japanese could turn the historically rooted dark page, their bilateral
trade and investment might reach a much higher level.
23

Acknowledgements
We would like to thank Professor Daniel Trefler (the Co-Editor), anonymous refer-
ees, and participants in conferences and workshops for their insightful comments and
suggestions, which have led to a significant improvement of the paper. Zhigang Tao ac-
knowledges the financial support of a GRF grant from the Research Grants Council of
the Hong Kong SAR Government (HKU753312). Yi Che acknowledges financial support
from Grant of Liberal Arts Research and Innovation in Shanghai Jiao Tong University
(13QN18).
References
[1] Blomberg, Brock S. and Gregory D. Hess. 2006. “How Much Does Violence Tax
Trade?”, Review of Economics and Statistics 88, 599-612
[2] Cameron, A. Colin, Jonah Gelbach, and Douglas Miller. 2008. “Bootstrap-Based Im-
provements for Inference with Clustered Errors”, Review of Economics and Statistics
90, 414-427
[3] Chi, Jingde, 1987. A History of the Investigation of China’s Losses during World
War II, Taiwan: Academia Historica Press
[4] Davis, Donald R. and David E. Weinstein. 2002. “Bones, Bombs, and Break Points:
the Geography of Economic Activity”, American Economic Review 92. 1269-1289
[5] Felbermayr, Gabriel and Jasmin Groschl. 2013. “Within U.S. Trade and the Long
Shadow of the American Secession”, Economic Inquiry, forthcoming
[6] Glick, Reuven and Alan M. Taylor. 2010. “Collateral Damage: Trade Disruption and
the Economic Impact of War”, Review of Economics and Statistics 92, 102-127
24

[7] Guiso, Luigi, Paola Sapienza and Luigi Zingales. 2009. “Cultural Biases in Economic
Exchange?”, Quarterly Journal of Economics 124, 1095-1131
[8] Head, Keith, Thierry Mayer, and John Ries. 2010. “The Erosion of Colonial Trade
Linkages after Independence”, Journal of International Economics 81, 1-14
[9] Huntington, Samuel P. 1996. The Clash of Civilizations and the Remaking of World
Order, Simon & Schuster.
[10] Martin, Philippe, Thierry Mayer, and Mathias Thoenig. 2008. “Make Trade Not
War?”, Review of Economic Studies 75, 865-900
[11] Michaels, Guy and Xiaojia Zhi. 2010. “Freedom Fries”, American Economic Journal:
Applied Economics 2, 256-81
[12] Miguel, Edward and Gerard Roland. 2011. “The Long-run Impact of Bombing Viet-
nam”, Journal of Development Economics 96, 1-15
[13] Nunn, Nathan and Leonard Wantchekon. 2011. “The Slave Trade and the Origins
of Mistrust in Africa”, American Economic Review, 101, 3221-3252
[14] Przeworski, Adam, Michael E. Alvarez, Jose Antonio Cheibub, and Fernando
Limongi. 2000. Democracy and Development: Political Institutions and Well-being
in the World, 1950-1990, New York: Cambridge University Press
[15] Santos Silva, Joao M.C. and Silvana Tenreyro. 2006. “The Log of Gravity”, Review
of Economics and Statistics 88, 641-658
25

Table 1: Values of Key Variables of Chinese Regions with Japan
Names of Chinese
Regions (their
Abbreviations)
Trade
Value
with
Japan
in 2001
(million
US$)
Imports
from
Japan
in 2001
(million
US$)
Exports
to
Japan
in 2001
(million
US$)
Number of
Japanese-
Invested
Enterprises
in 2001
Capital
Investment
by Japanese
Investors in
2001
(million
US$)
Accumulated
Capital
Investment
by Japanese
Investors
until 2001
(million US$)
Civilian
Casualties
(%)
Distance
between
Regional
Capital
and
Tokyo
(km)
Hainan (HaiN) 281.5 190.0 91.5 48 4.8 92.5 0 3550.6
Qinghai (QH) 50.7 8.0 42.7 6 0.3 0.8 0 3389.2
Tibet (TB) 7.8 6.4 1.5 - - - 0 4538.5
Xinjiang (XJ) 148.5 118.1 30.4 12 0 8.9 0 4463.1
Gansu (GS) 148.7 20.6 128.1 25 0.7 5.2 0.02 3223.9
Shaanxi (ShaanX) 417.7 271.5 146.2 97 6.4 115.5 0.02 2795.8
Sichuan (SC) 803.8 559.1 244.8 106 5.7 158.1 0.02 3345.6
Chongqing (CQ) 175.7 131.9 43.8 83 18.3 386.6 0.07 3163.1
Fujian (FJ) 4249.9 1430.7 2819.2 375 59.9 400.2 0.47 2215.1
Ningxia (NX) 96.8 32.2 64.6 13 0.2 11.0 0.57 2966.4
Yunnan (YN) 176.4 36.1 140.3 38 1.6 36.8 0.65 3714.4
Guizhou (GZ) 116.9 27.8 89.0 16 0.1 36.4 0.67 3282.4
Shandong (SD) 7620.2 1961.4 5658.8 1077 169.1 1006.9 0.83 2037.4
Beijing (BJ) 4167.9 2742.8 1425.1 706 189.5 2294.01 1.24 2090.4
Hebei (HeB) 924.6 311.9 612.7 282 68.6 433.8 1.24 2253.4
Tianjin (TJ) 4063.7 2309.6 1754.1 732 148.4 1206.9 1.24 2020
Guangdong (GD) 23345.8 14342.2 9003.6 442 200.4 1994.6 1.27 2904.6
Zhejiang (ZJ) 6747.5 2558.9 4188.6 780 99.8 871.3 1.38 1915
Inner Mongolia
(IMG)
227.6 14.9 212.7 57 1.3 23.1 1.44 2504.6
Anhui (AH) 608.2 273.9 334.2 117 6.6 146.3 1.75 2113
Shanghai (SH) 14807.6 8011.9 6795.7 2332 427.2 4508.9 2.09 1760.4
Jiangsu (JS) 14441.2 6560.8 7880.5 1596 481.9 2942.2 2.37 1971.3
Henan (HeN) 433.2 195.0 238.1 101 12.2 84.9 2.89 1567.4
Jiangxi (JX) 271.3 146.1 125.1 59 8.3 58.4 3.41 2366.3
Hunan (HuN) 404.6 205.2 199.3 39 0.3 104.8 4.57 2644
Hubei (HuB) 770.2 429.6 340.7 119 7.6 83.1 5.08 2427.6
Shanxi (ShanX) 472.3 58.2 414.1 48 0.3 17.1 5.81 2424.7
Guangxi (GX) 200.1 56.6 143.5 50 3.0 46.5 7.08 3342.4
Table

Table 2: Investment Results, Benchmark
(1) (2) (3) (4)
Dependent Variables (yrf)
Log Number
of Foreign
Invested
Enterprises
in 2001
Log Value of
Foreign
Capital
Investment
in 2001
Log Value of
Accumulated
Foreign
Capital
Investment
until 2001
Year of First
Entry of
Foreign
Investment
Civilian Casualties (%)*Japan Indicator -0.079 -0.233 -0.163 0.457
(zr * Japanf) (0.028)*** (0.088)** (0.073)** (0.230)*
[0.038]** [0.113]** [0.079]** [0.222]**
Log of Distance (drf) -1.213 -1.228 -1.117 1.271
(0.119)*** (0.150)*** (0.175)*** (0.383)***
[0.590]** [0.597]** [0.543]** [0.618]**
Region Fixed Effects Yes Yes Yes Yes
Country Fixed Effects Yes Yes Yes Yes
Number of Regions 27 27 27 27
Number of Countries 109 109 109 109
Number of Observations 971 971 971 971
Notes: The regression model specification is as shown in Equation (1). The dependent variables in Columns 1-4 are the
logarithm of the number of enterprises established by investors from foreign country f in Chinese region r that were still
operating in 2001, the logarithm of the value of capital investment (in million U.S. dollars) made by investors from
foreign country f in these enterprises in Chinese region r in 2001, the logarithm of the value of accumulated capital
investment (in million U.S. dollars) made by investors from foreign country f in these enterprises in Chinese region r
until 2001, and the calendar year of the occurrence of the first enterprise set up by investors from foreign country f in
Chinese region r, respectively. Civilian Casualties (%) denotes the percentage of civilian casualties in a Chinese region
during the Sino-Japanese war. Japan Indicator is an indicator variable that takes a value of one if the foreign country is
Japan and zero otherwise. Distance refers to the distance (in kilometers) between the capital city of Chinese region r and
the national capital city of foreign country f. Robust standard errors clustered at the region level are reported in the
parentheses and robust standard errors calculated using the percentile-t cluster bootstrap method (Cameron, Gelbach, and
Miller, 2008) are reported in brackets.
*** Significant at the 1% level.
** Significant at the 5% level.
* Significant at the 10% level.
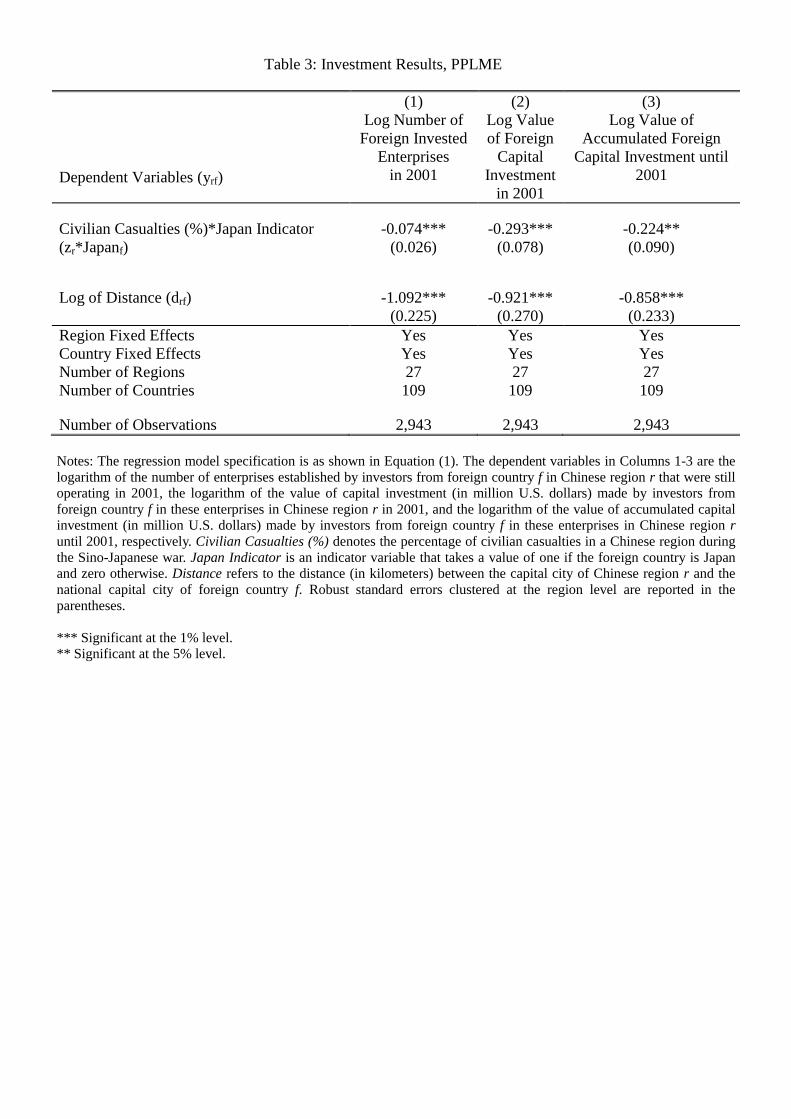
Table 3: Investment Results, PPLME
(1) (2) (3)
Dependent Variables (yrf)
Log Number of
Foreign Invested
Enterprises
in 2001
Log Value
of Foreign
Capital
Investment
in 2001
Log Value of
Accumulated Foreign
Capital Investment until
2001
Civilian Casualties (%)*Japan Indicator -0.074*** -0.293*** -0.224**
(zr*Japanf) (0.026) (0.078) (0.090)
Log of Distance (drf) -1.092*** -0.921*** -0.858***
(0.225) (0.270) (0.233)
Region Fixed Effects Yes Yes Yes
Country Fixed Effects Yes Yes Yes
Number of Regions 27 27 27
Number of Countries 109 109 109
Number of Observations 2,943 2,943 2,943
Notes: The regression model specification is as shown in Equation (1). The dependent variables in Columns 1-3 are the
logarithm of the number of enterprises established by investors from foreign country f in Chinese region r that were still
operating in 2001, the logarithm of the value of capital investment (in million U.S. dollars) made by investors from
foreign country f in these enterprises in Chinese region r in 2001, and the logarithm of the value of accumulated capital
investment (in million U.S. dollars) made by investors from foreign country f in these enterprises in Chinese region r
until 2001, respectively. Civilian Casualties (%) denotes the percentage of civilian casualties in a Chinese region during
the Sino-Japanese war. Japan Indicator is an indicator variable that takes a value of one if the foreign country is Japan
and zero otherwise. Distance refers to the distance (in kilometers) between the capital city of Chinese region r and the
national capital city of foreign country f. Robust standard errors clustered at the region level are reported in the
parentheses.
*** Significant at the 1% level.
** Significant at the 5% level.

Table 4: Trade Results, Benchmark
(1) (2) (3)
Dependent Variables (yrf) Log Value of
Total Trade
in 2001
Log Value of
Imports
in 2001
Log Value of
Exports
in 2001
Civilian Casualties (%)*Japan Indicator -0.159 -0.147 -0.120
(zr*Japanf) (0.065)** (0.071)** (0.076)
[0.080]** [0.076]* [0.102]
Log of Distance (drf) -1.499 -1.750 -1.422
(0.218)*** (0.224)*** (0.254)***
[0.521]*** [0.607]*** [0.692]**
Region Fixed Effects Yes Yes Yes
Country Fixed Effects Yes Yes Yes
Number of Regions 28 28 28
Number of Countries 227 227 227
Number of Observations 4,314 2,264 4,240
Notes: The regression model specification is as shown in Equation (1). The dependent variables in Columns 1-3 are the
logarithm of the value of trade (in million U.S. dollars) that Chinese region r conducted with foreign country f in 2001,
the logarithm of the value of imports (in million U.S. dollars) from foreign country f by Chinese region r in 2001, and the
logarithm of the value of exports (in million U.S. dollars) from Chinese region r to foreign country f in 2001,
respectively. Civilian Casualties (%) denotes the percentage of civilian casualties in Chinese region r during the Sino-
Japanese war. Japan Indicator is an indicator variable that takes a value of one if the foreign country is Japan and zero
otherwise. Distance refers to the distance (in kilometers) between the capital city of Chinese region r and the national
capital city of foreign country f. Robust standard errors clustered at the region level are reported in the parentheses and
robust standard errors using the percentile-t cluster bootstrap method (Cameron, Gelbach, and Miller, 2008) are reported
in brackets.
*** Significant at the 1% level.
** Significant at the 5% level.
* Significant at the 10% level.

Table 5: Trade Results, PPMLE
(1) (2) (3)
Dependent Variables (yrf) Log Value of Total
Trade in 2001
Log Value of
Imports in 2001
Log Value of
Exports in 2001
Civilian Casualties (%)*Japan Indicator -0.041*** -0.083*** -0.004***
(zr*Japanf) (0.00001) (0.00001) (0.00001)
Log of Distance (drf) -1.100*** -1.406*** -0.791***
(0.00001) (0.00002) (0.00001)
Region Fixed Effects Yes Yes Yes
Country Fixed Effects Yes Yes Yes
Number of Regions 28 28 28
Number of Countries 227 227 227
Number of Observations 6,356 6,356 6,356
Notes: The regression model specification is as shown in Equation (1). The dependent variables in Columns 1-3 are the
logarithm of the value of trade (in million U.S. dollars) that Chinese region r conducted with foreign country f in 2001,
the logarithm of the value of imports (in million U.S. dollars) from foreign country f by Chinese region r in 2001, and the
logarithm of the value of exports (in million U.S. dollars) from Chinese region r to foreign country f in 2001,
respectively. Civilian Casualties denotes the percentage of civilian casualties in Chinese region r during the Sino-
Japanese war. Japan Indicator is an indicator variable that takes a value of one if the foreign country is Japan and zero
otherwise. Distance refers to the distance (in kilometers) between the capital city of Chinese region r and the national
capital city of foreign country f. Robust standard errors clustered at the region level are reported in the parentheses.
*** Significant at the 1% level.

Table 6: Tests of Mechanisms
(1) (2) (3) (4) (5)
Dependent Variables (yirf)
Attitude
toward a
Foreign
Country
A Foreign
Country
Plays a
Negative
Role in
Asia
How
Much
Influence
Should a
Foreign
Country
Have?
A Foreign
Country
Considers
China’s
Interests
A
Foreign
Country
Practices
Unfair
Trade
with
China
Civilian Casualties (%)*Japan Indicator -0.076** 0.036*** -0.164** -0.018** 0.008***
(zr*Japanf) [0.037] [0.013] [0.081] [0.009] [0.003]
Log of Distance (drf) -0.598** 1.250 -9.588 -0.983 -0.021
[0.291] [1.942] [7.479] [0.699] [0.206]
Individual Fixed Effect Yes Yes Yes Yes Yes
Country Fixed Effect Yes Yes Yes Yes Yes
Individual Controls Yes Yes Yes Yes Yes
Regional Controls Yes Yes Yes Yes Yes
Number of Regions 9 9 9 9 9
Number of Countries 2 2 2 2 2
Number of Observations 1,641 1,793 1,729 1,671 1,793
Notes: The regression model specification is as shown in Equation (2). The regressions are carried out at the individual
level for surveyees in nine Chinese regions. The survey questions are related to the individual perceptions of two foreign
countries, i.e., Japan and the U.S. The dependent variable in Column 1 is the individual-level answer to the question
“How much do you trust the following foreign country to act responsibly in the world?” The question is asked separately
for Japan and for the U.S. The multiple choices for the answer are 1 (not at all), 2 (not very much), 3 (somewhat), and 4
(a great deal), with a higher value indicating a higher degree of trust. The dependent variable in Column 2 is an indicator
variable that takes a value of one if the citizen in a region considers a foreign country as playing a negative role in Asia
when answering the question “In your opinion, is the following foreign country playing a positive or negative role in
resolving the key problems facing Asia?”, and zero otherwise. The question is asked separately for Japan and for the U.S.
The dependent variable in Column 3 is the degree (1-10) that an individual chooses for the question “On a 10-point scale,
how much influence would you want the following foreign country to have in the world?”, with a higher value
corresponding to a higher degree of preference and positive attitude. The question is asked separately for Japan and for
the U.S. The dependent variable in Column 4 is the answer to the question “How much do you think the following
foreign country takes the interests of China into account when making foreign policy decisions?” The question is asked
separately for Japan and for the U.S. The multiple choices for the answer are 1 (not at all), 2 (not very much), 3
(somewhat), and 4 (a great deal), with a higher value indicating a higher degree of preference and positive attitude. The
dependent variable in Column 5 is an indicator variable that takes a value of one if the citizen in a region considers a
foreign country as practicing unfair trade with China when answering the question “In general, do you think that the
following country practices fair trade or unfair trade with China?”, and zero otherwise. The question is asked separately
for Japan and for the U.S. The individual responses to the questions for Japan and for the U.S. are treated as distinct
observations in the pooled sample in the regression analysis.
Civilian Casualties (%) denotes the percentage of civilian casualties in Chinese region r during the Sino-Japanese war.
Japan Indicator is an indicator variable that takes a value of one if the foreign country is Japan and zero otherwise.
Distance refers to the distance (in kilometers) between the capital city of Chinese region r and the national capital city of
foreign country f. In the regressions, we also include the interaction terms of the Japan indicator and each of the
individual characteristics variables that include gender, age, education (whether an individual had a college education or
above), urban residency, and income (whether an individual thinks she/he has high or very high income), and the
interaction terms of the Japan indicator and each of the regional characteristics variables that include GDP, population
size, the percentage of population with college degrees, railway density (length of railway per square kilometer of land
area), and land area. These interaction terms capture the differences in how the individual and regional characteristics
can affect the Chinese residents' attitudes toward Japan and the U.S. Robust standard errors using the percentile-t cluster
bootstrap method (Cameron, Gelbach, and Miller, 2008) are reported in brackets. The number of clusters is 9.

*** Significant at the 1% level.
** Significant at the 5% level.
* Significant at the 10% level.
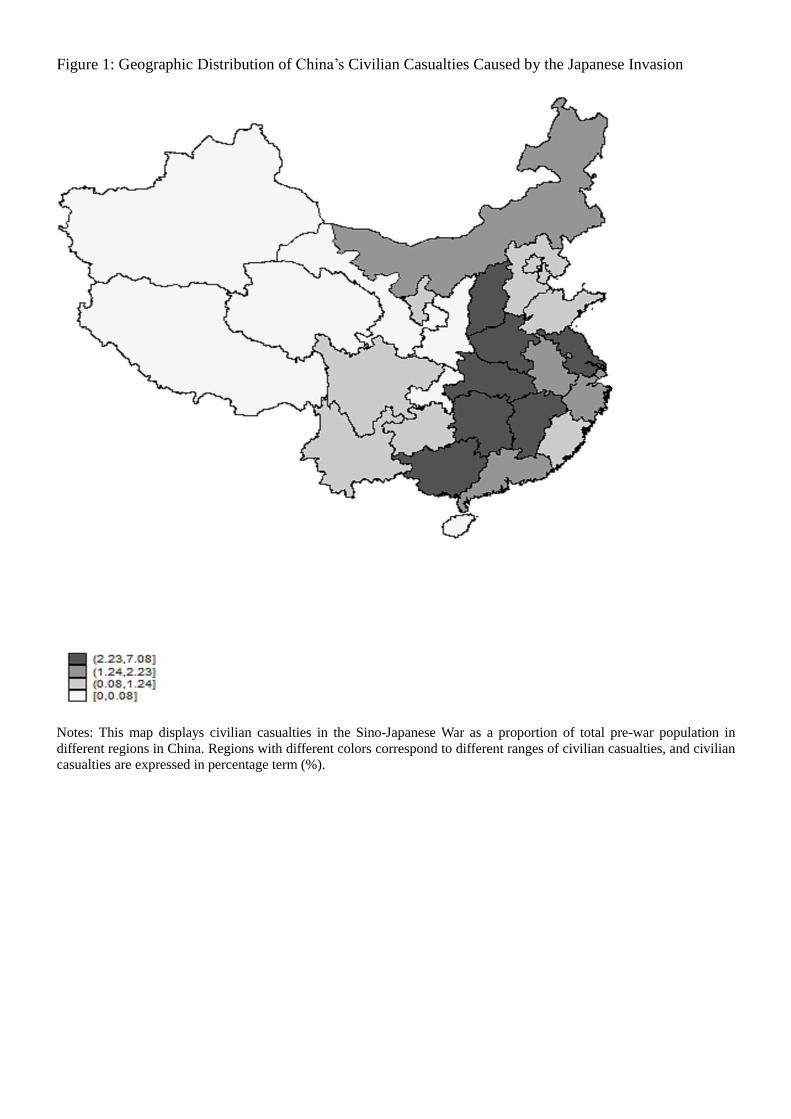
Figure 1: Geographic Distribution of China’s Civilian Casualties Caused by the Japanese Invasion
Notes: This map displays civilian casualties in the Sino-Japanese War as a proportion of total pre-war population in
different regions in China. Regions with different colors correspond to different ranges of civilian casualties, and civilian
casualties are expressed in percentage term (%).

Figure 2: Unadjusted Correlation between Civilian Casualties and Japanese Investment
Notes: The vertical axis in this figure represents the proportion of the number of Japanese-invested firms among all
foreign-invested enterprises existing in a Chinese region in 2001(in percentage terms). The horizontal axis denotes
the percentage of civilian casualties in a Chinese region during the Sino-Japanese war. The names of Chinese
regions are indicated by their abbreviations. Please refer to Table 1 for the full names and abbreviations of Chinese
regions.
AH
BJ
CQ
FJ
GS
GD
GX
GZHaiN
HeB
HeN
HuB
HuN
JS
JX
IMG
NX
QHShaanX
SD
SH
ShanXSC
TJ
XJYN
ZJ
05
10
15
20
Ja
pa
n's
Sha
re o
f th
e N
um
ber
of F
ore
ign
-in
veste
d F
irm
s (
%)
0 2 4 6 8Civilian Casualties (%)

Figure 3a: Unadjusted Correlation between Civilian Casualties and Trade with Japan
Notes: The vertical axis in this figure represents the share of a Chinese region’s trade value with Japan in the region’s
total foreign trade value in 2001 (in percentage term). The horizontal axis denotes the percentage of civilian casualties
in a Chinese region during the Sino-Japanese war. The names of Chinese regions are indicated by their abbreviations.
Please refer to Table 1 for the full names and abbreviations of Chinese regions.
BJ
TJ
HeB
ShanX
IMG
SH
JS
ZJ
AH
FJ
JX
SD
HeN
HuB
HuNGD
GX
HaiN
CQ
SC
GZ
YNTB
ShaanXGS
QH
NX
XJ
51
01
52
02
5
Ja
pa
n's
Sha
re o
f T
ota
l T
rad
e V
alu
e (
%)
0 2 4 6 8Civilian Casualties (%)

Figure 3b: Unadjusted Correlation between Civilian Casualties and Imports from Japan
Notes: The vertical axis in this figure represents the fraction of a Chinese region’s import value from Japan in the
region’s total import value in 2001 (in percentage term). The horizontal axis denotes the percentage of civilian
casualties in a Chinese region during the Sino-Japanese war. The names of Chinese regions are indicated by their
abbreviations. Please refer to Table 1 for the full names and abbreviations of Chinese regions.
BJ
TJ
HeB
ShanX
IMG
SH
JS
ZJAH
FJ
JX
SD
HeN
HuBHuNGD
GX
HaiN
CQ
SC
GZ
YN
TB
ShaanX
GS
QH
NX
XJ
01
02
03
04
0
Ja
pa
n’s
Sh
are
of T
ota
l Im
port
s (
%)
0 2 4 6 8Civilian Casualties (%)

Figure 3c: Unadjusted Correlation between Civilian Casualties and Exports to Japan
Notes: The vertical axis in this figure represents the share of a Chinese region’s export value to Japan in the region’s
total export value in 2001 (in percentage term). The horizontal axis denotes the percentage of civilian casualties in a
Chinese region during the Sino-Japanese war. The names of Chinese regions are indicated by their abbreviations.
Please refer to Table 1 for the full names and abbreviations of Chinese regions.
BJ
TJ
HeB
ShanX
IMG
SH
JS
ZJ
AH
FJ
JX
SD
HeN
HuB
HuN
GDGX
HaiN
CQ
SC
GZ
YN
TB
ShaanX
GSQH
NX
XJ
01
02
03
0
Ja
pa
n’s
Sh
are
of T
ota
l E
xpo
rts (
%)
0 2 4 6 8Civilian Casualties (%)

Figure 4a: Adjusted Correlation between the Attitude toward a Foreign Country and Civilian
Casualties*Japan Indicator
Notes: This figure uses the added variable plot method to present the adjusted correlation between the average degree
of positive attitude of the residents in a Chinese region toward a foreign country on the vertical axis and the interaction
term of the percentage of civilian casualties in the region during the Sino-Japanese war and the Japan indicator
variable on the horizontal axis. The variable of Attitude toward a Foreign Country on the vertical axis is the regional
average of the answer (1 (not at all), 2 (not very much), 3 (somewhat), 4 (a great deal), with a higher value indicating a
higher degree of positive attitude) to the question “How much do you trust the following foreign country to act
responsibly in the world?” The question is asked separately for Japan and for the U.S. The regional average values of
the responses to the question on the trust toward Japan and toward the U.S. are treated as distinct observations in the
pooled sample in generating the added variable plot. The variables on both axes are residuals after being conditioned
on the physical distance between a Chinese regional capital city and the national capital city of a foreign country, the
fixed effects for Chinese regions, and the fixed effects for foreign countries. The names of Chinese regions are
indicated by their abbreviations. Please refer to Table 1 for the full names and abbreviations of Chinese regions.
BJ
HeB
ZJ
HeNHuB
GD
SC
YN
XJ
BJ
HeB
ZJ
HeNHuB
GD
SC
YN
XJ
-.2
-.1
0.1
.2
Attitu
de
tow
ard
a F
ore
ign
Co
un
try
-2 -1 0 1 2Civilian Casualties (%)*Japan Indicator
Japan U.S.

Figure 4b: Adjusted Correlation between the View of the Role of a Foreign Country in Asia and Civilian
Casualties*Japan Indicator
Notes: This figure uses the added variable plot method to present the adjusted correlation between the proportion of
residents in a Chinese region holding a negative view of the role of a foreign country on the vertical axis and the
interaction term of the percentage of civilian casualties in the region during the Sino-Japanese war and the Japan
indicator variable on the horizontal axis. The vertical axis indicates the proportion of regional residents that consider a
foreign country as playing a negative role in Asia when answering the question “In your opinion, is the following
foreign country playing a positive or negative role in resolving the key problems facing Asia?” The question is asked
separately for Japan and for the U.S. The regional proportions of negative responses to the question for Japan and for
the U.S. are treated as distinct observations in the pooled sample in generating the added variable plot. The variables
on both axes are residuals after being conditioned on the physical distance between a Chinese regional capital city and
the national capital city of a foreign country, the fixed effects for Chinese regions, and the fixed effects for foreign
countries. The names of Chinese regions are indicated by their abbreviations. Please refer to Table 1 for the full names
and abbreviations of Chinese regions.
BJ
HeB
ZJ
HeN
HuB
GD
SC
YN
XJ
BJ
HeB
ZJ
HeN
HuB
GD
SC
YN
XJ
-.1
-.05
0
.05
.1
A F
ore
ign
Co
un
try P
lays a
Ne
ga
tive R
ole
in
Asia
-2 -1 0 1 2Civilian Casualties (%)*Japan Indicator
Japan U.S.

Figure 4c: Adjusted Correlation between the View of How Much Influence A Foreign Country Should
Have and Civilian Casualties*Japan Indicator
Notes: This figure uses the added variable plot method to present the adjusted correlation between the average degree
of influence that the residents in a Chinese region want a foreign country to have in the world on the vertical axis and
the interaction term of the percentage of civilian casualties in a region during the Sino-Japanese war and the Japan
indicator variable on the horizontal axis. The vertical axis is the average degree (1-10) that regional residents choose
for the question “On a 10-point scale, how much influence would you want the following country to have in the
world?”, where a higher value corresponds to a higher degree of preference and positive attitude. The question is
asked separately for Japan and for the U.S. The regional averages of responses to the question for Japan and for the
U.S. are treated as distinct observations in the pooled sample in generating the added variable plot. The variables on
both axes are residuals after being conditioned on the physical distance between a Chinese regional capital city and the
national capital city of a foreign country, the fixed effects for Chinese regions, and the fixed effects for foreign
countries. The names of Chinese regions are indicated by their abbreviations. Please refer to Table 1 for the full names
and abbreviations of Chinese regions.
BJ
HeB
ZJ
HeN
HuB
GD
SC
YN
XJ
BJ
HeB
ZJ
HeN
HuB
GD
SC
YN
XJ
-.4
-.2
0.2
.4
Ho
w M
uch
Influe
nce
A F
ore
ign C
ou
ntr
y S
ho
uld
Have
-2 -1 0 1 2Civilian Casualties (%)*Japan Indicator
Japan U.S.
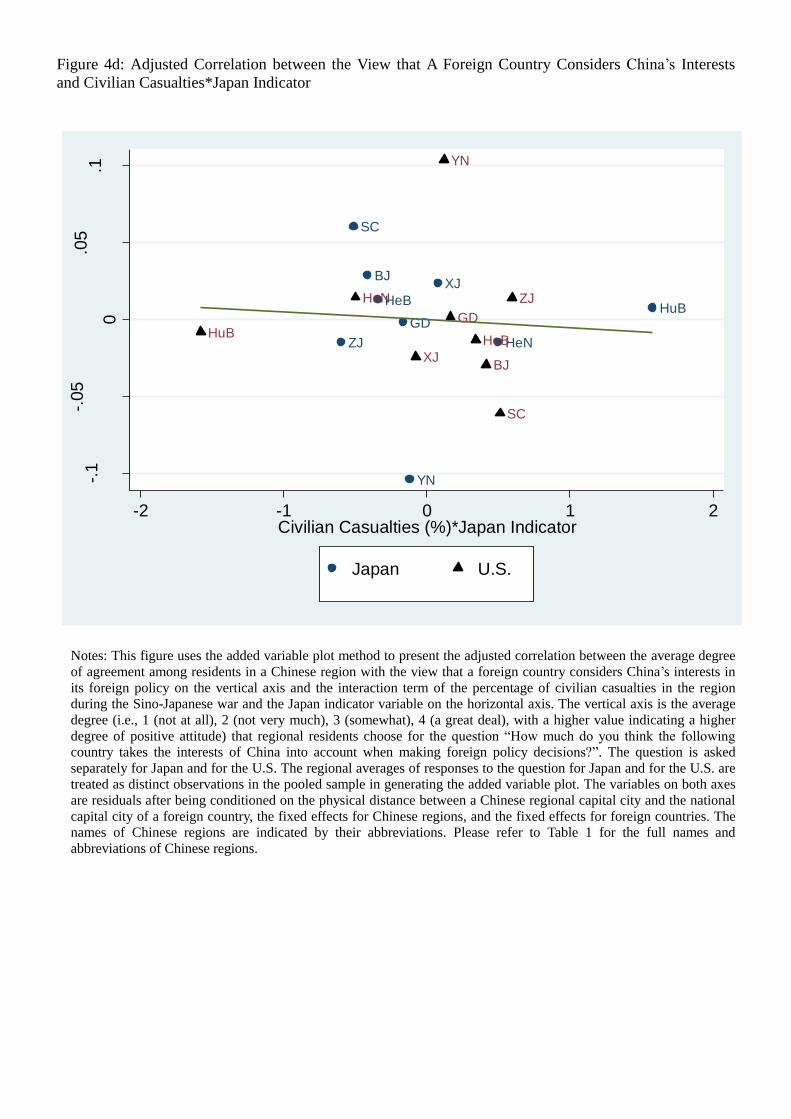
Figure 4d: Adjusted Correlation between the View that A Foreign Country Considers China’s Interests
and Civilian Casualties*Japan Indicator
Notes: This figure uses the added variable plot method to present the adjusted correlation between the average degree
of agreement among residents in a Chinese region with the view that a foreign country considers China’s interests in
its foreign policy on the vertical axis and the interaction term of the percentage of civilian casualties in the region
during the Sino-Japanese war and the Japan indicator variable on the horizontal axis. The vertical axis is the average
degree (i.e., 1 (not at all), 2 (not very much), 3 (somewhat), 4 (a great deal), with a higher value indicating a higher
degree of positive attitude) that regional residents choose for the question “How much do you think the following
country takes the interests of China into account when making foreign policy decisions?”. The question is asked
separately for Japan and for the U.S. The regional averages of responses to the question for Japan and for the U.S. are
treated as distinct observations in the pooled sample in generating the added variable plot. The variables on both axes
are residuals after being conditioned on the physical distance between a Chinese regional capital city and the national
capital city of a foreign country, the fixed effects for Chinese regions, and the fixed effects for foreign countries. The
names of Chinese regions are indicated by their abbreviations. Please refer to Table 1 for the full names and
abbreviations of Chinese regions.
BJ
HeB
ZJ HeN
HuBGD
SC
YN
XJ
BJ
HeB
ZJHeN
HuBGD
SC
YN
XJ
-.1
-.05
0
.05
.1
A F
ore
ign
Co
un
try C
onsid
ers
Ch
ina's
In
tere
sts
-2 -1 0 1 2Civilian Casualties (%)*Japan Indicator
Japan U.S.

Figure 4e: Adjusted Correlation between the View of A Foreign Country Practicing Unfair Trade with
China and Civilian Casualties*Japan Indicator
Notes: This figure uses the added variable plot method to present the adjusted correlation between the percentage of
citizens in a Chinese region who believe that a foreign country is practicing unfair trade with China on the vertical
axis and the interaction term of the percentage of civilian casualties in a Chinese region during the Sino-Japanese war
and the Japan indicator variable on the horizontal axis. The vertical axis indicates the percentage of regional residents
who consider a foreign country as practicing unfair trade with China when answering the question “In general, do you
think that the following country practices fair trade or unfair trade with China?” The question is asked separately for
Japan and for the U.S. The regional proportions of respondents with negative answers to the question for Japan and for
the U.S. are treated as distinct observations in the pooled sample in generating the added variable plot. The variables
on both axes are residuals after being conditioned on the physical distance between a Chinese regional capital city and
the national capital city of a foreign country, the fixed effects for Chinese regions, and the fixed effects for foreign
countries. The names of Chinese regions are indicated by their abbreviations. Please refer to Table 1 for the full names
and abbreviations of Chinese regions.
BJ
HeB
ZJ
HeN
HuB
GD
SC
YN
XJ
BJ
HeB
ZJ
HeN
HuB
GD
SC
YN
XJ
-.04
-.02
0
.02
.04
A F
ore
ign
Cou
ntr
y P
ractice
s U
nfa
ir T
rade
with
Ch
ina
-2 -1 0 1 2Civilian Casualties (%)*Japan Indicator
Japan U.S.

Appendix Figure A1: Adjusted Correlation between Foreign Investment and Civilian Casualties*Japan
Indicator
Notes: This figure uses the added variable plot method to present the adjusted correlation between the logarithm of the
number of foreign-invested firms in a Chinese region on the vertical axis and the interaction term of the percentage of
civilian casualties in a Chinese region during the Sino-Japanese war and the Japan indicator variable on the horizontal
axis. We include the logarithm of the number of Japanese-invested firms in a Chinese region and the logarithm of the
number of U.S.-invested firms in a Chinese region as distinct observations in the pooled sample in generating the
added variable plot. The variables on both axes are residuals after being conditioned on the physical distance between
a Chinese regional capital city and the national capital city of a foreign country, the fixed effects for Chinese regions,
and the fixed effects for foreign countries. The names of Chinese regions are indicated by their abbreviations. Please
refer to Table 1 for the full names and abbreviations of Chinese regions.
AH
BJ
FJ
GS
GD GXGZ
HaiN
HeB
HeN HuB
HuN
JS
JX
NX
QH
SD
ShanX
ShaanX
SH
SC
TJ
XJ
YN
ZJ
CQ
AH
BJ
FJ
GS
GDGX GZ
HaiN
HeB
HeNHuB
HuN
JS
JX
NX
QH
SD
ShanX
ShaanX
SH
SC
TJ
XJ
YN
ZJ
CQ
-.4
-.2
0.2
.4
Log
Num
ber
of F
ore
ign
-in
ve
ste
d F
irm
s
-4 -2 0 2 4Civilian Casualties (%)*Japan Indicator
Japan U.S.

Appendix Figure A2a: Adjusted Correlation between Trade and Civilian Casualties*Japan Indicator
Notes: This figure uses the added variable plot method to present the adjusted correlation between the logarithm of the
trade value of a Chinese region with a foreign country on the vertical axis and the interaction term of the percentage of
civilian casualties in a region during the Sino-Japanese war and the Japan indicator variable on the horizontal axis. We
include the logarithm of the trade value of a Chinese region with Japan and that with the U.S. as distinct observations
in the pooled sample in generating the added variable plot. The variables on both axes are residuals after being
conditioned on the physical distance between a Chinese regional capital city and the national capital city of a foreign
country, the fixed effects for Chinese regions, and the fixed effects for foreign countries. The names of Chinese
regions are indicated by their abbreviations. Please refer to Table 1 for the full names and abbreviations of Chinese
regions.
BJ
TJHeB
ShanXIMG
SH
JS
ZJAH
FJ
JX
SD
HeN
HuB
HuN
GDGX
HaiN
CQ
SC
GZ
YN
TB
ShaanX
GS
QH
NX
XJ
BJ
TJHeB
ShanXIMG
SH
JS
ZJAH
FJ
JX
SD
HeN
HuB
HuN
GDGX
HaiN
CQ
SC
GZ
YN
TB
ShaanX
GS
QH
NX
XJ
-.5
0.5
Log
Tra
de V
alu
e
-4 -2 0 2 4Civilian Casualties (%)*Japan Indicator
Japan U.S.

Appendix Figure A2b: Adjusted Correlation between Imports and Civilian Casualties*Japan Indicator
Notes: This figure uses the added variable plot method to present the adjusted correlation between the logarithm of the
import value from a foreign country by a Chinese region on the vertical axis and the interaction term of the percentage
of civilian casualties in a Chinese region during the Sino-Japanese war and the Japan indicator variable on the
horizontal axis. We include the logarithm of the import value from Japan by a Chinese region and the logarithm of the
import value from the U.S. by a Chinese region as distinct observations in the pooled sample in generating the added
variable plot. The variables on both axes are residuals after being conditioned on the physical distance between a
Chinese regional capital city and the national capital city of a foreign country, the fixed effects for Chinese regions,
and the fixed effects for foreign countries. The names of Chinese regions are indicated by their abbreviations. Please
refer to Table 1 for the full names and abbreviations of Chinese regions.
AH
BJ
CQ
FJ
GS
GD
GX
GZ
HaiN
HeB
HeN
HuB
HuNJS
JX
IMG
NX
QHShaanX
SDSH
ShanX
SCTJ
XJ
TB
YN
ZJ
AH
BJ
CQ
FJ
GS
GD
GX
GZ
HaiN
HeB
HeN
HuB
HuN JS
JX
IMG
NX
QHShaanX
SDSH
ShanX
SCTJ
XJ
TB
YN
ZJ
-1-.
50
.51
Log
Im
po
rt V
alu
e
-4 -2 0 2 4Civilian Casualties (%)*Japan Indicator
Japan U.S.

Appendix Figure A2c: Adjusted Correlation between Exports and Civilian Casualties*Japan Indicator
Notes: This figure uses the added variable plot method to present the adjusted correlation between the logarithm of the
export value to a foreign country from a Chinese region on the vertical axis and the interaction term of the percentage
of civilian casualties in a region during the Sino-Japanese war and the Japan indicator on the horizontal axis. We
include the logarithm of the export value to Japan by a Chinese region and the logarithm of the export value to the U.S.
by a Chinese region as distinct observations in the pooled sample in generating the added variable plot. The variables
on both axes are residuals after being conditioned on the physical distance between a Chinese regional capital city and
the national capital city of a foreign country, the fixed effects for Chinese regions, and the fixed effects for foreign
countries. The names of Chinese regions are indicated by their abbreviations. Please refer to Table 1 for the full names
and abbreviations of Chinese regions.
AH
BJ
CQ
FJ
GS
GD
GX
GZ
HaiNHeB
HeN
HuB
HuN
JS
JX
IMG
NX
QH
ShaanX
SD
SH
ShanX
SCTJ
XJ
TB
YN
ZJ
AH
BJ
CQ
FJ
GS
GD
GX
GZ
HaiNHeB
HeN
HuB
HuN
JS
JX
IMG
NX
QH
ShaanX
SD
SH
ShanX
SCTJ
XJ
TB
YN
ZJ
-.5
0.5
Log
Exp
ort
Valu
e
-4 -2 0 2 4Civilian Casualties (%)*Japan Indicator
Japan U.S.

Appendix Table: The Magnitude of Impacts of the Sino-Japanese War on Bilateral Investment and Trade
(1) (2) (3) (4) (5)
Chinese
Regions
Number of
Japanese-
Invested
Enterprises
in 2001
Capital
Investment
in 2001
(million US$)
Accumulated
Capital
Investment
until 2001
(million US$)
Trade
Value
in 2001
(million US$)
Import
Value
in 2001
(million US$)
Anhui 16.2 3.6 42.0 169.2 70.5
Beijing 69.2 74.3 466.5 821.7 500.0
Chongqing 0.5 0.4 4.4 2.0 1.4
Fujian 13.9 8.9 30.8 317.6 98.8
Gansu 0.04 0.01 0.02 0.5 0.06
Guangdong 44.3 80.4 415.4 4714.2 2677.5
Guangxi 28.0 6.7 54.0 225.3 58.9
Guizhou 0.8 0.03 4.0 12.5 2.7
Hainan 0 0 0 0 0
Hebei 27.6 26.9 88.2 182.3 56.9
Henan 23.1 11.2 40.2 199.1 82.8
Hubei 47.8 12.2 69.2 622.1 320.8
Hunan 14.1 0.5 78.5 294.0 137.9
Inner Mongolia 6.5 0.6 5.5 52.1 3.2
Jiangsu 298.8 360.9 1143.6 5441.9 2285.7
Jiangxi 15.9 8.9 32.7 147.1 73.2
Ningxia 0.6 0.04 1.0 8.8 2.7
Qinghai 0 0 0 0 0
Shaanxi 0.2 0.04 0.4 1.3 0.8
Shandong 70.6 44.3 137.1 1005.6 239.3
Shanghai 385.0 282.1 1545.5 4920.7 2461.5
Shanxi 22.0 0.05 16.3 436.3 49.7
Sichuan 0.2 0.04 0.5 2.6 1.6
Tianjin 71.7 58.2 245.4 801.2 421.0
Tibet - - - 0 0
Xinjiang 0 0 0 0 0
Yunnan 2.0 0.03 3.9 18.2 3.4
Zhejiang 85.0 43.5 197.2 1480.5 519.1
Total 1244.0 1023.8 4622.5 21876.8 10069.5
Notes: This table provides information on the increase in the number of Japanese-invested enterprises in a Chinese
region in 2001 (Column 1), the increase in the value of capital investment made by Japanese investors in these
enterprises in a Chinese region in 2001 (Column 2), the increase in the accumulated value of capital investment made by
Japanese investors in these enterprises in a Chinese region until 2001 (Column 3), the increase in the trade value of a
Chinese region with Japan in 2001 (Column 4), and the increase in the value of imports by a Chinese region from Japan
in 2001 (Column 5), if there had been no Japanese invasion of China.