Journal of Economics and Management Research - LU ...
105
University of Latvia Faculty of Business, Management and Economics 2020 Volume Journal of Economics and Management Research 2255 - 9000 9
-
Upload
khangminh22 -
Category
Documents
-
view
0 -
download
0
Transcript of Journal of Economics and Management Research - LU ...

University of LatviaFaculty of Business, Management and Economics
2020Volume
Journal of Economics and Management Research
2255 - 900099 772255 900008
ISSN 2255-9000
Julija ŽakemoOrganisational Innovativeness: the Role of LMX
Dāniels JuknaDevelopment of Borrowers’ Solvency Assessment Model: Logistic Regression Application
Viesturs Pauls KarnupsLatvia-South Africa Economic Relations 1918–1940
P. S. Okonji, O. O. Olayemi, B. E. A. Oghojafor, D. MgbeIn�uence of Entrepreneurial Traits on the Performance of Small and Medium Sized Enterprises (Smes) in Lagos State, Nigeria
Frank W. Hager, Norbert G. BrinkPersonal Support Networks as Moderators in Dyadic Employee-Supervisor Relationships
Julia Liodorova, Valeriya FursovaForensic Accounting in the World: Past and Present
Bamgbose Olalekan SodiqFactors In�uencing the Buying Behaviour of Millennials Towards Insurance Products in the Nigerian Insurance Market
1 2
University of LatviaFaculty of Business, Management and Economics
Journal of Economics and Management Research
Founded in 2001 as Acta Universitatis Latviensis, series “Economics. Business Administration”
Volume 9
Riga 2020

Journal of Economics and Management Research, Volume 9.Riga: University of Latvia, 2020, 104 pages.
The Journal of Economics and Management Research is an interdisciplinary scientific journal in the field of economics, business management, national economy, structural and social policies, innovation perspectives and institutional capability.
The Journal of Economics and Management Research, a Scientific Journal of the University of Latvia, is published once per year.
General Editor – Prof. Dr. Viesturs Pauls Karnups
EDITORIAL BOARDProf. Dr. Signe Bāliņa, University of Latvia Prof. Dr. Jean David Avenel, Paris-Est Creteil (Val de Marne) University (France) Assoc. Prof. Dr. Džineta Dimante, University of LatviaProf. Dr. Gundars Kaupins, Boise State University (USA) Prof. Dr. Natalia Kuznetsova, St. Petersburg University (Russia) Prof. Dr. Kristina Levišauskaitė, Vytautas Magnus University (Lithuania) Prof. Dr. Barry Lesser, Dalhousie University (Canada)Prof. Dr. Nikolay Nenovsky, University of Picardie Jules Verne (France) Prof. Dr. Josef Neuert, University of Applied Sciences Kufstein (Austria) Prof. Dr. Tiiu Paas, Tartu University (Estonia) Prof. Dr. Gunnar Prause, TSEBA/Tallinn University of Technology (Estonia) Prof. Dr. Arild Sæther, Agder Academy of Sciences and Letters (Norway) Prof. Dr. Bruno Sergi, Messina University (Italy) Prof. Dr. Biruta Sloka, University of LatviaProf. Dr. Baiba Šavriņa, University of LatviaProf. Dr. Ligita Šimanskienė, Klaipeda University (Lithuania)Prof. Dr. Ērika Šumilo, University of LatviaAssoc. Prof. Dr. Kamil Zajackowski, University of Warsaw (Poland)Assoc. Prof. Gundars Bērziņš, University of Latvia Prof. Dr. Margarita Dunska, University of Latvia
Journal is available:https://www.apgads.lu.lv/izdevumi/brivpieejas-izdevumi/zurnali-un-periodiskie-izdevumi/journal-of-economics-and-management-research/
Layout: Andra LiepiņaCover design: Agris Dzilna
© University of Latvia, 2020ISSN 2255-9000https://doi.org/10.22364/jemr.9

TABLE OF CONTENTS
From the Editor 5
Julija ŽakemoORGANISATIONAL INNOVATIVENESS: THE ROLE OF LMX 6
Dāniels JuknaDEVELOPMENT OF BORROWERS’ SOLVENCY ASSESSMENT MODEL: LOGISTIC REGRESSION APPLICATION 25
Viesturs Pauls KarnupsLATVIA-SOUTH AFRICA ECONOMIC RELATIONS 1918–1940 42
Patrick S. Okonji, Olufemi O. Olayemi, Ben E. Akpoyomare Oghojafor, D. MgbeINFLUENCE OF ENTREPRENEURIAL TRAITS ON THE PERFORMANCE OF SMALL AND MEDIUM SIZED ENTERPRISES (SMES) IN LAGOS STATE, NIGERIA 50
Frank W. Hager, Norbert G. BrinkPERSONAL SUPPORT NETWORKS AS MODERATORS IN DYADIC EMPLOYEE-SUPERVISOR RELATIONSHIPS 67
Bamgbose Olalekan SodiqFACTORS INFLUENCING THE BUYING BEHAVIOUR OF MILLENNIALS TOWARDS INSURANCE PRODUCTS IN THE NIGERIAN INSURANCE MARKET 86
The Authors 102


FROM THE EDITOR
Dear Reader,This is the issue for 2020 and we expect to be able to publish the next issue
in December 2021.Most of the authors are PhD students and we encourage articles from both
established academics, as well as prospective academics.For past and future authors the good news is that we have been added to
the EBSCO database system. The journal can be found in the EBSCO Business Source Complete database.
We hope you enjoy this issue and are looking forward to the next issue.Best wishes
Viesturs Pauls KarnupsGeneral Editor

ORGANISATIONAL INNOVATIVENESS: THE ROLE OF LMX
JULIJA ŽAKEMOMPhil., MBA
Abstract
Organisational innovativeness has been discussed as a paradigm industry-wide (DeMiranda, et al., 2009) and as a national source of competitive advantage (Ludviga, 2012). Studies indicate that innovativeness might depend on leadership and leaders’ capacities to establish right organisational climate. Current study investigates if the quality of relationship between the leaders and subordinates might influence the overall organisational innovativeness. The aim of the research is to test how the relationship between leaders and subordinates (measured by LMX scale, Graen, Uhl-Bien, 1995) impacts organisational innovativeness. The quantitative data were gathered via a structured survey within 80 large-size organizations with a total number of 405 respondents. To test the model, the hierarchical regression analysis was used. The results showed that the quality of relationship between the leader and the subordinate plays a statistically significant role in organisational inno-vativeness. This study allows a more comprehensive understanding of LMX from the societal perspective. Implications for the business practitioners in Latvia and managerial literature on LMX and innovativeness are discussed.
Keywords: Latvia, leader-member exchange (LMX); organisational inno va-tiveness, Latvian business context
JEL code: D01, D04, D21, D23
INTRODUCTION
Organisational innovativeness as a capability to produce new solutions, experiment, and engage in creative processes (Lumpkin and Dess, 2001) is emphasised by many authors as a fundamental element of survival and competitiveness for organisations (e.g. Little, et al., 2017; Anderson et al., 2014; Deschamps, 2009) and as a ground of regional development (Ludviga, 2012). Innovation and innovativeness are politically declared as a “survival skill” for organisations, nations, and humankind (Schumpeter, 1942) and recently has started to be regarded as a new development paradigm industry-wide (DeMiranda, et al., 2009). It is stated by the Innovation Policy Platform (IPP, 2013), developed by the Organisation for Economic Co-operation and Development (OECD) and the World Bank, that the innovation is crucial for long-term economic growth, as it fosters competitiveness, creates jobs, helps to address environmental and health issues, contributes to sustainable growth. Latvia ranks 33rd in Global Innovation
ORGANISATIONAL INNOVATIVENESS: THE ROLE OF LMX
Julija Žakemo
Journal of Economics and Management Research. Vol. 9, 2020https://doi.org/10.22364/jemr.9.01

Julija Žakemo 7
Index 2017, in comparison, Finland is ranked 8th and Estonia 25th (INSEAD, 2019). Thus, Latvia has perspectives for its growth and this of utmost actuality for Latvian economy.
Studies of organisational innovativeness suggest that innovativeness may have difficulties in application to reality (Wang and Ahmed, 2007; Riivari and Lämsä, 2014). This research has an attempt to reveal the eventual reasons for it. On the micro-level, organisations consist of individuals – employees and managers, teams, and interaction processes between them. According to promoters of micro-foundation movement, ‘unwrapping’ the individual-level factors (related to individuals) provides important starting point for analysis of macro-level (organisational) outcomes, such as organisational innovativeness, as individuals within the organisation have an influence on processes and routines, which, in turn, play a significant role in organisational outcomes (Felin, et al., 2015, p. 604).
The role of leadership in innovativeness has been shown to be important in previous studies (e.g. Buschens et al., 2013). Studies suggest that a leader has a role of a catalysator of change in the organisation (Trevino, et al., 2014). The attitudes and decision-making of top leadership resonate throughout the entire organisation (Kaptein, 2008; Trevino, et al., 2003). In the present study the focus is on a relational leadership, which represents micro-foundation of the organisation.
One of the most popular and useful approaches for understanding relational leadership and its influence on workplace outcomes is a leader–member exchange (LMX) theory (Yu, et al., 2018). This theory conceptualises leadership as a reciprocal process born in the interaction between leaders and followers (Graen and Uhl-Bien, 1995). Indeed, an important factor in the leadership process is a continuous and mutual relationship that a leader has with individual followers (Ferris, et al., 2009). Studies have found that high-quality relationship between both parties can affect both, the overall functioning of an organisation and employee personal well-being, so crucial to individuals’ and organisations’ productivity and effectiveness in working life (Graen and Uhl-Bien, 1995). Interesting, that according to Lord and Brown (2001) the employee perspective remains an underexplored source of understanding leadership processes. This study responds to this call.
In the following parts the key terms will be explained, methodology of the study will be discussed, the results will be introduced and analysed con-sidering Latvia’s business context so that it can be practically applied by business managers doing business in the Baltics.
THEORETICAL BACKGROUND
Leader – member exchange (LMX) theory describes how the leader and follower develop an interpersonal relationship over time, as two parties influence each other (Dansereau, Graen and Haga, 1975; Graen and Uhl–Bien, 1995).

8 ORGANISATIONAL INNOVATIVENESS: THE ROLE OF LMX
The terms “leader-member,” “leader-follower,” and “supervisor-subordinate or leader – employee” are used interchangeably, and it goes in line with Norvapalo (2014). LMX theory of leadership is stating that high-quality relationships form in-group circles which can be distinguished by high trust, commitment and loyalty and result in employee satisfaction, commitment, and empowerment (Harris, Wheeler and Kacmar, 2009). High LMX refers therefore to high quality of relationship, while low LMX means low quality of relationship among leader and follower.
According to Bennis (Bennis, 2007, p. 18) the phenomena of leadership can be explained as “grounded in a relationship”. Rost (1995) distinguishes four essential elements of leadership, namely: 1) a relationship based on influence, 2) leaders’ and followers’ intention of enhancing such relationship, 3) the parties’ intention of the changes, and 4) the presence of mutual purposes. Hollander (1995) was one of the first researchers who pointed on the two-way influence between leaders and followers, speaking of relationship of the parties involved. He has stated that a major component of the leader–follower relationship is the leader’s perception of his or her self, relative to his or her followers, and how they in turn perceive the leader. Indeed, it has often stated throughout the history of leadership studies that leadership exists only in the interaction between the leaders and followers (Grint, 2000). The nature of interactions depends on the characteristics that everyone brings to the relationship, including their physical and psychological traits and disposes them to approach interpersonal situations in a certain way (Phillips and Bedeian, 1994).
Thus, in relational approach leadership is viewed as a relationship between parties, such as a leader and an employee. In particular, relational approach stresses processes rather than individuals, and view organisational members and leadership as made in processes (Fairhurst and Uhl-Bien, 2012). It is emphasised that this exchange process is constructing values, attitudes, and behaviours of the parties involved (Uhl-Bien, 2006; Hosking, 2007). Additionally, the contextual nature of leadership relationships, for example, a societal context (Osborn, et al., 2002), is acknowledged in relational approach. In general, it can be said that a switch from other approaches to relational one is a substantial since a focus has been changed from being the leader-centred to a leadership as a process of exchanges with the employees, and therefore both parties are viewed as contributors to the relationship, please see the figure 1 below. Moreover, Yukl, et al. (2009) and Yukl (2013) pointed out that within this process, both, leaders and followers are expected to behave ethically and concerning each other when fulfilling their responsibilities.
According to LMX theory, there exists an exchange of information (cog-nitions) and emotions among the parties, and it can be referred to as low and high LMX (Anand, et al., 2011; Liden, Sparrowe and Wayne, 1997; Sparrowe and Liden, 1997). High quality LMX relationships (high LMX) imply high quality of informational exchange; such relationships are based on mutual trust,

Julija Žakemo 9
loyalty, respect, as well as emotional comfort and liking (Bauer and Green, 1996). High LMX are formed by a leader with the subordinates who constitute the “in-group” circle (Dansereau, et al., 1975). According to social exchange theory, people tend to develop high-quality relationships based upon how frequently interaction occurs, as links become stronger (Dienesch and Liden, 1986). As a result, subordinates who are “in-group” followers are empowered with greater responsibilities, receiving more constructive attention from the leader, and these employees have bigger access to resources, they are given more freedom for performing their roles; relationships of this type exit the boundaries of the formal contract.
In the case of “out-group members”, the quality of exchange of information and emotional support is low, there is generally lower level of trust; more control is used from the part of the leader and less initiative from the part of subordinate is observed. Such relationships indicate on low LMX (Graen and Uhl-Bien, 1995). Low-quality relationships put subordinates at a relative disadvantage in terms of job benefits and career progress (Fernandez and Vecchio, 1997). In low-quality relationships, members receive less access to the supervisor, resources, and more restricted information, potentially leading to dissatisfaction with their job, lower organizational commitment, and, further, employee turnover (Gerstner and Day, 1997). Low LMX relationships are characterized by economic exchanges based mainly on formal and tangible assets, such as employment contracts and payment (Dulebohn, et al., 2012).
Organisational innovativeness is organisational “overall internal receptivity to new ideas” and capability to experiment and engage in creative processes (Wang and Ahmed, 2004, p. 205). Innovativeness is a precondition for innovation (Walsh, et al., 2009; Utterback, 1994), which in turn, means “creating and delivering a new customer value to the marketplace” (Carlson & Wimot, 2006). Innovativeness will be conceptualised as a multi-dimensional concept that consists of five dimensions: product, market, process, behavioural and strategic innovativeness (Wang and Ahmed, 2004).
According to Garcia and Calantone (2002), innovativeness is most frequently used as a measure of the degree of newness of an innovation. As to Adair (2009), to innovate means to bring to light something new, i.e. a new idea, a method or
Figure 1. Perspectives of Relational leadership theory Source: Uhl-Bien, 2006: 654, adapted with modifications

10 ORGANISATIONAL INNOVATIVENESS: THE ROLE OF LMX
a product. He suggests that innovation as such is a relative concept, as what is innovative to one is a traditional way of doing things to another, but what is in the essence of innovation – the two aspects – to create ‘new’ ideas and to realise them. However, also creativity is considered to be the concept which explains the birth of novel and applicable ideas about products, practices, services, or procedures (Tierney and Farmer, 2011; Sterneberg and Lubart, 1999). Creativity scholars emphasise that creativity is a “potent competitive weapon” for organisations (Amabile, 1998, p. 87) and numerous studies show that cultivating employee creativity results in effective organisational outcomes, leading to a conclusion that a major objective for leaders in the 21st century is to be creative and to be able to enhance creativity (Aragon-Correa, et al., 2013; Dubkevics, 2015).
As it is argued that creative behaviour refers to the actions which result in generation of ideas that are both novel and useful (Sternberg and Frensch 2014; Lubart, 2008), it is an interrelated concept to that of innovation (Oldham and Cummings, 1996). Although the distinctions have been proposed, there remains a lack of general agreement between the researchers over what constitutes precisely creativity and when does the innovation begin.
According to Anderson, Potocnik and Zhou (2014), whereas creativity has been conceived as the generation of novel and useful ideas, innovation has been more referred to be both the production of creative ideas as the first stage, and their implementation as the second stage. Some literature in the field (Anderson, et al., 2014) however indicates that the boundaries between the concepts are not as clear. Paulus, et al., 2002, for example, observe creativity not just as the early stage of innovation process, but, because of its cyclical character – process of idea generation and its implementation – as a synonym to innovativeness suggesting that innovation and creativity can be used interchangeably (see also Basadur, 2004; Csikszentmihalyi, 2006). Following Zaltman, Duncan, and Holbek (1973), the ideas can be assessed on a continuum in terms of novelty and radicality, similarly, innovation may include novel and radical ideas, as well as ideas that are less novel and more incremental. An argument by Rank, et al. (2004) sheds the light in this debate – creativity, according to them, involves primarily intra-individual cognitive processes whereas innovation represents inter-individual social processes in the workplace.
This study applies Wang and Ahmed’s (2004) consideration of organisational innovativeness. The authors have distinguished the following types of or gani-sational innovativeness: product, process, market, behaviour, and strategic innovativeness. Product innovativeness refers to the newness of an organisation’s products and services which are delivered to the market. Market innovativeness deals with new approaches of addressing the target audiences. Process innovativeness involves the usage of modernised or otherwise novel methods of production, managerial styles, and technologies that stimulate enhancement of production and its quality. Behaviour innovativeness means stimulation of

Julija Žakemo 11
creative potential of the employees, so that a so called ‘climate for innovativeness’ can occur. Last but not least, strategy innovativeness refers to the organization’s capability to achieve its goals, being fast and flexible in the market and it indicates the leadership readiness to experiment, search for new and original solutions.
Governance of the organisation is underlined as an essential factor for the development of innovations in many studies (Damanpour and Wischnevsky, 2006; Drucker, 1998; Hill and Snell, 1988; Huse and Gabrielsson, 2008). It is argued (e.g. Yukl, 2002) that in general, leaders have a powerful source of influence on employees’ work behaviours, and innovative behaviour is no exception.
High-quality exchanges with leaders provide employees with opportunities for skill development and self-improvement since supervisors give these employees their support, decision latitude, and freedom so that the employees can initiate, control, and carry out their tasks without excessive supervision (Sanders, et al., 2010). Subsequently, employees go beyond contractual expectations by performing spontaneous extra role behaviours (Basu and Green, 1997; Sparrowe and Liden, 1997; Wayne, Shore, and Liden, 1997). Moreover, when employees perceive that they have been fairly rewarded by their leader, they tend to react more innovatively in a higher job demand situation (Janssen, 2000). This occurs simply because employee view the existence of distribution equity with regards to the rewards thus being encouraged to engage in innovative work behaviour to a greater extend (Pucetaite, et al., 2016; Nie, Lamsa, and Pucetaite, 2018).
Indeed, high-quality LMX relationships are built on trust, respect, and mutual obligation (Brower, et al., 2000; Walumbwa, et al., 2010; Graen and Uhl-Bien, 1995), none of which would be present if a leader did not recognise and reward good performance and clarify expectations. Characteristics such as humbleness, authenticity and stewardship are mentioned as core qualities of a leader, clearly distinguishing most interpersonal leadership perspectives from more transactional and transformational approaches to leadership (van Dierendonck 2011; Van Wart 2012; Tummers and Knies 2013; Ricard, 2017). In this interpersonal perspective, the leader is a facilitator who builds relationships directly with the people in the organisation, providing a moral example and demonstrating that he/she is able to take responsibility for the whole organisation and its members (stewardship). Therefore, followers receiving goal clarification, recognition, and praise for their work feel a sense of obligation to their leader and are likely to experience higher quality relationships with them (Wayne, et al., 2002).
The current study tests on such control variables which are important to Latvian business context, for example the role of language being used in manager-subordinate dyads in formation of organisational trust and innovativeness. As argued (Pucetaite, Lamsa, 2008; Alvesson, 2011; Kooskora, 2008), leadership is closely connected with the social culture. The LMX theory does not particularly emphasise the role of socio-cultural context which, in fact, can cause peculiarities of leadership process (Nie and Lamsa, 2015). Even though the leader is considered
12 ORGANISATIONAL INNOVATIVENESS: THE ROLE OF LMX
as somebody who exerts an impact on organisational culture (Alvesson, 2011) through social learning processes (Bandura, 1986), it has also been found that in different cultural contexts leadership can have different connotations (Pučėtaitė and Lämsä, 2008; Alvesson, 2011; Harris and Carr, 2008). From this point of view, it is culture that shapes leadership. Following this line of argument, the current research considers the importance of specific socio – cultural context, in which the processes of leadership take place. The society in focus of this study, i.e. Latvia is a Baltic country that previously was a part of the Soviet Union. Since 2004 it is a member of NATO and the European Union. Latvia has a total population of less than 2 million. The main ethnic groups are Latvians at 57.7%, followed by Russians at 29.6%, Belarusian 4.1%, Ukrainian 2.7%, Polish 2.5%, Lithuanian 1.4%, and others at 2% (Central Statistic Bureau, 2017).
It can be argued that Latvia, like other countries which went through the change of socio-political formation, experienced the phenomena best described by the term ‘brute capitalism’ suggested by Young (2003). Looking back at the beginning of capitalistic relationship in our region, the words by Young (2003, p.14) can be used as an illustration:
“…all businesses [are placed] in some antisocial circumstance of cutthroat competition for survival. This free-market extremism pushes the logic of individual autonomy as far as it will go. […] The goal is dominion over others; there [is] no need for fiduciary responsibilities. Self-interest without consideration of the whole set of circumstances is all [what is] needed...”
Indeed, in the analysis of the impact of rapid economic and political changes in Estonian society Kooskora (2008) demonstrated that rapid change of social values resulted in a low awareness of responsibility of a corporate world and in low trust of society towards business. The situation was similar in other Baltic countries. Huettinger (2008) study based on Hofstede model (2003) showed that all cultural dimensions among the three Baltic Republic score very similarly. He also argues that “in many cases, incompetent managers led new companies into failure and employees into unemployment”. As suggested by a study that explored expectations towards business ethics on the basis of social representations of the concept (Bulatova, 2016) in the period from 2003 to 2005, business ethics in Latvia was associated with “unnecessary waste of time”, and the word combination per se did not make any sense. As noticed by Mole (2003) citizens of Latvia and Lithuania ‘know very well about unjustified and unexpected hardships of economic transition’. Pučėtaitė (2014) points out that it is a heritage of a soviet past in a post-socialistic context that explains a lack of responsibility, low trust and opportunistic behaviour in economic relationships. Analysing trust towards political institutions in Lithuania, Pučėtaitė and Lämsä (2008) argue that in post – socialistic societies leaders are expected to be confident and decisive while the followers have to show obedience. However, cases of Enron, World.com, Apple, Solomon Brothers and many others shake the questions of moral grounds of capitalism. Therefore, the call for a responsible leader seems to be an actual

Julija Žakemo 13
topic not only for Latvian society. It can also be argued that it is not a political formation as such, but rather a concrete leadership practice, which matters when one poses a question of ethical or unethical leadership. This study draws attention that organisational innovativeness and organisational trust can be a consequence of concrete relationships which occur between leaders and followers, and that innovativeness and trust can be enhanced when high quality relationship takes place, i.e. ethical concerns of the parties involved are met and leaders realise their role in this process.
There exists however already a theoretical background to assume that relationship leadership tested by LMX, has an impact on organisational innovativeness and innovativeness in particular (e.g. Basu and Green, 1997; Pucetaite, 2014). As to Dick, et al., “leaders act through their followers and a leader’s behaviour is successful because it is translated into followers’ actions” (Dick, et al., 2007, p. 134). By extension, it is reasonable to expect that leaders who are keen in innovative decisions will likely channel their own aspirations towards producing innovative outcomes through mobilizing followers to produce such outcomes.
Hence, LMX is discussed here as an indication on the leader’s capability to create conditions for organisational innovativeness. It is hypothesised that leaders who form high LMX are more likely to encourage innovativeness among their followers compared to low-LMX leaders. Therefore, it was decided to test the existing model (Pucetaite, 2014) and the hypothesis that LMX has a statistically significant effect on organisational innovativeness.
According to De Souza, individual enters relationships under certain conditions of the context that restrict or enable reaction possibilities (De Souza, 2014), therefore broad and nuanced understanding of a phenomenon can be reached only when taking into account context factors. For example, Huy identified language and tenure as socio-emotional factor having important implication for the success and positive organisational level outcomes (Huy, 2011). This research follows Spector and Brannick (2011) who recommend avoiding using demographic variables only as proxies for variables if they are of a real interest. They suggest that context variables should be directly investigated since they can explain the reasons for observed results (Spector and Brannick, 2011).
METHODOLOGY OF THE STUDY
An electronic survey was sent to employees of 80 large size organisations of Latvia. Since the model is tested in the situation of Latvian business context, it was decided to quantitatively test the model on the sample of large-sized business of Latvia which constitutes 236 enterprises, as to the year 2016 (Central Statistics Bureau of Latvia, 2016). According to Investorwords (2019) online resource, it is a company which has a turnover of more than £5.75m or employs more

14 ORGANISATIONAL INNOVATIVENESS: THE ROLE OF LMX
than 250 staff. Central Statistics Bureau (CSB, 2019) data for 2017 suggest that there were 93775 economically active enterprises in Latvia, out of which Micro businesses are 86,2%, Small enterprises constitute 11,1%, medium – 2,3%, and Big ones – are counted just for 0,4%.
Assuming continuous data, the researcher should determine if a categorical variable will play a primary role in data analysis (Barlett, et al., 2001). If so, the categorical sample size formulas should be used. Assuming the alpha level a priori at .05 level, as well as keeping in mind that a seven-point Likert scale will be applied and having set the level of acceptable error at 3%, the estimated standard deviation is 1.167. In that case for a population of 236, the required sample size is 118. However, since this sample size exceeds 5% of the population (1,679*.05 = 84), Cochran’s (1977 quoted in Barlett, et al., 2001) correction formula should be used to calculate the final sample size. Following the calculations, 78 large-size companies is a sufficient sample size for this research.
The questionnaire consisted of three parts: 1. demographical part, measuring language spoken between the parties,
respondents belonginess to a generation, gender, education, status, tenure of experience within the same organisation, and industry in which the company operates;
2. the LMX scale (Graen and Uhl-Bien, 1995), 3. the Organisational innovativeness measurements instrument (Wang and
Ahmed, 2004). Measurement of the independent variable: LMX was measured by a 7-statement
questionnaire (Graen and Uhl-Bien, 1995) applying a five-point Likert scale (1 meaning “totally disagree” and 5 “totally agree”).
Measurement of the dependent variable: Organizational innovativeness in turn, was measured by Wang and Ahmed’s (2004) questionnaire consisting of 20 questions, covering five dimensions, namely: product (4 items), market (4 items), strategic (4 items), process (4 items), and behavioural innovativeness (4 items), altogether the scale has 20 questions. Some of the statement examples are “new products and services in our company often take us up against new competitors”, “in our company, we tolerate individuals who do things in a different way.” Again, a 7-point Likert scale is applied for answering the questions (1 = strongly disagree, 7 = strongly agree). The third, sixth, ninth and nineteenth questions are reverse questions in the scale.
Mumford and Licuanan (2004) concluded that one cannot expect existing leadership models which are developed to predict performance in routine settings, to be entirely applied to the leadership of innovative individuals. There are various discussions as to validity of perception of innovativeness, and there is an argument that such measuring does not reflect the real status of the organisation’s innovativeness, while others state this being an adequate technique because it reflects comparative estimation of innovativeness in

Julija Žakemo 15
connection to other companies in the field and thus reflects critical views and societal comprehension of the phenomena within the company. It is supported by the studies by Nie and Lamsa (2015), Pucetaite, et al. (2016).
Table 1Measurement of the research variables and composition of the survey
Variable Survey items Measurement scale Reference
Organisational Innovativeness
Section 1: statements 1–20
7-point Likert scale 20-item scale (Wang, Ahmed, 2004)
Leader-member exchange (LMX)
Section 3:statements 1–7
5-point Likert scale 7-item scale (Graen and Uhl-Bien, 1995)
Context factors Section 4:gender Male/femaleeducation Secondary/college/bachelor/master/doctoralage Years (belonginess to a generation)status Specialist/manger/top managerlanguage Both native/native vs foreign/both foreign
The questionnaire was translated from English to Latvian and then back to English, i.e. a translation and back-translation method was used, which is stated to ensure the reliability and validity of the instrument (Brislin, 1970).
RESULTS
As seen in Table 2 below, reliability tests of the scales of LMX and those of organisational innovativeness has yielded high Cronbach’s alphas (coefficients are above 0.7), indicating on high internal consistency of the scales and meaning that the data can be used for further analysis.
Table 2Cronbach’s Alfa and Descriptive statistics of the research constructs (n = 405)
Variable No of items per scale
Cronbach’s Alfa Mean Std.
DeviationMinimum
Maximum
LMX 7 0.88 3.69** 0.67 1.00 5.00Innovativeness 20 0.80 5.18* 0.71 1.90 6.60Product innovativeness 4 0.84 5.30 0.94 2.50 7.00Market innovativeness 4 0.75 5.22 0.85 1.00 6.75 Process innovativeness 4 0.79 5.24 0.82 1.00 6.75Strategic innovativeness 4 0.75 5.18 0.81 2.25 6.75Behavioural innovativeness 4 0.88 4.97 0.97 1.00 7.00
** 5-point Likert scale* 7-point Likert scale

16 ORGANISATIONAL INNOVATIVENESS: THE ROLE OF LMX
Organisational innovativeness of Latvian large-size organisations is perceived as high (significantly above average in 7-point scale) by employees. The highest component is product innovativeness, followed by process innovativeness, whereas, the lowest evaluation is assigned to behavioural and strategic innovativeness.
To test the hypothesis of the study, data was analysed using hieratical linear modelling since it allows specifying a fixed order of entry for variables in order to test the effects of certain predictors independently of the influence of other factors. Table 3 below summarises the results of the regressions of the test score on various set of regressors. Trust and Innovativeness were treated as one-dimensional constructs to avoid multicollinearity which may cause problems to regression analysis. Table 3 below presents the summary of hierarchical linear regression.
Table 3Summary of the results of hierarchical regression
Variable Model 1 Model 2 Model 3 Model 4 Model5 Model 6 Model 7 Model 8Industry Sect 2 0.47*** 0.44*** 0.24* 0.27* 0.24* 0.23* 0.23* 0.18Industry Sect 3 0.49*** 0.34** 0.10 0.08 0.05 0.03 0.03 0.08Industry Sect 4 0.33* 0.18 0.09 0.13 0.10 0.09 0.10 0.13Industry Sect 5 0.05 -0.15 -0.21 -0.15 -0.16 -0.15 -0.15 -0.16Industry Sect 6 0.60*** 0.30* 0.12 0.15 0.16 0.14 0.12 0.11Industry Sect 7 0.31* 0.18 0.15 0.19 0.18 0.18 0.18 0.19LMX 0.56*** 0.30*** 0.33*** 0.34*** 0.34*** 0.35*** 0.36***Gender (male) -0.01 0.00 0.01 0.01 0.01 -0.03Generation Y -0.06 -0.06 -0.07 -0.07 -0.08Generation X 0.09 0.09 0.01 0.01 0.01Generation BB 0.26* 0.26* 0.16 0.16 0.18Status (mid-manager) -0.12 -0.14 -0.13 -0.19*
Status (top-manager) -0.11 -0.15 -0.14 -0.24
Tenure (2 to 5 years) -0.02 -0.02 0.00
Tenure (15 plus years) 0.23** 0.23** 0.25***
Language 2 0.06 0.05Language 3 0.09 0.10Education 3 -0.08Education 4 0.30***(Constant) 4.86 2.91 1.84 1.87 1.86 1.90 1.82 1.83

Julija Žakemo 17
Variable Model 1 Model 2 Model 3 Model 4 Model5 Model 6 Model 7 Model 8Adjusted R Square 0.06 0.33 0.46 0.47 0.47 0.48 0.48 0.53
R Square Change 0.08 0.27 0.00 0.01 0.00 0.01 0.00 0.05
F Change 5.43 162.94 0.02 3.46 1.42 5.28 0.78 20.84
Sig. F Change 0.00 0.00 0.89 0.02 0.24 0.01 0.46 0.00
*p < 0.05; **p < 0.01; ***p < 0.001
Adjusted R Square tells how “good” the model is at predicting or explaining the values of dependent variable (Stock and Watson, 2012, p. 227).
Since the industry factor is above organisational context and cannot be controlled by a leader, industry was not the object of interest in this research and is treated as a control variable. In the first step control variables (Industry dummies) were inserted (see Model 1). Industry sector dummies where created with Sector 1 as baseline. LMX was entered as independent variable. Data in the Table 3 (Model 1) show that Industry factor alone is able to explain only 6% of organisational innovativeness (adjusted R2 = 0.06). Interestingly that Sector 6 named ‘other industries’, which include art, entertainment, health and social activities, and education, appeared to report the highest innovativeness, followed by sector 2 ‘electricity, gas, water supply and waste management’ and sector 3 ‘manufacturing and construction’. Sector 5 ‘service’ has no impact on organisational innovativeness.
When LMX is added (Model 2), the model explains 33% of organisational innovativeness (adjusted R2 = 0.33), what is consistent with the Hypothesis of the study (LMX has a statistically significant impact on organisational innovativeness).
Adding the variables of contextual factors, it was tested weather contextual factors are statistically significant moderators in LMX and innovativeness relationship. Model 3 particularly shows that gender has no additional effect on innovativeness (adjusted R2 = 0.46; it is the same as in the previous model and change is not significant). Model 4 shows the effect of employee s or manager’s age (measured as generation) and can explain additional 1% of organisational innovativeness (adjusted R2 = 0.47; Sig. F Change = 0.02) and this change is significant. Thus, age has an impact on innovativeness, and especially “Baby Boomers” show a significant relationship with dependent variable.
Model 5 shows the effect of status and explains the same 47% of organisational innovativeness (adjusted R2 = 0.47), thus status does not add any power. However, the tenure (Model 6) shows additional effect on organisational innovativeness (adjusted R2 = 0.48; Sig. F Change = 0.01). Moreover, respondents with tenure more than 15 years show significant effect on dependent variable (B = 0.23; sig = 0.007). Language of communication (Model 7) does not add any explanatory

18 ORGANISATIONAL INNOVATIVENESS: THE ROLE OF LMX
power to the model (adjusted R2 = 0.48; Sig. F Change = 0.46). However final model which adds education (Model 8) exhibits additional 5% explanatory power (adjusted R2 = 0.53; Sig. F Change = 0.00). Model 8 therefore explains 53% of organisational innovativeness.
Hence, the results of hierarchical multiple regression analysis support the main hypothesis. The correlation between the LMX and organisational innovativeness was found to be 0.521, p < 0.001.
CONCLUSIONS
Organisational innovativeness of Latvian large-size organisations is perceived by the employees as high (all components evaluated significantly above average). Latvian organisations are evaluated to be more active in product and process innovativeness, but less active in behavioural and strategic innovativeness.
Industry sector in which organisation operates has statistically significant, but still low impact on organisational innovativeness (it accounts only for 6% of organisational innovativeness). Sector named ‘other industries’, which include art, entertainment, health and social activities, and education, appeared to report the highest innovativeness, followed by ‘electricity, gas, water supply and waste management’ and ‘manufacturing and construction’. Service sector has no impact on organisational innovativeness.
Leader-member exchange (LMX) quality is essential for increasing organisational innovativeness (it accounts for 27% to 31% of organisational innovativeness of Latvian large-size organisations), thus it serves as micro-foundation of organisational innovativeness. The strongest effect of LMX is revealed in the case of behaviour innovativeness, followed by its effect on process innovativeness, but the weakest effect was found on product innovativeness. LMX alone has no significant effect on strategic and product innovativeness. This shows that the leader through the relationship with the subordinate can directly influence the behaviour and organisation of the processes but cannot directly influence the strategic and product innovativeness.
To summarise, as innovativeness corresponds to an organisational capability for generation of new and useful ideas, certain atmosphere of trust should take place, where knowledge and idea sharing can occur. The role of a leader who is able to develop high quality relationships, which are based on mutual reciprocity, respect, loyalty, and trust, is argued to be crucial in this process as quality of dyadic relationship echoes throughout the entire organisation. Current research contributes to knowledge and understanding of the LMX theory by contextualizing it in Latvian setting.
In line with the conclusions, the following is recommended for leaders of large-size organisations: Leaders should ‘vision’ innovativeness: discussions on the matters of innovativeness should be raised within the organisations.

Julija Žakemo 19
The leaders of the organisations should enhance the meaning of innovativeness and provide support for initiatives of the employees with their innovative solutions. For example, groupwork and innovativeness (creativity) workshops should take place within the organisations, even if the direct tasks of the employees are not connected with the workshops’ capacity development, but such activities generally enhance the level of innovativeness, and participation in such workshops should be incorporated in annual evaluations.
Leaders should ensure high quality relationship with subordinates, which primarily is based on trust. Leader who are able to sustain high quality relationships, which is based on mutual reciprocity, respect, loyalty, and trust is crucial in this process as quality of dyadic relationship echoes throughout the organisation. Leaders should also trust their employees: delegation also should include trusting, employees should be able to voice their concerns, communication should be open and transparent throughout the organisation. Employees should not be afraid to make mistakes to a reasonable extent. When concrete rationalised solutions or problems are raised by the employees, it is of utmost importance to give a constructive feedback, react, and, if possible, find the ways of incorporating new ideas into organisational decisions.
Leaders should be trusted and act as role-models: managers should act as creative and innovative personalities, one whom employees can trust. Leaders should also monitor the innovativeness: Recognition of innovative solutions should be linked to effectiveness and efficiency. This also includes allowing for mistakes and recognition of moral choice decisions.
Leaders should take into consideration organisational context in which they operate, for example gender distribution of the workforce; age of employee, tenure and even use of language (native or not) in their communication, since this impacts how relationship with subordinates will result in innovativeness.
REFERENCES 1. Adair, J., 2009. Effective teambuilding: How to make a winning team. Pan
Macmillan. 2. Amabile, T. M., 1998. How to kill creativity. Harvard Business Review, September/
October, pp. 77–87. 3. Anand, S., Hu, J., Liden, R. C. & Vidyarthi, P. R., 2011. Leader-member exchange:
Recent research findings and prospects for the future, 311–325. In A. Bryman (Ed.) The Sage Handbook of Leadership. London: Sage Publications.
4. Anderson, N., Potočnik, K. & Zhou, J., 2014. Innovation and Creativity in Organizations: A State-of-the-Science Review and Prospective Commentary. Journal of Management, 40 (5), 1297–1333. Alvesson, 2011.
5. Aragón-Correa, J. A., Martín-Tapia, I., Hurtado-Torres, N. E., 2013. Proactive environmental strategies and employee inclusion: The positive effects of information sharing and promoting collaboration and the influence of uncertainty. Organization & Environment, 26(2), 139–161.

20 ORGANISATIONAL INNOVATIVENESS: THE ROLE OF LMX
6. Bandura, A., 1986. Social foundation of thougB34:B41ht and action. Englewood Cliffs, New Jersey: Prentice-Hall.
7. Basadur, M., 2004. Leading Others To Think Innovatively Together: Creative Leadership. The Leadership Quarterly, 15, pp. 103–121.
8. Barlett, J. E., Kotrlik, J. W., Higgins, C. C., 2001. Organizational research: Determining appropriate sample size in survey research. Information Technology, Learning, and Performance Journal, Spring iss., pp. 43–50.
9. Basu, R., Green, S. G., 1997. Leader-member exchange and transformational leadership: an empirical examination of innovative behaviors in leader-member dyads. Journal of Applied Social Psychology, 27 (6), pp. 477–99.
10. Bauer, T. N., Green, S. G., 1996. Development of leader-member exchange: A longitudinal test. Academy of management journal, 39(6), pp. 1538–1567.
11. Bennis, W., 2007. The Challenges of Leadership in the Modern World. American Psychological Association. Vol. 62, (1), 2–5.
12. Brislin, R. W., 1970. Back – Translation for Cross – Cultural research. Journal of Cross-Cultural Psychology. September 1(3), 185–216.
13. Bulatova, J., 2016. Morality as an Index of Mental Health of the Organisation: Building a model of healthy leadership. In: M. C. C. Arruda and B. Rok (Ed.) Understanding Ethics and Responsibilities in a Globalising World. Springer: Switzerland.
14. Buschgens, T., Bausch, A., Balkin, D. B., 2013. Organisational Culture and Innovation: A Meta-Analytic review. Journal of Product Innovation Management 30 (4), pp. 763–781.
15. Carlson C. R., Wilmot, W. W., 2006. Innovation: The Five Disciplines for Creating What Customers Want. Random House, New York.
16. CSB, 2017. Employment in different sectors in Latvia on the second quarter of 2017. Available at: http://www.csb.gov.lv/en/statistikas-temas/occupied- posts-and-jobvacancies-paid-working-hours-key-indicators-30604.html; [assessed: 09.09.2017]. Central Statistic Bureau, 2017).
17. Damanpour, F., Wischnevsky, J. D., 2006. Research on innovation in organi-za tions: Distinguishing innovation-generating from innovation-adopting or-ganizations. Journal of engineering and technology management, 23(4), 269–291.
18. Dansereau, F. Jr., Graen, G. and Haga, W. J., 1975. A vertical dyad linkage approach to leadership within formal organization: a longitudinal investigation of the role making process, Organizational Behavior & Human Performance. 13(1), pp. 46–78.
19. DeMiranda, P. C., Aranha, J. A. S., Zardo, J., 2009. Creativity: people, environment and culture, the key elements in its understanding and interpretation. Science and Public Policy, 36(7), pp. 523–535.
20. Deschamps, J-P., 2009. Innovation Leaders: How Senior Executives Stimulate, Steer and Sustain Innovation. John Wiley & Sons.
21. De Souza, D. E., 2014. Culture, context and society: The underexplored potential of critical realism as a philosophical framework for theory and practice. Journal of Social psychology, 17, pp. 141–151.
22. van Dierendonck, D., Patterson, K., 2015. Compassionate love as a cornerstone of servant leadership: An integration of previous theorizing and research. Journal of Business Ethics, 128(1), pp. 119–131.
23. Dienesch, R. M., Liden, R. C., 1986. Leader-Member Exchange Model of Leadership: A Critique and Further Development. The Academy of Management Review, 11(3), pp. 618–634.

Julija Žakemo 21
24. Drucker, P. F., 1998. The discipline of innovation. Leader to Leader, 1998(9), 13–15.
25. Dubkevics, L., 2015. Interrelation between organizational culture and climate for creativity in state theatres in Latvia. Journal of Business Management, (9).
26. Dulebohn, J. H., Bommer, W. H., Liden, R. C., Brouer, R. L., Ferris, G. R., 2012. A Meta-Analysis of Antecedents and Consequences of Leader-Member Exchange: Integrating the Past With an Eye Toward the Future, Journal of Management. Vol. 38, pp. 1715–1759.
27. Fairhurst, G. T., Uhl-Bien, M., 2012. Organizational discourse analysis (ODA): Examining leadership as a relational process. The Leadership Quarterly, 23(6), pp. 1043–1062, Fairhurst and Uhl-Bien, 2012.
28. Felin, T., Foss, N. J. & Ployhart, R. E., 2015. The Microfoundations Movement in Strategy and Organization Theory. The Academy of Management Annals, 9(1), pp. 575–632.
29. Ferris, G. R., Liden, R. C., Munyon, T. P., Summers, J. K., Basik, K. J., Buckley, R. M., 2009. Relationships at Work: Toward a Multidimensional Conceptualization of Dyadic Work Relationships. Journal of Management. 35 (6), pp. 1379–1403.
30. Garcia, R., Calantone, R., 2002, A critical look at technological innovation typology and innovativeness terminology: a literature review. The Journal of Product Innovation Management, Vol. 19, pp. 110–132.
31. Gerstner, C. R., Day, D. V., 1997. Meta-Analytic review of leader–member exchange theory: Correlates and construct issues. Journal of applied psychology, 82(6), pp. 827–844.
32. Graen, G. B., Uhl-Bien, M., 1995. Relationship-Based Approach to Leadership: Development of Leader-Member Exchange (LMX) Theory of Leadership over 25 Years: Applying a Multi-Level Multi-Domain Perspective. Leadership Quarterly, 6, pp. 219–247.
33. Grint, 200034. Harris, S., Carr, C., 2008. National cultural values and the purpose of businesses.
International Business Review, 17(1), pp. 103–117.35. Harris, K. J., Whealer, A. R., Kacmar, M., 2009. Leader–member exchange
and empowerment: Direct and interactive effects on job satisfaction, turnover intentions, and performance. The Leadership Quarterly, 20(3), pp. 371–382.
36. Hollander, E. P., 1995. Ethical challenges in the leader-follower relationship. Business Ethics Quarterly, 5(1), pp. 55–65.
37. Hosking, D. M., 2007. Not leaders, not followers: A post-modern discourse of leadership processes. Follower-centred perspectives on leadership: a tribute to the memory of James R. Meindl, Information Age, Charlotte, NC, 243–263.
38. Hill, C. W., Snell, S. A., 1988. External control, corporate strategy, and firm performance in research‐intensive industries. Strategic management journal, 9(6), pp. 577–590.
39. Hofstede, G., 2003. What is culture? A reply to Baskerville. Accounting, Organizations and Society, Vol. 28, pp. 811–813.
40. Huettinger, M., 2008. Cultural dimensions in business life: Hofstede’s indices for Latvia and Lithuania. Baltic Journal of Management, 3(3), pp. 359–376.
41. Huy, Q. N., 2011. How middle managers` group-focus emotions and social identities influence strategy implementation. Strategic Management Journal, 32(13), pp. 1387–1410.

22 ORGANISATIONAL INNOVATIVENESS: THE ROLE OF LMX
42. Innovation Policy Platform (IPP), 2013. Available at: https://www.fostero-penscience.eu/content/innovation-policy-platform-ipp, [accessed: 12.11.2014].
43. Janssen, O., Yperene, N. W. V., 2004, Employees’ Goal Orientations, The Quality Of Leader-Member Exchange, And The Outcomes Of Job Performance And Job Satisfaction, Academy of Management Journal, 47(3), pp. 368–384.
44. Kaptein, M., 2008. Developing and testing a measure for the ethical culture of organisations; the corporate ethics virtue model. Journal of Organisational Behaviour, 29(7), pp. 923–947.
45. Kooskora, M., 2008. Understanding Corporate Moral Development in the Context of Rapid and Radical Changes. The Case of Estonia. Academic dissertation defended in University of Jyväskylä.
46. Liden, R. C., Sparrowe, R. T., & Wayne, S. J., 1997. Leader-Member Exchange Theory: The Past and Potential for the Future. In. G. R. Ferris (Ed.), Research in personnel and human resources management (Vol. 15, pp. 47–120). Greenwich, CT: JAI Press.
47. Lord, R. G., & Brown, D. J., 2001. Leadership, values, and subordinate self-concepts. The Leadership Quarterly, 12(2), pp. 133–152.
48. Ludviga, I., 2012. National Identity and Culture Grounded Competitive Advantage: Innovative Business Models. Conference paper. 7th International Scientific Conference “Business and Management”. May 10–11, 2012. Vilnius, Vilnius Gediminas Technical University.
49. Lumpkin, G. T., Dess, G. G., 2001. Linking two dimensions of entrepreneurial orientation to firm performance: The moderating role of environment and industry life cycle. Journal of Business Venturing, 16, pp. 429–451.
50. Mole, J., 2003. Mind your Manners: Business Cultures in Europe – Managing Business Cultures. Nicholas Brealey Publishing: London.
51. Nie, D., Lämsä, A. M., 2015. The leader–member exchange theory in the Chinese context and the ethical challenge of guanxi, Journal of Business Ethics, 128 (4), pp. 851–861.
52. Nie, D., Lämsä, A. M., Pučėtaitė, R., 2018. Effects of responsible human resource management practices on female employees’ turnover intentions. Business Ethics: A European Review, 27(1), pp. 29–41. Nie and Lamsa (2015).
53. Nie, Lamsa, and Pucetaite, 2018. 54. Norvapalo, K., 2014. The Quality and Development of the Leader-Follower
Relationship and Psychological Capital. A Longitudinal Case Study in a Higher Education Context. University of Jyvaskyla.
55. Oldham, G. R., Cummings, A.,1996. Employee creativity: Personal and contextual factors at work. Academy of management journal, 39(3), pp. 607–634.
56. Osborn, R. N., Hunt, J. G., Jauch, L. R., 2002. Toward a contextual theory of leadership. Leadership Quarterly, 13, pp. 797−837.
57. Paulus, P. B., Putman, V. L., Dugosh, K. L., Dzindolet, M. T., Coskun, H., 2002. Social and cognitive influences in group brainstorming: Predicting production gains and losses. European review of social psychology, 12(1), pp. 299–325.
58. Pučėtaitė, R., Novelskaitė, A., Lämsä, A. M., Riivari, E., 2016. The relationship between ethical organisational culture and organisational innovativeness: Comparison of findings from Finland and Lithuania. Journal of business ethics, 139(4), pp. 685–700.
59. Pučėtaitė, R., 2014. Stimulating organizational innovativeness through ethical leadership practices: the mediating role of organizational trust. 19th International

Julija Žakemo 23
Scientific Conference; Economics and Management 2014, ICEM, Latvia. Procedia – Social and Behavioral Sciences 156, pp. 231–235.
60. Pučėtaitė, R., Lämsä, A. M., 2008. Developing organizational trust through advancement of employees’ work ethics in a post-socialist context. Journal of Business Ethics 82, pp. 325–337.
61. Rank, J., Pace, V. L., Frese, M., 2004. Three avenues for future research on creati-vity, innovation, and initiative. Applied psychology, 53(4), pp. 518–528.
62. Riivari, E., Lämsä, A. M., 2014. Does it pay to be ethical? Examining the relation-ship between organisations’ ethical culture and innovativeness. Journal of Business Ethics, 124(1), pp. 1–17.
63. Rost, J. C., 1995. Leadership: A Discussion about Ethics. Business Ethics Quarterly, 5 (1), pp. 129–142.
64. Schumpeter, J., 1942. Capitalism, socialism, and democracy. London: Unwin University Books Press.
65. Sparrowe, R. T., Liden, R. C., 1997. Process and Structure in Leader-Member Exchange. Academy of Management Review. 22(2), pp. 522–55.
66. Spector, P. E., Brannick, M. T., 2011. Methodological urban legends: The misuse of statistical control variables. Organizational Research Methods, 14(2), pp. 287–305.
67. Sternberg, R. J., Lubart, T. I., 1999. The concept of creativity: Prospects and paradigms. Handbook of creativity, 1, pp. 3–15. 495.
68. Sternberg, R. J., Frensch, P. A., 2014. Complex problem solving: Principles and mechanisms. Psychology Press: UK.
69. Stock, J. H. and M. W. Watson(2012): “Disentangling the Channels of the 2007–2009 Recession,” NBER Working Papers 18094, National Bureau of Economic Research, Inc.
70. Treviño, L. K., den Nieuwenboer, N., Kreiner, G. E., Bishop, D., 2014. A grounded theory study of legitimacy work among ethics and compliance officers, Organizational Behavior and Human Decision Processes, 123, pp. 186–205.
71. Treviño L. K., Brown, M., Hartman, L., P., 2003. A qualitative investigation of perceived executive ethical leadership: Perceptions from inside and outside the executive suite. Human Relations, 56(1), pp. 5–37.
72. Tummers, L. G., & Knies, E. (2013). Leadership and meaningful work in the public sector. Public Administration Review, 73(6), pp. 859–868.
73. Tierney, P., Farmer, S. M., 2011. Creative self-efficacy development and creative performance over time. Journal of Applied Psychology, 96(2), pp. 277–293.
74. Uhl-Bien, M., 2006. Relational Leadership Theory: Exploring the social processes of leadership and organizing. The Leadership Quarterly 17(6), pp. 654–676.
75. Utterback, J. M., 1994. Mastering the Dynamics of Innovation. Harvard Business School Press, Boston, MA.
76. Van Wart, M., Hondeghem, A., Bouckaert, G., Ruebens, S., 2012. Administrative Leadership in the context of governance. In Rome: Paper for the XVI Annual Conference of the International Research Society for Public Management Panel on Leadership in the public sector: back to the future.
77. Walumbwa, F. O., Mayer, D. M. Wang, P., Wang, H., Workman, K., Christensen, A. L., 2011. Linking ethical leadership to employee performance: The roles of leader–member exchange, self-efficacy, and organizational identification. Organizational Behavior and Human Decision Processes, 115 (2), pp. 204–213.
78. Walsh M., Lynch P., Harrington D., 2009. Innovativeness: A Conceptual Framework, Antecedents, Dimensions & Outcomes, RIKON (Research in

24 ORGANISATIONAL INNOVATIVENESS: THE ROLE OF LMX
Innovation, Knowledge & Organisational Networks) Group). In: EuroCHRie, 22–24th October, Helsinki. Prieiga.
79. Wang, C. L., Ahmed, P. K., 2004. The development and validation of the orga-nizational innovativeness construct using confirmatory factor analysis. European Journal of Innovation Management 7, pp. 303–313. 537.
80. Wang, C. L., Ahmed, P. K., 2007. Dynamic capabilities: A review and research agenda. International Journal of Management Reviews, 9, pp. 31–51.
81. Wayne, S. J., Shore, L. M., Liden, R. C., 1997. Perceived organizational support and leader-member exchange: A social exchange perspective. Academy of Management journal, 40(1), pp. 82–111.
82. Wayne, S. J., Shore, L. M., Bommer, W. H., Tetrick, L. E., 2002. The Role of Fair Treatment and Rewards in Perceptions of Organizational Support and Leader–Member Exchange. Journal of Applied Psychology. 87(3), pp. 590–598.
83. Yu, et al., 201884. Yukl, G. A., Gordon, A., Taber, T. 2002. A Hierarchical Taxonomy of Leadership
Behavior: Integrating a Half Century of Behavior Research. Journal of Leadership and Organisational Studies.9 (1), pp. 15–32.
85. Yukl, G., O’Donnell, M., Taber, T., 2009. Influence of leader behaviors on the leader‐member exchange relationship, Journal of Managerial Psychology, 24(4), pp. 28999. 569.
86. Yukl, G. A., 2013. Leadership in organizations. (8th ed.) Harlow: Pearson Education.
87. Zaltman, G., Duncan, R., Holbek, J., 1973. Innovations and organizations. John Wiley & Sons.

DEVELOPMENT OF BORROWERS’ SOLVENCY ASSESSMENT MODEL: LOGISTIC
REGRESSION APPLICATION
DĀNIELS JUKNAMg. oec.
Abstract
Borrowers’ solvency assessment models can not only increase company’s profit, but also potentially decrease the impact from the negative economic consequences of the crisis. However, there is no consensus on such models. Considering the flaws in the scientific literature, the main aim of this article was to develop the borrowers’ solvency assessment model, which can be applied in practice. The most appropriate method for developing such models was found to be logistic regression, and this research goal is to identify the best modelling approach to achieve the highest borrowers’ solvency predictability. By implementing the best-chosen model, a nonbank lending company could provide a 42.5% lower total borrowers risk of default than without implementing such a model. Depending on the risk policy of the non-bank lending company, three methodologies were developed based on different assumptions about the significance of type 1 error and type 2 error in the company to determine the exact cut-off value.
Keywords: Latvia, lending, logistic regression, nonbank loans, solvency assessment
JEL classification: C31, C55, E51
INTRODUCTION
Issuing a loan is an unsafe business, but at the same time, it is one of the main activities and sources of income for financial institutions in Latvia. One of the biggest challenges for lenders is to develop effective lending and risk policies to ensure the desired return and to prevent a recurrence of the negative economic consequences of the 2007 US mortgage crisis, which included serious shortcomings in assessing borrowers’ solvency.
Studies show that statistical models improve the accuracy of lending decisions and make lending more cost-effective, but there is no consensus on how to develop such models. Different publications use different methods, including different factors and select different model valuation indicators. In addition, many studies do not include or establish factor relative importance and do not conclude which factors are associated with good or bad borrower solvency. The shortcomings and incomplete information in the publications were considered to achieve
DEVELOPMENT OF BORROWERS’ SOLVENCY ASSESSMENT MODEL ..
Dāniels Jukna
Journal of Economics and Management Research. Vol. 9, 2020https://doi.org/10.22364/jemr.9.02

26 DEVELOPMENT OF BORROWERS’ SOLVENCY ASSESSMENT MODEL ..
the highest possible results for the borrower solvency assessment model. By doing that answers to three questions are sought: (1) what factors allow to assess the borrowers’ solvency; (2) which factor values are associated with a borrower with good solvency; (3) what are the relative importance of factors in the borrower solvency assessment model. Answers to these three questions provide statistical borrower solvency assessment model suitable for a non-bank lending company, which could be applicable in practice.
Research methods used in the study are statistical parametric (multifactor logistic regression) data processing method to create a borrower solvency as-sessment model, determining the relationship of independent variables with the borrowers’ solvency and factor relative importance; mathematical program-ming method (GRG nonlinear) to determine the cut-off value of the best classes for the respective methodology.
A solvency assessment model for non-bank borrowers was developed using the logistic regression method and a step-by-step modelling approach with the Akaike information criterion. The obtained model can be applied in practice, considering the value of independent variables and certain cut-off value, which is obtained based on the risk policy of a non-bank lending company. The implementation of the obtained model would ensure a 14.6% low total risk of default of borrowers, which is 42.5% lower than without the introduction of such a model.
The article is structured as follows. Section 1 briefly reviews the literature on the topic of borrowers’ solvency assessment. Section 2 presents the data and describes the methodology employed in this study. Section 3 provides the borrowers solvency assessment model results and efficiency of implementing it. The last section concludes.
LITERATURE REVIEW
Analysis of the borrower solvency assessment has received a fair share of attention in international literature (see for example Bolton (2009), Vidal and Barbon (2019)), however in case of Latvia the available literature is rather limited.
The solvency assessment of borrowers is based on a points system, which determines the risk level and solvency of a person, depending on the charac-teristics of the borrower, historical and current liabilities, and other factors (Anderson, 2007). The development of a borrower solvency assessment model can also be cost-effective, for example, one experiment with historical data in Bolivia concluded that rejecting 12% of loans disbursed to riskier customers in 2000 would have reduced the number of overdue loans by 28% (Schreiner, 2003).
The purpose of developing a risk score scale is to create a segmentation or index that can be used to classify consumers into two or more different groups (Bolton (2009) recommends to divide consumers into two groups – borrowers

Dāniels Jukna 27
with poor and good solvency), so econometric methods for modelling a dependent variable, as well as statistical classification methods are commonly used (Glennon et al., 2008).
The borrowers’ solvency models in the market are sufficiently general and standardised (Glennon et al., 2008) and in Latvia they are not sufficiently explained, therefore making decisions based on these models is not recommended.
There may be a lag in the borrowers’ solvency assessment model since this model does not include data for the whole population (applications rejected by the lender are not considered). To carry out this study and to develop an appropriate model, it is assumed that all other potential borrowers have similar characteristics as borrowers mentioned in this data set have. This assumption is based on the findings of the study that there were minimal differences in the accuracy of the model classification compared to the model based on the financial institution’s existing customers and the model based on all applications (Banasik et al., 2003).
Choosing the right factors is an important step in developing a solvency assessment model, as they will be used to predict the probability to default. It can be concluded that most of the publications mention the relationships of the variable that are not based on the results of the model.
Factors are used to distinguish borrowers with poor solvency can be distinguished from borrowers with good solvency by five categories of data: (1) demographic and educational indicators; (2) financial indicators; (3) em-ployment indicators; (4) loan repayment discipline indicators; (5) other data (Mpofu & Mukosera, 2012).
The following relationships between demographic and educational indicators and borrower solvency can be found in the studies available in the literature: women are often found to be less risky men; the risk of default decreases with age and is also lower for married borrowers with dependents (possibly due to existing dual income (Schreiner, 2003)); homeowners represent a category of less risky borrowers because the house can be used as collateral; education is a very strong predictor of default, as borrowers with a higher level of education show much less default than other borrowers (Vojtek and Kocenda (2008)).
The financial indicators, for example, the amount of income, are important factors in assessing borrowers’ solvency and are economically interpretable, as they show that borrowers with larger amounts of money have a lower risk of default (borrowers have more money to repay loan payments). However, another study found that risk of default does not depend on the absolute amount of income (i.e. the difference between income and liabilities), but it does depend on relative income (i.e. the ratio of expenses to income) (Vidal and Barbon (2019)). This means that high-income and high-spending borrowers are also risky.
The following relationships between employment indicators and borrower solvency can be found in the studies: self-employed people are often rated lower than employees (employment stability indicates payment stability), (Vojtek and
28 DEVELOPMENT OF BORROWERS’ SOLVENCY ASSESSMENT MODEL ..
Kocenda (2006)); frequent changes in low-skilled jobs are riskier. On the other hand, some of the employment indicators, such as the employment sector or the number of years worked in an enterprise, are not statistically significant factors (Vojtek and Kocenda (2008)).
The following relationships between loan repayment discipline indicators and borrower solvency can be found in the studies: collateral reduces risk of default; recent loans are much riskier than those whose customers have a longer relationship with the financial institution (Vojtek and Kocenda (2006)); the risk of default increases with number of days overdue, delay status, debt to payment ratio and debt amount (Bolton, 2009). This information significantly reduces the problem of asymmetric information between the borrower and the lender.
In addition, studies provide information on the relationship between such other factors and the borrowers’ solvency: the risk of default is higher if the borrower has applied at night (00:00–05:59), used the Android operating system; the risk of default is lower if the borrower has applied in the evening (18:00–23:59), used the IOS operating system or went to the lender’s website through a direct channel; a borrower who uses a paid email provider is associated with good solvency; if the borrower has more than two or no telephone numbers, they have a higher risk of default than those who have only one telephone number; if the borrowers’ e-mail consists of borrowers’ personal information (for example, name, surname), then these borrowers have a lower risk of default (Berg et al., 2019); loans for home improvement and renovation work are riskier than those for real estate (Vojtek and Kocenda (2008)).
DATA AND METHODOLOGY
The methods commonly used to assess solvency are econometric modelling or statistical methods. Historically, discriminant analysis and linear regression were the most widely used methods for determining solvency and are still used in the development of solvency assessment models in some studies as complementary methods, however, in recent years, logistic regression is probably the most widely used method for assessing solvency (Bolton, 2009).
The logistic regression model is an extension of the linear discriminant analysis, which allows overcoming problems with data abnormality. The logistic regression method can also deal with category data – the solution is to use dummy variables for each data category. One of the disadvantages of logistic regression is that this method is sensitive between explanatory variables, so it is necessary to make sure that there are no such variables in the training data set. Another disadvantage of this method is the sensitivity to missing values (all observations with missing values should be deleted) (Vojtek and Kocenda (2006)).
The risk of default is usually constructed in the form of an index so that all borrowers can be divided into two or more classes. Borrowers’ solvency dependent value is usually dichotomous, consisting of two values – good solvency

Dāniels Jukna 29
and poor solvency (Samreen et al., 2013) and it complies with the rules of logistic regression method (Bolton, 2009).
When developing borrowers’ solvency assessment models, a threshold of 90 days is usually used to distinguish customers with good solvency from customers with bad solvency (Choy and Laik (2011)), but companies can also use a threshold of 30, 60 or even 180 days, two or three delayed payments or any other event that is related to a fall in a company’s profitability. Defining borrowers with poor solvency is important before developing a solvency assessment model, as it directly affects the results of the model (Vidal and Barbon (2019)).
All available variables may be included in the borrower solvency assessment model, but various problems may be identified, such as multicollinearity between variables, the variables in the model are not statistically significant, the variables are not stable, and the variable has too few observations. These problems can be identified and remedied gradually by developing new models and deciding which one is the best, but there are ways in which these problems can be eliminated before borrowers’ solvency assessment models are developed: (1) if an independent variable does not reach 1,500 borrowers with poor solvency, it is recommended to exclude it from the model; (2) factor analysis can be used to reduce the number of variables to be included in the borrower solvency assessment model and to avoid multicollinearity between variables (Samreen et al., 2013); (3) information values is used to select important independent variables in binary models, ranking variables based on their significance (Bhalla, 2015).
It is considered that there is no optimal number of variables that should be used in the development of borrower solvency assessment models. Loan applications can include between 3 and 20 variables and in some cases the number is even higher (Berg et al., 2019). To achieve sufficient predictability of a borrowers’ solvency, the model should include at least 1500 borrowers with poor solvency, but the model may include fewer observations (e.g. 50–100) if no other observations are available. In this case the model should be reviewed regularly as information for new borrowers becomes available (Vidal and Barbon (2019)).
Factor analysis is method that could help to avoid multicollinearity between variables. However, it has drawbacks, for example, (1) this method does not allow to determine which exact variable from the obtained group of factors should be selected and used for modelling; (2) the factor analysis may show a high correlation between two important factors, such as the borrowers’ income and the borrowers’ credit liabilities, but excluding either of these factors, significant discrimination against borrowers may disappear, (3) the factor analysis also does not provide information on how much multicollinearity is already in the model (Samreen et al., 2013). To avoid multicollinearity between variables without using factor analysis, the Variation-Inflation Factor (VIF) can be used. The VIF value in models should not exceed 10, however, it is also not recommended to use a model with this value that exceed 4 (Bock, 2019).

30 DEVELOPMENT OF BORROWERS’ SOLVENCY ASSESSMENT MODEL ..
As the logistic regression model is one of the most used statistical techniques for solving the problem of binary classification, and for such models, independent variables can be estimated using information values using the formula:
where IV – information value, a – the ratio of properly classified borrowers with poor solvency, b – the ratio of properly classified borrowers with good solvency.
The higher the value of the information, the greater the ability of the relevant independent variable to distinguish good solvency borrowers from poor solvency borrowers. When choosing independent variables to be included in the borrower solvency assessment model, it is recommended that the information value be higher than 0.10, which could indicate that the variable has moderate discrimination (predictive power), but the information values are sensitive enough to how the independent variable is grouped (Bolton, 2009). The threshold for including independent variables in the model could be chosen even lower, for example 0.02, which indicates that the independent variable has at least some predictive power with respect to the dependent variable (Tan, 2020). The reason for such a low threshold in one of the studies is that logistic regression model could include more available variables, for instance, social and demographic variables, despite the fact that they tend to present lower information values (Vojtek and Kocenda (2008)). One of the main disadvantages of information values is that they are assessed for each independent variable separately (Bhalla, 2015), which in turn means that the ability of the interaction of independent variables to distinguish borrowers with good solvency from those with poor solvency is not assessed.
Table 1Information values for independent variables
Independent variable Information value Predictability
Education Level 0.5202 Very highEmail contains personal information 0.4940 HighThe part of the day of filling in the application 0.2056 ModerateAge 0.1238 ModeratePurpose of the loan 0.0869 PoorEmail domain 0.0857 PoorIndustry 0.0777 PoorMarital status 0.0712 PoorBasic income 0.0690 PoorTotal income 0.0443 Poor

Dāniels Jukna 31
Independent variable Information value Predictability
Monthly credit liabilities 0.0381 PoorGender 0.0309 PoorApplication completion time (hours) 0.0278 PoorAmount of outstanding debt 0.0129 No predictabilityAdditional income 0.0100 No predictabilityAmount of outstanding debts for the last two years 0.0070 No predictability
Number of dependents 0.0019 No predictabilitySource: author’s calculations based on a non-bank lending company customers data
Using information criteria such as the Akaike Information Criterion (AIC), a gradual selection of the best models can be made. The selection of the variable in the final model is mainly based on successive statistical tests, and this approach is reliable and widely used for borrowers’ solvency assessment models (Votjek and Kocenda (2008)). A lower AIC value indicates that the model is better given the number of independent variables and the number of observations. The comparison of AIC in the logistic regression model is based on relative increases rather than absolute values, but it is not determined what the optimal relative increase is to consider that there are no significant differences between the models (Date, 2019). To compare different models using AIC, the absolute difference formula of the respective model AIC and the minimum AIC found in the models is recommended (see formula 2). If this difference is greater than 10, then it indicates that there is a significant difference between the models (Burnham and Anderson (2004)).
where Δi – Akaike absolute difference of information criteria, AICi – the Akaike information criterion for the respective model, AICmin – the minimum Akaike information criterion found in the models.
Various indicators can be used to determine the suitability and predictability of borrowers’ solvency assessment models, such as the Gini coefficient (the value should exceed 0.7) (Bolton, 2009), Pearson’s Chi-squared, the Hosmer-Lemeshow test (the null hypothesis of the test is that the model is correctly specified) (Bartlett, 2014), the first and second error estimates (classification table with a specific cut-off value), the divergence statistical indicator, Tjur’s coefficient of discrimination (Blochlinger and Leippold (2006)). Several indicators are compared to evaluate the models and the best model is adopted by analysing diagnostic tests and lender’s risk policy. The best model can be chosen with a slightly higher Gini coefficient, but with a lower first-type error, as it may be more important for the lender to reduce the amount of loans issued to borrowers

32 DEVELOPMENT OF BORROWERS’ SOLVENCY ASSESSMENT MODEL ..
who default. This means that the lender’s risk policy is decisive in choosing the best models.
Unpublished customers data from a non-bank lending company were used in the study. For the development of the borrower solvency assessment model, a total of 20570 borrowers to whom the Non-Bank Lending Company has issued loans between January 2017 and December 2019 are available. 70% of all available data (14399 observations) is used to develop the borrower solvency model, while 6171 observations are used to assess the predictability and discrimination of the model (this sample is not used during the model development phase). The data set is randomly divided into model development and test data sets using R studio software. In the model development data set, borrowers with poor solvency is about 25% (10842 borrowers with good solvency and 3557 borrowers with poor solvency).
MAIN FINDINGS
In this study, several logistic regression models have been developed and the best ones have been selected for which predictability, stability and suitability have been tested. These models provide a basis for testing an important hypothesis that could help to understand the best modelling approach (see table 2).
Table 2Summary of all models and their basic indicators
Model number
DescriptionSign. level for
variablesAIC Max. VIF
1. Model with the largest number of independent variables At least 95% 11063 1.511
2. Model without independent variable monthly credit liabilities At least 95% 11065 1.511
3. A model which is developed based on information values At least 95% 11151 1.512
4.A model which is developed based on step-by-step AIC-based approach and information values
At least 95% 11066 1.513
5.Model with the smallest number of independent variables and insignificant differences in AIC
At least 95% 11073 1.513
Source: author’s calculations based on a non-bank lending company customers data
The first model has been chosen as one of the models to be used in the further analysis, as it includes the most independent variables and their classes (dummy variables) compared to the other models, and all their coefficients have reached a 95% significance level (this model is considered to be a comparable model because it also has the lowest AIC).

Dāniels Jukna 33
In the second model the independent variable monthly credit liabilities has been removed. This model satisfies the AIC difference indicator, as it does not exceed 10. The amount of the borrowers’ credit liabilities is usually not known exactly at the time of loan issuance, because not all lenders provide information on the borrower’ s credit liabilities to all credit information offices in Latvia (Credit information bureau, 2020; Consumer Rights Protection Centre, 2020). This model could be used to determine whether, without knowing the borrowers’ credit obligations, the borrowers’ solvency could be predicted just as well.
The information values of the independent variables in the literature are considered as one of the main methods indicating which independent variables are important to predict borrowers’ solvency. The third model showed a significant difference between the Akaike information criterion comparing to the first model, but this does not yet indicate that the model based on information values is less discriminatory. To make sure that a step-by-step modelling approach is better than modelling initially from information values, the third model is chosen as one of those for which the model’s suitability and predictability are tested.
Given the information values, it has been found that the purpose of the loan for home improvement is an important factor in assessing the solvency of borrowers, but the first and second models do not include this factor. If only step-by-step modelling AIC-based approach were used, borrowers’ solvency assessment models would not include the above-mentioned factor. To check whether the information values have added value in the development of models (by adding the independent variable home improvement), the fourth model is also chosen in the further analysis. For this model, the AIC difference does not exceed 10, so there is no significant difference between the first and fourth models.
As the fourth model did not show a significant difference in the Akaike information criterion between the first model, a fifth model was developed in which two independent variables are excluded from the fourth model. In order to find out which of the two models (the one with the largest number of independent variables or the one with the smaller number of independent variables) provides better results and solvency predictability, the fifth model is also chosen in the further analysis. It should be noted that the AIC difference for this model does not exceed 10, so there is no significant difference between the first and fifth models.
The factor signs of all models that have chosen for further analysis are summarised in Table 3. All the obtained models show the same signs for the independent variables, which indicates that the independent variables are sufficiently stable and the inclusion or exclusion of different independent variables from the models does not affect the relationship of the independent variable to the dependent variable or borrowers’ solvency. It also shows that there is no multicollinearity in the models (this is indicated by VIF that does not exceed 5 in any model).

34 DEVELOPMENT OF BORROWERS’ SOLVENCY ASSESSMENT MODEL ..
Table 3Relationships of independent variables with dependent variables in different models
Independent variable / model 1. 2. 3. 4. 5.
Age + + + + +Man − − − − −Basic education − − − − −Vocational education − − − − −Higher Education + + + + +Married + + + + +Living together − − − − −Email domain – Inbox.lv − − − − −Email contains personal information + + + + +Vehicle repair − −Purchase of consumer goods − −Home improvement + + +Health Care − − − −Refinancing − − − − −Art, recreation, entertainment − − − −Education + + + +Extraction and processing of materials − − − − −Trade − − − −The application is completed at night − − − − −The application is completed in the evening − − − −Application completion time + + + + +Basic income + + + + +Monthly credit liabilities + + +Outstanding debt − − − −Debts paid + + +
Source: author’s calculations based on a non-bank lending company customers data
To determine which of the models has the highest discrimination, predictability, and which of them can be considered the best model, all five models are initially compared using six criteria: sum of squared deviations, Pearson’s Chi-squared (this corresponds to Pearson’s Chi-squared test), Hosmer-Lemeshow test, Gini coefficient (corresponding to the Kolmogorov-Smirnov test), Tjur’s coefficient of discrimination and percent of cases correctly classified (hereafter – classification indicator) for the test population (cut-off = 0.5).
The evaluation indicators of the models are presented in Table 4 and calculated using R studio software. These indicators are similar for all models and this indicates that relatively small changes have been made to the models, which does

Dāniels Jukna 35
not significantly affect the suitability and predictability of the models. The sum of squared deviations and Pearson’s Chi-squared do not provide any statistical interpretation but ranking them can lead to a conclusion as to which model is better. The Hosmer-Lemeshow test for all five models exceeds 5%, which shows that the H0 hypothesis that there is no bad model for predicting a dependent variable cannot be rejected, so all five models are suitable for forecasting. The Gini coefficient is high enough for all models (it exceeds 70%, which is the recommended value for the model to be predictive). Also, Gini coefficient is not so high (less than 90%) that there may be some errors in the data. The Tjur’s coefficient of discrimination is used to estimate the coefficient of determination, which is about 35% in all models (except for the third model, where this coefficient is about 34%). This shows that in the model the dependent variable is explained on average around 34%–35% of the independent variables. In addition, the classification indicator of the test data set has been assessed, which has been calculated by dividing the correctly classified borrowers by the total number of borrowers. The cut-off value for good and bad solvency is chosen to be 0.5, but this does not mean that this value is determined as the best. By choosing a cut-off value of 0.5, all models have achieved a classification indicator about 83%, which indicates that in 83% of cases the borrowers in the test set would be classified correctly (borrowers’ solvency would be correctly determined), while in 13% the model would give an erroneous result.
Table 4Comparison of evaluation indicators of five models
Indicator Model 1 Model 2 Model 3 Model 4 Model 5
Sum of squared deviations 11012.6 11017.4 11116.6 11017.7 11028.6Pearson’s Chi-squared 14384.0 14376.4 14453.7 14304.4 14351.2Hosmer-Lemeshow test 65.08% 64.95% 64.67% 64.95% 64.84%Gini coefficient 85.21% 85.22% 84.99% 85.19% 85.18%Tjur’s coefficient of discrimination 35.09% 35.06% 34.38% 35.00% 34.95%
Classification indicator (cut-off = 0.5) 82.95% 82.94% 82.63% 82.82% 82.87%
Source: author’s calculations based on a non-bank lending company customers data
To be able to compare all five models with each other, these models are ranked according to the above six model evaluation indicators. A score of “1” indicates that the model has the highest score in the respective indicator, while a rank of “5” indicates that the model has achieved the lowest score in the respective indicator. The values of the ranking evaluation indicators of five models are presented in Table 5. Considering ranked evaluation indicators, the best model is the first model, while the worst model is the third model.

36 DEVELOPMENT OF BORROWERS’ SOLVENCY ASSESSMENT MODEL ..
Table 5Comparison of ranked evaluation indicators of five models
Indicator Model 1 Model 2 Model 3 Model 4 Model 5
Sum of squared deviations 1 2 5 3 4Pearson’s Chi-squared 4 3 5 1 2Hosmer-Lemeshow test 1 3 5 2 4Gini coefficient 2 1 5 3 4Tjur’s coefficient of discrimination 1 2 5 3 4
Classification indicator (cut-off = 0.5) 1 2 5 4 3
Average 1.67 2.17 5.00 2.67 3.50Rank by 5 indicators 1 2 5 3 4
Source: author’s calculations based on a non-bank lending company customers data
The first model and the second model have very similar results, and they are among the two best models. This suggests that the exclusion of the borrowers’ monthly credit liabilities from the model did not lead to such a significant deterioration. If databases that cost enough are used to determine the monthly credit liabilities, then the Non-Bank Lending Company may choose to assess the solvency of the borrowers using the second model without obtaining information from the databases on the borrowers’ monthly credit liabilities.
The third model, compared to other models, has the lowest results in all model evaluation indicators, so this model has the lowest discriminability. This suggests that a step-by-step modelling approach is better than the initial modelling from information values. It is valuable to use information values to identify comparable variable models or to comment possible correlations, but it is not possible to rely entirely on them and build a model based on information values, as this gives lower results compared to other approaches.
The fourth model additionally includes the purpose of the loan for home improvement, which according to the information values can predict the dependent variable, but this model has worse results than the first and second models. This means that information values have not provided added value in the development of models.
The fourth model has a higher predictability than the fifth model in terms of model evaluation indicators, which shows that the number of independent variables in the respective models is not excessive and that the addition of each new statistically significant independent variable provides better predictability (this could be due to large amount of data and adding new independent variable does not significantly reduce the number of degrees of freedom and thus does not lead to model redundancies).

Dāniels Jukna 37
The final model (the first model) shows a high rate of discrimination of the dependent variables, as Gini coefficient is 85.21%. The values and statistics of independent variables for this model are shown in Table 6. Considering the independent variables of the model, solvency can be explained by 35.09% (it is estimated using the Tjur’s coefficient of discrimination). If the cut-off is chosen to be 0.5 for the final model, then the classification indicator of the tested data is estimated at 82.95% (the indicator is obtained from the classification tables).
Table 6Values and statistics of independent variables of the final model
Variables Value Standard error
Z statistics Pvalue Sign.
levelIntercept 1.1520 0.1212 9.505 0.0000 ***Age 0.0236 0.0022 10.537 0.0000 ***Male -1.1570 0.0488 -23.707 0.0000 ***Basic education -2.2320 0.0749 -29.8 0.0000 ***Vocational education -0.9960 0.0652 -15.272 0.0000 ***Higher education 0.3282 0.0663 4.954 0.0000 ***Married 0.3215 0.0617 5.208 0.0000 ***Living together -0.2049 0.0583 -3.516 0.0004 ***Email domain - Inbox.lv -0.5773 0.0547 -10.557 0.0000 ***Email contains personal information 1.3890 0.0497 27.945 0.0000 ***Vehicle repair -0.2567 0.0767 -3.349 0.0008 ***Purchase of consumer goods -0.3007 0.0678 -4.433 0.0000 ***Health Care -0.5948 0.0707 -8.419 0.0000 ***Refinancing -0.8360 0.0781 -10.703 0.0000 ***Art, recreation, entertainment -0.2830 0.1163 -2.432 0.0150 *Education 0.4092 0.1652 2.477 0.0132 *Extraction and processing of materials -0.3705 0.0619 -5.982 0.0000 ***Trade -0.2443 0.0675 -3.618 0.0003 ***The application is completed at night -2.7240 0.1562 -17.443 0.0000 ***The application is completed in the evening -0.2464 0.0558 -4.414 0.0000 ***Application completion time 0.0073 0.0015 4.91 0.0000 ***Basic income 0.0003 0.0001 3.837 0.0001 ***Monthly credit liabilities 0.0004 0.0002 2.193 0.0283 *Outstanding debt -0.0005 0.0001 -4.469 0.0000 ***Debts paid 0.0000 0.0000 2.132 0.0330 *
“***” – more than 99.9% significance, “**” – more than 99% significance, “*” – more than 95% significance, “.” – more than 90% significance, “ ” – less than 90% significance.
Source: author’s calculations based on a non-bank lending company customers data

38 DEVELOPMENT OF BORROWERS’ SOLVENCY ASSESSMENT MODEL ..
For the model to be applicable to a non-bank lending company, it is necessary to find out what is the most appropriate cut-off value to separate borrowers with good solvency from borrowers with poor solvency. As the risk policy for a non-bank lending company does not specify which criteria must be considered to select a most appropriate cut-off, three different methodologies are proposed in the work:
1. minimising the first type of error (minimise the potential risk of lending to borrowers with poor solvency, thus increasing the overall loan repayment rates);
2. minimising the second type of error (minimise the unearned profit from those borrowers who have good solvency, but who were rejected, thus issuing loans to as many borrowers as possible with less risk); and
3. minimising the first and second types of error (maximise classification indicator).
As shown in Table 7 for all methodologies has achieved its set goal. The first methodology has the smallest first type of error (4.88%) compared to other methodologies, while with this methodology company would issue 3609 loans (58.5% of applications), which is significantly less compared to other methodologies, which would provide at least 1,400 more loans. The second methodology has the smallest second type of error (0.94%) compared to other methodologies, thus using this methodology company would issue a loan almost after every application (93.5% of applications). It should be noted that this methodology will lead to low repayment rates (the repayment rate will be even lower than the second type of error, as this model only estimates borrowers who have become customers, but did not take into account rejected applications). The third methodology achieves the highest classification indicator, which means that if 0.508 is selected for the cut-off, then this is the scenario in which the solvency of the borrowers is determined most accurately. The first type of error has been significantly reduced in the model compared to actual non-performing borrowers (from 25% to 12%), which means that the model is able to discriminate against borrowers well enough to reduce the number of loans to non-performing borrowers by about twice.
Table 7Obtained error, classification indicators for three methodologies
Methodology Cutoff Error type 1 Error type 2Classification
indicatorIssued loans
Methodology 1 0.800 4.88% 20.99% 74.14% 3609
Methodology 2 0.201 19.82% 0.94% 79.24% 5768
Methodology 3 0.508 11.89% 5.10% 83.00% 5022
Source: author’s calculations based on a non-bank lending company customers data

Dāniels Jukna 39
If the non-bank lending company has not developed a risk policy and it is not determined which type of error is more significant, then it is recommended to use the third methodology model, in which the first and second types of error are balanced. A classification table has been developed for this methodology (see Table 8).
Table 8Classification table for the third methodology
PrognosisActual
0 10 834 3151 734 4288
Source: author’s calculations based on a non-bank lending company customers data
Using the logistic regression method in the third methodology, the model incorrectly classifies 1,049 borrowers, of which 734 borrowers are the ones to whom the loan will be issued, but they would have poor solvency. The default risk in this case would be 14.62%, which is lower than if this model were not implemented.
Most of the variables included in the final model are often used in theoretically based models of borrower behaviour and solvency assessment in the literature, as well as the economic significance of the estimated coefficients has been assessed in the analyses performed in this work and based on the literature. The final borrowers’ solvency assessment model can be applied in practice, considering the value of independent variables and a specific cut-off value, which is obtained based on the risk policy of the non-bank lending company.
CONCLUSION
The logistic regression is the most appropriate method in practice as in borrower solvency models the dependent variable is binary. To avoid subjective lending decisions and to make the results of the model statistically significant, easy to interpret and be traceable over time, it is necessary to define a specific set of rules that classify borrowers with poor solvency.
Solvency assessment models (1) may include all available independent variables and progressively sought issues that may affect the model or (2) may not include these issues in the first model using a variety of approaches and methods. With a gradual modification of the models, higher discriminability can be achieved than with the elimination of problems in the first model.
Several indicators are compared to evaluate different models, and the best model is adopted based on the analysis of diagnostic tests and based on the lender’s risk policy, however, the lender’s risk policy is decisive in the selection of the best models.

40 DEVELOPMENT OF BORROWERS’ SOLVENCY ASSESSMENT MODEL ..
The borrowers’ monthly credit liabilities could be excluded from the model without significantly reducing predictability and discriminability. Such models are important to the lender because the amount of the borrowers’ credit obligations is usually difficult to determine and change over time.
A step-by-step modelling approach is better than initially building models from information values. The values of the information are valuable to use to identify comparable variable models or to comment on possible correlations in the models.
Information values did not have added value to the development of models, as models that were created without the involvement and influence of information values showed higher results. This repudiate that information value is one of the best methods for selecting independent variables in binary models.
The number of independent variables in the respective models is not excessive and the addition of each new statistically significant independent variable provides better predictability (in general, a large amount of data is available on borrowers, which does not reduce the number of degrees of freedom relatively).
Using six different indicators of model suitability, predictability, and discriminability, the best model is the one that uses a step-by-step approach estimating the Akaike information criterion with as many statistically significant independent variables as possible.
Independent variables may indicate good or poor solvency, but the existence of a single independent variable indicating poorer solvency does not immediately indicate to the borrower that the borrower is poor solvency, as the model is designed with all factors in mind.
For the model to be applicable to a non-bank lending company, it is ne-cessary to find out what is the most appropriate cut-off value. If the non-bank lending company does not have a detailed risk policy, it is recommended to use a methodology in which the first and second types of errors are equally important and in which the highest classification indicator is achieved.
The obtained borrower solvency assessment model can be applied in practice, considering the value of independent variables and certain cut-off value, which is obtained based on the risk policy of a non-bank lending company. The im-plementation of the obtained model would ensure a 14.6% low total risk of default of borrowers, which is 42.5% lower than without the introduction of such a model.
REFERENCESAnderson, R., 2007. The Credit Scoring Toolkit: Theory and Practice for Retail Credit Risk
Management and Decision Automation. Oxford: Oxford University Press.Banasik, J., Crook, J., Thomas, L., 2003. Sample Selection Bias in Credit Scoring Models.
Journal of the Operational Research Society, 54 (3), 822–832 p.Bartlett, J., 2014. The Hosmer-Lemeshow goodness of fit test for logistic regression. [online]
Available at: <https://thestatsgeek.com/2014/02/16/the-hosmer-lemeshow-goodness-of-fit-test-for-logistic-regression/> [Accessed 11 March 2020].
Dāniels Jukna 41
Berg, T., Burg, V., Pu, M., Gombovic, A., 2019. On the Rise of FinTech’s – Credit Scoring using Digital Footprints. The Review of Financial Studies, hhz099, 66 p.
Bhalla, D., 2015. Weight of Evidence (WOE) and Information Value (IV) Explained. [online] Available at: <https://www.listendata.com/2015/03/weight-of-evidence-woe- and-information.html> (Accessed 25 February 2020).
Blochlinger, A., Leippold, M., 2006. Economic Benefit of Powerful Credit Scoring. Journal of Banking & Finance, 30 (3), 851–873 p.
Bock, T., 2019. What are Variance Inflation Factors (VIFs). [online] Available at: <https://www.displayr.com/variance-inflation-factors-vifs/> (Accessed 25 February 2020).
Bolton, C., 2009. Logistic regression and its application in credit scoring. Pretoria: University of Pretoria.
Burnham, K. P., Anderson, D. R., 2004. Multimodel Inference – Understanding AIC and BIC in Model Selection. Sociological Methods & Research, 33 (2), 261–304 p.
Choy, M., Laik, M. N., 2011. A Markov Chain approach to determine the optimal performance period and bad definition for credit scorecard. International Journal’s Research Journal of Social Science and Management, 1 (6), 227–234 p.
Consumer Rights Protection Centre, 2020. Companies that have received a special permit (license) for the provision of consumer credit services. [online] Available at: <http://www.ptac.gov.lv/lv/table/kapitalsabiedribas-kuras-sanemu-licenci-pateretaju-krediteanas-pakalpojumu-sniegsanai> (Accessed 12 January 2020).
Credit information bureau, 2020. Sources of Credit Information. [online] Available at: <http://www.kib.lv/individuals/sources-of-credit-information/> (Accessed 15 January 2020).
Date, S., 2019. The Akaike Information Criterion. [online] Available at: <https://towardsdatascience.com/the-akaike-information-criterion-c20c8fd832f2> (Accessed 16 January 2020).
Glennon, D., Kiefer, N. M., Larson, E. C., 2008. Development and Validation of Credit-Scoring Models. Journal of Credit Risk, 4 (3), 70 p.
Mpofu, T. P., Mukosera, M., 2012. Credit Scoring Techniques: A Survey. International Journal of Science and Research, 3 (8), 165–168 p.
Pritchard, J., 2018. How Credit Scores Work and What They Say About You. [online] Available at: <https://www.thebalance.com/how-credit-scores-work-315541> (Accessed 12 December 2019).
Samreen, A., Sarwar, A., Zaidi, F. B., 2013. Design and Development of Credit Scoring Model for the Commercial Banks in Pakistan: Forecasting Creditworthiness of Corporate Borrowers. International Journal of Business and Commerce, 3 (17), 1–26 p.
Schreiner, M., 2003. Scoring: The Next Breakthrough in Microcredit. Washington: Consultative Group to Assist the Poor/World Bank Group.
Vidal, M. F., Barbon, F., 2019. Technical Guide – Credit Scoring in financial inclusion. Washington: Consultative Group to Assist the Poor/World bank.
Tan, J., 2020. Weight of Evidence (WoE) and Information Value (IV). [online] Available at: <https://towardsdatascience.com/model-or-do-you-mean-weight-of-evidence-woe-and-information-value-iv-331499f6fc2> (Accessed 25 February 2020).
Unpublished materials of a non-bank lending company.Vojtek, M., Kocenda, E., 2006. Credit Scoring Methods. Czech Journal of Economics and
Finance, 56 (3–4), 152–167 p.Vojtek, M., Kocenda, E., 2008. Default Predictors in Retail Credit Scoring: Evidence from
Czech Banking Data. Emerging Markets Finance and Trade, 47 (6), 80–98 p.

LATVIA-SOUTH AFRICA ECONOMIC RELATIONS 1918–1940
VIESTURS PAULS KARNUPSDr. oec.
Abstract
The Republic of South Africa was the first country on the continent of Africa to recognise the renewed independence of the Republic of Latvia on 29 August 1991. This paper provides an overview of Latvian-South African economic relations in the interwar period. In the interwar period Latvian and South African economic relations were mainly confined to foreign trade. Latvia’s foreign trade in relation to South Africa (then known as the Union of South Africa) was more or less regulated by Latvia’s 1923 treaty with Great Britain. Latvia’s main imports from South Africa in the interwar period were fruits (including oranges, mandarins, apricots, grapes, pears, etc.), tanning extracts and materials, paint and varnish extracts and materials, raw wool, palm kernels and oil, and furs and hides, whilst Latvia’s main exports to South Africa were fish and fish conserves (including “Sprotes”), confectionery and chocolates, timber and timber products, paper and paper products, plywood, and liquors etc. In general, despite a growth in trade in the 1930s, trade and thus economic relations were of marginal significance to both countries in the interwar period.
Keywords: Latvia, South Africa, Interwar, Trade, Import, Export
JEL code: F10, F14, N14, N15, N74, N75
INTRODUCTION
For most Latvians, South Africa was an unknown country. A number of Latvians (mainly Jewish) had emigrated to South Africa around the turn of the 20th century. Some even took part in the Anglo-Boer War (1899–1902) on the Boer side.1 In the 1930s, Jewish Latvians in Johannesburg formed a Latvian club, popularised Latvia, discussed Latvian affairs (albeit mainly in Yiddish), read Latvian newspapers and celebrated Latvian Independence Day on 18th November.2
South Africa in the interwar period was essentially a dual economy structured along racial lines. A minority white population (20.9% in 1936 as against a majority African population – 68.8% in 1936)3 dominated the South African economy. This was reflected in the income per head of the population.
1 Krasnais, V., (1938), p. 394.2 Veigners, I. (1993), p. 242.3 South African Statistics 2000 (2000), Table 1.3.
LATVIA-SOUTH AFRICA ECONOMIC RELATIONS 1918–1940
Viesturs Pauls Karnups
Journal of Economics and Management Research. Vol. 9, 2020https://doi.org/10.22364/jemr.9.03

Viesturs Pauls Karnups 43
Although the overall income per head in South Africa was on average in 1936 SA£36, the figure for whites was SA£130 and for Africans SA£10.4
Latvia was recognised de iure by Western Europe on 26 January 1921. This collective act of recognition, was accepted by Latvia as conferring final and unreserved de iure recognition on the part of all the states represented on the Allied Supreme War Council, namely, Belgium, the British Empire (and thus South Africa), France, Italy, and Japan.
Although South Africa did not have direct representation in Latvia (South African affairs were handled by the British representative), Latvia had three honorary consulates in South Africa – Durban (1928–1931), Johannesburg (1928–1946) and Cape Town (1925–1947). The General-consulate of Latvia was in Cape Town and the first general-consul from 1927 to 1928 was Pieter Johannes Zoutendyk, an auctioneer and notary public. From 1932 to 1947, the consul-general was Sydney Mellin Wale, a director in the Schlesinger Group.
Table 1Selected economic indicators for Latvia and South Africa in the interwar period
Latvia South Africa
Population (millions) 2 (1939) 9.6 (1936)Share of urban population (%) 34.6 (1935) 31.4 (1936)Share of agriculture in the labour force (%) 67.8 (1935) 33 (1936)National Income (millions Ls) 1256 (1938) 10670 (1939)*National Income per capita (Ls) 628 (1938) 1112 (1939)Share of Agriculture in NI (%) 39.2 (1938) 12.1 (1940)+Share of Manufacturing in NI (%) 20.5 (1938) 11.6 (1940)+
* Conversion of 1939 South African pounds to US dollars and conversion of 1939 US dollars to Lats+ Based on GDPSources: Clarke, C. (1940); Nkosi, M. (1986); Darbiņš, A. & Vītiņš, V. (1947); South African
Statistics 2000 (2000); The 1936 Census of the Union of South Africa (1943); Feinstein, C. H. (2005)
As can be seen from Table 1, despite the large difference in population, Latvia’s share of urban population was only slightly more than that of South Africa. The share of agriculture in the labour force was twice that of South Africa5, but the National Income per capita was over 8 times less than that of South Africa due in part to the large share of agriculture in Latvia’s NI and South Africa’s large mining sector (especially gold and diamonds). Latvia’s share of manufacturing in NI was nearly double that of South Africa. However, South Africa was (and is) one of the most mineral rich countries in the world, with massive gold, diamond,
4 Feinstein, C. H. (2005), p. 71.5 This is for the total population, however, the differences between the white population and the African
population was striking – for example, 75% of the African labour force was engaged in agriculture com-pared to 26% of the white population (see Industrialisation and Foreign Trade (1945), p. 26).

44 LATVIA-SOUTH AFRICA ECONOMIC RELATIONS 1918–1940
coal, iron ore and platinum deposits spread across the country. Latvia, on the other hand, had only gypsum deposits, as well as extensive deposits of peat.6 Thus, the share of mining in South Africa’s GDP in 1940 was 20.6%.7
LATVIAN-SOUTH AFRICAN ECONOMIC RELATIONS 1922–1939
In the interwar years, Latvian and South African economic relations was mainly confined to foreign trade. Some South African and Latvian trade had already been in existence in the early 1920s. However, direct Latvian-South African trade commenced in 1922.
Latvia’s foreign trade in the 1920s was based in large measure on a system of commercial and trade treaties. By 1929, Latvia had concluded commercial treaties with all important European states (except for Spain), including its two most important trading partners – Great Britain (22.06.1923) and Germany (28.06.1926). They provided the regulatory framework within which were stated the obligations undertaken by Latvia in its foreign trade relations with its trading partners up to 1931.
Latvia’s foreign trade in relation to South Africa was more or less regulated by Latvia’s 1923 treaty with Great Britain. Article 26 of the 1923 Treaty of Commerce and Navigation between Great Britain and Latvia states:
“The stipulations of the present Treaty shall not be applicable to India or to any of His Britannic Majesty’s self-governing Dominions, Colonies, Possessions, or Protectorates, unless notice is given by His Britannic Majesty’s representative at Rīga of the desire of His Britannic Majesty that the said stipulations shall apply to any such territory.
Nevertheless, goods produced or manufactured in India or in any of His Britannic Majesty’s self-governing Dominions, Colonies, Possessions, or Protectorates shall enjoy in Latvia complete and unconditional most-favoured-nation treatment so long as goods produced or manufactured in Latvia are accorded in India or such self-governing Dominions, Colonies, Possessions, or Protectorates treatment as favourable as that accorded to goods produced or manufactured in any other foreign country”.
Most Colonies, Possessions and Protectorates had acceded to the Treaty, as well as self-governing Dominions such as Canada by the end of 1927. However, South Africa, which did not accede to the Treaty, after many representations from Latvia, agreed that Latvian goods imported into South Africa would be given more or less most-favoured-nation treatment.8
6 For a detailed study of the peat industry in Latvia in the interwar period, see Karnups, V. P. (2016).7 Nkosi, M. (1986), p. 88.8 LVVA, 295 f., 1. apr., 348 l., p. 110.

Viesturs Pauls Karnups 45
Similarly, Article 1 of the 1934 Commercial Agreement between the Government of Latvia and His Majesty’s Government in the United Kingdom, with Protocol allowed for the continuation of previous arrangements under the previous treaty:
“…The articles enumerated in Part II of the First Schedule to this Agreement… shall not on importation into Latvia … be subjected to duties or charges other or higher than those specified in the Schedule, provided… enjoys most-favoured-nation treatment in Latvia in accordance with Article 26 or Article 27 of the Treaty of Commerce and Navigation between Great Britain and Latvia, signed on the 22nd June, 1923.”
LATVIAN-SOUTH AFRICAN TRADE 1922–1939
As noted previously, some Latvian-South African trade had occurred in 1920–21. The value of Latvian imports from and exports to South Africa can be seen in the Figure 1.
0100200300400500600700800900
1000
1922
1923
1924
1925
1926
1927
1928
1929
1930
1931
1932
1933
1934
1935
1936
1937
1938
1939
*
Imports (1000
Exports (1000 Ls)
Figure 1. LatviaSouth Africa Imports and Exports 1922–1939
* The data for 1939 is for eight months only – to 31 August 1939 Sources: Latvijas Statistiskā gada grāmatas [Latvian Statistical Yearbooks]. 1921–1939;
Latvijas ārējā tirdzniecība un tranzits – 1922–1939. [Latvian Foreign Trade and Transit. 1922–1939.]; Mēneša Biļetens Nr. 10, oktobris 1939 [Monthly Bulletin, No. 10, October 1939)
As Figure 1 shows exports fluctuated substantially in the interwar period, reaching a pre-Depression low in 1925. Nevertheless, they recovered well, reaching their pre-Depression high in 1926 of 864 thousand lats. Exports fell with Great Depression, although they recovered fairly quickly, starting to rise from 1934 and reaching their peak in 1936. Imports, on the other hand, remained very low in the early 1920s, but increased rapidly with a pre-Depression peak in

46 LATVIA-SOUTH AFRICA ECONOMIC RELATIONS 1918–1940
1930 and a value of 252 thousand lats. Imports also fell with Great Depression, although they recovered fairly quickly, starting to rise from 1932 and reaching their peak in 1938. Generally, exports substantially exceeded imports throughout the interwar period.
LATVIAN EXPORTS TO SOUTH AFRICA
Latvia’s main exports to South Africa were Fish and Fish conserves (including “Sprotes”9), Timber and timber products, Confectionery and chocolates, Plywood, Liquors etc., and Paper and paper products (See Table 2).
Table 2Latvia’s Main Exports to South Africa (1922–1939)
Year tonnesValue
(1000 Ls) tonnesValue
(1000Ls) tonnesValue
(1000 Ls) tonnesValue
(1000Ls) l itresValue
(1000Ls) tonnesValue
(1000 Ls)
1922Less than 1 tonne
Less than 1000 Ls 0 0 2217 197 0 0 206
Less than 1000 Ls 0 0
1923Less than 1 tonne
Less than 1000 Ls 0 0 6794 746 0 0 0 0
Less than 1 tonne
Less than 1000 Ls
1924Less than 1 tonne
Less than 1000 Ls 0 0 1437 164 0 0 16
Less than 1000 Ls 6 3
1925 4 6 0 0 642 75 14 4 671 2 11 61926 19 44 0 0 2993 482 6 3 0 0 136 811927 10 21 0 0 5036 653 5 3 0 0 145 80
1928 18 31 1 3 2862 396 6 3 189Less than 1000 Ls 216 108
1929 25 44 22 52 2843 497 22 10 148Less than 1000 Ls 99 48
1930 22 40 4 9 3114 395 3 1 6Less than 1000 Ls 64 33
1931 20 31 9 15 963 56 14 5 0 0 131 601932 11 13 13 20 1180 48 11 3 0 0 112 42
1933 19 20 8 12 658 38 9 2 18Less than 1000 Ls 73 19
1934 11 11 11 14 1573 107 20 8 0 0 200 41
1935 19 17 33 26 1688 99 226 49 122Less than 1000 Ls 146 34
1936 22 24 46 49 2370 166 613 158 217 1 578 171
1937 22 46 18 33 708 138 138 76 151Less than 1000 Ls 393 157
1938 21 45 23 46 1175 142 456 181 72Less than 1000 Ls 130 59
1939* 7 15 20 34 0 0 0 0 0 0 225 80
Liquors etc.Paper and paper products
Fish and Fish conserves (including "Sprotes")
Confec�onery and chocolates
Timber and �mber products Plywood
* January–August 1939 (with commencement of W WII, Latvia ceased publication of detailed foreign trade statistics)Sources: Latvijas Statistiskā gada grāmatas [Latvian Statistical Yearbooks]. 1921–1939; Latvijas ārējā
tirdzniecība un transits – 1922–1939. [Latvian Foreign Trade and Transit. 1922–1939.]; Mēneša Biļetens Nr. 10, oktobris 1939 [Monthly Bulletin, No. 10, October 1939
9 “Šprotes” or sprats are close relatives of anchovies, sardines, and herrings. The Latvian style is to smoke and/or preserve them in oil.

Viesturs Pauls Karnups 47
The most important Latvian export to South Africa in the interwar period both in terms of volume and value was timber and timber products. Timber and timber product exports reached an early peak in 1923 and peaked again in 1927. The post-Depression peak in terms of volume and value was in 1936. South Africa was an important market for the Latvian Forestry industry. Plywood exports began in 1925 and increased steadily in 1930s, reaching a peak in 1936. Paper and paper product exports were also a small, but important part of exports throughout the interwar period, reaching a peak in terms of volume and value in 1936.
A small, but consistent export to South Africa was fish and fish conserves (including “Sprotes”, with a pre-Depression peak in 1929 and a post-Depression peak in 1936–1937. Similarly, liquors of all types (including vodka) were a small, but consistent export to South Africa, reaching a pre-Depression peak in 1928 and a post-Depression peak in 1936. Confectionery and chocolates exports were also a small, but consistent export to South Africa, which commenced in 1928 and reach a peak in terms of volume in 1936.
Latvia also exported to South Africa small quantities of berries, halva, mushroom and cucumber conserves, jams and marmalades, bone meal and glues, flax threads, and textile goods.
LATVIAN IMPORTS FROM SOUTH AFRICA
Latvia’s main imports from South Africa were Fruits (including oranges, mandarins, apricots, grapes, pears, etc.), Furs and hides, Tanning extracts and materials, Paint and varnish extracts and materials, Raw wool, and Palm kernels and oil. The amounts and value of Latvia’s main imports imported from South Africa in the interwar period are shown in Table 3.
Imports from South Africa played only a minor role in Latvia’s trade with South Africa. The main import from South Africa in terms of volume and value was tanning extracts and materials. These commenced in 1928 and consistently through to 1939, with a peak in terms of volume and value in 1935. Similarly, paint and varnish extracts and materials were a small, but consistent import from South Africa, reaching a peak in terms of volume and value in 1938. Furs and hides were a small and intermittent import, which commenced in 1922 and reach a peak in terms of volume in 1936 and in terms of value in 1939. Similarly, both raw wool and palm kernels and oil were intermittent imports in the interwar period, reaching peaks in 1933 and 1934 respectively.
Latvia also imported from South Africa small quantities of tobacco, medicinal plants, asbestos, sesame seeds, textiles, and gold.

48 LATVIA-SOUTH AFRICA ECONOMIC RELATIONS 1918–1940
Table 3Latvia’s Main Imports from South Africa (1922–1939)
Year tonnesValue
(1000 Ls) tonnesValue
(1000 Ls) tonnesValue
(1000 Ls) tonnesValue
(1000 Ls) tonnesValue
(1000 Ls) tonnesValue
(1000 Ls)
1922 0 0 0 0 0 0 0 0 0 0Less than 1 tonne
Less than 1000 Ls
1923 0 0 0 0 0 0 0 0 0 0Less than 1 tonne
Less than 1000 Ls
1924 0 0 0 0 0 0 0 0 0 0Less than 1 tonne
Less than 1000 Ls
1925 0 0 0 0 0 0 0 0 0 0 0 0
1926 0 0 0 0 0 0 0 0 0 0Less than 1 tonne
Less than 1000 Ls
1927 0 0 0 0 0 0 0 0 0 0Less than 1 tonne
Less than 1000 Ls
1928 2 3 57 9Less than 1 tonne
Less than 1000 Ls 0 0 202 117 0 0
1929 27 33 242 152Less than 1 tonne 1 0 0 0 0
Less than 1 tonne
Less than 1000 Ls
1930 150 152 108 61Less than 1 tonne
Less than 1000 Ls
Less than 1 tonne
Less than 1000 Ls 0 0
Less than 1 tonne
Less than 1000 Ls
1931 59 46 0 0Less than 1 tonne
Less than 1000 Ls 2 4 5 2 4 8
1932 10 7 68 16Less than 1 tonne
Less than 1000 Ls 12 41 3 1 0 0
1933 0 0 515 149Less than 1 tonne
Less than 1000 Ls 39 151 0 0 0 0
1934 0 0 184 47Less than 1 tonne
Less than 1000 Ls 12 54 227 28 0 0
1935 22 15 402 97Less than 1 tonne
Less than 1000 Ls 5 16 148 20 0 0
1936 9 6 323 97Less than 1 tonne
Less than 1000 Ls 2 3 0 0 6 14
1937 3 6 393 174Less than 1 tonne 1 4 20 0 0 0 0
1938 58 93 171 50 410 217 9 46 0 0Less than 1 tonne 3
1939* 0 0 232 116 0 0Less than 1 tonne 3 0 0 1 134
Furs and hides
Fruits (including oranges, mandarins, apricots, grapes, pears, etc.)
Tanning extracts and materials
Paint and varnish extracts and
materials Raw wool Palm kernels and oil
* January–August 1939 (with commencement of W WII, Latvia ceased publication of detailed foreign trade statistics)Sources: Latvijas Statistiskā gada grāmatas [Latvian Statistical Yearbooks]. 1921–1939; Latvijas ārējā
tirdzniecība un transits – 1922–1939. [Latvian Foreign Trade and Transit. 1922–1939.]; Mēneša Biļetens Nr. 10, oktobris 1939 [Monthly Bulletin, No. 10, October 1939
CONCLUSION
In the interwar years, Latvian and South African economic relations were exclusively confined to foreign trade.
In 1929, when Latvian foreign trade reached its pre-Depression peak, Latvian exports to South Africa made up 0.26% of total Latvian exports, and South African imports made up 0.4% of total Latvian imports. Similarly, in 1937, when Latvian foreign trade reached its post-Depression peak, Latvian imports from South Africa made up 0.09% of total Latvian imports and Latvian exports to South Africa made up 0.18% of total Latvian exports. One suspects that

Viesturs Pauls Karnups 49
the figures from the point of view of South Africa would be significantly less. In other words, trade and thus economic relations were of marginal significance to both countries in the interwar period.
It is interesting to note that in 2015, Latvian exports to South Africa totalled 6.9 million EUR or 0.1% of total Latvian exports (mainly wood and articles of wood, machines, mechanisms and electrical equipment, and vehicles). Whilst imports from South Africa totalled 1.0 million EUR or 0.01% of total Latvian imports (mainly food industry products, chemical industry products and plant products). As in the interwar period, Latvia has a positive trade balance with South Africa. Also as in the interwar period there are no Latvian investments in South Africa. Nevertheless, there is some minor South African foreign direct investments in Latvia to a value of 33.12 thousand EUR in 2016.10
REFERENCESClarke, C. (1940), The Conditions of Economic Progress, London: MacMillan and Co.
Ltd.Darbiņš, A. & Vītiņš, V. (1947), Latvija: Statistisks pārskats [Latvia: A Statistical
Overview], Germany: P. Mantinieka & E. Ķiploka Apgadi.Feinstein, C. H. (2005), An Economic History of South Africa, Cambridge: Cambridge
University Press.Industrialisation and Foreign Trade (1945), Geneva: League of Nations (Ser. L. o. N. P.
1945.II.A.10).Karnups, V. P., (2016), Kūdra Latvijā 1918.–1940. gadā: ieskats ekonomikas vesture
[Peat in Latvia 1918–1940: Insights from Economic History], in Akadēmiskā Dzīve, Nr. 52, 2015/2016, Riga: LU Akadēmiskais apgāds, pp. 43–50.
Krasnais, V. (1938) reprint 1980, Latviešu kolonijas [Latvian Colonies] – Melbourne: Kārļa Zariņa Fonds.
Latvijas ārējā tirdzniecība un transits [Latvian Foreign Trade and Transit]. 1922–1939, Rīga: Valsts Statistiskā Pārvalde.
Latvijas Statistiskā gada grāmatas [Latvian Statistical Yearbooks]. 1921–1939, Rīga: Valsts Statistiskā Pārvalde.
LVVA, Latvijas Valsts Vēstures arhīvs [Latvian State Historical Archives].Mēneša Biļetens Nr. 10, oktobris 1939 [Monthly Bulletin, No. 10, October 1939].Nkosi, M. (1986), The South African Economy: Structural Changes and Implications
for the Future, in African Journal of Political Economy / Revue Africaine d’Economie Politique, 1986, Vol. 1, No. 1, SOUTHERN AFRICA IN CRISIS (1986), pp. 75–94.
South African Statistics 2000 (2000), Pretoria: Statistics South Africa.The 1936 Census of the Union of South Africa (1943), in Population Index Vol. 9, No. 3
( Jul., 1943), pp. 153–155.Veigners, I. (1993), Latvieši ārzemēs [Latvians Abroad], Rīga : Latvijas enciklopēdija.
10 Data from Latvian Ministry of Foreign Affairs, https://www.mfa.gov.lv/arpolitika/divpusejas-attieci-bas/latvijas-un-dienvidafrikas-republikas-attiecibas#ekonomika [Accessed 04.07.2020].

INFLUENCE OF ENTREPRENEURIAL TRAITS ON THE PERFORMANCE OF SMALL AND
MEDIUM SIZED ENTERPRISES (SMES) IN LAGOS STATE, NIGERIA
PATRICK S. OKONJIPhD
OLUFEMI O. OLAYEMIPhD
BEN E. AKPOYOMARE OGHOJAFORPhD
D. MGBEMSc
Abstract
Factors such as political instability, government policies, infrastructural inadequacy and entrepreneurs’ non-possession of relevant personal charac-teristics are connected on the high failure rate of small businesses in Nigeria. On the back of these identified problems the study focused on Influence of entrepreneurial traits on the performance of Small and Medium Sized Enterprises in Lagos State., Specifically, resilience, innovativeness, drive for achievement, and risk taking propensity were the entrepreneurship traits examined in relation to the performance of SMEs in Lagos state. Primary source of data through a questionnaire was used to achieve the stated objectives. Random sampling method was used to collate data of 125 entrepreneurs who participated in the study. Frequency tables and percentages were used for data presentation and the Regression analysis was used to test the formulated hypotheses, with the aid of statistical package for social sciences (version 21.0). The study summarised that there are significant relationships between the tested traits and the growth of SMEs in Nigeria. The study recommended that owner/entrepreneurs should individually improve their skills in these critical traits’ areas. In addition, the government should provide institutional support in terms of training and development. Government should also create an enabling environment for business to thrive, through provision of infrastructures.
Keywords: Nigeria, Entrepreneurial, Traits, Small and Medium Scale Enter-prises, Performance
JEL code: D00, D20, D22, M20
INFLUENCE OF ENTREPRENEURIAL TRAITS ON THE PERFORMANCE..
P. S. Okonji, O. O. Olayemi, B. E. A. Oghojafor, D. Mgbe
Journal of Economics and Management Research. Vol. 9, 2020https://doi.org/10.22364/jemr.9.04
P. S. Okonji, O. O. Olayemi, B. E. A. Oghojafor, D. Mgbe 51
INTRODUCTION
The evolution of entrepreneurship is an essential and crucial phenomenon in modern business management. Entrepreneurship is a key factor that drives the global market, ensures industrial development and facilitates economic growth, which is linked and majorly driven small and medium sized enterprises (SMEs), which are regarded as agent or driving force of market economies that provides the platform for national development and economic growth in any economy (Stefanovic, Ljubodrag, & Sloboda, 2011). SMEs are regarded as facilitators for self-reliance, by ensuring the explore of local raw materials which serve not only as tool for self-reliance for industrial development, they also generate more employment opportunities for the populace, improve investment drive in an economy and facilitate industrial development of both rural areas and urban centres (Roy & Wheeler, 2006; Raymond, Moses, Ezenyirimba & Otugo, 2014).
Rufai (2011) suggested that one of the major tool necessary for eradicating poverty and unemployment in Nigeria, is sensitising citizens about the importance of entrepreneurship, helping them to acquire other competencies such as resilience and self-efficacy, inculcating the entrepreneurial drive and knowledge for them to be creators of labour and not seekers of labour and finally to become successful entrepreneurs. Ezenwafor and Okoli (2014) after a thorough research in unemployment situation in the eastern part of Nigeria came up with the conclusion that it is sad that that no government in Nigeria can provide sufficient or full employment to its citizenry and the only viable option or way out is entrepreneurship. The challenges of unemployment and unemployment low standard of living occasioned by poverty have served as a push factor necessitating the need for entrepreneur to start their business in order to upgrade their standard. These start-ups / businesses are expected to have a multiplier effect by generating wealth for the entrepreneur, increase the living condition, increase national productivity and improve national growth thereby eliminating poverty in the long run. Numerous entrepreneurs are finding it difficult to survive and sustain their businesses in the country. The post COVID economic challenges will take its toll on the small scale businesses with the fluctuating rate of the dollar to Naira exchange rate, fall in the price of crude oil in the global market, high inflation rate, poor assess and inadequate capital, government policies summersaults and the general harsh economic environment in Nigeria. These issues have posed grave challenges in the management and survival of Small and Medium Enterprises initiated by entrepreneurs.
Despite the challenges associated with small scale businesses and entrepreneurship development, it is still the golden chicken that lays the golden eggs in terms of job creation, development of indigenous entrepreneurs and economic growth in Nigeria. Therefore, the will-power, self-efficacy, resilience and determination of the individual entrepreneurs come to bear. Despite the challenges of the economy and operating business environment, the resolve
52 INFLUENCE OF ENTREPRENEURIAL TRAITS ON THE PERFORMANCE..
of the entrepreneur is an important factor that can shape how far a small scale business can survive and grow. It is worth investigating the extent of influence that entrepreneurship resilience and owners’ characteristics, and how they affect growth and development of certain Small and medium enterprises based in Lagos. It is worth investigating the extent of influence that entrepreneurship resilience and owners’ characteristics, and how they affect growth of certain Small and medium enterprises.
The key objective of the study is to assess the influence of entrepreneurship characteristics on the performance small and medium enterprises (SMEs) in Lagos, Nigeria. The specific objectives are: 1. To examine how resilience of an entrepreneur affects the performance of Small
and Medium enterprises.2. To investigate the extent to which innovativeness enhance the performance of
small and medium enterprises in Nigeria.3. To find out how the drive for achievement enhances the performance of small
and medium enterprise in Nigeria.4. To ascertain the extent to which risk taking propensity of an entrepreneur
influence the performance of small and medium enterprise in Nigeria.
RESEARCH HYPOTHESES
The research hypotheses of the study are as follows:Hypothesis One: Resilience of an entrepreneur does not promote the growth
of small and medium enterprises in Nigeria.Hypothesis Two: There is no significant relationship between innovativeness
and the performance of small and medium enterprises in Nigeria.Hypothesis Three: Drive for achievement does not enhance the performance
of small and medium enterprise in Nigeria.Hypothesis Four: Risk taking propensity of an entrepreneur does not have
significant influence on the growth of small and medium enterprise in Nigeria.The findings of this study are likely to benefit entrepreneurs, small business
start-ups, small scale business industrialists, and future management researchers. Also, the government at all levels and institutions that provide support to small scale businesses will gain from this study. The study will therefore be instrumental to the knowledge and comprehension of the concept of entrepreneurship characteristics, and their influence on the growth and performance of SMEs in Nigeria. Lastly, the study will constitute a useful addition to work already done in the field of entrepreneurship and business management, thus serving as a reference for future research work. The study will be limited to the influence of entrepreneurship resilience, innovativeness, need for achievement and risk

P. S. Okonji, O. O. Olayemi, B. E. A. Oghojafor, D. Mgbe 53
propensity of entrepreneurs on the growth of small and medium enterprises in Lagos, Nigeria.
REVIEW OF RELEVANT LITERATURE
Entrepreneurship
The term ‘Entrepreneurship’ can be defined as discovering a business opportunity, generating resources to harness the business opportunity, and taking risk to run the business successfully (Umaru & Obeleagu-Nzelibe, 2014). Entrepreneur is a word gotten from French word ‘entrepre’ which means one who undertakes revolution, transforms the all inputs into economic goods. Entrepreneurship entails starting or new organisation or revolving or being part of revitalising mature organisation in response to a perceived opportunity. The most obvious form of entrepreneurship is that of starting a new business (Esuh, 2011). For instance, Oyelola, Ajiboshin, Raimi, Raheem and Igwe (2013) points out that an entrepreneur is an individual that embarks on a new business from inception or takes over from the founding founder or inherits that venture and is capable to nurture and transform it to profitable venture. Entrepreneurship is also seen as service rendering; establishing and nurturing a service venture in response to the identified needs of people (Akanwa & Agu, 2005).
Entrepreneurs are saddle with responsibility of ensuring social and economic development of nation and this can be done through the process of identifying of business opportunities, evaluating and selecting the most profitable venture, allocation and distribution of the necessary resources, coordination of factors of production such as other factors of production such as capital, labour and land, planning and controlling operations of the organisation, utilisation of indigenous raw materials, risk bearing, creating of employment opportunities, marketing activities for customer satisfaction, and innovation to meet with the needs of local market (Oyelola, et al., 2013). Entrepreneurship in Nigeria could be traced when people in the rural areas and peasant farmers in various communities were producing more yields than they anticipated, as such; they would need for exchange as a result of the fact that when they produce, they was great need for their farm produce to sold and exchanged for some form of medium of exchange (goods for goods, goods for money) with people that needed these farm produce. (Oyelola, et al., 2013)
Small and medium scale enterprises
According to International Labour Organization (2005), there is no globally unified agreed definition of Small and Medium Enterprise (SMEs). There have been about 50 definitions in about 75 countries to define what a small and medium enterprise is based on the economic and social condition that is prevalent in that country. For instance, the Economic commission (2016) defines enterprises as

54 INFLUENCE OF ENTREPRENEURIAL TRAITS ON THE PERFORMANCE..
entities which employ between one and ten persons and a turnover of less than thirty million Euros. While medium–sized enterprise is one with less than two hundred employees and an annual turnover of less than fifty million Euros. In Nigeria, the Small and Medium Industries and Equity Investment Scheme (SMIEIS) defines small and medium enterprise base on the following basis. Asset: Its total assets base is less than 200 million naira (which equals $1.43 million) excluding land and working capital, Staff employed: The number of staff employed are not less than 10 persons and with the number of staff employed not less than 10 (Sanusi 2009; Sule, 2006).
Entrepreneurial characteristics
Successful entrepreneurs possess certain individual characteristics such as being hopeful, visionary, disciplined, tenacious, resilient, accommodating, passionate, focused, willing to learn, ethical, hard-working and having initiative, drive for success, risk tolerance, integrity is a major key characteristics, and ‘I can do it spirit’ (Tobak, 2013; Ezenwafor, 2013). Patricio and Neyland (2013), opine that for a successful entrepreneur to succeed and withstand environmental shocks, he or she must possess certain personal traits / characteristics for this to be so, they include he or she must goal oriented, committed to the business, take pro-active measures when needed, thriving in uncertainty, innovation must be continuously searched for to set him or her apart, he or she must be passionate among the business, being creative and innovative,, confident, he or she must be a risk taker, to listen and learn.
Entrepreneurship resilience
Resilience is comparatively a present day concept in the social sciences (Martin, 2012) which also connotes self-efficacy and determination of an individual to succeed against all odd. Resilience is seen as the tendency to respond to disturbance without regressive behaviour (Horne & Orr, 1998). Some scholars define resilience, as attributes of a system’s strength to withstand opposition or “bounce back” (Dawley, Pike & Tomaney, 2010, p. 652) or withstand external crises (Simmie & Martin, 2010) and thus generate consistent economic growth. Most studies that has been conducted has placed much emphasis on the cognitive resilience and little emphasis on the resilience on the system, thereby creating a gap in literature(Ayala & Manzano, 2014).
In explaining resilience to entrepreneurship, an entrepreneurial individual and firm applies resilience in ensuring creativity and organising skills to survive difficult times in the business environment and to stand against shocks that are prevalent in the socio-economic climate of operation (Johannisson, 2011). Like a more established firm such as multinational company or other large scale business organisation, the chances of an unforeseen circumstance are ever-present with a small scale business or individual entrepreneur who possibly have little or

P. S. Okonji, O. O. Olayemi, B. E. A. Oghojafor, D. Mgbe 55
no organisational structure, little capital base and other limitations such as human and material resources (Vogus & Sutcliffe, 2007). The ability of an entrepreneur to react and adapt to unforeseen and possibly environmental shocks as a lot to determine an organisation relevance and survival (Gutschick & Bassiri Rad, 2003). More established companies that have the resources and financial might, expertise, structure to absorb and withstand external shocks (Gilbert, 2005; Shane, 2003; Sine, Mitsuhashi, & Kirsch, 2006; Morrisse & Ingram, 2016).
Innovativeness
Innovativeness can be seen as the length to which an individual adopts innovation in the execution of a project, idea that creates value or task. Innovativeness is also seen as a component of human personality or characte-ristics of a person to follow new ways of doing things, taking decisions and solving complex problems (Kirton, 2003; Marcati, Guido, & Peluso, 2008). It entails generating brilliant innovation and bringing to reality creative ideas; it is the creation of new value and turning ideas into success. Innovativeness is the transformation of ideas into knowledge and knowledge into capital, without which a venture will not be successful or run out of steam (Okpara, 2007).
One of the critical performance indices of a firm is innovativeness. As an entrepreneurship characteristic innovativeness, riding on the wings of opportunity and being creative in the identifying and exploiting of opportunities (Omerzel, 2016). Drucker (1985) sees innovation is seen as the engine house by that allows entrepreneurs seek and exploit opportunities. Innovativeness which is described as ability to find originality towards the getting way of action also includes the preference of entrepreneurs to engage in creativity and experimentation (Rauch, 2010). A major key which is innovativeness is very important to entrepreneurs because it allows them to recognise important opportunities and seek for new and better ways of accomplishing objectives and achieving goals (Ward, 2004). Thus, innovativeness in entrepreneurs has been predicted to aid performance and growth of businesses. (Olayemi, 2014; Olayemi, & Okonji, 2016).
Drive for achievement
The drive for achievement alludes to an individual’s aim for significant accomplishment, ability to learn quickly, and to achieve something that you planned to do or attempted to do. Entrepreneurs have been theorised to possess a strong need for achievement and motivation (Kerr, Kerr, & Xu, 2017). The McClelland need for achievement is a character originating from (1985) “acquired-needs theory” and this is a dominant need affecting a person behaviour in the workplace. Research has established that a high need for achievement predicts entry into entrepreneurship (Korunka, Frank, Lueger & . Mugler, 2003). Frank, Lueger & Korunka (2007) affirms that the need for achievement is a trait

56 INFLUENCE OF ENTREPRENEURIAL TRAITS ON THE PERFORMANCE..
that alludes an individual’s entrepreneurial drive and keeps them going in difficult and changing business environment. It has also been discovered that the need for achievement is strongly linked to entrepreneurship intent, and business performance (Collins, Hange, & Locke, 2004). Entrepreneurship trait of drive for achievement has been found to be a determinant of business success and growth of business endeavours (Karabulut, 2016).
Risk taking propensity
Martijn and Daan (2017) define risk as uncertainty whose probability of occurrence and payoffs can be quantified. Risk taking propensity as an important characteristic of entrepreneurship, entrepreneurs are different from others by their acumen based on their understanding and acting based on luck/lucky chance irrespective unpredictability and complexities, they face. Entrepreneurs are those who are known for handling risk and taking risky opportunities (Kerr, Kerr, & Xu, 2017).Khilstrom and Laffont (1979) were able to establish a theory that explains why most risk seekers are likely to be entrepreneurs and those that score (risk averters) are likely to be employees because they avoid risk and fear failure. Risk taking disposition is a state in which an individual is able to handle risk and withstand these risky situations which are mostly taken for prestige, for the survival of their business, to harness key opportunities with reduced risk and most likely favourable result (Karabulut, 2016).
Organisational performance
Organisational performance is an assessment of the extent to which an entity achieved its stated goals and objectives in the service of its stakeholders. Moullin (2003) assert that performance is primarily concerned with assessing how an organisation is being or has been administered with respect to the values it delivers for customers and other stakeholders. An organisation is deemed to have performed well when it meets the expectations of both the primary and secondary stakeholders. The concepts of effectiveness and efficiency have been traditionally used to measure organisational performance. According to Neely and Adams (2001) effectiveness measures the extent to which an organisation meets promised stakeholders’ needs. While efficiency focuses on the input-output relationship in meeting stakeholders needs. Researchers studying organisational performance have used both subject and objective criteria (Richard, Devinney, Yips and Johnson, 2009). The objective or quantitative criteria include growth in sales, revenue, profit, market share and productivity. On the other hand, qualitative or subjective criteria are customer satisfaction, goals achievement, employee satisfaction and behaviour, quality of leadership, innovation among others (Zimon 2018 & Gupta and Batra 2016).
Frank and Roessl (2015) posit that the difficulty in obtaining objective data such as income statements in SMEs make it more convenient to resort to

P. S. Okonji, O. O. Olayemi, B. E. A. Oghojafor, D. Mgbe 57
subjective indicators in SMEs performance measurement. The inability of SMEs to establish performance measurement and needed culture for the collection of decision data compel researchers to rely on subjective rather than objective measures of performance.(Heilbrunn, Rozenes and Vitner, 2011 & Dess and Robinson,1984). Besides, there is an emerging consensus among several authors that subjective criteria could be more reliable and credible for measuring SMEs performance in the emerging and developing economies (Lukas, Tan and Hult, 2001, Brouthers, 2002). This is even more instructive in Nigeria where income statements are padded to meet the requirements of specific stakeholders.
The theoretical foundation for this study is active learning. Active Learning Model was advanced by Erickson and Pakes (1995), opines that a firm or business has a greater chance of survival, when it adequately by investing raise their effectiveness and efficiency through acquiring the appropriate training and formal education that would actually facilitates it competitiveness both externally and internally, and therefore enhance its growth and its ability o respond and withstand various environment variables that might likely impair its operations and success, both the government and the individual entrepreneurs have a serious role to play in this. The government is expected to provide a conducive and supportive business environment for these SMEs that will encourage business and entrepreneurs of Small and Medium Scale enterprises are also expected to learn and gain the required experience through training and formal education which would help it have a competitive advantage. And with these two factors in place entrepreneurial firms and business stands a greater chance of growing, and experiences sustainable development (Agwu & Emeti, 2014). Nigeria then stands a chance in achieving its entrepreneurial goals, generating employment, if not full and enhancing economic development only when and development of entrepreneurship characteristics and appropriate investments are put into the management of their businesses through active learning.
Another scholar Lebusa (2011) also conducted a research to ascertain the relationship that existed students’ performance and their level of efficacy, and the result showed positive significant relationship existed between the students’ performance and their level of efficacy. On the contrary, Powers (1991) had a contrary believed that self-efficacy enhanced an individual’s optimism which has a negative effect on the level an individual performances and that people tend to put in lesser effort when they have a high confidence of achieving success He believed that people make less effort when there is a confidence of when they know they can be successful in achieving a goal or task. Bandura and Jourden (1991) also carried out a study and discovered that self-efficacy decreases an individual’s performance because when he or she believes he or she can do or has the confidence of being able to perform a particular task this might prompt that person to put believing that even that that level of effort he or she can still achieve maximum result. Stone (1994) discovered that an individual’s overestimation of his or her ‘can do spirit’ and abilities, which will produce overconfidence which can also help to reduce his or her actual performance.

58 INFLUENCE OF ENTREPRENEURIAL TRAITS ON THE PERFORMANCE..
Vancouver, Thompson, Tischner, and Putka (2001) conducted two phases to determine the relationship that exist between self-efficacy and a person’s performance. The first which was conducted with 56 undergraduates came out positive, that there actually self-efficacy actually affects an individual’s performance, while the other phase of the study which was conducted for another set of 185 undergraduates carried out in other to replicate the first studies to show if there was actually consistency between the first and second studies, the result of the second came out negative in tandem with the first research, which showed that performance facilitates self-efficacy and not the other way round, which challenged previous studies conducted by other scholars on the most accepted relationship that existed between self-efficacy and individual performance.
Another study was carried out by Vancouver, Thompson, Tischner, and Putka (2002) to study the relationship between self- efficacy and an individual performance. This time, they used computer game to carry out this study on undergraduates of an academic institution on 2 experimental levels. In the first study participant recipients were allowed to undertake any 10 experiment trials before the actual self-efficacy test was conducted, and was used to measure the relationship between the two variables. The studies later discovered that there was not positive significant relationship between self-efficacy and individual’s performance, but rather self-efficacy decreased individual’s per-formance instead of enhancing it. In the second study that was also carried on 104 undergraduates, there was still a negative relationship between self-efficacy and individual performance which was in tandem with the first study been carried out. Chen, Greene and Cride (1998) developed an instrument that was used to assess self-efficacy with dimensions such as financial control skills, innovation, marketing,risk-taking and management, while DeNobel, Jung and Ehrlich (1999) also developed an entrepreneurial domain scale in other to measure an entrepreneur intention and action and the result showed that there was relationship self-efficacy and entrepreneur intentions and performance.
Contrary to findings on the relationship between risk taking and performance, Egele, Muhammed and Mutanyo (2018) reported that entrepreneurial risk taking does not have positive influence on SMEs’ performance studied firms in Kano, Nigeria. Similarly, Bar and Kunday (2014) in a study to determine the role of entrepreneurial traits and human capital on internalisation degree of SMEs in Turkey found that the propensity for risk taking does not have any positive influence on internalisation of a company. Sidek and Zainol (2014)’s work on the impact of psychological traits and business performance of entrepreneurs in Malaysia, entrepreneurs with higher performance exhibited higher achievement needs and higher propensities for risk taking than their low performing peers. Zhao, Seibert, and Hills (2005) studies were conducted to examine the relation-ship that exist between self-efficacy measured in entrepreneurial specific domain and entrepreneurial intentions and actions. The study was conducted on 778 MBA students in 5 different universities mainly at their Business Facilities and was conducted at two phases, firstly when they were coming into the institution and

P. S. Okonji, O. O. Olayemi, B. E. A. Oghojafor, D. Mgbe 59
before they graduated. And the end of the research it was discovered that there was a positive significant relationship between entrepreneurial specific domain and entrepreneurial intentions and actions to create new starts up, business and manage them
Brice and Spencer (2007) another study which was conducted on graduating students in an institution in order to analyse the relationship between self-efficacy and the ability to manage a firm adequately. The result of the study discovered that there was a positive significant relationship between self-efficacy and effective management, and those entrepreneurs that scored high in self-efficacy did better at effectively managing their business. Entrepreneurs that did not possess self-efficacy, was seen as a hindrance and barrier that impeded their ability to effectively manage well. Hmieleski and Baron (2008) another study was conducted by them to investigate the relationship between self-efficacy and enterprise/ business growth. The reverse was the case compared to other studies been carried out. They discovered that there was a negative relation between the two variables, there asserting that self-efficacy reduces a firm growth under certain moderating variables and conditions investigated the effect of self-efficacy on venture growth and results proved a positive effect. In this study, self-efficacy was measured in entrepreneurial specific domain and firm performance was the focus.
METHODOLOGY
This study adopted the survey design. The targeted population for this study consists of all registered Small and Medium Enterprises (SMEs), both of which have been in operations for a minimum of five years in Lagos, Nigeria, which has been described as the commercial centre of Nigeria with the highest SMEs (CBN, 2010). The sampling frame of the study consists of owners of selected small scale businesses in the Mainland area of Lagos metropolis. The systematic random sampling was employed in selecting 125 SMEs both in service (65%) and manufacturing (35%) sectors by the researcher. 30 of those polled were females while 95 of them were females. The age brackets were 30-50 years while the start-up capital ranges between Five hundred Naira (#500,000.00) and Ten million Naira (#10,000,000.00). The primary data were collected through well-structured questionnaires adapted from various authors. Perseverance/ resilience (Duckworth and Quinn 2009), Innovativeness (Janssen, 2000), Achievement (Lynn, 1969) and Risk taking propensity (Meertens and Lion, 2008). Organi-sational performance questionnaire was developed by the authors. It was measured through questions on customer satisfaction relative to competitors, customer satisfaction, repeat purchases, market share growth among others.
To determine the validity of the instrument, the questionnaire was subjected to content validity where the opinion of scholars in the department of Business Administration, faculty of management sciences. For the purpose of the reliability

60 INFLUENCE OF ENTREPRENEURIAL TRAITS ON THE PERFORMANCE..
of the instrument, thirty-five (35) copies of the questionnaire were administered as a pilot study test while the reliability analysis was carried out using Statistical Package for Social Scientist (SPSS 21 Version).The Cronbach’s Alphas are: Resilience 0.869. Innovativeness 0.76, Achievement 0.82, Risk taking 0.70 and Performance 0.681 respectively. Data were analysed using Descriptive statistics and inferential statistics. Regressions were used to establish relationships between the dependent and the independent variables.). The Statistical Package for Social Science (SPSS) version 21 was used to analyse the data obtained. The outputs of the analysis were presented in tables and figures.
ANALYSIS AND INTERPRETATIONS
Hypothesis one: Perseverance/resilience does not promote the growth of SME’s in Nigeria.
Table 1Regression results for hypothesis one
Model
Unstandardised
Coefficients
Standardised Coefficients t Sig. F R R2 Adj.
R2
Std. Error of the
EstimateB Std. Error Beta
(Constant) 1.030 .244 2.211 .01270.149 .671a .450 .449 .34219Perseverance/
resilience .543 .151 .671 6.326 .000
a. Dependent Variable: (growth of SME)
Results obtained show that the coefficient of regression R= 0.671 while the coefficient of determination (R²) is 0.449. This means that the value of the dependent variable can be explained by about 49% percent of the independent variable. Furthermore the F-statistic (70.149) is significant at 5% level since the probability of its value (0.000) is lesser than the 0.05 level of significance. This simply implies that the model is statistically significant, based on this, the H1 is rejected and resilience significantly promotes growth of SME’s in Nigeria.
Hypothesis Two: There is no significant relationship between innovativeness and performance of SME’s in Nigeria.
Table 2Regression results for hypothesis two
Model
Unstandardised Coeffi
cients
Standardised Coefficients t Sig. F R R2 Adj.
R2
Std. Error of the
EstimateB Std.
Error Beta
(Constant) 1.112 .401 3.124 .000 42.225 .785a .616 .614 .135241Innovativeness 1.341 .103 .785 7.345 .000a. Dependent Variable: (performance of SME’s)
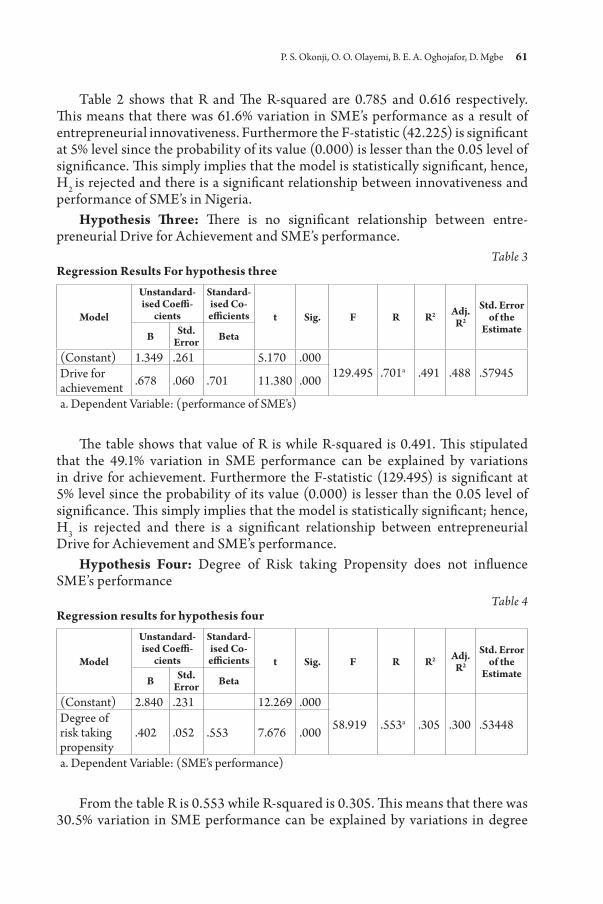
P. S. Okonji, O. O. Olayemi, B. E. A. Oghojafor, D. Mgbe 61
Table 2 shows that R and The R-squared are 0.785 and 0.616 respectively. This means that there was 61.6% variation in SME’s performance as a result of entrepreneurial innovativeness. Furthermore the F-statistic (42.225) is significant at 5% level since the probability of its value (0.000) is lesser than the 0.05 level of significance. This simply implies that the model is statistically significant, hence, H2 is rejected and there is a significant relationship between innovativeness and performance of SME’s in Nigeria.
Hypothesis Three: There is no significant relationship between entre-preneurial Drive for Achievement and SME’s performance.
Table 3Regression Results For hypothesis three
Model
Unstandardised Coeffi
cients
Standardised Coefficients t Sig. F R R2 Adj.
R2
Std. Error of the
EstimateB Std.
Error Beta
(Constant) 1.349 .261 5.170 .000129.495 .701a .491 .488 .57945Drive for
achievement .678 .060 .701 11.380 .000
a. Dependent Variable: (performance of SME’s)
The table shows that value of R is while R-squared is 0.491. This stipulated that the 49.1% variation in SME performance can be explained by variations in drive for achievement. Furthermore the F-statistic (129.495) is significant at 5% level since the probability of its value (0.000) is lesser than the 0.05 level of significance. This simply implies that the model is statistically significant; hence, H3 is rejected and there is a significant relationship between entrepreneurial Drive for Achievement and SME’s performance.
Hypothesis Four: Degree of Risk taking Propensity does not influence SME’s performance
Table 4Regression results for hypothesis four
Model
Unstandardised Coeffi
cients
Standardised Coefficients t Sig. F R R2 Adj.
R2
Std. Error of the
EstimateB Std.
Error Beta
(Constant) 2.840 .231 12.269 .000
58.919 .553a .305 .300 .53448Degree of risk taking propensity
.402 .052 .553 7.676 .000
a. Dependent Variable: (SME’s performance)
From the table R is 0.553 while R-squared is 0.305. This means that there was 30.5% variation in SME performance can be explained by variations in degree

62 INFLUENCE OF ENTREPRENEURIAL TRAITS ON THE PERFORMANCE..
of risk taking propensity. Furthermore the F-statistic (58.919) is significant at 5% level since the probability of its value (0.000) is lesser than the 0.05 level of significance. This simply implies that the model is statistically significant; hence, H4 is rejected and the Degree of Risk taking Propensity does influence SME’s performance.
CONCLUSIONS AND RECOMMENDATIONS
The progress of a nation depends on the quality of entrepreneurship and the characteristics of entrepreneurs willing to bear the business risk. Entrepreneurship development has become a main source of development, a key driver of economic and social development, as entrepreneurs produce new products to the market with their ideas, establish businesses, and mobilise resources associating with financial, social and risk. The efforts by entrepreneurs and the level of entrepreneurship resilience to weather the storm of businesses in Nigeria is critical to economic development, given that ‘white collar’ jobs are shrinking from the government and private sector. The study has shown that innovativeness, perseverance, risk taking propensity and drive for achievement are critical entrepreneurship characteristics that entrepreneurs should possess, in order to withstand the pressures from the business environment and achieve business growth. The combination of entrepreneurial traits and a favourable macro-economic environment is a sine qua non for optimum performance of small and medium scale enterprises in Nigeria. Entrepreneurs/ owners must possess a reasonable amount of these traits to successful manage their enterprises. The willingness to take risk is a fundamental requirement for entrepreneurship and small and medium scale enterprises development. Owner/ managers must be willing to stake their resources in an uncertain and complex business environment. Innovation is required to meet the ever changing needs of the stakeholders. The ability to innovate helps the business to renew itself and remain tops in the competitive environment. The need for achievement is necessary to motivate the entrepreneurs towards higher performance. While resilience is required in the face of challenges the business will face. The environment will throw up challenges requiring the tenacity of the entrepreneur to weather the storms of the environment.
The study has exposed entrepreneurship resilience and owners’ characteristics to explain business development and survival of the small-scale business in the economy. The study recommends the owner/entrepreneurs should individually improve their skills in these critical traits’ areas. In addition, the government should provide institutional support in terms of training and development. Agencies such SMDAN should be mandated to provide regular workshops to identify the level of traits possessed by owner/ managers and nurture them to the fullest. Entrepreneurs should be schooled on the qualitative and quantitative means of risk evaluation, on the need to set realistic and not over ambitious goals

P. S. Okonji, O. O. Olayemi, B. E. A. Oghojafor, D. Mgbe 63
and the ability to identify fundamental changes in the environment requiring strategic shift instead of hanging in ignorantly to their destruction. The provision of support policies will be a good complement by the government.
REFERENCESAkanwa, P. U., & Agu, C. N. (2005). Entrepreneurship: Theory and practice in
Nigeria. Owerri, Resources Development Centre.Ayala, J. C., & Manzano, G. (2014). The resilience of the entrepreneur. Influence on
the success of the business. A Longitudinal Analysis, Journal of Economic Psychology, 42, 126–135.
Bandura, A. & Jourden, F. J. (1991). Self regulatory mechanisms governing the impact of social comparison on complex decision making.. Journal of Personality and Social Psychology, 60(6), 941–951.
Bar, E. and Kunday, O. (2014)., Investigating the role of entrepreneurial traits and human capital on internalization degree of small and medium enterprises in Turkey. International Journal of Business and Social Sciences, 5(2), 192–201.
Brice, J., & Spencer, B. (2007). Entrepreneurial Profiling: A decision policy analysis of the influence of entrepreneurial self-efficacy on entrepreneurial intent. Academy of entrepreneurship Journal, 13 (2), 47–67.
Chen, C. C., Greene, P. G., & Crick, A. (1998). Does entrepreneurial self-efficacy distinguish entrepreneurs from Managers? Journal of Business Venturing, 13, 295–316.
Collins, C. J., Hange, P. J. & Locke, E. A. (2004). The relationship of achievement motivation to entrepreneurial behavior: A meta-analysis. Human Performance, 17, 95–117.
Dawley, S., Pike, A., & Tomaney, J. (2010). Towards the resilient region? Local Economy 25(8), 650–667.
DeNobel, N. F., Jung, D., & Ehrlich, S. B. (1999). Entrepreneurial self-efficacy: The development of a measure and its relationship to entrepreneurial action. In Reynolds, R. D. Bygrave, W. D., Manigart, S., Mason, S., Meyer, G. D., & Sapienze, H. J. (eds). Frontiers of Entrepreneurship Research. Waltham, MA, P & R Publications.
Drucker, P. (1985). Innovation and entrepreneurship: Practice and principles. New York, Harper and Row.
Duckworth, A. L. and Quinn, P. D. (2009). Development and validation of the short grit scale (GRIT-S). Journal of Personality Assessment, 91(2), 166–174.
Egele, A. C., Muhammad, K. and Mutanyo, J. (2018). Entrepreneurial risk taking and performance of small and medium scale enterprises(SMEs) in Kano Nigeria. Journal of Social Sciences, 4(3), 213–224.
Ericson, R., & Pakes, A. (1995). Markov-perfect industry dynamics: A framework for empirical work, The Review of Economic Studies, 62(1), 53–82.
Ezenwafor, J. I. (2013). Adequacy of exposure to entrepreneurship management skills as perceived by graduating business education students of tertiary institutions in Anambra state. International Journal of Adult Education Studies, 2(1), 1–13.
Ezenwafor, J. I., & Okoli, C. I. (2014). Assessment of personal characteristics needed to become successful entrepreneurs by managers of small & medium enterprises in Anambra and Enugu States, Journal of Emerging Trends in Economics and Management Sciences, 5(7), 51.
64 INFLUENCE OF ENTREPRENEURIAL TRAITS ON THE PERFORMANCE..
Frank, H., and Roessl, D. (2015). Problematization of entrepreneurial SME manage-ment as a field of research: Overcoming the size-based approach. Review of managerial Science, 9(2), 225–240.
Frank, H., Lueger, M., & Korunka, C. (2007). The significance of personality in business startup intentions, startup realization and business success. Entrepreneurship & Regional Development, 19(3), 227–251.
Gilbert, C. G. (2005). Unbundling the structure of inertia: Resource versus routine rigidity, Academy of Management Journal, 48(5), 741–763.
Gupta, V. K., and Batra (2016). Entrepreneurial orientation and firm performance in Indian SMEs: Universal contingency perspectives. International Small Business Journal: Researching Entrepreneurship, 34(5), 660–672.
Gutschick, V. P., & Bassirirad, H. (2003). Extreme events as shaping physiology, ecology, and evolution of plants: Toward a unified definition and evaluation of their consequences, New Phytologist, 160(1), 21–42.
Hmieleski, K. M., & Baron, R. A. (2008). Entrepreneurs optimism and new venture performance: A social cognitive perspective. Academy of Management Journal, 52(3), 473–488.
Jenssen, O. (2000). Job demands perceptions of efforts-rewards fairness and innovative work behaviour. Journal of Occupational and Organizational Psychology, 73(3), 287–302.
Johannisson, B. (2011). Towards a practice theory of entrepreneuring, Small Business Economics, 36(2), 135–150.
Horne, M. J., and Orr, J. (1990). Assessing behaviour that creates resilient organiza-tions. Employment Relations Today, 24, 29-39.
Karabulut, A. T. (2016). Personality traits on entrepreneurial intention. Procedia-Social and Behavioral Sciences, 229, 12–21.
Kerr, S. P., Kerr, W. R., & Xu, T. (2017). Personality Traits of Entrepreneurs: A Review of Recent Literature (No. w24097). National Bureau of Economic Research.
Kihlstrom, S., and Laffout, J. J. (1979). A general equilibrium entrepreneurial theory of firms formation based on risk aversion. Journal of Political Economy, 87(4), 719–748.
Kirton, J. M. (2003). Adaption-innovation in the context of Diversity and Change. London: Routhledge.
Korunka, C., H., Frank, M. Lueger, & Mugler, J. (2003). The entrepreneurial perso-nality in the context of resources, environment, and the startup process. A configurationally approach. Entrepreneurship Theory and Practice, 28(1), 23–42.
Lebusa, M. J. (2011). Does entrepreneurial education enhance undergraduate students’ entrepreneurial self efficacy? A case at one Technology University in South Africa, China and US Business Review, 10(1), 53–64.
Lynn, R. (1969). An achievement motivation questionnaire. British Journal of Psychology, 60(4), 529–534.
Marcati, A., Guido, G., and Peluso, A. M. (2008). The role of SME entrepreneur’s innovativeness and personality in the adoption of innovation. Research Policy, 37(9), 1579–1596.
Martijn, B., and Daan, W. (2017). Entrepreneurship risk perception and firm performance. Utrecet university School of Economics, Discussion paper series, 17–04.
Martin, R. (2012). Regional economic resilience, Hysteresis and recessionary shocks, Journal of Economic Geography, 12(1), 1–32.
McClelland, D. C. (1985). Human Motivation. Scott Foresman, Glenview, IL.

P. S. Okonji, O. O. Olayemi, B. E. A. Oghojafor, D. Mgbe 65
Meertens, R. M., and Lion, R. (2008). Measuring an individual’s tendency to take risk: The risk propensity scale. Journal of Applied Social Psychology, 38(6),1506–1520.
Morisse, M., & Ingram, C. (2016). A mixed blessing: Resilience in the entre pre neurial socio-technical system of Bitcoin. Journal of Information Systems and Technology Management, 13(1), 3–26.
Moullin, M. (2003). Defining performance measurement. Perspective on performance, 2(2), 3–15.
Neely, A., and Adams, C. (2001). The performance perspective. Cost Management, 15(1), 7–19.
Okpara, F. O. (2007). The value of creativity and innovation in entrepreneurship. Journal of Asia Entrepreneurship and Sustainability, 3(2), 1.
Olayemi, O. O. (2014). Entrepreneurial Orientation Dimensions as Determinants of Business Performance in Nigeria, Unpublished Doctoral Dissertation, University of Lagos, Akoka Yaba
Olayemi, O. O., and Okonji, P. S. (2016). Entrepreneurial orientation dimensions as determinants of business performance in Nigeria, UNILAG Journal of Business, Vol. 2, No. 2. pp. 13–25, University of Lagos.
Omerzel, D. G. (2016). The impact of entrepreneurial characteristics and organisa-tional culture on innovativeness in tourism firms. Managing Global Transitions, 14(1), 93.
Oyelola, O. T., Ajiboshin, I. O., Raimi, L., Raheem, S., & Igwe, C. N. (2013). Entrepreneurship for sustainable economic growth in Nigeria. Journal of Sustainable Development Studies, 2(2).
Patricio, A., & Neyland, S. (2013). 10 important personal characteristics of entre-preneurs.Accessed from www.hiscox;com/small-business-insurance blog 10 on 8th April, 2014.
Powers, W. T. (1991). Commentary on Bandura’s Human Agency.American Psycho-logists, 46, 151–153.
Rauch, A. (2010). Dispositions of entrepreneurs: Exploring entrepreneurs’ personality characteristics. In Lukes, M. Laguna, M. (Eds.), Entrepreneurship: A Psychological Approach, Prague, Oeconomica.
Raymond, A. E., Moses, C. O., Ezenyirimba, E., & Otugo, N. E. (2014). The appraisal of entrepreneurship and SME on sustainable economic growth in Nigeria. Scholars Journal of Economics, Business and management, 1(8), 367–372.
Richard, P. J. T., Devinney, G., Yips, S., and Johnson, G. (2009). Measuring organiza-tional performance: Towards methodological best practices. Journal of management, 35(3),718–724.
Roy, M. A., & Wheeler, D. (2006). A survey of micro enterprise in urban West Africa: Drivers shaping the sector, Development in Practice, 16(5), 452–464.X
Rufai, R. A. (2011). Why we set up entrepreneurship studies in varsities. Daily Sun, Tuesday, February 8, 36.
Sammie, J., and Martin, R. (2010). Economic resilience of regions: towards an evolutionary approach. Cambridge Journal of Regions, Economy and Society, 3(1), 27–43.
Sanusi, A. (2009). Small and medium scale enterprises in Nigeria: The problems and prospects. Paper presented at Institute of Directors on entrepreneurial skills acquisitionand economic development, Lagos.
Shane, S. (2003). A general theory of entrepreneurship: The individual-opportunity nexus, Cheltenham, UK, E. Elgar.

66 INFLUENCE OF ENTREPRENEURIAL TRAITS ON THE PERFORMANCE..
Sidek, S., and Zainol, F. A. (2014). Psychological traits and business performance of entrepreneurs in small construction industry in Malaysia. International Business Management Journal, 2(1), 170–185.
Sine, W. D., Mitsuhashi, H., & Kirsch, D. A. (2006). Revisiting burns and stalker: Formal structure and new venture performance in emerging economic sectors, Academy Of Management Journal, 49(1), 121–132.
Stefanovic, I., & Milosevic, D. M. (2011). Significance and development problems of SMEs in contemporary market economy.Serbian Journal of Management, 4(1), 127–136.
Stefanovic, I., Ljubodrag, R., & Sloboda, P. (2011). Entrepreneurs’ motivational factors: Empirical Evidence from Serbia. Serbian Journal of Management, 6(1), 73–83.
Stone, D. N. (1994). Overconfidence in initial self efficacy judgments: effect on decision process and performance. Organizational Behavior and Human Decision Processes, 59, 452–474.
Sule, E. K. (2006). Small scale industries in Nigeria: Concepts appraisal of some governments policies and suggested solutions to identified problems. Economic and Financial Review, 24(4), 24.
Tobak, S. (2013). Skills you need to be the next great entrepreneur. Accessed from wtp://www.inc.com/stevetobac/10-skills-toland—amanagement-job.html on 8th April, 2014.
Umaru, D. M., and Obeleagu-Nzelibe, C. G. (2014). Entrepreneurship skills and profitability of small and medium enterprises (SMEs): Resource acquisition strategies for new ventures in Nigeria, Proceeding of 25th International Business Research Conference, 13–14 January, Taj Hotel, Cape Town, South Africa.
Vancouver, J. B. & Kendall, L. N. (2006). When self efficacy negatively related to motivation and performance in a learning context. Journal of Applied Psychology, 91(5), 1146–1153.X
Vancouver, J. B., Thompson, C. M., & Williams, A. A. (2001). The changing signs in the relationship among self efficacy, personal goals and performance. Journal of Applied Psychology, 86(4), 605–620.
Vancouver, J. B., Thompson, C. M., Tischner, E., & Putka, D. J. (2002). Two studies examining the negative effect of self efficacy on performance. Journal of Applied Psychology, 87(3), 506–516.
Ward, W. T. (2004). Cognition, creativity, and entrepreneurship. Journal of Business Venturing, 19, 173–188.
Zhao, H., Seibert, S. E., & Hills, G. E. (2005). The mediating role of self- efficacy in the development of entrepreneurial intentions. Journal of Applied Psychology, 90(6), 1265–1272.X
Zimon, G. (2018). Influence of group purchasing organizations on financial situation of Polish SMEs. Deconomia Coperilana, 9(1), 87–104.

PERSONAL SUPPORT NETWORKS AS MODERATORS IN DYADIC
EMPLOYEE-SUPERVISOR RELATIONSHIPS
FRANK W. HAGERDipl.-Wirt.-Ing. (FH), MBA, M.A.
NORBERT G. BRINKDipl.-Ing, Dipl.-Ing. (FH)
Abstract
Health-promoting management behaviour and the associated social support require professional and social competences of supervisors. The behaviour of leaders has an impact on motivation, commitment, as well as on the mental and physical health of their employees – and consequently on their ability to work and employability. Thus, from an entrepreneurial point of view, the skill of managers to provide adequate social support is an indispensable prerequisite for the economic success of the organisation. The two-way relationship (dyad) between the leader and the led, as a reciprocal, dynamic negotiation process, is in the focus of this investigation. For this research in the field of social support, the functions and effects of personal, social support networks have been considered. The question arises, as to whether they can compensate or moderate inadequate social support from supervisors and its effects on the employee’s state of health. From a differential view, social support networks can be understood as a matrix, providing the infrastructure for the production and distribution of a broad spectrum of social support benefits, which in turn represent the social resources of an employee – an important factor for her/his physical and mental health. Social resources in the form of social relationships and social interactions can help to cope with workloads and to better master challenges. In stressful situations, it is helpful to receive emotional or practical support from the support networks of the primary environment. The sample comprises of managers in middle management (N = 132) from different German automotive suppliers. In the examination, the Survey of Perceived Supervisor Support (SPSS), the Short Form Health Survey (SF-36) and the Evaluation of Social Systems Scale (EVOS) has been used. It was postulated that the quality of social support networks (mirrored by the EVOS-dimensions “quality of relationships” and “self-efficacy”) moderate the relationship between perceived supervisor support and employees self-rated health. Partly, significant correlations between perceived supervisory support and the self-rated health dimensions “emotional well-being”, “energy/fatigue” and “role limitations due to personal or emotional problems” could be determined. It was also possible to gain the important insight that the networking of employees outside the official hierarchical structures plays an essential role in coping with stress.
PERSONAL SUPPORT NETWORKS AS MODERATORS IN DYADIC ..
Frank W. Hager, Norbert G. Brink
Journal of Economics and Management Research. Vol. 9, 2020https://doi.org/10.22364/jemr.9.05

68 PERSONAL SUPPORT NETWORKS AS MODERATORS IN DYADIC ..
Keywords: Germany, perceived supervisor support, self-rated health, social support networks
JEL code: M12, J24, J28
INTRODUCTION
In this work, the focus is on the social support provided by the supervisor. Inversely, in the case of a positive evaluation, the superior in a dyadic relationship receives an increased degree of loyalty from his or her employee, more commitment to the organisation’s goals and a greater willingness to take on duties and unpleasant tasks.1 According to the relevant literature from support research and a veritable flood of research reports in this field, it is assumed in this article that especially dyadic employee-supervisor relationships initiate a process of mutual investment in professional activity in which the development potential of interpersonal relationships is exploited. This results in a significantly higher team performance, which goes far beyond the basic performance and makes a decisive contribution to team success.2
Whether employees cooperate and show the aforementioned loyalty depends largely on their leadership behaviour and the quality of the provided social support, whether they function as a resource and whether they are perceived as such by employees. Thus, executives who perform little or no management duties, focus unilaterally on the achievement of goals rather than on the needs of employees, exercise strong control, withhold information or deal with destructively, represent less as a resource than a burden.3 Studies confirm the link between social supervisor support and sick leave as well as early retirement.4 In conclusion, supervisor support has a positive influence on stress perception5, exhaustion6, job
1 Lewicka, D., Glinska-Newes, A., Morrow, D. L., & Gorka, J. (2018). The effect of job characteristics on employee loyalty: the mediation role of vertical trust and perceived supervisor support. Market-ing and Management of Innovations, 2, p. 169. Rousseau, V., & Aubé, C. (2010): Social Support at Work and Affective Commitment to the Organization: The Moderating Effect of Job Resource Adequacy and Ambient Conditions, The Journal of Social Psychology, 150(4), pp. 321–340.
2 Bierhoff, H.-W. (2006). Sozialpsychologie. Stuttgart: Kohlhammer, p. 471. Rousseau, V., & Aubé, C. (2010). Social Support at Work and Affective Commitment to the Organization: The Moderating Effect of Job Resource Adequacy and Ambient Conditions, The Journal of Social Psychology, 150(4), pp. 321–340.
3 Stummer, H. (2007). Entsolidarisierung von Führungsverhalten und mögliche Auswirkungen auf die Gesundheit.Industrielle Beziehungen: Zeitschrift für Arbeit, Organisation und Management, 14(3), pp. 270–278.
4 Stadler, P., Spieß, E. (2004). Mitarbeiterorientiertes Führen und soziale Unterstützung am Arbeitsplatz. Grundzüge und Beispiele eines Informations- und Handlungskonzepts. Bundesanstalt für Arbeits-schutz und Arbeitsmedizin, Dortmund, p. 10.
5 Cohen, S., & Wills, T. A. (1985). Stress, social support, and the buffering hypothesis. Psychological Bul-letin, 98(2), pp. 310–357.
6 Leiter, M., & Maslach, C. (1988). The impact of interpersonal environment on burnout and organiza-tional commitment. Journal of Organizational Behavior, 9, pp. 297–308.

Frank W. Hager, Norbert G. Brink 69
satisfaction7 und mental health8 of the employees. If the led employee evaluates supervisor support as deficient, a need for help is perceived and she/he decides to ask others from support networks for help as part of a coping strategy.9
After the model in this study, affected employees will first consult close persons in the work area or the organisation and try to activate their knowledge, experience, advice, and assessments and possibly also their active support to solve their problem. If these efforts are not successful, for example, if the nature of the problems requires more specific knowledge, empathy, trust, etc. than is available in the primary social support networks, help is sought outside these boundaries. People in the primary support network are displaced by those who can provide more targeted support in problem situations. In a quasi-centrifugal movement out of the primary environment, people are contacted who are increasingly distant, less familiar or emotionally close. According to this view, professionals are the last link in a chain of help request activities, which is reached when the help request appears unsuccessful to both previous instances. Hence, in the course of the help search process, a successive expansion of the personal support network would take place due to increasingly specialised persons; at the same time, a decrease in the emotional closeness or familiarity with the network members would be expected. The question arises as to whether private support networks (primary and secondary environment) can compensate for deficient social support of the supervisor and its negative effects on the health status of employees. Against the background of this mechanism it is believed, the health benefits of the primary environment’s support networks are higher, in the case of the emergence of a compensation.
Due to the emotional closeness and familiarity in the primary environment, not only the quality of the relationship was considered as a possible compensating (moderating) variable in the collection of the data, but also self-efficacy with the supporting network members.
In general, the localisation and precise classification of social support networks are difficult, as they can only be defined and located through the subjective perception of an individual. A recording of social networks through different structural characteristics (e.g. scope, frequency of contacts, density, distance, homogeneity, heterogeneity or social participation)10, which is common in network research, was not possible due to the quantitative research approach. The model of hierarchical compensation suggested by Cantor (1979) assumes the existence
7 Adams, J., Claus, A., Claus, M. et al. (2018). Soziale Unterstützung und Arbeitszufriedenheit – Unter-schiede zwischen verschiedenen Tätigkeitsbereichen. Präventive Gesundheitsförderung, 13, pp. 18–23.
8 Kienle, R., Knoll, N., & Renneberg, B. (2006). Soziale Ressourcen und Gesundheit: Soziale Unterstüt-zung und dyadisches Bewältigen. In: Renneberg, B., Hammelstein, P. (Eds) Gesundheitspsychologie. Berlin, Heidelberg: Springer, pp. 107–117.
9 Die gesunde Arbeit. Berlin: De Gruyter, p. 120. Rudow (2014) distinguishes two support systems in the workplace: supervisor support and peer (co-worker) support.
10 Diewald, M. (1990). Soziale Beziehungen – Verlust oder Liberalisierung? Soziale Unterstützung in in-formellen Netzwerken. Berlin: Edition Sigma, pp. 102–105.

70 PERSONAL SUPPORT NETWORKS AS MODERATORS IN DYADIC ..
of different preference orders, which largely determine to whom a person would turn in the case of an urgent need for help or a problem. In essence, this model states that preference for certain supporters depends primarily on the nature of the relationship, but is largely independent of the type of support provided. In general, relatives – especially partners and children – would be regarded as the most appropriate supporters in the individual value system, followed by extra-familial relationships such as friends and, most recently, formal organisations or professional supporters. Thus, in this study, the targeted selection of the support networks was based on the theoretical significance of Cantor (1979) and was categorised in “work colleagues”, “family” and “friends”. The networks were precisely defined in the first paragraph and evaluated by the individual based on a questionnaire.
The hypotheses below were tested by correlation analysis, a linear regression and a moderator analysis. The sample is adequate with N=132, but not representative. Greater test strength and results that are more valid could be achieved with a larger number of participants. It is also unclear whether the results in other industries and job-profiles are comparable to those obtained in this research.
SOCIAL SUPPORT NETWORKS
According to Jansen (1999), social networks can generally be defined as a set of nodes “[...] connected by a set of relations.” Actors, represented by nodes, are therefore connected by relationships (edges) between them. Edges represent the relationship of the nodes to each other. The relationship between two nodes can be, for example, a personal knowledge, a kinship, a friendship or a formal relationship.11 As already mentioned, a social network can be understood as a kind of matrix that is responsible for the distribution of social support. To an extent, social networks are structural prerequisites for receiving social support.12 The characteristics of formal and informal networks are describing the involvement of an individual in structurally and content wise different network structures with different actors.13
However, this equates the (general) concept of a network with functions of social relationships – in particular with social support in the sense of support resources and support networks. One variant of this form of use, which can also
11 Jansen, D. (1999). Einführung in die Netzwerkanalyse: Grundlagen, Methoden, Anwendungen. Opla-den: Leske und Budrich, p. 53. Siehe diesbezüglich auch Keupp, H. (1987). Soziale Netzwerke. Eine Metapher des gesellschaftlichen Umbruchs? In: Röhrle, B. & Keupp, H.: Soziale Netzwerke. Frankfurt: Campus, p. 12: “Menschen werden als Knoten dargestellt, von denen Verbindungsbänder zu anderen Menschen laufen, die wiederum als Knoten symbolisiert werden.”
12 Berkman, L, & Glass, T. (2000). Social Integration, Social Networks, Social Support, and Health. In: Kawachi, I. (Ed.) (2000): Social Epidemiology. Oxford: University Press, pp. 137–173.
13 Ibarra, H. (1993). Personal Networks of Women and Minorities in Management: A Conceptual Frame-work. The Acadamy of Management Review, p. 58.

Frank W. Hager, Norbert G. Brink 71
be problematised, assumes a theoretically and conceptually broader definition of the term as a personal or egocentric network and operationalises it via the concept of social support. From an empirical point of view, this form of use leads to the same restriction as a functional definition of the term.14 As can easily be seen, the definition of (personal) support networks is problematic. For this investigation, therefore, a separate derivation and definition of the term must take place. In this article, a social support network is understood as a specific section and subset of the personal network (generally defined as the private web of social relationships), from which an individual has received one or more forms of social support – or, if their subjective assessment is taken as a basis – believes to receive it when needed. In general, according to Röhrle (1987), in this context, one could also apply the terms of sectors or zones since support networks are normatively defined subunits of networks and/or personal networks.15 There are two reasons for this differentiation: On the one hand, personal social networks contain not insignificant parts of “neutral” relationships, that do not provide any kind of support. It is also argued by Lairaiter (2008) that a social network does not only consist of supporting individuals.
If search strategies are used as a survey criterion, only about one-third to one-half of the members of a personal network is perceived as supportive or designated as such. Accordingly, personal networks include not only supportive, but also indifferent, non-supporting, as well as stressful and conflictual relationships.16 Petzold & Märtens (2013) also concluded that personal networks should not be valued exclusively positive and as a component of personal resources. It should also be considered that social relationships and thus egocentric networks are multifunctional. This additionally prohibits equating them with a function (e.g. social support).17 Consequently, the term support network must be clearly distinguished from a general (personal) social network term in the further course of this work.
The definition of support networks used for this research and their composition is extremely important, because the quantification of relevant investigation characteristics in the design of the questionnaire and its evaluation is aimed at ensuring the comparability of the data and making the statistical evaluation procedures accessible with regard to possible comparisons and dependencies.
14 Lairaiter, A.-R. (2008). Soziales Netzwerk in der Psychologie. Forum Gemeindepsychologie, 13(1), München: Deutsches Jugendinstitut. URL: http://www.gemeindepsychologie.de/fg-1-2008_06.html Last accessed: 18.03.2019.
15 Röhrle, B. (1987). Soziale Netzwerke und soziale Unterstützung. Befunde und Rezeptionsvarianten eines “neuen“ Konzepts in der Psychologie. Heidelberg: Universität, Psychologisches Institut, p. 21.
16 Lairaiter, A.-R. (2008). Soziales Netzwerk in der Psychologie. Forum Gemeindepsychologie, 13(1), München: Deutsches Jugendinstitut. URL: http://www.gemeindepsychologie.de/fg-1-2008_06.html.
17 Petzold, H., & Märtens, M. (2013). Wege zu effektiven Psychotherapien. Wiesbaden: Springer VS, p. 19 & 198, bezugnehmend auf Wellman, B. (1982). Studying Personal Communities. In: Marsden, P. V., & Lin, N. (Eds.), Social Structure and Network Analysis, Beverly Hills: Sage, p. 79.

72 PERSONAL SUPPORT NETWORKS AS MODERATORS IN DYADIC ..
The classification and definition of the support networks for this study will be carried out below.
Colleagues are support sources with a high degree of availability for employees. The support benefits depend on the quality of the relationship in the individual case.18 In a team, a department, etc. different characters meet, who have to work together daily. As a result, there are different relationships between individual colleagues or characters. Henderson & Argyle (1985) distinguish four different types of working relationships: [1] rather intimate, [2] positive but superficial, [3] indifferent (neutral) and [4] negative.19 As already mentioned, due to the empirical research design and considering the higher sample size, not all network characteristics could be systematically and individually collected for each individual employee. The interviewees themselves determined how their colleagues or network members should be classified in the respective specified support network and regarding the quality of their relationships. The authors assume that colleagues who see themselves on a daily basis and also talk about private matters (and not just about professional matters) “know each other well” (network-density). This study focuses on the close and trusted relationships according to Henderson & Argyle (1985) since they are most relevant for the quality of a support network (a measure of relationship strength). In the introduction (instruction) of the respective question battery, the strength of the relationship between the network members was explicitly asked. The instructions for the question battery support network “colleagues” are as follows:
“In the following, your work colleagues are in focus. If there are trusted people in your organisation with whom you maintain a close, trusting relationship and receive social support through them, how would you rate the quality of this support network? Please answer the following questions.”
After relationships based on partnership, the family has the greatest supportive importance.20 By their nature, family relationships are permanent, which is essential, both for the willingness to provide help and for their acceptance and success. Lack of reciprocity has less of an impact on the current relationship design, as it can be restored in the long term because there is a perception that some other person in the relationship system has already made comparable inputs for oneself in the past or one can expect it in the future if needed. 21
18 Haß, W. (2002). Soziale Unterstützungsnetzwerke von Menschen mit chronischer Polyarthritis – Eine explorative, netzwerkanalytische Studie. Dissertation. Köln: Wirtschafts- und Sozialwissenschaftlichen Fakultät, Universität Köln, p. 53. URL: https://kups.ub.uni-koeln.de/683/1/11v4582.pdf.
19 Henderson, M. & Argyle, M. (1985). Social support by four categories of work colleagues: Relationship between activities, stress and satisfaction. Journal of Occupational Behavior, 6, pp. 229–239.
20 Diewald, M. (1990). loc. cit., p. 107.21 Ibid., p. 108.

Frank W. Hager, Norbert G. Brink 73
After the partnership, parents and children occupy the most important position in this ranking, followed by siblings and finally other relatives. Diewald (1990) speaks of a “hierarchical structure concerning normative solidarity obligations.” Overall, regular interactions and shared life experiences also shape the individual significance of individual kinships (also beyond the family’s core) and can further enhance the perceived quality of support. In this study, “family” is to be understood as the core that comprises a few selected relatives of both parents (bilaterally). The support network is part of the social system “entire family” and consists only of preferred relatives with whom the person actively maintains relationships, is in close contact and receives social support. Because a person’s support network involves both, some family members of the mother and the father (patrilateral and matrilateral), not all members of the person’s support network are related to all others, but all are closely or remotely related to the person. For this investigation, it is irrelevant whether members of the person’s support network live in different places, meet regularly, or whether the support network is composed of one or both lineage groups. 22 The question battery “family” was introduced as follows:
“Please think now of your close family circle and of those family members with whom you maintain close, trusting relationships and receive social support through them. How would you rate the quality of this support network? Please answer the following questions.”
According to Diewald (1990), friendships are “[...] primarily important for sociability, for conveying recognition and appreciation, for acquiring new competencies and orientations, for conveying norms and information, as well as for motivational support.” They are not as strongly characterised by rules and obligations as relationships within a family, but they are characterised by a freedom of design. This means that they must be maintained or renewed in a permanent process.23 Friendships protect against the feeling of isolation,24 they strengthen self-esteem25 and convey the feeling of being personally accepted26, especially because friendships, unlike kinships, arise through free election, and their very
22 The lineage group consists only of the close blood relatives of the mother or the father and forms an ef-fective social unit.
23 Haß, W. (2002). Soziale Unterstützungsnetzwerke von Menschen mit chronischer Polyarthritis – Eine explorative, netzwerkanalytische Studie. Dissertation. Köln: Wirtschafts- und Sozialwissenschaftlichen Fakultät, Universität Köln, p. 52 referring to Beck, Ulrich (1986): Die Risikogesellschaft. Auf dem Weg in eine andere Moderne. Frankfurt: Suhrkamp.
24 Laursen, B., Bukowski, W. M., Aunola, K. and Nurmi, J. (2007). Friendship Moderates Prospective As-sociations Between Social Isolation and Adjustment Problems in Young Children. Child Development, 78, pp. 1395–1404.
25 Keefe, K., & Berndt, T. J. (1996). Relations of Friendship Quality to Self-Esteem in Early Adolescence. The Journal of Early Adolescence, 16(1), pp. 110–129.
26 Bishop, J. A., & Inderbitzen, H. M. (1995). Peer Acceptance and Friendship: An Investigation of their Relation to Self-Esteem. The Journal of Early Adolescence, 15(4), pp. 476–489.

74 PERSONAL SUPPORT NETWORKS AS MODERATORS IN DYADIC ..
existence thus enables the individual to feel socially attractive.27 On the one hand, friendships are much more sensitive to asymmetries in interactions (e.g. social recognition). Support from them is more strongly linked to the principle of reciprocity than from families. On the other hand, friends are more likely than relatives to contribute to life satisfaction. In addition, they have proven to be particularly important for emotional support and leisure activities. They are often consulted as trusted persons in life decisions. Accordingly, it was found empirically that friends are obviously preferred to relatives. And while the former tends to refer more to professionals, relatives seem to offer more lay solutions.28 The instruction of the question battery ”friends” within the questionnaire was initiated as follows:
“Now focus on your close friends with whom you maintain close, trusting contacts and receive social support through them. How would you rate the quality of this support network? Please answer the following questions.”
HYPOTHESES
[1] There are significant correlations between the SF-36 (physical and mental health dimensions) and Perceived Supervisor Support. The personal support-networks [2] “colleagues”, [3] “family and [4] “friends” will moderate this relationship. [5] The health-promoting effect of support networks from the primary environment can be rated higher than that of support networks in the secondary environment due to their emotional proximity to the network members.
METHODOLOGY
A cross-sectional survey design has been used to determine the desired research results. The data has been collected by the recruitment of employees in different German industries and branches, online on XING-Network29. The online survey has been conducted via the platform “SoScisurvey”30. The participants received no incentives.
To measure Perceived Supervisory Support, the SPSS scale (Kottke & Sharafinski, 1988) has been used.31 The SPSS scale is based on the Perceived
27 Rapsch, A. (2004). Soziologie der Freundschaft: Historische und gesellschaftliche Bedeutung von Ho-mer bis heute. Stuttgart: Ibidem, p. 110.
28 Haß, W. (2002). loc. cit., p. 52.29 https://www.xing.com/30 https://www.soscisurvey.de/31 Kottke, J. L., & Sharafinski, C. (1988). Measuring perceived supervisory and Organizational Support.
Educational and Psychological Measurement, 48, pp. 1075–1079.

Frank W. Hager, Norbert G. Brink 75
Organizational Support Survey by Eisenberger et al. (1986)32 – with one difference – all items refer to the supervisor, not to the organisation as a global entity. Given that the definitions of Perceived Organisational Support and Perceived Supervisory Support are practically identical in nature, their measure-ments have been adapted to accommodate these similarities. The SPSS consists of 16 items with a 7-point Likert scale anchored from “strongly disagree (1) to “strongly agree” (7). Example items include: “My supervisor really cares about my well-being.” “My supervisor is willing to help me when I need a special favour.” “My supervisor tries to make my job as interesting as possible.” The items “If my supervisor could hire someone to replace me at a lower salary, he/she would do so.” and “If given the opportunity, my supervisor would take advantage of me.” must be reversed during summation of the total values. Higher scores indicate that participants perceived their supervisors to be more supportive. Cronbach’s alpha in the present study was measured at .912.
The EVOS-scale can be used to assess of relationship quality and collective effectiveness in multi-person systems. The EVOS has two subscales, consisting of four and five items. There is also a final consensus item. Example of subscale “quality of relationship”: “For me, the way we talk to each other, is…“. Examples of subscale “collective efficacy”: “For me, the way we decide what needs to be done, is…”. Members of the social system answer the questionnaire with help of a 4-point rating scale. The format is ranging from “very poor” (0) to “very good” (3). The answers of the consensus item “I think we will give similar answers to this questions” range from “strongly disagree” to “strongly agree”. The consensus item is not an integral part of the scale and may be left out (as in this study). The answers to the items of the two subscales are added (without consensus item) to a total score [8], [14]. Cronbach’s alphas for the subscales in the present study were measured at ,811 for quality of relationship, and ,829 for collective efficacy.
The SF-36 (v.1.0) is a general health questionnaire that consists of 36 questions. It allows statements about the individual’s state of health by means of 8 different dimensions. It makes statements about: [1] general health perceptions – 5 questions, [2] physical functioning – 10 questions, [3] role limitations due to physical health problems – 4 questions, [4] bodily pain – 2 questions, [5] energy/fatigue – 4 questions, [6] emotional well-being – 5 questions, [7] role limitations due to personal or emotional problems – 3 questions, [8] Social functioning – 2 questions. For the evaluation of the SF-36 Questionnaire v1.0, all answers are first recoded into predetermined points using a recoding table. The average score of all questions of the respective health dimension is then calculated so that 8 average scores are obtained for the 8 dimensions. These 8 scores describe the patient’s state of health in their respective dimensions, which can be assessed using comparison tables. The possible score ranges from 0 to 100 points. 0 points represent the greatest possible restriction of health, while
32 Eisenberger, R., Huntington, R., Hutchinson, S., & Sowa, D. (1986). Perceived organizational Support. Journal of Applied Psychology, 71, pp. 500–507.

76 PERSONAL SUPPORT NETWORKS AS MODERATORS IN DYADIC ..
100 points represent the absence of health restrictions. In this study the internal consistency (Cronbach’s α) for the scale physical functioning was .831, the role limitations due to physical health problems .814, the scale bodily pain .843, the scale general health perceptions .804, the scale energy/fatigue. 817, the scale social functioning .867, the scale role limitations due to personal or emotional problems .910 and the scale mental well-being .881.
RESULTS
The sample represents a subset of the population of all employees in middle management in Germany. It was necessary to exclude 3 individuals from the sample, 2 (0.3%) for error in the age record and 1 (0.1%) for not responding more than 50% of the SF-36 items, totalling 132 participants with data available for analysis. The age of the participants ranges from 20 to 59 years (M = 37.12, SD = 13.34). The authors found no normal distribution for the age of the interviewees, as the specified significance limit for this study falls far short of p < .050. 67 participants (50.76%) are male and 65 females (49,24%). Table 1 presents the results from the correlation analysis between Perceived Supervisor Support and the eight SF-36 health dimensions.
Table 1Pearson Correlation (Perceived Supervisor Support and the eight SF36 health dimensions)
perceived supervisor support
physical functioning .012
bodily pain -.023
role limitations due to physical health problems .034*
role limitations due to personal or emotional problems -.234**
emotional well-being .312**
social functioning .101
energy/fatigue .344**
general health perceptions .074*
** Correlation is significant at the 0.01 level (2-tailed) * Correlation is significant at the 0.05 level (2-tailed)
Since the correlation analysis shows no significant interactions worth mentioning in all SF-36 physical and mental health dimensions and Perceived Supervisor Support, the first hypothesis is rejected. Accordingly, no correlation could be measured between the individual health dimensions of the SF-36 questionnaire (physical functioning, bodily pain, role limitations due to

Frank W. Hager, Norbert G. Brink 77
physical health problems, social functioning and general health perceptions) and perceived supervisor support. Significant correlations were found in the factors “role limitations due to personal or emotional problems”, “emotional well-being” and “energy/fatigue.”
Table 2 shows the results of the Pearson correlation between EVOS dimensions “quality of relationship”/“collective efficacy” and the eight SF-36 health dimensions for all participants.
Table 2Pearson Correlation (EVOS dimensions “quality of relationship”/“collective efficacy” and the eight SF36 health dimensions)
quality of relationship“colleagues”
collective efficacy
“colleagues”
quality of relationship
“family”
collective efficacy“family”
quality of relationship
“friends”
collective efficacy
“friends”physical functioning .058 -.012 .056 .034 .011 .022
bodily pain .011 .053* -.013 .110* -.027 .080
role limitations due to physical health problems
-.045 .045 -.049 .091* .015 -.024
role limitations due to personal or emotional problems
-.310* -.189* -.216* -.272** -.124* -.156*
emotional well-being .332** .328** .220* .189** .199** .189*
social functioning -.027 .043 .102* .067 -.021 .043
energy/fatigue .324** .302** .156** .201** -.057 .110
general health perceptions .121* .081* -.021 .114 .037 -.019
** Correlation is significant at the 0.01 level (2-tailed) * Correlation is significant at the 0.05 level (2-tailed)
The hypothesis that the health-promoting effect of support networks from the primary environment can be rated higher than that of support networks in the secondary environment due to their emotional proximity to the network members was rejected. There are no significant correlations between SF-36 dimensions and the support networks “friends” and “family”. There are only
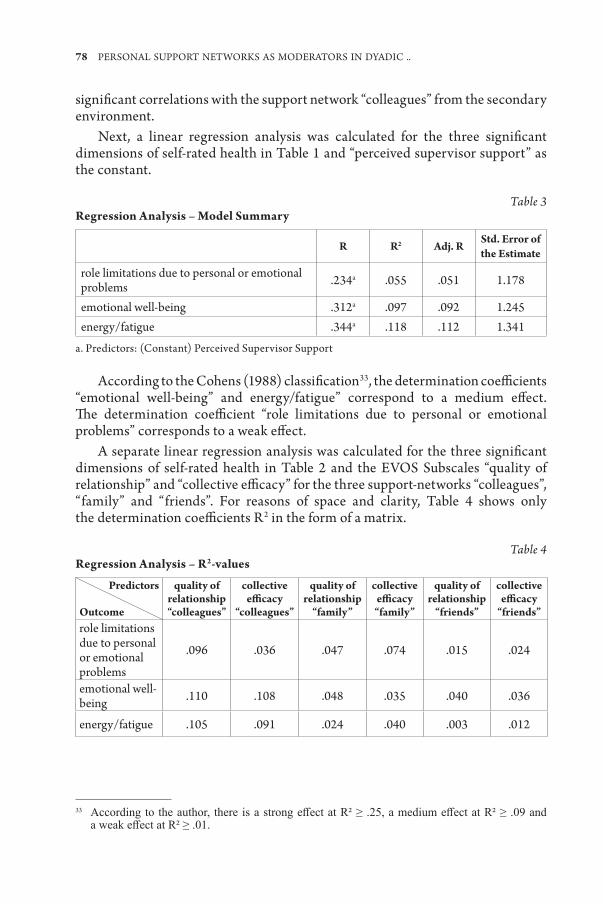
78 PERSONAL SUPPORT NETWORKS AS MODERATORS IN DYADIC ..
significant correlations with the support network “colleagues” from the secondary environment.
Next, a linear regression analysis was calculated for the three significant dimensions of self-rated health in Table 1 and “perceived supervisor support” as the constant.
Table 3Regression Analysis – Model Summary
R R2 Adj. RStd. Error of the Estimate
role limitations due to personal or emotional problems .234a .055 .051 1.178
emotional well-being .312a .097 .092 1.245energy/fatigue .344a .118 .112 1.341
a. Predictors: (Constant) Perceived Supervisor Support
According to the Cohens (1988) classification33, the determination coefficients “emotional well-being” and energy/fatigue” correspond to a medium effect. The determination coefficient “role limitations due to personal or emotional problems” corresponds to a weak effect.
A separate linear regression analysis was calculated for the three significant dimensions of self-rated health in Table 2 and the EVOS Subscales “quality of relationship” and “collective efficacy” for the three support-networks “colleagues”, “family” and “friends”. For reasons of space and clarity, Table 4 shows only the determination coefficients R2 in the form of a matrix.
Table 4Regression Analysis – R2values
Predictors
Outcome
quality of relationship“colleagues”
collective efficacy
“colleagues”
quality of relationship
“family”
collective efficacy“family”
quality of relationship
“friends”
collective efficacy
“friends”role limitations due to personal or emotional problems
.096 .036 .047 .074 .015 .024
emotional well-being .110 .108 .048 .035 .040 .036
energy/fatigue .105 .091 .024 .040 .003 .012
33 According to the author, there is a strong effect at R² ≥ .25, a medium effect at R² ≥ .09 and a weak effect at R² ≥ .01.

Frank W. Hager, Norbert G. Brink 79
In the regression analysis (Table 4), a medium-strong effect was determined for the support network “colleagues” in its two EVOS dimensions “quality of relationship” and “collective efficacy” for the outcome variables “emotional well-being” and “energy/fatigue”. The same applies to the EVOS dimension “quality of relationship” for the outcome variable “role limitations due to personal or emotional problems”. For the EVOS dimensions of the other two support networks “family” and “friends”, only a weak effect could be determined for the outcome variables.
According to ANOVA, the regression of the models makes a statistically significant prediction (Sig. .000 ≤ .050). Finally, surprisingly no significant effects of the SF-36 dimensions were associated with gender. Emotional well-being was positively associated with job tenure (β = .192; p < .05).
Quality of supportnetwork:M1: Collective efficacy “colleagues”
M2: Quality of relationship “colleagues”
Perceived supervisor support
Selfreported Health:OC1: Role limitations due to physical
health problemsOC2: Emotional well-being
OC3: Energy/fatigue
Figure 1. Model of the moderator analysis. M = Moderator variable, OC = Outcome variable
Source: author’s construction
The prerequisite for the moderator analysis, the normal distribution of the dependent variable and the moderator variable, is given. The previous correlation analysis in Table 1 shows, that perceived supervisory support has a significant influence in the SF-36 factors “role limitations due to personal or emotional problems”, “emotional well-being” and “energy/fatigue”
A moderator analysis (Table 5) should check the role of the Support Networks “quality of relationship “colleagues” and collective efficacy “colleagues” as a possible moderator between Perceived Supervisor Support and SF-36s’ significant three dimensions (Table 1). The reason for choosing Support Network “colleagues” is the R² ≥ .09 according to Cohens (1988) classification. All weak predictors have been dropped.
This indirect effect was tested for significance using the bootstrapping procedures outlined by Hayes (2018). Bootstrapping uses random sampling with replacement to increase accuracy in sampling estimates. The PROCESS macro,

80 PERSONAL SUPPORT NETWORKS AS MODERATORS IN DYADIC ..
model 4, was used to test the model. This analysis used 5,000 bootstrap samples created from the original sample to estimate bias-corrected standard errors and 95% confidence intervals for the indirect effect of perceived supervisor support on health outcomes via support networks (Table 5).
Table 5Results of the Moderator Analysis
quality of relationship“Colleagues”
collective efficacy“Colleagues”
Relationship: perceived supervisor support on role limitations due to personal or emotional problems
-.551/1.045 p < .037 -.341/1.645 p < .057
Relationship: Perceived supervisor support on emotional well-being -1.359/-.459 p < .001 -1.211/-.261 p < .001
Relationship: perceived supervisor support on energy/fatigue -1.113/-.879 p < .001 -1.659/-.255 p < .001
As described by Hayes (2018) indirect effects are considered significant at p < .050 if zero is not included in the 95% confidence interval.34 The results in Table 5 show a moderating effect of the EVOS dimensions “quality of relation-ship” and “collective efficacy” of the support network “colleagues” on both SF-36 dimensions “emotional well-being” and “energy/fatigue”. Hypotheses 3 and 4 are rejected.
DISCUSSION
The present study aimed at finding out in a first step, whether there are significant correlations between Perceived Supervisor Support and Self-rated psychological and physical health. The hypothesis that all eight dimensions of the SF-36 questionnaire correlate significantly with Perceived Supervisor Support had to be rejected. For better clarity and understanding, these eight subcategories could have been combined into a physical (PCS = physical component summary) and a mental (MCS = mental component summary) summation scale. However, this approach was deliberately omitted, since from the author’s point of view “energy/fatigue” and “general health perceptions”, as well as “social functioning” cannot be assigned one hundred percent to both sum scales, and thus there would be a danger of generating fewer meaningful mixed categories. As the results show, this distinction was rightly made, since the individual correlations “role limitations due to personal or emotional problems”, “emotional well-being” and “energy/fatigue” with the dependent variable “perceived supervisor support” are
34 Hayes, A. F. (2018). Partial, conditional, and moderated mediation: Quantification, Inference, and In-terpretation. Communication Monographs, 85. London: Taylor & Francis, pp. 4–40.

Frank W. Hager, Norbert G. Brink 81
stronger than the respective correlations with the two mixed categories and thus details could be better worked out.
Following the ICD classification system35 and focusing on the research results for the diagnosis of burnout syndrome since the mid-1970s, then the most important validated test procedures show which symptoms are used to operationalise the burnout syndrome today. These symptoms have intersections with the three previously mentioned individual dimensions of SF-36. Maslach (1982) describes the burnout syndrome based on criteria, such as “emotional exhaustion” “depersonalisation“ and “professional efficacy”. Emotional ex haus-tion results from excessive emotional or physical effort (tension). It is the stress dimension of burnout syndrome. Those affected feel weak, powerless, tired and dull. They suffer from weakness of drive and are easily irritable.36 A study by Fradelos et al. (2014) confirms these connections: “The “Emotional Exhaustion” subscale of the Maslach Burnout Inventory (MBI) appears to be strongly and negatively correlated with the “Energy/Fatigue” (R = –0.658, p = 0.000) and “Emotional Well-Being” (R = –0.675, p = 0.000).”37 With the reaction of the depersonalisation, the concerned individual establishes a distance between him or herself and his or her clients (patients, pupils, persons in need of care, customers, etc.). This manifests itself in an increasing indifference and sometimes cynical attitude towards them. The work becomes an impersonal routine. Again, Fradelos et al. (2014) found a correlation between the subscale of the MBI “Depersonalization” with “Emotional Well-being” (R = –0.543, p = 0.000) and “Energy/Fatigue” (R = –0.462, p = 0.000).38 It becomes clear that the SF-36 dimensions “Emotional Well-Being” and “Energy/Fatigue” reflect this burnout (stress) dimension (partially) and are also predicted by Perceived Supervisor Support (Table 3).
This makes it clear how strongly professional life is shaped by the demands of employees are faced with on a daily basis and which are of importance to them – demands made on employees from outside or which they make on themselves. As long as employees judge their external and personal resources to be sufficient for meeting these requirements, they perceive them positively as challenges. If they judge their resources (including the support of superiors) to be insufficient to cope satisfactorily with the requirements, stress arises. In this study, everything indicates that mental health was initially affected by stress caused by poor support from the supervisor, which could lead to burnout symptoms. “Role Limitations due to personal or emotional Problems” is another value that correlates significantly with “perceived supervisor support” (Table 1).
35 The ICD is the global health information standard for mortality and morbidity statistics.36 Maslach, C. (1982). Burnout: The Cost of Caring. Englewood Cliffs: Prentice Hall.37 Fradelos, E., Tzitzikos, G., Giannouli, V., Argyrou, P., Vassilopoulou, C., & Theofilou, P. (2014). Assess-
ment of Burn-Out and Quality of Life in Nursing Professionals: The Contribution of Perceived Social Support. Progress in Health Sciences, 4(1), p. 107.
38 Fradelos, E., Tzitzikos, G., Giannouli, V., Argyrou, P., Vassilopoulou, C., & Theofilou, P. (2014). loc. cit., p. 107.

82 PERSONAL SUPPORT NETWORKS AS MODERATORS IN DYADIC ..
This factor of SF-36 indicates the extent to which emotional problems affect work or other daily activities. It is only a weakly correlating value. While the regression analysis shows, that “Perceived Supervisor Support” is a significant predictor of “Role Limitations due to personal or emotional Problems”, the strength of the regression coefficient is weak (R2 = .055, p = 0.01). The results underline the importance of social support as a relief and protection factor with direct effect (main-effect hypothesis) on the stress perception of employees.
Basically this finding is not a novelty, because assumptions on the effect of social support are typically closely linked to models of stress development and stress management. The evaluation of a situation as acceptable, irrelevant or potentially negative depends on the individually available resistance resources, which include the available social resources. In addition, the mobilization of social support is also part of the adaptive stress management strategies.39
In a further step it was examined, whether the quality of social support networks – both in “personal” spheres (family, relatives & friends) and in “organisational” spheres (colleagues) – influences the relationship between “perceived supervisor support” and the SF-36 dimensions “Emotional well-being”, “energy/fatigue” and “role limitations due to personal or emotional problems” At this point, it is interesting to note that the EVOS subscales Quality of Relationship “Colleagues” and collective efficacy “colleagues” has the strongest and significant correlations and proved to be significant predictors, with the SF-36 dimensions “Emotional Well-Being” und “energy/fatigue”. This suggests that preferably colleagues have an influence on the mental health of an employee. In this context, the emotional closeness to the respective supporter40 or to the members of the support network may play a less important role than the same understanding of the supporter for the deficient work situation.
The results of the moderator analysis show that poor supervisor support can be better handled, to some extent, by employees, if they develop or maintain good quality work relationships and a sense of cohesion. A community that holds together and maintains a trusting team climate, thus can (partially) compensate this leader deficit. The same is for the team efficiency: Effective teams are convinced that they will succeed. This, in turn, motivates them to work harder. Small successes increase self-confidence and motivate the team to improve their technical and interpersonal skills through training. The higher these skills become, the greater the self-confidence and the ability to confirm the trust. If this condition is prevalent in the group, the team is able to compensate for poor
39 Hager, F. W., & Seibt, T. (2018). Team Relationship Quality – A Moderator between Supervisor Sup-port and perceived Stress. Proceedings of the 10th CER Comparative Research Conference – Interna-tional Scientific Conference for PhD Students of EU Countries, 10(2), London: Sciemcee Publishing, p. 15.
40 It cannot be assumed that every collegial relationship is a close friendship at the same time.

Frank W. Hager, Norbert G. Brink 83
supervisory support (for a limited time). For executives, therefore, team efficacy should be seen as an important factor that has to be changed for the better.41
CONCLUSION
A supervisor cannot always prevent stressful phases. However, he or she can prevent stressful situations by increasing self-efficacy and team (relationship) quality. The more the individual team members are aware of their self-efficacy, the more the group benefits – and the team can function well even in stressful times where the supervisor is limited or unavailable. Executives are therefore obliged to support team members identifying their responsibilities in day-to-day business and to increase their self-confidence in order to be more optimistic and self-confident in their future tasks and challenges. It is necessary that employees‘ achievements, as well as learning experiences, are reflected and tools for influencing the environment, as well as the distancing are made tangible. In the context of team development processes, the effects of action and behaviour on colleagues can be identified to create an improved team climate.42 Another goal of supervisors is the continuous improvement of the cohesion and relationship quality within their team. Communication should be meaningful and demanding. This aim includes the necessity that team members trust each other enough to exchange suggestions and to express ideas on their own. Strong communication within the team is a prerequisite, without it, the potential a team could achieve under other circumstances would suffer. Not only the potential, but as this study shows, also employee’s health is suffering from a lack of relationship quality among colleagues. Even if this is not necessarily the focus of teambuilding measures: Emotions are of great importance for the development of mental strength and interpersonal relationships – and thus for the health of the company’s social capital. Hence, supervisors should invest more time in expanding their (emotional) support skills in promoting the emotional attachment among teammates, enhancing climate and cohesion among their subordinates.
REFERENCESAdams, J., Claus, A., Claus, M. et al. (2018). Soziale Unterstützung und Arbeitszu-
frieden heit – Unterschiede zwischen verschiedenen Tätigkeitsbereichen. Präventive Gesundheitsförderung, 13, pp. 18–23.
Berkman, L, & Glass, T. (2000). Social Integration, Social Networks, Social Support, and Health. In: Kawachi, I. (Ed.) (2000). Social Epidemiology. Oxford: University Press, pp. 137–173.
Bierhoff, H.-W. (2006). Sozialpsychologie. Stuttgart: Kohlhammer.
41 Hager, F. W., & Seibt, T. (2018). loc. cit., p. 16.42 Ibid.

84 PERSONAL SUPPORT NETWORKS AS MODERATORS IN DYADIC ..
Bishop, J. A., & Inderbitzen, H. M. (1995). Peer Acceptance and Friendship: An Investigation of their Relation to Self-Esteem. The Journal of Early Adolescence, 15(4), Beverly Hills: Sage, pp. 476–489.
Cohen, J. (1988). Statistical Power Analysis for the Behavioral Sciences. New York: Erlbaum.
Diewald, M. (1990). Soziale Beziehungen – Verlust oder Liberalisierung? Soziale Unterstützung in informellen Netz-werken. Berlin: Edition Sigma, pp. 102–105.
Fradelos, E., Tzitzikos, G., Giannouli, V., Argyrou, P., Vassilopoulou, C., & Theofilou, P. (2014). Assessment of Burn-Out and Quality of Life in Nursing Professionals: The Contribution of Perceived Social Support. Progress in Health Sciences, 4(1), pp. 102–109.
Hager, F. W., & Seibt, T. (2018). Team Relationhip Quality – A Moderator between Supervisor Support and perceived Stress. Proceedings of the 10th CER Comperative Research Conference – International Scientific Conference for PhD Students of EU Countries, 10(2), pp. 12–16, London: Sciemcee Publishing.
Haß, W. (2002). Soziale Unterstützungsnetzwerke von Menschen mit chronischer Polyarthritis – Eine explorative, netz-werkanalytische Studie. Dissertation. Köln: Wirtschafts- und Sozialwissenschaftlichen Fakultät, Universität Köln, URL: https://kups.ub.uni-koeln.de/683/1 /11v4582.pdf.
Hayes, A. F. (2018). Partial, conditional, and moderated moderated mediation: Quantification, inference, and interpretation. Communication Monographs, 85. London: Taylor & Francis, pp. 4–40.
Henderson, M. & Argyle, M. (1985). Social support by four categories of work colleagues: Rela-tionship between activities, stress and satisfaction. Journal of Occupational Behavior, 6, pp. 229–239.
Ibarra, H. (1993). Personal Networks of Women and Minorities in Management: A Conceptual Framework. The Acada-my of Management Review, pp. 56–87.
Jansen, D. (1999). Einführung in die Netzwerkanalyse: Grundlagen, Methoden, Anwendungen. Opladen: Leske und Budrich.
Keefe, K., & Berndt, T. J. (1996). Relations of Friendship Quality to Self-Esteem in Early Adolescence. The Journal of Early Adolescence, 16(1), Beverly Hills: Sage, pp. 110–129.
Keupp, H. (1987). Soziale Netzwerke. Eine Metapher des gesellschaftlichen Umbruchs? In: Röhrle, B., & Keupp, H.: Soziale Netzwerke. Frankfurt: Campus.
Kienle R., Knoll N., & Renneberg B. (2006). Soziale Ressourcen und Gesundheit: Soziale Unterstützung und dyadisches Bewältigen. In: Renneberg, B., Hammelstein, P. (Eds) Gesundheitspsychologie. Berlin, Heidelberg: Springer, pp. 107–117.
Lairaiter, A.-R. (2008). Soziales Netzwerk in der Psychologie. Forum Gemeinde-psychologie, 13(1), München: Deutsches Jugendinstitut. URL: http://www.gemeindepsychologie.de/fg-1-2008_06.html. Last accessed: 18.03.2019.
Laursen, B., Bukowski, W. M., Aunola, K., and Nurmi, J. (2007). Friendship Moderates Prospective Associations Between Social Isolation and Adjustment Problems in Young Children. Child Development, 78(4), Chichester: Wiley, pp. 1395–1404.
Leiter, M., & Maslach, C. (1988). The impact of interpersonal environment on burnout and organizational commitment. Journal of Organizational Behavior, 9, pp. 297–308.
Lewicka, D., Glinska-Newes, A., Morrow, D. L., & Gorka, J. (2018). The effect of job characteristics on employee loyalty: the mediation role of vertical trust and

Frank W. Hager, Norbert G. Brink 85
perceived supervisor support. Marketing and Management of Innovations, 2, pp. 168–185.
Maslach, C. (1982). Burnout: The Cost of Caring. Englewood Cliffs: Prentice Hall.Maslach, C., & Leiter, M. P. (2007). Burnout – Definition and Assessment –
A Mediation Model of Burnout and Engagement Implications for Interventions. Fink, G. (Ed.) Encyclopedia of Stress. Amsterdam: Elsevier, pp. 368–371.
Petzold, H., & Märtens, M. (2013). Wege zu effektiven Psychotherapien. Wiesbaden: Springer VS.
Rapsch, A. (2004). Soziologie der Freundschaft: Historische und gesellschaftliche Bedeutung von Homer bis heute. Stuttgart: Ibidem.
Rousseau, V., & Aubé, C. (2010). Social Support at Work and Affective Commitment to the Organization: The Moderating Effect of Job Resource Adequacy and Ambient Conditions, The Journal of Social Psychology, 150(4), pp. 321–340.
Röhrle, B. (1987). Soziale Netzwerke und soziale Unterstützung. Befunde und Rezeptionsvarianten eines neuen Konzepts in der Psychologie. Heidelberg: Universität Heidelberg, Psychologisches Institut.
Rudow (2014). Die gesunde Arbeit. Berlin: De Gruyter.Stadler, P., Spieß, E. (2004). Mitarbeiterorientiertes Führen und soziale Unter-
stützung am Arbeitsplatz. Grundzüge und Beispiele eines Informations- und Handlungskonzepts. Bundesanstalt für Arbeitsschutz und Arbeitsmedizin, Dortmund.
Stummer, H. (2007). Entsolidarisierung von Führungsverhalten und mögliche Auswirkungen auf die Gesundheit.Industrielle Beziehungen. Zeitschrift für Arbeit, Organisation und Management, 14(3), pp. 270–278.
Wellman, B. (1982). Studying Personal Communities. In: Marsden, P. V., & Lin, N. (Eds.), Social Structure and Network Analysis, Beverly Hills: Sage.

FACTORS INFLUENCING THE BUYING BEHAVIOUR OF MILLENNIALS TOWARDS
INSURANCE PRODUCTS IN THE NIGERIAN INSURANCE MARKET
BAMGBOSE OLALEKAN SODIQ
Abstract
Investigating the factors affecting the purchase of insurance products and services among Millennials in Nigeria was the main purpose of the study. The study was guided by the following research objectives; exploring the methods millennials in Nigeria prefer in the accessing of insurance products and services; The assessment of the impact of the methods of promotion and messaging on the millennial population in Nigeria with regards to the uptake of insurance products and services and; to investigate the factors that influences the buying decision among the millennials in Nigeria; These where the major objectives of the study. It was ascertained that majority of the millennial age group in Nigeria, prefers to have a direct dealing with insurance company when buying insurance products and services. A further revelation shows that millennials, prefers the need of having insurance brokers/agents taking them through available options, regarding their choice of purchase. The study confirms that the prefer mode of information search among the millennial, is the television and radio with the social media following closely. With mobile payments confirmed as the most preferred modes of payment. The millennial prefers to purchase insurance products and services that was marketed on the social media and the internet, due to their preference of the internet over the traditional mainstream media. Mobile advertisements are becoming more popular among the Millennial population. With an increase in age and net income, direct dealing with insurance brokers and agents becomes more pronounced rather than peer referencing and the use of social media.
Keywords: Nigeria, Millennial. Millennial Population, Advertisement, Com-pet itive market, Messaging, Social Media
JEL code: D01, D12, D15, D19, D40
INTRODUCTION
Akinlo (2012), defines insurance as the process through which individuals known as insurers accept the financial risk of another individual known as the insured for consideration in the form of premiums paid. Haufler (2013), argued that for a sustainable economic growth, a developed insurance industry is an essential catalyst.
FACTORS INFLUENCING THE BUYING BEHAVIOUR OF MILLENNIALS TOWARDS ..
Bamgbose Olalekan Sodiq
Journal of Economics and Management Research. Vol. 9, 2020https://doi.org/10.22364/jemr.9.06

Bamgbose Olalekan Sodiq 87
Insurance has its origins among the Chinese and Babylonian traders in the 3rd and 2nd millennia BC, respectively. To ensure that they did not lose their goods should a ship capsize, Chinese merchants would redistribute the goods among many vessels to limit the loss. The early Babylonian sailing merchants on the other hand developed a system where on receiving a loan to fund a shipment, the merchant would pay the lender an additional sum in exchange for the lender’s guarantee to cancel the loan should the shipment be stolen or lost at sea (Vaughan, 1997).
Globally, the western European countries and the United states of America, dominate the world insurance markets (Global Fortune 500, 2015). In fact, 65% world’s insurance premium is accounted for among the Group of Seven (G7) countries (KPMG, 2014). Companies such as Berkshire Hathaway (Property/casualty insurance) of USA, AXA (Life/health Insurance) of France and Allianz (Property/casualty insurance) of Germany leading in first, second and third place respectively (Global Fortune 500, 2015). In Africa, South Africa, Morocco, Nigeria and Egypt are the leading countries in gross insurance premiums with penetration rates of 14.28%, 2.97%, 0.68% and 0.68% respectively (KPMG, 2014).
Nigeria’s insurance industry ranked fifth highest in Africa in terms of penetration after South Africa, Namibia, Kenya and Mauritius. The insurance industry in Nigeria consists of a number of players namely; 51 insurance companies (including foreign reinsurance companies’ operating liaison offices in Nigeria) and 4 reinsurance companies, 460 registered insurance brokers and about 15,000 insurance agents (NIA digest, 2019). The ratio of the total annual gross insurance premium underwritten in a given year to the Gross Domestic Product (GDP), measures the insurance penetration for Africa as 3% (A.I.O, 2019). This is relatively higher than the average emerging markets average of 2.65%, but much lower than the advanced market of 8.07% and a global average of 6.13% (Pricewaterhouse,2019). The uptake of insurance products in Nigeria is impacted by several factors. These include awareness, access, cost and complexity of the products. Additionally, buyer behaviour is influenced by socialisation, economic status, social status, age, gender, educational level and religion. When investigating the uptake of insurance products in the market in Nigeria, it is critical to reflect on the factors affecting the buying behaviour of certain age group towards insurance services.
Of interest to this study is the millennial age group generation, which includes those born between the year period of 1986 and 2000 (Strauss & Howe 2000). Of the total population of Nigeria, this cohort makes up about 42.54% of the population (National Bureau of Statistics, 2019).
As a result of the emerging technologies, the millennial has emerged as a new kind of consumer that is discerning, well informed and pressed for time. They are looking for real-time access, faster and easier ways of transacting, clarity in product information and ease of payment. Recent events in the world economy have resulted in a drop in consumerism, with potential customers holding on to

88 FACTORS INFLUENCING THE BUYING BEHAVIOUR OF MILLENNIALS TOWARDS ..
their money. They are now more careful with how they spend, have an increase propensity to shop around and negotiate deals (Parsons & McLaren, 2011).
As consumers seek more meaningful associations from products and services, they are moving away from wanting value for money to wanting value for time (Parsons & McLaren, 2011). Millennials are characterised by heavy digital media usage and a unique preference for smart phones. They are both experimental and experiential. They are quick to criticise and expect instant feedback. They are spending more time on the social spaces on the internet and increasingly, their work and play revolves around online platforms essentially; the internet is their first port of call for all things.
The millennial is global in nature and outlook. The market make-up is not only from different regions, nationalities and cultures, the product and service requirements have also taken a global character. The awareness to insurance among the millennial is now very much on the rise globally. The same options and standards of service is therefore expected from insurance providers (Ryan, 2014).
They exist in a time when consumer-driven marketing is increasingly im-portant as customers seize control of the process and actively “pull” information helpful to them. Consumer-driven marketing activities included Internet reviews and word-of-mouth recommendations from friends and family, as well as in-store interactions and recollections of past experiences (McKinsey, 2009).
A modification of the consumer decision making process has also had an effect on the millennials’ purchase behaviour. According to McKinsey (2009), the traditional decision making process of a consumer is depicted in funnel shaped model whereby consumers systematically narrow the initial-consideration set as they weigh options, make decisions, and buy products. Then, the post-sale phase becomes a trial period determining consumer loyalty to brands and the likelihood of buying their products again (McKinsey, 2009).
This is however changing. The contemporary consumer now moves back and forth between the stages depending on how much time they have and the quality of the references they are using. The resulting consumer purchase decision journey is circular (MacKinsey, 2009). Tapscott and Williams (2008) say technology has made the process more complex and dynamic and time starved consumers are demanding empowerment.
Li & Bernoff (2011) make reference to an emerging phenomenon they call the groundswell- a social trend in which people use technologies to get the things they need from each other, rather than from traditional institutions like corporations. It is a result of people’s desire to connect, new interactive technologies and online economies. Reference groups in the post-internet age no longer require face to face contact. They are now virtual communities involved in mass collaboration with a great influence on individual product choice.

Bamgbose Olalekan Sodiq 89
STATEMENT OF THE PROBLEM
Various studies have been undertaken to look at the insurance industry in Nigeria and its challenges. Gitau (2013), for example siting the strategies employed by insurance companies in Nigeria towards improving the low insurance penetration. while Odemba (2013), sited the factors influencing the purchase of life insurance products in Nigeria. Adeda (2014), also stated the problems faced by insurance companies in Nigeria towards building a competitive insurance market.
The results of the various research carried out gives a good insight into the area of insurance services purchase, but do not indicate if there is variation in uptake of insurance based on age demographics. The insurance industry in Nigeria, in addition, has targeted customers mostly on the basis of traditionally available products and services. These include the long term products (Annuities and life insurance) and the short term products (General and medical insurance which last for one year or less). Insurance companies have also focused on the purchasing power of the prospective customers. There is need to review this and begin segmenting the market, looking at demographically influenced buyer behaviour.
REVIEW OF THE LITERATUREDirect Channel of Insurance Sales
Brophy (2013), defines direct channel as a process whereby insurance companies uses their own resources and capacity to distribute their products and services. Brophy (2013) points out how insurance companies have set up networks of branches that provide this direct service. A client in need of an insurance product or service walks into the company’s premises and deals with the company’s employees without any intermediation, hence direct channel. The insurance companies have also used their employees to seek out prospective clients especially by way of referral (Incentive Marketing Association, 2004). The employee represents the company and therefore in all respects, the company is viewed to be selling directly to the client.
Brokers as a channel of insurance sales
Cummins & Doherty (2006), define an insurance broker as “an individual or business firm, with some degree of independence from the insurer, which stands between the buyer and seller of insurance.” They go ahead to indicate that intermediaries play a decisive role in facilitating the exchange between consumers and providers of financial services.
The Insurance Act, 2003, allows for the use of brokers in the sourcing of insurance and reinsurance business, in return for payment in the form of commissions.

90 FACTORS INFLUENCING THE BUYING BEHAVIOUR OF MILLENNIALS TOWARDS ..
Allen &Santomero, 2001; Freixas & Rochet, 1997, traditionally argued that market imperfections, such as asymmetric information and transaction costs, are the reason for the need for brokers and financial intermediaries in financial services. With the emergence of new technologies and globalisation which in effect minimise the asymmetry and transactional costs, this argument is challenged. The fact that the demand for these intermediaries has even increased points to the existence of other factors other than market imperfections driving the demand for financial intermediation (Allen & Santomero, 1998; Scholtens & van Wensveen, 2000; Schmidt, Hackethal & Thyrell (1999); Allen & Gale, 1997).
Agents as a channel of insurance sales
According to the Insurance Act (2003), an agent is an individual who in consideration of a commission, solicits or procures insurance business for an insurer, a reinsurer or a broker. Sales people represent customers to the company championing their interests and managing the buyer- seller relationship (Kotler, 2000). Arulsuresh & Rajamohan (2010), describe an agent as a primary source for procurement of insurance business. Customers also do not want to make a complicated decision on their own. (Mayer, 2008; Williams, 1999).
Agnihotri & Rapp (2012), note that the above intermediaries will need to move their current skill sets to include data analysis and communicating via social media. They will also need to enhance knowledge of competition as com petitive intelligence has emerged as a key tool to success in competitive environ ments. Kazemi Tame (2007), argues along the same lines indicating that the insurance industry extremely requires creativity, innovation, and entre preneurship activities.
Bancassurance
The process in which banks sells insurance products of its own insurance subsidiary, either through its own distribution channel or through outside agents is referred to as Bancassurance, Yuan (2011), Bancassurance has been traced back to France in 1980’s with the development of the consumer and mortgage credit as well as the liberalisation of the financial markets (Artikis, Mutenga & Staikouras; 2008).
In Nigeria, effective 1st April, 2017, the National Insurance Commission (Naicom), issued operational guidelines on Bancassurance services. Banks in Nigeria are allowed to be involve in the marketing and selling of insurance products and services.
Online Platforms
The developments in communications and technology have changed distribution channels, allowing underwriters to bypass traditional intermediaries like insurance brokers Debling, (1998).

Bamgbose Olalekan Sodiq 91
Several research studies have been undertaken in regards to the use of online platforms in the marketing of products and services (De Valck, Van Bruggen &Wierenga, 2009; Ohbyung & Yixing, 2010; Trusov, Bucklin & Pauwels, 2008; Van Den Bulte & Wuyts, 2007). Steyn, Wallströ and Pitt (2010) however, point out that these studies have barely touched on financial services. However, Majtánová and Brokešová (2012), argued that the online social network sites (OSNSs), can be used for the marketing of financial services with a leaning to insurance. They indicate that even when insurance marketing has been considered online, it is discussed within the confines of websites of the insurance companies leaving Social media out.
These social sites serve to create online word-of-mouth marketing which for insurance companies would include Evangelist marketing, Community marketing, viral marketing and referral programs: (Farkas, Laurin &Tomek, 2008). The platforms allow varied comments open for all to read. It has been scientifically proven that 50 per cent of these are positive and only 33 per cent are critical of the company or product (Jansen, Zhang, Sobel, & Chowdury, 2009). Banan (2009), opined that social online platforms work better than the insurance companies’ web sites which suffer low rates of repeat visits.
Insurance companies can utilise online platforms by creating applications or direct links to their home web sites allowing customers to purchase insurance policies, Majtanova & Brokesova (2012). This could allow for improved trust with clients regarding the security of their personal information and provide an opportunity for interaction with professional employees during the purchasing of an insurance policy.
Mobile Payment Platforms
The mobile phone has now become an extension of most users’ digital experiences. Where as in the past it was used primarily for communication, it now serves as a nerve centre for access to information and entertainment. The smart phone has further enhanced the user experience with applications and programs that have opened up a whole new world of possibilities (International Telecommunication Union, 2010).
Globally, more people now have mobile phones than have bank accounts. Morgan Stanley expects mobile internet usage to overtake desktop usage by 2015 (Meeker, 2010). Uptake of smartphones has increased dramatically with research indicating that the number of people with smartphones has leapt from 9% to 24% in the space of a year, and this is predicted to rise next year as cheaper devices become available (Mintel, 2011).

92 FACTORS INFLUENCING THE BUYING BEHAVIOUR OF MILLENNIALS TOWARDS ..
Promotion and messaging – targeting the millennials
The earning potential of millennials makes them an important consumer group (Taylor & Cosenza, 2002). This age group do greater percentage of the aggregate societal spending (Cui, Trent, Sullivan and Matinu, 2003; Krotz, 2005). Much of their interest is in the purchasing of jewelleries, clothes, sporting equipment, shoes, health and beauty kits, entertainment, and food (Barbagallo, 2003). The age or life-stage of this generation makes them unique to other age groups (Krotz, 2005). With a variety of electronic technology at their disposal, they are accustomed to instant global communication, material excess and media saturation (Barbagallo, 2003).
Selecting the appropriate medium in reaching the millennials is usually a challenge, due to the availability of a wide variety of media options (Hershatter & Epstein, 2010; Kinley, Josiam and Lockett, 2010). Valentine and Powers (2013) found that millennials primarily used electronic media with television ranking first, the internet second, magazines third and radio fourth. The internet and television were rated high as a source of advertising information. Free community papers, in-store ads, Billboards, radio, direct mail, magazines, daily newspapers and weekly newspaper were rated low as a source of advertising information. Overall, traditional print media was rated lower than electronic media.
CONSIDERATIONS FOR PURCHASE
Novelty of New Brands
Curtin (2009) notes that millennials are inclined towards western culture in many ways, including in how they spend their money. They are highly adaptable to new brands and products, but generally not loyal to these brands thus earning themselves the tag of “brand switchers” (Xu, 2007; Noble, Haytko and Phillips, 2009; Olivier and Tanguy, 2008). It is important to note though that this does not in any way directly imply that millennials have reached their purchasing potential. This can only be expected to increase and grow with time (Juristic and Azevedo, 2011; Waters, 2006).
Millennials are not as brand-loyal or as driven by the same kind of brand label consciousness as the previous age cohorts (Wolfe, 2004). They have grown up in an era where shopping has become a form of entertainment with experiential aspects in a retail setting (Bakewell and Mitchell, 2003).
Gupta, Brantley and Jackson (2010) hold that millennials are attracted to distinctive brands through which they can self-express. They are also seen to carry a materialistic and consumer culture that is a result of technological innovation (Hanzaee and Aghasibeig, 2010). They openly express their concerns and feeling through various media (Hershatter and Epstein, 2010) and retailers are now alive to this facts, using the same media to gain feedback and insight from millennials,

Bamgbose Olalekan Sodiq 93
whom they have hitherto been unable to reach through conventional methods (Engel et al., 2011).
Environmental consciousness
Millennials have shown that they are environmentally conscious even in their purchase decisions (Henrichs, 2008). They are concerned about social responsibility and environmental issues (Barber, Taylor & Dodd, 2009; Smith, 2012). They are supportive of social causes and socially responsible companies (Furlow, 2011). A majority are likely to trust socially responsible companies more and pay attention to their messaging, with resultant increase in purchase of their products (Millennial Case Study, 2006).
Some studies have found that millennials are the most environmentally conscious (Vermillion & Peart, 2010). They favour socially and environmentally friendly brands (Spehar, 2006). Studies have also shown that educated consumers are increasingly worried about the long-term effects of products on their health, community, and environment (Spehar, 2006). However, according to Vermillion & Peart (2010), consumers will not purchase a product only for its environmentally friendly attributes. A product must also contain an added benefit, such as safety, health, or cost efficiency.
Customer Delight
An emerging area of interest in consumer behaviour is customer delight. Whereas customer satisfaction is broadly characterised as a “post-purchase evaluation of product quality given pre-purchase expectation” (Kotler, 1991), customer delight is described as the act of surprising a customer by exceeding his or her expectations, which in turn creates a positive emotional reaction (Scott, 2004, and Seth, R. and Seth, K., 2005). It has also been shown that delighted customers had significantly high levels of willingness to pay, commitment loyalty, and repeat purchase (Barnes, Beauchamp, and Webster 2010). They are also more prone to sharing their experiences with others 62 per cent of the time (Swanson and Davis 2012). Beauchamp and Barnes (2015) identified employee affect, effort and skill as specific types of employee factors necessary to delight millennials.
Peer Referencing
Smith (2012) alludes to the fact that millennials use peers as a measure of merit of a product considering them to be more credible than traditional media or company sources of information. Li and Bernoff (2011) make reference to an emerging phenomenon they call the groundswell- a social trend in which people use technologies to get the things they need from each other, rather than from traditional institutions like corporations. They are increasingly success-driven, demonstrating their achievements through status products (Meister &

94 FACTORS INFLUENCING THE BUYING BEHAVIOUR OF MILLENNIALS TOWARDS ..
Willyerd, 2010). They will thus choose the brands that will help them construct and maintain this and other identities (Elliot & Wattanasuwan, 1998). Parsons & Maclaran (2011) find that brands provide numerous ways in which consumers can express themselves and with which to obtain the approval of peers, enabling them to make a social statement of who they are or who they would like to be.
Parsons &Maclaran (2011), find that brands provide numerous ways in which consumers can express themselves and with which to obtain the approval of peers, enabling them to make a social statement of who they are or who they would like to be.
Price Gauzente and Roy (2012), note that Millennials are price sensitive and take
time to gathering and processing price-related information, including looking at non-price features. The first impression that millennials get, of a retailer’s website for example, impacts their decision on whether to return. This is because, they form their judgements and opinions very quickly (Kim & Fesenmaier, 2007; Lindgaard, Fernandes, Dudek & Brown, 2006).
Eastman & Liu (2012), found that millennials have higher levels of status consumption than Generation X or Baby Boomer consumers. Furthermore, Young and Hinesly (2012), emphasis that there should be further study undertaken to determine the motives that underlie millennials’ behaviours.
DATA COLLECTION METHODS
The research made use of primary data which was collected using question-naires, through stratified and simple random sampling techniques. The ques-tionnaire included both open ended and closed-ended questions (Kothari, 2011). The questionnaires were administered through the help of research assistants to ensure reliability, clarification, accuracy and efficiency. Questionnaire enables data to be collected relatively quickly and also the researcher would not need to be present when the questionnaires were completed. This is useful for large populations when interviews would be impractical (Kosinski, Matz, Goling, Popov & Stillwell 2015).
The questionnaire was divided into four sections. The first section sought for background information of the respondents while the subsequent sections addressed each of the research objectives. The questions were designed to collect both qualitative and quantitative data.
The questionnaire used questions designed to give the respondents alternatives that most closely corresponded to their position on the subject, and agreement scale questions based on a five-point scale with steps labelled Agree, strongly Agree, Disagree, Strongly Disagree and indifference. Questions were designed to ensure the relevance, logicality, simplicity and briefness of the questionnaire.

Bamgbose Olalekan Sodiq 95
REGRESSION ANALYSIS
A regression analysis was conducted due to the positive correlation that exist among the factors relating to the likelihood to buy. The dependent variable is the probability preference of buying as for the independent variable, online presence, customer service, brand loyalty, peer reference and price of the product were the main factors. The tables below show the regression analysis output:
Table 1Model Summary
Model RR
SquareAdjusted R
Square
Std. Errorof the
Estimate
Change StatisticsR SquareChange
FChange df1 df2
Sig. FChange
1 .567a .322 .311 .60939 .322 29.817 5 314 .000
Table 2Coefficients
ModelUnstandardized Coefficients
StandardizedCoefficients
T Sig.B Std. Error Beta(Constant) .946 .159 5.937 .000Online presence .146 .037 .196 3.916 .000Brand loyalty .291 .044 .324 6.553 .0001Peer reference .143 .041 .178 3.491 .001Price .017 .045 .023 .383 .702Customer service .102 .035 .170 2.873 .004
a. Dependent Variable: Likelihood to buy
The likelihood of an individual to buying insurance products based on online presence, customer service, brand loyalty, peer reference and price of the product makes the model fit for predicting. The model is fit to predict 32% of the likelihood to purchase based on the R Square value of 0.322.
From the coefficient table above, price has no significant effect on the predictor (ability to purchase) hence, the need to drop it from the model.
Y = β0 + β1X1 + β2X2 + .... + βnXn + ε
X1 = online presenceX2 = brand loyalty.X3 = Peer referenceX4 = Customer service The regression model from Table 4.23 takes the form;Y = .946 + .146 (X1) + .291 (X2) + .143 (X3) +.102 (X4).

96 FACTORS INFLUENCING THE BUYING BEHAVIOUR OF MILLENNIALS TOWARDS ..
If the four independent variables (online presence, brand loyalty, peer reference and customer service) are held constant, the value of probability to buy among millennials will be 0.946 according to the study. The regression coefficient of 0.146 and p-value of 0.000, shows the positive relationship between the probability to buy and online presence. Holding other variables constant. An increase of a unit of online presence, where other variables are held constant, shows an increase of 0.146 in the likelihood to buy among millennials.
A positive relationship also exists between brand loyalty and likelihood to buy as shown by a regression coefficient of 0.291 and a p-value of 0.000. This shows that likelihood of buying insurance services among millennials, increases with brand loyalty. The findings show that, holding all other variable constant a positive relationship exist between peer reference and likelihood to buying insurance services as shown by a regression coefficient of 0.143 and a p-value of 0.001. This shows that a unit increase in peer reference would lead to a 0.143 increase in likelihood to buy insurance services among millennials. Holding all other variable constant, a positive relationship exists between customer service and likelihood to buy insurance services as shown by a regression coefficient of 0.102 and a p-value of 0.004. This shows that a unit increase in customer service would lead to a 0.102 increase in likelihood to buying insurance services among millennials.
DISCUSSION OF FINDINGS
Methods of Accessing Insurance Products
From the research study it was established that 77.6% respondents prefer dealing with insurance offices personally when buying insurance products. Approximately 50% considers dealing with broker, agent or bank in purchasing insurance products. A further 34% of the respondents consider purchasing insurance products via alternative channels. Thus, agreeing with the imperfect market traditional thinking, such as asymmetric information and transaction costs.
Information search and options evaluation are pre-requisites needed in the purchasing decision making of a potential buyer of insurance services {Allen and Santomero, 2001; Freixas and Rochet, 1997). The research study reveals that the millennials age group in Nigeria, even though they are digitally inclined and prefer to handle insurance product options evaluation and products information searches on their own, still feel the need to have an insurance specialist take them through the solutions available for them.
The millennial in satisfying their search for information on any products, prefers the use of television, radio and the social media as revealed by the research study. Thus, indicating a contradiction from preference of respondents on the internet over mainstream media. This is explained by the fact that television

Bamgbose Olalekan Sodiq 97
and radio are been viewed as passive sources of information while online sources are taken to be active sources. The preference for both TV and online sources among the millennial are supported by an increased online TV viewership among the age group. Valentine and Powers (2013), opined that millennials primarily used electronic media with television ranking first, the internet second, magazines third and radio fourth. Although, product information accessibility methods chosen amongst the millennials is not influenced by their gender, the educational level, income level and age of the respondents however have influence on the accessibility methods chosen. It appears that the higher the level of education and income level, the more likely for the millennial to prefer online access to information. Age though has the reverse effect on social media; as one gets older, the less likely their preference towards social media and the more likely preference to deal directly with the insurance company or interactions with an intermediary.
As online experience is fast becoming an extension of the day to day life of the millennial age group, thus indicating the importance it has on the purchase of insurance products among the group. Mobile, card and online payments, as an option of payment have direct/positive relationship with the Income and education levels among the millennial age group. The higher the level of education and income, the more likely respondents’ preference to these alternative mode of payments options. Cash though remains the most preferred mode of payment.
The preference for non-cash modes confirms the fact that millennials are pressed for time. As they seek more meaningful associations from products and services, they are moving away from wanting value for money to wanting value for time (Parsons and Maclaran, 2011). The study also confirmed mobile payments as one of the preferred modes of payment. This confirms earlier studies that have indicated that we are able to carry out commerce by making payments through mobile phones which are now available in most places and have been enabled to carry out payment transactions. (Ballagas, Borchers, Rohs and Sheridan, 2006; Berg, Mörtberg and Jansson, 2005; Carton, Hedman, Damsgaard, Tan and McCarthy, 2012).
Promotion and messaging of insurance products and services
The study indicated that a vast majority of millennials prefer the internet to traditional mainstream media and are more likely to buy a product if it was marketed on social media. They are also likely to buy a product if friends and other users said good things about it on social media and the internet. Additionally, they are on social media at least once a day, which makes it a very powerful tool for promotion and messaging. This agrees with Hershatter & Epstein (2010) who observed that millennials access their content online using apps and on social media like Twitter and Facebook.

98 FACTORS INFLUENCING THE BUYING BEHAVIOUR OF MILLENNIALS TOWARDS ..
The positive correlation between the likelihood to buy a product and the product’s presence on the internet by way of advertising or feedback from friends and other users on their experience with a product, is an indicator that the internet has an influence on the purchase habits of millennials. This agrees with earlier findings that millennials are increasingly spending more time on the internet. Chaffey and Ellis-Chadwick (2012) have indicated how the bargaining power of a retail shopper is greatly increased when they are using the internet as they are able to evaluate products and compare prices.
The study further revealed that a majority of millennials are more likely to buy a product if it was marketed on social media and more likely to buy a product if friends and other users said good things about it on social media and the internet. This establishes the emergence of the internet and social media as prominent promotion and messaging platform of particular interest here is that the mobile phone has emerged as the preferred tool for internet access. Mintel (2011) indicated that the uptake of smartphones has increased dramatically with research indicating that the number of people with smartphones has leapt from 9% to 24% in the space of a year, and this is predicted to rise in coming years as cheaper devices become available. Availability of product information online and the ability to share experiences with networks empowers the millennial to make an informed decision, and feel that their information search and comparisons have been effective. This supports Tapscott and Williams (2008) assertion that technology has made the buying process more complex and dynamic and time starved consumers are demanding empowerment.
The study also confirmed findings of the study by InMobi (2012) indicating that millennials are getting more accustomed to mobile advertisements with a majority becoming as comfortable with mobile advertising as they are with TV or online advertising
Considerations for purchase of insurance products and services
A majority of the millennials show an inclination toward new brands, which agrees with previous studies that indicate that they are highly adaptable to new brands and products. These studies however also indicate that they are generally not loyal to these brands thus earning themselves the tag of “brand switchers” (Xu, 2007, Noble et al., 2009, Olivier and Tanguy, 2008). The study revealed on the contrary that they are loyal to the brands they choose which might be attributed to the Nigerian culture or to the ability or lack thereof to incur costs switching brands.
The green agenda seems to resonate well with the millennials with a majority preferring goods whose production has least impact on the environment, and that are produced using ethical means. Earlier studies have indicated the same outcomes (Henrichs, 2008; Barber, Taylor and Dodd, 2009; Smith, 2012).

Bamgbose Olalekan Sodiq 99
The study also revealed peer referencing as a strong consideration for purchase in the earlier years of a millennial’s life. As they grow older, the less likely they are to find out about new products on their network on social media, or to choose products that help them make a statement. This would give an indication that peer referencing could be a useful communication tool for insurance companies, especially to the younger millennial market. The same effect with regard to advancement in age, is observed with increase in income. The more income the millennial makes, the less likely they are to refer to their peers for purchase decisions, and the less likely they are to make a statement through their purchases. With age also, the study revealed that they feel that they are getting value for money from their insurance services and are comfortable with the quality of service they receive. These trends are similar to the correlations found between individual characteristics specifically age and net income on, mode of accessing information about products and services, methods of accessing insurance and frequency of using promotional messaged on social media; with the increase in age and net income, individuals prefer to deal directly with the insurance agent and brokers rather than peers and social media.
Pricing and product standardisation came out as an issue of interest although it appears that the products available and their prices are not known to approximately a third of the millennial population. This indicates that there hasn’t been enough effort put into first of all assessing the insurance needs of this particular age group and further, pricing the resultant products services at levels that are commensurate with their income levels.
With regards to customer service, half the population under study is satisfied with the service levels, feedback mechanisms and claims handling and repayment. The study showed a direct relationship between customer service and likelihood of the millennial to buy. As customers’ service levels increase, so does the likelihood to buy.
CONCLUSION
Methods of accessing insurance products
The study established that direct access to the insurance company, and use of intermediaries like brokers and agents still remains the preferred method of accessing insurance products and services. It also revealed that banc assurance and other non-traditional intermediaries are emerging as likely alternatives for the millennials. Television and radio remain the preferred sources through which information is passively accessed. Active information searches though indicated that online sources are preferred. Cash payments remain the preferred payment mode with non-cash options gaining traction. The study therefore concludes that even though the traditional methods of access to information and payment remain strong, alternative methods are also gaining popularity especially with the millennial age group.

100 FACTORS INFLUENCING THE BUYING BEHAVIOUR OF MILLENNIALS TOWARDS ..
Promotion and messaging of insurance products and services
The internet and social media have emerged as strong platforms through which information on products and services is sourced. This is strengthened by the fact that the mobile phone is now ubiquitous and forms the primary mode of internet access by the millennials. The study concludes that the internet and social media are now a critical part of business promotion and messaging and must form an integral part of insurance companies’ marketing endeavours.
Considerations for purchase of insurance products and services
The study revealed that millennials are brand conscious and will be attracted to new brands and will be loyal to them. It also showed that the green agenda is gaining popularity with peer referencing, price and customer service being important considerations for millennials when they are making a purchase. The indication here is that the purchase activity for millennials is an experience that encompasses their emotions, world view and general status in society. It is important to them how a product of service feels, how it looks to others, its impact on the environment and the relations it provides for them with the provider of the product or service.
RECOMMENDATIONS
For further penetration of insurance services among the millennial in Nigeria. The following recommendations for improvement are implored:
Accessibility of insurance products
In the contemporary business world, the Nigerian insurance companies must develop a broad eye- view of the customer, where the customers’ needs and potential are known and are delivered to them back on their terms – in real time. A multi-intermediary approach to business should be developed by insurance companies allowing the potential customers the access to information and services through their preferred methods. They should in addition modernize their IT architecture across all lines of business to support this approach.
Communication of insurance products and services
The use of email, short messaging services (SMS), website, social media, and telemarketing, should be mostly used by insurance companies in passing information regarding their products and service to the millennial population. This will enhance easy assessments, review and interaction by customers.

Bamgbose Olalekan Sodiq 101
Considerations for purchase of insurance products and services
The emotional and the physical needs of the target population, should be considered by the Nigerian insurance companies when researching and developing products and services that meets their needs. experience service provision, gives a sustainable competitive advantage to whatever the insurance company.
REFERENCESAnon (2009) The Consumer Decision Journey. McKinsey [Online]. Available: http://
www.mckinsey.com/insights/marketingsales/the_consumer_decision_journey. Artikis, P. G., Mutenga, S., & Staikouras, S. K. (2008). A practical approach to blend
insurance in the banking network. The Journal of Risk Finance, Vol. 9, No. 2, pp. 106–124.
Bamasak, O. (2011). Exploring consumers’ acceptance of mobile payments – An empirical study. International Journal of Information Technology, Com muni-cations & Convergence, 1(2), 173–185.
Chaffey, D., & Ellis-Chadwick, F. (2012). Digital Marketing: Strategy, Implementation and Practice. Fifth Edition. Harlow, Pearson Education Limited
Chou, Y., Lee, C., & Chung, J. (2004). Understanding m-commerce payment systems through the analytic hierarchy process. Journal of Business Research, 57(12), 1423–1430.
Debling, F. (1998). Mail myopia: or examining financial services marketing from a brand commitment perspective. Marketing Intelligence and Planning, Vol. 16, No. 1, pp. 38–46.
Eastman, K. L., Eastman, J. K., and Eastman, A. D. (2002). Issues in marketing online insurance products: An exploratory look at agents’ use, attitudes, and views of the impact of the Internet. Risk Management and Insurance Review, 2002, Vol. 5, No. 2, pp. 117–134. ISSN 1540-6296.
Gauzente, C., & Roy, Y. (2012). Message content in keyword campaigns, click behaviour, and price consciousness: a study of Millennial consumers. Journal of Retailing and Consumer Services, 19(1), 78–87.
Hershatter, A., & Epstein, M. (2010). Millennial and the world of work: an organization and management perspective. Journal of Business Psychology, Vol. 25, No. 2, pp. 211–223.
Juristic, B., & Azevedo, A. (2011). Building customer-brand relationships in the mobile communications market: the role of brand tribalism and brand reputation, Brand Management, Vol. 18, No. 4/5, pp. 349–366.

102 THE AUTHORS
THE AUTHORS
Julija Žakemo (orig. Jacquemod) is a lecturer at RISEBA University and she is also teaching at University of Latvia, such subject areas as Business Ethics and Corporate Social Responsibility, Management psychology, Social Psychology, Human Recourse Management. Scientific interests include Toxic leadership, Organisational culture, Employee engagement, Ethical Leadership, etc.
Dāniels Jukna has a Master’s degree in Economics (subfield of Mathematical Economics) from the University of Latvia. He has obtained a diploma with excellence and his master’s thesis was defended excellently. Also in 2018, he has received a bachelor’s degree in financial engineering and a financial analyst qualification at Riga Technical University. Achieving high results during my studies, he was included in the Gold Fund of Riga Technical University. He has a demonstrated experience in financial sector, project management and business development. Since 2018, he is Chief Executive officer in LLC Hedge Capital Company which is engaged in issuing loans to natural persons in Latvia. His research interests cover the topics of econometric modelling, solvency assessment, financial analysis and multilevel optimization.
Frank W. Hager, Dipl.-Wirt.-Ing. (FH), MBA, M.A. is a Doctoral Student (PhD) at the University of Latvia, Faculty of Business, Management and Economics, Riga, Latvia. Before joining the Doctoral Programme at the University of Latvia, he has studied industrial engineering and logistics at the University of Applied Sciences in Hof/Germany and Stellenbosch University/South Africa, as well as organizational development at the Technical University (TU) in Kaiserslautern/Germany. He served as Area Sales Manager and Product Manager (textiles, automotive and adhesive segment) in several manufacturing, globally active companies. He is also holding certificates as a Mediator and Process Consultant from the University of Augsburg.
Norbert G. Brink, Dipl.-Ing., Dipl.-Ing. (FH) studied mechanical engineering with a focus on industrial and production engineering at the University of Applied Sciences of Koblenz and the Technical University of Dresden as well as economics at the FernUniversität in Hagen. Since the end of 2016 he has been studying for a PhD at the Faculty of Business, Management and Economics at the University of Latvia in Riga. Norbert G. Brink is a successful manager with
THE AUTHORS
THE AUTHORS

THE AUTHORS 103
over 30 years of professional experience. After working as CEO in the electrical and electronic industry as well as in the metal and plastics processing industry, he founded BRINK GmbH in 2004, which over the years has developed into a successful virtual system supplier. Mr. Brink gives lectures at various European universities and also acts as a speaker.
David Udom, holds a PhD degree in Educational Management. He is a researcher at the Department of Vocational & Technical Education, University of Benin, Benin City, Nigeria. He research is focused on Human Resource Management, Educational Management and Nigerian Politics.
Oyedele Ola Olusegun is an Assistant Professor at the Federal University of Agriculture, College of Management Sciences, Department of Entrepreneurial Studies, Ogun State Nigeria. His research is focused on Innovation of Entrepreneurship and Economic Modelling. He obtained a PhD in Business Administration from Kwara State University Nigeria.
Kowo Solomon Akpoviroro is an Assistant professor in Business and Entrepreneurship at Kwara State University Nigeria, Faculty of Management Sciences, Department of Business and Entrepreneurship. He has a Bachelor degree in Economics, Master Degree in Business Administration and also obtained a PhD in Business Administration from Kwara State University Nigeria. Has published 75 articles on international Business, Entrepreneurship and Human Resources in Europe and USA.
Oyero Mutiu Adeleke works as a Research Director at the Department of Entrepreneurial Studies, College of Management Sciences, Federal University of Agriculture, Abeokuta, Ogun State, Nigeria. Specialisation in Entrepreneurship and Business Researching.
Patrick S. Okonji (PhD), Olufemi O. Olayemi (PhD), Ben E. Akpoyomare Oghojafor (PhD), D. Mgbe (MSc.) – Department of Business Administration, Faculty of Management Sciences, University of Lagos, Nigeria.
Bamgbose Olalekan Sodiq – Department of Insurance, Lagos State Polytechnic, Ikorodu, Lagos, Nigeria.

Journal of Economics and Management Research. Volume 9, 2020
LU Akadēmiskais apgādsAspazijas bulv. 5, Rīga, LV-1050
www. apgads.lu.lv