Journal of Asian Finance, Economics and Business, v. 4, no. 2
93
Boston University OpenBU http://open.bu.edu BU Open Access Articles BU Open Access Articles 2017-05-30 Journal of Asian Finance, Economics and Business, v. 4, no. 2 This work was made openly accessible by BU Faculty. Please share how this access benefits you. Your story matters. Version Citation (published version): 2017. "Journal of Asian Finance, Economics and Business, Vol.4 No.2" https://hdl.handle.net/2144/27518 Boston University
-
Upload
khangminh22 -
Category
Documents
-
view
1 -
download
0
Transcript of Journal of Asian Finance, Economics and Business, v. 4, no. 2
Boston UniversityOpenBU http://open.bu.eduBU Open Access Articles BU Open Access Articles
2017-05-30
Journal of Asian Finance,Economics and Business, v. 4, no. 2
This work was made openly accessible by BU Faculty. Please share how this access benefits you.Your story matters.
VersionCitation (published version): 2017. "Journal of Asian Finance, Economics and Business, Vol.4 No.2"
https://hdl.handle.net/2144/27518Boston University

Volume 4 Issue 2 May 2017
�L�i�n�k�a�g�e� �b�e�t�w�e�e�n� �P�u�b�l�i�c� �P�o�l�i�c�y�,� �G�r�e�e�n� �T�e�c�h�n�o�l�o�g�y� �a�n�d� �G�r�e�e�n� �P�r�o�d�u�c�t�s� �o�n� �E�n�v�i�r�o�n�m�e�n�t�a�l� �A�w�a�r�e�n�e�s�s� �i�n� �t�h�e� �U�r�b�a�n� �K�u�a�l�a� �L�u�m�p�u�r�,� �M�a�l�a�y�s�i�a/ Md. Khaled Saifullah, Fatimah Binti Kari, Md. Arphan Ali
�S�u�s�t�a�i�n�a�b�i�l�i�t�y� �P�r�a�c�t�i�c�e�s� �a�s� �D�e�t�e�r�m�i�n�a�n�t�s� �o�f� �F�i�n�a�n�c�i�a�l� �P�e�r�f�o�r�m�a�n�c�e�:� �A� �C�a�s�e�o�f�M�a�l�a�y�s�i�a�n�C�o�r�p�o�r�a�t�i�o�n�s/ Ezeoha Bright Amacha, Omkar Dastane�
�A�n� �E�x�p�l�o�r�a�t�o�r�y� �T�r�e�a�t�i�s�e� �o�n� �C�o�n�s�c�i�o�u�s�n�e�s�s� �a�n�d� �E�s�p�o�u�s�a�l� �o�f� �H�a�l�a�l� �S�u�p�p�l�y�-�C�h�a�i�n�:� �A�n�I�n�d�i�a�n�P�e�r�s�p�e�c�t�i�v�e/ Rajasekhara Mouly Potluri, Jung Wan Lee, Lohith Sekhar Potluri
�B�r�a�n�d�s� �a�n�d� �C�o�m�p�e�t�i�n�g� �F�a�c�t�o�r�s� �i�n� �P�u�r�c�h�a�s�i�n�g� �H�a�n�d� �P�h�o�n�e�s� �i�n� �t�h�e� �M�a�l�a�y�s�i�a�n� �M�a�r�k�e�t/ Mahfuzur Rahman, Yusof Ismail, Mohamed Albaity, Che Ruhana Isa
5
6
7
8
� �
�H�o�w� �V�u�l�n�e�r�a�b�l�e� �i�s� �I�n�d�o�n�e�s�i�a’�s� �F�i�n�a�n�c�i�a�l� �S�y�s�t�e�m� �S�t�a�b�i�l�i�t�y�t�o� �E�x�t�e�r�n�a�l� �S�h�o�c�k�?/ Nika Pranata, Nurzanah
�O�i�l� �P�r�i�c�e� �F�l�u�c�t�u�a�t�i�o�n�s� �a�n�d� �S�t�o�c�k� �M�a�r�k�e�t� �M�o�v�e�m�e�n�t�s�:� �A�n� �A�p�p�l�i�c�a�t�i�o�n� �i�n� �O�m�a�n/ Abdelghani Echchabi, Dhekra Azouzi
�S�u�b�s�i�d�y� �R�a�t�i�o�n�a�l�i�s�a�t�i�o�n� �f�o�r� �G�e�n�e�r�a�l� �P�u�r�p�o�s�e� �F�l�o�u�r�:� �M�a�r�k�e�t� �a�n�d� �E�c�o�n�o�m�i�c�s� �I�m�p�l�i�c�a�t�i�o�n�s/ Fatimah Binti Kari, Muhammad Mehedi Masud, Md. Khaled Saifullah
�E�v�a�l�u�a�t�i�o�n� �o�f� �E�c�o�n�o�m�i�c� �P�o�t�e�n�t�i�a�l� �a�n�d� �L�e�v�e�l� �o�f� �C�o�n�c�e�n�t�r�a�t�i�o�n� �o�f� �t�h�e� �R�e�g�i�o�n�s� �o�f� �K�a�z�a�k�h�s�t�a�n/ Nailya K. Nurlanova, Anel A. Kireyeva, Rashid M. Ruzanov
1
2
3
4

Journal of Asian Finance, Economics and Business Vol. 4 No. 2
The Journal of Asian Finance, Economics and Business (JAFEB) has been indexed in Cabell's
Directories, Crossref, and Directory of Open Access Journals.
The Journal of Asian Finance, Economics and Business (JAFEB) is an international peer-reviewed journal
and is published four issues per year quarterly in full English in joint sponsorship from the Korea
Distribution Science Association (hereinafter called “KODISA”) and the Institute of Economics under the
Ministry of Education and Science of the Republic of Kazakhstan (hereinafter called “Institute of
Economics”).
The Journal of Asian Finance, Economics and Business (JAFEB) publishes four issues per year quarterly
on the following dates: February 28, May 30, August 30, and November 30.
The Journal of Asian Finance, Economics and Business (JAFEB) is published in international standards
both in print and online versions with Digital Object Identifier (DOI) information. Print ISSN: 2288-4637 /
Online ISSN: 2288-4645
Editorial Office:
Administrative Sciences Department, Metropolitan College, Boston University
808 Commonwealth Avenue, Boston, MA 02215, USA
Tel: (+1 617) 358-5627 Fax: (+1 617) 353-6840
E-mail: [email protected]
Offprints Publishing Office:
Korea Distribution Science Association
Hanshin Officetel 1030, 2463-4 Shinheung-dong Sujeong-gu, Seongnam-city, Gyeonggi-do, KOREA
Tel: (+82 31) 740-7292 Fax: (+82 31) 740-7361
E-mail: [email protected].
Homepage of the Journal:
For submission to the Journal, please access to http://www.jafeb.org
Printed by Dunam Publishing Tel: (+82 2) 478-2066 Fax: (+82 2) 478-2068
Publication Date of This Issue:
The Journal of Asian Finance, Economics and Business Vol. 4 No. 2 is published on May 30, 2017.
Disclaimer:
The Publisher, Association and Editors cannot be held responsible for errors or any consequences arising
from the use of information contained in this Journal: the views and opinions expressed do not necessarily
reflect those of the Publisher, Association and Editor. The author(s) of each article appearing in this
Journal is/are solely responsible for the content thereof; the publication of an article shall not constitute or
be deemed to constitute any representation by the Editors, the KODISA, the KODISA Journals, or the
Institute of Economics that the data presented therein are correct or sufficient to support the conclusions
reached or that the experiment design or methodology is adequate.
Copyright � 2014-2017 JAFEB and KODISA. All rights reserved
�
Price: ₩ 50,000

Editorial Board
Editor–in-Chief
Jung Wan Lee, Ph.D.
Administrative Sciences Department, Metropolitan College
Boston University, USA
Editor for
Southeast Asia
Hooi Hooi Lean, Ph.D.
School of Social Sciences
Universiti Sains Malaysia, Malaysia
Editor for
East Asia
Teng-Tsai Tu, Ph.D.
Graduate Institute of International Business
National Taipei University, Taiwan
Editor for
Central Asia
Azimkhan A. Satybaldin, Ph.D.
The Institute of Economics under the Ministry of Education and Science
Republic of Kazakhstan
Publishing Editor
Myoung-Kil Youn, Ph.D.
Department of Medical IT Marketing, College of Health Industry
Eulji University, Korea (the Republic of)
Associate Editors
D. Tripati Rao, Ph.D.
Professor of Economics. Business Environment Area
Indian Institute of Management Lucknow, India
Wee-Yeap Lau, Ph.D.
Department of Applied Statistics, Faculty of Economics and Administration
University of Malaya, Malaysia
Moh'd Mahmoud Ajlouni, Ph.D.
Department of Banking and Finance, Faculty of Economics
Yarmouk University, Jordan
Anel A. Kireyeva, Ph.D.
The Institute of Economics under the Ministry of Education and Science
Republic of Kazakhstan
Nailya K. Nurlanova, Ph.D.
The Institute of Economics under the Ministry of Education and Science
Republic of Kazakhstan
Jung-Lieh Hsiao, Ph.D.
Graduate Institute of International Business
National Taipei University, Taiwan
Jooh Lee, Ph.D.
Department of Management & Entrepreneurship, College of Business
Rowan University, USA
Rajasekhara Mouly Potluri, Ph.D.
School of Business & Entrepreneurship
American University of Nigeria, Nigeria
Muhammad Ayub Siddiqui, Ph.D.
Bahria Institute of Management and Computer Sciences
Bahria University, Pakistan
Tahereh Alavi Hojjat, Ph.D.
Professor of Economics & Finance, Division of Business
DeSales University, USA
Tantatape Brahmasrene, Ph.D.
Professor of Finance and International Business, College of Business
Purdue University Northwest, USA�
���������� ��� ������������ �������� ����
Volume 4 Issue 2 May 30 2017
[Regular Research Article]
How Vulnerable is Indonesia’s Financial System Stability to External Shock?
----- Nika Pranata, Nurzanah ·················································································································· 5
Oil Price Fluctuations and Stock Market Movements: An Application in Oman
----- Abdelghani Echchabi, Dhekra Azouzi ··························································································· 19
Subsidy Rationalisation for General Purpose Flour: Market and Economics Implications
----- Fatimah Binti Kari, Muhammad Mehedi Masud, Md. Khaled Saifullah ········································· 25
Evaluation of Economic Potential and Level of Concentration of the Regions of Kazakhstan
----- Nailya K. Nurlanova, Anel A. Kireyeva, Rashid M. Ruzanov ························································ 37
Linkage between Public Policy, Green Technology and Green Products on Environmental Awareness
in the Urban Kuala Lumpur, Malaysia
----- Md. Khaled Saifullah, Fatimah Binti Kari, Md. Arphan Ali ····························································· 45
Sustainability Practices as Determinants of Financial Performance:
A Case of Malaysian Corporations
----- Ezeoha Bright Amacha, Omkar Dastane ······················································································ 55
An Exploratory Treatise on Consciousness and Espousal of Halal Supply-Chain:
An Indian Perspective
----- Rajasekhara Mouly Potluri, Jung Wan Lee, Lohith Sekhar Potluri ················································ 69
Brands and Competing Factors in Purchasing Hand Phones in the Malaysian Market
----- Mahfuzur Rahman, Yusof Ismail, Mohamed Albaity, Che Ruhana Isa ········································· 75

Nika Pranata, Nurzanah / Journal of Asian Finance, Economics and Business Vol 4 No2 (2017) 5-17 5
Print ISSN: 2288-4637 / Online ISSN 2288-4645
doi:10.13106/jafeb.2017.vol4.no2.5
How Vulnerable is Indonesia’s Financial System Stability
to External Shock?
Nika Pranata1
, Nurzanah2
Received: February 13, 2017. Revised: March 27, 2017. Accepted: May 2, 2017.
Abstract
The main objective of the study is to measure the vulnerability of Indonesia's financial system stability in response to external shocks,
including from regional economies namely three biggest Indonesia major trading partners (China, the U.S and Japan) and other external
factors (oil price and the federal funds rate). Using Autoregressive Distributed Lag (ARDL) model and Orthogonalized Impulse Response
Function (OIRF) with quarterly data over the period Q4 2002 - Q1 2016, results confirm that, 1) oil price response has the largest effect to
Indonesia financial stability system and the effect period is the longest compared to others, represented by NPL and IHSG; 2) among those
three economies, only China’s economic growth has significantly positive effect to Indonesia financial stability system. Based on the findings
it is better for the authorities to: 1) Diversify international trade commodities by decreasing share of oil, gas, and mining export and boosting
other potential sectors such as manufacture, and fisheries; 2) Ensure the survival of Indonesia large coal exporter companies without
neglecting burden of national budget; and 3) Create buffer for demand shock from specific countries by diversifying and increasing share of
trading from other countries particularly from ASEAN member states.
Keywords: Financial Stability, External Shocks, Regional Economies.
JEL Classification Code: F65, G20.
1. Background 1
External shocks are considered as major determinants of
financial stability and have significant effects on emerging
markets (Almansour, Aslam, Bluedorn, & Duttagupta, 2015).
The recovery of global economic downturn in 2015 that was
slower than expected has created a risk-off behavior
amongst investors; most notable is spillover effects on
emerging markets. To what extent the downturn is mainly
related to the economic slowdown in China, the uncertainty
over U.S monetary policy normalization, and the sustained
fall in commodity prices including oil prices (Cashin,
Mohaddes, & Raissi, 2016; International Monetary Fund,
2016; Maćkowiak, 2007). Cashin et al. (2016) find that
China negative output shock brings significant spillovers and
larger impact on all ASEAN-5 countries except for the
1 First Author and Corresponding Author. Economic Research Center,
Lembaga Ilmu Pengetahuan Indonesia (LIPI), Indonesian Institute
of Sciences, Indonesia [Postal Address: Gd. Widya Graha Lt.5
Ruang 524, Jalan Gatot Subroto No. 10, Jakarta Selatan 12710,
Indonesia] E-mail: [email protected]
2 Program Planner, Bandung Regency. E-mail: [email protected]
Philippines than the Asia-Pacific region, showing countries
exposing more trading with advanced economies are much
more vulnerable to negative shocks. Nguyen, Tran, and Le
(2014) confirm findings that the U.S monetary policy shocks
is likely impacting East Asia indirectly through the role of
China that slowdowns in imports and exports and weaken
commodity prices. Such conditions make market confidence
drop, capital inflows decrease (Maćkowiak, 2007), currency
depreciate, corporate and household performance depress,
NPL rises and credit weaken (Bank Indonesia, 2015).
In terms of global recovery challenges, it is also
compelling by the fact that the contribution of EMs to global
economic growth is bigger than advanced economies,
accounted 58%. Indeed, Indonesia’s Financial System
Stability (IFSS) have been marked moderate at least in the
last quarter of 2015 after having undergone a slowing trend
since 2012, reflected by inflation reached 3.35% (yoy),
which hits farther than inflation target range of 4±1%. To be
more detailed, here is a brief description of Indonesian
economic structure as follows:
Indonesia is a small open economy with domestic
oriented economic structure, commodity exporter, and
6
W
vul
cap
Ind
eco
com
gro
Ch
In
cre
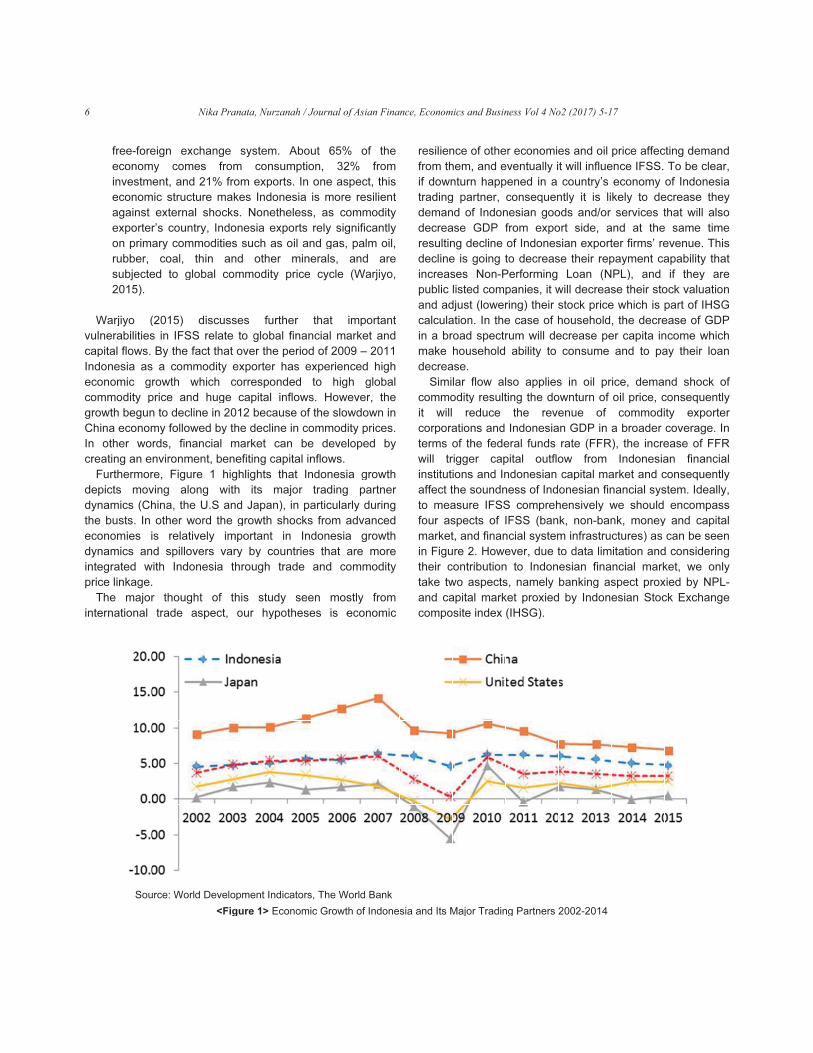
F
dep
dyn
the
eco
dyn
inte
pric
T
inte
fr
e
in
e
a
e
o
ru
s
2
Warj
nera
pital
done
onom
mmo
owth
ina
oth
eatin
Furt
picts
nam
e bu
onom
nam
egra
ce li
The
erna
ree-
econ
nves
econ
agai
expo
on p
ubb
subje
2015
rjiyo
abil
l flow
esia
mic
odit
h be
eco
her
ng a
herm
s m
mics
usts.
mie
mics
ated
inka
m
ation
-fore
nom
stm
nom
nst
orter
prima
ber,
ecte
5).
(
ities
ws.
as
gr
ty p
egun
onom
wo
an e
mor
mov
(Ch
. In
s i
an
d w
age.
ajor
nal
Sou
eign
my
ent,
mic s
ext
r’s c
ary
co
ed t
(201
s in
By
s a
row
price
n to
my f
rds,
nvir
re,
ving
hina
oth
s r
d s
with
r th
tra
urce:
n ex
com
, an
struc
tern
coun
com
oal,
to g
15)
IFS
the
com
wth
e an
dec
follo
, fin
ronm
Figu
al
a, th
her w
rela
spillo
Ind
houg
de
Wo
N
xch
mes
nd 2
ctur
al s
ntry
mmo
thi
glob
d
SS r
fac
mmo
wh
nd
cline
owed
nanc
men
ure
long
he U
wor
tive
over
done
ght
asp
orld D
Nika P
ang
s fr
1%
re m
shoc
y, In
odit
in
bal c
iscu
rela
ct th
odity
ich
hug
e in
d by
cial
t, be
1
g w
U.S
d th
ely
rs v
esia
of
pect
Deve
<
Pran
ge s
rom
fro
make
cks.
don
ies
and
com
usse
ate t
at o
y ex
co
ge c
201
y the
ma
ene
high
with
and
he g
imp
vary
th
th
t, o
elop
Figu
nata,
syst
m c
m e
es I
. No
nesi
suc
d o
mmo
es
to g
over
xpo
orres
capi
12 b
e de
arke
efitin
hligh
its
d Ja
grow
porta
y by
roug
is
our
pmen
ure 1
Nurz
tem
cons
expo
ndo
onet
a ex
ch a
othe
odity
fur
globa
r the
rter
spo
ital
beca
eclin
et c
ng ca
hts
s m
apan
wth
ant
y co
gh
stud
hyp
nt In
1> E
zana
m. A
sum
orts.
ones
thel
xpo
as o
er m
y pr
rthe
al fi
e pe
ha
nde
infl
ause
ne in
can
apit
tha
majo
n), in
sho
in
ount
trad
dy
poth
dica
Econ
ah / J
Abou
mptio
. In
sia
less
orts
il an
mine
rice
er
inan
eriod
s e
ed
ows
e of
n co
be
tal in
at In
or
n pa
ocks
Ind
tries
de
see
hese
ators
nomi
Journ
ut
on,
one
is m
s, as
rely
nd g
eral
cy
tha
ncia
d of
xpe
to
s. H
the
omm
e de
nflow
ndon
trad
artic
s fro
don
s th
and
en
es
s, Th
c Gr
nal of
65%
32
e as
more
s co
y sig
gas,
s,
cle
t
l ma
200
erien
hig
How
slo
mod
eve
ws.
nesi
ding
cula
om a
nesia
hat
d co
mos
is e
he W
rowt
of As
% o
2%
spec
e re
omm
gnifi
, pa
and
(W
imp
arke
09 –
nced
gh
weve
owdo
ity p
elope
ia g
g p
arly d
adv
a g
are
omm
stly
eco
World
th of
ian F
of t
fro
ct, th
esilie
mod
ican
alm o
d a
Warjiy
porta
et a
– 20
d hi
glob
er, t
own
price
ed
grow
partn
duri
anc
grow
mo
mod
fro
onom
d Ban
f Ind
Fina
the
om
his
ent
dity
ntly
oil,
are
yo,
ant
and
011
igh
bal
the
n in
es.
by
wth
ner
ing
ced
wth
ore
dity
om
mic
nk
one
nce,
sia a
Eco
resi
from
if d
trad
dem
dec
resu
dec
incr
pub
and
calc
in a
mak
dec
S
com
it
corp
term
will
inst
affe
to m
four
mar
in F
thei
take
and
com
and
nom
ilien
m th
own
ding
man
crea
ultin
cline
reas
blic
d ad
cula
a br
ke
crea
Simi
mmo
will
pora
ms o
tr
tituti
ect t
mea
r as
rket
Figu
ir c
e tw
d ca
mpo
Its M
mics a
nce
hem
ntur
g pa
nd o
ase
ng d
e is
ses
liste
djust
ation
road
hou
ase.
lar
odity
re
atio
of th
rigge
ions
the s
asur
spec
t, an
ure 2
contr
wo a
apita
site
Majo
and B
of o
, an
n ha
artne
of In
GD
decli
goi
No
ed c
t (lo
n. In
d sp
useh
flow
y re
edu
ns a
he f
er
s an
sou
re I
cts
nd fi
2. H
ribu
aspe
al m
e ind
or Tr
Busin
othe
nd e
app
er,
ndon
DP f
ine
ng t
on-P
comp
ower
n the
pectr
hold
w al
esult
ce
and
fede
cap
nd In
ndn
FSS
of I
inan
Howe
tion
ects
mark
dex
radin
ness
er ec
even
pene
con
nesi
from
of I
to d
Perfo
pan
ring
e ca
rum
ab
lso
ting
the
Ind
eral
pital
ndo
ness
S co
IFSS
ncia
eve
n to
s, na
ket p
(IHS
ng P
Vol
cono
ntua
ed in
nseq
an
m e
ndo
decr
orm
ies,
) th
ase
m wil
bility
app
the
e
done
fun
o
nes
s of
omp
S (b
l sy
r, d
Ind
ame
prox
SG)
artn
4 No
omie
ally i
n a
quen
goo
expo
ones
reas
ming
, it w
eir s
of h
ll de
y to
plies
e do
reve
esia
nds
outflo
sian
Ind
preh
ban
stem
ue t
don
ely
xied
).
ers 2
o2 (2
es a
t wi
cou
ntly
ods
ort s
sian
se th
Lo
will d
stoc
hou
ecre
con
s in
ownt
enu
an G
rate
ow
cap
one
hens
k, n
m in
to d
esia
ban
d by
2002
2017)
and
ll in
untr
it i
and
side
exp
heir
oan
dec
ck p
seh
ease
nsum
n oil
turn
ue
GDP
e (F
fro
pital
esian
sive
non-
nfras
data
an f
nking
y Ind
2-20
) 5-1
oil
flue
ry’s
s li
d/or
e, a
port
rep
(N
reas
price
hold
e pe
me
l pr
of
of
P in a
FFR
om
ma
n fin
ely w
-ban
stru
lim
fina
g as
done
014
17
pric
ence
eco
kely
ser
and
ter f
paym
PL)
se t
e wh
, the
er ca
and
ice,
oil p
co
a br
), th
Ind
arke
nanc
we
nk,
ctur
itati
ncia
spe
esia
ce af
e IFS
onom
y to
rvice
at
firms
men
), a
their
hich
e de
apit
d to
de
pric
omm
road
he i
don
et an
cial
sho
mo
res)
ion
al m
ct p
an S
ffec
SS.
my
o de
es t
the
s’ re
nt ca
and
r sto
is p
ecre
ta in
o pa
ema
ce, c
modi
der
ncre
esia
nd c
sys
ould
ney
as
and
mark
prox
Stoc
cting
To
of I
ecre
that
e sa
even
apa
if
ock
part
ease
ncom
ay t
nd
cons
ity
cov
ease
an
cons
stem
en
y an
can
d co
ket,
xied
ck E
g de
be
ndo
ease
t wil
ame
nue
bilit
they
valu
t of
e of
me w
their
sho
sequ
ex
vera
e of
fina
sequ
m. Id
com
nd c
n be
nsid
we
by
Exch
eman
clea
ones
e th
ll al
e tim
e. Th
ty th
y a
uatio
IHS
f GD
whi
r loa
ock
uen
port
ge.
f FF
anc
uen
deal
mpa
capit
e see
derin
e on
NP
hang
nd
ar,
sia
ey
so
me
his
hat
are
on
SG
DP
ch
an
of
tly
ter
In
FR
cial
tly
ly,
ss
tal
en
ng
nly
PL-
ge

Nika Pranata, Nurzanah / Journal of Asian Finance, Economics and Business Vol 4 No2 (2017) 5-17 7
Note. This figure is modified from illustration of Bank Indonesia definition of financial system stability
<Figure 2> IFSS and its External Factors Framework
Generally, the framework used is Autoregressive
Distributed Lag (ARDL) model to investigate magnitude of
the effect of external movement to IFSS, and
Orthogonalized Impulse Response Function (OIRF) to see
how IFSS response to external shocks with the dataset
used over the period Q4 2002 - Q2 2016, examining to what
extent external shocks, namely GDP China, U.S, and Japan,
oil prices and FFR impact on IFSS indicators, represented
by NPL and IHSG.
The paper is organized as follows. Section 2 is research
objectives. Section 3 highlights literature reviews. Section 4
presents data and research methods. Section 5 analyzes
empirical results and finally section 6 is conclusion and
policy recommendation.
2. Research Objectives
In this study, we intend to investigate how is the response
of IFSS to economic dynamics of Indonesia’s trade major
partners and other external factor shocks and how
vulnerable it is.
3. Literature Review
In the era where the world economies have been
integrated globally both in real and financial sectors, not
only does domestic shocks fluctuate domestic
macroeconomic but also by external ones. Almansour et al.
(2015) using structural VAR estimate the growth effects of
external factors and conclude that EMs remain vulnerable to

8 Nika Pranata, Nurzanah / Journal of Asian Finance, Economics and Business Vol 4 No2 (2017) 5-17
external shocks. Nguyen et al. (2014) also apply structural
VAR and IRF, investigating whether or not external shocks
play important role in macroeconomic fluctuations of East
Asian countries over the period 2001-2012. Authors find that
the trade impact of the U.S. in Southeast Asia has been
imparted through China. Bermingham and Conefrey (2014)
employ VAR and IRF analysis to assess the slowdown on
mortgage delinquency in Irish. Their results further suggest
that a negative shock to U.S GDP growth impacts on an
increase in number of mortgages. Cashin et al. (2016)
studies how shocks to China’s GDP are spread
internationally using global VAR over period Q1 1981 to Q1
2013. Additionally, Horvath, Rusnák, & others (2009) focus
on responses of small open economy to external shocks,
study case in Slovakia using VAR model and IRF analysis.
Their findings show that external shocks are very important
source in fluctuations of Slovak price level. Another study
case in Croatia done by Krznar, Kunovac, and others, (2010)
finds similar result with Horvath et al. (2009) that external
shocks impact on domestic economic activity and prices.
Finally, Aghion, Bacchetta, and Banerjee (2004) emphasize
the role of financial sectors to small open economies as
determinant factors affecting instability through capital
liberalization, assuming firms facing credit constraint.
Some key important indicators of external shocks are
advanced economies’ GDP, oil price and FFR. In the
context of small open economy framework, the degree of
openness is attributed by the part of GDP, reflecting the
amount of export. GDP movements can be used to identify
the demand shocks (Krznar et al., 2010), the extent to which
these shocks are responsible for volatility in financial market.
Furthermore, role of financial sectors can be as important as
determinants of instability in which funding sources
potentially increase the response to shocks and the scope
for volatility (Aghion et al., 2004). They assume firms facing
financial constraints with the constraint being tighter at a
lower level of financial development, full capital account
liberalization therefore may destabilize the economy.
Nations need to improve the risk-management procedures
and to maintain the external debt at sustainable levels in
response to rising Non-Performing Loans (NPL).
Additionally, capital market enables economic agents to
pool, price and exchange risk. To extent, countries with
deeper capital market face less severe business cycle
output contraction and lower chances of an economic
downturn compared to those with less developed capital
market (Tharavanij, 2007).
Furthermore, the oil price affects the domestic
macroeconomic fluctuations through global supply and
demand for oil by the fact that the fourth largest oil
consuming countries in 2014 were the U.S, China, Japan
and India, consecutively (Khan & Ahmed, 2011; Nguyen et
al., 2014; Ratti & Vespignani, 2016). Besides the oil prices
have a simultaneous impact on U.S real output and U.S
monetary policy (Leeper, Sims, Zha, Hall, & Bernanke,
1996), that when a positive oil-price shock happens, real
GDP declines and the overall price level increases (Cavallo,
Wu, & others, 2012). The FFR influences EMs economies
through trade channel for the U.S is reported as the second
largest importer after euro area and the third largest
exporter after the euro and China. Known as the world’s
dominant economy in term of proportion in global GDP and
its financial markets account the largest, reflecting both of
the size and depth of the economy. In particular,
correlations across national stock markets are highest when
the U.S. stock market is declining.
Vector Autoregression (VAR) and Impulse Response
Function (IRF) models have been applied broadly in
macroeconomics. In the context of a small open economy, a
VAR is used to identify the impact of external shocks to
financial stability; to what extent macroeconomics
fluctuations in the EMs are affected by external shocks; IRF
is used to estimate size of external spillover effects
(Bermingham & Conefrey, 2014; Cashin et al., 2016;
Horvath et al., 2009; Krznar et al., 2010; Maćkowiak, 2007;
Nguyen et al., 2014). The contributions of this paper are the
following. To our knowledge, no other research addresses
the determinants of IFSS indicators (NPL and IHSG) to
economic dynamics of Indonesia’s trade major partners
(The U.S, Japan and China) and other external factor
shocks (oil prices and FFR). Not only using IRF, the results
of our model is also obtained by implementing a different
approach that is ARDL model. The use of ARDL analysis
has the advantage that, (1) settles endogeneity issues
(Pesaran & Shin, 1999; Pesaran, Shin, & Smith, 2001); (2)
determines cointegration of small sample cases (Tang,
2003); (3) captures both long run and short run coefficients
through its bound test and conditional unrestricted error
correction model (UECM); and (4) allows independent
variables to have different number of lags.
4. Data and Research Methods
Using quarterly data over the period of Q4 2002 to Q1
2016, this study analyzes the response of Indonesia’s
financial system stability to external shocks.
Furthermore, models implemented in this study are as
follows:
����� �
�� �
�����
�� �
�� ��
����
�����
�
� ������������
����
����
�
� �����
�� �
�
(1)
Nika Pranata, Nurzanah / Journal of Asian Finance, Economics and Business Vol 4 No2 (2017) 5-17 9
���� ����
�� �
�����
�� �
�� ��
����
�����
�
���������������
����
����
�
�������
����
�
(2)
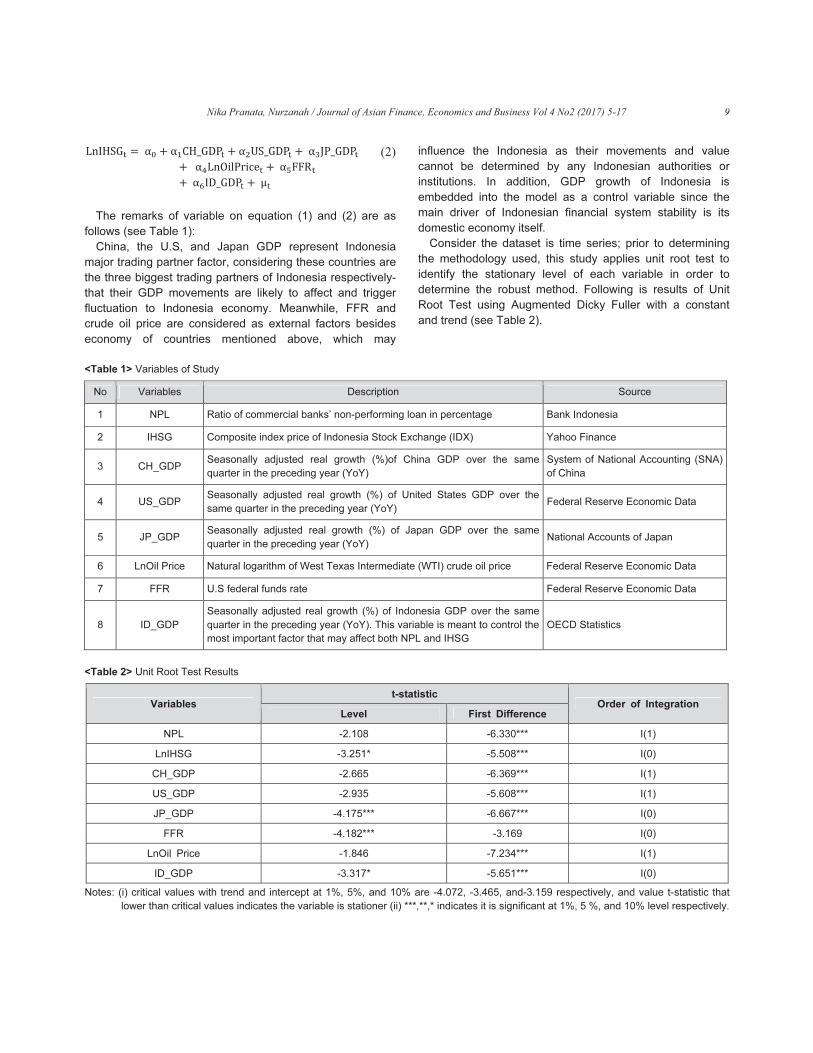
The remarks of variable on equation (1) and (2) are as
follows (see Table 1):
China, the U.S, and Japan GDP represent Indonesia
major trading partner factor, considering these countries are
the three biggest trading partners of Indonesia respectively-
that their GDP movements are likely to affect and trigger
fluctuation to Indonesia economy. Meanwhile, FFR and
crude oil price are considered as external factors besides
economy of countries mentioned above, which may
influence the Indonesia as their movements and value
cannot be determined by any Indonesian authorities or
institutions. In addition, GDP growth of Indonesia is
embedded into the model as a control variable since the
main driver of Indonesian financial system stability is its
domestic economy itself.
Consider the dataset is time series; prior to determining
the methodology used, this study applies unit root test to
identify the stationary level of each variable in order to
determine the robust method. Following is results of Unit
Root Test using Augmented Dicky Fuller with a constant
and trend (see Table 2).
<Table 1> Variables of Study
No Variables Description Source
1 NPL Ratio of commercial banks’ non-performing loan in percentage Bank Indonesia
2 IHSG Composite index price of Indonesia Stock Exchange (IDX) Yahoo Finance
3 CH_GDP
Seasonally adjusted real growth (%)of China GDP over the same
quarter in the preceding year (YoY)
System of National Accounting (SNA)
of China
4 US_GDP
Seasonally adjusted real growth (%) of United States GDP over the
same quarter in the preceding year (YoY)
Federal Reserve Economic Data
5 JP_GDP
Seasonally adjusted real growth (%) of Japan GDP over the same
quarter in the preceding year (YoY)
National Accounts of Japan
6 LnOil Price Natural logarithm of West Texas Intermediate (WTI) crude oil price Federal Reserve Economic Data
7 FFR U.S federal funds rate Federal Reserve Economic Data
8 ID_GDP
Seasonally adjusted real growth (%) of Indonesia GDP over the same
quarter in the preceding year (YoY). This variable is meant to control the
most important factor that may affect both NPL and IHSG
OECD Statistics
<Table 2> Unit Root Test Results
Notes: (i) critical values with trend and intercept at 1%, 5%, and 10% are -4.072, -3.465, and-3.159 respectively, and value t-statistic that
lower than critical values indicates the variable is stationer (ii) ***,**,* indicates it is significant at 1%, 5 %, and 10% level respectively.
Variables
t-statistic
Order of Integration
Level First Difference
NPL -2.108 -6.330*** I(1)
LnIHSG -3.251* -5.508*** I(0)
CH_GDP -2.665 -6.369*** I(1)
US_GDP -2.935 -5.608*** I(1)
JP_GDP -4.175*** -6.667*** I(0)
FFR -4.182*** -3.169 I(0)
LnOil Price -1.846 -7.234*** I(1)
ID_GDP -3.317* -5.651*** I(0)

10 Nika Pranata, Nurzanah / Journal of Asian Finance, Economics and Business Vol 4 No2 (2017) 5-17
From the above result, we can see that all of variables are
stationer either at I(0) or at I(1). Therefore, we can apply
Autoregressive Distributed Lag (ARDL) as the methodology
as Pesaran et al. (2001) stated that ARDL can be used for
set of variables with different order of stationary as long as it
does not exceed first difference level of stationary, whereas
Johansen’s cointegration only allows same difference order.
Then the next step is to identify the long run relationship
by estimating the following ARDL representation of equation
for both NPL and IHSG as dependent variables:
��������
����
�����
��
�
��
����� ��
��
�
��
��������
��
�
��
��������������
��
�
��
�������
��
�
��
���������
��
�
��
� �����
���
� ������
���� �
�� ��
���
��������
������
���������
���
� ����
������
�����
������
�
(3)
���� ����
�� ���
�� ��
��
�
��
��������
��
�
��
��������������
��
�
��
�������
��
�
��
���������
��
�
��
� �����
���
� �����
����
�� ��
���
�������
�����
���������
���
� ���
����
�����
������
�
(4)
Where � is first difference of related variables, �0 is
intercept, p is optimal lag length, and μt is white noise
residuals.
Furthermore, the bound test under Pesaran et al. (2001)
is used to investigate the presence of long run relationship
between dependent variable and joint independent variables.
The bound test is basically based on F-test method. The null
and alternative hypotheses both for NPL and IHSG as
dependent variables are as follows respectively:
<H0> β1 = β2 = β3 = β4 = β5 = β6 = β7 = 0, i.e.,
no presence of long run relationship;
<H1> β1 ≠β2 ≠β3 ≠β4 ≠β5 ≠β6 ≠β7 ≠0, i.e., there
is a long run relationship between
dependent variable and joint independent
variables.
(5)
<H0> 1 = 2 = 3 = 4 = 5 = 6 = 7 = 0,
i.e., no presence of long run relationship;
<H1> 1 ≠ 2 ≠ 3 ≠ 4 ≠ 5 ≠ 6 ≠ 7 ≠ 0,
i.e., there is a long run relationship
between dependent variable and joint
independent variables.
(6)
Moreover, the ARDL bound test applies Wald-test (F-
statistic). Pesaran et al. (2001) provides two critical values
which are I(0) or lower critical bound and I(1) or upper
bound. The former assumes that there is no cointegration or
long run relationship between dependent variable and joint
independent variables, whereas the latter assumes
otherwise. In short, if the F-statistic value exceeds I(1) or
upper bound, it implies that there is a long relationship
among variables. If the F-statistic value is below I(0), it
means otherwise; other than the F-test that has a value in
between I(0) and I(1) cannot be concluded.
The next step is to investigate short run elasticity between
dependent variable and independent variables. This is
implemented by running ARDL Error Correction Model from
equation (3) and (4) expressed as follows respectively:
��������
����
�����
��
�
��
�������
�����
�
��
������� ��
��
�
��
���������
��
�
��
���������������
��
�
��
�������
��
�
��
���������
��
�
��
� ������
� ��
(7)
����� ����
��������
��
�
��
��������
��
�
��
���� ����
�
��
��������
��
�
��
��������������
��
�
��
������
��
�
��
��������
��
�
��
� ������
����
(8)
Nika Pranata, Nurzanah / Journal of Asian Finance, Economics and Business Vol 4 No2 (2017) 5-17 11
Where λ is the speed of adjustment parameter, and EC is
residuals estimated form cointegration model of equation (2).
In addition, we adopted Orthogonalized Impulse
Response Function (OIRF) in order to capture the response
of Indonesian financial system stability indicators (in this
paper represented by NPL and IHSG) to one standard
deviation shock of each external factor over specific period
of time.
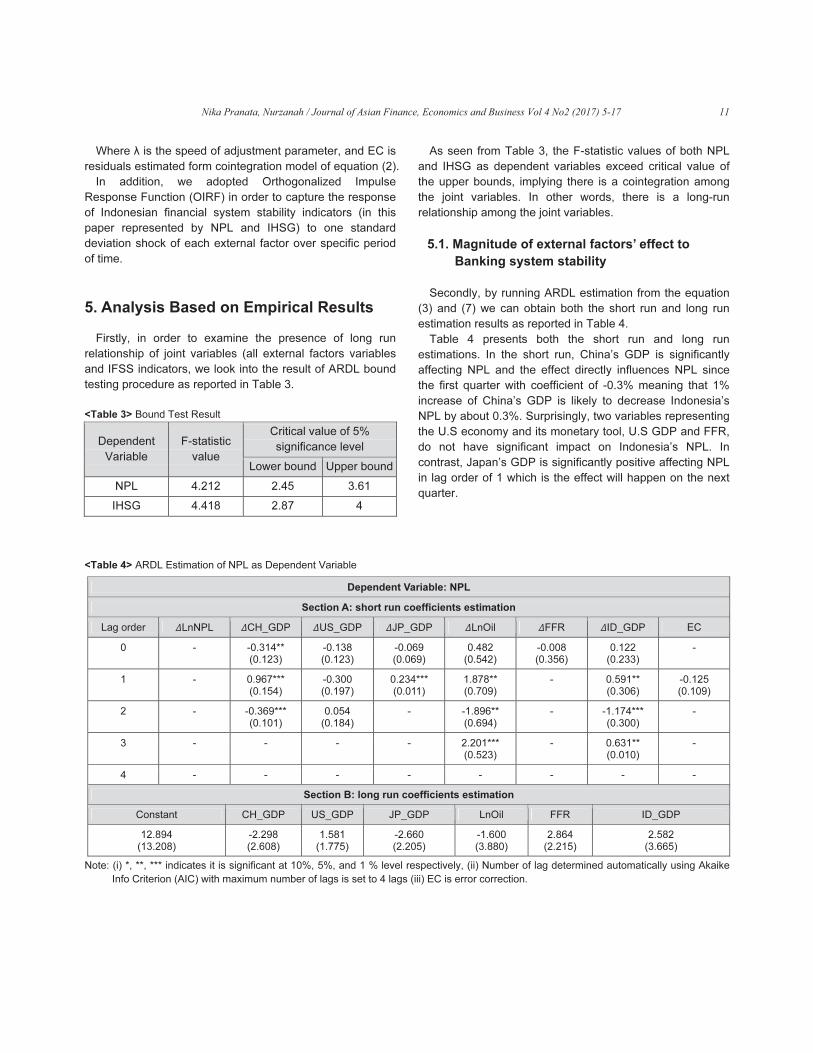
5. Analysis Based on Empirical Results
Firstly, in order to examine the presence of long run
relationship of joint variables (all external factors variables
and IFSS indicators, we look into the result of ARDL bound
testing procedure as reported in Table 3.
<Table 3> Bound Test Result
Dependent
Variable
F-statistic
value
Critical value of 5%
significance level
Lower bound Upper bound
NPL 4.212 2.45 3.61
IHSG 4.418 2.87 4
As seen from Table 3, the F-statistic values of both NPL
and IHSG as dependent variables exceed critical value of
the upper bounds, implying there is a cointegration among
the joint variables. In other words, there is a long-run
relationship among the joint variables.
5.1. Magnitude of external factors’ effect to
Banking system stability
Secondly, by running ARDL estimation from the equation
(3) and (7) we can obtain both the short run and long run
estimation results as reported in Table 4.
Table 4 presents both the short run and long run
estimations. In the short run, China’s GDP is significantly
affecting NPL and the effect directly influences NPL since
the first quarter with coefficient of -0.3% meaning that 1%
increase of China’s GDP is likely to decrease Indonesia’s
NPL by about 0.3%. Surprisingly, two variables representing
the U.S economy and its monetary tool, U.S GDP and FFR,
do not have significant impact on Indonesia’s NPL. In
contrast, Japan’s GDP is significantly positive affecting NPL
in lag order of 1 which is the effect will happen on the next
quarter.
<Table 4> ARDL Estimation of NPL as Dependent Variable
Dependent Variable: NPL
Section A: short run coefficients estimation
Lag order �LnNPL �CH_GDP �US_GDP �JP_GDP �LnOil �FFR �ID_GDP EC
0 - -0.314**
(0.123)
-0.138
(0.123)
-0.069
(0.069)
0.482
(0.542)
-0.008
(0.356)
0.122
(0.233)
-
1 - 0.967***
(0.154)
-0.300
(0.197)
0.234***
(0.011)
1.878**
(0.709)
- 0.591**
(0.306)
-0.125
(0.109)
2 - -0.369***
(0.101)
0.054
(0.184)
-
-1.896**
(0.694)
- -1.174***
(0.300)
-
3 - - - - 2.201***
(0.523)
- 0.631**
(0.010)
-
4 - - - - - - - -
Section B: long run coefficients estimation
Constant CH_GDP US_GDP JP_GDP LnOil FFR ID_GDP
12.894
(13.208)
-2.298
(2.608)
1.581
(1.775)
-2.660
(2.205)
-1.600
(3.880)
2.864
(2.215)
2.582
(3.665)
Note: (i) *, **, *** indicates it is significant at 10%, 5%, and 1 % level respectively, (ii) Number of lag determined automatically using Akaike
Info Criterion (AIC) with maximum number of lags is set to 4 lags (iii) EC is error correction.

12 Nika Pranata, Nurzanah / Journal of Asian Finance, Economics and Business Vol 4 No2 (2017) 5-17
Note: Trade share is calculated as (tij/TI), where tij is the total trade of Indonesia with country “j” and TI is the total international trade of
Indonesia.
<Figure 3> Trade share of Indonesia’s major trading partner with Indonesia over Total of Indonesia’s international trade
If we look at Figure 3, reasons behind the different effect
of each country are simply as follows: (1) the increase of
China’s GDP is significantly decreasing Indonesia’s banking
NPL, the extent to which because over the years share of
China’s trade with Indonesia to Indonesia’s total
international trade was increasing about 125% from 2002 to
2014, (2) the U.S’s GDP does not significantly affect NPL of
Indonesian banking due to the share of Indonesia trade with
the U.S did not differ much over that period, and (3) the
effect of Japan’s GDP is contrary to the effect of China that
Indonesia trade share with Japan was constantly declining.
Japan is losing more than a third of its total trade share with
Indonesia over the period of 2002 to 2014. That declining
trend share does not merely mean Japan has no important
role to Indonesian economy, yet because Japan has
changed its strategy instead from trade oriented to
investment oriented in relation with ASEAN countries. For
instance, Japanese automotive companies have built
factories in ASEAN countries during that period.
Consequently, Indonesia automatically reduced the number
of vehicles imported from Japan since it produced
domestically in Indonesia, yet it did not count as Japan’s
export instead of it increased Japan’s GNI (Gross National
Income).
Interestingly, among other external factors, oil price
movement has shown the largest effect to Indonesian NPL
with coefficient of -1.9% from two lag order, meaning 1%
increase in current world crude oil price is expected to
decrease NPL by approximately 1.9% in the next two
quarters. This is because within the period of the study
Indonesia’s oil and gas export ratio to total export is large,
averaged approximately 20% of total export, that did not
even include mining and agriculture commodities which both
affect directly e.g., coal that is substitute product of oil. The
decrease of oil price is likely followed by the decline of coal
price, and indirectly affects other mining and agriculture
commodities e.g., gold, crude palm oil, and etc.
This also strengthen by the fact that within the last decade
which is mostly covered by the period of study, commodities
(which the price of them are generally adjusting crude oil
price) has become one of growth engines for Indonesia,
besides there is also so called 2000s commodity boom
where price of crude oil increased dramatically since 2000
and peaked to USD 140 per barrel in Q2 2008. As a
consequence, in that period, Indonesia’s economic growth
also rose steadily and hit 6.3% growth before it began to fall
gradually starting from 2014 in line with the constant
decrease of oil price which bottomed to USD 28.5 in the
beginning of 2016 caused by slower demand of energy from
China and world awareness to use clean energy. This also
triggered slower economic growth of Indonesia which
consequently increases banking non-performing loan ratio
as also supported by Khandelwal, Miyajima, & Santos (2016)
and Miyajima (2016) that stated downturn in oil price could
lead to slower credit and deposit growth and the increase of
NPL.
In terms of long run, there is no significant effect of any
external factors covered in the model. This is because the
effect of external factors to Indonesian banking stability
system is immediately experienced in the short time.
0.00%
5.00%
10.00%
15.00%
20.00%
25.00%
2002 2003 2004 2005 2006 2007 2008 2009 2010 2011 2012 2013 2014
Trade Share
Share of Indonesia's Trade with its major partners
China Japan US

Nika Pranata, Nurzanah / Journal of Asian Finance, Economics and Business Vol 4 No2 (2017) 5-17 13
5.2. Response of NPL to external factors’ shock
By implementing Orthogonolized Impulse Response
Function (OIRF), below is the result of the response of NPL
to external factors’ shock.
<Figure 4> Response of NPL to external factors’ shock
-.5
0
.5
1
0 5 10
Response of NPL to China's GDP Shock
95% CI orthogonalized irf
Quarter
Graphs by irfname, impulse variable, and response variable
-.5
0
.5
1
0 5 10
Response of NPL to US' GDP Shock
95% CI orthogonalized irf
step
Graphs by irfname, impulse variable, and response variable
-.5
0
.5
1
0 5 10
Response of NPL to Japan's GDP Shock
95% CI orthogonalized irf
step
Graphs by irfname, impulse variable, and response variable
-.4
-.2
0
.2
0 5 10
Response of NPL to US Federal Fund Rate's Shock
95% CI orthogonalized irf
step
Graphs by irfname, impulse variable, and response variable
-.05
0
.05
.1
.15
0 5 10
Response of NPL to Crude Oil Price's Shock
95% CI orthogonalized irf
step
Graphs by irfname, impulse variable, and response variable
14 Nika Pranata, Nurzanah / Journal of Asian Finance, Economics and Business Vol 4 No2 (2017) 5-17
Figure 4 indicates that in terms of other countries’
economy factor, China’s GDP shock has the steepest
impulse meaning it has the largest effect; an increase in
China GDP will cause NPL to decrease starting from the 2nd
quarter after the increase of GDP until the effect dies out on
the 5th
quarter. In addition, regarding the longest effect of
external shock to NPL is given by oil price. From the figure 4
we can see that the decrease even does not stop on the
10th
quarter which is our maximum lag period.
5.3. Magnitude of external factors’ effect to
Banking system stability Index
By running ARDL estimation from the equation (4) and (8)
we can get both short run and long run estimation result as
reported in Table 5.
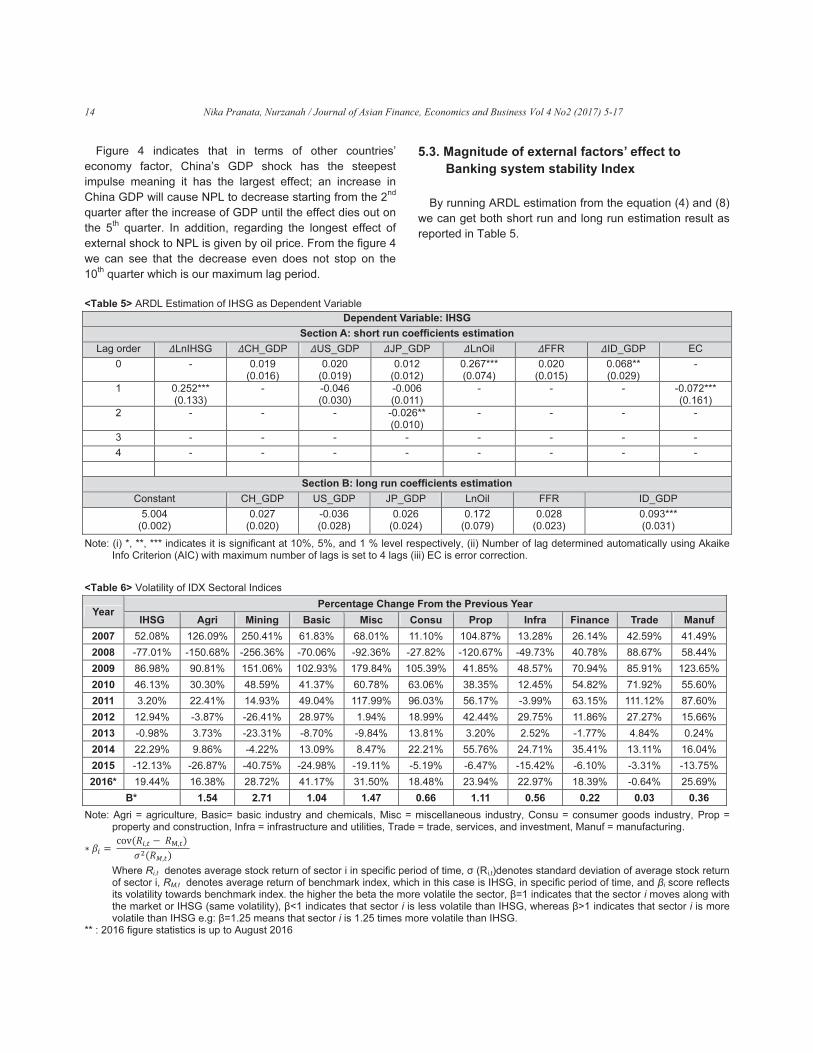
<Table 5> ARDL Estimation of IHSG as Dependent Variable
Dependent Variable: IHSG
Section A: short run coefficients estimation
Lag order �LnIHSG �CH_GDP �US_GDP �JP_GDP �LnOil �FFR �ID_GDP EC
0 - 0.019
(0.016)
0.020
(0.019)
0.012
(0.012)
0.267***
(0.074)
0.020
(0.015)
0.068**
(0.029)
-
1 0.252***
(0.133)
- -0.046
(0.030)
-0.006
(0.011)
- - -
-0.072***
(0.161)
2 - - - -0.026**
(0.010)
- - - -
3 - - - - - - - -
4 - - - - - - - -
Section B: long run coefficients estimation
Constant CH_GDP US_GDP JP_GDP LnOil FFR ID_GDP
5.004
(0.002)
0.027
(0.020)
-0.036
(0.028)
0.026
(0.024)
0.172
(0.079)
0.028
(0.023)
0.093***
(0.031)
Note: (i) *, **, *** indicates it is significant at 10%, 5%, and 1 % level respectively, (ii) Number of lag determined automatically using Akaike
Info Criterion (AIC) with maximum number of lags is set to 4 lags (iii) EC is error correction.
<Table 6> Volatility of IDX Sectoral Indices
Year
Percentage Change From the Previous Year
IHSG Agri Mining Basic Misc Consu Prop Infra Finance Trade Manuf
2007 52.08% 126.09% 250.41% 61.83% 68.01% 11.10% 104.87% 13.28% 26.14% 42.59% 41.49%
2008 -77.01% -150.68% -256.36% -70.06% -92.36% -27.82% -120.67% -49.73% 40.78% 88.67% 58.44%
2009 86.98% 90.81% 151.06% 102.93% 179.84% 105.39% 41.85% 48.57% 70.94% 85.91% 123.65%
2010 46.13% 30.30% 48.59% 41.37% 60.78% 63.06% 38.35% 12.45% 54.82% 71.92% 55.60%
2011 3.20% 22.41% 14.93% 49.04% 117.99% 96.03% 56.17% -3.99% 63.15% 111.12% 87.60%
2012 12.94% -3.87% -26.41% 28.97% 1.94% 18.99% 42.44% 29.75% 11.86% 27.27% 15.66%
2013 -0.98% 3.73% -23.31% -8.70% -9.84% 13.81% 3.20% 2.52% -1.77% 4.84% 0.24%
2014 22.29% 9.86% -4.22% 13.09% 8.47% 22.21% 55.76% 24.71% 35.41% 13.11% 16.04%
2015 -12.13% -26.87% -40.75% -24.98% -19.11% -5.19% -6.47% -15.42% -6.10% -3.31% -13.75%
2016* 19.44% 16.38% 28.72% 41.17% 31.50% 18.48% 23.94% 22.97% 18.39% -0.64% 25.69%
Β* 1.54 2.71 1.04 1.47 0.66 1.11 0.56 0.22 0.03 0.36
Note: Agri = agriculture, Basic= basic industry and chemicals, Misc = miscellaneous industry, Consu = consumer goods industry, Prop =
property and construction, Infra = infrastructure and utilities, Trade = trade, services, and investment, Manuf = manufacturing.
� ����
����������
����
��
�����
Where Ri,t denotes average stock return of sector i in specific period of time, σ (Ri,t)denotes standard deviation of average stock return
of sector i, RM,t denotes average return of benchmark index, which in this case is IHSG, in specific period of time, and βi score reflects
its volatility towards benchmark index. the higher the beta the more volatile the sector, β=1 indicates that the sector i moves along with
the market or IHSG (same volatility), β<1 indicates that sector i is less volatile than IHSG, whereas β>1 indicates that sector i is more
volatile than IHSG e.g: β=1.25 means that sector i is 1.25 times more volatile than IHSG.
** : 2016 figure statistics is up to August 2016
Nika Pranata, Nurzanah / Journal of Asian Finance, Economics and Business Vol 4 No2 (2017) 5-17 15
Regarding short run effect, interestingly we can see that
the only external factor that significant is oil price with the
coefficient of 0.27% implying that 1% increase of crude oil
price is expected to increase IHSG by 0.26%. This is
because mining sector, which its performance heavily
affected by oil price, is the most volatile sector in IDX in
period of 2007 to 2016 as can be seen its beta (β) higher
than any other sectors (the higher the beta the more volatile
the sector) (see Table 6).
Similar to effect of external factors to NPL, in the long run
there is no single external factor that has a long run impact
to IHSG. The only variable matters in the long run is
economic resilience of Indonesia itself which in this study
measured by GDP growth.
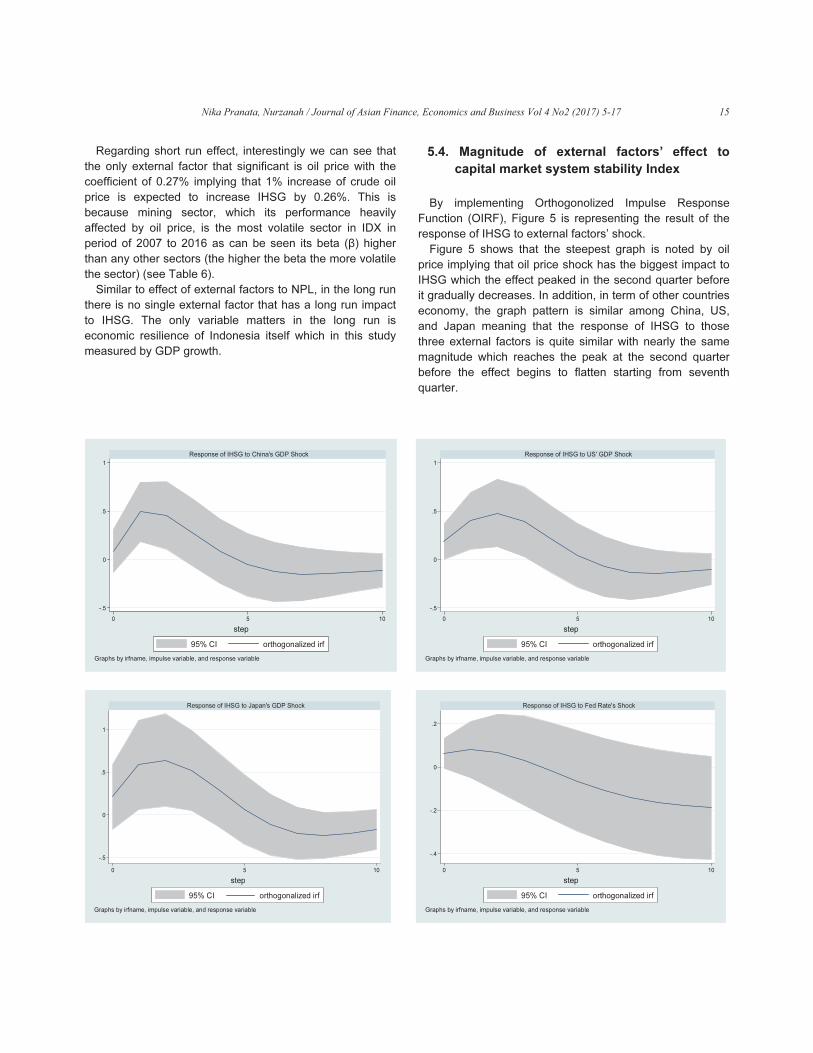
5.4. Magnitude of external factors’ effect to
capital market system stability Index
By implementing Orthogonolized Impulse Response
Function (OIRF), Figure 5 is representing the result of the
response of IHSG to external factors’ shock.
Figure 5 shows that the steepest graph is noted by oil
price implying that oil price shock has the biggest impact to
IHSG which the effect peaked in the second quarter before
it gradually decreases. In addition, in term of other countries
economy, the graph pattern is similar among China, US,
and Japan meaning that the response of IHSG to those
three external factors is quite similar with nearly the same
magnitude which reaches the peak at the second quarter
before the effect begins to flatten starting from seventh
quarter.
-.5
0
.5
1
0 5 10
Response of IHSG to China's GDP Shock
95% CI orthogonalized irf
step
Graphs by irfname, impulse variable, and response variable
-.5
0
.5
1
0 5 10
Response of IHSG to US' GDP Shock
95% CI orthogonalized irf
step
Graphs by irfname, impulse variable, and response variable
-.5
0
.5
1
0 5 10
Response of IHSG to Japan's GDP Shock
95% CI orthogonalized irf
step
Graphs by irfname, impulse variable, and response variable
-.4
-.2
0
.2
0 5 10
Response of IHSG to Fed Rate's Shock
95% CI orthogonalized irf
step
Graphs by irfname, impulse variable, and response variable

16 Nika Pranata, Nurzanah / Journal of Asian Finance, Economics and Business Vol 4 No2 (2017) 5-17
6. Conclusion and Policy
Recommendations
The study tries to test the vulnerability of Indonesia's
financial system stability on external shocks using an ARDL
and OIRF framework with quarterly data over the period Q4
2002 to Q1 2016. Results are the following. First, oil price
responses emerged the largest and the longest effect to
Indonesia financial stability system, represented by NPL and
IHSG. Second, only China’s economic growth has
significantly positive effect to Indonesia financial stability
system.
Finally, according to the analysis and empirical results
there are some recommendations which should be better to
be implemented by Indonesian authorities to improve the
soundness of Indonesian financial system. First, considering
oil price has the largest effect to IFSS, Indonesia should
diversify its international trade product commodities by
decreasing share of oil, gas, and mining export share and
boosting other potential sectors such as manufacture, and
fisheries.
Second, taking into account the spillover effect of recent
downturn of oil price followed by low coal price that threaten
the balance sheet (financial balance) of Indonesia large coal
exporter companies (such as Adaro, PT Bukit Asam, Indo
Tambang Raya Megah, etc.) government should think
carefully and have win-win solution to ensure the survival of
those companies without neglecting burden of national
budget, a good example of such kind of policy is the recent
project of 35,000 Mega Watt which involving those
companies as the electricity supplier by giving them share of
the target by allowing them to build power plant and giving
subsidy to the price of electricity paid by consumers. The
bankruptcy of those companies will lead to vulnerability of
IFSS from both aspects of corporation and household
considering they are labor intensive companies.
Third, to buffer demand shock from specific country,
particularly in this study is China, it is better for government
authority establish policies that attract Indonesian exporter
firms’ to geographically diversify their country markets
especially to ASEAN countries as it currently is benefiting
them with the presence of ASEAN Economic Community
(AEC) Agreements. In addition, this Intra-Regional
Geographical Diversification buffer has proven able to
lowering the volatility of international trade output (Brixiová,
Meng, & Ncube, 2015; Newfarmer, Shaw, & Walkenhorst,
2009).
References
Aghion, P., Bacchetta, P., & Banerjee, A. (2004). Financial
development and the instability of open economies.
Journal of Monetary Economics, 51(6), 1077–1106.
https://doi.org/10.1016/j.jmoneco.2003.12.001
Almansour, A., Aslam, A., Bluedorn, J., & Duttagupta, R.
(2015). How vulnerable are emerging markets to
external shocks?. Journal of Policy Modeling, 37(3),
460–483.
<Figure 5> Response of IHSG to external factors’ shock
0
.05
.1
.15
0 5 10
Response of IHSG to Oli Price's Shock
95% CI orthogonalized irf
step
Graphs by irfname, impulse variable, and response variable

Nika Pranata, Nurzanah / Journal of Asian Finance, Economics and Business Vol 4 No2 (2017) 5-17 17
https://doi.org/10.1016/j.jpolmod.2015.03.009
Bank Indonesia (2015). Economic report on Indonesia.
Jakarta: Indonesia: Bank Indonesia.
Bermingham, C., & Conefrey, T. (2014). The Irish
macroeconomic response to an external shock with
an application to stress testing. Journal of Policy
Modeling, 36(3), 454–470.
Brixiová, Z., Meng, Q., & Ncube, M. (2015). Can Intra-
Regional Trade Act as a Global Shock Absorber in
Africa?
Cashin, P. A., Mohaddes, K., & Raissi, M. (2016). China’s
Slowdown and Global Financial Market Volatility: Is
World Growth Losing Out?. International Monetary
Fund Working Paper WP/16/63. Retrieved from
https://www.imf.org/external/pubs/ft/wp/2016/wp1663.
Cavallo, M., & Wu, T. (2012). Measuring oil-price shocks
using market-based information. International
Monetary Fund Working Paper WP/12/19. Retrieved
from https://www.imf.org/external/pubs/cat/longres.
aspx?sk=25658.0
Horvath, R., Rusnák, M., & others. (2009). How important
are foreign shocks in small open economy? The case
of Slovakia. Global Economy Journal, 9(1), 1524–
1561.
International Monetary Fund. (2016). Economic Outlook
Update. Washington.
Khan, M. A., & Ahmed, A. (2011). Macroeconomic effects of
global food and oil price shocks to the Pakistan
economy: a Structural Vector Autoregressive (SVAR)
analysis. The Pakistan Development Review, 491–
511.
Khandelwal, P., Miyajima, M. K., & Santos, M. A. O. (2016).
The Impact of Oil Prices on the Banking System in the
GCC. International Monetary Fund Working Paper
WP/16/161. Retrieved from https://www.imf.org/
external/pubs/ft/wp/2016/wp16161.pdf
Krznar, I., Kunovac, D., & others. (2010). Impact of external
shocks on domestic inflation and GDP. CNB
Occasional Pulications Working Papers 26. Retrieved
from http://nbhnetra.hnb.hr/publikac/istrazivanja/w-
026.pdf
Leeper, E. M., Sims, C. A., Zha, T., Hall, R. E., & Bernanke,
B. S. (1996). What does monetary policy do?.
Brookings Papers on Economic Activity, 1996(2), 1–
78.
Maćkowiak, B. (2007). External shocks, US monetary policy
and macroeconomic fluctuations in emerging markets.
Journal of Monetary Economics, 54(8), 2512–2520.
Miyajima, K. (2016). An Empirical Investigation of Oil-Macro-
Financial Linkages in Saudi Arabia. International
Monetary Fund Working Paper WP/16/22. Retrieved
from https://www.imf.org/external/pubs/cat/longres.
aspx?sk=43702.0
Newfarmer, R., Shaw, W., & Walkenhorst, P. (2009).
Breaking into new markets: Emerging lessons for
export diversification. Washington, DC: World Bank.
Retrieved from http://documents.worldbank.org/
curated/en/821641468323336000/Breaking-into-new-
markets-emerging-lessons-for-export-diversification
Nguyen, T. L. H., Tran, T. G., & Le, T. H. M. (2014). The
impact of external shocks on small open economies:
Evidence from east asian countries. International
Journal of Economics and Finance, 6(2), 206-217.
http://dx.doi.org/10.5539/ijef.v6n2p206
Pesaran, M. H., Shin, Y. (1999). An autoregressive
distributed lag modelling approach to cointegration
analysis. In Econometrics and Economic Theory in the
20th Century: The Ragnar Frisch Centennial
Symposium. (pp.1–31). https://doi.org/10.1017/
CCOL521633230
Pesaran, M. H., Shin, Y., & Smith, R. J. (2001). Bounds
testing approaches to the analysis of long run
relationships. Journal of Applied Econometric, 16,
289–326. https://doi.org/10.1002/jae.616
Ratti, R. A., & Vespignani, J. L. (2016). Oil prices and global
factor macroeconomic variables. Energy Economics,
59, 198–212.
Tang, T. C. (2003). Japanese aggregate import demand
function: reassessment from the bounds testing
approach. Japan and the World Economy, 15(4), 419–
436.
Tharavanij, P. (2007). Capital Market, Severity of Business
Cycle, and Probability of an Economic Downturn.
MPRA Paper No. 4953.
Warjiyo, P. (2015). Indonesia: Global Spillover and Policy
Response. in Reuven Glick and Mark M. Spiegel
(Eds.). Policy Challenges in a Diverging Global
Economy. (pp.349-369). Asia Economic Policy
Conference, November 19–20, 2015. San Francisco,
California: The Federal Reserve Bank of San
Francisco. Retrieved from http://www.frbsf.org/
economic-research/files/Warjiyo-AEPC-2015.pdf

18 Nika Pranata, Nurzanah / Journal of Asian Finance, Economics and Business Vol 4 No2 (2017) 5-17
Abdelghani Echchabi, Dhekra Azouzi / Journal of Asian Finance, Economics and Business Vol 4 No2 (2017) 19-86 19
Print ISSN: 2288-4637 / Online ISSN 2288-4645
doi:10.13106/jafeb.2017.vol4.no2.19
Oil Price Fluctuations and Stock Market Movements:
An Application in Oman
Abdelghani Echchabi1
, Dhekra Azouzi2
Received: February 25, 2017. Revised: March 27, 2017. Accepted: May 2, 2017.
Abstract
It is undisputable that crude oil and its price fluctuations are major components that affect most of the countries’ economies. Recent studies
have demonstrated that beside the impact that crude oil price fluctuations have on common macroeconomic indicators like gross domestic
product (GDP), inflation rates, exchange rates, unemployment rate, etc., it also has a strong influence on stock markets and their
performance. This relationship has been examined in a number of settings, but it is yet to be unraveled in the Omani context. Accordingly,
the main purpose of this study is to examine the possible effect of the oil price fluctuations on stock price movements. The study applies
Toda and Yamamoto’s (1995) Granger non-causality test on the daily Oman stock index (Muscat Securities Market Index) and oil prices
between the period of 2 January 2003 and 13 March 2016. The results indicated that the oil price fluctuations have a significant impact on
stock index movements. However, the stock price movements do not have a significant impact on oil prices. These findings have significant
implications not only for the Omani economy but also for the economy of similar countries, particularly in the Gulf Cooperation Council (GCC)
countries. The latter should carefully consider their policies and strategies regarding crude oil production and the generated income
allocation as it might potentially affect the financial markets performance in these countries.
Keywords: Oil Price, Muscat Stock Exchange, Toda and Yamamoto, Oman.
JEL Classification Code: B26, C22, E44, G14.
1. Introduction1
It is vital for each investor to understand that many forces
impact stock prices. On one hand, there are internal factors
that are directly linked to the financial performance of the
company and its development. This includes the earnings’
tendency, the distribution of dividends, mergers and
acquisitions, innovations, the hiring strategy, etc. On the
other hand, there are external factors such as gross
domestic product (GDP), inflation rates, exchange rates,
unemployment rate, and fluctuations in gold prices and in
US Dollar (USD) value, etc. Undoubtedly, these factors
have a strong and significant influence on stock markets
and their performance (Siddiqui, 2014). As the relationship
1 First Author and Corresponding Author. Department of Accounting
and Finance, College of Business Administration, A’Sharqiyah
University, Oman [Postal Address: Al Yehmadi, Ibra, North
Sharqiyah P. O. Box 42, Ibra 400, Oman]
E-mail: [email protected] and
2 Faculty of Economic Sciences and Management, University of
Tunis El-Manar, Tunisia [Postal Address: 17, Rue Sidi Gaieb -
Kairouan 3100, Tunisia] E-mail: [email protected]
between stock prices, gold prices and USD value is
presented, a missing piece needs to be added, namely, the
oil prices. In fact, oil price fluctuations have an impact not
only on the overall economy of a country but also on the
economic performance of related economies. According to
Balcidar and Ozdemir (2013), oil is an important element of
the economy since it is an intermediary factor that transfers
wealth from oil importing countries to oil exporting countries.
Hence, the change in oil price affects the global economy.
In this regards, oil price fluctuations have an effect on the
macroeconomic level. Specifically, their impact is recorded
on a number of economic variables including inflation,
unemployment, GDP growth, interest rate, exchange rate,
and financial markets, etc. On the microeconomic level,
many studies have shown that oil price change has an
impact on the cost of goods and services, the cost of
production, the company’s returns and earnings and
consequently, it can alter its dividend distribution policy.
Given the significance of the oil price fluctuations in most of
the economies, the objective of the paper is to examine the
relationship between the oil price and stock index in Oman,
which is one of the main crude oil exporters in world. This
study applies Toda and Yamamoto’s (1995) Granger non-
causality test to achieve this objective.

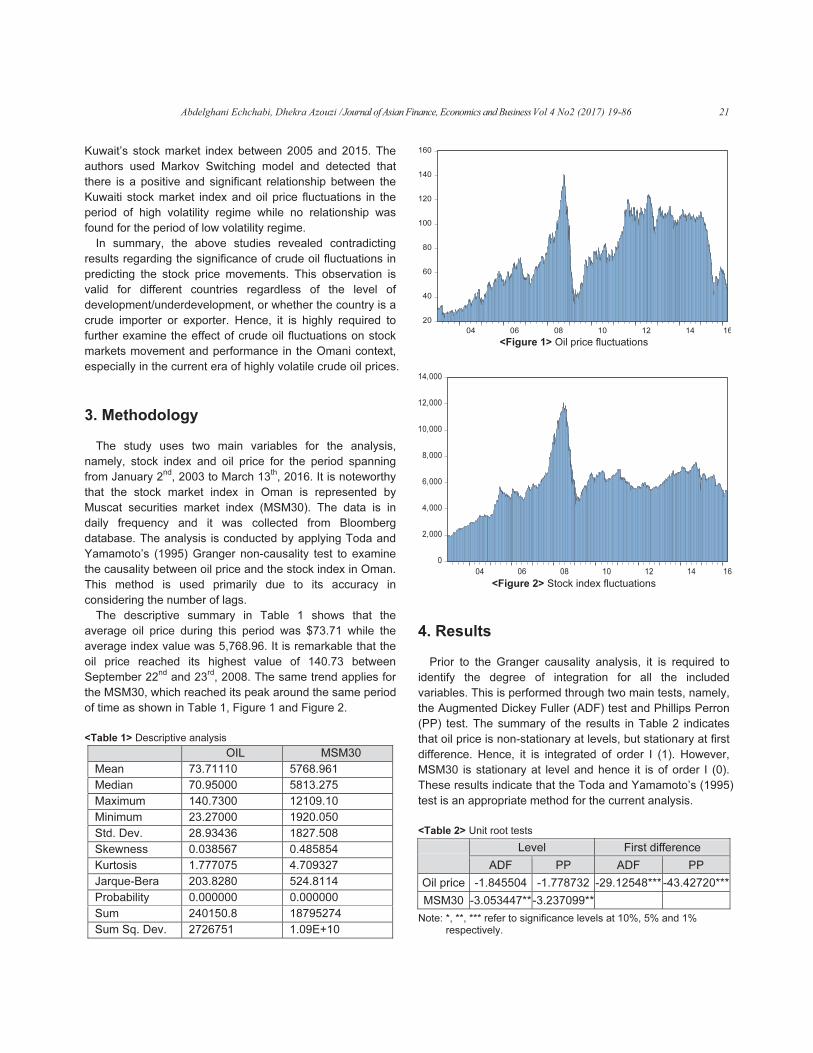
20 Abdelghani Echchabi, Dhekra Azouzi / Journal of Asian Finance, Economics and Business Vol 4 No2 (2017) 19-23
The rest of the paper is organized as follows: section two
reviews the prior studies in the area; section three discusses
the methodology that is applied in this study and describes
the variables and proxies used; section four summarizes the
results of the study; and finally section five provides
practical and research recommendations.
2. Literature Review
The financial literature is rich with empirical studies that
link the fluctuation in oil prices and the stock market
performance. A brief literature review of the studies
conducted in the mentioned area in different parts of the
world is presented in this section. In the context of
developed countries, Jones and Kaul (1996) studied the
reaction of international stock markets to oil price shocks.
The study covered Canada, United Kingdom, Japan and
United States, between 1960 and 1991. The authors found
no relationship between the two variables.
In a similar context, Papapetrou (2001) examined the
relationship between oil prices, real stock prices, interest
rate, real economic activities and employment levels in
Greece using a multivariate vector-autoregression (VAR).
The findings revealed that oil prices are important in
explaining stock price movements in Greece. Subsequently,
Aloui, Jammazy, and Dakhlaoui (2008) focused on the
volatility spillovers between crude oil markets and major
stock markets for the period between 1989 and 2007. The
authors used two different analytical approaches and found
that oil price volatility has a negative impact on stock market
behavior. Furthermore, Bjornland (2009) analyzed the
impact of oil prices on stock market returns in Norway
between 1993 and 2005. By applying structural VAR models,
the author found that an increase in oil prices positively
impacts the stock market returns.
In a relatively recent study, Ramos and Veiga (2013)
analyzed the non-linear effects of oil price changes in stock
markets. They found that oil price spikes depress
international stock markets but not the opposite. In other
words, drops in oil price do not necessarily increase stock
market returns. This conclusion is valid for developed
countries. However, emerging market returns are not
sensitive to oil price variations. Regarding emerging
countries, Basher and Sadorsky (2006) studied the impact
of oil price changes on a large set of emerging stock market
returns. They found that positive shocks to oil prices
depress the emerging markets’ stock prices and US dollar
exchange rates in the short run. Similarly, Liao and Chen
(2008) examined the effects of oil and gold prices on
individual industries in the Taiwanese context by applying
the threshold GARCH model (TGARCH). The study covered
the period spanning from January 1998 through December
2005 and concluded that for both the electronic and rubber
industrial sub-indices, a positive impact of the fluctuation in
oil prices was detected.
On the other hand, Ono (2011) examined the impact of oil
prices on real stock returns for Brazil, Russia, India and
China between 1999 and 2009 using VAR models. The
findings showed a positive and significant impact of oil
prices on real stock returns only for China, India and Russia.
Adaramola (2012) has also examined the long-run and
short-run dynamic effects of oil price on stock returns in
Nigeria between 1985 and 2009 using Johansen
cointegration test. A bi-variate model was applied and
revealed a significant positive relation of stock return to oil
price shocks in the short-run and a significant negative
relation of stock return to oil price shocks in the long-run.
Furthermore, Basher, Huang and Sadorsky (2012) studied
the dynamic relationship between oil prices, exchange rates
and emerging markets stock prices. They found strong
evidence that oil price risk impacts stock price returns in
various emerging markets. The study revealed that oil price
increases have a positive impact on excess stock market
returns for daily and monthly data, in emerging markets,
whereas for weekly and monthly data, oil price decreases
have positive and significant impacts on emerging market
returns.
In a more recent study, Ansar and Asghar (2013)
analyzed the impact of oil prices on the consumer price
index (CPI) and Karachi Stock Exchange index (KSE-100)
from 2007 through 2012 using multi regression model and
found a positive relationship between oil prices, CPI and
KSE-100 Index. In the Gulf Cooperation Council (GCC)
context, Hammoudeh and Aleisa (2004) investigated the
relationship between the GCC stock markets performance
and the oil price index. The authors found a bidirectional
relationship between Saudi stock returns and oil price
changes while the other GCC markets are less dependent
on oil price fluctuations. Similarly, Arouri and Rault (2012)
examined the long run link between oil prices and stock
markets in GCC using bootstrap panel cointegration
techniques and seemingly unrelated regression (SUR)
methods. The findings revealed that oil price increases have
a positive impact on stock prices for all GCC countries
except Saudi Arabia.
Moreover, Abdalla (2013) examined the impact of oil price
fluctuations on stock market returns in Saudi Arabia over the
period from 2007 through 2011. The author applied a
bivariate vector autoregressive-generalized autoregressive
conditional heteroscedasticity (VAR-GARCH) model and
found a positive impact of oil price fluctuations on stock
market returns. In a recent study, Al Hayky and Naim (2016)
investigated the dynamic relationship between oil price and
Abdelghani Echchabi, Dhekra Azouzi / Journal of Asian Finance, Economics and Business Vol 4 No2 (2017) 19-86 21
Kuwait’s stock market index between 2005 and 2015. The
authors used Markov Switching model and detected that
there is a positive and significant relationship between the
Kuwaiti stock market index and oil price fluctuations in the
period of high volatility regime while no relationship was
found for the period of low volatility regime.
In summary, the above studies revealed contradicting
results regarding the significance of crude oil fluctuations in
predicting the stock price movements. This observation is
valid for different countries regardless of the level of
development/underdevelopment, or whether the country is a
crude importer or exporter. Hence, it is highly required to
further examine the effect of crude oil fluctuations on stock
markets movement and performance in the Omani context,
especially in the current era of highly volatile crude oil prices.
3. Methodology
The study uses two main variables for the analysis,
namely, stock index and oil price for the period spanning
from January 2nd
, 2003 to March 13th
, 2016. It is noteworthy
that the stock market index in Oman is represented by
Muscat securities market index (MSM30). The data is in
daily frequency and it was collected from Bloomberg
database. The analysis is conducted by applying Toda and
Yamamoto’s (1995) Granger non-causality test to examine
the causality between oil price and the stock index in Oman.
This method is used primarily due to its accuracy in
considering the number of lags.
The descriptive summary in Table 1 shows that the
average oil price during this period was $73.71 while the
average index value was 5,768.96. It is remarkable that the
oil price reached its highest value of 140.73 between
September 22nd
and 23rd
, 2008. The same trend applies for
the MSM30, which reached its peak around the same period
of time as shown in Table 1, Figure 1 and Figure 2.
<Table 1> Descriptive analysis
OIL MSM30
Mean 73.71110 5768.961
Median 70.95000 5813.275
Maximum 140.7300 12109.10
Minimum 23.27000 1920.050
Std. Dev. 28.93436 1827.508
Skewness 0.038567 0.485854
Kurtosis 1.777075 4.709327
Jarque-Bera 203.8280 524.8114
Probability 0.000000 0.000000
Sum 240150.8 18795274
Sum Sq. Dev. 2726751 1.09E+10
<Figure 1> Oil price fluctuations
<Figure 2> Stock index fluctuations
4. Results
Prior to the Granger causality analysis, it is required to
identify the degree of integration for all the included
variables. This is performed through two main tests, namely,
the Augmented Dickey Fuller (ADF) test and Phillips Perron
(PP) test. The summary of the results in Table 2 indicates
that oil price is non-stationary at levels, but stationary at first
difference. Hence, it is integrated of order I (1). However,
MSM30 is stationary at level and hence it is of order I (0).
These results indicate that the Toda and Yamamoto’s (1995)
test is an appropriate method for the current analysis.
<Table 2> Unit root tests
Level First difference
ADF PP ADF PP
Oil price -1.845504 -1.778732 -29.12548*** -43.42720***
MSM30 -3.053447**-3.237099**
Note: *, **, *** refer to significance levels at 10%, 5% and 1%
respectively.
20
40
60
80
100
120
140
160
04 06 08 10 12 14 16
0
2,000
4,000
6,000
8,000
10,000
12,000
14,000
04 06 08 10 12 14 16

22 Abdelghani Echchabi, Dhekra Azouzi / Journal of Asian Finance, Economics and Business Vol 4 No2 (2017) 19-23
Having checked the order of integration of the model
variables and ensured that Toda and Yamamoto test is
appropriate for this study, the latter is then applied. The
results of the Granger non-causality test following Toda and
Yamamoto (1995) is summarized in Table 3. The results
indicate that the oil price fluctuations have a significant
impact on the local stock index fluctuations. However, the
stock index fluctuations do not have a significant impact on
oil price movements. This is illustrated by the Chi square
values that are significant at 1% for the impact of oil price on
stock exchange, while not significant for the impact of stock
index on oil prices. This finding is in line with those of Arouri
and Rault (2012), Abdalla (2013), and Al Hayky and Naim
(2016). Nevertheless, they contradict the findings of
Hammoudeh and Aleisa (2004). This indicates that any
major changes in the crude oil prices will potentially have a
significant impact on the Muscat Stock Exchange
performance. Hence, the authorities should carefully
manage the crude oil production and more importantly the
generated income allocation in a way that would enhance
the stock market’s performance.
<Table 3> Granger non-causality tests
Variables Oil price Stock index
Oil price - 20.72***
MSM30 3.36 -
5. Discussion and Conclusion
The main objective of this study is to investigate the
potential impact of oil price fluctuations on the stock price
movements in Oman. Using Toda and Yamamoto’s (1995)
Granger non-causality test, the results revealed that oil price
fluctuations have a significant impact on stock price indices,
while stock price indices do not have any impact on oil price
fluctuations.
These findings have significant contributions to the
financial economics and macroeconomic theory, to the
practitioners as well as to the policy makers and regulators.
Particularly, these findings enrich the theory on the oil price
fluctuations and its influence on the economy as a whole
and specifically on the financial markets in respective
countries. This is particularly significant in Oman, one of the
major exporter of crude oil and gas. The country has been
recently active in establishing vital substitutes to the oil and
gas income, mainly through the development of marine
infrastructure, agricultural production, services platforms,
and above all, the financial market. The latter is a major
element in the mobilization of investment funds in the
country where the listed financial assets have tremendously
increased over the last few years.
Though the current study brought about significant
contributions, it still suffers from a number of limitations
which should be considered in future studies. Primarily, this
study focused on a single country, namely, Oman. This
does not provide a comprehensive idea on the relationship
between oil price fluctuations and the Muscat stock index in
other settings. It is recommended in this regard that future
studies should cover a wider area. On the other hand, this
study used only two proxies for the respective variables. It is
preferable at this level to use different proxies to reach a
more robust research.
References
Abdalla, S. Z. S. (2013). Modelling the Impact of Oil Price
Fluctuations on the Stock Returns in an Emerging
Market: The Case of Saudi Arabia. Interdisciplinary
Journal of Research in Business, 2(10), 10-20.
Adaramola, A. O. (2012). Oil Price Shocks and Stock Market
Behaviour: The Nigerian Experience. Journal of
Economics, 3(1), 19-24.
Al Hayky, A., & Naim, N. (2016). The Relationship Between
Oil Price and Stock Market Index: An Empirical
Study from Kuwait. As presented at Middle East
Economic Association 15th International
Conference.
Aloui, C., Jammazy, R., & Dakhlaoui, I. (2008). Crude Oil
Volatility Shock and Stock Market Returns. The
Journal of Energy Markets, 1(3), 69-93.
Ansar, I., & Asghar, N. (2013), The Impact of Oil Prices on
Stock Exchange and CPI in Pakistan. Journal of
Business and Management, 7(6), 32-36.
Arouri, M., & Rault, C. (2012). Oil Prices and Stock Markets
in GCC Countries: Empirical Evidence from Panel
Analysis. International Journal of Financial
Economics, 17, 242-253.
Balcidar, M., & Ozdemir, Z. (2013). The Casual Nexus
between oil prices and equity markets in the US: A
Regime switching model. Energy Economics, 39,
271-282.
Basher, S. A., & Sadorsky, P. (2006). Oil Price Risk and
Emerging Stock Markets. Global Finance Journal,
17, 224-251.
Basher, S. A., Huang, A. A., & Sadorsky, P. (2012). Oil
Prices, Exchange Rates and Emerging Stock
Markets. Energy Economics, 34, 227-240.

Abdelghani Echchabi, Dhekra Azouzi / Journal of Asian Finance, Economics and Business Vol 4 No2 (2017) 19-23 23
Bjornland, H. C. (2009). Oil Price Shocks and stock market
booms in an oil exporting country. Scottish Journal
of Political Economics, 56(2), 232-254.
Hammoudeh, S., & Aleisa, E. (2004). Dynamic relationship
among GCC stock markets and NYMEX oil futures.
Contemporary Economic Policy, 22, 250–269.
Jones, C. M., & Kaul, G. (1996). Oil and the stock markets.
Journal of Finance, 51, 463-491.
Liao, S. J., & Chen, J. T. (2008). The Relationship among Oil
Prices, Gold Prices, and the Individual Industrial
Sub- Indices in Taiwan. Working Paper presented
at International Conference on Business and
Information (BAI2008), Seoul, South Korea.
Ono, S. (2011). Oil price shocks and stock markets in BRICs.
European Journal of Comparative Economics, 8,
29-45.
Papapetrou, E. (2001). Oil Price Shocks, Stock Market,
Economic Activity and Employment in Greece.
Energy Economics, 23, 511-532.
Ramos, S., & Veiga, H. (2013). Oil Price Asymmetric effects:
Answering the puzzle in International Stock
Markets. Energy Economics, 38, 136-145.
Siddiqui, M. M. (2014). Oil Price Fluctuation and Stock
Market Performance - The Case of Pakistan.
Journal of International Business and Economics,
2(1), 47-53.
Toda, H. Y., & Yamamoto, T. (1995). Statistical inference in
Vector Autoregressions with possibly integrated
processes. Journal of Econometrics, 66, 225-250.

24 Abdelghani Echchabi, Dhekra Azouzi / Journal of Asian Finance, Economics and Business Vol 4 No2 (2017) 19-23

Fatimah Binti Kari, Muhammad Mehedi Masud, Md. Khaled Saifullah
/ Journal of Asian Finance, Economics and Business Vol 4 No2 (2017) 25-36 25
Print ISSN: 2288-4637 / Online ISSN 2288-4645
doi:10.13106/jafeb.2017.vol4.no2.25
Subsidy Rationalisation for General Purpose Flour:
Market and Economics Implications*
Fatimah Binti Kari1
, Muhammad Mehedi Masud2
, Md. Khaled Saifullah3
Received: March 22, 2017. Revised: April 9, 2017. Accepted: May 2, 2017.
Abstract
Subsidies are an instrumental policy making tool for many governments, but their importance depends on the market situation of the national
economy. Efficient subsidy implementation would allow the government to correct market failure thereby aligning social and private costs and
benefit. The general objective of this study is to justify the need to rationalise subsidies for food items such as flour. This study assessed the
structure and conducts of the general purpose flour market in Malaysia; and analysed the impact of subsidies on market performance to
recommend policies to increase market efficiency under the subsidy rationalisation program. To accomplish these objectives, the study
adopted a microeconomics market analysis as well as the standard structure and performance analysis method. These two approaches
showed the characteristics of an industry’s consumer behaviour, competition, as well as the efficiency associated with government regulatory
policies on the flour industry. One of the biggest influences on the domestic market is related to the food consumption behaviour of the
general population. Food consumption behaviour reflects global trends. As income rises, food trends tend to be consumed in processed form
or in such a way that adds value in another manner such as the preparation of food products.
Keywords: Subsidies, Policy, Rationalise, Flour, Malaysia.
JEL Classification Code: H20, H24, H70.
1. Introduction1
Subsidies are a decision making tool for many
governments, but their significance relies on the market
situation of the national economy. Effective implementation
of the subsidies would allow the government to correct
market failures, which would align the costs as well as social
and private benefits. Thus, government intervention in the
* This work was supported by the University of Malaya under the
Employment Structure in Future Cities grant [GC003E-15SUS].
1 First Author. Department of Economics, Faculty of Economics and
Administration, University of Malaya, Malaysia.
E-mail: [email protected]
2 Corresponding Author. Department of Development Studies,
Faculty of Economics and Administration, University of Malaya,
Malaysia. [Postal Address: 50603 Kuala Lumpur, Wilayah
Persekutuan Kuala Lumpur, Malaysia]
E-mail: [email protected]
3 Department of Economics, Faculty of Economics and
Administration, University of Malaya, Malaysia.
E-mail: [email protected]
market is required because typical price mechanisms have
a number of failures that cannot bring social benefits to all
parts of the national economy. Based on this argument, the
Malaysian government pays a high level of subsidies on
energy and some selected essential food items such as
sugar, rice, cooking oil, and flour. A subsidy that ultimately
decreases the prices of goods for the end user would
normally increase the demand and the overall usage of the
goods. One form of government intervention is the payment
of subsidies in order to increase the welfare level of poor
people.
Malaysia, like other countries, pays a high level of
subsidies on food, energy, education, and other social
sectors of the economy in order to improve poor households’
access to various commodities, primarily food and energy.
This is also to reduce their poverty level. In 2013,
government expenditure on subsidies equated to nearly 16
per cent of its operating expenditure, which is about 5.1 per
cent of the total gross domestic product (GDP) (EPU, 2015).
Although this can bring social benefits through access to
affordable energy and employment in the economy, it may
also carry economic and environmental costs. In addition,

26 Fatimah Binti Kari, Muhammad Mehedi Masud, Md. Khaled Saifullah
/ Journal of Asian Finance, Economics and Business Vol 4 No2 (2017) 25-36
these subsides are costly for the government because an
increase in energy prices also increases the budget in order
to cover the negative effects of the shock on the energy
prices.
General purpose (GP) flour is a price-controlled item in
Malaysia at RM1.35 per kilogram (kg). The government
pays all flour millers including Malayan Flour the price
difference against the current market price of RM1.80 -
RM2.00 per kg (subject to a certain volume quota set in
2007). Volume split between uncontrolled and controlled
flour is 80:20. This study seeks to justify the need to
rationalise subsidies for food items such as flour while also:
(a) assessing the structure and conduct of the flour market
in Malaysia; (b) analysing the impact of subsidies on market
performance; and (c) recommending policies to increase
market efficiency under the subsidy rationalisation program.
1.1. Subsidy: A Drawback
According to World Trade Reports 2006 (World Trade
Organization, 2006), introducing a subsidy or any other
government measure within a perfect market framework
renders that market inefficient and welfare-diminishing. If a
market is inefficient, any form of government intervention
such as establishing subsidies, may affect economic welfare.
Since 2012, subsidy rationalisation was at the forefront of
Malaysia’s annual budget. Steps were taken in light of
widening fiscal deficit which represented about 5 per cent of
Malaysia’s GDP. Three major benefits of subsidy reforms
include:
1) To achieve greater overall efficiency gains where
subsidy savings, over consumption support, can be
directed to productive infrastructure spending on
education, science and technology, healthcare and
public transportation;
2) To improve economic efficiency. As we move closer to
market prices, supply and demand becomes more
market-responsive and are then driven by price signals.
Transport services and basic food industries can be
moved to become more competitive. They will become
more efficient because they will respond more efficiently
to price changes. Non-subsidised prices for goods and
services will force resources to be allocated with
minimum wastage;
3) To produce a more resilient economy, reinforced by
lower fiscal deficit and government debt.
1.2. Subsidy Rationalisation under the Economic
Transformation Plan (ETP)
For the last 10 years, Malaysia has been running a fiscal
deficit which has been growing progressively from RM5
billion in 1998, to a record high of RM47 billion in 2009. This
was due to the fact that government expenditure, including
subsidies, has been escalating, whereas government
revenue has been able to keep pace with economic growth.
Consequently, the government has to borrow a lot of money
to cover the shortfall. On the other hand, the Malaysian
government debt in 1997 was RM90 billion and has grown
at a rate of 12 per cent a year to reach a record of RM362
billion in 2009. In addition, as a proportion to the national
GDP, Malaysia is one of the world’s highest subsidised
countries utilising 4.7 per cent of its GDP compared to
Indonesia’s 2.7 per cent, the Philippine’s 0.2 per cent, as
well as other Organisation for Economic Co-operation and
Development (OECD) countries that average 1.5 per cent.
As of late, various studies conducted with international
bodies such as the International Monetary Fund (IMF) and
the World Bank has encouraged subsidy reforms in light of
Malaysia’s widening fiscal deficit. Strengthening the social
safety net is an integral part of the authorities’ fiscal strategy.
Untargeted fuel and food subsidies were regressive: as
households in the top two quintiles of per capita
consumption received 60 per cent of the subsidies while
only 3 per cent went to the bottom quintiles. The elimination
of fuel and food subsidies freed up resources that can be
redirected to better support the poor. To mitigate the impact
of subsidy rationalisation and the implementation of goods
and services tax (GST), the 2015 budget calls for increased
cash transfers to poorer households (those earning less
than RM4,000 per month). The authorities are also
reviewing overlapping and fragmented cash transfer
programs.
1.3. Market Structure
The market structure of the flour industry in Malaysia is a
typical example of a regulated or government controlled
market, given the existing Price Act 1999, Price Control Act
1946, Supply Control Act 1962, and the legal framework of
these acts. The price of food stuff or essential items such as
flour is regulated, given no provision for competitive price
practices. The fundamental reason for applying such price
control mechanisms as a pro-poor distributive strategy is to
close the income gap between poor and rich households.
Basically, the Malaysian flour industry has been dominated
by four major players in which Malayan Flour Mills (MFM)
and Federal Flour Mills (FFM) are the clear dominator the
market with both companies controlling about 57 per cent of
the domestic market share. Table 1 shows a brief overview
of the Malaysian flour industry which has been dominated
by several major players as well as other smaller firms.
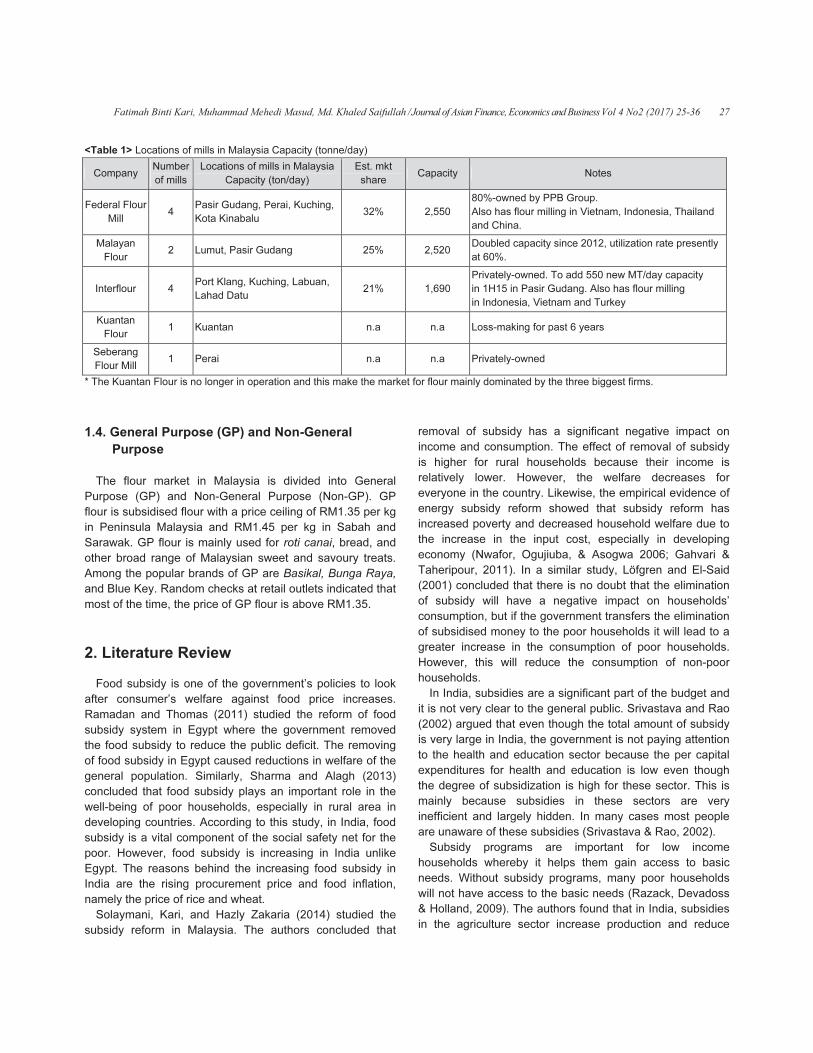
Fatimah Binti Kari, Muhammad Mehedi Masud, Md. Khaled Saifullah
/ Journal of Asian Finance, Economics and Business Vol 4 No2 (2017) 25-36 27
<Table 1> Locations of mills in Malaysia Capacity (tonne/day)
Company
Number
of mills
Locations of mills in Malaysia
Capacity (ton/day)
Est. mkt
share
Capacity Notes
Federal Flour
Mill
4
Pasir Gudang, Perai, Kuching,
Kota Kinabalu
32% 2,550
80%-owned by PPB Group.
Also has flour milling in Vietnam, Indonesia, Thailand
and China.
Malayan
Flour
2 Lumut, Pasir Gudang 25% 2,520
Doubled capacity since 2012, utilization rate presently
at 60%.
Interflour 4
Port Klang, Kuching, Labuan,
Lahad Datu
21% 1,690
Privately-owned. To add 550 new MT/day capacity
in 1H15 in Pasir Gudang. Also has flour milling
in Indonesia, Vietnam and Turkey
Kuantan
Flour
1 Kuantan n.a n.a Loss-making for past 6 years
Seberang
Flour Mill
1 Perai n.a n.a Privately-owned
* The Kuantan Flour is no longer in operation and this make the market for flour mainly dominated by the three biggest firms.
1.4. General Purpose (GP) and Non-General
Purpose
The flour market in Malaysia is divided into General
Purpose (GP) and Non-General Purpose (Non-GP). GP
flour is subsidised flour with a price ceiling of RM1.35 per kg
in Peninsula Malaysia and RM1.45 per kg in Sabah and
Sarawak. GP flour is mainly used for roti canai, bread, and
other broad range of Malaysian sweet and savoury treats.
Among the popular brands of GP are Basikal, Bunga Raya,
and Blue Key. Random checks at retail outlets indicated that
most of the time, the price of GP flour is above RM1.35.
2. Literature Review
Food subsidy is one of the government’s policies to look
after consumer’s welfare against food price increases.
Ramadan and Thomas (2011) studied the reform of food
subsidy system in Egypt where the government removed
the food subsidy to reduce the public deficit. The removing
of food subsidy in Egypt caused reductions in welfare of the
general population. Similarly, Sharma and Alagh (2013)
concluded that food subsidy plays an important role in the
well-being of poor households, especially in rural area in
developing countries. According to this study, in India, food
subsidy is a vital component of the social safety net for the
poor. However, food subsidy is increasing in India unlike
Egypt. The reasons behind the increasing food subsidy in
India are the rising procurement price and food inflation,
namely the price of rice and wheat.
Solaymani, Kari, and Hazly Zakaria (2014) studied the
subsidy reform in Malaysia. The authors concluded that
removal of subsidy has a significant negative impact on
income and consumption. The effect of removal of subsidy
is higher for rural households because their income is
relatively lower. However, the welfare decreases for
everyone in the country. Likewise, the empirical evidence of
energy subsidy reform showed that subsidy reform has
increased poverty and decreased household welfare due to
the increase in the input cost, especially in developing
economy (Nwafor, Ogujiuba, & Asogwa 2006; Gahvari &
Taheripour, 2011). In a similar study, Löfgren and El-Said
(2001) concluded that there is no doubt that the elimination
of subsidy will have a negative impact on households’
consumption, but if the government transfers the elimination
of subsidised money to the poor households it will lead to a
greater increase in the consumption of poor households.
However, this will reduce the consumption of non-poor
households.
In India, subsidies are a significant part of the budget and
it is not very clear to the general public. Srivastava and Rao
(2002) argued that even though the total amount of subsidy
is very large in India, the government is not paying attention
to the health and education sector because the per capital
expenditures for health and education is low even though
the degree of subsidization is high for these sector. This is
mainly because subsidies in these sectors are very
inefficient and largely hidden. In many cases most people
are unaware of these subsidies (Srivastava & Rao, 2002).
Subsidy programs are important for low income
households whereby it helps them gain access to basic
needs. Without subsidy programs, many poor households
will not have access to the basic needs (Razack, Devadoss
& Holland, 2009). The authors found that in India, subsidies
in the agriculture sector increase production and reduce

28 Fatimah Binti Kari, Muhammad Mehedi Masud, Md. Khaled Saifullah
/ Journal of Asian Finance, Economics and Business Vol 4 No2 (2017) 25-36
unemployment. Moreover, the wage in the agricultural
sector and consumption among urban and rural households
also increased. However, according to OECD (2007) and
Karami, Esmaeili and Najafi (2012), subsidy programs are
expensive, a burden on the government budget and could
be inefficient if the benefits are not received by the targeted
poor households. Moreover, Dhehibi and Gil (2003) found
that in Tunisia removing or reducing food subsidies will not
have a significant effect on the food expenditure structure
but for low income households it will have some effect on
their consumption.
3. Methodology
In order to achieve the research objectives, this study was
conducted based on qualitative methods and secondary
sources. Since the study is qualitative in nature, face to face
interview was conducted between two groups consisting of
consumers as well as restaurant owners and retailers to
examine the consumer and retail markets’ consumption
pattern of wheat flour. The interviews that were carried out
with consumers indicated that the GP flour (the subsidised
flour) is not popular among end consumers as many of them
use non-GP flour for their own consumption. To recommend
policies, previous studies and government policies were
assessed as a secondary source of information.
4. Results and Discussions
4.1. Consumers Perspectives
From the interviews that were carried out for the study,
most consumers consume non-GP flour particularly those
without benzoyl peroxide. This is mainly due to their general
awareness that bleached flour (GP flour) which is whiter and
finer has no vitamins and is hazardous to health. The
differences between bleached and unbleached flour is as
shown in Table 2. When some of the brand names of GP
flour were mentioned, many respondents indicated that they
have not seen or heard of the brand. In addition, they could
not differentiate between the brands of subsidised and non-
subsidised flour. Most of the respondents are unaware and
do not consume GP flour because the flour is not available
at their favourite stores, i.e., hypermarkets and nearby
retailers. From our observation, GP flour is mainly available
at 1Malaysia stores and stores that are targeted for
Bangladeshi and Indonesian residents.
As such, we could derive that the subsidised flour (GP
flour) does not reach the targeted consumers. Most
consumers such as housewives could not differentiate
between subsidised or non-subsidised flour but majority of
them prefer non-GP flour for their own consumption. Price is
not a determinant factor but health concern is the major
issue among this group of housewives.
<Table 2> Type of Flour
Bleached Flour Unbleached Flour
Colour White Less white / yellowish
Bleached
using
Bleaching chemicals such
as organic peroxides,
nitrogen dioxide, chlorine,
chlorine dioxide, or
azodicarbonamide
Aged naturally
Quality
Finer grain, making a
lighter loaf
Tougher grain, making a
denser loaf
Nutrition
Less vitamin E. Rest of
the nutrition, i.e. calories,
fats, fibre, proteins,
calcium and iron are
about the same.
More vitamin E. Rest of
the nutrition, i.e. calories,
fats, fibre, proteins,
calcium and iron are
about the same.
Source: Organics (2016)
4.2. Restaurant Owners
For restaurant owners, especially members of KIMMA
(Malaysian Indian Muslim Congress) and PRESMA
(Malaysian Muslim Restaurant Owners Association – with
3,200 members), the consumption of flour is estimated at
25kg per day and is mainly used for making roti canai. Most
of them got their supply of flour from wholesalers. From
25kg of flour, the restaurants are able to produce, on
average, 375 pieces of roti canai. Sales of roti canai
contributed only about RM300~RM400(10%~13%) from the
overall sales of RM3,000 per day.
The price of roti canai is about RM1.35 per piece but the
price varies depending on the location of the establishments
with the price of roti canai expected to be higher in city
centre vis-à-vis at suburban areas. The price also depended
on the add-on services provided by the restaurants, i.e. air-
condition section, Wi-Fi, and others. On the issue of
liberalization of flour subsidy, the representatives of KIMMA
and PRESMA note on the market forces and consumer
choices as carried out in many other countries.
4.3. Retailers
Most big retailers or hypermarkets got their supply of flour
directly from millers such as MFM. The amount of flour
supplied to these retailers depended on the quota allocated
to them. Majority or 80 per cent of retailers’ businesses are

wit
or r
the
onl
ava
per
De
nea
4.4
M
imp
5 p
net
imp
inc
sig
200
A
dec
RM
cou
F
h en
rest
e flo
y 10
ailab
r ce
man
arin
4. E
S
Mala
port
per
t im
port
reas
nific
09 (
<
<
An i
crea
M29
untr
Fatim
nd c
taur
ur s
0 pe
bility
ent o
nd f
g fe
Econ
Sub
aysi
s of
cen
port
s a
sed
cant
(Figu
<Fig
<Fig
incre
ased
bil
ies,
mah B
cons
ants
sale
er c
y of
of n
for f
estiv
nom
bsid
a i
f foo
nt of
ter o
re g
in i
t de
ure
gure
gure
eas
d M
lion
the
Binti
sum
s. T
s am
cent
f the
non-
flou
ve se
my
disi
s a
od,
f its
of fo
grea
inte
eclin
1).
e 1>
e 2>
se in
Mala
n to
e po
i Kar
mers
This
mon
are
e flo
-GP
r is
eas
and
ng
a s
bev
tot
ood
ater
rnat
ne in
Imp
Imp
n fo
ysia
o R
oore
ri, M
and
is in
ng th
e fro
our,
P an
sta
ons
d P
the
mal
vera
al im
com
r tha
tion
n th
pact o
pact o
ood
a’s f
RM28
est h
Muham
d on
n lin
hes
om t
, mo
nd o
ble
s suc
Pove
e Po
ll d
ages
mpo
mmo
an
al p
he v
on In
on In
pric
food
8 b
hous
mma
nly 2
ne w
e re
the
ost
only
acr
ch a
erty
oor
eve
s an
orts.
odit
its
price
valu
ncre
ncre
ces
d im
billio
seh
ad M
20 p
with
etail
25k
reta
20
ross
as H
y in
r Ho
elop
nd to
. Th
ies
exp
es o
ue o
ease
ease
dur
mpo
on).
olds
Mehed
per c
the
ers
kg p
ailer
~30
s the
Hari
n Ma
ous
ing
obac
he c
ove
ports
of fo
of its
e in F
e in F
ring
orts
As
s in
di Ma
cen
fac
are
pack
rs s
0 pe
e ye
Ray
alay
seho
co
cco
coun
er tim
s. In
od h
s ex
Food
Food
the
by
s in
Ma
Masud
t wi
ct tha
e fro
k. D
sell
er c
ear
ya.
ysi
old
ount
acc
ntry
me b
n re
has
xpo
d Pri
d Pri
e 20
4.4
n m
alay
d, Md
th s
at 9
om 1
epe
bet
cent
and
a:
ry
cou
is c
bec
ecen
con
rts
ces
ces
008-
4 pe
many
sia
d. Kh
sma
90 p
1kg
endi
twee
of
d on
in w
nted
con
caus
nt y
ntrib
as
in 2
in 2
-200
er c
y de
spe
haled
ll re
er c
pac
ng o
en 7
GP
nly d
whic
d fo
side
se its
year
bute
sho
2009
2009
09
cent
eve
ent a
d Saif
etaile
cent
ck a
on t
70~
flo
doub
ch
or ov
ered
s fo
rs, t
ed to
own
9
9
peri
(fro
elopi
a hi
fulla
ers
t of
and
the
~80
ur.
ble
its
ver
d a
ood
the
o a
in
iod
om
ing
igh
ah
/ Joourna
sha
the
Sur
of
bev
for
has
Mal
hou
per
Mal
mea
pov
com
4.5
In
sign
fuel
both
con
con
effe
fuel
tran
pro
rela
prov
the
wea
ear
serv
A
rath
con
effe
indu
con
uns
exc
4.6
T
ratio
hou
stud
Inte
al of A
are o
m
rvey
the
vera
hou
s be
lays
useh
cen
lays
asu
verty
mpa
5. S
M
n th
nific
l su
h e
nsum
nsum
ect w
l, w
nspo
ces
ative
vide
ge
aken
ly 2
vice
As fo
her s
nsum
ect
ustr
nsum
subs
cept
6. Im
o
The
ona
useh
dy
erna
Asian
of th
ost
y, ho
eir t
ages
useh
een
sia
hold
ntage
sia.
res
y lin
riso
ubs
Mark
he
cant
ubsid
exer
mers
mpti
was
whic
orta
s fo
ely
ed th
nera
ning
015
es ta
or t
soft
mpti
was
ry w
mers
sidis
for
mpa
of th
foll
alisa
hold
was
ation
n Fina
heir
re
ouse
tota
s wh
hold
re
inc
ds,
es
Fu
the
ne i
on w
sidy
ket
pas
su
dy a
rcise
s a
ion
exp
ch c
tion
or th
low
he s
al in
g rin
5. Th
axes
the
t as
ion
s tr
which
s. C
sed
GS
act
he P
owi
ation
ds. T
s b
nal
ance,
r inc
cen
eho
al e
hile
ds in
elativ
clud
wh
of
rthe
e le
nde
with
y R
Ad
st fi
bsid
and
es,
and
and
pect
cons
n se
he fu
pri
soft
nfla
nggi
his
s (G
sug
the
bas
rans
h wa
Clea
pric
ST a
of
Poo
ng
n of
To a
ase
Mon
, Eco
com
nt H
lds
expe
this
n ur
vely
de
ere
po
ermo
evel
ex, i
othe
Ratio
djus
ive
dy r
sug
the
pr
d su
ted,
stitu
ector
uel
ces
lan
tion
t tha
is a
GST
gar
gen
sed
smit
as a
arly,
ce w
nd g
1kg
or
disc
the
asse
ed o
neta
onomi
e o
Hous
in r
endi
s pe
rban
y co
a
S
oor
ore,
of
s m
er re
ona
stm
yea
ratio
gar
e m
rodu
upply
esp
utes
rs. F
sub
s for
ding
n tre
at h
lso
) in
sub
nera
on
tted
able
the
whi
gen
g Pa
cuss
e 1k
ess
on
ary
ics an
n fo
seh
rura
iture
erce
n ar
onst
sig
aba
pe
, th
hou
much
egio
alis
ment
ars,
onal
sub
mar
uce
y ac
pec
the
Furt
bsidy
r gl
g fo
end
it th
due
Ma
bsidy
al co
n h
thr
e to
e m
le p
era
ack
sion
kg p
this
the
Fun
nd Bu
ood
olds
l are
es
enta
reas
tant
gnifi
ah
eople
e h
use
h hi
ons.
atio
t
M
isat
bsid
rket
rs
ccor
ially
e m
ther
y wa
oba
or th
wa
he h
e to
lays
y, t
ons
ealt
roug
tran
mark
polit
l po
k of
n fo
pack
s im
for
nd
usines
and
s’ E
eas
on
ge
s. T
ov
can
and
e c
hard
hold
ighe
on:
alay
ion
y ra
ha
we
rdin
y for
main
rmor
as u
al pe
e co
s o
ighe
the
sia i
he
ume
th r
gh
nsfe
ket a
tical
olitic
f GP
ocus
k on
mpac
rmu
(IMF
ss Vo
d be
Exp
spe
foo
falls
his
ver
nt
d S
com
d-co
d in
er in
Pa
ysia
pro
ation
as
re
ngly.
r en
n in
re, t
unde
etro
ons
on th
est
intr
n A
gen
ers
reas
the
er th
adju
pro
cal c
P F
ses
n th
ct, th
ula
F) (
ol 4 N
ever
end
ent
od
s to
pat
tim
perc
Sara
mpar
ore
ncom
n th
ast
a ha
ogra
nalis
rea
abl
. Th
ergy
nput
the
erta
oleu
ume
he u
low
rodu
pril
nera
took
sons
foo
he p
uste
otes
clima
Flou
on
he i
he f
reco
(200
No2 (
rage
ditur
aro
and
ab
tern
me.
cen
awak
red
poo
me
e S
His
as
ams
satio
dily
le
he in
y su
t es
ma
aken
m m
er m
uptr
(RM
uctio
201
al im
k on
s. T
od
rice
d q
st re
ate o
ur o
the
nco
form
omm
08)
(201
es. A
re a
und
d n
out
n of
Rur
tage
k h
to
or i
belo
Saba
stor
und
wh
on p
ad
to
nitia
ubsi
spec
arke
n on
mar
mark
rend
M3.
on o
15.
mpa
n low
The
and
e inc
quite
ema
of th
on t
e im
ome
mula
men
as
7) 25
Acc
and
d 30
non-
20
exp
ral
e
have
P
nde
ow
ah r
ry a
derg
hich
prog
djus
rea
al in
dies
ciall
t ad
n the
rket
ket.
d du
76=
of go
ct h
wer
e in
d be
crea
e we
ains
he c
the
mpa
of
a use
nded
we
5-36
cord
In
0 pe
-alco
per
pen
are
of
e h
enin
ex, w
the
regio
and
gone
inc
gram
sted
align
flati
s su
ly i
djus
e ba
and
How
ue t
=US
ood
has
ing
flati
eve
ase
ell t
s m
coun
Inc
ct o
the
ed i
d b
ell a
6
ing
ncom
r ce
oho
r ce
ditu
eas
po
high
nsul
whi
e foo
on,
e tw
clude
ms.
an
n th
ona
uch
n th
stme
ack
d th
wev
to th
$1)
ds an
bee
sug
ona
erag
to th
to th
inim
ntry
com
of th
e po
in th
y th
as th
29
to
me
ent
olic
ent
ure
in
oor
her
lar
ch
od
in
wo
ed
In
nd
he
ary
as
he
ent
of
his
ver,
he
in
nd
en
gar
ary
es
he
he
mal
.
me
he
oor
his
he
he

30
lim
the
we
flou
I
cha
rea
(as
sim
pric
40
ass
form
the
und
bas
und
4.7
B
sub
los
ma
the
goi
pric
sel
Co
fea
los
rela
item
to t
wh
per
Pi (
Pi
est
illus
flou
the
cen
rea
6.0
Fa
ited
e fo
ight
ur fo
n e
arge
alisti
ssum
mula
ce i
per
sess
mul
e vu
der
sed
der
7. S
Base
bsid
s of
arket
e inc
ng t
ce o
ecte
mm
ature
s of
ative
ms
the f
ere
r ce
(1) i
(0)
tima
stra
ur ri
e ex
nt. U
al in
0~7.
Fatim
d da
ormu
tage
or an
exte
ed
ic
med
ation
ncre
r ce
s the
as w
ulner
the
on
pov
Scen
ed
dy ra
f inc
t lev
com
to b
of ne
ed
munit
e fo
f rea
e pr
in h
follo
RL
ent,
is th
the
ate
ated
ses
xpen
Usin
ncom
5 pe
ah B
ta s
ula
e of
ny lo
nsio
for
pric
d qu
n wa
ease
ent l
e im
were
rabl
11t
the
verty
nar
on
atio
com
vel,
e lo
be lib
eigh
to
ty 2
or su
al ho
rice
hous
owin
L de
wi is
he n
e pri
of
wit
s by
nditu
ng th
me o
er c
Binti
set a
is
the
ow
on,
AS
ce
ualit
as d
e fo
owe
mpac
e us
le 4
h
Ma
e p
y lev
rio 1
an
nali
me if
i.e.
oss
bera
hbou
re
201
uch
ous
cha
seho
ng:
enote
s th
new
ice
the
h an
40~
ures
he a
of p
cent.
Kari
ava
tha
e exp
inco
the
SEA
leve
ty is
done
or pr
est
ct o
sed
40 p
alay
ove
vel a
1: A
IM
sati
f pr
pri
(RL
ated
uring
eflec
5 w
an
seho
ange
old
es t
he s
(in
bef
los
n ex
~70
s of
abo
poor
.
i, Mu
ilab
t it
pen
ome
e sim
AN
el/be
s th
e to
rices
inco
f the
to f
per
ysia
erty
as a
A G
F s
on
ice
ce a
L) de
d ab
g AS
ct t
whe
eco
old i
e, w
exp
the
hare
mo
fore
ss
xam
0 pe
f po
ve e
r ho
uham
le to
re
nditu
e fam
mul
cou
enc
he s
o re
s an
ome
e su
facto
cen
Pla
line
anno
ene
study
on
is t
afte
epic
bove
SEA
the
re s
ono
nco
we u
pend
imp
e of
ost c
the
of
mple
r ce
oor
equ
ouse
mmad
o th
sts
ure o
mily
atio
untri
h m
sam
pres
nd t
e lev
ubsi
or in
nt po
an (1
e an
oun
eral
y (2
poo
to b
er do
cts th
e the
AN c
up
spa
omic
ome
se t
ditur
pact
f ite
case
e re
real
: su
ent,
hou
uatio
eho
d Me
he te
on
of h
y.
on w
es
mar
me).
sen
this
vel
dy r
n th
oor
11th
nd
ced
l Ov
200
or h
e a
oing
he d
e su
cou
pcom
tial
c co
as
the
res
t on
em i
es,
eform
l ho
uppo
and
use
on, t
lds
ehedi
eam
n th
ous
was
wh
rk
Th
t a
too
of t
ratio
e ge
hou
MP
the
d und
ver
8),
ous
djus
g aw
decl
ubsi
ntry
min
pric
omm
the
sha
as
rea
n ho
high
m o
ouse
ose
d tha
hold
the
can
i Ma
m. Th
he a
seho
ba
hich
pric
he s
gas
o is s
he
onal
ene
use
P). T
nu
der
rvie
the
seho
sted
way
line
ded
y wo
g
cing
muni
arit
ares
wei
al ho
ous
her)
of pr
eho
the
at th
d’s
ave
n th
asud,
he r
assu
old i
ased
ma
ces
seco
stron
set
poo
lisat
ral p
hold
The
mbe
the
ew
e inc
olds
d ba
with
in i
d pri
ould
ASE
g w
ity.
thm
of t
ight
ous
eho
pric
rice
old
e pri
he w
ave
erag
en
Md.
robu
ump
inco
d o
ay
for
ond
nom
to r
or ho
tion
pub
d as
inco
er o
11t
com
wil
ased
h su
nco
ices
be
EAN
would
To
etic
the
s. T
seho
old e
ce o
su
inco
ce o
weig
erag
ge im
be
. Kha
ust f
ption
ome
n th
rep
r 1
pa
mic
repr
ouse
, tw
blic a
s an
ome
of h
th
M
me i
ll in
d on
ubsi
ome
s in w
use
N E
d a
est
c me
con
This
old i
expe
of it
bsid
ome
of s
ght
ges
mpa
est
aled
feat
n o
e spe
he
pres
kg
art o
mea
rese
eho
wo ge
as w
nno
e lin
hous
P.
imp
clud
n th
dy.
if p
whi
ed. T
Eco
also
ima
ean
nsum
am
inco
end
em
dies
e ca
ubs
of f
0.0
act o
ima
Saifu
ture
on t
ent
pric
ent
pa
of t
ans
ent t
old.
ene
well
unc
ne w
seho
act
de t
e fr
Thu
price
ch t
This
onom
be
ate t
of t
mpti
moun
ome
iture
i, a
s. Th
an
sidis
lour
05 p
on t
ated
fullah
of
the
on
ces
a
ack
the
of
the
To
eral
as
ced
was
old
of
the
ree
us,
e is
the
s is
mic
e a
the
the
ion
nts
e in
es,
and
his
be
sed
r in
per
the
at
h
/ Jouurnal
T
incr
rela
pric
will
bas
ava
rea
item
sub
belo
Figu
ratio
<F
4.8
T
for
num
esti
geo
sha
as w
B
the
4.38
hou
thro
leve
poo
sign
ann
l of A
This
reas
ative
ce h
be
sic
ailab
ct to
m b
bstitu
ow
ure
ona
Figu
8. Sc
The
the
mbe
imat
ome
ares
weig
Base
est
8~4
useh
ough
el w
or
nific
num
Asian
es
se in
e pr
as i
clos
com
ble.
o ev
y s
ute,
rec
3
alisa
re 3
cen
sam
e 40
er o
ting
etric
of
ghts
ed o
tima
4.40
hold
h th
woul
hou
cant
m. Th
Fina
stim
n liv
rices
incr
se to
mmo
If t
ven
shifti
su
cogn
s
ation
> In
nari
me m
0 pe
of h
g th
me
the
s. Th
on t
ation
pe
d. U
he p
ld n
useh
aft
his m
ance, E
mate
ving
s by
eas
o th
odit
ther
a s
ing
ffer
nizes
how
n ba
com
io 2
met
er c
ous
he
ean
con
his c
he
n sh
er ce
Und
price
not
hold
er a
min
Econ
pr
cos
y sh
sed,
he a
ty f
re is
sma
com
ing
s th
ws
ased
me Lo
2: T
hod
cent
seho
real
of
nsum
can
40
ows
ent
er
e a
sign
. H
adju
imu
nomic
rovid
sts.
hiftin
the
bov
for
s a
all ch
mple
no
he l
the
d on
ost d
A
Taki
d wa
t po
old
l lo
the
mpt
be
per
s tha
out
bot
djus
nific
How
ustin
m c
cs and
des
If ho
ng a
e act
ve e
wh
pe
han
etely
loss
ikel
e i
AS
due
ASE
ng
as re
oor
und
oss
e re
tion
calc
cen
at in
t th
th s
stme
cant
weve
ng f
chan
d Bus
s a
ous
away
tual
stim
hich
erfec
ge
y o
s in
ihoo
nco
SEAN
to S
EAN
car
epe
wh
der
of
elati
item
cula
nt o
ncom
he r
scen
ent
ly a
er,
for 1
nge
siness
n u
seho
y fro
l los
mate
no
ct s
in t
ut o
n rea
od o
ome
N M
Subs
Mar
re o
eated
hich
the
ho
ive
ms i
ated
of vu
me
real
nari
bas
affec
this
10 p
of t
s Vol
upp
olds
om
ss w
e if t
o r
ubs
he p
of t
al in
of a
lo
Mark
idy R
rket
of t
d by
als
e 1
ouse
pric
in h
d as
ulne
loss
inc
os,
sed
ct th
s i
per
the
l 4 N
er
res
the
will b
he s
read
stitut
pric
that
ncom
a co
ost
ket.
Ratio
he
y ad
so f
1th
ehol
ce
ous
foll
erab
s on
com
the
on
he
nco
cen
inco
No2 (2
bou
spon
e ite
be s
sub
dy
te,
e of
ite
me.
onsu
du
onal
Vul
djus
facto
MP
d i
cha
seho
ows
ble p
nly re
e a
e l
n the
real
ome
nt in
ome
(2017
und
nd to
m fo
mal
sidis
sub
hou
f the
m a
Th
ume
ue
lisat
lne
sting
ors
P. A
inco
ange
old e
s:
poo
epre
amo
oss
e A
l inc
lo
nflat
e ma
7) 25
ary
o ch
or w
ller.
sed
bstitu
useh
e su
and
he p
er r
to
ion b
rab
g the
in
Alte
ome
e, u
expe
r ho
ese
ng
in
ASEA
com
ost
tion
ay b
5-36
on
hang
whic
The
item
utes
hold
ubs
int
proc
resp
su
base
ble 4
e fo
the
erna
e as
usin
end
ouse
nts
the
in
AN
me o
ca
rat
be d
n th
ges
ch th
e lo
m is
s a
ds w
idise
to th
edu
pons
ubsi
ed o
40%
ormu
e tot
tive
s th
g th
ditur
eho
abo
po
ncom
pri
of th
n b
te p
due
he
in
he
ss
s a
are
will
ed
he
ure
se.
dy
n
%
ula
tal
ly,
he
he
es
ld,
out
oor
me
ce
he
be
per
to
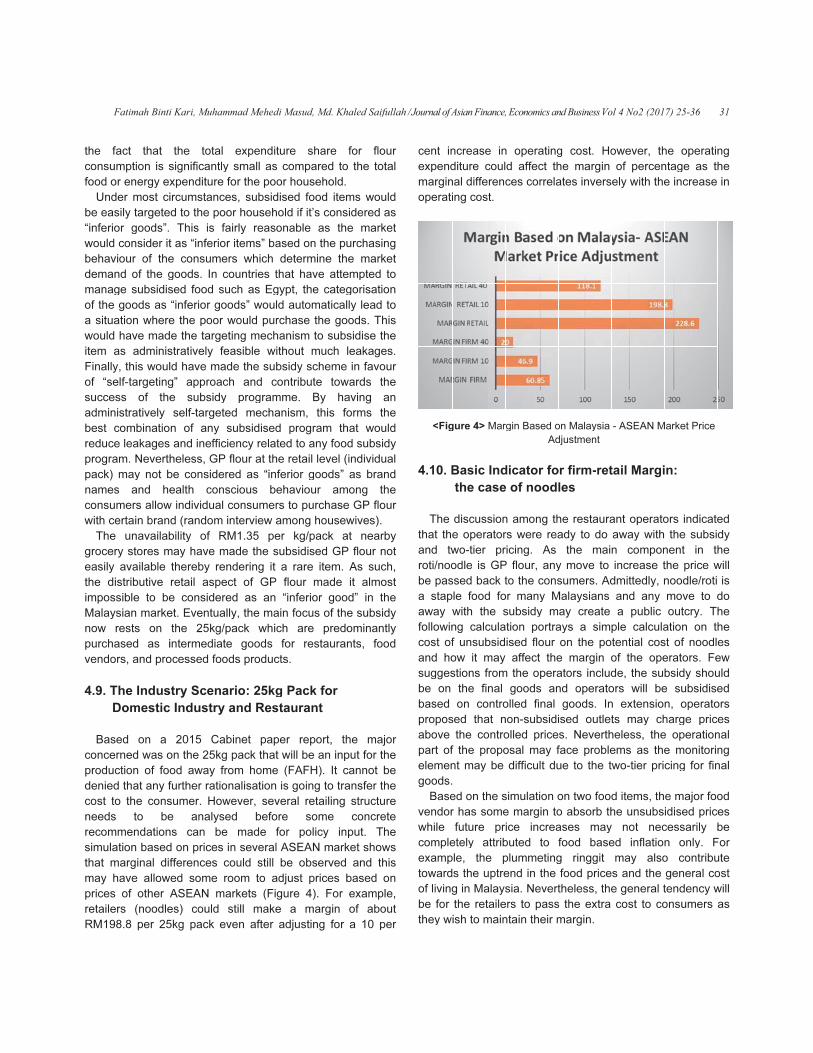
the
con
foo
U
be
“inf
wo
beh
dem
ma
of t
a s
wo
item
Fin
of
suc
adm
bes
red
pro
pac
nam
con
wit
T
gro
eas
the
imp
Ma
now
pur
ven
4.9
B
con
pro
den
cos
nee
rec
sim
tha
ma
pric
reta
RM
F
e fa
nsum
od o
Und
eas
ferio
uld
havi
man
anag
the
situa
uld
m a
nally
“se
cces
mini
st c
duce
ogra
ck)
mes
nsum
h ce
The
ocer
sily
e dis
poss
alays
w r
rcha
ndor
9. T
D
Base
ncer
oduc
nied
st to
eds
com
mula
at m
ay h
ces
ailer
M198
Fatim
act
mpt
r en
er m
sily t
or g
con
iour
nd o
ge s
goo
ation
hav
as a
y, th
elf-ta
ss
istra
com
e lea
am.
may
s a
mer
erta
un
ry st
ava
strib
sible
sian
rests
ased
rs, a
The
Dom
ed
rned
ction
d tha
o th
t
men
ation
marg
have
of
rs
8.8
mah B
th
tion
nerg
mos
targ
good
nside
r of
of th
subs
ods
n wh
ve m
adm
is w
arge
of
ative
mbina
akag
Nev
y no
and
rs al
in b
nava
tore
ailab
butiv
e to
n ma
s o
d a
and
Ind
mes
on
d wa
n of
at a
he c
to
nda
n ba
gina
e al
oth
(noo
per
Binti
at
is s
gy ex
st ci
gete
ds”.
er it
the
he g
sidis
as
here
mad
minis
woul
eting
the
ely
atio
ges
verth
ot b
he
llow
bran
ailab
es m
ble
ve
o be
arke
on
as i
pro
dus
stic
a
as o
f foo
ny f
cons
be
tion
ased
l dif
low
her A
odle
r 25
i Kar
the
sign
xpe
ircu
d to
Th
t as
e co
good
sed
“infe
e th
e th
strat
ld h
g” a
e s
sel
n o
and
hele
be c
ealt
w ind
d (r
bility
may
the
reta
e co
et. E
the
inte
oces
stry
Ind
20
on th
od
furth
sum
e
ns c
d on
ffere
wed
ASE
es)
5kg
ri, M
e to
nifica
ndit
mst
o the
his
“inf
ons
ds.
foo
erio
he p
he ta
tivel
ave
app
sub
f-tar
of a
d ine
ess,
cons
h
divid
and
y o
hav
reby
ail a
ons
Even
25
rme
ssed
Sc
dus
015
he 2
awa
her
mer.
ana
can
n pri
enc
som
EAN
cou
pac
Muham
otal
antly
ture
tanc
e po
is f
ferio
ume
In c
od s
or go
poor
arge
ly f
e ma
roac
sidy
rget
any
effic
GP
side
con
dual
dom
of R
ve m
y re
aspe
ider
ntua
5kg/
ediat
d foo
cena
stry
Ca
25kg
ay f
ratio
How
alys
be
ces
es
me
N m
uld
ck e
mma
e
y sm
e for
ces,
oor h
fairly
or ite
ers
cou
such
oods
wo
eting
feas
ade
ch
y p
ted
sub
cien
P flo
ered
nscio
con
inte
RM1
mad
ende
ect
red
ally,
/pac
te
ods
ario
y an
abin
g pa
from
ona
wev
sed
e m
in s
cou
roo
mark
stil
even
ad M
expe
mal
the
sub
hou
y re
ems
wh
ntrie
h as
s” w
ould
g m
sible
the
and
prog
me
bsid
ncy r
our a
as
ous
nsu
ervie
1.35
de th
ering
of
as
the
ck w
goo
pro
o: 2
nd R
et
ack
m ho
lisat
ver,
b
mad
seve
uld s
m t
kets
ll m
n af
Mehed
endit
l as
e po
bsid
seh
eas
s” ba
ich
es t
s Eg
woul
pur
mech
e w
e su
d c
gram
echa
dised
rela
at th
“in
b
mer
ew a
5 pe
he s
g it
GP
an
e ma
whi
ods
oduc
25kg
Res
pap
that
ome
tion
sev
befo
de f
eral
still
to a
(Fi
make
fter
di Ma
ture
s co
or h
dise
hold
ona
ase
det
that
gypt
ld a
rcha
hani
itho
bsid
cont
mme
anis
d p
ted
he re
ferio
eha
rs to
amo
er
subs
a r
P flo
“in
ain f
ch
for
cts.
g P
stau
per
t wil
e (F
is g
vera
ore
for
l AS
be
adju
gure
e a
adj
Masud
e s
ompa
hous
d fo
if it
able
d on
term
t ha
t, th
auto
ase
sm
ut
dy s
ribu
e.
sm,
prog
to a
etail
or g
aviou
o pu
ong
kg/p
sidis
rare
our
nferi
focu
are
r re
Pack
ura
rep
ll be
FAFH
goin
al re
s
po
SEA
ob
st p
e 4
a m
usti
d, Md
shar
ared
seho
ood
t’s c
as
n th
mine
ave
he c
mat
the
to s
muc
sche
ute
By
thi
ram
any
l lev
good
ur
urch
hou
pack
sed
e ite
ma
or g
us o
e p
esta
k fo
nt
port
e an
H).
ng to
etail
ome
licy
AN m
serv
price
4). F
marg
ing
d. Kh
re
d to
old.
item
cons
s th
e pu
e th
atte
categ
tical
e go
subs
ch
eme
tow
ha
s fo
m th
foo
vel (
ds”
am
hase
usew
k a
GP
em.
de
goo
of th
redo
ura
or
t, th
n inp
It c
o tra
ling
e
in
mark
ved
es b
For
gin
for
haled
for
o the
ms
side
e m
urch
he m
emp
gori
lly le
oods
sidis
leak
in f
ward
avin
orm
hat
d su
(indi
as
mong
e GP
wive
at n
P flo
As
it a
od”
e su
omi
nts,
he
put f
cann
ansf
str
co
put
ket s
an
bas
exa
of
a 1
d Saif
flo
e to
wou
red
mark
hasi
mark
pted
sati
ead
s. Th
se t
kage
favo
ds t
ng
ms t
wou
ubsi
ividu
bra
g t
P flo
es).
near
our n
suc
almo
in t
ubsi
nan
fo
ma
for t
not
fer t
uctu
ncre
. T
show
nd th
ed
amp
abo
10 p
fulla
our
otal
uld
as
ket
ing
ket
to
ion
to
his
the
es.
our
the
an
the
uld
idy
ual
and
the
our
rby
not
ch,
ost
the
idy
ntly
ood
ajor
the
be
the
ure
ete
The
ws
his
on
ple,
out
per
ah
/ Joourna
cen
exp
mar
ope
<
4.1
T
that
and
roti/
be
a s
awa
follo
cos
and
sug
be
bas
pro
abo
par
elem
goo
B
ven
whi
com
exa
tow
of li
be
they
al of A
nt in
pend
rgin
erati
<Fig
0. B
The
t the
d tw
/noo
pas
stap
ay w
owin
st of
d ho
gges
on
sed
pos
ove
t of
men
ods.
Base
ndor
le
mple
amp
ward
iving
for
y wi
Asian
ncre
ditur
nal d
ing c
gure
Bas
the
disc
e op
wo-t
odle
ssed
le f
with
ng c
f un
ow
stion
the
on
sed
the
f the
nt m
ed o
r ha
futu
etely
le,
s th
g in
the
ish t
n Fina
ease
re c
diffe
cos
4>
sic
e ca
cuss
pera
tier
e is
d ba
food
h th
calc
nsub
it m
ns f
e fin
co
tha
e co
e pr
may
on th
s so
ure
y a
the
he u
Ma
ret
to m
ance,
e in
coul
renc
t.
Mar
Ind
ase
sion
ator
pr
GP
ack t
d fo
he s
cula
bsid
may
from
nal
ontro
at n
ontro
ropo
be
he s
ome
pr
attrib
e p
uptre
alays
taile
main
, Eco
n op
d a
ces
rgin B
dica
e of
n am
rs w
ricin
P flo
to th
or m
subs
tion
ised
aff
m the
goo
olled
non-
olled
osal
diff
simu
e ma
ice
bute
plum
end
sia.
ers t
ntain
onomi
pera
affec
cor
Base
ator
no
mon
were
g.
our,
he c
many
sidy
n po
d flo
fect
e op
ods
d fin
sub
d pr
ma
ficul
ulati
argi
inc
ed t
mme
in t
Ne
to p
n the
ics an
ating
ct th
rrela
ed o
Ad
r fo
oodl
g th
e rea
As
any
cons
y M
y m
ortra
our
the
pera
s an
nal
bsidi
rice
ay f
t du
on o
in to
crea
to f
eting
the
vert
ass
eir m
nd Bu
g co
he m
ates
on M
djust
r fi
les
he r
ady
the
y mo
sum
Mala
ay
ays
on
e m
ator
nd o
goo
ised
s. N
face
ue t
on t
o ab
ases
food
g r
foo
thel
s the
mar
usines
ost.
mar
s inv
Malay
tmen
rm-
resta
to
e m
ove
mers
ysia
cre
a s
the
marg
s in
ope
ods
d ou
Nev
e pr
to th
two
bsor
s m
d b
ringg
d pr
ess
e ex
gin.
ss Vo
Ho
rgin
vers
ysia
nt
-ret
aura
do
mai
e to
s. Ad
ans
ate
simp
po
gin o
nclud
rato
. In
utlet
erth
oble
he tw
food
rb th
may
base
git
rice
, the
xtra
ol 4 N
owe
of
ely
- AS
tail
ant
awa
n c
inc
dmit
and
a
ple
tent
of t
de,
ors
n ex
ts m
hele
ems
wo-
d ite
he u
y no
ed
ma
s an
e ge
cos
No2 (
ever
per
with
SEA
Ma
ope
ay w
com
reas
tted
d a
pub
cal
tial
the
the
will
xten
may
ss,
s as
-tier
ems
unsu
ot
infla
ay
nd t
ene
st to
(201
r, th
rcen
h the
N M
argi
erato
with
mpon
se t
ly, n
any
blic
cula
cos
ope
sub
be
nsio
y ch
the
s the
pri
s, th
ubs
nec
ation
also
the
ral t
o co
7) 25
he o
ntag
e in
Marke
n:
ors
the
nent
the
noo
mo
out
ation
st of
erat
bsid
e su
n, o
harg
e op
e m
cing
e m
idise
cess
n o
o c
gen
tend
onsu
5-36
ope
ge a
crea
et Pr
indi
e su
t in
pric
dle/
ve
tcry
n o
f no
ors.
dy s
ubsi
ope
ge p
pera
moni
g fo
majo
ed p
saril
only
cont
nera
denc
ume
6
eratin
as th
ase
rice
icate
ubsi
n th
ce w
/roti
to d
. Th
on th
oodl
. Fe
shou
idise
rato
pric
ation
torin
r fin
r foo
pric
y b
y. F
tribu
al co
cy w
ers
31
ng
he
in
ed
dy
he
will
is
do
he
he
es
ew
uld
ed
ors
es
nal
ng
nal
od
es
be
For
ute
ost
will
as
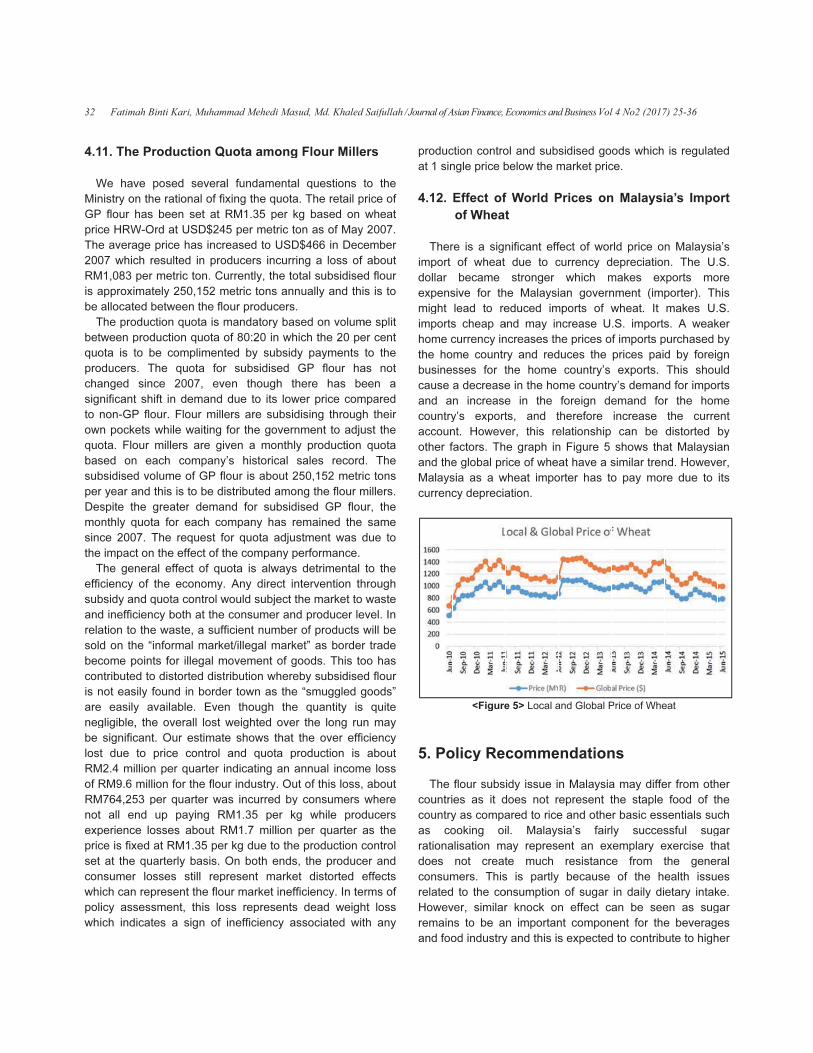
32
4.1
W
Min
GP
pric
The
200
RM
is a
be
T
bet
quo
pro
cha
sig
to
ow
quo
bas
sub
per
De
mo
sin
the
T
effi
sub
and
rela
sol
bec
con
is n
are
neg
be
los
RM
of R
RM
not
exp
pric
set
con
wh
pol
wh
Fa
11. T
We
nistr
P flo
ce H
e av
07 w
M1,0
app
allo
The
twee
ota
oduc
ange
nific
non
n po
ota.
sed
bsid
r ye
spit
onth
ce
e imp
The
cien
bsid
d ine
ation
d o
com
ntrib
not
e ea
gligi
sig
t du
M2.4
RM9
M764
t al
perie
ce is
t at
nsum
ich
icy
ich
Fatim
The
hav
ry o
our
HRW
vera
whic
083
roxi
ocate
pro
en p
is t
cers
ed
cant
n-GP
ock
Flo
on
dised
ar a
te th
ly q
200
pac
ge
ncy
dy an
effic
n to
n th
me p
bute
eas
asily
ible,
nific
ue
4 mi
9.6
4,25
l e
enc
s fix
the
mer
can
ass
ind
ah B
e Pr
ve
n th
has
W-O
age
ch r
per
mat
ed b
oduc
prod
to b
s. T
sin
t sh
P flo
ets
our
n ea
d vo
and
he
quot
07. T
ct on
nera
of
nd q
cien
o the
he “
poin
ed to
sily f
y a
, the
cant
to
illion
mill
53 p
nd
ce lo
xed
qu
r lo
n rep
sess
icat
Binti
rod
pos
he ra
s be
Ord a
pric
resu
r me
tely
betw
ction
duct
be c
The
ce
ift i
our.
wh
mill
ach
olum
this
grea
ta fo
The
n the
al e
the
quot
ncy b
e wa
info
ts fo
o dis
foun
avail
e ov
t. O
pric
n pe
ion
per
up
osse
at R
arte
sse
pres
sme
tes
Kari
duct
sed
ation
een
at U
ce h
ulted
etric
250
wee
n qu
tion
com
qu
20
n de
Flo
ile w
lers
co
me o
s is t
ater
or e
e req
e eff
effec
ec
ta c
both
aste
orma
or il
stort
nd i
able
vera
Our e
ce c
er q
for
qua
pa
es a
RM1
erly
es s
sent
ent,
a s
i, Mu
tion
sev
nal
set
USD
has
d in
c ton
0,15
n th
uota
quo
mplim
uota
07,
ema
our
wait
are
omp
of G
to b
r de
each
que
fect
ct of
ono
contr
h at
e, a
al m
llega
ted
n bo
e. E
all lo
esti
cont
uart
the
arter
aying
abou
1.35
bas
still
t the
this
sign
uham
n Q
vera
of f
at
D$24
incr
pro
n. C
52 m
he fl
a is
ota
men
fo
ev
and
mill
ting
e gi
pany
GP f
be d
ema
h co
est f
t of t
f qu
omy
rol w
the
suf
mark
al m
dist
orde
Eve
ost
mat
trol
ter
flou
r wa
g R
ut R
5 pe
sis.
rep
e flo
s lo
of
mmad
Quo
al fu
ixing
RM
45 p
reas
oduc
urre
metr
our
man
of 8
ted
r s
ven
due
ers
for
iven
y’s
flour
istri
and
omp
for q
the
uota
. An
wou
e co
fficie
ket/il
move
tribu
er to
en t
we
te s
and
indi
ur in
as i
RM1
RM1
er kg
On
pres
our m
oss
ine
d Me
ta a
und
g th
M1.3
per m
sed
cers
ently
ric t
pro
nda
80:2
by
ubs
tho
e to
are
the
n a
hist
r is
ibute
for
pany
quo
com
a is
ny d
uld s
nsu
ent
llega
eme
ution
own
thou
ight
show
d q
cati
ndus
ncu
.35
1.7
g du
bot
sent
mar
rep
effici
ehedi
amo
ame
he q
35 p
met
to U
s inc
y, th
ons
oduc
tory
20 in
su
sidis
oug
o its
e su
e go
mo
toric
abo
ed a
su
y ha
ta a
mpa
alw
dire
subje
ume
num
al m
ent
n w
n as
ugh
ted
ws t
quot
ing
stry
urred
pe
mill
ue to
th e
ma
ket
prese
ienc
i Ma
ong
enta
uota
per k
ric t
USD
curr
he to
s an
cers
y ba
n wh
bsid
ed
h t
s low
ubsi
over
onth
cal
out 2
amo
bsid
as r
adju
ny p
ways
ct i
ect
r an
mbe
mark
of g
here
s the
the
ove
that
ta p
an
. Ou
d by
er k
lion
o the
ends
arke
inef
ents
cy a
asud,
g Fl
al q
a. T
kg b
ton
D$4
ring
otal
nua
s.
ased
hich
dy p
GP
ther
wer
disi
rnme
ly p
sal
250
ong
dise
rem
ustm
perf
s de
nter
the
nd p
r of
ket”
good
eby
e “s
e q
er th
the
prod
ann
ut of
y co
kg w
pe
e pr
s, th
et d
fficie
s de
asso
Md.
lou
ques
The
bas
as o
466
a l
sub
ally a
d on
h the
paym
P flo
re h
pric
ng
ent
prod
es
,152
the
ed G
aine
ment
form
etrim
rven
ma
prod
pro
as
ds.
sub
mug
quan
he lo
e ov
duct
nual
f thi
onsu
whil
r qu
rodu
he p
disto
ency
ead
ocia
. Kha
r M
stion
reta
ed
of M
in D
oss
bsid
and
n vo
e 20
men
our
has
ce c
thro
to a
ducti
rec
2 m
e flou
GP
ed t
t wa
manc
men
ntion
arket
uce
oduc
bor
Thi
bsid
ggle
ntity
ong
ver
ion
inc
is lo
ume
le p
uart
uctio
prod
orte
y. In
we
ted
aled
Mille
ns t
ail p
on
May
Dece
s of
dised
d thi
lum
0 pe
nts
ha
be
com
ough
adju
ion
cord
metri
ur m
flou
the
as d
ce.
ntal
n th
t to
er le
cts w
rder
s to
dised
ed g
is
run
effic
is
com
oss,
ers w
prod
er a
on c
duce
ed e
n te
eigh
wit
Saifu
ers
to t
rice
whe
200
emb
abo
d flo
s is
me sp
er ce
to t
as n
een
mpar
h th
ust t
quo
. T
c to
mille
ur, t
sam
due
to t
hrou
was
vel.
will
r tra
oo h
d flo
good
qu
n m
cien
abo
e lo
abo
whe
duce
as t
cont
er a
effec
rms
ht lo
th a
fullah
the
e of
eat
07.
ber
out
our
to
plit
ent
the
not
a
red
heir
the
ota
The
ons
ers.
the
me
to
the
ugh
ste
In
be
ade
has
our
ds”
uite
may
ncy
out
oss
out
ere
ers
the
trol
and
cts
s of
oss
any
h
/ Jouurnal
pro
at 1
4.1
T
imp
doll
exp
mig
imp
hom
the
bus
cau
and
cou
acc
othe
and
Mal
curr
5.
T
cou
cou
as
ratio
doe
con
rela
How
rem
and
l of A
duc
1 sin
2.
Ther
port
lar
pens
ght
ports
me c
ho
sine
use
d a
untry
coun
er f
d the
lays
renc
Po
The
untri
untry
co
ona
es
nsum
ated
wev
main
d foo
Asian
ction
ngle
Effe
of
re is
of
be
sive
lead
s ch
curr
me
sse
a de
n in
y’s
nt.
facto
e glo
sia a
cy d
olic
flou
es
y as
ooki
alisa
not
mers
d to
ver,
ns to
od in
Fina
n co
e pric
ect
Wh
s a
wh
ecam
for
d to
hea
renc
cou
s fo
ecre
ncre
exp
How
ors.
oba
as a
depr
<Fig
cy R
ur su
as
s co
ing
ation
t c
s. T
the
sim
o be
ndu
ance, E
ontro
ce b
t of
heat
sign
eat
me
r th
o re
p a
cy in
untr
or t
ease
ease
port
weve
Th
al pr
a w
recia
gure
Re
ubs
it d
mpa
oi
n m
reat
This
e co
milar
e a
stry
Econ
ol an
belo
f W
t
nific
du
str
he M
educ
and
ncre
ry a
the
e in
e in
ts,
er,
e g
ice
whea
atio
e 5>
co
idy
does
ared
il.
ay
te
s is
onsu
r kn
n im
y an
nomic
nd s
ow th
World
cant
ue t
rong
Mala
ced
ma
ase
and
ho
the
n th
and
this
rap
of w
at im
n.
> Loc
mm
issu
s no
d to
Ma
rep
mu
pa
ump
nock
mpo
d th
cs and
subs
he m
d P
t eff
to c
ger
aysi
im
y in
es th
red
me
e ho
he
d t
s re
h in
whe
mpo
cal a
me
ue i
ot r
rice
alays
prese
ch
artly
tion
k on
ortan
his is
d Bus
sidis
mar
Pric
fect
curre
wh
ian
mpor
ncre
he p
duce
co
me
fore
ther
elati
n Fig
at h
orter
and G
end
n M
repre
e an
sia’s
ent
res
y be
n of
n e
nt c
s ex
siness
sed
ket
ces
of
ency
hich
gov
rts
ease
price
es t
untr
cou
eign
efor
ons
gure
have
r ha
Glob
dati
Mala
ese
nd o
s
an
sista
ecau
sug
ffec
com
xpec
s Vol
go
pric
on
wor
y d
h m
vern
of w
e U
es o
he
ry’s
untry
n de
re
ship
e 5
e a s
as to
bal P
ion
ysia
nt t
othe
fairl
ex
anc
use
gar
ct ca
pon
cted
l 4 N
ods
ce.
n M
rld p
depr
mak
nme
whe
.S.
f im
pric
ex
y’s d
ema
incr
ca
sho
simi
o pa
Price
ns
a m
the
r ba
ly
xem
e f
of
in d
an
nent
d to
No2 (2
s wh
Mala
price
recia
es
ent
eat.
imp
mpor
ces
xport
dem
and
reas
an b
ows
ilar
ay
e of W
ay d
sta
asic
suc
plar
from
the
daily
be
for
con
(2017
hich
aysi
e o
ation
ex
(imp
It
ports
rts p
paid
ts.
man
fo
se
be
s tha
tren
mor
Whe
diffe
aple
ess
cces
ry e
m t
e he
y di
see
r the
ntrib
7) 25
is r
ia’s
n M
n. T
xpor
port
ma
s. A
purc
d b
Thi
d fo
r th
the
dist
at M
nd. H
re d
eat
er fr
foo
sent
ssfu
exer
the
ealt
etar
en a
e be
ute
5-36
regu
s Im
Mala
The
rts
ter).
kes
A w
has
y fo
s s
or im
he
e c
torte
Mala
How
due
rom
od o
tials
ul
rcise
ge
th is
ry in
as
eve
to h
ulate
mpo
aysia
U.
mo
. Th
U.
weak
sed
oreig
shou
mpor
hom
urre
ed
aysia
weve
to
oth
of th
s su
sug
e th
ener
ssu
ntak
sug
erag
high
ed
ort
a’s
.S.
ore
his
.S.
ker
by
gn
uld
rts
me
ent
by
an
er,
its
her
he
ch
gar
hat
ral
es
ke.
gar
es
her
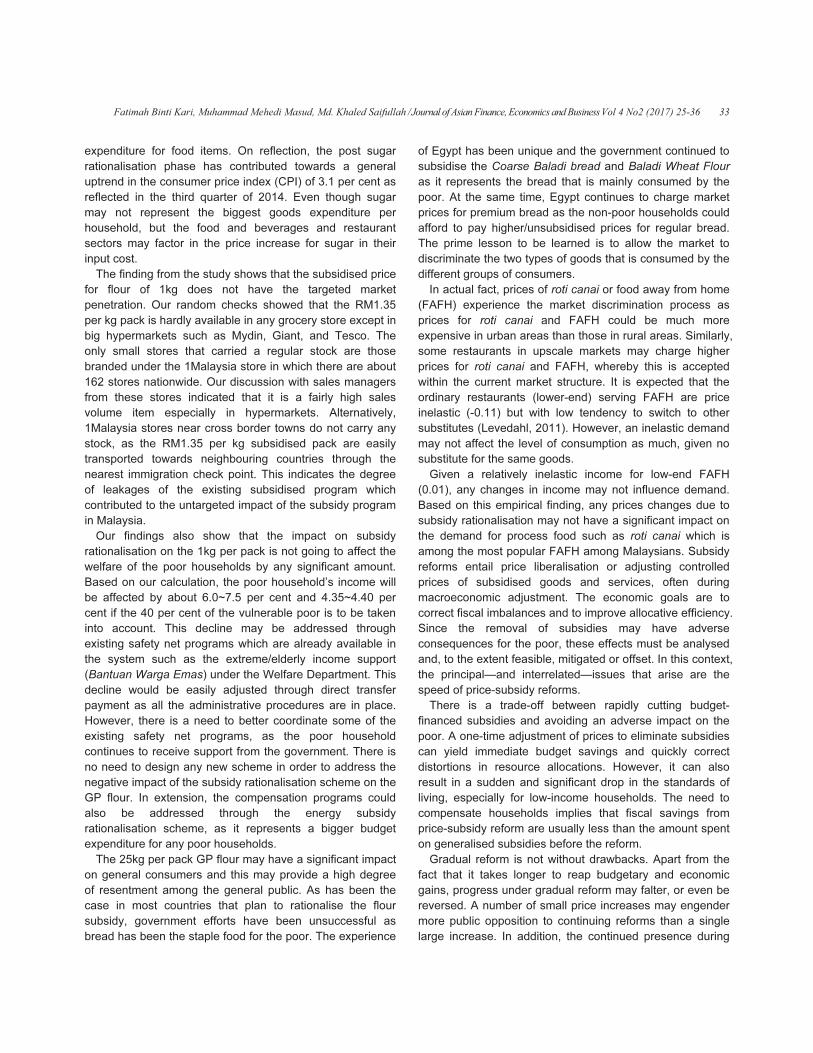
Fatimah Binti Kari, Muhammad Mehedi Masud, Md. Khaled Saifullah
/ Journal of Asian Finance, Economics and Business Vol 4 No2 (2017) 25-36 33
expenditure for food items. On reflection, the post sugar
rationalisation phase has contributed towards a general
uptrend in the consumer price index (CPI) of 3.1 per cent as
reflected in the third quarter of 2014. Even though sugar
may not represent the biggest goods expenditure per
household, but the food and beverages and restaurant
sectors may factor in the price increase for sugar in their
input cost.
The finding from the study shows that the subsidised price
for flour of 1kg does not have the targeted market
penetration. Our random checks showed that the RM1.35
per kg pack is hardly available in any grocery store except in
big hypermarkets such as Mydin, Giant, and Tesco. The
only small stores that carried a regular stock are those
branded under the 1Malaysia store in which there are about
162 stores nationwide. Our discussion with sales managers
from these stores indicated that it is a fairly high sales
volume item especially in hypermarkets. Alternatively,
1Malaysia stores near cross border towns do not carry any
stock, as the RM1.35 per kg subsidised pack are easily
transported towards neighbouring countries through the
nearest immigration check point. This indicates the degree
of leakages of the existing subsidised program which
contributed to the untargeted impact of the subsidy program
in Malaysia.
Our findings also show that the impact on subsidy
rationalisation on the 1kg per pack is not going to affect the
welfare of the poor households by any significant amount.
Based on our calculation, the poor household’s income will
be affected by about 6.0~7.5 per cent and 4.35~4.40 per
cent if the 40 per cent of the vulnerable poor is to be taken
into account. This decline may be addressed through
existing safety net programs which are already available in
the system such as the extreme/elderly income support
(Bantuan Warga Emas) under the Welfare Department. This
decline would be easily adjusted through direct transfer
payment as all the administrative procedures are in place.
However, there is a need to better coordinate some of the
existing safety net programs, as the poor household
continues to receive support from the government. There is
no need to design any new scheme in order to address the
negative impact of the subsidy rationalisation scheme on the
GP flour. In extension, the compensation programs could
also be addressed through the energy subsidy
rationalisation scheme, as it represents a bigger budget
expenditure for any poor households.
The 25kg per pack GP flour may have a significant impact
on general consumers and this may provide a high degree
of resentment among the general public. As has been the
case in most countries that plan to rationalise the flour
subsidy, government efforts have been unsuccessful as
bread has been the staple food for the poor. The experience
of Egypt has been unique and the government continued to
subsidise the Coarse Baladi bread and Baladi Wheat Flour
as it represents the bread that is mainly consumed by the
poor. At the same time, Egypt continues to charge market
prices for premium bread as the non-poor households could
afford to pay higher/unsubsidised prices for regular bread.
The prime lesson to be learned is to allow the market to
discriminate the two types of goods that is consumed by the
different groups of consumers.
In actual fact, prices of roti canai or food away from home
(FAFH) experience the market discrimination process as
prices for roti canai and FAFH could be much more
expensive in urban areas than those in rural areas. Similarly,
some restaurants in upscale markets may charge higher
prices for roti canai and FAFH, whereby this is accepted
within the current market structure. It is expected that the
ordinary restaurants (lower-end) serving FAFH are price
inelastic (-0.11) but with low tendency to switch to other
substitutes (Levedahl, 2011). However, an inelastic demand
may not affect the level of consumption as much, given no
substitute for the same goods.
Given a relatively inelastic income for low-end FAFH
(0.01), any changes in income may not influence demand.
Based on this empirical finding, any prices changes due to
subsidy rationalisation may not have a significant impact on
the demand for process food such as roti canai which is
among the most popular FAFH among Malaysians. Subsidy
reforms entail price liberalisation or adjusting controlled
prices of subsidised goods and services, often during
macroeconomic adjustment. The economic goals are to
correct fiscal imbalances and to improve allocative efficiency.
Since the removal of subsidies may have adverse
consequences for the poor, these effects must be analysed
and, to the extent feasible, mitigated or offset. In this context,
the principal—and interrelated—issues that arise are the
speed of price-subsidy reforms.
There is a trade-off between rapidly cutting budget-
financed subsidies and avoiding an adverse impact on the
poor. A one-time adjustment of prices to eliminate subsidies
can yield immediate budget savings and quickly correct
distortions in resource allocations. However, it can also
result in a sudden and significant drop in the standards of
living, especially for low-income households. The need to
compensate households implies that fiscal savings from
price-subsidy reform are usually less than the amount spent
on generalised subsidies before the reform.
Gradual reform is not without drawbacks. Apart from the
fact that it takes longer to reap budgetary and economic
gains, progress under gradual reform may falter, or even be
reversed. A number of small price increases may engender
more public opposition to continuing reforms than a single
large increase. In addition, the continued presence during

34 Fatimah Binti Kari, Muhammad Mehedi Masud, Md. Khaled Saifullah
/ Journal of Asian Finance, Economics and Business Vol 4 No2 (2017) 25-36
the phase-out period of institutions needed to administer the
price subsidies contributes to the risk of a reversal of the
reforms. Finally, a gradual approach may fail if it is adopted
to postpone politically difficult reforms. Such failure can be
avoided by publicly adopting a detailed timetable of
measures and the options for protecting the real income
among the poor households.
Fiscal considerations: A high share of explicit subsidies
in spending implies a greater potential for rapid budgetary
savings. The budgetary savings will be offset in part—at
least in the short run—by compensation for the poor.
Elimination of implicit subsidies, on the other hand, will not
generally yield budgetary savings, although the revenues of
public-sector agencies could increase. Consequently, the
speed of reform for the implicit subsidies should reflect the
availability of resources, including from external sources.
Since the monetary value of subsidy are tied up to the
physical amount of subsidised flour, rationalisation of GP
flour subsidy includes the proposal to transfer this subsidy
through the existing income support program managed by
the Welfare Department under the Ministry of Women,
Family and Community Development. Since the delivery of
income support program has been aligned based on mean
testing method, this is expected to better target the poor
families facing an increase in the cost of living. This is not
expected to affect the operating expenditure of the income
support program as it is an existing program managed by
the Welfare Department.
Availability of social protection instruments and
administrative capacity: Compensating the poor for the
elimination of subsidies requires not only resources, but also
a system to deliver compensation to those who need it.
Price-subsidy reform can be rapid when countries already
have the social protection instruments that can be adapted
to the needs of the poor during any reform. If new social
safety net instruments need to be established, the
administrative capacity to design and implement adequate
and well-targeted social protection will affect the speed of
reform. Availability of information on the socioeconomic and
demographic characteristics of the poor will also influence
the speed.
Willingness of governments to act on a technically
sound reform package: Political considerations have an
impact on whether reforms are implemented in a timely
manner. In part, they are determined by the popularity of the
government and by the level of organization of the middle
class. Even under favourable conditions, governments may
opt for a slower pace of reform in order to assess and react
to unintended consequences, including any adverse political
repercussions, and adjust the timing and speed of reforms
accordingly. As noted above, however, this runs the risk of
reform reversal.
Assess the gains from price-subsidy reform: These
would include improved resource allocation (e.g., improved
availability of price-controlled items), resource savings that
could finance critical public services, or reduce the deficit or
taxes, and the beneficial impact on real incomes of some
households (see below).
Examine the short-term impact of increasing prices of
consumer items on real household incomes,
particularly the incomes of the poor: Both the direct and
indirect effects of changes in the price of subsidised items
must be considered by following these steps.
Assess the direct impact of a reduction in subsidies
on real household incomes: This study has identified that
liberalising the domestic GP flour market may not affect the
real income of the poor households. Nevertheless, we
cannot ignore the fact that food price increases had an
immediate and significant impact on the level of real
consumption of low-income households. This was
attributable to the high share of food (over 30%) in total
expenditures of low-income households and the high
increase in food (above 75%) as reflected in the post GST
implementation. However, in the case of GP flour and the
1kg pack, it only represents about 0.05% of the
expenditures of the poor households. Thus, any move to
liberalise the domestic markets may not affect the welfare of
the low-income households. Not all poor households lose
from price-subsidy reform. For example, households that
produce more food than they consume may gain from the
liberalization of food prices. Those employed in the traded-
goods sector may also benefit from the elimination of implicit
exchange rate subsidies.
The impact of price-subsidy reform on real household
income (particularly of the poor) should be monitored:
There must be continuous monitoring of social outcomes
during the implementation of subsidy reforms. In many
countries, weak governance and administrative capacity
hamper the targeting and delivery of benefits. Weak
governance can divert and waste resources allocated for
price subsidies. Weak administrative capacity reflects the
lack of cost-effective mechanisms to channel income
transfers or targeted price subsidies to the designated
population groups, and can be rooted in such factors as
insufficient information on the poor and lack of equipment.
Even where administrative capacity exists, targeting and
delivery can be difficult. Determining eligibility on the basis
of income may lead to miss targeted benefits if the
administrative capacity is weak.
Fatimah Binti Kari, Muhammad Mehedi Masud, Md. Khaled Saifullah
/ Journal of Asian Finance, Economics and Business Vol 4 No2 (2017) 25-36 35
6. Conclusions
This study has attempted to address three fundamental
issues which include: a) To assess the structure and
conduct of the flour market in Malaysia; b) To analyse the
impact of subsidies on market performance; and c) To
recommend policies to increase market efficiency under the
subsidy rationalisation program.
The interviews that were carried out with consumers
indicated that the subsidised GP flour is not popular among
end consumers as many of them use non-GP flour for their
own consumption. The unpopularity is partly due to the
unavailability of the flour at their favourite shops. The
subsidised flour could be easily found at shops targeting
Indonesian and Bangladeshi immigrants. In a way, the
subsidised flour does not reach the target consumers.
These findings strengthen our view on the liberalisation of
the 1kg per pack that it will not affect the welfare of poor
households.
For restaurant owners and retailers, the liberalisation of
the 25kg per pack will have little effect on them. As stated
earlier, retailers regard GP flour as a service item and they
are not gaining much margin from the product. For
restaurant owners, the price of roti canai depends on the
location of the stores and other add-on services requested
by consumers at their store and are thus not totally
dependent on the subsidised flour.
The findings show that the liberation on the 1kg per pack
GP flour may not affect the welfare of poor households as
much as real income may be reduced by approximately 4.38
~7.58 per cent. This can be compensated through the
existing safety net programs implemented by various
agencies. Similarly, liberation for the 25kg per pack
demands more consideration as it affects the demand for
FAFH and this may have an impact on the general
consumers. However, our findings show that the producer-
retail margin may be sufficient to absorb the minor
adjustment of the unsubsidised price based on data from
the ASEAN countries. Furthermore, the price inelastic
nature given the limited substitute for FAFH may result in
insignificant reduction in demand given the new
unsubsidised prices. In extension, the low-income elasticity
for low-end FAFH may not affect the market demand for end
products such as roti canai or local cake/delicacies which
use GP flour as the main ingredient. This study also shows
that the efficiency cost associated with price and production
control (quota) is fairly significant and this must be
addressed within the current market structure.
It is projected that the Malaysian economy is expected to
expand approximately 4.5 to 5.5 per cent in 2015, driven
primarily by growth in domestic demand. In line with the
growth in consumer demand, interest in good quality
pastries and bread is rising, and the number of specialties
cafes and pastry shops serving bakery products is similarly
increasing. All these factors are boosting wheat imports. As
domestic consumption stabilises and there is a need to
reduce the available stock, wheat imports are forecast to
drop by 8 per cent in 2012/13 and subsequently increased
by 6.5 per cent in 2013/14. The price of wheat import is
lower due to slow export demand in 2015/16. The projection
of 2015 to 2017 indicates that the import price will remain
almost unchanged. World wheat production is projected to
reach record levels due to upward revisions for the
European Union and Canada (IGC and USDA FAS). Global
stocks ending in 2015 are projected to reach their highest
level in twelve years, but consumption is also expected to
rise (AMIS and IGC). However, there is a significant effect of
ringgit depreciation over import cost. The impact of price
depreciation shows that the Malaysian government now has
to pay 25 per cent higher than before. This indicates that the
U.S. dollar has become stronger which makes U.S. exports
more expensive for the Malaysian government (importer)
which may reduce imports.
In conclusion, there is a strong justification for the
government to rationalise the GP flour subsidy as it has
some distorted effect on the market efficiency and
competiveness. Malaysia may need to adjust to a more
competitive price and market structure for the GP flour
industry such as in neighbouring ASEAN countries which
have moved towards less regulated markets that has
contributed towards a much more efficient and competitive
market. Alternative compensation strategies for the poor
household must include greater targeting for income transfer
to eliminate leakages and market distortion effects.
References
Dhehibi, B., & Gil, J. M. (2003). Forecasting food demand in
Tunisia under alternative pricing policies. Food
Policy, 28(2), 167-186.
EPU (2015). The Malaysian Economy in Figures 2015.
Malaysia: Prime Minister’s Department.
Gahvari, F., & Taheripour, F. (2011). Fiscal reforms in
general equilibrium: Theory and an application to
the subsidy debate in Iran. The B.E. Journal of
Economic Analysis and Policy, 11(1), 1-54.
International Monetary Fund (2008). Fuel and Food Price

36 Fatimah Binti Kari, Muhammad Mehedi Masud, Md. Khaled Saifullah
/ Journal of Asian Finance, Economics and Business Vol 4 No2 (2017) 25-36
Subsidies: Issues and Reforms Options. Policy
Papers. Washington D.C, United States.
Karami, A., Esmaeili, A. K., & Najafi, B. (2012). Assessing
effects of alternative food subsidy reform in Iran.
Journal of Policy Modeling, 34, 788-799.
Levedahl, J. W. (2011). Price elasticities of demand for food
away from home (FAFH). Paper Presented at the
Agricultural & Applied Economics Association’s
2011 AAEA & NAREA Joint Annual Meeting.
Pittsburgh, Pennsylvania.
Löfgren, H., & El-Said, M. (2001). Food subsidies in Egypt:
reform options, distribution and welfare. Food
Policy, 26(1), 65-83.
Nwafor, M., Ogujiuba, K., & Asogwa, R. (2006). Does
subsidy removal hurt the poor? Evidence from
computable general equilibrium analysis. Working
Paper: African Institute for Applied Economics.
Dakar, Senegal.
Organisation for Economic Co-operation and Development.
(2005). Agricultural policies in OECD countries:
Monitoring and evaluation 2007. Paris, France.
Organics (2016, October 28). Bleached vs unbleached flour.
Retrieved from organics.org website:
http://organics.org/bleached-vs-unbleached-flour/
Ramadan, R., & Thomas, A. (2011). Evaluating the impact of
reforming the food subsidy program in Egypt: a
mixed demand approach. Food Policy, 36(5), 638-
646.
Razack, A., Devadoss, S., & Holland, D. (2009). A general
equilibrium analysis of production subsidy in a
Harris-Todaro developing economy: an application
to India. Applied Economics, 41(21), 2767-2777.
Sharma, V. P., & Alagh, M. (2013). Food Subsidy in India: Its
Components, Trends, Causes and Reforms for
Public Policy. Indian Journal of Agricultural
Economics, 68(2), 195-221.
Solaymani, S., Kari, F., & Hazly Zakaria, R. (2014).
Evaluating the role of subsidy reform in addressing
poverty levels in Malaysia: a CGE poverty
framework. Journal of Development Studies, 50(4),
556-569.
Srivastava, D. K., & Rao, C. B. (2002). Government
subsidies in India: issues and approach. National
Institute of Public Finance and Policy.
World Trade Organization. (2006). World trade report 2006:
Exploring the links between subsidies, trade and
the WTO. World Trade Organization.

Nailya K. Nurlanova, Anel A. Kireyeva, Rashid M. Ruzanov / Journal of Asian Finance, Economics and Business Vol 4 No2 (2017) 37-44 37
Print ISSN: 2288-4637 / Online ISSN 2288-4645
doi:10.13106/jafeb.2017.vol4.no2.37
Evaluation of Economic Potential and Level of Concentration of
the Regions of Kazakhstan*
Nailya K. Nurlanova1
, Anel A. Kireyeva2
, Rashid M. Ruzanov3
Received: March 8, 2017. Revised: April 25, 2017. Accepted: May 2, 2017.
Abstract
This research is devoted to the development of methods general and standard methodological approaches and approbation those for the
evaluation of economic potential and level of concentration of the regions of Kazakhstan. This paper presents the results of development of
the authors on the selection and justification of the methodological approaches for quantitative evaluation of the economic potential (the
degree of territorial differentiation of the profile) and concentration of regions. In this study, we used scientific methods: method of analysis
the main trends of economic development, and method of evaluation of concentration of the region. Based on the analysis of foreign
techniques developed and tested methodical approaches to the assessment of the economic potential (index and coefficient methods).
Proposed methodological approaches to the assessment profile of the territory and developed a system of indicators, which includes an
aggregated index of spatial concentration, which accurately reflects the concentration of production in the region. This study shows the
results of the analysis of the potential regional disparities and trends of economic development of Kazakhstan. By using, the proposed
methodology shows the possibility of their use; we calculated the indicators of integrated assessment of the economic potential and
indicators of spatial concentration.
Keywords: Region, Spatial Development, Economic Potential, Concentration, Kazakhstan.
JEL Classification Code: O31, R11, R12.
1. Introduction1
In the modern conditions of unstable development of the
global economic system, the spatial factor becomes
increasingly important in the evaluation of the phenomena
and trends of economic development at the global level and
within a country, and its regions. In addition, this requires a
* This study have supported by Institute of Economics of the
Ministry of Education and Science of the Republic of Kazakhstan.
1 First Author. Deputy Director. Institute of Economics of the
Ministry of Education and Science of the Republic of Kazakhstan
[29 Kurmangazy Street, Almaty 050010, Republic of Kazakhstan]
E-mail: [email protected]
2 Corresponding Author. Chief Scientist. Institute of Economics of
the Ministry of Education and Science of the Republic of
Kazakhstan [29 Kurmangazy Street, Almaty 050010, Republic of
Kazakhstan] E-mail: [email protected]
3 Chief Scientist. Institute of Economics of the Ministry of Education
and Science of the Republic of Kazakhstan [29 Kurmangazy
Street, Almaty 050010, Republic of Kazakhstan]
clear methodological framework that provides methods and
tools for assessing spatial relationships and their changes.
Research in the field of spatial development have
fragmentary, were not integrated and not supported
methodologically until recently. Methodological tools in
domestic practice used to analyze the state and dynamics of
socio-economic development of regions far from perfect.
The consequence of this was lack of clear understanding of
the real situation and tendencies of development of the
national economy in a modern space, especially in light of
the current transformations within the country and in the
world. Meanwhile, a drastic change in recent years has
been so multifaceted and dynamic that escalated the need
for scientific understanding of the conditions and prospects
of spatial development of Kazakhstan's economy. There is
also the need to study the empirical material in the
evaluation of adaptive possibilities of application of foreign
models and methods in the area of spatial development.
Thus, for the development of effective policy of spatial
development of the country required a new methodological
approach to the study of problems of the analysis and
increase of efficiency of use of the economic potential of the

38 Nailya K. Nurlanova, Anel A. Kireyeva, Rashid M. Ruzanov / Journal of Asian Finance, Economics and Business Vol 4 No2 (2017) 37-44
region. Because of which it is possible to conduct a
comprehensive assessment of the socio-economic situation
of regions, to identify positive and negative factors
influencing their development, to identify potentially
untapped reserves. Obtained in the process evaluation
results will determine the causes of disparities in regional
development and to develop recommendations to reduce
them.
Therefore, this study aims to study the disparities in
development of regions and to provide specific
recommendations. In this study in the course of the study
obtained the following results: First, based on the analysis of
foreign techniques developed and tested methodical
approaches to the assessment of the economic potential of
the region and its competitive advantages based on the use
of the index and coefficient methods. Second, by modifying
the foreign approaches to the assessment profile of the
territory has developed a system of indicators, which
includes an aggregated index of spatial concentration of
Herfindale-Hirschman Index (HHI) and the modified
Krugman Dissimilarity Index (KDI), which accurately reflects
the concentration of production in the region. Third, this
research shows the results of the analysis of trends and of
the degree of differentiation of economic development of
regions of Kazakhstan, their potential and competitive
advantage for the period 2000-2015. We conclude that the
growth of regional disparities remains a leading trend, and in
the economy of the Kazakhstan are concentrated in a
limited number of regions with special advantages.
The study divided into the following sections. The Section
2 proposes to consider the theoretical aspects of the spatial
development. Section 3 sets the methods of evaluation of
the level of economic potential and concentration of the
regions of Kazakhstan. Section 4 is conclusion.
2. Theoretical Background and
Literature Review
A study of the basic theory of spatial development should
base on the analysis of theoretical ideas and schools of
thought that have played a significant role in the formation of
a system of ideas about the object of study. It should note
that the theory of spatial development has a rich scientific
heritage in a sufficiently large time interval. Initial theoretical
studies of spatial development associated with the
description of the economy of the territory consolidation of
information on economic systems. Therefore, all the initial
economic study carried out within a particular geographical
space, i.e. the object of study was the economics of a
particular geographical area or locality (Pred, 1966;
Saushkin, 1973; Krugman, 1991). Then, concepts of the
regional economy expanded due to several new aspects of
research of economic space, but it retains its value and the
issues that have been characteristic of the economy of
regions. The emphasis was on modeling the economic
linkages at different spatial levels. Thus, scientists estimated
spatial development in economics went through three
stages, which differed as to the condition of the object of
study – the economy and the content of the economic
science (Pchelincev, 2004; Minakir, 2011).
The next stage of development of the regional economy
due to phenomenon of globalization, i.e. integration of the
national subsystems in the common economic space.
Therefore, there is a need for long-term forecasting of
economic development and accounting of external effects
leads to obvious practical needs of spatial organization as a
function of spatial development. In many cases, economic
space from the point of view of the regional economy is the
territory, which is a set of objects and relations between
them. Granberg (2010) explores the structural features of
the organization of the regional space and offers different
models of regional development. Kolomak (2010) showed
that the interaction occurs in the development of various
kinds of spatial structures. Therefore, he explored the
external effects of the organization of the regional space.
The modern theory of spatial analysis explores regional
characteristics of subsystems and involves the analysis of
resources of the region (Kireyeva & Nurlanova, 2013;
Dezhina, 2013). Therefore, it is possible to build an
optimization model of the spatial organization and shaping
the strategic directions of development of these systems. In
addition, the economic science will create new concepts
based on developing a new strategy for spatial development.
That is why special importance given to research involving
new territorial aspects of the organization of life and spatial
differentiation. In this case, particular attention is to form
regional policy studies as an independent direction of spatial
development economy (Leontiev, 1997; Maslakov, Zubkov,
& Plenkin, 2000; Anokhin & Schulze, 2009). Thus,
summarizing the analysis of existing theories and concepts,
we conclude that important subject in spatial economics is
part of studies that cover the problems of concentration and
specialization of production. The space may not be confined
to one country or region; problems of complex development;
heterogeneity of socio-economic development and
polarization; the problem of relations and interactions
between “center” and “periphery”; problems of urbanization
and agglomeration and others.
In addition, in studies of contemporary authors used a
new model of spatial development, such as “theory of
proximity” or “traceability”, which is associated with the
problems of sustainable development of economy and

Nailya K. Nurlanova, Anel A. Kireyeva, Rashid M. Ruzanov / Journal of Asian Finance, Economics and Business Vol 4 No2 (2017) 37-44 39
society with local development of individual areas (Boschma,
2005; Courlet & Pecqueur, 2013). It seems to us that the
methodology of modern spatial analysis should integrated
with the cluster approach to the organization of space
(Kireyeva, 2016). For some countries, especially for the
newly industrialized economies of East Asia (Taiwan, South
Korea, Singapore), such approach have become important
tool. Such approaches through enhanced national economic
model based on the transition from an export-oriented policy
to a new policy of spatial development.
However, in Kazakhstan since the beginning of the 21st
century is finding new ways of divergence from dependence
on raw materials. An important tool for establishing
knowledge-based policy, which aimed at ensuring of
territories base on “theory of proximity”. Further, determines
the need to develop a general and standard of
methodological approaches, and approbation them for the
evaluation of level economic potential and concentration of
the regions of Kazakhstan. Therefore, it is need to proceed
to the next section of this research.
3. Methodology of Research
The initial methodological basis of this project will serve
as scientific developments of foreign and domestic scientists
in the field of economic, regional and innovation
developments, as well as some aspects of the assessment
of economic potential and concentration. The study of
foreign experience of evaluation of profiling regions has led
to the conclusion that all existing in regional economic
science methodological approaches are not mutually
exclusive, but complement each other. In essence, they
applied in parallel in various combinations that depend on
the peculiarities of spatial development. For example, the
number of social and economic resources (factors of
production) is a key component of spatial development. The
prospects for economic and social progress in the region
depend on not only resources, but also the specifics of their
placement.
One of the main objectives in the development of
methodological approaches to the assessment of the
economic profile of the region is the justification of methods,
criteria and indicators for the analysis of dynamics of
development of economic space, assessment of the level of
concentration of industrial production in the country. In other
words, it is necessary to develop accurate, objective and
comprehensive methods for the assessment of the
economic profile of the area capable to be a convenient tool
for mapping of existing resources and definition of reserves
of economic growth and implementation of many aspects of
regional policy.
Under the methodological approaches to the analysis of
spatial development of the national economy is a set of tools
in location analysis and development of regional economic
systems, the most important of which are the following:
1) Index method – based on relative indicators expressing
the ratio of level of the analyzed index for any period,
or the ratio of level of the analyzed indicator in different
regions among themselves or with the average value
of this indicator.
2) Coefficient method – based on the calculation of
certain relative indicators (ratios) whose values can be
compared for various periods of time on various
activities, as well as with the accepted regulatory
values.
The proposed new approach based on the classification
of methods to assess the potential and economic profile of
the territory. According to this approach, these methods can
be classified into the following two groups:
1) method of analysis the main trends of economic
development;
2) method of evaluation of concentration and industry
specialization of the region.
In this paper presents the developed methodological tools
that will allow analyzing of economic potential and
concentration of the regions of Kazakhstan. Two
approaches suggested and reflected strong methodological
positions with evident implication. These methods are not
identical, but they are interlinked, that needs to clarified and
expanded.
3.1. Analysis of Economic Potential of the
Regions of Kazakhstan
One of the most important indicators to assess the
economic potential of the territory and its competitiveness is
the indicator of the gross regional product (GRP). GRP
characterizes the level of economic development,
peculiarities of its structure, and the efficiency of certain
sectors of the economy. GRP, as the most general indicator
aimed at homogenization social and economic trends
provides a clear picture of regional differences and often
requires a more detailed analysis of structural changes. The
original statistical data of the state statistics sometimes raise
doubts on completeness of reflection in the GRP socio-
economic processes. However, such a generalized nature
makes this indicator the most convenient for analysis of the
most important economic contrast changes the dynamics in
terms of regions.

40 Nailya K. Nurlanova, Anel A. Kireyeva, Rashid M. Ruzanov / Journal of Asian Finance, Economics and Business Vol 4 No2 (2017) 37-44
<Table 1> Methodological approaches to the assessment of the economic potential of the region and its competitive advantages
No. Indicator Calculation formula Shorthand notation
1 Coefficient of GRP (CGRP
) CGRP
= GRP/GDP GRP – gross regional product
GDP – gross domestic product
2
Coefficient of the volume of
industrial production in the
region (CVIP
)
CVIP
= VIPR / VIP
C
VIPR – volume of industrial production in the region
VIPC – volume of industrial production of the country
3
Coefficient of the volume of
investments into fixed capital
of the region (CVIFC
)
CVIFC
= VIFCР/ VIFC
с
VIFCR – volume of investments into fixed capital of the region
VIFCС
– volume of investments into fixed capital of the country
4 Coefficient of the volume of
retail trade in the region (CVRT
) C
VRT = VRT
R/ VRT
C
VRTR – volume of retail trade in the region
VRTС
– volume of retail trade in the country
5 Coefficient of the volume of
exports of the region (CVE
)
CVE
= VER/ VE
C
VER – volume of exports of the region
VEС
– volume of exports of the country
6
Coefficient of the percentage
of the region's population with
incomes below the subsistence
minimum (CP)
1/CP = P
R/ P
с
PR – indicator of the percentages of the region's population with
incomes below the subsistence minimum of the region
PС
– indicator of the percentages of the region's population with
incomes below the subsistence minimum of the country
7
Coefficient of the level of
unemployment in the region
(CU)
1/CU = U
R/ U
C
UR – indicator of the unemployment in the region
UС
– indicator of the unemployment in the country
8
Coefficient of the average
monthly wage in the region
(CAMW
)
CAMW
= AMWR/ AMW
C
AMWR – indicator of the average monthly wage in the region
AMWС
– indicator of the average monthly wage in the country
Note – compiled by the authors
In the European countries to calculate, the integral
indicators in the regions proposed the classification of main
regional indicators. For example, the economy GRP per
capita (the level of purchasing power); employment by
sectors of economic activity; the number of applications for
the European patent for 1 million, etc. Based on the analysis
of international practices in estimating capacity and
economic profile of the territory by using the indexes and
coefficients methods, we can distinguish formal and
comprehensive system of indicators reflecting the
contribution of the territory economic potential of the country
(see Table 1).
Further, we proposed to calculate of the generalized of
integrated index of economic potential of the region and its
competitive advantages (IPCA), which can be calculated by
the following formula:
����
� �����
� ���
� ���
� ����
� ��
�
�
��
�
�
��
�����������������������
������� (1)
In the end, it can be noted that the proposed methodical
approach of estimation of economic potential of the territory
and its competitive advantages takes into account regional
specifics. At the same time, effective use of the results of
evaluation of the potential of the territory gives the possibility
of solving large complex practical problems related to the
dynamics and ordering of factors of competitive advantages
and alignment with the resource capabilities of the region.
Qualitative integrated assessment of the economic
potential of the regions of Kazakhstan and its
competitiveness based on source data of state statistics and
economic indicators, as they contain a wide range of
different economic aspects in the regions. The obtained
results of integrated indicators, which characterized
economic potential and competitive advantages of regions
of Kazakhstan in 2010, are shown in Table 2.
The results of calculations of integrated indicators of
economic potential and competitive advantages of regions
of Kazakhstan in 2015 are presented in Table 3.

42 Nailya K. Nurlanova, Anel A. Kireyeva, Rashid M. Ruzanov / Journal of Asian Finance, Economics and Business Vol 4 No2 (2017) 37-44
<Table 2> Indicators of integrated assessment of the economic potential and competitive advantages of Kazakhstan’s regions in 2010
Region of Kazakhstan
Indicators
CGRP CVIP CVFC CVRТ CVE CSP CU CAMW IPCA
Akmola region 0,027 0,015 0,023 0,026 0,008 1,477 1,000 0,703 3,279
Aktobe region 0,054 0,079 0,078 0,064 0,100 1,083 1,094 0,898 3,452
Аlmaty region 0,046 0,030 0,066 0,040 0,003 0,985 1,036 0,753 2,958
Аtyrau region 0,130 0,258 0,238 0,041 0,334 1,102 1,074 1,911 5,087
East Kazakhstan region 0,057 0,053 0,031 0,092 0,036 0,774 1,018 0,791 2,851
Zhambyl region 0,020 0,010 0,032 0,021 0,004 1,226 1,018 0,662 2,993
West Kazakhstan region 0,048 0,082 0,050 0,030 0,020 0,970 1,036 1,032 3,268
Karaganda region 0,086 0,085 0,045 0,103 0,079 1,711 1,055 0,857 4,021
Kostanay region 0,039 0,037 0,026 0,032 0,030 1,016 1,018 0,738 2,935
Kazylorda region 0,039 0,067 0,053 0,025 0,062 0,970 0,983 0,899 3,098
Mangistau region 0,068 0,136 0,080 0,024 0,084 0,560 0,906 1,716 3,575
Pavlodar region 0,047 0,070 0,040 0,037 0,027 1,625 1,036 0,837 3,718
North Kazakhstan region 0,021 0,007 0,056 0,024 0,002 1,204 1,000 0,666 2,981
South Kazakhstan region 0,055 0,026 0,011 0,050 0,030 0,565 0,983 0,741 2,462
Almaty city 0,081 0,009 0,085 0,087 0,070 1,912 0,935 1,428 4,608
Astana city 0,180 0,035 0,086 0,303 0,079 2,500 0,921 1,373 5,477
Note – compiled and calculated according to the Committee on statistics RK.
<Table 3> Indicators of integrated assessment of the economic potential and competitive advantages of Kazakhstan’s regions in 2015
Region of Kazakhstan
Indicators
CGRP
CVIP
CVFC
CVRТ
CVE
CSP
CU C
AMW I
PCA
Akmola region 0,027 0,017 0,028 0,029 0,006 0,966 1,020 0,706 2,798
Aktobe region 0,048 0,067 0,080 0,068 0,068 1,556 1,020 0,878 3,785
Аlmaty region 0,049 0,030 0,069 0,052 0,005 1,120 1,020 0,738 3,082
Аtyrau region 0,102 0,265 0,171 0,029 0,360 1,000 1,000 1,832 4,759
East Kazakhstan region 0,059 0,060 0,052 0,094 0,028 1,120 1,042 0,819 3,274
Zhambyl region 0,025 0,015 0,032 0,029 0,002 0,903 1,020 0,677 2,703
West Kazakhstan region 0,049 0,099 0,041 0,032 0,120 0,966 1,000 0,894 3,201
Karaganda region 0,075 0,078 0,062 0,089 0,052 2,000 1,020 0,891 4,267
Kostanay region 0,036 0,029 0,029 0,036 0,021 1,120 1,000 0,749 3,020
Kazylorda region 0,034 0,054 0,040 0,027 0,038 0,875 1,000 0,863 2,931
Mangistau region 0,058 0,126 0,081 0,023 0,122 0,933 1,000 1,837 4,180
Pavlodar region 0,045 0,060 0,054 0,046 0,019 1,867 1,042 0,845 3,977
North Kazakhstan region 0,020 0,009 0,018 0,025 0,002 0,667 1,000 0,670 2,411
South Kazakhstan region 0,061 0,033 0,068 0,055 0,029 0,459 0,926 0,699 2,331
Almaty city 0,103 0,019 0,098 0,107 0,064 7,000 0,980 1,469 9,840
Astana city 0,209 0,040 0,078 0,259 0,064 4,667 0,909 1,283 7,508
Source: Statistical Yearbook of the Republic of Kazakhstan by the Committee on statistics
The obtained results of the analysis indicate that in the
group of leading regions with a high level of integrated index
of economic potential and its competitive advantages
included the fallowing regions – Astana city (9,840), Almaty
city (7,508), Atyrau region (4,759), Karaganda region (4,267)
and Mangystau region (4,180). The leader according to the
assessment is Astana city, which is natural on the eve of the
international innovation exhibition “EXPO-2017”. Second place
takes to the southern capital – Almaty city, thus again confirmed
its status as the economic, financial, and innovative center
of the country. Third place takes West Kazakhstan region,
which has the largest production capacity due to raw mining
materials.
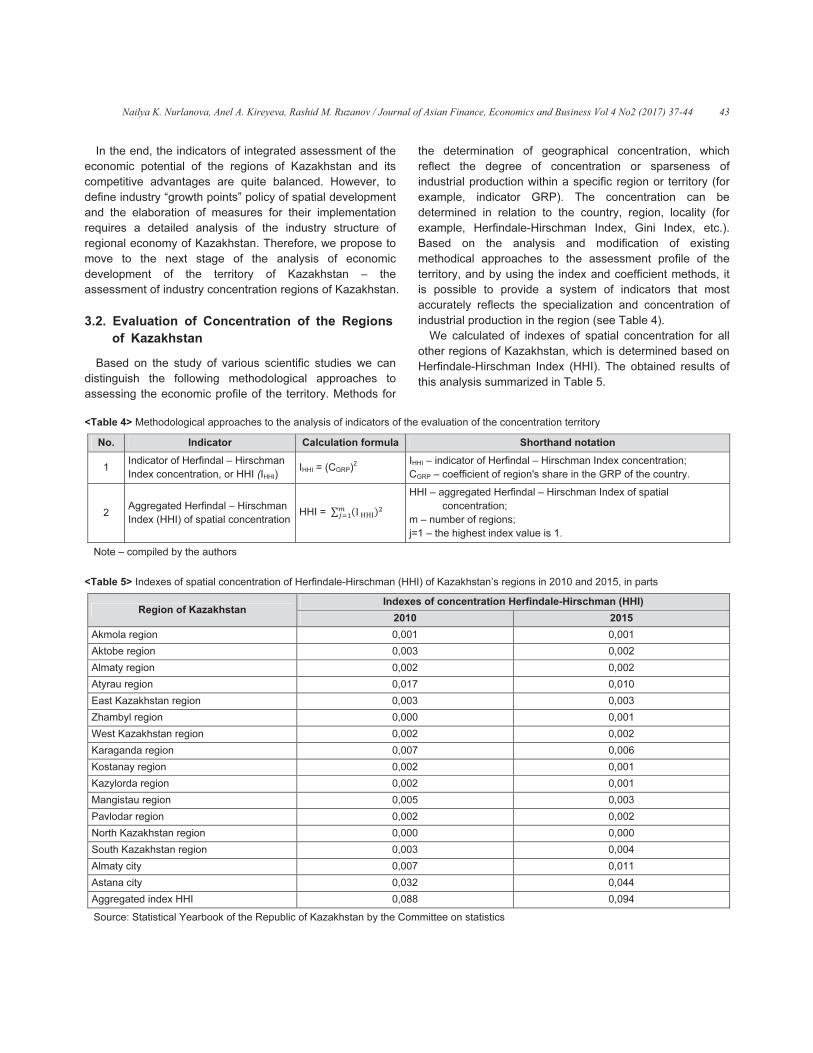
Nailya K. Nurlanova, Anel A. Kireyeva, Rashid M. Ruzanov / Journal of Asian Finance, Economics and Business Vol 4 No2 (2017) 37-44 43
In the end, the indicators of integrated assessment of the
economic potential of the regions of Kazakhstan and its
competitive advantages are quite balanced. However, to
define industry “growth points” policy of spatial development
and the elaboration of measures for their implementation
requires a detailed analysis of the industry structure of
regional economy of Kazakhstan. Therefore, we propose to
move to the next stage of the analysis of economic
development of the territory of Kazakhstan – the
assessment of industry concentration regions of Kazakhstan.
3.2. Evaluation of Concentration of the Regions
of Kazakhstan
Based on the study of various scientific studies we can
distinguish the following methodological approaches to
assessing the economic profile of the territory. Methods for
the determination of geographical concentration, which
reflect the degree of concentration or sparseness of
industrial production within a specific region or territory (for
example, indicator GRP). The concentration can be
determined in relation to the country, region, locality (for
example, Herfindale-Hirschman Index, Gini Index, etc.).
Based on the analysis and modification of existing
methodical approaches to the assessment profile of the
territory, and by using the index and coefficient methods, it
is possible to provide a system of indicators that most
accurately reflects the specialization and concentration of
industrial production in the region (see Table 4).
We calculated of indexes of spatial concentration for all
other regions of Kazakhstan, which is determined based on
Herfindale-Hirschman Index (HHI). The obtained results of
this analysis summarized in Table 5.
<Table 4> Methodological approaches to the analysis of indicators of the evaluation of the concentration territory
No. Indicator Calculation formula Shorthand notation
1
Indicator of Herfindal – Hirschman
Index concentration, or HHI (IHHI
)
IHHI
= (CGRP
)2
IHHI
– indicator of Herfindal – Hirschman Index concentration;
CGRP
– coefficient of region's share in the GRP of the country.
2
Aggregated Herfindal – Hirschman
Index (HHI) of spatial concentration
HHI = ∑ ������
���
���
HHI – aggregated Herfindal – Hirschman Index of spatial
concentration;
m – number of regions;
j=1 – the highest index value is 1.
Note – compiled by the authors
<Table 5> Indexes of spatial concentration of Herfindale-Hirschman (HHI) of Kazakhstan’s regions in 2010 and 2015, in parts
Region of Kazakhstan
Indexes of concentration Herfindale-Hirschman (HHI)
2010 2015
Akmola region 0,001 0,001
Aktobe region 0,003 0,002
Аlmaty region 0,002 0,002
Аtyrau region 0,017 0,010
East Kazakhstan region 0,003 0,003
Zhambyl region 0,000 0,001
West Kazakhstan region 0,002 0,002
Karaganda region 0,007 0,006
Kostanay region 0,002 0,001
Kazylorda region 0,002 0,001
Mangistau region 0,005 0,003
Pavlodar region 0,002 0,002
North Kazakhstan region 0,000 0,000
South Kazakhstan region 0,003 0,004
Almaty city 0,007 0,011
Astana city 0,032 0,044
Aggregated index HHI 0,088 0,094
Source: Statistical Yearbook of the Republic of Kazakhstan by the Committee on statistics
Nailya K. Nurlanova, Anel A. Kireyeva, Rashid M. Ruzanov / Journal of Asian Finance, Economics and Business Vol 4 No2 (2017) 37-44 43
According to the data obtained, we can conclude that the
greatest spatial concentration by GRP demonstrated in
2015 – Almaty city, which is 1.3 times more compared to
2010. At the same time, clear trends in concentration not
observed. In some regions, the concentration decreased in
2015 (Atyrau region, Mangistau region and Aktobe region),
others increased (Almaty city, Astana city, South
Kazakhstan region and Zhambyl region). Overall, the
comparison between the dynamics of different indicators of
concentration illustrates the close connection between
regions of Kazakhstan.
4. Conclusions
This research prepared on the results of scientific
research within the grant project of the Committee of
Science of Ministry of education and science of the Republic
of Kazakhstan on the theme “The new policy of spatial
development of economy of Kazakhstan on the principles of
inclusiveness and “smart specialization”: concept, key
priorities, institutions and mechanisms of implementation”.
This paper presents the results of development of the
authors on the selection and justification of the
methodological approaches for quantitative evaluation of the
economic potential, the degree of territorial differentiation of
the profile and concentration of regions. This study shows
the results of the analysis of the potential regional disparities
and trends of economic development of Kazakhstan. By
using, the proposed methodology shows the possibility of
their use, evaluation of economic profile of the territory and
identified of prospective regions. It provides some
suggestions for improvement of future studies dealing with
this subject. Based on this research finding of this paper, the
practical implications listed below:
Firstly, the economic science will create new concepts
based on developing a new strategy for spatial development.
That is why special importance given to research involving
new territorial aspects of the organization of life and spatial
differentiation. Analysis of existing theories and concepts,
we conclude that important subject in spatial economics is
part of studies that cover the problems of concentration and
specialization of production. However, in Kazakhstan since
the beginning of the 21st century is finding new ways of
divergence from dependence on raw materials. An
important tool for establishing knowledge-based policy,
which aimed at ensuring of territories base on “theory of
proximity”.
Secondly, we proposed new approach based on the
classification of methods to assess the potential and
economic profile of the territory. According to this approach,
these methods can be classified into the following two
groups: method of analysis the main trends of economic
development, and method of evaluation of concentration of
the region. Based on a reasonable methodology and
analysis of statistical information for identification we used
the indicators of integrated assessment of the economic
potential and indicators of spatial concentration.
Thirdly, assessment of economic potential and spatial
concentration in the regions of Kazakhstan is consistent with
the trends of many countries with developing market
economy. In addition, the obtained results coincide with the
findings of the integrated assessment of competitive
advantages, despite the fact that the latter assessment
obtained by systematization of the factors of competitive
advantage and their linkage with the resource capabilities of
the region.
Fourthly, the most competitive regions according to the
obtained results are Almaty city, Astana city, Atyrau region
and Karaganda region. These regions are the prospects for
the natural development of the agglomeration process; their
growth will be determined by the location of the area of
specialization, the distribution of which closely linked to the
territorial localization. Therefore, it is possible to hypothesize,
to reduce the excessive specialization and the need for
industrial diversification of resource regions, which, if
adverse changes in world market conditions continue to
take the position, and leadership positions are put forward
service and industrial areas focused on the production of
innovative products. Thus, we can conclude on the gradual
restructuring of the old model the spatial distribution to new
model of formation of knowledge economy in the regions of
Kazakhstan.
References
Anokhin, S., & Schulze, W. S. (2009). Entrepreneurship,
innovation, and corruption. Journal of Business
Venturing, 24(5), 465-476.
Boschma, R. (2005). Proximity and innovation: A critical
assessment. Regional Studies, 39(1), 61-74.
Courlet, C., & Pecqueur, B. (2013). L’économie Territoriale.
Grenoble: PUG.
Dezhina, I. G. (2013). Tekhnologicheskie platformy i inno
vacionnye klastery: Vmeste ili porozn'? Innovacii,
2(172), 35-43.

44 Nailya K. Nurlanova, Anel A. Kireyeva, Rashid M. Ruzanov / Journal of Asian Finance, Economics and Business Vol 4 No2 (2017) 37-44
Granberg, A. G. (2010). Osnovy regional'noj ehkonomiki:
Uchebnik dlya vuzov. Moskwa: GU VSHEH.
Kireyeva, A. A. (2016). A theoretical assessment of the
formation of IT clusters in Kazakhstan: Approaches
and positive effects. International Journal of
Research in Business and Social Science, 5(3),
54-65.
Kireyeva, A. A., & Nurlanova, N. K. (2013). The problems of
spatial modernization of the economy and new
approaches to way out from crisis: Kazakhstan’s
experience. Journal Distribution of Science, 11(3),
39-48.
Kolomak, E. A. (2010). Prostranstvennye ehksternalii kak
resurs ehkonomicheskogo rosta. Region:
ehkonomika i sociologiya, 4, 73-87.
Krugman, P. (1991). Geography and Trade. Cambridge, MA:
MIT Press.
Leontiev, V. (1997). Mezhotraslevaya ehkonomika. Moskwa:
Ehkonomika.
Maslakov, V. V., Zubkov, K. I., & Plenkin, Y. V. (2000). Model'
regiona – Kvazikorporacii. Region: ehkonomika
and sociologiya, 2, 17-36. Retreived from
http://webirbis.usue.ru
Minakir, P. А. (2011). O Prostranstvennoj Ehkonomike i
Prostranstvennom Razvitii. Economist, 9, 37-41.
Pchelincev, О. С. (2004). Regional'naya Ehkonomika v
Sisteme Ustojchivogo Razvitiya. Moskwa: Nauka.
Pred, A. R. (1966). The Spatial Dynamics of U.S. Urban-
Industrial Growth. 1800-1914: Interpretive and
Theoretical Essays Cambridge, MA: MIT Press.
Saushkin, U. G. (1973). Ehkonomicheskaya Geografiya:
Istoriya, Teoriya, Metody, praktika. Мoskwa: Mysl’.
Storper, M. (1997). The Regional World: Territorial
Development in a Global Economy. N.Y.: The
Guilford Press.

Md. Khaled Saifullah, Fatimah Binti Kari, Md. Arphan Ali / Journal of Asian Finance, Economics and Business Vol 4 No2 (2017) 45-53 45
Print ISSN: 2288-4637 / Online ISSN 2288-4645
doi:10.13106/jafeb.2017.vol4.no2.45
Linkage between Public Policy, Green Technology and
Green Products on Environmental Awareness
in the Urban Kuala Lumpur, Malaysia
Md. Khaled Saifullah1
, Fatimah Binti Kari2
, Md. Arphan Ali3
Received: March 5, 2017. Revised: April 4, 2017. Accepted: May 2, 2017.
Abstract
The main purpose of this study is to investigate the factors that have an impact on public policy, green products and technology in Kuala
Lumpur, given government initiatives to boost the environment awareness. The data used in this study was collected by distribution
questionnaires randomly in six areas of Kuala Lumpur and 400 respondents were interviewed. Based on a literature review, three
hypotheses were stated and tested using structural equation modeling (SEM). SEM is a statistical analysis method that involved two or more
variables in analyzing structural relationships among the variables. The SEM model shows that green products and government policies
have a direct influence on environmental awareness. However, green technology does not have a direct influence on environmental
awareness. Since, knowledge on green technology does not have a significant impact on raising environmental awareness among the
public, a much more pragmatic awareness campaign needs to be put in place to use green technology as a part of modern living. The study
suggests that the urban population needs to be more aware of the environmental issue as cities tend to have better infrastructure to raise
public awareness on green issues. Moreover, the government should increase the environmental awareness among younger generation
through workshops, seminars, campaigns, and pamphlets.
Keywords: Public Policy, Green Technology, Green Products, Environmental Awareness, Malaysia.
JEL Classification Code: Q50, Q51, Q56.
1. Introduction
1
Good awareness of environmental issues is important for
a healthy natural environment (Patchen, 2006). Many
researchers have worked on the environmental issues and
awareness. Their findings indicate that there is a strong
* The authors would like to acknowledge the University of Malaya,
Kuala Lumpur for funding of this work under the grant
Employment Structure in Future Cities (GC003E-15SUS).
1 First Author and Corresponding Author. Department of Economics,
Faculty of Economics and Administration, University of Malaya.
Malaysia. [50603 Kuala Lumpur, Wilayah Persekutuan Kuala
Lumpur, Malaysia] E-mail: [email protected]
2 Department of Economics, Faculty of Economics and Administration,
University of Malaya. Malaysia. [50603 Kuala Lumpur, Wilayah
Persekutuan Kuala Lumpur, Malaysia]
E-mail: [email protected]
3 Department of Economics, Faculty of Economics and Administration,
University of Malaya. Malaysia. [50603 Kuala Lumpur, Wilayah
Persekutuan Kuala Lumpur, Malaysia]
E-mail: [email protected]
relationship between environmental policies, awareness and
issues (Masud et al., 2016; Patchen, 2006; Kollmuss &
Agyeman, 2002; Doss & Morris, 2001; Huq & Toulmin,
2006). According to Schultz and Oskamp (1996), people’s
attitude and knowledge on environment issues and
awareness are very important to improve the natural
environment. Individuals’ views on natural environment and
surrounding reflect their knowledge on environmental issues.
A positive attitude and perception on environmental issues
and awareness plays a significant role in conserving the
environment (Bradley, Waliczek, & Zajicek, 1999).
Environmental awareness is a precondition for
understanding the environmental issues. Leiserowitz (2007)
studied the environmental awareness, he argued that public
perception significantly affects the future environmental
policies and development. Likewise, Schmidt (2007) also
found that concern for the environment is significant towards
environmental preservation.
Malaysia has initiated green initiatives in recent years to
minimize the degradation of the environment as well as
achieve a sustainable growth. Efforts made by the

46 Md. Khaled Saifullah, Fatimah Binti Kari, Md. Arphan Ali / Journal of Asian Finance, Economics and Business Vol 4 No2 (2017) 45-53
government as well as the private sector in conserving
energy and promoting renewable resources have been
exemplary. Through the efforts on leveraging the green
technology, it is expected that Malaysia will achieve
sustainable development and will eventually triumph in
accelerating towards a high income nation. However,
Malaysia’s effort in introducing green technology started
back in 2009, where the Malaysian government established
the basic foundation for green economy.
In terms of policy perspectives, environmental issues
have been given due emphasis since the implementation of
Sixth Malaysia Plan (EPU, 1990) in which environmental
management was directly integrated into the national
development planning as well as the national project. Under
the Seventh Malaysia Plan (EPU, 1995) and Eight Malaysia
plan (EPU, 2000), the emphasis on environmental issues
continued to be given due emphasis. From the Ninth
Malaysia Plan (EPU, 2005) onwards, environmental issues
were introduced as one of the main issues. The Seventh
Malaysia Plan (EPU, 1995) asserted Malaysia’s commitment
towards enhancing environmental awareness among the
population to promote an environmental friendly lifestyle.
The plan stated that the relevant ministries will develop
policies, strategies and programs on environmental
education, awareness and training. The imparting of
knowledge and instilling of awareness is expected to help
Malaysians adopt a more environment friendly lifestyle.
Environmental ethics and a sense of responsibility will be
inculcated and the population will be encouraged to take an
active role in the protection and maintenance of the
environment.
The private sector, non-governmental organizations, and
the media will be encouraged to play a bigger role to
complement the Government’s efforts in this endeavor. The
Seventh Malaysia Plan also proposed the national policy on
the environment which aims at promoting economic, social
and cultural progress through environmentally sound and
sustainable development. Subsequently, under the Tenth
Malaysia Plan (EPU, 2010), the New Economic Model also
focused on the environmental management in which the
principle of sustainable development strategies was the
main theme. The sustainability principles were discussed in
line with the use of natural resources for a country which
intended to enhance national income and achieve high
income status by 2020.
This paper attempts to assess the environmental
awareness of the general public related to public policy,
green product and green technology. Moreover, the rest of
this paper is organized as follows; Section 2 discusses the
literature review on environmental awareness, green
products, green technology and government policy. Section
3 presents the methodology and model specification of the
study. Section 4 analyses the results and Section 5
concludes the study.
2. Literature Review
Environmental awareness influences human behavior in
several ways, such as reducing wasteful or harmful
consumption patterns and raising preference for
environmental friendly products, selective waste collection,
or different forms of protest that may represent ecological
sensibility. However, Friedman (2008) states that “the
convergence of global warming, global flattening, and global
crowding is driving those five big problems – energy supply
and demand, petro dictatorship, climate change, energy
poverty, and biodiversity loss – well past their tipping points
into new realms we've never seen before”.
Afroz, Masud, Akhtar, and Duasa (2012) conducted a
study in public environmental awareness and performance
in Kuala Lumpur. The researchers found that 69 percent of
the respondents were satisfied with the environmental
quality of Kuala Lumpur. On the other hand, Mei, Wai, and
Ahamad (2016) found that environmental awareness and
behaviour towards the awareness is not positively related.
The environmental awareness is not strong enough to
positively reflect in the behaviour. Similarly, Liu (2009) found
in Tianjin, China that the respondents have very poor
understanding on environmental awareness but they
showed a positive attitude towards environmental issues.
Fisman (2005) argued that children should be educated in
school about the environmental awareness from a very
young age. The author also found that there is a significant
positive effect on learning about the local environment and
knowledge of environmental perceptions. Moreover,
environmental knowledge does not have any relation with
socioeconomic status of primary school children but there is
a significant improvement in the surrounding environment of
high school students. Banna et al. (2016) found that not
everyone is willing to pay for the environmental friendly
technology. Moreover, the adoption and training of using the
environmental friendly technology also has a price.
Therefore, training to adopt green technology should be a
part of corporate social responsibility (CSR) of companies.
Assuming the urban residents may have access to
information on green products, this will encourage them to
purchase and use green products. Studies have shown that
a group of environmentally conscious consumers in more
than 80 percent of Thai, Malaysian and Korean consumers
from the emerging markets in the region, are willing to pay
premium price to purchase green products (Dunlap &
Scarce, 1991; Lung, 2010). D'Souza, Taghian, Lamb and
Peretiatkos (2006) noted that all products offered should be

Md. Khaled Saifullah, Fatimah Binti Kari, Md. Arphan Ali / Journal of Asian Finance, Economics and Business Vol 4 No2 (2017) 45-53 47
environmentally safe without a need to trade off quality and
pay premium prices. It has also been stated that the
consumers express environmental concerns based on
product characteristics, accuracy of green product claims,
information provided on the products and its benefits
(Forkink, 2010; Luchs, Naylor, Irwin, & Raghunathan, 2010).
Barr and Gilg (2006) found that committed individuals put
forward a higher importance on environmental issues and
develop a high level of environmental concern and express
a personal responsibility to help the environment. By clearly
stating the benefits of a product on packaging or in
advertising, negative perceptions towards an environment
friendly product's effectiveness, such as environmental
concerns, can be surmounted (Luchs et al., 2010).
In purchase of green marketing products, consumers
should have the awareness of the products marketed in
green marketing. Companies try to influence each of these
decisions by providing information that can assist in the
product review. Therefore, it is important for consumers to
develop environmental awareness of green products and
technology. Previous studies have been conducted on the
consumers’ perception and attitude towards green products
and technology (Cox, 2008; Haytko & Matulich, 2008,
D'Souza & Taghian, 2005; D'Souza et al., 2006). Indeed,
there has been a substantial research conducted on
consumer characteristics (Banerjee, Gulas, & Iyer, 1995;
Schlegelmilch, Diamantopoulos, & Bohlen, 1994), yet there
is no agreement on the "true" profile of a green consumer
(D'Souza et al., 2006). Lee (2008) stated that there are a
few studies conducted on the green marketing issues in
Asian countries, including Malaysia, as compared to
developed countries.
Recent initiatives of promoting green technology and
green economy include green manufacturing hub, green
infrastructure, low carbon emission, efficient use of
resources and a healthy and well educated population.
Information technology (IT) can have a detrimental influence
on the environmental footprint of organizations (Siegler &
Gaughan, 2008). Some of the examples of green
information communication technology (ICT) would be the
energy saving, disposal of electronic waste, virtualization of
server resources, regulatory compliance, telecommuting,
end-user satisfaction and return of the investment on the
product used (Kounatze, 2009). Green IT plays an important
role in environmental sustainability which finally leads to the
solution to improved sustainability.
Malaysia has made a strong commitment in implementing
its green policy. As reflected in the policy statement, green
technology shall be a driver to accelerate the national
economy and promote sustainable development. Together
with this objective, policies attempt to minimize growth of
energy consumption while enhancing economic development.
At the macro level, the green technology and industry is
expected to contribute to national economy. Similarly, green
technology is expected to be promoted through education
and public awareness in order to encourage its use. Under
the New Economic Model (2010-2015), green policies were
given due emphasis which includes new elements such as
reducing carbon foot print, ability to better assess green
investment, using non-collateral basic criteria and assessing
viability of green technology projects. Moreover, there
should be venture capital for green economy and green
technology. Based on policy evolution timeframe, Malaysia’s
environmental planning started off with strong focus on
nature conservation (1980-1990), followed by government
reforms based on Agenda 21 as seen in the introduction of
new instrument and supra structure reforms 1990-2005 and
active green investment from 2006 until the present date
(EPU, 1990; 1995; 2000; 2005).
3. Research Method
3.1. Site Selection
The target population was defined with respect to the
sampling unit of the study. Sample was clustered based on
the municipal council represented by Parliamentary zone
which includes Ampang, Setapak, Pantai Dalam, Petaling
Jaya Utara, Batu, and Putrajaya. The areas were divided
into six clusters to capture the diverse groups in terms of
race, employment and the overall-socio-economic status.
The survey was conducted from January 2016 to April 2016.
Randomness of the survey was based on alternating
working days versus weekends to carry out the survey
among potential respondents. In extension, randomness
was also based on the willingness of the general public to
respond to the survey. A total of 400 questionnaires were
completed over the sampled period.
3.2. Sampling Technique and Sample Size
This study used multi-stage of sampling technique to
collect the data and obtain study objective. Using cluster
sampling technique, Kuala Lumpur was clustered into six
clusters based on geographic location. A total of 400
questionnaires were distributed among young generation
through face-to-face interviews. Out of 400 questionnaires,
28 questionnaires were incomplete, resulting in 372 usable
questionnaires to obtain study aims. This study used a
questionnaire as the primary instrument to collect data. The
questionnaires were divided into two sections (A and B).
Section A consisted of the demographic information of the

48
res
edu
env
wit
3.3
T
to
gre
adv
sha
nor
Rin
acc
rob
app
con
mo
The
bet
stru
var
T
the
size
ana
(20
sig
Wh
bee
al.
obs
par
of t
199
num
(Kl
bey
sen
ind
of a
rec
sam
3.4
I
cle
rela
gov
hyp
spon
ucat
viron
h 1
3. Da
This
ana
een
vant
apes
rma
ngle
cord
bust
plica
nstru
odel
e M
twee
uctu
riabl
The
e ap
e o
alys
010)
nific
hile
en r
(20
serv
ram
the
96).
mbe
ine,
yond
nsiti
icat
abo
com
mple
4. H
n o
ar r
ation
vern
poth
Md
nden
tion
nme
bein
ata
s stu
alyse
te
tage
s of
lity
e, G
ding
res
able
ucts
has
Mea
en
ural
les
sam
pplic
of 2
sis.
), sa
cant
no
requ
10)
vatio
eter
outc
Th
er o
20
d 4
ve,
te p
out 3
men
e siz
Hypo
rder
repr
nsh
nme
hese
d. Kha
nts,
. S
enta
ng “
Ana
udy
e th
echn
e of
f da
dat
Götz
to C
sult.
e for
s (H
s tw
asur
late
pa
(Vin
mpl
catio
200
Acc
amp
t ap
pre
uired
is t
ons
r pro
com
his p
of p
10).
400)
and
oor
372
nde
ze f
oth
r to
rese
ip b
ent
es h
aled
w
Secti
al aw
“stro
alys
ado
he e
nolo
f usi
ata.
ta s
z,
Chin
Ot
r for
Hair
wo p
reme
ent
art
nzi,
e s
on o
off
cord
ple
ppro
ecis
d, o
hat
for
opo
me m
post
aram
. Ho
), th
d co
fit (
is c
d g
for th
hesi
hav
enta
betw
poli
have
d Saif
which
ion
war
ongl
sis T
opte
effec
gy
ng
For
set (
We
n an
her
rma
et
parts
ent
va
sho
Chi
ize
of S
fers
ding
size
oxim
se g
one
a m
r ea
ortio
migh
tulat
met
owe
he S
onst
(Hai
cons
uide
his s
is
ve a
ation
ween
cy
e be
fullah
h
B
rene
ly di
Tec
ed S
ct o
on
SEM
r ex
(Ha
etze
nd N
adv
tive
al.,
s; m
pa
riab
ows
n, H
ade
EM
s en
to
e p
matio
guid
rule
minim
ach
n is
ht be
tion
ters
ver,
SEM
ruct
ir et
side
eline
stud
a cl
n of
n gr
on
een t
h, Fa
incl
con
ess
isag
chni
Stru
of p
n e
M is
xam
ir, S
ls,
New
van
e mo
20
meas
art
bles
s th
Hens
equ
. Re
nou
Ha
lays
ons
delin
e of
mum
pa
les
e in
su
ne
, if t
M s
ting
t al.
ered
es,
dy a
ear
f th
reen
env
take
atima
ude
ntain
bas
gree
ique
uctu
ubli
envi
s tha
ple,
Sars
&
wste
tage
ode
12;
sure
dem
an
he
sele
acy
efer
gh
air,
s a
an
nes
f thu
m su
aram
ss th
dou
gge
eces
the
stati
a g
, 20
d ad
it w
as 3
und
is s
n pr
viron
en in
ah B
ed
ned
sed
e” an
e
ral
c p
ronm
at it
, SE
sted
W
d (1
es o
and
Rin
eme
mon
nd
rela
er, &
y rem
rring
sta
Bla
vita
d e
reg
umb
ugge
mete
han
ubt
ests
ssita
sam
stic
good
010)
equ
was
72.
ders
stud
odu
nme
nto
Binti K
the
29
on
nd 5
Equ
polic
men
can
EM
dt, R
Wilso
1999
of u
d to
ngle
ent p
stra
the
ation
& Wa
mai
g to
atisti
ack,
al r
expla
gard
b rec
este
er.
5:1
(Ba
tha
ate
mple
al a
dnes
). Th
uate
dec
stan
dy;
ucts,
enta
acc
Kari
ir
9 ite
a
5 be
uatio
cy, g
ntal
n be
is a
Ring
on,
9) S
sing
ide
e et
part
ation
eir
nsh
ang
ns
Ho
ical
Ba
role
ana
ding
com
ed r
If t
, the
aum
at m
a g
e siz
ana
ss-o
here
. In
cide
ndin
part
, gre
al aw
coun
i, Md
gen
ems
5-po
eing
on M
gree
aw
e ap
appr
gle,
20
SEM
g SE
entity
al.
and
ns
indi
ip
g, 20
a p
oe (2
str
abin
in
ation
sa
mme
ratio
the
e st
gart
mode
grea
ze is
lysis
of-fit
efore
line
ed to
ng a
ticul
een
ware
nt (F
d. Arp
nder
s to
oint
“str
Mod
en p
war
pplie
ropr
&
09)
M is a
EM
y th
, 20
d st
the
cato
bet
010)
prime
200
reng
an
gai
ns o
mpl
ende
o is l
ob
tatis
tner
els
ater
s to
s m
t me
e, a
e wi
o us
and
larly
tec
ene
Figu
phan
r, a
as
Lik
rong
delin
prod
rene
ed to
riate
Men
. M
able
are
e ke
009)
truct
re
or.
twee
).
e co
8),
gth
nd A
ining
of o
le s
ed b
less
bserv
stica
r & H
with
sam
o la
migh
easu
a sa
ith t
se t
to d
y to
chno
ess,
re 1
n Ali
age
sses
kert
gly a
ng (
duct
ess.
o dif
e fo
na,
More
e to
e tha
ey d
). A
tura
latio
And
en
onc
a s
for
Ande
g s
outc
size
by H
s tha
vati
al str
Hom
h a
mple
arge
ht b
ure
mpl
the
the
deve
o fin
olog
foll
1).
/ Jou
e a
ss t
sca
agre
(SE
ts a
T
ffere
r no
201
eov
rea
at it
drivi
A SE
al pa
onsh
d t
late
cern
amp
r da
erso
tead
ome
ha
Hair
an fi
on
reng
mbu
larg
e si
e (e.
be t
wou
le si
abo
targ
elop
nd t
gy a
lowi
urna
and
the
ale
ee”.
M)
and
The
ent
on-
12;
ver,
ach
t is
ing
EM
art.
hip
the
ent
in
ple
ata
on.
dy,
es.
ave
et
ive
or
gth
rg,
ger
ize
.g.,
too
uld
ize
ove
get
p a
the
and
ing
al of AAsia
<
<
<
4.
4.1
A
and
of 4
This
<Ta
Ge
Ma
F
Ag
20
21
31
41
51
Ed
No
Pri
Low
Hig
Hig
Dip
Ba
Ma
Ph
Ot
Sou
an Fi
<H1>
<H2>
<H3>
Re
1. D
A tot
d co
400
s in
able
ende
ale
ema
ge
&
-30
-40
-50
& a
duca
o form
imar
wer
gher
gh s
plom
ache
aster
hD
hers
urce:
inanc
> Gr
aw
> Go
en
> Gr
re
esu
Dem
tal o
ollec
que
dica
1> S
er
ale
belo
abov
ation
mal
ry ed
Sec
r Sec
choo
ma
lor D
r De
s
: Fie
ce, E
<
reen
ware
over
nviro
reen
late
ults
mog
of 40
cted
estio
ates
Socio
ow
e
n
edu
duca
cond
cond
ol
Degr
egree
eld su
Econo
<Fig
n pro
enes
rnm
onm
n tec
ed to
s an
grap
00 q
thr
onn
s a r
oeco
catio
ation
dary
dary
ree
e
urve
omic
gure
oduc
ss.
ment
ment
chn
o en
nd
phic
ques
oug
aire
resp
onom
on
n
edu
y edu
ey, 2
cs an
e 1>
cts a
pol
tal a
olog
nviro
Di
c C
stion
gh fa
es, 2
pons
mic a
ucatio
ucati
2016
d Bu
Pro
are p
icie
awa
gies
onm
isc
Char
nna
ace-
28 q
se ra
nd d
on
ion
usine
pose
posi
es ar
rene
s (G
ment
cus
rac
ires
-to-f
ques
ate
demo
ess V
ed re
itive
re p
ess
reen
al a
ssio
cter
s we
face
stio
of 9
ogra
Fre
163
209
130
205
20
14
3
2
3
65
23
23
50
188
8
2
8
Vol 4
esea
ely re
posit
.
n Te
awar
on
isti
ere s
e int
nna
93%
phic
eque
3
9
0
5
8
No2
arch
elate
tivel
ech)
rene
cs
succ
terv
aires
% (n=
c prof
ency
(201
mo
ed to
ly re
) are
ess.
cess
view
s ha
=37
files
y
17) 4
del
o en
elate
e po
.
sful
s. O
ad m
2) (
of th
Pe
43
56
34
55
5.3
3.7
0.8
0.5
0.8
17
6.1
6.1
13
50
2.1
0.5
2.1
45-53
nviro
ed to
ositi
ly d
Out
miss
see
he re
ercen
3.82
6.18
4.95
5.11
38
76
81
54
81
7.47
18
18
3.44
0.54
15
54
15
3
onm
o
vely
istri
of a
sing
e Ta
espo
(n
ntag
menta
y
bute
a tot
dat
ble
nden
= 37
ge(%
al
ed
tal
ta.
1).
nts
72)
%)

Md. Khaled Saifullah, Fatimah Binti Kari, Md. Arphan Ali / Journal of Asian Finance, Economics and Business Vol 4 No2 (2017) 45-53 49
Table 1 show that males comprised 43.82% of the
respondents, while females constituted 56.18%. Table 1
also shows the age distribution of respondents in the study
area. The age group 21-30 had the highest number of
respondents (55.11%), followed by age group of 20 & below
(34.95%). Most of the respondents were young generation.
The age group of 51 & above has the lowest respondent
(0.81%). Moreover, the study found that most of the
respondents have bachelor degree (50.54%), and 0.54% of
the respondents do not have any formal education. A very
small number of respondents has masters and PhD degrees.
Thus, the finding is consistent with the aim of being a
developed nation by 2020.
4.2. Tests for Confirmatory Factor Analysis (CFA)
To determine the discriminate validity, confirmatory factor
analysis (CFA) was applied (Davis & Consenza, 1993). The
purpose of CFA is to choose the relevant items that indicate
a certain variable (Malhotra & Briks, 2007). Kline (2010)
stated that the aim of measurement model is to observing
the appropriateness of indicators representing latent
variables. In the same context, Hair et al. (2010) argued that
the purpose of measurement theory is to estimate the
relationship between observed and latent variables. The
competence of a measurement model is performed by CFA.
In order to do that, four types of fit indices - normed chi-
square, root mean square approximation (RMSEA), chi-
squared statistic and comparative fit index (CFI), are used to
determine how the model fits with the data. For an adequate
model fit: normed chi-square has to be less than 5; RMSEA
less than 0.088; and CFI values greater than 0.90 (Hair et
al., 2010; Byrne, 2009). Based on the CFA tests, all four
dimensions had adequate model-to-data fit: the CFI value
was above 0.90; and the RMSEA value was less than 0.088.
This study also shows that some items have significant
factor loadings (greater than 0.70), which indicate adequate
discriminant and convergent validity (see Table 2).
<Table 2> Construct validity of confirmatory factor analysis
Items Stand. Loadings
Environmental Awareness
Regulations implemented by the government to protect the environment are still not enough (EA1) 0.68
Enforcement of regulations and law are not effective (EA2) 0.72
The level of consciousness and knowledge amongst Malaysians regarding environmental care is still inadequate
(EA3)
0.69
There is no clear channel for making complaints about environmental pollution (EA4) 0.61
Pollution badly affects the flora and fauna (EA5) 0.70
The manufacturing industry does not care about the environment (EA6) 0.56
Green Products
The purchase of green products is a good investment for future generations (GP1) 0.67
The purchase and demand of green products exert pressure on companies/manufacturers to be more aware
about environmental conservation (GP2)
0.61
Green products are relatively more expensive compared to other products/brands (G3P) 0.58
Green products have a positive impact on the environment (GP4) 0.74
Application of solar energy in buildings can reduce the use of electricity (GP5) 0.69
Government Policy (Govt. Policy)
Lack of exposure or publicity about the policy/programs(GvP1) 0.55
Implementation of the policy/programme is less effective (GvP2) 0.69
The introduction of green technology modules at all school levels (GvP3) 0.74
Enhance awareness and knowledge of public through suitable programs and campaigns (GvP4) 0.64
Green Technology (Green Tech)
Have you ever heard of green technology? (GT4) 0.62
Do you know about the green technology initiative promoted by the government? (GT5) 0.51
To your knowledge, paper (green technology product) currently found in the market? (GT6) 0.20

50
4.3
S
ass
mo
tes
gre
aw
<Fi
<Ta
**
**
3. Te
Stru
soci
odel
sted
een
aren
gure
able
Hy
* Sig
** Si
Md
Test
ctur
atio
(Kl
to e
tec
nes
e 2>
e 3>
poth
H1
H2
H3
gnific
gnif
d. Kha
t for
ral e
on a
line,
exa
chno
s (s
> stru
Hyp
hesi
1
2
3
cant
ican
aled
r St
equa
amo
, 20
min
olog
see
uctur
pothe
is
at 5
nt at
d Saif
truc
atio
ong
010)
ne th
gy,
Figu
ral e
esis
En
En
En
EA
EA
EA
EA
EA
EA
GP
GP
GP
GP
GP
Gv
Gv
Gv
Gv
GT
GT
GT
5 per
1 pe
fullah
ctu
n m
the
). In
he r
gov
ure
quat
and
nviro
nviro
nviro
A1
A2
A3
A4
A5
A6
P1
P2
P3
P4
P5
vP1
vP2
vP3
vP4
T4
T5
T6
rcen
erce
h, Fa
ral
mode
ma
n th
relat
vern
2).
tion
d pat
onme
onme
onme
nt lev
nt le
atima
Eq
eling
ain
is s
tion
nme
mod
th co
enta
enta
enta
←
←
←
←
←
←
←
←
←
←
←
←
←
←
←
←
←
←
vel
evel
ah B
uat
g (S
con
stud
ship
nt
delin
oeffic
al Aw
al Aw
al Aw
En
En
En
En
En
En
G
G
G
G
G
G
G
G
G
Gr
Gr
Gr
Binti K
tion
SEM
nstru
y, a
p be
poli
ng of
cien
ware
ware
ware
nviro
nviro
nviro
nviro
nviro
nviro
reen
reen
reen
reen
reen
ovt.
ovt.
ovt.
ovt.
reen
reen
reen
Kari
n M
M) is
ucts
a st
etwe
cy
f env
ts
enes
enes
enes
onme
onme
onme
onme
onme
onme
n Pro
n Pro
n Pro
n Pro
n Pro
Poli
Poli
Poli
Poli
n Tec
n Tec
n Tec
i, Md
ode
use
s of
truct
een
and
viron
s
s
s
enta
enta
enta
enta
enta
enta
oduc
oduc
oduc
oduc
oduc
icy
icy
icy
icy
chno
chno
chno
d. Arp
elin
ed t
a h
tura
gre
d e
men
Path
←
←
←
al Aw
al Aw
al Aw
al Aw
al Aw
al Aw
ct
ct
ct
ct
ct
olog
olog
olog
phan
ng (
to a
hypo
al m
een
nvir
ntal a
h
Gr
Go
Gr
ware
ware
ware
ware
ware
ware
y
y
y
n Ali
(SE
sse
othe
mode
pro
ronm
awar
reen
ovt.
reen
eness
eness
eness
eness
eness
eness
/ Jou
EM)
ss t
esiz
el w
oduc
men
rene
n Pro
Poli
n Tec
s
s
s
s
s
s
urna
the
zed
was
cts,
ntal
ess
oduc
cy
ch
al of A
cts
Asia
In
squ
than
than
(Ma
F
vari
indi
by
sup
sup
sho
T
gov
env
sign
hav
stat
sho
pro
stat
an Fi
n Fig
uare
n 3)
n 0.
asud
Figu
iabl
icate
the
ppor
ppor
own
The
vt.
viron
nific
ve p
tistic
ows
duc
tistic
inanc
gure
ed p
); C
.90)
d, K
re 2
e is
es t
e ex
rted
rted
in t
SEM
pol
nme
cant
posit
cally
tha
cts,
cally
ce, E
e 2,
per d
FI =
); p
Kari,
2 sh
s en
that
xog
at a
bec
table
M m
icy
enta
. Ho
tive
y in
at, th
gov
y sig
.
.
-.
1
1
.
.
.
.
1
1
.
.
.
1
1
.
.
1
1
.4
Econo
the
deg
= 0.9
= 0
Yah
how
viro
45%
geno
a si
cau
e 3.
mode
(β
al a
owe
infl
nsign
he f
vern
gnifi
β
237
569
.003
.000
.031
985
766
793
753
.000
.142
939
972
983
.000
.061
986
739
.000
.067
418
omic
e mo
ree
939
0.00
hay
ws th
onm
% o
ous
gnif
se
el sh
=
awa
ever
uen
nific
facto
nme
ican
3
0
1
0
2
0
1
0
7
cs an
ode
of
(gre
and
ya, &
hat
enta
of th
fac
fican
it is
how
.5
aren
, gr
nce
cant
ors
ent
nt (p
d Bu
l ha
free
eate
d R
& Al-
the
al a
he e
ctor
nt le
no
ws th
569)
ness
een
on
t. T
of e
pol
p< 0
P-v
.0
*
. 9
*
*
*
*
*
*
*
*
*
*
*
*
*
*
*
*
*
.0
usine
d an
edom
er th
RMS
-Am
e R-
awar
endo
s.
evel
t sig
hat g
) h
s a
n tec
env
he
env
licy
0.10
valu
12**
***
990
***
***
***
***
***
***
***
***
***
***
***
***
***
***
***
***
***
11**
ess V
n ad
m (2
han
EA
min,
-squ
rene
ogen
Hyp
(p<
gnif
gree
have
and
chno
viron
SE
viron
an
).
e
*
*
Vol 4
deq
251
0.9
= 0
201
uare
ess
nou
poth
< 0.
ican
en p
e p
b
olog
nme
M r
nme
nd g
No2
uate
.657
90);
0.05
14; H
ed fo
(0.4
s fa
hesis
10);
nt at
prod
posi
both
gy (β
enta
resu
ental
gree
(201
e fit
7/12
GFI
52 (l
Hair
or t
45).
acto
s H
; ho
t lev
duct
tive
a
β =
al aw
ult i
l aw
en
S
S
Un
S
S
S
S
S
S
S
S
S
S
S
S
S
S
S
S
S
S
17) 4
to t
26)
I = .
ess
r et
the
Th
r wa
H1 a
wev
vel
ts (β
e in
are
-.00
ware
n T
ware
tech
Rem
Supp
Supp
nsup
Supp
Supp
Supp
Supp
Supp
Supp
Supp
Supp
Supp
Supp
Supp
Supp
Supp
Supp
Supp
Supp
Supp
Supp
45-53
the d
= 1
.932
s tha
al.,
end
e R
as e
and
ver,
(p<
β = .
nflue
st
03)
enes
Tabl
enes
hno
mark
porte
porte
ppor
porte
porte
porte
porte
porte
porte
porte
porte
porte
porte
porte
porte
porte
porte
porte
porte
porte
porte
3
data
.99
2 (g
an 0
201
doge
R-sq
expl
H
H3
0.1
.237
ence
atis
doe
ss a
e 3
ss,
ology
k
ed
ed
rted
ed
ed
ed
ed
ed
ed
ed
ed
ed
ed
ed
ed
ed
ed
ed
ed
ed
ed
a: ch
(le
reat
0.08
10).
eno
uare
laine
2 a
is n
10)
7) an
e o
stica
es n
and
3 al
gree
y a
hi-
ss
ter
88)
us
ed
ed
are
not
as
nd
on
ally
not
is
so
en
are
Md. Khaled Saifullah, Fatimah Binti Kari, Md. Arphan Ali / Journal of Asian Finance, Economics and Business Vol 4 No2 (2017) 45-53 51
5. Conclusion and Recommendation
The government of Malaysia is promoting a series of
programmes regarding environmental awareness through
different agencies and ministries as part of the vision 2020.
The main purpose of this study is to investigate the factors
that have an impact on environmental awareness in Kuala
Lumpur regardless of government undertaking initiatives to
boost the environment awareness. The finding of the study
concludes that quite a few number of respondents did not
have a formal education, and more than 53% of the
respondents have university degree, which is consistent
with the aim of being a developed nation by 2020. The
finding shows that green products and government policy
have direct influence on environmental awareness. However,
green technology does not have direct influence on
environmental awareness.
The findings of the study suggest that government should
come out with appropriate plan and policy in order to raise
the environmental awareness. For instance, policymakers
should play a vital role in creating awareness among
communities and younger generation through campaigns,
pamphlets, information dissemination, seminars and
workshops. More importantly environmental awareness and
issues should be part of education curriculum in school, as
early as primary school (Fisman, 2005). As awareness is a
prerequisite for favourable attitude towards raising
environmental consciousness, information should be
circulated and displayed to the young generation so they are
more confident and willing to cooperate with the
environmental awareness raising activities that are
proposed or implemented.
The awareness and adaptation of green technologies and
products should be in top down approach. There should be
support from top management for adaptation and used of
green technologies and products for industries. The New
Economics Model (NEM) of Malaysia focuses on the
environmental issues for a sustainable development. The
policies of NEM should be clearly stated, hence, it can be
understood and adopted by everyone. The main problem
with green technology and products is that the cost of this
technology and products is high as compared to its
substitute products and technology. In Malaysia the scale of
productions of green technology and products is still small
as compared to developed countries. Therefore, there
should be initiatives from public and private sectors on
production of green technology and products in a more
economical manner.
References
Afroz, R., Masud, M. M., Akhtar, R., & Duasa, J. B. (2012).
Public environmental awareness and performance
in Kuala Lumpur City, Malaysia: A case study on
household electrical and electronic equipment.
Environment and Urbanization Asia, 3(2), 385-396.
Banerjee, S., Gulas, C. S., & Iyer, E. (1995). Shades of
green: A multidimensional analysis of
environmental advertising. Journal of Advertising,
24(2), 21-31.
Banna, H., Afroz, R., Masud, M. M., Rana, M. S., Koh, E. H.,
& Ahmad, R. (2016). Financing an efficient
adaptation programme to climate change: A
contingent valuation method tested in Malaysia.
Cahiers Agricultures, 25(2), 25003.
Barr, S., & Gilg, A. (2006). Sustainable lifestyles: Framing
environmental action in and around the Home.
Geoforum, 37, 906-920.
Baumgartner, H., & Homburg, C. (1996). Applications of
structural equation modeling in marketing and
consumer research: A review. Int. J. Res. Market,
13(2), 139-161.
Bradley, J. C., Waliczek, T., & Zajicek, J. (1999).
Relationship between environmental knowledge
and environmental attitude of high school students.
J. Environ. Educ, 30(3), 17-21.
Byrne, B. M. (2016). Structural equation modeling with
AMOS: Basic concepts, applications, and
programming. Routledge.
Chin, W. W., & Newsted, P. R. (1999). Structural equation
modeling analysis with small samples using partial
least squares. Statistical Strategies for Small
Sample Research, 2, 307-342.
Cox, M. J. (2008). Sustainable communication: A study of
green advertising and audience reception within
the growing arena of corporate social responsibility.
Case study: British Petroleum. Earth &
Environment, 3, 32-51.
Davis, D., & Consenza, R. M. (1993). Business research for
decision making (3rd ed.). California: Wadsworth
Doss, C. R., & Morris, M. L. (2001). How does gender affect
the adoption of agricultural innovations? Agric.
Econ, 25, 27-39.
D'Souza, C., & Taghian, M. (2005). Green advertising
effects on attitude and choice of advertising
themes. Asia Pacific Journal of Marketing and
Logistics, 17(3), 9-21.

52 Md. Khaled Saifullah, Fatimah Binti Kari, Md. Arphan Ali / Journal of Asian Finance, Economics and Business Vol 4 No2 (2017) 45-53
D'Souza, C., Taghian, M., Lamb, P., & Peretiatkos, R.
(2006). Green products and corporate strategy: An
empirical investigation. Society and Business
Review, 1(2), 144-157.
Dunlap, R., & Scarce, R. (1991). Environmental problems
and protections. Public Opinion Quarterly, 55, 651-
672.
EPU. (1990). Sixth Malaysia Plan 1991-1995. Malaysia:
Prime Minister’s Department.
EPU. (1995). Seventh Malaysia Plan 1996-2000. Malaysia:
Prime Minister’s Department.
EPU. (2000). Eight Malaysia Plan 2001-2005. Malaysia:
Prime Minister’s Department.
EPU. (2005). Ninth Malaysia Plan 2006-2010. Malaysia:
Prime Minister’s Department.
EPU. (2010). Tenth Malaysia Plan 2011-2015. Malaysia:
Prime Minister’s Department.
Fisman, L. (2005). The effects of local learning on
environmental awareness in children: An empirical
investigation. The Journal of Environmental
Education, 36(3), 39-50.
Forkink, A. (2010). Perception, Awareness, and Acceptance
of Green Kitchen Cleaners: Go Green Market
Research. Retrieved July 6, 2016, from
https://www.greenbook.org/Content/GoGreen/Gree
n_Cleaners_report.pdf
Friedman, T. L. (2008). Hot, flat, and crowded: Why we
need a green revolution--and how it can renew.
USA: Macmillan.
Hair, J. F., Sarstedt, M., Ringle, C. M., & Mena, J. A. (2012).
An assessment of the use of partial least squares
structural equation in marketing research. Journal
of the Academy of Marketing Science, 40(3), 414-
433.
Hair, J. F., Black, W. C., Babin, J. B., & Anderson, R. E.
(2010). Multivariate Data Analysis (7thed.). Upper
Saddle River, NJ: Prentice Hall.
Haytko, D. L., & Matulich, E. (2008). Green advertising and
environmentally responsible consumer behaviors:
Linkages examined. Journal of Management and
Marketing Research, 1, 2-11.
Hoe, S. L. (2008). Issues and procedures in adopting
structural equation modeling technique. Journal of
Applied Quantitative Methods, 3(1), 76-83.
Huq, S., & Toulmin, C. (2006). Three eras of climate change.
IIED Opinion. In
Kline, R. B., (2010). Principles and Practice of Structural
Equation Modeling. New York: Guilford Press.
Kollmuss, A., & Agyeman, J. (2002). Mind the gap: why do
people act environmentally and what are the
barriers to pro-environmental behavior?. Environ.
Educ. Res, 8(3), 239-260.
Kounatze, C. R. (2009). Towards green ICT strategies:
Assessing policies and programmes on ICT and
the environment. Organisation for Economic Co-
operation and Development. Retrieved from
https://www.oecd.org/sti/ieconomy/42825130.pdf
Lee, K. (2008). Opportunities for green marketing: Young
consumers. Marketing Intelligence and Planning,
26, 573-586.
Leiserowitz, A. (2007). Human development report 2007/
2008: Fighting climate change: Human solidarity in
a dividend world. UNDP.
Liu, Q., Li, H. M., Zuo, X. L., Zhang, F. F., & Wang, L.
(2009). A survey and analysis on public awareness
and performance for promoting circular economy in
China: A case study from Tianjin. Journal of
Cleaner Production, 17(2), 265-270.
Luchs, M. G., Naylor, R. W., Irwin, J. R., & Raghunathan, R.
(2010). The sustainability liability: Potential
negative effects of ethicality on product preference.
Journal of Marketing, 74, 18-31.
Lung, S. (2010). Green consumerism-The way to effectively
differentiate your products in Asia-Pacific Market.
Online Article. Retrieved July, 4, 2016, from
http://ezinearticles.com/?Green-Consumerism---The
-Way-to-Effectively-Differentiate-Your-Products-in-
Asia-Pacific-Market&id=4875312
Malhotra, N. K., & Birks, D. F. (2007). Marketing research:
An applied approaches third multivariate analysis.
Upper Saddle River, NJ: Prentice Hall.
Masud, M. M., Al-Amin, A. Q., Junsheng, H., Ahmed, F.,
Yahaya, S. R., Akhtar, R., & Banna, H. (2016).
Climate change issue and theory of planned
behaviour: relationship by empirical evidence.
Journal of Cleaner Production, 113, 613-623.
Masud, M. M., Kari, F. B., Yahaya, S. R. B., & Al-Amin, A. Q.
(2014). Impact of residents' livelihoods on attitudes
towards environmental conservation behaviour: An
empirical investigation of Tioman Island Marine
Park area, Malaysia. Ocean & Coastal
Management, 93, 7-14.
Mei, N. S., Wai, C. W., & Ahamad, R. (2016). Environmental
awareness and behaviour index for Malaysia.
Procedia-Social and Behavioral Sciences, 222,
668-675.
Patchen, M. (2006). Public attitudes and behavior about
climate change: What shapes them and how to
influence them. East Lafayette, Indiana: University
of Purdue.
Ringle, C. M., Götz, O., Wetzels, M., & Wilson, B. (2009).
On the use of formative measurement
specifications in structural equation modeling: A
Monte Carlo simulation study to compare
Md. Khaled Saifullah, Fatimah Binti Kari, Md. Arphan Ali / Journal of Asian Finance, Economics and Business Vol 4 No2 (2017) 45-53 53
covariance-based and partial least squares model
estimation methodologies. METEOR Research
Memoranda (RM/09/014): Maastricht University.
Retrieved from
http://digitalarchive.maastrichtuniversity.nl/fedora/
objects/guid:a76b91a7-a200-43c2-986c-c47ce15f
014b/datastreams/ASSET1/content
Schlegelmilch, B. B., Diamantopoulos, A., & Bohlen, G. M.
(1994). The value of socio-demographic
characteristics for predicting environmental
consciousness. In Park, C. W., & Smith, D. C.
(Eds.), Marketing Theory and Applications: The
Proceedings of the 1994 American Marketing
Association's Winter Educator's Conference (pp.
341-352)
Schmidt, J. (2007). Blogging practices: An analytical
framework. J. Comput. Med. Commun, 12(4),
1409-1427.
Schultz, P. W., & Oskamp, S., (1996). Effort as a moderator
of the attitude-behavior relationship: general
environmental concern and recycling. Soc.
Psychol., 375-383.
Siegler, K., & Gaughan, B. (2008). A practical approach to
Green IT. Webinar. Retrieved July 14, 2016, from
http://www.itmanagement.com/land/green-it-webin
ar/?tfso=2058
Staniskis, J. K., & Stasiskiene, Z. (2006). An integrated
approach to environmental education and research:
A case study. Clean Technologies and
Environmental Policy, 8(1), 49–58.
Vinzi, V. E., Chin, W. W., Henseler, J., & Wang, H. (2010).
Handbook of Partial Least Squares: concepts,
methods and applications. Berlin: Springer-Verlag.

54 Md. Khaled Saifullah, Fatimah Binti Kari, Md. Arphan Ali / Journal of Asian Finance, Economics and Business Vol 4 No2 (2017) 45-53

Ezeoha Bright Amacha, Omkar Dastane / Journal of Asian Finance, Economics and Business Vol 4 No2 (2017) 55-68 55
Print ISSN: 2288-4637 / Online ISSN 2288-4645
doi:10.13106/jafeb.2017.vol4.no2.55
Sustainability Practices as Determinants of Financial Performance:
A Case of Malaysian Corporations
Ezeoha Bright Amacha1
, Omkar Dastane2
Received: January 26, 2017. Revised: April 7, 2017. Accepted: May 2, 2017.
Abstract
This research is carried out to investigate the relationship between sustainability practices and performance in a financial sense for
Malaysian Oil and Gas sector. Objectives include to study the state of sustainability disclosure among Malaysian oil and gas companies, to
understand if companies that practiced sustainability had better performances to their financial bottom-line and to conduct a data analysis to
understand the relationship between Environmental, social and governance performance [represented by the acronym ACSI] and financial
performance. Sustainability performance is measured using ACSI checklist, which is an adaptation of the GRI 3.0 by Global reporting
initiative while financial performance was measured on financial and profitability parameters namely EBITDA, EPS and PE ratio. Secondary
data sources are used which were then converted into a rating scale to develop quantitative data. SPSS 21 is used for the analysis. The
result shows that the majority of oil and gas companies in Malaysia had poor performance in terms of sustainability disclosure. On all three
chosen profitability parameters, the companies that practiced sustainability were found to perform better than their counterparts that did not.
Strong and significant relationship exists between sustainability practices and better financial performance.
Keywords: Sustainability, Financial Performance, Profitability, Oil & Gas Sector.
JEL Classification Code: M20, M14, M48, Q56.
1. Introduction
1
According to the international institute of sustainable
development, the concept of sustainability originated around
1962 when the post-world war II community and the
environmental movement were being gradually merged
(Lowitt et al., 2009). In 1987, the World Commission on
Environment and Development’s was summoned with the
aim to come up with a standard definition for sustainable
development, it was an event that was basically concerned
about how continuous development can be achieved and
managed without upsetting the balance of nature (Goodland,
1995). Since then, the term ‘sustainability’ has taken a new
approach especially since the 1990s as there is now a shift
from merely focusing on environmental issues to a focus on
1. First Author. Lord Ashcroft International Business School, FTMS
Malaysia Center, Anglia Ruskin University, United Kingdom [Postal
Address: Cambridge Campus, East Road, Cambridge CB1 1PT,
United Kingdom].
2. Corresponding Author. Senior Lecturer. Centre for Postgraduate
Studies, School of Accounting and Business Management, FTMS
Global College, Malaysia [Postal Address: Cyberjaya Campus, Block
3420, Persiaran Semarak Api, Cyber 4, Cyberjaya, Selangor,
Malaysia] E-mail: [email protected]
merging environmental, social and global economic issues
(Lowitt et al., 2009; Mebratu, 1998; Pearce & Warford, 1993;
Reed, 1997). The recognition of sustainability can be seen
today as many organizations are now embarking on
programs such as corporate governance, CSR, green
production, green value chain, paperless banking and
reduction of water consumption (Choi & Yu, 2014; Lowitt et
al., 2009; Statman, 2000); In addition, according to Siew et
al. (2013) stakeholders are also seeking disclosures of
organizations business activities that includes financial,
social and environmental performance. Sustainability
awareness in business organizations continues to grow as
the world face up to social, environmental and ecological
problems such as gender and economic inequality, human
rights abuses, global warming, carbon emissions, gas flaring
and various levels of environmental degradation (Enquist et
al., 2007; Lowitt et al., 2009; Luus et al., 2007).
In respect to these events, the business case for
sustainability has continued to grow to unprecedented levels
over (Epstein & Buhovac, 2014). Various research works
has been done on sustainability with the most research in
developed countries like USA, Australia, United Kingdom,
Germany, France and a few others (Epstein & Buhovac,
2014). The bulk of the research has focused on best

56 Ezeoha Bright Amacha, Omkar Dastane / Journal of Asian Finance, Economics and Business Vol 4 No2 (2017) 55-68
practices across industries such as tourism, banking &
finance, construction, transportation and agriculture
(Christmann, 2000; Shriberg & MacDonald, 2013). In other
parts of Europe, research has been done on sustainable
management systems in Romania (Burja, 2012). There has
also been notable research in developed countries that
focused on the link between sustainability practices and
company profitability on basis of firm valuation (Bartlett,
2012), ROE, EBITDA and ROI (Flammer, 2012; Griffin &
Mahon, 1997; Kusuma & Koesrindartoto, 2014; Luus et al.,
2007; Siew et al., 2013). In South America (Petrini &
Pozzebon, 2010); Indonesia, Japan, China and India,
research was also done on the effects of sustainability
practices on profitability (Fuji et al., 2012; Kusuma &
Koesrindartoto, 2014) and the effect of corporate
sustainability on employees (Aggarwal, 2013; Choi & Yu,
2014). In Africa, major research work has been done in
terms of rethinking environmental sustainability practices as
well as reconciling sustainability and profitability (Kipesha &
Zhang, 2013; Oribu et al., 2014). In Malaysia, majority of the
research on sustainability focused on industry practices
(Osman et al., 2012). There has been research linking
sustainability practice and reporting to company financial
performance in terms of share price stability and growth as
well as on the issue of sustainability as it affects corporate
performance. Research was also done on gender diversity
in boards and management positions in Malaysia
(Marimuthu, 2009). Generally, there is not adequate
literature to determine the effects practicing sustainability
will have on the financial performance of organizations in
Malaysia. Therefore, this research will aim to plug that gap,
add to existing literature and also provide scope for further
research work on the subject.
The business case for sustainability continues to be made
by scholars like (Epstein & Buhovac, 2014); however,
there’s also question to be asked in that, is there any real
financial benefit for business organizations that practice
sustainability? On top of this, considering that several
factors can affect profitability of a business, such as size,
marketing, location and even financial capability, does the
practice of sustainability contribute in any way to said
profitability? These are questions that need to be answered.
Currently, most successful business organizations are
integrating concept of environmental management,
corporate ethics and brand reputation into their processes
(Lopez et al., 2007). And it has often been argued that the
ability of a firm to adopt sustainability practices should give
them competitive advantage over firms that do not (Adams
& Zutshi, 2004). However, the validity of this claim and the
extent to which it is applicable remains an issue of debate.
Looking around various academic literatures, it can be said
that majority of the compliers to sustainability come from the
developed country (Flammer, 2012; Griffin & Mahon, 1997;
Luus et al., 2007; Siew et al., 2013). So, it is interesting to
know the position of developing countries on this matter.
There might be a lack of legislation, willingness or even a
lack of understanding on the part of business managers in
these parts of the world as to the gains of practicing
sustainability, if any.
The main aim of this research is to understand the effect
that the practice of sustainability has on the profitability of
Malaysian companies; it seeks to deal with the issue in a
Malaysian context and the financial performance of the
organization will also be reviewed which will then lead to an
understanding as to whether Malaysian stakeholders have a
preference for companies that practice sustainability.
Objectives: (1) To understand the level involvement of
Malaysian oil and gas companies in the practice of
sustainability. (2) To understand if companies practicing
sustainability perform better than those that do not. (3) To
understand the strength of relationship between
sustainability practices and better financial performance.
Research Questions: (1) What is the level of involvement of
Malaysian oil and gas in the practice of sustainability; and
what is the outcome of this result in a ranking system? (2) In
comparison, do companies that practice sustainability has
better financial performance than those that do not? (3) Is
there a linear association between sustainability practices
and profitability; and in the case where a relationship exists,
what is the strength of this relationship?
2. Literature Review
Research has revealed that there is no single accepted
definition for the concept of sustainability at this point (Berns
et al., 2009). However, the Brundtland commission
summoned by the United Nations defined Sustainable
development as “development that meets the present needs
without compromising the ability of future generations to
meet their needs”. In other words, the need of the current
day has to be met whilst preserving resources to meet the
needs of future generations. Bartlett (2012) defined it as
“development that does not compromise the ability of future
generations to meet their needs”. Despite a slight difference
in these definitions, the key point of unity here is the
commitment to a future generation and a general
acceptance of the importance of the concept (Berns et al.,
2009). Bartlett (2012) is of the opinion that the Brundtland
commission focuses more on the needs of the present
which he argued, has nothing to do with sustainability and
only secondarily identified the needs of the future, which he
argued should be the main concept of sustainability. From a
business perspective, Kocmanova et al. (2011) defined

Ezeoha Bright Amacha, Omkar Dastane / Journal of Asian Finance, Economics and Business Vol 4 No2 (2017) 55-68 57
sustainability as the corporate strategy that monitors long-
term corporate growth, efficiency, performance and
competitiveness by incorporating economic, environmental
and social performances into corporate management. This
could be one of the most suitable definitions in terms of
clarity in the business world, because, it directly echoes the
sentiment of the Triple bottom line concept by John
Elkington. From the perspective of this definition, the
concept of sustainability is seen from the eyes of a business
manager, and places a requirement that business
organizations must be responsible to and accountable for
their economic, social and ecological bottom lines.
The triple bottom line theory: This concept was introduced
by John Elkington in the mid-1990s; it refers to how an
organization deals with and reports on its impact and
behavior towards people, planet and profit (Atu, 2013;
Morland, 2006; Norman & MacDonald, 2003; Slaper & Hall,
2011; Sridhar & Jones, 2012). Triple bottom line concept
places equal attention on the environmental, social and
economic aspects of a business as the guide towards policy
formulation and measurement of business performance
(Sridhar & Jones, 2012). TBL places equal importance on
the relationship between the planet, people and profit in the
sense that, businesses derive the majority of their material
inputs from the planet, while the process of converting these
inputs to outputs is done by people and the basis of the
organizations reaping profits come from these activities,
Norman and MacDonald (2003) agree with these sentiments.
Sustainability and the triple bottom line is made up of issues
such as climate change, environmental management and
systems, human capital management, corporate governance,
stakeholder engagement, social responsibility and
accountability (Petrini & Pozzebon, 2010); triple bottom line,
3p sheds more light on the inter relationship and the
importance of being responsible to all these aspects of a
business. In every way it is looked at, the activities of every
business organization have various negative and positive
impacts on people, the environment and the economy
(Reddy & Gordon, 2010), therefore, this concept is
important because of its consideration for all three
components and its proposal that businesses must be both
responsible for and accountable to all three components.
However, on the flip side of the coin, there have been a few
criticisms of the triple bottom line concept, according to
Tripathi et al. (2013); Sridhar and Jones (2012), measuring
social and environmental impacts can be difficult or even
unrealistic, because unlike financial performance, it cannot
be quantified in monetary terms; there is also a criticism that
the practicality of the model is still in question according to
(Hubbard, 2009; Norman & MacDonald, 2003; Tripathi et al.,
2013). Despite these valid criticisms, there is a general
acceptance that the 3BL remains the key model for
organizations to follow in their pursuit of sustainability. Due
to its wide acceptability in the field of sustainability, this
study will draw a lot from the theory of the triple bottom line
in investigating and analyzing the impact of sustainability
practices on organizational performance of Bursa Malaysia
listed companies that fall under the oil and gas sector. It is
the guiding concept for this research study.
Sustainability reporting: Sustainability reporting is a broad
term that is used in describing the reporting on economic,
social and environmental impacts of business which should
clearly outline both the positive and negative impacts of the
business (Atu, 2013; GRI, 2006). It is a concerted effort to
integrate economic, environmental and social considerations
into the evaluation and decision making processes of the
reporting organization. What can be deduced from these
definitions is that, all activities of organizations have various
impacts on the society and environment (Reddy & Gordon,
2010); therefore, the concept of sustainability reporting was
proposed in other to measure and disclose such impacts of
the business organizations, beyond traditional accounting
reports (Atu, 2013). The key for organizations to manage
their progress towards sustainability is through
measurement (Elkington, 1997; Elkington, 2004).
According to Maharaj and Herremans (2008) the number
of companies that started reporting environmental or
sustainability activities has increased greatly since Shell
Canada started the trend in the year 1991. Despite this, the
overall consensus remains that the level of involvement and
reporting remains low. Factors such as government &
stakeholder pressures, regulatory standards are some of the
reasons why sustainability reporting became important
(Pramanik et al., 2008; Roberts, 1992; Tilt, 1994; Yew,
2000). However, in Malaysia, just like the principal subject of
corporate sustainability, TBL reporting is still at early stages
(Janggu et al., 2007; Thompson & Zakaria, 2004).
According to Mokhtar and Sulaiman (2012) there is now a
growing worry among stakeholders and the general public
that activities such as waste dumping, logging and bush
burning are happening with high regularity, and this has led
to serious questioning of the role of business organizations
in the society. However, despite obvious merits of
sustainability reporting, critics say it is just an organizational
tool to make good impression, and to take away public
attention from real ethical and moral accountability issues
(Bansal, 2005). For this reason, the study, understanding
and practice of sustainability and sustainability reporting
cannot be underestimated. To enable proper understanding
and reporting of sustainability activities, organizations like
GRI and Dow Jones have come out with frameworks that
have been acclaimed as generally acceptable and widely
used for reporting triple bottom line activities of a business.

58
The
use
org
H
<
<
<
3.
T
Bot
it w
usi
qua
inc
ann
ese
ed
gani
Hypo
<H1
<H2
<H3
Me
This
th e
will f
ng
antit
lude
nua
org
as
zati
othe
> P
s
> M
re
p
p
> T
e
p
eth
s stu
explo
follo
qu
tativ
e b
l re
gani
a f
ons
eses
Publ
secto
Mala
elea
polic
perfo
Ther
exte
perfo
hod
udy
orat
ow a
alita
ve d
but
epor
Ez
izat
fram
s in
s:
icly
or h
aysia
ase/
cies
orm
re i
nt
orm
dol
use
tory
a de
ative
data
are
rts,
eoha
ions
mew
prac
list
have
an
/pub
a
anc
s s
of
anc
og
es co
and
educ
e, s
a fo
no
pre
a Bri
s ha
work
ctice
ted
e hig
com
blish
nd
ce th
stron
sus
ce o
gy
omb
d ex
ctive
seco
or a
ot b
ss
ight A
<
ave
k in
e of
Ma
gh le
mpa
h
pr
han
ng p
stain
f the
bina
xpla
e ap
ond
analy
be
rele
Ama
<Fig
a s
me
f sus
lays
eve
nies
the
acti
tho
pos
nab
e co
ation
anato
ppro
dary
ysis
limit
ease
cha,
gure
set o
eas
stain
sian
ls o
s in
ir
ces
se c
itive
ility
omp
n of
ory
ach
da
s; so
ted
es a
Omk
e 1>:
of p
surin
nab
co
f su
the
sus
s, h
com
e co
pr
panie
met
res
h. Th
ata
ome
to
and
kar D
: Co
para
ng t
ility
mpa
ustai
e en
stai
have
mpan
orre
ract
es.
thod
earc
his r
so
e of
su
ind
Dast
nce
amet
the
(se
anie
inab
nerg
nab
e
nies
elatio
ices
ds a
ch d
rese
urce
f th
stai
depe
tane /
ptua
ters
inv
ee F
es in
bility
gy s
bility
bett
s, wh
on
s a
at va
desi
earc
es
he d
inab
ende
/ Jou
al fra
s tha
volve
igur
n th
y pra
sect
y i
ter
hich
betw
and
ario
ign
ch is
to
data
bility
ent
urna
amew
at c
eme
re 1
he e
actic
tor,
initia
fin
h do
wee
fin
us s
is a
s do
gen
a so
y re
res
l of A
work
can
ent
).
ener
ces
whi
ative
nanc
o not
en t
nanc
stag
appli
one
nera
ourc
epor
sear
Asian
k ado
be
of
rgy
.
ich
es,
cial
t.
the
cial
ges.
ied;
by
ate
ces
rts,
rch
n Fin
opte
nanc
ed fro
artic
coll
Bur
bec
pub
add
of e
resu
leve
usin
data
mat
sou
rep
201
not
T
will
par
und
a s
com
sec
are
ce, Ec
om A
cles
ecte
rsa
caus
blicly
ditio
exte
ult o
el o
ng t
a co
teria
urce
orts
14 u
upd
The
com
ticu
der t
selec
mpa
ctor
“I
cono
ACS
s. A
ed f
Mal
se th
y lis
n, m
erna
of th
of c
time
olle
als
s a
s fro
until
date
res
me
lar s
that
ctio
ny’s
spe
nve
omics
SI fra
Also
from
ays
he c
sted
most
al au
his,
cred
e se
ctio
pos
re b
om
201
ed fo
sear
from
sect
t sec
n fr
s pr
ecific
estm
s and
amew
o, th
m se
sia, t
com
d in
t pu
udito
sec
ibilit
eries
n, a
sted
be c
the
16 i
or c
rch
m a
tor a
ctor
rom
ima
cally
ment
d Bus
work
he
elec
the
mpan
n th
ublic
ors
cond
ty a
s of
ann
d in
cons
cho
s no
erta
use
sub
and
r. Th
the
ary b
y in
t h
sines
k. (A
stu
cted
leg
nies
e B
cly li
to a
dary
and
f lon
ual
n th
side
ose
ot in
ain c
es p
b-gr
wil
he s
e B
busi
oil
oldi
ss Vo
ACSI
dy
Ma
itim
s are
Burs
sted
aud
y da
rel
ngit
rep
he c
ered
n y
nclu
com
purp
roup
l inv
sam
ursa
nes
& g
ing
ol 4 N
I, 20
use
alay
acy
e re
sa M
d co
it th
ata
iabi
udin
ports
com
. Th
ear
uded
mpan
posiv
p; th
volv
ples
a M
ss ac
gas,
co
No2
011)
es
sian
y of
cog
Mala
omp
heir
sou
lity.
nal
s an
mpan
he r
of
d so
nies
ve s
his i
ve al
s to
Mala
ctivi
the
omp
(201
sec
n co
the
gnize
aysi
panie
acc
urce
Th
dat
nd a
ny’s
rese
201
ome
.
sam
s be
ll th
be
aysia
ity fa
erefo
anie
17) 5
cond
omp
dat
ed i
ia s
es e
coun
wil
he s
a. F
all r
s w
earc
10 t
of
mplin
eca
e co
use
a lis
allin
ore,
es”
55-68
dary
panie
ta is
n M
stoc
emp
nts,
l us
stud
For
rele
webs
ch co
to 2
the
ng a
use
omp
ed in
sting
ng u
, org
an
8
y da
es l
s no
Mala
ck e
ploy
the
sual
dy w
the
van
sites
ons
2013
par
as t
e it f
pani
n th
gs,
nde
gan
nd
ata
liste
ot in
aysia
exch
the
erefo
ly h
will
e tim
nt on
s a
ider
3. D
ram
the
focu
es o
e a
bas
er th
izat
hav
so
ed o
que
a an
hang
e se
ore,
have
be
me s
nline
nd
rs a
Data
eter
sam
uses
ope
naly
sed
he e
tions
ve
ourc
on th
estio
nd a
ge,
rvic
, as
e hig
don
seri
e te
oth
annu
a fro
rs a
mpl
s on
eratin
ysis
on
ener
s wh
oth
es
he
on
are
in
es
s a
gh
ne
es
ext
her
ual
om
are
es
n a
ng
is
a
gy
ho
her

Ezeoha Bright Amacha, Omkar Dastane / Journal of Asian Finance, Economics and Business Vol 4 No2 (2017) 55-68 59
businesses as core or supplementary businesses are not
considered. The researcher only considers companies that
have been publicly listed in the Bursa Malaysia not later
than year 2008 and companies that have been incorporated
for at least for the past 10 years. Out of 32 companies that
fell under the oil and gas sector, 11 companies did not meet
the target population criteria because they are either
investment holding companies with multiple business focus
or were listed in the Bursa Malaysia after the year 2008. So,
the sample of 21 companies that met the criteria are oil and
gas companies listed on the Bursa Malaysia. In the course
of this paper, specifically to answer research question 2; the
chosen companies are divided into 2 parts which are those
companies that fully integrate the triple bottom line
[economic, social and ecology] concept in their business
and disclose accordingly in either a separate sustainability
report or annual reports and the other section will be
companies who have no record of full or partial sustainability
practices and disclosure.
3.1. Data Analysis Technique
3.1.1. The Level of Sustainability Practice
Involvement.
Using annual/sustainability reports available online, this
part examines the level of sustainability practices by
Malaysian companies in the oil and gas sector on matters
such as climate change, environmental issues, workplace
health and safety, human capital management, corporate
conduct, stakeholder engagement and governance which
are the main domains for measurement according to the
checklist adapted from (Siew et al., 2013). There are 9
domains with 68 items which are of the highest importance
to institutional investors and stakeholders (ACSI, 2011,
p.13); it is presented in a tabular form; the checklist is
according to Australian Council of Super Investors, and is
drawn heavily from the GRI 3.0 reporting guidelines. It was
used in analyzing construction industry in Australia and the
researcher found the checklist to be of relevance to analyze
oil and gas sector. A rating value of 0 or 1 is used; 0 means
the absence of information while 1 means presence of
information provided by the oil and gas companies.
The aim of H1 is to understand the level of involvement of
Malaysian oil and gas companies in the practice of
sustainability. Once information has been entered into the
checklist; Euclidean distance test is conducted to further
balance the result of the checklist items against the reported
items by the organizations. Euclidean distances are used
to show the magnitude of differences in the level of
disclosures (Danielsson, 1980). In this case, the problem
can be viewed as the distance between 2 points whereby
one point represents what is expected of oil and gas
companies in Malaysia [9 domains and 68 items] and the
other point represents actual activities/practices disclosed
by the organizations. Euclidean distances can be used in
addressing the shortcomings that can come up as a result of
using a simple checklist such as the one used in Hypothesis
1; it can also be used in simplifying the result of the data
entered into the checklist. The representative score [which
in this case is distance measured] is hence an accurate
reflection of the level of consistency in reporting achieved
throughout all domains (Siew et al., 2013). Because there
are nine domains involved, Euclidean distance is measured
by;
�� �����������
����
� ������
���
� �������
���
Adapted from: (Siew et al., 2013)
In this case, D is the Euclidean distance, p is the
maximum number of items per domain, q is the number of
disclosures by the companies and n = 9 represents the total
number of domains. The scale used for measuring levels of
sustainability practice involvement is as follows: excellent (0
- 6), good (7-14), average (15 - 20) and poor (> 20). After
the Euclidean distance is calculated for each of the chosen
companies, the result should fall under the scale and give a
conclusive indication of the level of their involvement in
sustainability practices based on their disclosures as
identified in the checklist.
3.1.2. Comparative Analysis of Practicing and
Non-practicing Companies.
In this part, a comparative analysis is conducted. For
clear comparison, the 21 participating companies are split
into 2 parts which are – those that disclosed sustainability
activities either in a separate report or through their annual
report to be denoted by D and those companies that do not
practice sustainability and did not disclose anything of such
in any online document, to be denoted by ND.
Where D = “Disclosing” companies.
Where ND = “Non-disclosing” companies.
The chosen parameters for measurement and
comparative analysis are EBITDA margin and PE Ratio.
EBITDA margin is a profitability measure while PE ratio is
an equity measure, both profitability and equity is measured
in this study to give a broader and better balanced
assessment of organizational performance in this context. In
other to conduct the comparative analysis, the mean values

60 Ezeoha Bright Amacha, Omkar Dastane / Journal of Asian Finance, Economics and Business Vol 4 No2 (2017) 55-68
of both parameters will be compared over 4 years, from
2010 to 2013. The reason for this is that a longitudinal time
series data of 4 consecutive years can give more
consistency in terms of result, rather than measuring only
for 1 or 2 years. The two parameters to be considered are
EBITDA margin and PE ratio; both parameters have been
identified in past research studies as important factors for
the valuation of organizations (Kusuma & Koesrindartoto,
2014).
3.1.3. Strength of Relationship
Correlation analysis is used to understand if two
measurement variables have a linear relationship, and to
quantify the strength of that relationship. It's used to test
hypotheses on the existence of relationship between
variables, which in this case is sustainability practices & firm
performance. The level of association is measured by a
correlation coefficient, denoted by r. It is also called
Pearson's correlation coefficient. Correlation coefficient is
measured on a scale that varies from + 1 through 0 to – 1,
complete correlation between two variables is expressed by
either + 1 or -1. When one variable increases as the other
increases, it denotes a positive correlation; when one
decreases as the other increases it is negative. Complete
absence of correlation is denoted by 0 (Saunders & Lewis,
2012). To do this, the 9 variables for measuring
sustainability will be grouped under the acronym “ACSI”.
This is because the checklist used in deriving the
quantitative data for statistical analysis in this study comes
from the ACSI (2011), in addition, the 9 independent
variables used in measuring sustainability are also adapted
from the ACSI checklist. The statistical data was derived by
converting the binary scores [0 for absence and 1 for
presence of information reported] into an aggregate score
by using a simple formula [number of disclosure/required
disclosure * 5], where 5 is the maximum attainable. For
example; there are 9 disclosures under climate change; if an
organization reports 6 disclosures, then that would be
calculated as 6/9*5 to get an aggregate score of 3. Where
an organization had 0 aggregate score, then a score of 1
will be given. These details are further clarified in the data
sets and will be attached along with the research work.
3.2. Measures of Variables
3.2.1. Independent Variables
There is currently no framework by Malaysian investors or
government to analyze sustainability practices. Therefore,
this research has adopted a framework set by Australian
Council of Superannuation Investors [ACSI]. The framework
draws from and combines a range of sustainability
guidelines in the world such as GRI, Carbon disclosure
project and global framework for climate risk control (ACSI,
2011). This framework/checklist was used in (Kusuma &
Koesrindartoto, 2014; Siew et al., 2013) in analyzing
construction sector in Australia. The researcher has found
guidelines and provisions of the framework to be relevant to
the oil and gas industry and therefore will be applying it in
this study. This framework is also in line with the concept of
the triple bottom line which is the guiding theoretical
framework that has been used throughout this study. In the
ACSI framework, there are originally 9 domains under which
there are a further 68 items – therefore, the 9 domains make
up the independent variables for this study, while the 68
items under it can be referred to as the independent sub-
variables. Sustainability practices will be measured in this
study based on these identified variables. Below, the
independent variables to measure sustainability in this study
are re listed as follows:
1. Climate change.
2. Environmental management systems.
3. Environmental efficiency
4. Environmental issues [others]
5. Work place health and safety.
6. Human capital management.
7. Corporate conduct.
8. Stakeholder engagement.
9. Governance.
3.2.2. Dependent Variables
Firm performance in this study will be measured based on
profitability and equity. The 3 dependent variables that will
be used to measure performance in this study are;
1. EBITDA margin = EBITDA/Revenue
When EBIDTA is not given in annual report, the
formula will be as follows: Gross Profit + Interest +
Taxes + depreciation and amortization/revenue.
2. PE Ratio = current share price/earnings per share
3. EPS: net income / average outstanding common
shares
Measures like EBITDA, EPS and PE ratio have been
identified as important parameters to judge financial
performance of business organizations, both parameters
have been used in previous research such as (Siew et al.,
2013).

Ezeoha Bright Amacha, Omkar Dastane / Journal of Asian Finance, Economics and Business Vol 4 No2 (2017) 55-68 61
4. Results
4.1. H1 – level of sustainability involvement based
on disclosure.
Based on the result of the checklist and Euclidean
distance to measure the level of involvement as against the
expectations of investors, the chosen companies can be
judged as follows. Only 3 companies had “excellent” level of
sustainability involvement and disclosure, 4 companies fell
under the “good” category, 15 companies fell under the
“average category” while none of the companies fell under
the poor category; as show in below table (see Table 1).
<Table 1> Sustainability Involvement Rating
RATING
GRADE
[Euclidean score]
Number of
companies
% of
companies
Excellent 0-6 3 14
Good 7-14 4 18
Average 15-20 15 68
Poor > 20 0 0
Further analysis of the checklist reveals a very clear
pattern in the involvement of Malaysian oil and gas
companies in practice of sustainability, majority of the
companies had excellent levels of involvement in terms of
economic sustainability through corporate governance,
whistle blowing policy, code of conducts and ethics and
other aspects of economic sustainability, the level of
involvement in terms of social sustainability was also found
to be relatively good as majority of the companies engaged
in philanthropic CSR, had good human capital management
policies as well as good work place health and safety
activities. However, for an industry that records one of the
highest environmental impacts of any part of an economic,
the involvement in environmental sustainability was really
poor. Only about 7 companies had high level involvement in
managing climate change and environmental efficiency, the
majority of the oil and gas companies were found to be
lacking very far behind in this regard. The result shows that
the vast majority of the oil companies have average to low
level of sustainability practices involvement, though there is
no listed reasons for this by the companies individually,
UNEP (2000) are of the opinion that reasons for not
engaging in sustainability involvement could be as a result
of doubts about the advantages of such practices;
competitors not disclosing their involvement; a possible lack
of interest by key stakeholders such as shareholders and
clients and the possibility that revealing some information
especially about carbon emission, waste and water handling
could be damaging to the reputation of companies,
especially those that are not very strong from a financially
point of view. It remains to be seen if this is the case with
regards to the oil and gas companies in Malaysia.
4.2. H2: Below is the result of comparative
analysis of both set of companies, as
denoted by D and ND (see Table 2).
<Table 2> Comparative Analysis
RATIO 2010 2011 2012 2013
EBITDA MARGIN
[D]
19% 26% 21% 26%
EBITDA MARGIN
[ND]
30% 14% 20% 17%
PE RATIO [D] 17.35 21.37 16.64 23.62
PE RATIO [ND] 8.98 15.38 15.62 22.21
EARNINGS PER
SHARE [D]
RM12.60 (RM4.92) RM0.31 RM0.42
EARNINGS PER
SHARE [ND]
RM0.05 RM0.04 RM0.09 RM0.08
EBITDA margin provides an indication of cash flows in a
company and is normally used by analysts to assess
corporate financial health (KPMG, 2010). It is calculated
from a company’s earning power divided by its operating
revenue (KPMG, 2010). The result shows that in 2010, ND
companies outperformed D companies by up to 11%;
however, from 2011 to 2013, D companies outperformed
ND companies by 12%, 1% and 9% respectively. PE ratio is
an equity valuation used in measuring the share price of a
company in other to know whether it has a high or low value,
a high PE ratio shows high share price valuation while a low
PE ratio shows that the share price of a company is
undervalued. The result shows that D companies
consistently outperformed ND companies in all the years
under review 2010 to 2013; though in 2012 and 2013, the
margin of was quite closer than the previous years. EPS
was also used to measure financial performance in this
study. EPS shows the profitability level of an organization
from the perspective of the shareholders. For 3 out of the 4
years in review, D companies outperformed ND companies,
except in 2011 when D companies recorded an average
loss of RM4.92 as against a gain of 4 cents made by ND
companies. Therefore, as the results of the comparative
analysis shows, based on the 3 varying parameters that was
used in measuring the financial performance of the
Malaysian oil and gas companies over time, it can be said
that Malaysian oil and gas companies that reported their
sustainability involvement and practices performed
considerably better than those that did not. However, this is
not to say that this was the singular factor that was
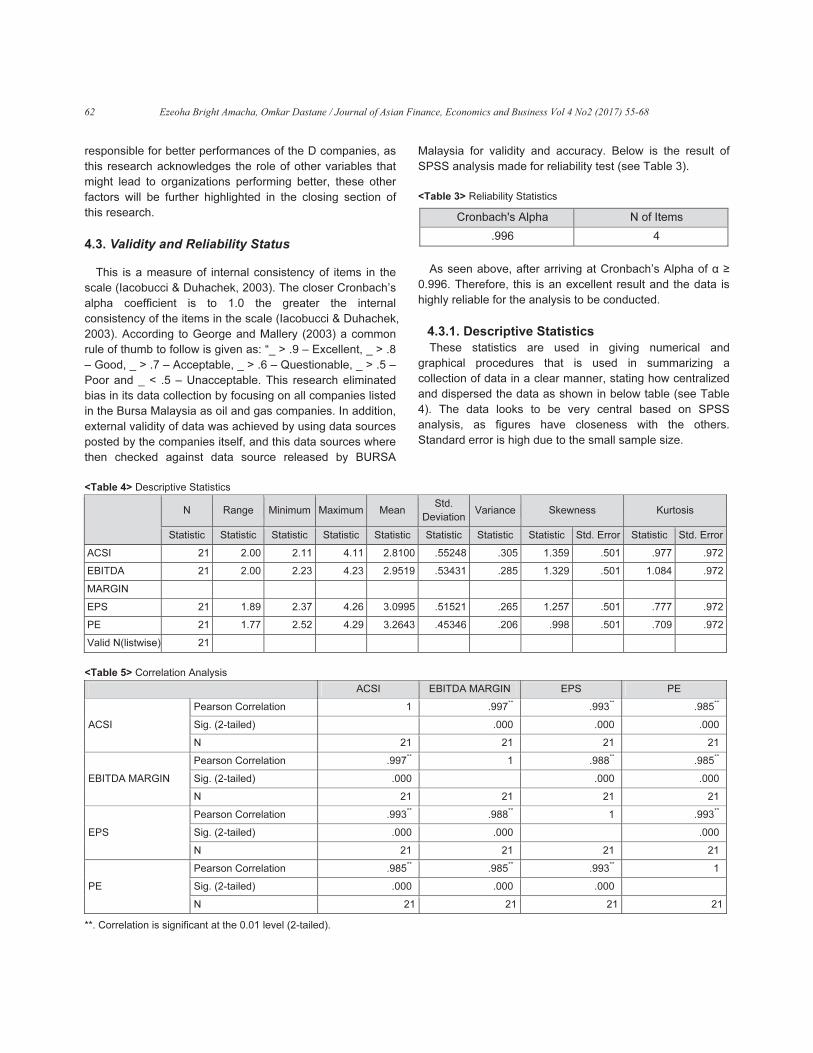
62 Ezeoha Bright Amacha, Omkar Dastane / Journal of Asian Finance, Economics and Business Vol 4 No2 (2017) 55-68
responsible for better performances of the D companies, as
this research acknowledges the role of other variables that
might lead to organizations performing better, these other
factors will be further highlighted in the closing section of
this research.
4.3. Validity and Reliability Status
This is a measure of internal consistency of items in the
scale (Iacobucci & Duhachek, 2003). The closer Cronbach’s
alpha coefficient is to 1.0 the greater the internal
consistency of the items in the scale (Iacobucci & Duhachek,
2003). According to George and Mallery (2003) a common
rule of thumb to follow is given as: “_ > .9 – Excellent, _ > .8
– Good, _ > .7 – Acceptable, _ > .6 – Questionable, _ > .5 –
Poor and _ < .5 – Unacceptable. This research eliminated
bias in its data collection by focusing on all companies listed
in the Bursa Malaysia as oil and gas companies. In addition,
external validity of data was achieved by using data sources
posted by the companies itself, and this data sources where
then checked against data source released by BURSA
Malaysia for validity and accuracy. Below is the result of
SPSS analysis made for reliability test (see Table 3).
<Table 3> Reliability Statistics
Cronbach's Alpha N of Items
.996 4
As seen above, after arriving at Cronbach’s Alpha of α ≥
0.996. Therefore, this is an excellent result and the data is
highly reliable for the analysis to be conducted.
4.3.1. Descriptive Statistics
These statistics are used in giving numerical and
graphical procedures that is used in summarizing a
collection of data in a clear manner, stating how centralized
and dispersed the data as shown in below table (see Table
4). The data looks to be very central based on SPSS
analysis, as figures have closeness with the others.
Standard error is high due to the small sample size.
<Table 4> Descriptive Statistics
N Range Minimum Maximum Mean
Std.
Deviation
Variance Skewness Kurtosis
Statistic Statistic Statistic Statistic Statistic Statistic Statistic Statistic Std. Error Statistic Std. Error
ACSI 21 2.00 2.11 4.11 2.8100 .55248 .305 1.359 .501 .977 .972
EBITDA 21 2.00 2.23 4.23 2.9519 .53431 .285 1.329 .501 1.084 .972
MARGIN
EPS 21 1.89 2.37 4.26 3.0995 .51521 .265 1.257 .501 .777 .972
PE 21 1.77 2.52 4.29 3.2643 .45346 .206 .998 .501 .709 .972
Valid N(listwise) 21
<Table 5> Correlation Analysis
ACSI EBITDA MARGIN EPS PE
ACSI
Pearson Correlation 1 .997**
.993**
.985**
Sig. (2-tailed) .000 .000 .000
N 21 21 21 21
EBITDA MARGIN
Pearson Correlation .997**
1 .988**
.985**
Sig. (2-tailed) .000 .000 .000
N 21 21 21 21
EPS
Pearson Correlation .993**
.988**
1 .993**
Sig. (2-tailed) .000 .000 .000
N 21 21 21 21
PE
Pearson Correlation .985**
.985**
.993**
1
Sig. (2-tailed) .000 .000 .000
N 21 21 21 21
**. Correlation is significant at the 0.01 level (2-tailed).

Ezeoha Bright Amacha, Omkar Dastane / Journal of Asian Finance, Economics and Business Vol 4 No2 (2017) 55-68 63
4.3.2. Correlation
This test is basically done to understand relationship
between variables and to establish the strength of that
relationship (Hinkle et al., 2003; Moinester & Gottfried, 2014;
Taylor, 1990; Rodgers & Nicewander, 1988). The correlation
statistical test data is show below and explained afterwards
(see Table 5).
At ρ 0.997, test showed that sustainability performance
(measured by ACSI) had a strong positive relationship with
EBITDA margin of the oil and gas companies, the same can
be said of earnings per share at 0.993 and price to earnings
ratio at 0.985. In addition to the positive correlation, the
strength of this relationship was also significant for all three
financial performance variables measured at Sig. (2-tailed)
0.000. Though a positive result, some scholars believe that
a small sample size might not provide adequate consistency
(Goodwin & Leech, 2006; Hinkle et al., 2003; Moinester &
Gottfried, 2014) believes that a small sample size might also
have some slight effect on r value making it either skew to a
very strong or very weak relationship. Therefore, the sample
size of 21 might not have been enough to show a high level
of consistency for the results. The coefficient of
determination (r2) is <0.5 for all the measures of financial
performance; that is <50 per cent of the variation in a
company’s financial bottom line can be explained by
variation in their sustainability performance measured here
by the ACSI checklist scores. Therefore, there is adequate
evidence from this research to justify claims that there is
strong positive correlation between profitability and
sustainability performance. All three of the correlation
coefficients were well above the <0.5 mark, which suggests
a strong positive correlation.
5. Discussion
5.1. Hypothesis 1
Quite a number of scholars have done research on
various areas of the economy that shows that there is some
kind of gains to be had if companies are involved in
sustainability practices (Feldman et al., 1996; Khaveh et al.,
2012; Klassen & McLaughlin, 1996; Konar & Cohen, 2001).
Based on the evidence of this study, only 14% of Malaysian
oil and gas companies had excellent levels of sustainability
evident in their reporting, while another 18% had
considerably good level of involvement. Breaking it down
though, majority of the companies had excellent level of
corporate conduct, governance and stakeholder
engagement, philanthropy was also another section where
the companies performed excellently, however, most were
lacking in environmental performance. There could be a few
mitigating factors for this such as lack of talent Baharin and
Abdullah (2011), unwillingness from business managers
(Adams et al., 2004), or even a lack of legislation or
enforcement, though in the case of Malaysia, the Bursa
Malaysia has adequate legislation, another mitigating factor
for this might also be the lack of a localized framework with
which Malaysian organizations can operate and implement
sustainability processes, this is especially evident in this
study seeing as a measurement framework by Australian
investors was applied herein. Despite organizations like
Global reporting initiative giving frameworks that can be
used, it can be argued that such frameworks may only be
more suitable for developed countries. Therefore, it might be
time for Malaysian key stakeholders to develop a framework
with which key industries can apply and measure
sustainability performance and involvement.
Secondly, during the filling of the checklist, it can be seen
that the extent of women in top management was either not
reported or low altogether. This is also a sustainability issue
that has been touched on in various reports such as Lord
Davis report (Thornton, 2013). According to studies, these
may be down to cultural factors, environmental factors or
due to the fabric of the organizations founded by male
managers; whatever the reasons might be, Malaysian oil
and gas companies may want to start having more women
in management and reporting as such, various scholars
conducted research and found a positive correlation of this
towards better organizational performance (Smith et al.,
2006). Based on this evidence the research will reject the
hypothesis 1 that oil and gas companies in Malaysia have
high sustainability involvement.
5.2. Hypothesis 2
Over the four years reviewed, the result came out that
companies that fully involved in and reported their
sustainability activities performed better than their
counterparts that did not, this is despite the fact that only 8
out of the 21 were in the D category. After the result, a
review of the size of the organizations was also done to
understand if the financial capability or size of the
organization had any role in their activities, strikingly, some
smaller organizations actually had far better sustainability
performance than organizations bigger than them. This goes
to reinforce the belief among scholars that commitment of
management remains of the keys to sustainability
involvement; it is a choice between the business managers
whether or not they will go down the sustainability route.
Below is a comparison of the size of companies sampled in
this research (see Table 6).

64 Ezeoha Bright Amacha, Omkar Dastane / Journal of Asian Finance, Economics and Business Vol 4 No2 (2017) 55-68
<Table 6> Sustainability Disclosure
Source: Bursa Malaysia (2015)
The above shows that though the size of a company
might be a factor in sustainability involvement, it is basically
a management decision whether or not they want to be
involved. On this evidence therefore the proposition 2, that
sustainability practicing organizations perform better than
those that do not is valid and acceptable as a result of this
study.
5.3. Hypothesis 3
Corporate sustainability & the perceived impact on
organizational financial performance have been researched
in recent times, a number of research studies have been
performed over the past 10 years to examine this
relationship. However, the results have been quite
inconclusive, inconsistent, and contradictory at times. It
ranges from positive (Burhan & Rahmanti, 2012; Ngwakwe,
2009; Orlitzky et al., 2003; Schadewitz & Niskala, 2010) to
negative (Detre & Gunderson, 2011; Lopez et al., 2007) to
mixed (Jones, 2005; Manescu, 2011) and even some
researchers found out an insignificant relationship (Buys et
al., 2011; Humphrey et al., 2012). The result of Pearson
Correlation r conducted showed all profitability ratios had a
strong positive relationship with the level of sustainability
involvement represented by the ACSI checklist, additionally,
the strength of the relationship was discovered to be
significant as well. Looking at the result of Pearson r,
EBITDA margin displayed the best relationship with
sustainability involvement at 0.993. The EBITDA is used in
measuring the cash flow of an organization, overall it is
known as a good measure to understand cash flow of very
large organizations and how they can deal with debt, cash
flow can come about as a result of investor confidence
whereby they can invest more money into the organization
(Flammer, 2012).
6. Conclusion
After environmental and social performance is compared
against the financial performance of 21 Bursa Malaysia
listed oil and gas companies, through SPSS Pearson
Correlation data analysis, the research concludes that there
is a strong relationship between sustainability practices and
financial performance of the companies, in addition, these
relationships were found to be very significance. Based on a
Participating companies DISCLOSURE Size [Mkt Cap]
PETRONAS Gas Berhad D 44.48 B
Alam Maritim Resources Berhad D 614M
Sapurakencana Petroleum Bhd ND 14.02B
Perdana Petroleum Bhd D 752.41M
Petra Energy Berhad ND 440.80M
Scomi Group Berhad ND 384.32M
Shell Refining Company Berhad D 1.48B
Uzma Berhad ND 552.17M
Petron Malaysia Refining & Marketing Bhd D 699.30M
Petroliam Nasional Bhd (PETRONAS) D 44.48B
Dayang Enterprise Holdings Berhad ND 2.02B
Barakah Offshore Petroleum D 695.26M
KNM Group Berhad ND 1.20B
Daya Materials Berhad ND 223M
Wah Seong Corporation Berhad ND 976.36M
Kejuruteraan Samudra Timur Berhad ND 88.96M
Petronas Dagangan Berhad D 18.34B
Deleum Berhad ND 628M
Dialog Group Berhad ND 7.69B
Perisai Petroleum Teknologi Berhad ND 686.05M
TH Heavy Engineering Bhd ND 377.77M
Ezeoha Bright Amacha, Omkar Dastane / Journal of Asian Finance, Economics and Business Vol 4 No2 (2017) 55-68 65
review of key literatures in this field of sustainability, it can
be said that efforts to identify the impact of sustainability on
financial performance are, at the very least in part, efforts to
legitimize the practice of sustainability so that space can be
created for broader purposes in business activities, with the
aim being to establish that business can also be about doing
good, rather than just doing well. The impact of business on
our lives, along with the meaningful purposes that people
[investors, shareholders, workers etc.] seek to pursue
through them implies a bigger and far reaching question that
organizational scholars are confronted with. In the
Malaysian context and as a developing nation, how does the
populace live with oil and gas companies that impact on
lives, society, economy and environment both in a negative
and positive way? What is the needed legislation that might
be made to improve sustainability performance? How do oil
and gas companies adjust to sustainability demands as it is
in the developed nations? These are key questions and a
simple correlation between sustainability practices and
financial performance, though useful for literature and partial
decision making do not necessarily answer these questions,
though based on this research, an argument can be made
that there are indeed financial benefits for investing in
sustainability. On the scholarly side of things, research still
has to be done to reach a conclusive point at which we can
determine the extent to which the financial bottom-line of an
organization is positively affected by their involvement in
sustainability practices, this research will include a model
that can as well be used in determining the extent to which
other variables [size, finances, location, employees,
marketing] contribute to well-being of an organization.
References
ACSI. (2011). ESG reporting guide for Australian companies.
Building the foundation for meaningful reporting.
(1st ed.). The Australian Council of Superannuation
Investors.
Adams, C., & Zutshi, A. (2004). Corporate social
rresponsibility: Why business should act
responsibly and be accountable. Australian
Accounting Review, 14(3), 31-39.
Aggarwal, P. (2013). Impact of sustainability performance of
company on its financial performance: a study of
listed Indian companies, Global Journal of
Management and Business Research Finance.
13(11), 61-69.
Atu, O. O. K. (2013). Triple bottom line accounting: a
conceptual expose. IOSR Journal of Business and
Management, 13(4), 30-36.
Bansal, P. (2005). Evolving sustainably: a longitudinal study
of corporate sustainable development. Strategic
Management Journal, 26, 197-208.
Bartlett, A. A. (2012). The earning of sustainability. Teachers
Clearinghouse for Science and Society Education
Newsletter, 31(1), 1-17.
Berns. M., Townend. A., Khayat. Z., Balagopal. B., Reeves.
M., Hopkins. M. S., & Kruschwitz. N. (2009).
Sustainability and competitive advantage. MIT
Sloan Management Review, 51(1), 19-26.
Burhan, N. A. H., & Rahmanti, W. (2012). The impact of
sustainability reporting on company performance,
Journal of Economics, Business, and Accountancy,
15(2), 257-272.
Burja. V. (2012). Environmental management systems and
companies’ sustainable performance in Romania.
Annales Universitatis Apulensis Series
Oeconomica, 14(1), 226-235.
Buys, P., Oberholzer, M., & Andrikopoulos, P. (2011). An
investigation of the economic performance of
sustainability reporting companies versus non-
reporting companies: A South African perspective.
Journal of Social Sciences, 29(2), 151-158.
Choi. Y., & Yu. Y. (2014). The influence of perceived
corporate sustainability practices on employees
and organizational performance. Sustainability, 6,
348-364.
Christmann, P. (2000). Effects of ‘best practices’ of
environmental management on cost advantage.
Academy of Management Journal, 43, 663-680.
Danielsson., P. (1980). Euclidean Distance Mapping.
Computer graphics and image processing, 14, 227-
248.
Detre, J. D., & Gunderson, M. A. (2011). The Triple bottom
line: what is the impact on the returns to
agribusiness?. International Food and Agribusiness
Management Review, 14(4), 165-178.
Elkington, J. (1997). Cannibals with forks: the triple bottom
line of 21st century business. USA: New Society
Publishers.
Elkington, J. (2004). Enter the Triple Bottom Line. in
Henriques, A. & Richardson, J. (Eds.), The triple
bottom line: does it all add up. London: EarthScan.
Enquist, B., Edvardsson, B., & Petros, S. S. (2007). Values
based service quality for sustainable business.
Managing Service Quality, 17(4), 385-403.
Epstein. M. J., Buhovac. A. R., & Yuthas. K. (2010). Why
Nike kicks butt in sustainability. Organizational
Dynamics, 39(4), 353-356.
Epstein. M. J., & Buhovac. A. R. (2014). Making

66 Ezeoha Bright Amacha, Omkar Dastane / Journal of Asian Finance, Economics and Business Vol 4 No2 (2017) 55-68
sustainability work. Best practices in managing and
measuring corporate social, environmental and
economic impacts (2nd ed.). Greenleaf Publishing
Limited. Sheffield.
Feldman, S. J., Soyka, P. A., & Ameer, P. G. (1996). Does
improving environmental management systems
and performance result in higher stock price?
Journal of Investing, 6(4), 87-97.
Flammer, C. (2012). Corporate social responsibility and
stock prices: the environmental awareness of
shareholders. MIT Sloan School of Management.
Retrieved from: http://corporate-sustainability.org
/wp-content/uploads/arcs-2012-Flammer.pdf
George, D., & Mallery, P. (2003). SPSS for windows step by
step: A simple guide and reference. 11.0 update
(4th ed.). Boston: Allyn & Bacon.
GRI. (2006). Sustainability Reporting Guidelines. Version
3.0
Griffin, J., & Mahon, J. (1997). The corporate social
performance and corporate financial performance
debate. Business & Society, 36(5), 5–31.
Goodland, R. (1995). The concept of environmental
sustainability. Annual review of ecology and
systematics, 26, 1-24.
Haque. M. S. (2000). Environmental discourse and
sustainable development: linkages and limitations.
Elsevier Science Inc. Ethics and the Environment,
5(1), 3–21.
Hinkle, D. E., Wiersma, W., & Jurs, S. G. (2003). Applied
statistics for the behavioral sciences (5th ed.).
Boston: Houghton Mifflin.
Hubbard, G. (2009). Measuring organizational performance:
beyond the triple bottom line, Business Strategy
and the Environment, 19, 177–191
Humphrey, J. E., Lee, D. D., & Shen, Y. (2012). The
independent effects of environmental, social and
governance initiatives on the performance of UK
firms. Australian Journal of Management, 37(2),
135-151
Iacobucci. D., & Duhachek. A. (2003). Advancing alpha:
measuring reliability with confidence. Journal of
Consumer Psychology, 13(4), 478–487.
Janggu, T., Joseph, C., & Madi, N. (2007). The current state
of corporate social responsibility among industrial
companies in Malaysia. Social Responsibility
Journal, 3(3), 9-18.
Jones, S. (2005). Notes of the University of Sydney Pacioli
Society. Abacus, 41(2), 211-216.
Kipesha, E. F., & Zhang, X. (2013). Sustainability,
profitability and outreach tradeoffs: evidences from
microfinance institutions in East Africa. European
Journal of Business and Management, 5(8), 36-148.
Klassen, R. D., & McLaughlin, C. P. (1996). The impact of
environmental management on firm performance.
Management Science, 42(8), 1199-1214.
KPMG. (2010). Corporate sustainability: a progress report.
KPMG’s research preview.
Kocmanova, A., Hrebicek, J., & Docekalova, M. (2011).
Corporate governance and sustainability.
Economics and Management, 16, 543-550.
Konar, S. & Cohen, M. A. (2001). Does the market value
environmental performance? Review of Economics
and Statistics, 83, 281–289.
Kusuma, A. P. A., & Koesrindartoto, D. P. (2014).
Sustainability practices sustainability and financial
performance. An empirical evidence from Indonesia.
International Conference on Trends in Economics,
Humanities and Management, 11-15.
Khaveh, A., Nikhashemi, S. R., Yousefi, A., & Haque, A.
(2012). Voluntary sustainability disclosure, revenue,
and shareholders wealth - a perspective from
Singaporean companies. Business Management
Dynamics, 1(9), 06-12.
Lopez. M. V., Garcia. A., & Rodriguez, L. (2007).
Sustainable development and corporate
performance: a study based on the Dow Jones
sustainability index. Journal of Business Ethics,
75(3), 285-300.
Lowitt, E. M., Hoffman, A. J, Walls, J., & Caffrey, A. M.
(2009). Sustainability and its impact on the
corporate agenda. Boston, MA: Accenture LLP and
Geneva, Switzerland: World Business Council for
Sustainable Development.
Luus, K., Beckerman, S., & Nash, T. (2007). Economic
implications of environmental sustainability for
companies: a case study of 3M. Undergraduate
Economic Review. 3 (1), 1-22.
Maharaj, R., & Herremans, I. M. (2008). Shell Canada: over
a decade of sustainable development reporting
experience. Corporate Governance, 8, 235-247.
Manescu, C. (2011). Stock returns in relation to
environmental, social and governance performance:
Mispricing or compensation for risk?. Sustainable
development, 19(2), 95-118.
Marimuthu, M. (2009). Ethnic and gender diversity in boards
of directors and their relevance to financial
performance of Malaysian companies. Journal of
Sustainable Development, 2(3), 139 -148.
Mebratu., D. (1998). Sustainability and sustainable
development: historical and conceptual review,
International Institute for Industrial Environmental
Economics, 8, 493-520.
Moinester, M., & Gottfried, R. (2014). Sample size
estimation for correlations with pre-specified

Ezeoha Bright Amacha, Omkar Dastane / Journal of Asian Finance, Economics and Business Vol 4 No2 (2017) 55-68 67
confidence interval. The Quantitative Methods for
Psychology, 10(2), 124-130.
Mohamed, Z. M., & Janggu, T. (2006). ‘Corporate Social
Disclosure (CSD) of construction company in
Malaysia. Malaysian Accounting Review, 5(1), 85-
114.
Mokhtar, N., & Sulaiman, M. (2012). Environmental
reporting practices of Malaysian government linked
companies (GLCs). International Journal of
Economics and Management, 6(2), 241-277.
Morland, M. P. (2006). Triple bottom line reporting as social
grammar: integrating corporate social responsibility
and corporate codes of conduct. Business Ethics,
European Review, 15, 352-364.
Ngwakwe, C. C. (2009). Environmental responsibility and
firm performance: evidence from Nigeria.
International Journal of Humanities and Social
Sciences, 3(2), 97-103.
Norman, W., & MacDonald, C. (2003). Getting to the bottom
of “Triple Bottom Line”. In Press, Business Ethics
Quarterly, 2-19. Retrieved from:
http://www.businessethics.ca/3bl/triple-bottom-
line.pdf
Orlitzky, M., Schmidt, F. L., & Rynes, S. L. (2003). Corporate
social and financial performance: a meta-analysis.
Organization Studies, 24(3), 403-441.
Oribu, W., King’oriah, G., Agwata, J., & Gongera, G. E.
(2014). Business sustainability: a need to re-look
environmental practices and initiatives. European
Journal of Business and Management, 6(3), 143-
152.
Osman, W. N., Udin, Z. M., & Salleh, D. (2012). Adoption
level of sustainable construction practices: a study
on Malaysia’s construction stakeholders. Journal of
Southeast Asian Research, 12(3), 12-23.
Petrini, M., & Pozzebon, M. (2010). Integrating sustainability
into business practices: learning from Brazilian
firms. Brazilian Administration Review, 7(4), 362-
378.
Pramanik, A. K., Shil, N. C., & Das, B. (2008). Corporate
environmental reporting: an emerging issue in the
corporate world. International Journal of Business
& Management, 3(12), 146-154.
Pearce, D. W., & Warford, J. J. (1993). World without end:
economics, environment, and sustainable
development. New York and Oxford: Oxford
University Press.
Reed, D. (1997). Structural adjustment, the environment
and sustainable development. London: Earthscan
Publications.
Reddy, K., & Gordon, L. W. (2010). The effect of
sustainability reporting on financial performance:
an empirical study using listed companies. Journal
of Asia Entrepreneurship and Sustainability, 6(2),
19-42.
Siew, R. Y. J., Balatbat, M. C. A., & Carmichael, D. G. (2013).
The relationship between sustainability practices
and financial performance of construction
companies. Smart and Sustainable Built
Environment, 2(1), 6–27.
Rodgers, J. L., & Nicewander, W. A. (1988). Thirteen ways
to look at the correlation coefficient. The American
Statistician, 42(1), 59-66.
Roberts, R. W. (1992). Determinants of corporate social
responsibility disclosure: an application of
stakeholder theory. Accounting, Organizations and
Society, 17(6), 595-612.
Saunders, M., & Lewis, P. (2012). Research methods for
business students. (6th ed.). Pearson Education
Limited. Essex.
Schadewitz, H., & Niskala, M. (2010). Communication via
responsibility reporting and its effect on firm value
in Finland. Corporate Social Responsibility and
Environmental Management, 17, 96-106.
Shriberg, M., & MacDonald, L. (2013). Sustainability
leadership programs: emerging goals, methods &
best practices. Journal of Sustainability Education,
5. Retrieved from: http://graham.umich.edu/media/
pubs/Shriberg-MacDonald-ustainabilityLeadership
Programs.pdf
Slaper, T. F., & Hall, T. J. (2011). The triple bottom line: what
is it and how does it work? Indiana Business
Review, Spring.
Smith, N., Smith, V., & Verner, M. (2006). Do women in top
management affect firm performance? a panel
study of 2,500 Danish firms. International Journal
of Productivity and Performance Management,
55(7), 569-593.
Sridhar, K., & Jones, G. (2013). The three fundamental
criticisms of the triple bottom line approach: an
empirical study to link sustainability reports in
companies based in the Asia-Pacific region and
TBL shortcomings. Asian Journal Business Ethics,
2, 91–98.
Statman, M. (2000). Socially responsible investments.
Financial Analysts Journal, 56(3), 30-39.
Taylor, R. (1990). Interpretation of the correlation coefficient:
a basic review. Journal of Diagnostic Medical
Sonography, 6(1), 35-39.
Thornton. (2013), Women in senior management: setting
the stage for growth. Grant Thornton International
Business Report 2013. Retrieved from
https://www.grantthornton.jp/pdf/press/IBR2013_Wi
B_report_en.pdf

68 Ezeoha Bright Amacha, Omkar Dastane / Journal of Asian Finance, Economics and Business Vol 4 No2 (2017) 55-68
Thompson, P., & Zakaria, Z. (2004). Corporate social
responsibility reporting in Malaysia. Journal of
Corporate Citizenship, 13, 125-136.
Tilt, C. A. (1994). The influence of external pressure groups
on corporate social disclosure. Accounting,
Auditing & Accountability Journal, 7(4), 47-72.
Tripathi, D. K, Kaushal, A., & Sharma, V. (2013). Reality of
triple bottom line. Global Journal of Management
and Business Studies, 3, 153-158.
United Nations Environmental Programme. (2000). Global
environmental outlook 2000: UNEP’s millennium
report on the environment. London: Earthscan
Publications, 1999.
Yew, L. (2000). From third world to first. The Singapore story:
1965–2000. New York: Harper-Collins.
Rajasekhara Mouly Potluri, Jung Wan Lee, Lohith Sekhar Potluri / Journal of Asian Finance, Economics and Business Vol 4 No2 (2017) 69-74 69
Print ISSN: 2288-4637 / Online ISSN 2288-4645
doi:10.13106/jafeb.2017.vol4.no2.69
An Exploratory Treatise on Consciousness and Espousal of
Halal Supply-Chain: An Indian Perspective
Rajasekhara Mouly Potluri1
, Jung Wan Lee2
, Lohith Sekhar Potluri3
Received: February 26, 2017. Revised: April 4, 2017. Accepted: May 2, 2017.
Abstract
The purpose of this research is to be acquainted with the awareness and approval of halal supply chain among Indian manufacturers and
distribution network members for haulage and warehousing activities from the perception of respective service suppliers. A total of 20
respondents, which consist of 10 transportation companies and 10 warehousing companies from the State of Andhra Pradesh in India were
selected for the study by using purposive sampling method. The principal focal points of the discussions are on awareness and adoption of
halal transportation and warehousing services chosen for the study in the comprehensive halal supply chain. A total of 90 percent and 70
percent of respondents from the transportation and warehousing companies respectively agreed that they know only about the concept of
halal but do not have any exposure and ken on the halal supply chain. However, findings of this research won’t have extensive validity in the
market, gaining an enough familiarity with the halal supply chain in the Indian social context is of immense importance. This is a pioneering
attempt aimed to investigate the awareness and adoption levels of halal supply chain among Indian businessmen which are precious for
supply chain companies to customize their services in the country as well to the world of academia.
Keywords: Halal, Supply chain, Transportation, Warehousing, India.
JEL Classification Code: L91, M10, N75, Z12.
1. Introduction1
In the present day’s extremely competitive business
milieu, companies are always in the quest to find the crucial
flourishing strength in the organization to hang around with
perfect full-fledged competitiveness in every possible facet.
For that reason, supply-chain is an activity which can be
considered by almost all companies in every kind of industry,
from the core to services. In the last two to three decades,
radical changes have taken place in the supply-chain
system with the introduction of technology. Modern day’s
1 First Author and Corresponding Author. Associate Professor,
School of Business & Entrepreneurship, American University of
Nigeria. Nigeria. [98 Lamido Zubairu Way, Yola By-Pass, PMB
2250, Yola, Adamawa State, Nigeria]
E-mail: [email protected] and [email protected]
2 Administrative Sciences Department, Metropolitan College, Boston
University. United States. [808 Commonwealth Avenue, Boston,
MA 02215, USA] E-mail: [email protected]
3 Department of Computer Science and Engineering, Amrita
University. India. [Kasavanahalli, Off Sarjapur Main Road,
Bangalore-560035, Karnataka, India]
E-mail: [email protected]
business people have always attempted to trim down
various preventable costs in every area of their business as
a most crucial way to proliferate their firm’s profitability.
According to Qur’an’s Chapter 2:168 Al-Baqarah,
“Almighty issued a clear guideline especially to Muslims and
even to all, to obtain only permitted things and said
absolutely, that people should eat only lawful or good food
available on earth by not following the footsteps of evil”.
Halal means “permissible” or “allowed” which encompasses
all that is permissible to be consumed by Muslims,
according to Shariah, i.e. Islamic law. The Muslim
community should use only permitted things, food or actions
as per Qur’an, which is garnered through the Halal supply
chain services. A competent strategic thinking with the ideal
administration, even in supply chain activities, categorically
proffers all kinds of fruitful benefits to manufacturers as well
as to network members in any business. The increasing
trend of population in general and the Muslim population in
particular, as well as the awareness about halal products in
India, leads to the tremendous potential for halal based
activity.
Researchers like Christopher (1988), Van Amstel and Van
Goor (2001), Van Assen, Amstel, and De Vaan (2010) and
Tieman, Jack, Vorst, and Ghazali (2012) emphasized that
70 Rajasekhara Mouly Potluri, Jung Wan Lee, Lohith Sekhar Potluri / Journal of Asian Finance, Economics and Business Vol 4 No2 (2017) 69-74
halal manufacturers require an aggressive supply chain
approach in line with the Shariah which will be a perfect
value addition to acquiring a dominant competitive
advantage in a highly competitive market. The popularity of
halal products are almost abysmal in India but almost cent
percent of Muslims have a confident intention to know more
about halal beyond their present ken which is simply the
prayer offering before and during slaughtering of animals for
food.
In the present situation, the general propensity towards
halal products or services is not exclusively meant for
Muslims. Non-Muslims were also found to prefer halal
products or services in different parts of the globe. This was
proven by the researchers like Abdul Talib, Mohd Ali and
Jamaludin (2008) and Belkhatir, Bala, and Belkhatir (2009)
which mentioned that halal orientation is not at all sighted as
exclusively related to Shariah i.e., Islamic law and a majority
of non-Muslims are also intensively on track to purchase
halal products and services with a view that the products are
fresher, more hygienic and delicious. The enhancing trend
of demand for halal products and the indomitable intention
of Indian Muslims to follow Shariah provides an
unquestionably great satisfaction to halal compliance, as
well as to obtain the most hygienic and quality products. In
addition, notable researcher, Tieman (2011) stated that
consistency in maintaining halal integrity throughout the
supply chain is the prime responsibility of manufacturers.
Based on the importance of research on the halal supply
chain, Jaafar, Endut, Faisol, and Omar (2011) stressed on
the need to introduce halal supply chain services by logistic
firms to meet the demand from halal manufacturers around
the world. Researchers in this study have a tendency to
prefer halal service providers as an alternative to halal
manufacturers for this research. Accordingly, this study was
initiated with a purpose to investigate the awareness and
espousal of halal supply chain among Indian manufacturers
and network members for haulage and warehousing from
the point of view of supply chain firms.
2. Literature Review
Halal is an Arabic word derived from the verb Hala which
bears the meaning of “opening a node, unwind, unscrew,
unravel, untangle, disentangle, disengage, or resolving
something”. As mentioned by researchers such as Al-Jallad
(2008), Malboobi and Malboobi (2010), and Latif (2011),
halal in Islamic term means, “things, food, or actions
permitted by God’s will or instruction, clean, pure, and
opposed to haram”. Mohamad, Badruldin, Sharifuddin,
Rezai, and Abdullah (2012) elaborated the meaning of halal
by stressing on how a Muslim or a person leads his/her life
and said that it is not only restrained to the nature and kinds
of food that a Muslim is permitted to use. Whether it is a
normal supply chain or a halal supply chain, it has to
flawlessly synchronize the activities of suppliers,
manufacturers, storage and warehouses which are all
meant to deliver the expected level of value with the right
quantities and distributed to the right location at the right
time which is a perfect competitive advantage to any firm.
The prime responsibility of supply chain is to minimize
diverse costs involved in the procurement of raw materials,
storing and processing, and delivery of final products to the
final consumer.
Manzouri, Rahman, and Arshad (2011) stated that the
conventional supply chain concentrated on a sequence of
procedure in which raw materials are transformed into
finished products, then distributed to the final consumers but
halal supply chain concerted on the assimilation of business
process and actions from the position of source to the point
of utilization as per Islamic law is known as Shariah (Omar
& Jaafar, 2011). Tieman (2011) said that only halal supply
chains can protect the products from contamination because
of the precautionary measures they have taken in
transportation, packaging, product handling, and human
resources. The principal focus of traditional supply chain is
on cost minimization, whereas halal supply chain ponders
over halalness of the halal product. The activities of both
categories of the supply chains are akin but working with
different objectives. The snowballing trend of consumption
patterns of Indian Muslims on halal products demonstrates
the method to halal services. Hence, espousal of the halal
supply chain will be the most crucial reliant variable for this
exploratory study.
The confident delivery of halal oriented products could be
possible only through a flawless halal supply chain.
Bahrudin, Illyas, and Desa (2011) stated that it is imperative
for the manufacturers to uphold the halal reliability all
through the supply chain as a fundamental endeavor to
prevent consumer fraud regarding the halal quality of the
products. Present consumers are greatly concerned with all
the activities of a manufacturer right from the procurement
of all the input factors to manufacturing process, technology
used, supply chain activities, corporate social responsibility
(CSR) implementation, promotional programs etc., because
of which almost all the manufacturers in every segment are
cautious in every bit of the design of their activity. There is
no exception to manufacturers of halal products and
services.
Designing and introduction of supply chain services with
halal orientation should be the crucial obligation of the
manufacturers. Even though the present halal principles
control food making, groundwork, treatment and storage, all
these do not ensure that the products are halal at the point

Rajasekhara Mouly Potluri, Jung Wan Lee, Lohith Sekhar Potluri / Journal of Asian Finance, Economics and Business Vol 4 No2 (2017) 69-74 71
of consumption if the manufacturers do not apply halal
supply chain throughout the delivery process (Tieman,
2006). Though India is the second largest market and also
the second largest Muslim populated country in the world,
there is no confidence in the adoption and awareness about
halal products from the Islamic community. Even the
academic research on halal is almost negligible in India,
either it may be about perceptions and consciousness
towards halal or supply chain services. Just like traditional
supply chain, halal supply chain entails activities like
transportation, warehousing, sourcing, and product handling;
but the decisive facets like haulage and warehousing shows
its mark in protecting the halalness of products.
As mentioned by Talib, Rubin, and Zhengyi (2013), halal
transportation plays a critical role where there is a possibility
of cross-contamination between halal and non-halal
products. As mentioned by Tieman (2011), extensive
research has to be taken up by the academia in this
discipline and Islam has to proffer more concrete discourses
to Muslims for consuming only halal goods (Al-Qaradawi,
2007). The susceptibility of halal supply chains (Bonne &
Verbeke, 2008; Zailani, Ariffin, Abd Wahid, Othman, &
Fernando, 2010), the magnitude and potentiality of halal
market (Alam & Sayuti, 2011) pressurized businessmen to
stretch its product line with halal orientation to win the hearts
of Muslim customers (Tieman, 2013). The Muslim
community has been acknowledged as an unexploited and
feasible market which eventually roots from their mounting
demographics and success of Muslim entrepreneurs in due
course, connecting this segment with evident purchasing
power (Sandikci, 2011). The significant portion of the
Muslim population in India with a 24 percent growth rate in
the last decade has made India a major potential market for
Islamic marketing in general and halal products and
services in particular.
As per the latest census in the year 2011, the Muslim
population has increased from 13.4 percent in 2001 to 14.2
percent with a notable increase of population in some
border states. In between 2001 to 2011, the Muslim
population in India increased from 138 million to 171.8
million with a percentage of 24.4 (Ghosh & Singh, 2015).
Even though Muslims are less in number as compared to
Hindus, India is going to be one of the largest Muslim
populated country in the world (Pew Research Center, 2012)
and third largest Muslim populated country by 2030 after
Indonesia and Pakistan with a stunning 236.2 million
(Mohammed, 2013). This increasing trend of Islamic
populace around the globe in general and India in particular
definitely is an enormous business opportunity for the
corporate sector which is planning to enter the market with
halal oriented products and services because of proliferating
tendency of consciousness and acceptance of halalness.
3. Research Methodology
The researchers initiated this research with a view to
exploring the awareness and espousal levels of halal
oriented logistic services provided by Indian companies.
Through this study, researchers evidently observed that this
exploratory study is the first gallant effort in India where
awareness and adoption levels of halal products and
services are very negligible. This is because there is no
availability of sufficient information regarding halal or halal
oriented services and the culture spread among Indian
Muslims that conveyed specific information about their
activities, interests, opinions, values, traditions, taboos and
other social relations. As a result, researchers thought that
qualitative method is necessary for the study, where data is
garnered by conducting a sequence of personal interviews
and through small focus groups (Sekaran & Bougie, 2009).
In view of the fact that this concept is an absolutely novel-
fangled approach to India without any such service
providers to get a better understanding of the chosen
subject matter for research. Even though findings of this
study in terms of external validity are limited, gaining a rich
and complex understanding of the halal supply chain in the
Indian social context is of great significance.
The researchers have selected a purposive sample of 10
transportation companies and 10 warehousing companies
on the basis of hypothetical dissemination of the research
problem under consideration. Two researchers carried out
semi-structured personal discussions with both higher and
middle-level executives who have a competent ken and rich
experience in this field from the two chosen classes of
respondents who were spread-out in the coastal districts of
Andhra Pradesh. The prime focus of the interviews and
discussions are on awareness and adoption of halal and
halal services chosen for the study. As planned by
Hannabuss (1996), two researchers concentrated on
recording and transcribing the outcome of the interviews
with the two types of respondents. As mentioned by De
Ruyter (1996) and Sekaran and Bougie (2009), the
researchers planned and succeeded to garner data through
small focus group interviews which are a perfect method for
innovating a novel idea with highly lucrative, transparent and
meaningful discussion. Moreover, both researchers and
respondents were involved in through reciprocal, impulsive
discussions with all the intra and intergroup members
(Walden, 2006; Sekaran & Bougie, 2009) which extract
constructive input for the chosen topic. Focus groups
framed for the discussion consists of around five
respondents who are highly experienced in the chosen
fields of the study.
Two of the researchers conducted the focus group work.
One acted as a moderator of the discussion and the other
72 Rajasekhara Mouly Potluri, Jung Wan Lee, Lohith Sekhar Potluri / Journal of Asian Finance, Economics and Business Vol 4 No2 (2017) 69-74
as the note taker to garner the data relating to awareness
and espousal of halal and halal services. The moderator-
initiated discussion by raising both close-ended and open-
ended questions. As said by Sekaran and Bougie (2009),
one of the researchers acted as a moderator and took the
responsibility for discussion by initiating the research topic,
raising questions, controlling arguments, along with careful
observation of proceedings of the discussion. The second
researcher (note-taker) took detailed notes of these
discussions. The core theme for the focus group is the halal
supply chain services, which is further divided into four sub-
themes viz., respondents’ background, awareness levels
about halal, espousal of halal services, perceptions of
respondents to know more about the investigative topic. As
noted by Miles and Huberman (1994), researchers should
very cautiously note down the outcome of all the
conversations and views expressed by all the members in
the focus group. The collected information is then put on
paper in an organized way and analyzed based on which
the final conclusions are framed as mentioned in the next
part of this study.
4. Results and Findings
4.1. Consciousness of Supply Chain Service
Providers
Astonishingly, almost all the supply chain service
providers hired by the Indian manufacturers are totally
unaware about the halal and halal supply chain services.
The majority of the service providers stated that halal means
only prayer offerings before and during slaughtering of
animals for food. Of the selected respondents, 90 percent of
the respondents from transportation companies and 70
percent of the warehousing companies stated that they are
aware of halal concept only but not halal supply chain. Even
though the respondents are in the same business for the
past two to three decades, they are ignorant of the halal
concept in the domain of transportation and warehousing.
4.2 Espousal of Halal Supply Chain
When researchers questioned the selected respondents
about the espousal rate, almost all expressed their lack of
knowledge straight away and said that they have never
heard about halal supply chain. They said that halal is
related only to food products and not at all concerned with
transportation and warehousing. Every respondent accepted
that most of their customers simply asked for transport and
warehousing services but never demanded halal backdrop
services. Thus, the need for either halal or halal supply
chain service was never felt. Further, respondents also
expressed their opinion out rightly about the background of
their customers who are mostly non-Muslims. Surprisingly,
even Muslim manufacturers hired to transport and
warehousing companies that are also proffering non-halal
services even to Muslim customers. Presently, there is no
enactment either from the government or any stress from
Islamic community that enforces the introduction of halal
products and services. Some of the supply chain service
providers thought that adopting halal supply chain in India
has severe obstacles like the lack of awareness and
understanding about halal, lack of pressure from
competitors and consumers, as well as non-accessibility of
halal products and services.
4.3. Intentions to Know about Halal Supply Chain
Services
Whatever may be the reason, it is evident that the
overwhelming majority of transport and warehousing
companies have an indomitable intention to know more
about halal and halal supply chain, keeping in mind the
future potential of the market along with forecasting of
demands from the market. In the focus group interactions,
the majority of the service providers reiterated that
customization of their services to the Muslim community
definitely enhances their firm’s profit picture for which it is an
imperative situation to learn about halal supply chain
services. If such service providers know concretely about
halal supply chain, it will be an added competitive
advantage to the firm which in turn, is a lucrative business
opportunity.
5. Practical Implication
This research proffers most worthy and resourceful
information to the sectors which are involved in food,
clothing, pharmaceuticals, cosmetics, and supply chain
services etc. Islamic formal educational institutions along
with religious organizations have to take an initiative to
popularize Islam in general and halal concept in particular. It
is an inspired decision to target this lucrative segment which
provides alluring profitability particularly food, cosmetics,
medicines etc., with halal-certified products because of the
increasing trend of the Muslim population in India from the
present to wooing around 236 million by 2030. Uniquely,
Islamic religious organizations have a colossal responsibility
to improve the conceptual knowledge of the community on
matters related to their lifestyle, particularly about halal and

Rajasekhara Mouly Potluri, Jung Wan Lee, Lohith Sekhar Potluri / Journal of Asian Finance, Economics and Business Vol 4 No2 (2017) 69-74 73
haram. These religious institutions have to come up with a
suitable curriculum based on the cohesiveness of the
community. As a final point, the extensive popularization of
the Islamic religion requires extra attention from the religious
groups and educational institutions from the primary to
university level along with the introduction of halal
excellence centers in different parts of the country.
6. Conclusion and Suggestions for Future
Study
Halal and halal supply chain are two novel concepts in a
country like India, which increases the lifespan of people by
using only permitted halal products and services as per
Shariah, the Islamic law. The trend of using exclusively halal
based things, food and actions proffer enormous business
opportunity to manufacturers and service providers on one
side, and on another side, it gives greater satisfaction in
following Islamic principles with a stringent manner. The
present escalating trend observed towards halal and
frequently highlighted in different media is the rising usage
of halal products and services in non-Muslim communities,
which means that products with this nature are healthier and
more hygienic than others. Even though Indians do not have
a proper understanding about halal and the adoption level is
almost minute, this will be a market with mammoth potential
for halal products because of the increasing trend of Muslim
population and their attitude towards halal products and
services. The focus group’s semi-structured interviews
confirmed that the apparent benefits only encourage
consumers for adoption. This investigative study attempts to
garner awareness and espousal of halal supply chain
services provided or hired by the Indian manufacturers with
a minimum sample which has a greater scope for further
research with a more significant sample size focusing on
Muslim dominated areas from other parts of the country.
In this context, the following hypotheses generated from
the present study are worthy of investigation:
1. The awareness of halal supply chain practices are
extremely low, both among Muslim and non-Muslim
stakeholders in India;
2. There is a strong intention among the various
stakeholders to have knowledge and usage of halal
products in India; and
3. There is a vast scope for marketing of halal products
by adopting halal supply chain practices in India.
References
Abdul Talib, H. H., Mohd Ali, K. A., & Jamaludin, K. R.
(2008). Quality assurance in Halal food
manufacturing in Malaysia: a preliminary study.
Paper presented to International Conference on
Mechanical and Manufacturing Engineering
(ICME2008). Johor Bahru, Malaysia.
Alam, S. S., & Sayuti, N. M. (2011). Applying the Theory of
Planned Behavior (TPB) in Halal food purchasing.
International Journal of Commerce and
Management, 21(1), 8-20.
Al-Baqarah (2:168). Holy Qur’ān. Retrieved 3 January 2015
from http://quran.com/2/168
Al-Qaradawi, Y. (2007). The lawful and the prohibited in
Islam. Malaysia: Islamic Book Trust.
Al-Jallad, N. (2008). The concepts of Al-Halal and Al-Haram
in the Arab-Muslim culture: A translational and
lexicographical study. Language Design, 77-86.
Bahrudin, S. S. M., Illyas, M. I., & Desa, M. I. (2011).
Tracking and tracing technology for Halal product
integrity over the supply chain. Paper presented at
the 2011 International Conference on Electrical
Engineering and Informatics. Bandung, Indonesia.
Belkhatir, M., Bala, S., & Belkhatir, N. (2009). Business
process re-engineering in supply chains examining
the case of the expanding Halal industry.
Proceedings of the 11th International Conference
on Enterprise Information System. Milan, Italy.
Bonne, K., & Verbeke, W. (2008). Religious values informing
halal meat production and the control and delivery
of halal credence quality. Agriculture and Human
Values, 25(1), 35-47.
Christopher, M. G. (1998). Logistics and supply chain
management – strategies for reducing cost and
improving service. London: Financial Times
Professional Limited.
De Ruyter, K. (1996). Focus versus nominal group
interviews: A comparative analysis. Marketing
Intelligence & Planning, 14(6), 44-50.
Ghosh, A., & Singh, S. (2015). Census: Hindu share dips
below 80%, Muslim share grows but slower.
Retrieved 28 January 2015, from The Indian
Express.com: http://indianexpress.com/article/india
/india-others/census-hindu-share-dips-below-80-muslim
-share-grows-but-slower/99/#sthash.Aoyuyr5N.dpuf
Hannabuss, S. (1996). Research interviews. New Library
World, 97(5), 22-30.

74 Rajasekhara Mouly Potluri, Jung Wan Lee, Lohith Sekhar Potluri / Journal of Asian Finance, Economics and Business Vol 4 No2 (2017) 69-74
Jaafar, H. S., Endut, I. R., Faisol, N., & Omar, E. N. (2011).
Innovation in logistics services – Halal logistics.
Paper presented at the 16th International
Symposium on Logistics (ISL 2011). Berlin,
Germany.
Latif, M. A. (2011). Definition of Halal terms and Malaysia
standards and industries. The First Gulf
Conference on Halal Industry and Its Services. The
State of Kuwait.
Malboobi, M. T., & Malboobi, M. A. (2010). Halal concept
and products derived from modern biotechnology.
International Workshop for Islamic Scholars on
Agri-biotechnology: Shariah Compliance, (pp. 21-
28). Georgetown, Penang.
Manzouri, M., Rahman, M. N. A., & Arshad, H. (2011). Order
management in supply chain: A case study in
automotive companies. American Journal of
Engineering and Applied Science, 4, 372-379.
Miles, M. B., & Huberman, A. M. (1994). Qualitative data
analysis: An expanded sourcebook. Sage
Publications, Incorporated.
Mohamad, Z., Badruldin, B., Sharifuddin, J., Rezai, G., &
Abdullah, M. (2012). Clients’ perception towards
JAKIM service quality in Halal certification. Journal
of Islamic Marketing, 3(1), 59-71.
Mohammed, A. (2013). Demographic Dividend and Indian
Muslims - i. Retrieved 30 January 2015, from The
Milli Gazette: http://www.milligazette.com/news/
6953-demographic-dividend-and-indian-muslims-i
Omar, E. N., & Jaafar, H. S. (2011). Halal transportation in
the food industry – A conceptual model. IEEE
Symposium on Business, Engineering and
Industrial Applications (ISBEIA), (pp. 384-389).
Langkawi, Malaysia.
Pew Research Center (2012). The Global Religious
Landscape: Muslims. Retrieved 28 January 2015,
from Pew Research Center Website:
http://www.pewforum.org/2012/12/18/global-religious
-landscape-muslim/
Sandikci, O. (2011). Researching Islamic marketing: the
past and future perspectives. Journal of Islamic
Marketing, 2(3), 246-58.
Sekaran, U., & Bougie, R. (2009). The research method for
business: A skill building approach, 5th Edition.
Singapore: John Wiley & Sons.
Talib, M. S. A., Rubin, L., & Zhengyi, V. K. (2013).
Qualitative research on critical issues in Halal
logistics. Journal of Emerging Economies and
Islamic research, 1(2), 1-20.
Tieman, M. (2006). From Halal to Haram. The Halal Journal,
November-December.
Tieman, M. (2011). The application of Halal in supply chain
management: In-depth interviews. Journal of
Islamic Marketing, 2(2), 186-195.
Tieman, M., Jack, G. A. J., Vorst V. D., & Ghazali, M. C.
(2012). Principles in Halal supply chain
management. Journal of Islamic Marketing, 3(3),
217-243.
Tieman, M. (2013). Establishing the principles in Halal
logistics. Journal of Emerging Economies and
Islamic Research, 1(1), 1-13.
Van Amstel, W. P., & Van Goor, A. R. (2001). Van logistiek
naar supply chain management. Deventer, the
Netherlands: Kluwer.
Van Assen, M., Van Amstel, W. P., & De Vaan, M. (2010).
Praktijkboek supply chain management: aanpak,
concepten en modellen voor operational
excellence in de keten (Practice of supply chain
management: Approach, concepts and models for
operational excellence in the supply chain).
Deventer, the Netherlands: Kluwer.
Walden, G. R. (2006). Focus group interviewing in the
library literature: A selective annotated bibliography
1996-2005. Reference Services Review, 34(2),
222-241.
Zailani, S., Ariffin, Z., Abd Wahid, N., Othman, R., &
Fernando, Y. (2010). Halal traceability and Halal
tracking systems in strengthening Halal food
supply chains for the food industry in Malaysia.
Journal of Food Technology, 8(3), 74-81.

Mahfuzur Rahman, Yusof Ismail, Mohamed Albaity, Che Ruhana Isa / Journal of Asian Finance, Economics and Business Vol 4 No2 (2017) 75-80 75
Print ISSN: 2288-4637 / Online ISSN 2288-4645
doi:10.13106/jafeb.2017.vol4.no2.75
Brands and Competing Factors in Purchasing Hand Phones
in the Malaysian Market
Mahfuzur Rahman1
, Yusof Ismail2
, Mohamed Albaity3
, Che Ruhana Isa4
Received: March 21, 2017. Revised: April 23, 2017. Accepted: May 2, 2017.
Abstract
Hand phones are standard paraphernalia among university students. Factors that motivate them to own the gadget would be of interest to
both the students as well as marketers. Hand phone usage is an unexamined field in academic literature, this exploratory study attempts to
investigate student purchasing motives in cellular phone markets. It also intends to know the student’s satisfaction with the different services
and its future impact on socio economic changes. In this study, undergraduates (n=336) were requested to specify their purchase criteria of
hand phone. The instrument used in the study to collect feedback from the respondents contains a combination of open-ended and scaled
questions, and some background demographics. The study employed content analysis, Pearson’s correlation, and t-tests as the primary
tools to analyze the responses. Results show that brand was rated as the most important factor in student purchase decisions. Other factors,
arranged in decreasing order of importance comprise price, product quality, features, durability, availability, promotion, and post purchase
service. Brand and price correlated significantly. It is also observed that there is very little difference regarding preference between brand
and price in purchasing a hand phone. Marketers may formulate suitable strategies out of the findings to promote hand phones to university
undergraduates in Malaysia by emphasizing at brands and price.
Keywords: Brand, Consumer Product, Hand Phone, Market Research, Price, Undergraduates.
JEL Classification Code: M39, D10, E29, E31.
1. Introduction1
Hand phone markets became very competitive due to the
presence of many manufacturers in hand phone industry
(Karjaluoto et al., 2005; Keelson, 2012; Liu, 2002; Singh &
Goyal, 2009). Current and potential customers are
pampered with many choices of hand phones due to rapid
advancement of mobile technology (Bukhari et al., 2013; Liu,
2002; Riquelme, 2001; Singh & Goyal, 2009; Turnbull, Leek,
& Ying, 2000).
1 First Author and Corresponding Author. Senior Lecturer, Department
of Finance and Banking, Faculty of Business and Accountancy,
University of Malaya, Malaysia. [Jalan University, 50603 Kuala
Lumpur, Malaysia] E-mail: [email protected]
2 Academic Fellow, Department of Business Administration, Kulliyyah
of Economics and Management Sciences, International Islamic
University Malaysia, Malaysia. E-mail: [email protected]
3 Mohamed Albaity, Assistant Professor, Department of Finance and
Economics, College of Business Administration, University of
Sharjah, Sharjah, United Arab Emirates.
E-mail: [email protected]
4 Professor, Department of Accounting, Faculty of Business and
Accountancy, University of Malaya, Malaysia.
E-mail: [email protected]
There are many factors that attract users to buy hand
phones, which include brand, quality and price. Despite
these, brands play a vital role in hand phone industry. The
most popular brands of hand phones in Malaysian market
include Nokia, Samsung, and Sony Ericson. There are
several factors like product attributes, social status,
durability and ease of use that motivate students to
purchase reputable hand phones. Brands are perceived as
a warranty not only for quality and performance but also for
distinction and emotional attachment (Balakrishnan, 2009).
According to Kay (2006), branding is an important strategy
to win consumer preferences and to establish long term
relationship with customer. In the hand phone industry,
brand is not projected as a link between products and
companies, rather the brand image. However, an increasing
number of hand phone companies are now undertaking
brand building activities in order to generate long-term
profits (Aaker & Jacobson, 2001).
Aaker and Joachimsthaler (1999) demonstrated that both
personal and situational factors have direct effect on a
brand. However, there are many factors that influence the
student to purchase hand phone other than brands like price,
functions, promotions, post-purchase service, model, sales
and others. In fact, price elasticity of demand is high for the
lower or no earning group like student. It will therefore be
76 Mahfuzur Rahman, Yusof Ismail, Mohamed Albaity, Che Ruhana Isa / Journal of Asian Finance, Economics and Business Vol 4 No2 (2017) 75-80
interesting to know students’ preferred factors in purchasing
hand phones. However, the rapid globalization of
developing countries is stimulating consumers in these
markets to buy luxury brands. Against this backdrop, it is
necessary to find out whether the trend exists across
various levels of income groups. Globalization has brought
changes in cultural values in various countries (De Mooij,
1998) and created awareness among consumers about
multinational luxury brands (Kumar et al., 2009). Consumer
perceived brands as an extension of their self-image (Belk,
1988) and the need to purchase branded products is driven
by the desire to enhance self-image in the social context.
Yet price elasticity of demand is higher for individuals with
lower or no income like student than individuals with higher
income like working individuals.
Mobile phone markets are one of the most turbulent
market environments today due to increased competition.
Marketers have special interest in consumer buying decision
process and the factors that determine consumer choices
among different mobile phone brands. On this basis, this
paper attempts to ascertain the preferences of hand phone
brands among students of two public universities in
Malaysia. By knowing their preferences, hand phone
marketers can mount appropriate strategies to attract and
maintain this market segment.
Next section of the literature review deals with brands,
perceived quality, satisfaction and hand phone brands,
product attributes and hand phone brands, social status and
hand phone brands, trust of new technology and hand
phone brands, consumer choice in market and hand phone
brands. It is followed by data collection method and analysis.
Next sections present findings and discussions. The paper
ends with conclusion and future research direction.
2. Literature Review
Mobile phones have been a standard item just like
standard textbook among university students in Malaysia.
Born in the technological era, students seem to be able to
cope with courses without textbooks, but not so much hand
phones and related personal communication gadgets.
According to Muniz and O'Guinn (2001), brands can be
powerful symbolic products, having considerable social
impact, and provoking considerable loyalty. A reputable
brand is associated status in a society. Strong brands carry
strong appeal to consumers in comparison with those of
competitors (Kay, 2006). Petruzzellis (2010) argues that
brand attitudes do relate positively to consumer intention to
use (purchase) specific mobile phones over others. Most
purchases reflect social objectives and values and very few
products are bought to satisfy basic needs through utilitarian
benefits (Chernev, 2004). Brand is a strategic asset and a
powerful source of differentiation which plays a critical role
in marketing strategy (Lim & O'Cass, 2001).
The perception of high quality and expected satisfaction
of branded product influences the customer to purchase
branded hand phone. Perceived quality and customer
satisfaction lead to customer loyalty as brand is considered
to add extra value in form of emotional benefits, which
extend beyond product attributes and functional benefits
(Martensen et al., 2004). Consumers generally associate
branded products with high quality. Consumers desire to
promote self-consistency and self-esteem when brands fit
with their desired self-image (Fournier, 1998). Such
perceptions conjure the image of brand personality
(Plummer, 2000) that is defined as the set of human
characteristics associated with a brand. Brand personality
can be described and communicated in terms of both
demographic and psychographic characteristics (Aaker,
1997), providing features for the brand position in
consumer’s mind. A well-established brand personality
heightens emotional ties with the brand, increases
preference and patronage and develops trust and loyalty.
Moreover, the product experience results in active
construction of meanings associated with the behaviors,
thoughts and feelings that occur during consumption
(Padgett & Allen, 1997), which consequently impact on
consumer purchase criteria of a product. This results in
many university students purchase hand phones based on
brands. According to Keller (1998), a customer focuses on
the functional, emotional and self-expressive benefits of
brands.
Attributes refer to the features that an object may or may
not have, which include both intrinsic and extrinsic (Mowen
& Minor, 1998). Benefits are the positive outcomes that
emerge from the attributes. People seek products that have
attributes that will solve their problems and fulfill their needs
(Mowen & Minor, 1998). Understanding why a consumer
choose a product based upon its attributes helps marketers
to understand consumers preferences for certain brands
(Gwin & Gwin, 2003). People chose brand the latter offer
particular attributes within a budget range. Both tangible and
intangible attributes of a product are equally important in
choosing a product or brand (Myers, 2003). Research
shows that there is no evidence that certain attributes are
more related to customer loyalty than others (Romaniuk &
Sharp, 2003). It was found that the more (non-negative)
attributes are associated with a brand, the more loyal the
customer tends to be (Romaniuk & Sharp, 2003). Romaniuk
and Sharp (2003) suggested that marketers should focus
more on how many attributes the brand should be
associated with and not what attributes since product
attribute is an important factor for customer to buy a specific

Mahfuzur Rahman, Yusof Ismail, Mohamed Albaity, Che Ruhana Isa / Journal of Asian Finance, Economics and Business Vol 4 No2 (2017) 75-80 77
product or a brand. One should be cautioned that
unfounded belief in product attribute can mislead consumer
into expecting something that is not there (Mason &
Bequette, 1998). Hence, if products fall short of customer
expectations, they cause dissatisfaction. Some attributes
may still be important in influencing consumer choice.
Approximately 95 per cent of all nations have mobile
phone networks, and the majority of these countries have
more mobile phone than landline subscribers, and probably
today more mobile phones than TVs (Botelho & Pinto, 2004).
Unlike other technology, mobile phone is now perceived as
a social necessity, especially among teenagers (Skog,
2002). The mobile phone has become a true “extension of
man” (Castells et al., 2004). While being a simple status
symbol hand phone brand has been positioned in relation to
the benefits it provides. The status-symbol system is
substitute with experience. Indeed, the mobile phone has
become an everyday, highly regarded, multipurpose
interpersonal communication device (Levinson, 2004; Ling,
2002). However, even though the mobile market is greatly
subject to the commoditization phenomenon, brand is one of
the most strategic elements in distinguishing the products
for the consumer. Consumer trust on technology can be
reinforced through a strong brand, proves to be a primary
factor affecting consumers' intentions of using a hand phone
(Doney, Cannon, & Mullen, 1998). When highlighting the
role of trust of technology, mobile technology trust lets
customers shape their attitudes and behaviours on the
utilitarian basis.
Recently, the explosive growth of usage of hand phone
has attracted students. Thus, the history of consumers'
usage of mobile phones suggests the attraction of
consumers to innovation. Furthermore, previous studies (Ha
& Stoel, 2004) show that innovative consumers are in
general better educated and younger than the rest of the
population, have higher incomes and occupational status,
and are more often female than male. Consumption
attitudes link personal values to actual consumption
behaviors. The utilitarian components of attitude hold much
potential for advancing the understanding of consumer
attitudes. The benefits that come from the hand phone
usage can be functional, such as comfort, functions
availability, durability (Kay, 2006). This is particularly evident
in the mobile phone market, in which the very differentiating
factors are no longer the core product innovations that can
be easily commoditized, but the additional attributes that
bring added value. A wide range of value-added services,
such as call-divert and mail box facilities, are now becoming
standard. However, the intense competition has led to a
sharp fall in prices, which has enhanced the commonality of
mobile phone usage and led to the mobile phone becoming
an increasingly common part of everyday life in most
developed countries. Branding offers the marketers the
escape mechanisms from the commodity spiral. It gives a
higher value alluring the product with new dimensions. In
fact, when the product as driver of customer values begins
to get commoditised, brand helps increase value by adding
dimension and promotes discrimination (Verma, 2007).
Normally, students obtain information about hand phone
through friends and families, advertisement and from their
own experience. In the long-run promotion and advertising
help brands by making consumer less price sensitive and
more brand loyal (Mela, Gupta, & Lehman, 1997). According
to Evans, Moutinho, and Raaj (1996), publicity of an
advertisement is crucial in changing consumer knowledge,
attitude and behavior towards brands. However, famous
brands are more successful due to the influence of the
brand itself regardless of the content of the advertisement.
Therefore, advertisement for less popular brands may be
less successful even though the content may be good.
Though advertisement is important for brand preference,
liking towards the brand itself can influence liking for the
brand. However according to the study by Gaskill (2004),
consumers like or dislike towards advertisement does not
necessarily lead to brand acceptance or rejection. So, even
though consumers may like the ad that they see, it does not
necessarily mean that they will go out and buy the branded
product advertised. Usually the consumers attitude towards
the ad is the same as their attitude towards the brand.
However, advertisers must remember that advertising
messages are interpreted differently between different
genders.
3. Methodology and Data
The study used quantitative approach to generate highly
relevant complementary data for analysis. This research
selected students from main campus of two public
universities in Malaysia. The field work was completed
within two months. The university students have been
chosen since the authors agreed that they represent their
peers in purchasing mobile phone. A questionnaire was
developed to investigate the factors that influence consumer
choice. The questionnaire was divided into four sections: the
first section deals with students personal use products,
factors in buying hand phone, and the decision criteria of
buying. Second section uses scale questions to learn about
the importance of the factors to purchase hand phones. The
third section deals with understanding of brand by students,
choice between brand and other factors to purchase hand
phones as well as reasons to purchase other than branded
hand phones. The last section seeks respondent
demographics. Apart from general information such as

78 Mahfuzur Rahman, Yusof Ismail, Mohamed Albaity, Che Ruhana Isa / Journal of Asian Finance, Economics and Business Vol 4 No2 (2017) 75-80
gender, age and education, respondents were asked to
specify the number of the mobile phones, favorite
connection and name of the brand they use.
4. Results and Discussions
Table 1 reports the demographic profile of the
respondents. Majority of the respondents were female
(58.9%), Malaysian (53.9%), pursuing bachelor of business
administration (57.1%), having two hand phones (46.4%)
and using Nokia branded hand phones (37.8%).
<Table 1> Demographic profile (N=336)
Source: Author’s estimation
The results in Table 2 provide in detail synopsis of a
selected Malaysian urban university’s students’ behavior in
choosing hand phone. The hand phone has constantly
changed its function from the original. The basic changes
are in design, size, color of covers, ring tones, logos,
screensavers, and by the actual use such as timing and
placing the phone calls and messages.
Paired sample t-test analysis was carried out to
investigate whether there is any difference in mean between
each of the factors that is considered by students in their
purchase of hand phone in Malaysia. The highest mean was
reported for price (4.6) and the lowest was for post purchase
service (2.8). This suggests that the consumers in this
sample focus the most on the price of the hand phone and
the least on the post purchase service. The results in Table 2
show that there is significant difference between all factors
<Table 2> Paired sample Mean test of all the variables
Variables Mean
difference
t Correlation
Availability - Brand -0.83 -10.97* -0.40
Availability - Durability -0.50 -8.51* 0.28
Availability - Model (Features) -0.89 -14.86* 0.11
Availability - Post purchase
service
0.78 12.31* 0.51
Availability - Price -1.08 -14.70* -0.28
Availability - Product quality -0.83 -13.61* 0.21
Availability - Promotion 0.40 5.62* 0.31
Brand - Durability 0.33 6.10* 0.16
Brand - Model (Features) -0.07 -1.22 -0.02
Brand - Post purchase service 1.61 17.68* -0.32
Brand - Price -0.26 -6.20* 0.44
Brand - Product quality 0.00 0.00 -0.17
Brand - Promotion 1.22 15.12* -0.14
Durability - Model (Features) -0.40 -6.72* -0.02
Durability - Post purchase service 1.28 18.21* 0.34
Durability - Price -0.59 -10.12* 0.08
Durability - Product quality -0.33 -6.48* 0.35
Durability - Promotion 0.89 13.42* 0.33
Model (Features) - Post purchase
service 1.67 22.87* 0.21
Model (Features) - Price -0.19 -3.60* 0.06
Model (Features) - Product quality 0.07 1.12 -0.01
Model (Features) - Promotion 1.29 17.24* 0.03
Post purchase service - Price -1.86 -20.07* -0.33
Post purchase service - Product
quality -1.61 -21.90* 0.27
Post purchase service - Promotion -0.38 -5.50* 0.49
Price - Product quality 0.26 4.21* -0.03
Price - Promotion 1.48 16.96* -0.30
Product quality - Promotion 1.22 18.73* 0.36
Source: Author’s estimation
except between product quality model (feature) and brand.
The results also show the mean difference between each
pair. The mean difference ranges between -1.86 (for post
purchase service and price) and 1.67 (post purchase
service and model, features). In addition, bivariate
correlation is reported in Table 2. The correlation is the
lowest between availability and brand (-0.40) and highest
between availability and post purchase service (0.51). This
suggests that the higher the availability of the product the
more important is the brand of the phone. Moreover, the
model (feature) has close to zero correlation with product
quality, price, brand, and durability. That is, the features
alone do not reflect quality, price, brand or durability.
Similarly, price has almost zero relationship with product
quality of the mobile phones which means that for students,
price is not perceived to reflect quality.
Demographic
characteristic
Percentage
Gender
Female
Male
58.9
41.1
Nationality
Malaysia
Others
53.9
47.1
Area of study
BAcc
BBA
BEcon
BHS
BIRK
LLB
Other
19.9
57.1
11.6
2.1
3.0
2.7
3.6
Number of hand
phones
One
Two
Three
45.5
46.4
8.0
Hand phone brands
Blackberry
iPhone
Nokia
Samsung
Sony Ericsson
1.8
9.2
37.8
33.0
18.2
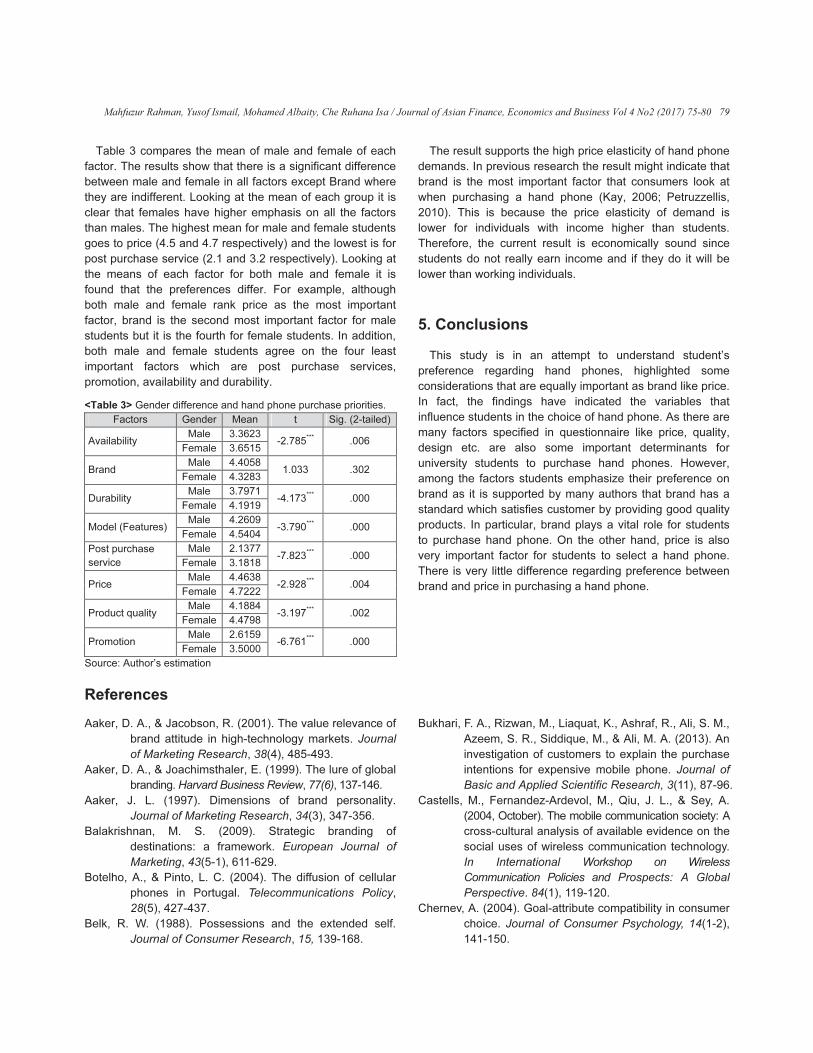
Mahfuzur Rahman, Yusof Ismail, Mohamed Albaity, Che Ruhana Isa / Journal of Asian Finance, Economics and Business Vol 4 No2 (2017) 75-80 79
Table 3 compares the mean of male and female of each
factor. The results show that there is a significant difference
between male and female in all factors except Brand where
they are indifferent. Looking at the mean of each group it is
clear that females have higher emphasis on all the factors
than males. The highest mean for male and female students
goes to price (4.5 and 4.7 respectively) and the lowest is for
post purchase service (2.1 and 3.2 respectively). Looking at
the means of each factor for both male and female it is
found that the preferences differ. For example, although
both male and female rank price as the most important
factor, brand is the second most important factor for male
students but it is the fourth for female students. In addition,
both male and female students agree on the four least
important factors which are post purchase services,
promotion, availability and durability.
<Table 3> Gender difference and hand phone purchase priorities.
Factors Gender Mean t Sig. (2-tailed)
Availability
Male 3.3623
-2.785***
.006
Female 3.6515
Brand
Male 4.4058
1.033 .302
Female 4.3283
Durability
Male 3.7971
-4.173***
.000
Female 4.1919
Model (Features)
Male 4.2609
-3.790***
.000
Female 4.5404
Post purchase
service
Male 2.1377
-7.823***
.000
Female 3.1818
Price
Male 4.4638
-2.928***
.004
Female 4.7222
Product quality
Male 4.1884
-3.197***
.002
Female 4.4798
Promotion
Male 2.6159
-6.761***
.000
Female 3.5000
Source: Author’s estimation
The result supports the high price elasticity of hand phone
demands. In previous research the result might indicate that
brand is the most important factor that consumers look at
when purchasing a hand phone (Kay, 2006; Petruzzellis,
2010). This is because the price elasticity of demand is
lower for individuals with income higher than students.
Therefore, the current result is economically sound since
students do not really earn income and if they do it will be
lower than working individuals.
5. Conclusions
This study is in an attempt to understand student’s
preference regarding hand phones, highlighted some
considerations that are equally important as brand like price.
In fact, the findings have indicated the variables that
influence students in the choice of hand phone. As there are
many factors specified in questionnaire like price, quality,
design etc. are also some important determinants for
university students to purchase hand phones. However,
among the factors students emphasize their preference on
brand as it is supported by many authors that brand has a
standard which satisfies customer by providing good quality
products. In particular, brand plays a vital role for students
to purchase hand phone. On the other hand, price is also
very important factor for students to select a hand phone.
There is very little difference regarding preference between
brand and price in purchasing a hand phone.
References
Aaker, D. A., & Jacobson, R. (2001). The value relevance of
brand attitude in high-technology markets. Journal
of Marketing Research, 38(4), 485-493.
Aaker, D. A., & Joachimsthaler, E. (1999). The lure of global
branding. Harvard Business Review, 77(6), 137-146.
Aaker, J. L. (1997). Dimensions of brand personality.
Journal of Marketing Research, 34(3), 347-356.
Balakrishnan, M. S. (2009). Strategic branding of
destinations: a framework. European Journal of
Marketing, 43(5-1), 611-629.
Botelho, A., & Pinto, L. C. (2004). The diffusion of cellular
phones in Portugal. Telecommunications Policy,
28(5), 427-437.
Belk, R. W. (1988). Possessions and the extended self.
Journal of Consumer Research, 15, 139-168.
Bukhari, F. A., Rizwan, M., Liaquat, K., Ashraf, R., Ali, S. M.,
Azeem, S. R., Siddique, M., & Ali, M. A. (2013). An
investigation of customers to explain the purchase
intentions for expensive mobile phone. Journal of
Basic and Applied Scientific Research, 3(11), 87-96.
Castells, M., Fernandez-Ardevol, M., Qiu, J. L., & Sey, A.
(2004, October). The mobile communication society: A
cross-cultural analysis of available evidence on the
social uses of wireless communication technology.
In International Workshop on Wireless
Communication Policies and Prospects: A Global
Perspective. 84(1), 119-120.
Chernev, A. (2004). Goal-attribute compatibility in consumer
choice. Journal of Consumer Psychology, 14(1-2),
141-150.
80 Mahfuzur Rahman, Yusof Ismail, Mohamed Albaity, Che Ruhana Isa / Journal of Asian Finance, Economics and Business Vol 4 No2 (2017) 75-80
Doney, P. M., Cannon, J. P., & Mullen, M. R. (1998).
Understanding the influence of national culture on
the development of trust. Academy of Management
Review, 23(3), 601-620.
Evans, M. J., Moutinho, L., & Van Raaij, W. F. (1996).
Applied Consumer Behaviour. Addison-Wesley.
Fournier, S. (1998). Consumers and their brands: Developing
relationship theory in consumer research. Journal of
Consumer Research, 24(4), 343-373.
Gaskill, A. (2004). The influence of consumption values on
motorcycle brand choice. Doctoral Dissertation.
Auckland University of Technology.
Gwin, C. F., & Gwin, C. R. (2003). Product attributes model:
A tool for evaluating brand positioning. Journal of
Marketing Theory and Practice, 11(2), 30-42.
Ha, Y., & Stoel, L. (2004). Internet apparel shopping
behaviors: the influence of general innovativeness.
International Journal of Retail & Distribution
Management, 32(8), 377-385.
Karjaluoto, K., Karvonen, J., Kesti, M., Koivumäki, T.,
Manninen, M., Pakola, J., Ristola, A., & Salo, J.
(2005). Factors affecting consumer choice of
mobile phones: two studies from Finland. Journal
of Euromarketing, 14(3), 59-82.
Kay, M. J. (2006). Strong brand and corporate brands.
European Journal of Marketing, 40(7/8), 742-760.
Keller, K. L. (1998). Branding perspectives on social
marketing. NA-Advances in Consumer Research
Volume 25. 299-302.
Kumar, A., Lee, H. J., & Kim, Y. K. (2009) Indian consumers’
purchase intention toward a United States versus
local brand. Journal of Business Research, 62,
521-527.
Keelson, S. A. (2012). Factors Affecting Consumer Choice
of Multiple Mobile Services. Global Journal of
Business Research, 6(4), 59-67.
Levinson, P. (2004). Cellphone: the story of the world's most
mobile medium and how it has transformed
everything!. New York: Macmillan.
Martensen, A., Grønholdt, L., & Trajcevski, S. (2004).
Building customer-brand relationships on the
internet: development of an online brand equity
model. In Proceedings of the 8th International
Conference on Corporate Reputation, Identity and
Competitiveness, Fort Lauderdale, Florida, 20-23
May 2004.
Mason, K., & Bequette, J. (1998). Product experience and
consumer product attribute inference accuracy.
Journal of Consumer Marketing, 15(4), 343-357.
Myers, C. A. (2003). Managing brand equity: a look at the
impact of attributes. Journal of Product & Brand
Management, 12(1), 39-51.
Mela, C. F., Gupta, S., & Lehmann, D. R. (1997). The long-
term impact of promotion and advertising on
consumer brand choice. Journal of Marketing
Research. 34(2), 248-261.
Mowen, J. C., & Minor, M. (1998). Consumer Behavior. 5th.
(Ed.). Upper Saddle River. NJ: Prentice Hall.
Muniz, A. M., & O'Guinn, T. C. (2001). Brand community.
Journal of Consumer Research, 27(4), 412-432.
De Mooij, M. (1998). Global Marketing and Advertising:
Understanding Cultural Paradoxes. London, UK:
Sage Publications.
Liu, C.-M. (2002). The effects of promotional activities on
brand decision in the cellular telephone industry.
Journal of Product & Brand Management, 11(1),
42-51.
Ling, R. (2002). Adolescent girls and young adult men: Two
sub-cultures of the mobile telephone. Revista de
Estudios de Juventud, 57(2), 33-46. Retrieved from.
http://www.itu.int/osg/spu/ni/ubiquitous/Papers/Yout
h_and_mobile_2002.pdf
Petruzzellis, L. (2010). Mobile phone choice: technology
versus marketing. The brand effect in the Italian
market. European Journal of Marketing, 44(5), 610
-634
Padgett, D., & Allen, D. (1997). Communicating experiences:
A narrative approach to creating service brand
image. Journal of Advertising, 26(4), 49-62.
Plummer, J. T. (2000). How personality makes a difference.
Journal of Advertising Research, 40(6), 79-83.
Riquelme, H. (2001). Do consumers know what they want?
Journal of Consumer Marketing, 18(5), 437-448.
Romaniuk, J., & Sharp, B. (2003). Measuring brand
perceptions: Testing quantity and quality. Journal of
Targeting, Measurement and Analysis for Marketing,
11(3), 218-229.
Skog, B. (2002). 16 Mobiles and the Norwegian teen:
identity, gender and class. Perpetual Contact, 255-
274. Cambridge University Press.
Singh, J., & Goyal, B. B. (2009). Mobile handset buying
behavior of different age and gender groups.
International Journal of Business and Management,
4(5), 179-187.
Turnbull, P. W., Leek, S., & Ying, G. (2000). Customer
confusion: The mobile phone market. Journal of
Marketing Management, 16(1-3), 143-163.
Verma, H. V. (2007). Branding: Context, content and
consequences. Journal of Management Research,
7(1), 27-39.
Appendix 81
Appendix�
�
The Journal of Asian Finance,
Economics and Business (JAFEB)�
����������� �������������������� ������ � �
�
����������������� �!�
�
Aims and Scope
The Journal of Asian Finance, Economics and Business
(JAFEB) publishes original research analysis and inquiry
into issues of Asian Finance, Economics and Business
Management. The JAFEB is an international peer-reviewed
journal, which is devoted to contemporary issues of finance,
economics and business in Asia, including Central Asia,
East Asia, South Asia, Southeast Asia, and Middle East.
The journal is published four issues per year quarterly in full
English.
Mission
The mission of JAFEB is to bring together the latest
theoretical and empirical finance, economics and business
management research in Asian markets. The journal
audience includes: business school academics and
researchers, economists, social scientists, international
business persons, and policy makers, as well as managers
from both for profit and not for profit corporations.
Call for Paper
The Journal of Asian Finance, Economics and Business
(JAFEB) is an open access journal that publishes research
analysis and inquiry into contemporary issues of finance,
economics and business in Asia. The journal is published
four issues per year quarterly in English by both printed and
online with DOI. The quality publication system of KODISA
journals meets the international standard of journal
publications.
[Types of Paper]
Regular Research Article: This should describe new and/or
carefully investigated findings, and research methods should
be given in sufficient detail for others to verify the work.
Articles should be 5,000 - 7,000 words long to describe and
interpret the work clearly. All regular research articles are
peer-reviewed by minimum 3 referees.
Short Communication Article: This short communication is
suitable for reporting the results of small investigations or
giving details of new models, innovative methods or
techniques. The style of main sections doesn’t need to
conform to that of full-length papers. Short communications
should be usually 2,000~4,000 words long. Short
communication articles are also peer-reviewed.
Review and Perspective Article: Submissions of review
and perspective covering topics of current interest are
welcome and encouraged. Review articles should be
concise, usually 2,000~4,000 words long. Review articles are
also peer-reviewed.
Fees and Charges of Publication: "FREE".
Submission
In order to submit your paper, please send your manuscript
and associated files in MS Word format by e-mail to the
editorial office: [email protected]. Authors are encouraged
to include tables and figures as part of the main file. All
manuscripts must be accompanied by a letter which
indicates briefly why the article is suitable for publication in
the Journal of Asian Finance, Economics and Business
(JAFEB) and attests that “The article has not been previously
published and is not under review elsewhere“. All
manuscripts must be prepared according to the JAFEB
submission guidelines.
Editorial Office:
Administrative Sciences Department, Metropolitan College,
Boston University
808 Commonwealth Avenue, Boston, MA 02215, USA Tel:
(+1 617) 358-5627 Fax: (+1 617) 353-6840 E-mail:
[Guide for Authors]
Authors are encouraged to include tables and figures as part
of the main file. All manuscripts must be accompanied by a
letter which indicates briefly why the article is suitable for
publication in the Journal of Asian Finance, Economics and
Business (JAFEB) and attests that “The article has not been
previously published and is not under review elsewhere. All
manuscripts must be prepared according to the JAFEB
submission guidelines. Please read the detailed guidelines of
manuscript preparation and submission at
http://www.jafeb.org.

82 Appendix
1. Introduction
The Journal of Asian Finance, Economics and Business
(JAFEB) is an international peer-reviewed journal devoted to
contemporary issues of finance, economics and business in
Asia, including Central Asia, East Asia, South Asia,
Southeast Asia, and Middle East. The journal is published
four issues per year quarterly in full English by the joint effort
of an international consortium of Asian finance, economics
and business institutes and the KODISA. The mission of
JAFEB is to bring together the latest theoretical and empirical
finance, economics and business management research in
Asian regions.
1.1. Submission
Authors are requested to submit their papers electronically
by e-mail attachments to Editorial office: [email protected].
The attached files should be in MS Word, WordPerfect or
RTF format. Any supplemental files should also be in
Microsoft Word, RTF, Word Perfect, or Excel format. PDFs
are not acceptable. Authors are requested to submit the text,
tables, and artwork in electronic form to this address. The
Publisher and Editor regret that they are not able to consider
submissions that do not follow these procedures. All
correspondence, including notification of the Editor's decision
and requests for revision, takes place by e-mail.
1.2. Submission Declaration
Submission of an article implies that the work described has
not been published previously (except in the form of an
abstract or as part of a published seminar, lecture or
academic thesis), that it is not under consideration for
publication elsewhere, that its publication is approved by all
authors and tacitly or explicitly by the responsible authorities
where the work was carried out, and that, if accepted, it will
not be published elsewhere including electronically in the
same form, in English or in any other language, without the
written consent of the copyright-holder. Each submission must
contain “Submission Declaration Statements” in its cover letter
as follows:
[“We hereby confirm that the manuscript has no any actual or
potential conflict of interest with any parties, including any
financial, personal or other relationships with other people or
organizations within three years of beginning the submitted
work that could inappropriately influence or be perceived to
influence. We confirm that the paper has not been published
previously, it is not under consideration for publication
elsewhere, and the manuscript is not being simultaneously
submitted elsewhere.”]
1.3. Publication Ethics and Publication Malpractice
The journal is committed to upholding the highest standards
of publication ethics and takes all possible measures against
any publication malpractices. All authors submitting their
works to the journal for publication as original articles attest
that the submitted works represent their authors’
contributions and have not been copied or plagiarized in
whole or in part from other works. The authors acknowledge
that they have disclosed all and any actual or potential
conflicts of interest with their work or partial benefits
associated with it. In the same manner, the journal is
committed to objective and fair double-blind peer-review of
the submitted for publication works and to prevent any actual
or potential conflict of interests between the editorial and
review personnel and the reviewed material. Any departures
from the above-defined rules should be reported directly to
the Editors-in-Chief, who is unequivocally committed to
providing swift resolutions to any of such a type of problems.
Further to the above, the journal is following the highest
standards of publication ethics and the Code of Conduct for
Journal Editors. By joining and supporting the Committee on
Publication Ethics (COPE) the journal will help support the
ethical imperative in promoting publication ethics and
providing advice for editors and publishers
(http://publicationethics.org/resources/guidelines).
1.4. Plagiarism Policies and Ethical Guidelines
The Journal of Asian Finance, Economics and Business
(JAFEB) uses the iThenticate software to detect instances of
overlapping and similar text in submitted manuscripts. You
can be reassured that JAFEB is committed to actively
combating plagiarism and publishing original research. To
find out more about Cross Check visit
http://www.crossref.org/crosscheck.html.
iThenticate is also available to authors and researchers who
wish to check their papers before submission. iThenticate
compares submitted documents to extensive data
repositories to create a comprehensive Similarity Report,
which highlights and provides links to any significant text
matches, helping to ensure that you are submitting an
original and well-attributed document. iThenticate for
Researchers is a separate service to Cross Check. Per
JAFEB’s "Code of Ethics" authors are expected to adhere to
the guidelines outlined in this section.
1.5. Conflict of Interest
All authors are requested to disclose any actual or potential
conflict of interest including any financial, personal or other
Appendix 83
relationships with other people or organizations within three
years of beginning the submitted work that could in
appropriately influence, or be perceived to influence, their
work.
1.6. Copyright
Upon acceptance of an article, authors will be asked to
complete a "Journal Publishing Agreement Form" of the
Publisher. Acceptance of the agreement will ensure the
widest possible dissemination of information. An e-mail will
be sent to the corresponding author confirming receipt of the
manuscript together with a "Journal Publishing Agreement
Form" or a link to the online version of this agreement.
The corresponding author will be responsible for the
following:
1) Ensuring that all authors are identified on the copyright
agreement, and notifying the editorial office of any changes
in the authorship.
2) Warranting and indemnifying the journal owner and
publisher on behalf of all co-authors.
Although such instances are very rare, you should be aware
that in the event that a co-author has included content in his
or her portion of the article that infringes the copyright of
another or is otherwise in violation of any other warranty
listed in the agreement, you will be the sole author
indemnifying the publisher and the editor of the journal
against such violation.
The journal will permit the author to use the article elsewhere
after publication, including posting the final post-acceptance
manuscript version on the author's personal web pages or in
an institutional repository maintained by the institution to
which the author is affiliated, in other works or for the
purposes of the author's teaching and research, provided
acknowledgement is given to the Journal as the original
source of the publication.
KODISA applies the Creative Commons Attribution-Non
Commercial 4.0 International (CC BY-NC 4.0) to works we
publish (read the human-readable summary or the full license
legal code).
This license was developed to facilitate open access –
namely, free immediate access to, and unrestricted reuse of,
original works of all types. Under this license, authors agree
to make articles legally available for reuse, without
permission or fees, for virtually any purpose. Anyone may
copy, distribute or reuse these articles, as long as the author
and original source are properly cited.
2. The Preparation of Manuscripts (Main Document)
2.1. Language
Please write your text in good English (American or British
usage is accepted, but not a mixture of these).
2.2. Word Count
While no maximum length for manuscripts is prescribed,
authors are encouraged to write concisely. As a guide,
regular articles should be between 5,000 - 7,000 words in
length.
2.3. Style of Presentation
1) Use A4 or Letter sheet size.
2) Margins should be 20mm for A4 size and one inch (25mm)
for Letter size at the top, bottom, and sides of the page.
3) Font type should be 12-point Times Roman throughout
the document.
4) Double-space all body text, including abstract, references,
end notes and appendices.
5) Number all pages in your manuscript, starting with the
Abstract page.
6) Manuscript text should be left-aligned.
2.4. Use of Word Processing Software
It is important that the file be saved in the native format of the
word processor used. The text should be in single-column
format. Keep the layout of the text as simple as possible.
Most formatting codes will be removed and replaced on
processing the article. Do not embed "graphically designed"
equations or tables, but prepare these using the word
processor's facility. Do not import the figures into the text file
but, instead, indicate their approximate locations directly in
the electronic text and on the manuscript. To avoid
unnecessary errors you are strongly advised to use the
"spell-check" and "grammar-check" functions of your word
processor.
3. The Presentation of Manuscripts
3.1. Article Structure
Divide your article into clearly defined and numbered
sections. Subsections should be numbered 1.1. (then 1.1.1.,

84 Appendix
1.1.2., ...), 1.2., etc. (the abstract is not included in section
numbering). Use this numbering also for internal cross-
referencing: do not just refer to "the text". Any subsection
may be given a brief heading. Each heading should appear
on its own separate line.
3.1.1. Introduction
State the objectives of the work and provide an adequate
background, avoiding a detailed literature survey or a
summary of the results.
3.1.2 Literature Review
Provide an adequate background with detailed literature
survey or a summary of the results of previous studies.
3.1.3. Methodology
Provide sufficient detail to allow the work to be reproduced.
Methods already published should be indicated by a
reference: only relevant modifications should be described.
3.1.4. Results
Provide sufficient detail to allow the results to be meaningful
and informative.
3.1.5. Discussion
This should explore the significance of the results of the work,
not repeat them. A combined Results and Discussion section
is often appropriate. Avoid extensive citations and discussion
of published literature.
3.1.6. Conclusions
The main conclusions of the study may be presented in a
short Conclusions section, which may stand alone or form a
subsection of a Discussion or Results and Discussion
section.
3.1.7. Appendices
If there is more than one appendix, they should be identified
as A, B, etc. Formulae and equations in appendices should
be given separate numbering: Eq. (A.1), Eq. (A.2), etc.; in a
subsequent appendix, Eq. (B.1) and so on. Similarly for
tables and figures: Table A.1; Fig. A.1, etc.
3.2. Tables, Figures and Artwork
3.2.1. Abbreviations
Define abbreviations that are not standard in this field in a
footnote to be placed on the first page of the article. Such
abbreviations that are unavoidable in the abstract must be
defined at their first mention there, as well as in the footnote.
Ensure consistency of abbreviations throughout the article.
3.2.2. Mathematical Formulae
Present simple formulae in the line of normal text where
possible. In principle, variables are to be presented in italics.
Use the solidus (/) instead of a horizontal line, (e.g., X p /Y m).
Powers of e are often more conveniently denoted by exp.
Number consecutively any equations that have to be
displayed separate from the text (if referred to explicitly in the
text).
3.2.3. Other Symbols
Greek letters and unusual symbols should be identified in the
margin. Distinction should be made between capital and
lower case letters; between the letter O and zero; between
the letter I, the number one and prime; between k and kappa.
The numbers identifying mathematical expressions should
be placed in parentheses.
3.2.4. Footnotes
Footnotes should be used sparingly. Number them
consecutively throughout the article, using superscript Arabic
numbers. Many word processors build footnotes into the text,
and this feature may be used. Should this not be the case,
indicate the position of footnotes in the text and present the
footnotes themselves separately at the end of the article. Do
not include footnotes in the Reference list.
3.2.5. Table Footnotes
Indicate each footnote in a table with a superscript lowercase
letter.
3.2.6. Artwork
1) Make sure you use uniform lettering and sizing of your
original artwork.
2) Save text in illustrations as "graphics" or enclose the font.
3) Only use the following fonts in your illustrations: Arial,
Courier, Times, Symbol.
4) Number the illustrations according to their sequence in the
text.
5) Provide captions to illustrations separately.
6) Produce images near to the desired size of the printed
version.
7) Submit each figure as a separate file. Please do not:
8) Supply embedded graphics in your word processor
document;
9) Supply files that are optimized for screen use (like GIF,
BMP, PICT, WPG);
10) Supply files that are too low in resolution;
11) Submit graphics that are disproportionately large for the
content.

Appendix 85
3.2.7. Color Artwork
Please make sure that artwork files are in an acceptable
format (TIFF, EPS or MS Office files) and with the correct
resolution. If, together with your accepted article, you submit
usable color figures then the Publisher will ensure that these
figures will appear in color in the printed version. For color
reproduction in print, you will receive information regarding
the costs from the Publisher after receipt of your accepted
article. Please note: Because of technical complications
which can arise by converting color figures to "gray scale"
(for the printed version should you not opt for color in print)
please submit in addition usable black and white versions of
all the color illustrations.
3.2.8. Figure Captions
Ensure that each illustration has a caption. Supply captions
separately, not attached to the figure. A caption should
comprise a brief title (not on the figure itself) and a
description of the illustration. Keep text in the illustrations
themselves to a minimum but explain all symbols and
abbreviations used.
3.2.9. Tables
Number tables consecutively in accordance with their
appearance in the text. Place footnotes to tables below the
table body and indicate them with superscript lowercase
letters. Avoid vertical rules. Be sparing in the use of tables
and ensure that the data presented in tables do not duplicate
results described elsewhere in the article.
3.3. Citation and Reference Style Guides
Per JAFEB’s "Citation and Reference Style Guides" authors
are expected to adhere to the guidelines of APA (American
Psychological Association).
Text: Citations in the text should follow the referencing style
used by the American Psychological Association. You are
referred to the Publication Manual of the American
Psychological Association, Sixth (6th) Edition, ISBN 978-1-
4338-0561-5. Details concerning this referencing style can
also be found at http://linguistics.byu.edu/faculty/henrichsenl
/apa/apa01.html.
References List: references should be arranged first
alphabetically and then further sorted chronologically if
necessary. More than one reference from the same author(s)
in the same year must be identified by the letters 'a', 'b', 'c',
etc., placed after the year of publication.
Web References: As a minimum, the full URL should be
given and the date when the reference was last accessed.
Any further information, if known (DOI, author names, dates,
reference to a source publication, etc.), should also be given.
Web references can be listed separately (e.g., after the
reference list) under a different heading if desired, or can be
included in the reference list.
3.3.1. Citation in Text
Please ensure that every reference cited in the text is also
present in the reference list (and vice versa). Any references
cited in the abstract must be given in full. Unpublished results
and personal communications are not recommended in the
reference list, but may be mentioned in the text. If these
references are included in the reference list they should
follow the standard reference style of the journal.
All citations in the text should refer to:
Single author: the author's name (without initials, unless
there is ambiguity) and the year of publication;
Two authors: list all authors' last names with "and" in the
text or “&” in parentheses separating the two authors and the
year of publication;
More than three up to five authors: at first citation list all
authors' last names with "and" in the text or “&” in
parentheses separating the last two authors and the year of
publication; If more than six authors, list the first six authors
followed by et al. and the year of publication. In subsequent
citations use the first author et al.
Groups of references should be listed first alphabetically,
then chronologically. For example, Kim and Lee (2008)
suggest ..., or Kim, Lee and Cormier (2009) find that ..., or
Kim, Lee, Cormier and Youn (2007) have shown that ...'
When citing a list of references in the text, put the list in
alphabetical order and separate authors by semicolons; for
example, several studies (Kim & Lee, 2008; Kim, Lee, &
Cormier, 2009; Kim, Lee, Cormier, & Youn, 2007; Youn &
Kim, 2003) support this conclusion.
To cite a direct quotation, give pages after the year,
separated by a comma and a space. For example: "Smith
argues that for something to happen it must be not only
'favorable and possible but also wanted and triggered' (2008,
p.38)".
3.3.2. List of References
References should be arranged first alphabetically and then
further sorted chronologically if necessary. More than one
reference from the same author(s) in the same year must be
identified by the letters "a", "b", "c", etc., placed after the year
of publication.
Reference to an article in journals:
Kim, P.-J. (2009). A study on the risk management of Korean
86 Appendix
firms in Chinese market. Journal of Distribution Science, 7(2),
5-28.
Lee, J. W., & Cormier, J. F. (2010). Effects of consumers’
demographic profile on mobile commerce Adoption. Journal
of Distribution Science, 8(1), 5-11.
Youn, M.-K., Kim, Y.-O., Lee, M.-K., & Namkung, S. (2006).
Domestic restrictions on the opening of retail stores. Journal
of Distribution Science, 6(2), 121-160.
Reference to a book (ISBN):
Greenberg, P. (2001). CRM at the speed of light (5th ed.).
Emeryville, CA: Lycos Press.
Youn, M.-K. & Kim, Y. -O. (2016). Principles of distribution (2nd
ed.). Seoul, Korea: Doonam Publishing.
Reference to a thesis for doctorate (or master's thesis):
Kim, Y. M. (2001). Study on factors of introduction of supply
chain management of Korean companies. Seoul, Korea:
Thesis for Doctorate in Jungang University.
Reference to a chapter in an edited book:
Burton, R. R. (1982). Diagnosing bugs in a simple procedure
skill. In D. H. Sleeman & J. S. Brown (Eds.), Intelligent
Tutoring Systems (pp.120-135), London, UK: Academic
Press.
For published conference proceedings:
Lee, J. W., & Kim, Y. E. (2007). Green distribution and its
economic impact on the distribution industry. Proceedings of
the Second International Conference of KODISA (pp.12-32).
Seoul, Korea: KODISA.
For magazine articles:
Youn, M.-K. (2010, July). Distribution science in medical
industry. Medical Distribution Today, 39(4), 86-93.
For newspaper articles:
Kim, Y.-E. (2011). New challenges and opportunities for
traditional markets. Korea Distribution News, 21 January,
Section 3-4. Seoul, Korea.
For newspaper articles (non-authored):
Korea Distribution News (2011). Future of traditional markets.
Korea Distribution News, 21 January, Section 3-4. Seoul,
Korea.
For Internet resources:
Kim, D.-H., & Youn, M.-K. (2012). Distribution knowledge,
research, and journal. Proceeding of 2012 Summer
International Conference of KODISA (pp.73-78). Seoul,
Korea. Retrieved August 30, 2012, from http://kodisa.org/
index.php?mid=Conferences &document_srl =8862.
China National Petroleum Corporation (2009). 2009 Annual
Reports. Beijing, China: CNPC. Retrieved September 30,
2010, from http://www.cnpc.com.cn/resource/english/images1
/2009.pdf
4. The Information of Title Page
4.1. Title
Concise and informative. Maximum 15 words. Titles are
often used in information-retrieval systems. Avoid
abbreviations and formulae where possible.
4.2. Author Names and Affiliations
Where the family name may be ambiguous (e.g., a double
name), please indicate this clearly. Present the authors'
affiliation addresses (where the actual work was done) below
the names. Indicate all affiliations with a lower-case letter
immediately after the author's name and in front of the
appropriate address. Provide the full postal address of each
affiliation, including the country name, and, the e-mail
address of each author. Note: This information should be
provided on a separate sheet and authors should not be
identified anywhere else in the manuscript.
4.3. Corresponding Author
Clearly indicate who will handle correspondence at all stages
of refereeing and publication, also post-publication. Ensure
that telephone (with country and area code) are provided in
addition to the e-mail address.
4.4. Abstract
A concise and factual abstract is required. 150–200 words in
total are recommended. The abstract should state briefly 1)
the purpose of the research, 2) research design and
methodology, 3) the principal results, and 4) major
conclusions. An abstract is often presented separately from
the article, so it must be able to stand alone. For this reason,
non-standard or uncommon abbreviations should be avoided,
but if essential they must be defined at their first mention in
the abstract itself.
4.5. Keywords
Immediately after the abstract, provide a maximum of 5
keywords. These keywords will be used for indexing
purposes.
Appendix 87
4.6. JEL Classification Code
Immediately after keywords, provide a maximum of 5 JEL
Classification codes. These codes will be used for indexing
purposes.
4.7. Acknowledgements
Collate acknowledgements in a separate section at the end
of the title page and do not, therefore, include them on the
main document (manuscripts) or otherwise. List here those
individuals who provided help during the research (e.g.,
providing language help, writing assistance or proof reading
the article, etc.).
5. The Checklist of Submission
It is hoped that this list will be useful during the final checking
of an article prior to sending it to the journal's Editor for
review. Please consult this Guide for Authors for further
details of any item. For email submissions you have
prepared 3 files:
File 1. The Title Page
Ensure that the following items are present:
- Full detail of authors
- One author designated as corresponding author:
• E-mail address
• Full postal address
• Telephone and fax numbers
- The title page must contain “Submission Declaration
Statement” in its cover letter as follows:
[“We hereby confirm that the manuscript has no any
actual or potential conflict of interest with any parties,
including any financial, personal or other relationships
with other people or organizations within three years of
beginning the submitted work that could inappropriately
influence or be perceived to influence.
We confirm that the paper has not been published
previously, it is not under consideration for publication
elsewhere, and the manuscript is not being
simultaneously submitted elsewhere.”]
Author identification: Every effort should be made to ensure
that submission material outside of the title page file contains no
clues as to author identity. Footnotes containing information
pertaining to the identity of the author or institutional affiliation
should be on separate pages. The complete title of the article
and the name of the author(s) should be typed only on the title
page file to ensure anonymity in the review process.
Subsequent pages should have no author names, but may
carry a short title at the top. Information in text, citations,
references, or footnotes that would identify the author should be
masked from the manuscript file. These may be reinserted in
the final draft. In addition, the author's name should be removed
from the document's Properties, which in Microsoft Word is
found in the File menu. When submitting a revised version of a
manuscript, please be sure to submit a blind version of your
response letter detailing changes made to the manuscript as
this is letter can be accessed by reviewers.
File 2. The Main Document (Manuscript)
The text of the paper, including abstract, text, references and
notes, tables, figure captions, figures, but without the names
of authors, or any acknowledgements. Check that you have
removed all author identification (names and affiliations) and
any acknowledgements from the main document that you
are going to submit. Please make sure that authors' names
are not included in the document/file properties.
Further considerations
1) All information about all figure captions and all tables
(including title, description, footnotes) has been provided
2) Manuscript has been "spell checked" and "grammar
checked"
3) References are in the correct format for this journal
4) All references mentioned in the Reference list are cited in
the text, and vice versa
6. After Acceptance
6.1. Proofs
One set of page proofs (as PDF files) will be sent by e-mail
to the corresponding author (if we do not have an e-mail
address then paper proofs will be sent by post) or, a link will
be provided in the e-mail so that authors can download the
files themselves. The author(s) may list the corrections
(including replies to the Query Form) and return them to the
Publisher in an e-mail. Please list your corrections quoting
line number. If, for any reason, this is not possible, then mark
the corrections and any other comments (including replies to
the Query Form) on a printout of your proof and return by fax,
or scan the pages and e-mail, or by post. Please use this
proof only for checking the typesetting, editing, completeness
and correctness of the text, tables and figures. Significant
changes to the article as accepted for publication will only be
considered at this stage with permission from the Editor. We

88 Appendix
will do everything possible to get your article published
quickly and accurately. Therefore, it is important to ensure
that all of your corrections are sent back to us in one
communication: please check carefully before replying, as
inclusion of any subsequent corrections cannot be
guaranteed. Proofreading is solely your responsibility. Note
that the Publisher may proceed with the publication of your
article if no response is received .
6.2. Offprints
The corresponding author, at no cost, will be provided with a
PDF file of the article via e-mail. For an extra charge, paper
offprints can be ordered via the offprint order form which is
sent once the article is accepted for publication. The PDF file
is a watermarked version of the published article and
includes a cover sheet with the journal cover image and a
disclaimer outlining the terms and conditions of use.
Offprints Publishing Office:
Korea Distribution Science Association
Address: Hanshin Officetel Suite 1030, 2463-4 Shinheung-
dong Sujeong-gu, Seongnam-city, Gyeonggi-do, KOREA
(461-720)
Tel: (+82 31) 740-7292 Fax: (+82 31) 740-7361
E-mail: [email protected]
Bank Account Number(Beneficiary) :470-910012-72205
Beneficiary Name: Korea Distribution Science Association
SWIFT Code: HNBN KRSE XXX
Bank Name: HANA BANK
6.3. Copyright Transfer Agreements
This journal uses a transfer of copyright agreement that
requires just one author (the corresponding author) to sign
on behalf of all authors. Please identify the corresponding
author for your work when submitting your manuscript for
review. The corresponding author will be responsible for the
following:
1) Ensuring that all authors are identified on the copyright
agreement, and notifying the editorial office of any changes
in the authorship.
2) Securing written permission (by letter or e-mail) from each
co-author to sign the copyright agreement on the co-author’s
behalf.
3) Warranting and indemnifying the journal owner and
publisher on behalf of all co-authors.
Although such instances are very rare, you should be aware
that in the event that a co-author has included content in his
or her portion of the article that infringes the copyright of
another or is otherwise in violation of any other warranty
listed in the agreement, you will be the sole author
indemnifying the publisher and the editor of the journal
against such violation. The journal will permit the author to
use the article elsewhere after publication, including posting
the final post-acceptance manuscript version on the author’s
personal web pages or in an institutional repository
maintained by the institution to which the author is affiliated,
in other works or for the purposes of the author’s teaching
and research, provided acknowledgement is given to the
Journal as the original source of publication.

Appendix 89
Journal Publishing Agreement Form
To: Journal of Asian Finance, Economics and Business (JAFEB), on behalf of the Korea Distribution
Science Association (KODISA)
Section 1: In consideration of the undertaking set out in section 2, and upon acceptance by the Editor for publication in the
Journal, the author(s) grants to KODISA ('the Publisher'), subject to Section 4, the exclusive right and license to publish the Article
entitled:
[please insert the manuscript title about here]____________(‘the Title’)____________
by [please list full names of all authors in order about here]____________(‘the Author’)___
to be published in Journal of Asian Finance, Economics and Business (‘the Journal’)_
This license includes the right to publish, including the right to sub-license appropriate publishing or distribution rights, the
material in the article in both printed and electronic form; the Article may be published in printed, online, CD-ROM,
microfiche or in other media formats.
Section 2: The Publisher here by undertakes to prepare and publish the Article named in Section 1 in the Journal, subject
only to its right to refuse publication if there is a breach of the Author’s warranty in Section 4 or there are other reasonable
grounds; in such case the Publisher assigns to the Author any and all copyright and other rights in the Article otherwise
assigned to it under this Agreement.
Section 3: The Editor of the Journal and the Publisher are empowered to make such editorial changes as may be
necessary to make the Article suitable for publication. Every effort will be made to consult the Author if substantive
changes are required.
Section 4: The Author warrants that the Article is the Author’s original work, has not been published before, and is not
currently under consideration for publication elsewhere; and that the Article contains no libelous or unlawful statements
and that it in no way infringes the rights of others, and that the Author, as the owner of the copyright, is entitled to make
this assignment.
Section 5: The Publisher, KODISA, reserves the right to refuse to publish your Article where its publication creates legal
liability, or where circumstances come to light that were not known to the Editor, including prior publication, conflict of
interest, manifest error etc. The Publisher is the ultimate custodian of academic quality and integrity, and will ensure that
this will be done only in exceptional circumstances and on reasonable grounds. In such circumstances the Article will be
returned to the Author together with all rights in it.
Name of the First Author ___________________________________
Signed___________________________________________ Date ___________________
Name of the Corresponding Author _________________________
Signed___________________________________________ Date ___________________�