Peripherally inserted central catheter in critically ill patients
Upload
independentCategory
view
0download
0
www.cell-research.com | Cell Research
Xiaosong Liu et al.1177
npg
ORIGINAL ARTICLE
Yamanaka factors critically regulate the developmental signaling network in mouse embryonic stem cellsXiaosong Liu1, Jinyan Huang2, Taotao Chen1, Ying Wang1, Shunmei Xin1, Jian Li3, Gang Pei1, 2, Jiuhong Kang1
1Laboratory of Molecular Cell Biology, Institute of Biochemistry and Cell Biology, Shanghai Institutes for Biological Sciences, Chinese Academy of Sciences, Shanghai 200031, China; 2Department of Bioinformatics, School of Life Sciences and Technology, Tongji University, Shanghai 200092, China; 3Agilent Technologies, Shanghai 200001, China
Correspondence: Jiuhong KangTel: +86-21-54921373; Fax: +86-21-54921011E-mail: [email protected] 16 June 2008; revised 12 August 2008; accepted 1 September 2008; published online 25 November 2008
npg
Yamanaka factors (Oct3/4, Sox2, Klf4, c-Myc) are highly expressed in embryonic stem (ES) cells, and their over-expression can induce pluripotency in both mouse and human somatic cells, indicating that these factors regulate the developmental signaling network necessary for ES cell pluripotency. However, systemic analysis of the signaling pathways regulated by Yamanaka factors has not yet been fully described. In this study, we identified the target promoters of endogenous Yamanaka factors on a whole genome scale using ChIP (chromatin immunoprecipitation)-on-chip in E14.1 mouse ES cells, and we found that these four factors co-occupied 58 promoters. Interestingly, when Oct4 and Sox2 were analyzed as core factors, Klf4 functioned to enhance the core factors for development regulation, whereas c-Myc seemed to play a distinct role in regulating metabolism. The pathway analysis revealed that Yamanaka factors collectively regulate a developmental signaling network composed of 16 developmental signaling pathways, nine of which represent earlier unknown pathways in ES cells, including apoptosis and cell-cycle pathways. We further analyzed data from a recent study examining Yamanaka factors in mouse ES cells. Interestingly, this analysis also revealed 16 developmental signaling pathways, of which 14 pathways overlap with the ones revealed by this study, despite that the target genes and the signaling pathways regulated by each individual Yamanaka factor differ significantly between these two datasets. We suggest that Yamanaka factors critically regulate a developmental signaling network composed of approximately a dozen crucial developmental signaling pathways to maintain the pluripotency of ES cells and probably also to induce pluripotent stem cells.Keywords: embryonic stem cell, pluripotency, Yamanaka factor, signal pathway, ChIP-on-chipCell Research (2008) 18:1177-1189. doi: 10.1038/cr.2008.309; published online 25 November 2008
Cell Research (2008) 18:1177-1189.© 2008 IBCB, SIBS, CAS All rights reserved 1001-0602/08 $ 30.00 www.nature.com/cr
Introduction
Embryonic stem (ES) cells are of great interest because of their capacity for unlimited self-renewal and multi-lineage differentiation in response to specific stimuli. With future research, these cells may serve as a potentially unrestricted source for tissue replacement in regenerative medicine. cDNA microarray analyses have revealed a long list of genes, whose transcript levels changed significantly during ES cell differentiation [1, 2]. Recent studies showed that these genes regulate
the pluripotency and differentiation of ES cells, primarily through effects on different developmental signaling pathways, including Notch, transforming g rowth f ac to r b (TGF-b ) , Wing les s /Wnt , and Hedgehog signaling pathways [3-7]. Even the “simplest” developmental response to intra- and extracellular signaling is determined by a complex interplay between developmental signaling pathways, involving extensive feedback regulation and multiple levels of cross-talk [6]. However, the signaling network involved in ES cell pluripotency maintenance and differentiation remains unknown, limiting the applications of ES cells in regenerative medicine. In addition to the limitations of human ES cells, there exist potential ethical issues associated with the use of human embryos as well as rejection reactions after allogenic transplantation.
In 2006, induced pluripotent stem (iPS) cells were
Yamanaka factors regulate developmental signaling network1178
npg
Cell Research | Vol 18 No 12 | December 2008
generated by retrovirus-mediated ectopic expression of the Yamanaka factors (Oct4, Sox2, Klf4, c-Myc) in mouse embryonic or adult fibroblasts [8]. With the recent successful induction of human iPS cells by Yamanaka factors or several other factor combinations in adult human fibroblasts [9-11], iPS cells have been recognized as a breakthrough that could potentially resolve the ethical issues and rejection problems associated with the use of human ES cells in regenerative medicine. Yamanaka factors are believed to initiate most, if not all, of the important developmental signaling pathways necessary for iPS cell induction, and they are also important for ES cell pluripotency. Therefore, studying the cell-signaling network regulated by the Yamanaka factors in ES cells may illuminate the fundamental properties and mechanisms of ES cell pluripotency and shed light on the mechanisms of iPS cell generation.
ChIP (chromatin immunoprecipitation)-on-chip is a high-throughput technique that identifies DNA sequences occupied by transcription factors and other DNA-binding proteins on a genome-wide scale. When combined with gene-expression analysis, ChIP-on-chip has proved to be a powerful tool for gaining insight into the key intracellular signaling pathways governed by specific factors [12-14]. Owing to concerns regarding ES cell line identity, several sets of cDNA microarray data from different ES cell lines and their derivatives have been collected and are publicly available [1, 2]. In contrast to the rich collection of cDNA microarray data, only one ChIP-on-chip dataset has been recently published reporting target promoters of exogenously expressed Yamanaka factors in J1 mouse ES cells [15]. As ChIP-on-chip analysis was performed after the genes of Yamanaka factors and others (Nanog, Dax1, Rex1, Zpf281, and Nac1) were individually over-expressed in J1 cells [15], the potential effects of bio-tag and differential gene expression or over-expression could not be completely excluded in that study. In this study, we identified the promoters occupied by endogenous Yamanaka factors and analyzed the developmental signaling network regulated by these factors in E14.1 mouse ES cells. We also analyzed the published data from J1 cells [15] and compared the results with those from E14.1 cells.
Results
Global occupancy mapping of endogenous Yamanaka factors
The promoter occupancy of the endogenous Yamanaka factors was analyzed by the ChIP-on-chip method [8, 16]. The four Yamanaka factors in E14.1 mouse ES cells maintained in ES-specific medium were ChIP
enriched by ChIP grade antibodies. Combined with the control DNA, the ChIP-enriched DNA fragments were hybridized to a Mouse Promoter ChIP-on-chip Microarray Set (Agilent) covering from −8 kb upstream to +2.5 kb downstream of the transcriptional start sites (TSS) of ~17 000 of the best-defined transcripts. Target genes for the four factors were identified using Agilent G4477AA ChIP Analytics 1.3.1 software, where the “binding peak” in promoter regions and the binding activity of the four factors were defined using an error modeling. The high quality of our dataset is demonstrated in several ways. First, typical peak positions resulting from ChIP signals indicated efficient ChIP enrichment for each transcription factor (Supplementary information, Figure S1). Second, well-known target genes of the Yamanaka factors were found in our binding lists; the different probe hits of each Yamanaka factor target gene and their relative position to the transcription start-site of the corresponding gene were shown in Supplementary information, Table S1. For example, the earlier-identified Oct4 targets, including POU5F1, SOX2, FBXO15, ZIC3, GJA1, SALL4, CDX2, GDF3, DPPA3, UTF1, and FZD5 [17-28], were all included in our list of genes occupied by Oct4 (Supplementary information, Table S1). Third, we have also validated several of the predicted target loci of the Yamanaka factors by ChIP-PCR assays using primer sets containing or adjacent to the positive probes, and all tested target loci were significantly enriched over the negative controls (Supplementary information, Figure S2).
The number of target genes for c-Myc, Klf4, Oct4, and Sox2 was 3 869, 1 505, 904, and 864, respectively (Figure 1A). The distance between each target site and the corresponding TSS was analyzed for each individual Yamanaka factor, and the vast majority of target sites specifically enriched to the proximity of TSS (approximately ±2 kb from TSS) (Figure 1B). A recent BioChIP-on-chip analysis of ectopically expressed c-Myc, Klf4, Oct4, and Sox2 in J1 cells revealed that 3 582, 1 790, 783, and 819 genes were occupied by these factors, respectively [15]. Between these two datasets, the overlapping targets for c-Myc, Klf4, Oct4, and Sox2 were 2 030, 380, 149, and 133, respectively, indicating that our present ChIP-on-chip dataset using endogenous factors represents a distinct and useful resource for studying target genes of Yamanaka factors and their potential biological roles in ES cells.
Further analysis showed that 1 389, 306, and 58 genes were co-occupied by at least 2, 3, or 4 Yamanaka factors, respectively (Figure 1C). Similar results were obtained when we analyzed the BioChIP-on-chip data (Supplementary information, Figure S3) [15].

www.cell-research.com | Cell Research
Xiaosong Liu et al.1179
npg
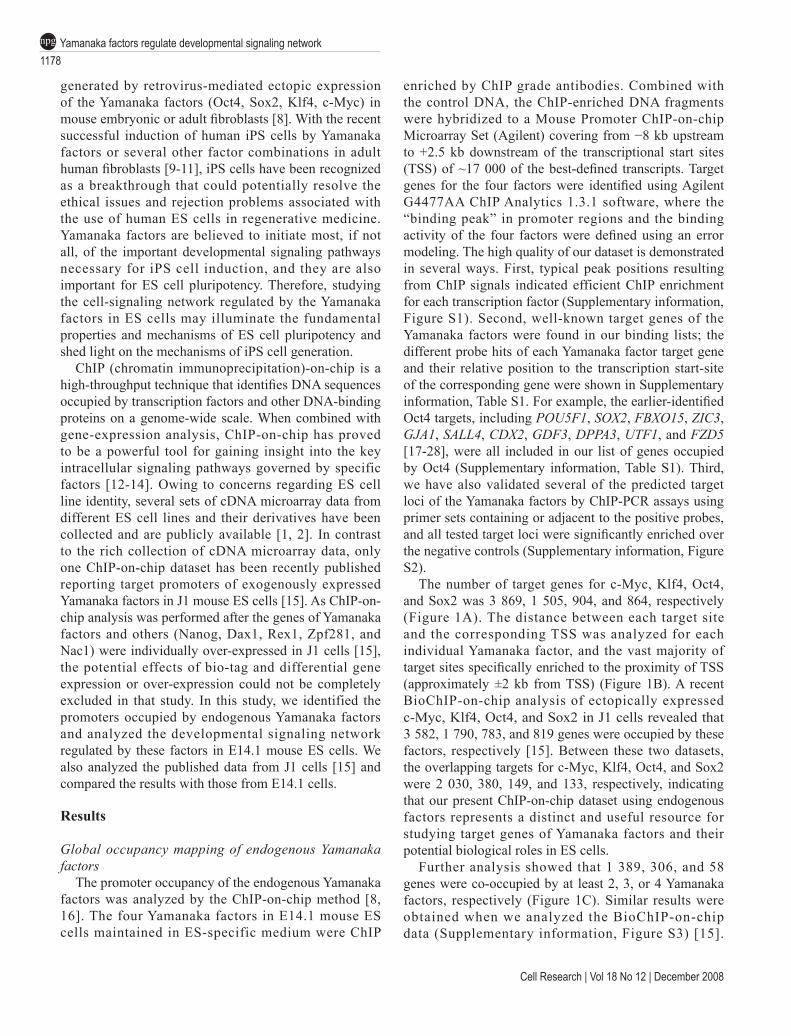
Furthermore, as revealed by supervised clustering [29] and gene set enrichment analysis (GSEA) [30], binding of Yamanaka factors with specific gene promoters through differential combinations was one of the mechanisms for the binding factors to accurately regulate spatiotemporal expression of the target genes (Figure 2). Specifically, the target genes of c-Myc were largely activated whenever occupied by c-Myc alone or in combination with other Yamanaka factors (Figure 2A and 2B). However, although genes co-occupied by two or more Yamanaka factors with or without c-Myc were activated (bars a, b in Figure 2A, 2C, and 2D), genes occupied by only one of the non-c-Myc factors (Oct4, Sox2, or Klf4) were largely repressed (bar c in Figure 2A, 2B, and 2D).
Functional analysis of cell signaling regulated by Yamanaka factors
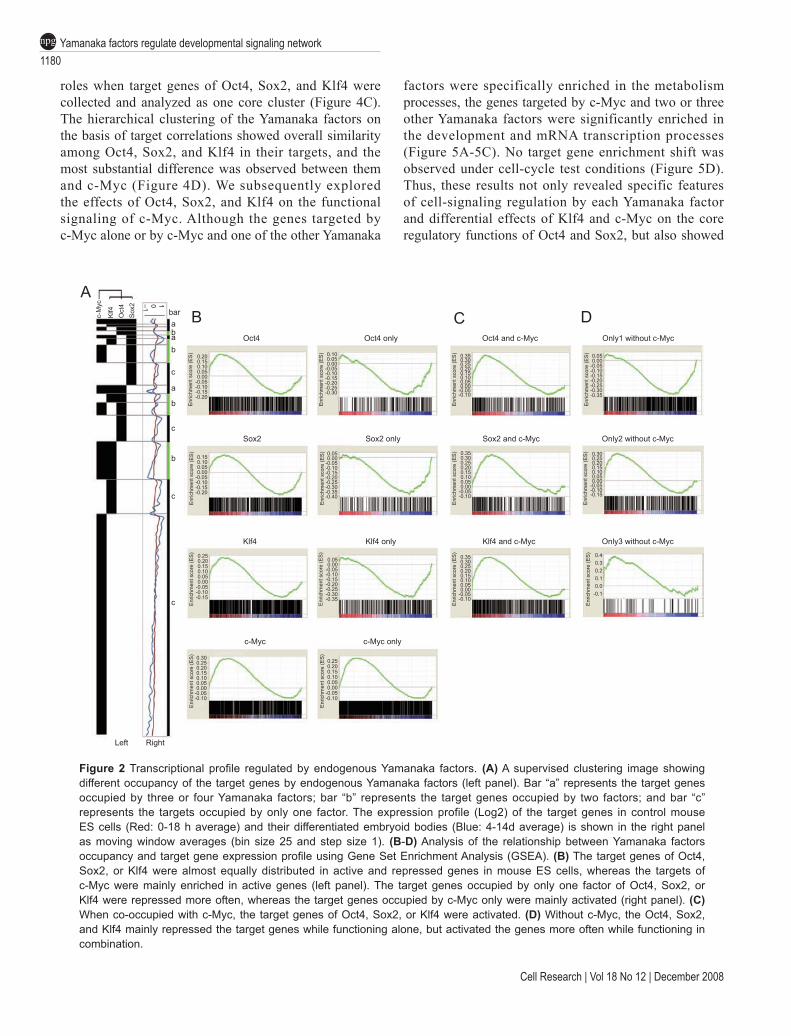
To gain insight into the cell-signaling pathways regulated by Yamanaka factors in mouse ES cells, we utilized the PANTHER (Protein ANalysis THrough Evolutionary Relationships, http://www.pantherdb.org/) Classification System to functionally classify the gene targets of Yamanaka factors. Compared with the expected enrichment, target genes of Yamanaka factors were enriched to a similar extent in the cell-cycle processes, where 273, 102, 68, and 56 of c-Myc, Klf4, Oct4, and Sox2 targets were respectively enriched. In contrast, the target genes of Oct4, Sox2, and Klf4 (410, 229, and 626) were significantly enriched in the development and
mRNA transcription processes, whereas the targets of c-Myc (706) were mainly enriched in the metabolism processes (Figure 3A and 3B).
To understand the role of the core factors Oct4 and Sox2 in ES cells, the target genes of Oct4 and Sox2 were assembled as core cluster genes for cell-signaling analysis. Compared with the expected distribution, the Oct4 and Sox2 core cluster genes were significantly enriched in the development and mRNA transcription processes, but not in the metabolism processes (Figure 4A). The significant role of Oct4 and Sox2 in the development and mRNA transcription processes in human ES cells was also indicated by our analysis of the published Oct4 and Sox2 ChIP-on-chip data in human ES cells (Supplementary information, Figure S4) [31]. Interestingly, Klf4 functioned as an enhancing factor for Oct4 and Sox2 core factors in regulating the developmental processes, whereas c-Myc seemed to play a distinct role in the metabolic processes. The core cluster genes targeted by Klf4 are mainly distributed in the development and mRNA transcription processes; on the contrary, the c-Myc targeted core cluster genes are mainly distributed in the metabolism processes (Figure 4A). Further analysis using the DAVID program (discussed in the following sections) confirmed this conclusion, and, among the 67 biological processes shared by Oct4 and Sox2 target genes, 66 were shared by Oct4, Sox2, and Klf4 target genes, whereas only 12 were shared by Oct4, Sox2, and c-Myc targets (Figure 4B). Consistent with this result, c-Myc also showed distinct
Figure 1 Summary of the endogenous Yamanaka factors occupancy in mouse embryonic stem cells. (A) Number of target promoters occupied by each endogenous Yamanaka factor. (B) Chromosomal target loci distribution of each endogenous Yamanaka factor to the TSS. The x-axis represents the relative distance to the TSS of target promoters. (C) Number of target promoters occupied by multiple Yamanaka factors. Black bars represent the targets occupied by only 1, 2, 3, or 4 factors; red dots represent the accumulated number of target promoters by at least 1, 2, 3, or 4 factors.
Sox2Oct4Klf4c-Myc
–8 –7 –6 –5 –4 –3 –2 –1 TSS 1 2 Peak position from TSS (kb)
A
B C9876543210
600050004000300020001000
0
Freq
uenc
y (%
)
Num
ber o
f gen
es
Number of factors per gene
5389
4000
13891083
30658 248
ChIP-on-chip for endogenousYamanaka factors
OnlyAt least
c-Myc Klf4 Oct4 Sox2
Target promoters 3869 1505 904 864
4 fac
tors
3 fac
tors
2 fac
tors
1 fac
tor
Yamanaka factors regulate developmental signaling network1180
npg
Cell Research | Vol 18 No 12 | December 2008
Figure 2 Transcriptional profile regulated by endogenous Yamanaka factors. (A) A supervised clustering image showing different occupancy of the target genes by endogenous Yamanaka factors (left panel). Bar “a” represents the target genes occupied by three or four Yamanaka factors; bar “b” represents the target genes occupied by two factors; and bar “c” represents the targets occupied by only one factor. The expression profile (Log2) of the target genes in control mouse ES cells (Red: 0-18 h average) and their differentiated embryoid bodies (Blue: 4-14d average) is shown in the right panel as moving window averages (bin size 25 and step size 1). (B-D) Analysis of the relationship between Yamanaka factors occupancy and target gene expression profile using Gene Set Enrichment Analysis (GSEA). (B) The target genes of Oct4, Sox2, or Klf4 were almost equally distributed in active and repressed genes in mouse ES cells, whereas the targets of c-Myc were mainly enriched in active genes (left panel). The target genes occupied by only one factor of Oct4, Sox2, or Klf4 were repressed more often, whereas the target genes occupied by c-Myc only were mainly activated (right panel). (C) When co-occupied with c-Myc, the target genes of Oct4, Sox2, or Klf4 were activated. (D) Without c-Myc, the Oct4, Sox2, and Klf4 mainly repressed the target genes while functioning alone, but activated the genes more often while functioning in combination.
c-Myc c-Myc only
Left Right
Oct4 Oct4 only Oct4 and c-Myc Only1 without c-Myc
Sox2 Sox2 only Sox2 and c-Myc Only2 without c-Myc
Klf4 Klf4 only Klf4 and c-Myc Only3 without c-Myc
A B bar
a
a
a
b
b
b
b
c
c
c
c
C D c-M
yc
Klf4
Oct
4S
ox2 10–1
0.200.150.100.050.00
-0.05-0.10-0.15-0.20
0.150.100.050.00
-0.05-0.10-0.15-0.20
0.250.200.150.100.050.00
-0.05-0.10-0.15
0.300.250.200.150.100.050.00
-0.05-0.10
0.250.200.150.100.050.00
-0.05-0.10
0.100.050.00
-0.05-0.10-0.15-0.20-0.25-0.30
0.350.300.250.200.150.100.050.00
-0.05-0.10
0.350.300.250.200.150.100.050.00
-0.05-0.10
0.350.300.250.200.150.100.050.00
-0.05-0.10
0.40.30.20.10.0
-0.1
0.300.250.200.150.100.050.00
-0.05-0.10-0.15
0.050.00
-0.05-0.10-0.15-0.20-0.25-0.30-0.35
0.050.00
-0.05-0.10-0.15-0.20-0.25-0.30-0.35-0.40
0.050.00
-0.05-0.10-0.15-0.20-0.25-0.30-0.35
Enr
ichm
ent s
core
(ES
)
Enr
ichm
ent s
core
(ES
)
Enr
ichm
ent s
core
(ES
)
Enr
ichm
ent s
core
(ES
)
Enr
ichm
ent s
core
(ES
)
Enr
ichm
ent s
core
(ES
)
Enr
ichm
ent s
core
(ES
)
Enr
ichm
ent s
core
(ES
)
Enr
ichm
ent s
core
(ES
)
Enr
ichm
ent s
core
(ES
)
Enr
ichm
ent s
core
(ES
)
Enr
ichm
ent s
core
(ES
)
Enr
ichm
ent s
core
(ES
)
Enr
ichm
ent s
core
(ES
)
roles when target genes of Oct4, Sox2, and Klf4 were collected and analyzed as one core cluster (Figure 4C). The hierarchical clustering of the Yamanaka factors on the basis of target correlations showed overall similarity among Oct4, Sox2, and Klf4 in their targets, and the most substantial difference was observed between them and c-Myc (Figure 4D). We subsequently explored the effects of Oct4, Sox2, and Klf4 on the functional signaling of c-Myc. Although the genes targeted by c-Myc alone or by c-Myc and one of the other Yamanaka
factors were specifically enriched in the metabolism processes, the genes targeted by c-Myc and two or three other Yamanaka factors were significantly enriched in the development and mRNA transcription processes (Figure 5A-5C). No target gene enrichment shift was observed under cell-cycle test conditions (Figure 5D). Thus, these results not only revealed specific features of cell-signaling regulation by each Yamanaka factor and differential effects of Klf4 and c-Myc on the core regulatory functions of Oct4 and Sox2, but also showed
www.cell-research.com | Cell Research
Xiaosong Liu et al.1181
npg
Figure 3 Functional analysis of the cell signaling regulated by endogenous Yamanaka factors. The cell-signaling role of endogenous Yamanaka factors targeted genes were functionally analyzed using the PANTHER classification system. The y-axis represents the relative enrichment calculated as follows: the obtained number of genes in our binding lists for “developmental process”, “mRNA transcription”, “protein metabolism and modification” and “cell cycle” are divided by the expected number of genes calculated for all mouse genes. The values above and below 1 indicate the enrichment or depletion of the target genes in the categories, respectively. The numbers above each bar represent “the genes included in the category”/“the genes expected in the category”. All targets occupied by Oct4, Sox2, Klf4, or c-Myc, and the targets occupied by Oct4, Sox2, Klf4, or c-Myc only were separately analyzed in (A) and (B). Target genes of Oct4, Sox2, and Klf4 were mainly enriched in the developmental process and mRNA transcription, whereas the targets of c-Myc were significantly enriched in protein metabolism.
c-Myc targets
Sox2 targets
Oct4 targets
Klf4 targets
c-Myc only
Sox2 only
Oct4 only
Klf4 only
3.5
3.0
2.5
2.0
1.5
1.0
0.5
0
3.5
3.0
2.5
2.0
1.5
1.0
0.5
0
Rel
ativ
e en
richm
ent
Developmental mRNA transcription Protein metabolism and Cell cycle processes modification
Developmental mRNA transcription Protein metabolism and Cell cycle processes modification
326/
301
202/
211 39
/28.
5
131/
40.4
250/
201
35/2
7
47/2
7.7
109/
38.5
514/
338
43/4
5.7
43/4
6.5
55/6
4.7
180/
89
17/1
2
20/1
2
26/1
7
66/2
9
112/
66
209/
70
310/
115
404/
287 11
7/63
201/
67
316/
110
706/
481
113/
106
105/
112
200/
185
273/
127
56/2
8 68/2
9
102/
49
Rel
ativ
e en
richm
ent
A
B
the importance of the connections and interactions between these factors in eliciting precise signaling regulations for the maintenance of ES cell pluripotency.
Pathway analysis of the developmental signaling network regulated by Yamanaka factors
To determine the signaling pathways regulated by Yamanaka factors, we inputted the UniProt ID of the Yamanaka factor target genes into the KOBAS software
[8, 32, 33]. The KEGG pathways selected by KOBAS mainly contain 25, 14, 114, and 39 developmental, cancer, metabolism, and other signaling pathways, respectively (Supplementary information, Table S2). Consistent with the result of PANTHER classification that target genes of Yamanaka factors were significantly enriched in the development and mRNA transcription processes, KOBAS analysis revealed that about half of the developmental signaling pathways were regulated

Yamanaka factors regulate developmental signaling network1182
npg
Cell Research | Vol 18 No 12 | December 2008
Figure 4 Distinctive effects of Klf4 and c-Myc on the signaling regulated by the Oct4 and Sox2 core cluster genes. (A) “Oct4 plus Sox2” represents the core cluster genes that are occupied by the factors containing Oct4 or Sox2; “Oct4 plus Sox2 only” represents the genes occupied by the factors containing Oct4 or Sox2, but not Klf4 and c-Myc; “Oct4 plus Sox2 and Klf4” represents the “Oct4 plus Sox2” genes co-occupied by Klf4; “Oct4 plus Sox2 and c-Myc” represents the “Oct4 plus Sox2” genes co-occupied by c-Myc; “Oct4 plus Sox2 and Klf4 and c-Myc” represents the “Oct4 plus Sox2” genes co-occupied by Klf4 and c-Myc together. The “Oct4 plus Sox2” core genes were enriched in the developmental processes, mRNA transcription, and cell cycle, but not in the protein metabolism. Klf4 enhanced the developmental and mRNA transcription signaling of “Oct4 plus Sox2” core genes, whereas c-Myc enhanced their protein metabolism signaling. (B) Number of bioprocesses involved in by each endogenous Yamanaka factor. Significantly involved bioprocesses for the target genes of Yamanaka factors were revealed by the DAVID program. The overlapping bioprocesses between Oct4 and Sox2 were 67, among which 66 were also overlapped by Klf4, but only 12 were overlapped by c-Myc. (C) “Oct4 plus Sox2 plus Klf4” represents the core cluster of genes that are occupied by the factors containing Oct4, Sox2, or Klf4. “Oct4 plus Sox2 plus Klf4 only” represents the genes occupied by the factors containing Oct4, Sox2, or Klf4, but not c-Myc; “Oct4 plus Sox2 plus Klf4 and c-Myc” represents the “Oct4 plus Sox2 plus Klf4” genes co-occupied by c-Myc. The “Oct4 plus Sox2 plus Klf4” core genes were still enriched in developmental processes, mRNA transcription and cell cycle, whereas c-Myc attenuated their role in development and mRNA transcription signaling, but enhanced their signaling in protein metabolism. (D) Hierarchical clustering of endogenous Yamanaka factors based on their target correlations reveals the overall target similarity among Oct4, Sox2, and Klf4.
A B
C D 3.5
3.0
2.5
2.0
1.5
1.0
0.5
0
7
6
5
4
3
2
1
0
Rel
ativ
e en
richm
ent
Rel
ativ
e en
richm
ent
Developmental mRNA Protein metabolism Cell cycle processes transcription and modification
Developmental mRNA Protein metabolism Cell cycle processes transcription and modification
95/1
5
283/
123
465/
205 341/
116
124/
89.6 44
5/19
629
1/11
015
4/85
.5
192/
143
174/
86.5
81/4
993
/37.
8
353/
329
61/1
85
115/
61
40/2
933
/18.
5
269/
117.
5
90/1
4
Oct4 plus Sox2 Factors Number of bioprocesses
c-Myc 62
Oct4 205
Sox2 84
Klf4 242
Sox2 Oct4 Klf4 Myc
Oct4 plus Sox2 only
Oct4 plus Sox2and Klf4 only
Oct4 plus Sox2plus Klf4Oct4 plus Sox2plus Klf4 onlyOct4 plus Sox2 plus Klf4 andc-Myc
Oct4 plus Sox2and c-Myc onlyOct4 plus Sox2 and c-Myc and Klf4
Overlap 6766
12
Correlation1.000
0.500
0.300
–0.200
50/1
7.6
92/5
8
37/2
8
205/
9790
/97
16/2
3.5
63/4
736
/29.
6
108/
5240
/25.
615
/6.2
32/1
2.3
21/7
.8
Sox2 1.0000
Oct4 0.521 1.000
Klf4 0.314 0.307 1.000
Myc –0.249 –0.223 –0.294 1.000
by Yamanaka factors (Figure 6A). We also performed similar analyses using the recently published BioChIP-on-chip data obtained from J1 cells [15]. On the one hand, pathways regulated by each individual Yamanaka factor appeared to differ between the two datasets (ours from E14.1 cells and the published dataset from J1 cells); on the other hand, for both datasets, the four Yamanaka factors collectively regulated 16 developmental signaling pathways, and among these, 14 were shared between the two datasets (Supplementary information, Table S3). The 14 overlapping pathways included Wnt, TGF-b, Notch, MAPK, ErbB, p53, JAK-STAT, Hedgehog, gap junction, cell cycle, axon guidance, focal adhesion, apoptosis, and adherens junction signaling pathways (Supplementary information, Table S3). Supplementary information, Table S4 shows the significantly enriched
KEGG signaling pathways for each endogenous Yamanaka factor (P < 0.1). Figure 6B shows the reciprocal regulation among the four Yamanaka factors, as well as their regulation of the well-established ES cell pluripotency-associated signaling pathways. The regulatory circuit among the four factors was extremely complex, exhibiting autoregulation, interconnectivity, and feed-forward regulation [20, 31]. Consistent with the result of previous BioChIP-on-chip analysis [15], we found that Oct4, Sox2, and Klf4 were able to autoregulate in ES cells, whereas c-Myc could not. Similar to the case where accurate regulation of ES cell gene transcription is achieved by different combinations of Yamanaka factors, the well-established ES cell pluripotency-associated pathways were also accurately regulated by the Yamanaka factors through cooperation
www.cell-research.com | Cell Research
Xiaosong Liu et al.1183
npg
and differential combinations. The p53 signaling pathway was regulated by all four factors; the Wnt and TGF-b signaling pathways were regulated by Oct4, Sox2, and c-Myc; the Hedgehog signaling pathway was regulated by Oct4 and Klf4; and the MAPK signaling pathway was regulated by Oct4. In addition to regulating the earlier-established ES cell pluripotency-related developmental signaling pathways (Supplementary information, Figure S5), nine additional developmental signaling pathways (including adherens junction, apoptosis, axon guidance, cell cycle, cytokine-cytokine receptor interaction, dorsal-ventral axis formation, ErbB, focal adhesion, and gap junction signaling pathways) were regulated by the Yamanaka factors (Figure 6C). On the basis of the reported functions of these pathways [34-40], we hypothesize that they may function as the signaling pathways important for ES cell pluripotency and iPS cell induction. Collectively, our results indicate that Yamanaka factors regulate about 16 out of the 25 developmental signaling pathways in the KEGG pathway Mus musculus database. These important developmental
signaling pathways likely constitute the developmental signaling network, which is necessary for mouse ES cell pluripotency and might also be necessary for iPS cell generation.
Discussion
In this study, we identified the global targets of endogenous Yamanaka factors in E14.1 mouse ES cells and simultaneously analyzed the signaling networks regulated by these factors in E14.1 cells and in J1 mouse ES cells, on the basis of our results and the results of a recent study [15]. Many similarities were found between these two datasets in terms of the signaling networks regulated by Yamanaka factors. The target genes of Oct4, Sox2, and Klf4 from both studies were significantly enriched in the developmental processes, whereas the targets of c-Myc were mainly enriched in the metabolism processes (Figure 3 and Supplementary information, Figure S6). Both datasets showed distinct effects of Klf4 and c-Myc on the functional signaling regulated
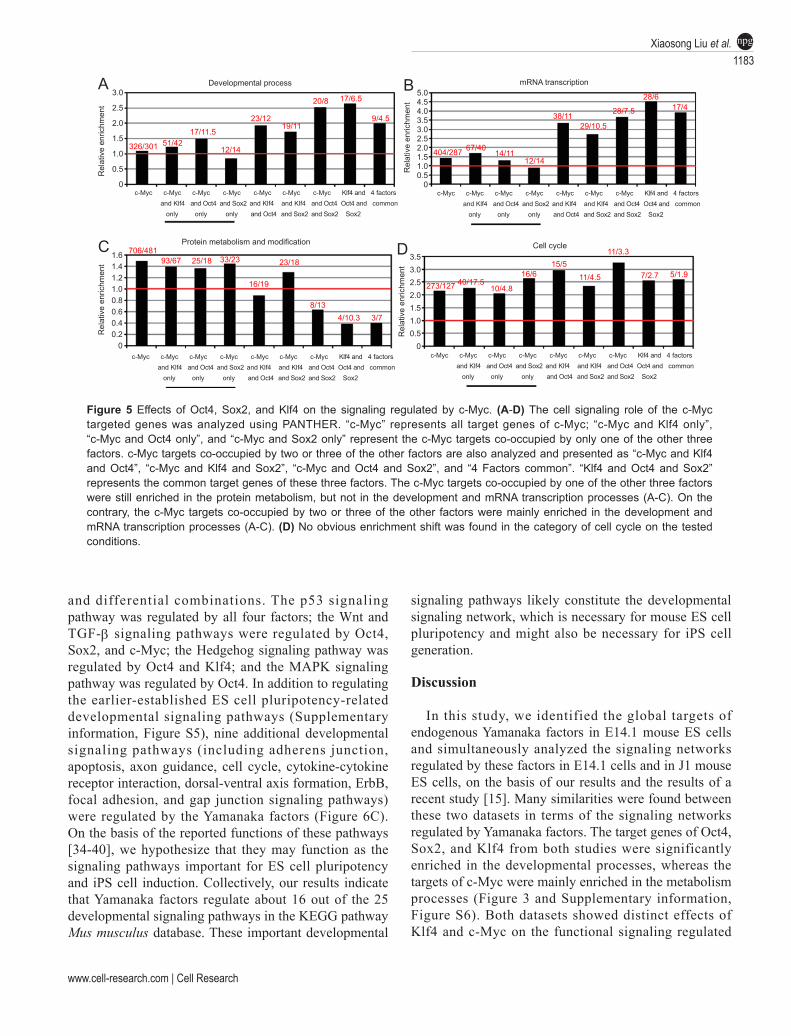
Figure 5 Effects of Oct4, Sox2, and Klf4 on the signaling regulated by c-Myc. (A-D) The cell signaling role of the c-Myc targeted genes was analyzed using PANTHER. “c-Myc” represents all target genes of c-Myc; “c-Myc and Klf4 only”, “c-Myc and Oct4 only”, and “c-Myc and Sox2 only” represent the c-Myc targets co-occupied by only one of the other three factors. c-Myc targets co-occupied by two or three of the other factors are also analyzed and presented as “c-Myc and Klf4 and Oct4”, “c-Myc and Klf4 and Sox2”, “c-Myc and Oct4 and Sox2”, and “4 Factors common”. “Klf4 and Oct4 and Sox2” represents the common target genes of these three factors. The c-Myc targets co-occupied by one of the other three factors were still enriched in the protein metabolism, but not in the development and mRNA transcription processes (A-C). On the contrary, the c-Myc targets co-occupied by two or three of the other factors were mainly enriched in the development and mRNA transcription processes (A-C). (D) No obvious enrichment shift was found in the category of cell cycle on the tested conditions.
A B
C D
Developmental process
Protein metabolism and modification Cell cycle
c-Myc c-Myc c-Myc c-Myc c-Myc c-Myc c-Myc Klf4 and 4 factors and Klf4 and Oct4 and Sox2 and Klf4 and Klf4 and Oct4 Oct4 and common only only only and Oct4 and Sox2 and Sox2 Sox2
c-Myc c-Myc c-Myc c-Myc c-Myc c-Myc c-Myc Klf4 and 4 factors and Klf4 and Oct4 and Sox2 and Klf4 and Klf4 and Oct4 Oct4 and common only only only and Oct4 and Sox2 and Sox2 Sox2
c-Myc c-Myc c-Myc c-Myc c-Myc c-Myc c-Myc Klf4 and 4 factors and Klf4 and Oct4 and Sox2 and Klf4 and Klf4 and Oct4 Oct4 and common only only only and Oct4 and Sox2 and Sox2 Sox2
c-Myc c-Myc c-Myc c-Myc c-Myc c-Myc c-Myc Klf4 and 4 factors and Klf4 and Oct4 and Sox2 and Klf4 and Klf4 and Oct4 Oct4 and common only only only and Oct4 and Sox2 and Sox2 Sox2
mRNA transcription
404/287 67/40 14/11
12/14
38/11 29/10.5
28/7.5
28/617/4
23/1219/11
20/8 17/6.5
9/4.5
17/11.5
12/1451/42326/301
706/48193/67 25/18 33/23 23/18
16/19
8/134/10.3
273/127 40/17.510/4.8
16/615/5
11/4.5
11/3.3
7/2.7 5/1.9
3/7
3.0
2.5
2.0
1.5
1.0
0.5
0
1.61.41.21.00.80.60.40.2
0
5.04.54.03.53.02.52.01.51.00.5
0
3.53.02.52.01.51.00.5
0
Rel
ativ
e en
richm
ent
Rel
ativ
e en
richm
ent
Rel
ativ
e en
richm
ent
Rel
ativ
e en
richm
ent
Yamanaka factors regulate developmental signaling network1184
npg
Cell Research | Vol 18 No 12 | December 2008
by the core factors Oct4 and Sox2 (Figure 4A and Supplementary information, Figure S7). Furthermore, the developmental signaling pathways collectively regulated by the four Yamanaka factors overlapped significantly between these two studies, with 14 out of 16 pathways in common (Supplementary information, Table S3). These results indicate that both sets of data are of high quality and will be useful for ES cell and iPS cell study, whereas ChIP-on-chip data-based signaling network analysis is a powerful tool in revealing the fundamental features of ES cells.
Despite that the two studies revealed similar signaling networks regulated by the Yamanaka factors, there were also obvious differences. Between these two datasets, the overlapping targets of c-Myc, Klf4, Oct4, and Sox2 were only 2 030, 380, 149, and 133, respectively. The developmental signaling pathways regulated by individual Yamanaka factors were also different in the
two datasets (Supplementary information, Table S5). The use of different ES cell lines [1, 2] and the different experimental processes in these two studies (ChIP-on-chip analyses of endogenous Yamanaka factors in our study versus BioChIP-on-chip analyses of ectopically expressed Yamanaka factors in the study by Kim et al.) likely account for the differences in the results. The BioChiP-on-chip experiment was performed in different bio-factor-transfected J1 cells. Furthermore, only 48% and 62% of endogenous Nanog- and c-Myc-binding targets could be enriched in J1 cells by the bio-Nanog and bio-c-Myc ChIP experiment [15]. Our analyses showed that exogenous Yamanaka factors significantly enriched 4 846 target genes and regulated 117 KEGG pathways, whereas endogenous Yamanaka factors enriched more target genes (5 389) but regulated fewer pathways (96) (Supplementary information, Table S6). These results thus indicate that our ChIP-on-chip data
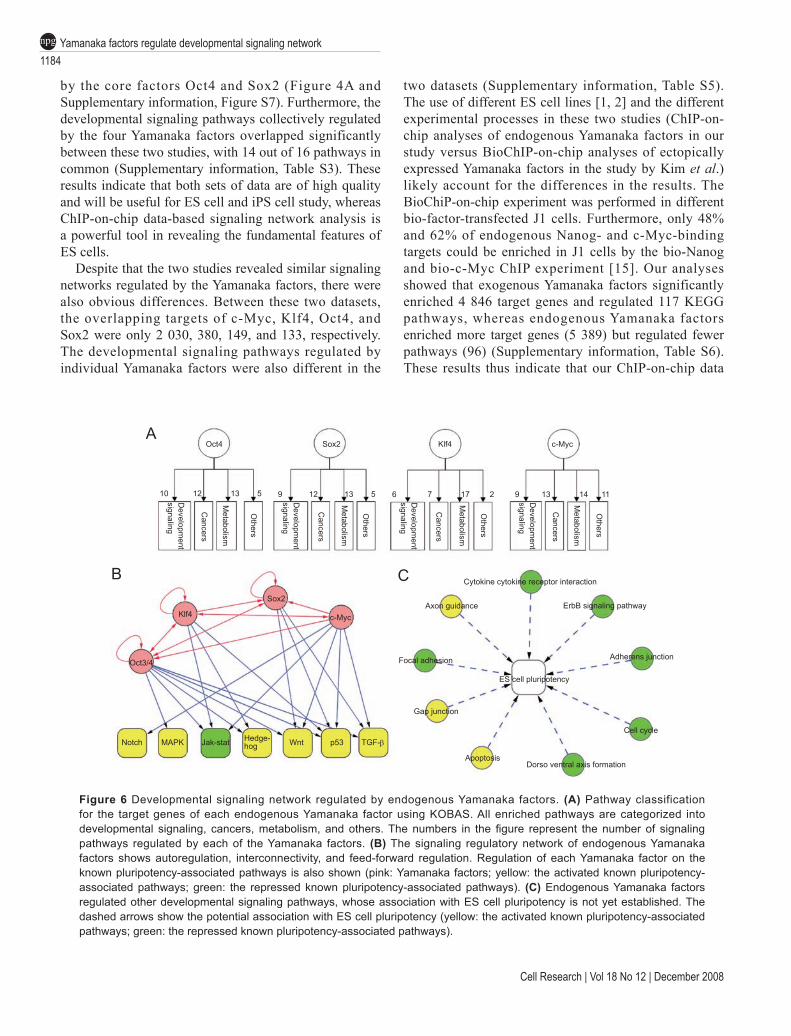
Figure 6 Developmental signaling network regulated by endogenous Yamanaka factors. (A) Pathway classification for the target genes of each endogenous Yamanaka factor using KOBAS. All enriched pathways are categorized into developmental signaling, cancers, metabolism, and others. The numbers in the figure represent the number of signaling pathways regulated by each of the Yamanaka factors. (B) The signaling regulatory network of endogenous Yamanaka factors shows autoregulation, interconnectivity, and feed-forward regulation. Regulation of each Yamanaka factor on the known pluripotency-associated pathways is also shown (pink: Yamanaka factors; yellow: the activated known pluripotency-associated pathways; green: the repressed known pluripotency-associated pathways). (C) Endogenous Yamanaka factors regulated other developmental signaling pathways, whose association with ES cell pluripotency is not yet established. The dashed arrows show the potential association with ES cell pluripotency (yellow: the activated known pluripotency-associated pathways; green: the repressed known pluripotency-associated pathways).
A
10 12 13 5 9 12 13 5 6 7 17 2 9 13 14 11
B
Developm
entsignaling
Developm
entsignaling
Developm
entsignaling
Developm
entsignaling
Metabolism
Metabolism
Metabolism
Metabolism
Others
Others
Others
Others
Klf4
Sox2
Oct3/4
Notch MAPK Jak-stat Wnt p53
c-Myc
Cytokine cytokine receptor interaction
Axon guidance ErbB signaling pathway
Dorso ventral axis formation
Adherens junction
Cell cycle
ES cell pluripotency
Focal adhesion
Gap junction
Apoptosis
Cancers
Cancers
Cancers
Cancers
Oct4 Sox2 Klf4 c-Myc
C
Hedge-hog TGF-b
www.cell-research.com | Cell Research
Xiaosong Liu et al.1185
npg
using endogenous Yamanaka factors will be a highly valuable resource for future studies on the mechanisms of ES cell pluripotency and iPS cell generation.
The consensus-binding motif utilized by endogenous Yamanaka factors was analyzed by MEME [41] using all probes commonly bound by the four factors. We found that the consensus motif of Yamanaka factors (P < 2.93e−6) consisted of the identified Sox-Oct cis-element (ATGC[A,T][A,T][A,G,C][A,T]) [20, 42, 43], indicating a core regulatory role of Oct4 and Sox2 among the Yamanaka factors. Surprisingly, we found that Klf4 and c-Myc showed very different effects on the functional signaling regulated by the core factors Oct4 and Sox2. Klf4 enhanced the role of Oct4 and Sox2 in regulating developmental pathways, whereas c-Myc clearly did not. Although somewhat unexpected, these results are consistent with the recent study showing that pluripotency was induced in both mouse and human fibroblasts by Yamanaka factors without c-Myc [10].
Among the well-described ES cell pluripotency signaling pathways regulated by Yamanaka factors, Hedgehog, BMP/TGF-b, Wnt, and Notch pathways constitute the stem-cell-signaling network. These signaling pathways play key roles in a variety of processes, including cell fate determination during embryogenesis, self-renewal of ES cells, maintenance of adult tissue homeostasis, tissue repair during chronic persistent inflammation, and carcinogenesis [26, 44, 45]. The JAK/STAT pathway is important in mediating cell fates, including processes such as apoptosis, differentiation, and proliferation in response to growth-promoting factors and cytokines [46, 47]. MAPK/ERK signaling is active in undifferentiated human ES cells and is down-regulated upon differentiation [48]. These signaling pathways may thus constitute a complex signaling network actively maintaining ES cell pluripotency [49-59].
Interestingly, in addition to the seven well-known ES cell pluripotency-related pathways, Yamanaka factors regulate nine other developmental signaling pathways (Supplementary information, Table S3). Although no literature suggests that these pathways are involved in ES cell pluripotency, some of them, including those associated with apoptosis and cell-cycle signaling, are obviously connected to ES cell pluripotency and iPS cell generation. Moreover, the reported functions of other signaling pathways suggest that these pathways may also be involved in ES cell pluripotency and iPS cell generation. Indeed, adherens junctions (consisting of transmembrane cadherin molecules and their associated cytoplasmic a-, b-, and γ-catenin proteins) are critical for the formation of stable cell adhesions and subsequent 3D tissue organization [34]. During early
vertebrate development, morphogenic cell movements are essential for determining and forming the embryo axis [37]. ErbB receptor tyrosine kinases, in response to growth factor ligands, induce a variety of cellular responses, including proliferation, differentiation, and motility [39, 60]. Focal adhesion kinase (FAK) is a crucial signaling component activated by numerous stimuli, and it functions as a biosensor or integrator to control cell migration, growth factor signaling, cell-cycle progression, and cell motility [40, 61]. In the ventricular zone, cortical neuroblasts display extensive coupling via gap junctions. Interneuronal coupling via gap junctions in the developing cortical plate has been demonstrated through dye-coupling experiments [62].
Through using the DNA microarray data in mouse ES cells (0 and 6 h) and their differentiated embryoid bodies (9 and 14 days) and the KOBAS services [8, 32, 33], the expression and connection of the target genes involved in these signaling pathways were further analyzed. In the notch signaling pathway, C-terminal binding protein 1 (ctbp1), a direct downstream target of the stem cell feature governing transcription factor tcf3 [63], as well as of tcf7 and lef1, was notably up-regulated in ES cells, whereas the factors such as notch3, crebbp, and notch1 were down-regulated. In the MAPK pathway, myc, pla2g1b, acvr1c, Pdgfc, and pdgfa were obviously up-regulated, whereas akt3, pdgfrb, pdgfra, and fgf8 were almost not expressed. In the Hedgehog pathway and adherens junctions pathway, most of the genes were up- or down-regulated, respectively. In the Wnt pathway, wif1 and Sox17 were extremely down-regulated, while myc and nuclear factor of activated T-cells (nfatc1) were up-regulated. In the p53 signaling pathway, trp53, bid, atm, cycs, and rrm2 were up-regulated, whereas ccnd2 was down-regulated. The factor cblb, which is known to direct the degradation of activated KIT and lead to the down-regulation of KIT signaling in stem cells [64], was up-regulated, whereas most of the genes in the JAK/STAT pathway were down-regulated. In the TGF-b signaling pathway, inhbb, acvr1c, and Myc were up-regulated, whereas smad1, smad3, smad4, and smad5 were repressed. The factors trp53 and nfkb2 were up-regulated in the apoptosis pathway. NFATc1, a factor known to balance quiescence and proliferation of stem cells through CDK4 [65], was up-regulated in the axon guidance pathway. In the cytokine-cytokine receptor interaction pathway, pdgfra, pdgfrb, and flt1 were obviously down-regulated, and ccnd2 and crebbp were down-regulated in the cell-cycle pathway. Nine genes were down-regulated in the ErbB pathway. In the dorso-ventral axis formation pathway, 3 genes were up-regulated and 11 genes were down-regulated. In the

Yamanaka factors regulate developmental signaling network1186
npg
Cell Research | Vol 18 No 12 | December 2008
focal adhesion pathway, 21 genes were down-regulated whereas spp1 was up-regulated. In the gap junction pathway, Kras was up-regulated. Collectively, these results indicate that Notch, Wnt, MAPK, p53, TGF-b, Hedgehog, apoptosis, axon guidance, and gap junction signaling pathways are probably activated, whereas the others are repressed in ES cells.
It is of interest to note a very recent study by Chen et al. [66] that profiled the whole-genome binding sites of 13 transcription factors, including the Yamanaka factors in mouse ES cells. It is noticed that although a large number of Yamanaka factor target genes (Oct4: 6 851, Sox2: 6 754, Klf4: 6 998, c-Myc: 8 047) were listed in that study, only about 50% of the Yamanaka factor targets identified by the promoter binding data from Kim et al. [15] and our study could be found in that list, suggesting that the cut-off standard used in the Chen et al. study may be too strict. However, when the Chen et al. [66] data were analyzed for developmental signaling pathways regulated by the Yamanaka factors, 13 pathways were found to overlap with those identified by the data of Kim et al. and our study (data not shown). These results indicate that our findings on the developmental signaling network regulated by the Yamanaka factors will prove useful in the future to elucidate the molecular nature of pluripotency, self-renewal, and reprogramming.
In summary, on the basis of the ChIP-on-chip data of endogenous Yamanaka factors in mouse ES cells and follow-up signaling pathway analyses, our study not only provides a novel insight into the developmental signaling network collectively regulated by the Yamanaka factors, but also reveals the distinct effect of each individual Yamanaka factor. As mentioned above, the signaling pathways revealed from these data may represent a fundamental feature and a basic signaling network required for ES cell pluripotency and iPS cell generation. As the key nodes of these identified pathways are well studied, our study may provide insight into how ES cell pluripotency and iPS cell induction may be controlled through agonists or antagonists of specific signaling pathways. Given that virus-mediated iPS cell generation is likely to induce genetic alterations and cancer [67], generation of iPS cells with signaling pathway agonists and/or antagonists would greatly reduce the tumorigenic risk of the iPS cell technology and could, therefore, contribute to developing and applying patient-specific iPS cells in regenerative medicine.
Materials and Methods
Cells and cell cultureMurine ES cells E14.1 were cultured without feeder cells
(irradiated murine embryonic fibroblasts, MEF) and grown under
typical mES cell condition in Dulbecco’s modified Eagle medium (DMEM; GIBCO) supplemented with 15% heat-inactivated fetal bovine serum (FBS; GIBCO), 0.055 mM b-mercaptoethanol (GIBCO), 2 mM L-glutamine, 0.1 mM MEM non-essential amino acid and 1 000 U/ml leukemia inhibitory factor (LIF, Chemicon) [43]. All investigated E14.1 mES cells showed typical clone morphology and growth rate in undifferentiated status.
AntibodiesThe OCT4(sc-8628), SOX2(sc-17320), KLF4(sc-20691), and
c-MYC(sc-764) antibodies used in the ChIP step were purchased from Santa Cruz Biotechnology, which have been used in many earlier ChIP and ChIP-on-chip studies and have been shown to recognize the responsive genes [20, 42, 68-73].
Chromatin immunoprecipitation and hybridizationThe standard Agilent mammalian ChIP-on-chip protocol 9.1 is
available online (http://www.chem.agilent.com/scripts/generic.asp?lpage=11617&indcol=N&prodcol=Y). In brief, E14.1 murine ES cells were grown to a final count of 1 × 10⁸ cells for each ChIP-on-chip analysis. The cells were harvested with diastase and chemically crosslinked in 50 ml 0.5% formaldehyde for 20 min at room temperature. The cells were then rinsed twice with 50 ml 1 × PBS and stored at −80 °C before use. The cells were resuspended and lysed in lysis buffers and then sonicated to shear the crosslinked DNA to an average length of 500 bp. As the sonication conditions vary mainly depending on cell line, cell number, degree of crosslinking, and equipment, we used a Bioruptor sonicator (Diagenode) and sonicated the 1 × 10⁸ E14.1 cells with an intensity set at high for a 26 × 15 s pulse (30-s pause between pulses) at 4 °C while the samples were kept immersed in an ice-water bath. Fifty microliters of the sonicated lysate was saved for whole-cell extract (WCE)DNA extraction. The remaining lysate was incubated overnight at 4 °C with 100 µl of Dynal Protein A magnetic beads pre-incubated with 10 µg of specific antibody. The Dynal beads were washed five times with RIPA buffer and one time with TE containing 50 mM NaCl. To elute the bound complex from beads, 210 ml of the elution buffer was added, and the beads were incubated for 15 min at 65 °C with interval vortexing every 2 min. As for the WCE DNA extraction, 150 ml of elution buffer was added to 50 ml of the sonicated lysate. Both the immunoprecipitated DNA sample eluted from the Dynal beads and the WCE DNA sample were incubated overnight at 65 °C to reverse the chemical crosslinking between protein and DNA. The DNA samples were then purified by treatment with RNaseA, proteinase K, and phenol:chloroform:isoamyl alcohol extraction. Purified DNA was treated with Whole Genome Amplification Kit (WGA2, Sigma) [73], which allowed more linear amplification of a small amount of DNA than traditional ligation-mediated PCR [74]. We used a standard protocol for modified WGA amplification (http://www.genomecenter.ucdavis.edu/farnham/protocol.html). Amplified DNA was labeled and purified using Invitrogen Bioprime random primer labeling kits (IP DNA was labeled with Cy5 fluorophore; WCE DNA was labeled with Cy3 fluorophore). The labeled IP and WCE DNA were combined in equal amounts (5 mg) and hybridized to mouse promoter arrays in Agilent hybridization chambers for 40 h at 65 °C. After washing, slides were scanned and analyzed. At least three biological replicates of hybridization were performed for each sample.
www.cell-research.com | Cell Research
Xiaosong Liu et al.1187
npg
Real-time PCRAll real-time PCR reactions were performed with 20 ml SYBR
Green Master Mix (Toyobo) reaction and run on an Mx3000P thermocycler (Stratagene). The PCR profile consisted of 95 °C for 5 min and 40 cycles of 95 °C 15 s, 60 °C 30 s, and 72 °C 30 s; then, 95 °C 5 min, 60 °C 30 s, and ramp-up to 95 °C for a dissociation curve. The fold enrichment was calculated by comparing the DCt value of target promoters and that of a negative control. Primer sets for real-time PCR were designed ±200 bp from the potential binding sites using the sequence information from UCSC mm8, NCBI build 36 (February 2006). All primer sets are listed in Supplementary information, Table S7.
Array design and data extractionThe Mouse Promoter ChIP-on-chip Microarray Set used in
this study was manufactured by Agilent Technologies (http://www.agilent.com). Each microarray set (product number: G4490A) contains two slides (design number: slide 1=014716 and slide 2=014717) that mainly cover from 8 kb upstream to 2.5 kb downstream of the transcriptional start sites of ~17 000 of the best-defined mouse transcripts represented by RefSeq. All sequence information was sourced from UCSC mm8, NCBI build 36 (February 2006). The data were extracted from image files by Feature Extraction V9.5.3.1, and peak analysis was performed using Agilent ChIP Analytics V1.3.1.
Microarray data processingFor gene expression analysis, the expression data were obtained
from an earlier study [1], in which a triplicate 11-point time-course study compared ES cells and embryoid bodies (time course: 0, 6, 12, 18, 24, 36, 48 h, 4, 7, 9, and 14 days). Gene Set Enrichment Analysis (GSEA) is a computational method that determines whether an a priori defined set of genes shows statistically significant, concordant differences between two biological states or phenotypes [30]. Experimental expression values were analyzed by GSEA.
As earlier suggested [15], to produce the supervised clustering image in Figure 2A (left panel), we first carried out unsupervised hierarchical clustering across the transcription factors on the basis of their target correlations, using Cluster and Treeview software [29]. To produce a cluster view of common targets of multiple factors and unique targets of a single factor, we first randomized the order of target genes and then sequentially sorted the targets of each factor from c-Myc to Sox2. For the target gene expression profile image in Figure 2A (right panel), the effects of the expression values of each gene on mES cell differentiation measured at 0, 6, 12, and 18 h (0-18 h average), and on day 4, day 7, day 9, and day 14 (4-14 day average) were averaged. We then added the target gene expression values in the sequenced order mentioned above, before applying the moving window average.
DAVID analysisBiological functions of target genes were obtained using the
Gene Functional Classification Tool “DAVID” (http://david.abcc.ncifcrf.gov/home.jsp). The analysis procedure consisted of uploading a gene list into the system and submitting the list. The classification may be re-executed by the user under different parameters. Each cluster was given an enrichment score. The key biology for each cluster can be downloaded for functional analysis.
Genes were clustered according to functional similarity. This analysis provided information about how consistent a particular process is within a given gene group. The processes of all gene clusters for each transcription factor were combined and compared to produce the table shown in Figure 4B.
Visualization of signaling pathway networkCytoscape software version 2.6 [75] was used to visualize the
signaling regulatory networks shown in Figure 6B and 6C.
Acknowledgments
We thank Drs J Zhao, DS Li, L Xiao (Chinese Academy of Sciences, China), Drs B Leo and H Wang (Agilent Technologies, USA) for helpful discussions and technical assistance, and Drs HK Mei and Y Qiu (GlaxoSmithKline, UK) for the DAVID analysis. This research was supported by the Ministry of Science and Technology (2005CB522406, 2006CB943900, 2007CB947904, 2007CB947100, 2009CB941100, and 2007CB948000), National Natural Science Foundation of China (30621091, 30625014, 30623003, and 90713047), Shanghai Municipal Commission for Science and Technology (07PJ14099, 06ZR14098, and 06DZ22032), and the Chinese Academy of Sciences (KSCX2-YW-R-56 and 2007KIP204).
References
1 Boyer LA, Plath K, Zeitlinger J, et al. Polycomb complexes repress developmental regulators in murine embryonic stem cells. Nature 2006; 441:349-353.
2 Hailesellasse Sene K, Porter CJ, Palidwor G, et al. Gene function in early mouse embryonic stem cell differentiation. BMC Genomics 2007; 8:85.
3 Prakash N, Wurst W. A Wnt signal regulates stem cell fate and differentiation in vivo. Neurodegener Dis 2007; 4:333-338.
4 Silver SJ, Rebay I. Signaling circuitries in development: insights from the retinal determination gene network. Development 2005; 132:3-13.
5 Doroquez DB, Rebay I. Signal integration during development: mechanisms of EGFR and Notch pathway function and cross-talk. Crit Rev Biochem Mol Biol 2006; 41:339-385.
6 Vivekanand P, Rebay I. Intersection of signal transduction pathways and development. Annu Rev Genet 2006; 40:139-157.
7 Werner T. Bioinformatics applications for pathway analysis of microarray data. Curr Opin Biotechnol 2008; 19:50-54.
8 Takahashi K, Yamanaka S. Induction of pluripotent stem cells from mouse embryonic and adult fibroblast cultures by defined factors. Cell 2006; 126:663-676.
9 Takahashi K, Tanabe K, Ohnuki M, et al. Induction of pluripotent stem cells from adult human fibroblasts by defined factors. Cell 2007; 131:861-872.
10 Nakagawa M, Koyanagi M, Tanabe K, et al. Generation of induced pluripotent stem cells without Myc from mouse and human fibroblasts. Nat Biotechnol 2008; 26:101-106.
Yamanaka factors regulate developmental signaling network1188
npg
Cell Research | Vol 18 No 12 | December 2008
11 Yu J, Vodyanik MA, Smuga-Otto K, et al. Induced pluripotent stem cell lines derived from human somatic cells. Science 2007; 318:1917-1920.
12 de Haan G, Gerrits A, Bystrykh L. Modern genome-wide genetic approaches to reveal intrinsic properties of stem cells. Curr Opin Hematol 2006; 13:249-253.
13 Vigano MA, Mantovani R. Hitting the numbers: the emerging network of p63 targets. Cell Cycle 2007; 6:233-239.
14 Schebesta A, McManus S, Salvagiotto G, et al. Transcription factor Pax5 activates the chromatin of key genes involved in B cell signaling, adhesion, migration, and immune function. Immunity 2007; 27:49-63.
15 Kim J, Chu J, Shen X, Wang J, Orkin SH. An extended transcriptional network for pluripotency of embryonic stem cells. Cell 2008; 132:1049-1061.
16 Maherali N, Sridharan R, Xie W, et al. Directly reprogrammed fibroblasts show global epigenetic remodeling and widespread tissue contribution. Cell Stem Cell 2007; 1:55-70.
17 Hough SR, Clements I , Welch PJ , Wiederhol t KA. Differentiation of mouse embryonic stem cells after RNA interference-mediated silencing of OCT4 and Nanog. Stem Cells 2006; 24:1467-1475.
18 Ralston A, Rossant J . Cdx2 acts downstream of cell polarization to cell-autonomously promote trophectoderm fate in the early mouse embryo. Dev Biol 2008; 313:614-629.
19 Zhang J, Tam WL, Tong GQ, et al. Sall4 modulates embryonic stem cell pluripotency and early embryonic development by the transcriptional regulation of Pou5f1. Nat Cell Biol 2006; 8:1114-1123.
20 Chew JL, Loh YH, Zhang W, et al. Reciprocal transcriptional regulation of Pou5f1 and Sox2 via the Oct4/Sox2 complex in embryonic stem cells. Mol Cell Biol 2005; 25:6031-6046.
21 Levasseur DN, Wang J, Dorschner MO, Stamatoyannopoulos JA, Orkin SH. Oct4 dependence of chromatin structure within the extended Nanog locus in ES cells. Genes Dev 2008; 22:575-580.
22 Lim LS, Loh YH, Zhang W, et al. Zic3 is required for maintenance of pluripotency in embryonic stem cells. Mol Biol Cell 2007; 18:1348-1358.
23 Player A, Wang Y, Bhattacharya B, et al. Comparisons between transcriptional regulation and RNA expression in human embryonic stem cell lines. Stem Cells Dev 2006; 15:315-323.
24 Tokuzawa Y, Kaiho E, Maruyama M, et al. Fbx15 is a novel target of Oct3/4 but is dispensable for embryonic stem cell self-renewal and mouse development. Mol Cell Biol 2003; 23:2699-2708.
25 Tomioka M, Nishimoto M, Miyagi S, et al. Identification of Sox-2 regulatory region which is under the control of Oct-3/4-Sox-2 complex. Nucleic Acids Res 2002; 30:3202-3213.
26 Katoh Y, Katoh M. Conserved POU-binding site linked to SP1-binding site within FZD5 promoter: Transcriptional mechanisms of FZD5 in undifferentiated human ES cells, fetal liver/spleen, adult colon, pancreatic islet, and diffuse-type gastric cancer. Int J Oncol 2007; 30:751-755.
27 Nishimoto M, Fukushima A, Okuda A, Muramatsu M. The gene for the embryonic stem cell coactivator UTF1 carries a regulatory element which selectively interacts with a complex composed of Oct-3/4 and Sox-2. Mol Cell Biol 1999; 19:5453-5465.
28 Nishimoto M, Miyagi S, Yamagishi T, et al. Oct-3/4 maintains the proliferative embryonic stem cell state via specific binding to a variant octamer sequence in the regulatory region of the UTF1 locus. Mol Cell Biol 2005; 25:5084-5094.
29 Eisen MB, Spellman PT, Brown PO, Botstein D. Cluster analysis and display of genome-wide expression patterns. Proc Natl Acad Sci USA 1998; 95:14863-14868.
30 Subramanian A, Tamayo P, Mootha VK, et al. Gene set enrichment analysis: a knowledge-based approach for interpreting genome-wide expression profiles. Proc Natl Acad Sci USA 2005; 102:15545-15550.
31 Boyer LA, Lee TI, Cole MF, et al. Core transcriptional regulatory circuitry in human embryonic stem cells. Cell 2005; 122:947-956.
32 Hartl D, Irmler M, Romer I, et al. Transcriptome and proteome analysis of early embryonic mouse brain development. Proteomics 2008; 8:1257-1265.
33 Wu J, Mao X, Cai T, Luo J, Wei L. KOBAS server: a web-based platform for automated annotation and pathway identification. Nucleic Acids Res 2006; 34:W720-W724.
34 Hegland DD, Sullivan DM, Rovira II, et al. Regulation of endothelial cell adherens junctions by a Ras-dependent signal transduction pathway. Biochem Biophys Res Commun 1999; 260:371-376.
35 Nicola NA. Cytokine pleiotropy and redundancy: a view from the receptor. Stem Cells 1994; 12: discussion 12-14.
36 Ozaki K, Leonard WJ. Cytokine and cytokine receptor pleiotropy and redundancy. J Biol Chem 2002; 277:29355-29358.
37 Myers DC, Sepich DS, Solnica-Krezel L. Convergence and extension in vertebrate gastrulae: cell movements according to or in search of identity? Trends Genet 2002; 18:447-455.
38 Soto X, Mayor R, Torrejon M, et al. Galphaq negatively regulates the Wnt-beta-catenin pathway and dorsal embryonic Xenopus laevis development. J Cell Physiol 2008; 214:483-490.
39 Marmor MD, Skaria KB, Yarden Y. Signal transduction and oncogenesis by ErbB/HER receptors. Int J Radiat Oncol Biol Phys 2004; 58:903-913.
40 Mitra SK, Hanson DA, Schlaepfer DD. Focal adhesion kinase: in command and control of cell motility. Nat Rev Mol Cell Biol 2005; 6:56-68.
41 Bai ley TL, Wil l iams N, Mis leh C, Li WW. MEME: discovering and analyzing DNA and protein sequence motifs. Nucleic Acids Res 2006; 34:W369-373.
42 Rodda DJ, Chew JL, Lim LH, et al. Transcriptional regulation of nanog by OCT4 and SOX2. J Biol Chem 2005; 280:24731-24737.
43 Loh YH, Wu Q, Chew JL, et al . The Oct4 and Nanog transcription network regulates pluripotency in mouse embryonic stem cells. Nat Genet 2006; 38:431-440.
44 Sato N, Sanjuan IM, Heke M, et al. Molecular signature of human embryonic stem cells and its comparison with the mouse. Dev Biol 2003; 260:404-413.
45 James D, Levine AJ, Besser D, Hemmati-Brivanlou A. TGF-beta/activin/nodal signaling is necessary for the maintenance of pluripotency in human embryonic stem cells. Development 2005; 132:1273-1282.
46 Darnell Jr JE. Transcription factors as targets for cancer
www.cell-research.com | Cell Research
Xiaosong Liu et al.1189
npg
therapy. Nat Rev Cancer 2002; 2:740-749.47 Darnell JE. Validating Stat3 in cancer therapy. Nat Med 2005;
11:595-596.48 Armstrong EJ, Bischoff J. Heart valve development: endothelial
cell signaling and differentiation. Circ Res 2004; 95:459-470.49 Wang J, Shou J, Chen X. Dickkopf-1, an inhibitor of the
Wnt signaling pathway, is induced by p53. Oncogene 2000; 19:1843-1848.
50 Verheyen EM. Opposing effects of Wnt and MAPK on BMP/Smad signal duration. Dev Cell 2007; 13:755-756.
51 Sun Y, Lowther W, Kato K, et al. Notch4 intracellular domain binding to Smad3 and inhibition of the TGF-beta signaling. Oncogene 2005; 24:5365-5374.
52 Duncan AW, Rattis FM, DiMascio LN, et al. Integration of Notch and Wnt signaling in hematopoietic stem cell maintenance. Nat Immunol 2005; 6:314-322.
53 Hayward P, Brennan K, Sanders P, et al. Notch modulates Wnt signalling by associating with Armadillo/beta-catenin and regulating its transcriptional activity. Development 2005; 132:1819-1830.
54 Espinosa L , Ing les -Es teve J , Agui le ra C, Bigas A. Phosphorylation by glycogen synthase kinase-3 beta down-regulates Notch activity, a link for Notch and Wnt pathways. J Biol Chem 2003; 278:32227-32235.
55 Baker JC, Beddington RS, Harland RM. Wnt signaling in Xenopus embryos inhibits bmp4 expression and activates neural development. Genes Dev 1999; 13:3149-3159.
56 Zorn AM, Butler K, Gurdon JB. Anterior endomesoderm specification in Xenopus by Wnt/beta-catenin and TGF-beta signalling pathways. Dev Biol 1999; 209:282-297.
57 Warner DR, Greene RM, Pisano MM. Cross-talk between the TGF-beta and Wnt signaling pathways in murine embryonic maxillary mesenchymal cells. FEBS Lett 2005; 579:3539-3546.
58 Dreesen O, Brivanlou AH. Signaling pathways in cancer and embryonic stem cells. Stem Cell Rev 2007; 3:7-17.
59 Katoh Y, Katoh M. Hedgehog signaling pathway and gastrointestinal stem cell signaling network (review). Int J Mol Med 2006; 18:1019-1023.
60 Pinkas-Kramarski R, Alroy I, Yarden Y. ErbB receptors and EGF-like ligands: cell lineage determination and oncogenesis through combinatorial signaling. J Mammary Gland Biol Neoplasia 1997; 2:97-107.
61 Montell DJ. Command and control: regulatory pathways controlling invasive behavior of the border cells. Mech Dev 2001; 105:19-25.
62 Kandler K, Katz LC. Relationship between dye coupling and spontaneous activity in developing ferret visual cortex. Dev Neurosci 1998; 20:59-64.
63 Nguyen H, Rendl M, Fuchs E. Tcf3 governs stem cell features and represses cell fate determination in skin. Cell 2006; 127:171-183.
64 Zeng S, Xu Z, Lipkowitz S, Longley JB. Regulation of stem cell factor receptor signaling by Cbl family proteins (Cbl-b/c-Cbl). Blood 2005; 105:226-232.
65 Horsley V, Aliprantis AO, Polak L, Glimcher LH, Fuchs E. NFATc1 balances quiescence and proliferation of skin stem cells. Cell 2008; 132:299-310.
66 Chen X, Xu H, Yuan P, et al. Integration of external signaling pathways with the core transcriptional network in embryonic stem cells. Cell 2008; 133:1106-1117.
67 Liu SV. iPS cells: a more critical review. Stem Cells Dev 2008; 17:391-397.
68 Okumura-Nakanishi S, Saito M, Niwa H, Ishikawa F. Oct-3/4 and Sox2 regulate Oct-3/4 gene in embryonic stem cells. J Biol Chem 2005; 280:5307-5317.
69 Wang H, Yang L, Jamaluddin MS, Boyd DD. The Kruppel-like KLF4 transcription factor, a novel regulator of urokinase receptor expression, drives synthesis of this binding site in colonic crypt luminal surface epithelial cells. J Biol Chem 2004; 279:22674-22683.
70 Sze KL, Lee WM, Lui WY. Expression of CLMP, a novel tight junction protein, is mediated via the interaction of GATA with the Kruppel family proteins, KLF4 and Sp1, in mouse TM4 Sertoli cells. J Cell Physiol 2008; 214:334-344.
71 Boyd KE, Wells J, Gutman J, Bartley SM, Farnham PJ. c-Myc target gene specificity is determined by a post-DNA binding mechanism. Proc Natl Acad Sci USA 1998; 95:13887-13892.
72 Zeller KI, Haggerty TJ, Barrett JF, et al. Characterization of nucleophosmin (B23) as a Myc target by scanning chromatin immunoprecipitation. J Biol Chem 2001; 276:48285-48291.
73 Jin VX, O’Geen H, Iyengar S, Green R, Farnham PJ. Identification of an OCT4 and SRY regulatory module using integrated computational and experimental genomics approaches. Genome Res 2007; 17:807-817.
74 O’Geen H, Nicolet CM, Blahnik K, Green R, Farnham PJ. Comparison of sample preparation methods for ChIP-chip assays. Biotechniques 2006; 41:577-580.
75 Shannon P, Markiel A, Ozier O, et al. Cytoscape: a software environment for integrated models of biomolecular interaction networks. Genome Res 2003; 13:2498-2504.
(Supplementary information is linked to the online version of the paper on the Cell Research website.)
Copyright © 2022 FDOKUMEN