Designing Platforms to Biophysically Regulate T Cell Activation
214
Designing Platforms to Biophysically Regulate T Cell Activation Ho Wai (Matthew) Chin Division of Medicine University College London This thesis is submitted for the degree of Doctor of Philosophy
-
Upload
khangminh22 -
Category
Documents
-
view
0 -
download
0
Transcript of Designing Platforms to Biophysically Regulate T Cell Activation

Designing Platforms to Biophysically
Regulate T Cell Activation
Ho Wai (Matthew) Chin
Division of Medicine
University College London
This thesis is submitted for the degree of
Doctor of Philosophy


I would like to dedicate this thesis to my mother and my late father.

Declaration
I, Ho Wai (Matthew) Chin hereby declare that except where specific reference is made to the
work of others, the contents of this thesis are original and have not been submitted in whole
or in part for consideration for any other degree or qualification in this, or any other
University. This thesis is the result of my own work and includes nothing which is the
outcome of work done in collaboration, except where specifically indicated in the text. This
thesis contains less than 100,000 words including appendices, bibliography, footnotes, tables
and equations and has less than 150 figures.
Ho Wai (Matthew) Chin
2020


Abstract
Mechanosensitivity is found in almost every known cell type. While much work has focused
on the biophysical regulation of adherent cell behaviours, relatively little is known about the
mechanobiology of non-adherent cells such as T cells. The recent rise of cancer
immunotherapy has ignited a major incentive for investigating how physical parameters may
be harnessed to optimise therapeutic T cell processing. This need stems from the fact that
current processing methods are multi-step, labour-intensive, costly and time-consuming.
Moreover, T cell activation commonly requires the use of antibody-coated microbeads that
lack control over mechanical parameters and require downstream separation. This thesis
describes a Nature Inspired Engineering approach to improve T cell processing with
hardware platforms for T cell activation. Exploiting T cell mechanosensitivity, a
polyacrylamide hydrogel-integrated culture device was developed to stimulate Jurkat T cells
with immobilised anti-CD3/CD28. Substrate stiffness and surface ligand density were
simultaneously altered to fine-tune T cell activation. Interleukin-2 (IL-2) and post-stimulation
proliferation revealed a synergistic effect between substrate stiffness and surface ligand
density. Moreover, a trade-off between stimulation strength and post-stimulation proliferation
was observed. Relative to stiff hydrogels (62.4 ± 16.7 kPa), soft hydrogels (11.8 ± 3.0 kPa)
induced lower IL-2 secretion but higher post-stimulation cell proliferation. Surprisingly, both
soft and stiff hydrogels stimulated higher IL-2 secretion than the gold standard T cell-
activating material (Dynabeads). Image analysis revealed an underuse of Dynabead surfaces
for stimulation due to their heterogeneous dispersion in culture wells. To extend the use of
the hydrogel platform, two enabling technologies have been developed for pilot studies – a
highly customisable microfluidic system and nanopatterned hydrogels. The former provided a
means to automate T cell stimulation under flow conditions, whereas the latter offered gold
nanoparticle arrays for spatial control over immobilised ligands. The combination of these
tools provide a basis upon which biophysical parameters may be optimised to intensify T cell
processing.


Impact Statement
T cell-based immunotherapy is a therapeutic modality that uses a major class of immune
system enforcers, known as T cells, to seek and destroy cancer cells. The manufacture can be
largely divided into extraction of T cells, laboratory-based processing and infusion into the
patient. Central to the processing is T cell activation, which is required to generate large
numbers of therapeutic cells needed by the patient and convert them into specialised
antitumour cell types. This critical step is usually done by stimulating T cells with artificial
materials designed to “biomimic” cells and signals that are normally needed to elicit
activation in the body. However, this approach is heavily molecule-centric and employs
superficial geometric designs – as exemplified by antibody-coated microbeads. This is
despite growing evidence of T cell mechanosensitivity which allows activation to be
modulated by a variety of physical factors such as substrate stiffness and stimulatory ligand
density. T cell activation materials and methods that harness biophysical cues have not yet
been thoroughly explored, but may lead to novel strategies that improve the current
manufacturing paradigm in cost-effectiveness, flexibility and logistics.
The work described in this thesis provides three technical platforms for T cell activation. The
core technology includes a hydrogel-integrated screening device to study T cell behaviours.
In particular, the hydrogel acts a versatile material upon which stiffness, ligand density and
biochemical cues may be simultaneously tuned to derive optimal conditions for T cell
activation. In addition, a microfluidic system is put forward to enable the automation of
hydrogel-based T cell activation, as well as modular interface with future upstream and
downstream operations in cell processing. Lastly, a nanopatterned hydrogel platform is
provided as a way to precisely fine-tune ligand density such that this parameter may be more
accurately quantified in optimisation.

Overall, the platforms have demonstrated how easy-to-manipulate physical and chemical
parameters may be exploited to gain flexible control of T cell activation. Insights gained from
this research have also highlighted processing bottlenecks and technical considerations that
need to be addressed in automated T cell processing. Furthermore, hardware prototypes
developed in this work could be used as technological foundations upon which point-of-care,
low-volume cell processors may be developed.
Mass deployment of T cell-based immunotherapy is currently limited by high costs,
complicated logistics and long processing durations. Furthermore, the level of control over
cell products is hindered by difficulties in routinely generating therapeutic cells with high
biological consistency and predictability. Technologies such as those described in this thesis
are therefore particular beneficial as they allow for exploration of cheaper, faster and more
controlled ways of cell manufacturing via automation, reduction in volume and unit
operations, as well as an expansion of tuneable parameters. The customisability possessed by
the hardware platforms not only allow them to be adapted for future incarnations of T cell
therapies, but also other applications such as tissue engineering and mechanobiological
studies.

Preface
Some of the work described in this thesis has previously been presented in the following
conferences:
Transforming Immunotherapy with Nature-Inspired Engineering.
M. H. W. Chin, E. Gentleman, M-O. Coppens, R. Day. American Institute of Chemical
Engineers (AIChE) Annual Meeting. Pittsburgh, PA, USA. 2018. Oral presentation.
A Mechanobiologically Inspired Platform for Therapeutic T-Cell Activation.
M. H. W. Chin, E. Gentleman, M-O. Coppens, R. Day. 5th Tissue Engineering and
Regenerative Medicine International Society (TERMIS) World Congress. Kyoto, Japan.
2018. Poster presentation.
Biophysical Fine-Tuning of Immune Cell Behaviour by using a Biomaterial-based Culture
Platform.
M. H. W. Chin, E. Gentleman, M-O. Coppens, R. Day. 19th International Union of Pure and
Applied Biophysics (IUPAB)and 11th European Biophysical Societies’ Association (EBSA)
Congress. Edinburgh, UK. 2018. Poster presentation.
A Hydrogel-based Platform for the Ex Vivo Activation and Expansion of T Cell.
M. H. W. Chin, E. Gentleman, M-O. Coppens, R. Day. TERMIS European Chapter Meeting.
Davos, Switzerland. 2017. Poster presentation.
A Biomaterial-based Platform for the Optimisation of Immune Cell Culture.
M. H. W. Chin, E. Gentleman, M-O. Coppens, R. Day. Chemical Engineering Day UK.
Birmingham, UK. 2017. Oral and poster presentations.


Acknowledgements
I would like to thank all my supervisors – Prof. Richard Day (Division of Medicine,
University College London), Prof. Marc-Olivier Coppens (Department of Chemical
Engineering, University College London) and Dr. Eileen Gentleman (Centre for Craniofacial
and Regenerative Biology, King’s College London). This journey would not have been
possible without their interdisciplinary guidance. All of them have been very open to my
ideas from the beginning and each has made unique, invaluable contribution to my training.
I am grateful for Richard’s willingness for me to build this project up all the way from
scratch. Under his supervision, I was able to develop my independence yet maintain a
collaborative spirit that is much needed in research.
I would like to especially thank Marc-Olivier for introducing me to the concept of Nature-
Inspired Engineering. I have benefited much intellectually from the stimulating environment
of the Centre for Nature Inspired Engineering (CNIE), which he directs. I would not have
been able to conduct some of the experiments if not for the extra funds kindly offered by the
CNIE. I have also very much enjoyed my conversations with him on complex systems theory
and process intensification.
Eileen provided essential training all the way from day one of my rotation in her group and
continued to give insightful, constructive feedback on my work throughout my PhD journey.
She introduced me to the fascinating world of mechanobiology and how biomaterial stiffness
can be exploited to alter cell behaviours. The experimental techniques I learnt during my time
in her group were indispensable to this PhD project.
Many thanks to Dr. Stefan Guldin and Dr. Alaric Taylor (Department of Chemical
Engineering) for providing me with the facilities needed to perform nanopatterning
experiments. In particular, Alaric helped perform AFM imaging of my nanopatterned
substrates and provided technical help while I was working in their laboratory. Michael

Norman (KCL) kindly offered to measure the stiffness of my hydrogels with AFM
nanoindentations. Prof. Vijay Chudasama and Dr. Daniel Richards (Department of
Chemistry) helped with UV-vis characterisation of streptavidin-acrylamide. Also, Dr. Sanjay
Sathasivam performed XPS on my nanopatterned substrates. Prof. Nicolas Szita and Joseph
Harvey (Department of Biochemical Engineering) provided useful feedback in the early days
of my design process for the microfluidic system. Prof. Sergio Quezada (UCL Cancer
Institute) provided some comments on my microfluidics concept. All micro-milling described
in this thesis was outsourced to Protolabs (Telford, Shropshire, UK). Jakob Pyszkowski at
Optics11 (Amsterdam, The Netherlands) conducted additional mechanical characterisation of
my hydrogels.
I would like to express my gratitude to my friends – Dr. Ha Phuong Nguyen, Dr. Francesco
Di Maggio and Dr. Roberta Menezes – with whom I had many happy memories in my early
days at UCL. I would also like to thank Dr. Ketevan Paliashvili, Dr. Alexander Popov, as
well as other members of the Applied Biomedical Engineering Group for their support
throughout my time in the Division of Medicine.
I would like to take this opportunity to pay tribute to pioneers whose work has inspired me –
Conrad Waddington, Alan Turing, Denis Noble, Stuart Kauffman, Donald Ingber and Sui
Huang. In particular, Ingber’s paper “Can cancer be reversed by engineering the tumor
microenvironment?” was what got me interested in mechanobiology and biomaterials in the
first place. Standing on the shoulders of giants does indeed make you see far and, perhaps one
day, further.
Lastly, I would like to thank my parents, who have given me everything since the day I was
born. It is with deep sorrow that my father did not stay in this world long enough to see me
graduate. He will be dearly missed.

Contents
Contents ................................................................................................................................... xv List of Figures ......................................................................................................................... xix List of Tables ......................................................................................................................... xxv Abbreviations ....................................................................................................................... xxvii Chapter 1 Introduction .......................................................................................................... 31
1.1 Motivation and hypothesis ....................................................................................... 31 1.2 The immune system and cancer ............................................................................... 32
1.2.1 Immune defence against pathogens ................................................................. 32 1.2.2 T cells ............................................................................................................... 35 1.2.3 T cell activation and the immunological synapse ............................................ 36 1.2.4 Cancer-immunity cycle .................................................................................... 40
1.3 Cancer immunotherapy ............................................................................................ 43 1.3.1 Conception and early challenges ..................................................................... 43 1.3.2 Checkpoint blockade therapy ........................................................................... 44 1.3.3 Adoptive T cell therapy ................................................................................... 45
1.4 Mechanobiology ...................................................................................................... 46 1.4.1 Biophysical regulation of TCR triggering ....................................................... 49 1.4.2 Artificial cell niches to probe T cell mechanobiology ..................................... 51
1.5 Process intensification ............................................................................................. 53 1.6 Nature-inspired engineering ..................................................................................... 54 1.7 Thesis outline ........................................................................................................... 56
Chapter 2 Biophysical T cell activation platform ................................................................. 59 2.1 Introduction .............................................................................................................. 59 2.2 Materials and methods ............................................................................................. 62
2.2.1 Materials .......................................................................................................... 62 2.2.2 Preparation of polyacrylamide hydrogels ........................................................ 62 2.2.3 Characterisation of streptavidin-acrylamide .................................................... 64 2.2.4 Antibody immobilisation ................................................................................. 65 2.2.5 Immunofluorescence imaging .......................................................................... 66
2.2.6 Stiffness measurements .................................................................................... 67 2.2.7 Cell culture ....................................................................................................... 67 2.2.8 Device design and fabrication .......................................................................... 68 2.2.9 T cell stimulation ............................................................................................. 68 2.2.10 IL-2 ELISA ...................................................................................................... 70 2.2.11 Image processing ............................................................................................. 70 2.2.12 Statistical analysis ............................................................................................ 71
2.3 Results ...................................................................................................................... 73 2.4 Discussion ................................................................................................................ 89 2.5 Conclusions .............................................................................................................. 95
Chapter 3 Development of microfluidic hardware for automated T cell stimulation .......... 97 3.1 Introduction .............................................................................................................. 97 3.2 Materials and methods ........................................................................................... 100
3.2.1 Materials ........................................................................................................ 100 3.2.2 Peristaltic pump assembly .............................................................................. 100 3.2.3 Pump calibration ............................................................................................ 102 3.2.4 Microfluidic device ........................................................................................ 104 3.2.5 Cell culture ..................................................................................................... 104 3.2.6 T cell stimulation ........................................................................................... 105 3.2.7 Statistical analysis .......................................................................................... 108
3.3 Results .................................................................................................................... 109 3.4 Discussion .............................................................................................................. 117 3.5 Conclusions ............................................................................................................ 124
Chapter 4 Hydrogel-based antibody nanoarrays ................................................................ 125 4.1 Introduction ............................................................................................................ 125 4.2 Materials and methods ........................................................................................... 127
4.2.1 Materials ........................................................................................................ 127 4.2.2 Preparation of block copolymer micellar solution ......................................... 128 4.2.3 Fabrication of AuNP arrays ........................................................................... 129 4.2.4 X-ray photoelectron spectroscopy ................................................................. 131 4.2.5 Transfer lithography ....................................................................................... 131 4.2.6 Atomic force microscopy ............................................................................... 132 4.2.7 Image-based particle analysis ........................................................................ 132 4.2.8 Antibody immobilisation ............................................................................... 132 4.2.9 Cell culture and T cell stimulation ................................................................. 133 4.2.10 Statistical analysis .......................................................................................... 133
4.3 Results .................................................................................................................... 134
4.4 Discussion .............................................................................................................. 142 4.5 Conclusions ............................................................................................................ 146
Chapter 5 Conclusions ........................................................................................................ 147 5.1 Tuning T cell activation with physicochemical cues ............................................. 147 5.2 Microfluidics-based T cell activation .................................................................... 149 5.3 Gold nanoparticle-patterned hydrogels .................................................................. 149
Chapter 6 Future work ........................................................................................................ 151 6.1 3D hydrogels .......................................................................................................... 151 6.2 Phenotypic analysis ................................................................................................ 152 6.3 Integration of label-free biosensing ....................................................................... 152 6.4 Artificial lymph node ............................................................................................. 153
References .............................................................................................................................. 155 Appendix A ............................................................................................................................ A-1
A.1 UV-vis spectroscopy of streptavidin-acrylamide ................................................... A-1 A.2 Additional mechanical characterisation of hydrogels ............................................ A-2 A.3 Post-stimulation (48 hours) cell viabilities ............................................................ A-1 A.4 MATLAB code for image analysis ........................................................................ A-2
Appendix B ............................................................................................................................ B-1 B.1 Arduino sketch for peristaltic pump operation ...................................................... B-1 B.2 Engineering drawing: master mould for microfluidic layer .................................. B-4 B.3 Pump control unit version 1.0 ................................................................................ B-5
Appendix C ............................................................................................................................ C-1 C.1 MATLAB code to detect AuNPs on glass in AFM images ................................... C-1 C.2 MATLAB code to detect AuNPs on gels in AFM images .................................... C-3


List of Figures
Figure 1.1 Schematic of the transmembrane TCR-CD3 complex, formed by TCR α and β chains associated with three dimeric signal transduction modules CD3εδ, CD3εγ and CD3ζζ. ITAM refers to immunoreceptor tyrosine-based activation motif. Reproduced from [33]. .... 38 Figure 1.2 Receptors in a mature immunological synapse. (a) Receptors that are exploited in the work described in this thesis include TCR-CD3 (signal 1), CD28 (signal 2) and LFA-1 (adhesion). (b) Spatial organisation of receptors within the IS: centre is the cSMAC, middle ring is the pSMAC, and outer ring is the dSMAC. Reproduced from [34]. ............................ 39 Figure 1.3 Impact of T cell differentiation on anti-tumour efficacy. Although activation is crucial in therapeutic T cell processing, excessive stimulation may compromise proliferative capacity of the cells. Reproduced from [35]. ........................................................................... 40 Figure 1.4 The cancer-immunity cycle. APCs (Antigen-presenting cells). CTLs (Cytotoxic T lymphocytes). Reproduced from [44]. ..................................................................................... 43 Figure 1.5 Process flow diagram of typical CAR-T cell manufacturing. Key: IPC (In-process control); QC (quality control). Reproduced from [76]. ........................................................... 46 Figure 1.6 (a) Imaging methods have enabled the visualisation of how cells dynamically and mechanically interact with substrate materials. Shown here are traction force microscopy images of a T cell pushing and pulling on flexible micro-pillars coated with anti-CD3 and anti-CD28. Forces are represented by arrows. Scale bar: 5 µm. Reproduced from [88]. (b) Schematic to illustrate how substrate stiffness directs mesenchymal stem cell (MSC) differentiation into distinct lineages. Reproduced from [97]. .................................................. 48 Figure 1.7 Artificial antigen-presenting cell (aAPC) design considerations. Although a lot of work has been done on various ligation methods, combinations of ligands and scaffold materials, the effect of physical properties is relatively unexplored. Reproduced from [127]................................................................................................................................................... 53 Figure 1.8 Diagram of relations between chapters. Double-headed arrows are included to indicate the interdependence of different technologies or “co-inventions” – the end goal drives the current work, but the current work dictates the direction to reach that goal. Chapter 5 is omitted as it is the Conclusions. ........................................................................................ 58 Figure 2.1 Schematic representation of the fabrication of PA hydrogels. (1) Glass slides were cleaned by O2 plasma to generate (2) silanol groups on the surface. (3) The activated glass slides were amino-silanised by APTES and (4) subsequently functionalised by glutaraldehyde. (5) A gel-casting sandwich was then set up (arrow indicates photograph of it) for (6) hydrogel polymerisation. (7) After the polymerisation, the coverslip and spacers were removed, leaving a layer of hydrogel attached to the glass slide (arrow indicates photograph of a hydrogel-coated slide). ...................................................................................................... 65

Figure 2.2 Conjugation of anti-CD3 to PA hydrogels via biotin-streptavidin capture. (a) Top row (x-y projection): Representative confocal microscopy images (top-down view) of streptavidin-doped PA hydrogels coated with biotinylated anti-CD3 and detected using a secondary antibody, FITC-conjugated anti-mouse IgG, which appears as green in the left image. Negative controls (middle and right images) showed minimal binding of the secondary antibody to the hydrogel when anti-CD3 was absent and there was no autofluorescence from gels in the absence of antibodies. All gels depicted here correspond to those of 0.05% w/v crosslinker. Bottom row (x-z projection): Representative side projections of hydrogels. The green layer visible in the left image represents the antibody layer. Scale bar is 100 µm. (b) Mean fluorescence intensities (MFIs) of hydrogels (0.05% w/v crosslinker) incubated with (+) primary and secondary antibodies compared with MFIs of those without (-) either the primary or secondary. (c) Pre-normalisation of surface ligand density: significant reduction in MFI was observed with increasing stiffness when the same concentration (100 µg/mL) of streptavidin-conjugated acrylamide was used. (d) Post-normalisation of surface ligand density: no significant MFI differences were observed in anti-CD3-coated hydrogels. For (b-d), data = mean ± standard deviation. Data points represent individual MFI readings obtained from at least 3 separate hydrogels per condition and at least 2 ROIs per gel. *** denotes p ≤ 0.001; NS means no significance. One-way ANOVA with Tukey’s test (a = 0.05). ........................................................................................................... 74 Figure 2.3 Left column: Z-axis profiles of mean fluorescence intensity (MFI) versus depth obtained by confocal microscopy for streptavidin-doped PA hydrogels of different degrees of crosslinking, coated with biotinylated anti-CD3. Percentages refer to crosslinker concentrations. Data presented as mean with standard deviation error bars. Data points represent individual MFI readings obtained from at least 3 separate hydrogels per condition and at least 2 ROIs per gel. Right column: Representative x-z projection images of respective hydrogels. Scale bar = 100 µm. .............................................................................. 75 Figure 2.4 Representative fluorescence images (3D reconstruction from z-stacks) of an anti-CD3-coated PA hydrogel with (a) the anti-CD3 layer labelled with FITC-conjugated secondary antibody (green) and (b) the bulk of the gel labelled with Alexa Fluor 568 (red). The cross-sectional merged view of (a) and (b) is shown in (c). ............................................ 75 Figure 2.5 Young’s modulus (E) of hydrogels obtained via AFM nanoindentation. The E values derived from individual load-indentation curves from two independent gels per crosslinker concentration were pooled together and averaged. Data = mean ± standard deviation. Values displayed above bars indicate mean E values. **** denotes p ≤ 0.0001. Welch’s ANOVA with Games-Howell post-hoc test (a = 0.05). ............................................ 76 Figure 2.6 Hydrogel-integrated multiwell culture chamber for T cell stimulation. (a) Exploded view of the assembly. (b) The interior of the assembly with a detailed view showing how the recessed rectangular slot enabled alignment and fitting of the PDMS gasket. (c) The gasket was created using a PTFE mould and could be easily detached using tweezers (preferably with flat tips). (d) Top and side views show 200 µL of culture medium loaded in each microwell without any leakage. (e) Image of Jurkat cells inside the hydrogel-integrated culture chamber, as viewed from the bottom viewing window using an inverted phase contrast microscope. Scale bar = 100 µm. (f) A gel-coated slide removed from the assembly after aspiration of culture medium from the microwells. Residual medium formed circular droplets on the slide where the microwells were before disassembly. Scale bar = 10 mm. .... 78 Figure 2.7 Stimulation of Jurkat cells using anti-CD3-coated PA hydrogels. P-values returned by two-way ANOVA are noted above the plots. (a) IL-2 secretion from the cells stimulated on Ab-coated hydrogels of different formulations. P-values of main effects
([Crosslinker] and [Anti-CD3]) and interaction effect ([Crosslinker] ´ [Anti-CD3]) returned by ANOVA are noted above the plot. [Crosslinker] refers to crosslinker concentration of hydrogels. [Anti-CD3] refers to concentration of anti-CD3 in the coating solution. Data presented as geometric means with 95% confidence interval error bars back-transformed from the log10 scale to the original scale. Points represent individual data points from 3 independent experiments (N = 3). Two-way ANOVA (with interaction; White-adjusted for heteroscedasticity) on log10-transformed data followed by Games-Howell post-hoc test (a = 0.05). # Significant difference (p < 0.0001) from d. † Significant difference (p < 0.01) from e. * p < 0.05. ** p < 0.01. (b) The effect of stimulation time on IL-2 secretion from Jurkat cells stimulated by gels of 0.05% w/v (soft) and 0.4% w/v (stiff) crosslinker. Both stiff and soft gels were coated with 10 µg/mL of anti-CD3. P-values returned by two-way ANOVA are noted above the plots. Data presented as geometric means with 95% confidence interval error bars back-transformed from log10 scale. N = 3. Two-way ANOVA (without interaction) on log10-transformed data, followed by Tukey’s post-hoc test on the main effect of stimulation time (a = 0.05). P-values from pairwise comparisons are shown below the plot. .................. 80 Figure 2.8 IL-2 secretion by Jurkat cells stimulated by soft gels (0.05% w/v crosslinker), stiff gels (0.4% w/v crosslinker) presenting both signal 1 (anti-CD3) and 2 (anti-CD28). Dynabeads presenting the same signals were included as a positive control. Tissue culture plastic devoid of any stimulatory signals was employed as a negative control. ART two-way ANOVA (with interaction), followed by post-hoc interaction contrast (difference-in-differences) analysis (a = 0.05). P-values for main effect (substrate type and time) and interaction (substrate type ´ time) effects returned by ANOVA are noted above the plot. Substrate type refers to the substrate material employed to stimulate Jurkat cells. Data presented as mean ± standard deviation. N = 3. Post-hoc comparisons between groups stimulated by soft gels, stiff gels and Dynabeads are shown in table below the plot, where the p-values indicate whether there is a significant difference in the differential response between a pair of substrate types for a particular stimulation time relative to that of another pair for another stimulation time. NS means not significant. ............................................................... 82 Figure 2.9 Image processing pipeline to analyse cell-bead interactions. Illustrated here is an example that required extra processing to quantify cells and beads, due to the presence of a large cluster. A circle detection algorithm was first applied to the microscopy image in (a) to yield the results in (b). (c) The large cluster (boundary outlined in blue), however, returned some false negatives and positives (indicated by “+” markers) Cell and bead numbers detected by the algorithm are given below the plot. (d) The rest of the cells and beads as detected by the algorithm. (e) Manual counting of cells and beads inside the cluster using yellow markers. ........................................................................................................................ 84 Figure 2.10 Detected cell-bead interactions in phase contrast microscopy images. Left column: green markers superimposed on detected bead-bound cells. Scale bar = 100 µm. Middle column: Histograms to show the number of Dynabeads bound to cells detected by the image processing pipeline. Right column: Pie charts showing the relative proportions of cell-bound beads versus unbound beads. ........................................................................................ 85 Figure 2.11 (a) Post-stimulation proliferation of Jurkat cells. Data = mean ± standard deviation. N =3. (b) Cell diameters of Jurkat cells in post-stimulation proliferation time course. Data presented as mean ± standard deviation. N =3. Two-way ANOVA with Tukey’s test (a = 0.05). * Significant difference (p < 0.01) from Dynabeads (same time). ☨ Significant difference (p < 0.01) from all (same time). ¥ Significant difference (p < 0.001) soft PA gel (same time). NS Not significant (same time). .......................................................................... 86

Figure 2.12 Stimulatory signals and adhesive cues synergistically potentiated T cell activation. αCD3, αCD28, αLFA-1 and “isotype” were all biotinylated Abs and immobilised on streptavidin-doped hydrogels. “Isotype” refers to the negative control: isotype control of anti-CD3 – mouse IgG2a,κ. Data presented as mean ± standard deviation. N =3. Two-way ANOVA (a = 0.05). P-values returned by ANOVA for the main effects (Adhesive signal and [Crosslinker]) are noted above the plot. “Adhesive signal” refers to the comparison made between the groups (+ αCD3, + αCD28, – αLFA-1) and (+ αCD3, + αCD28, + αLFA-1), as the difference between them is the presence/absence of the adhesive signal αLFA-1. [Crosslinker] refers to the crosslinker concentration of hydrogels. NS means not significant................................................................................................................................................... 88 Figure 3.1 Peristaltic pump assembly. (a) The pump head was obtained by disassembling a DC peristaltic dosing pump. The interior of the pump head consisted of three-roller rotor assembly that was used to compress and relax a piece of soft silicone tubing. (b) The original DC motor was replaced by a stepper motor to enable low speed control with higher precision................................................................................................................................................. 101 Figure 3.2 Modules in pump control unit. (a) A compact design: the shields were stacked on top of the Arduino Uno microcontroller. (b) The Arduino Uno board handled the logic necessary to control the stepper motor. After uploading code via its USB port, the board could be used as part of a standalone device by connecting it to the mains via the on-board 5.5 mm/2.1 mm centre-positive DC barrel plug. (c) The motor shield provided the power, circuitry (especially H-bridges) and dedicated ports (M1 and M2 in diagram) required to drive and interface with the stepper motor. (d) The LCD shield acted as the user interface such that the flow rate could be selected without the need for code modification on a computer. ............................................................................................................................... 102 Figure 3.3 Pump calibration set-up. Water from an input reservoir was pumped through the tubing and dispensed into a glass vial placed on an electronic balance. The mass of water was measured every 5 minutes of pump runtime. ......................................................................... 103 Figure 3.4 (a) Fluidic circuit employed for T cell stimulation under flow conditions. Cells were flowed through the hydrogel-integrated microfluidic device from the input reservoir to the output reservoir using a peristaltic pump driven by a stepper motor. The flow rate (motor speed) was set using a control unit connected to the stepper motor. (b) Cross-sectional diagram of the microfluidic device. In flow experiments, cells flowed over a hydrogel-coated surface inside the PDMS channel (red box). Arrows indicate flow direction. ...................... 107 Figure 3.5 (a) Pump calibration curve to convert motor speed (in full-steps per second) into flow rate, and vice versa. Data presented as mean ± standard deviation. Dots represent individual readings. Line equation as well as R2 and adjusted R2 (R2adj) values for the linear regression are displayed. When a flow rate was selected by the user on the control unit, the equation was used to convert the flow rate into the speed required to drive the motor. It should be noted that the motor was in “micro-stepping” mode, meaning that each full-step was divided into 16 “micro-steps” automatically in the background by the microcontroller code. (b) Precision of the pump at each flow rate (varied by motor speed) coefficient of variation (CV), expressed as a percentage here. .................................................................... 109 Figure 3.6 (a) Exploded view of the microfluidic device. (b) Assembled view of the microfluidic device. (c) Jurkat cells in the microfluidic channel as viewed using an inverted phase contrast microscope. (d) Leak test showing the confinement of dyed water within the microfluidic channel. (e) Biocompatibility of the modified 50 mL centrifuge tube was tested by incubating cells in it for 24 hours under standard culture conditions (N = 1). ................. 111

Figure 3.7 (a) The microfluidic system as set up in the tissue culture cabinet. The peristaltic pump was put into an enclosure measuring 16 × 11 × 9 cm (H × W × D) to protect the stepper motor from the humidified incubator environment. Silica gel beads were also placed inside the enclosure to absorb any potential moisture. The control unit measures 4.7 × 8 × 5.3 cm (H × W × D). (b) The entire fluidic circuit was transferred into the incubator for Jurkat cell stimulation. As shown, the components took up only about a quarter of a shelf in the incubator. The input reservoir was fixed on a magnetic stirrer to keep cells suspended throughout the flow experiment. ............................................................................................ 112 Figure 3.8 Jurkat cell performance post-microfluidic processing. (a) IL-2 secretion from Jurkat cells after 1 and 2 passes through the microfluidic device containing an anti-CD3/CD28-coated PA hydrogel. Data presented as mean ± standard deviation. Dots represent individual readings. N = 3. Paired t-test (a = 0.05). ****p < 0.0001. ***p < 0.001. (b) Dynamic mode: cells were suspended in the input reservoir with magnetic stirring and pumped through the microfluidic device at 30 µL/min. Static mode: cells were loaded into the microfluidic device inside an incubator and incubated for different durations. N = 1. (c) Output cell concentration at 30 mins compared to the initial cell concentration at the input (ratios expressed as percentages). “Total cell concentration” refers to that in the output reservoir at 30 mins. ............................................................................................................... 114 Figure 3.9 The cost of the custom-built pump (“Custom”) compared to three commercial peristaltic pumps. “Shenchen” refers to Shenchen Baoding SP-Minipump Compact Peristaltic Pump. “Longer” refers to Longer Dispensing Peristaltic Pump BT100-1F. “Harvard” refers to Harvard Apparatus Peristaltic Pump P-70. Apart from “Custom”, all prices exclude tax. Prices of “Shenchen” and “Longer” were obtained from Darwin Microfluidics. The price of “Harvard” was obtained from a quote offered by Biochrom Ltd. ......................................... 116 Figure 3.10 Interfacing devices with the Arduino Uno microcontroller – a single-master, multi-slave configuration. Only two pins (A4 and A5) on the Arduino board (“master”) are needed for I2C communication with “slave devices”. In I2C terminology, A4 and A5 are known as SDA and SCL which refer to serial data and serial clock, respectively. A typical I2C message begins with a “start” condition and ends with a “stop” condition. Each slave device must have a unique 7-bit address for the master device (Arduino) to select – an essential feature that allows multiple slaves to share the same two pins on the master. The read/write bit specifies data direction – i.e. whether the master should read from or write data to the slave. An “acknowledge/not acknowledge” pulse then follows to check whether slaves are ready for data transfer. If the slaves are not ready then the master must either generate a “stop” signal or repeat the “start” condition. The actual data are sent in 8-bit packets (bytes). Any number of bytes can be sent but each byte must be followed by an “acknowledge/not acknowledge” bit so the system knows whether to proceed with the next lot of data transfer................................................................................................................................................. 119 Figure 4.1 (a) Overview of the use of BCMN to fabricate AuNP nanoarrays on hydrogels for nanoscale control of surface ligand density. (b) Right (red box): set-up utilised for dip-coating. Left (purple box): AuNPs were formed on the substrate surface via exposure to H2 plasma. ................................................................................................................................... 130 Figure 4.2 XPS Au-4f photoelectron spectra of dip-coated glass surface after each treatment step. Top: glass only control. Middle: dip-coated glass slide pre-plasma treatment. Bottom: glass slide after hydrogen plasma treatment. Solid line represents the fitted (“envelope”) spectrum. Dashed line represents the background. ................................................................ 135 Figure 4.3 (a) Electroless deposition was employed to visually confirm the presence and coverage of AuNPs on PA hydrogels after lifting them off from nanopatterned glass slides.

(b) Representative images of PA hydrogels derived from different plasma and swelling durations. ................................................................................................................................ 136 Figure 4.4 AFM data of AuNPs on glass (a – d) and PA hydrogel (e – h). Aerial (a, e) and tilted (c, g) views show that AuNPs were present on both glass and hydrogel. (b, f) Quasi-hexagonal formation of AuNPs. (d, h) Height profiles of AuNPs on glass and hydrogel extracted from blue line in a and red line in e, respectively. (i) Plain hydrogel without AuNPs. (j) Height profiles (measured along red lines in i) of nanoscale pits present in the control gel. All gradient colour bars indicate height (z-direction). ........................................ 138 Figure 4.5 Example images showing MATLAB detection of AuNPs on (a) hydrogel and (b) glass. Green and blue markers indicate positions of detected AuNPs on hydrogel and glass, respectively. (c) Diameter of detected AuNPs. (d) Interparticle (centre-to-centre) distance of AuNPs as computed by 1st nearest neighbour analysis. All data presented as mean ± standard deviation. 2 × 2 µm ROIs were analysed from 3 samples per substrate, with at least 950 AuNPs per ROI. Welch’s t-test (a = 0.05). **** p < 0.0001. ............................................... 139 Figure 4.6 (a – e) Immunofluorescence images of anti-CD3 immobilised on AuNP-decorated hydrogel surfaces obtained by confocal microscopy using a secondary antibody (anti-mouse IgG FITC). (a) Anti-CD3-coated hydrogel imaged at the edge to show the difference between nanopatterned gel and plain glass. (b) Nanopatterned region of gel remained dark in the absence of anti-CD3. (c, d, and e) Negative controls. All “+ anti-CD3” gels were coated with 10 µg/mL of the antibody before imaging. (f) IL-2 secretion from Jurkat cells after 24 hours of stimulation by anti-CD3 (10 µg/mL coating solution) immobilised on PA gel-presented AuNPs. The negative control (– anti-CD3) represents a AuNP-coated hydrogel without anti-CD3. Data presented as mean ± standard deviation. Dots represent individual readings. N = 3. Two-sample t-test (a = 0.05). **** means p < 0.0001. .............................. 141 Figure 6.1 Adopting a multiscale, “networks-in-networks” approach to deploy cell-based cancer immunotherapies. Living and non-living (hardware/software) systems that are dealt with in cancer immunotherapy can themselves be regarded as parts of larger systems. Here, the microfluidic platform prototype is intended to be the “cell processing module”. It is envisioned that centre-to-centre and device-to-device variability may be minimised by connecting cell processing systems via a cloud-based platform and sharing data among them................................................................................................................................................. 154

List of Tables
Table 1.1 Major cell types of the immune system and their main functions .......................... 35 Table 2.1 Recipe for polyacrylamide hydrogel fabrication ..................................................... 63 Table 2.2 Concentrations of antibodies used for different formulations of coating solution .. 66 Table 3.1 Comparison of custom pump and control unit dimensions with those of commercial pumps ................................................................................................................. 113 Table 3.2 Price list of all major* components used in the programmable peristaltic pump . 115 Table 4.1 Characteristics of the di-block copolymer used in this study ............................... 128 Table 5.1 Toolset developed by the work described in this thesis. ....................................... 147

Abbreviations
aAPC Artificial antigen-presenting cell
AFM Atomic force microscopy
AICD Activation-induced cell death
ANOVA Analysis of variance
APC Antigen-presenting cell
APS Ammonium persulfate
AuNP Gold nanoparticle
BAC N,N’-bis(acryloyl)cystamine
BCMN Block copolymer micelle nanolithography
Bisacrylamide N,N’-methylenebisacrylamide
BSA Bovine serum albumin
CD Cluster of differentiation
CLP Common lymphoid progenitor
cSMAC Central supramolecular activation cluster
CTL-4 Cytotoxic T lymphocyte–associated antigen 4
DAPI 4’,6-diamidino-2-phenylindole
DC Dendritic cells (biology); direct current (electronics)
dSMAC Distal supramolecular activation cluster
EBL Electron beam lithography
ELISA Enzyme-linked immunosorbent assay
FA Focal adhesion

FasL Fas ligand
FBS Foetal bovine serum
FDA United States Food and Drug Administration
FIB Focused ion beam
FITC Fluorescein isothiocyanate
GMP Good Manufacturing Practice
HAuCl4·3H2O Gold(III) chloride trihydrate
HBS HEPES-buffered saline
HEPES 4-(2-hydroxyethyl)-1-piperazineethanesulfonic acid
HS-(CH2)11-EG3-NTA Nitriloacetic acid-terminated alkanethiol
HSC Hematopoietic stem cell
ICAM-1 Intercellular adhesion molecule 1
IL Interleukin
IS Immunological synapse
ITAM Immunoreceptor tyrosine-based activation motif
LCD Liquid crystal display
LFA-1 Lymphocyte function-associated antigen 1
MFI Mean fluorescence intensity
MHC Major histocompatibility complex
MPP Multipotent progenitor
MSC Mesenchymal stem cell
NH2OH·HCl Hydroxylamine hydrochloride
NiCl2 Nickel(II) chloride
NIE Nature-inspired engineering
p-MHC Peptide-major histocompatibility complex
PA Polyacrylamide
PAMP Pathogen-associated molecular pattern

PBS Phosphate-buffered saline
PBST PBS containing 0.1% (v/v) Tween-20
PD-1 Programmed cell death protein 1
PD-L1 Programmed death-ligand 1
PDMS Polydimethylsiloxane
PI Process intensification
PMMA Poly(methyl methacrylate)
POC Point of care
PRR Pattern recognition receptors
PS-b-P2VP Poly(styrene-block-2-vinylpyridine
pSMAC Peripheral supramolecular activation cluster
PTFE Polytetrafluoroethylene
RGB Red, green and blue
ROI Region of interest
RPMI Roswell Park Memorial Institute
SMAC Supramolecular activation cluster
TAA Tumour-associated antigen
TC Cytotoxic T cell
TCM Central memory T cell
TCR T cell receptor
TEMED Tetramethylethylenediamine
TH Helper T cell
TIM-3 T cell immunoglobulin and mucin domain-containing protein-3
Treg Regulatory T cell
TSA Tumour-specific antigen
TSCM Stem cell memory T cell
UV-vis Ultraviolet-visible

VP Vinyl pyridine
w/v % Weight per volume percent
XPS X-ray photoelectron spectroscopy

Chapter 1 Introduction
1.1 Motivation and hypothesis
Forces are ubiquitous in this universe – their top-down influences on the human body
therefore should not be ignored in the pursuit of understanding and manipulating biological
systems. Yet, the dominant paradigm in biology leans heavily towards reductionistic,
molecular-scale investigations that favour gene-centric, bottom-up causative explanations
[1,2]. This traditional approach has been successfully employed since the 20th century to
identify biomolecules and mechanistically delineate cell signalling pathways. However, it
may be limited in its power to explain how nonlinear interactions on the lower, molecular
level and higher-level constraints (e.g. the microenvironment) synergise to give rise to
emergent properties such as cell phenotypes [3–5].
The field of mechanobiology has in recent decades revealed that top-down physical
influences (e.g. mechanical microenvironmental cues) are as crucial as bottom-up molecular
regulations (e.g. genes and intracellular signalling proteins) [6]. Indeed, phenomena such as
the direction of stem cell differentiation by matrix stiffness are the result of complex
interactions among inter-dependent networks (e.g. gene regulatory, cytoskeletal and cell
networks) across multiple scales [7]. Translating the nonlinear perspective of biology to
medicine and treatments may therefore lead to previously unexplored or underappreciated
avenues. In particular, modern cancer immunotherapies (e.g. checkpoint blockade and
adoptive T cell therapy) are still in a nascent stage and they present many opportunities for
optimisation by new mechanobiological insights.
The overall aim of the work presented in this thesis is therefore to investigate how
biophysical parameters may be exploited to improve biological control of T cell activation
and logistics in bioprocessing. Motivated by the nonlinear perspective of biology, the premise

32 Introduction
of this thesis is based upon the main hypothesis that top-down, biophysical perturbations (in
particular, substrate stiffness) can be harnessed to regulate T cell activation.
1.2 The immune system and cancer
1.2.1 Immune defence against pathogens
The immune system of multicellular organisms, such as humans and other mammals, is a
massively parallel, distributed system encompassing complex networks of interdependent
white blood cells (leukocytes) that together form a defence line in the host against pathogens
[8–10]. The system can largely be divided into the innate immune system and the adaptive
(“acquired”) immune system (see Table 1.1 for a list of major cell types). Both systems
cooperate with each other via intercellular communications mediated by a variety of secreted
proteins (e.g. cytokines and chemokines), cell-surface receptors and cell-cell interactions.
Innate immunity provides a mechanism of rapid response to microbes that have successfully
entered the host organism (Figure 1.1). The innate immune system only recognises a limited
number of specific targets and is therefore more general relative to adaptive immunity. Such
recognition is mediated by antigen presenting cells (APCs), especially macrophages and
dendritic cells (DCs), which sample tissue environments via continuous phagocytosis and
pinocytosis of microbes. Specifically, APCs seek out pathogen-associated molecular patterns
(PAMPs) and engage with them using germline-encoded receptors, known as pattern
recognition receptors (PRRs), such as such as toll-like receptors (TLRs) [11]. Here, PAMPs
are essentially “signatures” expressed by pathogens in the form of carbohydrates,
polypeptides, and nucleic acids.
Upon pathogen detection, APCs secrete chemical messengers known as cytokines that
regulate a wide range of responses in other immune cells – for example, proliferation,
differentiation and gene expression. A well-known class of cytokines is the interleukin (IL),
with well over 60 of them identified since the initial discovery of IL-1 more than four

1.2 The immune system and cancer 33
decades ago [12]. A range of interleukins and their diverse functions have been
comprehensively reviewed in [12] and [13].
Figure 1.1 Simplified schematic of the innate and adaptive immune systems. Pathogens display PAMPs that
can be recognised by cells (such as neutrophils, macrophages and natural killer cells) of the innate immune
system using PRRs. Innate immune cells primarily carry out the tasks of phagocytosis and secretion of
cytokines (such as tumour necrosis factor, TNF) or chemokines (such as chemokine (C-C motif) ligand 3,
CCL3) to amplify the immune response or recruit other cells [14]. Dendritic cells act as the bridge between
the two immune systems by presenting antigens to the T cell receptor (TCR) of naïve T cells in an MHC II-
restricted manner. Activated T cells then undergo clonal expansion and become memory or effector cells.
Effector cells can be either CD4+ T helper (TH) cells or CD8+ cytotoxic T lymphocytes (CTLs). TH cells are
able to secrete cytokines, such as interleukin-2 (IL-2) or interferon gamma (IFNγ). B cells can be activated by
recognising antigens with their B cell receptor (BCR) and become plasma cells that secrete antibodies, or
memory B cells, which rapidly differentiate into plasma cells upon re-infection [15].

34 Introduction
DCs are professional APCs capable of internalising and breaking pathogen-derived proteins
into peptide fragments (antigens), which associate with major histocompatibility (MHC)
molecules to form peptide-MHC complexes (p-MHC) on the cell surface [16]. Here, MHC
molecules exist in two classes – class I molecules (on all nucleated cells in vertebrates) which
present antigens of a cytosolic or nuclear (endogenous) origin, and class II molecules (mainly
on APCs) for extracellularly derived (exogenous) antigens [17]. Once activated, DCs become
highly migratory and move to nearby lymph nodes where they present p-MHCs to T cells to
trigger adaptive immunity.
While both invertebrates and vertebrates are capable of simple processes of innate immunity,
vertebrates are able to mount more sophisticated, adaptive immune responses with T cells and
B cells. Adaptive immune responses are highly specific in the pathogen that induced them. In
addition to eradication of pathogens, adaptive immune responses often result in the
establishment of “immunological memory” [18]. This memory effect is reflected by the pre-
existence of clonally expanded, long-lived antigen-specific T cells that can rapidly mount a
robust immune response upon re-encounter with the original antigen that induced them.

1.2 The immune system and cancer 35
Table 1.1 Major cell types of the immune system and their main functions
Immunity Cell type Function
Innate Basophil Release of histamines that cause inflammation, may contribute to
allergy
Neutrophil First responder at infection/trauma site, phagocytosis, degranulation
Eosinophil Release of toxins to kill bacteria and parasites
Mast cell Recruitment of macrophages and neutrophils, release of histamines
and heparin, dilates blood vessels, wound healing
Natural killer cell Killing of virus-infected cells and tumour cells
Innate/adaptive
interface
Macrophage Phagocytosis, antigen presentation
Dendritic cell Antigen presentation
Adaptive B cell Antibody secretion
T cell Immune response mediation, cell destruction, regulation, memory
1.2.2 T cells
T cells are a subset of lymphocytes that act as enforcers of adaptive immunity [11]. They
originate from hematopoietic stem cells (HSCs) in the bone marrow. To develop into T cells,
the HSCs first differentiate into multipotent progenitors (MPPs) and then to common
lymphoid progenitors (CLPs). CLPs then migrate to the thymus via the bloodstream and
undergo further differentiations, from thymocytes to finally T cells [19,20]. T cells can be
categorised into three major types – helper T cells (TH), cytotoxic T cells (TC) and regulatory
T cells (Treg). TH cells have limited cytotoxicity and mainly secrete cytokines that regulate
other leukocytes such as B cells. In contrast, the main role of TC cells is to cause lysis of
targeted pathogens with secreted perforin and granzymes. Treg cells, on the other hand, are
responsible for suppressing immune responses by inhibiting T cell proliferation and cytokine
production. These cell types can be identified by their surface markers: TH (CD4+), TC
(CD8+) and Treg (CD4+/CD25+). There exist many different subtypes of T cells characterised

36 Introduction
by various combinations of cell surface markers, as well as cytokine profiles – see [21] and
[22].
1.2.3 T cell activation and the immunological synapse
T cells are equipped with highly specific cell surface receptors, T cell receptors (TCRs), that
recognise antigenic fragments presented by MHCs on APCs. Structurally, the TCR consists
of two different protein chains (a heterodimer) that are disulfide-linked, membrane-bound
and antigen-binding [23–25]. Most (~95%) T cells in humans express TCRs made up of α
and β chains (αβ TCRs), whereas a small subset (~5%) possesses γδ TCRs (in this thesis,
“TCR” refers to “αβ TCR”) [26]. The αβ TCR non-covalently associates with signal-
transducing CD3 subunits (CD3εγ, CD3εδ, and CD3ζζ). Together, they form a multimeric,
transmembrane collection commonly known as the TCR-CD3 complex [27] (Figure 1.2).
Located on the cytoplasmic tails of the CD3 signal transduction modules are immunoreceptor
tyrosine-based activation motifs (ITAMs). ITAMs are responsible for initiating the signalling
cascade that involves ultimately leads to T cell activation when a cognate antigen binds to the
αβ TCR [28].
During antigen presentation, a distinct junction between an APC and a T cell. This cell-cell
interface is known as the immunological synapse (IS) (Figure 1.3 a) [29]. Three main
categories of signals are integrated at the IS – stimulatory (TCR-antigen) signal,
costimulatory/checkpoint signal and integrin-based adhesion [29]. Immunofluorescence
imaging studies over the past two decades have led to the canonical model of the IS, which
adopts a bull’s eye spatial pattern of receptors (Figure 1.3 b) [30–32]. The radially
symmetrical rings of the bull’s eye pattern are known as supramolecular activation clusters
(SMACs) – central SMAC (cSMAC), peripheral SMAC (pSMAC) and distal SMAC
(dSMAC) [32]. The cSMAC is where stimulatory signals reside – TCR-MHC complex and
CD28. In contrast, the pSMAC is enriched in the cytoskeletal protein, talin, as well as
adhesion molecules such as the linkage between lymphocyte function-associated antigen 1
(LFA-1) and intercellular adhesion molecule 1 (ICAM-1). The dSMAC is typically
characterised by the presence of molecules such as the transmembrane phosphatase CD45.

1.2 The immune system and cancer 37
However, it should be noted that the T cell-APC interface is a dynamic structure and may not
always form a stable bull’s eye configuration [33].
For a full T cell activation to occur, two signals are generally required – signal 1: TCR and
signal 2: costimulation from CD28 [34]. Stimulating a T cell through the TCR without
costimulation can induce a hyporesponsive state, known as anergy, where the cell becomes
refractory to restimulation. When a T cell is activated, it undergoes a dramatic shift in its
metabolism, differentiates from a naïve state into an effector, clonally expands and releases
cytokines. These cellular responses make activation a crucial process harnessed by cancer
immunotherapy to prepare T cells such that the final cell product can mount an effective anti-
tumour response in patients (Figure 1.4).
There are hardwired molecular pathways (immune checkpoints) to prevent over-activation of
T cells and maintain self-tolerance. These mechanisms include expression of the well-known
cytotoxic T lymphocyte antigen-4 (CTLA-4) and programmed death-1 (PD-1) [34]. Such
regulatory signals are upregulated in activated T cells, reaching a peak at around 24-48 hours
post-stimulation. It is now known that cancer cells may exploit these mechanisms to create a
immunosuppressive microenvironment and evade immune destruction [35]. Checkpoint
blockade immunotherapies have been developed precisely to address this issue (Chapter
1.3.2).

38 Introduction
Figure 1.2 Schematic of the transmembrane TCR-CD3 complex, formed by TCR α and β chains
associated with three dimeric signal transduction modules CD3εδ, CD3εγ and CD3ζζ. ITAM refers to
immunoreceptor tyrosine-based activation motif. Reproduced from [36].

1.2 The immune system and cancer 39
Figure 1.3 Receptors in a mature immunological synapse. (a) Receptors that are exploited in the work
described in this thesis include TCR-CD3 (signal 1), CD28 (signal 2) and LFA-1 (adhesion). (b) Spatial
organisation of receptors within the IS: centre is the cSMAC, middle ring is the pSMAC, and outer ring is
the dSMAC. Reproduced from [37].

40 Introduction
Figure 1.4 Impact of T cell differentiation on anti-tumour efficacy. Although activation is crucial in
therapeutic T cell processing, excessive stimulation may compromise proliferative capacity of the cells.
Reproduced from [38].
1.2.4 Cancer-immunity cycle
The ability for the immune system to distinguish between “self” and “non-self” entities is
remarkable. It has been estimated that the more than 1016 foreign molecules can be
recognised and distinguished by the immune system from 105 “self” molecules [39]. The
small set of genes in the human genome that encodes the TCR has the potential to generate
between 1015 and 1020 different TCR clonotypes (populations of T cells that carry an identical
TCR) [40]. Using stochastic computational modelling, Lythe et al. estimated that, given the
~1011 naïve T cells circulating in the adult human body [41], the number of distinct TCR
clonotypes is ~1010 and mean T cell clonotype size is ~10 [42]. This estimation means that
the immune system has to rapidly increase the population size of a particular clone should a
compatible pathogen be detected.

1.2 The immune system and cancer 41
Cancer is typically characterised by various genetic alterations and the dysregulation of
normal cellular processes [43]. It is widely known that these altered processes result in the
expression of tumour-specific antigens (TSA; also known as tumour neoantigens) or tumour-
associated antigens (TAA) on the tumour cell surface [44]. The former category refers to
antigens that are not found in the normal human genome, whereas the latter can be found at
low levels in some normal cells. Tumour antigens may also have a viral origin and are known
to be associated with a significant subset of human tumours, such as cervical carcinoma and
adult T cell leukaemia [45,46].
These antigens provide a means for the immune system to recognise and eradicate tumours in
a series of steps within the “cancer-immunity cycle” (Figure 1.5), which has been thoroughly
covered in [47]. In this cycle, neoantigens are captured by APCs such as DCs, which then go
on to prime and activate T cells by presenting them with the captured antigens on MHC
molecules. Activated, tumour-reactive cytotoxic T cells, then traffic to the tumour, recognise
cancer cells via the TCR-cognate antigen binding, and initiate killing of the targeted cells.
The lysis of cancer cells releases further antigens and the cancer recognition-killing cycle
continues.
The requirement for DC maturation (binding of PRRs of DCs to PAMPs) to present antigen
to naïve T cells, however, is complicated by the fact that cancers typically lack PAMPs and
are therefore poorly immunogenic [48]. An alternative path to instigate an anti-tumour
immune response may be through the release of damage-associated molecular patterns
(DAMPs) from damaged or stressed tumour cells, due to conditions such as hypoxia or
nutrient deprivation [49]. DAMPs are molecules that have a physiological function inside the
cell, but become “danger signals” to the immune system when exposed to the extracellular
space. Dying tumours may release sufficient DAMPs which, in combination with tumour
antigens, activate local DCs. This may then lead to T cell priming against the presented
tumour antigens in a class II-restricted manner [50].
Nevertheless, humans still suffer from cancer because cancer cells can evolve a myriad of
immunosuppressive mechanisms to achieve “tumour-immune escape” [51]. For example, it
has been discovered that the programmed death receptor ligand-1 (PD-L1) is overexpressed

42 Introduction
in different cancer types, ranging from ovarian cancer to hepatocellular carcinoma [52].
Tumours may induce apoptosis of cytotoxic T cells via the ligation of PD-L1 to PD-1 [53].
Furthermore, tumours may recruit, activate and promote the expansion of Treg cells, which
then downregulate anti-tumour immunity [54]. In addition, DAMPs have also been shown to
facilitate chronic inflammation and immunosuppression in the microenvironment. Reports
have implicated this double-edged sword nature of DAMPs, as several of them have been
linked to tumour pathogenesis and are now used as prognostic markers – for example, S100
proteins and galectins in melanoma [55,56].

1.3 Cancer immunotherapy 43
Figure 1.5 The cancer-immunity cycle. APCs (Antigen-presenting cells). CTLs (Cytotoxic T
lymphocytes). Reproduced from [47].
1.3 Cancer immunotherapy
1.3.1 Conception and early challenges
The idea of manipulating the immune system to treat cancer has been known for over 150
years. It was first conceived in the mid-19th century by Wilhelm Busch, who noticed tumour
regression in some sarcoma patients after surviving postoperative wound infections of
erysipelas [57]. This observation led to one of the earliest documented uses of
immunotherapy in 1868, when Busch intentionally inoculated cancer patients with erysipelas-
causing bacteria. As a result, tumour regression was induced and complete remission was
achieved with iterations of the inoculation procedure [58]. The work was later repeated by

44 Introduction
Friedrich Fehleisen, who both identified Streptococcus pyogenes to be the erysipelas-causing
agent and used it to elicit tumour regression in patients with inoperable malignancies [59].
Similarly, William B. Coley, a bone surgeon at New York Cancer Hospital (now Memorial
Sloan-Kettering Cancer Center), reported anticancer effects caused by erysipelas [60].
However, he increased the safety and potency of the therapy by creating a mixture of toxins
from heat-killed S. pyogenes and Serratia marcescens, rather than injecting live bacteria
directly into patients [61,62]. Today, the concoction is known as "Coley’s Toxin" and Coley
is often regarded as the "Father of Cancer Immunotherapy" [63].
It is worth noting that the pioneering work by Busch, Fehleisen and Coley predates the
discovery of X-ray (1895), making the idea of oncological immunotherapy older than that of
radio- or chemotherapy [64]. However, the use of Coley’s Toxin in the 20th century was
heavily criticised by the contemporary medical community for its lack of reliable outcome
and poor standardisation in toxin preparation [65,66]. Therefore, interests in toxin-based
immunotherapy quickly waned as radiotherapy rose to centre stage in cancer treatments.
1.3.2 Checkpoint blockade therapy
One of the most successful forms of modern cancer immunotherapy to date is a class of
therapeutic agents known as checkpoint inhibitors [67]. These drugs are monoclonal
antibodies that target immune checkpoints such as CTLA-4 and the PD-1/PD-L1 pathway.
By blocking these regulatory pathways, the natural constraints on T cell reactivity are
unleashed and cancers overexpressing the inhibitory proteins can no longer exploit those
mechanisms to dampen anti-tumour immunity [68]. This therapeutic strategy has already
proven effective in the treatment of different cancers [68]. For example, the first FDA-
approved checkpoint inhibitor ipilimumab (Yervoy; Bristol-Myers Squibb), which targets
CTLA-4, has demonstrated efficacy against cutaneous melanoma [69]. The anti-PD-1
checkpoint inhibitor pembrolizumab (Keytruda; Merck) has been employed to treat classical
Hodgkin lymphoma [70].

1.3 Cancer immunotherapy 45
1.3.3 Adoptive T cell therapy
Another kind of cancer immunotherapy is based on the direct manipulation or augmentation
of immune cells to mount an anti-tumour response. A well-known form of cell-based
immunotherapy is adoptive T cell therapy.
Several variants of adoptive T cell therapy exist – these include tumour-infiltrating
lymphocytes (TILs), TCR-transduced T cells and chimeric antigen receptor (CAR) T cells,
among others. The pros and cons of each of these therapies have been reviewed by
Papaioannou et al. [71]. This treatment modality has in recent years gained substantial
scientific and public interests due to the promising clinical trial results demonstrated by
CAR-T cells [72]. Here, CARs are artificial receptors designed to possess molecular domains
for both tumour-specific antigen recognition and T cell activation [73]. These receptors are
usually grafted onto autologous T cells via transduction by a viral vector [74]. Using CAR-T
therapy, complete remission has been achieved in up to 90% of patients with acute
lymphoblastic leukaemia (ALL) and chronic lymphocytic leukaemia (CLL) in various clinical
studies [75–78]. In 2017, the US Food and Drug Administration (FDA) also recently
approved the use of two CAR-T products – tisagenlecleucel (Kymriah; Novartis) [79] and
axicabtagene ciloleucel (Yescarta; Kite/Gilead) [80].
Currently, the main mode of manufacturing for adoptive T cell therapy is built around a
centralised model that begins with the extraction of immune cells (leukapheresis), which are
then cryopreserved and shipped to a Good Manufacturing Practice (GMP)-compliant
manufacturing facility (Figure 1.6) [81,82]. There, the cells undergo ex vivo manipulation,
which includes activation, expansion and/or genetic modification. Finally, cells are returned
to the treatment centre and infused into the patient. Throughout this multi-step process, the
cells are passed through apheresis machines, culture flasks/bags, centrifuges and bioreactors
and handled by a range of personnel, which all contribute to the cost, error susceptibility and
processing time.
To obviate the labour in maintaining both APC and T cell cultures, biological APCs are
commonly replaced with so-called “artificial antigen-presenting cells” (aAPCs) for T cell

46 Introduction
activation [83]. Most aAPCs developed to date are anti-CD3/CD28-coated microbeads, with
Dynabeads being the current gold standard. Dynabeads have been extensively employed to
activate T cells in multiple CAR-T clinical trials [73,84,85]. After activation, the beads will
need to be removed (e.g. by magnetic separation) from the cell product prior to release or
downstream processing. However, the bead removal step may lead to cell loss or damage, as
well as contamination issues if incomplete.
Figure 1.6 Process flow diagram of typical CAR-T cell manufacturing. Key: IPC (In-process control); QC
(quality control). Reproduced from [86].
1.4 Mechanobiology
The rise of modern cancer immunotherapy almost coincides with that of mechanobiology.
Both fields are similar in the sense that their concepts are not new, but previously
underappreciated by mainstream biological and medical communities [1,87]. Indeed, the
molecular biology revolution in the 20th century led biologists to instead focus much of their
efforts on deciphering the genetic basis of life. Yet, there is now mounting evidence
implicating the critical role of mechanical signals in both normal physiology and pathological
phenomena such as cancer [88–92].

1.4 Mechanobiology 47
Basic physiological functions, such as hearing, rely on the mechano-sensation of cells. For
instance, deflection of hair cell stereocilia by sound waves open up mechanically gated ion
channels and induce currents that are sent down nerve fibres [93]. Another example is bone
loss in astronauts during extended periods in space due to disruption of mechanically
regulated osteoblastic functions under microgravity [94,95].
Advances in imaging, biomaterial fabrication, micro- and nanotechnologies have now led to a
renaissance in studying cellular mechanobiology (example in Figure 1.7 a) [96–99]. It has
been shown that cells are able to sense and respond to microenvironmental physical signals
via mechanotransduction – the process of converting extracellular physical cues into
intracellular biochemical signals [100,101]. The wide range of mechanically influenced
processes include apoptosis, migration, adhesion and differentiation [102,103]. For example,
the Engler lab has demonstrated that the differentiation of mesenchymal stem cells (MSCs)
into osteogenic and adipogenic lineages can be controlled by the stiffness of planar hydrogels
(Figure 1.7 b) [104].
The process of mechanotransduction can be mediated by transmembrane “mechanosensors”
such as focal adhesion (FA) protein complexes [105]. Adherent cells such as MSCs attach
themselves to proteins in the extracellular matrix via FAs, which are mechanically coupled to
the cytoskeletal network. Harnessing the linkage between the cytoskeletal network and FA
receptors (e.g. integrins), cells are able to exert forces on substrate materials and allow
mechanical feedback to be relayed back to the cytoplasm and nucleus [100]. In fact, many
essential enzymes and substrates involved in cell metabolism (e.g. DNA replication, RNA
processing and glycolysis) physically associate with the cytoskeleton and nucleoskeleton.
Forces exerted on these solid-state networks may therefore distort the shape of the
immobilised molecules and alter their biophysical properties (e.g. thermodynamics), which in
turn change intracellular biochemistry (e.g. chemical reaction rates) [106].
In addition to adherent cells, there is mounting evidence that suggests non-adherent cells,
such as lymphocytes, are able to sense physical cues via FA-independent mechanosensory
mechanisms. For instance, T cells and B cells have been shown to exhibit mechanosensing
properties, mediate through T cell receptors (TCRs) [107–109] and B cell receptors (BCRs)

48 Introduction
[110], respectively. Recent studies have begun to unravel how mechanosensitivity enables
tuning of essential immunological processes, such as T cell activation [107,108] and
cytotoxic T lymphocyte (CTL)-mediated target cell killing [111].
Figure 1.7 (a) Imaging methods have enabled the visualisation of how cells dynamically and mechanically
interact with substrate materials. Shown here are traction force microscopy images of a T cell pushing and
pulling on flexible micro-pillars coated with anti-CD3 and anti-CD28. Forces are represented by arrows.
Scale bar: 5 µm. Reproduced from [98]. (b) Schematic to illustrate how substrate stiffness directs
mesenchymal stem cell (MSC) differentiation into distinct lineages. Reproduced from [112].
1.4 Mechanobiology 49
1.4.1 Biophysical regulation of TCR triggering
The mechanical regulation of T cell activation has been widely reported [113–115]. For
example, Liu et al. employed a biomembrane force probe to demonstrate that when the TCR
engages with an agonist the average lifetime of the TCR-ligand bond displays a force-
dependent biphasic pattern [114]. According to this pattern, tensile force applied to the bond
prolongs average bond lifetime, which eventually reaches a maximum and decreases with
further increment of the force. Here, the counterintuitive, initial increase in bond lifetime is
known as a "catch bond" [116] and the opposite trend is known as a "slip bond", the kinetics
of which was theorised by George I. Bell in his seminal paper [117]. On the contrary, only
slip-bond characteristics were observed when antagonist ligands were engaged. Another
important observation made by Liu et al. is that more stimulatory ligands require higher force
magnitudes to reach maximum bond lifetimes, which are also longer. Here, the implications
of bond lifetime to T cell activation are significant because it has been observed that the
TCR-ligand bond lifetime (hence force duration) correlates with calcium fluxes inside the
cell, an early marker of T cell activation [114]. Hence, it was hypothesised in the study that T
cells can exploit this mechanism to discriminate between different types of antigens.
The TCR catch-slip transition (Figure 1.8) is fascinating in the sense that similar
characteristics have been observed with other types of adhesion molecules. When marginated
leukocytes in blood vessels make contact with the endothelium, they tend to follow a cascade
of tethering, rolling, deceleration, firm arrest, and extravasation. These processes are
regulated by several classes of adhesion molecules [118]. In particular, the initial tethering
and rolling of leukocytes on endothelial cells are predominantly mediated by selectins and
their ligands. For cell rolling to be possible, selectin-ligand bonds must associate and
dissociate rapidly at the leukocyte-endothelium interface. Simultaneously, these molecular
interactions take place under hydrodynamic shear that imposes a torque and pushing force (in
the direction of the flow) on the cell [119,120]. Since shear forces oppose molecular adhesive
forces at the interface, one might expect the former to shorten the average lifetime of selectin-
ligand bonds by accelerating dissociation (slip bond behaviour). However, selectin-ligand

50 Introduction
interactions have also been revealed to exhibit catch bond behaviour, where the average bond
lifetime increases with tensile force < 20 pN [121].
Figure 1.8 Diagram to illustrate the catch-slip transition that the TCR exhibits. A receptor-ligand bond acts
as a catch bond when the bond lifetime gets extended by a stronger binding state induced by the applied
force. A slip bond is the opposite of a catch bond. When the force is too high, a catch bond will get
overpowered and ruptured.
In vivo mechanical forces may affect TCR triggering at the highly dynamic interface between
a T cell and an APC [122,123]. Notably, T cells are known to "crawl" along the surface of
APCs and scan for agonist ligands recognised by the TCR. This kind of contact was termed a
"kinapse", as opposed to a more stationary immunological "synpase", by Dustin [124]. Thus,
cell motility can impart tangential forces on the TCR-ligand complex and there is already
evidence such forces can cause structural changes to the complex [113]. Also, pulling forces
perpendicular to the cell surface have been shown to play a role in TCR signalling [99,125].
For example, Li et al showed that tethering a T cell via its TCR complex to a surrogate APC
did not induce calcium signalling, unless a normal pulling force or shear stress was applied to
the T cell [125]. Taken together, the aforementioned forces are all different manifestations of
1.4 Mechanobiology 51
cytoskeletal dynamics (actin polymerisation and myosin-based contractility), the absence of
which can abrogate activation [98,99,126,127].
Several models connecting force-dependent structural changes to intracellular signalling have
been proposed and extensively reviewed [128]. For example, it has been suggested that force
can induce conformational changes in CD3 signalling chains that associate with the TCR
[129,130]. When the TCR is unbound, the cytoplasmic tails of the CD3ε subunits are hidden
in the inner leaflet of the plasma membrane. However, in the bound state, force-induced
conformational changes can expose the cytoplasmic tails along with the ITAMs. The
exposure of ITAMs to the cytoplasm therefore renders tyrosine residues accessible to kinases,
which mediate phosphorylation and downstream signalling.
1.4.2 Artificial cell niches to probe T cell mechanobiology
To probe the mechanosensitivity of T cell activation, a number of antibody-coated hydrogel-
and elastomer-based culture substrates have been created [107–109,131,132]. Experiments
involving these biomaterials have demonstrated the critical role of substrate stiffness in T cell
activation, as indicated by changes in cell proliferation, cytokine secretion and differentiation.
Although the existence of stiffness dependence is clear, the quantitative trend is still obscure.
On the one hand, O’Connor et al. stimulated human T cells on soft (50-100 kPa) and stiff
(>2.3 MPa) polydimethylsiloxane (PDMS) substrates [108]. Here, the stiffness range is high
relative to that covered by normal and pathological human lymphoid organs, such as axillary
lymph nodes (mean stiffness for normal: 17.7 kPa; mean stiffness for metastatic: 45.4 kPa, as
determined by shear wave ultrasound)[133]. They observed higher ex vivo proliferation and
IL-2 secretion on the soft substrates as a result. On the other hand, Judokusumo et al. used
murine T cells on polyacrylamide hydrogels with stiffness ranging from 2-100 kPa [107].
This experimental set-up produced an opposite trend in which IL-2 secretion was enhanced
with increasing stiffness. It is therefore difficult to compare the two studies due to differences
in their choice of substrate material, cell species and stiffness range. Also, it should be noted
that they used different ligation methods to immobilise antibodies onto surfaces – the PDMS

52 Introduction
substrates relied on physisorption, whereas the hydrogels made use of biotin-streptavidin
interactions.
Assuming the aforementioned variations had little effect on the mechanosensitive response,
speculations within the field have developed around the existence of an optimal stiffness at
about 100 kPa for maximum activation [134]. Interestingly, this postulated bell-shaped
response evokes reminiscence of the force-dependent biphasic pattern in TCR kinetics
mentioned earlier, and future experiments might draw clearer connections between the two.
In support of this view, substrate stiffness is known to modulate the loading rate (the speed at
which force builds up) in receptor-ligand bonds as explained by the "molecular clutch" model
[135] which has been extensively studied in the context of integrin-based force transmission.
A deeper understanding that links TCR mechanotransduction to substrate stiffness may allow
future immunomodulatory biomaterials to precisely tune TCR-ligand bond lifetimes as a
means to direct proliferation, differentiation and cytokine secretion. Nevertheless, the current
standard practice in T cell manufacturing involves polyclonal expansion of T cells by
activating them with microbeads coated with CD3- and CD28-specific antibodies. The design
of such commercial microbeads has overlooked the importance of biophysical parameters
(Figure 1.9). For example, substrate stiffness [107,108], topography [136], ligand spacing
[137] and ligand mobility [138]. If these parameters were not controlled, low expansion rates
and/or suboptimal functionality of cell products may result [139].

1.5 Process intensification 53
Figure 1.9 Artificial antigen-presenting cell (aAPC) design considerations. Although a lot of work has been
done on various ligation methods, combinations of ligands and scaffold materials, the effect of physical
properties is relatively unexplored. Reproduced from [140].
1.5 Process intensification
Process intensification (PI) is a concept originally defined and introduced in the field of
Chemical Engineering [141]. According to Stankiewicz and Moulijn, PI is:
“The development of novel apparatuses and techniques that, compared to those commonly
used today, are expected to bring dramatic improvements in manufacturing and processing,
substantially decreasing equipment size/production capacity ratio, energy consumption, or
waste production, and ultimately resulting in cheaper, sustainable technologies.” [141]
54 Introduction
Implementations of PI may be broadly categorised as “process-intensifying equipment” and
“process-intensifying methods”. A major aim of the work presented in this thesis was to
achieve both, by means of biomaterial-based prototype development and delineating
biophysical parameters that may be exploited to control T cell activation. It should be noted
that therapeutic T cell processing is especially amenable to the PI methodology due to the
large number of unit operations, highly trained personnel and costly, specialised equipment
involved [82].
1.6 Nature-inspired engineering
Nature-inspired engineering (NIE) is an umbrella term that encompasses inspiration derived
from both living and non-living systems found in nature. A subset of NIE that is specifically
relevant to this thesis is “bio-inspiration”, which concerns living systems. This concept
should not be confused with “biomimicry” or “biomimetics” [142–144]. To understand NIE
requires first clarifying the fundamental differences between these terms.
Biomimicry refers to the superficial imitation of biological systems and does not require a
thorough understanding of the underlying principles that make those structures or processes
well-suited for their specific functions. It often comes with the connotation of directly
copying nature structurally or aesthetically. Moreover, it is generally associated with the
premise that nature has evolved the optimal solutions for different tasks – the mentality that
“nature has solved it, now copy it”. The “evolution” part is mainly attributed to Darwinian
natural selection leveraged by biomimicry advocates as a driving mechanism behind, and
justification for, the so-called “optimal” solutions to engineering problems [145]. An example
is the flapping wings of ornithopters or biomimetic robots designed to mimic the flight of
birds.
In contrast, NIE requires a mechanistic understanding behind desirable characteristics that
natural entities possess. The distilled principles are then applied in a new context that
surpasses the capabilities offered by nature. Direct copying is only useful when the emulated
natural feature can outperform current technologies for the engineering problem – oftentimes

1.6 Nature-inspired engineering 55
this is not the case. Using the aforementioned flight example, airplanes can fly higher, longer
and faster than birds not by precisely mimicking avian wings, but through studying the
aerodynamics that allow birds soar into the sky. The inspiration from bird aerodynamics
ultimately led to the abandonment of avian anatomical models, which would be impractical to
generate the lift and thrust required by large-scale, high-speed commercial and military
aircrafts [146].
Evolution is not a conscious process and it is subject to a complex mix of constraints imposed
by the environment and the species’ own developmental history. The rationale for bio-
inspired designs over biomimetic ones stems from the very premise upon which biomimicry
is grounded – that evolution has over millions of years refined organisms with features well-
adapted to their environment. Here, the key is that what is optimal to a particular organism
within their habitat at a certain time may not necessarily translate to optimal designs for
engineering requirements. The definition of optimality is hence context-dependent.
In medicine, technologies and drugs are constantly being developed to help humans
overcome diseases, reduce suffering and prolong longevity. Medical demands may therefore
benefit from the NIE methodology. Indeed, recent decades have already seen a rise in NIE-
derived biomaterials with medical applications – these include gecko-inspired tissue
adhesives [147] and surgical staples inspired by the micro-barbs on porcupine quills [148].
Applying the NIE concept, this thesis is not about fabricating materials that mimic in vivo cell
niches or antigen-presenting cells for in vitro T cell activation. Instead, the present work was
inspired by the mechanosensitivity of TCR signalling and modular nature of the immune
system. These principles were translated to create hardware platforms based on which
process-intensified strategies in T cell manufacturing may be explored.

56 Introduction
1.7 Thesis outline
This thesis consists of three main results chapters (Chapters 2 – 4). Relations between
chapters in this thesis are depicted in (Figure 1.10). The “Core Technology” (T cell-
activating hydrogel; Chapter 2) forms the basis for the two “Enabling Technologies” –
microfluidic system (Chapter 3) and antibody nanoarrays (Chapter 4). The Enabling
Technologies in turn allow the Core Technology to be interfaced with other technologies. All
technologies were developed to give room for further exploration (Chapter 6) and set the
foundations for intensified T cell manufacturing. The link between Chapter 2 and Chapter 3
can be considered as the technology translation arm, whereas that between Chapter 2 and
Chapter 4 leans towards fundamental screening. Chapter 5 is omitted from the figure
because it is the Conclusions.
Chapter 2 is related to biomaterial fabrication and static cell culture. It describes the use of
antibody-coated polyacrylamide hydrogels as a stiffness-tuneable platform for Jurkat T cell
activation. It discusses how substrate stiffness and surface ligand density can be
simultaneously tuned to regulate T cell activation (measured as IL-2 secretion and post-
stimulation cell proliferation). Based on image processing, reasons behind the differential T
cell responses to hydrogels and Dynabeads are examined. Furthermore, it also evaluates T
cell activation levels induced by hydrogels presenting different biophysical and biochemical
cues. Supplementing this work is the development of a hydrogel-integrated culture device
that is used throughout the work to present uniform stimulatory surfaces for T cell
stimulation.
Chapter 3 is about microfluidics, mechatronic prototyping and flow-based T cell stimulation.
It first describes the design of a programmable, micro-flow-rate peristaltic pump to
demonstrate how low-cost, off-the-shelf components may be utilised to build a highly
customisable fluidic platform. It then discusses the integration of the hydrogel (developed in
Chapter 2) with the microfluidic set-up for T cell activation experiments under flow
conditions. Cell viability, IL-2 secretion data, costs and device dimensions are presented to

1.7 Thesis outline 57
allow for comparison with commercial fluidic hardware as well as evaluation of tuneable
parameters such as flow and agitation.
Chapter 4 concerns the fabrication of an alternative version of the hydrogel presented in
Chapter 2 via the use of a nanopatterning method – block copolymer micelle
nanolithography. The goal of this chapter is to refine the hydrogel system with nanoscale
spatial control over surface-immobilised anti-CD3. It presents material characterisation
methods ranging from X-ray photoelectron spectroscopy to atomic force microscopy. The
formation of gold nanoparticle arrays on glass and hydrogel substrates are confirmed and
quantitatively analysed using image analysis. From there, it discusses the various fabrication
parameters that need to be optimised and how the nanopatterned hydrogels may be used in
the context of fundamental, multiparameter screening experiments.
Chapter 5 summarises the findings and provides a main conclusion.
Chapter 6 discusses various avenues that may be explored in the future, using the prototyped
platforms presented in this thesis as a basis or foundational framework.
.

58 Introduction
Figure 1.10 Diagram of relations between chapters. Double-headed arrows are included to indicate the
interdependence of different technologies or “co-inventions” – the end goal drives the current work, but the
current work dictates the direction to reach that goal. Chapter 5 is omitted as it is the Conclusions.

Chapter 2 Biophysical T cell activation platform
2.1 Introduction
The last two decades have seen a tremendous increase in mechanobiological studies on
various cell types, from mesenchymal stem cells to cancer cells [149–152].
Mechanosensitivity is now recognised as an important feature in the regulation of numerous
biological processes including cell proliferation, differentiation and migration [7,153]. The
need to study mechanotransduction gains its momentum, in part, from the equally expanding
fields of tissue engineering and regenerative medicine [154]. As a result, a lot of work has
focussed on how mechanical cues from the extracellular matrix or engineered biomaterials
can be harnessed to control cell behaviours, such as stem cell differentiation [155]. The cell
types of particular interest are often adherent cells that employ membrane-associated
macromolecular assemblies – known as focal adhesions – to attach themselves to substrates
[105]. However, the mechanosensing abilities of nonadherent cells (especially lymphocytes)
are much less studied and have only been examined within the last 7-8 years [107–109,156–
158]. The coincidental rise of cancer immunotherapy has therefore presented a unique
opportunity to study immune cells from a previously ignored perspective in a medically
relevant context.
Biomaterials for therapeutic T cell activation and expansion
Adoptive T cell therapy requires ex vivo processing where T cells are expanded to clinically
desirable doses and differentiated into effector cell types [81]. A critical process to jumpstart
the expansion and differentiation is T cell activation [34]. In clinical manufacturing,
activation is implemented by stimulating the T cells with anti-CD3/CD28-coated materials –
the current gold standard being the commercial microbeads, Dynabeads®. However, the
presence of beads increases contamination risks and prolongs processing time due to

60 Biophysical T cell activation platform
downstream bead separation steps, which might reduce cell viability and result in cell loss
[159]. Furthermore, the design of bead-based expansion platforms has overlooked the
importance of physical parameters and may contribute to suboptimal cell responses during
the bioprocessing [160]. T cell activation is therefore a critical step to target in terms of
translating mechanobiological insights to improvements in therapeutic T cell manufacturing.
Multiparameter considerations in T cell mechano-regulation
Recent reports have established the role of the TCR as a mechanosensor and the force-
dependent nature of T cell activation [113,161–163]. It is now known that T cells can use
their TCRs to sense physical cues such as environmental stiffness, geometry and topography
[99,107–109,122,164]. Yet, a direct comparison between the studies is difficult as they
employed different experimental designs including: the choice of biomaterial, stiffness
ranges, antibodies, conjugation methods and T cell types. For example, using streptavidin-
doped polyacrylamide (PA) hydrogels (2 - 200 kPa) coated with biotinylated anti-
CD3/CD28, Judokusumo et al. found that IL-2 production from mouse naïve CD4+ T cells
increased with stiffness. In contrast, O’Connor et al. utilised PDMS (0.1 – 2 MPa) with
physically adsorbed antibodies and observed an opposite trend with human naïve CD4+ T
cells. A recent published report has shown, using anti-CD3/CD28-coated PDMS and PA
hydrogels, that the opposing stiffness-dependent trends might actually be two sides of the
same coin – a biphasic response [165]. Moreover, this biphasic response becomes a
monotonic one when ligands to T cell integrins are also present, implicating the interaction
between TCR-based and integrin-based mechano-regulations. Another important factor –
surface density of stimulatory ligands – has also been shown to regulate T cell activation in
recent reports [137,156,166]. However, all aforementioned studies were carried out under
conditions where either stiffness or ligand density was fixed. Taken together, these
observations warrant a multiparametric investigation into how T cell activation can be
regulated by substrate stiffness and ligand density simultaneously using the same biomaterial.

2.1 Introduction 61
Objectives
The objectives of this Chapter are as follows:
1. Develop a T cell stimulation platform that harnesses physical microenvironmental
properties and enables multiparameter control of stimulation conditions.
2. Investigate the effect of simultaneous tuning of substrate stiffness, ligand density and
biochemical cues has on the regulation of T cell activation.
3. Expand and highlight the set of tuneable parameters in bead-free T cell activation
protocols using the insights and tools developed in this project.

62 Biophysical T cell activation platform
2.2 Materials and methods
2.2.1 Materials
3-aminopropyltriethoxysilane (APTES), glutaraldehyde, phosphate-buffered saline (PBS),
acrylamide, N,N’-methylenebisacrylamide (bisacrylamide), ammonium persulfate (APS) and
tetramethylethylenediamine (TEMED), bovine serum albumin (BSA), Tween-20, FITC-
conjugated goat anti-mouse IgG and RPMI-1640 cell culture medium (with L-glutamine)
were purchased from Sigma-Aldrich. Biotinylated mouse monoclonal antibodies (Ab) – anti-
human CD3ε (anti-CD3; clone: OKT3), anti-human CD28 (anti-CD28; clone: CD28.2), anti-
human CD11a/CD18 (anti-LFA-1; clone: m24) and IgG2a,κ isotype control (isotype; clone:
MOPC-173) – were all obtained from BioLegend. Streptavidin-conjugated acrylamide, Alexa
Fluor 568, foetal bovine serum (FBS), Press-to-Seal™ silicone sheets and Dynabeadsä
Human T-Activator CD3/CD28 and DynaMagä-2 magnet were acquired from Thermo
Fisher. Human IL-2 DuoSet ELISA kits were purchased from R&D Systems. Jurkat cells
were provided as a kind gift by Prof. Hans Stauss (Institute of Immunity & Transplantation,
University College London). All solutions were made in PBS unless otherwise specified.
Deionised water was purified to 18.2 MΩ-cm with a Millipore system. SYLGARDä 184
Silicone Elastomer Kit was obtained from Dow Corning.
2.2.2 Preparation of polyacrylamide hydrogels
Polyacrylamide (PA) hydrogels were fabricated following established methods [167,168]
(Figure 2.1). For ease of handling, hydrogels were attached to microscope glass slides, which
served as backing templates. In order for the gels to attach, the slides were first amino-
silanised. To this end, the slides were pre-washed in a detergent (Alconox®, 10 g/L in
ultrapure water) followed by a multi-solvent clean in the order: acetone, methanol and
isopropanol. The slides were then dried under a stream of nitrogen gas (to prevent oxidation)
and activated by oxygen plasma (0.4 mbar, 200 W, 10 minutes [169,170]; Pico, Diener
Electronic), in order to generate silanol (Si–OH) groups at the surface. The surface of each
slide was then then covered with 1 mL of APTES for 5 minutes and then rinsed with

2.2 Materials and methods 63
ultrapure water. Afterwards, the APTES-functionalised slides were immersed in a solution of
0.5% (v/v) glutaraldehyde (30 minutes), for subsequent glass-gel attachment via reaction with
amide groups of PA [171], followed by another rinsing step. Hydrogels were then created
using a pre-gel solution consisting of the monomer, acrylamide, its crosslinker, bis-
acrylamide, as well as streptavidin-conjugated acrylamide for antibody immobilisation
(Table 2.1). Hydrogels were formed via free-radical polymerisation, initiated with 1/100 total
volume of 10% (w/v) APS in PBS and 1/1000 total volume of TEMED. The monomer-to-
crosslinker ratio was varied to make gels of different stiffness. All aforementioned steps took
place at room temperature.
The set-up used for gel polymerisation consisted of a rectangular coverslip raised above an
amino-silanised slide by 0.5 mm-thick spacers, which were cut from a Press-to-Seal™
silicone sheet (step 5 in Figure 2.1). Immediately after addition of APS and TEMED, the pre-
gel solution was vortexed and pipetted into the 0.5 mm gap of the set-up. Due to capillary
action, the pre-gel solution would spread evenly across the surface of the slide.
Polymerisation was allowed to take place for 1 hour at room temperature before the coverslip
and spacers were removed. The hydrogel-coated slides were then immersed in PBS and
washed overnight with gentle shaking at 4 °C. The next day the PBS was changed, and the
hydrogels were stored at 4 °C before use. All gels were used within 2 weeks of
polymerisation.
Table 2.1 Recipe for polyacrylamide hydrogel fabrication Concentration (w/v %) Volume from stock (µL)
Acrylamide Bis-acrylamide
Streptavidin-acrylamide
(×10-3) 40% (w/v)
acrylamide
2% (w/v) bis-
acrylamide
2mg/mL streptavidin-acrylamide
PBS
10 0.05 1.6 250 25 8 717 10 0.1 4.0 250 50 20 680 10 0.4 70 250 200 350 200

64 Biophysical T cell activation platform
2.2.3 Characterisation of streptavidin-acrylamide
Ultraviolet-visible (UV-vis) spectroscopy was performed using a Varian Cary 100 UV-vis
spectrophotometer in order to determine the ratio of acrylamide to streptavidin in the
commercially obtained streptavidin-conjugated acrylamide. A stock solution of streptavidin-
acrylamide (2 mg/mL in PBS) was diluted 1/10 before UV-vis analysis. The concentration of
streptavidin was determine using absorbance measured at 280 nm (A280) and a molar
extinction coefficient (emolar) of 56,141 M-1cm-1 (derived from percent extinction coefficient,
e1%, of 32; value obtained from Abcam [172]). The acrylamide concentration was therefore
calculated as the total concentration of streptavidin-acrylamide subtracted by the
concentration of streptavidin (Appendix A.1).

2.2 Materials and methods 65
Figure 2.1 Schematic representation of the fabrication of PA hydrogels. (1) Glass slides were cleaned by O2
plasma to generate (2) silanol groups on the surface. (3) The activated glass slides were amino-silanised by
APTES and (4) subsequently functionalised by glutaraldehyde. (5) A gel-casting sandwich was then set up
(arrow indicates photograph of it) for (6) hydrogel polymerisation. (7) After the polymerisation, the coverslip
and spacers were removed, leaving a layer of hydrogel attached to the glass slide (arrow indicates photograph
of a hydrogel-coated slide).
2.2.4 Antibody immobilisation
Antibody immobilisation on hydrogels was achieved by conjugating biotinylated antibodies
to streptavidin-doped PA hydrogels. The procedure was performed by incubating hydrogels
with antibody solution overnight at 4 °C in a sealed, humidified petri dish. For T cell
stimulation, a total of 4 antibody combinations were tested – (1) anti-CD3 only, (2) anti-CD3
and anti-CD28 (ratio 1:1), (3) anti-CD3, anti-CD28 and anti-LFA-1 (ratio 1:1:1) and (4) anti-
CD28, anti-LFA-1 and isotype control of anti-CD3 (ratio 1:1:1) (Table 2.2). All antibodies
were biotinylated for surface immobilisation and the total protein concentration in the coating
solution was fixed at 10 µg/mL for all combinations, as previously described [107,109].

66 Biophysical T cell activation platform
Similar to the polymerisation set-up, the antibody solution was pipetted into the gap created
by spacers (1 mm-thick) between a glass coverslip and the hydrogel-coated microscope slide.
This approach was chosen to ensure a uniform distribution of the antibody solution over the
gel surface, while keeping the volume at a minimum. After overnight incubation, the
hydrogels were washed 3 times in PBS (5 minutes per wash) on an orbital shaker to remove
any unbound antibodies.
Table 2.2 Concentrations of antibodies used for different formulations of coating solution
Combination # Antibody concentration (µg/mL)
Anti-CD3 Anti-CD28 Anti-LFA-1 Isotype to anti-CD3
1 10 0 0 0 2 5 5 0 0 3 3.3 3.3 3.3 0 4 0 3.3 3.3 3.3
2.2.5 Immunofluorescence imaging
Immunofluorescence was used for confirming antibody immobilisation and comparing
surface ligand densities. Ab-coated hydrogels were first incubated with 3% (w/v) BSA in
PBST (PBS containing 0.1% (v/v) Tween-20) for 1 hour at room temperature, in order to
block any unoccupied binding surfaces. Afterwards, a solution of fluorescently tagged
secondary antibody – goat anti-mouse IgG (whole molecule)-FITC – was added to the
hydrogels at 1:200 in 3% BSA-PBST. The gels were then incubated in the dark for 1 hour at
room temperature. Afterwards, the gels were 5 times in PBST (10 minutes per wash) before
imaging.
The fluorescently stained hydrogels were imaged using a confocal microscope (Leica TCS
SPE) equipped with a 10X objective lens. Image acquisition parameters were chosen for ease
of visualisation: format = 1024 x 1024; speed = 600 Hz; frame average = 2; gain = 912.6;
laser power = 30%. Z-stack image series were acquired from at least 3 regions of interest
(ROIs) per gel and 3 independent gels per stiffness.

2.2 Materials and methods 67
Fiji (version 2.0.0-rc-65/1.51w; a distribution of ImageJ) was used to analyse image stacks
obtained from confocal microscopy. Here, the mean fluorescence intensity (MFI) was
calculated in 2 different ways to provide information about the spatial distribution of the
fluorescence signal and its magnitude. In one of the approaches, z-axis profiles were
generated by plotting the mean grey intensity of the ROI versus scan depth along the z-
direction for each image stack. The mean grey intensities from experimental replicates and
repeats were then pooled together and averaged to give an MFI for different depths. In the
other approach, the maximum intensity values along the z-axis were used to derive the MFI.
Here, replicate and repeat maximum values were pooled together and averaged to obtain MFI
values as a single metric of surface ligand density for each experimental condition.
2.2.6 Stiffness measurements
The Young’s modulus (E) of hydrogels attached on glass slides was measured by nano-
indentation using an atomic force microscope (Nanowizard® 4 AFM). Glass beads (10 µm
diameter; Whitehouse Scientific) were mounted onto tipless triangular silicon nitride
cantilevers (spring constant 0.12 - 0.24 N/m; Bruker) using UV crosslinked Loctite
superglue. Cantilevers were then calibrated using thermal tuning to confirm the spring
constant. Force measurements were made in 10 areas (at least 20-30 indentations per area)
on the surface of each gel (2 independent gels per formulation), while all samples were
immersed in PBS. Gels were indented 0.5 - 1.5 µm with an extend speed of 4 µm/s. E was
then determined using JPK SPM software 6.1 (JPK Instruments AG) and fitted to the
Hertzian model. The Poisson’s ratio was assumed to be 0.5.
2.2.7 Cell culture
Jurkat cells – an immortalised line of human CD4+ T cells – were used as a model system due
to their well-known upregulation of interleukin-2 (IL-2) secretion upon activation [173]. Cell
culture was carried out in RPMI-1640 medium supplemented with 2 mM L-glutamine and
10% (v/v) FBS under standard culture conditions (37°C, 5% carbon dioxide and 95% relative
humidity). The concentration of cells was maintained between 1 ´ 105 and 1 ´ 106 viable

68 Biophysical T cell activation platform
cells/mL, according to American Type Culture Collection (ATCC) instructions. Cell number
and viability were quantified using Via1-Cassettes™ (ChemoMetec) in a NucleoCounter®
NC-200™ automated cell counter running the Viability and Cell Count Assay (optimal
detection range: 5 ´ 104 - 5 ´ 106 cells/mL).
2.2.8 Device design and fabrication
Hydrogel-coated microscope slides were incorporated into custom-made, reusable multiwell
culture chambers for T cell stimulation experiments. The set-up was formed by sandwiching
a gel-coated slide between two micromilled poly(methyl methacrylate) (PMMA)
compression plates. The 12 through-holes (6.4 mm diameter) in the top plate were used to
compartmentalise the hydrogel into microwells. Also, the bottom plate was designed to
include a rectangular window so that well contents could be inspected using an inverted
microscope. To create a leak-free seal, a polydimethylsiloxane (PDMS) gasket was placed
between the top plate and gel-coated slide. The PDMS gasket was fabricated by mixing the
base elastomer and curing agent in a mass ratio of 10:1. The mixture was then cast in a
micromilled polytetrafluoroethylene (PTFE) mould, degassed for 10 minutes and cured at
85°C for 2 hours. To align through-holes of the top compression plate with those of the
gasket, the bottom side of the plate was micromilled along the edge to form a rectangular slot
into which the protrusion feature of the gasket would fit. The entire culture chamber was held
together using M3 hex screws and nuts, which were made of nylon to avoid potential rusting.
All parts of the culture chamber and the PTFE mould were digitally designed using
Autodesk’s prototyping software Fusion 360. Before and after cell experiments, all parts of
the culture chambers were washed in 70% ethanol and ultrapure water, followed by
ultraviolet (UV) sterilisation in a tissue culture hood for 1 hour.
2.2.9 T cell stimulation
A preliminary screening experiment was carried out to investigate the effect of substrate
stiffness (crosslinker concentration) and surface ligand density on the activation of Jurkat
cells when stimulated through their TCRs. To this end, streptavidin-doped PA hydrogels of

2.2 Materials and methods 69
different crosslinker concentrations (0.05%, 0.1% and 0.4% w/v) were coated with anti-CD3
at 10 and 30 µg/mL. Uncoated hydrogels (0 µg/mL anti-CD3) were included as a negative
control. Hydrogels were equilibrated in complete culture medium for 30 mins prior to cell
seeding. Hydrogel surfaces were seeded with Jurkat cells at 2.7´105 cells/mL (concentration
chosen to minimise cell overlapping in the microwells). Cells were then incubated for 24
hours under standard culture conditions before supernatants were harvested for IL-2 ELISA
analysis. In cytokine kinetics experiments, one well for each time point was used and
supernatants were collected at 6 hours, 24 hours and 48 hours of stimulation.
In addition, the performance of Ab-coated hydrogels was compared with that of Dynabeads
in terms of IL-2 secretion and post-stimulation proliferation. As Dynabeads were coated with
both anti-CD3 and anti-CD28, the formulation of Ab coating solution for hydrogels was
changed to include anti-CD28 as well as anti-CD3 (ratio 1:1; [total biotinylated protein] = 10
µg/mL). Furthermore, the manufacturer-optimised protocol for Dynabeads recommends a cell
seeding concentration of 1´106 cells/mL for T cell activation and expansion. Thus, the same
seeding concentration was used for hydrogels as well. Soft (0.05% w/v crosslinker) and stiff
(0.4% w/v crosslinker) hydrogels were chosen for this experiment. Dynabeads were prepared
according to the manufacturer-optimised protocol and mixed with cells at a 1:1 cell-to-bead
in tissue culture plates. The DynaMagä-2 magnet was used to aggregate beads during
washing steps and separate them from cells before sample collection. Uncoated tissue culture
plastic was used as a negative control. IL-2 secretion was assayed at 6 hours, 24 hours and 48
hours. At 48 hours of stimulation, cells were reseeded at a concentration of 5´105 cells/mL in
new tissue culture plates and then cultured for another 6 days. During this proliferation
period, cell numbers and diameters were measured every 2 days. Culture medium was also
replenished at the same time points.
In the final study, the effect of biochemical cues was investigated. Anti-LFA-1, in addition to
anti-CD3 and anti-CD28, was included in the Ab coating solution (ratio 1:1:1; [total
biotinylated protein] = 10 µg/mL). The negative control included the same Abs apart from
anti-CD3, which was replaced by its isotype control to demonstrate that the activation of
Jurkat cells was a TCR-specific response.

70 Biophysical T cell activation platform
2.2.10 IL-2 ELISA
IL-2 secretion was used as a functional readout of T cell activation and measured by ELISA.
All IL-2 ELISAs were performed using a commercial kit according to manufacturer’s
instructions. Briefly, the concentration of IL-2 for each sample was estimated from the
optical density values measured by a Multiskan FC microplate photometer (Thermo
Scientific). All IL-2 standards and supernatants were assayed in duplicates and background
values (culture medium-only) were subtracted from them. To account for optical
imperfections in the microwell plate, readings at 540 nm were subtracted from those at 450
nm, as per the manufacturer’s instructions. Standard curves were generated with a
recombinant human IL-2 standard (provided by the ELISA kit) and plotted using a third-
order polynomial interpolation on GraphPad Prism 6.0.
2.2.11 Image processing
Images of cells and Dynabeads were taken using a phase contrast microscope (Zeiss
Primovert) equipped with a 5-megapixel camera (Axiocam 105 color). To quantify cells and
beads, images were processed using a custom algorithm written in MATLAB (version
R2019a; MathWorks). The pipeline included a pre-processing stage, where non-uniform
illumination correction and foreground object enhancement were performed. As cells and
beads appeared as circular objects in the images, an inbuilt MATLAB circle detection
function (called imfindcircles()), was utilised to identify them. The function found
circles with radii within specified search ranges by applying a two-stage circular Hough
transform to the image (for details, see [174]). As cells appeared bigger than Dynabeads,
radii of the detected circles were used by the algorithm to distinguish between them. For two
circles to touch or overlap, the distance between their centres must be less than or equal to the
sum of their radii. Therefore, the algorithm was designed to loop through every detected
circle and calculate their distances from the rest in order to identify cell-bead contacts.
Manual counting was also performed for one of the images by placing markers on cells and
beads using ImageJ.

2.2 Materials and methods 71
2.2.12 Statistical analysis
All statistical tests were performed using R (version 3.6.1) on RStudio (version 1.2.500).
Statistical significance for all tests was set at p < 0.05. Levene’s test and Shapiro-Wilk test
were employed to assess the homogeneity of variances and normality, respectively. It was
taken into account that the normality test could become overpowered for large sample sizes
(> 30 or 40), or underpowered with small sample sizes [175]. Normality test results were
therefore also compared with histograms of residuals to gain better insights into the
distribution of data before deciding on whether to perform data transformation, as well as
between parametric and nonparametric tests. For data that followed the assumption of
homogeneous variances, Tukey’s test was used for post-hoc analysis. For those that violated
the assumption, Games-Howell test (R package: “tadaatoolbox”) was used instead. For
cytokine secretion data, negative controls were excluded from statistical analyses because
their inclusion would reduce the statistical power to detect differences between (treated)
groups pertinent to the experimental questions.
Fluorescent characterisation of ligand density and hydrogel stiffness data were analysed using
one-way analysis of variance (ANOVA), followed by Tukey’s post-hoc test for pairwise
comparisons of means. Hydrogel stiffness measurements violated the assumption of
homogeneity of variance. Therefore, the data were analysed with one-way ANOVA with
Welch’s correction, followed by Games-Howell post-hoc analysis [176].
Jurkat cell cytokine secretion was tested in multifactorial experiments, and two-way ANOVA
was employed to analyse the data. The interaction model of ANOVA was used when the
interaction effect between factors was significant. Otherwise, the additive model was
employed. In some cases the main effect (defined as that of one independent variable on the
dependent variable, averaged across all levels of other independent variables) were
significant, but not the interaction. In those situations, a post-hoc analysis was performed if
the significant main effect was associated with a factor with more than 2 levels. Aligned rank
transformation (ART) ANOVA (from the R package “ARTool”) was utilised to analyse
multifactorial data that were non-normal but did not violate the assumption of homogeneous
variances [177]. This decision was made because ART ANOVA is a nonparametric method

72 Biophysical T cell activation platform
that allows interaction effects to be examined. Interaction contrasts, or “differences of
differences”, were assessed in post-hoc analysis following ART ANOVA.
When applicable, log10 transformation was applied to normalise the data before statistical
analysis. To improve post-analysis interpretability, the log10 data were back-transformed and
presented in the original scale along with geometric means and 95% confidence intervals. If
transformation was not required, data were presented in original scale as means with standard
deviations.

2.3 Results 73
2.3 Results
Surface ligand density characterisation
Biotinylated anti-CD3 (10 µg/mL coating solution) was successfully conjugated to
streptavidin-doped PA hydrogel, as demonstrated by immunofluorescence (Figure 2.2 a). In
addition, conjugation was further validated and quantified by MFI values (Figure 2.2 b),
where hydrogels treated with both primary and secondary antibodies exhibited significantly
higher intensities than those with either of the antibodies alone. Side (x-z) projections
indicated that the antibody layer was confined to approximately the top 30-35 µm of the
hydrogel (Figure 2.2 a and Figure 2.3).
When the same concentration (100 µg/mL) of streptavidin-acrylamide was used to fabricate
hydrogels, there was a significant reduction in MFI with increasing crosslinker concentration
(Figure 2.2 c). Therefore, streptavidin-acrylamide concentration had to be increased with
crosslinker concentration in order to maintain the same level of surface ligand density for all
hydrogels. After the adjustment, no significant MFI differences were observed (Figure 2.2 d)
and hydrogels produced from this optimised recipe were chosen for T cell stimulation
experiments.
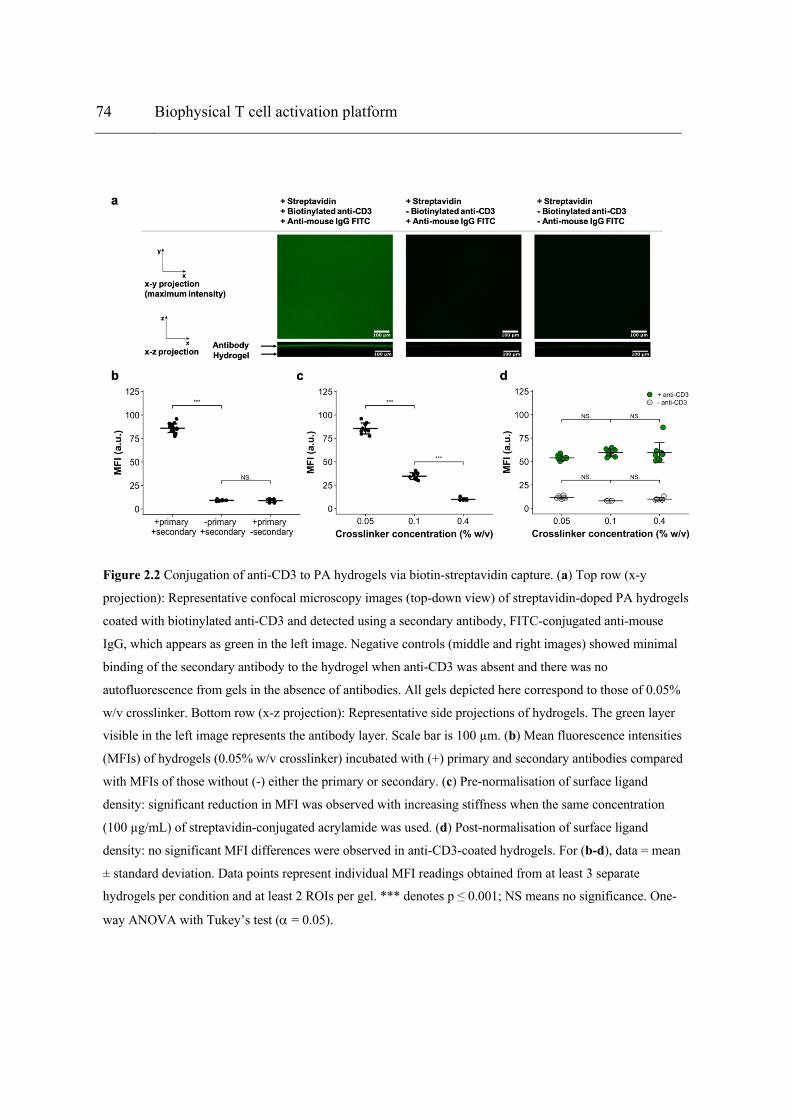
74 Biophysical T cell activation platform
Figure 2.2 Conjugation of anti-CD3 to PA hydrogels via biotin-streptavidin capture. (a) Top row (x-y
projection): Representative confocal microscopy images (top-down view) of streptavidin-doped PA hydrogels
coated with biotinylated anti-CD3 and detected using a secondary antibody, FITC-conjugated anti-mouse
IgG, which appears as green in the left image. Negative controls (middle and right images) showed minimal
binding of the secondary antibody to the hydrogel when anti-CD3 was absent and there was no
autofluorescence from gels in the absence of antibodies. All gels depicted here correspond to those of 0.05%
w/v crosslinker. Bottom row (x-z projection): Representative side projections of hydrogels. The green layer
visible in the left image represents the antibody layer. Scale bar is 100 µm. (b) Mean fluorescence intensities
(MFIs) of hydrogels (0.05% w/v crosslinker) incubated with (+) primary and secondary antibodies compared
with MFIs of those without (-) either the primary or secondary. (c) Pre-normalisation of surface ligand
density: significant reduction in MFI was observed with increasing stiffness when the same concentration
(100 µg/mL) of streptavidin-conjugated acrylamide was used. (d) Post-normalisation of surface ligand
density: no significant MFI differences were observed in anti-CD3-coated hydrogels. For (b-d), data = mean
± standard deviation. Data points represent individual MFI readings obtained from at least 3 separate
hydrogels per condition and at least 2 ROIs per gel. *** denotes p ≤ 0.001; NS means no significance. One-
way ANOVA with Tukey’s test (a = 0.05).

2.3 Results 75
Figure 2.3 Left column: Z-axis profiles of mean fluorescence intensity (MFI) versus depth obtained by
confocal microscopy for streptavidin-doped PA hydrogels of different degrees of crosslinking, coated with
biotinylated anti-CD3. Percentages refer to crosslinker concentrations. Data presented as mean with standard
deviation error bars. Data points represent individual MFI readings obtained from at least 3 separate
hydrogels per condition and at least 2 ROIs per gel. Right column: Representative x-z projection images of
respective hydrogels. Scale bar = 100 µm.
Figure 2.4 Representative fluorescence images (3D reconstruction from z-stacks) of an anti-CD3-coated PA
hydrogel with (a) the anti-CD3 layer labelled with FITC-conjugated secondary antibody (green) and (b) the
bulk of the gel labelled with Alexa Fluor 568 (red). The cross-sectional merged view of (a) and (b) is shown
in (c).

76 Biophysical T cell activation platform
Mechanical characterisation of hydrogels
Varying the crosslinker concentration, while keeping monomer concentration fixed (10%
w/v), provided a straightforward way of tuning hydrogel stiffness (Figure 2.5). Increasing the
crosslinker concentration from 0.05% (w/v) to 0.4% (w/v) raised the stiffness by
approximately 5-fold, from 11.8 ± 3.0 kPa to 62.4 ± 16.7 kPa. It should, however, be noted
that a slightly larger range (from 8.7 ± 0.7 kPa to 102.0 ± 6.7 kPa) was determined when the
hydrogels were commercially tested (A.2). Nevertheless, the Young’s modulus values
obtained from testing conducted either in-house or outsourced to equipment manufacturers
(Optics11, Amsterdam, The Netherlands) fall within the range covered by normal and
metastatic human lymphoid organs, such as axillary lymph nodes (mean stiffness for normal:
17.7 kPa; mean stiffness for metastatic: 45.4 kPa) reported by Bae et al. [133].
Figure 2.5 Young’s modulus (E) of hydrogels obtained via AFM nanoindentation. The E values derived from
individual load-indentation curves from two independent gels per crosslinker concentration were pooled
together and averaged. Data = mean ± standard deviation. Values displayed above bars indicate mean E
values. **** denotes p ≤ 0.0001. Welch’s ANOVA with Games-Howell post-hoc test (a = 0.05).

2.3 Results 77
Hydrogel-integrated multiwell culture chambers
The custom-built culture chambers (Figure 2.6) were specifically designed for suspension
cells such as Jurkat cells, based on the principle that all cells within the device would
sediment to the bottom of the microwell, where the entire bottom surface was covered by a
layer of hydrogel. A leak-free seal was achieved between the hydrogel-coated slide and the
top compression plate by a PDMS gasket (Figure 2.6 b), which was successfully created
using a micromilled PTFE mould (Figure 2.6 c). It was found that four M3 hex screws
provided sufficient clamping force to keep the entire assembly intact without ripping the
hydrogel or snapping the microscope slide. The confinement of culture medium within each
well could be viewed from the side of the top compression plate (Figure 2.6 d). Furthermore,
cells in each well could be inspected using an inverted microscope as the bottom compression
plate had a rectangular viewing window (Figure 2.6 e). After aspirating the culture medium,
the residual liquid on the gel-coated slide formed circular droplets that matched the positions
and dimensions of the wells, highlighting the lack of cross-contamination between wells
(Figure 2.6 f).

78 Biophysical T cell activation platform
Figure 2.6 Hydrogel-integrated multiwell culture chamber for T cell stimulation. (a) Exploded view of the
assembly. (b) The interior of the assembly with a detailed view showing how the recessed rectangular slot
enabled alignment and fitting of the PDMS gasket. (c) The gasket was created using a PTFE mould and
could be easily detached using tweezers (preferably with flat tips). (d) Top and side views show 200 µL of
culture medium loaded in each microwell without any leakage. (e) Image of Jurkat cells inside the
hydrogel-integrated culture chamber, as viewed from the bottom viewing window using an inverted phase
contrast microscope. Scale bar = 100 µm. (f) A gel-coated slide removed from the assembly after aspiration
of culture medium from the microwells. Residual medium formed circular droplets on the slide where the
microwells were before disassembly. Scale bar = 10 mm.

2.3 Results 79
Effect of substrate stiffness and ligand density on Jurkat cell IL-2 secretion
In general, the stiffest hydrogel tested (0.4% w/v crosslinker) stimulated a significantly
higher IL-2 secretion from Jurkat cells than the softest one (0.05% w/v crosslinker) (Figure
2.7 a). Increasing anti-CD3 concentration in the coating solution from 10 µg/mL to 30 µg/mL
further elevated IL-2 concentrations. There was minimal IL-2 secretion from the negative
control group (0 µg/mL anti-CD3), confirming that gels alone without the stimulatory signal
were unable to activate the cells. Two-way ANOVA revealed that there was a significant
interaction effect (p = 3.83´10-4) between anti-CD3 concentration and crosslinker
concentration.
The stiffest and softest gels in the 10 µg/mL anti-CD3 group (0.05 and 0.4% w/v crosslinker)
were also chosen for a time course experiment, where the cells were stimulated for various
durations (Figure 2.7 b). The 10 µg/mL group was chosen because the concentration was
sufficient to induce measurable IL-2 levels (as previously reported [109]), while the volume
of Ab usage could be minimised in this preliminary screening. ELISA results revealed a more
rapid increase in IL-2 secretion in the first 24 hours for cells stimulated by the stiff gel
relative to those stimulated by the soft one. However, there was no significant difference
between 48 hours and 24 hours for both gels, possibly because the cells were reaching peak
cytokine secretion.

80 Biophysical T cell activation platform
Figure 2.7 Stimulation of Jurkat cells using anti-CD3-coated PA hydrogels. P-values returned by two-way
ANOVA are noted above the plots. (a) IL-2 secretion from the cells stimulated on Ab-coated hydrogels of
different formulations. P-values of main effects ([Crosslinker] and [Anti-CD3]) and interaction effect
([Crosslinker] ´ [Anti-CD3]) returned by ANOVA are noted above the plot. [Crosslinker] refers to
crosslinker concentration of hydrogels. [Anti-CD3] refers to concentration of anti-CD3 in the coating
solution. Data presented as geometric means with 95% confidence interval error bars back-transformed from
the log10 scale to the original scale. Points represent individual data points from 3 independent experiments
(N = 3). Two-way ANOVA (with interaction; White-adjusted for heteroscedasticity) on log10-transformed
data followed by Games-Howell post-hoc test (a = 0.05). # Significant difference (p < 0.0001) from d. †
Significant difference (p < 0.01) from e. * p < 0.05. ** p < 0.01. (b) The effect of stimulation time on IL-2
secretion from Jurkat cells stimulated by gels of 0.05% w/v (soft) and 0.4% w/v (stiff) crosslinker. Both stiff
and soft gels were coated with 10 µg/mL of anti-CD3. P-values returned by two-way ANOVA are noted
above the plots. Data presented as geometric means with 95% confidence interval error bars back-
transformed from log10 scale. N = 3. Two-way ANOVA (without interaction) on log10-transformed data,
followed by Tukey’s post-hoc test on the main effect of stimulation time (a = 0.05). P-values from pairwise
comparisons are shown below the plot.
2.3 Results 81
Comparison of hydrogels and Dynabeads in Jurkat cell stimulation
Hydrogels and Dynabeads presenting both primary and costimulatory signals (anti-
CD3/CD28) triggered IL-2 secretion in Jurkat cells (Figure 2.8). Similar to the time course
experiment (Figure 2.7 b) where hydrogels presented only anti-CD3 to the cells, the stiff gel
stimulated a higher level of IL-2 secretion than the soft one in the first 24 hours. Post-hoc
difference-in-differences analysis supported this observation, as the differential change in IL-
2 over time between the stiff and soft gel-stimulated groups was significant (soft-stiff | 6
hours : soft-stiff | 24 hours; p-value = 1.19 ´ 10-4). This change, however, was less significant
when the comparison was made between 24 hours and 48 hours (soft-stiff | 24 hours : soft-
stiff | 48 hours; p-value = 9.6719 ´ 10-3). Here, it should be noted that both soft and stiff gels
were coated with the same anti-CD3 concentration (10 µg/mL). Interestingly, Dynabeads
induced only a modest level of IL-2 secretion compared to the two hydrogel-stimulated
groups. Additional viability measurements showed that all cells remained >80% viable after
48 hours of stimulation (Fig. A.3). It was therefore hypothesised that differences in the
quantity of cells interacting with the surface of the Dynabeads versus that interacting with the
gels may not have been equivalent. An image processing pipeline was therefore developed to
quantify the number of cells directly in contact with the Dynabeads (Figure 2.9 and Figure
2.10).

82 Biophysical T cell activation platform
Figure 2.8 IL-2 secretion by Jurkat cells stimulated by soft gels (0.05% w/v crosslinker), stiff gels (0.4%
w/v crosslinker) presenting both signal 1 (anti-CD3) and 2 (anti-CD28). Anti-CD3/CD28 Dynabeads
were added at a bead-to-cell ratio of 1:1, as a positive control. Tissue culture plastic (TCP) devoid of any
stimulatory signals was employed as a negative control. ART two-way ANOVA (with interaction),
followed by post-hoc interaction contrast (difference-in-differences) analysis (a = 0.05). P-values for
main effect (substrate type and time) and interaction (substrate type ´ time) effects returned by ANOVA
are noted above the plot. Substrate type refers to the substrate material employed to stimulate Jurkat
cells. Data presented as mean ± standard deviation. N = 3. Post-hoc comparisons between groups
stimulated by soft gels, stiff gels and Dynabeads are shown in table below the plot, where the p-values
indicate whether there is a significant difference in the differential response between a pair of substrate
types for a particular stimulation time relative to that of another pair for another stimulation time. NS
means not significant.

2.3 Results 83
Quantification of cell-bead interactions
The MATLAB image processing algorithm automated and accelerated the identification of
hundreds of Dynabeads and cells in microscopy images (Figure 2.9 and Figure 2.10).
Results returned by the algorithm showed that the majority of cells were not in contact with
any beads, while some were bound to >3 beads (Figure 2.10 middle column). Less than half
of the detected Dynabeads were bound to at least 1 cell (Figure 2.10 right column). It was
noticed that one of the images contained a large cluster consisting of tightly packed cells and
beads (Figure 2.9 a), which led to a low accuracy of cell/bead detection in that region of the
image. It was therefore decided to present a comparison of results generated from both
manual counting and the algorithm (Figure 2.9 c, e). Cells and beads outside of the cluster
could be more accurately detected (Figure 2.9 d) and the same trends were observed, where
the majority of cells and beads were unbound. Nevertheless, the high proportion of unbound
beads reflected suboptimal cell-bead interactions despite the fact that the beads were added at
the manufacture-recommended cell-to-bead ratio of 1:1 at the start of the experiment.

84 Biophysical T cell activation platform
Figure 2.9 Image processing pipeline to analyse cell-bead interactions. Illustrated here is an example that
required extra processing to quantify cells and beads, due to the presence of a large cluster. A circle detection
algorithm was first applied to the microscopy image in (a) to yield the results in (b). (c) The large cluster
(boundary outlined in blue), however, returned some false negatives and positives (indicated by “+” markers)
Cell and bead numbers detected by the algorithm are given below the plot. (d) The rest of the cells and beads
as detected by the algorithm. (e) Manual counting of cells and beads inside the cluster using yellow markers.

2.3 Results 85
Figure 2.10 Detected cell-bead interactions in phase contrast microscopy images. Left column: green
markers superimposed on detected bead-bound cells. Scale bar = 100 µm. Middle column: Histograms to
show the number of Dynabeads bound to cells detected by the image processing pipeline. Right column:
Pie charts showing the relative proportions of cell-bound beads versus unbound beads.

86 Biophysical T cell activation platform
Post-stimulation performance of hydrogel- and bead-stimulated cells
Jurkat cells were reseeded in new tissue culture plates after 48 hours of stimulation by
hydrogels or Dynabeads and then monitored for a further 6 days (Figure 2.11 a). Overall,
cells stimulated by the soft hydrogel and Dynabeads proliferated more than those stimulated
by the stiff one. On day 4, cell count of the stiff gel group was less than all other groups and
the difference became more pronounced on day 6. The relatively low proliferation rate
prompted further investigation into the health of stimulated Jurkat cells. As cell size is a well-
known indicator of T cell metabolic fitness and activation state, it was decided to monitor
variations in cell diameter using the automated cell counter [178,179]. Similar to the
proliferation data, the stiff gel-stimulated group stood out with significantly smaller cells
relative to other groups at various time points throughout the culture period (Figure 2.11 b).
Figure 2.11 (a) Post-stimulation proliferation of Jurkat cells. Data = mean ± standard deviation. N =3. (b)
Cell diameters of Jurkat cells in post-stimulation proliferation time course. Data presented as mean ± standard
deviation. N =3. Two-way ANOVA with Tukey’s test (a = 0.05). * Significant difference (p < 0.01) from
Dynabeads (same time). ☨ Significant difference (p < 0.01) from all (same time). ¥ Significant difference (p
< 0.001) soft PA gel (same time). NS Not significant (same time).

2.3 Results 87
Effect of immobilised integrin-specific antibodies on cytokine secretion
To investigate the effect of adhesion on hydrogel-stimulated Jurkat cells, LFA-1 integrin
antibodies (aLFA-1) were immobilised as well as stimulatory ligands (aCD3 and aCD28)
(Figure 2.12). IL-2 ELISA results showed that, in addition to a stiffness-dependent effect (p
= 1.09 × 10⁻⁵), the inclusion of aLFA-1 significantly (p = 6.53 × 10⁻⁹) boosted cytokine
secretion. It should be highlighted that the total antibody concentration was fixed (10 µg/mL,
as previously described [109]) and divided equally among antibodies in the coating solution
for all conditions. Thus, the condition containing aLFA-1 had relatively less of aCD3 and
aCD28 (3.3 µg/mL each) compared with the condition without aLFA-1 (5 µg/mL each). The
condition with aLFA-1 stimulated a higher level of cytokine release from both the stiff and
soft hydrogel groups relative to the absence of aLFA-1, suggesting that adhesive cues
worked in synergy with stimulatory signals to potentiate T cell activation.

88 Biophysical T cell activation platform
Figure 2.12 Stimulatory signals and adhesive cues synergistically potentiated T cell activation. αCD3,
αCD28, αLFA-1 and “isotype” were all biotinylated Abs and immobilised on streptavidin-doped
hydrogels. “Isotype” refers to the negative control: isotype control of anti-CD3 – mouse IgG2a,κ. Data
presented as mean ± standard deviation. N =3. Two-way ANOVA (a = 0.05). P-values returned by
ANOVA for the main effects (Adhesive signal and [Crosslinker]) are noted above the plot. “Adhesive
signal” refers to the comparison made between the groups (+ αCD3, + αCD28, – αLFA-1) and (+
αCD3, + αCD28, + αLFA-1), as the difference between them is the presence/absence of the adhesive
signal αLFA-1. [Crosslinker] refers to the crosslinker concentration of hydrogels. NS means not
significant.

2.4 Discussion 89
2.4 Discussion
Biomaterials and antibody conjugation
T cells may be stimulated using antibodies immobilized on a range of materials, such as PA
hydrogels, polystyrene microbeads, tissue culture plastic or glass [108]. These materials
differ not only in stiffness, but also nano-/micro-topography, curvature and surface chemistry
that could influence T cell-material interactions [180]. Different protein conjugation
strategies suitable for each material and the material’s intrinsic binding capacity may also
lead to variations in antibody orientation and density. Moreover, it is unlikely T cells could
deform stiff (MPa – GPa) substrates with their pico-newton traction forces [99,163,181,182].
To systematically study the effect of substrate stiffness on T cell activation, we focused on
PA hydrogels, due to their well-known biocompatibility and mechanical tunability in the kPa
range [168,183]. As anti-CD3/CD28 microbeads have been employed as the gold standard
materials in adoptive T cell therapy trials [184], we decided to also compare, not the
stiffness-dependent effects per se, but the general stimulatory performance of our PA
hydrogels against Dynabeads (Figure 2.8 and Figure 2.11).
In the present study, the immobilisation strategy reported by Judokusumo et al. was utilised
because the streptavidin-biotin bond is the strongest known non-covalent interaction
(dissociation constant, Kd, in the order of 10-15 M), and can be achieved in a single incubation
step [185]. Although physical adsorption is also a straightforward method, it comes with the
risks of instability over long incubation periods and protein detachment as cells push and pull
against the substrate [99]. Maximum intensity values were used as a metric of surface ligand
density. This decision was made based on the assumption that most of the antibody would be
at the gel surface due to steric effects. To support this assumption, hydrogels were co-labelled
with FITC and AlexaFluor568 to visually validate the limited antibody penetration through
the gel matrix (Figure 2.4). Interestingly, Burnham et al. also suggested the role of porosity-
dependent steric effects in restricting the diffusion of proteins through hydrogels [186].
The decrease in fluorescence intensity with increasing crosslinker concentration (stiffness)
reflects that independent control of surface ligand density and substrate stiffness is limited in

90 Biophysical T cell activation platform
the current biomaterial design (Figure 2.2 c). A plausible reason for this limitation is that
porosity, which is lower for gels with higher crosslinking densities or stiffness, can affect the
surface accessibility of streptavidin to biotinylated antibodies [187,188]. This problem was
tackled by adjusting the streptavidin-acrylamide concentration of each gel formulation until
the fluorescence intensities were no longer significantly different from each other across the
stiffness range (Figure 2.2 d). Similar optimisation strategies were also implemented by
Judokusumo et al. [107], Wan et al. [110] and Saitakis et al. [109] to control surface ligand
densities for their streptavidin-doped hydrogels. However, it should be noted that
fluorescence bands in cross-sectional gel images and intensity-depth profiles indicate that
there was penetration of antibody molecules 30 – 40 µm into the gel matrix. Therefore,
estimation of the true number of ligands cells could sense would be confounded by i) a
resolution-related uncertainty in the actual start and end to the antibody layer within the
fluorescence bands and ii) the extent to which T cells could sense near-surface antibodies
(especially with invadopodia- or filopodia-like cell protrusions commonly observed during
immune surveillance [189–192]. The former issue may be resolved by anchoring antibodies
on gel-surface-presented gold nanoparticles via a combination of block copolymer micelle
nanolithography, nano-contact transfer lithography and antibody-gold conjugation [193]. The
latter problem may be addressed by fluorescently labelling the actin cytoskeleton (and/or
TCRs) of T cells as well as surface-immobilised ligands and visualising them in a side (x-z)
projection via confocal microscopy.
Substrate stiffness and ligand density synergise to regulate T cell activation
Nevertheless, the present study has demonstrated a clear dependence of T cell activation on
both ligand density and hydrogel stiffness (Figure 2.7 a). In particular, the interaction effect
revealed by two-way ANOVA suggests there is a synergistic interplay between the two
parameters, and it can be exploited to potentiate activation. This observation is largely
consistent with previously published findings, which only considered one of the two
parameters. For example, it has been shown that T cell cytokine secretion can be elevated
with increasingly dense nanopatterned anti-CD3 molecules immobilised on glass
[137,156,166]. Similarly, the enhancement of activation by substrate stiffness agrees with the

2.4 Discussion 91
trends observed by Judokusumo et al. and Saitakis et al. who also used streptavidin-doped
PA hydrogels [107,109]. There is only one published study to date that has used a 2D
hydrogel platform to investigate the effect of ligand density on activation (measured in terms
of CD8+ T cell fold expansion) [132]. Still, stiffness- and ligand density-dependent effects
were examined separately in the study, with either one of the two parameters kept constant in
their activation experiments.
Comparison between hydrogels and Dynabeads
It was interesting that both the stiff and soft hydrogel-stimulated groups (both coated with
anti-CD3 : anti-CD28 in a 1:1 ratio at a total antibody concentration at 10 µg/mL, as
previously described [109]) produced more IL-2 than cells stimulated by Dynabeads (positive
control) dosed at the manufacturer’s recommended bead-to-cell ratio (Figure 2.8). Yet, it
should be emphasised that hydrogels and beads differ not only in stiffness, but also in
geometry and stimulatory ligand distribution. Hydrogels are mechanically orders of
magnitude softer than Dynabeads, which are primarily made of polystyrene (Young’s
modulus: 3.2 – 3.4 GPa [194]). While the former offered a contiguous planar surface to
interact with T cells, the latter presented ligands on a much smaller surface with curvature
(bead diameter: 4.5 µm). Thus, in the case of hydrogels, the number of cell-engaged ligands
is primarily limited by the size of the immunological synapse or cell spreading area. In terms
of bead-based activation, the number of ligands presented to a Jurkat cell will be proportional
to the number of beads bound to it. In addition, the comparison is made difficult by the
unknown anti-CD3/CD28 density on Dynabeads (but described as “optimised” by the
manufacturer). Nevertheless, multiple studies have shown that the number of stimulatory
ligands presented to a T cell (global ligand density) has a more dominant effect on activation
over the local ligand density, which depends on the inter-ligand spacing [156,195].
In spite of the differences between hydrogels and Dynabeads, extracting some information
about cell-bead interaction may still be useful in speculating reasons behind the low IL-2
output. To this end, the number of beads bound or unbound to cells was counted to evaluate
how much simulation the cells were receiving. Microscopy images have shown that the actual
bead distribution in culture was not at a bead-to-cell ratio of 1:1, as in the theoretical dose

92 Biophysical T cell activation platform
(Figure 2.9 and Figure 2.10). The self-written MATLAB algorithm has further revealed that
most of the detected beads were not bound to cells. The drawback of the algorithm, however,
is that it is less accurate in distinguishing between cells and beads in large, three-dimensional
cell/bead aggregates. One possible way to analyse these aggregates is to use fluorescence
microscopy to visualise DAPI-labelled cell nuclei. The image processing algorithm can then
be adapted to detect the fluorescently stained nuclei with techniques such as image
segmentation based on pixel intensity thresholding. However, Dynabeads would not be easily
visualised alongside stained cells, unless the beads had fluorescent labels co-conjugated with
stimulatory ligands. It is not known whether this approach would affect the ability of
Dynabeads to engage and activate T cells. Perhaps, a more appropriate method would be
digital holographic microscopy – a label-free method to visualise cells and beads in 3D
[196,197].
Tuning hydrogel mechanics to balance activation and post-stimulation proliferation
A surprising result from the present study is that the trends in IL-2 secretion appear to be the
inverse of those in post-stimulation proliferation (Figure 2.11 a). The stiff-gel-stimulated
group, which previously secreted the most IL-2, became the one that proliferated the least.
This result may reflect a trade-off between activation level and post-stimulation cell fitness
that should be considered in the context of hydrogel-based stimulation. It is unlikely that the
low proliferation was due to anergy because the hydrogels presented a costimulatory signal
(anti-CD28) [198]. It was therefore hypothesised that the proliferation of stiff-gel-stimulated
cells might have been impeded by other T cell dysfunctions such as exhaustion from
overactivation [199], or activation-induced cell death (AICD) [200]. The accompanying
smaller cell size in the stiff-gel-stimulated group over the proliferation period seems to
support the hypothesis (Figure 2.11 b). Taken together, the observations prompt for further
phenotypic analysis to dissect the exact nature of the observed cellular dysfunction. For
example, stimulated cells can be screened for upregulation of exhaustion or AICD markers,
such as T cell immunoglobulin and mucin domain-containing protein-3 (TIM-3),
programmed cell death protein-1 (PD-1) [201–203] or Fas ligand (FasL) [204].

2.4 Discussion 93
From a immunotherapeutic standpoint, it would not be useful to activate T cells in a way that
hinders their subsequent proliferative capacity and in vivo persistence. In this case, the soft
hydrogel may be a more desirable immunostimulatory material than the stiff one. However, it
should be pointed out that a model system (Jurkat T cell line) was used in the present study.
Although Jurkat cells recapitulate a lot of aspects of TCR signalling, primary human T cells
may respond differently to the same stimuli [173]. Moreover, donor-to-donor variability will
eventually have to be taken into consideration in order to develop a more clinically relevant T
cell-activating biomaterial. Nonetheless, the findings have overall demonstrated that hydrogel
stiffness can be exploited to regulate the activation level.
Integrin-mediated adhesion as a signal amplifier
When a mature immunological synapse (IS) is formed at the interface between a T cell and an
APC, there are two main classes of molecules that are known to mediate adhesion between
the two cells – stimulatory molecules (TCR – pMHC ligation) in the cSMAC and adhesion
molecules (LFA-1 – ICAM-1 ligation) in the pSMAC [29]. The integrin LFA-1 is widely
believed to serve the function of IS stabilisation and enhance the sensitivity of antigen
recognition [205]. It has been demonstrated in a mouse model that LFA-1 engagement can
result in a 100-fold increase in the sensitivity of antigen recognition [206]. The functions of
TCR and LFA-1 are highly intertwined – the engagement of the former is necessary for the
activation of the latter, and ligation of the latter feeds back to mechanically tune the
activation of the former via cytoskeletal tension [207,208]. Yet, integrin-mediated
mechanosensing in T cell activation is dispensable when there is a sufficient density of T
cell-activating ligands [156]. Studies have shown that TCR engagement alone can induce
actin polymerisation around the receptor and cause the cell to generate traction forces on the
substrate via actomyosin-mediated pulling, which is centripetally directed towards the cell
centre from the cell edge [98,127,208]. Given these findings, the activation-potentiating
property of LFA-1 seems to be an attractive parameter to control for fine-tuning T cell
activation.
In the present study, it has been shown that anti-LFA-1 (which replaces ICAM-1 found on
natural APCs) can be immobilised on both stiff and soft PA gels to boost IL-2 secretion.
94 Biophysical T cell activation platform
Strikingly, hydrogels coated with anti-LFA-1 elicited higher IL-2 secretion than those
without, even though the former presented less anti-CD3/28 (3.3 µg/mL each in coating
solution) than the latter (5 µg/mL each in coating solution) (Figure 2.12). This synergistic
response was likely due to a reduction in the stimulatory dose threshold for T cell activation
caused by the aforementioned mechanical cooperativity between LFA-1 and TCR.
Nevertheless, one should be cautious and determine whether integrin-mediated adhesions
would hinder cell detachment from the hydrogel during bioprocessing. If cells were difficult
to detach for downstream processes then one of the main reasons for using a bead-free
activation approach would be defeated. Furthermore, immobilising a third ligand type in
addition to anti-CD3/28 might also drive up the cost of manufacturing the biomaterial.
Moving forward, one could utilise immunofluorescence to track the detachment or
attachment of T cells to hydrogels coated with the different ligand combinations presented in
this study.
Hydrogel-integrated culture platform for nonadherent cells
In addition to the biological findings, a hydrogel-integrated platform was also developed for
T cell stimulation. This platform differs from previous studies which utilised hydrogel-coated
coverslips in multi-well tissue culture plates. The smaller size of the coverslip relative to the
well diameter means that some cells may sediment to the gap between the hydrogel and the
wall of the well. The set-up used by previous studies would have therefore made it difficult to
control the actual number of cells interacting with the antibody-coated gel and thereby
increased well-to-well differences. Using the present hydrogel-integrated platform, the entire
bottom surface of each well was coated with the hydrogel such that all sedimented cells
would have to settle on the stimulatory surface. However, improvements can still be made to
the design. For example, a custom-made lid with condensation rings and a chimney well
design can be adopted such that contamination risks could be reduced while maintaining
adequate gas exchange.

2.5 Conclusions 95
2.5 Conclusions
In this chapter, antibody-coated PA hydrogels were exploited as a platform to demonstrate
the dependence of T cell activation on substrate stiffness, ligand density and adhesive cues.
Unlike the conventional method of using gel-coated coverslips, a hydrogel-integrated culture
device was developed to provide surfaces fully covered by the gel for T cell activation
experiments. Results have revealed that the synergistic interaction between stiffness and
ligand density can be harnessed to potentiate activation, but caution must be taken to avoid
inducing cellular dysfunction as an undesirable side effect. Adhesive cues provided by anti-
LFA-1 could be used in conjunction with anti-CD3/28 to further enhance IL-2 secretion. T
cell exhaustion and AICD have been proposed as possible reasons behind the low post-
stimulation proliferation of the stiff-gel-stimulated group and will need to be further
investigated. Based on the findings, the soft hydrogel formulated would be more favourable
than the stiff hydrogel in cell processing, as the former stimulated higher IL-2 secretion and
comparable proliferation rate to Dynabeads. To explain the lower IL-2 secretion from
Dynabead-stimulated cells, an image processing pipeline was developed to semi-
automatically detect the number of beads and cells in phase contrast microscopy images.
Image analysis revealed that the majority of detected beads were not bound to any cell which
means there was an underutilisation of available stimulatory cues in bead-stimulated samples.
This observation therefore serves as another reason for using a bead-free T cell activation
platform. The insights from the present study will likely benefit from further phenotypic
analyses to elucidate how the different cue combinations can affect differentiation in the
context of primary human T cells, as differentiation status is known to have a significant
impact on the efficacy of adoptive immunotherapy [209].


Chapter 3 Development of microfluidic hardware
for automated T cell stimulation
3.1 Introduction
The prevalent industry model for T cell-based immunotherapies such as CAR-T cells is that
of a highly centralised mode of manufacturing with limited facilities worldwide [86,210,211].
Numerous labour-intensive unit operations are involved in the bioprocessing – cell isolation
(apheresis), shipment to the manufacturing facility, ex vivo manipulation (activation,
expansion, viral transduction), return trip to treatment centre and infusion into the patient.
Costs encompassing research and development, FDA assessments, quality control, labour,
shipping, logistics, and many other factors have together incurred huge price tags for
therapeutic T cell products [212]. For example, the two CD19-directed CAR-T cell products
arpproved by the FDA –Kymriah (Novartis) and Yescarta (Kite/Gilead) – are priced at USD
$475,000 and $373,000, respectively. They are among the most expensive cancer therapies to
date. Furthermore, the UK National Institute for Health and Care Excellence has recently
deemed Yescarta as not cost-effective and thereby recommended against its use [213].
Limitations of current automated T cell processing platforms
One way to reduce manufacturing cost, user-related variability and labour is automation.
Current automated bioreactors, such as the CliniMACS Prodigy (Miltenyi Biotech), WAVE
Bioreactor (GE Life Systems) and G-Rex flask (Wilson Wolf Manufacturing), have opened
up the possibility of decentralised, point-of-care (POC) manufacturing. In particular, the
CliniMACS Prodigy is currently the most widely used automated platform for cell
manufacturing as it integrates many different operations – a device category known as
“GMP-in-a-box” [214]. However, the savings in labour are counterbalanced by significant

98 Development of microfluidic hardware for automated T cell stimulation
capital expenditure ($150,000 for the instrument and another $12,000 to process one patient’s
cells [215]) and ongoing maintenance associated with the platform. Limitation to the
platform’s customisability also means that it may not be the ideal option to handle more
complex expansion protocols, such as those for tumour antigen-associated (TAA) T cells
[216]. Moreover, each CliniMACS Prodigy machine can only process one patient’s cells at
any one time. Scaling up to treat multiple patients would require the manufacturing centre to
operate in parallel many machines that increase space requirements and drive up costs [217].
Intensification of bioprocessing
The complicated landscape of manufacturing personalised therapeutic T cells has made it
difficult to envisage the hydrogels presented in Chapter 2 can alone have significant cost
reduction impact without a translational pathway to deploy them. The unit operation of T cell
activation is particularly amenable to scaled-down, automated processing, as nature has
already demonstrated its feasibility in sub-millilitre [218] “modules” – lymph nodes.
Integrating biophysically optimised T cell-activating hydrogels into low-volume, automated
platforms may therefore serve as a potential gateway to intensifying bioprocessing.
Advances in microfabrication have given birth to a plethora of microfluidic devices suitable
for culturing and manipulating human cells in tightly controlled, low-volume
microenvironments [219–221]. However, a majority of these devices were designed for
fundamental cellular studies or preclinical drug evaluation. In the context of immune cells,
microfluidic chips have been employed as model systems to study T cell-tumour interactions,
single-cell activation, as well as simulated infections [222–226]. On the other hand, devices
developed specifically for bioprocessing in adoptive cell-based immunotherapies are rare. So
far, reported devices have mainly focused on immune cell separation and gene delivery
methods for creating CAR-T cells [227–232]. Integration of microfluidic-based T cell
activation in therapeutic cell manufacturing therefore remains to be explored.

3.1 Introduction 99
Objectives
To address the aforementioned challenges this chapter aims to demonstrate the following:
1. Development of low-cost, open-source hardware for automated T cell stimulation
under flow conditions.
a. Design and implementation of a microfluidic device that can integrate an
antibody-coated hydrogel.
b. Design and implementation of compact peripheral devices for precise and
programmable control of microfluidic flow.
2. Proof-of-concept study to explore the feasibility of the microfluidic approach.
3. Identification of processing parameters and bottlenecks that need to be addressed in
microfluidic T cell stimulation.

100 Development of microfluidic hardware for automated T cell stimulation
3.2 Materials and methods
3.2.1 Materials
SYLGARDä 184 Silicone Elastomer Kit was obtained from Dow Corning. The open-source
microcontroller board Arduino Uno R3 was purchased from Cool Components. Adafruit
Motor Shield v2.3 for Arduino, NEMA-17 Two-Phase Bipolar Stepper Motor (step angle:
1.8° per step; 200 steps per revolution), SourcingMap Flexible Shaft Coupling (4 mm-to-4
mm) and Gikfun Peristaltic Dosing Pump, including its silicone tubing (5/32” (3.97 mm) OD;
3/32” (2.38 mm) ID), were purchased from Amazon UK. RGB liquid crystal display (LCD)
shield (16x2 character display) was obtained from The Pi Hut. Tygon® silicone tubing (1/16”
(1.56 mm) OD; 1/50” (0.51 mm) ID; 23G fitted), 23G stainless steel fluidic couplers (0.025”
(0.64 mm) OD; 0.013” (0.33 mm) ID), razor sharp stainless steel biopsy punch (0.5 mm OD),
barbed fittings for 3/32” (2.38 mm) ID tubing were acquired from Darwin Microfluidics.
3.2.2 Peristaltic pump assembly
The custom-designed peristaltic pump primarily consisted of a pump head mechanically
coupled to a stepper motor, which was wired to a control unit. The pump head originated
from the Gikfun peristaltic dosing pump, which was disassembled and repurposed for the
present custom-built pump (Figure 3.1 a). Specifically, the brushed direct current (DC)
motor of the Gikfun pump was replaced with a NEMA-17 bipolar stepper motor because the
latter motor type allowed for microprocessor-controlled, low speed operation with high
precision [233] (Figure 3.1 b). The design of the pump head composed of a plastic cassette
and base that together formed the casing for a three-roller rotor assembly and silicone tubing.
A flexible coupling (4 mm to 4 mm) was used to transmit torque from the shaft of the stepper
motor to that of the pump head. The stepper motor was connected to a control unit
comprising of an Arduino Uno microcontroller which was interfaced with two modular
circuit boards (shields) – an Adafruit Motor Shield v2.3 and RGB LCD shield (Figure 3.1 c).
The Arduino board and motor shield were connected to separate power lines. In contrast, the
LCD shield drew power directly from the Arduino board through the inter-integrated circuit

3.2 Materials and methods 101
(I2C) interface pins. The stepper motor was designed to take 200 steps for a complete
mechanical rotation of 360°. A custom Arduino code (Appendix B.1) was written using the
standard Arduino Integrated Development Environment (IDE) software (v1.8.10) to control
the stepper motor and allow a user to input the flow rate directly on the LCD shield keypad.
To enable low-flow-rate pumping, the microcontroller was programmed to operate the
stepper motor using micro-stepping at 16 micro-steps per full-step.
Figure 3.1 Peristaltic pump assembly. (a) The pump head was obtained by disassembling a DC
peristaltic dosing pump. The interior of the pump head consisted of three-roller rotor assembly that was
used to compress and relax a piece of soft silicone tubing. (b) The original DC motor was replaced by a
stepper motor to enable low speed control with higher precision.

102 Development of microfluidic hardware for automated T cell stimulation
Figure 3.2 Modules in pump control unit. (a) A compact design: the shields were stacked on top of the
Arduino Uno microcontroller. (b) The Arduino Uno board handled the logic necessary to control the stepper
motor. After uploading code via its USB port, the board could be used as part of a standalone device by
connecting it to the mains via the on-board 5.5 mm/2.1 mm centre-positive DC barrel plug. (c) The motor
shield provided the power, circuitry (especially H-bridges) and dedicated ports (M1 and M2 in diagram)
required to drive and interface with the stepper motor. (d) The LCD shield acted as the user interface such
that the flow rate could be selected without the need for code modification on a computer.
3.2.3 Pump calibration
The Arduino AccelStepper library was used in the code to set the speed of the stepper motor
(Appendix B.1) [234]. Specially, the speed (in full-steps per seconds) was defined by calling
the function setSpeed() in the code. To translate motor speed into flow rate (µL/min), the
pump was calibrated by measuring the mass of water dispensed at various motor speeds
(Figure 3.3). The outlet nozzle of the pump was hung using a tripod above a glass vial placed
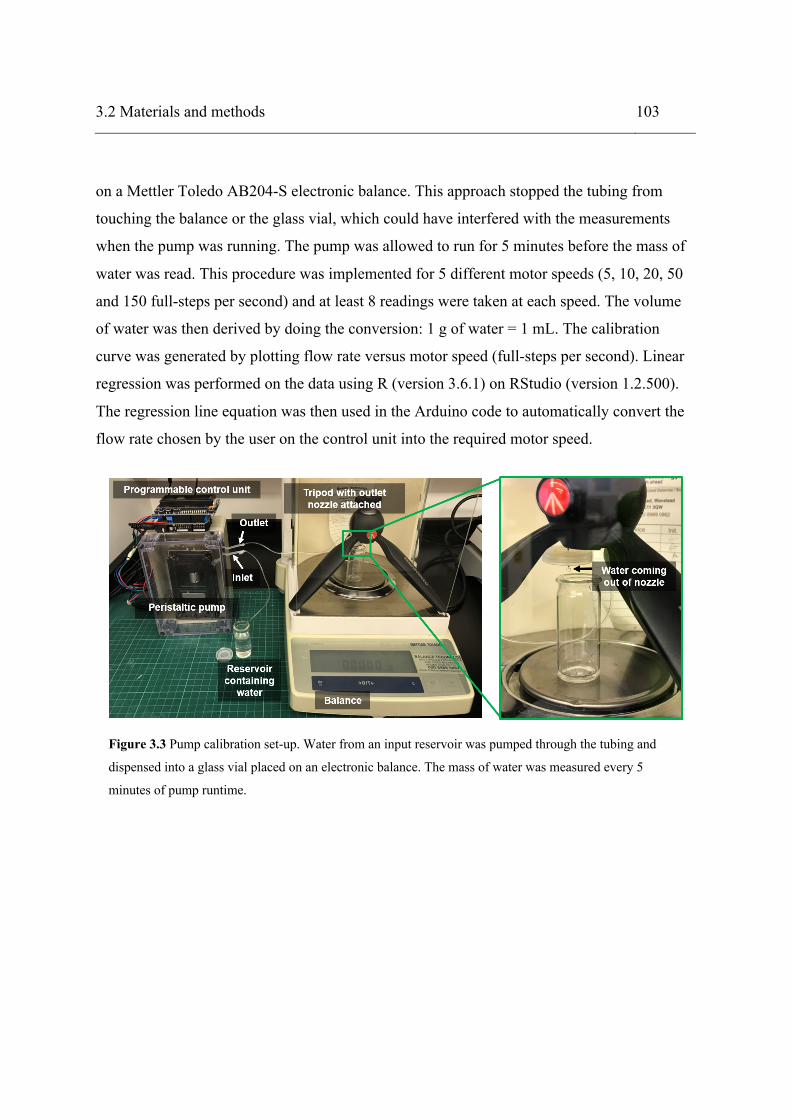
3.2 Materials and methods 103
on a Mettler Toledo AB204-S electronic balance. This approach stopped the tubing from
touching the balance or the glass vial, which could have interfered with the measurements
when the pump was running. The pump was allowed to run for 5 minutes before the mass of
water was read. This procedure was implemented for 5 different motor speeds (5, 10, 20, 50
and 150 full-steps per second) and at least 8 readings were taken at each speed. The volume
of water was then derived by doing the conversion: 1 g of water = 1 mL. The calibration
curve was generated by plotting flow rate versus motor speed (full-steps per second). Linear
regression was performed on the data using R (version 3.6.1) on RStudio (version 1.2.500).
The regression line equation was then used in the Arduino code to automatically convert the
flow rate chosen by the user on the control unit into the required motor speed.
Figure 3.3 Pump calibration set-up. Water from an input reservoir was pumped through the tubing and
dispensed into a glass vial placed on an electronic balance. The mass of water was measured every 5
minutes of pump runtime.

104 Development of microfluidic hardware for automated T cell stimulation
3.2.4 Microfluidic device
Apart from the hydrogel, all parts and moulds were designed using the 3D CAD software
Autodesk Fusion 360. The core of the microfluidic device was a PA hydrogel-coated
microscope glass slide with surface-immobilised anti-CD3/CD28. The hydrogel fabrication
and antibody immobilisation methods were the same as those described in Chapter 2.2.2. For
all experiments, the hydrogel with 0.4% (w/v) crosslinker was used because it previously
induced the highest level of activation in Chapter 2.
The fluidic channels were created by casting PDMS into a micromilled PTFE mould
(Appendix B.2). The PDMS layer was created using the same composition (10:1 ratio of
base elastomer to curing agent) and curing conditions (10-minute degassing followed by
curing at 85°C for 2 hours) described in Chapter 2.2.8. After curing, the PDMS layer was
peeled from the mould and inlet/outlet ports were created using a biopsy punch. The fluidic
seal was achieved by clamping the gel-coated slide and PDMS layer between two
micromilled PMMA plates using M3 hex screws and nuts. Blue-dyed water was used to
check for leaks of the assembled device under flow conditions.
In flow experiments, the microfluidic device drew cells from an input reservoir and the
processed cells were collected in an output reservoir. Both reservoirs were created by
modifying the caps of Corning® 50 mL polypropylene centrifuge tubes (self-standing) for
fluidic connections and ensuring adequate gas exchange. In particular, two holes were drilled
into the cap of the tube – one for a 0.2 µm syringe filter (VWR) and one for microfluidic
tubing. To test that the biocompatibility of the modified tube per se, 10 mL of Jurkat cells
were added to the tube at 1 ´ 106 cells/mL and incubated for 24 hours before cell viability
was measured.
3.2.5 Cell culture
Cell culture was carried out as previously described in Chapter 2.2.7. Briefly, cells were
cultured in in RPMI-1640 medium supplemented with 2 mM L-glutamine and 10% (v/v) FBS
under standard culture conditions. The concentration of cells was maintained between 1 ´ 105

3.2 Materials and methods 105
and 1 ´ 106 viable cells/mL. Cell number and viability were quantified using Via1-
Cassettes™ (ChemoMetec) in a NucleoCounter® NC-200™ automated cell counter running
the Viability and Cell Count Assay.
Cell biocompatibility with the microfluidic device was tested under static and dynamic
conditions. In static mode, the microfluidic channel was filled with 75 µL of Jurkat cells at 1
× 106 cells/mL. Fluidic plugs were then inserted into the inlet and outlet in order to seal them
off. These fluidic plugs were created by sealing one end of stainless steel fluidic couplers
using a glue gun. Once loaded, entire device was placed inside an incubator for 12 hours and
24 hours. At each time point, the cells were aspirated from the channel using a 1 mL syringe
fitted with a 23G needle inserted into the outlet tubing. The volume of cell suspension was
then increased by diluting 1:5 in complete RPMI-1640 medium before samples were taken
for viability measurements on the automated cell counter.
Under dynamic conditions, the inlet and outlet of the microfluidic device were connected to
the pump and output reservoir, respectively. Cells were first added to the input reservoir at 1
× 106 cells/mL and kept suspended by magnetic stirring (Hanna Instruments HI-200M Mini
Stirrer) with rotation speed set at ~200 rpm. The entire set-up, apart from the control unit,
was then placed inside an incubator. The cells were pumped through the device at 30 µL/min
for various durations (0.5, 2.5, 5 and 8 hours). At each time point, samples were taken from
the output reservoir for cell viability measurements.
3.2.6 T cell stimulation
The PDMS layer was autoclaved (13-minute sterilising cycle at 134°C) before each use.
Furthermore, the PMMA parts, along with the autoclaved PDMS layer, were UV-sterilised
inside a tissue culture cabinet for 40 mins prior to device assembly. Before it was connected,
the tubing was also washed by flushing through 70% ethanol and sterile PBS, three times
each. Hydrogels were rinsed three times in sterile PBS before being placed into the
microfluidic device. After cell experiments, the PMMA parts, PDMS layer and tubing were
rinsed three times in 70% ethanol and three more in ultrapure water. The microfluidic device

106 Development of microfluidic hardware for automated T cell stimulation
was connected to the peripheral apparatus as shown in Figure 3.4 a. All wash and assembly
steps were conducted inside a tissue culture cabinet.
Before cell experiments, the entire closed fluidic circuit was washed by pumping through
sterile PBS for 10 mins, followed by complete RPMI-1640 medium for another 10 mins. The
input reservoir was pre-loaded and the pump tubing was primed with Jurkat cells at 1 × 10⁶
cells/mL before making fluidic connection with the rest of the system. The whole set-up was
then placed inside an incubator with the control unit sitting outside. A magnetic stirrer was
placed under the input reservoir (which contained a micro stir bar) and set to rotate at ~200
rpm. A cross-sectional view depicting the flow of cells through the device is shown in Figure
3.4 b.
The pump motor was then started by the control unit with the flow rate set at 30 µL/min. The
flow was stopped after 30 mins and cells were given an additional 1.5 hrs in the output
reservoir before samples were collected for IL-2 ELISA analysis (ELISA protocol was the
same as that described in Chapter 2.2.10). The rest of the cell suspension was then
transferred back to the input reservoir for a second pass through the device, again for 30
mins. The re-stimulated cells were allowed to settle for 1 hour and then supernatants were
taken for ELISA. Therefore, all ELISA samples were taken at 2 hrs after initial contact with
the antibody-coated hydrogel in the device.

3.2 Materials and methods 107
Figure 3.4 (a) Fluidic circuit employed for T cell stimulation under flow conditions. Cells were flowed
through the hydrogel-integrated microfluidic device from the input reservoir to the output reservoir using a
peristaltic pump driven by a stepper motor. The flow rate (motor speed) was set using a control unit
connected to the stepper motor. (b) Cross-sectional diagram of the microfluidic device. In flow experiments,
cells flowed over a hydrogel-coated surface inside the PDMS channel (red box). Arrows indicate flow
direction.
108 Development of microfluidic hardware for automated T cell stimulation
3.2.7 Statistical analysis
All statistical analyses were performed using R (version 3.6.1) on RStudio (version 1.2.500).
Linear regression was implemented for peristaltic pump calibration data using the “ggpubr
v0.2.3” package. To evaluate the precision of the pump, coefficient of variation (CV), or
relative standard deviation, for each mean flow rate was computed by dividing the standard
deviation by the mean flow rate and expressing the ratio as a percentage. For IL-2 ELISA
data, paired t-tests were carried out to compare mean IL-2 concentrations between the
number of passes through the microfluidic device. Statistical significance was set at p < 0.05.

3.3 Results 109
3.3 Results
Pump calibration
Calibration data showed that a linear relationship between motor speed and flow rate was
obtained (R2adj =1; Figure 3.5 a). Varying the motor speed from 5 to 150 full-steps per
second generated flow rates in the range of 1 to 40 µL/min. CV values indicated that the
pump generally exhibited good precision (< 10%) for flow rates above 7.8 µL/min (Figure
3.5 b). However, the precision abruptly decreased below the aforementioned threshold flow
rate, with CV reaching as high as ~25%.
Figure 3.5 (a) Pump calibration curve to convert motor speed (in full-steps per second) into flow rate, and
vice versa. Data presented as mean ± standard deviation. Dots represent individual readings. Line equation
as well as R2 and adjusted R2 (R2adj) values for the linear regression are displayed. When a flow rate was
selected by the user on the control unit, the equation was used to convert the flow rate into the speed
required to drive the motor. It should be noted that the motor was in “micro-stepping” mode, meaning that
each full-step was divided into 16 “micro-steps” automatically in the background by the microcontroller
code. (b) Precision of the pump at each flow rate (varied by motor speed) coefficient of variation (CV),
expressed as a percentage here.

110 Development of microfluidic hardware for automated T cell stimulation
Microfluidic device and fluidic circuitry
The hydrogel-integrated microfluidic device was successfully assembled (as depicted in
Figure 3.6 a and b) to provide an environment within which Jurkat cells could flow and
interact with immobilised anti-CD3/CD28. The microscope-compatibility of the device meant
that it was possible to view cells within the microfluidic channel easily through the bottom
viewing window with low-power objectives of an inverted microscope (Figure 3.6 c).
Mechanical compression of the parts created a reversible leak-free fluidic seal as
demonstrated by the confinement of blue-dyed water within the channel under flow
conditions (Figure 3.6 d). In addition, biocompatibility of the modified reservoir tube was
assessed in order to demonstrate the feasibility of using it as a container to host Jurkat cells
before and after the microfluidic processing (Figure 3.6 e). After 24 hours of incubation in
the reservoir tube cells exhibited good viability (94.1%). The overall size of the fluidic set-up
was compact – the motor-connected pump head was only 12 cm in height and easily fitted
into a 16 × 11 × 9 cm (Height (H) × Width (w) × Depth (D)) enclosure (Figure 3.7 a).
Similarly, the control unit was of portable dimensions, measuring 4.7 × 8 × 5.3 cm (H × W ×
D). These dimensions are generally smaller than those of the commercial Harvard Apparatus
peristaltic pumps (Table 3.1). Furthermore, the entire set-up was small enough to put inside
an incubator to carry out flow experiments (Figure 3.7 b).

3.3 Results 111
Figure 3.6 (a) Exploded view of the microfluidic device. (b) Assembled view of the microfluidic device. (c)
Jurkat cells in the microfluidic channel as viewed using an inverted phase contrast microscope. (d) Leak test
showing the confinement of dyed water within the microfluidic channel. (e) Biocompatibility of the modified
50 mL centrifuge tube was tested by incubating cells in it for 24 hours under standard culture conditions (N =
1).

112 Development of microfluidic hardware for automated T cell stimulation
Figure 3.7 (a) The microfluidic system as set up in the tissue culture cabinet. The peristaltic pump was put
into an enclosure measuring 16 × 11 × 9 cm (H × W × D) to protect the stepper motor from the humidified
incubator environment. Silica gel beads were also placed inside the enclosure to absorb any potential
moisture. The control unit measures 4.7 × 8 × 5.3 cm (H × W × D). (b) The entire fluidic circuit was
transferred into the incubator for Jurkat cell stimulation. As shown, the components took up only about a
quarter of a shelf in the incubator. The input reservoir was fixed on a magnetic stirrer to keep cells suspended
throughout the flow experiment.
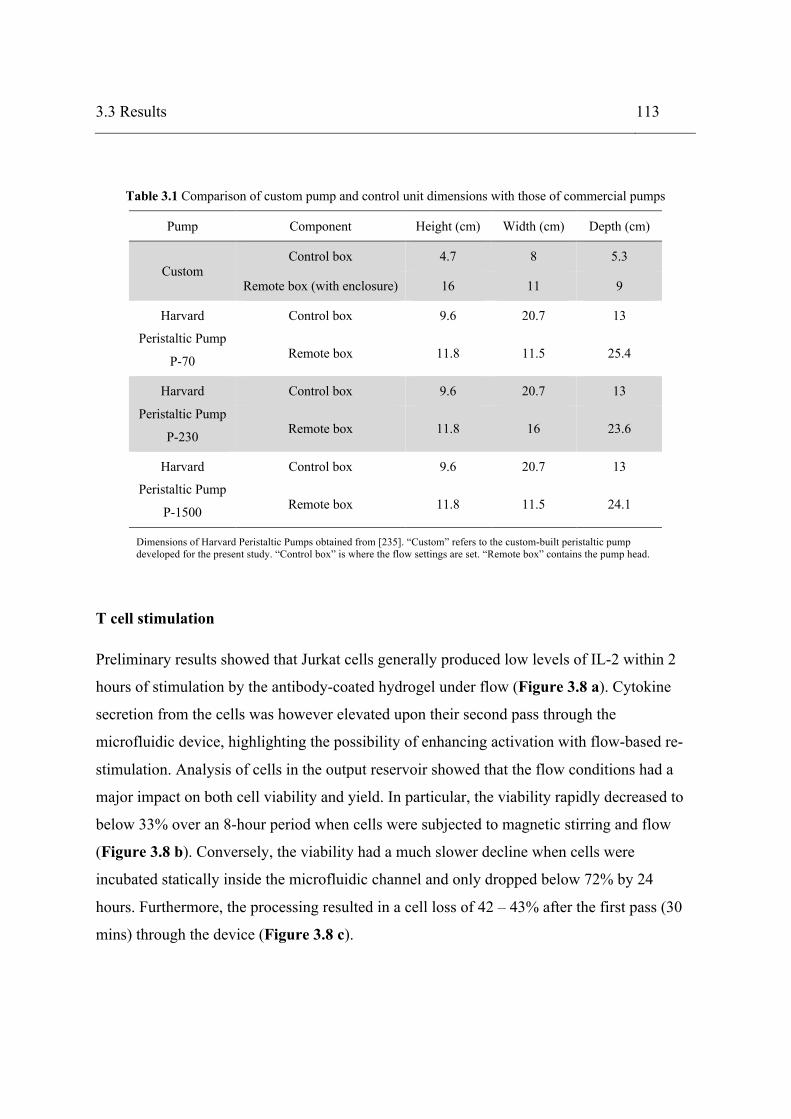
3.3 Results 113
Table 3.1 Comparison of custom pump and control unit dimensions with those of commercial pumps
Pump Component Height (cm) Width (cm) Depth (cm)
Custom Control box 4.7 8 5.3
Remote box (with enclosure) 16 11 9
Harvard
Peristaltic Pump
P-70
Control box 9.6 20.7 13
Remote box 11.8 11.5 25.4
Harvard
Peristaltic Pump
P-230
Control box 9.6 20.7 13
Remote box 11.8 16 23.6
Harvard
Peristaltic Pump
P-1500
Control box 9.6 20.7 13
Remote box 11.8 11.5 24.1
Dimensions of Harvard Peristaltic Pumps obtained from [235]. “Custom” refers to the custom-built peristaltic pump developed for the present study. “Control box” is where the flow settings are set. “Remote box” contains the pump head.
T cell stimulation
Preliminary results showed that Jurkat cells generally produced low levels of IL-2 within 2
hours of stimulation by the antibody-coated hydrogel under flow (Figure 3.8 a). Cytokine
secretion from the cells was however elevated upon their second pass through the
microfluidic device, highlighting the possibility of enhancing activation with flow-based re-
stimulation. Analysis of cells in the output reservoir showed that the flow conditions had a
major impact on both cell viability and yield. In particular, the viability rapidly decreased to
below 33% over an 8-hour period when cells were subjected to magnetic stirring and flow
(Figure 3.8 b). Conversely, the viability had a much slower decline when cells were
incubated statically inside the microfluidic channel and only dropped below 72% by 24
hours. Furthermore, the processing resulted in a cell loss of 42 – 43% after the first pass (30
mins) through the device (Figure 3.8 c).

114 Development of microfluidic hardware for automated T cell stimulation
Figure 3.8 Jurkat cell performance post-microfluidic processing. (a) IL-2 secretion from Jurkat cells after 1
and 2 passes through the microfluidic device containing an anti-CD3/CD28-coated PA hydrogel. Data
presented as mean ± standard deviation. Dots represent individual readings. N = 3. Paired t-test (a = 0.05).
****p < 0.0001. ***p < 0.001. (b) Dynamic mode: cells were suspended in the input reservoir with
magnetic stirring and pumped through the microfluidic device at 30 µL/min. Static mode: cells were loaded
into the microfluidic device inside an incubator and incubated for different durations. N = 1. (c) Output cell
concentration at 30 mins compared to the initial cell concentration at the input (ratios expressed as
percentages). “Total cell concentration” refers to that in the output reservoir at 30 mins.

3.3 Results 115
Price comparison
One of the major motivations behind creating the custom peristaltic pump was to demonstrate
the feasibility of using low-cost instruments for microfluidic cell processing. The price of the
peristaltic pump (Table 3.2) was therefore compared with three other commercial pumps
capable of low-flow-rate operation (Figure 3.9). Here, the comparison revealed that the total
cost of major pump components is 2.7 to 28-fold cheaper than the three commercial pumps.
In particular, it is only ~3.6% the cost of the most expensive pump compared (Harvard
Apparatus Peristaltic Pump P-70).
Table 3.2 Price list of all major* components used in the programmable peristaltic pump
Component Price inc VAT
(£) Retailer
Manufacturer’s
catalogue number Source
Arduino Uno R3 19.98
Cool Components
Ltd. SKU 583 [236]
Adafruit Motor Shield v2.3 21.98 Amazon UK ADA 1438 [237]
Adafruit RGB LCD Shield Kit
w/ 16×2 Character Display 22.50 The Pi Hut ADA 714 [238]
Adafruit Stepper Motor –
NEMA-17 size – 200 steps/rev 12.07 Amazon UK ADA 324 [239]
Gikfun 12V DC Dosing Pump
Peristaltic Dosing Head
(tubing included)
13.98 Amazon UK AE 1207 [240]
SourcingMap Flexible
Coupling (4×4 mm) 3.01 Amazon UK a18061200ux0185 [241]
Total 93.52
All displayed prices were obtained at the time of purchase. *Major components refer to those that are integral to the normal functioning of the pump. Materials used for the pump enclosure are not included as they can easily be replaced by other cheap materials, ranging from generic plastic wraps to 3D-printed polymer, without affecting the pump’s operation.
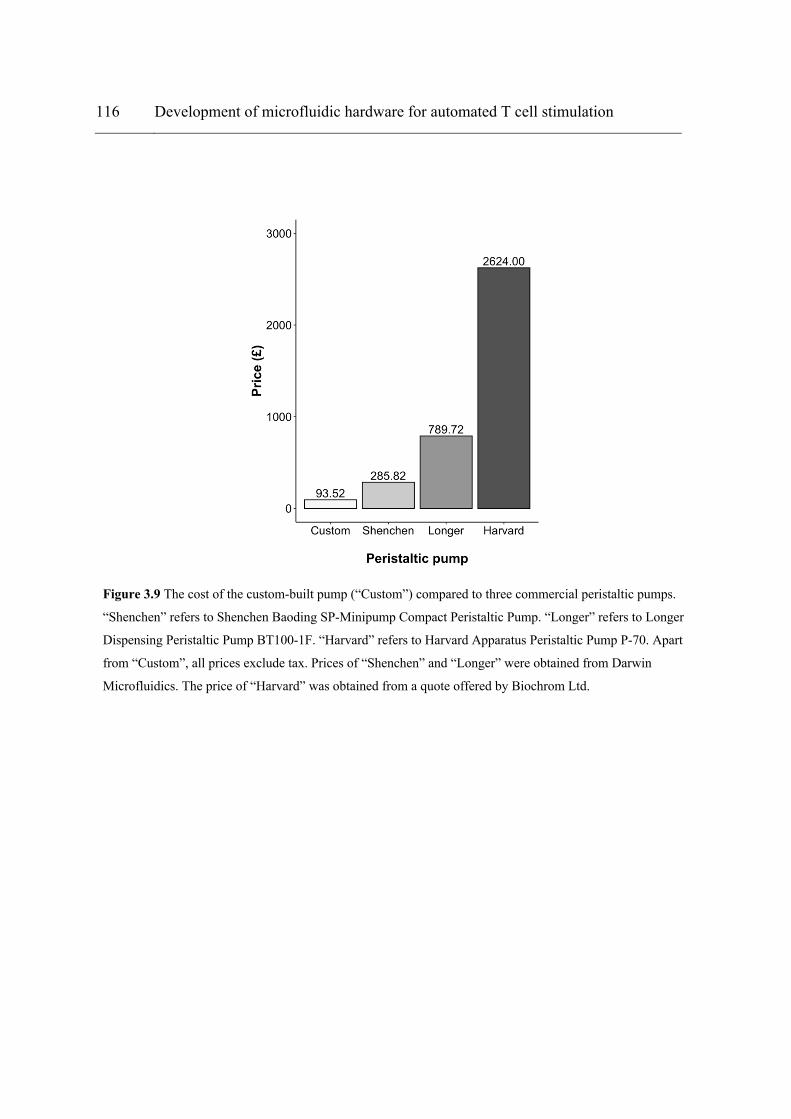
116 Development of microfluidic hardware for automated T cell stimulation
Figure 3.9 The cost of the custom-built pump (“Custom”) compared to three commercial peristaltic pumps.
“Shenchen” refers to Shenchen Baoding SP-Minipump Compact Peristaltic Pump. “Longer” refers to Longer
Dispensing Peristaltic Pump BT100-1F. “Harvard” refers to Harvard Apparatus Peristaltic Pump P-70. Apart
from “Custom”, all prices exclude tax. Prices of “Shenchen” and “Longer” were obtained from Darwin
Microfluidics. The price of “Harvard” was obtained from a quote offered by Biochrom Ltd.

3.4 Discussion 117
3.4 Discussion
In T cell manufacturing, labour-intensive manual procedures and highly trained technicians
are still required for some specialised protocols, such as the production of young tumour-
infiltrating lymphocytes (TILs) [242,243]. The young TIL protocol, in particular, requires
rapid activation and expansion of TILs extracted from resected tumours. These TILs are
cultured in microwell plates and tissue culture flasks, activated by anti-CD3 and
supplemented with IL-2. The time, cost and space requirements therefore warrant an
automated approach.
One way to address the aforementioned challenges is to exploit microfluidic technologies,
which could potentially decentralise future T cell bioprocessing in a point-of-care manner.
Specifically, successful activation of T cells in controlled, low-volume microenvironments
would mean that the device may be used as a wearable “artificial lymph node” that is
temporarily interfaced with the patient’s circulatory system to stimulate incoming T cells. In
this sense, the human body would be used as a “bioreactor” for downstream cell expansion,
to compensate for the low volume of microfluidic devices. Such miniaturised, “lab-on-body”
approach has never been explored in the context of immunotherapy before due to a previous
lack of enabling technologies. Nowadays, however, the concept has already been
demonstrated in other areas, such as the intravascular aphaeretic circulating tumour cell
isolation system [244] and automated wearable artificial kidney [245].
The present pilot study was conducted to test the feasibility in using a microfluidic system
with programmable flow control to automate labour-intensive T cell stimulation protocols. In
addition, the integrated hydrogel would offer additional parameters that can be harnessed by
the user – substrate stiffness, activation signals and ligand density (as already demonstrated in
Chapter 2).
Design considerations, modularity and customisability
The use of a shield-stack formation for the control unit bears multiple technical advantages.
The Arduino microcontroller board per se is incapable of delivering the current required to

118 Development of microfluidic hardware for automated T cell stimulation
drive the stepper motor (350 mA at a rated voltage of 12 V [246]) because its maximum DC
current output per input/output (I/O) pin is only 40 mA [247,248]. Including a motor shield in
the present set-up therefore allowed the stepper motor to draw power directly from the mains
electrical supply. The separation of power lines for the Arduino and stepper motor also meant
that the Arduino circuitry was protected from electrical noises, which could cause
unintentional resets or damages to the electronics [249]. Moreover, the use of prototyping
“breadboards” was ruled out in favour of the stackable motor shield because the latter
allowed stepper motors to be interfaced easily and compactly in a “plug-and-play” manner. In
contrast, breadboards required the use of jumper wires which restricted the mobility or
placement of the control unit in relation to the pump (Appendix B.3 depicts an early version
of the control unit that relied on a breadboard for wiring). Loose wires might also pose as a
potential hazard to both the user and electronics especially in the wet environment of a tissue
culture lab.
The control unit was designed with future expansion in mind, where its functions can be
extended beyond mere pump operation. While commercial pumps have very limited
customisability in both hardware and software, the control unit and pump head developed in
this study are totally customisable. One of the enabling factors behind this customisability is
that the circuit boards (including the motor shield and LCD shield) utilise the I2C protocol to
communicate with each other [250]. In essence, this communication protocol – invented by
Philips Semiconductors – is a convenient way for a single “master” device to control multiple
“slave” devices, or multiple masters to control a single, or multiple slaves. The master device
in the present context is the Arduino microcontroller, while the shields act as slave devices.
The I2C communication is established at the expense of only 2 pins on the Arduino board
(Figure 3.10). Each I2C-compatible slave device is “addressable” by their own unique
address and therefore can share the same 2 pins on the master device, freeing up the I/O
interface to additional slave devices for any future applications.
One potential application that can take advantage of the system’s inherent customisability is
the incorporation of label-free biosensing for real-time detection of T cell activation. This
functionality could be employed to reduce the cost and time needed for quality control in T

3.4 Discussion 119
cell processing by avoiding the use of costly instruments or lengthy protocols associated with
conventional fluorescence labelling [184,251]. For instance, electrodes similar to those
developed by Rollo et al. may be embedded into the microfluidic channel for label-free, in-
flow detection of activated T cells using bioimpedance-based, or capacitance-based
measurements [252,253]. Furthermore, Temiz et al. at IBM Research have already recently
demonstrated the concept of microfluidic flow monitoring with capacitance measurements
using an Arduino and smartphone communication [254].
Figure 3.10 Interfacing devices with the Arduino Uno microcontroller – a single-master, multi-slave
configuration. Only two pins (A4 and A5) on the Arduino board (“master”) are needed for I2C
communication with “slave devices”. In I2C terminology, A4 and A5 are known as SDA and SCL which
refer to serial data and serial clock, respectively. A typical I2C message begins with a “start” condition and
ends with a “stop” condition. Each slave device must have a unique 7-bit address for the master device
(Arduino) to select – an essential feature that allows multiple slaves to share the same two pins on the
master. The read/write bit specifies data direction – i.e. whether the master should read from or write data
to the slave. An “acknowledge/not acknowledge” pulse then follows to check whether slaves are ready for
data transfer. If the slaves are not ready then the master must either generate a “stop” signal or repeat the
“start” condition. The actual data are sent in 8-bit packets (bytes). Any number of bytes can be sent but
each byte must be followed by an “acknowledge/not acknowledge” bit so the system knows whether to
proceed with the next lot of data transfer.

120 Development of microfluidic hardware for automated T cell stimulation
Microfluidic device chassis considerations
Fluidic sealing by mechanical compression has previously been successfully employed to
fabricate microfluidic devices for cell culture [255,256]. This method was chosen for the
present study as the seal is reversible and allows for easy replacement of the internal hydrogel
substrate. In contrast, common methods for PDMS-glass bonding such as oxygen plasma
treatment [257–259] can destroy antibodies immobilised on the hydrogel-coated slide [260].
Polymerising the gel in the microfluidic channel post-assembly was ruled out because the
capillary effect would cause the solution to fill and block the channel.
As discussed in Chapter 2.4, hydrogels presenting different biochemical and biophysical
cues may potentially be exploited to steer T cell to different cell fates. Being able to test
different formulations of hydrogels under flow conditions would therefore be useful to
elucidating optimal T cell activation parameters. A major advantage of the fluidic seal
reversibility is that different hydrogels could be swapped in for the aforementioned test.
Moreover, manufacturing cost and time of the device are reduced as the microfluidic layer
and PMMA chassis are reusable and only require straightforward wash protocols between
operations. To further improve substrate customisability, future developments on this device
may convert the hydrogel compartment into a single-use, disposable cartridge. In clinical
manufacturing, these hydrogel cartridges could be shipped to hospitals or treatment centres
such that clinicians might choose the cartridge with the desired T cell activation cues.
While the stainless steel fluidic couplers provided a simple way to connect tubing to the
microfluidic device, they possess several limitations that need to be addressed. Firstly, there
isn’t any locking mechanism in place and hence there is a risk of tubing detachment and
contamination, especially when the fluidic circuit gets moved about in the laboratory.
Secondly, tubing insertion may become inconsistent in the sense that the end of the fluidic
coupler can be at a different height inside the channel every time it is inserted by the user – if
it is too deep inside then it could reduce the flux of cells entering or exiting the device. As an
improvement, a more robust fluidic connection may be formed using threaded fittings.
Specifically, screw threads can be cut into the inlet/outlet through-holes in the PMMA plate
3.4 Discussion 121
in order to form receiving ports for tubing-connected threaded nuts – an example is the IDEX
PEEK fittings [261].
Features of the custom-built pump
It would be detrimental to reducing the cost of processing if the microfluidic operation per se
required expensive peripheral devices. The peristaltic pump developed in the present study
demonstrated micro-flow-rate capabilities comparable to commercial pumps, such as the SP-
Minipump Compact Peristaltic Pump (flow rate range: 24 µL/min to 190 mL/min) or Harvard
Peristaltic Pump P-1500 (flow rate range: 10 µL/min to 1,500 mL/min), but at a fraction of
their costs (Figure 3.9).
Some commercial pumps have both the control unit and pump head integrated into the same
chassis, while others have adopted a remote format where the control and pump head are
separate. The former type would either require (i) a long tubing that leads into the incubator
or (ii) the pump box to be put inside the incubator. Case (i) would greatly increase the dead
volume of the fluidic system, whereas case (ii) would require opening and closing the
incubator every time the user wishes to operate the pump or adjust flow settings. For these
reasons, a remote configuration was utilised in the present project.
The dimension and price comparisons (Table 3.1 and Figure 3.9) did not take into account
the unique functions of each commercial pump. They therefore should not be taken as direct
comparisons. However, one might argue that a fair comparison can still be made as no
additional functions were used beyond simple pumping of cells through the microfluidic
device. In addition, the Arduino code and pump hardware can easily be modified to include
additional functionalities to control parameters such as flow directions. Overall, the custom
devices are a proof-of-concept demonstration that microfluidic T cell processing in an
academic laboratory setting may be automated using low-cost, open-source hardware and
software.

122 Development of microfluidic hardware for automated T cell stimulation
T cell stimulation under flow conditions
The preliminary results (Figure 3.8 a) seem to suggest that the number of successive
encounters of T cells with a stimulatory surface under flow (stimulation cycles) may be
exploited to tune their activation level. However, a larger study will be required to determine
parameter values that are functionally beneficial to T cell manufacturing. Such parameters
may include the optimal number of times the cells will need to pass through the device, or
duration of their interaction with the antibody-coated hydrogel (hence stimulation time).
Some of these further studies may be implemented with a redesigned microfluidic channel.
For example, the channel can be changed from a linear configuration to a serpentine one to
increase the residence time of cells inside the device. Moreover, a fluidic loop may be built to
recirculate cells back to the input reservoir to control the rate of stimulation cycles.
T cell activation is a highly dynamic process consisting of a wide range of molecular events
that take place within seconds or minutes of encounter with a stimulatory surface, and last for
hours or days until the cell attains functional characteristics [262]. It would therefore be
useful to assess not only cytokine secretion (detectable only hours after TCR ligation), but
earlier events such as intracellular [Ca2+] elevation [34], or CD69 expression (detectable
within one hour of TCR ligation) [263]. Measuring these dynamic changes would give a
more comprehensive picture based on which flow parameters can be tuned. In particular, it
would be desirable to determine if fluid flow needs to be pulsed to give cells a longer period
for sustained TCR signalling, or continuous flow at a particular flow rate is already sufficient
for T cell activation. Fundamentally, addressing this pulsed-versus-continuous flow question
will likely add to the debate of whether a stable, mature immunological synapse is absolutely
required for a full T cell activation [264,265].
Intriguingly, the higher cytokine secretion observed with increasing stimulation cycles in the
same time window invokes the serial encounter model for T cell activation [266–268]. This
model postulates that a T cell can be activated by the summation of interrupted TCR signals
culminated through sequential encounters with the same or multiple stimulatory surfaces over
a period of time. Thus, the model implies the existence of a “counting” ability, or
“biochemical memory”, in T cells that allows them to temporally integrate a series of short

3.4 Discussion 123
signals until a critical activation threshold is achieved [128,269]. This notion is supported by
imaging studies of interactions between T cells and DCs in lymph nodes [270,271]. The
mechanism behind this “memory” could be mediated by signalling intermediates that do not
instantaneously “die away” upon TCR unbinding, but linger or decrease gradually until TCR
rebinding – phosphorylated c-Jun has been implicated as a candidate of such a counting
device [269]. Physiologically, T cells may exploit such serial encounters with APCs to carry
out rapid immune surveillance of the microenvironment. Future direct imaging of T cell-
hydrogel synaptic (or kinaptic) interactions would therefore offer mechanistic insights into
how T cells are activated inside the microfluidic device, which already has an in-built bottom
viewing window for this purpose.
It should be noted that the measured IL-2 levels were very low compared to those obtained in
Chapter 2. Future studies will need to clarify whether this observation was due to an
insufficiency in either activation, T cell number in the channel, time given for cytokine
secretion, or a combination of different factors. Nevertheless, the reduced viability under
dynamic conditions (Figure 3.8 b) and low throughput of cells (Figure 3.8 c) seem to
already suggest that they play a role in the issue. The lower viability and throughput could be
a result of inadequate gas exchange in the microfluidic channel and/or unintentional cell lysis
caused by shear forces from magnetic stirring. Almost two decades ago, Carswell and
Papoutsakis revealed the high sensitivity of transformed human T cells to hydrodynamic
forces, with reduced proliferation rates recorded at as low as 30 rpm in 100-mL spinner flasks
[272]. It was shown in the same study that primary human T cells could sustain greater
agitation rates without detrimental impact on proliferation up to 120 rpm. A plausible
mechanical explanation to the different agitation tolerances is that the bigger, transformed
cells may be more susceptible to hydrodynamic forces [273]. In the present study, however, a
stir rate of ~200 rpm was used on the magnetic stirrer because it was found that the lowest
allowed setting of 100 rpm was insufficient to rotate the stir bar in the input reservoir. Thus,
there was a compromise between hydrodynamic force-induced cell damage and rotation
speed needed to suspend the cells. Taken together, future work should address this issue by
redesigning the input reservoir. For instance, the reservoir could adopt a similar design to that
of spinner flasks with a vertical impeller. To save incubator space, the impeller may be driven

124 Development of microfluidic hardware for automated T cell stimulation
directly by a small DC motor attached to the reservoir lid rather than a magnetic stir plate
commonly required by commercial spinner flasks.
Another reason for the low throughput of cells could be potential gel swelling in the hydrated
environment of the device. As the hydrogel was covalently attached to an underlying glass
slide, it is expected that the majority of swelling would be in the Z-direction (into the
channel). Future studies could therefore determine the swelling ratio (fractional increase in
gel weight due to water absorption), as well as changes in the linear dimensions.
3.5 Conclusions
In this chapter, a hydrogel-integrated microfluidic device with programmable flow functions
has been developed as a proof-of-concept that the price and room requirements of automated
cell processing in an academic laboratory could be radically reduced. In a “do-it-yourself”
fashion, the microfluidic device was assembled without the need for a clean room or costly
lithography instruments. The low-cost, compact peristaltic pump was built using off-the-shelf
components and has demonstrated comparable performance to commercial devices and
possesses superior customisability. Furthermore, the present study has highlighted the
importance of including commonly underappreciated mechanical factors in immune cell
processing. Overall, this present hardware platform presents itself as a new tool and has set
the foundations upon which various future strategies can be developed to achieve bioprocess
intensification of cell-based immunotherapeutic manufacturing.

Chapter 4 Hydrogel-based antibody nanoarrays
4.1 Introduction
The work presented in this Chapter is an attempt to address some shortcomings of the
streptavidin-doped PA hydrogel method described in Chapter 2. In particular, there was an
issue regarding the penetration of antibody into the hydrogel matrix and limited control of
surface ligand density. If one wishes to quantitatively determine how substrate stiffness and
ligand density regulate T cell activation, then the nanoscale spacing between ligands cannot
be ignored [137,156,166].
Spatial control of ligands with block copolymer micelle nanolithography
In recent years, a nanopatterning method – block copolymer micelle nanolithography
(BCMN) [274–276] – originally developed by the Spatz lab more than 2 decades ago has
been employed in various instances to interrogate T cells with anti-CD3 immobilised on
nano-scopically arranged gold nanoparticles (AuNPs). Using AuNPs as anchoring points for
antibodies allows the user to tune ligand density by controlling the inter-particle spacing, as
only a single or a few antibodies can bind to each AuNP due to steric hindrance. However, a
majority of the experiments were conducted using rigid glass substrates. Control over
substrate stiffness was therefore omitted [137,156,166].
A number of mechanobiology investigations have employed the same patterning method to
investigate the combined effect of substrate stiffness and nanoscale ligand spacing on the
adhesion of human breast myoepithelial cells [277] and differentiation of mesenchymal stem
cells [278]. Instead of patterning glass, they created quasi-hexagonal arrays of AuNPs on
stiffness-tuneable substrates such as PA hydrogels or poly(ethylene glycol) (PEG) hydrogels.

126 Hydrogel-based antibody nanoarrays
BCMN principles
In BCMN, the formation of regularly spaced NPs on substrates relies on the ability of
amphiphilic block-copolymers to self-assemble into micelles in solution and form
homogeneously dispersed micro-domains when deposited on surfaces. This fabrication
process often utilises di-block copolymers such as poly(styrene-block-2-vinylpyridine) (PS-b-
P2VP), where one polymer molecule contains two blocks – PS and P2VP. The blocks are
connected to each other end-to-end via covalent bonds. Spherical micelles spontaneously
form when the block copolymer is dissolved in a nonpolar solvent (such as toluene) above the
critical micelle concentration [279,280]. Specifically, the PS block forms the outer shell of
the micelle while the less soluble, more polar P2VP block becomes the inner core. The
micellar cores can then be exploited as nanoreactors in which precursor metal salts are loaded
for the synthesis of metallic NPs. The micellar core loading is made possible by the fact that
inorganic compounds such as tetrachloroauric acid (HAuCl4) bind selectively to the P2VP
block of PS-b-P2VP [281]. A monolayer of metallic ion-loaded micelles can then be formed
by dip-coating the substrate in the micellar solution.
A number of different factors dictate the resulting arrangement of micelles on the substrate.
The driving mechanism behind the monolayer of quasi-hexagonally arranged structures is the
capillary forces acting between the spherical micelles during solvent evaporation at the
immersion edge [282,283]. Steric effects and electrostatic repulsion also contribute to the
lateral ordering of deposited micelles on the substrate.
To form “naked” AuNPs on the surface, the precursor metal salt needs to be reduced to
elemental metal and the polymer matrix of the micelles must be removed. Various reports on
optimising BCMN have led to the conclusion that etching by either hydrogen plasma or
oxygen plasma is a simple way to achieve both aforementioned steps simultaneously [284–
286].
BCMN offers a number of parameters that can be harnessed by the user to control the
resulting particle spacing. Increasing the retraction speed at which the substrate is
perpendicularly withdrawn from the micellar solution deposits a thicker polymer film, which

4.2 Materials and methods 127
in turn results in a tighter packing of NPs after plasma treatment. Moreover, the molecular
weight and concentration of the di-block copolymer can also be varied to tune the spacing
[287,288].
Objectives
The objectives of this Chapter are as follows:
1. Determine optimal BCMN parameters needed to fabricate continuous, regular AuNP
arrays on PA hydrogels.
2. Anchor anti-CD3 on AuNPs to control surface ligand density and limit antibody
penetration into the hydrogel matrix.
3. Determine the rate-limiting steps in the fabrication process.
4.2 Materials and methods
4.2.1 Materials
Di-block copolymer, poly(styrene-block-2-vinylpyridine) (PS-b-P2VP), was purchased from
Polymer Source. Toluene (99%), N,N’-bis(acryloyl)cystamine (BAC), gold(III) chloride
trihydrate (HauCl4·3H2O), nickel(II) chloride (NiCl2), HEPES-buffered saline (HBS) and
hydroxylamine hydrochloride (NH2OH·HCl) were obtained from Sigma Aldrich.
Nitriloacetic acid (NTA)-terminated alkanethiol (HS-(CH2)11-EG3-NTA) was purchased from
Prochimia Surfaces. Recombinant His-tagged protein-G was obtained from Prospec Bio.
Purified mouse anti-human CD3ε (anti-CD3; clone: OKT3) was purchased from BioLegend.
Deionised water was purified to a resistivity of 18.2 MΩ-cm with a Millipore system.

128 Hydrogel-based antibody nanoarrays
4.2.2 Preparation of block copolymer micellar solution
AuNP arrays were fabricated using block copolymer micelle nanolithography, as previously
described by Glass et al. [274]. To prepare for the micellar solutions, PS-b-P2VP (see Table
4.1 for polymer characteristics) was dissolved in toluene at 5 mg/mL. The solution was then
stirred in a glass vial at room temperature for 24 hours. The gold salt (HauCl4·3H2O) was
subsequently added at a loading ratio [n(HauCl4·3H2O)]/n(repeating units of 2VP)] of 0.5,
such that stoichiometrically every second 2VP unit would form a complex with HauCl4. The
amount of gold salt used was calculated using the following formula [289]:
𝑚!"#$%!·'!"( = 𝑚)*%+,-. ×𝑅𝑒𝑝𝑒𝑎𝑡𝑖𝑛𝑔𝑢𝑛𝑖𝑡𝑠𝑜𝑓2𝑉𝑃
𝑀𝑊/0 +𝑀𝑊/12/× 𝐿 ×𝑀𝑀!"#$%!·'!"(
where
𝑚!"#$%!·'!"( = 𝑚𝑎𝑠𝑠𝑜𝑓𝐻𝐴𝑢𝐶𝑙3 · 3𝐻1O
𝑚)*%+,-. = 𝑚𝑎𝑠𝑠𝑜𝑓𝑃𝑆 − 𝑏 − 𝑃2𝑉𝑃
𝑅𝑒𝑝𝑒𝑎𝑡𝑖𝑛𝑔𝑢𝑛𝑖𝑡𝑠𝑜𝑓2𝑉𝑃 =𝑀𝑊/12/
𝑀𝑀12/
𝑀𝑊/12/ = 𝑚𝑜𝑙𝑒𝑐𝑢𝑙𝑎𝑟𝑤𝑒𝑖𝑔ℎ𝑡𝑜𝑓𝑃2𝑉𝑃(𝑠𝑒𝑒𝐓𝐚𝐛𝐥𝐞𝟒. 𝟏) 𝑀𝑊/0 = 𝑚𝑜𝑙𝑒𝑐𝑢𝑙𝑎𝑟𝑤𝑒𝑖𝑔ℎ𝑡𝑜𝑓𝑃𝑆(𝑠𝑒𝑒𝐓𝐚𝐛𝐥𝐞𝟒. 𝟏)𝑀𝑀12/ = 𝑚𝑜𝑙𝑎𝑟𝑚𝑎𝑠𝑠𝑜𝑓2𝑉𝑃 = 105.14𝑔/𝑚𝑜𝑙
𝐿 = 𝑙𝑜𝑎𝑑𝑖𝑛𝑔𝑟𝑎𝑡𝑖𝑜 = 0.5
𝑀𝑀!"#$%!·'!"( = 𝑚𝑜𝑙𝑎𝑟𝑚𝑎𝑠𝑠𝑜𝑓𝐻𝐴𝑢𝐶𝑙3 · 3𝐻1O = 393.83𝑔/𝑚𝑜𝑙
Table 4.1 Characteristics of the di-block copolymer used in this study
Polymer MWPS (g/mol) MWP2VP (g/mol) PSunits P2VPunits
PS-b-P2VP 110,000 52,000 1056 495
After addition of the gold salt, the solution was left to stir for 24 hours at room temperature.
Due to the gold salt’s sensitivity to both light and moisture, the procedure was implemented
in a dry, nitrogen-filled glove box, with the solution-containing vial wrapped in aluminium
foil.

4.2 Materials and methods 129
4.2.3 Fabrication of AuNP arrays
The formation of AuNPs on substrates was achieved by first depositing a micellar layer onto
rectangular slides of either silicon or glass (Figure 4.1 a). The substrates underwent a pre-
cleaning process (described in Chapter 2.2.2), where they were cleaned with multiple
solvents and oxygen plasma. The substrates were then dip-coated into the micellar solution
with a retraction speed of 25 mm/min, using an in-house-built dip-coater equipped with a
bipolar stepper motor controlled by a PhidgetStepper Bipolar HC controller (Figure 4.1 b
right box). Substrates were then allowed to dry in air. Subsequently, dip-coated substrates
were exposed to plasma (5% H2 in 95% N2 at 0.4 mbar for 30 mins) in a Diener Electronic
Pico plasma system to remove the polymer and reduce the gold salt into elemental gold
(Figure 4.1 b left box). During optimisation, various durations of plasma treatment were
tested. Resulting AuNP-decorated substrates were stored in the dark until use.

130 Hydrogel-based antibody nanoarrays
Figure 4.1 (a) Overview of the use of BCMN to fabricate AuNP nanoarrays on hydrogels for nanoscale
control of surface ligand density. (b) Right (red box): set-up utilised for dip-coating. Left (purple box):
AuNPs were formed on the substrate surface via exposure to H2 plasma.

4.2 Materials and methods 131
4.2.4 X-ray photoelectron spectroscopy
X-ray photoelectron spectroscopy (XPS) was employed to monitor the oxidation state of Au
after each preparation step. The measurements were performed using a Thermo Scientific™
K-Alpha™ spectrometer with monochromatic Al Kα radiation (1486.6 eV). A dual beam
charge compensation system was used to avoid charging the sample surface. High-resolution
scans of Au 4f peaks were acquired using a 20 eV pass energy to investigate the type of
chemical species present. All binding energies were referenced to the background C 1s peak
at 285 eV. XPS data were processed using the CasaXPS v2.3 software package (Casa
Software Ltd.) and exported to MATLAB (version R2019a; MathWorks) for visualisation.
The oxidation state of Au was determined by comparing with reference XPS data in [290].
4.2.5 Transfer lithography
AuNP-decorated substrates were incubated with the BAC transfer linker (10 mM in absolute
ethanol) for 1 hour on an orbital shaker. The substrates were then washed 3 times in ethanol
(10 minutes per wash) and dried with a nitrogen stream. Afterwards, a pre-gel solution
consisting of 0.4% (w/v) crosslinker (see Table 2.1 for recipe) was then poured onto the
AuNP-decorated side of the substrates using the same method described in Chapter 2.2.2.
The PA hydrogels were allowed to swell for 4 days in ultrapure water at 37ºC before they
were detached to ensure successful transfer of AuNPs. All the aforementioned steps took
place at room temperature. For quality control, a sample was taken from each batch of
nanopatterned PA gels for electroless gold deposition – a rapid, qualitative confirmation of
AuNP transfer. To this end, the gels were immersed in an aqueous mixture of 0.4 mM
NH2OH·HCl and 0.1% (w/v) HauCl4·3H2O. The gels were agitated on a shaker for 3 mins
throughout the incubation, after which the reaction was stopped by taking the gels out and
rinsing with water.

132 Hydrogel-based antibody nanoarrays
4.2.6 Atomic force microscopy
Atomic force microscopy (AFM) topographical characterisation of nanopatterned substrates
was performed using a Bruker Dimension Icon® AFM system with silicon probe tips
(Bruker). Images were acquired under tapping mode in air with a scan rate of 0.2 Hz and tip
velocity of 2 µm/s. For nanopatterned hydrogels, samples underwent were dried slightly on a
hot plate at 55 ºC for 30 mins to remove excess PBS prior to AFM measurements.
4.2.7 Image-based particle analysis
Initial analysis of AFM data was performed using the open source software Gwyddion v2.54.
On Gwyddion, height profiles of particles were extracted, height maps and tilted 3D views
were generated. AuNPs on glass were identified by a self-written MATLAB script, which
used thresholding to generate binary images, followed by the regionprops() function to
extract diameters of each particle (Appendix C.1). It was discovered that the topography of
hydrogels was more complex than that of glass and made it difficult to identify individual
AuNPs by simple thresholding. Therefore, the MATLAB particle detection algorithm was
modified to identify AuNPs on hydrogels using imfindcircles()(Appendix C.2). Both
MATLAB scripts utilised knnsearch()to compute the interparticle spacings for all
detected AuNPs. Here, the spacing was defined as the centre-to-centre distance between a
given AuNP to its first nearest neighbour. All processed data were then exported to Rstudio
(version 1.2.500) for statistical analysis and visualisation.
4.2.8 Antibody immobilisation
Anti-CD3 antibodies were immobilised on gold nanoparticles in a site-directed manner using
the method described by Matic et al. [166]. Briefly, the immobilisation was implemented by
first immersing AuNP-decorated PA hydrogels in HS-(CH2)11-EG3-NTA linker (1 mM in
70% ethanol) for 1.5 hours at room temperature. Gels were then rinsed twice with 70%
ethanol, once with PBS, and then blocked using 3% (w/v) BSA in PBS at 37 ºC for 1 hour.
Subsequently, gels were washed twice in PBS and once in HBS (pH 7.5). The NTA groups

4.2 Materials and methods 133
on AuNPs were then loaded with Ni2+ to facilitate the binding of proteins with histidine
residues (His-tag). His-tagged protein G was used to both bind the Ni complex and couple
anti-CD3 in an active orientation. The procedure was conducted by incubating the hydrogels
with 10 mM NiCl2 in HBS for 30 minutes at room temperature, followed by 3 washes in
HBS. Gels were then incubated with 10 µg/mL His-tagged protein G in HBS for 1 hour at
room temperature, followed by 2 washes in HBS and once in PBS. Anti-CD3 was then added
to hydrogels at 10 µg/mL in PBS, incubated overnight at 4 ºC and then washed 3 times in
PBS to remove any excess antibody. To confirm immobilisation of anti-CD3, a secondary
antibody (anti-mouse IgG) fluorescently labelled with FITC was used in
immunofluorescence-based detection (same protocol and confocal microscopy parameters as
in Chapter 2.2.5).
4.2.9 Cell culture and T cell stimulation
Cell culture and T cell stimulation were carried out using the same protocol described in
Chapter sections 2.2.7 and 2.2.9, respectively. Briefly, nanopatterned hydrogels were
integrated into the custom-built culture chambers (Chapter 2.2.8) and each well was seeded
with Jurkat T cells at 2.7´105 cells/mL. The cells were stimulated for 24 hours under standard
conditions. Plain PA hydrogels were included as negative controls. Activation was measured
as IL-2 secretion using human IL-2 ELISA (same protocol as Chapter 2.2.10).
4.2.10 Statistical analysis
IL-2 ELISA data were statistically analysed using R (version 3.6.1) on Rstudio (version
1.2.500). Two-sample t-test was used to compare mean IL-2 concentrations. Statistical
significance was set at p < 0.05. To account for unequal sample sizes of AuNPs on hydrogel
and glass, Welch’s t-test was employed to compare particle diameters and inter-particle
spacings. Shapiro-Wilk test and Levene’s test were employed to examine assumptions of data
normality and homogeneity, respectively.

134 Hydrogel-based antibody nanoarrays
4.3 Results
Reduction of Au3+ to Au0 by hydrogen plasma
XPS results showed that the gold salt inside block copolymer micelles was successfully
reduced to metallic AuNPs after 30 mins of hydrogen plasma treatment (Figure 4.2). Before
the plasma treatment, the 2 most intense peaks in the XPS spectrum (middle curve), with
binding energies 85.2 eV and 88.9 eV, can be attributed to the spin-orbit components of Au-
4f photoelectrons emitted from Au3+ (from HauCl4·3H2O). Hydrogen plasma treatment
resulted in a 1 eV shift (84.2 eV and 87.9 eV) in the Au 4f peaks, which are assigned to Au0.
Transfer of AuNPs from glass to hydrogels
The transfer of AuNPs from dip-coated glass slides to hydrogels was confirmed using
electroless plating of gold (Figure 4.3 a). In this procedure, surface-confined colloidal
AuNPs were used as seeds that were grown into larger particles by the treatment of
hydroxylamine/Au3+. Deposition of gold on hydrogel surfaces yielded a purple colour typical
of AuNPs due to surface plasmon resonance. The purple colour was also confined to regions
that mirrored the dip-coated areas of glass slides, indicating that the deposition only occurred
on surfaces with gold seeds. Coverage and intensity of the purple colour indicated that 30
mins of hydrogen plasma and a swelling time of 4 days provided appropriate conditions for
AuNP transfer.

4.3 Results 135
Figure 4.2 XPS Au-4f photoelectron spectra of dip-coated glass surface after each treatment step. Top:
glass only control. Middle: dip-coated glass slide pre-plasma treatment. Bottom: glass slide after
hydrogen plasma treatment. Solid line represents the fitted (“envelope”) spectrum. Dashed line
represents the background.

136 Hydrogel-based antibody nanoarrays
Figure 4.3 (a) Electroless deposition was employed to visually confirm the presence and coverage of
AuNPs on PA hydrogels after lifting them off from nanopatterned glass slides. (b) Representative
images of PA hydrogels derived from different plasma and swelling durations.

4.3 Results 137
Image analysis of AuNPs on different substrates
AFM images showed that a monolayer of AuNPs (bright dots) was present on both glass and
hydrogel substrates (Figure 4.4). Line scans revealed that AuNPs on glass were typically
about 9 nm in height, while those on hydrogels protruded approximately 2 nm above the
surface. MATLAB-based image analysis showed that glass-confined AuNPs had larger
projected diameters (35.6 ± 10.3 nm) than those on hydrogels (11.2 ± 3.4 nm). Furthermore,
analysis of particle spacing showed that the centre-to-centre distance between AuNPs on gels
(42.2 ± 13.8 nm) was smaller than that for glass-supported AuNPs (52.99 ± 11.2 nm). While
particles exhibited a clear quasi-hexagonal arrangement on glass, the hexagonality was less
pronounced on hydrogels. Line scans for nanopatterned and plain hydrogels showed that
hydrogel surfaces were generally more complex than those of glass with more sub-nanometre
roughness and nanoscale pits.

138 Hydrogel-based antibody nanoarrays
Figure 4.4 AFM data of AuNPs on glass (a – d) and PA hydrogel (e – h). Aerial (a, e) and tilted (c, g)
views show that AuNPs were present on both glass and hydrogel. (b, f) Quasi-hexagonal formation of
AuNPs. (d, h) Height profiles of AuNPs on glass and hydrogel extracted from blue line in a and red line in
e, respectively. (i) Plain hydrogel without AuNPs. (j) Height profiles (measured along red lines in i) of
nanoscale pits present in the control gel. All gradient colour bars indicate height (z-direction).

4.3 Results 139
Figure 4.5 Example images showing MATLAB detection of AuNPs on (a) hydrogel and (b) glass.
Green and blue markers indicate positions of detected AuNPs on hydrogel and glass, respectively. (c)
Diameter of detected AuNPs. (d) Interparticle (centre-to-centre) distance of AuNPs as computed by 1st
nearest neighbour analysis. All data presented as mean ± standard deviation. 2 × 2 µm ROIs were
analysed from 3 samples per substrate, with at least 950 AuNPs per ROI. Welch’s t-test (a = 0.05). ****
p < 0.0001.

140 Hydrogel-based antibody nanoarrays
Confirmation of antibody immobilisation and T cell activation
Immunofluorescence from the secondary antibody (FITC-conjugated anti-mouse IgG)
revealed the presence of anti-CD3 on gold nanopatterned PA hydrogels (Figure 4.6 a). The
texture of the hydrogel was less intense towards its slightly slanted edge – an artefact of the
polymerisation procedure. In contrast to the anti-CD3-coated nanopatterned gel, minimal
fluorescence was observed in the absence of anti-CD3 (Figure 4.6 b). Compared to the
nanopatterned gel in a, the plain gel appeared much darker, suggesting a residual amount of
antibody in the gel matrix after staining (Figure 4.6 c). Other controls exhibited minimal
fluorescence when the secondary antibody was absent, highlighting the specific binding of
the secondary antibody to anti-CD3 (Figure 4.6 d, e). IL-2 ELISA results showed that PA
hydrogels presenting anti-CD3 anchored on quasi-hexagonally arranged AuNPs were able to
induce T cell activation (Figure 4.6 f). The IL-2 concentration from the anti-CD3-stimulated
cells was around 24-fold of that from the negative control (– anti-CD3).

4.3 Results 141
Figure 4.6 (a – e) Immunofluorescence images of anti-CD3 immobilised on AuNP-decorated hydrogel
surfaces obtained by confocal microscopy using a secondary antibody (anti-mouse IgG FITC). (a) Anti-
CD3-coated hydrogel imaged at the edge to show the difference between nanopatterned gel and plain
glass. (b) Nanopatterned region of gel remained dark in the absence of anti-CD3. (c, d, and e) Negative
controls. All “+ anti-CD3” gels were coated with 10 µg/mL of the antibody before imaging. (f) IL-2
secretion from Jurkat cells after 24 hours of stimulation by anti-CD3 (10 µg/mL coating solution)
immobilised on PA gel-presented AuNPs. The negative control (– anti-CD3) represents a AuNP-coated
hydrogel without anti-CD3. Data presented as mean ± standard deviation. Dots represent individual
readings. N = 3. Two-sample t-test (a = 0.05). **** means p < 0.0001.

142 Hydrogel-based antibody nanoarrays
4.4 Discussion
Advances in micro- and nanotechnologies in the last two decades have led to biomaterial
fabrication methods that permit high-precision spatial control over surface-immobilised
ligands, as well as material topography. Examples of micropatterning techniques (feature
size: 1 to >10 µm) include photolithography [291,292] and microcontact printing [208,293].
Nanopatterning methods (feature size: < 100 nm) encompass electron beam lithography
(EBL) [294], focused ion beam (FIB) lithography [295], and dip-pen nanolithography [296].
Nevertheless, there is generally a compromise between patterning speed and resolution
among them – nanoscale methods typically take hours to pattern just 1 cm2 [287]. Moreover,
highly specialised, expensive instruments and clean room facilities are often required to
achieve such a high resolution. These reasons make BCMN an appealing method as it can be
used to nanopattern large areas relatively quickly (25 mm/min dip-coating speed used in the
present study) in a conventional laboratory.
Processing bottlenecks in nanopatterned hydrogel fabrication
The present study included the extra step of transferring the patterned AuNPs from glass
substrates to hydrogels. Despite the high patterning speed of BCMN, the transfer of the
nanopatterned AuNPs to hydrogels took days to complete (Figure 4.3). This process relies on
the use of the BAC transfer linker, which covalently couples the AuNPs on one end and
copolymerises into the PA gel matrix on the other end. Furthermore, the swelling of
hydrogels in water was needed to aid the detachment of gel-bound particles from the glass
surface.
Electroless deposition revealed that the resulting AuNP pattern coverage became less uniform
when the duration of hydrogen plasma treatment was too long (~ 60 mins). A plausible
explanation is that long plasma exposure can cause embedding of AuNPs into the glass
substrate and subsequent difficulty in detachment – a phenomenon also observed by Yuan et
al. [297]. While 10 mins of plasma exposure and 4 days of gel swelling led to relatively
uniform coverage of AuNPs, it was decided to use 30 mins to ensure reduction of Au3+ to Au0

4.4 Discussion 143
(confirmed by XPS; Figure 4.2) and minimise any potential contamination of the hydrogel
surface by the di-block copolymer.
It should also be pointed out that the electroless gold deposition was employed because it
offered a rapid, qualitative way to confirm AuNP transfer from glass surfaces to hydrogels
and proved to be convenient when AFM instruments were not readily available.
Image-based characterisation of nanoarrays
The observed quasi-hexagonal arrangement of AuNPs on glass agrees with previous work by
others (Figure 4.4) [274]. However, the hydrogel topography was interesting as nanoscale
pits were discovered in addition to AuNPs. The pits were likely a result of previously trapped
air bubbles within the pre-gel solution. It is possible that the presence of these pits might have
affected the amount of antibodies available to T cells in Chapter 2. Line profiles also
showed that the hydrogel surface is generally more rugged than that of glass. If the antibodies
were bound to the hydrogel per se (as in Chapter 2) instead of AuNPs, then the rougher gel
topography would offer a more variable surface area for antibody binding.
Unexpectedly, the inter-particle spacing between AuNPs on hydrogels was found to be
smaller than that obtained from glass surfaces (Figure 4.5 d). The swelling of hydrogel
should theoretically lead to a slight increase in particle spacing relative to glass. However, it
should not be forgotten that the gels were actually dried briefly on a hot plate before AFM
imaging. This step was implemented to remove excess buffer from the gel as it was found to
be difficult to perform the imaging under wet conditions. Due to its impermeability to fluids,
glass cannot expand or contract the way hydrogels do. By transferring AuNPs to a hydrogel,
the AuNPs might have been brought closer together by the shrunk hydrogel after the drying
process. This artefact therefore warrants alternative imaging methods that are better suited for
hydrated samples such as cryogenic scanning electron microscopy, or liquid-phase
transmission electron microscopy.
The gel-bound AuNPs appeared to be smaller in height and diameter than those on glass
surfaces (Figure 4.5 c). This observation was likely due to a higher penetration of AuNPs
into the gel matrix than glass. As the pre-gel solution was added to the glass-confined

144 Hydrogel-based antibody nanoarrays
nanoarray, the solution would wrap around each AuNP and fill the gaps between them. The
polymerised, nanopatterned gel was subsequently lifted off from the glass substrate and
inverted. So, the previously less exposed, or embedded, part of the AuNP would now become
exposed and contribute to the projected 2D shape observed top-down by AFM. Nevertheless,
the lower diameter of exposed AuNPs can be treated as a good side effect of the processing
as it reduces the chance of binding multiple anti-CD3 molecules to the same AuNP.
Although it was possible to perform confocal imaging of nanopatterned hydrogels, it was
technically difficult due to the fine monolayer of anti-CD3-conjugated AuNPs which was
easy to miss while focussing. Still, the higher fluorescence in the anti-CD3-coated
nanopatterned hydrogel suggests that the ligands preferentially bound to AuNPs, rather than
the gel itself (Figure 4.6 a – e). The low level of fluorescence in plain hydrogel was likely
due to inadequate washing after the staining procedure (Figure 4.6 c).
Anti-CD3 immobilisation on AuNPs
In this study, the antibody immobilisation method employed by Matic et al. [166] was used
because it allows for anti-CD3 IgG molecules to be coupled in an active orientation for T cell
stimulation. In contrast, control over antibody orientation was uncertain in the streptavidin-
biotin capture method described in Chapter 2. Yet, the present procedure requires multiple
linker molecules to be first grafted onto AuNPs before the actual coupling of anti-CD3. The
hours-long procedure along with the number of steps or different reagents needed would
make this an unattractive translational pathway to manufacturing T cell-activating
biomaterials for clinical use. A different, more straightforward procedure might be
immobilising anti-CD3 F(ab’)2 fragments directly on AuNPs via the well-known gold-thiol
conjugation chemistry, as implemented by Delcassian et al. [137]. This method uses
dilsulfide (– S – S –) bonds that are native to the IgG molecule and known to strongly adsorb
to gold surfaces [298–300]. Although the binding is a single-step process, a downside is that
the user would need to first spend time on digesting whole IgG molecules with pepsin to
remove the Fc portion and expose the inter-heavy chain disulfide bridges in the hinge region
[301]. Further processing to the F(ab’)2 fragments may be done using reducing agents such as
2-mercaptoethylamine or tris(2-carboxyethyl)phosphine. The reduction cleaves the F(ab’)2

4.4 Discussion 145
fragments into F(ab) fragments with free thiol (sulfhydryl) groups, which can also be
conjugated to gold [302]. Either way, downstream purification and validation with gel
electrophoresis will need to be conducted to confirm successful generation of these antibody
fragments.
T cell response to anti-CD3 nanoarray stimulation
The fabricated anti-CD3-conjugated nanoarrays were able to induce secretion of IL-2 from
Jurkat T cells. This result shows that nanopatterned PA hydrogels may be utilised in the
future for a more controlled version of the multiparametric (substrate stiffness ´ ligand
density) experiment conducted in Chapter 2.
Using EBL-nanopatterned glass presenting anti-CD3-bound AuNPs surrounded by a lipid
bilayer, Cai et al. reported a lateral inter-particle spacing threshold of 50 nm for TCR
triggering in human CD4+ T cells [303]. On the other hand, Delcassian et al. reported a
spacing threshold of 69 nm for human CD4+ T cell activation, using BCMN-derived anti-
CD3 nanoarrays on glass [137]. Although the inter-particle spacing and substrate stiffness
were fixed in this proof-of-concept study, the aforementioned findings by others seem to
support the observed T cell activation as the inter-particle spacing between gel-supported
AuNPs was 42.2 ± 13.8 nm.
146 Hydrogel-based antibody nanoarrays
4.5 Conclusions
In this study, BCMN was successfully employed to fabricate AuNP as anchoring points for
anti-CD3 on PA hydrogels. The resulting nanoarray was able to elicit IL-2 secretion from
Jurkat T cells, suggesting that the material may be used as a versatile screening tool to
determine how different combinations of substrate stiffness and ligand densities can be
harnessed to regulate T cell activation. Due to logistical reasons, only a single stiffness was
utilised to stimulate T cells. Nevertheless, one could potentially include stiffnesses presented
in Chapter 2 for nanopatterning to enable a comparison. In addition, the anti-CD3-gold
conjugation method can be extended to include other costimulatory or adhesion molecules,
such as anti-CD28 and anti-LFA-1. The same material may also be integrated into the
microfluidic system presented in Chapter 3 for flow experiments. Although the use of a
continuous nanoarray means that the ligand density will be directly proportional to particle
spacing, further tuning of the micellar loading will be needed to deduce the optimal AuNP
size for one ligand per AuNP, if one wishes to control the exact number of ligands presented
to a T cell. Techniques such as fluorescence photobleaching may then be exploited to probe
the ligand occupancy of AuNPs [303,304]. Given the relatively long fabrication time,
nanopatterned hydrogels is likely to be more suited for laboratory screening than actual
deployment in T cell manufacturing. Although solvents such as toluene are convenient to use
in the fabrication process, the involvement of these toxic substances would make BCMN-
derived materials face complicated regulatory hurdles in the translational pathway. To keep
the fabrication simple and rapid, the streptavidin-doped hydrogel system (Chapter 2) seems
to be a more attractive option.

Chapter 5 Conclusions
T cell-based immunotherapy is a promising form of cancer treatment currently limited in its
accessibility, scalability and biological control over therapeutic cell potency. Addressing
these issues, this thesis describes a nature-inspired engineering (NIE) methodology employed
to improve the control of T cell activation through hardware and software solutions (Table
5.1). The work presented involves a number of technologies that span from the nano- to
microscale in bio-interfacing materials, and from the micro- to macroscale in aspects that
involve hardware. Furthermore, custom algorithms have been written for image analysis of
cells and particles, and for fluidic control.
Table 5.1 Toolset developed by the work described in this thesis.
Hardware prototypes Software algorithms
Hydrogel-integrated culture chambers Cell/bead detection image processing pipeline
Hydrogel-integrated microfluidic platform Peristaltic pump micro-flow-rate control
Microcontroller-based, modular fluidic control system Automated image-based analysis of AuNPs
5.1 Tuning T cell activation with physicochemical cues
In Chapter 2, a hydrogel-integrated culture platform has been created to probe T cell
activation with the simultaneous tuning of substrate stiffness, surface ligand density and
biochemical cues. This culture platform, unlike conventional gel-coated coverslips used in
previous reports [107,109,168], provided surfaces fully covered by the stimulatory hydrogel
for T cell stimulation. Moreover, I showed that substrate stiffness of PA hydrogels may be
harnessed to balance stimulatory strength and proliferative capacity. Specifically, it was
demonstrated that 62.4 kPa lies in a stiffness range where there is significant compromise
between cytokine secretion and proliferation. The implication of this finding, in the context

148 Conclusions
of immunotherapy, is that substrate stiffness may be a mechanical, and alternative, way to
prevent T cell exhaustion during the stimulation step. Indeed, there is already some early
evidence suggesting that T cell exhaustion and unresponsiveness, which are characteristic of
chronic lymphocytic leukaemia, may be reversed using mechanically soft biomaterials [305].
On the contrary, current biomaterial-assisted methods to counteract exhaustion are primarily
biochemical-centric – for example, local delivery of PD-1-blocking antibodies [306] and
CD2-induced co-stimulation [307].
The comparison between hydrogels and Dynabeads is interesting as it highlights other crucial
parameters that T cell manufacturing may consider. These tuneable factors include geometry
and contact areas between cells and the stimulatory surface. Furthermore, the result
demonstrates the potential of a bead-free activation approach, where T cells are forced to
make contact with the stimulatory surface via means such as simple sedimentation or
microfluidic confinement. Invoking the NIE principle mentioned in Chapter 1.6, slavishly
mimicking aspects of a natural APC may deviate the design of artificial T cell-activating
materials from the goal of achieving optimal ex vivo manufacturing conditions. While some
properties, such as mechanosensing, are useful, micro-sized beads require downstream
separation and their dispersion in culture may reduce the spatial homogeneity of anti-
CD3/CD28 presentation to T cells.
A major drawback of the current hydrogel design was the limited ligand control (orientation
and density). Yet, the hydrogels were able to induce comparable activation responses relative
to Dynabeads. Therefore, the extent to which limited ligand control would pose as a problem
within the larger context of immunotherapeutic bioprocessing remains to be explored. To this
end, the biological readout could be expanded to include flow cytometry-based phenotypic
analysis, rather than measuring proliferation and end-point of cytokine secretion only. In
addition, it would be beneficial to further study cell interactions with the hydrogels – in
particular, tracking cell attachment over time via fluorescence microscopy.

5.2 Microfluidics-based T cell activation 149
5.2 Microfluidics-based T cell activation
The hydrogel-based platform has laid the foundations for the “Core Technology” on which
other “Enabling Technologies” are based (Figure 1.10). In Chapter 3, a hydrogel-integrated
microfluidic system was designed to pave a translational pathway for the hydrogel to be
deployed in future, automated T cell processing. The system architecture of the microfluidic
prototype was inspired by the modular nature of biological systems including the immune
system. This modularity allows the system to be highly customisable, such that it may
continue to be adapted as a platform in rapidly emerging bioprocessing protocols [308].
The current device suffers from its poor ability to retain a high cell viability. In the chapter, I
identified multiple factors that could have contributed to this issue – shear-induced cell
damage due to stirring, gas permeability of the device and channel blockage caused by gel
swelling. In the next design iteration, an upgrade to, or replacement of, the stirring
mechanism, as well as further characterisation (swelling ratio quantification) will be needed
to improve the whole system.
Nevertheless, the preliminary data point towards increasing the number of times cells flow
over the anti-CD3/CD28-coated hydrogel to enhance T cell activation. Passing cells through
the device multiple times may therefore presents itself as a relatively simple way to i) reuse
the same immobilised antibodies for multiple stimulation cycles and ii) control T cell
activation level simultaneously.
5.3 Gold nanoparticle-patterned hydrogels
In Chapter 4, the formation of regularly spaced AuNPs on PA hydrogels has provided yet
another tool that extends the functionality of the Core Technology. Motivated by results
obtained from the streptavidin-doped hydrogel method, the nanopatterned hydrogel would be
suited for studying, quantitatively, how stiffness and ligand density thresholds for T cell
activation are synergistically modified.

150 Conclusions
The lengthy time to produce AuNP-patterned hydrogels, however, makes it undesirable for
large-scale fabrication. Toxic reagents, such as toluene, would also make it problematic to be
clinically approved. The use of BCMN is therefore limited to the laboratory. Nevertheless,
compared to other patterning methods, BCMN is still one of the most straightforward
methods to date as it can coat large areas in a relatively short time, without compromising on
nanoscale resolution.
To further improve the fabrication time, I proposed in the chapter that alternative antibody-
gold immobilisation strategies could be adopted, such as the use of F(ab’)2 fragments. Future
T cell activation studies involving BCMN-derived hydrogels should include a wider range of
stiffness and ligand combinations (anti-CD3/CD28, anti-CD3/CD28/LFA-1) to test stiffness-
and ligand-dependent effects. Lastly, parameters such as loading of micelles with the gold
salt should be optimised to achieve one ligand per AuNP for a more direct control over ligand
density.

Chapter 6 Future work
This thesis has presented T cell stimulatory materials in the form of 2D hydrogels that can be
integrated with microfluidic devices and nanopatterned. The substrates provided well-
controlled microenvironments within which substrate stiffness and ligand density were
altered. To further explore ways of intensifying T cell processing, improvement to both the
hydrogel design, microfluidic hardware, as well as a deeper understanding of the phenotypic
makeup of the resultant cell population will be needed. Essentially, this thesis seeks to
provide scaled-down engineering solutions to the challenges of biological control,
accessibility and scalability in T cell-based immunotherapy. In this chapter, additional
directions are presented as future steps towards achieving this overarching goal.
6.1 3D hydrogels
Future experiments may include 3D hydrogels that maximise the antibody-coated surface
area for T cell stimulation. Coupled with the microfluidic system, it is envisioned that these
3D hydrogels may be fabricated to possess cell-sized interconnected pore networks such that
T cells can flow from the inlet, through the gel matrix, and exit through the outlet. This work
would likely require design iterations to ensure that the 3D gel network would not introduce
clogs in the fluidic compartment. The 3D gels may be fabricated using additive
manufacturing (e.g. 3D printing and electrospinning) [309]. Moreover, the microfluidic
device may also be modified for more robust interface such that the gels can be integrated as
single-use cartridges that are more suited for clinical settings.
Anti-CD3/CD28-coated Dynabeads are used for polyclonal expansion of T cells in
manufacturing. However, there is currently an increasing demand for materials that allow the
activation and expansion of antigen-specific T cells [83,310]. In this regard, the microfluidic

152 Future work
platform may be modified to double up as a enrichment platform where tumour antigens can
be immobilised on the hydrogel to specifically capture and activate tumour-reactive T cells.
6.2 Phenotypic analysis
In the present work, only IL-2 secretion and proliferation were measured. However, the
differentiation status of activated T cells is known to have a large impact on the eventual anti-
tumour efficacy (Figure 1.4). Future studies should inform this aspect by replacing Jurkat T
cells with primary human T cells and performing post-stimulation flow cytometry. Here, it
would be desirable to determine whether certain combinations of physical parameters can
promote differentiation to central memory T cells (TCM; expression: CD45RO+, CCR7+,
CD28+, CD95+) or stem cell memory T cells (TSCM; expression: CD45RO-, CCR7+, CD28+,
CD95+), which are known to exhibit superior in vivo persistence relative to effector cell types
[311–313].
6.3 Integration of label-free biosensing
Taking inspiration from the robustness of biological systems, future automated cell
processing platforms may be engineered to self-correct or self-stabilise through the use
of built-in feedback mechanisms. This feature would be beneficial as it could reduce the
burden of IPC/QC procedures routinely performed in T cell processing (Figure 1.6).
Furthermore, the high customisability of the microcontroller-based control unit described
in this thesis would permit its implementation. The feedback loops may be enabled via
the use of existing label-free biosensing methods (e.g. impedance spectroscopy) that
could rapidly provide information about cell behaviour in real time to other modules
within the system [219]. Feedback mechanisms do not need to be limited to maintenance
of cell products in local treatment centres, but can be exploited to regulate an entire
network of bioprocessing systems in different locations. For instance, machine learning
algorithms can be trained to recognise different cell attributes (e.g. cell-type-specific
fingerprints from optical diffraction tomography [314]) from data collected by biosensors

6.4 Artificial lymph node 153
at different sites. The improved model is then relayed back to all systems via a cloud-
based service. Thus, output from a local sensor component can lead to a network-wide
enhancement of manufacturing robustness over time. This idea is not far-fetched, as there
are already “cognitive computing” platforms that exist for a similar intent, such as
Google Cloud AI or IBM Watson (Figure 6.1).
6.4 Artificial lymph node
The “GMP-in-a-box” idea, exemplified by Miltenyi’s CliniMACS Prodigy system, is
already one step closer to scaled-down, POC immune cell manufacturing. Yet, the
human body is capable of mediating immune responses in even more compact
“modules”, such as lymph nodes. It may therefore be reasonable to take advantage of the
existing immune system. In this way, the need for intermediary devices and personnel in
processing could be obviated. For this reason, implantable immunomodulatory
biomaterials have been developed to prime immune cells in vivo [315]. Once implanted,
however, further control that can be exerted on the immune cells will be limited.
To fully utilise the immune system, an alternative approach to cell processing might be
halfway between in vitro and in vivo – a concept reserved for future exploration. To
balance controllability and speed, immunomodulatory hardware may be interfaced
directly with the patient’s immune system via the bloodstream, but placed
extracorporeally in a portable/wearable manner. In this sense, the device will be remote
enough to allow for any automatic or manual override (e.g. detachment or flow rate
adjustment), but intimate enough to remove the need for an intermediary apparatus. It
should be highlighted that similar systems already exist – common examples include
wearable electronic insulin pumps used by diabetics and numerous other “smart” health
monitoring systems [316,317].

154 Future work
Figure 6.1 Adopting a multiscale, “networks-of-networks” paradigm to deploy cell-based cancer
immunotherapies. Living and non-living (hardware/software) systems that are dealt with in cancer
immunotherapy can themselves be regarded as parts of larger systems. Here, the microfluidic platform
prototype is intended to be the “cell processing module”. It is envisioned that centre-to-centre and
device-to-device variability may be minimised by connecting cell processing systems via a cloud-based
platform and sharing data among them.

References
1. Ingber DE. Can cancer be reversed by engineering the tumor microenvironment?
Semin Cancer Biol. 2008;18(5):356–364.
2. Soto AM, Sonnenschein C. One hundred years of somatic mutation theory of
carcinogenesis: Is it time to switch? BioEssays [Internet]. 2014 Jan [cited 2019 Nov
14];36(1):118–20. Available from: http://www.ncbi.nlm.nih.gov/pubmed/24323923
3. Dinicola S, D’Anselmi F, Pasqualato A, Proietti S, Lisi E, Cucina A, et al. A systems
biology approach to cancer: fractals, attractors, and nonlinear dynamics. OMICS
[Internet]. 2011 Mar [cited 2016 Jul 7];15(3):93–104. Available from:
http://dx.doi.org/10.1089/omi.2010.0091
4. Noble D. A theory of biological relativity: no privileged level of causation. Interface
Focus [Internet]. 2012 Feb 6 [cited 2018 Nov 29];2(1):55–64. Available from:
http://www.ncbi.nlm.nih.gov/pubmed/23386960
5. Huang S, Ingber DE. A Non-Genetic Basis for Cancer Progression and Metastasis:
Self-Organizing Attractors in Cell Regulatory Networks. Wakefield L, Hunter K,
editors. Breast Dis [Internet]. 2007 Apr 12 [cited 2019 Nov 14];26(1):27–54. Available
from: https://www.medra.org/servlet/aliasResolver?alias=iospress&doi=10.3233/BD-
2007-26104
6. Mammoto T, Mammoto A, Ingber DE. Mechanobiology and Developmental Control.
Annu Rev Cell Dev Biol [Internet]. 2013 Oct 6 [cited 2019 Nov 14];29(1):27–61.
Available from: http://www.ncbi.nlm.nih.gov/pubmed/24099083
7. Engler AJ, Sen S, Sweeney HL, Discher DE. Matrix Elasticity Directs Stem Cell
Lineage Specification. Cell. 2006;126(4):677–689.

8. Uthaisangsook S, Day NK, Bahna SL, Good RA, Haraguchi S. Innate immunity and its
role against infections. Ann Allergy, Asthma Immunol [Internet]. 2002 Mar 1 [cited
2019 Nov 12];88(3):253–65. Available from:
https://www.sciencedirect.com/science/article/pii/S1081120610620054
9. Hoebe K, Janssen E, Beutler B. The interface between innate and adaptive immunity.
Nat Immunol [Internet]. 2004 Oct [cited 2019 Nov 12];5(10):971–4. Available from:
http://www.nature.com/articles/ni1004-971
10. Danilova N. The evolution of immune mechanisms. J Exp Zool Part B Mol Dev Evol
[Internet]. 2006 Nov 15 [cited 2019 Nov 12];306B(6):496–520. Available from:
http://doi.wiley.com/10.1002/jez.b.21102
11. Mogensen TH. Pathogen Recognition and Inflammatory Signaling in Innate Immune
Defenses. Clin Microbiol Rev [Internet]. 2009 Apr 1 [cited 2019 Nov 12];22(2):240–
73. Available from: http://www.ncbi.nlm.nih.gov/pubmed/19366914
12. Akdis M, Aab A, Altunbulakli C, Azkur K, Costa RA, Crameri R, et al. Interleukins
(from IL-1 to IL-38), interferons, transforming growth factor β, and TNF-α: Receptors,
functions, and roles in diseases. J Allergy Clin Immunol [Internet]. 2016 Oct 1 [cited
2019 Nov 12];138(4):984–1010. Available from:
http://www.ncbi.nlm.nih.gov/pubmed/27577879
13. Charles A Janeway J, Travers P, Walport M, Shlomchik MJ. Induced innate responses
to infection. 2001 [cited 2019 Nov 12]; Available from:
https://www.ncbi.nlm.nih.gov/books/NBK27122/
14. Sokol CL, Luster AD. The chemokine system in innate immunity. Cold Spring Harb
Perspect Biol. 2015;7(5):1–20.
15. Shapiro-Shelef M, Calame KC. Regulation of plasma-cell development. Vol. 5, Nature
Reviews Immunology. Nature Publishing Group; 2005. p. 230–42.
16. Buckwalter MR, Albert ML. Orchestration of the immune response by dendritic cells.
Curr Biol [Internet]. 2009 May 12 [cited 2019 Nov 12];19(9):R355–61. Available
from: http://www.ncbi.nlm.nih.gov/pubmed/19439254

17. Neefjes J, Jongsma MLM, Paul P, Bakke O. Towards a systems understanding of
MHC class i and MHC class II antigen presentation. Vol. 11, Nature Reviews
Immunology. Nature Publishing Group; 2011. p. 823–36.
18. Laidlaw BJ, Craft JE, Kaech SM. The multifaceted role of CD4+ T cells in CD8+ T
cell memory. Nat Rev Immunol [Internet]. 2016 Feb 19 [cited 2019 Nov
12];16(2):102–11. Available from: http://www.nature.com/articles/nri.2015.10
19. Yang Q, Jeremiah Bell J, Bhandoola A. T-cell lineage determination. Immunol Rev
[Internet]. 2010 Nov [cited 2019 Nov 12];238(1):12–22. Available from:
http://www.ncbi.nlm.nih.gov/pubmed/20969581
20. Lai AY, Kondo M. T and B lymphocyte differentiation from hematopoietic stem cell.
Semin Immunol [Internet]. 2008 Aug [cited 2019 Nov 12];20(4):207–12. Available
from: http://www.ncbi.nlm.nih.gov/pubmed/18583148
21. Golubovskaya V, Wu L. Different Subsets of T Cells, Memory, Effector Functions,
and CAR-T Immunotherapy. Cancers (Basel) [Internet]. 2016 Mar 15 [cited 2019 Nov
12];8(3). Available from: http://www.ncbi.nlm.nih.gov/pubmed/26999211
22. Luckheeram RV, Zhou R, Verma AD, Xia B. CD4+T cells: differentiation and
functions. Clin Dev Immunol [Internet]. 2012 [cited 2019 Nov 13];2012:925135.
Available from: http://www.ncbi.nlm.nih.gov/pubmed/22474485
23. Wucherpfennig KW, Gagnon E, Call MJ, Huseby ES, Call ME. Structural Biology of
the T-cell Receptor: Insights into Receptor Assembly, Ligand Recognition, and
Initiation of Signaling. Cold Spring Harb Perspect Biol [Internet]. 2010 Apr 1 [cited
2019 Nov 12];2(4):a005140–a005140. Available from:
http://www.ncbi.nlm.nih.gov/pubmed/20452950
24. Birnbaum ME, Berry R, Hsiao Y-S, Chen Z, Shingu-Vazquez MA, Yu X, et al.
Molecular architecture of the αβ T cell receptor-CD3 complex. Proc Natl Acad Sci U S
A [Internet]. 2014 Dec 9 [cited 2019 Nov 12];111(49):17576–81. Available from:
http://www.ncbi.nlm.nih.gov/pubmed/25422432
25. Kuhns MS, Badgandi HB. Piecing together the family portrait of TCR-CD3

complexes. Immunol Rev [Internet]. 2012 Nov 1 [cited 2019 Nov 12];250(1):120–43.
Available from: http://doi.wiley.com/10.1111/imr.12000
26. Ramachandran P, Aggarwal A, Chin Wang J. Gamma-Delta T-cell Lymphoma: An
Overview. In: Peripheral T-cell Lymphomas [Internet]. IntechOpen; 2019 [cited 2019
Nov 12]. Available from: https://www.intechopen.com/books/peripheral-t-cell-
lymphomas/gamma-delta-t-cell-lymphoma-an-overview
27. Wang J, Reinherz EL. The structural basis of αβ T-lineage immune recognition: TCR
docking topologies, mechanotransduction, and co-receptor function. Immunol Rev
[Internet]. 2012 Nov [cited 2019 Nov 13];250(1):102–19. Available from:
http://www.ncbi.nlm.nih.gov/pubmed/23046125
28. Guy CS, Vignali DAA. Organization of proximal signal initiation at the TCR:CD3
complex. Immunol Rev [Internet]. 2009 Nov [cited 2019 Nov 13];232(1):7–21.
Available from: http://www.ncbi.nlm.nih.gov/pubmed/19909352
29. Dustin ML. The immunological synapse. Vol. 2, Cancer immunology research. 2014.
p. 1023–33.
30. Johnson KG, Bromley SK, Dustin ML, Thomas ML. A supramolecular basis for CD45
tyrosine phosphatase regulation in sustained T cell activation. Proc Natl Acad Sci U S
A [Internet]. 2000 Aug 29 [cited 2019 Nov 13];97(18):10138–43. Available from:
http://www.ncbi.nlm.nih.gov/pubmed/10963676
31. Freiberg BA, Kupfer H, Maslanik W, Delli J, Kappler J, Zaller DM, et al. Staging and
resetting T cell activation in SMACs. Nat Immunol [Internet]. 2002 Oct 3 [cited 2019
Nov 13];3(10):911–7. Available from:
http://www.ncbi.nlm.nih.gov/pubmed/12244310
32. Monks CRF, Freiberg BA, Kupfer H, Sciaky N, Kupfer A. Three-dimensional
segregation of supramolecular activation clusters in T cells. Nature [Internet]. 1998
Sep 3 [cited 2019 Nov 13];395(6697):82–6. Available from:
http://www.ncbi.nlm.nih.gov/pubmed/9738502
33. Dustin ML. Modular design of immunological synapses and kinapses. Cold Spring

Harb Perspect Biol [Internet]. 2009 Jul 1 [cited 2019 Nov 13];1(1):a002873. Available
from: http://www.ncbi.nlm.nih.gov/pubmed/20066081
34. Smith-Garvin JE, Koretzky GA, Jordan MS. T Cell Activation. Annu Rev Immunol
[Internet]. 2009 Apr [cited 2019 Oct 20];27(1):591–619. Available from:
http://www.annualreviews.org/doi/10.1146/annurev.immunol.021908.132706
35. Tormoen GW, Crittenden MR, Gough MJ. Role of the immunosuppressive
microenvironment in immunotherapy. Adv Radiat Oncol [Internet]. 2018 [cited 2019
Nov 13];3(4):520–6. Available from: http://www.ncbi.nlm.nih.gov/pubmed/30370351
36. Franco R, Martínez-Pinilla E, Lanciego JL, Navarro G. Basic Pharmacological and
Structural Evidence for Class A G-Protein-Coupled Receptor Heteromerization. Front
Pharmacol [Internet]. 2016 [cited 2019 Nov 13];7:76. Available from:
http://www.ncbi.nlm.nih.gov/pubmed/27065866
37. Huppa JB, Davis MM. T-cell-antigen recognition and the immunological synapse. Nat
Rev Immunol [Internet]. 2003 Dec [cited 2019 Nov 12];3(12):973–83. Available from:
http://www.nature.com/articles/nri1245
38. Restifo NP, Dudley ME, Rosenberg SA. Adoptive immunotherapy for cancer:
harnessing the T cell response. Nat Rev Immunol. 2012;12(4):269–281.
39. Inman JK. The antibody combining region: Speculations on the hypothesis of general
multispecificity. Theor Immunol. 1978;243–78.
40. Laydon DJ, Bangham CRM, Asquith B. Estimating T-cell repertoire diversity:
limitations of classical estimators and a new approach. Philos Trans R Soc B Biol Sci
[Internet]. 2015 Aug 19 [cited 2019 Nov 12];370(1675):20140291. Available from:
https://royalsocietypublishing.org/doi/10.1098/rstb.2014.0291
41. Jenkins MK, Chu HH, McLachlan JB, Moon JJ. On the Composition of the
Preimmune Repertoire of T Cells Specific for Peptide–Major Histocompatibility
Complex Ligands. Annu Rev Immunol [Internet]. 2010 Mar 22 [cited 2020 Mar
25];28(1):275–94. Available from:
http://www.annualreviews.org/doi/10.1146/annurev-immunol-030409-101253

42. Lythe G, Callard RE, Hoare RL, Molina-París C. How many TCR clonotypes does a
body maintain? J Theor Biol. 2016 Jan 21;389:214–24.
43. Hanahan D, Weinberg RA. Hallmarks of Cancer: The Next Generation. Cell [Internet].
2011;144(5):646–74. Available from:
http://www.sciencedirect.com/science/article/pii/S0092867411001279
44. Schumacher TN, Schreiber RD. Neoantigens in cancer immunotherapy. Science
[Internet]. 2015 Apr 3;348(6230):69 LP – 74. Available from:
http://science.sciencemag.org/content/348/6230/69.abstract
45. Coulie PG, Van den Eynde BJ, van der Bruggen P, Boon T. Tumour antigens
recognized by T lymphocytes: at the core of cancer immunotherapy. Nat Rev Cancer
[Internet]. 2014 Feb 24 [cited 2019 Nov 12];14(2):135–46. Available from:
http://www.nature.com/articles/nrc3670
46. Fujita Y, Rooney CM, Heslop HE. Adoptive cellular immunotherapy for viral
diseases. Bone Marrow Transplant [Internet]. 2008 Jan 5 [cited 2019 Nov
12];41(2):193–8. Available from: http://www.nature.com/articles/1705906
47. Chen DS, Mellman I. Oncology Meets Immunology: The Cancer-Immunity Cycle.
Immunity [Internet]. 2013 Jul 25 [cited 2018 Nov 13];39(1):1–10. Available from:
https://www.sciencedirect.com/science/article/pii/S1074761313002963
48. Berzofsky JA. Cancer: Improving immunotherapy: Revisiting the immunologist’s little
secret. Vol. 4, Science Translational Medicine. NIH Public Access; 2012. p. 120fs4.
49. Hernandez C, Huebener P, Schwabe RF. Damage-associated molecular patterns in
cancer: A double-edged sword [Internet]. Vol. 35, Oncogene. Nature Publishing
Group; 2016 [cited 2020 Apr 3]. p. 5931–41. Available from:
http://www.ncbi.nlm.nih.gov/pubmed/27086930
50. Garg AD, Nowis D, Golab J, Vandenabeele P, Krysko D V., Agostinis P.
Immunogenic cell death, DAMPs and anticancer therapeutics: An emerging
amalgamation. Vol. 1805, Biochimica et Biophysica Acta - Reviews on Cancer.
Elsevier; 2010. p. 53–71.

51. Rabinovich GA, Gabrilovich D, Sotomayor EM. Immunosuppressive strategies that
are mediated by tumor cells. Annu Rev Immunol [Internet]. 2007 [cited 2016 Jun
23];25:267–96. Available from:
http://dx.doi.org/10.1146/annurev.immunol.25.022106.141609
52. Wang X, Teng F, Kong L, Yu J. PD-L1 expression in human cancers and its
association with clinical outcomes. Onco Targets Ther [Internet]. 2016 [cited 2019
Nov 13];9:5023–39. Available from: http://www.ncbi.nlm.nih.gov/pubmed/27574444
53. Dong H, Strome SE, Salomao DR, Tamura H, Hirano F, Flies DB, et al. Tumor-
associated B7-H1 promotes T-cell apoptosis: A potential mechanism of immune
evasion. Nat Med [Internet]. 2002 Aug 24 [cited 2019 Nov 13];8(8):793–800.
Available from: http://www.ncbi.nlm.nih.gov/pubmed/12091876
54. Zou W. Immunosuppressive networks in the tumour environment and their therapeutic
relevance. Nat Rev Cancer [Internet]. 2005 Apr 18 [cited 2019 Nov 13];5(4):263–74.
Available from: http://www.nature.com/articles/nrc1586
55. Boone BA, Lotze MT. Targeting damage-associated molecular pattern molecules
(DAMPs) and DAMP receptors in melanoma. Methods Mol Biol [Internet]. 2014
[cited 2020 Mar 25];1102:537–52. Available from:
http://www.ncbi.nlm.nih.gov/pubmed/24258998
56. Yazawa EM, Geddes-Sweeney JE, Cedeno-Laurent F, Walley KC, Barthel SR,
Opperman MJ, et al. Melanoma cell galectin-1 ligands functionally correlate with
malignant potential. J Invest Dermatol. 2015 Jul 18;135(7):1849–62.
57. Busch W. Uber den Einfluss welche heftigere Erysipeln zuweilig auf organisierte
Neubildungenausuben. Verhandlungen des Naturhistorischen Vereines der Preuss
Rheinlande und Westphalens. 1866;23:28–30.
58. Busch W. Aus der sitzung der medicinischen section vom 13.November 1867. Berliner
Klin Wochenschrift. 1868;5:137–138.
59. Fehleisen F. Die Aetiologie des Erysipels. DMW - Dtsch Medizinische Wochenschrift.
1883;9(16):237–238.
60. Coley WB. Contribution To The Knowledge Of Sarcoma. Ann Surg. 1891;14:199–
220.
61. Coley WB. The Treatment Of Malignat Tumors By Repeated Inoculations Of
Erysipelas. Am J Med Sci. 1893;105(5):487–510.
62. Coley WB. The Treatment of Inoperable Sarcoma by Bacterial Toxins (the Mixed
Toxins of the Streptococcus erysipelas and the Bacillus prodigiosus). Proc R Soc Med
[Internet]. 1910 [cited 2019 Nov 6];3(Surg Sect):1–48. Available from:
http://www.ncbi.nlm.nih.gov/pubmed/19974799
63. McCarthy EF. The Toxins of William B. Coley and the Treatment of Bone and Soft-
Tissue Sarcomas. Iowa Orthop J. 2006;26:154–8.
64. Rontgen WC. On A New Kind Of Rays. Science. 1896;3(59):227–231.
65. Kienle GS. Fever in Cancer Treatment: Coleys Therapy and Epidemiologic
Observations. Glob Adv Heal Med. 2012;1(1):92–100.
66. Parish CR. Cancer immunotherapy: The past, the present and the future*. Immunol
Cell Biol. 2003;81(2):106–113.
67. Phan GQ, Yang JC, Sherry RM, Hwu P, Topalian SL, Schwartzentruber DJ, et al.
Cancer regression and autoimmunity induced by cytotoxic T lymphocyte-associated
antigen 4 blockade in patients with metastatic melanoma. Proc Natl Acad Sci U S A
[Internet]. 2003 Jul 8 [cited 2019 Nov 6];100(14):8372–7. Available from:
http://www.ncbi.nlm.nih.gov/pubmed/12826605
68. Hargadon KM, Johnson CE, Williams CJ. Immune checkpoint blockade therapy for
cancer: An overview of FDA-approved immune checkpoint inhibitors. Int
Immunopharmacol [Internet]. 2018 Sep 1 [cited 2019 Nov 13];62:29–39. Available
from:
https://www.sciencedirect.com/science/article/pii/S1567576918302522?via%3Dihub
69. Lugowska I, Teterycz P, Rutkowski P. Immunotherapy of melanoma. Contemp Oncol
(Poznan, Poland) [Internet]. 2018 Mar [cited 2019 Nov 14];22(1A):61–7. Available
from: http://www.ncbi.nlm.nih.gov/pubmed/29628796

70. Armand P, Chen Y-B, Redd RA, Joyce RM, Bsat J, Jeter E, et al. PD-1 blockade with
pembrolizumab for classical Hodgkin lymphoma after autologous stem cell
transplantation. Blood [Internet]. 2019 Jul 4 [cited 2019 Nov 14];134(1):22–9.
Available from: https://ashpublications.org/blood/article/134/1/22/260653/PD1-
blockade-with-pembrolizumab-for-classical
71. Papaioannou NE, Beniata O V, Vitsos P, Tsitsilonis O, Samara P. Harnessing the
immune system to improve cancer therapy. Ann Transl Med [Internet]. 2016 Jul [cited
2019 Nov 12];4(14):261. Available from:
http://www.ncbi.nlm.nih.gov/pubmed/27563648
72. Whilding LM, Maher J. CAR T-Cell immunotherapy: The path from the by-Road to
the freeway? Mol Oncol. 2015;9(10):1994–2018.
73. Maude SL, Teachey DT, Porter DL, Grupp SA. CD19-targeted chimeric antigen
receptor T-cell therapy for acute lymphoblastic leukemia. Blood [Internet]. 2015 Jun
[cited 2016 Oct 5];125(26):4017–23. Available from: http://dx.doi.org/10.1182/blood-
2014-12-580068
74. Milone MC, Fish JD, Carpenito C, Carroll RG, Binder GK, Teachey D, et al. Chimeric
Receptors Containing CD137 Signal Transduction Domains Mediate Enhanced
Survival of T Cells and Increased Antileukemic Efficacy In Vivo. Mol Ther.
2009;17(8):1453–1464.
75. Grupp SA, Kalos M, Barrett D, Aplenc R, Porter DL, Rheingold SR, et al. Chimeric
antigen receptor-modified T cells for acute lymphoid leukemia. N Engl J Med
[Internet]. 2013 Apr [cited 2017 Mar 15];368(16):1509–18. Available from:
http://dx.doi.org/10.1056/NEJMoa1215134
76. Kalos M, Levine BL, Porter DL, Katz S, Grupp SA, Bagg A, et al. T cells with
chimeric antigen receptors have potent antitumor effects and can establish memory in
patients with advanced leukemia. Sci Transl Med [Internet]. 2011 Aug [cited 2017 Jan
19];3(95):95ra73. Available from: http://dx.doi.org/10.1126/scitranslmed.3002842
77. Maude SL, Frey N, Shaw PA, Aplenc R, Barrett DM, Bunin NJ, et al. Chimeric
antigen receptor {T} cells for sustained remissions in leukemia. N Engl J Med

[Internet]. 2014 Oct [cited 2016 Oct 5];371(16):1507–17. Available from:
http://dx.doi.org/10.1056/NEJMoa1407222
78. Porter DL, Levine BL, Kalos M, Bagg A, June CH. Chimeric antigen receptor-
modified T cells in chronic lymphoid leukemia. N Engl J Med [Internet]. 2011 Aug
[cited 2017 Mar 13];365(8):725–33. Available from:
http://dx.doi.org/10.1056/NEJMoa1103849
79. FDA. Food and Drug Administration Center for Drug Evaluation and Research.
Oncologic Drugs Advisory Committee (ODAC); morning session; Wednesday, July
12, 2017. [Internet]. 2017. Available from:
https://www.fda.gov/media/107138/download
80. FDA. YESCARTA (axicabtagene ciloleucel) [Internet]. 2017 [cited 2020 Feb 20].
Available from: https://www.fda.gov/vaccines-blood-biologics/cellular-gene-therapy-
products/yescarta-axicabtagene-ciloleucel
81. June CH. Principles of adoptive T cell cancer therapy. J Clin Invest [Internet]. 2007
May [cited 2016 Nov 17];117(5):1204–12. Available from:
http://dx.doi.org/10.1172/JCI31446
82. Levine BL, Miskin J, Wonnacott K, Keir C. Global Manufacturing of CAR T Cell
Therapy. Mol Ther Methods Clin Dev. 2017;4:92–101.
83. Neal LR, Bailey SR, Wyatt MM, Bowers JS, Majchrzak K, Nelson MH, et al. The
Basics of Artificial Antigen Presenting Cells in T Cell-Based Cancer
Immunotherapies. J Immunol Res Ther [Internet]. 2017 [cited 2019 Nov 13];2(1):68–
79. Available from: http://www.ncbi.nlm.nih.gov/pubmed/28825053
84. Hollyman D, Stefanski J, Przybylowski M, Bartido S, Borquez-Ojeda O, Taylor C, et
al. Manufacturing Validation of Biologically Functional T Cells Targeted to CD19
Antigen for Autologous Adoptive Cell Therapy. J Immunother. 2009;32(2):169–180.
85. Kochenderfer JN, Yu Z, Frasheri D, Restifo NP, Rosenberg SA. Adoptive transfer of
syngeneic T cells transduced with a chimeric antigen receptor that recognizes murine
CD19 can eradicate lymphoma and normal B cells. Blood [Internet]. 2010 Nov 11

[cited 2019 Nov 13];116(19):3875–86. Available from:
https://ashpublications.org/blood/article/116/19/3875/28040/Adoptive-transfer-of-
syngeneic-T-cells-transduced
86. Kaiser AD, Assenmacher M, Schröder B, Meyer M, Orentas R, Bethke U, et al.
Towards a commercial process for the manufacture of genetically modified T cells for
therapy. Cancer Gene Ther [Internet]. 2015 Mar [cited 2016 Nov 23];22(2):72–8.
Available from: http://dx.doi.org/10.1038/cgt.2014.78
87. Ingber DE. Mechanical control of tissue morphogenesis during embryological
development. Int J Dev Biol [Internet]. 2006 Jan 1 [cited 2019 Nov 12];50(2–3):255–
66. Available from: http://www.ncbi.nlm.nih.gov/pubmed/16479493
88. Schedin P, Keely PJ. Mammary Gland ECM Remodeling, Stiffness, and
Mechanosignaling in Normal Development and Tumor Progression. Cold Spring Harb
Perspect Biol [Internet]. 2011 Jan 1 [cited 2019 Nov 13];3(1):a003228–a003228.
Available from: http://www.ncbi.nlm.nih.gov/pubmed/20980442
89. Azevedo AS, Follain G, Patthabhiraman S, Harlepp S, Goetz JG. Metastasis of
circulating tumor cells: Favorable soil or suitable biomechanics, or both? Cell Adh
Migr [Internet]. 2015 Sep 3 [cited 2019 Nov 13];9(5):345–56. Available from:
http://www.ncbi.nlm.nih.gov/pubmed/26312653
90. Eyckmans J, Boudou T, Yu X, Chen CS. A hitchhiker’s guide to mechanobiology. Dev
Cell [Internet]. 2011 Jul 19 [cited 2019 Nov 13];21(1):35–47. Available from:
http://www.ncbi.nlm.nih.gov/pubmed/21763607
91. Ingber D. Mechanobiology and diseases of mechanotransduction. Ann Med [Internet].
2003 Jan 8 [cited 2019 Nov 13];35(8):564–77. Available from:
http://www.tandfonline.com/doi/full/10.1080/07853890310016333
92. Paszek MJ, Zahir N, Johnson KR, Lakins JN, Rozenberg GI, Gefen A, et al. Tensional
homeostasis and the malignant phenotype. Cancer Cell. 2005;8(3):241–254.
93. Qiu X, Müller U. Mechanically Gated Ion Channels in Mammalian Hair Cells. Front
Cell Neurosci [Internet]. 2018 [cited 2019 Nov 13];12:100. Available from:

http://www.ncbi.nlm.nih.gov/pubmed/29755320
94. Stoltz J-F, Magdalou J, George D, Chen Y, Li Y, De Isla N, et al. Influence of
mechanical forces on bone: Introduction to mechanobiology and mechanical
adaptation concept. J Cell Immunother [Internet]. 2018 Sep 1 [cited 2019 Nov
13];4(1):10–2. Available from:
https://www.sciencedirect.com/science/article/pii/S2352177518300086
95. Ulbrich C, Wehland M, Pietsch J, Aleshcheva G, Wise P, van Loon J, et al. The impact
of simulated and real microgravity on bone cells and mesenchymal stem cells. Biomed
Res Int [Internet]. 2014 [cited 2019 Nov 13];2014:928507. Available from:
http://www.ncbi.nlm.nih.gov/pubmed/25110709
96. Yeung T, Georges PC, Flanagan LA, Marg B, Ortiz M, Funaki M, et al. Effects of
substrate stiffness on cell morphology, cytoskeletal structure, and adhesion. Cell Motil
Cytoskelet [Internet]. 2005 Jan [cited 2017 May 19];60(1):24–34. Available from:
http://dx.doi.org/10.1002/cm.20041
97. Ladoux B, Mège R-M. Mechanobiology of collective cell behaviours. Nat Rev Mol
Cell Biol [Internet]. 2017 Dec 8 [cited 2019 Nov 13];18(12):743–57. Available from:
http://www.nature.com/articles/nrm.2017.98
98. Bashour KT, Gondarenko A, Chen H, Shen K, Liu X, Huse M, et al. CD28 and CD3
have complementary roles in T-cell traction forces. Proc Natl Acad Sci U S A
[Internet]. 2014 Feb [cited 2016 Jul 21];111(6):2241–6. Available from:
http://dx.doi.org/10.1073/pnas.1315606111
99. Husson J, Chemin K, Bohineust A, Hivroz C, Henry N. Force generation upon T cell
receptor engagement. PLoS One [Internet]. 2011 May [cited 2017 Mar 7];6(5):e19680.
Available from: http://dx.doi.org/10.1371/journal.pone.0019680
100. Ingber DE. Cellular mechanotransduction: putting all the pieces together again.
FASEB J [Internet]. 2006 May [cited 2019 Nov 13];20(7):811–27. Available from:
http://www.ncbi.nlm.nih.gov/pubmed/16675838
101. DuFort CC, Paszek MJ, Weaver VM. Balancing forces: architectural control of

mechanotransduction. Nat Rev Mol Cell Biol [Internet]. 2011 May 21 [cited 2019 Nov
13];12(5):308–19. Available from: http://www.nature.com/articles/nrm3112
102. Huang C, Dai J, Zhang XA. Environmental physical cues determine the lineage
specification of mesenchymal stem cells. Biochim Biophys Acta - Gen Subj [Internet].
2015 Jun [cited 2019 Nov 13];1850(6):1261–6. Available from:
http://www.ncbi.nlm.nih.gov/pubmed/25727396
103. Vogel V, Sheetz M. Local force and geometry sensing regulate cell functions. Nat Rev
Mol Cell Biol [Internet]. 2006 Apr 22 [cited 2019 Nov 13];7(4):265–75. Available
from: http://www.ncbi.nlm.nih.gov/pubmed/16607289
104. Wen JH, Vincent LG, Fuhrmann A, Choi YS, Hribar KC, Taylor-Weiner H, et al.
Interplay of matrix stiffness and protein tethering in stem cell differentiation. Nat
Mater [Internet]. 2014 Oct 10 [cited 2019 Nov 13];13(10):979–87. Available from:
http://www.nature.com/articles/nmat4051
105. Shemesh T, Geiger B, Bershadsky AD, Kozlov MM. Focal adhesions as
mechanosensors: A physical mechanism. Proc Natl Acad Sci U S A. 2005 Aug
30;102(35):12383–8.
106. Ingber DE. The riddle of morphogenesis: A question of solution chemistry or
molecular cell engineering? Cell [Internet]. 1993 Dec 31 [cited 2019 Nov
13];75(7):1249–52. Available from:
https://www.sciencedirect.com/science/article/pii/009286749390612T
107. Judokusumo E, Tabdanov E, Kumari S, Dustin ML, Kam LC. Mechanosensing in T
lymphocyte activation. Biophys J [Internet]. 2012 Jan [cited 2016 Jul 21];102(2):L5-7.
Available from: http://dx.doi.org/10.1016/j.bpj.2011.12.011
108. O’Connor RS, Hao X, Shen K, Bashour K, Akimova T, Hancock WW, et al. Substrate
rigidity regulates human T cell activation and proliferation. J Immunol [Internet]. 2012
Aug [cited 2016 May 6];189(3):1330–9. Available from:
http://dx.doi.org/10.4049/jimmunol.1102757
109. Saitakis M, Dogniaux S, Goudot C, Bufi N, Asnacios S, Maurin M, et al. Different
TCR-induced T lymphocyte responses are potentiated by stiffness with variable
sensitivity. Elife. 2017 Aug;6.
110. Wan Z, Zhang S, Fan Y, Liu K, Du F, Davey AM, et al. B cell activation is regulated
by the stiffness properties of the substrate presenting the antigens. J Immunol
[Internet]. 2013 May 1 [cited 2019 Apr 28];190(9):4661–75. Available from:
http://www.ncbi.nlm.nih.gov/pubmed/23554309
111. Basu R, Whitlock BM, Husson J, Le Floc’h A, Jin W, Oyler-Yaniv A, et al. Cytotoxic
T cells use mechanical force to potentiate target cell killing. Cell [Internet]. 2016 Mar
[cited 2016 Apr 26];165(1):100–10. Available from:
http://dx.doi.org/10.1016/j.cell.2016.01.021
112. Halder G, Dupont S, Piccolo S. Transduction of mechanical and cytoskeletal cues by
YAP and TAZ. Nat Rev Mol Cell Biol [Internet]. 2012 Sep 16 [cited 2019 Nov
13];13(9):591–600. Available from: http://www.nature.com/articles/nrm3416
113. Kim ST, Takeuchi K, Sun Z-YJ, Touma M, Castro CE, Fahmy A, et al. The alphabeta
T cell receptor is an anisotropic mechanosensor. J Biol Chem [Internet]. 2009 Nov
[cited 2017 Mar 7];284(45):31028–37. Available from:
http://dx.doi.org/10.1074/jbc.M109.052712
114. Liu B, Chen W, Evavold BD, Zhu C. Accumulation of dynamic catch bonds between
TCR and agonist peptide-MHC triggers T cell signaling. Cell [Internet]. 2014 Apr
[cited 2014 Apr 22];157(2):357–68. Available from:
http://dx.doi.org/10.1016/j.cell.2014.02.053
115. Das DK, Feng Y, Mallis RJ, Li X, Keskin DB, Hussey RE, et al. Force-dependent
transition in the T-cell receptor \textbeta{}-subunit allosterically regulates peptide
discrimination and pMHC bond lifetime. Proc Natl Acad Sci. 2015;112(5):1517–1522.
116. Dembo M, Torney DC, Saxman K, Hammer D. The Reaction-Limited Kinetics of
Membrane-to-Surface Adhesion and Detachment. Proc R Soc B Biol Sci.
1988;234(1274):55–83.
117. Bell G. Models for the specific adhesion of cells to cells. Science. 1978
Dec;200(4342):618–627.
118. Kadono T, Venturi GM, Steeber DA, Tedder TF. Leukocyte Rolling Velocities and
Migration Are Optimized by Cooperative L-Selectin and Intercellular Adhesion
Molecule-1 Functions. J Immunol. 2002;169(8):4542–4550.
119. Sundd P, Pospieszalska MK, Cheung LS-L, Konstantopoulos K, Ley K. Biomechanics
of Leukocyte Rolling. Biorheology. 2011;48(1):1–35.
120. Tees DFJ, Goetz DJ. Leukocyte Adhesion: An Exquisite Balance of Hydrodynamic
and Molecular Forces. Physiology. 2003;18(5):186–190.
121. Marshall BT, Long M, Piper JW, Yago T, Mcever RP, Zhu C. Direct observation of
catch bonds involving cell-adhesion molecules. Nature. 2003;423(6936):190–193.
122. Basu R, Huse M. Mechanical communication at the immunological synapse. Trends
Cell Biol [Internet]. 2017 Apr [cited 2017 Mar 19];27(4):241–54. Available from:
http://dx.doi.org/10.1016/j.tcb.2016.10.005
123. Krummel MF, Cahalan MD. The Immunological Synapse: a Dynamic Platform for
Local Signaling. J Clin Immunol. 2010;30(3):364–372.
124. Dustin ML. Cell adhesion molecules and actin cytoskeleton at immune synapses and
kinapses. Curr Opin Cell Biol. 2007;19(5):529–533.
125. Li Y-C, Chen B-M, Wu P-C, Cheng T-L, Kao L-S, Tao M-H, et al. Cutting Edge:
mechanical forces acting on T cells immobilized via the TCR complex can trigger
TCR signaling. J Immunol [Internet]. 2010 Jun [cited 2016 Jul 4];184(11):5959–63.
Available from: http://dx.doi.org/10.4049/jimmunol.0900775
126. Kaizuka Y, Douglass AD, Varma R, Dustin ML, Vale RD. Mechanisms for
segregating T cell receptor and adhesion molecules during immunological synapse
formation in Jurkat T cells. Proc Natl Acad Sci. 2007 Dec;104(51):20296–20301.
127. Hui KL, Balagopalan L, Samelson LE, Upadhyaya A. Cytoskeletal forces during
signaling activation in Jurkat T-cells. Mol Biol Cell [Internet]. 2015 Feb [cited 2016
Jun 23];26(4):685–95. Available from: http://dx.doi.org/10.1091/mbc.E14-03-0830

128. van der Merwe PA, Dushek O. Mechanisms for T cell receptor triggering. Nat Rev
Immunol [Internet]. 2011 Jan [cited 2017 Apr 22];11(1):47–55. Available from:
http://dx.doi.org/10.1038/nri2887
129. Xu C, Gagnon E, Call ME, Schnell JR, Schwieters CD, Carman C V, et al. Regulation
of T Cell Receptor Activation by Dynamic Membrane Binding of the CD3
Cytoplasmic Tyrosine-Based Motif. Cell. 2008;135(4):702–713.
130. Kuhns MS, Davis MM. The safety on the TCR trigger. Cell [Internet]. 2008 Nov [cited
2017 Mar 15];135(4):594–6. Available from:
http://dx.doi.org/10.1016/j.cell.2008.10.033
131. Lambert LH, Goebrecht GKE, Leo SE De, O’Connor RS, Nunez-Cruz S, Li T-D, et al.
Improving T Cell Expansion with a Soft Touch. Nano Lett. 2017;17(2):821–826.
132. Hickey JW, Dong Y, Chung JW, Salathe SF, Pruitt HC, Li X, et al. Engineering an
Artificial T‐Cell Stimulating Matrix for Immunotherapy. Adv Mater [Internet]. 2019
Jun 10 [cited 2019 Aug 8];31(23):1807359. Available from:
https://onlinelibrary.wiley.com/doi/abs/10.1002/adma.201807359
133. Bae SJ, Park JT, Park AY, Youk JH, Lim JW, Lee HW, et al. Ex vivo shear-wave
elastography of axillary lymph nodes to predict nodal metastasis in patients with
primary breast cancer. J Breast Cancer. 2018 Jun 1;21(2):190–6.
134. Ben-Akiva E, Meyer RA, Wilson DR, Green JJ. Surface engineering for lymphocyte
programming. Adv Drug Deliv Rev. 2017;114:102–115.
135. Elosegui-Artola A, Trepat X, Roca-Cusachs P. Control of Mechanotransduction by
Molecular Clutch Dynamics. Trends Cell Biol. 2018;
136. Fadel TR, Steenblock ER, Stern E, Li N, Wang X, Haller GL, et al. Enhanced Cellular
Activation with Single Walled Carbon Nanotube Bundles Presenting Antibody
Stimuli. Nano Lett. 2008;8(7):2070–2076.
137. Delcassian D, Depoil D, Rudnicka D, Liu M, Davis DM, Dustin ML, et al. Nanoscale
ligand spacing influences receptor triggering in T cells and NK cells. Nano Lett
[Internet]. 2013 Oct [cited 2016 Nov 27];13(11):5608–14. Available from:

http://dx.doi.org/10.1021/nl403252x
138. Hsu C-J, Hsieh W-T, Waldman A, Clarke F, Huseby ES, Burkhardt JK, et al. Ligand
Mobility Modulates Immunological Synapse Formation and T Cell Activation. PLoS
One. 2012;7(2).
139. Li Y, Kurlander RJ. Comparison of anti-CD3 and anti-CD28-coated beads with
soluble anti-CD3 for expanding human T cells: Differing impact on CD8 T cell
phenotype and responsiveness to restimulation. J Transl Med [Internet]. 2010 Dec 26
[cited 2019 Feb 12];8(1):104. Available from: https://translational-
medicine.biomedcentral.com/articles/10.1186/1479-5876-8-104
140. van der Weijden J, Paulis LE, Verdoes M, van Hest JCM, Figdor CG. The right touch:
design of artificial antigen-presenting cells to stimulate the immune system. Chem Sci
[Internet]. 2014 May [cited 2016 Jul 30];5(9):3355. Available from:
http://xlink.rsc.org/?DOI=C4SC01112K
141. Stankiewicz AI, Moulijn JA. Process intensification: Transforming chemical
engineering. Chem Eng Prog [Internet]. 2000;96(1):22–34. Available from:
https://www.cheric.org/research/tech/periodicals/view.php?seq=51366
142. Perera AS, Coppens M-O. Re-designing materials for biomedical applications: from
biomimicry to nature-inspired chemical engineering. Philos Trans R Soc A Math Phys
Eng Sci [Internet]. 2019 Feb 11 [cited 2019 Nov 9];377(2138):20180268. Available
from: https://royalsocietypublishing.org/doi/10.1098/rsta.2018.0268
143. Vullev VI. From Biomimesis to Bioinspiration: What’s the Benefit for Solar Energy
Conversion Applications? J Phys Chem Lett [Internet]. 2011 Mar 3 [cited 2019 Nov
9];2(5):503–8. Available from: https://pubs.acs.org/doi/10.1021/jz1016069
144. Whitesides GM. Bioinspiration: something for everyone. Interface Focus [Internet].
2015 Aug 6 [cited 2019 Nov 9];5(4):20150031. Available from:
https://royalsocietypublishing.org/doi/10.1098/rsfs.2015.0031
145. Fish FE, Beneski JT. Evolution and Bio-Inspired Design: Natural Limitations. In:
Biologically Inspired Design [Internet]. London: Springer London; 2014 [cited 2019

Nov 9]. p. 287–312. Available from: http://link.springer.com/10.1007/978-1-4471-
5248-4_12
146. Harris JS. An airplane is not a bird. Am Herit Invent Technol. 1989;5(2):18–22.
147. Mahdavi A, Ferreira L, Sundback C, Nichol JW, Chan EP, Carter DJD, et al. A
biodegradable and biocompatible gecko-inspired tissue adhesive. Proc Natl Acad Sci
U S A [Internet]. 2008 Feb 19 [cited 2019 Nov 10];105(7):2307–12. Available from:
http://www.ncbi.nlm.nih.gov/pubmed/18287082
148. Cho WK, Ankrum JA, Guo D, Chester SA, Yang SY, Kashyap A, et al.
Microstructured barbs on the North American porcupine quill enable easy tissue
penetration and difficult removal. Proc Natl Acad Sci U S A [Internet]. 2012 Dec 26
[cited 2019 Nov 10];109(52):21289–94. Available from:
http://www.ncbi.nlm.nih.gov/pubmed/23236138
149. Reilly GC, Engler AJ. Intrinsic extracellular matrix properties regulate stem cell
differentiation. J Biomech. 2010 Jan 5;43(1):55–62.
150. Huang S, Ingber DE. Cell tension, matrix mechanics, and cancer development. Cancer
Cell. 2005;8(3):175–176.
151. Wang N, Butler J, Ingber D. Mechanotransduction across the cell surface and through
the cytoskeleton. Science. 1993;260(5111):1124–1127.
152. Choquet D, Felsenfeld DP, Sheetz MP. Extracellular matrix rigidity causes
strengthening of integrin- cytoskeleton linkages. Cell. 1997 Jan 10;88(1):39–48.
153. Maul TM, Chew DW, Nieponice A, Vorp DA. Mechanical stimuli differentially
control stem cell behavior: morphology, proliferation, and differentiation. Biomech
Model Mechanobiol [Internet]. 2011 Dec 21 [cited 2019 Oct 19];10(6):939–53.
Available from: http://www.ncbi.nlm.nih.gov/pubmed/21253809
154. Guilak F, Butler DL, Goldstein SA, Baaijens FPT. Biomechanics and mechanobiology
in functional tissue engineering. J Biomech [Internet]. 2014 Jun 27 [cited 2019 Oct
19];47(9):1933–40. Available from: http://www.ncbi.nlm.nih.gov/pubmed/24818797

155. Li D, Zhou J, Chowdhury F, Cheng J, Wang N, Wang F. Role of mechanical factors in
fate decisions of stem cells. Regen Med [Internet]. 2011 Mar [cited 2019 Oct
19];6(2):229–40. Available from: http://www.ncbi.nlm.nih.gov/pubmed/21391856
156. Deeg J, Axmann M, Matic J, Liapis A, Depoil D, Afrose J, et al. T cell activation is
determined by the number of presented antigens. Nano Lett. 2013 Nov
13;13(11):5619–26.
157. Hu J, Gondarenko AA, Dang AP, Bashour KT, O’Connor RS, Lee S, et al. High-
Throughput Mechanobiology Screening Platform Using Micro- and Nanotopography.
Nano Lett [Internet]. 2016 Apr [cited 2016 May 6];16(4):2198–204. Available from:
http://dx.doi.org/10.1021/acs.nanolett.5b04364
158. Sunshine JC, Perica K, Schneck JP, Green JJ. Particle shape dependence of CD8+ T
cell activation by artificial antigen presenting cells. Biomaterials [Internet]. 2014 Jan
[cited 2016 Jul 14];35(1):269–77. Available from:
http://dx.doi.org/10.1016/j.biomaterials.2013.09.050
159. Plouffe BD, Murthy SK, Lewis LH. Fundamentals and application of magnetic
particles in cell isolation and enrichment: a review. Rep Prog Phys [Internet]. 2015 Jan
[cited 2016 Nov 26];78(1):16601. Available from: http://dx.doi.org/10.1088/0034-
4885/78/1/016601
160. Cheung AS, Mooney DJ. Engineered materials for cancer immunotherapy. Nano
Today [Internet]. 2015 Aug 1 [cited 2019 Oct 19];10(4):511–31. Available from:
https://www.sciencedirect.com/science/article/pii/S1748013215000778
161. Kim ST, Shin Y, Brazin K, Mallis RJ, Sun Z-YJ, Wagner G, et al. TCR
mechanobiology: torques and tunable structures linked to early T cell signaling. Front
Immunol [Internet]. 2012 Apr [cited 2017 Mar 7];3:76. Available from:
http://dx.doi.org/10.3389/fimmu.2012.00076
162. Harrison DL, Fang Y, Huang J. T-Cell Mechanobiology: Force Sensation,
Potentiation, and Translation. Front Phys [Internet]. 2019 Apr 2 [cited 2019 Apr
5];7:45. Available from:
https://www.frontiersin.org/article/10.3389/fphy.2019.00045/full

163. Feng Y, Brazin KN, Kobayashi E, Mallis RJ, Reinherz EL, Lang MJ. Mechanosensing
drives acuity of αβT-cell recognition. Proc Natl Acad Sci U S A [Internet]. 2017 Aug
[cited 2017 Sep 5]; Available from: http://dx.doi.org/10.1073/pnas.1703559114
164. Hivroz C, Saitakis M. Biophysical Aspects of T Lymphocyte Activation at the Immune
Synapse. Front Immunol [Internet]. 2016 Feb [cited 2016 Dec 14];7:46. Available
from: http://dx.doi.org/10.3389/fimmu.2016.00046
165. Wahl A, Dinet C, Dillard P, Nassereddine A, Puech P-H, Limozin L, et al. Biphasic
mechanosensitivity of T cell receptor-mediated spreading of lymphocytes. Proc Natl
Acad Sci U S A [Internet]. 2019 Mar 26 [cited 2019 Oct 17];116(13):5908–13.
Available from: http://www.ncbi.nlm.nih.gov/pubmed/30850545
166. Matic J, Deeg J, Scheffold A, Goldstein I, Spatz JP. Fine tuning and efficient T cell
activation with stimulatory aCD3 nanoarrays. Nano Lett [Internet]. 2013 Nov [cited
2016 Oct 16];13(11):5090–7. Available from: http://dx.doi.org/10.1021/nl4022623
167. Pelham RJ, Wang YL. Cell locomotion and focal adhesions are regulated by substrate
flexibility. Proc Natl Acad Sci U S A [Internet]. 1997 Dec [cited 2016 Oct
15];94(25):13661–5. Available from: http://dx.doi.org/10.1073/pnas.94.25.13661
168. Tse JR, Engler AJ. Preparation of Hydrogel Substrates with Tunable Mechanical
Properties. Curr Protoc Cell Biol. 2010;
169. Körstgens V, Pröller S, Buchmann T, Moseguí González D, Song L, Yao Y, et al.
Laser-ablated titania nanoparticles for aqueous processed hybrid solar cells.
Nanoscale. 2015 Feb 21;7(7):2900–4.
170. Michelotti N, de Silva C, Johnson-Buck AE, Manzo AJ, Walter NG. Single Molecule
Tools, Part B:Super-Resolution, Particle Tracking, Multiparameter, and Force Based
Methods [Internet]. Methods in enzymology. Elsevier; 2010 [cited 2020 Apr 1]. 121–
48 p. (Methods in Enzymology; vol. 475). Available from:
http://www.pubmedcentral.nih.gov/articlerender.fcgi?artid=3013281&tool=pmcentrez
&rendertype=abstract
171. Xing W-L, Cheng J, editors. Frontiers in Biochip Technology. Frontiers in Biochip

Technology. Kluwer Academic Publishers; 2006.
172. Recombinant Streptavidin protein (Active) (ab123480) | Abcam [Internet]. [cited 2019
Oct 2]. Available from: https://www.abcam.com/recombinant-streptavidin-protein-
active-ab123480.html?productWallTab=ShowAll
173. Abraham RT, Weiss A. Jurkat T cells and development of the T-cell receptor
signalling paradigm. Nat Rev Immunol [Internet]. 2004 Apr 1 [cited 2019 Apr
18];4(4):301–8. Available from: http://www.nature.com/articles/nri1330
174. Yuen H, Princen J, Illingworth J, Kittler J. Comparative study of Hough Transform
methods for circle finding. Image Vis Comput [Internet]. 1990 Feb 1 [cited 2019 Sep
18];8(1):71–7. Available from:
https://www.sciencedirect.com/science/article/pii/026288569090059E?via%3Dihub
175. Ghasemi A, Zahediasl S. Normality tests for statistical analysis: A guide for non-
statisticians. Int J Endocrinol Metab. 2012 Apr;10(2):486–9.
176. McDonald JH. Homoscedasticity and heteroscedasticity. In: Handbook of Biological
Statistics. 3rd ed. Sparky House Publishing; 2014. p. 156.
177. Wobbrock JO, Findlater L, Gergle D, Higgins JJ. The Aligned Rank Transform for
nonparametric factorial analyses using only ANOVA procedures. In: Conference on
Human Factors in Computing Systems - Proceedings. 2011. p. 143–6.
178. Rathmell JC, Heiden MGV, Harris MH, Frauwirth KA, Thompson CB. In the absence
of extrinsic signals, nutrient utilization by lymphocytes is insufficient to maintain
either cell size or viability. Mol Cell. 2000;6(3):683–92.
179. Levine BL, Bernstein WB, Connors M, Craighead N, Lindsten T, Thompson CB, et al.
Effects of CD28 costimulation on long-term proliferation of CD4+ T cells in the
absence of exogenous feeder cells. J Immunol [Internet]. 1997 Dec 15 [cited 2019 Oct
6];159(12):5921–30. Available from: http://www.ncbi.nlm.nih.gov/pubmed/9550389
180. Delcassian D, Sattler S, Dunlop IE. T cell immunoengineering with advanced
biomaterials. Integr Biol [Internet]. 2017 Mar [cited 2017 Apr 21];9(3):211–22.
Available from: http://dx.doi.org/10.1039/c6ib00233a

181. Evans ND, Gentleman E. The role of material structure and mechanical properties in
cell–matrix interactions. J Mater Chem B [Internet]. 2014 [cited 2016 Jun
14];2(17):2345. Available from: http://xlink.rsc.org/?DOI=c3tb21604g
182. Liu Y, Blanchfield L, Ma VP-Y, Andargachew R, Galior K, Liu Z, et al. DNA-based
nanoparticle tension sensors reveal that T-cell receptors transmit defined pN forces to
their antigens for enhanced fidelity. Proc Natl Acad Sci U S A [Internet]. 2016 May
[cited 2016 Jun 9];113(20):5610–5. Available from:
http://dx.doi.org/10.1073/pnas.1600163113
183. Denisin AK, Pruitt BL. Tuning the Range of Polyacrylamide Gel Stiffness for
Mechanobiology Applications. Vol. 8, ACS Applied Materials and Interfaces.
American Chemical Society; 2016. p. 21893–902.
184. Wang X, Rivière I. Clinical manufacturing of CAR T cells: foundation of a promising
therapy. Mol Ther Oncolytics [Internet]. 2016 Jun [cited 2016 Jul 30];3:16015.
Available from: http://dx.doi.org/10.1038/mto.2016.15
185. Regnier FE, Cho W. Affinity Targeting Schemes for Biomarker Research. Proteomic
Metabolomic Approaches to Biomark Discov [Internet]. 2013 Jan 1 [cited 2019 Apr
17];197–224. Available from:
https://www.sciencedirect.com/science/article/pii/B9780123944467000133
186. Burnham MR, Turner JN, Szarowski D, Martin DL. Biological functionalization and
surface micropatterning of polyacrylamide hydrogels. Biomaterials [Internet]. 2006
Dec 1 [cited 2019 Apr 27];27(35):5883–91. Available from:
https://www.sciencedirect.com/science/article/pii/S0142961206006879
187. Lin S, Gu L. Influence of Crosslink Density and Stiffness on Mechanical Properties of
Type I Collagen Gel. Mater (Basel, Switzerland) [Internet]. 2015 Feb 6 [cited 2019
Apr 17];8(2):551–60. Available from: http://www.ncbi.nlm.nih.gov/pubmed/28787956
188. Mullen CA, Vaughan TJ, Billiar KL, McNamara LM. The Effect of Substrate
Stiffness, Thickness, and Cross-Linking Density on Osteogenic Cell Behavior.
Biophys J [Internet]. 2015 Apr 7 [cited 2019 Apr 17];108(7):1604–12. Available from:
https://www.sciencedirect.com/science/article/pii/S0006349515001873

189. Sage PT, Varghese LM, Martinelli R, Sciuto TE, Kamei M, Dvorak AM, et al. Antigen
Recognition Is Facilitated by Invadosome-like Protrusions Formed by
Memory/Effector T Cells. J Immunol. 2012 Apr 15;188(8):3686–99.
190. Dupré L, Houmadi R, Tang C, Rey-Barroso J. T lymphocyte migration: An action
movie starring the actin and associated actors. Vol. 6, Frontiers in Immunology.
Frontiers Research Foundation; 2015.
191. Cai E, Marchuk K, Beemiller P, Beppler C, Rubashkin MG, Weaver VM, et al.
Visualizing dynamic microvillar search and stabilization during ligand detection by T
cells. Science. 2017 May 12;356(6338).
192. Huse M. Mechanical forces in the immune system. Nat Rev Immunol. 2017 Oct
27;17(11):679–90.
193. Wang X, Li S, Yan C, Liu P, Ding J. Fabrication of RGD Micro/Nanopattern and
Corresponding Study of Stem Cell Differentiation. Nano Lett [Internet]. 2015 Mar 11
[cited 2019 Oct 18];15(3):1457–67. Available from:
https://pubs.acs.org/doi/10.1021/nl5049862
194. Brandrup J, Immergut EH, Grulke EA. Polymer Handbook, 2 Volumes Set, 4th
Edition [Internet]. JOHN WILEY & SONS INC; 2003 [cited 2019 Oct 16]. 2336 p.
Available from:
http://www.ebook.de/de/product/3607711/j_brandrup_edmund_h_immergut_eric_a_gr
ulke_polymer_handbook_2_volumes_set.html
195. Majedi FS, Hasani-Sadrabadi MM, Thauland TJ, Li S, Bouchard L-S, Butte MJ.
Augmentation of T-Cell Activation by Oscillatory Forces and Engineered Antigen-
Presenting Cells. Nano Lett. 2019 Sep 3;
196. El-Schich Z, Kamlund S, Janicke B, Alm K, Wingren AG. Holography: The
Usefulness of Digital Holographic Microscopy for Clinical Diagnostics. In:
Holographic Materials and Optical Systems. InTech; 2017.
197. Kemper B, Von Bally G. Digital holographic microscopy for live cell applications and
technical inspection. Appl Opt. 2008 Feb 1;47(4).

198. Schwartz RH. T cell anergy. Annu Rev Immunol. 2003 Apr;21(1):305–34.
199. Wherry EJ. T cell exhaustion. Nat Immunol. 2011 Jun;12(6):492–9.
200. Ruiz-Ruiz MC, Oliver FJ, Izquierdo M, López-Rivas A. Activation-induced apoptosis
in Jurkat cells through a myc-independent mechanism. Mol Immunol [Internet]. 1995
Sep [cited 2019 Oct 17];32(13):947–55. Available from:
http://www.ncbi.nlm.nih.gov/pubmed/7477000
201. Ferris RL, Lu B, Kane LP. Too Much of a Good Thing? Tim-3 and TCR Signaling in
T Cell Exhaustion. J Immunol. 2014 Aug 15;193(4):1525–30.
202. Yun SJ, Lee B, Komori K, Lee MJ, Lee BG, Kim K, et al. Regulation of TIM-3
expression in a human T cell line by tumor-conditioned media and cyclic AMP-
dependent signaling. Mol Immunol. 2019 Jan 1;105:224–32.
203. Tomkowicz B, Walsh E, Cotty A, Verona R, Sabins N, Kaplan F, et al. TIM-3
suppresses anti-CD3/CD28-induced TCR activation and IL-2 expression through the
NFAT signaling pathway. PLoS One. 2015 Oct 22;10(10).
204. Aguirre A, Shoji KF, Sáez JC, Henríquez M, Quest AF. FasL-triggered death of Jurkat
cells requires caspase 8-induced, ATP-dependent cross-talk between fas and the
purinergic receptor P2X7. J Cell Physiol [Internet]. 2013 Feb 1 [cited 2019 Oct
17];228(2):485–93. Available from: http://doi.wiley.com/10.1002/jcp.24159
205. Wang Y, Shibuya K, Yamashita Y, Shirakawa J, Shibata K, Kai H, et al. LFA-1
decreases the antigen dose for T cell activation in vivo. Int Immunol [Internet]. 2008
Sep [cited 2019 Oct 18];20(9):1119–27. Available from:
http://www.ncbi.nlm.nih.gov/pubmed/18644832
206. Bachmann MF, McKall-Faienza K, Schmits R, Bouchard D, Beach J, Speiser DE, et
al. Distinct roles for LFA-1 and CD28 during activation of naive T cells: adhesion
versus costimulation. Immunity [Internet]. 1997 Oct 1 [cited 2019 Oct 18];7(4):549–
57. Available from: http://www.ncbi.nlm.nih.gov/pubmed/9354475
207. Verma NK, Kelleher D. Not Just an Adhesion Molecule: LFA-1 Contact Tunes the T
Lymphocyte Program. J Immunol. 2017 Aug 15;199(4):1213–21.

208. Tabdanov E, Gondarenko S, Kumari S, Liapis A, Dustin ML, Sheetz MP, et al.
Micropatterning of TCR and LFA-1 ligands reveals complementary effects on
cytoskeleton mechanics in T cells. Integr Biol [Internet]. 2015 Oct [cited 2016 Sep
24];7(10):1272–84. Available from: http://dx.doi.org/10.1039/c5ib00032g
209. Golubovskaya V, Wu L. Different subsets of T cells, memory, effector functions, and
CAR-T immunotherapy. Cancers (Basel). 2016 Mar 15;8(3).
210. Harrison RP, Ruck S, Rafiq QA, Medcalf N. Decentralised manufacturing of cell and
gene therapy products: Learning from other healthcare sectors. Biotechnol Adv
[Internet]. 2018 Mar 1 [cited 2019 Nov 3];36(2):345–57. Available from:
https://www.sciencedirect.com/science/article/pii/S0734975017301647
211. Eyles JE, Vessillier S, Jones A, Stacey G, Schneider CK, Price J. Cell therapy
products: focus on issues with manufacturing and quality control of chimeric antigen
receptor T-cell therapies. J Chem Technol Biotechnol [Internet]. 2019 Apr [cited 2019
Nov 3];94(4):1008–16. Available from: http://doi.wiley.com/10.1002/jctb.5829
212. Prasad V. Tisagenlecleucel — the first approved CAR-T-cell therapy: implications for
payers and policy makers. Nat Rev Clin Oncol [Internet]. 2018 Jan 4 [cited 2019 Dec
2];15(1):11–2. Available from: http://www.nature.com/articles/nrclinonc.2017.156
213. National Institute for Health and Care Excellence. Axicabtagene ciloleucel for treating
diffuse large B-cell lymphoma and primary mediastinal large B-cell lymphoma after 2
or more systemic therapies | NICE Guidance [Internet]. NICE; 2019 [cited 2019 Nov
4]. Available from: https://www.nice.org.uk/Guidance/TA559
214. Mock U, Nickolay L, Philip B, Cheung GW-K, Zhan H, Johnston ICD, et al.
Automated manufacturing of chimeric antigen receptor T cells for adoptive
immunotherapy using CliniMACS Prodigy. Cytotherapy [Internet]. 2016 Aug 1 [cited
2019 Mar 17];18(8):1002–11. Available from:
https://www.sciencedirect.com/science/article/abs/pii/S1465324916303838
215. Regalado A. This Lab-in-a-Box Could Make Gene Therapy Less Elitist | MIT
Technology Review [Internet]. MIT Technology Review. 2017 [cited 2019 Nov 4].
Available from: https://www.technologyreview.com/s/603762/this-lab-in-a-box-could-

make-gene-therapy-less-elitist/
216. Fesnak AD, Hanley PJ, Levine BL. Considerations in T Cell Therapy Product
Development for B Cell Leukemia and Lymphoma Immunotherapy. Curr Hematol
Malig Rep [Internet]. 2017 [cited 2019 Nov 4];12(4):335–43. Available from:
http://www.ncbi.nlm.nih.gov/pubmed/28762038
217. Dwarshuis NJ, Parratt K, Santiago-Miranda A. Cells as advanced therapeutics: State-
of-the-art, challenges, and opportunities in large scale biomanufacturing of high-
quality cells for adoptive immunotherapies. Adv Drug Deliv Rev [Internet]. 2017 May
15 [cited 2019 Nov 4];114:222–39. Available from:
https://www.sciencedirect.com/science/article/abs/pii/S0169409X17300893?via%3Dih
ub
218. YING M, PANG BSF. Three-dimensional ultrasound measurement of cervical lymph
node volume. Br J Radiol [Internet]. 2009 Aug 5 [cited 2019 Nov 4];82(980):617–25.
Available from: http://www.birpublications.org/doi/10.1259/bjr/17611956
219. Primiceri E, Chiriacò MS, Rinaldi R, Maruccio G. Cell chips as new tools for cell
biology – results, perspectives and opportunities. Lab Chip [Internet]. 2013 Aug 28
[cited 2019 Mar 17];13(19):3789. Available from:
http://xlink.rsc.org/?DOI=c3lc50550b
220. Bhatia SN, Ingber DE. Microfluidic organs-on-chips. Nat Biotechnol [Internet]. 2014
Aug 1 [cited 2019 Mar 18];32(8):760–72. Available from:
http://www.nature.com/articles/nbt.2989
221. Ghaemmaghami AM, Hancock MJ, Harrington H, Kaji H, Khademhosseini A.
Biomimetic tissues on a chip for drug discovery. Drug Discov Today [Internet]. 2012
Feb [cited 2019 Oct 29];17(3–4):173–81. Available from:
http://www.ncbi.nlm.nih.gov/pubmed/22094245
222. Moore N, Doty D, Zielstorff M, Kariv I, Moy LY, Gimbel A, et al. A multiplexed
microfluidic system for evaluation of dynamics of immune–tumor interactions. Lab
Chip [Internet]. 2018 Jun 26 [cited 2019 Oct 29];18(13):1844–58. Available from:
http://xlink.rsc.org/?DOI=C8LC00256H

223. Dura B, Servos MM, Barry RM, Ploegh HL, Dougan SK, Voldman J. Longitudinal
multiparameter assay of lymphocyte interactions from onset by microfluidic cell
pairing and culture. Proc Natl Acad Sci U S A [Internet]. 2016 [cited 2019 Oct
29];113(26):E3599-608. Available from:
http://www.ncbi.nlm.nih.gov/pubmed/27303033
224. Gopalakrishnan N, Hannam R, Casoni GP, Barriet D, Ribe JM, Haug M, et al.
Infection and immunity on a chip: a compartmentalised microfluidic platform to
monitor immune cell behaviour in real time. Lab Chip [Internet]. 2015 Mar 21 [cited
2019 Oct 29];15(6):1481–7. Available from:
http://www.ncbi.nlm.nih.gov/pubmed/25608968
225. Adriani G, Pavesi A, Tan AT, Bertoletti A, Thiery JP, Kamm RD. Microfluidic models
for adoptive cell-mediated cancer immunotherapies. Drug Discov Today [Internet].
2016 [cited 2019 Oct 30];21(9):1472–8. Available from:
http://www.ncbi.nlm.nih.gov/pubmed/27185084
226. Sarkar S, Motwani V, Sabhachandani P, Cohen N, Konry T. T Cell Dynamic
Activation and Functional Analysis in Nanoliter Droplet Microarray. J Clin Cell
Immunol [Internet]. 2015 [cited 2019 Oct 30];6(3). Available from:
https://www.ncbi.nlm.nih.gov/pmc/articles/PMC4657871/
227. Chen C-A, Chen C-H, Ghaemmaghami AM, Fan S-K. Separation of dendritic and T
cells using electrowetting and dielectrophoresis. In: 2012 7th IEEE International
Conference on Nano/Micro Engineered and Molecular Systems (NEMS) [Internet].
IEEE; 2012 [cited 2019 Oct 30]. p. 183–6. Available from:
http://ieeexplore.ieee.org/document/6196752/
228. Civin CI, Ward T, Skelley AM, Gandhi K, Peilun Lee Z, Dosier CR, et al. Automated
leukocyte processing by microfluidic deterministic lateral displacement. Cytometry A
[Internet]. 2016 [cited 2019 Oct 30];89(12):1073–83. Available from:
http://www.ncbi.nlm.nih.gov/pubmed/27875619
229. Shevkoplyas SS, Yoshida T, Munn LL, Bitensky MW. Biomimetic Autoseparation of
Leukocytes from Whole Blood in a Microfluidic Device. Anal Chem. 2005;77(3):933–

937.
230. Sharei A, Zoldan J, Adamo A, Sim WY, Cho N, Jackson E, et al. A vector-free
microfluidic platform for intracellular delivery. Proc Natl Acad Sci U S A.
2013;110(6):2082–7.
231. Moore N, Chevillet JR, Healey LJ, McBrine C, Doty D, Santos J, et al. A Microfluidic
Device to Enhance Viral Transduction Efficiency During Manufacture of Engineered
Cellular Therapies. Sci Rep [Internet]. 2019 Oct 22 [cited 2019 Oct 30];9(1):15101.
Available from: http://www.ncbi.nlm.nih.gov/pubmed/31641163
232. Jarrell JA, Twite AA, Lau KHWJ, Kashani MN, Lievano AA, Acevedo J, et al.
Intracellular delivery of mRNA to human primary T cells with microfluidic vortex
shedding. Sci Rep [Internet]. 2019 Dec 1 [cited 2019 Oct 30];9(1):3214. Available
from: http://www.nature.com/articles/s41598-019-40147-y
233. Brooker G. Introduction to Biomechatronics. 1st ed. Kay DR, editor. Introduction to
Biomechatronics. Raleigh, NC: SciTech Publishing, Inc.; 2012. 1–602 p.
234. McCauley M. AccelStepper: AccelStepper library for Arduino [Internet]. 2010 [cited
2019 Oct 24]. Available from:
http://www.airspayce.com/mikem/arduino/AccelStepper/
235. Harvard Apparatus. Harvard Peristaltic Pump Series User’s Manual (5423-001-Rev-D)
[Internet]. [cited 2019 Nov 1]. Available from:
https://www.harvardapparatus.com/pumps-liquid-handling/peristaltic-pumps/harvard-
apparatus-peristaltics/harvard-peristaltic-pump-p-1500.html
236. Cool Components. Arduino Uno - R3: Cool Components [Internet]. 2017 [cited 2019
Oct 25]. Available from: https://coolcomponents.co.uk/products/arduino-uno-revision-
3?_pos=1&_sid=5150e47ea&_ss=r
237. Amazon. Adafruit MotorShield v2.3 (assembly kit) - Motor/Stepper/Servo Shield for
Arduino: Amazon.co.uk [Internet]. 2015 [cited 2019 Oct 25]. Available from:
https://www.amazon.co.uk/gp/product/B00TDN8TSK/ref=ppx_yo_dt_b_asin_title_o0
6_s00?ie=UTF8&psc=1

238. The Pi Hut. Adafruit RGB LCD Shield Kit w/ 16x2 Character Display: The Pi Hut
[Internet]. 2016 [cited 2019 Oct 25]. Available from:
https://thepihut.com/products/adafruit-rgb-lcd-shield-kit-w-16x2-character-display-
only-2-pins-used-positive-display
239. Amazon. Adafruit Stepper motor - NEMA-17 size - 200 steps: Amazon.co.uk
[Internet]. 2014 [cited 2019 Oct 25]. Available from:
https://www.amazon.co.uk/Adafruit-Stepper-motor-NEMA-17-
ADA324/dp/B00EYIFW70
240. Amazon. Gikfun 12V DC Dosing Pump Peristaltic Dosing Head with Connector For
Arduino Aquarium Lab Analytic Diy AE1207U: Amazon.co.uk [Internet]. 2018 [cited
2019 Oct 25]. Available from: https://www.amazon.co.uk/Gikfun-Peristaltic-
Connector-Aquarium-
Analytic/dp/B07D7TN1BW/ref=sr_1_fkmr0_1?keywords=Gikfun+12V+DC+Dosing+
Pump+Peristaltic+Dosing+Head+with+Connector+For+Arduino+Aquarium+Lab+Ana
lytic+Diy+AE1207&qid=1564752814&s=gateway&sr=8-1-f
241. Amazon. Sourcingmap 4mm to 4mm Shaft Coupling 25mm Length 18mm Diameter
Stepper Motor Coupler Aluminum Alloy Joint Connector for 3D Printer CNC Machine
DIY Encoder: Amazon.co.uk [Internet]. 2018 [cited 2019 Oct 25]. Available from:
https://www.amazon.co.uk/Sourcingmap-Coupling-Diameter-Aluminum-
Connector/dp/B06X9VZWYP/ref=sr_1_4_sspa?keywords=shaft%2Bcoupling%2B4m
m%2Bto%2B4mm&qid=1572030876&sr=8-4-
spons&spLa=ZW5jcnlwdGVkUXVhbGlmaWVyPUExTEFKQjdWVzBPUk9NJmVu
Y3J5cHRlZElkPUEwNTI5NTk1MlB
242. Tavera RJ, Forget M-A, Kim YU, Sakellariou-Thompson D, Creasy CA, Bhatta A, et
al. Utilizing T-cell Activation Signals 1, 2, and 3 for Tumor-infiltrating Lymphocytes
(TIL) Expansion: The Advantage over the Sole Use of Interleukin-2 in Cutaneous and
Uveal Melanoma. J Immunother. 2018 May;41(9):399–405.
243. Wang X, Rivière I. Manufacture of tumor- and virus-specific T lymphocytes for
adoptive cell therapies. Cancer Gene Ther [Internet]. 2015 Feb 27 [cited 2019 Nov
12];22(2):85–94. Available from: http://www.nature.com/articles/cgt201481

244. Kim TH, Wang Y, Oliver CR, Thamm DH, Cooling L, Paoletti C, et al. A temporary
indwelling intravascular aphaeretic system for in vivo enrichment of circulating tumor
cells. Nat Commun [Internet]. 2019 Dec 1 [cited 2019 Dec 19];10(1):1478. Available
from: http://www.nature.com/articles/s41467-019-09439-9
245. Gura V, Rivara MB, Bieber S, Munshi R, Smith NC, Linke L, et al. A wearable
artificial kidney for patients with end-stage renal disease. JCI Insight. 2016 Jun
2;1(8):e86397.
246. Adafruit. Stepper motor - NEMA-17 size - 200 steps/rev, 12V 350mA ID: 324
[Internet]. [cited 2019 Oct 30]. Available from: https://www.adafruit.com/product/324
247. Arduino. Arduino - Board [Internet]. [cited 2019 Oct 30]. Available from:
https://www.arduino.cc/en/reference/board
248. D’Ausilio A. Arduino: A low-cost multipurpose lab equipment. Behav Res Methods
[Internet]. 2012 Jun 25 [cited 2019 Oct 30];44(2):305–13. Available from:
http://www.ncbi.nlm.nih.gov/pubmed/22037977
249. McRoberts M. Beginning Arduino [Internet]. 2nd ed. Beginning Arduino. Berkeley,
CA: Apress; 2013 [cited 2019 Oct 30]. Available from:
http://link.springer.com/10.1007/978-1-4302-5017-3_1
250. Leens F. An introduction to I2C and SPI protocols. IEEE Instrum Meas Mag
[Internet]. 2009 Feb [cited 2019 Oct 30];12(1):8–13. Available from:
http://ieeexplore.ieee.org/document/4762946/
251. Roddie C, O’Reilly M, Dias Alves Pinto J, Vispute K, Lowdell M. Manufacturing
chimeric antigen receptor T cells: issues and challenges. Cytotherapy [Internet]. 2019
Mar 1 [cited 2019 Jun 4];21(3):327–40. Available from:
http://www.ncbi.nlm.nih.gov/pubmed/30685216
252. Rollo E, Tenaglia E, Genolet R, Bianchi E, Harari A, Coukos G, et al. Label-free
identification of activated T lymphocytes through tridimensional microsensors on chip.
Biosens Bioelectron [Internet]. 2017 Aug 15 [cited 2019 Oct 31];94:193–9. Available
from: http://www.ncbi.nlm.nih.gov/pubmed/28284079

253. Cheung KC, Di Berardino M, Schade-Kampmann G, Hebeisen M, Pierzchalski A,
Bocsi J, et al. Microfluidic impedance-based flow cytometry. Cytom Part A [Internet].
2010 May 21 [cited 2019 Oct 31];77A(7):648–66. Available from:
http://doi.wiley.com/10.1002/cyto.a.20910
254. Temiz Y, Delamarche E. Sub-nanoliter, real-time flow monitoring in microfluidic
chips using a portable device and smartphone. Sci Rep [Internet]. 2018 Dec 13 [cited
2019 Oct 31];8(1):10603. Available from: http://www.nature.com/articles/s41598-018-
28983-w
255. Reichen M, Macown RJ, Jaccard N, Super A, Ruban L, Griffin LD, et al.
Microfabricated modular scale-down device for regenerative medicine process
development. PLoS One [Internet]. 2012 Dec [cited 2017 May 9];7(12):e52246.
Available from: http://dx.doi.org/10.1371/journal.pone.0052246
256. Sharifi F, Htwe SS, Righi M, Liu H, Pietralunga A, Yesil-Celiktas O, et al. A Foreign
Body Response-on-a-Chip Platform. Adv Healthc Mater [Internet]. 2019 Jan 29 [cited
2019 Nov 1];8(4):1801425. Available from:
http://doi.wiley.com/10.1002/adhm.201801425
257. and JCM, Whitesides* GM. Poly(dimethylsiloxane) as a Material for Fabricating
Microfluidic Devices. 2002 [cited 2019 Nov 1]; Available from:
https://pubs.acs.org/doi/10.1021/ar010110q
258. McDonald JC, Duffy DC, Anderson JR, Chiu DT, Wu H, Schueller OJA, et al.
Fabrication of microfluidic systems in poly(dimethylsiloxane). Electrophoresis
[Internet]. 2000 Jan 1 [cited 2019 Nov 1];21(1):27–40. Available from:
http://doi.wiley.com/10.1002/%28SICI%291522-
2683%2820000101%2921%3A1%3C27%3A%3AAID-ELPS27%3E3.0.CO%3B2-C
259. Tang KC, Liao E, Ong WL, Wong JDS, Agarwal A, Nagarajan R, et al. Evaluation of
bonding between oxygen plasma treated polydimethyl siloxane and passivated silicon.
J Phys Conf Ser [Internet]. 2006 Apr 1 [cited 2019 Nov 1];34(1):155–61. Available
from: http://stacks.iop.org/1742-
6596/34/i=1/a=026?key=crossref.0d00ee34143deffd8dcb73536d22b462

260. Flounders A., Brandon D., Bates A. Patterning of immobilized antibody layers via
photolithography and oxygen plasma exposure. Biosens Bioelectron [Internet]. 1997
Jan 1 [cited 2019 Nov 1];12(6):447–56. Available from:
https://www.sciencedirect.com/science/article/pii/S0956566396000644
261. Idex Health & Science. Fluid Connections | Idex Health and Science [Internet]. [cited
2019 Nov 1]. Available from: https://www.idex-hs.com/store/fluidics/fluidic-
connections.html
262. Valitutti S, Coombs D, Dupré L. The space and time frames of T cell activation at the
immunological synapse. FEBS Lett [Internet]. 2010 Dec [cited 2017 Jun
13];584(24):4851–7. Available from: http://dx.doi.org/10.1016/j.febslet.2010.10.010
263. Ziegler SF, Ramsdell F, Alderson MR. The activation antigen CD69. Stem Cells
[Internet]. 1994 [cited 2019 Nov 2];12(5):456–65. Available from:
http://doi.wiley.com/10.1002/stem.5530120502
264. Zarnitsyna V, Zhu C. T cell triggering: insights from 2D kinetics analysis of molecular
interactions. Phys Biol [Internet]. 2012 Aug [cited 2019 Nov 3];9(4):045005.
Available from: http://www.ncbi.nlm.nih.gov/pubmed/22871794
265. Dustin ML, Allen PM, Shaw AS. Environmental control of immunological synapse
formation and duration. Vol. 22, Trends in Immunology. Elsevier Ltd; 2001. p. 192–4.
266. Friedl P, Gunzer M. Interaction of T cells with APCs: The serial encounter model. Vol.
22, Trends in Immunology. 2001. p. 187–91.
267. Rachmilewitz J, Lanzavecchia A. A temporal and spatial summation model for T-cell
activation: Signal integration and antigen decoding. Vol. 23, Trends in Immunology.
2002. p. 592–5.
268. Faroudi M, Zaru R, Paulet P, Müller S, Valitutti S. Cutting Edge: T Lymphocyte
Activation by Repeated Immunological Synapse Formation and Intermittent Signaling.
J Immunol. 2003 Aug 1;171(3):1128–32.
269. Rosette C, Werlen G, Daniels MA, Holman PO, Alam SM, Travers PJ, et al. The
Impact of duration versus extent of TCR occupancy on T cell activation: A revision of

the kinetic proofreading model. Immunity. 2001;15(1):59–70.
270. Mempel TR, Henrickson SE, Von Andrian UH. T-cell priming by dendritic cells in
lymph nodes occurs in three distinct phases. Nature [Internet]. 2004 Jan [cited 2016 Jul
13];427(6970):154–9. Available from: http://dx.doi.org/10.1038/nature02238
271. Henrickson SE, Mempel TR, Mazo IB, Liu B, Artyomov MN, Zheng H, et al. T cell
sensing of antigen dose governs interactive behavior with dendritic cells and sets a
threshold for T cell activation. Nat Immunol [Internet]. 2008 Mar [cited 2019 Nov
3];9(3):282–91. Available from: http://www.ncbi.nlm.nih.gov/pubmed/18204450
272. Carswell KS, Papoutsakis ET. Culture of human T cells in stirred bioreactors for
cellular immunotherapy applications: Shear, proliferation, and the IL-2 receptor.
Biotechnol Bioeng. 2000 May 5;68(3):328–38.
273. Al-Rubeai M, Singh RP, Emery AN, Zhang Z. Cell cycle and cell size dependence of
susceptibility to hydrodynamic forces. Biotechnol Bioeng [Internet]. 1995 Apr 5 [cited
2019 Nov 2];46(1):88–92. Available from:
http://www.ncbi.nlm.nih.gov/pubmed/18623266
274. Glass R, M ller M, Spatz JP. Block copolymer micelle nanolithography.
Nanotechnology [Internet]. 2003 Oct 1 [cited 2019 May 29];14(10):1153–60.
Available from: http://stacks.iop.org/0957-
4484/14/i=10/a=314?key=crossref.cd31d7735aa721852765437f75f3f7b3
275. Möller M, Spatz JP, Roescher A. Gold nanoparticles in micellar poly(styrene)-b-
poly(ethylene oxide) films—size and interparticle distance control in monoparticulate
films. Adv Mater [Internet]. 1996 Apr 1 [cited 2019 Nov 10];8(4):337–40. Available
from: http://doi.wiley.com/10.1002/adma.19960080411
276. Spatz JP, Herzog T, Mößmer S, Ziemann P, Möller M. Micellar Inorganic-Polymer
Hybrid Systems—A Tool for Nanolithography. Adv Mater [Internet]. 1999 Feb 1
[cited 2019 Nov 10];11(2):149–53. Available from:
http://doi.wiley.com/10.1002/%28SICI%291521-
4095%28199902%2911%3A2%3C149%3A%3AAID-ADMA149%3E3.0.CO%3B2-
W

277. Oria R, Wiegand T, Escribano J, Elosegui-Artola A, Uriarte JJ, Moreno-Pulido C, et
al. Force loading explains spatial sensing of ligands by cells. Nature [Internet]. 2017
Dec 6 [cited 2019 Nov 10];552(7684):219–24. Available from:
http://www.nature.com/articles/nature24662
278. Li Z, Cao B, Wang X, Ye K, Li S, Ding J. Effects of RGD nanospacing on
chondrogenic differentiation of mesenchymal stem cells. J Mater Chem B [Internet].
2015 Jun 25 [cited 2019 Nov 7];3(26):5197–209. Available from:
http://xlink.rsc.org/?DOI=C5TB00455A
279. Gao Z, Eisenberg A. A model of micellization for block copolymers in solutions.
Macromolecules [Internet]. 1993 Dec [cited 2019 Nov 10];26(26):7353–60. Available
from: https://pubs.acs.org/doi/abs/10.1021/ma00078a035
280. Izzo D, Marques CM. Formation of micelles of diblock and triblock copolymers in a
selective solvent. Macromolecules [Internet]. 1993 Dec [cited 2019 Nov
10];26(26):7189–94. Available from:
https://pubs.acs.org/doi/abs/10.1021/ma00078a012
281. Spatz JP, Sheiko S, Möller M. Ion-Stabilized Block Copolymer Micelles: Film
Formation and Intermicellar Interaction. Macromolecules [Internet]. 1996 Jan [cited
2019 Nov 10];29(9):3220–6. Available from:
https://pubs.acs.org/doi/10.1021/ma951712q
282. Denkov ND, Yoshimura H, Nagayama K, Kouyama T. Nanoparticle Arrays in Freely
Suspended Vitrified Films. Phys Rev Lett [Internet]. 1996 Mar 25 [cited 2019 Nov
10];76(13):2354–7. Available from:
https://link.aps.org/doi/10.1103/PhysRevLett.76.2354
283. Dushkin CD, Kralchevsky PA, Paunov VN, Yoshimura H, Nagayama K. Torsion
Balance for Measurement of Capillary Immersion Forces. Langmuir [Internet]. 1996
Jan [cited 2019 Nov 10];12(3):641–51. Available from:
https://pubs.acs.org/doi/10.1021/la950560p
284. Spatz JP, Mössmer S, Hartmann C, Möller M, Herzog T, Krieger M, et al. Ordered
Deposition of Inorganic Clusters from Micellar Block Copolymer Films. Langmuir

[Internet]. 2000 Jan [cited 2017 Apr 7];16(2):407–15. Available from:
http://pubs.acs.org/doi/abs/10.1021/la990070n
285. El-Atwani O, Aytun T, Mutaf OF, Srot V, van Aken PA, Ow-Yang CW. Determining
the Morphology of Polystyrene- block-poly(2-vinylpyridine) Micellar Reactors for
ZnO Nanoparticle Synthesis. Langmuir [Internet]. 2010 May 18 [cited 2019 Nov
10];26(10):7431–6. Available from: https://pubs.acs.org/doi/10.1021/la904143f
286. Kästle G, Boyen H-G, Weigl F, Lengl G, Herzog T, Ziemann P, et al. Micellar
Nanoreactors—Preparation and Characterization of Hexagonally Ordered Arrays of
Metallic Nanodots. Adv Funct Mater [Internet]. 2003 Nov 4 [cited 2019 Nov
10];13(11):853–61. Available from: http://doi.wiley.com/10.1002/adfm.200304332
287. Lohmüller T, Aydin D, Schwieder M, Morhard C, Louban I, Pacholski C, et al.
Nanopatterning by block copolymer micelle nanolithography and bioinspired
applications. Biointerphases [Internet]. 2011 Mar [cited 2019 Nov 10];6(1):MR1–12.
Available from: http://avs.scitation.org/doi/10.1116/1.3536839
288. Darhuber AA, Troian SM, Davis JM, Miller SM, Wagner S. Selective dip-coating of
chemically micropatterned surfaces. J Appl Phys [Internet]. 2000 Nov 13 [cited 2019
Nov 10];88(9):5119–26. Available from:
http://aip.scitation.org/doi/10.1063/1.1317238
289. Kratzer D, Ludwig-Husemann A, Junges K, Geckle U, Lee-Thedieck C.
Nanostructured Bifunctional Hydrogels as Potential Instructing Platform for
Hematopoietic Stem Cell Differentiation. Front Mater [Internet]. 2019 Jan 29 [cited
2019 May 29];5:81. Available from:
https://www.frontiersin.org/article/10.3389/fmats.2018.00081/full
290. Boyen H-G, Kästle G, Weigl F, Koslowski B, Dietrich C, Ziemann P, et al. Oxidation-
resistant gold-55 clusters. Science [Internet]. 2002 Aug 30 [cited 2019 Nov
5];297(5586):1533–6. Available from:
http://www.ncbi.nlm.nih.gov/pubmed/12202824
291. Fodor SP, Read JL, Pirrung MC, Stryer L, Lu AT, Solas D. Light-directed, spatially
addressable parallel chemical synthesis. Science [Internet]. 1991 Feb 15 [cited 2019

Nov 11];251(4995):767–73. Available from:
http://www.ncbi.nlm.nih.gov/pubmed/1990438
292. Orth RN, Wu M, Holowka DA, Craighead HG, Baird BA. Mast Cell Activation on
Patterned Lipid Bilayers of Subcellular Dimensions. Langmuir [Internet]. 2003 [cited
2019 Nov 11];19(5):1599–605. Available from:
https://pubs.acs.org/doi/full/10.1021/la026314c
293. Whitesides GM, Ostuni E, Takayama S, Jiang X, Ingber DE. Soft Lithography in
Biology and Biochemistry. Annu Rev Biomed Eng [Internet]. 2001 Aug [cited 2019
Nov 11];3(1):335–73. Available from:
http://www.ncbi.nlm.nih.gov/pubmed/11447067
294. Senaratne W, Prabuddha Sengupta, Vladimir Jakubek, David Holowka, Ober CK,
Baird B. Functionalized Surface Arrays for Spatial Targeting of Immune Cell
Signaling. J Am Chem Soc [Internet]. 2006 [cited 2019 Nov 11];128(17):5594–5.
Available from: https://pubs.acs.org/doi/full/10.1021/ja058701p
295. Santoro F, Zhao W, Joubert L-M, Duan L, Schnitker J, van de Burgt Y, et al.
Revealing the Cell–Material Interface with Nanometer Resolution by Focused Ion
Beam/Scanning Electron Microscopy. ACS Nano [Internet]. 2017 Aug 22 [cited 2019
Nov 11];11(8):8320–8. Available from:
https://pubs.acs.org/doi/10.1021/acsnano.7b03494
296. Ki-Bum Lee, Jung-Hyurk Lim A, Mirkin CA. Protein Nanostructures Formed via
Direct-Write Dip-Pen Nanolithography. J Am Chem Soc [Internet]. 2003 [cited 2019
Nov 11];125(19):5588–9. Available from:
https://pubs.acs.org/doi/abs/10.1021/ja034236p
297. Yuan J, Hajebifard A, George C, Berini P, Zou S. Ordered gold nanoparticle arrays on
glass and their characterization. J Colloid Interface Sci [Internet]. 2013 Nov 15 [cited
2019 Nov 11];410:1–10. Available from:
http://www.ncbi.nlm.nih.gov/pubmed/23998371
298. Bain CD, Evall J, Whitesides GM. Formation of monolayers by the coadsorption of
thiols on gold: variation in the head group, tail group, and solvent. J Am Chem Soc

[Internet]. 1989 Aug [cited 2019 Nov 11];111(18):7155–64. Available from:
https://pubs.acs.org/doi/abs/10.1021/ja00200a039
299. Shen M, Rusling J, Dixit CK. Site-selective orientated immobilization of antibodies
and conjugates for immunodiagnostics development. Methods [Internet]. 2017 [cited
2019 Nov 11];116:95–111. Available from:
http://www.ncbi.nlm.nih.gov/pubmed/27876681
300. Henrik Grönbeck, Alessandro Curioni A, Andreoni W. Thiols and Disulfides on the
Au(111) Surface: The Headgroup−Gold Interaction. 2000 [cited 2019 Nov 11];
Available from: https://pubs.acs.org/doi/full/10.1021/ja993622x
301. Peluso P, Wilson DS, Do D, Tran H, Venkatasubbaiah M, Quincy D, et al. Optimizing
antibody immobilization strategies for the construction of protein microarrays. Anal
Biochem [Internet]. 2003 Jan 15 [cited 2019 Nov 12];312(2):113–24. Available from:
https://www.sciencedirect.com/science/article/pii/S0003269702004426
302. Kirley TL, Greis KD, Norman AB. Selective disulfide reduction for labeling and
enhancement of Fab antibody fragments. Biochem Biophys Res Commun [Internet].
2016 [cited 2019 Nov 11];480(4):752–7. Available from:
http://www.ncbi.nlm.nih.gov/pubmed/27983990
303. Cai H, Muller J, Depoil D, Mayya V, Sheetz MP, Dustin ML, et al. Full control of
ligand positioning reveals spatial thresholds for T cell receptor triggering. Nat
Nanotechnol [Internet]. 2018 Jul 30 [cited 2019 Nov 11];13(7):610–7. Available from:
http://www.nature.com/articles/s41565-018-0113-3
304. Cai H, Wolfenson H, Depoil D, Dustin ML, Sheetz MP, Wind SJ. Molecular
Occupancy of Nanodot Arrays. ACS Nano [Internet]. 2016 [cited 2019 Nov
11];10(4):4173–83. Available from: http://www.ncbi.nlm.nih.gov/pubmed/26966946
305. Dang AP, De Leo S, Bogdanowicz DR, Yuan DJ, Fernandes SM, Brown JR, et al.
Enhanced Activation and Expansion of T Cells Using Mechanically Soft Elastomer
Fibers. Adv Biosyst [Internet]. 2018 Feb 1 [cited 2019 Aug 8];2(2):1700167. Available
from: http://doi.wiley.com/10.1002/adbi.201700167

306. Wang C, Ye Y, Hochu GM, Sadeghifar H, Gu Z. Enhanced Cancer Immunotherapy by
Microneedle Patch-Assisted Delivery of Anti-PD1 Antibody. Nano Lett. 2016 Apr
13;16(4):2334–40.
307. McKinney EF, Lee JC, Jayne DRW, Lyons PA, Smith KGC. T-cell exhaustion, co-
stimulation and clinical outcome in autoimmunity and infection. Nature. 2015 Jul
30;523(7562):612–6.
308. Guedan S, Ruella M, June CH. Emerging Cellular Therapies for Cancer. Annu Rev
Immunol [Internet]. 2019 Apr 26 [cited 2020 Apr 6];37(1):145–71. Available from:
https://www.annualreviews.org/doi/10.1146/annurev-immunol-042718-041407
309. Gill EL, Li X, Birch MA, Huang YYS. Multi-length scale bioprinting towards
simulating microenvironmental cues. Vol. 1, Bio-Design and Manufacturing. Springer;
2018. p. 77–88.
310. Turtle CJ, Riddell SR. Artificial antigen-presenting cells for use in adoptive
immunotherapy. Cancer J [Internet]. 2010 [cited 2019 Nov 14];16(4):374–81.
Available from: http://www.ncbi.nlm.nih.gov/pubmed/20693850
311. Busch DH, Fräßle SP, Sommermeyer D, Buchholz VR, Riddell SR. Role of memory T
cell subsets for adoptive immunotherapy. Semin Immunol [Internet]. 2016;28(1):28–
34. Available from: http://www.ncbi.nlm.nih.gov/pmc/articles/PMC5027130/
312. McLellan AD, Ali Hosseini Rad SM. Chimeric antigen receptor T cell persistence and
memory cell formation. Immunol Cell Biol [Internet]. 2019 Aug 15 [cited 2019 Nov
14];97(7):664–74. Available from: http://www.ncbi.nlm.nih.gov/pubmed/31009109
313. Mahnke YD, Brodie TM, Sallusto F, Roederer M, Lugli E. The who’s who of T-cell
differentiation: Human memory T-cell subsets. Eur J Immunol [Internet]. 2013 Nov 1
[cited 2019 Nov 14];43(11):2797–809. Available from:
http://doi.wiley.com/10.1002/eji.201343751
314. Yoon J, Jo Y, Kim M, Kim K, Lee S, Kang S-J, et al. Identification of non-activated
lymphocytes using three-dimensional refractive index tomography and machine
learning. Sci Rep [Internet]. 2017 Dec 27 [cited 2019 Nov 14];7(1):6654. Available

from: http://www.nature.com/articles/s41598-017-06311-y
315. Ali OA, Mooney DJ. Immunologically active biomaterials for cancer therapy. Curr
Top Microbiol Immunol [Internet]. 2011 [cited 2016 May 6];344:279–97. Available
from: http://dx.doi.org/10.1007/82_2010_69
316. Vadlapatla R, Wong EY, Gayakwad SG. Electronic drug delivery systems: An
overview. J Drug Deliv Sci Technol [Internet]. 2017 Oct 1 [cited 2019 Nov
14];41:359–66. Available from:
https://www.sciencedirect.com/science/article/pii/S1773224717302186
317. Chan M, Estève D, Fourniols J-Y, Escriba C, Campo E. Smart wearable systems:
Current status and future challenges. Artif Intell Med [Internet]. 2012 Nov 1 [cited
2019 Nov 14];56(3):137–56. Available from:
https://www.sciencedirect.com/science/article/pii/S0933365712001182

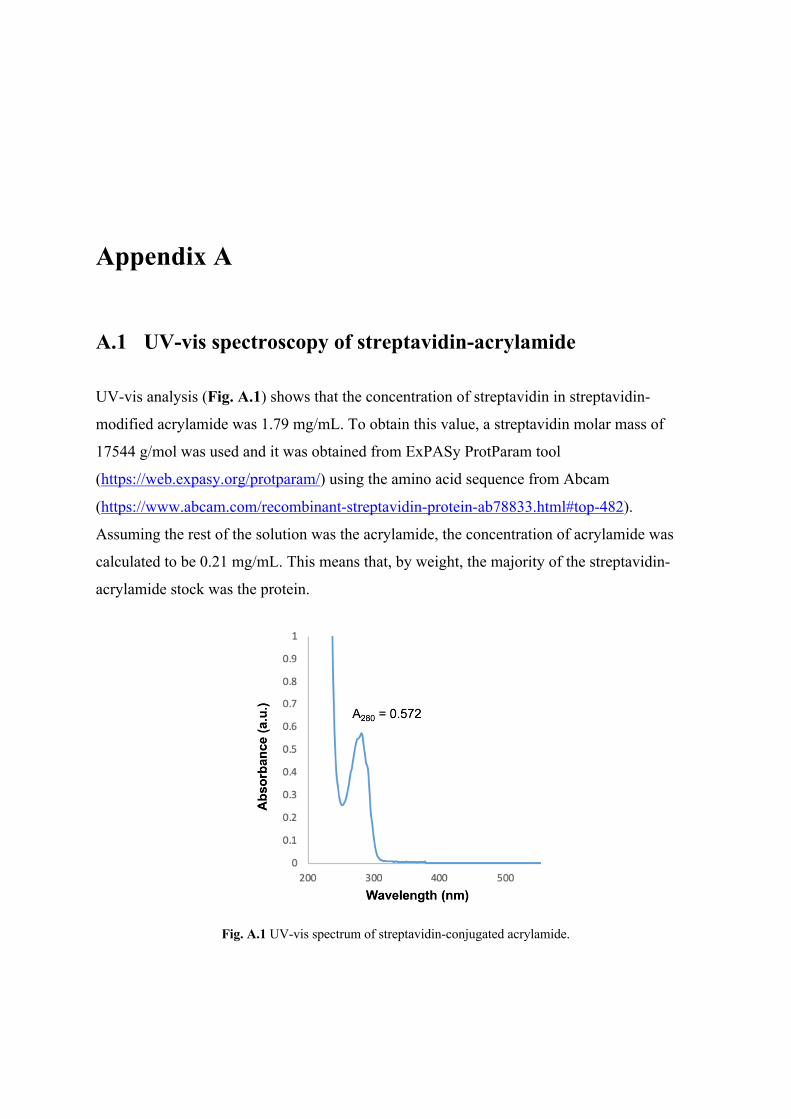
Appendix A
A.1 UV-vis spectroscopy of streptavidin-acrylamide
UV-vis analysis (Fig. A.1) shows that the concentration of streptavidin in streptavidin-
modified acrylamide was 1.79 mg/mL. To obtain this value, a streptavidin molar mass of
17544 g/mol was used and it was obtained from ExPASy ProtParam tool
(https://web.expasy.org/protparam/) using the amino acid sequence from Abcam
(https://www.abcam.com/recombinant-streptavidin-protein-ab78833.html#top-482).
Assuming the rest of the solution was the acrylamide, the concentration of acrylamide was
calculated to be 0.21 mg/mL. This means that, by weight, the majority of the streptavidin-
acrylamide stock was the protein.
Fig. A.1 UV-vis spectrum of streptavidin-conjugated acrylamide.

A-2
A.2 Additional mechanical characterisation of hydrogels
Young’s moduli of hydrogels (Fig. A.2) were measured using a Piuma Nanoindenter
(Optics11) equipped with a spherical tip (114 mm diameter; cantilever spring constant 0.44
N/m). Indentations were performed as grid scans (10´10; step size 100 mm) made under
hydrated conditions, with all samples immersed in PBS in a 35 mm petri dish. The Hertzian
model was then applied to the load-indentation curves. Calculation of E was performed at a
defined indentation depth (1 – 2.5 mm) within the linear elastic regime of the hydrogels.
Poisson ratio was assumed to be 0.5.
Fig. A.2 Young’s moduli (E) of hydrogels obtained from the Piuma Nanoindenter. Values above bars
indicate mean E values, calculated from the pooled data obtained from the 100 indentations done for each
crosslinker concentration. Data presented as mean ± standard deviation.

A.3 Post-stimulation (48 hours) cell viabilities
Fig. A.3 Viabilities of Jurkat T cells after 48 hours of stimulation by different substrate materials. All
substrates presented anti-CD3/CD28 as stimulatory cues. Soft gel refers to crosslinker concentration of
0.05% (w/v) (or Young’s modulus of 11.8 kPa). Stiff gel refers to a crosslinker concentration of 0.4% (w/v)
(or Young’s modulus of 62.4 kPa). Data = mean ± standard deviation. Values displayed above bars indicate
mean cell viabilities. N = 3. Viability was measured using the NucleoCounter® NC-200™ automated cell
counter running the Viability and Cell Count Assay.

A-2
A.4 MATLAB code for image analysis
%% Title: Script for automated particle analysis | Author: Matthew Chin % This script is intended for the detection of cells and Dynabeads (or any % particles that appear as circular) in phase contrast microscopy images. % All images used were taken using a 20x objective on a Zeiss Primovert % microscope % Requires function RemoverOverLap.m from % <https://uk.mathworks.com/matlabcentral/fileexchange/42370-circles-overlapremover> % Requires function snip.m from % <https://uk.mathworks.com/matlabcentral/fileexchange/41941-snip-m-snipelements-out-of-vectors-matrices> clear all close all clc; %% Load and display the image startingFolder = pwd; imFile = uigetfile('*.png'); rgb = imread(imFile); whos I = rgb2gray(rgb); Ix_pixelLength = length(I(1,:)); xmax = Ix_pixelLength*.22; figure('Color','w'); % Figure 1 imshow(I); image([0 xmax],[],I) colormap(gray(256)); title('Original Image','FontSize',18); text(size(I,2),size(I,1)+120, ...
'Jurkat cells w/ Dynabeads (48 hrs)', ... 'FontSize',14,'HorizontalAlignment','right');
text(size(I,2),size(I,1)+200, .... 'Magnificaton: 20x | 0.22 \mum per px', ... 'FontSize',14,'HorizontalAlignment','right');
%% Correct nonuniform illumination and enhance foreground objects % imtophat calculates the morphological opening (removes foreground) and then % subtracts it from the original image I2 = imtophat(I,strel('disk',20)); % Use a disk-shaped structuring element figure('Color','w'); % Figure 2 imshow(I2); title('Background subtracted','FontSize',18); saveas(gcf,'Background_subtracted.png') % Use imadjust to increase the contrast of the processed image I2 % by saturating 1% of the data at both low and high intensities and % by stretching the intensity values to fill the uint8 dynamic range I3 = imadjust(I2);
figure('Color','w'); % Figure 3

A.4 MATLAB code for image analysis A-3
imshow(I3); title('Contrast enhanced','FontSize',18); saveas(gcf,'Contrast_enhanced.png') %% Detect and measure Dynabeads % By default, imfindcircles finds circular objects that are % brighter than the background. The cells and beads already appear as % bright circles so we don't need to do anything extra %============================== OPTIONAL =================================% % Gain a rough idea of the radii you are dealing with. % imdistline creates a draggable tool that can be moved to fit across % a cell or bead and the numbers can be read to get an approximate estimate % of its radius % d = imdistline; % delete(d)
%=========================================================================%
[centers1,radii1] = imfindcircles(I3,[4 14],... 'Sensitivity',0.75,... 'EdgeThreshold',0.15,... 'Method','twostage');
% imfindcircles detects more circular objects % (with both weak and strong edges) when you set the threshold % to a lower value % sprintf('Number of beads found: %f', length(centers1)) figure('Color','w'); % Figure 4 imshow(I3); c1 = viscircles(centers1,radii1,'Color','g'); title("Detected Dynabeads: " + length(radii1),...
'FontSize',18); saveas(gcf,'Detected_beads1.png') % Remove overlapping circles [centers_beads,radii_beads]=RemoveOverLap(centers1,radii1,5,2); figure('Color','w'); % Figure 5 imshow(I3); c2 = viscircles(centers_beads,radii_beads,'Color','b'); removed = length(radii1)-length(radii_beads); old = length(radii_beads); title("Overlapping circles removed: "+removed,...
'FontSize',18); saveas(gcf,'Overlapping_circles_removed.png') % Remove big circles that are more likely to be % cells or false positives than beads indices = find(abs(radii_beads)>5); radii_beads(indices) = []; centers_beads(indices,:) = []; removed = old - length(radii_beads); figure('Color','w'); % Figure 6 imshow(I3); c3 = viscircles(centers_beads,radii_beads,'Color','r'); title("Large circles removed: "+removed,...
'FontSize',18); saveas(gcf,'Large_circles_removed.png') % Remove small circles that are more likely to be false positives

A-4
indices = find(abs(radii_beads)<3); radii_beads(indices) = []; centers_beads(indices,:) = []; figure('Color','w'); % Figure 7 imshow(I); c4 = viscircles(centers_beads,radii_beads,'Color','g'); title("Dynabeads detected: " + length(radii_beads),...
'FontSize',18); saveas(gcf,'small_circles_removed.png') %% Detect and measure cells [centers_cells,radii_cells] = imfindcircles(I3,[15 35],...
'Sensitivity',0.9,..., 'EdgeThreshold',0.2,... 'Method','twostage');
%% Superimpose circular labels for detected cells and Dynabeads figure('Color','w'); imshow(I); % Figure 8 % display cell detections c5 = viscircles(centers_cells,radii_cells,'Color','b'); % display Dynabead detections c6 = viscircles(centers_beads,radii_beads,'Color','r'); title("Detected cells (blue): "+length(radii_cells)+" | Detected Dynabeads (red): "+length(radii_beads),...
'FontSize',18); saveas(gcf,'cells_and_beads1.png') %% Find connected components in binary image figure('Color','w'); % Figure 9 BW = imbinarize(I); imshow(BW); title('Binary', 'FontSize', 18); saveas(gcf,'binary.png') figure('Color','w'); % Figure 10 se = strel('disk', 8); % create a disk-shaped structuring element BW2 = imdilate(BW, se); imshow(BW2); title('Dilated Binary Image', 'FontSize', 18); saveas(gcf,'Dilated_binary.png') % find connected components in the binary image cc = bwconncomp(BW2); %% Identify and extract the biggest cell-bead cluster % Compute geometric measurements of the labeled objects using regionprops stats = regionprops(cc, 'Area','PixelIdxList','PixelList'); area_values = [stats.Area]; % Obtain the index of the region with the largest area [maxValue,idx] = max([stats.Area]); % Obtain row and column coordinates of boundary pixels of the largest % region, disregarding holes enclosed by connected component regions boundaries = bwboundaries(BW2,'noholes'); x_region = boundaries{idx}(:, 2); y_region = boundaries{idx}(:, 1); % x- and y-coorindates of centroids of detected cells

A.4 MATLAB code for image analysis A-5
x_cellCircles = centers_cells(:,1); y_cellCircles = centers_cells(:,2); % x- and y-coorindates of centroids of detected beads x_beadCircles = centers_beads(:,1); y_beadCircles = centers_beads(:,2); %====== Find cells that lie within the biggest cell-bead cluster ====% [in_cells,on_cells] = inpolygon(x_cellCircles,y_cellCircles,x_region,y_region); % number of cell centroids lying inside the tested region numel(x_cellCircles(in_cells)) % number of cell centroids lying on the edge of the tested region numel(x_cellCircles(on_cells)) % number of cell centroids lying outside of the tested region numel(x_cellCircles(~in_cells)) %====== Find beads that lie within the bigges cell-bead cluster ====% [in_beads,on_beads] = inpolygon(x_beadCircles,y_beadCircles,x_region,y_region); % number of bead centroids lying inside the tested region numel(x_beadCircles(in_beads)) % number of bead centroids lying on the edge of the tested region numel(x_beadCircles(on_beads)) % number of bead centroids lying outside of the tested region numel(x_beadCircles(~in_beads)) %% Remove all labels that lie in the biggest cell-bead cluster % Delete cells in cluster centers_cells(in_cells,:) = []; radii_cells(in_cells) = []; % Delete beads in cluster centers_beads(in_beads,:) = []; radii_beads(in_beads) = []; figure('Color','w'); % Figure 11 imshow(I); c7 = viscircles(centers_cells,radii_cells,'Color','b'); c8 = viscircles(centers_beads,radii_beads,'Color','r'); title("[Final] Detected cells not in the huge cluster (blue): "+length(radii_cells)+" | Detected Dynabeads (red): "+length(radii_beads),...
'FontSize',18); saveas(gcf,'cells_and_beads2.png') figure('Color','w'); % Figure 12 plot(x_region,y_region); % boundary defined by the largest cell-bead cluster axis equal hold on plot(x_cellCircles(in_cells),y_cellCircles(in_cells),'b+'); % cells inside plot(x_cellCircles(~in_cells),y_cellCircles(~in_cells),'bo'); % cells outside plot(x_beadCircles(in_beads),y_beadCircles(in_beads),'r+'); % beads inside plot(x_beadCircles(~in_beads),y_beadCircles(~in_beads),'ro'); % beads outside hold off set(gca, 'ydir', 'reverse') % flip the y-axis so that the output plot mirrors the original image title('"+" = inside of cluster | "o" = outside of cluster | blue = cells | red = Dynabeads', 'FontSize', 18); saveas(gcf,'cells_and_beads_inoutofcluster.png') %% Find cell-bead clusters

A-6
num_cells = length(centers_cells); % numebr of cells num_beads = length(centers_beads); % numebr of beads tol = 40; % set the overlap tolerance cell_bead_contacts = zeros(num_cells,1); for i = 1:num_cells
for j = 1:num_beads d_ij = sqrt((centers_cells(i,1)-
centers_beads(j,1)).^2+(centers_cells(i,2)-centers_beads(j,2)).^2); k = radii_cells(i)+radii_beads(j)+tol; if d_ij < k % if the cell and the bead are in contact
cell_bead_contacts(i) = cell_bead_contacts(i)+1; % save the detected contacts
end end
end contacts_idx = find(cell_bead_contacts); figure('Color','w'); % Figure 13 plot(x_cellCircles(contacts_idx),y_cellCircles(contacts_idx),'g+',...
'MarkerSize',12,... 'LineWidth',2);
axis equal hold on plot(x_cellCircles(in_cells),y_cellCircles(in_cells),'b+') % cells inside plot(x_cellCircles(~in_cells),y_cellCircles(~in_cells),'bo') % cells outside plot(x_beadCircles(in_beads),y_beadCircles(in_beads),'r+') % beads inside plot(x_beadCircles(~in_beads),y_beadCircles(~in_beads),'ro') % beads outside hold off set(gca, 'ydir', 'reverse') title('Contacts','FontSize', 18); saveas(gcf,'contacts_inoutofcluster.png') % Update x and y coordinates of cells and beads to include only those % outside of the cluster x_cellCircles = centers_cells(:,1); y_cellCircles = centers_cells(:,2); x_beadCircles = centers_beads(:,1); y_beadCircles = centers_beads(:,2); figure('Color','w'); % Figure 14 imshow(I); hold on plot(x_cellCircles(contacts_idx),y_cellCircles(contacts_idx),'g+',... 'MarkerSize',12,... 'LineWidth',2); title('Cell-bead contacts','FontSize', 18); saveas(gcf,'contacts_superimposed.png') figure('Color','w'); % Figure 15 h = histogram(cell_bead_contacts) xlabel('Number of detected Dynabead contacts','FontSize',14,'FontWeight','bold') ylabel('Number of detected cells','FontSize',14,'FontWeight','bold') ax = gca; ax.XAxis.FontSize = 12; ax.YAxis.FontSize = 12; saveas(gcf,'histogram.png') num_boundBeads = length(find(bead_cell_contacts)); num_unboundBeads = num_beads - num_boundBeads;

A.4 MATLAB code for image analysis A-7
figure('Color','w'); % Figure 16 pie_chart = [num_unboundBeads num_boundBeads]; p = pie(pie_chart); labels = {'Unbound beads','Cell-bound beads'}; legend(labels,'FontSize',14) set(findobj(p,'type','text'),'fontsize',14)


Appendix B
B.1 Arduino sketch for peristaltic pump operation
// Stepper motor control using an Arduino Uno connected to // an Adafruit Motorshield v2.3 and LCD shield for // low-flow-rate peristaltic pumping // Author: Matthew Chin #include <Wire.h> #include <Adafruit_RGBLCDShield.h> #include <utility/Adafruit_MCP23017.h> #include <stdio.h> #include <Adafruit_MotorShield.h> #include <AccelStepper.h> // Requires the Adafruit_Motorshield v2 library // https://github.com/adafruit/Adafruit_Motor_Shield_V2_Library // And AccelStepper with AFMotor support // https://github.com/adafruit/AccelStepper // And Adafruit RGB LCD shield library // https://github.com/adafruit/Adafruit-RGB-LCD-Shield-Library // The LCD shield uses the I2C SCL and SDA pins. On classic Arduinos // this is Analog 4 and 5 so you can't use those for analogRead() anymore // However, you can connect other I2C sensors to the I2C bus and share // the I2C bus. Adafruit_RGBLCDShield lcd = Adafruit_RGBLCDShield(); // These #defines make it easy to set the backlight color #define RED 0x1 #define YELLOW 0x3 #define GREEN 0x2 #define TEAL 0x6 #define BLUE 0x4 #define VIOLET 0x5 #define WHITE 0x7 // Using Adafruit Motor Shield v2: create an object for the shield Adafruit_MotorShield AFMS = Adafruit_MotorShield(); // Request the Stepper motor from the Adafruit_MotorShield using // getStepper(steps, stepper#), // where steps = how many steps per revolution the stepper motor has // The stepper motor has 1.8 degrees per revolution so 200 steps // Stepper# is which port it is connected to. If you're using M1 and M2, its port 1. // If you're using M3 and M4 indicate port 2 Adafruit_StepperMotor *myStepper1 = AFMS.getStepper(200, 1);

B-2
int stepperSPS = 0; // Save steps per second in stepperSPS int flow_rate = 0; // Save the flow rate (uL/min) in flow_rate // you can change these to SINGLE or DOUBLE or INTERLEAVE or MICROSTEP! void forwardstep1() { myStepper1->onestep(FORWARD, MICROSTEP); } void backwardstep1() { myStepper1->onestep(BACKWARD, MICROSTEP); } AccelStepper Astepper1(forwardstep1, backwardstep1); // use functions to step void setup() { Serial.begin(9600); // set up Serial library at 9600 bps Serial.println("Stepper engaged!"); /*####################### LCD ###########################*/ // set up the LCD's number of columns and rows: lcd.begin(16, 2); // Print a message to the LCD. We track how long it takes since // this library has been optimized a bit and we're proud of it :) int time = millis(); lcd.print("Flow rate:"); time = millis() - time; Serial.print("Took "); Serial.print(time); Serial.println(" ms"); lcd.setBacklight(WHITE); /*####################### Stepper ###########################*/ AFMS.begin(); // create with the default frequency 1.6KHz //AFMS.begin(1000); // OR with a different frequency, say 1KHz Astepper1.setSpeed(0); } uint8_t i=0; char buffer[12]; // This is the buffer for the string the sprintf outputs to void loop() { uint8_t buttons = lcd.readButtons(); if (buttons) { lcd.clear(); lcd.setCursor(0,0); // Increase flow rate by 1 uL/min every time the UP button is pressed if (buttons & BUTTON_UP) { lcd.setBacklight(TEAL); lcd.print("Flow rate:"); lcd.setCursor(0,1); if (stepperSPS < 800){ flow_rate ++; stepperSPS = (flow_rate + 0.021)/0.27; Serial.print("Flow rate is "); Serial.print(flow_rate); Serial.println(" uL/min"); Serial.print("Motor steps per second is "); Serial.println(stepperSPS); sprintf(buffer, "= %2d uL/min", flow_rate);

B.1 Arduino sketch for peristaltic pump operation B-3
lcd.print(buffer); delay(20); } else{ lcd.print(buffer); } } // Decrease flow rate by 1 uL/min every time the DOWN button is pressed if (buttons & BUTTON_DOWN) { lcd.setBacklight(TEAL); lcd.print("Flow rate:"); lcd.setCursor(0,1); if (stepperSPS > 0){ flow_rate --; stepperSPS = (flow_rate + 0.021)/0.27; Serial.print("Flow rate is "); Serial.print(flow_rate); Serial.println(" uL/min"); Serial.print("Motor steps per second is "); Serial.println(stepperSPS); sprintf(buffer, "= %2d uL/min", flow_rate); lcd.print(buffer); delay(20); } else{ lcd.print(buffer); } } // We don't need the left and right buttons to do anything, // so just display the current flow rate if pressed if (buttons & BUTTON_LEFT) { lcd.print("Flow rate:"); lcd.setCursor(0,1); sprintf(buffer, "= %2d uL/min", flow_rate); lcd.print(buffer); } if (buttons & BUTTON_RIGHT) { lcd.print("Flow rate:"); lcd.setCursor(0,1); sprintf(buffer, "= %2d uL/min", flow_rate); lcd.print(buffer); } // Use SELECT button to move the stepper motor if (buttons & BUTTON_SELECT) { lcd.setBacklight(VIOLET); lcd.print("Running:"); lcd.setCursor(0,1); sprintf(buffer,"%2d uL/min", flow_rate); lcd.print(buffer); Astepper1.setMaxSpeed(stepperSPS); Astepper1.setSpeed(stepperSPS); Serial.println("Microstepping"); while (stepperSPS>0) { Astepper1.runSpeed(); } } }

B-4
B.2 Engineering drawing: master mould for microfluidic layer

B.3 Pump control unit version 1.0 B-5
B.3 Pump control unit version 1.0
Fig. A.4 An earlier version of the pump control unit. There was a lack of stackable headers on the motor
shield. Furthermore, the attachment of an L298N motor driver to a heat sink greatly increased the height
required. It was therefore impossible to directly interface the motor shield with the LCD shield by stacking
the latter on top. Instead, connections between the motor shield and the rest of the control unit were made
using a breadboard and jumper wires.


Appendix C
C.1 MATLAB code to detect AuNPs on glass in AFM images
%% Title: Script for automated nanoparticle analysis | Author: Matthew Chin % This script is intended for the detection AuNPs in AFM images. % Settings optimised for glass surfaces. clear all close all clc; %% Load and display the image startingFolder = pwd; imFile = uigetfile('*.png'); rgb = imread(imFile); whos I = rgb2gray(rgb); figure('Color','w'); % Figure 1 imshow(I); colormap(gray(256)); title('Original Image','FontSize',18); %% Correct nonuniform illumination and enhance foreground objects % imtophat calculates the morphological opening (removes foreground) and then % subtracts it from the original image I2 = imtophat(I,strel('disk',20)); % Use a disk-shaped structuring element figure('Color','w'); % Figure 2 imshow(I2); title('Background subtracted','FontSize',18); I3 = imadjust(I2); figure('Color','w'); % Figure 3 imshow(I3); title('Contrast enhanced','FontSize',18); %% Detect and measure AuNPs I4 = im2bw(I3, 0.5); figure('Color','w'); % Figure 3 imshow(I4); title('Binary','FontSize',18); stats = regionprops('table',I4,'Centroid',... 'MajorAxisLength','MinorAxisLength');

C-2
nm_per_px = (2/length(I))*1000; % 2 um x 2 um image diameter = stats.MajorAxisLength*nm_per_px; mean(diameter) writematrix(diameter,'diameter_AuNP_glass3.txt'); % Export data %% Calculate inter-particle distances centres = stats.Centroid; % % Impelemnt k-nearest neighbour search [n,dist] = knnsearch(centres,centres,'k',2); % first column consists of distance between queried particle and itself so % it will always be zero and meaningless. So, remove that column: dist(:,1) = []; interparticle_dist = dist*nm_per_px; % Convert distance to from px to nm writematrix(interparticle_dist,'InterparticleDist_AuNP_glass3.txt'); % Export data % Mean inter-particle distance mean_inter_dist = mean(interparticle_dist); figure('Color','w'); % Figure 1 imshow(I), hold on plot(centres(:,1), centres(:,2), 'o','MarkerSize',5,'LineWidth',2), hold on title("Detected AuNPs: " + length(centres),... 'FontSize',40); saveas(gcf,'Detected_AuNP_glass.png')

C.2 MATLAB code to detect AuNPs on gels in AFM images C-3
C.2 MATLAB code to detect AuNPs on gels in AFM images
%% Title: Script for automated nanoparticle analysis | Author: Matthew Chin % This script is intended for the detection AuNPs in AFM images. % Parameters optimised for PA hydrogel surfaces. clear all close all clc; %% Load and display the image startingFolder = pwd; imFile = uigetfile('*.png'); rgb = imread(imFile); whos I = rgb2gray(rgb); figure('Color','w'); % Figure 1 imshow(I); colormap(gray(256)); title('Original Image','FontSize',18); %% Correct nonuniform illumination and enhance foreground objects % imtophat calculates the morphological opening (removes foreground) and then % subtracts it from the original image I2 = imtophat(I,strel('disk',20)); % Use a disk-shaped structuring element figure('Color','w'); % Figure 2 imshow(I2); title('Background subtracted','FontSize',18); % Use imadjust to increase the contrast of the processed image I2 % by saturating 1% of the data at both low and high intensities and % by stretching the intensity values to fill the uint8 dynamic range I3 = imadjust(I2); figure('Color','w'); % Figure 3 imshow(I); title('Contrast enhanced','FontSize',18); %% Detect and measure AuNPs % By default, imfindcircles finds circular objects that are % brighter than the background. The AuNPs already appear as % bright circles so we don't need to do anything extra figure('Color','w'); % Figure 4 imshow(I), hold on [centres,radii] = imfindcircles(I3,[2 5],... 'Sensitivity',0.75,... 'EdgeThreshold',0.1,... 'Method','twostage'); c1 = viscircles(centres,radii,'Color','g'); title("Detected AuNPs: " + length(radii),... 'FontSize',40);

C-4
saveas(gcf,'Detected_AuNP.png') nm_per_px = (2/length(I))*1000; % 2 um x 2 um image diameter = 2*radii*nm_per_px; %writematrix(diameter,'diameter_AuNP_gel.txt'); % Export data %% Calculate inter-particle distances % Impelemnt k-nearest neighbour search [n,dist] = knnsearch(centres,centres,'k',2); % first column consists of distance between queried particle and itself so % it will always be zero and meaningless. So, remove that column: dist(:,1) = []; interparticle_dist = dist*nm_per_px; % Convert distance to from px to nm %writematrix(interparticle_dist,'InterparticleDist_AuNP_gel.txt'); % Export data % Mean inter-particle distance mean_inter_dist = mean(interparticle_dist)