Tanla Platforms
24
18 November 2021 Initiating Coverage Tanla Platforms HSIE Research is also available on Bloomberg ERH HDF <GO> & Thomson Reuters Version 2.0 Tanla Platforms (Tanla) is a leading player in the fast-growing CPaaS market (22% CAGR), which is being led by increased online transactions. The company’s business model has changed several times in the past two decades, but it has found success in the Application-to-Person (A2P) messaging and platform business, which grew at 46% CAGR over FY15-21. Tanla's enterprise messaging capabilities were strengthened by the acquisition of Karix (market leader in India CPaaS). It has emerged as an integrated CPaaS solutions provider with an asset-light business model in its new avatar (V2.0). Its enterprise segment processes ~169bn+ messages per year and has a market share of 40%. Tanla has tasted success with the launch of Trubloq, a blockchain based platform deployed with major telcos, and processes ~63% of India's A2P messaging traffic. Tanla is expected to grow strongly, based on: (1) continued growth in enterprise messaging volumes; (2) increasing Trubloq platform volumes (higher margins); (3) scaling up of Wisely platform (developed by Tanla in partnership with Microsoft); and (4) up-selling and client addition. Over FY21- 24E, we project revenue/EBITDA/EPS CAGRs of +26/30/27%. We initiate coverage on Tanla with a TP of INR 1,600, valuing it at 30x FY24E EPS, supported by its top quartile growth, higher RoE of 44%, excellent cash generation, and net cash of INR 8.5bn (~5% of market cap). The stock is trading at a P/E of 30/26x FY23/24E (~25% discount to listed peer). Karix provides a flip to enterprise business: Tanla acquired Karix from Blackstone in Apr-19. Karix commands a market share of ~30% and has a long-standing relationship with clients in verticals like BFSI, ecommerce, healthcare, travel, social media, and government. The acquisition has been a turning point in Tanla’s journey, growth in its enterprise business (~93% of revenue, nine quarter CQGR of 8.3%) is primarily led by Karix. Karix’ revenue has grown at 20% CAGR over FY16-21. We expect enterprise CAGR of 25% over FY21-24E, with a gross margin of ~21%. Trubloq propels growth: The Trubloq platform (launched in Sep-20) is built on distributed ledger technology (DLT) and is used to filter unsolicited and fraud messages, as mandated by TRAI. Trubloq processes ~20-25bn messages monthly, which is a market share of ~63%. Since its inception, the platform business (~7% of total revenue) has grown at a four quarter CQGR of 17.4%. We expect 40% revenue CAGR in the platform business over FY21- 24E, with a gross margin of ~90%. Strong Q2 and improving cash conversion: Enterprise revenue increased 36.5/41.5% QoQ/YoY to INR 7.8bn in Q2, led by higher volumes and an increase in ILD rates. Platform revenue increased 12.6/90.2% QoQ/YoY to INR 0.6bn. The gross margin for enterprise/platform stood at 22.1/92.6% in the quarter. The working capital management has improved, leading to a strong CF conversion (OCF/EBITDA at 129/119% in FY21/H1FY22). Financial summary (consolidated) YE March (INR mn) FY18 FY19 FY20 FY21 FY22E FY23E FY24E Net Sales 7,916 10,040 19,428 23,415 32,829 39,994 46,588 Gross Profit 961 1,433 3,911 5,777 8,937 10,743 12,346 EBITDA 652 967 1,850 4,335 6,931 8,228 9,486 APAT* 191 298 1,284 3,561 5,270 6,277 7,254 Diluted EPS (INR) 1.4 2.2 9.4 26.2 38.7 46.1 53.3 P/E (x) NA NA 147.5 53.2 35.9 30.2 26.1 EV / EBITDA (x) NA NA 101.3 42.4 25.9 21.2 17.7 RoE (%) 2.8 4.2 18.0 44.7 47.6 38.6 31.8 Source: Company, HSIE Research, *FY20 APAT is excluding accelerated depreciation BUY CMP (as on 17 Nov 2021) INR 1,392 Target Price INR 1,600 NIFTY 17,899 KEY STOCK DATA Bloomberg code TANLA IN No. of Shares (mn) 136 MCap (INR bn) / ($ mn) 189/2,545 6m avg traded value (INR mn) 225 52 Week high / low INR 1,393/415 STOCK PERFORMANCE (%) 3M 6M 12M Absolute (%) 49.1 53.1 235.5 Relative (%) 41.6 32.0 199.0 SHAREHOLDING PATTERN (%) Jun-21 Sep-21 Promoter 42.29 42.51 FIs & Local MFs 12.90 13.35 FPIs 0.04 0.04 Public & Others 44.77 44.10 Pledged Shares 0.00 0.00 Source : BSE Amit Chandra [email protected] +91-22-6171-7345 Mohit Motwani [email protected] +91-22-6171-7328
-
Upload
khangminh22 -
Category
Documents
-
view
2 -
download
0
Transcript of Tanla Platforms

18 November 2021 Initiating Coverage
Tanla Platforms
HSIE Research is also available on Bloomberg ERH HDF <GO> & Thomson Reuters
Version 2.0 Tanla Platforms (Tanla) is a leading player in the fast-growing CPaaS market
(22% CAGR), which is being led by increased online transactions. The
company’s business model has changed several times in the past two decades,
but it has found success in the Application-to-Person (A2P) messaging and
platform business, which grew at 46% CAGR over FY15-21. Tanla's enterprise
messaging capabilities were strengthened by the acquisition of Karix (market
leader in India CPaaS). It has emerged as an integrated CPaaS solutions
provider with an asset-light business model in its new avatar (V2.0). Its
enterprise segment processes ~169bn+ messages per year and has a market
share of 40%. Tanla has tasted success with the launch of Trubloq, a
blockchain based platform deployed with major telcos, and processes ~63% of
India's A2P messaging traffic.
Tanla is expected to grow strongly, based on: (1) continued growth in
enterprise messaging volumes; (2) increasing Trubloq platform volumes
(higher margins); (3) scaling up of Wisely platform (developed by Tanla in
partnership with Microsoft); and (4) up-selling and client addition. Over FY21-
24E, we project revenue/EBITDA/EPS CAGRs of +26/30/27%. We initiate
coverage on Tanla with a TP of INR 1,600, valuing it at 30x FY24E EPS,
supported by its top quartile growth, higher RoE of 44%, excellent cash
generation, and net cash of INR 8.5bn (~5% of market cap). The stock is
trading at a P/E of 30/26x FY23/24E (~25% discount to listed peer).
Karix provides a flip to enterprise business: Tanla acquired Karix from
Blackstone in Apr-19. Karix commands a market share of ~30% and has a
long-standing relationship with clients in verticals like BFSI, ecommerce,
healthcare, travel, social media, and government. The acquisition has been a
turning point in Tanla’s journey, growth in its enterprise business (~93% of
revenue, nine quarter CQGR of 8.3%) is primarily led by Karix. Karix’
revenue has grown at 20% CAGR over FY16-21. We expect enterprise CAGR
of 25% over FY21-24E, with a gross margin of ~21%.
Trubloq propels growth: The Trubloq platform (launched in Sep-20) is built
on distributed ledger technology (DLT) and is used to filter unsolicited and
fraud messages, as mandated by TRAI. Trubloq processes ~20-25bn
messages monthly, which is a market share of ~63%. Since its inception, the
platform business (~7% of total revenue) has grown at a four quarter CQGR
of 17.4%. We expect 40% revenue CAGR in the platform business over FY21-
24E, with a gross margin of ~90%.
Strong Q2 and improving cash conversion: Enterprise revenue increased
36.5/41.5% QoQ/YoY to INR 7.8bn in Q2, led by higher volumes and an
increase in ILD rates. Platform revenue increased 12.6/90.2% QoQ/YoY to
INR 0.6bn. The gross margin for enterprise/platform stood at 22.1/92.6% in
the quarter. The working capital management has improved, leading to a
strong CF conversion (OCF/EBITDA at 129/119% in FY21/H1FY22).
Financial summary (consolidated) YE March (INR mn) FY18 FY19 FY20 FY21 FY22E FY23E FY24E
Net Sales 7,916 10,040 19,428 23,415 32,829 39,994 46,588
Gross Profit 961 1,433 3,911 5,777 8,937 10,743 12,346
EBITDA 652 967 1,850 4,335 6,931 8,228 9,486
APAT* 191 298 1,284 3,561 5,270 6,277 7,254
Diluted EPS (INR) 1.4 2.2 9.4 26.2 38.7 46.1 53.3
P/E (x) NA NA 147.5 53.2 35.9 30.2 26.1
EV / EBITDA (x) NA NA 101.3 42.4 25.9 21.2 17.7
RoE (%) 2.8 4.2 18.0 44.7 47.6 38.6 31.8
Source: Company, HSIE Research, *FY20 APAT is excluding accelerated depreciation
BUY
CMP (as on 17 Nov 2021) INR 1,392
Target Price INR 1,600
NIFTY 17,899
KEY STOCK DATA
Bloomberg code TANLA IN
No. of Shares (mn) 136
MCap (INR bn) / ($ mn) 189/2,545
6m avg traded value (INR mn) 225
52 Week high / low INR 1,393/415
STOCK PERFORMANCE (%)
3M 6M 12M
Absolute (%) 49.1 53.1 235.5
Relative (%) 41.6 32.0 199.0
SHAREHOLDING PATTERN (%)
Jun-21 Sep-21
Promoter 42.29 42.51
FIs & Local MFs 12.90 13.35
FPIs 0.04 0.04
Public & Others 44.77 44.10
Pledged Shares 0.00 0.00
Source : BSE
Amit Chandra
+91-22-6171-7345
Mohit Motwani
+91-22-6171-7328

Page | 2
Tanla Platforms: Initiating Coverage
Focus Charts Global CPaaS players’ FY21 revenue (USD mn) and
market share (%)
CPaaS players to clock strong CAGRs over FY21-24E
Source: Company, Bloomberg, HSIE Research, FY21=CY20 for global
players
Source: Bloomberg, HSIE Research, Tanla based on HSIE estimates
Tanla handles ~169bn messaging volumes, translating to
~40% market share
Strong revenue and gross profit over last nine quarters
Parameter Value
Total messages sent per day in India (bn) 1.2
Total messages sent per year (bn) – A 432
Messages processed by Tanla in FY21(bn) – C 169
Market share 39%
Number of smartphone mobile users (mn) – B 750
Number of messages per mobile user per year (Nos) - A/B 576
Number of messages per mobile user per month (Nos) 48
Number of messages per mobile user per day (Nos) 2
Number of messages processed by Tanla per mobile user per
year (Nos) - C/B 225
Number of messages processed by Tanla per mobile user per
month (Nos) 19
Number of messages processed by Tanla per mobile user
per day (Nos) 1
Source: Company, HSIE Research Source: Company, HSIE Research
Strong client addition across buckets over last three
years
Revenue per > INR 10mn client has increased by ~2x
over the last three years
Source: Company, HSIE Research, X-axis refers to revenue contribution
by a client in INR mn
Source: Company, HSIE Research,*: FY22 is based on H1FY22 annualised
53.5%
39.0%
25.9%
28.8%
28.0%
27.2%
26.0%
24.9%
24.5%
17.0%
12.7%
0% 10% 20% 30% 40% 50% 60%
Sinch
Twilio
Tanla Platforms
Five9
Ringcentral
Total CPaaS
Route Mobile
Link Mobility
Bandwidth
8X8
Vonage Holdings
83
153
101105
3212
149
99
34
13
146127
2919
175
0
50
100
150
200
10mn -
100mn
100mn -
500mn
>500mn >10mn
No of client in various buckets
FY18 FY21 Q1FY22 Q2FY22Nos
98
142 150
177
70
90
110
130
150
170
190
FY18 FY20 FY21 FY22*
Revenue per > INR 10mn client (INR mn)
Twilio, 1,762,
20%
Verint
Systems,
1,274, 15%
Vonage
Holdings,
1,248, 14%Ringcentral,
1,184, 14%
Sinch, 875,
10%
8X8, 532, 6%
Five9, 435,
5%
Link
Mobility,
377, 4%
Bandwidth,
343, 4%
Tanla
Platforms,
315, 4%
Route
Mobile, 189,
2%Kaleyra, 147,
2%
16.8%
8.3% 8.8%
16.2%
12.1%13.0%
0.0%
2.0%
4.0%
6.0%
8.0%
10.0%
12.0%
14.0%
16.0%
18.0%
Platform
revenue
Enterprise
revenue
Total
revenue
Platform
gross
profit
Enterprise
gross
profit
Total
gross
profit
9 QTR CQGR (Q1FY20 - Q2FY22)

Page | 3
Tanla Platforms: Initiating Coverage
Contents
CPaaS: niche and thriving .................................................................................... 4
Tanla Platforms: market leader in CPaaS ......................................................... 6
Enterprise business: Karix powering growth .................................................... 7
Platform business: driven by Trubloq ............................................................ 10
Wisely: the next leg of growth .......................................................................... 12
Financial prowess .............................................................................................. 13
Company description ......................................................................................... 15
Quarterly performance ........................................................................................ 17
Valuation and recommendation......................................................................... 19
Financials ................................................................................................................ 21

Page | 4
Tanla Platforms: Initiating Coverage
CPaaS: niche and thriving Communications Platform as a Service (or CPaaS) is a cloud-based platform that
enables enterprises to add communication channels such as audio, video, and
messaging into the existing core application. The CPaaS industry is gaining
significant traction in the enterprise communications ecosystem. It is a value add for
enterprises since it eliminates their need to invest in hardware infrastructure and
internal servers. SMS, WhatsApp, RCS, email, are the various communication
channels, but SMS remains the primary source of revenue for CPaaS providers.
WhatsApp is also gaining traction as more use cases emerge (for example,
communicating with chatbots of a financial services company), but it’s still in the
early stages of adoption. The pace of digitalisation, aided by COVID, as well as an
increase in mobile phone users, online transactions, and online shopping, have
enhanced the need for businesses to engage with their customers more actively.
Conversing with customers across different communication channels such as SMS,
audio, email, chat, etc. has become a vital part of any company's customer
engagement strategy. According to Gartner, 90% of worldwide organisations would
be using CPaaS solutions to improve customer engagement by 2023.
As per a Juniper research report, the worldwide CPaaS market would increase at a
29% CAGR from CY20 to CY25E. The global revenue of twelve publicly traded CPaaS
communication providers was USD 8.7 bn in FY21, and is predicted to grow to USD
27.4 bn in FY26, clocking a 26% CAGR (in line with Juniper research estimate).
Global CPaaS players poised to clock robust growth over next five years
Source: HSIE Research, Bloomberg, companies include Twilio, Ringcentral, Sinch, Five9, Vonage Holdings,
Verint Systems, 8x8, Bandwidth, Route Mobile, Tanla Platforms, Link Mobility and Kaleyra, estimates are
Bloomberg consensus estimates, except for Tanla, which are HSIE estimates (assumed USD-INR of 74),
estimates for Vonage and Route Mobile extrapolated for FY25 and FY26, FY21=CY20, FY26=CY25
3.2 3.4 4.4 5.4 6.8
8.7
11.6
14.8
17.9
22.4
27.4
0.0
5.0
10.0
15.0
20.0
25.0
30.0
FY
16
FY
17
FY
18
FY
19
FY
20
FY
21
FY
22E
FY
23E
FY
24E
FY
25E
FY
26E
Global CPaaS (USD bn)

Page | 5
Tanla Platforms: Initiating Coverage
FY21 revenue of major CPaaS players globally (USD mn) FY21-24E revenue CAGR for global CPaaS players
Source: HSIE Research, Bloomberg, FY21=CY20
Source: HSIE Research, Bloomberg, Tanla based on HSIE estimates
Global CPaaS at a glance
CPaaS Player Twilio Ring
central Sinch Five9
Vonage
Holdings
Verint
Systems 8X8
Band
width
Route
Mobile
Tanla
Platforms
Link
Mobility Kaleyra
Agg
(USD bn)
Country USA USA Sweden USA USA USA USA USA India India Norway Italy Global
Market Cap (USD bn) 54.3 24.4 10.5 11 4.3 3.1 2.6 2 1.5 2.5 0.7 0.5 117.5
Revenue CAGR
(FY21-24E) 39.0% 28.0% 53.5% 28.8% 12.7% -7.3% 17.0% 24.5% 26.0% 25.9% 24.9% 50.4% 27.2%
EBITDA Margin FY21 -16.7% -1.4% 9.4% 5.7% 8.0% 18.9% -16.1% 2.6% 12.4% 18.5% 8.3% -16.0% 1.7%
EBITDA Margin FY24E 9.7% 14.8% 16.0% 17.5% 14.1% 27.9% 8.7% 11.7% 14.9% 20.4% 14.2% 7.8% 14.1%
FY24E EV/EBITDA 109 69 18 70 19 13 39 28 26 18 10 17 22
FY24E P/S 11.5 9.8 3.3 11.9 2.4 3.1 3.1 3 4.0 4.1 1.4 0.9 3.2
Source: Company, Bloomberg, HSIE Research, Tanla Platforms based on HSIE estimates, assumed USD-INR of 74
Indian CPaaS players growing at similar rate to global counterparts
The major Indian CPaaS players have also shown a strong growth rate, owing to
increased digital engagement of enterprises with their customers via the digital
medium, reflecting the global CPaaS players' growth trajectory. The Indian CPaaS
market expanded at a 27% CAGR from USD 280 mn in FY16 to USD 734 mn in FY20.
Indian CPaaS companies grow at a CAGR of 27% Tanla - the largest CPaaS player in India
Source: HSIE Research, VCCEdge, companies include Tanla Platforms,
Route Mobile, ACL Mobile, Gupshup, Valuefirst, Infobip and Netcore
Source: HSIE Research, VCCEdge
53.5%
39.0%
25.9%
28.8%
28.0%
27.2%
26.0%
24.9%
24.5%
17.0%
12.7%
0% 10% 20% 30% 40% 50% 60%
Sinch
Twilio
Tanla Platforms
Five9
Ringcentral
Total CPaaS
Route Mobile
Link Mobility
Bandwidth
8X8
Vonage Holdings
280 329
413
556
734
0
100
200
300
400
500
600
700
800
FY16 FY17 FY18 FY19 FY20
Indian CPaaS (USD mn)
274
135
80 75 70 68
32
0
50
100
150
200
250
300
Tanla
Platforms
Route
Mobile
Gupshup Valuefirst ACL
Mobile
Netcore Infobip
Indian CPaaS players revenue - FY20 (USD mn)
Twilio, 1,762,
20%
Verint
Systems,
1,274, 15%
Vonage
Holdings,
1,248, 14%Ringcentral,
1,184, 14%
Sinch, 875,
10%
8X8, 532, 6%
Five9, 435,
5%
Link
Mobility,
377, 4%
Bandwidth,
343, 4%
Tanla
Platforms,
315, 4%
Route
Mobile, 189,
2%Kaleyra, 147,
2%

Page | 6
Tanla Platforms: Initiating Coverage
Tanla Platforms: market leader in CPaaS Tanla, with a CPaaS volume market share of ~40% and Trubloq volume market share
of ~63%, is the market leader in the Indian CPaaS market. According to estimates,
1.2bn commercial SMSes are sent in India every day, while Tanla handles 169bn
messages annually, or ~0.5 bn messages per day, implying a market share of ~40%.
With 750 mn active smartphone mobile phone users, this equates to two messages
per day per mobile phone user, of which Tanla processes around one message/day.
The Trubloq platform processes ~70bn messages per quarter and has a 63% market
share (as per company reporting). According to this data, the total number of
messages processed at the industry level is 1.2 bn per day.
Parameter Value
Total messages sent per day in India (bn) 1.2
Total messages sent per year (bn) – A 432
Messages processed by Tanla in FY21(bn) – C 169
Market share % 39%
Number of smartphone mobile users (mn) – B 750
Number of messages per mobile user per year (Nos) - A/B 576
Number of messages per mobile user per month (Nos) 48
Number of messages per mobile user per day (Nos) 1.6
Number of messages processed by Tanla per mobile user per year (Nos) - C/B 225
Number of messages processed by Tanla per mobile user per month (Nos) 19
Number of messages processed by Tanla per mobile user per day (Nos) 0.6
Source: Company, HSIE research
Tanla has two revenue sources: (1) platform revenues from telcos in the form of
revenue share as a result of Tanla's platforms [short messaging service center (SMSC)
and Trubloq] deployed with telcos to filter unsolicited messages and route them to
end-users and (2) enterprise revenues from businesses for communication solutions.
Tanla serves enterprises in a variety of industries, including BFSI, e-commerce,
logistics, and healthcare, as well as the Indian government on messaging solutions,
such as the Cowin vaccination and Aadhar-related communications. Its quarterly
revenue has doubled (2.1x) from INR 3.9bn in Q1FY20 to INR 8.4bn in Q2FY22,
thanks to strong industry dynamics and leadership positioning. The gross margin has
also increased by 800bps (from 19.4% in Q1FY20 to 27.4% in Q2FY22), reflecting
embedded non-linearity in the business.
Total revenue grows by 2.1x over past 10 quarters,
exhibiting a strong CQGR of 8.8%
EBITDA margin expands 800bps over 10 quarters,
led by operating leverage and rising contribution of
high-margin platform business
Source: Company, HSIE Research Source: Company, HSIE Research
3,9
46
4,8
72
5,3
90
5,2
21
4,5
56
5,8
33
6,5
42
6,4
85
6,2
63
8,4
16
-20%
-10%
0%
10%
20%
30%
40%
-
2,000
4,000
6,000
8,000
10,000
Q1
FY
20
Q2
FY
20
Q3
FY
20
Q4
FY
20
Q1
FY
21
Q2
FY
21
Q3
FY
21
Q4
FY
21
Q1
FY
22
Q2
FY
22
Total Revenue (INR mn) QoQ growth
76
7
98
6
1,0
40
1,1
20
1,0
53
1,3
43
1,6
12
1,7
69
1,7
34
2,3
02
19
.4%
20
.2%
19
.3%
21
.5%
23
.1%
23
.0%
24
.6%
27
.3%
27
.7%
27
.4%
10%
15%
20%
25%
30%
-
500
1,000
1,500
2,000
2,500
Q1
FY
20
Q2
FY
20
Q3
FY
20
Q4
FY
20
Q1
FY
21
Q2
FY
21
Q3
FY
21
Q4
FY
21
Q1
FY
22
Q2
FY
22
Tanla Platforms Gross Profit
Tanla Platforms Gross MarginINR mn

Page | 7
Tanla Platforms: Initiating Coverage
Revenue segments and gross profit quarterly trajectory Revenue
(INR mn) Q1FY20 Q2FY20 Q3FY20 Q4FY20 Q1FY21 Q2FY21 Q3FY21 Q4FY21 Q1FY22 Q2FY22 CQGR %
Platform revenue* 154 191 236 209 185 328 477 462 554 624 16.8%
QoQ growth %
24.0% 23.6% -11.4% -11.5% 77.3% 45.4% -3.1% 19.9% 12.6%
% of revenue 3.9% 3.9% 4.4% 4.0% 4.1% 5.6% 7.3% 7.1% 8.8% 7.4%
Enterprise revenue* 3,792 4,681 5,154 5,012 4,371 5,505 6,065 6,023 5,709 7,792 8.3%
QoQ growth % 0 23.5% 10.1% -2.8% -12.8% 25.9% 10.2% -0.7% -5.2% 36.5%
% of revenue 96.1% 96.1% 95.6% 96.0% 95.9% 94.4% 92.7% 92.9% 91.2% 92.6%
Total Revenue 3,946 4,872 5,390 5,221 4,556 5,833 6,542 6,485 6,263 8,416 8.8%
QoQ growth %
23.5% 10.6% -3.1% -12.7% 28.0% 12.2% -0.9% -3.4% 34.4%
Source: Company, HSIE, *: platform and enterprise revenue for Q1FY20 derived with assumption of 97.4% platform gross margin
Gross Profit Q1FY20 Q2FY20 Q3FY20 Q4FY20 Q1FY21 Q2FY21 Q3FY21 Q4FY21 Q1FY22 Q2FY22 CQGR
Platform GP 150 186 230 200 176 313 451 437 533 578 16.2%
Gross Margin % 97.4% 97.4% 97.5% 95.7% 95.1% 95.4% 94.5% 94.6% 96.2% 92.6% -475*
% of Total GP 19.6% 18.9% 22.1% 17.9% 16.7% 23.3% 28.0% 24.7% 30.7% 25.1%
Enterprise GP 617 800 810 920 877 1,030 1,161 1,332 1,201 1,724 12.1%
Gross Margin % 16.3% 17.1% 15.7% 18.4% 20.1% 18.7% 19.1% 22.1% 21.0% 22.1% 587*
% of Total GP 80% 81% 78% 82% 83% 77% 72% 75% 69% 75%
Tanla GP 767 986 1,040 1,120 1,053 1,343 1,612 1,769 1,734 2,302 13.0%
Gross Margin % 19.4% 20.2% 19.3% 21.5% 23.1% 23.0% 24.6% 27.3% 27.7% 27.4% 793*
Source: Company, HSIE Research, *bps change over Q1FY20 to Q2FY22
Enterprise business: Karix powering growth Tanla added muscle to the enterprise segment when it acquired Karix in April 2019.
In a cash-and-stock agreement, Karix was acquired from Blackstone (Tanla paid cash
of INR 1.12bn and Blackstone had a 14.6% stake in Tanla post the transaction). Tanla's
CPaaS capacity was expanded with this acquisition, which established its presence
across all touchpoints of the CPaaS ecosystem, allowing enterprises the benefit of
working with a single CPaaS provider.
Karix has a 30% market share in enterprise messaging and has a long-standing
relationship with its clients, serving over 1,300 enterprises across various industries,
including catering to the top 7-9 banks, e-commerce players, financial services
providers, IT, healthcare, consumer goods, social media firms, and retailers. Karix
added 167/259/160 new customers in FY20/FY21/H1FY22 as a result of its excellent
standing in the CPaaS industry. Its revenue increased at a CAGR of 20% from FY16-
21.
Karix demonstrates strong growth through long-standing client relationships
Source: Company, VCCEdge, HSIE Research
4,427 4,455
5,402
8,805
10,176
11,237
3,000
4,000
5,000
6,000
7,000
8,000
9,000
10,000
11,000
12,000
FY16 FY17 FY18 FY19 FY20 FY21
Karix Revenue (INR mn)

Page | 8
Tanla Platforms: Initiating Coverage
Growing client base with impressive mining capability
From FY18 to Q2FY22, the number of clients in the INR 10-100 million, 100-500
million, and >500 million revenue buckets increased significantly, demonstrating
Tanla's strong client mining/hunting capabilities. With rising use cases and volume, a
client would typically start with lesser contributions and progressively upgrade to
higher contributions.
The number of clients generating more than INR 500mn in sales has climbed from 3
in FY18 to 19 in Q2FY22, demonstrating that Tanla's solutions are increasingly being
employed by enterprises for consumer engagement. Top clients are driving growth,
with CAGRs of 15/23/45% (over FY18-21) for clients in the INR 10-100 million, 100-
500 million, and >500 million revenue buckets, confirming Tanla's excellent
positioning/offerings to enterprise clients.
Tanla's average revenue per >INR 10mn client has increased by ~2x from FY18,
demonstrating that it has been able to negotiate its pricing with enterprises very well,
apart from the fact that it has also grown its customer base and messaging volumes.
Top-20 customer concentration: a blessing in disguise?
Tanla's top 20 clients generated INR 13.3/14.8/9.6bn in sales in FY20/FY21/H1FY22,
accounting for 68.3/63.1/65.7% of total revenue. High client concentration may appear
to be a concentration risk, but the fact that the company's top 20 clients (such as ICICI
Bank) have been with the company for 15 years or more provides a cushion for future
revenue visibility.
In our view, Tanla's future performance is assured by the stickiness of its top 20
clients, new customer additions, and other revenue sources via other communication
mediums like WhatsApp. Aside from that, global expansion and bolt-on acquisitions
are two other factors that could boost revenue growth even further.
Increasing number of clients in high revenue streams
showcases Tanla’s execution of land and expand strategy
Growth is driven by top clients; >INR 500mn client
CAGR is higher than company average
Source: Company, HSIE Research, X-axis refers to revenue contribution by
a client in INR mn
Source: Company, HSIE Research, X-axis refers to revenue
contribution by a client in INR mn
83
153
101105
3212
149
99
34
13
146127
2919
175
0
50
100
150
200
10mn -
100mn
100mn -
500mn
>500mn >10mn
No of client in various buckets
FY18 FY21 Q1FY22 Q2FY22Nos
2.3 3.8 3.9
9.9
3.4
7.0
11.9
22.3
1.7 3.7
8.9
14.3
-
5.0
10.0
15.0
20.0
25.0
10mn - 100mn 100mn - 500mn >500mn >10mn
Revenue by client bucket (INR bn) and CAGR over FY18-21
FY18 FY21 H1FY22

Page | 9
Tanla Platforms: Initiating Coverage
Average revenue per >INR 10mn client grows ~2x,
indicating rising volumes and better pricing
Revenue concentration from top 20 customers is
gradually coming down, but still high
Source: Company, HSIE Research, *: FY22 annualised based on H1FY22 Source: Company, HSIE Research
Robust growth coupled with operating leverage
The enterprise business has been on a steady upward trend, hitting new highs in
recent quarters and generating a revenue of INR 7.79 bn (+36.5% QoQ) in Q2FY22.
Tanla bills enterprises telco charges of INR 13p per SMS, of which it keeps 3p per
SMS. SMS communication contributes 90%+ of current revenue (in line with global
trends). However, the company has expanded capabilities across all other
communication channels, including WhatsApp, email, and voice.
The WhatsApp channel is gaining traction, and revenue from it has doubled from
Q1FY22. Gross margin for the enterprise business has increased by 580bps from
16.3% in Q1FY20 to 22.1% in Q2FY22, as a consequence of increased volumes,
increasing use cases, and client addition.
Enterprise business striking a new high; increase in ILD
rates propels growth in Q2FY22
GM expands 580bps from Q1FY20 to Q2FY22
Source: Company, HSIE Research Source: Company, HSIE Research
13,279 14,784
9,652
68.3%
63.1%
65.7%
60.0%
62.0%
64.0%
66.0%
68.0%
70.0%
-
2,000
4,000
6,000
8,000
10,000
12,000
14,000
16,000
FY20 FY21 H1FY22
Revenue from top 20 customers (INR mn)
as a % of total revenue
98
142 150
177
70
90
110
130
150
170
190
FY18 FY20 FY21 FY22*
Annualised average revenue by >10mn client (INR mn)
3,7
92
4,6
81
5,1
54
5,0
12
4,3
71
5,5
05
6,0
65
6,0
23
5,7
09
7,7
92
-20%
-10%
0%
10%
20%
30%
40%
-
2,000
4,000
6,000
8,000
10,000
Q1
FY
20
Q2
FY
20
Q3
FY
20
Q4
FY
20
Q1
FY
21
Q2
FY
21
Q3
FY
21
Q4
FY
21
Q1
FY
22
Q2
FY
22
Enterprise Business revenue (INR mn) QoQ growth
50% of the quarterly growth in Q2FY22
contributed by increase in ILD charges
61
7
80
0
81
0
92
0
87
7
1,0
30
1,1
61
1,3
32
1,2
01
1,7
24
16.3%17.1%
15.7%
18.4%
20.1%18.7%19.1%
22.1%21.0%
22.1%
10%
12%
14%
16%
18%
20%
22%
24%
-
500
1,000
1,500
2,000
Q1
FY
20
Q2
FY
20
Q3
FY
20
Q4
FY
20
Q1
FY
21
Q2
FY
21
Q3
FY
21
Q4
FY
21
Q1
FY
22
Q2
FY
22
Enterprise Business Gross Profit (INR mn)
Enterprise Gross Margin

Page | 10
Tanla Platforms: Initiating Coverage
Multiple industry tailwinds to boost growth
The enterprise business is poised to grow rapidly at several trigger points,
particularly with the transformational shift towards online transactions in a variety of
industries, including e-commerce, logistics, social media, retail, BFSI, and others.
From the present 750+ mn smartphone users, India is on course to reach 1 billion
smartphone users by 2023, and this rise in user base will be a big driver of growth,
with greater app installations and messaging opportunities.
In addition, a growing number of use cases, such as two-factor authentication,
webinar invitations, recharge offers, flight updates, OTPs for transactions on fintech
platforms and mobile banking, push notifications from ride-hailing and food delivery
apps, and so on, will increase message volumes. Tanla, with its recurring additions of
new customers, the stickiness of its top 20 customers, and possible international
expansion, can benefit greatly from the industry's expanding volumes. Based on a
volume CAGR of 15% and gross margins stabilising at 20-21%, we project enterprise
revenue to expand at a CAGR of 25% over FY21-FY24E.
Enterprise business to clock 25% CAGR over FY21-21E,
led by a rise in messaging volumes
GM for enterprise business to be in 20-21% range
Source: Company, HSIE Research Source: Company, HSIE Research
Platform business: driven by Trubloq Tanla’s platform business is primarily comprised of Trubloq, a blockchain-based
platform developed on distributed ledger technology (DLT). Trubloq was launched
in accordance with the new Telecom Regulatory Authority of India (TRAI) standards
to handle unsolicited commercial communications (UCC) using blockchain
technology and improve security by filtering out spam and fraud messages.
It is a platform that is used by all of India's major telcos (VI, BSNL, and Airtel), as
well as two telecoms in the UAE (Etisalat and Du). Since its commercial launch in
September 2020, Trubloq has served over 44,000 enterprises and handled over 250bn
transactions (750mn transactions per day). In India, Trubloq has a 63% market share
for A2P messages. Tanla is one of VI's largest short messaging service center (SMSC)
vendors. The SMSC is responsible for routing messages to end users and generates
revenue in partnership with the telcos.
3,147 4,400
6,583 7,848
8,719
16.9%
20.0%21.7% 21.3% 20.5%
0.0%
5.0%
10.0%
15.0%
20.0%
25.0%
-
2,000
4,000
6,000
8,000
10,000
FY20 FY21 FY22E FY23E FY24E
Enterprise Business Gross Profit
Enterprise Business Gross Margin
18,639
21,964
30,291
36,813
42,581
15,000
20,000
25,000
30,000
35,000
40,000
45,000
FY20 FY21 FY22E FY23E FY24E
Enterprise Revenue (INR mn)
Page | 11
Tanla Platforms: Initiating Coverage
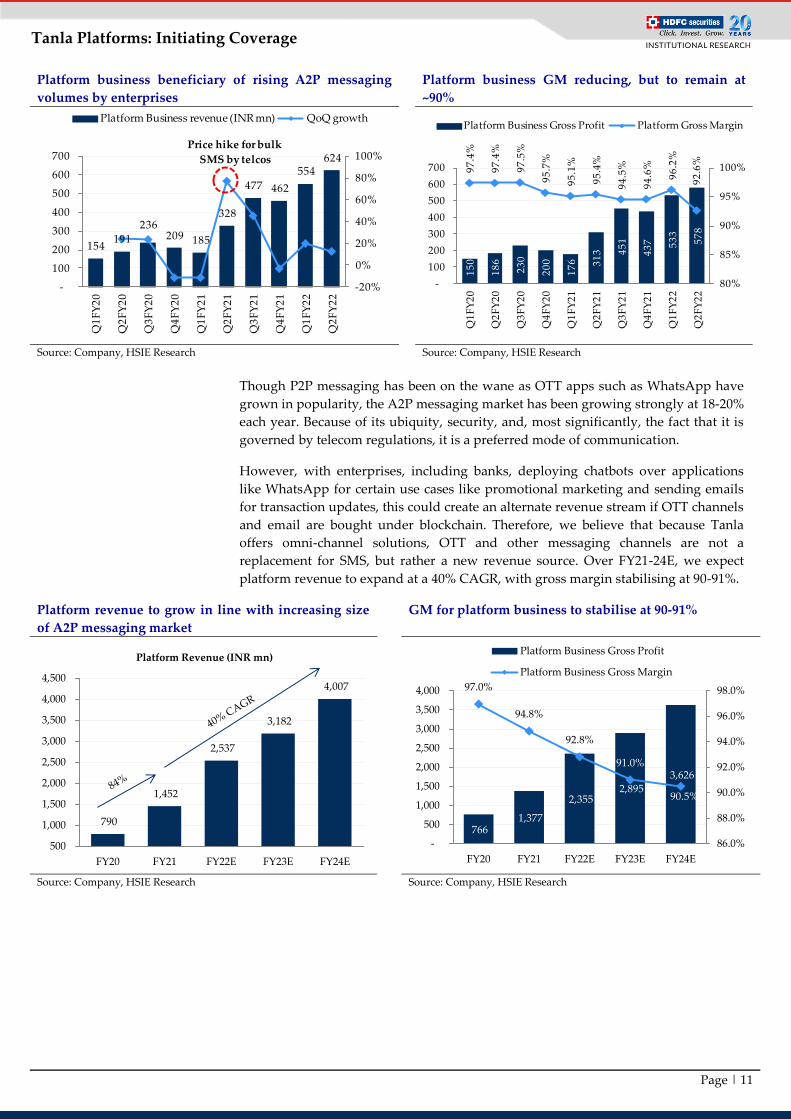
Platform business beneficiary of rising A2P messaging
volumes by enterprises
Platform business GM reducing, but to remain at
~90%
Source: Company, HSIE Research Source: Company, HSIE Research
Though P2P messaging has been on the wane as OTT apps such as WhatsApp have
grown in popularity, the A2P messaging market has been growing strongly at 18-20%
each year. Because of its ubiquity, security, and, most significantly, the fact that it is
governed by telecom regulations, it is a preferred mode of communication.
However, with enterprises, including banks, deploying chatbots over applications
like WhatsApp for certain use cases like promotional marketing and sending emails
for transaction updates, this could create an alternate revenue stream if OTT channels
and email are bought under blockchain. Therefore, we believe that because Tanla
offers omni-channel solutions, OTT and other messaging channels are not a
replacement for SMS, but rather a new revenue source. Over FY21-24E, we expect
platform revenue to expand at a 40% CAGR, with gross margin stabilising at 90-91%.
Platform revenue to grow in line with increasing size
of A2P messaging market
GM for platform business to stabilise at 90-91%
Source: Company, HSIE Research Source: Company, HSIE Research
790
1,452
2,537
3,182
4,007
500
1,000
1,500
2,000
2,500
3,000
3,500
4,000
4,500
FY20 FY21 FY22E FY23E FY24E
Platform Revenue (INR mn)
766 1,377
2,355 2,895
3,626
97.0%
94.8%
92.8%
91.0%
90.5%
86.0%
88.0%
90.0%
92.0%
94.0%
96.0%
98.0%
-
500
1,000
1,500
2,000
2,500
3,000
3,500
4,000
FY20 FY21 FY22E FY23E FY24E
Platform Business Gross Profit
Platform Business Gross Margin
154 191
236 209 185
328
477 462
554 624
-20%
0%
20%
40%
60%
80%
100%
-
100
200
300
400
500
600
700
Q1
FY
20
Q2
FY
20
Q3
FY
20
Q4
FY
20
Q1
FY
21
Q2
FY
21
Q3
FY
21
Q4
FY
21
Q1
FY
22
Q2
FY
22
Platform Business revenue (INR mn) QoQ growth
Price hike for bulk
SMS by telcos
15
0
18
6
23
0
20
0
17
6
31
3
45
1
43
7
53
3
57
8
97
.4%
97
.4%
97
.5%
95
.7%
95
.1%
95
.4%
94
.5%
94
.6%
96
.2%
92
.6%
80%
85%
90%
95%
100%
-
100
200
300
400
500
600
700
Q1
FY
20
Q2
FY
20
Q3
FY
20
Q4
FY
20
Q1
FY
21
Q2
FY
21
Q3
FY
21
Q4
FY
21
Q1
FY
22
Q2
FY
22
Platform Business Gross Profit Platform Gross Margin
Page | 12
Tanla Platforms: Initiating Coverage
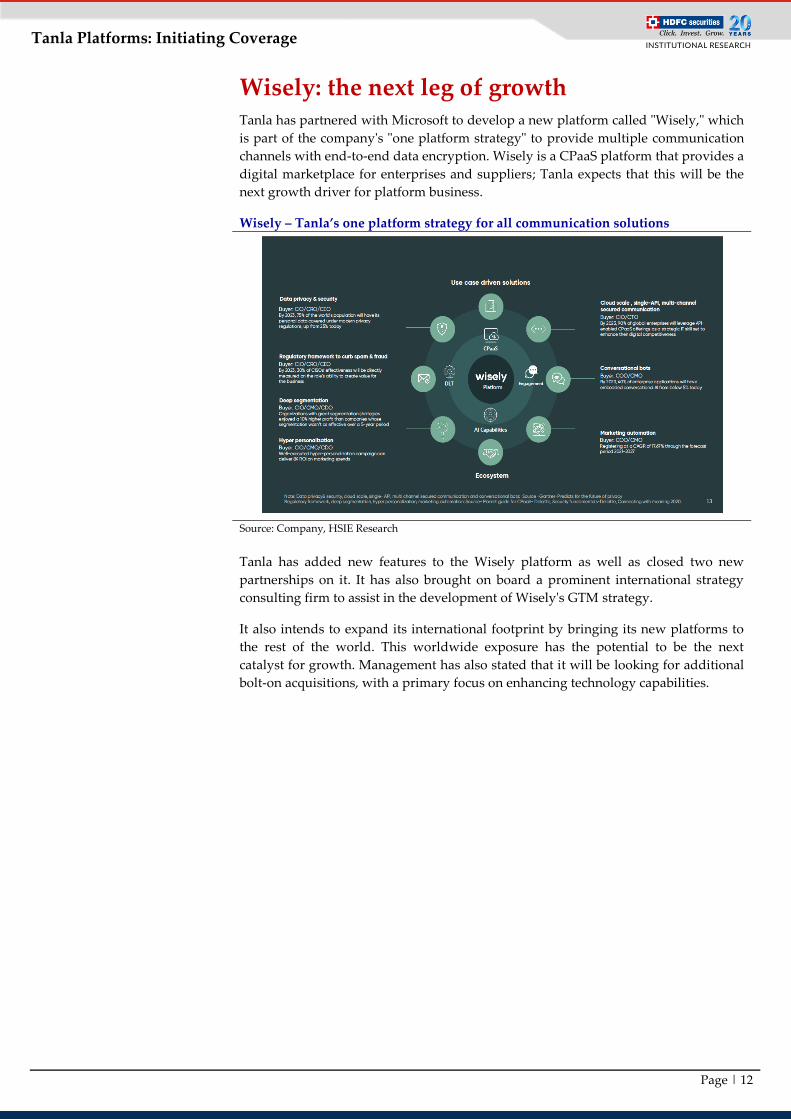
Wisely: the next leg of growth Tanla has partnered with Microsoft to develop a new platform called "Wisely," which
is part of the company's "one platform strategy" to provide multiple communication
channels with end-to-end data encryption. Wisely is a CPaaS platform that provides a
digital marketplace for enterprises and suppliers; Tanla expects that this will be the
next growth driver for platform business.
Wisely – Tanla’s one platform strategy for all communication solutions
Source: Company, HSIE Research
Tanla has added new features to the Wisely platform as well as closed two new
partnerships on it. It has also brought on board a prominent international strategy
consulting firm to assist in the development of Wisely's GTM strategy.
It also intends to expand its international footprint by bringing its new platforms to
the rest of the world. This worldwide exposure has the potential to be the next
catalyst for growth. Management has also stated that it will be looking for additional
bolt-on acquisitions, with a primary focus on enhancing technology capabilities.

Page | 13
Tanla Platforms: Initiating Coverage
Financial prowess
Tanla has demonstrated superior execution capabilities and robust financial
performance as a result of (1) innovation-led platform launches; (2) long-standing
relationships with enterprises and the telcos; (3) strong industry tailwinds, with the
enterprises looking up to CPaaS players for high levels of engagements with their
customers; and (4) increasing messaging volumes on account of high online
transactions. Tanla's revenue increased by 40% from INR 4.3bn in FY16 to INR 23.4bn
in FY21, thanks to the above factors and the acquisitions of Karix and Gamooga in
FY20.
The company has largely maintained its EBITDA margin performance in line with
the industry norm of 8-10%, although the FY21 EBITDA margin was higher at 18.5%,
owing to platform business (higher-margin) and a significant reduction in other
expenses. Even in H1FY22, the company was able to maintain its solid margin profile
(21.3%). Tanla's outstanding operating performance, along with an asset-light model,
a debt-free balance sheet, and better working capital management, has resulted in
strong net income and abundant cash flow.
Tanla exhibits strong revenue CAGR of 40%, led by
Karix acquisition and DLT platform launch
EBITDA margin expands strongly in FY21, led by
growth in enterprise and platform business
Source: Company, HSIE Research Source: Company, HSIE Research
Tanla wirnesses significant improvement in
profitability in last two years
Strong profitability and better working capital
management leads to healthy cash generation
Source: Company, HSIE Research, FY20 PAT is adjusted for accelerated
depreciation of INR 2,908mn
Source: Company, HSIE Research
655
561
652 96
7 1,85
0
4,33
5
3,13
2
15%
10%8%
10% 10%
19%
21%
0%
5%
10%
15%
20%
25%
-
500
1,000
1,500
2,000
2,500
3,000
3,500
4,000
4,500
5,000
FY16 FY17 FY18 FY19 FY20 FY21 H1FY22
EBITDA (INR mn) EBITDA Margin
927 716 323
(304)
2,392
5,610
141%128%
50%
-31%
129%129%
-50%
0%
50%
100%
150%
200%
(1,000)
0
1,000
2,000
3,000
4,000
5,000
6,000
FY16 FY17 FY18 FY19 FY20 FY21
OCF (INR mn) OCF/EBITDA
4,316 5,793
7,916 10,040
19,428
23,415
3,000
13,000
23,000
33,000
FY16 FY17 FY18 FY19 FY20 FY21
Revenue (INR mn)
72 409
191 298
1,284
3,561
1.7%
7.1%
2.4%3.0%
6.6%
15.2%
0.0%
2.0%
4.0%
6.0%
8.0%
10.0%
12.0%
14.0%
16.0%
-
500
1,000
1,500
2,000
2,500
3,000
3,500
4,000
FY16 FY17 FY18 FY19 FY20 FY21
APAT (INR mn) APAT Margin

Page | 14
Tanla Platforms: Initiating Coverage
Rewarding shareholders; strong cash reserves
The company has rewarded its shareholders with a dividend and two share buybacks
as a result of its high free cash flow conversion. In FY21, it paid INR 1.61bn in
dividends and buybacks, accounting for 45% of net profit. It has conducted two
buybacks: (1) a buyback of INR 1.54bn via a tender offer for 19mn shares
(representing 12.5% of equity), announced in April 2020, at a price of INR 81/share,
implying a premium of 55% to the market price at the time of announcement;
however, the actual shares tendered were 87.8% of total shares offered for buyback;
(2) a buyback of INR 650mn (8% of net cash) via open market transactions for a
weighted average price of INR 920.8, which the company announced in July 2021.
As of September 30, 2021, the company had a healthy cash balance of INR 8.5bn, with
about half of it in bank fixed deposits.
Tanla Platforms growth to outstrip that of the industry
We expect the enterprise and platform businesses to drive revenue growth for the
company as a whole, clocking a 26% CAGR between FY21 and FY24E. We also
forecast the company's gross/EBITDA/PAT margins to increase 183/185/36bps from
24.7/18.5/15.2% in FY21 to 26.5/20.4/15.6% in FY24E.
Tanla’s growth bolstered by increasing digitisation Gross margin to expand by 183bps over FY21-24E
Source: Company, HSIE Research Source: Company, HSIE Research
EBITDA margin to expand 185bps over FY21-24E
Company to maintain strong net profitability
Source: Company, HSIE Research Source: Company, HSIE Research, FY20 PAT adjusted for accelerated
depreciation of INR 2,908mn
19,428 23,415
32,829
39,994
46,588
500
5,500
10,500
15,500
20,500
25,500
30,500
35,500
40,500
45,500
50,500
FY20 FY21 FY22E FY23E FY24E
Revenue (INR mn)
3,913 5,777
8,937 10,743
12,346
20.1%
24.7%27.2% 26.9%
26.5%
0.0%
5.0%
10.0%
15.0%
20.0%
25.0%
30.0%
-
2,000
4,000
6,000
8,000
10,000
12,000
14,000
FY20 FY21 FY22E FY23E FY24E
Tanla Platforms Gross Profit
Tanla Platforms Gross Margin
1,850 4,335 6,931 8,228 9,486
9.5%
18.5%
21.1% 20.6%20.4%
0.0%
5.0%
10.0%
15.0%
20.0%
25.0%
-
2,000
4,000
6,000
8,000
10,000
FY20 FY21 FY22E FY23E FY24E
EBITDA (INR mn) EBITDA Margin
1,284 3,561 5,270 6,277 7,254
6.6%
15.2%16.1% 15.7% 15.6%
0.0%
2.0%
4.0%
6.0%
8.0%
10.0%
12.0%
14.0%
16.0%
18.0%
-
1,000
2,000
3,000
4,000
5,000
6,000
7,000
8,000
FY20 FY21 FY22E FY23E FY24E
APAT (INR mn) APAT Margin
Page | 15
Tanla Platforms: Initiating Coverage
Company description Tanla Platforms is one of the leading cloud communications providers in India,
offering enterprises A2P messaging and CPaaS solutions to connect with their
customers. It offers a footprint across the whole CPaaS ecosystem, allowing
enterprises to harness capabilities across various touchpoints and produce value.
The company’s capabilities include: (1) Using Gamooga, an AI-driven marketing
automation tool, for data-driven insights; (2) Karix, whose solutions are deployed in
form of an API, integrated with enterprise applications to embed communication
features like SMS, voice, chat, email, and push notifications; (3) Trubloq, a
blockchain-based distributed ledger technology (DLT) platform for filtering
unsolicited messages and preventing fraud; and (4) SMSCs (SMS Centers)
implemented in key telco networks that route messages to end mobile customers.
Tanla has 800bn interactions in a year, which has helped it become a leading
communications provider.
Key statistics
Parameter Value
Interactions per year (bn) 800
Revenue market share 42%
DLT Volume market share 63%
NLD Volume market share 41%
ILD Volume market share 75%
Customers across segments (Nos) 1,300
Karix market share 30%
Source: Company, HSIE Research
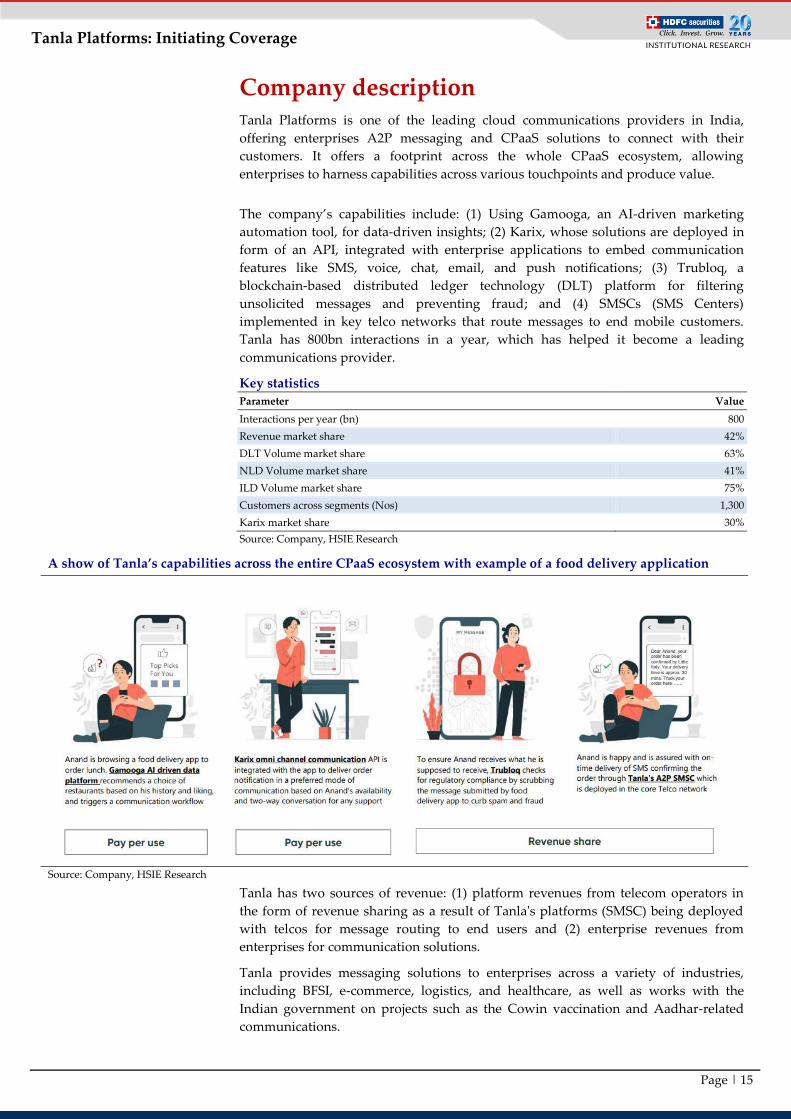
A show of Tanla’s capabilities across the entire CPaaS ecosystem with example of a food delivery application
Source: Company, HSIE Research
Tanla has two sources of revenue: (1) platform revenues from telecom operators in
the form of revenue sharing as a result of Tanla's platforms (SMSC) being deployed
with telcos for message routing to end users and (2) enterprise revenues from
enterprises for communication solutions.
Tanla provides messaging solutions to enterprises across a variety of industries,
including BFSI, e-commerce, logistics, and healthcare, as well as works with the
Indian government on projects such as the Cowin vaccination and Aadhar-related
communications.

Page | 16
Tanla Platforms: Initiating Coverage
The company has grown from a pure A2P messaging solution supplier to a full-
fledged CPaaS player in the last 10-15 years, bolstered by the acquisition of Karix in
April 2019. Tanla underwent a series of restructuring activities during this time,
including adding value added services (VAS), phasing out de-growing businesses
due to changing industry dynamics and regulatory landscape, adding capabilities in
the form of a blockchain-based DLT network as mandated by the Indian telecom
regulator, TRAI, and acquiring Karix (a Tanla customer), a leader in the CPaaS
vertical with a strong client base. The geographical contribution to revenue shifted as
a result of the various initiatives, with India contributing 66% of total income in FY21
compared to 3% in FY11.
Geographical shift in Tanla’s revenues
Source: Company, HSIE Research
Board composition and key management personnel
Board of Directors Designation Previous / Current Experience
Mr. D. Uday Kumar Reddy Founder, Chairman and CEO Founder of Tanla and leading the company since its inception in 1999
Aravind Viswanathan CFO Previously worked as SVP and CFO (iDEAS Global Business Line) at Wipro
Dr. A.G.Ravindranath
Reddy Non-Executive Director
Corporate consultant for the past 30 years specialising in corporate laws, economic
laws, foreign exchange laws, and corporate restructuring
Ms. Amrita Gangotra Independent Director Managing Director at ITyukt Digital Solutions with over 32 years of experience.
Previously worked with Airtel, Vodafone, Nestle, HCL Comnet , Allen Bradley
Mr. Deepak Goyal Executive Director,
Chief Business Officer
Joined Tanla in July, 2020 and Karix (known as Air2Web) in 2006 as VP Sales. Has
over 25 years of experience and previously worked with Velti, Tulip Telecom , Free
Markets Inc., Wyse Technology
Mr. Rahul Khanna Independent Director
CIO at Habrok Capital Management LLP with over 19 years of experience.
Previously worked with Fidelity International, Aditya Birla Sunlife Asset
Management
Mr. Rohit Bhasin Independent Director 37 years of experience in general management and finance and led organisations
such as Standard Chartered Bank, AIG Inc., PWC
Mr. Sanjay Baweja Independent Director
A turnaround and M&A strategist with over three decades of experience. Previously
worked with Emaar MGF Land Limited, Bharti Airtel, Xerox Modicorp, Ballarpur
Industries, and was CFO - Suzlon Energy, CFO - Flipkart, CFO - Tata
Communications
Mr. Sanjay Kapoor Non-Executive Director Previously worked with Xerox and is ex-Chairman of Micromax and ex-CEO of
Bharti Airtel (India and South Asia)
Source: Company, HSIE Research
97%87%
79% 75%
38% 32%
14% 11%19% 23%
34%
3%13%
21% 25%
62% 68%
86% 89%81% 77%
66%
0%
20%
40%
60%
80%
100%
FY11 FY12 FY13 FY14 FY15 FY16 FY17 FY18 FY19 FY20 FY21
Overseas India

Page | 17
Tanla Platforms: Initiating Coverage
Revenue and gross profit assumptions
Revenue Segment (INR mn) FY20 FY21 FY22E FY23E FY24E CAGR
Platform revenue 790 1,452 2,537 3,182 4,007 40.3%
Growth %
83.8% 74.7% 25.4% 25.9%
% of revenue 4.1% 6.2% 7.7% 8.0% 8.6%
Enterprise revenue 18,639 21,964 30,291 36,813 42,581 24.7%
Growth % 0 17.8% 37.9% 21.5% 15.7%
% of revenue 95.9% 93.8% 92.3% 92.0% 91.4%
Total Revenue 19,429 23,416 32,828 39,994 46,588 25.8%
Growth % 93.5% 20.5% 40.2% 21.8% 16.5%
Gross Profit FY20 FY21 FY22E FY23E FY24E CAGR
Platform GP 766 1,377 2,355 2,895 3,626 38.1%
Gross Margin % 97.0% 94.8% 92.8% 91.0% 90.5%
% of Total GP 19.6% 23.8% 26.3% 26.9% 29.4%
Enterprise GP 3,147 4,400 6,582 7,848 8,719 25.6%
Gross Margin % 16.9% 20.0% 21.7% 21.3% 20.5%
% of Total GP 80% 76% 74% 73% 71%
Tanla Platforms GP 3,913 5,777 8,936 10,743 12,346 28.8%
Gross Margin % 20.1% 24.7% 27.2% 26.9% 26.5%
Source: Company, HSIE Research
Quarterly performance Tanla Platforms reported a robust Q2FY22, with revenue of INR 8.4bn, up
+34.4/44.3% QoQ/YoY, thanks to higher messaging volumes from existing customers,
the addition of 87 new customers, the emergence of new use cases, and higher ILD
rates (which contributed 50% of the growth in Q2). BFSI led the way in terms of
growth, with substantial traction in the e-commerce, retail, and government verticals.
Revenue from >INR 10 million clients increased by 46.4% YoY to INR 8.2bn (97.3% of
revenue), while average revenue per >INR 10 million client increased by 13.8% to
INR 47mn. The top 20 customers' revenue concentration fell by 473bps, showing that
other customers' participation is gradually increasing. Strong growth combined with
embedded non-linearity in operating expenses resulted in a 432/451bps increase in
gross/EBITDA margin YoY. PAT grew by 67.1% YoY to INR 1.4bn, with a strong cash
conversion of 132%.
The company generated INR 2.2bn in free cash flows and has INR 8.5bn in cash
reserves. To drive the next stages of high growth, the company plans to: (1) continue
making significant investments in Wisely, in line with its one platform strategy; (2)
build capabilities on existing platforms for new use cases; (3) add more enterprises to
its client base; (4) scout for bolt-on acquisition opportunities to enhance
communication capabilities; and (5) expand globally.
Q2FY22 business highlights: Enterprise revenue increased 36.5/41.5% QoQ/YoY
to INR 7.8bn, thanks to higher messaging volumes from enterprises and higher
ILD rates, while gross margin increased 342bps to 22.1%. In H1FY22, there were
160 new clients added, compared to 153 in H1FY21. Platform revenue increased
12.6/90.2% QoQ/YoY to INR 0.6bn, owing to an increase in the volume of
transactions processed by the DLT platform Trubloq, but gross margin contracted
280bps to 92.6%. However, when direct costs such as sales, marketing, and
personnel are factored in, the gross margin for platform businesses is 70-75%.

Page | 18
Tanla Platforms: Initiating Coverage
Key takeaways: (1) The Wisely platform, which is currently in beta testing phase,
has been updated with new features. The company has closed two additional
substantial partnerships for this platform, which is expected to be announced in
Q3FY22; (2) revenue from the WhatsApp channel doubled QoQ, and email has
been expanding well; (3) NLD volumes grew faster than ILD volumes, but ILD
grew faster in value terms due to price hikes; (4) contracts with enterprises
typically last three years, and most of them are auto-renewable.
Quarterly financial snapshot (INR mn) - consolidated
YE March (INR mn) Q2FY22 Q2FY21 YoY (%) Q1FY22 QoQ (%)
Total Revenue 8,416 5,832 44.3 6,264 34.4
Cost of services 6,114 4,489 36.2 4,529 35.0
Gross Profit 2,302 1,343 71.4 1,735 32.7
Employee benefits expense 331 228 44.8 253 30.6
Connectivity and related expenses 35 28 25.0 28 27.6
Other expenses 150 112 34.3 109 37.8
EBITDA 1,787 975 83.2 1,345 32.8
Depreciation 104 99 5.0 91 13.8
EBIT 1,683 876 92.1 1,254 34.2
Interest Cost 6 1 547.3 2 255.5
Other Income (including E/O) 31 47 (33.7) 43 (26.9)
PBT before Share of Associates 1,708 923 85.2 1,295 31.9
Shares of Associates 0 0 NM 0
PBT 1,708 923 85.2 1,295 31.9
Tax expense 347 108 221.2 250 38.5
RPAT 1,362 815 67.1 1,045 30.3
E/o items 0 0
0
APAT 1,362 815 67.1 1,045 30.3
Margin Analysis Q2FY22 Q2FY21 YoY bps Q1FY22 QoQ bps
Cost of services % of sales 72.6 77.0 (432) 72.3 34
Employee Cost % of sales 3.9 3.9 1 4.0 (11)
Connectivity and other exp % of sale 0.4 0.5 (6) 0.4 (2)
Other Expenses % of sales 1.8 1.9 (13) 1.7 4
Gross Margin (%) 27.4 23.0 432 27.7 (34)
EBITDA Margin (%) 21.2 16.7 451 21.5 (25)
EBIT Margin (%) 20.0 15.0 497 20.0 (2)
Tax Rate (%) 20.3 11.7 859 19.3 NM
APAT Margin (%) 16.2 14.0 221 16.7 (50)
Source: Company, HSIE Research
Business Revenues (INR mn) Q2FY22 Q2FY21 YoY (%) Q1FY22 QoQ (%)
Enterprise Business Revenue 7,792 5,505 41.5 5,709 36.5
Platform Business Revenue 624 328 90.2 554 12.6
Total Revenue 8,416 5,833 44.3 6,263 34.4
Enterprise Business Gross Profit 1,724 1,030 67.4 1,201 43.5
Platform Business Gross Profit 578 313 84.7 533 8.4
Total Gross Profit 2,302 1,343 71.4 1,734 32.8
Enterprise Gross Margin (%) 22.1 18.7 341 21.0 109
Platform Gross Margin (%) 92.6 95.4 (280) 96.2 (358)
Source: Company, HSIE Research
Page | 19
Tanla Platforms: Initiating Coverage
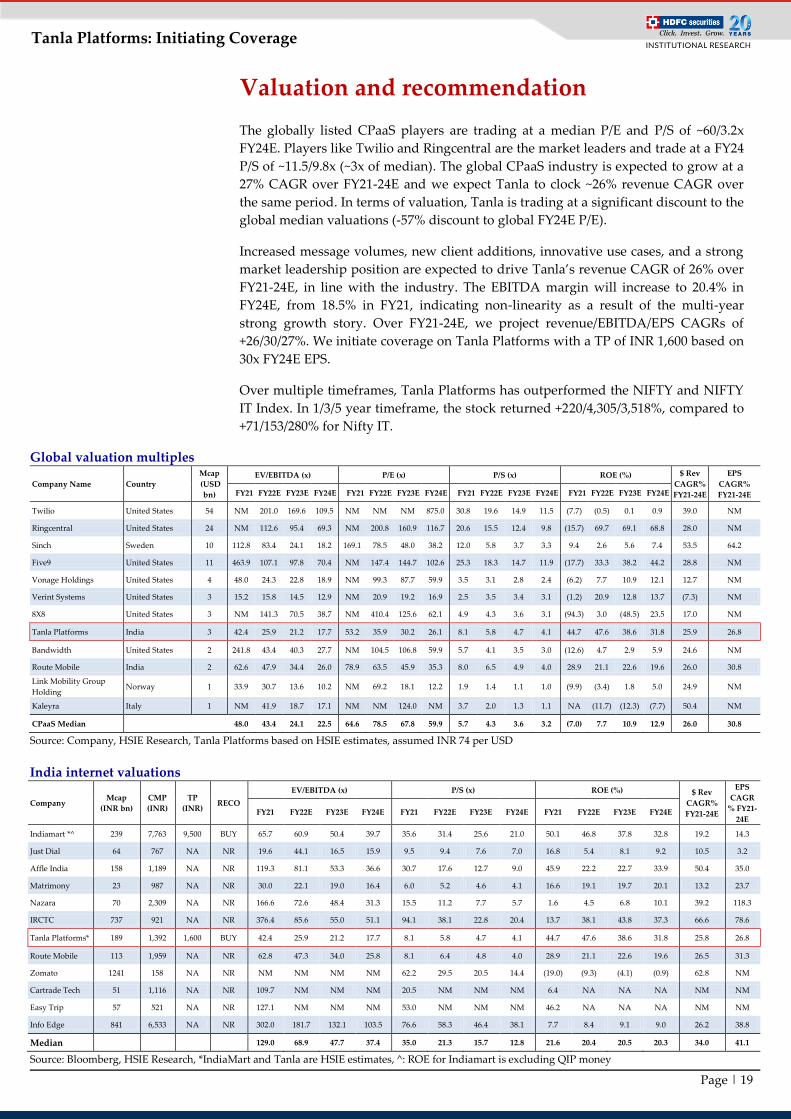
Valuation and recommendation
The globally listed CPaaS players are trading at a median P/E and P/S of ~60/3.2x
FY24E. Players like Twilio and Ringcentral are the market leaders and trade at a FY24
P/S of ~11.5/9.8x (~3x of median). The global CPaaS industry is expected to grow at a
27% CAGR over FY21-24E and we expect Tanla to clock ~26% revenue CAGR over
the same period. In terms of valuation, Tanla is trading at a significant discount to the
global median valuations (-57% discount to global FY24E P/E).
Increased message volumes, new client additions, innovative use cases, and a strong
market leadership position are expected to drive Tanla’s revenue CAGR of 26% over
FY21-24E, in line with the industry. The EBITDA margin will increase to 20.4% in
FY24E, from 18.5% in FY21, indicating non-linearity as a result of the multi-year
strong growth story. Over FY21-24E, we project revenue/EBITDA/EPS CAGRs of
+26/30/27%. We initiate coverage on Tanla Platforms with a TP of INR 1,600 based on
30x FY24E EPS.
Over multiple timeframes, Tanla Platforms has outperformed the NIFTY and NIFTY
IT Index. In 1/3/5 year timeframe, the stock returned +220/4,305/3,518%, compared to
+71/153/280% for Nifty IT.
Global valuation multiples
Company Name Country
Mcap
(USD
bn)
EV/EBITDA (x) P/E (x) P/S (x) ROE (%) $ Rev
CAGR%
FY21-24E
EPS
CAGR%
FY21-24E FY21 FY22E FY23E FY24E FY21 FY22E FY23E FY24E FY21 FY22E FY23E FY24E FY21 FY22E FY23E FY24E
Twilio United States 54 NM 201.0 169.6 109.5 NM NM NM 875.0 30.8 19.6 14.9 11.5 (7.7) (0.5) 0.1 0.9 39.0 NM
Ringcentral United States 24 NM 112.6 95.4 69.3 NM 200.8 160.9 116.7 20.6 15.5 12.4 9.8 (15.7) 69.7 69.1 68.8 28.0 NM
Sinch Sweden 10 112.8 83.4 24.1 18.2 169.1 78.5 48.0 38.2 12.0 5.8 3.7 3.3 9.4 2.6 5.6 7.4 53.5 64.2
Five9 United States 11 463.9 107.1 97.8 70.4 NM 147.4 144.7 102.6 25.3 18.3 14.7 11.9 (17.7) 33.3 38.2 44.2 28.8 NM
Vonage Holdings United States 4 48.0 24.3 22.8 18.9 NM 99.3 87.7 59.9 3.5 3.1 2.8 2.4 (6.2) 7.7 10.9 12.1 12.7 NM
Verint Systems United States 3 15.2 15.8 14.5 12.9 NM 20.9 19.2 16.9 2.5 3.5 3.4 3.1 (1.2) 20.9 12.8 13.7 (7.3) NM
8X8 United States 3 NM 141.3 70.5 38.7 NM 410.4 125.6 62.1 4.9 4.3 3.6 3.1 (94.3) 3.0 (48.5) 23.5 17.0 NM
Tanla Platforms India 3 42.4 25.9 21.2 17.7 53.2 35.9 30.2 26.1 8.1 5.8 4.7 4.1 44.7 47.6 38.6 31.8 25.9 26.8
Bandwidth United States 2 241.8 43.4 40.3 27.7 NM 104.5 106.8 59.9 5.7 4.1 3.5 3.0 (12.6) 4.7 2.9 5.9 24.6 NM
Route Mobile India 2 62.6 47.9 34.4 26.0 78.9 63.5 45.9 35.3 8.0 6.5 4.9 4.0 28.9 21.1 22.6 19.6 26.0 30.8
Link Mobility Group
Holding Norway 1 33.9 30.7 13.6 10.2 NM 69.2 18.1 12.2 1.9 1.4 1.1 1.0 (9.9) (3.4) 1.8 5.0 24.9 NM
Kaleyra Italy 1 NM 41.9 18.7 17.1 NM NM 124.0 NM 3.7 2.0 1.3 1.1 NA (11.7) (12.3) (7.7) 50.4 NM
CPaaS Median
48.0 43.4 24.1 22.5 64.6 78.5 67.8 59.9 5.7 4.3 3.6 3.2 (7.0) 7.7 10.9 12.9 26.0 30.8
Source: Company, HSIE Research, Tanla Platforms based on HSIE estimates, assumed INR 74 per USD
India internet valuations
Company Mcap
(INR bn)
CMP
(INR)
TP
(INR) RECO
EV/EBITDA (x) P/S (x) ROE (%) $ Rev
CAGR%
FY21-24E
EPS
CAGR
% FY21-
24E FY21 FY22E FY23E FY24E FY21 FY22E FY23E FY24E FY21 FY22E FY23E FY24E
Indiamart *^ 239 7,763 9,500 BUY 65.7 60.9 50.4 39.7 35.6 31.4 25.6 21.0 50.1 46.8 37.8 32.8 19.2 14.3
Just Dial 64 767 NA NR 19.6 44.1 16.5 15.9 9.5 9.4 7.6 7.0 16.8 5.4 8.1 9.2 10.5 3.2
Affle India 158 1,189 NA NR 119.3 81.1 53.3 36.6 30.7 17.6 12.7 9.0 45.9 22.2 22.7 33.9 50.4 35.0
Matrimony 23 987 NA NR 30.0 22.1 19.0 16.4 6.0 5.2 4.6 4.1 16.6 19.1 19.7 20.1 13.2 23.7
Nazara 70 2,309 NA NR 166.6 72.6 48.4 31.3 15.5 11.2 7.7 5.7 1.6 4.5 6.8 10.1 39.2 118.3
IRCTC 737 921 NA NR 376.4 85.6 55.0 51.1 94.1 38.1 22.8 20.4 13.7 38.1 43.8 37.3 66.6 78.6
Tanla Platforms* 189 1,392 1,600 BUY 42.4 25.9 21.2 17.7 8.1 5.8 4.7 4.1 44.7 47.6 38.6 31.8 25.8 26.8
Route Mobile 113 1,959 NA NR 62.8 47.3 34.0 25.8 8.1 6.4 4.8 4.0 28.9 21.1 22.6 19.6 26.5 31.3
Zomato 1241 158 NA NR NM NM NM NM 62.2 29.5 20.5 14.4 (19.0) (9.3) (4.1) (0.9) 62.8 NM
Cartrade Tech 51 1,116 NA NR 109.7 NM NM NM 20.5 NM NM NM 6.4 NA NA NA NM NM
Easy Trip 57 521 NA NR 127.1 NM NM NM 53.0 NM NM NM 46.2 NA NA NA NM NM
Info Edge 841 6,533 NA NR 302.0 181.7 132.1 103.5 76.6 58.3 46.4 38.1 7.7 8.4 9.1 9.0 26.2 38.8
Median
129.0 68.9 47.7 37.4 35.0 21.3 15.7 12.8 21.6 20.4 20.5 20.3 34.0 41.1
Source: Bloomberg, HSIE Research, *IndiaMart and Tanla are HSIE estimates, ^: ROE for Indiamart is excluding QIP money

Page | 20
Tanla Platforms: Initiating Coverage
Tanla P/E (1-yr fwd) trend
Source: Bloomberg, HSIE Research
20.0
22.0
24.0
26.0
28.0
30.0
32.0
34.0
36.0
Dec
-20
Jan
-21
Feb
-21
Mar
-21
Ap
r-21
May
-21
Jun
-21
Jul-
21
Au
g-2
1
Sep
-21
Oct
-21
No
v-2
1
P/E (1-yr fwd) 1 Yr Mean 1SD + 1SD - 2SD + 2SD -

Page | 21
Tanla Platforms: Initiating Coverage
Financials Consolidated Income Statement YE March (INR mn) FY17 FY18 FY19 FY20 FY21 FY22E FY23E FY24E
Net Revenues 5,793 7,916 10,040 19,428 23,415 32,829 39,994 46,588
Growth (%) 34.2 36.6 26.8 93.5 20.5 40.2 21.8 16.5
Cost of services 4,945 6,955 8,607 15,517 17,638 23,892 29,251 34,242
Gross Profit 848 961 1,433 3,911 5,777 8,937 10,743 12,346
Employee Expenses 144 142 229 1,089 861 1,255 1,515 1,695
Connectivity and related expenses 20 38 27 82 117 153 200 233
Other operating Expenses 122 130 209 890 464 598 800 932
EBITDA 561 652 967 1,850 4,335 6,931 8,228 9,486
EBITDA Margin (%) 9.7 8.2 9.6 9.5 18.5 21.1 20.6 20.4
EBITDA Growth (%) (14.4) 16.2 48.4 91.3 134.3 59.9 18.7 15.3
Depreciation 196 573 732 3,778 396 474 515 563
EBIT 365 79 235 (1,928) 3,939 6,457 7,713 8,923
Other Income (Including EO Items) 25 48 106 (364) 219 141 147 160
Interest 0 0 3 64 11 15 15 16
PBT 390 126 338 (2,356) 4,148 6,583 7,846 9,068
Tax (Incl Deferred) (19) (65) 37 (261) 586 1,313 1,569 1,814
Minority Interest 0 0 0 0 0 0 0 0
Share of profit / (Loss) of associate 0 0 (3) (17) 0 0 0 0
RPAT 409 191 298 (2,112) 3,561 5,270 6,277 7,254
EO (Loss) / Profit 0 0 0 (3,395) 0 0 0 0
APAT 409 191 298 1,284 3,561 5,270 6,277 7,254
APAT Growth (%) 465.0 (53.3) 56.1 330.5 177.4 48.0 19.1 15.6
Adjusted EPS (Rs) 3.0 1.4 2.2 9.4 26.2 38.7 46.1 53.3
EPS Growth (%) 465.0 (53.3) 56.1 330.5 177.4 48.0 19.1 15.6
Consolidated Balance Sheet YE March (INR mn) FY17 FY18 FY19 FY20 FY21 FY22E FY23E FY24E
SOURCES OF FUNDS
Share Capital – Equity 107 112 116 146 136 135 135 135
Reserves 6,456 6,764 7,140 6,871 8,795 13,090 19,187 26,235
Total Shareholders Funds 6,563 6,876 7,255 7,017 8,931 13,226 19,323 26,370
Minority Interest 0 0 0 0 0 0 0 0
Long Term Debt 0 0 469 43 35 35 35 35
Short Term Debt 0 0 130 10 9 9 9 9
Total Debt 0 0 599 54 43 43 43 43
Net Deferred Taxes (Net) (69) (145) (168) (567) (428) (428) (428) (428)
Long Term Provisions & Others 3 2 3 110 87 121 148 172
TOTAL SOURCES OF FUNDS 6,497 6,733 7,689 6,613 8,633 12,962 19,086 26,158
APPLICATION OF FUNDS
Net Block 4,619 4,520 3,497 1,228 1,223 1,274 1,400 1,536
CWIP 245 0 58 133 64 64 64 64
Goodwill 5 0 0 1,346 1,346 1,346 1,346 1,346
Investments 39 0 0 0 0 0 0 0
LT Loans & Advances & Others 178 110 204 841 370 593 562 655
Total Non-current Assets 5,086 4,630 3,758 3,548 3,002 3,276 3,371 3,600
Inventories 221 0 0 0 0 0 0 0
Debtors 1,136 2,055 3,078 3,258 3,731 5,397 6,794 8,041
Other Current Assets 64 855 1,759 2,511 3,122 4,393 5,352 6,234
Cash & Equivalents 1,333 1,654 2,305 2,006 5,841 9,630 14,899 21,477
Total Current Assets 2,755 4,564 7,142 7,774 12,695 19,420 27,045 35,752
Creditors 1,234 2,375 2,023 2,806 5,062 7,016 8,218 9,573
Other Current Liabilities & Provns 110 86 1,188 1,903 2,003 2,719 3,113 3,622
Total Current Liabilities 1,344 2,461 3,212 4,709 7,065 9,734 11,331 13,194
Net Current Assets 1,411 2,103 3,930 3,066 5,630 9,686 15,714 22,558
TOTAL APPLICATION OF FUNDS 6,497 6,733 7,689 6,613 8,633 12,962 19,086 26,158
Source: Company, HSIE Research

Page | 22
Tanla Platforms: Initiating Coverage
Consolidated Cash Flow YE March (INR mn) FY17 FY18 FY19 FY20 FY21 FY22E FY23E FY24E
Reported PBT and exceptional items 390 126 335 (1,868) 4,148 6,583 7,846 9,068
Non-operating & EO items (0) (23) (46) 443 (162) (141) (147) (160)
Interest expenses 0 0 0 0 0 15 15 16
Depreciation 196 573 732 3,778 396 474 515 563
Working Capital Change 130 (354) (1,325) 485 1,790 (455) (703) (334)
Tax Paid 0 0 0 (447) (561) (1,313) (1,569) (1,814)
OPERATING CASH FLOW ( a ) 716 323 (304) 2,392 5,610 5,164 5,956 7,338
Capex (71) (95) 121 (2,112) (317) (525) (640) (699)
Free cash flow (FCF) 645 228 (183) 280 5,293 4,638 5,316 6,639
Investments 0 0 (20) 0 0 0 0 0
Non-operating Income 25 43 100 111 219 141 147 160
INVESTING CASH FLOW ( b ) (46) (52) 201 (2,001) (98) (384) (493) (539)
Debt Issuance/(Repaid) 0 0 599 (622) (54) 0 0 0
Interest Expenses 0 0 0 (5) (11) (15) (15) (16)
FCFE 645 228 416 (346) 5,229 4,624 5,301 6,624
Share Capital Issuance/buyback 154 84 179 14 (1,476) (819) 0 0
Dividend 0 (33) (41) (61) (136) (156) (180) (207)
FINANCING CASH FLOW ( c ) 154 50 737 (673) (1,677) (990) (195) (222)
NET CASH FLOW (a+b+c) 824 321 633 (282) 3,836 3,789 5,269 6,577
EO Items, Others (0) 0 17 (17) 0 0 0 0
Closing Cash & Equivalents 1,333 1,654 2,305 2,006 5,841 9,630 14,899 21,477
Source: Company, HSIE Research
Key Ratios FY17 FY18 FY19 FY20 FY21 FY22E FY23E FY24E
PROFITABILITY (%)
GPM 14.6 12.1 14.3 20.1 24.7 27.2 26.9 26.5
EBITDA Margin 9.7 8.2 9.6 9.5 18.5 21.1 20.6 20.4
APAT Margin 7.1 2.4 3.0 6.6 15.2 16.1 15.7 15.6
RoE 6.2 2.8 4.2 18.0 44.7 47.6 38.6 31.8
RoIC (or Core RoCE)* 5.2 1.2 4.0 15.7 91.4 168.8 164.2 161.0
RoCE* 6.3 2.9 4.2 18.7 46.8 48.9 39.2 32.1
EFFICIENCY
Tax Rate (%) NM NM 10.8% NM 14.1% 19.9% 20.0% 20.0%
Fixed Asset Turnover (x) 1.2 1.5 2.0 3.0 3.5 4.6 5.2 5.5
Inventory (days) 14 0 0 0 0 0 0 0
Debtors (days) 72 95 112 61 58 60 62 63
Other Current Assets (days) 4 39 64 47 49 49 49 49
Payables (days) 78 110 74 53 79 78 75 75
Other Current Liab & Provns (days) 7 4 43 36 31 30 28 28
Cash Conversion Cycle (days) (9) 21 59 20 (3) 1 7 8
Debt/EBITDA (x) 0.0 0.0 0.6 0.0 0.0 0.0 0.0 0.0
Net D/E (x) -0.2 -0.2 -0.2 -0.3 -0.6 -0.7 -0.8 -0.8
Interest Coverage (x) NM NM 73 NM 366 435 510 570
PER SHARE DATA (Rs)
EPS 3.0 1.4 2.2 9.4 26.2 38.7 46.1 53.3
CEPS 4.4 5.6 7.6 37.2 29.1 42.2 49.9 57.5
Dividend 0.0 1.5 1.5 3.5 3.5 1.5 3.5 1.5
Book Value 48.2 50.5 53.3 51.6 65.6 97.2 142.0 193.8
VALUATION
P/E (x) 462.9 991.1 635.0 147.5 53.2 35.9 30.2 26.1
P/BV (x) 28.9 27.5 26.1 27.0 21.2 14.3 9.8 7.2
EV/Revenue (x) 32.5 23.7 18.7 9.6 7.8 5.5 4.4 3.6
EV/EBITDA (x) 335.2 288.0 194.0 101.3 42.4 25.9 21.2 17.7
OCF/EV (%) 0.4 0.2 (0.2) 1.3 3.1 2.9 3.4 4.4
FCF/EV (%) 0.3 0.1 (0.1) 0.1 2.9 2.6 3.0 4.0
FCFE/Mkt Cap (%) 0.3 0.1 0.2 (0.2) 2.8 2.4 2.8 3.5
Dividend Yield (%) 0.0 0.1 0.1 0.3 0.3 0.1 0.3 0.1
Source: Company, HSIE Research,* ROIC and ROCE for FY17, FY18 and FY20 calculated assuming a tax rate of 20%

Page | 23
Tanla Platforms: Initiating Coverage
Rating Criteria
BUY: >+15% return potential
ADD: +5% to +15% return potential
REDUCE: -10% to +5% return potential
SELL: > 10% Downside return potential
RECOMMENDATION HISTORY
0
200
400
600
800
1,000
1,200
1,400
1,600
1,800
No
v-2
0
Dec
-20
Jan
-21
Feb
-21
Ma
r-2
1
Ap
r-2
1
Ma
y-2
1
Jun
-21
Jul-
21
Au
g-2
1
Sep
-21
Oct
-21
No
v-2
1
Tanla TPDate CMP Reco Target
18-Nov-21 1,392 BUY 1,600

Page | 24
Tanla Platforms: Initiating Coverage
Disclosure:
We, Amit Chandra, MBA & Mohit Motwani, MBA authors and the names subscribed to this report, hereby certify that all of the views expressed in this
research report accurately reflect our views about the subject issuer(s) or securities. HSL has no material adverse disciplinary history as on the date of
publication of this report. We also certify that no part of our compensation was, is, or will be directly or indirectly related to the specific recommendation(s) or
view(s) in this report.
Research Analyst or his/her relative or HDFC Securities Ltd. does not have any financial interest in the subject company. Also Research Analyst or his relative
or HDFC Securities Ltd. or its Associate may have beneficial ownership of 1% or more in the subject company at the end of the month immediately preceding
the date of publication of the Research Report. Further Research Analyst or his relative or HDFC Securities Ltd. or its associate does not have any material
conflict of interest.
Any holding in stock –No
HDFC Securities Limited (HSL) is a SEBI Registered Research Analyst having registration no. INH000002475.
Disclaimer:
This report has been prepared by HDFC Securities Ltd and is solely for information of the recipient only. The report must not be used as a singular basis of any
investment decision. The views herein are of a general nature and do not consider the risk appetite or the particular circumstances of an individual investor;
readers are requested to take professional advice before investing. Nothing in this document should be construed as investment advice. Each recipient of this
document should make such investigations as they deem necessary to arrive at an independent evaluation of an investment in securities of the companies
referred to in this document (including merits and risks) and should consult their own advisors to determine merits and risks of such investment. The
information and opinions contained herein have been compiled or arrived at, based upon information obtained in good faith from sources believed to be
reliable. Such information has not been independently verified and no guaranty, representation of warranty, express or implied, is made as to its accuracy,
completeness or correctness. All such information and opinions are subject to change without notice. Descriptions of any company or companies or their
securities mentioned herein are not intended to be complete. HSL is not obliged to update this report for such changes. HSL has the right to make changes and
modifications at any time.
This report is not directed to, or intended for display, downloading, printing, reproducing or for distribution to or use by, any person or entity who is a citizen
or resident or located in any locality, state, country or other jurisdiction where such distribution, publication, reproduction, availability or use would be
contrary to law or regulation or what would subject HSL or its affiliates to any registration or licensing requirement within such jurisdiction.
If this report is inadvertently sent or has reached any person in such country, especially, United States of America, the same should be ignored and brought to
the attention of the sender. This document may not be reproduced, distributed or published in whole or in part, directly or indirectly, for any purposes or in
any manner.
Foreign currencies denominated securities, wherever mentioned, are subject to exchange rate fluctuations, which could have an adverse effect on their value or
price, or the income derived from them. In addition, investors in securities such as ADRs, the values of which are influenced by foreign currencies effectively
assume currency risk. It should not be considered to be taken as an offer to sell or a solicitation to buy any security.
This document is not, and should not, be construed as an offer or solicitation of an offer, to buy or sell any securities or other financial instruments. This report
should not be construed as an invitation or solicitation to do business with HSL. HSL may from time to time solicit from, or perform broking, or other services
for, any company mentioned in this mail and/or its attachments.
HSL and its affiliated company(ies), their directors and employees may; (a) from time to time, have a long or short position in, and buy or sell the securities of
the company(ies) mentioned herein or (b) be engaged in any other transaction involving such securities and earn brokerage or other compensation or act as a
market maker in the financial instruments of the company(ies) discussed herein or act as an advisor or lender/borrower to such company(ies) or may have any
other potential conflict of interests with respect to any recommendation and other related information and opinions.
HSL, its directors, analysts or employees do not take any responsibility, financial or otherwise, of the losses or the damages sustained due to the investments
made or any action taken on basis of this report, including but not restricted to, fluctuation in the prices of shares and bonds, changes in the currency rates,
diminution in the NAVs, reduction in the dividend or income, etc.
HSL and other group companies, its directors, associates, employees may have various positions in any of the stocks, securities and financial instruments dealt
in the report, or may make sell or purchase or other deals in these securities from time to time or may deal in other securities of the companies / organizations
described in this report.
HSL or its associates might have managed or co-managed public offering of securities for the subject company or might have been mandated by the subject
company for any other assignment in the past twelve months.
HSL or its associates might have received any compensation from the companies mentioned in the report during the period preceding twelve months from the
date of this report for services in respect of managing or co-managing public offerings, corporate finance, investment banking or merchant banking, brokerage
services or other advisory service in a merger or specific transaction in the normal course of business.
HSL or its analysts did not receive any compensation or other benefits from the companies mentioned in the report or third party in connection with
preparation of the research report. Accordingly, neither HSL nor Research Analysts have any material conflict of interest at the time of publication of this
report. Compensation of our Research Analysts is not based on any specific merchant banking, investment banking or brokerage service transactions. HSL may
have issued other reports that are inconsistent with and reach different conclusion from the information presented in this report.
Research entity has not been engaged in market making activity for the subject company. Research analyst has not served as an officer, director or employee of
the subject company. We have not received any compensation/benefits from the subject company or third party in connection with the Research Report.
HDFC securities Limited, I Think Techno Campus, Building - B, "Alpha", Office Floor 8, Near Kanjurmarg Station, Opp. Crompton Greaves, Kanjurmarg
(East), Mumbai 400 042 Phone: (022) 3075 3400 Fax: (022) 2496 5066 Compliance Officer: Binkle R. Oza Email: [email protected] Phone: (022)
3045 3600
HDFC Securities Limited, SEBI Reg. No.: NSE, BSE, MSEI, MCX: INZ000186937; AMFI Reg. No. ARN: 13549; PFRDA Reg. No. POP: 11092018; IRDA
Corporate Agent License No.: CA0062; SEBI Research Analyst Reg. No.: INH000002475; SEBI Investment Adviser Reg. No.: INA000011538; CIN -
U67120MH2000PLC152193
HDFC securities
Institutional Equities
Unit No. 1602, 16th Floor, Tower A, Peninsula Business Park,
Senapati Bapat Marg, Lower Parel, Mumbai - 400 013
Board: +91-22-6171-7330 www.hdfcsec.com