
Biomethane Production Facility Pipeline Interconnection in ...
Upload
khangminh22Category
view
1download
0
ENTE PER LE NUOVE TECNOLOGIE,L'ENERGIA E L'AMBIENTE
IT0600150
ISSN/0393-3016
Y IRRADIATION FACILITY AT ENEA-CASACCIA CENTRE(ROME)
S. BACCARO, A. CECILIA, A. PASQUALI
ENEA - Unità Tecnico Scientifica Tecnologie Fisiche AvanzateCentro Ricerche Casaccia, Roma
RT/2005/28/FIS

ENTE PER LE NUOVE TECNOLOGIE,L'ENERGIA E L'AMBIENTE
Y IRRADIATION FACILITY AT ENEA-CASACCIA CENTRE(ROME)
S. BACCARO, A. CECILIA, A. PASQUALI
ENEA - Unità Tecnico Scientifica Tecnologie Fisiche AvanzateCentro Ricerche Casaccia, Roma
RT/2005/28/FIS
I contenuti tecnico-scientifici dei rapporti tecnici dell'ENEA rispecchiano l'opinione degli autori enon necessariamente quella dell'Ente.
The technical and scientific contents of these reports express the opinion of the authors but notnecessarily the opinion of ENEA.
IMPIANTO DI IRRAGGIAMENTO y CALLIOPE PRESSO IL CENTRE RICERCHEENEA-CASACCIA (ROMA)
RiassuntoIn questo lavoro viene descritto l'impianto di irraggiamento y "Calliope" del Centro Ricerche
ENEA-Casaccia (Roma). In particolare vengono riportate le principali caratteristiche dell'impiantodi irraggiamento necessarie per definire le modalità di tempo e di irraggiamento. Le tecnichedosimetriche"utilizzate sono: la dosimetria di Fricke, la Red-Perspex e quella ESR con alanina. Nelprimo caso la dose assorbita è misurata attraverso cambiamenti chimici indotti dalla radiazione inuna soluzione mentre nel secondo metodo si utilizza l'aumento della densità ottica del dosimetrodovuto all'irraggiamento. Infine la tecnica ESR ad alanina si basa sull'analisi dei radicali liberiindotti dall'irraggiamento nell'aminoacido a-alanina.
Nel lavoro è anche fornita una simulazione del campo di radiazione all'interno della cella diirraggiamento realizzata con il codice FLUKA, che include un'ottima descrizione dei processi diiterazione elettromagnetici fino ad un'energia di l\,keV.
Parole chiave: radiazione y, Dosimetria, Impianto di irraggiamento.
Y IRRADIATION FACILITY AT ENEA-CASACCIA CENTRE (ROME)
AbstractA description of "Calliope" y irradiation plant of ENEA-Casaccia Centre (Rome) is presented in
this paper. In particular the main characteristics of the irradiation facility necessary to define timeand irradiation procedure are summarised. The plant is equipped with dosimetrie services thatevaluate absorbed doses in materials during irradiation. Dosimetrie techniques used are Fricke, Red-Perspex and alanine-ESR dosimetries. In the first case, absorbed dose is determined by chemicalchanges induced in a solution by irradiation and the second method uses the optical density increaseinduced in dosimeter by irradiation. The last method is based on the analysis of the free radicalconcentration induced in a-alanine amino-acid during irradiation.
The paper provides also a simulation of the y radiation field inside the irradiation cell realisedby using FLUKA. code, which includes a good description of the electromagnetic physics down toabout l\,keV.
Keywords: y radiation, Dosimetry, Irradiation plant.


Index
Introduction 3Chapterl : Calliope irradiation plant and dosimetry 4
1.1 Irradiation plant 41.2 Irradiation and dosimetry 8
1.2.1 Charge particle equilibrium and thickness 81.3 Dosimetrie methods used for y radiation 10
1.3.1 Fricke dosimeter 101.3.2 Red Perspex Dosimeter 121.3.3 Alanine dosimetrie method 13
1.3.3 a- Alanine dosimeter calibration for low doses 141.3.3 b- Alanine dosimeter calibration for high doses 15
1.4 Interaction of X-rays and y radiation with matter 161.4.1 Photoelectric effect 171.4.2 Compton effect 171.4.3 Pair production 18
1.5 Absorbed dose calculation 18Chapter 2: Ionising radiation damage test on electronic devices at Calliope plant 21
2.1 Radiation induced damage on electronic devices 212.2 MIL-STD-883 and ESA/SCC BASIC specifications 21
Chapter 3: Simulation of Calliope radiation field with FLUKA code 233.1 Dose rate theoretical estimation and comparison with experimental results 23
Acknowledgements 26References 27


IntroductionThe aim of this work is the description of "Calliope" y irradiation plant (Research Centre
ENEA-Casaccia, Rome) and the definition of the physical sizes, methods, devices and/or set-upsused to measure absorbed dose in inorganic, organic, organic-biological and/or devices submittedto y irradiation.
The term ionising radiation refers to each kind of radiation able to induce ionisation and/orexcitation of atoms through primary and secondary interactions, when radiation impinges matter.Charged particles induce ionisation and excitation processes through Coulombic interaction withatomic electrons. Generally, X- and y-rays interact with matter through three main processes:photoelectric effect, Compton scattering and pair production. The result of that interaction is theemission of secondary charged particles, which in turn may induce further ionisation and excitationprocesses.Neutron too may induce the production of secondary charged particles through different kinds ofinteraction, such as (n, p), (n, d), (n, a) or (n, t) processes; in this sense they can be consideredionising radiation.Other kinds of radiation, such as UV, can not be considered ionising due to their inability to crossthe greatest part of materials [1,2].
According to ASTM E 170-76 [3], dosimetry is the process through which it is possible toobtain measurements describing an ionisation, a radiation field, some of the field components orthe absorption in matter of the field associated energy.
Dosimeter techniques can be divided in "absolute" and "relative" methods: in the first case,they allow the absorbed dose estimation by the measurement of a physical size; an example isrepresented by the absolute calorimetrie dosimetry, based on the temperature increase of theirradiated medium. On the contrary, relative dosimeters require an inter-calibration with anabsolute method [4]. At Calliope plant three kinds of dosimeters are used: Fricke solution, RedPerspex and alanine dosimeter. Among them, the solid state dosimeter methods (Red Perspex andalanine) are relative measurement methods and they are periodically calibrated with an absolutedosimeter method, which is represented by Fricke dosimeter.
At present, the plant is involved in radiation processing research on industrial materials, such aspolymers and on devices to be used in hostile radiation environment such as nuclear plants,aerospace experiments and High Energy Physics experiments [5-30]. As it will be shown inparagraph 2.2, very special cares are devoted to the qualification of electronic devices, which haveto be tested according to either MIL-STD-883 and ESA/SCC BASIC Specifications No.22900procedures.

Chapter 1: Calliope irradiation plant and dosimetry
1.1 Irradiation plantThe Calliope plant, located at the Research Centre ENEA-Casaccia, was constructed in 1967-
68 to carry out research activities and pilot experiences on agricultural product treatment byradiation (seed stimulation and food irradiation). Differently, in the eighties the plant has beeninvolved in radiation processing research on industrial materials (polymers and optical fibres) andon devices to be used in hostile radiation environment such as nuclear plants, aerospaceexperiments and High Energy Physics experiments. One of the main activities carried out in theLaboratory of the Calliope plant concerns the R&D of scintillating materials to be used asdetectors in High Energy and Medium Energy Physics experiment.The Calliope plant is a pool-type irradiation facility equipped with a 60Co y source [31, 32] in ahigh volume (7x6x3.9 m3) shielded cell. The source has cylindrical geometry with the 48 sourcerods arranged in two concentric cylinders of about 20 cm outer radius and 26 cm height (Figure 1).
r, i,117M.V IJJMcV
Figure 1: Cherenkov effect1 (a) and top view of the Calliope facility with 60Co decay (b)
The emitted radiation consists of two y photons of 1.173 and 1.332 MeV emitted in coincidence,with a mean photon's energy of 1.25 MeV. The maximum licensed activity for this plant is3.7xl015 Bq (100 kCi) but the present activity is 6.72xlO14 Bq (18.1 kCi) at January 2005 the 1st.In this plant it is possible to choice the dose rate at which to irradiate the sample. 5.4 kGy/h is themaximum dose rate along the rack longitudinal axis. The storage water pool dimensions are2x4.5x8 m3 and two separate source emergency storage wells are positioned on the bottom of thepool. On the roof of the cell a trap door allows the introduction or the withdraw of radioactivematerials in case of source recharge. The irradiation cell biological protection is realised in bariticconcrete having thickness up to 180 cm. The main Calliope features are reported in Table I;moreover, Figure 2 and 3 reports the lateral and x-y view of the plant. Inside the irradiation cell, ahumidity measuring element ("Polyga™", AMPERE S.p.A.) is positioned for the measurement ofrelative air humidity, temperature and ozone which are recorded by a coupled Data-Chart 2000Series (Ampere S.p.A.). The system detector & recorder is particularly useful in case of suddenscream, because it allows to date the exact time of the scream. Moreover, the possibility to transferacquired data on PC by a flash card allows the emission of an official irradiation certificate.
1 Cherenkov radiation is electromagnetic radiation emitted when a charged particle passes through an insulator at aspeed greater than that of light in the medium. The characteristic "blue glow" of nuclear reactors is due to Cherenkovradiation. It is named for P. A. Cherenkov, the 1958 Nobel Prize winner who was the first to rigorously characterize it.
4

Table I: Calliope main features
SOURCE:GEOMETRY:
EMITTED RADIATION:PHOTON ENERGY:MAX LICENSED ACTIVITY:PRESENT ACTIVITY(l-2-05) :MAX DOSE RATE:
ÒUCo, SS double encapsulated;cylindrical rack, with radioisotope pencils placed ontwo levels of external rack surface;2 Y photos emitted in coincidence;1.173 and 1.332 MeV (average 1.25 MeV);3.7xl015Bq(100kCi);6.72xlO14Bq(18.1kCi);5.4 kGy/h along the rack longitudinal axis.
"i nl o t capacity
trap door ;to introduce jor withdraw jsources ;
Pis
• C .
irradiation cell
. , . . f
)• • o Storage pool
•V 'LUÌ:-'
» •
Closing plug
opening for pump
INOX steal well
60Figure 2: Lateral view of the Co plant
i- Monitoring systamfor vaster pool Biological screen
„ | U External* ; . J labyrinth
building. .
access
i Labyrinth
Storage pool •
Si * y^J Source
Irradiation oellScroan vJ ndov/t
T
Ozone control system .-. il
Loadrg Aunloadlng area mobile system Unselsrrlc [ ^ Confrd aonsolt*
Slidng metal-dad doorContrd room If
Laboratory n . " | j Optical l*or»tory !j"j
i "f"
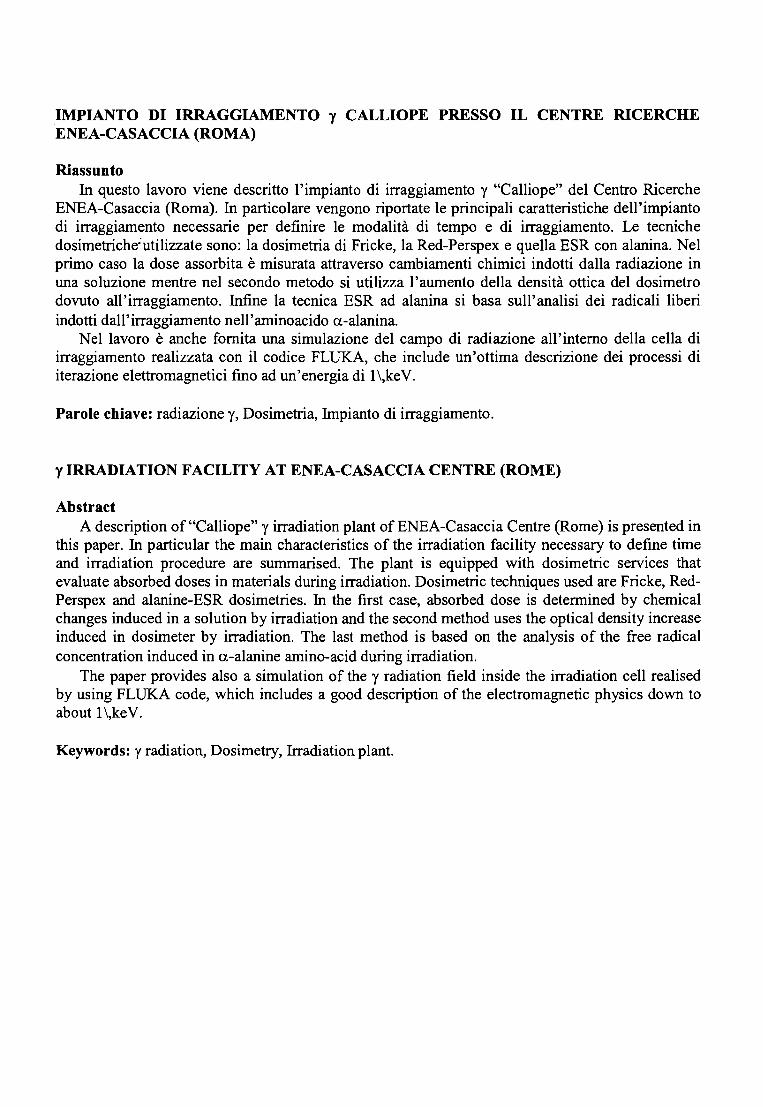
Figure 3: Calliope plant x-y view
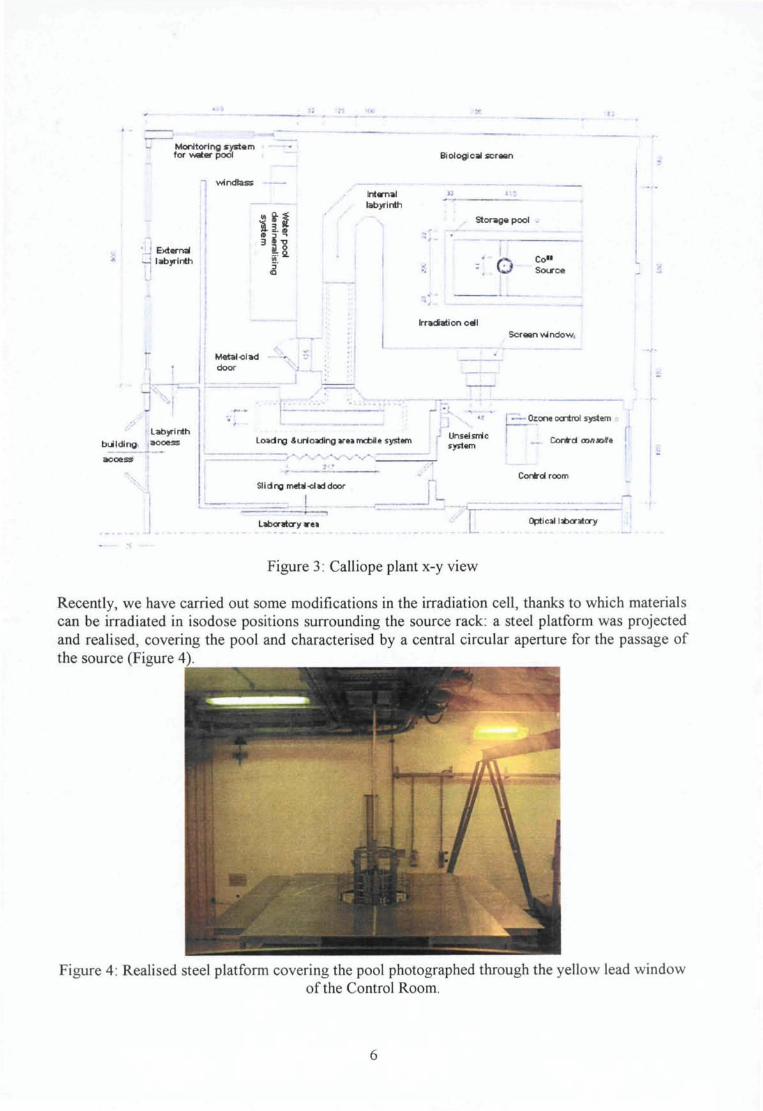
Recently, we have carried out some modifications in the irradiation cell, thanks to which materialscan be irradiated in isodose positions surrounding the source rack: a steel platform was projectedand realised, covering the pool and characterised by a central circular aperture for the passage ofthe source (Figure 4).
Figure 4: Realised steel platform covering the pool photographed through the yellow lead windowof the Control Room.
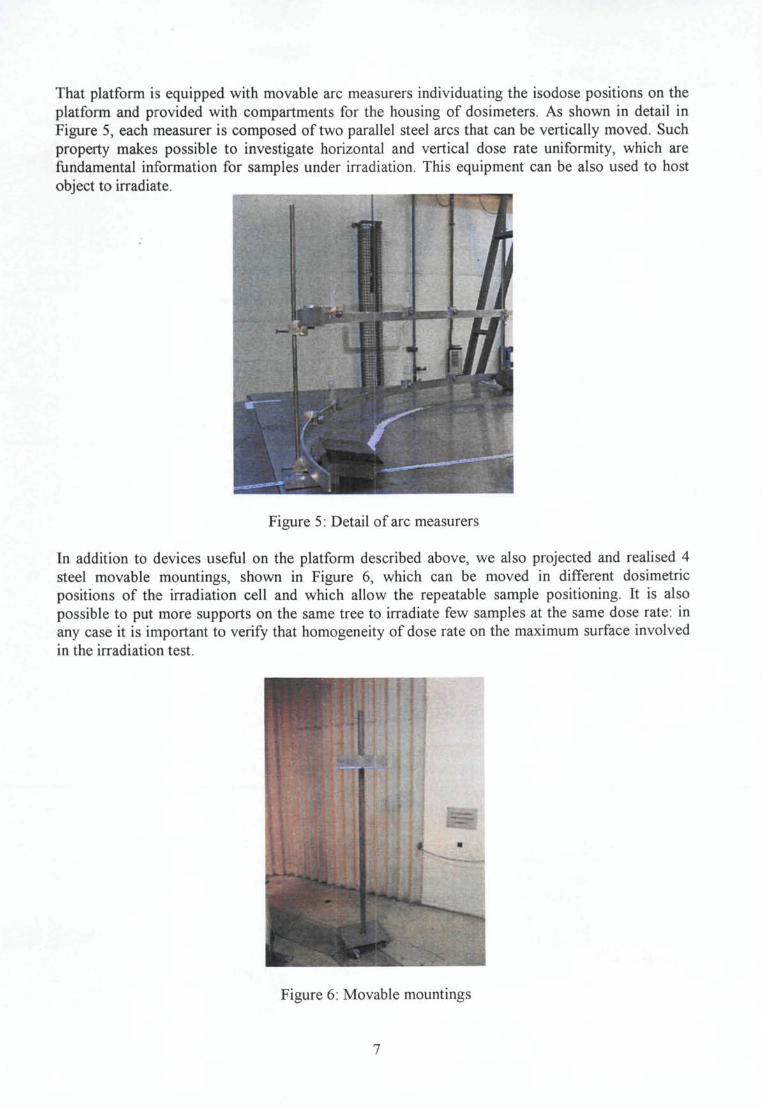
That platform is equipped with movable arc measurers individuating the isodose positions on theplatform and provided with compartments for the housing of dosimeters. As shown in detail inFigure 5, each measurer is composed of two parallel steel arcs that can be vertically moved. Suchproperty makes possible to investigate horizontal and vertical dose rate uniformity, which arefundamental information for samples under irradiation. This equipment can be also used to hostobject to irradiate.
Figure 5 : Detail of arc measurers
In addition to devices useful on the platform described above, we also projected and realised 4steel movable mountings, shown in Figure 6, which can be moved in different dosimetriepositions of the irradiation cell and which allow the repeatable sample positioning. It is alsopossible to put more supports on the same tree to irradiate few samples at the same dose rate: inany case it is important to verify that homogeneity of dose rate on the maximum surface involvedin the irradiation test.
Figure 6: Movable mountings

1.2 Irradiation and dosimetryA radiation generates in its surroundings a radiation field including either directly or indirectly
ionising radiation. In the first case, radiation consists of charged particles having sufficient energyto produce ionisation and/or excitation via collision processes; in the second case radiationconsists of uncharged particles (photons, neutrons, etc.) whose interaction with matter gives riseeither to directly ionising particles or nuclear reactions.
Dosimetry is the process through which it is possible to obtain a measurement describing anionisation, a radiation field, some field components or the absorption in the matter of the fieldassociated energy. The most used size in radiation dosimetry, furnishing a quantitative correlationbetween radiation and its effect, is the absorbed dose.
According to ICRU-Report 33 [33], the absorbed dose is defined as the ratio between energyids) released from radiation to matter in a certain volume and the volume mass (dm).
D = £ (1)dm
In (1) e is the energy released in the volume from an ionising radiation field, defined as:*=^n-/?OI,,+le (2)
where:-R^ is the radiant energy entering the volume V, or sum of the energies (with the exception of therest energy) of all directly and indirectly ionising particles entering the considered volume;- Rout is the radiant energy leaving the volume V, or the sum of the energies (with the exception of
the rest energy) of all directly and indirectly ionising particles going out from the consideredvolume;- ]T(2 is s u m °f aU released energies minus the sum of all the energy expended in each nuclear
transformation and in the elementary processes happened in the volume V.In the SI the absorbed dose is measured in Gray (Gy) equivalent to 100 rad:
lGy = l ^ - (3)
The dose rate is the dose absorbed per unit time:
1.2.1 Charge particle equilibrium and thicknessLet us consider a volume V] of air in which a uniform photon radiation field is present
(Figure 7). Moreover, in the internal part of Vi let us take into consideration a small volume V2
whose distance from Vi is high enough to brake secondary electron radiation. Due to theinteraction with matter, in the volume V2 photons will give rise to secondary electrons which willbe meanly equal (in energy and number) to electrons produced in every V2 volume. Theconsequence is that the number of electrons entering a volume V2 with a certain energy anddirection will be equal to the number of electrons having the same properties and leaving the samevolume. That condition is known as the charge particle equilibrium condition and it guarantees nostorage of secondary electrons in every volume V2, because the energy lost out of every volumeV2 is equal to the energy lost in V2 by secondary particles produced outside each volume [1, 34].
To realize the charged particle equilibrium conditions during an irradiation, irradiated sampleshould be surrounded by an absorber of suitable thickness, defined as the charged particleequilibrium thickness. The thickness value depends on sample electron density and on the energyof impinging radiation. In the curve representing the absorbed dose dependence on sample depth(Figure 8) that value corresponds to the thickness where the curve achieves its highest value. As itcan be seen, the curve is characterised by an initial increasing course due to fluency increment of
8
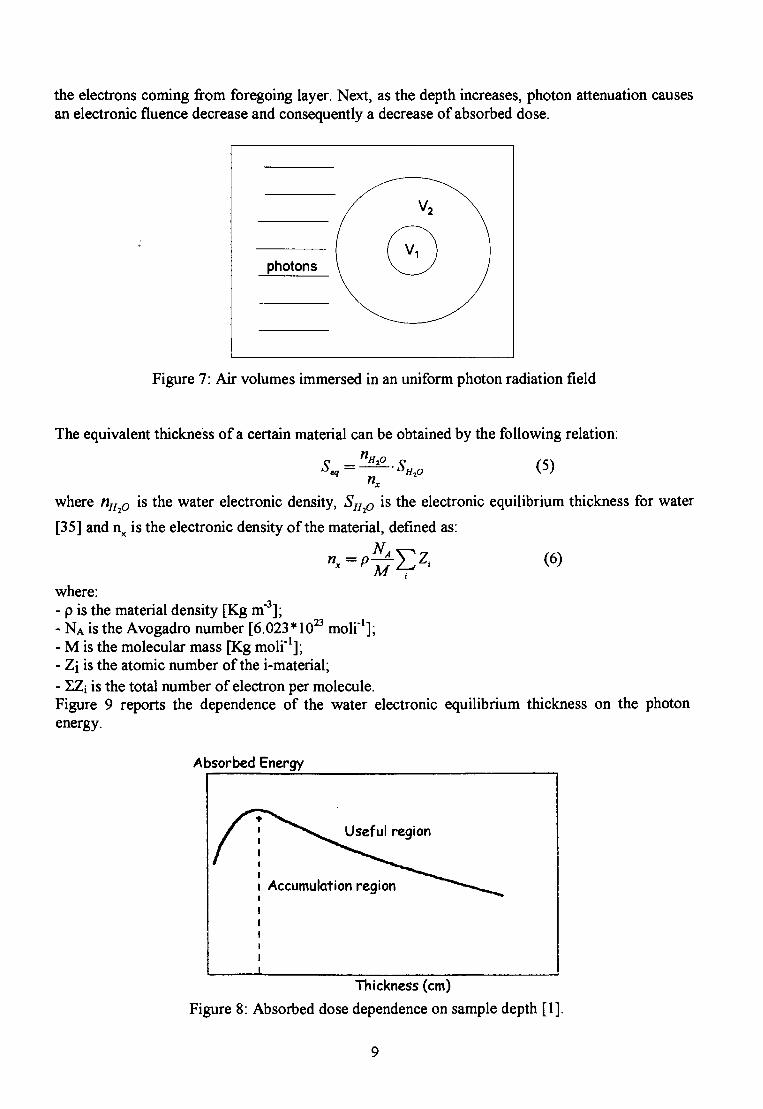
the electrons coining from foregoing layer. Next, as the depth increases, photon attenuation causesan electronic fluence decrease and consequently a decrease of absorbed dose.
photons
Figure 7: Air volumes immersed in an uniform photon radiation field
The equivalent thickness of a certain material can be obtained by the following relation:
nH-,0= o«
x
(5)
where nH^o is the water electronic density, SHiO is the electronic equilibrium thickness for water
[35] and nx is the electronic density of the material, defined as:
n*=p—YZi (6)
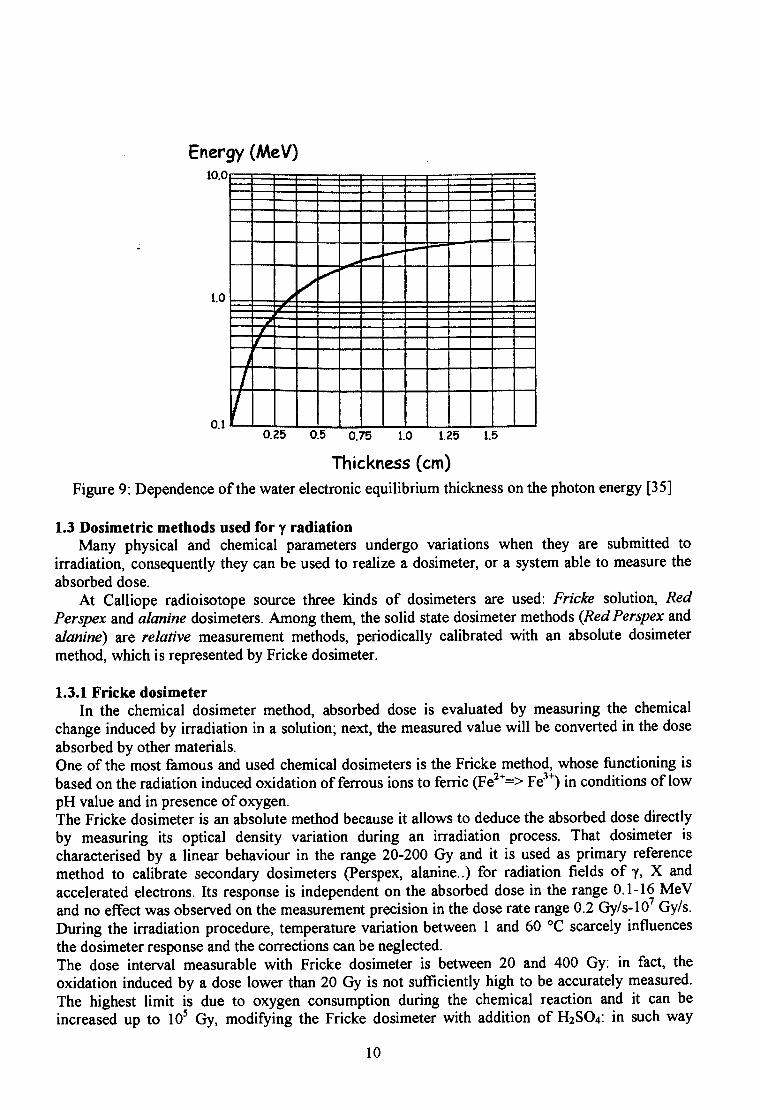
where:- p is the material density [Kg m'3];- NA is the Avogadro number [6.023*1023 moli'1];- M is the molecular mass [Kg moli"1];- Zi is the atomic number of the i-material;- 2Zi is the total number of electron per molecule.Figure 9 reports the dependence of the water electronic equilibrium thickness on the photonenergy.
Absorbed Energy
Useful region
Accumulation region
Thickness (cm)
Figure 8: Absorbed dose dependence on sample depth [1].
Energy (MeV)10.0
1.0
0.1 !
/
S
i -
0.25 1.50.5 0.75 1.0 1.25
Thickness (cm)Figure 9: Dependence of the water electronic equilibrium thickness on the photon energy [35]
1.3 Dosimetrie methods used for y radiationMany physical and chemical parameters undergo variations when they are submitted to
irradiation, consequently they can be used to realize a dosimeter, or a system able to measure theabsorbed dose.
At Calliope radioisotope source three kinds of dosimeters are used: Fricke solution, RedPerspex and alanine dosimeters. Among them, the solid state dosimeter methods (RedPerspex andalanine) are relative measurement methods, periodically calibrated with an absolute dosimetermethod, which is represented by Fricke dosimeter.
1.3.1 Fricke dosimeterIn the chemical dosimeter method, absorbed dose is evaluated by measuring the chemical
change induced by irradiation in a solution; next, the measured value will be converted in the doseabsorbed by other materials.One of the most famous and used chemical dosimeters is the Fricke method, whose functioning isbased on the radiation induced oxidation of ferrous ions to ferric (Fe2+=> Fe3+) in conditions of lowpH value and in presence of oxygen.The Fricke dosimeter is an absolute method because it allows to deduce the absorbed dose directlyby measuring its optical density variation during an irradiation process. That dosimeter ischaracterised by a linear behaviour in the range 20-200 Gy and it is used as primary referencemethod to calibrate secondary dosimeters (Perspex, alanine..) for radiation fields of y, X andaccelerated electrons. Its response is independent on the absorbed dose in the range 0.1-16 MeVand no effect was observed on the measurement precision in the dose rate range 0.2 Gy/s-10 Gy/s.During the irradiation procedure, temperature variation between 1 and 60 °C scarcely influencesthe dosimeter response and the corrections can be neglected.The dose interval measurable with Fricke dosimeter is between 20 and 400 Gy: in fact, theoxidation induced by a dose lower than 20 Gy is not sufficiently high to be accurately measured.The highest limit is due to oxygen consumption during the chemical reaction and it can beincreased up to 105 Gy, modifying the Fricke dosimeter with addition of H2SO4: in such way
10

ferrous ions undergo oxidation without oxygen consumption. Fricke dosimeter is composed of awater solution of FeSO4 {o Fe(NH4)(SO4)2} 10"3 M, H2SO4 0.4 M e NaCl IO"3 M [36].The main reactions happening in the dosimeter during the irradiation are the following:
Fe2+ + OH' -> Fe3+ + OH~ 0)
Fe2+ + HO2' -* Fe3+ + HO
Fe2+ + HnO, -> Fe3+ + HO~ + OH' 01)
Every hydrogen atom causes the formation of an hydroperoxide {H0'2 ), which in turn oxides threeferrous ions according to reactions (9), (10) and (11). Moreover, every hydroxyl radical oxides aFe2+ion and every hydroperoxide molecole oxides two Fe2+ion. The radiolitic yield (moli/J) can beexpressed with the following expression:
+GOH 02)
Using a 60Co source, G(Fe3+) is equal to 1.61 umoli/J.The quantitative analysis of the Fe3+ concentration induced by ionising radiation in Frickedosimeter is performed by measuring the solution absorbance at 304 nm. In particular, for a Frickedosimeter composed of an oxygenated solution of Fe(NH4)(SO4)2 10"3 M, NaCl 10"3M and H2SO40.8 N, the relation between absorbed dose (Gy) and absorbance measurement is the following:
A(0D)
where:- A(OD)è the optical density variation of solution due to irradiation;
- e is the molar extinction coefficient of ferrous ions at 304 nm (E(Fe3+ @ 25°C) = 220 ±2/w2M~1
a 304 nm) [37];
- G(Fe3+) is the number of ferric ions produced per unit of absorbed energy (expressed in 100 eV
unit) calculated in (1.61±0.02)10-6 M-J"1 for 60Co radiation;- p is the density of the irradiated solution 1024 Kgm~$ ;-1 is the optical path, equal to 0.01 m.The role of the NaCl in the Fricke dosimeter is to reduce negative effects of possible organicimpurities on the system answer, as it is described in the reference standard [36].From a solution of H2SO4 0.8 N and an absorption cell of 1 cm, equation (13) becomes:
DGrqy=k*A(OD) = (276±6)*A(OD) 0 4 )
where:
11

In (15) A4 is the absorbance of irradiated dosimeter, Ac is the control absorbance of dosimeterbefore irradiation and Ao is the intrinsic absorbance of the container. Equation (14) turned out to bein perfect agreement with the result of dosimeter calibration performed at the "Istituto Nazionale diMetrologia delle radiazioni ionizzanti " (ENEA-Casaccia).
1.3.2 Red Perspex DosimeterSolid state dosimeters, such as photographic films, solid scintillators and opportunely doped
plastic materials are diffusively used since many years. Their functioning is based on the variationof their coloration due to treatment with different particles (y-rays, electrons...). Plastic dosimetersoffer several advantages which allow a large use of them: reduced dimensions, tissue-equivalentproperties, answer independent on dose rate and great reproducibility.Red 4034 Perspex dosimeters2 used at Calliope irradiation source are a particular variety ofpolimethylmetacrilate (PMMA) whose applicability range lies between 5-40 kGy [38]. Perspexdosimeter is a relative method, consequently it needs a calibration with an absolute dosimetermethod, which in our case is the Fricke dosimeter.The experimental procedure followed to construct the Red Perspex calibration curve consists oftwo phases:
1) in the first step, a Fricke dosimeter placed inside a sample compartment is positioned in afixed and reproducible position in the irradiation cell and the dose rate is measured in thatposition;
2) in the second step, two groups of Red 4034 Perspex dosimeters undergo irradiation at thedoses of 5, 10, 20, 30, 43 and 50 kGy in the same operative conditions used for Frickedosimeter method.
Irradiation induces a dosimeter absorbance variation at the wavelength of 640 nm. Hence, toconstruct the calibration curve Perspex-Fricke it is necessary to study for each irradiation step thedependence of the absorbed dose on the specific absorbance of each irradiated dosimeter. Next,assuming the specific absorbance (A) as independent variable, the dose (D) as dependent variableand fitting the curve reported in Figure 10 with a polynomial function, the dose dependence on themeasured specific absorbance will be the following:
y=-0.18+96.4-x-116-x2+877-x3+1082-x4 (16)
2 Red Perspex dosimeters used at Calliope plant are produced at the Irradiation and Dosimetry Service, ChemistryDivision, Building 10.30, Aere Harwell, Didcot (Oxfordshire) and they below Batch AJ set.
12
0,05 0,10 0,15 0,20 0,25 0,30
Absorbance per mm (mm'1)
Figure 10 : Experimental data fit with a polynomial curve
1.3.3 Alanine dosimetrie methodThe alanine dosimeter method is considered one of the most powerful dosimeter techniques and
it is based on the detection of stable free radicals induced by ionising radiation in the a-alanineamino-acid, by the Electron Spin Resonance (ESR) [39].In fact, the irradiation of alanine amino-acid (CH3-CHNH2-COOH) induces the formation of
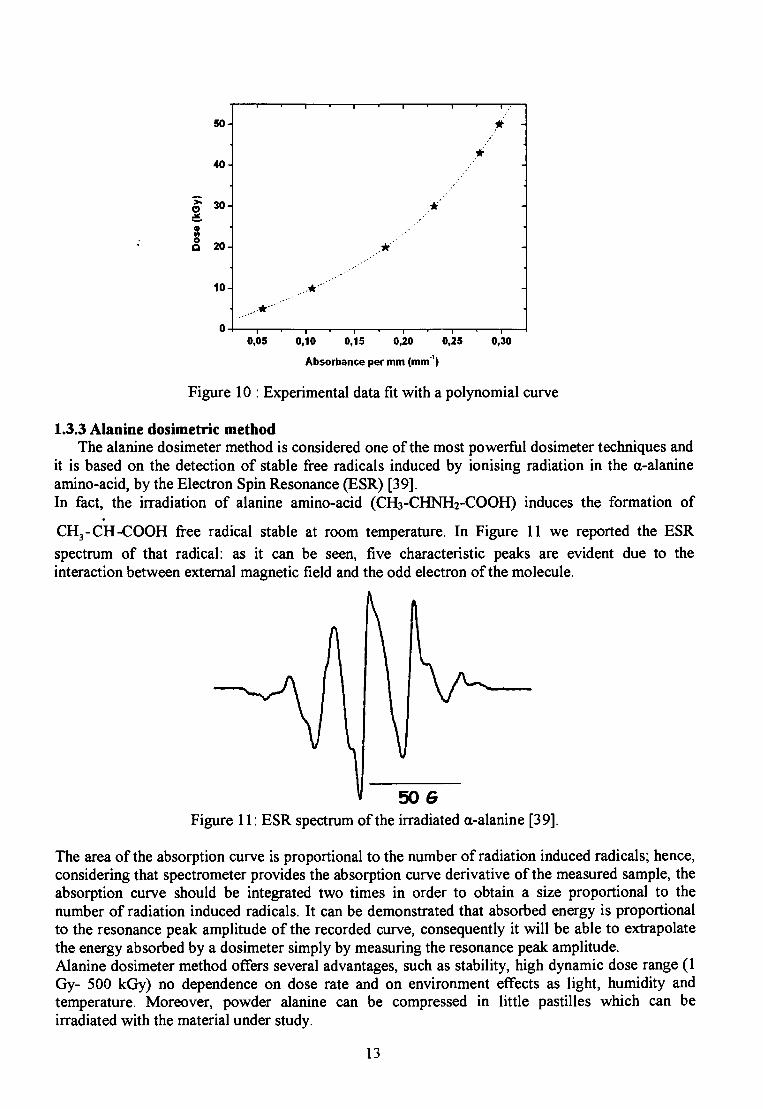
CH3-CH-COOH free radical stable at room temperature. In Figure 11 we reported the ESRspectrum of that radical: as it can be seen, five characteristic peaks are evident due to theinteraction between external magnetic field and the odd electron of the molecule.
506Figure 11: ESR spectrum of the irradiated a-alanine [39].
The area of the absorption curve is proportional to the number of radiation induced radicals; hence,considering that spectrometer provides the absorption curve derivative of the measured sample, theabsorption curve should be integrated two times in order to obtain a size proportional to thenumber of radiation induced radicals. It can be demonstrated that absorbed energy is proportionalto the resonance peak amplitude of the recorded curve, consequently it will be able to extrapolatethe energy absorbed by a dosimeter simply by measuring the resonance peak amplitude.Alanine dosimeter method offers several advantages, such as stability, high dynamic dose range (1Gy- 500 kGy) no dependence on dose rate and on environment effects as light, humidity andtemperature. Moreover, powder alanine can be compressed in little pastilles which can beirradiated with the material under study.
13

At Calliope plant, alanine dosimeter is calibrated on the absolute Fricke dosimeter. ASTMstandards [39] to be followed for the alanine dosimeter calibration on Fricke, establish twodifferent EPR parameter set-ups, in conformity with a dose value lower or higher than 500 Gy(Tables II e III). For that reason, at Calliope plant two alanine calibration curves are used withrespect to Fricke: one for low doses (< 500 Gy) and the other for high doses (> 500 Gy).Dosimeters used for low dose calibration are described in Table IV, while the ones adopted for thehigh dose calibration are described in Table V.
Table II: ASTM Instrument parameters for low doses (<500 Gy) [39]Power (mW)Sweep width(G):Modulation (G):Sweep time (s):Filter T.C. (ms):Receiver Gain (dB):Receiver Offset:Receiver Phase:Field Offset (G):Sweep numbers:Sample Height 3(mm):
7.9220010.121.03285008.93515
1.3.3 a - Alanine dosimeter calibration for low dosesTo construct the calibration curve for alanine dosimeter at doses lower than 500 Gy, Fricke
dosimeter is located in a dosimeter cell in a position fixed and reproducible to measure theabsorbed dose in that position. Once dose rate has been evaluated, alanine dosimeter is irradiated atthe doses of 3, 10, 20, 46, 54, 80, 117 and 389 Gy in the same operative conditions. Next, thealanine EPR signal is measured with a spectrometer (Bruker EMS 104) and it is normalised to themass. The alanine dosimeters used for low doses (<500 Gy) were produced in Germany, by DrAWieser (MESSTECHNIK, Altomunsterstr. 71, D-80997 Munchen). The dose dependence (D) onthe resonance peak to peak amplitude normalised to the mass (hp-p/m) represents the calibrationcurve, whose interpolation furnishes the dose dependence on the EPR signal (Figure 12):
h (17)D(Gy) = -3.7 + 1 1 1 * - ^
mTable III: ASTM Instrument parameters for high doses (>500 Gy) [39]
Power (raW)Sweep width(G):Modulation (G):Sweep time (s):Filter T.C. (ms):Receiver Gain (dB):Receiver Offset:Receiver Phase:Field Offset (G):Sweep numbers:Sample Height:
3.972001.0110.581.95008.93
218
3 It indicates the sample position within the cavity, equal to 20 , where h is the sample height.
14

Table IV: Composition of dosimeters for low dosesDosimeter:Materials:
Shape:
Mass:Density:Dynamic dose range:Detection threshold:
AWM23085% wt L-a-alanine15% wt paraffin waxcylindrical, 4.8 mm diameterand 10 mm length.230 l%(mg)1.27g/cmJ
1 Gy - 500 kGy0.1 Gy
aoa
400
300 -
200
I 1 1 1 1 J
100 -
0 0.5 1 1.5 2 2.5 3 3.5 4
h /m fa.u.l(peak-peak)
Figure 12: Alanine dosimeter calibration for low doses (< 500 Gy)
1.3.3 b - Alanine dosimeter calibration for high dosesTo construct the calibration curve for high doses, Gold Bruker dosimeters were used, whose
dynamic dose range varies between 500 Gy to 50 kGy and whose properties are reported in TableV. In that case, the irradiation doses are equal to 0.4, 0.8, 1.5, 6 and 23 kGy.
Table V: Composition of dosimeters for high dosesDosimeter:Shape:
Mass:Dynamic dose interval:
Bruker, Gold(l% error mass)cylindrical, 4.8 mm diameter and 5 mmheight88±1% (mg)500 Gy - 50 kGy
Also for high doses, the dependence of the dose on the EPR signal intensity normalised to the massis linear and it can be interpolated with the following curve (Figure 13):
15

D(Gy) = -0.31 + 1.99 *•m
(18)
(peak-peak]
Figure 13: Alanine dosimeter calibration for high doses (>500 Gy)
1.4 Interaction of X-rays and y radiation with matterThe physical processes involved in the energy transfer mechanism from y radiation to matterdepend on the energy (hv) of the impinging photons and on the material. In the energy rangebetween 0.01 MeV and 100 MeV the dominant processes are:
1. Photoelectric effect;2. Compton effect;3. Pair production.
The relative importance of the three processes is reported in Figure 14 in function of the atomicnumber Z and the photon energy hv [40]. The curves are referred to regions where none of theadjacent effects is dominant.
I
120
100
80
I 60of
"5 40N
20
Photoelectric effectdominant
Pair productiondominant
Compton effectdominant
0.01 0.1 10 100
Energy (MeV)
Figure 14: Relative importance of Photoelectric, Compton and Pair production effects [40]
16
1.4.1 Photoelectric effectThe Photoelectric effect is the emission of an atomic electron after the absorption of an incidentquantum hv; the emitted electron is called "photoelectron" and it generally belongs to an inneratomic shell. The kinetic energy of the emitted electron (Epe) is given by:
Ept=hu-E0 (19)
where hv is the energy of the impinging photon and Eo is the electron binding energy. The energyEo is then converted in characteristic X-rays or Auger electrons, produced when the vacancycreated by the emitted electron is filled. X-rays are dominant in high Z elements while Augerelectrons are characteristic of light elements: X-rays are generally reabsorbed in a secondphotoelectric process and the total photon energy is absorbed in the detector. The Photoelectriceffect is as much probable as the electron is bonded to the atom. In fact, this process is mostprobable for electrons belonging to the K shell, which represent the greatest part of the emittedphotoelectrons. Moreover, for every shell, the photoelectric emission is as more probable as thephoton energy is near Eo. The cross section of this process is monotonically decreasing withphoton energy and it is characterised by typical absorption peaks at the photoelectric energy edgeof the different shells (M, K, L). The Moseley law defines the energy edge value:
)= Rhc±—5—£ (20)
nwhere Rhc=13.6 eV, Z is the atomic number, a is the screen constant and n the principal quantumnumber [41]. As far as the photoelectric cross section is concerned, there is no analytic expressionvalid for every kind of photon energy. Practically, the adopted methods and the approximationsdepend on the energy region.
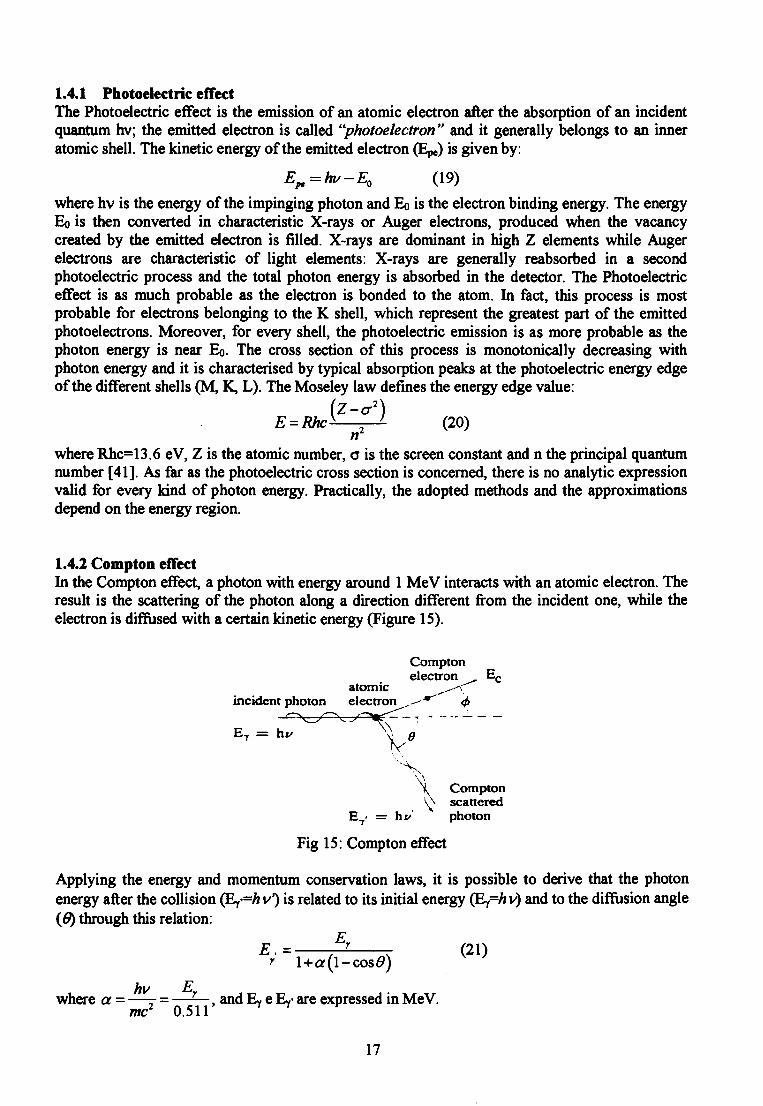
1.4.2 Compton effectIn the Compton effect, a photon with energy around 1 MeV interacts with an atomic electron. Theresult is the scattering of the photon along a direction different from the incident one, while theelectron is diffused with a certain kinetic energy (Figure IS).
Comptonelectron E c
atomic _̂ _-~:incident photon electron ,-~^r 4>
ET = hi/
Comptonscattered
y = hf photon
Fig 15: Compton effect
Applying the energy and momentum conservation laws, it is possible to derive that the photonenergy after the collision (Er'=hvr) is related to its initial energy (Ey=h v) and to the diffusion angle(0) through this relation:
l + a(l-cos0)I F
where a = —=- = ——, and Ey e Ev- are expressed in MeV.me2 0.511 ^ ^ V
17
The kinetic energy of the Compton electron is given by:
Ec=E-E,= «0°"') * (22)c r r l + a ( l - c o s 0 ) r
From the aforementioned relations, it follows that the energy spectrum of the Compton electronranges from 0 (corresponding to 0=0°) to a maximum value (corresponding to #=180°) expressedby this relation:
The Compton effect is dominant at energies between 0.8 MeV and 4 MeV [42].
1.4.3 Pair productionIn the Pair production process, a photon is completely absorbed and its energy is converted in acouple electron-positron. Due to energy and momentum conservation laws, the process is possibleonly in the atomic or electronic Coulomb field. The pair production process is an edge-mechanismand it may happen in the atomic nucleus only if hv»2moc2 (1.02 MeV), where mo is the rest massof the electron and c is the light velocity [40, 42]. The quantity of energy transformed in kineticenergy of the couple electron-positron is:
Ee+-Ee_=hv-2mc2 (24)
Between the two particles, the positron tends to acquire more energy than the electron because ofthe Coulombic repulsion of the nucleus. Then, it annihilates with an atomic electron with theconsequent emission of two 0.511 MeV photons. The Pair production process may also happen inthe Coulombic field of the atomic electron. That process is greatly less probable than the onetaking place in the nucleus field and it is characterised by edge energy of 4 moc2. The cross-section related to this process is given by:
z = 4Z2are2f(E,Z) (25)
where f(E,Z) is a slowly varying function depending on the screen level offered by electrons, a isthe hyperfine constant and re is the classical electron radius [43]. The photon mean free pathbefore its conversion to the couple (e+-e') is given by:
where N in the number of atoms in the unitary volume and x is the cross section related to the pairproduction; it is related to the radiation length through this expression:
V=f^ (27)where the radiation length indicates the mean free path after which an electron reduces its initialenergy of a factor e, through the Bremsstrahlung radiation.
1.5 Absorbed dose calculationTo calculate the energy deposition and the penetration of photons (x-ray, y-ray, bremsstrahlung)in biological, shielding and other materials, it is necessary to introduce the basic quantities mass
attenuation coefficient — and mass energy-absorption coefficient —— .KP) \P J
The mass attenuation coefficient is defined as:
18

H.-LJL) (28)
where Io is the incident intensity of a monoenergetic photon flux, penetrating a layer of materialwith mass thickness x and density p and emerging with intensity /.The mass energy-absorption coefficient involves the further emission of radiation produced bycharged particles when they travel through the medium, and it is defined as:
( * ) - ^ (29)P P
where g factor represents the average fraction of the kinetic energy of secondary charged particles(produced in all the types of interactions) that is subsequently lost in radiative energy-lossprocesses as the particles slow to rest in the medium and —— is the mass energy-transfer
Pcoefficient.Knowing the mass energy absorption coefficient it is possible to convert the absorbed doses in theFricke dosimeter (water) to doses absorbed in other materials through the following relationship:
2>_=M DH.n (30)
I P )H2O
where Du n is the dose absorbed in water and ^-2L is the mass attenuation coefficient.I P
As an example, if dose absorbed in air is required, the previous formula (for 60Co field) willbecome the following:
Nn _[PL. n 2666*10-'(cm'Ig)L'aria — / \ ' *^" " — -
I P )H2O
When silicon based electronic devices are irradiated, it will be useful to know the conversion factorof the dose absorbed in water with respect to dose absorbed in silicon:
/O 2.965 *10-2(c/w2/g)
The mass attenuation coefficients used in (31) and in (32) are reported in [44].For non homogeneous materials, the mass attenuation coefficient can be evaluated by the followingrelationship:
where — and w; are the mass attenuation coefficient and the atomic weight fraction of each i-l P ),
atomic specie inside the sample.
19
In the case of high dimension objects, it could be useful to know the dose distribution inside thethickness. In conditions of charge particle equilibrium conditions and under the hypothesis thatsecondary charged particles loose energy only through collision processes (as at 6 Co energies),the dose absorbed in a material coincides with kerma, K, which represents the sum of the initialkinetic energies of all the charged particles liberated by uncharged ionizing radiation (neutronsand photons) in a sample of matter, divided by the mass of the sample.Consequently, knowing the kerma behaviour throughout a certain material thickness:
K = KQ*B*e~llx
it is possible to know also the absorbed dose behaviour inside the material:
= D*B*e~ia (35)
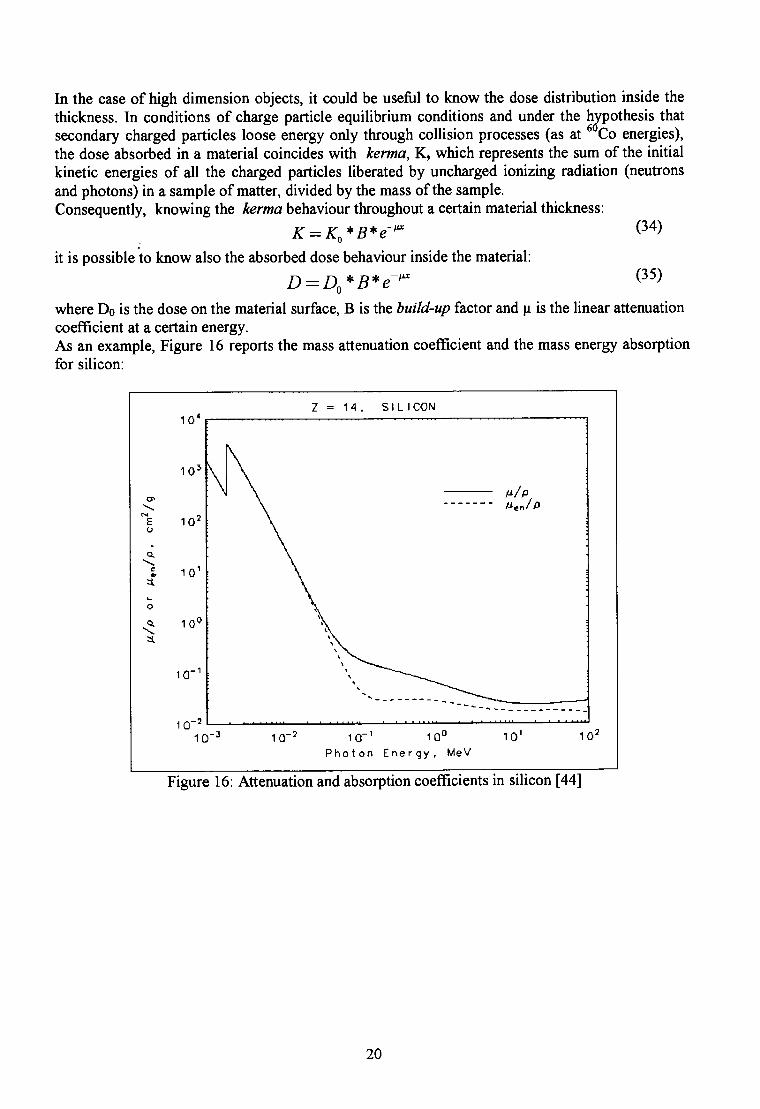
where Do is the dose on the material surface, B is the build-up factor and \i is the linear attenuationcoefficient at a certain energy.As an example, Figure 16 reports the mass attenuation coefficient and the mass energy absorptionfor silicon:
'"Eo
aCV
=4
P
1 n*1 0
1 0 5
1 0 2
1 0 1
10
1 0 ' 1
1 Q1C
\
- 3
Z = 1 4 .
\
\
\
\
\
\
V10"2 10"1
Phoi on
SILICON
10°E n e r g y , MeV
- M/P
10' 1 » .
Figure 16: Attenuation and absorption coefficients in silicon [44]
20
Chapter 2: Ionising radiation damage test on electronic devices at Calliopeplant
2.1 Radiation induced damage on electronic devicesWith the advent of new High Energy Physics and Astrophysics experiments where electronic
systems are exposed to high fluxes of energetic particles [45]-[52], the interest on electronicdevice radiation damage has increased more and more.
The physical processes involved in the radiation damage of electronic devices are particularlycomplex and they depend on several parameters, such as the kind of radiation, energy and fluence.In general they can be grouped in two classes: 1) ionization damage; 2) bulk damage.
The ionization damage, also called surface damage, is caused by electron-hole pairs generatedin silicon dioxide (SÌO2) and other insulators by ionizing radiation. In SÌO2, electrons are muchmore mobile than holes and they are quickly collected at the positive electrode, even if somefraction of them recombine with holes. The charge yield, i.e. the fraction of the electron-hole pairssurviving the initial recombination, depends on the type and energy of the impinging particles.The holes, escaping the initial recombination, are relatively immobile and they slowly undergo ahopping transport between localized sites in the oxide in presence of an electric field. Some ofthem can be trapped giving rise to accumulation of positive charge in the oxide or can generateinterface states at the SiCVSi interface, so affecting the device operation.The bulk damage or displacement damage is caused by collisions of energetic protons, neutrons,ions and electrons, which transfer sufficient energy to knock out a Si atom from its lattice position.A vacancy-interstitial pair called Frenkel defect is so generated, which migrates until a stabledefect is formed by association with other defects, impurities or dopants.
2.2 MIL-STD-883 and ESA/SCC BASIC SpecificationsAt Calliope plant it is possible to perform ionizing damage test on electronic componentsaccording to procedures defined in MIL-STD-883 and in ESA/SCC BASIC SpecificationsNo.22900. The difference between the two protocols is that MEL-STD-883 defines the proceduresto test electronic devices to be used in Military and Aerospace electronic systems, while ESA/SCCBASIC Specifications No.22900 are strictly devoted to the qualification of integrated circuits anddiscrete semiconductors suitable for Space applications.
As far as the adopted dose rate concerned, according to MIL specifications (standardconditions) the dose rate has to lie between 50 rads(Si)/s and 300 rads(Si)/s (i.e., between 0.5Gy(Si)/s and 3 Gy(Si)/s) and it has not to vary more than ±10% during each irradiation.In ESA specifications, two dose rate windows can be adopted:1) the standard dose rate between 3.6 krad(Si) and 36 krad(Si)/h (i.e., between 36 Gy(Si)/h to 360Gy(Si)/h);2) the low dose rate between 36 rad(Si)/h and 360 rad(Si)/h (i.e., between 0.36 Gy(Si)/h and 3.6Gy(Si)/h).
Depending on the expected maximum dose rate, the total irradiation time must be less than 96hours. The time interval between the end of the irradiation and the beginning of the deviceelectrical characterization has to be less than 1 hour. Moreover, the time interval between oneirradiation step and the beginning of the next exposure must be at most 2 hours. After irradiation,the eventual accelerated aging have to be performed keeping the component under bias and at 100°C for 1 week [53]-[55].
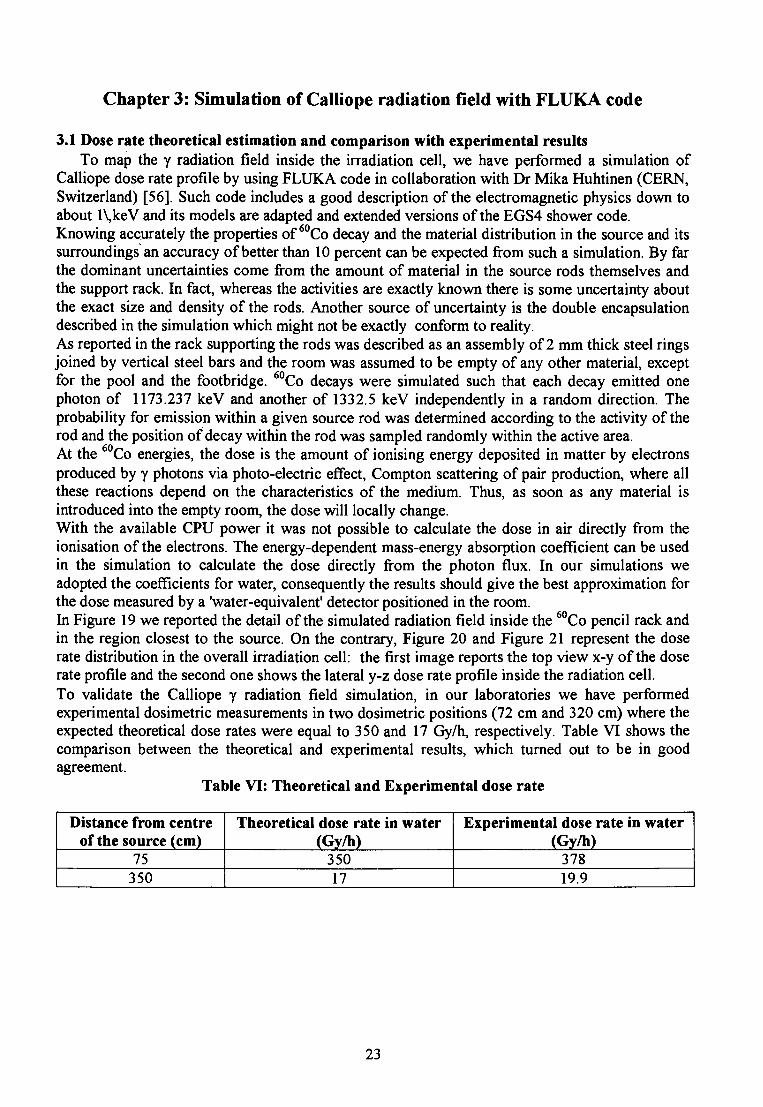
During the irradiation procedure test specimens have to be surrounded by equilibrium material,which will minimize dose enhancement from low energy scattered radiation by producing chargeparticle equilibrium. To this purpose, both MIL and ESA specifications recommend the use of acontainer of at least 1.5 mm Pb with an inner lining of at least 0.7 mm Al. In fact, considering thefraction of attenuated photons as a function of energy and thickness for Pb (Figure 17) and Al(Figure 18), we can easily evict that the 1.5 mm Pb (0.7 mm Al) layer absorbs 95% (99%) of the
21
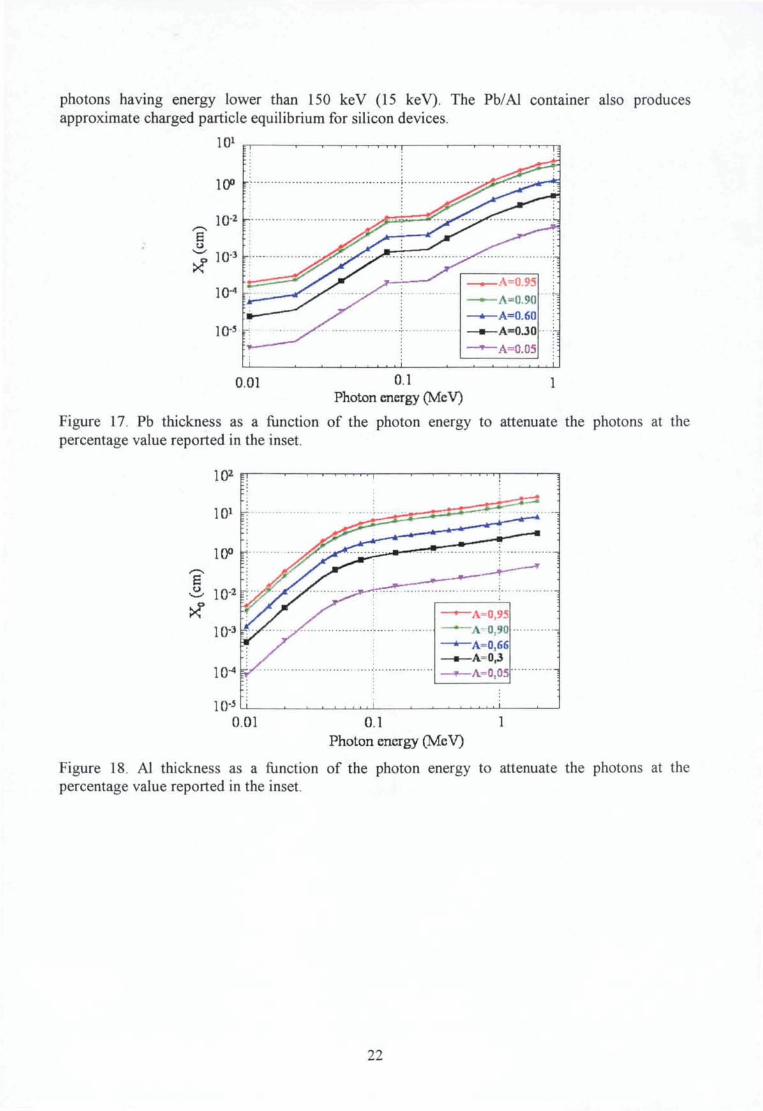
photons having energy lower than 150 keV (15 keV). The Pb/AJ container also producesapproximate charged particle equilibrium for silicon devices.
101
Eu
io-3 -
0.01 10.1Photon energy (MeV)
Figure 17 Pb thickness as a function of the photon energy to attenuate the photons at thepercentage value reported in the inset.
102 F
IO1 n
10°
10*
10"3 "
10"3 i ,
s s s s,— * ., _ ._:=
r-
-*—* :, •* ;
—•—A=0,95—•—A 0,90—*—A=0,66—.—A=0,3—•— A=0,05
i
-,
001 10.1Photon energy (MeV)
Figure 18. Al thickness as a function of the photon energy to attenuate the photons at thepercentage value reported in the inset.
22
Chapter 3: Simulation of Callìope radiation field with FLUKA code
3.1 Dose rate theoretical estimation and comparison with experimental resultsTo map the y radiation field inside the irradiation cell, we have performed a simulation of
Calliope dose rate profile by using FLUKA code in collaboration with Dr Mika Huhtinen (CERN,Switzerland) [56]. Such code includes a good description of the electromagnetic physics down toabout l\,keV and its models are adapted and extended versions of the EGS4 shower code.Knowing accurately the properties of 60Co decay and the material distribution in the source and itssurroundings an accuracy of better than 10 percent can be expected from such a simulation. By farthe dominant uncertainties come from the amount of material in the source rods themselves andthe support rack. In fact, whereas the activities are exactly known there is some uncertainty aboutthe exact size and density of the rods. Another source of uncertainty is the double encapsulationdescribed in the simulation which might not be exactly conform to reality.As reported in the rack supporting the rods was described as an assembly of 2 mm thick steel ringsjoined by vertical steel bars and the room was assumed to be empty of any other material, exceptfor the pool and the footbridge. Co decays were simulated such that each decay emitted onephoton of 1173.237 keV and another of 1332.5 keV independently in a random direction. Theprobability for emission within a given source rod was determined according to the activity of therod and the position of decay within the rod was sampled randomly within the active area.At the 60Co energies, the dose is the amount of ionising energy deposited in matter by electronsproduced by y photons via photo-electric effect, Compton scattering of pair production, where allthese reactions depend on the characteristics of the medium. Thus, as soon as any material isintroduced into the empty room, the dose will locally change.With the available CPU power it was not possible to calculate the dose in air directly from theionisation of the electrons. The energy-dependent mass-energy absorption coefficient can be usedin the simulation to calculate the dose directly from the photon flux. In our simulations weadopted the coefficients for water, consequently the results should give the best approximation forthe dose measured by a 'water-equivalent' detector positioned in the room.In Figure 19 we reported the detail of the simulated radiation field inside the 60Co pencil rack andin the region closest to the source. On the contrary, Figure 20 and Figure 21 represent the doserate distribution in the overall irradiation cell: the first image reports the top view x-y of the doserate profile and the second one shows the lateral y-z dose rate profile inside the radiation cell.To validate the Calliope y radiation field simulation, in our laboratories we have performedexperimental dosimetrie measurements in two dosimetrie positions (72 cm and 320 cm) where theexpected theoretical dose rates were equal to 350 and 17 Gy/h, respectively. Table VI shows thecomparison between the theoretical and experimental results, which turned out to be in goodagreement.
Table VI: Theoretical and Experimental dose rate
Distance from centreof the source (cm)
75350
Theoretical dose rate in water(Gy/h)
35017
Experimental dose rate in water(Gy/h)
37819.9
23

I20
10
-10
-20
tV
w,z
yu,x
•O
O
O
O
•SO -40
5.7E+O4 1.8E+O4 1.0E+04 5.SE+03 3.2E+03 1.8E+O3 l.OE+03 5.6E4O2 3.2E+02 1.8E+02 1.0E+02 4.7E+02
Figure 19: Top view x-y of the dose rate profile represented by colour code (Gy/h) in region nearthe source
J. 400
300
200
100
-100
-200
-300
-400
-40(1 -300 -200 -100 100 200 300•C(ctn)
33E+04 1.0E+04 4.7E+03 2.2E+03 1.0E+03 4.8E+O2 2.2E+O2 1.0E+02 4.9E+01 2.3E+01 1.1E+01 6.8E+00
Figure 20: Top view x-y of the dose rate profile represented by colour code (Gy/h) inside theirradiation cell.
24

400
300
200
100
-100
-200
-300
-400
. j . . . : . . . J . . . : . . . L . . . ' . . . J . . . . ' . . . J .
-150 -100 -50 0 50 100 150 200 %cm)
2.2E+04 1.0E+04 3.2E+03 1.0E+03 3.2E+02 1.0E+02 3.2E+01 1.0E+01 3.2E+00 1.0E+00 3.2E-01 1.2E-O3
Figure 21: Lateral y-z dose rate profile represented by colour code (Gy/h) inside the radiation cell.
25

AcknowledgementsAuthors are grateful to Dr Mika Huhtinen (CERN, Switzerland) for having provided thesimulation of the Calliope y radiation field and to the Director of Calliope plant (Dr ArmandoFestinesi, FIS-ION, ENEA-Casaccia Research Centre) for the continuous support andencouragement during the realisation of this work.Moreover, they thank Mr Antonio Lucchi (FIS-ION, ENEA-Casaccia Research Centre) for themechanical support in the realisation of the steel platform, movable arc measurers and movablemountings, thanks to which the potentialities of the plant were strongly improved.
26

REFERENCES[I] Roesch W., Attix F.H., "Basic concepts of dosimetry", in Radiation dosimetry, New York,Roesch W., Attix F.H. (eds), Academic Press, 1968.[2] Pelliccioni M., "Elementi di dosimetria delle radiazioni", ENEA, 1983.[3] ASTM E 170-76, "Standard Definitions of Terms relating to Dosimetry", 1976.[4] Baccaro S., Borgia B., Festinesi A, "Gamma and neutron irradiation facilities at Enea
Casaccia Centre (Rome)", Report Cern-CMS/TN, 95-192 (RADH), 1995.[5] S. Baccaro, "Radiation damage session" Convenor's report, in Proceedings of the 8th
International Conference on "Astroparticle, Particle and Space Physics, Detectors andMedical Physics Applications", Villa Olmo, Corno, Italy, 6-10 October 2003, edited by M.Barone, E. Borchi, J. Huston, C. Leroy, P. G. Rancoita, P. Riboni & R. Ruchti, WorldScientific Edition, 2004.
[6] S. Baccaro, U. Buontempo and P. D'Atanasio, "Radiation induced degradation of EPR by IRoxidation profiling" Rad. Phys. Chem., Vol.42, pp.211-214, 1993.
[7] S. Baccaro, B. Caccia, S. Onori, M. Pantaloni, "The influence of dose rate and oxygen on theirradiation induced degradation in ethylene-propylene rubber" NIMB, 105, pp. 97-99 (1995).
[8] S. Baccaro, LA. Pajewski, G. Scoccia, R. Volpe, J.M. Rosiak, "Mechanical properties ofpolyvinylpyrrolidone (PVP) hydrogels undergoing radiation" NIMB 105, pp. 100-102, 1995.
[9] P. Anelli, S. Baccaro, M. Carenza, G. Palma, "Radiation Grafting on hydrophilic monomersonto ethylene-propylene rubber", Rad. Phys. Chem. Vol. 46, No 4-6, pp. 1031-1035, 1995.
[10] S. Baccaro, K. Blazek, F. de Notaristefani, P. Maly, J.A. Mares, R. Pani, R. Pellegrini, A.Soluri, "Scintillation properties of YAP:Ce" NIMA 361, pp. 209-215, 1995.
[II] S. Baccaro, "Radiation induced effects in ethylene-propylene copolymer with antioxidant"in "Irradiation of Polymers" Eds by R.L. Clough and S.W. Shalaby, American ChemicalSociety Series 620, pp. 323, 1996.
[12] S. Baccaro, G. De Cesare, A. Ferrari, G. Maiello, M. Montecchi, M. Petti, "Conductivityeffects in amorphous hydrogenated silicon film induced by gamma-ray irradiation", Sensorsand Actuators B, 31, pp. 107, 1996.
[13] S. Baccaro, B. Bianchilli, C. Casadio, G. Rinaldi, "Radiation induced effects on ParticulateComposites from Epoxy Resin and Fly-Ash" Rad. Phys.Chem. Vol.52, No. 1-6, pp. 187-192,1998.
[14] S. Baccaro, A. Cecilia, M. Montecchi, T. Malatesta, F. De Notaristefani, S. Tomoli, F.Vittori "Refractive index and absorption length of YAP:Ce scintillation crystal and reflectanceof the coating using in YAP:Ce3+ single-crystal matrix", NIMA 406, pp. 479-485, 1998.
[15] F. Cataldo, Y. Keheyan, S. Baccaro, "The effect of gamma-irradiation on anthracite coaland bitumen" Journal of Radioanalytical and Nuclear Chemistry, Vol. 262, No. 2, pp. 443-450, 2004.
[16] F. Cataldo, Y. Keheyan, S. Baccaro, "Gamma radiolysis of chiral molecules: R(+) limonene,S(-) limonene and R(-)-a-phellandrene" Journal of Radioanalytical and Nuclear Chemistry,Vol. 262, No. 2, pp. 423-428, 2004.
[17] F. Xia, S. Baccaro, D. Zhao, M. Falconieri, G. Chen, "Gamma ray Irradiation InducedOptical Band Gap Variations in Chalcogenide Glasses, accepted by NIMB.
[18] S. Baccaro, A. Cemmi, C. Colombi, M. Fiocca, G. Gambarini, B. Lietti, G. Rosi, "Inphantom dose mapping in neutron capture therapy by means of solid state detectors", NIMB213, pp. 666-669, 2004.
[19] A. Cecilia, S. Baccaro, A. Cemmi, V. Colli, G. Gambarini, G. Rosi, L. Scolari, "Alanine andTLD coupled detectors for fast neutron dose measurements in Neutron Capture Thererapy(NCT)", Radiation Protection Dosimetry Vol. 110, Nos 1-4, pp. 637-640, 2004.
[20] G. Chen, Y. Yang, D. Zhao, F. Xia, "Composition Effects on Optical Properties of Tb3+-doped Heavy Germinate Glasses", J. Am. Ceramic Soc. 88 [2], pp. 293-296, 2005.
27

[21] A. Cecilia, S. Baccaro, A. Piegari, I. Di Sartina, "Optical coatings behaviour under yirradiation for space applications", Proc. SPIE Vol. 5494, pp. 529-535, 2004.
[22] M. Kobayashi, Y. Usuki, M. Ishii, N. Seguttuvan, K. Tanji, M. Chiba, K. Hara, H. Takano,M. Niki, P. Bohaceck, S. Baccaro, A. Cecilia, M. Diemoz, "Significant improvement ofPbWO4 Scintillating Crystals by Doping with Trivalent ions", NIMA 434, pp. 412-423, 1999.
[23] S. Baccaro, P. Bohacek, A. Cecilia, M. Montecchi, E. Mihokova, M. Niki, "Effect of Ladoping on Calcium Tungstate (CaWO4) crystals radiation hardness", Phys. Stat. Sol. (a) 178,pp. 799, 2000.
[24] S. Baccaro, A. Cecilia, A. Cemmi, G. Chen, E. Mihokova, M. Niki, "Opticalcharacterisation under irradiation of Ce3+ (Tb3+)-doped phosphate scintillating glasses", IEEETrans. Nucl. Science, Vol. 48, NO3, 2001.
[25] S. Baccaro, A. Cecilia, G. Chen, J. Mares, E. Mihokova, M. Niki, P. Polato, G. Zanella, R.Zannoni, "Effect of y irradiation on optical properties of Ce3+ doped phosphate and silicatescintillating glasses", Rad. Phys. Chem., Vol. 63/ 3-6, pp. 227-230, March 2002.
[26] S. Baccaro, A. Cecilia, G. Chen, Y. Du, L. Nencini, S. Wang, "Optical transmittance andirradiation resistance of rare-earth (Ce3+, Tb3+, Pr3*) doped heavy germanate glasses",Radiation Effects and Defects in Solids, Vol. 158, pp. 451-456, 2003.
[27] S. Baccaro, V. Brunella, A. Cecilia, L. Costa, "Gamma irradiation of Poly (Vinyl Chloride)for medical applications", NIMB, 208C pp. 195-198, 2003.
[28] S. Baccaro, F. Cataldo, A. Cecilia, A. Cemmi, F. Padella, A. Santini, "Interaction betweenreinforce carbon black and polymeric matrix for industrial applications", NIMB, 208C, pp.191-194, 2003.
[29] S. Baccaro, A. Cecilia, A. Venezia, A. Fedorov, M.V. Korzhik, A. Barisevich, V. Domenev,"Radiation damage of REA103:Ce3+(RE=Y, Lu) scintillators under y and neutron irradiation",NIMA 537, pp. 431-434, 2005.
[30] S. Baccaro, A. Cecilia, D. Passaro, "ESR dating of Middle Pleistocene coral", will bepresented at LED2005 Conference, which will be held in Cologne 24-29 July 2005.
[31] Y. Tabata, Y. Ito, S. Tagawa, Handobook of Radiation Chemistry, CRC Press, 1991.[32] A.R. Rutledge, L.V. Smith, J.S. Merrit, NIMA 206, pp. 211, 1983.[33] ICRU Report 33- Radiation Quantities and Units, 1980.[34] PELLICCIONI M., "Fondamenti fisici della radioprotezione", Bologna, Pitagora editrice, 1993.[35] Norma I.E.C. 15B.4.1, 1994.[36] ASTM E 1026-95, "Standard Practice for Using the Fricke Reference Standard Dosimetry
System", 1995.[37] D. Mosse et al., Phys. Med. Biol. 1982 Vol.27 n° 4, 583-596.[38] ASTM E 1276-96, "Standard Practice for Use of Polymethylmethacrylate Dosimetry
System", 1996.[39] ASTM E 1607-96, "Standard Practice for Use of the Alanyne-EPR Dosimetry System",1996.[40] Price W.J., Rivelazioni delle radiazioni nucleari, Bulzoni Editore, Roma, 1972.[41] Segre' E., Nuclei e particelle, Zanichelli, Bologna, 1982.[42] Arnaldi U., Fisica delle radiazioni, Boringhieri Editore, 1971.[43] Leo W.R., Techniques for nuclear and particle physics experiments, Sprinter Verlag 1991.[44] J.H. Hubbell, S.M. Seltzer, "Tables of X-rays Mass Attenuation Coefficients and Mass
Energy-Absorption Coefficients, from 1 keV to 20 MeV for elements Z=l to 92 and 48Additional Substances of Dosimetrie Interest",http://physics.nist.gov/PhysRefData/XrayMassCoef April 1996.
[45] M. Bruzzi, "Radiation effects in silicon detectors for future High Energy Physicsexperiments: a short overview", Proceedings of the 7th International Conference on AdvancedTechnology and Particle Physics, Villa Olmo (Corno, Italy), 15-19 October 2001.
28
[46] D. Binder et al., IEEE Trans. Nucl. Sci., NS-22 (1975) 2675.[47] A. E. Waskiewicz et al., IEEE Trans. Nucl. Sci., 33 (1986) 1710.[48] C. Pickel et al., IEEE Trans. Nucl. Sci., 32 (1985) 4176.[49] CMS Technical Proposal, CERN/LHCC 94-38 (1994).[50] ATLAS Technical Proposal, CERN/LHCC 94-43 (1994).[51] P. Riedler, "Silicon pixel and strip detectors for LHC experiments", Proceedings of the 1st
Coordination Meeting of the CBM Experiment at the future GSI facility, 15-16 November2002.
[52] S. Albergo et al., Nucl. Instr. Meth., A422, 238, 1999.[53] "Total dose steady-state irradiation test method", ESA/SCC Basic Specification No. 22900,
European Space Agency.[54] "Ionizing radiation (total dose) test procedure", MIL-STD-883E, method 1019.4.[55] M. Menichelli, "Total dose test for commercial-off-the-shelf components to be used in a
space experiment: a survey on current technologies", Proceedings of the 7th InternationalConference on Advanced Technology and Particle Physics, Villa Olmo (Corno, Italy), 15-19October 2001.
[56] M. Huhtinen, P. Lecomte, D. Luckey, F. Nessi-Tedaldi, F. Pauss, "High-energy protoninduced damage in PbWO4 calorimeter crystals", ETHZ-IPP-PR-2004-03 November 30st,2004.
29

Edito dal!'Funzione Centrale Relazioni Esterne
Unità Comunicazione
Lungotevere Thaon di Revel, 76 - 00196 Roma
www.enea.it
Stampa: Laboratorio Tecnografico ENEA - CR Frascati
Finito di stampare nel mese di settembre 2005
Copyright © 2022 FDOKUMEN