XO-5b: A Transiting Jupiter-sized Planet with a 4 day Period
10
arXiv:0805.2399v1 [astro-ph] 15 May 2008 Submitted to Astrophysical Journal Preprint typeset using L A T E X style emulateapj v. 03/07/07 XO-5b: A TRANSITING JUPITER-SIZED PLANET WITH A FOUR DAY PERIOD Christopher J. Burke 1 P. R. McCullough 1 , Jeff A. Valenti 1 , Doug Long 1 , Christopher M. Johns-Krull 2 , P. Machalek 1,3 , Kenneth A. Janes 4 , B. Taylor 4 , Michael L. Fleenor 5 , Cindy N. Foote 6 , Bruce L. Gary 7 , Enrique Garc´ ıa-Melendo 8 , J. Gregorio 9 , T. Vanmunster 10 (Received 2008 May 15) Submitted to Astrophysical Journal ABSTRACT The star XO-5 (GSC 02959-00729, V=12.1, G8V) hosts a Jupiter-sized, R p =1.15±0.12 R J , tran- siting extrasolar planet, XO-5b, with an orbital period of 4.187732±0.00002 days. The planet mass (M p =1.15±0.08 M J ) and surface gravity (g p =22±5ms −2 ) are significantly larger than expected by empirical M p -P and M p -P-[Fe/H] relationships. However, the deviation from the M p -P relationship for XO-5b is not large enough to suggest a distinct type of planet as is suggested for GJ 436b, HAT- P-2b, and XO-3b. By coincidence XO-5 overlies the extreme H I plume that emanates from the interacting galaxy pair NGC 2444/NGC 2445 (Arp 143). Subject headings: planetary systems – stars: individual (GSC 02959-00729) – galaxies: individual (NGC 2444, NGC 2445) 1. INTRODUCTION We report the discovery of a Jupiter-sized planet, XO- 5b, that transits the G8V, V=12.1, star GSC 02959- 00729 (XO-5) with an orbital period, P∼ 4 days. XO-5b provides a valuable addition to the empirical population trends amongst transiting extrasolar plan- ets (Torres et al. 2008), especially at P>4 day periods where only four other well characterized transiting plan- ets are known (OGLE-TR-111b, HAT-P-1b, HAT-P-2b, & HD 17156b, Pont et al. 2004; Bakos et al. 2007,b; Barbieri et al. 2007, respectively). With a sample of the first six known transiting planets, Mazeh et al. (2005) pointed out the possibility of a linearly decreasing trend of planet mass as a function of increasing orbital pe- riod. Torres et al. (2008) and Southworth (2008) have recently revisited this and other relationships amongst the now larger sample of transiting planets analyzed in a homogeneous fashion. As shown in Section 4, XO-5b is one of the few planets that is inconsistent with general trends based on the currently known sample of transiting Jupiter-sized planets. In Section 2 we describe the photometric and spec- troscopic observations that we used to discover and characterize the XO-5, XO-5b system. Section 3.1 de- scribes our spectroscopic determination of the atmo- spheric properties of XO-5, which we combine with the- oretical isochrones to constrain the stellar mass and ra- Electronic address: [email protected] 1 Space Telescope Science Institute, 3700 San Martin Dr., Balti- more, MD 21218 2 Dept. of Physics and Astronomy, Rice University, 6100 Main Street, MS-108, Houston, TX 77005 3 Johns Hopkins University, Dept. of Physics and Astronomy, Baltimore, MD 21218 4 Boston University, Astronomy Dept., 725 Commonwealth Ave.,Boston, MA 02215 5 Volunteer Observatory, Knoxville, TN 6 Vermillion Cliffs Observatory, Kanab, UT 7 Hereford Arizona Observatory, Hereford, AZ 8 Esteve Duran Observatory Foundation, Montseny 46, 08553 Seva, Spain 9 Atalaia, Portugal 10 CBA Belgium Observatory, Landen, Belgium dius. The mass estimate of XO-5 is employed along with a high precision transit light curve to measure the radius of XO-5b in Section 3.2. Radial velocity measurements determine the mass of XO-5b as outlined in Section 3.3. In Section 3.4, the database of transit light curves enables refining the transit ephemeris for XO-5b. We conclude in Section 4 how the discovery of XO-5b adds to the un- derstanding of the population of transiting Jupiter-sized planets. 2. OBSERVATIONS 2.1. XO Survey Photometry McCullough et al. (2005) provides details of the XO survey; additional details of the candidate tran- siting planet selection process can be found in McCullough & Burke (2007). XO-5b is the fifth Hot Jupiter transiting planet announced by the XO survey (McCullough et al. 2006; Burke et al. 2007; Johns-Krull et al. 2008; McCullough et al. 2008), and was identified as a candidate from the 62 ◦ × 7 ◦ field of view centered on 8 h RA. This field was observed at a 10 min cadence with an overall rms noise, σ =0.011 mag, for this V=12.1 star during two seasons: Nov. 2003-Mar. 2004 and Nov. 2004-Mar. 2005. XO-5 is well isolated; XO-5 contributes 90% of the flux in the 75 ′′ radius aper- ture used for XO photometry. Figure 1 shows the XO light curve phased to the pe- riod with the most significant transit event identified by the Box-fitting Least Squares algorithm (Kov´acs et al. 2002). In the phased light curve, two full transit events and five partial events contribute to the detection. After subtracting a transit model (determined from the high precision light curve in Figure 3), the average residual RMS during transit nights is σ =0.008 mag (30% lower noise than the average for the entire light curve). Adding in quadrature the Signal to Noise Ratio (SNR) for each transit yields an overall detection SNR T otal ∼ 12. It is not routine to follow up all candidates with this low of SNR T otal . However, SNR T otal is only one of several crite- ria for selecting candidates (McCullough & Burke 2007; Burke et al. 2007). The efficiency of photometric fol-
-
Upload
independent -
Category
Documents
-
view
1 -
download
0
Transcript of XO-5b: A Transiting Jupiter-sized Planet with a 4 day Period
arX
iv:0
805.
2399
v1 [
astr
o-ph
] 1
5 M
ay 2
008
Submitted to Astrophysical JournalPreprint typeset using LATEX style emulateapj v. 03/07/07
XO-5b: A TRANSITING JUPITER-SIZED PLANET WITH A FOUR DAY PERIOD
Christopher J. Burke1 P. R. McCullough1, Jeff A. Valenti1, Doug Long1, Christopher M. Johns-Krull2,P. Machalek1,3, Kenneth A. Janes4, B. Taylor4, Michael L. Fleenor5, Cindy N. Foote6, Bruce L. Gary7,
Enrique Garcıa-Melendo8, J. Gregorio9, T. Vanmunster10
(Received 2008 May 15)Submitted to Astrophysical Journal
ABSTRACT
The star XO-5 (GSC 02959-00729, V=12.1, G8V) hosts a Jupiter-sized, Rp=1.15±0.12 RJ, tran-siting extrasolar planet, XO-5b, with an orbital period of 4.187732±0.00002 days. The planet mass(Mp=1.15±0.08 MJ) and surface gravity (gp=22±5 m s−2) are significantly larger than expected byempirical Mp-P and Mp-P-[Fe/H] relationships. However, the deviation from the Mp-P relationshipfor XO-5b is not large enough to suggest a distinct type of planet as is suggested for GJ 436b, HAT-P-2b, and XO-3b. By coincidence XO-5 overlies the extreme H I plume that emanates from theinteracting galaxy pair NGC 2444/NGC 2445 (Arp 143).Subject headings: planetary systems – stars: individual (GSC 02959-00729) – galaxies: individual
(NGC 2444, NGC 2445)
1. INTRODUCTION
We report the discovery of a Jupiter-sized planet, XO-5b, that transits the G8V, V=12.1, star GSC 02959-00729 (XO-5) with an orbital period, P∼ 4 days.XO-5b provides a valuable addition to the empiricalpopulation trends amongst transiting extrasolar plan-ets (Torres et al. 2008), especially at P>4 day periodswhere only four other well characterized transiting plan-ets are known (OGLE-TR-111b, HAT-P-1b, HAT-P-2b,& HD 17156b, Pont et al. 2004; Bakos et al. 2007,b;Barbieri et al. 2007, respectively). With a sample of thefirst six known transiting planets, Mazeh et al. (2005)pointed out the possibility of a linearly decreasing trendof planet mass as a function of increasing orbital pe-riod. Torres et al. (2008) and Southworth (2008) haverecently revisited this and other relationships amongstthe now larger sample of transiting planets analyzed in ahomogeneous fashion. As shown in Section 4, XO-5b isone of the few planets that is inconsistent with generaltrends based on the currently known sample of transitingJupiter-sized planets.
In Section 2 we describe the photometric and spec-troscopic observations that we used to discover andcharacterize the XO-5, XO-5b system. Section 3.1 de-scribes our spectroscopic determination of the atmo-spheric properties of XO-5, which we combine with the-oretical isochrones to constrain the stellar mass and ra-
Electronic address: [email protected] Space Telescope Science Institute, 3700 San Martin Dr., Balti-
more, MD 212182 Dept. of Physics and Astronomy, Rice University, 6100 Main
Street, MS-108, Houston, TX 770053 Johns Hopkins University, Dept. of Physics and Astronomy,
Baltimore, MD 212184 Boston University, Astronomy Dept., 725 Commonwealth
Ave.,Boston, MA 022155 Volunteer Observatory, Knoxville, TN6 Vermillion Cliffs Observatory, Kanab, UT7 Hereford Arizona Observatory, Hereford, AZ8 Esteve Duran Observatory Foundation, Montseny 46, 08553
Seva, Spain9 Atalaia, Portugal10 CBA Belgium Observatory, Landen, Belgium
dius. The mass estimate of XO-5 is employed along witha high precision transit light curve to measure the radiusof XO-5b in Section 3.2. Radial velocity measurementsdetermine the mass of XO-5b as outlined in Section 3.3.In Section 3.4, the database of transit light curves enablesrefining the transit ephemeris for XO-5b. We concludein Section 4 how the discovery of XO-5b adds to the un-derstanding of the population of transiting Jupiter-sizedplanets.
2. OBSERVATIONS
2.1. XO Survey Photometry
McCullough et al. (2005) provides details of theXO survey; additional details of the candidate tran-siting planet selection process can be found inMcCullough & Burke (2007). XO-5b is the fifthHot Jupiter transiting planet announced by the XOsurvey (McCullough et al. 2006; Burke et al. 2007;Johns-Krull et al. 2008; McCullough et al. 2008), andwas identified as a candidate from the 62◦ × 7◦ field ofview centered on 8h RA. This field was observed at a 10min cadence with an overall rms noise, σ = 0.011 mag,for this V=12.1 star during two seasons: Nov. 2003-Mar.2004 and Nov. 2004-Mar. 2005. XO-5 is well isolated;XO-5 contributes 90% of the flux in the 75′′ radius aper-ture used for XO photometry.
Figure 1 shows the XO light curve phased to the pe-riod with the most significant transit event identified bythe Box-fitting Least Squares algorithm (Kovacs et al.2002). In the phased light curve, two full transit eventsand five partial events contribute to the detection. Aftersubtracting a transit model (determined from the highprecision light curve in Figure 3), the average residualRMS during transit nights is σ = 0.008 mag (30% lowernoise than the average for the entire light curve). Addingin quadrature the Signal to Noise Ratio (SNR) for eachtransit yields an overall detection SNRTotal ∼ 12. It isnot routine to follow up all candidates with this low ofSNRTotal. However, SNRTotal is only one of several crite-ria for selecting candidates (McCullough & Burke 2007;Burke et al. 2007). The efficiency of photometric fol-
2
Fig. 1.— Discovery phased light curve from the XO Project data.(Top) The phased light curve around the transit event. (Bottom)The phased light curve over the full orbital period. The individ-ual measurements (points) are shown binned (solid line) to reducenoise. The transit occurs at ∆t = 0.0 day and any secondaryeclipse for a circular orbit would occur at ∆t = 2.1 day (dottedline). No secondary eclipse is evident above the noise.
lowup provided by the XO Extended Team is an addi-tional resource of the XO project to aid in following upthese lower SNRTotal candidates.
2.2. XO Extended Team and Follow Up Photometry
The Extended Team (E.T.) provides photometric fol-low up of XO candidates. The E.T. (M. F., C. F.,E. G-M., J. G., F. M., G. M., and T. V.) is acollaboration of professional and amateur astronomers(McCullough et al. 2005, 2006). The E.T. obtains lightcurves of XO candidates at higher angular resolution andguides the photometric and spectroscopic follow up nec-essary to classify a candidate as a bona fide planetarycompanion. Table 1 provides E.T. photometry for XO-5.For the E.T. light curves, the median differential magni-tude out of transit provides the flux normalization andthe standard deviation out of transit provides the un-certainty in the measurements. Figure 2 shows the E.T.light curves obtained for XO-5b.
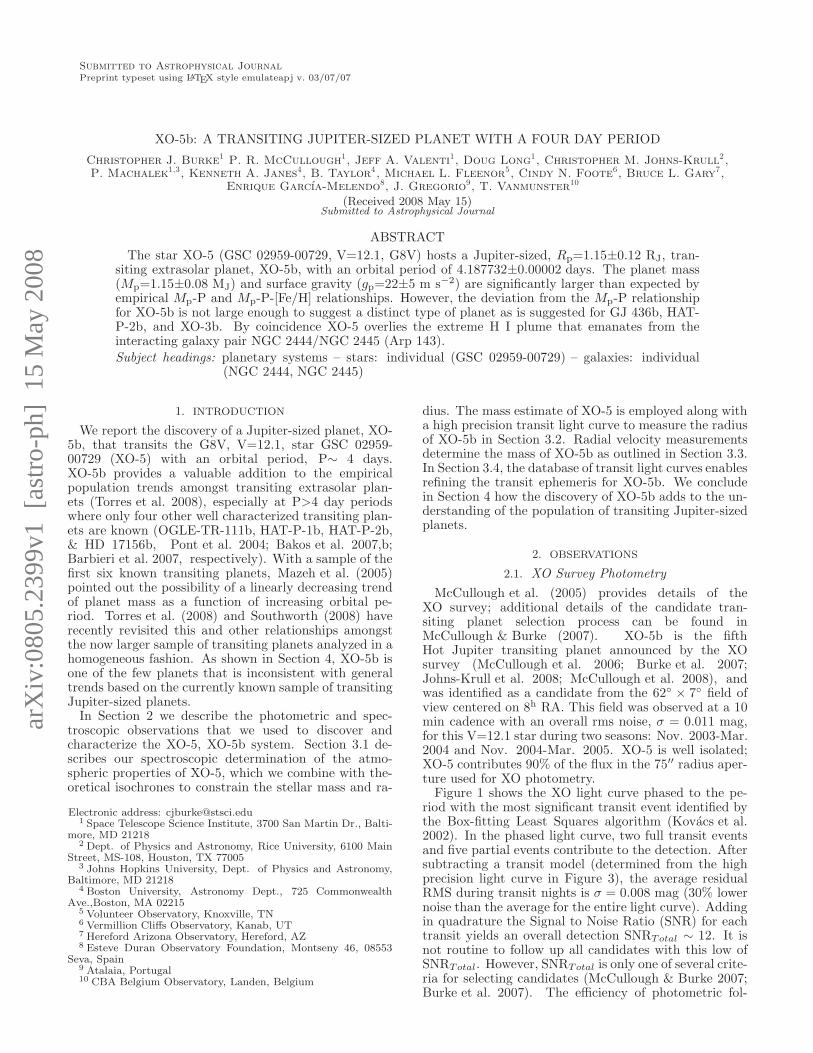
On 2008 January 20 we observed a transit event ofXO-5b with the 1.8-m Perkins Telescope at Lowell Ob-servatory using the PRISM instrument in imaging mode(Janes et al. 2004). The observations are a continuousseries of R-band images covering a 10.8′ × 8.8′ subar-ray field of view with 10s exposure time and 30s readoutresulting in an overall tcad =40 s cadence. The detec-tor has 0.36′′ pixels, and the FWHM seeing was 1.8′′.The target was observed over the airmass range, 1.12 ≤X ≤ 1.6, with observations commencing at high airmass.The evening was nonphotometric; several percent trans-parency variations in raw photometric magnitudes ex-ist around the linear trend with airmass. To removethe transparency variations a differential light curve iscalculated employing four other comparable bright starsas comparison. The resulting differential light curve ofXO-5 is shown in Figure 3. The out of transit data arelimited in duration. Thus, minimizing the scatter dur-ing the flat, in-transit portion of the light curve, guidedthe choice of photometric aperture size and comparisonstars. The resulting noise during the in-transit portionis σexp = 0.002 mag for each exposure. This is ∼ 20%higher noise than expected from Poisson, scintillation(Dravins et al. 1997), sky, and read noise. More relevant
Fig. 2.— Binned light curves from the Extended Team for XO-5. The text in color matches the corresponding light curve andindicates the date and passband of the observations.
Fig. 3.— Top: Light curve from the 1.8m Perkins Telescope atLowell Observatory in the R-band (points), along with the best-fittransit model in a χ2 sense during the MCMC analysis (solid line).Bottom: Residual of data from the best-fit transit model.
for transit detection and characterization is the photo-metric noise rate, σpnr = σexp
√
tcad/60s = 0.0016 magmn−1, which takes into account the dead time of detectorreadout. The calibration and photometry was performedin IRAF with a customization in the IRAF phot task toreport magnitudes to 10−4 precision, rather than the de-fault of 10−3 precision.
We obtained photometric B, V, RC, and IC magnitudesfor XO-5 using a 0.35-m telescope (Table 2). Photomet-ric observations were obtained on three separate nightswith 2-6 Landolt star fields (Landolt 1992) interspersedwith the XO-5 field in order to define the color and air-mass transformation from the instrumental system to thestandard system. Each night 20-40 Landolt stars definedthe transformation with rms scatter of 0.04, 0.03, 0.02,0.03 for the BV RI passbands, respectively. The result-ing standard photometry in Table 2 is the weighted aver-age amongst the three nights. Standard star photometryof XO-5 from TASS (Droege et al. 2006) agrees with ourphotometry. Photometry from 2MASS (Skrutskie et al.2006) is also given in Table 2. XO-5 is saturated in SDSS(Adelman-McCarthy et al. 2008) images and too faint forthe TYCHO-2 (Høg et al. 2000) database.
2.3. Arp 143 - Potential Archival Measurements
By coincidence, XO-5 lies near the line of sight to theinteracting galaxy pair NGC 2444/5 cataloged as Arp143 in the ’Material Emanating from E Galaxies’ group
3
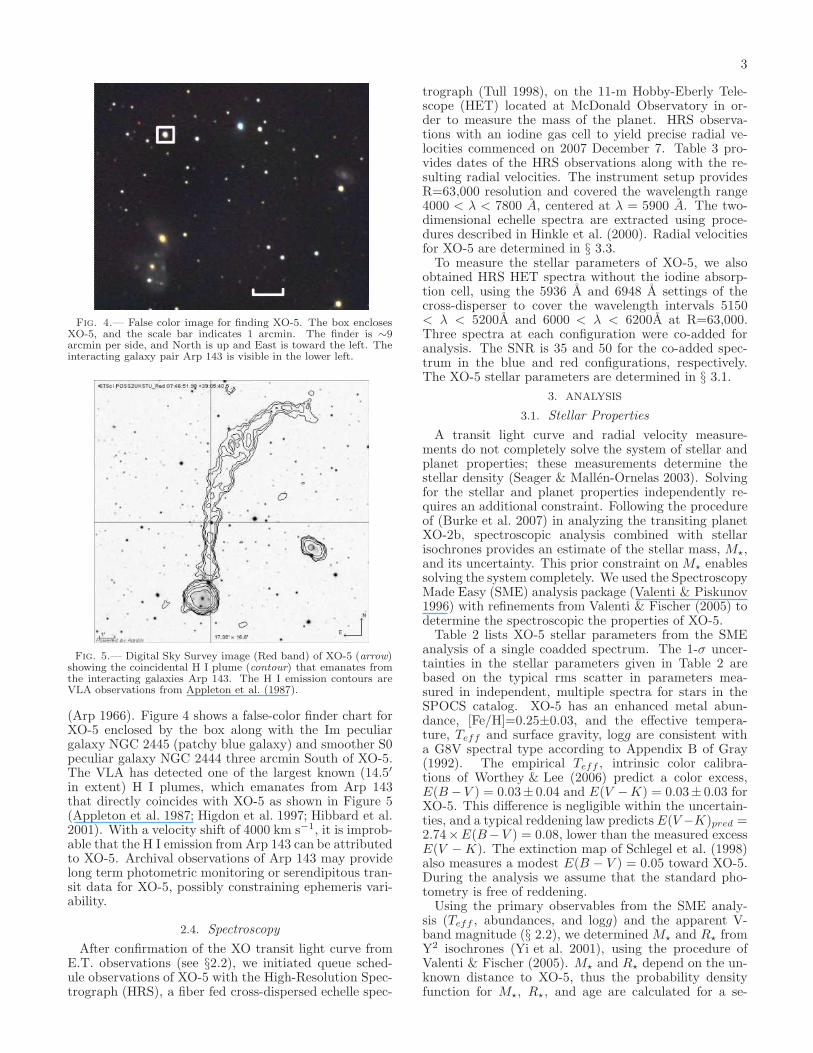
Fig. 4.— False color image for finding XO-5. The box enclosesXO-5, and the scale bar indicates 1 arcmin. The finder is ∼9arcmin per side, and North is up and East is toward the left. Theinteracting galaxy pair Arp 143 is visible in the lower left.
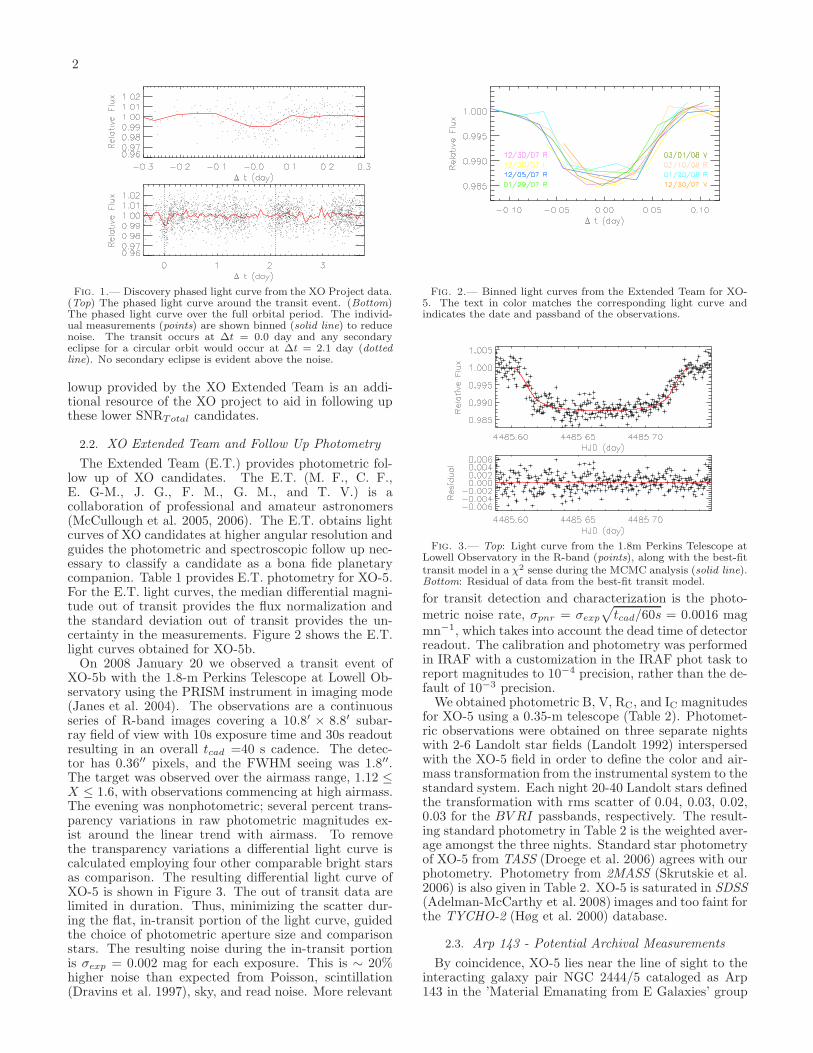
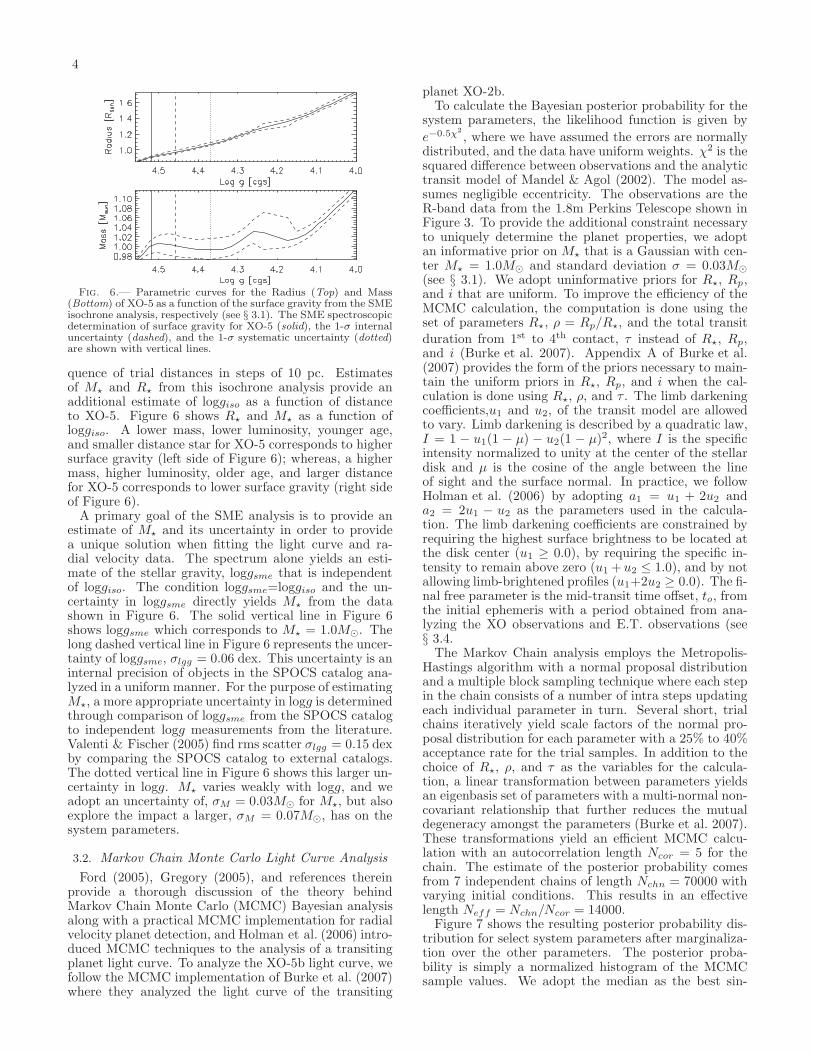
Fig. 5.— Digital Sky Survey image (Red band) of XO-5 (arrow)showing the coincidental H I plume (contour) that emanates fromthe interacting galaxies Arp 143. The H I emission contours areVLA observations from Appleton et al. (1987).
(Arp 1966). Figure 4 shows a false-color finder chart forXO-5 enclosed by the box along with the Im peculiargalaxy NGC 2445 (patchy blue galaxy) and smoother S0peculiar galaxy NGC 2444 three arcmin South of XO-5.The VLA has detected one of the largest known (14.5′
in extent) H I plumes, which emanates from Arp 143that directly coincides with XO-5 as shown in Figure 5(Appleton et al. 1987; Higdon et al. 1997; Hibbard et al.2001). With a velocity shift of 4000 km s−1, it is improb-able that the H I emission from Arp 143 can be attributedto XO-5. Archival observations of Arp 143 may providelong term photometric monitoring or serendipitous tran-sit data for XO-5, possibly constraining ephemeris vari-ability.
2.4. Spectroscopy
After confirmation of the XO transit light curve fromE.T. observations (see §2.2), we initiated queue sched-ule observations of XO-5 with the High-Resolution Spec-trograph (HRS), a fiber fed cross-dispersed echelle spec-
trograph (Tull 1998), on the 11-m Hobby-Eberly Tele-scope (HET) located at McDonald Observatory in or-der to measure the mass of the planet. HRS observa-tions with an iodine gas cell to yield precise radial ve-locities commenced on 2007 December 7. Table 3 pro-vides dates of the HRS observations along with the re-sulting radial velocities. The instrument setup providesR=63,000 resolution and covered the wavelength range4000 < λ < 7800 A, centered at λ = 5900 A. The two-dimensional echelle spectra are extracted using proce-dures described in Hinkle et al. (2000). Radial velocitiesfor XO-5 are determined in § 3.3.
To measure the stellar parameters of XO-5, we alsoobtained HRS HET spectra without the iodine absorp-tion cell, using the 5936 A and 6948 A settings of thecross-disperser to cover the wavelength intervals 5150< λ < 5200A and 6000 < λ < 6200A at R=63,000.Three spectra at each configuration were co-added foranalysis. The SNR is 35 and 50 for the co-added spec-trum in the blue and red configurations, respectively.The XO-5 stellar parameters are determined in § 3.1.
3. ANALYSIS
3.1. Stellar Properties
A transit light curve and radial velocity measure-ments do not completely solve the system of stellar andplanet properties; these measurements determine thestellar density (Seager & Mallen-Ornelas 2003). Solvingfor the stellar and planet properties independently re-quires an additional constraint. Following the procedureof (Burke et al. 2007) in analyzing the transiting planetXO-2b, spectroscopic analysis combined with stellarisochrones provides an estimate of the stellar mass, M⋆,and its uncertainty. This prior constraint on M⋆ enablessolving the system completely. We used the SpectroscopyMade Easy (SME) analysis package (Valenti & Piskunov1996) with refinements from Valenti & Fischer (2005) todetermine the spectroscopic the properties of XO-5.
Table 2 lists XO-5 stellar parameters from the SMEanalysis of a single coadded spectrum. The 1-σ uncer-tainties in the stellar parameters given in Table 2 arebased on the typical rms scatter in parameters mea-sured in independent, multiple spectra for stars in theSPOCS catalog. XO-5 has an enhanced metal abun-dance, [Fe/H]=0.25±0.03, and the effective tempera-ture, Teff and surface gravity, logg are consistent witha G8V spectral type according to Appendix B of Gray(1992). The empirical Teff , intrinsic color calibra-tions of Worthey & Lee (2006) predict a color excess,E(B −V ) = 0.03± 0.04 and E(V −K) = 0.03± 0.03 forXO-5. This difference is negligible within the uncertain-ties, and a typical reddening law predicts E(V −K)pred =2.74×E(B−V ) = 0.08, lower than the measured excessE(V − K). The extinction map of Schlegel et al. (1998)also measures a modest E(B − V ) = 0.05 toward XO-5.During the analysis we assume that the standard pho-tometry is free of reddening.
Using the primary observables from the SME analy-sis (Teff , abundances, and logg) and the apparent V-band magnitude (§ 2.2), we determined M⋆ and R⋆ fromY2 isochrones (Yi et al. 2001), using the procedure ofValenti & Fischer (2005). M⋆ and R⋆ depend on the un-known distance to XO-5, thus the probability densityfunction for M⋆, R⋆, and age are calculated for a se-
4
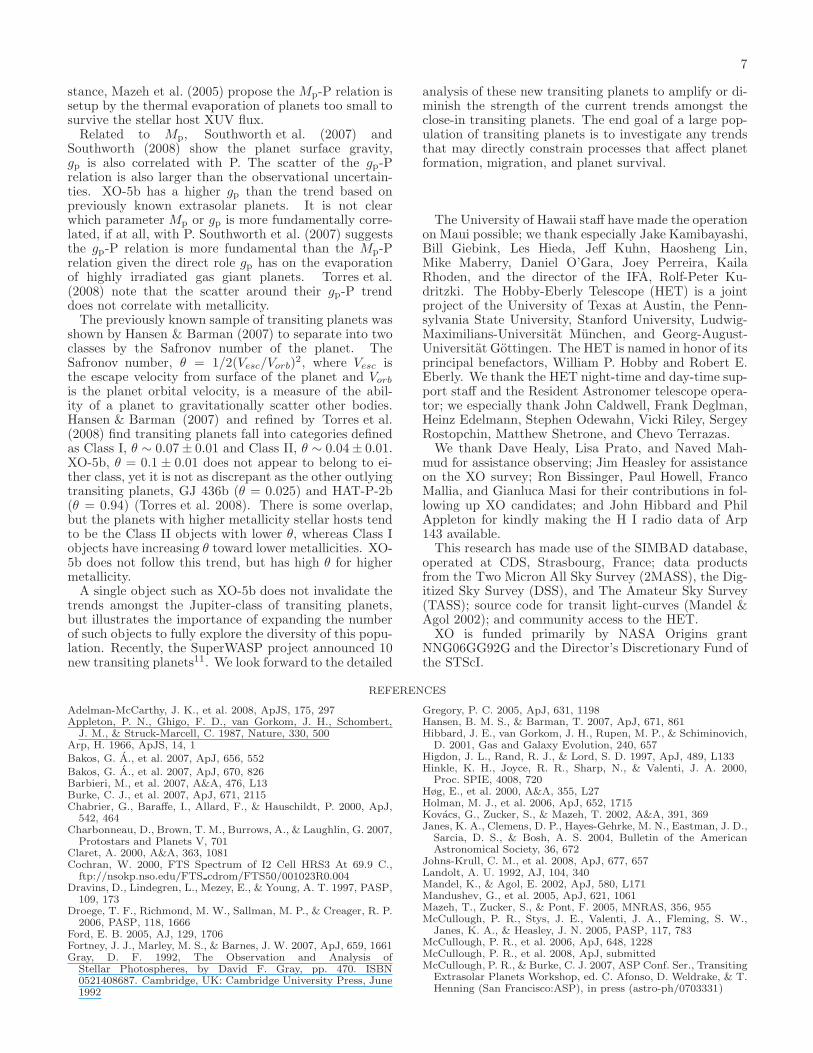
Fig. 6.— Parametric curves for the Radius (Top) and Mass(Bottom) of XO-5 as a function of the surface gravity from the SMEisochrone analysis, respectively (see § 3.1). The SME spectroscopicdetermination of surface gravity for XO-5 (solid), the 1-σ internaluncertainty (dashed), and the 1-σ systematic uncertainty (dotted)are shown with vertical lines.
quence of trial distances in steps of 10 pc. Estimatesof M⋆ and R⋆ from this isochrone analysis provide anadditional estimate of loggiso as a function of distanceto XO-5. Figure 6 shows R⋆ and M⋆ as a function ofloggiso. A lower mass, lower luminosity, younger age,and smaller distance star for XO-5 corresponds to highersurface gravity (left side of Figure 6); whereas, a highermass, higher luminosity, older age, and larger distancefor XO-5 corresponds to lower surface gravity (right sideof Figure 6).
A primary goal of the SME analysis is to provide anestimate of M⋆ and its uncertainty in order to providea unique solution when fitting the light curve and ra-dial velocity data. The spectrum alone yields an esti-mate of the stellar gravity, loggsme that is independentof loggiso. The condition loggsme=loggiso and the un-certainty in loggsme directly yields M⋆ from the datashown in Figure 6. The solid vertical line in Figure 6shows loggsme which corresponds to M⋆ = 1.0M⊙. Thelong dashed vertical line in Figure 6 represents the uncer-tainty of loggsme, σlgg = 0.06 dex. This uncertainty is aninternal precision of objects in the SPOCS catalog ana-lyzed in a uniform manner. For the purpose of estimatingM⋆, a more appropriate uncertainty in logg is determinedthrough comparison of loggsme from the SPOCS catalogto independent logg measurements from the literature.Valenti & Fischer (2005) find rms scatter σlgg = 0.15 dexby comparing the SPOCS catalog to external catalogs.The dotted vertical line in Figure 6 shows this larger un-certainty in logg. M⋆ varies weakly with logg, and weadopt an uncertainty of, σM = 0.03M⊙ for M⋆, but alsoexplore the impact a larger, σM = 0.07M⊙, has on thesystem parameters.
3.2. Markov Chain Monte Carlo Light Curve Analysis
Ford (2005), Gregory (2005), and references thereinprovide a thorough discussion of the theory behindMarkov Chain Monte Carlo (MCMC) Bayesian analysisalong with a practical MCMC implementation for radialvelocity planet detection, and Holman et al. (2006) intro-duced MCMC techniques to the analysis of a transitingplanet light curve. To analyze the XO-5b light curve, wefollow the MCMC implementation of Burke et al. (2007)where they analyzed the light curve of the transiting
planet XO-2b.To calculate the Bayesian posterior probability for the
system parameters, the likelihood function is given by
e−0.5χ2
, where we have assumed the errors are normallydistributed, and the data have uniform weights. χ2 is thesquared difference between observations and the analytictransit model of Mandel & Agol (2002). The model as-sumes negligible eccentricity. The observations are theR-band data from the 1.8m Perkins Telescope shown inFigure 3. To provide the additional constraint necessaryto uniquely determine the planet properties, we adoptan informative prior on M⋆ that is a Gaussian with cen-ter M⋆ = 1.0M⊙ and standard deviation σ = 0.03M⊙
(see § 3.1). We adopt uninformative priors for R⋆, Rp,and i that are uniform. To improve the efficiency of theMCMC calculation, the computation is done using theset of parameters R⋆, ρ = Rp/R⋆, and the total transitduration from 1st to 4th contact, τ instead of R⋆, Rp,and i (Burke et al. 2007). Appendix A of Burke et al.(2007) provides the form of the priors necessary to main-tain the uniform priors in R⋆, Rp, and i when the cal-culation is done using R⋆, ρ, and τ . The limb darkeningcoefficients,u1 and u2, of the transit model are allowedto vary. Limb darkening is described by a quadratic law,I = 1 − u1(1 − µ) − u2(1 − µ)2, where I is the specificintensity normalized to unity at the center of the stellardisk and µ is the cosine of the angle between the lineof sight and the surface normal. In practice, we followHolman et al. (2006) by adopting a1 = u1 + 2u2 anda2 = 2u1 − u2 as the parameters used in the calcula-tion. The limb darkening coefficients are constrained byrequiring the highest surface brightness to be located atthe disk center (u1 ≥ 0.0), by requiring the specific in-tensity to remain above zero (u1 + u2 ≤ 1.0), and by notallowing limb-brightened profiles (u1+2u2 ≥ 0.0). The fi-nal free parameter is the mid-transit time offset, to, fromthe initial ephemeris with a period obtained from ana-lyzing the XO observations and E.T. observations (see§ 3.4.
The Markov Chain analysis employs the Metropolis-Hastings algorithm with a normal proposal distributionand a multiple block sampling technique where each stepin the chain consists of a number of intra steps updatingeach individual parameter in turn. Several short, trialchains iteratively yield scale factors of the normal pro-posal distribution for each parameter with a 25% to 40%acceptance rate for the trial samples. In addition to thechoice of R⋆, ρ, and τ as the variables for the calcula-tion, a linear transformation between parameters yieldsan eigenbasis set of parameters with a multi-normal non-covariant relationship that further reduces the mutualdegeneracy amongst the parameters (Burke et al. 2007).These transformations yield an efficient MCMC calcu-lation with an autocorrelation length Ncor = 5 for thechain. The estimate of the posterior probability comesfrom 7 independent chains of length Nchn = 70000 withvarying initial conditions. This results in an effectivelength Neff = Nchn/Ncor = 14000.
Figure 7 shows the resulting posterior probability dis-tribution for select system parameters after marginaliza-tion over the other parameters. The posterior proba-bility is simply a normalized histogram of the MCMCsample values. We adopt the median as the best sin-

5
gle point estimate of the posterior probability. The 1-σcredible interval for a parameter is given by the symmet-rical interval around the median that contains 68% ofthe samples. Figure 8 shows the joint posterior proba-bility for the stellar limb darkening coefficients, u1 andu2. The constraints on the limb darkening coefficients arenot very constraining. Figure 8 shows theoretically calcu-lated limb darkening coefficients in various photometricpassbands from Claret (2000) for a star with the physicalproperties of XO-5. The best estimates for limb darken-ing coefficients (diamond symbol) from the R-band tran-sit light curve is consistent with the theoretical R-bandcoefficient (triangle symbol).
Using the SME isochrone analysis, the MCMC sam-ples for R⋆ translate into distance to and age estimatesof XO-5. Similar to the procedure that defines the prioron M⋆, The SME isochrone analysis provides a para-metric relationship between R⋆ versus trial distance andage (i.e., for a given stellar radius estimate, the SMEisochrone analysis has a best distance and age estimatefor the system).
The theoretical planet models of Fortney et al. (2007)characterize the amount of heavy elements (elementsheavier than H & He) for a given orbital semi-major axis,Rp, and Mp. The best estimate of Rp for XO-5b is consis-tent with zero heavy element content, and the 1-σ upperlimit is 5 M⊕ of heavy elements. Table 5 summarizes theproperties of XO-5b.
The uncertainties given in Table 5 for XO-5b and Ta-ble 2 for XO-5 represent the internal precision of theexperiment. These uncertainties represent the expectedscatter of values obtained if the experiment was repeatedwith similar quality data and identical procedures. Othersystematic sources of error are most likely comparable orlarger than the internal precision. The sources of sys-tematic error only enter into the prior for M⋆. In lightof these potential sources of systematic uncertainty, theanalysis is repeated with an increased standard deviationof the Gaussian prior on M⋆ to σ = 0.07 M⊙. This largeruncertainty on M⋆ did not increase the uncertainties inthe other parameters beyond the most significant digitas given in Table 2 and Table 5. This indicates the pho-tometric noise rather than uncertainty in M⋆ dominatesthe uncertainty in the system parameters.
After fixing the prior on M⋆, the light curve analy-sis yields an additional estimate of loggmcmc as given inTable 2. loggmcmc does not differ significantly from theSME based loggsme. We redetermined the stellar prop-erties by fixing loggsme=loggmcmc when analyzing thespectra. This reduced M⋆ = 0.02 M⊙. This variationis within our original uncertainty of M⋆. Thus, we didnot iterate the MCMC analysis with the SME analysis(Sozzetti et al. 2007).
3.3. Radial Velocity Measurements
We determined the mass of XO-5b using the radial ve-locity techniques described by McCullough et al. (2006),Burke et al. (2007), and Johns-Krull et al. (2008). Wesummarize the procedure here, where we derive radialvelocity information from the HET spectra (see § 2.4).An iodine gas cell imprints iodine absorption lines onthe spectrum of XO-5 and this is compared to a modelspectrum to obtain radial velocity shifts with respect tothe topocentric frame. We construct model spectra by
Fig. 7.— Marginalized posterior probability for the XO-5 andXO-5b parameters from MCMC samples. We adopt the medianof the posterior probability (solid) vertical line as the point esti-mate of the parameter. The dashed lines indicate the 68% credibleinterval.
Fig. 8.— Joint posterior probability for the stellar limb darken-ing coefficients, u1 and u2. The solid contours are isoprobabilitycontours containing 68% and 90% of the MCMC samples. Theremaining 10% of the samples lying outside the region of highestprobability are also shown (points). The theoretically calculatedlimb darkening coefficients are shown for various passbands (trian-gle) along with the best estimate limb darkening coefficients fromthe MCMC analysis of the R-band transit light curve (diamond).The R-band light curve coefficients are consistent with the theoret-ically calculated R-band coefficients. The prior limits for the limbdarkening coefficients are indicated with dashed lines.
multiplying a very high-resolution FTS spectrum of theSun (scaled to better match the observed line depths ofXO-5) times a very high-resolution FTS spectrum of aniodine gas cell (Cochran 2000) and then convolving theresult with a Voigt profile to approximate the line-spreadfunction of the instrument. A radial velocity shift is de-termined independently for each ∼15 A row of the 2-Dechelle spectrum of XO-5 over the wavelength range withstrong iodine absorption, 5210 < λ < 5700 A. The indi-vidual stellar radial velocity estimates from each of the15 A sections (after transformation to the barycentricframe) determines the stellar radial velocity measure-ment at each epoch and its associated 1-σ uncertainty(see Table 3).
Figure 9 shows the resulting radial velocity curvephased with the XO-5b ephemeris determined from thetransits and assuming zero eccentricity. The typical un-certainty per epoch is σRV = 20 − 40 m s−1, limitedmainly by Poisson noise in the spectrum. The radialvelocity semi-amplitude, K=145±10 m s−1. This ampli-tude results in Mp =1.15±0.08 MJ for XO-5b, assuming

6
Fig. 9.— a) The radial velocity of XO-5 oscillates sinusoidallywith a semi-amplitude K = 145±10 m s−1, implying XO-5b’s massis 1.15±0.08 MJ. b) The period and phase of the radial velocitieswere fixed at values determined by the transits. The mean stellarradial velocity with respect to the solar system’s barycenter hasbeen subtracted. In order to determine K, we used the HET spectracalibrated with an iodine absorption cell (filled circles). c) In thisrepresentation of the data, a circular orbit yields a straight line ofslope −K.
M⋆=1.0 M⊙ for XO-5 and a circular orbit for XO-5b.
3.4. Ephemeris and Transit Timing Variations
The XO, E.T., and Perkins Telescope transit lightcurves enable refining the ephemeris for XO-5b. Thehigh precision light curve from the Perkins Telescope(see § 2.2), provides the estimate for the mid-transit zeropoint of the ephemeris as well as the transit model em-ployed to derive mid-transit timing for the other lowerprecision light curves from the E.T. and XO survey.The MCMC samples from the Perkins Telescope lightcurve analysis (lower right panel of Figure 7) providethe best estimate and error for the ephemeris zero point,HJDo =2454485.6664±0.0004 (σ = 35 s).
To refine the orbital period of XO-5b, the remainingXO and E.T. light curves (E.T. light curves are shown inFigure 2) provide mid-transit timing estimates. The bestfitting transit model in a χ2 sense to the high precisionPerkins Telescope light curve (Figure 3) is fit to the otherlight curves with only mid-transit time and out of transitflux zero point as the only free parameters. The expectedvariations in the transit model as a function of photomet-ric bandpass is negligible compared to the photometricnoise in the E.T. and XO light curves, so the limb dark-ening coefficients are fixed to the values from analyzingthe R-band Perkins light curve. Table 4 provides mid-transit timings along with their uncertainty. The XOobservations have 10 min cadence and ∼1% photometricnoise making transit timing uncertain to 28 min. Thisuncertainty comes from comparing the a transit model fita by-eye estimate of the mid-transit timing. Within theuncertainties there is not a significant systematic differ-ence between mid-transit timings estimated by-eye andfrom the model fit. The much higher quality E.T. lightcurves have an uncertainty of 4.3 min in mid-transit tim-ing. This uncertainty is estimated from comparing thegroups of mid-transit timing observations for the sameevent but different observers.
With these uncertainties, an ephemeris model with pe-riod as the only free parameter results in χ2 = 12.6 withν = 14 degrees of freedom indicating the timings are con-sistent with a fixed period, P =4.187732±0.00002 day.
The ephemeris for XO-5b accumulates a 5 min uncer-tainty by 2010. Given the large uncertainty in transitmid-point timing from the XO survey data, the periodwas calculated using E.T. data alone. The earliest, andonly, E.T. light curve from the 2006-2007 observing sea-son for XO-5b provides the strongest constraint on theorbital period. The remaining E.T. light curves are fromthe 2007-2008 observing season for XO-5b. The periodderived from E.T. data alone is within 1-σ of the deter-mination that includes the XO survey data.
4. DISCUSSION & CONCLUSION
The transit candidate of Mandushev et al. (2005) il-lustrates the non-negligible potential for triple stars tohave transit light curves and radial velocity variationsconsistent with a planet. However, in the case of XO-5b,attempts to explain the light curve and spectroscopy witha physical stellar triple fail. We employ the Y2 isochroneappropriate for the the physical properties of XO-5 sup-plemented with the low-mass stellar isochrone between0.072< M⋆ <0.5 M⊙ from Chabrier et al. (2000), stellarlimb darkening coefficients from Claret (2000), the lightcurve synthesis routine of Wilson (1993), and assume anypotential stellar binary has zero orbital eccentricity tomodel a stellar triple system. The constraints on thetransit duration and transit depth from the light curverequire M⋆ > 0.90 M⊙ for the primary of a stellar binaryblended with the light of XO-5. The required primaryof the stellar binary has >45% the flux of XO-5 andhas a radial velocity semi-amplitude, K > 18 km s−1.Such a binary would be readily apparent in the spec-trum of XO-5 given the narrow spectral features for XO-5, v sin i < 3.3 km s−1. We cannot completely rule outthe possibility of a line-of-sight faint background binaryblended with the light of XO-5 as an explanation for theobservations. However, the sinusoidal shape of the radialvelocity variations necessitate the line-of-sight binary tohave a systemic velocity similar to XO-5 otherwise theradial velocity curve develops asymmetries that are notobserved (Torres et al. 2005).
Torres et al. (2008) and Southworth (2008) recentlyderived transiting planet properties in a uniform fash-ion in order to further test various trends amongst thetransiting planets that have previously been examinedwith smaller and less homogeneous samples of transit-ing planets (Mazeh et al. 2005). The larger sample oftransiting planets in Torres et al. (2008) still shows ageneral trend for decreasing Mp with increasing orbitalperiod, but there is significant scatter and some very sig-nificant outliers (GJ 436b, HAT-P-2b, and XO-3b). Fur-thermore, Torres et al. (2008) find a Mp-P-[Fe/H] rela-tion that reduces the scatter in the Mp-P relation. Atfixed period, the more metal poor stars host higher massplanets. XO-5b has ∆Mp = 0.6±0.08 MJ higher massthan then Mp-P trend defined in Torres et al. (2008).The metallicity correction to the Mp-P trend found byTorres et al. (2008), ∆Mp = −0.14 MJ in the case ofXO-5b, is opposite sign from what is measured. As com-mented by Torres et al. (2008), the Mp-P-[Fe/H] rela-tion does have a scatter larger than observational uncer-tainties. Thus, additional physical conditions impact theMp-P relation, the full variety of Jupiter-class extrasolarplanets has not been fully explored, or the trend is morerelevant to shorter orbital periods than XO-5b. For in-
7
stance, Mazeh et al. (2005) propose the Mp-P relation issetup by the thermal evaporation of planets too small tosurvive the stellar host XUV flux.
Related to Mp, Southworth et al. (2007) andSouthworth (2008) show the planet surface gravity,gp is also correlated with P. The scatter of the gp-Prelation is also larger than the observational uncertain-ties. XO-5b has a higher gp than the trend based onpreviously known extrasolar planets. It is not clearwhich parameter Mp or gp is more fundamentally corre-lated, if at all, with P. Southworth et al. (2007) suggeststhe gp-P relation is more fundamental than the Mp-Prelation given the direct role gp has on the evaporationof highly irradiated gas giant planets. Torres et al.(2008) note that the scatter around their gp-P trenddoes not correlate with metallicity.
The previously known sample of transiting planets wasshown by Hansen & Barman (2007) to separate into twoclasses by the Safronov number of the planet. TheSafronov number, θ = 1/2(Vesc/Vorb)
2, where Vesc isthe escape velocity from surface of the planet and Vorb
is the planet orbital velocity, is a measure of the abil-ity of a planet to gravitationally scatter other bodies.Hansen & Barman (2007) and refined by Torres et al.(2008) find transiting planets fall into categories definedas Class I, θ ∼ 0.07 ± 0.01 and Class II, θ ∼ 0.04 ± 0.01.XO-5b, θ = 0.1 ± 0.01 does not appear to belong to ei-ther class, yet it is not as discrepant as the other outlyingtransiting planets, GJ 436b (θ = 0.025) and HAT-P-2b(θ = 0.94) (Torres et al. 2008). There is some overlap,but the planets with higher metallicity stellar hosts tendto be the Class II objects with lower θ, whereas Class Iobjects have increasing θ toward lower metallicities. XO-5b does not follow this trend, but has high θ for highermetallicity.
A single object such as XO-5b does not invalidate thetrends amongst the Jupiter-class of transiting planets,but illustrates the importance of expanding the numberof such objects to fully explore the diversity of this popu-lation. Recently, the SuperWASP project announced 10new transiting planets11. We look forward to the detailed
analysis of these new transiting planets to amplify or di-minish the strength of the current trends amongst theclose-in transiting planets. The end goal of a large pop-ulation of transiting planets is to investigate any trendsthat may directly constrain processes that affect planetformation, migration, and planet survival.
The University of Hawaii staff have made the operationon Maui possible; we thank especially Jake Kamibayashi,Bill Giebink, Les Hieda, Jeff Kuhn, Haosheng Lin,Mike Maberry, Daniel O’Gara, Joey Perreira, KailaRhoden, and the director of the IFA, Rolf-Peter Ku-dritzki. The Hobby-Eberly Telescope (HET) is a jointproject of the University of Texas at Austin, the Penn-sylvania State University, Stanford University, Ludwig-Maximilians-Universitat Munchen, and Georg-August-Universitat Gottingen. The HET is named in honor of itsprincipal benefactors, William P. Hobby and Robert E.Eberly. We thank the HET night-time and day-time sup-port staff and the Resident Astronomer telescope opera-tor; we especially thank John Caldwell, Frank Deglman,Heinz Edelmann, Stephen Odewahn, Vicki Riley, SergeyRostopchin, Matthew Shetrone, and Chevo Terrazas.
We thank Dave Healy, Lisa Prato, and Naved Mah-mud for assistance observing; Jim Heasley for assistanceon the XO survey; Ron Bissinger, Paul Howell, FrancoMallia, and Gianluca Masi for their contributions in fol-lowing up XO candidates; and John Hibbard and PhilAppleton for kindly making the H I radio data of Arp143 available.
This research has made use of the SIMBAD database,operated at CDS, Strasbourg, France; data productsfrom the Two Micron All Sky Survey (2MASS), the Dig-itized Sky Survey (DSS), and The Amateur Sky Survey(TASS); source code for transit light-curves (Mandel &Agol 2002); and community access to the HET.
XO is funded primarily by NASA Origins grantNNG06GG92G and the Director’s Discretionary Fund ofthe STScI.
REFERENCES
Adelman-McCarthy, J. K., et al. 2008, ApJS, 175, 297Appleton, P. N., Ghigo, F. D., van Gorkom, J. H., Schombert,
J. M., & Struck-Marcell, C. 1987, Nature, 330, 500Arp, H. 1966, ApJS, 14, 1
Bakos, G. A., et al. 2007, ApJ, 656, 552
Bakos, G. A., et al. 2007, ApJ, 670, 826Barbieri, M., et al. 2007, A&A, 476, L13Burke, C. J., et al. 2007, ApJ, 671, 2115Chabrier, G., Baraffe, I., Allard, F., & Hauschildt, P. 2000, ApJ,
542, 464Charbonneau, D., Brown, T. M., Burrows, A., & Laughlin, G. 2007,
Protostars and Planets V, 701Claret, A. 2000, A&A, 363, 1081Cochran, W. 2000, FTS Spectrum of I2 Cell HRS3 At 69.9 C.,
ftp://nsokp.nso.edu/FTS cdrom/FTS50/001023R0.004Dravins, D., Lindegren, L., Mezey, E., & Young, A. T. 1997, PASP,
109, 173Droege, T. F., Richmond, M. W., Sallman, M. P., & Creager, R. P.
2006, PASP, 118, 1666Ford, E. B. 2005, AJ, 129, 1706Fortney, J. J., Marley, M. S., & Barnes, J. W. 2007, ApJ, 659, 1661Gray, D. F. 1992, The Observation and Analysis of
Stellar Photospheres, by David F. Gray, pp. 470. ISBN0521408687. Cambridge, UK: Cambridge University Press, June1992
Gregory, P. C. 2005, ApJ, 631, 1198Hansen, B. M. S., & Barman, T. 2007, ApJ, 671, 861Hibbard, J. E., van Gorkom, J. H., Rupen, M. P., & Schiminovich,
D. 2001, Gas and Galaxy Evolution, 240, 657Higdon, J. L., Rand, R. J., & Lord, S. D. 1997, ApJ, 489, L133Hinkle, K. H., Joyce, R. R., Sharp, N., & Valenti, J. A. 2000,
Proc. SPIE, 4008, 720Høg, E., et al. 2000, A&A, 355, L27Holman, M. J., et al. 2006, ApJ, 652, 1715Kovacs, G., Zucker, S., & Mazeh, T. 2002, A&A, 391, 369Janes, K. A., Clemens, D. P., Hayes-Gehrke, M. N., Eastman, J. D.,
Sarcia, D. S., & Bosh, A. S. 2004, Bulletin of the AmericanAstronomical Society, 36, 672
Johns-Krull, C. M., et al. 2008, ApJ, 677, 657Landolt, A. U. 1992, AJ, 104, 340Mandel, K., & Agol, E. 2002, ApJ, 580, L171Mandushev, G., et al. 2005, ApJ, 621, 1061Mazeh, T., Zucker, S., & Pont, F. 2005, MNRAS, 356, 955McCullough, P. R., Stys, J. E., Valenti, J. A., Fleming, S. W.,
Janes, K. A., & Heasley, J. N. 2005, PASP, 117, 783McCullough, P. R., et al. 2006, ApJ, 648, 1228McCullough, P. R., et al. 2008, ApJ, submittedMcCullough, P. R., & Burke, C. J. 2007, ASP Conf. Ser., Transiting
Extrasolar Planets Workshop, ed. C. Afonso, D. Weldrake, & T.Henning (San Francisco:ASP), in press (astro-ph/0703331)
8
Pont, F., Bouchy, F., Queloz, D., Santos, N. C., Melo, C., Mayor,M., & Udry, S. 2004, A&A, 426, L15
Schlegel, D. J., Finkbeiner, D. P., & Davis, M. 1998, ApJ, 500, 525Seager, S., & Mallen-Ornelas, G. 2003, ApJ, 585, 1038Skrutskie, M. F., et al. 2006, AJ, 131, 1163Southworth, J., Wheatley, P. J., & Sams, G. 2007, MNRAS, 379,
L11Southworth, J. 2008, MNRAS, 386, 1644Sozzetti, A., Torres, G., Charbonneau, D., Latham, D. W.,
Holman, M. J., Winn, J. N., Laird, J. B., & O’Donovan, F. T.2007, ApJ, 664, 1190
Torres, G., Konacki, M., Sasselov, D. D., & Jha, S. 2005, ApJ, 619,558
Torres, G., Winn, J. N., & Holman, M. J. 2008, ApJ, 677, 1324
Tull, R. G., MacQueen, P. J., Sneden, C., & Lambert, D. L. 1995,PASP, 107, 251
Tull, R. G. 1998, Proc. SPIE, 3355, 387Valenti, J. A., & Fischer, D. A. 2005, ApJS, 159, 141Valenti, J. A., & Piskunov, N. 1996, A&AS, 118, 595Wilson, R. E. 1993, New Frontiers in Binary Star Research, 38, 91Worthey, G., & Lee, H. -. 2006, ArXiv Astrophysics e-prints,
arXiv:astro-ph/0604590Yi, S., Demarque, P., Kim, Y.-C., Lee, Y.-W., Ree, C. H., Lejeune,
T., & Barnes, S. 2001, ApJS, 136, 417Zacharias, N., Urban, S. E., Zacharias, M. I., Wycoff, G. L., Hall,
D. M., Monet, D. G., & Rafferty, T. J. 2004, AJ, 127, 3043

9
TABLE 1XO, E.T., & Perkins Light Curve Dataa
Heliocentric Julian Date Light Curve Uncertainty Filter Nb Observatory[mag] (1-σ) [mag]
2452961.13135 -0.0033 0.0113 W 1 XO2452961.13135 -0.0095 0.0113 W 1 XO2452961.14526 0.0286 0.0113 W 1 XO2452961.14526 0.0048 0.0113 W 1 XO2452964.11816 0.0187 0.0100 W 1 XO
a The complete version of this table is in the electronic edition of this article.The printed edition contains only a sample.b Average of N measurements
TABLE 2Stellar Properties
Parameter Value of XO-5 ReferenceGSC ID 02959-00729 aRA (J2000.0) 7h46m51s.98 aDec (J2000.0) +39◦05′40′′.5 aGalactic Latitude b [deg] 26.94 a” Longitude l [deg] 180.63 aV 12.13±0.03 b(B-V) 0.84±0.05 b(V-Rc) 0.47±0.05 b(V-Ic) 0.83±0.05 bVTASS 12.17±0.06 c(V-Ic)TASS 0.82±0.08 cJ 10.77±0.02 d(J-H) 0.33±0.03 d(H-K) 0.10±0.03 dSpectral Type G8V bDistance [pc] 270±25 bµα [mas yr−1] -32.3±2.7 eµδ [mas yr−1] -24.4±5.6 eStellar Mass [M⊙] 1.0±0.03 b,fStellar Radius [R⊙] 1.11±0.09 bTeff [K] 5510±44 b,f[Fe/H] 0.25±0.03 b,flogg [cm s−2] 4.52±0.06 b,flogg [cm s−2] 4.34±0.07 b,gv sin i [km s−1] 1.8±0.5 b,f[Na/H] 0.18±0.03 b,fStellar ρ [g cm−3] 1.02±0.2 bAge [Gyr] 8.5±0.8 b
References:a) SIMBADb) this workc) TASS (Droege et al. 2006)d) 2MASS (Skrutskie et al. 2006)e) UCAC2 (Zacharias et al. 2004)f) SME Spectroscopic Determination (§ 3.1)g) Transit Light Curve Determination (§ 3.2)
TABLE 3XO-5 Radial Velocity Shifts
Julian Date Radial Velocity Uncertainty-245000 Shift [m s−1] (1-σ) [m s−1]
4442.7789 75.4 364452.7562 -147.4 464456.7451 -76.6 284458.9892 131.2 204461.7447 -120.5 414464.7206 0.7 824466.7167 -24.8 434476.6851 110.0 214478.6743 -130.2 144479.6874 72.8 24

10
TABLE 4Mid-Transit Times
Heliocentric Julian Date Uncertainty Observatory IDb
-2450000 (1-σ) [day]2999.0114 0.02 XO3354.9557 0.02 XO3359.1669 0.02 XO3375.9428 0.02 XO3417.8079 0.02 XO3438.7377 0.02 XO3442.9195 0.02 XO4129.7088 0.003 MF4439.6022 0.003 EGM4464.7268 0.003 CF4464.7331 0.003 CF4485.6730 0.003 CF4485.6685 0.003 JG4506.6061 0.003 MF4527.5427 0.003 JG
a Observatory ID is author initials, except XO is XOsurvey data.
TABLE 5The Planet XO-5b
Parameter ValueP 4.187732±0.00002 dtc 2454485.6664±0.0004 (HJD)K 145±10 m s−1
a 0.0508±0.0005 A.U.i 86.8±0.9 degMp 1.15±0.08 MJ
Rp 1.15±0.12 RJ
gp 22±5 m s−2
a/R⋆ 9.81±0.8Rp/R⋆ 0.106±0.003τ 3.13±0.07 hrImpact parameter, b 0.55±0.09loggp 3.35±0.09 cgsρp 1.02±0.3 g cm−3
Teq = Teff (R⋆/2a)1/2 1244±48 KSafronov 0.10±0.01