TRANSMISSION SPECTRA OF TRANSITING PLANET ATMOSPHERES: MODEL VALIDATION AND SIMULATIONS OF THE HOT...
17
arXiv:1010.2451v2 [astro-ph.EP] 24 Nov 2010 REVISED FOR APJ Preprint typeset using L A T E X style emulateapj v. 11/12/01 TRANSMISSION SPECTRA OF TRANSITING PLANET ATMOSPHERES: MODEL VALIDATION AND SIMULATIONS OF THE HOT NEPTUNE GJ 436B FOR JWST MEGAN SHABRAM 1, 2 ,J ONATHAN J. FORTNEY 2, 3 ,THOMAS P. GREENE 4 ,RICHARD S. FREEDMAN 4, 5 Revised for ApJ ABSTRACT We explore the transmission spectrum of the Neptune-class exoplanet GJ 436b, including the possibility that its atmospheric opacity is dominated by a variety of nonequilibrium chemical products. We also validate our transmission code by demonstrating close agreement with analytic models that use only Rayleigh scattering or water vapor opacity. We find broad disagreement with radius variations predicted by another published model. For GJ 436b, the relative coolness of the planet’s atmosphere, along with its implied high metallicity, may make it dissimilar in character compared to “hot Jupiters." Some recent observational and modeling efforts suggest low relative abundances of H 2 O and CH 4 present in GJ 436b’s atmosphere, compared to calculations from equilibrium chemistry. We include these characteristics in our models and examine the effects of absorption from methane- derived higher order hydrocarbons. To our knowledge, the effects of these nonequilibrium chemical products on the spectra of close-in giant planets has not previously been investigated. Significant absorption from HCN and C 2 H 2 are found throughout the infrared, while C 2 H 4 and C 2 H 6 are less easily seen. We perform detailed simulations of JWST observations, including all likely noise sources, and find that we will be able to constrain chemical abundance regimes from this planet’s transmission spectrum. For instance, the width of the features at 1.5, 3.3, and 7 µm indicates the amount of HCN versus C 2 H 2 present. The NIRSpec prism mode will be useful due to its large spectral range and the relatively large number of photo-electrons recorded per spectral resolution element. However, extremely bright host stars like GJ 436 may be better observed with a higher spectroscopic resolution mode in order to avoid detector saturation. We find that observations with the MIRI low resolution spectrograph should also have high signal-to-noise in the 5 - 10 µm range due to the brightness of the star and the relatively low spectral resolution (R ∼ 100) of this mode. Subject headings: planetary systems; James Webb Space Telescope, radiative transfer; stars: GJ 436, HD 209458 1. INTRODUCTION The rise of exoplanet characterization since the initial dis- covery of the transit of planet HD 209458b a decade ago (Charbonneau et al. 2000; Henry et al. 2000) has been truly stunning. The initial steps in atmospheric characterization of hot Jupiters came after the realization that the transmis- sion spectra of transiting planets would be diagnostic of the temperature and chemical mixing ratios in these atmospheres (Seager & Sasselov 2000; Brown 2001; Hubbard et al. 2001). As with perhaps all subfields of astronomy and planetary sci- ence, the return on the investment in these myriad observations is amplified when the data sets are compared to models that aim to simulate the conditions in the atmospheres of these planets. The model atmospheres, whether 1D or 3D, aim to predict the temperature structure, chemical mixing ra- tios, and wavelength dependent opacity, as a function of height. A comparison of transmission spectra data with models can enable constraints on the mixing ratios of atomic and molecular absorbers (e.g. Charbonneau et al. 2002; Fortney et al. 2003; Tinetti et al. 2007; Swain et al. 2008; Sing et al. 2009; Madhusudhan & Seager 2009; Désert et al. 2009; Burrows et al. 2010). Of course it then directly follows that constraints on these atmospheres are model dependent, as it is likely that the choices that one makes in constructing a model atmosphere affect the calculated spectrum. In this excit- ing field, the great difficulty in obtaining high signal-to-noise observations, along with the somewhat unconstrained nature of current atmosphere models, can make interpretation difficult. This was again typified by the recent works of Stevenson et al. (2010) and Beaulieu et al. (2010), who, based on separate data reductions and model fits, disagree on the probable mixing ra- tio of methane in the atmosphere of GJ 436b, which we dicuss below. At the forefront of exoplanet characterization, detections of lower mass objects have expanded the reservoir of constraints to parameter space beyond hot Jupiters, broadening the scope of planetary characterization. The premier hot Neptune, GJ 436b a 22.6 M ⊕ planet orbiting an M2.5 star, was detected via ra- dial velocity reflex motion by Butler et al. (2004), and later re- visited by Maness et al. (2007). The first photometric detec- tion of transits were obtained by Gillon et al. (2007b), provid- ing the missing link needed to determine the mass and in turn the bulk density. Gillon et al. (2007a) and Deming et al. (2007) refined system parameters with a Spitzer transit lightcurve at 8 µm, and Deming et al. (2007) and Demory et al. (2007) re- ported a detection of the planet’s secondary eclipse at 8 µm as well. A recent attempt at transit characterization was Pont et al. (2009), who probed the 1.4 µm water band using NICMOS on board the Hubble Space Telescope. This was the first attempt at a multi-wavelength transmission spectrum obtained for GJ 436b. Ground based efforts have yielded H- and K-band ra- dius measurements (Alonso et al. 2008; Cáceres et al. 2009), 1 Department of Astronomy, University of Florida, 211 Bryant Space Center, Gainesville, FL 32611 2 Department of Astronomy and Astrophysics, University of California, Santa Cruz, CA 95064 3 Alfred P. Sloan Research Fellow 4 Space Science and Astrobiology Division, NASA Ames Research Center, Mail Stop 245-3, Moffett Field, CA 94035 5 SETI Institute, 515 Whisman Road, Mountain View, CA 94043 1
-
Upload
independent -
Category
Documents
-
view
0 -
download
0
Transcript of TRANSMISSION SPECTRA OF TRANSITING PLANET ATMOSPHERES: MODEL VALIDATION AND SIMULATIONS OF THE HOT...

arX
iv:1
010.
2451
v2 [
astr
o-ph
.EP
] 24
Nov
201
0REVISED FORAPJ
Preprint typeset using LATEX style emulateapj v. 11/12/01
TRANSMISSION SPECTRA OF TRANSITING PLANET ATMOSPHERES: MODEL VALIDATION ANDSIMULATIONS OF THE HOT NEPTUNE GJ 436B FORJWST
MEGAN SHABRAM 1,2, JONATHAN J. FORTNEY2,3, THOMAS P. GREENE4, RICHARD S. FREEDMAN4,5
Revised for ApJ
ABSTRACT
We explore the transmission spectrum of the Neptune-class exoplanet GJ 436b, including the possibility thatits atmospheric opacity is dominated by a variety of nonequilibrium chemical products. We also validate ourtransmission code by demonstrating close agreement with analytic models that use only Rayleigh scattering orwater vapor opacity. We find broad disagreement with radius variations predicted by another published model.For GJ 436b, the relative coolness of the planet’s atmosphere, along with its implied high metallicity, may makeit dissimilar in character compared to “hot Jupiters." Somerecent observational and modeling efforts suggest lowrelative abundances of H2O and CH4 present in GJ 436b’s atmosphere, compared to calculations from equilibriumchemistry. We include these characteristics in our models and examine the effects of absorption from methane-derived higher order hydrocarbons. To our knowledge, the effects of these nonequilibrium chemical productson the spectra of close-in giant planets has not previously been investigated. Significant absorption from HCNand C2H2 are found throughout the infrared, while C2H4 and C2H6 are less easily seen. We perform detailedsimulations ofJWSTobservations, including all likely noise sources, and find that we will be able to constrainchemical abundance regimes from this planet’s transmission spectrum. For instance, the width of the features at1.5, 3.3, and 7µm indicates the amount of HCN versus C2H2 present. The NIRSpec prism mode will be usefuldue to its large spectral range and the relatively large number of photo-electrons recorded per spectral resolutionelement. However, extremely bright host stars like GJ 436 may be better observed with a higher spectroscopicresolution mode in order to avoid detector saturation. We find that observations with the MIRI low resolutionspectrograph should also have high signal-to-noise in the 5−10µm range due to the brightness of the star and therelatively low spectral resolution (R∼ 100) of this mode.
Subject headings:planetary systems; James Webb Space Telescope, radiative transfer; stars: GJ 436, HD 209458
1. INTRODUCTION
The rise of exoplanet characterization since the initial dis-covery of the transit of planet HD 209458b a decade ago(Charbonneau et al. 2000; Henry et al. 2000) has been trulystunning. The initial steps in atmospheric characterizationof hot Jupiters came after the realization that the transmis-sion spectra of transiting planets would be diagnostic of thetemperature and chemical mixing ratios in these atmospheres(Seager & Sasselov 2000; Brown 2001; Hubbard et al. 2001).As with perhaps all subfields of astronomy and planetary sci-ence, the return on the investment in these myriad observationsis amplified when the data sets are compared to models that aimto simulate the conditions in the atmospheres of these planets.
The model atmospheres, whether 1D or 3D, aim topredict the temperature structure, chemical mixing ra-tios, and wavelength dependent opacity, as a function ofheight. A comparison of transmission spectra data withmodels can enable constraints on the mixing ratios ofatomic and molecular absorbers (e.g. Charbonneau et al. 2002;Fortney et al. 2003; Tinetti et al. 2007; Swain et al. 2008;Sing et al. 2009; Madhusudhan & Seager 2009; Désert et al.2009; Burrows et al. 2010). Of course it then directly followsthat constraints on these atmospheres aremodel dependent, asit is likely that the choices that one makes in constructing amodel atmosphere affect the calculated spectrum. In this excit-ing field, the great difficulty in obtaining high signal-to-noise
observations, along with the somewhat unconstrained nature ofcurrent atmosphere models, can make interpretation difficult.This was again typified by the recent works of Stevenson et al.(2010) and Beaulieu et al. (2010), who, based on separate datareductions and model fits, disagree on the probable mixing ra-tio of methane in the atmosphere of GJ 436b, which we dicussbelow.
At the forefront of exoplanet characterization, detections oflower mass objects have expanded the reservoir of constraintsto parameter space beyond hot Jupiters, broadening the scope ofplanetary characterization. The premier hot Neptune, GJ 436ba 22.6M⊕ planet orbiting an M2.5 star, was detected via ra-dial velocity reflex motion by Butler et al. (2004), and laterre-visited by Maness et al. (2007). The first photometric detec-tion of transits were obtained by Gillon et al. (2007b), provid-ing the missing link needed to determine the mass and in turnthe bulk density. Gillon et al. (2007a) and Deming et al. (2007)refined system parameters with aSpitzertransit lightcurve at8 µm, and Deming et al. (2007) and Demory et al. (2007) re-ported a detection of the planet’s secondary eclipse at 8µm aswell. A recent attempt at transit characterization was Pontet al.(2009), who probed the 1.4µm water band using NICMOS onboard theHubble Space Telescope. This was the first attemptat a multi-wavelength transmission spectrum obtained for GJ436b. Ground based efforts have yielded H- and K-band ra-dius measurements (Alonso et al. 2008; Cáceres et al. 2009),
1 Department of Astronomy, University of Florida, 211 BryantSpace Center, Gainesville, FL 326112 Department of Astronomy and Astrophysics, University of California, Santa Cruz, CA 950643 Alfred P. Sloan Research Fellow4 Space Science and Astrobiology Division, NASA Ames Research Center, Mail Stop 245-3, Moffett Field, CA 940355 SETI Institute, 515 Whisman Road, Mountain View, CA 94043
1

2 Shabram, et al.
in addition to radius measurements from EPOXI obtained byBallard et al. (2010) in the 0.35 - 1.0µm range. Using IRACon-boardSpitzer, Beaulieu et al. (2010) very recently obtainedtransit depth measurements at 3.6, 4.5 and 8µm.
In order to study the dayside of the planet Stevenson et al.(2010) obtained secondary eclipse measurements in sixSpitzer bandpasses, from 3.6 to 24µm. They andMadhusudhan & Seager (2010) interpret their results as provid-ing evidence of thermochemical disequilibrium in GJ 436b’sdayside atmosphere. The fits by Madhusudhan & Seager(2010) to the Stevenson et al. (2010) observations are quitein-teresting in the mixing ratios of CH4, H2O, CO, and CO2 thatthey require. They postulate a metal-rich atmosphere, in linewith our understanding of Uranus and Neptune. However, com-pared to equilibrium chemistry, CH4 is strongly depleted, whileH2O is also depleted, and CO and CO2 are strongly enhanced.Higher order hydrocarbon molecules, e.g., C2HX or HCN, werenot considered in their fits, even though these molecules arethe first products resulting from methane destruction via pho-tolysis (Moses et al. 2005) or reduction (Zahnle et al. 2009a),and are strong absorbers in the near and mid infrared. Whensuggesting that a low CH4 abundance may be due to the pho-tolysis and/or vertical mixing, these higher-order hydrocarbonmolecules should be included. Alternatively, Beaulieu et al.(2010) interpret the Stevenson et al. (2010) data (some re-reduced by their team), as well as primary transit data, as po-tentially indicating a methane-rich atmosphere with a temper-ature inversion. This only further strengthens the points thatdifferences between data reduction methods and models clearlyimpacts conclusions.
The coming of theJames Webb Space Telescopewill bringthe next advancement in understanding exoplanet atmospheresand exoplanetary atmosphere modeling, as it will help to re-duce the under-constrained nature of current models. For aplanet like GJ 436b where there are already signs from pho-tometry that the atmospheric chemistry is complex, the spec-tral capabilities ofJWSTwill enhance our understanding, suchas the identification of more complex chemical compositionregimes and temperature structures. Understanding the integra-tion times and applicable wavelength bands needed to resolvespectral features of particular atmospheres is key for planningfuture science initiatives withJWST.
GJ 436b is a particularly interesting planet because it is thetransiting Neptune-class object that orbits the brightestparentstar. This means it may long remain the best studied extrasolarNeptune-class object. Given the poor signal-to-noise of trans-mission spectroscopy obtained withHST(Pont et al. 2009), andthe uncertainties that arise from using a small number of widephotometric bands strung together as spectra, it may well fall toJWSTto enable robust atmospheric characterization.
Deriving accurate transit depths can be a complex task. Prob-lems with SpitzerIRAC primary transit observations includethe issue of variable stellar fluxes between transit visits,due tostarspots. In the most common situation where a planet doesnot occult spots directly, the unocculted parts of the stellar sur-face appear less bright, due to the spots. Compared to a stel-lar surface that lacks spots, one would derive a deeper tran-sit depth (see, e.g. Pont et al. 2008; Agol et al. 2010). Thereis also the difficulty of extracting the transit depth with great
accuracy, which yields different groups to find different tran-sit depths, with the same data sets (e.g., Beaulieu et al. 2008;Désert et al. 2009). However, given that the interpretationoftransmission spectroscopy is in principle less sensitive to theatmospheric pressure-temperature profile than day-side emis-sion spectroscopy, transmission spectroscopy may lead to themost robust determinations of atmospheric abundances.
Here we examine the transmission spectrum signatures ofa variety of atmospheric chemistries, including those fromthermochemical equilibrium calculations, those favored byStevenson et al. (2010), and those that include abundant higherorder hydrocarbons not considered by these authors, guidedbyresults from Zahnle et al. (2009a). We combine these modelswith a detailed simulation of the NIRSpec and MIRI Low Reso-lution Spectrograph instruments that will be aboardJWST, for arealistic simulation of what further knowledge we may gain forthis important planet. In §2, we make simple comparisons be-tween our models, analytic relations, and other published work,in order to establish the robustness of derived atmosphericpa-rameters, and to validate our code. We find large differencesbetween our work and that of G. Tinetti and collaborators. In§3, we describe model transmission spectra for GJ 436b whileinvestigating various chemistries. In §4 we presentJWSTsim-ulations of GJ 436b transmission spectra, and discuss the possi-bilities for identifying important atmospheric signatures in thenear future. In §5 we discuss implications of our transmissionspectra models as well as address future endeavors for atmo-spheric characterization via theoretical work.
2. TRANSMISSION MODEL: DESCRIPTION AND VALIDATION
We model the transmission spectrum of planets using a de-scendent of the code first described in Hubbard et al. (2001).Here we ignore the effects of refraction and a glow of photonsaround the planet’s limb due to Rayleigh scattering, both ofwhich Hubbard et al. (2001) found to be negligible for close-in planets. Later works using this code included Fortney et al.(2003), which investigated simple two-dimensional modelsofthe atmosphere of HD 209458b, but included one planet-wideP-T profile, with 2D changes in the atmospheric opacities.Fortney (2005) examined the possible effects of cloud opacityfor the slant viewing geometry appropriate for transits. Were-fer the reader to Fortney et al. (2010), which described the codein some detail, and extended our treatment to 3D planetary at-mosphere models.
In either 1D or 3D, atmosphericP-T profiles are lain atopan opaque atmosphere at a reference pressure of either 1 or 10bar. The radius at this pressure level is adjusted to yield thebest fit to observations. Along 1000 light ray paths throughthe atmosphere parallel to the star-planet-observer axis,the lo-cal atmospheric density and opacity are each typically sam-pled at 1000 points along each ray6 For absorption, the wave-length dependent cross-section is calculated based on contri-butions from a variety of atoms and molecules. The abun-dances can be based either on local chemical equilibriumat a given atmosphericP–T point (Lodders & Fegley 2002,2006; Lodders 2009), or they can be arbitrary. The Rayleighscattering cross-section is described in Fortney et al. (2010),and in practice for our H2/He dominated atmospheres, wefind a cross-section of 1.645e-24 cm2 molecule−1 at 450 nm,and scale byλ−4 at other wavelengths. Here we define the
6 Some phrases used in the original description of the code in Hubbard et al. (2001) may lead to the impression that the code replaces the true geometry of theatmosphere with a slab having the same column density. In theHubbard et al. (2001) work this “slab” approximation was only done for the simulation of the weakglow of multiply Rayleigh-scattered photons. This approximation has never been made for 1D or 3D calculations of the transmission spectrum.

GJ 436b Transmission Spectra 3
wavelength-dependent transit radius as the radius where thetotal slant optical depth reaches 0.56, following the results ofLecavelier des Etangs et al. (2008b)7, who use a method simi-lar to our former one.
2.1. Opacities
Opacities generally used in the field of exoplanet atmo-spheres are discussed in detail in Sharp & Burrows (2007)and Freedman et al. (2008). Freedman et al. (2008) outlinethe opacities that we use in modeling the atmospheres of hotJupiters, other Jupiter-class planets, Neptune-class planets, andbrown dwarfs (e.g. Fortney et al. 2008a,b; Saumon et al. 2006;Cushing et al. 2008). We will not repeat the discussions in thatpaper, but we will touch on the issues of water opacity andhigher-order hydrocarbons in turn.
It is well established theoretically (Burrows et al. 1997;Marley et al. 1999; Seager & Sasselov 2000; Sudarsky et al.2000; Barman et al. 2001) that water vapor opacity is the domi-nant infrared opacity source in warm giant planet atmospheres.There is also inescapable observational evidence that thisistrue for brown dwarfs (e.g. Kirkpatrick 2005), and this clearlyappears to be true for hot Jupiters as well (e.g. Swain et al.2008; Grillmair et al. 2008). Comprehensiveab initio calcu-lations of line lists of hundreds of millions of lines for H2Ohave been tabulated by, for instance, Partridge & Schwenke(1997) and by Barber et al. (2006). Both tabulations are widelyused. One of us (R. S. Freedman) has done extensive com-parisons of these two particular line lists at the tempera-tures of interest for planets and brown dwarfs, those below2500 K, and these differences are described in Freedman et al.(2008) at being “slight.” In the detailed fits of M.S. Mar-ley and collaborators to L- and T-type brown dwarfs, there isno hint that the Partridge & Schwenke (1997) database is in-sufficient to match the high signal-to-noise medium-resolutionNIR and mid-IR spectra that have been achieved for scoresof objects (e.g. Cushing et al. 2008; Stephens et al. 2009). InFigure 1 we show calculated absorption cross-sections at 1500K and 1 mbar. Clearly the Partridge & Schwenke (1997) andBarber et al. (2006) line lists are nearly identical in this pres-sure/temperature regime. If transmission spectra calculated bytwo different atmosphere codes differ (see §2.3), the choice be-tween these two water line lists cannot be an important con-tributing factor.
2.2. Transmission Model Validation
We can validate the predictions of the transmission spec-trum code by turning to previous work. In particular,Lecavelier des Etangs et al. (2008a) have shown that the re-lation between absorption cross-section, mixing ratio, atmo-spheric temperature structure, and transit radius can be treatedanalytically. There is a particuarly straighforward relationfor the wavelength-dependent transit radius for an atmospherethat obeys a few simple constraints. These constraints are anisothermal temperature structure, a constant gravitational accel-eration with height, and an opacity cross sectionσ that variesas
σ = σo(λ/λo)α, (1)
whereσ andσo are the wavelength dependent cross-section,and a reference cross-section, respectively, andλ andλo arethe wavelength and a reference wavelength, respectively. Giventhese constraints, the planet’s radius can be written as
dRp
dlnλ= α
kTµg
= αH, (2)
whereRp is the transit radius,λ is the wavelength,k is Boltz-mann’s constant,T is the temperature,µ is the mean molecularmass,g is the surface gravity, andH is the scale height. For apure Rayleigh scattering atmosphere,α = −4. In Figure 2 wepresent an isothermal model atT = 1500K,g = 25 m s−2, andµ = 2.32, with all opacity turned off, save Rayleigh scattering.We find a model slope that is within 1% of the analytic relationfrom Eq. (2), which we regard as excellent agreement.
2.3. Comparison With Other Work for Simple Models
In §2.1 we described our implementation of the water vaporline list of Partridge & Schwenke (1997). As a further test ofthe transmission code we can isolate specific wavelength re-gions where water opacity closely obeys theα-relation fromEq. (1). In particular, in Figure 3a we show the absorptioncross-section vs. wavelength at 1500 K and 10 mbar. We haveover-plotted fits forα in three spectral regions. The bluest andreddest wavelength ranges have a large negative slope, whilethe middle wavelength range has a positive slope. If our trans-mission spectrum model is working correctly, we should be ableto match the transit radius slope ofdRp/dlnλ from Equation(2), for an atmosphere with a constant gravity and scale height,with water vapor being the only opacity source. We choose1500 K and the surface gravity of HD 209458b, 980 cm s−2.This model is plotted in Figure 3b. One can readily see that overthe three defined wavelength ranges that our model matches theanalytic relation.
Our choice of an isothermal HD 209458b-like model wasbased on models presented by G. Tinetti and collaborators ina recent paper by Beaulieu et al. (2009). These authors usedSpitzer IRAC observations to measure the transit depth in 4bandpasses from 3 to 10µm. Their nice model fit, compared tothe data (shown in their Figure 10), allowed the authors to as-sert that water vapor was the main absorber in that atmosphere.This may well be true. However, as shown in Fortney et al.(2010), our own HD 209458b models were not able to repro-duce the largevariation in absorption depths. As discussedin Fortney et al. (2010), we are generally unable to match themuch larger variation in transit radius of the models of Tinettiand collaborators (e.g. Tinetti et al. 2007, 2010). Although ourtwo groups use different water opacity databases (Tinetii etal. use the BT2 list) it does not appear that can be a contributingfactor.
To help sort out this issue, we became interested in sim-ple tests. Figure 9 of Beaulieu et al. (2009) additionally showstransmission spectra for isothermal model atmospheres of HD209458b at 1500, 2000, and 2500 K, with opacity due onlyto water vapor (with a mixing ratio of 4.5× 10⁻⁴, the samevalue we use here). We compare our 1500 K model to thatof Beaulieu et al. (2009), as well as the analytic relations,inFigure 4. (The model from Beaulieu et al. (2009) was obtained
7 In our published work he have used two different methods to calculate the “transit radius.” In our earliest work, (e.g. Hubbard et al. 2001; Fortney et al. 2003)we used the profile of the slant optical depth vs. radius, set atop an opaque circle, to generate synthetic images from which we calculated the amount of stellar fluxblocked by the planet. We then defined a larger opaque circle whose cross-sectional area blocked this same amount of lightas the planetary model—the radius of thislarger circle yielded our transit radius. More recently we have chosen the tau=0.56 level as the transit radius, simply for computation ease, but we find fine agreementbetween the two methods, as did Lecavelier des Etangs et al. (2008b). Generally, for simple tests we find excellent agreement between our recent work and that ofT. Barman Barman (e.g. 2007), who use a method similar to our current one, as well as with E. Miller-Ricci Kempton (e.g. Miller-Ricci et al. 2009).

4 Shabram, et al.
using a data extraction software package.) The differencesarelarge. Here we are able to match the analytic relations, whilethe model from Beaulieu et al. (2009) cannot.
It is not immediately clear what causes these dramatic dif-ferences between the two models. The large differences remainat 2000 K and 2500 K as well. As shown in Figure 1, differ-ences in water opacity databases cannot be a culprit. Differ-ences in abundances can generally not be a reason either, as ahigher (lower) water abundance would move the transit radiusup (down) at all wavelengths. Also, that issue was eliminatedfor the simple test presented here. We are left in the positionof identifying what we believe is a problem, with Tinetti et al.models, but we are not in a position to speculate as to its cause.
We only dwell on this issue at length because it is the matchof models to observations that allows for the identificationofabsorption features, and the determination of the mixing ratiosof specific components. We are left to doubt the validity ofthe Tinetti transmission models, and the derivations of atmo-spheric abundances from some of the papers in which thosemodels were used. We further wish to stress that at this timewe have only compared to transmission spectrum models, andnot to day-side emission spectrum models. Certainly the com-parison between models is an area in need of future work. Aninteresting avenue would be to model the transmission spec-trum of solar system planets, such as Earth (Pallé et al. 2009)or Saturn (Nicholson et al. 2006), which we will pursue in thenear future. Our description of our methods complete, we cannow turn our application to GJ 436b.
3. APPLICATION TO GJ436B
GJ 436b is a relatively small planet with a bulk densitysimilar to Neptune (Gillon et al. 2007b; Torres et al. 2008).Itmay be mostly composed of fluid water, but a layer of H-He dominated atmosphere is clearly needed to account forthe observed radius (Gillon et al. 2007b; Adams et al. 2008;Nettelmann et al. 2010). GJ 436b is one of the least-irradiatedtransiting planets, which makes its atmosphere cooler thanmany other well-studied planets. Based on thermochemi-cal equilibrium models, the low temperatures suggests thedominant carbon-bearing molecule in the gaseous envelopeis methane (Spiegel et al. 2010; Madhusudhan & Seager 2010;Lewis et al. 2010).
The recent Stevenson et al. (2010) secondary eclipse mea-surements from warmSpitzer, however, have been interpretedby these authors as suggesting otherwise. An atmosphere who’scarbon chemistry is methane-dominate would tend to yield asmall flux ratio in the 3.6µm band, with more flux in the 4.5µm band. However, Stevenson et al. (2010) report a strong de-tection at 3.6µm, and non-detection at 4.5µm. This could beindicative of extensive methane depletion, which would allowone to probe deeply, to hotter gas, in the 3.6µm band, while alarge mixing ratio for CO and CO2, which both absorb stronglyin the 4.5 µm band, could suppress flux in this bandpass(Stevenson et al. 2010; Madhusudhan & Seager 2010). LargeCO and CO2 abundances have been shown to be indicators ofhigh metallicity (Lodders & Fegley 2002; Visscher et al. 2006;Zahnle et al. 2009b).
In the favored scenarios, the CO/CH4 and CO2/CH4 mixingratios are enhanced due to vertical mixing from hotter, CH4-poor gas below, along with the photochemical destruction ofCH4 by incident UV photons. If relatively abundant CH4 isindeed destroyed, this will give rise to a whole host of higher-
order hydrocarbons, which is well understood for our solar sys-tem’s giant planets (e.g. Moses et al. 2005). Detailed chem-ical models, including photochemistry and vertical mixing,were applied to cool transiting planets by Zahnle et al. (2009a),which predicted the formation of abundant C2H2, C2H4, C2H6,and HCN. More recently, the theory of a methane-poor atmo-sphere for GJ 436b was challenged by Beaulieu et al. (2010),who, with a combination of modestly different eclipse depthsat 3.6 and 4.5µm, compute emission and transmission spectramodels that allow abundant methane.
3.1. Abundances and Opacities at the Terminator
Since a goal of the work is to explore the prospects for broad-wavelength-coverage spectra withJWST, we choose to explorea diverse set of model atmospheres. Our choices are guided bypredictions from equilibrium chemistry, nonequilibrium chem-istry, and fits to published spectra of the planet. Cross sectionsfor the main molecules expected from thermochemical equilib-rium are shown in Figure 5. There are certainly a rich numberof molecular bands, particularly at wavelengths blueward of 5µm, where NIRCam and NIRSpec will be sensitive.
In Figure 6, we present GJ 436b model transmission spec-tra, using these cross sections. One model is for a 30× solarmetallicity atmosphere in thermochemical equilibrium (black),as well as two models (red and blue) with abundances takendirectly from the “red model” and “blue model” in Table 2 ofStevenson et al. (2010). These mixing ratios are somewhat de-pleted in water, strongly depleted in methane, and CO and CO2-rich compared to our equilibrium calculations. In all cases, weinclude the atomic sodium and potassium abundances derivedfrom the equilibrium model. For the three chemistry cases, weuse two differentP–T profiles. In the upper panel, a hotter“dayside average" profile (named “2 pi”) is used, which sim-ulates inefficient day night energy redistribution. The bottompanel uses a cooler planet-wide average profile (named “4 pi”)(e.g., Fortney et al. 2005). The twoP–T profiles are plotted inFigure 7. These models (which we will refer to as models ‘a’through ‘f’), as well as models discussed in the following sec-tions are described in Table 1. At the current time we do notinvestigate time-variable temperature structure or abundances.The only published model of the atmospheric dynamics of GJ436b show little variability (Lewis et al. 2010), and there is noobservational evidence as yet. For the twoP–T profile cases,we adjust the 10 bar radius of all models so that the radii alignin the optical. The main chemical difference between the hot-ter and cooler profiles is that the hotter model yields a largermixing ratio of Na and K, yielding stronger features in the opti-cal. A structural difference is that the larger scale heightin thewarmer model leads to modestly larger changes in radius as afunction of wavelength.
Compared to our equilibrium model, the two models fromStevenson et al. (2010) (models ‘c’ through ‘f’ in Table 1)show considerably smaller radii in the near and mid-infrared,which is predominantly due to the smaller mixing ratio of wa-ter. Therefore, a clear probe of the water mixing ratio is thenear-IR radius, compared to the optical radius, where waterva-por is much less important. As expected the differences be-tween the equilibrium model and the red/blue models are great-est in wavelengths where methane and water are the dominantabsorbers, and smallest where CO and CO2 are the dominantabsorbers.

GJ 436b Transmission Spectra 5
3.2. Nonequilibrium Chemical Products: Absorption Features
Stevenson et al. (2010) and Madhusudhan & Seager (2010)suggested that there could be evidence for a very low CH4 mix-ing ratio in the atmosphere of GJ 436b, due to a combination ofvertical mixing and photolysis of CH4. However, they did notinvestigate how the methane-derived nonequilibrium chemicalproducts may affect the spectra of the planet’s atmosphere.Re-cently, Zahnle et al. (2009a) have investigated nonequilibriumcarbon for isothermal “warm Jupiter” atmospheres (800< T <1200 K) at a range of metallicities. These temperatures are sim-ilar to those suggested for GJ 436b. Zahnle et al. (2009a) findthat methane is sustained at higher regions in the atmosphere,water is more stable, and OH and H2 quickly combine to formH2O and H. This effectively increases the C to O ratio leading toincreased abundances of molecules such as HCN, C2H2, C2H4,and C2H6. Given the uncertainties in modeling this chemistry,and the wide range of atmosphere models that are consistentwith the GJ 436b data to date, our next aim is to explore trans-mission spectra with a range of nonequilibrium chemical prod-ucts, guided by the results of Zahnle et al. (2009a).
The cross sections for these first generation products ofmethane, which are strong absorbers in the infrared, can befound in Figure 8. Data for C2H2, C2H4 and C2H6, which arelikely incomplete, are from the HITRAN database, while thatfor HCN is from the calculations of Harris et al. (2008). Thecross-sections are similar in magnitude to those of the equi-librium chemistry products (Figure 5). HCN and C2H2 haveprominent features at 1.5, 3.3, 7, and 13µm, C2H4 has a signif-icant impact to absorption at 9.5µm, but C2H6 has very littleeffect, with most of its opacity residing between 10 and 13µm.In Figure 9 we explore transmission spectra including the opac-ities with these nonequilibrium products. We begin with model‘e’ in from Table 1, also shown as the red model from the toppanel of Figure 6. This model uses a dayside averageP–T pro-file with the same best fit mixing ratios as the “red model” fromTable 2 of Stevenson et al. (2010).
In addition to the original parameters of model ‘e’, we in-clude absorption from HCN, C2H2, C2H4 and C2H6, with mix-ing ratios of 1× 10⁻⁴, 1× 10⁻⁵, 1× 10⁻³ and 1× 10⁻⁸ re-spectively, shown as the cyan model in Figure 9 (model ‘g’from Table 1). We derive these chemical abundances basedon Zahnle et al. (2009a), where they depict mixing ratios as afunction of height andKzz (eddy diffusion coefficient) for anatmosphere at 1000 K. The mixing ratios chosen are similar towhat is expected for an atmosphere that is vigorously mixing(Kzz = 1011).
It is worthwhile to explore some variations on this model.One variation removes the blanketing effects of hydrogencyanide (HCN), shown in purple (model ‘h’ from Table 1).This model illustrates the difference in the width of the featuresat 3.3, 7 and 13µm, where HCN and C2H2 have overlappingopacity. When the features are thick, they are dominated byHCN opacity. When we remove HCN, we see thinner features,indicating that C2H2 dominates over HCN. This characteris-tic may allow further constraints on the mixing ratios of cooltransiting planet atmospheres. In green is a model with thesenonequilibrium products absent at pressures below 10 mbar(model ‘i’ from Table 1). The green model illustrates the condi-tion of modest vertical mixing, withKzz on the order of 106 cm2
s−1, similar to that favored by Madhusudhan & Seager (2010).In this case, nonequilibrium products are not stable higherinthe atmosphere than the∼ 10 mbar pressure level (Zahnle et al.
2009a). The main absorption features in the infrared will beweakened, as the green model confirms. The strength of thesefeatures could be constraints on vertical mixing andKzz.
Absorption from these nonequilibrium products may maskfeatures that would otherwise show an under-abundance of wa-ter in the transmission spectrum, as Figure 9 shows. The redmodel, which generally shows smaller radii in the near- andmid-IR than in the optical, instead shows significantly largerradii when the nonequilibrium products are introduced. Spec-troscopy, rather than photometry, will be key towards disen-tangling the effects of various molecules on the transmissionspectrum.
3.3. Comparison with Data
In Figure 10, we explore model fits to recentSpitzerIRACdata for 3.6, 4.5, and 8µm (Beaulieu et al. 2010), as well asdata from EPOXI in the 0.35 - 1.0µm range (Ballard et al.2010), HST NICMOSin the 1.1 - 1.9µm range (Pont et al.2009), ground based H-band (Alonso et al. 2008), and groundbased K-band (Cáceres et al. 2009). We plot our models in highresolution, and as band-averages, where appropriate. Look-ing at the optical and near infrared, the best match is to themodel that uses abundances from equilibrium chemistry, shownin grey (model ‘a’ from Table 1).
In the mid-infrared, for theSpitzerIRAC data we see thesame trend that we found in Fortney et al. (2010): in com-parison to Beaulieu et al. (2008) data for HD 189733b and toBeaulieu et al. (2009) data for HD 209458b, our models can-not match the largeramplitudeof the features–the implieddramatic change in absorption depth as a function of wave-length. The models of G. Tinetti and collaborators, used in theBeaulieu et al. (2010) paper, do fit the observation reasonablywell. However, as discussed in §2.3, we find that the Tinetti etal. models overestimate the amplitude of absorption features.
It is clear that our models do not agree with the large peak totrough variation of spectra required by Beaulieu et al. (2010) tofit their data. If the methods employed by Beaulieu et al. (2008,2009, 2010) are correct, and the error bars are not underesti-mated, the results for all of these planets imply that dramaticrevisions to models of these atmospheres are needed. Given theuncertainties in the reduction of IRAC transit data, it may be upto JWSTto confirm speculations about the molecules present atthe terminator of GJ 436b.
4. PROSPECTS FOR JWST FOR GJ436
We now evaluate the observability of the differences in theGJ 436b models by comparing them through the eyes ofJWST.We have developed a code that simulatesJWSTspectra by com-puting the number of photons detected using a model of thehost star, a transmission model of the planet, and estimatesofthe total efficiency (detected electrons per incident photon) ateach wavelength for the variousJWSTdispersive spectroscopicmodes. Noise is also modeled and added to the simulated spec-tra.
The star GJ 436 is relatively bright over the 0.7−5µm spec-tral region, and the transmission models predict that GJ 436bwill have absorption features from many species over this wave-length range. Therefore we illustrate the model similarities anddifferences with simulations ofJWSTobservations using theNIRSpecR≡ λ/δλ ∼ 100 spectroscopic mode over this spec-tral range. The double-pass CaF2 prism used in this mode pro-vides spectroscopic resolution varying fromR≃ 30 atλ ∼ 1.2

6 Shabram, et al.
µm to R> 200 atλ > 4.3 µm. We approximate this with afourth order polynomial fit over the 0.7−5 µm range, and weassume that the prism has total transmission efficiency of 0.81after two passes. We estimate that the optical efficiency of NIR-Spec’s 14 reflective surfaces (te Plate et al. 2005) is approxi-mately 0.58 overλ = 1−5µm, consistent with the values calcu-lated by the NIRSPec team (P. Jakobsen, private communica-tion 2003) and assumed by Deming et al. (2009) after remov-ing the grating blaze function. We adopt a quantum efficiencyof 0.75 across the entireλ = 1−5 µm spectral range, consis-tent with the NIRSpec detector requirements (Rauscher et al.2007). The telescope is estimated to have total reflectivityof0.9 across this wavelength range. Total efficiency was modeledto decrease linearly by a factor of 2.0 as wavelength decreasesfrom 1.0 to 0.7µm, driven mostly by reduction in reflectivity inthe 14 reflective NIRSpec surfaces.
Like Deming et al. (2009), we assume there will be no lossesfrom the 1.′′6 wide entrance slit and that the only significantnoise sources are photon noise and systematic noise due tosmall guiding errors during exposures. Photon noise is sim-ulated by adding Poisson noise appropriate for the number ofdetected photo-electrons in each resolution bin. We adopt thesystematic noise value of 5× 10⁻⁵ estimated by Deming et al.(2009). We do assume that this noise is Gaussian in its distribu-tion although Deming et al. (2009) found that it was somewhatnon-Gaussian. Even with high precision JWST instruments,we will suffer systematic noise at these modest but significantlevels. In the "1-(in-transit/star)" computation, any additionalnatural or instrumental noise occurring at frequencies greaterthan the inverse of the transit observation period will impact theextracted spectrum. This simulation program was coded in C,and it uses the public domain RANLIB package for simulatingphoton noise and Gaussian systematic noise.
A high fidelity stellar model of the GJ 436 host star was notreadily available, so we used a model of GJ 411 which has M2V spectral type, similar to the M2.5 V type of GJ 436. Usingour simulation code, we re-binned the Kurucz (2009)R= 1000model of GJ 411 to the instrumental resolution of theJWSTNIRSpec prism at each wavelength interval overλ = 0.7−5µm.Next, our code computed the number of stellar photons fromthis binned flux, reducing it by the ratio of the squared modelplanet radius divided by the squared stellar radius (assumed tobe 3.2×1010 cm) at each wavelength. We used a distance of10.2 pc to GJ 436 and an integration time of 1800 s for thesecalculations. This integration time is∼ 33% shorter than the2740 s duration of the transit (Pont et al. 2009). We used theresultant simulated in-transit spectrum and the simulatedstellarspectrum of equal integration time to compute the absorptiondepth at each wavelength, 1 - (in-transit / star). This is plottedfor GJ 436b models in Figure 11.
Models ‘a’, ‘c’, and ‘e’ (shown in black, blue, and red re-spectively) are plotted in the top panel of Figure 11. These areJWSTsimulations of the models in the top panel of Figure 6.Models ‘e’, ‘g’, ‘h’, and ‘i’ are plotted in the bottom panel inred, purple, cyan and green respectively, and areJWSTsimu-lations of the models in Figure 9. The absorption features arelabeled here for clarity. In particular, in the top panel thedif-ferences between the water rich model (black) and water poormodels (red and blue) are readily apparent, as is the strong CO2feature at 4.3µm and CO feature at 4.5µm. In the bottompanel, the absorption features due to nonequilibrium HCN andC2H2 are clearly apparent, as is CH4 absorption from 3-4µm.
The prospects for detailed characterization of this planet, andothers withJWST, is good.
Given the high brightness of GJ 436b (K = 6.1 or KAB = 7.9mag), it is likely that its observation will require use of a detec-tor subarray that is smaller in the dispersion direction than the∼ 350 pixel length of the complete 0.6−5 µm R∼ 100 spec-trum (Tumlinson 2008). Therefore, we find that acquiring theentire spectrum shown at the signal-to-noise in Figure 11 mayrequire 2 or 3 transits. These observations may be best acquiredin the higher resolutionR= 1000 mode for stars as bright as GJ436.
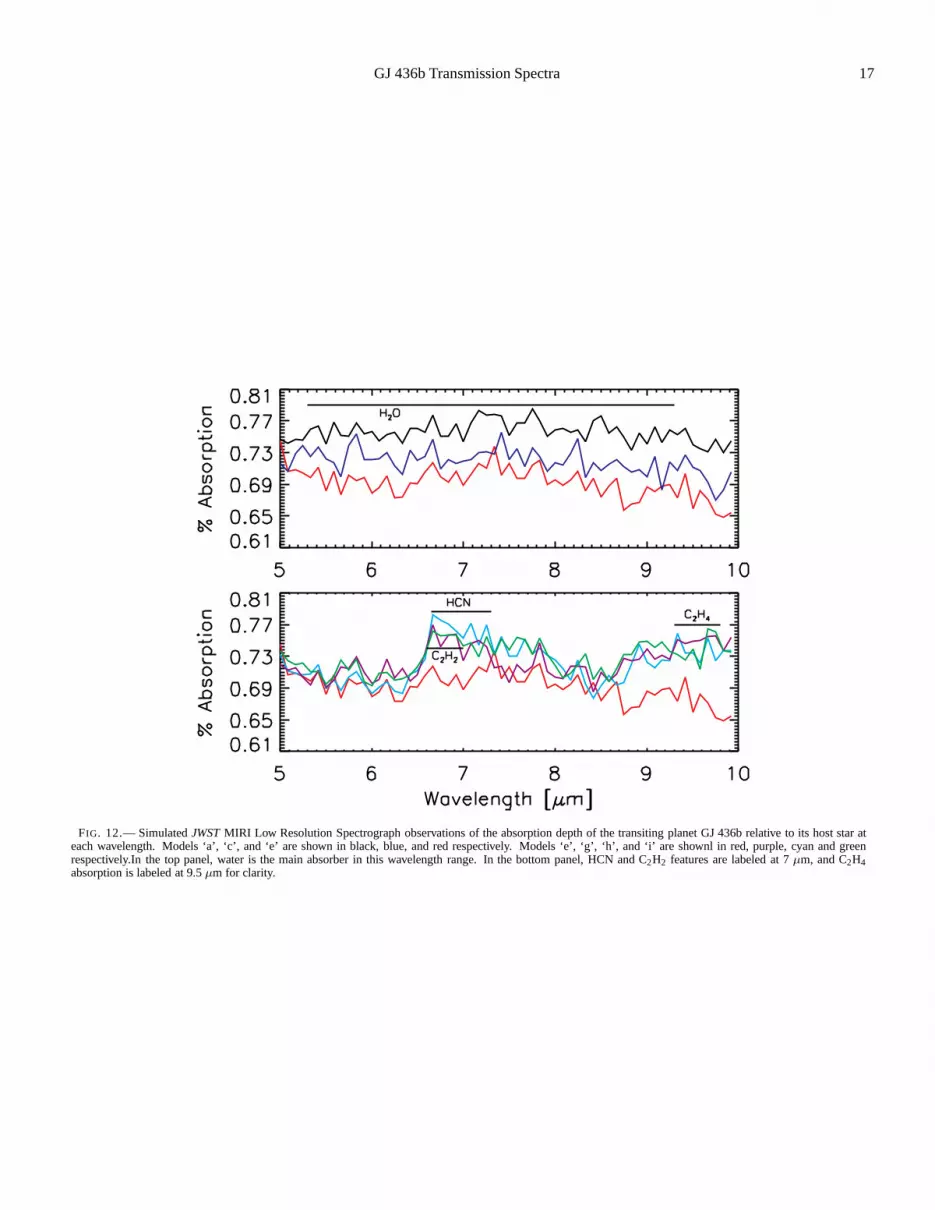
At λ = 5−10 µm MIRI low resolution spectrograph (LRS;R∼ 100) observations were also simulated for these models ina similar fashion using details of LRS models and actual mea-sured performance. These simulations are shown in Figure 12and are another independent way of looking at the effects ofnonequilibrium chemistry in the atmosphere of GJ 436b. Inthe top panel (models ‘a’, ‘c’ and ‘e’ are shown as black, blue,and red respectively), water is the main opacity source in thiswavelength range. The bottom panel (showing models ‘e’, ‘g’,‘h’, and ‘i’ as red, purple, cyan, and green respectively) showsthe clear distinction of HCN and C2H2 between the differentmodels shown at 7µm. Absorption from C2H4 is shown at 9.5µm as well. Observations using MIRI will be the only way toprobe the 9.5µm feature created by the presence of C2H4. Thesimulations were also made for a total integration time of 30m in transit and 30 m on the star. The flux of GJ 436 is lessthan 1 Jy over this wavelength range, faint enough for its entireλ = 5−10µm spectrum to be acquired simultaneously, which isan advantage MIRI will have over NIRSpec observations thatrequire multiple transits to obtain the full spectrum.
The noise included in the spectral simulations and shownin Figures 11 and 12 are likely lower limits to the actualnoise recorded inJWSTspectra. Common-mode low frequencynoises due to the observatory will likely be eliminated by thedifferential measurement of the star and planet. All data for thesimulated spectra shown are obtained on time scales of 2 – 3eclipses, so any global variation in the star on longer time scales(i.e., subsequent transits or eclipses) will also be removed. Vari-ation of the planet between transits will be recorded, and thiscould, in principle, limit the usefulness of co-adding multi-ple spectra. Variations in theJWSTinstrumentation, the hoststar, or the planet on time scales shorter than 2 – 3 transitor eclipse events will appear in the data as systematic or ran-dom noise. Nevertheless, we expect thatJWST should beable to obtain high signal-to-noise exoplanet spectra given thatSpitzerwas able to obtain signal-to-noise approaching 104 (e.g.,Machalek et al. 2010, and references therein) with its olderde-tectors, about a factor of 2 less than we predict for the system-atic noise ofJWST.
5. DISCUSSION AND CONCLUSIONS
We have explored possible transmission spectra of GJ 436b.We have investigated equilibrium chemistry cases and havecompared them to mixing ratios derived to fit recent secondaryeclipse measurements in the near infrared. The differencesinthese mixing ratio regimes have a significant effect when com-paring the corresponding transmission spectra. The lack ofwa-ter in some cases will be easily detected byJWSTassuming thespectrum is not dominated by absorption from nonequilibriumchemical products of methane. For this reason, we have madethe first attempt to include opacity from higher order hydro-

GJ 436b Transmission Spectra 7
carbons for close-in giant planet atmosphere models. Specif-ically, we have included absorption from HCN, C2H2, C2H4,and C2H6. The special condition that favors production of thesemolecules the most is the relatively low temperatures foundinthis planet.
HST andSpitzermay be limited in the capabilities neededto observe this planet’s transmission spectrum. The Pont etal.(2009) near-IR spectrum fromHubble suffered from instru-mental systematics that could not be overcome. Reduction ofSpitzer IRAC transit data suffers from the problem that dif-ferent groups reducing the same data sets achieve differentre-sults, with errors bars that do not overlap (Beaulieu et al. 2008;Désert et al. 2009). Transit depths observed at different epochsallow for stellar vairability to complicate the interpretation.These observations areextremely challenging, such that manyresults for GJ 436b, and many of the transiting planets, mustberegarded as provisional.
We have shown thatJWSTshould be able to make importantbreakthroughs in answering questions about the chemical mix-ing ratios in the planet’s atmosphere. Specifically, the presenceof higher order hydrocarbons in the transmission spectrum ofthis planet would reinforce the recent claim of non-detection ofmethane in the emission spectrum. We also may be able to con-strain the composition and structure at the planetary limb.If hy-drocarbon chemistry is present, it will be possible to constrainthe abundances of these species. For example, HCN and C2H2have strong absorption overlapping at 1.5, 3.3, 7, and 13µm.The thickness of the feature in each wavelength region will tellus which molecule is more abundant in the atmosphere. Whenthere is minimal HCN, the signature of C2H2 in these wave-length regions will be characteristically thinner. This phenom-ena is depicted forJWST’s NIRSpec in the lower panel of Fig-ure 11 for the 1.5 and 3.3µm features as well as for the MIRILRS in the lower panel of Figure 12 at 7µm. The strengthof the features in the infrared produced by these hydrocarbonsmay also be instrumental in constraining information regardingatmospheric mixing. Weak features may indicate a small eddydiffusion coefficient (Kzz), pointing towards weak vertical mix-ing in the planet’s atmosphere, with these molecules forming athigher pressure levels.
In order to produce accurate model spectra of an exoplanet,including nonequilibrium chemical products (due to mixingandphotochemistry) a self consistent code is needed. This wouldensure that the molecular mixing ratios, and their impact onopacities, are consistent with the atmosphericP–Tprofile. Thisalone is difficult, but should be addressed in the future. In prin-
ciple, all of this should be done in a three-dimensional model.Perhaps someday exquisite observations will warrant such atreatment. ClearlyJWSTwill be an effective tool for reducingthe under-constrained nature of current models, yet the bright-ness of GJ 436 may be a limitation. The NIRSpec prism modewill be able to observe a larger spectral range at high signal-to-noise with fewer transits for planets orbiting stars that arerelatively dimmer than GJ 436. This issue however, does notpertain to obtaining spectra in the 5 - 10µm range using theMIRI LRS. This study is the first in a series of papers that willinvestigate models of transmission and emission spectra oftran-siting planets, convolved with our realistic model ofJWSTob-servations. For a complementary approach over a large phasespace ofJWSTexoplanet observations, see Belu et al. (2010).
The model dependent nature of our understanding of thecomposition and structure of exoplanet atmospheres ensuresthat it will always be useful to refine atmosphere models. Thusdeveloping, scrutinizing and refining these models brings uscloser to the true nature of these planets. In §2 we validatedourmodel against analytic relations, but found that a similar Tinettiet al. model could not match these same relations. Recentwork on including nonequilibrium and photochemical prod-ucts (Liang et al. 2004; Zahnle et al. 2009b,a) will yield bet-ter predictions of chemical mixing ratios. Transmission spec-trum models that incorporate the full 3D nature of the plane-tary atmosphere, which is particularly imporant at the termina-tor region (Fortney et al. 2010; Burrows et al. 2010) will yielda more accurate understanding of the temperature structureandchemical abundances. The conditions of GJ 436b coupled withJWSTwill provide the chance to explore the possibility of acompositionally complicated atmosphere in great detail, ex-panding our knowledge of planets as unique to their particularcircumstance.
We thank Jean-Michel Désert, David Sing, David Spiegel,Alain Lecavelier des Etangs, Mark Marley, Heather Knutson,and Adam Burrows for useful discussions, and Eliza Kemp-ton, Travis Barman, and Nikku Madhusudhan for discussionsand the sharing of model results. J. J. F. and M. S. acknowl-edge the support of theSpitzerTheory Program and a Univer-sity Affiliated Research Center (UARC) Aligned Research Pro-gram (ARP) grant. UARC is a partnership between Universityof California, Santa Cruz and NASA Ames Research Center.T. P. G. acknowledges support from the JWST NIRCam instru-ment, NASA WBS 411672.05.05.02.02.
REFERENCES
Adams, E. R., Seager, S., & Elkins-Tanton, L. 2008, ApJ, 673,1160Agol, E., Cowan, N. B., Knutson, H. A., Deming, D., Steffen, J. H., Henry,
G. W., & Charbonneau, D. 2010, ApJ, 721, 1861Alonso, R., Barbieri, M., Rabus, M., Deeg, H. J., Belmonte, J. A., & Almenara,
J. M. 2008, A&A, 487, L5Ballard, S., Christiansen, J. L., Charbonneau, D., Deming,D., Holman, M. J.,
Fabrycky, D., A’Hearn, M. F., Wellnitz, D. D., Barry, R. K., Kuchner, M. J.,Livengood, T. A., Hewagama, T., Sunshine, J. M., Hampton, D.L., Lisse,C. M., Seager, S., & Veverka, J. F. 2010, ApJ, 716, 1047
Barber, R. J., Tennyson, J., Harris, G. J., & Tolchenov, R. N.2006, MNRAS,368, 1087
Barman, T. 2007, ApJ, 661, L191Barman, T. S., Hauschildt, P. H., & Allard, F. 2001, ApJ, 556,885Beaulieu, J., Tinetti, G., Kipping, D. M., Ribas, I., Barber, R. J., Y-K. Cho, J.,
Polichtchouk, I., Tennyson, J., Yurchenko, S. N., Griffith,C. A., Batista, V.,Waldmann, I., Miller, S., Carey, S., Mousis, O., Fossey, S. J., & Aylward, A.2010, A&A submitted, arXiv:1007.0324
Beaulieu, J. P., Carey, S., Ribas, I., & Tinetti, G. 2008, ApJ, 677, 1343
Beaulieu, J. P., Kipping, D. M., Batista, V., Tinetti, G., Ribas, I., Carey, S.,Noriega-Crespo, J. A., Griffith, C. A., Campanella, G., Dong, S., Tennyson,J., Barber, R. J., Deroo, P., Fossey, S. J., Liang, D., Swain,M. R., Yung, Y.,& Allard, N. 2009, MNRAS in press, arXiv:0909.0185
Belu, A. R., Selsis, F., Morales, J., Ribas, I., Cossou, C., &Rauer, H. 2010,arXiv:1008.0028
Brown, T. M. 2001, ApJ, 553, 1006Burrows, A., Marley, M., Hubbard, W. B., Lunine, J. I., Guillot, T., Saumon,
D., Freedman, R., Sudarsky, D., & Sharp, C. 1997, ApJ, 491, 856Burrows, A., Rauscher, E., Spiegel, D. S., & Menou, K. 2010, ApJ, 719, 341Butler, R. P., Vogt, S. S., Marcy, G. W., Fischer, D. A., Wright, J. T., Henry,
G. W., Laughlin, G., & Lissauer, J. J. 2004, ApJ, 617, 580Cáceres, C., Ivanov, V. D., Minniti, D., Naef, D., Melo, C., Mason, E., Selman,
F., & Pietrzynski, G. 2009, A&A, 507, 481Charbonneau, D., Brown, T. M., Latham, D. W., & Mayor, M. 2000, ApJ, 529,
L45Charbonneau, D., Brown, T. M., Noyes, R. W., & Gilliland, R. L. 2002, ApJ,
568, 377

8 Shabram, et al.
Cushing, M. C., Marley, M. S., Saumon, D., Kelly, B. C., Vacca, W. D., Rayner,J. T., Freedman, R. S., Lodders, K., & Roellig, T. L. 2008, ApJ, 678, 1372
Deming, D., Harrington, J., Laughlin, G., Seager, S., Navarro, S. B., Bowman,W. C., & Horning, K. 2007, ApJ, 667, L199
Deming, D., Seager, S., Winn, J., Miller-Ricci, E., Clampin, M., Lindler,D., Greene, T., Charbonneau, D., Laughlin, G., Ricker, G., Latham, D., &Ennico, K. 2009, PASP, 121, 952
Demory, B.-O., Gillon, M., Barman, T., Bonfils, X., Mayor, M., Mazeh, T.,Queloz, D., Udry, S., Bouchy, F., Delfosse, X., Forveille, T., Mallmann, F.,Pepe, F., & Perrier, C. 2007, A&A, 475, 1125
Désert, J.-M., Lecavelier des Etangs, A., Hébrard, G., Sing, D. K., Ehrenreich,D., Ferlet, R., & Vidal-Madjar, A. 2009, ApJ, 699, 478
Fortney, J. J. 2005, MNRAS, 364, 649Fortney, J. J., Lodders, K., Marley, M. S., & Freedman, R. S. 2008a, ApJ, 678,
1419Fortney, J. J., Marley, M. S., Lodders, K., Saumon, D., & Freedman, R. 2005,
ApJ, 627, L69Fortney, J. J., Marley, M. S., Saumon, D., & Lodders, K. 2008b, ApJ, 683, 1104Fortney, J. J., Shabram, M., Showman, A. P., Lian, Y., Freedman, R. S., Marley,
M. S., & Lewis, N. K. 2010, ApJ, 709, 1396Fortney, J. J., Sudarsky, D., Hubeny, I., Cooper, C. S., Hubbard, W. B.,
Burrows, A., & Lunine, J. I. 2003, ApJ, 589, 615Freedman, R. S., Marley, M. S., & Lodders, K. 2008, ApJS, 174,504Gillon, M., Demory, B., Barman, T., Bonfils, X., Mazeh, T., Pont, F., Udry, S.,
Mayor, M., & Queloz, D. 2007a, A&A, 471, L51Gillon, M., Pont, F., Demory, B.-O., Mallmann, F., Mayor, M., Mazeh, T.,
Queloz, D., Shporer, A., Udry, S., & Vuissoz, C. 2007b, A&A, 472, L13Grillmair, C. J., Burrows, A., Charbonneau, D., Armus, L., Stauffer, J.,
Meadows, V., van Cleve, J., von Braun, K., & Levine, D. 2008, Nature, 456,767
Harris, G. J., Larner, F. C., Tennyson, J., Kaminsky, B. M., Pavlenko, Y. V., &Jones, H. R. A. 2008, MNRAS, 390, 143
Henry, G. W., Marcy, G. W., Butler, R. P., & Vogt, S. S. 2000, ApJ, 529, L41Hubbard, W. B., Fortney, J. J., Lunine, J. I., Burrows, A., Sudarsky, D., & Pinto,
P. 2001, ApJ, 560, 413Kirkpatrick, J. D. 2005, ARA&A, 43, 195Kurucz, R. 2009, http://kurucz.harvard.edu/stars/GL411/gl411allpr0.1000resam251Lecavelier des Etangs, A., Pont, F., Vidal-Madjar, A., & Sing, D. 2008a, A&A,
481, L83Lecavelier des Etangs, A., Vidal-Madjar, A., Désert, J.-M., & Sing, D. 2008b,
A&A, 485, 865Lewis, N. K., Showman, A. P., Fortney, J. J., Marley, M. S., Freedman, R. S.,
& Lodders, K. 2010, ApJ in press, arXiv:1007.2942Liang, M., Seager, S., Parkinson, C. D., Lee, A. Y.-T., & Yung, Y. L. 2004, ApJ,
605, L61Lodders, K. 2009, arXiv:0910.0811, in: Formation and Evolution of
Exoplanets, R. Barnes (ed.), Wiley, Berlin, in pressLodders, K. & Fegley, B. 2002, Icarus, 155, 393—. 2006, Astrophysics Update 2 (Springer Praxis Books, Berlin: Springer,
2006)Machalek, P., Greene, T., McCullough, P. R., Burrows, A., Burke, C. J., Hora,
J. L., Johns-Krull, C. M., & Deming, D. L. 2010, ApJ, 711, 111Madhusudhan, N. & Seager, S. 2009, ApJ, 707, 24—. 2010, ApJ submitted, arXiv:1004.5121Maness, H. L., Marcy, G. W., Ford, E. B., Hauschildt, P. H., Shreve, A. T.,
Basri, G. B., Butler, R. P., & Vogt, S. S. 2007, PASP, 119, 90Marley, M. S., Gelino, C., Stephens, D., Lunine, J. I., & Freedman, R. 1999,
ApJ, 513, 879Miller-Ricci, E., Seager, S., & Sasselov, D. 2009, ApJ, 690,1056
Moses, J. I., Fouchet, T., Bézard, B., Gladstone, G. R., Lellouch, E., &Feuchtgruber, H. 2005, Journal of Geophysical Research (Planets), 110, 8001
Nettelmann, N., Kramm, U., Redmer, R., & Neuhaeuser, R. 2010, A&A inpress, arXiv:1002.4447
Nicholson, P. D., Hedman, M. M., Gierasch, P. J., & the Cassini VIMS Team.2006, in Bulletin of the American Astronomical Society, Vol. 38, Bulletin ofthe American Astronomical Society, 39.06, 555–+
Pallé, E., Zapatero Osorio, M. R., Barrena, R., Montañés-Rodríguez, P., &Martín, E. L. 2009, Nature, 459, 814
Partridge, H. & Schwenke, D. W. 1997, J. Chem. Phys., 106, 4618Pont, F., Gilliland, R. L., Knutson, H., Holman, M., & Charbonneau, D. 2009,
MNRAS, 393, L6Pont, F., Knutson, H., Gilliland, R. L., Moutou, C., & Charbonneau, D. 2008,
MNRAS, 385, 109Rauscher, B. J., Alexander, D., Brambora, C. K., Derro, R., Engler, C., Fox,
O., Garrison, M. B., Henegar, G., Hill, R. J., Johnson, T., Lindler, D. J.,Manthripragada, S. S., Marshall, C., Mott, B., Parr, T. M., Roher, W. D.,Shakoorzadeh, K. B., Smith, M., Waczynski, A., Wen, Y., Wilson, D., Xia-Serafino, W., Cabelli, C., Cheng, E., Garnett, J., Loose, M.,Zandian, M.,Zino, J., Ellis, T., Howe, B., Jurado, M., Lee, G., Nieznanski, J., Wallis, P.,York, J., Regan, M. W., Bagnasco, G., Böker, T., De Marchi, G., Ferruit, P.,Jakobsen, P., & Strada, P. 2007, in Society of Photo-OpticalInstrumentationEngineers (SPIE) Conference Series, Vol. 6690, Society of Photo-OpticalInstrumentation Engineers (SPIE) Conference Series
Saumon, D., Marley, M. S., Cushing, M. C., Leggett, S. K., Roellig, T. L.,Lodders, K., & Freedman, R. S. 2006, ApJ, 647, 552
Seager, S. & Sasselov, D. D. 2000, ApJ, 537, 916Sharp, C. M. & Burrows, A. 2007, ApJS, 168, 140Sing, D. K., Désert, J., Lecavelier Des Etangs, A., Ballester, G. E., Vidal-
Madjar, A., Parmentier, V., Hebrard, G., & Henry, G. W. 2009,A&A, 505,891
Spiegel, D. S., Burrows, A., Ibgui, L., Hubeny, I., & Milsom,J. A. 2010, ApJ,709, 149
Stephens, D. C., Leggett, S. K., Cushing, M. C., Marley, M. S., Saumon, D.,Geballe, T. R., Golimowski, D. A., Fan, X., & Noll, K. S. 2009,ApJ, 702,154
Stevenson, K. B., Harrington, J., Nymeyer, S., Madhusudhan, N., Seager, S.,Bowman, W. C., Hardy, R. A., Deming, D., Rauscher, E., & Lust,N. B.2010, Nature, 464, 1161
Sudarsky, D., Burrows, A., & Pinto, P. 2000, ApJ, 538, 885Swain, M. R., Vasisht, G., & Tinetti, G. 2008, Nature, 452, 329te Plate, M., Holota, W., Posselt, W., Koehler, J., Melf, M.,Bagnasco,
G., & Marenaci, P. 2005, in Society of Photo-Optical InstrumentationEngineers (SPIE) Conference Series, Vol. 5904, Society of Photo-OpticalInstrumentation Engineers (SPIE) Conference Series, ed. J. B. Heaney &L. G. Burriesci, 185–198
Tinetti, G., Deroo, P., Swain, M. R., Griffith, C. A., Vasisht, G., Brown, L. R.,Burke, C., & McCullough, P. 2010, ApJ, 712, L139
Tinetti, G., Vidal-Madjar, A., Liang, M.-C., Beaulieu, J.-P., Yung, Y., Carey, S.,Barber, R. J., Tennyson, J., Ribas, I., Allard, N., Ballester, G. E., Sing, D. K.,& Selsis, F. 2007, Nature, 448, 169
Torres, G., Winn, J. N., & Holman, M. J. 2008, ApJ, 677, 1324Tumlinson, J. 2008, JWST-STScI-001601, SM-12, 1Visscher, C., Lodders, K., & Fegley, B. J. 2006, ApJ, 648, 1181Zahnle, K., Marley, M. S., & Fortney, J. J. 2009a, arXiv:0911.0728, ApJL
submittedZahnle, K., Marley, M. S., Freedman, R. S., Lodders, K., & Fortney, J. J. 2009b,
ApJ, 701, L20

GJ 436b Transmission Spectra 9
TABLE 1
MODEL TRANSMISSIONSPECTRA FORGJ 436B
AbundancesModel Profile H2O CH4 CO CO2 HCN C2H2 C2H4 C2H6
a 2pi 30×Solarb 4pi 30×Solarc 2pi 1×10⁻⁴ 1×10⁻⁷ 1×10⁻⁴ 1×10⁻⁶ — — — —d 4pi 1×10⁻⁴ 1×10⁻⁷ 1×10⁻⁴ 1×10⁻⁶ — — — —e 2pi 3×10⁻⁶ 1×10⁻⁷ 7×10⁻⁴ 1×10⁻⁷ — — — —f 4pi 3×10⁻⁶ 1×10⁻⁷ 7×10⁻⁴ 1×10⁻⁷ — — — —g 2pi 3×10⁻⁶ 1×10⁻⁷ 7×10⁻⁴ 1×10⁻⁷ 1×10⁻⁴ 1×10⁻⁵ 1×10⁻³ 1×10⁻⁸
h 2pi 3×10⁻⁶ 1×10⁻⁷ 7×10⁻⁴ 1×10⁻⁷ — 1×10⁻⁵ 1×10⁻³ 1×10⁻⁸
i 2pi 3×10⁻⁶ 1×10⁻⁷ 7×10⁻⁴ 1×10⁻⁷ same as g, but absent atP< 10 mbar
FIG. 1.— Absorption cross-section of water vapor at 1500 K and 1 mbar. The Partridge & Schwenke (1997) opacity is in red while Barber et al. (2006) in blue.Differences are very small.

10 Shabram, et al.
FIG. 2.— Planet radius vs. wavelength for an isothermal, pure Rayleigh-scattering atmosphere. The analytical relation ofLecavelier des Etangs et al. (2008a) isshown as the solid line, while our constant-gravity isothermal model is the dashed line. The slopes of the lines agree to 1%.

GJ 436b Transmission Spectra 11
FIG. 3.— (a) Cross-section of water vapor at 1500 K and 1 mbar, with analytic fits to α across three wavelength ranges. See Equations (1) and (2) for details.Vertical dotted lines show the wavelength range of validitywhere we expect the analytic relation to hold. (b) The resulting planetary radius vs. ln(wavelength) ofthe model. Across the three wavelength ranges, the fit to the linear radius vs. ln(wavelength) is very good. Again, vertical dotted lines show the range of wavelengthvalidity.

12 Shabram, et al.
FIG. 4.— Absorption depth vs. wavelength for a 1500 K isothermalmodel, with the surface gravity of HD 209458b. In black is ourmodel from Figure 3b. Thesolid-colored curves are the analytic relations from Figure 3b as well. In orange is a 1500 K, HD 209458b-gravity, model fromBeaulieu et al. (2009). It is readilyseen that our model presented here is a substantially betterfit to the analytic relation.
FIG. 5.— Cross sections for the main equilibrium chemistry molecules at 10 mbar and 1500 K. NH3, CH4, H2O, CO and CO2 are represented by the black, red,blue, green and purple curves respectively.

GJ 436b Transmission Spectra 13
FIG. 6.— Planet radius vs. wavelength for 2pi (dayside average)and 4pi (planet wide average)P–T profiles, at 3 different chemical abundance regimes. Theblack models are in chemical equilibrium with 30× solar metallicity (models ‘a’ and ‘b’ from Table 1). The red and blue models adapt the abundances specified inStevenson et al. (2010) (models ‘c’ through ‘f’), and are best fits to secondary eclipse measurements at 3.6 and 4.5µm. The Band average radii are plotted for thesetwo bandpasses as squares in grey, cyan and orange corresponding to the black, blue and red models respectively.

14 Shabram, et al.
FIG. 7.— Model pressure-temperature profiles for GJ 436b used inthe current work. Profiles assume [M/H]=+1.5, or just above 30× solar. “2pi” is a daysideaverage profiles while “4pi” is a planetwide average.

GJ 436b Transmission Spectra 15
FIG. 8.— Cross sections for the main higher-order hydrocarbon products at 10 mbar and 1500 K. HCN, C2H2, C2H4 and C2H6 are represented by the black,green, orange and cyan curves respectively.
FIG. 9.— Planet radius vs. wavelength using a 2pi (dayside average)P-T profile for the ‘red’ model described in Stevenson et al. (2010) shown in red (model ‘e’from Table 1. Also shown are ‘red’ models with additional absorption due to nonequilibrium chemical products. In purpleis model ‘e’ including absorption fromHCN, C2H2, C2H4, and C2H6 with abundances of 1× 10⁻⁴, 1× 10⁻⁵, 1× 10⁻³ and 1× 10⁻⁸ respectively (model ‘g’ from Table 1). In cyan depicts this modelagain, removing absorption from HCN, revealing C2H2 as the dominant feature at 3.3µm (model ‘h’ from Table 1). In green we include chemical abundances thatbecome absent above 10 mbar, a condition adapted from Zahnleet al. (2009a) (model ‘i’ from Table 1).
16 Shabram, et al.
FIG. 10.— We present model fits to data from Ballard et al. (2010) (0.35 - 1.0µm from EPOXI), Pont et al. (2009) (1.1 - 1.9µm usingHST NICMOS), Alonso et al.(2008) (ground based H-band), Cáceres et al. (2009) (groundbased K-band) and Beaulieu et al. (2010) (SpitzerIRAC 3.6, 4.5, and 8µm bands). The grey model isa 30× solar metallicity model with a 2piP–T profile (model ‘a’ from Table 1). We show the red and cyan models from Figure 9 again here (models ‘e’ and ‘g’ fromTable 1, respectively). It is clear that we are unable to reproduce the large peak to trough variation in spectra that allowed Beaulieu et al. (2010) to assert reasonableagreement of their models to current data.
FIG. 11.— SimulatedJWSTNIRSpec prism mode observations of the absorption depth of the transiting planet GJ 436b relative to its host star at eachwavelength.An integration time of 1800 s was used for both the in-transitand star-only spectra simulations. The models shown were previously plotted in Figures 6 and 9.Models ‘a’, ‘c’, and ‘e’ are shown in black, blue, and red respectively. Models ‘e’, ‘g’, ‘h’, and ‘i’ are shown in red, purple, cyan and green respectively. It is clearthat we will be able to understand complex mixing ratio regimes withJWST.
GJ 436b Transmission Spectra 17
FIG. 12.— SimulatedJWSTMIRI Low Resolution Spectrograph observations of the absorption depth of the transiting planet GJ 436b relative to its host star ateach wavelength. Models ‘a’, ‘c’, and ‘e’ are shown in black,blue, and red respectively. Models ‘e’, ‘g’, ‘h’, and ‘i’ areshownl in red, purple, cyan and greenrespectively.In the top panel, water is the main absorber inthis wavelength range. In the bottom panel, HCN and C2H2 features are labeled at 7µm, and C2H4absorption is labeled at 9.5µm for clarity.
![GJ;FZL S'lQF I]lGJl;"8L - Navsari Agriculture University](https://static.fdokumen.com/doc/165x107/631833c83394f2252e029bf5/gjfzl-slqf-ilgjl8l-navsari-agriculture-university.jpg)