World Geography and Global Issues Unit 6 - Social Studies ...
336
6th Grade Social Studies: World Geography and Global Issues SS0606 Unit 6: Economics and World Trade Michigan Citizenship Collaborative Curriculum Page 1 of 15 Copyright © 2010-2015 Oakland Schools February 16, 2015 Sixth Grade Social Studies: World Geography and Global Issues Unit 6: Economics and World Trade Big Picture Graphic Overarching Question: How can a global perspective help me understand my world? Previous Unit: Human-Environment Interactions This Unit: Economics and World Trade Next Unit: Government and Global Politics Questions To Focus Assessment and Instruction: 1. How has globalization affected the interactions of buyers and sellers? 2. How can the social science fields of geography, history, economics, and political science help us explain why some countries are “rich” while others are “poor”? 3. To what extent are trade restrictions an effective tool in a globalized economy? Types of Thinking Identifying Perspectives Cause and Effect Description Problem Solving Classifying / Grouping
-
Upload
khangminh22 -
Category
Documents
-
view
1 -
download
0
Transcript of World Geography and Global Issues Unit 6 - Social Studies ...

6th Grade Social Studies: World Geography and Global Issues SS0606 Unit 6: Economics and World Trade
Michigan Citizenship Collaborative Curriculum Page 1 of 15 Copyright © 2010-2015 Oakland Schools February 16, 2015
Sixth Grade Social Studies: World Geography and Global Issues
Unit 6: Economics and World Trade
Big Picture Graphic
Overarching Question:
How can a global perspective help me understand my world?
Previous Unit:
Human-Environment Interactions
This Unit:
Economics and World Trade
Next Unit:
Government and Global Politics
Questions To Focus Assessment and Instruction:
1. How has globalization affected the interactions of buyers and sellers?
2. How can the social science fields of geography, history, economics, and political science help us explain why some countries are “rich” while others are “poor”?
3. To what extent are trade restrictions an effective tool in a globalized economy?
Types of Thinking Identifying Perspectives Cause and Effect Description Problem Solving Classifying / Grouping

6th Grade Social Studies: World Geography and Global Issues SS0606 Unit 6: Economics and World Trade
Michigan Citizenship Collaborative Curriculum Page 2 of 15 Copyright © 2010-2015 Oakland Schools February 16, 2015
Graphic Organizer

6th Grade Social Studies: World Geography and Global Issues SS0606 Unit 6: Economics and World Trade
Michigan Citizenship Collaborative Curriculum Page 3 of 15 Copyright © 2010-2015 Oakland Schools February 16, 2015
High School Foundations (see World History and Geography) REDO
F1 World Historical and Geographical “Habits of Mind” and Central Concepts
Explain and use key conceptual devices world historians/geographers use to organize the past including different spatial frames (e.g., global, interregional, and regional).
Unit Abstract
In this unit students explore economics through the global lens of world trade. Throughout the unit, students use current events to consider current economic conditions, the interactions of buyers and sellers in a global economy, and how economic globalization has increased interdependence among countries. The unit begins with students reviewing economic concepts learned in earlier grades such as scarcity, choice, and opportunity cost. With teacher guidance, students apply an economic perspective to the social phenomena explored throughout the course as they revisit the economic consequences of natural disasters, migration, population, culture, human-environment interactions. To better understand why some countries are “rich” while others are “poor,” students use ideas from economics, geography, history, and political science to explain some of the disparities. They first explore three distinct economic systems: command, market, and mixed, and evaluate the different levels of government involvement in each. In doing so, students learn that while most countries today use a mixed economic system, they vary in the amount of power and authority the government retains over the economic decisions. Students also consider how some economic systems are more efficient than others in allocating scarce resources. To expand students’ notions of wealth, they use maps, text selections, and data charts to explore different ways to measure societal well-being and evaluate various factors that affect economic growth and development. Through a historical perspective, students then consider the impact of imperialism on the economic development of former colonies. Using Africa as a case study, students identify specific consequences of colonialism and create a group presentation highlighting some success stories relating to economic growth and development. The unit concludes with an examination of how and why countries interact through trade. After considering why countries trade, students investigate how improvements in transportation and communication affected global commerce. They explore how specialization by countries has made the world more interdependent than ever before. Through a trading activity, students explore how governments use tariffs, quotas, embargos, and sanctions to restrict trade and examine the impact of trade policies on domestic economies. They then explore the advantages and disadvantages of multilateral and regional trade agreements using the North American Free Trade Agreement (NAFTA) as an example. Students then use evidence to analyze arguments relating to free trade. Literacy Adolescent literacy practices continue to be integrated throughout the unit. Since this unit contains complex vocabulary, students continue to build their understanding of economic terminology. Through a variety of scaffolded reading activities, students summarize chunks of text and reflect on their meaning. Literacy practices include vocabulary building, summarization, and application activities from video, data sets, and informational texts. Both informational and argumentative texts

6th Grade Social Studies: World Geography and Global Issues SS0606 Unit 6: Economics and World Trade
Michigan Citizenship Collaborative Curriculum Page 4 of 15 Copyright © 2010-2015 Oakland Schools February 16, 2015
are integrated into the unit. Reading strategies and writing exercises are deliberately placed to support students’ growing independence. Challenges in Teaching This unit presents several challenges for students. First, the vocabulary is complex and technical. Students need continued support for these new and challenging terms. Second, it is often difficult for students to overcome their own experiential limitations to understand the plight of people living in the developing world. Therefore, it is essential to humanize the economic indicator data for students. This information is not simply about numbers, it is about human beings and their quality of life. Finally, teachers must recognize that they do not have time to teach about everything related to world trade or level of development. The use of case studies is one way in which teachers can give students a window on the world. However, it is imperative that teachers point out the limitations of any single case to adequately represent the depth and complexity of the issue being considered. Focus Questions
1. How has globalization affected the interactions of buyers and sellers? 2. How can the social science fields of geography, history, economics, and political science
help us explain why some countries are “rich” while others are “poor”? 3. To what extent are trade restrictions an effective tool in a globalized economy?
Content Expectations 6 and 7 Explain how historians use a variety of sources to explore the past (e.g., artifacts, H1.2.1: primary and secondary sources including narratives, technology, historical maps,
visual/mathematical quantitative data, radiocarbon dating, DNA analysis). 6 and 7 Read and comprehend a historical passage to identify basic factual knowledge and H1.2.2: the literal meaning by indicating who was involved, what happened, where it
happened, what events led to the development, and what consequences or outcomes followed.
6 and 7 Identify the point of view (perspective of the author) and context when reading and H1.2.3: discussing primary and secondary sources. 6 and 7 Compare and evaluate competing historical perspectives about the past based on H1.2.4: proof. 6 and 7 Describe and use cultural institutions to study an era and a region (political, H1.4.1: economic, religion/belief, science/technology, written language, education, family). 6 and 7 Describe and use themes of history to study patterns of change and continuity. H1.4.2:

6th Grade Social Studies: World Geography and Global Issues SS0606 Unit 6: Economics and World Trade
Michigan Citizenship Collaborative Curriculum Page 5 of 15 Copyright © 2010-2015 Oakland Schools February 16, 2015
6 and 7 Use historical perspective to analyze global issues faced by humans long ago and H1.4.3: today. 7 – G1.1.1 Explain and use a variety of maps, globes, and web based geography technology to
study the world, including global, interregional, regional, and local scales. 6 – G1.2.4: Use observations from air photos, photographs (print and CD), films (VCR and DVD) 7 – G1.2.3: as the basis for answering geographic questions about the human and physical
characteristics of places and regions. 6 and 7 Apply the skills of geographic inquiry (asking geographic questions, acquiring G1.2.6: geographic information, organizing geographic information, analyzing geographic
information, and answering geographic questions) to analyze a problem or issue of importance to a region of the world.1
6 and 7 Use the fundamental themes of geography (location, place, human environment G1.3.1: interaction, movement, region) to describe regions or places on earth. 6 and 7 Explain the locations and distributions of physical and human characteristics of G1.3.2: Earth by using knowledge of spatial patterns. 6 and 7 Explain the different ways in which places are connected and how those connections G1.3.3: demonstrate interdependence and accessibility. 6 and 7 Describe the human characteristics of the region under study (including languages, G2.2.1: religion, economic system, governmental system, cultural traditions). 6 and 7: Explain that communities are affected positively and negatively by changes in G2.2.2: technology.2 6 and 7 Analyze how culture and experience influence people’s perception of places and G2.2.3: regions.3 6 and 7 Identify and explain examples of cultural diffusion in the world.4
1 The expectations identified the western and eastern hemisphere. We have combined them to reflect a global perspective. 2 The examples listed in the expectations have been removed because their specificity impedes the significant conceptual understanding contained in the expectation. The sixth grade examples read: “e.g., Canada with regard to mining, forestry, hydroelectric power generation, agriculture, snowmobiles, cell phones, air travel.” The seventh grade examples state: “e.g., increased manufacturing resulting in rural to urban migration in China, increased farming of fish, hydroelectric power generation at Three Gorges, pollution resulting from increased manufacturing and automobiles.” 3 The examples listed in the expectations have been removed because they do not support the expectation. The sixth
grade examples read: “the Caribbean Region that presently displays enduring impacts of different immigrant groups – Africans, South Asians, Europeans – and the differing contemporary points of view about the region displayed by islanders and tourists.” The seventh grade examples read: “that beaches are places where tourists travel, cities have historic buildings, northern places are cold, equatorial places are very warm.

6th Grade Social Studies: World Geography and Global Issues SS0606 Unit 6: Economics and World Trade
Michigan Citizenship Collaborative Curriculum Page 6 of 15 Copyright © 2010-2015 Oakland Schools February 16, 2015
G4.1.1: 7 – G4.1.2: Compare roles of women in traditional African societies in the past with roles of
women as modern micro-entrepreneurs in current economies. 6 and 7 List and describe the advantages and disadvantages of different technologies used G4.2.1: to move people, products, and ideas throughout the world.5 6 and 7 Identify factors that contribute to conflict and cooperation between and among G4.4.1: cultural groups (control/use of natural resources, power, wealth, and cultural
diversity). 6 and 7 Identify the ways in which human-induced changes in the physical environment in G5.1.3: one place can cause changes in other places.6 6 - G6.1.1: Conduct research on contemporary global topics and issues.
Globalization – Investigate the significance of globalization and describe its impact on international economic and political relationships.
6 – C4.3.1: Explain the geopolitical relationships between countries.7 6 - C4.3.2: Explain the challenges to governments and the cooperation needed to address 7 - C4.3.4: international issues.8
4 The examples in the expectations have been removed because they unnecessarily limit the scope of the concept of
cultural diffusion when teaching students about globalization and world trade. Sixth grade is limited to the Americas with examples of “baseball, soccer, music, architecture, television, languages, health care, Internet, consumer brands, currency, restaurants, international migration.” Seventh grade is likewise limited to the Eastern Hemisphere, which limited examples of “the spread of sports, music, architecture, television, Internet, Bantu languages in Africa, Islam in Western Europe. 5 The examples have been removed for clarity. The sixth grade examples included “call centers in the Eastern Hemisphere that service the Western Hemisphere; the United States and Canada as hubs for the Internet; transport of people and perishable products; and the spread of individuals’ ideas as voice and image messages on electronic networks such as the Internet.” The seventh grade examples included “opportunities for employment, entrepreneurial and educational opportunities using the Internet; the effects of technology on reducing the time necessary for communications and travel; the uses and effects of wireless technology in developing countries; and the spread of group and individual’s ideas as voice and image messages on electronic networks such as the Internet.” 6 Since the specificity of the examples tends to distract from essential understanding of the expectation, they have been removed. In grade six, the examples include “cutting forests in one region may result in river basin flooding elsewhere; building a dam floods land upstream and may permit irrigation in another region.” The seventh grade examples include “cutting forests in one region may result in river basin flooding elsewhere as has happened historically in China; building dams floods land upstream and permits irrigation downstream as in Southern Africa, the Aswan Dam flooded the upper Nile Valley and permitted irrigation downstream.” 7 The examples “(e.g., petroleum and arms purchases in Venezuela and Ecuador; foreign aid for health care in Nicaragua)” have been removed for clarity. 8 The expectation identifies migration and human rights as examples. This unit uses environment issues such as climate change as an example of an international issue.

6th Grade Social Studies: World Geography and Global Issues SS0606 Unit 6: Economics and World Trade
Michigan Citizenship Collaborative Curriculum Page 7 of 15 Copyright © 2010-2015 Oakland Schools February 16, 2015
6 – C4.3.3: Give examples of how countries work together for mutual benefits through
international organizations. 6 – E1.1.1: Explain how incentives vary in different economic systems (e.g., acquiring money,
profit, goods, wanting to avoid loss in position in society, job placement).9 7 – E1.1.2: Describe the circular flow model (that businesses get money from households in
exchange for goods and services and return that money to households by paying for the factors of production that households have to sell) and apply it to a public service (e.g., education, health care, military protection).
7 – E2.3.1: Explain how national governments make decisions that impact both that country and
other countries that use its resources. 6 – E2.3.1: Describe the impact of governmental policy (sanctions, tariffs, treaties) on that
country and on other countries that use its resources.10 6 – E3.1.1: Use charts and graphs to compare imports and exports of different countries in the
world11 and propose generalizations about patterns of economic interdependence. 7 – E3.1.1: Explain the importance of trade (imports and exports) on national economies in the
world.12 6 and 7 Diagram or map the movement of a consumer product from where it is manufactured E3.1.2: to where it is sold to demonstrate the flow of materials, labor, and capital (e.g., global
supply chain for computers, athletic shoes, and clothing). 6 and 7 Explain and compare how economic systems (traditional, command, and market) E3.3.1: answer four basic questions: What should be produced? How will it be produced?
How will it be distributed? Who will receive the benefits of production?
9 This lesson also addresses the related seventh grade expectation: 7-E1.1.1: Explain the role of incentives in different economic systems (acquiring money, profit, goods, wanting to avoid loss, position in society, job placement). 10 As used in this unit, this expectation addresses the historical governmental policy of imperialism and colonization. 11 The phrase “western hemisphere” has been replaced with “world” to provide students with a global perspective. 12 The expectation was unnecessarily limited to the Eastern Hemisphere with the following examples: “natural gas in North Africa, petroleum Africa, mineral resources in Asia.” We have revised the expectation to reflect a global approach since we are focusing on globalization and world trade, which is not limited only to the Eastern Hemisphere.
6th Grade Social Studies: World Geography and Global Issues SS0606 Unit 6: Economics and World Trade
Michigan Citizenship Collaborative Curriculum Page 8 of 15 Copyright © 2010-2015 Oakland Schools February 16, 2015
Common Core State Standards for Literacy in History and Social Studies RH.6-8.1: Cite specific textual evidence to support analysis of primary and secondary sources. RH.6-8.2: Determine the main ideas or information of a primary or a secondary source; provide
an accurate summary of the source distinct from prior knowledge or opinions. RH.6-8.4: Determine the meaning of words and phrases as they are used in a text, including
vocabulary specific to domains related to history/social studies.
RH.6-8.6: Identify aspects of a text that reveal an author’s point of view or purpose (e.g., loaded language, inclusion or avoidance of particular facts).
RH.6-8.7: Integrate visual information (e.g., in charts, graphs, photographs, videos, or maps)
with other information in print and digital texts.
RH.6-8. 10: By the end of grade 8, read and comprehend science/technical texts in the grades 6–8 text complexity band independently and proficiently.
WHST.6-8.1: Write arguments focused on discipline-specific content. a. Introduce claim(s) about a topic or issue, acknowledge and distinguish the
claim(s) from alternate or opposing claims, and organize the reasons and evidence logically.
b. Support claim(s) with logical reasoning and relevant, accurate data and evidence that demonstrate an understanding of the topic or text, using credible sources.
WHST.6-8.4: Produce clear and coherent writing in which the development, organization, and
style are appropriate to task, purpose, and audience. WHST.6-8.9: Draw evidence from informational texts to support analysis reflection, and research.
Key Concepts globalization/global trade productive resources circular flow economic systems (command, mixed, market economies) role of the government level of development economic growth technology balance of trade colonization economic growth imperialism interdependence specialization

6th Grade Social Studies: World Geography and Global Issues SS0606 Unit 6: Economics and World Trade
Michigan Citizenship Collaborative Curriculum Page 9 of 15 Copyright © 2010-2015 Oakland Schools February 16, 2015
trade restrictions/barriers Duration 4 weeks Lesson Sequence Lesson 1: What is Economics? Lesson 2: Comparing Economic Systems: What Role Does Government Play? Lesson 3: Why are some countries “rich” and others “poor”? Lesson 4: How did Imperialism Affect the Future Economic Growth and Development of
Colonized Countries? Lesson 5: Why Do Countries Trade? Lesson 6: How and Why Do Countries Restrict Trade? Assessments Resources Equipment/Manipulative Chart paper – large with 1 sheet per 4 students Computer with LCD display, PowerPoint capability and screen Global Investigator’s Notebook Glue sticks – one for each pair of students Highlighters Internet access Light colored cardstock – one piece for each pair of students Markers Scissors – one for each pair of students World atlas or a map of Asia with countries labeled Student Resource 20 Questions about Development. 23 April 2011. 18 January 2015
<http://www.youtube.com/watch?v=VqcwUEBK7Jk>. A student geography textbook such as Wiggins, Grant, et al. My World Geography: Boston, MA:
Pearson, 2011, 56-67. Circular Flow. Federal Reserve Bank of St. Louis. 18 February 2015
<http://www.stlouisfed.org/education_resources/economic-lowdown-video-companion-series/episode-6-circular-flow/>.
Trading Around the World. International Monetary Fund. 22 January 2015
<http://www.imf.org/EXTERNAL/NP/EXR/CENTER/STUDENTS/TRADE/index.htm>.
6th Grade Social Studies: World Geography and Global Issues SS0606 Unit 6: Economics and World Trade
Michigan Citizenship Collaborative Curriculum Page 10 of 15 Copyright © 2010-2015 Oakland Schools February 16, 2015
World Trade Organization. 22 January 2015 <http://www.wto.org>. Teacher Resource 7 Ways Humans are Damaging the Planet. Mother Nature Network. 28 January 2015
<http://www.mnn.com/earth-matters/wilderness-resources/photos/7-ways-humans-are-damaging-the-planet/changing-our>.
Amadeo, Kimberly. Advantages for NAFTA. About.com. 22 January 2015
<http://useconomy.about.com/od/tradepolicy/p/NAFTA_Advantage.htm>.
- - -. Arguments For and Against Free Trade. 22 January 2015 <http://idebate.org/es/node/17550>.
- - -. Disadvantages of NAFTA. About.com. 22 January 2015
<http://useconomy.about.com/od/tradepolicy/p/NAFTA_Problems.htm>. Aral Sea - Dried Sands. 28 Jan. 2015 <http://www.global-greenhouse-
warming.com/images/AralSeaDriedup.jpg>. Bangladesh vs. the U.S.: How much does it cost to make a denim shirt? CNN. 21 January 2015
<http://www.cnn.com/2013/05/02/world/asia/bangladesh-us-tshirt/index.html?sr=sharebar_google>.
A Brief History of Money. Young Explorers. The British Museum. 21 January 2015
<http://www.britishmuseum.org/explore/young_explorers/discover/videos/a_brief_history_of_money.aspx>.
Brokaw, Alex. 10 Everyday Items That Cost Way More Because of US Taxes. Minyanville. 22
January 2015 <http://www.minyanville.com/trading-and-investing/taxes/articles/us-imports-tariffs-us-import-taxes/7/25/2012/id/42412>.
Buy American Logos. Word Press. 21 January 2015
<http://rixxblog.files.wordpress.com/2011/11/buy-american.jpg>. Callaham, Art. “What is Government’s Role in the Economy?” Herald Mail Media. 3 April 2011. 18
January 2015 <http://articles.herald-mail.com/2011-04-03/opinion/29382360_1_local-government-private-sector-private-sector-jobs>.
Car Exports Cartogram. World Mapper. 21 January 2015
<http://worldmapper.org/images/largepng/77.png>. Car Imports Cartogram. World Mapper. 21 January 2015
<http://worldmapper.org/images/largepng/78.png>.

6th Grade Social Studies: World Geography and Global Issues SS0606 Unit 6: Economics and World Trade
Michigan Citizenship Collaborative Curriculum Page 11 of 15 Copyright © 2010-2015 Oakland Schools February 16, 2015
Cardwell Diane and Keith Bradsher. U.S. Will Place Tariffs on Chinese Solar Panels. New York Times. 10 October 2012. 22 January 2015 <http://www.nytimes.com/2012/10/11/business/global/us-sets-tariffs-on-chinese-solar-panels.html>.
Cereals Exports. World Mapper. 21 January 2015
<http://worldmapper.org/images/largepng/47.png>. Chinese Solar Panel Prices Rising. Market Watch. 22 January 2015
<http://www.marketwatch.com/story/chinese-solar-panel-prices-rising-20-in-the-us-2014-04-10>.
Clothing Exports Cartogram. World Mapper. 21 January 2015
<http://www.worldmapper.org/display.php?selected=83>. Clothing Graphic. Word Press. 21 January 2015
<http://heelsandheadphones.files.wordpress.com/2011/10/clothes.jpg>. Clothing Imports Cartogram. World Mapper. 21 January 2015
<http://worldmapper.org/images/largepng/84.png>. Colonies and Protectorates in Africa around 1914. New York Public Library. 21 January 2015
<http://exhibitions.nypl.org/africanaage/maps/african-col-1914.jpg>. Continents Map. Wikipedia. 18 January 2015
<http://upload.wikimedia.org/wikipedia/commons/b/b2/BlankMap-World-Continents.PNG>. Countries Ranked by Gross Domestic Product. Wikipedia. 18 January 2015
<http://en.wikipedia.org/wiki/List_of_countries_by_GDP_(nominal)>. Countries Ranked by HDI. Wikipedia. 19 January 2015
<http://en.wikipedia.org/wiki/List_of_countries_by_Human_Development_Index>. Country Income Groups. The World Bank Group. 21 January 2015 <http://3.bp.blogspot.com/-
TynYipnWots/T_TRa7c8VbI/AAAAAAAAErM/qTSsbkJ_nzg/s1600/CIG+2011.png>. Currency Converter. Oanda. 21 January 2014 <http://www.oanda.com/currency/converter/>. Different Kinds of Currency. Dreamstime. 21 January 2015
<http://thumbs.dreamstime.com/z/international-currency-banknotes-different-world-countries-30003776.jpg>.
Egbo, Carol. Supplemental Materials (Unit 6, Lessons 1-6). Teacher-made materials. Oakland
Schools, 2015. - - - . PowerPoint (Unit 6, Lessons 1, 3-5). Teacher-made materials. Oakland Schools, 2014.

6th Grade Social Studies: World Geography and Global Issues SS0606 Unit 6: Economics and World Trade
Michigan Citizenship Collaborative Curriculum Page 12 of 15 Copyright © 2010-2015 Oakland Schools February 16, 2015
Electronics Exports. World Mapper. 21 January 2015
<http://worldmapper.org/images/largepng/89.png>. Electronics Imports. World Mapper. 21 January 2015
<http://worldmapper.org/images/largepng/90.png>. “Episode 6 - Circular Flow.” The Economic Lowdown Video Series. Federal Reserve Bank of St.
Louis. 18 January 2015 <http://www.stlouisfed.org/education_resources/economic-lowdown-video-companion-series/episode-6-circular-flow/>.
Exploring Africa. Module Nine: African Economies. Michigan State University. 21 January 2015
<http://exploringafrica.matrix.msu.edu/students/curriculum/m9/activity4.php>. From fiber to fashion: Unzipping the apparel global value chain.” Asian International Economists
Network. 5 July 2013. 21 January 2015 <http://aienetwork.org/infographic/12/from-fiber-to-fashion-unzipping-the-apparel-global-value-chain>.
GDP Growth Rate. Global Finance. 18 January 2015 <http://www.gfmag.com/tools/global-
database/economic-data/12369-countries-lowest-gdp-growth.html#axzz2sBpfLKH0>. GDP Map. Wikipedia. 21 January 2015
<http://upload.wikimedia.org/wikipedia/commons/0/08/Map_of_countries_by_GDP_%28nominal%29_in_US%24.png>.
German East Africa Map. Ibilio. 21 January 2015
<http://www.ibiblio.org/HTMLTexts/Albert_Frederick_Pollard/A_Short_History_Of_The_Great_War/map12.png>.
“Germany: CTA Handles Its First 13,000 TEU Ship.” World Maritime News. 21 January 2015
<http://worldmaritimenews.com/archives/51942/germany-cta-handles-its-first-13000-teu-ship/>.
“Ghana’s sustained agricultural growth: putting underused resources to work.” Development
Progress. Oct. 2010. 21 April 2014 <http://www.developmentprogress.org/ghanas-sustained-agricultural-growth-putting-underused-resources-work>.
Hartsfield-Jackson International Airport, just outside of Atlanta. 28 Jan. 2015
<http://torontoist.com/2009/11/google_earth_at_gallery_44/>. Hoovler, Evan. “15 stunning satellite pics of man-made objects visible from space.” Blastr. 24
January 2012. 28 Jan. 2015 <http://blastr.com/2012/01/15-stunning-satellite-pic.php>. Kremer, William. “How much bigger can container ships get?” BBC News Magazine. 21 January
2015 <http://www.bbc.com/news/magazine-21432226>.
http://www.ibiblio.org/HTMLTexts/Albert_Frederick_Pollard/A_Short_History_Of_The_Great_War/map12.png

6th Grade Social Studies: World Geography and Global Issues SS0606 Unit 6: Economics and World Trade
Michigan Citizenship Collaborative Curriculum Page 13 of 15 Copyright © 2010-2015 Oakland Schools February 16, 2015
Lam, Joyce and Justine Lee. The Berlin Conference (1884-1885): Dominant Diplomacy, Dire Consequences. 21 January 2015 <http://21548675.nhd.weebly.com/the-berlin-conference.html>.
Made in Cambodia Label. Flickr. 21 January 2015
<https://www.flickr.com/photos/cambodia4kidsorg/74486342/>. Map of Countries HDI. Wikipedia. 21 January 2015
<http://upload.wikimedia.org/wikipedia/commons/thumb/3/32/2013_UN_Human_Development_Report_Quartiles.svg/863px-2013_UN_Human_Development_Report_Quartiles.svg.png>.
Money Through the Ages. A History of Money. YouTube. 21 January 2015
<http://www.youtube.com/watch?v=3FMHh6T86GE>. North-South Divide. Wikipedia. 21 January 2015 <http://en.wikipedia.org/wiki/North-South_divide]>. Orange Orchards in Uruguay. Bonjourlife. 28 Jan. 2015 <http://bonjourlife.com/legendary-photo-
project-earth-from-the-air/>. Overfishing Cartoon. Word Press. 28 Jan. 2015
<http://oceankeshi.wordpress.com/2013/01/30/the-importance-of-plankton/>. Pearson, Natalie Obiko. India May Back Solar Duties as Probe Says U.S., China Dumped.
Bloomberg Businessweek. 15 May 2014. 22 January 2015 <http://www.businessweek.com/news/2014-05-14/india-may-back-solar-duties-after-probe-says-u-dot-s-dot-china-dumped>.
Population Living Below National Poverty Line. 21 January 2015
<http://sealofexcellence.files.wordpress.com/2013/08/percent_poverty_world_map.jpg>. Prominent Hill Copper and Gold Mine in Australia. The Advertiser. 28 Jan. 2015
<http://www.adelaidenow.com.au/business/oz-minerals-beats-copper-and-gold-forecasts-at-prominent-hill/story-e6frede3-1225991670624>.
Read, Richard. Solar World wins key U.S. ruling. The Oregonian. 14 February 2014. 22 January
2015 <http://www.oregonlive.com/business/index.ssf/2014/02/solarworld_wins_key_us_ruling.html>.
Resources for history teachers. 21 January 2015
<http://resourcesforhistoryteachers.wikispaces.com/WHII.6>. Sao Paulo. 18 January 2015
<http://thestorewpp.tv/storage/GE_Sao%20Paulo_Street%20Art3.jpg?__SQUARESPACE_CACHEVERSION=1344871219089>.
6th Grade Social Studies: World Geography and Global Issues SS0606 Unit 6: Economics and World Trade
Michigan Citizenship Collaborative Curriculum Page 14 of 15 Copyright © 2010-2015 Oakland Schools February 16, 2015
Sherratt, Andrew. Trade Routes: Growth of Global Trade. Archatlas. 21 January 2015
<http://www.archatlas.org/Trade/Trade.php?Reload=Reload>. Shrimp Farm in Thailand. Bonjourlife. 28 Jan. 2015 <http://bonjourlife.com/legendary-photo-
project-earth-from-the-air/>. Solar Power Plant in Andalusia, Spain. Lloyd Kahn’s Blog. 28 Jan. 2015 <http://lloydkahn-
ongoing.blogspot.com/2011/04/earth-from-above-aerial-photography-by.html>. Success Stories. Tokyo International Conference on African Development. 21 April 2014
<http://www.ticad.net/stories/index.html> (site no longer available). Tanzania Map. World Atlas. 21 January 2015
<http://www.worldatlas.com/webimage/countrys/africa/tz.htm>. Tariff Information. 21 January 2015 <http://www.minyanville.com/trading-and-
investing/taxes/articles/us-imports-tariffs-us-import-taxes/7/25/2012/id/42412>. Top Trading Partners. Foreign Trade. U.S. Census Bureau. 21 January 2015
<http://www.census.gov/foreign trade/statistics/>. Toy Exports Cartogram. World Mapper. 21 January 2015
<http://worldmapper.org/images/largepng/57.png>. Toy Imports. World Mapper. 21 January 2015
<http://www.worldmapper.org/display.php?selected=58>. Trade Data. U.S. Census. 21 January 2015 <http://www.census.gov/foreign-
trade/statistics/highlights/top/top1312yr.html>. U.S. Exports to the World. U.S. Census Bureau. 21 January 2015 <http://www.census.gov/foreign-
trade/statistics/product/enduse/exports/c0000.html>. U.S. Imports. U.S. Census Bureau. 21 January 2015 <http://www.census.gov/foreign-
trade/statistics/product/enduse/imports/c0000.html>.
U.S. Tariffs on Chinese Solar Panels Boomerang. Washington Post. 12 August 2013. 22 January
2015 <http://www.washingtonpost.com/opinions/us-tariffs-on-chinese-solar-panels-
boomerang/2013/08/12/fef555e6-f577-11e2-a2f1-a7acf9bd5d3a_story.html>. “What Does Economic Growth Mean?” How Geography Influences Economic Growth. Poverty
Education. 18 January 2015 <http://www.povertyeducation.org/geography-and-economic-growth.html>.
6th Grade Social Studies: World Geography and Global Issues SS0606 Unit 6: Economics and World Trade
Michigan Citizenship Collaborative Curriculum Page 15 of 15 Copyright © 2010-2015 Oakland Schools February 16, 2015
What is a Market Economy? U.S. Department of State. 18 January 2015 <http://www.4uth.gov.ua/usa/english/trade/market/mktec2.htm>.
For Further Professional Knowledge De Blij, Harm. Why Geography Matters. New York, NY: Oxford Press, 2007. - - -. The Power of Place. New York, NY: Oxford Press, 2009. Fisher, Chris and Binns, Tony, editors. Issues in Geography Teaching. New York:NY: Routledge,
2000. Gersmehl, Phil. Teaching Geography. New York, NY: Guilford Press, 2008. Geography Framework for the 2010 National Assessment of Educational Progress. 15 January
2012. http://www.nagb.org/publications/frameworks/gframework2010.pdf Rischard, J.F. High Noon: 20 Global Problems, 20 Years to Solve Them. New York, NY: Basic
Books, 2002. U.S. National Geography Standards. 5 February 2012.
http://www.nationalgeographic.com/xpeditions/standards/10/index.html
6th Grade Social Studies: World Geography and Global Issues SS060601 Unit 6: Economics and World Trade Lesson 1
Michigan Citizenship Collaborative Curriculum Page 1 of 7 Copyright © 2010-2015 Oakland Schools January 28, 2015
Lesson 1: What is Economics?
Big Ideas of the Lesson
Economics is the study of how people choose to use resources to produce or consume
goods and services to meet their wants and needs.
Economists study the production, distribution, and consumption of goods and services.
An economic system is a way in which a society organizes the production, consumption, and distribution of goods and services.
Due to advances in technology and human innovation, the economic systems of many different countries have become interconnected and interdependent.
Economists and others refer to the development of increased interconnections and interdependence of many different economic systems marked by free trade and the free flow of capital, labor, and resources as economic globalization.
Lesson Abstract: In this lesson students review economic concepts learned in previous grades as well as economic ideas covered in previous units of this 6th grade curriculum. Students engage in several group activities to review economic terms and definitions. Through direction instruction aided by a PowerPoint presentation, students apply an economic perspective to social studies phenomena explored in units 1-5 such as natural disasters, migration and urbanization, culture and cultural landscapes, and human-environmental interactions. Finally, students locate and share current events relating to economics and classify them according to scale: local, national or global as they develop a working definition of economic globalization. Content Expectations: Grades 6 and 7 – G1.3.1; G1.3.3; G2.2.1; G5.1.3; E3.3.1 Grade 6 – G1.2.4 Grade 7 – G1.2.3 Common Core State Standards for Literacy in History and Social Studies: RH.6-8.1 and 2 Key Concepts economic system globalization productive resources Lesson Sequence 1. Begin the lesson by cutting apart the “Cards for Vocabulary Match” located in the
Supplemental Materials (Unit 6, Lesson 1) and distributing one card to each student. Explain that half of the students have economic vocabulary terms, while the rest of the students have definitions. Students are to find their “match” and then sit down. On your signal, have students stand up and try to locate their “match.” When students think they have located their appropriate partner, have the pair sit down.

6th Grade Social Studies: World Geography and Global Issues SS060601 Unit 6: Economics and World Trade Lesson 1
Michigan Citizenship Collaborative Curriculum Page 2 of 7 Copyright © 2010-2015 Oakland Schools January 28, 2015
2. When all students are seated, have pairs stand up one at a time and read off the vocabulary term and respective definition. Ask the rest of the class if they agree that the match is a correct one. Explain that in this unit students will have the opportunity to apply these economic terms which they learned in previous grades to the global or world economy.
3. Divide students in pairs and give each pair a copy of the “Pieces for the Graphic Organizer” located in the Supplemental Materials (Unit 6, Lesson 1), a pair of scissors, a glue stick and a sheet of light-colored cardstock. Explain that these pieces can be used to create a graphic organizer illustrating how economics works. Explain that students should place the pieces in a logical order and use arrows to show connections. Make sure students use a pencil to draw arrows so changes can be made if needed.
4. Give students time to construct their graphic organizers. Then, have students quietly stand and move around the room observing the organizers constructed by other pairs. Discuss similarities and differences with the whole class. Have students return to their desks and make any changes they’d like to make based on their observations and conversations with other students.
5. Introduce students to the lesson question by displaying Slide 1 of the PowerPoint (Unit 6, Lesson 1). Move to Slide 2 and ask students if they began their organizer with this piece. Allow them to make changes if they did not. Engage students in a brief stop and jot activity, asking students to identify the three kinds of productive resources in their Global Investigator’s Notebooks (GLIN). Then use Slide 3 and Word Cards #6 through #9 to discuss the fact that the three kinds of resources (land, labor, and capital) are referred to as ‘factors of production.’ Teacher Note: In earlier grades students should have learned that the three kinds of resources as natural, human and capital resources. In building on this vocabulary, students should now be able to connect these ideas to land, labor, and capital.
6. Display Slide 4 and discuss how the factors of production (resources) are used to produce goods and services. As you continue through Steps 7 – 11 below, be sure to continue to have students refer to their own organizer and make any corrections needed. Teacher Note: Since students will first work with a partner to construct the graphic organizer, it is recommended that students create a corrected version of their own in their GLINs later in the lesson.
7. Using Slides 5 and 6, discuss the fundamental problem of economics -- scarcity. Briefly guide students in identifying examples of scarcity at different scales. Possible examples include:
Local: A local community may lack the factory space for a certain business to create all the goods it wants to create.
State: There is a scarcity of fertile farm land in the Upper Peninsula of Michigan so people have to find other uses for the land such as mining or forestry.
U.S.: There is a scarcity of workers for some types of high-tech jobs. 8. Using Slides 7 and 8, discuss how scarcity forces societies to make choices. Make sure to
explain that scarcity also forces individuals to make choices by asking students to identify personal examples of scarcity. Teacher Note: There is a tendency to think of scarcity in terms of a scarcity of money. Economists, however, do not consider money an example of scarcity because governments can always print more if they choose. It may be helpful to push students to think of a choice they had to make based on having a limited amount of time.
6th Grade Social Studies: World Geography and Global Issues SS060601 Unit 6: Economics and World Trade Lesson 1
Michigan Citizenship Collaborative Curriculum Page 3 of 7 Copyright © 2010-2015 Oakland Schools January 28, 2015
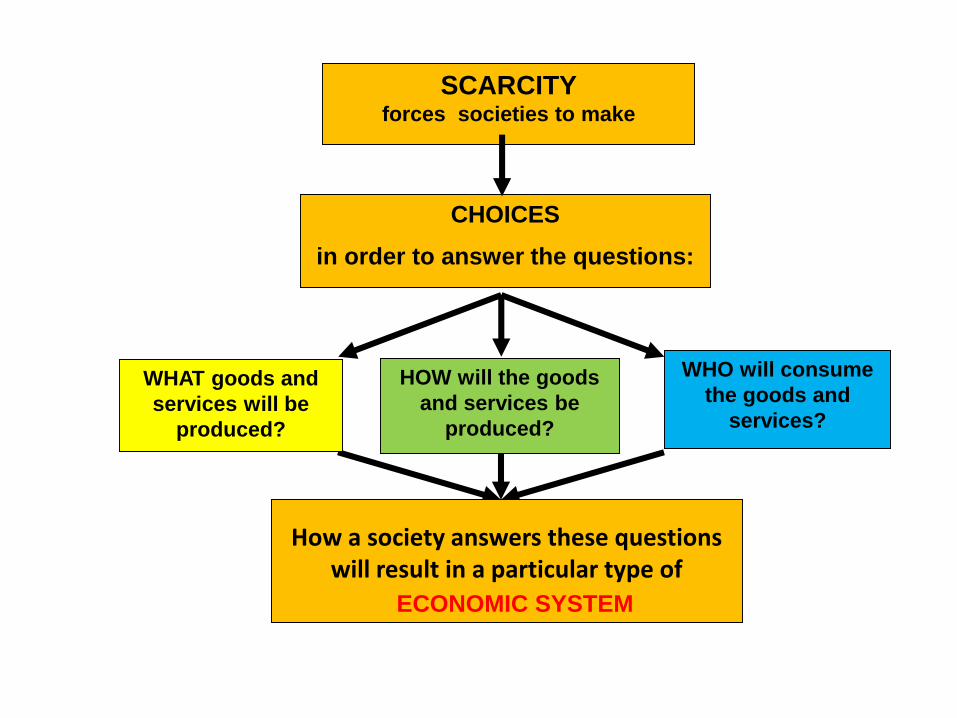
9. Using Slide 9, discuss the three fundamental economic questions societies must answer when
making a choices due to scarcity. Note that students should have explored these three questions in fourth grade. Then, using Slide 10, review that a society creates a particular type of ‘economic system’ by how it answers these questions.
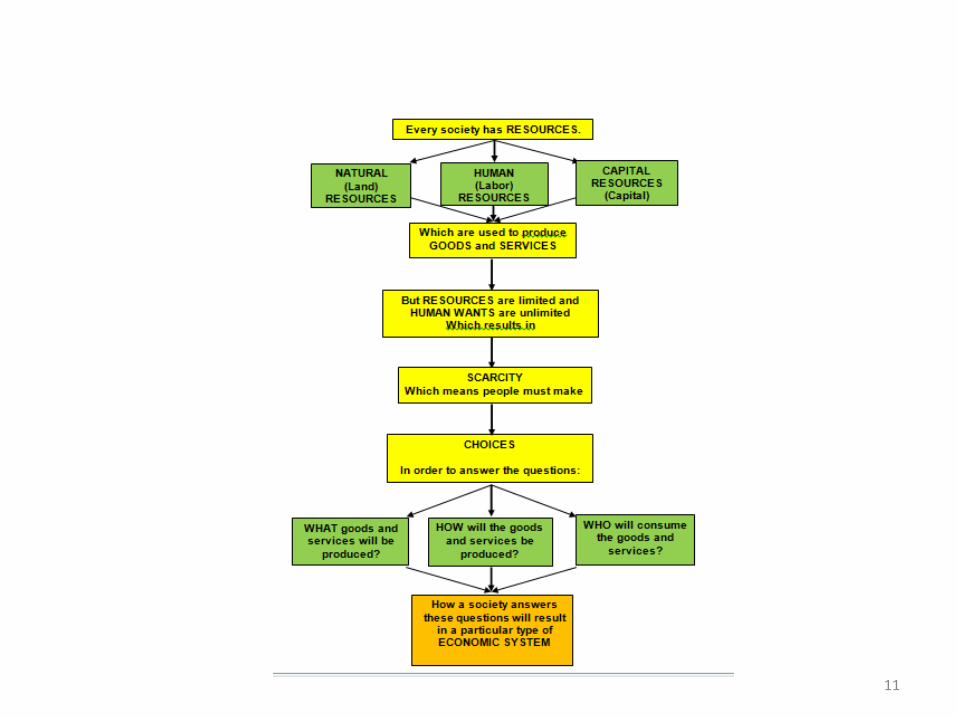
10. Display Slide 11 to show the completed organizer. Have students glue down the graphic
organizer pieces and go over the arrows in pencil or marker. Have students copy the organizer into their GLINs so they can access them in subsequent lessons. (Teacher Note: Since students are working in pairs, there will be only one organizer per pair available. Teachers should be creative in how they ensure that each student has a completed organizer in his/her GLIN at this point in the lesson).
11. Display Slide 12 and explain that there have been numerous times in previous units where
students have already studied economics. As this slide demonstrates, students explored the types of questions economists ask in Unit 1.
12. Ask students to identify another economic connection from a previous unit and describe it in their Global Investigator’s Notebooks. Allow students time to write and then have them share answers in the large group.
13. Give each student a copy of the “PowerPoint Notes, pages 1 and 2,” located in the Supplemental Materials (Unit 6, Lesson 1). Display Slide 13 and remind students that they studied various effects of natural disasters in Unit 2. Then, display Slide 14 and have them describe one example of an economic effect on their PowerPoint Notes at Number 1. Have them briefly share their ideas. Then display Slide 15 and discuss some economic effects of natural disasters that were addressed in Unit 2.
14. Display Slide 16 and remind students that in Unit 3 they investigated migration. Then, using Slide 17, review how “push and pull” factors influence migration. Using Slides 18 and 19 and Numbers 2 and 3 on the “PowerPoint Notes, pages 1 and 2,” have students identify examples of economic push and pull factors. Give students time to write and then have some students share their answers with the whole class. Display Slide 20 and remind students that they categorized different examples of migration in Unit 3. Then, display Slide 21 and discuss the three examples of economic-related migration.
15. Display Slide 22 and remind students that they studied urbanization as an important global process related to migration. Then, display Slide 23 and have students identify an economic reason that people migrate to cities by completing Number 4 on their PowerPoint Notes. Give students time to write and then have them share their examples in the large group. Display Slide 24 to discuss economic reasons that were studied in Unit 3.
16. Display Slide 25 and remind students that in Unit 4 they studied culture. Have students describe a cultural component relating to economics by completing Number 5 on their PowerPoint Notes. Give students time to write and then have them share their examples in the large group. Display Slide 26 to discuss examples that were covered in Unit 4.
6th Grade Social Studies: World Geography and Global Issues SS060601 Unit 6: Economics and World Trade Lesson 1
Michigan Citizenship Collaborative Curriculum Page 4 of 7 Copyright © 2010-2015 Oakland Schools January 28, 2015
17. Display Slide 27 and review how students investigated cultural landscapes in Unit 4. Then, display Slide 28 and have students describe a connection between cultural landscapes and economics by completing Number 6 on their PowerPoint Notes. Give students time to write and then have them share their ideas in the large group. Note that possible connections include:
Cultural landscapes often reflect economic activities such as mining.
Cultural landscapes often reflect businesses such as airports and hotels.
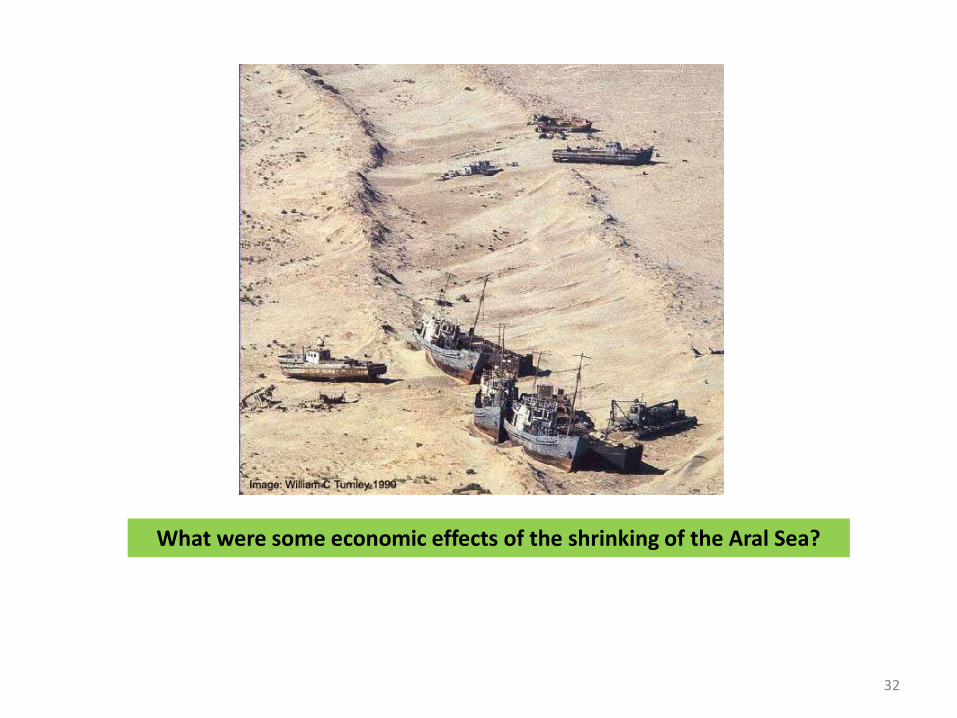
18. Display Slide 29 and review how Human/Environment Interaction was explored in Unit 5. Then display Slide 30 and briefly review what the photographs reveal about the Aral Sea. Next, display Slide 31 and have students identify how economics was related to this environmental problem by completing Number 7 on their PowerPoint Notes. Give students time to write and then discuss their answers. Note that answers should center on the idea that rivers feeding the Aral Sea were diverted in order to irrigate land for cotton.
19. Remind students that the shrinking of the Aral Sea also had economic effects in addition to economic causes. Display Slide 32 and ask students to identify an example of this by completing Number 8 on their PowerPoint Notes. Discuss their ideas. Note that possible examples include:
The fishing industry in the region was destroyed.
Many people lost their jobs. 20. Display Slide 33 and review how students investigated natural resources in Unit 5. Then,
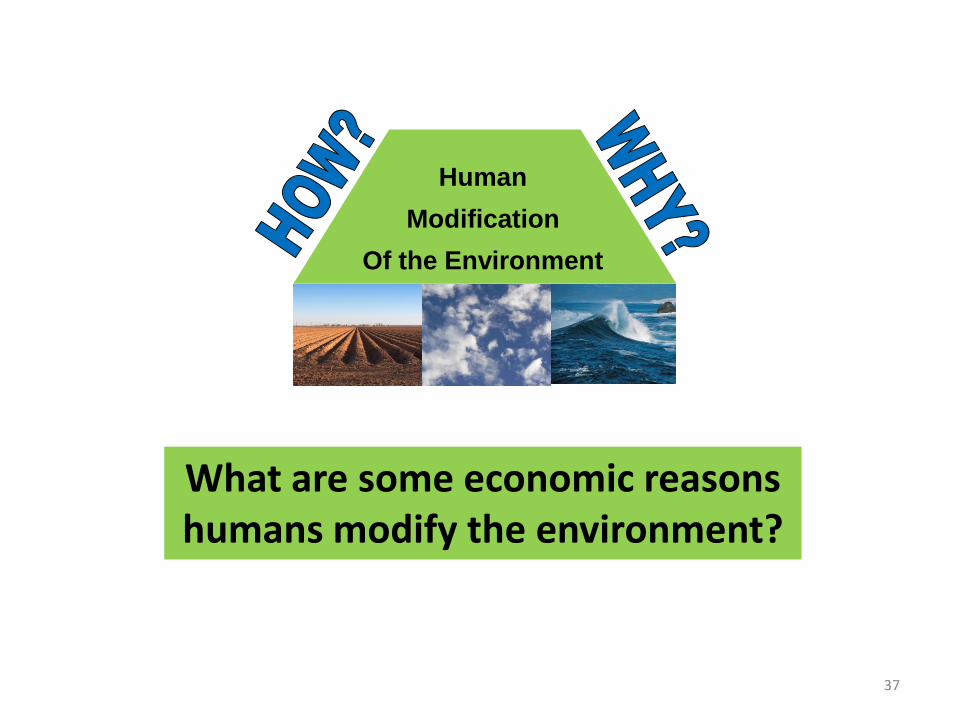
display Slides 34 and 35 and review the activity in which students explored the relationship between having natural resources and wealth. Have students describe what they learned in this activity by completing Number 9 on their PowerPoint Notes.
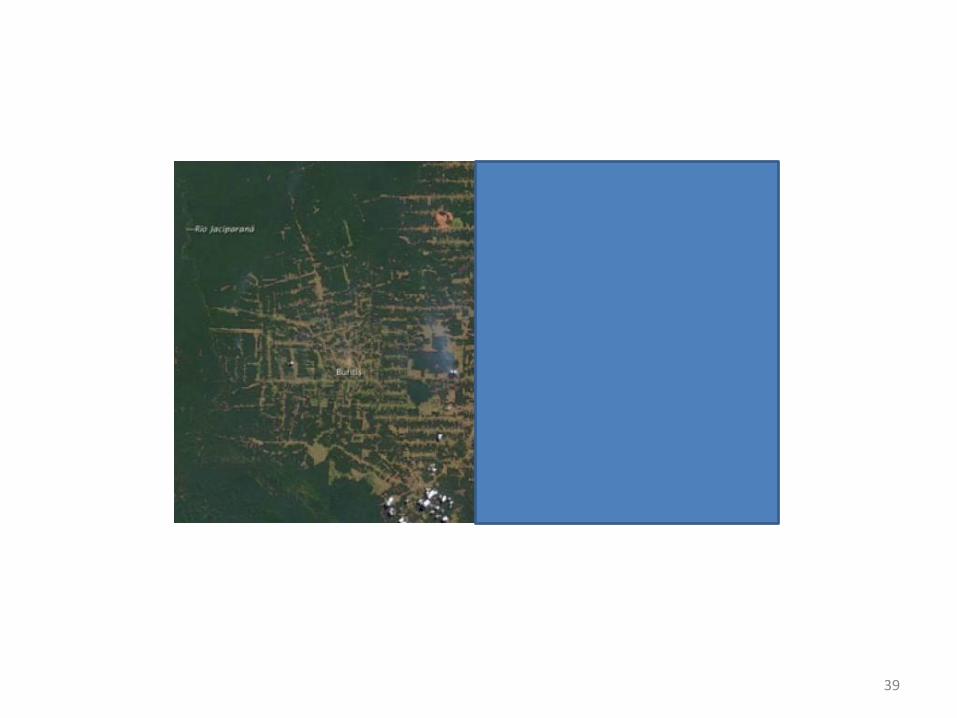
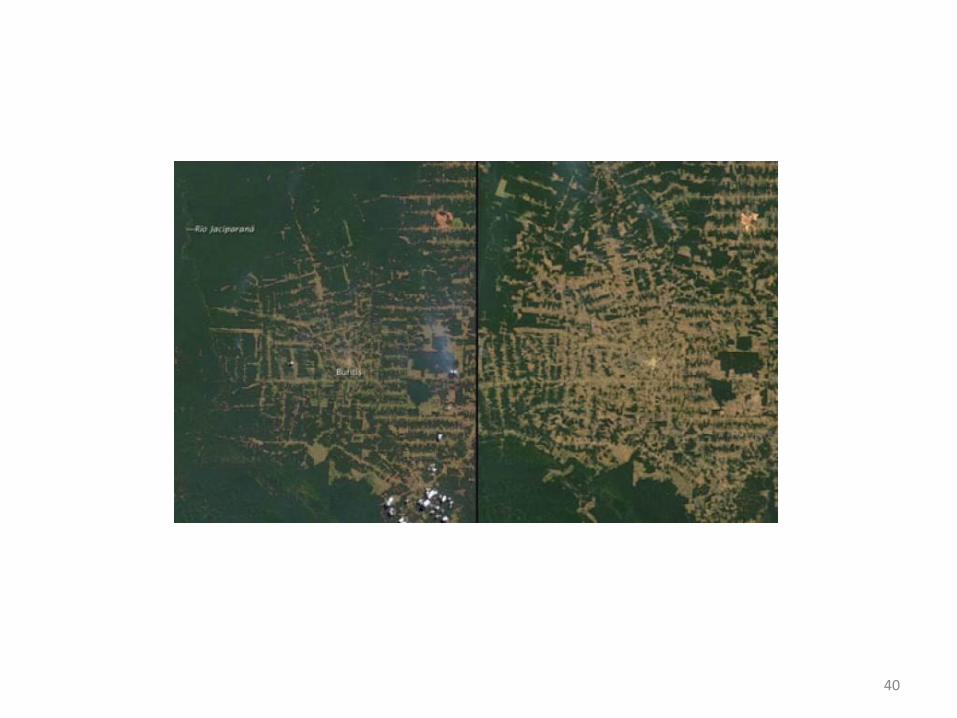
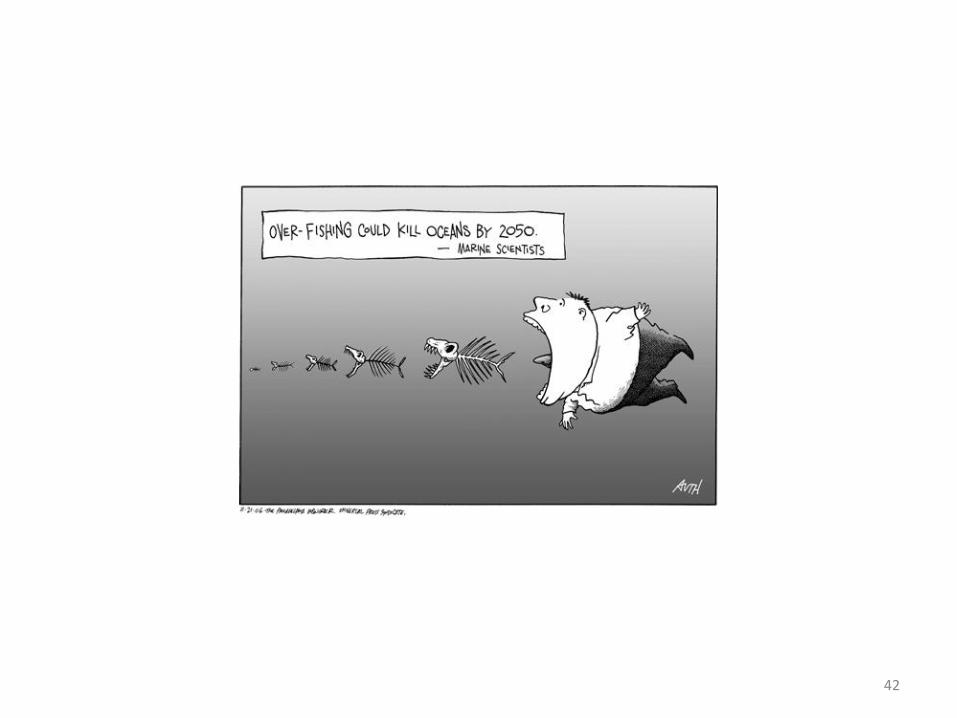
21. Display Slide 36 and review how students investigated human modification of the environment in Unit 5. Then, display Slide 37 and have students identify an economic reason for modification by completing Number 10 on their PowerPoint Notes. Discuss student ideas. Then use Slides 38 - 42 to discuss examples of economic reasons people modify their environments. Note these examples show how people modify the environment by:
the economic activity of mining;
the economic activity of lumbering in the rainforests;
building factories to manufacture a variety of goods; and
the economic activity of commercial fishing. 22. Give each student a copy of the “Locating and Sharing Economic News” chart located in the
Supplemental Materials (Unit 6, Lesson 1). Explain that students should locate a news story relating to economics through one of the following methods:
Using a newspaper
Viewing a television newscast
Searching for an online news story
Then, students should summarize the news story on the chart. This can be assigned for homework.
6th Grade Social Studies: World Geography and Global Issues SS060601 Unit 6: Economics and World Trade Lesson 1
Michigan Citizenship Collaborative Curriculum Page 5 of 7 Copyright © 2010-2015 Oakland Schools January 28, 2015
23. Place students in small groups and have them share their news stories. As each student
shares explain that the group should categorize the story according to scale: local, state, national, and global.
24. When groups have finished, explain that due to advances in technology and human innovation, the economic systems of many different countries have become interconnected and interdependent. Then use Slide 43 and Word Card #10 to describe economic globalization to students. Economic globalization is the development of increased interconnections and interdependence of many different economic systems marked by free trade and the free flow of capital, labor, and resources.
25. Have students continue working in their small groups to discuss and identify whether any of the
stories shared represent the idea of globalization. Push students’ thinking by referring to the characteristics of globalization as described on Slide 44. Students should analyze each story for evidence of globalization.
26. Have each group identify a spokesperson to share their analysis of globalization in the stories they researched. Students should share their group’s ideas of how the stories did or did not represent the idea of globalization, identifying evidence supporting their positions. Guide students in identifying specific economic terms and concepts as they share their analyses.

6th Grade Social Studies: World Geography and Global Issues SS060601 Unit 6: Economics and World Trade Lesson 1
Michigan Citizenship Collaborative Curriculum Page 6 of 7 Copyright © 2010-2015 Oakland Schools January 28, 2015
Reference Section
Content Expectations 6 – G1.2.4: Use observations from air photos, photographs (print and CD), films (VCR and DVD) 7 – G1.2.3: as the basis for answering geographic questions about the human and physical
characteristics of places and regions. 6 and 7 Use the fundamental themes of geography (location, place, human environment G1.3.1: interaction, movement, region) to describe regions or places on earth. 6 and 7 Explain the different ways in which places are connected and how those connections G1.3.3: demonstrate interdependence and accessibility. 6 and 7 Describe the human characteristics of the region under study (including languages, G2.2.1: religion, economic system, governmental system, cultural traditions). 6 and 7 Identify the ways in which human-induced changes in the physical environment in G5.1.3: one place can cause changes in other places.1 6 and 7 Explain and compare how economic systems (traditional, command, and market) E3.3.1: answer four basic questions: What should be produced? How will it be produced?
How will it be distributed? Who will receive the benefits of production? Common Core State Standards for Literacy in History and Social Studies RH.6-8.1: Cite specific textual evidence to support analysis of primary and secondary sources. RH.6-8.2: Determine the main ideas or information of a primary or a secondary source; provide
an accurate summary of the source distinct from prior knowledge or opinions. Instructional Resources Equipment/ Manipulative Global Investigator’s Notebook Glue sticks – one for each pair of students Light colored cardstock – one piece for each pair of students Scissors – one for each pair of students Student Resource A student geography textbook such as Wiggins, Grant, et al. My World Geography: Boston, MA:
Pearson, 2011, 56-58.
1 Since the specificity of the examples tends to distract from essential understanding of the expectation, they have been removed. In grade six, the examples include “cutting forests in one region may result in river basin flooding elsewhere; building a dam floods land upstream and may permit irrigation in another region.” The seventh grade examples include “cutting forests in one region may result in river basin flooding elsewhere as has happened historically in China; building dams floods land upstream and permits irrigation downstream as in Southern Africa, the Aswan Dam flooded the upper Nile Valley and permitted irrigation downstream.”

6th Grade Social Studies: World Geography and Global Issues SS060601 Unit 6: Economics and World Trade Lesson 1
Michigan Citizenship Collaborative Curriculum Page 7 of 7 Copyright © 2010-2015 Oakland Schools January 28, 2015
Teacher Resource 7 Ways Humans are Damaging the Planet. Mother Nature Network. 28 January 2015
<http://www.mnn.com/earth-matters/wilderness-resources/photos/7-ways-humans-are-damaging-the-planet/changing-our>.
Aral Sea - Dried Sands. 28 Jan. 2015 <http://www.global-greenhouse-
warming.com/images/AralSeaDriedup.jpg>. Egbo, Carol. Supplemental Materials (Unit 6, Lesson 1). Teacher-made materials. Oakland
Schools, 2015. - - - . PowerPoint (Unit 6, Lesson 1). Teacher-made materials. Oakland Schools, 2015. Hartsfield-Jackson International Airport, just outside of Atlanta. 28 Jan. 2015
<http://torontoist.com/2009/11/google_earth_at_gallery_44/>. Hoovler, Evan. “15 stunning satellite pics of man-made objects visible from space.” Blastr. 24
January 2012. 28 Jan. 2015 <http://blastr.com/2012/01/15-stunning-satellite-pic.php>. Orange Orchards in Uruguay. Bonjourlife. 28 Jan. 2015 <http://bonjourlife.com/legendary-photo-
project-earth-from-the-air/>. Overfishing Cartoon. Word Press. 28 Jan. 2015
<http://oceankeshi.wordpress.com/2013/01/30/the-importance-of-plankton/>. Prominent Hill Copper and Gold Mine in Australia. The Advertiser. 28 Jan. 2015
<http://www.adelaidenow.com.au/business/oz-minerals-beats-copper-and-gold-forecasts-at-prominent-hill/story-e6frede3-1225991670624>.
Shrimp Farm in Thailand. Bonjourlife. 28 Jan. 2015 <http://bonjourlife.com/legendary-photo-
project-earth-from-the-air/>. Solar Power Plant in Andalusia, Spain. Lloyd Kahn’s Blog. 28 Jan. 2015 <http://lloydkahn-
ongoing.blogspot.com/2011/04/earth-from-above-aerial-photography-by.html>.

6th Grade Social Studies: World Geography and Global Issues SS060601 Unit 6: Economics and World Trade Lesson 1
Michigan Citizenship Collaborative Curriculum Page 1 of 10 Copyright © 2010-2015 Oakland Schools January 28, 2015
Graphic Organizer
Every society has RESOURCES.
NATURAL (Land)
RESOURCES
CAPITAL RESOURCES
(Capital)
HUMAN (Labor)
RESOURCES
WHAT goods and services will be
produced?
WHO will consume the goods and
services?
HOW will the goods and services be
produced?
How a society answers these questions will result
in a particular type of ECONOMIC SYSTEM.
Which are used to produce
GOODS and SERVICES
But RESOURCES are limited and HUMAN WANTS are unlimited
Which results in
SCARCITY
Which means people must make
CHOICES
In order to answer the questions:

6th Grade Social Studies: World Geography and Global Issues SS060601 Unit 6: Economics and World Trade Lesson 1
Michigan Citizenship Collaborative Curriculum Page 2 of 10 Copyright © 2010-2015 Oakland Schools January 28, 2015
Big Idea Card
Big Ideas of Lesson 1, Unit 6
Economics is the study of how people choose to use resources to produce or
consume goods and services to meet their wants and needs.
Economists study the production, distribution, and consumption of goods and services.
An economic system is a way in which a society organizes the production, consumption, and distribution of goods and services.
Due to advances in technology and human innovation, the economic systems of many different countries have become interconnected and interdependent.
Economists and others refer to the development of increased interconnections and interdependence of many different economic systems marked by free trade and the free flow of capital, labor, and resources as economic globalization.

6th Grade Social Studies: World Geography and Global Issues SS060601 Unit 6: Economics and World Trade Lesson 1
Michigan Citizenship Collaborative Curriculum Page 3 of 10 Copyright © 2010-2015 Oakland Schools January 28, 2015
Word Cards
1 economics the study of how people use resources to produce, distribute and consume goods and services Example: Trucks, ships, and railroads are used for distribution.
(SS060601)
2 economic system an organized way a society uses to produce, distribute, and consume goods and services Example: An economic system where the interactions of buyers and sellers determine what is produce, how it is produced and for whom is known as a market economic system.
(SS060601)
3 consumption the process of using natural resources or goods and services Example: The snowy winter resulted in an increase in the consumption of snow shovels and warm clothing.
(SS060601)
4 production the process of making goods and services Example: An assembly line is used in the production of automobiles.
(SS060601)
5 distribution moving goods and services directly to or near consumers Example: Trucks, ships, and railroads are used for the distribution of goods across the United States.
(SS060601)
6 factors of production the resources used to produce goods and services Example: The factors of production are also called “productive resources” and include land, labor, and capital.
(SS060601)

6th Grade Social Studies: World Geography and Global Issues SS060601 Unit 6: Economics and World Trade Lesson 1
Michigan Citizenship Collaborative Curriculum Page 4 of 10 Copyright © 2010-2015 Oakland Schools January 28, 2015
7 natural (land) resources
any physical environmental item that people perceive to be useful Example: Natural resources include water, soil, trees, and minerals.
(SS060601)
8 human (labor) resources workers and their abilities, talents, training, skills, and knowledge used to produce goods or services Example: Human resources may refer to physical or mental efforts.
(SS060601)
9 capital resources equipment or goods (machinery, tools, factories, stores, vehicles, etc.) that are used to produce other goods and services Example: Tractors used to harvest crops are capital resources.
(SS060601)
10 economic globalization the development of increased interconnections and interdependence of many different economic systems marked by free trade and the free flow of capital, labor, and resources Example: Economic globalization has made countries more connected and interdependent than ever before.
(SS060601)

6th Grade Social Studies: World Geography and Global Issues SS060601 Unit 6: Economics and World Trade Lesson 1
Michigan Citizenship Collaborative Curriculum Page 5 of 10 Copyright © 2010-2015 Oakland Schools January 28, 2015
Cards for Vocabulary Match
SCARCITY ECONOMIC
SYSTEM
when individuals, regions and
countries produce certain kinds of
goods and services
a product that people in one
country buy from people in another
country
HUMAN RESOURCES
the rate at which goods or services
are produced
the act or process of trying to get or win something that someone else is also trying to get or win
NATURAL RESOURCES
PROFIT
the amount of a product or service that is available for consumers to buy
EXPORT
the money or value that is
gained after you subtract the
costs involved
an organized way a society uses to
produce, distribute and consume goods
and services
SPECIALIZATION
the act or process of exchanging goods or services one has
for the goods or services one wants
IMPORT
DEMAND
a product that people in one country sell to
people in another country
TRADE
consumers’ willingness and
ability to purchase a product or service
SUPPLY
any physical environmental item that people perceive
to be useful in the production of a good
or service
workers and their skills used to
produce a good or service
CAPITAL RESOURCES
equipment or goods that are used to
produce other goods and services
COMPETITION PRODUCTIVITY not enough

6th Grade Social Studies: World Geography and Global Issues SS060601 Unit 6: Economics and World Trade Lesson 1
Michigan Citizenship Collaborative Curriculum Page 6 of 10 Copyright © 2010-2015 Oakland Schools January 28, 2015
Teacher Guide for Matching from Vocabulary Cards
CAPITAL RESOURCES – equipment or goods that are used to produce other goods and services
COMPETITION – the act or process of trying to get or win something that someone else is also trying to get or win
DEMAND - consumers’ willingness and ability to purchase a product or service
ECONOMIC SYSTEM – an organized way a society uses to produce, distribute and consume goods and services
EXPORT – a product that people in one country sell to people in another country
HUMAN RESOURCES – workers and their skills used to produce a good or service
IMPORT - a product that people in one country buy from people in another country
NATURAL RESOURCES - any physical environmental item that people perceive to be useful in producing goods and services
PRODUCTIVITY – the rate at which goods or services are produced
PROFIT - the money or value that is gained after you subtract the costs involved
SCARCITY – not enough
SPECIALIZATION - when individuals, regions and countries produce certain kinds of goods and services
SUPPLY - the amount of a product or service that is available for consumers to buy
TRADE – the act or process of exchanging goods or services one has for the goods or services one wants

6th Grade Social Studies: World Geography and Global Issues SS060601 Unit 6: Economics and World Trade Lesson 1
Michigan Citizenship Collaborative Curriculum Page 7 of 10 Copyright © 2010-2015 Oakland Schools January 28, 2015
Pieces for Creating the Graphic Organizer
But RESOURCES are limited and
HUMAN WANTS are unlimited Which results in
SCARCITY
Which means people must make choices.
NATURAL (Land)
RESOURCES
CAPITAL
RESOURCES
HUMAN (Labor)
RESOURCES
Every society has RESOURCES.
Which are used to produce
GOODS and SERVICES
CHOICES
In order to answer the questions:
How a society answers these questions will result in a particular
type of ECONOMIC SYSTEM
WHAT goods and services will be
produced?
WHO will consume
the goods and
services?
HOW will the goods
and services be
produced?

6th Grade Social Studies: World Geography and Global Issues SS060601 Unit 6: Economics and World Trade Lesson 1
Michigan Citizenship Collaborative Curriculum Page 8 of 10 Copyright © 2010-2015 Oakland Schools January 28, 2015
PowerPoint Notes page 1
1. Describe one economic effect of a natural disaster such as an earthquake. 2. What is an example of an economic pull factor? 3. What is an example of an economic push factor? 4. What is one economic reason that people move to cities? 5. What is a component of culture that relates to economics? 6. What is a connection between cultural landscapes and economics? 7. How are economics related to the shrinking of the Aral Sea?

6th Grade Social Studies: World Geography and Global Issues SS060601 Unit 6: Economics and World Trade Lesson 1
Michigan Citizenship Collaborative Curriculum Page 9 of 10 Copyright © 2010-2015 Oakland Schools January 28, 2015
PowerPoint Notes page 2
8 What was one economic effect of the shrinking of the Aral Sea? 9. What did you learn about economics when you explored the relationship between having natural resources and wealth? 10. What are some economic reasons that people modify the environment?

6th Grade Social Studies: World Geography and Global Issues SS060601 Unit 6: Economics and World Trade Lesson 1
Michigan Citizenship Collaborative Curriculum Page 10 of 10 Copyright © 2010-2015 Oakland Schools January 28, 2015
Locating and Sharing Economic News
Who?
What?
Where?
When?
Why?
Where did you locate the information?

6th Grade Social StudiesUnit 6, Lesson 1:
What is Economics?
1

Every society has RESOURCES.

Every society has RESOURCES.
NATURAL(Land)
RESOURCES
CAPITALRESOURCES
HUMAN(Labor)
RESOURCES

Every society has RESOURCES
NATURAL(Land)
RESOURCES
CAPITALRESOURCES
HUMAN(Labor)
RESOURCES
which are used to produce
GOODS and SERVICES

But RESOURCES are limited and
HUMAN WANTS are unlimited
which results in

But RESOURCES are limited and
HUMAN WANTS are unlimited
which results in
SCARCITY

SCARCITYforces societies to make

SCARCITYforces societies to make
CHOICES
in order to answer

SCARCITYforces societies to make
CHOICES
in order to answer the questions:
WHAT goods and
services will be
produced?
WHO will consume
the goods and
services?
HOW will the goods
and services be
produced?
SCARCITYforces societies to make
CHOICES
in order to answer the questions:
WHAT goods and
services will be
produced?
WHO will consume
the goods and
services?
HOW will the goods
and services be
produced?
How a society answers these questions will result in a particular type of
ECONOMIC SYSTEM
11

Economists study ?
… how people produce, distribute, and
consume goods and services
This includes:
• Scarcity, choice, and decision making
• Different kinds of economic systems
• Productive resources (natural, human,
capital)
• Specialization, trade, and interdependence
12

Effects of Natural Disasters
13

Economic Effects of Natural Disasters???
14

Economic Effects of Natural Disasters
• Disruption of the economy
• Loss of jobs due to damage of buildings, etc.
• Physical damage to businesses and industry
• Loss of businesses
• Disruptions in trade
15

Migration
16

Push/Pull Factors
17

Push/Pull Factors
What is an example of an economic push factor?
18

Push/Pull Factors
What is an example of an economic push factor?
What is an example of an economic pull factor?
19

20

From 1955 until 1973, over one million guest workers arrived in the Federal Republic of Germany, mostly from Italy, Spain, and Turkey.
Many people from Mexico and other Latin American countries migrate to the United States looking for jobs and a better life.
The State of Qatar has one of the fastest growing economies in the world and a relatively small native population. This situation has led to an influx of foreign nationals and a population boom.
21

Migration
Causes Effects
Urbanization
22

What are some economic reasons that people move to cities?
23

24
What are some economic reasons that people move to cities?
• Jobs
• More opportunities
• A chance for a better life
• A greater variety of goods

CULTURE
Cultural
Components
Relating to
Economics
25

CULTURE
Cultural
Components
Relating to
Economics
The ways people make a living
They types of currency people use
The ways in which goods are made
People’s beliefs about wealth and
material goods
26

27
Cultural Landscapes

How do Cultural
Landscapes Reflect
Economics?
28

Human/
Environment
Interaction
Using
the
Environment
Adapting
to the
Environment
Modifying
the
Environment
29

Photographs of the Aral Sea
2000 2012
30

Photographs of the Aral Sea
2000 2012Source: Photographs of the Aral Sea.
http://meridian.aag.org/changingplanet/index.cfm?action=main.module§ionID=1&moduleID=4&pageID=18How did economics relate to the shrinking of the Aral Sea?
31
What were some economic effects of the shrinking of the Aral Sea?
32

NATURAL
RESOURCES
How do
people use
them?
What
are they?Where are
they?
33

ACTIVITY
34

Letter Natural Resources Rich, Poor or In the Middle?
Acobalt, copper, niobium, tantalum, petroleum, industrial and gem diamonds, gold, silver, zinc, manganese, tin, uranium, coal, hydropower, timber
B deepwater harbor, feldspar
C
nickel, uranium, rare earth oxides, peat, cobalt, copper, platinum, vanadium, arable land, hydropower, niobium, tantalum, gold, tin, tungsten, kaolin, limestone
D petroleum, natural gas, fish
E
coal, copper, lead, molybdenum, phosphates, rare earth elements, uranium, bauxite, gold, iron, mercury, nickel, potash, silver, tungsten, zinc, petroleum, natural gas, timber
F none
G
hydropower, fertile agricultural land, gold, diamonds, petroleum, hardwoods, limestone, iron ore, copper, chromium ore, zinc, tungsten, mica, silver
Hlimestone, arable land, hydropower, unexploited deposits of uranium, coal, and bauxite
Dem. Rep of the Congo
Hong Kong
Burundi
Quatar
United States
Macao
South Sudan
Malawi
RICH POOR
What did you learn about economics in this activity?
35

Human
Modification
Of the Environment
36
Human
Modification
Of the Environment
What are some economic reasons humans modify the environment?
37

38
39
40

41
42
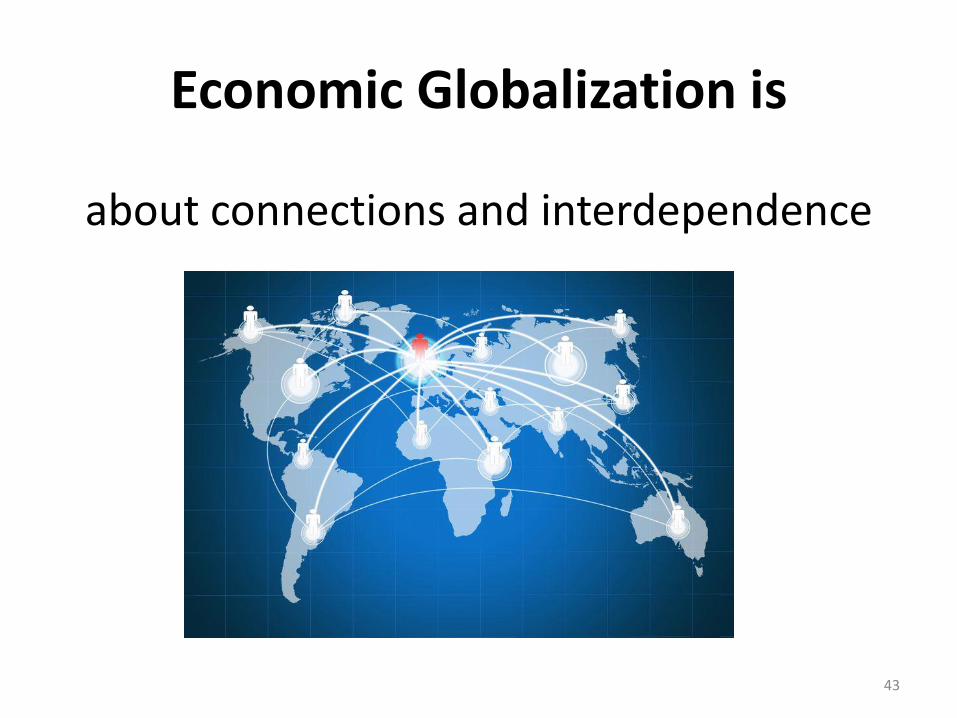
Economic Globalization is
about connections and interdependence
43

Criteria/ Definition of Economic Globalization
• The development of increased interconnections and interdependence
• of many different economic systems
• marked by free trade and the free flow of capital, labor, and resources
44
45
Property of Oakland Schools
Author: Carol EgboEditor: Amy Bloom
Copyright © 2010-2015 Oakland Schools

6th Grade Social Studies: World Geography and Global Issues SS060602 Unit 6: Economics and World Trade Lesson 2
Michigan Citizenship Collaborative Curriculum Page 1 of 5 Copyright © 2010-2015 Oakland Schools January 18, 2015
Lesson 2: Comparing Economic Systems: What Role Does Government Play?
Big Ideas of the Lesson
All societies have to answer the three main economic questions: What to produce? How to
produce? Who should get what is produced? Different types of economic systems result when different groups of people have the power
and authority to answer the three main economic questions. In a command system, the economic questions are answered by the government. In a market system, the economic questions are answered by the interaction of buyers and
sellers. Most countries today have a mixed economic system which means part of the economy is
driven by the interactions of buyers and sellers and part of it is controlled by the government. Not all mixed economic systems are the same; they differ in the amount of power and
authority the government has over the economy.
Lesson Abstract: In this lesson students are introduced to three different economic systems: command, market and mixed. The lesson begins students reading an informational text selection which describes both command and market economies. They use this information to distinguish the major characteristics of command and market economic systems using a checklist. Building on what they have learned about a market economic system, they view a video describing the circular flow model. Next, they identify potential problems in a pure market economy and investigate the role of the U.S. government in attempting to prevent such problems. Students conclude the lesson by analyzing an argument relating to the role the government should play in the U.S. economy. Content Expectations: Grades 6 and 7 – H1.2.3; G1.2.6; G2.2.1; E3.3.1
Grade 7 – E.1.1.1; E1.1.2 Grade 6 – H1.4.1; G6.1.1; E.1.1.1
Common Core State Standards for Literacy in History and Social Studies: RH.6-8.1, 2, 4, and 6; WHST.6-8.4 and 9. Key Concepts circular flow economic systems (command, mixed, and market economies) role of the government Lesson Sequence 1. Pose the following question and have students answer it in their Global Investigator’s
Notebook: What are the three main economic questions all countries have to answer? Give students time to think and write. Then, have students check their answers by referring to the graphic organizer they created in Lesson 1.

6th Grade Social Studies: World Geography and Global Issues SS060602 Unit 6: Economics and World Trade Lesson 2
Michigan Citizenship Collaborative Curriculum Page 2 of 5 Copyright © 2010-2015 Oakland Schools January 18, 2015
2. Review the term “economic system” by reminding students that countries create an economic system to answer the three questions. Using Word Cards #11 and #12 introduce the terms “command economy” and “market economy.” Then, give each student a copy of the “Command and Market Economies” text selection, located in the Supplemental Materials (Unit 6, Lesson 2). Have students read the text independently and then work with a partner to highlight the differences between the two economic systems.
3. Distribute the “Comparing Command and Market Economies” chart located in the Supplemental Materials (Unit 6, Lesson 2). Explain that students should carefully review the text and use the information to help them complete the chart, as well as answer the three questions beneath the chart.
4. Give students time to complete the chart and then lead a discussion on command and market economies using the questions at the bottom of the chart and the following questions:
How are the three main economic questions answered in a command economy?
How are the three main economic questions answered in a market economy?
Over the last 50 years many countries that had a command economy have moved toward creating a market economy. Why do you think this is true?
In which system would people have the most economic freedom?
Do you think economic freedom is important to people? Why or why not?
In which system would there probably be the greatest differences in wealth among people? Why do you think this is true?
5. Refer students to the final paragraph of the text selection and ask them to summarize the main idea of this paragraph. Guide them in understanding that although the United States and many other countries are said to have market economies, the government does play a role to some extent. As students will see later in the lesson, there are no examples of pure command or pure market economies.
6. Using Word Card #13, discuss the term “circular flow.” Teacher Note: This term should have been introduced in fourth grade. If students experienced the MC3 lessons you can help them access their prior knowledge by asking them if they remember a book called The Go-Around Dollar and a simulation that involved a gas station, a book store, a pet store and a video rental. If students need some support, you may even wish to repeat the simulation by using Lesson 3 of Unit 4 of the MC3 fourth grade materials.
7. To explore the circular flow model, show the video located at http://www.stlouisfed.org/education_resources/economic-lowdown-video-companion-series/episode-6-circular-flow/ to students or have them view it individually on a computer. Teacher Note: This video, produced by the Federal Reserve Bank of St. Louis, gives a clear explanation of the model. The website provides a place where you can register your class through the Instructor Management Panel. This allows students to access online questions relating to the video content. A “Transcript” of the video has been included in the Supplemental Materials (Unit 6, Lesson 2) so you can preview the content.
8. Remind students that in a country with a pure market economy, the government would play no role in the economy at all. Ask students if this might lead to any potential problems. Discuss

6th Grade Social Studies: World Geography and Global Issues SS060602 Unit 6: Economics and World Trade Lesson 2
Michigan Citizenship Collaborative Curriculum Page 3 of 5 Copyright © 2010-2015 Oakland Schools January 18, 2015
their ideas and then divide students in pairs and give each pair a copy of the “What Can Happen in a Pure Market Economy?” chart located in the Supplemental Materials (Unit 6, Lesson 2). Explain that students should read each scenario on the chart and identify the problem and a way in which government might play a role in preventing the problem from happening. Make sure to tell them to leave the fourth column blank. It is labeled “How does the U.S. government prevent this from happening?”
9. Give pairs time to work and then place two pairs together to form a group of four. Have pairs
share their charts in the small group. Give each student a copy of “The Role of the Government in the U.S. Economy” chart located in the Supplemental Materials (Unit 6, Lesson 2). Then, have students work in their groups of four to use the information to complete the last column of the chart they began in Step 8. Note that a completed answer sheet has been included in the Supplemental Materials (Unit 6, Lesson 2) for reference.
10. Using the “Lesson Graphic Organizer” located in the Supplemental Materials (Unit 6, Lesson 2) as a guide, draw a continuum on a board or display a continuum on a document camera. Using Word Card #14, explain that most economists describe most countries as having a “mixed economy.” Those with more governmental control of the economy are located at the left side of the continuum, closer to the pure command side. Those with less government control are located on the right side near the pure market side.
11. Give each student a copy of the “Economic System Continuum” activity sheet located in the Supplemental Materials (Unit 6, Lesson 2). Explain that students should read the descriptions of the economic systems of the five different countries and then place the letter of each country on the continuum where they think it belongs. As an alternative, students could discuss the placement in small groups. Review students’ responses with the whole class by having students share their results or construct a human continuum with a student representing each country on the handout. As you review, discuss where students placed each of the countries making sure they support their choice with evidence. Note that a continuum showing where most economists would place the countries has been included in the Supplemental Materials (Unit 6, Lesson 2) for reference. Actual countries resembling each of the descriptions are as follows:
A: China
B: Japan
C: United States
D: Sweden
E: France 12. As a final literacy-based activity, give each student a copy of the “What is Government’s Role
in the Economy?” text selection located in the Supplemental Materials (Unit 6, Lesson 2). Explain that students should read the text carefully and analyze the argument being made by the author by answering the questions in the boxes. A sheet showing sample answers to the questions has been included in the Supplemental Materials (Unit 6, Lesson 2). This activity may also serve as an assessment for this lesson.
6th Grade Social Studies: World Geography and Global Issues SS060602 Unit 6: Economics and World Trade Lesson 2
Michigan Citizenship Collaborative Curriculum Page 4 of 5 Copyright © 2010-2015 Oakland Schools January 18, 2015
Reference Section
Content Expectations 6 and 7 Identify the point of view (perspective of the author) and context when reading and H1.2.3: discussing primary and secondary sources. 6 – H1.4.1: Describe and use cultural institutions to study an era or a region (political, economic,
religion/belief, science/technology, written language, education, family).1 6 and 7 Apply the skills of geographic inquiry (asking geographic questions, acquiring G1.2.6 geographic information, organizing geographic information, analyzing geographic
information, and answering geographic questions) to analyze a problem or issue of importance to a region of the world.2
6 and 7 Describe the human characteristics of the region under study (including languages, G2.2.1: religion, economic system, governmental system, cultural traditions). 6 - G6.1.1: Conduct research on contemporary global topics and issues.
Globalization – Investigate the significance of globalization and describe its impact on international economic and political relationships.
6 – E1.1.1: Explain how incentives vary in different economic systems (e.g., acquiring money,
profit, goods, wanting to avoid loss in position in society, job placement).3 7 – E1.1.2: Describe the circular flow model (that businesses get money from households in
exchange for goods and services and return that money to households by paying for the factors of production that households have to sell) and apply it to a public service (e.g., education, health care, military protection).4
6 and 7 Explain and compare how economic systems (traditional, command, and market) E3.3.1: answer four basic questions: What should be produced? How will it be produced?
How will it be distributed? Who will receive the benefits of production? Common Core State Standards for Literacy in History and Social Studies RH.6-8.1: Cite specific textual evidence to support analysis of primary and secondary sources.
1 This lesson only addresses distinctions among economic systems. 2 The expectations identified the western and eastern hemisphere. We have combined them to reflect a global perspective. 3 This lesson also addresses the related seventh grade expectation: 7-E1.1.1: Explain the role of incentives in different economic systems (acquiring money, profit, goods, wanting to avoid loss, position in society, job placement). 4 This lesson does not include an application to a public service.

6th Grade Social Studies: World Geography and Global Issues SS060602 Unit 6: Economics and World Trade Lesson 2
Michigan Citizenship Collaborative Curriculum Page 5 of 5 Copyright © 2010-2015 Oakland Schools January 18, 2015
RH.6-8.2: Determine the main ideas or information of a primary or a secondary source; provide an accurate summary of the source distinct from prior knowledge or opinions.
RH.6-8.4: Determine the meaning of words and phrases as they are used in a text, including
vocabulary specific to domains related to history/social studies. RH.6-8.6: Identify aspects of a text that reveal an author’s pointy of view or purpose (e.g.,
loaded language, inclusion or avoidance of particular facts). WHST.6-8.4: Produce clear and coherent writing in which the development, organization, and
style are appropriate to task, purpose, and audience. WHST.6-8.9: Draw evidence from informational texts to support analysis reflection, and research. Instructional Resources Equipment/ Manipulative Computer and LCD display Global Investigator’s Notebook Internet access
Student Resource A student geography textbook such as Wiggins, Grant, et al. My World Geography: Boston, MA:
Pearson, 2011, 62-63. Circular Flow. Federal Reserve Bank of St. Louis. 18 January 2015
<http://www.stlouisfed.org/education_resources/economic-lowdown-video-companion-series/episode-6-circular-flow/>.
Teacher Resource Callaham, Art. “What is Government’s Role in the Economy?” Herald Mail Media. 3 April 2011. 18
January 2015 <http://articles.herald-mail.com/2011-04-03/opinion/29382360_1_local-government-private-sector-private-sector-jobs>.
Egbo, Carol. Supplemental Materials (Unit 6, Lesson 2). Teacher-made materials. Oakland
Schools, 2013. “Episode 6 - Circular Flow.” The Economic Lowdown Video Series. Federal Reserve Bank of St.
Louis. 18 January 2015 <http://www.stlouisfed.org/education_resources/economic-lowdown-video-companion-series/episode-6-circular-flow/>.
What is a Market Economy? U.S. Department of State. 18 January 2015
<http://www.4uth.gov.ua/usa/english/trade/market/mktec2.htm>.

6th Grade Social Studies: World Geography and Global Issues SS060602 Unit 6: Economics and World Trade Lesson 2
Michigan Citizenship Collaborative Curriculum Page 1 of 18 Copyright © 2010-2015 Oakland Schools January 26, 2015
Graphic Organizer

6th Grade Social Studies: World Geography and Global Issues SS060602 Unit 6: Economics and World Trade Lesson 2
Michigan Citizenship Collaborative Curriculum Page 2 of 18 Copyright © 2010-2015 Oakland Schools January 26, 2015
Big Idea Card
Big Ideas of Lesson 2, Unit 6
All societies have to answer the three main economic questions: What to produce? How to produce? Who should get what is produced?
Different types of economic systems result when different groups of people have the power and authority to answer the three main economic questions.
In a command system, the economic questions are answered by the government.
In a market system, the economic questions are answered by the interaction of buyers and sellers.
Most countries today have a mixed economic system which means part of the economy is driven by the interactions of buyers and sellers and part of it is controlled by the government.
Not all mixed economic systems are the same; they differ in the amount of power and authority the government has over the economy.

6th Grade Social Studies: World Geography and Global Issues SS060602 Unit 6: Economics and World Trade Lesson 2
Michigan Citizenship Collaborative Curriculum Page 3 of 18 Copyright © 2010-2015 Oakland Schools January 26, 2015
Word Cards
11 command economy
an economic system in which the three main economic questions are answered by the government Example: In a command economy, prices are set by the government.
(SS060602)
12 market economy
an economic system in which the three main economic questions are answered by the interaction of buyers and sellers
Example: In a market economy, prices are set when sellers and buyers agree on the price for a good or service.
(SS060602)
13 circular flow
the pattern in which goods and services and resources flow in the marketplace
Example: In the circular flow model, you can see how money travels from people to businesses and back to people again.
(SS060602)
14 mixed economy a combination of command and market economies Example: Most countries in the world today have mixed economies.
(SS060602)
15 monopoly
a situation in which one company controls an industry or is the only provider of a product or service Example: The company had a monopoly on tires so it could set the prices high and did not have to worry about competition.
(SS060602)
16 regulation
a government rule with the force of law that states what may or may not be done or how something must be done Example: Many government regulations are aimed at protecting the health and safety of consumers.
(SS060602)

6th Grade Social Studies: World Geography and Global Issues SS060602 Unit 6: Economics and World Trade Lesson 2
Michigan Citizenship Collaborative Curriculum Page 4 of 18 Copyright © 2010-2015 Oakland Schools January 26, 2015
COMMAND AND MARKET ECONOMIES
Products such as bread, meat, clothing, refrigerators, and houses are produced and sold in virtually every country of the world today. The production methods and resources used to make these products are often very similar in different countries. For example, bread is made by bakers using flour and water, often with salt, sugar, and yeast added, then baked in ovens. Once the bread has been baked, the loaves are sold to consumers in stores that, at least superficially, can look very much alike, even in countries with very different kinds of economic systems.
Command Economies and Clothing Despite those apparent similarities, there are many differences. Let’s compare the market economies of North America, Western Europe, and Japan to the command economies found in the former Soviet Union, Eastern Europe, and parts of Asia over the past half century. The processes used to determine what products to make, how to make them, what prices to charge for them, and who will consume them are starkly different. To see those differences more clearly, let’s look at how production and sales decisions are made in the two kinds of systems for a specific kind of products -- shirts and blouses.
In command economies, government committees of economic planners, production experts, and political officials establish production levels for these goods and designate which factories will produce them. These central planning committees also establish the prices for the shirts and blouses, as well as the wages for the workers who make them. It is this set of central decisions that determines the quantity, variety, and prices of clothing and other products.
Three problems often occur within this system: poor planning decisions, the inability to respond efficiently to change, and limited choices for consumers. Since production and distribution decisions are made centrally, there tends to be more surpluses and shortages. A shortage is when the products sell out quickly, disappearing from store shelves. Products sell out quickly when factories fail to meet their production quotas or the central planning group underestimates how many shirts people want to buy at the prices they set. In either case, unless the planners take steps to increase production, raise prices, or both, the shortages will continue. Surpluses occur when the central planning group underestimates how many shirts people want to buy at the prices they set. Moreover, it is difficult for central planners to respond efficiently to changes in the economy because decisions are made centrally. Such decision-making requires large amounts of information. Gathering and responding to that information takes time, which makes it difficult to respond to changing economic conditions efficiently. Finally, the choices of products tend to be limited. When central planners make the decisions on the varieties of the product they produce and what workers get paid, there is no incentive for individuals and businesses to be innovative, which limits choices.
As the number of people living in the command economies increases, along with the number and sophistication of new products, it becomes harder and harder for central planners to avoid or eliminate shortages of the many things consumers want -- or surpluses of the products they don't. With more products, more people, and rapidly changing production technologies, the central planners face an explosion in the number of decisions they have to make, and in the number of places and ways where something could go wrong in their overall plan for the national economy.
Market Economies and Clothing
Big shortages and big surpluses do not happen in the market economies because economic decision making is different. To begin with, no central government planning group decides how many shirts or blouses to manufacture, or what styles and colors. Decisions in a market economy are made through the interactions of buyers and sellers. Anyone -- individual or company -- can decide to produce and sell shirts

6th Grade Social Studies: World Geography and Global Issues SS060602 Unit 6: Economics and World Trade Lesson 2
Michigan Citizenship Collaborative Curriculum Page 5 of 18 Copyright © 2010-2015 Oakland Schools January 26, 2015
and blouses in a market economy. Many will do just that if they believe they can sell these products at prices high enough to cover their costs -- and earn more money than they can doing something else. This leads to direct competition between different firms making and selling shirts and blouses. Competition is one of the basic reasons why there are generally so many different styles, fabrics, and brands of clothing for consumers to choose from in market economies.
Of course, if consumers decide to buy just one kind of shirt and blouse month after month and year after year, producers would soon learn that there was no reason to produce any other kind. But that simply hasn't happened where people are allowed to choose from a wide selection of clothing products.
Another key point about market economies is that the prices for shirts, blouses, and other products sold in stores aren't set by a central government planning committee. Instead, every seller is free to raise or lower prices according to changing market conditions. For example, if one kind of shirt becomes very popular for a time, and stores are worried about running out until they can get more, the store may raise price of such shirts, at least until new shipments arrive.
This price increase accomplishes two things at the same time. First, by making this kind of shirt more expensive compared to other shirts and products, some consumers will choose to buy fewer of them and more of other items. Second, sellers are affected. The higher price goes directly to those who produce and sell the shirts -- not the government. So, the higher price results in an increase in the profits of firms that makes and sells this shirt. The increase in profits enables those firms to produce and sell more of those shirts. Firms that make other products also see those higher profits going to the shirt producers, which lead some firms to stop making something else and start making those popular shirts.
For all of these reasons -- consumers buying fewer shirts, current shirt-makers producing more shirts, and other firms deciding to begin making shirts -- any shortage will soon be eliminated. In a market economy, it doesn't take a central planning committee to make any of these decisions. In fact, the process happens faster, and in some sense automatically, precisely because consumer and producer decisions are decentralized.
Market economies provide no magic solutions to economic problems, however. Government plays a critical role in helping correct problems that can't be fully solved by a system of private markets. In a market economy, costs associated with production are not always paid by the producer. For example, if pollution is a byproduct of manufacturing, it may not be factored into the price that a consumer pays for the product. These external elements are passed on to others who are not party to the production or consumption of goods and services. Governments play a role in addressing negative externalities through laws, regulations or taxes. Moreover, market economies are not necessarily stable or fair to everyone. They are not immune to problems such as inflation (a continual increase in the price of goods), unemployment, pollution, poverty, and barriers to international trade. The primary difference between command and market economies, however, is the extent to which the central government controls the economy.
Adapted from: What is a Market Economy? U.S. Department of State. 18 January 2015 <http://www.4uth.gov.ua/usa/english/trade/market/mktec2.htm>.
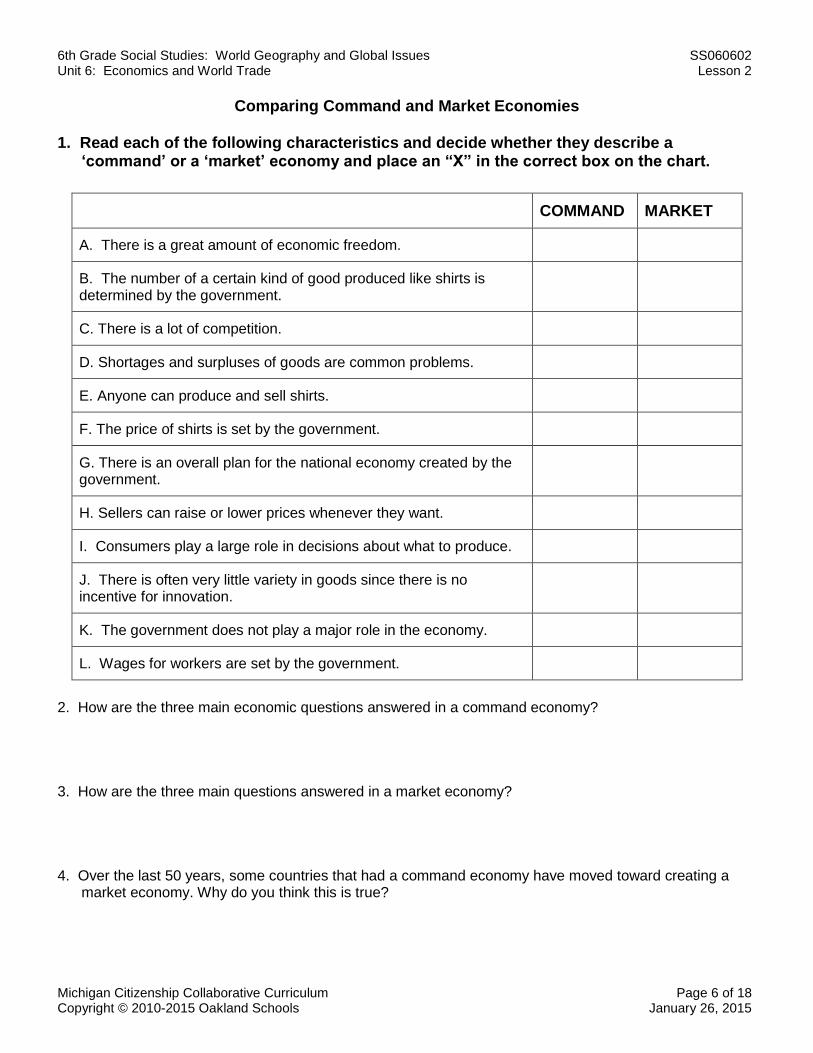
6th Grade Social Studies: World Geography and Global Issues SS060602 Unit 6: Economics and World Trade Lesson 2
Michigan Citizenship Collaborative Curriculum Page 6 of 18 Copyright © 2010-2015 Oakland Schools January 26, 2015
Comparing Command and Market Economies
1. Read each of the following characteristics and decide whether they describe a ‘command’ or a ‘market’ economy and place an “X” in the correct box on the chart.
2. How are the three main economic questions answered in a command economy? 3. How are the three main questions answered in a market economy? 4. Over the last 50 years, some countries that had a command economy have moved toward creating a
market economy. Why do you think this is true?
COMMAND MARKET
A. There is a great amount of economic freedom.
B. The number of a certain kind of good produced like shirts is determined by the government.
C. There is a lot of competition.
D. Shortages and surpluses of goods are common problems.
E. Anyone can produce and sell shirts.
F. The price of shirts is set by the government.
G. There is an overall plan for the national economy created by the government.
H. Sellers can raise or lower prices whenever they want.
I. Consumers play a large role in decisions about what to produce.
J. There is often very little variety in goods since there is no incentive for innovation.
K. The government does not play a major role in the economy.
L. Wages for workers are set by the government.
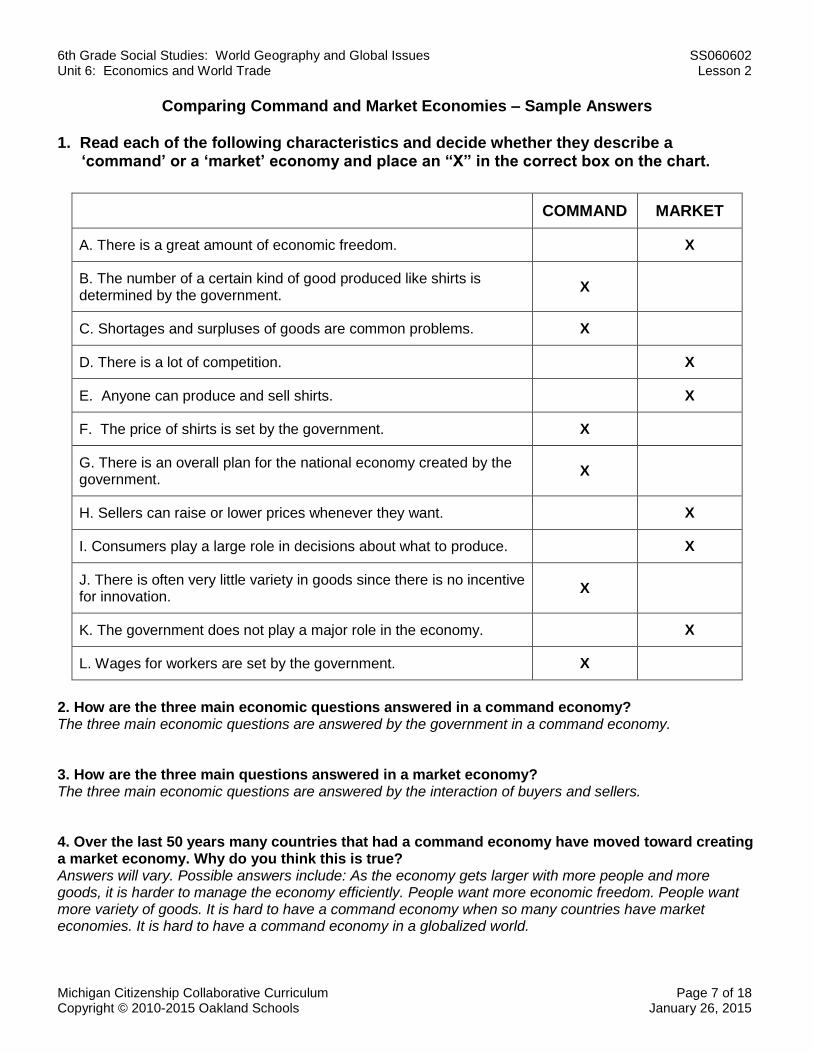
6th Grade Social Studies: World Geography and Global Issues SS060602 Unit 6: Economics and World Trade Lesson 2
Michigan Citizenship Collaborative Curriculum Page 7 of 18 Copyright © 2010-2015 Oakland Schools January 26, 2015
Comparing Command and Market Economies – Sample Answers
1. Read each of the following characteristics and decide whether they describe a ‘command’ or a ‘market’ economy and place an “X” in the correct box on the chart.
2. How are the three main economic questions answered in a command economy? The three main economic questions are answered by the government in a command economy. 3. How are the three main questions answered in a market economy? The three main economic questions are answered by the interaction of buyers and sellers. 4. Over the last 50 years many countries that had a command economy have moved toward creating a market economy. Why do you think this is true? Answers will vary. Possible answers include: As the economy gets larger with more people and more goods, it is harder to manage the economy efficiently. People want more economic freedom. People want more variety of goods. It is hard to have a command economy when so many countries have market economies. It is hard to have a command economy in a globalized world.
COMMAND MARKET
A. There is a great amount of economic freedom. X
B. The number of a certain kind of good produced like shirts is determined by the government.
X
C. Shortages and surpluses of goods are common problems. X
D. There is a lot of competition. X
E. Anyone can produce and sell shirts. X
F. The price of shirts is set by the government. X
G. There is an overall plan for the national economy created by the government.
X
H. Sellers can raise or lower prices whenever they want. X
I. Consumers play a large role in decisions about what to produce. X
J. There is often very little variety in goods since there is no incentive for innovation.
X
K. The government does not play a major role in the economy. X
L. Wages for workers are set by the government. X

6th Grade Social Studies: World Geography and Global Issues SS060602 Unit 6: Economics and World Trade Lesson 2
Michigan Citizenship Collaborative Curriculum Page 8 of 18 Copyright © 2010-2015 Oakland Schools January 26, 2015
Circular Flow Video Transcript
Let’s face it, the economy is complex and can be difficult to understand.
Luckily, economists have developed models to help us learn and understand how the economy functions. One of the most useful is the circular flow model.
The circular flow model highlights the “flows” within the economy―the flow of economic resources, goods and services, and the flow of money.
To demonstrate the usefulness of the circular flow model, let’s follow a few dollars through a cycle.
Imagine you are a hungry consumer who hears the homemade fries at the diner down the street calling your name. You take your money to the diner for a tasty meal.
When you pay your check, you are buying goods and services. But the money doesn’t remain in the cash register for long.
Alice, the diner owner, uses the money to purchase resources. She buys homegrown potatoes from a farmer; pays the server, who took your order, his wages; and makes a payment on the loan she got to buy new equipment for the diner. All of these are costs of production.
After she has paid her costs of production, the remaining money is her profit—the income she earns as an entrepreneur owning and operating her diner.
Let’s say your money goes to the farmer, and that for him is income. That money won’t remain in his wallet forever, though. Before you know it he will spend it, and the cycle will begin again.
The circular flow model shows the interaction between two groups of economic decision-makers―households and businesses―and two types of economic markets―the market for resources and the market for goods and services. While the real economy is much more complex, the simple circular flow model is useful for understanding some key economic relationships.
Let’s start with the two groups of economic decision-makers.
On one side of the model are households. Households consist of one or more persons who live in the same housing unit, such as a family. Households own all the economic resources in the economy. The economic resources are land, labor, capital, and entrepreneurial ability.
Land resources are natural resources. For example, these could be actual land owned by a farmer or other natural resources such as oil, water, and trees.
Labor is just what it sounds like―work for which you are paid.
Capital resources are goods used to produce other goods and services. For example, think of a hammer used by a carpenter or a computer used at a business.
Finally, entrepreneurial ability is the human resource that combines the other resources to produce new goods and services and bring them to market. So, an entrepreneur might combine land, labor, and capital in new ways―taking risks along the way―to bring a product or service to market.
On the other side we have businesses. A business is a privately owned organization that produces goods and services and then sells them. Businesses can be large, such as an automobile manufacturer, or small, such as a diner. And, businesses may produce goods, such as computers and bicycles, and services, such as haircuts and car repairs.
But households and businesses are not isolated, they interact in markets.

6th Grade Social Studies: World Geography and Global Issues SS060602 Unit 6: Economics and World Trade Lesson 2
Michigan Citizenship Collaborative Curriculum Page 9 of 18 Copyright © 2010-2015 Oakland Schools January 26, 2015
At the top of the model we have the market for resources. The market for resources is where households sell and businesses buy economic resources―land, labor, capital, and entrepreneurial ability. Notice that it is households who own all the economic resources.
You might think of capital, say a delivery truck, as being owned by a business. But who owns the businesses? You guessed it―households. Whether a small diner owned by an individual, a partnership owned by several individuals, or a corporation owned by stockholders, all of these businesses are owned by people who are also members of a household.
Let’s look at some transactions in the market for resources by a business. A diner: it uses a mix of economic resources, such as land―potatoes for fries; labor―cooks and wait staff, and capital ―kitchen equipment and cash register; resources to produce goods and services―in this case cheeseburgers, fries, and milkshakes. The business buys these economic resources from households.
For example, let’s say you work at the diner. You are selling and the diner is buying your labor resources. Those homemade fries come from potatoes― natural resources―bought from a local farm, which is owned by a household. The new milkshake machine and French fry cutter―capital resources―were bought from a business three states over and the stockholders of that business are members of households. Finally, the diner itself is owned by Alice, who is a member of a household and an entrepreneur who has turned her skill of making the best homemade fries in town into a successful business.
In exchange for their resources, households earn income. Each resource has its own income category.
Households receive wages for their labor, rent for use of their land, interest for use of their capital, and profit for their entrepreneurial ability. For working at the diner, for example, your income would be wages paid in the form of a paycheck at the end of the month.
So, in the market for resources, households sell resources and businesses buy resources. The resources flow one way (counter-clockwise) and money flows in the other (clockwise).
At this point in the cycle, households sell resources to businesses. So, households are holding income and businesses are holding resources. But, what do households do with the income? What do businesses do with the resources?
To answer these questions, let’s focus on the bottom of the model, the market for goods and services, where the goods and services produced by businesses are bought.
Let’s start with businesses. Businesses use the economic resources they buy in the market for resources to produce goods, such as computers and bicycles, and services, such as haircuts and car repairs.
Businesses sell these goods and services to households in the market for goods and services. For example, the diner produces cheeseburgers, fries, and milkshakes.
Households use part of their incomes to buy goods and services. The payment businesses receive is called revenue. For example, at the diner, revenue comes from customers paying for their food.
In short, the market for goods and services is simply where the goods and services produced by businesses are bought.
So, in the markets for goods and services, businesses sell goods and services and households buy goods and services. Products flow one way (counter-clockwise) and money flows in the other (clockwise).
Let’s step back a bit and notice a few things about the circular flow model.

6th Grade Social Studies: World Geography and Global Issues SS060602 Unit 6: Economics and World Trade Lesson 2
Michigan Citizenship Collaborative Curriculum Page 10 of 18 Copyright © 2010-2015 Oakland Schools January 26, 2015
First, it shows how businesses and households interact in the two markets―the market for resources and the market for goods and services. Notice that households and businesses are both buyers and sellers.
Households are sellers in the market for resources. Households sell land, labor, capital, and entrepreneurial activity in exchange for money, which in this case is called income.
Households are buyers in the market for goods and services. Households exchange income for goods and services.
Businesses are sellers in the market for goods and services. Businesses sell goods and services in exchange for money, which in this case is called revenue.
Businesses are buyers in the markets for resources. Businesses exchange the revenue earned in the market for goods and services to buy land, labor and capital in the market for resources. In this case, the money spent is called the cost of production.
Second, the model shows the flow of money in exchange for goods and services and resources.
Money flows clockwise, while goods, services, and resources flow counter-clockwise.
The circular flow model is a simple tool for learning about the economy. It shows the relationship between households and businesses and how these different decision-makers in the economy fit together.
Plus, it shows how money keeps economic resources and goods and services moving around and around and around the economy. And that’s something Alice appreciates.
Source: “Episode 6 - Circular Flow.” The Economic Lowdown Video Series. Federal Reserve Bank of St. Louis. 18 January 2015 <http://www.stlouisfed.org/education_resources/economic-lowdown-video-companion-series/episode-6-circular-flow/>.

6th Grade Social Studies: World Geography and Global Issues SS060602 Unit 6: Economics and World Trade Lesson 2
Michigan Citizenship Collaborative Curriculum Page 11 of 18 Copyright © 2010-2015 Oakland Schools January 26, 2015
What Can Happen in a Pure Market Economy?
What is the problem? How might
government help solve the problem?
How does the U.S. government prevent this
from happening?
In order to cut costs, a toy company has decided to use lead paint because it is cheaper.
Since pollution control devices are expensive a paper-making company has decided to dump its waste directly in the river next to its factory.
One large company that makes tires has bought out all the other tire companies in the country. Now it has a monopoly – it is the only company that sells tires. It doubles the price of tires.
To get people to buy its goods, a company begins to make hourly automated phone calls to every cell phone in the country.
All the highway bridges in the country are privately owned. As a result, people have to pay a toll every time they cross a bridge.
A fast-food chain has begun to add horsemeat to its burgers in order to lower the cost of making them.
To protect from invasion or attack, we need people and equipment to defend ourselves.
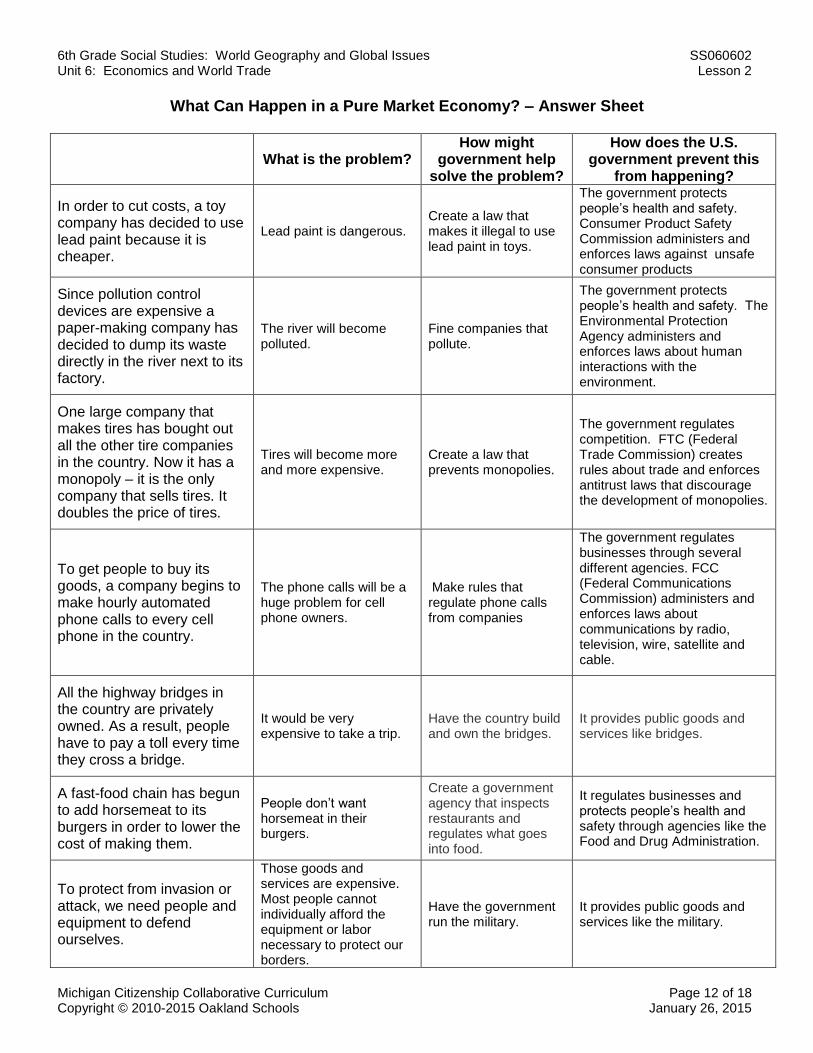
6th Grade Social Studies: World Geography and Global Issues SS060602 Unit 6: Economics and World Trade Lesson 2
Michigan Citizenship Collaborative Curriculum Page 12 of 18 Copyright © 2010-2015 Oakland Schools January 26, 2015
What Can Happen in a Pure Market Economy? – Answer Sheet
What is the problem? How might
government help solve the problem?
How does the U.S. government prevent this
from happening?
In order to cut costs, a toy company has decided to use lead paint because it is cheaper.
Lead paint is dangerous. Create a law that makes it illegal to use lead paint in toys.
The government protects people’s health and safety. Consumer Product Safety Commission administers and enforces laws against unsafe consumer products
Since pollution control devices are expensive a paper-making company has decided to dump its waste directly in the river next to its factory.
The river will become polluted.
Fine companies that pollute.
The government protects people’s health and safety. The Environmental Protection Agency administers and enforces laws about human interactions with the environment.
One large company that makes tires has bought out all the other tire companies in the country. Now it has a monopoly – it is the only company that sells tires. It doubles the price of tires.
Tires will become more and more expensive.
Create a law that prevents monopolies.
The government regulates competition. FTC (Federal Trade Commission) creates rules about trade and enforces antitrust laws that discourage the development of monopolies.
To get people to buy its goods, a company begins to make hourly automated phone calls to every cell phone in the country.
The phone calls will be a huge problem for cell phone owners.
Make rules that regulate phone calls from companies
The government regulates businesses through several different agencies. FCC (Federal Communications Commission) administers and enforces laws about communications by radio, television, wire, satellite and cable.
All the highway bridges in the country are privately owned. As a result, people have to pay a toll every time they cross a bridge.
It would be very expensive to take a trip.
Have the country build and own the bridges.
It provides public goods and services like bridges.
A fast-food chain has begun to add horsemeat to its burgers in order to lower the cost of making them.
People don’t want horsemeat in their burgers.
Create a government agency that inspects restaurants and regulates what goes into food.
It regulates businesses and protects people’s health and safety through agencies like the Food and Drug Administration.
To protect from invasion or attack, we need people and equipment to defend ourselves.
Those goods and services are expensive. Most people cannot individually afford the equipment or labor necessary to protect our borders.
Have the government run the military.
It provides public goods and services like the military.

6th Grade Social Studies: World Geography and Global Issues SS060602 Unit 6: Economics and World Trade Lesson 2
Michigan Citizenship Collaborative Curriculum Page 13 of 18 Copyright © 2010-2015 Oakland Schools January 26, 2015
The Role of the Government in the U.S. Economy
Role Example
The government regulates competition.
FTC (Federal Trade Commission) creates rules about trade and enforces antitrust laws that discourage the development of monopolies.
The government regulates businesses through several different agencies.
The government establishes agencies to administer and enforce laws about:
FCC (Federal Communications Commission) - communications by radio, television, wire, satellite and cable
EPA (Environmental Protection Agency) - human interactions with the environment
FDA (Food and Drug Administration) - food and medicines
The government provides public goods and services.
Bridges and interstate highways
Postal services
National defense
The government regulates the money supply.
The Federal Reserve System acts as a central bank.
The government protects people’s health and safety.
The government establishes agencies to administer and enforce laws about:
EPA (Environmental Protection Agency) - human interactions with the environment.
FDA (Food and Drug Administration) - food and medicines
Consumer Product Safety Commission - unsafe consumer products

6th Grade Social Studies: World Geography and Global Issues SS060602 Unit 6: Economics and World Trade Lesson 2
Michigan Citizenship Collaborative Curriculum Page 14 of 18 Copyright © 2010-2015 Oakland Schools January 18, 2015
Economic System Continuum
Country Description
A Government owns or controls most of the factors of production—almost all land and capital—and dominates the economy by answering all three basic economic questions. There is some private enterprise. For example, farmers may work small plots of land and farm them for profit.
B Almost all business is privately owned. Government, however, provides administrative guidance. For example, an Economic Planning agency channels production into areas seen as vital to the nation’s economic future. The government regulates banking activity and has the power to regulate interest at commercial banks.
C The great majority of businesses are privately owned and operated. Government plays a role mainly through regulation and providing some public goods and services such as national defense and public education.
D
The majority of production is carried out by private business. However, in an effort to distribute wealth more evenly, there is an extensive social welfare system. This system provides health care, housing allowances, elderly care, and monetary support for children, etc. High taxes, sometimes as much as 80% of income, are used to provide these services and redistribute the nation’s wealth.
E The majority of production is in private hands, but there is government ownership of a few sectors such as railway and electricity. The government may also suggest or indicate what it considers desirable production targets for private industries.
Pure Command
Economy
Complete Government
Control
Pure Market
Economy
No Government
Control

6th Grade Social Studies: World Geography and Global Issues SS060602 Unit 6: Economics and World Trade Lesson 2
Michigan Citizenship Collaborative Curriculum Page 15 of 18 Copyright © 2010-2015 Oakland Schools January 18, 2015
Economic System Continuum – Sample Answers
Pure Command
Economy
Complete Government
Control
Pure Market
Economy
No Government
Control
A B C D E

6th Grade Social Studies: World Geography and Global Issues SS060602 Unit 6: Economics and World Trade Lesson 2
Michigan Citizenship Collaborative Curriculum Page 16 of 18 Copyright © 2010-2015 Oakland Schools January 18, 2015
What is government's role in the economy?
April 03, 2011 By ART CALLAHAM
There’s been a lot of talk about the economy lately. Add to that the role of federal, state and local
government, and you have a subject that will usually set anyone’s hair on fire. So, what is the role of
government in the economy?
On one side, you have conservatives, who believe the government’s role in the economy must be “hands
off.” The more conservative in nature, the more and more hands off. Some conservatives beat their chests
and shout, “Don’t spend taxpayer money (often expressed as “my money”) on airport runways, new roads
(unless it goes in front of my house), libraries, school construction, the arts, senior centers, etc. And, by the
way, I don’t want any debt. You won’t have it if you don’t spend.”
Analyzing Position #1: According to the author what role do conservatives think the government
should play in the economy?
On the other side are liberals, who believe government should have its hands in everything, including the
economy. The more liberal in nature, the more and more hands on. Some liberals beat their chests and
shout, “If you can’t buy it, afford it or have it, the government should provide it to you (maybe even for free).
And, by the way, we support borrowing.”
Analyzing Position #2: According to author what role do liberals think the government should play
in the economy?
In spite of the strategies of the far left and the far right, there is a key role for government to play in our
economy. That role is creating jobs. And I don’t mean jobs “within the government.” I mean private-sector
jobs. Governments create jobs in the private sector by funding projects. Capital, infrastructure, building and
bond projects are some government-funded projects.
Analyzing the Author’s Argument: According to author what role does he think the government
should play in the economy?

6th Grade Social Studies: World Geography and Global Issues SS060602 Unit 6: Economics and World Trade Lesson 2
Michigan Citizenship Collaborative Curriculum Page 17 of 18 Copyright © 2010-2015 Oakland Schools January 18, 2015
When one level of government funds a project, it often attracts funding from other levels of government,
sometimes from private foundations, and sometimes from the private sector in terms of private capital
fundraising.
An example of this process is the Washington County Free Library renovation. The first funder in terms of
responsibility was the county, which put up $7 million to renovate the central branch of the library. That
money attracted $11.5 million in state funding, $1.5 million in city funding, $3 million in private citizen
contributions…and $1 million from a foundation — a total of $24 million.
A similar situation occurred with Hagerstown Regional Airport’s runway extension, where $4 million in local
government funding attracted another $57 million from other levels of government.
Analyzing the Argument: Does this section offer strong evidence to support his argument? Why or
why not?
Critics may dispute the necessity of renovating the library or extending the runway, and I’m not going to
justify either project (although I fully support both). What I’m writing about is the economy, jobs, partnering
between levels of government, borrowing money and how money attracts other money. Let’s start by
looking at the government and its role in creating private-sector jobs.
Most large projects allocate 60 percent of the total project costs to labor. In my two examples, the total
government dollar participation was $61 million for the runway and $20 million for the library. Using my
formula, that’s $36 million at the airport and $12 million at the library — or $48 million total.
Let’s use $56,000 annually per job as an estimate of the average cost of wages plus benefits. That $48
million equates to about 850 job years. To keep the math simple, let’s say the average job on either of the
projects lasted 2 years. In that scenario, over a two-year period, the government funding brought 425 jobs
to this community.
Analyzing the Argument: Does this section offer strong evidence to support his argument? Why or
why not?
Art Callaham is a local community activist and president of the Washington County Free Library Board of
Trustees.
Source: Callaham, Art. “What is Government’s Role in the Economy?” Herald Mail Media. 3 April 2011. 18 January 2015 <http://articles.herald-mail.com/2011-04-03/opinion/29382360_1_local-government-private-sector-private-sector-jobs>.
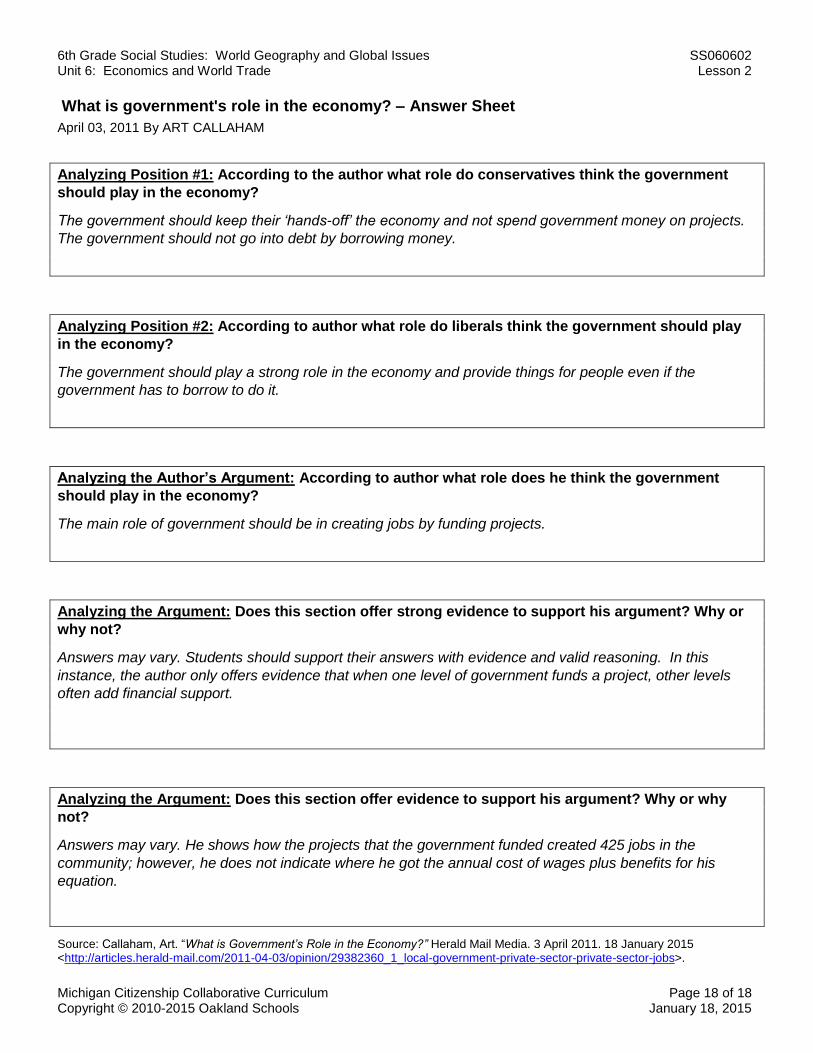
6th Grade Social Studies: World Geography and Global Issues SS060602 Unit 6: Economics and World Trade Lesson 2
Michigan Citizenship Collaborative Curriculum Page 18 of 18 Copyright © 2010-2015 Oakland Schools January 18, 2015
What is government's role in the economy? – Answer Sheet
April 03, 2011 By ART CALLAHAM
Analyzing Position #1: According to the author what role do conservatives think the government
should play in the economy?
The government should keep their ‘hands-off’ the economy and not spend government money on projects.
The government should not go into debt by borrowing money.
Analyzing Position #2: According to author what role do liberals think the government should play
in the economy?
The government should play a strong role in the economy and provide things for people even if the
government has to borrow to do it.
Analyzing the Author’s Argument: According to author what role does he think the government
should play in the economy?
The main role of government should be in creating jobs by funding projects.
Analyzing the Argument: Does this section offer strong evidence to support his argument? Why or
why not?
Answers may vary. Students should support their answers with evidence and valid reasoning. In this
instance, the author only offers evidence that when one level of government funds a project, other levels
often add financial support.
Analyzing the Argument: Does this section offer evidence to support his argument? Why or why
not?
Answers may vary. He shows how the projects that the government funded created 425 jobs in the
community; however, he does not indicate where he got the annual cost of wages plus benefits for his
equation.
Source: Callaham, Art. “What is Government’s Role in the Economy?” Herald Mail Media. 3 April 2011. 18 January 2015 <http://articles.herald-mail.com/2011-04-03/opinion/29382360_1_local-government-private-sector-private-sector-jobs>.

6th Grade Social Studies: World Geography and Global Issues SS060603 Unit 6: Economics and World Trade Lesson 3
Michigan Citizenship Collaborative Curriculum Page 1 of 7 Copyright © 2010-2015 Oakland Schools January 18, 2015
Lesson 3: Why are some countries “rich” and others “poor”?
Big Ideas of the Lesson
Not all countries are the same in terms of well-being. Social scientists use several different ways to measure if a country is “rich” or “poor”.
One way social scientists measure the well-being of a country is by looking at economic outcomes. The Gross Domestic Product (GDP) is an economic indicator which measures the total value of all goods and services produced in a country. By looking at changes in a country’s GDP, social scientists can tell whether a country is producing more goods than it did in the prior year.
Another way in which social scientists measure the wealth of a country is by the level of development. Level of development is measured by indicators that relate to the quality of life such as years of schooling, life expectancy, and income. When social scientists measure the well-being of a country based on its level of development, they are considering both economic and social factors.
In most cases, economic growth leads to development, or improved quality of life in a country.
Factors like technology, political stability and improvements in infrastructure (roads, water supply and electricity) can lead to economic growth. However, factors like conflict, lack of resources, and natural hazards can negatively affect economic growth.
Lesson Abstract: In this lesson students explore why some countries are “rich” while others are “poor.” In doing so, students consider different ways to measure the wealth of a country and evaluate various factors that affect economic growth and development. The lesson begins with an analysis of an informational text selection and the creation of a graphic organizer summarizing the text. Students next analyze maps and data sets relating to Gross Domestic Product, GDP Growth, and the Human Development Index. Working in small groups, they provide reasons why factors such as technological innovation and political stability would lead to economic growth and development. Then, working first independently and then in a ‘give one, get one’ activity, students identify examples of why factors such as natural hazards, conflict, and climate might negatively affect economic growth and development. Content Expectations: Grades 6 and 7 – H1.4.1; G1.2.6; G1.3.2; G2.2.1; G4.2.1; E3.3.1
Grade 7 – G1.2.3; E2.3.1 Grade 6 – G1.2.4
Common Core State Standards for Literacy in History and Social Studies: RH.6-8.2, 4, 7 and 10; WHST.6-8.4, and 9. Key Concepts level of development economic growth technology

6th Grade Social Studies: World Geography and Global Issues SS060603 Unit 6: Economics and World Trade Lesson 3
Michigan Citizenship Collaborative Curriculum Page 2 of 7 Copyright © 2010-2015 Oakland Schools January 18, 2015
Lesson Sequence 1. Begin the lesson displaying Slide 1 of the PowerPoint (Unit 6, Lesson 3) and pose the lesson
question to the class: “Why are some countries “rich” while others are “poor”?” Write the question on the board and have students do a quick write in their Global Investigator’s Notebook (GLIN). You may need to prompt students’ thinking with follow up questions such as:
What do you think people mean when they say a country is rich?
How might living in a rich country differ from living in a poor country?
What may account for different levels of wealth among countries?
2. Have students form groups of four students each and share their responses. Then, push students to think a little deeper by considering how geography, history, economics, and civics/government might influence whether a country is rich or poor. Allow students a few minutes to discuss this question and distribute large pieces of chart paper to each group along with a few markers for each group. Have students divide the chart paper into four sections and have them title each section to reflect the four social studies disciplines of geography, history, economics, or civics/government. Instruct students to record their group’s ideas on the chart.
3. Then have students conduct a gallery walk around the room, reviewing their classmates’ charts. Debrief the activity by discussing the commonalities they found on the charts. Then explain to students that in this lesson and the next they will explore the question (why are some countries rich and others poor) further. Teacher Note: Students may need some prompting with this step. Below are some ways that social studies concepts relate to whether a country is rich or poor:
Geography – How might location such as proximity to trade routes (waterways), the natural resources such as oil, fresh water, fertile land, etc., diversity of landforms, climate, etc. affect how wealthy a country is?
History – How might past events such as war, famine, colonization, etc. affect the wealth of a country today?
Economics – How might the type of economic system, the goods and services produced, products exported or imported, trade and trade barriers affect the wealth of a country?
Civics/Government – How might the stability in a country (internal and external threats to people) affect a country’s wealth? Is power distributed to generate wealth for many or for a few?
4. Give each student a copy of the “PowerPoint Notes, pages 1 and 2” located in the Supplemental Materials (Unit 6, Lesson 3). Display Slide 2 of the PowerPoint (Unit 6, Lesson 3) and ask students whether they think the photo on the slide depicts a rich or a poor country by completing Number 1 on their “PowerPoint Notes.” Then, discuss their answers with the whole class.
5. Display Slide 3 and ask students to complete Number 2 of the “PowerPoint Notes” by
carefully examining the complete photo of the city. Discuss their answers. Explain to students that, just like it is hard at times to tell if people are rich or poor, it is often difficult and complicated to determine if a country is rich or poor or somewhere in the middle. Therefore, economists often use economic growth as a way to compare countries instead of the labels

6th Grade Social Studies: World Geography and Global Issues SS060603 Unit 6: Economics and World Trade Lesson 3
Michigan Citizenship Collaborative Curriculum Page 3 of 7 Copyright © 2010-2015 Oakland Schools January 18, 2015
‘rich’ or ‘poor.’
6. Give each student a copy of the informational text selection “What Does Economic Growth Mean?” located in the Supplemental Materials (Unit 6, Lesson 3). Explain that students should read the text and stop to answer the questions embedded in the text. Give students time to complete the assignment. Then, display Slide 4 and lead a discussion using the questions on the slide. An “Answer Sheet” with possible answers has been included in the Supplemental Materials (Unit 6, Lesson 3).
7. Remind students that one good way to summarize text is to create a graphic organizer. Give each student a copy of the “Constructing a Graphic Organizer” sheet and “Graphic Organizer Pieces” located in the Supplemental Materials (Unit 6, Lesson 3). Slide 5 shows these resources. Explain that students should complete the organizer by reviewing the text selection they read in Step 6.
8. Display Slide 6 and draw student attention to the final paragraph of the text selection from Step 4. Using Word Card #17 discuss the term “Gross Domestic Product.”
9. Display Slide 7 and have students draw two inferences from the map by completing Number 3 on their “PowerPoint Notes.” Have them share ideas in the large group. Be sure students understand the meaning of inference – an idea or conclusion that is drawn from evidence and reasoning.
10. Display Slide 8 and give each student a copy of the “Countries Ranked by Gross Domestic Product” chart located in the Supplemental Materials (Unit 6, Lesson 3). Have students analyze the data on the chart and then complete Numbers 4 and 5 on their “PowerPoint Notes.” Then, discuss their answers to the questions. If students fail to make the inference that the countries with the lowest GDPs are very small countries make sure to use prompting questions to guide them to this inference.
11. Pose the following question: Is a large GDP an indicator of economic growth? Discuss student answers and then draw their attention back to the last paragraph of the text used in Step 6. Discuss how economic growth is not necessarily reflected in GDP, but rather GDP growth.
12. Display Slide 9 and give each student a copy of the “Countries Ranked by Gross Domestic Product Growth” chart located in the Supplemental Materials (Unit 6, Lesson 3). Have students analyze the data on the chart and compare it to the GDP data they analyzed in Step 10. Make sure they compare the data side by side. Then have them complete Number 6 on their PowerPoint Notes. Make sure to draw attention to Italy which ranks in the top 10 in terms of GDP but in the lowest 10 for GDP growth.
13. Using Word Cards #18 - #19 and Slide 10 discuss the term ‘development’ using the following questions. Note that these questions are also found on Slide 11.
Is economic growth the same as development? Why or why not?
Would GDP be an effective indicator of development? Why or why not?
Is development dependent on economic growth? Why or why not?
Should development just be measured in terms of economic development? Why or why

6th Grade Social Studies: World Geography and Global Issues SS060603 Unit 6: Economics and World Trade Lesson 3
Michigan Citizenship Collaborative Curriculum Page 4 of 7 Copyright © 2010-2015 Oakland Schools January 18, 2015
not?
Should development include factors relating to social development or quality of life? If so, what might some of these factors be?
14. If time permits, have students view the video “Twenty Questions about Development” located at
https://www.youtube.com/watch?v=VqcwUEBK7Jk. This video explores the difficulty in trying to adequately define ‘development’ as well as challenges that result from trying to categorize countries in terms of level of development.
15. Using Slides 12 and 13, explain that the United Nations has developed the “Human
Development Index” in an effort to provide a frame of reference for both social and economic development.
16. Display Slide 14 and have students draw an inference from the map by completing Number 7
on their “PowerPoint Notes.” Have them share ideas in the large group. Discuss the map using the following questions:
How do different regions of the world compare according to the HDI index?
In what region are the countries with the highest HDI ratings located? Why do you think this is the case?
In what region are the countries with the lowest HDI ratings located? Why do you think this is the case?
17. Display Slide 15 and give each student a copy of the “Countries Ranked by HDI” chart located in the Supplemental Materials (Unit 6, Lesson 3). Have students analyze the data on the chart and draw an inference from the data by completing Number 8 on their “PowerPoint Notes.” Have them share ideas in the large group.
18. Display Slide 16 and have students place the three data charts from Steps 10, 12, and 17 side by side. Ask students to compare the charts and complete Number 9 on their “PowerPoint Notes” by drawing three conclusions from the data. Possible conclusions may include:
Several countries that do not rank in the top 10 for GDP or GDP Growth rank high on the HDI chart.
None of the top ten countries for GDP Growth occur in the top ten HDI countries.
None of the bottom ten countries for GDP Growth occur in the bottom ten HDI countries. 19. Display Slide 17 and discuss student answers to the question, “What factors are likely to lead
to economic growth?” Then, display Slide 18 and share some of the factors social scientists identify as factors leading to economic growth.
20. Place students in small groups of three or four. Give each group a copy of the “Factors Leading to Economic Growth” chart located in the Supplemental Materials (Unit 6, Lesson 3). Slide 19 shows this resource. Explain that group members should work together to come up with reasons why the factors listed on the chart would result in economic growth. Give students time to complete the activity and then discuss their reasons with the whole class. Be sure students add to their chart as they learn new information. A chart showing sample answers has been included in the Supplemental Materials (Unit 6, Lesson 3) for reference.

6th Grade Social Studies: World Geography and Global Issues SS060603 Unit 6: Economics and World Trade Lesson 3
Michigan Citizenship Collaborative Curriculum Page 5 of 7 Copyright © 2010-2015 Oakland Schools January 18, 2015
21. Using Slide 20 explain that just as factors can positively affect economic growth, other factors can negatively affect economic growth and development. Give each student a copy of the “Factors That Can Negatively Affect Economic Growth and Development” chart located in the Supplemental Materials (Unit 6, Lesson 3) and display Slide 21. Then use Slides 22 and 23 to model for students how to fill out the chart.
22. Have each student begin to fill out examples on their own chart. Explain that if they are struggling with a particular area such as ‘government’ they should bypass it and go on. After a reasonable amount of time have students get up and move around the room sharing answers with each other in order to complete their charts. Review the chart with the whole class if necessary. A chart showing sample answers has been included in the Supplemental Materials (Unit 6, Lesson 3) for reference.
Reference Section
Content Expectations 6 and 7 Describe and use cultural institutions to study an era and a region (political, H1.4.1: economic, religion/belief, science/technology, written language, education, family). 6 – G1.2.4: Use observations from air photos, photographs (print and CD), films (VCR and DVD) 7 – G1.2.3: as the basis for answering geographic questions about the human and physical
characteristics of places and regions. 6 and 7 Apply the skills of geographic inquiry (asking geographic questions, acquiring G1.2.6: geographic information, organizing geographic information, analyzing geographic
information, and answering geographic questions) to analyze a problem or issue of importance to a region of the world.1
6 and 7 Explain the locations and distributions of physical and human characteristics of G1.3.2: Earth by using knowledge of spatial patterns. 6 and 7 Describe the human characteristics of the region under study (including languages, G2.2.1: religion, economic system, governmental system, cultural traditions). 6 and 7 List and describe the advantages and disadvantages of different technologies used G4.2.1: to move people, products, and ideas throughout the world.2
1 The expectations identified the western and eastern hemisphere. We have combined them to reflect a global perspective. 2 The examples have been removed for clarity. The sixth grade examples included “call centers in the Eastern Hemisphere that service the Western Hemisphere; the United States and Canada as hubs for the Internet; transport of people and perishable products; and the spread of individuals’ ideas as voice and image messages on electronic networks such as the Internet.” The seventh grade examples included “opportunities for employment, entrepreneurial and educational opportunities using the Internet; the effects of technology on reducing the time necessary for
6th Grade Social Studies: World Geography and Global Issues SS060603 Unit 6: Economics and World Trade Lesson 3
Michigan Citizenship Collaborative Curriculum Page 6 of 7 Copyright © 2010-2015 Oakland Schools January 18, 2015
7 – E2.3.1: Explain how national governments make decisions that impact both that country and
other countries that use its resources. 6 and 7 Explain and compare how economic systems (traditional, command, and market) E3.3.1: answer four basic questions: What should be produced? How will it be produced?
How will it be distributed? Who will receive the benefits of production?
Common Core State Standards for Literacy in History and Social Studies RH.6-8.2: Determine the main ideas or information of a primary or a secondary source; provide
an accurate summary of the source distinct from prior knowledge or opinions. RH.6-8.4: Determine the meaning of words and phrases as they are used in a text, including
vocabulary specific to domains related to history/social studies. RH.6-8.7: Integrate visual information (e.g., in charts, graphs, photographs, videos, or maps)
with other information in print and digital texts. RH.6-8. 10: By the end of grade 8, read and comprehend science/technical texts in the grades 6–
8 text complexity band independently and proficiently. WHST.6-8.4: Produce clear and coherent writing in which the development, organization, and style
are appropriate to task, purpose, and audience. WHST.6-8.9: Draw evidence from informational texts to support analysis reflection, and research. Instructional Resources Equipment/ Manipulative Computer with PowerPoint capability Global Investigator’s Notebook (GLIN) Internet access Large chart paper (1 sheet per 4 students) Markers
Student Resource A student geography textbook such as Wiggins, Grant, et al. My World Geography: Boston, MA:
Pearson, 2011, 64-65. 20 Questions about Development. 23 April 2011. 18 January 2015
<http://www.youtube.com/watch?v=VqcwUEBK7Jk>.
communications and travel; the uses and effects of wireless technology in developing countries; and the spread of group and individual’s ideas as voice and image messages on electronic networks such as the Internet.”

6th Grade Social Studies: World Geography and Global Issues SS060603 Unit 6: Economics and World Trade Lesson 3
Michigan Citizenship Collaborative Curriculum Page 7 of 7 Copyright © 2010-2015 Oakland Schools January 18, 2015
Teacher Resource Continents Map. Wikipedia. 18 January 2015
<http://upload.wikimedia.org/wikipedia/commons/b/b2/BlankMap-World-Continents.PNG>. Countries Ranked by Gross Domestic Product. Wikipedia. 18 January 2015
<http://en.wikipedia.org/wiki/List_of_countries_by_GDP_(nominal)>. Countries Ranked by HDI. Wikipedia. 18 January 2015
<http://en.wikipedia.org/wiki/List_of_countries_by_Human_Development_Index>. Egbo, Carol. Supplemental Materials (Unit 6, Lesson 3). Teacher-made materials. Oakland
Schools, 2015. - - - . PowerPoint (Unit 6, Lesson 3). Teacher-made materials. Oakland Schools, 2015. GDP Growth Rate. Global Finance. 18 January 2015 <http://www.gfmag.com/tools/global-
database/economic-data/12369-countries-lowest-gdp-growth.html#axzz2sBpfLKH0>. GDP Map. Wikipedia. 18 January 2015
<http://upload.wikimedia.org/wikipedia/commons/0/08/Map_of_countries_by_GDP_%28nominal%29_in_US%24.png>.
Map of Countries HDI. Wikipedia. 18 January 2015
<http://upload.wikimedia.org/wikipedia/commons/thumb/3/32/2013_UN_Human_Development_Report_Quartiles.svg/863px-2013_UN_Human_Development_Report_Quartiles.svg.png>.
Sao Paulo. 18 January 2015
<http://thestorewpp.tv/storage/GE_Sao%20Paulo_Street%20Art3.jpg?__SQUARESPACE_CACHEVERSION=1344871219089>.
“What Does Economic Growth Mean?” How Geography Influences Economic Growth. Poverty
Education. 18 January 2015 <http://www.povertyeducation.org/geography-and-economic-growth.html>.

6th Grade Social Studies: World Geography and Global Issues SS060603 Unit 6: Economics and World Trade Lesson 3
Michigan Citizenship Collaborative Curriculum Page 1 of 18 Copyright © 2010-2015 Oakland Schools January 26, 2015
Graphic Organizer
ECONOMIC
GROWTH DEVELOPMENT Economic
Factors
GDP Growth
Income
Social Factors
Life Expectancy
Years of Schooling
Measuring Economic Well-
Being of a Country

6th Grade Social Studies: World Geography and Global Issues SS060603 Unit 6: Economics and World Trade Lesson 3
Michigan Citizenship Collaborative Curriculum Page 2 of 18 Copyright © 2010-2015 Oakland Schools January 26, 2015
Big Idea Card
Big Ideas of Lesson 3, Unit 6
Not all countries are the same in terms of well-being. Social scientists use
several different ways to measure if a country is “rich” or “poor”.
One way social scientists measure the well-being of a country is by looking at economic outcomes. The Gross Domestic Product (GDP) is an economic indicator which measures the total value of all goods and services produced in a country. By looking at changes in a country’s GDP, social scientists can tell whether a country is producing more goods than it did in the prior year.
Another way in which social scientists measure the wealth of a country is by the level of development. Level of development is measured by indicators that relate to the quality of life such as years of schooling, life expectancy, and income. When social scientists measure the well-being of a country based on its level of development, they are considering both economic and social factors.
In most cases, economic growth leads to development, or improved quality of life in a country.
Factors like technology, political stability and improvements in infrastructure (roads, water supply and electricity) can lead to economic growth. However, factors like conflict, lack of resources, and natural hazards can negatively affect economic growth.

6th Grade Social Studies: World Geography and Global Issues SS060603 Unit 6: Economics and World Trade Lesson 3
Michigan Citizenship Collaborative Curriculum Page 3 of 18 Copyright © 2010-2015 Oakland Schools January 26, 2015
Word Cards
17 Gross Domestic Product (GDP) the total value of all goods and services produced in a country Example: GDP is often used as a measurement of economic development.
(SS060603)
18 development improved quality of life
Example: Development leads to increased literacy rates and decreased poverty.
(SS060603)
19 quality of life the well-being of a person or a group Example: Education and health care can all improve quality of life.
(SS060603)
20 development indicators factors used to compare the development of one region against another
Example: GDP and life expectancy are development indicators.
(SS060603)
21 infrastructure the basic equipment, structures, and systems needed for a society or community to run Example: Growth in developing countries is often difficult due to the lack an adequate infrastructure such as transportation, communication, sewage, water and electric systems.
(SS060603)
(SS060603)

6th Grade Social Studies: World Geography and Global Issues SS060603 Unit 6: Economics and World Trade Lesson 3
Michigan Citizenship Collaborative Curriculum Page 4 of 18 Copyright © 2010-2015 Oakland Schools January 26, 2015
PowerPoint Notes - page 1
1. SLIDE 2: Do you think this is a rich country or a poor country? Why? 2. SLIDE 3: Does this change your answer to Number 1? Why or why not? 3. SLIDE 7: What are two inferences you can draw from this map?
1
2
4. SLIDE 8: What is one inference you can make about the countries with the highest GDPs? 5. SLIDE 8: What is one inference you can make about the countries with the lowest GDPs?

6th Grade Social Studies: World Geography and Global Issues SS060603 Unit 6: Economics and World Trade Lesson 3
Michigan Citizenship Collaborative Curriculum Page 5 of 18 Copyright © 2010-2015 Oakland Schools January 26, 2015
PowerPoint Notes – page 2 6. SLIDE 9: How does this data compare to the GDP data you analyzed on SLIDE 8? 7. SLIDE 14: What is one inference you can draw from this map? 8. SLIDE 15: What is one inference you can draw from the data on the chart? 9. SLIDE 16: What are three conclusions you can draw from comparing the three charts?
1
2
3
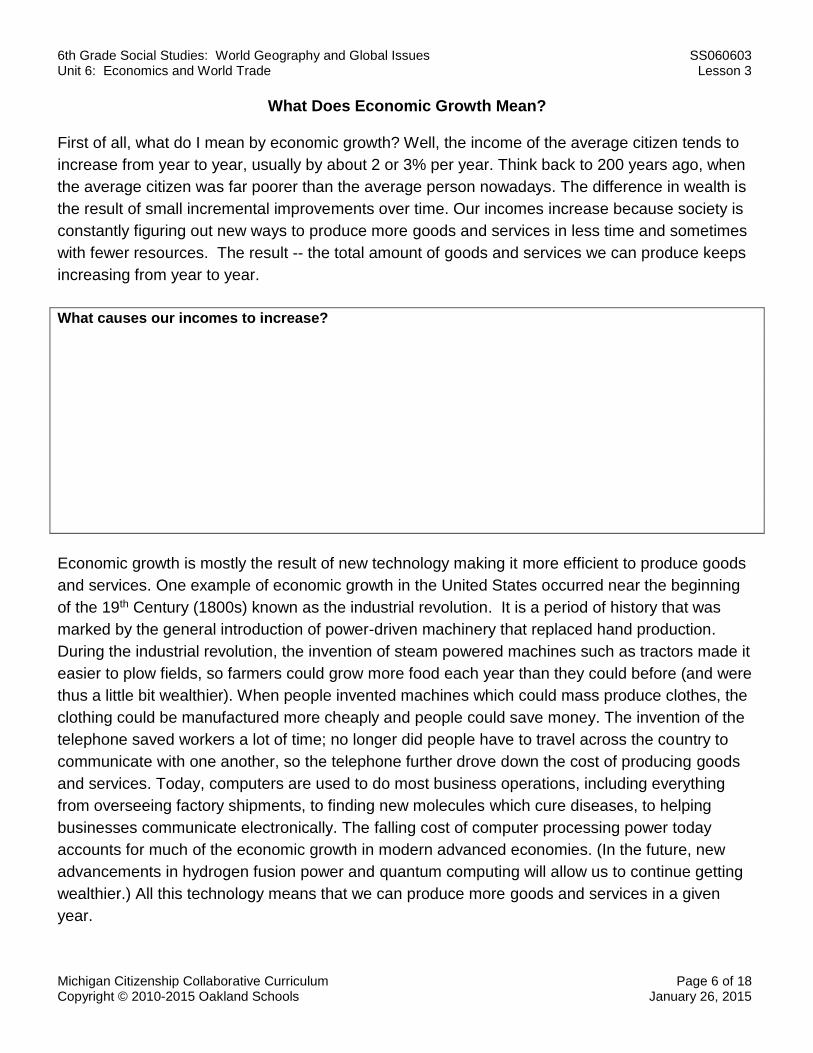
6th Grade Social Studies: World Geography and Global Issues SS060603 Unit 6: Economics and World Trade Lesson 3
Michigan Citizenship Collaborative Curriculum Page 6 of 18 Copyright © 2010-2015 Oakland Schools January 26, 2015
What Does Economic Growth Mean? First of all, what do I mean by economic growth? Well, the income of the average citizen tends to
increase from year to year, usually by about 2 or 3% per year. Think back to 200 years ago, when
the average citizen was far poorer than the average person nowadays. The difference in wealth is
the result of small incremental improvements over time. Our incomes increase because society is
constantly figuring out new ways to produce more goods and services in less time and sometimes
with fewer resources. The result -- the total amount of goods and services we can produce keeps
increasing from year to year.
What causes our incomes to increase?
Economic growth is mostly the result of new technology making it more efficient to produce goods
and services. One example of economic growth in the United States occurred near the beginning
of the 19th Century (1800s) known as the industrial revolution. It is a period of history that was
marked by the general introduction of power-driven machinery that replaced hand production.
During the industrial revolution, the invention of steam powered machines such as tractors made it
easier to plow fields, so farmers could grow more food each year than they could before (and were
thus a little bit wealthier). When people invented machines which could mass produce clothes, the
clothing could be manufactured more cheaply and people could save money. The invention of the
telephone saved workers a lot of time; no longer did people have to travel across the country to
communicate with one another, so the telephone further drove down the cost of producing goods
and services. Today, computers are used to do most business operations, including everything
from overseeing factory shipments, to finding new molecules which cure diseases, to helping
businesses communicate electronically. The falling cost of computer processing power today
accounts for much of the economic growth in modern advanced economies. (In the future, new
advancements in hydrogen fusion power and quantum computing will allow us to continue getting
wealthier.) All this technology means that we can produce more goods and services in a given
year.
6th Grade Social Studies: World Geography and Global Issues SS060603 Unit 6: Economics and World Trade Lesson 3
Michigan Citizenship Collaborative Curriculum Page 7 of 18 Copyright © 2010-2015 Oakland Schools January 26, 2015
What is the main cause of economic growth?
Economists like to talk about the Gross Domestic Product (GDP), which is just the total amount of
goods and services produced by a country in a year. GDP growth means that the total amount of
goods and services that the country can produce keeps getting bigger every year. In Canada and
the US, GDP has grown by about 1.75% per year on average for the last 200 years, leading to
more goods and services per person (higher incomes).
What is one way economists measure economic growth?
Adapted from: “What Does Economic Growth Mean?” How Geography Influences Economic Growth. Poverty Education. 3 February 2015 <http://www.povertyeducation.org/geography-and-economic-growth.html>.

6th Grade Social Studies: World Geography and Global Issues SS060603 Unit 6: Economics and World Trade Lesson 3
Michigan Citizenship Collaborative Curriculum Page 8 of 18 Copyright © 2010-2015 Oakland Schools January 26, 2015
What Does Economic Growth Mean? – Answer Sheet
What causes our incomes to increase?
We are able to produce more goods and service (stuff) in less time and with less resources
What is the main cause of economic growth?
New technology is the main cause of economic growth. Technology increases efficiency.
What is one way economists measure economic growth?
Economists measure economic growth using the GDP (Gross Domestic Product) of countries.

6th Grade Social Studies: World Geography and Global Issues SS060603 Unit 6: Economics and World Trade Lesson 3
Michigan Citizenship Collaborative Curriculum Page 9 of 18 Copyright © 2010-2015 Oakland Schools January 26, 2015
Constructing a Graphic Organizer

6th Grade Social Studies: World Geography and Global Issues SS060603 Unit 6: Economics and World Trade Lesson 3
Michigan Citizenship Collaborative Curriculum Page 10 of 18 Copyright © 2010-2015 Oakland Schools January 26, 2015
Graphic Organizer Pieces
Technological
Improvements
Steam-
powered
tractors
Machines that
could mass produce
clothes
Telephones
Computers
More food could be
grown
Clothing could
be manufactured
more cheaply
Saved workers
a lot of time
Helped to run
businesses
More goods
could be
produced
Economic
Growth

6th Grade Social Studies: World Geography and Global Issues SS060603 Unit 6: Economics and World Trade Lesson 3
Michigan Citizenship Collaborative Curriculum Page 11 of 18 Copyright © 2010-2015 Oakland Schools January 26, 2015
Completed Graphic Organizer
Technological
Improvements
Machines that
could mass produce
clothes
Telephones
Computers
Steam-
powered
tractors
Clothing could
be manufactured
more cheaply
Saved workers
a lot of time
Helped to run
businesses
More food could be
grown
More goods
could be
produced
Economic
Growth
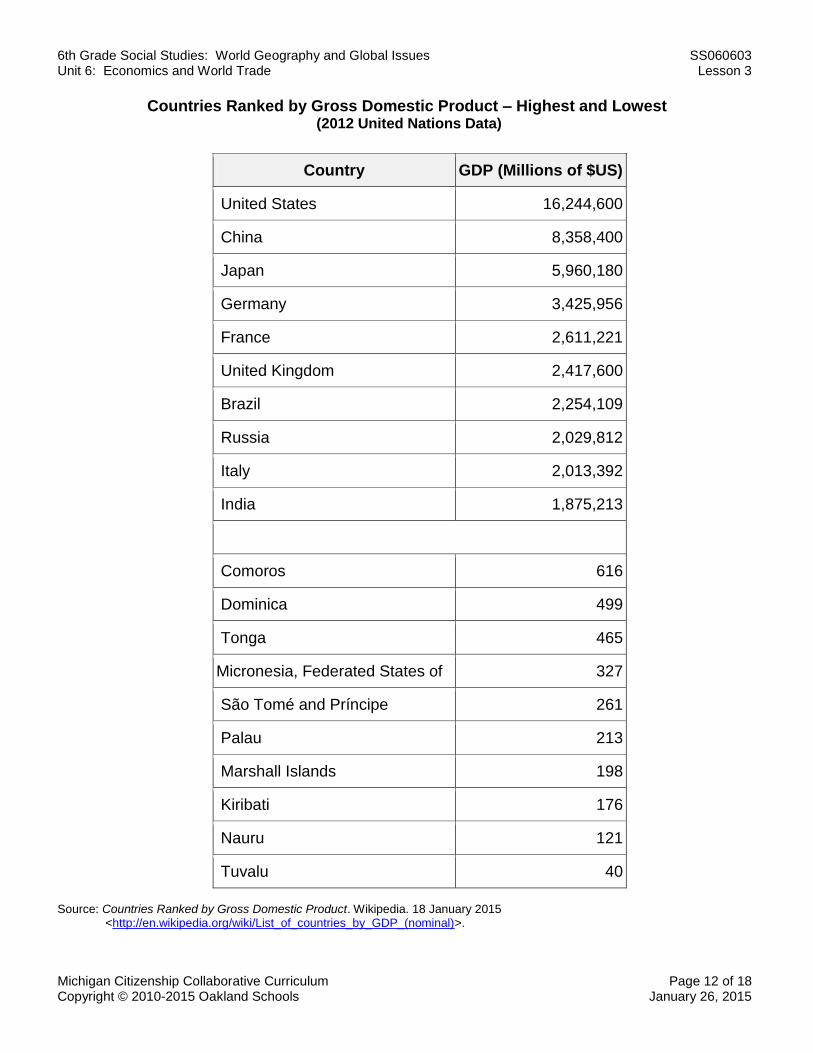
6th Grade Social Studies: World Geography and Global Issues SS060603 Unit 6: Economics and World Trade Lesson 3
Michigan Citizenship Collaborative Curriculum Page 12 of 18 Copyright © 2010-2015 Oakland Schools January 26, 2015
Countries Ranked by Gross Domestic Product – Highest and Lowest (2012 United Nations Data)
Country GDP (Millions of $US)
United States 16,244,600
China 8,358,400
Japan 5,960,180
Germany 3,425,956
France 2,611,221
United Kingdom 2,417,600
Brazil 2,254,109
Russia 2,029,812
Italy 2,013,392
India 1,875,213
Comoros 616
Dominica 499
Tonga 465
Micronesia, Federated States of 327
São Tomé and Príncipe 261
Palau 213
Marshall Islands 198
Kiribati 176
Nauru 121
Tuvalu 40
Source: Countries Ranked by Gross Domestic Product. Wikipedia. 18 January 2015
<http://en.wikipedia.org/wiki/List_of_countries_by_GDP_(nominal)>.

6th Grade Social Studies: World Geography and Global Issues SS060603 Unit 6: Economics and World Trade Lesson 3
Michigan Citizenship Collaborative Curriculum Page 13 of 18 Copyright © 2010-2015 Oakland Schools January 26, 2015
Countries Ranked by % of Gross Domestic Product Growth – Highest and Lowest (2012 United Nations Data)
Country 2003-2013 average %
Qatar 13.4
Azerbaijan 12.6
Turkmenistan 11.6
Libya 11.4
Equatorial Guinea 10.8
Angola 10.4
China 10.3
Mongolia 9.4
Myanmar 8.9
Bhutan 8.8
Denmark 0.7
Jamaica 0.7
Tuvalu 0.6
The Bahamas 0.6
Tonga 0.4
Italy -0.1
Greece -0.2
Portugal -0.2
San Marino -0.7
Zimbabwe -1.6
Source: GDP Growth Rate. Global Finance. 18 January 2015 <http://www.gfmag.com/tools/global-database/economic-
data/12369-countries-lowest-gdp-growth.html#axzz2sBpfLKH0>.

6th Grade Social Studies: World Geography and Global Issues SS060603 Unit 6: Economics and World Trade Lesson 3
Michigan Citizenship Collaborative Curriculum Page 14 of 18 Copyright © 2010-2015 Oakland Schools January 26, 2015
Countries Ranked by the UN Index of Human Development (2013) -- Highest and Lowest
Rank Country
1 Norway
2 Australia
3 United States
4 Netherlands
5 Germany
6 New Zealand
7 Ireland
7 Sweden
9 Switzerland
10 Japan
177 Burundi
178 Guinea
180 Central African Republic
181 Eritrea
182 Mali
183 Burkina Faso
184 Chad
185 Mozambique
186 Democratic Republic of the Congo
187 Niger
Source: Countries Ranked by HDI. Wikipedia. 18 January 2015
<http://en.wikipedia.org/wiki/List_of_countries_by_Human_Development_Index>.
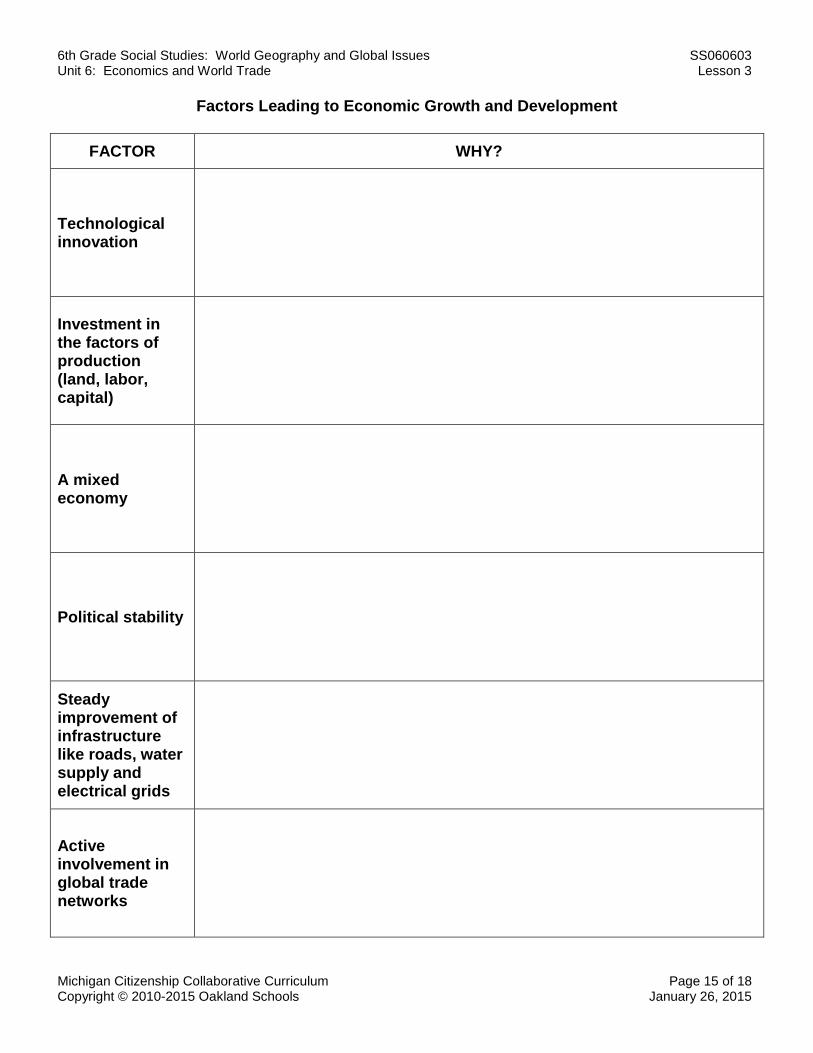
6th Grade Social Studies: World Geography and Global Issues SS060603 Unit 6: Economics and World Trade Lesson 3
Michigan Citizenship Collaborative Curriculum Page 15 of 18 Copyright © 2010-2015 Oakland Schools January 26, 2015
Factors Leading to Economic Growth and Development
FACTOR WHY?
Technological innovation
Investment in the factors of production (land, labor, capital)
A mixed economy
Political stability
Steady improvement of infrastructure like roads, water supply and electrical grids
Active involvement in global trade networks

6th Grade Social Studies: World Geography and Global Issues SS060603 Unit 6: Economics and World Trade Lesson 3
Michigan Citizenship Collaborative Curriculum Page 16 of 18 Copyright © 2010-2015 Oakland Schools January 26, 2015
Factors Leading to Economic Growth and Development – Possible Answers
FACTOR WHY?
Technological innovation
As the text we read said, technology is a main reason for economic growth because it allows people to make goods more efficiently.
Investment in the factors of production (land, labor, capital)
When you invest in human resources such as people and capital resources such as new factories, more goods can be produced which leads to economic growth.
A mixed economy
A mixed economy balances economic freedom with government support for the economy. This would foster more economic growth than a pure command or market economy.
Political stability When a government is stable there is less conflict and the country can concentrate on economic growth.
Steady improvement of infrastructure such as roads, water supply and electrical grids
Infrastructure such as good roads, a strong water supply and plenty of electricity are needed to produce goods efficiently.
Active involvement in global trade networks
Global trade allows a country to get goods it needs in exchange for selling goods it produces. This will lead to economic growth.

6th Grade Social Studies: World Geography and Global Issues SS060603 Unit 6: Economics and World Trade Lesson 3
Michigan Citizenship Collaborative Curriculum Page 17 of 18 Copyright © 2010-2015 Oakland Schools January 26, 2015
Factors That Can Negatively Affect Economic Growth and Development
FACTOR EXAMPLE
GE
OG
RA
PH
IC
CLIMATE
NATURAL RESOURCES
LOCATION
NATURAL HAZARDS
PO
LIT
ICA
L GOVERNMENT
CONFLICT
SO
CIA
L
POPULATION
EDUCATION
DISCRIMINATION/ INEQUALITY

6th Grade Social Studies: World Geography and Global Issues SS060603 Unit 6: Economics and World Trade Lesson 3
Michigan Citizenship Collaborative Curriculum Page 18 of 18 Copyright © 2010-2015 Oakland Schools January 26, 2015
Factors That Can Negatively Affect Economic Growth and Development – Completed Chart
FACTOR EXAMPLE
GE
OG
RA
PH
IC
CLIMATE Tropical climate where land is often not fertile and water is scarce
NATURAL RESOURCES
Lack of natural resources
LOCATION Being land-locked
NATURAL HAZARDS
Being vulnerable to natural hazards like earthquakes
PO
LIT
ICA
L
GOVERNMENT Corruption and poor management
CONFLICT Being involved in a war or domestic conflict
SO
CIA
L
POPULATION Rapid population growth
EDUCATION Lack of educational opportunities
DISCRIMINATION/ INEQUALITY
When some groups have less opportunities than others

6th Grade Social StudiesUnit 6, Lesson 3:
Why are some countries “rich” while others are “poor”?”
1
• What do you think people mean when they say a country is rich?
• How might living in a rich country differ from living in a poor country?
• What may account for different levels of wealth among countries?

2
Rich country or Poor country????????

3

4
What causes our incomes to increase?
What is the main cause of economic growth?
What is one way economists measure economic growth?

5
ACTIVITY

6
17

7
Gross Domestic Product

8
ANALYZING GDP DATA

9
ANALYZING GDP GROWTH DATA

10
18 19
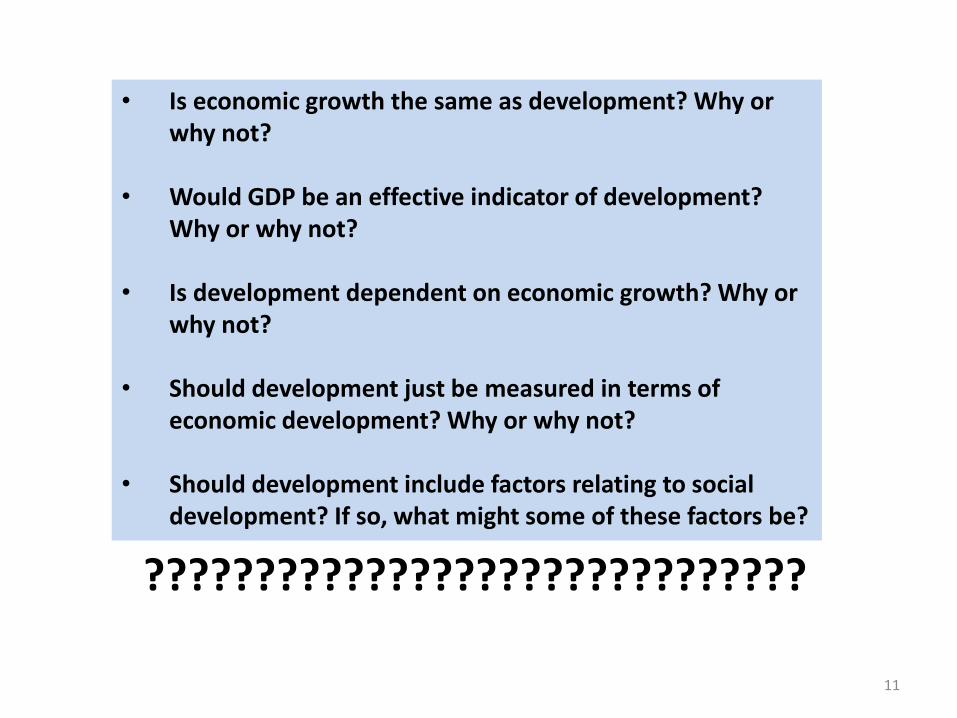
11
• Is economic growth the same as development? Why or why not?
• Would GDP be an effective indicator of development? Why or why not?
• Is development dependent on economic growth? Why or why not?
• Should development just be measured in terms of economic development? Why or why not?
• Should development include factors relating to social development? If so, what might some of these factors be?
??????????????????????????????

12
The HDI is a single statistic which serves as a frame of reference for both social and economic development.
The United Nations Human Development Index
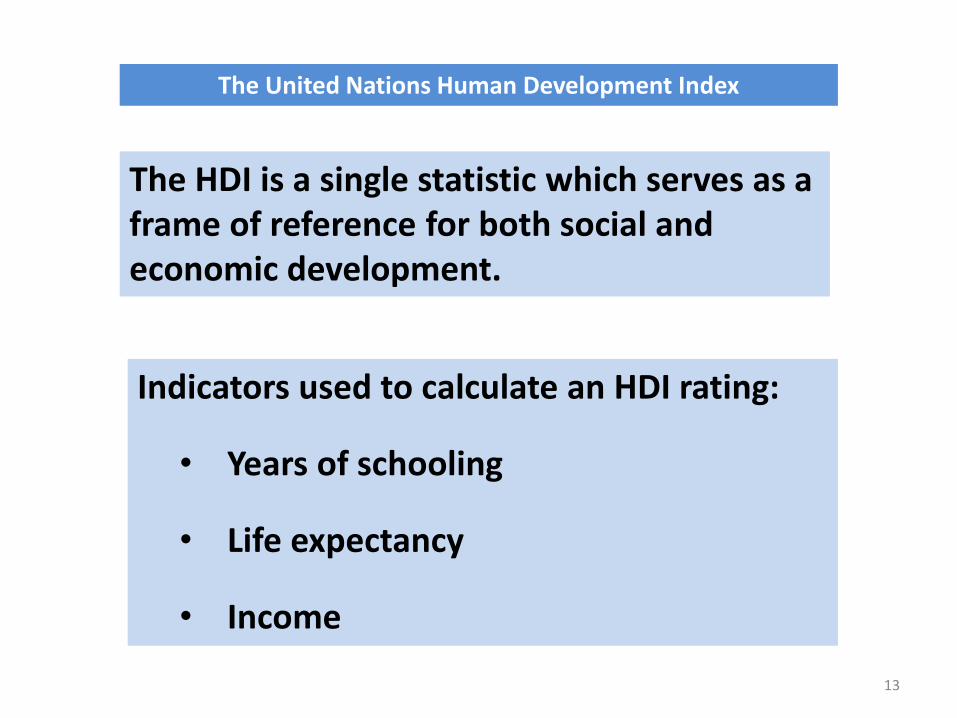
13
Indicators used to calculate an HDI rating:
• Years of schooling
• Life expectancy
• Income
The United Nations Human Development Index
The HDI is a single statistic which serves as a frame of reference for both social and economic development.
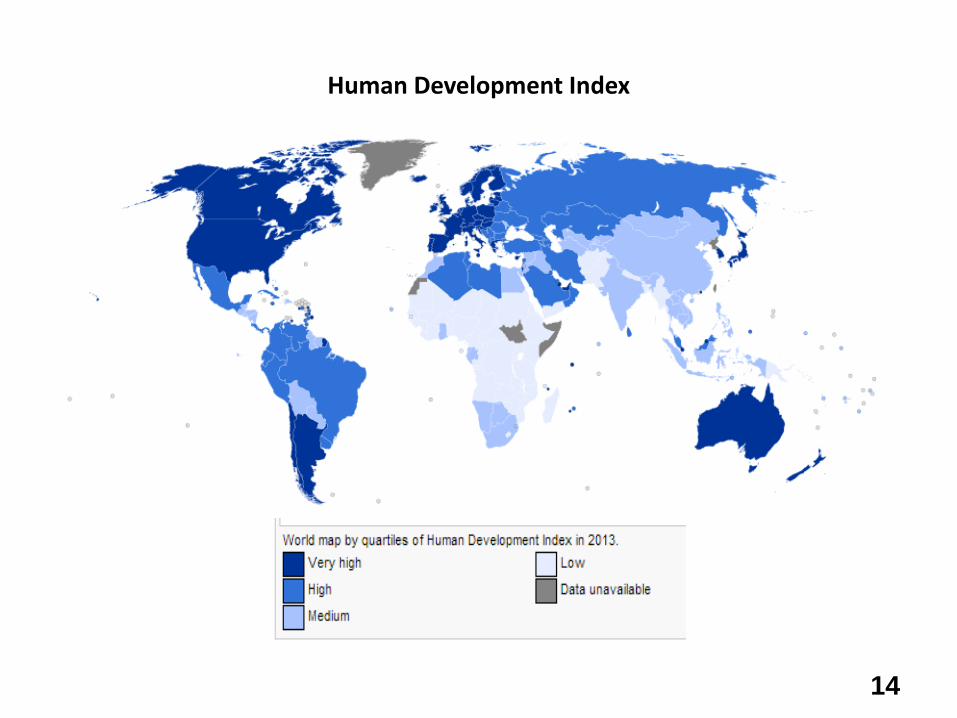
14
Human Development Index

15
ANALYZING HDI DATA

16
COMPARING DATA
GDP HDIGDP Growth

17
What factors are likely to lead to economic growth in a country?

18
• Technological innovation
• Investment in the factors of production (land, labor, capital)
• A mixed economy
• Political stability
• Steady improvement of infrastructure like roads, water supply and electrical grids
• Active involvement in global trade networks

19
ACTIVITY

20
What factors are likely to negatively affect economic growth in a country?

21
ACTIVITY

22
ACTIVITY
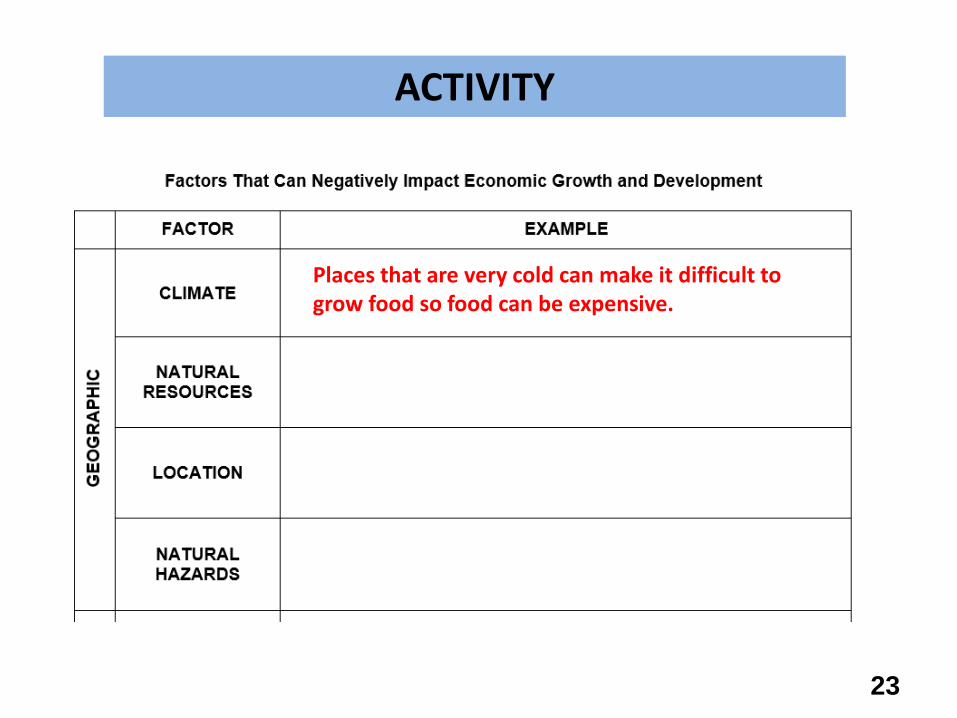
23
ACTIVITY
Places that are very cold can make it difficult to grow food so food can be expensive.

24
Property of Oakland Schools
Author: Carol EgboEditor: Amy Bloom
Copyright © 2010-2015 Oakland Schools

6th Grade Social Studies: World Geography and Global Issues SS060604 Unit 6: Economics and World Trade Lesson 4
Michigan Citizenship Collaborative Curriculum Page 1 of 9 Copyright © 2010-2015 Oakland Schools January 21, 2015
Lesson 4: How did Imperialism Affect the Future Economic Growth and Development of Colonized Countries?
Big Ideas of the Lesson
During the 1800s, several European countries divided up the continent of Africa in order to colonize it.
The colonizing countries wanted raw materials from their colonies for their industries. They also wanted markets for the manufactured goods they were producing.
Colonization caused long-lasting social, economic, and political problems for the people of Africa.
Many current problems relating to economic growth and development such as lack of infrastructure and slow industrial growth can be traced back to colonial times.
Lesson Abstract: In this lesson students explore how imperialism and colonization have left a legacy in Africa in terms of economic growth and development for African nations. After analyzing several maps showing global economic data, students draw inferences about imperialism in Africa using a historical map and a political cartoon. Through a case study of the country of Tanzania, students identify specific consequences of colonialism. They demonstrate what they have learned by writing an argument about the effects of colonization on the economies of African countries today. Finally, students work in small groups to create presentations describing recent African “success stories” relating to economic growth and development. Content Expectations: Grades 6 and 7 – H1.2.1; H1.2.2; H1.2.3; H1.2.4; H1.4.2; H1.4.3; G1.2.6, G1.3.1; G1.3.2; G1.3.3; G2.2.1, G2.2.2; G2.2.3; G4.4.1
Grade 7 – G1.1.1; G4.1.2; E3.1.1 Grade 6 – G6.1.1; C4.3.1; E2.3.1
Common Core State Standards for Literacy in History and Social Studies: RH.6-8.1, 2, 4; WHST.6-8.4 and 9 Key Concepts balance of trade colonization level of development economic growth imperialism Lesson Sequence 1. Briefly review the content covered in the previous lesson by asking students to identify three
factors that promote economic growth and development in a country. Have them list the factors in their Global Investigator’s Notebook. Give them time to write and then have them share their lists with a partner and then in the large group. Teacher Note: In the previous lessons students learned that factors like technology, political stability and improvements in infrastructure (roads, water supply and electricity) can lead to economic growth.

6th Grade Social Studies: World Geography and Global Issues SS060604 Unit 6: Economics and World Trade Lesson 4
Michigan Citizenship Collaborative Curriculum Page 2 of 9 Copyright © 2010-2015 Oakland Schools January 21, 2015
2. Explain to students that this lesson will focus on answering why some countries are so far behind others in terms of their level of economic development. Introduce the lesson question to the class by displaying Slide 1 of the PowerPoint (Unit 6, Lesson 4): “How did imperialism affect the future economic growth and development of colonized countries?” Use Word Card #22 to explain the meaning of the term “imperialism.” (Teacher Note: Students should have been introduced into the idea of colonies during their study of American history in grade five.) Explain to students that while every country is different in terms of its past, there are some experiences that many of the poor countries have in common. To better understand how to answer the lesson question, tell students that we are going to focus on economic growth and development in the countries of Africa. Move to Slides 2 and 3 and ask students to draw conclusions about Africa based on the map. Students should notice that all the countries of Africa are considered “less economically developed.”
3. Display Slide 4 and review the term “gross domestic product.” If necessary, refer students to
Word Card # 17 from Lesson 3. Ask students to make a generalization about the GDPs of African countries based on the map. Using Slides 5 – 7 repeat this process by having students focus their attention on Africa on each map.
4. Pose the following question: Why do you think Africa as a region ranks low on so many different economic indicators? Have students write an answer in their GLINs and then discuss ideas in the large group. Make sure to address any racist comments that may attribute economic problems to skin color. Discuss how slow economic growth is connected to many complicated factors including geographic challenges and historical events.
5. Display Slide 8 and have students engage in a turn and talk in response to the following questions on the slide:
What kind of map is this? (This kind of map is a special purpose or thematic map.)
What type of information does it contain? (The map contains historical economic data.)
What story does this map tell? (The map tells about trade among England, Africa, and North America during colonial times, otherwise known as the triangular trade route.)
Discuss students’ answers with the whole class. Be sure students recognize that the colonies played a role in trade during an era when England was politically and economically strong. Trace the flow of raw materials and finished products as their movement is depicted on the map. Using Word Cards # 22 and #23, discuss the terms “imperialism” and “colonization.” Note that students should be familiar with “colonization” as it relates to the early American history they studied in 5th grade.
6. Display Slide 9 to help set the historical context for students. Use the slide to discuss how colonization affected the American colonies. Students will likely remember “no taxation without representation” and the Boston Tea Party. It is important to connect these events to aspects of colonialism. Teacher Note: The idea of using colonies to obtain raw materials and requiring the colonies to pay for police and army protection along with other institutions established by England through taxes should not be new. Use the timeline on the slide to explain how the first industrial revolution led to the need for more and more raw materials, as well as more and more markets for manufactured goods. As
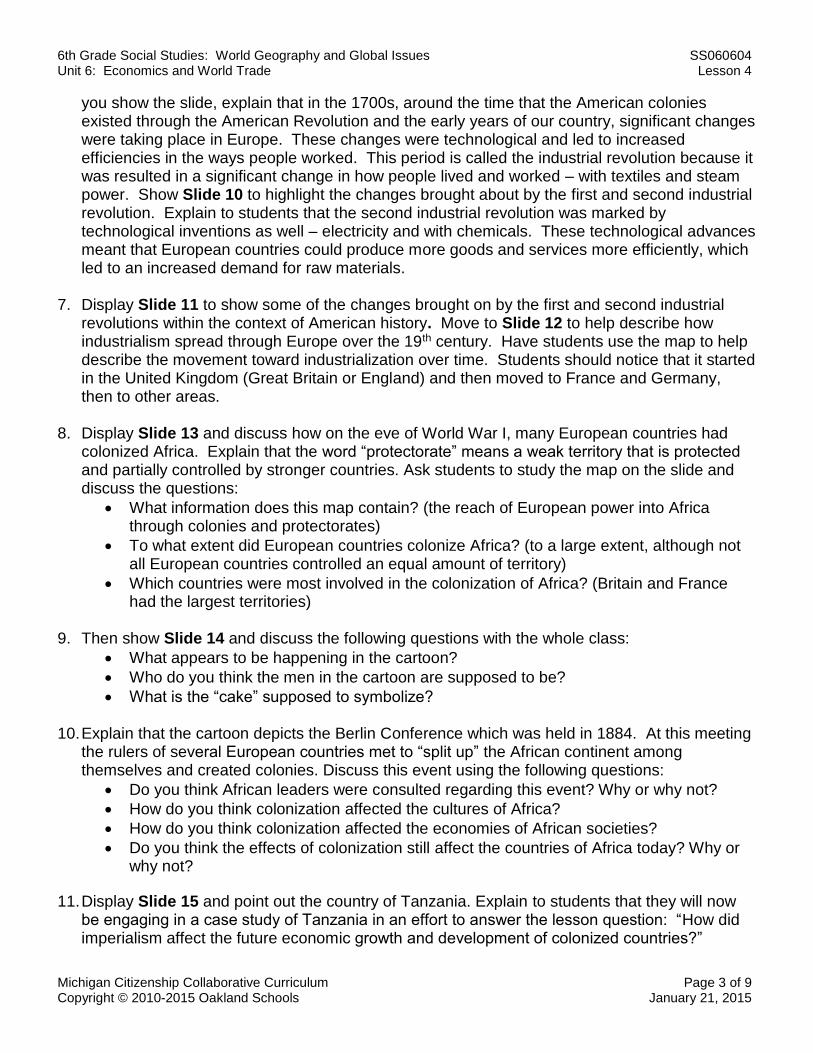
6th Grade Social Studies: World Geography and Global Issues SS060604 Unit 6: Economics and World Trade Lesson 4
Michigan Citizenship Collaborative Curriculum Page 3 of 9 Copyright © 2010-2015 Oakland Schools January 21, 2015
you show the slide, explain that in the 1700s, around the time that the American colonies existed through the American Revolution and the early years of our country, significant changes were taking place in Europe. These changes were technological and led to increased efficiencies in the ways people worked. This period is called the industrial revolution because it was resulted in a significant change in how people lived and worked – with textiles and steam power. Show Slide 10 to highlight the changes brought about by the first and second industrial revolution. Explain to students that the second industrial revolution was marked by technological inventions as well – electricity and with chemicals. These technological advances meant that European countries could produce more goods and services more efficiently, which led to an increased demand for raw materials.
7. Display Slide 11 to show some of the changes brought on by the first and second industrial revolutions within the context of American history. Move to Slide 12 to help describe how industrialism spread through Europe over the 19th century. Have students use the map to help describe the movement toward industrialization over time. Students should notice that it started in the United Kingdom (Great Britain or England) and then moved to France and Germany, then to other areas.
8. Display Slide 13 and discuss how on the eve of World War I, many European countries had colonized Africa. Explain that the word “protectorate” means a weak territory that is protected and partially controlled by stronger countries. Ask students to study the map on the slide and discuss the questions:
What information does this map contain? (the reach of European power into Africa through colonies and protectorates)
To what extent did European countries colonize Africa? (to a large extent, although not all European countries controlled an equal amount of territory)
Which countries were most involved in the colonization of Africa? (Britain and France had the largest territories)
9. Then show Slide 14 and discuss the following questions with the whole class:
What appears to be happening in the cartoon?
Who do you think the men in the cartoon are supposed to be?
What is the “cake” supposed to symbolize? 10. Explain that the cartoon depicts the Berlin Conference which was held in 1884. At this meeting
the rulers of several European countries met to “split up” the African continent among themselves and created colonies. Discuss this event using the following questions:
Do you think African leaders were consulted regarding this event? Why or why not?
How do you think colonization affected the cultures of Africa?
How do you think colonization affected the economies of African societies?
Do you think the effects of colonization still affect the countries of Africa today? Why or why not?
11. Display Slide 15 and point out the country of Tanzania. Explain to students that they will now be engaging in a case study of Tanzania in an effort to answer the lesson question: “How did imperialism affect the future economic growth and development of colonized countries?”

6th Grade Social Studies: World Geography and Global Issues SS060604 Unit 6: Economics and World Trade Lesson 4
Michigan Citizenship Collaborative Curriculum Page 4 of 9 Copyright © 2010-2015 Oakland Schools January 21, 2015
Remind students that there were economic causes for colonization, as well as economic consequences. Teacher Note: Although this case study sits within a unit on economics and world trade, it is important to note that the causes of colonization were not only economic. Political and racial reasons also supported imperialism at this time. Some historians argue that one of the most important economic reasons for colonization was the belief by some Europeans that the development of trade and commerce in Africa was an essential component to the restitution of "civilization" in Africa. These were often missionaries. Historians today reject this ethnocentric conception of civilization. However, many Europeans during this time in history believed that Africa was not "civilized". They saw trade, commerce, and the introduction of Christianity as key to development in Africa. For more background information, go to http://exploringafrica.matrix.msu.edu/students/curriculum/m9/activity4.php
12. Give each student a copy of the “Research Packet” located in the Supplemental Materials (Unit 6, Lesson 4). Review the directions on the first page of the packet. Note that the packet includes the following text selections and activities:
“The Germans in Tanzania” (Activity #1, Readings 1 and 2)
“Colonization and Agriculture” (Activity #2)
“British Occupation” text selection and Text Question Sheet (Activity #3)
“Post-Independence Tanzania” text selection and Activity #4 (Parts 1 and 2)
“Balance of Trade” (Activity #5) Be sure to explain to students that as they work through each activity, they are to record their
findings on the chart at the front of the packet. Teacher Note: This lesson is organized with the teacher leading Activity #1, and students
progress through the remaining activities at their individual pace. Answer sheets for all the activities have been included in the Supplemental Materials (Unit 6, Lesson 4). As an alternative you may wish to have students work in pairs. Alternatively, the entire case study could be more teacher-directed with the five activities done, one at a time.
13. Engage students in Activity #1 by placing students into pairs. Assign pairs one of the two
readings for Activity #1. There should be an equal number of students reading each piece. Teacher Note: The readings contain the same information but each is written from a different perspective: Reading 1 is from an African perspective while Reading 2 is from an economic perspective. Have students work independently with the text, answering questions in the gray boxes as they read. Then, working with their partner, have the pairs use a highlighter to re-read the selection together, highlighting loaded language and adjectives that convey a perspective. Once students have finished, combine them into teams of four students each. Each team should have two members that read Reading 1 and two members that read Reading 2. Display Slide 16 and have small groups of students discuss the causes and consequences of colonization using the following prompt: “Was colonization of Africa a necessary evil?” Have students discuss the question, using information from their reading. Be sure to encourage students to reflect on the language used in their readings. After about 5-7 minutes, have a few

6th Grade Social Studies: World Geography and Global Issues SS060604 Unit 6: Economics and World Trade Lesson 4
Michigan Citizenship Collaborative Curriculum Page 5 of 9 Copyright © 2010-2015 Oakland Schools January 21, 2015
groups summarize their conversations. Explain to the class that the answer to the question depends on one’s perspective. Today, many of the problems faced by people in Africa can be traced to this period of history.
14. Have students return to the Research Packet distributed in Step 12. Have students record
what they learned in Activity #1 in the appropriate place on the chart. Then, have students continue working through the case study by completing Activity 2-5 in the packet. After each activity, students should record what they learned on the chart on the first page of the Research Packet.
15. When students have completed the case study with all five activities, give them a copy of the “Effects of Imperialism” chart located in the Supplemental Materials (Unit 6, Lesson 4). Explain that they should use their case study notes and case study text selections to help them complete the chart. If scaffolding is needed, place students into pairs to complete the handout. Give students time to complete the charts and then lead a discussion of the effects they have identified. A chart showing examples has been included in the Supplemental Materials (Unit 6, Lesson 4).
16. Pose the following questions: Do the effects of colonization still affect the economies of African countries today? Why or why not? Give students time to think and have them engage in a stop and jot to record their thoughts. Then, discuss students’ answers and ask them to support their answer with a specific effect discussed in Step 15.
17. As a combined assessment and writing activity, have students write their own argument stating their position on the issue discussed in Step 16. Give each student a copy of the “Argument Writing Criteria and Guide” located in the Supplemental Materials (Unit 6, Lesson 4). After reviewing the “Argument Writing Criteria and Guide” with the whole class, have students use it to create a writing plan for their argument. When the plans are finished, place students in pairs and have them peer edit the plans. Have students use the plan to complete a draft. Then, have students complete a final copy and share their final essays in small groups.
18. As a culminating or optional activity, divide students into six groups and give each group a
copy of the “African Success Stories Presentation Guide,” the “Summary Chart,” and one of the six single page stories located in the Supplemental Materials (Unit 6, Lesson 4). Review the guide with students and answer any questions they may have. Give students time to plan and practice their presentations. Then, have each group present their “success story” to the entire class. A “Presentation Rubric” has been included in the Supplemental Materials (Unit 6, Lesson 4).
Reference Section Content Expectations 6 and 7 Explain how historians use a variety of sources to explore the past (e.g., artifacts, H1.2.1: primary and secondary sources including narratives, technology, historical maps,
visual/mathematical quantitative data, radiocarbon dating, DNA analysis). 6 and 7 Read and comprehend a historical passage to identify basic factual knowledge and
6th Grade Social Studies: World Geography and Global Issues SS060604 Unit 6: Economics and World Trade Lesson 4
Michigan Citizenship Collaborative Curriculum Page 6 of 9 Copyright © 2010-2015 Oakland Schools January 21, 2015
H1.2.2: the literal meaning by indicating who was involved, what happened, where it happened, what events led to the development, and what consequences or outcomes followed.
6 and 7 Identify the point of view (perspective of the author) and context when reading and H1.2.3: discussing primary and secondary sources. 6 and 7 Compare and evaluate competing historical perspectives about the past based on H1.2.4: proof. 6 and 7 Describe and use cultural institutions to study an era and a region (political, H1.4.1: economic, religion/belief, science/technology, written language, education, family). 6 and 7 Describe and use themes of history to study patterns of change and continuity. H1.4.2: 6 and 7 Use historical perspective to analyze global issues faced by humans long ago and H1.4.3: today. 7 – G1.1.1 Explain and use a variety of maps, globes, and web based geography technology to
study the world, including global, interregional, regional, and local scales. 6 and 7 Apply the skills of geographic inquiry (asking geographic questions, acquiring G1.2.6: geographic information, organizing geographic information, analyzing geographic
information, and answering geographic questions) to analyze a problem or issue of importance to a region of the world.1
6 and 7 Use the fundamental themes of geography (location, place, human environment G1.3.1: interaction, movement, region) to describe regions or places on earth. 6 and 7 Explain the locations and distributions of physical and human characteristics of Earth G1.3.2: by using knowledge of spatial patterns. 6 and 7 Explain the different ways in which places are connected and how those connections G1.3.3: demonstrate interdependence and accessibility. 6 and 7 Describe the human characteristics of the region under study (including languages, G2.2.1: religion, economic system, governmental system, cultural traditions). 6 and 7: Explain that communities are affected positively and negatively by changes in G2.2.2: technology.2
1 The expectations identified the western and eastern hemisphere. We have combined them to reflect a global perspective. 2 The examples listed in the expectations have been removed because their specificity impedes the significant conceptual understanding contained in expectation. The sixth grade examples read: “e.g., Canada with regard to mining, forestry, hydroelectric power generation, agriculture, snowmobiles, cell phones, air travel.” The seventh grade

6th Grade Social Studies: World Geography and Global Issues SS060604 Unit 6: Economics and World Trade Lesson 4
Michigan Citizenship Collaborative Curriculum Page 7 of 9 Copyright © 2010-2015 Oakland Schools January 21, 2015
6 – G2.2.3: Analyze how culture and experience influence people’s perception of places and
regions.3 6 and 7 Identify and explain examples of cultural diffusion in the world.4 G4.1.1: 7 – G4.1.2: Compare roles of women in traditional African societies in the past with roles of
women as modern micro-entrepreneurs in current economies. 6 and 7 Identify factors that contribute to conflict and cooperation between and among G4.4.1: cultural groups (control/use of natural resources, power, wealth, and cultural
diversity). 6 - G6.1.1: Conduct research on contemporary global topics and issues.
Globalization – Investigate the significance of globalization and describe its impact on international economic and political relationships.
6 – C4.3.1: Explain the geopolitical relationships between countries.5 6 – E2.3.1: Describe the impact of governmental policy (sanctions, tariffs, treaties) on that
country and on other countries that use its resources.6 7 – E3.1.1: Explain the importance of trade (imports and exports) on national economies in the
world.7
examples state: “e.g., increased manufacturing resulting in rural to urban migration in China, increased farming of fish, hydroelectric power generation at Three Gorges, pollution resulting from increased manufacturing and automobiles.” 3 The examples listed in the expectations have been removed because they do not support the expectation. The sixth grade examples read: “the Caribbean Region that presently displays enduring impacts of different immigrant groups – Africans, South Asians, Europeans – and the differing contemporary points of view about the region displayed by islanders and tourists.” The seventh grade examples read: “that beaches are places where tourists travel, cities have historic buildings, northern places are cold, equatorial places are very warm. 4 The examples in the expectations have been removed because they unnecessarily limit the scope of the concept of
cultural diffusion when teaching students about globalization and world trade. Sixth grade is limited to the Americas with examples of “baseball, soccer, music, architecture, television, languages, health care, Internet, consumer brands, currency, restaurants, international migration.” Seventh grade is likewise limited to the Eastern Hemisphere, which limited examples of “the spread of sports, music, architecture, television, Internet, Bantu languages in Africa, Islam in Western Europe. 5 The examples “(e.g., petroleum and arms purchases in Venezuela and Ecuador; foreign aid for health care in Nicaragua)” have been removed for clarity. 6 As used in this lesson, this expectation addresses the historical governmental policy of imperialism and colonization. 7 The expectation was unnecessarily limited to the Eastern Hemisphere with the following examples: “natural gas in North Africa, petroleum Africa, mineral resources in Asia.” We have revised the expectation to reflect a global approach since we are focusing on globalization and world trade, which is not limited only to the Eastern Hemisphere.
6th Grade Social Studies: World Geography and Global Issues SS060604 Unit 6: Economics and World Trade Lesson 4
Michigan Citizenship Collaborative Curriculum Page 8 of 9 Copyright © 2010-2015 Oakland Schools January 21, 2015
Common Core State Standards for Literacy in History and Social Studies RH.6-8.1: Cite specific textual evidence to support analysis of primary and secondary
sources. RH.6-8.2: Determine the main ideas or information of a primary or a secondary source;
provide an accurate summary of the source distinct from prior knowledge or opinions.
RH.6-8.4: Determine the meaning of words and phrases as they are used in a text, including
vocabulary specific to domains related to history/social studies. WHST.6-8.4: Produce clear and coherent writing in which the development, organization, and
style are appropriate to task, purpose, and audience. WHST.6-8.9: Draw evidence from informational texts to support analysis, reflection, and research. Instructional Resources Equipment/ Manipulative Global Investigator’s Notebook Highlighters
Student Resource A student geography textbook such as Wiggins, Grant, et al. My World Geography: Boston, MA:
Pearson, 2011. Teacher Resource Colonies and Protectorates in Africa around 1914. New York Public Library. 21 January 2015
<http://exhibitions.nypl.org/africanaage/maps/african-col-1914.jpg>. Country Income Groups. The World Bank Group. 21 January 2015 <http://3.bp.blogspot.com/-
TynYipnWots/T_TRa7c8VbI/AAAAAAAAErM/qTSsbkJ_nzg/s1600/CIG+2011.png>. Exploring Africa. Module Nine: African Economies. Michigan State University. 21 January 2015
<http://exploringafrica.matrix.msu.edu/students/curriculum/m9/activity4.php>. Egbo, Carol. Supplemental Materials (Unit 6, Lesson 4). Teacher-made materials. Oakland
Schools, 2015. - - - . PowerPoint (Unit 6, Lesson 4). Teacher-made materials. Oakland Schools, 2015. GDP Map. Wikipedia. 21 January 2015
<http://upload.wikimedia.org/wikipedia/commons/0/08/Map_of_countries_by_GDP_%28nominal%29_in_US%24.png>.
German East Africa Map. Ibilio. 21 January 2015
<http://www.ibiblio.org/HTMLTexts/Albert_Frederick_Pollard/A_Short_History_Of_The_Great_War/map12.png>.

6th Grade Social Studies: World Geography and Global Issues SS060604 Unit 6: Economics and World Trade Lesson 4
Michigan Citizenship Collaborative Curriculum Page 9 of 9 Copyright © 2010-2015 Oakland Schools January 21, 2015
“Ghana’s sustained agricultural growth: putting underused resources to work.” Development
Progress. Oct. 2010. 21 April 2014 <http://www.developmentprogress.org/ghanas-sustained-agricultural-growth-putting-underused-resources-work>.
Lam, Joyce and Justine Lee. The Berlin Conference (1884-1885): Dominant Diplomacy, Dire
Consequences. 21 January 2015 <http://21548675.nhd.weebly.com/the-berlin-conference.html>.
Map of Countries HDI. Wikipedia. 21 January 2015
<http://upload.wikimedia.org/wikipedia/commons/thumb/3/32/2013_UN_Human_Development_Report_Quartiles.svg/863px-2013_UN_Human_Development_Report_Quartiles.svg.png>.
North-South Divide. Wikipedia. 21 January 2015 <http://en.wikipedia.org/wiki/North-
South_divide]>. Population Living Below National Poverty Line. 21 January 2015
<http://sealofexcellence.files.wordpress.com/2013/08/percent_poverty_world_map.jpg>. Resources for history teachers. 21 January 2015
<http://resourcesforhistoryteachers.wikispaces.com/WHII.6>. Success Stories. Tokyo International Conference on African Development. 21 April 2014
<http://www.ticad.net/stories/index.html> (site no longer available). Tanzania Map. World Atlas. 21 January 2015
<http://www.worldatlas.com/webimage/countrys/africa/tz.htm>.

6th Grade Social Studies: World Geography and Global Issues SS060604 Unit 6: Economics and World Trade Lesson 4
Michigan Citizenship Collaborative Curriculum Page 1 of 34 Copyright © 2010-2015 Oakland Schools January 21, 2015
Graphic Organizer
IMPERIALISM
Desire for New
Markets
Need for Raw
Materials
Boundary
Problems
Balance of Trade
Problems
Uneven Regional
Development
Exploitation of
Resources
Lack of
Industry
Lack of
Infrastructure
Weak
Economies

6th Grade Social Studies: World Geography and Global Issues SS060604 Unit 6: Economics and World Trade Lesson 4
Michigan Citizenship Collaborative Curriculum Page 2 of 34 Copyright © 2010-2015 Oakland Schools January 21, 2015
Big Idea Card
Big Ideas of Lesson 4, Unit 6
Economic growth is often viewed as a country’s ability to produce more goods in less time and is measured in Gross Domestic Product.
During the 1800s, several European countries divided up the continent of Africa in order to colonize it.
The colonizing countries wanted raw materials for their industries from their colonies. They also wanted markets for the manufactured goods they were producing.
Colonization caused long-lasting social, economic, and political problems for the people of Africa.
Many current problems relating to economic growth and development such as lack of infrastructure and slow industrial growth can be traced back to colonial times.

6th Grade Social Studies: World Geography and Global Issues SS060604 Unit 6: Economics and World Trade Lesson 4
Michigan Citizenship Collaborative Curriculum Page 3 of 34 Copyright © 2010-2015 Oakland Schools January 21, 2015
Word Cards
Word Cards from previous lessons used in this lesson:
Gross Domestic Product – Word Card #17 from Lesson 3
Development – Word Card #18 from Lesson 3
Infrastructure – Word Card #21 from Lesson 3
22 imperialism a policy or practice by which a country increases its power by gaining control over other areas of the world
Example: Imperialism led to the colonization of most of Africa in the 1800s.
(SS060604)
23 colonization the process by which a country takes control of another area in order to get raw materials and other benefits
Example: Countries in Europe colonized most of Africa in the late 1800s.
(SS060604)
24 balance of trade the difference between the amount of goods exported and the amount of goods imported Example: If the value of a country’s exports is less than what it pays for its imports, the country will have an unfavorable balance of trade.
25 export sending a product to another country for sale Example: The United States exports fruits and vegetables to other countries.
(SS060604)

6th Grade Social Studies: World Geography and Global Issues SS060604 Unit 6: Economics and World Trade Lesson 4
Michigan Citizenship Collaborative Curriculum Page 4 of 34 Copyright © 2010-2015 Oakland Schools January 21, 2015
26 import bringing a product into a country to be sold Example: The United States imports crude oil from many countries in western Asia or the Middle East.
(SS060604)
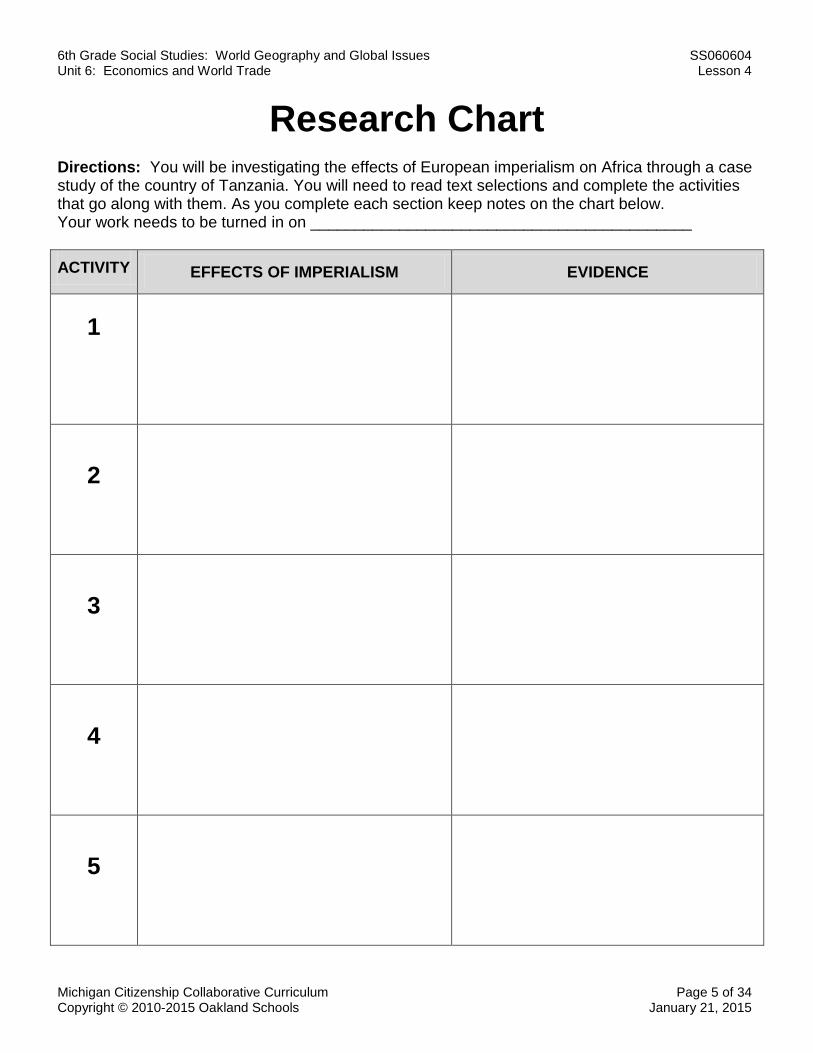
6th Grade Social Studies: World Geography and Global Issues SS060604 Unit 6: Economics and World Trade Lesson 4
Michigan Citizenship Collaborative Curriculum Page 5 of 34 Copyright © 2010-2015 Oakland Schools January 21, 2015
Research Chart
Directions: You will be investigating the effects of European imperialism on Africa through a case study of the country of Tanzania. You will need to read text selections and complete the activities that go along with them. As you complete each section keep notes on the chart below. Your work needs to be turned in on ___________________________________________
ACTIVITY EFFECTS OF IMPERIALISM EVIDENCE
1
2
3
4
5
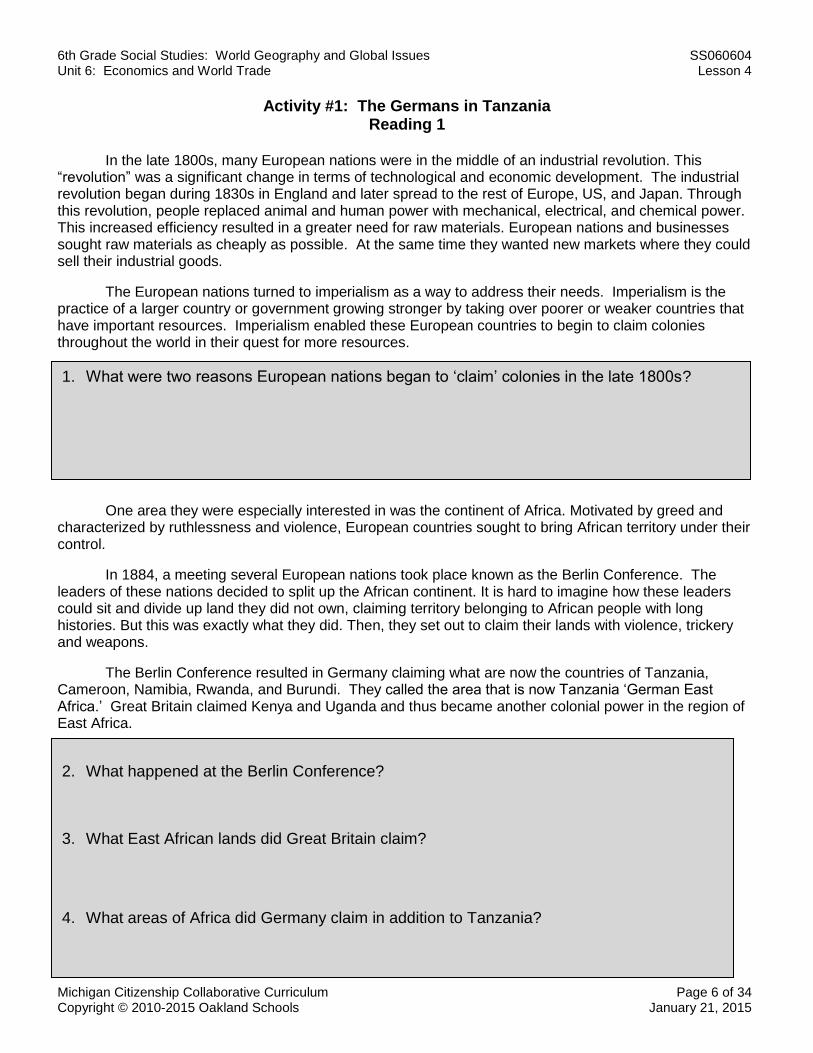
6th Grade Social Studies: World Geography and Global Issues SS060604 Unit 6: Economics and World Trade Lesson 4
Michigan Citizenship Collaborative Curriculum Page 6 of 34 Copyright © 2010-2015 Oakland Schools January 21, 2015
1. What were two reasons European nations began to ‘claim’ colonies in the late 1800s?
2. What happened at the Berlin Conference?
3. What East African lands did Great Britain claim?
4. What areas of Africa did Germany claim in addition to Tanzania?
Activity #1: The Germans in Tanzania Reading 1
In the late 1800s, many European nations were in the middle of an industrial revolution. This “revolution” was a significant change in terms of technological and economic development. The industrial revolution began during 1830s in England and later spread to the rest of Europe, US, and Japan. Through this revolution, people replaced animal and human power with mechanical, electrical, and chemical power. This increased efficiency resulted in a greater need for raw materials. European nations and businesses sought raw materials as cheaply as possible. At the same time they wanted new markets where they could sell their industrial goods.
The European nations turned to imperialism as a way to address their needs. Imperialism is the practice of a larger country or government growing stronger by taking over poorer or weaker countries that have important resources. Imperialism enabled these European countries to begin to claim colonies throughout the world in their quest for more resources.
One area they were especially interested in was the continent of Africa. Motivated by greed and characterized by ruthlessness and violence, European countries sought to bring African territory under their control.
In 1884, a meeting several European nations took place known as the Berlin Conference. The leaders of these nations decided to split up the African continent. It is hard to imagine how these leaders could sit and divide up land they did not own, claiming territory belonging to African people with long histories. But this was exactly what they did. Then, they set out to claim their lands with violence, trickery and weapons.
The Berlin Conference resulted in Germany claiming what are now the countries of Tanzania, Cameroon, Namibia, Rwanda, and Burundi. They called the area that is now Tanzania ‘German East Africa.’ Great Britain claimed Kenya and Uganda and thus became another colonial power in the region of East Africa.

6th Grade Social Studies: World Geography and Global Issues SS060604 Unit 6: Economics and World Trade Lesson 4
Michigan Citizenship Collaborative Curriculum Page 7 of 34 Copyright © 2010-2015 Oakland Schools January 21, 2015
Source: http://www.ibiblio.org/HTMLTexts/Albert_Frederick_Pollard/A_Short_History_Of_The_Great_War/map12.png
5. What were two problems caused by the way Europeans set the boundaries of their
colonies?
POINT OF VIEW: People view the same event in different ways. Therefore, we say they have a different ‘point of view.’ This is an important concept to understand when studying history. Describe below how you think each of the people listed viewed the Berlin Conference. A leader in Germany:
A leader in Tanzania:
In 1886 an agreement was reached between Great Britain and Germany that set the present boundary between Tanzania and Kenya. In 1890 another treaty between these two countries set the western boundary of Tanzania.
It is important to remember that the European nations set the boundaries throughout Africa with no real regard for the Africans living in these areas. Often a boundary cut the land of an ethnic group in half. In Tanzania, for example, the boundary between Tanzania and Kenya split the land of the Masai people in half. The opposite problem also existed. Many times a wide variety of groups were brought together who before had been independent political units. These groups did not think of themselves as a ‘nation’ at this time. In Tanzania, for example, the boundaries brought together many groups under the name “Tanganyika.” For the most part, these groups had been a collection of smaller units. In post-colonial times these artificial boundaries have sometimes caused tension and other problems in the newly-independent countries of Africa.

6th Grade Social Studies: World Geography and Global Issues SS060604 Unit 6: Economics and World Trade Lesson 4
Michigan Citizenship Collaborative Curriculum Page 8 of 34 Copyright © 2010-2015 Oakland Schools January 21, 2015
1. What were two reasons European nations began to ‘claim’ colonies in the late 1800s?
2. What happened at the Berlin Conference?
3. What East African lands did Great Britain claim?
4. What areas of Africa did Germany claim in addition to Tanzania?
Activity #1: The Germans in Tanzania Reading 2
In the late 1800s, many European nations were in the middle of an industrial revolution. This “revolution” was a significant change in terms of technological and economic development. The industrial revolution began during 1830s in England and later spread to the rest of Europe, US, and Japan. Through this revolution, people replaced animal and human power with mechanical, electrical, and chemical power. This increased efficiency resulted in a greater need for raw materials. European nations and businesses sought raw materials as cheaply as possible. At the same time they wanted new markets where they could sell their industrial goods.
The European nations turned to imperialism as a way to address their needs. Imperialism is the practice of a larger country or government growing stronger by taking over poorer or weaker countries that have important resources. Imperialism enabled the European countries to begin to claim colonies throughout the world in their quest for more resources.
One area they were especially interested in was the continent of Africa. Motivated by the need for raw materials, markets for products of the industrial revolution, and access to trade routes, European countries sought to bring African territory under their control.
In 1884, a meeting several European nations took place known as the Berlin Conference. The leaders of these nations decided to split up the African continent. There were many reasons why political leaders in Europe looked to colonize Africa, but the most important reasons were economic. As industrialization spread through Europe, European industries became more competitive with each other for raw materials. Since Europe did not have many raw materials, it obtained these resources from other places such as the Americas and Asia. Some European industrialists were encouraging their governments to colonize African countries as a way of guaranteeing a source of raw materials.
The Berlin Conference resulted in Germany claiming what are now the countries of Tanzania, Cameroon, Namibia, Rwanda, and Burundi. They called the area that is now Tanzania ‘German East Africa.’ Great Britain claimed Kenya and Uganda and thus became another colonial power in the region of East Africa.
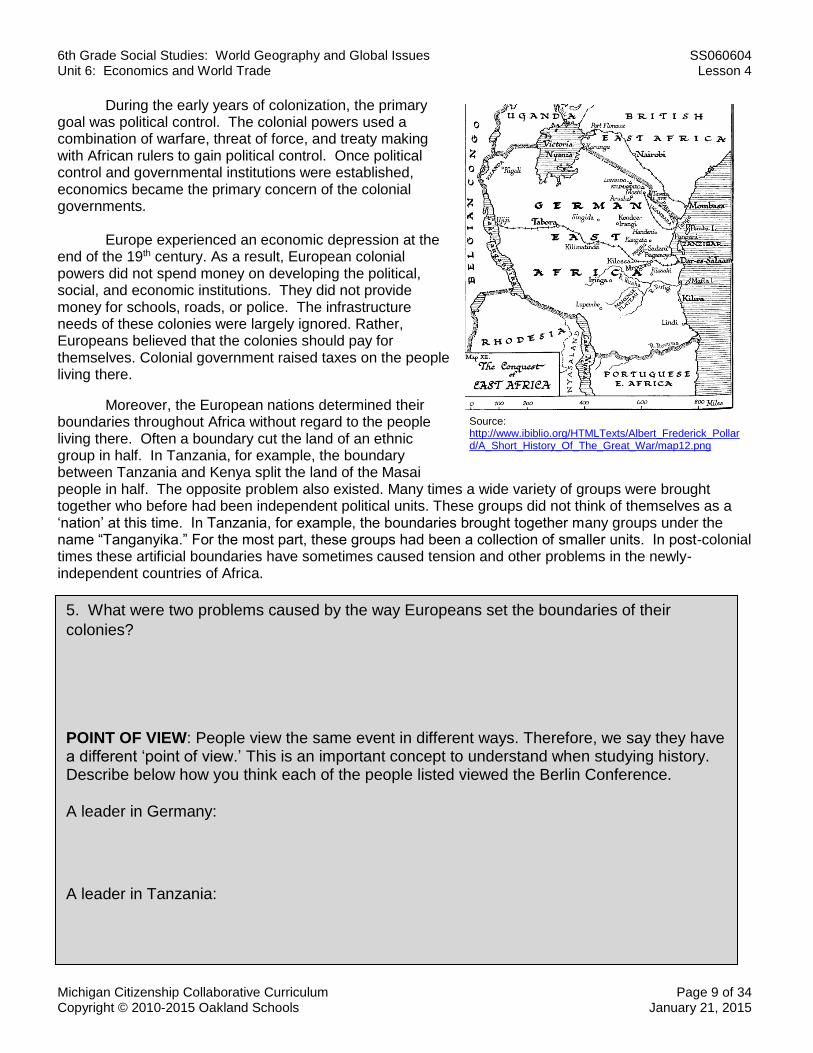
6th Grade Social Studies: World Geography and Global Issues SS060604 Unit 6: Economics and World Trade Lesson 4
Michigan Citizenship Collaborative Curriculum Page 9 of 34 Copyright © 2010-2015 Oakland Schools January 21, 2015
Source: http://www.ibiblio.org/HTMLTexts/Albert_Frederick_Pollard/A_Short_History_Of_The_Great_War/map12.png
5. What were two problems caused by the way Europeans set the boundaries of their
colonies?
POINT OF VIEW: People view the same event in different ways. Therefore, we say they have a different ‘point of view.’ This is an important concept to understand when studying history. Describe below how you think each of the people listed viewed the Berlin Conference. A leader in Germany:
A leader in Tanzania:
During the early years of colonization, the primary goal was political control. The colonial powers used a combination of warfare, threat of force, and treaty making with African rulers to gain political control. Once political control and governmental institutions were established, economics became the primary concern of the colonial governments. Europe experienced an economic depression at the end of the 19th century. As a result, European colonial powers did not spend money on developing the political, social, and economic institutions. They did not provide money for schools, roads, or police. The infrastructure needs of these colonies were largely ignored. Rather, Europeans believed that the colonies should pay for themselves. Colonial government raised taxes on the people living there.
Moreover, the European nations determined their boundaries throughout Africa without regard to the people living there. Often a boundary cut the land of an ethnic group in half. In Tanzania, for example, the boundary between Tanzania and Kenya split the land of the Masai people in half. The opposite problem also existed. Many times a wide variety of groups were brought together who before had been independent political units. These groups did not think of themselves as a ‘nation’ at this time. In Tanzania, for example, the boundaries brought together many groups under the name “Tanganyika.” For the most part, these groups had been a collection of smaller units. In post-colonial times these artificial boundaries have sometimes caused tension and other problems in the newly-independent countries of Africa.

6th Grade Social Studies: World Geography and Global Issues SS060604 Unit 6: Economics and World Trade Lesson 4
Michigan Citizenship Collaborative Curriculum Page 10 of 34 Copyright © 2010-2015 Oakland Schools January 21, 2015
Colonialism and Agriculture Activity #2
Information: During the 1800s, several European countries divided up the continent of Africa in order to colonize it. These countries expected to get both money and raw materials from their colonies. This caused serious problems for African people. They had already established systems of agriculture, trade, government, and so forth. The colonial system forced changes in these cultures and institutions. This activity shows how colonial governments forced a change in agriculture in many African societies. Assume you are a Tanzanian farmer in the times before colonialism. You devote most of your land to growing crops to feed your family. As the colonial power takes over, the colonial government tells you that you will have to pay a tax to the government. How could you get money to pay your tax? The colonial government tells you it will buy cotton if you grow it, and you can use the money to pay your tax. What are you probably forced to grow now? If you decided to grow cotton, you would have to use some of your land for it. How would this affect the amount of food you have for your family? Assume you decided to grow the cotton on part of your land, and you sell it to pay your tax. Next, the colonial government decides to raise the tax. What will this force you to do? How will this affect the amount of food you will have for your family? Little by little, more of your land is used for cotton. Before long, that is about all you grow. Now you will have to use the money you earn to do two things:
1. Pay ____________________________ 2. Buy ____________________________

6th Grade Social Studies: World Geography and Global Issues SS060604 Unit 6: Economics and World Trade Lesson 4
Michigan Citizenship Collaborative Curriculum Page 11 of 34 Copyright © 2010-2015 Oakland Schools January 21, 2015
Activity #3: British Occupation
German rule came to an end in Tanzania following World War I. Tanganyika, as the nation was known then, was made a territory by the winning countries, and Great Britain was given authority over the area. Thus, the British became the new colonial rulers. The British tried a different approach to govern the colony. They used what was called ‘indirect rule.’ This meant they tried to use local African leaders to a greater degree than the Germans had. Their goals were still the same: to silence the majority of Africans and keep them ‘under control.’ The British saw Tanganyika mainly as a source of materials and money. They viewed neighboring Kenya, another of their colonies, in a different way. In Kenya they stressed white settlement. They restricted Africans to ‘tribal areas.’ Europeans were given the cool, fertile land in the highlands. This difference in the way Great Britain viewed Kenya and Tanzania was reflected in the way they governed the two colonies. In general, Tanzania remained “less developed” by Great Britain since it had fewer European settlers. The British continued to stress the growth of cash crops such as sisal, rubber, coffee and cotton. They took over German plantations and resold them to British, Greek and Asian owners. The British centered their activities in four main areas: West Lake, Kilimanjaro/Arusha, Mbeya and the coast. Other areas were often forced to provide laborers for these four regions. This was accomplished through a tax system. The British imposed taxes on the people. In order to pay these taxes, men were forced to leave their homes and seek jobs in one of the four areas. The British built railroads to connect these regions with the coast. They also built roads to supplement the railroads. More schools were built in the four regions than elsewhere in Tanzania. These improvements were for the benefit of the colonial system, not the Tanzanian people. This regional imbalance of programs and building continued up to the time of independence in 1961, and caused future development problems. It is important to consider the idea of colonial ‘improvement’ and ‘development.’ Some people, in an effort perhaps to justify colonialism, have pointed to the building of railroads and schools as positive effects. But these projects were motivated by self-interest, not concern for African people. Railroads and roads were built because colonial powers like Great Britain wanted an efficient way to get raw materials to ports where they would be shipped to Europe. Schools were built because the colonial system needed lower level clerks and office help for their government. The main purpose of schools was to educate a class of African clerical workers. The development of industry in Tanganyika was discouraged by the British. It is important to remember that the colonial powers were looking for new markets for their own industrial goods. They did not want competition from African industry and did everything possible to discourage industrial growth. Africans were therefore forced to buy manufactured goods from Europe. This shortage of industry has continued to be a development problem for Tanzania. The same is true for other countries of Africa. Besides discouraging industrial growth in Tanzania, Great Britain also exploited mineral wealth, just as the Germans had done. The British took what they could for their own industries and also made money on the gold, diamonds and other minerals they extracted from Tanzania. This exhausted some of these mineral deposits. In the post-colonial er,a Tanzania had to search out new deposits and develop them.
6th Grade Social Studies: World Geography and Global Issues SS060604 Unit 6: Economics and World Trade Lesson 4
Michigan Citizenship Collaborative Curriculum Page 12 of 34 Copyright © 2010-2015 Oakland Schools January 21, 2015
British Occupation Activity #3
1. Kenya has more Europeans living there now than Tanzania. Based on what you have read,
what is one reason for this?
2. How did some Tanzanian families manage to pay the taxes imposed by the British?
3. What was the main purpose of colonial schools?
4. What might be some of the reasons the British centered their activities in four main areas?
5. Why did the British discourage the growth of industry in Tanzania?
Main Ideas: Review the information on the British occupation and then write the main idea of each
of the paragraphs numbered below: Paragraph #3 Paragraph #7

6th Grade Social Studies: World Geography and Global Issues SS060604 Unit 6: Economics and World Trade Lesson 4
Michigan Citizenship Collaborative Curriculum Page 13 of 34 Copyright © 2010-2015 Oakland Schools January 21, 2015
Activity #4: Post-Independence Tanzania Challenges After a long, hard struggle Tanzania gained independence from Great Britain in 1961. In December of 1962, a new constitution was adopted and Tanzania became a republic. Like other newly independent African countries, however, Tanzania faced many problems and challenges resulting from its colonial past. These problems affected economic growth and development. During colonial times, profits had been taken out of Tanzania by the international companies that controlled the trade of raw materials instead of being invested in the Tanzanian economy. In addition, the colonial government had spent very little money on commercial, communication or transportation networks, yet all of these are necessary for economic growth and development. In addition, the colonial government had built few schools and had wished only to educate clerks and office workers to assist the colonial government. As a result, Tanzania lacked college graduates as well as a skilled workforce. At independence, then, the Tanzanian people inherited a weak economy and needed to build social programs like education and infrastructure like roads and phone networks.
Industrial Development Industrial development was another large challenge following independence. The colonial powers had discouraged the development of industry. They were looking for new markets for their own goods and did not want African nations like Tanzania to be able to make these manufactured goods themselves. Therefore, there was little industry in Tanzania. Additionally, the Europeans had taken much of the mineral wealth in Tanzania for their own industries. The European colonial powers made a great deal of money extracting gold, diamonds and other minerals. This had exhausted some of these mineral deposits. Tanzania had to search out new deposits and develop them. This was often a costly process since many of the most accessible mines were dry. Industrial growth in Tanzania has often been slowed by lack of adequate resources. Industry depends heavily on energy and fuel. The rising demand for oil and gas worldwide, along with the lack of such resources in Tanzania, has made it difficult to catch up to other nations. Resource poor places like Tanzania often spend more than 50% of their income on importing fuel. Another challenge has been the fact that capital equipment is required to build up industry. For example, in order to establish a factory for making cars, countries have to import machinery for their factories. The prices of such machinery have increased is costly and has steadily increased over time. People living in industrialized nations often have trouble understanding the problems facing nations like Tanzania. In developing industry, these nations constantly face difficult choices. For example, Tanzanian leaders may decide to buy raw materials for a tire factory. This might mean they have no money left to buy spare parts for their electrical plants. If there is a breakdown in these plants, power gets cut to all factories. This means that even though the factory has the materials to make tires, it still cannot operate. This causes further problems, such as a shortage of tires in the country. Trucks may not get the tires they need. This could lead to difficulties in getting goods to market. African nations like Tanzania often face these interconnected problems.
6th Grade Social Studies: World Geography and Global Issues SS060604 Unit 6: Economics and World Trade Lesson 4
Michigan Citizenship Collaborative Curriculum Page 14 of 34 Copyright © 2010-2015 Oakland Schools January 21, 2015
Post-Independence Tanzania Activity #4
PART 1 Following independence, Tanzania wanted to foster economic growth and development for its citizens. Describe four problems the nation faced in trying to accomplish this and what had caused the problem.
Problem Cause of the problem
PART 2 Re-read the last paragraph of the text selection. Then, on a separate sheet of paper, create a graphic organizer explaining the sequence of events described in the paragraph. Begin your organizer with this sentence:
Money is used for raw materials for a tire factory.
End your organizer with this phrase
This could lead to difficulties in getting goods to market.

6th Grade Social Studies: World Geography and Global Issues SS060604 Unit 6: Economics and World Trade Lesson 4
Michigan Citizenship Collaborative Curriculum Page 15 of 34 Copyright © 2010-2015 Oakland Schools January 21, 2015
Activity #5: Balance of Trade
The concept of balance of trade is important to understand when studying about economic growth and development. A country that spends more on imports than it makes from selling exports can have financial problems. Unfortunately, this is frequently the case in many African countries such as Tanzania. The prices paid for the goods Tanzania exports, which are mainly agricultural products, often do not cost as much as the prices of the goods it imports. Therefore, Tanzania often earns less money than it spends. A specific example is sisal which is used to make rope and twine. Since colonial times sisal has been a major export of Tanzania. Much of the country’s export earnings, therefore, have come from the sale of sisal. A few years ago, synthetic fibers began to be popular. Countries began to buy these fibers instead of sisal. Tanzania lost income because of this. However, the items Tanzania needed to import, such as tractors, kept going up in price. Directions: Use the “Balance of Trade Chart” and the directions below to explore the Tanzanian example above.
1. In Year 1, Tanzania made the same amount of money exporting sisal as it spent in importing tractors. Draw four circles for INCOME under the EXPORT box and four circles for EXPENSES under the IMPORT box.
2. In Year 2, Tanzania made the same amount of money exporting sisal as in Year 1, but it spent more importing tractors. Draw four circles for INCOME under the EXPORT box and five circles for EXPENSES under the IMPORT box.
3. In Year 3, fewer countries bought sisal so Tanzania made less money exporting it. The price of tractors had increased, however. Draw three circles for INCOME under the EXPORT box and six circles for EXPENSES under the IMPORT box.
4. In Year 4, Tanzania made the same amount exporting sisal as it had in Year 3 but the price of tractors had gone up again. Draw three circles for INCOME under the EXPORT box and seven circles for EXPENSES under the IMPORT box.
5. Now, go back and subtract the EXPENSES from the INCOME to calculate the RESULT of
trade for each year.
Balance of Trade – the difference between the amount of goods exported and the amount of goods imported.
Favorable Balance of Trade – a country exports more than it imports
Unfavorable Balance of Trade – a country imports more than it exports
Sisal plant
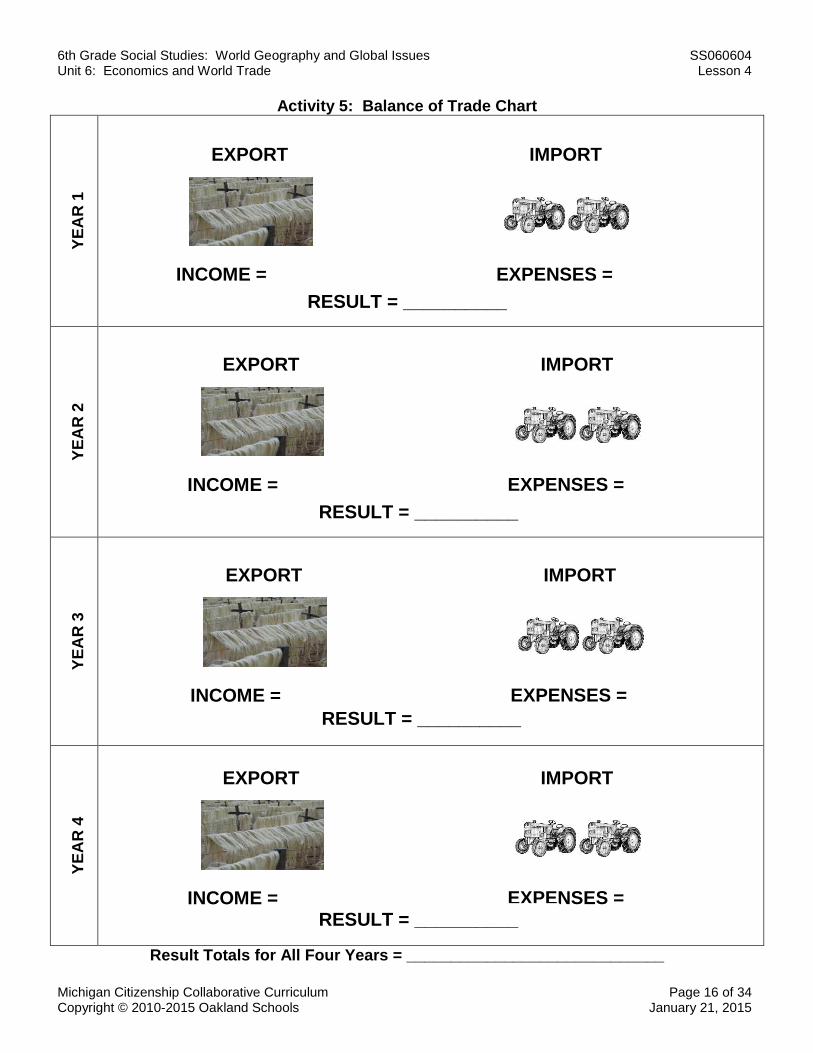
6th Grade Social Studies: World Geography and Global Issues SS060604 Unit 6: Economics and World Trade Lesson 4
Michigan Citizenship Collaborative Curriculum Page 16 of 34 Copyright © 2010-2015 Oakland Schools January 21, 2015
Activity 5: Balance of Trade Chart
YE
AR
1
YE
AR
2
YE
AR
3
YE
AR
4
Result Totals for All Four Years = _____________________________
EXPORT IMPORT
INCOME = EXPENSES =
RESULT = __________
EXPORT IMPORT
INCOME = EXPENSES =
RESULT = __________
EXPORT IMPORT
INCOME = EXPENSES =
RESULT = __________
EXPORT IMPORT
INCOME = EXPENSES = RESULT = __________

6th Grade Social Studies: World Geography and Global Issues SS060604 Unit 6: Economics and World Trade Lesson 4
Michigan Citizenship Collaborative Curriculum Page 17 of 34 Copyright © 2010-2015 Oakland Schools January 21, 2015
Answer Sheet -- Activity 1: Germans in Tanzania 1. What were two reasons European nations began to ‘claim’ colonies in the late 1800s?
To obtain raw materials for industry To have new markets for selling manufactured goods
2. What happened at the Berlin Conference?
The countries of European divided up Africa among themselves. 3. What East African lands did Great Britain claim?
Kenya and Uganda
4. What areas of Africa did Germany claim in addition to Tanzania?
Cameroon, Namibia, Rwanda, Burundi
5. What were two problems caused by the way Europeans set the boundaries of their colonies?
Ethnic groups were split apart. Groups that had been separate political groups were brought together to form one country.
POINT OF VIEW: People view the same event in different ways. Therefore, we say they have a different ‘point of view.’ This is an important concept to understand when studying history. Describe below how you think each of the people listed viewed the Berlin Conference. A leader in Germany:
Answers will vary
A leader in Tanzania: Answers will vary

6th Grade Social Studies: World Geography and Global Issues SS060604 Unit 6: Economics and World Trade Lesson 4
Michigan Citizenship Collaborative Curriculum Page 18 of 34 Copyright © 2010-2015 Oakland Schools January 21, 2015
Answer Sheet – Activity 2: Colonialism and Agriculture Information: During the 1800s, several European countries divided up the continent of Africa in order to colonize it. These countries expected to get both money and raw materials from their colonies. This caused serious problems for African people. They had already established systems of agriculture, trade, government, and so forth. The colonial system forced changes in these cultures. This activity shows how colonial governments forced a change in agriculture in many African cultures. Assume you are a Tanzanian farmer in the times before colonialism. You devote most of your land to growing crops to feed your family. As the colonial power takes over, the colonial government tells you that you will have to pay a tax to the government. How could you get money to pay your tax? Possible Answers: borrow money, sell some of your crops, or sell something you own. The colonial government tells you it will buy cotton if you grow it, and you can use the money to pay your tax. What are you probably forced to grow now? cotton If you decided to grow cotton, you would have to use some of your land for it. How would this affect the amount of food you have for your family? There will be less food. Assume you decided to grow the cotton on part of your land, and you sell it to pay your tax. Next, the colonial government decides to raise the tax. What will this force you to do? Grow more cotton. How will this affect the amount of food you will have for your family? There will be less food. Little by little, more of your land is used for cotton. Before long, that is about all you grow. Now you will have to use the money you earn to do two things:
1. Pay taxes 2. Buy food

6th Grade Social Studies: World Geography and Global Issues SS060604 Unit 6: Economics and World Trade Lesson 4
Michigan Citizenship Collaborative Curriculum Page 19 of 34 Copyright © 2010-2015 Oakland Schools January 21, 2015
Answer Sheet – Activity #3: British Occupation 1. Kenya has more Europeans living there now than Tanzania. Based on what you have read,
what is one reason for this?
Great Britain stressed bringing European settlers to Kenya to live in the fertile areas of the highlands. This was not the case with Tanzania.
2. How did some Tanzanian families manage to pay the taxes imposed by the British?
Men left their homes and looked for jobs in certain areas of Tanzania.
3. What was the main purpose of colonial schools?
The British wanted to educate clerks who could work in the colonial government.
4. What might be some of the reasons the British centered their activities in four main areas?
It made it easier to build railroads and roads because they didn’t have to build them all over Tanzania. Colonial offices and other parts of the government could be centered in just four areas.
5. Why did the British discourage the growth of industry?
They wanted Tanzanians to have to buy manufactured goods from Britain.
Main Ideas: Review the information on the British occupation and then write the main idea of each
of the paragraphs numbered below. Paragraph #3 The British governed Kenya and Tanganyika in different ways. Paragraph #7
Improvements made by the colonial powers were designed to help the colonial government not the people of the colonized country.

6th Grade Social Studies: World Geography and Global Issues SS060604 Unit 6: Economics and World Trade Lesson 4
Michigan Citizenship Collaborative Curriculum Page 20 of 34 Copyright © 2010-2015 Oakland Schools January 21, 2015
Answer Sheet – Activity #4: Post-independence Tanzania, PART 1
PART 1 Following independence Tanzania wanted to foster economic growth and development for its citizens. Describe four problems the nation faced in trying to accomplish this and what had caused the problem.
Problem Cause of the problem
Tanzania had a weak economy. Profits earned during colonial times had not been invested in the Tanzania economy.
Tanzania lacked college graduates and a skilled workforce
The colonial government had only wanted to educate clerks and office helpers.
There was little industry in Tanzania.
The colonial government had discouraged the growth of industry so that Tanzania would have to buy manufactured goods from the colonizing country.
Tanzania had to search for new mineral deposits and develop them.
The colonial powers had extracted many minerals from Tanzania.

6th Grade Social Studies: World Geography and Global Issues SS060604 Unit 6: Economics and World Trade Lesson 4
Michigan Citizenship Collaborative Curriculum Page 21 of 34 Copyright © 2010-2015 Oakland Schools January 21, 2015
Answer Sheet – Activity #4: Post-independence Tanzania, PART 2
Money is used for raw materials for a tire factory
No money left for spare parts for electrical plants
Breakdown in electrical plants
Power cut to all factories
Tire factory cannot operate
Shortage of tires in the country
Trucks can’t get the tires they need
Problems getting goods to market
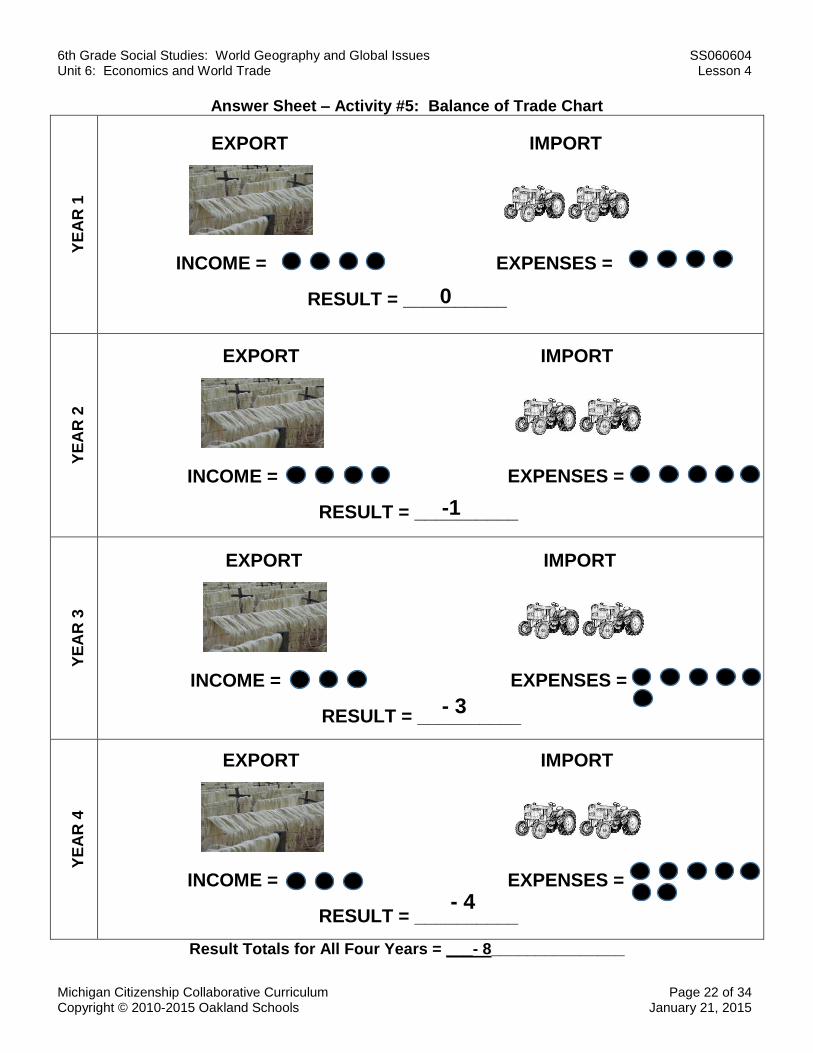
6th Grade Social Studies: World Geography and Global Issues SS060604 Unit 6: Economics and World Trade Lesson 4
Michigan Citizenship Collaborative Curriculum Page 22 of 34 Copyright © 2010-2015 Oakland Schools January 21, 2015
Answer Sheet – Activity #5: Balance of Trade Chart
YE
AR
1
YE
AR
2
YE
AR
3
YE
AR
4
Result Totals for All Four Years = ___- 8_______________
EXPORT IMPORT
INCOME = EXPENSES =
RESULT = __________
EXPORT IMPORT
INCOME = EXPENSES =
RESULT = __________
0
-1
EXPORT IMPORT
INCOME = EXPENSES =
RESULT = __________ - 3
EXPORT IMPORT
INCOME = EXPENSES =
RESULT = __________ - 4

6th Grade Social Studies: World Geography and Global Issues SS060604 Unit 6: Economics and World Trade Lesson 4
Michigan Citizenship Collaborative Curriculum Page 23 of 34 Copyright © 2010-2015 Oakland Schools January 21, 2015
Effects of Imperialism
Directions: Summarize what you have learned by describing five (5) effects of colonialism on the countries of Africa. For each effect give a Tanzanian example as evidence.
EFFECT TANZANIAN EXAMPLE

6th Grade Social Studies: World Geography and Global Issues SS060604 Unit 6: Economics and World Trade Lesson 4
Michigan Citizenship Collaborative Curriculum Page 24 of 34 Copyright © 2010-2015 Oakland Schools January 21, 2015
Sample Answers -- Effects of Imperialism
Directions: Summarize what you have learned by describing five (5) effects of colonialism on the countries of Africa. For each effect give a Tanzanian example as evidence.
EFFECT TANZANIAN EXAMPLE
Boundary problems The boundary set between Tanzania and Kenya split the Masai people in half.
Cash crops were stressed over food crops. Farmers had to grow cotton instead of food in order to raise money to pay taxes.
Africans had to pay taxes to the colonial governments.
People lacked the money to pay the taxes and had to earn it by growing cotton instead of food.
Food shortages People grew cotton instead of food in order to raise money.
Land ownership by Europeans Large sisal and cotton plantations were given to Europeans.
Men had to leave home to find jobs in other areas.
Some men were forced to leave home to find jobs in order to raise money to pay taxes.
Uneven development in regions of the countries The British centered their activities in just four regions. These had better roads, communication, etc.
Lack of transportation networks Roads and railroads were built only to benefit the colonial power. They mainly ran to ports where raw materials could be sent out of Tanzania.
Lack of educational opportunities The colonial government was mainly interested in educating clerks who would work for the government.
Lack of schools and colleges The British had not stressed the building of schools or colleges because education was not a priority.
Lack of industrial growth The British wanted to be able to sell manufactured products to Tanzania so they discouraged industrial growth in the country.
Exploitation of mineral resources Minerals like gold and diamonds were depleted by the Germans and the British.
Weak economies Profits were taken out of Tanzania by the Germans and later the British. This left a weak economy after Independence.
Dependence on agricultural products for export
Industrial growth had been discouraged so Tanzania had mainly agricultural goods like cotton and sisal to export after Independence. This led to an unfavorable balance of trade.

6th Grade Social Studies: World Geography and Global Issues SS060604 Unit 6: Economics and World Trade Lesson 4
Michigan Citizenship Collaborative Curriculum Page 25 of 34 Copyright © 2010-2015 Oakland Schools January 21, 2015
Argument Writing Criteria and Guide
1. Introduce your claim about the extent to which the effects of colonization continue to affect the economies of African countries today.
My Claim is:
2. Support your claim with logical reasoning and relevant, 3. Use words, phrases, and clauses to create cohesion accurate data and evidence that demonstrate an and clarify the relationships among claim(s),reasons and evidence. understanding of the issue.
The best evidence that supports my claim includes: The reasons why each piece of evidence supports my claim:
1 1
2 2
3 3
4. Provide a concluding statement or section that follows from and supports the argument presented.

6th Grade Social Studies: World Geography and Global Issues SS060604 Unit 6: Economics and World Trade Lesson 4
Michigan Citizenship Collaborative Curriculum Page 26 of 34 Copyright © 2010-2015 Oakland Schools January 21, 2015
African Success Stories Presentation Guide
Directions: In your small group, read the text selection on your assigned country. Discuss the project described in the text and how it is helping to solve one or more development problems. Summarize what you have learned by completing the “Summary Chart.” Then, create a plan for presenting the information to the class.
During your presentation you must:
1. Point out the location of your country on a map of Africa.
2. Share two or three important details about your country.
3. Describe the project that is being implemented in your country.
4. Describe the development problem the project is trying to help address.
5. Explain why you think this project will / will not promote economic growth and development.
6. Describe how this project might be extended to other countries of Africa.
PLANNING CHECKLIST
Task
Our group read the text carefully.
Our group discussed the text.
Our group completed the Summary Chart.
Our group created a plan for our presentation.
Our group developed our presentation.
Our group practiced our presentation.

6th Grade Social Studies: World Geography and Global Issues SS060604 Unit 6: Economics and World Trade Lesson 4
Michigan Citizenship Collaborative Curriculum Page 27 of 34 Copyright © 2010-2015 Oakland Schools January 21, 2015
African Success Stories Summary Chart
Important details about the country
Description of project
Description of problem
Reasons why this project will promote economic growth and development
Describe ways the project might be extended

6th Grade Social Studies: World Geography and Global Issues SS060604 Unit 6: Economics and World Trade Lesson 4
Michigan Citizenship Collaborative Curriculum Page 28 of 34 Copyright © 2010-2015 Oakland Schools January 21, 2015
Ghana's Sustained Agricultural Growth At independence, Ghana seemed to have a bright future. Rich in land, timber and gold, it was also the world's leading cocoa producer. The country had one of the best education systems in Africa and, well before independence in 1957, was largely self-governing. The promise vanished as the economy declined, and then all but collapsed in the 1970s amid turbulent politics. Annual cocoa production, once at more than 500,000 tons, was down to less than 170,000 tons by 1983.
At that point, however, the country's fortunes turned around, in the overall economy in general and in the agriculture sector in particular. Over the past 25 years, Ghana has ranked among the top five performers in the world in terms of agricultural growth. Cocoa has recovered, surpassing its previous production levels. Staple food output has risen much faster than the population has grown: by 2005/07, production per person was more than 80% higher than it was in 1981/83. And growth in higher-value vegetables and fruit for domestic and export markets has been encouraging.
Overall sustained economic and agricultural growth has been accompanied by rapid poverty reduction. Growth has created a vibrant market for local farmers, and higher incomes have reduced poverty and greatly improved the demand side of food security.
The share of the population living in poverty fell from 52% in 1991/92 to 28.5% in 2004/06, with rural poverty falling from 64% to 40% over the same period. Child malnutrition has almost halved since the end of the 1980s. Ghana should soon become the first country in Africa to achieve the first Millennium Development Goal (MDG 1) of halving its poverty and hunger.
Ghana was able to turn its agriculture sector around primarily because of the country's economic reforms, which began in 1983. The government's determination and sustained effort, combined with consistent support from the donor community, have been remarkable and have ensured that the reforms have been deep and sustainable. Better technology for cassava and other food crops has helped as well.
Adapted from: “Ghana’s sustained agricultural growth: putting underused resources to work.” Development Progress.
Oct. 2010. 21 January 2015 <http://www.developmentprogress.org/sites/developmentprogress.org/files/ghana_agriculture_0.pdf>.

6th Grade Social Studies: World Geography and Global Issues SS060604 Unit 6: Economics and World Trade Lesson 4
Michigan Citizenship Collaborative Curriculum Page 29 of 34 Copyright © 2010-2015 Oakland Schools January 21, 2015
Empowering Women Farmers in Nigeria
Opening new opportunities for women is a key to development, as well to strengthen efforts to achieve the Millennium Development Goals (MDGs) by 2015. In Nigeria, where cultural attitudes and traditional beliefs often circumscribe women’s roles and hinder access to training and education, a women’s project is changing lives.
The initiative supported by the Japan Women-in-Development Fund, established in cooperation with the United Nations Development Programme (UNDP), is helping women farmers improve their livelihoods. The project is supported by the United Nations Development Fund for Women (UNIFEM) and several Nigerian NGOs.
Women in the Onna Local Government Area in the Niger Delta are receiving technical support through the project to improve cassava production and processing. Cassava tuber roots look similar to a sweet potato and are rich in carbohydrates. The leaves provide about the same amount of protein as an egg. Cassava is processed into high-quality starch, flour and animal feed, and is also used to make products such as paper and gum. The crop is often grown by poor women farmers in Africa, and frequently on marginal land.
The crop is vital for both food security and income generation, especially with rising food commodity prices hitting developing countries hard. Nigeria is the world’s largest producer of cassava, and the government has set up a presidential initiative to promote cultivation of the crop. The women’s initiative builds on this.
An International Institute of Tropical Agriculture (IITA) station in the area has supported the effort by facilitating training workshops on cultivation and processing methods, and providing cassava stems to plant, as well as processing equipment. The local community council donated land for equipment storage.
Women farmers and their families are benefitting from higher crop yields and higher earnings from the sale of cassava products. The project also offers training in economic decision-making and technical and entrepreneurship skills. The network of partners involved, from the local to the international level, are helping women in Nigeria gain a brighter future.
Adapted from: Success Stories. Tokyo International Conference on African Development. 21 April 2014 <http://www.ticad.net/stories/index.html>.

6th Grade Social Studies: World Geography and Global Issues SS060604 Unit 6: Economics and World Trade Lesson 4
Michigan Citizenship Collaborative Curriculum Page 30 of 34 Copyright © 2010-2015 Oakland Schools January 21, 2015
A Millennium Village Thrives in Uganda
Africa faces the greatest challenges of any region in tackling extreme poverty, which afflicts the lives of millions on the continent. Despite stronger economic growth, more than 40 percent of the population of Africa still lives on less than $1 a day, and education and health systems are inadequate in many areas.
As part of the global campaign to achieve development goals, the United Nations Trust Fund for Human Security is supporting the Millennium Villages project.
Working with national governments and local districts, Millennium Villages in 12 poor rural areas in different regions of Africa, comprising 79 villages with a total population of about 400,000 people have been established in cooperation with the local communities to serve as pilots for scaling up the fight against poverty. Plans to establish more villages are under way.
The Millennium Village in Ruhiira, Uganda shows how modest inputs can enable communities to improve their lives and livelihoods.
The village has set up 55 project committees and developed 9 community action plans. Overall, 1,500 people participated in community empowerment training events. Twenty-one people have been trained in business management, and 14 banana marketing groups (356 producers) have been formed with the aim of bulking, reducing the line of middlemen and enabling farmers to earn more income.
Also, 11 micro credit groups, many led by women, have been organized into a village bank with a capital base of $7,000. Women have been trained in making banana beads, enabling them to earn an additional $1.20 a day, and a women’s group built a 500-ton grain storage facility. The community has refurbished or built three schools, and the number of boys and girls enrolled has increased from 1,315 to 2,171, and all students now receive nutritious school meals. The number of girls in school increased from 608 to 1,095.
At the health unit, a new outpatient block was constructed, new staff recruited and essential medicines stocked. Average monthly attendance at clinic increased from 120 to 920 patients.
To improve diets and reduce malnutrition, the village is growing more corn and beans, as well as other fruits, leafy green vegetables and sweet potatoes. Corn production has increased from 43 to 316 tons, and surpluses are marketed. The village has also constructed 8 new water sources.
The project has revealed two important lessons. The first is that when the villagers feel ownership of the project, they are its drivers, and community contributions of resources, funds and time exceed expectations. The second lesson is that promoting community participation requires careful and consistent efforts to cultivate people’s self-confidence and leadership and to earn the community’s trust. Adapted from: Success Stories. Tokyo International Conference on African Development. 21 April 2014
<http://www.ticad.net/stories/index.html>.
6th Grade Social Studies: World Geography and Global Issues SS060604 Unit 6: Economics and World Trade Lesson 4
Michigan Citizenship Collaborative Curriculum Page 31 of 34 Copyright © 2010-2015 Oakland Schools January 21, 2015
Bed Net Factory in Tanzania Combats Malaria
Malaria, a deadly disease spread by mosquitoes, kills over 1 million people annually, and infects between 350 and 500 million people worldwide. Africa bears 90% of the global impact of malaria deaths and illness, and an African child dies from malaria every 30 seconds.
Africa loses an estimated $12 billion each year to the costs of malaria care and reduced productivity. In the hardest hit countries, the disease lowers the growth of GNP (gross national product) by 2% per year. Malaria is a leading cause of death and illness in Tanzania, and accounts for about 40 per cent of all outpatients treated by health services.
Reducing the spread of malaria is one of the Millennium Development Goals, and is a vital step that supports other MDGs, including reducing poverty and child deaths, and achieving universal primary education.
The Arusha net factory in Tanzania is a joint venture by Sumitomo Chemical of Japan and A to Z Textile Mills, a Tanzanian company, that reflects the spirit of the TICAD process.
The factory is producing Olyset long-lasting insecticidal net with technology developed by Sumitomo. The nets are a crucial tool in the fight against malaria in Tanzania and across Africa, and are the only such nets recommended by the World Health Organization manufactured in Africa.
The factory makes 10 million nets per year, and has created over 3,200 jobs supporting at least 20,000 people.
To stem malaria, Africa needs tens of millions of long-lasting insecticidal bed nets every year. The Arusha factory demonstrates that the nets can be produced in Africa, by Africans and for Africans, thanks to a partnership with a Japanese company.
Tanzania is committed to implementing anti-malaria initiatives, including increasing the use of the insecticide treated nets, promoting prompt and effective treatment of malaria, as well as use of preventive treatment of malaria among pregnant women.
Adapted from: Success Stories. Tokyo International Conference on African Development. 21 April 2014
<http://www.ticad.net/stories/index.html>.
6th Grade Social Studies: World Geography and Global Issues SS060604 Unit 6: Economics and World Trade Lesson 4
Michigan Citizenship Collaborative Curriculum Page 32 of 34 Copyright © 2010-2015 Oakland Schools January 21, 2015
Former Soldiers in Sierra Leone Trade Armaments for Development
The recovery of Sierra Leone from a devastating civil war is a vital step for the country and for West Africa. Tens of thousands were killed, and more than 2 million people were displaced during the conflict, which ended in 2002, leaving the country one of the poorest in Africa and the world.
Peace-building activities are laying a foundation for economic growth and strengthening democratic governance. These are essential for enabling communities to improve their lives, reduce poverty, and make progress towards achieving the Millennium Development Goals.
The Arms for Development project is a joint initiative of the Government of Sierra Leone and the United Nations Development Programme. Japan is supporting the project as part of efforts to promote consolidation of peace and democratization in Africa, which is a major priority of the Fourth Tokyo International Conference on African Development (TICAD IV).
The project is promoting conditions for lasting peace, human security and socio-economic development. It encourages former soldiers to turn in weapons in exchange for help with community development initiatives. It is also building two border posts, one on the border with Liberia and the other on the border with Guinea.
So far, the project has raised awareness about the dangers posed by illicit small arms and light weapons, and helped communities in border areas understand the need to reduce crime. Voluntary surrender of arms in exchange for assistance with development projects is underway in 22 areas.
The project has enabled one area to construct four classrooms for 120 pupils and toilet facilities. Local women championed the initiative so that girls can attend senior secondary school within their community rather than in urban areas. The local classes reduce families’ financial burden for their children’s education. The village of Masimgbi also constructed and equipped four classrooms and a principal’s office.
Five communities have built community centers to improve recreation facilities for teenagers, providing them with local opportunities for local activities, rather than heading for urban areas. The centers are also used for community meetings.
The project has also assisted the expansion of a health center with construction of a ward for 20 patients. Plans are underway for the Ministry of Health to provide additional staff and drugs for the health center.
Adapted from: Success Stories. Tokyo International Conference on African Development. 21 April
2014 <http://www.ticad.net/stories/index.html>.
6th Grade Social Studies: World Geography and Global Issues SS060604 Unit 6: Economics and World Trade Lesson 4
Michigan Citizenship Collaborative Curriculum Page 33 of 34 Copyright © 2010-2015 Oakland Schools January 21, 2015
Improving Energy Access in Burkina Faso
In rural homes across Africa there is no connection to the electrical grid, so preparing meals and other work at home are laborious tasks for women. They spend up to six hours per day collecting firewood, fetching water, husking and pounding grain, with no time left for outside employment. Girls often perform poorly in school due to inconsistent attendance, and are forced to drop out to help their mothers.
In Burkina Faso and other countries in West Africa, the Multi-Functional Platform is empowering women and their communities, bringing new economic opportunities. Japan, in cooperation with the United Nations and other partners is assisting the initiative.
The platform is powered by a diesel engine mounted on a chassis, to which a variety of processing equipment can be attached, including cereal mill, husker, battery charger, and joinery and carpentry equipment.
With the platform, tasks such as milling and husking sorghum, millet, maize and other grains become profitable economic activities. The platform also generates electricity for lighting, refrigeration and to pump water. This helps provide clean water to communities along with improved health care and education services.
Women now have more hours in the day to develop profitable activities to boost their productivity. They are able to sell better quality products and increase their income using low-cost, effective technology.
In Burkina Faso, a survey found that 19 platforms helped local communities earn more than $500,000 in one year. Families are escaping poverty, with more money for food, clothing, and children’s education.
The platform is bringing big benefits for girls, who can devote less time to work at home and increase their school attendance and improve their grades and academic achievement.
As Burkina Faso sets it sights on achieving the Millennium Development Goals, the platform is making an important contribution. As a result, plans are underway to expand the pilot project to national scale and install 400 platforms in five regions.
Lessons learned from this initiative can serve as the basis to expand the approach across Sub Saharan Africa, where an estimated 100 million people in rural areas could benefit.
Adapted from: Success Stories. Tokyo International Conference on African Development. 21 April 2014 <http://www.ticad.net/stories/index.html>.

6th Grade Social Studies: World Geography and Global Issues SS060604 Unit 6: Economics and World Trade Lesson 4
Michigan Citizenship Collaborative Curriculum Page 34 of 34 Copyright © 2010-2015 Oakland Schools January 21, 2015
Rubric for Presentations
Scoring Guide
3 – Good
2 – Fair
1 – Needs Work
Group Content
(What they said) Delivery
(How they said it) Comments

6th Grade Social StudiesUnit 6, Lesson 4:
How did imperialism affect the future economic growth
and development of colonized countries?
1

2
Less Economically Developed Countries

3
Less Economically Developed Countries
More Economically Developed Countries

4
Gross Domestic Product

5
Human Development Index
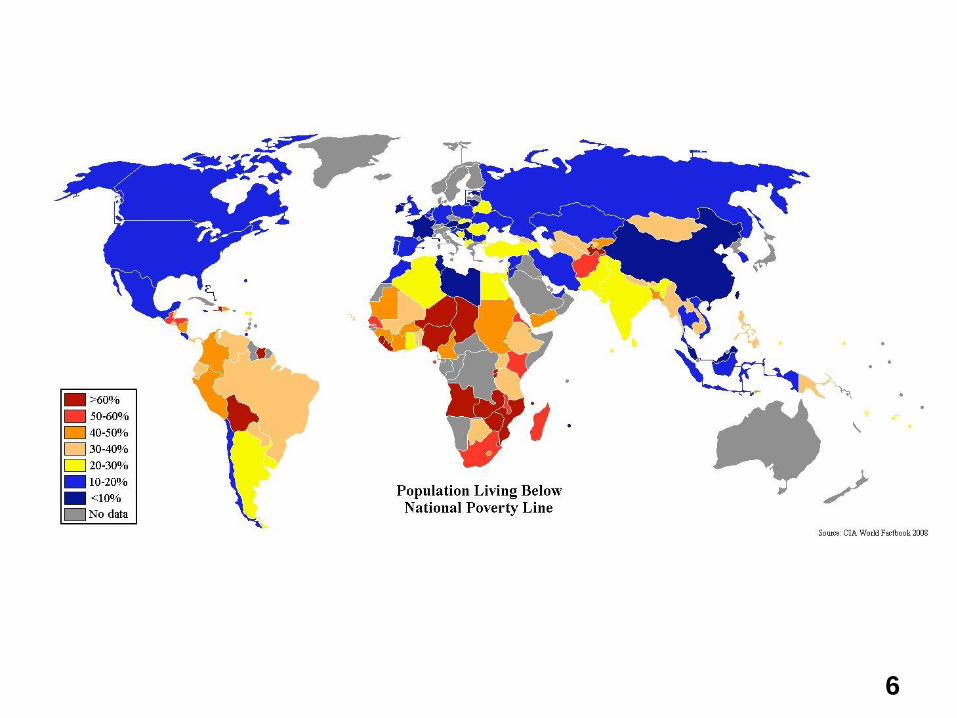
6
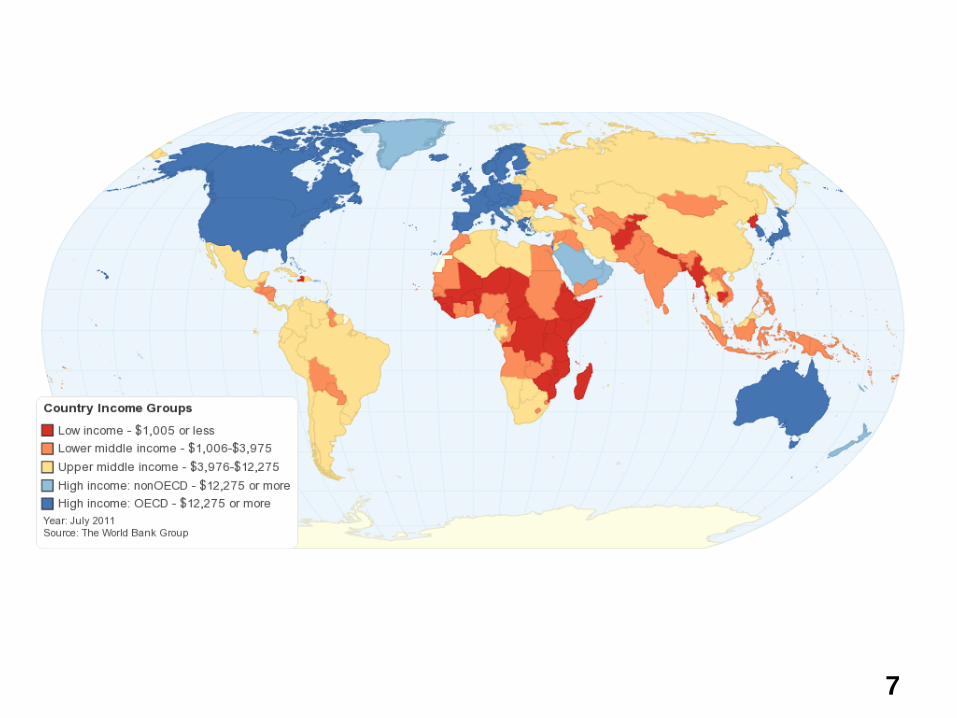
7

8
Turn and Talk:• What kind of map is this?• What type of information does it contain?• What story does this map tell?

9
1700200019001800
Independence
Colonization of North America begins
First Industrial Revolution 1712-1830
Development of textile industry and
steam power
World War I1914-1918
American Civil War
1861-1865
The Tea Act and the Boston Tea Party

10
1700 200019001800
Second Industrial Revolution
Electricity and Chemicals1875-1905
• 1879 – Thomas Edison invents the incandescent light bulb
• 1903 – The Wright Brothers make the first successful airplane flight
First Industrial Revolution Textiles and Steam
1712-1830
• 1712 – The Newcomen steam engine
• 1793 – Eli Whitney patents the cotton gin.
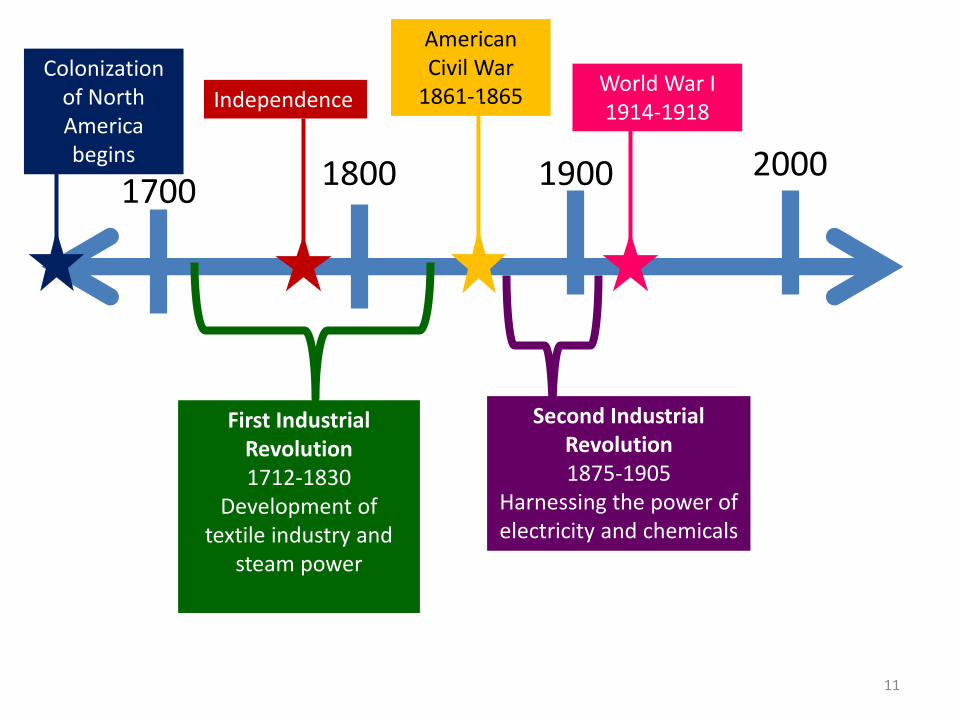
11
1700200019001800
Independence
Colonization of North America begins
Second Industrial Revolution 1875-1905
Harnessing the power of electricity and chemicals
First Industrial Revolution 1712-1830
Development of textile industry and
steam power
World War I1914-1918
American Civil War
1861-1865
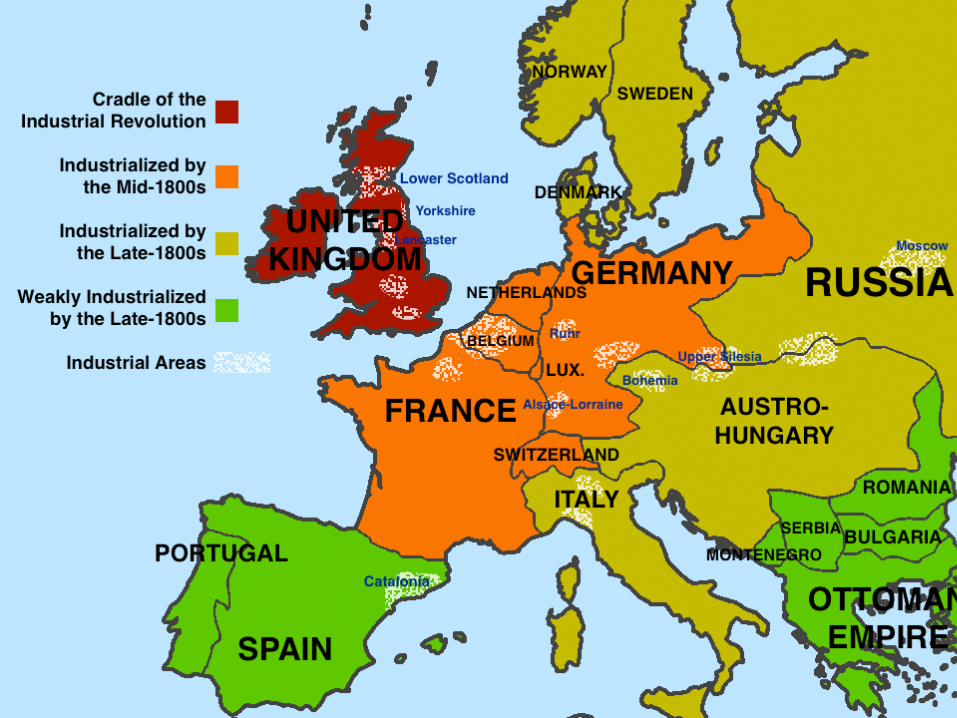
12

13
Discussion Questions:
• What information does this map contain?
• To what extent did European countries colonize Africa?

14

15

16
Was the colonization of Africa a necessary evil?

17
Property of Oakland Schools
Author: Carol EgboEditor: Amy Bloom
Copyright © 2010-2015 Oakland Schools

6th Grade Social Studies: World Geography and Global Issues SS060605 Unit 6: Economics and World Trade Lesson 5
Michigan Citizenship Collaborative Curriculum Page 1 of 10 Copyright © 2010-2015 Oakland Schools January 21, 2015
Lesson 5: Why Do Countries Trade?
Big Ideas of the Lesson
Countries trade with each other for the same reasons people trade with each other. They do not have the resources or capability to satisfy their own needs and wants.
Countries have been trading with each other for thousands of years because trade benefits trading partners.
Improvements in communication and transportation have greatly changed global trade.
Over time the speed, volume, geographic range, diversity and complexity of global trade have increased.
Countries specialize in the goods they can produce most efficiently and trade to get other goods they want or need.
Specialization and trade make the countries of the world interdependent.
Lesson Abstract: In this lesson students investigate how and why countries actively participate in global trade. The lesson begins with a simple trading simulation. Students then examine the role of currency and exchange rates in global trade. After exploring how improvements in transportation and communication have affected global trade, students use cartograms and other data students to investigate the concept of specialization. Finally, students examine the complex nature of global trade through a mapping activity relating to the manufacture of Levi’s jeans. Content Expectations: Grades 6 and 7 – H1.4.2; H1.4.3; G1.2.6; G1.3.3; G2.2.2; G4.2.1;
G4.4.1; E3.1.2 Grade 6 – C4.3.1; E3.1.1 Grade 7 – E3.1.1; E2.3.1
Common Core State Standards for Literacy in History and Social Studies: RH.6-8.1, 2, 4, and 7; WHST.6-8.9. Key Concepts balance of trade interdependence specialization global trade Teacher Note: Prior to beginning this lesson, ask each student to bring in four small items to trade. Possible items include pieces of candy, pencils, cookies, small amounts of popcorn in plastic bags, etc. It may be helpful for the teacher to have some additional items on hand so that if a student forgets, they can still participate in the lesson simulation. Lesson Sequence 1. Begin the lesson by writing the word “globalization” on the board (this term has been used
multiple times in the previous units). Ask students to write what the word globalization means to
6th Grade Social Studies: World Geography and Global Issues SS060605 Unit 6: Economics and World Trade Lesson 5
Michigan Citizenship Collaborative Curriculum Page 2 of 10 Copyright © 2010-2015 Oakland Schools January 21, 2015
them in their Global Investigator’s Notebook (GLIN). Give students time to think and write. Then, have them share ideas with a partner and then with the whole class. Guide students to recognize that globalization is the worldwide movement toward economic, financial, trade, and communications integration (see Word Card #27). Next, ask students to list the factors that have led to globalization in their GLIN. After students have a chance to write, have them share their list with a partner and discuss the factors with the whole class. Some factors that have led to globalization include improvements in communication, improvements in transportation, and the existence of global problems that affect all countries. If students have not listed expanded global trade as a factor make sure to add this factor to the list. Then, explain that in this lesson students will explore how and why countries participate in the complex system of global trade.
2. Display the PowerPoint (Unit 6, Lesson 5) to the class. Use Slide 1 to introduce the lesson
question to students. Give each student a copy of the “Trading Simulation” sheet located in the Supplemental Materials (Unit 6, Lesson 5). Show students Slide 2, which also shows this resource. Divide students into trading groups of five or six students each and have them bring their four trading items referenced above. If students do not have trading items, supply them for students. Explain to the class that there will be two rounds of trading in this simulation. Instruct students to divide their four trading items into groups of 2 items each for each trading round.
3. Display Slide 3 and have students complete the first box on the “Trading Simulation” sheet as shown by the arrow on the slide. Move to Slide 4 and explain that students can now begin to trade with members of their group. Give a reasonable amount of time for the trading, about 3-5 minutes. Then, display Slide 5 and have students complete the second box on the sheet which requires students to list the items they ended up with after the trading session.
4. Display Slide 6 to show students where to write comments about the trading experience. Give them time to record their thoughts. Then, use the following questions to discuss their comments.
Why did you agree to trade for certain items?
Did you keep any of your own items? Why?
Did anyone refuse to trade with you? Why do you think they did not want to trade? 5. Using Slides 7 and 8, complete the second round of training but this time, allow students to
trade with anyone in the class. Be sure students complete the second round box on the “Trading Simulation” sheet.
6. Display Slide 9 and have students complete the final two boxes on the “Trading Simulation” sheet. Then, discuss their answers to the two questions in the boxes. In your discussion make sure to stress the following points:
Trade benefits both partners.
Having more trading partners increases the variety and amount of trading items available. 7. Give each student a copy of the “PowerPoint Notes” located in the Supplemental Materials
(Unit 6, Lesson 5). Remind students that in the trading simulation they were trading, or

6th Grade Social Studies: World Geography and Global Issues SS060605 Unit 6: Economics and World Trade Lesson 5
Michigan Citizenship Collaborative Curriculum Page 3 of 10 Copyright © 2010-2015 Oakland Schools January 21, 2015
bartering, goods for goods. Display Slide 10 and have them answer the question at Number 1 on their PowerPoint Notes. Then, have them discuss the reasons people usually trade money for goods instead of goods for goods.
8. Display Slide 11 and have students describe what the slide shows by completing Number 2 on their PowerPoint Notes. Then, pose and discuss the following question: How might the fact that every country has its own currency affect global trade (Word Card # 28)? Using Word Cards #29 and #30, explain that not all countries’ currency is of the same value. Exchange rates allow people to measure and equate the currencies of different countries. This enables different countries to purchase goods from other countries.
9. Display Slide 12. Explain to the class that, as students complete this lesson and Lesson 6, they will be tracking the exchange rates for various currencies. Also post a copy of the “Exchange Rate Tracker,” located in the Supplemental Materials (Unit 6, Lesson 5) in the room so students can add data to the chart.
10. Divide students into pairs and give each pair a copy of the “Exchange Rate Tracker – Partner
Data” sheet located in the Supplemental Materials (Unit 6, Lesson 5). Display Slide 13, which shows this resource. Assign each pair to one of the currencies listed on the chart used in Step 9. Teacher Note: The classroom chart contains two extra rows in case a few students want to track additional currencies to investigate.
11. Have students write today’s date on the first row of their chart. Working with a partner, have students use the website, http://www.oanda.com/currency/converter/ located at the top of the “Exchange Rate Tracker – Partner Data” to find the exchange rate for their assigned currency for today’s date and record it on their sheet. Record students’ findings on the “Exchange Rate Tracker” that is posted in the classroom. Have students engage in this activity each day until they have completed their handout. Teacher Note: Another way to do this activity is to pre-select dates and have students record the exchange rates for their currency using the website: http://www.oanda.com/currency/converter/. Have students use the “Recent Trends” graph, which looks like this:
12. After students have completed their handout for the day “Exchange Rate Tracker – Partner
Data,” engage students in a brief discussion after all currencies are listed on the posted group chart for “Exchange Rate Tracker.” This chart was posted in the classroom as described in

6th Grade Social Studies: World Geography and Global Issues SS060605 Unit 6: Economics and World Trade Lesson 5
Michigan Citizenship Collaborative Curriculum Page 4 of 10 Copyright © 2010-2015 Oakland Schools January 21, 2015
Step 9. Explain to students that they will continue to add to their data each day.
13. Display Slide 14 and ask students to answer the question on the slide by completing Number 3 on their “PowerPoint Notes.” Discuss their answers. Then, display Slide 15 to show the class the animation of the expansion of trade routes from 3500 BCE to 1500 CE. Ask students how they think this expansion affected people and cultures. After eliciting several answers, explain that although the reasons countries trade have remained much the same, trade itself has greatly changed. Using Slides 16-21, discuss these changes. Make sure to stress ways these changes directly affect them as consumers for each slide. For example, the expansion of the geographic range of trade means students can get goods from places much farther away than in the past.
14. Display Slide 22 and discuss students’ answers to the question on the slide. Then, use Slides 23 and 24 to discuss how improvements in communication and transportation have led to many of the changes discussed in the previous slides.
15. Display Slides 25 and 26 to use the example of container ships to demonstrate improvement in transportation. Explain that one container is known as a TEU (Twenty-foot Equivalent Unit.) In the 1950s, the average container ship carried a maximum of 800 containers. Today a container ship can carry 18,000 containers.
16. Refer back to the simulation you began the lesson with and review how expanding the number of trading partners gave students more choice in goods. Then, discuss how the U.S. benefits from trading with many different countries. Explain that, like all countries, the U. S. trades with some countries more than others.
17. Display Slide 27 and have students predict and list the top five trading partners of the U.S. by completing the left side of the chart at Number 4 on their “PowerPoint Notes.”
18. Display Slides 28 – 32 to reveal the actual top five and have students write the country names on the right side of the chart at Number 4 on their “PowerPoint Notes.” Discuss possible reasons that these five countries are the top trading partners of the U.S. Note that reasons include proximity to the U.S. (Canada and Mexico) and availability of inexpensive goods (China).
19. Using Slide 33, review the terms “export” and “import” from the previous lesson. Also review the term “balance of trade” with the class. Give each student a copy of the “Trade Data for 2013” activity sheet located in the Supplemental Materials (Unit 6, Lesson 5). Slide 34 shows this resource. Have students independently complete the activity. An answer sheet has been included in the Supplemental Materials (Unit 6, Lesson 5). You may wish to assign this activity as homework. Discuss the questions included on the “Trade Data for 2013” activity sheet in the large group after students have completed the assignment.
20. Display Slide 35 and explain that this cartogram shows the export of a particular product. Guide students in identifying countries that export a lot of the item such as the U.S. as well as countries that export very little such as the countries of Africa. Then, have students predict what the export item is by completing Number 5 on their “PowerPoint Notes.” Discuss their
6th Grade Social Studies: World Geography and Global Issues SS060605 Unit 6: Economics and World Trade Lesson 5
Michigan Citizenship Collaborative Curriculum Page 5 of 10 Copyright © 2010-2015 Oakland Schools January 21, 2015
predictions and then display Slide 36 to reveal that the item is ‘cereals.’
21. Display Slide 37 and have students answer the question on the slide by completing Number 6 on their “PowerPoint Notes.” Then, discuss their answers. Give each student a copy of the “Top U.S. Exports, 2013” data chart located in the Supplemental Materials (Unit 6, Lesson 5). Note that Slide 38 shows this resource. Have students highlight or mark each export they correctly listed at Number 6. Use the following questions to discuss the export data:
In general, how would you describe the type of items the U.S. exports?
How many of these exports are made in Michigan?
Were there any exports you were surprised to see on the list? Which ones? 22. Explain that countries like the U.S. have a large population and people who want a lot of goods.
Display Slide 39 and ask why a country like the U.S. would export some goods instead of keeping them all in the U.S. Have students identify possible reasons by completing Number 7 on their “PowerPoint Notes.”
23. Using Slides 40-43 explore various reasons that countries export goods. At Slide 42, make sure to connect back to the beginning of the lesson when students explored different currencies and the concept of ‘exchange rate.’
24. Using Word Card #32 and Slide 44 discuss the term “specialization” and how countries specialize in making the goods they can produce most efficiently. Display Slide 45 and discuss how specialization leads to trade.
25. Display Slide 46 and explain that this cartogram shows the import of a particular good. Guide students in identifying countries that import a lot of the item such as the U.S. as well as countries that import very little such as China. Then, have students predict what the import item is by completing Number 8 on their “PowerPoint Notes.” Discuss their predictions and then display Slide 47 to reveal that the item is clothing.
26. Display Slide 48 and guide students in identifying countries that are major exporters of clothing. Note that you may wish to have students search clothing labels at home as a supplemental activity.
27. Display Slide 49 and read the statement on the slide. Ask students to explain whether they agree or disagree with the statement by completing Number 9 on their “PowerPoint Notes.” Discuss their ideas. Guide students to the idea that the U.S. is certainly capable of producing clothing but chooses to import clothing instead. Ask students to identify possible reasons for this.
28. Display Slide 50 and guide students in analyzing the information on the slide. Discuss the information using these questions:
What appears to be the biggest reason it is cheaper to make a shirt in Bangladesh?
Why would labor costs be so much lower in Bangladesh?
How do you think wages compare in the U.S, and Bangladesh?
How do you think working conditions compare in the U.S. and Bangladesh?
If the U.S. decided to stop importing clothes and increase the manufacturing of clothing in

6th Grade Social Studies: World Geography and Global Issues SS060605 Unit 6: Economics and World Trade Lesson 5
Michigan Citizenship Collaborative Curriculum Page 6 of 10 Copyright © 2010-2015 Oakland Schools January 21, 2015
the U.S., what is likely to happen to the price of clothing? 29. Display Slide 51 and have students answer the question on the slide by completing Number 10
on their “PowerPoint Notes.” Then, discuss their answers with the whole class. 30. Display Slide 52 and ask students to analyze the cartogram showing an import. Then, display
Slide 53 which shows the export of the same item. Ask students to predict what good is represented on the cartograms. Display Slide 54 and discuss how these cartograms show the import and export of toys.
31. Using Slides 55 – 60 repeat the process used in Step 30 to discuss the import and export cartograms for cars and electronics.
32. Give each student a copy of the “Top U.S. Imports, 2013” data chart located in the Supplemental Materials (Unit 6, Lesson 5). Note that Slide 61 shows this resource. Use the following questions to discuss the import data:
In general, how would you describe the types of items the U.S. imports?
How many of these imports are part of your everyday life?
Why does the U.S. export and import some of the same items like cars?
Were there any imports you were surprised to see on the list? Which ones? 33. Display Slide 62 and discuss the logos on the slide using the following questions:
Why would some people support a “Buy American” campaign?
What would buying American goods have to do with protecting jobs?
What would happen if we stopped trading with other countries and became dependent on only American goods?
34. Explain that despite the fact that trade can affect things like jobs, the U.S. and other countries
of the world continue to import goods. Display Slide 63 and ask students to identify reasons countries import by completing Number 11 on their “PowerPoint Notes.” Then, discuss their ideas.
35. Using Slides 64-66 explore various reasons that countries import goods.
36. Display Slide 67 and ask students to describe the item in the photograph. Explain that product labels can be somewhat misleading because many products are just assembled in a particular country but their parts come from many different places. Display Slide 68 and discuss how this process makes trade increasingly complex.
37. Display Slide 69 and remind students that in the lesson on cultural diffusion they explored how jeans were invented in the U.S. and then spread throughout the world. Ask students to answer the question on the slide by completing Number 12 on their “PowerPoint Notes.”
38. Display Slide 70 to reveal that most Levi’s jeans are made outside of the United States now. Give each student a copy of the “Where are Levi’s Jeans Made?” map activity located in the Supplemental Materials (Unit 6, Lesson 5). Slide 71 shows this resource.

6th Grade Social Studies: World Geography and Global Issues SS060605 Unit 6: Economics and World Trade Lesson 5
Michigan Citizenship Collaborative Curriculum Page 7 of 10 Copyright © 2010-2015 Oakland Schools January 21, 2015
39. Explain that students should read through the sequence showing how Levi’s jeans are made and then add arrows and the numbers from the top of the page to the map to show the sequence. Make sure they have access to a map showing the countries of Asia.
40. Give students time to complete the activity. Then, display Slide 72 and have students compare the map on the slide to the one they created in Step 39. Unless you are using the map for evaluation purposes, allow them to make changes as needed.
41. Using Slides 73 and 74, discuss how specialization leads to trade and in turn trade leads to interdependence. Then, have students complete the graphic organizer at Number 13 on their “PowerPoint Notes.”
42. Display the summary data from the “Exchange Rate Tracker” that students have been collecting throughout the lesson. Discuss the data using the following questions:
Which currencies had the biggest changes in exchange rate?
Which currencies had the least?
How might these changes affect trading in countries? Remind students that they will be continuing to collect exchange rate data throughout the next lesson.
Reference Section
Content Expectations 6 and 7 Describe and use themes of history to study patterns of change and continuity. H1.4.2: 6 and 7 Use historical perspective to analyze global issues faced by humans long ago and H1.4.3: today. 6 and 7 Apply the skills of geographic inquiry (asking geographic questions, acquiring G1.2.6: geographic information, organizing geographic information, analyzing geographic
information, and answering geographic questions) to analyze a problem or issue of importance to a region of the world.
6 and 7 Explain the different ways in which places are connected and how those connections G1.3.3: demonstrate interdependence and accessibility. 6 and 7 Explain that communities are affected positively or negatively by changes in G2.2.2: technology.1 6 and 7 List and describe the advantages and disadvantages of different technologies used G4.2.1: to move people, products, and ideas throughout the world.2
1 The examples have been removed from this expectation for clarity.

6th Grade Social Studies: World Geography and Global Issues SS060605 Unit 6: Economics and World Trade Lesson 5
Michigan Citizenship Collaborative Curriculum Page 8 of 10 Copyright © 2010-2015 Oakland Schools January 21, 2015
6 and 7 Identify factors that contribute to conflict and cooperation between and among G4.4.1: cultural groups (control/use of natural resources, power, wealth, and cultural
diversity). 6 – C4.3.1: Explain the geopolitical relationships between countries. 7 – E2.3.1: Explain how national governments make decisions that impact both that country and
other countries that use its resources (e.g., sanctions and tariffs enacted by a national government to prevent imports, most favored trade agreements, the impact China is having on the global economy and the U.S. economy in particular).
6 – E3.1.1: Use charts and graphs to compare imports and exports of different countries in the
world3 and propose generalizations about patterns of economic interdependence. 7 – E3.1.1: Explain the importance of trade (imports and exports) on national economies. 6 and 7 Diagram or map the movement of a consumer product from where it is manufactured E3.1.2: to where it is sold to demonstrate the flow of materials, labor, and capital (e.g., global
supply chain for computers, athletic shoes, and clothing). Common Core State Standards for Literacy in History and Social Studies RH.6-8.1: Cite specific textual evidence to support analysis of primary and secondary sources. RH.6-8.2: Determine the main ideas or information of a primary or a secondary source; provide
an accurate summary of the source distinct from prior knowledge or opinions. RH.6-8.4: Determine the meaning of words and phrases as they are used in a text, including
vocabulary specific to domains related to history/social studies. RH.6-8. 7: Integrate visual information (e.g., in charts, graphs, photographs, videos, or maps) with
other information in print and digital texts. WHST.6-8.9: Draw evidence from informational texts to support analysis reflection, and research.
2 The sixth grade examples include: “call centers in the Eastern Hemisphere that service the Western Hemisphere; the United States and Canada as hubs for the Internet; transport of people and perishable products; and the spread of individuals’ ideas as voice and image messages on electronic networks such as the Internet.” The seventh grade examples include “opportunities for employment, entrepreneurial and educational opportunities using the Internet; the effects of technology on reducing the time necessary for communications and travel; the uses and effects of wireless technology in developing countries; and the spread of group and individual’s ideas as voice and image messages on electronic networks such as the Internet.” 3 The phrase “western hemisphere” has been replaced with “world” to provide students with a global perspective.

6th Grade Social Studies: World Geography and Global Issues SS060605 Unit 6: Economics and World Trade Lesson 5
Michigan Citizenship Collaborative Curriculum Page 9 of 10 Copyright © 2010-2015 Oakland Schools January 21, 2015
Instructional Resources Equipment/ Manipulative Global Investigator’s Notebook World atlas or a map of Asia with countries labeled
Student Resource A student geography textbook such as Wiggins, Grant, et al. My World Geography: Boston, MA:
Pearson, 2011, 66-67. Teacher Resource A Brief History of Money. Young Explorers. The British Museum. 21 January 2015
<http://www.britishmuseum.org/explore/young_explorers/discover/videos/a_brief_history_of_money.aspx>.
Bangladesh vs. the U.S.: How much does it cost to make a denim shirt? CNN. 21 January 2015
<http://www.cnn.com/2013/05/02/world/asia/bangladesh-us-tshirt/index.html?sr=sharebar_google>.
Buy American Logos. Word Press. 21 January 2015
<http://rixxblog.files.wordpress.com/2011/11/buy-american.jpg>. Car Exports Cartogram. World Mapper. 21 January 2015
<http://worldmapper.org/images/largepng/77.png>. Car Imports Cartogram. World Mapper. 21 January 2015
<http://worldmapper.org/images/largepng/78.png>. Cereals Exports. World Mapper. 21 January 2015
<http://worldmapper.org/images/largepng/47.png>. Clothing Exports Cartogram. World Mapper. 21 January 2015
<http://www.worldmapper.org/display.php?selected=83>. Clothing Graphic. Word Press. 21 January 2015
<http://heelsandheadphones.files.wordpress.com/2011/10/clothes.jpg>. Clothing Imports Cartogram. World Mapper. 21 January 2015
<http://worldmapper.org/images/largepng/84.png>. Currency Converter. Oanda. 21 January 2014 <http://www.oanda.com/currency/converter/>. Different Kinds of Currency. Dreamstime. 21 January 2015
<http://thumbs.dreamstime.com/z/international-currency-banknotes-different-world-countries-30003776.jpg>.
Egbo, Carol. Supplemental Materials (Unit 6, Lesson 5). Teacher-made materials. Oakland
Schools, 2015.

6th Grade Social Studies: World Geography and Global Issues SS060605 Unit 6: Economics and World Trade Lesson 5
Michigan Citizenship Collaborative Curriculum Page 10 of 10 Copyright © 2010-2015 Oakland Schools January 21, 2015
- - - . PowerPoint (Unit 6, Lesson 5). Teacher-made materials. Oakland Schools, 2015. Electronics Exports. World Mapper. 21 January 2015
<http://worldmapper.org/images/largepng/89.png>. Electronics Imports. World Mapper. 21 January 2015
<http://worldmapper.org/images/largepng/90.png>. From fiber to fashion: Unzipping the apparel global value chain.” Asian International Economists
Network. 5 July 2013. 21 January 2015 <http://aienetwork.org/infographic/12/from-fiber-to-fashion-unzipping-the-apparel-global-value-chain>.
“Germany: CTA Handles Its First 13,000 TEU Ship.” World Maritime News. 21 January 2015
<http://worldmaritimenews.com/archives/51942/germany-cta-handles-its-first-13000-teu-ship/>.
Kremer, William. “How much bigger can container ships get?” BBC News Magazine. 21 January
2015 <http://www.bbc.com/news/magazine-21432226>. Made in Cambodia Label. Flickr. 21 January 2015
<https://www.flickr.com/photos/cambodia4kidsorg/74486342/>. Money Through the Ages. A History of Money. YouTube. 21 January 2015
<http://www.youtube.com/watch?v=3FMHh6T86GE>. Sherratt, Andrew. Trade Routes: Growth of Global Trade. Archatlas. 21 January 2015
<http://www.archatlas.org/Trade/Trade.php?Reload=Reload>. Top Trading Partners. Foreign Trade. U.S. Census Bureau. 21 January 2015
<http://www.census.gov/foreign trade/statistics/>. Toy Exports Cartogram. World Mapper. 21 January 2015
<http://worldmapper.org/images/largepng/57.png>. Toy Imports. World Mapper. 21 January 2015
<http://www.worldmapper.org/display.php?selected=58>. Trade Data. U.S. Census. 21 January 2015 <http://www.census.gov/foreign-
trade/statistics/highlights/top/top1312yr.html>. U.S. Exports to the World. U.S. Census Bureau. 21 January 2015 <http://www.census.gov/foreign-
trade/statistics/product/enduse/exports/c0000.html>. U.S. Imports. U.S. Census Bureau. 21 January 2015 <http://www.census.gov/foreign-
trade/statistics/product/enduse/imports/c0000.html>.

6th Grade Social Studies: World Geography and Global Issues SS060605 Unit 6: Economics and World Trade Lesson 5
Michigan Citizenship Collaborative Curriculum Page 1 of 14 Copyright © 2010-2015 Oakland Schools January 21, 2015
Graphic Organizer
SPECIALIZATION
TRADE
INTERDEPENDENCE

6th Grade Social Studies: World Geography and Global Issues SS060605 Unit 6: Economics and World Trade Lesson 5
Michigan Citizenship Collaborative Curriculum Page 2 of 14 Copyright © 2010-2015 Oakland Schools January 21, 2015
Big Idea Card
Big Ideas of Lesson 5, Unit 6
Countries trade with each other for the same reasons people trade with each other. They do not have the resources or capability to satisfy their own needs and wants.
Countries have been trading with each other for thousands of years because trade benefits trading partners.
Improvements in communication and transportation have greatly changed global trade.
Over time the speed, volume, geographic range, diversity and complexity of global trade have increased.
Countries specialize in the goods they can produce most efficiently and trade to get other goods they want or need.
Specialization and trade make the countries of the world interdependent.

6th Grade Social Studies: World Geography and Global Issues SS060605 Unit 6: Economics and World Trade Lesson 5
Michigan Citizenship Collaborative Curriculum Page 3 of 14 Copyright © 2010-2015 Oakland Schools January 21, 2015
Word Cards
27 integration combining parts so that they work together Example: The integration of communication and transportation systems across the planet has made global trade possible.
(SS060605)
28 global trade the exchange of goods or services between individuals, organizations, or governments of different nations Example: Many nations of the world participate in global or international trade.
(SS060605)
29 currency money; a medium of exchange Example: Each country has its own type of currency.
(SS060605)
30 exchange rate an amount of domestic currency compared to an equivalent amount of foreign currency Example: The exchange rate today was one U.S. dollar to about 6 Chinese Yuan.
(SS060605)
31 Euro a single currency shared by many countries that belong to the European Union Example: The Euro is the official currency in countries such as France, Spain and Germany.
(SS060605)
32 specialization a method of production where a country focuses on the production of a limited scope of products in order to gain greater degrees of efficiency
Example: Specialization is the basis of global trade.
(SS060605)
1 $ = ??? Euros

6th Grade Social Studies: World Geography and Global Issues SS060605 Unit 6: Economics and World Trade Lesson 5
Michigan Citizenship Collaborative Curriculum Page 4 of 14 Copyright © 2010-2015 Oakland Schools January 21, 2015
33 interdependence the condition when countries are dependent on other each other for products they cannot produce efficiently for themselves
Example: Interdependence happens as a result of specialization.
(SS060605)

6th Grade Social Studies: World Geography and Global Issues SS060605 Unit 6: Economics and World Trade Lesson 5
Michigan Citizenship Collaborative Curriculum Page 5 of 14 Copyright © 2010-2015 Oakland Schools January 21, 2015
TRADING SIMULATION
ROUND 1
What did you start with?
What did you end with?
Comments on the trading: ROUND 2
What did you start with?
What did you end with?
Comments on the trading:
THINKING ABOUT THE SIMULATION
How was trading different in ROUND 2?
What did you learn about trading?

6th Grade Social Studies: World Geography and Global Issues SS060605 Unit 6: Economics and World Trade Lesson 5
Michigan Citizenship Collaborative Curriculum Page 6 of 14 Copyright © 2010-2015 Oakland Schools January 21, 2015
PowerPoint Notes
1. Why do we usually use money instead of trading goods for goods? 2. What is shown on the slide (Slide 11)?
3. Is global trade something new??? ______ yes _____ no Give evidence for your answer: 4. What are the top five trading partners of the United States?
PREDICTION ACTUAL
1 1
2 2
3 3
4 4
5 5
5. What export do you think the cartogram on Slide 35 shows?
6. What do you think are other major U.S. exports?

6th Grade Social Studies: World Geography and Global Issues SS060605 Unit 6: Economics and World Trade Lesson 5
Michigan Citizenship Collaborative Curriculum Page 7 of 14 Copyright © 2010-2015 Oakland Schools January 21, 2015
PowerPoint Notes, page 2
7. Why do countries export goods? 8. What imported good do you think the cartogram shows? 9. Agree or disagree? Explain your answer. 10. What do you think are other major U.S. imports? 11. Why do countries import goods? 12. Where do you think Levi’s Jeans are made? 13.

6th Grade Social Studies: World Geography and Global Issues SS060605 Unit 6: Economics and World Trade Lesson 5
Michigan Citizenship Collaborative Curriculum Page 8 of 14 Copyright © 2010-2015 Oakland Schools January 21, 2015
Exchange Rate Tracker – Class Data
1 U. S. Dollar =
Date
Date Date
Date
Date
Date
Date
Canadian Dollar
Chinese Yuan
Euro
Greek Drachma
Haitian Gourde
Indian Rupee
Iraqi Dinar
Japanese Yen
Mongolian Tugrik
Nigerian Naira
North Korean Won
Saudi Riyal
South Korean Won
Currency Converter. Oanda Corp. 1996 - 2014. 21 January 2015
<http://www.oanda.com/currency/converter/>.

6th Grade Social Studies: World Geography and Global Issues SS060605 Unit 6: Economics and World Trade Lesson 5
Michigan Citizenship Collaborative Curriculum Page 9 of 14 Copyright © 2010-2015 Oakland Schools January 21, 2015
Exchange Rate Tracker – Partner Data
Currency Converter. Oanda Corp. 1996 - 2014. 21 January 2015 <http://www.oanda.com/currency/converter/>.
Partners: _________________________ __________________________ Assigned Currency: ____________________________________________
Date 1 U.S. Dollar =

6th Grade Social Studies: World Geography and Global Issues SS060605 Unit 6: Economics and World Trade Lesson 5
Michigan Citizenship Collaborative Curriculum Page 10 of 14 Copyright © 2010-2015 Oakland Schools January 21, 2015
Trade Data for 2013
Data are goods only, in billions of dollars
Rank Country Exports Imports Total Trade Percent of Total Trade
1 Canada 300.3 332.1 632.4 16.4%
2 China 122.0 440.4 562.4 14.6%
3 Mexico 226.2 280.5 506.6 13.2%
4 Japan 65.1 138.5 203.7 5.3%
5 Germany 47.4 114.6 162.1 4.2%
6 Korea, South 41.6 62.2 103.8 2.7%
7 United Kingdom 47.4 52.6 100.0 2.6%
8 France 32.0 45.3 77.3 2.0%
9 Brazil 44.1 27.6 71.7 1.9%
10 Saudi Arabia 19.0 51.8 70.8 1.8%
Trade Data http://www.census.gov/foreign-trade/statistics/highlights/top/top1312yr.html
1. What percentage of U.S. trade comes from trade with Canada, China, and Mexico combined?
2. What does this tell you about trade with these three countries?
3. A favorable balance of trade means a country exports more than it imports. With which countries does the U.S have a favorable balance of trade?
4. With what country does the U.S. appear to have the most unfavorable balance of trade?
5. How might the unfavorable balance of trade with this country be a problem?
6. How does the U.S. balance of trade with Canada compare with the balance of trade with China?

6th Grade Social Studies: World Geography and Global Issues SS060605 Unit 6: Economics and World Trade Lesson 5
Michigan Citizenship Collaborative Curriculum Page 11 of 14 Copyright © 2010-2015 Oakland Schools January 21, 2015
Trade Data for 2013 – Sample Answers Data are goods only, in billions of dollars
Rank Country Exports Imports Total Trade Percent of
Total Trade
1 Canada 300.3 332.1 632.4 16.4%
2 China 122.0 440.4 562.4 14.6%
3 Mexico 226.2 280.5 506.6 13.2%
4 Japan 65.1 138.5 203.7 5.3%
5 Germany 47.4 114.6 162.1 4.2%
6 Korea, South 41.6 62.2 103.8 2.7%
7 United Kingdom 47.4 52.6 100.0 2.6%
8 France 32.0 45.3 77.3 2.0%
9 Brazil 44.1 27.6 71.7 1.9%
10 Saudi Arabia 19.0 51.8 70.8 1.8%
Trade Data.. http://www.census.gov/foreign-trade/statistics/highlights/top/top1312yr.html
7. What percentage of U.S. trade comes from trade with Canada, China, and Mexico combined? 44.2%
8. What does this tell you about trade with these three countries?
Almost half of U.S. trade is with these three countries so trade with these countries is very important to the United States.
9. A favorable balance of trade means a country exports more than it imports. With which countries does the U.S have a favorable balance of trade?
only Brazil
10. With what country does the U.S. appear to have the most unfavorable balance of trade?
China
11. How might the unfavorable balance of trade with this country be a problem?
The U.S. could get too dependent on Chinese goods and owe China a lot of money.
12. How does the U.S. balance of trade with Canada compare with the balance of trade with China?
The U.S. almost has an equal balance of trade with Canada but it has a very unfavorable balance of trade with China.

6th Grade Social Studies: World Geography and Global Issues SS060605 Unit 6: Economics and World Trade Lesson 5
Michigan Citizenship Collaborative Curriculum Page 12 of 14 Copyright © 2010-2015 Oakland Schools January 21, 2015
Top U.S. Exports to the World, 2013 (In thousands of dollars)
Civilian aircraft, engines, equipment, and parts 105,547,180
Fuel oil 64,344,343
Petroleum products, other 61,014,197
Passenger cars, new and used 56,097,345
Other parts and accessories of vehicles 54,645,906
Industrial machines, other 48,803,393
Pharmaceutical preparations 47,937,979
Semiconductors 42,580,142
Electric apparatus 40,137,919
Telecommunications equipment 39,710,737
Plastic materials 36,174,271
Chemicals-organic 35,422,761
Medicinal equipment 34,086,563
Nonmonetary gold 33,406,928
Minimum value shipments 32,130,566
Computer accessories 31,362,045
Chemicals-other 30,378,192
Industrial engines 29,199,903
Measuring, testing, control instruments 24,751,304
Other industrial supplies 24,681,324
Other household goods 23,593,730
Soybeans 22,876,737
Gem diamonds 20,909,157
Trucks, buses and special purpose vehicles 20,736,458
Finished metal shapes 20,206,347
Meat, poultry, etc. 18,463,541
Computers 16,690,431
Engines and engine parts (carburetors, pistons, etc.) 16,467,626
Materials handling equipment 15,294,161
Excavating machinery 14,714,628
Generators, accessories 14,180,613
Newsprint 13,377,396
Other foods 12,862,322
Drilling & oilfield equipment 12,247,606
Jewelry, etc 11,763,202
Toiletries and cosmetics 11,309,941
Iron and steel mill products 11,116,258
Photo, service industry machinery 11,072,465
Laboratory testing instruments 10,979,867
Wheat 10,686,675
U.S. Exports to the World. http://www.census.gov/foreign-trade/statistics/product/enduse/exports/c0000.html
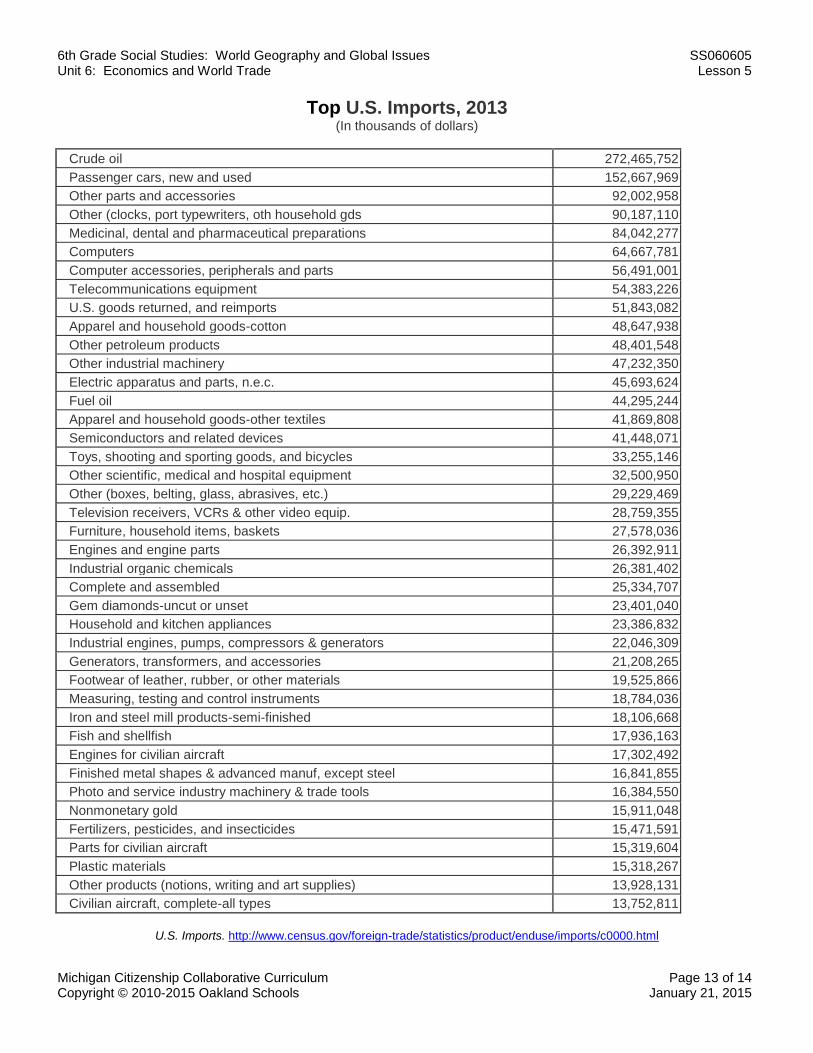
6th Grade Social Studies: World Geography and Global Issues SS060605 Unit 6: Economics and World Trade Lesson 5
Michigan Citizenship Collaborative Curriculum Page 13 of 14 Copyright © 2010-2015 Oakland Schools January 21, 2015
Top U.S. Imports, 2013 (In thousands of dollars)
Crude oil 272,465,752
Passenger cars, new and used 152,667,969
Other parts and accessories 92,002,958
Other (clocks, port typewriters, oth household gds 90,187,110
Medicinal, dental and pharmaceutical preparations 84,042,277
Computers 64,667,781
Computer accessories, peripherals and parts 56,491,001
Telecommunications equipment 54,383,226
U.S. goods returned, and reimports 51,843,082
Apparel and household goods-cotton 48,647,938
Other petroleum products 48,401,548
Other industrial machinery 47,232,350
Electric apparatus and parts, n.e.c. 45,693,624
Fuel oil 44,295,244
Apparel and household goods-other textiles 41,869,808
Semiconductors and related devices 41,448,071
Toys, shooting and sporting goods, and bicycles 33,255,146
Other scientific, medical and hospital equipment 32,500,950
Other (boxes, belting, glass, abrasives, etc.) 29,229,469
Television receivers, VCRs & other video equip. 28,759,355
Furniture, household items, baskets 27,578,036
Engines and engine parts 26,392,911
Industrial organic chemicals 26,381,402
Complete and assembled 25,334,707
Gem diamonds-uncut or unset 23,401,040
Household and kitchen appliances 23,386,832
Industrial engines, pumps, compressors & generators 22,046,309
Generators, transformers, and accessories 21,208,265
Footwear of leather, rubber, or other materials 19,525,866
Measuring, testing and control instruments 18,784,036
Iron and steel mill products-semi-finished 18,106,668
Fish and shellfish 17,936,163
Engines for civilian aircraft 17,302,492
Finished metal shapes & advanced manuf, except steel 16,841,855
Photo and service industry machinery & trade tools 16,384,550
Nonmonetary gold 15,911,048
Fertilizers, pesticides, and insecticides 15,471,591
Parts for civilian aircraft 15,319,604
Plastic materials 15,318,267
Other products (notions, writing and art supplies) 13,928,131
Civilian aircraft, complete-all types 13,752,811
U.S. Imports. http://www.census.gov/foreign-trade/statistics/product/enduse/imports/c0000.html

6th Grade Social Studies: World Geography and Global Issues SS060605 Unit 6: Economics and World Trade Lesson 5
Michigan Citizenship Collaborative Curriculum Page 14 of 14 Copyright © 2010-2015 Oakland Schools January 21, 2015
Where are Levi’s Jeans Made?
1. Yarn is sourced from the Republic of Korea.
2. Fabric is woven and dyed in Taipei, China.
3. Fabric is cut in Bangladesh.
4. Zippers are produced in the Philippines.
5. Assembled into jeans in Cambodia.
6. Exported to the rest of the world.
DIRECTIONS: Use arrows and the numbers above to show the ‘Journey of Levi’s Jeans.’
6th Grade Social StudiesUnit 6, Lesson 5:
Why Do Nations Trade?
1
TRADE

2

3
Divide your goods you brought to trade into two piles of two.

4
Trade with the members of your group.
Divide your goods you brought to trade into two piles of two.

5

6

7
Trade with anybody in the class.

8
9

10
Why do we usually use money instead of trading goods for goods?

11

12

13

14
Is global trade something new?????
Give evidence for your answer.

15

16
How has trade changed?????
Volume
Geographic range
Complexity
Diversity
TRADE

17
How has trade changed?????
Speed
Volume
Geographic range
Complexity
Diversity
TRADE

18
How has trade changed?????
Speed
Volume
Geographic range
Complexity
Diversity
TRADE

19
How has trade changed?????
Speed
Volume
Geographic range
Complexity
Diversity
TRADE
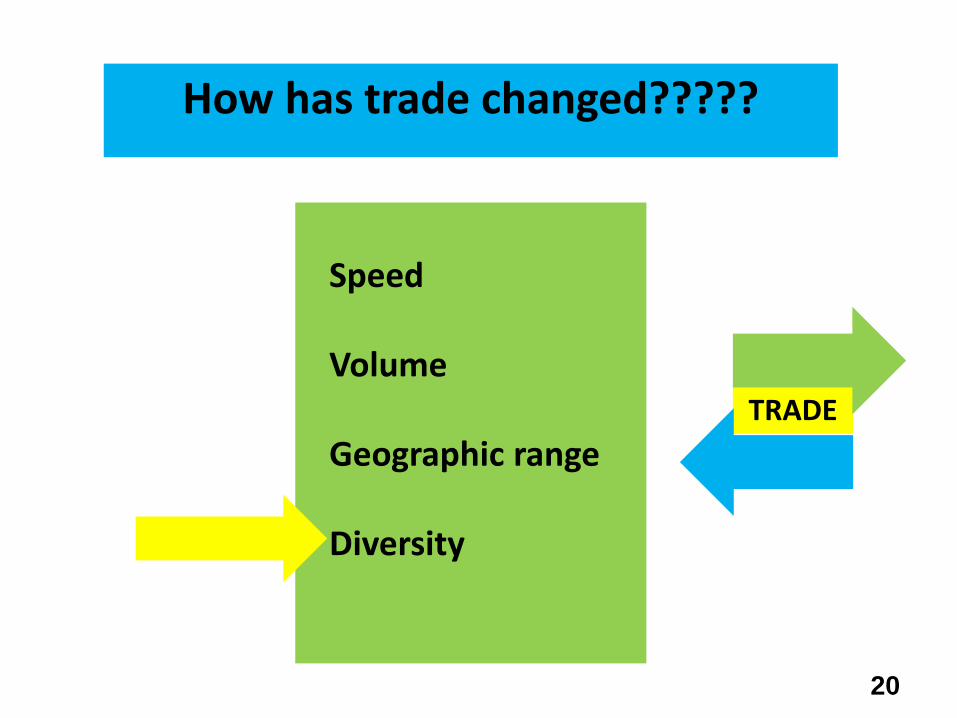
20
How has trade changed?????
Speed
Volume
Geographic range
Diversity
Diversity
TRADE
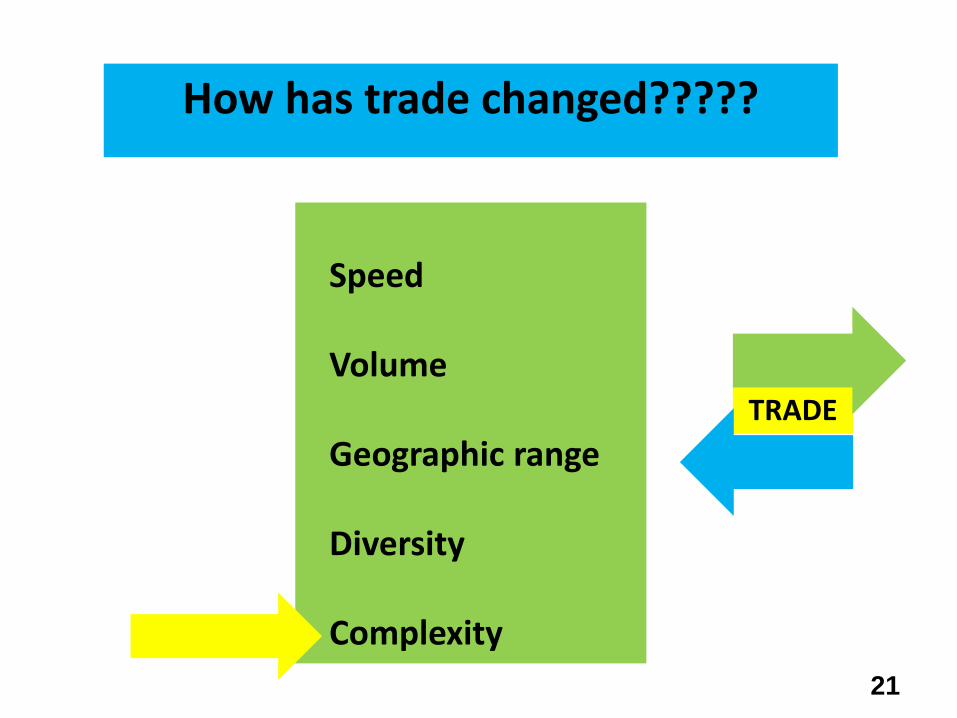
21
How has trade changed?????
Speed
Volume
Geographic range
Diversity
Complexity
TRADE

22
What has caused these changes?????

23
What has caused these changes?????
Improvements in Communication
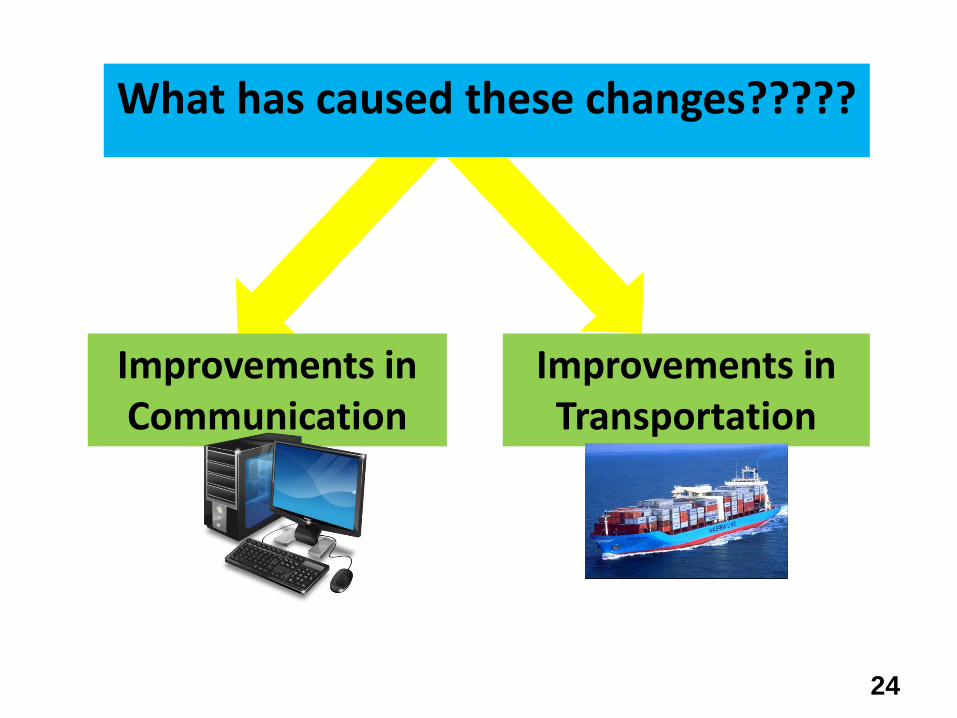
24
What has caused these changes?????
Improvements in Communication
Improvements in Transportation

251 TEU (Twenty-foot Equivalent Unit)
Container Ship used in Global Trade

26

27
What are the top 5 trading partners of the U.S.?
?
1.
2.
3.
4.
5.

28
What are the top 5 trading partners of the U.S.?
?
1. Canada
2.
3.
4.
5.

29
What are the top 5 trading partners of the U.S.?
?
1. Canada
2. China
3.
4.
5.

30
What are the top 5 trading partners of the U.S.?
?
1. Canada
2. China
3. Mexico
4.
5.

31
What are the top 5 trading partners of the U.S.?
?
1. Canada
2. China
3. Mexico
4. Japan
5.

32
What are the top 5 trading partners of the U.S.?
?
1. Canada
2. China
3. Mexico
4. Japan
5. Germany

33
26

34
ACTIVITY
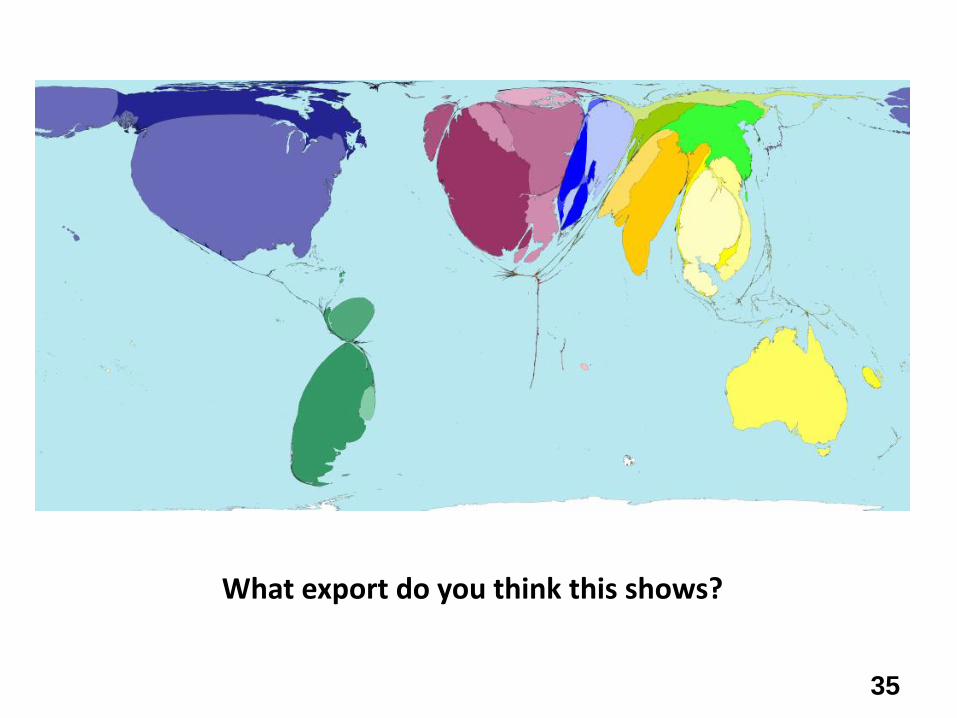
35
What export do you think this shows?

36
Cereals (wheat, rice, barley and corn)

37
What are other major U.S. exports?

38
Civilian aircraft, engines, equipment, and parts 105,547,180
Fuel oil 64,344,343
Petroleum products, other 61,014,197
Passenger cars, new and used 56,097,345
Other parts and accessories of vehicles 54,645,906
Industrial machines, other 48,803,393
Pharmaceutical preparations 47,937,979
Semiconductors 42,580,142
Electric apparatus 40,137,919
Telecommunications equipment 39,710,737
Plastic materials 36,174,271
Chemicals-organic 35,422,761
Medicinal equipment 34,086,563
Nonmonetary gold 33,406,928
Minimum value shipments 32,130,566
Computer accessories 31,362,045
Chemicals-other 30,378,192
Industrial engines 29,199,903
Measuring, testing, control instruments 24,751,304
Other industrial supplies 24,681,324
Other household goods 23,593,730
Soybeans 22,876,737
Gem diamonds 20,909,157
Trucks, buses and special purpose vehicles 20,736,458
Finished metal shapes 20,206,347
Meat, poultry, etc. 18,463,541
Computers 16,690,431
Engines and engine parts (carburetors, pistons, etc.) 16,467,626
Materials handling equipment 15,294,161
Excavating machinery 14,714,628
Generators, accessories 14,180,613
Newsprint 13,377,396
Other foods 12,862,322
Drilling & oilfield equipment 12,247,606
Jewelry, etc 11,763,202
Toiletries and cosmetics 11,309,941
Iron and steel mill products 11,116,258
Photo, service industry machinery 11,072,465
Laboratory testing instruments 10,979,867
Wheat 10,686,675
39
Why Do Countries Export?
More goods are being produced than a country needs.
Goods can be sold to other countries at higher prices than those if sold domestically.
Goods can be sold in order to earn foreign currency which can be used to purchase imports.
Selling exports can increase levels of employment.

40
Why Do Countries Export?
More goods are being produced than a country needs.
Goods can be sold to other countries at higher prices than those if sold domestically.
Goods can be sold in order to earn foreign currency which can be used to purchase imports.
Selling exports can increase levels of employment.

41
Why Do Countries Export?
More goods are being produced than a country needs.
Goods can be sold to other countries at higher prices than if sold domestically.
Goods can be sold in order to earn foreign currency which can be used to purchase imports.
Selling exports can increase levels of employment.

42
Why Do Countries Export?
More goods are being produced than a country needs.
Goods can be sold to other countries at higher prices than if sold domestically.
Goods can be sold in order to earn foreign currency which can be used to purchase imports.
Selling exports can increase levels of employment.
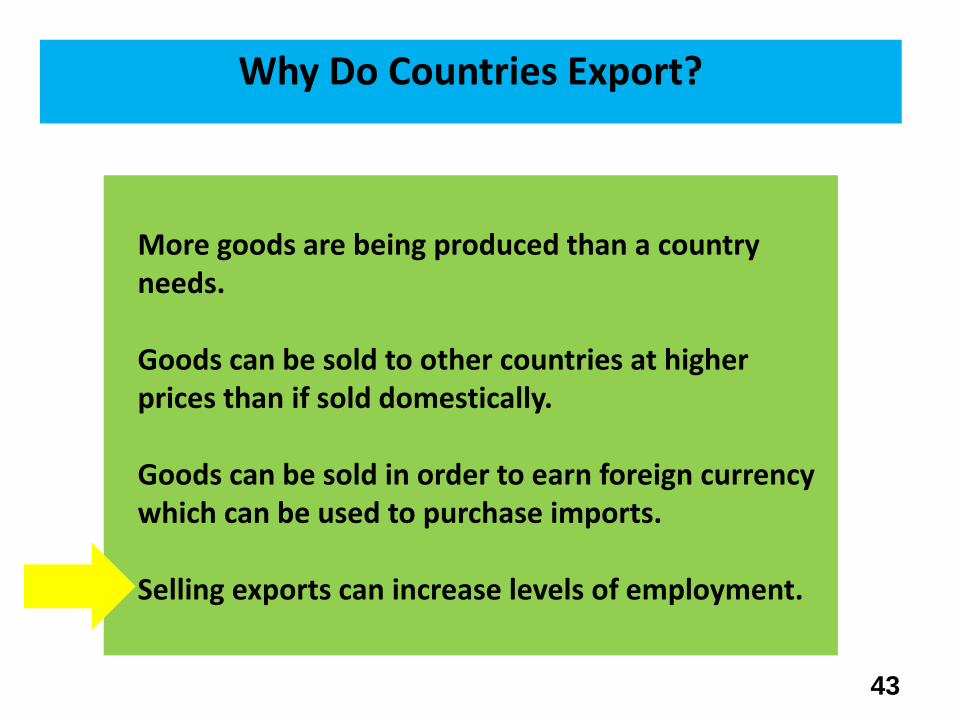
43
Why Do Countries Export?
More goods are being produced than a country needs.
Goods can be sold to other countries at higher prices than if sold domestically.
Goods can be sold in order to earn foreign currency which can be used to purchase imports.
Selling exports can increase levels of employment.

44
SPECIALIZATION
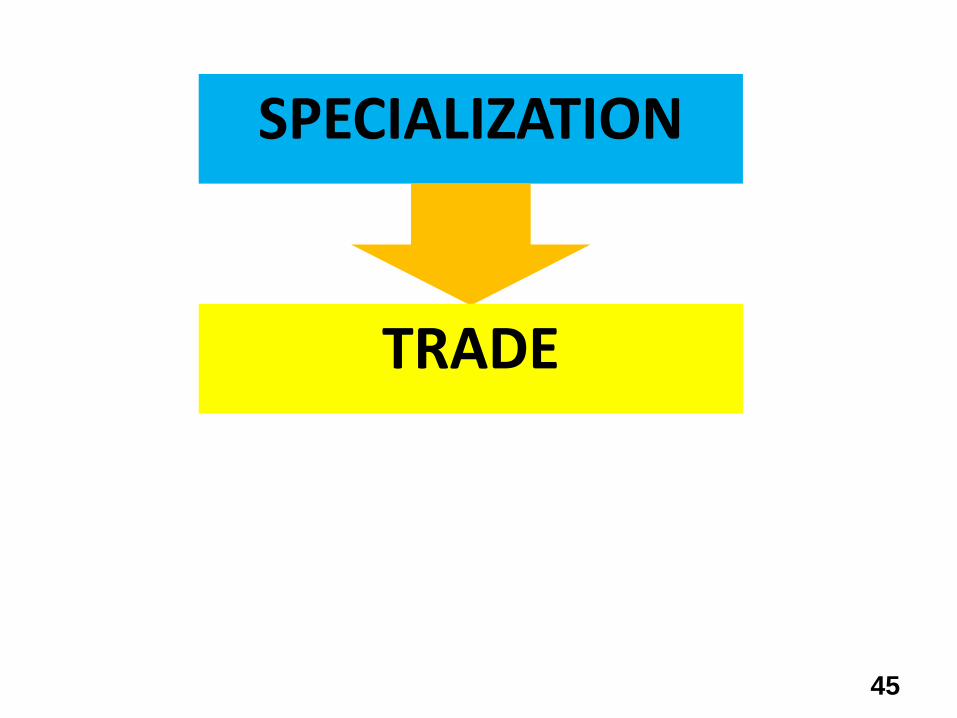
45
SPECIALIZATION
TRADE

46
What imported good do you think this shows?

47
Clothing

48
What countries are big exporters of clothing?

49
We import clothes because we aren’t capable of making clothes in the U.S. Agree or disagree?
Explain your answer.

50

51
What are other major U.S. imports?

52
IMPORT
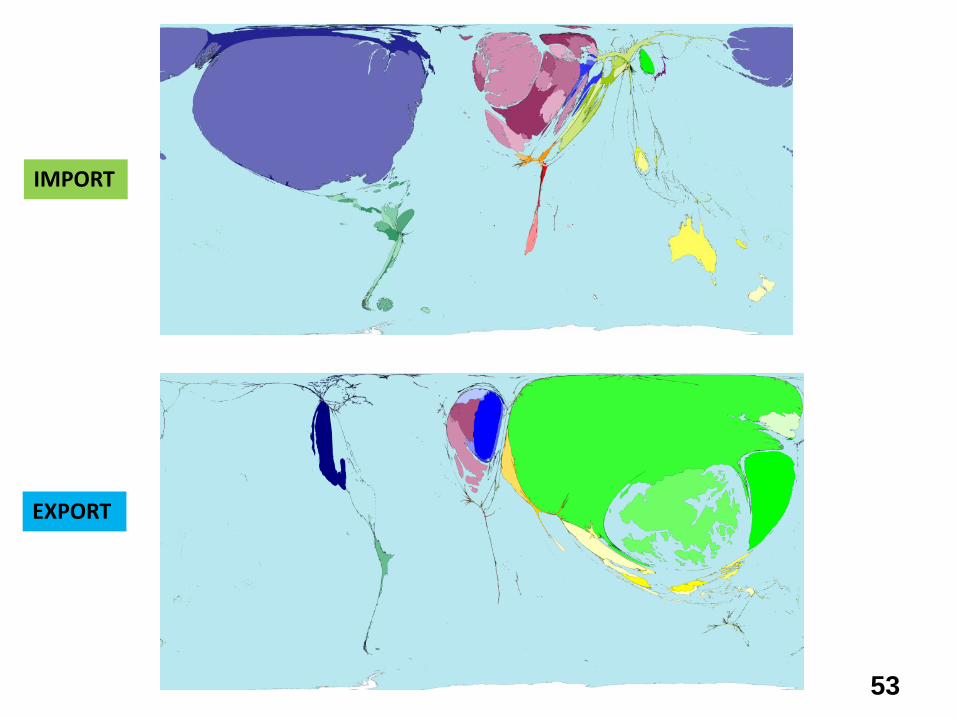
53
IMPORT
EXPORT

54
IMPORT
EXPORT
Toys

55
IMPORT
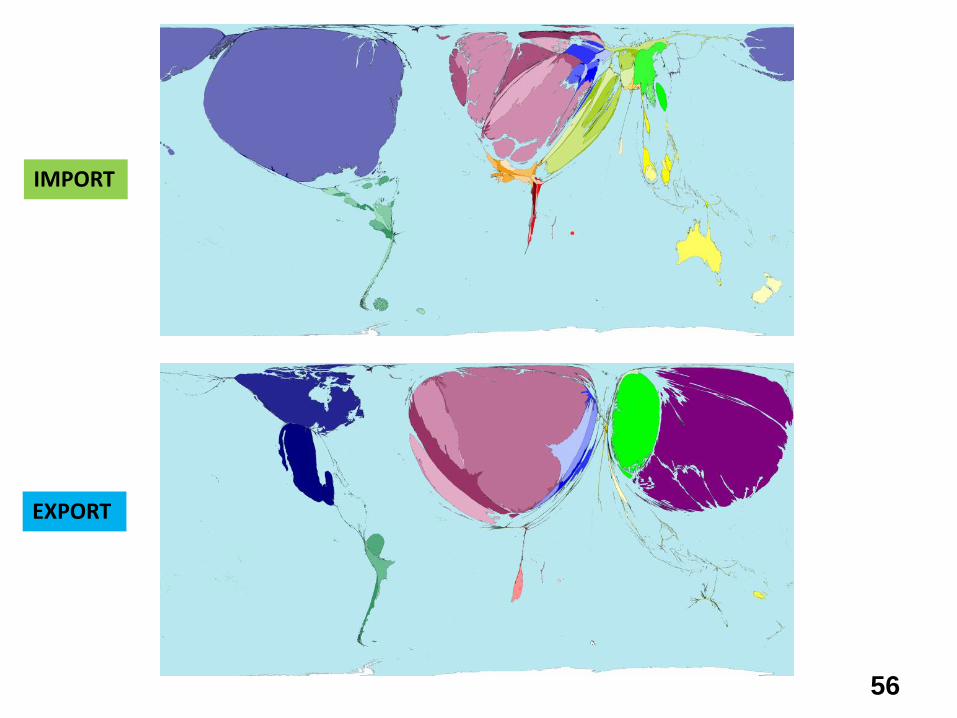
56
IMPORT
EXPORT

57
IMPORT
EXPORT
Cars
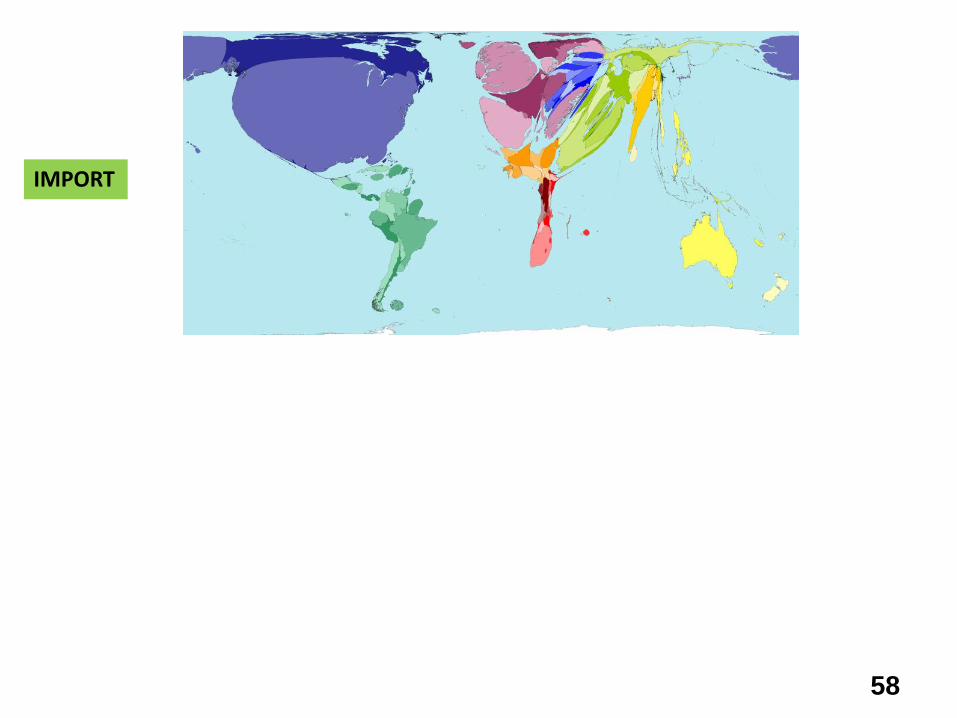
58
IMPORT

59
IMPORT
EXPORT

60
IMPORT
EXPORT
Electronics

61
Crude oil 272,465,752
Passenger cars, new and used 152,667,969
Other parts and accessories 92,002,958
Other (clocks, port typewriters, oth household gds 90,187,110
Medicinal, dental and pharmaceutical preparations 84,042,277
Computers 64,667,781
Computer accessories, peripherals and parts 56,491,001
Telecommunications equipment 54,383,226
U.S. goods returned, and reimports 51,843,082
Apparel and household goods-cotton 48,647,938
Other petroleum products 48,401,548
Other industrial machinery 47,232,350
Electric apparatus and parts, n.e.c. 45,693,624
Fuel oil 44,295,244
Apparel and household goods-other textiles 41,869,808
Semiconductors and related devices 41,448,071
Toys, shooting and sporting goods, and bicycles 33,255,146
Other scientific, medical and hospital equipment 32,500,950
Other (boxes, belting, glass, abrasives, etc.) 29,229,469
Television receivers, vcr's & other video equip. 28,759,355
Furniture, household items, baskets 27,578,036
Engines and engine parts 26,392,911
Industrial organic chemicals 26,381,402
Complete and assembled 25,334,707
Gem diamonds-uncut or unset 23,401,040
Household and kitchen appliances 23,386,832
Industrial engines, pumps, compressors & generators 22,046,309
Generators, transformers, and accessories 21,208,265
Footwear of leather, rubber, or other materials 19,525,866
Measuring, testing and control instruments 18,784,036
Iron and steel mill products-semi-finished 18,106,668
Fish and shellfish 17,936,163
Engines for civilian aircraft 17,302,492
Finished metal shapes & advanced manuf, except steel 16,841,855
Photo and service industry machinery & trade tools 16,384,550
Nonmonetary gold 15,911,048
Fertilizers, pesticides, and insecticides 15,471,591
Parts for civilian aircraft 15,319,604
Plastic materials 15,318,267
Other products (notions, writing and art supplies) 13,928,131
Civilian aircraft, complete-all types 13,752,811

62

63
Why Do Countries Import?
A country wants goods that are essential but not available in the domestic market.
A country wants goods that are highly desired but not available in the domestic market.
A country wants goods that can be produced cheaper or more efficiently by another country. levels of employment.

64
Why Do Countries Import?
Countries want goods that are essential but not available in the domestic market..
A country wants goods that are highly desired but not available in the domestic market.
A country wants goods that can be produced cheaper or more efficiently by another country. levels of employment.
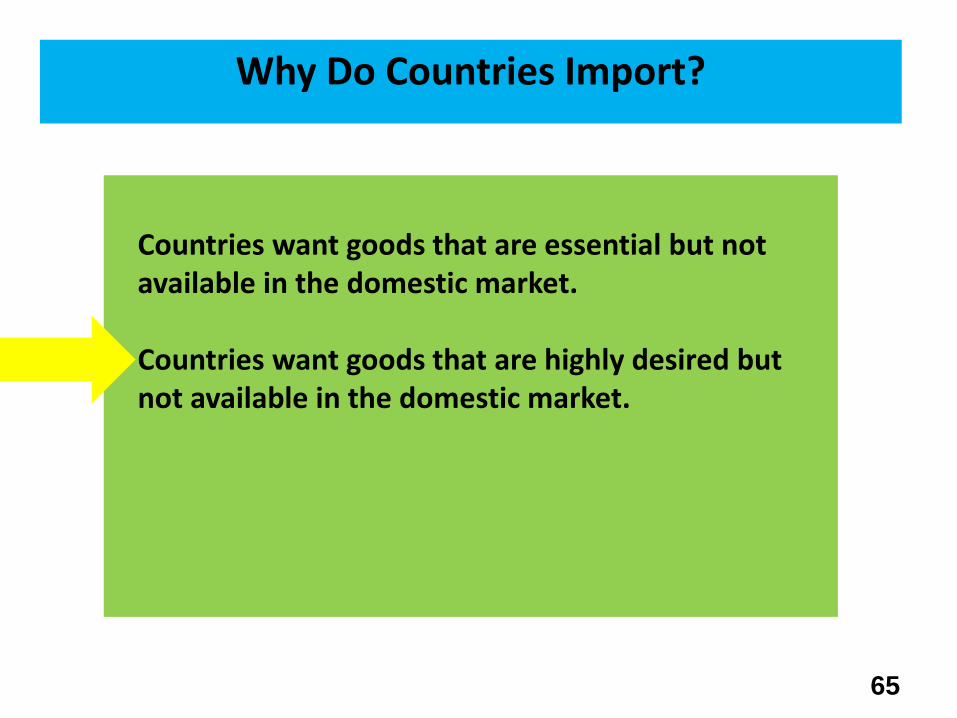
65
Why Do Countries Import?
Countries want goods that are essential but not available in the domestic market..
Countries want goods that are highly desired but not available in the domestic market.
A country wants goods that can be produced cheaper or more efficiently by another country. levels of employment.

66
Why Do Countries Import?
Countries want goods that are essential but not available in the domestic market..
Countries want goods that are highly desired but not available in the domestic market.
Countries want goods that can be produced cheaper or more efficiently by another country.

67

68
How has trade changed?????
Speed
Volume
Geographic range
Diversity
Complexity
TRADE

69
ACTIVITY
Where do you think Levi’s Jeans are
made?

70
ACTIVITY
All Levi’s jeans are made outside America with one exception -- a single line of jeans produced at a factory called “White Oak” in Greensboro, North Carolina.

71
ACTIVITY

72

73
SPECIALIZATION
TRADE
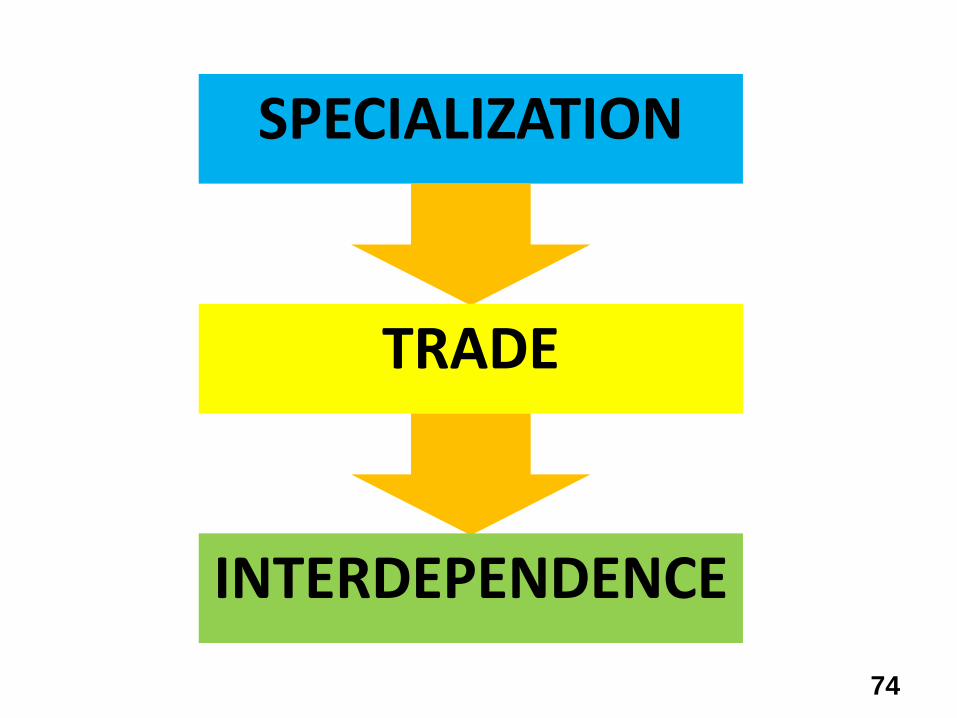
74
SPECIALIZATION
TRADE
INTERDEPENDENCE

75
Property of Oakland Schools
Author: Carol EgboEditor: Amy Bloom
Property of Oakland Schools
Author: Carol EgboEditor: Amy Bloom
Copyright © 2010-2015 Oakland Schools
6th Grade Social Studies: World Geography and Global Issues SS060606 Unit 6: Economics and World Trade Lesson 6
Michigan Citizenship Collaborative Curriculum Page 1 of 7 Copyright © 2010-2015 Oakland Schools February 8, 2015
Lesson 6: How and Why Do Countries Restrict Trade?
Big Ideas of the Lesson
Despite the many benefits of free trade, countries often restrict trade through tariffs, quotas, sanctions, or embargos.
On the positive side, trade restrictions can protect domestic industries, save jobs, bring in revenue for a government, and help a country attain a political or social goal.
On the negative side, trade restrictions can cause prices to increase for consumers, result in fewer choices of goods, bring about shortages, and invite retaliation in the form of restrictions from other countries.
Often countries form trade agreements to bring about freer trade.
Lesson Abstract: In this lesson students investigate how and why countries restrict trade. The lesson begins with an online simulation in which students experience global trade which is primarily free but with one or two restrictions. Students then analyze a set of cards describing tariffs, quotas, sanctions, and embargoes and explore why countries impose such restrictions. Next, students are introduced to multi-lateral and regional trade agreements. In a text-based activity, they explore advantages and disadvantages of the North American Free Trade Agreement (NAFTA). Students then work in small inquiry groups to investigate five documents relating to issues arising from the production and sale of solar panels. Finally, students analyze two short arguments relating to free trade. Content Expectations: Grades 6 and 7 – G1.2.6; G1.3.3; G4.4.1;
Grade 6 – E2.3.1; E3.1.1; C4.3.1; C4.3.2; C4.3.3 Grade 7 – E2.3.1; E3.1.1; C4.3.4;
Common Core State Standards for Literacy in History and Social Studies: RH.6-8.1, 2, 4, 6, and 10; WHST.6-8.1, 4, and 9. Key Concepts globalization/global trade interdependence role of government trade restrictions/barriers
Teacher Note: This lesson begins with a computer-based online simulation. Therefore, make sure you have a computer lab or cart of laptop computers available on the first day of the lesson. Lesson Sequence 1. Pose the following question and have students answer it in their Global Investigator’s Notebook
(GLIN): What are some of the benefits of global trade? Give students time to think and write. Then, have them share answers in the large group.
2. Briefly review the trading simulation that began Lesson 5. Explain that students will now have

6th Grade Social Studies: World Geography and Global Issues SS060606 Unit 6: Economics and World Trade Lesson 6
Michigan Citizenship Collaborative Curriculum Page 2 of 7 Copyright © 2010-2015 Oakland Schools February 8, 2015
the opportunity to participate in another simulation. This one, however, will relate to global trade and involve an online activity.
3. Give each student a copy of the “Trading Around the World” Overview Sheet and Score Sheet located in the Supplemental Materials (Unit 6, Lesson 6). Review both sheets with students. Note that you may wish to show the website used in this activity on a demonstration computer as you explain the simulation.
4. Have students engage in the simulation and end it after around 30 minutes. Place students in groups of four and have them share their Score Sheets and experiences.
5. Using Word Card #34, discuss the term “free trade”. Then, ask students whether or not the simulation they just played was an example of free trade. Push students’ thinking by requiring them to provide evidence for their answer. Note that although the simulation shows mainly unrestricted trade, some students should have experienced restrictions such as the following:
“I cannot trade with you. Our countries have no currency and exchange agreement.”
“I cannot trade with you. Our countries are in a trade dispute.” 6. Explain that although free trade has many advantages, many countries restrict trade for a
variety of reasons. Keeping the same groups as used in Step 4, give each group a copy of the “Inquiry Cards” and “Inquiry Chart” located in the Supplemental Materials (Unit 6, Lesson 6). Have students cut the cards apart. Explain that the cards show various ways and reasons countries restrict trade. Explain that groups should analyze each card and fill out the chart. Give groups time to complete the activity.
7. Give each group a copy of Word Cards #35- #38. Discuss the four terms on the cards. Explain that students should now group the Inquiry Cards according to which Word Card (trade restriction) they describe. Explain that they should notate any Inquiry Card that belongs with more than one Word Card. Give the groups time to categorize the Inquiry Cards. Note that they should be arranged in the following way:
Word Card #35 – Tariff: Inquiry Cards 1,2,3,5 and 6
Word Card #36 – Quota: Inquiry Cards 4,5 and 7
Word Card #37 – Sanction: Inquiry Card 9
Word Card #38 – Embargo: Inquiry Card 8 8. Discuss trade restrictions with the whole class using the following questions:
Based on what you learned from the cards, what are some reasons countries restrict trade?
How do you think the tariff on Chinese tires affected the price of Chinese tires in the U.S.?
Do you think the tariff on Chinese tires had any effect on the price of domestic tires in the U.S.? If so, what?
What are some ways countries might respond when a tariff is placed on their exports by another country?
How is a tariff different from a quota?
Do you think there is any advantage to placing a quota instead of a tariff? Why or why not?
How is a sanction different from an embargo?
Why do you think sanctions are more common than embargoes?

6th Grade Social Studies: World Geography and Global Issues SS060606 Unit 6: Economics and World Trade Lesson 6
Michigan Citizenship Collaborative Curriculum Page 3 of 7 Copyright © 2010-2015 Oakland Schools February 8, 2015
What are some reasons you think a country would place a trade sanction or embargo on another country?
How might trade restrictions affect the variety of goods available to consumers?
9. Explain that despite what they have been learning about trade restrictions, the countries of the world have been working toward freer trade since the end of World War II. For example, most countries belong to the World Trade Organization (WTO), which oversees global trade. Explain that the WTO:
serves as a forum for multilateral trade negotiation
administers multilateral trade agreements
decides trade disputes
reviews national trade policies
Teacher Note: You may wish to have students visit the WTO website (www.wto.org ) which has a great deal of student-friendly information.
10. Pose the following question: What might be some of the challenges to getting large numbers of countries to agree on a trade issue? Tell students that to answer this question, they should first think about the following: “Suppose our class wants to come to an agreement around an issue, say the amount of homework students get. Now, while many students do not like homework, some may see that using time out of school to continue learning is valuable and may help them in the future. For example, a student who reads and studies more than other students may have higher test scores or otherwise be more attractive to competitive colleges, which may open doors in terms of careers, etc. Other students may be involved in many extra-curricular activities, have jobs after school or responsibilities at home that make it difficult to do homework. Students may have different life and career goals. Students also may have different types of resources available to help with homework – from human resources such as parents to capital equipment to do the homework like computers. Students may also differ in the amount of time they have available. With different goals and different resources available, it may be hard to get the entire class to agree. The same issues exist with countries in trade – differences in goals and available resources often make it difficult for many countries to join together in one agreement because it may not meet their needs or be in their best interest. It is often easier to find common ground when there are fewer people trying to reach agreement.” Explain that because of these challenges there tend to be more regional trade agreements than multilateral, or many nation, trade agreements. Regional trade agreements are between neighboring countries. Share the following list of regional agreements with students:
Andean Trade Preference Act: Bolivia, Colombia, Ecuador, Peru, Venezuela
ECOWAS (Economic Community of West African States): Benin, Burkina Faso, Cameroon, Cote d’Ivoire, Congo, Gabon, Gambia, Ghana, Guinea Bissau, Liberia, Mali, Mauritania, Niger, Nigeria, Senegal, Sierra Leone, Togo
EU (European Union) : Austria, Belgium, Cyprus, Czech Republic, Denmark, Estonia,
6th Grade Social Studies: World Geography and Global Issues SS060606 Unit 6: Economics and World Trade Lesson 6
Michigan Citizenship Collaborative Curriculum Page 4 of 7 Copyright © 2010-2015 Oakland Schools February 8, 2015
Finland, France, Germany, Greece, Hungary, Ireland, Italy, Latvia, Lithuania, Luxembourg, Malta, The Netherlands, Poland, Portugal, Slovakia, Slovenia, Spain, Sweden, United Kingdom
Greater Arab Free Trade Area: Kuwait, Bahrain, Morocco, Egypt, Jordan, Oman, Iraq, Lebanon, Libya, Sudan, Syria, Saudi Arabia, Tunisia, the United Arab Emirates, Palestine, Yemen, Qatar
NAFTA (North American Free Trade Agreement): Canada, Mexico, United States
South Asia Free Trade Agreement: India, Pakistan, Bangladesh, Nepal, Sri Lanka, the Maldives, Bhutan
11. Explain that NAFTA is the trade agreement that is likely to most affect students. Place students
in pairs and give each pair a copy of the “Advantages of NAFTA” information sheet, the “Disadvantages of NAFTA” information sheet and the comparison “T-chart” located in the Supplemental Materials (Unit 6, Lesson 6). Explain that pairs should read the information sheets and then complete the T-chart.
12. Give students time to complete the NAFTA activity. Then, have students share their T-Charts through a “Gallery Walk.” Once finished, allow students time to add or change the T-charts as necessary. A chart with sample answers has been included in the Supplemental Materials (Unit 6, Lesson 6) for reference.
13. Review the steps in the inquiry process by giving students a copy of the “Geographic Inquiry” graphic organizer located in the Supplemental Materials (Unit 6, Lesson 6). This graphic is from Lesson 2 of Unit 1 where the process was introduced. Explain that students will now be working in small inquiry groups to further investigate the question: How and why do some countries restrict trade?
14. Give each group a set of “Documents #1 - #5” and a copy of the “Inquiry Chart” located in the Supplemental Materials (Unit 6, Lesson 6). Explain that students should first find a logical way to organize their information. Teacher Note: The most useful way is to place the documents in chronological order. Students should then analyze the documents, taking notes on note cards or paper and then summarizing the information on the Inquiry Chart. Finally, students should prepare a written summary of their answer to the question: How and why do some countries restrict trade?
15. Give groups time to complete the activity and then have groups share their written summaries. If time permits you, may want groups to give a more formal presentation.
16. Explain that people continue to argue for and against free trade. Give each student a copy of the “Analyzing an Argument” sheet located in the Supplemental Materials (Unit 6, Lesson 6). Review the sheet with students and have them complete it independently. This activity could be assigned as homework. As an assessment, you may wish to have students write their own argument for or against free trade.
17. Display the summary data from the “Exchange Rate Tracker” that students have been collecting throughout the last two lessons. Discuss the data using the following questions:

6th Grade Social Studies: World Geography and Global Issues SS060606 Unit 6: Economics and World Trade Lesson 6
Michigan Citizenship Collaborative Curriculum Page 5 of 7 Copyright © 2010-2015 Oakland Schools February 8, 2015
Which currencies had the biggest changes in exchange rate?
Which currencies had the least?
How might these changes affect trading in countries?
Do you think there is any connection between currency exchange rates and trade restrictions? If so, what?
Reference Section
Content Expectations 6 and 7 Apply the skills of geographic inquiry (asking geographic questions, acquiring G1.2.6: geographic information, organizing geographic information, analyzing geographic
information, and answering geographic questions) to analyze a problem or issue of importance to a region of the world.1
6 and 7 Explain the different ways in which places are connected and how those connections G1.3.3: demonstrate interdependence and accessibility. 6 and 7 Identify factors that contribute to conflict and cooperation between and among G4.4.1: cultural groups (control/use of natural resources, power, wealth, and cultural diversity). 6 – E2.3.1: Describe the impact of governmental policy (sanctions, tariffs, treaties) on that country
and on other countries that use its resources. 7 – E2.3.1: Explain how national governments make decisions that impact both that country and
other countries that use its resources (e.g., sanctions and tariffs enacted by a national government to prevent imports, most favored trade agreements, the impact China is having on the global economy and the U.S. economy in particular).
6 – E3.1.1: Use charts and graphs to compare imports and exports of different countries in the
world2 and propose generalizations about patterns of economic interdependence. 7 – E3.1.1: Explain the importance of trade (imports and exports) on national economies. 6 – C4.3.1: Explain the geopolitical relationships between countries. 6 - C4.3.2: Explain the challenges to governments and the cooperation needed to address 7 –C4.3.3: international issues.3
1 The terms Western Hemisphere and Eastern Hemisphere in the expectations has been replaced with “world”. 2 The term “Western Hemisphere” in the expectation has been replaced with “world” to help develop students’ global perspective. 3 The expectation identifies migration and human rights as examples. This unit uses environment issues such as climate change as an example of an international issue.
6th Grade Social Studies: World Geography and Global Issues SS060606 Unit 6: Economics and World Trade Lesson 6
Michigan Citizenship Collaborative Curriculum Page 6 of 7 Copyright © 2010-2015 Oakland Schools February 8, 2015
6 – C4.3.3: Give examples of how countries work together for mutual benefits through
international organizations. Common Core State Standards for Literacy in History and Social Studies RH.6-8.1: Cite specific textual evidence to support analysis of primary and secondary
sources. RH.6-8.2: Determine the main ideas or information of a primary or a secondary source;
provide an accurate summary of the source distinct from prior knowledge or opinions.
RH.6-8.4: Determine the meaning of words and phrases as they are used in a text, including
vocabulary specific to domains related to history/social studies. RH.6-8.6: Identify aspects of a text that reveal an author’s point of view or purpose (e.g.,
loaded language, inclusion or avoidance of particular facts). RH.6-8. 10: By the end of grade 8, read and comprehend science/technical texts in the grades
6–8 text complexity band independently and proficiently. WHST.6-8.1: Write arguments focused on discipline-specific content. a. Introduce claim(s) about a topic or issue, acknowledge and distinguish the
claim(s) from alternate or opposing claims, and organize the reasons and evidence logically.
b. Support claim(s) with logical reasoning and relevant, accurate data and evidence that demonstrate an understanding of the topic or text, using credible sources.
WHST.6-8.4: Produce clear and coherent writing in which the development, organization, and
style are appropriate to task, purpose, and audience. WHST.6-8.9: Draw evidence from informational texts to support analysis reflection, and research. Instructional Resources Equipment/ Manipulative Global Investigator’s Notebook Scissors – one for each pair of students Student Resource A student geography textbook such as Wiggins, Grant, et al. My World Geography: Boston, MA:
Pearson, 2011, 66-67. Trading Around the World. International Monetary Fund. 22 January 2015
<http://www.imf.org/EXTERNAL/NP/EXR/CENTER/STUDENTS/TRADE/index.htm>. World Trade Organization. 22 January 2015 <http://www.wto.org>.

6th Grade Social Studies: World Geography and Global Issues SS060606 Unit 6: Economics and World Trade Lesson 6
Michigan Citizenship Collaborative Curriculum Page 7 of 7 Copyright © 2010-2015 Oakland Schools February 8, 2015
Teacher Resource Amadeo, Kimberly. Advantages for NAFTA. About.com. 22 January 2015
<http://useconomy.about.com/od/tradepolicy/p/NAFTA_Advantage.htm>.
- - -. Arguments For and Against Free Trade. 22 January 2015 <http://idebate.org/es/node/17550>.
- - -. Disadvantages of NAFTA. About.com. 22 January 2015
<http://useconomy.about.com/od/tradepolicy/p/NAFTA_Problems.htm>.
Brokaw, Alex. 10 Everyday Items That Cost Way More Because of US Taxes. Minyanville. 22 January 2015 <http://www.minyanville.com/trading-and-investing/taxes/articles/us-imports-tariffs-us-import-taxes/7/25/2012/id/42412>.
Cardwell Diane and Keith Bradsher. U.S. Will Place Tariffs on Chinese Solar Panels. New York
Times. 10 October 2012. 22 January 2015 <http://www.nytimes.com/2012/10/11/business/global/us-sets-tariffs-on-chinese-solar-panels.html>.
Chinese Solar Panel Prices Rising. Market Watch. 22 January 2015 <http://www.marketwatch.com/story/chinese-solar-panel-prices-rising-20-in-the-us-2014-04-10>.
Egbo, Carol. Supplemental Materials (Unit 6, Lesson 6). Teacher-made materials. Oakland
Schools, 2015. Pearson, Natalie Obiko. India May Back Solar Duties as Probe Says U.S., China Dumped.
Bloomberg Businessweek. 15 May 2014. 22 January 2015 <http://www.businessweek.com/news/2014-05-14/india-may-back-solar-duties-after-probe-says-u-dot-s-dot-china-dumped>.
Read, Richard. Solar World wins key U.S. ruling. The Oregonian. 14 February 2014. 22 January
2015 <http://www.oregonlive.com/business/index.ssf/2014/02/solarworld_wins_key_us_ruling.html>.
Tariff Information. 21 January 2015 <http://www.minyanville.com/trading-and-
investing/taxes/articles/us-imports-tariffs-us-import-taxes/7/25/2012/id/42412>.
U.S. Tariffs on Chinese Solar Panels Boomerang. Washington Post. 12 August 2013. 22 January
2015 <http://www.washingtonpost.com/opinions/us-tariffs-on-chinese-solar-panels-
boomerang/2013/08/12/fef555e6-f577-11e2-a2f1-a7acf9bd5d3a_story.html>.

6th Grade Social Studies: World Geography and Global Issues SS060606 Unit 6: Economics and World Trade Lesson 6
Michigan Citizenship Collaborative Curriculum Page 1 of 21 Copyright © 2010-2015 Oakland Schools February 8, 2015
Graphic Organizer
TRADE
FREE TRADE
Quota Sanction Embargo Tariff

6th Grade Social Studies: World Geography and Global Issues SS060606 Unit 6: Economics and World Trade Lesson 6
Michigan Citizenship Collaborative Curriculum Page 2 of 21 Copyright © 2010-2015 Oakland Schools February 8, 2015
Big Idea Card
Big Ideas of Lesson 6, Unit 6
Despite the many benefits of free trade, countries often restrict trade through tariffs, quotas, sanctions, or embargos.
On the positive side, trade restrictions can protect domestic industries, save jobs, bring in revenue for a government, and help a country attain a political or social goal.
On the negative side, trade restrictions can cause prices to increase for consumers, result in fewer choices of goods, bring about shortages, and invite retaliation in the form of restrictions from other countries.
Often countries form trade agreements to bring about freer trade.
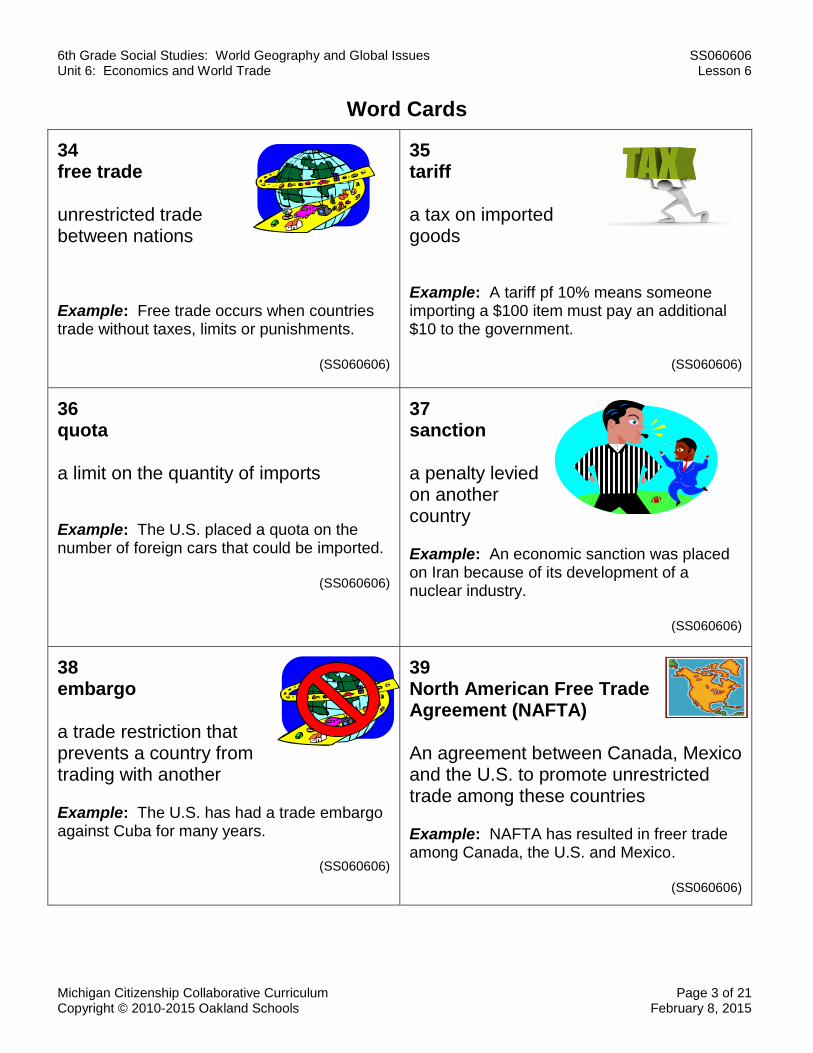
6th Grade Social Studies: World Geography and Global Issues SS060606 Unit 6: Economics and World Trade Lesson 6
Michigan Citizenship Collaborative Curriculum Page 3 of 21 Copyright © 2010-2015 Oakland Schools February 8, 2015
Word Cards
34 free trade unrestricted trade between nations Example: Free trade occurs when countries trade without taxes, limits or punishments.
(SS060606)
35 tariff a tax on imported goods Example: A tariff pf 10% means someone importing a $100 item must pay an additional $10 to the government.
(SS060606)
36 quota a limit on the quantity of imports Example: The U.S. placed a quota on the number of foreign cars that could be imported.
(SS060606)
37 sanction a penalty levied on another country Example: An economic sanction was placed on Iran because of its development of a nuclear industry.
(SS060606)
38 embargo a trade restriction that prevents a country from trading with another Example: The U.S. has had a trade embargo against Cuba for many years.
(SS060606)
39 North American Free Trade Agreement (NAFTA) An agreement between Canada, Mexico and the U.S. to promote unrestricted trade among these countries
Example: NAFTA has resulted in freer trade among Canada, the U.S. and Mexico.
(SS060606)
6th Grade Social Studies: World Geography and Global Issues SS060606 Unit 6: Economics and World Trade Lesson 6
Michigan Citizenship Collaborative Curriculum Page 4 of 21 Copyright © 2010-2015 Oakland Schools February 8, 2015
Trading Around the World
Website: http://www.imf.org/EXTERNAL/NP/EXR/CENTER/STUDENTS/TRADE/index.htm Overview: In this simulation you will experience the challenges and excitement of international trade. See if you can get the best price for the goods you sell and the biggest bargains for the goods you buy. Make sure to watch at the top of the page how the global economy is doing: the prices you’ll be able to get and the deals you can make depend on how healthy the global economy is. Playing the Game: Before you start, think about what you want to accomplish as a trader:
Do you want to build up as much wealth as you can by selling as much of your commodities as you can?
Do you want to buy the widest range of goods to satisfy diverse consumer tastes at home? Or do you want to focus on buying the raw materials for a particular industry?
You will be assigned a game number so you can return to the game later. Make sure to write this number down on your Score Sheet. To begin the game, select an avatar (for example, Sophie from Europe or Neema from Africa), then begin trading. Choose a trader and item and enter a buy or sell price to start a transaction. The other trader either accepts the buy or sell price, or makes a counteroffer. You may choose to accept the counteroffer or cancel the trade. While trading, the following information is always displayed:
Your avatar Your money – amount and currency Your goods for sale – items and amounts Your suggested purchase list based on your avatar identity A map of the world showing traders in each continent, including your own avatar highlighted The state of the global economy
The simulation ends when one of the following happens:
You run out of money You run out of goods to sell All the other traders run out of money All the other traders run out of goods to sell You quit the simulation You have been inactive for a given time period
Make sure to fill out your Score Sheet at the beginning and end of the simulation.

6th Grade Social Studies: World Geography and Global Issues SS060606 Unit 6: Economics and World Trade Lesson 6
Michigan Citizenship Collaborative Curriculum Page 5 of 21 Copyright © 2010-2015 Oakland Schools February 8, 2015
Trading Around the World - SCORE SHEET
Your Avatar: __________________________ Your Continent: __________________________
How much money did you begin with? ____________________
What goods did you have for sale in the beginning?
Goods Amounts
How much money did you end up with? ______________________________
What goods did you have left?
Goods Amounts
What goods did you buy?
Goods Amounts
6th Grade Social Studies: World Geography and Global Issues SS060606 Unit 6: Economics and World Trade Lesson 6
Michigan Citizenship Collaborative Curriculum Page 6 of 21 Copyright © 2010-2015 Oakland Schools February 8, 2015
INQUIRY CARDS
CARD #1 When the United States invaded Iraq in 2003, France refused to follow. Years later, in its final hours, the Bush Administration reciprocated with a proposed increase in import tax on French Roquefort cheese from 100% to 300%. A tariff three times as high would have seen a pound of the blue-green cheese selling anywhere from $60 to $100 in the United States. This revenge-driven import tax never came to be, and the tariff on Roquefort remained at 100%.
CARD #2 A single paper clip sells for less than a cent. Some 11 billion of them are sold in the U.S. every year. Cheap and nearly disposable, it's hard to imagine that a large majority of domestically sold paper clips are still manufactured in the U.S. For the most part, this is thanks to import taxes reaching as high as 127% on Chinese manufactured paper clips. American companies have benefited from import taxes against China since 1994, when the US government deemed Chinese competition unfair.
CARD #3 Since the Great Depression, the United States has supported farmers. Most forms of support are payments from the government. In a few cases, however, the government has protected farmers with high tariffs or import taxes on products (sugar, dairy products, tobacco). The import rate on certain tobacco products can reach as high as 350%, making it one of the most protected American products around.
CARD #4 In the 1970s and 1980s, U.S. automobile manufacturers and labor unions supported government quotas on foreign car imports to limit competition and preserve American jobs.
CARD #5 The broom tariff – which includes hand-operated mechanical floor sweepers, mops, and feather dusters, is complicated. Brooms are subject to an 8% tariff, or import tax when valued under $0.96. There is also a quota of 121,478 dozen units. When valued at more than $0.96 each, brooms are free of a quota, but receive the highest tax at 32%.
CARD #6 The U.S. placed a tariff on tires made in China. In 2009, a 35% tariff was slapped on tires manufactured in China. By making imported Chinese tires a lot more expensive it was hoped that people would buy more American tires. Policy makers also hoped that this would increase the number of tire manufacturing jobs in the U.S. It didn’t.
CARD #7 The history of the U.S. peanut tariff reaches back in our history. America's domestic peanut program has its roots in the Agricultural Adjustment Act of 1933, which set an import quota at 775 metric tons. This limited the amount of peanuts that could be imported to 775 metric tons a year. By the year 2000, the peanut quota was capped at 7% of US production. This means the amount of peanuts that can be imported cannot be over 7% of the amount of peanuts produced in the U.S.
CARD #8 Following the communist revolution in
Cuba, and later the Cuban Missile
Crisis, the United States banned all
trade with the island nation of Cuba.
Although there has been a slight
relaxing of restrictions, political
differences still keep the two
countries from trading.
CARD #9 In 2013 the U.S. worked to block Iran from selling any oil abroad because of its nuclear program.
Adapted from: Tariff Information. 21 January 2015 <http://www.minyanville.com/trading-and-investing/taxes/articles/us-imports-
tariffs-us-import-taxes/7/25/2012/id/42412>.

6th Grade Social Studies: World Geography and Global Issues SS060606 Unit 6: Economics and World Trade Lesson 6
Michigan Citizenship Collaborative Curriculum Page 7 of 21 Copyright © 2010-2015 Oakland Schools February 8, 2015
INQUIRY CHART
PRODUCT HOW IS TRADE BEING
RESTRICTED? REASON FOR THE RESTRICTION
1
2
3
4
5
6
7
8
9

6th Grade Social Studies: World Geography and Global Issues SS060606 Unit 6: Economics and World Trade Lesson 6
Michigan Citizenship Collaborative Curriculum Page 8 of 21 Copyright © 2010-2015 Oakland Schools February 8, 2015
INQUIRY CHART - Sample Answers
PRODUCT
HOW IS TRADE BEING RESTRICTED?
REASON FOR THE RESTRICTION
1
French
Roquefort
Cheese
An import tax has been put on the French cheese.
To punish France for not joining the U.S. in invading Iraq in 2003
2 paperclips An import tax was put on Chinese paper clips.
To allow American companies to compete with the Chinese companies making paperclips
3 Tobacco An import tax has been put on tobacco.
To protect American farmers who grow tobacco
4 Cars A limit was placed on the number of foreign cars that could be imported into the U.S.
To limit competition and preserve American jobs
5 Brooms
An import tax has been placed on brooms. There is also a limit on the number of cheap brooms that can be imported.
To protect the U.S companies that make brooms
6 Tires An import tax was placed on tires manufactured in China.
To try and increase the number of tire manufacturing jobs in the U.S.
7 Peanuts
A limit has been placed on the amount of peanuts that can be imported.
To help the domestic peanut program of the U.S.
8 All goods The U.S. placed a ban on trade with Cuba.
Because of political differences
9 Oil from Iran The U.S. worked to block the sale of oil from Iran
Because of U.S. objections to Iran’s nuclear program
6th Grade Social Studies: World Geography and Global Issues SS060606 Unit 6: Economics and World Trade Lesson 6
Michigan Citizenship Collaborative Curriculum Page 9 of 21 Copyright © 2010-2015 Oakland Schools February 8, 2015
Some Advantages of NAFTA By Kimberly Amadeo
NAFTA created the world’s largest free trade area. It allows the 450 million people in the U.S., Canada and Mexico to export to each other at a lower cost. As a result, it is responsible for $1.6 trillion in goods and services annually. Estimates are that NAFTA increases the U.S. economy, as measured by GDP, by as much as .5% a year (Source: USTR, Quantification of NAFTA Benefits). How does NAFTA benefit trade? First, it eliminates tariffs. This reduces inflation by decreasing the costs of imports. Second, NAFTA creates agreements on international rights for business investors. This reduces the cost of trade, which spurs investment and growth especially for small businesses. Third, NAFTA provides the ability for firms in member countries to bid on government contracts. Fourth, NAFTA also protects intellectual property -- ideas, inventions, or processes that come from the work of the mind or intellect. Trade between the NAFTA signatories more than quadrupled, from $297 billion in 1993 to $1.6 trillion in 2009 (latest data available). Exports from the U.S. to Canada and Mexico grew from $142 billion to $452 billion in 2007, and then declined to $397 billion in 2009, thanks to the 2008 financial crisis. Exports from Canada and Mexico to the U.S. increased from $151 billion to $568 billion in 2007, then down to $438 billion in 2009 (Source: Office of the US Trade Representative, NAFTA). Thanks to NAFTA, agricultural exports to Canada and Mexico grew from 22% of total U.S. farm exports in 1993 to 30% in 2007. Exports to the two countries nearly doubled, growing 156% compared to a 65% growth to the rest of the world (Source: U.S. Foreign Agricultural Service, NAFTA). NAFTA increased farm exports because it eliminated high Mexican tariffs. Mexico is the top export destination for U.S.-grown beef, rice, soybean meal, corn sweeteners, apples and beans. It is the second largest export destination for corn, soybeans and oils (Source: USTR, NAFTA Facts, March 2008). The U.S. imported $116.2 billion in oil from Mexico and Canada as shale oil (down from $157.8 billion in 2007). This also reduces U.S. reliance on oil imports from the Middle East. It is especially important now that the U.S. no longer imports oil from Iran. Since NAFTA eliminates tariffs, oil prices are lower. The same is true for food imports, which totaled $29.8 billion in 2010 (up from $28.9 billion in 2009). Without NAFTA, prices for fresh vegetables, chocolate, fresh fruit (except bananas) and beef would be higher (Source: USTR, NAFTA Imports). Adapted from. Amadeo, Kimberly. Advantages for NAFTA. About.com. 21 January 2105 <http://useconomy.about.com/od/tradepolicy/p/NAFTA_Advantage.htm>.
inflation – the rate at which the general level of prices for goods and services is rising
signatories – a signer or one of the signers of a document
6th Grade Social Studies: World Geography and Global Issues SS060606 Unit 6: Economics and World Trade Lesson 6
Michigan Citizenship Collaborative Curriculum Page 10 of 21 Copyright © 2010-2015 Oakland Schools February 8, 2015
Some Disadvantages of NAFTA By Kimberly Amadeo
NAFTA has many disadvantages. Since labor is cheaper in Mexico, many manufacturing industries moved part of their production from high-cost U.S. states. This resulted in a loss of U.S. jobs. Nearly 80% of the losses were in manufacturing. California, New York, Michigan, and Texas were hit the hardest because they had high concentrations of the industries that moved plants to Mexico. These industries included motor vehicles, textiles, computers, and electrical appliances. (Source: Economic Policy Institute, "The High Cost of Free Trade," May 3, 2011).
Not all companies in these industries moved to Mexico. The ones that stayed used the threat of moving during union organizing drives. When it became a choice between joining the union and losing the factory, workers chose the factory. Without union support, the workers had little bargaining power. This kept down wage growth. Between 1993 and 1995, 50% of all companies in the industries that were moving to Mexico used the threat of closing the factory.
Thanks to NAFTA, Mexico lost 1.3 million farm jobs. The 2002 Farm Bill subsidized U.S. agriculture by as much as 40% of net farm income. When NAFTA removed tariffs, corn and other grains were exported to Mexico below cost. Rural Mexican farmers could not compete. At the same time, Mexico reduced its subsidies to farmers from 33.2% of total farm income in 1990 to 13.2% in 2001. (Source: International Forum on Globalization, Exposing the Myth of Free Trade, February 25, 2003; The Economist, Tariffs and Tortillas, January 24, 2008). NAFTA expanded the maquiladora program, in which U.S.-owned companies employed Mexican workers near the border to cheaply assemble products for export to the U.S. This grew to 30% of Mexico's labor force. These workers have "no labor rights or health protections workdays stretch out 12 hours or more” according to Continental Social Alliance. (Source: Worldpress.org, Lessons of NAFTA, April 20, 2001). In response to NAFTA competitive pressure, Mexico agribusiness used more fertilizers and other chemicals, costing $36 billion per year in pollution. Rural farmers expanded into more marginal land, resulting in deforestation at a rate of 630,000 hectares per year. (Source: Carnegie Endowment, NAFTA's Promise and Reality, 2004) Adapted from: Amadeo, Kimberly. Disadvantages of NAFTA. About.com. 21 January 2015
<http://useconomy.about.com/od/tradepolicy/p/NAFTA_Problems.htm>.
maquiladora – a factory run by a U.S. company in Mexico to take advantage of free labor and lax regulation
union – a group of people joined or associated together for a common purpose
subsidies - a direct payment by a government to a private business or charity
agribusiness – the companies and people associated with the production, processing, and distribution of agricultural products
hectares – unit of land equal to 100 ares, 10,000 square meters, or 2.471 acres

6th Grade Social Studies: World Geography and Global Issues SS060606 Unit 6: Economics and World Trade Lesson 6
Michigan Citizenship Collaborative Curriculum Page 11 of 21 Copyright © 2010-2015 Oakland Schools February 8, 2015
Advantages and Disadvantages of NAFTA
ADVANTAGES DISADVANTAGES

6th Grade Social Studies: World Geography and Global Issues SS060606 Unit 6: Economics and World Trade Lesson 6
Michigan Citizenship Collaborative Curriculum Page 12 of 21 Copyright © 2010-2015 Oakland Schools February 8, 2015
Advantages and Disadvantages of NAFTA – Sample Answer Key
ADVANTAGES DISADVANTAGES
Allowed countries to export at a lower cost
Increased the U.S. economy
Decreased the costs of imports
Helped small businesses grow
Increased trade
Boosted U.S. farm exports
Reduced oil and grocery prices
Reduced the U.S. reliance on oil imports from the Middle East
U.S. jobs were lost
Union membership was affected
Wage growth was kept down
Companies used the threat of moving with workers
Mexico lost many farm jobs
There was an increase in the number of Mexican workers working near the border who work long hours without labor rights or health protection
Environmental damage in Mexico as a result of pollution and deforestation

6th Grade Social Studies: World Geography and Global Issues SS060606 Unit 6: Economics and World Trade Lesson 6
Michigan Citizenship Collaborative Curriculum Page 13 of 21 Copyright © 2010-2015 Oakland Schools February 8, 2015
Geographical Inquiry
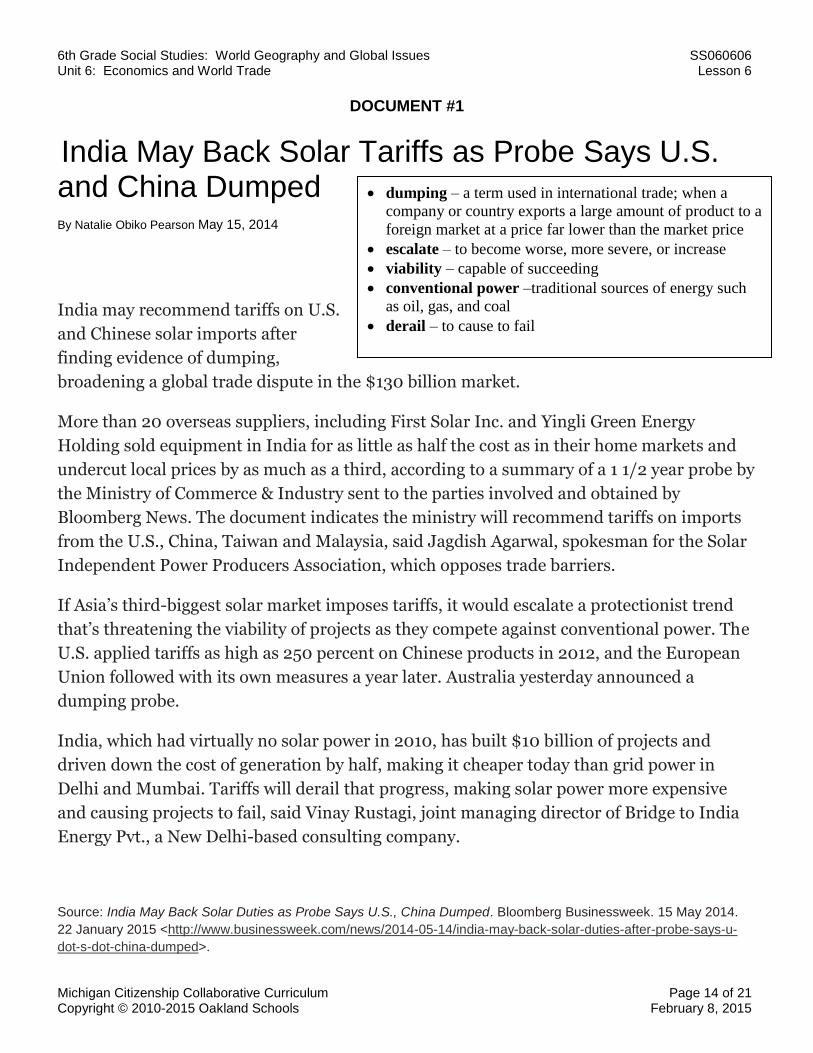
6th Grade Social Studies: World Geography and Global Issues SS060606 Unit 6: Economics and World Trade Lesson 6
Michigan Citizenship Collaborative Curriculum Page 14 of 21 Copyright © 2010-2015 Oakland Schools February 8, 2015
dumping – a term used in international trade; when a
company or country exports a large amount of product to a
foreign market at a price far lower than the market price
escalate – to become worse, more severe, or increase
viability – capable of succeeding
conventional power –traditional sources of energy such
as oil, gas, and coal
derail – to cause to fail
DOCUMENT #1
India May Back Solar Tariffs as Probe Says U.S. and China Dumped
By Natalie Obiko Pearson May 15, 2014
India may recommend tariffs on U.S.
and Chinese solar imports after
finding evidence of dumping,
broadening a global trade dispute in the $130 billion market.
More than 20 overseas suppliers, including First Solar Inc. and Yingli Green Energy
Holding sold equipment in India for as little as half the cost as in their home markets and
undercut local prices by as much as a third, according to a summary of a 1 1/2 year probe by
the Ministry of Commerce & Industry sent to the parties involved and obtained by
Bloomberg News. The document indicates the ministry will recommend tariffs on imports
from the U.S., China, Taiwan and Malaysia, said Jagdish Agarwal, spokesman for the Solar
Independent Power Producers Association, which opposes trade barriers.
If Asia’s third-biggest solar market imposes tariffs, it would escalate a protectionist trend
that’s threatening the viability of projects as they compete against conventional power. The
U.S. applied tariffs as high as 250 percent on Chinese products in 2012, and the European
Union followed with its own measures a year later. Australia yesterday announced a
dumping probe.
India, which had virtually no solar power in 2010, has built $10 billion of projects and
driven down the cost of generation by half, making it cheaper today than grid power in
Delhi and Mumbai. Tariffs will derail that progress, making solar power more expensive
and causing projects to fail, said Vinay Rustagi, joint managing director of Bridge to India
Energy Pvt., a New Delhi-based consulting company.
Source: India May Back Solar Duties as Probe Says U.S., China Dumped. Bloomberg Businessweek. 15 May 2014.
22 January 2015 <http://www.businessweek.com/news/2014-05-14/india-may-back-solar-duties-after-probe-says-u-
dot-s-dot-china-dumped>.

6th Grade Social Studies: World Geography and Global Issues SS060606 Unit 6: Economics and World Trade Lesson 6
Michigan Citizenship Collaborative Curriculum Page 15 of 21 Copyright © 2010-2015 Oakland Schools February 8, 2015
subsidies – monetary assistance given by the
government to a person or group to support of
an effort deemed within the public interest
dumping – a term used in international trade;
when a company or country exports a large
amount of product to a foreign market at a
price far lower than the market price
DOCUMENT #2
U.S. Will Place Tariffs on Chinese Solar Panels By DIANE CARDWELL and KEITH BRADSHER
Published: October 10, 2012
The Commerce Department issued its final ruling
Wednesday in a long-simmering trade dispute
with China, imposing tariffs ranging from about
24 to nearly 36 percent on most solar panels
imported from the country.
s
The penalties are somewhat lower than those announced by the department earlier this year, when the
government determined that Chinese companies were benefiting from unfair government subsidies and
were selling their products in the United States below the cost of production, a practice known as
dumping.
For one of the biggest panel makers, Suntech, the duties are slightly higher, moving to almost 36
percent from about 34 percent.
The trade case stemmed from a legal filing nearly a year ago by a coalition of manufacturers, led by
SolarWorld, a German company with considerable manufacturing in the United States. The coalition
stated that Chinese companies, which dominate global sales with a two-thirds market share, were
competing unfairly in the American market.
“This is another important step in returning the solar marketplace in the United States to fair
competition,” said Timothy C. Brightbill, a lawyer representing the companies that brought the case.
At the same time, Mr. Brightbill said, he was concerned that the Commerce Department did not expand
the scope of the ruling, which applies to panels made up of Chinese-produced solar cells. That has
allowed companies to sidestep the duties by assembling panels composed of cells produced elsewhere,
even if their components come from China. “We are looking to the administration for an explanation on
how they will close or address this loophole in the scope.”
The Chinese government had no immediate response to the decision, which was issued in the early
hours of the morning Beijing time.
Source: U.S. Will Place Tariffs on Chinese Solar Panels. New York Times. 10 October 2013. 22 January 2015 <http://www.nytimes.com/2012/10/11/business/global/us-sets-tariffs-on-chinese-solar-panels.html>.

6th Grade Social Studies: World Geography and Global Issues SS060606 Unit 6: Economics and World Trade Lesson 6
Michigan Citizenship Collaborative Curriculum Page 16 of 21 Copyright © 2010-2015 Oakland Schools February 8, 2015
counterproductive – not helpful; making the thing
you want to happen lesson likely to happen
polysilicon – a form of silicon used as a raw
materials in solar and electrical industries
DOCUMENT #3
U.S. tariffs on Chinese solar panels boomerang By Washington Post Editorial
Board, Published: August 12, 2013
WHEN THE Commerce Department slapped tariffs on Chinese solar panels last year, industry analysts
had good reason to worry that it would spark a costly and counterproductive trade war. Now, in another
example of why tariffs and other trade barriers should be imposed with extreme caution, their fears are
being borne out. In retaliation for last year’s penalties, the Chinese government has begun enforcing
tariffs of its own on American polysilicon, an ingredient in solar panel manufacturing.
U.S. polysilicon makers account for about a quarter of the international market, much of their product
shipped to China. Or at least that was the case last year. In the beginning of 2013, Michigan-
based Hemlock Semiconductor announced that it was firing hundreds of workers, perhaps for good,
partially in anticipation of the trade restrictions that have just been phased in. Upon hearing that the
Chinese government would punish U.S. firms, stocks of non-U.S. polysilicon makers soared. Tariffs on
both sides, meanwhile, promise to push up the price of solar equipment in the United States.
U.S. Tariffs on Chinese Solar Panels Boomerang. Washington Post. 12 August 2013. 22 January 2015 <http://www.washingtonpost.com/opinions/us-tariffs-on-chinese-solar-panels-boomerang/2013/08/12/fef555e6-f577-11e2-a2f1-a7acf9bd5d3a_story.html>.

6th Grade Social Studies: World Geography and Global Issues SS060606 Unit 6: Economics and World Trade Lesson 6
Michigan Citizenship Collaborative Curriculum Page 17 of 21 Copyright © 2010-2015 Oakland Schools February 8, 2015
supply constraints – factors that prevent
production from keeping pace with demand for a
product, usually due to lack of infrastructure,
credit, labor, etc.
input costs – the costs of materials, labor and
overhead in the production of a good or service
vendors – a business that sells a particular type of
product
DOCUMENT #4
Chinese solar-panel prices rising 20% in the U.S. Increase due to supply constraints, rising input costs, and trade dispute
April 10, 2014
By Claudia Assis, MarketWatch
SAN FRANCISCO (MarketWatch) — The price of Chinese-made solar panels
delivered to the U.S. could increase by up to 20% by the end of the year, GTM
Research said Thursday.
The increase is due to supply constraints, rising input costs, and the ongoing trade dispute between the two
countries, the Boston-based green-energy consultancy said in a report.
Chinese-made modules are significantly cheaper than those made in other areas, and GTM Research
estimated they were 55% of total modules shipped to the U.S. last year.
Chinese firms are quoting modules at 80 cents to 85 cents per watt for delivery in the second half of the
year, compared to 70 cents per watt at the end of 2013, the report said.
The ongoing U.S.-China trade case is the “primary driver” behind the price increase, the report said.
More duties on Chinese and Taiwanese solar modules would push up U.S. pricing beyond current levels, as
the firms would pass on tariff-induced penalties onto customers or contract out cell and module production
to vendors based in higher-cost countries such as India, South Korea, and Malaysia, GTM Research said.
The U.S. began investigating earlier this year allegations that solar-panel manufacturers in China and
Taiwan could be evading duties.
Cheap and plentiful solar panels from China have fueled the boom in rooftop solar systems, and analysts at
Cowen and Co. have said U.S. solar-panel manufacturing capacity is so constrained that U.S. manufacturers
are unlikely to reap benefits from any potential trade barriers.
Source: Chinese Solar Panel Prices Rising. Marketwatch. 10 April 2014. 22 January 2015
<http://www.marketwatch.com/story/chinese-solar-panel-prices-rising-20-in-the-us-2014-04-10>.

6th Grade Social Studies: World Geography and Global Issues SS060606 Unit 6: Economics and World Trade Lesson 6
Michigan Citizenship Collaborative Curriculum Page 18 of 21 Copyright © 2010-2015 Oakland Schools February 8, 2015
unanimous – being in complete agreement
subsidiary – owned or controlled by another company
subsidies - monetary assistance given by the government to a person or group to support of
an effort deemed within the public interest
polysilicon – a form of silicon used as a raw materials in solar and electrical industries
DOCUMENT #5
SolarWorld wins key U.S. ruling on the way to more tariffs on
Chinese products By Richard Read on February 14, 2014 at 11:00 AM, updated February 14, 2014 at 5:47 PM
SolarWorld, the manufacturer with a solar-panel plant in Hillsboro, cleared a significant hurdle Friday in its bid for more tariffs on Chinese and Taiwanese products imported to the United States.
The U.S. International Trade Commission declared in a unanimous preliminary determination that imports of Chinese panels made with Taiwanese solar cells injure the domestic manufacturing industry.
SolarWorld Industries America Inc., a subsidiary of Germany’s SolarWorld, filed the case Dec. 31, accusing China of illegal subsidies and both China and Taiwan of dumping products in the United States at unfairly low prices. The company asked the U.S. government to close a loophole that enables Chinese companies to evade tariffs by making their panels with solar cells manufactured in Taiwan.
“Step by step, U.S. solar producers are returning to a day when they no longer are forced to compete with the government of China,” said Mukesh Dulani, president of SolarWorld Industries America. The company employs more than 600 in Hillsboro making solar cells and panels.
The Chinese government did not immediately respond to the U.S. commission's decision Friday. In January, Beijing retaliated against U.S. tariffs by imposing duties on imports of U.S. polysilicon, the raw material used to make wafers for solar cells.
In an interview, SolarWorld's Dulani said tariffs, if imposed, could enable SolarWorld to increase its workforce again in Hillsboro, where its plant once employed more than 1,000. "We again could get above 1,000," he said, "and we are working very hard to get there."
Dulani said tariffs would create an even playing field, enhancing the ability of SolarWorld and other U.S. manufacturers to innovate. SolarWorld is working in both Hillsboro and Germany, for example, to invent lower-cost crystals that go into wafers for making solar cells.
"With innovation, prices will keep dropping like they were before all this dominance by China," Dulani said. Without the duties, he said, "more companies are closing and that will destroy long-term innovation for the world."
But Jigar Shah, president of the Coalition for Affordable Solar Energy, a group of solar-panel installers and other U.S. companies, said that if federal officials impose additional tariffs, panel prices will rise and Americans will lose jobs as purchases decline.
“It is now official,” Shah said in a news release. “A German company is one step closer to manipulating U.S. trade procedure in order to prop up its own failing business and inflict harm on a job-creating industry.”
6th Grade Social Studies: World Geography and Global Issues SS060606 Unit 6: Economics and World Trade Lesson 6
Michigan Citizenship Collaborative Curriculum Page 19 of 21 Copyright © 2010-2015 Oakland Schools February 8, 2015
“By raising the cost of solar for American homeowners,” Shah said, “SolarWorld is poised to inflict critical damage on an industry which last year added more than 20,000 solar installation, sales and distribution jobs to the U.S. economy.”
The trade case next moves to the U.S. Commerce Department, which is expected in late March to make a preliminary determination on anti-subsidy duties for Chinese products. Then in June, the Commerce Department is scheduled to make a preliminary determination on anti-dumping duties for China and Taiwan.
If Commerce imposes the preliminary duties, the U.S. International Trade Commission could act about a year from now to make the tariffs final.
Source: Solar World wins key U.S. ruling. The Oregonian. 14 February 2014. 22 January 2015
<http://www.oregonlive.com/business/index.ssf/2014/02/solarworld_wins_key_us_ruling.html>.

6th Grade Social Studies: World Geography and Global Issues SS060606 Unit 6: Economics and World Trade Lesson 6
Michigan Citizenship Collaborative Curriculum Page 20 of 21 Copyright © 2010-2015 Oakland Schools February 8, 2015
Inquiry Chart
Important information to help answer the question: How and why do some countries restrict trade?
#1
#2
#3
#4
#5
6th Grade Social Studies: World Geography and Global Issues SS060606 Unit 6: Economics and World Trade Lesson 6
Michigan Citizenship Collaborative Curriculum Page 21 of 21 Copyright © 2010-2015 Oakland Schools February 8, 2015
Analyzing Arguments For and Against Free Trade
Argument #1: For
Through global competition, specialization, and access to technology, free trade and openness allow countries to grow
faster—India and China started in the 1980s with restrictive trade policies, but as they have liberalized they have also
improved their growth enormously1. The International Trade Commission estimates that a free trade agreement
between just Colombia and the US would increase the US GDP by $2.5 billion2. When industries have to compete with
competition around the world, they are pushed towards innovation and efficiency. Entrepreneurs are more productive if
they have to compete. Free trade increases access to technology which also increases overall development. Because
of free trade, prices are lower for everyone. Trade offers benefits to both developed and developing nations by
encouraging competition, efficiency, lower prices, and opening up new markets to tap into.
1Panagariya, Arvind (2003), “Think Again: International Trade”, Foreign Policy Magazine
2White House (2010), “Benefits of US-Colombia Trade Promotion Agreement
Argument #2: Against
Although free trade may promote innovation and growth, because of issues like dumping (where rich countries sell
their products very cheaply in poorer countries and make it impossible for local industry to compete), or jobs being
exported to places where labor is cheaper, free trade has significant costs and does not necessarily foster benefits for
all. It is necessary to grow infant industries and create jobs, and free trade hurts both.
Which argument do you think is the strongest argument?
Give 3 reasons for your answer:
Source: Arguments For and Against Free Trade. 22 January 2015 <http://idebate.org/es/node/17550>.