world expo 2010 shanghai: exploring international visitors
139
WORLD EXPO 2010 SHANGHAI: EXPLORING INTERNATIONAL VISITORS’ EVALUATIONS OF EXPERIENCE QUALITY by Shanna Beth Saubert A thesis submitted in partial fulfillment of the requirements for the Master of Science degree for the Department of Recreation, Park & Tourism Studies in the School of Health, Physical Education, and Recreation Indiana University April 2011
-
Upload
khangminh22 -
Category
Documents
-
view
0 -
download
0
Transcript of world expo 2010 shanghai: exploring international visitors
WORLD EXPO 2010 SHANGHAI: EXPLORING INTERNATIONAL VISITORS’
EVALUATIONS OF EXPERIENCE QUALITY
by
Shanna Beth Saubert
A thesis
submitted in partial fulfillment
of the requirements for the Master of Science degree
for the Department of Recreation, Park & Tourism Studies
in the School of Health, Physical Education, and Recreation
Indiana University
April 2011

ii
Accepted by the Graduate Faculty, Indiana University, in partial fulfillment of the
requirements for the degree of Master of Science.
Masters Thesis Committee
____________________________________
David M. Compton, Ed.D.
____________________________________
Craig M. Ross, Re.D.
____________________________________
Fernando F. Ona, Ph.D.

iii
ACKNOWLEDGEMENTS
When I first came to Indiana University in the summer of 2009, I was unsure of
what to expect. Being a master’s student in the Department of Recreation, Park and
Tourism Studies has truly been an unforgettable experience. In the course of a little over
two years in Bloomington, I have been blessed with overwhelming support from my
cohort as well as various faculty and staff members. (Bonus thanks to DD!)
I would like to initially express my generally overwhelming gratitude to all the
members of my committee for providing their invaluable support through time, patience,
and input which allowed me to delve into a topic of interest and further commit to
exploring personal research with academic integrity. Many heartfelt thanks to Dr. David
Compton (my committee chair, former department chair, assistantship supervisor, and
academic advisor!) for being so committed to my academic and professional
development as a researcher in this and many other projects. His continuous
encouragement, counsel, commitment, and dedication have been such a tremendous
influence on my graduate experience. His care and consideration of students is
phenomenal and I am grateful for having been allowed the opportunity to work with him.
I have greatly appreciated the opportunity to cooperate with Dr. Shane Pegg from the
School of Tourism at the University of Queensland in Australia. He has allowed me to
work in-part with the collaborative research team and also shared his data with me across
the ocean with the assistance of, and sometimes in spite of, technology. Dr. Craig Ross
has provided much needed insight and guidance throughout this process keeping me on
task with the formatting and making sure all my ducks were in a row. Dr. Kiboum Kim

iv
has assisted in refining the methodology and analysis which was greatly appreciated.
Additionally, Dr. Fernando Ona has been incredibly supportive of my research interests
and was always willing to provide assistance, advice, and encouragement. Thanks for not
letting me crawl under a rock and believing in me and my future. I wish him much luck
in Boston and fully intend to visit him when I am in Europe.
My friends at IU (Annie, Julie, Donica, Tyler, Rachel, Lauren, Kelly, and Frank)
– thanks for always being willing to talk, listen, and run with me when I was too stressed
and/or forgot to do basic things like eat or sleep. Through the good times and bad, I have
been blessed with good friends who kept me accountable to myself and connected with
reality. Elmo says, “Thank you for not driving me nuts and having a brain that works.”
My lifelong friends and adopted sisters (Carmie & Brittany) – thanks for sticking
by me all these years. Also, for the countless Facebook messages, texts, emails, and
phone calls which were always welcome reprieves when we have been separated by
geography. They have known me since I could not even spell my name correctly (and
someone still refuses to!) and continually believe in me even when I don’t believe in
myself.
Finally, to my family – thank you times infinity for surrounding me with your
unconditional love and endless support. I am truly blessed with a wonderfully large and
geographically dispersed extended family. I have been lucky enough to be born with
exceptional parents (Lysle and Brenda) and a wonderful older brother (Robert). They
keep me energized and laughing, reasonably grounded but believing I could fly with my
goals and dreams. And for almost all imaginable intents and purposes, they truly defy
description.
God has obviously blessed me beyond belief. Thanks to everyone for believing in
me. I truly know and believe in my heart that I could not have done it alone.

v
Shanna Beth Saubert
World Expo 2010 Shanghai:
Exploring international visitors’ evaluations of experience quality
Large international events provide unique opportunities for individuals to engage
in cross-cultural experiences. When individuals have positive/meaningful experiences,
they are more likely to recommend the event or attend similar events in the future.
Previous studies have mostly examined the effects of motivations and individual
evaluations of service quality without considering the potential for interaction effects
from additional factors related to the experience. This study explored how experience
quality at international events such as the World Expo 2010 in Shanghai may be
explained by the relationships observed between visitor motivations, perceptions of
service factors, and reactions to various experiential factors. The hypotheses for this
study included: (1) variances in international visitors’ evaluations of experience quality is
explained by variables including gender, age, and previous experience including visits to
Shanghai, attending national celebration events in China, and/or at a prior World Expo;
(2) variances in international visitors’ evaluations of experience quality is explained by
variables of experience factors, visitor motivations, and service quality; and (3) variances
in international visitors’ evaluations of experience quality is explained by the interaction
between variables of experience factors, motivations, and service quality.
Secondary analysis was conducted on a total of 168 questionnaires completed by
visitors to the World Expo 2010 Shanghai. The first hypothesis was tested using one-way
ANOVA analysis and found no significant difference for the variables based on gender;
however, there were significant differences in evaluations of experience factors and

vi
overall experience quality for individuals based on age. Visitors aged 25-34 had
noticeably lower average scores than other age groups. Correlation analysis was used to
test the second hypothesis. Significant correlations were found to exist between each of
the variables. Finally, multiple regression analysis found visitor motivations and
experience factors to have significant effects on the evaluation of overall experience
quality. The effects of service quality on the remaining variance were negligible.
Results suggest that experience factors, visitor motivations, and the
performance/quality of service factors may positively influence the experience quality for
visitors to large international events. Furthermore, when considering future examinations
of experience quality, visitor motivations and reactions to experience factors are more
significant than the performance/quality of service factors.
Keywords: experience, service quality, motivation, international events
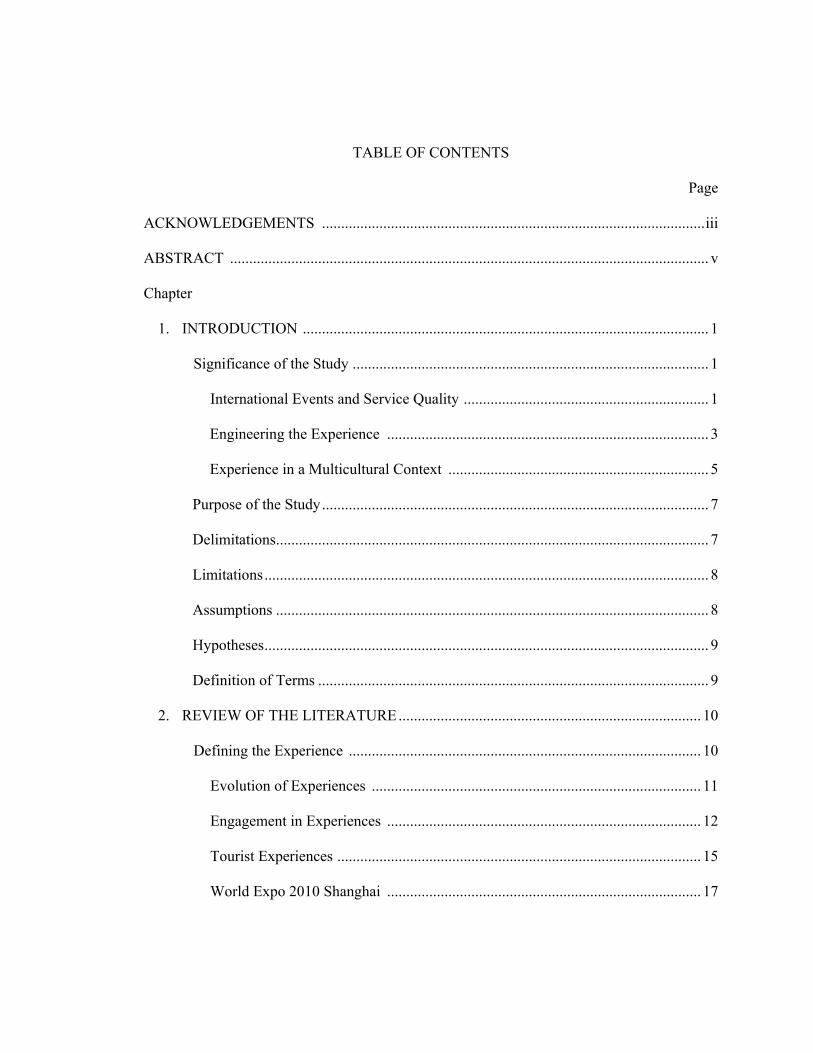
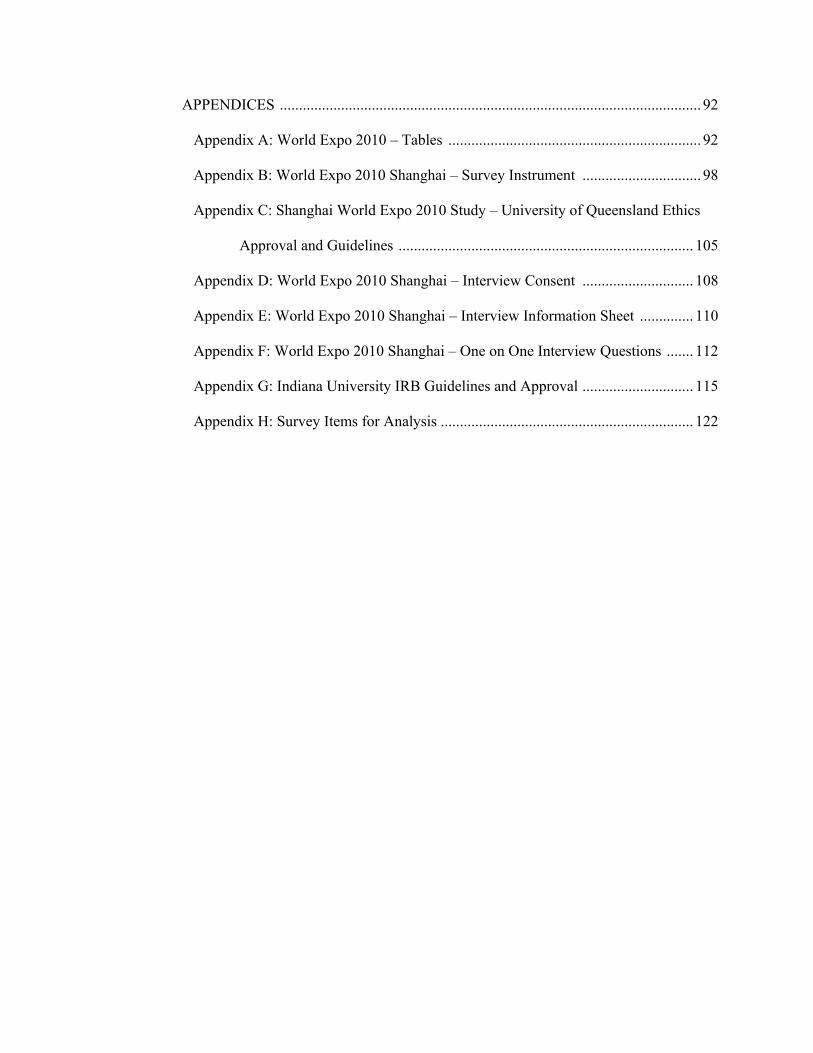
TABLE OF CONTENTS
Page
ACKNOWLEDGEMENTS .................................................................................................... iii
ABSTRACT ............................................................................................................................. v
Chapter
1. INTRODUCTION .......................................................................................................... 1
Significance of the Study ............................................................................................. 1
International Events and Service Quality ................................................................ 1
Engineering the Experience .................................................................................... 3
Experience in a Multicultural Context .................................................................... 5
Purpose of the Study ..................................................................................................... 7
Delimitations ................................................................................................................. 7
Limitations .................................................................................................................... 8
Assumptions ................................................................................................................. 8
Hypotheses .................................................................................................................... 9
Definition of Terms ...................................................................................................... 9
2. REVIEW OF THE LITERATURE ............................................................................... 10
Defining the Experience ............................................................................................ 10
Evolution of Experiences ...................................................................................... 11
Engagement in Experiences .................................................................................. 12
Tourist Experiences ............................................................................................... 15
World Expo 2010 Shanghai .................................................................................. 17

Planned Behavior ....................................................................................................... 20
Needs ..................................................................................................................... 20
Theory of Planned Behavior ................................................................................. 21
Motivation ............................................................................................................. 23
Service Quality .......................................................................................................... 25
Basic Standards ..................................................................................................... 25
SERVQUAL ......................................................................................................... 25
Satisfaction ............................................................................................................ 27
SERVPERF ........................................................................................................... 30
Evaluating Experience Quality .................................................................................. 32
Separate and Holistic Measures ............................................................................ 32
Experience Quality ................................................................................................ 34
Summary ................................................................................................................... 37
3. METHODOLOGY ....................................................................................................... 39
Research Paradigm .................................................................................................... 39
Justification ........................................................................................................... 39
History ................................................................................................................... 40
Modern Research ................................................................................................... 41
Applied Paradigm .................................................................................................. 44
Data ........................................................................................................................... 44
Secondary Analysis ............................................................................................... 44
Authorization and Sample ..................................................................................... 45
Instrumentation ..................................................................................................... 46
Data Collection ..................................................................................................... 47

Methods ..................................................................................................................... 48
Research Design .................................................................................................... 48
Variables ............................................................................................................... 49
Proposed Model .................................................................................................... 50
Analysis ................................................................................................................. 51
Methodological Strengths ..................................................................................... 52
4. RESULTS ..................................................................................................................... 54
Descriptive Analyses ................................................................................................. 54
Participants ............................................................................................................ 54
Evaluations of Experience Quality ......................................................................... 62
Variable Reliability ................................................................................................... 67
ANOVA ..................................................................................................................... 68
Correlations ............................................................................................................... 70
Multiple Regression .................................................................................................. 72
Summary of Results ................................................................................................... 73
5. DISCUSSION, IMPLICATIONS, AND CONCLUSION ........................................... 74
Discussion .................................................................................................................. 74
Theoretical Application .......................................................................................... 74
Scale Reliability ..................................................................................................... 75
Participant Characteristics ...................................................................................... 75
Explaining Experience Quality .............................................................................. 77
Implications for Future Research ................................................................................ 79
Conclusion .................................................................................................................. 80
REFERENCES ............................................................................................................. 81
APPENDICES .............................................................................................................. 92
Appendix A: World Expo 2010 – Tables .................................................................. 92
Appendix B: World Expo 2010 Shanghai – Survey Instrument ............................... 98
Appendix C: Shanghai World Expo 2010 Study – University of Queensland Ethics
Approval and Guidelines ............................................................................. 105
Appendix D: World Expo 2010 Shanghai – Interview Consent ............................. 108
Appendix E: World Expo 2010 Shanghai – Interview Information Sheet .............. 110
Appendix F: World Expo 2010 Shanghai – One on One Interview Questions ....... 112
Appendix G: Indiana University IRB Guidelines and Approval ............................. 115
Appendix H: Survey Items for Analysis .................................................................. 122

LIST OF TABLES
Table 1. Visitor Demographics .........................................................................................54
Table 2. Visitor Socio-Demographic Information .............................................................57
Table 3. Visitor Travel Characteristics .............................................................................59
Table 4. Days Spent in Shanghai .......................................................................................61
Table 5. Total Days Spent Attending World Expo 2010 Shanghai ...................................62
Table 6. Reliability Statistics .............................................................................................68
Table 7. ANOVA Comparison of Visitors Between the July and October Collection
Phases ..................................................................................................................69
Table 8. ANOVA Comparison of Visitors’ Evaluations of Experience Quality ...............70
Table 9. Correlations Between Variables .........................................................................71
Table 10. Experience Quality Multiple Regression Model ...............................................72
Table A1. Pavilions by Zone .............................................................................................93
Table A2. Forums ..............................................................................................................96
Table A3. Types of Events .................................................................................................97
Table H1. Survey Items Clustered by Variables and Categories .....................................123
LIST OF FIGURES
Figure 1. Pine and Gilmore’s Types of Experiences ........................................................14
Figure 2. Map of the Expo Site .........................................................................................19
Figure 3. Cole, Crompton, and Willson’s Structural Model .............................................27
Figure 4. Theoretical Model for Examining Experience Quality .....................................50
Figure 5. Visitor Gender Between Collection Phases ........................................................55
Figure 6. Theoretical Model with Correlations ..................................................................71
1
Chapter 1
INTRODUCTION
Experience quality at international events such as the World Expo 2010 in
Shanghai may be explained by the relationships observed between experience factors,
service quality, and planned behavior. Visitor perceptions of their experiences may be
affected by service quality factors such as travel costs, time requirements, opportunities
for social interaction, and destination-specific characteristics. The desire of visitors to
seek and engage in either spontaneous or directed experiences might also vary based on
cultural differences. In this sense, cultural orientation could be indicative of one’s
preparations for, anticipation of, and expectations from an experience. Examining the
effects of service quality on international event experiences may provide critical
information for leisure service providers regarding the intention of visitors to recommend
and/or attend similar events in the future.
Significance of the Study
International Events and Service Quality
In the organization and administration of international events, there are numerous
factors which influence customer experience. Service quality is a key factor in planning
as well as the design of experiences based on the anticipated market who will attend the
event. International events are typically designed to attract customers from a wide
variety of countries, ethnic backgrounds, and diverse interests. In a global context,
1
international events are affected by the phenomenon referred to as globalization.
The process, according to Kelleher and Klein (2006), is defined as “…increasing
interconnectedness between societies such that events in one part of the world more and
more affect people and societies far away” (p. 208). Globalization has become the source
by which different cultures interact via economics, politics, technology, and culture
through service provision in addition to the dissemination of people, ideas, and products
(Reisinger & Turner, 2003; Steger, 2003; Zeithaml, Bitner, & Gremler, 2009).
Considering the current state of global interconnectedness, event planners must
increasingly be aware of the changing global economy and new technological
innovations. These changes simultaneously increase fluidity and communication while
also further enabling visitors with more control and opportunities to engage in co-
production.
Global competitiveness is impacting the daily operations of all types of service
organizations in a variety of ways: definitions of service quality are merging;
business environments are changing; information, capital, products, and services
flow across international borders at speeds unheard of just a few months ago.
(Milakovich, 2005, pp. 12-13)
The evidence of globalization has been made more apparent with a multitude of available
influential examples from around the world including Europe (Michelin, IKEA, and
Volkswagen), Asia (Sony), and American companies ranging in service provisions from
McDonalds to the Walt Disney Corporation to Facebook who have influenced cross-
cultural interactions and the global economy (Gopinath, 2008; Griswold, 1994; Petracca
& Sorapure, 2007). Since most of the world is now connected via globalization, the
performance metrics which could traditionally be applied to service quality for potential
analysis have become even more convoluted based on interactions within and beyond an

2
organization’s control. Given that service quality may vary depending on region (Gursoy
& Gavcar, 2003; Loker-Murphy & Pearce, 1995), nationality (Pecotich & Rosenthal,
2001; Pizam & Sussmann, 1995), or culture (Chick, 1998; Handwerker, 2002), it could
be advanced that the effects of globalization on services marketing may require
examination from a cross-cultural perspective.
The SERVQUAL framework developed by Parasuraman, Zeithaml, and Berry
(1985, 1986, 1988) has been one of the most widely cited methods for evaluating overall
service quality. The survey instrument identified 21 attributes to providing excellent
service within five core dimensions of reliability, responsiveness, assurance, empathy
with the customer, and tangibles. Each attribute was measured with two ratings for both
customer expectations and perceptions resulting in a quantified measure of service
quality (Zeithaml et al., 2009). The instrument has shown incredible flexibility in
adapting the dimensions of service quality to more accurately reflect the cultural needs
and attitudes of various national populations (Gnoth, 1997; Lee & Carter, 2009; Wickens,
2002).
Interestingly, SERVQUAL cannot measure customer satisfaction, tendency to
recommend, or other factors affecting the customer’s experience. The determination of
whether an international event is successful is dependent on the experiences and reactions
of people from different cultures. Since there are noticeable differences between western
and eastern cultures regarding service expectations and motivations (Chen, 2001;
Dong, 2006; Lang, 1996), SERVQUAL must be considered in conjunction with other
methods to more accurately gauge visitor experiences at international events.

3
Engineering the Experience
The traditional managerial practice of meeting or exceeding prescribed service
standards for reliability, response, and recovery has overlooked the importance of
planning and organizing for the overall visitor experience. International event planners
and organizers have typically focused on hygiene factors rather than the personal context
of the visitor’s interaction dynamics during the experience. Additionally, little attention
has been paid to engineering a set of visitor outcomes that match expectations, intentions,
and motivations for the visit. Careful attention to the construction and engineering of the
visitor experience was exemplified by the Imagineering concept of the Walt Disney
Corporation and has been used for decades to create a vivid, relevant, and compelling set
of interactions (Berger, 2007; Petracca & Sorapure, 2007; Smoodin, 1994). Rather than
merely planning the physical structures for an international event, the organizers may
need to carefully examine the actual visitor experience as one that is co-created and
individuated. International events are thereby more adequately evaluated as a series of
on-going processes involving simultaneous production and consumption as the visitor is
directly involved in co-creating their experiences (Pine & Gilmore, 1999; Rossman &
Schlatter, 2008).
While service marketing and management techniques can control certain
interactions within the process, there are also many personal facets which require
immediate and longer-term reflection and thus can have a greater impact. The overall
quality and/or value of events is decided by visitors based on a multitude of elements
including social, personal, environmental, and consequential interactions (Cole,
Crompton, & Willson, 2002; Crouch, 1994; Reisinger & Turner, 2003). According to

4
research, experiences which have proven to be valuable and distinctly memorable have
shown a much higher propensity for re-engagement and recommendation to others
(Daengbuppha, Hemmington, & Wilkes, 2006; Morgan, 2009).
Experiences are ultimately chosen and evaluated based on a multitude of factors.
The most commonly examined elements have included location, availability,
engagement, perceived value, motivation, cultural awareness, and recognized quality
(Csikszentmihalyi & LeFevre, 1989; Ekinci & Hosany, 2006; Wong, 2004). Much of the
literature surrounding experience quality has been based on psychosocial theories
including self-efficacy theory (Bandura, 1997), self-determination theory (Ryan & Deci,
2000), and flow theory (Csikszentmihalyi, 1997). However, the theory of planned
behavior (Ajzen & Driver, 1991, 1992; Ajzen & Fishbein, 1980; Fishbein & Ajzen, 1975)
appears to be especially useful in examining differences exhibited in visitor motivations,
anticipations, and expectations at international events. The theory of planned behavior
states that behavior can be predicted by the determinants of intention which include
behavioral, normative, and control beliefs. Successfully engineered experiences are
predicated on the assumption that people have specific needs to be met and make plans
accordingly. Different cultures may have different methods for engagement with the
event and interacting with other people at international events (Cole et al., 2002; Richards
& Palmer, 2010). It thereby seems that cultural accommodation and tolerance might also
affect individual evaluations of experience quality.
5
Experience in a Multicultural Context
Culture is broadly defined as the concept of shared knowledge, experiences, and
ideas that can exist within a company, community, country, or society (Daft, 2008;
Edfelt, 2010; Lee & Carter, 2009). It encompasses everything from technology,
language, symbols, economics, religion, politics, structures and organization, values,
attitudes, customs, to the education needed for adaptation and perpetuation. Effective
cultural practices are able to constantly adapt to changing needs of a population, whether
minor or significant. Cross-cultural management theory expounds on the need to
understand and educate oneself and others using cultural relativity with the intent to
positively affect interactions for all involved (Giroux, 1999; Griswold, 1994; Kelleher &
Klein, 2006).
Results from various studies suggest that delivering products and services to
citizens of a country, temporary visitors, and/or other non-citizens produces varying
levels of success (Bird & Fang, 2009; Iwasaki, 2008; Pecotich & Rosenthal, 2001). Since
everyone is unique, universal approaches are not always effective as individuals often
have other needs or certain styles may not fit with personalities, ethics, and motivations
(Williams, 2002). Both positive and negative responses to particular experiences can be
predicated on such personal characteristics or additional outside influences from the
greater society, culture, and the environment. Even with a wealth of international
influences, service providers cannot successfully attract their target population without
considering cultural differences which may explain variations in service and experience
quality at international events.

6
There seem to be multiple dimensions of cultural differences which may influence
visitor experience including value orientations, cultural patterns, and cultural variability
(Reisinger, 2009; Reisinger & Turner, 2003; Stewart, 2005). Multiple studies relate the
extremity of differences between Asian and Western cultures and the likelihood of
experiencing extreme culture shock (Chen, 2001; Dong, 2006; Lang, 1996; Samovar &
Porter, 1991). Culture shock occurs every time individuals are exposed to a different
culture. It can be caused by an inability to cope, sensory overload, a partial or complete
incompatibility with beliefs or value systems, and confrontations based on barriers related
to language, food, dress, manners, or the environment (Hofstede, 1997; Pearce, Morrison,
& Rutledge, 1998; Rogers & Steinfatt, 1999). Visitors with more shared characteristics,
such as language or manners, often feel more comfortable or familiar with the host
culture which alleviates some of these issues (Reisinger & Turner, 2003; Stephan &
Stephan, 1985). However, people may also seek to expand their knowledge through
unique experiences in completely foreign cultures (Chen & Chen, 2011; Iwaskaki, 2008;
Williams, 2002). In such cases, the evaluation of the multicultural experience might be
made regardless of service quality. Therefore, cultural differences between the host
culture and tourists are particularly important for analyzing planned behavior, service,
and experience quality at international events where visitors may have different values
and perceptions of the world in addition to being members of different cultural groups or
speaking different languages.
7
Purpose of the Study
There appears to be a need to examine the relationships between experience
quality, service quality, and planned behavior as they may be modified by cultural
differences. Using data available from a survey of visitors at the World Expo 2010
Shanghai (n=168), this study proposes to analyze the relationship between motivation,
experience, and service factors in predicting overall experience quality. The analysis of
secondary data has proven viable for many studies in leisure behavior (Chen, 1996;
Dong, 2006; Lang, 1996; Tan, 2000; Van Puymbroeck, 2004). This study may add to the
body of knowledge in international event experience research by exploring three crucial
questions: (a) do socio-demographic variables account for variations in experience
factors, service quality, planned behavior, and/or experience quality, (b) is experience
quality influenced by planned behavior, experience factors, and/or service quality, and (c)
can existing differences in perceived experience quality be explained as a result of
planned behavior, experience factors, and/or service quality.
Delimitations
This research was delimited to the following:
1. A secondary data set derived from a study of visitors who attended the World
Expo 2010 in Shanghai, China was provided as an SPSS file.
2. The primary sample included data from 168 international visitors aged 18 and
above who completed surveys administered in July and October of 2010.
3. Additional information was made available from 10 face-to-face interviews
conducted in July and October of 2010 and provided as mp3 files for review.
8
Limitations
The following factors were considered to limit the interpretation of results from
this study:
1. Secondary data was provided from a larger post-attendance study.
2. The accuracy and reliability of measurement scales and items in the survey was
determined by the original research team.
3. The sample population was confined to international visitors at a large
international event, restricting generalization.
4. Attitudes and behaviors towards event experiences may change over time.
Assumptions
This study was based upon the following assumptions:
1. Examining the international event from a post-positivistic perspective provided a
unique opportunity to examine experiences in a cross-cultural setting.
2. Visitors to international events were more likely to be willing to provide
information related to their unique motivations, service encounters, and the
quality of their experiences.
3. Study participants understood the instructions and provided accurate information
related to their personal experiences.
4. The instruments and items used in this study were direct measures of motivation,
experience factors, service quality, and experience quality.
9
Hypotheses
The hypotheses for this study included:
H1: Variances in international visitors’ evaluations of experience quality is explained by
variables including gender, age, and previous experience including visits to Shanghai,
attending national celebration events in China, and/or at a prior World Expo.
H2: Variances in international visitors’ evaluations of experience quality is explained by
variables of visitor motivations, responses to experience factors, and perceived
service quality.
H3: Variances in international visitors’ evaluations of experience quality is explained by
the interaction between variables of motivations, experience factors, and perceived
service quality.
Definition of Terms
For the purposes of this study, the following terms are defined:
Experience Factors: attributes related to a visitor’s direct and indirect observations,
encounters, and knowledge of an event (Ralston, Ellis, Compton, & Lee, 2007).
Experience Quality: visitors’ perceived satisfaction with the overall event
experience based on a collective measurement of personal, service, and experience factors.
Motivation: the reasons for why visitors choose to attend specific events and
decide to act as they do (Ajzen & Fishbein, 1980).
Service Quality: the level to which an organization’s staff and/or volunteers
respond and/or adapt to meet visitor expectations for service at an event (Zeithaml et al.,
2009).

10
Chapter 2
REVIEW OF THE LITERATURE
Large international events present unique challenges for event organizers.
International visitors are engaged in multiple encounters with opportunities to respond
either positively or negatively due to language and/or cultural barriers with the host
community. Difficulties may arise because while focused on increasing the number of
visitors to the event, organizers can potentially lose their target audience by detracting
from the quality of the overall experience. Visitor experiences are often analyzed and/or
predicted by the separate constructs of planned behavior and service quality. Previous
experiential research has been conducted using these constructs to examine tourism
experiences, visitor services, and leisure experiences as well as the new field of
experience management which has focused more on identifying the factors which may
enhance the experience. Tourists’ motivations and perceptions of service quality are both
important elements in evaluating the overall event experience. However, experience
quality is a multidimensional concept which may be influenced by relationships between
many additional factors.
Defining the Experience
According to the Oxford Dictionary (2010), experience has multiple definitions
including: a) participation and observation of events; b) knowledge and/or skills gained
over time; and c) “an event or occurrence that leaves an impression on someone.”
11
Experiences provide individuals with practical knowledge that can be applied in the
future. There are many types of experiences including educational experiences, travel
experiences, recreational experiences, and entertainment experiences which depend upon
varying levels of involvement. People seek different types of experiences based on
multiple factors related to fulfilling various needs and desires.
Evolution of Experiences
Most event and experience literature has recognized the impact of the work done
by Pine and Gilmore (1999). In their book, they described the historical progression of
economic growth from commodities (agricultural products) to goods (manufactured
products) to services (intangible products) to experiences (events and memories). This
trend has been reflected more noticeably when considering the current economic situation
domestically and abroad. According to records on international economic accounts from
the U.S. Department of Commerce’s Bureau of Economic Analysis (2010), while the
deficit on goods based on more imports than exports has recently increased to $171.2
billion, the surplus on services has increased to $36.8 billion. Travel, transportation, and
other private services experienced the largest increases in both receipts and payments
among the many different types of services documented.
Considering the focus of economic relationships between providers and
customers has changed over time, organizers are now responsible for recognizing the
multidimensionality of customer experiences. One study involving marketing research
for twelve separate products collected data which supports the consideration of additional
variables in providing for experiences (Gentile, Spiller, & Noci, 2007). According to the
literature reviewed for the study, individuals chose experiences in order to fulfill and/or

12
confirm needs related to lifestyle, pragmatism, senses, emotions, cognitive, and relational
dimensions. Evaluations of experiences can also be determined by perceptions, actions,
relationships, and system of values and beliefs which are unique to individual customers.
The successful marketing strategies for the customer experience with the diverse range of
products in this study can be applied further to examining other types of experiences
where the customer is also a producer of their experience.
Engagement in Experiences
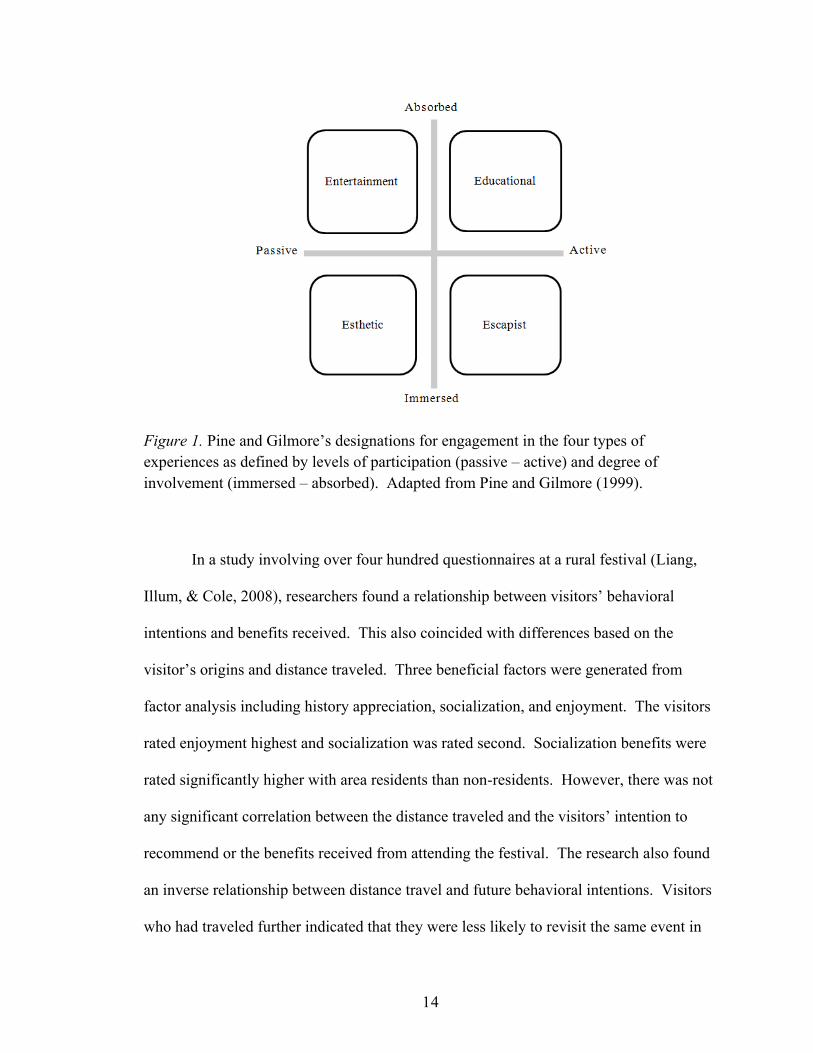
According to Pine and Gilmore (1999), visitors can be engaged actively or
passively to multiple and varying degrees during an experience depending on the
situation. Furthermore, personal behavior tends to reflect the degree to which the visitor
is willing to be engaged, whether absorbed by or immersed in the experience. Thus,
visitor experiences are separated into four types based on these interrelationships –
entertainment, educational, escapist, and esthetic. Pine and Gilmore’s four types of
experiences are further illustrated in Figure 1.
Pine and Gilmore (1999) explained the differences between the four types of
experiences based upon factors related to the experience as well as visitor motivations,
intentions, and behaviors. Entertainment experiences reflect the personal desire to be
entertained. While being entertained, visitors are passively absorbing the input provided
to their senses. Concerts, circus acts, variety shows, and sometimes even cities depend
upon the ability to attract and provide specific experiences where the consumer is not
expected to do anything but observe. In contrast, visitors can actively absorb their
experiences in what are termed educational experiences. Attending demonstrations,
classes, and lessons increases personal knowledge and/or skills by actively engaging the

13
mind and/or the body. Educational experiences provide individuals with an opportunity
for personal change. When people go to museums, for example, they have chosen to
learn about something new or different without any intention to influence the exhibits.
Alternatively, esthetic experiences are those which provide visitors with an
opportunity to be immersed passively in the experience. Esthetic experiences involve the
observation of pleasing physical environments such as enjoying sunsets while on
vacation or going to a relaxing spa. Rather than being outside the situation being
observed, one is actually within the situation itself. Finally, escapist experiences allow
visitors to escape either physically or psychologically from typical, everyday lives.
Holiday vacations, virtual reality systems, and theme parks offer visitors with escapist
experiences that are not available otherwise. The visitor is actively immersed in the
experience which they co-create. Each type of experience – entertainment, educational,
esthetic, escapist – tends to provide different benefits to visitors based on the nature of
the experience, the motivations behind engaging in the experience, and the level of
personal involvement one has during the experience (Pine & Gilmore, 1999).
14
Figure 1. Pine and Gilmore’s designations for engagement in the four types of
experiences as defined by levels of participation (passive – active) and degree of
involvement (immersed – absorbed). Adapted from Pine and Gilmore (1999).
In a study involving over four hundred questionnaires at a rural festival (Liang,
Illum, & Cole, 2008), researchers found a relationship between visitors’ behavioral
intentions and benefits received. This also coincided with differences based on the
visitor’s origins and distance traveled. Three beneficial factors were generated from
factor analysis including history appreciation, socialization, and enjoyment. The visitors
rated enjoyment highest and socialization was rated second. Socialization benefits were
rated significantly higher with area residents than non-residents. However, there was not
any significant correlation between the distance traveled and the visitors’ intention to
recommend or the benefits received from attending the festival. The research also found
an inverse relationship between distance travel and future behavioral intentions. Visitors
who had traveled further indicated that they were less likely to revisit the same event in
15
the future. While not to an overwhelming degree, the visitor responses to the festival
experience were somewhat mediated by factors related to benefits received and the
choice of location for the event.
Tourist Experiences
Tourism has the unique position of simultaneously encouraging preservation and
authenticity while seeking cultural exchange (Williams, 2002). In the book Travel as a
Political Act, travel writer Rick Steves declared, “…travel can be a powerful force for
peace. Travel promotes understanding at the expense of fear. And understanding bridges
conflicts between nations” (2009, p. 191). When individuals are engaged at international
events, there is a mutual understanding based on expressing views about nature and
culture in a safe and peaceful environment without ideology or politics (Lee, 2003). The
qualities that make different cultures unique often serve to attract tourists and generate
intercultural dialogue.
Tourists often travel with the expectation to be engaged in unique experiences
which are much different from their typical daily routines. Residents of a city hosting an
event may not have the same reactions as visiting tourists because of their degree of
familiarity with the location and the local culture. Residents are those individuals who
live and/or work in the immediate vicinity where an event is held while visitors are those
who are only visiting the location for a pre-designated period of time without a
permanent residence or employment. The distinction between residents and visitors is
important because many people travel with the specific intention of gaining personal
experience with another culture (Chen, 2006; Freestone & Geldens, 2008; Relyea,
Cocchiara, & Studdard, 2008). According to the theory of planned behavior (Ajzen &
16
Fishbein, 1980; Ajzen & Driver, 1991, 1992; Fishbein & Ajzen, 1975), active
participation and interpersonal contact may create positive changes in beliefs, attitudes,
intentions, and behaviors. Therefore, event planners and organizers can potentially affect
evaluations of the experience through positive engagement and interpersonal service
interactions with the visitors.
Visitor reactions to experiences are influenced by multiple interactions (Rossman
& Schlatter, 2008). The three phases of leisure experiences encompass anticipation of
the event, participation in the event, and reflections on the event. The interactions during
the anticipation phase encompass promotions and communication providing general and
specific information about the event. While participating in the event, the visitor
interacts with other people, service staff, and the environment. Additionally, visitors
respond to and derive meaning from a variety of objects which are physical, social,
and/or symbolic in nature. An important element affecting the visitor reactions to an
event is how the different interactions are produced. Interactions can vary whether they
are either spontaneous or planned. While visitors and event planners may intend for
specific interactions to take place, interactions may also take place outside the control of
individual visitors and event managers. These interactions include meeting new people,
learning through observation of another culture, and perceptions and reactions to the
physical environment and related surroundings of the event.
Tourism provides a significant revenue source across the globe as people travel
internationally for academic, professional, and recreational purposes. The World
Tourism Organization of the United Nations has estimated that annual international
tourism generated $852 billion (€611 billion) in export earnings for 2009 (2010). As

17
such, tourism is currently the leading category for international trade. Events are
widespread and are categorized into groups based on their importance or scope (local,
regional, national, continental, etc), character or purpose (recreation, professional and/or
competitive, and auxiliary), and regularity (Bjelac & Radovanovic, 2003). Large sport
and tourism events benefit host communities by improving economics, creating jobs,
investing in infrastructure, enhancing cultural awareness, protecting the environment, and
contributing to peace and international understanding (Getz, 2003; Lee, 2003; Turco,
Swart, Bob, & Moodley, 2003). International mega-events such as the Olympics or the
World Expo, formerly the World’s Fair, attract large groups of people from various
nations with the purpose of increasing peace and cooperation among individuals of
diverse backgrounds.
World Expo 2010 Shanghai
There have been noteworthy international exhibitions bringing nations and
individuals together since 1851. The first World’s Fair was held in London, England and
had twenty-five countries in attendance (Expo 2010 Shanghai China, 2010). The event
has changed significantly in nature and scope since inception 160 years ago. The most
recent event organized by the International Exhibitions Bureau was the World Exposition
2010 Shanghai, also known by its shortened name of the World Expo. This was the first
time that the exposition was held in a developing country (Xu, 2010).
The event’s theme “Better City, Better Life” was meant to highlight ideas for
better lives in urban environments by promoting change in policies, strategies, and
sustainable development (Bureau of Shanghai World Expo Coordination, 2010). A series
of three forums intended to engage diplomats, international organizations, and visitors in

18
intercultural and diplomatic discussions included a Summit Forum, Theme Forum, and
Public Forum (Expo 2010 Shanghai China, 2010; Xu, 2010). The event also had
substantial security measures to provide for the safety of all in attendance. Providing
service to visitors was accomplished with the assistance of almost 80,000 volunteers
(Expo 2010 Shanghai China, 2010).
Shanghai provided an interesting backdrop with a population of 19 million in a
metropolis which has attracted many multinational companies, resulting in it being the
wealthiest province city in China (Ramzy, 2010). From May 1st – October 31st, 2010
(184 days) over 73 million people visited Shanghai for the Expo (Expo 2010 Shanghai
China, 2010). On the 5.26 km2 (over 2 square miles) site there were five main zones
divided to incorporate five theme pavilions, pavilions for 246 participating nations and
international organizations, and 33 public venues for holding 22,925 cultural events.
There were also over one thousand events provided by performing groups from 176
countries, thirteen international organizations, thirty-six cities, and four enterprises (Expo
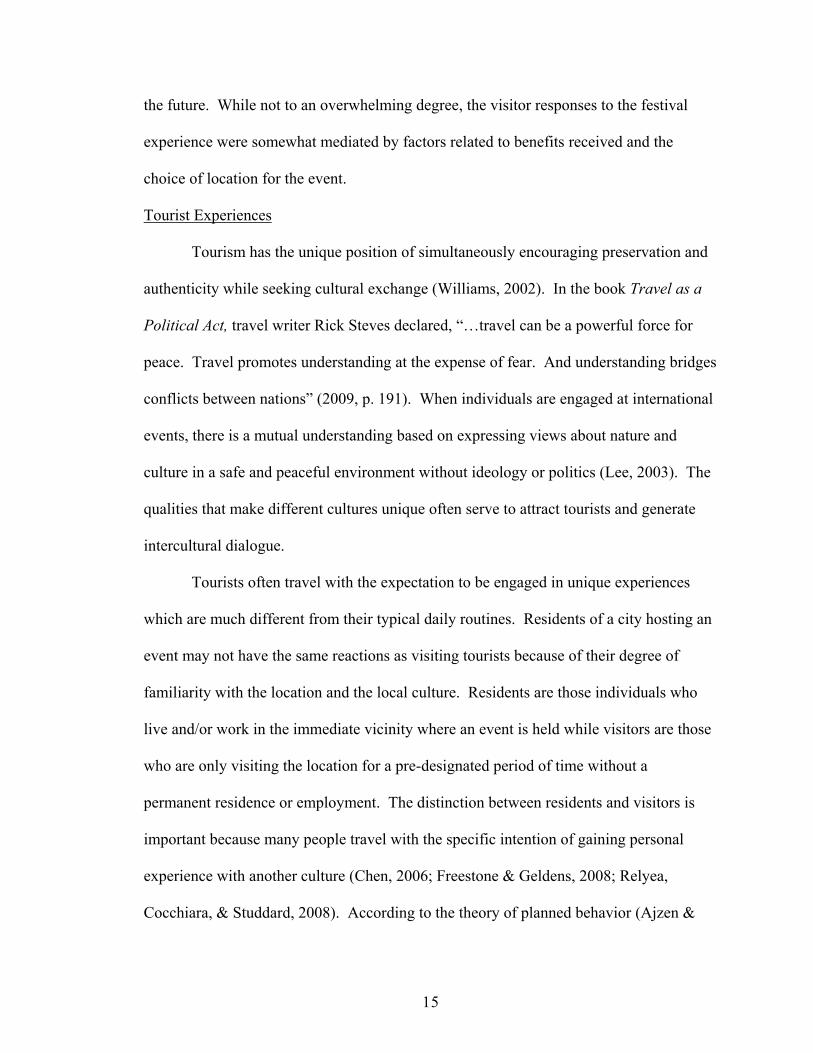
2010 Shanghai China, 2010). The complexity of the Expo design and management is
illustrated more fully by maps of the five zones in Figure 2 and a more complete listing
of pavilions, events, and forums present at the Expo is available in Appendix A.
International events such as the World Expo 2010 Shanghai are designed to
attract visitors from a wide variety of countries, ethnic backgrounds, and diverse interests
and to encourage engagement in the host culture (Bjelac & Radovanovic, 2003; Edfelt,
2010; Getz, 2003). Visitors from various cultural backgrounds attend the event with
preconceived behaviors, expectations, and interpretations of the service and experience to
be received (Bird & Fang, 2009; Chen & Chen, 2011; Morgan, 2009). Therefore, while
19
planning positive experiences is important for event planners and organizers, the
determination of one’s experience quality may be related to additional factors of
motivations and perceived service quality.
Figure 2. Map of the Expo site identifying each of the five zones. Adapted from Expo
2010 Shanghai China website (2010).
Zone C
Zone B
Zone A
Zone D
Zone E
20
Planned Behavior
Needs
Every individual has specific needs which need to be addressed in life. While the
Constitution of the United States proclaims the rights of individuals to include “life,
liberty, and the pursuit of happiness,” such lofty goals are not universal norms. Accepted
social norms which are apparent in both laws and folkways determine whether an
individual’s behavior is right or wrong, good or bad relative to the society which the
individual belongs to or identifies with (Schaefer, 2004). In many nations across the
globe, freedom and/or happiness is not a priority as basic necessities needed to sustain
life are barely met. Some of these differences are based on cultural variations between
societies and ideologies while other noticeable differences are more aptly attributed to
political and social issues related to poverty and/or injustice.
Basic necessities for sustaining life include food, water, shelter, and rest.
Individuals and groups tend to act and behave in order to fulfill these needs for
themselves and others. Once these basic needs for survival are met, subsequent needs
tend to arrange themselves via a hierarchy such as that proposed by Maslow (1954). The
needs identified beyond the basic physiological needs previously mentioned tend to
address psychological fulfillment. These include issues of safety and security, desire for
social interaction and acceptance, esteem from self and others, and finally self-
actualization via situations which engage the senses and induce feelings of personal
achievement, pleasure, or novelty. While self-actualization is most desirable, not all
experiences provide the opportunity to meet all of one’s higher needs and desires. The
21
reasons underlying personal behavior have been further tested via theoretically-based
psychological research methods including the theory of planned behavior.
Theory of Planned Behavior
The theory of planned behavior originally put forth by Ajzen and Fishbein (1980;
see also Fishbein & Ajzen, 1975) uses beliefs and attitudes to predict intentions and
behaviors. Beliefs are formed by the interrelationships between direct observations,
previous experience, inferential beliefs, and information obtained from outside sources
such as friends or the media. Basically as individuals observe events and behaviors,
individual responses to and perceptions of experiences are mediated directly and
indirectly by information gained from a variety of conscious and subconscious sources
which include previous life experiences and observations, inferred expectations based on
previous experience, and secondary information provided by friends, family, television,
radio, movies, and so forth. Subsequent attitudes towards different experiences reflect
preconceptions regarding expected value and include social conditioning through
exposure to different experiences. Attitudes about a single event experience can thereby
vary between individuals based on differences between assigned value and prior
exposure. Depending on beliefs and attitudes, intentions then identify how individuals
plan to act based on the four main elements of behavior, target, situation, and time.
Intentions are highly subjective and dynamic as they may change at any given moment to
reflect personal developments and experiences over time as well as influences from
interactions in a variety of situations. Furthermore, one’s beliefs, attitudes, and intentions
at any given moment may elicit different behaviors.

22
Behavior is the summation of one’s personality, actions, and reactions (Reisinger,
2009). Considering the intertwined variables of planned behavior, the theory of planned
behavior focuses not only on the prediction of behavior but also on how to affect change
by relying on the influence of continuously accumulated experiences (Ajzen & Fishbein,
1980; Fishbein & Ajzen, 1975). The impact of specific experiences on an individual are
thereby not easily separated as past experiences inform current reactions which
subsequently affect future intentions and behaviors.
The theory of planned behavior has been used in numerous studies for different
purposes. The studies by Ajzen and Driver (1991, 1992) have been especially helpful to
researchers by supplying evidence as to how to apply their theoretical basis to practice.
In an influential study involving college students, Ajzen and Driver (1992) investigated
individual involvement, moods, attitudes, subjective norms, perceived control, and
intentions through the use of a questionnaire. Subjective norms were related to perceived
social pressures to act in a certain manner. Perceived control reflected how involved the
individual was in making decisions and choices regarding their actions and engagement
in specific activities. An initial pilot study was used to refine their methods and then 146
undergraduate college students participated in the main study which utilized pre- and
post-engagement questionnaire distribution periods. They found that attitudes, subjective
norms, and perceived behavioral control were predictors of intentions and that perceived
control was also a predictor of behavior. The individual attitudes towards behaviors,
subjective norms, and perceived control were also indicative of the intention to
participate in activities and leisure behaviors.

23
According to another study by March and Woodside (2005), tourist experiences
included both planned and unplanned consumption behaviors. Planned behaviors
identified in the study included costs such as airplane tickets and hotel reservations based
on the predetermined time period. Unplanned consumption behaviors incorporated those
decisions that were made spontaneously, such as for additional souvenirs or unexpected
side trips. In combining data collected during separate entry and exit surveys to a site in
Canada, the study found that most visitors spent significantly more than they had
originally intended. The data further supported evidence that behaviors varied according
to individual motivations, experiences with the products, and the composition of the
travel party (size, age, gender, etc). Another major finding of the study was that while
the visitors were limited in terms of time available at a particular location there was some
flexibility related to one’s spending ability.
Motivation
As an important aspect regarding one’s intentions, motivation refers to the reasons
for why visitors attend specific events and act as they do. The motivation to act in a
certain manner may be extrinsic or intrinsic, meaning either for a reward or purely for
inherent satisfaction (Ryan & Deci, 2000). In either case, the individual is acting in order
to meet a specific need or desire. According to tourism literature, tourists are grouped in
segments differently depending upon whether they are motivated to travel and be
engaged in familiar experiences or whether they tend to desire experiences which are
strange or novel (Cohen, 1972, 1979; Uriely, 2005). Those who desire familiar
experiences will have very different expectations than their counterparts wishing to
explore unknown situations. Visitors to international events may also attend based on the
24
desire to engage in experiences which involve intellectual, social, achievement, or
stimulus-avoidance behaviors (Chen & Chen, 2011; Manfredo, Driver, & Tarrant, 1996;
Morgan & Xu, 2009). The motivations which underlie individual behaviors may thereby
be related and synthesized with the concepts for engagement in the four types of
experience (entertainment, educational, esthetic, and escapist) as previously mentioned
from Pine & Gilmore (1999).
In order to understand more about visitor motivations and the different types of
experiences desired at events, Pegg and Little (2008) developed a six-page multi-item
questionnaire. This questionnaire was distributed to visitors attending the Tamworth
Country Music Festival in January of 2008 by staff and post-graduate students from the
University of Queensland’s School of Tourism. During a five day period of data
collection, 1320 questionnaires were collected. Results reported by Pegg and Patterson
(2010) found that visitors had identified various motivations for attendance including
loving the music and an expressed desire for social connection with other visitors.
According to the data, the atmosphere of the festival was also an important influence for
the visitors. This reflects the notion that preconceived motivations may be significant in
the planning stages of an experience; however, once visitors are on-site there are
additional factors which may subsequently affect interactions and perceptions.
The evidence suggests that individuals will make choices and react differently to
experiences based on a variety of factors related to planned behavior. Since attending
events such as the World Expo 2010 may involve a significant amount of travel and
subsequent financial support for international visitors, it is important to understand
individual motivations for attending in addition to statements of desired expectations
25
from an experience. Once the visitor arrives at the event, individual responses towards
the experience are affected by a series of interactions and perceptions regarding
satisfaction with service factors.
Service Quality
Basic Standards
Service quality is a component for evaluating customer satisfaction based on
identifying perceptions regarding the provider’s ability and execution in meeting specific
standards and requirements. Most service providers recognize that there is a basic level
of service required for all providers. Visitors typically expect relative cleanliness, clear
communication, dependability through adherence to schedules, and consideration of the
individual as well as of groups (Zeithaml et al., 2009). Gaps in service quality identify
where service providers have failed during the process to meet the customer’s
expectations or desired standards for listening, design, marketing, or delivery of services.
Meeting basic service requirements for the majority of visitors requires understanding the
relationship between the importance and performance of multiple service factors by
recognizing where needs are met and where changes are deemed necessary to improve
service provision.
SERVQUAL
The SERVQUAL framework is an instrument which quantifiably examines 21
attributes which have been deemed necessary to provide excellent service (Milakovich,
2005; Parasuraman et al., 1986). Since the development of SERVQUAL, service quality
has mostly been evaluated based on expectations and performance within five prescribed
dimensions of reliability, responsiveness, assurance, empathy, and tangibles as identified

26
by Parasuraman and colleagues (1985, 1986, 1988). The instrument has been typically
utilized by researchers and service providers to identify how well services are provided
and where improvements need to be made from the customer or visitor’s perspective.
The dimensions are separately defined in terms of requirements placed on the service
provider. Reliability refers to whether the service is performed dependably, according to
stated promises. Responsiveness is related to service recovery as staff and/or volunteers
need to willingly be attentive to visitors, responding promptly to issues and concerns.
The elements of assurance and empathy portray the visitor’s desire to engage with
individuals who are knowledgeable, trustworthy, and demonstrate consideration in
treating them as individuals. Finally, tangibles relate mostly to appearance as visitors are
constantly evaluating the event’s physical environment, personnel, and all forms of
correspondence. Each of the 21 attributes is measured in terms of discrepancies between
visitor expectations and perceptions (Zeithaml et al., 2009).
The SERVQUAL framework has been widely used as it is easily adapted based
on desired research parameters. However, sometimes service providers have not been
able to address all of the needs for intended customers and additional factors have
required consideration. In examining experience literature for instance, Cole et al. (2002)
found it particularly useful to examine service quality and satisfaction separately. In a
rather complex study, they developed a model for exploring relationships between service
quality, satisfaction, behavioral intentions, performance quality, and quality of
experience. Using data from 282 questionnaires completed by visitors to a wildlife
refuge in Texas, a total of seven out of eight original hypotheses were supported
including: performance quality influenced quality of experience, satisfaction, and service
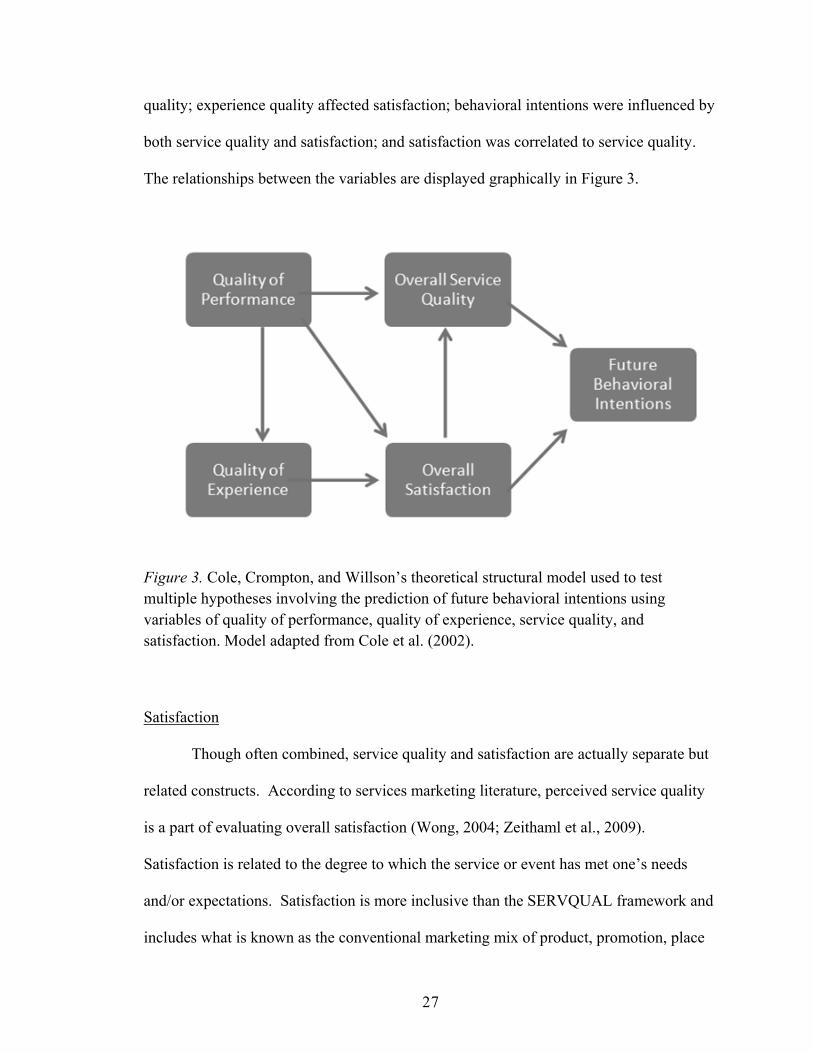
27
quality; experience quality affected satisfaction; behavioral intentions were influenced by
both service quality and satisfaction; and satisfaction was correlated to service quality.
The relationships between the variables are displayed graphically in Figure 3.
Figure 3. Cole, Crompton, and Willson’s theoretical structural model used to test
multiple hypotheses involving the prediction of future behavioral intentions using
variables of quality of performance, quality of experience, service quality, and
satisfaction. Model adapted from Cole et al. (2002).
Satisfaction
Though often combined, service quality and satisfaction are actually separate but
related constructs. According to services marketing literature, perceived service quality
is a part of evaluating overall satisfaction (Wong, 2004; Zeithaml et al., 2009).
Satisfaction is related to the degree to which the service or event has met one’s needs
and/or expectations. Satisfaction is more inclusive than the SERVQUAL framework and
includes what is known as the conventional marketing mix of product, promotion, place
28
(distribution), and price (Hurd, Barcelona, & Meldrum, 2008) and is then expanded to
include subjective perceptions of interactions with other people, physical evidence and
other tangibles, and the process or mechanisms used in service delivery (Zeithaml et al.,
2009). Satisfaction with service can be affected by price, features and attributes of the
product or service, personal moods or emotional responses, perceived quality of the
product or service, and situational factors.
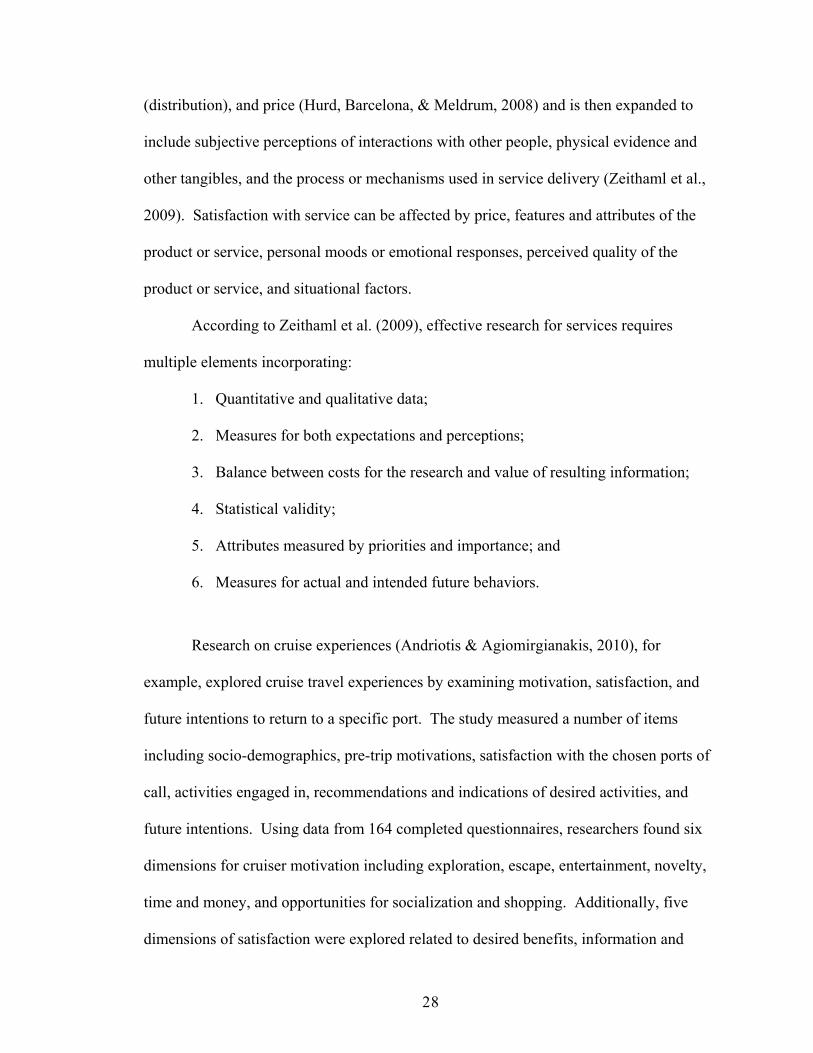
According to Zeithaml et al. (2009), effective research for services requires
multiple elements incorporating:
1. Quantitative and qualitative data;
2. Measures for both expectations and perceptions;
3. Balance between costs for the research and value of resulting information;
4. Statistical validity;
5. Attributes measured by priorities and importance; and
6. Measures for actual and intended future behaviors.
Research on cruise experiences (Andriotis & Agiomirgianakis, 2010), for
example, explored cruise travel experiences by examining motivation, satisfaction, and
future intentions to return to a specific port. The study measured a number of items
including socio-demographics, pre-trip motivations, satisfaction with the chosen ports of
call, activities engaged in, recommendations and indications of desired activities, and
future intentions. Using data from 164 completed questionnaires, researchers found six
dimensions for cruiser motivation including exploration, escape, entertainment, novelty,
time and money, and opportunities for socialization and shopping. Additionally, five
dimensions of satisfaction were explored related to desired benefits, information and

29
communication, dining, tour pace, and product and services provided during the
experience. Exploration and escape were primary motivations indicated by the
participants in the study while the product and services and pacing of tours significantly
shaped overall satisfaction. The motivations and satisfaction measures used in this study
reflect how personal and social elements can combine and influence visitor evaluations of
different experiences.
In a recent study (Gopalan & Narayan, 2010), researchers found that managing
satisfaction for tourist experiences requires collaboration from multiple parties. They
introduced a conceptual framework based on case studies for services in India and
Singapore. Ratings of satisfaction with service encounters were affected by additional
interactions with immigration officials, managers at attractions, and even politicians and
legislators. The analysis of data also showed statistical differences in ratings from
individuals based on age regarding safety, cleanliness, and comfort. An additionally
interesting finding was that younger tourists in the study were found to be more
concerned with fulfilling needs related to basic services than counterparts in other age
groups.
Many visitors are directly involved with creating and engaging in the event
experience. As such, they are actually part of the production process as co-creators.
During events, visitors are engaged in multiple types of interactions that may affect how
satisfied they are with the quality of service and experience received (Finsterwalder &
Tuzovic, 2010). Visitor experiences are not simple occurrences between the individual
and the service provider, but rather a culmination of multiple encounters. Visitors tend to
interact with many individuals during an event for various reasons including to increase

30
personal skills, to engage socially with other visitors, as well as more traditional
interactions with service staff. Events are a type of product which incorporate services
but they are also social experiences. The social aspect of events include additional
variables outside the control of event planners and organizers related to interactions with
the environment and other visitors as well as internalized personal behaviors.
SERVPERF
Cronin and Taylor (1992) suggested that an organization’s performance of service
factors provides a more accurate measurement of satisfaction than the previously utilized
SERVQUAL method. In the course of their study, they primarily investigated the
relationships between consumer satisfaction, service quality, and purchase intentions.
After reviewing the literature, they found inconsistencies in measuring service quality
based on individual attitudes and satisfaction. They decided to develop a new
performance-only measurement scale called SERVPERF. In exploring whether
performance-based measurement is more effective, they used both weighted and non-
weighted equations. Using data from a total of 660 questionnaires completed by
consumers, the study measured expectations, perceptions of performance, and importance
of variables. Factor analysis did not confirm SERVQUAL’s five-factor structure.
Instead, all items were summed or averaged as they were found to all be loaded on a
single factor. Furthermore, the non-weighted SERVPERF scale explained more of the
variation in quality of service. Also, while service quality precedes satisfaction,
satisfaction impacted future purchase intentions. Purchase intentions were affected by
consumer satisfaction more than service quality. Results found that the SERVPERF

31
scale was able to explain more of the variation in service quality than the previously
utilized SERVQUAL scale.
The data from Cronin and Taylor’s (1992) study was used further by Brady,
Cronin, and Brand (2002) in comparison with additional data collected in two different
stages from the same city’s population in order to test the reliability of the SERVPERF
scale. In total, the data utilized was incorporated from three separate studies. They used
the same surveys in both the second and third studies, however, they chose to use a
different scale than the original study in order to enhance the research. The new scale
utilized 10 items rather than the 22 used in both SERVQUAL and SERVPERF. The
results found support for many of Cronin and Taylor’s prior conclusions. First, there was
not a confirmation of the five factor scale previously utilized in SERVQUAL. Rather,
the assumption that performance-based measures of service quality (SERVPERF) reflect
a more accurate depiction for service quality was supported. More specifically, the
models which used the SERVPERF scale found an increase in the Goodness-of-Fit
Indices as well as a decrease in Chi-square values and residual estimates. Third, the
results indicated a statistically significant path between service quality and customer
satisfaction, as well as between customer satisfaction and purchase intentions. The path
between service quality and purchase intentions was less significant, representing only
three of the five industries examined. The revised SERVPERF scale with its 10 items
therefore supported all of the previous conclusions and was argued to be a better
reflection of the construct of service quality than the SERVQUAL scale.
Overall satisfaction with an event requires incorporating complex internal
evaluations of perceived service quality with accurate scales for measurement. Perceived

32
satisfaction with quality of service is subjectively evaluated by visitors in a series of
interactions with other visitors, staff and employees, and the overall environment.
Different markets may also require a change of emphasis on the dimensions of service
quality based on cultural idiosyncrasies.
Evaluating Experience Quality
Separate and Holistic Measures
Focusing on motivations and satisfaction with events provides information as to
how event experiences are evaluated. Experiences at international events are subjectively
evaluated by visitors based on a series of on-going processes involving simultaneous
production and consumption (Pine & Gilmore, 1999; Rossman & Schlatter, 2008).
Visitors choose where to go, what to do, and how to engage in the event and with other
people. According to multiple researchers, the primary goal of international events
should be to focus on providing experiences rather than delivering services (Huang &
Hsu, 2010; Pine & Gilmore, 1999; Ralston et al., 2007).
Completing an analysis of the strengths, weaknesses, opportunities, and threats
(SWOT) to satisfaction allows event planners and organizers to address changing needs
and desires of visitors. The Experience Factor Model by Ralston et al. (2007) addresses
the need to combine evaluations of experience factors with service factors. According to
the model, optimal experiences are based on the integration and interaction between
previously validated service factors from SERVQUAL with eight separate factors related
to the experience. These experience factors include the chosen theme, targeted
impressions, fewer negative cues, multiple sensory engagement, inclusion of
memorabilia, customization, and employees performing appropriately and in character.
33
Each experience factor reflects a different aspect important to the delivery of optimal
experiences. As the visitors are engaged they are both co-creators and consumers of the
experience. Furthermore, there appears to be a potential inverse relationship in visitor
satisfaction with the quality of events based on whether event organizers and planners
place more emphasis on service or experience factors. Event planners and organizers
must include both aspects in order to provide optimal experiences without sacrificing on
service provision.
According to an ethnographic study by Daengbuppha et al. (2006), individuals
have three stages of interaction at events. First, there is a pre-consumption experience
involving the individual visitor motivations to attend. Then there is an interactive
experience in which the visitor is involved in co-creation and consumption of the
experience. In this stage, the level of involvement, choices, perceptions, and reactions
are conditioned by personal factors, such as mood and background, and environmental
factors, such as the setting and cultural surroundings. The process of interacting with the
experience provided and the experience consumed is also evaluated simultaneously.
Finally, after the interaction phase is complete, there is a process of evaluating individual
satisfaction with an event. People interact with locations and change perceptions and
interpretations of experiences based on separate personal and environmental factors. The
results from this ethnography also further reflect the three stages of leisure experiences
described by Rossman and Schlatter (2008).
A study by Huang and Hsu (2010) investigated the impact of customer
interactions on visitors’ cruise experiences and satisfaction ratings. The researchers used
data collected from over six hundred online surveys completed by Americans. They used

34
an adapted service encounter model and found three main types of social contact for
cruisers. While on vacation, the tourists were affected by contacts with the local
community, the service personnel, and encounters with fellow tourists as there were
interactions both within and between groups. The results of the research found
interactions between the cruise participants had a direct impact on the overall cruise
experience. These encounters also were indirectly related to satisfaction with the
vacation as perceptions regarding the overall experience mediated the effects. The study
further found that the quantity of encounters was not as important as the quality of the
encounters in affecting vacation satisfaction. The cruise visitors had indicated desires to
be engaged in different types of quality interactions ranked by whether they were aimed
towards relaxation, learning, social interaction, family, and fitness. Relaxation and
learning interactions were ranked highest by the cruisers participating in this study.
Experience Quality
Experience quality is a collective measure of visitor satisfaction based on
personal, service, and experience factors. The measurement incorporates perceptions
resulting from a combination of expectations, satisfaction with service, and the
interpretation of multiple encounters (McAllister, Whiteford, Hill, Thomas, & Fitzgerald,
2006; McLeod & Wainwright, 2009; Ralston et al., 2007). In addition to previous
measures of planned behavior and satisfaction with service quality, event experiences
also incorporate social interactions and encounters. Every interaction which engages the
visitor with the event, the environment, or with other people including staff, volunteers,
and/or other visitors may affect experience quality.

35
Some researchers have recently identified a need to look at experiences more
holistically. The overall quality of experiences such as those at international events are
complex and dynamic requiring the incorporation of personal, service, and experience
factors. In one study, researchers examined the application of Pine and Gilmore’s
concepts of different experiences in relation to tourism (Oh, Fiore, & Jeoung, 2007).
They proposed that a definitive division between the four dimensions (entertainment,
education, esthetics, and escapism) does not always apply as some experiences blend
various elements from more than one dimension. “Edutainment”, for example, combines
education and entertainment in some venues including museums for science and history
where visitors learn information in entertaining environments. However, the researchers
also recognized the unique qualities of each dimension in contributing to how tourists
consume their experiences. Optimal tourist experiences combine elements from all four
dimensions. Additionally, a review of the available literature proposed that there are
additional factors which appear to affect the perceived quality of the experience including
personal values, perceived benefits, memories, perceived overall quality, and
customer/tourist satisfaction. In order to develop a measurement scale for examining the
four realms of experience in the tourism industry, questionnaires were completed by a
total of 419 guests at 58 B&B locations in a Midwestern state. The questionnaires
included items for education, esthetics, entertainment, escapism, arousal, memory,
overall quality, and satisfaction. In their study, the esthetic dimension explained the most
variance within the model for predicting tourist’s memory, arousal, satisfaction, and
overall quality. The results found support of Pine and Gilmore’s four dimensions of
experience but also concluded that predicting the consequences of tourist experiences (ex.

36
arousal, memory, satisfaction, and overall quality) may be difficult because of other
factors specific to the destination.
In another study, Hosany and Witham (2009) identified items to evaluate
experience measures, arousal, memories, overall perceived quality, overall satisfaction,
and the intention to recommend by utilizing a survey instrument adapted from a
previously validated tourist experience scale. Most of the measurements were completed
using 7-point Likert scale items. Experience dimensions were represented with sixteen
statements split between the four anticipated dimensions identified by Pine and Gilmore
(1999). Arousal measures encapsulated whether the cruise experience was interesting,
enjoyable, exciting, and stimulating. Memories from the experience rated agreement
with the following three questions: “I will have wonderful memories about this cruise
experience”; “I will remember many positive things about this cruise experience”; and “I
won’t forget my experience on this cruise”. Overall perceived quality and satisfaction
were each measured using two items incorporating dichotomies. Perceived quality was
rated either poor or excellent and inferior or superior. Satisfaction was assessed from
extremely dissatisfied to extremely satisfied and terrible to delighted. Finally, the
intention to recommend asked visitors how likely the chances were of them
recommending the cruise to others including friends and family. In total, 169
questionnaires were completed by vacationers on a cruise traveling between Singapore
and Hong Kong. Confirmatory factor analysis supported the four dimensions of
experiences previously identified by Pine and Gilmore (entertainment, education,
esthetic, and escapism). Study participants rated the dimensions in the following order of
esthetics, entertainment, education, and escapism. The results of further analysis found

37
the four dimensions have different levels of importance in predicting outcomes regarding
the other variables in the study – memory, arousal, overall perceived quality, satisfaction,
and intention to recommend. For the cruise visitors, the dimension of esthetics accounted
for most of the variance in the five variables examined. When compared with the
previous study, it seems that the type of experience visitors are engaged in will affect the
order of importance for the different dimensions as each experience is designed to affect
visitors differently.
Summary
A review of the pertinent literature seems to indicate that experience quality is a
multidimensional construct. Visitors may desire certain experiences over others based on
how they expect or want to be engaged and what benefits they expect from participating
in the experience. Individual visitor perceptions may also vary over time with the actual
experience received as the effects of arousal and memory become more apparent.
Overall satisfaction with international event experiences can further be evaluated based
on several factors specific to the destination, motivations of the visitor, quality of service,
and interpretations of the experience. Thus, evaluations regarding the quality of
experiences may vary widely between individuals and groups based on relationships
between personal and service-related factors.
Evaluations of experiences encompass individual measures related to experience
factors, personal motivations, and satisfaction with service as well as overall measures
related to the quality of the experience itself. Existing research indicates that
motivations, experience factors, and perceived service quality may impact the evaluation
of experience quality at international events. This study has examined experience quality

38
by exploring relationships between the variables of experience factors, motivations, and
satisfaction for visitors attending the World Expo 2010 Shanghai and was designed to
overcome discrepancies which exist in current event and experience literature.

39
Chapter 3
METHODOLOGY
This study utilized secondary data collected from international visitors to the
World Expo 2010 Shanghai to explore experience quality in relation to motivations,
experience factors, and perceived service quality. The data analyzed was part of a more
comprehensive study conducted by a team of faculty and graduate students from the
School of Tourism at the University of Queensland in collaboration with Indiana
University Bloomington and the Shanghai University of Engineering Science. The larger
study was entitled “Staging memorable events: An examination of service and experience
factors at the Shanghai World Expo,” and overseen by Dr. Shane Pegg as principal
investigator. The study had multiple aims including: develop a profile of Expo visitors;
examine motivations for attendance; determine overall satisfaction; measure the total
experience; and compare evaluations of service with experience.
Research Paradigm
Justification
All research efforts are founded upon worldviews or paradigms which form the
basis of inquiry. In order to conduct rigorous research efforts, researchers need to be
aware of their own worldviews/paradigms and how to best implement them (Creswell,
2009; Creswell & Plano Clark, 2007). In the social sciences, the wide range of
paradigms used reflects a variety of views from which to explore human social life. Each
paradigm has inherent assumptions about the nature of social reality. In other words,

40
paradigms identify “what is real, what is true, what is most acceptable, what and who are
most powerful, and even the very nature of people, objects, and events in the world”
(McMurry, Pace, & Scott, 2004, p. 9). Paradigms, or worldviews, thus provide valuable
information regarding how researchers view the world and conduct their research based
on a basic set of beliefs or assumptions.
Generally speaking, different paradigms may be more or less useful according to
various settings and applications so they tend to be neither true nor false (Babbie, 2007;
Schaefer, 2004). Student researchers tend choose specific paradigms based on their
philosophical views formed by participation in individual academic disciplines,
collaboration and learning from advisers and faculty, and also past research experience.
As such, the chosen paradigm reflects the specific elements of ontology, epistemology,
and methodology (Ponterotto, 2005). Ontology refers to the nature of reality and/or
being. Epistemology concerns the theory of knowledge and incorporates the concepts of:
a) what is knowledge; b) how do people gain knowledge; and c) how do people retain the
knowledge gained. Finally, methodology incorporates both the processes and procedures
involved in one’s research (Creswell, 2009). Researchers inevitably choose specific
research methods based on the appropriate fit and the salient effects of personal views
regarding ontology and epistemology (Ponterotto, 2005).
History
As societies have evolved over time, personal philosophies regarding how the
world works and how individuals and groups interact have changed as well (Goodale &
Godbey, 1988). Ancient philosophers in Greece, for example, followed schools of
Cynicism, Skepticism, Stoicism, Epicureanism, and Hedonism to contemplate existence,
41
which have (in part) continued to affect individuals and societies. Over the course of
history, scientific inquiries into the nature of existence and the human condition have
been based upon realism, empiricism, rationalism, pragmatism, positivism, and
postpositivism.
Fairly simple definitions can be derived from Goodale and Godbey (1988) in their
examination of the leisure experience. Empiricism requires experimentation and closely
controlled sensory observations in order to gain knowledge. Rationalism is based on
reason and logic and holds that there are pre-existing factors that are independent of and
affects one’s reasoning towards or deductions of actual experiences. Pragmatism is a
way of defining truth by examining concepts based on their practical consequences. In
social reform movements, individuals used pragmatism to further the idea that “learning,
intelligence, thoughts and ideas are instruments to be used to consciously shape and
improve individual and social life” (p. 146). Positivism insists on the use of the scientific
method in conducting research on physical and social phenomenon, including the use of:
a) observations; b) hypotheses; c) predictions; and d) experiments. In contrast to
positivism, postpositivism considers the idea that human knowledge is based on personal
experience and may change based on warranted evidence over the course of time.
Modern Research
Modern social science research incorporates a wide variety of paradigms
(Creswell, 2009; Lincoln & Guba, 2000; Schaefer, 2004). Most researchers tend to
consider four principal paradigms including postpositivism, constructivism,
advocacy/participatory, and pragmatism. Each of these philosophies should be identified
and examined individually to form accurate comparisons.
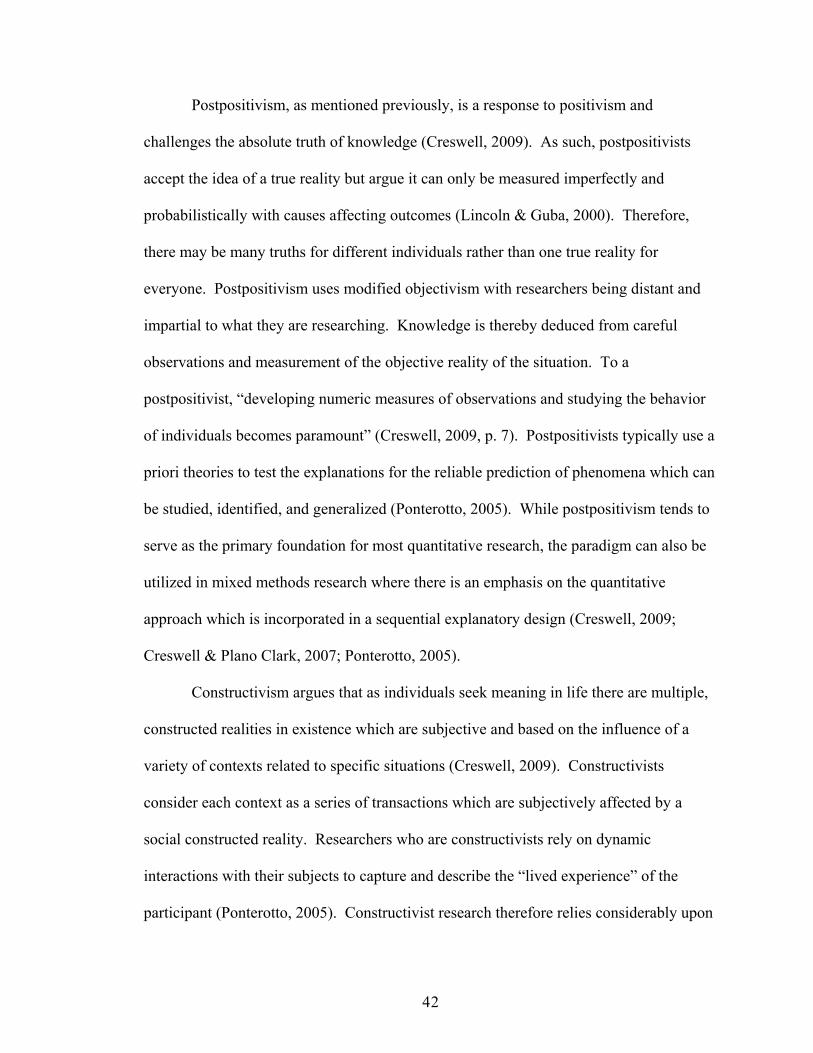
42
Postpositivism, as mentioned previously, is a response to positivism and
challenges the absolute truth of knowledge (Creswell, 2009). As such, postpositivists
accept the idea of a true reality but argue it can only be measured imperfectly and
probabilistically with causes affecting outcomes (Lincoln & Guba, 2000). Therefore,
there may be many truths for different individuals rather than one true reality for
everyone. Postpositivism uses modified objectivism with researchers being distant and
impartial to what they are researching. Knowledge is thereby deduced from careful
observations and measurement of the objective reality of the situation. To a
postpositivist, “developing numeric measures of observations and studying the behavior
of individuals becomes paramount” (Creswell, 2009, p. 7). Postpositivists typically use a
priori theories to test the explanations for the reliable prediction of phenomena which can
be studied, identified, and generalized (Ponterotto, 2005). While postpositivism tends to
serve as the primary foundation for most quantitative research, the paradigm can also be
utilized in mixed methods research where there is an emphasis on the quantitative
approach which is incorporated in a sequential explanatory design (Creswell, 2009;
Creswell & Plano Clark, 2007; Ponterotto, 2005).
Constructivism argues that as individuals seek meaning in life there are multiple,
constructed realities in existence which are subjective and based on the influence of a
variety of contexts related to specific situations (Creswell, 2009). Constructivists
consider each context as a series of transactions which are subjectively affected by a
social constructed reality. Researchers who are constructivists rely on dynamic
interactions with their subjects to capture and describe the “lived experience” of the
participant (Ponterotto, 2005). Constructivist research therefore relies considerably upon

43
the participant’s views of the situation being examined. Questions asked in this type of
research need to be quite general and/or broad so that the participants can individually
construct the meaning of a particular situation while also being engaged in discussions
and/or interactions with other people (Creswell, 2009). As such, constructivism tends to
be utilized in qualitative research which is aimed at producing a theory or pattern of
meaning (Creswell, 2009; Ponterotto, 2005).
In contrast with the two preceding theories, the advocacy/participatory approach
considers the existence of either a form of participative reality or a political reality.
Researchers using this approach reject the postpositvist assumptions which tend to
impose structural laws and theories which do not quite fit in cases of examining
marginalized individuals in society or social justice issues, and argue that the
constructivist viewpoint does not go far enough in advocacy for action agendas to help
marginalized individuals (Creswell, 2009). The advocacy/participatory paradigm links
the research inquiry with politics, associated political agendas, institutions, and also the
researcher’s life (Creswell, 2009).
Pragmatism, discussed briefly in the previous section, relies on many ideas and
diverse approaches as it values both objective and subjective knowledge (Creswell,
2009). As such, pragmatism is not quite committed to any single system of philosophy or
reality. Pragmatists believe that studies can incorporate both quantitative and qualitative
methods, using multiple paradigms to address research problems (Creswell & Plano
Clark, 2007). Rather than considering absolutes, pragmatists consider the truth as what is
working at the time. Researchers who adopt a pragmatic stance towards their inquiry are
encouraged to use multiple methods, different paradigms, various assumptions, and
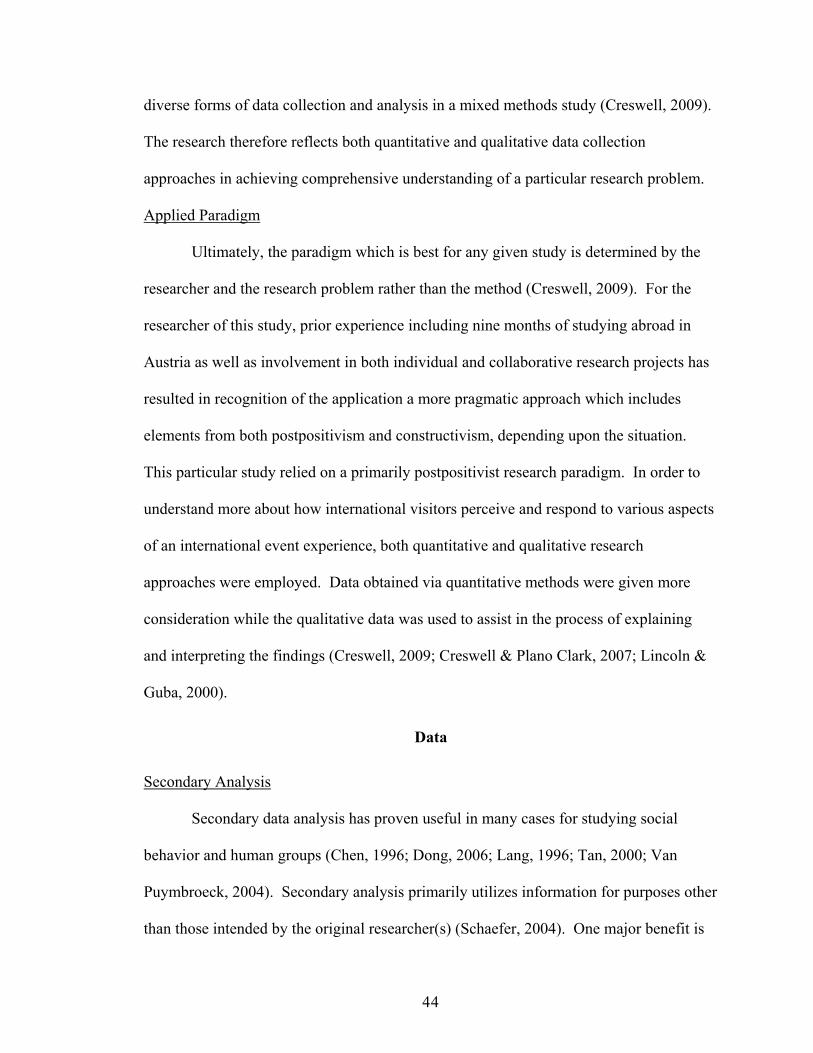
44
diverse forms of data collection and analysis in a mixed methods study (Creswell, 2009).
The research therefore reflects both quantitative and qualitative data collection
approaches in achieving comprehensive understanding of a particular research problem.
Applied Paradigm
Ultimately, the paradigm which is best for any given study is determined by the
researcher and the research problem rather than the method (Creswell, 2009). For the
researcher of this study, prior experience including nine months of studying abroad in
Austria as well as involvement in both individual and collaborative research projects has
resulted in recognition of the application a more pragmatic approach which includes
elements from both postpositivism and constructivism, depending upon the situation.
This particular study relied on a primarily postpositivist research paradigm. In order to
understand more about how international visitors perceive and respond to various aspects
of an international event experience, both quantitative and qualitative research
approaches were employed. Data obtained via quantitative methods were given more
consideration while the qualitative data was used to assist in the process of explaining
and interpreting the findings (Creswell, 2009; Creswell & Plano Clark, 2007; Lincoln &
Guba, 2000).
Data
Secondary Analysis
Secondary data analysis has proven useful in many cases for studying social
behavior and human groups (Chen, 1996; Dong, 2006; Lang, 1996; Tan, 2000; Van
Puymbroeck, 2004). Secondary analysis primarily utilizes information for purposes other
than those intended by the original researcher(s) (Schaefer, 2004). One major benefit is

45
that while analyzing secondary data, the researcher does not have the risk of potentially,
even unintentionally, influencing the behavior of the intended subject or desired group.
This method of data collection thereby significantly decreases the likelihood of personal
bias of the researcher affecting the results of the study. Time requirements for data
collection and analysis are also partially mediated since the data has already been
collected and/or partially synthesized (Trochim & Donnelly, 2008). However, utilizing
secondary data also tends to limit the researcher regarding personal decisions and specific
information about the choice of sample population, setting, data collection methods, and
access to data in its original form. Unless the data utilized is from a source that is
publicly available, such as national census records, researchers should obtain
authorization to use the original data from the primary investigator(s) of the original
study (Creswell, 2009).
Authorization and Sample
Prior to the completion of the initial study conducted by the interdisciplinary team
of researchers, authorization was given by Principal Investigator Dr. Shane Pegg to
utilize part of the comprehensive data set for the purposes of this study. Specifically,
data was made directly available from post-attendance surveys of international visitors to
the Expo. In December 2010, the primary data set was transmitted electronically as a
single SPSS file in an email attachment from Dr. Pegg. Survey data for this study was
selected from 168 visitors to the Expo who were not residents of Shanghai. In addition,
multiple audio file attachments (mp3 format) were similarly provided from a total of ten
selected interviews split between the two collection phases (July and October of 2010)
and were used to further inform the results. During the course of multiple conversations

46
via Skype© and email correspondence, additional information was provided regarding
instrumentation and data collection for the more comprehensive initial study from which
this research was based upon.
Instrumentation
The comprehensive study involved a questionnaire developed by a collaborative
team of researchers from the University of Queensland, Indiana University Bloomington,
and the Shanghai University of Engineering Science (see Appendix B). The six-page
survey instrument was developed using a modified format from a survey previously
validated by five separate studies including a study of visitor motivations and perceived
service quality at the Tamworth Music Festival in Australia (scale reliability of .83)
(Pegg & Little, 2008). Experience factor information was included from Hosany and
Witham’s survey of cruiser experiences, satisfaction, and intentions to recommend,
which had consistent factor loadings greater than .58 (2009). The questionnaire was
originally created in English and was also translated into Mandarin for administration.
The final format for the post-attendance questionnaire included thirty-four questions
which collected information about event visitors including the following:
1. Socio-economic and demographic variables – age, gender, marital status,
education, occupation, size of local community;
2. Travel characteristics – party size, length of stay, time spent at Expo;
3. Past experience – Shanghai, World Expo, Chinese national celebrations, Beijing
Olympics;
4. Travel planning – information sources used, method of transportation;
5. Motivations;

47
6. Event attendance – places, venues, events, services;
7. Satisfaction with service quality – people, place, process, promotion, product; and
8. Evaluations of factors related to the experience.
The questionnaire utilized primarily multiple choice and 7-point Likert scale items (1 –
Strongly Disagree, 7 – Strongly Agree). There were also additional qualitative questions
incorporating open-ended response items which were not available for secondary
analysis.
Data Collection
The World Expo 2010 Shanghai was registered through the International
Exhibitions Bureau as an international event designed to showcase national cultures and
facilitate intercultural dialogue from May 1st – October 31st, 2010. Due to the heightened
level of security at the event, the team of researchers were given permission to distribute
questionnaires but were restricted to the entrance/exit points of the World Expo site in
Shanghai. Researchers utilized convenience sampling to distribute copies of both the
consent document and questionnaire at nine major entry/exit points to the Expo.
Consistency was an important aspect of the overall study as training and debriefing for all
members of the research team was mandatory, utilizing protocols approved by the
University of Queensland Ethical Review Committee (see Appendix C).
Data for the comprehensive study was collected onsite at the Expo by the research
team in two separate phases in July and October of 2010. The time periods chosen were
intended to provide and compare samples relative to the beginning and ending periods of
the event, as well as to refine and test methodology. The final sample over the two
collection stages included over 1,200 surveys in total with data from questionnaires
48
submitted in both Mandarin and English. Inclusion criteria for visitors included: (1)
being in attendance at the World Expo 2010 in Shanghai, (2) being at least 18 years of
age, (3) being able to read and write in either Mandarin or English, and (4) being willing
to participate in the research. Exclusion criteria for visitors included: inability to
communicate and/or unwillingness to participate. Additional qualitative information was
assembled through a process of recording, transcribing, and coding forty face-to-face
qualitative interviews which were conducted by senior members of the research team
during both phases (see Appendices D, E, and F regarding the interview format).
Considering the study was exploratory in nature, there were not any anticipated
detrimental factors to participating in the study and individuals were able to withdraw at
any time without penalty.
Methods
Research Design
The three research hypotheses for this study using secondary data were tested
using an independent groups design. The two stages of data collection (July and October
of 2010) divided the data into its respective categories. According to Pagano (2010), the
independent groups design is used more often than repeated measures. Researchers
choose an independent groups design for its efficiency as well as due to time and/or cost
constraints related to maintaining the same subjects over time. While the repeated
measures design may be more powerful, identifying variability among and between
subjects within the aggregate population was more important for the purposes of this
research and therefore required an independent groups design.

49
Variables
The three sets of independent variables used in this study were visitor motivation,
satisfaction with service quality, and experience factors in order to explore the dynamics
for evaluating the dependent variable of experience quality. These variables were
supported with evidence from the literature review and presented as clusters of
information in the questionnaire which was used in the more comprehensive research
study. In this study of secondary data, the clusters were represented by categories and
specific items used were measured using a 7-point Likert scale in the questionnaire (see
Appendix H for more detail). Motivation items were grouped by the four categories
identified by Pine and Gilmore (1999) – entertainment, education, esthetics, and
escapism. Experience factor items were separated into six groups based on their relation
to entertainment, education, esthetics, escapism, arousal, and memory (Hosany &
Witham, 2009). Items related to service quality were separated into two parts of
performance and importance (Cronin & Taylor, 1992; Pegg & Little, 2008). Finally, the
dependent variable of experience quality included items related to overall perceived
quality, overall satisfaction, and future purchase intentions (Hosany & Witham, 2009;
Pegg & Little, 2008; Pine & Gilmore, 1999). Variables used to categorize the results
included visitor socio-demographics (age, education, gender, marital status, size of local
community, and occupation), travel characteristics (size of travel party, length of trip, and
time spent at Expo), and past experiences (visiting Shanghai or attending previous World
Expo, Chinese national celebrations, and the 2008 Beijing Summer Olympics).
50
Proposed Model
Based on the synthesis of the literature in the previous chapter, a model was
created to test the relationships between the variables identified in the study as personal
characteristics, elements of planned behavior, satisfaction with service quality,
experience factors, and the overall evaluation regarding the quality of the event
experience. The proposed model is illustrated further in Figure 4. This more clearly
identified the expected and potential relationships between the variables which were to be
analyzed for the purposes of testing the three hypotheses.

51
Figure 4. Theoretical model for examining experience quality.
Analysis
Satisfaction
Experience Quality
Experience
Factors
Planned
Behavior
• Product Quality
• Service Quality
• Price
• Promotion
• Needs
• Intentions
• Motivations
• Expectations
• People
• Process
• Physical Evidence
• Destination
Personal Factors
• Cultural Orientation
• Socio-demographics
• Emotions / Mood
• Past Experience(s)
52
There were several statistical methods and procedures used in the process of this
research. The methods chosen were primarily quantitative in nature and performed
sequentially in order to achieve an optimal understanding of the data. The data intended
for secondary analysis was initially received via email as an SPSS file attachment.
Quantitative data from the surveys were examined and analyzed using the Statistical
Package for the Social Sciences (SPSS 17.0®). SPSS software is a computer program
commonly used to perform simple and complex data analyses (Pagano, 2010).
In order to test the hypotheses, the identified items were grouped together for the
four variables and then separated according to their respective categories. Since some of
the submitted questionnaires did not include answers to all of the identified questions,
individual visitor’s average scores related to the items were inserted in those cases where
the data was missing. Additionally, summative scores were compiled for the four
variables identified in this study for the purpose of analysis. Summative scores were
deemed appropriate for this study due to the small sample size, missing and/or
incomplete data for some items, and consideration that an examination of individual
items or categories would have required much more strenuous analysis and in-depth
knowledge of either hierarchical linear modeling (HLM) or structural equation modeling
(SEM) which would have been beyond the intended scope of this study and the current
capacity of the researcher.
The four clusters of variables (motivation, experience factors, service quality, and
experience quality) were analyzed using reliability scale analysis in order to eliminate
any questions that were not statistically valid as well as to identify patterns of the
individual items. In social sciences, factors that account for at least fifty percent of the

53
total variance are statistically valid items (Pagano, 2010). Secondly, the analysis of
variance (ANOVA) was used to compare and profile the visitors’ evaluations of their
overall experience based on socio-demographics, travel characteristics, and past
experiences. Using ANOVA replaced the need to do multiple t-tests to examine
differences between the variables (Pagano, 2010). ANOVA provided analysis of the
variables for significant variances both between and within groups based on ratings of
various attributes and factors. Correlation analysis between composite scores for
motivation, experience factors, service quality, and experience quality were also utilized
to test the three hypotheses– whether significant relationships exist between visitor
motivations, evaluations of experience factors and service quality, and assessments of
experience quality. Factor loadings greater than .30 were considered significant
(Pagano, 2010). Finally, multiple regression analysis provided evidence as to whether
experience quality can be predicted by the variables of motivation, experience factors,
and service quality. The equation for regression used was
y' = b1x1 + b2x2 + b3x3 + a
where y’ represents the dependent variable of predicted or expected experience quality
based on the independent factors of motivation (x1), experience factors (x2), and service
quality (x3).
Methodological Strengths
Due to the use of an independent groups design, this study had a higher potential
for encountering threats to validity. Threats to validity can fall into categories of content
validity, predictive or concurrent validity, or construct validity (Creswell, 2009). Content
validity was established by using questions previously shown to measure the indicated

54
variables. Predictive validity and construct validity were evaluated using reliability scale
analysis. Since the questionnaire was created by combining previous studies, validity and
reliability were primarily tested with sampling error (Reisinger & Turner, 2003; Riddick
& Russell, 2008). Sampling error was partially mitigated because the sample population
used for this study has been identified as international visitors to the World Expo 2010
Shanghai. Since the population for this study was international visitors to the Expo, the
sample was not homogenous though it was significantly smaller than that of the initial
comprehensive research.

55
Chapter 4
RESULTS
Descriptive Analyses
Participants
Data taken from surveys completed by 168 international visitors was utilized in
this study of secondary data. This data represented a fairly finalized set of international
visitors to the Expo after exclusions were made by the principal investigator of the more
comprehensive study. Within the provided dataset, 77 participants represented the July
collection while 91 visitors participated in the October collection phase. Examining the
characteristics of participants was necessary for exploring the first hypothesis for this
study. Basic visitor demographics are summarized in Table 1.
Table 1
Visitor Demographics Data Collection Phase
Characteristics July October Total
Gender
Male
Female
No Answer
55
21
1
50
41
105
62
1
Age
18-24
25-34
35-44
45-54
55-64
65+
No Answer
29
19
12
11
5
1
19
17
14
21
10
9
1
48
36
26
32
15
10
1
Marital Status
Single
Married
Separated/Divorced/Widowed
No Answer
46
22
6
3
39
44
8
85
66
14
3

56
Participants in the study represented a range of various socio-demographic statuses
including gender, age, and marital status. Regarding the issue of gender, more men
participated in the study than women (105 compared with 62). This was reflected in both
stages of data collection, although the October 2010 phase did collect significantly more
responses from females than the July 2010 phase (see Figure 5). Also, the majority of
respondents reported an age range from 18-54 representing approximately 85% of the total
sample population. The single highest represented age bracket was 18-24 year olds with a
total of 48 respondents (28.7%).
Figure 5. Visitor gender discrepancies between collection phases.
55
50
21
41
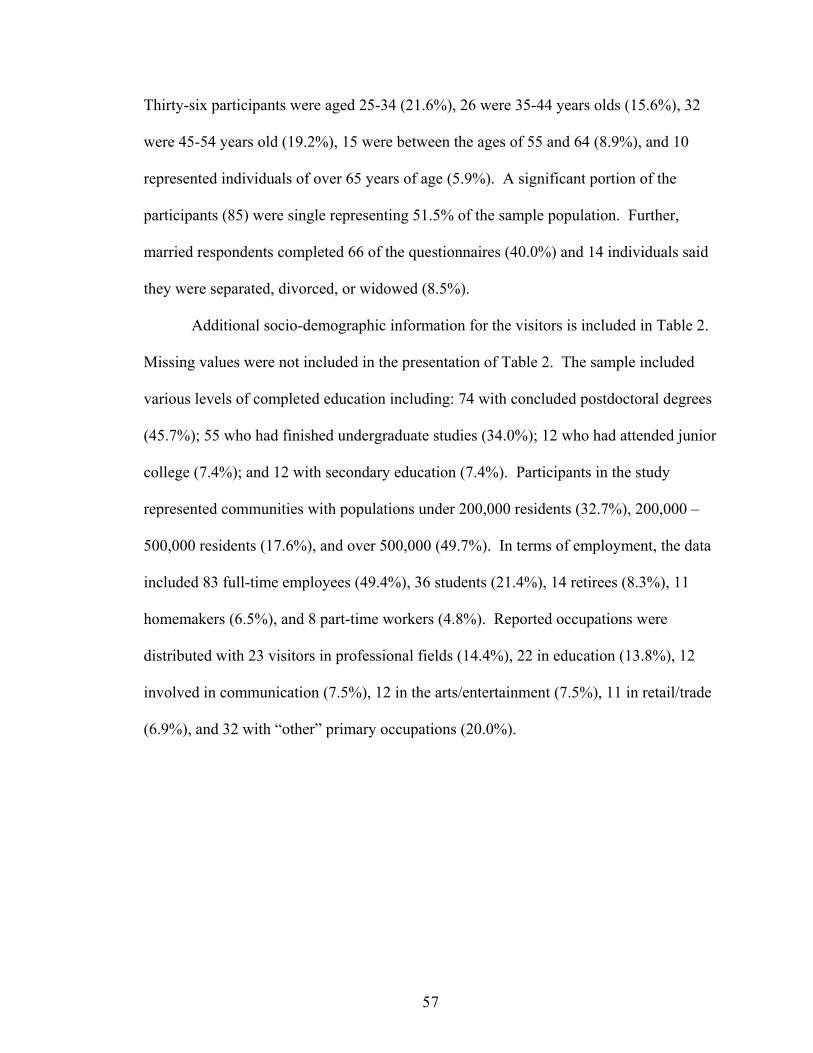
57
Thirty-six participants were aged 25-34 (21.6%), 26 were 35-44 years olds (15.6%), 32
were 45-54 years old (19.2%), 15 were between the ages of 55 and 64 (8.9%), and 10
represented individuals of over 65 years of age (5.9%). A significant portion of the
participants (85) were single representing 51.5% of the sample population. Further,
married respondents completed 66 of the questionnaires (40.0%) and 14 individuals said
they were separated, divorced, or widowed (8.5%).
Additional socio-demographic information for the visitors is included in Table 2.
Missing values were not included in the presentation of Table 2. The sample included
various levels of completed education including: 74 with concluded postdoctoral degrees
(45.7%); 55 who had finished undergraduate studies (34.0%); 12 who had attended junior
college (7.4%); and 12 with secondary education (7.4%). Participants in the study
represented communities with populations under 200,000 residents (32.7%), 200,000 –
500,000 residents (17.6%), and over 500,000 (49.7%). In terms of employment, the data
included 83 full-time employees (49.4%), 36 students (21.4%), 14 retirees (8.3%), 11
homemakers (6.5%), and 8 part-time workers (4.8%). Reported occupations were
distributed with 23 visitors in professional fields (14.4%), 22 in education (13.8%), 12
involved in communication (7.5%), 12 in the arts/entertainment (7.5%), 11 in retail/trade
(6.9%), and 32 with “other” primary occupations (20.0%).
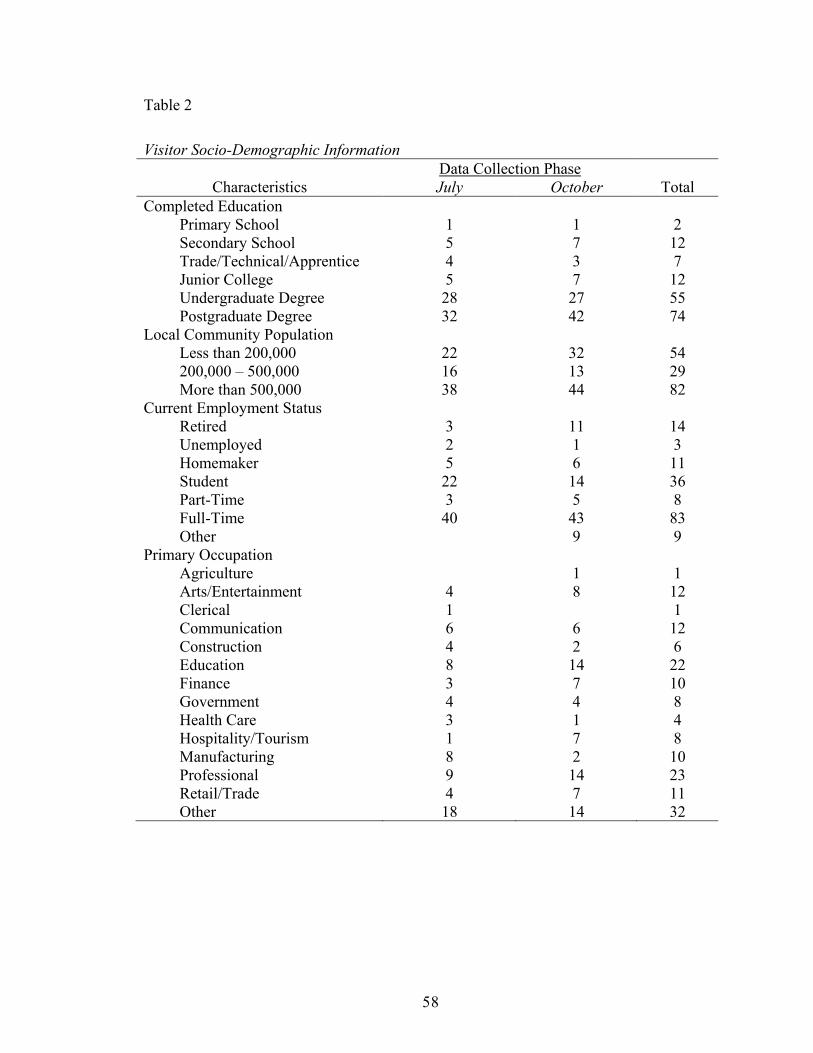
58
Table 2
Visitor Socio-Demographic Information
Data Collection Phase
Characteristics July October Total
Completed Education
Primary School
Secondary School
Trade/Technical/Apprentice
Junior College
Undergraduate Degree
Postgraduate Degree
1
5
4
5
28
32
1
7
3
7
27
42
2
12
7
12
55
74
Local Community Population
Less than 200,000
200,000 – 500,000
More than 500,000
22
16
38
32
13
44
54
29
82
Current Employment Status
Retired
Unemployed
Homemaker
Student
Part-Time
Full-Time
Other
3
2
5
22
3
40
11
1
6
14
5
43
9
14
3
11
36
8
83
9
Primary Occupation
Agriculture
Arts/Entertainment
Clerical
Communication
Construction
Education
Finance
Government
Health Care
Hospitality/Tourism
Manufacturing
Professional
Retail/Trade
Other
4
1
6
4
8
3
4
3
1
8
9
4
18
1
8
6
2
14
7
4
1
7
2
14
7
14
1
12
1
12
6
22
10
8
4
8
10
23
11
32
59
Visitor travel characteristics were also included in the examination of individual
characteristics which may affect the different variables. The characteristics examined
included the size/type of the travel party, total days spent in Shanghai, number of days
spent visiting the Expo, whether the individual had previously been to Shanghai,
attendance at the Beijing Olympics or a national celebration within the past two years,
primary purpose for attending the Expo, prior World Expo attendance, information
sources used, and the visitor’s main form of transport. Data is included in Table 3. One
hundred participants (59.5%) reported that they were traveling with friends/family.
Twenty-three individuals were traveling with co-workers/business colleagues (13.7%),
while 21 were alone (12.5%), and 24 responded with the choice of “Other.” Visitors also
identified their primary purpose for attending the Expo as follows: 112 attended for
pleasure (67.1%); 24 attended for business (14.4%); 24 attended for educational purposes
(14.4%); and 7 responded “Other” (4.2%).
Various information sources were used in planning for the experience including
the internet or the official Expo website (83), friends and family (70), travel
books/brochures/pamphlets (33), travel agencies (19), knowledge gained during previous
trip experiences (18), as well as movies and/or television (15). It was not entirely
surprising that the participants for the study overwhelmingly retrieved information from
the internet as well as family and friends. The information derived from both sources
tends to be widely available and accessible in addition to being frequently relied upon.

60
Table 3
Visitor Travel Characteristics
Data Collection Phase
Characteristics July October Total
Party Size
Alone
With friends/family
With co-workers/business colleagues
Other
12
44
15
6
9
56
8
18
21
100
23
24
Previously Visited Shanghai
Yes
No
41
33
29
62
70
95
Attended Beijing Olympics or a National
Celebration in Past 2 Years
Yes
No
13
62
7
83
20
145
Attended Previous World Expo
Yes
No
24
52
35
56
59
108
Primary Purpose for Attending Expo 2010
Business
Pleasure
Education
Other
14
43
14
5
10
69
10
2
23
112
24
7
Information Sources Used
(check all that apply)
Friends & Family
Travel agency
Previous trips
Industry newsletter
Internet/Official website
Movies/Television
2008 Beijing Olympics
Travel books/Brochures/Pamphlets
Radio
Embassy/Tourism office
Other
33
6
8
3
34
5
1
12
2
3
12
37
13
10
4
49
10
1
21
1
4
7
70
19
18
7
83
15
2
33
3
7
19
Main Form of Transport Used
Personal motor vehicle
Bus
Hire car/Package tour
Train
Airplane
Other
11
4
1
18
36
1
5
1
3
18
55
1
16
5
4
35
91

61
After considering the “other” responses of 91 individuals representing 59.9% of
the sample population, transportation sources used by participants were ranked in the
following order: 35 flew in airplanes (23.0%), 16 used buses (10.5%), 5 took hired cars
or participated in package tours (3.3%), 4 used trains (2.6%), and 1 person used a
personal vehicle to get to the Expo. Participants in the study stayed an average of 18
days in Shanghai with open-ended responses ranging from 1-270 days. In terms of the
visiting the Expo, participants spent an average of 10 days at the Expo with responses
varying between 1 and 210. The range of responses is reflected in Tables 4 and 5.
Prior experience with Shanghai, international events, and the World Expo
presentation was examined using three questions. While 95 of the Expo visitors were
visiting Shanghai for the first time (57.6%), 70 of the participants had visited Shanghai
before (42.4%). Additionally, only 20 of the participants had attended the Olympics or a
national celebration in the previous two years (12.1%) compared with 145 who had not
(87.9%). Further to the purposes of this study, 108 participants had never attended a
World’s Expo (64.7%) compared with 59 who had (35.3%).
The participants were also asked how far in advance they had begun planning for
their visit to the World Expo. Responses were varied as 49 had planned less than a week
(29.7%), 36 had been preparing for more than 12 weeks (21.8%), 29 had planned for a
period of 7-12 weeks (17.6%), 28 had been planning for between 3 and six weeks
(17.0%), and 23 prepared for 1-3 weeks (13.9%). Considering international visitors came
to the World Expo in Shanghai from places both far and near, it was not surprising that
there was some variance in levels of preparation.

62
Table 4
Days Spent in Shanghai
f p
Valid 1.0 1 .6
2.0 11 6.5
3.0 22 13.1
4.0 18 10.7
5.0 20 11.9
6.0 4 2.4
7.0 13 7.7
8.0 14 8.3
9.0 2 1.2
10.0 11 6.5
12.0 4 2.4
14.0 3 1.8
15.0 6 3.6
17.0 1 .6
20.0 2 1.2
21.0 1 .6
27.0 1 .6
30.0 3 1.8
40.0 3 1.8
60.0 1 .6
62.0 2 1.2
86.0 1 .6
190.0 1 .6
201.0 2 1.2
210.0 1 .6
215.0 1 .6
270.0 1 .6
Missing 18 10.7
Total 168 100.0
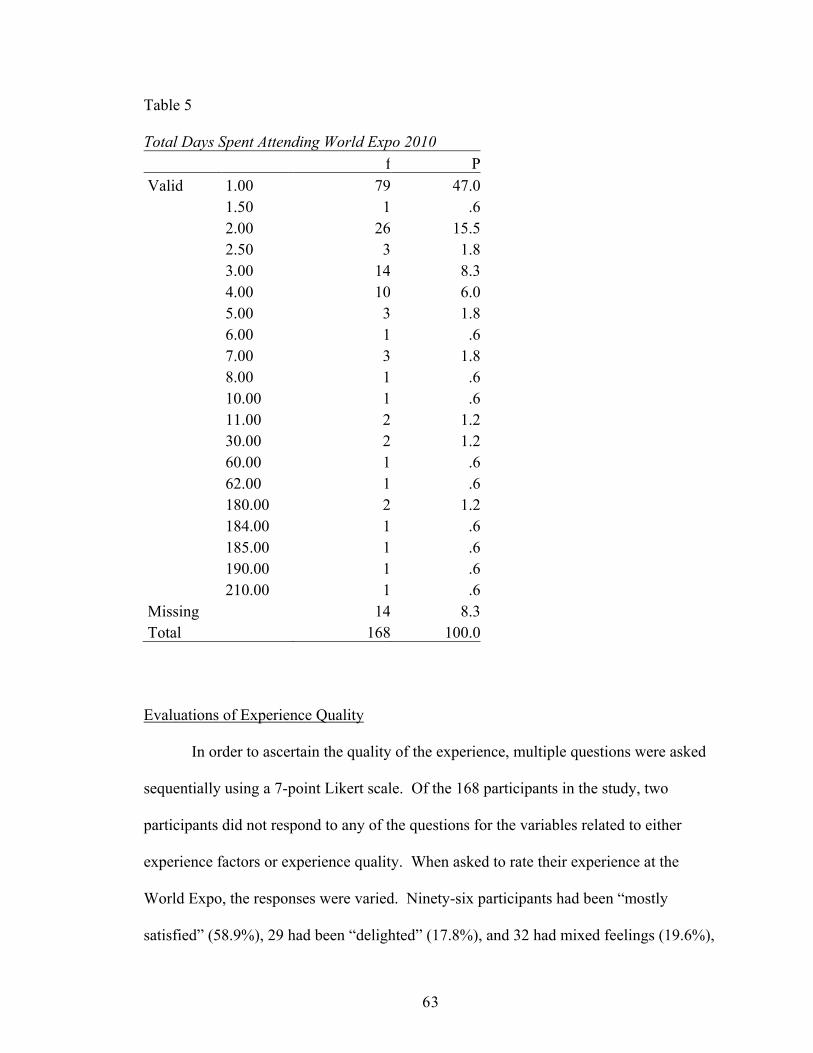
63
Table 5
Total Days Spent Attending World Expo 2010
f P
Valid 1.00 79 47.0
1.50 1 .6
2.00 26 15.5
2.50 3 1.8
3.00 14 8.3
4.00 10 6.0
5.00 3 1.8
6.00 1 .6
7.00 3 1.8
8.00 1 .6
10.00 1 .6
11.00 2 1.2
30.00 2 1.2
60.00 1 .6
62.00 1 .6
180.00 2 1.2
184.00 1 .6
185.00 1 .6
190.00 1 .6
210.00 1 .6
Missing 14 8.3
Total 168 100.0
Evaluations of Experience Quality
In order to ascertain the quality of the experience, multiple questions were asked
sequentially using a 7-point Likert scale. Of the 168 participants in the study, two
participants did not respond to any of the questions for the variables related to either
experience factors or experience quality. When asked to rate their experience at the
World Expo, the responses were varied. Ninety-six participants had been “mostly
satisfied” (58.9%), 29 had been “delighted” (17.8%), and 32 had mixed feelings (19.6%),
64
Participants were then asked to identify their personal agreement with whether attending
the Expo was important. Within the range of responses there were 29 “strongly agree”
(27.6%), 29 “agree” (27.6%), 19 “slightly agree” (18.1%); and 18 were neutral (17.1%).
Finally, participants were asked to rate the overall experience. Interestingly, over 60 of
the study participants did not choose to answer the last two questions while only 5 had
failed to provide ratings of the World Expo. However, of those that answered, 64
reported being “mostly satisfied” (61.5%), 19 had been “delighted” with the overall
experience (18.3%), and 18 had “mixed” experiences (17.3%).
Individual visitor evaluations of experience quality at the World Expo were
ultimately looked at in conjunction with socio-demographics, travel characteristics, and
past experiences. This was done in order to begin to examine the first hypothesis.
Participants’ summative scores for experience quality ranged from 7 to 40. The average
score was 28.7 with a median of 30.0. To describe the impact of socio-demographics,
travel characteristics, and past experiences on evaluations of experience quality, the data
was divided into responses below and above the average experience quality scores. Also,
each individual variable was considered separately since some had higher response rates
which may have otherwise affected the interpretation of the responses. In order to
explore the dataset further, the information compared responses with above average
experience quality scores. The variation in responses was considered in terms of
percentages of the responses within a particular category as well as the actual number of
individuals who fit within the category.
There was little difference between the sexes regarding overall evaluations as 61
men (59.2%) and 35 women (56.5%) responded positively to their experience. However,
65
in regards to age, the extreme age groups were most responsive to their experience with
respondents in brackets for those aged 18-24 and over 65 both having 70% of their
populations responding positively. The data for the six age groups included 165
responses with 34 visitors aged 18-24 (70.8%), 15 visitors aged 25-34 (42.9%), 13
visitors aged 35-44 (50.0%), 17 visitors aged 45-54 (54.8%), 10 visitors aged 55-64
(66.7%), and 7 visitors over 65 years old (70.0%) having above average experience
quality. An examination of marital status designations and above average experience
quality included over half of the responses with 51 singles (61.4%), 34 married
individuals (51.5%), and 9 individuals who were either separated, widowed, or divorced
(64.3%). With a 10% difference in population responses, it seems that singles who have
never been married, separated, widowed, or divorced may have evaluated their
experiences more positively than their married counterparts.
Responses for above average experience quality ratings as related to completed
levels of education varied widely in numbers though not in percentage of participants and
were as follows: 66.7% of secondary school (8); 63.9% of postgraduate degree recipients
(46); 58.3% of those who had attended junior college (7); 57.1% of individuals with
trade/technical/apprenticeship training (4); and 50.9% of undergraduate alumni (28).
Also, one of the two visitors who had not completed education after the primary level
(50.0%) indicated positive experience scores. With such a wide range, it is difficult to
make general comparisons based on completed levels of education other than those who
had completed secondary school and postgraduate degrees had the most positive response
rates. Comparisons of community size included 34 individuals from communities
smaller than 200,000 residents (63.0%), 21 individuals living in communities ranging
66
from 200,000-500,000 (72.4%), and 41 individuals from communities over 500,000
(51.3%). It was interesting that those individuals from middle-sized communities had the
highest level of positive response. A wide range of occupations were also represented by
employees including: 100% of agriculture (1); 75.0% of government (6); 75.0% of
finance (6); 63.6% of education (14); 62.5% of hospitality or tourism (5); 58.3% of
communication (7); 56.5% of those in professional fields (13); 54.5% of retail (6); 50.0%
of arts and entertainment (6); 50.0% of health employees (2); 30.0% of manufacturing
(3); 16.7% of construction (1); and 20 for “other” fields (62.5%). The one clerical
employee who participated provided information which evaluated experience quality as
below the average score.
The composition of the travel party were not significantly different as 60.9% of
those in the company of business associates or colleagues (14), 55.0% of those traveling
alone (11), and 54.5% of individuals traveling with family and/or friends (54) evaluated
experience quality above the average score. Since the number of days spent in Shanghai
had such a large range, the mean score was considered. Seventy-seven respondents
below the average 18 day trip period (60.2%) and 13 participants who were in Shanghai
20 or more days (65.0%) responded positively. Visitors also responded with an average
of 10 days spent attending the Expo. In examining their responses, 66.7% of those above
the average time (8) spent in the Expo and 59.3% of those below the average (83) had
positive evaluations. Regarding transport choices to get to the Expo in Shanghai, 81.3%
of bus riders (13), 60.0% of airplane travelers (21), 50.0% of train travelers (2), 40.0% of
those who had hired cars or participated in guided tours (2), and 58.4% of individuals
with “other” forms of transportation had responded with above the average score for

67
experience quality. The individual responding in the category of having traveled by
personal vehicle submitted an experience quality score lower than the average. When
asked about their primary purpose for attending the World Expo, above average
evaluations of experience quality represented 66.7% of those attending for educational
purposes (16), 60.9% of those attending for business (14), and 57.7% of individuals
attending for personal pleasure and/or enjoyment (64). With less than 10% variance
between the categories, it seems unlikely that the primary purpose for attending would
affect the overall experience quality.
The final category for examination involved previous experiences. Thirty-seven
of individuals returning to Shanghai (52.9%) and 57 of those visiting for the first time
(61.3%) reported above average scores in experience quality. While first-time visitors
had somewhat higher response rates, it is unclear whether the novelty of the location
affected the quality of their experience. Visitors were also asked whether they had
attended the Olympics or a national celebration in China within the past two years. Of
the 20 international visitors who had attended such events, only 9 responded with above
average experience quality evaluations (45.0%). Contrariwise, above average evaluations
were reported by 86 from the total of 143 participants who had not attended these events
(60.1%). Previous World Expo experiences were inconclusive as 56.1% of those who
had never been (60) and 62.1% of those with prior World Expo experience (36) had
above average scores. Those with prior experiences at World Expos may have had
higher scores for experience quality but the response rates for the two categories was not
even as 107 individuals reported a lack in prior experience and only 58 had gone to a
previous Expo, to represent a total of 165 questionnaires with completed items for both.

68
There were noticeable differences in the categories of age, community size,
attendance at the Olympics or national events within the past two years, previous visits to
Shanghai, and types of transport used to get to the Expo. In addition to descriptive
statistics, further analysis was needed in order to more fully examine the effects of socio-
demographics, travel characteristics, and previous experience upon international visitors’
reported evaluations of experience quality.
Variable Reliability
Scale reliability statistics were utilized to examine the data after summative scores
were calculated for the four variables. Summative scores were the result of combining
items from the questionnaire using methods from previous studies (Cole, Crompton, &
Willson, 2002; Cronin & Taylor, 1992; Hosany & Witham, 2009; Pegg & Little, 2008).
The reliability statistics for the individual scales are included in Table 6. The four
variable sets were measured as follows: motivation included 11 items (α = .85);
experience factors had 20 items (α = .89); service quality incorporated 12 items (α = .94);
and experience quality comprised 6 items total (α = .83). As all four scales included
Cronbach’s alphas (α) above 0.8, it appears the constructs were measured appropriately
and were reliable (Pagano, 2010).
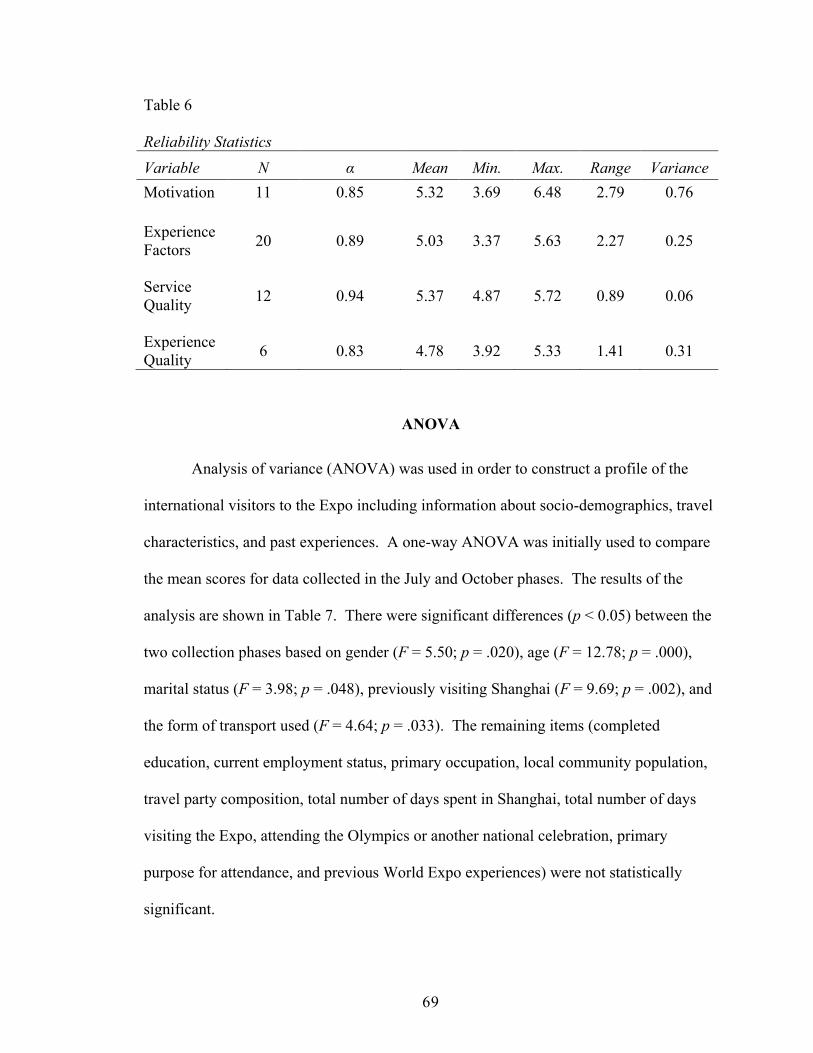
69
Table 6
Reliability Statistics
Variable N α Mean Min. Max. Range Variance
Motivation 11 0.85 5.32 3.69 6.48 2.79 0.76
Experience
Factors 20 0.89 5.03 3.37 5.63 2.27 0.25
Service
Quality 12 0.94 5.37 4.87 5.72 0.89 0.06
Experience
Quality 6 0.83 4.78 3.92 5.33 1.41 0.31
ANOVA
Analysis of variance (ANOVA) was used in order to construct a profile of the
international visitors to the Expo including information about socio-demographics, travel
characteristics, and past experiences. A one-way ANOVA was initially used to compare
the mean scores for data collected in the July and October phases. The results of the
analysis are shown in Table 7. There were significant differences (p < 0.05) between the
two collection phases based on gender (F = 5.50; p = .020), age (F = 12.78; p = .000),
marital status (F = 3.98; p = .048), previously visiting Shanghai (F = 9.69; p = .002), and
the form of transport used (F = 4.64; p = .033). The remaining items (completed
education, current employment status, primary occupation, local community population,
travel party composition, total number of days spent in Shanghai, total number of days
visiting the Expo, attending the Olympics or another national celebration, primary
purpose for attendance, and previous World Expo experiences) were not statistically
significant.

70
Table 7
ANOVA Comparison of Visitors Between the July and October Collection Phases
Source df F p
Gender 1 5.50 .020
Age 1 12.78 .000
Marital status 1 3.98 .048
Completed education 1 .05 .817
Current employment status 1 .00 .995
Primary occupation 1 .58 .446
Local community population 1 .29 .590
Travel party/size 1 2.02 .157
Total days in Shanghai 1 .12 .728
Days visiting the Expo 1 1.57 .212
Visited Shanghai before 1 9.69 .002
Attended Olympics or National Celebration in past 2 years 1 3.54 .062
Primary purpose for attending World Expo 2010 1 .70 .403
Previously visited a World Expo 1 .85 .357
Main form of transport used to travel to the Expo 1 4.64 .033
A second ANOVA was conducted to determine whether the variables identified
were statistically related to the reported quality of visitor experiences. This was related
to the first hypothesis for this study involving whether variances in socio-demographics,
travel characteristics, and/or previous experiences affect experience quality. According
to the subsequent analysis (see Table 8), the only factor found to be statistically
significant (p < 0.05) in predicting overall evaluations of experience quality was the
number of days spent visiting the Expo (F = 1.61; p = .041). There was no significant
difference between groups for all other items.
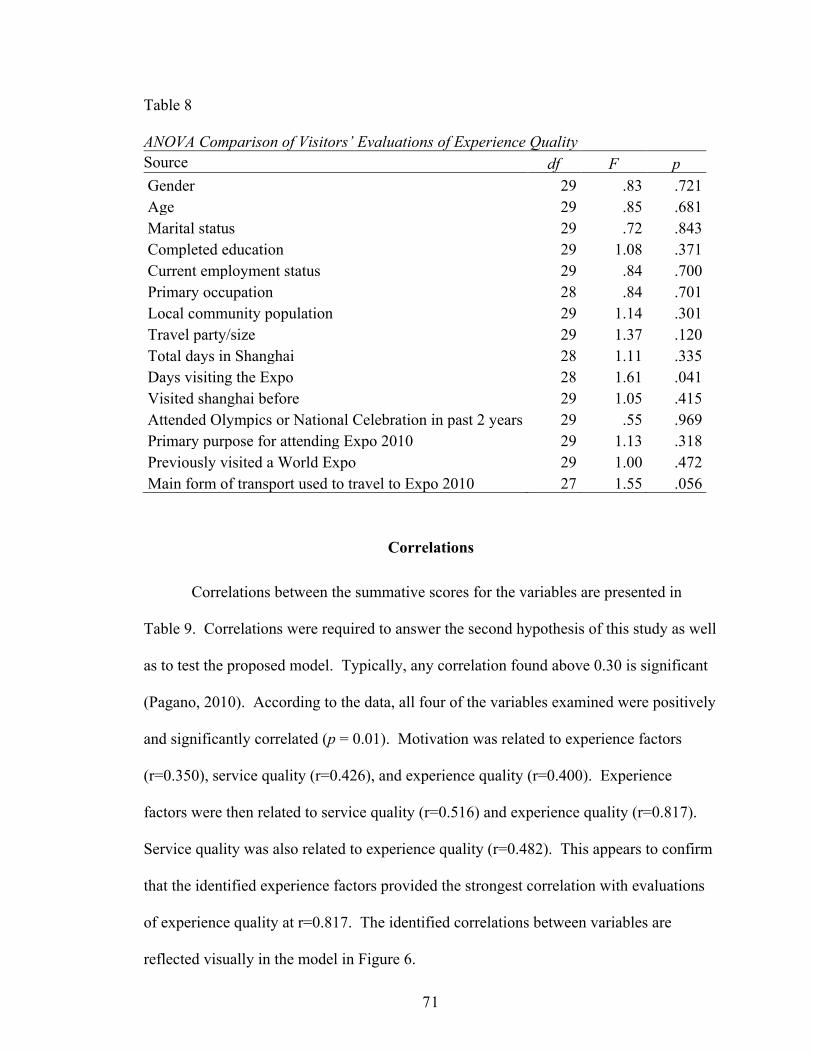
71
Table 8
ANOVA Comparison of Visitors’ Evaluations of Experience Quality
Source df F p
Gender 29 .83 .721
Age 29 .85 .681
Marital status 29 .72 .843
Completed education 29 1.08 .371
Current employment status 29 .84 .700
Primary occupation 28 .84 .701
Local community population 29 1.14 .301
Travel party/size 29 1.37 .120
Total days in Shanghai 28 1.11 .335
Days visiting the Expo 28 1.61 .041
Visited shanghai before 29 1.05 .415
Attended Olympics or National Celebration in past 2 years 29 .55 .969
Primary purpose for attending Expo 2010 29 1.13 .318
Previously visited a World Expo 29 1.00 .472
Main form of transport used to travel to Expo 2010 27 1.55 .056
Correlations
Correlations between the summative scores for the variables are presented in
Table 9. Correlations were required to answer the second hypothesis of this study as well
as to test the proposed model. Typically, any correlation found above 0.30 is significant
(Pagano, 2010). According to the data, all four of the variables examined were positively
and significantly correlated (p = 0.01). Motivation was related to experience factors
(r=0.350), service quality (r=0.426), and experience quality (r=0.400). Experience
factors were then related to service quality (r=0.516) and experience quality (r=0.817).
Service quality was also related to experience quality (r=0.482). This appears to confirm
that the identified experience factors provided the strongest correlation with evaluations
of experience quality at r=0.817. The identified correlations between variables are
reflected visually in the model in Figure 6.
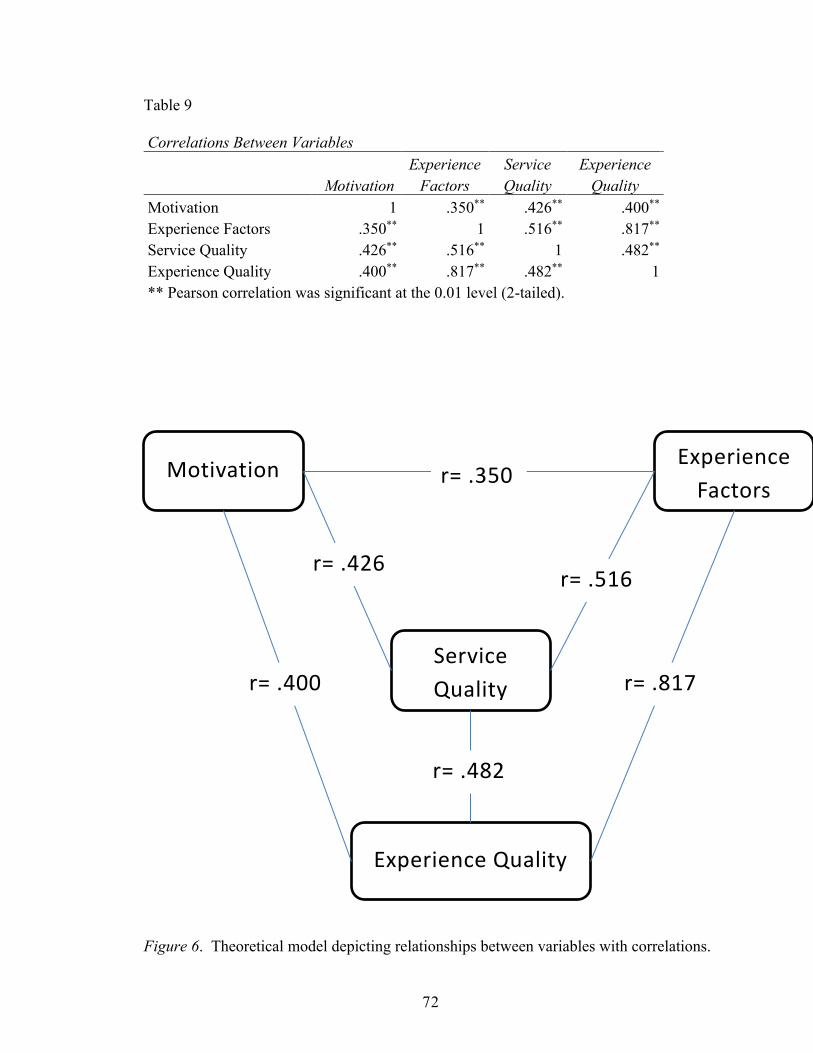
72
Table 9
Correlations Between Variables
Motivation
Experience
Factors
Service
Quality
Experience
Quality
Motivation 1 .350** .426** .400**
Experience Factors .350** 1 .516** .817**
Service Quality .426** .516** 1 .482**
Experience Quality .400** .817** .482** 1
** Pearson correlation was significant at the 0.01 level (2-tailed).
Figure 6. Theoretical model depicting relationships between variables with correlations.
Service
Quality
Experience Quality
Experience
Factors
Motivation r= .350
r= .426
r= .400
r= .516
r= .817
r= .482

73
Multiple Linear Regression
The final step in analyzing the data involved multiple linear regression analysis to
determine whether experience quality can be accurately predicted by variables of
motivation, experience factors, and service quality. Using regression analysis
specifically addressed the third hypothesis used for this study. To determine the effects
of variables of motivation, experience factors, and service quality on perceived
experience quality, multiple linear regression was conducted using the collective scores
for both the independent and dependent variables. The results from the multiple linear
regression are depicted in Table 10. Results from the analysis appear to provide evidence
that visitor motivations and perception of experience factors may be used in predicting
perceptions of experience quality at large international events.
Table 10
Experience Quality Multiple Linear Regression Model
Variable B SE B β Sig.
Motivation .067 .028 1.22 .018
Experience Factors .273 .020 .739 .000
Service Quality .023 .026 .050 .373
R= .817 R2= .667 𝑆𝑦.𝑥= 3.572

74
According to the results, 66.7% of the variance in international visitors’
evaluations of experience quality appears to be predicted by the three independent
variables of motivation, experience factors, and perceptions of service quality (R2=6.67,
F=106.695, p<.05). Both motivations (β = .122, p = .018) and experience factors (β =
.739, p = .000) were found to be statistically significant predictors of experience quality.
Contrariwise, individuals’ satisfaction with service quality (β = .050, p = .373) appears to
have had a minimal effect on the prediction of evaluations for overall experience quality
after the effects of motivation and experience factors were considered.
Summary of Results
The international visitors to the World Expo 2010 Shanghai participating in this
particular study had a variety of individual experiences while at the World Expo 2010 in
Shanghai. The various analyses used in this study produced multiple results for
consideration. Descriptive statistics provided information related to the profile of the
international visitors who had attended the Expo and participated in the study. Second,
the reliability scale statistics appear to provide evidence in further support of the items
used in measuring the constructs for motivation, experience factors, service quality, and
experience quality which had been identified and tested in previous studies. The tests for
reliability also appear to provide further support for the use of summative scores for the
constructs.
Exploring such a complex concept as experience quality required multiple
analyses with the consideration of individual variables as well as interaction effects. This
study found statistically significant relationships between the dependent variable of
experience quality and the three independent variables of motivation, experience factors,

75
and service quality. As visitor motivations were found to be statistically significant in
predicting experience quality along with experience factors, the theory of planned
behavior was further supported. The results also provided evidence to suggest that
experiences are multidimensional. Evaluations of experiences are made on an individual
basis so there are many different factors which should be considered.
76
Chapter 5
DISCUSSION, IMPLICATIONS, AND CONCLUSION
The multiple analyses used in examining the data provide interesting insights into
the visitor experience at a large international event. The following sections explore the
results of the reliability scale statistics, followed by the descriptive analyses, correlations,
ANOVAs, and finally multiple linear regression. The results of this study support the
recognition of the inherent multidimensionality of the event experience (Cole et al., 2002;
Pine & Gilmore, 1999; Ralston et al., 2007) and recognize that the quality of a particular
experience may differ based on the effects and interactions between a variety of personal
characteristics (Reisinger, 2009; Reisinger & Turner, 2003). Since the World Expo 2010
Shanghai was an international event aimed at bringing together people from various
world cultures, it is important to also consider evidence regarding the impact of cross-
cultural research.
Discussion
Theoretical Application
The theory of planned behavior posits that one’s intentions and motivations are
related to their beliefs and attitudes (Ajzen & Fishbein, 1980; Ajzen & Driver, 1991,
1992). In the course of this study, the results of the correlation analysis found significant
relationships between the three independent variables (motivation, experience factors,
and service quality) and the dependent variable (experience quality). Furthermore,
multiple linear regression supported the hypothesis that evaluations of experience quality

77
may be predicted by one’s motivations and perceptions and/or responses to experience
factors. Examining the effects of visitor motivations in addition to perceptions and/or
reactions to experience factors and service quality provides more information regarding
how the quality of experiences should be evaluated. Since the theory of planned behavior
is focused on not only predicting behavior but also affecting change (Ajzen & Driver,
1992), providing positive quality experiences to visitors at large international events is
important in the effort to promote intercultural dialogue, peace, and understanding.
Scale Reliability
The scales used to measure the four variables in this study had noticeably high
Cronbach alphas over the 0.8 level. Correlation analysis also found noticeable
significance between all of the variables. The results thereby support previous research
involving the pre-determination of clusters based upon grouping items around
motivation, experience factors, service quality, and experience quality (Cole et al., 2002;
Hosany & Witham, 2009; Pegg & Patterson, 2010). The shift in examining items
separately towards a summation of scores for service quality as advocated by Cronin and
Taylor (1992) was also supported and further applied to the variables of motivation,
experience factors, and experience quality.
Participant Characteristics
The variances in international visitor ratings of experience quality were not found
to be significantly explained by demographic, socio-demographic, or travel
characteristics. Descriptive statistics presented a few perceptible differences in above
average evaluations of experience quality in age, community size, transport types,
previous visits to Shanghai, and prior attendance at either the Olympics or national events

78
within the past two years. While most age groups had above average experience quality
evaluations, individuals aged 25-34 seemed to be the hardest to please with 51.7% (or 20
out of the 35 respondents) reporting the lowest average scores. Individuals aged 35-44
were evenly divided between below and above average scores. The employment status of
participants also reflected that retirees and students represented the highest number of
reported above average scores while homemakers and those who were unemployed had
mostly below average evaluations for the quality of their experience. These trends have
been previously noticed in other studies as well (Gopalan & Nararyan, 2010; March &
Woodside, 2005).
Following the descriptive statistics, the one-way ANOVA involving information
about the individual event visitors showed differences in evaluations of experience
quality were only statistically related to the number of days spent attending the Expo.
This information was supported by additional qualitative information provided by some
of the international visitors participating in the study. In addition to the quantitative data
set provided for analysis via an SPSS file, the original study’s principal investigator (Dr.
Pegg) also provided a random sample of exit interviews which were conducted by the
research team after the questionnaires were collected. Ten interviews conducted with
international visitors in English (6 from July 2010 and 4 from October 2010) were sent as
audio (mp3) files to serve as supplementary materials to the quantitative results. Within
the qualitative interviews, three of the respondents indicated a reluctance to either
identify what impressed them while attending the event or how they would describe their
Expo experience based on their lack of familiarity with the event. Those who had been
attending the Expo for longer periods of time had been able to see more pavilions,
79
interact with other visitors and service personnel, and reflect on their experiences. Based
on such information, it seems that most of the exit interviews confirmed the relationship
discovered via ANOVA between the length of stay and experience quality. While these
interviews were somewhat helpful in exploring the international event visitors’
experience, the results were inconclusive.
Explaining Experience Quality
Results from the regression analysis provided information as to which variables
were more statistically capable of affecting experience quality. The data indicated that
visitor motivations and their responses to experience factors were more conclusive than
perceptions of service quality received. One’s motivation seemed critical to predicting
experience quality and was supported by evidence from previous studies (Gentile et al.,
2007; Liang et al., 2008).
Once again, qualitative information gleaned from the exit interviews provided
further support of these results. When asked what they had seen and heard, interviewed
participants were more likely to note experiential factors such as the large size of the
event, the beauty and architecture, video and audiovisual presentations, cultural
opportunities with food and music, and interactions with locals from the countries
represented in the pavilions. The noted importance of cultural exchanges at international
events further supported evidence from prior studies (Chen, 2006; Freestone & Geldens,
2008; Relyea et al., 2008). This sentiment was also echoed by a statement within the
official Shanghai Declaration of the World Expo 2010, jointly issued on the final day of
the Expo by participants in the Summit Forum which included representatives from
participating nations, world regions, and international organizations:

80
Cities should endeavor to protect tangible and intangible cultural heritage and
encourage the development of multicultural society. Like the ocean that embraces
all rivers, cities should keep an open spirit and actively engage in intercultural
exchanges and interactions. Cities should pursue cultural innovation based on
respect for cultural traditions and the preservation of cultural diversity, so as to
generate lasting momentum for urban and human development (World Expo 2010
Shanghai, 2010).
Multicultural experiences are increasingly becoming important for both intercultural
dialogue and diplomatic exchanges at multiple levels including personal and political
relationships.
Visitors also noted their disappointment with long lines to get into the pavilions
but subsequently attributed this to being in China rather than any fault related to service
quality. Perhaps some of the service quality items are not separate from experience
factors. Based on this study, visitor considerations of service may change depending on
the size, scope, and location of an event. This diverges from the model presented in
previous studies by Cole et al. (2002), Hosany and Witham (2009), and Finsterwalder and
Tuzovic (2010) which had found service to be a separately identified significant indicator
in overall experiences.
Information from the exit interviews further supported the notion that the
interviewed participants may have had more memorable interactions with volunteers in
the pavilions and local residents of Shanghai than with those individuals identified as
service staff and personnel. This supported Huang and Hsu’s (2010) study which found
the quantity of interactions with locals, service personnel, and fellow tourists was not as
important as the quality of such encounters. In fact, a few of the interviews maintained
the idea that some of the international visitors had actually avoided interacting with
service personnel and all of the visitors seem to have unanimously felt that
81
communication barriers, both potential and/or actual, had not affected their experiences.
They noted the use of English as a lingua franca which facilitated easier communication
for individuals from primarily English speaking countries (Australia, USA, Canada) as
well as non-English speaking countries (Czechoslovakia, Japan, Croatia, Norway,
Brazil).
Implications for Future Research
Social science research is intrinsically involved in exploring human experience.
Examining experience quality at international events where individuals are engaged in
tourist experiences, service encounters, and inherent cross-cultural exchanges provides
useful information for how to interpret part of this important concept. This study has
provided information regarding a single line of inquiry into visitor experiences at
international events. While the scales and items used were highly correlated, the
prediction of experience quality from the four variables presented did not include service
quality. Evidence regarding the problem of whether service quality should remain a
separate construct or be integrated in with experience factors remains inconclusive.
Since service quality did not significantly impact experience quality, previous methods of
measurement using primarily the SERVQUAL method may not be as potent as
considering the use of a combination of service and experience factors.
Future research related to exploring experience quality should consider three main
problems which this study was not able to fully address. First, future research needs to
include the three phases of experience – planning, engagement, and recollection – in
order to gauge one’s complete experience at any event (Daengbuppha et al., 2006; Pine &
Gilmore, 1999; Rossman & Schlatter, 2008). The restricted access to the site as well as

82
the use of secondary data significantly limited the dataset to examining experience
quality solely from a post-event perspective. Secondly, future research endeavors in
examining experience quality should consider including data from a higher sample size.
The World Expo had approximately 73 million visitors and 246 participating nations and
organizations (Expo 2010 Shanghai, 2010), yet this study included information for only
168 of the international visitors. A higher sample size including information from more
international visitors as well as including data from the resident population may be worth
further exploration. Lastly, the cultural differences between residents and people from
other countries need to be considered in how individuals respond to particular
experiences. Local residents may, in fact, respond differently to an event hosted in their
community than those who make the effort to travel to attend the same event (Liang et
al., 2008; Reisinger & Turner, 2003).
Conclusion
This study used secondary data to explore visitor evaluations of experience
quality at an international event. The results from this study, combined with support
from other studies, demonstrate support for previously identified relationships between
variables of motivation, experience factors, service quality, and experience quality. This
indicates that organizers of international events should consider the effects of individual
motivations in conjunction with factors related to the experience and service quality
provided in evaluations of the quality of the event, considering the variables were found
to be significantly correlated to one another. Finally, the analysis supported the
multidimensionality of international event visitors’ experience which was predicted by
motivation and experience factors. These trends merit further examination to determine
significant patterns over time.
83
REFERENCES
Ajzen, I., & Driver, B.L. (1991). Prediction of leisure participation from behavioral,
normative, and control beliefs: An application of the theory of planned behavior.
Leisure Sciences, 13(3), 185-204.
Ajzen, I., & Driver, B.L. (1992). Application of the theory of planned behavior to leisure
choice. Journal of Leisure Research, 24(3), 207-224.
Ajzen, I., & Fishbein, M. (1980). Understanding attitudes and predicting social behavior.
Englewood Cliffs, NJ: Prentice-Hall.
American Psychological Association. (2010). Publication manual of the American
Psychological Association (6th ed.). Washington, DC: American Psychological
Association.
Andriotis, K., & Agiomirgianakis, G. (2010). Cruise visitors’ experience in a
Mediterranean port of call. International Journal of Tourism Research, 12, 390-
404. doi:10.1002/jtr.770
Babbie, E. (2007). The practice of social research (11th ed.). Belmont, CA: Wadsworth.
Bandura, A. (1997). Self-efficacy: The exercise of control. New York: W.H. Freeman.
Berger, A.A. (2007). Media and society: A critical perspective. Boulder, CO: Rowman
and Littlefield Publishers.
Bird, A., & Fang, T. (2009). Cross cultural management in the age of globalization.
International Journal of Cross Cultural Management, 9(2), 139-143.
doi:10.1177/1470595809335713
84
Bjelac, Z., & Radovanovic, M. (2003). Sports events as a form of tourist product, relating
to the volume and character of demand. Journal of Sport Tourism, 8(4), 260-269.
Brady, M.K., Cronin, J.J., & Brand, R.R. (2002). Performance-only measurement of
service quality: A replication and extension. Journal of Business Research, 55,
17-31.
Bureau of Economic Analysis. (2010). International economic accounts. Retrieved from
http://www.bea.gov/international/index.htm#trade
Bureau of Shanghai World Expo Coordination. (2010). Expo 2010 Shanghai China
Official Guidebook. China: China Publishing Group.
Chen, B.T-H. (2006, Dec.). Analysis of leisure and tourism behaviors of international
and American graduate recreation majors in the central United States (Doctoral
dissertation). Available from ProQuest Dissertations and Theses database.
(Publication No. AAT 3255098)
Chen, J.S. (1996). Factors influencing tourists’ choices of heritage destinations (Doctoral
dissertation). Available from ProQuest Dissertations and Theses database.
(Publication No. AAT 9716206).
Chen, J.S. (2001). A case study of Korean outbound travelers’ destination images by
using correspondence analysis. Tourism Management, 22, 345-350.
Chen, L-J., Chen, J.S. (2011, Apr.). The motivations and expectations of international
volunteer tourists: A case study of “Chinese village traditions.” Tourism
Management, 32(2), 435-442.
Chick, G. (1998). Leisure and culture: Issues for anthropology of leisure. Leisure
Sciences, 20, 111-133.
85
Cohen, E. (1972). Toward a sociology of international tourism. Social Research, 39(1),
164-189.
Cohen, E. (1979). A phenomenology of tourist types. Sociology, 13, 179-201.
Cole, S.T., Crompton, J.L., & Willson, V.L. (2002). An empirical investigation of the
relationships between service quality, satisfaction and behavioral intentions
among visitors to a wildlife refuge. Journal of Leisure Research, 34(1), 1-24.
Creswell, J.W. (2009). Research design: Qualitative, quantitative, and mixed methods
approaches (3rd ed). Thousand Oaks, CA: SAGE Publications.
Creswell, J.W., & Plano Clark, V.L. (2007). Designing and conducting mixed methods
research. Thousand Oaks, CA: SAGE Publications.
Cronin, J.J., & Taylor, S.A. (1992, July). Measuring service quality: A reexamination and
extension. The Journal of Marketing, 56(3), 55-68.
Crouch, G.I. (1994). The study of international tourism demand: A review of findings.
Journal of Travel Research, 33(1), 12-23.
Csikszentmihalyi, M. (1997). Finding flow: The psychology of engagement with everyday
life. New York: Basic Books.
Csikszentmihalyi, M., & LeFevre, J. (1989). Optimal experience in work and leisure.
Journal of Personality and Social Psychology, 56, 815-822.
Daengbuppha, J., Hemmington, N., & Wilkes, K. (2006). Using grounded theory to
model visitor experiences at heritage sites: Methodological and practical issues.
Qualitative Market Research: An International Journal, 9(4), 367-388.
doi:10.1108/13522750610689096
Daft, R.L. (2008). The leadership experience (4th ed). Mason, OH: South-Western.
86
Dong, E. (2006). Leisure lifestyles in urban China: A case study in Hangzhou, Chengdu,
Beijing, Shanghai, Quingdao, and Shenzhen (Doctoral dissertation). Available
from ProQuest Dissertations and Theses database. (Publication No. AAT
3248339).
Edfelt, R.B. (2010). Global comparative management: A functional approach. Thousand
Oaks, CA: SAGE Publications.
Ekinci, Y., & Hosany, S. (2006). Destination personality: An application of brand
personality to tourism destinations. Journal of Travel Research, 45, 127-139.
Expo 2010 Shanghai China. (2010). Homepage. Accessed via http://en.expo2010.cn/
Finsterwalder, J., & Tuzovic, S. (2010). Quality in group service encounters: A
theoretical exploration of the concept of a simultaneous multi-customer co-
creation process. Managing Service Quality, 20(2), 109-122.
doi:10.1108/09604521011027552
Fishbein, M., & Ajzen, I. (1975). Belief, attitude, intention and behavior: An introduction
to theory and research. Reading, MA: Addison-Wesley Publishing.
Freestone, P., & Geldens, P. (2008). ‘For more than just the postcard’: Student exchange
as a tourist experience? Annals of Leisure Research, 11(1-2), 41-56.
Gentile, C., Spiller, N., & Noci, G. (2007, Oct.). How to sustain the customer experience
components that co-create value with the consumer. European Management
Journal, 25(5), 395-410. doi:10.1016/j.emj.2007.08.005
Getz, D. (2003). Sport event tourism: Planning, development, and marketing. In S.
Hudson (Ed.), Sport and adventure tourism (pp. 49-88). New York: Haworth
Hospitality Press.

87
Giroux, H.A. (1999). The mouse that roared: Disney and the end of innocence. Lanham,
MD: Rowman & Littlefield Publishers.
Gnoth, J. (1997). Tourism motivation and expectation formation. Annals of Tourism
Research, 24(2), 283-304.
Goodale, T.L., & Godbey, G.C. (1988). The evolution of leisure: Historical and
philosophical perspectives. State College, PA: Venture Publishing.
Gopalan, R., & Narayan, B. (2010, June). Improving customer experience in tourism: A
framework for stakeholder collaboration. Socio-Economic Planning Sciences,
44(2), 100-112. doi:10.1016/j.seps.2009.11.001
Gopinath, C. (2008). Globalization: A multidimensional system. Thousand Oaks, CA:
SAGE Publications.
Griswold, W. (1994). Cultures and societies in a changing world. Thousand Oaks, CA:
Pine Forge.
Gursoy, D., & Gavcar, E. (2003). International leisure tourists’ involvement profile.
Annals of Tourism Research, 30(4), 906-926. doi:10.1016/S0160-7383(03)00059-
8
Handwerker, W.P. (2002). The construct validity of cultures: Cultural diversity, culture
theory, and a method for ethnography. American Anthropologist, 104, 106-122.
Hofstede, G. (1997). Cultures and organizations: Software of the mind (2nd ed). New
York: McGraw-Hill.
Hosany, S., & Witham, M. (2009). Dimensions of cruisers’ experiences, satisfaction, and
intention to recommend. Journal of Travel Research, 49, 1-14.
doi:10.1177/0047287509346859

88
Huang, J., & Hsu, C.H.C. (2010). The impact of customer-to-customer interaction on
cruise experience and vacation satisfaction. Journal of Travel Research, 49(1),
79-92. doi:10.1177/0047287509336466
Hurd, A.R., Barcelona, R.J., & Meldrum, J.T. (2008). Leisure services management.
Champaign, IL: Human Kinetics.
Iwasaki, Y. (2008). Pathways to meaning-making through leisure-like pursuits in global
contexts. Journal of Leisure Research, 40(2), 231-249.
Kelleher, A., & Klein, L. (2006). Global perspectives: A handbook for understanding
global issues (2nd ed.). Upper Saddle River, NJ: Pearson Education.
Lang, C.-T. (1996). A typology of international travelers to nature-based tourism
destinations (Doctoral dissertation). Available from ProQuest Dissertations and
Theses database. (Publication No. AAT 9713543).
Lee, K., & Carter, S. (2009). Global marketing management: Changes, new challenges,
and strategies (2nd ed.). Oxford: Oxford University.
Lee, Y-T. (2003). Conference on sport and tourism. Journal of Sport Tourism,8(2), 75-
93.
Liang, Y., Illum, S.F., & Cole, S.T. (2008). Benefits received and behavioural intentions
of festival visitors in relation to distance traveled and their origins. International
Journal of Event Management Research, 4(1), 12-22.
Lincoln, Y.S., & Guba, E.G. (Eds.). (2000). Handbook of qualitative research. Thousand
Oaks, CA: SAGE Publications.
Loker-Murphy, L., & Pearce, P.L. (1995). Young budget travelers: Backpackers in
Australia. Annals of Tourism Research, 22(4), 819-843.

89
Manfredo, M.J., Driver, B.L., & Tarrant, M.A. (1996). Measuring leisure motivation: A
meta-analysis of the recreation experience preference scales. Journal of Leisure
Research, 28(3), 188-213.
March, R., & Woodside, A.G. (2005). Testing theory of planned versus realized tourism
behavior. Annals of Tourism Research, 32(4), 905-924.
doi:10.1016/j.annals.2004.07.012
Maslow, A. (1954). Motivation and personality. New York: Harper and Row.
McAllister, L., Whiteford, G., Hill, B., Thomas, N., & Fitzgerald, M. (2006, Aug.).
Reflection in intercultural learning: Examining the international experience
through a critical incident approach. Reflective Practice, 7(3), 367-381. doi:
10.1080/14623940600837624
McLeod, M., & Wainwright, P. (2009, Spring). Researching the study abroad experience.
Journal of Studies in International Education, 13(1), 66-71.
doi:10.1177/1028315308317219
Milakovich, M. (2005). Improving service quality in the global economy: Achieving high
performance in public and private sectors (2nd ed.). Boca Raton, FL: CRC Press.
Morgan, M., & Xu, F. (2009). Student travel experiences: Memories and dreams. Journal
of Hospitality Marketing & Management, 18, 216-236.
doi:10.1080/19368620802591967
Morgan, M. (2009). What makes a good festival? Understanding the event experience.
Event Management, 12(2), 81-93.
Oh, H., Fiore, A.M., & Jeoung, M. (2007, Nov.). Measuring experience economy
concepts: Tourism applications. Journal of Travel Research, 46, 119-132.
doi:10.1177/0047287507304039

90
Oxford Dictionaries. (2010, Apr.). Oxford dictionaries. Oxford University Press.
Retrieved from http://www.oxforddictionaries.com
Pagano, R.R. (2010). Understanding statistics in the behavioral sciences (9th ed.).
Belmont, CA: Wadsworth.
Parasuraman, A., Zeithaml, V.A., & Berry, L.L. (1985). A conceptual model of service
quality and its implications of future research. Journal of Marketing, 49(4), 41-50.
Parasuraman, A., Zeithaml, V., & Berry, L.L. (1986, Aug.). SERVQUAL: A multiple-item
scale for measuring customer perceptions of service quality. Cambridge, MA:
Marketing Science Institute.
Parasuraman, A., Zeithaml, V.A., & Berry, I.L. (1988). SERVQUAL: A multiple item
scale for measuring consumer perceptions of service quality. Journal of Retailing,
64(1), 12-40.
Pearce, P.L., Morrison, A.M., & Rutledge, J.L. (1998). Tourism bridges across
continents. Sydney: McGraw-Hill.
Pecotich, A., & Rosenthal, M. (2001). Country of origin, quality, brand and consumer
ethnocentrism. Journal of Global Marketing, 15(2), 31-60.
Pegg, S., & Patterson, I. (2010). Rethinking music festivals as a staged event: Gaining
insights from understanding visitor motivations and the experiences they seek.
Journal of Convention & Event Tourism, 11(2), 85-99.
doi:10.1080/15470141003758035
Pegg, S., & Little, D. (2008). Study on the 2008 Tamworth Country Music Festival.
Brisbane, Australia: Uniquest.
Petracca, M., & Sorapure, M. (Eds.). Common culture: Reading and writing about
American popular culture (5th ed.). Upper Saddle River, NJ: Pearson Education.

91
Pine, B.J.P., & Gilmore, J.H. (1999). The experience economy: Work is theatre and every
business is a stage. Boston: Harvard Business School.
Pizam, A., & Sussmann, S. (1995). Does nationality affect tourist behavior? Annals of
Tourism Research, 22(4), 901-917.
Ponterotto, J. (2005). Qualitative research in counseling psychology: A primer on
research paradigms and philosophy of science. Journal of Counseling Psychology,
52(2), 126-136.
Ralston, L.S., Ellis, G.D., Compton, D.M., & Lee, J. (2007). Staging memorable events
and festivals: An integrated model of service and experience factors. International
Journal of Event Management Research, 3(2), 24-38.
Ramzy, A. (2010, May 17). Shanghai is ready for its close-up. TIME Magazine, 175(19),
38-41.
Reisinger, Y. (2009). International tourism: Cultures and behavior. Burlington, MA:
Elsevier Butterworth-Heinemann.
Reisinger, Y., & Turner, L.W. (2003). Cross-cultural behaviour in tourism: Concepts
and analysis. Oxford: Butterworth-Heinemann.
Relyea, C., Cocchiara, F.K., & Studdard, N.L. (2008). The effect of perceived value in
the decision to participate in study abroad programs. Journal of Teaching in
International Business, 19(4), 346-361. doi: 10.1080/08975930802427551
Richards, G., & Palmer, R. (2010). Eventful cities: Cultural management and urban
revitalisation. Oxford: Butterworth-Heinemann
Riddick, C.C., & Russell, R. (2008). Research in recreation, parks, sport, and tourism.
Champaign, IL: Sagamore Publishing.

92
Rogers, E., & Steinfatt, T. (1999). Intercultural communication. Prospect Heights, IL:
Waveland Press.
Rossman, J.R., & Schlatter, B.E. (2008). Recreation programming: Designing leisure
experiences (5th ed). Champaign, IL: Sagamore.
Ryan, R., & Deci, E. (2000). Self-determination theory and the facilitation of intrinsic
motivation, social development, & well-being. American Psychologist, 55, 68-78.
Samovar, L., & Porter, R. (1991). Communication between cultures. Belmont, CA:
Wadsworth Publishing.
Schaefer, R.T. (2004). Sociology matters. New York: McGraw-Hill.
Smoodin, E. (Ed.). (1994). Disney discourse: Producing the magic kingdom. New York:
Routledge.
Steger, M.B. (2003). Globalization: A very short introduction. Oxford: Oxford University
Press.
Stephan, W.G., & Stephan, C. (1985). Intergroup anxiety. Journal of Social Issues, 41,
157-176.
Steves, R. (2009). Travel as a political act. New York: Nation Books.
Stewart, V. (2005, Nov.) A world transformed: How other countries are preparing
students for the interconnected world of the 21st century. Phi Delta Kappan,
87(3), 229-232.
Tan, A.Y.F. (2000). Modeling international tourist flows to Indonesia and Malaysia
(Doctoral dissertation). Available from ProQuest Dissertations and Theses
database. (Publication No. AAT 9995917).
Trochim, W.M.K., & Donnelly, J.P. (2008). The research methods knowledge base (3rd
ed.). Mason, OH: Cengage Learning.
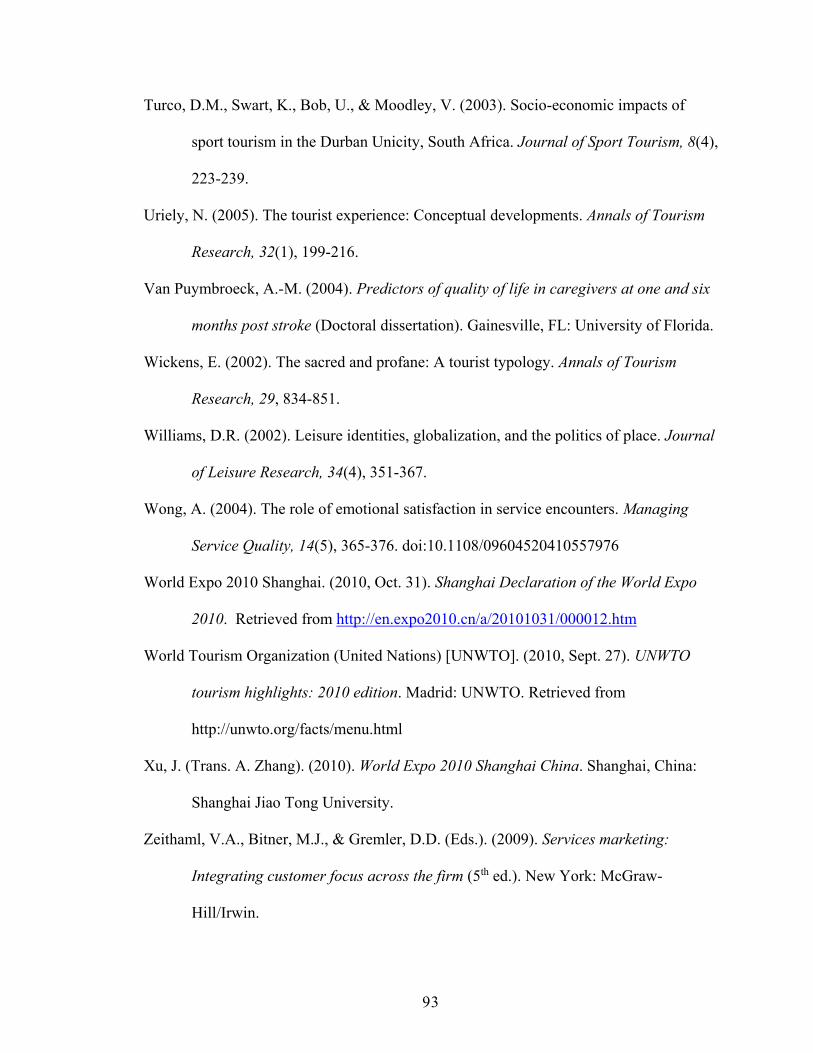
93
Turco, D.M., Swart, K., Bob, U., & Moodley, V. (2003). Socio-economic impacts of
sport tourism in the Durban Unicity, South Africa. Journal of Sport Tourism, 8(4),
223-239.
Uriely, N. (2005). The tourist experience: Conceptual developments. Annals of Tourism
Research, 32(1), 199-216.
Van Puymbroeck, A.-M. (2004). Predictors of quality of life in caregivers at one and six
months post stroke (Doctoral dissertation). Gainesville, FL: University of Florida.
Wickens, E. (2002). The sacred and profane: A tourist typology. Annals of Tourism
Research, 29, 834-851.
Williams, D.R. (2002). Leisure identities, globalization, and the politics of place. Journal
of Leisure Research, 34(4), 351-367.
Wong, A. (2004). The role of emotional satisfaction in service encounters. Managing
Service Quality, 14(5), 365-376. doi:10.1108/09604520410557976
World Expo 2010 Shanghai. (2010, Oct. 31). Shanghai Declaration of the World Expo
2010. Retrieved from http://en.expo2010.cn/a/20101031/000012.htm
World Tourism Organization (United Nations) [UNWTO]. (2010, Sept. 27). UNWTO
tourism highlights: 2010 edition. Madrid: UNWTO. Retrieved from
http://unwto.org/facts/menu.html
Xu, J. (Trans. A. Zhang). (2010). World Expo 2010 Shanghai China. Shanghai, China:
Shanghai Jiao Tong University.
Zeithaml, V.A., Bitner, M.J., & Gremler, D.D. (Eds.). (2009). Services marketing:
Integrating customer focus across the firm (5th ed.). New York: McGraw-
Hill/Irwin.

94
APPENDIX A
World Expo 2010 – Tables

95
Table A1
Pavilions by Zone Pavilions
Theme Pavilions Pavilion of City Being Pavilion of Footprint
Pavilion of Future Pavilion of Urban Planet Urbanian Pavilion
Zone A
Democratic People's Republic of
Korea Pavilion Hong Kong Pavilion India Pavilion
Iran Pavilion Iraq Pavilion Israel Pavilion
Japan Pavilion Kazakhstan Lebanon
Macau Morocco Nepal
Oman Pakistan Qatar
Republic of Korea Saudi Arabia Sri Lanka
Taiwan Turkmenistan United Arab Emirates Pavilion
Uzbekistan Vietnam
Bangladesh Kyrgystan Maldives
Mongolia Tajikistan Timor-Leste
Afghanistan Bahrain Jordan
Palestine Syria Yemen
Laos Myanmar
Anhui Beijing Chongqing
Fujian Gansu Guangdong
Guangxi Guizhou Hainan
Hebei Heilongjiang Henan
Hubei Hunan Inner Mongolia
Jiangsu Jiangxi Jilin
Liaoning Ningxia Qinghai
Shaanxi Shandong Shanghai
Shanxi Sichuan Tianjin
Tibet Xinjiang Yunnan
Zhejiang
China's Joint Provincial Pavilion
Asia Joint Pavilion 3
Asia Joint Pavilion 2
Asia Joint Pavilion 1
96
Zone B
Australia Brunei Darussalam Cambodia
Citizen's Initiative DEVNET IFRC
Indonesia Life & Sunshine Malaysia
MeteoWorld New Zealand Pacific
Philippines Singapore Thailand
United Nations WTCA
ASEAN BFA COMESA
FFA GEF ICOM
INBAR LAS SCO
UCLG UITP WWC
WWF
Joint Pavilion of International Organizations
Zone C
Algeria Angola Argentina
Austria Belarus Belgium - EU
Bosnia and Herzegovina Brazil Canada
Chile Columbia Croatia
Cuba Czech Denmark
Egypt Estonia Finland
France Germany Greece
Hungary Iceland Ireland
Italy Latvia Libya
Lithuania Luxembourg Mexico
Monaco Netherlands Nigeria
Norway Peru Poland
Portugal Romania Russia
Serbia Slovakia Slovenia
South Africa Spain Sweden
Switzerland Tunisia Turkey
Ukraine United Kingdom USA
Venezuela
African Union Commission Benin Botswana
Burundi Cameroon Cape Verde
Central African Chad Comoros
Côte d'Ivoire Democratic Republic of the Congo Djibouti
Equatorial Guinea Eritrea Ethiopia
Gabon Gambia Ghana
Guinea Guinea-Bissau Kenya
Lesotho Liberia Madagascar
Malawi Mali Mauritania
Mauritius Mozambique Guinea Namibia
Niger Republic of the Congo Rwanda
Senegal Seychelles Sierra Leone
Somalia Sudan Togo
Uganda United Republic of Tanzania Zambia
Zimbabwe
Africa Joint Pavilion

97
Zone C (cont.)
Antigua and Barbuda Barbados Belize
Caribbean Community Caribbean Development Bank Dominica
Grenada Guyana Haiti
Jamaica Saint Kitts and Nevis Saint Lucia
Saint Vincent and the Grenadines Suriname The Bahamas
Trinidad and Tobago
Cyprus Liechtenstein Malta
San Marino
Albania Armenia Azerbaijan
Bulgaria Georgia Montenegro
Republic of Moldova
Bolivia Costa Rica Dominican Republic
Ecuador El Salvador Guatemala
Honduras Nicaragua Panama
Uruguay
Zone D
Aurora Pavilion China Railway Pavilion Cisco Pavilion
Coca-Cola Pavilion Japanese Industry Pavilion Oil Pavilion
PICC Pavilion Republic of Korea Business Pavilion Shanghai Corporate Joint Pavilion
Space Home Pavilion State Grid Pavilion
Zone E
Broad Pavilion China State Shipbuilding Corporation Pavilion
Information and Communication
Pavilion
Private Enterprises Joint Pavilion SAIC-GM Pavilion Space Pavilion
Vanke Pavilion
Alsace's UBPA Case Chengdu's UBPA Case Hamburg's UBPA Case
London's UBPA Case Macau's UBPA Case Madrid's UBPA Case
Makkah's UBPA Case Ningbo's UBPA Case Odense's UBPA Case
Rhone-Alpes Light Show Rhone-Alpes Pavilion Shanghai's UBPA Case
UBPA Display (Central) UBPA Display (North) UBPA Display (South)
Vancouver's UBPA Case Xi'an's UBPA Case
Caribbean Community
Europe Joint Pavilion 1
Europe Joint Pavilion 2
Joint Pavilion of Central and South American Countries
The former Yugoslav Republic of Macedonia

98
Table A2
Forums
Summit Forum
Theme Forum
1. ICT and Urban Development
2. Cultural Heritage and Urban Regeneration
3. Science & Technology Innovation and Urban Future
4. Towards a Low-Carbon City: Environmental Protection and Urban
Responsibilities
5. Economic Transformations and Urban-Rural Relations
6. Harmonious City and Livable Life
Public Forum
1. Youth Forums
2. Youth Summit Forum
3. Autonomous Regional, Provincial and Municipal Forums
4. Shanghai District Forums
5. Culture and Media Forum

99
Table A3
Types of Events
Events of national pavilions and international organizations
Events of organizers
Opening Ceremony
China Pavilion Day
Closing Ceremony
Events of provinces, municipalities, and autonomous regions
Events by community residents
May: The Europe month
June: The Africa month
July: The America month
August: The Oceania month
September: The Asia month
October: The China month

100
APPENDIX B
World Expo 2010 Shanghai – Survey Instrument

101
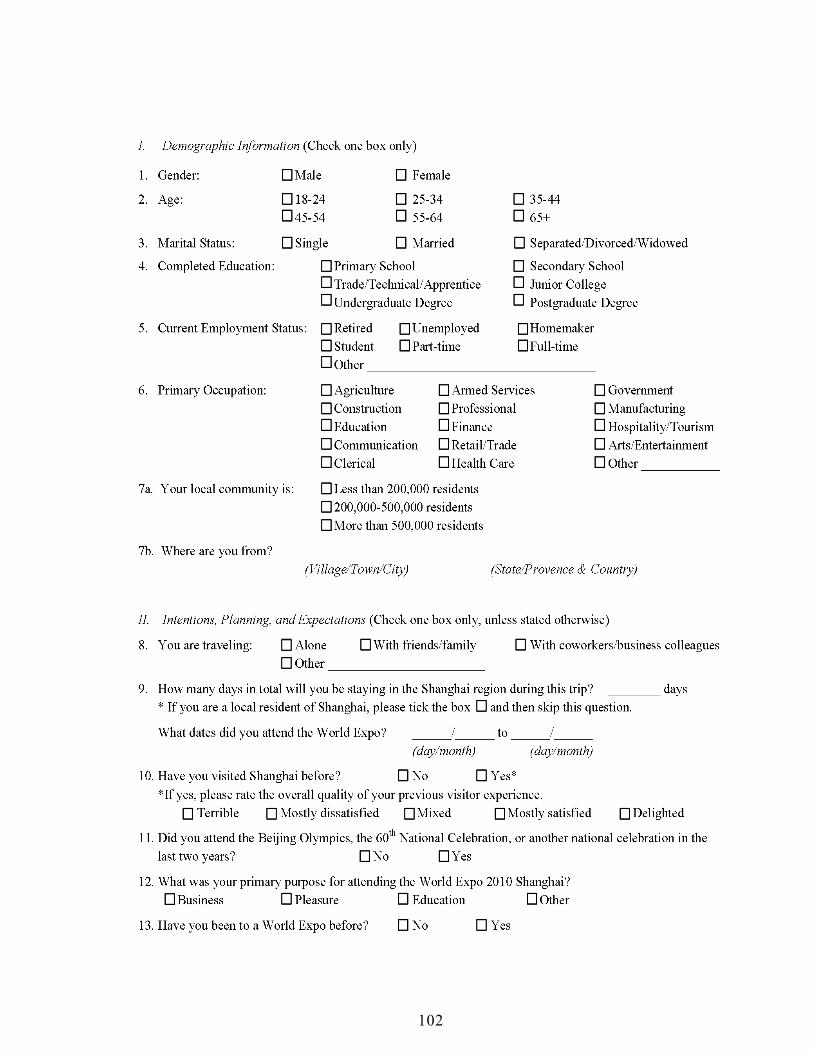
102

103
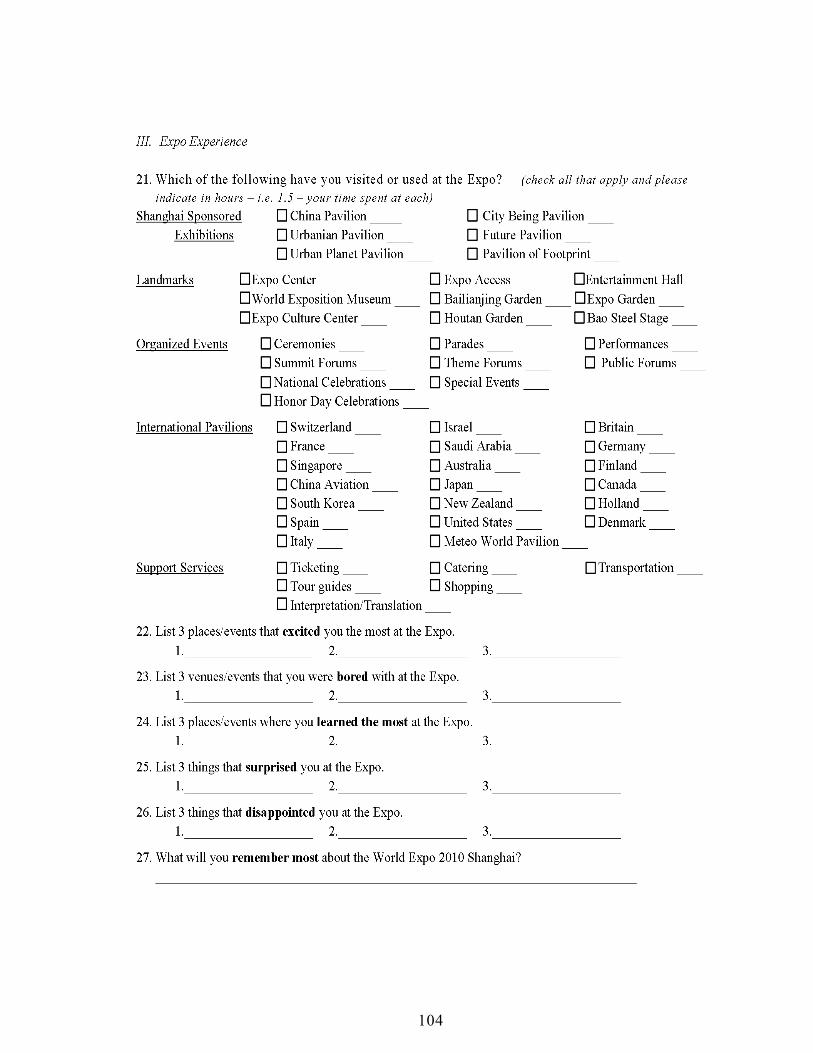
104
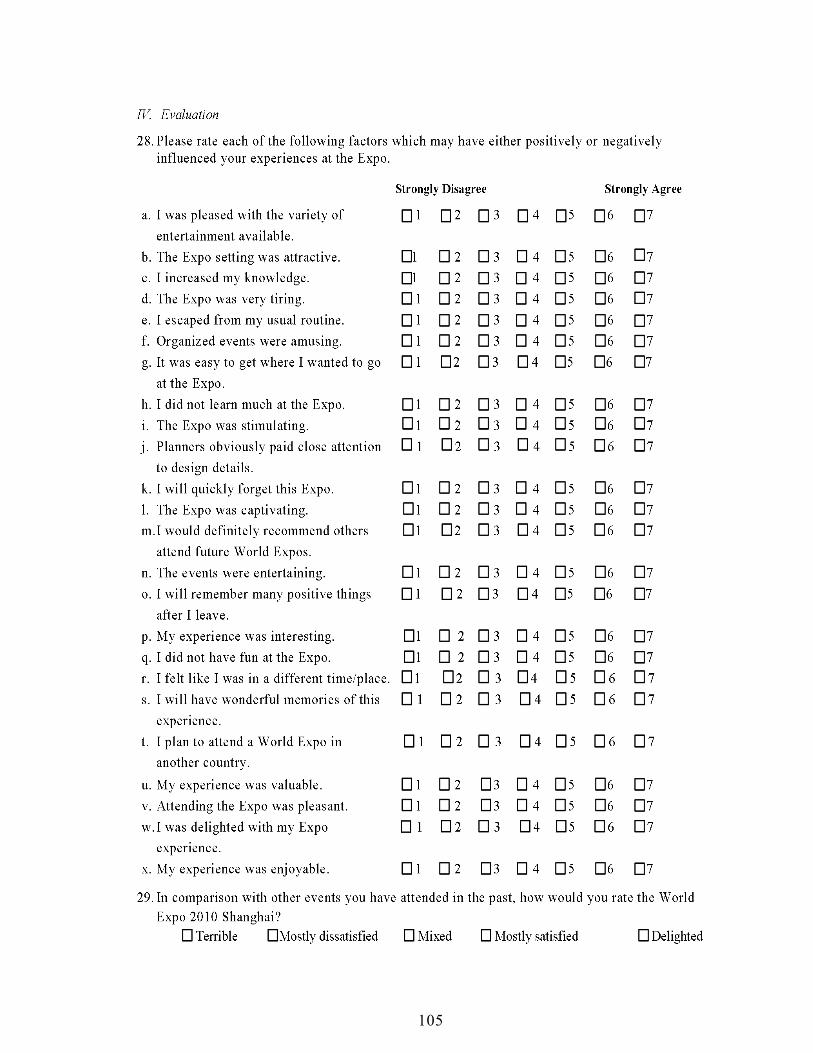
105

106

107
APPENDIX C
Shanghai World Expo 2010 Study –
University of Queensland Ethics Approval and Guidelines
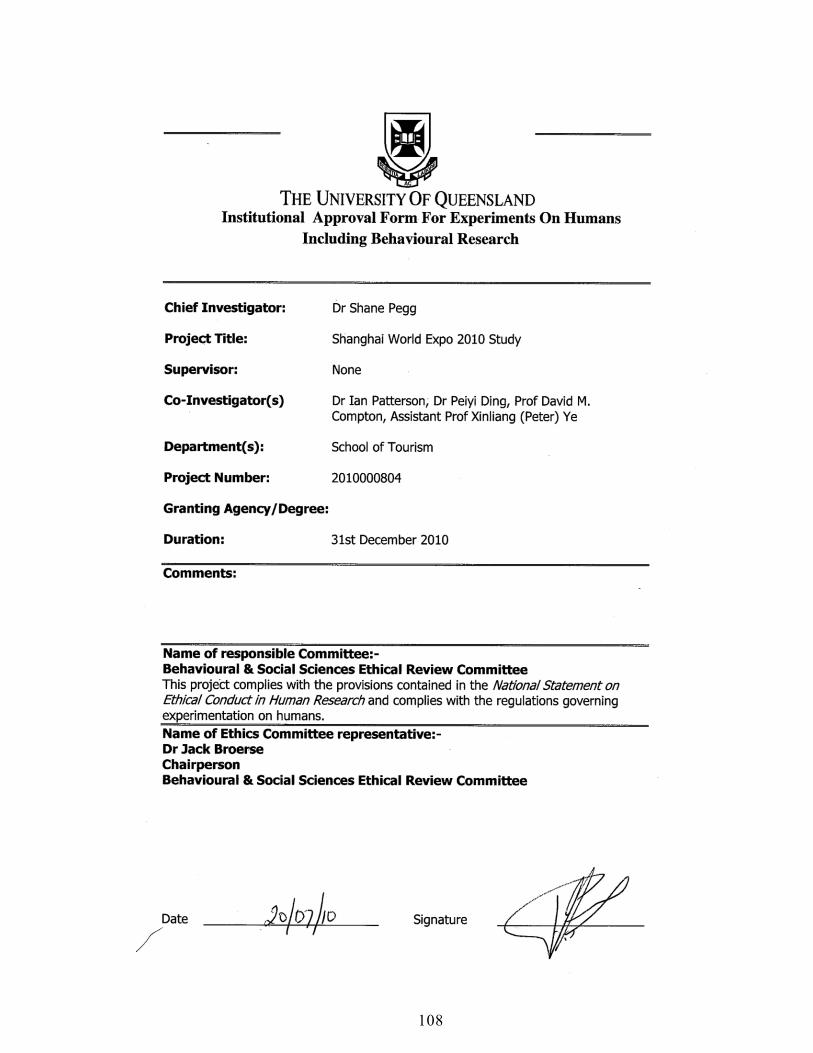
108

109

110
APPENDIX D
World Expo 2010 Shanghai –
Interview Consent

111

112
APPENDIX E
World Expo 2010 Shanghai –
Interview Information Sheet

113

114
APPENDIX F
World Expo 2010 Shanghai –
One on One Interview Questions
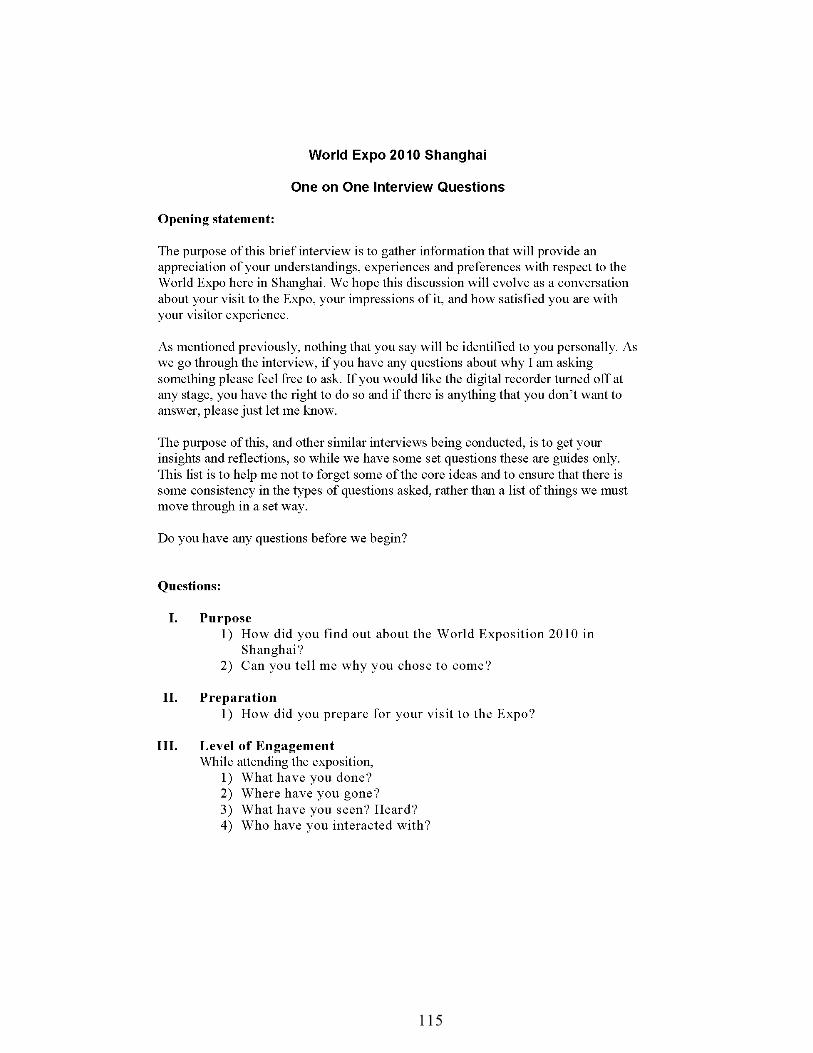
115

116
117
APPENDIX G
Indiana University IRB Guidelines and Approval
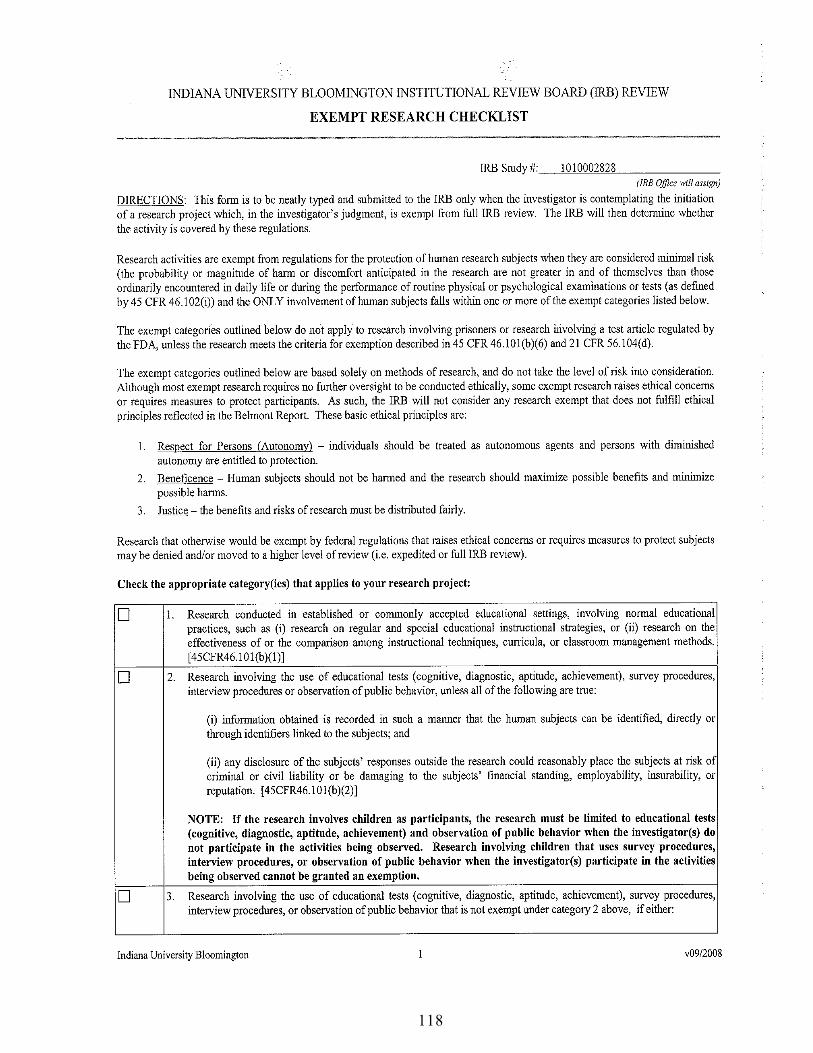
118
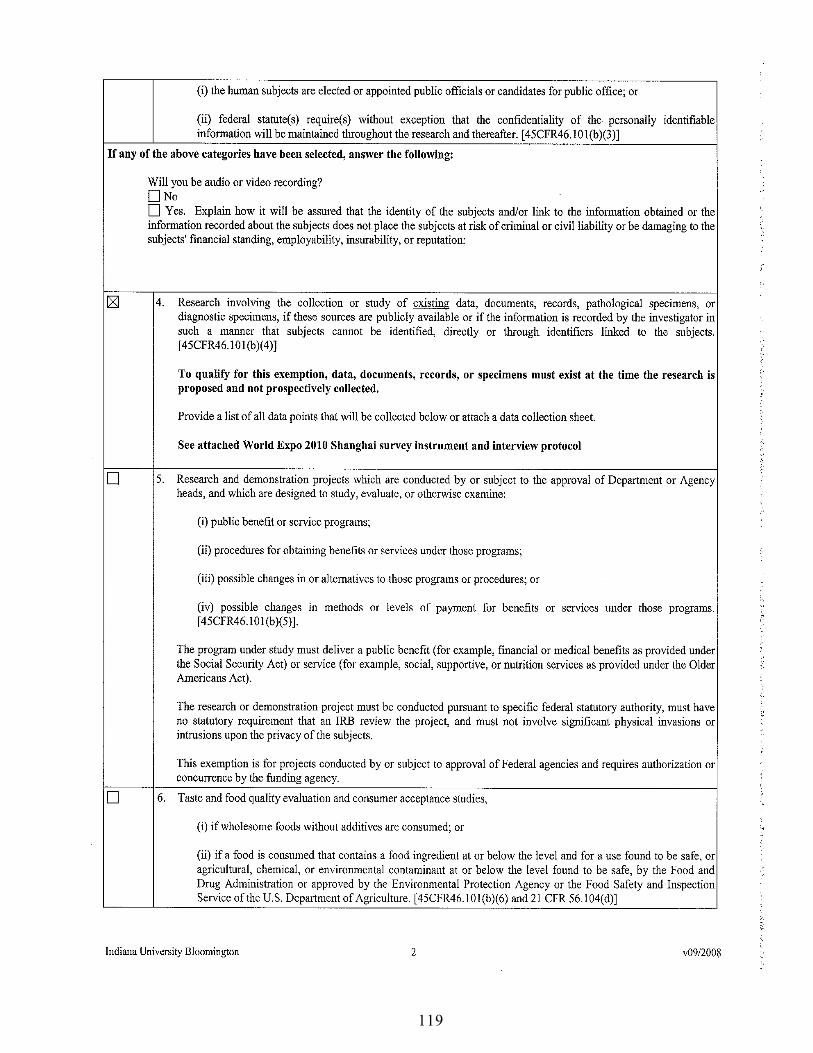
119
120

121

122

123

124
APPENDIX H
Survey Items for Analysis

125
Table H1
Survey Items Clustered by Variable and Categories Motivation
Entertainment
17f. I wanted to visit Shanghai.
17g. I wanted to have fun.
Education
17a. I like traveling to other countries.
17b. I wanted a new experience.
17c. I wanted to learn new things.
Esthetics
17i. I wanted to try new foods.
17k. I was excited to visit the Expo.
17l. I wanted to meet new people.
Escapism
17e. I wanted to get away.
17h. I wanted to relax.
17j. I wanted to be in control.
Experience Factors
Entertainment
28a. I was pleased with the variety of entertainment available.
28f. Organized events were amusing.
28l. The Expo was captivating.
28n. The events were entertaining.
28q. I did not have fun at the Expo. (Reverse Item)
Education
28c. I increased my knowledge.
28h. I did not learn much at the Expo. (Reverse Item)
Esthetics
28b. The Expo setting was attractive.
28g. It was easy to get where I wanted to go at the Expo.
28j. Planners obviously paid close attention to design details.
28v. Attending the Expo was pleasant.
Escapism
28e. I escaped from my usual routine.
28r. I felt like I was in a different time/place.
Arousal
28d. The Expo was very tiring. (Reverse Item)
28i. The Expo was stimulating.
28p. My experience was interesting.
28x. My experience was enjoyable.
Memory
28k. I will quickly forget this Expo. (Reverse Item)
28o. I will remember many positive things after I leave.
28s. I will have wonderful memories of this experience.

126
Table H1 cont.
Service Quality
Performance
31a. The Expo’s theme “Better City, Better Life” was evident.
31b. Expo facilities were well maintained.
31c. Expo events were scheduled well.
31d. Expo staff and volunteers were very helpful.
31e. Transportation services provided to and from the Expo were very efficient.
31f. Shanghai residents are very accommodating.
31g. I felt safe while at the Expo.
31h. The Expo was well-organized.
31i. The Expo was held in a good location.
31j. The information I have received (eg. official guides, manuals, maps) were
very useful.
31k. The Expo was a good value for the price I paid to attend.
Importance
31l. Attending the World Expo 2010 Shanghai was important to me.
Experience Quality
Overall Perceived Quality
28u. My experience was valuable.
29. In comparison with other events you have attended in the past, how would
you rate the World Expo 2010 Shanghai? (5-point scale ranging from
Terrible – Delighted)
Overall Satisfaction
28w. I was delighted with my Expo experience.
32. Considering all factors listed in questions #28 and #31, how would you rate
your overall experience at the World Expo 2010 Shanghai? (5-point scale
ranging from Terrible – Delighted)
Purchase Intentions
28m. I would definitely recommend others attend future World Expos.
28t. I plan to attend a World Expo in another country.