World Energy Review 2021 | Eni
164
-
Upload
khangminh22 -
Category
Documents
-
view
1 -
download
0
Transcript of World Energy Review 2021 | Eni


World Energy Review 2021


Reflecting and highlighting the ongoing energy transition process, the World Oil, Gas and Renewables, now at its 20th edition, turns into World Energy Review, a single document that, by tracking the main changes in the energy sector in 2020, aims to be a useful tool for their understanding.
The World Energy Review is split into three sections. The first one revolves around oil with a special focus on the evolution of crude oil quality and the refining industry. The second section offers an overview about the natural gas market and the third one is about the main renewable sources (solar and wind power).
Due to COVID-19 pandemic, in 2020 the energy sector faced unprecedented challenges. It was the first year of energy reduction since 2009 and the largest contraction since the Second World War.
• In 2020 world oil demand collapsed (nearly 9% vs 2019). Brent price fell to its lowest levelin over 15 years (average 41.7 $/b) and sometimes hovered below 20 $/b. For the first timein history, US crude oil, WTI, dropped even below zero for one day.
• To face the reduction in demand, OPEC+ implemented record cuts in crude oil production.At the same time, the contraction in prices also led to a fall in non-OPEC production.
• World oil production declined by 6.5% in 2020, affecting all categories of crude andsubstantially freezing the average quality.
• In 2020 global gas demand decreased after 10 years of growth (-1.5% vs 2019), mainlydriven by North America (-4.1%), Russia (-3.2%) and Europe (-2.6%). Meanwhile Chinashowed a remarkable increase (+6.5%), among the top-10 gas consuming countries, andconfirmed itself as the 1st world importer.
• Global gas production interrupted the positive trend of the last 10 years with a contractionof 2.8% in 2020 vs 2019, largely due to Russian (-6%) and US (-2.5%) declines.
• Despite the pandemic impact on gas demand, LNG kept on increasing its share on totaltraded natural gas reaching 40% (38% in 2019). In 2020, 484 bcm of LNG were traded, ofwhich over 70% imported by Asian countries. Over the last year, US increased its LNGexports by 59%.
• In 2020 wind expansion almost doubled compared to 2019 (+111 GW vs +58 GW), bringingglobal wind capacity to 733 GW (+17.8% vs 2019). China led the expansion (65% of newadditions), followed by the US (13%).
• Solar energy continued to dominate renewable capacity expansion with 127 GW of newinstallations. Total solar capacity has now reached about the same level as wind capacitythanks largely to expansion in China (49 GW).
Claudio Descalzi Chief Executive Officer and General Manager

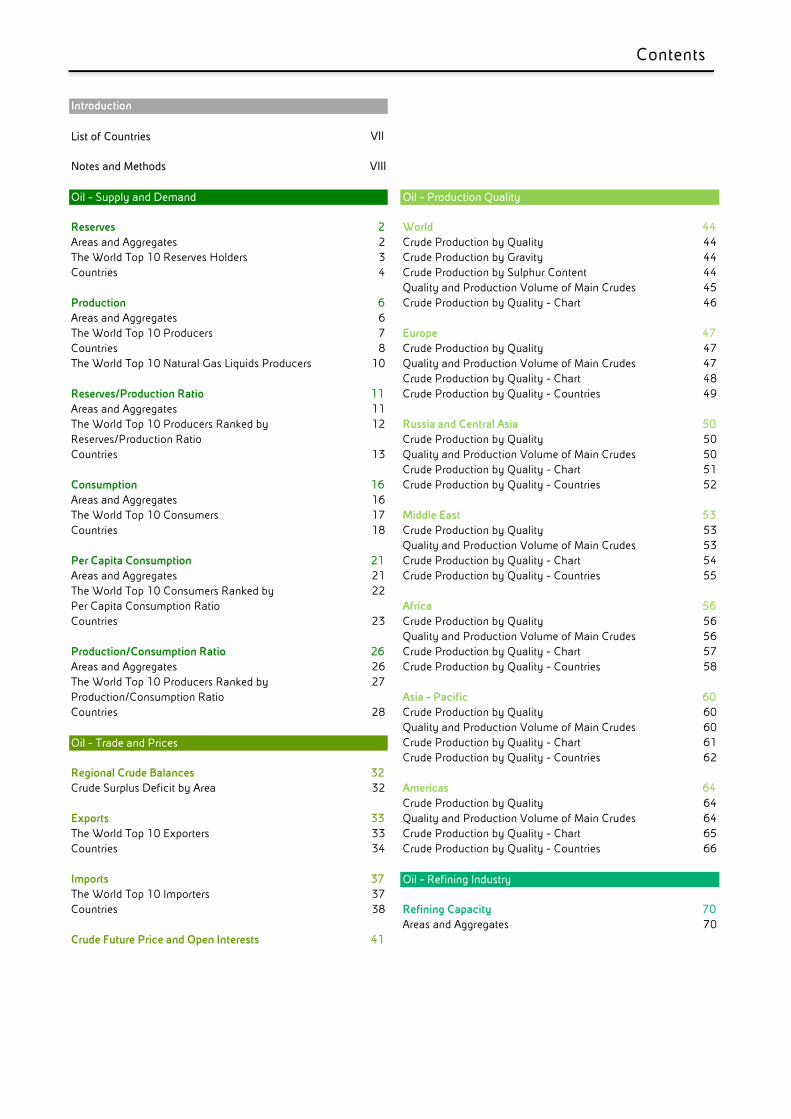
Contents
Introduction
List of Countries VII
Notes and Methods VIII
Oil - Supply and Demand Oil - Production Quality
444444
Reserves Areas and Aggregates The World Top 10 Reserves Holders Countries
2 World2 Crude Production by Quality3 Crude Production by Gravity4 Crude Production by Sulphur Content 44
45Quality and Production Volume of Main Crudes6 Crude Production by Quality - Chart 46
4767 Europe8 Crude Production by Quality 47
ProductionAreas and AggregatesThe World Top 10 ProducersCountries The World Top 10 Natural Gas Liquids Producers 10 Quality and Production Volume of Main Crudes 47
48Crude Production by Quality - Chart11 Crude Production by Quality - Countries 491112 Russia and Central Asia 50
50
Reserves/Production RatioAreas and Aggregates The World Top 10 Producers Ranked byReserves/Production RatioCountries
Crude Production by Quality13 Quality and Production Volume of Main Crudes 50
51Crude Production by Quality - Chart16 Crude Production by Quality - Countries 52
53
ConsumptionAreas and Aggregates The World Top 10 ConsumersCountries
1617 Middle East 18 Crude Production by Quality 53
5354
Quality and Production Volume of Main Crudes21 Crude Production by Quality - Chart21 Crude Production by Quality - Countries 5522
56
Per Capita ConsumptionAreas and Aggregates The World Top 10 Consumers Ranked byPer Capita Consumption RatioCountries
Africa23 Crude Production by Quality 56
5657
Quality and Production Volume of Main Crudes26 Crude Production by Quality - Chart26 Crude Production by Quality - Countries 5827
60
Production/Consumption RatioAreas and Aggregates The World Top 10 Producers Ranked byProduction/Consumption RatioCountries
Asia - Pacific28 Crude Production by Quality 60
60Oil - Trade and Prices 61
Quality and Production Volume of Main CrudesCrude Production by Quality - ChartCrude Production by Quality - Countries 62
Regional Crude BalancesCrude Surplus Deficit by Area
3232 Americas 64
646465
ExportsThe World Top 10 ExportersCountries
Crude Production by Quality33 Quality and Production Volume of Main Crudes33 Crude Production by Quality - Chart34 Crude Production by Quality - Countries 66
37 Oil - Refining IndustryImportsThe World Top 10 ImportersCountries
3738 Refining Capacity 70
Areas and Aggregates 70Crude Future Price and Open Interests 41
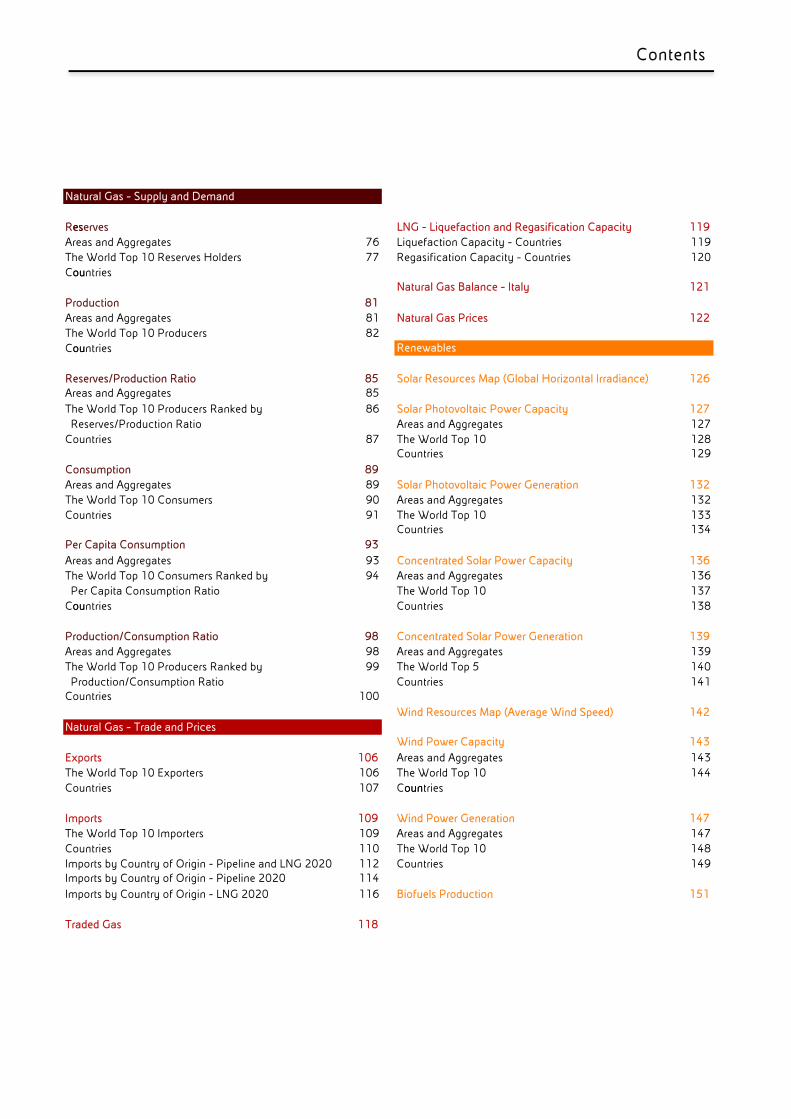
Contents
Natural Gas - Supply and Demand
119119
es LNG - Liquefaction and Regasification Capacity76 Liquefaction Capacity - Countries77 Regasification Capacity - Countries 120
ReservesAreas and Aggregates The World Top 10 Reserves Holders Countriesou
Natural Gas Balance - Italy 121
8181 Natural Gas Prices 122
ProductionAreas and AggregatesThe World Top 10 ProducersCountries
82ou Renewables
85 Solar Resources Map (Global Horizontal Irradiance) 126Reserves/Production RatioAreas and Aggregates
The World Top 10 Producers Ranked by
85
86 Solar Photovoltaic Power Capacity 127127 Reserves/Production Ratio
Countries Areas and Aggregates
87 The World Top 10 128129Countries
132132
ConsumptionAreas and Aggregates The World Top 10 ConsumersCountries
8989 Solar Photovoltaic Power Generation90 Areas and Aggregates 91 The World Top 10 133
Countries 134
136
Per Capita Consumption
Areas and Aggregates The World Top 10 Consumers Ranked by
93
93 Concentrated Solar Power Capacity94 Areas and Aggregates 136
137 Per Capita Consumption RatioCountries
The World Top 10ou Countries 138
139139
Production/Consumption RatioAreas and Aggregates The World Top 10 Producers Ranked by
98 Concentrated Solar Power Generation98 Areas and Aggregates 99 The World Top 5 140
Countries 141100
Production/Consumption RatioCountries
Wind Resources Map (Average Wind Speed) 142Natural Gas - Trade and Prices
143
143144
ExportsThe World Top 10 ExportersCountries
Wind Power Capacity
106 Areas and Aggregates 106 The World Top 10107 Countriesoun
147147148
109 Wind Power Generation109 Areas and Aggregates 110 The World Top 10112 Countries 149
ImportsThe World Top 10 ImportersCountriesImports by Country of Origin - Pipeline and LNG 2020Imports by Country of Origin - Pipeline 2020
Imports by Country of Origin - LNG 2020
114
116 Biofuels Production 151
Traded Gas 118
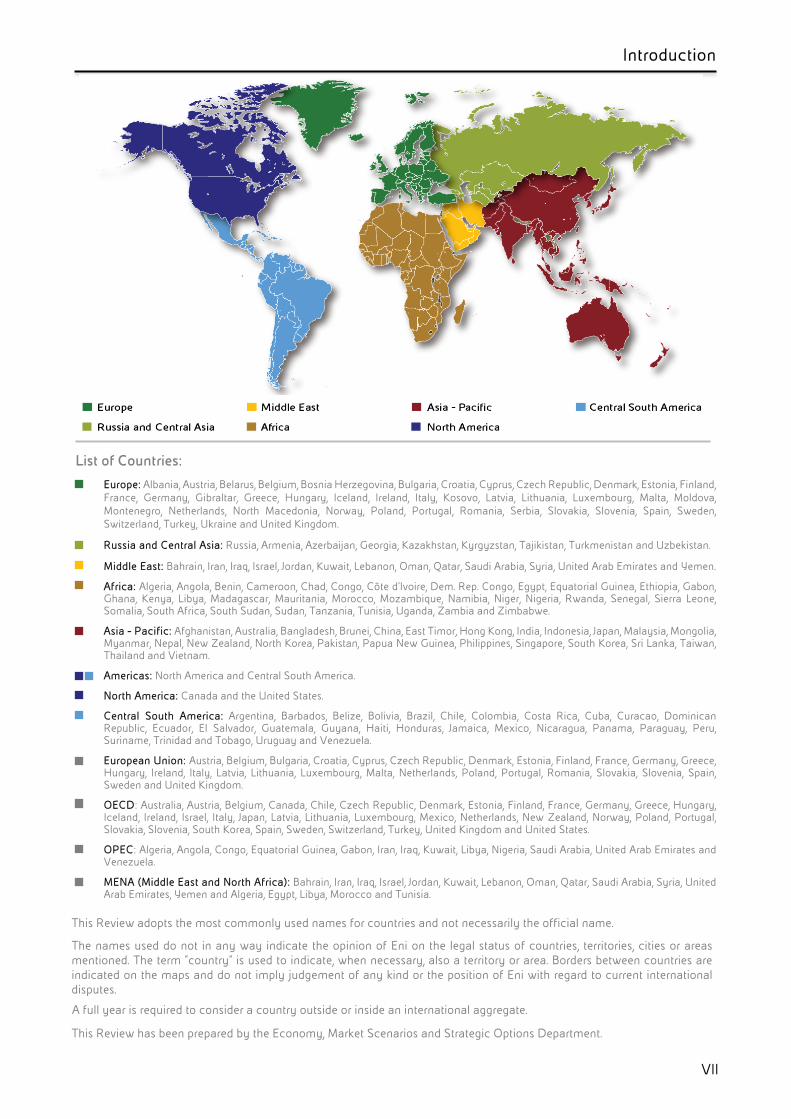
Introduction
List of Countries:
Europe: Albania, Austria, Belarus, Belgium, Bosnia Herzegovina, Bulgaria, Croatia, Cyprus, Czech Republic, Denmark, Estonia, Finland, France, Germany, Gibraltar, Greece, Hungary, Iceland, Ireland, Italy, Kosovo, Latvia, Lithuania, Luxembourg, Malta, Moldova, Montenegro, Netherlands, North Macedonia, Norway, Poland, Portugal, Romania, Serbia, Slovakia, Slovenia, Spain, Sweden, Switzerland, Turkey, Ukraine and United Kingdom.
Russia and Central Asia: Russia, Armenia, Azerbaijan, Georgia, Kazakhstan, Kyrgyzstan, Tajikistan, Turkmenistan and Uzbekistan.
Middle East: Bahrain, Iran, Iraq, Israel, Jordan, Kuwait, Lebanon, Oman, Qatar, Saudi Arabia, Syria, United Arab Emirates and Yemen.
Africa: Algeria, Angola, Benin, Cameroon, Chad, Congo, Côte d’Ivoire, Dem. Rep. Congo, Egypt, Equatorial Guinea, Ethiopia, Gabon, Ghana, Kenya, Libya, Madagascar, Mauritania, Morocco, Mozambique, Namibia, Niger, Nigeria, Rwanda, Senegal, Sierra Leone, Somalia, South Africa, South Sudan, Sudan, Tanzania, Tunisia, Uganda, Zambia and Zimbabwe.
Asia - Pacific: Afghanistan, Australia, Bangladesh, Brunei, China, East Timor, Hong Kong, India, Indonesia, Japan, Malaysia, Mongolia, Myanmar, Nepal, New Zealand, North Korea, Pakistan, Papua New Guinea, Philippines, Singapore, South Korea, Sri Lanka, Taiwan, Thailand and Vietnam.
Americas: North America and Central South America.
North America: Canada and the United States.
Central South America: Argentina, Barbados, Belize, Bolivia, Brazil, Chile, Colombia, Costa Rica, Cuba, Curacao, Dominican Republic, Ecuador, El Salvador, Guatemala, Guyana, Haiti, Honduras, Jamaica, Mexico, Nicaragua, Panama, Paraguay, Peru, Suriname, Trinidad and Tobago, Uruguay and Venezuela.
European Union: Austria, Belgium, Bulgaria, Croatia, Cyprus, Czech Republic, Denmark, Estonia, Finland, France, Germany, Greece, Hungary, Ireland, Italy, Latvia, Lithuania, Luxembourg, Malta, Netherlands, Poland, Portugal, Romania, Slovakia, Slovenia, Spain, Sweden and United Kingdom.
OECD: Australia, Austria, Belgium, Canada, Chile, Czech Republic, Denmark, Estonia, Finland, France, Germany, Greece, Hungary, Iceland, Ireland, Israel, Italy, Japan, Latvia, Lithuania, Luxembourg, Mexico, Netherlands, New Zealand, Norway, Poland, Portugal, Slovakia, Slovenia, South Korea, Spain, Sweden, Switzerland, Turkey, United Kingdom and United States.
OPEC: Algeria, Angola, Congo, Equatorial Guinea, Gabon, Iran, Iraq, Kuwait, Libya, Nigeria, Saudi Arabia, United Arab Emirates and Venezuela.
MENA (Middle East and North Africa): Bahrain, Iran, Iraq, Israel, Jordan, Kuwait, Lebanon, Oman, Qatar, Saudi Arabia, Syria, United Arab Emirates, Yemen and Algeria, Egypt, Libya, Morocco and Tunisia.
VII
This Review adopts the most commonly used names for countries and not necessarily the official name.
The names used do not in any way indicate the opinion of Eni on the legal status of countries, territories, cities or areas mentioned. The term “country” is used to indicate, when necessary, also a territory or area. Borders between countries are indicated on the maps and do not imply judgement of any kind or the position of Eni with regard to current international disputes.
This Review has been prepared by the Economy, Market Scenarios and Strategic Options Department.
A full year is required to consider a country outside or inside an international aggregate.

Introduction
Notes and Methods
The sources of the data are: CME, DECC, EIA DOE, Enerdata, Energy Intelligence, ICE, ICIS Consulting, International Energy Agency, IHS Global Insight, Italian Ministry for Ecological Transition, JODI, Norwegian Petroleum Directorate, Oil & Gas Journal, OPEC, S&P Global Platts, Wood MacKenzie and other official sources.
In all the chapters of oil, in some countries figures may include oil from non conventional sources and others sources of supply.
The figures for “Reserves” refer to proven reserves as at 31st December. The figures for other chapters indicate annual averages.
Blank spaces in the tables indicate that the figure was not available, zero indicates a figure that is not significant (except for the chapters “Production Quality” where “zero” is used for both not available and not significant figures). Totals may differ from the sum of the individual figures as a result of rounding up/down. Percentages have been calculated before rounding.
The difference between the Consumption and the Production of oil is given by the change and stocks, the processing gains obtained in refining and the amount of biofuels which is not included in Production.
In all the chapters, the list of the “The world top 10…” is drawn up by ordering the countries on the basis of the last available year. In the chapters “Reserves/Production Ratio” and “Production/Consumption Ratio”, the list of the “The world top 10…” is drawn up by selecting the largest producers in the last available year and ordering them on the basis of the value of the reserves/production and production/consumption ratio. In the chapter “Per Capita Consumption”, the list of the world top is drawn up by selecting the largest consumers in the last available year and ordering them by the value of per capita consumption.
In the chapter “Production Quality” figures for total oil production in each area or country do not coincide with the figures in the “Production” chapter of the Review. This is due to the exclusion of natural gas liquids and extra heavy crude from the figures for the first (except for Venezuela). Moreover, it has not been possible to allocate or define total production. In some countries the ‘Ultra Light’ category also includes, in total or in part, the production of condensates. For Canada the production includes syncrude.
API degree is used universally to express a crude’s relative density. The arbitrary formula used to obtain it is: API gravity = (141.5/SG at 60°F) -131.5, where SG is the specific gravity of the fluid. Lighter the crude, higher the API gravity. The API scale was designed so that most values would fall between 10 and 70 API gravity degrees. Fresh water has an API density of 10.
Atmospheric distillates yields are obtained according to TBP (True Boiling Point) technique, ASTM D2892 procedure. Figures are expressed in mass percentage.
For the definition of the qualitative parameters for single crudes, the data of “Eni–R&M downstream laboratories” have been used, wherever possible. Quality levels, indicating API gravity and sulphur content, are defined as follows.
Quality levels - API gravity and sulphur content
Ultra Light API level equal to or greater than 50° and a low sulphur content Light & Sweet API level equal to or greater than 35° and less than 50°, sulphur content less 0.5% Light & Medium Sour API level equal to or greater than 35° and less than 50°, sulphur content equal to or greater than 0.5% and less than 1% Light & Sour API level equal to or greater than 35° and less than 50°, sulphur content equal to or greater than 1%
Medium & Sweet API level equal to or greater than 26° and less than 35°, sulphur content less 0.5% Medium & Medium Sour API level equal to or greater than 26° and less than 35°, sulphur content equal to or greater than 0.5% and less than 1% Medium & Sour API level equal to or greater than 26° and less than 35°, sulphur content equal to or greater than 1%
Heavy & Sweet API level equal to or greater than 10° and less than 26°, sulphur content less 0.5% Heavy & Medium Sour API level equal to or greater than 10° and less than 26°, sulphur content equal to or greater than 0.5% and less than 1% Heavy & Sour API level equal to or greater than 10° and less than 26°, sulphur content equal to or greater than 1%
Supply and Demand Trade and Prices
Production Quality
Oil
VIII

Introduction
The “Refining Capacity” set of tabulations provides the following information:
- Refineries: includes asphalt and lube oriented units, when dedicated topping capacity is present. Condensate refineries are included.
- Primary Capacity: represents a pro rated annual average of available capacity, excluding turnarounds. - Conversion Capacity (FCC eqv.): sum of conversion capacity, converted to “Catcracking (FCC) equivalent” capacity. “FCC
equivalent” capacity equals 1; other conversion capacities can be higher or lower than 1 (the equivalent factors are reported below in the next table).
- Complexity Ratio – FCC eqv.: ratio of Conversion Capacity (converted to FCC equivalent) over Primary Capacity, calculated on a weight basis. The higher is the complexity index, the higher is the capability of a refinery to produce high equivalent quality and value products.
- Complexity Ratio – NCI (Nelson Complexity Index): is another measure of secondary conversion capacity in comparison to the primary distillation capacity. The units are rated in terms of their costs relative to the primary distillation unit. The higher is the index the higher is the capability of a refinery to produce high quality and value products.
The equivalent factors for the FCC equivalent calculation, reported below, change according to the type and the configuration of the conversion unit and are from ICIS Consulting. The factors for the Nelson calculation are standard factors, modified as necessary by Eni. Oxygenates and Aromatics are excluded.
Refining Industry
Conversion type Conversion type
Alkylation 0.00 10.00 Hydrodesulf-diesel 0.00 2.50
Alkylation-hydrofluoric 0.00 10.00 Hydrodesulf-gasoline 0.00 2.50
Alkylation-sulfunic 0.00 10.00 Hydrodesulf-kero 0.00 2.50
Asphalt 0.25 1.50 Hydrodesulf-mid-distillates 0.00 2.50
Coking-delayed 1.35 6.00 Hydrodesulf-naphta 0.00 2.50
Coking-f/d 1.35 6.00 Hydrodesulf-residue 0.20 2.50
Coking-fluid 1.35 6.00 Hydrodesulf-gvgo 0.05 2.50
Coking-fxc 1.35 6.00 Isomerization-c4 0.00 15.00
Condensate distillation 0.00 1.00 Isomerization-In 0.00 15.00
Crude 0.00 1.00 Lube 0.50 60.00
Deasphalting 0.00 1.50 Polymerization 0.00 10.00
Deasphalting-c3 0.00 1.50 Reforming-aromax 0.00 5.00
Deasphalting-c4 0.00 1.50 Reforming-btx 0.00 5.00
Deep catcraking 1.10 6.00 Reforming-cc 0.00 5.00
Distillate dewaxing 0.10 85.00 Reforming-cyclic 0.00 5.00
Fluid cat-cracking 1.00 6.00 Reforming-Ipg feed 0.00 5.00
Fluid catcracking-residue 1.90 6.00 Reforming-sr 0.00 5.00
Heavy residual gasification 1.30 12.00 Thermal cat-cracking 0.80 2.75
Hydrocracking-distillates 1.30 6.00 Thermal cracking 0.65 2.75
Hydrocracking-mild 0.30 6.00 Vacuum 0.00 2.00
Hydrocracking-residue 0.40 6.00 Visbreaking 0.25 2.75
IX

Introduction
Natural Gas Renewables
The sources of the data are: Cedigaz, DECC, EIA DOE, Enerdata, International Energy Agency (IEA), International Renewable Energy Agency (IRENA), IHS Global Insight, Italian Ministry for Ecological Transition, Norwegian Petroleum Directorate, Oil & Gas Journal, OPEC, Wood MacKenzie and other official sources.
Blank spaces in the tables indicate that the figure was not available, zero indicates a figure that is not significant (except for the two chapters “Imports by Country of Origin” and “LNG Liquefaction and Regasification Capacity” in the section “Natural Gas” and for the whole section “Renewables”).
Totals may differ from the sum of the individual figures as a result of rounding up/down.
Percentages have been calculated before rounding.
In all the chapters of natural gas, the figures of some countries may include natural gas from non conventional sources and others sources of supply.
The figures for “Reserves” of natural gas refer to proven reserves as at 31st December. The figures for other chapters indicate annual averages.
In the chapters “Production”, “Consumption”, “Exports” and “Imports” of natural gas, figures are assessed by using the same calorific value per cubic metre (40 MJ/cm, GCV), in order to make data among countries comparable.
In the chapter “Production” of natural gas, the figures concern traded production and do not include quantities of flared, dispersed or re-injected gas.
In the chapter “Imports” of natural gas, the figure reported as total imports for a single country may differ from the sum of “Imports by LNG and pipeline” for the same country, because of the different sources and different calorific attached to the cubic metre. The imports of liquefied natural gas cover only the dry marketable equivalent after regasification.
In all the chapters, the list of the “The world top 10 or 5…” is drawn up by ordering the countries on the basis of the last available year. In the chapters “Reserves/Production Ratio” and “Production/Consumption Ratio” of natural gas, the list of the “The world top 10…” is drawn up by selecting the largest producers in the last available year and ordering them on the basis of the value of the reserves/production and production/consumption ratio. In the chapter “Per Capita Consumption” of natural gas, the list of the world top is drawn up by selecting the largest consumers in the last available year and ordering them by the value of per capita consumption.
In the chapter ”Trade and Prices”of natural gas, the annual averages of gas prices are calculated by taking into account the delivery period of the quotations.
X
World Energy Review 2021
Reserves
Production
Reserves/Production Ratio
Consumption
Per Capita Consumption
Production/Consumption Ratio
Oil - Supply and Demand

Oil - Supply and Demand Reserves
Areas and Aggregates(*)
(million barrels as at 31st December)
World Oil Reserves (2020) 1,740,264 million barrels as at 31st December
World Oil Reserves Growth (2005-2020) 373, 716 million barrels as at 31st December
(*) Data source: Eni’s estimates on Enerdata Global Energy Market & CO2 Data and other official data sources.
World Energy Review 20212

Oil - Supply and Demand Reserves
The World Top 10 Reserves Holders(*)
(million barrels as at 31st December)
The World Top 10 (2020)
(*) Data source: Eni’s estimates on Enerdata Global Energy Market & CO2 Data and other official data sources.
World Energy Review 2021 3

Oil - Supply and Demand Reserves
Countries(*)
(million barrels as at 31st December)
(*) Data source: Eni’s estimates on Enerdata Global Market & CO2 Data and other official data sources. (**) The original data are from Italian Ministry for Ecological Transition. They have been converted by Eni considering 1 ton of oil equal to 7.3 barrels.
World Energy Review 20214

Oil - Supply and Demand Reserves
Countries(*)
(million barrels as at 31st December)
(*) Data source: Eni’s estimates on Enerdata Global Energy Market & CO2 Data and other official data sources.
World Energy Review 2021 5

Oil - Supply and Demand Production
Areas and Aggregates(*)
Crude and non conventional oil, natural gas liquids (thousand barrels/day)
World Oil Production (2020) 89,230 thousand barrels/day
World Oil Production Growth (2005-2020) 7,092 thousand barrels/day
(*) Data source: Eni’s calculations on IEA (2021) Monthly Oil Data Services data. All rights reserved.
World Energy Review 20216

Oil - Supply and Demand Production
The World Top 10 Producers (*)
Crude and non conventional oil, natural gas liquids (thousand barrels/day)
The World Top 10 (2020)
(*) Data source: IEA (2021) Monthly Oil Data Services. All rights reserved.
World Energy Review 2021 7

Oil - Supply and Demand Production
Countries(*)
Crude and non conventional oil, natural gas liquids (thousand barrels/day)
(*) Data source: IEA (2021) Monthly Oil Data Services. All rights reserved.
World Energy Review 20218
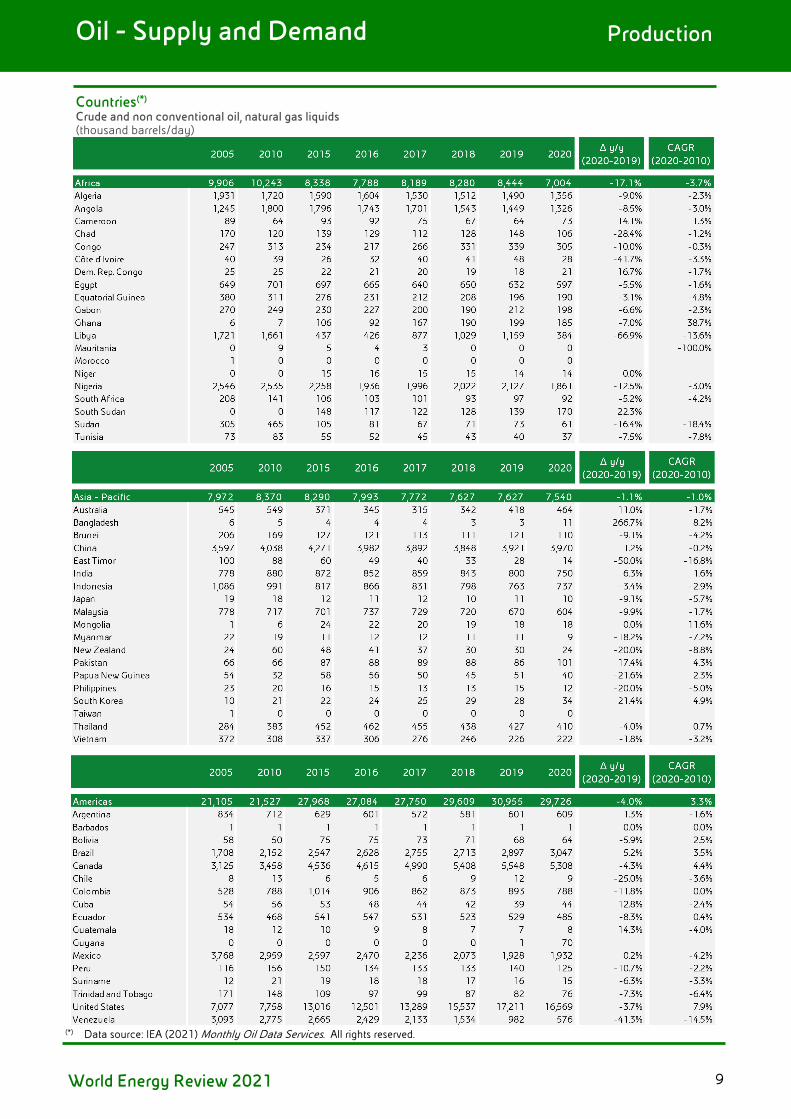
Oil - Supply and Demand Production
Countries(*)
Crude and non conventional oil, natural gas liquids (thousand barrels/day)
(*) Data source: IEA (2021) Monthly Oil Data Services. All rights reserved.
World Energy Review 2021 9
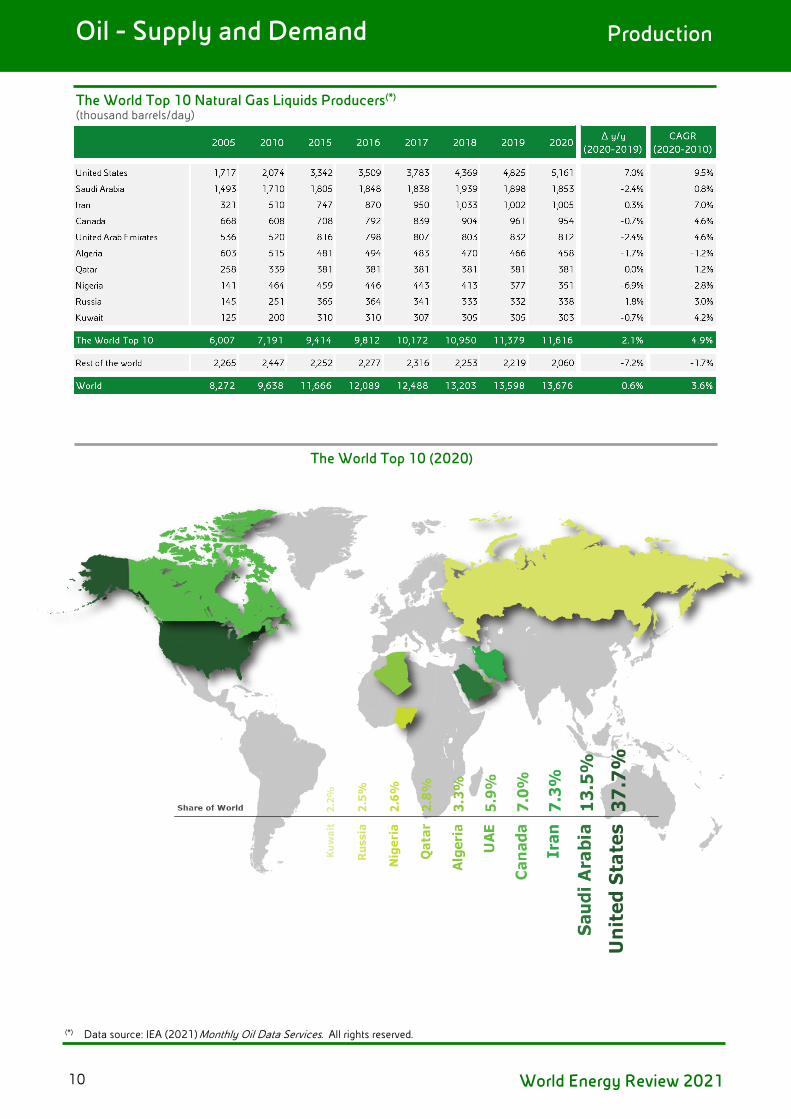
Oil - Supply and Demand Production
The World Top 10 Natural Gas Liquids Producers(*)
(thousand barrels/day)
The World Top 10 (2020)
(*) Data source: IEA (2021) Monthly Oil Data Services. All rights reserved.
World Energy Review 202110

Oil - Supply and Demand Reserves/Production Ratio
Area and Aggregates(*)
(years)
Reserves/Production Ratio (2020) World: 53 years
(*) Data source: Eni’s calculations on Enerdata Global Energy Market & CO2 Data, IEA (2021) Monthly Oil Data Services and other official datasources. All rights reserved.
World Energy Review 2021 11

Oil - Supply and Demand Reserves/Production Ratio
The World Top 10 Producers Ranked by Reserves/Production Ratio(*) (years)
The World Top 10 (2020)
(*) Data source: Eni’s calculations on Enerdata Global Energy Market & CO2 Data, IEA (2021) Monthly Oil Data Services and other official datasources. All rights reserved.
World Energy Review 202112

Oil - Supply and Demand Reserves/Production Ratio
Countries(*)
(years)
(*) Data source: Eni’s calculations on Enerdata Global Energy Market & CO2 Data, IEA (2021) Monthly Oil Data Services and other official datasources. All rights reserved.
World Energy Review 2021 13

Oil - Supply and Demand Reserves/Production Ratio
Countries(*)
(years)
sources. All rights reserved.
(*) Data source: Eni’s calculations on Enerdata Global Energy Market & CO2 Data, IEA (2021 ) Monthly Oil Data Services and other official data
World Energy Review 202114

Oil - Supply and Demand Reserves/Production Ratio
Countries(*)
(years)
(*) Data source: Eni’s calculations on Enerdata Global En ergy Market & CO2 Data, IEA (2021) Monthly Oil Data Services and other official datasources. All rights reserved.
World Energy Review 2021 15

Oil - Supply and Demand Consumption
Areas and Aggregates(*)
(thousand barrels/day)
World Oil Consumption (2020) 91,018 thousand barrels/day
World Oil Consumption Growth (2005-2020) 6,460 thousand barrels/day
(*) Data sources: Eni’s calculations on IEA (2021) Monthly Oil Data Services data. All rights reserved.
World Energy Review 202116

Oil - Supply and Demand Consumption
The World Top 10 Consumers(*)
(thousand barrels/day)
The World Top 10 (2020)
(*) Data source: IEA (2021) Monthly Oil Data Services. All rights reserved.
World Energy Review 2021 17

Oil - Supply and Demand Consumption
Countries(*)
(thousand barrels/day)
(*) Data source: IEA (2021) Monthly Oil Data Services. All rights reserved.
World Energy Review 202118

Oil - Supply and Demand Consumption
Countries(*)
(thousand barrels/day)
(*) Data source: IEA (2021) Monthly Oil Data Services. All rights reserved.
World Energy Review 2021 19

Oil - Supply and Demand Consumption
Countries(*)
(thousand barrels/day)
(*) Data source: IEA (2021) Monthly Oil Data Services. All rights reserved.
World Energy Review 202120

Oil - Supply and Demand Per Capita Consumption
Areas and Aggregates(*)
(barrels)
Per Capita Consumption (2020)
(*) Data source: Eni’s calculations on IEA (2021) Monthly Oil Data Services and IHS Global Insight data. All rights reserved.
World Energy Review 2021 21
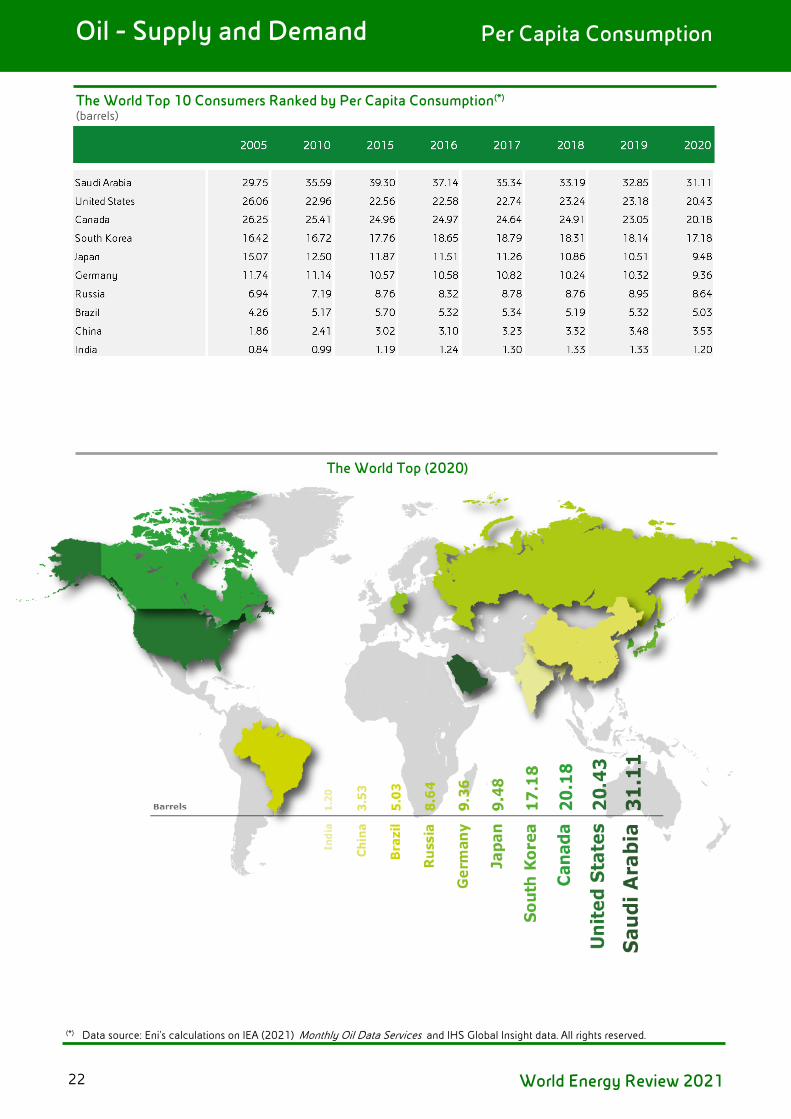
Oil - Supply and Demand Per Capita Consumption
The World Top 10 Consumers Ranked by Per Capita Consumption(*) (barrels)
The World Top (2020)
(*) Data source: Eni’s calculations on IEA (2021) Monthly Oil Data Services and IHS Global Insight data. All rights reserved.
World Energy Review 202122

Oil - Supply and Demand Per Capita Consumption
Countries(*) (barrels)
(*) Data source: Eni’s calculations on IEA (2021) Monthly Oil Data Services and IHS Global Insight data. All rights reserved.
World Energy Review 2021 23

Oil - Supply and Demand Per Capita Consumption
Countries(*) (barrels)
(*) Data source: Eni’s calculations on IEA (2021) Monthly Oil Data Services and IHS Global Insight data. All rights reserved.
World Energy Review 202124

Oil - Supply and Demand Per Capita Consumption
Countries(*) (barrels)
(*) Data source: Eni’s calculations on IEA (2021) Monthly Oil Data Services and IHS Global Insight data. All rights reserved.
World Energy Review 2021 25

Oil - Supply and Demand Production/Consumption Ratio
Areas and Aggregates(*)
Production/Consumption Ratio (2020)
(*) Data source: Eni’s calculations on IEA (2021) Monthly Oil Data Services data. All rights reserved.
World Energy Review 202126
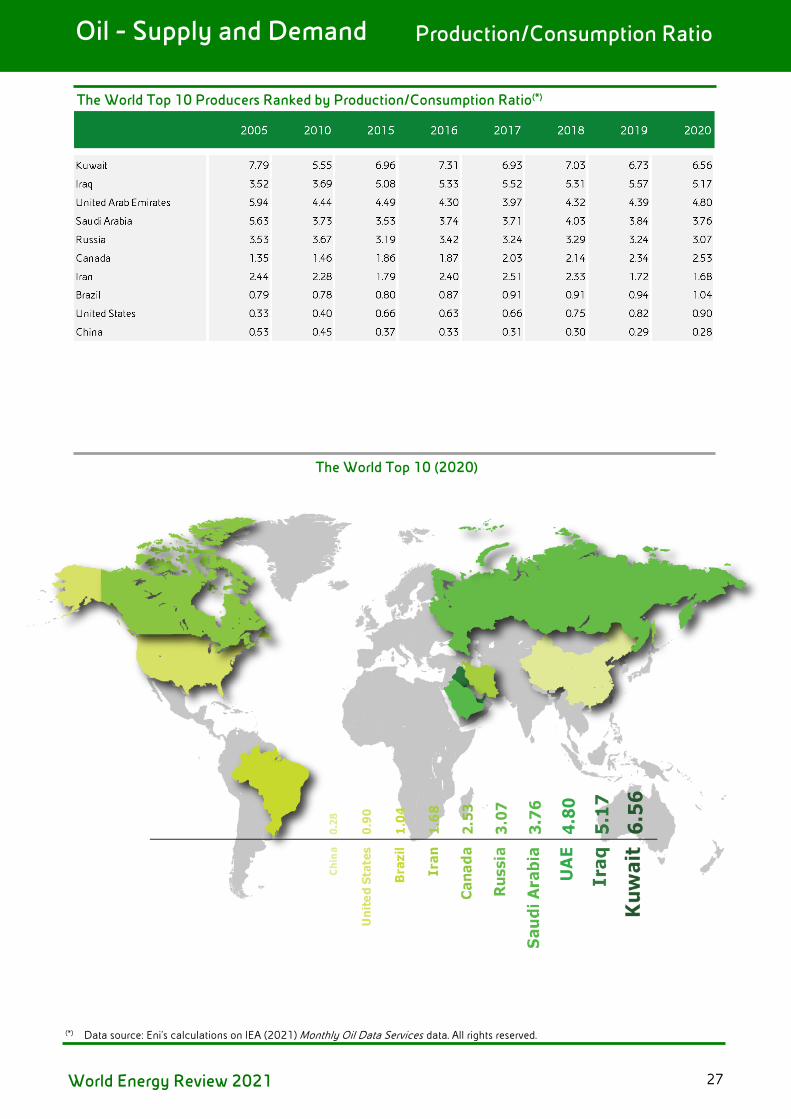
Oil - Supply and Demand Production/Consumption Ratio
The World Top 10 Producers Ranked by Production/Consumption Ratio(*)
The World Top 10 (2020)
(*) Data source: Eni’s calculations on IEA (2021) Monthly Oil Data Services data. All rights reserved.
World Energy Review 2021 27

Oil - Supply and Demand Production/Consumption Ratio
Countries(*)
(*) Data source: Eni’s calculations on IEA (2021) Monthly Oil Data Services data. All rights reserved.
World Energy Review 202128
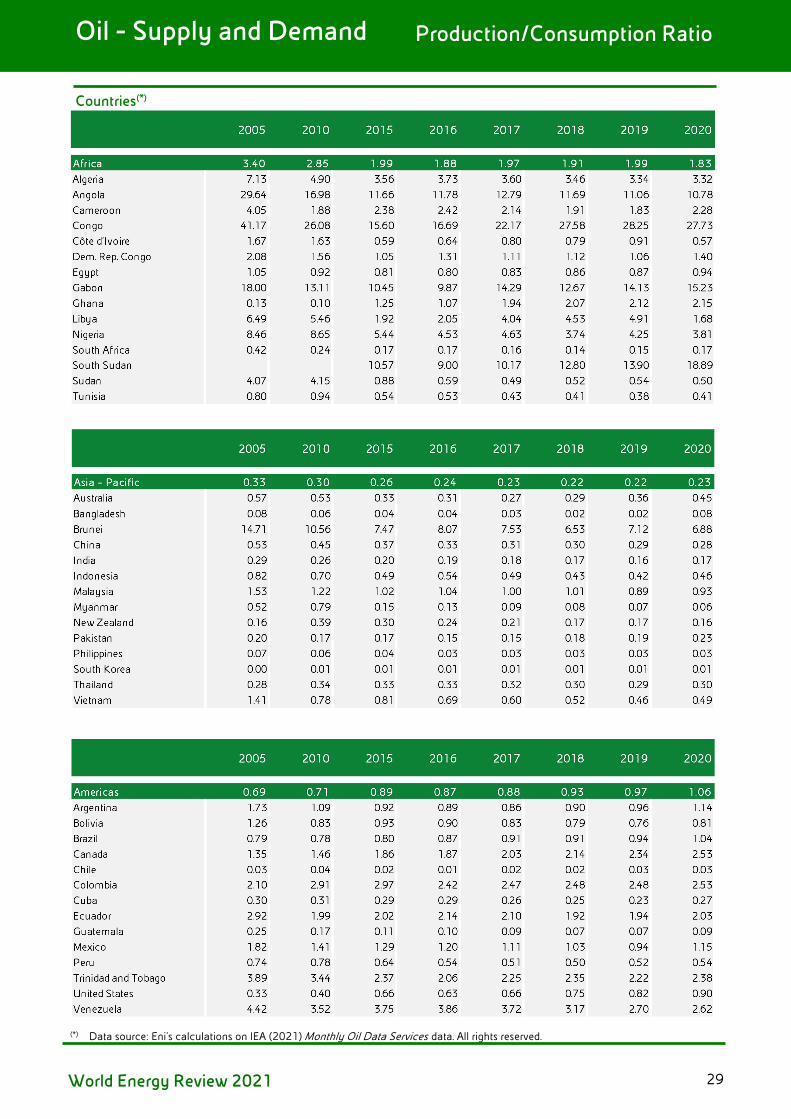
Oil - Supply and Demand Production/Consumption Ratio
Countries(*)
(*) Data source: Eni’s calculations on IEA (2021) Monthly Oil Data Services data. All rights reserved.
World Energy Review 2021 29


Regional Crude Balances
Exports
Imports
Crude Future Price and Open Interests
Oil - Trade and Prices
World Energy Review 2021

Regional Crude Balances
Crude Surplus Deficit by Area(*)
(thousand barrels/day)
Crude Surplus Deficit by Area (2019 and 2020)
(million barrels/day)
(*) Data source: Eni’s elaborations on IEA (2021) Monthly Oil Data Services and Wood MacKenzie data. All rights reserved.
World Energy Review 202132
Oil - Trade and Prices

Exports
The World Top 10 Exporters(*)
Crude and non conventional oil (thousand barrels/day)
The World Top 10 (2020)
(*) Data source: Eni’s estimates on Enerdata G lobal Energy Market & CO2 Data, IEA (2021) Monthly Oil Data Services and other official data
sources. All rights reserved.
World Energy Review 2021 33
Oil - Trade and Prices

Exports
Countries(*)
Crude and non conventional oil (thousand barrels/day)
(*) Data source: Eni’s estimates on
Enerdata Global Energy Market & CO2 Data, IEA (2021) Monthly Oil Data Services and other official datasources. All rights reserved.
World Energy Review 202134
Oil - Trade and Prices

Exports
Countries(*)
Crude and non conventional oil (thousand barrels/day)
(*) Data source: Eni’s estimates on
Enerdata Global Energy Market & CO2 Data, IEA (2021) Monthly Oil Data Services and other official datasources. All rights reserved.
World Energy Review 2021 35
Oil - Trade and Prices

Exports
Countries(*)
Crude and non conventional oil (thousand barrels/day)
(*) Data source: Eni’s estimates on
Enerdata Global Energy Market & CO2 Data, IEA (2021) Monthly Oil Data Services and other official datasources. All rights reserved.
World Energy Review 202136
Oil - Trade and Prices

Imports
The World Top 10 Importers(*)
Crude and non conventional oil (thousand barrels/day)
The World Top 10 (2020)
(*) Data source: Eni’s estimates on Enerdata Global Energy Market & CO2 Data, IEA (2021) Monthly Oil Data Services and other official datasources. All rights reserved.
World Energy Review 2021 37
Oil - Trade and Prices

Imports
Countries(*) Crude and non conventional oil (thousand barrels/day)
(*) Data source: Eni’s estimates on Enerdata Global Energy Market & CO2 Data, IEA (2021) Monthly Oil Data Services and other official datasources. All rights reserved.
World Energy Review 202138
Oil - Trade and Prices
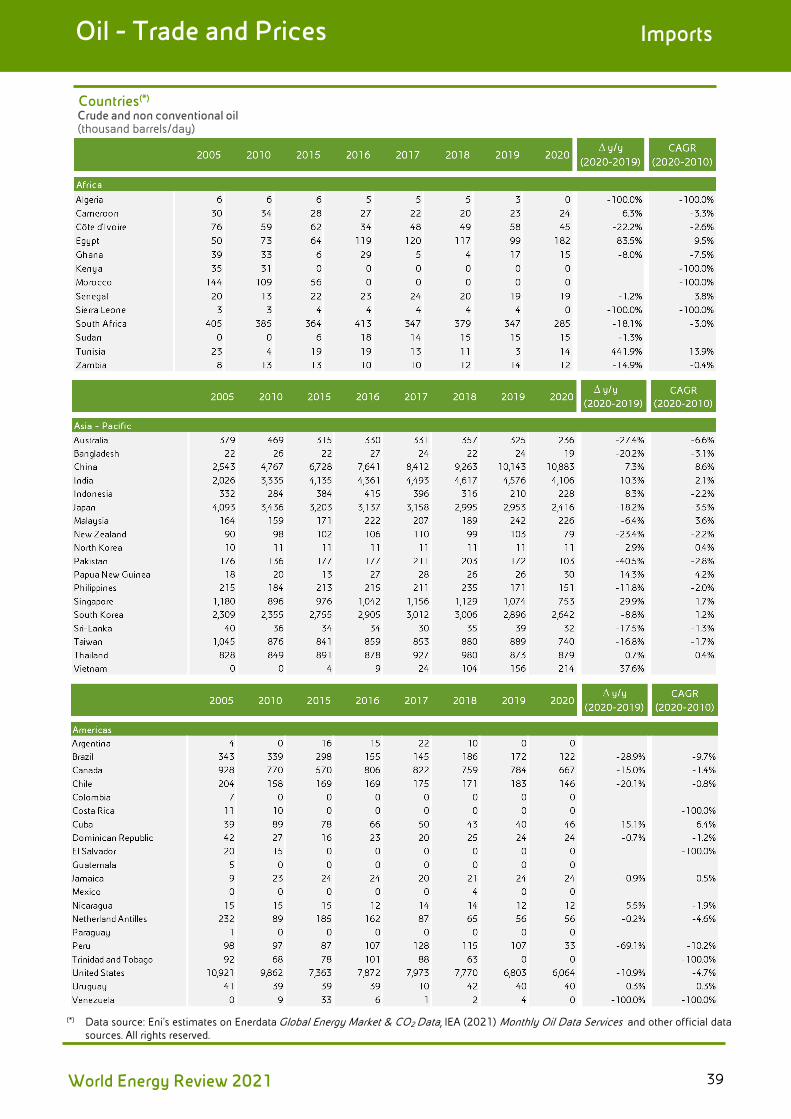
Imports
Countries(*) Crude and non conventional oil (thousand barrels/day)
(*) Data source: Eni’s estimates on Enerdata Global Energy Market & CO2 Data, IEA (2021) Monthly Oil Data Services and other official datasources. All rights reserved.
World Energy Review 2021 39
Oil - Trade and Prices

Crude Future Prices and Open Interests(*)
ICE Brent Price 1 Month(*)
(US$/barrel) WTI vs Brent 1 Month Differential(*)
(US$/barrel)
ICE Brent Total Open Interests(*)
(no. contracts - daily totals) CME WTI Total Open Interests(*)(no. contracts - daily totals)
(*) Data source: ICE London and CME New York.
Oil - Trade and Prices Crude Future Prices and Open Interests
World Energy Review 202140


World
Europe
Russia and Central Asia
Middle East
Africa
Asia Pacific
Americas
Oil - Production Quality
World Energy Review 2021
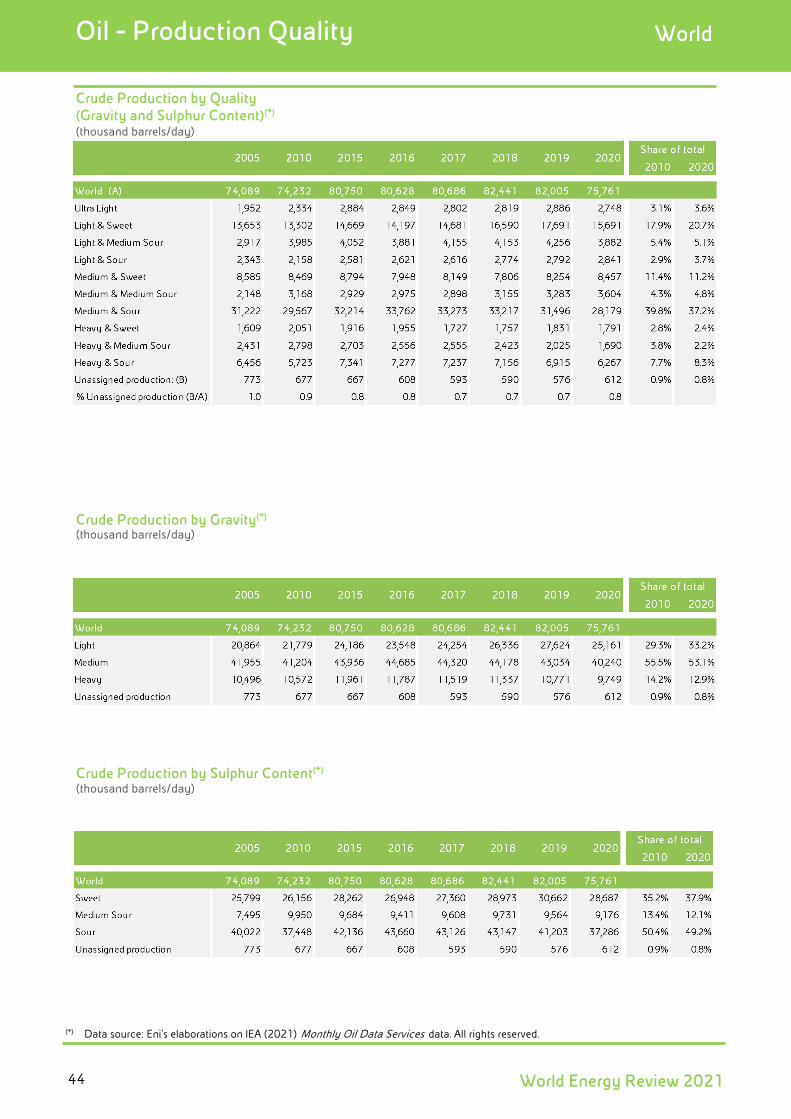
Oil - Production Quality World
Crude Production by Quality (Gravity and Sulphur Content)(*) (thousand barrels/day)
Crude Production by Gravity(*)
(thousand barrels/day)
Crude Production by Sulphur Content(*)
(thousand barrels/day)
(*) Data source: Eni’s elaborations on IEA (2021) Monthly Oil Data Services data. All rights reserved.
World Energy Review 202144

Oil - Production Quality World
Quality and Production Volume of Main 2020 Crudes(*)
(thousand barrels/day)
(*) Data source: Eni.
World Energy Review 2021 45

Oil - Production Quality World
Crude Production by Quality(*)
(thousand barrels/day)
Crude Production by Quality(*) (selected years, thousand barrels/day)
(*) Data source: Eni’s elaborations on IEA (2021) Monthly Oil Data Services data. All rights reserved.
World Energy Review 202146

Oil - Production Quality Europe
Crude Production by Quality(*) (thousand barrels/day)
Quality and Production Volume of Main Crudes 2020(**)
(thousand barrels/day)
(*) Data source: Eni’s elaborations on IEA (2021) Monthly Oil Data Services data. All rights reserved. (**) Data source: Eni.
World Energy Review 2021 47

Oil - Production Quality Europe
Crude Production by Quality(*)
(thousand barrels/day)
Crude Production by Quality(*) (selected years, thousand barrels/day)
(*) Data source: Eni’s elaborations on IEA (2021) Monthly Oil Data Services data. All rights reserved.
World Energy Review 202148

Oil - Production Quality Europe
Countries(*)
(thousand barrels/day)
(*) Data source: Eni’s elaborations on IEA (2021) Monthly Oil Data Services data. All rights reserved.
World Energy Review 2021 49

Oil - Production Quality Russia and Central Asia
Crude Production by Quality(*) (thousand barrels/day)
Quality and Production Volume of Main Crudes 2020(**)
(thousand barrels/day)
(*) Data source: Eni’s elaborations on IEA (2021) Monthly Oil Data Services data. All rights reserved. (**) Data source: Eni.
World Energy Review 202150

Oil - Production Quality Russia and Central Asia
Crude Production by Quality(*)
(thousand barrels/day)
Crude Production by Quality(*) (selected years, thousand barrels/day)
(*) Data source: Eni’s elaborations on IEA (2021) Monthly Oil Data Services data. All rights reserved.
World Energy Review 2021 51

Oil - Production Quality Russia and Central Asia
Countries(*)
(thousand barrels/day)
(*) Data source: Eni’s elaborations on IEA (2021) Monthly Oil Data Services data. All rights reserved.
World Energy Review 202152

Oil - Production Quality Middle East
Crude Production by Quality(*) (thousand barrels/day)
Quality and Production Volume of Main Crudes 2020(**)
(thousand barrels/day)
(*) Data source: Eni’s elaborations on IEA (2021) Monthly Oil Data Services data. All rights reserved. (**) Data source: Eni.
World Energy Review 2021 53
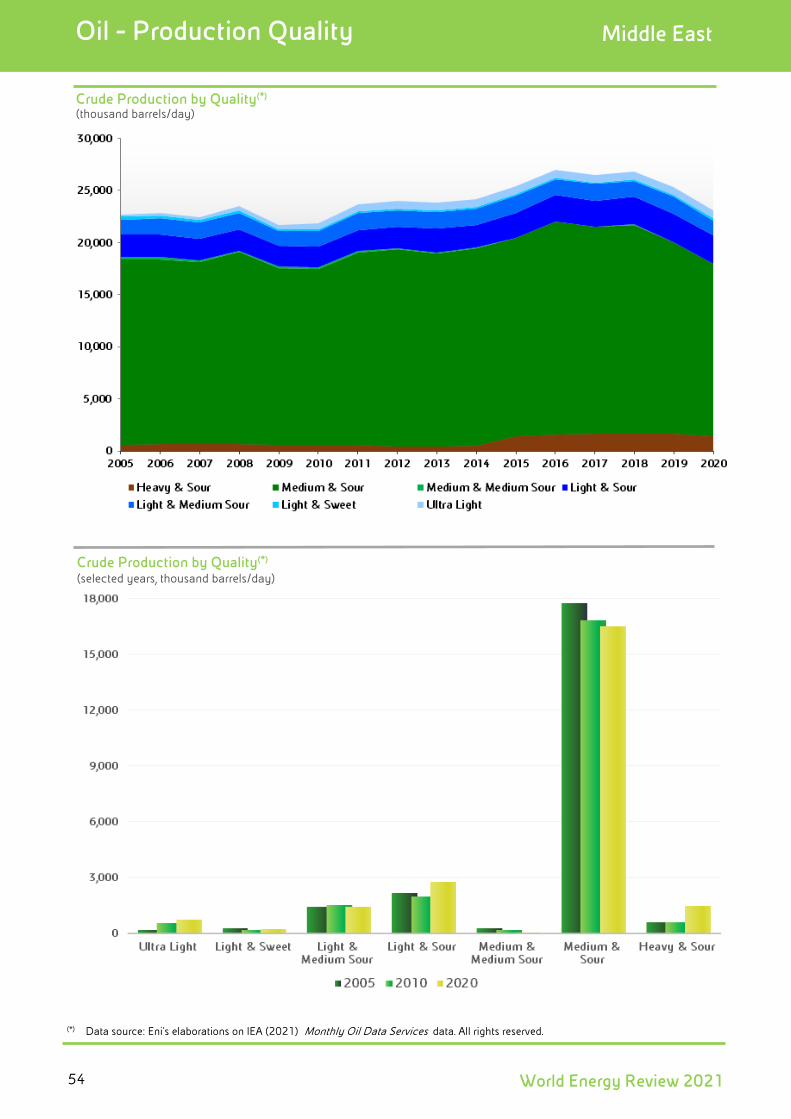
Oil - Production Quality Middle East
Crude Production by Quality(*)
(thousand barrels/day)
Crude Production by Quality(*) (selected years, thousand barrels/day)
(*) Data source: Eni’s elaborations on IEA (2021) Monthly Oil Data Services data. All rights reserved.
World Energy Review 202154

Oil - Production Quality Middle East
Countries(*)
(thousand barrels/day)
(*) Data source: Eni’s elaborations on IEA (2021) Monthly Oil Data Services data. All rights reserved.
World Energy Review 2021 55

Oil - Production Quality Africa
Crude Production by Quality(*) (thousand barrels/day)
Quality and Production Volume of Main Crudes 2020(**)
(thousand barrels/day)
(*) Data source: Eni’s elaborations on IEA (2021) Monthly Oil Data Services data. All rights reserved. (**) Data source: Eni.
World Energy Review 202156
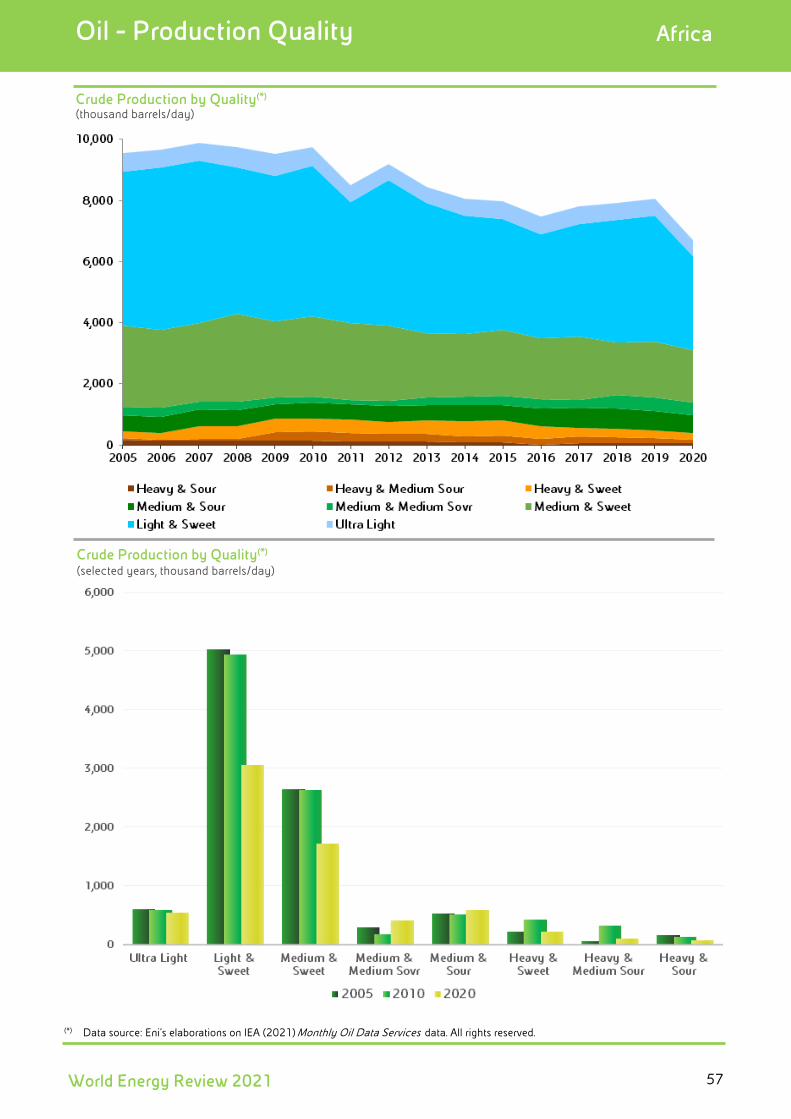
Oil - Production Quality Africa
Crude Production by Quality(*)
(thousand barrels/day)
Crude Production by Quality(*) (selected years, thousand barrels/day)
(*) Data source: Eni’s elaborations on IEA (2021) Monthly Oil Data Services data. All rights reserved.
World Energy Review 2021 57

Oil - Production Quality Africa
Countries(*) (thousand barrels/day)
(*) Data source: Eni’s elaborations on IEA (2021) Monthly Oil Data Services data. All rights reserved.
World Energy Review 202158

Oil - Production Quality Africa
Countries(*) (thousand barrels/day)
(*) Data source: Eni’s elaborations on IEA (2021) Monthly Oil Data Services data. All rights reserved.
World Energy Review 2021 59
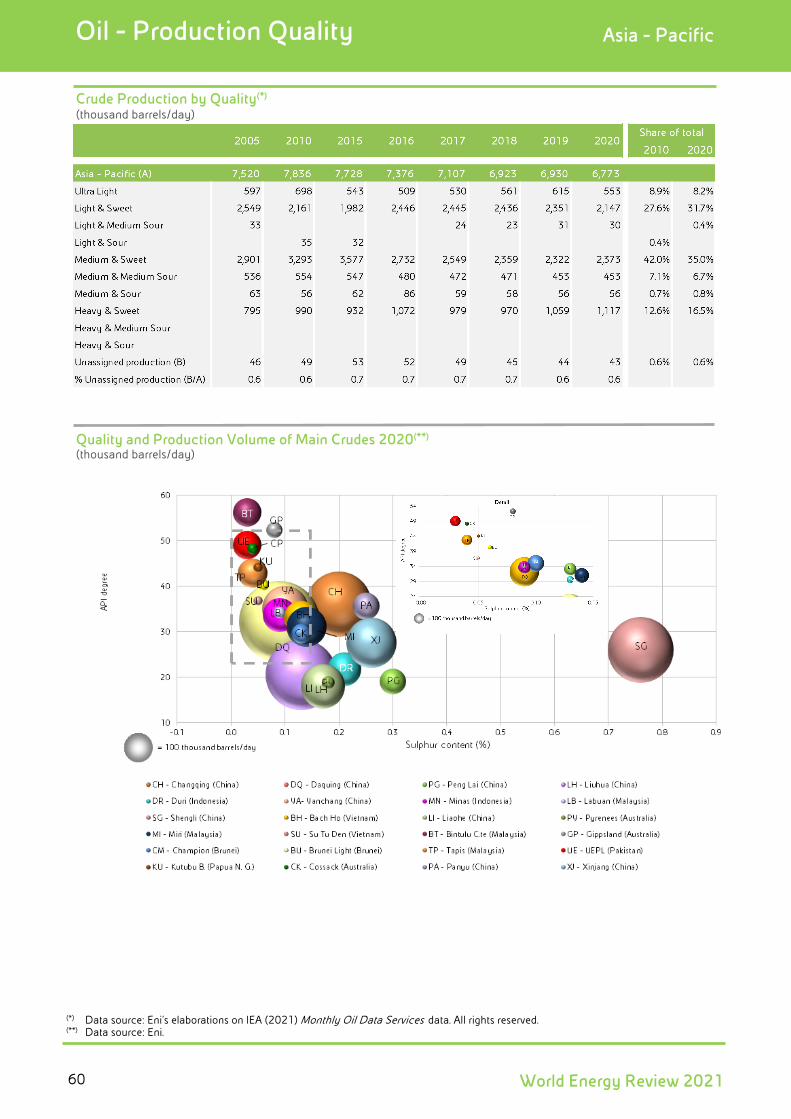
Oil - Production Quality Asia - Pacific
Crude Production by Quality(*) (thousand barrels/day)
Quality and Production Volume of Main Crudes 2020(**)
(thousand barrels/day)
(*) Data source: Eni’s elaborations on IEA (2021) Monthly Oil Data Services data. All rights reserved. (**) Data source: Eni.
World Energy Review 202160

Oil - Production Quality Asia - Pacific
Crude Production by Quality(*)
(thousand barrels/day)
Crude Production by Quality(*) (selected years, thousand barrels/day)
(*) Data source: Eni’s elaborations on IEA (2021) Monthly Oil Data Services data. All rights reserved.
World Energy Review 2021 61

Oil - Production Quality Asia - Pacific
Countries(*) (thousand barrels/day)
(*) Data source: Eni’s elaborations on IEA (2021) Monthly Oil Data Services data. All rights reserved.
World Energy Review 202162

Oil - Production Quality Asia - Pacific
Countries(*) (thousand barrels/day)
(*) Data source: Eni’s elaborations on IEA (2021) Monthly Oil Data Services data. All rights reserved.
World Energy Review 2021 63

Oil - Production Quality Americas
Crude Production by Quality(*) (thousand barrels/day)
Quality and Production Volume of Main Crudes 2020(**)
(thousand barrels/day)
(*) Data source: Eni’s elaborations on IEA (2021) Monthly Oil Data Services data. All rights reserved. (**) Data source: Eni.
World Energy Review 202164

Oil - Production Quality Americas
Crude Production by Quality(*)
(thousand barrels/day)
Crude Production by Quality(*) (selected years, thousand barrels/day)
(*) Data source: Eni’s elaborations on IEA (2021) Monthly Oil Data Services data. All rights reserved.
World Energy Review 2021 65

Oil - Production Quality Americas
Countries(*) (thousand barrels/day)
(*) Data source: Eni’s elaborations on IEA (2021) Monthly Oil Data Services data. All rights reserved.
World Energy Review 202166

Oil - Production Quality Americas
Countries(*) (thousand barrels/day)
(*) Data source: Eni’s elaborations on IEA (2021) Monthly Oil Data Services data. All rights reserved.
World Energy Review 2021 67


World Energy Review 2021
Refining Capacity
Oil – Refining Industry

Oil - Refining Industy Refining Capacity
Areas and Aggregates(*)
World Primary Capacity (2020) 5,182 million tons
World Primary Capacity Growth (2005-2020) 817 million tons
(*) Data source: Eni’s calculations on ICIS Consulting data. (**) Belarus and Ukraine aren’t included in Europe but in Russia and Central Asia.
World Energy Review 202170
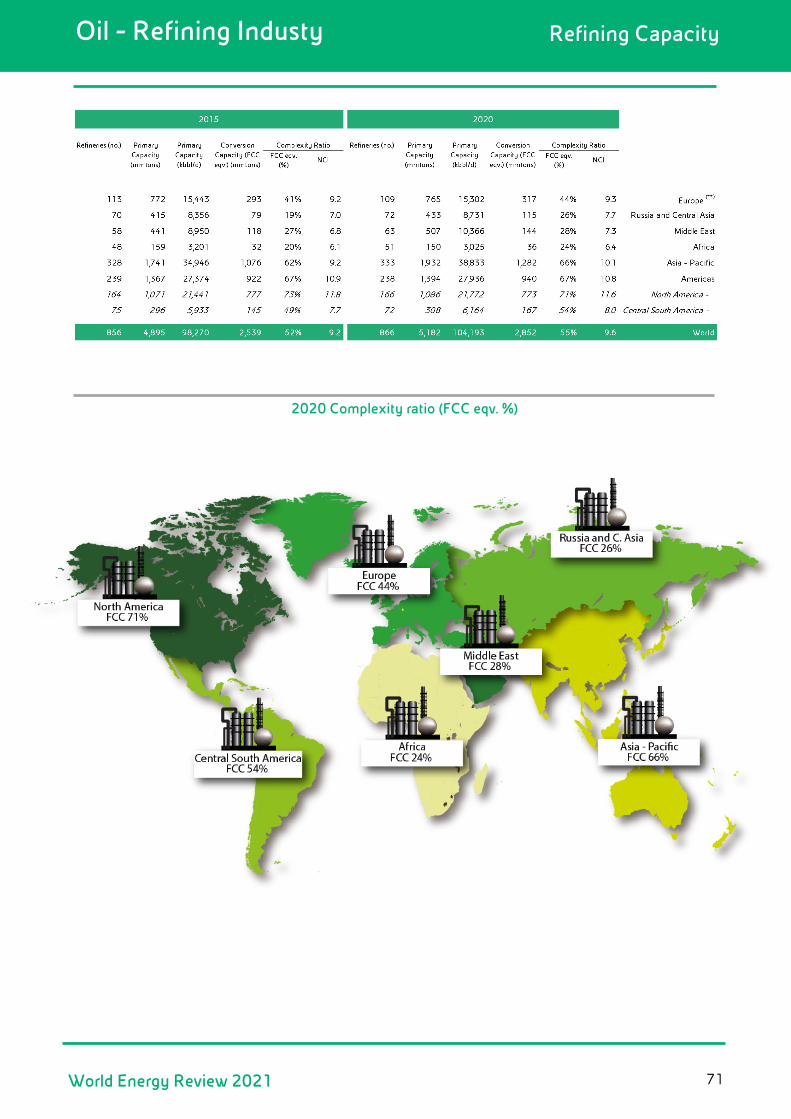
Oil - Refining Industy Refining Capacity
2020 Complexity ratio (FCC eqv. %)
World Energy Review 2021 71


Natural Gas - Supply and Demand
Reserves
Production
Reserves/Production Ratio
Consumption
Per Capita Consumption
Production/Consumption Ratio
World Energy Review 2021

Natural Gas - Supply and Demand Reserves
Areas and Aggregates(*)
(billion cubic metres as at 31st December)
World Natural Gas Reserves (2020) 213,253 billion cubic metres as at 31st December
World Natural Gas Reserves Growth (2005-2020) 40,511 billion cubic metres as at 31st December
(*) Data source: Eni’s estimates on Enerdata Global Energy Market & CO2 Data and other official data sources.
76 World Energy Review 2021

Natural Gas - Supply and Demand Reserves
The World Top 10 Reserves Holders(*)
(billion cubic metres as at 31st December)
The World Top 10 (2020)
(*) Data source: Eni’s estimates on Enerdata Global Energy Market & CO2 Data and other official data sources.
77World Energy Review 2021

Natural Gas - Supply and Demand Reserves
Countries(*)
(billion cubic metres as at 31st December)
( *) Data source: Eni’s estimates on Enerdata Global Energy Market & CO2 Data and other official data sources.
(**) Data source: Italian Ministry for Ecological Transition.
78 World Energy Review 2021

Natural Gas - Supply and Demand Reserves
Countries(*)
(billion cubic metres as at 31st December)
(*) Data source: Eni’s estimates on Enerdata Global Energy Market & CO2 Data and other official data sources.
79World Energy Review 2021

Natural Gas - Supply and Demand Reserves
Countries(*)
(billion cubic metres as at 31st December)
(*) Data source: Eni’s estimates on Enerdata Global Energy Market & CO2 Data and other official data sources.
80 World Energy Review 2021

Natural Gas - Supply and Demand Production
Areas and Aggregates(*)
(billion cubic metres)
World Natural Gas Production (2020) 3,878.04 billion cubic metres
World Natural Gas Production Growth (2005-2020) 1,124.67 billion cubic metres
(*) Data source: Eni’s calculations. The original data are from IEA (2021) Extended Balances. and, for Italy, from Italian Ministry for Ecological Transition. All rights reserved. Data have been converted by Eni using a unified gross calorific value of 40 MJ/cm.
81World Energy Review 2021

Natural Gas - Supply and Demand Production
The World Top 10 Producers(*)
(billion cubic metres)
The World Top 10 (2020)
(*) Data source: the original data are from IEA (2021) Extended Balances. All rights reserved. Data have been converted by Eni using a unitedgross calorific value of 40 MJ/cm.
82 World Energy Review 2021

Natural Gas - Supply and Demand Production
Countries(*) (billion cubic metres)
(*) Data source: the original data are from IEA (2021) Extended Balances and, for Italy, from Italian Ministry for Ecological Transition. All rights reserved. Data have been converted by Eni using a unified gross calorific value of 40 MJ/cm.
83World Energy Review 2021
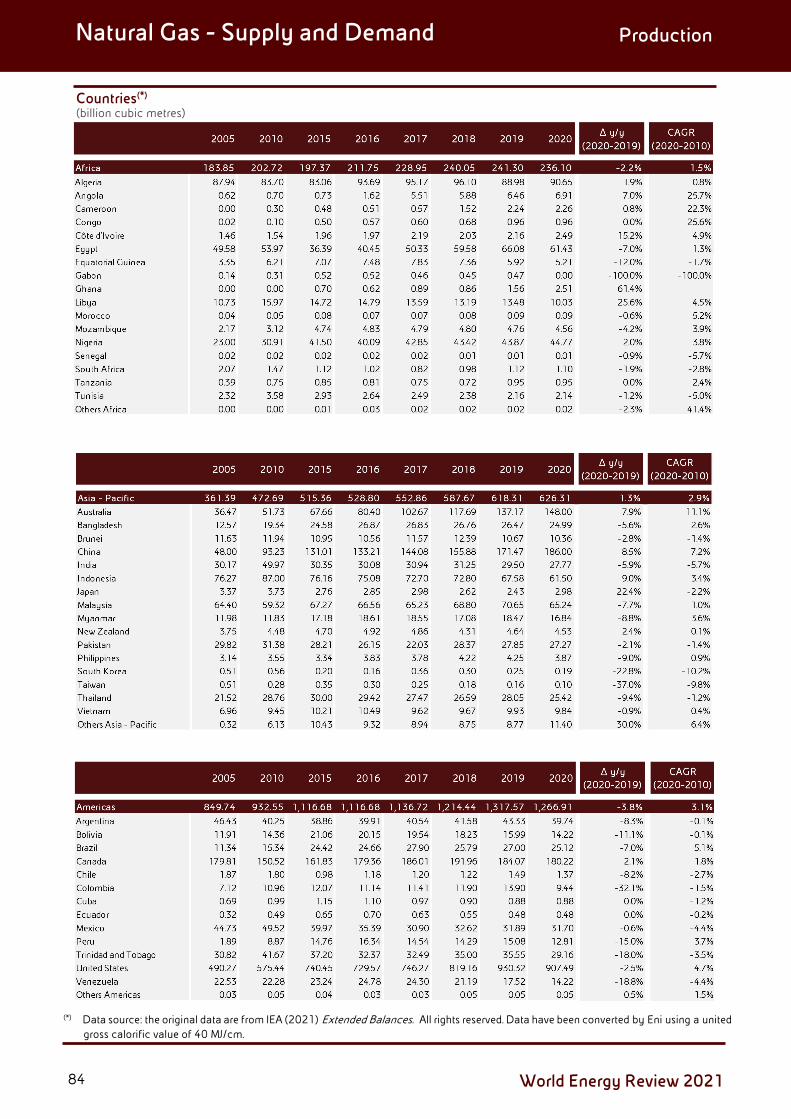
Natural Gas - Supply and Demand Production
Countries(*) (billion cubic metres)
(*) Data source: the original data are from IEA (2021) Extended Balances. All rights reserved. Data have been converted by Eni using a unitedgross calorific value of 40 MJ/cm.
84 World Energy Review 2021

Natural Gas - Supply and Demand Reserves/Production Ratio
Areas and Aggregates(*)
(years)
Reserves/Production Ratio (2020) World : 55 years
(*) Data source: Eni’s calculations on Enerdata Global Energy & CO2 Data, IEA (2021) Extended Balances and other official data sources. All rights reserved.
85World Energy Review 2021

Natural Gas - Supply and Demand Reserves/Production Ratio
The World Top 10 Producers Ranked by Reserves/Production Ratio(*)
(years)
The World Top 10 (2020)
(*) Data source: Eni’s calculations on Enerdata Global Energy & CO2 Data, IEA Extended Balances and other official data sources. All rights reserved.
86 World Energy Review 2021

Natural Gas - Supply and Demand Reserves/Production Ratio
Countries(*)
(years)
(*) Data source: Eni’s calculations on Enerdata Global Energy & CO2 Data, IEA (2021) Extended Balances and other official data sources. All rights reserved.
87World Energy Review 2021

Natural Gas - Supply and Demand Reserves/Production Ratio
Countries(*)
(years)
All rights reserved.
(*) Data source: Eni’s calculations on Enerdata Global Energy & CO2 Data, IEA (2021) Extended Balances and other official data sources.
88 World Energy Review 2021
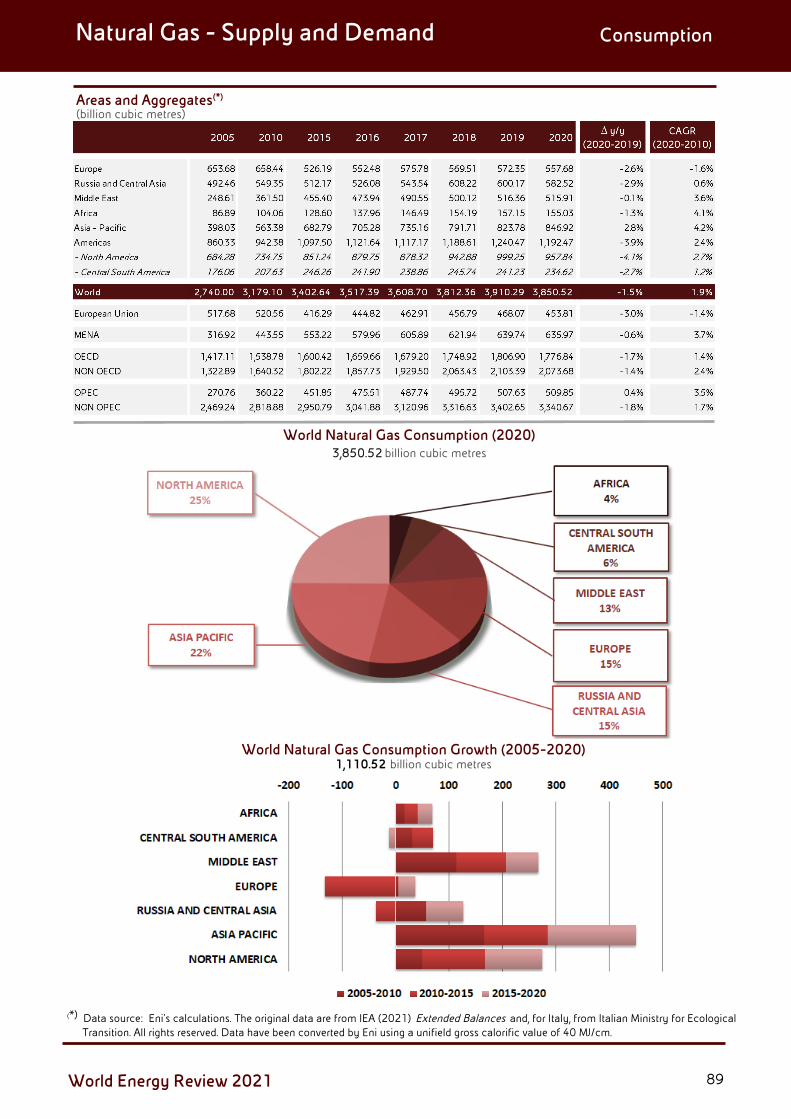
Natural Gas - Supply and Demand Consumption
Areas and Aggregates(*)
(billion cubic metres)
World Natural Gas Consumption (2020) 3,850.52 billion cubic metres
World Natural Gas Consumption Growth (2005-2020) 1,110.52 billion cubic metres
(*) Data source: Eni's calculations. The original data are from IEA (2021) Extended Balances and, for Italy, from Italian Ministry for Ecological Transition. All rights reserved. Data have been converted by Eni using a unifield gross calorific value of 40 MJ/cm.
89World Energy Review 2021
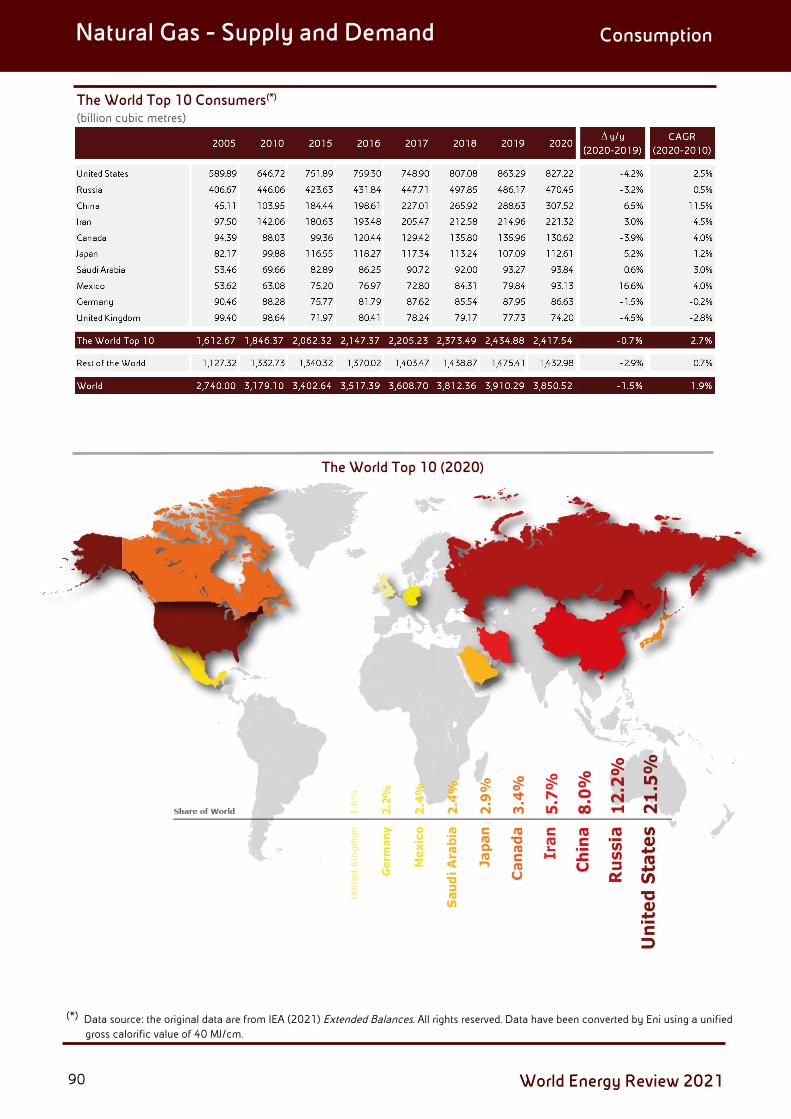
Natural Gas - Supply and Demand Consumption
The World Top 10 Consumers(*)
(billion cubic metres)
The World Top 10 (2020)
(*) Data source: the original data are from IEA (2021) Extended Balances. All rights reserved. Data have been converted by Eni using a unified gross calorific value of 40 MJ/cm.
90 World Energy Review 2021
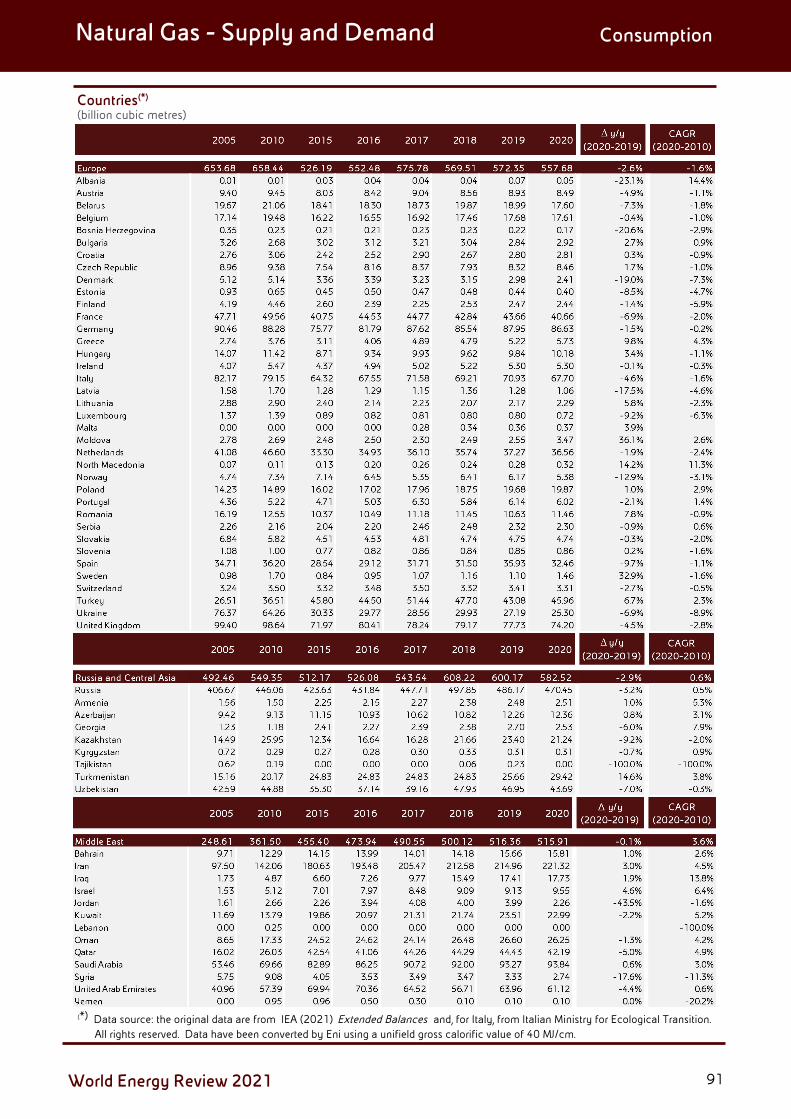
Natural Gas - Supply and Demand Consumption
Countries(*) (billion cubic metres)
(*) Data source: the original data are from IEA (2021) Extended Balances and, for Italy, from Italian Ministry for Ecological Transition. All rights reserved. Data have been converted by Eni using a unifield gross calorific value of 40 MJ/cm.
91World Energy Review 2021

Natural Gas - Supply and Demand Consumption
Countries(*) (billion cubic metres)
(*) Data source: the original data are from IEA (2021) Extended Balances. All rights reserved. Data have been converted by Eni using a unified gross calorific value of 40 MJ/cm.
92 World Energy Review 2021

Natural Gas - Supply and Demand Per Capita Consumption
Areas and Aggregates(*)
(cubic metres)
Per Capita Consumption (2020)
(*) Data source: Eni calculations on IEA (2021) Extended Balance, Italian Ministry for Ecological Transition and IHS Global Insight data. All rights reserved.
93World Energy Review 2021
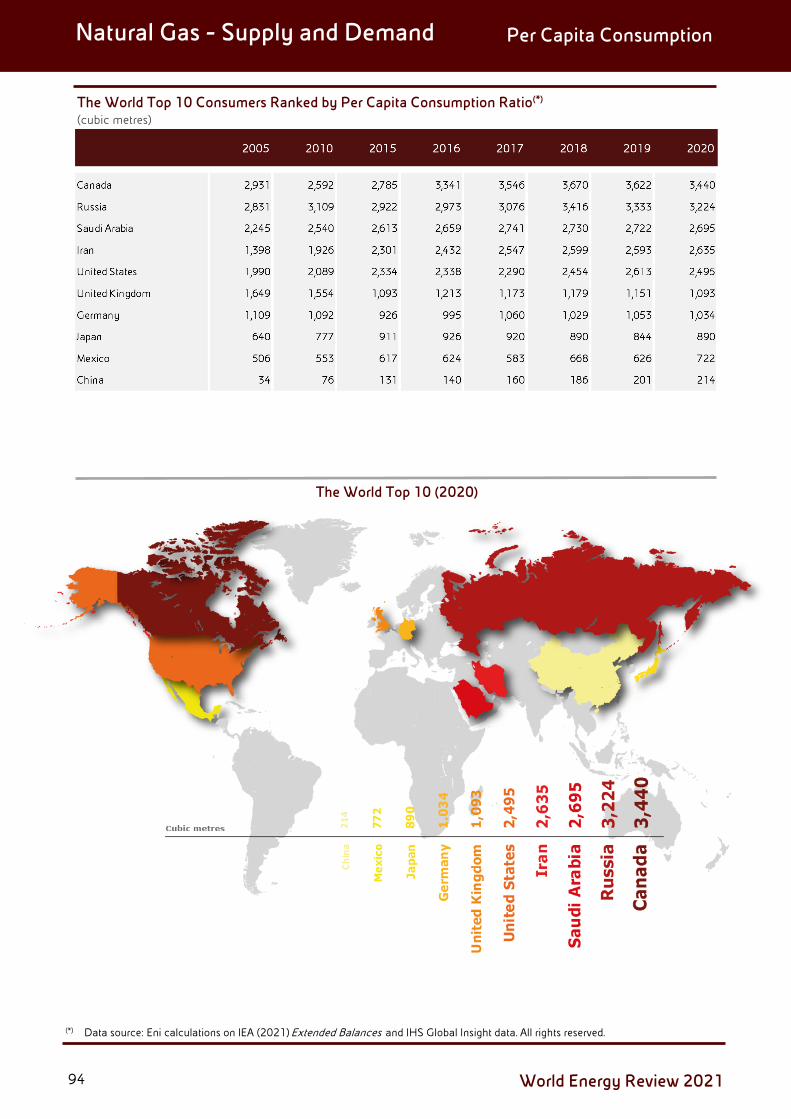
Natural Gas - Supply and Demand Per Capita Consumption
The World Top 10 Consumers Ranked by Per Capita Consumption Ratio(*)
(cubic metres)
The World Top 10 (2020)
(*) Data source: Eni calculations on IEA (2021) Extended Balances and IHS Global Insight data. All rights reserved.
94 World Energy Review 2021

Natural Gas - Supply and Demand Per Capita Consumption
Countries(*)
(cubic metres)
(*) Data source: Eni calculations on IEA (2021) Extended Balances, Italian Ministry for Ecological Transition and IHS Global Insight data. All rights reserved.
95World Energy Review 2021

Natural Gas - Supply and Demand Per Capita Consumption
Countries(*)
(cubic metres)
(*) Data source: Eni calculations on IEA (2021) Extended Balances and IHS Global Insight data. All rights reserved.
96 World Energy Review 2021

Natural Gas - Supply and Demand Per Capita Consumption
Countries(*)
(cubic metres)
(*) Data source: Eni calculations on IEA (2021) Extended Balances and IHS Global Insight data. All rights reserved.
97World Energy Review 2021

Natural Gas - Supply and Demand Production/Consumption Ratio
Areas and Aggregates(*)
Production/Consumption Ratio (2020)
(*) Data source: Eni calculations on IEA (2021) Extended Balances and, for Italy, on Ministry for Ecological Transition data. All rights reserved.
98 World Energy Review 2021

Natural Gas - Supply and Demand Production/Consumption Ratio
The World Top 10 (2020)
The World Top 10 Producers Ranked by Production/Consumption Ratio (*)
(*) Data source: Eni calculations on IEA (2021) Extended Balances data. All rights reserved.
99World Energy Review 2021

Natural Gas - Supply and Demand Production/Consumption Ratio
Countries(*)
(*) Data source: Eni calculations on IEA (2021) Extended Balances and, for Italy, on Ministry for Ecological Transition data. All rights reserved.
100 World Energy Review 2021

Natural Gas - Supply and Demand Production/Consumption Ratio
Countries(*)
(*) Data source: Eni calculations on IEA (2021) Extended Balances data. All rights reserved.
101World Energy Review 2021

Natural Gas - Supply and Demand Production/Consumption Ratio
Countries(*)
(*) Data source: Eni calculations on IEA (2021) Extended Balances data. All rights reserved.
102 World Energy Review 2021


Natural Gas – Trade and Prices
Exports
Imports
Traded Gas
LNG – Liquefaction and Regasification Capacity
Natural Gas Balance – Italy
Natural Gas Prices
World Energy Review 2021

Natural Gas - Trade and Prices Exports
The World Top 10 Exporters(*)
(billion cubic metres)
The World Top 10 (2020)
(*) Data source: the original data are from IEA (2021) Extended Balances. All rights reserved. Data have been converted by Eni using a unified gross calorific value of 40 MJ/cm.
106 World Energy Review 2021

Natural Gas - Trade and Prices Exports
Countries(*)
(billion cubic metres)
(*) Data source: the original data are from IEA (2021) Extended Balances and, for Italy, from Italian Ministry for Ecological Transition. All rights reserved. Data have been converted by Eni using a unified gross calorific value of 40 MJ/cm.
107World Energy Review 2021

Natural Gas - Trade and Prices Exports
Countries(*)
(billion cubic metres)
(*) Data source: the original data are from IEA (2021) Extended Balances. All rights reserved. Data have been converted by Eni using a unified gross calorific value of 40 MJ/cm.
108 World Energy Review 2021

Natural Gas - Trade and Prices Imports
The World Top 10 (2020)
The World Top 10 Importers(*)
(billion cubic metres)
(*) Data source: the original data are from IEA (2021 ) Extended Balances and, for Italy, from Italian Ministry for Ecological Transition. All rights reserved. Data have been converted by Eni using a unified gross calorific value of 40 MJ/cm.
109World Energy Review 2021

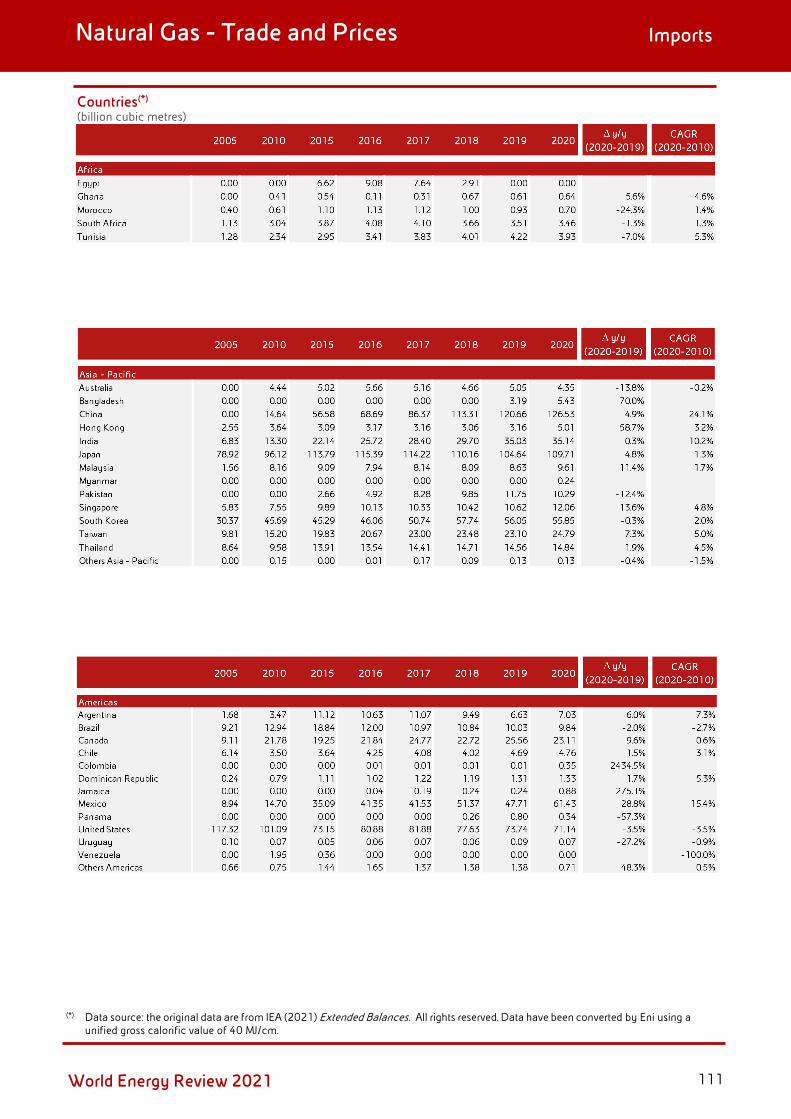
Natural Gas - Trade and Prices Imports
Countries(*)
(billion cubic metres)
(*) Data source: the original data are from IEA (2021 ) Extended Balances and, for Italy, from Italian Ministry for Ecological Transition. All rights reserved. Data have been converted by Eni using a unified gross calorific value of 40 MJ/cm.
110 World Energy Review 2021
Natural Gas - Trade and Prices Imports
Countries(*)
(billion cubic metres)
(*) Data source: the original data are from IEA (2021) Extended Balances. All rights reserved. Data have been converted by Eni using aunified gross calorific value of 40 MJ/cm.
111World Energy Review 2021

Natural Gas - Trade and Prices Imports
Imports by Country of Origin - Pipeline and LNG 2020(*)
(billion cubic metres)
(*) Data source: IEA (2021) Natural Gas Information. All rights reserved.
112 World Energy Review 2021

Natural Gas - Trade and Prices Imports
113World Energy Review 2021

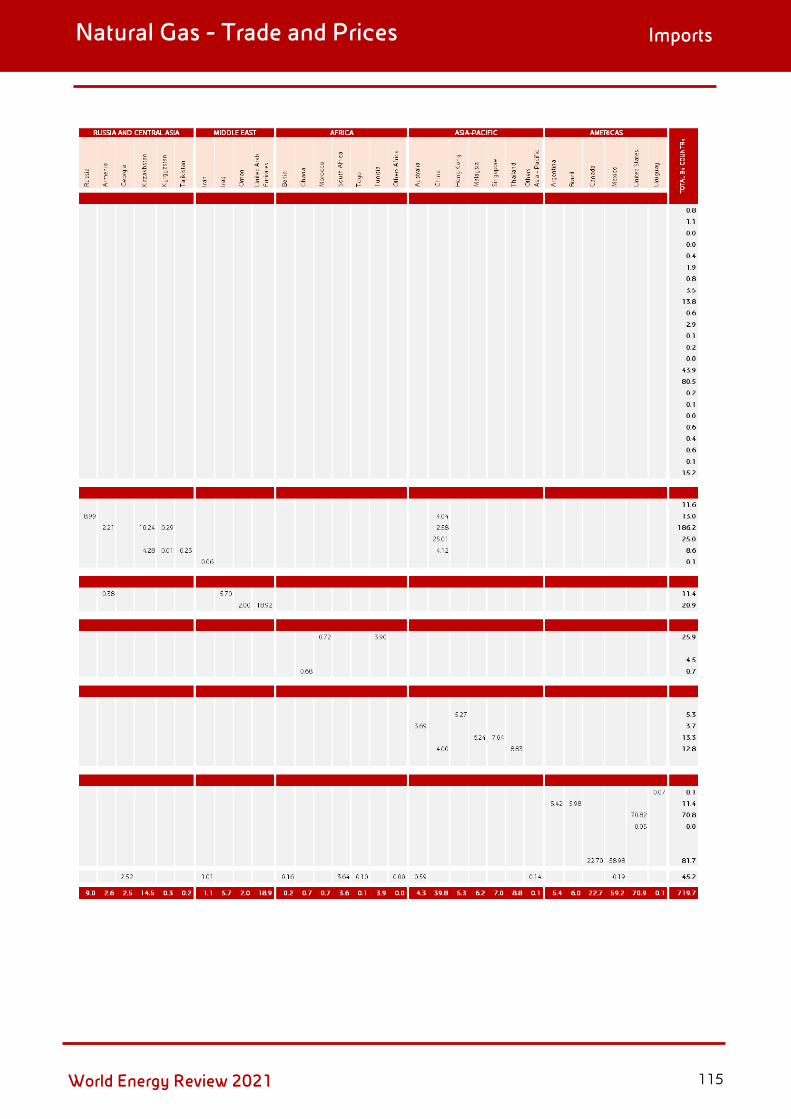
Natural Gas - Trade and Prices Imports
Imports by Country of Origin - Pipeline 2020(*)
(billion cubic metres)
(*) Data source: IEA (2021) Natural Gas Information. All rights reserved.
114 World Energy Review 2021
Natural Gas - Trade and Prices Imports
115World Energy Review 2021

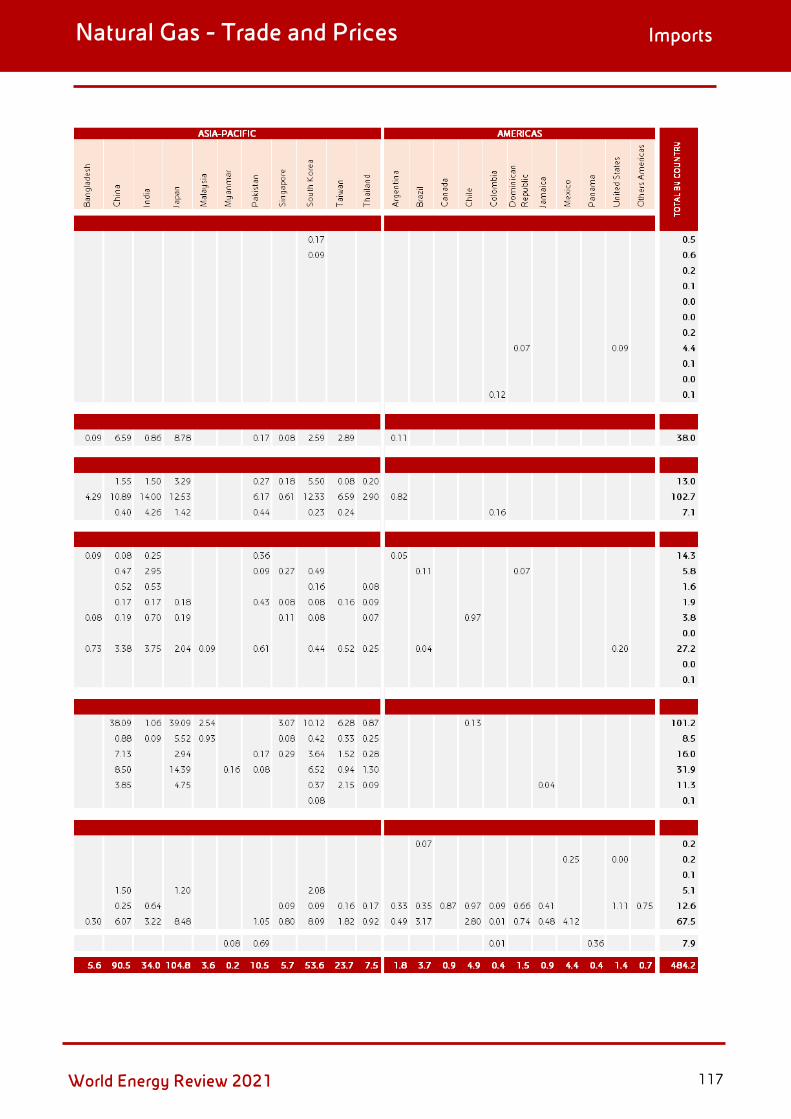
Natural Gas - Trade and Prices Imports
Imports by Country of Origin - LNG 2020(*)
(billion cubic metres)
(*) Data source: IEA (2021) Natural Gas Information. All rights reserved.
116 World Energy Review 2021
Natural Gas - Trade and Prices Imports
117World Energy Review 2021

Natural Gas - Trade and Prices Traded Gas
Total Traded Gas on Production (percentage)
118 World Energy Review 2021

Natural Gas - Trade and Prices LNG - Liquefaction and Regasification Capacity
Liquefaction Capacity - Countries(*)
(billion cubic metres)
(*) Nominal Capacity. Data source: Wood Mackenzie LNG Tool.
119World Energy Review 2021

Natural Gas - Trade and Prices LNG - Liquefaction and Regasification Capacity
Regasification Capacity - Countries(*)
(billion cubic metres)
(*) Data source: Wood Mackenzie LNG Tool. (**) The United States includes Puerto Rico.
120 World Energy Review 2021
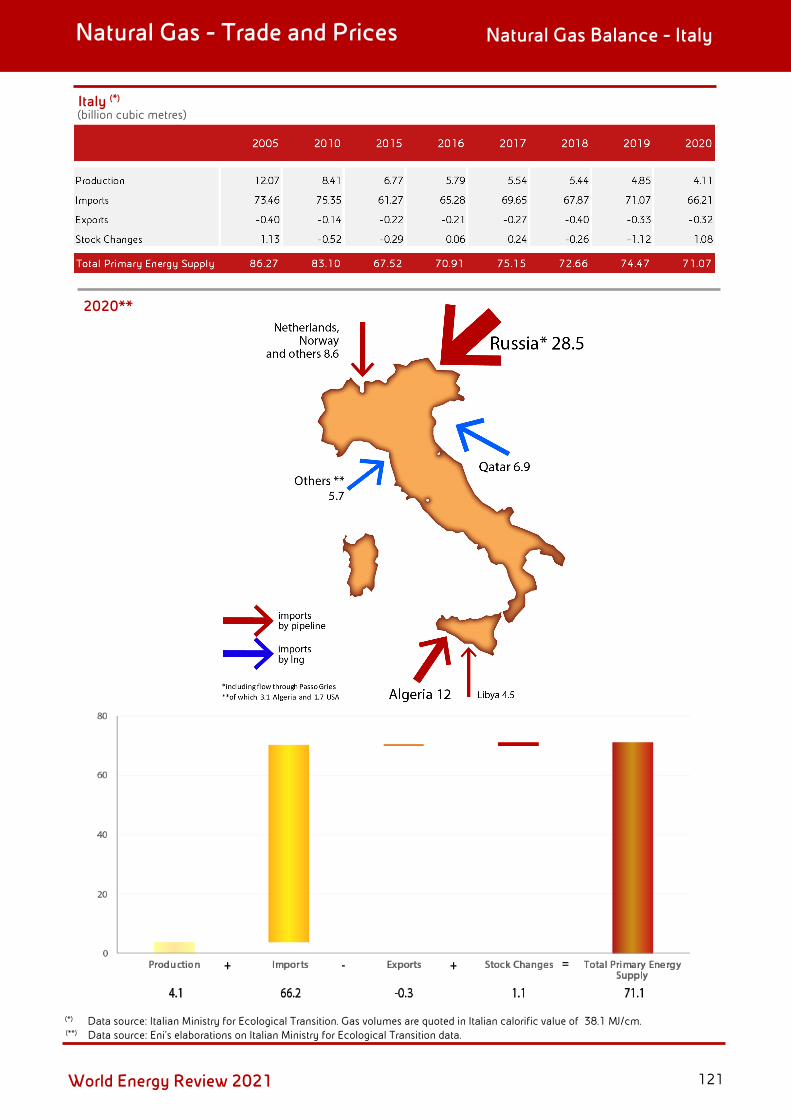
Natural Gas - Trade and Prices Natural Gas Balance - Italy
2020**
Italy (*)
(billion cubic metres)
(*) Data source: Italian Ministry for Ecological Transition. Gas volumes are quoted in Italian calorific value of 38.1 MJ/cm. (**) Data source: Eni's elaborations on Italian Ministry for Ecological Transition data.
121World Energy Review 2021

Natural Gas - Trade and Prices Natural Gas Prices
Natural Gas Prices(*)
($/Mbtu)
TTF(*)
($/Mbtu)Henry Hub(*)
($/Mbtu)
Japan(*)
($/Mbtu)
(*) Data source: ICE London, Wood Mackenzie and EIA DOE.
122 World Energy Review 2021


World Energy Review 2021
Renewables
Solar Photovoltaic
Concentrated Solar Power
Wind
Biofuels
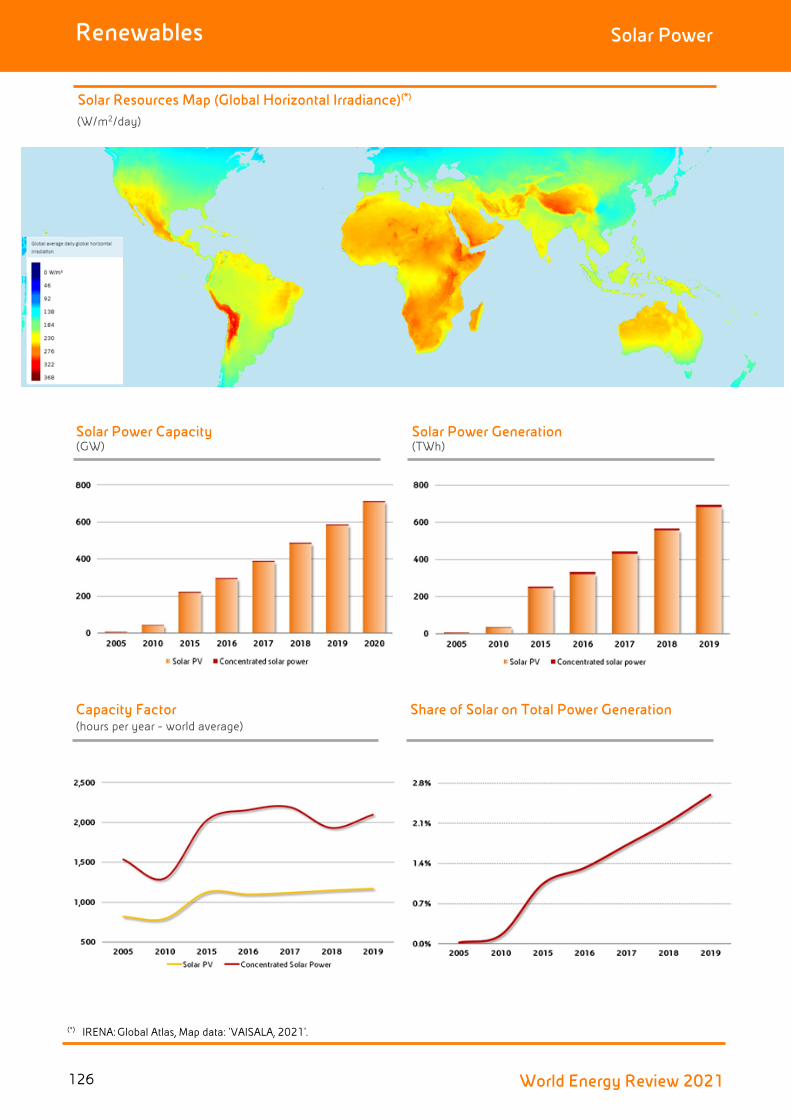
Renewables Solar Power
Solar Resources Map (Global Horizontal Irradiance)(*)
(W/m2/day)
Solar Power Capacity (GW)
Solar Power Generation (TWh)
Capacity Factor(hours per year - world average)
Share of Solar on Total Power Generation
(*) IRENA: Global Atlas, Map data: ‘VAISALA, 2021'.
126 World Energy Review 2021

Renewables Solar Photovoltaic Power Capacity
Areas and Aggregates(*) (MW)
World Solar Photovoltaic Power Capacity (2020) 707,495 MW
World Solar Photovoltaic Power Capacity Growth (2005-2020) 702,948 MW
(*) Data source: Eni's calculations on IRENA (2021), Renewable Energy Statistics 2021 The International Renewable Energy Agency Abu Dhabi, data.
Solar Photovoltaic Power Capacity
127World Energy Review 2021

Renewables Solar Photovoltaic Power Capacity
The World Top 10(*)
(MW)
The World Top 10 (2020)
(*) Data source: IRENA (2021), Renewable Energy Statistics 2021 The International Renewable Energy Agency, Abu Dhabi.
128 World Energy Review 2021

Renewables Solar Photovoltaic Power Capacity
Countries(*)
(MW)
(*) Data source: IRENA (2021), Renewable Energy Statistics 2021 The International Renewable Energy Agency, Abu Dhabi.
129World Energy Review 2021
Renewables Solar Photovoltaic Power Capacity
Countries(*)
(MW)
(*) Data source: IRENA (2021), Renewable Energy Statistics 2021 The International Renewable Energy Agency, Abu Dhabi.
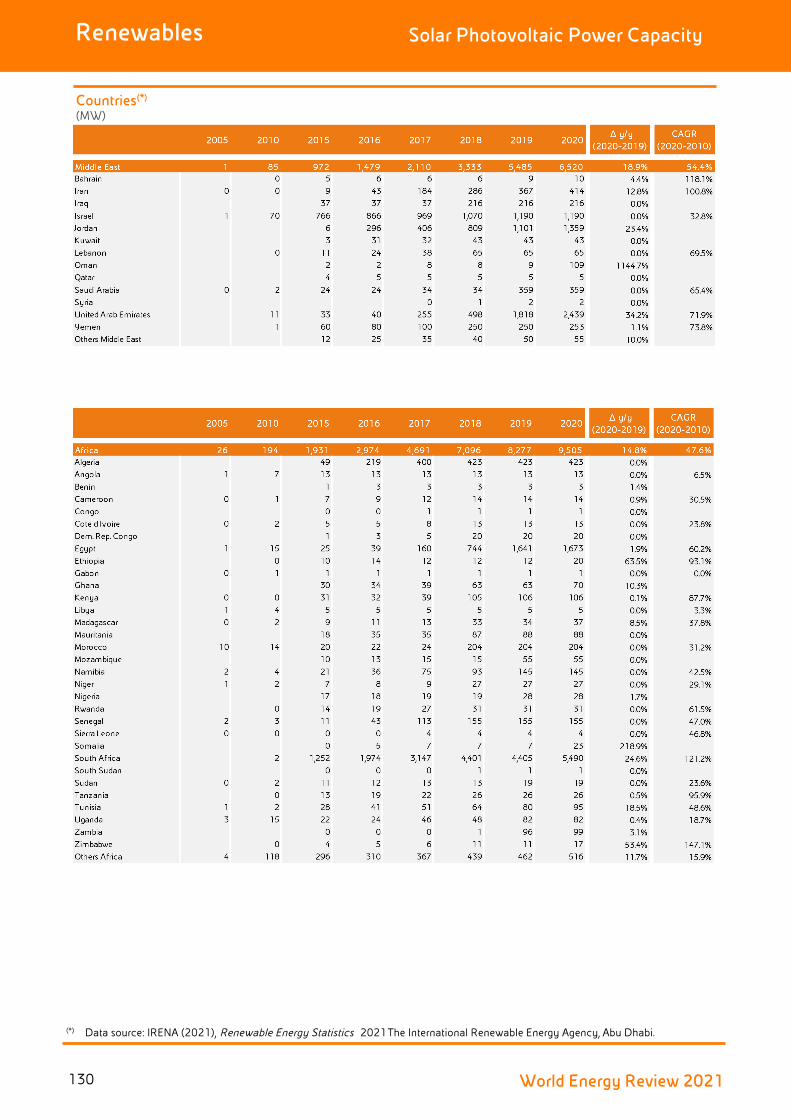
130 World Energy Review 2021

Renewables Solar Photovoltaic Power Capacity
Countries(*)
(MW)
(*) Data source: IRENA (2021), Renewable Energy Statistics 2021 The International Renewable Energy Agency, Abu Dhabi.
131World Energy Review 2021

Renewables Solar Photovoltaic Power Generation
Areas and Aggregates(*) (GWh)
World Solar Photovoltaic Power Generation (2019) 681,076 GWh
World Solar Photovoltaic Power Generation Growth (2005-2019) 677,341 GWh
(*) Data source: Eni's calculations on IEA (2021) Extended Balances data. All rights reserved. (**) When 2020 data is missing, the figure refers to the latest available years.
132 World Energy Review 2021

Renewables Solar Photovoltaic Power Generation
The World Top 10(*) (GWh)
The World Top 10 (2020)
(*) Data source: IEA (2021) E xtended Balances. All rights reserved. (**) When 2020 data is missing, the figure refers to the latest available years.
133World Energy Review 2021
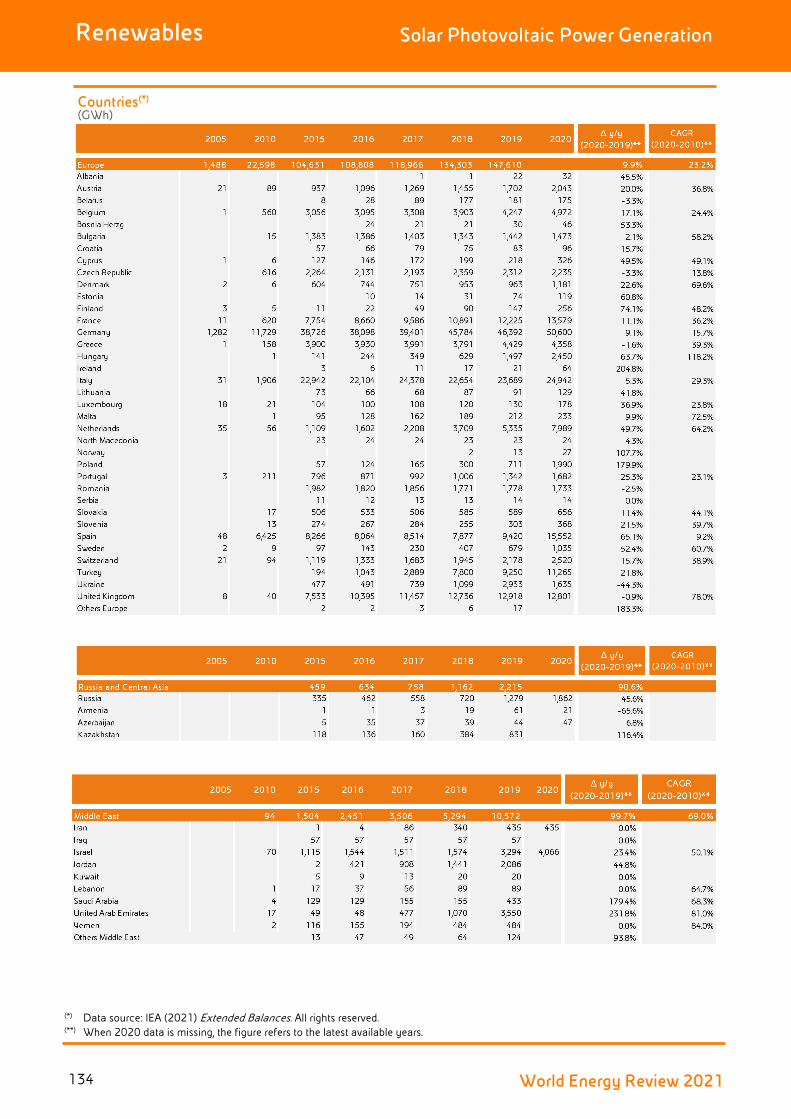
Renewables Solar Photovoltaic Power Generation
Countries(*) (GWh)
(*) Data source: IEA (2021) E xtended Balances. All rights reserved. (**) When 2020 data is missing, the figure refers to the latest available years.
134 World Energy Review 2021

Renewables Solar Photovoltaic Power Generation
Countries(*) (GWh)
(*) Data source: IEA (2021) E xtended Balances. All rights reserved.
(**) When 2020 data is missing, the figure refers to the latest available years.
135World Energy Review 2021
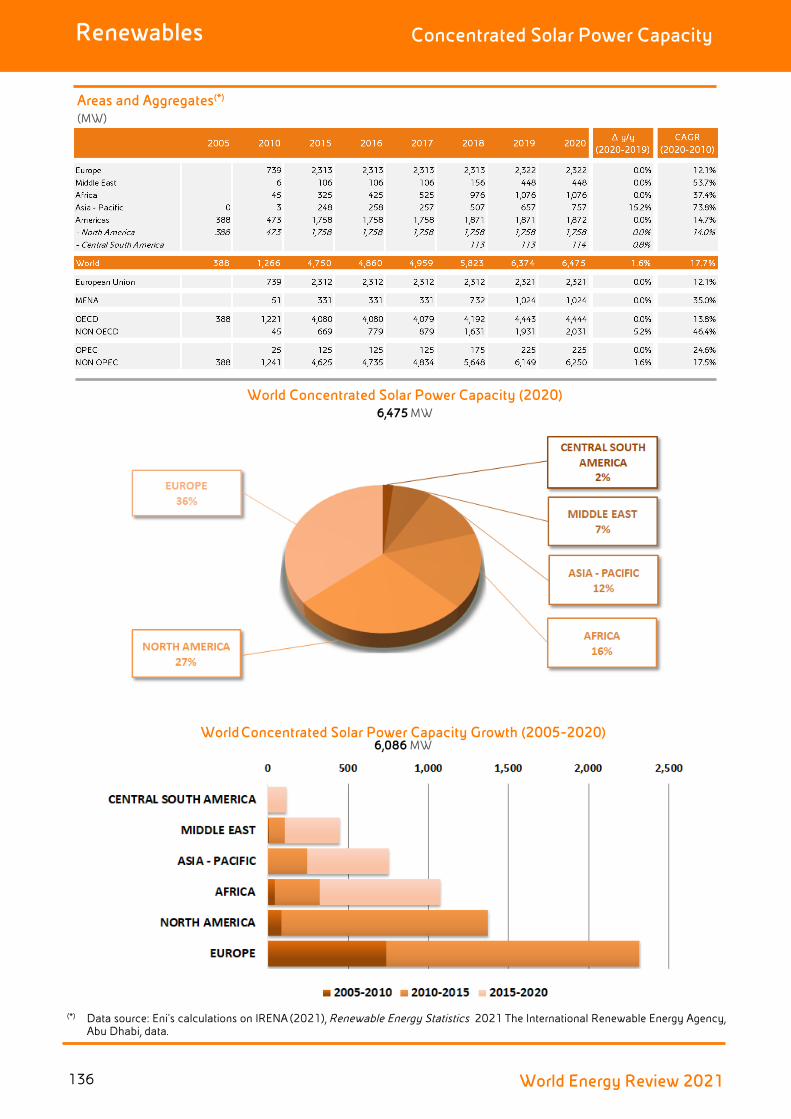
Renewables Concentrated Solar Power Capacity
Areas and Aggregates(*) (MW)
World Concentrated Solar Power Capacity (2020) 6,475 MW
World Concentrated Solar Power Capacity Growth (2005-2020) 6,086 MW
(*) Data source: Eni's calculations on IRENA (2021), Renewable Energy Statistics 2021 The International Renewable Energy Agency, Abu Dhabi, data.
136 World Energy Review 2021

Renewables Concentrated Solar Power Capacity
The World Top 10(*) (MW)
The World Top 10 (2020)
(*) Data source: IRENA (2021), Renewable Energy Statistics 2021 The International Renewable Energy Agency, Abu Dhabi.
137World Energy Review 2021

Renewables Concentrated Solar Power Capacity
Countries(*)
(MW)
(*) Data source: IRENA (2021), R e newable Energy Statistics 2021 The International Renewable Energy Agency, Abu Dhabi.
138 World Energy Review 2021

Renewables Concentrated Solar Power Generation
Areas and Aggregates(*)
(GWh)
World Concentrated Solar Power Generation (2019) 13,368 GWh
World Concentrated Solar Power Generation Growth (2005-2020) 12,771 GWh
(*) Data source: Eni's calculations on IEA (2021) Extended Balances data. All rights reserved. (**) When 2020 data is missing, the figure refers to the latest available years.
139World Energy Review 2021

Renewables Concentrated Solar Power Generation
The World Top 5(*)
(GWh)
The World Top 5 (2020)
(*) Data source: IEA (2021) Extended Balances. All rights reserved. (**) When 2020 data is missing, the figure refers to the latest available years.
140 World Energy Review 2021

Renewables Concentrated Solar Power Generation
Countries(*)
(GWh)
(*) Data source: IEA (2021) Extended Balances. All rights reserved. (**) When 2020 data is missing, the figure refers to the latest available years.
141World Energy Review 2021

Renewables Wind Power
Wind Resources Map (Average Wind Speed)(*)
(m/s)
Wind Power Capacity (GW)
Wind Power Generation (TWh)
Capacity Factor(hours per year - world average)
Share of Wind on Total Power Generation
(*) IRENA: Global Atlas, Map data: ‘VAISALA, 2021'.
142 World Energy Review 2021

Renewables Wind Power Capacity
Areas and Aggregates(*)
(MW)
World Wind Power Capacity (2020) 733,276 MW
World Wind Power Capacity Growth (2005-2020) 674,871 MW
(*) Data source: Eni's calculations on IRENA (2021), Renewable Energu Statistics 2021 The International Renewable Energy Agency,Abu Dhabi, data.
143World Energy Review 2021

Renewables Wind Power Capacity
The World Top 10(*)
(MW)
The World Top 10 (2020)
(*) Data source: IRENA (2021), Renewable Energy Statistics 2021 The International Renewable Energy Agency, Abu Dhabi.
144 World Energy Review 2021

Renewables Wind Power Capacity
Countries(*)
(MW)
(*) Data source: IRENA (2021), Renewable Energy Statistics 2021 The International Renewable Energy Agency, Abu Dhabi.
145World Energy Review 2021

Renewables Wind Power Capacity
Countries(*)
(MW)
(*) Data source: IRENA (2021), Renewable Energy Statistics 2021 The International Renewable Energy Agency, Abu Dhabi.
146 World Energy Review 2021
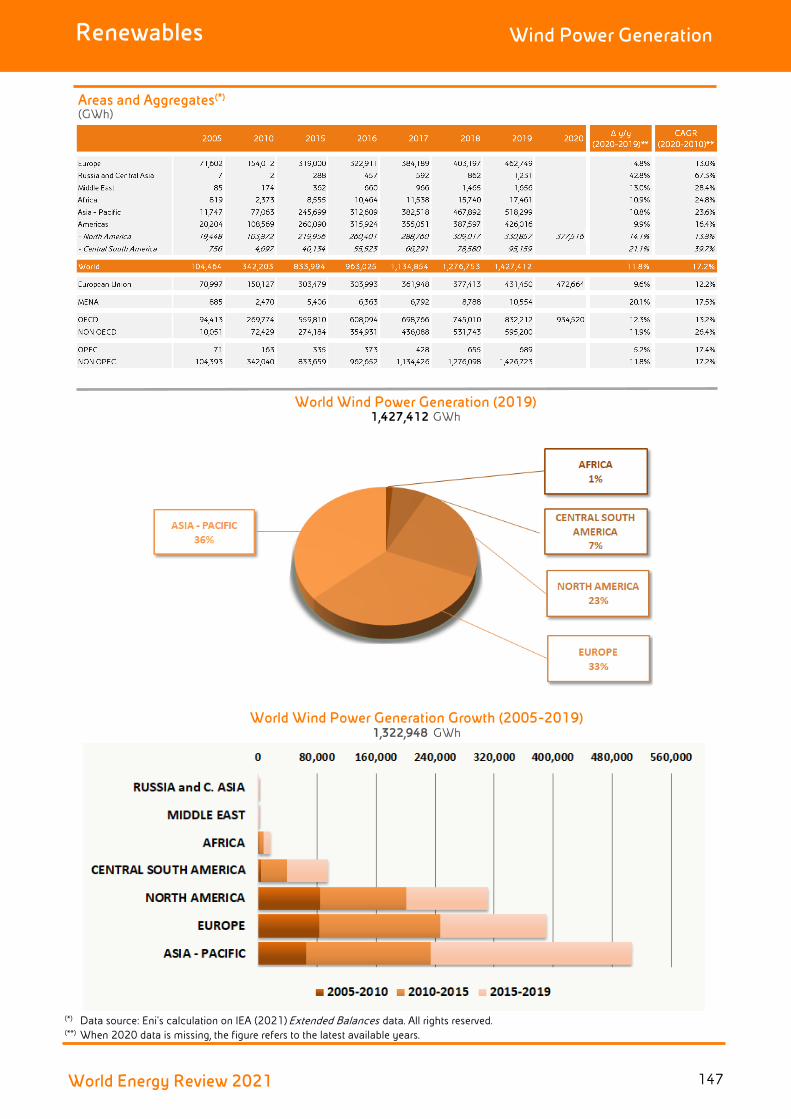
Renewables Wind Power Generation
Areas and Aggregates(*)
(GWh)
World Wind Power Generation (2019) 1,427,412 GWh
World Wind Power Generation Growth (2005-2019) 1,322,948 GWh
(*) Data source: Eni's calculation on IEA (2021) Extended Balances data. All rights reserved.(**) When 2020 data is missing, the figure refers to the latest available years.
147World Energy Review 2021

Renewables Wind Power Generation
The World Top 10(*)
(GWh)
The World Top 10 (2020)
(*) Data source: IEA (2021) Extended Balances. All rights reserved. (**) When 2020 data is missing, the figure refers to the latest available years.
148 World Energy Review 2021

Renewables Wind Power Generation
Countries(*)
(GWh)
(*) Data source: IEA (2021) Extended Balances. All rights reserved.(**) When 2020 data is missing, the figure refers to the latest available years.
149World Energy Review 2021

Renewables Wind Power Generation
Countries(*)
(GWh)
(*) Data source: IEA (2021) Extended Balances. All rights reserved.(**) When 2020 data is missing, the figure refers to the latest available years.
150 World Energy Review 2021

Renewables Biofuels Production
Total Biofuels(*)
(thousand barrels/day) 2020
World: 2,485 thousand barrels/day
Biogasoline(*)
(thousand barrels/day)
World
World
2020
World: 1,640 thousand barrels/day
Biodiesel(*)
(thousand barrels/day)
World
2020
World: : 819 thousand barrels/day
(*) Data source: IEA (2021) Extended Balances and EIA DOE. All rights reseved. Total Biofuels include biogasoline (also ethanol used pure in Brazil "Hydrous"), biodiesel and other liquid biofuels.
151World Energy Review 2021


Eni SpA
Headquarters
Piazzale Enrico Mattei, 1 - Rome - Italy
Capital Stock: € 4,005,358,876.00 fully paid up
Rome Companies Register Tax Identification Number 00484960588
Branches
Via Emilia, 1 - San Donato Milanese (MI) - Italy
Piazza Ezio Vanoni, 1 - San Donato Milanese (MI) - Italy
Web site
eni.com
Produced by
Eni SpA
Cover PhotoEni Green Data Center - HPC5

Eni SpAPiazzale Enrico Mattei, 100144 RomaPh. +39 0659821 - Fax +39 06 59822141
eni.com