Energy Sector Evaluation - 29-03-2021 - Eng - Web.pdf - IDEV
124
An IDEV Sector Evaluation Independent Development Evaluation From experience to knowledge... From knowledge to action... From action to impact African Development Bank November 2020 Summary Report Refocusing Support for Improved and Sustained Energy Access in Africa Evaluation of the AfDB’s Assistance to the Energy Sector (1999-2018):
-
Upload
khangminh22 -
Category
Documents
-
view
0 -
download
0
Transcript of Energy Sector Evaluation - 29-03-2021 - Eng - Web.pdf - IDEV

An ID
EV S
ecto
r Eva
luat
ionIndependent Development Evaluation
From experience to knowledge... From knowledge to action... From action to impact
African Development Bank
November 2020
Summary Report
Refocusing Support for Improved and Sustained Energy Access in Africa
Evaluation of the AfDB’s Assistance to the Energy
Sector (1999-2018):

IDEV conducts different types of evaluations to achieve its
strategic objectives
Thematic Evaluations Project Cluster Evaluations
Regional Integration Stra
tegy
Evaluations
PCR and XSR Validation SynthesesImpact Evaluations
Project Performance Evaluations
Coun
try S
trate
gy E
valu
atio
ns
Evaluation Syntheses
Corporate Evaluations
Sect
or E
valu
atio
n
Sect
or E
valu
atio
ns

An ID
EV S
ecto
r Eva
luat
ionIndependent Development Evaluation
From experience to knowledge... From knowledge to action... From action to impact
African Development Bank
November 2020
Refocusing Support for Improved and Sustained Energy Access in Africa
Evaluation of the AfDB’s Assistance to the Energy
Sector (1999-2018):
Summary Report

© 2020 African Development Bank Group All rights reserved – Published November 2020 Evaluation of the AfDB’s Assistance to the Energy Sector (1999-2018): Refocusing Support for Improved and Sustained Energy Access in Africa - Summary Report An IDEV Sector Evaluation, November 2020
Disclaimer
Unless expressly stated otherwise, the findings, interpretations and conclusions expressed in this publication are those of the various authors of the publication and are not necessarily those of the Management of the African Development Bank (the “Bank”) and the African Development Fund (the “Fund”), Boards of Directors, Boards of Governors or the countries they represent.
Use of this publication is at the reader’s sole risk. The content of this publication is provided without warranty of any kind, either express or implied, including without limitation warranties of merchantability, fitness for a particular purpose, and non- infringement of third-party rights. The Bank specifically does not make any warranties or representations as to the accuracy, completeness, reliability or current validity of any information contained in the publication. Under no circumstances including, but not limited to, negligence, shall the Bank be liable for any loss, damage, liability or expense incurred or suffered which is claimed to result directly or indirectly from use of this publication or reliance on its content.
This publication may contain advice, opinions, and statements of various information and content providers. The Bank does not represent or endorse the accuracy, completeness, reliability or current validity of any advice, opinion, statement or other information provided by any information or content provider or other person or entity. Reliance upon any such opinion, advice, statement, or other information shall also be at the reader’s own risk.
About the AfDB
The overarching objective of the African Development Bank Group is to spur sustainable economic development and social progress in its regional member countries (RMCs), thus contributing to poverty reduction. The Bank Group achieves this objective by mobilizing and allocating resources for investment in RMCs and providing policy advice and technical assistance to support development efforts.
About Independent Development Evaluation (IDEV)
The mission of Independent Development Evaluation at the AfDB is to enhance the development effectiveness of the institution in its regional member countries through independent and instrumental evaluations and partnerships for sharing knowledge.
Independent Development Evaluation (IDEV)African Development Bank GroupAvenue Joseph Anoma, 01 BP 1387, Abidjan 01, Côte d’IvoirePhone: +225 20 26 28 41E-mail: [email protected]
Photo Credit: AfDB Projects on Flickr Original language: English – Translation: AfDB Language Services Department Design & layout: A Parté Design
ACKNOWLEDGMENTS
Task Managers Joseph Mouanda, Chief Evaluation Officer, IDEV.1, Hajime Onishi, Principal Evaluation Officer, IDEV.1.
Team Members Clement Mensah, Consultant, IDEV.1; Samson Houetohossou, Evaluation Officer, IDEV.2; Michel Aka Tano, IDEV.1; Junior Consultant; and Rita Effah, Young Professional, IDEV.1.
Consultants Stephen Nash; Nils Junge; Denzel Hankinson; Guido Mattei; Janet Laing; Eugenia Masvikeni; Kamu Karekaho; Mamadou Coulibaly; Laurent Senghi Kitoko; and Taoufik Laâbi.
Internal Peer Reviewers Andrew Ajuang Anguko, Chief Quality and Methods Advisor, IDEV.0; Girma Kumbi, Chief Evaluation Officer, IDEV.2; and Svetlana Negroustoueva, Principal Evaluation Officer, IDEV.2.
External Peer Reviewer Peter N. Freeman, Individual Consultant
Internal Bank Reference Group
Achraf Tarsim, Regional Sector Manager Energy, Infrastructure & Financial Sector, RDGN; Adama Moussa, Chief Renewable Energy Officer, PERN; Alex Ansah-Owusu, Chief Regional Energy Markets Expert, PESD; Callixte Kambanda, Division Manager, PESR; Carlos Mollinedo, Energy Economist / Policy Specialist, PESR; Daniel Schroth, Acting Director, PERN; Humphrey Ndwiga-Richard, Regional Sector Manager, RDGE; Ihcen Naceur, Portfolio Data Analyst, PEVP and Monojeet Pal, Division Manager, PERN.
Knowledge management and communications officers
Jacqueline Nyagahima, Principal Knowledge Management Officer, IDEV.3; Magdaline Ncabira Nkando, Knowledge Management Consultant, IDEV.3; Dieter Gijsbrechts, Senior Knowledge Management, Communications and Events Officer, IDEV.3; and Tomas Zak, Junior Consultant, IDEV.3.
Other assistance provided by:
Myrtha Diop, Senior Administrative Assistant, IDEV.0; Henda Ayari, Team Assistant, IDEV.1; and Ruby Adzobu-Agyare, Secretary, IDEV.0.
Special thanks to: We are grateful for financial support from the Norad Evaluation Department.
Division Managers Rufael Fassil, Foday Turay (OIC prior to 12/2019)
Evaluator General Roland Michelitsch, Karen Rot-Münstermann (Acting prior to 9/2019 and since 10/2020)

ContentsAbbreviations and Acronyms vExecutive Summary 1Management Response 9
Introduction 17
Methodology 19
Bank’s Engagement in the Development of the Energy Sector in Africa 23
Bank Policies and Strategies for the Energy Sector 23Overview of the Energy Sector Portfolio, 1999-2018 24
Relevance of the Bank’s Support to the Energy Sector 31
Performance of Evaluated Operations 41Effectiveness 41Efficiency 48Sustainability 52Factors Hindering or Enabling Project Results 56
The Road Ahead – Implementing the NDEA Strategy 59Context and Rationale for the NDEA 59The Bank’s Capacity to deliver the NDEA Strategy 60The early years of the NDEA Strategy implementation 64
Conclusions and Recommendations 69Conclusions 69Lessons 71Recommendations 71
Annexes 75
Table of Contents

List of FiguresFigure 1: AfDB Corporate and Energy Policies, Strategies and Initiatives 23Figure 2: Trends in the Energy Sector Share of Total Bank Group Net Approvals (1999-2018) 24Figure 3: Renewable Energy Resources Gaining Traction since the Approval of the 2012 Energy Policy 26Figure 4: Increased Bank-Support to the Private Sector 28Figure 5: Relevance of Energy Sector Projects 38Figure 6: Summary of Outputs Achievement Analysis for Selected PBOs 44Figure 7: Efficiency of Energy Sector Projects 48Figure 8: Sustainability of Energy Sector Projects 52Figure 9: Factors Affecting Implementation of Energy Sector Operations 57Figure 10: Annual Average Investment Required to Meet the NDEA Targets 60Figure 11: AfDB’s Indicative Lending Target Compared with Actual Approvals in the Energy Sector (in UA Billion) 66
List of TablesTable 1: Bank Group Energy Sector Assistance (1999-2018): Infrastructure versus Enabling Environment Investments 25Table 2: 2018 Progress against Level 2 Indicators: Extract from the 2019 ADER 37Table 3: Summary of the Main Project Outputs Achievement 43Table 4: Summary of Main Project Outcomes 45Table 5: Key Informant Awareness of the NDEA Before Case Study Interviews 64
List of BoxesBox 1: The 510 MW Ouarzazate Solar Complex in Morocco 25Box 2: Desert to Power - Harnessing the Sun to Power the Sahel Region 26Box 3: The Quest for a Holistic Approach to Maximize the Productive Use of Electricity and Improve Sustainable Economic Growth 36Box 4: Key Enabling and Hindering Factors in Tanzania Linked to the Country Context 44Box 5: Trade-off Between Cost Recovery and Affordability 47Box 6: Multinational (Ethiopia-Djibouti) Power Interconnection Project 50Box 7: High Ex-Post EIRR for Power Interconnection Projects and its Implications 51
Table of Contents

v v
An ID
EV S
ecto
r Eva
luat
ion
Abbreviations and Acronyms
ADER Annual Development Effectiveness Review
ADF African Development Fund
AEMP Africa Energy Market Place
AFD French Development Agency
AfDB African Development Bank Group
CSP Country Strategy Paper
CSPE Country Strategy and Programme Evaluation
DBDM Development and Business Delivery Model
EIRR Economic Internal Rate of Return
ESMAPEnergy Sector Management Assistance Program
FIRR Financial Internal Rate of Return
GCI General Capital Increase
IDA International Development Association
IDEV Independent Development Evaluation
LIC Low Income Country
LMIC Lower-Middle-Income Country
MDB Multilateral Development Bank
MIC Middle-Income Country
NDEA New Deal on Energy for Africa
NPV Net Present Value
NSO Non-Sovereign Operation
PAR Project Appraisal Report
PBO Program-Based Operation
PCR Project Completion Report
PERN Department of Renewable Energy and Energy Efficiency, AfDB
PESR Energy Financial Solutions, Policy and Regulation Department AfDB
PEVP Power, Energy, Climate and Green Growth Complex, AfDB
PPP Public-Private Partnership
QAE Quality at Entry
RDGE Regional Directorate General for East Africa, AfDB
RDGN Regional Directorate General for North Africa, AfDB
RMC Regional Member Country
RMF Results Measurement Framework
SAP Systems, Applications, and Products
SDG Sustainable Development Goal
SEFA Sustainable Energy Fund for Africa
SO Sovereign Operation
SSA Sub-Saharan Africa
TA Technical Assistance
TOC Theory of Change
TYS Ten-Year Strategy
UA* Unit of Account
USAID United States Agency for International Development
USD United States Dollar
*1 Unit of Account (UA) = 1.38 United States Dollars (USD) as of 30 November 2018


1Executive Summary 1Executive Summary
An ID
EV S
ecto
r Eva
luat
ion
Executive Summary
Background
The African Development Bank’s Ten-Year Strategy (TYS) 2013-2022 focused on improving the quality of Africa’s growth through inclusive growth and the transition to green growth. Access to energy is an important pre-requisite to inclusive, broad-based economic growth which is environmentally sustainable. This report summarizes the evidence, findings and lessons from an independent evaluation of the support provided by the African Development Bank Group (AfDB, or “the Bank”) to the energy sector for the period 1999-2018. An evaluation of the Bank’s support to the energy sector was timely given the access to electricity gap in Sub-Saharan Africa (SSA), emerging energy-related challenges posed by climate change, and the opportunities presented by advances in renewable energy technologies. The evaluation is expected to support the implementation of the Bank’s strategy for the New Deal on Energy for Africa 2016-2025 (NDEA), a partnership-driven effort with the aspirational goal of achieving universal access to energy in Africa by 2025.
Bank support to the energy sector
Between 1999 and 2018, the Bank devoted nearly 13 billion units of account (UA) to support various investment and non-investment interventions in Regional Member Countries (RMCs). The sector accounted for about 18.9% of overall Bank Group commitments, ranking third in terms of total assistance after multisector (22%)1 and transport (19.4%). 62 percent of projects over the period were approved following the introduction of the Bank’s 2012 Energy Policy. Over the 1999-2018 period, investment projects aimed at closing the energy access gap dominated the Bank’s portfolio, with policy and institutional level reform interventions also seeing a notable increase. The Bank’s active portfolio in the energy sector constituted 62 percent of a total
of 306 approved projects between 1999 to 2018. These projects also constituted 89 percent by net amount approved.
Of this energy sector assistance, the power generation subsector dominated. Of the UA 13 billion energy sector support over the 1999-2018 period, about half – UA 6 billion (49%) - targeted power generation projects. The next top three subsectors after power generation were National Grid Extension/Upgrade (21%), Regional Interconnection (12%), and Program-based Operations (9%). However, a gradual decline of power generation was observed mainly after the approval of the 2012 energy policy, with a large refocus on transmission and distribution gaining momentum. Support to energy efficiency and clean cooking, while inceasing in the Bank’s energy sector portfolio post-2011, is still marginal.
The ADB funding window of the Bank Group accounts for nearly two-thirds of energy sector commitments, totaling almost UA 8 billion. Although, project lending remains the most dominant financial instrument used by the Bank. Program-Based Operations (PBOs) are gaining traction within the Bank’s energy sector portfolio. In recent years, the Bank Group has put more emphasis on leveraging more capital resources to support infrastructure development in RMCs. These were drawn from multiple other sources of financing channeled by the Bank – e.g. climate finance facilities2, co-financing arrangements3, and Bank-administered trust funds.4
There is a growing interest in clean electricity generation, with the Bank’s commitment to leveraging Africa’s abundant renewable energy resources gaining traction. There has been a decisive shift towards renewables in the Bank’s financing of power generation projects. In particular, the 2012-2015 period marked a break from the past, where renewable energy accounted for two-thirds of total power generation assistance. Solar and wind energy

2 Evaluation of the AfDB’s Assistance to the Energy Sector (1999-2018): Refocusing Support for Improved and Sustained Energy Access in Africa - Summary Report
sources make up the bulk of the Bank’s renewable energy commitment.
The Southern Africa Region is the largest recipient of the Bank’s energy sector assistance, totaling about 29 percent (amounting to UA 4 billion) and largely attributed to South Africa. The share of the Bank’s energy support to the Central Africa Region is the lowest (5%) and has not significantly increased over time. The Bank’s energy sector assistance devoted to transition states increased, while multinational operations are gaining momentum to serve the African regional integration purpose.
A sizeable share of the Bank’s energy sector assistance was devoted to investments in Africa’s private power sector between 1999 and 2018. Starting with virtually zero investment in 1999, the Bank Group had, as of December 2018, UA 2.72 billion of net approvals in investments in Africa’s private power sector. This represents nearly one-fifth of the total Bank net approvals to the energy sector over the 1999-2018 period. The private sector made an important contribution to expanding power generation capacity in the RMCs, mainly toward thermal projects, with the involvement of Independent Power Producers (IPPs).
Purpose of the evaluation
This evaluation aims to inform future strategic and operational directions for the Bank’s assistance to the energy sector, including its flagship NDEA, by taking stock of the results of the Bank’s assistance over the 1999-2018 period and drawing lessons for future work. It is intended to help the Bank’s Management to (i) account for the development results of the Bank’s investment in the energy sector, by determining the extent to which the Bank has contributed to the development of the energy sector in RMCs; and (ii) learn from its operational experience by identifying lessons on how the Bank can contribute most effectively to improving the energy sector performance of its RMCs.
Methodology
In line with the status of the Bank’s energy sector portfolio, summative and formative approaches were used to conduct the evaluation. Firstly, a summative approach was used to assess the completed projects, especially those falling under the approval period 1999-2015. This approach served both accountability and learning purposes. It allowed the evaluation team to draw conclusions about past performance, to inform ongoing and future energy sector efforts. The evaluation design used a combined theory-based approach and a system-based approach, with the standard OECD-DAC evaluation criteria: relevance, effectiveness and efficiency of the Bank’s assistance to the energy sector, and the sustainability of the benefits. The evaluation used a four-point rating scale: highly satisfactory, satisfactory, unsatisfactory, and highly unsatisfactory.
Secondly, for the projects approved since the adoption of the NDEA (i.e. those since 2016), many of which were still ongoing at the time of the evaluation, a formative approach was pursued (except for the assessment of the early years of implementation which is summative). This allowed assessment of the overall quality of the NDEA strategy. The assessment reviews the AfDB’s activities across the energy sector, since the launch of the NDEA strategy, to evaluate the extent to which the strategy is reflected in those activities. The assessment also considered the design process and quality of the NDEA as well as the adequacy of the institutional arrangements in place to deliver the deal. This overall objective is broken down into four parts: (i) assess the relevance of the NDEA’s objectives; (ii) assess the quality and relevance of NDEA design to meet the objectives; (iii) assess the capacity to deliver the NDEA, and (iv) assess evidence from the first years of implementation of the NDEA. The formative approach was geared towards course-correction, both analytically and in informing recommendations.

3Executive Summary 3Executive Summary
An ID
EV S
ecto
r Eva
luat
ion
The evaluation comprises six core components, as follows: (i) a portfolio review, (ii) a policy and literature review, (iii) country case studies, (iv) cluster evaluations, (v) a quality at entry assessment, and (vi) benchmarking.
As with any evaluation, this evaluation inevitably has some limitations. The first relates to indicators with limited data availability. The second concerns the challenge posed by the lack of application of a common TOC across the various background papers. This has implications for the merit of the assessment of some intermediate outcomes, which have been duly highlighted when appropriate in this report. Finally, there were multiple and sometimes incoherent databases as well as issues with data completeness from SAP (Systems, Applications, and Products) in the case of the Portfolio Review, including project classification. To address this challenge, the Power, Energy, Climate, and Green Growth (PEVP) Complex database on energy sector projects was used as a comparator to generate a harmonized database.
Findings
The Summative approach: Performance of evaluated operations
How relevant is the Bank’s support to the energy sector?
The relevance of the Bank’s support was found to be satisfactory. Projects approved before 2012 show a higher percentage of satisfactory or over (84% compared to 74% after) in terms of relevance. The Bank’s support to the energy sector has been relevant for supporting the African continent as a whole in addressing its energy sector challenges. The objectives of the Bank’s energy sector strategic documents (policies, strategies, and initiatives) mainly focus on enhancing equitable energy access, securing supply, and alleviating the impact of climate change for sustainable, green, and inclusive socio-economic
growth and development in Africa. These objectives are aligned to the Bank’s corporate policies and strategies, the RMCs’ priorities, and international targets (e.g. the Bank’s TYS 2013-2022 and Medium-Term Strategy, MTS 2008-2013) in addition to relevant sector policy and strategy documents including those for regional integration: Infrastructure Consortium for Africa (ICA); Climate Change Action Plan (CCAP) for 2011-2015 and 2016-2020; Millennium Development Goals (MDGs) and most recently the Sustainable Development Goals (SDGs). Also, the objectives of the Bank’s energy sector projects/programs and initiatives were generally aligned to its corporate policies and strategies, applicable Country Strategy Papers (CSPs), and the RMCs’ priorities.
The quality of the Bank’s 2012 energy policy is comparable to that of other Multilateral Development Banks (MDBs), with the Bank’s interventions adding value in the areas of (i) private sector participation, (ii) climate change, and (iii) regional cooperation. The NDEA’s design responds to the shortcomings noted in its review of the AfDB’s pre-NDEA energy sector portfolio in many ways. However, a common TOC for the energy sector that should be referred to at the design stage of each of the projects is not presented in either of the policy/strategy documents. Accordingly, while the objectives of the NDEA are clear, the logical framework by which it aims to achieve those objectives (TOC) is less clear. Comparator strategies to the NDEA exhibit similar shortcomings in their logical frameworks. The NDEA’s overall targets, however, are excessively ambitious compared to the objectives of the comparator strategies and the SDGs.
The design of the Bank’s energy sector projects was generally unsatisfactory, due to shortcomings in some critical areas like risk assessment, and long-term sector planning. It was not conducive to achieving the expected increased access to and use of reliable and affordable electricity for all because of issues on regulatory environments in RMCs, and less focus on transmission and distribution aspects of the power value chain.

4 Evaluation of the AfDB’s Assistance to the Energy Sector (1999-2018): Refocusing Support for Improved and Sustained Energy Access in Africa - Summary Report
To what extent has the Bank’s support to the energy sector been effective?
Overall, the effectiveness of the Bank’s support to the energy sector was assessed as satisfactory. The Bank support to the energy sector delivered the planned outputs; however, progress has been slow on the high-level objectives that the Bank’s support aims to contribute to. In general, access to energy in Africa remains low and progress towards access-for-all is slow.
The Bank’s support increased access to electricity through increased power supply (through power generation or power exchange). Nevertheless, improving sector governance is still challenging, with weaknesses in RMCs’ regulatory frameworks. Those weaknesses stem from the absence of comprehensive energy policies in RMCs, which restrict the potential of tariff reforms. The Bank’s intervention did not always contribute to increasing the affordability of RMCs’ energy services to end-user beneficiaries, especially to the poor. The Bank’s use of non-lending activities to support the achievement of project outcomes was relatively limited, although effective when employed. At the same time, the Bank also missed opportunities to provide non-lending policy and Technical Assistance (TA) support that could have contributed to the success of operations.
To what extent has the Bank’s assistance been delivered efficiently?
The efficiency of the Bank’s project support was found to be unsatisfactory. It is, however, important to note that since 2009, energy sector delays declined substantially. The evaluation highlighted issues of delays and cost overruns that compromised the performance of energy sector projects and posed the most important threat to project efficiency, with power interconnections accounting for the bulk of delays. Challenges were also related to slippages in implementation schedules due to delays in loan/grant effectiveness and changes in project design. However, between public and private sector projects, the latter experienced
only moderate delays. It is also important to note that between 2009 and 2018, energy sector delays declined substantially to an average of eleven months, compared to the 1999 – 2008 period when the average was 47 months. Variations in cost, overruns or underruns, also affected project implementation across all sectors. Private sector operations experienced a high average percentage of cost variation (24%) compared to public sector operations (10%).
The ex-ante Economic Internal Rate of Return (EIRR), computed as part of the project design, was estimated in almost all sampled projects. However, results from the economic appraisal of investment projects are uncertain because they are based on the future values of variables that are subject to significant variability. The legitimacy of EIRR assessments is therefore questionable in some cases, considering the extent to which hidden parameters can influence the final result when using a traditional method such as “with- and without” project scenario or a least-cost analysis. In addition, the sensitivity analyses require a more rigorous assessment.
To what extent are the results of the Bank’s support to the energy sector sustainable?
Overall, the sustainability of achievements of energy sector interventions was judged to be satisfactory, although the precarious financial sustainability of the sector threatens the long-term sustainability of results achieved. A significant decline was observed for energy sector interventions approved since 2012. Nonetheless, most of the sampled projects (93%) were technically sound. A case in point is the use of higher transmission voltage (e.g. 400 kV), which is considered technically appropriate as it reduces the magnitude of the transmitted current and thus losses associated with long transmission lines. In addition, opting for higher voltage allows for power transmission underwater (as in the case of Morocco/Spain) and permits the asynchronous interconnection of networks that operate at different frequencies, or are otherwise incompatible. The use of fiber optic

5Executive Summary 5Executive Summary
An ID
EV S
ecto
r Eva
luat
ion
technology on the transmission network for system communication and monitoring is deemed state-of-the-art in the energy industry (seen, for example, in the Manantali and Morocco/Spain projects).
Overall, there are no significant issues regarding the environmental and social sustainability of the sampled projects. This is likely due to environmental sustainability having been featured strongly in the design of energy sector projects. However, while the design included environmental impact assessment studies for category 1 projects, their implementation was not always guaranteed.
Leveraging low carbon technologies together with indigenous resources to meet Africa’s energy needs is important for the sector’s sustainability. This is supported by the fact that the cost of renewable energy technologies (e.g. solar PV and wind) has fallen rapidly. However, despite this impressive cost reduction, some analysis suggests that a more aggressive reduction in carbon emissions would result in higher system costs. While the carbon emissions from power generation are relatively small for many African countries, land-use change and agriculture have been the major drivers of greenhouse gas emissions. These emissions have typically been driven by deforestation to provide firewood and charcoal for cooking and heating.
The likelihood of long-term maintenance of electricity infrastructure was associated with the strength of the utilities’ business model (i.e. institutional sustainability, capacity strengthening). Securing financial resources to ensure coverage of recurrent costs including maintenance of energy infrastructures was dependent upon the institutional and financial strength of the operating utility in its revenue generation efforts. The Bank’s support to RMCs for assessing, mobilizing, and protecting resources for the recurrent costs of infrastructure maintenance was uneven across projects. In contrast, power interconnection projects are generating enough income for exporting countries to ensure continued exports.
The Bank promoted private sector participation in power generation and infrastructure maintenance funding. However, several factors limited absolute benefits from private sector participation. These include: (i) a governance structure with private sector participation that did not guarantee value for money or long-term maintenance; (ii) increased operational and maintenance costs; and (iii) poor transmission infrastructure.
Regional and national policies and regulatory frameworks are the critical factors influencing institutional sustainability, especially in power interconnection projects where revenue is generated directly or indirectly for both importing and exporting countries. Ongoing monitoring and management action to support the institutional strengthening of utility companies was present in 60 percent of the sampled projects.
The Formative approach: NDEA implementation
What is the actual capacity of delivering the NDEA?
The assessment of the NDEA implementation shows that the current level of allocation of Bank resources is insufficient to meet the targets set by the NDEA. The AfDB has increased funding for the energy sector since the launch of the NDEA, but not to the extent required to meet the strategy’s objectives. The ADB’s recent 125 percent capital increase to $208 billion through the 7th General Capital Increase (GCI) and the replenishment of the African Development Fund (ADF) will be critical to achieving NDEA targets over the coming years. Increasing the volume of Non-Sovereign Operations (NSOs) will also expand opportunities to leverage other sources of finance, thereby increasing the impact of the AfDB’s contribution to the sector.
The Bank’s reorganization to deliver the High 5s5 has faced several challenges. As with financial resources, there was no explicit nor designated commitment to human resources to implement the NDEA. However, the AfDB signaled a clear commitment to resourcing efforts to implement the

6 Evaluation of the AfDB’s Assistance to the Energy Sector (1999-2018): Refocusing Support for Improved and Sustained Energy Access in Africa - Summary Report
NDEA through the creation of the PEVP Complex in 2016 and the recruitment of new staff. However, accountabilities for the NDEA’s targets are not well cascaded through the respective complexes for the NDEA to be implemented more systematically. In addition, the NDEA targets are not effectively reflected in individuals’ work programs within the Complex. The extent to which human resources are allocated to comparator donor and MDB strategies is also mixed. USAID’s6 Power Africa has the clearest description of human resource allocations intended to implement the strategy.
The AfDB’s initial strategy for the NDEA put partnerships at its heart. The NDEA is described as a “partnership-driven effort” to achieve universal access to energy in Africa. There is some evidence of the AfDB coordinating donor activities to achieve the NDEA’s objective with some specific initiatives, such as the Africa Energy Market Place and the Desert to Power Initiative, which demonstrate the AfDB’s convening power well and the potential to use the NDEA to mobilize action across the continent. Furthermore, the Bank has been successful in bringing more partners and donors into existing platforms and facilities such as the SEFA. However, while development partners are generally aware of the NDEA, this potential is not being fully exploited to achieve the NDEA’s goals. Indeed, in general, the AfDB’s pool of partners across RMCs has a poor understanding of the NDEA. In contrast, all the comparator strategies contain some description of how partnerships would be used, with Power Africa’s being the clearest.
About the early years of the NDEA Strategy implementation
Stakeholder awareness of the NDEA, especially at the country-level, is low. Less than half of the energy sector stakeholders interviewed in country case studies were aware of the NDEA, with awareness being less than 10 percent in one country. While the AfDB has strong partnerships in place with many RMC governments, those partnerships appear to have placed little emphasis on the NDEA
as a strategy. The low awareness of the NDEA among stakeholders may also be related to a lack of follow up after presentations were launched in the early days of the NDEA. Some of the comparator strategies against which the NDEA is benchmarked have been disseminated more effectively. Given the importance of the NDEA’s objectives to the AfDB’s overall strategy and achieving the High 5s, improved dissemination of the strategy, both internally and externally, is likely to be critical to its future success.
Overall, there are shortcomings in the operationalization of the NDEA. There are no processes in place by which progress against the NDEA objectives is tracked regularly or under which areas of underperformance are systematically addressed. While there has not been a systematic approach to rebalancing the portfolio to achieve NDEA targets, there has been a reallocation of funds that is broadly consistent with NDEA objectives. However, the immediate next steps set out in the NDEA Strategy were not executed. For instance, a ‘pilot’ in Mozambique generated interest in the NDEA, but implementation support was limited. The reduced focus on NDEA flagships coincided with the setting up of a new NDEA-focused Complex. Moreover, the objectives of the NDEA seem not to be well embedded in PEVP’s decision making. Finally, only two-thirds of the Bank’s financing target between 2016 and 2018 was achieved.
Recommendations
Independent Development Evaluation (IDEV) makes the following recommendations:
1. The Bank should improve the quality of NDEA management, measurement, and reporting of results. Priority areas of action include:
ı Review the targets set for the AfDB’s contribution to meeting the NDEA’s objectives and assign clear accountabilities that are cascaded through the respective complexes.

7Executive Summary 7Executive Summary
An ID
EV S
ecto
r Eva
luat
ion
ı Ensure that the design, monitoring, and evaluation of energy sector interventions and strategy documents are based on a well-articulated TOC.
2. The Bank should strengthen its assistance to RMCs to enhance their capacity to formulate and implement comprehensive energy policies which encompass long-term power development plans, energy security strategies, and energy efficiency/conservation plans. Priority areas of action include:
ı Increase the use of non-lending instruments (e.g. analytical work, TA) to help elaborate possible least-cost energy solutions.
ı Strengthen policy dialogue based on established and well-structured national sector reform strategies and road maps, to attain and maintain national government commitment.
3. The Bank should increase support to RMCs, through its power utility transformation program, to enhance power utilities’
performance and ensure the financial sustainability of the power system. Priority areas of action include:
ı Consider balancing its investments between power generation, and transmission and distribution.
ı Consider employing a holistic approach to electricity cost drivers, innovative subsidy design, and electricity pricing to inform tariff design to support the implementation of the NDEA’s power utility transformation program.
4. The Bank should increase its funding to RMCs and the private sector for sustainable energy access in Africa. Priority areas of action include:
ı Scale-up blended finance approaches to mobilize more private sector investments and creative concessional finance, and thereby contribute to overcoming the persistent financing gap in the energy sector in Africa.
ı Increase resources for TA and project preparation to optimize its investments.


9Management Response 9Management Response
An ID
EV S
ecto
r Eva
luat
ion
Management ResponseManagement welcomes IDEV’s evaluation of the Bank’s assistance to the energy sector from 1999 to 2018. IDEV’s evaluation is timely, as Management will soon initiate its mid-term review of the Bank’s Strategy for the New Deal on Energy for Africa. In addition, as part of the recent Seventh General Capital Increase (GCI-VII) and the Fifteenth Replenishment of the African Development Fund (ADF-15), the Bank is pursuing several new commitments in the energy sector: (i) enhanced energy policy dialogue, (ii) scaled-up access to electricity through on-grid and renewable-based decentralised energy solutions, (iii) a transition to increased renewable energy generation, (iv) more attention to energy efficiency, and (v) stronger regional power transmission interconnectors, power pools, and trading. It is against this background that Management responds to the issues raised by IDEV and lists the actions it proposes to take.
Introduction
The Bank is acutely aware of widespread energy poverty across its regional member countries (RMCs) and the urgent need to address Africa’s energy deficit. That is why the Bank made increasing efforts to address the shortfall in power over the period covered by IDEV’s evaluation (1999 – 2018).
Notably, in 2012, the Bank revised its Energy Sector Policy to support RMCs to (i) provide all of their populations and productive sectors with access to modern, affordable, and reliable energy services and (ii) develop their energy sector in a manner that is socially, economically, and environmentally sustainable. These objectives require significant resources. This is why the Bank launched in 2016 the New Deal on Energy for Africa 2016-2025 (NDEA).
The NDEA is a partnership-driven initiative that guides the Bank’s interventions to power the continent in order to end energy poverty, catalyse industrialisation, and stimulate economic growth. To achieve this goal, the NDEA takes a holistic view of the energy sector’s needs. This view encompasses on-grid generation, transmission, and distribution as well as distributed energy solutions, energy efficiency, and clean cooking. To implement the NDEA, the Bank established in 2017 the Power, Energy, Climate Change and Green Growth (PEVP) Complex.
The evaluation period (1999-2018), especially the second decade, saw significant changes in the energy sector, changes under which the Bank encouraged: more private sector investment, more focus on renewables (resulting from significant cost reductions), a greater role for distributed solutions, more focus on regional integration targeting universal energy access, emphasis on innovative financing approaches, the establishment of regional power pools, and the acceleration of power sector reforms.
At the same time, the IDEV report identified several gaps that Management had also identified in recent years, including the absence of comprehensive energy policies in RMCs, which restrict the potential of tariff reforms. The Bank’s interventions did not always contribute to increasing the affordability of RMCs’ energy services to end-user beneficiaries, especially to the poor. The Bank’s use of non-lending activities to support the achievement of project outcomes was relatively limited, although effective when employed. At the same time, the Bank missed opportunities to provide technical Assistance (TA) support that could have contributed to greater success of the operations.
To address these gaps, Management took the following actions: (i) the establishment in 2018 of the Africa Energy Marketplace, which enhances policy dialogue by bringing public and private stakeholders together; (ii) the design of the Sustainable Utility Transformation

10 Evaluation of the AfDB’s Assistance to the Energy Sector (1999-2018): Refocusing Support for Improved and Sustained Energy Access in Africa - Summary Report
Program to improve utilities’ performance; (iii) work since 2018 to establish the African Energy Sector Technical Assistance Programme (AESTAP) to augment resources for non-lending activities; and (iv) more focus since 2016 on project implementation in the context of the roll-out of the Bank’s Development and Business Delivery Model.
IDEV’s evaluation also notes limited overall progress towards universal energy access, resulting principally from limitations in RMCs, such as inadequate long-term sector planning and the difficult financial situation of RMCs’ utilities. Considering the immense scale of the energy access challenge, the Bank recognises the need for better stakeholder coordination and integrated energy access plans.
Looking ahead, the following elements of IDEV’s evaluation will improve the Bank’s support and guide the Bank’s interventions across all aspects of the energy sector:
ı Recalibrate the NDEA’s objectives and targets. In the context of the upcoming mid-term review, the Bank will thoroughly review the NDEA, including its alignment with other stakeholders’ goals (e.g. the UN’s Sustainable Development Goal 7). The review will also assess the Bank’s contribution to those goals and estimate the financial and human resources required to reach them.
ı Increase funding for universal energy access. The GCI-VII and the ADF-15 replenishment will support RMCs in financing universal access to energy as RMCs multiply their efforts. This resource mobilisation and the pursuit of the “One Bank” model will increase Bank personnel working in the sector.
ı Enhance policy dialogue. In the energy sector, good policies are essential for progress. For that reason, the Bank will scale up policy dialogue, including the Africa Energy Market Place. It will also increase its knowledge and analytical work, such as the Electricity Regulatory Index (ERI), to better guide and orient its operations. Special
initiatives such as Desert to Power will serve as a dedicated platform for high-level policy dialogue to accelerate electrification in the Sahel region, especially for the G5 Sahel countries.
ı Adopt a holistic approach that focusses on utilities and power pools. Utilities anchor the energy sector, but most are in a dire financial situation. The Bank will accelerate implementation of the Sustainable Utility Transformation Programme and Regional Power Project Acceleration Programme (including PIDA PAP1/2 projects such as Inga III and the establishment of regional power markets), working closely with partners. The Bank will also improve power systems’ flexibility so that sources of renewable energy can better penetrate the market, as per the recommendations of the Bank’s 2018/19 Revisiting Power Sector Reforms in Africa report. The Sustainable Energy Fund for Africa (SEFA)’s Green Baseload Component will back these efforts.
ı Focus more on distributed energy access solutions. Considering that most Africans live in rural areas, decentralised solutions need to be integrated in countries’ electrification policies and appropriate regulatory frameworks must be put in place. The Bank has been at the forefront of scaling up distributed solutions through programs such as the Green Mini-Grid Market Development Program, the Facility for Energy Inclusion, and the Distributed Energy Service Companies (DESCO) Financing Program.
ı Step up innovative financing. Traditional financing approaches are not enough to fund universal energy access in the next decade. The Bank will therefore proliferate novel approaches, building on successes such as the Bank’s first results-based financing project (in Rwanda) and blending concessional and climate finance to improve sustainability and de-risk projects as was done for Burkina Faso’s Yeleen Rural Electrification Program, Kenya’s Lake Turkana Wind project (an independent power producer), Morocco’s Noor solar projects, and others.

11Management Response 11Management Response
An ID
EV S
ecto
r Eva
luat
ion
ı Improve tracking and reporting. To increase the visibility of the Bank’s achievements in energy access, a tracking and reporting tool is being developed that will be especially useful for monitoring NDEA targets. This tool will be complemented by a more robust M&E system that is based on a well-articulated theory of change and deploys carefully chosen indicators and rigorous risk monitoring as an integral part of the life cycle of energy sector interventions.
Relevance of the Bank’s Support
Management welcomes IDEV’s finding that the Bank’s support for the energy sector has been highly relevant. Whether boosting access to equitable energy, securing power supply, or mitigating the impacts of climate change to promote sustainable, green, and inclusive growth, the Bank’s interventions have been closely aligned with the priorities of countries and regional economic community as well as with the Bank’s own strategic orientations and policies.
At the same time, Management recognises the need for more long-term, integrated sector planning, the development of more human capital, and more assessment and mitigation of risk when designing projects, for example by making utilities more financially sustainable, by moving towards cost-reflective retail tariffs, and by making networks more reliable. The Bank is therefore enhancing its risk assessment practices and wherever possible will mitigate risks through other interventions (e.g., technical assistance and policy-based operations).
Management also considers it critical to optimise the coordination and sequencing of the Bank’s and partners’ interventions (e.g., sector reforms, utility strengthening, or transmission lines linked to generation projects), for instance through the Africa Energy Market Place. The Bank will pay particular attention to designing and planning priority regional programmes and projects, which are the most affected by implementation delays.
The energy sector interfaces closely with other Bank priorities such as food security and health and the approach to these nexus areas will be developed further during the mid-term review of the NDEA.
Management agrees with the need to better structure NDEA objectives with a revised results measurement framework. This framework will measure development outcomes, emphasising attribution where feasible and accounting more precisely for the Bank’s contribution to overall development. In addition, Management will take stock of performance against NDEA targets and will establish a basis for accelerating those targets. These measures will be reflected in the review of the Bank’s Results Measurement Framework, now underway.
Effectiveness of the Bank’s Support
Management welcomes IDEV’s finding that the Bank’s energy sector interventions delivered their planned outputs, especially better access to electricity. However, IDEV notes that overall progress on the high-level goals to which the Bank aimed to contribute was slow as a result of enormous access and resource deficits and RMCs’ slow conceptualisation and implementation of projects. For its part, since launching the NDEA in 2016, the Bank has accelerated its efforts to “Light Up and Power Africa” with a higher volume of investments averaging about UA 1.17 billion per year from 2016 to 2019 (UA 1.47 billion in 2019) compared with about UA 0.83 billion during 2012-2015. Headroom availability and other factors, such as the financial sustainability of the energy sector for non-sovereign operations, nonetheless limited the Bank’s interventions. Sustained policy dialogue to develop an environment conducive to energy operations, combined with the additional resources made available from GCI-VII and ADF-15, will supply the means the Bank needs to reach its goals.

12 Evaluation of the AfDB’s Assistance to the Energy Sector (1999-2018): Refocusing Support for Improved and Sustained Energy Access in Africa - Summary Report
Management agrees that the Bank should deepen the links between non-lending activities and investment outcomes. Through a strategic, selective and proactive business development approach, the Bank plans to leverage its unique diagnostic tools, such as the Electricity Regulatory Index, to work closely with RMCs and partners to address issues related to policy/legal/regulatory frameworks or technical capacity. Its activities will take the form of technical assistance and capacity-building initiatives (financed by trust funds or special funds), either as standalone operations or as part of larger investments.
Efficiency of the Bank’s Support
Despite significant improvements in the latter part of the evaluation period, the evaluation finds that delays leading to cost overruns compromised projects’ performance/efficiency. Management recognises that energy projects, especially sovereign operations, often face delays during implementation. The main reasons for the delays are protracted loan ratification processes, difficult compliance with conditions precedent (environmental and social, financial management, release of counterpart funds, etc.), and procurement processes that are often prolonged. In multinational projects, the complexity is compounded. These issues are common for all financiers and the Bank works in concert with other partners through regular dialogue, participation in sector working groups and through specific interventions that support training to address them.
Although delays are often caused by factors external to the Bank, Management sees an opportunity to implement projects more efficiently by paying closer attention to certain elements at the design stage. The Bank’s human resource capacity is an important factor: Despite the increased number of energy operations approved in recent years (mostly sovereign operations), the number of staff
dedicated to sovereign operations has not grown commensurately. This situation will be addressed as overall staffing is reviewed. In terms of the ecosystem, the landscape is similar, and Management expects that the ongoing implementation of the “One Bank” model will make a number of corporate services more effective and efficient.
IDEV’s evaluation also questions the economic appraisal of investment operations. Appraisals are based on the future values of variables, which have considerable uncertainty. It is true that the paucity of data at the country and regional levels often hampers the accuracy of these parameters. Given the high uncertainty of future values of variables and indicators, a more rigorous method of cost-benefit analysis should be applied. For instance, sensitivity analyses might consider the robustness of development impacts in more adverse scenarios.
Sustainability of Energy Sector Interventions
IDEV rates the sustainability of the Bank’s interventions as satisfactory despite the weak financial situation of energy sector entities in most countries. It is noteworthy that 93% of sampled projects were technically sound and environmentally and socially sustainable despite challenges in implementing environmental and social management plans (ESMPs). Management will strengthen the implementation of ESMPs by ensuring that clients execute their commitments fully and expeditiously.
Operations and maintenance costs are usually paid by utilities’ operating revenues. Because of the weak finances of most African utilities, however, much of the power infrastructure is in a poor state of repair. This increases system losses and renders power supply unreliable. Rather than supporting RMCs to access, mobilise, and protect resources for recurrent

13Management Response 13Management Response
An ID
EV S
ecto
r Eva
luat
ion
costs and the maintenance of infrastructure, the Bank’s Sustainable Utility Transformation Programme promotes measures to improve utilities’ financial viability—thereby rendering utilities creditworthy (e.g., off-takers to independent power producers)—and finance recurrent operations and maintenance costs. The programme also aims to improve technical and managerial competencies at utilities.
Conclusion
The ADF-15 replenishment and GCI-VII will support the Bank’s ambitions to improve energy access and thus boost Africa’s development. The increase in resources, combined with PEVP’s development
of innovative solutions and its accelerated efforts to mobilise funding for upstream and investment activities, will strengthen the Bank’s contribution to RMCs’ energy sector, especially in ADF countries. More resources from the Bank, especially in ADF countries, will also make it easier to leverage resources from other sources of concessional and climate finance, such as the European Commission and the Green Climate Fund.
The findings, lessons, and recommendations in IDEV’s evaluation reaffirm efforts already underway and will encourage further development of the Bank’s energy sector work, including its accelerated achievement of NDEA targets, thereby contributing strongly to SDG7.
Management Action Record
Recommendation Management Response
Recommendation 1 - The Bank should improve the quality of NDEA management, measurement, and reporting of results
a. Review targets for AfDB’s contribution to the NDEA’s objectives and assign clear accountabilities that are cascaded through the respective complexes.
b. Ensure that the design, monitoring, and evaluation of energy sector interventions, and strategies documents are based on a well-articulated TOC.
AGREED-Management agrees that the NDEA’s operationalisation, measurement, and reporting could be strengthened. Work is already underway. For instance, the PEVP Complex’s KPIs have increasingly clearer linkages to the NDEA. Further actions are being planned, such as a new approach to the second phase of the NDEA in the context of the refined One Bank delivery model.
Further actions:
1. As part of the NDEA’s mid-term review, the Bank will review the NDEA’s theory of change, its implementation approach, and the sector results framework, which it will align more closely with the Bank’s Results Measurement Framework. The revised targets for the Bank’s contribution to meeting the NDEA objectives will be cascaded to departments and divisions where relevant. (PEVP, Q3 2021)
2. The Bank will update and roll out the “NDEA Dashboard,” which will track progress and estimates funding and capacity requirements for achieving universal access to electricity. (PEVP, Q3 2021)
3. All energy operations in 2022 will be based on the revised theory of change and new sector results framework. (PEVP, Q4 2022)

14 Evaluation of the AfDB’s Assistance to the Energy Sector (1999-2018): Refocusing Support for Improved and Sustained Energy Access in Africa - Summary Report
Management Action Record
Recommendation Management Response
Recommendation 2 - The Bank should strengthen its assistance to RMCs to enhance their capacity to formulate and implement comprehensive energy policies, which encompass long-term power development plans, energy security strategies, and energy efficiency /conservation plans.
a. Increase the use of non-lending instruments (e.g., analytical work, TA) to help elaborate possible least-cost energy solutions.
b. Strengthen policy dialogue based on an established and well-structured national sector reform strategies and road maps, to attain and maintain national government commitment.
AGREED-Management agrees with the recommendation, which speaks to the need for more resources for analytical energy sector work (e.g., integrated energy access plans), policy work, and regulatory work. The Bank is already supporting RMCs with sector- and policy-level work: for example, it is supporting a cost of service study in Zambia and sector reforms in Angola and Uganda. Its intention to scale up this work is reflected in the ADF-15 and GCI-VII commitments.
Further actions:
4. The Bank will increase its financing of upstream activities in the areas of knowledge, policy, regulation, power utilities, and regional power pools. Channelling these additional resources could take different forms—e.g., a “pass-through” vehicle, a multi-donor trust fund, or the Africa Energy Sector Technical Assistance Programme (AESTAP), now under development—depending on the evolution of ongoing resource mobilisation discussions. (PEVP & FIRM, Q4 2021)
5. The Bank will expand the Africa Energy Market Place’s coverage from 12 to 20 countries to provide a structured platform for policy dialogue that brings together RMCs, donors, development finance institutions, and the private sector. (PEVP & RDVP, Q4 2022)
6. The Bank will expand the coverage of the Electricity Regulatory Index (ERI) to all ADF countries (Q3 2021) and will support at least six countries with implementing ERI recommendations to improve the sector’s enabling environment. (PEVP, Q4 2022)
Recommendation 3 - The Bank should increase support to RMCs, through its power utility transformation program, by enhancing the power utilities’ performance and ensuring the financial sustainability of the power system.
a. Consider balancing its investments between power generation, and transmission and distribution.
b. Consider employing a holistic approach to electricity cost drivers, innovative subsidy design and electricity pricing to inform tariff design.
AGREED-Management agrees with the recommendation but notes that the Bank’s investments cover all aspects of the sector’s value chain. In addition, the Bank tailors its interventions to each country’s or region’s needs and to the resources provided by other partners. For example, the Sustainable Utility Transformation Programme rehabilitates and upgrades generation, transmission, and distribution infrastructure, focusing on reducing system losses, improving collection rates, enhancing sector governance, and improving management. In contrast, the Power Solutions Support initiative—currently being prepared—aims through advisory and technical support to assist RMCs, regional economic communities, and power pools with power sector reforms and the structuring of public-private partnerships to augment private sector finance and complement public resources in the energy sector.
Further actions:
7. The Bank will support four regional power projects/initiatives as part of the implementation of its Regional Project Acceleration Programme. This will allow RMCs and/or regional economic communities to meet their commitments to PIDA PAP1/2 and the African Union Commission’s Continental Master Plan. The programme will cover legal instruments, project preparation, and capacity-building activities to establish power markets and expand cross-border trade in power. (PEVP, Q4 2022)
8. The Bank will support five ADF countries with utility reforms that address technical and commercial losses, financial performance and sustainability, technical and operational performance, and skills gaps. As part of this work, the Bank will expand the African Network of Centres of Excellence in Electricity (ANCEE). (PEVP, Q4 2022)

15Management Response 15Management Response
An ID
EV S
ecto
r Eva
luat
ion
Management Action Record
Recommendation Management Response
Recommendation 4 - The Bank should increase its funding to RMCs and private sector for sustainable energy access in Africa by:
a. Scaling-up blended finance approaches by building on successful work to date.
b. Striving to increase resources for TA and project preparation to optimize its investments
AGREED-Management agrees with the recommendation to scale up blended finance solutions, capitalising on the Bank’s track record with global climate finance facilities (the Climate Investment Funds, the Global Environment Facility, the Green Climate Fund), with co-financers (the European Commission, Korea-Africa Energy Investment Facility, others) and with in-house trust funds/special funds (notably the SEFA Special Fund). Indeed, the Bank views resource mobilisation as crucial to its ambition to scaling up results across all facets of the energy sector. In this regard, work is underway to raise the SEFA’s resources from ~USD 100 million towards its target of USD 500 million and to establish the Canada-AfDB Climate Finance Facility, which will contribute to the energy sector.
Further actions:
9. The Bank will scale up technical assistance and blended finance facilities, such as SEFA, and will endeavour to establish AESTAP to increase technical assistance and innovative finance solutions. (PEVP, Q4 2022)


17Introduction 17Introduction
An ID
EV S
ecto
r Eva
luat
ion
Introduction
This report presents results from an evaluation by the Independent Development Evaluation (IDEV) of the African Development Bank Group (AfDB, or “the Bank”) on the Bank’s assistance to the energy sector from 1999-2018. Summative and formative approaches were used to conduct the evaluation, in line with the status of the portfolio (before and after the approval of the New Deal on Energy for Africa in 2016). Given the importance of the energy sector to the Bank’s Ten-Year Strategy (TYS) and the High 5 priority areas, the evaluation also encapsulates a forward-looking perspective.
The report presents the context – including highlights of global as well as Africa-specific energy challenges, the evaluation’s purpose and scope, and the methodology, including limitations. This is followed by a description of the Bank’s engagement in the energy sector, as well as the development effectiveness of the Bank’s support to the energy sector in Africa from 1999-2018. This includes an assessment of the Quality at Entry (QAE) of the New Deal on Energy for Africa (NDEA), covering the period 2016-2018. The final section concludes the report, proffering actionable and strategic recommendations based on the findings of the evaluation.
Purpose and objectives: This evaluation aims to inform the Bank’s strategies and operational approach to energy sector assistance by taking stock of the results of the Bank’s assistance over the 1999-2018 period and drawing lessons for future work. It is intended to help the Bank’s Board and Management to: (i) account for the development results of the Bank’s investment in the energy sector by determining the extent to which the Bank has contributed to the development of the energy sector in Regional Member Countries (RMCs); and (ii) learn from its operational experience by identifying lessons
on how the Bank can contribute most effectively to improving the energy sector performance of its RMCs.
Evaluation Questions: The evaluation used standard international7 evaluation criteria: relevance, effectiveness and efficiency of the Bank’s assistance to the energy sector, and sustainability of the benefits. These criteria provided the basis for the evaluation questions as captured below:
ı To what extent are the Bank’s activities and objectives of projects in the energy sector relevant to the priorities, policies, and development needs of the target groups and recipient countries, and in coordination and synergy with other development partners?
ı To what extent have the Bank’s activities (lending and non-lending) been effective?
ı To what extent has the Bank’s assistance been delivered efficiently?
ı To what extent are the results of the Bank’s assistance sustainable?
ı What factors enable or hinder the achievement of the results of the Bank’s assistance?
Scope: The evaluation covered a period of 20 years, from 1999 to 2018, and took into consideration all physical infrastructure projects and studies, as well as Technical Assistance (TA) activities related to institutional strengthening and capacity building approved during the above evaluation period. Energy projects that utilized the Bank’s new financing instruments, including results-based financing, partial risk guarantees, and equity participation were also considered.
18 Evaluation of the AfDB’s Assistance to the Energy Sector (1999-2018): Refocusing Support for Improved and Sustained Energy Access in Africa - Summary Report
This report presents the results of the energy sector evaluation and consists of the following sections: section 2 provides the evaluation methodology; section 3 describes the Bank’s engagement in the development of the energy sector in Africa; section 4 highlights the relevance of the Bank’s support to the
energy sector; section 5 presents the performance of the evaluated operations; section 6 outlines the road ahead through the implementation of the NDEA strategy; and lastly, section 7 summarizes conclusions, lessons and recommendations.

19Methodology 19Methodology
An ID
EV S
ecto
r Eva
luat
ion
Methodology
The evaluation used summative and formative evaluation approaches.8 A summative approach was used to assess 62 completed projects, amounting around UA 4 billion of net approvals, especially those approved during the period 1999-2015, whereby direct and intermediate outcomes (effectiveness), efficiency, and issues of sustainability were assessed. This approach served both accountability and learning purposes. It allowed the evaluation team to draw lessons and recommendations, with the intent to inform ongoing and future energy sector interventions at the strategic and operational levels. The evaluation design used a combined theory-based approach and system-based approach9. In the absence of an explicit Theory of Change (TOC) for the Bank’s policy, strategy, and appraisal reports guiding many of the operations reviewed in the evaluation, the evaluation team reconstructed an Energy Sector Logic Model (Annex 1).
In assessing development effectiveness, the evaluation used a four-point rating scale as defined in Annex 1 of the Technical Annexes: highly satisfactory, satisfactory, unsatisfactory, and highly unsatisfactory. Different lines of evidence were used to support the ratings. Where possible, ratings were attributed to each individual project-level evaluation - where not, a rating was given to the cluster of sub-sector projects provided in a given synthesis or review. The evaluation comprises six core components as follows:
ı Policy and literature review. This involved a desk-review of relevant literature regarding the energy sector in Africa. It focused on identifying the developments that have influenced the evolution of the energy sector in Africa and assessed how the Bank has responded to these trends through its policies and strategies. Thus, this review documents the evolution of the AfDB’s energy policy including its 2012 Energy Policy.
In doing so, the review benchmarked the Bank’s energy policies to Africa-focused energy policies of other development agencies (Annex 2).
ı Portfolio review. This assessed the Bank’s energy sector portfolio over the evaluation period, highlighting key characteristics including the Bank’s net approvals by subsector, region, type of operation, and funding instrument. It also assessed the efficiency of project delivery. The analysis drew on Project Completion Reports (PCRs) and ex-post evaluation documents available for projects approved and completed between 1999 and 2018 (62 projects). Findings derived from this review informed the next steps of the evaluation, particularly the country case studies.
ı Country Case Studies. Country case studies were conducted for the summative and formative approaches of the evaluation. For the summative evaluation, seven in-depth project-level field studies were conducted, and two synthesis reports prepared. The first report was a synthesis of four renewable energy projects (Bujagali and Buseruka I & II in Uganda, Sahanivotry in Madagascar and Cabeolica in Cape Verde) and the second was a synthesis of three conventional power generation projects (Abu Qir and El Kureimat power plants in Egypt and Thika power plant in Kenya). Countries were selected taking into account the characteristics of projects/programs (in which the portfolio review identified the type of their intervention), type of case study approach, availability of PCRs, the relative weight of the different sub-sectors in the energy portfolio and type of countries (middle income, lower-income or fragile states). The country selection also considered the relationship between the project status and the evaluation criteria.

20 Evaluation of the AfDB’s Assistance to the Energy Sector (1999-2018): Refocusing Support for Improved and Sustained Energy Access in Africa - Summary Report
The analyses were based on desk research and interviews with relevant stakeholders. Interviews were carried out during visits to the respective countries in November and December 2015. For the evaluation of the quality of the NDEA Strategy, ecosystem-based country case studies were conducted for Côte d’Ivoire, Democratic Republic of Congo (DRC), Morocco, Uganda, and Zambia. The countries were selected based on the following selection criteria: (i) a mix of Low-Income and Lower-Middle-Income Countries; (ii) the number of energy projects launched during the 2016-18 period; and (iii) regional representativeness. Greater weight was given to countries which have launched more than one project in the NDEA era. In each selected country, all projects approved since 2016 were considered.
The ecosystem-based case studies aimed at assessing the readiness of selected countries to benefit from the NDEA Strategy and its impact on programming in specific countries. They advanced the AfDB’s understanding of the role of ecosystem-based factors in the success or failure of the implementation of the NDEA Strategy. In conducting the ecosystem-based case studies, key informant interviews were held with five main energy sector stakeholder groups: (i) AfDB country office staff, (ii) National Government – policymakers, civil servants in the energy sector, etc., (iii) Development Partners active in the energy sector, (iv) Utility company staff and private sector companies and investors, and (v) Civil society stakeholders.
ı Cluster Evaluations. Cluster evaluations were conducted for four main clusters of interventions: (i) power interconnection – seven projects, (ii) rural electrification – six projects, (iii) energy-related Program-Based Operations (PBOs) – eight projects, and (iv) private sector operations – nine renewables and five conventional Public-Private Partnership (PPP) projects. The list of projects included in each cluster is captured in
Annex 4. For the power interconnection and rural electrification clusters, a purposive sampling strategy was used due to the limited number of completed projects. For the energy PBOs, a purposive sampling strategy was used to ensure that the selected countries were illustrative of the overall Bank portfolio and they reflected a diversity of cases fulfilling the following five selection criteria: evaluability, contemporary relevance, diversity in terms of type of PBOs, diversity in terms of country contexts, and size. The cluster evaluations used both qualitative and quantitative methods, including: (i) desk review of relevant and available internal documents; (ii) consultation with relevant AfDB staff; (iii) consultations with the staff of relevant government offices; (iv) field visits to project sites to hold discussions with local officials, non-governmental organizations, and a sample of the project beneficiaries; and (v) drafting and finalizing the project evaluation reports.
ı Quality at Entry Assessment of the NDEA Strategy. The QAE assessment considers the design process and quality of the NDEA Strategy and the adequacy of the institutional arrangements in place to deliver the NDEA. The overall objective is to assess the: (i) relevance of the NDEA’s objectives; (ii) rationale for the absolute level of the NDEA targets; (iii) design of NDEA; and (iv) resources mobilized to deliver the NDEA.
ı Benchmarking. The benchmarking analysis sought to compare the NDEA to the Africa-focused energy sector strategies of one other Multilateral Development Bank (MDB, namely the World Bank) and two bilateral donors (USAID, and the Agence Française de Développement – AFD) with a large and active presence in Africa’s energy sector. The benchmarking compares the logical frameworks used in designing the comparator strategies;
21Methodology 21Methodology
An ID
EV S
ecto
r Eva
luat
ion
the resources and institutions put in place to implement the strategies; and the mechanisms put in place to monitor the results achieved by the strategies. The analysis performed through the benchmarking exercise identifies the characteristics of a ‘good’ strategy and considers the extent to which the NDEA possesses these characteristics.
Evaluation challenges and limitations. It is also important to bring to light specific issues which may have affected the evaluation. These include:
ı Data availability. All background papers presented project-specific findings according to the relevance, efficiency, effectiveness, and sustainability of the Bank’s assistance. While some background papers presented evaluation questions and indicators similar to the Evaluation Matrix (Annex 3), others (e.g. Project Results Assessments, or PRAs) did not explicitly present evaluation questions or operationalize indicators in a manner coherent with the Evaluation Matrix. Consequently, for several of the Evaluation Matrix indicators, little if any data was found in the background documents. In addition, several background documents did not present findings for some evaluation questions due to a lack of data. When a limited amount of indicator data was available to address an evaluation question, due to any of the above factors, the trustworthiness of the findings was treated with caution and articulated moderately.
ı Non-uniform application of the TOC for background papers prepared by different teams at different times: The lack or lack of application of a common TOC across the various background papers posed a challenge for the analysis of the achievement of intermediate
outcomes. For example, “increased employment during construction/operation” was frequently identified as an intermediate outcome in PRAs and other background papers. However, this outcome was not included in the list of the intermediate outcomes in the TOC/logic model contained in the Portfolio Review used to guide the preparation of this report. Some evaluator judgment was thus exercised to integrate as appropriate the pertinent outcome data without adding to the list of intermediate outcomes for analysis. The inconsistent use of a TOC in conducting the evaluation has implications for the merit of the assessment of some intermediate outcomes, which have been duly highlighted when appropriate in this report.
ı Multiple and sometimes incoherent databases in the case of the Portfolio Review: In developing a portfolio database, some limitations were observed when it comes to the quality of the Bank’s SAP database. This is a generic problem in the Bank whereby project data are not frequently updated. A case in point is the energy subsector classification. While the Bank revised its sector classification system in 2015, operations captured in the SAP post-2015 still used the old subsector classification. For example, the 2015 Bank Group Revised Project Classification System – in the case of the energy sector – includes new classifications for energy efficiency projects, but these are not used. This made it difficult to classify the various energy operations, as those captured in the SAP were in some cases inaccurate. To address this challenge, the Power, Energy, Climate, and Green Growth (PEVP) Complex database on energy sector projects was used as a comparator to generate a harmonized database.


23Bank’s Engagement in the Development of the Energy Sector in Africa 23Bank’s Engagement in the Development of the Energy Sector in Africa
An ID
EV S
ecto
r Eva
luat
ion
Bank’s Engagement in the Development of the Energy Sector in Africa
Over the period 1999-2018, the Bank not only had policy frameworks but also fully supported the development of the energy sector in Africa.
Bank Policies and Strategies for the Energy Sector
The Bank’s involvement in Africa’s energy sector over the period 1999-2018 was guided by
several corporate and sectoral policy and strategy documents, including the 1994 Energy Sector Policy, the 2012 Energy Sector Policy, and the 2016 New Deal on Energy for Africa Strategy. These and other Bank strategies and initiatives introduced over the period are illustrated graphically below. Please refer to the descriptions of the Bank’s corporate and sectoral policy and strategy documents in detail in Annex 6 of the Technical Annexes.
2013Development Bank Group’s
Ten-Year Strategy (TYS 2013-2022)
2014Bank Group
Regional Integration Policy and
Strategy (RIPoS)
2014–2023
2016New Development
and Business Delivery Model
(DBDM) and Updated Decentralisation
Action Plan
2016New Deal on Energy
for Africa (NDEA) Strategy refocusing support to Africa’s
Energy Sector
2008Clean Energy
Investment Framework
for Africa
2004Financing Energy
Services for Small-scale Users in
Africa Program (FINESS)
1994Energy Sector Policy 2009
Bank Group Regional
Integration Strategy
2009-2012
2015 High 5 for transfor-ming Africa Energy
Sector Policy
2012Energy Sector Policy
2012Programme for
Infrastructure Development in
Africa (PIDA)
2011Climate Change
Action Plan (CCAP) for
2011-2015
2008Medium
Term Strategy
2008-2012
2006High Level
Panel Review
2015 Sustainable
Development Goals
Figure 1: AfDB Corporate and Energy Policies, Strategies and Initiatives

24 Evaluation of the AfDB’s Assistance to the Energy Sector (1999-2018): Refocusing Support for Improved and Sustained Energy Access in Africa - Summary Report
Overview of the Energy Sector Portfolio, 1999-201810
Energy infrastructure development remains a core priority of the Bank’s assistance to RMCs. Between 1999 and 2018, the Bank devoted nearly UA 13 billion to support investment and non-investment interventions in RMCs. The sector’s share of total Bank net approvals rose from a low of 5 percent in 1999 to a high of 39 percent in 2007, and then declined to approximately 18 percent in 2018 (Figure 2). Thus, over the 1999-2018 period, the sector accounted for about 19 percent of overall Bank Group commitments, ranking third in terms of total assistance after multisector (22%) and transport (19%).
The Bank’s active portfolio in the energy sector constituted 62 percent of total approved projects (306) between 1999 and 2018. This includes 69 newly approved projects and 122 ongoing projects. Completed/closed projects make up about 35 percent while projects which were approved but either abandoned or terminated constitute just 3 percent.
Compared to other sectors, the energy sector’s prominence saw drastic growth in the period following 2004. The sector’s share in total Bank
support increased from around 6 percent over the 1999-2003 period to nearly 24 percent for the 2012-2015 period. Over the 2012-2015 period, the greatest share of the Bank’s commitments was devoted to the energy sector. This positive trend is largely attributable to the Bank’s renewed commitment to responding to the energy development challenge in RMCs, as demonstrated by the launch of the 2012 energy policy alongside earlier interventions including the 2008 Clean Energy Investment Framework for Africa and the Climate Change Action Plan (CCAP) for 2011-2015.
Over the 1999-2018 period, investment projects aimed at closing the energy access gap dominated the Bank’s portfolio. Policy and institutional level reform interventions saw a notable increase; of these, the power generation subsector was pre-eminent. Overall, while infrastructure investments make up the bulk of energy sector assistance, the Bank is scaling up investments to address enabling environment issues, to foster private sector involvement in RMCs’ energy sectors. As shown in Table 1, during the evaluation period, the Bank approved 306 energy sector projects, with the majority (63% by number of projects and 89% by net amount approved) of them dedicated to investment, while the remaining went to soft components. Of the UA 13 billion in
Figure 2: Trends in the Energy Sector Share of Total Bank Group Net Approvals (1999-2018)
UA M
illio
n
Approval Year
Perc
enta
ge
Energy Sector Net Approvals Energy Sector Share of Total Bank Group Net Approvals
0
200
400
600
800
1000
1200
1400
1600
1800
0%
5%
10%
15%
20%
25%
30%
35%
40%
45%
1999
2000
2001
2002
2003
2004
2005
2006
2007
2008
2009
2010
2011
2012
2013
2014
2015
2016
2017
2018
39,3%
33,2%
Source: Calculated by IDEV, based on internal Bank databases.

25Bank’s Engagement in the Development of the Energy Sector in Africa 25Bank’s Engagement in the Development of the Energy Sector in Africa
An ID
EV S
ecto
r Eva
luat
ion
Type of Intervention 1999-2018(UA Million)
1999-2003(UA Million)
2004-2007(UA Million)
2008-2011(UA Million)
2012-2015(UA Million)
2016-2018(UA Million)
Infrastructure Investment 1,1484.53 (89.3%)
384.18 (86.5%)
1,411.06 (99.2%)
3,456.48 (96.1%)
3,574.53(79.1%)
2,658.28 (92.2%)
Enabling Environment 1179.59(9.2%)
4.41(1.0%)
0.00 (0.0%)
123.29 (3.4%)
871.48(19.3%)
180.41(6.3%)
Project Preparation 161.23 (1.3%)
55.49 (12.5%)
10.67 (0.8%)
15.33 (0.4%)
70.79(1.6%)
8.95 (0.3%)
Other (including energy efficiency, clean cooking, etc.)
36.86 (0.3%)
0.00 (0.0%)
0.00 (0.0%)
0.00 (0.0%)
0.00 (0.0%)
36.86 (1.3%)
Total 12,862.21 (100.0%)
444.08(100.0%)
1,421.72(100.0%)
3,595.11(100.0%)
4,516.80(100.0%)
2,884.50(100.0%)
Source: Calculated by IDEV, based on internal Bank databases.
In line with its commitment to catalyzing clean energy investments in RMCs, the AfDB approved the Ouarzazate Solar Power Station in Morocco in 2012. The project, one of the largest solar complexes in the world, had the objective of reducing the country’s energy dependence on external markets by developing renewable energies. For both phase I&II of the project, the Bank committed nearly €200 million (senior loan) and USD 219 million (Clean Technology Fund). So far, the project has added an installed capacity of about 160 MW and generated an additional energy supply of 414 GWh (as of 2017).
Source: IDEV. 2018. Project Results Assessment- Ouarzazate Solar Power Station.
Box 1: The 510 MW Ouarzazate Solar Complex in Morocco
Table 1: Bank Group Energy Sector Assistance (1999-2018): Infrastructure versus Enabling Environment Investments
energy sector support over the 1999-2018 period, about half – UA 6 billion (49%) – targeted power generation projects. The next top three subsectors after power generation are National Grid Extension/Upgrade (21%), Regional Interconnection (12%), and PBOs (9%) – see Table A5.3 of Annex 5. Investment in power generation gradually declined after the approval of the 2012 energy policy, with a great refocus on transmission and distribution.
There is a growing interest in clean electricity generation. The Bank is making inroads in renewable energy development in recent years. While conventional energy constituted the bulk of Bank-funded power generation investments over the two-decade period (55.3%), investments in renewable energy have picked up since the approval of the Bank’s 2012 Energy Strategy. The main driver for the shift in the Bank’s energy portfolio are Climate
Investment Funds11-supported projects, driven largely by transactions in Morocco (Ouarzazate Solar Complex, see Box 112, the Wind & Hydro Program, Midelt Solar Complex), South Africa (Sere Wind Farm, Xina CSP IPP), and Kenya (Menengai Geothermal Development and IPPs). As shown in Figure 3, the share of conventional energy commitments in total Bank power generation assistance has seen a sharp decline, from nearly 99 percent over the 1999-2003 period to a low 5 percent over the 2016-2018 period. The Bank is supporting the transition towards a more decarbonized energy sector in its energy operations. In line with its 2012 energy sector policy, the Bank supported power generation from conventional sources as appropriate (e.g. the gas-based projects such as Ciprel in 2013 and Azito in 2019, for which a lot of project preparation was done within the review period).

26 Evaluation of the AfDB’s Assistance to the Energy Sector (1999-2018): Refocusing Support for Improved and Sustained Energy Access in Africa - Summary Report
The Bank’s commitment to leveraging Africa’s abundant renewable energy resources is gaining traction. There has been a decisive shift towards renewables in the Bank’s financing of power generation projects. In particular, the 2012-2015 period marked a break from the past, where renewable energy accounted for two-thirds of total power generation assistance. Over the 2016-2018 period, of the UA 0.82 billion committed to power generation, 95 percent was devoted solely to renewable energy operations.13 This is reflective of the Bank’s ambitious commitment to the implementation of the NDEA. For example, in 2017, 100% of the Bank’s energy investments were in renewable energy, making up about 1,400 megawatts in total power.14 Also, the Desert-to-Power initiative (Box 2) is a demonstration of how the Bank intends to harness the solar potential in the Sahel/Sahara region.
Solar and wind energy sources make up the bulk of the Bank’s renewable energy commitment.
As shown in Figure 3, solar and wind energy accounted for 62 percent of power sub-sector assistance between 2016 and 2018. This shows an increase of about 12 percentage points as compared to the 2012-2015 period and nearly 54 percentage points as compared to the 2008-2011 period. Collectively, this transition towards a more decarbonized energy sector in Bank-funded energy operations bears testament to power generation developments on-the-ground in RMCs.
The Southern Africa Region is the largest recipient of the Bank’s energy sector assistance, with about 29 percent (amounting to UA 4 billion) and largely accounted for by South Africa. However, since the approval of the NDEA
The Desert to Power initiative is set to stretch across the Sahel region and expected to connect 250 million people with electricity by tapping into the region’s abundant solar resources. It will make the Sahel the world’s largest solar production zone with up to 10 000 MW of solar generation capacity and speed up economic development through the deployment of solar technology. The eleven countries that will benefit from this initiative comprise Burkina Faso, Ethiopia, Eritrea, Djibouti, Mali, Mauritania, Niger, Nigeria, Senegal, Sudan, and Chad.
Box 2: Desert to Power - Harnessing the Sun to Power the Sahel Region
Figure 3: Renewable Energy Resources Gaining Traction since the Approval of the 2012 Energy Policy
100
80
60
40
20
0
Approval Period
Conventional RE-Geothermal RE-HydroPower RE-Solar & Wind
Perc
enta
ge o
f app
rova
ls
1999-2018 1999-2003 2004-2007 2008-2011 2012-2015 2016-2018
Net Power Generation Commitment by Main Energy Source in percent and approval period, UA 6.36 Billion.
31.3%
11.2%
55.3%
94.4%
23.3%
8.3%
62.4%
85.2%
8.1%
49.6%
4.1%
16.7%
33.7%4.9%
5.4%27.8%
62%
Source: Calculated by IDEV, based on internal Bank databases.

27Bank’s Engagement in the Development of the Energy Sector in Africa 27Bank’s Engagement in the Development of the Energy Sector in Africa
An ID
EV S
ecto
r Eva
luat
ion
in 2016, the West and East Africa regions have received more support, 27 percent and 23 percent, respectively, compared to 14 percent for the Southern Africa Region (see Table A5.4 of Annex 5). During the evaluation period, the share of the Bank’s energy support to the Central Africa Region was the lowest (5%) and did not significantly increase over time. Apart from the situation of the Central Africa Region, this shift collectively reflects efforts to adopt a more equitable approach in the Bank’s assistance to RMCs.
The Bank’s energy sector assistance devoted to transition states15 increased, and multinational operations are also gaining momentum. Even though less than 8 percent of the Bank’s energy sector assistance was devoted to transition states over the 1999-2018 period, between 2016 and 2018, the share of net approvals to transition states increased by about 11 percentage points as compared to the 2012-2015 period (see Table A5.5 of Annex 5). At the same time, multinational operations are gaining momentum to serve the African regional integration purpose (19% in the 2016-18 period, compared to 1% in the 2004-07 period and 10% in the 2012-15 period). Put together, more than two-thirds (67%) of the Bank’s energy sector assistance was devoted to middle-income countries. The relative lower involvement in low-income countries could be explained by several factors, including: (i) a demand-driven approach; (ii) limited ADF funding - that are dedicated to public sector projects; (iii) countries not being mature enough for private investments in the energy sector.
The ADB funding window of the Bank Group accounts for nearly two-thirds of energy sector commitments, totaling almost UA 8 billion. ADF is the second most important source of funding for energy sector projects in RMCs, about 27 percent (Table A5.6 of Annex 5). When it comes to instruments (Table A5.7 in Annex 5), project lending remains the dominant financial instrument used by the Bank. Approximately 77 percent of energy sector assistance was project-based lending, followed by project grants (9%) and policy-based lending (7%).
PBOs are gaining traction within the Bank’s energy sector portfolio. While PBOs totaled just UA 100 million over the 2008-2011 period, they increased to UA 780 million between 2012 and 2015, about eight-fold. This reflects the Bank’s commitment to supporting policy reforms in RMCs. PBOs are mostly in the form of public sector loans, or Sovereign Operations (SO), rather than TA. It is important to note, however, that the Bank often provides TA that is embedded in its core lending, which is not recognized explicitly as TA in these numbers. The Bank’s capacity to provide pure TA (that is not directly linked to a transaction) is currently limited, but it is considering the launch of a new TA-focused trust fund (African Energy Sector TA Programme, or AESTAP) to fill this gap. The need for additional TA is echoed in the ecosystem-based country case studies. While challenges in applying NDEA principles are often related to issues at the country level that fall under the responsibility of government, it appears that the AfDB has not necessarily recognized these challenges or pushed forward interventions to tackle them.
A sizeable share of the Bank’s energy sector assistance was devoted to investments in Africa’s private power sector between 1999 and 2018. Starting with virtually zero investment in 1999, the Bank had, as of December 2018, committed UA 2.72 billion in investments to Africa’s private power sector, representing nearly one-fifth of total Bank net approvals to the energy sector over 1999-2018 (Figure 4). This comprises a total of 85 projects, with nearly 90 percent approved over the 2009-2018 period. For example, in 2018, the Bank approved nine infrastructure investment projects via its private sector financing window, amounting to UA 325 million. This renewed commitment16 to stepping up investments in the private power sector affirms the important role of the private sector in delivering on the Bank’s infrastructure development agenda. This reorientation is aligned with the TYS 2013-2022 called, “At the Center of Africa’s Transformation”, which boosts support to private sector financing.

28 Evaluation of the AfDB’s Assistance to the Energy Sector (1999-2018): Refocusing Support for Improved and Sustained Energy Access in Africa - Summary Report
Substantial growth in Special and Trust Funds. In recent years, the Bank has put more emphasis on leveraging capital resources to support infrastructure development in RMCs. The complementary resources were drawn from multiple other sources of financing channeled by the Bank - e.g. climate finance facilities (GCF, CIFs, GEF), co-financing arrangements (AGTF, JICA’s ACFA, and EU), and Bank-administered trust funds (SEFA, NEPAD, IPPF). Over the review period, a sizable amount of energy assistance was financed through special and trust funds, about UA 0.78 billion (6% of total energy sector commitments). The volume of special funds committed to energy sector projects has increased substantially, from a low of UA 0.05 billion over the 1999-2003 period to UA 0.36 billion between 2012 and 2015, a clear demonstration of effort to mobilize resources from partners to co-finance energy projects, including climate funds. For example, between 1999-2018, close to UA 420 million from CIFs17 were used to support various energy projects (Table A5.8 in Annex 5).
In the last decade, the Bank has, through PPP models – including co-financing and syndication - leveraged more private capital to boost infrastructure development efforts in RMCs. For example, for all 2016 approvals, total private co-financing for infrastructure projects18 by the Bank totaled around US$ 1.9 billion (UA 1.35 billion). Of this, private direct mobilization was US$1.1 billion (UA 0.78 billion) while the remaining US$820.5 million (UA 583 million) was indirectly mobilized19. This reflects recent developments on the continent when it comes to private sector financing in the energy sector. Out of forty-five privately financed projects that reached financial close in 2017, 91 percent were energy sector projects, totaling US$1.95 billion (UA 1.42 billion).20 The private sector made an important contribution to expanding power generation capacity in RMCs, mainly toward thermal projects, with the involvement of Independent Power Producers (IPPs).
Figure 4: Increased Bank-Support to the Private Sector
Source: Calculated by IDEV, based on Bank internal databases
Energy Sector Net Approvals by Type of Operation
UA M
illio
n
1999
2000
2001
2002
2003
2004
2005
2006
2007
2008
2009
2010
2011
2012
2013
2014
2015
2016
2017
2018
2,723
10,234
14,000
10,500
7,000
3,500
0
Private Public
Approval Year


31Relevance of the Bank’s Support to the Energy Sector 31Relevance of the Bank’s Support to the Energy Sector
An ID
EV S
ecto
r Eva
luat
ion
Relevance of the Bank’s Support to the Energy Sector
The relevance of the Bank’s support to the energy sector was examined at four levels: strategic objectives, quality of policies’ design, the objectives of projects, and the design of projects.
Overall, the relevance of the Bank’s support to the energy sector was assessed as satisfactory. Projects approved before 2012 show a higher percentage of satisfactory or over (84% compared to 74% after 2012) in terms of relevance. The objectives of the Bank’s energy sector strategic documents (policies, strategies, and initiatives) were found to be aligned to its corporate policies and strategies, the RMCs’ priorities, and international targets. However, the design of the Bank’s energy sector interventions was generally unsatisfactory, due to shortcomings in some critical areas such as risk assessment as well as long-term sector planning. As per the TOC, the design of interventions is not fully conducive to achieving results because of the issues on regulatory environments in RMCs mainly for Non-Sovereign Operation (NSOs), and less focus on transmission and distribution.
Alignment of the Bank’s energy strategic objectives
The objectives of the Bank’s energy sector strategic documents (policies, strategies, and initiatives) mainly focus on enhancing equitable energy access, securing supply, and alleviating the impact of climate change for sustainable, green, and inclusive socio-economic growth
and development in Africa. These objectives are aligned to:
ı The Bank’s Ten-Year Strategy (TYS 2013-2022)21
and Medium-Term Strategy (MTS 2008-2013)22, as well as relevant sector policy and strategy documents including those for regional integration (Bank Policies and Strategies for the “Energy Sector” Section).
ı The Infrastructure Consortium for Africa (ICA)23.
ı The Climate Change Action Plans for 2011-2015 and 2016-2020.
ı The Millennium Development Goals (MDGs) and most recently the Sustainable Development Goals (SDGs).
Also, the RMCs’ national plans and targets were often conceived with the MDGs and SDGs in mind, specifically, Goal 1 (to eradicate poverty and hunger) and Goal 7 (to ensure environmental sustainability). Although energy was not one of the eight MDGs, it was internationally recognized that access to modern energy is a prerequisite to achieving these goals and this has been taken into account in the formulation of the new SDGs, specifically Goal 7 (SDG 7) which calls for ensuring “access to affordable, reliable, sustainable and modern energy for all” by 2030.
The relevance of the NDEA strategy’s goal
Finding 1: The objectives of the Bank’s energy sector strategic documents (policies, strategies, and initiatives) were aligned to its corporate policies and strategies, the RMCs’ priorities, and international targets.
Finding 2: The relevance of the NDEA to the needs of the African continent is clear, with targets aligned with the energy priorities of RMCs. However, the targets are all highly ambitious; arguably overly ambitious given the resources made available.

32 Evaluation of the AfDB’s Assistance to the Energy Sector (1999-2018): Refocusing Support for Improved and Sustained Energy Access in Africa - Summary Report
Overall, the NDEA’s broad goal is aligned with and relevant to the urgent and indisputable need for improved access to energy across Africa. Also, the outcomes that the NDEA is targeting are consistent with and relevant to the AfDB’s overall strategy as well as with other multilateral commitments, such as the Paris Climate Change Agreement and many of the global goals. At the country-level, based on the analysis of the five case studies, the picture is mixed. On the one hand, the headline objectives of the NDEA are clearly in line with the policy objectives of most RMC governments. However, it is less clear that the shift in priorities highlighted by the NDEA (for example, more balanced coverage of the energy sector value chain, and improved coverage of distributed energy access solutions and rural communities) is echoed through those government policies and strategies. Further, the shift in focus represented by the NDEA is not evident in many RMC government policies and strategies. The country case studies highlight that country-level energy policies and strategies are largely focused on on-grid electricity provision. Government policies are often focused on the supply-side and pay little attention to distributed energy access solutions. The fact that policymaking is generally at a nascent stage in these areas means that the readiness of countries for investments in these parts of the sector is also low. The case studies highlight that this, in turn, results in concessional loans primarily being allocated to large scale centralized generation and transmission projects, rather than to decentralized solutions.
The targets set for the NDEA are aligned with the NDEA objectives, although they seem very ambitious with regard to the countries’ energy ecosystems. Four targets are identified: (i) adding 160 GW of new power generation capacity; (ii) adding 130 million new on-grid connections; (iii) adding 75 million new off-grid connections; and, (iv) increasing the number of households using clean cooking solutions by 150 million. These targets need
to be met for this vision to become a reality and the AfDB has made several assumptions in deriving the targets set under the NDEA. The four targets have been defined to feed into this objective, through an increase in power generation capacity, more on-grid and off-grid electricity connections, and improved access to clean cooking solutions. The assumptions and logic for the level at which these targets have been set are summarised in Annex 4 of the Technical Annexes.
The analytical justification for the quantification of most of the NDEA targets is reasonable and the goals and objectives for the NDEA have been clearly and consistently stated. The exception to this is the clean cooking target, which does not equate to universal access. However, the targets are very ambitious, and it is questionable whether RMCs have the readiness to implement projects that the AfDB and its partners might support in line with the NDEA.24 Most countries have their own access targets, which are different from the NDEA’s, and usually more modest, i.e. lower targets or similar targets but over longer periods. Also, there are some shortcomings in the way the targets have been quantified. Firstly, the targets are set as absolute targets, rather than as percentage targets. This means that the targets are not adjusted if underlying assumptions turn out to be incorrect (for example, if population growth or GDP growth is different from that assumed). Secondly, this slightly increases the risk of unintended consequences (for example, building surplus power generation capacity that unnecessarily increases the financial burden on utilities). However, it seems highly unlikely that the NDEA target by itself would have this effect. Finally, in the case of the GW target, the amount of capacity required would depend greatly on the supply mix assumed. Typically, a unit of solar PV generation capacity will generate less power than a unit of wind generation, which in turn will generate less power than a unit of baseload generation capacity (such as a combined cycle power plant or a coal-fired plant).

33Relevance of the Bank’s Support to the Energy Sector 33Relevance of the Bank’s Support to the Energy Sector
An ID
EV S
ecto
r Eva
luat
ion
Alignment of the Bank’s project objectives
At the project level, almost all (99%) of the sixty-two sampled projects were rated as satisfactory or higher in terms of the relevance to Bank objectives as it relates to the policies and strategies as well as stakeholder priorities (Figure 5). Evidence demonstrated an alignment between project objectives and the Bank’s corporate policies and strategies, applicable CSPs, and RMCs’ priorities. These findings were consistent across all energy sub-sectors (power generation either from renewable or conventional sources, power interconnection, and rural electrification). Country policy, strategy or planning documents that were shown as evidence to support the relevance of the Bank’s investments included economic development plans or agendas; white papers; integrated resource plans (IRP); least-cost development plans (LCDPs); energy sector strategic plans; poverty reduction strategy papers (DSRP/PRSP); and agricultural development and strategic infrastructure plans. More specifically, the objectives of renewable projects (NSO and SO) fit perfectly with key RMC objectives of increasing access to least-cost power. This was addressed through the construction of hydro generation plants with the involvement of private developers (e.g. Madagascar Sahanivotry, Uganda Bujagali, Uganda Buseruka, and Zambia Itezhi-Tezhi), wind farms (e.g. Cape Verde Cabeolica25, Kenya Lake Turkana, and Morocco Tangier II), or solar (e.g. Morocco Ouarzazate and South Africa Xina). Moreover, the evaluation finds a satisfactory picture of the relevance of the energy-related PBOs – based on their programming within the CSP for three of the five energy sector PBOs evaluated, and broad adherence to the Bank’s policy and guidelines and international good practice. Finally, AfDB activities in the energy sector since 2016 have
been consistent with the objectives of the NDEA. A wide range of initiatives has been promoted, which together cover the various themes set out under the NDEA. The Bank has started to ramp up its activities in areas that previously received less attention, for example, off-grid electricity access solutions and clean cooking. A review of project appraisal reports for Morocco, Côte d’Ivoire, and DRC found that they cite consistency with the NDEA and its themes as a rationale for the Bank’s involvement. Alignment between project outcomes and the NDEA strategic priorities are identified, but are not cited as driving project origination or development activities.
The design of the 2012 Energy Policy
The formulation and implementation of the energy policies and strategies of the MDBs, including the Bank, take place within an external environment that is divided in its views about the role of energy in development. The achievement of robust and ambitious energy strategies is challenged as there are strong lobby groups for energy resources, and views may differ between oil-producing and non-oil producing countries. Unlike other development agencies, the AfDB focuses exclusively on Africa in terms of its mandate. However, the European Union (EU) has an Africa-EU Energy Partnership, while the World Bank has a significant interest in improving the energy sector in Africa as evidenced by its Energy Direction Paper (2013) and the Independent Evaluation Group’s evaluation of the World Bank Group’s Support to Electricity Access (2015). The World Bank’s approach to energy sector reforms has evolved over the past two decades, and there is now greater recognition of the complexity and time required for lasting reforms as well as the highly contextual nature of appropriate institutional and business models. Bilateral aid in the energy
Finding 3: The objectives of the Bank’s energy sector projects/programs were generally aligned to its corporate policies and strategies, applicable CSPs, and the RMCs’ priorities.
Finding 4: The quality of the Bank’s 2012 energy policy is comparable to that of other MDBs and the Bank’s interventions contain some value-added.

34 Evaluation of the AfDB’s Assistance to the Energy Sector (1999-2018): Refocusing Support for Improved and Sustained Energy Access in Africa - Summary Report
sector is also widespread with initiatives such as the USAID Power Africa initiative, and the Japanese International Cooperation Agency’s (JICA) support to assist Africa to achieve inclusive economic growth. JICA has an Energy Strategy Paper for its global approach, but does not have a specific paper on Africa. Bilateral agencies rarely have specific energy policies or strategies, but rather general policies for providing development aid to specific countries.
Evidence related to the value of the Bank’s interventions was found in (i) private sector participation, (ii) climate change, and (iii) regional cooperation. The 2012 Energy Policy supported African governments to increase the extent of PPPs through the development of new financing instruments and the implementation of PPP programs. Overall, 25 percent of the Bank’s energy sector loans went to the private sector during the evaluation period. The scaling up of renewable energy technologies, one example of a PPP program, was implemented by the Bank to attract private investment. Also, the Bank launched the Africa50 Fund (in 2015) aimed at accelerating the continent’s infrastructure development by mobilizing capital with equity participation from member states, other institutions, and the private sector. The Bank also introduced climate change reforms through the Climate Change Action Plan (CCAP) 2011-2015/2016-2020 and its support to African governments in their access to international climate finance, integrating climate change planning into their energy strategies. The 2012 Energy Policy supported regional cooperation reforms and many initiatives are underway, with the most comprehensive being the Programme for Infrastructure Development in Africa or PIDA, launched in 2010. Regional power pools have been established to share energy resources and promote the development of regional electricity markets. The objectives of sampled interconnection projects were evaluated as being highly consistent with the donors’ sectoral agenda including regional economic cooperation and integration, private sector development, and environmental protection.26
The design of the NDEA strategy
The NDEA’s design responds to many of the shortcomings noted in its review of the AfDB’s pre-NDEA energy sector portfolio in many ways (e.g. the initial focus on power generation, regional bias, and institutional capacity). The targets and themes identified by the NDEA indicate a rebalancing in the AfDB’s approach to its energy sector portfolio. The NDEA does not have a specific country or regional focus, but the re-focusing would also be consistent with a regional rebalancing of the Bank’s work in the sector, for example, energy access interventions targeting the ‘bottom of the pyramid’ are likely to be particularly relevant in lower-income countries. Finally, the NDEA recognizes that TA and capacity building are required to complement the financing that the AfDB provides, to facilitate lending activities and increase the efficacy of projects to which the AfDB provides funding.
While the objectives of the NDEA are clear, the logical framework by which it aims to achieve those objectives is less clear. Indeed, a clearly articulated TOC could have helped to promote a common understanding of the NDEA following its launch. The Bank does not have a TOC for the NDEA and the components of the NDEA do not map clearly to a TOC. This is not uncommon when the NDEA is assessed against comparator strategies; however, this lack of a clear TOC may contribute to some of the initial challenges in implementing the NDEA. More broadly, a TOC for the energy sector that is normally developed at the design stage of each of the projects
Finding 5: While the objectives of the NDEA are clear, the logical framework by which it aims to achieve those objectives is less clear. The Bank does not have a TOC for the NDEA and the components of the NDEA (the universal access goal, together with the targets, themes, flagships, and principles) do not map clearly to a TOC. This is not uncommon when the NDEA is assessed against the comparator strategies.

35Relevance of the Bank’s Support to the Energy Sector 35Relevance of the Bank’s Support to the Energy Sector
An ID
EV S
ecto
r Eva
luat
ion
is not presented in either of the policy/strategy documents.27 A TOC would ensure clear performance expectations, unpack the Bank’s contribution compared to other partners, and help establish a rigorous performance management system.
The AfDB published a Results Measurement Framework28 (RMF) for the High 5s, including the NDEA, shortly after they were launched. The RMF aligns with the NDEA Strategy in most instances. There are some inconsistencies between the Level 2 targets proposed in the NDEA Strategy and the Bank’s current RMF (2016-2025). The RMF for the NDEA clearly distinguishes between the NDEA’s aspirational targets and the AfDB’s contribution towards those targets. The four key targets set by the NDEA are aspirational targets for the continent. The AfDB has set its own targets (referred to as Level 2 in the RMF) that map to these outcomes. However, the RMF Level 2 indicators are lower.29 Moreover, the NDEA Strategy does not include specific renewable energy technologies or carbon reduction targets, whereas the RMF now being used does. As noted earlier, the
NDEA is technology-neutral; however, the overall AfDB strategy places greater emphasis on green growth and environmental sustainability, in addition to the inclusion of these more granular targets. These targets are more consistent with ensuring that the NDEA is aligned with the Bank’s overall strategy. Further, the current RMF includes a target for off-grid connections (or people connected) whereas the NDEA Strategy includes installed capacity (in MW) of off-grid connections as a Level 2 indicator. The inclusion of a connections target seems to be more intuitive and more aligned with the NDEA’s Level 1 indicators. The annual targets shown in Table 2 simply represent a linear interpolation of the 2025 targets. This differs from the RMF presented in the NDEA Strategy which indicates lower targets for the first half of the NDEA (i.e. the period to 2020), with progress against the NDEA targets being back loaded. Given the time required to rebalance the portfolio and the timescales over which many energy sector projects are implemented, it seems reasonable to expect progress against the targets to accelerate during the NDEA period, as indicated in the strategy.
Table 2: 2018 Progress against Level 2 Indicators: Extract from the 2019 ADER
Indicator 2018 Actual 2018 Target2025 Target (cumulative 2015-2025)
New total power capacity installed MW 447 880 8,800
New renewable power capacity installed MW 197 560 5,600
People with new [on-grid] electricity connectionsOf which are women
0.6 million0.3 million
2.4 million1.2 million
24 million12 million
People connected with off-grid systemsOf which are women
--
1.2 million0.6 million
12 million6 million
People provided with clean cooking accessOf which are women
--
3.2 million1.6 million
32 million16 million
New or improved power distribution lines km 2,430 3,520 35,200
New or improved power transmission lines km 480 576 5,760
Emissions reduction in energy MtCO2 0.7 1.8 18
Source: Annual Development Effectiveness Review (ADER) 2019.

36 Evaluation of the AfDB’s Assistance to the Energy Sector (1999-2018): Refocusing Support for Improved and Sustained Energy Access in Africa - Summary Report
The Bank’s energy Complex, PEVP, also monitors its pipeline using similar indicators to the Bank’s RMF indicators described in Annex 6 of the Technical Annexes. However, the Key Performance Indicators (KPIs) used to manage performance within the Complex are mostly focused on approvals rather than the NDEA targets that the approved projects should be aligned with. The projects are selected based on a broad alignment with AfDB priorities; however, the project pipeline is not actively managed to ensure alignment with the NDEA and the achievement of its targets. PEVP project databases track many of the indicators shown in Annex 6 of the Technical Annexes, such as power generation capacity, numbers of connections, and avoided CO2 emissions. This database appears to provide much of the data that would be required to track actual and predicted future performance against the NDEA, using information about the Bank’s project pipeline. However, it appears that set targets are not always effectively cascaded down throughout PEVP, with some managers not being aware of the targets in place for their areas of focus.
The monitoring framework for the NDEA compares well when benchmarked against similar strategies. However, there are two shortcomings related to PEVP’s monitoring
framework that may be increasingly important during the NDEA implementation period. First, the database does not effectively track the contributions made by all the TA facilitated by the Bank, for example through trust funds that it manages. Some TA might be instrumental in facilitating capacity additions or new connections. Second, the database does not track and consolidate the impact of investments that are made by funds that the Bank invests in. PEVP is increasingly investing in funds, ranging from private equity funds to AfDB-seeded funds, such as the Facility for Energy Inclusion30. PEVP’s database includes the AfDB’s financial contribution to the fund, but it does not include the contribution of investments within that fund towards NDEA targets. Power Africa’s documentation of its monitoring and evaluation implementation plan is clearest and reporting on progress against the strategy is regular and public. The NDEA is also relatively clear, especially in terms of evaluability, because it had the clearest indicators and targets of any of the comparator strategies. Some of the indicators in the World Bank strategy had more general definitions of indicators, and it appears as if not all of the indicators were systematically tracked and reported on. AFD’s Energy Transition Strategy had very high high-level indicators, general definitions of indicators, and no apparent public reporting of progress.
Access to reliable and affordable energy is just one of a range of critical ingredients that need to be in place to catalyze economic growth. This should be taken into consideration when designing selected interventions that are implemented under the NDEA with efforts to expand access to energy being financially sustainable and, where appropriate, targeted at activities likely to stimulate economic growth, such as the productive use of energy. Accordingly, synergy between the NDEA Strategy and other sectors should be paramount to increase energy demand and achieve the High 5s. For example, rural electrification cluster evaluation highlighted the need for a synergy between rural electrification and other development projects (e.g. irrigation, agriculture, water supply, health, education, microcredit, etc.) to foster development impact. This was the case in Tunisia and, to some extent, in Mozambique. The benefits of rural electrification were more pronounced in Tunisia, where the Government integrated electrification with other development initiatives within its integrated rural development strategy. This approach optimized electricity use, rural business development and expansion, and increased standards of living. Nonetheless, in rural areas, the available electricity was not used optimally due predominantly to a limited availability of complementary economic activities and the inability of many households to pay electricity tariffs.
Box 3: The Quest for a Holistic Approach to Maximize the Productive Use of Electricity and Improve Sustainable Economic Growth

37Relevance of the Bank’s Support to the Energy Sector 37Relevance of the Bank’s Support to the Energy Sector
An ID
EV S
ecto
r Eva
luat
ion
Finding 6: The design of the Bank’s energy sector projects was unsatisfactory due to shortcomings in some critical areas such as risk assessment and long-term sector planning. The design of interventions is not conducive to achieving results due to issues on regulatory environments in RMCs, and less focus on transmission and distribution.
The Bank’s project design
At the project level, 74 percent of the sampled projects (6131) are rated as satisfactory or higher in terms of the relevance of the project design. Project design for SOs experienced shortcomings in three main areas: risk assessments, quality of front-end work for PPPs, and a lack of comprehensive national energy policies. Firstly, the main risks were reasonably well-identified during project design, but insufficiently analyzed. They suffered from optimistic assumptions which include the following: (i) utilities’ ability to operate and maintain the project assets effectively; (ii) low tariff regimes; (iii) limited development of transmission and distribution networks; (iv) availability of gas to run the power plant for thermal projects; and (iv) political interference. Other risks, in power interconnection projects, include the capacity of the exporting countries to generate enough electricity to meet national demand as well as contractual obligations to international customers, the political tensions between the trading countries for power interconnection projects, and the limits on power purchasing agreements. On the positive side, for NSOs and PBOs (except for Angola), the risk assessment and mitigation are largely satisfactory across the individual interventions in the renewable energy sector, although some key risks such as market risk and construction risk are inadequately assessed or mitigated (e.g. the South Africa Xina Solar One Project). Secondly, there was no evidence for any of the four evaluated interventions that an assessment of value for money or counterfactual analysis was conducted. Thirdly, the importance of assistance in policy development and reform is well recognized in the Bank’s energy policies and strategy,
but the Bank did not systematically support RMCs in comprehensive national energy policies, including tariffs.32 The energy sector PBO cluster evaluation found that the design proved to be the weakest dimension of the energy sector PBO mechanism. This insufficient synergy in implementing the different Bank strategies jeopardized the achievement of the energy interventions’ objectives (Box 3).
Finally, the global approach used in pursuit of the energy intervention objectives was limited. There are three issues identified in the evaluation of the adequacy of the Bank’s interventions. These include: (i) insufficient focus on transmission infrastructure; (ii) limited support to develop appropriate cost recovery tariff schemes; and, (iii) inadequate emphasis on the enabling environment, e.g. energy sector reforms. Further details include:
ı Insufficient focus on transmission and distribution infrastructure. The existing transmission and distribution infrastructure in Africa is old and insufficiently maintained with about one-fifth of generated electricity on the continent wasted. Given this, the Bank has been directing significant investment towards the development of transmission and distribution infrastructure for the last twenty-one years, but its investment amount has not been proportionate to the needs. The current transmission capacity is not enough to address the growth of power generation, most particularly in the need for transmission through the introduction of renewable energy.33 Also, significant energy losses continue to occur between sources of supply and points of distribution across the continent. Transmission and distribution losses reduce the supply ultimately available to end-users by more than 20 percent in some countries, averaging 18 percent across the region. This rate, excluding South Africa, is more than double the world average.34
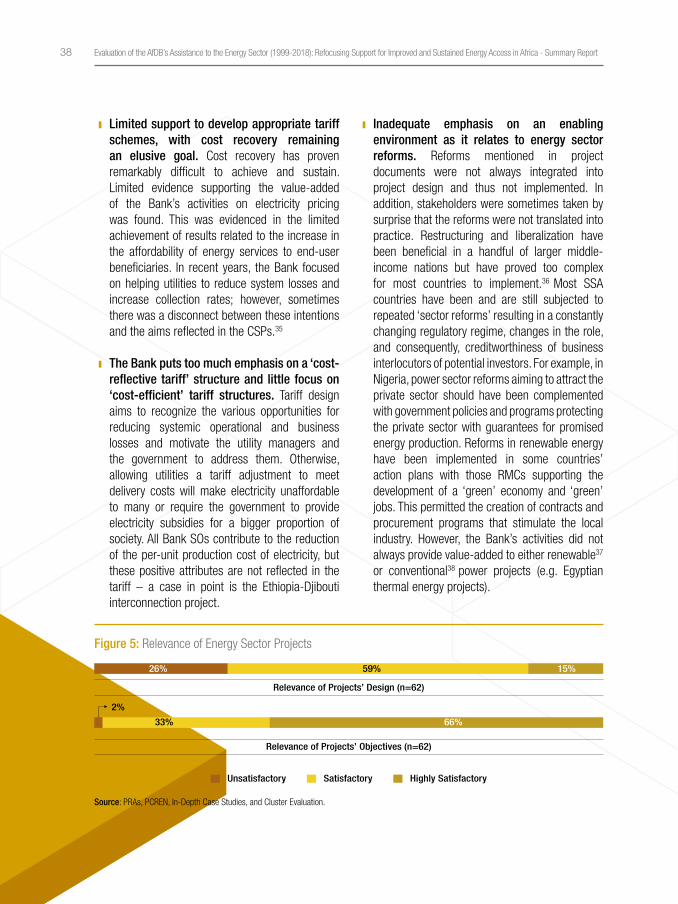
38 Evaluation of the AfDB’s Assistance to the Energy Sector (1999-2018): Refocusing Support for Improved and Sustained Energy Access in Africa - Summary Report
ı Limited support to develop appropriate tariff schemes, with cost recovery remaining an elusive goal. Cost recovery has proven remarkably difficult to achieve and sustain. Limited evidence supporting the value-added of the Bank’s activities on electricity pricing was found. This was evidenced in the limited achievement of results related to the increase in the affordability of energy services to end-user beneficiaries. In recent years, the Bank focused on helping utilities to reduce system losses and increase collection rates; however, sometimes there was a disconnect between these intentions and the aims reflected in the CSPs.35
ı The Bank puts too much emphasis on a ‘cost-reflective tariff’ structure and little focus on ‘cost-efficient’ tariff structures. Tariff design aims to recognize the various opportunities for reducing systemic operational and business losses and motivate the utility managers and the government to address them. Otherwise, allowing utilities a tariff adjustment to meet delivery costs will make electricity unaffordable to many or require the government to provide electricity subsidies for a bigger proportion of society. All Bank SOs contribute to the reduction of the per-unit production cost of electricity, but these positive attributes are not reflected in the tariff – a case in point is the Ethiopia-Djibouti interconnection project.
ı Inadequate emphasis on an enabling environment as it relates to energy sector reforms. Reforms mentioned in project documents were not always integrated into project design and thus not implemented. In addition, stakeholders were sometimes taken by surprise that the reforms were not translated into practice. Restructuring and liberalization have been beneficial in a handful of larger middle-income nations but have proved too complex for most countries to implement.36 Most SSA countries have been and are still subjected to repeated ‘sector reforms’ resulting in a constantly changing regulatory regime, changes in the role, and consequently, creditworthiness of business interlocutors of potential investors. For example, in Nigeria, power sector reforms aiming to attract the private sector should have been complemented with government policies and programs protecting the private sector with guarantees for promised energy production. Reforms in renewable energy have been implemented in some countries’ action plans with those RMCs supporting the development of a ‘green’ economy and ‘green’ jobs. This permitted the creation of contracts and procurement programs that stimulate the local industry. However, the Bank’s activities did not always provide value-added to either renewable37 or conventional38 power projects (e.g. Egyptian thermal energy projects).
Figure 5: Relevance of Energy Sector Projects
Source: PRAs, PCREN, In-Depth Case Studies, and Cluster Evaluation.
Relevance of Projects’ Objectives (n=62)
Relevance of Projects’ Design (n=62)
26% 59% 15%
33% 66%
2%
Unsatisfactory Satisfactory Highly Satisfactory


41Performance of Evaluated Operations 41Performance of Evaluated Operations
An ID
EV S
ecto
r Eva
luat
ion
Performance of Evaluated Operations
Effectiveness
The effectiveness of the Bank’s support to the energy sector was rated at three levels: (i) achievement of high-level objectives, (ii) achievement of project outputs, and (iv) achievement of project outcomes.
Overall, the effectiveness of the Bank’s support to the energy sector was assessed as satisfactory; there is no difference as to whether the projects were approved before or after 2012. The Bank’s support to the energy sector in the 1999-2018 period delivered and sometimes exceeded the expected outputs. Overall, support led to an increase in the supply and access to electricity through power generation and cross-border exchange; however, it sometimes failed to increase the reliability of electricity services. Also, progress towards reducing the electricity tariff was limited. These outcomes were mainly negatively influenced by design shortcomings that are linked to country context factors beyond the Bank’s control. Concerning the high-level objectives, notwithstanding the increase in the number of people gaining access to electricity, access to energy in Africa remains low, and progress towards access-for-all is slow. In addition, access to clean cooking solutions, while not part of the Bank’s activity before the NDEA, is particularly low, with little or no progress made in recent years in many countries across the continent.
Achievement of high-level objectives
Access to energy in Africa remains low and progress towards access-for-all is slow. Overall, access to electricity remains a challenge in many areas, in particular, those referred to as the ‘last mile’. The ecosystem-based country case studies undertaken as part of this evaluation show that while access remains the continent’s main challenge in the sector, the picture is more nuanced at the country level. In addition, access to clean cooking solutions is particularly low, with little or no progress made in recent years.
According to the World Economic Outlook (WEO) 2019 Special Report on Africa, a handful of countries (including South Africa, Ethiopia, Ghana, Kenya, Rwanda, and Senegal) are likely to be successful in reaching full electricity access by 2030. While East and South Asia appear to be on track to substantially reduce their access gaps by 2030, Africa overall has substantial hurdles to emulating this progress. Africa still has a heavy reliance on oil-based electricity generation, while SSA has the largest access deficit region-wise; about 573 million people did not have access to electricity as of 2017. Without a reversal of present trends, it is projected that globally about 650 million people will be without electricity by 2030. Of these, 9 out of 10 will be resident in SSA .39 Amongst the evaluation case study countries, Zambia and DRC have substantial energy deficits to be addressed, while Uganda and Côte d’Ivoire are both likely to have a surplus of on-grid electricity over the coming years, even though many citizens still do not have access to modern energy services. This suggests
Finding 7: The achievement of high-level objectives of the Bank’s assistance to the energy sector is unsatisfactory in terms of access to electricity and clean cooking solutions, reliability, and cost of electricity services. Concerning the reliability of electricity, regular power shortages
limit access and use of electricity, with electricity prices remaining high. This situation is due to several reasons including a heavy reliance on oil-based electricity generation and the financial gap to address an increasing demand due to population growth.

42 Evaluation of the AfDB’s Assistance to the Energy Sector (1999-2018): Refocusing Support for Improved and Sustained Energy Access in Africa - Summary Report
that the emphasis of investment needs to shift in some countries from on-grid electricity generation to distribution and distributed energy access solutions. Morocco, another country covered through the case studies, has a more advanced energy sector, with relatively high energy access. Many of the areas with low energy access are rural. According to the latest update to Sustainable Energy for All’s “Tracking Sustainable Development Goal 7” report, in rural areas, only 22 percent of the population has access to electricity. The cost to serve these regions is higher and the affordability gap (i.e. the gap between the cost to serve and customers’ ability to pay) is also higher. Without accelerated action, once population growth is accounted for, the absolute number of people without access to electricity in SSA in 2030 would be largely unchanged compared to today.40
In many countries across the continent, the main source of energy remains unsustainable traditional biomass. In SSA, only 30 percent of the population has access to clean fuels and technologies for cooking.41 Globally, it is estimated that 2.90 billion people did not have access to clean cooking solutions in 2017, largely unchanged from 2.96 billion in 2010. In six countries, all of them in SSA, less than 5 percent of the population had access to clean cooking solutions.
Reliability coupled with affordability limited the access and use of electricity. Energy supply is one of Africa’s greatest infrastructure challenges, with thirty countries already experiencing regular power shortages and many paying high premiums for emergency power supplies. One-third of the access-deficit countries face more than one weekly disruption in electricity supply that lasts over four minutes on average. Countries such as Eritrea, Eswatini, and South Sudan have more than three disruptions or aggregate disruption of more than two hours per week. In terms of affordability, according to the Regulatory Indicators for Sustainable Energy (RISE)42, of the access-deficit countries in 2017,43 the poorest 40 percent of households spent more than 5 percent of their monthly household expenditure on
30 kilowatt-hours (kWh) of electricity. For 285 million people with access to electricity in these countries, basic subsistence levels of electricity consumption were unaffordable. Pertinently, a third of the access-deficit countries face relatively high electricity tariffs above $0.15 per kWh, which amounts to monthly expenditures above $4.50 for just 30 kWh of electricity. High costs are often associated with landlocked countries (e.g. Rwanda), island states (e.g. Madagascar), or small transition countries with poorly developed infrastructure (e.g. Liberia, Somalia). Lastly, the prevalent use of generators due to the unreliability of the grid and frequent power cuts pushes up the cost of power for many utilities, reducing their competitiveness. In addition, the underlying cost of bulk power is often high due to the use of expensive liquid fuels, especially when combined with costly and inefficient emergency power plants. However, grid power, where available, is often billed to end consumers at well below cost. This results in utilities that are not financially viable and are unable to invest in network infrastructure. In turn, this means that reliability does not improve, which is arguably an even bigger issue than the cost for many energy utilities. Cross-subsidies add further complications; electricity is often very cheap for low consumption households and large industries, but much more expensive for small and medium-sized enterprises.
Achievement of project outputs
Out of 62 sampled projects, nearly 80 percent were found to be satisfactory or higher (with more than 75% of expected outputs achieved). This performance is observed across various subsectors even though national grid upgrade and extension interventions contributed the most.
Finding 8: Overall, the Bank’s support to the energy sector achieved and sometimes exceeded the expected outputs (e.g. assets delivered, capacity developed, and policies implemented) to improve access coverage of electricity.

43Performance of Evaluated Operations 43Performance of Evaluated Operations
An ID
EV S
ecto
r Eva
luat
ion
Physical Outputs
Table 3 shows that outputs were largely achieved, almost without exception. The achieved outputs are: (i) construction of physical infrastructure such as dams, power stations, transmission and distribution lines; (ii) installation of electromechanical equipment and monitoring instruments; (iii) provision of institutional support such as engineering services and environmental and social impacts mitigation measures; and, (iv) implementation of various studies.44 The aggregate planned construction of distribution lines from 20 operations (27,344 km) was exceeded by nearly 12 percent, about 3,261 km. Overall, transmission lines and total electricity production were almost as expected (98% and 96%, respectively).
Sector Management
A considerable number of PBO outputs were realized. Out of a total of 40 output indicators assessed, more than three-quarters were fully or partially achieved (Figure 6). Approximately 18 percent were not achieved at all, while the
achievement status of 8 percent could not be reported (termed as unclear). On a country-by-country basis, the performance of Angola’s Power Sector Reform Support Programme stood-out, with nearly 90 percent of all outputs being fully achieved. In the case of Burkina Faso’s Energy Sector Budget Support Programme, about two-thirds of the output indicators were achieved, compared to 61 percent and 57 percent for Tanzania and Nigeria, respectively.
For these PBOs, a combination of factors – largely country context and the appropriateness of the PBO mechanism – affected both PBO outputs and outcomes performance. In Tanzania for instance, close collaboration between the government and development partners contributed to the attainment of outputs. However, factors such as the relative weakness of the Ministry of Finance and other central agencies in effectively coordinating both implemented programs, negatively affected output performance, in particular in Tanzania (Box 4). This weak institutional environment is also recurring theme in Nigeria, Burkina Faso, and Angola. Also, the type of PBO mechanism to a large extent lacked a strategic approach to engage in policy dialogue.
Table 3: Summary of the Main Project Outputs Achievement
Source: Calculated by IDEV, based on Bank internal databases
IndicatorsNo. of
operations
Aggregate Aggregate delivery
rate
Share of projects with more than
75 percent achievement
Planned Actual Difference
Total km of Distribution lines 20 27,344.00 30,605.26 3,261.26 112 percent 85 percent
Total km of Transmission lines 20 6,844.40 6,687.92 156.48 98 percent 90 percent
Total installed Capacity added (in MW) 21 7,397.00 7,558.54 161.54 102 percent 95 percent
Total Renewable Energy Installed Capacity added (in MW)
9 2,186.00 2,168.00 - 18.00 99 percent 100 percent
Distribution substations and transformers constructed or rehabilitated
36 9,053.00 11,577 2,524 104 percent 86 percent
Production in GWh 15 46,933.18 44,901.85 2,031.33 96 percent 87 percent

44 Evaluation of the AfDB’s Assistance to the Energy Sector (1999-2018): Refocusing Support for Improved and Sustained Energy Access in Africa - Summary Report
Figure 6: Summary of Outputs Achievement Analysis for Selected PBOs
Source: Based on PBO Country Reports for Tanzania, Nigeria, Angola, and Burkina Faso.
Completed/Achieved Partially Completed/Achieved
Not Completed/Achieved Data Unavailable/Unclear
68% 8% 18%
17% 17%
29% 14%
6%22%
8%
67%
89% 11%
57%
61% 11%
Combined (n=40)
Burkina Faso (n=6)
Angola (n=9)
Nigeria (n=7)
Tanzania (n=18)
Enabling factors
ı Clearly structured policies/ strategies in energy and public financial management, with a high level of government ownership.
ı Strong political support for the implementation of both strategies.
ı Close collaboration with Development Partners on both strategies.
ı Good technical capacity within the Ministry of Energy & Minerals and the Energy and Water Utilities Regulatory Authority (EWURA) to lead power sector reforms.
Hindering factors
ı Continuing tensions between the Government and Development Partners in the wake of the Independent Power Tanzania Ltd (IPTL) scandal of 2014 and the subsequent suspension of budget support.
ı Limited delegation of decision making has led to some inefficiency and lack of continuity in policy implementation.
ı Relative weakness of the Ministry of Finance and other central agencies, who in comparison with earlier periods have less technical capability and coordinating power/ influence to effectively lead cross-cutting reforms and follow up on PBO commitments.
Source: PBO Energy Cluster Evaluation – Synthesis Report.
Box 4: Key Enabling and Hindering Factors in Tanzania Linked to the Country Context

45Performance of Evaluated Operations 45Performance of Evaluated Operations
An ID
EV S
ecto
r Eva
luat
ion
Capacity development
Since 2012, most of the Bank-funded energy projects include capacity development activities aimed at building individual knowledge and skills, systems (methods, routines, procedures), structures (authority, rights and duties, communication), infrastructure and equipment (hard- and software), work environment, and external factors. However, a critical review of capacity development for the power industry indicates that donors typically experienced difficulties in funding stand-alone capacity building programs. This is partly due to problems related to measuring the tangible impact of such initiatives relative to their cost. However, this trend is slowly changing through recognition of the fact that on-going capacity building is critical to ensure the success of energy infrastructure projects, as competent technical and managerial capacity is required to operate generation and transmission facilities to be commissioned or upgraded.45 In addition, governments, in particular the Ministry of Finance, are unwilling to allocate loans to capacity building and have insisted on the Bank adding a grant to address this activity, indicating it is a less efficient way for developing needed capacity in managing the investment. There is also indication that the utilities should plan funding into their staff development programs, i.e. working with Ministries of Manpower Planning and Development in the country.
Achievement of project outcomes
Increased coverage of access to electricity. Bank support to the energy sector has led to an increase in the supply of and access to electricity through boosting power generation and rural electrification, cross-border power exchange, and transmission infrastructure, in addition to increased use of conventional and renewable energy sources. Table 4 indicates, based on data from a sample of fifteen projects, that the Bank has contributed to financing around 44,902 GWh of additional electricity supply, with 1,451,506 new connections achieved - 44% more than planned.
Finding 9: Overall, the achievement of energy sector project outcomes is satisfactory. Around 74%of the 62 sampled projects were rated satisfactory or higher on the achievement of their outcomes. Bank support led to an increase in the supply and access to electricity through power generation and cross-border exchange; although it sometimes failed to improve the reliability of electricity services and reduce the electricity tariff due to country context factors beyond the Bank’s control. Coupled with low electricity consumption, this hindered the achievement of the higher-level objective of increased access to and use of reliable and affordable electricity for all.
Table 4: Summary of Main Project Outcomes
IndicatorsAggregate Aggregate
delivery rate
Share of projects with more than 75
percent achievementPlanned Actual Difference
Production in GWh (N=15) 46,933.18 44,901.85 - 2,031.33 96% 87%
New connections (N=21) 1,008,745 1,451,506 + 442,761 144% 86%
Public lighting (N=6) 12,716 19,441 + 6,725 153% 100%
Reduced electric energy cost (N=6) - - - 71% 33%
Reduction in technical losses (N=6) - - - 100% 63%
CO2 emissions avoided (tons per year) (N=8) 3,437,354 3,414,545 +22,809 100% 88%
Source: Calculated by IDEV, based on Bank internal databases and SNDR’s results database
46 Evaluation of the AfDB’s Assistance to the Energy Sector (1999-2018): Refocusing Support for Improved and Sustained Energy Access in Africa - Summary Report
Interconnection projects successfully achieved increased electricity access through accelerated power exchange. The cluster evaluation of six power interconnection projects found that these projects had accelerated power exchange among regions. In two projects (Ethiopia/Djibouti and Morocco), potential exchange capacities reached their limits soon after the project’s completion. This power exchange increase was due to imported electricity costs being lower than those of domestic generation. The increased transfer capacities enabled a rapid growth in net imports of power that further spurred the growth in demand for electricity in these countries.
Bank support sometimes failed to increase the reliability and quality of electricity-based power. Low fixed tariffs resulted in financial pressure on power utilities, which in turn forced the utility to implement cost-saving measures such as load shedding, with a concomitant decrease in the reliability and quality of the power supply (e.g. Benin, Ethiopia, Gambia rural electrification projects). It is worth noting that most of the power utilities in Africa are either government-owned or parastatals with governments possessing a controlling share. Therefore, power utilities have less flexibility in implementing their own financial decisions to improve the quality of service without the support of the Government. The Gambia and Benin rural electrification projects did not achieve improved grid/ transmission operations as measured by the instability of the voltage. This was confirmed by a household survey of intended beneficiaries who were overwhelmingly dissatisfied with the reliability and quality of their energy connection.
The power interconnection cluster evaluation confirms that anticipated improvements in reliability and quality of the electricity supply, hinging on imports of power, did not always materialize. Power system reliability improved with adequate power imports across the interconnectors in Morocco and Namibia; however, this was not the case for other importing countries, where electricity imports were unreliable. For example, in the Nigeria-Togo-Benin NEPA-CEB Power Interconnection Project,
the Communauté électrique du Bénin (CEB) system failed to increase reliability from an interconnection to the Nigerian grid. This was due to the instability of the Nigerian network and challenges associated with the synchronization of the two grids. Also, other West African Power Pool (WAPP) member country expectations that cheaper hydro sources of power could be generated and delivered over the interconnector to the CEB and Nigeria, have failed to materialize. Nor is it envisaged that these objectives will be delivered soon. In contrast, Morocco incorporated grid strengthening programs within the power interconnection project, which supported improved reliability.
The Bank’s interventions did not always contribute to increasing the affordability of RMCs’ energy services to end-user beneficiaries, especially to the poor. Around a third of sample projects achieved more than 75 percent of their cost reduction objectives. The affordability of energy services in the Uganda Bujagali Hydro Power project actually decreased due to various factors including increased consumer prices.46 In addition, the power interconnection cluster indicates that the goal of lowering electricity tariffs for the average consumer as a result of cheaper power imports over the interconnectors was not achieved in any of the evaluated projects. This was attributed not only to increased demand and the increasing use of thermal capacity to meet demand but also due to inefficiencies in the utilities’ domestic operations that were passed on to consumers. Also, even though both importing and exporting countries tried to supplement their electricity supply by adding renewable energy from wind and solar, the proportion of renewable energy in the generation mix and its average cost advantages are still limited. The use of renewable energy, therefore, did not make a significant impact on electricity tariffs. In addition, technical shortcomings and managerial and operational deficiencies increased the cost of utilities. As a result, these undermined the cost advantages provided by interconnectors. Consequently, the net effect is an increase in tariffs or at best a slowdown in the tariff growth rate.

47Performance of Evaluated Operations 47Performance of Evaluated Operations
An ID
EV S
ecto
r Eva
luat
ion
Effective tariff design and implementation require adequate metering as well as data on consumption patterns and lifeline tariffs, or other schemes protecting the poorest consumers.47
These mechanisms are neglected in the Bank’s current approach, whereby tariff studies as project components are only sporadically undertaken before or during the project implementation.48 A more holistic approach is required to tackle this issue (Box 5).
The Bank’s use of non-lending activities to support the achievement of project outcomes was partial and inconsistent, although effective when employed. The Bank created the enabling conditions to facilitate dialogue between key project actors, often through non-lending activities. These included: dialogue with relevant actors and national governments; institution-building with utilities; project-specific technical training; and funding of regional power pools (EAPP49, WAPP) to organize various training sessions.50 The Bank also promoted dialogue between responsible entities in Egypt to build strong relationships and maintain focus
on policy objectives. Other examples of non-lending provided to utility companies included: TA, improved financial policies and procedures, tariff studies, and institutional strengthening (e.g. Ethiopia-Djibouti project). Project-specific non-lending activities also included technical support (South Africa-Sere Wind project) and training programs (the Burundi-Preiel transmission infrastructure project).
Bank support for RMCs’ enabling environment has become an important intervention only since 2013. Thirty-two out of 45 enabling environment projects (in 22 countries) were approved after 2013. The Bank’s role in facilitating policy dialogue was often viewed as having been inadequate51, with some instances of insufficient legal support to a utility (e.g. Electra in Cape Verde) also identified. At least three projects would have benefited from stronger financial, legal, and technical support. For example, the weak financial stability of two utility companies (Madagascar and Cape Verde) and limited staff competencies in both technical and performance management (e.g. Nigeria-Togo-Benin project) were not properly addressed.52 In conventional thermal
A typical dilemma for power utilities in developing countries is to ensure full cost recovery where the tariff structure, based on the utilities’ long-run marginal costs (LRMC), is designed to cover maintenance and asset replacement costs while enabling low-income customers to access electricity at an affordable rate. In addition, another dilemma specific to utilities in SSA is that further increases in already high tariffs are difficult to justify, especially when compared with more developed regions of the world. (Source: WB-IEG, June 2016, Financial Viability of the Electricity Sector in Developing Countries: Recent Trends and Effectiveness of World Bank Interventions, p. 6).
To address this, many African countries have introduced ‘lifeline tariffs’ (priced below cost) for low-income customers. For example, the lifeline tariff in Kenya applies to households consuming less than 50 kWh a month, which is cross-subsidized by rates imposed on larger consumers (Source: ICA, November 2016, Building Quality Infrastructure for Africa’s Development, p. 8-9). The average of all tariffs weighted by consumption amounts must equal or exceed LRMC, but this is unfortunately not applied in most of the region. Even the LRMC itself is not always provided and/or updated through the long-term power development plan of the country. On the cost recovery side, a World Bank study recently revealed that only 21 out of 39 SSA countries were able to cover the operating expenditures of their electricity system and only two countries among them, the Seychelles and Uganda, have a financially viable electricity sector (Source: WB, August 2016, Financial Viability of Electricity Sectors in SSA: Quasi-Fiscal Deficits and Hidden Costs).
Given these constraints, aiming to reduce tariffs through the implementation of a single power generator or interconnection project (putting tariff reduction as one of the outcome indicators) without any considerations on the utilities’ systemic fiscal deficits would not be feasible. In fact, many of the Bank’s interconnection projects failed to meet this objective, as stated in the ‘achievement of outcomes’ section of this report. The most realistic solution to tackle the trade-off between affordability and cost recovery is to seek optimal electricity pricing by minimizing operating costs, reducing pricing inefficiencies and improving regulatory frameworks.
Box 5: Trade-off Between Cost Recovery and Affordability

48 Evaluation of the AfDB’s Assistance to the Energy Sector (1999-2018): Refocusing Support for Improved and Sustained Energy Access in Africa - Summary Report
projects, the need for further Bank assistance was identified, particularly during the early stages (e.g. TA and institutional strengthening to power utilities, promoting dialogue, studies of alternative fuels), while Bank support to interconnection projects was weak in terms of strengthening government capacities to implement and manage the constructed transmission infrastructure.
Efficiency
The efficiency of the Bank’s project support to the energy sector was assessed along two dimensions: timeliness (delays) and cost overruns; and economic performance.
The efficiency of the Bank’s project support was found to be unsatisfactory. However, efficiency improved during the 2012-2018 period. Overall, only 37 percent of the 58 completed projects reviewed achieved a satisfactory or highly satisfactory rating. Projects approved after 2011 were more efficient (62 percent rated high versus the previous 30 percent for project approved before 2011). The sampled projects evaluated were found to be economically viable; however, they experienced significant delays and procurement challenges. Comparing private sector operations to public ones, the former performed better, with 62 percent of operations achieving satisfactory or higher ratings – more than twice the rate for public sector operations. A similar trend is observed when the 2012-2018 period is compared to 1999-2011,
with the former showing significant improvement in terms of efficiency. The relatively better performance post-2011 is likely due to the majority of the sample considered (63% of completed cluster projects) being PBOs, which are usually less susceptible to delays. It is important to mention that while the ex-ante EIRR was calculated for all the sampled projects, the sensitivity analyses performed require more rigorous assessment. Therefore, they should be analysed with caution.
Delays and cost overruns
Project delays are still a major constraint on the implementation of the Bank’s energy sector operations. Within the sector, numerous delays occur and often start right from design through implementation to maintenance. Of 53 projects with the necessary data, only nine percent (five projects) were either completed before or on schedule. The remaining 91 percent experienced one form of delay or another. On average, each of the 53 projects was delayed by 34 months or nearly three years; this was due to their complexity. Power interconnection projects experienced the highest average project delay over the period, at 67 months. This translates into nearly five and a half lost years of output benefits. For example, the Ethiopia-Djibouti Power
Finding 10: The evaluation highlighted issues of delays and cost overruns that compromised the performance of the Bank support to energy sector and posed the most important threat to project efficiency.
Figure 7: Efficiency of Energy Sector Projects
Source: PRAs, In-Depth Field Case Studies, and Cluster Evaluations
9% 13% 40% 38%
24% 33% 36% 7%
Timeliness (n=58)
EIRR (n=45)
Highly Unsatisfactory Highly satisfactoryUnsatisfactory Satisfactory

49Performance of Evaluated Operations 49Performance of Evaluated Operations
An ID
EV S
ecto
r Eva
luat
ion
Interconnection Project alone was delayed by 23 months or nearly two years (Box 6). The average delay for power generation projects was moderate, usually less than two years (for those for which data are available), with the notable exception of the Bumbuna project in Sierra Leone.53 Projects targeted at enhancing the enabling environment of the energy sector had the lowest average delays or lost years of output, about one year and five months. This can be attributed to the non-physical nature of these projects (which includes PBOs).
Challenges were related to slippages in implementation schedules resulting from delays in loan/grant effectiveness and changes in project design; however, it is important to note that between 2009 and 2018, energy sector delays declined substantially compared to the 1999-2008 period. When disaggregated by type of operation, similar trends can be observed for both public and private sector operations, albeit the latter showing the least decline. When long time lapses occurred between approval and the start of project implementation, changes in external factors rendered the original design obsolete or assumptions false (e.g. input prices), requiring projects to be redesigned and incurring more delays. When projects were on schedule and transmission line assets functional, but not used due to delays in other project operations, a considerable strain was placed on borrowers to meet their loan servicing commitments since the transmission lines generated no revenues. Between 1999 and 2008, delays experienced per project averaged 47 months, or nearly four years. This declined sharply to 11 months for the 2009-2018 period, about 75 percentage points, meaning that for completed projects which were approved after 2009, the severity of delays has lessened drastically. These positive developments can be attributed partly to the Bank’s commitment to addressing project
quality at entry issues while supporting the energy-enabling environment of RMCs, including having in place capable project coordination units – all within the context of the 2012 Energy Sector Policy and the NDEA. In particular, the Bank’s recent reforms, including the introduction of the new procurement policy in 2017 and the 2015 Presidential Directive No 03/2015 concerning the Rules for Corporate Procurement Activities of the African Development Bank, may have contributed to improving the average time for procurement of goods and works as well as addressing slow disbursements.54
Between public and private sector projects, the latter experienced moderate delays. While the average delay per private sector project was around 12 months for the 1999-2008 period, the average delay for public sector operations over the same period was 53 months, over four times higher. In 2009-2018, the average delay for private sector operations was 8 months as opposed to 12 months for public sector operations. Accordingly, the average delays for private sector operations declined by 4 months (about 33.3%), while those of public sector operations declined by 41 months (77.4%). The relatively low delays experienced by the private sector or PPP projects are partly due to disbursement rates tending to be faster, which is one of the main sources of delay for energy sector projects generally. Also, in addition to bringing in more capital for investment in energy, the private sector’s technical expertise and efficiency expedited implementation, as some of the projects evaluated were completed on or before schedule. For projects that were delayed in delivering outputs and outcomes, they were, to a large extent, impaired by delays on the side of the government in disbursing counterpart funds. It is, however, important to note that even with private sector operations, delays persist particularly with contributions on the part of governments.
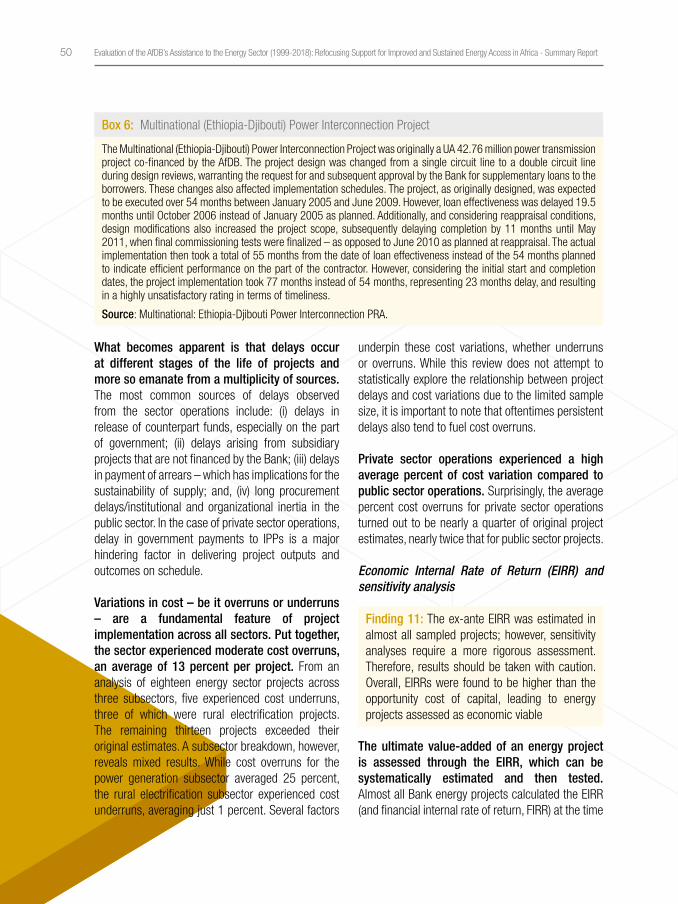
50 Evaluation of the AfDB’s Assistance to the Energy Sector (1999-2018): Refocusing Support for Improved and Sustained Energy Access in Africa - Summary Report
What becomes apparent is that delays occur at different stages of the life of projects and more so emanate from a multiplicity of sources. The most common sources of delays observed from the sector operations include: (i) delays in release of counterpart funds, especially on the part of government; (ii) delays arising from subsidiary projects that are not financed by the Bank; (iii) delays in payment of arrears – which has implications for the sustainability of supply; and, (iv) long procurement delays/institutional and organizational inertia in the public sector. In the case of private sector operations, delay in government payments to IPPs is a major hindering factor in delivering project outputs and outcomes on schedule.
Variations in cost – be it overruns or underruns – are a fundamental feature of project implementation across all sectors. Put together, the sector experienced moderate cost overruns, an average of 13 percent per project. From an analysis of eighteen energy sector projects across three subsectors, five experienced cost underruns, three of which were rural electrification projects. The remaining thirteen projects exceeded their original estimates. A subsector breakdown, however, reveals mixed results. While cost overruns for the power generation subsector averaged 25 percent, the rural electrification subsector experienced cost underruns, averaging just 1 percent. Several factors
underpin these cost variations, whether underruns or overruns. While this review does not attempt to statistically explore the relationship between project delays and cost variations due to the limited sample size, it is important to note that oftentimes persistent delays also tend to fuel cost overruns.
Private sector operations experienced a high average percent of cost variation compared to public sector operations. Surprisingly, the average percent cost overruns for private sector operations turned out to be nearly a quarter of original project estimates, nearly twice that for public sector projects.
Economic Internal Rate of Return (EIRR) and sensitivity analysis
The ultimate value-added of an energy project is assessed through the EIRR, which can be systematically estimated and then tested. Almost all Bank energy projects calculated the EIRR (and financial internal rate of return, FIRR) at the time
Finding 11: The ex-ante EIRR was estimated in almost all sampled projects; however, sensitivity analyses require a more rigorous assessment. Therefore, results should be taken with caution. Overall, EIRRs were found to be higher than the opportunity cost of capital, leading to energy projects assessed as economic viable
The Multinational (Ethiopia-Djibouti) Power Interconnection Project was originally a UA 42.76 million power transmission project co-financed by the AfDB. The project design was changed from a single circuit line to a double circuit line during design reviews, warranting the request for and subsequent approval by the Bank for supplementary loans to the borrowers. These changes also affected implementation schedules. The project, as originally designed, was expected to be executed over 54 months between January 2005 and June 2009. However, loan effectiveness was delayed 19.5 months until October 2006 instead of January 2005 as planned. Additionally, and considering reappraisal conditions, design modifications also increased the project scope, subsequently delaying completion by 11 months until May 2011, when final commissioning tests were finalized – as opposed to June 2010 as planned at reappraisal. The actual implementation then took a total of 55 months from the date of loan effectiveness instead of the 54 months planned to indicate efficient performance on the part of the contractor. However, considering the initial start and completion dates, the project implementation took 77 months instead of 54 months, representing 23 months delay, and resulting in a highly unsatisfactory rating in terms of timeliness.
Source: Multinational: Ethiopia-Djibouti Power Interconnection PRA.
Box 6: Multinational (Ethiopia-Djibouti) Power Interconnection Project

51Performance of Evaluated Operations 51Performance of Evaluated Operations
An ID
EV S
ecto
r Eva
luat
ion
of project appraisal.55 Table A5.9 in Annex 5 does not intend to compare projects by their EIRRs but to look at the difference between the ex-ante and ex-post EIRR of a single project. The Bank lacks a standard template/model for FIRR, EIRR, and corresponding net present value assessments that would allow for ease of comparison of similar projects across the continent. As it stands, each financial/economic analyst develops his/her own models and sets his/her own assumptions. Based on the evidence from the available data on twenty-eight projects (Table A5.9 in Annex 5), EIRRs were found to be higher than the opportunity cost of capital56 for all the projects except for the Buseruka hydropower project.57
Detailed analysis indicates that 57 percent of these projects recorded an EIRR above its ex-ante level, while 43 percent registered less than the ex-ante level, which indicates that there are still a worrying number of projects with EIRRs below expectations. For the Nigeria/Togo/Benin interconnection, the Ethiopia-Djibouti interconnection, and the Uganda Bujagali interconnection projects, the ex-post EIRRs were far higher than what had been forecast at appraisal with its implications (Box 7).
The results of the economic appraisal of investment projects are uncertain because they are based on the future values of variables
about which there is considerable uncertainty.60
The legitimacy of EIRR assessments is therefore questionable in some cases, considering the extent to which hidden parameters can influence the final result. This is the case when using a traditional method such as ‘with- and without-project’ scenarios, or least-cost analysis.61 Other issues that can influence the validity of this analysis include: (i) a lack of established methodological parameters for integrating external benefits into the analysis – such as improved quality of social services and improved livelihoods by projects;62 (ii) the unreliability of data on the fuel purchase price – especially critical for traditional fossil-fueled generation projects, and non-distributed energy or technical/non-technical losses - for national grid extension projects; and, (iii) the inability to reasonably estimate the future tariff level63 in developing contexts over the long-term.
The evaluation also raised some issues regarding challenges associated with the calculation of ex-post EIRRs resulting from a lack of available data. This applied to evaluation teams during the field visits and a lack of clarity on how EIRRs were calculated at the time of project appraisal.64 For rural electrification projects, two limitations were raised regarding the use of EIRR/FIRR for cost-benefit analysis. First, intangible benefits, which are
For the Nigeria/Togo/Benin project, there was an almost five-fold increase in the actual amount of electricity exported from Nigeria to Benin; more precisely, the 300 GWh annually estimated at appraisal was nearly 1,500 GWh/year as of the close of 2014. The high ex-post EIRR was also affected by the 32 percent increase in the price at which the Nigerian utility NEPA sells to Benin, from US$ 0.05/kWh in 2007 to US$ 0.0661/kWh in 2011. For the Ethiopia-Djibouti project, a huge utility’s consumer-related revenues58 has contributed to the high ex-post EIRR due to the Djibouti electricity authority’s failure to reduce domestic tariffs by 60 percent as was projected at appraisal, while getting low cost energy from interconnection. At appraisal, the consumer surplus59 was estimated for the ‘without project’ case by applying US$ 0.22/kWh as the cost of electricity production, while 6 US cents/kWh was assumed for the ‘with the project’ case. At completion, average prevailing tariffs were increased to 35 US cents/kWh while the import electricity price was 7 US cents per kWh, resulting in a larger consumer surplus. Even with the prevailing tariff set to reduce gradually over time to 20 US cents/kWh, Djibouti will continue to derive huge consumer surplus at a low import price. These two cases imply that there is a potential that huge economic benefits to society, especially to the poor, can effectively be secured through multinational power interconnection if a long-term surplus of electricity supply is expected from a neighboring country that exports electricity. A higher consumer surplus in turn leads to a better foundation in the importing countries for providing affordable electricity, while the issues of cost recovery and energy security remain.
Source: IDEV, Nigeria/Togo/Benin NEPA-CEB Power Interconnection and Ethiopia-Djibouti Power Interconnection PRAs.
Box 7: High Ex-Post EIRR for Power Interconnection Projects and its Implications

52 Evaluation of the AfDB’s Assistance to the Energy Sector (1999-2018): Refocusing Support for Improved and Sustained Energy Access in Africa - Summary Report
quite impossible to consider in the EIRR calculation process, given the limited interpretive validity of these indicators. Second, estimations of the FIRR were most useful when compared to a weighted average cost of capital (WACC). Three rural electrification projects compared the FIRR to the WACC, whereas interconnection project assessments consistently provided the WACC.
A sensitivity analysis is an effective tool to quantify the economic consequences of the alternative values of crucial input parameters. All seventeen projects under review used this analysis to double-check the project viability at the appraisal stage by applying several possible scenarios such as an increase in project costs and a decrease in electricity tariff over the project life. However, even such a powerful tool cannot eliminate the estimator’s discretion (e.g. scenario setting of future tariff level). The ultimate solution is to conduct a more rigorous risk analysis by computer simulation when resources are available.65 An excellent example among the Bank’s energy projects under review is the El Kureimat combined cycle power plant project, which applies a Monte-Carlo simulation66 to quantitative estimation of the possible financial, economic, and stakeholder impacts.
Sustainability
The evaluation examined five aspects of sustainability: (i) technical soundness, (ii) economic and financial sustainability, (iii) institution and capacity strengthening, (iv) ownership and sustainability of partnerships, and (v) environmental and social sustainability.
Overall, the sustainability of the achievements of the Bank’s energy sector interventions was judged to be likely, even though a significant decline was observed for interventions approved during the 2012-2018 period. Overall, 77 percent of 56 sampled projects were rated satisfactory or higher (81% before 2012 compared with 54% after). Compared to public sector operations, the performance of private sector operations in terms of ensuring the flow of associated benefits was slightly higher, 83 percent as against 75 percent. The performance was positive on the technical soundness, beneficiary ownership and sustainability of partnerships, and environment and social dimensions. The greatest area of concern was economic and financial sustainability; institutional and capacity-strengthening was also, to some extent, challenging.
Figure 8: Sustainability of Energy Sector Projects
Source: PRAs, In-Depth Field Case Studies, and Cluster Evaluations.
Environmental and Social Viability (n=50)
Ownership and sustainability of partnerships (n=52)
Institutional sustainability and strengthening (n=55)
Economic and Financial Viability (n=55)
Technical Soundness (n=27)
2%
4% 24%
11%
8% 62% 28%
71% 15%
65%
47%
85%
7%
5%
7%
12%
36%
7%
2%
Unsatisfactory SatisfactoryHighly Unsatisfactory Highly Satisfactory

53Performance of Evaluated Operations 53Performance of Evaluated Operations
An ID
EV S
ecto
r Eva
luat
ion
Technical Soundness
Most of the sampled projects were technically sound. 93% of the projects relied on sound technology that was appropriately chosen at the design stage. Only 7 percent of the sample was rated as unsatisfactory. The cluster of power interconnection projects, for instance, pointed to the use of higher transmission voltage (e.g. 400 kV), which is considered technically appropriate as it reduces the magnitude of the transmitted current and thus losses associated with long transmission lines. In addition, opting for higher voltage allows for power transmission underwater (e.g. Morocco/Spain) and asynchronous of networks that operate at different frequencies, or are incompatible. The use of fiber-optic technology on the transmission network for system communication and monitoring is deemed state-of-the-art in the energy industry (e.g. Manantali and Morocco/Spain projects). Among the problems, there were cases where geotechnical studies did not identify all the potential risks and eventually caused delays and cost overruns.67 This was also the case for the Manantali Energy project, where operational challenges were associated with the absence of redundancies in the western and eastern transmission lines which are both radials in nature. Accordingly, any feeder failure resulted in a total loss of supply, and the associated consumers lost power.
Environmental and Social Viability
Leveraging low carbon technologies, together with the indigenous energy resources, to meet Africa’s energy needs is important for the sector’s sustainability. Africa’s contribution to global carbon emissions remains relatively low as compared to per capita emissions of higher-income countries. However, as Africa grows economically and in population, its consumption of energy increases and this situation could change; thus, there is a risk that Africa’s greenhouse gas emissions will increase dramatically. The use of low carbon technologies is important in mitigating this risk. The use of renewable energy technologies and the role
of energy efficiency are important in addressing the energy access gap in an environmentally sustainable way. The role of traditional biomass is a particularly important driver of greenhouse gas emissions in many African countries. While the carbon emissions from power generation are relatively small for many African countries, land-use change, and agriculture are the major drivers of greenhouse gas emissions. These emissions have typically been driven by deforestation to provide firewood and charcoal for cooking and heating.
There were no significant issues with the environmental and social sustainability of the sampled projects. Around 90 percent of sampled projects received a rating of satisfactory or higher. An Environmental and Social Management Plan (ESMP) was prepared and implemented for all the sampled projects. Some identified issues included: (i) a high turnover of the environmental manager position that has limited the continuity of information about the performance of the ESMP (e.g. Egypt El-Kureimat); and, (ii) unfinished corporate social responsibility related activities that have caused friction between local populations and authorities (e.g. Madagascar-Sahanivotry).68 The environmental sustainability credentials of wind farm (e.g. Cabeolica) and power interconnection projects are strong, given that the significant reduction in GHG emissions (around 1,317,736 tons CO2 emissions avoided per year for 11 projects) occurs due to the replacement of self-generation diesel-fired power plants by cheaper and greener hydro energy produced or imported. In recent years, the cost of renewable energy technologies (e.g. solar PV and wind) has fallen rapidly. This means that renewable energy is playing a greater role in the energy sector, often because it is the most economically attractive option. The reduction in costs means that there is also less potential for tension between the use of renewable energy technologies and the first pillar of the Bank’s TYS, inclusive growth. However, despite this impressive cost reduction, some analysis suggests that a more aggressive reduction in carbon emissions would result in higher system costs.69

54 Evaluation of the AfDB’s Assistance to the Energy Sector (1999-2018): Refocusing Support for Improved and Sustained Energy Access in Africa - Summary Report
Ownership and sustainability of partnerships
RMC project ownership was confirmed in around 86 percent of sampled projects, moreover, the Bank strongly partnered in the energy sector. For 46 out of 53 sampled projects, the evaluation confirmed that interactions with relevant governmental bodies were sufficient to ensure continued maintenance and management of project outcomes. There are cases where the project was rated as highly unsatisfactory due to little dialogue between the community and the project, which caused dissatisfaction and distrust among beneficiaries.70 For the Bujagali project, there were issues with mitigation and compensation measures for local people during the construction of the dam; in addition, the transmission line might affect a sense of ownership of local beneficiaries. Overall, when the Bank invested in multilateral projects with other donors, sustainability conditions were strong, particularly due to the supervision of projects which provided timely adjustments.
Economic and Financial Viability
The picture on the economic and financial viability of the Bank’s projects is mixed: 52 percent of the sampled projects are rated as satisfactory or higher, and 48 percent as unsatisfactory or lower. The Bank’s contribution to RMCs’ efforts to assess, mobilize, and protect resources for the recurrent costs of infrastructure maintenance was also uneven across projects. In rural electrification projects, weak financial and institutional viability of utilities, as well as a lack of appropriate RMC reforms, resulted in inadequate financial resources. For example, insufficient electricity generation resulted in underutilized power lines. This, in turn, led to poor maintenance and loss in revenue for the power utility. With insufficient revenue, the utility cannot adequately invest in the entirety of the power system, resulting in an aging, inefficient transmission and distribution system.71 On the other hand, one project (South Africa-Sere) maintained an inventory of equipment needed for recurring maintenance. South Africa mitigated the
financial weaknesses of the national utility company with government investments and through payment guarantees for power purchase agreements in IPPs.
In contrast, power interconnection projects are generating enough income for the exporting countries to ensure their exports continue. The strong financial returns derived from the relatively cheap electricity received by importing countries also compare well with the higher costs associated with alternative solutions, including self-generation. For the NEPA-CEB project, apart from the fact that the project is generating enough income to ensure its continuation after completion, the project concept includes re-investment requirements to NEPA for the rehabilitation of the system every 20 years throughout the project’s life. This ensures sustainable operations to produce continued benefits over the long term. In the case of the Ethiopia-Djibouti Interconnection, Djibouti’s imports have been consistently above a figure of 300 GWh annually. This accounts for the US$85.25 million (UA 62 million) Ethiopia has generated from power exports to Djibouti in the last four years (AfDB, 2017 – PI Cluster).
Overall, the precarious financial sustainability of the energy sector in many RMCs threatens the long-term sustainability of results achieved by the Bank. A case in point is Ethiopia, where lower consumer tariff charges coupled with large technical and commercial losses have placed undue pressure on the Ethiopian Electric Power Corporation (now split into Ethiopia Electric Power and Ethiopia Electric Utility). In Ghana, similar challenges occur, where collection losses of up to 25 percent of purchases – including arrears from state institutions – stood at GHS 700 million (UA 93 million) in 2015.72 These losses have snow-balled into liquidity challenges throughout the sector, creating an undue financial burden on the Electricity Company of Ghana, the Takoradi International Company and the Volta River Authority. The presence of such challenges adversely affects the sustainability of increased access to electricity. This calls for the Bank to look into some of these issues through its CSPs.

55Performance of Evaluated Operations 55Performance of Evaluated Operations
An ID
EV S
ecto
r Eva
luat
ion
The likelihood of long-term maintenance of electricity infrastructure was associated with the strength of the utilities’ business model (i.e. institutional sustainability, capacity strengthening). Securing financial resources to cover recurrent costs that maintain energy infrastructures was dependent upon the institutional and financial strength of the operating utility in that revenue generation was essential. These favorable conditions were present in interconnection projects, less present in conventional power generation and renewable energy projects, and absent in rural electrification projects. Government ownership of the national utility was strongly associated with conflicting interests between a political agenda and a sound business model, which weakened the provision of electricity services. This was problematic across all rural electrification projects, particularly in the Benin and Gambia projects.
The Bank’s promotion of the private sector was also found in infrastructure maintenance funding; however, several factors limited absolute benefits from private sector participation. Evidence supporting the Bank’s promotion of the private sector in operation and maintenance was found in the Benin, Gambia, and Tunisia rural electrification projects. For example, in Tunisia, incentives were provided for outsourcing to private firms. The Ghana-Togo-Benin (WAPP power pool), Nigeria-Togo-Benin, Mali-Mauritania, and Morocco interconnection projects expected that private sector participation would generate greater value for money.73 The Bank’s promotion of the private sector to secure long-term maintenance was also successful through the PPP mechanism in three sampled projects (Cameroon-Dibamba, Cameroon-Sonel, South Africa-Sere). The Bank also contributed to creating the conditions necessary to secure financial resources for recurrent costs through self-financing PPPs for renewable energy projects (Uganda-Bujugali, Cape Verde-Cabeolica). A governance structure with private actor participation (South Africa-Eskom Holdings, Burundi – Preiel, Tunisia – ETAP) did not guarantee value for money or long-term maintenance, as PPP or privately funded projects were subject to similar
exogenous and endogenous factors as public projects. Projects facing increased operational and maintenance costs in the future will have to raise electricity tariffs unless consumer demand increases in response to increased plant power generation capacity (Uganda-Bujagali). Although Kenya-Thika was governed with a PPP model, its value for money was questionable as the plant is currently not fully operational due to the fast development of geothermal power and the consumer base had yet to materialize. Despite the energy generation potential of Nigeria, poor transmission infrastructure limited private investment.
Institutional Strengthening and Capacity Development
Regional and national policies and regulatory frameworks are the critical factors influencing institutional sustainability. This is especially apparent in power interconnection projects, where revenues are generated directly or indirectly for both importing and exporting countries. It was evident that regional policies and regulatory frameworks, together with appropriate political cooperation and RMC reforms, supported the institutional strength of utility companies.74 The power interconnection projects focused on measures to protect the financial viability of the utility with auditing and tariff studies, but did not address how the project integrated governmental reforms that protected its longevity (e.g. Ethiopia-Djibouti). Other projects (e.g. Morocco, Nigeria-Togo-Benin) were part of institutional and organizational reforms initiated by their governments, which protected the financial viability of the utility company, strengthened power grid infrastructures, and deregulated the electricity market to operate on open competitive market rules. Reforms did not, however, insulate the project from bilateral tensions, as evidenced in energy imports from Algeria to Morocco being reduced to 5 percent of line capacity due to political tensions. Ongoing monitoring and management action to support the institutional strengthening of utility companies was present in 60 percent of the sampled projects. For other projects, infrastructure maintenance was

56 Evaluation of the AfDB’s Assistance to the Energy Sector (1999-2018): Refocusing Support for Improved and Sustained Energy Access in Africa - Summary Report
threatened by institutional weaknesses, and low revenue-generating capacity, as a result of the national utility companies.75 While the Bank did raise concerns regarding the weak business model of the Egypt utility company (El Kureimat), it did not monitor the actions required for the utility to improve, for example.
Resilience to exogenous factors and risk management
Exogenous factors also weakened sustainability. Even when risks were identified, their impact on project implementation and delays was underestimated. Five projects (Benin-rural electrification 1 and 2, Gambia-rural electrification, Tunisia-rural electrification, Morocco-Ain Beni Mathar) were cases where risks associated with fuel prices and electricity imports severely affected project sustainability. Changes to market values of oil and gas impacted the potential for revenue generation in the energy-importing countries due to the import of more expensive energy.
Factors Hindering or Enabling Project Results
Over the review period, a wide range of factors – positive and negative – affected the performance of projects in the Bank’s energy portfolio. Specific to project implementation, some factors impaired performance, significant amongst which were delays in selecting staff / consultants / contractors and in receiving counterpart funds. Nearly half of the 61 completed projects experienced delays in selecting staff/consultants/contractors and in receiving counterpart funds - this is also common in other Bank sectors (Figure 9). This underscores the long energy sector project delays reported in the “Efficiency” section.
The second most important limiting factor to implementation within the sector were the Bank’s inefficient procurement and
disbursement procedures. This affected nearly a quarter of completed projects reviewed. For example, the implementation of the Electricity Transmission System Improvement Project in Ethiopia (2010) suffered from “…lengthy procurement for the deployment of civil works subcontractors … and a temporary local currency cash flow shortage from the contractors and client counterpart funds contributed to the delays.”76 In Botswana, the Morupule ‘B’ Power Project (2009), experienced delays in payment of works done by contractors. This delay significantly affected the cash-flows of contractors and posed risks to meeting construction schedules.77
More broadly, these factors, including other contextual factors, emanate from three main sources: (i) those that are not subject to government control; (ii) those subject to government control; and, (iii) those subject to executing agency control. For example, for factors that are not subject to government control, the Bank’s performance affected the performance of projects in equal measure (positively or negatively, see Table A5.10 in Annex 5). Specifically, delays arising from scarce resources for the Environmental and Social Safeguards department as well as the procurement, disbursement, and legal departments (in many cases consultants with limited knowledge of overall Bank operations/procedures assigned to the project team) tended to undermine Bank performance. This is followed by the performance of contractors/consultants, who contributed substantially and positively to the performance of six projects, and negatively to eight projects. For example, in the case of the Emergency Power Infrastructure Rehabilitation Project in Zimbabwe (2011), the engagement of a contractor with no experience within the African context posed enormous challenges in the procurement of materials.78 In the same project, other contractors had problems with the design, logistics, and finding subcontractors. The implementation of the Power Transmission Improvement Project in Kenya (2010) experienced similar issues, resulting in delayed commissioning of substations due to delayed line works.79

57Performance of Evaluated Operations 57Performance of Evaluated Operations
An ID
EV S
ecto
r Eva
luat
ion
For issues subject to government control, government commitment and release of counterpart funding substantially affected the performance of some projects, both positively and negatively. Concerning factors subject to the control of the executing agency, monitoring and evaluation-related issues stood out. The performance of eighteen projects was adversely affected by the lack and effective operationalization of monitoring and evaluation systems. For example, even though a monitoring and evaluation system was in place for the Power Interconnection Project (Djibouti/Ethiopia) and Bumbuna Project (Sierra
Leone), the monitoring indicators and monitoring plans were not followed through. In the case of the NELSAP Interconnection Project (Multinational), a Mid-term Review was not conducted as stipulated in the Project Appraisal Report. For the Emergency Power Infrastructure Rehabilitation Project in Zimbabwe, the implementing entity failed to track progress because responsibility for monitoring and evaluation was excluded from its scope of work, a situation that led to delays in reporting defects to contractors to take remedial action. All these issues have a serious bearing on the timeliness of project implementation.
Figure 9: Factors Affecting Implementation of Energy Sector Operations
Source: IDEV calculation, based on PCRs/PPERs.
Delays in selecting staff/consultants/contractors and in receiving counterpart funds (n=30)
Inef�cient procurement and disbursement procedures (n=15)
Changes in project scope/scale/design (n=13)
Quality of management including �nancial management (n=11)
De�ciency in estimating physical inputs, the base unit costs (n=11)
Other factors (n=7)
Changes in exchange rates, in �nancial and institutional arrangements (n=7)
Inadequacy of price/physical contingencies (n=7)
Unrealistic implementation schedule (n=5)
49%
25%
21%
18%
18%
11%
11%
11%
8%


59The Road Ahead – Implementing the NDEA Strategy 59The Road Ahead – Implementing the NDEA Strategy
An ID
EV S
ecto
r Eva
luat
ion
The Road Ahead – Implementing the NDEA Strategy
This section presents findings from the overall assessment of the quality of NDEA. It sets out the context and rationale for the NDEA. This is followed by the assessment of the Bank’s capacity to deliver the NDEA strategy. It then presents evidence concerning early implementation of NDEA by assessing the extent to which NDEA has been successfully operationalized.
Context and Rationale for the NDEA
Support for access to energy
As shown in the previous chapter, mainly during the 1999-2015 period, the achievement of high-level objectives of the Bank’s assistance to the energy sector is unsatisfactory in terms of access to electricity and clean cooking solutions, reliability, and cost of electricity services. Concerning the reliability of electricity, regular power shortages limit access and use of electricity, with electricity prices remaining high. This situation, to some extent, justified why the Bank decided that it was time for a change of course.
In 2015, the AfDB set the ambition to ‘Light Up and Power Africa’ as one of its High 5s.80 During the AfDB’s 2016 Annual Meeting in Lusaka81, energy was identified as the major priority for many RMCs.
The identification of the energy sector as a key priority for the AfDB is also consistent with the Bank’s TYS for 2013-202282, which identifies ‘Green Growth’ as one of two core objectives and ‘Infrastructure Development’ as one of five operational priorities. The NDEA (2016-2025) intends to address the need for universal access to energy by 2025. In 2016, a new Complex, PEVP, was established within the AfDB to deliver the NDEA. An overview of the NDEA is presented in Annex 2 of the Technical Annexes.
Achieving the ambitious targets set for the NDEA
The NDEA targets are all highly ambitious, arguably overly ambitious given the resources made available. The NDEA targets that are intended to help achieve the universal access goal are: (i) adding 160 GW of on-grid generation capacity by 2025; (ii) adding 130 million new on-grid connections by 2025; (iii) adding 75 million new off-grid connections by 2025; and, (iv) increasing access to a clean cooking solution, affecting 130 million households. For some of the more challenging targets, especially clean cooking and off-grid connections, there is a lack of in-country capacity or readiness to implement, meaning that there is also a lack of bankable projects that the AfDB can invest in. This calls for a review of the AfDB’s approach in implementing the NDEA to include additional support to build in-country capacity and readiness, which could improve the future pipeline of bankable projects in these sub-sectors. This would likely require directing additional AfDB resources (or leveraged resources from partners) towards TA.
Finding 12: After decades of support to the energy sector, the summative evaluation points to a need to refocus support for improved and sustained energy access in Africa, due to limited progress made so far.

60 Evaluation of the AfDB’s Assistance to the Energy Sector (1999-2018): Refocusing Support for Improved and Sustained Energy Access in Africa - Summary Report
Achieving these ambitious targets is estimated to require an investment of US$29-39 billion per annum until 2025.83 A recent analysis performed for the AfDB by MultiConsult illustrates the scale of investment required to meet the ambitious goals set by the NDEA. It is estimated that this totals US$230-310 billion (UA 168-226 billion) over the period 2018-2025, with the exact amount of investment required depending on the level of ambition regarding reductions in greenhouse gas emissions. Figure 10 summarises the breakdown in this investment requirement, both by region and by energy sub-sector. As with any modelling exercise of this sort, many of the assumptions could be challenged, but the figure does illustrate how the investment will be required across many parts of the energy sector. However, it is notable that the analysis only covers the power sector. The required investment in clean cooking, where both the ambition and the level of difficulty are arguably greater, has not been estimated.
The Bank’s Capacity to deliver the NDEA Strategy
Financial resources
Figure 10: Annual Average Investment Required to Meet the NDEA Targets
Source: MultiConsult, for AfDB (2019)
Annu
al in
vest
men
t req
uire
d to
202
5 ($
m)
8,000
7,000
6,000
5,000
4,000
3,000
2,000
1,000
0East Africa Southern Africa West Africa Central Africa North Africa
Generation Interconnectors Grid Mini-grid Off-grid
Finding 13: The evaluation highlights the need to scale up the Bank’s resources even beyond its current support to meet the targets set by the NDEA. The AfDB has increased funding for the energy sector since the launch of the NDEA, but not to the extent required to meet the strategy’s objectives. The ADB’s recent 125 percent capital increase to US$208 billion (UA 148 billion) through the 7th GCI and the replenishment of the ADF will be critical to achieving the NDEA’s targets over the coming years. Increasing finance from NSOs will also increase opportunities to leverage other sources of finance, thereby increasing the impact of AfDB’s contribution to the sector.

61The Road Ahead – Implementing the NDEA Strategy 61The Road Ahead – Implementing the NDEA Strategy
An ID
EV S
ecto
r Eva
luat
ion
Analysis by the Bank84 in 2016 suggested that anywhere between US$60-90 billion (UA 44-65 billion) per annum was required for the (Level 1) NDEA objectives to be met. The NDEA Strategy document estimated that compared with the level of investment across the sector at that time, there was a US$42.5-67.5 billion (UA 31-49 billion) investment gap. In terms of additional AfDB funding, the NDEA Strategy states that “the Bank will ramp up its investments … to invest $12 billion (UA 9 billion) over 5 years”, from 2016 to 2020. The NDEA also aimed to use this funding to leverage US$50 billon (UA 36 billion) in public and private investments in the energy sector over the same period. Additionally, the Bank aimed for a tripling of its climate finance to US$ 5 billion (UA 3.6 billion) p.a. to leverage a further US$20 billion (UA 15 billion) p.a. by 2020 (although only a portion of this finance would be allocated to activities that are aligned with NDEA).
Cost reductions may mean that the required investment is now slightly lower and thus more affordable. MultiConsult’s 2019 analysis85 for the AfDB on the investment needed to meet the NDEA’s power sector targets suggests that the annual investment requirement is US$29-39 billion (UA 21-28 billion) per annum. This amount is still very high, but is much lower than the $60-90 billion cited above. The lower amount does not include any allowance for the investment required in clean cooking; indeed, it is concerning that analysis purporting to estimate the investment required “to realize the AfDB’s New Deal on Energy for Africa” ignores such a key component of the strategy. However, it still seems likely that the investment required at today’s prices would be lower than that assessed in 2016. Further, the AfDB’s 2019 analysis86 is constrained in that it prescribes the split between on-grid and off-grid electricity. A least-cost optimization of the investment plan in the electricity sub-sector might further reduce the investment requirement.
The funding commitment is broadly aligned with the share of the NDEA targets that the AfDB aims to deliver. The AfDB’s Level 2 indicators for implementing the NDEA account for ~2-5 percent of the sector-wide Level 1 indicators, depending on which target is analysed. The funding target of US$12 billion equates to US$ 2.4 billion p.a. which, when compared to the total funding gap highlighted above, is ~3-6 percent of the total requirement. It is notable also that the cost of many of the technologies required to deliver the NDEA (especially electricity generation costs and the cost of some off-grid technologies) has declined substantially since the strategy was launched. If achieved, the US$12 billion funding commitment should be able to make a sizable contribution towards meeting the NDEA’s objectives.
Funding to the sector increased, but not to the extent required to meet NDEA goals. Following the approval and launch of the NDEA Strategy, the funds committed were not readily made available. It is understood that this has been a common challenge with implementing each of the High 5s, and is not unique to the NDEA. Around US$1.5 billion (UA 1.1 billion) per annum has been approved over the period 2016-2018. At an exchange rate of ~1.4 $/UA, this means the Bank is currently on track to invest ~US$7.7 billion for the NDEA. This is a noticeable increase compared with the US$6 billion invested during the five years before the NDEA, but remains well below the level that the NDEA was initially aiming for. It is unclear how much of the new capital under the 7th GCI will be available specifically for meeting NDEA targets based on borrowing countries’ needs. Furthermore, the latest ADF replenishment (US$7.6 billion) entered into force in 2020. As about 27 percent of the Bank’s contribution to the energy sector is from the ADF, the replenishment could have a material impact on the implementation of NDEA, despite short-term repurposing of the ADF towards general COVID-19 relief/recovery operations.

62 Evaluation of the AfDB’s Assistance to the Energy Sector (1999-2018): Refocusing Support for Improved and Sustained Energy Access in Africa - Summary Report
The Bank is falling short of NDEA targets in mobilizing other funds. The Bank’s target to leverage US$50 billion in further investment in the sector over the first five years of NDEA is extremely ambitious. This would require the AfDB to leverage, on average, four times its own capital contribution to projects. Analysis of PEVP’s database suggests that around US$5.7 billion of funds have been invested alongside AfDB funds on energy sector projects since the launch of the NDEA. This remains well short of the Bank’s target. This is partly a result of the AfDB’s portfolio continuing to be dominated by SO-activity. However, it is also noted that there may be some cases where the Bank’s catalytic impact may be under-reported: (i) PEVP’s reporting does not always capture the impact of TA on bringing in other sources of finance for energy sector projects; (ii) PEVP’s reporting on funds in which it invests does not always capture the full benefit of that investment, such as the additional funding at the project level. Capturing these effects of the Bank’s work is likely to become more important as the Bank provides more TA and invests in more funds.
It is also hard to identify firm funding commitments attached to other donor and MDB energy sector strategies in Africa. Annual funding for the World Bank’s Africa Strategy for IDA18-19 is expected to be roughly US$3 billion per year in the energy sector. This follows a decision in 2018 to increase funding to the SSA region by 100 percent (to $8 billion) for each IDA cycle. The decision was made possible by the largest IDA replenishment in World Bank history87 and an overall shift in priorities within the World Bank towards Africa. World Bank budgets are controlled at the regional level and not at the sector level, meaning that the funding is a statement of aspiration rather than a firm commitment. Also, the Power Africa Roadmap indicates that the United States Government committed US$7 billion to Power Africa when it was established in 2013. However, a recent progress report indicates that US$543 million has been disbursed in pursuit of Power Africa’s
goals since 2013 (excluding Millennium Challenge Corporation funding). Power Africa partners have committed US$56 billion.88 Interviews with current and former USAID officials indicate that substantial budgets have indeed been allocated, and it is worth noting that they are particularly large given the nature of Power Africa’s support, that being TA. Finally, AFD’s89 Energy Transition Strategy outlines AFD’s high-level financial commitments. They include €6 billion (UA 5 billion) to the energy sector in Africa between 2016 and 2020 (including €3bn under the AREI90 and €1.5bn between 2016 and 2022 to support the International Solar Alliance91).
Institutional and human capital requirements
At the time of its adoption, there was no detailed plan to deploy human resources to implement the NDEA. However, the AfDB signalled a clear commitment to resourcing efforts to implement the NDEA through the creation of the PEVP Complex in 2016. The NDEA Strategy document refers to the requirement for “additional skills and staffing” and the expectation that “the number of personnel working in this area will double by 2018”. Previously, energy was grouped with other infrastructure departments, including transport, water, and ICT. PEVP was set up specifically to implement the NDEA. This Complex, in turn, was set up initially with five departments: (i) Power Systems Development (PESD), (ii) Climate Change and Green Growth (PECG)92, (iii) Energy Statistics, Policy and Regulation (PESR), (iv) Renewable Energy and Energy Efficiency (PERN), and (v) Energy Partnerships (PENP)
Finding 14: The Bank’s reorganization to deliver the High 5s has faced several challenges. The creation of a new PEVP Complex in 2016 and the recruitment of new staff reflects the AfDB’s focus on the High 5s including the NDEA. However, responsibility for NDEA targets needs to be better cascaded through the Complex if the NDEA is to be implemented more systematically.

63The Road Ahead – Implementing the NDEA Strategy 63The Road Ahead – Implementing the NDEA Strategy
An ID
EV S
ecto
r Eva
luat
ion
– this department has been disbanded in 2018,93 with partnerships now mainstreamed across the remaining departments. Since PEVP was established in 2016, its headcount has gradually increased to ~70 people now focused on the energy sector. This is somewhat short of the ~100 indicated in the Strategy, but the increase in headcount has given the AfDB the capacity to increase its activities in the sector, both in terms of lending and additional catalytic activities such as Africa Energy Market Place (AEMP) and Electricity Regulatory Index (ERI).
The transition to the new Complex has led to challenges in implementing the NDEA, and there are very few staff assigned to some of the NDEA’s boldest targets; in addition, the structure of PEVP is complicated for a relatively small team. Key informant interviews carried out during the evaluation highlighted several issues with the creation of the new Complex, which may have hampered the implementation of the NDEA: (i) confusion during the transition to the new Complex – specifically, some staff was unclear on their role within PEVP and how or whether this was mapped to the objectives of the NDEA; (ii) resourcing challenges – some key staff with substantial institutional knowledge left the Bank and there were delays in recruiting replacements as well as the additional staff required; and, (iii) in scaling up efforts to address the High 5s, the Bank implemented a new business model – the DBDM. One of the DBDM’s key elements was to decentralize, with more of the Bank’s sector teams based outside the Headquarters in Abidjan. IDEV facilitated a separate evaluation of the DBDM,94 which found that the DBDM has sometimes led to a disconnect between the implementation of the High 5s within the country and the sector expertise that is typically focused at headquarters. The Bank is considering further refinements to its operating model to establish clearer reporting lines between headquarters and operational sector leads in the field.
Only a small number of staff are focused on some of the NDEA’s most challenging targets. An example is clean cooking, which as of now has only two PEVP staff focused on it, and they are often required to split their time between clean cooking and other focus areas. This largely reflects constraints already mentioned, such as RMCs’ unwillingness to reallocate capital to clean cooking when this would involve reducing the funds allocated to other priority areas. It also reflects pragmatism in gradually upscaling activities in an area that has not previously been a focus for the Bank. The ambitious targets95 in this sub-sector are inconsistent with the more cautious approach adopted in implementing the NDEA. Besides, PEVP has a headcount of around seventy people, but within it, there are three departments (since the removal of the Energy Partnerships department and except the PECG Department), each of which has two divisions. This, in turn, means that PEVP is quite top-heavy. Some key informants suggested that the implementation of the NDEA might benefit from a more multi-disciplinary approach, with staff being better equipped to move between different NDEA priorities depending on the specific needs of their client RMCs. This could lead to a more coordinated approach, although this might need to be complemented with appointing “champions” for each key NDEA target, with responsibility for ensuring that country-level programming is aligned with NDEA’s objectives.
The NDEA targets are not effectively disseminated to individuals working within the Complex. Some of the managers interviewed for this evaluation were not even aware of NDEA targets relevant to their areas of focus. Some staff reported that the NDEA has not had a significant impact on what they do. This suggests that the NDEA has not always been effectively disseminated within the Complex, and day-to-day decision making has not been explicitly realigned to reflect the NDEA priorities, although the complex seems to be structured around the NDEA focus areas.

64 Evaluation of the AfDB’s Assistance to the Energy Sector (1999-2018): Refocusing Support for Improved and Sustained Energy Access in Africa - Summary Report
The extent to which human resources are allocated to comparator donor and MDB strategies is also mixed. Power Africa has the clearest description of human resource allocations intended to implement the strategy. Power Africa has coordination teams in both Pretoria and Washington, D.C., in addition to country teams stationed in US embassies across Africa. The World Bank’s Africa Strategy for IDA18-19 also has some similarities to NDEA in that the strategy includes no explicit human resources plan, but the evaluation team is aware that substantial additional staff have been added, or reallocated, to support the implementation of the strategy. Interviews have confirmed that at least some of the intended resource allocations were implemented. The AFD’s Energy Transition Strategy includes no human resources plan.
The role of partnerships in implementing the NDEA
The NDEA is described as a ‘partnership-driven effort’ to achieve universal access to energy in Africa and there is some evidence of the AfDB coordinating donor activities to achieve the NDEA’s objectives. One of the best examples of this are AEMP activities that the Bank has coordinated.
The AEMP brings together all key stakeholders in a country’s energy sector to agree on the key priorities and set out which institutions and donors are leading on different activities. Twelve countries from across Africa have benefited from AEMP workshops to date, over three rounds. Each round of the AEMP brings together several countries so that there is also an opportunity for learning between those countries. However, the AfDB disbanded its Energy Partnerships department in 2018 and it is unclear at this stage whether this has any material impact on the AfDB’s ability to leverage partnerships in achieving the NDEA’s targets. On the one hand, the absence of dedicated resources focused on this activity might mean that it receives less attention; conversely, the management of important partnerships should ideally be mainstreamed across other activities anyway. In addition, case study analysis performed for this evaluation indicates that while development partners generally had better awareness of the NDEA than other types of stakeholders, there was no ongoing dialogue with those partners about the NDEA itself. Further, the AfDB did not appear to be driving an increase in aspirations or the change in focus that the NDEA articulates.
The early years of the NDEA Strategy implementation
Awareness of the NDEA
Finding 15: The AfDB’s Strategy for the NDEA put partnerships at its heart. Some specific initiatives, such as the Africa Energy Market Place, demonstrate well the AfDB’s convening power and the potential to use the NDEA to mobilize action across the continent. However, while development partners are generally aware of the NDEA, this potential is not being fully exploited to achieve the NDEA’s goals.
Finding 16: Stakeholder awareness of the NDEA, especially at the country-level, is low. Less than half of the stakeholders interviewed in the country case studies were aware of the NDEA, with awareness being less than 10 percent
Table 5: Key Informant Awareness of the NDEA Before Case Study Interviews
Côte d’Ivoire DRC Morocco Uganda Zambia TOTAL
Aware of NDEA 5 1 4 10 11 31
Total (N) 19 20 16 22 23 100
Percentage 26 % 5 % 25 % 45 % 48 % 31 %

65The Road Ahead – Implementing the NDEA Strategy 65The Road Ahead – Implementing the NDEA Strategy
An ID
EV S
ecto
r Eva
luat
ion
Awareness of the NDEA amongst key energy sector stakeholders is generally low. The level of awareness seen in stakeholders could be important on two levels. Firstly, partnerships are an important part of the NDEA Strategy and low awareness of the NDEA suggests that partnerships with governments, development partners, and other stakeholders have not been leveraged to promote the NDEA’s objectives. Secondly, low awareness might also indicate the extent to which the NDEA has not been central in driving AfDB’s energy sector activities. Awareness of the NDEA was low across all five countries with case study analysis, as shown in Table 5.
While the AfDB has strong partnerships in place with many RMC governments, those partnerships appear to have placed little emphasis on the NDEA as a strategy. One possible reason for low awareness of the NDEA among country stakeholders is that the NDEA targets do not appear to have been effectively disseminated to individuals working within PEVP. The low awareness of the NDEA among stakeholders may also be related to a lack of follow up after launch presentations in the early days of the NDEA. In most countries, NDEA awareness is limited to just a few informants.96 While a small number of very high-level publications have referred to projects implemented under the NDEA, and reference to NDEA targets is made in the Bank’s annual ADER reports, there have been no events or reports that disseminate a comprehensive overview of the NDEA’s implementation across Africa.
One of the comparator strategies against which the NDEA is benchmarked has been disseminated more effectively. Specifically, the USAID’s Power Africa roadmap has been widely disseminated, internally and externally, and the KPIs and targets of implementing staff are directly informed by the
strategy. The World Bank’s Africa Strategy for IDA 2018-19 does seem to inform and justify investment decisions to some extent, though the performance indicators do not appear to be passed through to operations staff in the form of targets. The AFD Energy Transition Strategy does not describe how it was disseminated.
Operationalization of the NDEA
A rebalancing of the PEVP portfolio in recent years is evident and is consistent with the NDEA’s objectives. The rebalancing illustrated above (section “The Bank’s Capacity to deliver the NDEA Strategy”) also addresses many of the shortcomings in the Bank’s energy portfolio identified in the pre-NDEA portfolio review. However, NDEA implementation did not improve in the following areas: (i) more systematic implementation of the NDEA, with progress against NDEA targets tracked more closely and used in day-to-day decision making and the setting of priorities within PEVP. Targets are not cascaded down to department and division managers and their teams; and, (ii) the portfolio rebalance towards clean cooking and off-grid electricity access. This is critical for the readiness and stakeholder capacity in these sub-sectors, which are challenging and complex, and the readiness of markets, companies, and projects to enable this rebalancing, provide more TA to develop regulations and business models to deliver the NDEA’s ambitious targets in these sub-sectors.
The immediate next steps set out in the NDEA Strategy were not implemented. For some of the flagships defined in the NDEA Strategy, clear next steps were defined. For example: (i) IPP procurement – the strategy sets a target of “launching 30 country-
Finding 17: Overall, there are shortcomings in the operationalization of the NDEA. There are no processes in place by which progress against NDEA objectives is tracked regularly or by which areas of underperformance are systematically identified so that they can be addressed.success.
in one country. Given the importance of the NDEA’s objectives to the AfDB’s overall strategy and achievement of the High 5s, improved dissemination of the strategy, both internally and externally, is likely to be critical to its future success.

66 Evaluation of the AfDB’s Assistance to the Energy Sector (1999-2018): Refocusing Support for Improved and Sustained Energy Access in Africa - Summary Report
specific programs over the next five years”; (ii) utility transformation – the strategy states that “the Bank will focus on supporting operational improvement at 30 utilities”; and, (iii) country-wide transformation – the strategy notes that “identifying and successfully engaging in the first two programs has to be one of the Bank’s top priorities”. While some activities have been taken forward in each of these areas, evidence from our interviews of PEVP staff has demonstrated that these specific next steps for taking forward the flagships were not executed. A ‘pilot’ in Mozambique generated interest in the NDEA, but implementation support was limited.
The reduced focus on the NDEA flagships coincided with the setting up of a new NDEA-focused Complex. It is understood that some initial work was performed to take forward some of the actions set out in the months following the approval of the NDEA Strategy. However, after the establishment
of the new PEVP Complex, it is understood that the flagships received less attention, although the new Complex remained committed to the themes set out in the NDEA Strategy. There are some exceptions to this, for example, a recent review of the flagship on regional and sub-regional projects.
Nearly two-thirds of the Bank’s financing target between 2016 and 2018 was achieved. Of a total of UA 4.3 billion (US$5 billion) lending volume target97 (2016-2018), 70 percent was committed. As shown in Figure 11, in 2016, UA 0.7 billion (58%) was committed to the sector compared to the target of UA 1.2 billion. For 2017, the Bank committed UA 1.0 billion (71%) out of a lending volume target of UA 1.4 billion, about 71 percent. In 2018, the share of actual commitments to the sector vis-à-vis the target was 76 percent. This trend shows steady growth in the Bank’s efforts to realizing its lending volume targets in the energy sector.
Figure 11: AfDB’s Indicative Lending Target Compared with Actual Approvals in the Energy Sector (in UA Billion)
Source: IDEV calculation, based on internal Bank databases and the NDEA Implementation Update Report, 2017.
2,4
2,0
1,6
1,2
0,8
0,4
0,0
Am
ount
(UA
bill
ion)
Approval Year
Target Actual
2016 2017 2018 2019 2020
0,7 1,01,3
1,21,4
1,7 2,0 2,2


69Conclusions and Recommendations 69Conclusions and Recommendations
An ID
EV S
ecto
r Eva
luat
ion
Conclusions and Recommendations
Conclusions
Access to clean, reliable, and affordable energy in Africa remains limited despite improvements over the last decade. Although the African continent’s energy profile is characterized by abundant energy resources in oil, gas, coal, and especially hydro potential, that potential is under-exploited and electricity access remains low across large parts of the continent. Thus, the continent continues to trail other regions when it comes to electrification, with over 645 million of its population without access to electricity. In SSA in particular, overall electricity access is 35 percent and a low 19 percent in rural areas.
Numerous challenges account for this phenomenon, including limited power infrastructure and long-running systemic failures. The African power sector, especially in SSA, is characterized by frequent load‐shedding, expensive short‐term rental of emergency power generation, and significant reliance on costly diesel for off‐grid captive power generation. Even where there is access to electricity, African countries contend with unreliable supply, owing to weak transmission and distribution infrastructure. Meanwhile, the continent’s energy demand is expected to grow threefold by 2060, with nearly nine out of 10 residents in SSA projected to still be without electricity by 2030. This signals the need to do more in ensuring improved access to reliable electricity access in Africa.
The AfDB has responded to the challenge by supporting RMCs’ energy sector development.
The AfDB has in the past two decades played a pivotal role in leveraging investments for energy infrastructure and reform in RMCs. The Bank’s financing for the energy sector increased significantly over the 1999-2018 period, with total commitments to energy infrastructure programs amounting to approximately UA 13 billion (US$19 billion). The Bank’s involvement in Africa’s energy sector over the period was guided by several corporate and sectoral policy and strategy documents, key amongst which include the 1994 Energy Sector Policy, the 2012 Energy Sector Policy, and the 2016 New Deal on Energy for Africa Strategy, or NDEA. The 2012 Energy Policy seeks to help African countries in building modern energy sectors that are socially, economically, and environmentally sustainable. This means a gradual transition from fossil fuels towards cleaner and renewable energy sources, an area that was less emphasized in the 1994 Energy Sector Policy. The NDEA Strategy operationalizes the objectives set out in the 2012 Energy Sector Policy.
The sector portfolio saw a significant increase in the years following the introduction of the 2012 Energy Policy, about 63 percent of the total number of approved projects. The number of projects increased from 55 in the 2008-2011 period to 103 and 90 respectively for the 2012-2015 and 2016-2018 periods. In addition, the sector’s active portfolio over the period constituted 62 percent of 306 approved projects. Over the same period, the power generation subsector dominates energy sector assistance. Of the UA 13 billion energy sector support, about half (49%) targeted power generation projects at UA 6 billion.
70 Evaluation of the AfDB’s Assistance to the Energy Sector (1999-2018): Refocusing Support for Improved and Sustained Energy Access in Africa - Summary Report
Support for renewable energy development has seen a significant boost in recent years, notably solar and wind. In particular, the 2012-2015 period marked a break from the past, where renewable energy accounted for two-thirds of total power generation assistance. Over the 2016-2018 period, of the UA 0.82 billion committed to power generation, 95 percent was devoted solely to renewable energy operations. Solar and wind energy sources make up the bulk of the Bank’s renewable energy commitment. Both energy sources accounted for 61 percent of power sub-sector assistance between 2016 and 2018. This shows an increase of about 23 percentage points over the 2012-2015 period and nearly 58 percentage points over the 2008-2011 period. Collectively, this transition towards a more ‘decarbonized’ energy sector in Bank-funded energy operations bears testament to power generation developments on-the-ground in RMCs. While PBOs totalled just UA 100 million over the 2008-2011 period, they increased to UA 780 million between 2012 and 2015, about eight-fold. This reflects the Bank’s commitment to supporting policy reforms in RMCs.
The relevance of the sector’s operations was deemed satisfactory albeit with some design defects. The evaluation found that the objectives of the Bank’s energy sector strategic documents (e.g. policies, strategies, and initiatives) were aligned to its corporate policies and strategies, RMCs’ priorities, and international targets. Three areas that undermined the adequacy of the sector’s interventions especially before the 2012 Energy Sector Policy include: (i) insufficient focus on transmission infrastructure, (ii) limited support to develop appropriate cost recovery tariff schemes, and (iii) less emphasis on the enabling environment (energy sector reforms). Also, the design of the Bank’s energy sector interventions was generally unsatisfactory, due to shortcomings in some critical areas such as risk assessment and long-term sector planning. Project designs for SOs experienced shortcomings in many ways, notably: (i) risk assessments, (ii) quality of front-end work for public-private partnerships, and (iii) lack of comprehensive national energy policies.
On effectiveness, the sector’s performance is satisfactory. Over the 1999-2018 period, the sector performed well on output and outcome indicators. The evaluation findings show that the Bank’s assistance to the energy sector has led to an increase in electricity supply as well as improved access to electricity. However, Bank support sometimes failed to increase the reliability and quality of electrical-based power. It did not always contribute to increasing the affordability of RMC energy services to end-user beneficiaries, especially to the poor. The Bank’s use of non-lending activities to support the achievement of project outcomes was partial and inconsistent, although effective when employed. At the same time, the Bank has also missed opportunities to provide non-lending policy and TA support that could have contributed to project success. The limited progress made so far, compared to the needs, points to the need to refocus support for improved and sustained energy access in Africa.
The efficiency of the Bank’s project support was found to be unsatisfactory. The evaluation highlighted issues of delays and cost overruns that compromised the performance of the energy sector and posed the most important threat to project efficiency, with power interconnection accounting for the bulk of delays. Challenges were related to slippages in implementation schedules resulting from delays in loan/grant effectiveness and changes in project design. The ex-ante EIRR was estimated in almost all sampled projects; however, the results of the economic appraisal of investment projects contain significant uncertainties. The legitimacy of EIRR assessments is therefore questionable in some cases as revealed by this evaluation, considering the extent to which hidden parameters can influence the result when using a traditional method like “with- and without-project” scenarios or least-cost analysis. Moreover, sensitivity analyses require a more rigorous assessment.
Overall, the sustainability of the achievements of the Bank’s energy sector interventions was judged to be likely, although the precarious financial sustainability of the sector threatens

71Conclusions and Recommendations 71Conclusions and Recommendations
An ID
EV S
ecto
r Eva
luat
ion
the long-term sustainability of the results achieved by the Bank. Environmental and social sustainability is assessed as satisfactory, alongside ownership and strong partnership. The likelihood of long-term maintenance of electricity infrastructure was associated with the strength of the utilities’ business model (e.g. institutional sustainability, capacity strengthening). Securing financial resources to cover recurrent costs that maintain energy infrastructures was dependent upon the institutional and financial strength of the operating utility in that revenue generation was essential. The Bank’s support to RMCs for assessing, mobilizing, and protecting resources for the recurrent costs of infrastructure maintenance was uneven across projects. In contrast, power interconnection projects are generating enough income such that exporting countries can ensure that exports continue. The Bank could employ non-lending instruments (e.g. institutional strengthening of power utilities) to help improve the financial state of power utilities.
Looking forward in terms of implementing the NDEA Strategy, the review of the design quality and the early years of implementation of the NDEA points to the urgency to scale-up the Bank’s resources even beyond current support to meet the targets set for the NDEA Strategy. In addition, the Bank’s reorganization to deliver the High 5s has faced several challenges. The AfDB’s Strategy for the NDEA put partnerships at its heart, although the AfDB’s key energy sector stakeholders across RMCs generally have a poor understanding of NDEA. The first years of the NDEA’s implementation were characterized by weak stakeholder awareness of the strategy, especially at the country-level, with some shortcomings in the operationalization of NDEA. However, by refocusing support for improved and sustained energy access in Africa through its NDEA Strategy, the Bank aims at moving towards poverty reduction and improving the lives of people in Africa. With the recent capital increase and ADF replenishment, the Bank is now in a better position to become a Bank of choice for energy sector development in RMCs as per its aspirations.
Lessons
The main lessons learned from this energy sector evaluation are presented in the various cluster evaluations (Rural electrification, Power Interconnection, Energy PBOs) with more substantial evidence already having been discussed or shared with the Board for information. They were also discussed with the Energy Complex during a series of capitalization workshops.
Recommendations
IDEV makes the following recommendations:
1. The Bank should improve the quality of NDEA management, measurement, and reporting of results. Priority areas of action include:
ı Review the targets set for the AfDB’s contribution to meeting the NDEA’s objectives and assign clear accountabilities that are cascaded through the respective complexes. The targets set for the AfDB’s contribution to meeting the NDEA’s objectives should be reviewed to reflect available financial resources – particularly with the successful GCI-VII and the ADF replenishment – as well as the timeline for delivering the strategy. The needed financing for the NDEA targets could still be further trimmed down by increasing local content in projects procurement (e.g. services, goods, and works). This would contribute to other High-5 objectives such as industrialization and job creation. Assigning clear accountabilities that are cascaded through the respective Complexes is also critical. To this end PEVP could play a coordinating role – but other Complexes also need to deliver, e.g. policy advice, mobilization, other sectors - energy demand, etc.

72 Evaluation of the AfDB’s Assistance to the Energy Sector (1999-2018): Refocusing Support for Improved and Sustained Energy Access in Africa - Summary Report
ı Ensure that the design, monitoring, and evaluation of energy sector interventions, and strategy documents are based on a well-articulated TOC. This will provide a clear system for analyzing how interventions in the energy sector are expected to work, by mapping each intervention through a series of steps (i.e. results chain) with appropriate indicators and assumptions for an improved sectoral RMF. The Bank should formalize the TOC for the NDEA and regularly report on progress against NDEA objectives and the actions being taken to address areas where the AfDB is falling behind the NDEA targets.
2. The Bank should strengthen its assistance to RMCs to enhance their capacity to formulate and implement comprehensive energy policies, which encompass long-term power development plans, energy security strategies, and energy efficiency/conservation plans. Priority areas of action include:
ı Increase the use of non-lending instruments (e.g. analytical work, TA) to help elaborate possible least-cost energy solutions. These should take into consideration the long-term forecast of the electricity demand of the country and/or the region. The above forecast will also be an analytical basis for effective cost-recovery tariff setting and regulation (see recommendation no. 3). This will complement the NDEA strategic theme related to rolling out waves of country-wide energy “turnarounds” that will include energy system planning and restructuring of the national legal, regulatory and institutional environments to attract investors. More focus on public-private coordination will then be critical.
ı Strengthen policy dialogue based on established and well-structured national sector reform strategies and road maps, to attain and maintain national government
commitment. The evaluation identified national government political commitment as a key determining factor in the success and failure of energy sector reforms and related national projects. Political interference in tariff setting and poor systematic monitoring and collection of outcome data can have dire consequences on the effectiveness of projects.
3. The Bank should increase support to RMCs, through its power utility transformation program, to enhance power utilities’ performance and ensure the financial sustainability of the power system. Priority areas of action include:
ı Consider balancing its investments between power generation, and transmission and distribution. This shift will help improve utilities’ operations as well as financial capacity by reducing transmission and distribution losses. It will also increase the credibility of the utilities as off-takers for independent power producer projects. The Bank is expected to increase investment in transmission and distribution infrastructure, considering the current trend whereby power generation has been extensively funded by private investors and other donors in recent years. Transmission and distribution losses (both technical and non-technical ones) need to be properly addressed through the provision of high-quality infrastructure which may include: (i) replacements of obsolete distribution infrastructure, (ii) rolling out pre-paid and smart-metering solutions and (iii) re-enforcing national distribution grids. These also help to address systemic revenues losses and electricity theft. Training and capacity-building for the utilities in RMCs will also improve operational performance and management. The governments with their utilities can finance electricity connection projects where grid extension is considered the least costly solution.

73Conclusions and Recommendations 73Conclusions and Recommendations
An ID
EV S
ecto
r Eva
luat
ion
ı Consider employing a holistic approach to electricity cost drivers, innovative subsidy design and electricity pricing to inform tariff design. This would support the implementation of the NDEA’s Power Utility transformation program which aims at supporting the drive to make national utilities credible off-takers in the sector. A holistic approach to energy sector programming, such as sector-wide programmatic approach, is required to better regulate and stabilize electricity tariffs—for the benefit of low-income consumers and to ensure the financial sustainability of the power system. More focus on affordability of energy, while ensuring the financial sustainability of utilities, is also critical.
4. The Bank should increase its funding to RMCs and the private sector for sustainable energy access in Africa. Priority areas of action include:
ı Scale-up blended finance approaches by building on successful work to date. This
can mobilize more private sector investments and creative concessional finance and thereby contribute to overcoming the persistent financing gap in the energy sector in Africa.
ı Strive to increase resources for TA and project preparation to optimize its investments. Additional resources to provide TA (either direct from the Bank or leveraged from other institutions including from RMCs) would help to meet the demand from RMCs for assistance in utility performance improvement and sector restructuring, as well as help with preparing the market for off-grid and clean cooking interventions, thereby increasing the project pipeline in these areas. This could be through increased contributions to existing trust funds notably SEFA and/or through a new trust fund such as the proposed African Energy Sector TA Programme initiative covering more upstream interventions from SEFA and/or through more TA accompanying core investment activities.


AnnexesAdditional Technical Annexes can be found on the following webpage:
http://idev.afdb.org/en/document/evaluation-afdbs-support-energy-sector-africa

76 Evaluation of the AfDB’s Assistance to the Energy Sector (1999-2018): Refocusing Support for Improved and Sustained Energy Access in Africa - Summary Report
Annex 1: AfDB’s Energy Sector Logic Model
ı The energy sector in RMCs remains largely underdeveloped
ı Installed capacity is insufficient to meet demand and is holding back growth
ı Reliance on emergency power supply in draining utility resources
ı Reliance on state utilities drains public resources and less efficiency
ı Inadequate supply of “Bankable” projects available to investors
ı Insufficient access to clean fuels and technologies for cooking
ı The power sector is the largest global emitter of greenhouse gases
Problem
Physical Infrastructure Development (Investing in electricity generation, transmission and distribution as well as improved cookstoves)
Sector Management Enhancement (Promoting energy sector reform, capacity development and governance)
Energy Efficiency and Renewables (Promoting energy efficiency and renewable energy, capacity development and governance)
Donor coordination and financial leverage (Promoting coordination of energy initiatives and the Bank’s leverage effect)
Coordination of energy initiatives and finance mobilization including fund for early stage project development
More clean energy generation and more efficient energy use
Physical Infrastructures built/expanded or rehabilitated (Power plant, transmission and distribution lines, substations, oil and gas plants, ooil and gas pipelines, renewable plants, smart grids and improved cookstoves)
Capacity developed (Greater local capacity to manage energy sector investments, including operation and maintenance of energy system and infrastructure)
Sound energy sector regulatory framework developed (Long-term planning, electricity pricing, liberalized, regulated markets, commercially operating utilities, and regional power pool)
Inputs Outputs
Assumptions: Sound institutional capacity and appropriate maintenance of infrastructure.

77Annexes
An ID
EV S
ecto
r Eva
luat
ion
Increased sustainable
socio-economic development and
job creation
Direct Outcomes Intermediate Outcomes Long-Term Outcome
Increased cross-border energy exchange
Increased energy generation
Increased appropriateness of
electricity pricing/use of cost recovery tariff
Improved regulatory framework
Increased quality of services delivery by energy sector
actors
Increased reliability of electricity
Reduced energy consumer price
Reduced pollution and greenhouse gas eemissions
Increased access to and use of reliable and affordable electricity
Increased energy demand
Successful implementation of other Bank High 5 priorities

78 Evaluation of the AfDB’s Assistance to the Energy Sector (1999-2018): Refocusing Support for Improved and Sustained Energy Access in Africa - Summary Report
Annex 2: Methodological Note
Summative Approach
Project sampling
The evaluation identified 306 energy sector projects and studies that were operational during the evaluation time frame from 1999 to 2018, of which 82 projects and 26 studies were completed as of 31 December 2018; the remaining were either ongoing or recently approved. The evaluation included or referenced 62 of the completed projects in the background papers used for this summary report. The sample represented 76% (62/82) of completed projects. The number/percentage of the project sample of 62 projects by energy sub-sector was as follows: (i) 22/35% power generation, (ii) 19/31% national grid upgrade/extension, (iii) 8/13% regional power interconnection and (iv) enabling environment 13/21%. The sampled project list by sub-sector and the line of evidence is presented in Annex 4.
Lines of evidence
Literature and policy reviewThe literature review consisted of a systematic identification and analysis of pertinent energy-related documents. It identified the main developments that have influenced the energy sector in Africa since 1999 and examined how these trends influenced the development community. Four sources of information were used for this purpose: (i) policy documents by the MDBs and bilateral institutions active in Africa; (ii) evaluation and research documents produced by these and other institutions; (iii) studies by energy sector specialists; and, (iv) interviews with Bank staff. The bibliography compiled from this review contains a large range of energy-related publications, including AfDB, World Bank, and European Union documents, policy and evaluation documents of bilateral institutions, and publications by energy sector specialists.
The policy review compared in detail the 2012 AfDB Energy Policy with the 2013 World Bank Group’s Energy Direction Paper. The review showed how the AfDB and other institutions’ policies have evolved over the last 15 years and assessed how the AfDB responded to identified issues. It also identified relevant lessons and assessed the value-added of the Bank’s approach to the energy sector in comparison to those of its development partners.
Portfolio review The portfolio review was a desk review of Project Appraisal Reports (PARs), Project Completion Reports (PCRs), Project Completion Report Evaluation Notes (PCR-EN), Extended Supervision Reports (XSRs), Extended Supervision Report Evaluation Notes (XSR-EN), Project Performance Evaluation Reports (PPERs), the Bank’s statistical publications and its internal SAP database. It had three specific objectives: (i) to provide an overview of trends in the Bank’s energy lending and approvals; (ii) to develop a Bank energy sector TOC, which would guide the entire evaluation as an analytical framework, and to refine the evaluation questions; and, (iii) to answer the evaluation questions related to efficiency and effectiveness. Projects were identified through a three-step screening process: (i) using the search category ‘energy’ in the Bank’s internal SAP database; (ii) using the search category ‘multi-sector’ and reference to institutional strengthening in the Bank’s internal SAP database and project appraisal reports; and, (iii) scrutinizing additional candidate programs/projects through consultation with the operational Complex including the Energy, Environment and Climate Change

79Annexes
An ID
EV S
ecto
r Eva
luat
ion
Department (ONEC) and the Private Sector Department (OPSM). A Portfolio Review provided a comprehensive analysis of the evolution of the Bank’s support to the energy sector, its characteristics, and composition by sub-sector; and assessed the development effectiveness of Bank support through desk reviews.
In-depth field case studies Seven in-depth field case studies were conducted, and two synthesis reports prepared. The first report was a synthesis of four renewable energy projects (Bujagali and Buseruka I & II in Uganda, Sahanivotry in Madagascar and Cabeolica in Cape Verde) and the second was a synthesis of three conventional power generation projects (Abu Qir and El Kureimat power plants in Egypt and Thika power plant in Kenya). The analyses were based on desk research and interviews with the relevant stakeholders. Interviews were carried out during visits to the respective countries in November and December 2015.
Cluster evaluations Cluster evaluations were conducted along four main clusters: power interconnection (7 projects), rural electrification (6 projects), energy-related PBO (8 projects), and private sector operations (9 renewables and 5 conventional PPP projects). The list of projects included in each cluster can be found in Annex 4. The cluster evaluations used both qualitative and quantitative methods, including: (i) a desk review of relevant and available internal documents; (ii) consultations with relevant AfDB staff; (iii) consultations with the staff of relevant government offices; (iv) field visits to project sites to hold discussions with local officials, non-government organizations, and a sample of the project beneficiaries; and, (v) drafting and finalizing the project evaluation reports.
Quality Assessment of the NDEA Strategy
Scope of the evaluation
Overall, the NDEA quality assessment considers the design process and quality of the NDEA and the adequacy of the institutional arrangements in place to deliver the NDEA. This overall objective is broken down into four parts:
ı Assess the relevance of the NDEA’s objectives. The assessment analyses the remaining gap in energy access across Africa, especially across sub-Saharan Africa (SSA). The assessment further analyses the gaps and priorities across the energy sector in Africa and examines whether the NDEA’s targets (e.g. to increase connections and to increase installed power generation capacity) are appropriate, given the identified needs. The assessment also considers the absolute level of the NDEA targets and whether these are well justified in light of the priorities identified across Africa’s energy sector.
ı Assess the design of the NDEA. Having reviewed the targets and outcomes of the NDEA, the detailed design of the NDEA is assessed. This part of the assessment considers the detailed design of the NDEA and whether it is likely to be successful in contributing to achieving the outcomes being targeted. The assessment also considers the framework put in place by AfDB for monitoring and evaluating the NDEA, and whether this framework is well-designed to highlight areas of both good and poor performance so that implementation of the NDEA can adapt in response to performance metrics.
ı Assess the capacity to deliver the NDEA. Given that the NDEA has now been underway for more than three years, it is reasonable to expect that the resources required to deliver the strategy are in

80 Evaluation of the AfDB’s Assistance to the Energy Sector (1999-2018): Refocusing Support for Improved and Sustained Energy Access in Africa - Summary Report
place. The review considers the financial resources required to deliver on the NDEA’s promise, as well as the human capital and institutional resources required to deliver the strategy. It considers whether the resources deployed to support both the efficient and sustainable implementation of the NDEA. The review considers accountability for delivering the NDEA, and how the measures adopted for monitoring progress in delivering the NDEA are cascaded to individuals and directorates within AfDB.
ı Assess evidence from the first few years of implementation of the NDEA. The NDEA was launched in 2016, so it is reasonable to expect that the strategy will be reflected in AfDB’s activities across the energy sector over the past few years. Analysis of the Bank’s portfolio is performed to assess the extent to which the NDEA has resulted in a refocusing of the Bank’s activities in the energy sector. The assessment also draws on evidence from specific country case studies to consider the extent to which the NDEA has been operationalized at the country level.
Approach
This assessment of the quality of the NDEA draws on three lines of inquiry which can be summarised as follows:
ı A quality at entry (QAE) assessment, which reviewed the design quality and implementation readiness of the NDEA strategy;
ı A benchmarking of the NDEA against a range of comparator MDB energy sector strategies, specifically sector strategies that are focused on Africa; and
ı Country case studies, which have been used to assess the extent to which the NDEA has been implemented at the country-level.
Quality at entry The QAE assessment is focused on the design quality and the implementation readiness of the NDEA Strategy. The QAE assessment includes a detailed analysis of the relevance of the NDEA to Africa’s energy sector and the targets that encapsulate the NDEA’s objectives. The QAE assessment also analyses the design of NDEA and the extent to which this design has considered operationalization of the strategy; available resources, financial resources, personnel, and institutional structures are also reviewed.
The QAE assessment is mostly based on a critical review of relevant design documents and semi-structured interviews with Bank staff and other stakeholders. A wide range of documents were reviewed in completing the assessment; these are described in more detail in the “Information Sources” section (Page 83). The documents reviewed included the NDEA Strategy itself as well as more recent AfDB documents that review the implementation of the AfDB’s projects in the energy sector. A one-week mission to the AfDB’s headquarters in Abidjan took place in September 2019, during which face-to-face semi-structured interviews took place. These interviews were used to understand in more detail how the NDEA was designed and how it has been implemented during the years since 2016. Further semi-structured interviews with regional AfDB staff and with other stakeholders took place remotely.
A detailed analysis of Africa’s energy sector also feeds into the QAE assessment. A wide range of reports and papers covering trends and challenges across Africa’s energy sector were reviewed in completing the assessment. These reports and stakeholder interviews were used get an idea of the key priorities in the sector and thus assess the relevance of the NDEA.

81Annexes
An ID
EV S
ecto
r Eva
luat
ion
The QAE assessment cuts across all components of the wider review of the NDEA that is presented in this report. The QAE assessment feeds into each of the four components of the assessment that were highlighted in the “Scope of evaluation section” (page 79). In particular, the detailed review of the NDEA Strategy and the extensive interviews performed in completing this work fed into our assessment of the design of the NDEA, the extent to which that design aids the implementation of the strategy, and the resources made available for implementation. Evidence regarding the NDEA’s implementation is also assessed through analysis of the AfDB’s activities across the energy sector at a portfolio level.
Benchmarking The benchmarking component of the assessment draws on learnings from other donors and MDBs. The NDEA is a strategy rather than a program and as such the NDEA is compared against the following strategies (comparator strategies):
ı The World Bank’s strategy for the energy sector in Africa for the International Development Association (IDA) 18–19 (World Bank AFR Energy Strategy IDA 18-19), the six years from July 1, 2017 to June 30, 2023.98 This Strategy aims to achieve structural transformation in SSA, accelerate the clean energy transition, and support the development of human capital.
ı Power Africa’s strategy as documented in the United States Agency for International Development’s (USAID’s) 2016 “Roadmap”99. Power Africa is a USAID program established in 2013 to increase access to electricity in SSA. The Roadmap outlines how Power Africa and its public and private sector partners will accelerate energy transactions and increase generation capacity by 30,000 megawatts (MW), additional 60 million new electricity connections, and improve the effectiveness of institutions in partner countries and regions.
ı The Agence Française de Développement’s (AFD) “Energy Transition Strategy of 2019-2022”. The strategy of the AFD aims to accelerate progress in achieving access to energy services for all, energy efficiency and demand management, as well as modernized and decarbonized energy supply through supporting energy transition policies, mobilizing and strengthening actors contributing to the energy transition, and supporting innovation.
The inception report also identified the Africa-EU Energy Partnership (AEEP) as a possible candidate for comparison, but after a review of their strategic documents and interviews with representatives of AEEP, it was decided that it was not a relevant comparator as their focus is mainly on coordination, rather than the implementation of projects.
Desk reviews of the strategy documents listed above were supplemented with semi-structured interviews of representatives of the institutions responsible for developing and implementing the strategies.
The benchmarking exercise was focused on assessing the design of the NDEA and its comparators, and the availability of resources to implement the strategies. The benchmarking compares the logical frameworks used in designing the comparator strategies, the resources and institutions put in place to implement the strategies, and the mechanisms put in place to monitor the results achieved by the strategies. The analysis performed through the benchmarking exercise identifies the characteristics of a good strategy and considers the extent to which the NDEA possesses these characteristics.

82 Evaluation of the AfDB’s Assistance to the Energy Sector (1999-2018): Refocusing Support for Improved and Sustained Energy Access in Africa - Summary Report
Ecosystem-based case studiesFive country case studies were used to understand how the NDEA has been implemented. Most of the analysis performed through the QAE of the NDEA strategy and benchmarking components of the assessment is reviewing the NDEA across Africa as a whole. To assess how the NDEA is working in practice, it is important to also consider its application at the country-level. Five country case studies have been performed, both to understand how the NDEA’s design at the continent-wide level has been cascaded to individual countries and to assess the early evidence on how the NDEA is being implemented at the country-level.
The case studies were designed to assess the country-level ecosystem100 as well as the projects being implemented in the country case studies. The case studies did not consider the application at a continent-wide level, which was considered through the other components of this assessment, as described previously. Figure A2.1 presents a schematic to illustrate this focus and how the case studies related to the Themes of the NDEA. The two levels on which the case studies assessed the application of the NDEA were:
ı Ecosystem level – At an ecosystem level, the case studies assessed the activities around coordination and partnership between the AfDB and partners engaged in the energy sector. The case studies assessed dialogue with policymakers and development partners around country policies, reaching targets, and leveraging resources.
ı Project level – The case studies also assessed the application of the NDEA principles and themes to the specific project(s) approved since the NDEA was launched, i.e. post-2016.
Countries were selected based on criteria to capture diverse geographic regions and income levels, as well as a range of project types. The RMCs selected for in-depth field case studies are (i) Côte d’Ivoire, (ii) Uganda, (iii) Democratic Republic of Congo, (iv) Morocco, and (v) Zambia. Countries were selected to reflect:
ı A mix of low-income countries (LIC) and lower-middle-income countries (LMIC);
ı A substantial number of energy projects launched during the 2016-18 period; and
ı Regional representativeness, i.e. covering all regions of Africa.
Figure A2.1: Schematic to Indicate the Focus of the Country Case Studies
Capacity
Access to energy
Energy transformations
(Theme 7)
Partnerships (Theme 4)
Infastructure investment
projects (Themes 3, 5)
Enabling environment projects
(Themes 1, 2)
NDEA application to projects
NDEA application to projects
Continent-wide: NDEA Principles and Targets

83Annexes
An ID
EV S
ecto
r Eva
luat
ion
A common approach was used across the case studies, with each covering the following six areas:
ı Country readiness for the Bank’s range of instruments, and the use of TA and project preparation facilities, which are normally crucial for enhancing QAE of Bank projects, in improving country readiness.
ı Understanding of the Bank’s value proposition to RMCs, especially regarding how the Bank is intervening in different countries in terms of investment-driven vs. TA-driven assistance, or other support.
ı The extent to which private sector capital has been mobilized for delivering energy infrastructure in RMCs.
ı Alignment of the NDEA with national energy strategies and policies.
ı Understanding whether there were any perceived or actual shortcomings in the Bank’s energy interventions in the country pre-NDEA.
ı Understanding what (if anything discernible) has changed in the Bank’s interventions in the country since the NDEA was launched.
Information Sources
Document review ı Evidence gathered from the AfDB includes secondary data and reports, and interviews with Bank staff.
When considering whether the NDEA addresses shortcomings in the AfDB’s previous work in the sector, the analysis already performed by IDEV in preparing the draft energy sector portfolio review has been consulted. The most substantial document is the NDEA Strategy (2016-2025)101; this has been a key source in performing this assessment. CSPs have been reviewed in completing the country case studies, as have relevant project appraisal documents for projects implemented after the launch of the NDEA.
ı A wide range of external documents have also been reviewed, including recent literature providing insights on the priority challenges to be addressed in Africa’s energy sector and information on the programs against which this assessment has benchmarked the NDEA.
Secondary data analysisThe assessment used the database of energy sector interventions to analyse energy sector commitments since the launch of the NDEA. The analysis assesses the extent to which commitments have increased since the launch of the NDEA and whether the resources committed are in line with the funding commitments made in the strategy for delivering the NDEA. Where the NDEA itself only delivers a small portion of the funding required to deliver on its goal, the AfDB’s effectiveness in crowding in/leveraging other sources of finance to achieve its objectives is also considered.
Key informant interviewsA significant information source for all three studies was key informant interviews, in particular, interviews with key AfDB staff. These interviews were an important source of evidence in assessing the NDEA’s design, as AfDB energy sector staff have the best overall understanding of the NDEA’s underlying philosophy. AfDB staff also helped by providing evidence of how the NDEA is affecting decision making, and the selection and design of specific interventions within the energy sector. Interviews were held with key informants regarding

84 Evaluation of the AfDB’s Assistance to the Energy Sector (1999-2018): Refocusing Support for Improved and Sustained Energy Access in Africa - Summary Report
the comparator strategies, as previously described in the “Benchmarking” section (page 81).. A total of 100 key informant interviews were also conducted for the country case studies, serving as the primary source of evidence for the analysis. A list of the key informants interviewed in performing this quality assessment is presented in Table A2.1 and an analysis of the key informants interviewed in completing the country case studies is presented in Table A2.2.
A range of key informants was interviewed in completing the country case studies, covering different stakeholder types. These key informant interviews are summarised in Table A2.2 below.
Table A2.1: Key AfDB Contacts in Completing the Quality at Entry Assessment
# Name Function
1 Mr. Wale Shonibare Acting VP, Power, Energy, Climate, and Green Growth
2 Mr. Daniel Schroth Advisor to the VP, PEVP Complex/Acting Director, Renewable Energy and Energy Efficiency
3 Mr. Monojeet Pal Division Manager, Renewable Energy and Energy Efficiency
4 Mr. Ihcen Naceur Portfolio and Project Support
5 Mr. Engedasew Negash Division Manager, Renewable Energy and Energy Efficiency
6 Mr. Joao Duarte Cunha Division Manager, Renewable Energy and Energy Efficiency
7 Mr. Jalel Chabchoub Chief Investment Officer / Energy Efficiency Specialist
8 Mr. Anthony Okon Nyong Director, Climate Change and Green Growth
9 Mr. Gareth Phillips Division Manager, Climate Change and Green Growth
10 Mr. Henry Paul Batchi Baldeh Director, Power Systems Development
11 Mrs. Angela Nalikka Division Manager, Power Systems Development
12 Mr. Callixte Kambanda Division Manager, Energy Policy, Regulation, and Statistics
13 Mr. Matheus Magala VP, Corporate Services and Human Resources
14 Mr. Cyril Blet Chief Accountability and Development Impact Officer
15 Mr. Rudolph Petras Principal Results Specialist
16 Mr. Achraf Tarsim Regional Sector Manager for North Africa (PEVP and PIVP)
17 Mr. Humphrey Richard Regional Energy Sector Manager for East Africa
Table A2.2: Key Informants Interviewed for the Ecosystem-Based Country Case Studies
Stakeholder group Côte d’Ivoire DRC Morocco Uganda Zambia Total
Operational staff of AfDB 3 1 2 1 4 11
National government (policymakers, energy sector officials, public utilities, etc.)
4 6 6 13 9 38
Development partners 5 2 5 3 3 18
Private sector (utilities personnel, investors) 6 8 3 3 4 24
Civil society (NGOs) 1 3 2 3 9
Total 19 20 16 22 23 100

85Annexes
An ID
EV S
ecto
r Eva
luat
ion
Annex 3: Evaluation Matrix
Evaluation Matrix for the Summative Approach
Evaluation Questions Evaluation Indicators or Judgement Criteria Atlas.ti Codes
RELEVANCE: Are the Bank’s activities in the energy sector being implemented in line with the country’s priorities and Bank’s policy framework?Bank’s activities (projects) are aligned with: (1) countries’ (RMCs’) own policies, strategies or action plans, (2) the Bank’s own CSP
1.0 To what extent are the Bank’s activities in the energy sector aligned with the priorities of RMCs and Regional Economic Countries (RECs) while providing a value-added by introducing reforms?
1.1 The energy sector strategy set in the Bank’s CSP {If any} is aligned with RMC’s sector policy/strategy and sub-sectors’ Action Plans.Bank’s activities (CSP) are aligned with (1) countries’ (RMCs’) own policies, strategies or action plans
1.1.1 CSP aligned w/RMC sector policy/strategy1.1.2 CSP aligned w/RMC action plan
1.2 The Bank’s CSPs introduced or facilitated reforms improving the RMCs overall performance of the energy sector policy framework, notably by introducing more consistency with its energy sector strategy.Implementation of the Bank’s CSP (policy dialogue, projects, TA, etc.) in RMC improved sector policy (i.e. knowledge, know-how, expertise, etc. from the Bank were useful)
1.2.1 CSP enabled RMC sector reforms 1.2.2 Improved RMC policy framework1.2.3 Improved RMC policy consistency
1.3 The Bank contributed to elaborate a sector or sub-sector action plan when missing or incomplete (coverage, priorities principles, institutions). - In how many cases were action plans missing or incomplete?- Bank’s activities (policy dialogue, projects, TA, etc.) contributed to RMCs’ sector action plans when needed (for example, there was a collaboration between the Bank and the RMC whereby the Bank assisted or partnered with the RMC to improve energy sector action plans).
1.3.1 Incomplete RMC action plan 1.3.2 Contribution to RMC action plan
2.0 To what extent have the Bank’s Interventions adapted over time, taking into account RMCs’ implementation performance
2.1 The design and approval stages allowed the Bank to realistically assess political economy constraints, institutional weaknesses, market failures, and any other issues, including underlying risks and assumptions.- Projects (financed by the Bank) were adapted to local realities during the planning (design and approval) stages.
2.1 1 Design approval assessment criteria2.1.2 Assessed RMC limitations risks/assumptions
RELEVANCE: Are the Bank’s activities in the energy sector being implemented in line with the country’s priorities and Bank’s policy framework?The Bank’s activities (projects) are aligned with: (1) countries’ (RMCs’) own policies, strategies or action plans, (2) the Bank’s own CSP
3.0 How efficient has the Bank been in delivering the expected outputs, without delays and cost overruns? How well does the Bank adapt to changing circumstances during project implementation?
3.1 The Bank’s energy portfolio (projects) faced delays and cost overruns similar to those incurred by other infrastructure projects such as those in the transport or water and sanitation sector.- The overall energy sector portfolio of the Bank is compared to the portfolio of other Bank sectors investing in infrastructure in terms of delays and cost overruns.
3.1.1 Delays cost overruns
3.2 The Bank’s design options, unreliable cost estimates, or Internal Rate Return (IRRs) are minor among the key issues faced during energy projects’ delayed Implementation.- Regarding the causes and consequences of delayed implementation… the Bank’s decisions regarding design, cost estimate, or return on investment (IRR) were not major issues.
3.2.1 Key issues faced during implementation3.2.2 Relative import of design cost IRR issues
3.3 Procurement of Bank-financed projects were conducted on time.- Preparation, negotiation, and signing of contracts for the implementation of Bank projects did not cause project delays.
3.3.1 Timely procurement of financed projects

86 Evaluation of the AfDB’s Assistance to the Energy Sector (1999-2018): Refocusing Support for Improved and Sustained Energy Access in Africa - Summary Report
Evaluation Questions Evaluation Indicators or Judgement Criteria Atlas.ti Codes
4.0 How appropriate are the project design at the approval? What are the key factors contributing to the efficient implementation of projects?
4.1 The Bank’s energy projects appraisal included a comprehensive range of assessments (engineering design, sector political economy, institutional governance and performances, PFM, corruption…).- A range of assessments was conducted to inform project design and approval decisions.
4.1.1 Range of project appraisal assessments
4.2 Internally, the Bank implemented a specific and reliable quality control mechanism before approval to avoid overambitious, over-optimistic designing, or budget underestimation by task teams.- A criterion-based quality at entry (Q@E) framework and process was used to inform project design and approval decisions.
4.2.1 QaE controls implemented
4.3 The assumptions and risks identified by each project are closely monitored afterward.- Data was collected, analyzed and reported on assumptions and risks inherent in the project design/logic model/TOC and used to inform project implementation decisions.
4.3.1 Risk monitoring implemented
5.0 How consistently have ex-ante and ex-post Financial Internal Rate of Return (FIRRs) and Economic Internal Rates of Return (ElRRs) been estimated (including sensitivity analysis)?
5.1 The Bank made consistent use of economic and financial analysis (Internal Rate Return IRRs) at appraisal stages, including systematic testing of alternative designs.- Appraisal of projects before approval used IRR/sensitivity analysis to test project design options and inform project design and approval decisions based on estimated financial and economic performance.
5.1.1 Ex-ante use of FIRR/EIRR 5.1.2 Ex-ante use of sensitivity analysis
5.2 The Bank made consistent use of economic and financial analysis (e.g.IRRs) even after project completion, including systematic validation of sensitivity analysis.- Appraisal of projects after completion used IRR/sensitivity analysis to inform final assessments of financial and economic performance against initial estimates.
5.2.1 Ex-post use of FIRR/EIRR 5.2.2 Ex-post use of sensitivity analysis
EFFECTIVENESS: To what extent has the Bank contributed to the development of the energy sector in RMCs?
6.0 To what extent the Bank’s expected development intermediate outcomes were achieved?What are the key factors that affected the effectiveness (degree of achievement) of the Bank’s energy assistance?
6.1 The Bank’s interventions contributed to specific measurable benefits as per each project design (results-based logical framework).- Were planned/expected outcomes achieved?- What factors facilitated or inhibited the achievement of planned outcomes?
6.1.1 Intermediate outcome achievement6.1.2 Barrier and enablers to achievement
6.2 Unintended consequences (positive or negative) different from the above were recorded after Bank projects’ completion.- Outputs and outcomes that were not planned/expected.
6.2.1 Unintended consequences

87Annexes
An ID
EV S
ecto
r Eva
luat
ion
Evaluation Questions Evaluation Indicators or Judgement Criteria Atlas.ti Codes
7.0 To what extent did the non-lending activities (Economic and Sector Work, policy dialogue, etc.) contribute to achieving the outcomes of the Bank’s projects?
7.1 The major changes in RMC’s energy policy framework and programming can be allocated to Bank’s non-lending activities. - Non-lending activities are understood to refer to conducting sector studies (e.g. ESW) and engaging RMCs in policy dialogue.- Changes in RMC energy policy, planning and activities can be attributed to the contribution made by the Bank, e.g. contributions can be for the assistance provided by the Bank to improve the countries sector policy and action plans through policy research and analysis, policy dialogue, assistance in drafting sector action plans, and training.
7.1.1 Non-lending activity contributions
7.2 The Bank’s new mechanisms (internal organizational changes and restructuring) were set in place in a timely manner and with adequate resources to fill-up their missions.- New mechanisms refer to internal organizational changes and restructuring such as the creation of the ONEC (Energy, Environment and Climate Change Department) in May 2010.
7.2.1 New mechanisms’ timely implementation7.2.2 New mechanisms’ adequately resourced
7.3 The Bank’s new mechanisms demonstrated their value-added and contributed to the outcomes achieved by the Bank’s energy interventions.- Same as above
7.3.1 New mechanisms’ value-added7.3.2 Contributed to outcomes
8.0 To what extent has the Bank’s monitoring been supportive in achieving the expected intermediate outcomes?
8.1 The Bank ensured that timely monitoring data was available from a reliable and updated set of indicators at the project and sector level.- The Bank regularly collects data to assess project performance and RMC energy sector performance.
8.1.1 Timely project monitoring data available8.1.2 Timely sector monitoring data available8.1.3 Updated project monitoring indicators 8.1.4 Updated sector monitoring indicators
8.2 The Bank’s country teams used monitoring data for project supervision. - Not only is the information collected, but it is analyzed, reported, and used for decision-making.
8.2.1 Project monitoring data used
8.3 The Bank’s project monitoring made consistent use of updated economic and financial analyses (Internal Rate Return (IRRs), Net Present Value (NPVs), Benefit-Cost Ratio).- Appraisal of projects during implementation used IRR/NPV to inform ongoing assessments of financial and economic performance against initial estimates.
8.3.1 Updated IRR NPV used for project monitoring
SUSTAINABILITY: To what extent has the Bank’s assistance in the energy sector contributed to sustainable results?
9.0 To what extent has the Bank contributed to helping RMCs obtain financial resources to cover the recurrent costs of energy infrastructure that has been built or rehabilitated?
9.1 The Bank contributed to a realistic assessment of the range of resources available with RMCs/concession holders for energy infrastructure maintenance, modernization, and extension.- The Bank acquired information about RMC resources available to finance the recurrent costs of energy infrastructure.
9.1.1 Assessed available RMC resources
9.2 The Bank’s interventions in the energy sector contributed to collect sufficient financial resources for energy infrastructure maintenance and operations.- The Bank’s lending and non-lending activities encouraged RMCs and perhaps other donors to fund the recurrent costs of energy infrastructure
9.2.1 Contributed to securing RMC financial resources 9.2.2 Leveraged other financial resources
9.3 The Bank’s interventions ensured that long-term financial commitments from RMCs to infrastructure maintenance were enshrined by Public Financial Management (PFM) or ring-fenced (protected).- RMC commitments to fund recurrent costs of energy infrastructure were protected, formalized, and irrevocable (through PFM, for example).
9.3.1 Ensured RMC financial commitments

88 Evaluation of the AfDB’s Assistance to the Energy Sector (1999-2018): Refocusing Support for Improved and Sustained Energy Access in Africa - Summary Report
Evaluation Questions Evaluation Indicators or Judgement Criteria Atlas.ti Codes
10.0 To what extent has the Bank contributed to have RMCs operationalizing an institutional framework that ensures value for money for infrastructure maintenance funding?
10.1 The Bank contributed to establishing or reinforcing autonomous agencies in charge of programming and managing Infrastructure maintenance.- The Bank encouraged a concessional approach to infrastructure maintenance; agencies autonomous to the government were made responsible for infrastructure maintenance.
10.1.1 Reinforced autonomous agencies (concessional approach)
10.2 The Bank contributed to the promotion of the private sector for maintenance works in RMCs and excluded works done in house.- The desirability of including the private sector was communicated to the RMC by the Bank and/or Bank’s projects; fixed-price contracts were instituted, and billing based on time worked and materials used was eliminated
10.2.1 Promoted private sector role in the maintenance
10.3 The Bank contributed to the setting by RMCs of the anti-corruption and transparency policies or measures in procurement and supervision of maintenance works of energy Infrastructure.- Potential or real issues concerning corruption and the need for transparency in procurement was explicitly addressed by the Bank with RMCs.
10.3.1 Contributed to anti-corruption/transparency
Evaluation Matrix for the Assessment of the NDEA
Evaluation question
Information sources Lines of inquiry
Document review
Secondary data analysis
Key informant interviews
Quality at Entry review
Bench-marking analysis
Ecosystem-based country case studies
Relevance of the NDEA
Do the outcomes being targeted by the NDEA reflect genuine challenges in the energy sector that need to be addressed?
• • • • •
Do the aims of the NDEA link to the AfDB’s wider priorities and its 2012 Energy Sector Policy?
• • • •
How have the targets for the NDEA been derived?
• • •
Are the targets for the NDEA relevant? • • • • •
Design of the NDEAAre the objectives or targets of the NDEA well defined?
• • • • •
Is there a clear logical framework and/or TOC that describes the rationale for the interventions that take place under the NDEA and how those interventions contribute towards the NDEA meeting its targets?
• • • •
Is there a clear distinction between the outputs that will be achieved by AfDB’s activities through the NDEA and the outcomes that the NDEA contributes towards?
• • • •

89Annexes
An ID
EV S
ecto
r Eva
luat
ion
Evaluation question
Information sources Lines of inquiry
Document review
Secondary data analysis
Key informant interviews
Quality at Entry review
Bench-marking analysis
Ecosystem-based country case studies
Is the logic that connects the proposed interventions to the outputs and the outputs to the outcomes sound? Are any assumptions on which the logical framework depends reasonable?
• • •
Have the NDEA interventions been designed in detail and are those detailed designs consistent with what the NDEA as a whole is trying to achieve?
• • • • •
Will the NDEA be effective in tackling the shortcomings in AfDB’s current energy portfolio identified in IDEV’s previous evaluations102 ?
• • • •
Does the NDEA have objectives, tackle barriers, or use approaches that other comparators do not?
• • •
Capacity to deliver the NDEAAre the institutional arrangements to support the sustainable implementation of the NDEA appropriate?
• • • •
Have the interventions required to implement the strategy been costed and have the financial resources required been made available?
• • • •
Have teams and personnel been assigned to implementing different components of the strategy?
• • • •
Does the AfDB have a clear, and explicitly budgeted internal and/or external monitoring framework to track the progress made by the NDEA in delivering the expected outputs?
• • • • •
First years of implementation of the NDEAHas the AfDB reallocated resources to reflect the NDEA’s priorities?
• • • •
Are stakeholders in RMCs aware of the NDEA and its impact on AfDB’s activities?
• •
How are the NDEA’s principles reflected in the AfDB’s dialogue with governments and development partners?
• •
How has the NDEA approach enhanced the AfDB’s engagement with development partners and private sector actors to leverage investments?
• • • •
How are themes operationalized at the project level? Which themes have had the greatest traction?
• • • • •
What challenges has the AfDB faced in applying the NDEA’s principles?
• • • •

90 Evaluation of the AfDB’s Assistance to the Energy Sector (1999-2018): Refocusing Support for Improved and Sustained Energy Access in Africa - Summary Report
Ann
ex 4
: Pro
ject
Lis
t Sa
mpl
ed P
roje
ct-le
vel E
valu
atio
n Li
st
No.
Publ
ic
or
priv
ate
Boar
d Ap
prov
al
Year
SA
P Co
dePr
ojec
t titl
eCo
untr
yPh
ases
Type
of i
nves
tmen
tTo
tal A
fDB
finan
cing
in
mill
ion
UA
1Pu
blic
2017
P-BJ
-FZ0
-001
Ener
gy S
ecto
r Sup
port
Proj
ect
Beni
nEn
ablin
g En
viron
men
tPB
O18
.69
2Pu
blic
2016
P-EG
-K00
-010
Mul
tisec
tor P
BO II
(Ene
rgy,
Fisc
al, B
usin
ess
envir
onm
ent,
Soci
al in
clus
ion)
- T
otal
is U
SD 5
00 (K
PI w
ill be
sha
red)
Egyp
tEn
ablin
g En
viron
men
tPB
O12
3.11
3Pu
blic
2016
P-M
G-F0
0-00
2Pr
ogra
mm
e d’
appu
i à la
réfo
rme
du s
ecte
ur d
e l’é
nerg
ieM
adag
asca
rEn
ablin
g En
viron
men
tPB
O13
.77
4Pu
blic
2015
P-EG
-K00
-009
Econ
omic
Gov
erna
nce
and
Ener
gy S
uppo
rt Pr
ogra
m (T
otal
US
D 50
0 bi
llion
- KP
I sha
red)
Egyp
tEn
ablin
g En
viron
men
tPB
O18
2.19
5Pu
blic
2015
P-BF
-FA0
-008
Pow
er S
ecto
r Bud
get S
uppo
rt Bu
rkin
a Fa
soEn
ablin
g En
viron
men
tPB
O20
.00
6Pu
blic
2014
P-M
U-FA
0-00
2Re
-dev
elop
men
t of S
t. Lo
uis
Pow
er s
tatio
nM
aurit
ius
Inve
stm
ent
Pow
er G
ener
atio
n75
.76
7Pu
blic
2012
P-M
A-FF
0-00
1Ce
ntra
le S
olai
re d
e Ou
arza
zate
- P
hase
1M
oroc
coIn
vest
men
tPo
wer
Gen
erat
ion
85.2
2
8Pu
blic
2011
P-CV
-FA0
-002
Deve
lopp
emen
t du
Syst
ème
de T
rans
mis
sion
Cape
Ver
deIn
vest
men
tNa
tiona
l Grid
Ext
. or
Upgr
ade
8.18
9Pu
blic
2011
P-ZA
-F00
-002
Esko
m re
new
able
ene
rgy
- Se
re w
ind
Sout
h Af
rica
Inve
stm
ent
Pow
er G
ener
atio
n5.
61
10Pu
blic
2011
P-GN
-F00
-004
Proj
et d
’Ele
ctrifi
catio
n Ru
rale
Guin
eaIn
vest
men
tNa
tiona
l Grid
Ext
. or
Upgr
ade
14.9
5
11Pu
blic
2010
P-ET
-FA0
-008
Elec
trici
ty T
rans
mis
sion
Sys
tem
Impr
ovem
ent
Ethi
opia
Inve
stm
ent
Natio
nal G
rid E
xt. o
r Up
grad
e14
7.86
12Pu
blic
2009
P-NG
-FA0
-002
Econ
omic
and
Pow
er S
ecto
r Ref
orm
Pro
gram
Nige
riaEn
ablin
g En
viron
men
tPB
O10
0.00
13Pu
blic
2008
P-EG
-FAA
-014
Ain
Sokh
una
Ther
mal
Pow
er P
roje
ctEg
ypt
Inve
stm
ent
Pow
er G
ener
atio
n26
2.10
14Pu
blic
2008
P-Z1
-FA0
-030
NELS
AP In
terc
onne
ctio
n Pr
ojec
t - N
BIM
ulti
Inve
stm
ent
Regi
onal
In
terc
onne
ctio
n1.
21

91Annexes
An ID
EV S
ecto
r Eva
luat
ion
No.
Publ
ic
or
priv
ate
Boar
d Ap
prov
al
Year
SA
P Co
dePr
ojec
t titl
eCo
untr
yPh
ases
Type
of i
nves
tmen
tTo
tal A
fDB
finan
cing
in
mill
ion
UA
15Pu
blic
2007
P-Z1
-F00
-030
Ghan
a - T
ogo
- Be
nin
Pow
er In
terc
onne
ctio
n (G
hana
)Gh
ana
Inve
stm
ent
Regi
onal
In
terc
onne
ctio
n14
.87
16Pu
blic
2009
P-TN
-FA0
-002
Proj
et d
’Ass
aini
ssem
ent d
e Re
stru
ctur
atio
nTu
nisi
aIn
vest
men
tNa
tiona
l Grid
Ext
. or
Upgr
ade
43.3
5
17Pu
blic
2006
P-ET
-FA0
-006
Rura
l Ele
ctrifi
catio
n Pr
ojec
t II
Ethi
opia
Inve
stm
ent
Natio
nal G
rid E
xt. o
r Up
grad
e86
.53
18Pu
blic
2011
P-ZW
-FA0
-001
Emer
genc
y Po
wer
Infra
stru
ctur
e Re
habi
litat
ion
Proj
ect I
Zim
babw
eIn
vest
men
tPo
wer
Gen
erat
ion
0.00
19Pu
blic
2009
P-KE
-FA0
-003
Mom
bass
a Na
irobi
Tra
nsm
issi
on L
ine
Keny
aIn
vest
men
tNa
tiona
l Grid
Ext
. or
Upgr
ade
50.0
0
20Pu
blic
2008
P-GN
-FA0
-005
Réha
bilit
atio
n de
s ré
seau
x él
ectri
ques
Guin
eaIn
vest
men
tNa
tiona
l Grid
Ext
. or
Upgr
ade
12.0
0
21Pu
blic
2007
P-UG
-FA0
-002
Buja
gali
Inte
rcon
nect
ion
Proj
ect
Ugan
daIn
vest
men
tNa
tiona
l Grid
Ext
. or
Upgr
ade
19.2
1
22Pu
blic
2004
P-SN
-FA0
-002
Proj
et d
’Ele
ctrifi
catio
n Ru
rale
Sene
gal
Inve
stm
ent
Natio
nal G
rid E
xt. o
r Up
grad
e9.
58
23Pu
blic
2001
P-M
Z-FA
0-00
4Ru
ral E
lect
rifica
tion
Proj
ect (
Elec
t III)
Moz
ambi
que
Inve
stm
ent
Natio
nal G
rid E
xt. o
r Up
grad
e11
.12
24Pu
blic
2007
P-BI
-FA0
-002
Réha
bilit
atio
n et
Ext
entio
n de
s In
frast
ruct
ures
Ele
ctriq
ues
Buru
ndi
Inve
stm
ent
Natio
nal G
rid E
xt. o
r Up
grad
e7.
32
25Pu
blic
2007
P-TZ
-FA0
-008
Elec
trici
ty V
Tanz
ania
Inve
stm
ent
Natio
nal G
rid E
xt. o
r Up
grad
e30
.00
26Pu
blic
2007
P-GH
-F00
-003
Pow
er S
yste
m R
einf
orce
men
t Pro
ject
(GED
AP I)
Ghan
aIn
vest
men
tNa
tiona
l Grid
Ext
. or
Upgr
ade
27.6
0
27Pu
blic
2002
P-Z1
-F00
-013
Nige
ria -
Ben
in -
Tog
o Po
wer
Inte
rcon
nect
ion
Proj
ect
Mul
tiIn
vest
men
tRe
gion
al
Inte
rcon
nect
ion
12.5
6
28Pu
blic
2002
P-TN
-FAC
-001
Proj
et d
’Ele
ctrifi
catio
n Ru
rale
VI
Tuni
sia
Prep
arat
ion
Natio
nal G
rid E
xt. o
r Up
grad
e0.
91
29Pu
blic
2000
P-Z1
-F00
-023
Proj
et E
nerg
ie d
e M
anan
tali
Mul
tiIn
vest
men
tRe
gion
al
Inte
rcon
nect
ion
3.76

92 Evaluation of the AfDB’s Assistance to the Energy Sector (1999-2018): Refocusing Support for Improved and Sustained Energy Access in Africa - Summary Report
No.
Publ
ic
or
priv
ate
Boar
d Ap
prov
al
Year
SA
P Co
dePr
ojec
t titl
eCo
untr
yPh
ases
Type
of i
nves
tmen
tTo
tal A
fDB
finan
cing
in
mill
ion
UA
30Pu
blic
2014
P-AO
-FA0
-002
Pow
er S
ecto
r Ref
orm
Sup
port
Prog
ram
me
Ango
laEn
ablin
g En
viron
men
tPB
O64
5.29
31Pu
blic
2009
P-BW
-FA0
-001
Mor
upul
e «B
» Po
wer
Tra
nsm
issi
on P
roje
ctBo
tsw
ana
Inve
stm
ent
Pow
er G
ener
atio
n38
.68
32Pu
blic
2009
P-LS
-FA0
-001
Elec
trici
ty S
uppl
y pr
ojec
tLe
soth
oIn
vest
men
tNa
tiona
l Grid
Ext
. or
Upgr
ade
11.0
0
33Pu
blic
2007
P-CV
-FA0
-001
Stre
ngth
enin
g Pr
oduc
tion,
Tra
nspo
rt &
Dist
ribut
ion
Sant
iago
Cape
Ver
deIn
vest
men
tPo
wer
Gen
erat
ion
4.82
34Pu
blic
2007
P-EG
-FAA
-013
Abu
Qir 1
300
MW
Ste
am P
ower
Pro
ject
Egyp
tIn
vest
men
tPo
wer
Gen
erat
ion
215.
13
35Pu
blic
2005
P-M
A-FA
C-01
2Ce
ntra
le T
herm
o-so
laire
Ain
Ben
i Mat
har
Mor
occo
Inve
stm
ent
Pow
er G
ener
atio
n11
8.08
36Pu
blic
2005
P-EG
-FAA
-012
El K
urei
mat
Com
bine
d Cy
cle
Pow
er P
lant
Pro
ject
Egyp
tIn
vest
men
tPo
wer
Gen
erat
ion
144.
58
37Pu
blic
2003
P-TN
-FAC
-002
Assa
inis
sem
ent R
esea
ux D
istri
butio
n El
ecTu
nisi
aIn
vest
men
tNa
tiona
l Grid
Ext
. or
Upgr
ade
63.3
9
38Pu
blic
2003
P-BJ
-FA0
-002
Deux
ièm
e Pr
ojet
d’E
lect
rifica
tion
Rura
leBe
nin
Inve
stm
ent
Natio
nal G
rid E
xt. o
r Up
grad
e12
.32
39Pu
blic
2004
P-Z1
-FA0
-008
Ethi
opia
- D
jibou
ti Po
wer
Inte
rcon
nect
ion
- Et
hiop
iaEt
hiop
iaIn
vest
men
tRe
gion
al
Inte
rcon
nect
ion
20.2
6
40Pu
blic
2003
P-RW
-KE0
-001
Prog
ram
me
AEP
et E
lect
ricite
(AEP
E)Rw
anda
Inve
stm
ent
Natio
nal G
rid E
xt. o
r Up
grad
e18
.77
41Pu
blic
1999
P-ZM
-FA0
-001
Vict
oria
Fal
ls -
Kat
ima
Tran
smis
sion
Lin
e Pr
ojec
tZa
mbi
aIn
vest
men
tNa
tiona
l Grid
Ext
. or
Upgr
ade
4.85
42Pu
blic
2000
P-GM
-FA0
-001
Rura
l Ele
ctrifi
catio
n Pr
ojec
tTh
e Ga
mbi
aIn
vest
men
tNa
tiona
l Grid
Ext
. or
Upgr
ade
2.97
43Pu
blic
2001
P-ET
-FA0
-004
Rura
l Ele
ctrifi
catio
n Pr
ojec
tEt
hiop
iaIn
vest
men
tNa
tiona
l Grid
Ext
. or
Upgr
ade
37.6
7
44Pu
blic
2002
P-M
A-FA
C-01
1Pr
ojet
de
Renf
orce
men
t des
Inte
rcon
nexio
ns E
lect
rique
sM
oroc
coIn
vest
men
tNa
tiona
l Grid
Ext
. or
Upgr
ade
65.0
2
45Pu
blic
2000
P-BJ
-FA0
-001
Elec
trific
atio
n de
17
cent
res
rura
uxBe
nin
Inve
stm
ent
Natio
nal G
rid E
xt. o
r Up
grad
e4.
80

93Annexes
An ID
EV S
ecto
r Eva
luat
ion
No.
Publ
ic
or
priv
ate
Boar
d Ap
prov
al
Year
SA
P Co
dePr
ojec
t titl
eCo
untr
yPh
ases
Type
of i
nves
tmen
tTo
tal A
fDB
finan
cing
in
mill
ion
UA
46Pu
blic
2010
P-KE
-FA0
-004
Pow
er T
rans
mis
sion
Sys
tem
Impr
ovem
ent P
roje
ct
Keny
aIn
vest
men
tNa
tiona
l Grid
Ext
. or
Upgr
ade
43.6
5
47Pr
ivate
20
11P-
KE-F
AA-0
01 K
enya
Thi
ka P
ower
Pla
ntKe
nya
Inve
stm
ent
Pow
er G
ener
atio
n23
.33
48Pr
ivate
20
06P-
CM-F
A0-0
02 A
ES S
ONEL
Cam
eroo
nIn
vest
men
tPo
wer
Gen
erat
ion
49.8
1
49Pr
ivate
20
11P-
CM-F
A0-0
05 K
ribi P
ower
Pro
ject
- C
amer
oon
Cam
eroo
nIn
vest
men
tPo
wer
Gen
erat
ion
23.7
2
50Pr
ivate
20
10P-
CM-F
AA-0
02Di
bam
ba P
ower
Pro
ject
- C
amer
oon
Cam
eroo
nIn
vest
men
tPo
wer
Gen
erat
ion
18.4
9
51Pr
ivate
20
12P-
GH-F
D0-0
02Ta
kora
di II
Exp
ansi
on P
ower
Pro
ject
Gh
ana
Enab
ling
Envir
onm
ent
PBO
15.8
6
52Pu
blic
2014
P-KM
-K00
-003
/P-
KM-K
00-0
06
Com
oros
: PAR
SE –
Ene
rgy
Sect
or S
uppo
rt Pr
ogra
mm
e &
PARS
EGF
- En
ergy
sec
tor r
efor
m a
nd fi
nanc
ial
gove
rnan
ce s
uppo
rt pr
ogra
mCo
mor
osEn
ablin
g En
viron
men
tPB
O4.
00
53Pr
ivate
20
07P-
MG-
FAB-
002
Saha
nivo
try S
mal
l Hyd
ropo
wer
M
adag
asca
rIn
vest
men
tPo
wer
Gen
erat
ion
4.98
54Pr
ivate
20
07P-
UG-F
AB-0
04 U
gand
a -
Buja
gali
Hydr
opow
er P
roje
ct
Ugan
daIn
vest
men
tPo
wer
Gen
erat
ion
78.5
8
55Pr
ivate
20
08P-
UG-F
AB-0
05Ug
anda
- B
user
uka
Hydr
opow
er P
roje
ct
Ugan
daIn
vest
men
tPo
wer
Gen
erat
ion
6.43
56Pr
ivate
20
10P-
CV-F
E0-0
01Ca
pe V
erde
Win
d Fa
rm -
CAB
EOLI
CACa
pe V
erde
Inve
stm
ent
Pow
er G
ener
atio
n11
.78
57Pr
ivate
20
07P-
EG-F
AA-0
13Eg
ypt -
ABU
QIR
130
0 M
W S
team
Pow
erEg
ypt
Inve
stm
ent
Pow
er G
ener
atio
n19
4.30
58Pu
blic
2006
P-M
Z- F
A0-0
06
PROJ
ET É
LECT
RICI
TÉ IV
M
ozam
biqu
eIn
vest
men
tNa
tiona
l Grid
Ext
. or
Upgr
ade
59Pr
ivate
20
05P-
EG-F
AA-0
12EL
KUR
EIM
AT C
C Po
wer
Pla
nt P
roje
ctEg
ypt
Inve
stm
ent
Pow
er G
ener
atio
n14
4.57
60Pr
ivate
20
02P-
NG-F
D0-0
01 N
iger
ia L
iqui
fied
Natu
ral G
as P
roje
ctNi
geria
Inve
stm
ent
Pow
er G
ener
atio
n71
.44
61Pu
blic
2012
N/A
Capa
city
Bui
ldin
g an
d As
sess
men
t of O
ptio
ns fo
r In
crea
sing
Acc
ess
to E
nerg
y in
Sud
anSu
dan
Enab
ling
Envir
onm
ent
Tech
nica
l Ass
ista
nce
0.34
62Pu
blic
2007
P-CV
-FA0
-001
Proj
ect t
o Bu
ild E
lect
ricity
Pro
duct
ion,
Tra
nsm
issi
on a
nd
Dist
ribut
ion
Capa
citie
s Sa
ntia
go Is
land
Enab
ling
Envir
onm
ent
Tech
nica
l Ass
ista
nce
4.76

94 Evaluation of the AfDB’s Assistance to the Energy Sector (1999-2018): Refocusing Support for Improved and Sustained Energy Access in Africa - Summary Report
Annex 5: Data Tables
Table A5.1: Total Bank Group Energy Sector Compared to Other Sectors
Table A5.2: Bank Group Energy Sector Assistance (1999-2018): Infrastructure versus Enabling Environment Investments (by Number of the Project)
Sector 1999-2018 1999-2003 2004-2007 2008-2011 2012-2015 2016-2018
Multi-sector 21.8% 32.3% 17.5% 27.0% 11.3% 25.3%
Transport 19.4% 11.3% 22.0% 20.8% 22.5% 17.2%
Energy 18.9% 5.6% 17.8% 21.3% 24.2% 17.4%
Finance 13.2% 14.9% 11.3% 10.1% 15.2% 14.1%
Agriculture 9.0% 15.4% 10.6% 3.9% 9.0% 10.2%
Social 7.7% 11.3% 8.8% 6.3% 8.9% 5.7%
Water Supply & Sanitation 7.4% 6.0% 9.2% 6.5% 7.2% 8.3%
Industry/Mining/Quarrying 1.3% 1.6% 2.1% 2.7% 0.3% 0.6%
Others* 1.3% 1.5% 0.7% 1.4% 1.3% 1.3%
Total 100.0% 100.0% 100.0% 100.0% 100.0% 100.0%
Total Net Approval (UA Million)
68,027.53 7,892.98 7,973.48 16,910.54 18,630.04 16,620.49
Approval Period Project Status
Type of Intervention
1999-2018
1999-2003
2004-2007
2008-2011
2012-2015
2016-2018 Approved On-
goingCompleted/
closedAbandoned/Terminated
Investment 63% 56% 68% 71% 57% 66% 62% 75% 45% 29%
Preparation 22% 30% 32% 20% 25% 12% 13% 14% 29% 43%
Enabling Environment 15% 15% 0% 9% 17% 20% 22% 11% 11% 29%
Others 1% 0% 0% 0% 0% 2% 3% 0% 0% 0%
Total 100% 100% 100% 100% 100% 100% 100% 100% 100% 100%
Total no. of projects 306 27 31 55 103 90 69 122 127 7
Source: Calculated by IDEV, based on Bank internal databases
Source: Calculated by IDEV, based on Bank internal databases

95Annexes
An ID
EV S
ecto
r Eva
luat
ion
Table A5.3: Subsector Share of Bank Group Commitment by Approval Period
Subsector 1999-2018 1999-2003 2004-2007 2008-2011 2012-2015 2016-2018
Power generation 49.4% 0.1% 79.1% 66.1% 41.7% 29.8%
National Grid Extension or Upgrade 21.2% 64.5% 15.3% 18.5% 12.6% 34.1%
Regional Interconnection 12.7% 9.5% 5.4% 4.5% 17.8% 18.8%
PBO 8.5% 0.0% 0.0% 2.8% 18.3% 5.9%
Oil & Gas 5.0% 24.9% 0.0% 7.5% 8.4% 0.0%
Other (including energy efficiency, clean cooking etc) 2.5% 0.0% 0.0% 0.0% 0.0% 11.0%
TA/Advisory 0.7% 1.0% 0.2% 0.6% 1.1% 0.4%
Total (%) 100.0% 100.0% 100.0% 100.0% 100.0% 100.0%
Total Net Approval (UA Million) 12,862.21 444.08 1,421.72 3,595.11 4,516.80 2,884.50
Table A5.4: Energy Sector Commitments by Sub-Region by Appraisal Period
Source: Calculated by IDEV, based on internal Bank databases
Region 1999-2018 (#) 1999-2003 (#) 2004-2007 (#) 2008-2011 (#) 2012-2015 (#) 2016-2018 (#)
Southern 29.0% (49) 16.0% (5) 27.7% (3) 39.9% (8) 31.6% (17) 14.0% (16)
North 22.3% (26) 39.2% (3) 40.6% (3) 27.2% (9) 19.6% (6) 8.6% (5)
East 19.1% (65) 12.8% (4) 19.2% (7) 15.0% (11) 20.4% (29) 23.2% (14)
West 15.8% (84) 24.8% (10) 5.7% (6) 8.3% (14) 16.6% (22) 27.3% (32)
Multi Region 9.1% (63) 7.2% (5) 0.8% (10) 3.0% (7) 10.3% (23) 19.3% (18)
Central 4.7% (19) - 6.0% (2) 6.5% (6) 1.4% (6) 7.7% (5)
Total (%) 100.0% (306) 100.0% (27) 100.0% (31) 100.0% (55) 100.0% (103) 100.0% (90)
Total Net Approval (UA Million) 12,862.21 444.08 1,421.72 3,595.11 4,516.80 2,884.50
Table A5.5: Energy Sector Commitments by Countries Transition-Based Status by Appraisal Period
Source: Calculated by IDEV, based on internal Bank databases
Source: Calculated by IDEV, based on internal Bank databases
Status 1999-2018 1999-2003 2004-2007 2008-2011 2012-2015 2016-2018
Transition Countries 7.6% 15.9% 6.5% 3.3% 5.2% 16.2%
Multinational 9.1% 7.2% 0.8% 3.0% 10.3% 19.3%
Non-Transition Countries 83.2% 76.9% 92.8% 93.6% 84.5% 64.5%
Total 100.0% 100.0% 100.0% 100.0% 100.0% 100.0%
Total Net Approval (UA Million) 12862.21 444.08 1421.72 3595.11 4516.80 2884.50

96 Evaluation of the AfDB’s Assistance to the Energy Sector (1999-2018): Refocusing Support for Improved and Sustained Energy Access in Africa - Summary Report
Table A5.6: Net Approval by Funding Window
Table A5.7: Net Approval by Financing Instrument (%)
Funding Window 1999-2018 1999-2003 2004-2007 2008-2011 2012-2015 2016-2018
African Development Bank 64.6% 64.0% 75.6% 68.9% 57.7% 64.9%
African Development Fund 26.7% 33.6% 22.2% 24.5% 31.1% 23.9%
Nigerian Trust Fund 0.3% 0.0% 0.0% 0.0% 0.4% 0.5%
Other (*) 8.4% 2.4% 2.3% 6.6% 10.8% 10.7%
Total 100.0% 100.0% 100.0% 100.0% 100.0% 100.0%
Total Net Approval (UA Million) 12,862.21 444.08 1,421.72 3,595.11 4,516.80 2,884.50
(*) Other includes DFID, EU Africa Investment Platform, and the Fragile States Facility.
Multi Debt Relief Initiative - Source: Calculated by IDEV, based on Bank internal databases
Source: Calculated by IDEV, based on internal Bank databases
Funding Instrument 1999-2018 1999-2003 2004-2007 2008-2011 2012-2015 2016-2018
Project Lending 76.7% 94.9% 94.0% 82.8% 63.1% 78.5%
Project Grants 9.2% 3.9% 3.7% 8.5% 9.6% 13.3%
Program-Based Lending 7.0% 0.0% 0.0% 2.8% 17.4% 0.7%
Special Funds 6.1% 1.1% 2.1% 5.9% 8.1% 5.9%
Guarantees 1.0% 0.0% 0.0% 0.0% 1.9% 1.6%
Project Preparation Facility 0.0% 0.0% 0.1% 0.1% 0.0% 0.0%
Total 100.0% 100.0% 100.0% 100.0% 100.0% 100.0%
Total Net Approval (UA Million) 12,862.21 444.08 1,421.72 3,595.11 4,516.80 2,884.50
Financing Instrument/Source Amount (UA Million) Percent
Project Lending 9,847.42 76,5%
African Development Bank 7482.61 58,1%
African Development Fund 2239.45 17,4%
DFID 25.36 0,2%
EU Africa Investment Platform 12.32 0,1%
Fragile States Facility 47.31 0,4%
Multi Debt Relief Initiative 5.64 0,0%
Nigerian Trust Fund 34.73 0,3%
Table A5.8: Net Approval by Instrument and Sources (%)

97Annexes
An ID
EV S
ecto
r Eva
luat
ion
Financing Instrument/Source Amount (UA Million) Percent
Project Grants 1,192.49 9,3%
African Development Bank 50.28 0,4%
African Development Fund 738.45 5,7%
EU Africa Investment Platform 62.13 0,5%
EU Africa Infrastructure Trust Fund 29.67 0,2%
Fund for African Private Sector Assistance 1.28 0,0%
Fragile States Facility 227.78 1,8%
Middle Inc Countries Fund 2.19 0,0%
NEPAD/IPPF 16.24 0,1%
Sustainable Energy Fund for Africa (SEFA) 18.23 0,1%
South-South Cooperation Trust Fund 0.34 0,0%
Trade and Industrial Organisation Support Fund (TSF) 4.00 0,0%
Trade and Industrial Organisation Support Fund (TSF) Grant 0.45 0,0%
Zimbabwe Multi-Donor Trust 41.46 0,3%
Policy-Based Lending 904.31 7,0%
African Development Bank 714.39 5,6%
African Development Fund 189.92 1,5%
Special Funds 789.64 6,1%
Accelerated Co-financing Facility for Africa (ACFA) 258.89 2,0%
Africa Growing Together Fund 17.99 0,1%
Climate Investment Funds (CIF) 38.55 0,3%
Clean Technology Fund 379.70 3,0%
Fund for African Private Sector Assistance (FAPA) Grant 0.53 0,0%
Global Environment Facility (GEF) 15.31 0,1%
Global Environmental Facility 13.19 0,1%
Korea-Africa Economic Cooperation (KOAFEC) 0.17 0,0%
OPEC-Organization of Petroleum Exporting Countries 12.36 0,1%
Strategic Climate Fund (SCF) Grant 1.47 0,0%
Sustainable Energy Fund for Africa (SEFA) Project Preparation Grant (PPG) 1.92 0,0%
Strategic Climate Fund 49.56 0,4%
Guarantees 132.18 1,0%
African Development Bank 41.57 0,3%
African Development Fund 16.60 0,1%
Private Sector Credit Enhancement Facility 74.01 0,6%
Project Preparation Facility 5.10 0,0%
African Development Fund 1.00 0,0%
NEPAD Infrastructure Project Preparation Facility (NEPAD-PPF) 4.10 0,0%
GRAND TOTAL 12,871.14 100,0%
Source: Calculated by IDEV, based on internal Bank databases

98 Evaluation of the AfDB’s Assistance to the Energy Sector (1999-2018): Refocusing Support for Improved and Sustained Energy Access in Africa - Summary Report
Data Source: Cluster – Cluster Evaluation Reports, PAR, PCR, Case Study (In-Depth Field Case Studies reports)
Table A5.9: Comparison of Economic Internal Rate of Return (N=17) at Ex-Ante and Ex-Post
Project Name Type Ex-ante EIRR (%)
Ex-post EIRR (%) andData Source Variation
Opportunity Cost of Capital
Power Generation
Uganda - Bujagali Hydropower Project Private 25.6 9 PRA - 12.0
Uganda - Buseruka Hydropower Project Private 22.7 10.4 Case Study - 12.0
Cape Verde Cabeolica Wind Farm Project Private 15.5 14.8 Case Study = 12.0
Egypt - Abu Qir 1300 MW Steam Power Project Public 22.0 13.2 PCR - 12.0
Egypt El Kureimat Combined Cycle Power Plant Project Public 15.6 15.0 Case Study = 10.0
Morocco Beni Mathar Power generation Public 16.7 15.8 PCR = 10.0
Egypt - Ain Sokhna 1300 MW Supercritical Thermal Power Plant
Public 13.0 36.0 Case Study ++ 12.0
Power Generation & Transmission
Kenya: Mombasa – Nairobi Transmission Project Public 37.5 41.3 PCR + 12.0
Kenya: Power Transmission System Improvement Project
Public 19.5 15.8 PCR - 12.0
Guinea Conakry - Electricity Network Rehabilitation and Extension Project
Public 36.9 38.6 PCR + 12.0
Lesotho Electricity Supply Project Public 16.5 20 PCR + 11.0
Power Interconnection Projects
Nigeria/Togo/Benin Power System Interconnection Project Public 39.8 81.33 Cluster Eva. +++ 12.00
Ethiopia-Djibouti Power Interconnection Project Public 25.0 62.00 Cluster Eva. +++ 12.00
Zambia-Namibia Victoria Falls-Katima Mulilo Power Interconnection Project
Public 15.1 28.10 Cluster Eva. ++ 12.00
Senegal-Mali-Mauritania Manantali Hydropower Project Public 16.0 17.00 Cluster Eva. = 12.00
Morocco-Spain Electric Network Interconnection Public 44.0 20.42 Cluster Eva. -- 12.00
Uganda - Bujagali Interconnection Project Public 26.1 70.0 PCR +++ 12.0
Rural Electrification Projects
Benin Project for the Electrification of 17 Rural Centers Public 10.0 25.90 Cluster Eva. ++ 10.00
Benin Second Rural Electrification Project Public 19.49 15.30 PCR - 10.00
Ethiopia Rural Electrification Project I Public 17.2 31.66 PCR ++ 12.00
Ethiopia Rural Electrification Project II Public 13.0 PAR 12.00
The Gambia Rural Electrification Project Public 15.4 13.00 PCR - 12.00
Tunisia ETAP Corporate Loan Project Public 19.0 26.00 PCR + 12.00
Tunisia Rural Electrification Project VI Public 9.4 12.40 Cluster Eva. + 12.00
Tunisia Electricity Distribution Networks Rehabilitation Project VII
Public 14.4 18.08 PCR + 12.00
Senegal - Rural Electrification Project Public 36.2 25.4 PCR -
Mozambique Rural Electrification III Public 13,7 12.0
Guinea - Rural Electrification Project Public 36.2 38.6 PCR + 12.0

99Annexes
An ID
EV S
ecto
r Eva
luat
ion
Table A5.10: List of Critical Success and Failure Factors in Energy Sector Projects
Factor No. of Projects Positively affected by
No. of Projects Negatively affected by
1. Not subject to Government Control
1.1 World Market prices 3
1.2 Natural events 3
1.3 Bank Performance 9 9
1.4 Performance of contractors/consultants 6 8
1.5 Civil war 3
1.6 Others 2
2. Subject to Government Control
2.1 Sector policies 7
2.2 Government commitment 7 7
2.3 Appointment of key staff 1 2
2.4 Counterpart funding 1 10
2.5 Administrative capacity 4 5
2.7 Other 4
3. Subject to Executing Agency Control
3.1 Management/choice of techniques and technologies 6 8
3.2 Staffing 4 5
3.3 Monitoring & Evaluation 3 18
3.4 Beneficiary Participation 6 2
3.5 Other 4
Source: IDEV calculation, based on PCRs/PPERs

100 Evaluation of the AfDB’s Assistance to the Energy Sector (1999-2018): Refocusing Support for Improved and Sustained Energy Access in Africa - Summary Report
Annex 6: References
Case Studies
ı AWF. Guidelines for preparation of the project completion report to be submitted by the recipient to the AWF.
Policy and Literature
ı African Development Bank, 2007. Energy Policy 2000 Review: Energy Efficiency for a Better Future. http://www.adb.org/documents/energy-policy-2000-review-energy-efficiency-better-future.
ı African Development Bank, 2014. “Evaluation of the bank assistance in the energy sector” Approach paper, Operations Evaluation Department (OPEV) African Development Bank, November 2014 Tunis, Tunisia.
ı African Development Bank, 2012. “Energy Sector Policy of the AfDB Group” African Development Bank.
ı Operational Resources and Policies Department (ORPC) Tunis, Tunisia.
ı African Development Bank, 2014. “Development Effectiveness Review 2014 - Energy” Thematic review, African Development Bank, Abidjan, Cote d’Ivoire.
ı African Development Bank, 2013. “Energy Sector Capacity Building Diagnostic & Needs Assessment Study” NEPAD, regional integration, and trade department African Development Bank, Tunis, Tunisia.
ı African Development Bank, 2013. “Review of the African Development Bank’s Economic and Sector Work 2005¬2010” Summary Report, Operations Evaluation Department (OPEV) African Development Bank, Tunis, Tunisia.
ı African Development Bank, 2014. “African Economic Outlook 2014” African Development Bank, Organisation for Economic Co-operation and Development, United Nations Development Programme (2014) www.africaneconomicoutlook.org/en.
ı African Development Bank, 2013. “Progress report on the implementation of the Climate Change Action Plan 2011-2015”.
ı African Development Bank, 2013. “Development of Wind Energy in Africa” Development Research Department of the African Development Bank Tunis, Tunisia.
ı African Development Bank, 2013. “At the center of Africa’s transformation - Strategy for 2013-2022” African Development Bank, Abidjan, Cote d’Ivoire.

101Annexes
An ID
EV S
ecto
r Eva
luat
ion
ı African Development Bank, 2012. “Climate Change Action Plan 2011-2015” Quality Assurance and Results Department (ORQR), African Development Bank, Tunis, Tunisia.
ı African Development Bank, 2011. “Africa’s Infrastructure: A Time for Transformation” Africa Infrastructure Country Diagnostic www.infrastructureafrica.org/aicd.
ı African Development Bank, 2011. “Climate Change Action Plan, 2011-2015”, Quality Assurance and Results Department, Compliance and Safeguards Division, AfDB, Tunis.
ı African Development Bank, 2011. “Central Africa Regional Integration Strategy Paper (RISP) 2011-2015”.
ı African Development Bank, 2010. “Financing of Sustainable Energy Solutions” committee of ten meetings Washington, DC October 2010.
ı African Development Bank, 2010. “Evaluation of the performance and effectiveness of the African development bank’s environmental policy and environmental assessment procedure” Operations Evaluation Department (OPEV).
ı African Development Bank, 2009. “African Development Bank Group Medium-Term Strategy 2008-2012”.
ı African Development Bank, 2009. “Independent Evaluation of Quality at Entry for ADF-11” Operations and Strategies; Information Note for ADF-11 Mid-Term Review, Background Paper.
ı African Development Bank, 1998. “Egypt, Morocco and Tunisia Energy Sector Impact Study” IDEV 1998. http://www.afdb.org/fileadmin/uploads/afdb/Documents/Evaluation-Reports-_Shared-With-OPEV_/00157897-EN-ENERGY-IMPACT-STUDY-IN-EGYPT-MOROCCO-AND-TUNISIA.PDF
ı African Union Commission and AfDB, 2012. “PIDA Programme for Infrastructure Development in Africa. Interconnecting, integrating and transforming a continent” http://www.afdb.org/fileadmin/uploads/afdb/Documents/Project-and-Operations/PIDA percent20note percent20English percent20for percent20web percent200208.pdf.
ı Alliance for Rural Electrification (ARE), 2014. “Renewable energy-based rural electrification - industry lessons learned to make public supporting schemes a success” www.ruralelec.org.
ı Alliance for Rural Electrification (ARE), 2014. “Best practices for clean energy access in Africa” October 2014Brussels, Belgium.
ı Anton E et al, 2009. “Underpowered: The State of the Power Sector in Sub-Saharan Africa” AICD background paper 6, The International Bank for Reconstruction and Development / The World Bank, Washington, DC.
ı Bank Information Center, 2009. “Quick Reference Guide to Policies on Extractive Industries Revenue and Contract Transparency at the International Financial Institutions” by Mainhardt-Gibbs H.
ı Bazilian M and al, 2013. “Oil, Energy Poverty and Resource Dependence in West Africa” Journal of Energy & Natural Resources Law Vol 31 No 1 2013.

102 Evaluation of the AfDB’s Assistance to the Energy Sector (1999-2018): Refocusing Support for Improved and Sustained Energy Access in Africa - Summary Report
ı BBC News, October 9, 2015, Tanzania closing hydropower plants.
ı Berthelemy J-C, Kauffmann C, Valfont M-A & L Wegner (eds), “Privatisation in Sub-Saharan Africa: Where Do We Stand?”, 2004. Paris: Organisation of Economic Development (OECD) Development Centre.
ı Besant-Jones, John E, 2006. “Reforming Power Markets in Developing Countries: What Have We Learned?” Energy and Mining Sector Board Discussion Paper 19, World Bank, Washington, DC.
ı Climate Investment Funds (CIF), 2014. “Draft Response to the Independent Evaluation of the Climate Investment Funds” https://www.climateinvestmentfunds.org/cif/sites/climateinvestmentfunds.org/files/CTF_SCF_TFC_12_8_Draft_Response_to_the_Independent_Evaluation_of_the_CIF_.pdf.
ı CSO Coalition, 2011. “Draft Comments on Proposed Energy Sector Policy African Development Bank” http://www.coalitionafdb.org/wp-content/uploads/2012/09/Collective-Comments-on-raft-Energy-Policy-09.04.11.pdf.
ı Dames B, 2012. “Equitable Access to Energy: A Driver for Jobs, Healthcare and Education” Brian Dames Chief Executive, Eskom Holdings SOC Ltd, South Africa
ı De Morai Sarmento E., 2014. “Evaluating infrastructure: the perspective from AfDB” http://www.3ieimpact.org/media/filer_public/2014/09/18/34evaluating_infrastructure_the_perspective_from_adb_sarmento.pdf.
ı Dolezalek S., 2015. “Cleantech Innovation and Venture Capital: What Now?” Managing Director and CleanTech Group Leader, VantagePoint Capital Partners, USA.
ı ECA, 2014 “Energy Access and Security in Eastern Africa: Status and Enhancement Pathways by the Economic Commission for Africa”.
ı ECOWAS, 2005. ECOWAS Energy Protocol A/P4/1/03
ı Energy Sector Management Assistance Program (ESMAP), 2014. “A Review of the ESMAP Rural Energy and Renewable Energy Portfolio” The International Bank for Reconstruction and Development/the World Bank Washington, D.C.
ı Energy Sector Management Assistance Program (ESMAP), 2003. “Energy and Poverty: How can Modern Energy Services Contribute to Poverty Reduction?” Proceedings from a Multi-Sector and Multi-Stakeholder Workshop Addis Ababa, Ethiopia, October 23-25, 2002.
ı Energy Sector Management Assistance Program (ESMAP), 2007. “Technical and Economic Assessment of Off-grid, Mini-grid and Grid Electrification Technologies”, World Bank (WB), Technical Paper 121/07, Washington D.C.
ı Energy Sector Management Assistance Program ESMAP, 2006. “A Review of ESMAP Rural Energy and Renewable Energy Portfolio” energy sector management assistance program World Bank.
ı European Commission Joint Research Centre, 2013. “The availability of renewable energies in a changing

103Annexes
An ID
EV S
ecto
r Eva
luat
ion
Africa, Assessing climate and non-climate effects”, Institute for Energy and Transport (IET) and Institute for Environment and Sustainability (IES), Ispra, Italy.
ı European Commission Joint Research Centre, 2011. “Renewable Energies in Africa”, European Union, Luxembourg.
ı European Commission “EU announces new rural electrification projects which will provide access to energy to more than 3 million people in poor rural areas” Press release IP/14/630 Brussels, 4 June 2014.
ı European Investment Bank, 2009. “EU-Africa Trust Fund Annual Report 2008”, EIB, Luxembourg.
ı European Union Africa Trust Fund, 2012. “Annual Report of EU Africa Trust Fund 2011”, www.eu-africa-infrastructure-tf.net.
ı European Investment Bank, 2014. “Tackling the energy challenge in Africa” EIB, Luxembourg 2014.
ı Fakir S, 2014. “The G20’s Energy Infrastructure Plans for Africa: What is Missing?” Heinrich Boll Foundation, Cape Town, June 2012.
ı Farlam P. “Assessing Public-Private Partnerships in Africa” The South African Institute of International Affairs Nepad Policy Focus Series.
ı Global Environment Facility GEF, 2010. “Advancing Sustainable Low-Carbon Transport”, Scientific and Technical Advisory Panel, GEF, Washington DC.
ı Gratwick, Nawaal, Eberhard, 2008. “An Analysis of Independent Power Projects in Africa: Understanding Development and Investment Outcomes.” Development Policy Review.
ı Gratwick, K., and Eberhard, 2008. “Demise of the Standard Model for Power Sector Reform and the Emergence of Hybrid Power Markets”, Energy Policy 36 October 2008.
ı Hancock K, 2015. “Energy regionalism and diffusion in Africa: How political actors created the ECOWAS Center for Renewable Energy and Energy Efficiency” Elsevier Energy Research & Social Science 5 (2015) 105-115.
ı Howells MI et al, 2005. “A model of household energy services in a low-income rural African village” Energy Policy 33 Elsevier (2005) 1833-1851.
ı IBRD, 2009. “Access, Affordability, and Alternatives: Modern Infrastructure Services in Africa”, Africa Infrastructure country diagnosis (AICD).
ı IEA, 2014. “Africa Energy Outlook - a focus on energy prospects in sub-Saharan Africa” - World Energy Outlook Special Report - International Energy Agency OECD/IEA, Paris 2014.
ı IEA, 2010. “Energy balances of Non-OECD Countries”, Paris: International Energy Agency.

104 Evaluation of the AfDB’s Assistance to the Energy Sector (1999-2018): Refocusing Support for Improved and Sustained Energy Access in Africa - Summary Report
ı IEA, 2008. “Worldwide trends in energy use and efficiency” OECD/IEA, 2008 http://www.iea.org/publications/freepublications/publication/Indicators_2008.pdf
ı IEG, World Bank, 2015, World Bank Group Support to Electricity Access, FY2000-FY2014, Washington DC.
ı IFC “Tower Power Africa: Energy Challenges and Opportunities for the Mobile Industry in Africa” Tower Power Africa, September 2014 IFC, the World Bank Group.
ı IMF (International Monetary Fund) 2013, “Energy Subsidy Reform in Sub-Saharan Africa: Experiences and Lessons”, IMF, Washington, DC.
ı IMF (International Monetary Fund) 2012, “Fiscal Regimes for Extractive Industries: Design and Implementation”, IMF, Washington, DC.
ı IPCC (Intergovernmental Panel on Climate Change), 2011. “Special Report on Renewable Energy Sources and Climate Change Mitigation”, IPCC, Geneva.
ı International Energy Agency, 2014. “World Energy Outlook”, IEA/OECD, Paris France.
ı International Energy Agency, 2014. “Africa Energy Outlook 2014” International Energy Agency IEA/OECD Paris, France 2014.
ı IEG, 2013. “Evaluation of the World Bank Group’s Support for Electricity Access” Approach Paper, December 2, 2013, World Bank, IFC, MIGA.
ı IFC (International Finance Corporation), 2012. “From Gap to Opportunity: Business Models for Scaling Up Energy Access”, IMF, Washington, DC.
ı IMF (International Monetary Fund), 2011. “New Growth Drivers for Low-Income Countries: The Role of BRICs.” IMF Policy Paper, Washington, DC.
ı International Institute for Sustainable Development (IISD), 2014. “Second High-Level Meeting Africa-EU Energy Partnership (AEEP) Report” European Union Energy Initiative Partnership Dialogue Facility (EUEI PDF), 11 -13 February 2014 in Addis Ababa, Ethiopia.
ı International Institute for Sustainable Development (IISD), 2009. “Investing in a Sustainable Future: Multilateral Development Banks’ Investments in Energy Policy” Winnipeg, Canada.
ı International Renewable Energy Agency, 2014. “Prospects for the African Power Sector” IRENA Abu Dhabi.
ı Japan International Cooperation Agency, 2013. JICA’s Strategy Paper for the Energy Sector, www.gwweb.iica.go.jp.
ı Johannes F. Linn, 2013. “Realizing the Potential of the Multilateral Development Banks” Brookings Institution.

105Annexes
An ID
EV S
ecto
r Eva
luat
ion
ı McKinsey and Co, 2015. “Brighter Africa: the Potential Growth of the SSA Electricity Sector”, February 2015.
ı Moody’s 2010 “Credit Analysis African Development Bank” Report Number: 127769, 22/09/2010 http://www.afdb.org/fileadmin/uploads/afdb/Documents/Financial-Information/AfDBpercent20MOODY’S percent20ANNUAL percent20REPORT percent202010 percent20published percent20Sept.pdf.
ı Newendorp T.; Thomas S, 2014. “Mobilizing Finance for Energy Development in Africa”. Oil Council http://www.oilcouncil.com/expert_insight_articles/mobilizing-finance-energy-development-africa.
ı OECD (Organisation for Economic Co-operation and Development), 2014. “African Economic Outlook”, OECD, Paris.
ı OECD (Organisation for Economic Co-operation and Development), 2012. “Demographic Change and Local Development: Shrinkage, Regeneration and Social Dynamics” OECD Local Economic and Employment Development (LEED) Working Paper Series.
ı Olson R., 2015. “sub-Saharan Africa’s sovereign wealth funds struggle in era of low oil” The Heritage Foundation, Financial Time blog.
ı PIAC, 2011. “Report on Petroleum Revenue Management for 2011” - Annual Report.
ı REN21, 2014. “ECOWAS renewable energy and energy efficiency status report”, Paris: REN21 Secretariat; 2014.
ı Rosnes O et al, 2009. “Powering Up: Costing Power Infrastructure Spending Needs in Sub-Saharan Africa” AICD background paper 5, The International Bank for Reconstruction and Development / The World Bank, Washington, DC.
ı Runde D.F., 2015. “Urbanization, Opportunity, and Development”, Center for Strategic and International Studies (CSIS) in Washington, D.C.
ı Sebastian Hermann, Asami Miketa, Nicolas Fichaux, 2014. “Estimating the Renewable Energy Potential in Africa”, IRENA-KTH working paper, International Renewable Energy Agency, Abu Dhabi.
ı SOFRECO, 2011. “Study on Programme for Infrastructure Development in Africa (PIDA). Phase III Report Energy”.
ı SOFRECO, 2011. “Study on Programme for Infrastructure Development in Africa (PIDA): Draft Africa Energy Outlook 2040” July 2011.
ı Sustainable energy for all, 2012. “Sustainable Energy For All Overview— Global Tracking Framework”, retrieved from https://www.iea.org/media/freepublications/oneoff/GlobaltrackingFrameworkoverview.pdf.
ı The Economist, 2015. “Private equity in Africa: Unblocking the pipes” Jan 24th, 2015 http://www.economist.com/node/21640349/print accessed the 03/02/2015.

106 Evaluation of the AfDB’s Assistance to the Energy Sector (1999-2018): Refocusing Support for Improved and Sustained Energy Access in Africa - Summary Report
ı The International Council for Science (ICSU), 2007. “Sustainable Energy in sub-Saharan Africa” ICSU Regional Office for Africa, Pretoria, Republic of South Africa July 2007.
ı The Infrastructure Consortium for Africa (ICA), 2014. “Infrastructure financing trends in Africa: ICA annual report 2013” www.icafrica.org Tunis Belvedere, Tunisia.
ı The Infrastructure Consortium for Africa (ICA), 2011. “Regional power status in African power pools report” ICA Tunis Belvedere, Tunisia November 2011.
ı The OPEC Fund for International Development (OFID) Annual Report, 2014, www.ofid.org.
ı The OPEC Fund for International Development (OFID), 2008. “Energy poverty in Africa” Proceedings of a Workshop held by OFID in Abuja, Nigeria June 8 -10, 2008.
ı The South African Institute of International Affairs (SAIIA), 2005. “Assessing Public-Private Partnerships in Africa” NEPAD Policy Focus Report No. 2, Pretoria South Africa.
ı Tverberg G. E. 2012 “Oil supply limits and the continuing financial crisis” 7th Biennial International Workshop “Advances in Energy Studies” Volume 37, Issue 1, January 2012.
ı UNEC, 2013. “Africa-BRICS Cooperation: Implications for Growth, Employment and Structural Transformation in Africa” - United Nations Economic Commission for Africa, 2013.
ı UNEP, 2014. “Financial institutions taking action on climate change” UNEP Report. Switzerland Geneva.
ı UN-HABITAT, 2011. “Infrastructure for Economic Development and Poverty Reduction in Africa” United Nations Human Settlements Programme.
ı United Nations, 2012. “The Millennium Development Goals Report 2012” Department of Economic and Social Affairs of the United Nations Secretariat UN, New York, 2012.
ı United Nations, 2014. Press release UN General Assembly’s Open Working Group proposes sustainable development goals, - 19. July 2014.
ı United Nations Press Release UN General Assembly Creates Key Group on Rio+20 Follow-up, United Nations Division for Sustainable Development, retrieved 26 February 2013.
ı United Nations, 2009. “Sustainable Development Report on Africa - Managing Land-Based Resources for Sustainable Development” United Nations Economic Commission for Africa New York.
ı United Nations Development Programme (UNDP) and the World Health Organisation (WHO), 2009. “The energy access situation in developing countries - a review focusing on the least developed countries and sub-Saharan Africa”, UNDP/WHO, New York.

107Annexes
An ID
EV S
ecto
r Eva
luat
ion
ı United Nations Development Programme (UNDP), 2005. “Sustaining Post-Conflict Economic Recovery: Lessons and Challenges” UNDP’s Bureau for Crisis Prevention and Recovery, BCPR Occasional Paper 1 October 2005.
ı United Nations Economic Commission for Africa, 2011. “Public-private partnerships in Africa’s energy sector: challenges, best practices, and emerging trends”. Addis Ababa, 1 July 2011.
ı United Nations Economic Commission for Africa, 2013. “Africa-BRICS Cooperation: Implications for Growth, Employment and Structural Transformation in Africa” UNECA Addis Ababa, Ethiopia.
ı United Nations Energy, 2009. “Energy, Development, and Security: Energy issues in the current macroeconomic context” UN-Energy and UNIDO.
ı United Nations Framework Convention on Climate Change, 2007. “Climate Change: Impacts, Vulnerabilities, and Adaption in Developing Countries”, Climate Change Secretariat, Bonn, Germany.
ı United Nations Human Settlements Programme (UN-HABITAT), 2011. “Infrastructure for Economic Development and Poverty Reduction in Africa” the Global Urban Economic Dialogue Series, UN-HABITAT, Nairobi Kenya.
ı U.S. Energy Information administration, 2014. “Power Africa annual report” USAID Power Africa Report, Washington D.C. July 2014.
ı Uyigue O. P., 2015. “Access to sustainable energy at Roguwa community in Nasarawa state, northern Nigeria”; The Community Research and Development Centre (CREDC) www.credcent.org.
ı WBCSD, 2012. “Business Solutions to Enable Energy Access For All”, World Business Council on Sustainable Development (WBCSD), Geneva www.wbcsd.org/Pages/EDocument/EDocumentDetails.aspx?ID=14165&NoSearchContextKey=true.
ı Wilson, E., Rai, N., and Best, S., 2014. “Sharing the Load: Public and private sector roles in financing pro-poor energy access”. IIED, London.
ı World Bank and African Development Bank, 2011. “Handbook on Infrastructure Statistics” Africa Infrastructure Knowledge Program December 2011.
ı World Bank, 2015. “The Power of the Mine A Transformative Opportunity for Sub-Saharan Africa” Directions in Development Energy and Mining, International Bank for Reconstruction and Development/The World Bank Washington DC.
ı World Bank, 2015. “Financing for Development Post 2015” The World Bank Washington DC.
ı World Bank, 2013. “Toward a Sustainable Energy Future for All: Directions for the World Bank Group’s Energy Sector” World Bank, Washington, DC.

108 Evaluation of the AfDB’s Assistance to the Energy Sector (1999-2018): Refocusing Support for Improved and Sustained Energy Access in Africa - Summary Report
ı World Bank, 2005. “Meeting the Challenge of Africa’s Development: A World Bank Group Action Plan.” Background Paper No secM2005-044, World Bank, Washington, DC.
ı World Bank, 2010. “Addressing the Electricity Access Gap”, Background Paper for the World Bank Group Energy Strategy, World Bank, Washington, DC.
ı World Bank, 2009. “Africa’s infrastructures A time for transformation” The Africa Development Forum series, World Bank, NW, Washington, DC.
ı World Bank, 2009. “World Bank Report”, G8 Energy ministers meeting, Rome, 24-25 May 2009
ı World Bank, 2008. “Making Sense of Africa’s Infrastructure Endowment” AICD Working Paper 1, WB Washington, DC January 2008.
ı World Bank, 2008. “Underpowered: The State of the Power Sector in Sub-Saharan Africa” Africa Infrastructure Country Diagnostic (AICD) Background Paper 6. WB Washington, DC January 2008.
ı World Bank, 2011. “Climate Change and the World Bank Group Phase I: An Evaluation of World Bank Win-win Energy Policy Reforms” WB Washington, DC.
ı World Energy Council, 2007. “Africa Region Report. Energy Policy Scenarios to 2050”.
ı World Economic Forum and IHS CERA, 2012. “Energy for Economic Growth Energy Vision Update 2012” Energy for Economic Growth Geneva, Switzerland.
ı Zhang G, 2012. “Thoughts on Energy and the World Economy” Vice Chairman, Economic Affairs Committee, Chinese People’s Political Consultative Conference and Former Head, National Energy Administration of China http://www3.weforum.org/docs/WEF EN EnergyEconomicGrowth Contributors 2012.pdf.
ı Association of Power Utilities of Africa and the African Development Bank Group. Revisiting Reforms in the Power Sector in Africa. https://africa-energy-portal.org/sites/default/files/2019-06/PSR percent20Report percent20Final_ENG_For percent20Print.pdf.
ı AfDB Group, 2017. AfDB Annual Report 2017.
ı AfDB Group. 2017. Update on Implementation: The New Deal on Energy for Africa - A Transformative Partnership to Light Up and Power Africa by 2025.
ı AfDB Group, 2018. Annual Development Effectiveness Review 2018: “Made in Africa” – Industrialising the Continent. https://www.afdb.org/fileadmin/uploads/afdb/Documents/Development_Effectiveness_Review_2018/ADER_2018_EN.pdf
ı Business Sweden (2017) note: ‘Exploring Private Investment in Power Generation: Capturing the Opportunities in Independent Power Projects in Eastern Africa. https://www.business-sweden.se/contentassets/99a903a7d7474da398e4e40568f66a59/energy-east-africa---exploring-private-investment-in-power-generation.pdf
109Annexes
An ID
EV S
ecto
r Eva
luat
ion
ı https://www.icafrica.org/en/topics-programmes/energy/energy-financing-trends/
ı https://www.icafrica.org/en/topics-programmes/private-sector-financing/
ı KPMG, 2016. KPMG Africa Infrastructure: Sub-Saharan Africa Power Outlook. https://assets.kpmg/content/dam/kpmg/pdf/2016/05/kpmg-sub-saharan-africa-power-outlook.pdf
ı IEA, IRENA, UNSD, WB, WHO, 2019. Tracking SDG 7: The Energy Progress Report 2019, Washington DC. https://trackingsdg7.esmap.org/data/files/download-documents/2019-Tracking percent20SDG7-Full percent20Report.pdf
ı Mobilization of Private Finance by Multilateral Development Banks and Development Finance Institutions, 2017. https://www.ifc.org/wps/wcm/connect/08aba552-5a05-4e7e-921a-2fe31774a21b/201806_Mobilization-of-Private-Finance_v2.pdf?MOD=AJPERES
ı USAID (2014b) “Memorandum of Understanding between the Government of Ghana and the Government of the United States of America Regarding Power Africa,” at 3(a)ii; International Monetary Fund (2016) “Third Review Under the Extended Credit Facility Arrangement and Request for a Waiver for Non-observance of Performance Criteria and Modification of Performance Criteria,”
ı World Bank Group. Harmonized List of Fragile Situations FY 19 a/ http://pubdocs.worldbank.org/en/892921532529834051/FCSList-FY19-Final.pdf
ı World Economic Forum’s Fostering Effective Energy Transition 2019 Edition. http://www3.weforum.org/docs/WEF_Fostering_Effective_Energy_Transition_2019.pdf
ı World Energy Council (2018). The World Energy Issues Monitor. https://www.worldenergy.org/wp-content/uploads/2018/05/Issues-Monitor-2018-HQ-Final.pdf
ı AfDB, 2018. Cabo Verde - Country Strategy and Program Evaluation (2008-2017): Technical report (May 2018). Independent Development Evaluation.
ı AfDB, 2018. PBOs Energy Cluster Evaluation – Synthesis Report Revised Final Report - April 2018. Independent Development Evaluation.
ı AfDB, 2016. Post Project Evaluation: Synthesis of Renewable Energy Projects (February 2016). Independent Development Evaluation. Not published (Background Paper).
ı AfDB, 2006. Post Project Evaluation: Synthesis of Thermal Projects (February 2016). Independent Development Evaluation. Not published (Background Paper).
ı AfDB, 2008. Powering Africa Through Interconnection: Cluster Evaluation Report (March 2018). Independent Development Evaluation. http://idev.afdb.org/sites/default/files/documents/files/Power percent20Interconnection percent20project percent20cluster percent20evaluation percent20EN.pdf

110 Evaluation of the AfDB’s Assistance to the Energy Sector (1999-2018): Refocusing Support for Improved and Sustained Energy Access in Africa - Summary Report
ı AfDB, 2018. Renewables Sector Review Note. 2018. Independent Development Evaluation. Not published (Background Paper).
ı AfDB, 2018. Review of PPP Interventions in the Conventional Power Sector. 2018. Independent Development Evaluation. Not published (Background Paper).
ı AfDB, 2018. Spurring local socio-economic development through rural electrification: cluster evaluation (March 2018). Independent Development Evaluation. http://idev.afdb.org/sites/default/files/documents/files/Rural percent20electrification percent20 percent28En percent29.pdf.
1. Multisector includes also large multisector PBOs with a significant energy component (e.g. Algeria, Nigeria, Egypt)
2. Green Climate Fund (GCF), Climate Investment Funds (CIFs), Global Environment Facility (GEF).
3. Africa Growing Together Fund (AGTF), Japan International Cooperation Agency (JICA) Accelerated Co-financing. Facility for Africa (ACFA), European Union (EU).
4. Sustainable Energy Fund for Africa (SEFA), New Partnership for Africa’s Development (NEPAD), Infrastructure Project Preparation Facility (IPPF).
5. Light up and Power Africa; Feed Africa; Industrialize Africa; Integrate Africa; and Improve the Quality of Life for the People of Africa.
6. USAID: United States Agency for International Development
7. The international criteria for evaluating development assistance were updated by the Organisation for Economic Co-operation and Development - Development Co-operation Directorate (OECD-DAC) in December 2019.
8. The World Bank, 2009. The road to results: designing and conducting effective development evaluations. By Linda G. Morra-Imas, Ray C. Rist. (See Chapter 5).
9. Ibid.
10. As of December 2018.
11. Also referred to as CIF
12. Latest information from the Energy Complex indicate that: “The total capacity of Noor OUARZAZATE is actually 580 MW and is fully operational since end 2018. The phase I and II financed by the Bank added an installed capacity of 510 MW over three plants (NOORo I; NOORo II and NOORo III). With an annual expected production of about 1 900 GWh, the NOOR Ouarzazate solar complex can mitigate nearly one million tons of GHG emissions annually and provide almost two million Moroccans with clean electricity.
13. https://www.afdb.org/en/news-and-events/the-african-development-bank-pledges-us-25-billion-to-climate-finance-for-2020-2025-doubling-its-commitments-19090/
14. See African Development Bank Group: Annual Report 2017, p. vi.
15. http://pubdocs.worldbank.org/en/892921532529834051/FCSList-FY19-Final.pdf
16. This has become more necessary as the AfDB Group together with other MDBs in 2015 jointly committed to scale-up finance for meeting the investment needs of the global goals through innovative instruments that leverage private capital as per their respective institutional mandates. See ‘From Billions to Trillions: MDB Contributions to Financing for Development.’ World Bank. 2015.
17. For the energy standpoint, the Climate Investment Funds comprised the Clean Technology Fund (CTF) and the Strategic Climate Change Fund (SCF) – https://www.climateinvestmentfunds.org/knowledge-center. The CIFs as a whole are referenced in Table H in Annex 5.
18. Including power, water, transportation, telecoms, IT and social infrastructure (such as schools and hospitals) in all countries of operation.
19. See Mobilization of Private Finance by Multilateral Development Banks and Development Finance Institutions 2017. http://documents.worldbank.org/curated/en/860721492635844277/pdf/114433-REVISED-11p-MDB-Joint-Report-Mobilization-Jul-21.pdf. (page 6)
20. See https://www.icafrica.org/en/topics-programmes/private-sector-financing/
21. The five Ten Year Strategy operational priorities (infrastructure development, regional economic integration, private sector development, governance and accountability, skills and technology) are in line with the principles in the 2012 energy policy. (Source: IDEV, 2015, Policy and Literature Review report, p. 20).
22. Energy infrastructure development is a key component of the infrastructure objectives set by MTS. (Source: Ibid.).
Endnotes
111Annexes
An ID
EV S
ecto
r Eva
luat
ion
23. The Infrastructure Consortium for Africa (ICA) was launched at the G8 Gleneagles summit and the AfDB agreed to host and provide facilities for ICA. Its declared aim was “to improve the lives and economic well-being of Africa’s people by catalysing donor and private sector financing for infrastructure projects and programs in the region” (Source: IDEV, 2015, Policy and Literature Review report, p. 14).
24. The overarching strategic objective of the NDEA is to achieve universal access to energy by 2025, which is five years ahead of the 2030 target set by SDG 7. This objective is articulated as an “aspirational vision” in the NDEA Strategy; it is not something that the AfDB claims will be achieved simply by implementing the NDEA. It is understood that these are outcomes that the NDEA aims to contribute toward; the targets are in effect Africa’s targets. The NDEA Strategy also clarifies that ‘universal’ access means 100 percent coverage in urban areas, but 95 percent coverage in rural areas.
25. The project is in line with the “Sector Plan for Renewable Energies” launched in 2012 with a target of 50 percent penetration of renewable energy by 2020.
26. IDEV, December 2015, Cluster Evaluation of Selected AfDB-funded Power Interconnection Projects Synthesis Report, p. 16.
27. The NDEA Strategy mentions that the monitoring and evaluation will be further refined and will draw on the upcoming new RMF being designed for the period 2016-2019. (Source: Bank Group Strategy for the New Deal on Energy for Africa, p. 43)
28. AfDB (2017), The Bank Group RMF 2016-2025 (https://www.afdb.org/fileadmin/uploads/afdb/Documents/Policy-Documents/Final_-_RMF_-__Rev.2_Final_.pdf).
29. The reason is that AfDB only includes a proportion of benefits in the RMF, in line with the Bank’s share of total funding for the project. For example, if AfDB contributes 50 percent of the finance for a 100 MW project, it would ‘count’ 50 MW against the RMF. This approach may be overly conservative, especially if the Bank’s role extends beyond pure lending, but it is consistent with the Bank’s approach to monitoring results across all sectors. In calculating the Level 2 indicators presented in Table 2, the AfDB has assumed that it provides 40 percent of financing to the projects in which it is involved, therefore the targets for these indicators have been scaled down accordingly. Note also that the RMF presents connection targets in terms of the number of people affected, rather than the number of connections. The AfDB has assumed an average household size of five.
30. Also referred to as FEI.
31. One project was not rated: Nigeria: EGDCSP – Economic governance, diversification and competitiveness support programme (incl. Energy sector governance & competitiveness).
32. However, on a positive note, as one of its strategic themes, the NDEA strategy aims to address the issue of having the right enabling policy environment in RMCs through “advising and supporting governments on designing policies and setting up efficient sector regulation and governance”.
33. KPMG 2014 “Sub-Saharan Africa Power Outlook”, KPMG Africa Infrastructure & Major Projects Group, South Africa.
34. OECD/IEA 2014 “Africa Energy Outlook”, International Energy Agency, Paris, France.
35. IDEV, 2015, Literature and Policy Review – AfDB Energy Sector Evaluation, IDEV, AfDB, Abidjan, p. viii.
36. World Bank, 2019, Rethinking Power Sector Reform in the Developing World.
37. IDEV, February 2016, In-Depth Field Case Studies: Synthesis of Renewable Energy Projects, p. 5.
38. IDEV, February 2016, In-Depth Field Case Studies: Synthesis of Thermal Projects, p. 5.
39. IEA, IRENA, UNSD, WB, WHO (2019), Tracking SDG 7: The Energy Progress Report 2019, Washington DC.
40. Ibid.
41. Source: WHO 2019
42. ESMAP (Energy Sector Management Assistance Program). 2017. State of Electricity Access Report. Washington, DC: World Bank. http://documents.worldbank.org/curated/en/364571494517675149/pdf/114841-revised-june12-final-sear-web-rev-optimized.pdf.
43. With an access deficit of over 5 million or an access rate of less than 90 percent. The 10 RMCs with the largest access-deficit population are Democratic Republic of Congo, Ethiopia, Ghana, Kenya, Madagascar, Mozambique, Nigeria, Sudan, Uganda, and Tanzania.
44. Rural electrification subsector projects include some social facilities such as public lighting points and streetlights, aiming at improving living conditions of the project beneficiaries including poor and marginalized populations in rural areas.
45. AfDB, 2013, Energy Sector Capacity Building Diagnostic & Needs Assessment Study
46. In this context, the Bank announced in January 2017 that the loan tenor will be restructured in order to help reduce the electricity tariff and to provide affordable electricity to Uganda.
47. Source: OECD/IEA, 2014, Africa Energy Outlook, International Energy Agency, Paris, p. 174.
48. Source: IDEV, 2016, Evaluation of Bank Assistance to the Energy Sector: Portfolio Review Report, p. 27.
49. Eastern Africa Power Pool (EAPP).
50. For example, in the Cameroon-Dibamba project, talks reinforced the national government’s sense of ownership. Other non-lending activities included Economic and Sector Work (ESW) as found in the Uganda-Buseruka and Cape Verde-Cabeolica renewable energy projects.

112 Evaluation of the AfDB’s Assistance to the Energy Sector (1999-2018): Refocusing Support for Improved and Sustained Energy Access in Africa - Summary Report
51. For example, in the Madagascar-Sahanivotry project, the lack of action by the Bank was identified as problematic and its limited role in policy dialogue was identified as an oversight. The Bank’s TA for the DRC Inga Project is an exception.
52. More precisely, the poor financial performance of the utility in Cape Verde (Electra) was affected by three main factors: (i) technical and commercial loses, (ii) high production costs and (iii) rigidity of the tariff structure.
53. Bumbuna experienced a 168-month delay on the original timeline, but the project PCR contends that there was no delay when compared with the revised timeline. However, there was not clear indication whether the Board approved the new timeline.
54. See Annual Development Effectiveness Review 2018: “Made in Africa” – Industrialising the Continent, p.6.
55. The EIRR can be used to demonstrate that public resources have been invested responsibly when it is compared against the opportunity cost of capital or the costs and benefits of alternative options for achieving the same objective. The IRR, as an investment decision tool, should not be used to rate mutually exclusive projects but only to decide whether a single project is worth investing in. In this sense, the IRR is not valid for ranking projects of different sizes.
56. The opportunity cost of capital is generally assumed to be 12 percent.
57. Low facility utilization rate (low plant load factor) is one of the critical reasons for this.
58. Utility’s consumer-related revenues is the revenue the utility is gaining by selling electricity to consumer.
59. A consumer surplus occurs when the consumer is willing to pay more for a given product than the current market price.
60. Typical examples of such data are the service life of a given investment project, investment costs, energy costs savings potential in relation to the utilization/load factor, escalation of energy prices, interest and discount rates, and exchange rates. (Source: Z. K. Morvay and Gvozdenac D.D., 2008, Applied Industrial Energy and Environmental Management, John Wiley & Sons, Ltd.)
61. The Least-Cost Analysis method is used to determine the most efficient way (the least cost) of performing a given task to reach a specified objective or set of benefits measured in terms other than money. For example, the objective might be to supply a fixed quantity of potable drinking water to a village. The examination of alternatives might entail wind pumping, run-of-river offtake, impoundment, etc. One would calculate all costs, capital and recurrent, to achieve the objective, apply economic adjustments and discount the resulting stream of costs for each alternative examined. The one with the lowest NPV would be the one most efficient (least cost). (Source: USAID, 2002, Best Practices Guide: Economic & Financial Evaluation of Renewable Energy Projects)
62. For example, Bumbuna Hydropower Project PCR mentions that the supply of power would contribute to improved quality of social services through for example re-allocation of the time, ordinarily used in fuel-wood collection (undertaken mainly by women and children), to more productive activities such as education.
63. Tariff setting is critical to achieve project viability (return on investment) for private energy projects and essential to maintain the project sustainability (cost recovery) for public energy projects.
64. IDEV, 2016, In-Depth Field Case Studies: Synthesis of Renewable Energy Projects, p. 19.
65. Recent IT technology has already eased this challenge. There is plenty of risk analysis software released at an affordable price. The issue would rather be the level of Bank staff expertise and IT literacy.
66. An analytical technique for solving a problem by performing a large number of trial runs, called simulations, and inferring a solution from the collective results of the trial runs, including methods for calculating the probability distribution of possible outcomes.
67. Cost overruns and delays were caused by poorer than expected ground conditions for the Buseruka Project. While geotechnical studies were carried out at the site, they contained a residual degree of uncertainty. For the Bujagali Hydropower, two geotechnical investigations were undertaken but cost overruns and delays resulted due to poor judgment exercised by both the design engineer and the project company. (Source: IDEV, 2016, In-Depth Field Case Studies: Synthesis of Renewable Energy Projects, p. 29.)
68. The project company agreed with the local communities to construct a healthcare centre as a part of their CSR activities along with the project, but it has not yet materialised. (Source: IDEV, February 2016, In-Depth Field Case Studies: Synthesis of Renewable Energy Projects, p. 30)
69. AfDB’s 2019 published analysis (Estimating Investment Needs for the Power Sector in Africa 2016-2025) of the cost of meeting the NDEA’s goals presents a low carbon scenario alongside its base case scenario. The low carbon scenario optimizes investments based on a carbon price that increases gradually from 20 $/tCO2eq in 2020 to 40 $/tCO2eq in 2030. This scenario results in GHG emissions being 40 percent lower in 2030. While total system costs only increased by 5.8 percent under this scenario, the capital-intensive nature of renewable energy solutions means that annual capital investment needs increased by 30 percent. As with any similar modeling exercise, these conclusions could likely be challenged; it is unclear, for example, that the modeling considers the impact on the cost of capital of concessional finance generally being unavailable for coal-fired projects. The report presenting the analysis suggests that “AfDB is in a position to front Africa’s case for the international community to cover these costs.” It should be mentioned that the estimations are quite different from the International Energy Agency (IEA) work.
70. The outcome of focus group discussions showed that the local authorities and villagers complained about the lack of dialogue with TANESCO on the design of the intervention (Source: Project Results Assessment of Tanzania Electricity-V).
71. While the operational performance of the electricity network in Ethiopia was recently improved, this remained a problem in Gambia where load shedding was applied, particularly during the rainy season.
72. USAID (2014b) “Memorandum of Understanding between the Government of Ghana and the Government of the United States of America Regarding Power Africa,” at 3(a)ii; International Monetary Fund (2016) “Third Review Under the Extended Credit Facility Arrangement and Request for a Waiver for Non-observance of Performance Criteria and Modification of Performance Criteria,” at 38.

113Annexes
An ID
EV S
ecto
r Eva
luat
ion
73. For the Mali-Mauritania project, institutional arrangements to ensure operational and management autonomy of assets were successful.
74. The Mali-Mauritania project exemplified institutional capacity building with the development of two new regional institutions (SOGEM, SEM) at project inception to ensure the viable operation and management of both project assets as well as the structures developed during implementation. This insulated the project from direct political interference while securing high-level political commitments.
75. Such as those in South Africa, Ethiopia, Cameroon and Egypt.
76. AfDB. 2017. PCR: Electricity Transmission System Improvement Project, page 10.
77. AfDB. 2016. PCR: Morupule B Power Project.
78. AfDB. 2017. PCR: Zimbabwe – Emergency Power Infrastructure Rehabilitation Project (EPIRP).
79. AfDB. 2017. PCR: Power Transmission Improvement Project Country: Kenya.
80. AfDB (2016), Scaling up implementation of the ten-year strategy: The High 5s Agenda.
81. https://www.afdb.org/en/news-and-events/2016-afdb-annual-meetings-to-focus-on-energy-and-climate-change-15346.
82. AfDB (2013), Strategy for 2013-2022: At the Center of Africa’s Transformation.
83. AfDB (2019), Estimating Investment Needs for the Power Sector in Africa.
84. AfDB (2016), Memorandum to the Board: Scaling up implementation of the ten-year strategy: The High 5s Agenda.
85. AfDB (2019), Estimating Investment Needs for the Power Sector in Africa 2016-2025.
86. Ibid.
87. http://ida.worldbank.org/replenishments/ida18-replenishment
88. Electrify Africa Act Progress Report (2019). https://www.usaid.gov/sites/default/files/documents/1869/FINAL_Electrify_Africa_Progress_Report_to_Congress.pdf
89. Agence Française du developpement.
90. Africa Renewable Energy Initiative.
91. We were not able to confirm the extent to which such resources have actually been allocated.
92. The PECG Department works across all sectors, so cannot be considered in the energy sector context alone.
93. The PEVP Complex informed IDEV that it has laid out a refined structure and this will be formally reflected in the Bank’s organisational structure shortly.
94. IDEV (2019), Independent Evaluation of the Implementation of the Development and Business Delivery Model of the AfDB (http://idev.afdb.org/en/document/independent-evaluation-implementation-development-and-business-delivery-model-afdb).
95. The clean cooking targets were increased significantly twice during the review process from an initial conservative base in response to feedback that the target was not adequate or ambitious.
96. There is potentially some degree of fatigue in RMCs with various agencies’ plans e.g. Scaling up Renewable Energy Program country-level plans (in the context of the Climate Investment Funds), SEforAll Action Agenda / Investment Prospectus, DFID’s Energy Compact Agreements etc.
97. Based on the lending volume target as captured in the NDEA Implementation Update. Exchange rates used for the conversion are as follows: 1 [USD] = 0.71914 [UA] (Nov. 2016); 1 [USD] = 0.72223 [UA] (Nov. 2017); 1 [USD] = 0.70550 [UA] (Nov. 2018); 1 [USD] = 0.71794 [UA] (June 2019 & 2020).
98. The IDA 18 covers the three-year period from July 2017 to June 2020. IDA19 covers the three-year period from July 2020 to June 2023. The World Bank’s Energy Directives Paper, published in 2013, was also reviewed, but its content has largely been superseded by the much more comprehensive and recent World Bank AFR Energy Strategy IDA 18-19.
99. Power Africa (2016), The Roadmap: A Guide to Reaching 30,000 Megawatts and 60 Million Connections
100. The term “ecosystem” refers to the case study’s focus on AfDB’s engagement with all relevant institutions and stakeholders within the energy sector of a given Regional Member Country (RMC).
101. AfDB (2016), The Bank Group’s Strategy for the New Deal on Energy for Africa 2016-2025 (https://www.afdb.org/fileadmin/uploads/afdb/Documents/Generic-Documents/Bank_s_strategy_for_New_Energy_on_Energy_for_Africa_EN.pdf).
102. For example, the AfDB’s Energy Sector Portfolio to the end of 2015, or in IDEV’s cluster analyses in the sector (covering areas such as policy-based operations, interconnection, and rural electrification)? Is the NDEA likely to be effective in securing more funding for rural electrification or reduce the risk of cost overruns (thus increasing efficiency) that has been an issue on previous projects in the sector?


An IDEV Sector Evaluation
idev.afdb.org
African Development Bank GroupAvenue Joseph Anoma, 01 BP 1387, Abidjan 01, Côte d’IvoirePhone: +225 20 26 28 41E-mail: [email protected] De
sign
& la
yout
: A P
arté
Des
ign
About this Evaluation
This report summarizes the findings and recommendations from an independent evaluation of the support provided by the African Development Bank Group to the energy sector for the period 1999-2018, during which the Bank devoted nearly 18 billion USD to various interventions in its Regional Member Countries (RMCs). The sector, which ranked third in terms of the Bank’s support, accrued about 19% of overall Bank commitments over this period. The evaluation aimed to help the Bank to account for its investments and learn from its experience so as to inform future strategic and operational directions for the Bank’s assistance to the energy sector (through the New Deal on Energy for Africa), and contribute to improving the performance of the sector in its RMCs.
The evaluation found that while the Bank’s support to the energy sector was relevant, there were shortcomings in long-term sector planning, risk assessment and resource allocation, among others The Bank’s support to the energy sector was deemed effective and sustainable; however, challenges were noted in sector governance, regulatory frameworks and the affordability of services, especially for the poor. The evaluation also found that the current level of allocation of Bank resources is insufficient to meet the targets set by the New Deal on Energy for Africa strategy.
The evaluation advised the Bank to increase its funding to RMCs and the private sector, increase its support to the capacities of RMCs to formulate and implement comprehensive energy policies, and to improve the management, measurement and reporting of its assistance to the energy sector.