DraftFinal 2021 Integrated Energy Policy Report
251
California Energy Commission COMMISSION REPORT DraftFinal 2021 Integrated Energy Policy Report Volume III: Decarbonizing the State’s Gas System Gavin Newsom, Governor JanuaryFebruary 2022 | CEC-100-2021-001-V3
-
Upload
khangminh22 -
Category
Documents
-
view
2 -
download
0
Transcript of DraftFinal 2021 Integrated Energy Policy Report

California Energy Commission
COMMISSION REPORT
DraftFinal 2021 IntegratedEnergy Policy Report
Volume III: Decarbonizing the State’s Gas System
Gavin Newsom, Governor JanuaryFebruary 2022 | CEC-100-2021-001-V3

California Energy Commission David Hochschild Chair
Siva Gunda Vice Chair
Commissioners Karen Douglas, J.D. J. Andrew McAllister, Ph.D.Patty Monahan
Melissa Jones Jennifer Campagna Catherine Elder Stephanie Bailey Primary Authors
Raquel Kravitz IEPR Project Manager
Aleecia Gutierrez Deputy Director, Energy Assessments Division
Heather Raitt IEPR Program Manager
Drew Bohan Executive Director
DISCLAIMER Staff members of the California Energy Commission (CEC) prepared this report. As such, it does not necessarilyrepresent the views of the CEC, its employees, or the State of California. The CEC, the State of California, its employees,contractors, and subcontractors make no warrant, express or implied, and assume no legal liability for the informationin this report; nor does any party represent that the uses of this information will not infringe upon privately owned rights. This report has not been approved or disapproved by the CEC nor has the Commission passed upon the accuracyor adequacy of the information in this report.

ACKNOWLEDGEMENTS Denise Costa
Anthony Dixon
Robert Gulliksen
Joe Long
Rachel MacDonald
John Mathias
Ryan Ong
Jason Orta
Peter Puglia
Harrison Reynolds
Carol Robinson
Courtney Wagner
Lana Wong
i

ABSTRACT This report presents assessments of major natural gas (or gas) trends and emerging issues facing the state as required by Public Resources Code, Division 15, Chapter 4. It provides updates on key gas topics that include gas market and price projections, production and supply, pipeline and storage infrastructure, consumption, and greenhouse gas emissions. An overarching theme of the report is the need for a comprehensive, long-term gas-planning process to achieve deep decarbonization of the gas system and ensure a safe, reliable, and equitable transition from fossil gas.
Keywords: Gas demand, supply, price, fossil gas, gas system, gas infrastructure, gas utility, stranded investments, renewable gas, renewable hydrogen, gas planning, gas market, reliability, reliability standards, and gas planning, prices and rates, demand, supply, storage, production, and interstate and intrastate gas pipelines.
Please use the following citation for this report:
Jones, Melissa, Jennifer Campagna, Catherine Elder, and Stephanie Bailey. 2022. DraftFinal 2021 Integrated Energy Policy Report, Volume III: Decarbonizing the State’s Gas System. California Energy Commission. Publication Number: CEC-100-2021-001-V3.
ii

TABLE OF CONTENTS Page
Executive Summary ........................................................................................................ 11
Natural Gas Research .......................................................................... 10799
CHAPTER 1: The Role of Gas in California’s Energy System ................................................ 99 Introduction .............................................................................................99 California Gas Use .....................................................................................99 GHG Emissions Attributed to Gas............................................................ 1111 Gas Supply for California ....................................................................... 1615 California Gas Infrastructure .................................................................. 1817 Gas Prices in California .......................................................................... 2220
CHAPTER 2: Gas and Electric Interdependencies ............................................................2724 The Gas Electricity Nexus ...................................................................... 2724 Gas-Electric Reliability Issues ................................................................. 2926 Gas Reliability Standards ....................................................................... 3027 Changing Daily Gas Demand for Electric Generators................................. 3430 Southern California Reliability ................................................................. 3632
CHAPTER 3: Extreme Weather Impacts on Gas-Electric Reliability....................................4944 Winter Storm Uri (Polar Vortex).............................................................. 4944 Hot Summer Demand Case .................................................................... 5751 Planning for Contingencies or Extreme Weather ...................................... 6155
CHAPTER 4: Opportunities for Renewable Gas and Renewable Hydrogen .........................6458 The Future of Renewable Gas in California .............................................. 6458 Future of Renewable Hydrogen in California ............................................ 7367
CHAPTER 5: Decarbonization and Gas System Planning ..................................................8679 Decarbonization Through Building Electrification ...................................... 8679 Gas System Implications From Building Decarbonization........................... 8780 Gas System Planning .............................................................................8982 The Need for Long-Term Gas Planning ................................................... 9184 Policy Issues for Gas Planning ................................................................ 9487
CHAPTER 6: Gas System Issues ....................................................................................9790 Overview of Gas Transmission and Distribution Systems .......................... 9790 Gas Infrastructure Issues Facing the State .............................................. 9891 Gas Utility Pipeline Safety .................................................................... 10092 Gas Storage Well Safety ...................................................................... 10698
iii

CHAPTER 7: Addressing Stranded Gas System Investments ........................................ 110102 Challenges for Gas Rates ................................................................... 110102 The Basic Equation for Asset Cost Recovery ........................................ 111103
CHAPTER 8: Improvements to Gas Forecasting and Assessments ................................ 121113 Improvements to Gas Demand Forecast ............................................. 122114 Gas System Assessments ................................................................... 128120
CHAPTER 9: Gas Price Outlook ................................................................................. 132123 North American Gas Price Outlook...................................................... 132123 California Price Outlook ..................................................................... 135125 Gas Production and Supply ................................................................ 138128 California Gas Price Outlook............................................................... 144132 Burner Tip Prices .............................................................................. 150138
CHAPTER 10: Policy Issues and Recommendations..................................................... 154141 Gas Issues to Support Building Decarbonization................................... 156143 Role of Clean Fuels in Utility Gas Systems ........................................... 157144
Acronyms................................................................................................................ 159146 Appendix A: Gas Demand Trends by Sector .................................................................. A-11 APPENDIX B: Gas Industry Basics ................................................................................ B-11 APPENDIX C: Greenhouse Gas Policies and Emission From Gas ...................................... C-11 APPENDIX D: Extreme Weather Events.........................................................................D-11 APPENDIX E: Gas Infrastructure .................................................................................. E-11 APPENDIX F: PLEXOS Gas Generation Assumptions and Results ..................................... F-11
LIST OF FIGURES Page
Figure 1: California Total Energy Consumption (2019) ...................................................... 99
Figure 5: 2019 California Methane Emissions by Percentage ............................................ 1514
Figure 2: California Gas Consumption by Sector (Metric Million British Thermal Units [MMBtu]) .................................................................................................................................. 1010 Figure 3: 2019 Greenhouse Gas Emissions by Type ........................................................1111 Source: CEC staff using California Air Resources Board (CARB) data ................................1111 Figure 4: CO2 Emissions by Sector From 2000 to 2019 ....................................................1313
iv

Figure 6: Interstate Gas Pipelines and Supply Basins Serving California ............................1615 Figure 7: California Dry Gas Production (Million Cubic Feet [MMcf]) .................................1817 Figure 8: California Gas Pipeline and Storage Infrastructure ............................................2019 Figure 9: United States and California Citygate Prices ($/Thousand Cubic Feet [Tcf]) ........2220 Figure 10: Recent Henry Hub and Border Prices .............................................................2421 Figure 11: PG&E and SoCalGas Prices 2010–2021 (MMBtu) .............................................2522 Figure 12: California Average Delivered Gas Prices ($/MMbtu) 2010–2020........................2623 Figure 13: California Net Peak Occurring Later in the Evening .........................................2825 Figure 14: Daily Gas Demand for PG&E From 1998 to 2020 .............................................3329 (Million Cubic Feet per Day [MMcfd]) .............................................................................3329 Figure 15: Daily Gas Demand for SoCalGas From 1998 to 2020 (MMcfd) ..........................3330 Figure 16: Daily Gas Demand on Summer Days (MMcf per Hour) .....................................3431 Figure 17: SoCalGas Transmission System .....................................................................3733 Figure 18: 2020 vs. 2021 Ehrenberg Receipts ................................................................4036 Figure 19: Thermal Image of Winter Storm Uri, February 15, 2021 ..................................5146 Figure 20: Gas Production in Texas and Key States (MMcf/d) – February-March 2021 .......5348 Figure 21: Key Hub Prices February 17, 2021 ($/MMBtu) ................................................5549 Figure 22: Summer Monthly Demand Profiles by Year .......................................................53 Figure 23: Probability Distributions for Both Demand and Supply Better Capture Curtailment Risk............................................................................................................................ 6357 Figure 24: Total Number of Operational Dairy Digesters in California ................................6660 Figure 25: Renewable Gas Potential Feedstocks in California (MMcf/year).........................6862 Figure 26: Estimated Production Costs of Renewable Gas by Feedstock ($/MMBtu) ...........6963 Figure 27: LCFS and RFS RIN Credits ............................................................................7165 Figure 28: GHG Footprint per Unit of Heat Energy ..........................................................7569 Figure 29: Cost of Hydrogen Production ($/kilogram [kg]) of Selected Hydrogen Production Methods......................................................................................................................8074 Figure 30: California’s Gas Transmission System ............................................................9790 Figure 31: Comparison of Utility Transmission Pipelines ..................................................9891 Figure 32: Gas Mains by Decade .................................................................................10092 Figure 33: Wellhead, Production Casing, and Tubing Illustration ....................................10698 Figure 34: Analytical Framework for Long-Term Gas Planning ..................................... 122114
v

Figure 35: PG&E and SoCalGas Demand Forecast (MMcfd).......................................... 125117
.............................................................................................................................. 127119 Figure 37: CEC Efforts to Develop Hydraulic Modeling Skillset...................................... 129121 Figure 38: Monthly Henry Hub Prices ......................................................................... 133124 Figure 39: Annual Henry Hub Prices .......................................................................... 134125 Figure 40: California Border Prices, Mid-Demand Case ................................................ 135126 Figure 41: California Monthly Citygate Mid-Demand Price Projections ........................... 136127 Figure 42: Annual Average California Citygate Mid-Demand Price Projections ................ 137127 Figure 43: United States Dry Gas Production and Annual Consumption ......................... 139129 Figure 44: United States Monthly Liquefied Gas Exports.............................................. 141130 Figure 45: Key Supply Basins and Interstate Pipelines Serving California ...................... 143132 Figure 46: Utility Transportation Service Revenue Requirements by Year ($) ................ 146134 Figure 47: Drivers and General CPUC Process for Forecasting Gas Transportation Rates 147135 Figure 48: Gas Utility Transportation Rates by Customer Class .................................... 149137 Figure 49: Delivered Gas Prices, Mid-Demand Case .................................................... 150138 Figure 50: Burner Tip Price Comparison by IEPR Common Case (MMBtu) ..................... 152140
Figure 36: Hourly Sendout on SoCalGas for High Summer Demand Day in 2015 and 2020
LIST OF TABLES Page
Table 1: Winter Supply and Storage Comparison ............................................................3935
Table 9: California Burner Tip Price Difference ........................................................... 151139
Table 2: Monthly Gas Balance 2021 Average Day Demand With Pessimistic EPNG (El Paso Outage Persists) ..........................................................................................................4237 Table 3: Monthly Gas Balance 2022 Average Day Demand With Pessimistic EPNG (El Paso Outage Persists) ..........................................................................................................4238 Table 4: Peak Day Gas Balance Pessimistic Case ............................................................4339 Table 5: Hot Summer Demand Case – Gas Balance ........................................................6054 Table 6: California Biogas Potential From Dairy Farms ....................................................6862 Table 7: Activities Captured in Gas Transmission and Distribution Safety Programs .........10294 Table 8: Out-of-State Burner Tip Price Differences ..................................................... 151139
vi

EXECUTIVE SUMMARY Introduction The 2021 Integrated Energy Policy Report (IEPR) provides information and policy recommendations on advancing a clean, reliable, and affordable energy system for all Californians. The 2021 IEPR is presented in the following volumes:
Volume I addresses actions needed to reduce the greenhouse gases (GHGs) related tothe buildings in which Californians live and work, with an emphasis on energy efficiency. Italso addresses reducing GHGs from the industrial and agricultural sectors.
Volume II examines actions needed to increase the reliability and resiliency of California’senergy system.
Volume III looks at the evolving role of gas in California’s energy system, both theimportance in near-term reliability and the need for the system to evolve as Californiaworks to achieve carbon neutrality — the point at which the removal of carbon pollutionfrom the atmosphere equals or exceeds emissions — by 2045.
Volume IV reports on California’s energy demand outlook, including a forecast to 2035and long-term energy demand scenarios to 2050. The analysis includes the electricity, gas,and transportation sectors.
Appendix assesses the benefits of California’s Clean Transportation Program.
California’s Gas System Is at an Inflection Point As California decarbonizes its energy system, the state is at an inflection point with rapidly emerging natural gas (or gas) issues. These issues include the impact of building electrification on gas demand, the interdependencies between the gas and electricity systems, and the potential role of renewable gas (gas produced from waste and a variety of renewable and sustainable biomass sources) and renewable hydrogen (for example, hydrogen produced from water using renewable power). Some decarbonization strategies, such as electrification that substitutes electric appliances for natural gas appliances in buildings, can reduce gas demand and potentially the need for gas infrastructure. Other strategies like substituting clean fuels (for example, renewable gas and renewable hydrogen) for fossil gas may allow utilities to repurpose at least portions of the gas system to deliver these clean fuels. Even as gas demand declines, the state will need to retain gas infrastructure during the transition to meet hard-to-electrify gas uses in industry, as well as thermal electric generation to support renewable integration and reliability. The timing and pace of the different decarbonization approaches will determine the longer-term need for and uses of the gas system in a clean energy economy.
To achieve deep decarbonization, policy makers will need a comprehensive understanding of the different GHG reduction strategies and associated climate and air quality impacts, as well as implications for the gas system. Ensuring a safe and reliable gas system during the transition from fossil gas is paramount. Further, the state must provide equity and affordability of gas service for customers. This goal is especially important for low-income customers and those in disadvantaged communities who already bear a disproportionate share of rate and
1

environmental impacts. The state must also address workforce issues and the role of gas utilities as the gas system evolves. Furthermore, fragmented local, state, and federal actions and programs will need closer coordination.
Defining pathways for gas system decarbonization and addressing key policy issues associated with the gas transition necessitate a comprehensive long-term gas planning process. While the state has such a process for the electricity system, this is not the case for the gas system. A proactive, rigorous, and transparent approach is essential to attaining meaningful long-term GHG reductions. This planning process requires a sound analytical framework for decision-making about the future role of and decarbonization pathways for the state’s gas system. The California Energy Commission (CEC) has made significant improvements in its existing gas price and rate forecasts and infrastructure assessments and is expanding the demand forecast to include enhancements for supporting long-term gas planning. Ongoing collaboration among California’s energy and climate agencies and stakeholders is necessary to ensure a safe, reliable, and equitable transition while achieving the state’s climate goals. Several commenters reinforced the need for long-term gas planning, recommending that the CEC continue the dialogue on transitioning away from fossil gas in the IEPR and other proceedings and forums.
Overview of Emerging Gas Issues For decades, gas has been an essential fuel for heating homes and businesses and meeting the fuel and feedstock needs of large commercial and industrial customers. Moreover, it has been California’s dominant source of electricity generation for several decades. It is the largest energy source in the state, accounting for 28 percent of total energy use, followed by gasoline use for transportation (Figure ES-1). While the electrification of building energy uses is expected to reduce residential and commercial gas demand over the coming decades, some gas uses in the industrial sector cannot be, or are hard to, electrify. This challenge has focused attention on the importance of a diversified energy system that includes clean fuels or molecules, such as renewable gas and renewable hydrogen, as well as clean electricity.
2

Figure ES-1: California Total Energy Consumption
Source: CEC Staffstaff with data from the United States Energy Information Administration
At the same time, there are critical interdependencies between gas and electricity that the state must carefully consider when planning to decarbonize both systems. As California brings rapidly increasing amounts of renewable resources onto the electricity grid, in the near term to midterm, gas generation is needed to integrate these renewables and ensure reliability. Over the longer term, some gas-fired or thermal generation may be needed, while new and emerging storage and zero-carbon fuels and technologies are brought to market. The 2021 SB 100 Joint Agency Report Achieving 100 Percent Clean Electricity in California: An Initial Assessment shows that some gas capacity is retained for reliability in 2045 but notes that cost reductions and innovation in zero-carbon firm resources and storage may reduce thermal capacity needs.
While gas demand for electric generation will continue the annual decline and the overall daily peak demand may be lower, the pattern of gas deliveries will likely show a sharper peak to meet steeper ramping requirements (fast increases and decreases in generation) and other renewable integration and grid reliability needs (Figure ES-2). Events on one system are tightly linked to the other system. For example, gas supply shortfalls can cause curtailment of electric generators that, in turn, can impact electric grid reliability. Also, gas price spikes typically result in higher electricity costs. This interdependency requires careful planning, especially for extreme weather events such as heat waves and polar vortexes (extreme cold), where the interdependencies are most prominent. Renewable gas and renewable hydrogen may become important clean fuels for thermal generation in the longer term depending on the availability and cost of these fuels. This may present opportunities for gas utilities to repurpose gas infrastructure.
3

Figure ES-2: Daily Gas Demand on Summer Days (Million Cubic Feet [MMcf] per Hour)
Source: CEC staff
Renewable gas and renewable hydrogen may also have the potential to meet hard-to-electrify gas uses in the industrial sector. Many industrial customers have limited opportunities for a cost-effective shift from fossil gas to low-carbon alternatives. There are industry requirements for heat and feedstock that cannot be directly electrified economically, as found in refining, steel manufacturing and processing, cement production, ammonia and fertilizer production, computer chip fabrication, and pharmaceuticals manufacturing. Decarbonization efforts must ensure that California’s industrial base, which is an essential driver of the economy, remains competitive while achieving GHG reductions. As well as being a low-carbon fuel, renewable gas produced from waste streams is a key state strategy to reducing methane emissions (a potent GHG) from landfills, wastewater, dairies, and other agricultural waste. Renewable hydrogen may also have several potential sources and uses in a decarbonized energy system.
Building electrification is the most promising decarbonization strategy and could result in significant reductions in residential and commercial building gas demand. This demand reduction, in turn, could allow reductions in gas infrastructure, generating cost savings that can help dampen the rate impacts of declining system demand for the remaining gas customers. The majority of gas distribution infrastructure serves residential and commercial customers. But the pace of building electrification may be slower than some studies suggest, as there remain challenges for widespread deployment. Given the many uncertainties about how much, where, and when building electrification will occur, current utility demand forecasts indicate only a 1 percent per year reduction in gas demand in the 2035 time frame (Figure ES-3). It may be possible to downsize gas distribution systems with more aggressive, targeted residential and commercial building electrification efforts than shown in the utility forecasts.
4

However, downsizing the high-pressure gas transmission and storage systems is likely to require greater demand reductions and may take significantly longer to achieve. Without conducting detailed analysis of gas system operations, it is difficult to assess accurately the amount of potential gas system reductions or associated cost savings that can be achieved from building electrification.
Figure ES-3: Total Statewide Gas Demand (MMcfd)
Source: 2020 California Gas Report
Building electrification may lead to gas rate and equity challenges. As residential and commercial customers exit the gas system by switching from gas to electricity, there will be fewer customers on the gas system. Gas system costs will be spread over a smaller customer base, leading to rate increases. These rate increases may encourage additional customers to switch from gas to electricity. However, this presents significant equity issues, as many who remain on the gas system will be in low-income communities and the least able to afford higher gas rates or invest in electrification. Coordinated planning and support will be essential to ensureensuring an equitable transition for those customers.
Reductions in gas throughput also raise the potential for stranded assets, as well as utility workforce issues and concerns about the long-term role of gas utilities. To avoid creating large amounts of stranded investments, utilities and decision-makers must identify ways to minimize and prioritize investments in the gas system, as well as reduce costs for operating and maintaining it. Other policy considerations include ensuring an adequate gas industry workforce to operate and maintain the gas system, as well as a focus on minimizing adverse impacts on gas workers, retaining skilled workers, and providing for displaced gas workers. It also includes addressing concerns about the role of gas utilities as the gas system evolves.
Finally, for several decades, gas demand from residential and commercial space heating during the winter peak season has driven gas infrastructure needs and reliability standards. As building decarbonization reduces winter gas heating, the increased daily gas peaks for electric generators are likely to become a key driver of gas infrastructure and reliability needs. This
5

shift, along with the electrification of transportation, will also change the magnitude, location, and daily and seasonal patterns of electricity demand. These changing use patterns will necessitate new approaches for gas demand forecasting, ratemaking, and cost allocation, as well as rethinking how to make infrastructure decisions that ensure gas and electric system reliability.
Need for Comprehensive Statewide Gas Planning Local, state, and federal efforts to transition away from fossil gas are historically fragmented and largely uncoordinated, though there are new interagency efforts to increase coordination for natural gas planning. Current state statutes and regulations require gas utilities to hook up or continue gas service to any customer willing to pay for it, which can impede efforts to minimize gas demand and infrastructure. To reduce or retire gas infrastructure, it will be important to ensure that all gas uses on a given distribution segment are eliminated. Federal efforts have yet to address gas and electricity market coordination issues or effectively minimize the upstream GHG emissions and environmental impacts of gas production and use. A myriad of other local, state, and federal issues and actions must be thought through in a cohesive fashion.
The need to address emerging gas issues in a systematic way highlights the importance of establishing a coordinated, transparent, and rigorous long-term gas planning process in the state. Such a process will ensure that decision-making regarding gas utility operations, rates, and infrastructure is aligned with climate goals to achieve GHG emission reductions. Further, the planning process must consider the needs and changing demand patterns of the primary users of the gas system during the transition. Long-term gas system planning will require an interagency collaboration involving the CEC, California Public Utilities Commission (CPUC), California Air Resource Board (CARB), and California Independent System Operator (California ISO). These entities all have key roles that should be brought to bear in planning for a decarbonized gas system. The agencies have already initiated coordination for ongoing planning efforts such as CARB’s scoping plan updates, the CPUC’s gas planning proceeding, and the CEC’s IEPR proceeding. The CPUC’s long-term gas-planning rulemaking (R.20-01-007) reinforces the need for coordinated long-term gas planning and decarbonization plans from California’s gas utilities. The agencies are also collaborating to create a long-term gas decarbonization blueprint for the state and are working toward releasing a joint white paper in 2022.
As described above, there are a host of policy issues that state agencies must address as part of long-term gas planning. Foremost is the need to ensure safe and reliable operations of the gas systems. Long-term planning should focus on reducing gas safety risks, ensuring the reliability of gas service, and reducing gas leaks that contribute to GHG emissions. Minimizing the potential for stranded investments in the gas system, along with explicitly addressing equity issues, is also crucial to long-term gas planning. One of the challenges in long-term planning is to strike a balance between these competing goals.
A critical step in gas system planning will be reevaluating and refining existing policies driving gas system investments and developing new policies in the context of the state’s climate goals. With declining gas demand, the paradigm that assumes gas infrastructure assets have a
6

useful life of 60 or more years may no longer apply. Current gas utility infrastructure investment decisions are made on a case-by-case basis in the short-term context of rate cases and other regulatory proceedings. Even when gas utilities must obtain formal approval to add or retire major infrastructure assets, those actions are not comprehensively assessed from a long-term climate perspective. This approach to investment decisions does not provide the rigorous or robust planning needed to address the state’s long-term use of the gas system and associated decarbonization. Further, a long-term gas planning process should include a broader set of stakeholders. For example, participation in gas utility proceedings tends to be limited to a small set of stakeholders — usually ratepayer advocates and a few large, sophisticated customers with long experience participating in adjudicatory-style proceedings. Yet, there is a growing list of stakeholders who have an interest in the future of the gas system, including environmental justice groups, building decarbonization advocates, local governments, and community-based organizations, among others. Their views are vital to long-term decision-making on the gas system and related decarbonization.
As the number of stakeholders increases, there needs to be more transparency about utility investment decisions and specific decarbonization plans than is provided in rate cases. The investment decisions in these cases are often based on settlements that may happen behind closed doors. Information on the reasons for investments is often sparse and contained in massive utility rate filings that are neither easily accessible to nor understood by less sophisticated stakeholders. In many instances, the justification for infrastructure investments is known only to the utility. All parties need to have a clear understanding of purpose and priority of utility investments going forward.
Commenters indicated general support for the comprehensive approach, the identification of policy issues, and main recommendations related to long-term gas planning in the Draft 2021 IEPR. The CEC appreciates the many suggestions for specific topics to address, policies to consider, and analysis that will be needed in planning for gas system decarbonization. The CEC intends to pursue the thoughtful input from commenters in upcoming IEPRs and other proceedings and stakeholder forums. The CEC looks forward to a robust collaboration with other key agencies and stakeholders to address the complex and challenging gas issues facing the state.
Analytical Framework for Long-Term Gas Planning The Scoping Order for the 2021 IEPR addressed two key gas-related issues: situational awareness of emerging topics in gas system planning and refinement and development of critical analytical products necessary for gas system planning. Consistent with its statutory responsibilities for gas forecasting and assessments, the CEC held several workshops in the 2021 IEPR proceeding focused primarily on the analytics and assessments necessary to support long-term gas planning. Some of this work includes long-standing efforts such as forecasting gas demand, as well as preparing forecasts of the North American gas market and gas prices.
Staff implemented significant improvements in price forecast products with revised modeling methods and newly created tools for forecasting gas commodity prices, gas transportation rates, and delivered gas prices for customers. Staff also built new analytical capabilities, such
7

as supply and demand balance tools and hydraulic modeling skills for assessing infrastructure. These tools allow the CEC to explore gas system issues at greater depth and with a sophistication closer to that applied by the utilities. In the 2021 IEPR proceeding, for the first time, staff collected filings from the gas utilities — like those used for the electricity demand forecast — to support the CEC’s gas demand forecast. These forms identify the key data, information, and methods that gas utilities use in preparing their own demand forecasts. Staff has already begun expanding the CEC’s gas demand forecast to ease long-term gas system planning.
It is critically important that a long-term gas planning process has a sound analytical framework at the foundation. Figure ES-4 is a process diagram showing how the various technical forecasts and assessments needed in gas planning could feed into such an overall analytical framework. Some steps would include feedback loops and iterative processes. Many of these are quantitative, while some are qualitative. Some areas will require incremental improvements over future planning cycles as the CEC collects more granular data and improves or develops new analytical tools. Developing this framework and working collaboratively with the other energy and climate agencies are a major focus for the CEC’s gas forecasting and assessment efforts.
Figure ES-4: Analytical Framework for Gas Planning
Source: CEC staff
8
CHAPTER 1: The Role of Gas in California’s Energy System
Introduction This chapter discusses the changing role of gas in meeting California’s energy needs, including trends in gas demand, greenhouse gas (GHG) emissions, prices, and rates, supply and interstate pipelines, and intrastate infrastructure.1 Appendix A details gas consumption by sector. Appendix B details GHG emissions by sector. Appendix C provides gas utility basics that serve as useful context for the analysis and discussions presented.
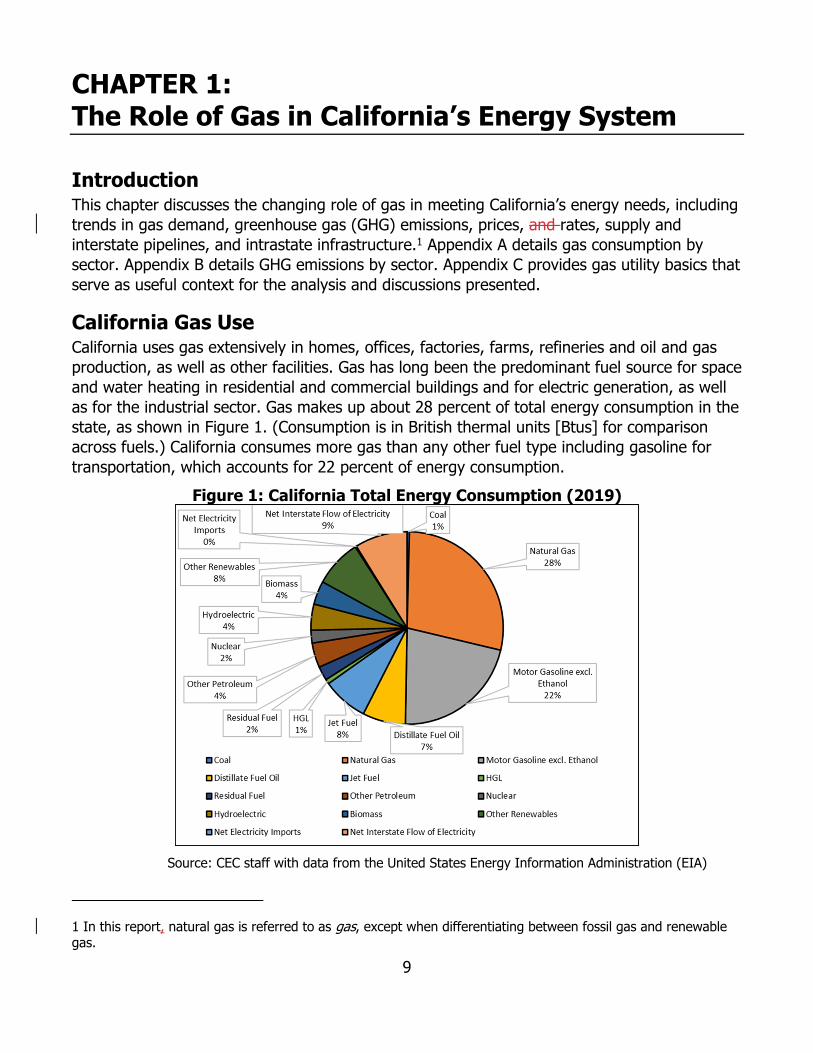
California Gas Use California uses gas extensively in homes, offices, factories, farms, refineries and oil and gas production, as well as other facilities. Gas has long been the predominant fuel source for space and water heating in residential and commercial buildings and for electric generation, as well as for the industrial sector. Gas makes up about 28 percent of total energy consumption in the state, as shown in Figure 1. (Consumption is in British thermal units [Btus] for comparison across fuels.) California consumes more gas than any other fuel type including gasoline for transportation, which accounts for 22 percent of energy consumption.
Figure 1: California Total Energy Consumption (2019)
Source: CEC staff with data from the United States Energy Information Administration (EIA)
1 In this report, natural gas is referred to as gas, except when differentiating between fossil gas and renewable gas.
9
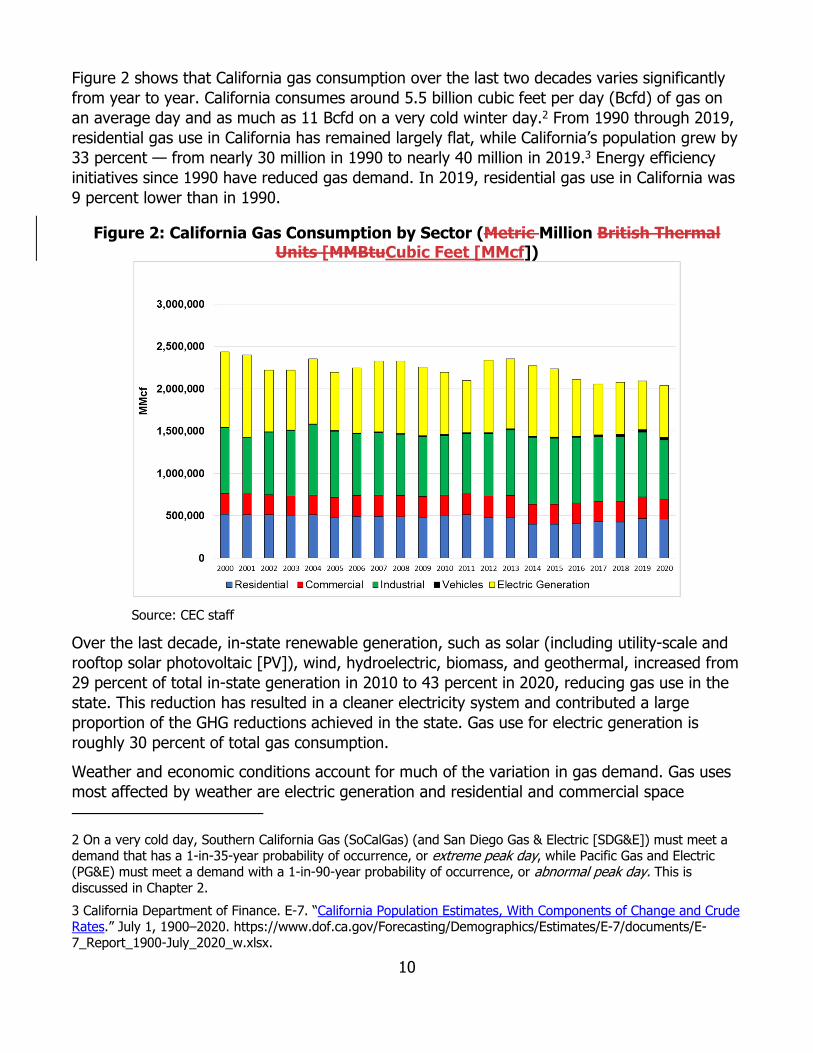
Figure 2 shows that California gas consumption over the last two decades varies significantly from year to year. California consumes around 5.5 billion cubic feet per day (Bcfd) of gas on an average day and as much as 11 Bcfd on a very cold winter day.2 From 1990 through 2019, residential gas use in California has remained largely flat, while California’s population grew by 33 percent — from nearly 30 million in 1990 to nearly 40 million in 2019.3 Energy efficiency initiatives since 1990 have reduced gas demand. In 2019, residential gas use in California was 9 percent lower than in 1990.
Figure 2: California Gas Consumption by Sector (Metric Million British Thermal Units [MMBtuCubic Feet [MMcf])
Source: CEC staff
Over the last decade, in-state renewable generation, such as solar (including utility-scale and rooftop solar photovoltaic [PV]), wind, hydroelectric, biomass, and geothermal, increased from 29 percent of total in-state generation in 2010 to 43 percent in 2020, reducing gas use in the state. This reduction has resulted in a cleaner electricity system and contributed a large proportion of the GHG reductions achieved in the state. Gas use for electric generation is roughly 30 percent of total gas consumption.
Weather and economic conditions account for much of the variation in gas demand. Gas uses most affected by weather are electric generation and residential and commercial space
2 On a very cold day, Southern California Gas (SoCalGas) (and San Diego Gas & Electric [SDG&E]) must meet a demand that has a 1-in-35-year probability of occurrence, or extreme peak day, while Pacific Gas and Electric (PG&E) must meet a demand with a 1-in-90-year probability of occurrence, or abnormal peak day. This is discussed in Chapter 2. 3 California Department of Finance. E-7. “California Population Estimates, With Components of Change and Crude Rates.” July 1, 1900–2020. https://www.dof.ca.gov/Forecasting/Demographics/Estimates/E-7/documents/E-7_Report_1900-July_2020_w.xlsx.
10

heating.4 Gas use in power plants varies significantly from year to year to meet hot summer air-conditioning demand, as well as cold winter heating demand. Further, gas is the swing fuel for electricity generation when hydropower conditions are reduced by drought, which also causes gas demand for electric generation to vary from year to year. (See Appendix A.)
Industrial gas demand in California fell starting in 2008 as the Great Recession pushed demand for manufactured goods and other industrial sector production down, but industrial gas demand recovered to reach a peak in gas use by 2018. The industrial gas sector accounted for roughly 35 percent of gas use in the state in 2020.
Appendix A details gas consumption trends for the different customer sectors.
GHG Emissions Attributed to Gas Overall GHG emissions related to gas totaled 39.33 million metric tonnes of carbon dioxide equivalent (MMTCO2e) from direct emissions of methane (such as dairies, livestock, landfills, wastewater, and pipeline fugitive emissions) and 132 MMTCO2e as carbon dioxide (CO2) from the combustion of gas (for example, residential, commercial, industrial, agriculture, and electric generation). In 2019, methane (CH4) accounted for 9 percent of statewide GHG emissions, while CO2 accounted for 83 percent (Figure 3).
Figure 3: 2019 Greenhouse Gas Emissions by Type
Source: CEC staff using California Air Resources Board (CARB) data
The largest contributions to CO2 emissions are from gas use in the industrial sector, followed by electric generation and the residential and commercial sectors. As discussed, the electricity
4 With climate change, the number of heating degree days — or days when the temperature is below 65 degrees and heating is needed for comfort — is expected to decrease. However, the number of cooling degree days, or days when the temperature is above 65 and air conditioning may be needed for comfort, are expected to increase.
11
sector has made great strides in reducing CO2 emissions below near-term GHG reduction targets by introducing large amounts of renewable resources to the state’s electricity grid. Building electrification can further reduce CO2 emissions as gas-fired generation declines and combustion in gas appliances decreases.
Direct methane emissions are largely attributed to agriculture and livestock, followed by landfills, wastewater, and pipeline fugitive emissions. Diversion and sequestration of unavoidable emissions from livestock and waste can be achieved by converting this waste to renewable gas. The CO2 emission from combusting renewable gas has a lower global warming potential (GWP) than methane emissions from waste decomposition.5 While in-state oil and gas production and gas pipelines contribute to methane emissions, they are smaller than those from other methane sources.
Carbon Dioxide Emission From Gas Use The overall CO2 emissions directly related to gas combustion is about 132 million metric tonnes carbon dioxide equivalent (MMTCO2e), or 38 percent of CO2 emissions in 2019.6 Figure 4 shows the CO2 emissions by sector over the last two decades.7 CO2 emissions from gas use in the electric sector have declined significantly over the last two decades because of retirements and efficiency improvements in gas-fired power plants, the proliferation of renewable resources on the electric grid, and reduced out-of-state coal imports.
5 The global warming potential (GWP) is a metric that allows comparisons of the global warming impacts of different gases. It is a measure of how much energy the emissions of 1 ton of a gas will absorb over a given period relative to the emissions of 1 ton of carbon dioxide (CO2). The larger the GWP, the more that a given gas warms the Earth compared to CO2 over that period. 6 Based on GHG emissions inventory and accumulation of all CO2 emissions attributable to gas combustion. Emissions from the electric sector include in-state and out-of-state emissions. Industrial emissions include refinery gas as gas-related emissions. 7 Emission data in this report use the latest CARB data available, which is for 2019. There is typically a two-year lag for CARB emissions data.
12

Figure 4: CO2 Emissions by Sector From 2000 to 2019
13

Source: CEC staff using CARB data CO2 emissions in the residential and commercial sectors come largely from space- and water-heating demand, which is provided by gas combustion. Industrial customers in the state, many of whom have unique energy demands, use gas for high-heat-related processes and on-site generation of electricity. While the transportation sector is the largest emitter of CO2, use of compressed natural gas (CNG) in vehicles is negligible compared to the use of gasoline and diesel in internal combustion engines.8
Methane Emissions Associated With Gas California’s methane emissions have steadily increased since 2000; the state emitted 39.33 MMTCO2e in 2019 compared to 34.01 MMTCO2e in 2000.9
Historically, agriculture has been the leading cause of methane emissions, followed by recycling and waste, and the industrial sector. The commercial, residential, and transportation sectors each emitted less than 1 MMTCO2e of methane in any given year over the last 19 years.10 Figure 5 shows methane emissions by source. Agriculture and landfills are the largest methane sources in the state, accounting for about 80 percent of total emissions in 2019. The portion of methane emissions attributed to gas pipelines is roughly 12 percent and another 4
8 CNG is produced by compression, cooling, and dehydration of natural gas (down to less than 1 percent of its volume) that is stored in pressurized tanks and can be used in place of gasoline or diesel in vehicles. 9 CARB. 2021. “GHG Inventory Raw Data.” https://ww2.arb.ca.gov/ghg-inventory-data. 10 Methane leakage for these sectors is attributed to the transmission and distribution of gas to these end uses. Overall emissions attributed to the residential, commercial, and transportation sectors are dominated by CO2emissions from the combustion of gas. For more information see CARB’s short-lived climate pollutant webpage at https://ww2.arb.ca.gov/our-work/programs/slcp.
14

percent from oil and gas production, with gas-related methane emissions accounting for 16 percent of the statewide total in 2019.11
Figure 5: 2019 California Methane Emissions by Percentage
Note: The data shown assume a 100-year GWP for methane consistent with CARB’s California’s 2017 Climate Change Scoping Plan. Source: CEC staff using CARB data
Converting waste to renewable gas is a primary focus for addressing methane emissions in the California Air Resources Board’s (CARB’s) Short-Lived Climate Pollutant Reduction Strategy.12
Renewable gas production has important societal benefits as a solution to waste disposal. Further, renewable gas use in trucks and heavy-duty vehicles has climate benefits compared to the use of diesel fuel. Injecting renewable gas into gas pipelines creates some methane leakage, and CARB recommends that California take steps to minimize potential methane leaks from renewable gas facilities, including pipelines. The California Public Utilities Commission (CPUC) has approved a new approach for methane leaks from gas pipelines, requiring utilities to prioritize repairs on lines that leak even if the leaks do not pose a physical threat.13
Reducing pipeline leakage is a key utility program discussed in Chapter 6 and Appendix E.
11 Methane emissions from out-of-state oil and gas production delivered for use in California are not included in these estimates. 12 CARB. 2017. Short-Lived Climate Pollutant Reduction Strategy. https://ww2.arb.ca.gov/sites/default/files/2020-07/final_SLCP_strategy.pdf. 13 CPUC. Methane Leak Proceeding (R.15-01-008). https://www.cpuc.ca.gov/about-cpuc/divisions/safety-policy-division/risk-assessment-and-safety-analytics/methane-leaks. In March 2018, the CPUC required California gas utilities to file proposed Leak Abatement Compliance Plans per D.17-06-016 at https://www.socalgas.com/sites/default/files/SCG-Risk-1_HPSystem_31.pdf. The leak abatement
15

Gas Supply for California Nearly 90 percent of gas supplies are from out-of-state production basins that are thousands of miles away. The remainder of gas supplies are from in-state gas production, which has been slowly declining since the 1980s. California receives supplies from diverse production basins in Alberta, Canada; Southern Wyoming; Northwest New Mexico; West Texas; and Southeast New Mexico. The interstate gas system is composed of a network of pipelines that connect production basins, storage fields, and load centers, often thousands of miles apart, as shown in Figure 6. These interstate gas pipelines deliver gas supplies to the California border, where gas is transferred to receipt points on the intrastate gas systems of California’s two gas utilities — Pacific Gas and Electric Company (PG&E) and Southern California Gas Company (SoCalGas) — and to a few large customers directly served off the interstate gas system (Kern River Pipeline).
Figure 6: Interstate Gas Pipelines and Supply Basins Serving California
program outlining best practices consistent with SB 1371 (2017) is available at https://docs.cpuc.ca.gov/PublishedDocs/Published/G000/M190/K740/190740714.PDF.
16

Source: 2020 California Gas Report
The mix of out-of-state supplies is roughly as follows:
20 percent from the Western Canada Sedimentary Basin (Alberta, Canada) via the GasTransmission Northwest pipeline system
30 percent from the Rocky Mountain Basin (Southern Wyoming) via the Ruby Pipelineand Kern River Pipeline
40 percent from the San Juan Basin (Northwest New Mexico) via El Paso Natural GasCompany and the TransWestern Pipeline
10 percent from the Permian Basin (West Texas and Southeast New Mexico) via El PasoNatural Gas Company and the TransWestern Pipeline
PG&E tends to rely more on Canadian gas, while SoCalGas relies more on gas from the Rocky Mountain region and the San Juan basin. SoCalGas generally receives mostly Permian Basin supplies over its southern mainline system, as the ability to move San Juan gas to the southern mainline is limited. Interstate pipelines deliver gas supplies at receipt points near Malin, Oregon; north and south of Topock, Arizona; and at Wheeler Ridge. One very important facet of out-of-state gas supplies is that California is located at the end of the interstate pipelines, with many demand centers in the Pacific Northwest and Southwest regions before gas reaches the state. When supplies are tight, flows into California can be limited by this upstream demand.
17
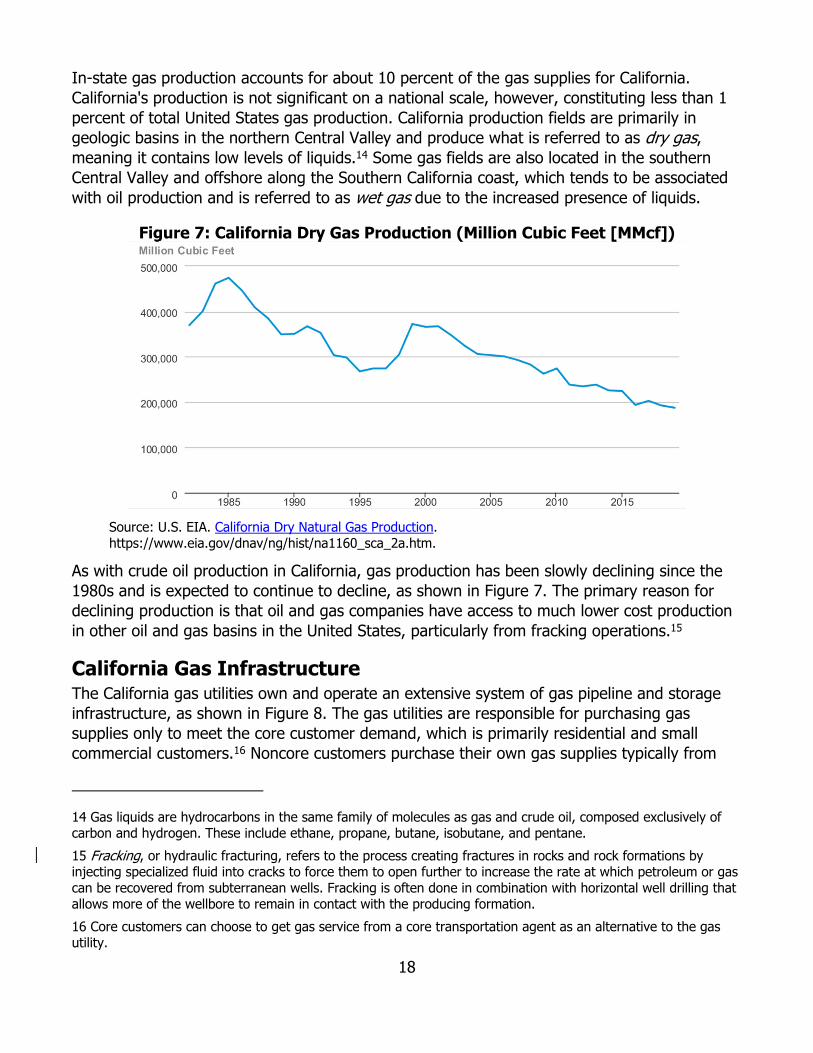
In-state gas production accounts for about 10 percent of the gas supplies for California. California's production is not significant on a national scale, however, constituting less than 1 percent of total United States gas production. California production fields are primarily in geologic basins in the northern Central Valley and produce what is referred to as dry gas, meaning it contains low levels of liquids.14 Some gas fields are also located in the southern Central Valley and offshore along the Southern California coast, which tends to be associated with oil production and is referred to as wet gas due to the increased presence of liquids.
Figure 7: California Dry Gas Production (Million Cubic Feet [MMcf])
Source: U.S. EIA. California Dry Natural Gas Production. https://www.eia.gov/dnav/ng/hist/na1160_sca_2a.htm.
As with crude oil production in California, gas production has been slowly declining since the 1980s and is expected to continue to decline, as shown in Figure 7. The primary reason for declining production is that oil and gas companies have access to much lower cost production in other oil and gas basins in the United States, particularly from fracking operations.15
California Gas Infrastructure The California gas utilities own and operate an extensive system of gas pipeline and storage infrastructure, as shown in Figure 8. The gas utilities are responsible for purchasing gas supplies only to meet the core customer demand, which is primarily residential and small commercial customers.16 Noncore customers purchase their own gas supplies typically from
14 Gas liquids are hydrocarbons in the same family of molecules as gas and crude oil, composed exclusively of carbon and hydrogen. These include ethane, propane, butane, isobutane, and pentane. 15 Fracking, or hydraulic fracturing, refers to the process creating fractures in rocks and rock formations by injecting specialized fluid into cracks to force them to open further to increase the rate at which petroleum or gas can be recovered from subterranean wells. Fracking is often done in combination with horizontal well drilling that allows more of the wellbore to remain in contact with the producing formation. 16 Core customers can choose to get gas service from a core transportation agent as an alternative to the gas utility.
18
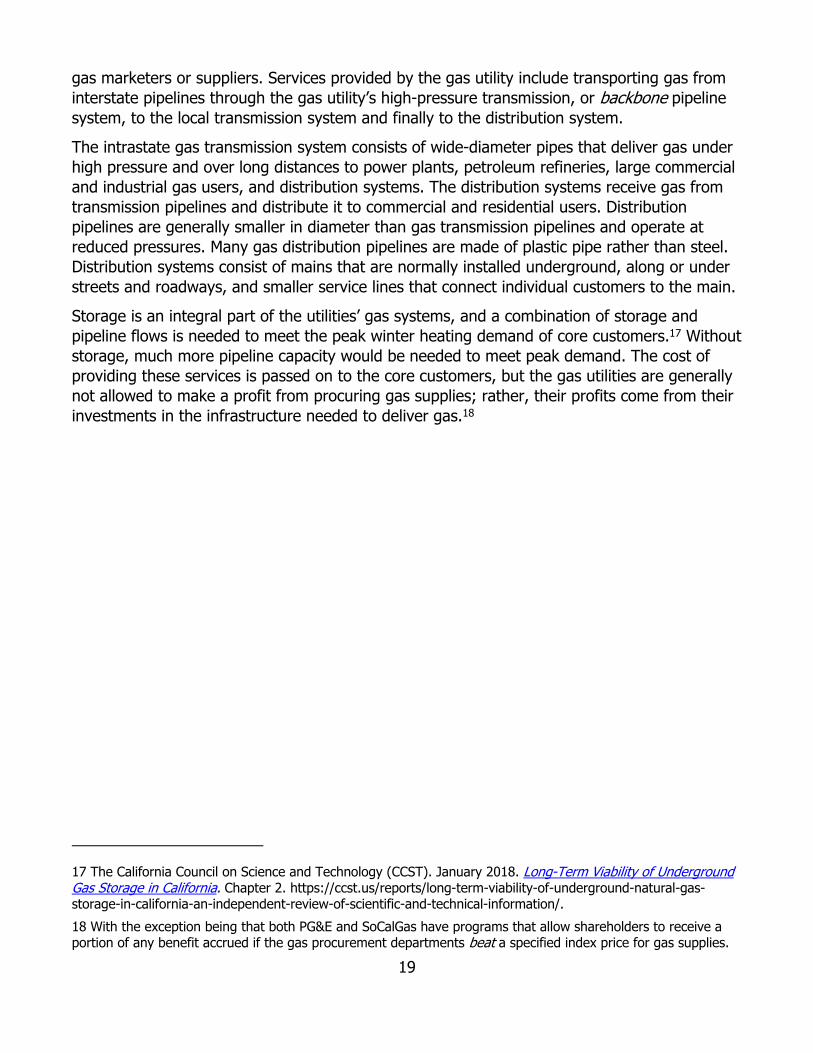
gas marketers or suppliers. Services provided by the gas utility include transporting gas from interstate pipelines through the gas utility’s high-pressure transmission, or backbone pipeline system, to the local transmission system and finally to the distribution system.
The intrastate gas transmission system consists of wide-diameter pipes that deliver gas under high pressure and over long distances to power plants, petroleum refineries, large commercial and industrial gas users, and distribution systems. The distribution systems receive gas from transmission pipelines and distribute it to commercial and residential users. Distribution pipelines are generally smaller in diameter than gas transmission pipelines and operate at reduced pressures. Many gas distribution pipelines are made of plastic pipe rather than steel. Distribution systems consist of mains that are normally installed underground, along or under streets and roadways, and smaller service lines that connect individual customers to the main.
Storage is an integral part of the utilities’ gas systems, and a combination of storage and pipeline flows is needed to meet the peak winter heating demand of core customers.17 Without storage, much more pipeline capacity would be needed to meet peak demand. The cost of providing these services is passed on to the core customers, but the gas utilities are generally not allowed to make a profit from procuring gas supplies; rather, their profits come from their investments in the infrastructure needed to deliver gas.18
17 The California Council on Science and Technology (CCST). January 2018. Long-Term Viability of Underground Gas Storage in California. Chapter 2. https://ccst.us/reports/long-term-viability-of-underground-natural-gas-storage-in-california-an-independent-review-of-scientific-and-technical-information/. 18 With the exception being that both PG&E and SoCalGas have programs that allow shareholders to receive a portion of any benefit accrued if the gas procurement departments beat a specified index price for gas supplies.
19

Figure 8: California Gas Pipeline and Storage Infrastructure
20
Credit: CEC staff
More detailed descriptions on the intrastate gas system are presented in Chapter 6 and Appendix E.
21

Gas Prices in California Until gas reaches the distribution systems, California enjoys lower gas prices than on average across the United States. This is demonstrated in Figure 9, which shows average citygate prices for the United States and California from 1984 through 2020.19
Figure 9: United States and California Citygate Prices ($/Thousand Cubic Feet [Tcf])
Source: CEC staff using EIA data
19 Citygates are where gas moves from transmission to distribution; the data shown here come from EIA, which is the independent statistical and analytical agency within the United States Department of Energy (U.S. DOE). EIA collects these price data, sampling companies that deliver gas to consumers, via Form EIA-857, and uses volumes (also reported on the form) to weight the prices. Response to the survey is mandatory. https://www.eia.gov/dnav/ng/TblDefs/NG_DataSources.html#s857.
22

Natural gas prices were relatively low and stable from the mid-1980s to 2000. The peak in gas prices in 2000–2001 coincides with the California energy crisis, when not only electricity but also gas prices increased dramatically. Following the energy crisis, the California Attorney General finalized a settlement with El Paso Corporation that provided $1.45 billion in relief to electricity and gas ratepayers for actions it said, “gamed the market and charged unlawful rates.”20
Gas prices dropped in 2003 but quickly rose starting in 2004, peaking in about 2010. The primary reason for the gas price increases was declining production and increasing production costs from conventional gas resources with the expectation of increased competition for scarce resources. Increases in the prices of oil and other globally traded commodities occurred in this period as well. Various developers proposed to construct liquefied natural gas (LNG) import facilities at several locations to import gas via tankers. Few of those facilities were built due to long lead time for approvals, opposition to their construction, and ultimately, a collapse in natural gas prices in 2010. Large and significant reductions in natural gas prices beginning around 2010 are attributed to the Great Recession and the successful application of hydraulic fracturing techniques, or fracking, to oil- and gas-bearing shale rock formations.21
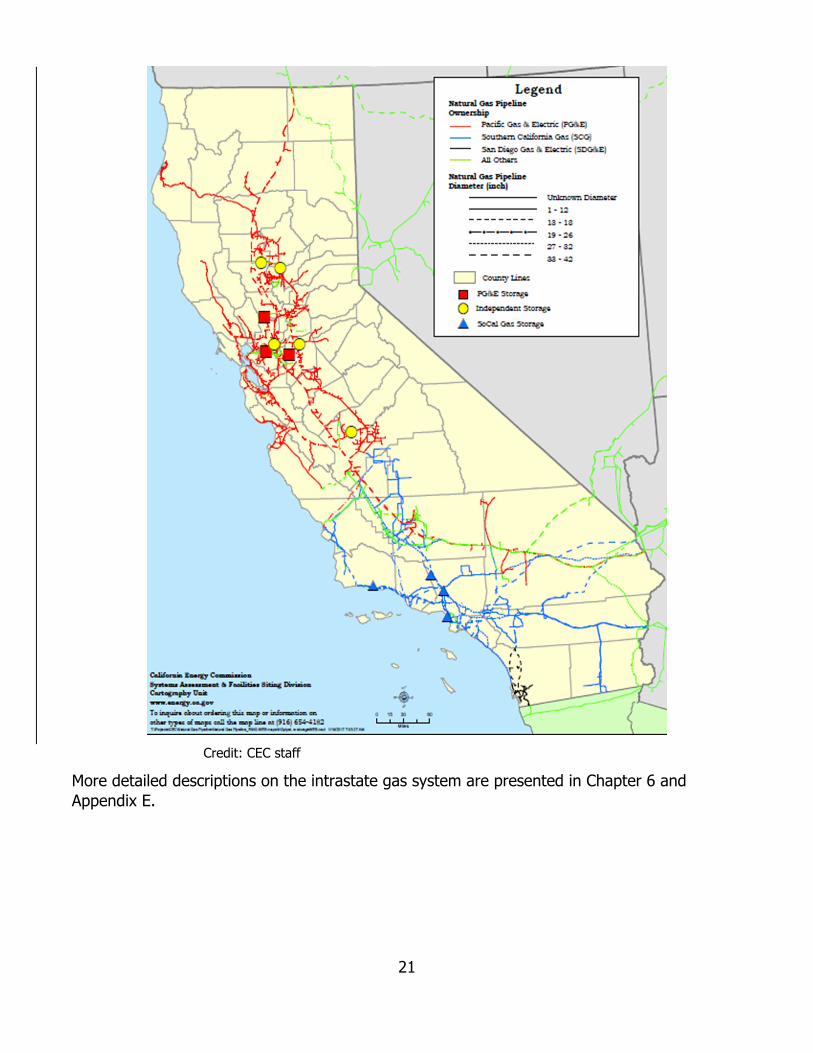
Figure 10 shows more recent Henry Hub and California border prices.22 These prices remained closely correlated until 2016, with a slight divergence to 2020. After 2016, excess Permian Basin gas production caused prices to drop for competing San Juan Basin gas, which led prices to fall for the PG&E Southern Border (normally known as “Topock”). While SoCal Border prices remain lower than at Henry Hub at first, they and prices at Malin become higher than those for southwest gas delivered into PG&E.
20 California Department of Justice press release. June 26, 2003. “Attorney General Lockyer Announces Finalization of El Paso Settlement That Gives Ratepayers $1.45 Billion in Relief and Resolves Market Manipulation Charges.” https://oag.ca.gov/news/press-releases/attorney-general-lockyer-announces-finalization-el-paso-settlement-gives. 21 U.S. Geological Survey. “What is Hydraulic Fracturing?” webpage. https://www.usgs.gov/faqs/what-hydraulic-fracturing?qt-news_science_products=0#qt-news_science_products. 22 Henry Hub is perhaps the best-known of all gas trading points in North America. Located near Erath, Louisiana, it is widely used as a reference point or benchmark for United States gas prices.
23
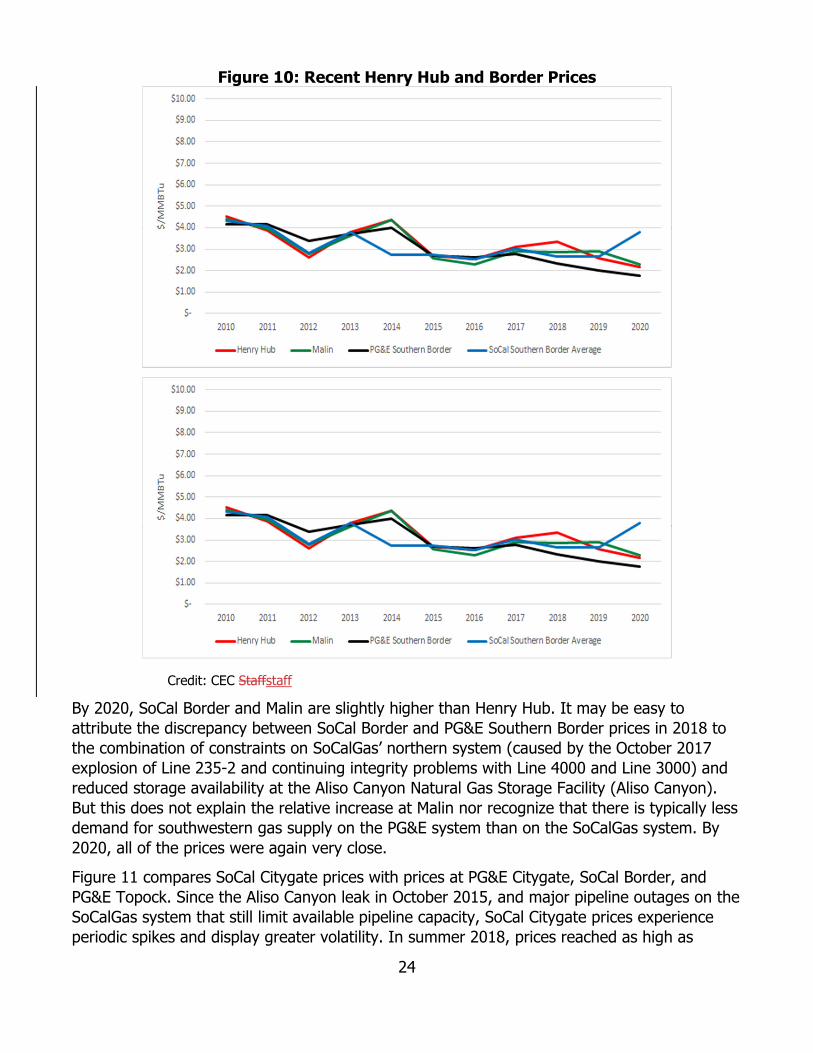
Figure 10: Recent Henry Hub and Border Prices
Credit: CEC Staffstaff
By 2020, SoCal Border and Malin are slightly higher than Henry Hub. It may be easy to attribute the discrepancy between SoCal Border and PG&E Southern Border prices in 2018 to the combination of constraints on SoCalGas’ northern system (caused by the October 2017 explosion of Line 235-2 and continuing integrity problems with Line 4000 and Line 3000) and reduced storage availability at the Aliso Canyon Natural Gas Storage Facility (Aliso Canyon). But this does not explain the relative increase at Malin nor recognize that there is typically less demand for southwestern gas supply on the PG&E system than on the SoCalGas system. By 2020, all of the prices were again very close.
Figure 11 compares SoCal Citygate prices with prices at PG&E Citygate, SoCal Border, and PG&E Topock. Since the Aliso Canyon leak in October 2015, and major pipeline outages on the SoCalGas system that still limit available pipeline capacity, SoCal Citygate prices experience periodic spikes and display greater volatility. In summer 2018, prices reached as high as
24
$40/MMBtu and $22/MMBtu in winter 2018–2019, while prices at SoCal Border and PG&E Citygate were less volatile.
SoCal Citygate prices continued to experience spikes and higher volatility in relation to the other citygate and border prices into 2020 and 2021. Prices during the summer 2020 heat wave increased to $13 per MMBtu. The price in February 2021 during the polar vortex (Storm Uri) event in the Mid-Continent and Southwest reached a high of $146 per MMBtu on February 13 to 16, 2021. This increase is much lower than the spikes experienced in other regions, including the $1,000 in Oklahoma or even the $246 at Ventura, Iowa. Prices decreased to $4 per MMBtu within a few days of the event. (See Chapter 3 and Appendix D for more detail on the impacts of Storm Uri.)
Figure 11: PG&E and SoCalGas Prices 2010–2021 (MMBtu)
Source: CEC staff
Delivered Gas Prices While the citygate prices to California are lower than average across the United States (as shown previously in Figure 9), the same is not true of “delivered” natural gas prices.23 Figure 12 displays the trend in the total delivered prices for California residential, commercial, industrial, and electric generation customers.
23 A delivered price is the sum of the price paid for commodity gas supply plus the transportation service rate charged by the utility to deliver that gas to the end user. That transportation service rate also typically includes some allocation of balancing service cost and any cost for the use of storage that the CPUC might assign to that particular customer class.
25

Figure 12: California Average Delivered Gas Prices ($/MMbtu) 2010–2020
$0.00
$2.00
$4.00
$6.00
$8.00
$10.00
$12.00
$14.00
$16.00
2010 2011 2012 2013
MMBtu/$
Residential Commercial
2014 2015 2016 2017 2018 2019 2020
Industrial Electric Gen
Source: CEC staff
Since 2010, those prices have increased. Delivered prices to electric generators, in contrast, have decreased. Residential prices tend to be the highest because the CPUC allocates to them a higher share of the utility revenue requirement owing to the need to maintain infrastructure to meet theirthe higher peak demand in very cold winter conditions and greater use of the distribution system. Reliability needs and gas-electric reliability interdependencies are addressed in Chapter 2. Chapter 9 discussed staff’s gas price outlook.
26

CHAPTER 2: Gas and Electric Interdependencies
There are critical interdependencies between electricity and gas system reliability in the state. Gas-fired generation has long been an integral part of the electricity system, providing baseload power, load following, and reliability. It has also served as the backstop during drought conditions that reduce the availability of in-state hydro generation, as well as imports of hydro from the Pacific Northwest and Southwest regions. The role of gas generation in the electricity system is shifting with the addition of large amounts of renewable generation, primarily solar and wind. Gas generators not only ensure reliability, but are key enablers of increasing amounts of renewable resources, which are the primary source of greenhouse gas (GHG) emission reductions in the electric sector. Further, a stable grid is essential to achieving emission reductions from electrification of residential and commercial buildings and electric vehicles to decarbonize the transportation sector. This chapter discusses gas and electric interdependencies.
The Gas Electricity Nexus California has seen large increases in renewable resources, especially in the last 10 years, that have changed the operation of the electric generation system. As detailed in Appendix A, the large influx of renewable resource on the grid has reduced gas from 53 percent of total electric generation in 2010 to 48 percent in 2020. Renewables have displaced a portion of daytime generation previously provided by gas, but the intermittency of solar and wind resources necessitates flexible or dispatchable resources that can quickly come on-line when the sun sets or winds stop blowing.
Today, gas-fired generators are the primary source of these flexible resources needed to handle renewable integration needs, although electricity storage is also beginning to serve a portion of that need. Gas-fired generators are used to meet the early morning ramp in electricity demand as the sun rises, which is expected to increase to meet electric heating demand with building decarbonization, and the much largerlarge afternoon and evening ramping requirements as solar generation declines with the setting sun. There will be a continued need for generation and electric storage that has quick start-and-stop capabilities and that can be ramped up quickly during a three-hour period in the afternoon and evening to meet these ramping needs.
An emerging issue highlighted by the summer 2020 heat wave is the need to better plan for the net demand peak or net peak of the grid, not just the highest total peak demand. Net demand is the total electricity demand minus utility-scale solar and wind generation at a given time. The net peak typically occurs later in the afternoon and evening than the total demand peak. Addressing the net peak is key in the transition to a 100 percent clean electric grid called for by Senate Bill 100 (De León, Chapter 312, Statutes of 2018).
27

Over the last decade, utility-scale renewable energy sources have reduced the need for gas-fired generation during the day, even as the total peak demand remained largely flat.24
Despite increases in renewable resources, however, reductions in the net peak have slowed in recent years because of the relative amounts of solar and wind deployed. While solar has helped meet daily peak demand on hot summer afternoons, little wind generation, which tends to increase in the evening, has recently been brought on-line, leaving other resources like gas power plants to meet the net peak once the sun sets. The timing of California’s total and net demand peaks over the last decade is shown in Figure 13. In 2012, the net demand peak occurred around the same time as total demand peak. By 2016, the average timing of the net demand peak shifted from before 5:00 p.m. to around 7:30 p.m., where it has remained. Customer-owned solar has also moved the total demand peak to later in the evening, although to a lesser extent than utility-scale solar. With no solar generation after the sun sets, grid operators instead dispatch gas-fired generation, imports, and storage to meet the net peak demand.
Figure 13: California Net Peak Occurring Later in the Evening
Source: CEC analysis of California Independent System Operator (California ISO) data
In the near term, as the state brings on additional renewable resources and procures additional resources to meet reliability challenges that were highlighted by the 2020 summer heat wave, gas-fired generators will continue to play an important role. There will be a transition period when gas generation will still be needed as demand response, battery storage, long-duration storage, and other emerging low-carbon fuels and technologies are brought to the market. The need to integrate renewable resources as they vary throughout
24 California Independent System Operator, California Public Utilities Commission, and California Energy Commission. January 13, 2021. Root Cause Analysis: Mid-August Extreme Heat Wave. https://www.energy.ca.gov/news/2021-01/caiso-cpuc-cec-issue-final-report-causes-august-2020-rotating-outages.
28

the day places additional demands on the gas system to meet the changing pattern of deliveries to gas-fired power plants. These demands present challenges for gas system operators, especially to meet the rapid increases in gas generation during the three-hour afternoon and evening ramp.
Drought conditions are expected to worsen with climate change (See Volume II of the 2021 Integrated Energy Policy Report [IEPR] for more information) and will require a backstop generation source. Renewables in recent years have begun to make up for hydro shortfalls in the spring months, but runoff from snow melting earlier in the summer means less hydro to meet needs later in the summer, which is likely to increase peak and net peak issues. Drought can also reduce the number of ancillary services currently provided by hydro resources such as spinning reserves, which will have to be provided by other generation sources.25
In the longer term, the 2021 SB 100 Joint Agency Report, Achieving 100 Percent Clean Electricity in California: An Initial Assessment shows that some gas capacity is retained for reliability needs, but cost reductions and innovation in zero-carbon firm resources and storage may reduce gas capacity needs in 2045.26 The study concludes that gas-fired capacity is the most economic option to provide capacity for reliability needs with current resource assumptions and demand scenarios.27 Cost reductions and innovation in zero-carbon firm resources and storage may reduce the amount of gas generation needed. Further, recent California Public Utilities Commission (CPUC) Integrated Resource Planning modeling of cases with high electrification load growth assumed construction of new gas capacity by 2040–2045 to address system reliability needs, despite additions of more than 150,000 megawatts (MW) of renewable energy and short-duration storage resources.28 Further analysis is needed to evaluate costs associated with maintaining an aging gas fleet operating in a high-renewables system.
Gas-Electric Reliability Issues The July 9, 2021, IEPR workshop on summer 2021 electric and natural gas reliability addressed the interplay and dynamic of the electricity system dependency on natural gas and ways that the transition away from it poses challenges in the near term. As discussed, gas system operations are shifting to accommodate the afternoon and evening ramps on the
25 Spinning reserves in a power system are generation capacity that is on-line but unloaded (not generating) and that can respond within 10 minutes to compensate for generation or transmission outages. 26 California Energy Commission, California Public Utilities Commission, and California Air Resources Board. March 2021. 2021 SB 100 Joint Agency Report, Achieving 100 Percent Clean Electricity in California: An Initial Assessment. CEC-200-2021-001, p. 17. https://www.energy.ca.gov/sb100#anchor_report. 27 Sierra Club, Natural Resources Defense Council, and Rocky Mountain Institute commented that incremental gas-fired electric generation capacity is completely misaligned with the state’s long-term planning in the Integrated Resources Planning proceeding as well as SB 100. CEC clarifies that no incremental gas capacity is added in the SB 100 analysis, but some existing gas capacity is retained for reliability. Sierra Club, Natural Resources Defense Council, Rocky Mountain Institute. Comments on Draft 2021 Integrated Energy Policy Report. TN 241326. Docket 21-IEPR-06. https://efiling.energy.ca.gov/GetDocument.aspx?tn=241326. 28 CPUC R.20-05-003. August 17, 2021. “Administrative Law Judge Ruling Seeking Comments on Proposed Preferred System Plan.” http://docs.cpuc.ca.gov/SearchRes.aspx?DocFormat=ALL&DocID=399450008.
29

electricity system and the net peak as the sun sets. However, electric generators get curtailed when there is insufficient gas to meet all demand in both cold weather conditions and under constrained system conditions in Southern California and other areas.
The state is beginning to see increasing gas demand for electric generation on summer evenings and a sharper peak demand on the gas system in this new role of integrating renewables. These two systems are deeply linked so that events and conditions in one have significant impact on the other. With the large increases in renewables the state is anticipating over the coming decade, fluctuations in gas demand for electric generation are likely to drive gas system operations in the coming years.
Historically, meeting the winter gas demand for residential and small commercial customers has been the basis for reliability standards. Peak summer demand has been lower than peak winter heating demand. However, as discussed above, the electric generation gas demand pattern is changing as additional renewables are added to the grid and system operators must meet bigger ramps, as well as meet the peak and net peak. Several issues will need to be considered in assessing gas and electric reliability as the systems transition:
The impact of extreme heat on summer gas demand for electric generators and theability to inject gas into storage to prepare for winter peak.
The impacts of extreme cold events such as a polar vortex on overall gas demand andthe potential for gas curtailments in winter that can impact electric reliability.
The pace of deploying technologies to displace gas for the gas system peak, net peak,and ramping.
The increasing load and changing demand patterns, both seasonal and daily, associatedwith electrification of buildings and transportation.
Gas Reliability Standards Over the last two decades, the CPUC has established reliability standards that address physical capabilities of the gas utilities’ systems.29 Those standards include a combination of gas flowing from interstate pipelines through intrastate pipelines and withdrawal from storage fields to balance supply and demand. As such, storage is an important infrastructure asset in managing gas system operations and reducing price spikes. The gas utilities serve two typesgeneral categories of customers: core customers areincludes residential, and small commercial andcustomers, while noncore customers includeincludes electric generators and,
29 The CPUC also established standards for physical infrastructure and reliability of supply under decisions in R.04-01-025, D.04-09-022, and D.06-09-039 and others. For a more detailed discussion of gas reliabilitystandards see: R.20-01-007 Track 1A Reliability Standards and Track 1B: Market Structure and Regulations: Workshop Report and Staff Recommendations. California Public Utilities Commission. October 2, 2020.https://apps.cpuc.ca.gov/apex/f?p=401:56:0.
30

large commercial and industrial customers., and others.30 The type of customer matters when it comes to reliability standards.
Gas utilities purchase gas and provide transportation and storage services for core customers. Stringent reliability standards for core customers have been designed to ensure that even under the most extreme cold conditions, gas service is maintained without interruption. Curtailing core demand is a measure of last resort. Outages to core customers take a long time to restore — from several days to weeks — and involve tremendous manpower. Safety requires that gas mains be brought back on-line individually and sequentially, and that service to each home or building is safely restored. This restoration requires gas utility workers to go to each house or business, while someone is home, to ensure that pilot lights are properly lit.31
In severe cases, such as during extreme cold winter events that occurred most recently in the winter 2021 polar vortex, where extensive areas were curtailed, the National Guard was called in to help light pilot lights. Safety concerns include the potential for explosions as pilot lights may flicker out inconsistently as line pressures drop or if restoration is improperly carried out.
The gas utilities provide gas transportation services to noncore customers and have no responsibility for purchasing gas on their behalf. Noncore customers either buy gas themselves or rely on gas suppliers or marketers for gas purchases and then schedule deliveries over the gas utilities’ gas systems. Historically, noncore customers have agreed to be curtailed under extreme conditions to preserve service to core customers in exchange for lower rates and, as such, have accepted a lower level of reliability.
Generally, reliability standards require the gas utilities meet a high peak winter demand under very cold conditions for core customers, driven mostly by space- and water -heating loads, with lower standards for noncore customers as follows:
Southern California Gas (SoCalGas) (and San Diego Gas & Electric [SDG&E]) must meeta demand that has a 1-in-35-year probability of occurrence, or extreme peak day, forcore local transmission customers and a 1-in-10-year cold day standard for noncorecustomers. Pacific Gas and Electric (PG&E) must meet a demand with a 1-in-90-yearprobability of occurrence, or abnormal peak day, for core local transmission customersand a 1-in-2-year standard for noncore customers, also referred to as a “cold/dry winterday standard.”
However, when these reliability standards were originally established, many noncore customers had alternatives to burning gas in their facilities such as distillate and diesel fuel. These customers are subject to curtailment when the utility is unable to meet all customer
30 SoCalGas commented that they serve at least five types of customers including core residential, core nonresidential, nondispatchable electric generation, dispatchable electric generation, and noncore commercial and industrial customers including large oil refineries. Southern California Gas. Comments on Draft 2021 Integrated Energy Policy Report. TN 241328. Docket 21-IEPR-06. https://efiling.energy.ca.gov/GetDocument.aspx?tn=241328. 31 A pilot light is a small flame that is kept lit in certain gas-fired appliances such as furnaces, water heaters, and gas fireplaces. When you turn these on gas is released to the main burner and the pilot light ignites that gas to turn on your appliance and provide heat.
31

demand, such as in cold weather.32 Prior to 1993, noncore customers were required to maintain alternate fuel capability as a condition of receiving noncore service but were subsequently relieved of that requirement.33 Largely because of air quality regulations, noncore customers no longer have dual-fuel capabilities. This has increased the risk of curtailments, which are even greater when the system design criteria cannot be maintained, such as during extended outages of system infrastructure like the pipeline outages experienced on the SoCalGas system in 2018–2019, some of which continue today.
When cold winter demand exceeds the reliability standards, noncore customers are at risk of being curtailed. Figure 14 and Figure 15 present histograms of actual daily demand experienced by the gas utilities and demonstrate the amount and frequency of peak cold demand and the risks of curtailments to noncore customers. Noncore customer curtailments can degrade electric system reliability and disrupt industrial operations important to the state’s economy. These figures demonstrate that lowering reliability standards would increase the risks of curtailments.
For the PG&E system, winter peak demand on cold day is roughly 3.6 billion cubic feet (Bcf), increasing to about 4 Bcf on an abnormally cold day. Over the last 22 years, PG&E experienced 13 days when total demand was above 4.1 Bcf, which captures core demand on a 1-in-90 day plus serving noncore on a 1-in-10 day. Demand for all customers under conditionsexpected to occur once every 10 years (for example 1-in-10) would reach 3.6 Bcf. Staff found95 days when demand exceeded 3.6 Bcf. This is shown in Figure 14.
32 SoCalGas commented that reliability standards ratified by the CPUC 2006 (D.06-09-039) assumed that these customers would curtail if ordered even though alternate fuel capability was no longer required. Southern California Gas. Comments on Draft 2021 Integrated Energy Policy Report. TN 241328. Docket 21-IEPR-06. https://efiling.energy.ca.gov/GetDocument.aspx?tn=241328. 33 CPUC Decision (D.93-09-082). Southern California Gas. Comments on Draft 2021 Integrated Energy Policy Report. TN 241328. Docket 21-IEPR-06. https://efiling.energy.ca.gov/GetDocument.aspx?tn=241328.
32

Figure 14: Daily Gas Demand for PG&E From 1998 to 2020 (Million Cubic Feet per Day [MMcfd])
Source: CEC staff using PG&E data from Pipe Ranger
For the SoCalGas system, winter peak demand on an abnormally cold day is roughly 4.98 Bcf. As shown in Figure 15, during the last 22 years SoCalGas experienced three days that exceeded both the 1-in-35 core and 1-in-10 noncore demand. SoCalGas also experienced eight days that exceeded demand under a lower 1-in-10 core plus noncore demand. Again, on those days, noncore curtailments would be expected, and core curtailments were at least a possibility.
Figure 15: Daily Gas Demand for SoCalGas From 1998 to 2020 (MMcfd)
Source: CEC staff using SoCalGas data from Envoy
33

Changing Daily Gas Demand for Electric Generators Meeting the gas needs of gas-fired generators presents a key example of interdependencies between gas and electric systems. Delivery of gas to the utility systems is done on a ratable basis, wherein a constant flow of gas supplies is delivered over 24 hours of the day from interstate pipelines. Many large commercial and industrial customers take gas from the system consistent with this delivery pattern for operations that function 24 hours a day, seven days a week. However, gas-fired generators take gas from the system when they are dispatched by the operators of the state’s electric balancing authorities.34 These electric generators can take large amounts of gas over a short period. Meeting renewable integration needs on the electric system, especially for steep ramping requirements in the afternoon and evening, poses challenges for gas system operators who must rely on storage and line pack, along with operational flow orders, to balance the large offtake of electric generators.35 Figure 16 shows the profile of deliveries throughout the day during several hot days in 2015, 2020, and 2021.
Figure 16: Daily Gas Demand on Summer Days (MMcf per Hour)
34 A balancing authority is responsible for operating a transmission control area. It matches generation with load and maintains consistent electric frequency of the grid, even during extreme weather conditions or natural disasters. In California there are eight balancing authorities, the largest of which are the California Independent System Operator, the Balancing Authority of Northern California, and Los Angeles Department of Water and Power. 35 An operational flow order (OFO) is a mechanism to protect the operational integrity of the pipeline. Gas utilities may issue and implement systemwide or customer-specific OFOs in the event of high or low pipeline inventory. OFOs require shippers to take action to balance their supply with their customers' usage on a daily basis within a specified tolerance band.
34

Source: CEC staff using SoCalGas data
In 2020, most peak -hour gas deliveries from the SoCalGas system were to serve dispatchable gas-fired generators and electric system ramping needs. These have proven to be far greater than the need in peak hours to serve core customer heating or thermal loads. For example, of the 77 hours in 2020 when SoCalGas deliveries to either core customers or electric generators exceeded 100,000 dekatherms per hour (Dths/hr) (equivalent to roughly 2.4 Bcfd of capacity),36 62 hours were to serve electric generators, while only 15 hours served core customers.37 As increasing ramping needs are expected to accompany the large amounts of renewables anticipated in the next decade, this change in the use of the gas system raises issues about how to meet a peakier gas demand profile and how to allocate costs among the different customer classes.
As the SB 100 joint agency study notes, in the longer term some gas capacity is retained for reliability needs in 2045.38 The California Independent System Operator (California ISO) and Los Angeles Department of Water Resourcesand Power (LADWP) also identify a need for local, in-basin gas or thermal generation in the Greater Los Angeles Area to support reliability, discussed below. Renewable gas and renewable hydrogen are zero-carbon fuels that may be
36 A dekatherm is the quantity of heat energy that is equivalent to one1 million British thermal units (Btu). A Btu is the quantity of heat required to raise the temperature of one1 pound of water one degree Fahrenheit at a specified temperature (such as 39°F). 37 SoCalGas Comments on Summer 2021 Reliability. p. 6. https://efiling.energy.ca.gov/getdocument.aspx?tn=238984. 38 California Energy Commission, California Public Utilities Commission, and California Air Resources Board. March 2021. 2021 SB 100 Joint Agency Report, Achieving 100 Percent Clean Electricity in California: An Initial Assessment. March 2021. CEC-200-2021-001. p. 17. https://www.energy.ca.gov/sb100#anchor_report.
35
able to displace or supplement fossil gas use in electric generation for reliability and renewable integration (Chapter 4).
Southern California Reliability There are continuing concerns about gas and electric reliability in Southern California with the continuingongoing limitations on the use of the Aliso Canyon storage facility and constrained pipeline capacity, along with the potential for additional infrastructure outages. For more than a decade, the state has faced concerns about energy reliability in the greater Southern California region. These started in 2010 with the phaseout of once-through cooling technologies at coastal power plants.39 They worsened with the unexpected closure of the San Onofre Nuclear Generating Station in 2013 and posed additional concerns following the 2015 leak at the Aliso Canyon storage facility that limited the availability of gas storage. In October 2017, the explosion on SoCalGas Line 235-2 and numerous other pipeline outages limited flowing gas supplies that exacerbated reliability concerns in the region. Pipeline constraints due primarily to maintenance outages and major repairs have resulted in price spikes and curtailment of noncore gas customers and continue to be problematic for the region.
These emerging issues have required ongoing efforts to monitor developments, assess reliability, and implement mitigation measures, as needed. Ensuring reliability in the region has required significant coordination among the California Energy Commission (CEC), CPUC, and California ISO. California’s energy agencies continue to explore options to reduce dependency strategically on fossil gas to meet various policy goals, which could help alleviate some of the reliability concerns in Southern California in the long run. SoCalGas and CPUC conducted gas supply and demand balance analyses for summer 2021, which were discussed at the IEPR Joint Agency workshop on summer 2021 electric and natural gas held July 9, 2021. A gas supply and demand balance (or gas balance) tracks increases and decreases in storage inventory over the year given demand and use of available pipeline capacity. It also calculates the difference between supply and demand that must be met with withdrawals or injections of stored gas. As discussed in Chapter 4, of particular concern in these analyses is that during hot summer conditions, as experienced this past summer, SoCalGas may not be able to inject enough gas into storage by November 1, 2021, to meet winter peak gas demand. Staff conducted additional supply/demand balance analysis of the SoCalGas system described below to assess the ability of the system to meet winter 2021–2022 peak demand.
Constraints on Transmission Pipeline Supply for Southern California As noted, California receives roughly 90 percent of its gas from outside the state, making it vulnerable to supply disruptions upstream. For Southern California, a significant portion of this gas comes from the El Paso and Transwestern pipelines, which bring gas from the San Juan
39 SWRCB Policy on the Use of Coastal and Estuarine Waters for Power Plant Cooling. https://www.waterboards.ca.gov/water_issues/programs/ocean/cwa316/. Once-through cooling technologies intake ocean water to cool the steam that is used to spin turbines for electricity generation. The ocean water that was used for cooling becomes warmer and is then discharged back into the ocean. The intake and discharge have negative impacts on marine and estuarine environments.
36

Basin (in the Four Corners area) and the Permian Basin (in Texas and New Mexico). Upstream impacts are always a factor during times of regional extreme heat and cold temperatures or freezing events, as gas supplies are reduced and upstream demand east of California consume more of what is available (Chapter 4). As shown in Figure 17, within the SoCalGas system, there are three major transmission zones — the Northern Zone, Southern Zone, and Wheeler Ridge Zone. Two other zones accept mainly limited supplies of California-sourced gas and have a relatively minor impact on the system. The Line 85 Zone carries a small amount of gas, and the Coastal Zone has declined steadily in importance because of reduced output from California’s gas production fields.
Figure 17: SoCalGas Transmission System
Source: SoCalGas
In the Northern Zone, Lines 235-2, 4000, and 3000 continue to operate at reduced pressure because of safety concerns. Line 4000 was out of service for remediation work from May 1 through September 30, 2021. With Line 4000 out of service, the transmission capacity of the Northern Zone was 870 MMcfd. Upon Line 4000’sthe return to service of Line 4000, the transmission capacity of the Northern zoneZone increased to 1,250 MMcfd. Line 3000 was removed for remediation work on September 11, 2021, and was expected to be out of service until December 31, 2021, but was later extended to January 31March 15, 2022. The CPUC gas balance assumes that roughly 700 MMcfd of this amount to come through Line 235-2 and 550 MMcfd from Kramer Junction. Upon Line 3000 return to service, the CPUC gas balance
37
assumes 420 MMcfd through Line 235-2 and 280 MMcfd through Line 3000.40 The return to service of Line 3000 provides an alternative source of supply but does not increase the Northern Zone capacity above 1,250 MMcfd. In the Southern Zone, SoCalGas has reduced the Ehrenberg receipt point from 1,210 MMcfd to 980 MMcfd because of a longstanding pressure reduction related to its Pipeline Safety Enhancement Plan (PSEP) and the loss of a right-of-way on Line 2000. The Southern Zone still can accept 1,210 MMcfd if 230 MMcfd is delivered to Otay Mesa and there is sufficient demand within the zone. However, recent summers have seen the day-to-day Southern Zone capacity constrained by low demand rather than pipeline capacity. With no gas storage fields in the Southern Zone and limited capacity to deliver gas west toward Los Angeles, SoCalGas has reduced the amount of gas it accepts into the zone to approximate expected daily burn to avoid overpressurizing the pipelines.
The Wheeler Ridge Zone can receive up to 810 MMcfd765 MMcfd on a firm basis; at times in the past, under certain operational conditions but only, Wheeler Ridge has received more than 765 MMcfd on a firm basis. This increase to 810 MMcfd is possible only if Line 235-2 is out of service, thus removing downstream competition on the pipelines..41 Since Line 235-2 is assumed to be in service, the gas balance analysis below assumes 765 MMcfd of capacity at Wheeler Ridge. Lastly, SoCalGas derated Line 85, which delivers gas from California natural gas producers, as part of its Pipeline Safety Enhancement Plan. The derating reduced the capacity of the pipeline from 160 MMcfd to 60 MMcfd. However, since the pipeline was delivering only about 80 MMcfd before the derating because of the decline in California gas production, the actual impact of this change is roughly 20 MMcfd.
CEC Winter 2021–2022 Reliability Assessment The reliability outlook of winter 2021–2022 for SoCalGas is essentially the same as in the previous two years. Pipeline capacity in the Northern System has increased with Line 235-2 and Line 4000 both returned to service, although at reduced pressure.42 This increase, however, is offset by a decrease in capacity in the Southern Zone due to a rupture on El Paso Natural Gas Company’s (EPNG’s) southern main line southeast of Phoenix. This main line delivers gas to SoCalGas at Ehrenberg, Arizona. That rupture iswas not hampering customer service as of the end of October 2021. Under the high -demand conditions of a cold winter day, however, customers on the Southern System are likely to see curtailments. Table 1 shows a comparison of assumptions for supply and storage availability used in the winter 2021–2022 assessment and the previous two winter assessments.
40 CPUC. November 2, 2021. Winter 2021–22 Southern California Reliability Assessment. https://www.cpuc.ca.gov/-/media/cpuc-website/divisions/energy-division/documents/natural-gas/aliso-canyon/winter2021-22-reliabilityassessment.pdf. 41 The CPUC used an assumption of 810 MMcfd for Wheeler Ridge in its Winter 2021-2022 Southern California Reliability Assessment, and SoCalGas commented that this assumption overstated receipt capacity. Southern California Gas. Comments on Draft 2021 Integrated Energy Policy Report. TN 241328. Docket 21-IEPR-06. https://efiling.energy.ca.gov/GetDocument.aspx?tn=241328. 42 The terms Northern Zone and Northern System are used interchangeably here, as are Southern Zone and Southern System.
38

As in prior years, the key risk to reliability is multiday cold weather events paired with additional facility outages. The National Oceanic and Atmospheric Administration (NOAA) is predicting La Niña conditions for winter 2021–2022.43 For California, La Niña is associated with a warm and dry winter.
Table 1: Winter Supply and Storage Comparison Winter 2019–2020 Winter 2020–2021 Winter 2021–2022
Pipeline Capacity (MMcfd) ~2,800 2,845 2,805
Total Storage Inventory (Bcf)*44 73.4 79 81.1
Percent Full (Total Storage) 87.70% 94% 96%
Maximum Aliso Capacity (Bcf) 45 34 34 41.16 *Total storage inventory is as of September 30 prior to each winter. Source: CEC staff
Gas market prices have increased in recent months with the daily spot price at Henry Hub averaging $5.16/MMBtu in September 2021.46 The United States Energy Information Administration’s (U.S. EIA’s) Short-Term Energy Outlook released in October 2021 projected that gas spot prices would remain just less than $6/MMBtu through January and then decline in 2022. Expected market pricing for the New York Mercantile Exchange shows a similar pattern. Higher prices this winter are linked to production losses due to COVID-19, but prices are expected to decline as production recovers. Price spikes on cold days are not unexpected or necessarily unreasonable; the CEC monitors these markets as part of its natural gas price forecasting responsibility.
Pipeline Supply Assumptions With Line 235-2 and Line 4000 operating, the Northern Zone capacity is assumed to be 1,250 MMcfd compared to 870 MMcfd last winter. Wheeler Ridge can delivercapacity is assumed tobe 765 MMcfd. California production delivered to SoCalGas is assumed to be 60 MMcfd. The assumption for these latter two receipt points is the same as in prior assessments.
The increased supply in the Northern Zone is offset by the decrease in the Southern Zone previously mentioned. The August 15, 2021, rupture on the El Paso pipeline near Phoenix remains under investigation; the pipeline has not yet projected a date for a return to full service. In the meantime, El Paso is operating that line at reduced pressure, which decreases delivery capability. Figure 18 shows deliveries from El Paso into SoCalGas at Ehrenberg,
43 NOAA. 2021. El Niña/Southern Osilation (ENSO) Diagnostic Discussion. https://www.cpc.ncep.noaa.gov/products/analysis_monitoring/enso_advisory/ensodisc.shtml. The announcement stated that there is an 87 percent chance that La Niña conditions continue through February 2022. 44 SoCalGas Envoy 45 D.20-11-004 Ordering Paragraph 1 maintained the interim Aliso Canyon storage capacity between zero to 34 Bcf. 46 “EIA Short Term Energy Outlook..” Found at https://www.eia.gov/outlooks/steo/.
39

MM
cfd
demonstrating the impact of the El Paso rupture. As a result, staff assumes supply into SoCalGas at Ehrenberg is reduced by 250 MMcfd.
Staff assumes that zero gas is delivered at Otay Mesa absent liquified natural gas (LNG) imports via Costa Azul. There are two ways to move gas to Otay Mesa. One is via the El Paso pipeline connection at Ehrenberg to the North Baja system. With the reduction in deliveries at Ehrenberg, staff expects virtually no gas to move to Otay Mesa this way. The other way is to bring in LNG via Costa Azul. While world market dynamics would suggest LNG prices should be higher, as of September 2021, Federal Energy Regulatory Commission (FERC) staff was reporting relatively low LNG import prices on the East Coast, which is separated from Southern California by the Panama Canal.47
Figure 18: 2020 vs. 2021 Ehrenberg Receipts
1,200
1,000
800
600
400
200
0
1/1
1/15
1/29
2/12
2/26
3/12
3/26 4/
9
4/23 5/
7
5/21 6/
4
6/18 7/
2
7/16
7/30
8/13
8/27
9/10
9/24
10/8
10/2
2
11/5
11/1
9
12/3
12/1
7
12/3
1
2020 Ehrenberg Reciepts 2021 Ehrenberg Reciepts
47 Federal Energy Regulatory Commission. September 2021. Market Assessments.“Market Assessments.” https://cms.ferc.gov/sites/default/files/2021-10/National%20Sep%202021%20Website%20Updates.pdf.
40

400
600
800
1,000 M
Mcf
d
1,200
200
0
1/1
1/15
1/29
2/12
2/26
3/12
3/26 4/
9
4/23 5/
7
5/21 6/
4
6/18 7/
2
7/16
7/30
8/13
8/27
9/10
9/24
10/8
10/2
2
11/5
11/1
9
12/3
12/1
7
12/3
1
2020 Ehrenberg Reciepts 2021 Ehrenberg Reciepts
Source: CEC staff using SoCalGas Envoy daily operations data
SoCalGas Winter 2021–2022 Gas Balance Staff evaluated three gas balance scenarios using SoCalGas’ 2020 California Gas Report forecast for average temperature demand. The base case assumes EPNG Line 2000 is fully operational April 1, 2022. The pessimistic case assumes limited pressure on Line 2000 continues to persist into the summer, while the optimistic case assumes Line 2000 is back in service January 1, 2022. Ehrenberg receipt capacity is assumed to be 730 MMcfd, while EPNG operates at limited pressure and 980 MMcfd once the pipeline is repaired.48
In the base case, total pipeline supply is 2,805 MMcfd and increases to 3,055 MMcfd April 1, 2022. On average pipeline supply is able to meet demand during the winter with storage withdrawals in December, January, and February. The pessimistic case assumes Ehrenberg receipts remain at 730 MMcfd and do not come back in service through the forecast period. The average winter outlook for the pessimistic case is effectively the same as the base case but has implications for the storage inventory in the summer.49 In the optimistic case, withdrawals occur only in December. Tables 2 and 3 show there are no curtailments in the pessimistic case on an average day.
48 Actual available withdrawal will depend on ending inventories each month of the winter and ongoing well maintenance. 49 Storage inventory reaches 83 Bcf by the end of May in all cases.
41

Table 2: Monthly Gas Balance 2021 Average Day Demand With Pessimistic EPNG (El Paso Outage Persists)
2021 Average Demand
2021 Average Demand
2021 Average Demand
Row Oct Nov Dec
1 Demand 2279 2597 3158
2 Available Pipeline Capacity 2805 2805 2805
3 Needed Withdrawal 0 0 -353
4 Inj/With (MMcfd) 0 0 -353
5 End of Month Inventory (MMcf) 81 81 70
6 Net Shortfall or Curtailment 0 0 0
Source: CEC staff
Table 3: Monthly Gas Balance 2022 Average Day Demand With Pessimistic EPNG (El Paso Outage Persists)
2022 Average Demand
Year
2022 Average Demand
Year
2022 Average Demand
Year
2022 Average Demand
Year
2022 Average Demand
Year
2022 Average Demand
Year
2022 Average Demand
Year
Row Jan Feb Mar Apr May June July
1 Demand 2956 2933 2397 2178 1861 1809 2242
2 Available Pipeline Capacity
2805 2805 2805 2805 2805 2805 2805
3 Needed Withdrawal
-151 -128 0 0 0 0 0
4 Inj/With (MMcfd)
-151 -128 100 240 240 150 0
5 End of Month
Inventory (MMcf)
66 62 65 72 80 84 84
6 Net Shortfall or Curtailment
0 0 0 0 0 0 0
Source: CEC staff
42

Peak -Day Analysis Staff produced a peak -day analysis looking at a 1-in-10 demand day for core and noncore load, as well as 1-in-35 demand for core plus 1-in-10 demand for noncore, shown in Table 4. AssumingOn a single peak day, assuming sufficient storage withdrawal capability, there is adequate supply is able to meet demand in both cases on a single peak day.. As storage declines in the winter, however, storage withdrawal over a multiday cold period could cause gas load curtailments. Consistent with the adopted curtailment order, those curtailments would be absorbed by electric generators and other noncore customers. Unusually cold weather could affect core customers on the Southern System.
Table 4: Peak -Day Gas Balance Pessimistic Case ROW Core + Noncore 1‐in‐10* 1‐in‐35 Core + Noncore
1‐in‐10** 1 TOTAL Demand (Sum Rows 2 to 5) 4,966 5,171 2 Available Pipeline Capacity*** 2,805 2,805 3 Needed Withdrawal (Row 6 minus Row 7) 2,161 2,366
*2020 California Gas Report, p. 140, Table 30 **2020 CGR, p. 139, Table 29 ***Average capacity projection for December 2021 to January 2022 Source: CEC staff
Heightened Southern System Risk The EPNG rupture likely places customers in SoCalGas’ Southern Zone at higher risk this winter should a cold day occur. This is because that system is limited to supply received at Ehrenberg or Otay Mesa. Gas from storage in the Los Angeles Basin cannot reach customers in the Southern Zone, except under limited, unusual system conditions. Most, but not all, of this load is in San Diego, with some in Imperial Valley. On a cold day, somewhat less than 20 percent of that load would be from noncore customers. On this basis,Low supplies coming in at Ehrenberg could put Southern System core customer load could be at risk of curtailment. CEC staff has constructed and run a preliminary hydraulic analysis that appears to confirm this risk assessment.5051
CPUC Winter 2021–2022 Reliability Assessment The CPUC staff conducted a winter 2021–2022 reliability assessment that also modeled supply and demand under several different weather and pipeline scenarios.52 In all scenarios, average daily demand is met throughout the winter. However, in the worst-case scenario, which
50 The potential for Southern Zone curtailments was confirmed by staff via hydraulic analysis of SoCalGas’ system on a cold day. 51 SoCalGas commented that the risk to Southern System core customer load may be overstated as its analysis finds no risk to core service on the Southern System or elsewhere this winter unless Aliso Canyon is not available. Southern California Gas. Comments on Draft 2021 Integrated Energy Policy Report. TN 241328. Docket 21-IEPR-06. https://efiling.energy.ca.gov/GetDocument.aspx?tn=241328. 52 CPUC. November 2, 2021. Winter 2021–22 Southern California Reliability Assessment. https://www.cpuc.ca.gov/-/media/cpuc-website/divisions/energy-division/documents/natural-gas/aliso-canyon/winter2021-22-reliabilityassessment.pdf.
43

assumes that the weather is cold and dry and the El Paso pipeline outage lasts all winter, storage is significantly drawn down by the end of the season. CPUC staff notes that when storage inventories are low, the amount of gas that can be withdrawn from storage also declines, making it more difficult to meet demand on cold days late in the season.
CPUC staff estimates that if the coldest day in 10 years were to occur between January and March under the worst-case conditions, SoCalGas would be unable to meet all customer demand. In the best-case scenario, which assumes an average weather winter with the El Paso interstate pipeline back in service by December 1, 2021, SoCalGas would be able to meet all customer demand on a 1-in-10 peak day.
The CPUC staff assessment concludes that service to most core customers is not expected to be at risk under current conditions. However, the El Paso outage creates uncertainty regarding gas supplies to SoCalGas’ Southern Zone and curtailments, or shut-offs, of customers in the Southern Zone could occur this winter if the region experiences a very cold day and the El Paso pipeline is not repaired.
Aliso Canyon and Local Reliability The afternoon session of the July 9, 2021, IEPR workshop on summer 2021 electric and natural gas reliability addressed topics related to the Aliso Canyon closure options and itsthe role of Aliso Canyon in ensuring reliability in the Greater Los Angeles Area.53 As CPUC Commissioner Martha Guzman Aceves noted, the issue before the CPUC in determining closure options for Aliso Canyon is tied to the interplay of gas and electric reliability and the challenges faced with climate change.54 She pointed to a letter from former Governor Edmund G. Brown Jr. and the former chair of the CEC to the former president of the CPUC making clear theirthe request that the facility be closed.55 The particular challenge is how to transition away from reliance on Aliso Canyon, recognizing the importance it plays in the reliability, safety, and economic hedging for the Greater Los Angeles Area and Southern California more broadly. Commissioner Guzman Aceves noted there are minimum local generation needs in the Greater Los Angeles Area, issues related to how the need is quantified, and the amount of local generation, new transmission, and other resource alternatives needed to support the transition
53 As used here, Greater Los Angeles Area refers to the counties of Los Angeles, Orange, Riverside, San Bernardino, and Ventura. July 9, 2021, IEPR Workshop on Summer 2021 Electric and Gas Reliability, Session 2 transcript. https://www.energy.ca.gov/event/workshop/2021-07/iepr-joint-agency-workshop-summer-2021-electric-and-natural-gas-1. 54 Ibid., pp. 6–8. July 9, 2021, IEPR Workshop on Summer 2021 Electric and Gas Reliability, Session 2 transcript. Pp 6-8. https://www.energy.ca.gov/event/workshop/2021-07/iepr-joint-agency-workshop-summer-2021-electric-and-natural-gas-1. 55 July 9, 2017, Letter from then-CEC Chair Robert Weisenmiller to former CPUC President Picker states: “With the State’s climate target in mind, Governor Brown has asked me to plan for the permanent closure of the Aliso Canyon natural gas storage facility, and I urge the California Public Utilities Commission (CPUC) to do the same.” https://efiling.energy.ca.gov/Lists/DocketLog.aspx?docketnumber=17-IEPR-11.
44

away from Aliso Canyon. The local reliability needs were the focus of the first panel, while the second panel addressed the various scenarios and strategies that could be employed.
At the workshop, the CPUC staff provided an overview the CPUC’s Alison Canyon storage facility closure options in Proceeding I.17-02-002. CPUC staff discussed the analysis underway by the independent consultant FTI of the potential and options for closure of Aliso Canyon in 2027–2035 and replacement of the associated energy services.56 They are assessing the amount of curtailment or shortfall that would occur on a cold winter day (1-in-10) if Aliso Canyon were closed, assuming current amounts of pipeline availability. FTI is analyzing different portfolios of options to fill the energy service shortfalls identified. Its preliminary analysis shows a shortfall of gas equivalent of around 4,500 MW (or 434 MMcfd) in 2027 and 2,866 MW (318 MMcfd) in 2035, assuming demand declines.
The CPUC has held two workshops on the shortfall analysis and replacement scenarios.57 FTI is updating gas storage inventory assumptions from the non-Aliso storage fields that CPUC staff considers to be more realistic than those used in the preliminary analysis. FTI will also be using the increased renewable generation and other assumptions from the latest integrated resource planning (IRP) and transmission planning process (TPP) that may lower the shortfall. The study uses portfolios that would close the gap resulting from Aliso Canyon closure, including additional gas transmission, expansion of demand reductions, an IRP electricity mix (of demand response, storage, and renewables), and new electric transmission. The fifth scenario is under development and will include a combination of the above resources. CPUC staff indicated that, depending on the results, the scenarios with an electricity focus could be fed into the IRP and TPP to support procurement decisions. Following the modeling report in Phase 2 of the CPUC’s proceeding, which showed that the Aliso Canyon is needed for reliability, the parties requested additional modeling. The next steps in the Aliso Canyon proceeding are addressed in an August 27, 2021, revised scoping memo that calls for additional modeling.58
The CPUC staff also discussed resource adequacy and IRP studies and treatment of local reliability areas, including new electric sector studies that could be done to inform decision-making regarding Aliso Canyon. Staff members note that scoping of any new studies would have to include the quantitative-versus-qualitative scope, the relationship between system and local components, and the roles and responsibilities for the analysis. CPUC staff is working to determine how FTI’s analysis can be leveraged with further work, potentially focusing on the
56 Presentation by Eileen Hlavka, “Assessing Aliso Canyon Natural Gas Facility Closure Options in CPUC Proceeding I.17 -02 -002.” July 9, 2021, IEPR Workshop on Summer 2021 Electric and Natural Gas Reliability. https://efiling.energy.ca.gov/getdocument.aspx?tn=238730. 57 CPUC Workshopsworkshops on November 17, 2020, and March 30, 2021. https://www.cpuc.ca.gov/regulatory-services/safety/pipeline-safety/aliso-canyon-well-failure/aliso-canyon-well-failure-order-instituting-investigation. 58 The ALJ Rulingruling calls for modeling: a sensitivity on simulation 9 for a winter 2030 1-in-35-year cold day, with minimum local generation, lowering the receipt point utilization to 55 percent for the Northern Zone and Southern Zone; and a winter 2030 1-in-10-year cold day using an increased receipt point utilization of 95 percent. https://docs.cpuc.ca.gov/SearchRes.aspx?DocFormat=ALL&DocID=403094525.
45

electric system during summer peak conditions to understand the reliability, cost, and emissions (both GHG and local) impacts of different assumptions regarding future availability of Aliso Canyon.59
Also at the workshop, the California ISO addressed the local capacity requirements and local issues that affect the need for generation and have implications for Aliso Canyon. Transmission-related studies include local capacity requirements for both 5- and 10-year projections; transmission alternatives to reduce local capacity requirements from a reliability, policy, and economic perspective; and special studies to support the Aliso Canyon proceeding. The Greater Los Angeles Area is one of the more complex in the system to study, as there are various transmission constraints that result in overlapping needs. Specific to Aliso Canyon, the California ISO has studied transmission alternatives focused primarily on the western Los Angeles boundary and overall area. These and ongoing analyses are a part of the picture; however, the ISO notes the need for comprehensive analysis of gas supply needs reaching beyond California ISO gas-fired generation needs.
A representative of LADWP discussed its LA100 study conducted with the National Renewable Energy Laboratory that assessed pathways and costs to achieving a 100 percent renewable electricity supply.60 The study examined what it would require to meet SB 100 Renewables Portfolio Standard (RPS) requirements of 60 percent renewables by 2030 and a more aggressive approach that would reach beyond to examine what it would take to meet 100 percent renewables by 2035 and 2045. The study found that LADWP has about 10 gigawatts (GW) of capacity on its system, which it would have to double to meet a high electrification (building electrification and electric vehicles) scenario by 2045. No matter which scenario, the study shows that there is still a significant amount of new transmission needed by 2030. Under the high-load scenario, there is a dramatic reduction in gas consumption in 2030. By 2045, however, LADWP still has a need for roughly 2,600 MW of renewable or thermal capacity in Los Angeles (down from 3,400 MW today) to meet peak demand and ensure reliability, whether it is renewable gas or hydrogen.61
The LA100 study estimated that the local, in-basin capacity needs from combustion turbines is roughly 2,100 MW in 2035 and 3,350 MW in 2045 for the Early and No Biofuels-Moderate scenario.62 This local capacity is heavily relied upon during stressed grid conditions, where low-
59 CPUC Presentation on California’s Integrated Resource Planning & Study of Aliso Canyon Futures, CEC Gas Electricity Reliability Workshop. https://www.energy.ca.gov/event/workshop/2021-07/iepr-joint-agency-workshop-summer-2021-electric-and-natural-gas-1. 60 Cochran, Jaquelin, Paul Denholm, Meghan Mooney, Daniel Steinberg, Elaine Hale, Garvin Heath, Bryan Palmintier, et al. 2021. LA100: The Los Angeles 100% Renewable Energy Study. National Renewable Energy Laboratory and LADWP. https://maps.nrel.gov/la100/report.3,350. 61 Transcript from the IEPR Joint Agency Workshop on Summer 2021 Electric and Natural Gas Reliability, July 9, 2021, Session 2. pp. 22–23. https://www.energy.ca.gov/event/workshop/2021-07/iepr-joint-agency-workshop-summer-2021-electric-and-natural-gas-1. 62 LADWP. January 28, 2022. Comments From the Los Angeles Department of Water and Power (LADWP) to the California Energy Commission (CEC) on the Draft Integrated Energy Policy Report (IEPR) Volume III. TN# 241320. LADWP requested to update the text as shown, “to be consistent with the LA100 Study and LADWP’s
46

frequency, high-impact events such as wildfires or earthquakes could severely reduce LADWP’s ability to import renewables from outside the Los Angeles Basin. The Early and No Biofuels scenario is particularly significant because it achieves 100 percent carbon-free energy by 2035. In September 2021, the Los Angeles City Council instructed LADWP to plan for achieving 100 percent carbon-free energy by 2035.63
LADWP has made a major commitment to green hydrogen to support its clean energy transition with its HyDeal that includes using a mix of hydrogen and natural gas at thermal power plants in Los Angeles.64 In addition, LADWP proposes to replace its coal-fired Intermountain Power Plant in Utah with an advanced class combined-cycle plant fueled with 30 percent hydrogen in 2025 on a pathway to meet 100 percent hydrogen in 2045. The project will use solar and wind resources from around the western region, including California, to produce hydrogen that would be stored in underground salt caverns near the project site. The hydrogen would be mixed with fossil gas and used in combustion technology at the existing power plant site.
LADWP’s hydrogen plans at the Intermountain Power Project are discussed in Chapter 4. With the complexity of the grid, LADWP indicated how important it is for it to conduct subhourly modeling and revisit changing technology and policy issues annually. LADWP also noted that it has a history of low-frequency, high-impact events where all of its transmission is compromised, most recently by fires. It identifies the need to develop an approach to planning that includes resilience when looking at the need for Aliso Canyon.
On October 1, 2021, the CPUC released a proposed decision by the administrative law judge (ALJ) and an alternate proposed decision by the assigned commissioner that sets the interim storage capacity at the Aliso Canyon facility. Commissioner Guzman Aceves’ proposed decision sets an interim storage range between zero and 41.16 billion cubic feet (Bcf), while the ALJ’s proposed decision sets the interim storage capacity at a range between zero and 68.6 Bcf.65
On November 4, 2021, the CPUC approved the proposal of assigned Commissioner Guzman
latest carbon free goals” rather than referencing the transcript from the July 9, 2021, IEPR Joint Agency Workshop on Summer 2021 Electric and Natural Gas Reliability. LADWP’s comments referenced: Steinberg, Daniel, Paul Denholm, Jaquelin Cochran, Brady Cowiestoll, Jennie Jorgenson, Matt Irish, Himanshu Jain, Lily Wu, Gord Stephen, and Sarah Awara. 2021. “Chapter 6: Renewable Energy Investments and Operations.” In The Los Angeles 100% Renewable Energy Study, edited by Jaquelin Cochran and Paul Denholm. Golden, CO: National Renewable Energy Laboratory. NREL/TP-6A20-79444-6. https://www.nrel.gov/docs/fy21osti/79444-6.pdf. 63 LADWP. January 28, 2022. Comments from the Los Angeles Department of Water and Power (LADWP) to the California Energy Commission (CEC) on the Draft Integrated Energy Policy Report (IEPR) Volume III. TN# 241320. LADWP requested to update the text in this paragraph “to be consistent with the LA100 Study and LADWP’s latest carbon free goals.” 64 LADWP’s Hydrogen Pathway. Presentation at the July 28, 2021, IEPR Workshop on Hydrogen to Support California’s Clean Energy Transition. https://efiling.energy.ca.gov/getdocument.aspx?tn=239025. 65 CPUC I.17-02-002. Decision Setting the Interim Range of Aliso Canyon Storage Capacity at Zero to 68.6 Billion Cubic Feet. Mailed October 1, 2021. https://docs.cpuc.ca.gov/SearchRes.aspx?docformat=ALL&docid=411231567.
47

Aceves to set the amount of working gas storage capacity in the field to an interim level of 41.1 billion Bcf to ensure SoCalGas meets minimum reliability needs for the region.66 The decision notes that the CPUC will revisit the level as needed, for example, because of planned maintenance and safety concerns. Also, SoCalGas is operating certain pipelines at reduced capacity, but if those pipelines become fully operational and more daily pipeline capacity becomes available, then the CPUC may determine it is appropriate to reduce the maximum storage limit at Aliso Canyon.
66 CPUC. November 4, 2021. Alternate Proposed Decision of Commissioner Guzman Aceves. https://docs.cpuc.ca.gov/PublishedDocs/Published/G000/M420/K154/420154131.PDF.
48

CHAPTER 3: Extreme Weather Impacts on Gas-ElectricReliability
Extreme weather conditions, including summer heat waves and extreme cold temperatures associated with winter polar vortexes, are likely to occur more frequently and with increasing severity with climate change.67 They pose major challenges for the gas and electricity systems (see Volume II of the 2021 Integrated Energy Policy Report [IEPR] for discussion of risks to the electricity system), jeopardizing reliability and resulting in high gas and electricity prices. These events are not explicitly planned for as they are often viewed as low-probability events. However, with the prospect of recurrent extreme events, staff conducted a detailed review of the impacts of the 2021 Winter Storm Uri that caused widespread disruptions to gas and electricity service in several regions of the United States and extremely high gas and electricity prices across large portions of the country.
Further, while heat waves pose reliability and price risks for several days, there is increasing concern that hot, dry conditions throughout the summer could not only affect summer gas and electric reliability, but also present challenges for winter reliability. High summer gas demand could prevent gas utilities from injecting enough gas into storage to meet winter peak demand on the gas system. This situation, in turn, could lead to additional concerns about electric reliability in the winter, which is typically the low-demand season on the electric grid.
This chapter summarizes impacts from Winter Storm Uri and discusses an analysis of hot summer demand that can serve as a proof of concept for future planning, with additional details presented in Appendix D. It also discusses planning for and minimizing impacts from extreme weather events.
Winter Storm Uri (Polar Vortex) Extreme cold temperatures have increasing importance in the context of gas-electric interdependencies. California is at risk from local and nationwide weather events, as the state relies on out-of-state gas imports from thousands of miles away to meet 90 percent of its gas needs. The vulnerability becomes more prominent when coupled with the fact that California is at the end of the interstate pipelines, with many demand centers that can extract gas from the pipelines before reaching California. As noted in the recently released Federal Energy Regulatory Commission (FERC) and North American Reliability Corporation (NERC) investigation of Winter Storm Uri in February 2021, extreme cold weather is a common
67 Extreme cold temperatures associated with polar vortexes have also occurred several times over the last decade with severe impacts on gas and electric reliability and prices. See Appendix D for further detail on extreme cold events.
49

occurrence in the United States.68 The February 2021 event is the fourth in the past 10 years that jeopardized gas and bulk-power system reliability, with attendant high prices. (See Appendix C for additional detail on Winter Storm Uri.)
California was largely insulated from the Winter Storm Uri impacts with gas supplies from Canada and the Rocky Mountain region, more temperate weather, and ample storage withdrawal to help meet demand. However, if an event comparable to Winter Storm Uri were to occur 500–1,000 miles westeast, a combination of high demand from low temperatures in California and freeze-offs of supply (extreme cold conditions that reduce or eliminate gas production) in the San Juan basin could cause similar blackouts, disruption of gas service, and price spikes. Current winter reliability measures are not sufficient to handle an extreme cold event of this magnitude.
Winter Storm Uri’s Extreme Cold Temperatures During the week of February 12–18, 2021, Winter Storm Uri brought unusually low temperatures to large regions of the United States, including the Northwest, Southwest, Central and Southern Plains, Great Lakes, Southeast regions, and Gulf Coast. Figure 19 shows the effect as the cold from the polar vortex pushed its way from the Arctic to the Gulf of Mexico.
68 FERC and NERC. 2021. February 2021 Cold Weather Grid Operations: Preliminary Findings and Recommendations. https://www.ferc.gov/february-2021-cold-weather-grid-operations-preliminary-findings-and-recommendations.
50

Figure 19: Thermal Image of Winter Storm Uri, February 15, 2021
Source: Extreme Winter Weather Causes U.S. Blackouts (nasa.gov)
In Texas, temperatures typically average around 60 degrees Fahrenheit (°F) during February, but on February 14, 2021, Texas averaged 15°F compared to Alaska’s 18°F. In Texas, temperature departures ranged from 14°F to 40°F. The Gulf Coast dealt with freezing temperatures and snow for an extended period. Other notable cold temperatures occurred in Kansas City, which dropped to -10°F on the morning of February 16, and Oklahoma City, with a high of only 11°F, its second coldest temperature on record.69 During Winter Storm Uri, California’s composite temperatures were between 57°F and 59°F for customers in the Southern California Gas (SoCalGas) service area and between 50°F and 54°F for Pacific Gas and Electric Company (PG&E).70 The weather in California was mild for February, so gas demand was on par with the historical five-year average.
69 National Weather Service. (n.d.). Climatological Data for Oklahoma City Will Rogers World AP, OK — February 2021. National Oceanic and Atmospheric Administration. Retrieved on Nov. 2, 2021. from https://www.weather.gov/wrh/Climate?wfo=oun. 70 SoCalGas Envoy and PG&E Pipe Ranger. Natural Gas Outlook Data.
51

Impacts on Gas Production U.S. gas production in February 2021 dropped by 16 percent compared to January. Most of these reductions were in Texas, with lessfewer reductions in eastern New Mexico and Oklahoma. As seen in Figure 20, Texas production was nearly cut in half February 16, while production in nearby states was reduced to about half of normal levels. To put these losses into perspective, California’s utilities forecast a peak winter demand for 2021 of 8.732 million cubic feet per day (MMcfd), meaning the production loss was more than enough to eliminate all California gas consumption on an extreme peak cold day.71 Figure 20 also shows production in North Dakota and South Dakota, which was unchanged in contrast to Texas, New Mexico, and Oklahoma. Gas production infrastructure in the Dakota region is commonly winterized, as the region experiences subzero temperatures every year.72 Gas producers in Canada who winterized their wells were also able to continue production during Winter Storm Uri.
In September 2021, the FERC and NERC released preliminary findings from their investigation of the Winter Storm Uri events showing that the gas system experienced the largest United States monthly decline of natural gas production on record.73 The FERC and NERC investigation found that gas production issues occurred at the wellheads and gathering lines due to shut-ins, freezing of production equipment, and power outages causing critical production equipment to fail. The interstate gas pipelines were affected by the lack of supply from production and processing, resulting in increased operational flow orders. However, most of the pipeline infrastructure itself was still operational, with only Northern Natural declaring force majeure.74
71 California Gas and Electric Utilities. 2020 California Gas Report. Compiled from pp. 85, 139 and 140. https://www.socalgas.com/sites/default/files/2020-10/2020_California_Gas_Report_Joint_Utility_Biennial_Comprehensive_Filing.pdf. 72 Winterization involves the installation or use of equipment, or addition of chemicals into the gas stream, by well, gathering, and processing operators to prevent infrastructure freeze-offs. Gas -fired power plants can also be winterized. 73 FERC and NERC. 2021. February 2021 Cold Weather Grid Operations: Preliminary Findings and Recommendations. Available at https://www.ferc.gov/february-2021-cold-weather-grid-operations-preliminary-findings-and-recommendations. 74 Enverus. 2021. Winter Storm Uri — Natural Gas Analysis. Presentation for the Texas Oil & Gas Association, slide 30. https://docs.txoga.org/files/2644-4-22-21-enverus_txoga_winter-storm-uri-natural-gas-analysis.pdf. FERC and NERC findings showed that gas pipelines were only minimally affected by power outages (because most have backup power) and were largely able to meet their firm transportation commitments. A force majeure is an unforeseeable circumstance that prevents someone from fulfilling a contract and includes both acts of nature (such as hurricanes or earthquakes) and extraordinary circumstances due to human intervention (for example, riots or worker strikes). A force majeure provision becomes applicable when performance becomes impossible and not when it simply becomes burdensome.
52
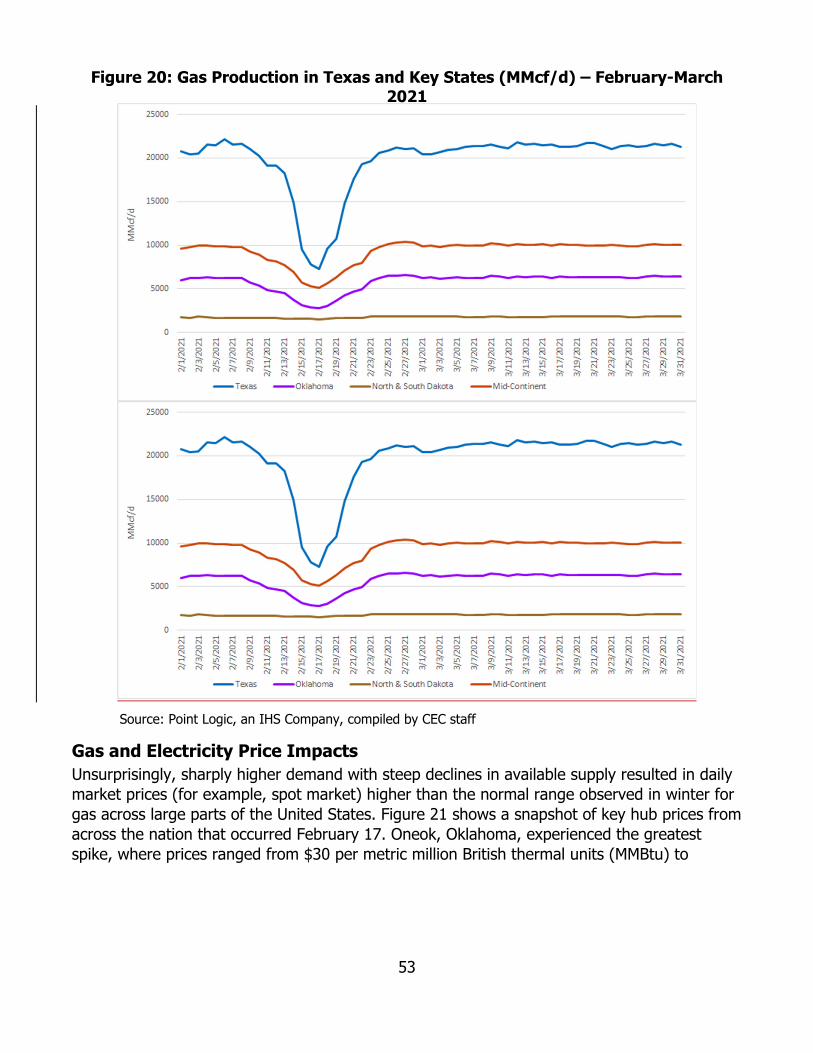
Figure 20: Gas Production in Texas and Key States (MMcf/d) – February-March 2021
Source: Point Logic, an IHS Company, compiled by CEC staff
Gas and Electricity Price Impacts Unsurprisingly, sharply higher demand with steep declines in available supply resulted in daily market prices (for example, spot market) higher than the normal range observed in winter for gas across large parts of the United States. Figure 21 shows a snapshot of key hub prices from across the nation that occurred February 17. Oneok, Oklahoma, experienced the greatest spike, where prices ranged from $30 per metric million British thermal units (MMBtu) to
53

$918.63 per MMBtu.75 El Paso Permian, located in Texas, had prices ranging from $10.44 per MMBtu to $192.90 per MMBtu. In Southern California, the SoCal Border daily spot price peaked at $112.90 per MMBtu on February 17.
High gas prices were then passed on to customers, and in some cases, prices were so high that legislatures in Texas and Oklahoma passed legislation allowing electric cooperatives to use securitization financing to recover expenses incurred due to Winter Storm Uri.76
Furthermore, the FERC approved a waiver of all penalties and interest associated with Winter Storm Uri imposed by El Paso Natural Gas Company (EPNG) on utilities such as Las Cruces Utilities. High gas prices also caused large price spikes in electricity prices. For example, in Texas, electricity prices in the Electric Reliability Council of Texas reached the price cap of $9,000 per megawatt-hour (MWh) for several hours spanning February 15–19, 2021.77 Texas ratepayers were exposed to open market prices and experienced roughly $38 billion in excess energy costs.78 On October 27, 2021, the Gas Consumer Emergency Market Protection Act was introduced in the U.S. House of Representatives to address high natural gas prices related to Winter Storm Uri and impose natural gas trading limits during national emergencies.79
75 There is some circularity concern about what drove the Oklahoma peak price. One of the power plants in Oklahoma is actually tied to ERCOT, and once ERCOT power prices hit with $9,000 per MWh cap, some believe the Oklahoma price followed. See report of Southwest Power Pool Market Monitor. 76 Hancock, K., K. Seliger, A. Paxton, et. al. 2021. Texas Senate Bill 1580. https://openstates.org/tx/bills/87/SB1580/. 77 The Electric Reliability Council of Texas or ERCOT operates an electricity market similar to the California Independent System Operator in which gas prices often set the prices of gas. 78 Bryce, Robert. June 11, 2021. “Texas Ratepayers areAre Being Saddled With Nearly $38 Billion in Excess Energy Costs From Winter Storm Uri.” Forbes. https://www.forbes.com/sites/robertbryce/2021/06/11/texas-ratepayers-are-being-saddled-with-nearly-38-billion-in-excess-energy-costs-from-winter-storm-uri/?sh=420cab1c6785. 79 Congressman Joaquin Castro press release. October 27, 2021. “Congressman Castro Introduces Bill to Prevent Natural Gas Price Gouging During Emergencies.” https://castro.house.gov/media-center/press-releases/congressman-castro-introduces-bill-to-prevent-natural-gas-price-gouging-during-emergencies.
54

Figure 21: Key Hub Prices February 17, 2021 ($/MMBtu)
Source: Aspen Environmental Group and CEC staff
Northern California and the Pacific Northwest had access to gas supplies from the Northern Rockies and Western Canadian Basin that are routinely winterized to keep supplies flowing. Northern California also had significant available storage. As a result, these regions were largely insulated from price shocks. Southern California does receive some gas from the Permian Basin (not winterized) and competed with southwestern markets that were in short supply.80 During February 12–18, 2021, gas supplies dropped as much as 47 percent for SoCalGas.81 Prices at the Southern California Citygate reached a high of $146 per MMBtu from February 13–16. However, due to the emergency circumstances, SoCalGas was allowed to withdraw additional gas from storage under Condition 1 of the Aliso Canyon Withdrawal Protocol. This withdrawal allowed SoCalGas to meet demand while limiting gas purchases on the open market, thereby minimizing core gas customer exposure to extreme market prices. Noncore customers in the SoCalGas service territory do not have access to storage and therefore could have been more exposed to spot market prices.82
Electric Reliability Impacts Moreover, some power plants could not get enough gas supply or experienced freezing and failure of various components and thus could not operate.83 Between this and other impacts from the cold that disrupted power generation, several electric utilities resorted to load
80 SoCalGas commented that Permian Basin supply is critically important for their customers in Imperial, Riverside, and San Diego Counties. Southern California Gas. Comments on Draft 2021 Integrated Energy Policy Report. TN 241328. Docket 21-IEPR-06. https://efiling.energy.ca.gov/GetDocument.aspx?tn=241328. 81 Presentation by Brian Walker, “SoCalGas SDG&E System Overview.” July 9, 2021, IEPR workshop on Summer 2021 Electric and Natural Gas Reliability, Session 3. https://efiling.energy.ca.gov/getdocument.aspx?tn=238755. 82 Noncore customers in the SoCalGas service territory have been unable to purchase storage services since the inventory levels restrictions following the Aliso Canyon storage field leak detected in October 2015. 83 The FERC and NERC investigation found that 1,045 generating units experienced 4,124 outages, derates, or failures to start, of which 604 were gas -fired generators.
55

shedding (or interruptions to customer service) or blackouts. The FERC and NERC investigation found that affected electricity balancing authorities declared energy emergencies and ordered firm load shed at different points of time within their respective footprints — totaling more than 23,400 MW during severely cold weather — to avoid entire system blackouts.84
Rolling blackouts were implemented across the Southwest Power Pool (which covers Arkansas to North Dakota) and parts of the Midwest Independent System Operator territory, including Omaha, Nebraska, and Kansas City, Missouri.85 In Texas, these blackouts were not just rolling blackouts, but were prolonged, some lasting for days. During Winter Storm Uri, more than 4 million Texans lost power on February 15, 1.4 million in the Houston area alone.86 The FERC and NERC investigation notes that the issue becomes cyclical: as gas infrastructure loses power, less supply is available to provide to generators and results in more power losses. The ripple effect is not only limited to the power generators, but also to customers who were then unable to receive gas to heat their homes.
Following the 2011 cold event, the FERC and NERC investigated the power outages and gas curtailments in the Southwest and released a report with recommended solutions to avoid similar problems in the future, including winterizing gas and electric infrastructure.87
Unfortunately, most utilities and gas producers in the region did not winterize their facilities. As discussed in Appendix C, the cost of winterizing a gas well is low in general and much lower than the societal cost of freeze-offs. This is especially the case when considering the impacts on the electricity system and the societal costs of blackouts. For example, Texas experienced losses of $4.3 billion during the week of extreme weather caused by Winter Storm Uri, and this figure does not account for the costs to other states and regions in the United States, or the associated loss of life.88 Winterizing gas production and gas power plants appears to be one of the primary solutions to address the impacts from extreme cold events.
84 FERC and NERC preliminary findings. https://www.ferc.gov/february-2021-cold-weather-grid-operations-preliminary-findings-and-recommendations. 85 SPP and MISO both provided reports of the electric systems response to Winter Storm Uri, as well as recommendations and lessons learned. https://www.spp.org/documents/65037/comprehensive%20review%20of%20spp's%20response%20to%20the% 20feb.%202021%20winter%20storm%202021%2007%2019.pdf. 86 Reuters. February 15, 2021. “Cold Snap Leaves One Dead, Over 4 Million Without Power in Texas.” US News. https://www.usnews.com/news/us/articles/2021-02-15/texas-grid-operator-starts-rotating-blackouts-amid-winter-storm. Despart, Zach and Nicole Hensley. February 15, 2021. “We Didn't Prepare for This: 1.4 Million in Houston Left Without Power on Coldest Day Since 1989.” Houston Chronicle. https://www.houstonchronicle.com/news/houston-texas/houston/article/We-didn-t-prepare-for-this-700-000-in-15952157.php. 87 FERC and NERC. 2011. Outages and Curtailments During the Southwest Cold Weather Event of February 1-5, 2011. https://www.ferc.gov/sites/default/files/2020-04/08-16-11-report.pdf. 88 Golding, Garrett, Anil Kumar, and Karel Mertens. “Cost of Texas’ 2021 Deep Freeze Justifies Weatherization.” Federal Reserve Bank of Dallas. https://www.dallasfed.org/research/economics/2021/0415. The estimate is based on the Value of Lost Load method that estimates indirect losses by valuing power had it been uninterrupted.
56

Hot Summer Demand Case California can expect to be exposed to increasing heat waves similar to what happened in August 2020. While heat waves may tax the electricity and gas systems for a few days, summer-long hot and dry conditions may create price and reliability impacts that extend to winter. Summer is when usually slack pipeline capacity is used to fill underground gas storage that is then withdrawn in winter. Pipeline capacity alone is insufficient to meet peak winter demand. In winter 2000, gas storage was not full by November 1 (the gas industry “start” of winter withdrawal season), and early cold (along with other factors such as price manipulation) sent prices skyrocketing.89 Contingency planning seeks to avoid price spikes and customer curtailments.
Reflecting on these hot temperature events, the California Energy Commission (CEC) realized that neither it, nor PG&E nor SoCalGas, prepares a forecast of gas demand assuming a hot and dry summer. Staff asked Aspen Environmental Group to explore ways one might be developed for the SoCalGas system. Aspen Environmental Group presented its results at the July 9, 2021, IEPR workshop.90 This hot summer analysis is detailed on Appendix C.
The August 2020 heat event particularly highlighted the imbalance between net peak demand and renewable energy production.91 As described in Chapter 2, renewables production falls off in the late afternoon when demand increases. This production drop, and limitations on the ability to store renewable energy, means that dispatchable or on-demand resources, generally gas-fired generation, are critical to meeting that late afternoon and evening demand.92 Further compounding the issue is climate change, as prolonged excessive heat creates bigger evening ramps to meet cooling needs. Further, overnight low temperatures remain higher, stressing transformers and other electrical equipment.
The rolling outages during the August 2020 event were in fact confined to those early evening hours. The Final Root Cause Analysis Mid-August 2020 Extreme Heat Wave93 analysis prepared by the California Independent System Operator (California ISO), California Public Utilities Commission (CPUC), and CEC identified additional issues such as the need to understand the
89 CCST. January 2018. Long-Term Viability of Underground Gas Storage in California. p. 517 (footnote 55). https://ccst.us/reports/long-term-viability-of-underground-natural-gas-storage-in-california-an-independent-review-of-scientific-and-technical-information/. 90 Presentation by Joseph Long, “SoCalGas Hot Summer Demand.” July 9, 2021, IEPR Joint Agency Workshop on Summer 2021 Electric and Natural Gas Reliability, Session 3. https://efiling.energy.ca.gov/getdocument.aspx?tn=238746. 91 Comments by M. Santa Cruz at the July 9, 2021, IEPR Joint Agency Workshop on Summer 2021 Electric and Natural Gas Reliability, Session 4. See transcript at https://efiling.energy.ca.gov/GetDocument.aspx?tn=240857&DocumentContentId=74692. 92 Presentation by Neil Millar, “Gas-Fired Generation Requirements in the LA Basin” July 9, 2021, IEPR Joint Agency Workshop on Summer 2021 Electric and Natural Gas Reliability, Session 4. https://efiling.energy.ca.gov/getdocument.aspx?tn=238729. 93 California ISO, CPUC, CEC. 2021. Final Root Cause Analysis Mid-August 2020 Extreme Heat Wave. http://www.caiso.com/Documents/Final-Root-Cause-Analysis-Mid-August-2020-Extreme-Heat-Wave.pdf. The report is discussed further in Volume II of the 2021 Integrated Energy Policy Report.
57
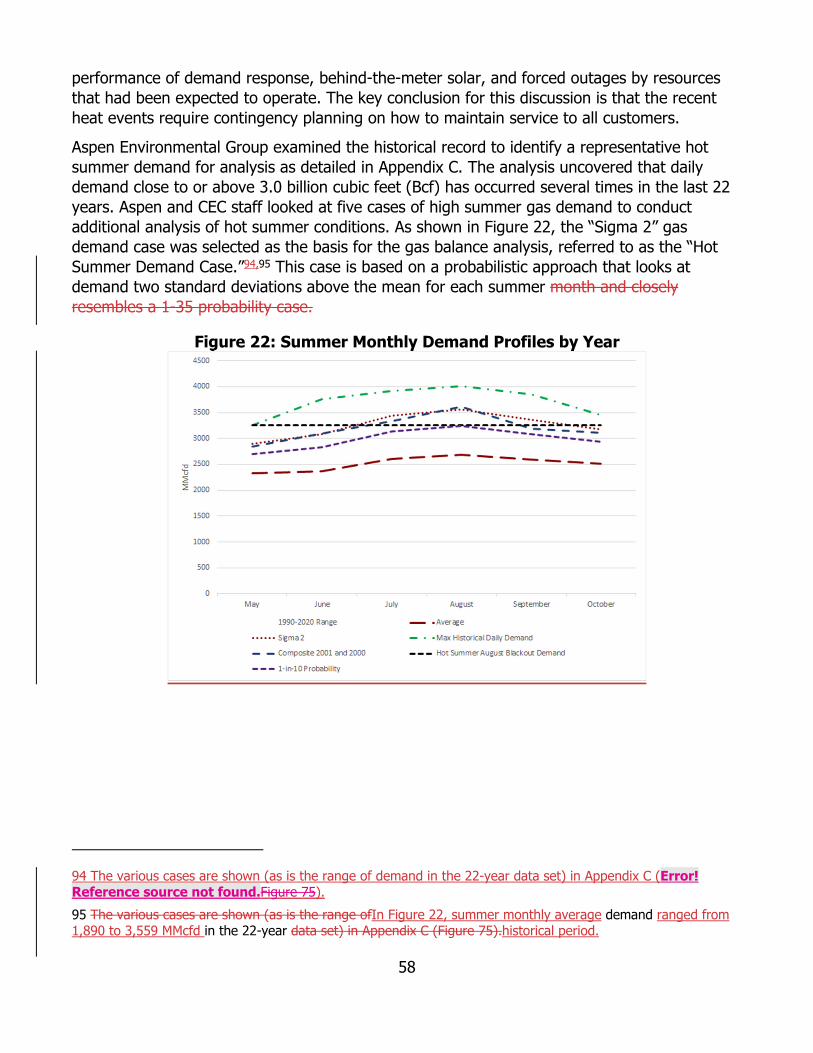
performance of demand response, behind-the-meter solar, and forced outages by resources that had been expected to operate. The key conclusion for this discussion is that the recent heat events require contingency planning on how to maintain service to all customers.
Aspen Environmental Group examined the historical record to identify a representative hot summer demand for analysis as detailed in Appendix C. The analysis uncovered that daily demand close to or above 3.0 billion cubic feet (Bcf) has occurred several times in the last 22 years. Aspen and CEC staff looked at five cases of high summer gas demand to conduct additional analysis of hot summer conditions. As shown in Figure 22, the “Sigma 2” gas demand case was selected as the basis for the gas balance analysis, referred to as the “Hot Summer Demand Case.”94,95 This case is based on a probabilistic approach that looks at demand two standard deviations above the mean for each summer month and closely resembles a 1-35 probability case.
Figure 22: Summer Monthly Demand Profiles by Year
94 The various cases are shown (as is the range of demand in the 22-year data set) in Appendix C (Error! Reference source not found.Figure 75). 95 The various cases are shown (as is the range ofIn Figure 22, summer monthly average demand ranged from 1,890 to 3,559 MMcfd in the 22-year data set) in Appendix C (Figure 75).historical period.
58
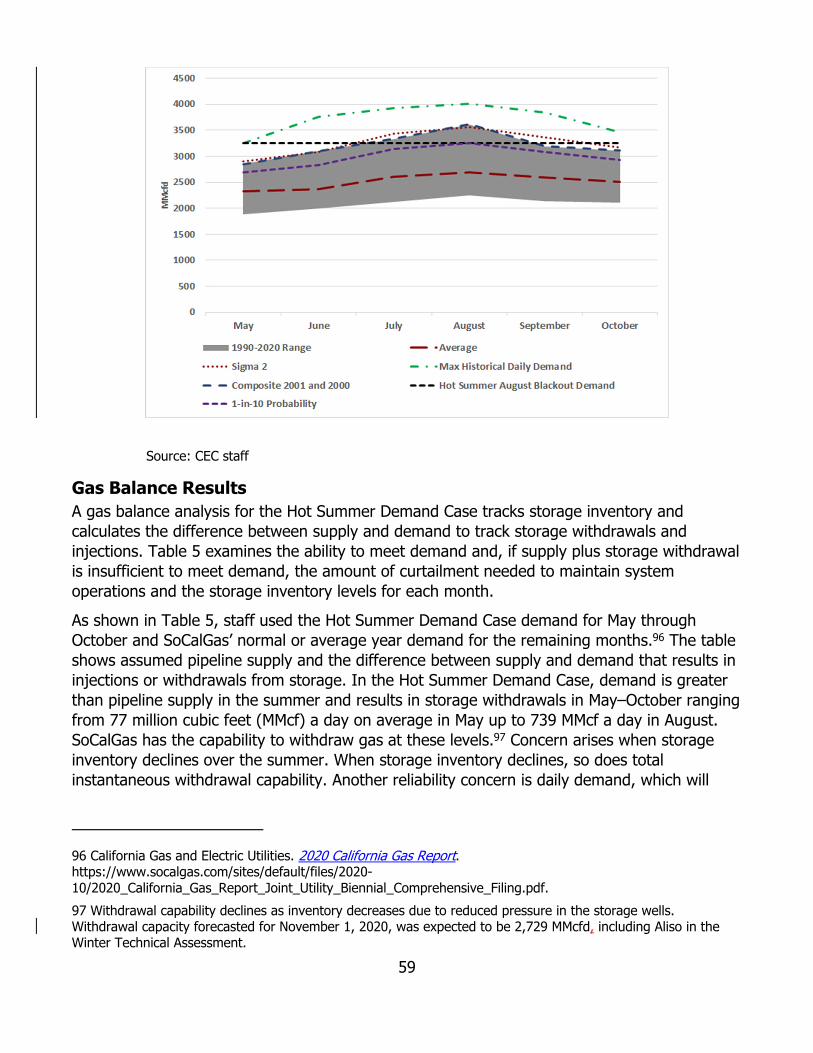
Source: CEC staff
Gas Balance Results A gas balance analysis for the Hot Summer Demand Case tracks storage inventory and calculates the difference between supply and demand to track storage withdrawals and injections. Table 5 examines the ability to meet demand and, if supply plus storage withdrawal is insufficient to meet demand, the amount of curtailment needed to maintain system operations and the storage inventory levels for each month.
As shown in Table 5, staff used the Hot Summer Demand Case demand for May through October and SoCalGas’ normal or average year demand for the remaining months.96 The table shows assumed pipeline supply and the difference between supply and demand that results in injections or withdrawals from storage. In the Hot Summer Demand Case, demand is greater than pipeline supply in the summer and results in storage withdrawals in May–October ranging from 77 million cubic feet (MMcf) a day on average in May up to 739 MMcf a day in August. SoCalGas has the capability to withdraw gas at these levels.97 Concern arises when storage inventory declines over the summer. When storage inventory declines, so does total instantaneous withdrawal capability. Another reliability concern is daily demand, which will
96 California Gas and Electric Utilities. 2020 California Gas Report. https://www.socalgas.com/sites/default/files/2020-10/2020_California_Gas_Report_Joint_Utility_Biennial_Comprehensive_Filing.pdf. 97 Withdrawal capability declines as inventory decreases due to reduced pressure in the storage wells. Withdrawal capacity forecasted for November 1, 2020, was expected to be 2,729 MMcfd, including Aliso in the Winter Technical Assessment.
59

vary above the monthly average demand, and the possibility that storage withdrawal may not be enough to meet the increased deliverability imbalance.
Table 5: Hot Summer Demand Case – Gas Balance Year 2021 2021 2021 2021 2021 2021 2021 2021 2021 2022 2022 2022
Month Apr May Jun Jul Aug Sept Oct Nov Dec Jan Feb Mar
Demand (MMcf)
2,194 2,897 3,079 3,439 3,559 3,368 3,172 2,597 3,158 2,956 2,933 2,397
Pipeline Supply (MMcf)
2,820 2,820 2,820 2,820 2,820 2,820 2,820 2,820 2,820 2,820 2,820 2,820
Storage Injection or Withdrawal
(MMcf)
626 -77 -259 -619 -739 -548 -352 223 -338 -136 -113 423
End of Month SoCalGas Storage
Inventory (Bcf)
72 69 61 42 19 3 -8 -1 -12 -16 -19 -6
Estimated Curtailment
(MMcf) 370 370 370 370 370 370
Injection or Withdrawal
After Curtailment
(MMcf)
626 293 111 -249 -369 -178 18 223 -338 -136 -113 423
End of Month SoCalGas Inventory
(Bcf)
72 81 84 76 65 59 60 67 56 52 49 62
Source: CEC staff
In the Hot Summer Demand Case, the prolonged withdrawal period during the summer months results in an inability to inject gas, and, as a result, storage inventory declines. Although SoCalGas relies mostly on the shoulder months (spring and fall) when demand is lower to fill storage, the utility still must be able to inject during some parts of the summer. Extended periods of high summer demand threaten the ability to prepare for winter inventory requirements, and in the Hot Summer Demand Case, storage inventory drops below zero by the end of October, leaving insufficient gas in storage on November 1.
60

To allow SoCalGas to meet winter inventory requirements of 60 Bcf in storage by November 1, the utility would undoubtedlylogically begin to curtail noncore load when demand is high.98
Assuming the total inventory needed for winter reliability is achieved through curtailment, on average SoCalGas would have to curtail 370 MMcf every day of the summer. Load curtailment allows for injection in May, June, and October, but SoCalGas would still have to withdraw gas in July, August, and September. Under this curtailment scenario, SoCalGas would reach 60 Bcf of storage inventory by November 1. SoCalGas would likely tailor its curtailments for each month rather than employ a flat curtailment strategy. SoCalGas’ planning strategy would curtail noncore customers as needed, and the magnitude would depend on demand expectations based on temperature forecasts and monitoring of storage inventory balances to meet winter reliability requirements. SoCalGas may end up curtailing more in May and June, for example, to prepare for the heavier electric generation demand in July, August, and September.
Staff’s hot summer analysis is a proof of concept for potential summer demand scenarios and ways to evaluate them. This same process can be used to test different demand levels. Sensitivity analysis can be done to test a threshold for reliability. Most important, there needs to be a definition of the level of reliability required and, therefore, the level of risk the state is willing to bear.
Planning for Contingencies or Extreme Weather Extreme cold events and hot conditions throughout the summer call for broader recognition of the range of events where the interconnections between gas and electricity threaten physical supply or price for either or both. NERC held webinars in the fall, reminding its members to plan ahead. The lack of backup fuel for gas-fired generators, as already discussed, and lack of jurisdiction over gas markets, since gas prices are fully deregulated, present challenges in developing solutions for these high-impact events. Given the continuing need for gas to ensure electric reliability as the state adds renewables and electrifies more end uses, it would be prudent to expand planning for adverse events. Options include broader discussion with the public about the risk of extreme weather events to engage them more actively in emergency load reductions and other emergency responses. Another option is to give greater emphasis to identifying solutions and the associated costs so that the public can understand the costs of reliability in the face of extreme events.
98 SoCalGas commented that noncore curtailments were only “speculative.” Southern California Gas. Comments on Draft 2021 Integrated Energy Policy Report. TN 241328. Docket 21-IEPR-06. https://efiling.energy.ca.gov/GetDocument.aspx?tn=241328. However, the CEC notes that following the Aliso Canyon leak, SoCalGas senior management told the joint agencies more than once that it would curtail service to noncore customers, if necessary, to fill storage for winter. Concern that SoCalGas would do so led to drafting of the first Aliso Canyon Withdrawal Protocol during the summer of 2016, which required SoCalGas to withdraw from Aliso Canyon to serve noncore customers as well as core customers.
61
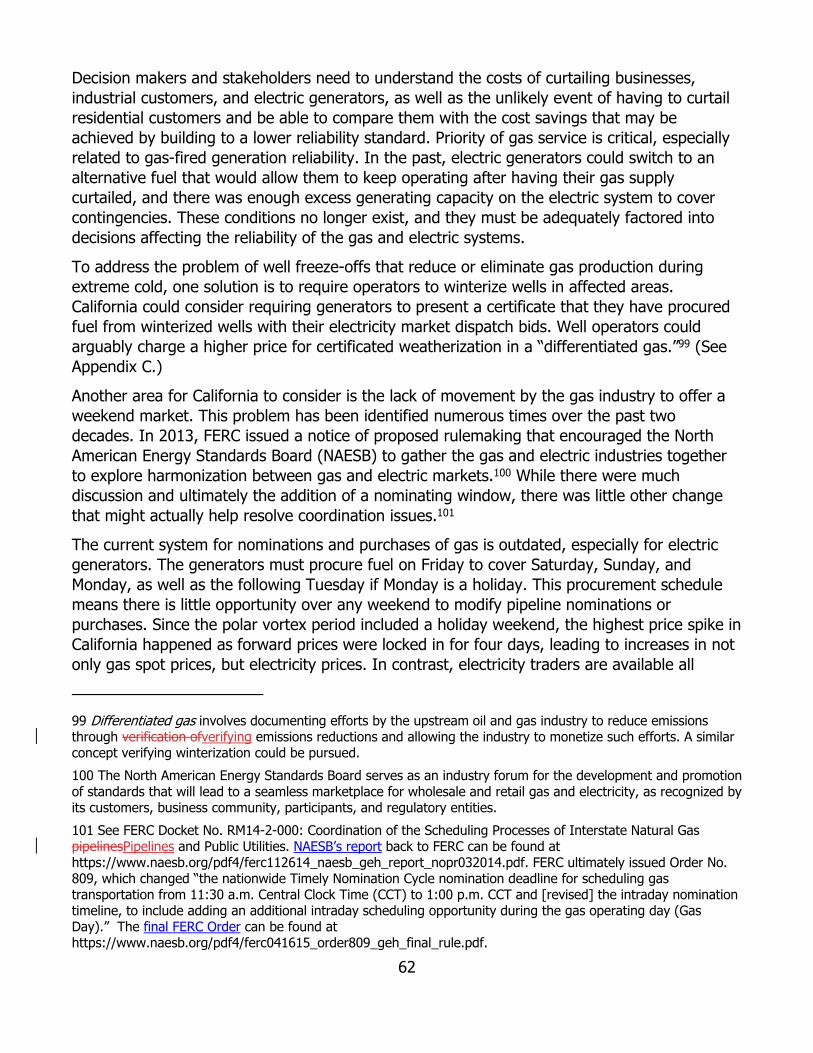
Decision makers and stakeholders need to understand the costs of curtailing businesses, industrial customers, and electric generators, as well as the unlikely event of having to curtail residential customers and be able to compare them with the cost savings that may be achieved by building to a lower reliability standard. Priority of gas service is critical, especially related to gas-fired generation reliability. In the past, electric generators could switch to an alternative fuel that would allow them to keep operating after having their gas supply curtailed, and there was enough excess generating capacity on the electric system to cover contingencies. These conditions no longer exist, and they must be adequately factored into decisions affecting the reliability of the gas and electric systems.
To address the problem of well freeze-offs that reduce or eliminate gas production during extreme cold, one solution is to require operators to winterize wells in affected areas. California could consider requiring generators to present a certificate that they have procured fuel from winterized wells with their electricity market dispatch bids. Well operators could arguably charge a higher price for certificated weatherization in a “differentiated gas.”99 (See Appendix C.)
Another area for California to consider is the lack of movement by the gas industry to offer a weekend market. This problem has been identified numerous times over the past two decades. In 2013, FERC issued a notice of proposed rulemaking that encouraged the North American Energy Standards Board (NAESB) to gather the gas and electric industries together to explore harmonization between gas and electric markets.100 While there were much discussion and ultimately the addition of a nominating window, there was little other change that might actually help resolve coordination issues.101
The current system for nominations and purchases of gas is outdated, especially for electric generators. The generators must procure fuel on Friday to cover Saturday, Sunday, and Monday, as well as the following Tuesday if Monday is a holiday. This procurement schedule means there is little opportunity over any weekend to modify pipeline nominations or purchases. Since the polar vortex period included a holiday weekend, the highest price spike in California happened as forward prices were locked in for four days, leading to increases in not only gas spot prices, but electricity prices. In contrast, electricity traders are available all
99 Differentiated gas involves documenting efforts by the upstream oil and gas industry to reduce emissions through verification ofverifying emissions reductions and allowing the industry to monetize such efforts. A similar concept verifying winterization could be pursued. 100 The North American Energy Standards Board serves as an industry forum for the development and promotion of standards that will lead to a seamless marketplace for wholesale and retail gas and electricity, as recognized by its customers, business community, participants, and regulatory entities. 101 See FERC Docket No. RM14-2-000: Coordination of the Scheduling Processes of Interstate Natural Gas pipelinesPipelines and Public Utilities. NAESB’s report back to FERC can be found at https://www.naesb.org/pdf4/ferc112614_naesb_geh_report_nopr032014.pdf. FERC ultimately issued Order No. 809, which changed “the nationwide Timely Nomination Cycle nomination deadline for scheduling gas transportation from 11:30 a.m. Central Clock Time (CCT) to 1:00 p.m. CCT and [revised] the intraday nomination timeline, to include adding an additional intraday scheduling opportunity during the gas operating day (Gas Day).” The final FERC Order can be found at https://www.naesb.org/pdf4/ferc041615_order809_geh_final_rule.pdf.
62
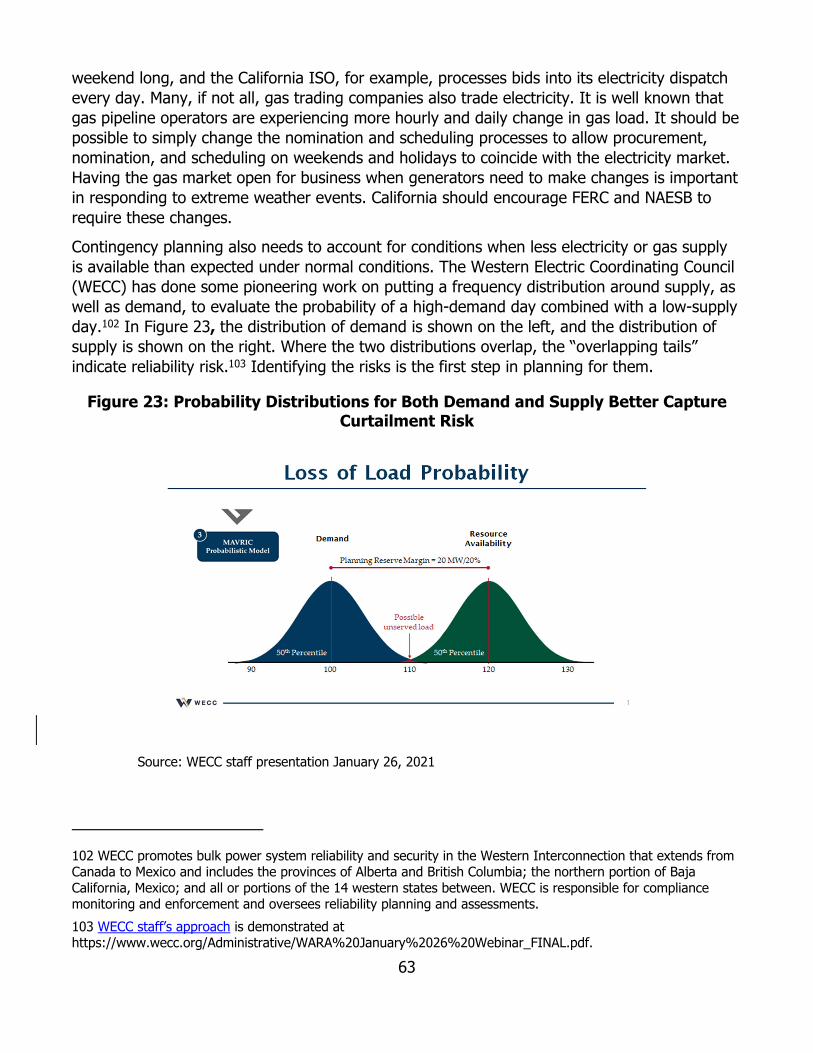
weekend long, and the California ISO, for example, processes bids into its electricity dispatch every day. Many, if not all, gas trading companies also trade electricity. It is well known that gas pipeline operators are experiencing more hourly and daily change in gas load. It should be possible to simply change the nomination and scheduling processes to allow procurement, nomination, and scheduling on weekends and holidays to coincide with the electricity market. Having the gas market open for business when generators need to make changes is important in responding to extreme weather events. California should encourage FERC and NAESB to require these changes.
Contingency planning also needs to account for conditions when less electricity or gas supply is available than expected under normal conditions. The Western Electric Coordinating Council (WECC) has done some pioneering work on putting a frequency distribution around supply, as well as demand, to evaluate the probability of a high-demand day combined with a low-supply day.102 In Figure 23, the distribution of demand is shown on the left, and the distribution of supply is shown on the right. Where the two distributions overlap, the “overlapping tails” indicate reliability risk.103 Identifying the risks is the first step in planning for them.
Figure 23: Probability Distributions for Both Demand and Supply Better Capture Curtailment Risk
Source: WECC staff presentation January 26, 2021
102 WECC promotes bulk power system reliability and security in the Western Interconnection that extends from Canada to Mexico and includes the provinces of Alberta and British Columbia; the northern portion of Baja California, Mexico; and all or portions of the 14 western states between. WECC is responsible for compliance monitoring and enforcement and oversees reliability planning and assessments. 103 WECC staff’s approach is demonstrated at https://www.wecc.org/Administrative/WARA%20January%2026%20Webinar_FINAL.pdf.
63

CHAPTER 4: Opportunities for Renewable Gas and RenewableHydrogen
There is increasing awareness that to fully decarbonize the gas system, there is a need for clean fuels or molecules in addition to clean electricity. Some gas uses, such as the need for industrial fuel and feedstock, are either difficult to electrify or cannot be directly electrified. There is also a need for clean fuels for thermal generation capacity to integrate increasing amounts of renewable resources and provide for reliability. Renewable gas and renewable hydrogen may prove to be cost-effective alternatives for these uses in the long run. Research and development, as well as incentive programs, will be needed to bring these opportunities to fruition. This chapter discusses the status, sources, availability, uses, costs, and other issues related to renewable gas and renewable hydrogen.
The Future of Renewable Gas in California The August 31, 2021, Integrated Energy Policy Report (IEPR) workshop on Renewable Gas explored the potential benefits of renewable gas and issues related to the role of the gas in California’s energy transition, including production costs, supply, policy, and incentives. Renewable gas, also known as biomethane, is biogas that has been upgraded to meet industry pipeline quality standards.104 There are several definitions of renewable gas and biomethane in statute and in use by different state agencies.105 Generally, renewable gas, also known as biomethane, includes, but is not limited to, gas that is produced from anaerobic decomposition or thermochemical conversion of biomass, including RPS-eligible sources.106 Several
104 Raw gas streams cannot be directly delivered to end users as they may contain a range of hydrocarbons, carbon dioxide, hydrogen sulfide, nitrogen, water, and other impurities or contaminants. It is treated to reach the minimum quality demanded by pipeline transmission and distribution companies. 105 For the RPS program, “biomethane” means landfill gas or digester gas, consistent with Section 25741 of the Public Resources Code. https://leginfo.legislature.ca.gov/faces/codes_displaySection.xhtml?lawCode=PUC§ionNum=399.12.6.&article =16 From the Health and Safety Code Section 25420 “biogas” means gas that is produced from the anaerobic decomposition of organic material. https://leginfo.legislature.ca.gov/faces/codes_displaySection.xhtml?lawCode=HSC§ionNum=25420. The CPUC IOU RNG tariff states that “biomethane” is gas from biogenic or other renewable sources, such as biogas, biomass, or power to gas from renewable electricity that has been conditioned or upgraded to comply with the gas quality specifications of this rule, including biomethane. https://docs.cpuc.ca.gov/PublishedDocs/Efile/G000/M349/K624/349624040.PDF. 106 The CEC has made clarifications to the general description of renewable gas based on definitions in statute and used by state agencies.
64

commenters suggested the CEC adopt new and expanded definitions for renewable gas.107 At this time the CEC is not proposing a new definition for renewable gas beyond what is in existing law or used by state agencies. The CEC intends to address issues related to defining renewable gas in future IEPRs and other proceedings in coordination with the CPUC and CARB.
As a substitute for fossil gas, renewable gas can be used in a variety of applications, including as a vehicle fuel, to generate electricity, or in thermal applications. Renewable gas can be injected into gas transmission or distribution pipelines, or it can be used locally at or near the site where the gas is created.
The four primary sources of biogas are landfills, livestock facilities, wastewater treatment plants, and waste management facilities.108 These four sources can use anaerobic digestion to create biogas, a process in which microorganisms break down organic materials in a closed space where there is no oxygen. Anaerobic digestion produces biogas that contains primarily methane and carbon dioxide, along with small amounts of other gases. Thermochemical conversion like pyrolysis, gasification, or combustion biomass to produce biofuels occurs when organics are converted or destroyed in thermal processes in the absence of oxygen.109
Landfill gas is biogas produced by anaerobic bacteriamicroorganisms that exist naturally in solid waste landfills. The Clean Air Act requires that many landfills operate a landfill gas collection system. Once collected, the landfill gas can be flared to produce carbon dioxide or used to generate electricity (or other uses).110 Of the roughly 300 landfills in California, 59 are producing biogas. Landfills are the largest source of biogas in California, but even though landfills are required to capture, use, or destroy methane, they still contribute 21 percent of methane emissions in California.
Livestock, wastewater treatment, and waste management facilities all generate organic material that can be used as a feedstock to produce biogas using anaerobic digesters. Livestock facilities use manure as the feedstock for anaerobic digestion. In California, dairy farms are the primary type of livestock facility that produces biogas. According to the United States Environmental Protection Agency (U.S. EPA) AgSTAR database,111 there are 273
107 Comments on defining renewable gas were submitted by the Bioenergy Association of California, Calgren, Coalition for Renewable Gas, Electrochaea, Clean Energy, Raven SR, PG&E, and SoCalGas. https://www.energy.ca.gov/data-reports/reports/integrated-energy-policy-report/2021-integrated-energy-policy-report. 108 The CPUC RNG Tariff states that the biogas used to produce RNG comes from a variety of sources, including municipal solid waste landfills, digesters at water resource recovery facilities (wastewater treatment plants), livestock farms, food production facilities, and organic waste management operations. RNG end uses include vehicle fuel, electricity generation, and utility gas services through local use or pipeline injection. https://docs.cpuc.ca.gov/PublishedDocs/Efile/G000/M349/K624/349624040.PDF. 109 Chandraratne, Meegalla R. and Asfaw G. Daful. “Recent Advances in Thermochemical Conversion of Biomass.” DOI: 10.5772/intechopen.100060. https://www.intechopen.com/online-first/78641 110 U.S. Environmental Protection Agency’s webpagewebpage on its Landfill Methane Outreach Program. https://www.epa.gov/lmop/frequent-questions-about-landfill-gas#areownersrequired. 111 U.S. EPA Livestock Anaerobic Digester database, accessed November 4, 2021. https://www.epa.gov/agstar/livestock-anaerobic-digester-database.
65

livestock digesters operating in the United States, with 41 of those in California. Twenty-five of the 41 have commenced operations since 2018, and more than 100 additional dairy digester projects are under construction in California. Figure 24 illustrates the growth of dairy digesters in California.
Figure 24: Total Number of Operational Dairy Digesters in California
Source: EPA AgstarAgSTAR database
Wastewater treatment facilities use sewage sludge as a feedstock for anaerobic digestion, but these facilities can use various waste streams (including food waste), a process known as “codigestion.” Anaerobic digestion of food waste is likely to become more prevalent in California as new laws take effect that require greater levels of food waste recycling. Of the roughly 242 wastewater treatment plants in California, more than 150 have digesters, with 5 of those injecting gas into pipelines. Many of these digesters have the potential to increase capacity to enable the codigestion of additional feedstocks.
Converting Biogas to Renewable Gas Biogas must be conditioned to remove impurities before use. Biogas conditioning involves the removal of moisture, particulates, and other contaminants. The levels of carbon dioxide, oxygen, nitrogen, sulfur, hydrogen sulfide, siloxanes, and volatile organic compounds in biogas generally must be reduced to specific limits, depending on the end use of the fuel. Pipeline injection requires higher levels of conditioning than does onsite use such as electricity generation or vehicle fueling. Raw biogas is typically composed of only 45 to 65 percent methane, depending on the feedstock source, but the methane content must be roughly 90 percent to be upgraded to renewable gas. Renewable gas can be injected into gas pipelines or it can be used locally. Pipeline injection allows the greatest flexibility for use but can be expensive due to extensive planning, land purchases, permitting, construction, and interconnection fees and equipment. Research in renewable gas processing technologies is ongoing to improve methane recovery rates and reduce the energy intensity of the biogas conditioning process.
66

Benefits of Renewable Gas Effective use of renewable gas has numerous benefits, including reduced greenhouse gas (GHG) emissions, improved waste management, new revenue sources for farmers and others, and job creation. Renewable gas is generally a carbon-neutral or even carbon-negative fuel. In the case of dairy digester projects, renewable gas is considered carbon-negative because the digesters capture methane emissions that would otherwise be released into the atmosphere.
A primary benefit of biogas utilization is to reducethe reduction of agriculture methane emissions through enteric strategies and anaerobic digesters. Enteric strategies involve selective breeding, diet modification, and feed additives to reduce methane emitted from the animals.112 For the unavoidable emissions at the source, anaerobic digestion is a process to treat biodegradable waste produced by livestock. This process reduces emissions by turning methane into a fuel source via biogas or refining the gas into biomethane, which can be injected into the pipeline as opposed to releasing it into the atmosphere.
According to the U.S. EPA, an anaerobic digester is cost-effective to install when a dairy has at least 500 cows. California has 899 dairies with 500 or more cows; however, only 41 are using biogas, and only 1218 are injecting refined biogas or renewable gas into the pipeline. Currently, more than 100 dairies are constructing digesters, but there is room for growth.113
Cost is a major barrier for dairies, as the capital costs for a 2,000-cow dairy are estimated to range from $5.1 million to $7.2 million.114 Incentives such as the Low Carbon Fuel Standard, Cap-and-Trade Program, or the Dairy Digester Research and Development Program may be needed to overcome cost barriers. The dairy sector has the highest carbon credit value due to the associated carbon abatement.
Renewable Gas Potential and Economics California consumed slightly more than 2,000,000 million cubic feet (MMcf (Bcf) of gas in 2020. Estimates of renewable gas production potential available for use in California vary widely from a low of 52,000 MMcf to a high of about 311,000 MMcf; as it stands, renewable gas could not fully replace fossil gas even if developed at highest potential. Figure 25 compares renewable gas potential based on the availability of feedstocks in California from a variety of studies.115
112 Alexiades, A. 2021. “Short-Lived Climate Pollutants Policy.” 2022 Scoping Plan Update – Short-Lived Climate Pollutants (SLCP) Public Workshop Presentations. California Air Resources Board Presentation on Sept. 8, 2021. https://ww2.arb.ca.gov/our-work/programs/ab-32-climate-change-scoping-plan/scoping-plan-meetings-workshops. 113 Calgren commented that there are 18 California dairy manure digesters injecting biogas into the pipeline. By the end of 2022, it expects that number to grow to 24 and to be close to 30 by the end of 2023. Calgren. Comments on 2021 Integrated Energy Policy Report. TN 241307. Docket 21-IEPR-06. https://efiling.energy.ca.gov/GetDocument.aspx?tn=241307. 114 California Air Resources Board. March 2017. “Short-Lived Climate Pollutant Reduction Strategy.” https://ww2.arb.ca.gov/sites/default/files/2020-07/final_SLCP_strategy.pdf. 115 This includes studies conducted by the California Biomass Collaborative, the UC Davis Institute of Transportation Studies, the American Gas Foundation, the United States Department of Energy, and ICF.
67

Figure 25: Renewable Gas Potential Feedstocks in California (MMcf/year)
Source: ICF
Figure 25 demonstrates the variation in estimates. Because each of these studies differs in the methods and assumptions they useused, it is difficult to directly compare them to one another. However, taken together, they provide a reasonable understanding of the range of potential renewable gas production.
Landfill gas is the primary source of renewable gas in California, but biogas from dairy digester projects is increasing rapidly. Nationally, swine and dairy operations could generate nearly 16 million megawatt-hours of electricity each year. California’s dairy industry represents a significant portion of that potential. Table 6 demonstrates the potential for expanded biogas production from candidate dairy farms in California, as well as associated methane emissions reduction. Some have raised concerns that this expansion might result in increased concentration of the industry and larger farms with greater local environmental impacts.
Table 6: California Biogas Potential From Dairy Farms Total Dairy Operations 2,165
Candidate Dairy Farms116 889 Number of Cows at Candidate Farms 1,352,000
Methane Emissions Reductions Potential 341,000 tons/year Methane Production Potential 27.9 billion cubic feet/year Energy Generation Potential 2,375,000 MWh/year
Source: United States Environmental Protection Agency. Market Opportunities for Biogas Recovery Systems at U.S. Livestock Facilities.
116 The U.S. EPA considers anaerobic digestion to be feasible if a dairy has at least 500 cows and employs flushed or scraped free stall barns or a dry lot.
68

In the current market, renewable gas cannot be produced as a commodity at costs competitive with fossil gas. As Figure 26 shows, the cost to produce renewable gas ranges from $6/million British thermal units (MMBtu) to more than $30/MMBtu, depending on the source of the feedstock.
Figure 26: Estimated Production Costs of Renewable Gas by Feedstock ($/MMBtu)
Source: American Gas Foundation
The Gas Technology Institute evaluated the conversion of an existing biomass plant in California into a renewable gas production site, using the wood waste feedstock and some of the existing infrastructure. The operating costs were estimated to be in the range of $13–$15 per MMBtu of renewable gas,117 which is commensurate with renewable gas production from other sources. Further research will be needed to identify the most cost-effective methods of renewable gas production in the future.
Policies and Incentives Numerous state and federal policies and incentives support renewable gas production. Incentives differ based on whether a specific project produces biogas or renewable gas.118 The primary driver for many project developers is monetization of the environmental credits from the produced renewable gas. The value of Renewable Identification Number (RIN) credits through the federal Renewable Fuel Standard (RFS) and credits from the Low Carbon Fuel Standard (LCFS), combined with the value of the fossil gas, can allow payback periods of three years or less. Credit values can range from $9 to $80 or more per MMBtu, depending on the
117 GTI. February 2019. Low-Carbon Renewable Natural Gas (RNG) from Wood Wastes. https://www.gti.energy/wp-content/uploads/2019/02/Low-Carbon-Renewable-Natural-Gas-RNG-from-Wood-Wastes-Final-Report-Feb2019.pdf. 118 Each of the numerous federal and state incentives and policies havehas different requirements. Some incentives apply only if biogas is upgraded to renewable gas, and others require the renewable gas to be injected into a pipeline.
69

feedstock used to generate renewable gas.119 Even excluding the capital costs of a dairy digester project, the value of renewable gas produced annually is roughly one-quarter of the annual operations and maintenance costs. For a typical 2,000-cow dairy, fuel sales may generate $149,000 per year, while RINs generate $1,060,000, and LCFS credits generate $865,000 per year.120
In 2009, the California Air Resources Board (CARB) approved an LCFS regulation to reduce the carbon intensity of transportation fuel in California. The LCFS offers incentives for the production of low-carbon transportation fuels based on the carbon intensity of the fuel. Fuels can be produced in California or out of state but must be used in California, and fuels that produce greater carbon reductions generate more credits under the LCFS. The LCFS uses the CA-GREET model to analyze the life-cycle GHG emissions of fuels. As of 2018, renewable gas produced at dairy digesters can generate about $45/MMBtu in credits, making renewable gas dairy digester projects financially attractive. Renewable gas from landfills, wastewater treatment plants, and food waste anaerobic digestion can earn LCFS credits of $10– $20/MMBtu. The LCFS has led to a rapid increase in renewable gas dairy digester projects over the past several years.
The RFS is a U.S. EPA program developed as part of the Energy Policy Act of 2005. The RFS requires that a portion of transportation fuels sold in the United States must come from renewable sources. RIN credits are used as a compliance mechanism to meet the annual renewable volume obligation for various categories of renewable fuel. Fuel refiners are required to obtain RIN credits to comply with the program.
Figure 27 shows the average production cost of biomethane and the value of LCFS and RFS RIN credits that can be generated for various types of biomethane production facilities. The figures are based on an LCFS credit value of $200/ton of CO2 and a RIN credit value of $14.50/MMBtu. The value of credits that can be generated depends partly on the previously existing emissions management strategy, such as venting or flaring emissions. For gases that would have been vented, there is a larger carbon abatement value than for those that would have been flared. Actual value varies based on term, location, and source.121
119 Smith, Aaron. February 3, 2021. “What’s Worth More: A Cow’s Milk or Its Poop?” https://asmith.ucdavis.edu/news/cow-power-rising. 120 Lee, H., and D.A. Sumner. 2018. “Dependence on Policy Revenue Poses Risks for Investments in Dairy Digesters.” California Agriculture, 72(4). http://dx.doi.org/10.3733/ca.2018a0037. 121 Presentation by Stephan Barsun, “RNG Market.” August 31, 2021, IEPR Commissioner Workshop on Renewable Natural Gas – RNG Supply, Availability, and Price in California. https://efiling.energy.ca.gov/getdocument.aspx?tn=239538.
70

Figure 27: LCFS and RFS RIN Credits
Source: CEC from a presentation by Stephan Barsun at Session 1 -— IEPR Commissioner Workshop on Renewable Natural Gas – RNG Supply, Availability, and Price in California. Aug. 31, 2021.
Senate Bill 1383 (Lara, Chapter 395, Statutes of 2016) set methane emissions reductions for California as part of a statewide effort to reduce short-lived climate pollutant (SLCP) emissions such as methane. The targets must reduce organic waste disposal 50 percent by 2020 and 75 percent by 2025. All jurisdictions in California must work toward meeting these targetsThe bill requires CARB to approve and implement a strategy to reduce emissions of SLCP to achieve a reduction in methane by 40 percent, hydrofluorocarbon gases by 40 percent, and anthropogenic black carbon by 50 percent below 2013 levels by 2030. The strategy must reduce organic waste disposal 50 percent by 2020 and 75 percent by 2025. All jurisdictions in California must work toward meeting these targets. SB 1383 also requires CARB to adopt regulations to reduce methane emissions from livestock and dairy manure management operations by up to 40 percent below 2013 levels by 2030 for each sector. It requires CPUC to direct gas corporations to implement not less than five dairy biomethane pilot projects to demonstrate interconnection to the common carrier pipeline system. It also requires California Department of Food and Agriculture to adopt regulations to achieve the organic waste reduction goals for 2020 and 2025, including a goal that not less than 20 percent of edible food that is disposed of is recovered for human consumption by 2025. It also required the CEC to develop recommendations in the 2017 IEPR for development and use of renewable gas. State agencies are to use the recommendations to implement policies and incentives to significantly increase the sustainable production and use of renewable gas.
Senate Bill 1440 (Hueso, Chapter 739, Statutes of 2018) requires that the California Public Utilities Commission (CPUC) consider adopting biomethane targets for each of the state’s gas utilities. The On January 3, 2022, the CPUC is consideringreleased a proposed decision (D.13-02-008) that sets biomethane targets thatfor gas utilities to support state policies, primarily
71
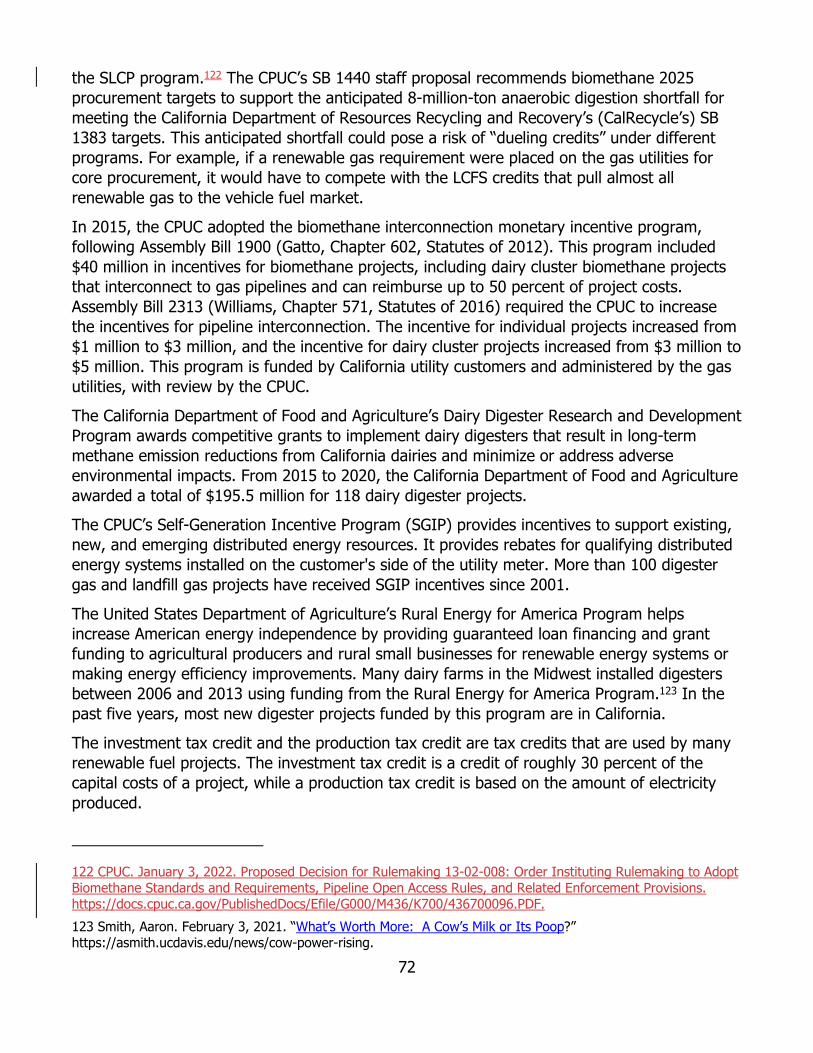
the SLCP program.122 The CPUC’s SB 1440 staff proposal recommends biomethane 2025 procurement targets to support the anticipated 8-million-ton anaerobic digestion shortfall for meeting the California Department of Resources Recycling and Recovery’s (CalRecycle’s) SB 1383 targets. This anticipated shortfall could pose a risk of “dueling credits” under different programs. For example, if a renewable gas requirement were placed on the gas utilities for core procurement, it would have to compete with the LCFS credits that pull almost all renewable gas to the vehicle fuel market.
In 2015, the CPUC adopted the biomethane interconnection monetary incentive program, following Assembly Bill 1900 (Gatto, Chapter 602, Statutes of 2012). This program included $40 million in incentives for biomethane projects, including dairy cluster biomethane projects that interconnect to gas pipelines and can reimburse up to 50 percent of project costs. Assembly Bill 2313 (Williams, Chapter 571, Statutes of 2016) required the CPUC to increase the incentives for pipeline interconnection. The incentive for individual projects increased from $1 million to $3 million, and the incentive for dairy cluster projects increased from $3 million to $5 million. This program is funded by California utility customers and administered by the gas utilities, with review by the CPUC.
The California Department of Food and Agriculture’s Dairy Digester Research and Development Program awards competitive grants to implement dairy digesters that result in long-term methane emission reductions from California dairies and minimize or address adverse environmental impacts. From 2015 to 2020, the California Department of Food and Agriculture awarded a total of $195.5 million for 118 dairy digester projects.
The CPUC’s Self-Generation Incentive Program (SGIP) provides incentives to support existing, new, and emerging distributed energy resources. It provides rebates for qualifying distributed energy systems installed on the customer's side of the utility meter. More than 100 digester gas and landfill gas projects have received SGIP incentives since 2001.
The United States Department of Agriculture’s Rural Energy for America Program helps increase American energy independence by providing guaranteed loan financing and grant funding to agricultural producers and rural small businesses for renewable energy systems or making energy efficiency improvements. Many dairy farms in the Midwest installed digesters between 2006 and 2013 using funding from the Rural Energy for America Program.123 In the past five years, most new digester projects funded by this program are in California.
The investment tax credit and the production tax credit are tax credits that are used by many renewable fuel projects. The investment tax credit is a credit of roughly 30 percent of the capital costs of a project, while a production tax credit is based on the amount of electricity produced.
122 CPUC. January 3, 2022. Proposed Decision for Rulemaking 13-02-008: Order Instituting Rulemaking to Adopt Biomethane Standards and Requirements, Pipeline Open Access Rules, and Related Enforcement Provisions. https://docs.cpuc.ca.gov/PublishedDocs/Efile/G000/M436/K700/436700096.PDF. 123 Smith, Aaron. February 3, 2021. “What’s Worth More: A Cow’s Milk or Its Poop?” https://asmith.ucdavis.edu/news/cow-power-rising.
72

The California Energy Commission (CEC) has funded numerous biogas and renewable gas projects through its Energy Research and Development Division. California’s gas utilities are also conducting research into the future of biomethane use. Conversion of woody biomass into renewable gas is one future possibility for producing greater volumes of renewable gas. Gasification and pyrolysis are two technology options for biomass conversion to renewable gas.124 Although there are no commercial facilities in operation, several gasification and pyrolysis technology projects are undergoing pilot-scale demonstration and development.
Future of Renewable Hydrogen in California Renewable hydrogen is emerging as an important element of California’s decarbonized energy system as the state looks for clean fuels or molecules to address hard-to-electrify end uses. Hydrogen is a colorless, odorless gas. It is the smallest, most abundant molecule in the universe, yet it is not found naturally on Earth. Hydrogen is produced from compounds including water, natural gas, and biomass. Hydrogen has been used for decades in petroleum refining, treating metals, fertilizer manufacturing, and food processing. Hydrogen can serve as a carrier of energy and be used in power generation, transportation, and industrial applications. It can also be stored for long periods. This section provides a general overview of hydrogen issues and is not intended to be an exhaustive discussion of the all the various sources, technologies, processes, and pathways for hydrogen production and use. The CEC intends to further address hydrogen issues in future IEPRs and other proceedings in collaboration with CPUC and CARB.
Most hydrogen produced today is produced from fossil fuels. However, hydrogen produced by splitting water using renewable electricity has significantly lower carbon emissions. Hydrogen produced in this way is known as renewable or “green” hydrogen. Renewable hydrogen can also be produced using renewables feedstocks and organic waste, including from RPS-eligible sources. At this time, there is no consensus on what constitutes renewable hydrogen and no statutory definition.125 Several commenters suggested the CEC adopt a formal definition of renewable hydrogen that includes a variety of conversion technologies, processes, and sources.126 However, considering the uncertainties surrounding the pathways for hydrogen production and use, as well as diversity of proposed definitions, it is premature to adopt a
124 Gasification is the conversion of biomass feedstocks to a gaseous fuel, while pyrolysis is the thermal decomposition of biomass in the absenseabsence of oxygen (that prevents combustion) to produce liquid fuels. These gas and liquid fuels can be used in conventional equipment (for example, boilers, engines, and turbines) or advanced equipment (such as fuel cells) for the generation of heat and electricity. 125 Staff could find no definition of “renewable hydrogen” in statute. California Public Utilities Code, Section 400.2 defines “green electrolytic hydrogen” as hydrogen gas produced through electrolysis and does not include hydrogen gas manufactured using steam reforming or any other conversion technology that produces hydrogen from a fossil fuel feedstock. https://leginfo.legislature.ca.gov/faces/codes_displayText.xhtml?lawCode=PUC&division=1.&title=&part=1.&chap ter=2.3.&article=17. 126 Comments on definitions for renewable hydrogen were submitted by the Bioenergy Association of California, Calgren, National Fuel Cell Research Center, H Cycle LLC, Green Hydrogen Coalition, Coalition for Renewable Gas, Electrochaea, Clean Energy, Raven SR, Air Products, PG&E, and SoCalGas. https://www.energy.ca.gov/data-reports/reports/integrated-energy-policy-report/2021-integrated-energy-policy-report.
73

formal definition at this time. A critical element of any definition for renewable hydrogen is the carbon intensity, as noted in comments.127 The CEC recognizes the need to further define the term and suggests the development of a tracking process for renewable hydrogen, similar to that used for the RPS. The CEC intends to consider issues associated with renewable hydrogen in future IEPRs and other proceedings in coordination with the CPUC and CARB.
Renewable hydrogen can serve as a low-carbon-intensity substitute for fossil fuels. While renewable hydrogen is emerging as an important pathway of decarbonizing California’s energy system, high costs limit its use economywide. Lowering production, storage, and transportation costs through increased efficiency and economies of scale, as well as increasing demand, is needed for hydrogen to become cost-competitive with other fuels and energy storage technologies.
Recent demonstrations of the potential of hydrogen, along with successful transitions into using hydrogen around the world, have moved the conversation about a hydrogen economy forward in California and across the West.
Hydrogen Production Hydrogen can be classified as grey, blue, or green hydrogen, depending on the production method and associated carbon intensity. The two most common methods for producing hydrogen are steam-methane reforming and electrolysis; fossil gas methane pyrolysis is an alternative.128 Grey hydrogen is produced from fossil fuels, emitting significant carbon dioxide in the process. Blue hydrogen is the same as grey hydrogen, except that the carbon emitted during the production process is captured and sequestered. Currently, 96 percent of hydrogen is produced from fossil fuels using steam-methane reforming that does not include carbon capture and sequestration (CCS) technologies.129
GreenOne method of producing green hydrogen is produced through electrolysis using renewable energy. As renewable energy production increases, the potential to use excess renewable electricity that would otherwise be curtailed for hydrogen production should help drive down the cost of green hydrogen. A power plant fueled with 100 percent green hydrogen would be essentially carbon-free.
Global hydrogen production accounts for 830 million tonnes of carbon dioxide (CO2) per year, equivalent to the total CO2 emissions of the United Kingdom and Indonesia combined. However, current legislation identifies only green electrolytic hydrogen as a type of hydrogen qualified to help California meet statutory GHG emission targets. Senate Bill 1369 (Skinner,
127 Comments from Bioenergy Association of California, National Fuel Cell Research Center, and Green Hydrogen Coalition. https://www.energy.ca.gov/data-reports/reports/integrated-energy-policy-report/2021-integrated-energy-policy-report. 128 Steam reforming is a process in which high-temperature steam (700°C–1,000°C) is used to produce hydrogen from a methane source, such as natural gas. Electrolysis allows carbon-free hydrogen production in a process that uses electricity to split water into hydrogen and oxygen. 129 Howarth, Robert W. and Mark Z. Jacobson. 2021. “How Green Is Blue Hydrogen?” Energy Science & Engineering, published by Society of Chemical Industry and John Wiley & Sons Ltd. https://doi.org/10.1002/ese3.956.
74

Chapter 567, Statutes of 2018) directs the CPUC, CARB, and CEC to “consider green electrolytic hydrogen an eligible form of energy storage and shall consider other potential uses of green electrolytic hydrogen.” Grey, blue, biomass-derived, and other types of hydrogen are not similarly identified or qualified in statute.
Blue hydrogen from fossil gas steam-methane reforming has been widely promoted as a clean alternative fuel, but a newly published, peer-reviewed study reports that its reduction in carbon emissions over gray hydrogen is small when the process accounts for all life-cycle emissions — from fossil gas production, to pipeline transportation, to blue hydrogen manufacturing. The study reported that total life-cycle carbon dioxide equivalent (CO2e) emissions for blue hydrogen produced from fossil gas are only 9 to 12 percent less than for gray hydrogen. The study assumed “a best-case scenario for blue hydrogen” in the analysis, including 85 percent carbon capture and sequestrations capture rates and a 3.5 percent rate of leakage from fossil gas production basins and infrastructure. These rates have been established by the current literature.
On the other hand, the study generously assumes that captured CO2 can indeed be stored at a commercial scale indefinitely for decades or centuries, yet there is no history to support that assumption. Most CO2 that is currently captured is used for enhanced oil recovery and released back to the atmosphere. Further, the study did not consider the energy cost and associated GHG emissions from transporting and storing the captured CO2. The study also found that the life-cycle GHG footprint of blue hydrogen is more than 20 percent greater than burning fossil gas or coal for heat and some 60 percent greater than burning diesel oil for heat, as shown in Figure 28.130
Figure 28: GHG Footprint per Unit of Heat Energy
Source: Howarth and Jacobson, 2021
130 Ibid.
75

Transportation and Storage of Hydrogen Transportation of hydrogen gas is a barrier to increased use. Estimates vary regarding how much hydrogen can be blended into existing gas transmission and distribution infrastructure without significant upgrades, with some showing quantities up to 20 percent in volume or up to 7 percent by weight without adverse effects.131 Repurposing existing gas pipelines to transport hydrogen may be possible but would require significant and potentially costly upgrades to compressors and related infrastructure because of higher pressures required for hydrogen transport.
Most hydrogen consumed in the United States is used in petroleum refining to lower the sulfur content of fuels, and in treating metals, producing fertilizer, and processing foods. Given these limited industrial uses, hydrogen is not transported on interstate pipelines or intrastate pipelines that serve large regions. Instead, regional networks of hydrogen pipelines link complexes of refineries and chemical manufacturers. The largest of these complexes is on the Gulf Coast. There is one industrial gas firm in Los Angeles that owns and operates 17 miles of hydrogen pipeline in the industrial districts of Torrance and Wilmington. For most other industrial uses, hydrogen is delivered by tanker trucks, but they cannot efficiently deliver the quantities of hydrogen that residential, commercial, industrial, or electric generation end users would require.
Hydrogen is typically stored as a compressed gas. The energy density of hydrogen by weight is very high, but the energy density per volume of compressed hydrogen is much lower than traditional fuels. This means that although hydrogen is very light, it generally needs to be compressed to very high pressures to store it. The high pressures required for hydrogen storage is a challenge to large-scale deployment. Salt caverns are a possible large-scale storage solution, which would enable lower costs, but salt caverns and similar geological formations are not found in California and are limited in geographic distribution in the West.
Hydrogen can also be stored as a cryogenic liquid or with solid materials that either absorb hydrogen or chemically combine with hydrogen, but these methods are not commonly used. Solid-state hydrogen storage is a technology with better energy density potential but will require years of research and development before it will be viable at larger scales.132
Uses of Hydrogen Hydrogen use for energy production is growing; in the energy sector, hydrogen can be used to power fuel cells that produce electricity. One example is hydrogen fuel cell electric vehicles. The fuel cell in the vehicle produces electricity, which is used to power an onboard electric motor. Hydrogen fuel cell vehicles exist in small numbers due to the high costs of the vehicles and competition from lower-cost battery-electric vehicles. California, along with Japan and
131 Presentation by Mike Petouhoff, “Introduction of EPIC Initiative The Role of Green Hydrogen in a Decarbonized CA -— A Roadmap and Strategic Plan.” July 28, 2021, IEPR workshop on Hydrogen to Support California’s Clean Energy Transition, Session 1. https://efiling.energy.ca.gov/GetDocument.aspx?tn=239050&DocumentContentId=72482. 132 Hydrogen can be stored on the surfaces of solids (by adsorption) or within solids (by absorption). In adsorption, hydrogen is attached to the surface of a material either as hydrogen molecules or as hydrogen atoms.
76

Germany, is at the forefront of fuel cell vehicle adoption and refueling station deployment. As of September 2021, California had 47 hydrogen fueling stations,133 and additional grant funding could provide at least 36 additional stations by the end of 2020.
Larger hydrogen fuel cells can be used to produce electricity for the power grid, to power buildings, or to provide backup power sources. One of the larger hydrogen generating plants is the 27 megawatt (MW) Red Lion Energy Center in Delaware, which uses hydrogen produced from landfill gas to operate the fuel cells. Another application of hydrogen is as a direct replacement for fossil gas — for example, as a heating fuel or as a fuel for power plants and industrial processes. Noncombustion use of hydrogen in smaller fuel cells, as distributed resources and in microgrids, could also support the grid and displace diesel use in backup generators, reducing criteria pollutants and GHG emissions.134
Electric Generation Hydrogen and hydrogen blends also have been used to fuel combustion turbines at refineries and steel plants for more than 20 years. The major gas turbine manufacturers now offer modifications to their combustion systems that convert fossil gas plants to burn a hydrogen/fossil gas blend, and manufacturers are working on designs that will be fueled by 100 percent hydrogen. A gas turbine fueled by hydrogen instead of gas will yield higher nitrogen oxides (NOx) emissions because hydrogen burns faster and hotter than gas. Manufacturers will therefore have to change the systems that control the mix of air and fuel to maintain NOx emissions compliance. These changes have proven especially challenging to implement successfully when the gas turbine runs at less than 50 percent of load. Dry low NOx is a process that premixes the fuel and air before they enter the gas turbine to reduce combustion flame temperatures and NOx emissions.135
Despite these limitations, electric utilities are still moving ahead with gas turbines fueled by hydrogen blends. The Los Angeles Department of Water and Power (LADWP) is repowering its 1,800 MW coal-fired Intermountain Power Project (IPP) in Delta, Utah, with an 840 MW, combined-cycle generator fueled by a 30 percent hydrogen blend that will begin operations in 2025. The project schedule plans to upgrade IPP to 100 percent hydrogen by 2045.136
The failure of a gas turbine at the Northern California Power Agency (NCPA)’s Lodi Energy Center in 2020 led the NCPA to repower the plant with a 300 MW combined-cycle generator that can be fueled by a 45 percent hydrogen blend. NCPA selected the Lodi Energy Center,
133 “Alternative Fueling Station Counts by State.” 2021. U.S. Department of Energy Alternative Fuels Data Center. Accessed September 15, 2021. https://afdc.energy.gov/stations/states. 134 National Fuel Cell Research Center. Comments on 2021 Integrated Energy Policy Report. TN 241309. Docket 21-IEPR-06. https://efiling.energy.ca.gov/GetDocument.aspx?tn=241309. 135 Bender, Bill. “Lean Pre-Mixed Combustion,” in Gas Turbine Handbook. National Energy Technology Laboratory. Accessed September 15, 2021. https://netl.doe.gov/sites/default/files/gas-turbine-handbook/3-2-1-2.pdf. 136 Presentation by Paul Schultz, “LADWP’s Hydrogen Pathway.” July 28, 2021, IEPR workshop on Hydrogen to Support California’s Clean Energy Transition. https://efiling.energy.ca.gov/GetDocument.aspx?tn=239025&DocumentContentId=72458.
77
because fossil gas distribution pipelines are available nearby for storage or hydrogen blending, and the power plant is near Interstate 5 and State Highway 99, allowing market opportunities in the transportation sector. Water supplies are adequate to supply an electrolysis plant large enough to provide hydrogen for the new generator and for transportation to other end users.137
Grid Reliability Hydrogen offers advantages to support electric grid reliability, especially given SB 100 study scenarios that show that up to 15 gigawatts (GW) of firm dispatchable generation may be needed to support renewable resources to meet the requirements of the statute. In a process where electric power is used in technologies to produce gas such as hydrogen, often referred to as power-to-gas (P2G), hydrogen has the potential to be more cost-effective as a long-duration storage medium than lithium-ion batteries and pumped hydroelectric facilities.138 As a P2G resource, hydrogen can meet this need for firm dispatchable generation by fueling either combustion turbines or fuel cells. Hydrogen-fueled gas turbines are generally more cost-effective than hydrogen fuel cells;139 however, major manufacturers are developing reversible fuel cells that can also serve as P2G resources.140
LADWP’s IPP repowering project will use the potential benefits of P2G. As well as the installation of the hydrogen/fossil gas-fueled generator described above, the project includes an upgrade to the high-voltage transmission infrastructure at its Delta, Utah, site to interconnect new renewable energy resources. The project is expected to add 4,300 MW of solar and wind capacity to the 400 MW of renewable capacity now interconnected at the IPP.141 The IPP plans to use this added renewable capacity to power the electrolytic manufacture of green hydrogen, which will be stored in salt caverns near the IPP site and withdrawn to fuel the new generator for the project when net demand on the electric grid increases.
Other major wind generation projects, which are also intended to supply electricity to green hydrogen electrolyzers, are under investigation or in different planning stages in California and Europe. Offshore wind, with average wind speeds higher than on land, is being developed in
137 California Energy Commission. 2021. Transcript – July 28, 2021, IEPR Workshop on Hydrogen to Support California's Clean Energy Transition - Session 1, pp. 79-84. https://efiling.energy.ca.gov/getdocument.aspx?tn=239968. 138 Presentation by Mike Petouhoff, “Introduction of EPIC Initiative: The Role of Green Hydrogen in a Decarbonized CA — A Roadmap and Strategic Plan.” July 28, 2021, IEPR workshop on Hydrogen to Support California’s Clean Energy Transition, Session 1. https://efiling.energy.ca.gov/GetDocument.aspx?tn=239050&DocumentContentId=72482. 139 Ibid. 140 Presentation by Venkat Venkataraman, “Bloom Energy’s Vision in Decarbonization With Hydrogen.” July 28, 2021, IEPR workshop on Hydrogen too Support California’s Clean Energy Transition. https://efiling.energy.ca.gov/GetDocument.aspx?tn=239030&DocumentContentId=72463. 141 Presentation by Paul Schultz., “LADWP’s Hydrogen Pathway.” July 28, 2021, IEPR workshop on Hydrogen to Support California’s Clean Energy Transition. https://efiling.energy.ca.gov/GetDocument.aspx?tn=239025&DocumentContentId=72458.
78
the state. Studies have shown that offshore wind turbines generate comparatively consistent and higher output, on average, throughout the day across all seasons than land-based turbines. Wind turbines off the Humboldt County coast, for example, could achieve a 52 percent annual capacity factor — much larger than the typical 30 percent to 40 percent capacity factors of land-based wind or solar rooftop photovoltaic (PV), which has capacity factors of 15 percent to 30 percent.142 German and Danish authorities have invested billions of dollars in new wind turbine capacity off the North and Baltic Seas — 40 GW in Germany by 2040 and 12 GW in Denmark — and in transmission interconnections to hydrogen electrolyzers onshore to supply Power-to-X applications.143 Power-to-X is a process in which electrolysis-produced hydrogen fuels residential, commercial, and industrial end uses, in addition to electric grid support.
Hydrogen Costs The greatest challenge to hydrogen supply growth, particularly green hydrogen, is its cost. A Columbia University study analyzed the cost of producing gray, blue, and green hydrogen. Green hydrogen costs six to seven times more to produce than gray hydrogen. Columbia University’s Center on Global Energy Policy analyzed the cost of different methods of producing hydrogen as shown in Figure 29.144
142 Presentation by Arne Jacobson., “Offshore Wind on California’s North Coast.” July 28, 2021, IEPR workshop on Hydrogen to Support California’s Clean Energy Transition. https://efiling.energy.ca.gov/GetDocument.aspx?tn=239028&DocumentContentId=72461. 143 Presentation by Ulrich Benterbusch. “Germany’s National Hydrogen Strategy and the Potential for Offshore Wind Electrolysis.” July 28, 2021, IEPR workshop on Hydrogen to Support California’s Clean Energy Transition. https://efiling.energy.ca.gov/GetDocument.aspx?tn=239026&DocumentContentId=72459. Presentation by Nick Jensen, “Achieving Climate Neutrality by 2050- The Role of PtX and Energy Islands.” July 28, 2021, IEPR workshop on Hydrogen to Support California’s Clean Energy Transition. https://efiling.energy.ca.gov/GetDocument.aspx?tn=239018&DocumentContentId=72453. 144 Freedman, S. Julio, Zhiyuan Fan, and Ke Tang. 2019. Low-Carbon Heat Solutions for Heavy Industry: Sources, Options, and Costs Today. p. 35, Figure 6. https://www.energypolicy.columbia.edu/sites/default/files/file-uploads/LowCarbonHeat-CGEP_Report_100219-2_0.pdf.
79

Figure 29: Cost of Hydrogen Production ($/kilogram [kg]) of Selected Hydrogen Production Methods
Source: Columbia University
The green hydrogen production methods that use wind, solar, or hydroelectric generation as inputs are more costly than the two production methods that use steam-methane reforming (SMR). This cost difference is largely attributable to input costs for electrolytic hydrogen production that are not required in SMR. These include electricity inputs, which account for more than 55 percent, and electrolysis costs, which account for more than 30 percent of the costs shown in Figure 29.145
Market transformation is widely expected to reduce the costs of hydrogen production, resulting in a large growth in supply and, in turn, demand from fuel cells and fuel-cell electric vehicles.
145 Ibid.
80

Various studies agree with the Columbia University analysis that electricity accounts for the largest input costs in production of green electrolytic hydrogen. However, the plummeting costs of electricity produced by solar and wind resources146 and growth in global investments in these resources are expected to drive down the cost of green hydrogen production enough to make it competitive with other fuels.
Efforts to Promote Renewable Hydrogen and Reduce Costs Local jurisdictions have joined state authorities to promote green electrolytic hydrogen. The LA100: Los Angeles 100 Percent Renewable Energy Study (LA100) was developed in response to a 2016 Los Angeles City Council motion147 directing LADWP to evaluate:
The pathways and costs to achieveachieving a 100 percent renewable electricity supply by 2045 while electrifying key end uses and maintaining the current high degree of reliability.
The potential benefits to the environment and health. Potential changes to local jobs and the economy. HowWays that communities can prioritize environmental justice.148
LADWP responded to this directive by contracting with the National Renewable Energy Laboratory (NREL) to prepare an integrated engineering-economic analysis.149 In development with LADWP staff, NREL evaluated nine scenarios under different customer demand projections, plus differing levels of energy efficiency, electrification, and demand response.150
The finding of this analysis that is common across all scenarios; also relevant here is the need for at least 2,600 MW of combustion turbines, sited within the Greater Los Angeles Area and fueled by green electrolytic hydrogen or other renewable fuels. LADWP plans to procure hydrogen to fuel these combustion turbines produced by manufacturers and distributed by the Southern California Gas Company (SoCalGas).151
146 Presentation by Stephen Szymanski, “Nel Hydrogen Electrolyser Solutions for Large Scale Hydrogen Production.” July 28, 2021, IEPR workshop on Hydrogen to Support California’s Clean Energy Transition. https://efiling.energy.ca.gov/GetDocument.aspx?tn=239029&DocumentContentId=72462. 147 LADWP. 2016. “LADWP Response to Council Motion.” 2016. Accessed August 23, 2021. https://www.ladwp.com/cs/idcplg?IdcService=GET_FILE&dDocName=OPLADWPCCB612016&RevisionSelectionMe thod=LatestReleased. 148 Presentation by Paul Schultz., “LADWP’s Hydrogen Pathway.” July 28, 2021, IEPR workshop on Hydrogen to Support California’s Clean Energy Transition. https://efiling.energy.ca.gov/GetDocument.aspx?tn=239025&DocumentContentId=72458. 149 NREL. 2021. The Los Angeles 100 Percent Renewable Energy Study. https://www.nrel.gov/analysis/los-angeles-100-percent-renewable-study.html. 150 Presentation by Paul Schultz., “LADWP’s Hydrogen Pathway.” July 28, 2021, IEPR workshop on Hydrogen to Support California’s Clean Energy Transition. https://efiling.energy.ca.gov/GetDocument.aspx?tn=239025&DocumentContentId=72458. 151 Comment by Marlon Santa Cruz, LADWP natural gas procurement manager, at the Energy Commission Gas Working Group, July 29, 2021.
81

A finding from the analysis that is common across all scenarios is the need for firm capacity from renewably fueled combustion turbines sited at LADWP’s existing in-basin generating stations. Electrolytic hydrogen is a renewable fuel that may support LADWP’s future firm capacity needs as it retires the once-through cooling units and decarbonizes its generation fleet. Among the many challenges for the deployment of hydrogen-fueled combustion turbines is development of the necessary infrastructure to produce and use cost-competitive green hydrogen. LADWP issued a request for information in August 2021 to better understand the opportunities and challenges for green hydrogen and is in the early stages of developing its strategy to maintain local, firm capacity.152
The Green Hydrogen Coalition (GHC) HyDeal North America is an initiative to bring together large potential hydrogen end users, distributors, and other stakeholders to plan and develop the competitive, high-volume supply and distribution chain necessary to reduce delivered green hydrogen costs to $1.50/kg. This initiative will first target Southern California, where the GHC HyDeal Los Angeles will also include the hydrogen-fueled combustion turbines LADWP expects will repower or replace its current thermal generation fleet as part of the LA100 program.153
The GHC also cosponsors the Western Green Hydrogen Initiative (WGHI), a public-private partnership to assist interested states and partners in advancing and accelerating deployment of green hydrogen infrastructure in the West for the benefit of the region’s economy and environment. WGHI cosponsors also include the National Association of State Energy Officials (NASEO) and the Western Interstate Energy Board (WIEB). CEC staff participates in the NASEO and WIEB. The initiative will engage interested western states and two Canadian provinces and will serve as the steering committee to assist in the development of a regional green hydrogen strategy, including the development of large-scale, long-duration green-hydrogen-based renewable energy storage.154
CEC Research and Development The CEC continues to fund research to develop, demonstrate, and deploy green hydrogen technologies. CEC held a series of public workshops this year to solicit stakeholder input on specific topics and obtain input and feedback on draft research initiatives being considered for the Electric Program Investment Charge (EPIC) 2021–2025 (EPIC 4) Investment Plan. Research themes that are expected to increase hydrogen usage in California include:
Decarbonization: The reduction of fossil fuels usage and GHG emissions.
152 LADWP. January 28, 2022. Comments from the Los Angeles Department of Water and Power (LADWP) to the California Energy Commission (CEC) on the Draft Integrated Energy Policy Report (IEPR) Volume III. TN# 241320. LADWP requested to update the text as shown in this paragraph, “to be consistent with the LA100 Study and LADWP’s latest carbon free goals.” 153 Presentation by Laura Nelson., “Building the Green Hydrogen Economy.” July 28, 2021, IEPR workshop on Hydrogen to Support California’s Clean Energy Transition. https://efiling.energy.ca.gov/GetDocument.aspx?tn=239038&DocumentContentId=72473. 154 Green Hydrogen Coalition. 2021. “Press Release: Western Green Hydrogen Initiative Launched.” Accessed September 16, 2021. https://www.ghcoalition.org/ghc-news/western-green-hydrogen-initiative-launched.
82

Resilience and reliability: o Provide firming and shaping to balance increasing amounts of intermittent
renewable generation to help match load and generation to keep the grid stable. o Support resilience for public safety power shutoff eventsshutoffs.
Entrepreneurship: Support clean energy entrepreneurs developing breakthrough technology solutions from idea to market.
Affordability: Improve the affordability of energy services for all electric ratepayers. The CEC approved the EPIC 4 Investment Plan at the November 15, 2021, Business Meeting and plans to submit it in December 2021 to the CPUC for final approval.155
United States Department of Energy: Hydrogen Shot Much of the investment needed to cut hydrogen production costs in the United States is being identified through the United States Department of Energy (U.S. DOE) Hydrogen Shot, which the Biden administration announced June 7, 2021. The Hydrogen Shot seeks to reduce the cost of clean hydrogen by 80 percent to $1 per 1 kilogram in 1 decade ("1 1 1") through several pathways:
Reduce electricity cost from more than $50/megawatt-hour (MWh) to $30/MWh by 2025 and $20/MWh by 2030.
Reduce capital cost by at least 80 percent. Reduce operating and maintenance cost.
The U.S. DOE followed up on this announcement by issuing a request for information on viable hydrogen demonstrations, including specific locations, that can help lower the cost of hydrogen, reduce carbon emissions and local air pollution, create good-paying jobs, and provide benefits to disadvantaged communities. If the Hydrogen Shot goals are achieved, scenarios suggest at least a fivefold increase in clean hydrogen use. One estimate reports a potential 16 percent CO2 emission reduction by 2050, as well as $140 billion in revenues and 700,000 jobs by 2030.156
European and United Nations Programs The European Union has implemented green hydrogen production targets of 6 GW, or 1 million tonnes per year, by 2024 and 40 GW, or 10 million tonnes per year, by 2040. The Green Hydrogen Catapult is an initiative of the United Nations Framework Convention on Climate Change’s Race to Zero campaign. The initiative aligns the production and use of green hydrogen to displace fossil fuels at a rate consistent with achieving net-zero global emissions by 2050 and limiting global temperature increases to 1.5 degrees Celsius.
155 CEC. November 15, 2021, Business Meeting Agenda. https://www.energy.ca.gov/sites/default/files/2021-10/21-11-15%20Agenda_ADA.pdf. 156 U.S. Department of Energy Hydrogen and Fuel Cell Technologies Office’s Hydrogen Shot webpage.web page. Accessed August 20, 2021. https://www.energy.gov/eere/fuelcells/hydrogen-shot.
83

Presenters at the 2021 IEPR Hydrogen workshop agreed that large prospective hydrogen end users in the industrial, electric generation, and transportation sectors will need to be enlisted to meet hydrogen targets. The switch from fossil gas or petroleum fuels to hydrogen by these large users is needed to justify the large investment in hydrogen pipeline transportation and storage infrastructure. Initiatives such as the U.S. DOE Hydrogen Shot, the HyDeal North America, and the HyDeal Los Angeles are designed to identify geographically concentrated end users of fossil gas and other fuels for whom cost-effective electrification alternatives are not available. Consequently, proposals to reduce these costs often include repurposing existing fossil gas infrastructure to safely distribute hydrogen and related blends with fossil gas.
One major concern about repurposing existing fossil gas infrastructure is the risk to pipeline materials if hydrogen is blended with fossil gas at concentrations higher than 20 percent. This concern is important because repurposing existing fossil gas infrastructure to transport and distribute hydrogen could greatly reduce the costs to transition from fossil gas to hydrogen. European utilities are now blending as much as 20 percent hydrogen with fossil gas in their pipelines with no apparent damage. However, previous research documented threats to pipeline integrity, such as hydrogen embrittlement, accelerated fatigue crack growth, and enhanced crack growth from existing defects due to exposure to hydrogen. The following are examples of the research efforts underway in the United States to resolve these concerns:
NREL in November 2020 announced a new collaborative research and development project known as HyBlend™ to address the technical barriers to blending hydrogen in fossil gas pipelines. NREL leads a team that includes six national laboratories and more than 20 participants from industry and academia who will produce:
o A model to estimate the life of metal and polymer piping and pipeline materials (for example, steel and polyethylene) when blends are used. Sandia National Laboratories and Pacific Northwest National Laboratory will conduct this research.
o A life-cycle emissions analysis of technologies using hydrogen and fossil gas blends. Argonne National Laboratory will conduct this research.
o A technoeconomic analysis to quantify the costs and opportunities for hydrogen production and blending within the fossil gas networks. NREL will conduct this research.
Southern California Gas Company is testing a new technology to separate hydrogen from fossil gas and simultaneously compress the gas. This technology would enable electric generators to burn the fuel mix required by equipment specifications.
Under Phase 4 of the CPUC’s Rulemaking (R.) 13-02-008, the CPUC administered the Hydrogen Blending Impacts Study, conducted by the University of California, Riverside.157 This project is aimed at assessing safety and performance concerns associated with injecting hydrogen into the existing natural gas pipeline infrastructure.
157 CPUC Rulemaking to Adopt Biomethane Standards and Requirements, Pipeline Open Access Rules, and Related Enforcement Provisions.
84

Experimental and modeling work is ongoing on leakage rates, impacts on durability and integrity of the pipeline system and components, and hydrogen-driven embrittlement. The expected release date of the study is February 2022.
An alternative process can convert green hydrogen and CO2 to green methane and water, which can be transmitted in fossil gas pipelines and used in the same way as fossil gas. No modifications to fossil gas pipelines or other infrastructure would be necessary; however, the cost of creating the green hydrogen and then reconverting it into green methane could be cost-prohibitive.158
158 Petouhoff, Mike. 2021. “Introduction of EPIC Initiative The Role of Green Hydrogen in a Decarbonized CA -— A Roadmap and Strategic Plan.” Accessed July 28, 2021. https://efiling.energy.ca.gov/GetDocument.aspx?tn=239050&DocumentContentId=7248.
85
CHAPTER 5: Decarbonization and Gas System Planning
Decarbonization strategies such as electrification of buildings and other gas uses can reduce demand for fossil gas and thereby reduce greenhouse gas (GHG) emissions. Residential and small commercial gas demand accounts for only about 25 percent of total statewide gas demand. Industry, large commercial, and electric generation make up the remaining 75 percent of gas use in the state. Even as residential and commercial gas demand declines, the state will need to retain gas infrastructure, at least for a transition period, to meet hard-to-electrify gas uses in industry, as well as electric generation needs. Finding clean energy sources and decarbonization strategies for these gas uses presents challenges and may take longer to achieve.
Reduced gas demand may also lead to the reduction or retirement of portions of the gas system and potentially reduce costs. However, opportunities to reduce or retire gas assets may be limited, at least in the near term to midterm. Other strategies like shifting from fossil gas to renewable gas and renewable hydrogen may allow utilities to repurpose at least some portion of the utility’s gas infrastructure. The longer-term need for the gas system will depend on the timing and pace of other decarbonization efforts targeted at reducing gas uses and the associated role in delivering clean fuels.
The 2019 Integrated Energy Policy Report (2019 IEPR) identified the need for California to initiate an interagency strategic planning process to identify the short- and long-term transition of the gas system to nonfossil gases and other cleaner energy solutions. This chapter addresses potential gas system impacts from building electrification and the need for coordinated, long-term, comprehensive gas system planning in the state.
Decarbonization Through Building Electrification A recent California Energy Commission (CEC) report on possible GHG reductions from building decarbonization indicates that electrification is technically possible for about 87 percent of residential and commercial gas consumption, as this portion of gas end use consumption can be disaggregated, or broken down, to gas technologies for which a suitable electric technology exists.159 CEC staff estimates that in 2030 building electrification combined with additional achievable energy efficiency measures can reduce natural gas usage by residential and commercial buildings between 24 percent and 72 percent.160 To put this in perspective,
159 Kenney, Michael, Nicholas Janusch, Ingrid Neumann, and Mike Jaske. 2021. California Building Decarbonization Assessment. CEC. Publication Number: CEC-400-2021-006-CMF. pp. 69–73. https://www.energy.ca.gov/data-reports/reports/building-decarbonization-assessment. 160 Ibid. The “business-as-usual” case gas consumption for residential and commercial buildings in 2030 is 593,925 MMcf (6,159 MMTherms). In the “minimal electrification” scenario, gas consumption is reduced to 76 percent of the “business-as-usual” case in 2030, while the “moderate electrification” scenario reduces it to 62
86
California consumes around 5.5 billion cubic feet (Bcf) of gas on an average day and as much as 11 Bcf on a very cold winter day. By 2030, reductions associated with building electrification under the business-as-usual case would reduce total gas use by only 8 percent, while the aggressive case, which is less likely occur, could reduce total gas use by 29 percent. This is a wide range of estimated gas demand reductions, and there are many uncertainties that must be better understood and addressed to bring the reductions.
Achieving these levels of gas demand reductions will require significant effort and are likely to be expensive, especially in the near term. The assessment concludes that reducing building-sector GHG emissions will require large-scale deployment of electric heat pumps, large investments in existing buildings, and an information campaign to familiarize consumers with high-efficiency electric appliances. It also concludes that newly constructed buildings have the lowest decarbonization costs. New construction presents clear opportunities to reduce gas system costs by avoiding investments in new gas infrastructure.
Recent decarbonization reports suggest that building electrification may lead to dramatic, near-term reductions in gas demand.161 However, building electrification may happen more gradually over the next 20 years and further into the future, depending in part on the amount of policy support for the transition. In addition, there is not yet a good understanding of where, when, and how much residential and commercial gas demand will decline and how much gas distribution infrastructure could be decommissioned as a result. In the meantime, maintaining a safe and reliable gas transmission system for the state’s business, industrial, and other customers is essential to California’s economic health. It is also key in ensuring a clean and reliable electricity system in the near term to midterm to support electrification and decarbonization of the transportation sector and other energy uses in the state. For more information on building decarbonization, see the 2021 IEPR, Volume I: Energy Efficiency and Building, Industrial, and Agricultural Decarbonization.
Gas System Implications From Building Decarbonization Over the last few years, several reports have addressed gas decarbonization issues and discussed different aspects of planning for the transition away from fossil gas. These include reports by organizations including GridWorks, the Environmental Defense Fund (EDF), E3 Consulting, the Rocky Mountain Institute (RMI), the Building Decarbonization Coalition (BDC), and others. A common theme in building decarbonization studies is the suggestion that decreases in gas demand from building electrification could allow the retirement of gas distribution assets and downsizing pipelines from transmission to distribution pressure, presenting opportunities to reduce gas system costs. Many of the assertions are based on a
percent. In the “aggressive electrification” scenarios, electrification efforts reduce gas consumption in residential and commercial buildings to 28 percent of the baseline forecast in 2030. Kenney, Michael, Nicholas Janusch, Ingrid Neumann, and Mike Jaske. 2021. California Building Decarbonization Assessment. CEC. Publication Number: CEC-400-2021-006-CMF. pp. 69–73. https://www.energy.ca.gov/data-reports/reports/building-decarbonization-assessment. 161 Gridworks. 2019. California’s Gas System in Transition. https://gridworks.org/wp-content/uploads/2019/09/CA_Gas_System_in_Transition.pdf.
87

research study conducted by E3 in 2019 that “hypothesized that geographically targeted electrification and retirement of the gas system could be one potential strategy to achieve these [cost] reductions, though other measures (for example, derating of pipes to lower pressures) may also be available.”162
E3 concluded: “Even in the high building electrification scenario, which assumes a rapid transition to 100 percent sales of all new water heaters and HVAC systems to electric heat pump equipment by 2040, there are still millions of gas customers remaining in California by 2050.”163 E3 suggests that to reduce capital investment and operations and maintenance (O&M) expense associated with aging infrastructure, an alternative is to target retirement of the gas distribution system. As E3 notes: “However, this strategy is somewhat speculative, hinging on successful identification of geographies ripe for retirement and successful targeting of electrification efforts. That overlay is particularly important because early retirement of utility infrastructure and consumer end use equipment carries real economic costs.”164
As suggested, reducing the size of the gas system as demand contracts may be possible. However, there are several factors that come into play when looking for gas assets to retire or downsize that may limit these opportunities. References are also made to local gas bans to support the idea that reduced gas demand will allow downsizing of the gas system. However, many of the local ordinances apply only to new construction. The CEC identified 17 local jurisdictions, mostly in Northern California, that require all electric for new construction.165
Some of these ordinances do not allow homes or other specified buildings to use gas, while other ordinances allow gas to be installed but with higher stringency requirements.166
In addition, several local governments including Alameda, Berkeley, Morgan Hill, San Francisco, San Jose, and Santa Cruz have adopted gas infrastructure limitations, which many characterize as “gas bans..” To ensure that gas infrastructure can be downsized or retired, it will be important to ensure that all customer gas uses (or load) on a given segment of the distribution system are eliminated. Only one remaining customer on that segment can stand in the way of that retirement. In addition, the gas utility is obligated to continue service to a customer who does not want to electrify. This service continuation could be addressed by
162 Aas, Dan, Amber Mahone, Zack Subin, Michael Mac Kinnon, Blake Lane, and Snuller Price. 2019. Natural Gas Distribution in California’s Low-Carbon Future: Technology Options, Customer Costs and Public Health Benefits. Research conducted for the CEC. Publication Number: CEC-500-2019-055-D. p. 66. https://www.energy.ca.gov/sites/default/files/2021-06/CEC-500-2019-055-F.pdf. 163 Ibid. p. 6 164 Ibid. p. 68 165 Kenney, Michael, Nicholas Janusch, Ingrid Neumann, and Mike Jaske. 2021. California Building Decarbonization Assessment. CEC. Publication Number: CEC-400-2021-006-CMF. pp. 69–73. https://www.energy.ca.gov/data-reports/reports/building-decarbonization-assessment. 166 PG&E notes that the State of California and more than 50 local jurisdictions are addressing decarbonization from a policy perspective through advancements in building codes and appliance standards. PG&E has provided written support for these state and local efforts where they are cost-effective and reduce emissions for its customers. Pacific Gas and Electric. Comments on Draft 2021 Integrated Energy Policy Report. TN 241334. Docket 21-IEPR-06. https://efiling.energy.ca.gov/GetDocument.aspx?tn=241334.
88

changing the utility obligation to serve and potentially moving away from postage stamp ratesetting that provides incentives for retaining gas service.167
In addition, retirement of gas distribution depends on where the segment is located in relation to other gas demand. For example, the need to serve a major gas user, like a college campus or industrial customer, downstream could present operational constraints that may limit opportunities to reduce gas distribution assets. Detailed hydraulic modeling is necessary to determine the feasibility of gas distribution downsizing.
The suggestion that reductions in gas demand could create opportunities to downsize pipelines from gas transmission to distribution to reduce costs may not be as straightforward as suggested. Distribution lines are subject to less stringent safety oversight than transmission lines because they operate at lower pressures and, thus, have lower maintenance costs. At some point, once gas demand drops below a certain level, this could allow what once was transmission to become distribution. However, there are potential safety issues and complications related to the definitions of transmission versus distribution that are discussed in Chapter 8. The savings achievable or the advisability of derating transmission pipelines is uncertain at this time.
Until detailed analyses of gas system impacts from building electrification have been conducted, it is premature to speculate on the magnitude of potential gas system reductions or cost savings that could be achieved. This type of gas system analysis will need to be included as a critical element of a comprehensive, long-term gas planning process. Some type of geographically targeted electrification will be essential to achieving reductions in the gas system footprint. As noted in Chapter 6, the CEC is funding two research projects that are looking at the potential for targeted electrification and gas decommissioning.
Gas System Planning A gas transition planning process is essential if the state is to meet its near-term and longer-term climate goals. While there is no formal process for long-term planning and determining the need for gas system investments similar to California’s electricity system planning and procurement process, the CEC and CPUC acknowledge the need for a comprehensive assessment of overall needs of the gas system in the long-term context of climate goals. Decarbonization through electrification or other means requires a more comprehensive and cohesive approach to planning and determining the appropriate size and cost of California’s gas system.168
167 Postage stamp rates refer to the concept employed by the U.S. Postal Service where one price is charged for mailing a letter regardless of the distance between the sender and receiver of the mail. On the gas system, gas customers pay the same rate regardless of where they are located in relation to the distribution system rather than paying a rate that varies by distance. 168 California Council on Science and Technology. January 2018. Long-Term Viability of Underground Natural Gas Storage in California. https://ccst.us/reports/long-term-viability-of-underground-natural-gas-storage-in-california-an-independent-review-of-scientific-and-technical-information/.
89

Today, most decisions involving gas infrastructure are geared around the short-term time frames for CPUC rate cases or capital expenditure proceedings, which are conducted every three to four years for each gas utility. A wide range of decisions about gas utility operations, infrastructure, and rates are often made in silos with limited transparency that lead to suboptimal outcomes for customers and long-term system planning.169 Some asset retirements and additions can be done without any specific permission at all and are just part of a category within the rate case. In many cases, the rate applications do not list specific projects but only dollar amounts for spending categories, and there is no deep review within categories as to the specific projects.
As discussed in Appendix B, California’s gas system grew organically over more than 100 years, starting in the 1860s with town gas manufactured from coal. By the 1920s and 1930s, welding technologies advanced to allow long-distance transmission of gas. When gas demand in the state exceeded in-state gas production, interstate pipelines began bringing gas to California. As opportunities arose, the gas utilities collaborated to request CPUC approval to purchase gas from proposed new interstate pipelines.
The PGT/Pacific Gas and Electric Company (PG&E) Pipeline Expansion that went into service in 1993 to bring Canadian gas into the state is roughly the last major pipeline investment approved by the CPUC. PG&E sought this expansion in a stand-alone CPCN application outside the rate case.170 By 2019, California offered the second largest gas market in the United States, accounting for 7.4 percent of the total 30.5 Tcf of the gas consumed across the country.171 It is a market that long has been attractive to pipeline investors, suppliers, and marketers. As shown in Figure 9Figure 9 in Chapter 1, California has enjoyed gas prices that are lower than the U.S. average price since the 1980s.
SoCalGas or San Diego Gas & Electric (SDG&E) or both have filed applications to add intrastate transmission capacity through stand-alone applications outside the general rate case process. These applications include the 2013 North-South Pipeline Project (Application No 13-12-013), the Line 6900 Expansion, and the 2015 Pipeline Reliability/Line 1600 project. However, none of these projects presented overall pictures of capacity needed to meet reliability measures. Instead, they were designed to meet specific needs, such as to move more gas from north to south on SoCalGas’ system or to move more gas to San Diego.
In short, there has never been a comprehensive plan for California’s gas system, although the CPUC and CEC have published infrastructure assessments or reviewed reliability standards
169 Karas, Natalie, Michael Colvin, et.al. January 2021. Aligning Gas Regulation and Climate Goals: A Road Map for State Regulators. Environmental Defense Fund, p. 5. http://blogs.edf.org/energyexchange/files/2021/01/Aligning-Gas-Regulation-and-Climate-Goals.pdf. 170 PGT-Pacific Gas and Electric Company Expansion Project is an 840-mile addition to the existing PGT and Pacific Gas and Electric Company gas pipeline system that went into operation on November 1, 1993, to provide additional, direct access to Canadian gas supplies. The project consists of two components: the PGT Expansion and the Pacific Gas and Electric Company Pipeline Expansion, or Line 401. 171 Data downloaded from EIA Natural Gas Monthly. The year 2019 is the latest for which all of the California demand data are complete.
90

from time to time.172 The latest CPUC assessment is now some 15 years old. While the CEC has often included an infrastructure review in its IEPR gas outlook, it has not consistently evaluated the utilities’ ability to meet demand but focused more on ensuring that interstate delivery capability exceeds intrastate take-away capacity.
The Need for Long-Term Gas Planning As noted above, the CEC identified the need for a long-term gas system plan in its 2019 IEPR, and the CPUC has opened the gas planning OIR to look at these issues. The gas system was originally built to serve residential and small commercial customers. Service to large customers such as industries and gas-fired power plants came later and tended to smooth out the winter-focused peak load factor of the residential customers who used gas primarily for space heating.173 These larger customers also had alternate fuel capability: fewer costs were allocated to them, and they were assumed to be interruptible.174 The assumption that large customers could be curtailed provided a large cushion to protect residential and commercial customers reliant on gas for space heat from curtailment.
As discussed, restoring service to small customers is very costly and time-consuming.175 Those customers, who are the very foundation of California’s gas system, are the most likely focus of electrification efforts. As they switch to electricity, curtailment risk for other customers should decrease, and a greater proportion of remaining gas demand would be for industry and electricity generation. The paradigm in which large customers can reasonably be curtailed more than occasionally is no longer sustainable. Few large customers can switch to an alternate fuel that is either permitted or that could be decarbonized. This could mean that California would need to revisit its priority of service, or curtailment priority, for strained gas system conditions.176 All of this points to the need for comprehensive planning for decarbonization and changes to the gas system as gas use declines.
The state has an extensive gas system that requires regular ongoing maintenance, repair, and infrastructure investment. In addition, there is spending for testing, repair, and replacement of pipe to meet more stringent state and federal safety requirements following the San Bruno
172 CPUC Decision No. 06-09-039 CPUC Decision No. 06-09-039 in Rulemaking 04-01-025 addressed “Infrastructure Adequacy and Slack Capacity, Interconnection and Operational Balancing Agreements, an infrastructure working group, gas supply and infrastructure adequacy for electric generators, gas quality and other matters.” August 13, 2021. https://docs.cpuc.ca.gov/PublishedDocs/PUBLISHED/FINAL_DECISION/60237.htm. 173 A load factor is a measure of utilization rate in which the average load or demand is divided by the peak load or demand. 174 See CPUC Decision 86-10-009 and the 1988 California Gas Report, at page 63. 175 California Council on Science and Technology. January 2018. Long-Term Viability of Underground Natural Gas Storage in California. https://ccst.us/reports/long-term-viability-of-underground-natural-gas-storage-in-california-an-independent-review-of-scientific-and-technical-information/. 176 A settlement adopted in CPUC D.16-07-008 developed a new curtailment order that protects minimum electric generation needed for local reliability and minimum refinery loads from curtailment until after other noncore loads have been curtailed. Changing gas demand profiles for electric generators may warrant revisiting curtailments priority.
91

explosion on the PG&E system. Testing and safety investments for storage wells are also required to meet new safety regulations established by the California Geologic Energy Management Division (CalGEM) following the methane leak at Aliso Canyon. In addition, there are ongoing costs for methane leakage prevention. These investments need to be better understood and justifications more carefully examined. While safety and reliability of the system are paramount, some prioritization of investments is needed to prevent stranded assets.
Infrastructure investments are treated as long-lived assets — with 60 to 80 years of useful life from a depreciation standpoint — under the assumption they will be needed over the full service life.177 These investments may no longer be needed for the full useful life in a system where gas demand is declining, even if the pace of demand reduction is slow. These issues are discussed further in Chapters 6 and 7. Generally, utilities base forecasts of future demand on business-as-usual scenarios, currently enacted statutes and decisions, assumptions, and programs without consideration of the GHG emission implications not required by statute or decision. California utilities project a slow decline (1 percent per year) in gas use over the next 10 years.178 This trajectory aligns with shareholder interests of continued use and expansion of the system. However, this trajectory may no longer reflect the long-term needs of the customers the system serves in light of the need to decarbonize energy end uses.
Cost recovery for ongoing investments in the gas system is complex and needs to be made more transparent.179 Many safety investments are mandatory, and the evaluation and approval of these investments are now standardized to quantify and balance safety and cost concerns. The process utilities use to identify the priority and schedules for pipeline safety and other investments is not well-understood, nor are the risk-based approaches that utilities rely on in making decisions about investment in gas infrastructure. It is not clear how the need to replace aging infrastructure or Aldyl-A pipe is determined in any given rate cycle and whether utilities have comprehensively assessed and prioritized investments over the long term.180 It is also unclear the extent to which utilities consider nonpipeline alternatives when deciding which pipelines to repair or safety investments to make. In some cases, targeted energy efficiency or building electrification programs could reduce or eliminate the need for repairs or replacement. There also does not appear to be a systematic long-term approach to planning for retirement of gas distribution assets that may be viable candidates due to the location at the ends of
177 While the physical life of a pipeline is about 70 to 75 years, the depreciation of the asset is often from 60 to 80 years. 178 California Gas and Electric Utilities. 2020 California Gas Report. Available at https://www.socalgas.com/sites/default/files/2020-10/2020_California_Gas_Report_Joint_Utility_Biennial_Comprehensive_Filing.pdf. 179 Karas, Natalie, Michael Colvin, et.al. January 2021. Aligning Gas Regulation and Climate Goals: A Road Map for State Regulators. Environmental Defense Fund, p. 5. http://blogs.edf.org/energyexchange/files/2021/01/Aligning-Gas-Regulation-and-Climate-Goals.pdf. 180 Aldyl-A is a type of plastic used for gas distribution pipelines that can become brittle and fail, long before its intended end of service life. DupontDuPont, a manufacturer of this plastic, issued its first warning about potential failures in 1982, followed by federal investigations and advisories to replace pipelines starting in 1998.
92

pipelines or for Aldyl-A pipelines that will eventually need to be replaced anyway. The CPUC gas planning OIR is a first step to developing the long-term approach to gas planning.
Various building decarbonization studies identify a pressing need for a long-term gas planning process in California that is transparent and rigorous, which is difficult to achieve in rate cases and capital expenditure proceedings.181 Stakeholder engagement related to gas utility infrastructure investments is limited to those who participate in rate cases. These tend to be ratepayer advocate groups and sophisticated customers, such as industry advocacy groups representing shippers or marketers, large industrial customers, and electric generators. These rate cases are adjudicatory-type proceedings involving extensive testimony and cross examination and that involve legal pleadings and briefs unfamiliar to outside stakeholders. In addition, rate cases often rely on settlements between parties that are not transparent to those who do not participate in the proceeding. Meaningful participation in these proceedings is hampered by difficulty accessing information on utility investments due to the sheer size of rate case filings. For example, PG&E’s last general rate case excluded gas transmission and storage. It covered a revenue requirement of $9 billion, and many issues were settled. Still, the CPUC final decision was 430 pages long, and the record contained at least 311 separate exhibits.
Long-term planning that includes an assessment of GHG emissions and evaluates a broad range of possible actions and solutions will help ensure gas utilities’ investment decisions will not interfere with attaining climate objectives. This long-term planning should look beyond just a five-year or 10-year time horizon. This planning should determine how gas utilities can support achievement of end-use decarbonization, as well as other decarbonization strategies including renewable gas and renewable hydrogen, while achieving state climate goals. EDF suggests that a gas plan for the state should establish a clear target for each major end use of gas in the system and allow for different options to emerge.182 They note that decarbonizing the gas system will not be a “one size fits all” approach, and different strategies will be needed for core residential customers, larger commercial and electric noncore customers, and electric generators.183
Long-term planning should also incorporate weather impacts from climate change, not just increasing long-term temperatures, but extreme hot and cold events as discussed in Chapter 3 and Appendix D. EDF notes that long-term planning should also consider a broad conversation on gas storage facilities and explore the public benefit of gas storage as the state moves to
181 Ibid. Gridworks. 2019. California’s Gas System in Transition. https://gridworks.org/wp-content/uploads/2019/09/CA_Gas_System_in_Transition.pdf. 182 EDF. Comments on Draft 2021 Integrated Energy Policy Report. TN 241323. Docket 21-IEPR-06. TN 241323. Docket 21-IEPR-06. https://efiling.energy.ca.gov/GetDocument.aspx?tn=241323. 183 Ibid.
93

decarbonize the economy.184 EDF’s comments suggest the state examine the substitutability of alternative fuels in the gas storage fields, and potential other uses, such as carbon sequestration.185 The long-term resilience of gas infrastructure with a changing climate should also be addressed in a planning process. Ongoing long-term planning will be needed to address new and changing needs of the gas system, protect customers from unnecessary costs, and support continued provision of safe, reliable, and affordable service in an evolving industry.
Comments filed by several key stakeholders support the need for long-term gas system planning and emphasize the importance of moving the conversation forward to meet the states decarbonization goals.186 In particular, the Northern California Power Agency (NCPA) urged the CEC to use the information in the 2021 IEPR as the starting point for further deliberation and not to “shelf” this critically important information.187 Commenters including SoCalGas, PG&E, EDF, and NCPA acknowledge the importance of collaboration between the state agencies and the engagement of a broad set of stakeholders. NCPA comments that in addition to working with sister agencies, successful gas planning will require collaboration with the providers of both electricity and natural gas. They note that providers are needed to fully understand the interdependences between the gas and electricity systems and the impact they will have on consumers and the total cost of energy.188 EDF suggests that the CEC could play a vital role in identifying key groups and convening community representatives via public participation hearings in addition to more formal stakeholder convening.189 Several commenters suggested policy and technical issues, as well as analysis, as well as those identified in the 2021 IEPR that should be included in long-term gas planning for the state. The CEC anticipates an inclusive dialogue on these and other gas decarbonization topics in future IEPRs and other proceedings and forums.
Policy Issues for Gas Planning California’s deep decarbonization goals will require reduction in the use of fossil gas in the state’s economy that raises cross-cutting policy issues involving the pace, order, and equity of the transition. In addition, there are key policy considerations such as the reliability and safety of gas infrastructure, the affordability and equity of gas service, the role of renewable gas and renewable hydrogen, the impacts to workers, and the role of gas utilities, among others.
184 Ibid. EDF notes that in addition to the recommendation to develop a plan for retiring Aliso Canyon, the conversation should include the other storage fields, recognizing the connection to lost economic benefits as storage is an important hedge against price volatility. 185 Ibid. 186 Comments from EDF, SoCalGas, PG&E, and NCPA. https://www.energy.ca.gov/data-reports/reports/integrated-energy-policy-report/2021-integrated-energy-policy-report. 187 Northern California Power Agency. Comments on Draft 2021 Integrated Energy Policy Report. TN 241321 Docket 21-IEPR-06. https://efiling.energy.ca.gov/GetDocument.aspx?tn=241321. 188 Ibid. 189 EDF. Comments on Draft 2021 Integrated Energy Policy Report. TN 241323. Docket 21-IEPR-06. TN 241323. Docket 21-IEPR-06. https://efiling.energy.ca.gov/GetDocument.aspx?tn=241323.
94
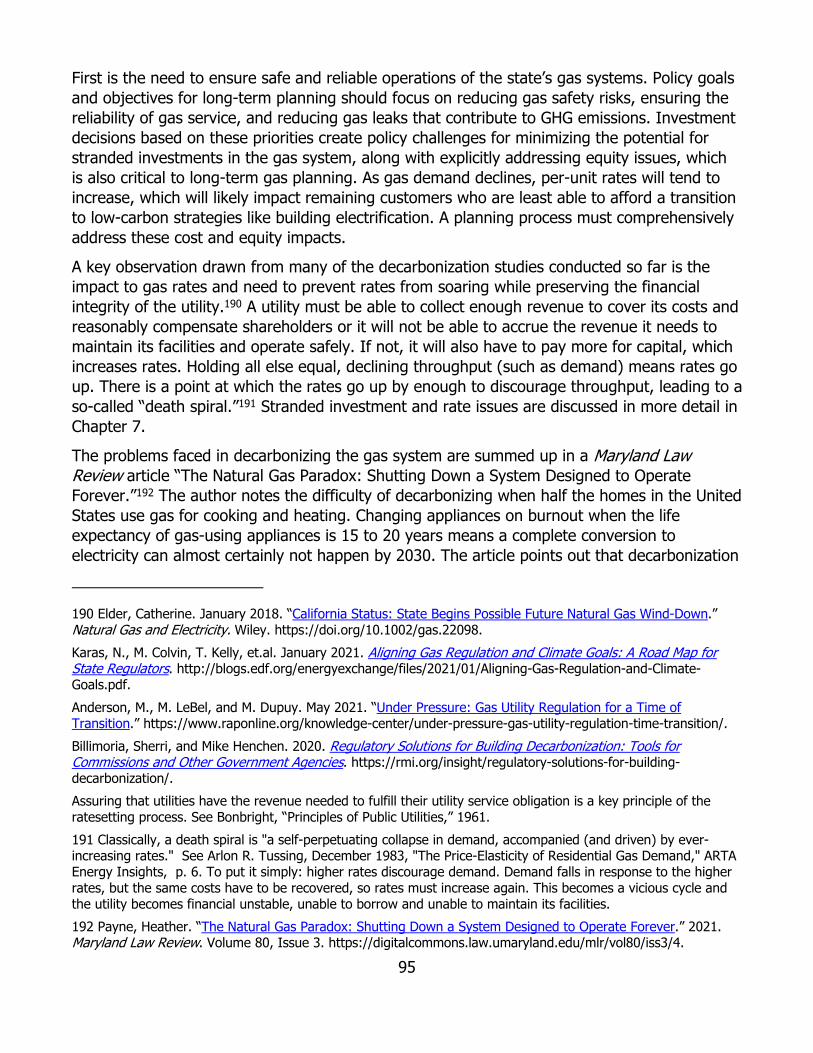
First is the need to ensure safe and reliable operations of the state’s gas systems. Policy goals and objectives for long-term planning should focus on reducing gas safety risks, ensuring the reliability of gas service, and reducing gas leaks that contribute to GHG emissions. Investment decisions based on these priorities create policy challenges for minimizing the potential for stranded investments in the gas system, along with explicitly addressing equity issues, which is also critical to long-term gas planning. As gas demand declines, per-unit rates will tend to increase, which will likely impact remaining customers who are least able to afford a transition to low-carbon strategies like building electrification. A planning process must comprehensively address these cost and equity impacts.
A key observation drawn from many of the decarbonization studies conducted so far is the impact to gas rates and need to prevent rates from soaring while preserving the financial integrity of the utility.190 A utility must be able to collect enough revenue to cover its costs and reasonably compensate shareholders or it will not be able to accrue the revenue it needs to maintain its facilities and operate safely. If not, it will also have to pay more for capital, which increases rates. Holding all else equal, declining throughput (such as demand) means rates go up. There is a point at which the rates go up by enough to discourage throughput, leading to a so-called “death spiral.”191 Stranded investment and rate issues are discussed in more detail in Chapter 7.
The problems faced in decarbonizing the gas system are summed up in a Maryland LawReview article “The Natural Gas Paradox: Shutting Down a System Designed to Operate Forever.”192 The author notes the difficulty of decarbonizing when half the homes in the United States use gas for cooking and heating. Changing appliances on burnout when the life expectancy of gas-using appliances is 15 to 20 years means a complete conversion to electricity can almost certainly not happen by 2030. The article points out that decarbonization
190 Elder, Catherine. January 2018. “California Status: State Begins Possible Future Natural Gas Wind-Down.” Natural Gas and Electricity. Wiley. https://doi.org/10.1002/gas.22098. Karas, N., M. Colvin, T. Kelly, et.al. January 2021. Aligning Gas Regulation and Climate Goals: A Road Map for State Regulators. http://blogs.edf.org/energyexchange/files/2021/01/Aligning-Gas-Regulation-and-Climate-Goals.pdf. Anderson, M., M. LeBel, and M. Dupuy. May 2021. “Under Pressure: Gas Utility Regulation for a Time of Transition.” https://www.raponline.org/knowledge-center/under-pressure-gas-utility-regulation-time-transition/. Billimoria, Sherri, and Mike Henchen. 2020. Regulatory Solutions for Building Decarbonization: Tools for Commissions and Other Government Agencies. https://rmi.org/insight/regulatory-solutions-for-building-decarbonization/. Assuring that utilities have the revenue needed to fulfill their utility service obligation is a key principle of the ratesetting process. See Bonbright, “Principles of Public Utilities,” 1961. 191 Classically, a death spiral is "a self-perpetuating collapse in demand, accompanied (and driven) by ever-increasing rates." See Arlon R. Tussing, December 1983, "The Price-Elasticity of Residential Gas Demand," ARTA Energy Insights, p. 6. To put it simply: higher rates discourage demand. Demand falls in response to the higher rates, but the same costs have to be recovered, so rates must increase again. This becomes a vicious cycle and the utility becomes financial unstable, unable to borrow and unable to maintain its facilities. 192 Payne, Heather. “The Natural Gas Paradox: Shutting Down a System Designed to Operate Forever.” 2021. Maryland Law Review. Volume 80, Issue 3. https://digitalcommons.law.umaryland.edu/mlr/vol80/iss3/4.
95

needs to start at home and with local building code enforcement — an issue with which the CEC has grappled in updating its building standards.193 It notes the “serious financial implications for captive ratepayers” and that much investment has been made without the knowledge that it would become stranded. The author splits the transition into three fundamental questions, some of which need to be addressed politically by legislatures and others by regulators: “(1) what policies are necessary and will be implemented to electrify heating, cooking, clothes drying, and hot water; (2) how should regulators shut down the gas distribution system and (3) how should regulators compensate — or not compensate — regulated monopoly utilities for the assets that have been stranded in the transition?”194 The author concludes that the longer society waits, the more difficult and expensive the transition will be.195
Studies sponsored by industry tend to focus on ensuring the transition allows different uses of the existing gas infrastructure, such as by blending renewable gas, hydrogen, or synthetic gas, or by incorporating gas certified as produced and delivered with lower upstream emissions, or by capturing and sequestering the emissions at combustion. Consultancy MJ Bradley & Associates has formed a “Downstream Natural Gas Initiative.” The initiative aims primarily at “helping customers become more energy efficient, reducing and eliminating methane emissions, and supplying customers with lower and zero-carbon sources of energy by gradually repurposing natural gas networks.”196 Downstream Natural Gas Initiative members include Consolidated Edison, DTE Energy, Enbridge Gas, Eversource, Liberty Utilities, National Grid, NiSource, NW Natural, Philadelphia Gas Works, PG&E, SoCalGas, and Vermont Gas. With some exceptions, these utilities are concentrated in coastal or near-coastal states.
Other policy considerations in gas planning include ensuring an adequate gas industry workforce to operate and maintain the gas system, as well as minimizing adverse impacts on gas workers, retaining skilled workers, and providing for displaced gas workers. In addition, the planning process must consider the needs of the primary users of the gas system during the transition from fossil gas and the changing gas demand and use patterns. The state must consider workforce impacts to avoid displacing utility workers, and the future role of gas utilities as the gas system evolves. All these issues have a bearing on the planning for the gas system as consumers move away from fossil gas.
193 Ibid. p. 703 CEC web page for the 2022 Building Energy Efficiency Standards. https://www.energy.ca.gov/programs-and-topics/programs/building-energy-efficiency-standards/2022-building-energy-efficiency. 194 Payne, Heather. 2021. “The Natural Gas Paradox: Shutting Down a System Designed to Operate Forever.” Maryland Law Review. Volume 80, Issue 3, p.706. https://digitalcommons.law.umaryland.edu/mlr/vol80/iss3/4. 195 Ibid. p. 754. 196 MJ Bradley & Associates. December 2020. The Role of Gas Networks in a Low-Carbon Future, p. 3. https://mjbradley.com/sites/default/files/MJBA_Long-term-Vision-of-Gas%20Networks-in-a-Low-Carbon-Future_December2020.pdf.
96

CHAPTER 6: Gas System Issues
Overview of Gas Transmission and Distribution Systems As California contemplates the gas transition, it is worth noting the physical footprint of the state’s gas infrastructure, shown in Figure 30. As described in Chapter 1, California’s gas systems are designed to deliver gas produced in-state and gas received from interstate pipelines from out-of-state production, particularly from Canada, the Rocky Mountains, and the Southwest. California’s gas systems also have interconnections at the Mexican border. Also interconnected to this system are underground gas storage fields. The gas transmission systems of Pacific Gas and Electric (PG&E) (Northern and Central California) and Southern California Gas (SoCalGas) (Central and Southern California) are not well-interconnected and act almost entirely as separate systems.
Figure 30: California’s Gas Transmission System
Source: 2020 California Gas Report
97

As California considers decarbonizing the gas system, the future and revenue requirements of thousands of miles of pipe, compression systems, storage wells, valves, regulators, and nearly 9 million service lines will have to be considered. What also need to be contemplated are the users of these systems — whether customers will elect to switch to lower-carbon substitutes. It is also important to know what the lower -carbon substitutes mean for these customers and the gas system. Questions include how many customers will choose to opt out of gas service, how many will choose hydrogen or renewable gas, and where are these customers located on the gas system. The timing of the transition is also important as the utilities and regulators contemplate revenue requirements and rates.
Gas Infrastructure Issues Facing the State Much of the gas utilities transmission system is aging and may be nearing the need for replacement. The pipe age matters because the older pipe is, the more prone it is to leak and fail. A large part of what California’s gas utilities spend on leak detection and remedy is not discretionary and, in fact, is required under regulations discussed below and in Appendix E. Figure 31 shows the miles of pipeline added by the gas utilities by age.
Figure 31: Comparison of Utility Transmission Pipelines
120%
Cumulative
% M
iles Added
by Decade
100%
80%
60%
40%
20%
0%
PG&E
SoCalGas + SDGE
Pre‐1940
1940 ‐1949
1950 ‐1950
1960 ‐1969
1970 ‐1979
1980 ‐1989
1990 ‐1999
2000 ‐2009
2010 ‐2019
2020 ‐2029
98

Cumulative
% M
iles Added
by Decade
120%
100%
80%
60%
40%
20%
0%
PG&E
SoCalGas + SDGE
Pre‐1940
1940 ‐1949
1950 ‐1950
1960 ‐1969
1970 ‐1979
1980 ‐1989
1990 ‐1999
2000 ‐2009
2010 ‐2019
2020 ‐2029
Source: CEC staff analysis
PG&E owns some 63 percent of the transmission pipeline among the three large investor-owned utilities, with the remainder owned by the Sempra utilities. The cumulative percentage installed by decade barely differs between PG&E and the Sempra utilities, as shown in Figure 31Figure 31. More than 60 percent of intrastate transmission pipelines were installed in 1970. Even transmission segments replaced as part of pipeline safety programs are almost 30 years old.197
Starting in the 1950s, most subdivisions in California were built with gas distribution lines included in the common utility trench with service lines installed from the street to the new home. Figure 32 shows the approximate age of distribution mains, which deliver into smaller pipes leading into homes and businesses.198 The number of miles of mains installed in each decade following this is fairly evenly spread across the decades until 1990, after which main installation declined.199 Main installations have declined significantly since 2010.
197 Virtually all the transmission of California gas utilities is at least 20 years old; 80 percent of their transmission lines were installed before 1980; 65 percent were installed before 1960. The expected physical lifetime of pipelines varies but is generally 70 to 75 years. 198 The date at which one’s home was built is a good, but not perfect, indicator of how old a given distribution main and service line are. 199 Not shown in the figure is that PG&E has 257 miles of distribution main for which it could not identify year of installation.
99

Figure 32: Gas Mains by Decade
Source: CEC staff analysis
Some neighborhoods have distribution and service lines made of a plastic called “Aldyl-A,” which can become brittle and fail, long before the intended end of service life.200 Both PG&E and SoCalGas have programs within their distribution revenue requests to cover the costs to replace a select number of miles of Aldyl-A pipe each year. Full replacement is generally not expected for another 30 years.
Gas Utility Pipeline Safety California’s gas infrastructure — transmission, distribution, and storage — are subject to federal and state regulations. Statewide gas infrastructure regulation predates federal regulations by nearly a decade. Since 1960, the California Public Utilities Commission (CPUC) (through General Order 112) had rules governing the design, construction, testing, maintenance, and operation of utility gas gathering, transmission, and distribution systems.201
The first federal statute in this area was the Natural Gas Pipeline Safety Act of 1968, which required that the United States Department of Transportation establish minimum federal safety standards for the transportation of gas. These minimum federal safety standards went into effect in 1970. In 2004, a separate administration within the United States Department of Transportation, the Pipeline and Hazardous Materials Safety Administration (PHMSA)), was created. A description of federal and state safety requirements for pipelines is presented in Appendix E.
200 DupontDuPont issues its first warning in 1982, followed by PMSMA investigations and advisories starting in 1998. 201 PG&E sold of some of its gas gathering lines following the Gas Accord (D.89-12-016) but still owns some gas gathering lines in California.
100

State and federal regulations were enhanced in recent years in response to the PG&E pipeline explosion in San Bruno in 2010 and the SoCalGas Aliso Canyon leak in 2015.202 In 2011, the CPUC adopted Decision (D.) 11-06-017, which ordered all California gas transmission pipeline operators to prepare Natural Gas Transmission Pipeline Comprehensive Pressure Testing Implementation Plans to either pressure test or replace all segments of gas pipelines that were not pressure tested or lacked sufficient details related to performance of any such test.203 The result of this decision was the establishment of the Pipeline Safety Enhancement Plans (PSEPs) prepared by PG&E, San Diego Gas & Electric (SDG&E), and SoCalGas. PG&E completed its last PSEP project in 2018. SoCalGas and SDG&E PSEP projects are still ongoing, as the last construction starts for the final projects are scheduled to occur in 2025.
Concern about the safety of California’s gas system intensified with the August 2010 explosion of the PG&E system at San Bruno, California. The CPUC found that PG&E did not have accurate records about key pipeline characteristics, including records about the composition of its pipelines, the type of welds used on its pipelines, or even the maximum allowable operating pressures. It ordered PG&E and SoCalGas to locate “traceable, verifiable and complete” records for their transmission lines.204 For any line segments where such records could not be located, the utility is required to either strength test the segment or replace that segment as part of their PSEP. PG&E’s PSEP work is done205 — the utility spent $2.42 billion to test or replace nearly 800 miles of pipeline, upgrade pipeline segments to allow in-line inspection (ILI), automate valves, and complete its records collection and maximum allowable pressure (MAOP) validation.206 SoCalGas and SDG&E asked the CPUC in Application No. 18-11-010 for permission to recover $941 million (most of which was capital, not operations and maintenance [O&M]) they had spent through April 2018.207 This amount is about half of the close to the $2 billion total estimate by SoCalGas that the CPUC rejected as conceptually reasonable but too “rudimentary” in Decision No. 14-06-007.208
202 On September 9, 2010, a 30-inch gas pipeline owned by PG&E exploded, killing eight people and destroying dozens of homes in the San Francisco suburb of San Bruno, California. 203 The Legislature later codified these requirements in Section 958 of the California Public Utilities Code. 204 CPUC. Commission Resolution L-410, Emergency Authorization to Ensure the Safety of Certain Pacific Gas and Electric Company, San Diego Gas & Electric Company, Southern California Gas Company, and Southwest Gas Corporation Natural Gas Pipelines. https://docs.cpuc.ca.gov/PublishedDocs/WORD_PDF/FINAL_RESOLUTION/129534.PDF 205 PG&E. PSEP Final Compliance Report. March 6, 2019. p.2. https://docs.cpuc.ca.gov/PublishedDocs/Efile/G000/M294/K992/294992975.PDF. PG&E’s last PSEP compliance report states that its “last PSEP project became operational in November 2018, completing a program that included an unprecedented amount of work to strength test and replace pipelines, upgrade for and perform in-line inspection (ILI) and automate valves.” 206 Ibid. pp. 3-4. 207 See Application No. 18-11-010, P. 16. Pp. 10–12 contain a list of individual pipeline safety enhancement projects completed. 208 Decision No.14-06-007, p. 2. https://docs.cpuc.ca.gov/PublishedDocs/Published/G000/M096/K540/96540390.PDF.
101

The PHSMA sets standards for the design, construction, operation, maintenance, and spill response planning of America's 2.6 million miles of gas and hazardous liquid transportation pipelines.209 The rules required gas system operators to know the specific characteristics of their systems and operating environment to identify threats, evaluate the risk, and take measures to reduce the risk.210 Also in response to the San Bruno explosion, PHMSA revised its integrity management requirements for transmission and distribution. The programs that house these compliance costs are known as “transmission integrity management programs (TIMP)” and “distribution integrity management programs (DIMP).” The kinds of activities captured in TIMP and DIMP safety programs are shown in Table 7.
Table 7: Activities Captured in Gas Transmission and Distribution Safety Programs Transmission Distribution
Expand rigorous integrity management principles beyond High Consequence Areas (HCAs)
Improving leak performance
Shift primary method of assessing HCAs from External Corrosion Direct Assessment to ILI based integrity assessments
Reducing and managing the leak backlog;
Shorten pipeline isolation and response times in populated areas
Evaluating cathodic protection on metallic distribution mains
Eliminate overpressure events Reducing size of emergency shutdown zones;
Enhance public awareness and emergency response capabilities
Reducing third-party dig-ins
Implement pipeline pathways to achieve a delineated right-of-way, and continue to evaluate, refine, and improve threat assessment and mitigation procedures
Reducing major overpressure events
Maintain and further develop our core monitoring and preventative maintenance programs
Ensuring DIMP regulatory compliance
Maintain our knowledge on our assets, allowing for informed, risk-based decision making
Effectively scheduling planned outages in advance
209 PHMSA Regulations web page, https://www7.phmsa.dot.gov/phmsa-regulations. 210 PHMSA. Cast and Wrought Iron Inventory. https://www.phmsa.dot.gov/data-and-statistics/pipeline-replacement/cast-and-wrought-iron-inventory.
102

Transmission Distribution
Improving completeness and accuracy of digital data
Source: PG&E Gas Safety Plan
Safety Work on PG&E Gas System PG&E’s distribution system pipeline replacement programs focus on high-risk, pre-1941 steel pipe and on pre-1985 Aldyl-A and similar plastic pipe. PG&E established the Plastic Pipe Replacement Program in 2012 to reduce risks associated with leaks from Aldyl-A plastic and similar plastic materials installed before 1985. Plastic materials of pre-1985 vintage have a susceptibility to slow crack growth when exposed to stress, such as tree roots, differential settlement, or rock impingement. External stress can cause the initiation and propagation of cracks leading to leaks. At the end of 2020, roughly 6,600 miles of main in PG&E’s gas distribution system were composed of pre-1985 Aldyl-A and other types of plastic. PG&E anticipates an increasing pace of plastic pipe replacement from the rate of 170 miles per year forecast for 2023, until it reaches a steady-state rate of 208 miles per year in 2030.
For PG&E, pipeline replacement for higher-pressure pipes may come from remediation of high consequence area (HCA) class location changes driven by residential, commercial, or industrial development or a combination that encroach on transmission pipelines and change the class location for the existing pipeline.211
Compressor stations along transmission systems enable the transportation of natural gas over long distances and through changes in elevation. The transmission systems of PG&E and SoCalGas have numerous compressor stations that ease the delivery of gas along their systems. These compressor stations use motors (in the form of an electric motor or a natural gas turbine) to pressurize the gas and pump it through the system. Retiring the Tionesta Compressor Station can reduce the amount of gas that PG&E receives at the Oregon border, as the capacity to pressurize the gas traveling along the system will be decreased. PG&E proposes to convert the Tionesta Compressor Station into a measurement and control facility, which will monitor, measure, and control pressure and flow on gas systems. To support this conversion, PG&E will install remote-controlled main line valves.212
While PG&E proposed to retire the Los Medanos storage facility in 2019, PG&E is now proposing to retain that facility. PG&E found that retaining the facility is cost-effective for customers while providing operating flexibility — such as reducing the impact of an outage at
211 A high consequence area is a buffer area on either side of a pipeline segment that passes through developed areas where people live (for example, city or suburbs) or gather (such as a school). Pipelines in HCAs are required to have safety features or meet extra safety measures or both. For more information, see https://www.chescoplanning.org/PIC/HCA.cfm. 212 Pacific Gas and Electric Company. 2023 General Rate Case, Prepared Testimony Exhibit (PG&E-3), Gas Operations. Chapters 6–10 Volume 2 of 3, pp. 6–31. https://pgera.azurewebsites.net/Regulation/ValidateDocAccess?docID=660352.
103

the McDonald Island storage facility. PG&E found that the compression provided by Los Medanos would allow more time for maintenance, repair, and outages of the compression facilities at McDonald Island. PG&E estimates that withdrawals from Los Medanos to support local transmission maintenance will reduce the complexity of the system changes PG&E would need to make without Los Medanos.
While PG&E does not expect significant retirement of assets during the 2023–2026 rate period, PG&E is beginning to look closely at alternatives to addressing compliance threats outside the traditional assessment mitigations. For example, to help reduce PG&E’s overall gas footprint, options such as electrification (converting gas customers to all-electric end users) can allow assets to be retired, thereby reducing the same amount of risk, if not more, than continuing to maintain the assets.213 When hydraulically feasible, transmission downrates, retirements, or electrification can obviate the need for traditional mitigation and risk management such as strength testing, ILIs, and external corrosion data analysis.214
Safety Work on SoCalGas System SoCalGas/SDG&E replace distribution pipelines usually because of leakage impacting integrity of the pipe, increased maintenance expenses, costs for installing or maintaining cathodic protection (a method for controlling corrosion of metal surfaces) or both, or the deteriorating pipe material, pipe wrap, or coating. Other criteria considered are whether the steel pipe meets cathodic protection mandates or the main is found to have active corrosion. In addition, the pipeline may be deemed unsafe or unfit for service due to manufacturing or other defects. Based on information collected during various O&M activities and field observations, technical staff identifies and prioritizes pipeline segments requiring replacement.
For higher-pressure SoCalGas/SDG&E pipelines, the utility prioritizes replacement of pre-1947 nonpiggable high-pressure pipelines, as well as early vintage medium-pressure steel mains.215
In early vintage steel mains, cold tar asphaltic wrap was used as the first layer of corrosion protection. Over time, the early generation pipe wrap degrades and disbonds from the pipe, causing cathodic protection current to leave the pipe around the disbanded coating, thereby not providing adequate protection.216 Ultimately, this lack of corrosion protection will lead to increased leakage. This program proactively prioritizes and increases the replacement of early vintage steel pipe.
213 PG&E 2023 General Rate Case Prepared Testimony Exhibit (PG&E-3) Gas Operations Chapters 1-5 Volume 1 of 3. pp. 1–10. https://www.pge.com/pge_global/common/pdfs/about-pge/company-information/regulation/general-rate-case/PGE-GRC-Application-2023.pdf. 214 Ibid. pp. 2–15. 215 A piggable pipeline is designed to allow a standard inspection tool, also referred to as a “pig,” to negotiate it, which requires basically a more or less constant bore that has sufficiently long radius bends and traps to launch and receive the pigs. 216 Cathodic disbondment in a pipeline is the breakdown of adhesion between a coating and the coated substrate to which it is applied, caused by cathodic reaction products being formed at defects in the coating film as the cathodic protection current passes into the substrate at the defective area.
104

SoCalGas is proposing to upgrade the Ventura Compressor Station, as its analyses find that upgrades are needed to meet the summer injection requirements of the La Goleta Storage Field. This storage field in needed to maintain core reliability in the winter and to meet gas demand on the coastal system, which has been impacted by reduced local gas production.217
SoCalGas estimates that there a quarter -million customers alone on SoCalGas’ Coastal System north of the Ventura Compressor Station that are served by the La Goleta Storage Field, which also supports customers south of the compressor station including Ventura, as well as occasionally in the Greater Los Angeles Area.
In the Northern Zone, SoCalGas Lines 235-2 and 3000 continue to operate at reduced pressure. Line 3000 is expected to return to service January 31, 2022. Line 4000 returned to service October 1, 2021, and increased the amount of firm backbone transportation service capacity available to 1,250 million cubic feet per day (MMcfd) in the Needles/Topock Zone.218
Line 85 is a backbone transmission line that runs from the Santa Clarita Valley north through the Grapevine and western Kern County to the Kettleman Hills in Kings County. The Line 85 Transmission Zone pipelines have served as an access point to the SoCalGas system for gas produced from oil and gas fields close to this part of the SoCalGas system. A 30-mile segment of Line 85 in north Los Angeles County between Frazier Park and Castaic includes roughly 9.35 miles of pipe that was installed before 1946 and is not capable of being assessed using in-line inspection technology (for example, is “nonpiggable”). Under SoCalGas’ approved PSEP, nonpiggable pipeline segments installed before 1946 are identified for replacement. SoCalGas determined it is feasible to derate the 30-mile segment of Line 85, resulting in reduced capacity from 160 to 60 MMcfd. SoCalGas estimates that the reduced receipt capacity in the Line 85 Transmission Zone does not impact its ability to receive gas at any of its other system receipt points or backbone transmission zones, nor does it impact local transmission service to customers.219
Under the Pipeline Safety Enhancement Plan, SDG&E will replace and strength test pipe along Line 1600, a 16-inch diameter, 50-mile pipeline. This work includes replacing 37 miles of existing pipe while strength testing about 13 miles of existing pipe. The replacement pipeline will incorporate thicker steel, a warning mesh placed above the pipeline to prevent accidental excavations, automatic shut-off valves, and new fiber optic technology to detect ground disturbances that could impact pipeline integrity.220
217 Southern California Gas Company CPUC-Energy Division Data Request 5 Re: Ventura Compressor Station Date Requested: July 23, 2021 Date Responded: August 6, 2021. 218 October 1, 2021, 12:56 p.m. Envoy Alert – Restoration of Firm BTS Capacity in the Northern Zone. https://socalgas-envoy.com/. 219 SoCalGas Advice Letter Number 5493 to the CPUC Subject: Revision to Rule No. 30 – Transportation of Customer-Owned Gas and Schedule No. G-BTS – Backbone Transportation Service. July 10, 2019. https://tariff.socalgas.com/regulatory/tariffs/tm2/pdf/5493.pdf. 220 SDG&E’s Pipeline Safety Enhancement Plan web page, https://www.sdge.com/major-projects/major-projects-pipeline-safety-enhancement-plan.
105
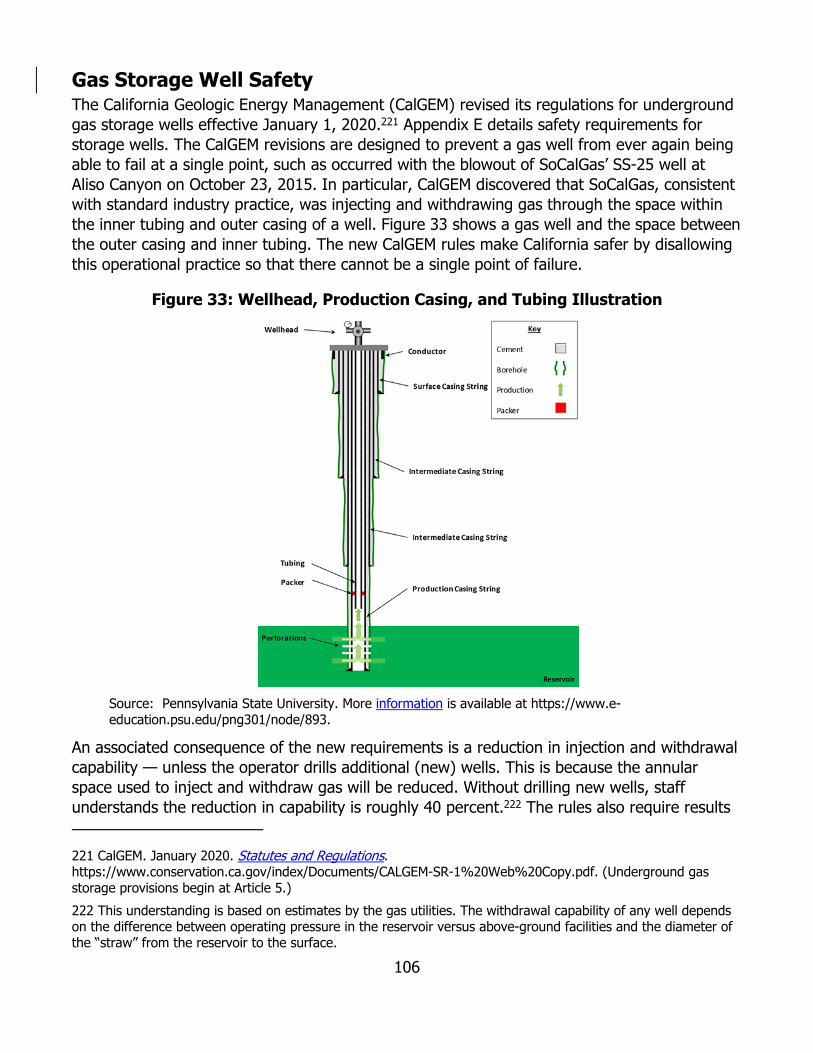
Gas Storage Well Safety The California Geologic Energy Management (CalGEM) revised its regulations for underground gas storage wells effective January 1, 2020.221 Appendix E details safety requirements for storage wells. The CalGEM revisions are designed to prevent a gas well from ever again being able to fail at a single point, such as occurred with the blowout of SoCalGas’ SS-25 well at Aliso Canyon on October 23, 2015. In particular, CalGEM discovered that SoCalGas, consistent with standard industry practice, was injecting and withdrawing gas through the space within the inner tubing and outer casing of a well. Figure 33 shows a gas well and the space between the outer casing and inner tubing. The new CalGEM rules make California safer by disallowing this operational practice so that there cannot be a single point of failure.
Figure 33: Wellhead, Production Casing, and Tubing Illustration
Source: Pennsylvania State University. More information is available at https://www.e-education.psu.edu/png301/node/893.
An associated consequence of the new requirements is a reduction in injection and withdrawal capability — unless the operator drills additional (new) wells. This is because the annular space used to inject and withdraw gas will be reduced. Without drilling new wells, staff understands the reduction in capability is roughly 40 percent.222 The rules also require results
221 CalGEM. January 2020. Statutes and Regulations. https://www.conservation.ca.gov/index/Documents/CALGEM-SR-1%20Web%20Copy.pdf. (Underground gas storage provisions begin at Article 5.) 222 This understanding is based on estimates by the gas utilities. The withdrawal capability of any well depends on the difference between operating pressure in the reservoir versus above-ground facilities and the diameter of the “straw” from the reservoir to the surface.
106

from two separate tests to establish a baseline of well conditions: changes in metrics such as temperature and pressure can indicate the presence of higher blowout risk, for example. Wells must be taken out of service to perform these initial tests. CEC staff has worked with staff at CPUC and CalGEM to help establish schedules for the testing to make sure gas is available to preserve reliability during high -demand periods.
Natural Gas Research The CEC’s Natural Gas Research Program funds efforts aimed at increasing knowledge of California’s gas infrastructure, safety, and so forth. Appendix E provides examples of recently completed projects, projects that were recently kicked off, and proposed future projects in gas infrastructure.
In June 2021, the CEC approved nearly $2 million in Natural Gas Research Program funds for two projects that aim to develop approaches to determine where gas infrastructure decommissioning is plausible, economically viable, and ratepayer-supported. The RAND Corporation received a $965,000 award to develop approaches in Southern California Gas territory, while the CEC awarded $1 million to Energy and Environmental Economics, Inc. (E3) to perform this work in PG&E’s service territory. These projects were launched during summer 2021.
For Fiscal Year 2021–2022, the proposed CEC Natural Gas Research Program initiatives are focused on decarbonization. These initiatives include the following proposals:
Location-Specific Analysis of Decommissioning to Support Long-Term Gas Planning. This proposal includes delivering location-specific analysis of promising candidate sites for decommissioning (for example, those with known pipe integrity and corrosion issues) and examining the implications of decommissioning on the remaining gas system. Projects under this proposal would prioritize examining gas decommissioning and electrification opportunities in underresourced communities.
Develop and demonstrate remote sensing and monitoring technologies and mitigation strategies to reduce the risk of potential damages due to natural force damages. o Technology Development and Demonstration for Plastic Pipeline Repair and Integrity
Improvement. This proposal includes: o Development and demonstration of technologies to assess, repair, and prevent
damages to plastic pipes widely used in gas mains and service lines o Technologies for early notification of potential risks, robotic internal inspection,
and repair technologies o New and cost-effective technologies to repair plastic pipe damages, technologies
to measure the performance of repaired plastic pipe systems o Emerging technologies that minimize or avoid service interruption during pipeline
repair. In its current rate application, PG&E reports that zonal electrification planning is still in the early stages. PG&E, in its recent general rate case filing, indicates that zonal electrification will therefore not have an impact in the 2023–2026 rate case period and will not likely be
107

sufficiently developed for implementation until after this rate case. PG&E comments agree with the emphasis on zonal electrification as a potential avenue to maintain long-term rate affordability in the 2021 IEPR.223 PG&E notes it has developed an internal gas asset analysis tool to identify locations where “zonal electrification,” or strategic decommissioning of the gas system, may reduce gas system costs. The tool aims to synthesize various system conditions and asset characteristics — such as, but not limited to, age of assets, risks, number of customers, and system throughput — to provide insight about locations that may warrant further engineering or costing review for zonal electrification or both. To help with systems-level planning, a version of this tool is in use with participating jurisdictions in PG&E’s service area. The CEC will work with PG&E to pursue avenues to leverage its zonal electrification tool for gas decarbonization planning.
As California considers the future role of its gas infrastructure, examples from other states and countries can provide insight. Consolidated Edison (Con Edison), an electric and gas utility in New York, identified 21 leak-prone gas mains and services (with plans to identify more sites) in which main retirement is feasible as. This identification is part of its program to replace leak-prone (cast iron and unprotected steel) gas mains and services in its distribution infrastructure by 2038. Buildings at the identified sites include single- and multifamily residenceshomes, mixed -use (residential and commercial), and religious institutions in New York City and its suburbs. At least some of these mains are those at the edges of the gas distribution system, whereby theirthe removal of these mains will not negatively impact system reliability or safety. In July 2021, Con Edison issued a request for proposal (RFP) for the full electrification of buildings at these sites. Con Edison’s RFP requires that respondents demonstrate a new approach toward full building electrification. Solutions shall put forth a holistic business model for conversions that, at scale, would result in net benefits to customers, contribute significantly to emissions reductions, and provide a sustainable path forward for wide-scale electrification. The RFP requires that the customer experience must also be addressed through this program to ensure the customers maintain reasonable energy costs, comfort, convenience, and reliability.
Lessons learned from this RFP can apply to all California gas utilities in the sense that initiatives to replace leak-prone pipes (particularly at the ends of distribution systems) can include decommissioning after buildings on that system are electrified. The experiences of the residents, tenants, and users of these buildings can be valuable to see how a fully electrified building responds to the weather needs that accompany all four seasons. The lessons here may be more applicable to PG&E and SDG&E as, like Con Edison, both provide electric and gas service to customers. Many Californians with gas service get their electricity service from a different provider. Coordinating the decommissioning of gas infrastructure with upgrades to a customer’s electricity service will need to be relatively seamless for large-scale building electrification.
223 Pacific Gas and Electric. Comments on Draft 2021 Integrated Energy Policy Report. TN 241334. Docket 21-IEPR-06. https://efiling.energy.ca.gov/GetDocument.aspx?tn=241334.
108

In California, public utilities, including gas utilities, are obligated to serve customers in their respective service territories under Public Utilities Code Section 451, which states, “Every public utility shall furnish and maintain such adequate, efficient, just, and reasonable service, instrumentalities, equipment, and facilities, including telephone facilities, as defined in Section 54.1 of the Civil Code, as are necessary to promote the safety, health, comfort, and convenience of its patrons, employees, and the public.” The implication here is that gas utilities are still incorporating existing customers and the addition of new customers as part of their planning. This incorporation impacts the work on pipeline replacement and maintenance.
Similar to Con Edison in New York, the CPUC can consider modifying utility gas pipeline replacement and maintenance programs to allow decommissioning of pipe to enable electrification service. This modification can include requiring the gas utilities to identify potential sites while providing hydraulic modeling to show that decommissioning of the sites won’t impact system reliability once the buildings there are electrified. Data from activities including leakage surveys, maintenance records, pipeline mapping, pipeline attribution data collection, and hydraulic models can inform decisions on whether to repair, replace, or decommission existing infrastructure. This includes leveraging existing programs that aim to replace vintage plastic pipe including Aldyl-A or other stock that’s further prone to leaks. Factors to be considered here include gas system reliability and cost to ratepayers.
In its current rate application, PG&E reports that zonal electrification planning is still in the early stages, and PG&E, in its recent general rate case filing indicates that zonal electrification will therefore not have an impact in the 2023–2026 rate case period and will not likely be sufficiently developed for implementation until after this rate case.
109

CHAPTER 7: Addressing Stranded Gas System Investments
Stranded investments are investments a utility makes that end up not being used. The investment is said to be stranded because, being unused, it is removed from rate base, and the utility is left with no way to recover the cost of that asset or earn its allowed profit from it. Utility assets are constructed using funds that the utility essentially borrows (either as debt from a bank or by issuing stock) or that comes from savings (prior profit retained by the company). That construction cost is recovered in rates over a long period, typically 30 years.224 If assets go unused, the utility not only receives less revenue, it also does not recover the cost of investment it had planned to recover over a long period.
This chapter discusses ways to manage stranded costs. The reality is that California utilities will inevitably continue investing to maintain their gas transmission and distribution systems, as discussed below.
Challenges for Gas Rates Public utility commissions set rates to recover operating costs and provide utilities with a reasonable rate of return (or allowed profit level). In general, rates are determined by totaling up operating costs, then adding depreciation and return on the rate base investment in facilities to get the total amount of costs to recover or the revenue requirement. Dividing that figure by the volume (in therms) of gas forecast to flow through the system, or throughput, yields a price per therm.225 This description leaves out details about how costs are calculated and allocated among the various customer classes, and the design of rates that sets how much to recover in a fixed fee versus a volumetric charge on consumption.
The fundamental challenge for gas rates stems from the idea that rates will rise when California has the same or rising system costs but lower demand over which to spread those costs. To give a simple example, imagine an operator of a Ferris wheel with a revenue requirement (operating cost plus profit) of $300 and that sets a ticket price of $3. The operator will need 100 riders (throughput) to recover the revenue requirement. But if there are only 90 riders, the operator receives only $270 and is short on revenue. Alternatively, if the cost increases to $350, and the operator cannot increase the ticket price and cannot get more riders, the operator will be short on revenue.
224 Rate experts call this amortization. While not completely analogous, this recovery of capital over time works similarly to a home mortgage that amortizes the bank’s recovery of principal over the mortgage term. 225 Most customer bills are stated in dollars per therm. Gas markets price gas in dollars per million Btu (MMBtu). An MMbtu is 10 therms or a “decatherm.” The demand forecast is often stated in million therms or mmtherms. Yet daily demand is often stated variously in million cubic feet per day, or MMcf per day. Cubic feet are a measure of volume, while Btus are a measure of heat. Some analysts convert between the two mentally. The CEC tries to be sensitive to unit conversions that may confuse readers and be explicit about them.
110

The more complex rate issues go to allocation of costs among customer classes. In the Ferris wheel example, think of tickets for seniors, adults, and children. Children may get a discounted rate, but if no children ride, then does the operator allocate the remaining costs evenly across the other rider categories, or are they allocated all to seniors? Or all to adults? Or can the costs be spread across the two groups but disproportionately to one category versus the other? Maybe the decision is made to not raise the ticket price for seniors, and it all goes into the adult ticket price. To continue the example, at what price do the adults decide the Ferris wheel is too expensive and stop riding? Then only the seniors would be left.
Among real-world gas customers, many Californians cannot afford higher energy costs. This situation raises equity issues as those who are least able to switch to electricity would be left paying higher gas rates as demand declines. NCPA comments that rate issues should not be siloed and notes that rate issues are intertwined with affordability.226 The CPUC is addressing these issues in proceedings including the Affordability Order Instituting Rulemaking (OIR), Building Decarbonization OIR, and the Gas System Planning OIR. The CEC continues to work with the CPUC on affordability and rate issues.227
The other problem is that eventually, if utilities cannot accrue enough revenue to cover operating expenses, they will be forced to cease operations. Utilities, like all other businesses, have trouble borrowing the capital needed to maintain the system when they are not making profits.228
The Basic Equation for Asset Cost Recovery The value of the assets that comprise California’s gas system are reported and used as an input to set rates at the California Public Utilities Commission (CPUC). The original cost of Pacific Gas and Electric’s (PG&E’s) total gas utility assets (otherwise known as “plant”) is $20.9 billion, with $8.3 billion of that depreciated (for. (For comparison, the original cost of PG&E’s electric system is $64.2 billion, with $29 billion depreciated)..)229 Southern California Gas (SoCalGas) reported an original investment cost of $14.2 billion, of which about half has been
226 Northern California Power Agency. Comments on Draft 2021 Integrated Energy Policy Report. TN 241321 Docket 21-IEPR-06. https://efiling.energy.ca.gov/GetDocument.aspx?tn=241321. 227 CPUC is holding an en banc February 28, 2022, and March 1, 2022, in the Affordability Proceeding Phase 3 Electric and Gas Rates https://www.adminmonitor.com/ca/cpuc/en_banc/. 228 See, for example, the CPUC’s most recent cost of capital decision for the major energy utilities: Decision No. 19-12-056, p. 16. There is also the legal problem that the utilities are entitled to fair compensation, as established decades ago by the United States Supreme Court in the Bluefield and Hope cases, as noted by the CPUC at p. 15 of its 2019 decision. The citations for those two cases are The Federal Power Commission v. Hope Natural Gas Company, 320 U.S. 591 (1944) and Bluefield Water Works & Improvement Company v. Public Service Commission of the State of Virginia, 262 U.S. 679 (1923). 229 See pages H-6 (gas) and H-3 (electricity) in Application No. 21-06-021: 2023 General Rate Case Application of Pacific Gas and Electric Company.
111
depreciated.230 San Diego Gas & Electric (SDG&E) reported roughly $2 billion in gas system investment, of which almost half has been depreciated.231
This value is often known as “rate base,” or the capital that the utilities spend to make infrastructure additions, less depreciation. (Depreciation is the decrease in the value of an asset as the asset is used.) Profit for a utility is set as an authorized rate of return that the utilities are allowed to earn on that rate base. That return is usually set to cover the cost for the utilities to borrow or obtain equity investment and to compensate shareholders. SoCalGas’ rate base is somewhat more than $7 billion. PG&E’s gas system rate base is around $13 billion. Assets are usually depreciated on a straight-line basis over the expected lifetime, which is 30 to 50 years or longer.232 A stranded asset is one that is not being used and is essentially retired before the end of the expected life, as shown below. If the costs are not removed from rate base, then consumers are paying for something they cannot use. Removing the costs from rate base before the end of the expected useful life leads to the question of how the California utilities will recover those costs and the associated allowed profit.
It is impossible to say at this point how much existing undepreciated investment in gas facilities has the potential to become stranded; California has yet to adopt any explicit gas use reduction target. The new building codes encourage but do not mandate electrification. Clearly, if all gas use disappeared, then all of the assets would be stranded. But given what is known about uses that are hard to electrify, electric resource modeling that still has gas providing generation in some hours of the day, and utility efforts to find decarbonized fuels to deliver with their existing pipeline assets, CEC staff is unable to quantify the amount of existing and future investment that could become stranded. However, staff knows that some assets will be stranded as throughput declines. California will need to reach agreement on how to recover these costs and minimize new investment to address the impact to both customer rates and allow fair recovery of costs by the utilities.
230 Appendix E, Statement of Original Cost and Depreciation Reserve, in Application No. 17-10-08. https://www.socalgas.com/regulatory/documents/a-17-10-008/SCG%202019%20GRC%20Application-10-06-17-FINAL.PDF. Accessed August 23, 2021. 231 Page 3 of Appendix G, Statement of Original Cost and Depreciation Reserve in Application No. 17-10-007. https://www.sdge.com/sites/default/files/SDGE_2019_GRC_Application_0.pdf (Accessed August 23, 2021) “Utility Costs and Affordability of the Grid of the Future.” February 2021. California Public Utilities Commission. p. 19. https://www.cpuc.ca.gov/-/media/cpuc-website/divisions/office-of-governmental-affairs-division/reports/2021/senate-bill-695-report-2021-and-en-banc-whitepaper_final_04302021.pdf. 232 Staff asked, in its 2021 IEPR Natural Gas Forms and Instructions, for the value of assets remaining to be depreciated by asset category, for example, how much in transmission, storage, distribution, and customer costs were depreciated versus undepreciated. The utilities informally replied that they do not track depreciation by asset category but only track the system total. SoCalGas, in Application No. 17-10-008 (its “2019 General Rate Case”) filed testimony (Exhibit SVG-36-R, Revised Direct Testimony of Flora Ngai) listing individual accounts separated into asset categories (Underground Storage, Transmission, Distribution and General Plant) and showing the expected life of the asset, the associated depreciation curve, and future net salvage value as authorized in its prior general rate case versus proposed in the current general rate case. SoCalGas shows a 64-year life for transmission mains, for example, and a 68-year life for distribution mains. Land rights depreciate over a 40-year life and computer equipment over 5 years. Staff does not know the ultimate level of detail captured in the asset subledger.
112

Potential Solutions to Ratemaking Issues Research about electricity rates and cost recovery may be useful in thinking about gas rates and impacts associated with electrification and the associated decrease in gas utility throughput. Severin Borenstein and his fellow faculty directors at the Haas Energy Institute demonstrated in a paper released before the CPUC’s rates en banc hearing in February 2021 that California electricity rates are higher than the incremental cost to generate and provide electricity to consumers.233 The rates are higher because of adders to recover the cost of programs that are not directly related to the cost of electricity, including energy efficiency, wildfire mitigation, cap-and-trade costs, and others. These adders generate economic inefficiencies first, but more important, these unnecessarily high electricity rates discourage electrification. The authors further point out that adding these costs onto electricity rates is the most regressive way of recovering them in that those with the least income bear a higher relative burden for these, which is part of the equity issue to be avoided in the gas transition.
The authors suggest that a better solution, with fewer ill effects, would be to pay for these programs via the state’s general fund and charge consumers for these programs via income and sales taxes that contribute to the general fund. NCPA commented that to avoid forcing a small segment of the economy to pay for statewide policy objectives that benefit the entire state, a shift to have these programs covered by the general fund warrants greater consideration.234 PG&E suggested using the state’s general fund to help offset rising gas rates as throughput to core customers declines over time.235 Other options include recovering them in fixed charges but tailoring the fixed charge to income. Recovery in income taxes or an income-based fixed charge keeps the recovery from being regressive. PG&E also identified the need for innovative financial mechanisms — for example, capitalization of zonal electrification projects instead of planned gas pipeline replacement work, including the costs of externalities such as greenhouse gas reductions — as being imperative to the success of decarbonizing the gas system.236
The authors note that gas rates include fewer program fees and thus are less regressive, although the public purpose program surcharge is a high proportion of noncore customer
233 Borenstein, Severin, Meredieth Fowlie, and James Sallee. February 2021. “Designing Electricity Rates for An Equitable Energy Transition.” Working Paper-314. https://github.com/marshallblundell/PfE. Incremental cost is an economist notion of what it costs to produce one more unit of something. The idea is that prices are set equal to incremental cost in a market in equilibrium that maximizes efficiency and benefits to producers and consumers. Prices not set equal to incremental cost produce suboptimal results. 234 Northern California Power Agency. Comments on Draft 2021 Integrated Energy Policy Report. TN 241321 Docket 21-IEPR-06. https://efiling.energy.ca.gov/GetDocument.aspx?tn=241321. 235 Pacific Gas and Electric. Comments on Draft 2021 Integrated Energy Policy Report. TN 241334. Docket 21-IEPR-06. https://efiling.energy.ca.gov/GetDocument.aspx?tn=241334. 236 Ibid.
113

rates.237 In thinking about gas system recovery of stranded costs, these same issues arise. The analysis argues that the best way to recover those costs to avoid income-regressive impacts would seem to be through the state’s general fund and not gas rates charged to remaining customers.
A common suggestion from decarbonization studies to address this problem is to retire parts of the gas system so that costs decline as demand declines.238 As discussed in Chapter 6, the California Energy Commission (CEC) recently launched two programs under GFO-20-503 — Strategic Pathways and Analytics for Tactical Decommissioning of Portions of Natural Gas Infrastructure to evaluate how California might identify parts of the system that can be retired.239 The difficulty will be identifying what facilities can be retired as every home in a given neighborhood must switch entirely away from gas to retire any part of that neighborhood’s distribution system. Beyond facilities retirement, some have suggested securitization of costs, thereby removing them from the revenue requirement. A similar concept would be to recover them in taxes or to recover them in electricity rates since electricity demand should increase as gas demand decreases.
Another concept that might reduce cost is to potentially convert transmission lines to distribution lines as throughput declines. Distribution lines are subject to less stringent safety oversight than transmission lines because distribution operates at lower pressures. As throughput declines, less gas would need to be forced through the larger-diameter and higher-pressure transmission lines. At some point, enough reduction could allow what once was transmission to become distribution.
A 2015 application by SDG&E to the CPUC gives an example and highlights the issues that would arise in implementing this approach. In Application No. 15-09-013, SDG&E proposed building a new gas transmission line in San Diego County. It would then derate its existing Line 1600 from 500 psi to 300 psi, putting it below 20 percent (specified minimum yield strength) SMYS.240 This proposal would allow SDG&E to recategorize the line from transmission to distribution. This reclassification would avoid the need to pressure test or
237 The gas public purpose program (PPP) surcharge recovers the costs of various gas utility programs authorized by the Commission: energy efficiency, energy savings assistance, the CARE discount, and the gas public purpose research and development program administered by the CEC. 238 Aas, Dan, Amber Mahone, Zack Subin, Michael Mac Kinnon, Blake Lane, and Snuller Price. April 2020. The Challenge of Retail Gas in California’s Low-Carbon Future — Technology Options, Customer Costs, and Public Health Benefits of Reducing Natural Gas Use. California Energy Commission. Publication No. CEC-500-2019-055. https://www.energy.ca.gov/publications/2019/challenge-retail-gas-californias-low-carbon-future-technology-options-customer. 239 RD&D made two awards under this GFO: one to E3 and one to the Rand Corporation. Results from these projects should be available in late 2022. 240 SMYS denotes the stress level at which a pipe will deform. It is an input to calculating maximum allowable operating pressure. See, for example, Chapter 19 in Stress Corrosion Cracking, Theory and Practice, V. S. Raja and Tetsuo Shoji, Eds,., 2011. https://www.elsevier.com/books/stress-corrosion-cracking/raja/978-1-84569-673-3.
114

replace Line 1600, which otherwise would be required by CPUC Decision No. 11-06-017.241 The CPUC rejected this proposal in Decision No. 18-16-028. In doing so, it asked the Safety and Enforcement Division (SED) to study how the utilities define transmission versus distribution.
SED held a workshop October 10, 2018, at which the various utilities presented their definitions, including those for additional technical concepts such as distribution centers and large volume customer. Contrary to the generalization that a line is defined as transmission if it is more than 16” in diameter and 60 pounds of operating pressure, the workshop showed that the utilities actually apply somewhat different definitions of transmission. Federal regulations define transmission line as a “pipeline, other than a gathering line, that: (1) Transports gas from a gathering line or storage facility to a distribution center, storage facility, or large volume customer that is not down-stream from a distribution center; (2) operates at a hoop stress of 20 percent or more of specified minimum yield strength (SMYS); or (3) transports gas within a storage field.”242 Distribution is anything that is not transmission or “gathering.” (Gathering lines collect gas from wells and move them to processing stations or transmission lines.) It does not define distribution center or large-volume customer. The definition is general but is intended to accommodate different circumstances existing in different parts of the United States.
SoCalGas often defines pipelines operating at greater than 20 percent SMYS as transmission even if they are downstream of a distribution center, for. For example, PG&E reported that it had reclassified 810 miles of distribution to transmission in reviewing its system for one of its safety certifications. This reclassification is the opposite direction of what is being discussed related to decarbonization, which is reclassifying transmission to distribution. This was documented in its 2014 Gas Safety Plan, where it explained that the change better captured the function of a given line and where that function changes from “transporting gas to distributing it for two or more customers.”243 PG&E also noted the change assures operational consistency so that “pipeline segments are treated as belonging to transmission or distribution for all purposes, not just for integrity management purposes.”244 This change reclassified as transmission several PG&E distribution feeder mains operating at more than 60 pounds but below 20 percent SMYS.
SED asked the utilities what would need to be reclassified if they had to use the other utility’s definitions. SoCalGas said that roughly 3,500 miles that operate at above 60 pounds of pressure but below 20 percent SMYS would probably be reclassified to transmission and could increase compliance costs by as much as $20 billion. PG&E said most, but not all, of the 800 miles it reclassified in 2015 would revert to distribution. The workshop delved deeper in
241 Amended Application No. 15-09-013 filed March 21, 2016. Volume I. p. 2. https://www.socalgas.com/regulatory/documents/a-15-09-013/A.15-09-013_Volume_I_Amendment_to_Application.pdf. Accessed August 24, 2021. 242 The Code of Federal Regulations (CFR) defines transmission (see 49 CFR Part 192.3). 243 PG&E Gas Safety Plan 2014. p. 17. https://www.pge.com/includes/docs/pdfs/safety/systemworks/gas/GasSafetyPlan_2014.pdf. 244 Ibid.
115

discussing risk on lines in high consequence areas even below 20 percent SMYS and what would be defined as transmission versus distribution under alternate definitions. The CPUC has included the topic of adopting consistent definitions or clarifying what it would require to reclassify transmission as distribution as part of the OIR on Gas Planning.245 Staff concludes that each utility could, in theory, reduce operating pressures and then reclassify those pipes as distribution, using their particular definitions. It is not clear to staff that PG&E sought any CPUC approval for its reclassification or that any is required. The savings achievable or advisability of derating is too difficult to estimate at this time.
Other States’ Consideration of Stranded Assets Issues California is not alone in seeking to reduce gas use to address climate change. New York is also seeking to reach net-zero-emissions by 2050. Synapse Economics prepared a paper submitted into the New York record on behalf of Natural Resources Defense Council (NRDC) that notes a common theme:
“The state’s current gas planning process is not up to the task of getting the state to net zero emissions. This process lacks transparency and other elements that help ensure outcomes are broadly aligned with state policy and are in the public interest.”246
The Synapse paper makes clear what those with utility economics experience may find obvious: the planning for a smaller gas utility must be realigned with the utility business model. The foundation of the business model is allowing profit that is calculated as a percentage rate of return on the value of used and useful assets in rate base. Running renewable gas and blending in hydrogen or synthetic gas would allow the assets to continue to be used. Offsets or carbon capture and sequestration may allow this as well. Gas utilities may also transition to a model in which they provide “comfort” or “energy.” Synapse cites two utilities in the United Kingdom that are taking this approach.
In addition, gas interconnection (including obligation to serve) policies, forecasting, planning, and new investment approval processes need be brought into alignment with the net-zero goal. Synapse suggests that new gas infrastructure should be depreciated more quickly (or accelerated depreciation) so that profit on the asset occurs over the shortened lifetime in which the asset will be used as load transitions to electricity.
Synapse also emphasizes the need for integrated gas and electric planning, noting that gas investment reviews have historically seen less transparency and consideration of alternatives than electricity.247 They should include evaluation of nonpipeline alternatives using a
245 CPUC. Order Instituting Rulemaking to Establish Policies, Processes, and Rules to Ensure Safe and Reliable Gas Systems in California and Perform Long-Term Gas System Planning. https://apps.cpuc.ca.gov/apex/f?p=401:56:0::NO:RP,57,RIR:P5_PROCEEDING_SELECT:R2001007. 246 Hopkins, Asa, Alice Napoleon, and Kenji Takahashi. June 29. 2020. Gas Regulation for a Decarbonized New York: Recommendations for Updating New York Gas Utility Regulation. Prepared for Natural Resources Defense Council. https://www.synapse-energy.com/sites/default/files/Gas_Regulation_Decarbonized_NY_19-082.pdf. 247 This is true in California as well; staff recalls a 2020 conversation with a gas utility in which it asked why electricity distribution lines were public records, but gas distribution lines were not.
116

transparent screening framework and better demand forecasts. Geographic targeting of electrification would allow strategic retirement of gas assets; Synapse recommends remaining gas costs should be distributed equitably across the system and depreciation should be accelerated. Corning Natural Gas is already proposing to shorten its depreciation period to 30 years.248 Utilities may also need to adjust the end-of-life salvage value that is embedded in depreciation calculations.
Securitization and exit fees are other ideas.249 Coal retirements have been financed in part with securitization, which removes a portion of the cost from rates and instead recovers them via bonds. California used this approach to finance the state’s purchase of electricity in the 2000 power crisis when its electric utilities were at or near bankruptcy. Fees to pay off the bonds could be added to electricity rates or to gas rates.
Massachusetts has a similar goal of reaching carbon neutrality by 2050 using a roadmap published by its Department of Energy and Environmental Affairs.250 The roadmap cites equity issues and affordability, aiming to decarbonize transportation, building energy use, and the electricity portfolio. It does not address the stranded cost or increasing gas utility rates issue head on.
Lucas Davis and Catherine Hausman raised similar issues.251 They studied utilities across the United States that have shrunk over time because of factors like population shifts:
“Utilities that lose customers maintain their pipeline infrastructure even as the customer base financing their operations is shrinking. As a result, historical capital cost recovery and some operations and maintenance costs do not decrease. In keeping with this, we observe that utility revenues shrink, but less than one-for-one — indicating higher bills for remaining customers.”
They suggest one idea for making sure these higher bills do not fall disproportionately to lower-income households, which is to electrify these households first. They note that geographically targeted electrification “does not solve the problem of how to pay for systemwide legacy costs.”252 Another idea is to increase hook-up fees so that they include some of the future capital recovery and operations and maintenance (O&M) costs; conversely, one could charge exit fees. Legacy costs could also be disallowed by regulators, some of the
248 New York Public Service Commission Case 20-G-0101. 249 Hopkins, Asa, Alice Napoleon, and Kenji Takahashi. June 29. 2020. Gas Regulation for a Decarbonized New York: Recommendations for Updating New York Gas Utility Regulation. Prepared for Natural Resources Defense Council, p. 30. https://www.synapse-energy.com/sites/default/files/Gas_Regulation_Decarbonized_NY_19-082.pdf. 250 Massachusetts Executive Office of Energy and Environmental Affairs. December 2020. Massachusetts 2050 Decarbonization Roadmap. https://www.mass.gov/doc/ma-2050-decarbonization-roadmap/download Accessed August 23, 2021. 251 Davis, Lucas, and Catherine Hausman. July 2021. “Who Will Pay for Legacy Utility Costs?” University of California, Berkeley, Energy Institute at Haas. https://haas.berkeley.edu/wp-content/uploads/WP317.pdf. 252 Whereas staff notes the intuitive appeal of geographic targeting to retire contiguous facilities and reduce both capital and O&M costs.
117

cost could be shifted to electricity ratepayers, and finally, some might be recovered via general taxes. Davis and Hausman point out this approach was used for some years by the postal service.253 Another option is to use cap-and-trade fees or a carbon tax.
The Regulatory Assistance Project (RAP) periodically releases white papers to advise state regulatory commissions, and a May 2021 paper on gas utility transition issues calls out three basic suggestions:
Reduce rate base via accelerated depreciation and increased customer contributions to line extensions.
Adopt efficient and equitable rate structures to reconsider the cost allocation between customer classes, as well as rate design.
Change utility incentives by decoupling revenue from throughput and considering performance-based ratemaking.254
Among structural reforms, RAP suggests not only incorporating zero-carbon resources into the gas portfolio, but actions such as reenvisioning the business as one of providing energy or heating services, perhaps fusing with an electric utility, or converting to a public entity or cooperative.255
RAP’s mention of main extensions, also referred to as “gas line extensions,” is worth more discussion. Customers who want to connect to gas service can do so at no cost if the revenue they would provide to the utility exceeds the cost of connecting them. The underlying principle was that the consumption added by a new customer would give more throughput over which to spread costs: rates to all would be lower. This concept needs to be reevaluated, as the installation of new mains, and service lines from mains to homes is a barrier to building decarbonization. It is also not clear that the calculation of the main extension allowance actually assures that the customer adds what the utilities would call a positive contribution to margin or whether it only assures that the expected revenue is higher than the cost of the line extension itself.
Current utility tariffs provide line extension allowances of about $1,500 to $2,000 per home for new gas customer hookups, covering at least a portion of the costs of both distribution main extensions and customer service extensions. These new hookups perpetuate and expand the use of fossil gas and miss the opportunity to electrify new buildings at the most favorable time — when they are being constructed. Continued line extension and the resulting pipes in buildings also drive increased construction cost relative to electricity-only buildings. Elimination of these allowances would provide an incentive for builders to go all-electric. At the same time, it would reduce the utility rate base by eliminating the cost of the allowances, thereby reducing future rate increases for the remaining gas customers. Gas allowances are based on
253 Op. cit. p. 42. 254 Anderson, M., M. LeBel, and M. Dupuy. May 2021. Under Pressure: Gas Utility Regulation for a Time of Transition. Regulatory Assistance Project. https://www.raponline.org/wp-content/uploads/2021/05/rap-anderson-lebel-dupuy-under-pressure-gas-utility-regulation-time-transition-2021-may.pdf. 255 Op. Cit. p. 53.
118

the assumption that the customer will continue to use gas for the entire life of the new facilities, a dubious proposition as the state endeavors to decarbonize.
On November 15, 2021, the CPUC released a Revised Assigned Commissioner’s Scoping Memo and Ruling in the Building Decarbonization Proceeding (R.19-01-011) that includes a staff proposal to eliminate gas line extension allowances, refunds, and discounts.256 The CEC supports the CPUC staff proposal as it related to residential and small commercial customers to support meeting building decarbonization efforts. Gas line extensions to industrial, agricultural, and large commercial customers may warrant additional consideration and analysis as many are difficult to electrify.257 SoCalGas notes that the 2021 IEPR has rightfully identified sectors such as industry, transportation, and electric generation that may not be able to electrify and states the importance of maintaining gas service to these customers. PG&E encourages the continuation of allowances, discounts, and refunds for projects that provide an economic or environmental benefit or both, including to industrial and large commercial applications that are difficult, or may be impossible, to electrify.258 PG&E notes that removal of the allowances, discounts, and refunds for these nonresidential projects creates additional hardship, which may cause developers to either abandon projects or develop projects outside California, thus, moving jobs and economic growth out of California.259
A related issue is obligation to serve. Staff has observed that the idea of retiring gas delivery infrastructure in an electrifying neighborhood can be stymied by a single customer who refuses to switch from gas to electricity. The Public Utilities Code obligates a gas utility to serve any customer who requests service, for which there is the line extension allowance that was discussed that covers all or a portion of that cost, and to continue providing service in perpetuity.260 These old policies are no longer logical in a world seeking decarbonization. SoCalGas notes that the obligation to serve should be addressed in totality of the public interest.261 PG&E comments suggest that the utilities’ obligation to serve must be addressed in
256 CPUC. Assigned Commissioner’s Scoping Memo and Ruling in r.19-01-011 Regarding Building Decarbonization. https://apps.cpuc.ca.gov/apex/f?p=401:56:0::NO:RP,57,RIR:P5_PROCEEDING_SELECT:R1901011 . 257 On January 28, 2022, the CPUC issued an ALJ Ruling in R.19-01-011. It asks parties to provide clarifications and more information needed to assist the Commission in resolving the Phase III issues regarding industrial, agricultural, and commercial customers and environmental or financial benefits to California ratepayers. http://docs.cpuc.ca.gov/SearchRes.aspx?DocFormat=ALL&DocID=445638734 258 Pacific Gas and Electric. Comments on Draft 2021 Integrated Energy Policy Report. TN 241334. Docket 21-IEPR-06. https://efiling.energy.ca.gov/GetDocument.aspx?tn=241334. 259 Ibid. PG&E further notes financial benefits for maintaining allowances, discounts, and refunds for certain nonresidential customer classes; nearly all these large commercial customers pay back their investment in the gas system within three years, reducing the remaining system costs for all remaining gas ratepayers, including residential customers. 260 The utilities’ obligation to serve their customers is mandated by state law and is part and parcel of the regulatory scheme under which the utilities received a franchise and under which the Commission regulates utilities under the Public Utilities Act. (See Pub. Util. Code §§ 451, 761, 762, 768, and 770.) 261 SoCalGas notes that the obligation to serve is but one leg of a stool adopted by the Legislature in defining the public interest relating to the provision of essential energy services and that an overly narrow effort to
119

a manner that allows a utility to deliver energy to a customer, regardless of the type of energy, so long as it is safe, reliable, and affordable.262 The Environmental Defense Fund notes that, as a matter of principle, the state may want to consider how it can update the utility’s obligation to serve to provide needed services to all customers, including heat, light, and power in a decarbonized manner.263 Using a distribution main to serve a single customer or handful of customers cannot be economic. California should allow its utilities to subject both new and continuing service to more detailed cost-effectiveness tests and abandon service where it is no longer economic unless extenuating circumstances that require continued gas service to a customer are present.264
Another idea would be to add a decommissioning fee to gas rates now. The funds accrued could be used to pay off stranded investments later. This idea would be akin to the nuclear decommissioning fees long added to California electricity rates.
All told, California can apply various tools to address stranded costs. The state can outright minimize them, and modifying the obligation to serve is a key step toward minimizing those costs as well as reducing gas use. In theory, California can shift stranded cost recovery to general taxes, it can shift them toward fixed fees that vary with income, it could accelerate depreciation, it could create a more significant decommissioning fund, or it could recover some of the costs by issuing bonds.
eliminate one leg, as it relates to electrification outcomes focused primarily on core residential customers, risks overlooking the totality of public interest considerations. Southern California Gas. Comments on Draft 2021 Integrated Energy Policy Report. TN 241328. Docket 21-IEPR-06. https://efiling.energy.ca.gov/GetDocument.aspx?tn=241328. 262 Pacific Gas and Electric. Comments on Draft 2021 Integrated Energy Policy Report. TN 241334. Docket 21-IEPR-06. https://efiling.energy.ca.gov/GetDocument.aspx?tn=241334. 263 Environmental Defense Fund. Comments on Draft 2021 Integrated Energy Policy Report. TN 241323. Docket 21-IEPR-06. TN 241323. Docket 21-IEPR-06. https://efiling.energy.ca.gov/GetDocument.aspx?tn=241323. 264 Abandoning service is the technical term for taking a line out of service and out of the rate base. Most abandonments must be approved by a regulator.
120

CHAPTER 8: Improvements to Gas Forecasting andAssessments
The Warren-Alquist Act directs the California Energy Commission (CEC) to forecast and assess gas demand, supply, transportation, price, rates, reliability, and efficiency.265 These forecasts and assessments are included in each Integrated Energy Policy Report (IEPR) cycle to identify impacts on public health and safety, the economy, energy diversity, resources, and the environment. The CEC is also required to identify emerging trends and impending or potential problems or uncertainties in the electricity and gas markets and industry. These forecasts and assessments form the foundation of energy policies and decisions affecting the state and are used by various state entities — the California Public Utilities Commission (CPUC), California Air Resources Board (CARB), the California Independent System Operator (California ISO), California Department of Water Resources, and California Department of Transportation — in carrying out their energy-related duties and responsibilities.
For the last several decades, the CEC has developed forecasts of gas demand, as well as gas prices and rates and assessments of gas supply, infrastructure, and markets. Staff also develops forecasts of transportation rates and burner-tip price, which are prices that electric generators face that are incorporated into production cost modeling of the electricity system. These products are widely used in integrated electricity resource planning, transmission planning, and energy policy and planning studies in California and throughout the western states.
For the 2021 IEPR, staff has improved existing and developed new forecasts and assessments to support long-term gas planning. The CEC has identified an analytical framework it is using for continuous improvements needed to support long-term gas planning in the state, as shown in Figure 34. The framework includes gas demand forecasts as a primary step in planning that are used in forecasting prices and rates and production cost modeling of the electricity system. These forecasts are also used in gas balance and hydraulic modeling of the gas system to assess the reliability, operations, safety, and asset replacements or retirements. The gas demand forecast method and results for the 2021 IEPR are discussed in Chapter 1 of the Forecast Volume. The framework also includes policy assessments of key gas issues, including greenhouse gas (GHG) emissions reductions, equity and rate impacts on disadvantaged communities, and the roles of the gas system in delivering renewable gas and renewable hydrogen to advance California’s clean energy goals.
265 The Warren-Alquist Act is the enabling statute for the CEC, which is the primary energy policy and planning agency for California. It established the CEC in 1974 to respond to the energy crisis of the early 1970s and the state’s unsustainable growing demand for energy resources. For more information, see https://www.energy.ca.gov/rules-and-regulations/warren-alquist-act.
121
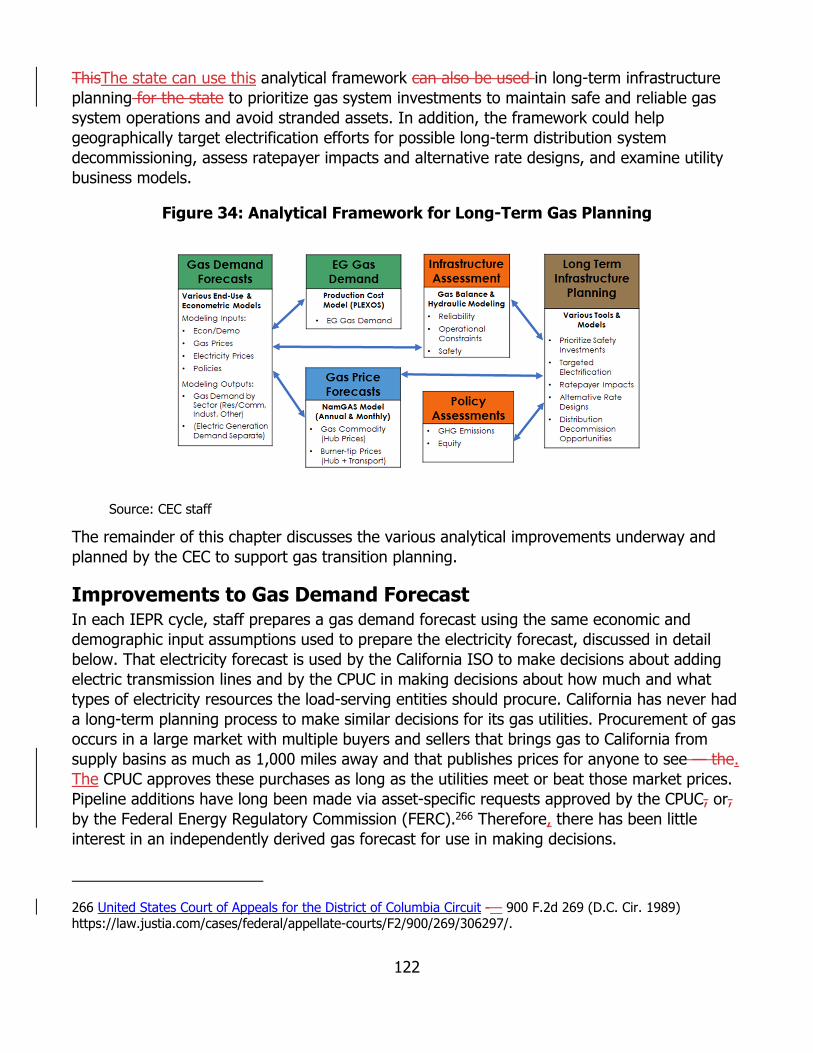
ThisThe state can use this analytical framework can also be used in long-term infrastructure planning for the state to prioritize gas system investments to maintain safe and reliable gas system operations and avoid stranded assets. In addition, the framework could help geographically target electrification efforts for possible long-term distribution system decommissioning, assess ratepayer impacts and alternative rate designs, and examine utility business models.
Figure 34: Analytical Framework for Long-Term Gas Planning
Source: CEC staff
The remainder of this chapter discusses the various analytical improvements underway and planned by the CEC to support gas transition planning.
Improvements to Gas Demand Forecast In each IEPR cycle, staff prepares a gas demand forecast using the same economic and demographic input assumptions used to prepare the electricity forecast, discussed in detail below. That electricity forecast is used by the California ISO to make decisions about adding electric transmission lines and by the CPUC in making decisions about how much and what types of electricity resources the load-serving entities should procure. California has never had a long-term planning process to make similar decisions for its gas utilities. Procurement of gas occurs in a large market with multiple buyers and sellers that brings gas to California from supply basins as much as 1,000 miles away and that publishes prices for anyone to see — the.The CPUC approves these purchases as long as the utilities meet or beat those market prices. Pipeline additions have long been made via asset-specific requests approved by the CPUC, or, by the Federal Energy Regulatory Commission (FERC).266 Therefore, there has been little interest in an independently derived gas forecast for use in making decisions.
266 United States Court of Appeals for the District of Columbia Circuit -— 900 F.2d 269 (D.C. Cir. 1989) https://law.justia.com/cases/federal/appellate-courts/F2/900/269/306297/.
122
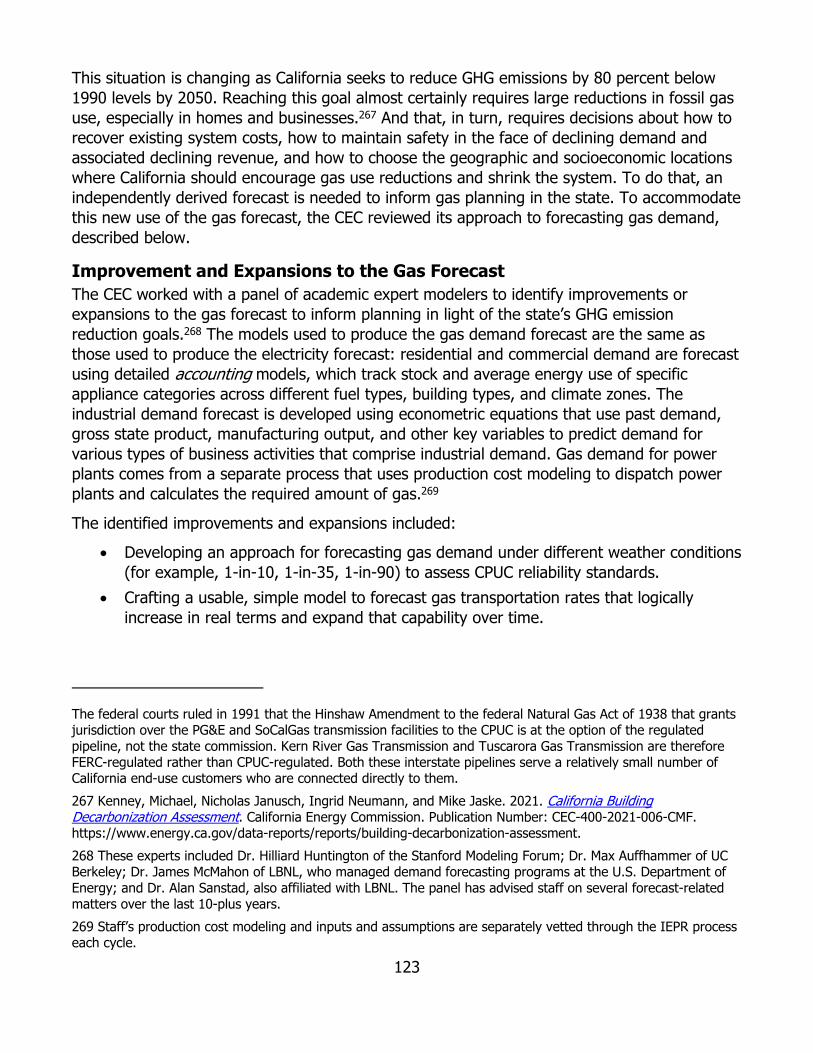
This situation is changing as California seeks to reduce GHG emissions by 80 percent below 1990 levels by 2050. Reaching this goal almost certainly requires large reductions in fossil gas use, especially in homes and businesses.267 And that, in turn, requires decisions about how to recover existing system costs, how to maintain safety in the face of declining demand and associated declining revenue, and how to choose the geographic and socioeconomic locations where California should encourage gas use reductions and shrink the system. To do that, an independently derived forecast is needed to inform gas planning in the state. To accommodate this new use of the gas forecast, the CEC reviewed its approach to forecasting gas demand, described below.
Improvement and Expansions to the Gas Forecast The CEC worked with a panel of academic expert modelers to identify improvements or expansions to the gas forecast to inform planning in light of the state’s GHG emission reduction goals.268 The models used to produce the gas demand forecast are the same as those used to produce the electricity forecast: residential and commercial demand are forecast using detailed accounting models, which track stock and average energy use of specific appliance categories across different fuel types, building types, and climate zones. The industrial demand forecast is developed using econometric equations that use past demand, gross state product, manufacturing output, and other key variables to predict demand for various types of business activities that comprise industrial demand. Gas demand for power plants comes from a separate process that uses production cost modeling to dispatch power plants and calculates the required amount of gas.269
The identified improvements and expansions included:
Developing an approach for forecasting gas demand under different weather conditions (for example, 1-in-10, 1-in-35, 1-in-90) to assess CPUC reliability standards.
Crafting a usable, simple model to forecast gas transportation rates that logically increase in real terms and expand that capability over time.
The federal courts ruled in 1991 that the Hinshaw Amendment to the federal Natural Gas Act of 1938 that grants jurisdiction over the PG&E and SoCalGas transmission facilities to the CPUC is at the option of the regulated pipeline, not the state commission. Kern River Gas Transmission and Tuscarora Gas Transmission are therefore FERC-regulated rather than CPUC-regulated. Both these interstate pipelines serve a relatively small number of California end-use customers who are connected directly to them. 267 Kenney, Michael, Nicholas Janusch, Ingrid Neumann, and Mike Jaske. 2021. California Building Decarbonization Assessment. California Energy Commission. Publication Number: CEC-400-2021-006-CMF. https://www.energy.ca.gov/data-reports/reports/building-decarbonization-assessment. 268 These experts included Dr. Hilliard Huntington of the Stanford Modeling Forum; Dr. Max Auffhammer of UC Berkeley; Dr. James McMahon of LBNL, who managed demand forecasting programs at the U.S. Department of Energy; and Dr. Alan Sanstad, also affiliated with LBNL. The panel has advised staff on several forecast-related matters over the last 10-plus years. 269 Staff’s production cost modeling and inputs and assumptions are separately vetted through the IEPR process each cycle.
123

Enhancing understanding of industrial uses of gas and other end uses that cannot electrify.
Developing a forecast for hot, dry summer conditions. Performing more granular disaggregation to support hydraulic modeling of gas
systems, geographically and hourly, especially the electric generation gas burn. Analyzing climate change impacts, such as the occurrence of extreme events (heat
dome, polar vortex). Ensuring time in the process to iterate between price and quantity. Get daily (and hourly) gas sendout data by customer class. Continuing collaboration with utilities in developing more sophisticated forecasting
methods corresponding to new circumstances.
IEPR Forms and Instructions As part of the IEPR cycle, the CEC for the first time issued forms requesting information from the gas utilities on their gas demand forecasts, the associated methods and forecasts of revenue requirements, and rates. Staff has also met with the utilities to ask questions, confirm details, and understand unexpected responses. Staff is using this information to inform development of and as a point of comparison against its own forecasts.
To enhance CEC staff’s knowledge of California’s gas system and with an eye toward improving future CEC gas demand and rate forecasts, staff collected the gas utility demand and rate forecasts from 2021 through 2035. Moreover, the CEC collected information on revenue requirements and expected pipeline replacement miles to understand utility system planning. This is a collaborative process among CEC staff, Pacific Gas and Electric Company (PG&E), San Diego Gas & Electricity (SDG&E), and Southern California Gas Company (SoCalGas). The process is modeled after that used to collect and analyze CEC electricity demand forms submitted by electricity providers while leveraging the gas utilities’ work on the California Gas Report. CEC staff has hosted webinars that walked through the forms while the utilities ask questions and provide input. PG&E, SDG&E, and SoCalGas have met with CEC staff and prepared presentations for staff that clarify the information the utilities submitted on the forms. The full list of data collected is presented in Appendix B.
Utility Gas Demand Forecasts The investor-owned utilities’ (IOUs) IEPR filings provide forecasts from the biennial California Gas Report for their gas demand by service territory and customer class. Figure 35 shows the PG&E and SoCalGas demand forecast. Overall, average demand for SoCalGas and PG&E is forecasted to be 2,132 million and 1,546 million cubic feet per day (MMcfd), respectively, by 2030.
The residential and commercial classes are expected to decline by roughly 1 percent per year in the forecast period for both utilities, while the industrial sector remains largely constant. Most notably, SoCalGas’ and PG&E’s electric generation demand forecasts differ, with SoCalGas forecasting a larger decline in electric generation demand through 2030, while PG&E maintains the same 1 percent per year decline for electric generation demand as in the
124

residential and commercial sectors. Natural gas vehicle demand is only 1.7 percent and 0.4 percent of total demand for SoCalGas and PG&E, respectively, but both utilities forecast a slow but steady increase over time.
Figure 35: PG&E and SoCalGas Demand Forecast (MMcfd)
Source: CEC staff using CGR data
Uses for Demand Forecasts Planning for the gas system requires expanding the CEC’s current gas demand forecasts. The forecasts can provide insight as to whether existing infrastructure can handle intraday summer power plant ramping while ensuring that storage fields have enough inventory to meet the winter peaking demand, which is driven by core residential and small commercial customers. As California further electrifies its energy uses, assessing the impact of power plant gas use and the intraday requirements on gas transmission infrastructure will become increasingly important.
While gas forecasts can help answer these questions, changes to the forecast must account for new complexities. To analyze the impact of decommissioning a portion of a gas distribution system, demand forecasts would need to become more granular, focused on smaller groups of localized customers. This granularization will require more attention to individual customer sectors (commercial, industrial, electric generation, petroleum refining) as to when, how, and where they use gas. As the electrification of the transportation sector continues, there are questions about how this will affect gas demand by petroleum refiners and power plants.
While hydraulic models, which simulate the operation of gas systems, of gas distribution systemssystem operations can provide insight into a local area’s reliability, more granular forecasting and knowledge of the gas system can promote decarbonization in disadvantaged
125

communities as well. As increasing amounts of renewable gas and hydrogen are injected into gas utility systems in the future, there are questions about what will be the ratepayer costs to modify gas systems, which customers will adopt these fuels, and how much will need to be factored into forecasts. Furthermore, expected future drier and warmer climates, state and local regulations and ordinances regarding the use of gas in buildings, and the timing of changes will also affect forecasts.
In addition to developing a greater understanding of gas demand forecasts, CEC staff requested information on forecasted gas utility revenue requirements. The decommissioning of gas infrastructure or related modification to accommodate larger quantities of renewable gas and hydrogen in the gas system creates important financial questions that will need to be addressed. Gas utilities will need to be well-funded and viable entities to provide safe and reliable gas service to remaining customers while decarbonizing their systems. If more customers electrify their homes and no longer procure gas service, remaining costs will be spread across a shrinking gas customer base that will include customers who cannot afford electrification. A better understanding of revenue requirements on a more granular level can point to a greater understanding of which parts of the gas system are more economical to decommission. Gas rates paid by various customers will also be affected. In terms of rates paid by customers, questions remain about whether savings from decommissioned gas infrastructure can offset increases resulting from a smaller customer base.
Staff plans to initiate a working group composed of gas demand forecasters, system planners, and other interested stakeholders. The working group would provide a venue for stakeholders to discuss gas demand forecasts, specific use cases, and needed improvements within the context of an evolving policy landscape. A similar working group — the Demand Analysis Working Group (DAWG) — exists for electricity system planning and has been enormously successful in developing a common understanding of and comfort with the detailed methods and assumptions used to inform critical planning decisions.
Other Improvements Underway There were three other improvements to the gas demand forecast. One is the effort to build into the demand forecast rates for gas transportation service that escalate in real terms. Transportation service rates plus gas commodity prices represent the cost of gas delivered to a consumer and, together, are an input to the demand forecast. With the lower gas use of decarbonization, the Commission will need to capture impacts to the transportation rate component of the delivered gas cost. Higher transportation rates may also affect dispatch of gas-fired power plants and will certainly affect the cost of electricity, which, in turn, is an input to the electricity demand forecast. Improving staff’s treatment of gas transportation rates is a key innovation to the forecast and is discussed in detail in Chapter 8 of this report.
Staff is also working to understand more precisely what business activities are driving demand in the industrial sectors and the impacts of end use reductions in the residential and commercial sectors. Staff is also working to better identify the load captured in the “Mining” category of North American Industry Classification System (NAICS) code. Load that is served directly from Kern River Gas Transmission will be captured and identified as enhanced oil recovery load. Other load in those NAICS codes will be collapsed into the industrial category.
126

This category will reflect more common usage in the gas industry and be more compatible with the utility forecasts and customer classes reflected in gas transportation rates.
Another task is to create probabilistic forecasts to cover peak- day demand. Today, the CEC produces a forecast that covers only annual demand under average conditions. The gas utilities have traditionally prepared forecasts of peak demand by month and day. These forecasts are used to allocate costs among customer classes, perform contingency planning, make decisions about when to add capacity, and understand the demand levels that would require curtailment of service to noncore customers. A daily gas demand forecast would allow the CEC to capture the impacts of more extreme weather events. In the 2021 IEPR, for example, the CEC explored how high gas demand could rise in a long, hot summer.270 (See Chapter 2.)
A further level of effort will capture increasing levels of disaggregation. This disaggregation is needed geographically and hourly. One concern is that the hourly ramp of gas burned by power plants is increasing, as illustrated in Figure 36, that compares hourly gas demand for SoCalGas on two days of similar total gas demand. Both were high-demand days for summer, around 3,200 million cubic feet (MMcf). What stands out is how much steeper the morning ramp is in 2020 versus 2015.
Figure 36: Hourly Sendout on SoCalGas for High Summer Demand Day in 2015 and 2020
Source: Aspen Environmental Group
270 Staff presented its initial thoughts on a hot, dry summer case at the July 9, 2021, IEPR Joint Agency Workshop on Summer 2021 Electric and Natural Gas Reliability. https://www.energy.ca.gov/event/workshop/2021-07/iepr-joint-agency-workshop-summer-2021-electric-and-natural-gas-1.
127

During summer months, there is little demand by residential and commercial customers. Instead, the ramp is caused almost entirely by power plants, and it increases from around 100 MMcf per hour to around 175 MMcf per hour. The other thing that stands out is that while it is common to talk about gas backing up renewables in the late afternoon/early evening hours as solar production declines, gas demand actually does not change much in those 4:00 p.m. to 9:00 p.m. hours. It slowly increases all afternoon and falls off rapidly after that, but that was also true in 2015. Staff must continue to follow this trend and develop a more complete understanding of how gas demand changes by hour. This trend also feeds into the CEC’s analysis of physical impacts to the gas system and ways that the system will change with decarbonization.
The staff is seeking input from stakeholders on these changes and will host meetings in 2022 to discuss proposed methods. Staff will continue its effort to improve the demand forecast to better meet the changing needs of the state’s policy and decarbonization planning.
Long-Term Gas Demand Scenarios Staff is developing long-term energy demand scenarios out to 2050 to identify energy demand and supply consequences and greenhouse gas (GHG) emission reductions from existing and near-term policies. The annual projections for electricity and natural gas for the residential and commercial sectors, and for all fuels in the transportation sectors, will be developed using the CEC’s forecasting models and supplemental tools. The energy projections for these sectors will then be used in an adapted version of E3’s PATHWAYS model to generate total energy demand and GHG emission consequences that covers all demand sectors for all relevant energy types. The scenarios capture fuel substitution (such as electrification) in the residential and commercial sectors plus additional achievable energy efficiency. These long-term scenarios were discussed at a DAWG meeting September 15, 2021,271 and will be presented at an IEPR workshop in early 2022. For more information on demand scenarios, see Chapter 4 of the 2021 IEPR, Volume IV: California Energy Demand Forecast.
Gas System Assessments As California contemplates its gas transition, the gas utilities’ hydraulic models provide valuable insight into the operation of gas transmission and distribution systems. The hydraulic model can inform the user if a gas system can provide service to customers without service curtailment. The hydraulic model is the gas equivalent of the power-flow model. Using engineering equations, the hydraulic model assesses pressures and flows on gas systems. A computer model is needed to run these equations because spreadsheet calculations would be too complicated on complex and dynamic gas systems.
Utilities use hydraulic models of their transmission and distribution systems as a planning tool. An example is to simulate changes in demand, such as the construction of a new subdivision or power plant. The model can help the utilities decide the diameter of pipe used to serve new
271 September 15, 2021, DAWG meeting documents can be found at https://www.energy.ca.gov/event/meeting/2021-09/demand-analysis-working-group-dawg-meeting-demand-scenarios.
128

customers. Analyses derived by the utilities can be used in regulatory proceedings — such as approval for new infrastructure or approval for decommissioning infrastructure. When gas utilities report available capacities on their systems, hydraulic models are used in these calculations. For example, if repairs to a gas compressor station reduce pipeline capacity on a given day, the hydraulic model estimates available capacity on that day.
Since 2016, the CEC has worked toward developing its hydraulic modeling capabilities, shown in Figure 37, by collecting models from the gas utilities and learning the modeling software. The Warren-Alquist Act requires that the CEC conduct assessments and forecasts of gas supply, production, transportation, delivery, distribution, demand, and prices. In addition to supporting the assessment of the gas system, the hydraulic models include demand nodes such as power plants and petroleum refineries. The models can help analysts and policy makers better understand the interaction between the electricity and gas systems, along with the interaction between the transportation fuel and gas systems. In February 2018, the CEC updated its data regulations to become the first state regulatory agency in the United States to require hydraulic modeling files. Subsequent to the CEC’s action, staff procured a Synergi Gas license and began a series of in-person and online training sessions with software vendor DNV.
Figure 37: CEC Efforts to Develop Hydraulic Modeling Skillset
Source: CEC staff
129

PG&E and SoCalGas helped CEC staff with developing this expertise. The CEC grants confidential designation to the hydraulic models submitted by the gas utilities because of the sensitivity of the data provided. Hydraulic models incorporate substantial amounts of data to perform simulations including:
Pipeline segment lengths and diameters. Maximum and minimum operating pressures. System supply and demand. Compressor systems. Valves. Regulators. Gas storage facilities.
The utilities have hosted in-person and online demonstrations of hydraulic models and have responded to information requests of staff. As well as collaborating with the utilities, the CEC follows gas regulatory proceedings and reviews documents from current and previously closed proceedings to gain background knowledge on the gas systems and link the utilities’ insight with the hydraulic models.
The gas utilities’ hydraulic models are on a software platform called Synergi Gas. Synergi Gas is used by most large gas utilities in the United States.272
To develop proficiency in hydraulic modeling of the DNV Synergi Gas software, staff performed the following simulations:
Analyzing different supply and demand scenarios Modifying compressor and regulator settings and observing intraday swings in
pressures, flows, and system linepack Trying different pressure settings for compressors and regulators. Simulating system operation during intraday swings in pressures, flows, and linepack Identifying spots that are vulnerable to high and low pressures Assessing impact of hypothetical service curtailments Simulating systemwide impact of disabling pipeline segments, compressor engines, or
other infrastructure Simulating storage injections and withdrawals
While the Aliso Canyon technical study spurred public interest in verifying gas utility hydraulic modeling findings, the analytical tools being developed by the CEC will be useful in the years to come as California considers the transition of the entire gas system. Hydraulic models can simulate the impact of activities that are part of the gas system transition, including pipe
272 Developed in the 1970s by Stoner and Associates of Mechanicsburg, Pennsylvania, industry vets call the software the Stoner Model. After several acquisitions, the software platform is now owned by Oslo, Norway-based DNV.
130

derating, the decommissioning of infrastructure, and modifications to infrastructure due to injections of renewable gas and hydrogen. The gas transition can impact all gas infrastructure, and as the system decarbonizes, hydraulic models of distribution and transmission systems will be of interest. Simulating future activities also requires future supply-and-demand scenarios. And as mentioned earlier in this report, understanding the gas transition will require more granular forecasts, such as ones that look at trends in distribution system use. The utilities would run simulations of these activities and, in return, would use the results to inform regulatory proposals.
131

CHAPTER 9: Gas Price Outlook
This chapter presents the California Energy Commission’s (CEC’s) outlook for gas commodity prices, transportation rates, delivered or customer prices (commodity price plus the transportation rate), and burner tip prices. For the 2021 Integrated Energy Policy Report (IEPR), the CEC made significant improvements to its models and methods to better reflect actual market conditions. The CEC has presented modeled results for gas prices and discussed the improvements that have been made.
CEC uses the North American Market Gas-Trade model (NAMGas) to simulate the long-term economic behavior of gas producers in supply basins and gas consumers in demand centers. The model is also structured to represent intrastate and interstate pipelines, liquefied natural gas (LNG) import and export facilities, and other infrastructure. The model encompasses the continental United States, as well as Alaska, Canada, and Northern Mexico.
CEC developed three cases for gas prices for the 2021 IEPR. These cases are typically known as “common” cases because key assumptions are common across various modeled projections within the IEPR, including electricity demand. These cases are defined as high price-low demand, midprice and demand, and low price-high demand using inputs and assumptions about the market conditions that will affect prices.273 Those inputs and assumptions include, for example, the changing cost of production and potential resources, as well as varying demand for the different customer sectors.
For the 2021 IEPR, CEC developed and launched a monthly model for gas prices that replaces the annual gas prices from the model used in previous IEPRs. This new model is a significant improvement over the older version in that it accounts for storage and seasonal effects not captured in the previous annual model. The annual model assumed storage would be a net zero, meaning gas injection into storage and gas withdrawals from storage would balance each other out over a year. The annual model did not capture seasonal variation in demand or price. The new monthly model, however, enables the CEC to see the monthly effects from changes in storage capacity, seasonal demand, and infrastructure.
North American Gas Price Outlook Henry Hub, a gas delivery point in Louisiana, provides prices that are crucial for understanding complex national gas pricing trends, as it is the national benchmark price used by major financial and physical market traders throughout North America. The CEC’s projections for Henry Hub prices derived from the NAMGas model show a steady but moderate price increase over the 10-year forecast. Yet, new or revised policies, as well as changes in supply or demand, can affect prices and change these projections. Emissions reduction policies — for example, establishing a carbon market or limiting or banning certain types of production (such
273 Higher prices suppress demand, while lower prices encourage demand.
132

as fracking) — can result in higher costs for producing gas, which, in turn, increases gas prices. Technological innovations in drilling techniques used for fracking in the early 2000s greatly increased gas supplies in the United States. As such, abundant supplies have contributed to overall low prices throughout the last two decades. In addition, societal changes, such as moving away from fossil fuels to more renewables and other cleaner forms of energy, can affect future prices.
Figure 38 shows the recent monthly prices and projected mid-demand prices (2021–2030) for Henry Hub. The new monthly model projects prices that vary by season. In the mid-demand projections, the model estimates that the Henry Hub price for 2021 will be $2.22/metric million British thermal units (MMBtu). Prices rise at about a 4.0 percent per in year average between 2021 and 2030, with most of the growth between 2021 and 2025 (about 5.6 percent per year).
Figure 38: Monthly Henry Hub Prices
Source: CEC staff
133

Figure 39: Annual Henry Hub Prices
Source: CEC staff
For comparison, Figure 39 demonstrates how these patterns would not be seen in the results from an annual model. The United States Energy Information Administration’s (U.S. EIA’s) mid case and the CEC’s mid-demand case track closely from 2024 through 2030. The price difference in 2020–2024 is due to modeling limitations on the NAMGas model. The increase in prices that appeared in September 2020 is a result of the COVID-19 pandemic causing reduced capital expenditures in the exploration and production of oil and gas. As prices continue to rise, drilling will increase, bringing more gas and associated gas production on-line. Increased supplies lead to lower prices than would otherwise occur.
134
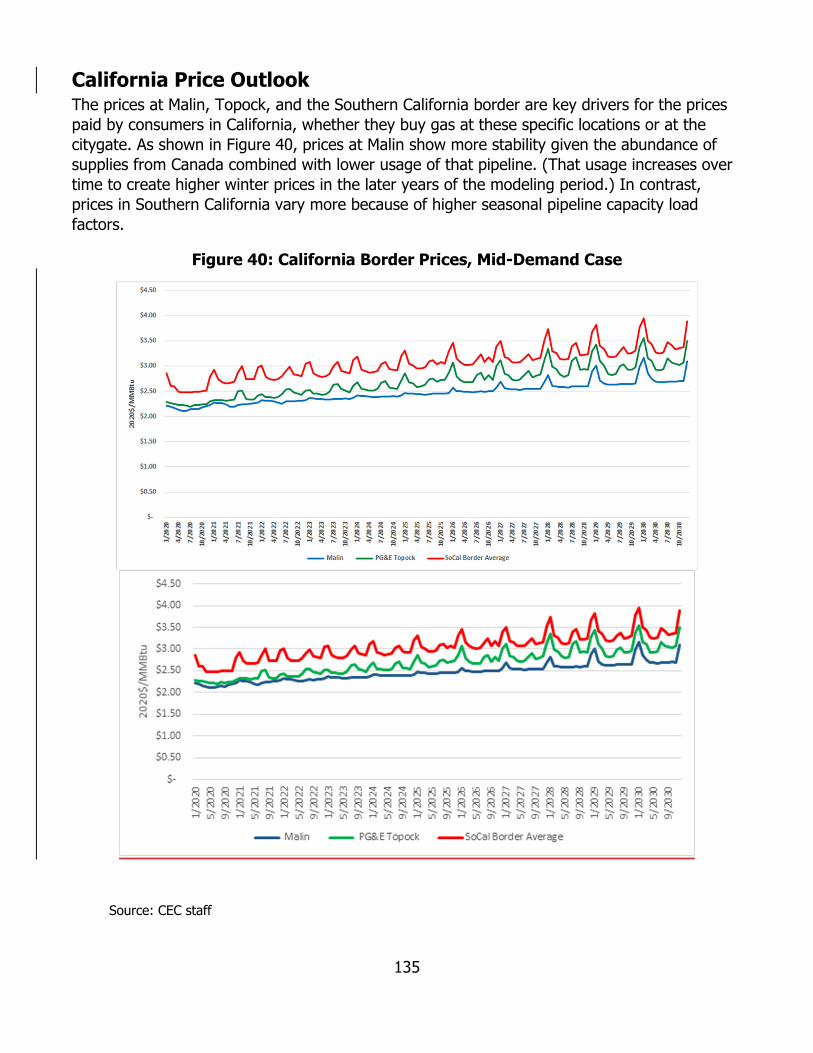
California Price Outlook The prices at Malin, Topock, and the Southern California border are key drivers for the prices paid by consumers in California, whether they buy gas at these specific locations or at the citygate. As shown in Figure 40, prices at Malin show more stability given the abundance of supplies from Canada combined with lower usage of that pipeline. (That usage increases over time to create higher winter prices in the later years of the modeling period.) In contrast, prices in Southern California vary more because of higher seasonal pipeline capacity load factors.
Figure 40: California Border Prices, Mid-Demand Case
Source: CEC staff
135

2020$/M
MBtu
$3.00
$2.00
$1.00
$‐
Once gas passes the border, it moves to the utilities’ intrastate gas systems and to end users who take gas directly off an interstate pipeline like the Kern River pipeline. Utilities supply gas to most core customers (mostly residential and small commercial) and, at a California Public Utilities Commission (CPUC) adopted rate, transport gas through their systems to noncore, large end users (power plants and industrial). Citygate is the commodity price for gas traded at the dropoff from backbone transmission for distribution to customers. Larger customers such as power generators often prefer to buy gas at the citygate instead of buying at the border and contracting for backbone transmission. The total price for gas paid by customers directly served by a utility (residential and small commercial) is interstate pipeline transportation, and an intrastate transportation charge, in addition to the commodity price, wherever that gas is actually purchased.274
Figure 41 shows the monthly Pacific Gas and Electric Company (PG&E) and SoCal citygate price projections, while Figure 42 shows annual projections. In around 2028, the high demand/low price case increases to yield prices above the mid-case. This result occurs as demand grows enough to push pipeline capacities to the maximum, and without expanding pipeline capacities, prices are pushed higher.
Figure 41: California Monthly Citygate Mid-Demand Price Projections $6.00
$5.00
$4.00
1/2020
5/2020
9/2020
1/2021
5/2021
9/2021
1/2022
5/2022
9/2022
1/2023
5/2023
9/2023
1/2024
5/2024
9/2024
1/2025
5/2025
9/2025
1/2026
5/2026
9/2026
1/2027
5/2027
9/2027
1/2028
5/2028
9/2028
1/2029
5/2029
9/2029
1/2030
5/2030
9/2030
PG&E Citygate SoCal Citygate SDG&E Citygate
274 Much of the gas procured to serve core customers is purchased in the supply basin at the price established in each month’s Bidweek market. The utility pays a commodity cost established in the basin and then a charge to move that gas over an interstate pipeline to reach California. Changes in gas requirements from the monthly baseload quantity are met by injecting into or withdrawing from storage or purchasing or selling gas in the daily spot market, often at the citygate price.
136

$6.00
$5.00
$4.00
$3.00
$2.00
$1.00
$‐
2020$/M
MBtu
1/2020
5/2020
9/2020
1/2021
5/2021
9/2021
1/2022
5/2022
9/2022
1/2023
5/2023
9/2023
1/2024
5/2024
9/2024
1/2025
5/2025
9/2025
1/2026
5/2026
9/2026
1/2027
5/2027
9/2027
1/2028
5/2028
9/2028
1/2029
5/2029
9/2029
1/2030
5/2030
9/2030
PG&E Citygate SoCal Citygate SDG&E Citygate
Source: CEC staff
Figure 42: Annual Average California Citygate Mid-Demand Price Projections
137
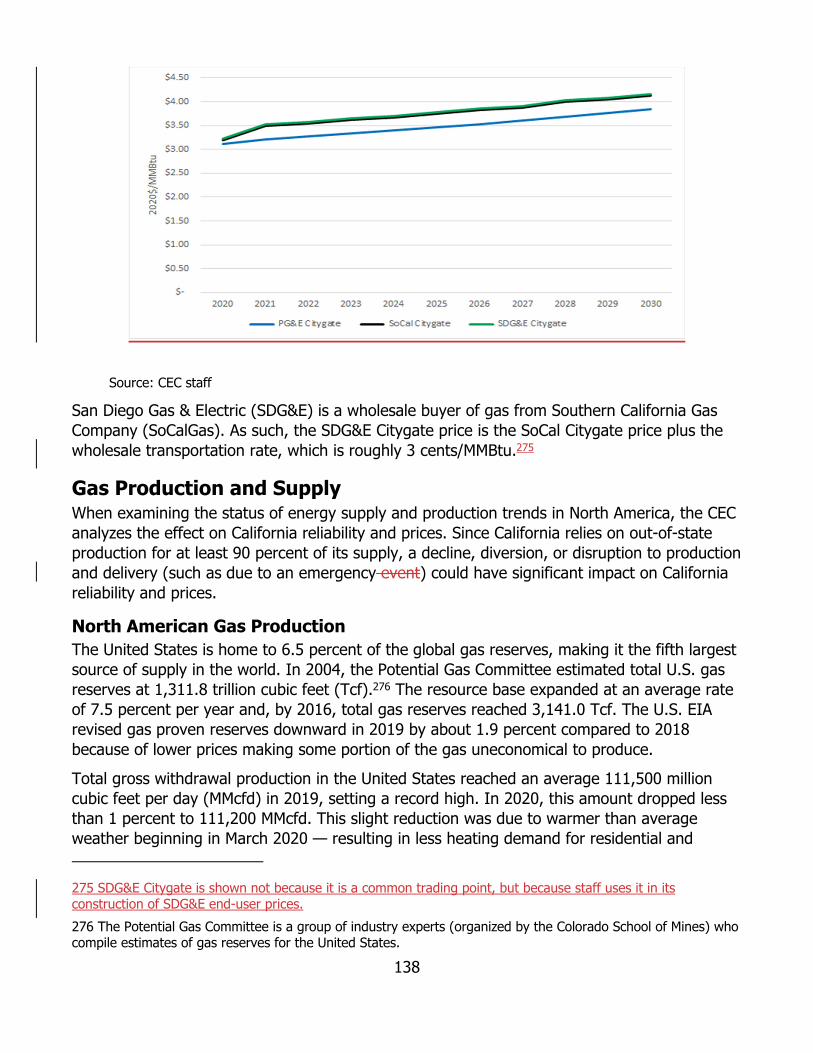
Source: CEC staff
San Diego Gas & Electric (SDG&E) is a wholesale buyer of gas from Southern California Gas Company (SoCalGas). As such, the SDG&E Citygate price is the SoCal Citygate price plus the wholesale transportation rate, which is roughly 3 cents/MMBtu.275
Gas Production and Supply When examining the status of energy supply and production trends in North America, the CEC analyzes the effect on California reliability and prices. Since California relies on out-of-state production for at least 90 percent of its supply, a decline, diversion, or disruption to production and delivery (such as due to an emergency event) could have significant impact on California reliability and prices.
North American Gas Production The United States is home to 6.5 percent of the global gas reserves, making it the fifth largest source of supply in the world. In 2004, the Potential Gas Committee estimated total U.S. gas reserves at 1,311.8 trillion cubic feet (Tcf).276 The resource base expanded at an average rate of 7.5 percent per year and, by 2016, total gas reserves reached 3,141.0 Tcf. The U.S. EIA revised gas proven reserves downward in 2019 by about 1.9 percent compared to 2018 because of lower prices making some portion of the gas uneconomical to produce.
Total gross withdrawal production in the United States reached an average 111,500 million cubic feet per day (MMcfd) in 2019, setting a record high. In 2020, this amount dropped less than 1 percent to 111,200 MMcfd. This slight reduction was due to warmer than average weather beginning in March 2020 — resulting in less heating demand for residential and
275 SDG&E Citygate is shown not because it is a common trading point, but because staff uses it in its construction of SDG&E end-user prices. 276 The Potential Gas Committee is a group of industry experts (organized by the Colorado School of Mines) who compile estimates of gas reserves for the United States.
138

commercial building use — and the economic slowdown from the COVID-19 pandemic response.277
Figure 43 shows that United States annual gas consumption outpaced production for most of the last two decades, a trend that reversed in 2018. As a result, the United States has become a net gas exporter. In 2020, gas exports reached a record 14.4 billion cubic feet per day (Bcfd), while imports fell to 7.0 Bcfd, the lowest amount since 1993.
In Mexico, demand for gas continues to grow, especially in the electricity generation sector. Exports from the United States reached an all-time high in June 2021.278 In 2020, the country imported about 5.46 Bcfd from the United States, mostly through pipelines. Petroleos Mexicanos, the Mexican state oil company, reported gas production of 3.64 Bcfd for 2020 and is forecasting an increase in a base-case scenario to 4.19 Bcfd in 2021.279
Figure 43: United States Dry Gas Production and Annual Consumption
Source: U.S. EIA.
In 2019, 98 percent of all U.S. gas imports came from Canada via pipelines, according to the U.S. EIA. Canadian imports of gas reached a peak of 8,092 MMcfd in 2017 and steadily declined to 6,850 MMcfd in 2020. Gas production in Canada dropped by 2.8 percent in 2019 to 1,570 MMcfd and dropped again by 1.8 percent to 1,543 MMcfd in 2020. The production decline was due to the government of Alberta imposing production limits because of historically low crude oil prices in early 2019, rising inventories, and lack of export capacity. The government extended the production limits through December 2020. While the action was
277 U.S. EIA. March 10, 2020. “United States Gas Production Grew Again in 2019, Increasing by 10 Percent.” https://www.eia.gov/todayinenergy/detail.php?id=43115. U.S. EIA. March 2, 2021. “Annual United States Gas Production Decreased by 1 Percent in 2020.” https://www.eia.gov/todayinenergy/detail.php?id=46956. 278 U.S. EIA. “Natural Gas Weekly Update for the Week Ending July 14, 2021.” https://www.eia.gov/naturalgas/weekly/archivenew_ngwu/2021/07_15/. 279 U.S. EIA webpage for Mexico energy information, https://www.eia.gov/international/analysis/country/MEX.
139

focused primarily on oil production, it resulted in a reduction in associated gas that would have been extracted along with the oil.280
There are 18 proposed LNG export facilities proposed to be built in Canada, 13 of which are on the coast of British Colombia, to get more gas to other markets. The LNG Canada facility in Kitimat, British Colombia, is the furthest along having begun preliminary construction. The facility will be able to take away up to 26 million tonnes per year, or about 3.5 Bcfd.
Liquefied Natural Gas Exports As of 2020, LNG demand has grown globally year over year. The 2019 daily global demand averaged 46.7 Bcfd, while 2020 averaged 49.9 Bcfd. The small increase in 2020 occurred despite the COVID-19 pandemic that caused a global reduction in gas demand. Between 2015 and 2019, global trade of LNG increased by 45 percent overall.
LNG exports increased from two countries from 2019 to 2020 (1) the United States, with a 1.5 Bcfd increase, and (2) Australia, with a 0.3 Bcfd increase. Total annual LNG exports from the United States grew by 579 billion cubic feet (Bcf) for a total of 2,390 Bcf for 2020. While the United States average daily exports experienced a significant dip in demand in June and July 2020, as seen in Figure 44, average daily exports grew to 6.5 Bcfd for the year. The LNG export amounts began recovering in the fall and winter heating season of 2020. Despite another dip in capacity for February 2021, exports during the spring of 2021 remained high, and average daily exports grew to 6.5 Bcfd for the year. The increase in United States exports was due to several new trains and associated facilities that began operating in 2020, including one new train each at Cameron LNG, Freeport LNG, and Corpus Christi LNG. Elba Island LNG made up the remaining gain with 10 trains beginning in September 2019.281
280 Alberta Oil Production Limit. https://www.alberta.ca/oil-production-limit.aspx. 281 U.S. EIA. “Natural Gas Weekly Update for the Week Ending June 30, 2021.” https://www.eia.gov/naturalgas/weekly/archivenew_ngwu/2021/07_01/.
140

Figure 44: United States Monthly Liquefied Gas Exports
Source: CEC staff
In Oregon, Pembina Pipeline Corporation has pausedcancelled the development of Jordan Cove LNG because of political and regulatory uncertainty. in December 2021.282 The Oregon Land Use Board of Appeals appealed a pair of permits approved by Coos County and the Town of Coos Bay that would have allowed for site preparation and channel dredging. There is no estimated start date for the facility.283
282 Niina H. Farah, Miranda Willson, Carlos Anchondo. December 2, 2021. “Jordan Cove Project Dies. What It Means for FERC, Gas.” E&E News, https://www.eenews.net/articles/jordan-cove-project-dies-what-it-means-for-ferc-gas/. 283 DiSavino, Scott. April 23, 2021. “Pembina Pauses Development of Oregon Jordan Cove LNG Plant.” Nasdaq. https://www.nasdaq.com/articles/pembina-pauses-development-of-oregon-jordan-cove-lng-plant-2021-04-23.
141

Sempra’s Costa Azul LNG facility (Baja California) achieved a milestone of being sanctioned by the Mexican government and reaching a final investment decision. The first production is expected by late 2024 with an initial capacity of 0.27 Bcfd and a maximum capacity of 0.35 Bcfd. Sempra is planning additional LNG facilities near the current one.284 This facility, targeting the East Asian markets, will transport gas from Texas and the western United States via a new pipeline in Mexico. This will present a trade advantage over gas being shipped through the Panama Canal.
LNG exports are prone to shift quickly because of pricing and international political issues. For example, if prices at international hubs such as the Japan Korea Marker or Title Transfer Facility (the Netherlands) drop while U.S. prices rise, this could reduce profitability and lead to a decline in exports. An issue specific to U.S. LNG exporters is that most exports are bought on an immediate physical basis rather than by long-term contract. This arrangement adds to the potential volatility of the U.S. LNG exporting market.
California Gas Production As of 2019, California accounted for 6.9 percent of total U.S. gas consumption, ranking it second behind Texas.285 As Figure 45Figure 45 shows, California relies mostly on supplies from the Western Canadian Sedimentary Basin (Alberta and British Columbia, Canada), Permian Basin (west Texas and southwestern New Mexico), San Juan Basin (northwestern New Mexico and southwestern Colorado), and Rocky Mountains (Wyoming).
California still relies on in-state production for 10 percent of its supplies. In-state gas production in 2020 was 457 MMcfd, a drop from the 539 MMcfd in 2019. The dip in production reflects a general trend of falling in-state production since 1985. While the COVID-19 pandemic contributed to the drop of gas demand and production operations in 2020, the decline is largely a reflection of the state’s move away from fossil fuels.
284 Lenton, Christopher. November 17, 2020. “Energía Costa Azul Sanctioned, Looks to Become Mexico’s First LNG Export Project.” Natural Gas Intelligence. https://www.naturalgasintel.com/energia-costa-azul-sanctioned-looks-to-become-mexicos-first-lng-export-project/. 285 U.S. EIA Frequently Asked Questions webpage, “Which States Consume and Produce the Most Natural Gas?” https://www.eia.gov/tools/faqs/faq.php?id=46&t=8.
142

Figure 45: Key Supply Basins and Interstate Pipelines Serving California
143

Source: CEC staff
Governor Gavin Newsom recently directed the California Geologic Energy Management Division (CalGEM) to cease providing new permits for all fracking and related activity by January 2024 (Chapter 1).286 The directive also called on the California Air Resources Board (CARB) to investigate ending all oil and gas extraction by 2045. As California continues to implement strategies to reduce GHG emissions, including energy efficiency measures, building decarbonization, and electrification, the state’s overall gas consumption is expected to decline.
California Gas Price Outlook The total cost of gas delivered to consumers is an input to the gas and electricity models staff uses to project energy demand by residential, commercial, and industrial customers. Prices for gas service in California consist of two main components: one for the commodity cost of the gas itself and one for the transportation service that moves gas from the state line to the consumer. Staff projects the commodity cost using its NAMGas model. Staff separately projects the transportation rate, as described in this section. CEC staff projects gas transportation rates only for PG&E, SoCalGas, and SDG&E, as these three gas utilities cover
286 Office of Governor Gavin Newsom. April 23, 2021. “Governor Newsom Takes Action to Phase Out Oil Extraction in California.” https://www.gov.ca.gov/2021/04/23/governor-newsom-takes-action-to-phase-out-oil-extraction-in-california/.
144

the electricity planning areas and the remaining gas demand served by other utilities will have no effect on the results that use these inputs.287
Rates for gas transportation service in California vary by customer class: residential, commercial, industrial, power generation, and a few others, such as wholesale. The general process for determining gas transportation rates is to identify and sum up costs, allocate costs to the various customer classes, and divide by forecasted gas throughput (also referred to as consumption, demand, or sendout). The utilities present these costs and their proposed allocation of them in periodic rate cases before the CPUC. Interested parties sometimes present alternatives, and the CPUC makes the final decision on the recovery of costs in rates, the costs allocation, and the final throughput forecast.
The cost allocation to the customer classes tends to not change very much from case to case. It is applied based on long-standing theory that costs should be allocated to those that cause them. Some of the allocators are throughput-related and correlate to reliability standards. As a result, the CPUC allocates the highest percentage of costs to residential customers because they are the largest consumer of gas under peak-demand conditions and the system is built to assure reliability to those customers under those conditions. Besides the allocators, the biggest drivers of rates are the revenue requirement and the forecast of how much gas will be used. The revenue requirement is a roll-up of all the costs the utility will incur to provide service. It includes employee salaries, equipment, cost of borrowing capital, new software (for example, a new customer information system or hydraulic modeling software), and, most important, the costs to maintain the gas system.
The factors that drive that revenue requirement are key to projecting rates for gas transportation service. That includes projecting costs for individual utility line-item programs and asset categories and understanding additions to the rate base. For the 2021 IEPR, staff sought detailed information from the utilities about individual program and asset revenue requirements for enhancing the rate forecast. The utilities responded that they did not project their revenue requirement or costs past the current ratesetting period.288 PG&E suggested its revenue requirement would escalate 5 percent but did not demonstrate any differentiation in costs among programs or asset categories. SoCalGas provided CEC staff with rates for 10 years but with no differentiation in costs among programs or asset categories. In the meantime, staff compiled and reviewed gas transportation service revenue requirements reported by the CPUC each year, which are shown in Figure 46.289
287 Load at the other, primarily municipal, gas utilities in California is so small that staff does not expect it to have a material impact on rates used in the demand forecast for other end uses. 288 Results from the 2021 IEPR Natural Gas Demand Forms and Instructions (Form 2.1). 289 See CPUC Gas & Electric Utility Cost Reports and the utilities’ 2020 and 2021 advice letters for rates effective “January 1.”
145

Figure 46: Utility Transportation Service Revenue Requirements by Year ($)
Source: CPUC data
Staff observed PG&E’s transportation revenue requirement increasing by 5.96 percent over the last 12 years, SoCalGas’ by 4.5 percent, and SDG&E’s by 6.5 percent. Looking at a more recent period, the six-year escalation rates are (negative) 0.47 percent for PG&E, 2.85 percent for SoCalGas, and 5.26 percent for SDG&E. Staff also considered the CPUC’s white paper for its February 2021 en banc hearing on Energy Rates and Costs.290 That study used EIA data on delivered gas prices (commodity plus transportation) to derive an escalation factor of 6.5 percent.291 Staff has typically assumed that gas transportation rates escalated only with inflation. The preliminary rate forecast presented at the August 30, 2021, IEPR Workshop used an annual escalation rate of 2.3 percent. Based on comments received on the preliminary rate forecast and further consideration of rate escalation in recent years, CEC staff proposes a moderate escalation of 4 percent.292
Figure 47 summarizes the general process used by CPUC for setting gas transportation rates and identifies the key drivers of rates. The CEC calculates the delivered, or end-use, prices for consumers, which are then used in the gas and electricity demand models for residential, commercial, and industrial customers. The gas end-use rates, along with the electricity end-use rates calculated by staff, serve as inputs for forecasting end-use demand.
290 CPUC. February 24, 2021. En Banc Hearing on Energy Rates and Costs. https://www.cpuc.ca.gov/industries-and-topics/electrical-energy/en-banc-rates-and-costs. 291 Ibid. 292 Comments of Solar Energy Industries Association. Docket 21-IEPR-05. TN# 239686. https://efiling.energy.ca.gov/getdocument.aspx?tn=239686. Comments of Solar Energy Industries Association. Docket 21-IEPR-05. TN# 239691. https://efiling.energy.ca.gov/getdocument.aspx?tn=239691.
146

Figure 47: Drivers and General CPUC Process for Forecasting Gas Transportation Rates
Source: CEC staff
California Gas Transportation Rates In support of the 2021 IEPR, Aspen Environmental Group developed a simple tool to calculate transportation rates by customer class for the state’s three gas utilities. This tool is a starting point to enhance the capabilities of the model and staff’s analytics over future IEPR cycles. The tool takes total revenue requirements, forecasted throughput (demand), and the CPUC-adopted class revenue spread (or allocation) to arrive at average rates by customer class. Future capabilities will allow staff to analyze other factors (for example, capital expenditures, pipeline safety enhancement work, operation and maintenance costs, and rate of return) that combine to create utility revenue requirements.
For this year’s analysis, the model used revenue requirements and class revenue allocation factors requested by gas utilities in their January 1, 2021, advice letters to the CPUC. As indicated above, staff escalated these revenue requirements by 4 percent per year through 2040 to remain conservative for the initial implementation. The amount of gas throughput, or
147
gas delivered to customers, is from the CEC’s 2019 California Energy Demand Forecast (2019 CED).293
The 2019 CED forecast projects demand only through 2030 and shows increasing demand for gas in the residential, commercial, and industrial classes.294 In calculating rates from 2030 to 2040, staff’s preliminary cases hold demand constant. If demand shrinks, rates would be higher, holding all other inputs the same. The assumption of constant demand after 2030 is a placeholder pending completion of work on long-term gas demand scenarios and a potential decision to capture those scenarios or some other assumption on post-2030 demand in the transportation rates. Again, with this new approach and knowing that the assumptions can easily be changed, staff has approached assumptions conservatively. Figure 48 Error! Reference source not found.shows the transportation rates from the new model by utility and customer class.295
As seen in the above figure, all rates increase throughout the forecasted period, with residential rising the most. Residential rates increase at about 2 percent per year. This increase is the result of using the 4 percent to escalate the utility revenue requirements combined with the percentpercentage annual reduction in demand.
293 California Energy Demand 2020-2030 Revised Forecast. https://www.energy.ca.gov/data-reports/reports/integrated-energy-policy-report/2019-integrated-energy-policy-report/2019-iepr. 294 Recall that gas use by electric generators comes not from the CED, but is generated separately, using production cost modeling. 295 All three gas utilities account for residential, commercial, industrial, and electric generation customer classes. While PG&E and SoCalGas also include Backbone and Backbone Transmission Service (BTS) as a customer class (respectively), SDG&E does not. Backbone or BTS is the rate for gas customers that only use the utilities’ gas transmission systems to transport gas to their respective end use, like large industrial and electric generators. PG&E backbone rates do vary by “path” (for example, Redwood versus Baja), and some generators connect not to backbone, but to local transmission. For the sake of simplicity, only a single average rate to PG&E generators is shown.
148

Figure 48: Gas Utility Transportation Rates by Customer Class
Source: CEC staff
While the revenue requirement is escalated in California at 4 percent per year, staff held transportation rates constant for power plants located outside California. Federal Energy Regulatory Commission (FERC) ratemaking for interstate pipelines is different than CPUC ratemaking for gas utilities and interstate pipelines. Rates for interstate pipelines do not change much over time, and FERC does not require periodic pipeline rate reviews. (In contrast, the CPUC reviews gas utility rates every three to four years.) Shippers subscribe to reserve firm capacity on interstate pipelines. This subscription happens during an open season, followed by contract execution. Contracts are typically in place for 15 to 20 years. FERC typically sets rates assuming 95 percent of pipeline design capacity as throughput. As for the rate, most of it is a fixed fee, with little of it being variable. This rate gives pipelines a very stable revenue stream. This means a pipeline is at risk of not recovering lost revenue, but it gets to keep all revenue when overcollected. Accordingly, unless an interstate pipeline is going to add capacity or is facing expiration of contracts, it almost never files a rate case with FERC.
CEC staff prepares the gas and electricity demand models simultaneously, which are organized along the following electricity planning areas described in the 2021 IEPR Forecast Volume. CEC staff models only PG&E, SoCalGas, and SDG&E for the gas end use rates, as these three gas utilities cover the electricity planning areas.
California Delivered Price of Gas Delivered prices are the final prices that a customer pays per unit of gas on their gas bill. Staff arrived at this price by adding the transportation rate derived from the new model to the commodity price produced in NAMGas model. Figure 49 shows the projected yearly delivered prices for residential, commercial, and industrial customers, respectively, in the 2021 IEPR mid-demand case. Prices for the three classes grow at an average of 2 percent per year, close to the revenue requirement escalation factor.
149

Figure 49: Delivered Gas Prices, Mid-Demand Case
Source: CEC staff
Burner Tip Prices Burner tip prices are the prices used in production cost, or PLEXOS, modeling to reflect the price paid by a power plant for gas. It includes the commodity price and transportation costs. The gas price is an important variable within the PLEXOS model, as it affects how power plants are dispatched within the Western Electric Coordinating Council (WECC) and how much natural gas each plant will consume. (This demand then feeds back to the total gas system demand for use in reliability and other assessments.) Appendix F describes key PLEXOS inputs, such as resources and renewable portfolio standards, and model results.
For the 2021 IEPR, staff modified the burner tip model that generates burner tip prices to better reflect price formation in the market. The modifications to the burner tip method caused a range of price shifts. The most significant changes in burner tip prices were to the Oregon, Washington, Rosarito, Baja, and Southern Nevada PLEXOS fuel groups.296 Each experienced a price decrease ranging from $0.82 to $1.32 per MMBtu when comparing the three common cases over a 10-year horizon to the former burner tip method, shown in Table 8. The price shift was primarily due to the change in assignment of gas market “hubs” to the power plant fuel groups and corrections to capture the correct transportation rate to move gas from the assumed purchase location to the power plant fuel group.
296 A “fuel group” is a set of regional power plants identified in the PLEXOS model that is assigned a specific burner tip location price.
150

Table 8: Out-of-State Burner Tip Price Differences
Plexos Fuel Group Previous Burner Hub and Transportation
Rate
New Burner Tip Huband Transportation
Rate
Average PriceChange Among
Cases OregonWA and
WashingtonOR West of Cascades
Seattle hub plus Northwest transportation
KingsgateSumas hub plus Northwest transportation
Decrease of $1.3202/MMBtu
WA and OR East of Cascades
Seattle hub plus Northwest transportation
Kingsgate hub plus GTN transportation
Decrease of $1.32/MMbtu
Rosarito and Baja Mexico-Baja hub plus North Baja transportation
Ehrenberg hub plus North Baja
transportation Decrease of
$1.23/MMBtu
Oregon Portland hub plus TransCanada GTN transportation
Sumas hub plus Westcoast transportation
Decrease of $0.92/MMBtu
Southern Nevada Las Vegas hub plus Kern River transportation
Opal hub plus Kern River transportation
Decrease of $0.82/MMBtu
Source: CEC staff
In addition to revising linked hubs for California’s burner tip prices, staff applied estimated transportation rates based on thefrom its end-use rate model developed by Aspen Environmental Group..297 The change in method resulted in a decreasecaused some of $0.94/MMBtu to an increase of $0.79/MMBtu in the burner tip priceprices to California generators to increase and some to decrease, as shown in Table 9.
Table 9: California Burner Tip Price Difference Plexos Fuel
Group Previous Burner
Hub and Transportation Rate
New Burner Tip Hub and Transportation Rate
Average PriceChange Among
Cases
PG&E Backbone (BB)
PG&E Citygate hub plus BB transportation
Malin and Topock hubs weighted averagePG&E Citygate hub plus end‐useG-EG rate estimated by
CEC rates model transportation298
DecreaseIncrease of $0.94469/MMBtu
PG&E Local Transmission
(LT) PG&E Citygate hub
plus LT transportation
PG&E Citygate hub plus end‐useG-EG rate estimated by CEC rates
model transportation
IncreaseDecrease of $0.05365/MMBtu
297 PG&E and NCPA comments suggested improved granularity in the burner tip prices. Pacific Gas and Electric. Comments on Draft 2021 Integrated Energy Policy Report. TN 241334. Docket 21-IEPR-06. https://efiling.energy.ca.gov/GetDocument.aspx?tn=241334. Northern California Power Agency. Comments on Draft 2021 Integrated Energy Policy Report. TN 241321 Docket 21-IEPR-06. https://efiling.energy.ca.gov/GetDocument.aspx?tn=241321. 298 Staff used PG&E Gas Schedule G-EG (the rates for gas transportation service to electric generators) to derive an average rate for all generators. Staff will develop a more granular breakout of the backbone versus local transmission rate for generators and assignment to generators in the price forecast of the next IEPR.
151

Plexos Fuel Group
Previous Burner Hub and
Transportation Rate New Burner Tip Hub and
Transportation Rate Average Price
Change Among Cases
SCG SoCalGas Citygate hub
plus TLS and BB transportation
SoCalGas Citygate hub plus end‐useCEC rates model transportation
Decrease of $0.35/MMBtu
Otay Mesa SDG&E Citygate hub
plus SDG&E transportation
SoCalGas Citygate hub plus end‐use model transportation
Decrease of $0.20/MMBtu
SDG&E SDG&E hub plus SDG&E transportation
SDG&E SoCalGas Citygate hub plus end‐useSDG&E rates model
transportation
Decrease of up to $0.61/MMBtu
Kern River/Mojave,
Daggett/Kramer hub and no transportation
Wheeler Ridge hub and no transportation
Increase of $0.19/MMBtu
S Cal Prod and TEOR
San Joaquin Valley hub and no
transportation Wheeler Ridge hub and no
transportation Increase of
$0.79/MMBtu
Source: CEC staff
The slightest change in prices could alter the dispatch of resources in the model runs of PLEXOS. A monthly price comparison for each case is shown in Figure 50Figure 50 shows acomposite average of all the burner tip prices for each of the three IEPR common cases.
Figure 50: Burner Tip Price Comparison by IEPR Common Case (MMBtu)
152

Source: CEC staff
Overall, the method change resulted in a 31.9 cent decrease for the low demand case, a 29.4 cent decrease for the reference case, and a 26.7 decrease for the high demand case when compared to the previous method. The monthly price over the forecast averaged $3.250 per MMBtu for the low demand case, $2.657 MMBtu for the reference case, and $2.197 per MMBtu for the high demand case. Notably, prices for the low price/high demand case display greater seasonal peaks, such that they reach into the peaks for the mid-demand case.
153

CHAPTER 10: Policy Issues and Recommendations
The following recommendations address three broad areas: long-term gas transition planning, gas issues associated with building decarbonization, and the roles of renewable gas and renewable hydrogen in a decarbonized gas system.
Create a Long-Term, Comprehensive Gas Planning Process for California California has a need for a long-term gas planning process to allow for a safe, reliable, and equitable transition off fossil gas. Key topics for the CEC, CPUC, and CARB to define and implement such a process will include:
Framing the policy objectives and principles: o Ensure gas system safety and reliability while achieving GHG reductions during
the transition from fossil gas. o Realign rate structures and address environmental impacts to explicitly address
equity issues and reduce burdens on disadvantaged communities and low-income customers.
o Prioritize infrastructure investments to minimize potential stranded assets and reduce costs for maintaining the gas system.
o Leverage workforce development and education to find equivalent roles for displaced workers, for example, in the nonfossil gas and water efficiency and reuse sectors.
Defining key elements of the planning process: The state must develop an inclusive, comprehensive, and transparent process for transitioning the gas system that involves gas utilities, labor, local communities (and disadvantaged communities), environmental groups, and various stakeholders.
Developing the analytical framework for long-term gas planning: Improve Natural Gas Demand Forecasts
o The CEC should develop natural gas forecasts at the granularity needed for gas system planning and reliability assessments: average annual monthly, 1-in-10 cold winter, and abnormal or extreme winter peak day, with hourly breakdowns. The CEC should also present more assessments that address uncertainty probabilistically.
o The CEC should collaborate with CPUC and stakeholders in the IEPR process to ensure gas forecasts can adequately support gas planning and geographic targeting of building decarbonization efforts to minimize and retire gas distribution assets.
Improve Long-Term Rate Forecasts 154

o The CEC should improve long-term gas price, rate, and revenue forecasts to support gas decarbonization planning for the gas system. As the gas transition is a long-term initiative, the CEC should continue to expand long-term rate forecasting models, tools, and techniques.
o The CEC should collaborate with the CPUC and stakeholders in the IEPR process on assumptions and scenarios for long-term rate forecasts, including revenue requirements. These long-term forecasts will be needed to minimize stranded assets and maximize the value of long-term investments for transitioning the gas system.
Improve Infrastructure Assessments o The CEC should verify utility gas infrastructure assessments and hydraulic
modeling results and conduct independent modeling of infrastructure options. As the gas transition entails significant changes to the gas system, more detailed hydraulic modeling simulations are needed to assess system impacts.
o The CEC should collaborate with CPUC and stakeholders in the IEPR process on hydraulic modeling assumptions and results and examine infrastructure options needed to safely and reliably operate the gas system safely and reliably as it evolves.
Interagency collaboration efforts: o Coordinate existing proceedings including CARB’s Scoping Plan, the CPUC’s Order
Instituting Rulemaking on Long-term Gas Planning, and the CEC’s IEPR as a long-term planning process is being developed.
o In 2022, the CEC, CPUC, and CARB should coordinate and develop a white paper and roadmap for gas decarbonization planning targeted for 2022.
ConsiderConsidering gas and electricity interdependencies: Since gas and electricity reliability are so closely intertwined, it is essential that near- to mid-term planning for both systems adequately accounts for these interdependencies. California must also increase its planning for extreme events.
o The CEC should expand its planning, monitoring, and assessment of gas and electric interdependencies critical to system reliability and integrating renewable resources.
o The CEC should work with the CPUC and stakeholders to expand planning for extreme events (winter cold from polar vortex and extended hot summers) to ensure sufficient gas supplies to maintain gas and electric system reliability and lower price spikes.
o California could pursue options to ensure that it receives gas supplies from winterized out-of-state wells. This could include leveraging “differentiated gas” programs that certify that gas has been procured from winterized wells.
o California could encourage FERC to pursue gas market changes that would more efficiently handle gas-electric coordination issues. Having the gas market open for business, including on weekends, when generators need to make changes to
155

gas nominations is extremely important in dealing with changing demand patterns and increasing extreme weather events.
o The CEC, in consultation with the CPUC and stakeholders, should assess the potential benefits to reliability from greater integration between the northern and southern gas systems to address extreme events.
EliminateEliminating longstanding pipeline constraints on SoCalGas pipelines. The pipeline availability on SoCalGas’ Line 235 has been constrained since the rupture in 2018. A long-term solution to the pipelines constraint is needed to enhance reliability in Southern California and limit price spikes that affect gas and electric rates.
DevelopDeveloping a plan for the retirement of Aliso Canyon: The CPUC, in consultation with the CEC, California ISO, LADWP, and stakeholders should develop an implementation plan to allow the retirement of Aliso Canyon with careful consideration of reliability, affordability, and equity.
Gas Issues to Support Building Decarbonization ConsiderConsidering modifying or eliminating the gas utility obligation to
serve. Currently gas utilities have an obligation to provide and maintain gas service to any customer willing to pay for it. This is cited as a significant barrier to achieving all-electric new homes in the state and to efforts to retire existing gas distribution assets in areas where electrification of existing buildings is possible.
o The CEC and CPUC could also work to clarify the utility obligation to serve to allow them to minimize or retire gas distribution infrastructure or both while providing customers with suitable substitutes. This will likely require statutory changes.
ConsiderConsidering limiting or eliminating service in targeted areas. The CPUC could consider limiting new service and eliminate gas service in some areas via decommissioning, as the gas utilities transition to a decarbonized gas system.
EliminateEliminating subsidized line extension allowances for new gas hookups. The CEC supports the elimination of line extension allowances for residential and small commercial customers as proposed by the CPUC staff in the Building Decarbonization Proceeding (R.19-01-011). These allowances perpetuate fossil gas use and present barriers to building decarbonization efforts.
AlignAligning gas rate structure with long -term clean energy goals. Rate structures are needed that support deep reductions in fossil gas usage and electrification efforts for residential and commercial customers. For this, rate cases will need to look beyond their three- to four-year cycles and focus on the long-term gas transition. Rate designs are needed to ensure gas utilities have access to the funds needed to maintain safe systems while transitioning their systems to allow increased quantities of cleaner fuels and reduced long-term demand for gas. Rate equity issues are discussed below.
GasIncorporating gas transition equity: The state must incorporate equity as a critical element of the gas transition. Electrification subsidies should focus on low-
156

income and disadvantaged community customers who are least able to afford new electric appliances. The CEC strongly supports the CPUC’s efforts, such as the rates en banc to carefully assess future impact to electric rates and consideration of alternate strategies to ensure reasonable rates and equity. The CEC also supports the CPUC’s ongoing efforts as part of its Long-Term Gas Planning rulemaking to holistically consider the energy transition and help develop strategies for an equitable transition.
WorkforceLeveraging workforce development. The state should leverage California’s workforce development and educational systems to find equivalent roles for displaced workers, for example, in the nonfossil gas and water efficiency and reuse sectors. The state should ensure an adequate workforce to support increased building electrification and operate a gas system with larger amounts of renewable hydrogen and renewable gas. The CEC and CPUC — in coordination with appropriate agencies such as the California Workforce Development Board, Department of Labor, and others — should engage with unions representing these workers and other stakeholders to define a plan and blueprint for gas transition workforce issues.
AlignAligning CEC-funded natural gas R&D for gas infrastructure decommissioning and safety. Geographic targeting of electrification programs and efforts will be needed to allow for the potential retirement of distribution assets that may offset rate impacts from reduced demand. Nearly $2 million of CEC Natural Gas Research Program funds have been allocated for two projects for developing approaches to determine where gas infrastructure decommissioning is plausible, economically viable, and ratepayer-supported. The CEC should continue to provide funds for similar R&D efforts to pursue pilot projects and other R&D efforts to better understand how best to target building electrification. In addition, the CEC staff should engage utilities in hydraulic modeling of the gas system to assess gas infrastructure impacts from building electrification and the plausibility and opportunities for reducing the footprint of the gas system. Finally, gas system safety will continue to be an important element of operating and maintaining the gas system, and R&D efforts should continue to support new and improved technologies and safety approaches.
Role of Clean Fuels in Utility Gas Systems EncourageEncouraging the use of renewable gas. Renewable gas can play a role
in meeting California’s climate and energy goals as a drop-in replacement for fossil gas. In addition, converting waste streams from dairies, landfills, and agriculture is a key state strategy in the CARB Short-Lived Climate Pollution Policy to reduce methane emissions. However, numerous challenges remain for renewable gas. Most important, incentives are necessary to produce renewable gas at a cost competitive with fossil gas. Incentives such as the LCFS already work well for renewable gas use in the transportation sector because they consider the climate benefits of renewable gas. As California continues to move toward its climate and clean energy goals, it will be important to set incentives that are commensurate with the climate benefits that can be achieved. The CEC, CPUC, and CARB could consider the following:
o Continue funding renewable gas research to enable advancements and lower costs in renewable gas production.
157
o Consider modifications to the LCFS program so that renewable gas incentives that apply to transportation fuels are expanded to applications other than transportation, such as the industrial sector.
o Evaluate other incentives for renewable gas production including from feedstocks beyond the primary feedstocks currently used, such as crop residue or forest biomass.
EncourageEncouraging the use of renewable hydrogen. Many industrial customers do not have access to cost-effective decarbonization alternatives, and renewable hydrogen could be a fuel to meet end uses that cannot or are difficult to electrify. In addition, even as the state moves to a zero-carbon electricity system, there are thermal generation needs that could be met with renewable hydrogen (and renewable gas).
o As part of a longer-term strategy to allow widespread use of renewable hydrogen, the state should continue to build on the current R&D and pilot efforts to explore the amount of hydrogen that can safely be blended into existing gas pipelines and the potential cost to modify the gas system to deliver this clean fuel.
o California could explore producing hydrogen onsite at generation stations or large industrial users, which could also collocate facilities to do double-duty by also providing hydrogen for transportation.
158

Acronyms
ALJ administrative law judge
Bcf billion cubic feet
Bcfd billion cubic feet per day
BDC Building Decarbonization Coalition
Btu British thermal unit
CalGEM California Geologic Energy Management Division
California ISO California Independent System Operator
CARB California Air Resources Board
CCS carbon capture and sequestration
CEC California Energy Commission
CED California Energy Demand
CH4 methane
CNG compressed natural gas
CO2 carbon dioxide
CO2e carbon dioxide equivalent
CPCN certificate of public necessity and convenience
CPUC California Public Utilities Commission
DAWG Demand Analysis Working Group
DIMP distribution integrity management program
Dth dekatherm
E3 Energy and Environmental Economics, Inc.
EDF Environmental Defense Fund
EPNG El Paso Natural Gas Company
F Fahrenheit
FERC Federal Energy Regulatory Commission
GHC Green Hydrogen Coalition
GHG greenhouse gas
GW gigawatt
159

ILI
GWP global warming potential
HCA high consequence area
IEPR Integrated Energy Policy Report
in-line inspection
IOU investor-owned utility
IRP Integrated Resource Plan
IPP Intermountain Power Project
kg kilogram
LA100 Los Angeles 100 Percent Renewable Energy Study
LADWP Los Angeles Department of Water and Power
LCFS Low Carbon Fuel Standard
LNG liquefied natural gas
MAOP maximum allowable pressure
MMBtu metric million British thermal units
MMcf million cubic feet
MMcfd million cubic feet per day
MMTCO2e million metric tonnes of carbon dioxide equivalent
MW megawatt
MWh megawatt-hour
NAESB North American Energy Standards Board
NAICS North American Industry Classification System
NAMGas North American Market Gas Trade Model
NASEO National Association of State Energy Officials
NCPA Northern California Power Agency
NERC North American Electric Reliability Corporation
NOx oxides of nitrogen
NOAA National Oceanic and Atmospheric Administration
NRDC Natural Resources Defense Council
NREL National Renewable Energy Laboratory
O&M operations and maintenance
160

P2G power to gas
PG&E Pacific Gas and Electric Company
PHMSA Pipeline and Hazardous Materials Safety Administration
PSEP Pipeline Safety Enhancement Plan
PV photovoltaic
RAP Regulatory Assistance Project
RFP request for proposal
RFS Renewable Fuels Standard
RIN Renewable Identification Number
RMI Rocky Mountain Institute
SB Senate Bill
SCAQMD South Coast Air Quality Management District
SCE Southern California Edison
SDG&E San Diego Gas & Electric Company
SED Safety and Enforcement Division
SGIP Self-Generation Incentive Program
SLCP Short-lived climate pollutant
SMR steam methane reforming
SMYS specified minimum yield strength
SoCalGas Southern California Gas Company
Tcf thousand cubic feet
TIMP transmission integrity management program
TPP Transmission Planning Process
U.S. DOE United States Department of Energy
U.S. EIA United States Energy Information Administration
U.S. EPA United States Environmental Protection Agency
WECC Western Electricity Coordinating Council
WIEB Western Interstate Energy Board
WGHI Western Green Hydrogen Initiative
161

APPENDIX A: Gas Demand Trends by Sector
California uses natural gas for a variety of end uses in the residential, commercial, industrial, agricultural, and electric sectors, as discussed in Chapter 1. Figure A-1 shows California gas demand by sector. Gas use for electric generation has shrunk from almost 37 percent of total gas consumption in 2000 to roughly 30 percent in 2020. For the same period, industrial demand increased from about 32 percent to almost 35 percent on total demand. Commercial and residential demand experienced a slight increase in percentage of total consumption between 2000 and 2020.
Figure A-1: California Gas Consumption by Sector
Source: CEC staff
Residential and Commercial Gas Demand Residential and small commercial gas customers are considered core customers. As such, the gas utilities procure gas and provide transportation and storage services on their behalf. From 1990 through 2019, residential gas use in California has declined slightly, reaching a peak in 1999, after which it remained relatively flat with a dip in demand in 2014, as shown in Figure A-2. At the same time California’s population grew by 33 percent — from nearly 30 million in 1990 to nearly 40 million in 2019.299 California residential gas demand was 9 percent lower in
299 California Department of Finance, E-7. California Population Estimates, with Components of Change and Crude Rates, July 1, 1900-2020. https://www.dof.ca.gov/Forecasting/Demographics/Estimates/E-7/documents/E-7_Report_1900-July_2020_w.xlsx.
A--1

2019 than in 1990.300 California’s three largest gas utilities — Pacific Gas and Electric (PG&E), San Diego Gas & Electric (SDG&E) and Southern California Gas (SoCalGas) — posted declines in residential gas demand between 1990 and 2019.301
Figure A-2: California Residential Gas Demand (1990–2019) (MMcf)
Source: CEC staff
Assembly Bill (AB) 3232 (Friedman, Chapter 373, Statutes of 2018) requires the CEC to assess the potential to reduce greenhouse gas (GHG) emissions from residential and commercial buildings by 40 percent of 1990 levels by 2030. As required by AB 3232, the CEC released an assessment that demonstrates California can achieve significantly more than 40 percent reduction in GHG emissions through strategies including electrification, electricity generation decarbonization, energy efficiency, refrigerant leakage reduction, distributed energy resources, decarbonizing the gas system, and demand flexibility.302
The California Department of Finance estimates that there are more than 9.2 million single-family homes and more than 4.5 million multifamily units, such as apartments and condominiums, in the state.303 These residential buildings used 479,170 million cubic feet of gas in 2019.304 Common residential uses of gas include cooking and water and space heating.
300 CEC webpage for Gas Consumption by Entity. https://ecdms.energy.ca.gov/gasbyutil.aspx. 301 Ibid. 302 Kenney, Michael, Nicholas Janusch, Ingrid Neumann, and Mike Jaske. 2021. California Building Decarbonization Assessment. California Energy Commission. Publication Number: CEC-400-2021-006-CMF. https://www.energy.ca.gov/data-reports/reports/building-decarbonization-assessment. 303 California Department of Finance. E-5 File, August 2021. E-5 File. http://www.dof.ca.gov/Forecasting/Demographics/Estimates/e-5/. 304 CEC webpage for Gas Consumption by Entity. https://ecdms.energy.ca.gov/gasbyutil.aspx.
A--2

In California, commercial buildings occupy more than 7.5 billion square feet and include restaurants, offices, warehouses, and schools.305 Commercial buildings consumed nearly 230,723 million cubic feet of gas in 2019.306 While commercial gas use is 29 percent higher in 2019 than in 1990, as shown in Figure A-3,307 California’s economy, as measured by the California gross state product, has more than doubled over that period.308
Figure A-3: California Commercial Gas Demand (1990–2019) in Millions of Cubic Feet
Source: CEC staff
305 Kenney, Michael, Nicholas Janusch, Ingrid Neumann, and Mike Jaske. 2021. California Building Decarbonization Assessment. California Energy Commission. Publication Number: CEC-400-2021-006-CMF. https://www.energy.ca.gov/data-reports/reports/building-decarbonization-assessment. p. 3. 306 CEC data. 307 CEC webpage for Gas Consumption by Entity. https://ecdms.energy.ca.gov/gasbyutil.aspx. 308 California Department of Finance. Gross State Product webpage. https://www.dof.ca.gov/Forecasting/Economics/Indicators/Gross_State_Product/documents/CA_GDP.xlsx.
A--3

Agricultural Gas Demand California’s agricultural sector, which includes nearly 70,000 farms and more than 24 million acres,309 used 11,192 MMcf of gas in 2019, 10 percent less than what California’s agricultural sector used in 1990, shown in Figure A-4.310 California had more than $50 billion in cash receipts for crops in 2019, which ranks as number one in the United States.311 California’s agricultural sector reduced its annual gas use while maintaining its status as the number one state in the dollar value of agricultural sales.
Figure A-4: California Agricultural Gas Demand (1990–2019) in MMcf
309 CDFA. California Agricultural Statistics Review 2019–2020. p. 2. https://www.cdfa.ca.gov/Statistics/PDFs/2020_Ag_Stats_Review.pdf. 310 CEC webpage for Gas Consumption by Entity. https://ecdms.energy.ca.gov/gasbyutil.aspx. 311 CDFA. California Agricultural Statistics Review 2019–2020. p. 3. https://www.cdfa.ca.gov/Statistics/PDFs/2020_Ag_Stats_Review.pdf.
A--4
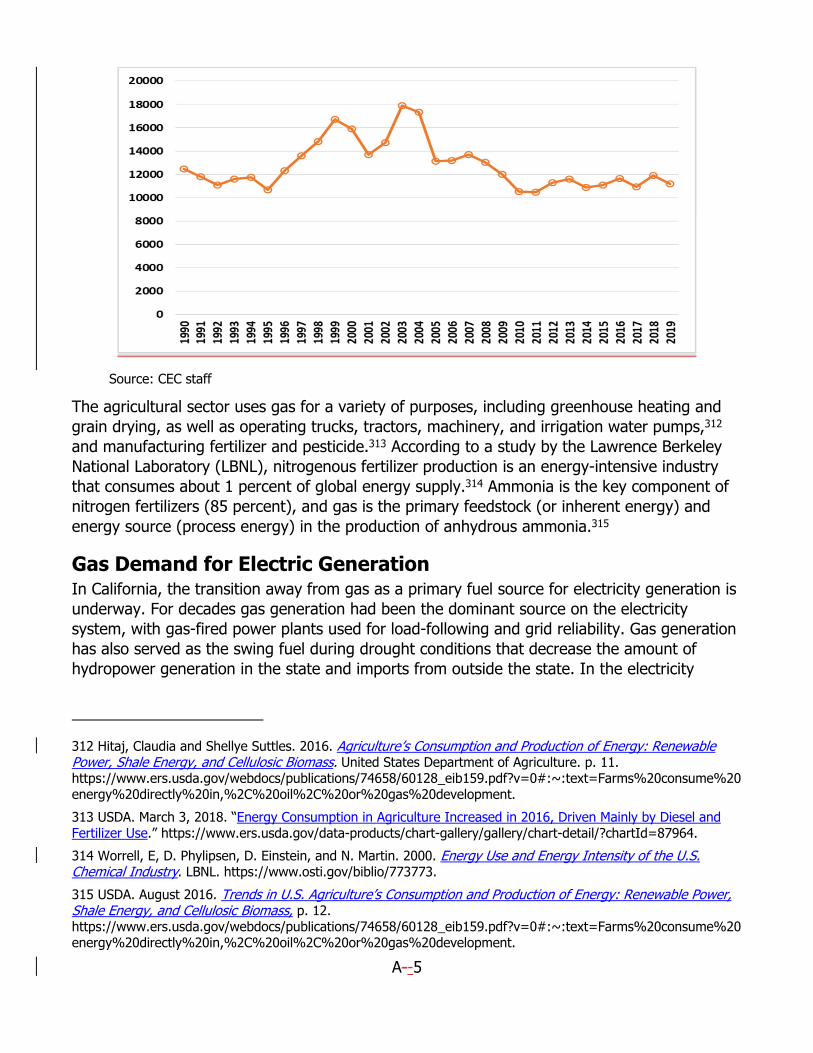
Source: CEC staff
The agricultural sector uses gas for a variety of purposes, including greenhouse heating and grain drying, as well as operating trucks, tractors, machinery, and irrigation water pumps,312
and manufacturing fertilizer and pesticide.313 According to a study by the Lawrence Berkeley National Laboratory (LBNL), nitrogenous fertilizer production is an energy-intensive industry that consumes about 1 percent of global energy supply.314 Ammonia is the key component of nitrogen fertilizers (85 percent), and gas is the primary feedstock (or inherent energy) and energy source (process energy) in the production of anhydrous ammonia.315
Gas Demand for Electric Generation In California, the transition away from gas as a primary fuel source for electricity generation is underway. For decades gas generation had been the dominant source on the electricity system, with gas-fired power plants used for load-following and grid reliability. Gas generation has also served as the swing fuel during drought conditions that decrease the amount of hydropower generation in the state and imports from outside the state. In the electricity
312 Hitaj, Claudia and Shellye Suttles. 2016. Agriculture’s Consumption and Production of Energy: Renewable Power, Shale Energy, and Cellulosic Biomass. United States Department of Agriculture. p. 11. https://www.ers.usda.gov/webdocs/publications/74658/60128_eib159.pdf?v=0#:~:text=Farms%20consume%20 energy%20directly%20in,%2C%20oil%2C%20or%20gas%20development. 313 USDA. March 3, 2018. “Energy Consumption in Agriculture Increased in 2016, Driven Mainly by Diesel and Fertilizer Use.” https://www.ers.usda.gov/data-products/chart-gallery/gallery/chart-detail/?chartId=87964. 314 Worrell, E, D. Phylipsen, D. Einstein, and N. Martin. 2000. Energy Use and Energy Intensity of the U.S. Chemical Industry. LBNL. https://www.osti.gov/biblio/773773. 315 USDA. August 2016. Trends in U.S. Agriculture’s Consumption and Production of Energy: Renewable Power,Shale Energy, and Cellulosic Biomass, p. 12. https://www.ers.usda.gov/webdocs/publications/74658/60128_eib159.pdf?v=0#:~:text=Farms%20consume%20 energy%20directly%20in,%2C%20oil%2C%20or%20gas%20development.
A--5
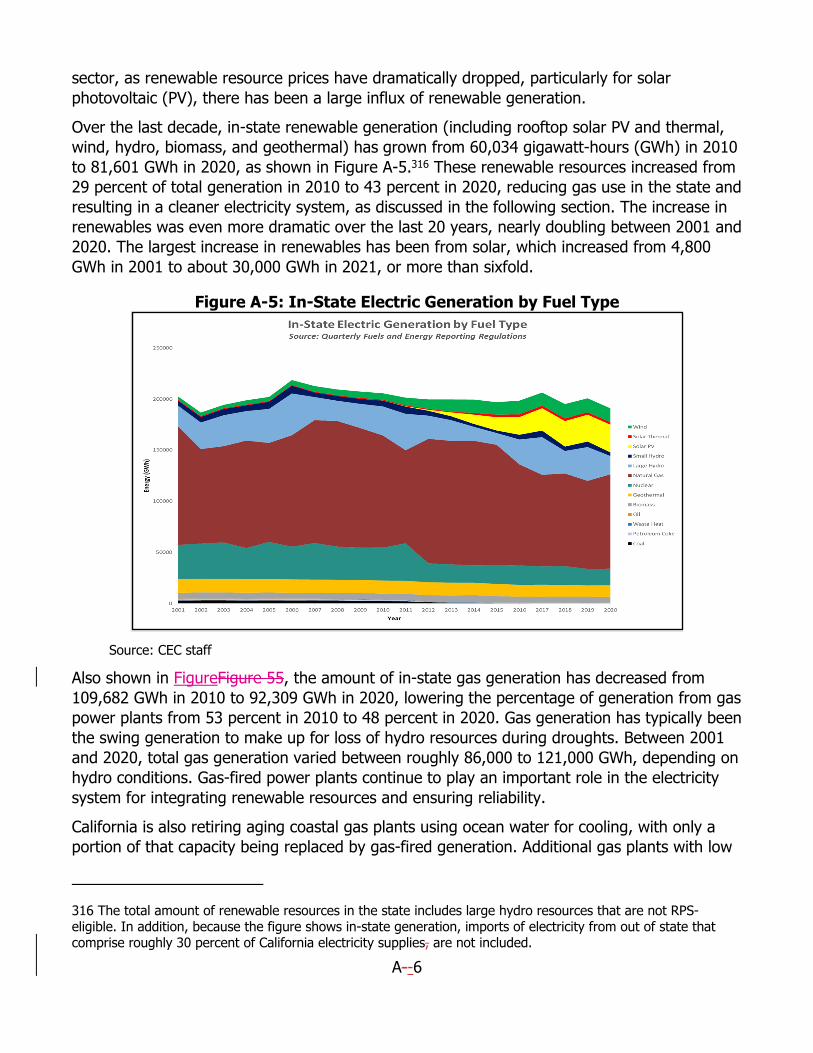
sector, as renewable resource prices have dramatically dropped, particularly for solar photovoltaic (PV), there has been a large influx of renewable generation.
Over the last decade, in-state renewable generation (including rooftop solar PV and thermal, wind, hydro, biomass, and geothermal) has grown from 60,034 gigawatt-hours (GWh) in 2010 to 81,601 GWh in 2020, as shown in Figure A-5.316 These renewable resources increased from 29 percent of total generation in 2010 to 43 percent in 2020, reducing gas use in the state and resulting in a cleaner electricity system, as discussed in the following section. The increase in renewables was even more dramatic over the last 20 years, nearly doubling between 2001 and 2020. The largest increase in renewables has been from solar, which increased from 4,800 GWh in 2001 to about 30,000 GWh in 2021, or more than sixfold.
Figure A-5: In-State Electric Generation by Fuel Type
Source: CEC staff
Also shown in FigureFigure 55, the amount of in-state gas generation has decreased from 109,682 GWh in 2010 to 92,309 GWh in 2020, lowering the percentage of generation from gas power plants from 53 percent in 2010 to 48 percent in 2020. Gas generation has typically been the swing generation to make up for loss of hydro resources during droughts. Between 2001 and 2020, total gas generation varied between roughly 86,000 to 121,000 GWh, depending on hydro conditions. Gas-fired power plants continue to play an important role in the electricity system for integrating renewable resources and ensuring reliability.
California is also retiring aging coastal gas plants using ocean water for cooling, with only a portion of that capacity being replaced by gas-fired generation. Additional gas plants with low
316 The total amount of renewable resources in the state includes large hydro resources that are not RPS-eligible. In addition, because the figure shows in-state generation, imports of electricity from out of state that comprise roughly 30 percent of California electricity supplies, are not included.
A--6

utilization rates are also expected to retire early, as they may not be economical to run. To meet air quality goals and reduce GHG emissions, gas generation is being replaced by clean resources including renewables, transmission upgrades, energy storage, energy efficiency, and demand response. By 2025, out-of-state coal imports will be eliminated from the resource mix, and the last remaining nuclear plant in the state, Diablo Canyon Power Plant, will be retired. As more renewables are added to the grid, the role of gas is shifting to meet large afternoon and evening ramps and net peaks as the sun sets.
Large Commercial Customer Gas Demand This section discusses large, or noncore, commercial customers. Unlike small commercial customers who are core customers and get their gas from utilities, noncore commercial customers contract directly or through marketers to procure and schedule transportation of gas on the utility gas systems. Figure A-6 shows large commercial gas demand by customer type grouped into 11 high-level NAICS categories.317
While noncore industrial customers account for nearly all ofdemand for that sector’s demandsector, most commercial customers are small businesses that qualify as core customers. In 2020, for example, core commercial customers accounted for about 84 percent of 2020 total commercial sector demand. The commercial sector includes businesses in the wholesale and retail trade of goods and services, not their manufacture. This sector also excludes businesses, public agencies, and other enterprises that provide primarily provide transportation, communications, and utilitiesutility services.
Figure A-6: Large Commercial Customer Gas Demand
Source: CEC staff
317 As with the industrial and all other sectors, the CEC collects commercial sector gas demand data from the gas utilities by NAICS code.
A--7

As shown in previously in FigureFigure 51, commercial sector gas demand in California is only a third of industrial demand, constituting about 11 percent of total statewide gas demand. Among these customers, those in health care averaged about 40 percent of total demand since 2010. Customers in this category include outpatient surgery and emergency centers, general medical and surgical, psychiatric and substance abuse hospitals, plus long-term nursing care and retirement facilities. Office demand, at 15.3 percent of total average demand since 2010, accounts for the second-largest defined category. The reason, in part because, is it includes large commercial subsectors (for example, banking and finance, insurance, real estate, professional, scientific, technical services, and public administration) that rely heavily on office space and staff to produce their services.
College gas demand is the third-largest category, averaging about 15 percent of total demand since 2010, and includes junior and four-year colleges, universities, and professional schools. Although small compared to demand for these three categories, the warehouse and food and liquor category of gas demand nearly doubled from 2010 to 2020 to account for almost 5 percent and about 4 percent of total demand, respectively.
Industrial Demand Industrial and large commercial customers are classified as noncore customers. As such, the gas utilities do not purchase gas for these customers and instead provide transportation and storage services for gas noncore customers. As discussed in the previous section, California’s solar and wind generation has reduced gas use for electric generation. As shown in FigureFigure 57Figure, industrial gas demand in 2020 exceeded electric generation demand to account for the largest share, or 34.5 percent, of total gas demand.
By regulation, the CEC also collects by regulation industrial sector gas demand information in the Quarterly Fuel and Energy Reports (QFER) from the California gas utilities for 48 industries within those subsectors. The industrial activities grouped in FigureFigure 57Figure are categorized according to the North American Industry Classification System (NAICS), which was developed for universal use by governments, gas and electric utilities, and other industries to classify all goods and services produced in the United States, Canada, and Mexico.318
Industrial gas demand in California fell from 2008 to 406,000 MMcf in 2009 as the Great Recession pushed demand for manufactured goods and other industrial sector production down, but it recovered to a peak of 484,000 MMcf by 2018, as shown in Figure A-7. Similarly, U.S. industrial gas demand bottomed out in 2009 before recovering through 2018.319 California is one of the most industrially diverse states, but in terms of gas demand, half is used in petroleum and coal products manufacturing (NAICS 324), and the top seven of 48 subsectors in 2020 accounted for 91 percent of all industrial gas used.
318 The North American Industry Classification System (NAICS) is the standard used by federal statistical agencies in classifying business establishments for collecting, analyzing, and publishing statistical data related to the U.S. business economy. 319 U.S. EIA. 2021. “U.S. Natural Gas Industrial Consumption.” Accessed September 9, 2021. https://www.eia.gov/dnav/ng/hist/n3035us2A.htm.
A--8

Figure A-7: Industrial Demand by High-Level NAICS Subsectors
Source: CEC staff
Some industrial uses cannot be electrified easily. There are industry requirements for heat and feedstock that cannot be directly electrified, as found in refining, steel manufacturing and processing, cement production, ammonia and fertilizer production, computer chip fabrication, and pharmaceuticals manufacturing.320 A recent study on deep decarbonization in the industrial sector shows that electrification has some potential for low-temperature processes in light industry in the short term and midterm, with a low potential in the long term in cement, refining, and other industries with high-temperature needs.321 The U.S. EPA study notes that hydrogen and CCS have long-term potential in some industries. Some advances are being made in industrial electrification. Steel manufacturing has been one, but Nucor Corporation announced in December 2019 it would build a micromill at Sedalia, Missouri, powering its electric arc furnaces via 75 MW of wind energy from Evergy Inc.322 Sweden’s LKAB (Europe’s largest iron ore producer) announced it had delivered steel produced using green hydrogen instead of coal as the reducing agent to remove oxygen from the iron ore.323 The project
320 Presentation by Jack Brouwer with University of California, Irvine, “Zero Emissions Energy with Hydrogen.” July 28, 2021, IEPR Workshop on Hydrogen to Support California’s Clean Energy Transition. Slide 9. https://efiling.energy.ca.gov/getdocument.aspx?tn=239034. 321 Presentation by Elizabeth Dutrow, “Evaluation of the Potential for Deep Decarbonization in the Industrial Sector by 2050.” August 3, 2021, IEPR Workshop to Accelerate Industrial Decarbonization. https://efiling.energy.ca.gov/getdocument.aspx?tn=239134. 322 Douglas, Jacob. December 7, 2019. “First U.S. Steel Plants Powered by Wind, Solar Energy are Coming for Industry With Big Carbon Footprint.” CNBC. https://www.cnbc.com/2019/12/07/first-us-steel-plants-powered-by-wind-solar-energy-are-coming.html. 323 Blank, Thomas Koch. December 16, 2020. “HYBRIT Project: Sweden Goes for Zero-Carbon Steel.” EnergyPost. https://energypost.eu/hybrit-project-sweden-goes-for-zero-carbon-steel/.
A--9

principals (LKAB, Swedish steelmaker SSAB, and energy company Vattenfall) expect industrial scale output to be achieved by 2026.324
The CEC also collects by regulation industrial sector fossil gas demand information in the Quarterly Fuel and Energy Reports (QFER) from the California utilities for 48 industries within those subsectors. This is not a complete catalogue of all industrial subsectors in North America, or even in California; it accounts only for subsectors in California for which utilities report fossil gas demand in their QFER forms. Industrial energy demand for any subsector, of course, varies temporally and between states and regions, depending on policy, economic, demographic, and weather variables.
324 Vetter, David. August 19, 2021. “How Sweden Delivered the World’s First Fossil Fuel-Free Steel.” Forbes. https://www.forbes.com/sites/davidrvetter/2021/08/19/how-sweden-delivered-the-worlds-first-fossil-fuel-free-steel/?sh=383b251e6b55.
A--10

APPENDIX B: Gas Industry Basics
California Gas Utilities The California Public Utilities Commission (CPUC) regulates the rates and services provided by the investor-owned gas utilities, including Pacific Gas and Electric (PG&E), Southern California Gas (SoCalGas), San Diego Gas & Electric (SDG&E), Southwest Gas, and a few small gas utilities.325 This includesThese rates and services include regulation of in-state transportation of gas over transmission and distribution pipelines, gas storage, procurement for core customers, as well as metering and billing. The CPUC also lightly regulates in-state independent gas storage operators, including Lodi Gas Storage, Wild Goose Storage, Central Valley Storage, and Gill Ranch. The gas utilities operate their gas systems and are referred to as “local distribution companies.” Further, the CPUC ensures that intrastate gas pipelines are designed, constructed, operated, and maintained according to safety standards set by the CPUC and the federal government.326 CPUC gas safety engineers are trained and qualified by the federal government. The CPUC enforces gas and liquefied petroleum gas safety regulations and inspects construction, operation, and maintenance activities.
California’s gas system grew organically over more than 100 years. San Francisco and Oakland had town gas manufactured from coal in the 1860s, while Marysville had town gas in 1857. Los Angeles had 43 gas lamps installed along Main Street in 1867.327 Pacific Lighting Company (the predecessor to SoCalGas) was founded in 1886.328 As gas lights were displaced by electricity, new uses were found for gas, including cooking and heating, and the production of fossil gas from oil and gas drilling in the state allowed the displacement of gas manufactured from coal. The Ventura County Power Company first distributed fossil gas in Southern California in 1904.
325 SDG&E and Southwest Gas (southern division) are wholesale customers of SoCalGas and receive deliveries of gas from SoCalGas that they then deliver to their own customers. A small gas utility, West Coast Gas is a PG&E wholesale customer. Also, there are several municipalities that are wholesale customers that are not regulated by the CPUC, including cities of Palo Alto, Long Beach, Coalinga, and Vernon. 326 The federal Pipeline and Hazardous Materials Safety Administration is responsible for regulating and ensuring the safe and secure movement of hazardous materials to industry and consumers by all modes of transportation, including pipelines. 327 Liquefied Natural Gas Company blog, “Southern California Gas Company- SoCal the Gas Company.” https://thegascompany.blogspot.com/2013/08/southern-california-gas-company-socal.html. Accessed November 4, 2021. 328 A history of manufactured gas plants and industry can be found at http://www.hatheway.net/state_site_pages/ca__main.htm. Allen Hathaway’s more extensive history focused on the West Coast and California can be found in “Manufactured Gas in California, 1852 – 1940: Basis for Remedial Action” in Practice Periodical of Hazardous, Toxic, and Radioactive Waste management, July 1999. http://www.hatheway.net/Downloads/1999_California_MG_Report.pdf.
B-1

California’s first transmission pipeline moving fossil gas more than 120 miles was built around 1910, moving gas from the Buena Vista field in Kern County to Los Angeles.329 By the 1920s and 1930s, pipeline welding technology advanced to allow long-distance transmission of gas. Once gas demand grew large enough that in-state production was insufficient to meet demand, interstate pipelines began bringing gas to California. In 2019, California offered the second largest gas market in the United States, accounting for 7.4 percent of the total 30.5 Tcf of the gas consumed across the country.330 It is a market that long has been attractive to pipeline investors, suppliers, and marketers. As shown in Figure 9 in Chapter 1, California has long enjoyed gas prices that are lower than the U.S. average price.
Starting in the late 1950s, the gas utilities collaborated in bringing analysis to the CPUC and requesting permission to purchase gas from proposed new interstate pipelines. This collaboration gave rise to the 1961 decision directing the utilities to file, every other July 1, their view of long-term gas demand versus supply and capacity to meet that demand.331 The PGT/PG&E Pipeline Expansion that went into service in 1993 is roughly the last major pipeline investment approved by the CPUC.332 The CPCN for the Expansion Project was sought by PG&E in a stand-alone application outside the general rate case process.
Before the late 1980s, gas utilities were vertically integrated, providing virtually all gas service to their customers. The gas utilities delivered and sold gas to all customers connected to their systems. The utilities bought that gas from the interstate pipelines, who bought it from producers. Oversupply led to development of a spot market, and California industries were eager to take advantage of the opportunity to purchase cheaper gas on the spot market, bypassing the gas utilities and the pipelines. In response to complaints by these customers, the CPUC instituted a rulemaking to explore how it might restructure the gas industry in California.333 Similar issues arose in other states, and Congress discussed possible legislation to convert interstate pipelines to common carriers, where any request for transportation service would have to be honored. As a result, FERC eliminated the so-called merchant function of pipelines and directed them to restructure their services and tariffs.334 Meanwhile, the CPUC decided in its rulemaking to eliminate the merchant function with respect to industrial customers and power plants. These customers were deemed “noncore.”335 Noncore customers were directed to buy their own gas. For them, the utility merely provides transportation
329 Important Dates in the Oil History of the San Joaquin Valley webpage. http://www.sjvgeology.org/history/sjv_chronology.html. 330 Data downloaded from EIA Natural Gas Monthly. The year 2019 is the latest for which all of the California demand data are complete. 331 Decision No. 62260 in Case 5924 332 PGT-Pacific Gas and Electric Company Expansion Project is an 840-mile addition to the existing PGT and Pacific Gas and Electric Company gas pipeline system that went into operation November 1, 1993, to provide additional direct access to Canadian gas supplies. The project consists of two components: the PGT Expansion and the Pacific Gas and Electric Company Pipeline Expansion, or Line 401. 333 Owens of Illinois. 334 See FERC Order No. 436. 335 Customers are noncore if they have an annual load or demand larger than 250,000 therms.
B-2
service. (For example, the utility delivers to the customer gas that it receives on the customers’ behalf.)
The CPUC unbundled backbone transmission costs from noncore transportation rates, giving noncore customers and marketers the opportunity to purchase firm capacity rights. However, the utility must reserve sufficient backbone capacity to meet core customers’ demand. Noncore customers also have option to purchase storage services from the gas utility or from independent storage providers,336 but the gas utility has no obligation to provide storage services for noncore customers.337 In the event that a utility is unable to meet the needs of all customers because of a lack of supply or infrastructure outages or constraints, noncore customers are curtailed to preserve service to the core. The reliability standards for each of the customer types isare discussed in detail in Chapter 2.
Interstate Gas Markets The FERC regulates the construction of interstate gas pipelines and storage connected to these pipelines, as well as construction of LNG facilities. Gas transportation in interstate commerce, including rates for these services, are set by FERC under the Natural Gas Act.338
Production of gas (or wellhead production) and the gathering and processing of gas are unregulated.
FERC has no jurisdiction over gas commodity transactions and gas prices, which are set in an unregulated North American market that covers the continental United States, Canada, and Mexico. California’s gas transmission system and most of its storage would be considered interstate commerce and, therefore, subject to FERC jurisdiction; however, it is exempted from FERC regulation by the 1957 Hinshaw Amendment to the Natural Gas Act.339 Most of the California market — about 75 percent that is served by PG&E, SoCalGas, and SDG&E — is exempt from federal regulation. However, interstate pipelines that deliver directly to in-state customers, such as the Kern River Pipeline, are subject to FERC jurisdiction. The distribution of gas is not under FERC jurisdiction and is instead regulated by the states.
These pipelines are independently operated, with no central coordination function for pipeline operations or reliability planning. In contrast, the electricity system is a regionally interconnected grid covering the western portions on the United States, Canada, and Mexico that is operated to meet reliability requirements established by the Western Electricity Coordinating Council, which is also responsible for elements of long-term transmission planning to ensure grid reliability for the region.
336 Several independently owned storage fields are connected to the PG&E system, but none have been developed on the SoCalGas system. 337 Noncore customers have not been able to purchase storage services on the SoCalGas system since the leak at Aliso Canyon because of the reduced amount gas that can be injected, stored, and withdrawn. 338 The Natural Gas Act of 1938. 339 Natural Gas Act § 1(c) establishes the following required characteristics of a Hinshaw pipeline: Pipeline must receive the gas within the State; Gasstate; gas must be consumed within the State; Pipelinestate; pipeline must be regulated by the Statestate. https://www.ferc.gov/industries-data/natural-gas/nga-hinshaw-pipelines.
B-3

FERC ratemaking for interstate pipelines is different than CPUC ratemaking for gas utilities and interstate pipelines. Rates for interstate pipelines do not change much over time, and FERC does not require periodic pipeline rate reviews. (In contrast, the CPUC reviews gas utility rates every three to four years.) Shippers subscribe to reserve firm capacity on interstate pipelines. This subscription happens during an open season, followed by contract execution. Contracts are typically in place for 15 to 20 years. FERC typically sets rates assuming 95 percent of pipeline design capacity as throughput. As for the rate, most of it is a fixed fee, with little of it being variable. This rate gives pipelines a very stable revenue stream. This means a pipeline is at risk of not recovering lost revenue, but it gets to keep all revenue when overcollected. Accordingly, unless an interstate pipeline is going to add capacity or is facing expiration of contracts, it almost never files a rate case with FERC.
B-4

APPENDIX C: Greenhouse Gas Policies and Emission From Gas
Overall greenhouse gas (GHG) emissions related to gas total 39.33 million metric tonnes of carbon dioxide (CO2) equivalent (MMTCO2e) from direct emissions of methane and 132 MMTCO2e as carbon dioxide (CO2) from the combustion of gas. The largest contributions to CO2 emissions are from gas use in the industrial sector, followed by electric generation and the residential and commercial sectors. The electricity sector has already made great strides in reducing CO2 emissions below near-term GHG reduction targets by introducing large amounts of renewable resources to the state’s electricity grid. Building electrification can reduce CO2 emissions as gas-fired generation declines and combustion in gas appliances decreases.
Direct methane emissions are largely attributed to agriculture and livestock followed by landfills, wastewater, and pipeline fugitive emissions. Diversion and sequestration of unavoidable emissions from livestock and waste by converting this waste to renewable gas can help eliminate the higher global warming potential (GWP) from methane emissions. Methane emissions are a bigger challenge for economywide emission reductions. While in-state oil and gas production and gas pipelines contribute to methane emissions, they the emissions are much smaller than from other methane sources. This chapter discusses the GHG policies that will shape the state’s future gas system and the major sources of GHG emissions associated with gas in the state.
The Changing Policy Landscape The following section provides an overview of relevant state and federal policies that are shaping the energy landscape in California. As the state continues to pursue clean energy goals, it is planning how to reduce reliance on gas while maintaining reliability. These policies set an overall goal of achieving carbon neutrality in the electricity sector through increased renewable energy, building decarbonization, increased alternative fuels, efficiency measures, and others. In pursuing these goals, the state is committed to ensuring that disadvantaged communities are not adversely impacted through high energy costs or environmental impacts on such issues as air and water quality. The California Energy Commission (CEC) plays a large role in implementing various existing and new state policies, as well as in the formation of future policy recommendations.
California Policies and Strategies The following lists legislation pertinent to gas and GHG emissions.
Existing Policies Executive Order B-55-18: established a statewide goal to achieve carbon neutrality by
2045. Senate Bill 1383 (Lara, Chapter 523, Statutes of 2014):) set a target of achieving a 40
percent reduction in statewide methane emissions below 2013 levels by 2030.
C-1

Senate Bill 350 (De León, Chapter 547, Statutes of 2015):) elevated the need for energy equity and updated renewables and energy efficiency goals toward reducing GHG emissions by 2030.
Senate Bill 32 (Pavley, Chapter 249, Statutes of 2016):) set a statewide goal to reduce California’s GHG emissions 40 percent below 1990 levels by 2030.
Assembly Bill 197 (Garcia, Chapter 250, Statutes of 2016):) assured that the state’s implementation of its climate change policies is transparent and equitable, with benefits reaching disadvantaged communities being fundamental to these efforts.
Senate Bill 100 (De León, Chapter 312, Statutes of 2018):) accelerated the state’s renewables goal to 60 percent by 2030 and put into law the state’s commitment to 100 percent renewable energy and a zero-carbon electricity system by 2045.
Assembly Bill 1420 (Salas, Chapter 601, Statutes of 2015):) ordered new safety requirements for active gas pipelines, particularly pipelines that are less than 4 inches in diameter or more than 10 years old, and that are in sensitive areas; new regulations were implemented by the California Geologic Energy Management Division (CalGEM) in October 2018.
New Policies The 2022 Building Efficiency Standards: encourages electric heat pump technology for
space and water heating, establishes electric-ready requirements for single-family homes, expands solar photovoltaic (PV) system and battery storage standards, and strengthens ventilation standards to improve indoor air quality. The California Energy Commission (CEC) adopted the update in August 2021 and submitted it to the California Building Standards Commission (scheduled for considerationapproved the update in December 2021).. The new standards will become effective January 1, 2023.
Assembly Bill 525 (Chiu, Chapter 231, Statutes of 2021):) requires the CEC to prepare a strategic plan for developing offshore wind resources, as well as specific megawatt targets for 2030 and 2045.
California’s Fracking Ban On April 23, 2021, Governor Newsom directed CalGEM to end the approval of new fracking permits in the state by January 2024.340 The directive is meant to be built upon Executive Order N-79-20, issued in September 2020, that focused primarily on transportation and transitioning the transportation fleet away from fossil fuels. However, the order also provided direction to CalGEM to draft a health and safety rule that “protects communities and workers from impacts of oil extraction activities.”
In May 2021, CalGEM released a publicly available draft of prerulemaking regulations regarding the phaseout of well stimulation treatment permitting to meet the January 2024
340 Office of Governor Gavin Newsom. April 23, 2021. “Governor Newsom Takes Action to Phase Out Oil Extraction in California.” https://www.gov.ca.gov/2021/04/23/governor-newsom-takes-action-to-phase-out-oil-extraction-in-california/.
C-2

directive to cease fracking permits.341 The proposed regulations specify that well stimulation treatment refers only to underground injections of fluid pertaining to oil and gas production and not disposal projects or other subsurface injections. It also sets the cutoff for new permit approval for January 1, 2024. CalGEM held a public comment period for the draft regulations that ended July 4, 2021.
There has not yet been a direct analysis of how this fracking ban could affect gas production or imports in the state. There is some concern that the lack of production may end up being displaced into imports from other states or countries due to the continuing baseline need for gas especially with industries that are difficult to decarbonize.342
Another part of the Governor’s April 2021 directive was for California Air Resources Board (CARB) to begin investigating how to best phase out all in-state oil extraction by 2045. CARB is developing the 2022 Scoping Plan Update, where it will include an evaluation of this issue.
Federal Actions On January 27, 2021, President Joseph Biden signed the Executive Order 14008 to "pursue action at home and abroad to avoid the most catastrophic impacts of that crisis and to seize the opportunity that tackling climate change presents." The order directs the Secretary of the Interior to "pause new oil and gas leases on public lands or in offshore waters pending completion of a comprehensive review and reconsideration of Federal oil and gas permitting and leasing practices," including "potential climate and other impacts associated with oil and gas activities on public lands or offshore waters." This order expanded upon the 60-day moratorium on new oil and gas leasing or drilling permits on federal land Biden enacted January 20, 2021.
Section 108 of the executive order “Oil and Natural Gas Development on Public Lands and in Offshore Waters” specifically defines actions related to natural gas. The text of this section is as follows:
“To the extent consistent with applicable law, the Secretary of the Interior shall pause new oil and gas leases on public lands or in offshore waters. This is pending completion of a comprehensive review and reconsideration of federal oil and gas permitting and leasing practices in light of the Secretary of the Interior’s broad stewardship responsibilities over the public lands and in offshore waters, including potential climate and other impacts associated with oil and gas activities on public lands or in offshore waters. The Secretary of the Interior shall complete that review in consultation with the Secretary of Agriculture, the Secretary of Commerce, through the National Oceanic and Atmospheric Administration, and the Secretary of Energy. In conducting this analysis,
341 CalGEM. May 21, 2021. Pre-Rulemaking Public Comment Period on the Development of a For Well-Stimulation Treatment Permitting Phase-Out, https://www.conservation.ca.gov/index/Documents/Public%20Notice%20-WST%20permitting%20phase-out.pdf. 342 Legal Grounds: Law and Policy Options to Facilitate a Phase-Out of Fossil Fuel Production in California. April 2020. https://www.law.berkeley.edu/wp-content/uploads/2020/04/Legal-Grounds.pdf.
C-3

and to the extent consistent with applicable law, the Secretary of the Interior shall consider whether to adjust royalties associated with coal, oil, and gas resources extracted from public lands and offshore waters, or take other appropriate action, to account for corresponding climate costs.”
GHG Emissions Attributed to Gas Emissions of CO2 and methane (CH4) from fossil gas contribute to California’s GHG emissions in several ways, which furthers climate change and reduces local air quality. The combustion of gas in appliances and power plants, which is primarily methane, releases CO2 into the atmosphere. Further, methane — a short-lived climate pollutant (SLCP) — leaks directly into the atmosphere from oil and gas production and the gas system, as wells as from organic waste streams. Methane remains in the atmosphere for around 20 years, compared to 100 years for CO2, and has a larger global warming potential (GWP). For example, 1 kilogram (kg) of methane released is equivalent to about 25 kg of CO2 in the atmosphere relative to the 100-yr GWP of the pollutants.343
The CARB keeps an annual inventory of GHG emissions and develops a scoping plan every five years to plan for the decline of California’s annual emissions in accordance with the California Global Warming Solution Act, Assembly Bill 32 (Núñez, Chapter 488, Statutes of 2006) and related state policies and regulations.344 Because of the climate -forcing potential, Senate Bill 1383 (Lara, Chapter 395, Statutes of 2016) directs CARB to reduce emissions of SLCPs to 40 percent below 2013 levels by 2030 as an immediate action to combat climate change.
The CARB and regional entities, such as the South Coast Air Quality Management District and Bay Area Air Quality Management District, establish air quality regulations to protect the health of sensitive groups in California.345 Environmental justice is critical to the suite of regulations regarding emissions as disadvantaged communities typically bear the burden of the some of the worst air quality in the state. In setting air quality standards and implementing GHG reduction programs, CARB works closely with the environmental justice community to ensure equity in planning for the decline of California carbon emissions.
Carbon Dioxide Emissions From Gas Use in California The overall CO2 emissions directly related to gas combustion is about 132 MMTCO2e, or 38 percent of CO2 emissions in 2019.346 Figure C-1 shows the CO2 emissions by sector over the
343 CARB’s GHG emissions inventory web page. https://ww2.arb.ca.gov/ghg-inventory-data 344 AB 32 created a comprehensive, multiyear program to reduce greenhouse gas GHG emissions in California that requires CARB to develop a scoping plan that describes the approach California will take to reduce GHGs to achieve the goal of reducing emissions to 1990 levels by 2020. The next update is due in 2022. https://ww2.arb.ca.gov/our-work/programs/ab-32-climate-change-scoping-plan/about. 345 Local air district map on the CARB Government Roles and Contacts web page. https://ww2.arb.ca.gov/our-work/programs/resource-center/introduction-community-air-quality/government-roles-and-contacts. 346 Based on GHG emissions inventory and aggregation of all CO2 emissions attributable to gas combustion. Emissions from the electricity sector include in-state and out-of-state emissions. Industrial emissions include refinery gas as gas-related emissions.
C-4

last two decades.347 CO2 emissions from gas use in the electric sector have declined significantly over the last two decades because of retirements and efficiency improvements in gas-fired power plants and the proliferation of renewable resources on the electric grid.
Emissions in the residential and commercial sectors come largely from space and water heating demand, which is provided by gas combustion. Industrial customers in the state, many of whom have unique energy demands, use gas for high--eat related processes and on-site generation of electricity.
Figure C-1: CO2 Emissions by Sector From 2000 to 2019
347 Emission data in this report uses the latest CARB data available, which are for 2019. There is typically a two-year lag for CARB emissions data.
C-5
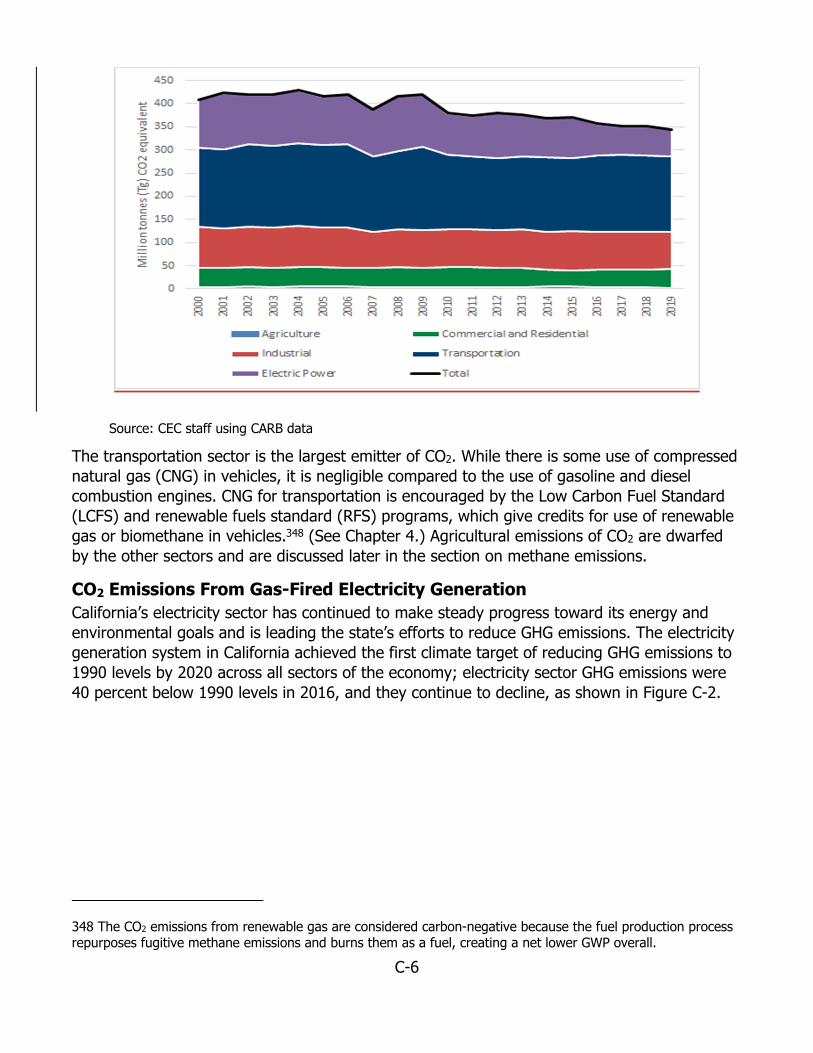
Source: CEC staff using CARB data
The transportation sector is the largest emitter of CO2. While there is some use of compressed natural gas (CNG) in vehicles, it is negligible compared to the use of gasoline and diesel combustion engines. CNG for transportation is encouraged by the Low Carbon Fuel Standard (LCFS) and renewable fuels standard (RFS) programs, which give credits for use of renewable gas or biomethane in vehicles.348 (See Chapter 4.) Agricultural emissions of CO2 are dwarfed by the other sectors and are discussed later in the section on methane emissions.
CO2 Emissions From Gas-Fired Electricity Generation California’s electricity sector has continued to make steady progress toward its energy and environmental goals and is leading the state’s efforts to reduce GHG emissions. The electricity generation system in California achieved the first climate target of reducing GHG emissions to 1990 levels by 2020 across all sectors of the economy; electricity sector GHG emissions were 40 percent below 1990 levels in 2016, and they continue to decline, as shown in Figure C-2.
348 The CO2 emissions from renewable gas are considered carbon-negative because the fuel production process repurposes fugitive methane emissions and burns them as a fuel, creating a net lower GWP overall.
C-6
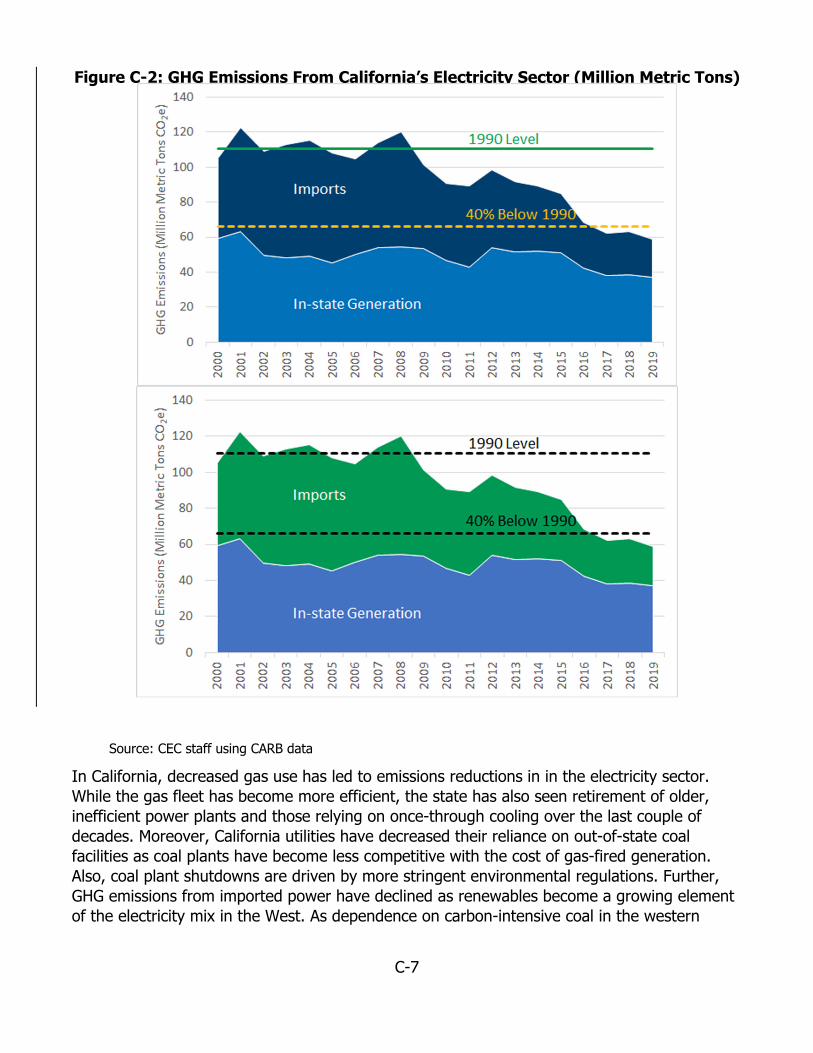
Figure C-2: GHG Emissions From California’s Electricity Sector (Million Metric Tons)
Source: CEC staff using CARB data
In California, decreased gas use has led to emissions reductions in in the electricity sector. While the gas fleet has become more efficient, the state has also seen retirement of older, inefficient power plants and those relying on once-through cooling over the last couple of decades. Moreover, California utilities have decreased their reliance on out-of-state coal facilities as coal plants have become less competitive with the cost of gas-fired generation. Also, coal plant shutdowns are driven by more stringent environmental regulations. Further, GHG emissions from imported power have declined as renewables become a growing element of the electricity mix in the West. As dependence on carbon-intensive coal in the western
C-7
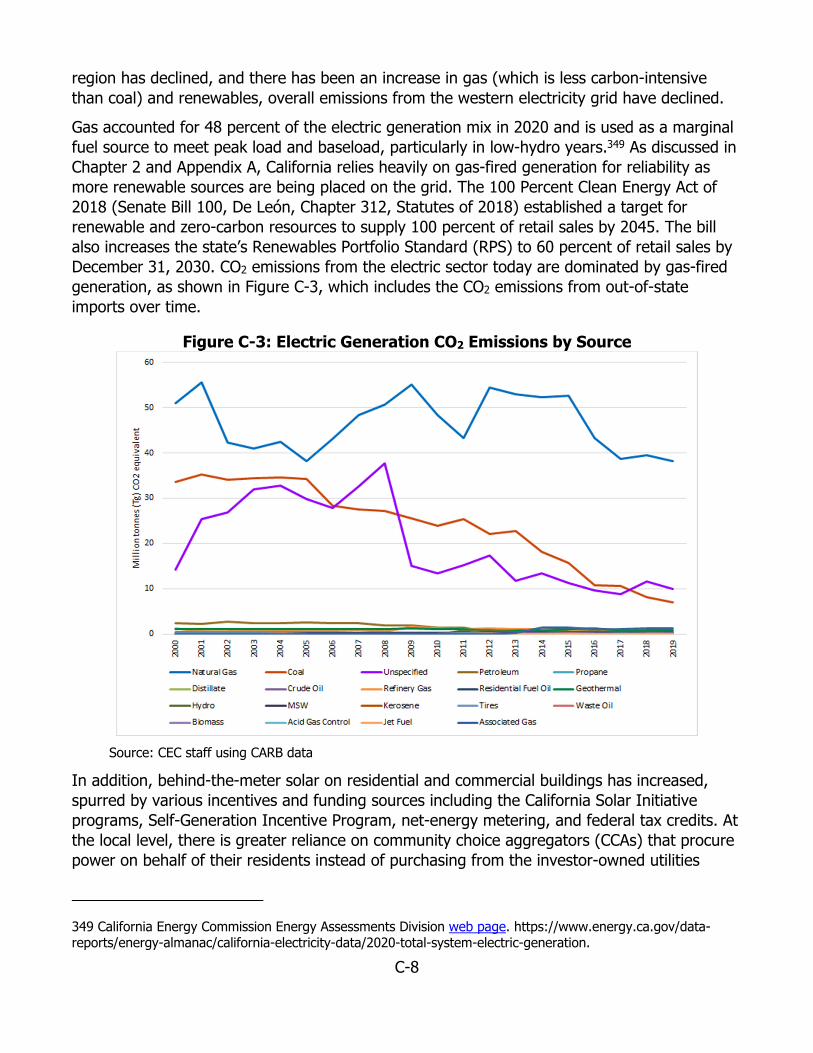
region has declined, and there has been an increase in gas (which is less carbon-intensive than coal) and renewables, overall emissions from the western electricity grid have declined.
Gas accounted for 48 percent of the electric generation mix in 2020 and is used as a marginal fuel source to meet peak load and baseload, particularly in low-hydro years.349 As discussed in Chapter 2 and Appendix A, California relies heavily on gas-fired generation for reliability as more renewable sources are being placed on the grid. The 100 Percent Clean Energy Act of 2018 (Senate Bill 100, De León, Chapter 312, Statutes of 2018) established a target for renewable and zero-carbon resources to supply 100 percent of retail sales by 2045. The bill also increases the state’s Renewables Portfolio Standard (RPS) to 60 percent of retail sales by December 31, 2030. CO2 emissions from the electric sector today are dominated by gas-fired generation, as shown in Figure C-3, which includes the CO2 emissions from out-of-state imports over time.
Figure C-3: Electric Generation CO2 Emissions by Source
Source: CEC staff using CARB data
In addition, behind-the-meter solar on residential and commercial buildings has increased, spurred by various incentives and funding sources including the California Solar Initiative programs, Self-Generation Incentive Program, net-energy metering, and federal tax credits. At the local level, there is greater reliance on community choice aggregators (CCAs) that procure power on behalf of their residents instead of purchasing from the investor-owned utilities
349 California Energy Commission Energy Assessments Division web page. https://www.energy.ca.gov/data-reports/energy-almanac/california-electricity-data/2020-total-system-electric-generation.
C-8

(IOU). The CCAs have varying levels of commitment to green energy but are established under the principle of cheaper and cleaner energy for their communities.350 Marin Clean Energy, for example, provides rates for its customers with a varying portfolio of energy sources from 60 percent renewable to 100 percent renewable and even locally generated energy.351 Sixty-five percent of California’s emissions come from gas-fired generation, 38 MMTCO2e in 2019, with unspecified imports second and coal power third. The remaining fuel sources make up less than 6 percent of California’s electricity sector CO2 emissions.
CO2 Emissions in the Residential and Commercial Sector Most gas combustion emissions in the residential and commercial sectors come from space-and water -heating demand. Commercial and residential gas demand is forecasted to decline at about 1 percent per year through 2035, according to the 2020 California Gas Report (CGR) forecast for both SoCalGas and PG&E.352 This decline is attributed to energy efficiency savings and advancing Title 24 building codes and standards. The future of emissions in these sectors will depend on the level of building decarbonization realized, as well as the change in demand for heating resulting from California’s changing climate. Building decarbonization is being driven largely by Title 24 standards and utility electrification or fuel substitution programs.353
(See Vol see the 2021 Integrated Energy Policy Report, Volume I: Energy Efficiency and Building, Industrial, and Agricultural Decarbonization for more information.)
The 2022 update to the Title 24 standards encourages electric heat pump technology for space and water heating, which consumes less energy and produces fewer emissions than gas-powered units. The update also establishes electric-ready requirements for single-family homes to position owners to use cleaner electric heating, cooking, and electric vehicle (EV) charging options whenever they choose to adopt those technologies. The 2022 update will be submitted to the The California Building Standards Commission, which is scheduled for consideration approved the 2022 update in December 2021. and the new standards will become effective January 1, 2023. At the community level, local governments have enacted reach codes across California that require building standards beyond what is already in Title
350 CalCCA states there are 23 CCA programs across California serving more than 11 million customers. https://cal-cca.org/. 351 Marin Clean Energy web page, https://www.mcecleanenergy.org/. 352 California Gas and Electric Utilities. 2020 California Gas Report. https://www.socalgas.com/sites/default/files/2020-10/2020_California_Gas_Report_Joint_Utility_Biennial_Comprehensive_Filing.pdf. 353 CEC press release. August 11, 2021. “Energy Commission Adopts Updated Building Standards to Improve Efficiency, Reduce Emissions From Homes and Businesses,” https://www.energy.ca.gov/news/2021-08/energy-commission-adopts-updated-building-standards-improve-efficiency-reduce-0.
C-9

24.354 For example, the City of Berkeley banned gas use in new buildings in December 2019.355
Local reach codes related to gas use are discussed in Chapter 5.
CO2 emissions from the residential and commercial sectors are dominated by gas with 92 percent of emissions coming from gas use, or about 37.56 MMTCO2e, as shown in Figure C-4. Another 6 percent of emissions comes from liquefied propane gas (or LPG) combustion, primarily in remote areas where there is an inability to obtain gas service. CO2 emissions from gas use in the residential and commercial sectors have dropped 4 percent in 2019 compared to 2000.
Achieving significant GHG reductions in the residential and commercial sectors will require decarbonization of the electric sector as well. As shown previously, gas accounts for 48 percent of California’s electricity mix, and increased electricity demand from residential and commercial end uses and emissions reductions will require decreasing reliance on gas-fired generation. Building decarbonization must therefore occur in sync with decarbonization of the electric sector.
Figure C-4: 2019 Residential and Commercial CO2 Emissions
Source: CEC staff using CARB data
CO2 Emissions From the Industrial Sector The industrial sector accounts for 23 percent of California’s CO2 emissions. Emissions in the industrial sector vary widely but include petroleum processing, general fuel use, and cogeneration under CARB emission data reporting. General fuel use is a category that captures
354 CEC Docket filing of Local Ordinances Exceeding the 2019 Energy Code https://efiling.energy.ca.gov/Lists/DocketLog.aspx?docketnumber=19-BSTD-06. 355 City of Berkeley Building Codes web page. https://www.cityofberkeley.info/Planning_and_Development/Building_and_Safety/Building_Codes.aspx.
C-10

the various industrial processes related to manufacturing of materials and resources, including glass and food, for example. Cement production accounts for almost 10 percent of California’s industrial process emissions. In some cases, decarbonization of the industrial sector is difficult or impossible due to the variety of combustion needs and the reliance on fossil fuels for high-temperature processing or as feedstock for which cost-effective alternatives do not exist. Each process requires advancements in the technology and specific incentives where fuel-switching to electricity is not economical. Cement production has been a focus due to the critical importance for infrastructure.356
Gas use accounts for about 46 percent of total industrial CO2 emissions at 38 MMTCO2e in 2019. The next highest emissions source is refinery gas that is composed of various hydrocarbons, including methane at about 21 percent of total CO2 emissions. The final 33 percent comes from a variety of industrial fuel sources and process emissions, including most notably petroleum coke from refineries and clinker production from cement manufacturing.
CO2 Emissions From the Transportation Sector CARB’s GHG emissions inventory shows less than 1 percent of CO2 emissions from the transportation sector come from natural gas vehicles, as shown in Figure C-5. The LCFS credit provides an incentive to use renewable gas as fuel in vehicles, which causes the transportation sector to dominate demand for renewable gas. SoCalGas has increasing demand for natural gas in transportation, growing to about 2 percent of SoCalGas’ total forecasted demand.
Figure C-5: Transportation CO2 Emissions
Source: CEC staff using CARB data
356 UC Davis Webinar on Greening Cement. https://energy.ucdavis.edu/greening-cement-webinar/.
C-11

Methane Emissions Associated With Gas California’s methane emissions have steadily increased since 2000; the state emitted 39.33 MMTCO2e in 2019 compared to 34.01 MMTCO2e in 2000.357 In 2019, methane accounted for 9 percent of statewide GHG emissions, as shown in Figure C-6. Methane emitted from the dairy, landfill, oil and gas production, and gas transmission and distribution sectors can be addressed through policy levers and technology innovation to decrease emissions from the source and redirect emissions as useable resources, where applicable. Renewable gas use provides value -added benefits as a fuel source, and the future demand will depend on policy and regulation valuing the renewable gas as a fuel for transportation, the electric sectorelectricity, and commercial and residential uses. Today, renewable gas is used only in the transportation sector in heavy-duty vehicles because of the LCFS.
Figure C-6: 2019 Greenhouse Gas Emissions by Type
Source: CEC staff using CARB data
Historically, agriculture has been the leading cause of methane emissions, followed by recycling and waste, and the industrial sector, as shown in Figure C-7. The commercial, residential, and transportation sectors each emitted less than 1 MMTCO2e of methane in any given year over the last 19 years.358
357 CARB. 2021. GHG Inventory Raw Data. https://ww2.arb.ca.gov/ghg-inventory-data. 358 Methane leakage for these sectors is attributed to the transmission and distribution of gas to these end uses. Overall emissions attributed to the residential, commercial, and transportation sectors are dominated by CO2 emissions from the combustion of gas. For more information, see https://ww2.arb.ca.gov/our-work/programs/slcp.
C-12
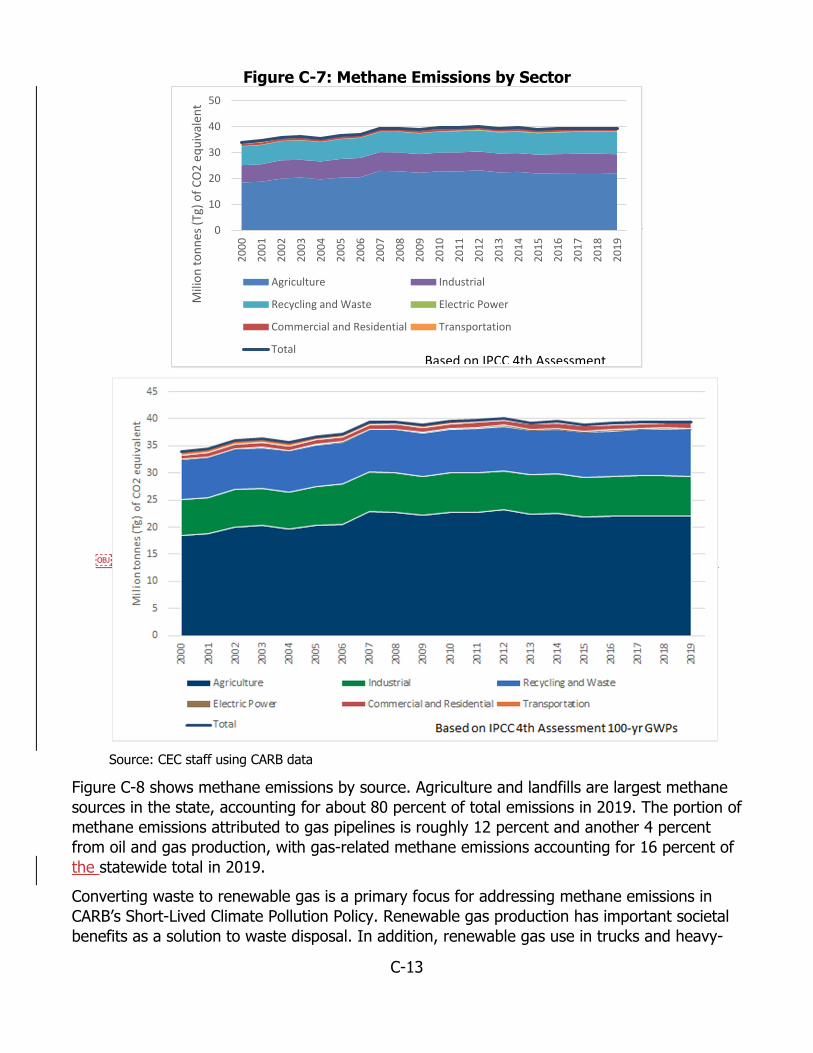
Figure C-7: Methane Emissions by Sector
0
10
20
30
40
50
2000
2001
2002
2003
2004
2005
2006
2007
2008
2009
2010
2011
2012
2013
2014
2015
2016
2017
2018
2019
Milion
tonnes
(Tg)
of C
O2
equivalen
t
Agriculture Industrial
Recycling and Waste Electric Power
Commercial and Residential Transportation
Total Based on IPCC 4th Assessment
Source: CEC staff using CARB data
Figure C-8 shows methane emissions by source. Agriculture and landfills are largest methane sources in the state, accounting for about 80 percent of total emissions in 2019. The portion of methane emissions attributed to gas pipelines is roughly 12 percent and another 4 percent from oil and gas production, with gas-related methane emissions accounting for 16 percent of the statewide total in 2019.
Converting waste to renewable gas is a primary focus for addressing methane emissions in CARB’s Short-Lived Climate Pollution Policy. Renewable gas production has important societal benefits as a solution to waste disposal. In addition, renewable gas use in trucks and heavy-
C-13
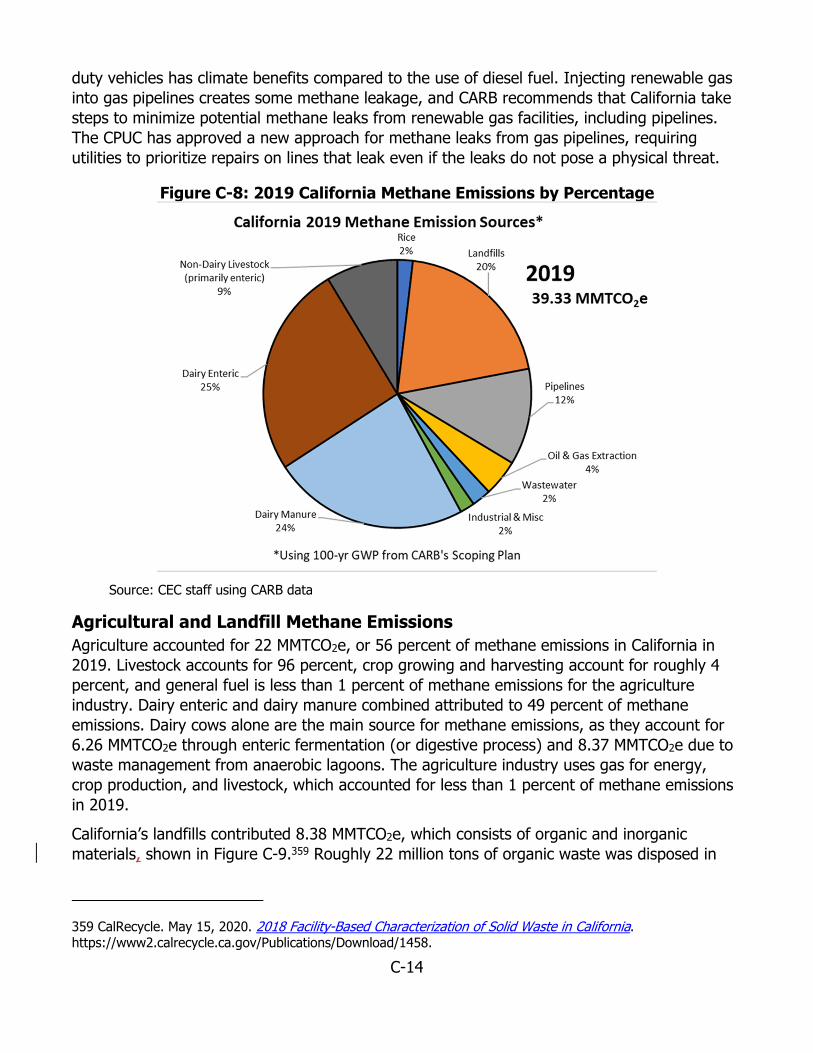
duty vehicles has climate benefits compared to the use of diesel fuel. Injecting renewable gas into gas pipelines creates some methane leakage, and CARB recommends that California take steps to minimize potential methane leaks from renewable gas facilities, including pipelines. The CPUC has approved a new approach for methane leaks from gas pipelines, requiring utilities to prioritize repairs on lines that leak even if the leaks do not pose a physical threat.
Figure C-8: 2019 California Methane Emissions by Percentage
Source: CEC staff using CARB data
Agricultural and Landfill Methane Emissions Agriculture accounted for 22 MMTCO2e, or 56 percent of methane emissions in California in 2019. Livestock accounts for 96 percent, crop growing and harvesting account for roughly 4 percent, and general fuel is less than 1 percent of methane emissions for the agriculture industry. Dairy enteric and dairy manure combined attributed to 49 percent of methane emissions. Dairy cows alone are the main source for methane emissions, as they account for 6.26 MMTCO2e through enteric fermentation (or digestive process) and 8.37 MMTCO2e due to waste management from anaerobic lagoons. The agriculture industry uses gas for energy, crop production, and livestock, which accounted for less than 1 percent of methane emissions in 2019.
California’s landfills contributed 8.38 MMTCO2e, which consists of organic and inorganic materials, shown in Figure C-9.359 Roughly 22 million tons of organic waste was disposed in
359 CalRecycle. May 15, 2020. 2018 Facility-Based Characterization of Solid Waste in California. https://www2.calrecycle.ca.gov/Publications/Download/1458.
C-14

2018, which accounted for more than half of the state’s landfill.360 Moreover, 1 million tons of edible organic food was discarded. California Senate Bill 1383 (Lara, Chapter 395, Statutes of 2016) established statewide targets to reduce organic waste disposed of in landfills — reductions of 50 percent by 2020 and 75 percent by 2025. In addition, at least 20 percent of disposed edible food must be rescued by 2025 and redirected to people in need.361 Landfill methane can be reduced through methods such as preventing food waste, improving recycling capabilities, capturing gas, and developing monitoring and response capabilities. Examples include providing edible food to communities, recycling of inedible materials into compost, developing automated monitoring and control systems to improve capture efficiency, and responding to methane leaks by landfill operators.362
Figure C-9: Composition of Landfill Waste
Source: CEC staff using CARB data
Although strategies are in place to phase out additional organic waste in landfills, they will not eliminate landfill emissions immediately from the current waste inventory. The existing waste will continue to decompose for decades and generate significant methane emissions.363
360 Presentation by Jeff Kessler. “Short-Lived Climate Pollutants.” August 31, 2021, IEPR Commissioner Workshop on Renewable Natural Gas – Policy Approaches for RNG. https://efiling.energy.ca.gov/getdocument.aspx?tn=239540. 361 CalRecycle. 2021. California’s Short-Lived Climate Pollutant Reduction Strategy. https://www.calrecycle.ca.gov/organics/slcp. 362 Presentation by Jeff Kessler. “Short-Lived Climate Pollutants.” August 31, 2021, IEPR Commissioner Workshop on Renewable Natural Gas – Policy Approaches for RNG. https://efiling.energy.ca.gov/getdocument.aspx?tn=239540. 363 Alexiades, A. 2021. “Short-Lived Climate Pollutants Policy.” 2022 Scoping Plan Update – Short-Lived Climate Pollutants (SLCP) Public Workshop Presentations. California Air Resources Board Presentation on Sept. 8, 2021. https://ww2.arb.ca.gov/our-work/programs/ab-32-climate-change-scoping-plan/scoping-plan-meetings-workshops.
C-15

Landfills in the United States make up roughly 93 percent of LCFS credits, but California’s landfills account for less than 10 percent of renewable gas supplies, as the majority comes from out of state. About 80 of the 300 landfills in California were identified by the U.S. Environmental Protection Agency as eligible candidates for biomethane or renewable natural gas production.364 Moreover, CARB approved the Landfill Methane Regulation (LMR) in 2010, which is one of the first regulations enacted in response to AB 32 and established statewide standards and monitoring practices to ensure gas collection and control systems are operating optimally to minimize methane emissions and capture landfill gas.365
Methane Emission From Wastewater The wastewaterWastewater treatment process accounts for 1.08 MMTCO2e, or 2 percent of methane emissionemissions in 2019. Methane emissions come from organic decomposition of organics inside the wastewater, and this that occurs at different stages in the treatment process. As in dairies, anaerobic digesters can be used to capture and turn methane into energy instead of resorting to flaring, which is the burning of gases that would otherwise be vented into the atmosphere. California has 153 existing wastewater treatment plants with anaerobic digesters.366 Wastewater can be codigested with organic waste materials such as foods that can result in up to three times more methane than biosolids and manure.367 The CPUC established a goal to convert these to codigestion treatment plants based on California Senate Bill 1440 (Hueso, Chapter 739, Statutes of 2018) that allows the state to adopt biomethane procurement targets.
Methane Emissions From Oil and Gas Production Oil and gas production, processing, storage, and transmission compressor stations accounted for 1.70 MMTCO2e, which contributes roughly 4 percent of California’s methane emissions. Methane is released because of leaks during the production process, shown in Table C-1. Gas associated with oil and gas production accounted for less than 1 percent of methane emissions in 2019.
364 Presentation by Stephan Barsun. “RNG Market.” August 31, 2021, IEPR Commissioner Workshop on Renewable Natural Gas – RNG Supply, Availability, and Price in California. https://efiling.energy.ca.gov/getdocument.aspx?tn=239538. 365 Alexiades, A. 2021. “Short-Lived Climate Pollutants Policy.” 2022 Scoping Plan Update – Short-Lived Climate Pollutants (SLCP) Public Workshop Presentations. California Air Resources Board Presentation on Sept. 8, 2021. https://ww2.arb.ca.gov/our-work/programs/ab-32-climate-change-scoping-plan/scoping-plan-meetings-workshops. 366 Presentation by Karin Sung. “CPUC Renewable Gas Programs.” August 31, 2021, IEPR Commissioner Workshop on Renewable Natural Gas – Policy Approaches for RNG. https://efiling.energy.ca.gov/getdocument.aspx?tn=239541. 367 U.S. EPA. 2016. “Organics: Anaerobic Digestion Co-Digestion.” https://archive.epa.gov/region9/organics/web/html/codigest.html.
C-16

Table C-1: 2019 Oil and Gas Production and Processing Emissions Sector & Activity Details 2019 MMTCO2e
Percentage of Related Emissions
Associated gas 0.00074 0% Distillate 0.00004 0% Gas 0.00581 0.3% Processing Fugitive emissions 0.15949 9.4% Production Fugitive emissions 1.36059 80% Storage Fugitive emissions 0.16393 9.6% Total 1.69970 ‐
Source: CEC staff using CARB data
Pipeline Methane Emissions and Leaks Most methane emissions related to gas occur during extraction and processing. California relies heavily on the interstate and intrastate pipelines, importing about 90 percent of its gas supply.368 Roughly 4.13 MMTCO2e was emitted, of which 4.09 MMTCO2e was attributed to leakage from gas pipeline transmission and distribution. Pipeline leakage is also referred to as “fugitive emissions.” Industrial gas pipeline fugitive emissions accounted for 82 percent, while commercial and residential leaks attributed to 18 percent in 2019.
Gas pipeline infrastructure is aging, with many pipelines installed more than 50 years ago. Furthermore, some distribution lines are composed of Aldyl-A pipe, which has been documented to fail and result in leakage.369 The Pipeline and Hazardous Materials Safety Administration develops and enforces regulations to ensure a safe, reliable, and environmentally sound operation of pipeline transportation.370
Differentiated Gas Emissions There is increasing interest in documenting efforts by the upstream oil and gas industry to reduce emissions through verification of emissions reductions and allowing the industry to monetize such efforts. Consumers pay a relatively small premium, such as 5 to 10 cents per MMBtu, on the gas they purchase from a verified supplier. The Gas Technology Institute calls this differentiated gas, which is defined as “geologic natural gas with a verified and minimized emissions footprint.”371 Others refer it as certified gas or responsible gas. The idea is to standardize an approach for measuring methane emissions and verifying emission reduction
368 Presentation by Melissa Jones. “2021 IEPR Workshop on Gas Market & Demand Forecasts.” Aug. 30, 2021, IEPR workshop on Natural Gas Market and Demand Forecasts. https://efiling.energy.ca.gov/getdocument.aspx?tn=239505. 369 Haine, S. 2014. Hazard Analysis & Mitigation Report on Aldyl A Polyethylene Gas Pipelines in California. CPUC. https://www.cpuc.ca.gov/-/media/cpuc-website/files/legacyfiles/r/8947-ra-doc-10-aldyla.pdf. 370 PHMSA webpageweb page, https://www.phmsa.dot.gov/. 371 GTI webpage GTI web page for Veritas. https://www.gti.energy/standardizing-an-approach-for-incorporating-measurements-into-methane-emissions-intensities/.
C-17

protocols along the gas value chain with the goal to developof developing “consistent, credible, and transparent measurement, reporting, and verification.”372
Methane intelligenceIntelligence (MiQ), another example of the concept, is a joint venture between the Rocky Mountain Institute and SystemIQ that measures and documents emissions across a range of levels, or “methane footprint.”373 Methane footprints higher than 2 percent are not eligible for certification.374 In July 2021, MiQ announced that Chesapeake Energy was the first company to participate. Chesapeake has committed to collaborating by having MiQ certify its gas production emissions from its Gulf Coast and Appalachian production assets. The company expects it will begin selling certified gas by the end of 2021.375 376
Highwood Emissions Management’s overview of emissions reduction initiatives for responsibly sourced oil and gas cites four certification standards:377 Equitable Origin 100™ Standard, ISO 14001:2015, MiQ Standard, and Trustwell Responsible Gas. The report also compares and contrasts global commitment programs and sustainability initiatives. Responsibly sourced gas (RSG) is defined as “natural gas that can be traced from an origin of production to an end user that meets standards set out in a voluntary initiative.”378 The CEC is aware of no requirement that California gas utilities, end users, or producers participate in such programs.
Responsibly Sourced Gas Initiative On September 21, 2021, the Tennessee Gas Pipeline, a subsidiary of Kinder Morgan, and Southwestern Energy Company announced the initiation of an RSG strategic agreement. The agreement seeks to reduce methane emissions across the value chain by receiving and transporting RSG to market and, in this case, specifically to a market in the Northeast.379
RSG goes through a rigorous verification process to certify that it meets or exceeds the standards established by the ONE Future coalition to achieve a 1 percent or lower methane intensity level, or 99 percent methane efficiency, by 2025. With this agreement, Project Canary will apply its TrustWellTM certification process and continuous emissions monitoring devices to Southwest Energy Company production sites in the Appalachian Basin, ensuring a methane
372 Op. cit. 373 MiQ webpage, https://miq.org/. 374 Ibid. 375 MiQ press release. July 14, 2021. “Chesapeake Energy Corporation Announces New Collaboration With MiQ and Equitable Origin.” https://miq.org/news/chesapeake-energy-corporation-announces-new-collaboration-with-miq-and-equitable-origin/. 376 MiQ press release. July 14, 2021. “Chesapeake Energy Corporation Announces New Collaboration With MiQ and Equitable Origin.” https://miq.org/news/chesapeake-energy-corporation-announces-new-collaboration-with-miq-and-equitable-origin/. 377 Highwood Emissions Management. May 10, 2021. “New Report: Voluntary Efforts to Reduce Greenhouse Gas Emissions.” https://highwoodemissions.com/the-highwood-bulletin/2021-voluntary-initiatives-report/. 378 Op cit, p. 13 379 RSG is gas that has been produced from a gas well and transported by companies whose operations have been independently verified as meeting certain environmental, social and governance standards, particularly related to methane emission reductions.
C-18

intensity rate of 0.28 percent or lower, per ONE Future upstream targets (production, compression, and gathering). SWN achieved an intensity rate of 0.055 percent in 2019, according to its annual Corporate Responsibility report, and is pursuing further emission reductions through various initiatives. The Kinder Morgan transportation network, including Tennessee Gas Pipelines, has significantly beat its 0.31 percent ONE Future transmission target with a rate of only 0.03 percent in 2019, as published in the company’s latest social and governance standards report. These combined industry segments substantially outperform the estimated average intensity rate of up to 1.41 percent for conventional gas emissions across the industry value chain, according to EPA data provided by a 2018 peer-reviewed article in Science magazine. Additional criteria evaluated by Project Canary’s Trustwell certification include impacts to air, land, water, and the community, as well as the mechanical integrity of well design and practices.
As part of the agreement, Southwest Energy will produce and Tennessee Gas Pipeline will transport the RSG on its existing pipeline infrastructure to benefit a large market in the Northeast beginning November 1, 2021. The RSG is expected to power the equivalent of roughly 100,000 homes annually while reducing GHG emissions equal to the removal of about 5,000 internal combustion engine vehicles from the road. Tennessee Gas Pipeline and Southwest Energy are founding members of the ONE Future Coalition, working together to reduce methane emissions.
C-19

APPENDIX D: Extreme Weather Events
Extreme weather events can increase demand or reduce supply (or both), leading to very serious impacts on gas and electric reliability. The United States Environmental Protection Agency (U.S. EPA) indicates that extreme weather events such as heat waves and large storms are likely to become more frequent or more intense with human-induced climate change.380 Extreme temperature conditions are becoming more common, including unusually hot summer days (highs) and hot summer nights (lows), where there is less “cooling off” at night. Heat waves are occurring three times more often than they did in the 1960s — about six per year compared with two per year, with the heat waves lasting longer and becoming more intense.381 More frequent and intense extreme heat events not only strain electricity supplies and at times gas supplies, but increase illness and death, especially among vulnerable populations.382
Extreme cold temperatures associated with polar vortex eventsvortexes have also occurred several times over the last decade with severe impacts on gas and electric reliability and prices. A polar vortex is an area of low pressure — a wide expanse of swirling cold air — that is parked in the polar regions. During winter, certain atmospheric conditions can allow the polar vortex at the North Pole to expand, sending cold air southward.383 This frigid air results in periods of much colder-than-normal temperatures in parts of the United States that are not accustomed to dealing with them. The cold creates increased heating demand that, in turn, leads to higher prices. It also disrupts energy supply and delivery, creating electricity blackouts because of either insufficient supply or power lines to accommodate local load. Extreme cold reduces gas supply because water and other liquids in the production stream freeze and stop the flow of gas from production wells. Power losses to gas processing plants near the wellhead can also reduce available gas supply.
Winter 2021 Polar Vortex (Storm Uri) This section is a case study of an extreme cold event, 2021 Winter Storm Uri, and the severe reliability and cost impacts on large regions of the United States. California was insulated from the Winter Storm Uri event with gas supplies from the Northwest and more temperate
380 U. S. EPA. Climate Change Indicators: Weather and Climate. https://www.epa.gov/climate-indicators/weather-climate. 381 Ibid. 382 Olmos, Sergio. July 1, 2021. “Heat-Related Death Toll Climbs to Nearly 100 in Washington State and Oregon.” New York Times. https://www.nytimes.com/2021/07/01/us/heat-wave-deaths-oregon-canada-washington.html#:~:text=the%20main%20story-,Heat%2DRelated%20Death%20Toll%20Climbs%20to%20Nearly%20100%20in%20Washington,some%20of%2 0whom%20lived%20alone.&text=PORTLAND%2C%20Ore. 383 NOAA webpageweb page “What is the Polar Vortex?” https://scijinks.gov/polar-vortex/.
D-1

weather. However, if an event comparable to Winter Storm Uri were to occur 500–1000 miles west, a combination of high demand from low temperatures in California and freeze-offs of supply in the San Juan basin would cause similar blackouts, disruption of gas service, and price spikes. Current winter reliability measures are not suited to handle an extreme cold event of this magnitude.
During the week of February 12–18, 2021, Winter Storm Uri brought unusually low temperatures to large regions of the United States, including the Northwest, Southwest, Central and Southern Plains, Great Lakes, Southeast regions, and the Gulf Coast. Figure D-1 shows the effect as the cold from the polar vortex pushed its waypushing from the Arctic to the Gulf of Mexico.
Figure D-1: Thermal Image of Winter Storm Uri, February 15, 2021
Source: Extreme Winter Weather Causes U.S. Blackouts (nasa.gov)
During Winter Storm Uri, California’s composite temperatures were between 57 and 59 degrees for customers in the SoCalGas service area and between 50 and 54 degrees Fahrenheit for PG&E.384 The weather was mild for February, so gas demand was on par with the historical five-year average. For SoCalGas, gas demand was lower from February 12 through 18, 2021, than compared to the utilities’ historical five-year average, as shown in Table D-1.
384 SoCalGas Envoy and PG&E Pipe Ranger. Natural Gas Outlook Data.
D-2
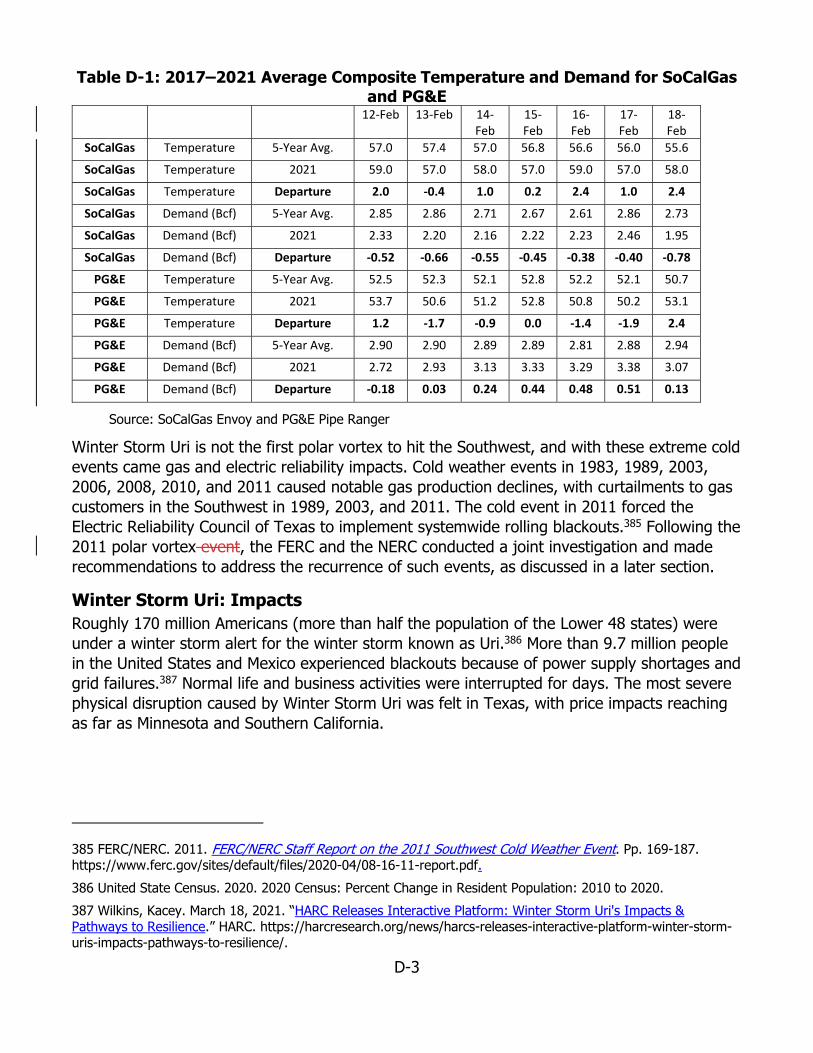
Table D-1: 2017–2021 Average Composite Temperature and Demand for SoCalGas and PG&E 12‐Feb 13‐Feb 14‐
Feb 15‐Feb
16‐Feb
17‐Feb
18‐Feb
SoCalGas Temperature 5‐Year Avg. 57.0 57.4 57.0 56.8 56.6 56.0 55.6
SoCalGas Temperature 2021 59.0 57.0 58.0 57.0 59.0 57.0 58.0
SoCalGas Temperature Departure 2.0 ‐0.4 1.0 0.2 2.4 1.0 2.4
SoCalGas Demand (Bcf) 5‐Year Avg. 2.85 2.86 2.71 2.67 2.61 2.86 2.73
SoCalGas Demand (Bcf) 2021 2.33 2.20 2.16 2.22 2.23 2.46 1.95
SoCalGas Demand (Bcf) Departure ‐0.52 ‐0.66 ‐0.55 ‐0.45 ‐0.38 ‐0.40 ‐0.78
PG&E Temperature 5‐Year Avg. 52.5 52.3 52.1 52.8 52.2 52.1 50.7
PG&E Temperature 2021 53.7 50.6 51.2 52.8 50.8 50.2 53.1
PG&E Temperature Departure 1.2 ‐1.7 ‐0.9 0.0 ‐1.4 ‐1.9 2.4
PG&E Demand (Bcf) 5‐Year Avg. 2.90 2.90 2.89 2.89 2.81 2.88 2.94
PG&E Demand (Bcf) 2021 2.72 2.93 3.13 3.33 3.29 3.38 3.07
PG&E Demand (Bcf) Departure ‐0.18 0.03 0.24 0.44 0.48 0.51 0.13
Source: SoCalGas Envoy and PG&E Pipe Ranger
Winter Storm Uri is not the first polar vortex to hit the Southwest, and with these extreme cold events came gas and electric reliability impacts. Cold weather events in 1983, 1989, 2003, 2006, 2008, 2010, and 2011 caused notable gas production declines, with curtailments to gas customers in the Southwest in 1989, 2003, and 2011. The cold event in 2011 forced the Electric Reliability Council of Texas to implement systemwide rolling blackouts.385 Following the 2011 polar vortex event, the FERC and the NERC conducted a joint investigation and made recommendations to address the recurrence of such events, as discussed in a later section.
Winter Storm Uri: Impacts Roughly 170 million Americans (more than half the population of the Lower 48 states) were under a winter storm alert for the winter storm known as Uri.386 More than 9.7 million people in the United States and Mexico experienced blackouts because of power supply shortages and grid failures.387 Normal life and business activities were interrupted for days. The most severe physical disruption caused by Winter Storm Uri was felt in Texas, with price impacts reaching as far as Minnesota and Southern California.
385 FERC/NERC. 2011. FERC/NERC Staff Report on the 2011 Southwest Cold Weather Event. Pp. 169-187. https://www.ferc.gov/sites/default/files/2020-04/08-16-11-report.pdf. 386 United State Census. 2020. 2020 Census: Percent Change in Resident Population: 2010 to 2020. 387 Wilkins, Kacey. March 18, 2021. “HARC Releases Interactive Platform: Winter Storm Uri's Impacts & Pathways to Resilience.” HARC. https://harcresearch.org/news/harcs-releases-interactive-platform-winter-storm-uris-impacts-pathways-to-resilience/.
D-3

Texas relied on gas for about 50 percent of its electric generation last February.388 The extreme cold caused shutdowns to a significant portion of the state’s gas production, as well as wind turbines, oil refineries, and other energy infrastructure.389 Figure D-2 shows a satellite map of Houston showing the intensity of nighttime lights during a fully functional electric system February 7 compared to Figure D-3, which shows the impact of electricity service blackouts with a considerable portion of electric generation was offline February 16.390 During Winter Storm Uri, more than 4 million Texans lost power on February 15, 1.4 million in the Houston area alone.391 Many of those outages continued into the next day and beyond. As a result of the widespread and prolonged storm, gas production diminished when it was needed most to heat homes and generate electricity. Disappointingly, recommendations after the prior experience in 2011 had not been implemented.
388 U.S. EIA. 2021. Electricity Data Browser. Net Generation for all sectors, monthly. https://www.eia.gov/electricity/data/browser/#/topic/0?agg=2,0,1&fuel=vvg&geo=0000000002&sec=g&freq=M &start=202102&end=202103&ctype=columnchart<ype=pin&rtype=s&datecode=null&maptype=0&rse=0&pin=. 389 KSAT. February 25, 2011. “Timeline: How the Historic Winter Storm, Texas Blackout Cold-Stunned the San Antonio Area.” https://www.ksat.com/news/local/2021/02/25/timeline-how-the-historic-winter-storm-texas-blackout-cold-stunned-the-san-antonio-area/. 390 Hansen, Kathryn. February 18, 2021. “Extreme Winter Weather Causes U.S. Blackouts.” NASA. https://appliedsciences.nasa.gov/our-impact/news/extreme-winter-weather-causes-us-blackouts. 391 Reuters. February 15, 2021. “Cold Snap Leaves One Dead, Over 4 Million Without Power in Texas.” US News. https://www.usnews.com/news/us/articles/2021-02-15/texas-grid-operator-starts-rotating-blackouts-amid-winter-storm. Despart, Zach and Nicole Hensley. February 15, 2021. “We Didn't Prepare for This: 1.4 Million in Houston Left Without Power on Coldest Day Since 1989.” Houston Chronicle. https://www.houstonchronicle.com/news/houston-texas/houston/article/We-didn-t-prepare-for-this-700-000-in-15952157.php.
D-4

Figure D-2: February 7, 1:00 a.m. CST Satellite View of Houston, Texas, Lights
Source: Extreme Winter Weather Causes U.S. Blackouts | NASA Applied Science NASA.gov
Figure D-3: February 16, 1:00 a.m. CST Satellite View of Houston, Texas, Lights
Source: Extreme Winter Weather Causes U.S. Blackouts | NASA Applied Science NASA.gov
Impacts on Gas Production U.S. gas production in February 2021 dropped by 16 percent compared to January. Most of these reductions were in Texas, with less in eastern New Mexico and Oklahoma. Preceding the storm (between February 1 and 10), average daily gas production in Texas was 21,708 million cubic feet per day (MMcf/d). As seen in Figure D-4, Texas production was nearly cut in half, plunging to 12,146 MMcf/d on February 16. This was 9,562 MMcf (44 percent) lower than the average pre-Winter Storm Uri levels. On February 17, production dropped further to 11,799
D-5
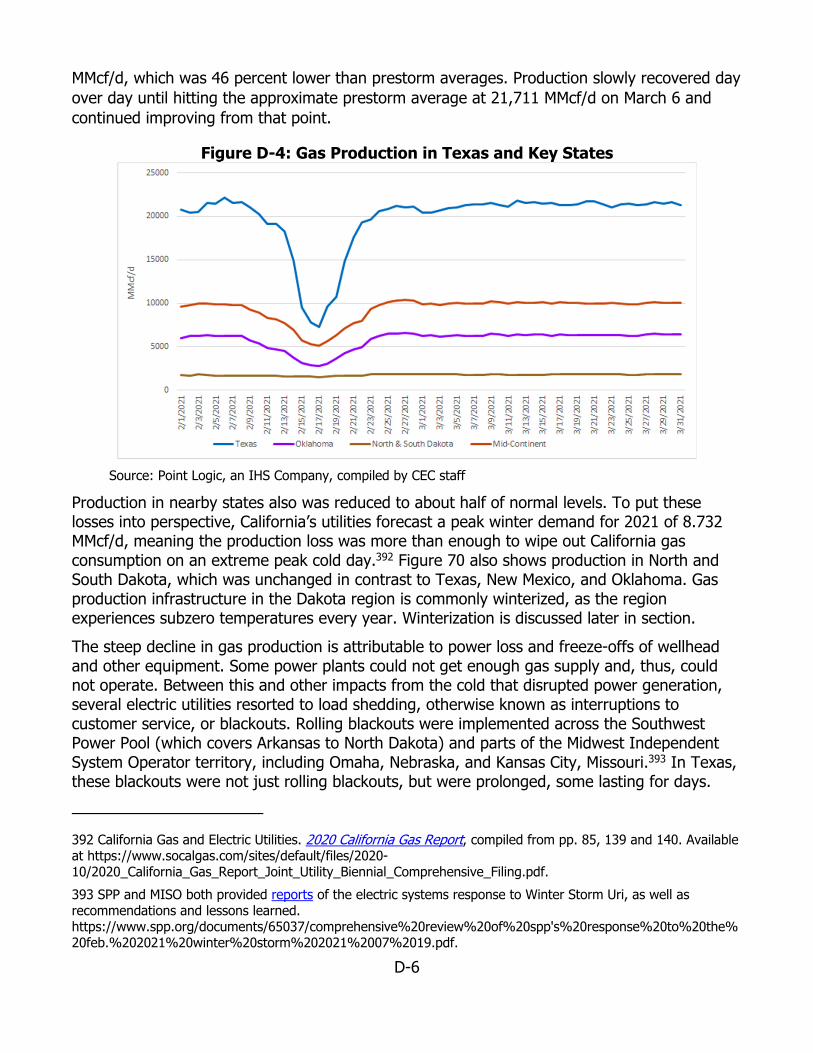
MMcf/d, which was 46 percent lower than prestorm averages. Production slowly recovered day over day until hitting the approximate prestorm average at 21,711 MMcf/d on March 6 and continued improving from that point.
Figure D-4: Gas Production in Texas and Key States
Source: Point Logic, an IHS Company, compiled by CEC staff
Production in nearby states also was reduced to about half of normal levels. To put these losses into perspective, California’s utilities forecast a peak winter demand for 2021 of 8.732 MMcf/d, meaning the production loss was more than enough to wipe out California gas consumption on an extreme peak cold day.392 Figure 70 also shows production in North and South Dakota, which was unchanged in contrast to Texas, New Mexico, and Oklahoma. Gas production infrastructure in the Dakota region is commonly winterized, as the region experiences subzero temperatures every year. Winterization is discussed later in section. The steep decline in gas production is attributable to power loss and freeze-offs of wellhead and other equipment. Some power plants could not get enough gas supply and, thus, could not operate. Between this and other impacts from the cold that disrupted power generation, several electric utilities resorted to load shedding, otherwise known as interruptions to customer service, or blackouts. Rolling blackouts were implemented across the Southwest Power Pool (which covers Arkansas to North Dakota) and parts of the Midwest Independent System Operator territory, including Omaha, Nebraska, and Kansas City, Missouri.393 In Texas, these blackouts were not just rolling blackouts, but were prolonged, some lasting for days.
392 California Gas and Electric Utilities. 2020 California Gas Report, compiled from pp. 85, 139 and 140. Available at https://www.socalgas.com/sites/default/files/2020-10/2020_California_Gas_Report_Joint_Utility_Biennial_Comprehensive_Filing.pdf. 393 SPP and MISO both provided reports of the electric systems response to Winter Storm Uri, as well as recommendations and lessons learned. https://www.spp.org/documents/65037/comprehensive%20review%20of%20spp's%20response%20to%20the% 20feb.%202021%20winter%20storm%202021%2007%2019.pdf.
D-6

Northern California and the Pacific Northwest region were largely sheltered from supply and price impacts because of their access to steady production from winterized wells located in Canada and the Rockies (primarily Wyoming). Northern California was also able to satisfy more of its demand with gas from underground storage. Southern California receives more gas supply from the Southwest region, and SoCalGas made up for the supply shortfalls by withdrawing gas from storage facilities.
Impacts on Gas and Electricity Prices Sharply higher demand with plunging supply resulted in high prices — prices much higher than the normal range observed in winter — in the daily market (for example, spot market) for gas across for large parts of the United States. As shown in Figure D-5, these high prices were then passed on to customers, and in some cases, prices were so high that Texas passed Senate Bill 1580 on June 18, 2021, allowing its electric cooperatives to use securitization financing to recover expenses incurred because of Winter Storm Uri.394 Oklahoma passed a similar securitization law. Some utilities have imposed a surcharge on customers, spread over several months, to pay off the higher gas procurement costs incurred as a result of Uri. Furthermore, the FERC approved a waiver of all penalties and interest associated with Winter Storm Uri imposed by El Paso Natural Gas Company (EPNG) on utilities such as Las Cruces Utilities (LCU). LCU also negotiated a $1.76 million reduction of the February 2021 invoice from its gas commodity supplier. As a result, LCU is reducing the collection period of the “emergency commodity recovery surcharge” added to customers’ monthly bills in June 2021 from 30 to roughly 20 months.395
394 Hancock, K., K. Seliger, A. Paxton, et. al. 2021. Texas Senate Bill 1580. https://openstates.org/tx/bills/87/SB1580/. 395 City of Las Cruces. August 24, 2021. “Las Cruces Reduces Penalty and Resulting Price Hike From Winter Storm Uri.” https://www.krwg.org/post/las-cruces-reduces-penalty-and-resulting-price-hike-winter-storm-uri#:~:text=The%20Federal%20Energy%20Regulatory%20Commission%20%28FERC%29%20approved%20a,2 021%20invoice%20from%20its%20natural%20gas%20commodity%20supplier.
D-7

Figure D-5: Key Hub Prices February 17, 2021 ($/MMBtu)
Source: Aspen Environmental Group and CEC staff
Southern California does receive some gas from the Permian Basin (not winterized) and competes with southwestern markets that were in short supply.396 During February 12–18, 2021, gas supplies dropped as much as 47 percent for SoCalGas.397 As shown in Table D-2Table, prices at the Southern California Citygate reached a high of $146 per MMBtu from February 13 through 16. However, Condition 14 of the Aliso Canyon protocol was met due to the emergency circumstanceslow OFO conditions, allowing SoCalGas to withdraw additional gas from storage. This withdrawal allowed SoCalGas to meet demand while limiting gas purchases on the open market (thereby minimizing exposure to extreme market prices).
396 SoCalGas commented that Permian Basin supply is critically important for customers in Imperial, Riverside, and San Diego Counties. Absent significant system reconfiguration and increased capacity elsewhere, a large enough loss of supply from the Permian Basin will result in core outages for those customers. SoCalGas. Comments on Draft 2021 Integrated Energy Policy Report. TN 241328. Docket 21-IEPR-06. https://efiling.energy.ca.gov/GetDocument.aspx?tn=241328. 397 Presentation by Brian Walker, “SoCalGas SDG&E System Overview.” July 9, 2021, IEPR workshop on Summer 2021 Electric and Natural Gas Reliability, Session 3. https://efiling.energy.ca.gov/getdocument.aspx?tn=238755.
D-8

Table D-2: Gas Spot Prices Before and During Winter Storm Uri ($/MMBtu) Hub Feb. Bid-
Week Feb. 12-18
Min Feb. 12-18
Max Difference
Alberta Energy Company $2.40 $3.21 $5.56 $2.35
PG&E- Citygate $3.55 $6.42 $8.81 $2.39 Malin $2.77 $6.18 $11.47 $5.28
Gas Transmission Northwest, Kingsgate
$2.33 $5.37 $11.67 $6.30
Sumas $2.75 $6.64 $15.00 $8.37 PG&E- Topock $2.62 $8.50 $106.98 $98.48
Southern California Border $3.04 $10.79 $112.90 $102.11
Southern California — Citygate $3.69 $11.26 $146.42 $135.16
Source: PointLogic, an IHS Company, compiled by CEC staff
In markets such as California ISO and ERCOT, gas-fired resources often set the price of electricity. This means that the price of gas is a key component of electricity prices. As cold-related failures cascaded, ERCOT reached its maximum allowable market price (for example, price cap) of $9,000 per megawatt-hour (MWh) for several hours spanning from February 15 through 19, shown in Figure 72. ERCOT serves most of Texas through the eight load zones shown at the bottom of Figure D-6. Figure D-6: ERCOT Real-Time Electricity Prices From February 14 Through 19, 2021
Source: ERCOT
D-9

Winter Storm Uri is estimated to have caused $26 billion in excess electricity prices for the week of February 15.398
FERC and NERC Staff Preliminary Investigation Winter Storm Uri resulted in substantial levels of firm load shed totaling 23,400 MW for the various balancing authorities affected by the extreme cold weather. In response, NERC announced a joint inquiry to “examine the root causes of the reliability events that have occurred throughout the county, in particular the regions served by ERCOT, MISO, and SPP.” FERC and NERC staff released preliminary findings and recommendations from the investigation September 23, 2021, with a final report expected in December 2021, which provides recommendations to ensure reliability during these extreme weather events.399 The cold temperatures had major implications for the gas system. According to the preliminary investigation, roughly 75 percent of outages of gas-fired generators were attributed to lack of fuel supply and freezing issues. The preliminary findings showed that gas production and processing declined by 71 percent and 82 percent, respectively. The investigation found that gas production issues occurred at the wellheads and gathering lines because of shut-ins, freezing of production equipment, and power outages causing critical production equipment to fail. Gas processing plants suffered losses from mechanical failure because of freezing, decreased supply from gathering facilities, power outages, and other mechanical failures. The interstate gas pipelines were affected by the lack of supply from production and processing resulting in increased operational flow orders. However, the majority of the pipeline infrastructure itself was still operational, with only Northern Natural declaring force majeure.400
The extreme cold weather along with these production and processing failures led to fuel supply losses to generators, which sparked outages and further firm load shed.
FERC and NERC Recommendations The preliminary report includes 28 recommendations, 9 of which are key recommendations delineating changes to reliability standards, including implementation timelines. Most of the recommendations are directed for completion by the winter 2022–2023 and winter 2023– 2024. These include provisions for critical gas infrastructure from firm load shed, winter preparedness plans for gas production infrastructure, and consideration of weatherization measures.
398 Bryce, Robert. June 11, 2021. “Texas Ratepayers Are Being Saddled With Nearly $38 Billion in Excess Energy Costs From Winter Storm Uri.” Forbes. https://www.forbes.com/sites/robertbryce/2021/06/11/texas-ratepayers-are-being-saddled-with-nearly-38-billion-in-excess-energy-costs-from-winter-storm-uri/?sh=420cab1c6785. 399 FERC. February 2021 Cold Weather Grid Operations: Preliminary Findings and Recommendations. https://www.ferc.gov/february-2021-cold-weather-grid-operations-preliminary-findings-and-recommendations. 400 Enverus presentation “Winter Storm Uri — Natural Gas Analysis.” Prepared for the Texas Oil & Gas Association. Slide 30. https://docs.txoga.org/files/2644-4-22-21-enverus_txoga_winter-storm-uri-natural-gas-analysis.pdf. FERC and NERC findings showed that natural gas pipelines were only minimally affected by power outages (because most have backup power) and were largely able to meet their firm transportation commitments.
D-10

The following key recommendations were outlined to address the impacts to customers and ensure deliverability of critical energy needs during cold weather events.
Directs generators to identify cold-weather-critical components and design or retrofit generating units to operate at lower temperatures. This includes enhanced training and testing of generating units and personnel in the case of an extreme weather event.
Directs the market operators or public utility commissions or both to identify compensation for generators who make infrastructure investments to harden facilities.
Recommends gas transportation, production, and processing facilities prepare cold-weather-preparedness plans.
FERC and NERC voluntarily recommend that producers consider winterization measures for freeze protection.
Establishes the need for a forum to discuss concrete actions to consider gas reliability to support the bulk-power system with regulatory bodies and energy stakeholders.
The final five key recommendations include review of fuel supply contracts, interim review of winter-readiness before implementing the previous recommendations, inspection and maintenance of facilities, and improvements to planning of reserve margins for winter electric reliability. Further recommendations are still being studied and will be included in FERC and NERC’s final report scheduled for release in late 2021. Five recommendations are under further study for reliability. The final 14 recommendations are included to prevent recurrence of similar outage eventsoutages, which are broader and do not include timelines for implementation. These recommendations include increased real-time monitoring of gas wellheads, flexibility of manual load shedding, emergency response centers, and accelerated outage reporting.
Winter Storm Uri halted gas supplies because of freezing of production and processing equipment, as well as power losses to infrastructure. FERC and NERC note that the issue becomes cyclical as gas infrastructure loses power, less supply is available to provide to generators and results in more power losses. The ripple effect is not only limited to the power generators, but to customers who were then unable to receive gas to heat their homes. The recommendations of FERC and NERC staff now require firm load to critical gas infrastructure to address the compounding effect of the interdependency between gas and electric reliability. Alternatives to gas were not an option as wind turbines froze and solar was unavailable. Gas-fired generation is used as a dispatchable resource to meet load as it ramps up during the day and was unable to provide these services as fuel supply dwindled. Minimizing load shedding and costs for gas and electricity during these events requires closer coordination in the planning process for both energy systems.401
401 Electricity and natural gas prices spiked during Uri, resulting in prices of $9,000/MWh for electricity in Texas and more than $900/MMbtu for gas in Oklahoma.
D-11

Extreme Weather Events — Potential Solutions
Winterization Winterization involves the installation or use of equipment, or addition of chemicals into the gas stream, by well and gathering and processing operators to prevent infrastructure freeze-offs. Because California gas supplies come from areas outside the state that experience freezing temperatures, California has an interest in ensuring that facilities are winterized. Producers in Canada, for example, inject methanol, insulate lines and chemical injection pumps, use small heaters, and conduct methanol storage to prevent freezing.402 Winterization ensured Canadian, and many U.S., producers were able to continue production during Winter Storm Uri.
After the 2011 cold event, the FERC and NERC investigated the power outages and gas curtailments in the Southwest and released a report with recommended solutions to avoid similar problems in the future. Most utilities and gas producers in the region, however, did not weatherize their facilities. The FERC and NERC speculated that gas producers may have limited market incentives to invest in elaborate winterization, as the revenue loss from a freeze-off is likely less than the cost of winterizing.403 Nonetheless, the cost of winterizing a gas well is low in general and much lower than the societal cost of freeze-offs.404
On the electricity side, rolling blackouts and curtailments due to cold events result in high economic losses to society, besides loss of life. The Perryman Group estimated that Winter Storm Uri caused a loss of economic activity of $195 billion to $295 billion.405 The Federal Reserve Bank of Dallas estimated $4.3 billion was lost just in Texas because of the power interruption during the February outage.406
By comparison, the FERC and NERC report on the February 2011 cold event estimated that winterizing gas-fired power plants in Texas could cost between $50,000 and $500,000 per plant (2011 dollars). Accounting for inflation, they found that winterizing all the gas-fired power plants in Texas could cost $95 million in today’s dollars. Winterizing new gas and oil
402 FERC/NERC. 2011. Report on Outages and Curtailments During the Southwest Cold Weather Event of February 1-5, 2011. https://www.ferc.gov/sites/default/files/2020-04/08-16-11-report.pdf. 403 Ibid. 404 Ibid. The FERC/NERC 2011 report estimated the cost for winterizing gas wells. The costs vary by equipment needs for each well from $2,500 to $35,000 per well with an annual operating and maintenance cost of $6,800. For 30,000 wells the total cost could vary from $75 million to $1.05 billion based on equipment needs per well. 405 Perryman Group. 2021. “Preliminary Estimates of Economic Costs of the February 2021 Texas Winter Storm.” https://www.perrymangroup.com/media/uploads/brief/perryman-preliminary-estimates-of-economic-costs-of-the-february-2021-texas-winter-storm-02-25-21.pdf. 406 Golding, Garrett, Anil Kumar, and Karel Mertens. “Cost of Texas’ 2021 Deep Freeze Justifies Weatherization.” Federal Reserve Bank of Dallas. https://www.dallasfed.org/research/economics/2021/0415. The estimate is based on the Value of Lost Load method that estimates indirect losses by valuing power had it been uninterrupted.
D-12
wells would cost between $20,000 and $50,000 per well and statewide would be between $85 million and $200 million annually.407
The Federal Reserve Bank of Dallas concludes that if events like these occur about once a decade, winterizing measures would save about $430 million annually. In reality, polar vortex events happen much more frequently. Taking the reserve's conclusion and comparing it to losses experienced from the February 2021 polar vortex event, the winterizing measures make sense economically. For example, Texas experienced losses of $4.3 billion during the week of extreme weather caused by Winter Storm Uri, and this figure does not account for the costs to other states and regions in the United States.408
In the Permian Basin, where supplies were disrupted because of well freeze-offs, some suggest winterizing only new wells because it would be less costly than retrofitting old wells.409
East Daley Capital Advisors Director Ryan Smith estimates that if producers began weatherizing new wells, half of the Permian Basin could be protected within two years.410
El Paso Electric (which is part of the Western Electric Coordinating Council, not ERCOT) is a notable example of a utility that actually did winterize after the 2011 cold event. El Paso Electric spent $4.5 million to winterize its electric generation fleet.411 This winterization involved building new interconnections and adding larger-diameter pipes to improve gas flow and pressure through pipelines. In addition, it weatherized its Newman, Rio Grande, and Copper electric generation plants and made heat tracing system improvements.412 The winterization measures can be temporary or executed in the short term or both before a cold event. Rockpoint Gas Storage, who owns several gas storage facilities in Canada and the United States, including in California, flew a team from Alberta, Canada, before Winter Storm Uri to temporarily winterize its Oklahoma facility (Salt Plains Gas Storage) and prevent a freeze-off. Actions included using tools and instruments, such as rented heaters, to keep pipes warm and prevent freeze-off.413
As for power plants, the least expensive option is to winterize when the plant is being built. Depending on the region, plants have different configurations. Power plants in southern states
407 Ibid. 408 Ibid. 409 Natural gas separators remove solid particles and liquids from a continuous gas stream supply. 410 Energy Intelligence, March 22, 2021. “Well Freeze-off Prevention: Not One Size Fits All.” Vol. 37, No. 12. 411 Kolenc, Vic. Feb. 17, 2021. “Electricity Primer: Not Being Connected to Rest of Texas Helped El Paso in Cold Wave.” El Paso Times. https://www.elpasotimes.com/story/news/local/el-paso/2021/02/17/el-paso-electric-not-part-texas-grid-power-outages-weather/6774067002/. El Paso’s report on the February 2-4, 2011, Weather Event. https://www.epelectric.com/files/html/Storm_2011/EPE_Response_with_Exhibits_A_-_D.pdf. 412 New Mexico Public Regulation Commission. Regular Open Meeting Feb. 24, 2001. https://api.realfile.rtsclients.com/PublicFiles/9ce35ae9dd194163979349178e937b5f/15d809d3-ef33-409e-a52c-46576fb96d6a/Feb.%2024%202021%20Minutes.pdf. 413 Dubchak, Jason. Rockpoint Storage. Information obtained by CEC staff via email, phone, and virtual Team meeting. May 27, 2021.
D-13

tend to have open outdoor designs (presumably to help keep equipment cooler during the hot summer months), whereas plants in northern states are built with much of the equipment inside a large building to protect from winter temperatures.
Storage California’s underground gas storage provided two benefits during Winter Storm Uri. One was price. Gas that had been stored during summer was lower in price than any daily spot gas utilities or generators would need to buy and allowed them to avoid higher-cost purchases. It also provided physical supply. As much as half the load on both PG&E and SoCalGas was served with gas from storage during the storm. However, not all of this gas was pulled from storage as a result of supply disruptions in the Permian Basin or elsewhere because of the price benefit of storage. Moreover, California’s reliance on Permian basin supply is relatively low. It is certainly not the case that California needed to pull all of that gas from storage to avoid gas service curtailment, as some withdrawals from storage were likely for economic reasons.
Diversified Supply Seeing the forecast for subfreezing temperatures and 60-mile-per-hour wind gusts in New Mexico, the New Mexico Gas Company, El Paso Electric, and the Public Service Company of New Mexico prepared by diversifying their gas and energy supply.414 They all modified their procurement decisions and applied strategies such as contracting for more gas and fuel oil and power from alternate locations that would be less affected by the storm. The New Mexico Gas Company, for example, shifted its daily spot gas purchases away from the Permian Basin gas to the San Juan Basin, where temperatures were not expected to result in freeze-offs.415 El Paso Electric and the Public Service Company of New Mexico used fuel oil at generation facilities and relied on nuclear power from the Palo Verde plant. El Paso Electric contracted with fuel oil suppliers for its Montana, Texas, power plant, providing them with the ability to offset any gas delivery shortfall. El Paso Electric was able to limit its spot gas purchases to one day, on February 15, 2021. The Public Service Company of New Mexico also purchased power from nongas resources in the Western grid.
Planning Another strategy used by New Mexico utility executives to avoid curtailments from Winter Storm Uri entailed advanced planning actions. The New Mexico Gas Company, for example, shifted its purchases of swing supply in the daily spot market to a different supply basin. This allowed the New Mexico Gas Company to avoid gas service curtailment. Still, San Juan prices spiked — from $2.80/MMBtu before to $250/MMBtu during the storm. The New Mexico Gas
414 The Weather Channel. February 16, 2021. “Winter Storm Uri Spread Snow, Damaging Ice From Coast to Coast, Including the Deep South (Recap).” https://weather.com/safety/winter/news/2021-02-14-winter-storm-uri-south-midwest-northeast-snow-ice. 415 Sawyer, Abigail. February 26, 2021. “Southwest Regulators Hear From Utilities in Aftermath of Texas Catastrophe.” California Energy Markets. https://www.newsdata.com/california_energy_markets/southwest/southwest-regulators-hear-from-utilities-in-aftermath-of-texas-catastrophe/article_e656a070-7897-11eb-9583-ab3a188c54a1.html.
D-14

Company has asked its regulatory commission for permission to recover those higher gas costs over an extended period to reduce the impacts to ratepayers.416
The Public Service Company of New Mexico hedged its gas prices in advance to minimize price impacts. El Paso Electric was able to use local generation and did not have to rely on the Western Electric Coordinating Council. El Paso Electric and the Public Service Company of New Mexico also pushed back maintenance outages. The Public Service Company of New Mexico specifically delayed maintenance at its San Juan Generating Station for two weeks to ensure coal-fired power would be available. The Public Service Company of New Mexico also prepared its electric generation facilities to operate in cold weather and minimized the use of gas during the winter storm.417 The combination of diversifying its electric generation fuel supply, improving its infrastructure, and planning allowed New Mexico utilities to preserve electricity and gas service during a severe weather event.
Summer Heat Storm Wave Analysis Gas Use in Hot Summer Conditions The heat storm in August 2020 heat wave caused blackouts that started on August 14 and recurred during the weekend on August 15. A compounding effect was the inability to schedule additional gas supplies because the gas market is closed on weekends. By Monday, additional gas was scheduled to meet high air-conditioning loads on the electric system, and heat persisted through Wednesday, August 19. Throughout the heat event, gas demand ranged from 2,616 MMcfd to 3,249 MMcfd, shown in Figure D-7. To put this in perspective, SoCalGas’s summer high day demand forecast for 2020 was 3,206 MMcfd. Actual demand exceeded this forecast, and the second half of August experienced an extended period of high gas demand.
A growing concern is that during these high-demand periods, gas utilities will be unable to inject gas into storage since the transmission pipelines are fully utilized to meet demand. If the state experiences very high summer gas demand, exacerbated by increasing steep daily ramping needs, not only are the gas utilities unable to fill storage, but gas must be withdrawn from storage. This impedes the gas utilities’ ability to meet its storage inventory requirements for the winter.
416 New Mexico Gas Company. 2021. “February Cold Weather Gas Costs and Proposed Bill Impacts.” https://www.nmgco.com/en/gas_price. 417 New Mexico Public Regulation Commission. February 24, 2021. Minutes of the Regular Open Meeting. pp. 5– 6.
D-15

Figure D-7: August 2020 Gas Demand
Source: CEC staff
Staff initially considered the August 2020 heat event as a demand scenario for the hot summer analysis, thinking it was the most extreme case experienced in the last two decades. However, review of the historical record demonstrated that it was not the most extreme case, and, in fact, there were many instances in the past 22 years where summer gas demand exceeded that of the 2020 heat eventwave.418
418 The state is burning less gas in total for electric generation than in the past, due to the large influx of renewable generation in the ensuing years.
D-16

Daily peak demand is more evenly spread over the summer than the average monthly demand but still is most likely to occur in August. The months of July and September are next most likely. Peak day demand ranges from about 3,000 to 4,000 MMcfd over the historical period and echoes the downward trend of gas demand over time as shown in Figure D-9.
Figure D-9: SoCalGas Summer Peak Day Demand
Source: CEC staff
Figure D-10 shows how in-state gas-fired capacity and generation have changed over time. Gas capacity rose following the 2000–2001 energy crisis and peaked in 2013, then declined with increasing retirements since that time.
D-17
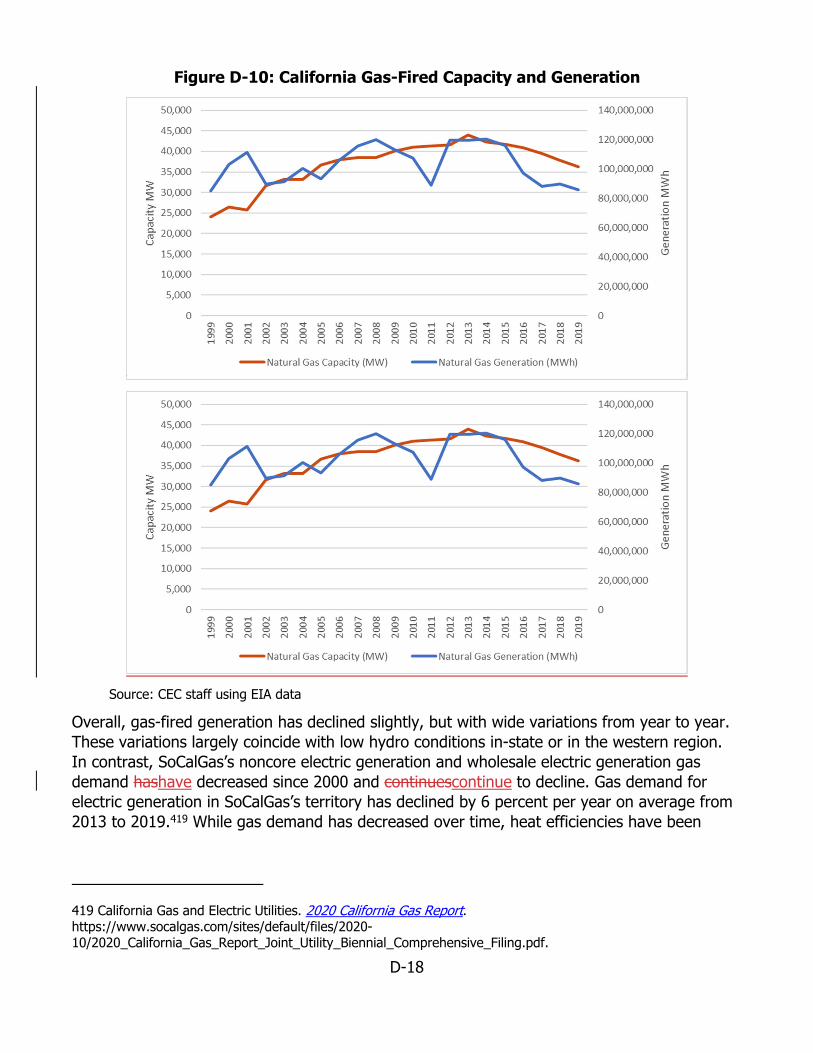
Figure D-10: California Gas-Fired Capacity and Generation
Source: CEC staff using EIA data
Overall, gas-fired generation has declined slightly, but with wide variations from year to year. These variations largely coincide with low hydro conditions in-state or in the western region. In contrast, SoCalGas’s noncore electric generation and wholesale electric generation gas demand hashave decreased since 2000 and continuescontinue to decline. Gas demand for electric generation in SoCalGas’s territory has declined by 6 percent per year on average from 2013 to 2019.419 While gas demand has decreased over time, heat efficiencies have been
419 California Gas and Electric Utilities. 2020 California Gas Report. https://www.socalgas.com/sites/default/files/2020-10/2020_California_Gas_Report_Joint_Utility_Biennial_Comprehensive_Filing.pdf.
D-18

increasing as older, less efficient plants are retired and less gas is used to generate more electricity.
Constructing a Hot Summer Scenario To construct a hot summer scenario, Aspen Environmental conducted analysis comparing demand on the SoCalGas system during August 2020 to daily gas demand going back to 2000. The initial hypothesis was that gas demand during August 2020’s heat wave (which ranged between 2.5 Bcf and 3.2 Bcf) might be representative of what California could expect in future heat events. What the analysis uncovered, however, was that daily demand close to or above 3.0 Bcf has occurred several times in the last 22 years. In fact, the highest demand was found by constructing a composite case combining daily demand from months in 2000 and 2001. Interestingly, a case taking demand two standard deviations from the average of daily demand in each month for all 22 years was very close to that same composite case. Another case looked at the demand level that would have a probability occurrence in that historical data set of 1-in-10 years. Staff identified five options to capture a hot summer scenario for analysis as shown (as is the range of demand in the 22-year data set) in Figure D-11:420
Case 1 – Hot Summer August 2020 Demand. The first case considered is the highest daily demand from August 2020, which was above normal, with demand held constant throughout the entire summer.
Case 2 – 2000–2001 Summer Demand. The second demand case is a composite of the highest average monthly demand levels in the historical record, which is a combination of 2000 and 2001.
Case 3 – Sigma 2 Demand. The third case uses a probabilistic approach looking at demand two standard deviations above the mean for each month. This case assumes that 97.5 percent of the demand days would be at or below this demand level. The Sigma 2 case is also very close to the definition for the 1-in-35 standard.421
Case 4 – 1-in-10 Demand. The fourth case is a demand that has a 1-in-10 probability of occurrence from the historical data.422
420 CEC Energy Almanac. https://www.energy.ca.gov/data-reports/energy-almanac/california-electricity-data/electric-generation-capacity-and-energy. The four demand scenarios are (1) Composite of 2000 and 2001, (2) August 2020 Blackout, (3) Sigma 2 and (4) 1-10 Probability. The composite scenario is the highest average demand month from 2000 and 2001. The August 2020 blackout scenario is August 2020 demand held constant throughout the summer months. The sigma 2 scenario is a probabilistic approach that looks at demand two standard deviations above the mean for each month and closely resembles a 1–35 probability case. The 1–10 probability scenario is derived from the 1990– 2000 historical data. 421 The 1-in-35 is a 2.25 percent probability of occurrence by definition. 422 Staff prepared sensitivity analysis to test demand based off a 10-year record and various levels of the standard deviation case.
D-19

Figure D-11: Summer Monthly Demand Profiles
Source: CEC staff
Figure D-11 also shows the historical peak day demand (the green dashed line at the top) or the highest daily peak demand in the record for each given month. The peak day was included to emphasize that daily demand can be even higher than the average monthly demand. The probability of occurrence of these peak days is next to zero, as shown in Table D-3, but recognizes that these demand levels have occurred in the past. The goal of developing the
D-20

cases is to test whether the system can maintain deliverability and whether storage can be filled for winter under a given demand level.
Table D-3: Probabilities of Max Historical Daily Demand May June July August September October
0.06% 0.00% 0.08% 0.11% 0.06% 0.21%
Source: CEC staff
Gas Balance Results Aspen Environmental Group conducted a gas balance analysis (described in Chapter 2) that tracks storage inventory and calculates the difference between supply and demand to track storage withdrawals and injections. Table D-4 provides a look at the ability to meet demand and, if supply plus storage withdrawal is insufficient to meet demand, the amount of curtailment implied to maintain system operations, and the storage inventory levels for each month. Gas demand for each month is shown on Line 2 of the table. For the summer months (May through October), staff included the under the Sigma 2 Demand Case.
Table D-4: Sigma 2 Gas Balance 2021 2021 2021 2021 2021 2021 2021 2021 2021 2022 2022 2022
Month Apr May Jun Jul Aug Sept Oct Nov Dec Jan Feb Mar
Demand (MMcf)
2,194 2,897 3,079 3,439 3,559 3,368 3,172 2,597 3,158 2,956 2,933 2,397
Pipeline Supply (MMcf)
2,820 2,820 2,820 2,820 2,820 2,820 2,820 2,820 2,820 2,820 2,820 2,820
Storage Injection or Withdrawal (MMcf)
626 ‐77 ‐259 ‐619 ‐739 ‐548 ‐352 223 ‐338 ‐136 ‐113 423
End of Month SoCalGas Storage Inventory
(Bcf)
72 69 61 42 19 3 ‐8 ‐1 ‐12 ‐16 ‐19 ‐6
Estimated Curtailment (MMcf)
370 370 370 370 370 370
Injection or Withdrawal
After Curtailment (MMcf)
626 293 111 ‐249 ‐369 ‐178 18 223 ‐338 ‐136 ‐113 423
End of Month SoCalGas Inventory
(Bcf)
72 81 84 76 65 59 60 67 56 52 49 62
Source: CEC staff
D-21

Staff used the SoCalGas normal or average year demand for the remaining months.423 The amount of pipeline capacity used in the analysis is 2,820 MMcfd, with Line 4000 back in service as of October 1, 2021. Line 3 of Table D-4 shows assumed pipeline supply, and Line 4 shows the difference between supply and demand that results in injections or withdrawals from storage. In the Sigma 2 Demand Case, demand is greater than pipeline supply in the summer and results in storage withdrawals in May–October. As shown on Line 4, SoCalGas would have to withdraw storage in amounts ranging from 77 MMcf a day on average in May up to 739 MMcf a day in August. SoCalGas has the capability to withdraw gas at these levels.424 Concern arises when storage inventory declines over the summer. When storage inventory declines, so does total instantaneous withdrawal capability.
Another reliability concern is daily demand, which will vary above the monthly average demand, and the possibility that storage withdrawal may not be sufficient to meet the increased deliverability imbalance. In this case, the prolonged withdrawal period during the summer months results in an inability to inject gas and as. As a result, storage inventory declines as shown in Line 5. Although SoCalGas relies mostly on the shoulder months (spring and fall) when demand is lower to fill storage, the utility still must be able to inject during some parts of the summer. Extended periods of high summer demand threaten the ability to prepare for winter inventory requirements andrequirement. Furthermore, in the Sigma 2 Demand Case, storage inventory drops below zero by the end of October, leaving insufficient gas in storage on November 1.
To allow SoCalGas to meet winter inventory requirements of 60 Bcf in storage by November 1, it would undoubtedly begin to curtail noncore load when demand is high. Assuming the total inventory needed for winter reliability is achieved through curtailment, on average, SoCalGas would have to curtail 370 MMcf every day of the summer, as shown on Line 6. Line 7 shows that net injections and withdrawals after curtailment allow for injection in May, June, and October, but SoCalGas would still have to withdraw gas in July, August, and September. Under this curtailment scenario, SoCalGas would reach 60 Bcf of storage inventory by November 1. SoCalGas would likely tailor its curtailments for each month rather than employ a flat curtailment strategy. SoCalGas’ planning strategy would curtail noncore customers as needed, and the magnitude would depend on demand expectations based on temperature forecasts and monitoring of storage inventory balances to meet winter reliability requirements. SoCalGas may end up curtailing more in May and June, for example, to prepare for the heavier electric generation demand in July, August, and September.
423 California Gas and Electric Utilities. 2020 California Gas Report. https://www.socalgas.com/sites/default/files/2020-10/2020_California_Gas_Report_Joint_Utility_Biennial_Comprehensive_Filing.pdf. 424 Withdrawal capability declines as inventory decreases due to reduced pressure in the storage wells. Withdrawal capacity forecasted for November 1st of1, 2020, was expected to be 2,729 MMcfd including Aliso in theirthe Winter Technical Assessment.
D-22

Next Steps Staff’s hot summer analysis is a proof of concept for potential summer demand scenarios and ways to evaluate them. This same process can be used to test different demand levels. Sensitivity analysis can be done to test a threshold for reliability. To conduct additional analysis, the California ISO and LADWP would need recalculated minimum generation values to evaluate electric reliability impacts under the different options.425 Reliable temperature data for the gas territory would allow a simplified model to estimate changes in gas demand related to heat events and customer responsiveness to weather events. Most important, there needs to be a definition of the level of reliability required and therefore the level of risk the state is willing to bear.
425 Minimum generation is generally the required minimum generation level of a utility systems thermal units needed to prevent electricity outages. For more information, see https://www.energy.ca.gov/resources/energy-glossary. Also see Aliso Canyon Risk Assessment Technical Report. April 4, 2016. https://documents.latimes.com/aliso-canyon-risk-assessment-technical-report/.
D-23

APPENDIX E: Gas Infrastructure
Gas Infrastructure Issues California consumes around 5.5 billion cubic feet of gas on an average day and as much as 11 billion cubic feet on a very cold winter day. Larger-diameter pipelines operating at pressures in the range of 600 pounds per square inch move gas from the state line to load centers, where the gas enters distribution lines. Distribution lines are smaller, usually smaller than 12 feet in diameter, and operate at much lower pressure, leading to the half-a-pound of pressure typical of the service lines that run from the gas mains under the streets up to the meters outside homes. PG&E, SoCalGas, and SDG&E submitted PHMSA forms to the CEC in 2021, and staff found that for all three utilities, more than 60 percent of the transmission pipeline miles were installed before 1970. But for transmission segments replaced as part of the safety programs discussed below, the newest of these pipelines is now reaching 30 years old. Compare this to the expected physical lifetime of 70 to 75 years for a pipeline, as cited by staff’s gas pipeline expert in the Aliso Canyon Joint Agency workshop May 23, 2019.426 The conclusion is that California’s transmission facilities are old and may be nearing the need for replacement. Data filed by the large utilities with PHSMA corroborate this finding. As shown in Figure E-1, virtually all the transmission is at least 20 years old; 80 percent of their transmission lines were installed before 1980; 65 percent were installed before 1960.
Staff expected that distribution facilities could be even older. PG&E, for example, first installed distribution systems to deliver “town” gas manufactured from coal in the 1870s. Many of those would have been cast iron.427 The big expansion in gas service began after 1930, once transmission pipeline couplings and welding techniques were perfected to allow long-distance transmission of gas and begin abandonment of the “town” gas manufacturing stations. PG&E announced in 2015 it had replaced all its cast-iron pipe.428 (SoCalGas’ latest annual report to PHSMA lists zero cast-iron pipe on its system.)
426 This assumes the steel pipeline is cathodically protected (which almost all steel transmission pipeline is). May 23, 2019, IEPR workshop on Southern California Energy Reliability transcript. p. 140, lines 8–12. https://efiling.energy.ca.gov/getdocument.aspx?tn=228898. The financial life and physical lifetime of a pipeline differ. This range refers to the physical lifetime rather than the transmission depreciation timelines. 427 PHMSA. Cast and Wrought Iron Inventory. https://www.phmsa.dot.gov/data-and-statistics/pipeline-replacement/cast-and-wrought-iron-inventory. 428 “PG&E Reaches Major Milestone Replacing Cast Iron Pipe Across Northern and Central California.” https://www.pge.com/en/about/newsroom/newsdetails/index.page?title=20150120_pge_reaches_major_mileston e_replacing_cast_iron_pipe_across_northern_and_central_california A PHMSA report, however, lists PG&E has having 55 miles of cast iron pipe as of 2021. https://portal.phmsa.dot.gov/analytics/saw.dll?PortalPages&PortalPath=%2Fshared%2FPDM%20Public%20Websi te%2FCI%20Miles%2FGD_Cast_Iron.
E-1

Figure E-1: Percentage Cumulative Transmission Miles Installed by Decade
120%
Cumulative
% M
iles Constructed
by Decads
100%
80%
60% Pre‐1940
40%
20%
0%
1940 ‐1949
1950 ‐1950
1960 ‐1969
1970 ‐1979
1980 ‐1989
1990 ‐1999
2000 ‐2009
2010 ‐2019
2020 ‐2029
Cumulative
% M
iles Constructed
by Decads
Pre‐1940
120%
100%
80%
60%
40%
20%
0%
1940 ‐1949
1950 ‐1950
1960 ‐1969
1970 ‐1979
1980 ‐1989
1990 ‐1999
2000 ‐2009
2010 ‐2019
2020 ‐2029
Source: CEC staff analysis
With the post-World War II expansion of housing construction, most subdivisions in California were built with gas distribution lines included in the common utility trench with service lines installed from the street to the new home. The date at which one’s home was built is a good, but not perfect, indicator of how old a given distribution main and service line are. FigureFigure 79Figure yields several observations. First, SoCalGas actually has more mains dating from before 1940 than PG&E. Not shown in the figure is that PG&E has 257 miles of distribution main for which it could not identify year of installation. But most of the distribution pipe in place today was installed after 1950. In fact, Figure E-2 shows the number of miles
E-2

installed each decade is pretty even from 1950 to 1990, after which it begins to fall off some. Mains installed in the decade from 2010 to 2019 fall even more.
Some neighborhoods have distribution and service lines made of a plastic called “Aldyl-A.” Aldyl-A has since been found to become brittle and fail long before the intended end of service life. Manufacturer DuPont sent its first warnings to customers about the higher incidence of “slit fractures” on these pipes in 1982 and encouraged operators to perform more frequent leak inspections on these pipes.429 By 1998, the National Transportation Safety Board (NTSB) issued a special investigative report on the failures it was seeing on these gas service lines.430
The PHSMA issued its first advisory in 1999.431 These were followed by several more investigations through 2007. The CPUC identified Aldyl-A as a major potential hazard in 2012.432 PG&E and SoCalGas have programs within their distribution revenue requests to cover the cost to replace a select number of miles of Aldyl-A pipe each year. Full replacement is generally not expected for another 30 years.
429 A much more detailed and complete treatment on the history of Aldyl-A in California can be found in a June 2014 report by CPUC staff: “Hazard Analysis & Mitigation Report.”Hazard Analysis & Mitigation Report.https://www.cpuc.ca.gov/-/media/cpuc-website/files/legacyfiles/r/8947-ra-doc-10-aldyla.pdf. 430 NTSB Special Investigative Report: PB98‐917001, NTSB/SIR‐98/01, http://www.ntsb.gov/news/events/1998/SIR‐98‐01/index.html. 431 ADB-99-01, Potential Failure Due to Brittle-Like Cracking of Certain Polyethylene Plastic Pipe Manufactured by Century Utility Products, Inc. Federal Register. March 11, 1999. (64 FR 12211). 432 Risk Assessment Section Hazard Database project, Report on Status and Initial Recommendations, March 14, 2012:.
E-3

Figure E-2: Gas Mains by Decade
Source: CEC staff analysis
Manufacturer DuPont sent its first warnings to customers about the higher incidence of “slit fractures” on these pipes in 1982 and encouraged operators to perform more frequent leak inspections on these pipes.433 By 1998, the National Transportation Safety Board (NTSB)
433 A more detailed and complete treatment on the history of Aldyl-A in California can be found in a June 2014 report by CPUC staff: Hazard Analysis & Mitigation Report. https://www.cpuc.ca.gov/-/media/cpuc-website/files/legacyfiles/r/8947-ra-doc-10-aldyla.pdf.
E-4

issued a special investigative report on the failures it was seeing on these gas service lines.434
The PHSMA issued its first advisory in 1999.435 These were followed by several more investigations through 2007. The CPUC identified Aldyl-A as a major potential hazard in 2012.436 Both PG&E and SoCalGas have programs within their distribution revenue requests to cover the cost to replace a select number of miles of Aldyl-A pipe each year. Full replacement is generally not expected for another 30 years.
The age of pipe matters because the older pipe is, the most prone it is to leak and fail. A large part of what California’s gas utilities spend on leak detection and remedy is not discretionary and, in fact, is required under regulations discussed below.
Gas Infrastructure Safety Programs In 2011, the CPUC adopted Decision (D.) 11-06-017, which ordered all California gas transmission pipeline operators to prepare natural gas transmission pipeline comprehensive pressure testing implementation plans to either pressure test or replace all segments of gas pipelines that were not pressure tested or lacked sufficient details related to performance of any such test.
General Order 112 aswas amended most recently in 2015, when the CPUC adopted Decision 15-06-044, which resulted in General Order 112-F,. General Order 112 requires the following:
Requires reportingReporting of all incidents where pressure exceeds MAOP, or where pipeline loses service or requires shut down due to low pressure.
IncreasesIncreased frequency of leak surveys of transmission system to twice a year. Test requirements for pipelines below 100 psig; clearance between gas pipelines and
other substructures of 12 inches when paralleling and 6 inches when crossing. AllThe retention of all installation and repair records must be retained so long as the
pipeline is in service, all repair records for a minimum of 75 years or until next repair or test is performed, whichever is longer.
ExpandsExpansion of liquefied natural gas rules to include mobile equipment. In 2018, new underground gas storage facility regulations of the California Geologic Management (CalGEM) Division of the California Department of Conservation went into effect.437 As well as PG&E and SoCalGas, independent storage operators are also subject to these regulations. These new regulations required:
434 NTSB Special Investigative Report: PB98‐917001, NTSB/SIR‐98/01, http://www.ntsb.gov/news/events/1998/SIR‐98‐01/index.html. 435 ADB-99-01, “Potential Failure Due to Brittle-Like Cracking of Certain Polyethylene Plastic Pipe Manufactured by Century Utility Products, Inc.” Federal Register. March 11, 1999. (64 FR 12211). 436 CPUC. March 14, 2012. Risk Assessment Section Hazard Database project, Report on Status and Initial Recommendations. https://www.cpuc.ca.gov/regulatory-services/safety/pipeline-safety/natural-gas-timeline. 437 California Department of Conservation Geologic Energy Management Underground Gas Storage Regulations. https://www.conservation.ca.gov/calgem/general_information/Pages/UGSRules.aspx.
E-5

Project-specific risk management plans. An emergency response plan. Additional project data and casing diagrams. Records management. Well construction and design standards (no single point of failure, a primary and
secondary barrier, cementing requirements, and so forth). Mechanical integrity testing. Pressure testing.
Federal Pipeline Safety Filings Under the IEPR proceeding, as previously mentioned, the CEC requested gas utilities’ 2020 federal U.S. PHMSA filings. These filings provide insight into the enormity of their gas systems as California contemplates the gas transition as shown in Table E-1.
Table E-1: Mileage and Number of Service Lines for California Gas Utilities (2020) PG&E SDG&E SoCalGas
Total Transmission Miles 6,504 218 3,341
Total Distribution Miles 43,509 8,236 51,424
Number of Services 3,606,370 691,677 4,523,399
Source: Mileage and Number of Service Lines for California Gas Utilities (2020)-) — PG&E, SDG&E, and SoCalGas filings of PHMSA Gas Distribution F7100.1-1 and Gas Transmission and Gathering F7100.2-1
Federal regulations require that gas transmission pipeline operators report how many miles of pipe travel through what are known as high-consequence areas (HCA), which are highly populated areas that fall under the following criteria:438
An equation has been developed based on research and experience that estimates the distance from a potential explosion at which death, injury, or significant property damage could occur. This distance is known as the “potential impact radius” (PIR) and is used to depict potential impact circles.
Operators must calculate the potential impact radius for all points along their pipelines and evaluate corresponding impact circles to identify what population is contained within each circle.
Potential impact circles that contain 20 or more structures intended for human occupancy, buildings housing populations of limited mobility, buildings that would be hard to evacuate (for example, nursing homes, schools), or buildings and outside areas
438 U.S. Department of Transportation webpageweb page “Fact Sheet: High Consequence Areas.” https://primis.phmsa.dot.gov/comm/factsheets/fshca.htm.
E-6
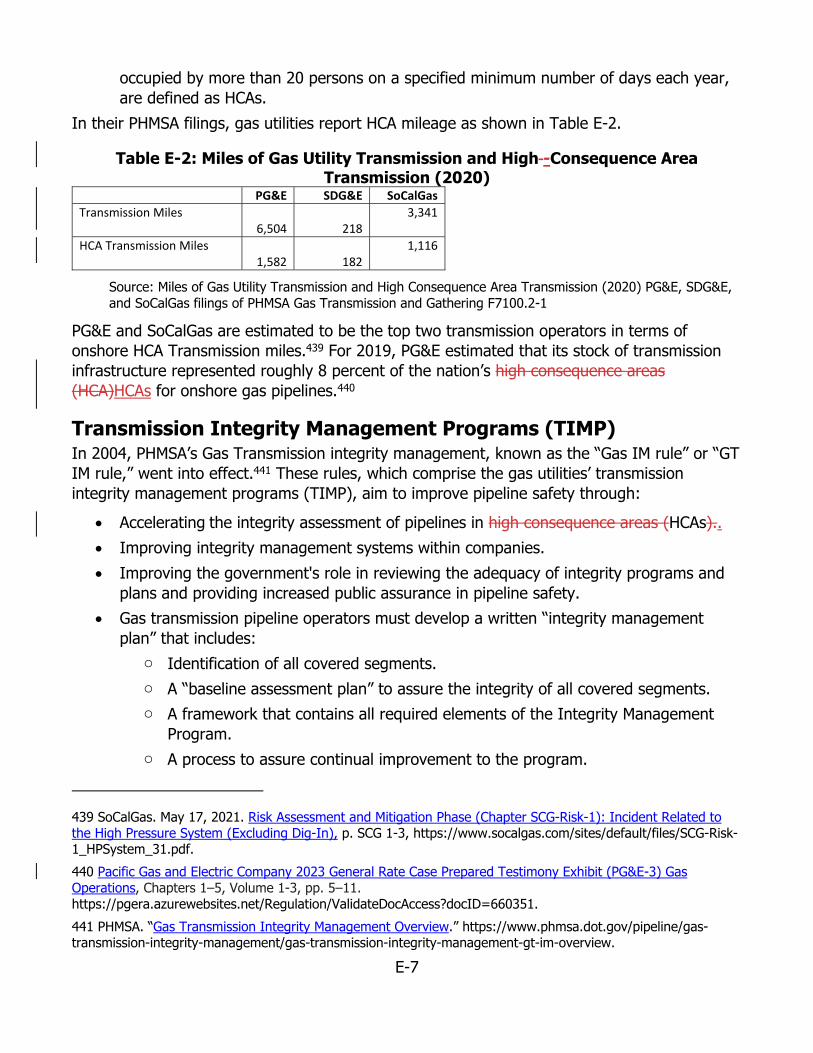
occupied by more than 20 persons on a specified minimum number of days each year, are defined as HCAs.
In their PHMSA filings, gas utilities report HCA mileage as shown in Table E-2.
Table E-2: Miles of Gas Utility Transmission and High -Consequence AreaTransmission (2020)
PG&E SDG&E SoCalGas Transmission Miles
6,504 218 3,341
HCA Transmission Miles 1,582 182
1,116
Source: Miles of Gas Utility Transmission and High Consequence Area Transmission (2020) PG&E, SDG&E, and SoCalGas filings of PHMSA Gas Transmission and Gathering F7100.2-1
PG&E and SoCalGas are estimated to be the top two transmission operators in terms of onshore HCA Transmission miles.439 For 2019, PG&E estimated that its stock of transmission infrastructure represented roughly 8 percent of the nation’s high consequence areas (HCA)HCAs for onshore gas pipelines.440
Transmission Integrity Management Programs (TIMP) In 2004, PHMSA’s Gas Transmission integrity management, known as the “Gas IM rule” or “GT IM rule,” went into effect.441 These rules, which comprise the gas utilities’ transmission integrity management programs (TIMP), aim to improve pipeline safety through:
Accelerating the integrity assessment of pipelines in high consequence areas (HCAs).. Improving integrity management systems within companies. Improving the government's role in reviewing the adequacy of integrity programs and
plans and providing increased public assurance in pipeline safety. Gas transmission pipeline operators must develop a written “integrity management
plan” that includes: o Identification of all covered segments. o A “baseline assessment plan” to assure the integrity of all covered segments. o A framework that contains all required elements of the Integrity Management
Program. o A process to assure continual improvement to the program.
439 SoCalGas. May 17, 2021. Risk Assessment and Mitigation Phase (Chapter SCG-Risk-1): Incident Related to the High Pressure System (Excluding Dig-In), p. SCG 1-3, https://www.socalgas.com/sites/default/files/SCG-Risk-1_HPSystem_31.pdf. 440 Pacific Gas and Electric Company 2023 General Rate Case Prepared Testimony Exhibit (PG&E-3) Gas Operations, Chapters 1–5, Volume 1-3, pp. 5–11. https://pgera.azurewebsites.net/Regulation/ValidateDocAccess?docID=660351. 441 PHMSA. “Gas Transmission Integrity Management Overview.” https://www.phmsa.dot.gov/pipeline/gas-transmission-integrity-management/gas-transmission-integrity-management-gt-im-overview.
E-7

o Provisions to implement industry standards invoked by reference. o A process to document (and notify OPS as required) any changes to its program.
A gas transmission pipeline operator's Integrity Management Program must include all of the following program elements:442
Identification of all HCAs. Baseline assessment plan. Identification of threats to each covered segment, including by the use of data
integration and risk assessment. A direct assessment plan, if applicable. Provisions for remediating conditions found during integrity assessments. A process for continual evaluation and assessment. A confirmatory direct assessment plan, if applicable. A process to identify and implement additional preventive and mitigative measures. A performance plan including the use of specific performance measures Recordkeeping provisions. Management of change process. Quality assurance process. Communication plan. Procedures for providing to regulatory agencies copies of the risk analysis or integrity
management program. Procedures to ensure that integrity assessments are conducted to minimize
environmental and safety risks. A process to identify and assess newly identified high consequence areas.
Gas Transmission System Leaks The gas utilities PHMSA filings also include information on transmission system incidents shown in Table E-3, Table E-4, and Table E-5. For California’s gas utilities the most common cause of these incidents is equipment failure, which, per PHMSA’s instructions includes, “releases from or failures of items other than pipe or welds, and includes releases or failures resulting from: malfunction of control/relief equipment including valves, regulators, or other instrumentation; compressors or compressor-related equipment; various types of connectors, connections, and appurtenances; the body of equipment, vessel plate, or other material (including those caused by: construction-, installation-, or fabrication-related and original
442 PHMSA. “GT IM Fact Sheet.” https://www.phmsa.dot.gov/pipeline/gas-transmission-integrity-management/gt-im-fact-sheet.
E-8

manufacturing-related defects or anomalies; and low temperature embrittlement); and, all other equipment-related releases or failures.”443
Table E-3: 2020 PG&E Transmission Leaks Eliminated/Repaired and Cause ofIncident
HCA Non-HCA External Corrosion 9 2 Construction 1 2 Equipment 65 233 Incorrect Operations 1 0 Vandalism (includes all intentional damage) 1 0 Natural Force Damage 0 1 Other Outside Force Damage (excluding Vandalism and all Intentional Damage) 0 2 Total 77 240
Source: 2020 PG&E Transmission Leaks Eliminated/Repaired and Cause of Incident -— PG&E filing of PHMSA Gas Transmission and Gathering F7100.2-1
Table E-4: 2020 SDG&E Transmission Leaks Eliminated/Repaired and Cause of Incident
HCA Non-HCA Equipment 6 1 Total 6 1
Source: SDG&E Transmission Leaks Eliminated/Repaired and Cause of Incident- — SDG&E filing of PHMSA Gas Transmission and Gathering F7100.2-1
Table E-5: 2020 SoCalGas Transmission Leaks Eliminated/Repaired and Cause of Incident
HCA Non-HCA External Corrosion 0 9 Construction 1 2 Equipment 6 25 Excavation Damage 0 1 Natural Force Damage 1 3 Other Outside Force Damage (excluding Vandalism and all Intentional Damage)
1 0
Total 9 40
Source: 2020 SoCalGas Transmission Leaks Eliminated/Repaired -— and Cause of Incident -— SoCalGas filing of PHMSA Gas Transmission and Gathering F7100.2-1
443 PHMSA. Instructions for Form PHMSA F 7100.2-1. p. 14. https://www.phmsa.dot.gov/sites/phmsa.dot.gov/files/docs/forms/12651/gtggannualinstructionsphmsa-f-71002-1cy-2014-and-beyond.pdf.
E-9

Gas Distribution System Leaks The gas utilities’ PHMSA filings also include information on distribution system incidents, shown in Table E-6, Table E-7, and Table E-8. Broken out in these tables are the total number of hazardous leaks, which PHMSA defines as a “leak that represents an existing or probable hazard to persons or property and requires immediate repair or continuous action until the conditions are no longer hazardous. A “hazardous leak” whichthat occurs abovegroundabove ground or belowgroundbelow ground is a leak and must be reported.”444
A significant proportion of total and hazardous leaks on the gas utilities’ distribution systems is due to corrosion failure, which PHMSA defines as a “leak caused by galvanic, atmospheric, stray current, microbiological, or other corrosive action.”445 Equipment failure is commonly listed as a cause and that’s defined as, a “leak caused by malfunctions of control and relief equipment including regulators, valves, meters, compressors, or other instrumentation or functional equipment,. Failures may be from threaded components, flanges, collars, couplings and broken or cracked components, or from O-Ringring failures, Gasketgasket failures, seal failures, and failures in packing or similar leaks. Leaks caused by over-pressurization resulting from malfunction of control or alarm device; relief valve malfunction: and valves failing to open or close on command; or valves which opened or closed when not commanded to do so.”446 Excavation damage is defined as, a leak resulting directly from excavation damage by operator's personnel (oftentimes referred to as “first party” excavation damage) or by the operator’s contractor (oftentimes referred to as “second party” excavation damage) or by people or contractors not associated with the operator (oftentimes referred to as “third party” excavation damage).”
444 PHMSA. Instructions for Completing Form PHMSA F 7100.1-1. p. 6. https://www.phmsa.dot.gov/sites/phmsa.dot.gov/files/2021-05/GD_Annual_Instructions_PHMSA%20F%207100.1-1_CY%202018%20through%202020.pdf. 445 Ibid. 446 Ibid.,. p. 8.
E-10

Table E-6: 2020 PG&E Distribution System Leaks and Hazardous Leaks Eliminated/Repaired and Cause
Mains Mains Services Services Total Hazardous Total Hazardous
Corrosion Failure 954
377 3,141
2,549
Natural Force Damage 72
44 442
278
Excavation Damage 213
198 1,383
1,363
Other Outside Force Damage 8
8 267
257
Pipe, Weld, Or Joint Failure 92
59 1,503
1,065
Equipment Failure 294
191 4,161
1,027
Incorrect Operations 459
206 2,842
1,893
Other Cause 67
36 8,196
1,266
Source: 2020 PG&E Distribution System Leaks and Hazardous Leaks Eliminated/Repaired and Cause- PG&E filing of PHMSA Gas Distribution F7100.1-1
Table E-7: 2020 SDG&E Distribution System Leaks and Hazardous Leaks Eliminated/Repaired and Cause
Mains Services
Total Hazardous Total Hazardous
Corrosion Failure 124 71 837 305
Natural Force Damage 22 15 50 21
Excavation Damage 63 59 292 286
Other Outside Force Damage ‐ ‐ 38 21
Pipe, Weld, Or Joint Failure 60 30 268 52
Equipment Failure 27 12 1,164 86
Incorrect Operations 9 6 79 10
Other Cause 54 28 37 18
Source: 2020 SDG&E Distribution System Leaks and Hazardous Leaks Eliminated/Repaired and Cause- SDG&E filing of PHMSA Gas Distribution F7100.1-1
E-11
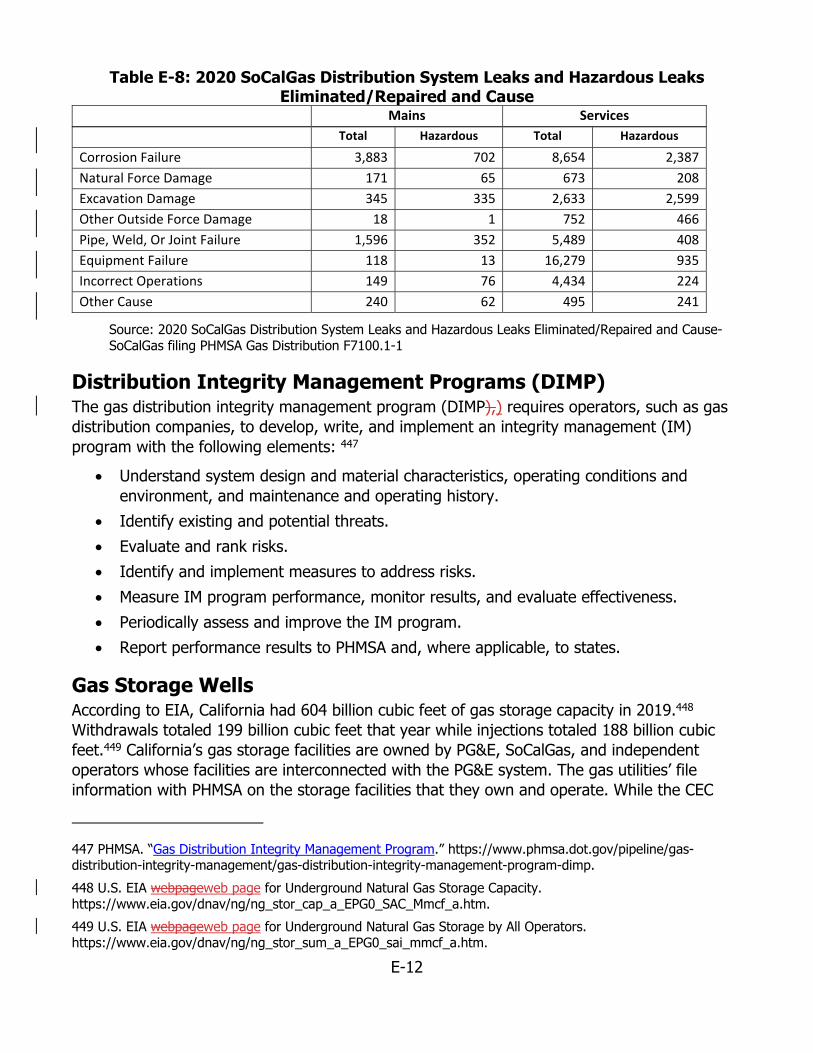
Table E-8: 2020 SoCalGas Distribution System Leaks and Hazardous Leaks Eliminated/Repaired and Cause
Mains Services Total Hazardous Total Hazardous
Corrosion Failure 3,883 702 8,654 2,387
Natural Force Damage 171 65 673 208
Excavation Damage 345 335 2,633 2,599
Other Outside Force Damage 18 1 752 466
Pipe, Weld, Or Joint Failure 1,596 352 5,489 408
Equipment Failure 118 13 16,279 935
Incorrect Operations 149 76 4,434 224
Other Cause 240 62 495 241
Source: 2020 SoCalGas Distribution System Leaks and Hazardous Leaks Eliminated/Repaired and Cause- SoCalGas filing PHMSA Gas Distribution F7100.1-1
Distribution Integrity Management Programs (DIMP) The gas distribution integrity management program (DIMP),) requires operators, such as gas distribution companies, to develop, write, and implement an integrity management (IM) program with the following elements: 447
Understand system design and material characteristics, operating conditions and environment, and maintenance and operating history.
Identify existing and potential threats. Evaluate and rank risks. Identify and implement measures to address risks. Measure IM program performance, monitor results, and evaluate effectiveness. Periodically assess and improve the IM program. Report performance results to PHMSA and, where applicable, to states.
Gas Storage Wells According to EIA, California had 604 billion cubic feet of gas storage capacity in 2019.448
Withdrawals totaled 199 billion cubic feet that year while injections totaled 188 billion cubic feet.449 California’s gas storage facilities are owned by PG&E, SoCalGas, and independent operators whose facilities are interconnected with the PG&E system. The gas utilities’ file information with PHMSA on the storage facilities that they own and operate. While the CEC
447 PHMSA. “Gas Distribution Integrity Management Program.” https://www.phmsa.dot.gov/pipeline/gas-distribution-integrity-management/gas-distribution-integrity-management-program-dimp. 448 U.S. EIA webpageweb page for Underground Natural Gas Storage Capacity. https://www.eia.gov/dnav/ng/ng_stor_cap_a_EPG0_SAC_Mmcf_a.htm. 449 U.S. EIA webpageweb page for Underground Natural Gas Storage by All Operators. https://www.eia.gov/dnav/ng/ng_stor_sum_a_EPG0_sai_mmcf_a.htm.
E-12

received these filings from PG&E and SoCalGas for well information for 2020, shown in Table E-9 and Table E-10, staff did not specifically request and receive the filings for the independently owned fields (Gill Ranch, Wild Goose, Central Valley Gas Storage, and Lodi Gas Storage).450 The filings include information on the number of storage wells in which gas only flows through the tubing or the casing or both.
Table E-9: Information on PG&E-Owned Gas Storage Facilities (2020) Pleasant Creek
Los Medanos
McDonald Island
Injection and/or Withdraw Wells 6 16 77
Monitoring and/or Observation Wells 0 2 8
Wells drilled during calendar year 0 0 0
Wells plugged and abandoned during calendar year 0 1 1
Wells with surface safety valves 6 16 76
Wells with subsurface safety valves 0 16 67
Wells with gas flow only through production tubing 0 2 23
Wells with gas flow only through production casing 0 0 0
Wells plugged and/or isolated.451 8 3 21
Wells with gas flow through both production tubing and production casing
6 14 54
Wells with some "other type" of gas flow: 0 0 0
Wells with new production tubing installed during calendar year
0 2 15
Wells with new production casing, new liner, or repairs to casing or liner during calendar year
0 0 4
Wells with wellhead remediation or repair during calendar year
0 2 15
Wells with casing, wellhead, or tubing leaks during calendar year
0 0 0
Wells with Pressure Test Mechanical Integrity Tests (MIT) the calendar year
0 2 16
Wells Logged for Corrosion/wall loss MIT during calendar year:
0 3 17
Number of Wells with MIT other than "pressure test" and "logged for corrosion/wall loss" during calendar year
0 0 0
450 Staff intends to delve into the independent storage facilities in the next IEPR cycle when additional information will be available through revised data regulations. https://www.energy.ca.gov/rules-and-regulations/energy-suppliers-reporting/clean-energy-and-pollution-reduction-act-sb-350/energy-data-collection-rulemaking. 451 As of the end of 2020, these wells either have a rig on the well or have a rig scheduled, to complete the following: 1. Inspect the well; and 2. Convert the well to tubing flow-only flow OR plug and abandon the well.
E-13
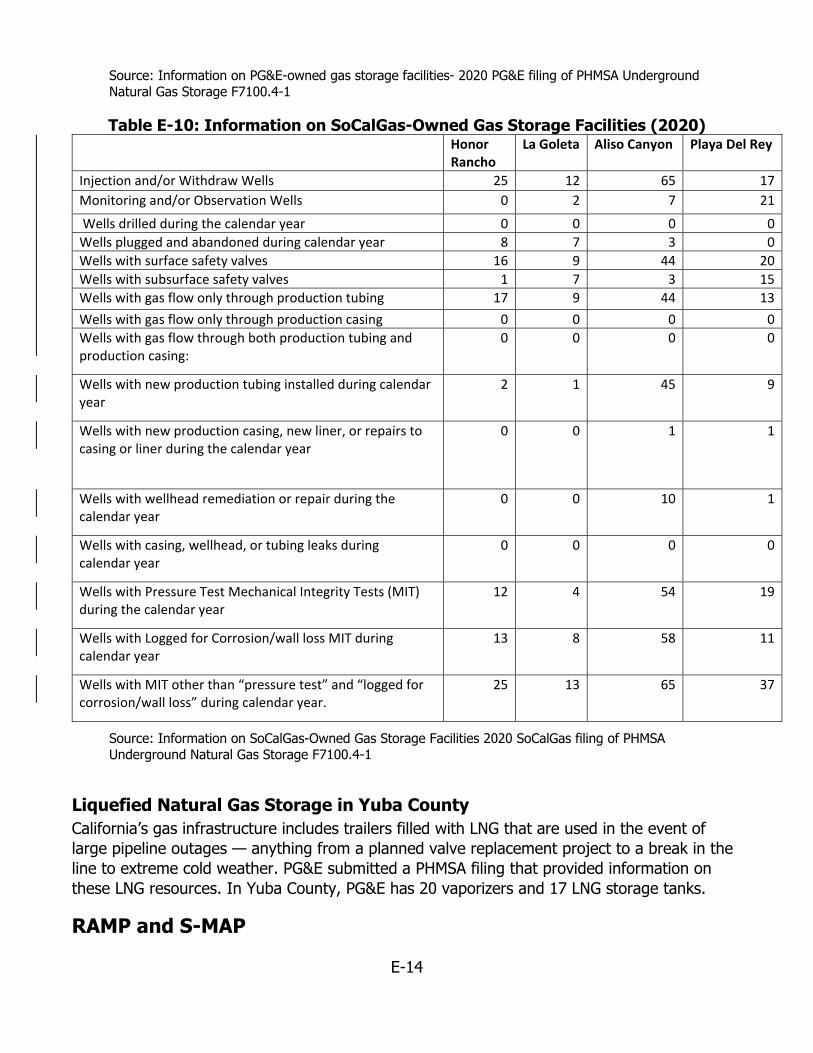
Source: Information on PG&E-owned gas storage facilities- 2020 PG&E filing of PHMSA Underground Natural Gas Storage F7100.4-1
Table E-10: Information on SoCalGas-Owned Gas Storage Facilities (2020)Honor Rancho
La Goleta Aliso Canyon Playa Del Rey
Injection and/or Withdraw Wells 25 12 65 17 Monitoring and/or Observation Wells 0 2 7 21
Wells drilled during the calendar year 0 0 0 0 Wells plugged and abandoned during calendar year 8 7 3 0 Wells with surface safety valves 16 9 44 20 Wells with subsurface safety valves 1 7 3 15 Wells with gas flow only through production tubing 17 9 44 13
Wells with gas flow only through production casing 0 0 0 0 Wells with gas flow through both production tubing and production casing:
0 0 0 0
Wells with new production tubing installed during calendar year
2 1 45 9
Wells with new production casing, new liner, or repairs to casing or liner during the calendar year
0 0 1 1
Wells with wellhead remediation or repair during the calendar year
0 0 10 1
Wells with casing, wellhead, or tubing leaks during calendar year
0 0 0 0
Wells with Pressure Test Mechanical Integrity Tests (MIT) during the calendar year
12 4 54 19
Wells with Logged for Corrosion/wall loss MIT during calendar year
13 8 58 11
Wells with MIT other than “pressure test” and “logged for corrosion/wall loss” during calendar year.
25 13 65 37
Source: Information on SoCalGas-Owned Gas Storage Facilities 2020 SoCalGas filing of PHMSA Underground Natural Gas Storage F7100.4-1
Liquefied Natural Gas Storage in Yuba County California’s gas infrastructure includes trailers filled with LNG that are used in the event of large pipeline outages — anything from a planned valve replacement project to a break in the line to extreme cold weather. PG&E submitted a PHMSA filing that provided information on these LNG resources. In Yuba County, PG&E has 20 vaporizers and 17 LNG storage tanks.
RAMP and S-MAP
E-14

CPUC Decision 14-12-025 incorporates a risk-based decision-making framework into the Rate Case Planrate case plan (RCP) for the energy utilities’ General Rate Casesgeneral rate cases (GRCs). The RCP was initially developed and adopted to guide the energy utilities on the type of information that is to be presented, and the procedural schedule that is to be followed, for addressing their revenue requirement requests in their GRCs.452 This decision incorporated two new procedures, which feed into the GRC applications in which the utilities request funding for such safety-related activities. These two procedures are (1) the filing of a Safety Model Assessment Proceeding (S-MAP) by each of the large energy utilities, which are to be consolidated; and (2) a subsequent Risk Assessment Mitigation Phase (RAMP). The twin purposes of S-MAP are to (1) allow parties to understand the models the utilities propose to use to prioritize programs/projects intended to mitigate risks; and (2) allow the CommissionCPUC to establish standards and requirements for those models.453 In the Risk Assessment and Mitigation Phase (RAMP), the utility presents the top ten asset-related risks for which the utility expects to seek recovery in the GRC. The focus of at least the initial RAMP will be on asset conditions and mitigating risks to those assets.454
As noted in the RAMP Report, damages resulting from excavation activity is the number 10 one RAMP risk and represents the greatest safety threat to SoCalGas’ pipeline infrastructure with potential for catastrophic consequences to public safety.455 PG&E also identifies third -party digs as a significant risk.456
Gas System R&D The CEC conducted research related to gas infrastructure. Gas operators have been known to use manual, paper-based methods for asset mapping and documentation; these methods are time-consuming, error-prone, and delay-creating. Digitization of maps is a challenge as digital systems fail to truly automate data capture and cannot create high-accuracy maps with traceability data or provide near-real-time data access. With CEC funding, the Gas Technology Institute (GTI) developed and demonstrated a high-accuracy-mapping (HAM) technology
452 CPUC. Decision Incorporating a Risk-Based Decision-Making Framework Into the Rate Case Plan and Modifying Appendix A of Decision 07-07-004. p. 2. https://docs.cpuc.ca.gov/PublishedDocs/Published/G000/M143/K549/143549328.PDF. 453 CPUC. Interim Decision Adopting the Multi-Attribute Approach (or Utility Equivalent Features) and Directing Utilities to Take Steps Toward a More Uniform Risk Management Framework. August 29, 2016. p. 5. https://docs.cpuc.ca.gov/PublishedDocs/Published/G000/M165/K862/165862364.PDF. 454 CPUC. Decision Incorporating a Risk-Based Decision-Making Framework Into the Rate Case Plan and Modifying Appendix A of Decision 07-07-004. p. 11. https://docs.cpuc.ca.gov/PublishedDocs/Published/G000/M143/K549/143549328.PDF. 455 SoCalGas. Revised SoCalGas Direct Testimony of Gina Orozco-Mejia (Gas Distribution).” December 2017. p. GOM-18. https://www.socalgas.com/regulatory/documents/a-17-10-008/SCG-04-R_Orozco-Mejia_Prepared_Direct_Testimony-1.pdf. 456 PG&E. Pacific Gas and Electric Company 2020 Risk Assessment and Mitigation Phase Report. June 30, 2020. p. 1–5, https://docs.cpuc.ca.gov/PublishedDocs/SupDoc/A2006012/2881/342386992.pdf.
E-15

solution: a prototype system to create and display high-accuracy maps using advances in mobile, geographic information system, and global positioning system technologies. This system offers gas utilities a viable option to map more than 90 percent of their underground assets within a 6-inch accuracy at about half the cost of systems with similar accuracy. The HAM system has been used by several utilities, including PG&E, who recently used it in the reconstruction of the fire-stricken town of Paradise, and plans to expand usage to distribution gas construction crews.457
The Sacramento-San Joaquin Delta has production, transmission, and distribution infrastructure that is vulnerable to levee subsidence, sea -level rise, and other environmental impacts. In 2020, the CPUC required utilities to conduct climate vulnerability studies every four years, including sea level rise, subsidence, and other impacts identified in California’s Fourth Climate Change Assessment and subsequent assessments. One of the CEC Natural Gas Research Program funded studies in California’s Fourth Climate Change Assessment advanced technology for measuring levee subsidence and applied this technology to improve the accuracy of data on levee subsidence related to gas infrastructure in the Sacramento-San Joaquin Delta. Researchers found areas of Sherman Island, including those with gas infrastructure, may fail to meet federal levee height standards over time. Of the areas surveyed, the most frequent time of concern is projected between 2040 and 2080, depending on actual sea -level rise and 100-year flood stage projections.458
In addition to assessing climate impacts on gas infrastructure, the CEC’s Natural Gas Research Program funded studies aimed at better understanding the climate impacts of gas infrastructure. Building on a decade of collaboration among NASA, CARB, and the CEC have been collaborating for a decade in supporting California’s ambitious climate change goals and studying methane emissions from a variety of sectors, including oil and gas, NASA, with.With funding support from CEC’s Natural Gas R&D Program as well as CARB, NASSA set out to undertake a comprehensive, multi-sector, statewide survey of methane point sources. This survey helped California to better understand the climate impacts from the gas system and informed approaches for continuous monitoring, detection, and mitigation. The field research led to direct identification and mitigation of methane leaks, and a publication in Nature. Results were shared with air quality management districts, utilities, and industry stakeholders to help develop a strategic monitoring program for sources of methane leaks. CARB is also using the findings to inform its oil and gas emission regulation and GHG inventory.
As California considers the future role of its gas infrastructure, examples from other states and countries can provide insight. Con Edison, an electric and gas utility in New York, identified 21 leak prone gas mains and services (with plans to identify more sites) in which main retirement is feasible as part of its program to replace leak-prone (cast iron and unprotected steel) gas mains and services in its distribution infrastructure by 2038. Buildings at the identified sites include single and multifamily residences; mixed use (residential and commercial); and
457 CEC. EPIC 2020 Annual Report. https://www.energy.ca.gov/sites/default/files/2021-05/CEC-500-2020-073.pdf. 458 Ibid.
E-16

religious institutions in New York City and its suburbs. At least some of these mains are those at the edges of the gas distribution system whereby their removal will not negatively impact system reliability and/or safety. In July 2021, Con Edison issued a request for proposal (RFP) for the full electrification of buildings at these sites. Con Edison’s RFP requires that respondents should demonstrate a new or novel approach towards full building electrification. Solutions shall put forth a holistic business model for conversions that, at scale, would result in net benefits to customers, contribute significantly to emissions reductions, and provide a sustainable path forward for wide-scale electrification. The RFP requires that the customer experience must also be addressed through this program, and maintain reasonable customer energy costs, comfort, convenience, and reliability.
Lessons learned from this RFP can apply to all of California’s gas utilities in the sense that initiatives to replace leak-prone pipes (particularly at the ends of distribution systems) can include decommissioning after buildings on that system are electrified. The experiences of the residents, tenants, and users of these buildings can be valuable to see how a fully electrified building responds to the weather needs that accompany all four seasons. The lessons here may be more applicable to PG&E and SDG&E, like Con Edison, which provide both electric and gas service to customers. Many Californians with gas service get their electricity service from a different provider. Coordinating the decommissioning of gas infrastructure with upgrades to a customer’s electricity service will need to be relatively seamless for large-scale building electrification.
In California, public utilities, including gas utilities, are obligated to serve customers in their respective service territories under Public Utilities Code Section 451, which states, “Every public utility shall furnish and maintain such adequate, efficient, just, and reasonable service, instrumentalities, equipment, and facilities, including telephone facilities, as defined in Section 54.1 of the Civil Code, as are necessary to promote the safety, health, comfort, and convenience of its patrons, employees, and the public.” The implication here is that gas utilities are still incorporating existing customers and the addition of new customers as part of their planning. This impacts the work on pipeline replacement and maintenance.
Similar to Con Edison in New York, the CPUC can consider modifying utility gas pipeline replacement and maintenance programs to allow for decommissioning of pipe to enable electrification service. This can include requiring the gas utilities to identify potential sites while providing hydraulic modeling to show that decommissioning of the sites won’t impact system reliability- once the buildings there are electrified. Data from activities including leakage surveys, maintenance records, pipeline mapping, pipeline attribution data collection, and hydraulic models can inform decisions on whether to repair, replace, or decommission existing infrastructure. This includes leveraging existing programs that aim to replace vintage plastic pipe including Aldyl-A or other stock that’s further prone to leaks. Factors to be considered here include gas system reliability and cost to ratepayers.
In its current rate application, PG&E reports that zonal electrification planning is still in the early stages, and PG&E, in its recent GRC filing indicates that zonal electrification will therefore not have an impact in the 2023–2026 rate case period and will not likely be sufficiently developed for implementation until after this rate case.
E-17

APPENDIX F: PLEXOS Gas Generation Assumptions and Results
California Energy Commission (CEC) staff uses Energy Exemplar’s production cost model and optimization simulation tool, PLEXOS. PLEXOS determines the least cost dispatch of generating resources to meet a given power demand with a defined set of assumptions, including available resources. Staff uses PLEXOS to simulate resource dispatch and resulting emissions across the Western Electricity Coordinating Council (WECC) footprint from 2021 to 2030 for three demand or load scenarios. California loads are based on the 2020 California EnergyDemand Update, which consist of a low, a mid, and a high case. Table F-1 summarizes these cases. This appendix describes key PLEXOS inputs, such as resources and renewables portfolio standards, and model results.
Table F-1: Summary of Integrated Energy Policy Report (IEPR) Preliminary Common Cases
Common Case 2020 California Energy Demand
Update
Price EnergyEfficiency
2030 Renewables Portfolio Standard
Target High Energy Consumption High Low Low AAEE 60 percent Mid Energy Consumption Mid Mid Mid AAEE 60 percent Low Energy Consumption Low High High AAEE 60 percent
Note: AAEE stands for “additional achievable energy efficiency.”
Source: CEC staff
WECC-Wide Resource Assumptions Key inputs to PLEXOS include existing electricity system resources, planned plant retirements, and near-future planned resource builds in the Western Interconnection as of January 31, 2021. The model includes state or province policies and energy targets to project a resource portfolio.
Table F-2 shows the estimated Renewables Portfolio Standard (RPS) energy targets in the mid demand case for all states that have a mandatory RPS target in 2022, 2026, and 2030. In California, the RPS energy target is based on the electricity retail sales and the annual RPS percent target. Outside of California, this is estimated from the percent of the balancing authority load for retail sales that qualifies for a state’s RPS.
Table F-2: Estimated Mid Demand Annual RPS Energy Targets (GWh) State 2022 2026 2030
Arizona 7,384 13,574 20,112 F-1

California 89,812 117,393 143,384 Colorado 10,387 10,629 11,194 Montana 1,239 1,264 1,296
New Mexico 3,144 7,247 9,510 Nevada 8,374 9,296 13,826 Oregon 7,013 11,209 14,256 Utah 4,210 5,094 5,239
Washington 11,834 11,901 12,149 Total 143,397 187,607 230,966
Source: CEC staff
Hydroelectric Generation California is in a deep drought. Less water means low hydropower (hydro) availability, a key zero-carbon energy resource. In the spring (April–June) and summer (July–September) of 2021, hydropower in the California Independent System Operator (California ISO) area generated less than in any of the six previous years. When water is scarce, however, hydroelectric generation is held for use during the summer to maintain grid reliability and to offset power plants with the highest greenhouse gas (GHG) emissions. These drought conditions impact the electricity sector in several ways, with the largest impact on reliability and gas generation through decreased hydroelectric supply. While less water means lower overall hydropower generation, it does not always impact reliability as it is used strategically when it can best support electric reliability. However, the more severe the drought, the greater potential for impacts to reliability and increased gas use.
Past hydropower shortages have been made up with fossil gas generation that increases GHG emissions. However, thanks to the rapid deployment of renewable energy, energy efficiency advancements, and energy storage, drought may not increase California’s long-term reliance on gas to the extent it has in the past. Although the 2021 water year was even drier than water year 2015, 15 percent less electricity was generated from fossil gas because renewables carried more of the load.459
The model uses a 15-year average monthly (2005–2019) hydro generation from the Quarterly Fuel and Energy Report Power Plant Owner Reporting Database and the U.S. Energy Information Administration (U.S. EIA).460 This range of years includes drought, as well as average and high levels of hydro generation. To date, drought-specific climate scenarios for hydroelectric generation are not used for IEPR common cases. Research is underway to provide technical details needed to better account for climate change impacts in the characterization of California’s hydro generators in production cost modeling.
459 Water year is defined from October 1 from any given year to September 30 of the following year. 460 Nyberg, Michael. 2021. QFER CEC-1304 Power Plant Owner Reporting Database. California Energy Commission. https://ww2.energy.ca.gov/almanac/electricity_data/web_qfer/index_cms.php. Form EIA-923. U.S. Energy Information Administration. https://www.eia.gov/electricity/data/eia923.
F-2

Thermal Plant Updates Staff updated various characteristics to the thermal power plants in the model. All thermal units in the WECC include recent price changes to the cold start costs and variable operations and maintenance costs based on the publicly available WECC Anchor Data Set.461 The July 2021 burner tip prices provided by the CEC NAMGas team are used in the model for gas plants. These prices have since been updated using the results presented here. Staff uses 2014–2018 hourly data from the U.S. Environmental Protection Agency’s Continuous Emissions Monitoring System to update the California fossil gas power plant heat rates.462
IEPR 2021 Preliminary Results This section presents staff’s preliminary IEPR 2021 PLEXOS simulation results (PLEXOS results). Results include California’s generation resource portfolio, California and WECC annual natural gas demand for power generation, and California annual GHG emissions.
In 2022, PLEXOS results estimate natural gas makes up about one-third of California’s in-state generation resource portfolio, while solar makes up only one-fifth and wind makes up less than one-tenth, as shown in Figure F-1. Over the planning horizon, results show solar and wind generation increase and natural gas generation decrease. By 2030, solar makes up a larger portion of the resource mix than natural gas (solar more than one-third and natural gas about one-fourth), as shown in Figure F-2. Although wind generation increases by more than 35 percent from 2022 to 2030, it only makes up 11 percent of California total in-state generation resources. Solar generation increases by 85 percent from 2022 to 2030 and is the largest resource type in California’s generation portfolio.
Biomass, geothermal, and hydroelectric remain roughly constant as a percentage of the California in-state generation resource portfolio. Diablo Canyon retires by 2025, so it is not a part of California’s generation resource portfolio after that date.
Figure F-1: California Generation Resource Mix (2022)
461 Cold start is the amount of time it takes for a power plant to come on-line after having been taken offline. A fast start plant can come on-line in minutes, while other plants may take up to hours to come on-line. 462 Deaver, Paul. 2019. Updating Thermal Power Plant Efficiency Measures and Operational Characteristics forProduction Cost Modeling. California Energy Commission. Publication Number: CEC-200-2019-001.
F-3

Source: CEC staff
Figure F-2: California Generation Resource Mix (2030)
Source: CEC staff
All three common cases show declining natural gas use in California from 2021 through 2030, with the low, mid, and high cases showing decreases of 50 percent, 19 percent, and 16 percent, respectively, as shown in Figure F-3.
F-4

Figure F-3: California Annual Natural Gas Use for Power Generation
Source: CEC staff
Although PLEXOS is not used to estimate imports into California by resource type, total net imports into California are estimated. In the mid case, imports make up roughly 32 percent of California’s total generation resource mix, and the rest comes from in-state generation. Over the planning horizon (2021–2030), the mid case shows net imports remain relatively flat, with average annual generation of 86,000 GWh while in-state generation increases from 170,000 GWh to 191,000 GWh, or about 0.8 percent per year.
By 2025, both Diablo Canyon nuclear units retire in PLEXOS. This generation, about 9 percent of the mix today, is replaced with a mix of renewables, energy efficiency, and natural gas generation. As a result of the retirements, natural gas use temporarily increases by roughly 4 percent from 2024 to 2025 for the mid and high cases, before it continues to decline through 2030. The low case shows a steeper decline in natural gas use compared to the mid and high cases. As a result, the total gas use in the low case remains flat through the retirement of Diablo Canyon rather than increasing.
PLEXOS results show California monthly natural gas use for electricity generation is cyclical, peaking in August and hitting a minimum in early spring. August natural gas use is generally four times that of March and one and a half times that of December. These patterns generally persist over the planning horizon for all three common cases, as shown in Figure F-4.
F-5

Figure F-4: California Monthly Natural Gas Use for Power Generation
Source: CEC staff
Compared to California, other western states have flatter natural gas use for electricity from 2021 to 2030 (Figure 5). For the rest of WECC, the mid and high cases show natural gas use decreasing by 1 percent and 6 percent, respectively. The low case for rest of WECC shows natural gas use increases by 1 percent from 2021 to 2030, but is roughly flat over the 10 year horizon. This increase can be at least partially attributed to coal plant retirements over the planning horizon. Natural gas plants and coal plants are direct competitors in many situations, thus as coal plants retire natural gas plants are used to replace some of the coal generation.
Like California, the rest of WECC states see a small increase in natural gas use from 2024 to 2025- all three cases show a 1 percent increase. This increase can be partly explained by Diablo Canyon units retiring by 2025, although this increase is smaller than the approximately 4 percent increase in California for all three cases.
In all three cases, gas use decreases from 2026 to 2027, roughly 3 percent to 4 percent in each case. This decrease can be explained by:
Additions of battery capacity to California in 2026–2027, which causes California to import less generation from out of state, decreasing the need for gas generation in the WECC.
Addition of renewable capacity to western states outside California, including 2026-2027. This renewable capacity takes the place of some of the gas resources.
Gas capacity retirements in western states outside California. This drop is strongest in the high case due to the significantly greater increases in generic battery and renewable capacity.
F-6

Figure F-5: Rest of WECC Annual Natural Gas Use for Power Generation
Source: CEC staff
In 2022, gas remains the primary generation supply for the summer and generates more than wind and solar combined in many months of the year (Figure F-6). By 2030, December is the only month that gas generates more MWh of electricity than solar and wind on an average day. By 2030, in the spring months (March–May), solar and wind combined can generate more than four times more electricity than gas (Figure F-6 and Figure F-7).
Figure F-6: California Monthly Generation Results (2022)
Source: CEC staff
0 5,000 10,000 15,000 20,000
Dec Nov Oct Sep Aug Jul
Jun May Apr Mar Feb Jan
Generation (MWh)
2022 California Generation by Type - Mid Case
Gas Nuclear Hydro Geothermal Biomass Solar Wind
F-7

Figure F-7: California Monthly Generation Results (2030)
0 5000 10000 15000 20000
Dec Nov Oct Sep Aug Jul
Jun May Apr Mar Feb Jan
Generation (MWh)
2030 California Generation by Type - Mid Case
Gas Hydro Geothermal Biomass Solar Wind
Source: CEC staff
All three common cases show a steady decline in California GHG emissions, see Figure F-8. The low, mid, and high cases show GHG decreases from 2021 to 2030 of 31 percent, 18 percent, and 15 percent, respectively. For the mid case, California GHG emissions start at 45 MMT (million metric tons or carbon dioxide) CO2 in 2022 and decline to 37 MMT CO2 by 2030. The mid and high cases show no decrease in GHG emissions in 2026–2027, the years just after the Diablo Canyon units retire.
Figure F-8: California Annual GHG Emissions
Source: CEC staff
F-8

California GHG intensities, including imports, show similar decreases from 2021 to 2030 compared to GHG emissions, see Figure F-9. Like GHG emissions, GHG intensities are projected to be flat in the years just after Diablo Canyon retires (2026–2027), which creates a short-term need for gas generation. For imports into California, staff assumes different GHG intensities (MT/MWh) for dedicated imports that can be tracked by ownership or long-term contracts. For imports not associated with ownership shares or long-term contracts, the emission intensity is based on CARB’s 2014 emissions inventory for imports from various regions.
For 2028 to 2030, results show GHG intensities for the high case dip below those for the mid case. In the high case, staff assumed additional battery capacity in the later years of the forecast (2026–2030). Increased use of battery resources will displace some gas generation and reduce the GHG intensity of California’s resource mix, see Figure F-9.
Figure F-9: California Annual Average GHG Intensity
Source: CEC staff
F-9