Policy and Market Factors Shaping National Nuclear Energy Strategies
49
Policy and Market Factors Shaping National Nuclear Energy Strategies FINAL – 4 May 2014 EBI: ADPaterson, WSHowes 1 Environmental Business International www.ebiusa.com Policy and Market Factors Shaping National Nuclear Strategies: Part II of “Redefining Leadership in Global Nuclear Energy Markets” AUTHORS Andrew D. Paterson Principal – Environmental Business International [email protected] 571-308-5845 Washington, DC Walter S. Howes Managing Partner – Verdigris Capital, LLC Board member - Environmental Business International [email protected] 202-342-5323 April 2014 Supply-side Enabling Factors for National Nuclear Energy Strategies Demand-side Drivers for National Nuclear Energy Strategies Author’s note: This project was sponsored by the Korea Atomic Energy Research Institute (KAERI). We would like to thank KAERI project coordinator Dr. Lee Byung-Wook for his guidance in developing themes for this manuscript. Florence Lowe-Lee, at the Global America Business Institute, also provided very helpful insights on key issues. Any errors or omissions are the responsibility of the authors.
Transcript of Policy and Market Factors Shaping National Nuclear Energy Strategies

Policy and Market Factors Shaping National Nuclear Energy Strategies FINAL – 4 May 2014
EBI: ADPaterson, WSHowes 1
Environmental Business International www.ebiusa.com
Policy and Market Factors Shaping National Nuclear Strategies:
Part II of “Redefining Leadership in Global Nuclear Energy Markets”
AUTHORS
Andrew D. Paterson Principal – Environmental Business International
[email protected] 571-308-5845 Washington, DC
Walter S. Howes
Managing Partner – Verdigris Capital, LLC Board member - Environmental Business International
[email protected] 202-342-5323
April 2014
Supply-side Enabling Factors for National Nuclear Energy Strategies
Demand-side Drivers for National Nuclear Energy Strategies
Author’s note: This project was sponsored by the Korea Atomic Energy Research Institute (KAERI). We would like to thank KAERI project coordinator Dr. Lee Byung-Wook for his guidance in developing themes for this manuscript. Florence Lowe-Lee, at the Global America Business Institute, also provided very helpful insights on key issues. Any errors or omissions are the responsibility of the authors.
Policy and Market Factors Shaping National Nuclear Energy Strategies FINAL – 4 May 2014
EBI: ADPaterson, WSHowes 2
OUTLINE PREFACE – Dr. Gail Marcus, former President - American Nuclear Society (2001-02)
I. EXECUTIVE SUMMARY - Part II: National Nuclear Energy Strategies
Key Supply and Demand Factors for Nuclear Energy going forward
II. Part II: Key Drivers and National Strategies in the Global Nuclear Energy Market
A. Drivers for National Strategy in Nuclear Energy Markets (follow-on from Part I)
1) Supply factors: historical; Cold War era; first wave of reactor construction by P5 nations
2) Demand factors: emerging; 21st Century; future reactor construction for urban demand
3) Economic factors and justification (some factors vary by country)
4) Finance and Policy issues – based on interaction of Supply and Demand factors
B. A Framework for Defining National Strategies: Supply-intensive vs. Demand-driven
1) Specific National Strategies
– “Renaissance” Strategy (“Heavy” and “Light”): Renewal, construction, export-oriented
– “Rollback” Strategy: Phase-out, shutdown, moratoriums
– “Restructuring” Strategy: Open to new construction, but needing policy intervention
2) Observations, and importance of International Partnerships
C. Recommendations; Importance of International Partnerships with Demand in Urban Asia
D. Conclusions
E. Appendix: Individual Country Profiles & National Strategy points
III. SUMMARY – Part I: Redefining Leadership in the Global Nuclear Energy Market REFERENCES Future Report: Part III – Strategies in Industry based on National Strategies with impact on Financing Options
Policy and Market Factors Shaping National Nuclear Energy Strategies FINAL – 4 May 2014
EBI: ADPaterson, WSHowes 3
PREFACE BY DR. GAIL H. MARCUS Dr. Gail H. Marcus, former Deputy Director-General of the OECD Nuclear Energy Agency (Paris), former president of the American Nuclear Society (2001-02), and author of Nuclear Firsts (2010); Sc.D. in Nuclear Engineering, MIT. In the early days of nuclear power, scientists and engineers explored a number of alternative nuclear technologies. The focus in the United States rapidly evolved almost exclusively to light water reactor technology, and led to a large new-build program. The number of reactors built in the US in the 1960s and 1970s far outstripped the number in any other country, and indeed, the total number of reactors built in the US comprised one-quarter of the world's total. Domestic demand in the US and industrial countries rebuilding from World War II fueled construction. There were a handful of other countries that also had significant domestic markets--Canada, the United Kingdom, France, the Soviet Union, and a little later, Japan. France and Japan started their nuclear programs with US technology, but moved to develop their own versions of the US designs. Canada, Britain, and the Soviet Union relied on different reactor technologies. Most of these countries conducted a secondary business selling reactors to other countries. In most cases, the buyers were countries with strong economies and burgeoning demand for electricity. Today, the situation is much different. There are only a few new reactor projects in the countries that traditionally had the strongest “supply-side” nuclear programs, education and infrastructure. Most of their vendors, however, are still active and are seeking projects outside their national borders. At the same time, several vendors from other countries have entered the marketplace. In particular, South Korea and China have emerged as supplier countries. China has a large domestic program, but both China and South Korea have begun to compete against the established vendors from Europe and the USA. Other differences between the past and the present are also important. For example, the market for new reactors, outside China and India, is increasingly in countries with smaller, mainly high-population-growth developing economies, compared to the developed OECD countries, where population growth has crested. For these countries, the multi-billion dollar investment required for a large nuclear reactor is difficult to support. Thus, those countries are increasingly seeking packages that include economic support for the projects, and indeed, that even include management of the facilities once they are operational. Russia offered a "build-own-operate" plan for Turkey, and Korea provided a package of financial incentives to the United Arab Emirates (UAE). Although many people express concern that the 123 nuclear cooperation agreements have hampered some opportunities abroad for US companies, the primary impediment has probably been the ability to finance projects. US vendors do have the Export-Import Bank to help with financing large projects abroad, but they do not have the resources to provide financing packages similar to those offered by Russian, Korean or French companies, which are backed by their governments. And US investor-owned utilities do not participate in these overseas bids the way EDF/Areva, KEPCO, or Rosatom do. Sovereign financing issues are therefore a major theme in this paper. The current market and policy landscape calls for new models for financing and supporting reactor projects in an increasingly diverse marketplace; in essence, “new modes of leadership” are evolving in nuclear energy. This paper (Part I and II, on “Redefining Leadership”) documents some of the key elements that are shaping National Nuclear Strategies, the importance of international alliances, and some of the critical factors that affect how companies might partner to offer services new entrant countries are seeking. In this regard, it may be helpful that many of the vendors are now multi-national companies, having bought each other up or merged over the last couple of decades. For example, both Westinghouse and GE have alliances with Japanese companies. Recent negotiations for UK nuclear projects involving both French and Chinese joint ventures, as well as a US-Japan joint venture, also demonstrate this trend. Thus, if we speak of the competitiveness of "US industry," we need to recognize that with more than 80% of the reactors today being built overseas, and primarily by national enterprises, not investor-owned utilities -- international joint ventures will be essential. As a result, leadership in nuclear energy has been redefined, and new ways of responding in an evolving landscape are needed.
Dr. Gail H. Marcus
Policy and Market Factors Shaping National Nuclear Energy Strategies FINAL – 4 May 2014
EBI: ADPaterson, WSHowes 4
EXECUTIVE SUMMARY – Part II: National Nuclear Energy Strategies
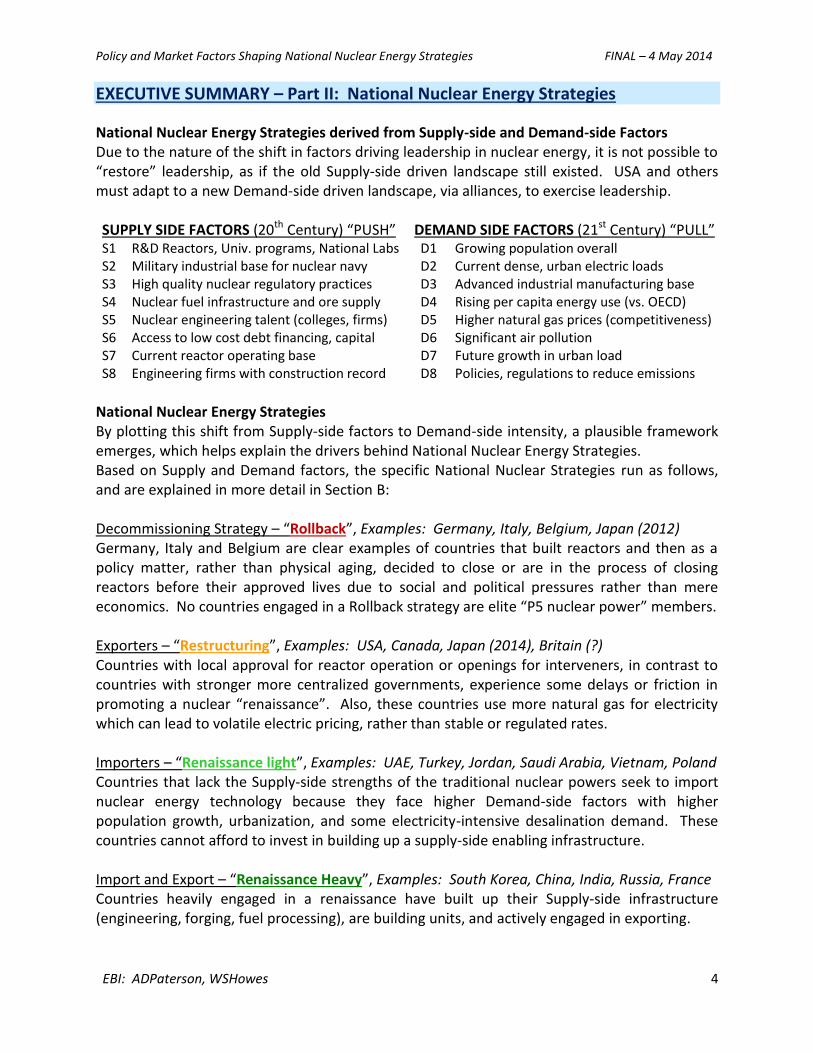
National Nuclear Energy Strategies derived from Supply-side and Demand-side Factors Due to the nature of the shift in factors driving leadership in nuclear energy, it is not possible to “restore” leadership, as if the old Supply-side driven landscape still existed. USA and others must adapt to a new Demand-side driven landscape, via alliances, to exercise leadership. SUPPLY SIDE FACTORS (20th Century) “PUSH” DEMAND SIDE FACTORS (21st Century) “PULL” S1 R&D Reactors, Univ. programs, National Labs S2 Military industrial base for nuclear navy S3 High quality nuclear regulatory practices S4 Nuclear fuel infrastructure and ore supply S5 Nuclear engineering talent (colleges, firms) S6 Access to low cost debt financing, capital S7 Current reactor operating base S8 Engineering firms with construction record
D1 Growing population overall D2 Current dense, urban electric loads D3 Advanced industrial manufacturing base D4 Rising per capita energy use (vs. OECD) D5 Higher natural gas prices (competitiveness) D6 Significant air pollution D7 Future growth in urban load D8 Policies, regulations to reduce emissions
National Nuclear Energy Strategies By plotting this shift from Supply-side factors to Demand-side intensity, a plausible framework emerges, which helps explain the drivers behind National Nuclear Energy Strategies. Based on Supply and Demand factors, the specific National Nuclear Strategies run as follows, and are explained in more detail in Section B: Decommissioning Strategy – “Rollback”, Examples: Germany, Italy, Belgium, Japan (2012) Germany, Italy and Belgium are clear examples of countries that built reactors and then as a policy matter, rather than physical aging, decided to close or are in the process of closing reactors before their approved lives due to social and political pressures rather than mere economics. No countries engaged in a Rollback strategy are elite “P5 nuclear power” members. Exporters – “Restructuring”, Examples: USA, Canada, Japan (2014), Britain (?) Countries with local approval for reactor operation or openings for interveners, in contrast to countries with stronger more centralized governments, experience some delays or friction in promoting a nuclear “renaissance”. Also, these countries use more natural gas for electricity which can lead to volatile electric pricing, rather than stable or regulated rates. Importers – “Renaissance light”, Examples: UAE, Turkey, Jordan, Saudi Arabia, Vietnam, Poland Countries that lack the Supply-side strengths of the traditional nuclear powers seek to import nuclear energy technology because they face higher Demand-side factors with higher population growth, urbanization, and some electricity-intensive desalination demand. These countries cannot afford to invest in building up a supply-side enabling infrastructure. Import and Export – “Renaissance Heavy”, Examples: South Korea, China, India, Russia, France Countries heavily engaged in a renaissance have built up their Supply-side infrastructure (engineering, forging, fuel processing), are building units, and actively engaged in exporting.

Policy and Market Factors Shaping National Nuclear Energy Strategies FINAL – 4 May 2014
EBI: ADPaterson, WSHowes 5
SUMMARY: Key Supply and Demand Factors for Nuclear Energy going forward http://www.atlanticcouncil.org/publications/reports/redefining-leadership-in-the-global-nuclear-energy-market
Success Factors for Nuclear Energy: Supply-side and Demand-side Intensity Drivers As previously mentioned a key question going forward will be how to define the best strategic partnership opportunities. In the past, as seen in the Figure below, the United States and Europe had the most favorable supply-side strengths. Summary of Supply and Demand Factors and National Nuclear Strategies Updated from Part I: Redefining Leadership in Global Nuclear Energy Markets” by Andrew Paterson, Walter Howes
During the expansion era of nuclear power construction in the 1960s to 1980s, the United States led the world in many of the key “Supply Side” success factors. The relative strength of each country or mini-region was assessed on a relative basis (on a scale from 1 as a low value to 5 as a high value), and then the combined ratings were indexed to the highest entity in the evaluation. The chart shows how much the demand-side factors have emerged as key drivers in the 21st Century for new reactor construction going forward, compared to the supply-side factors that drove construction among OECD countries in the last Century during the Cold War. On the supply-side, the United States wields superior ratings in (S2) a military industrial base for a nuclear navy; (S3) regulatory practices; (S5) nuclear engineering talent; (S6) access to low cost financing; and (S7) the current reactor base. By contrast, China lacks the operating base of leaders France and the United States; however, China, India, and growing Asia see higher demand side factors associated with rapid population growth and urbanization (D1, D2, D4, D7), as well as higher natural gas prices, which makes nuclear energy more competitive. Each of the Supply and Demand factors are described in more detail in Appendix E.

Policy and Market Factors Shaping National Nuclear Energy Strategies FINAL – 4 May 2014
EBI: ADPaterson, WSHowes 6
Part II: Key Drivers and National Strategies in the Global Nuclear Energy Market
A. Drivers for National Strategy in Nuclear Energy Markets (based on Part I)
1. Supply factors: historical; Cold War era; first wave of reactor construction by P5 nations 2. Demand factors: emerging; 21st Century; future reactor construction for urban demand 3. Economic factors and justification (factors vary by country, e.g., gas prices) 4. Finance and Policy issues – based on interaction of Supply and Demand factors 5. Summary of Individual Country Profiles (in Appendix E)
Shift from Supply-side enablers to Demand-side factors drives National Strategies The vast majority of the 435 reactors (370 GW) operating today were built from 1965 to 1985. Factors that accounted for the first wave of reactor construction were concentrated on the “Supply side” of the market arena, built around supporting the US Nuclear Navy, a nuclear weapons complex of DOE laboratories amid the Cold War between a Soviet Union and the NATO alliance, and focused on operational excellence for civilian reactors. Drivers: Supply-side and Demand-side Because of the nature of the shift in factors driving leadership in nuclear energy, it is not possible to “restore” leadership, as if the old “Supply-side push” landscape still existed. Instead, the US must adapt to the new “Demand-side pull” landscape, to exercise leadership in standards and practices via alliances – or even to stay in the game on this pivotal technology.
SUPPLY SIDE FACTORS (20th Century) “PUSH” DEMAND SIDE FACTORS (21st Century) “PULL” S1 R&D Reactors, Univ. programs, National Labs S2 Military industrial base for nuclear navy S3 High quality nuclear regulatory practices S4 Nuclear fuel infrastructure and ore supply S5 Nuclear engineering talent (colleges, firms) S6 Access to low cost debt financing, capital S7 Current reactor operating base S8 Engineering firms with construction record
D1 Growing population overall D2 Current dense, urban electric loads D3 Advanced industrial manufacturing base D4 Rising per capita energy use (vs. OECD) D5 Higher natural gas prices (competitiveness) D6 Significant air pollution D7 Future growth in urban load D8 Policies, regulations to reduce emissions
[Drivers developed for Part I and Part II by the authors; See Appendix E for more detail]
Supply-side factors are driven, in some cases strongly [+++] by governmental policy decisions, or “push”, such as a national commitment to a nuclear Navy, national laboratory funding, and the federal regulatory practices embodied by the Nuclear Regulatory Commission (NRC). In the US, reactors were licensed by the federal government but financed, built and operated by regional utilities and their private sector contractors and reactor vendors, which are driven by market factors, including investment return, reliable supply, and private sector training and management. In most countries, a national entity (e.g., EdF, CNNC, NPCIL, Rosatom) owns, finances, builds, and operates its reactors often with sanction from the sovereign government. Importantly, sovereign entities are now leading bids for new reactors in foreign countries.

Policy and Market Factors Shaping National Nuclear Energy Strategies FINAL – 4 May 2014
EBI: ADPaterson, WSHowes 7
A1. Supply-side enabling factors Supply-side factors are driven more by government policy providing high priority and top-down direction to move ahead on nuclear infrastructure under high quality regulation.
PRIMARY DRIVER: Supply Side Enabling Factors Policy Market S1 R&D Reactors, Univ. programs, Nat'l Labs; Technology innovation +++ S2 Military industrial base for nuclear navy +++ S3 High quality nuclear regulatory practices +++ S4 Nuclear fuel infrastructure and ore supply; spent fuel +++ ++ S5 Nuclear engineering talent (university programs, firms) ++ ++ S6 Access to low cost debt financing, capital (public or private) ++ ++ S7 Current reactor operating base + +++ S8 Engineering firms with recent construction experience +++ [Policy versus Market drivers are weighed as Strong (+++), Medium (++), and Weak (+).]
See appendix E for a more detailed description of each Supply and Demand factor, page 21-23.
A reactor fleet and its technical and fueling infrastructure are driven primarily by national policies and even ownership. Many cancellations occurred after 1975, not because of the Three Mile Island accident (March 1979), but because skyrocketing inflation with sharply higher interest rates and stagnant demand killed many capital intensive projects, not just reactors. Construction delays after the TMI accident and lower demand amid a protracted recession (1980-82) curbed new orders, but the US fleet became the largest in the world (104 reactors). A2: Demand-side factors: Dense urban loads drive demand for new reactors in 21st Century An important shift has taken place since 2000, as massive urbanization, especially in Asia, and other demand side or community level end-use factors, such as dense urban loads have emerged as the primary drivers for new nuclear reactor construction going forward. And, Asia sees much higher market prices for natural gas (>$14/Mbtu vs. $4-$5/Mbtu) than do industrial consumers and households in North America. While policy factors, such as permitting of gas supply and distribution to end-users, bear on these demand side factors, market growth in cities is mainly driving the need for large scale, reliable generation that nuclear energy provides: PRIMARY DRIVER: Demand Side “Market pull” Factors Policy Market D1 Growing population overall (native demographics, immigration) + +++ D2 Current dense, urban electric loads (baseload in large cities) + +++ D3 Advanced industrial and manufacturing base (energy intensity) + +++ D4 Rising per capita energy use (vs. flat demand in OECD) + +++ D5 Higher natural gas prices (nuclear is more competitive) ++ +++ D6 Significant air pollution (need for clean energy options) ++ +++ D7 Future growth in urban load (e.g., high rise buildings, mass transit) +++ +++ D8 Policies and regulations favoring reduced emissions +++ + [Policy versus Market drivers are weighed as Strong (+++), Medium (++), and Weak (+).]
Policy and Market Factors Shaping National Nuclear Energy Strategies FINAL – 4 May 2014
EBI: ADPaterson, WSHowes 8
Demand side factors are driven more by the benefits of nuclear power: reliability and “24 hour / 7-day per week” operation independent of weather, no local hazardous air pollutants, a smaller footprint (in the face of land use constraints), and economic development with broader electrification. Satisfying urban demand requires continual attention to public engagement. In addition, Demand-side factors are by their nature, more driven by market phenomenon – population growth, urban uses of energy, market pricing of other energy sources, and land use. The cost of being without electricity in major cities is greater than the cost of electricity. A city dwelling public supports the benefits of nuclear power, not just an abstract fuel source.
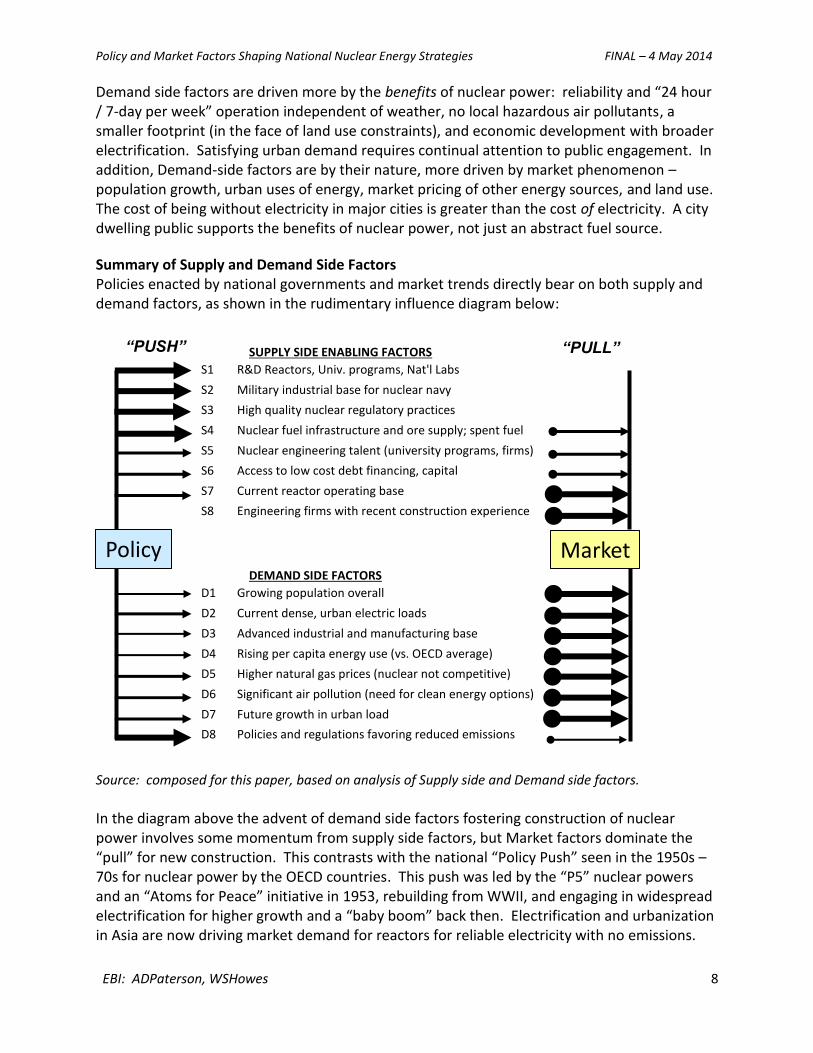
Summary of Supply and Demand Side Factors Policies enacted by national governments and market trends directly bear on both supply and demand factors, as shown in the rudimentary influence diagram below:
Source: composed for this paper, based on analysis of Supply side and Demand side factors.
In the diagram above the advent of demand side factors fostering construction of nuclear power involves some momentum from supply side factors, but Market factors dominate the “pull” for new construction. This contrasts with the national “Policy Push” seen in the 1950s – 70s for nuclear power by the OECD countries. This push was led by the “P5” nuclear powers and an “Atoms for Peace” initiative in 1953, rebuilding from WWII, and engaging in widespread electrification for higher growth and a “baby boom” back then. Electrification and urbanization in Asia are now driving market demand for reactors for reliable electricity with no emissions.
SUPPLY SIDE ENABLING FACTORS
S1 R&D Reactors, Univ. programs, Nat'l Labs
S2 Military industrial base for nuclear navy
S3 High quality nuclear regulatory practices
S4 Nuclear fuel infrastructure and ore supply; spent fuel
S5 Nuclear engineering talent (university programs, firms)
S6 Access to low cost debt financing, capital
S7 Current reactor operating base
S8 Engineering firms with recent construction experience
DEMAND SIDE FACTORS
D1 Growing population overall
D2 Current dense, urban electric loads
D3 Advanced industrial and manufacturing base
D4 Rising per capita energy use (vs. OECD average)
D5 Higher natural gas prices (nuclear not competitive)
D6 Significant air pollution (need for clean energy options)
D7 Future growth in urban load
D8 Policies and regulations favoring reduced emissions
Policy Market
“PUSH” “PULL”

Policy and Market Factors Shaping National Nuclear Energy Strategies FINAL – 4 May 2014
EBI: ADPaterson, WSHowes 9
A3. Economic factors and justification (some factors vary by country) In January 2013, EIA updated its estimated levelized costs for electricity capacity entering
service in the USA after 2018. These estimates importantly include the “game changing”
development of much cheaper gas prices in North America.
(Figures above do not include tax policy incentives, which vary by fuel source, and which expire or expired at
different times.) http://www.eia.gov/forecasts/aeo/er/pdf/electricity_generation.pdf
As shown above, electricity costs for nuclear power would be competitive in regions and countries that lack access to already built hydropower or cheap natural gas, or to old coal units without controls or CCS. In addition, the high reliability capacity factor of >90% is essential for large urban loads, versus the much lower capacity factors (<35%) seen with wind and solar. And wind and solar cost numbers do not include costs of storage or transmission for large scale wind farms, which could add 20%-50% more. Nuclear power remains competitive in Asia.

Policy and Market Factors Shaping National Nuclear Energy Strategies FINAL – 4 May 2014
EBI: ADPaterson, WSHowes 10
A4. Finance and Policy issues; Ownership Finance and policy issues must be framed with an understanding of ownership and sovereignty in the nuclear sector. In most countries, nuclear reactors are a sovereign operation. USA and Japan are exceptions with commercial utility ownership. In Germany, E.ON and RWE are also investor-owned utilities, but Germany made a national decision to shut down its nuclear plants by 2022. Canada, Sweden, and South Korea utilize hybrid or blended ownership structures. Major Nuclear Entities The table below summarizes major nuclear utilities in the world, now over $2 trillion in assets. Of note is the heavy involvement of state-owned enterprises. Nuclear energy is a political economy, not decided solely based on economics and the cost of electricity. Reactor licensing is government regulated, and construction and operations are not just “left to the market.” Major Nuclear Operators by Country
Source: Compiled from various sources, company web sites, IAEA.
Recently, the emerging trend is that entities joining the “nuclear renaissance” (renewed construction of reactors since the 1980s-90s) bring a balance sheet in excess of $50 billion. Less than that requires some form of credit support (e.g., federal loan) or reduction of long-term market risk, such as regulated or steady rates with high quality off-takers. Mega-cities make high quality off-takers – they need large amounts of electricity, and for the life of a reactor.
2012 2012
Country Company Govt Ownership Revenues Assets Reactors MWs
P5 France [UK] EDF / British Energy 100% $76,500 $330,000 58 62,400
P5 China China Gen'l Nuclear 100% Government $43,700 12 9,800
P5 China China Gen'l Nuclear 100% Construction Construction 19 19,700
P5 China China Nat'l Nuclear 100% $104,000 $306,000 8 8,330
P5 China China Nat'l Nuclear 100% Construction Construction 14 16,630
P5 Russia Rosatom 100% $12,028 $60,176 31 25,200
S.Korea KEPCO (with KHNP) 51% $46,042 $133,170 23 20,700
P5 USA Exelon 0% $25,000 $78,550 24 18,720
Japan TEPCO (post 2012) . 76% $67,750 $150,000 17 17,300
Japan Kansai Elec 10% . $35,000 $87,000 11 9,770
P5 USA Entergy 0% $10,750 $43,200 11 9,000
P5 USA DUKE 0% $23,600 $113,850 11 8,960
India NPCIL 100% $96,240 $120,000 17 7,300
Spain (Italy) Endesa (ENEL) . 90% $44,070 $78,000 8 7,000
Sweden Vattenfall 100% $26,720 $84,240 7 6,880
P5 USA TVA 100% $11,220 $46,480 6 6,710
Germany E.ON 0% $131,750 $152,600 7 6,700
Canada Ontario Power 100% $6,350 $37,600 10 6,600
Germany RWE 0% $52,200 $75,600 5 6,300
Canada Bruce Power 0% $8,800 $48,500 8 6,300
P5 USA Southern Co 0% $17,000 $63,150 6 5,870
P5 USA Dominion 0% $13,200 $46,800 6 5,350
$808,220 $2,098,616 319 291,520
$million $million
World 468 408,530
of world 68% 71%

Policy and Market Factors Shaping National Nuclear Energy Strategies FINAL – 4 May 2014
EBI: ADPaterson, WSHowes 11
Public vs. Private: Divergence in Ownership for Nuclear Reactor Capacity
In countries other than Japan and the United States, nuclear reactors are more typically owned
wholly or in a majority position by the national government. This mirrors ownership of oil and
gas energy resources worldwide by national energy companies. Only the federally chartered
Tennessee Valley Authority (TVA; with 6,600 MWe of nuclear capacity) resembles ownership
structures seen in many countries where most construction is underway. This chart depicts the
ownership structure for nuclear utilities in different countries versus the capacity operated
currently (GWe). [The size of bubble then shows construction of new reactors in GWs.]
Ownership of Nuclear Entities with Operating Capacity and New Construction
[Updated from Part I: Redefining Leadership in Global Nuclear Energy Markets]
Source: compiled with data from World Nuclear Association, Nuclear Engineering International-UK, EIA [US entities: TVA = Tennessee Valley Authority; DUKE = Duke Energy; DOM = Dominion Power; ETR = Entergy;
EXC = Exelon; SO = Southern Company. EdF = Électricité de France; also owns UK reactor fleet.]
Because of sovereign government dominance in the nuclear arena, there are no privately held “mega-utilities” (lower right quadrant), like an investor-owned version of Électricité de France (EdF; upper right quadrant) or China National Nuclear (CNNC). Bond markets prefer sovereign enterprises with those entities earning higher credit ratings than US utilities, for example. And, some of those entities participate in bids outside their native countries, e.g., EdF’s acquisition of

Policy and Market Factors Shaping National Nuclear Energy Strategies FINAL – 4 May 2014
EBI: ADPaterson, WSHowes 12
British Energy a few years ago, or KEPCO in UAE, or Rosatom in Turkey. New reactors in Britain will be built by foreign groups, principally by Areva (France), with equity now from China. Combined, the “P5” and “Next 5” countries govern 80% of global commercial nuclear reactor capacity (table below). As is characteristic of P5 status, those five countries – the nuclear arsenal powers and victors from WWII now with nearly 2 billion people – account for a majority (57%) of global reactor capacity; the “Next 5” account for about one-quarter of world capacity (23%). Fully half the world’s population lives in just those ten countries, so nuclear power is globally very significant, supplying nearly 14% of electricity worldwide. Those ten countries also produce almost 60% of world GDP (PPP 2011, World Bank data). Notably, with over 50 GWe of the 70 GWe under construction, Asia now accounts for 70% of new reactor build. Summary of Current Commercial Reactors and New Construction: “P5” and “Next 5”
Sources: World Nuclear Association (WNA), DOE Presented at World Nuclear Symposium 2012, London in “The Advent of “Market States: National sovereignty and nuclear strategy after Fukushima -- Renaissance, Rollback, or Restructuring?” by ADPaterson
Only a P5 seat wields political veto power in the UNSC, a concrete form of strategic leverage in a post-Cold War globalized set of power relations, thereby bolstering sovereign impact relative to other nations in an increasingly globalized economy. According to UNCTAD and WTO, the value of global trade in 2011 was four times greater than in 1990, twice that of 2000.

Policy and Market Factors Shaping National Nuclear Energy Strategies FINAL – 4 May 2014
EBI: ADPaterson, WSHowes 13
Global Nuclear Entities: A Domination of Sovereigns in Nuclear Energy The chart below was compiled for this paper, depicting in compressed form the universe of operating entities for the vast majority of currently operating reactors and those under construction. Note the dominance of the “P5” nuclear powers. However, with half of the 70 GWe of construction underway in China, leadership within the P5 countries is shifting to Asia and more to China specifically. In addition, China has ordered at least two of nearly every reactor type available and so within 5-10 years they will have built a sampling of the world market within their own borders. Other countries have standardized around one or two models, instead, for operating and maintenance efficiencies. Global Nuclear Operating Entities
[Chart compiled for this paper based on various sources: WNA, NEI, IAEA] Currently, the US prohibits foreign ownership of nuclear reactors for national security reasons, and this was a policy-related factor in the failure of the UniStar joint venture between Constellation and EdF for a third reactor at the Calvert Cliffs site, a French design EPR. However, uncertainties in market pricing of electricity rather than regulated rate-making was also a major factor foiling the financing of the project. In March 2013, the NRC upheld its denial of licensing the $8 billion+ project due to French (foreign) ownership by EdF.1
1 ENS: http://ens-newswire.com/2013/03/13/calvert-cliffs-reactor-license-denied-over-foreign-ownership/
Policy and Market Factors Shaping National Nuclear Energy Strategies FINAL – 4 May 2014
EBI: ADPaterson, WSHowes 14
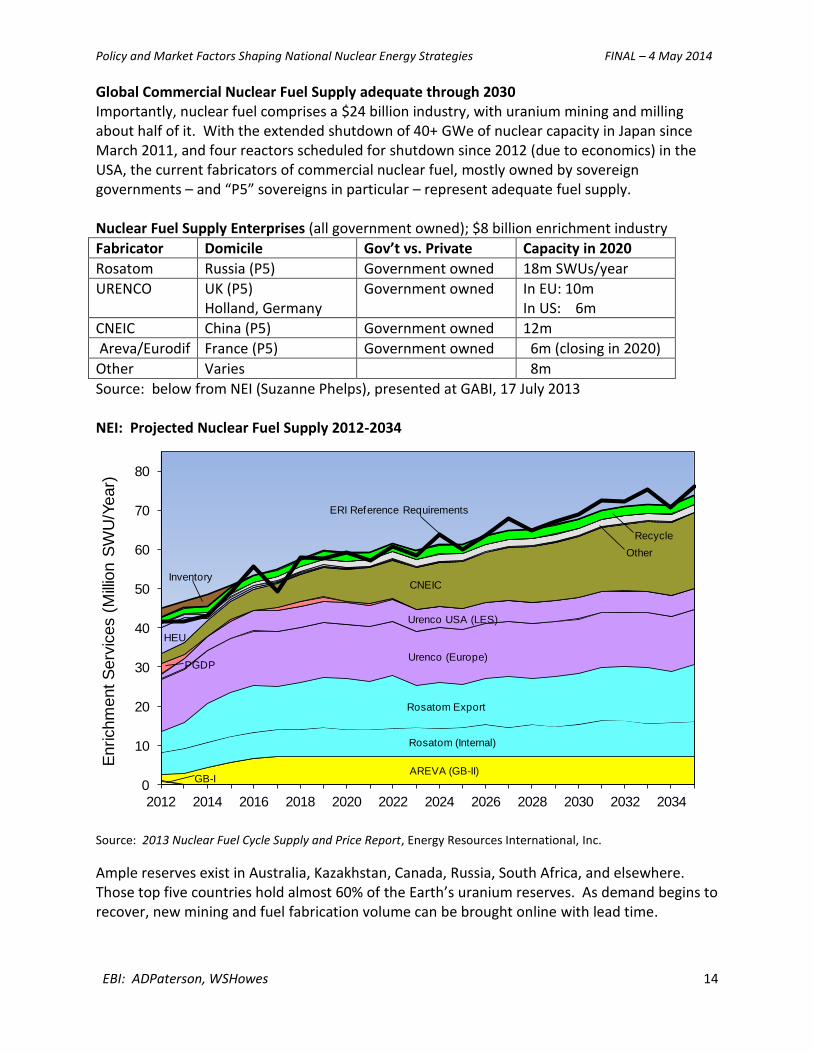
Global Commercial Nuclear Fuel Supply adequate through 2030 Importantly, nuclear fuel comprises a $24 billion industry, with uranium mining and milling about half of it. With the extended shutdown of 40+ GWe of nuclear capacity in Japan since March 2011, and four reactors scheduled for shutdown since 2012 (due to economics) in the USA, the current fabricators of commercial nuclear fuel, mostly owned by sovereign governments – and “P5” sovereigns in particular – represent adequate fuel supply. Nuclear Fuel Supply Enterprises (all government owned); $8 billion enrichment industry
Fabricator Domicile Gov’t vs. Private Capacity in 2020
Rosatom Russia (P5) Government owned 18m SWUs/year
URENCO UK (P5) Holland, Germany
Government owned In EU: 10m In US: 6m
CNEIC China (P5) Government owned 12m
Areva/Eurodif France (P5) Government owned 6m (closing in 2020)
Other Varies 8m
Source: below from NEI (Suzanne Phelps), presented at GABI, 17 July 2013 NEI: Projected Nuclear Fuel Supply 2012-2034
Source: 2013 Nuclear Fuel Cycle Supply and Price Report, Energy Resources International, Inc.
Ample reserves exist in Australia, Kazakhstan, Canada, Russia, South Africa, and elsewhere. Those top five countries hold almost 60% of the Earth’s uranium reserves. As demand begins to recover, new mining and fuel fabrication volume can be brought online with lead time.
GB-IAREVA (GB-II)
Rosatom (Internal)
Rosatom Export
Urenco (Europe)
Urenco USA (LES)
PGDP
CNEIC
HEU
Other
Recycle
Inventory
0
10
20
30
40
50
60
70
80
2012 2014 2016 2018 2020 2022 2024 2026 2028 2030 2032 2034
Enrichm
ent S
erv
ices (
Mill
ion S
WU
/Year)
R
ERI Reference Requirements

Policy and Market Factors Shaping National Nuclear Energy Strategies FINAL – 4 May 2014
EBI: ADPaterson, WSHowes 15
B. A Framework for Defining National Strategies: Supply-intensive vs. Demand-driven
1. Specific National Strategies – “Renaissance” Strategy (“Heavy” and “Light”): Renewal, construction, growth-driven – “Restructuring” Strategy: Open to new construction, but needing policy intervention – “Rollback” Strategy: Phase-out, shutdown, moratoriums
2. Observations, and importance of International Partnerships
B.1 National Nuclear Energy Strategies derived from Supply-side and Demand-side Factors By plotting this shift from Supply-side factors to Demand-side intensity, a plausible framework emerges, which helps explain the forces shaping National Nuclear Energy Strategies.
Source: ADPaterson; based on presentation Oct. 22 at FAS / GABI / KAIST, Washington, DC. Description of quadrants and Strategies (chart above) “High Supply-side; High Demand-side factors” (upper right) Renaissance Heavy Strategy China and India are the leading examples of rapidly urbanizing countries that must meet growing and massive energy demands for hundreds of millions of people in large cities with low emissions. Reactors are the only clean and reliable source with a small footprint at very large scale for large urban loads. Renewable energy sources (wind, solar, hydro, biomass) are not feasible everywhere, vulnerable to weather events and require large swaths of land to meet the scale of energy needed. Because of the scale of energy demand, and their need to import some forms of energy, China, India, and Japan and South Korea earlier, made the investments on the Supply-side to build a native nuclear engineering sector, so they are high in both sets of factors. Countries in this quadrant will export, and also import some key components to meet demands. France, Japan, South Korea, Russia and USA remain most active in export markets, as domestic demand will not be enough to sustain the engineering and industrial base needed.

Policy and Market Factors Shaping National Nuclear Energy Strategies FINAL – 4 May 2014
EBI: ADPaterson, WSHowes 16
“Low Supply-side; High Demand-side” (lower right) Renaissance Light Emerging countries, mostly in the Middle East and Southeast Asia, which face burgeoning urban growth and much larger demand for desalination and water treatment, must meet these demands or they could suffer significant instability or even civil disruptions, as seen with “Arab Spring”. However, these “emerging nuclear power users” lack basic nuclear engineering and operational “supply-side” infrastructure; they must import it via procurement, typically. With a lack of supply factor strengths, these countries will be importers of nuclear technology. “High Supply-side; Low Demand-side” (upper left) Restructuring Countries, like the USA and Canada, operate 117 reactors (100 in USA; 17 in Canada), and nuclear power still provides at least 20% of electricity in North America – much more in Chicago and sub-regions like the mid-Atlantic. Impetus remains to maintain a nuclear “supply-side” infrastructure given this level of supply. Still, North America does not see large urban growth and demand on the scale seen in Asia. A lull in reactor construction from 1985 to 2005 led to industrial restructuring and consolidation among reactor owners (e.g., Unicom merging with ComEd to form Exelon; Duke with Cinergy and Progress). Toshiba bought Westinghouse from BNFL in 2006, and GE merged its nuclear business with Hitachi in 2007. France and Russia are P5 countries, so that status and the prospects for exporting nuclear expertise keeps them committed to maintaining nuclear infrastructure and supply-side factors in “Renaissance” mode. Countries in this quadrant will be exporters because they wield strong supply-side enabling factors, but in the OECD they see less growth in domestic demand. Japan after Fukushima represents a special case, where a massive tsunami in March 2011 from a 9.0+ earthquake killed 19,000 people, and triggered a nuclear disaster at Fukushima. This event led to a “Rollback” (shutdown policy) of its 50 reactors by Prime Minister Noda’s DPJ government. But, a landslide loss (175 seats of a total of 480 in Dec. 2012) by the DPJ, allowed the LDP to recapture a solid majority. LDP is slowly moving Japan back toward prudently restarting plants, with local approval. The largest utility, TEPCO, was nationalized in 2012, a clear sign of “Restructuring”. Prior to the disaster, Japan with major reactor vendors (e.g., Toshiba, Hitachi, Mitsubishi) and construction experience combined with dense urban demand was engaged fully in Renaissance and made plans to expand nuclear from 30% of electricity supply to above 40%. With restarts, Japan could return slowly to a Renaissance strategy. “Low Supply-side; Low Demand-side” (lower left) Rollback Countries, like Germany and Italy, which are fully developed and now face declining population levels, see little influx stressing their cities, and no energy demand growth. Some, like Belgium and Germany, face more vocal anti-nuclear citizenry at the ballot box. They have cut back their investment in nuclear laboratories and are closing reactors rather than building them, in other words, deliberately shrinking their supply-side strengths. None are members of the UNSC “P5” nuclear powers, so they can indulge in Rollback. Countries in Rollback are decommissioning units, and will struggle to replace such baseload with emission free capacity.

Policy and Market Factors Shaping National Nuclear Energy Strategies FINAL – 4 May 2014
EBI: ADPaterson, WSHowes 17
Countries may fluctuate between strategies as supply and demand factors shift, or based on a change in political regime – as in Japan with the loss of power by LDP in 2009 after more than 40 years in power, or in Belgium to enable a coalition government. A shift in national strategy can also be triggered by a big event, such as Fukushima or Chernobyl or financial shock (Russian default in 1998; Global financial crisis of 2008-11); but the strength or weakness of factors will directly impact execution of a national strategy. Alliances will be needed to address key gaps. For example, the alliance formed by the UK with France (as in world wars), or Japan with the USA, both via acquisitions, enables these countries to bring more resources to a global market. Hence, based on their Supply and Demand ratings, the most active countries can be plotted relatively to reveal their national strategies, and emphasis for import, export, or both: National Nuclear Energy Strategies derived from Supply-side and Demand-side Factors
Source: ADPaterson; based on presentation Oct. 22 at FAS / GABI / KAIST, Washington, DC. Countries with the highest growth rates and rising urban loads find themselves in the Renaissance mode. More advanced (OECD) countries engaged in Renaissance strategy (e.g., France, Russia) have made top-down national commitments for more reactors and for exports, typically with sovereign financing support. Status as a P5 country bolsters this strategy in favor of nuclear power. Countries ranking lower in both Supply and Demand side factors can consider a Rollback strategy with few consequences to international alliances.
Policy and Market Factors Shaping National Nuclear Energy Strategies FINAL – 4 May 2014
EBI: ADPaterson, WSHowes 18
B2. International Partnerships with linkage to National Strategies
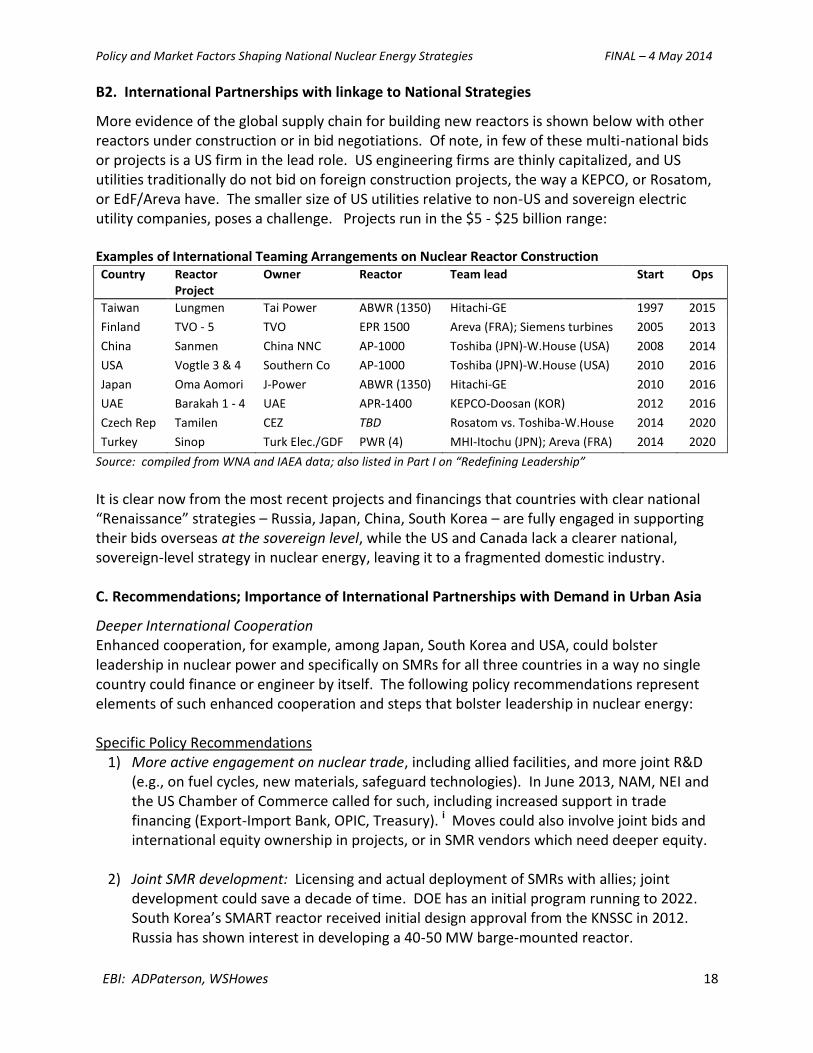
More evidence of the global supply chain for building new reactors is shown below with other reactors under construction or in bid negotiations. Of note, in few of these multi-national bids or projects is a US firm in the lead role. US engineering firms are thinly capitalized, and US utilities traditionally do not bid on foreign construction projects, the way a KEPCO, or Rosatom, or EdF/Areva have. The smaller size of US utilities relative to non-US and sovereign electric utility companies, poses a challenge. Projects run in the $5 - $25 billion range: Examples of International Teaming Arrangements on Nuclear Reactor Construction Country Reactor
Project Owner Reactor Team lead Start Ops
Taiwan Lungmen Tai Power ABWR (1350) Hitachi-GE 1997 2015
Finland TVO - 5 TVO EPR 1500 Areva (FRA); Siemens turbines 2005 2013
China Sanmen China NNC AP-1000 Toshiba (JPN)-W.House (USA) 2008 2014
USA Vogtle 3 & 4 Southern Co AP-1000 Toshiba (JPN)-W.House (USA) 2010 2016
Japan Oma Aomori J-Power ABWR (1350) Hitachi-GE 2010 2016
UAE Barakah 1 - 4 UAE APR-1400 KEPCO-Doosan (KOR) 2012 2016
Czech Rep Tamilen CEZ TBD Rosatom vs. Toshiba-W.House 2014 2020
Turkey Sinop Turk Elec./GDF PWR (4) MHI-Itochu (JPN); Areva (FRA) 2014 2020
Source: compiled from WNA and IAEA data; also listed in Part I on “Redefining Leadership”
It is clear now from the most recent projects and financings that countries with clear national “Renaissance” strategies – Russia, Japan, China, South Korea – are fully engaged in supporting their bids overseas at the sovereign level, while the US and Canada lack a clearer national, sovereign-level strategy in nuclear energy, leaving it to a fragmented domestic industry. C. Recommendations; Importance of International Partnerships with Demand in Urban Asia
Deeper International Cooperation Enhanced cooperation, for example, among Japan, South Korea and USA, could bolster leadership in nuclear power and specifically on SMRs for all three countries in a way no single country could finance or engineer by itself. The following policy recommendations represent elements of such enhanced cooperation and steps that bolster leadership in nuclear energy: Specific Policy Recommendations
1) More active engagement on nuclear trade, including allied facilities, and more joint R&D (e.g., on fuel cycles, new materials, safeguard technologies). In June 2013, NAM, NEI and the US Chamber of Commerce called for such, including increased support in trade financing (Export-Import Bank, OPIC, Treasury). i Moves could also involve joint bids and international equity ownership in projects, or in SMR vendors which need deeper equity.
2) Joint SMR development: Licensing and actual deployment of SMRs with allies; joint development could save a decade of time. DOE has an initial program running to 2022. South Korea’s SMART reactor received initial design approval from the KNSSC in 2012. Russia has shown interest in developing a 40-50 MW barge-mounted reactor.
Policy and Market Factors Shaping National Nuclear Energy Strategies FINAL – 4 May 2014
EBI: ADPaterson, WSHowes 19
3) Government investment for reactor construction (e.g., federal loans; credit support, such
as mentioned in the White House Climate Action Plan). US Export-Import Bank financing support on the Westinghouse bid in the Czech Republic is a clear example. This could entail a Presidential level agreement, as each named it a top multi-lateral priority. First units will not be bought by investor-owned utilities; as with the first reactors, government orders or financing will be needed to overcome risks on such large plants, or on SMRs.
4) International fuel management: Several experts and IAEA have endorsed multi-lateral fuel governance, with sovereign spent fuel take back, as the US does now on foreign research reactors. ii This would also increase NPT control of nuclear materials and strengthen arguments for less fragmentation of enrichment capability.
Other countries are looking to the US for deeper collaboration, renewal of Section 123 nuclear cooperation agreements, iii and for US leadership in nuclear power to address their own energy security and development. All of these policy recommendations will entail closer coordination (e.g., regular meetings, perhaps joint governance) among State, DOE, NRC, Commerce, and the trade financing units (OPIC, Ex-Im Bank). In her first state visit with President Obama in May 2013 Madame President Park of South Korea directly raised the issue of joint work on nuclear technology deployment as a top priority in their talks at the highest levels.iv Pentagon geo-strategist Thomas Barnett, formerly at the Naval War College, highlighted the importance of engaging in Asia strategically in his latest book: The Great Globalization Build-out “In the Big Push heyday of Western foreign aid the vast majority of infrastructure building was directed by Western public entities using public funds. It was Supply-Push, depending on how the West felt. Today the situation is reversed – the majority of building in emerging economies can be described as Demand-Pull. Asian companies are creating the physical connectivity to access raw materials while back home their governments and national flagship companies engage in massive build outs of road, rail, ports, power generation and distribution. After decades of hand-wringing by the West over ‘who is going to save the world’s poor?’; we find ourselves largely standing on the sidelines while Asians step up to save themselves... And, China accounts for 40% of the total.”
Thomas Barnett, author of The Pentagon’s New Map Great Powers – American and the World after Bush, 2009 [p. 320]
Clean, reliable electricity for major urban areas, particularly in Asia, poses the largest arena for development and deployment of reactors done right. The US will need to team with prominent allies in Asia, particularly Japan and South Korea, and eventually India, to achieve its own geo-political and economic objectives (e.g., trade expansion, lower global pollution levels, retention of nuclear engineering expertise), and to maintain safety and non-proliferation practices in this critical sector. Leadership in nuclear energy, and with SMRs, must now respond to a more intense demand-side landscape via alliances in Asia, where the market is unfolding and where
real progress can be made on global emissions and urban resilience.v

Policy and Market Factors Shaping National Nuclear Energy Strategies FINAL – 4 May 2014
EBI: ADPaterson, WSHowes 20
D. Conclusions
The interaction of these supply and demand factors comprises a dynamic landscape within which trans-national public-private partnerships are becoming more important. Because no single country is self-sufficient, and because the regions with highest demand factors are not those with historically strong supply factors, it appears that the best strategic opportunities for US industry may reside in countries with: – A robust track record of current operations of nuclear reactors (S2) – High quality nuclear regulatory capacity with strong ties to IAEA and US NRC (S3) – Superior engineering, skilled labor, and manufacturing in nuclear supply chain (S4, S5, S7) – Access to low cost capital for financing for capital intensive nuclear plants (S6) – Clear regimes of asset control for nuclear facilities (e.g., military bases, secured sites) – Strong presence in Asia (Japan and Korea are the most obvious allies based on current ties.) An accelerated push for SMRs substantially beyond the small DOE program (<$1 billion over ten years) underway now offers a clear option for US vendors and engineering firms to bring prudent growth and leadership on standards, practices, and regulations to the emerging and replacement market. A smaller, more secure and modular product offering would enable smaller countries with higher population growth and water desalination needs to develop without straining fossil resources further and with much lower emissions. Closing: Letting leadership in nuclear energy wither away… The USA cannot idly let its leadership position wither away in the global nuclear energy landscape, just as Britain did when it discovered “cheap North Sea gas” in the 1980s. Britain used up its cheap gas over three decades and is now dependent once again on imported energy, and faces higher electricity prices. In the nuclear arena, leadership cannot be “restored” based on the old “push” model of Supply-side dominance from the 20th Century. The Demand-side factors now are pulling nuclear power construction forward in the 21st Century to satisfy burgeoning electric demand, primarily in Asian Cities. USA and allies must redefine its leadership role via international partnerships and alliances that are unfolding now. “Energy disparities create dangerous friction between the energy haves and have-nots. Throughout history – both in war and in peace -- poverty and prosperity have been inextricably connected to energy through the enormous power it confers on those who have it and the vulnerability it spells for those who don’t, as well as the tension created by the breach between them. American leadership on energy development and climate change can be an effective means by which we affect world outcomes.” General James L. Jones,
Former National Security Director (2009-10), Supreme Allied Commander Europe (2003-06) Testimony to Senate Foreign Relations Comm., March 13, 2014
Leadership in the global nuclear energy market and in safeguards and regulatory policy no longer means selling or operating more reactors than the next country; instead, it will increasingly be executed through international cooperative agreements and by multinational consortiums and investments, supported by government policies mindful of long-term benefits, such as energy security, urban resilience for large cities, plus vital emissions reductions.

Policy and Market Factors Shaping National Nuclear Energy Strategies FINAL – 4 May 2014
EBI: ADPaterson, WSHowes 21
SUMMARY: Key Supply and Demand Factors for Nuclear Energy going forward http://www.atlanticcouncil.org/publications/reports/redefining-leadership-in-the-global-nuclear-energy-market
Success Factors for Nuclear Energy: Supply-side and Demand-side Intensity Drivers As previously mentioned a key question going forward will be how to define the best strategic partnership opportunities. In the past, as seen in the Figure below, the United States and Europe had the most favorable supply-side strengths. Summary of Supply and Demand Factors and National Nuclear Strategies Updated from Part I: Redefining Leadership in Global Nuclear Energy Markets” by Andrew Paterson, Walter Howes
During the expansion era of nuclear power construction in the 1960s to 1980s, the United States led the world in many of the key “Supply Side” success factors. The relative strength of each country or mini-region was assessed on a relative basis (on a scale from 1 as a low value to 5 as a high value), and then the combined ratings were indexed to the highest entity in the evaluation. The chart shows how much the demand-side factors have emerged as key drivers in the 21st Century for new reactor construction going forward, compared to the supply-side factors that drove construction among OECD countries in the last Century during the Cold War. On the supply-side, the United States wields superior ratings in (S2) a military industrial base for a nuclear navy; (S3) regulatory practices; (S5) nuclear engineering talent; (S6) access to low cost financing; and (S7) the current reactor base. By contrast, China lacks the operating base of leaders France and the United States; however, China, India, and growing Asia see higher demand side factors associated with rapid population growth and urbanization (D1, D2, D4, D7), as well as higher natural gas prices, which makes nuclear energy more competitive. A summary of Supply and Demand factors follows:

Policy and Market Factors Shaping National Nuclear Energy Strategies FINAL – 4 May 2014
EBI: ADPaterson, WSHowes 22
S1. R&D Reactors, National Labs and Technology Innovation: The US Department of Energy funds a significant complex of national laboratories with nuclear expertise (weapons, fuel, and reactors). Other P5 countries maintain such R&D infrastructure and programs, but less so than in China, Japan, and in South Korea. Britain’s nuclear engineering establishment has been hollowed out after two decades of inactivity, and now the entire nuclear fleet is owned by EdF (France). S2. Military industrial base for nuclear power: US nuclear power expertise and a commitment to light water reactors (LWRs) started with the construction of the nuclear navy in the 1950s-70s. Today the USA wields ten nuclear-powered aircraft carriers and about 80 nuclear submarines. No other country wields close to this operating base. Early on many retired officers from the US Nuclear Navy were hired as managers at nuclear utilities, bringing reactor management knowledge to the commercial sector. The fueling infrastructure and experience with naval reactors also contributed to US engineering experience. S3. High quality nuclear regulatory practices: The US NRC continues to provide the high benchmark for nuclear regulation. And, national nuclear regulators now meet more often at international forums and via IAEA to share best practices. Regulatory practices for emerging nuclear users are paramount to ensure public engagement, implementation of safeguards, reliable operations, and emissions savings. S4. Nuclear fuel infrastructure and ore supply: Russia and France lead in offering the full slate of fuel cycle services, including enrichment and reprocessing. By law the United States does not reprocess spent fuel, but for the past two decades, the “Megatons to Megawatts” program converted Russian nuclear warheads to reactor fuel (ended in 2013). China and India are developing reprocessing expertise and capacity, and URENCO, a consortium with $2 billion in annual revenues owned by the governments of Germany, Holland, and the UK, provides enriched nuclear fuel worldwide. Southeast Asia (not including China) and the Middle East lack most of the key supply side factors for nuclear power, but are rated quite high on demand side factors, particularly on population growth and urban demand with much faster growth in electricity consumption and demand for fresh water. The profound shift underway in commercial nuclear partnerships, in part, is being driven by demand side factors in rapidly developing urban Asia. Spent fuel will likely require “take back” arrangements because storage in these emerging countries is not and efficient or optimal situation. S5. Nuclear engineering talent and skilled labor (college programs, technical firms, union training): Almost half the US nuclear engineering programs at universities closed in the 1980s when demand slumped after Three Mile Island (1979), and as DOE funding was cutback during the Clinton Administration. In 2010, US colleges graduated more than 450 nuclear engineers (B.S. degrees) with as
many master’s and PhDs awarded; up from below 300 in the late 1990svi
. Skilled labor and union
training plays a major role in precision construction for reactors. Korea, Japan, France, Russia, China and India produce more nuclear engineering graduates now than the USA, and compared to a decade ago. S6. Access to low cost debt financing, capital (public or private): While the Euro currency crisis poses financing challenges in Europe, most of the P5 countries, plus Japan, South Korea, and India retain access to low cost capital, particularly for sovereign entities and national utilities in global bond markets. Still, US utilities garner credit ratings in the BBB to A range, while sovereigns garner AA to AAA ratings. S7. Current reactor operating base: Even with recent shutdowns of four reactors, US reactor capacity leads the world with 100 reactors operating in 2012, with France (58 reactors) and Japan (51) next in line, as the only other countries with more than 50 reactors installed. [See table on page 11]
Policy and Market Factors Shaping National Nuclear Energy Strategies FINAL – 4 May 2014
EBI: ADPaterson, WSHowes 23
S8. Engineering firms with recent construction experience: Since the acquisition in 2006 by Toshiba of Westinghouse Nuclear, and formation of Hitachi-GE Nuclear (2007), engineering firms in Asia (SK, Doosan, Hyundai, Mitsubishi, Shanghai Engineering) are garnering the most construction experience now going forward. Others, such as Fluor, Areva, CB&I/Shaw are seeking work in Asia to keep pace. Going forward, “demand side” market factors will favor construction in markets outside of the US and run much bigger outside North America and Europe. [See table of construction on page 11.] D1. Growing population overall: Unlike Japan or Europe, developing Asia and the Middle East see much higher population growth rates. With Mexico, the North American Free Trade Agreement (NAFTA) region is growing faster than Europe, and will surpass Europe in population before 2030. From 2000, Mexico will add another 30 million people before 2030, creating demand for more energy within the NAFTA bloc. And, Mexico will need alternatives (beyond its two reactors) as its oil production declines further from its peak in 2005. Population growth and urbanization in Asia will drive energy demand growth at higher rates than economic growth. “China’s automobile market will nearly triple in size to 40 million, nearly half of world production by 2020, according to one of the country’s top producers.” [FT] D2. Current dense, urban electric loads: The US and Europe only have 3 or 4 cities with more than 5 million people, whereas, Asia – principally China and India – will see dozens that large by 2030. More than 1,000 cities will top one million residents before 2040 worldwide, about 60 percent of them in Asia. D3. Advanced industrial and manufacturing base: An advanced industrial base requires high quality, reliable electricity and the OECD countries have that. But with more “off-shoring” since 2000, China, India, and Asia have built up their manufacturing capacity considerably with intensified industrialization. Some factory capacity is migrating back to North America because of cheap natural gas feedstock prices and reliable energy. But, those cheap natural gas prices also make nuclear reactors less competitive. D4. Rising per capita energy use (vs. OECD average): OECD countries are developed, so per capita energy use is not rising much, and may even decline. Asia is industrializing, and vehicle use will mushroom over the next decade. By 2025, new car sales in China may double that of US sales. Because oil is priced globally, this demand will raise oil prices unless more electric vehicles are sold. Charging such electric vehicles will increase urban electricity demand further. D5. Higher natural gas prices (nuclear competitiveness): Because natural gas prices in Asia run three or four times more expensive than in North America, nuclear power is more competitive despite the higher construction costs seen in the most recent reactor projects in a globalized nuclear supply chain. D6. Significant air pollution (need for clean energy options): China and India, due to their rising reliance on coal since 2000, are looking to reverse severe air pollution by building more nuclear plants. Large cities will need to reduce emissions to be livable, dramatized by each summer’s heat wave in Asia. D7. Future growth in urban load: The largest cities in North America and Europe are not growing rapidly, or at all. China alone will see 200 cities with more than 1 million people by 2030, and India similarly. D8. Policies and regulations favoring reduced emissions: Where countries have implemented either more regulations on emissions (Europe, North America) or subsidies, nuclear will be more competitive. In some countries, such policies entail a national entity ordering reactors, rather than tax policy.

Policy and Market Factors Shaping National Nuclear Energy Strategies FINAL – 4 May 2014
EBI: ADPaterson, WSHowes 24
E. APPENDIX: Country Profiles & National Strategy points Comparative Compilations of Key Demand-side Drivers
actual actual projected Growth %Growth
Population (million) 2000 2010 2020 2000 - 20 2000 - 20
USA 282 308 332 50 17.7%
Canada 30.8 34.1 36.2 5 17.5%
UK - Britain 58.9 62.3 67.2 8 14.1%
France 60.9 65.0 67.7 7 11.2%
Russia 146.3 142.4 149.7 3 2.3%
South Korea 47.0 49.4 51.4 4 9.4%
Japan 127.0 128.0 125.2 -2 -1.4%
China 1,270.0 1,340.0 1,440.0 170 13.4%
India 1,042.0 1,206.0 1,380.0 338 32.4%
Urban population 2000 2010 2020 2000 - 20 2000 - 20
USA 222.0 261.0 285.4 63 28.6%
Canada 24.0 27.3 29.7 6 23.6%
UK - Britain 44.8 49.3 55.1 10 23.1%
France 48.7 53.4 56.9 8 16.7%
Russia 102.4 102.7 110.8 8 8.2%
South Korea 37.4 40.2 42.0 5 12.3%
Japan 100.0 115.0 113.9 14 13.9%
China 533.4 635.0 775.0 242 45.3%
India 286.6 361.8 448.5 162 56.5%
Annual Elec. Consumed (million MWhs) 2000 2010 2020 2000-20 2000-20
USA 3,800 4,125 4,401 601 15.8%
Canada 590 586 634 44 7.5%
UK - Britain 335 329 340 5 1.5%
France 464 505 558 94 20.3%
Russia 751 861 900 149 19.8%
South Korea 263 450 600 337 128.1%
Japan 942 1,002 1,080 138 14.6%
China 1,180 4,100 8,200 7,020 594.9%
India 376.0 700.0 1,400 1,024 272.3%
Electricity Consumed per capita (MWhs) 2000 2010 2020 2000-20 2000-20
USA 13.5 13.4 13.3 -0.2 -1.6%
Canada 19.2 17.2 17.5 -1.6 -8.5%
UK - Britain 5.7 5.3 5.1 -0.6 -11.0%
France 7.6 7.8 8.2 0.6 8.2%
Russia 5.1 6.0 6.0 0.9 17.1%
South Korea 5.6 9.1 11.7 6.1 108.6%
Japan 7.4 7.8 8.6 1.2 16.3%
China 0.9 3.1 5.7 4.8 512.9%
India 0.4 0.6 1.0 0.7 181.1%
Policy and Market Factors Shaping National Nuclear Energy Strategies FINAL – 4 May 2014
EBI: ADPaterson, WSHowes 25
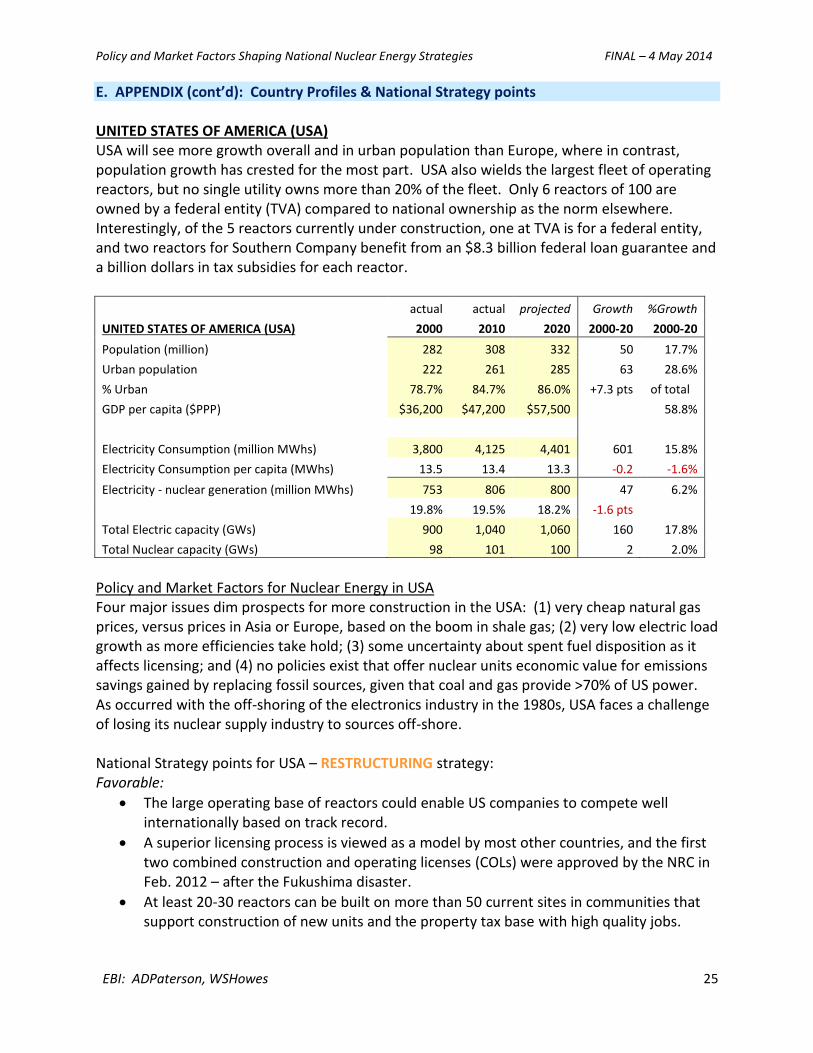
E. APPENDIX (cont’d): Country Profiles & National Strategy points UNITED STATES OF AMERICA (USA) USA will see more growth overall and in urban population than Europe, where in contrast, population growth has crested for the most part. USA also wields the largest fleet of operating reactors, but no single utility owns more than 20% of the fleet. Only 6 reactors of 100 are owned by a federal entity (TVA) compared to national ownership as the norm elsewhere. Interestingly, of the 5 reactors currently under construction, one at TVA is for a federal entity, and two reactors for Southern Company benefit from an $8.3 billion federal loan guarantee and a billion dollars in tax subsidies for each reactor.
actual actual projected Growth %Growth
UNITED STATES OF AMERICA (USA) 2000 2010 2020 2000-20 2000-20
Population (million) 282 308 332 50 17.7%
Urban population 222 261 285 63 28.6%
% Urban 78.7% 84.7% 86.0% +7.3 pts of total
GDP per capita ($PPP) $36,200 $47,200 $57,500 58.8%
Electricity Consumption (million MWhs) 3,800 4,125 4,401 601 15.8%
Electricity Consumption per capita (MWhs) 13.5 13.4 13.3 -0.2 -1.6%
Electricity - nuclear generation (million MWhs) 753 806 800 47 6.2%
19.8% 19.5% 18.2% -1.6 pts
Total Electric capacity (GWs) 900 1,040 1,060 160 17.8%
Total Nuclear capacity (GWs) 98 101 100 2 2.0%
Policy and Market Factors for Nuclear Energy in USA Four major issues dim prospects for more construction in the USA: (1) very cheap natural gas prices, versus prices in Asia or Europe, based on the boom in shale gas; (2) very low electric load growth as more efficiencies take hold; (3) some uncertainty about spent fuel disposition as it affects licensing; and (4) no policies exist that offer nuclear units economic value for emissions savings gained by replacing fossil sources, given that coal and gas provide >70% of US power. As occurred with the off-shoring of the electronics industry in the 1980s, USA faces a challenge of losing its nuclear supply industry to sources off-shore. National Strategy points for USA – RESTRUCTURING strategy: Favorable:
The large operating base of reactors could enable US companies to compete well internationally based on track record.
A superior licensing process is viewed as a model by most other countries, and the first two combined construction and operating licenses (COLs) were approved by the NRC in Feb. 2012 – after the Fukushima disaster.
At least 20-30 reactors can be built on more than 50 current sites in communities that support construction of new units and the property tax base with high quality jobs.
Policy and Market Factors Shaping National Nuclear Energy Strategies FINAL – 4 May 2014
EBI: ADPaterson, WSHowes 26
Challenges: ‒ US nuclear operators do not participate in foreign bids the way that EdF from France or
KEPCO from South Korea does. This reduces US competitiveness abroad on major bids. ‒ The US NRC must still resolve licensing of a spent fuel repository. The “waste
confidence” rule bears some impact on state approvals for any new units. ‒ Federal subsidies for reactors expire in 2021 (tax credits for up to 6,000 MWs). ‒ Many nuclear university programs closed down in the 1990s, unlike in Asia; and funding
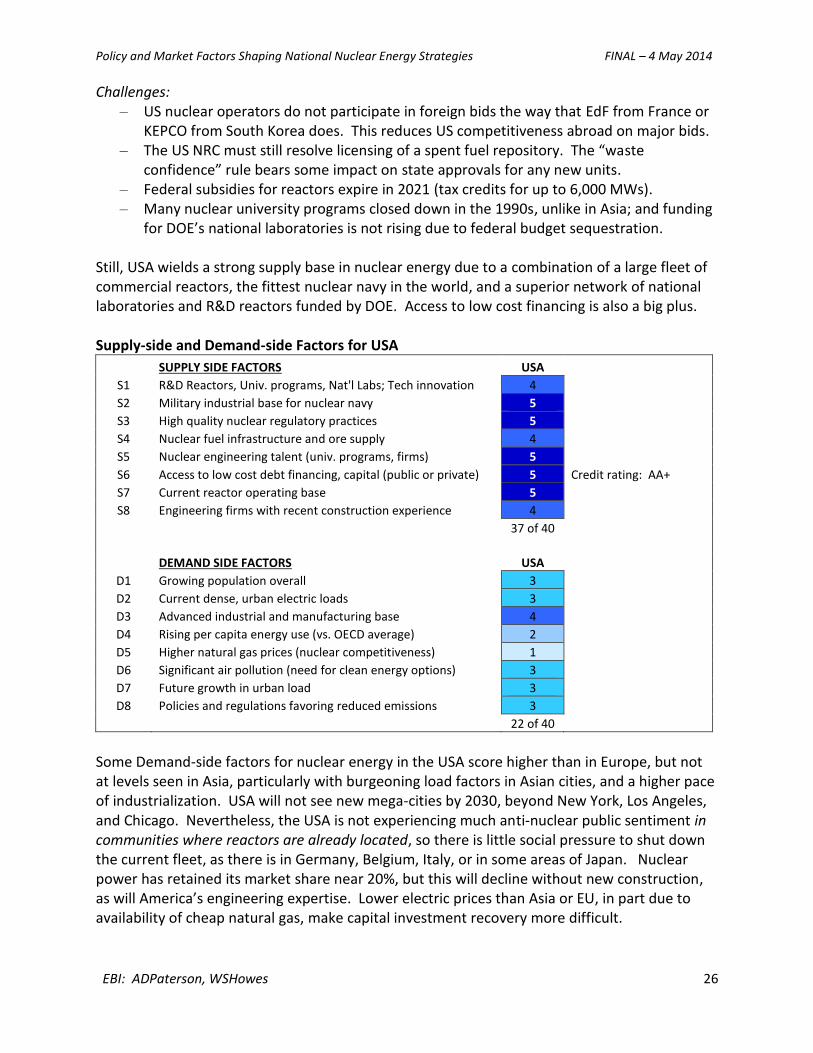
for DOE’s national laboratories is not rising due to federal budget sequestration. Still, USA wields a strong supply base in nuclear energy due to a combination of a large fleet of commercial reactors, the fittest nuclear navy in the world, and a superior network of national laboratories and R&D reactors funded by DOE. Access to low cost financing is also a big plus. Supply-side and Demand-side Factors for USA
SUPPLY SIDE FACTORS USA
S1 R&D Reactors, Univ. programs, Nat'l Labs; Tech innovation 4 S2 Military industrial base for nuclear navy 5 S3 High quality nuclear regulatory practices 5 S4 Nuclear fuel infrastructure and ore supply 4 S5 Nuclear engineering talent (univ. programs, firms) 5 S6 Access to low cost debt financing, capital (public or private) 5 Credit rating: AA+
S7 Current reactor operating base 5 S8 Engineering firms with recent construction experience 4
37 of 40
DEMAND SIDE FACTORS USA
D1 Growing population overall 3 D2 Current dense, urban electric loads 3 D3 Advanced industrial and manufacturing base 4 D4 Rising per capita energy use (vs. OECD average) 2 D5 Higher natural gas prices (nuclear competitiveness) 1 D6 Significant air pollution (need for clean energy options) 3 D7 Future growth in urban load 3 D8 Policies and regulations favoring reduced emissions 3
22 of 40
Some Demand-side factors for nuclear energy in the USA score higher than in Europe, but not at levels seen in Asia, particularly with burgeoning load factors in Asian cities, and a higher pace of industrialization. USA will not see new mega-cities by 2030, beyond New York, Los Angeles, and Chicago. Nevertheless, the USA is not experiencing much anti-nuclear public sentiment in communities where reactors are already located, so there is little social pressure to shut down the current fleet, as there is in Germany, Belgium, Italy, or in some areas of Japan. Nuclear power has retained its market share near 20%, but this will decline without new construction, as will America’s engineering expertise. Lower electric prices than Asia or EU, in part due to availability of cheap natural gas, make capital investment recovery more difficult.
Policy and Market Factors Shaping National Nuclear Energy Strategies FINAL – 4 May 2014
EBI: ADPaterson, WSHowes 27
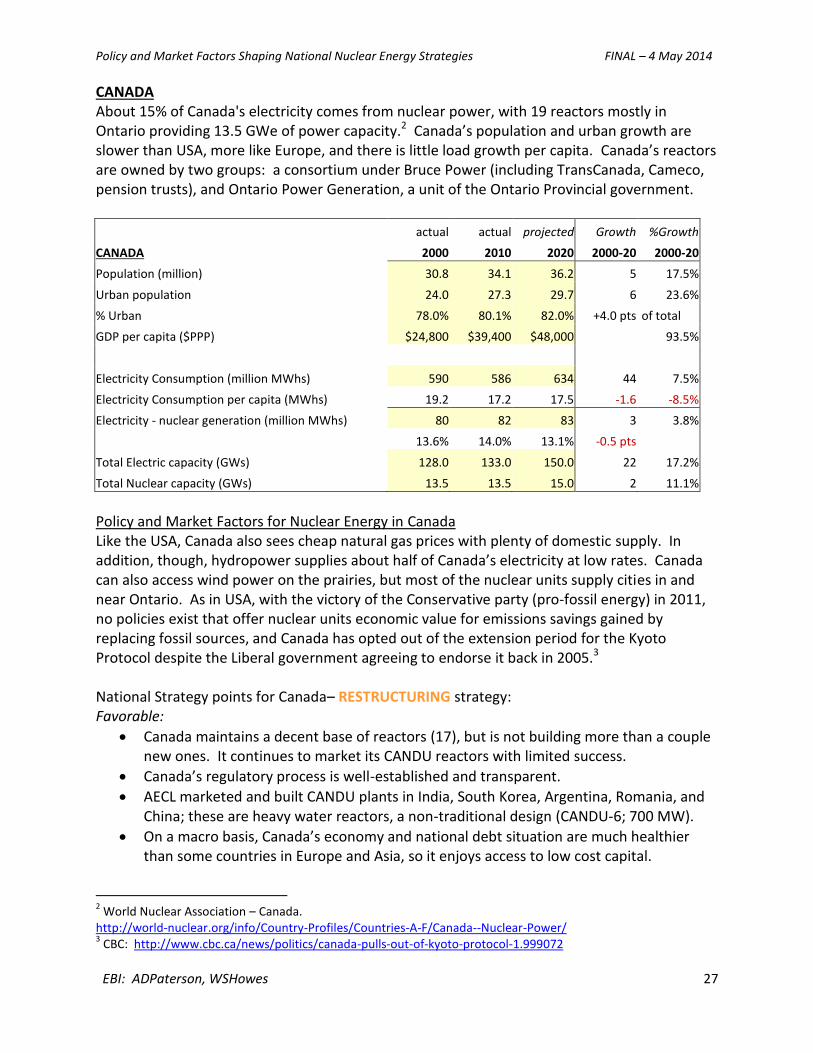
CANADA About 15% of Canada's electricity comes from nuclear power, with 19 reactors mostly in Ontario providing 13.5 GWe of power capacity.2 Canada’s population and urban growth are slower than USA, more like Europe, and there is little load growth per capita. Canada’s reactors are owned by two groups: a consortium under Bruce Power (including TransCanada, Cameco, pension trusts), and Ontario Power Generation, a unit of the Ontario Provincial government.
actual actual projected Growth %Growth
CANADA 2000 2010 2020 2000-20 2000-20
Population (million) 30.8 34.1 36.2 5 17.5%
Urban population 24.0 27.3 29.7 6 23.6%
% Urban 78.0% 80.1% 82.0% +4.0 pts of total
GDP per capita ($PPP) $24,800 $39,400 $48,000 93.5%
Electricity Consumption (million MWhs) 590 586 634 44 7.5%
Electricity Consumption per capita (MWhs) 19.2 17.2 17.5 -1.6 -8.5%
Electricity - nuclear generation (million MWhs) 80 82 83 3 3.8%
13.6% 14.0% 13.1% -0.5 pts
Total Electric capacity (GWs) 128.0 133.0 150.0 22 17.2%
Total Nuclear capacity (GWs) 13.5 13.5 15.0 2 11.1%
Policy and Market Factors for Nuclear Energy in Canada Like the USA, Canada also sees cheap natural gas prices with plenty of domestic supply. In addition, though, hydropower supplies about half of Canada’s electricity at low rates. Canada can also access wind power on the prairies, but most of the nuclear units supply cities in and near Ontario. As in USA, with the victory of the Conservative party (pro-fossil energy) in 2011, no policies exist that offer nuclear units economic value for emissions savings gained by replacing fossil sources, and Canada has opted out of the extension period for the Kyoto Protocol despite the Liberal government agreeing to endorse it back in 2005.3 National Strategy points for Canada– RESTRUCTURING strategy: Favorable:
Canada maintains a decent base of reactors (17), but is not building more than a couple new ones. It continues to market its CANDU reactors with limited success.
Canada’s regulatory process is well-established and transparent.
AECL marketed and built CANDU plants in India, South Korea, Argentina, Romania, and China; these are heavy water reactors, a non-traditional design (CANDU-6; 700 MW).
On a macro basis, Canada’s economy and national debt situation are much healthier than some countries in Europe and Asia, so it enjoys access to low cost capital.
2 World Nuclear Association – Canada.
http://world-nuclear.org/info/Country-Profiles/Countries-A-F/Canada--Nuclear-Power/ 3 CBC: http://www.cbc.ca/news/politics/canada-pulls-out-of-kyoto-protocol-1.999072

Policy and Market Factors Shaping National Nuclear Energy Strategies FINAL – 4 May 2014
EBI: ADPaterson, WSHowes 28
Challenges: ‒ Relatively cheap electricity prices, due primarily to cheap hydropower and low natural
gas prices, make reactors much less competitive for the domestic market. ‒ Unlike the USA, Canada is not a UNSC “P5” nuclear power, and does not maintain much
nuclear infrastructure for a navy or other military “supply-side” applications. Its supply side strength is thinner than that of the USA (a rating of 26 vs 37).
‒ Canada’s smaller size firms lack the balance sheet needed to lead large multiple reactor bids in foreign countries, and neither Bruce Power nor OPG participate in such bids.
‒ Poor sales and cost overruns ($1.2 billion since 2007) led to the Canadian government privatizing AECL in 2011 to engineering firm SNC-Lavalin ($7 billion in revenues).
Supply-side and Demand-side Factors for Canada
SUPPLY SIDE FACTORS CANADA
S1 R&D Reactors, Univ. programs, Nat'l Labs; Tech innovation 3 S2 Military industrial base for nuclear navy 1 S3 High quality nuclear regulatory practices 4 S4 Nuclear fuel infrastructure and ore supply 4 S5 Nuclear engineering talent (univ. programs, firms) 4 S6 Access to low cost debt financing, capital (public or private) 4 Credit rating: AAA
S7 Current reactor operating base 3 S8 Engineering firms with recent construction experience 3
26
DEMAND SIDE FACTORS CANADA
D1 Growing population overall 3 D2 Current dense, urban electric loads 2 D3 Advanced industrial and manufacturing base 4 D4 Rising per capita energy use (vs. OECD average) 4 D5 Higher natural gas prices (nuclear competitiveness) 1 D6 Significant air pollution (need for clean energy options) 1 D7 Future growth in urban load 2 D8 Policies and regulations favoring reduced emissions 2
19
Demand-side factors for nuclear energy in Canada run below even the UK or France, primarily because of inexpensive electricity prices and the lack of very large cities. From 2000 to 2020 Canada will add fewer than 6 million people. As in the USA, there is little social pressure to shut down the current fleet. With coal providing just 13% of electricity, there is a much smaller opportunity to replace coal with nuclear. Nuclear power will likely retain its market share near 15% through 2030, but Canada must amp up a stronger export effort or engage in broader international partnerships to stay competitive in the global nuclear energy market.
Policy and Market Factors Shaping National Nuclear Energy Strategies FINAL – 4 May 2014
EBI: ADPaterson, WSHowes 29
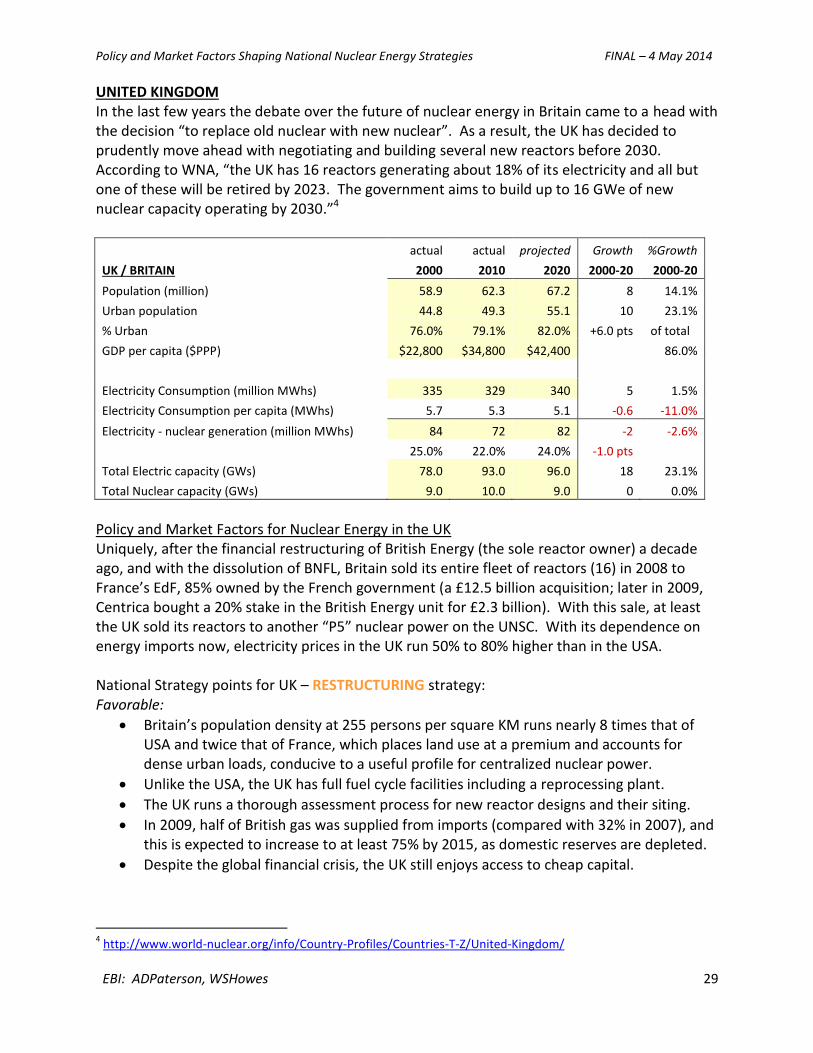
UNITED KINGDOM In the last few years the debate over the future of nuclear energy in Britain came to a head with the decision “to replace old nuclear with new nuclear”. As a result, the UK has decided to prudently move ahead with negotiating and building several new reactors before 2030. According to WNA, “the UK has 16 reactors generating about 18% of its electricity and all but one of these will be retired by 2023. The government aims to build up to 16 GWe of new nuclear capacity operating by 2030.”4
actual actual projected Growth %Growth
UK / BRITAIN 2000 2010 2020 2000-20 2000-20
Population (million) 58.9 62.3 67.2 8 14.1%
Urban population 44.8 49.3 55.1 10 23.1%
% Urban 76.0% 79.1% 82.0% +6.0 pts of total
GDP per capita ($PPP) $22,800 $34,800 $42,400 86.0%
Electricity Consumption (million MWhs) 335 329 340 5 1.5%
Electricity Consumption per capita (MWhs) 5.7 5.3 5.1 -0.6 -11.0%
Electricity - nuclear generation (million MWhs) 84 72 82 -2 -2.6%
25.0% 22.0% 24.0% -1.0 pts
Total Electric capacity (GWs) 78.0 93.0 96.0 18 23.1%
Total Nuclear capacity (GWs) 9.0 10.0 9.0 0 0.0%
Policy and Market Factors for Nuclear Energy in the UK Uniquely, after the financial restructuring of British Energy (the sole reactor owner) a decade ago, and with the dissolution of BNFL, Britain sold its entire fleet of reactors (16) in 2008 to France’s EdF, 85% owned by the French government (a £12.5 billion acquisition; later in 2009, Centrica bought a 20% stake in the British Energy unit for £2.3 billion). With this sale, at least the UK sold its reactors to another “P5” nuclear power on the UNSC. With its dependence on energy imports now, electricity prices in the UK run 50% to 80% higher than in the USA. National Strategy points for UK – RESTRUCTURING strategy: Favorable:
Britain’s population density at 255 persons per square KM runs nearly 8 times that of USA and twice that of France, which places land use at a premium and accounts for dense urban loads, conducive to a useful profile for centralized nuclear power.
Unlike the USA, the UK has full fuel cycle facilities including a reprocessing plant.
The UK runs a thorough assessment process for new reactor designs and their siting.
In 2009, half of British gas was supplied from imports (compared with 32% in 2007), and this is expected to increase to at least 75% by 2015, as domestic reserves are depleted.
Despite the global financial crisis, the UK still enjoys access to cheap capital.
4 http://www.world-nuclear.org/info/Country-Profiles/Countries-T-Z/United-Kingdom/

Policy and Market Factors Shaping National Nuclear Energy Strategies FINAL – 4 May 2014
EBI: ADPaterson, WSHowes 30
Challenges: ‒ While Britain sees some urban growth, its electricity consumption is basically flat. ‒ With little reactor construction the last two decades and the dissolution of BNFL, much
of Britain’s nuclear engineering capacity has withered and retired. It lacks the university or national laboratory infrastructure of the other “P5” nuclear powers.
‒ Now that France owns the UK nuclear fleet, it will be difficult for Britain to formulate an export strategy as it has done traditionally in its mercantile history, except in a subsidiary role to more active foreign partners.
Supply-side and Demand-side Factors for UK
SUPPLY SIDE FACTORS UK
S1 R&D Reactors, Univ. programs, Nat'l Labs; Tech innovation 2 S2 Military industrial base for nuclear navy 3 S3 High quality nuclear regulatory practices 4 S4 Nuclear fuel infrastructure and ore supply 4 S5 Nuclear engineering talent (univ. programs, firms) 3 S6 Access to low cost debt financing, capital (public or private) 5 Credit rating: AAA
S7 Current reactor operating base 3 S8 Engineering firms with recent construction experience 3
27
DEMAND SIDE FACTORS UK
D1 Growing population overall 2 D2 Current dense, urban electric loads 4 D3 Advanced industrial and manufacturing base 3 D4 Rising per capita energy use (vs. OECD average) 1 D5 Higher natural gas prices (nuclear competitiveness) 3 D6 Significant air pollution (need for clean energy options) 2 D7 Future growth in urban load 2 D8 Policies and regulations favoring reduced emissions 4
21
Demand-side factors for nuclear energy in the UK pose a mixed picture: Britain benefits from dense urban loads, but not much growth. The coalition government maintains a strong tri-partisan commitment to curbing GHG emissions, and electricity prices will likely stay higher than seen in North America because North Sea gas supplies continue to dwindle. Larger energy import vulnerabilities (in contrast to the 1980s) account for moderated public pressure against nuclear power, even in the wake of Fukushima. Indeed, nuclear power is seen as part of the UK solution to curbing GHG emissions. With more reactor construction now planned over the next decade than expected in the USA (e.g., 12-15 reactors versus just 5 in the USA), Britain will regain some experience that could better position some of its engineering firms and subsystem vendors globally, in partnership with reactor vendors building in the UK (Areva).
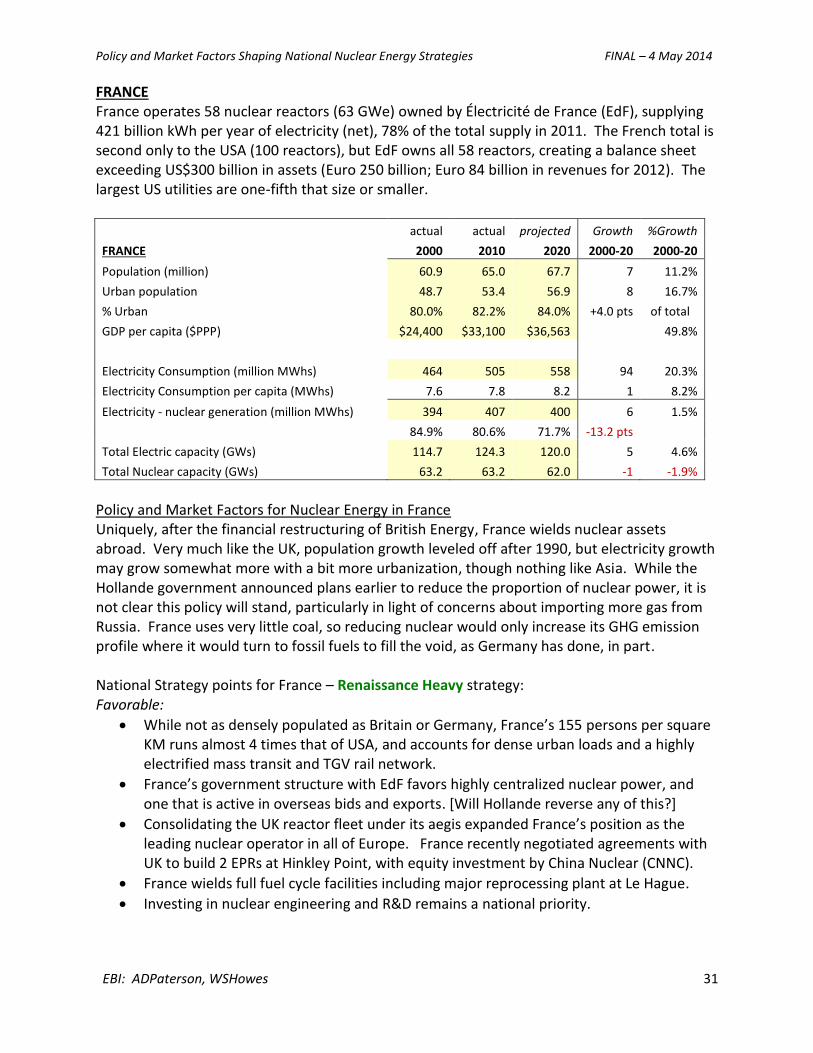
Policy and Market Factors Shaping National Nuclear Energy Strategies FINAL – 4 May 2014
EBI: ADPaterson, WSHowes 31
FRANCE France operates 58 nuclear reactors (63 GWe) owned by Électricité de France (EdF), supplying 421 billion kWh per year of electricity (net), 78% of the total supply in 2011. The French total is second only to the USA (100 reactors), but EdF owns all 58 reactors, creating a balance sheet exceeding US$300 billion in assets (Euro 250 billion; Euro 84 billion in revenues for 2012). The largest US utilities are one-fifth that size or smaller.
actual actual projected Growth %Growth
FRANCE 2000 2010 2020 2000-20 2000-20
Population (million) 60.9 65.0 67.7 7 11.2%
Urban population 48.7 53.4 56.9 8 16.7%
% Urban 80.0% 82.2% 84.0% +4.0 pts of total
GDP per capita ($PPP) $24,400 $33,100 $36,563 49.8%
Electricity Consumption (million MWhs) 464 505 558 94 20.3%
Electricity Consumption per capita (MWhs) 7.6 7.8 8.2 1 8.2%
Electricity - nuclear generation (million MWhs) 394 407 400 6 1.5%
84.9% 80.6% 71.7% -13.2 pts
Total Electric capacity (GWs) 114.7 124.3 120.0 5 4.6%
Total Nuclear capacity (GWs) 63.2 63.2 62.0 -1 -1.9%
Policy and Market Factors for Nuclear Energy in France Uniquely, after the financial restructuring of British Energy, France wields nuclear assets abroad. Very much like the UK, population growth leveled off after 1990, but electricity growth may grow somewhat more with a bit more urbanization, though nothing like Asia. While the Hollande government announced plans earlier to reduce the proportion of nuclear power, it is not clear this policy will stand, particularly in light of concerns about importing more gas from Russia. France uses very little coal, so reducing nuclear would only increase its GHG emission profile where it would turn to fossil fuels to fill the void, as Germany has done, in part. National Strategy points for France – Renaissance Heavy strategy: Favorable:
While not as densely populated as Britain or Germany, France’s 155 persons per square KM runs almost 4 times that of USA, and accounts for dense urban loads and a highly electrified mass transit and TGV rail network.
France’s government structure with EdF favors highly centralized nuclear power, and one that is active in overseas bids and exports. [Will Hollande reverse any of this?]
Consolidating the UK reactor fleet under its aegis expanded France’s position as the leading nuclear operator in all of Europe. France recently negotiated agreements with UK to build 2 EPRs at Hinkley Point, with equity investment by China Nuclear (CNNC).
France wields full fuel cycle facilities including major reprocessing plant at Le Hague.
Investing in nuclear engineering and R&D remains a national priority.

Policy and Market Factors Shaping National Nuclear Energy Strategies FINAL – 4 May 2014
EBI: ADPaterson, WSHowes 32
Challenges: ‒ Areva’s ongoing construction efforts in Finland (at TVO 5) and domestically at
Flamanville encountered significant cost overruns (>50%), which damages the competitiveness globally of its EPR product offering (1600 MWe).
‒ Labor costs in France and much of Europe also hinder competitiveness globally. ‒ Hollande’s policies on nuclear energy remain muddled, in contrast to Russia, or Asia.
Supply-side and Demand-side Factors for France
SUPPLY SIDE FACTORS FRANCE
S1 R&D Reactors, Univ. programs, Nat'l Labs; Tech innovation 5 S2 Military industrial base for nuclear navy 4 S3 High quality nuclear regulatory practices 5 S4 Nuclear fuel infrastructure and ore supply 5 S5 Nuclear engineering talent (univ. programs, firms) 5 S6 Access to low cost debt financing, capital (public or private) 4 Credit rating: AA
S7 Current reactor operating base 5 S8 Engineering firms with recent construction experience 5
38
DEMAND SIDE FACTORS FRANCE
D1 Growing population overall 2 D2 Current dense, urban electric loads 4 D3 Advanced industrial and manufacturing base 4 D4 Rising per capita energy use (vs. OECD average) 2 D5 Higher natural gas prices (nuclear competitiveness) 3 D6 Significant air pollution (need for clean energy options) 1 D7 Future growth in urban load 2 D8 Policies and regulations favoring reduced emissions 5
23
In 2014, France announced a “EUR 55 billion reactor life extension program. This includes spending EUR 15 billion replacing heavy components, EUR 10 billion on post-Fukushima modifications and EUR 10 billion to boost safety against external events.”5 This is clear evidence of a long term, top down national commitment to nuclear power. Because of its continental access, France can look to export electricity more than the UK can. So, demand-side factors for nuclear energy offer a moderately better landscape: though most of Europe is not seeing demand growth like Asia, France can wheel electricity with a very low GHG profile into neighboring countries. And, France is not moving ahead on hydro-fracturing for gas supply, so cheap natural gas does not pose the competitive threat as seen in North America. And, unlike North America, Europe is aiming to maintain its goals for GHG emission reductions which provide a positive policy driver for nuclear energy. Unlike its major operations rival, Japan, France is continuing to operate its entire fleet, a plus for future bids.
5 WNA: http://www.world-nuclear.org/info/Country-Profiles/Countries-A-F/France/

Policy and Market Factors Shaping National Nuclear Energy Strategies FINAL – 4 May 2014
EBI: ADPaterson, WSHowes 33
RUSSIA Rosenergoatom (Rosatom) is the sole nuclear utility (33 reactors; 24 GWe), after consolidation in 2001. In 2010 nuclear production was 170.1 billion kWh, 16.6% of Russia's electricity. Clearly Russia is a long time “P5” nuclear power with USA, China, UK and France. Russia’s top-down energy policy aims to reduce natural gas based power supply. To reach this goal will require doubling nuclear power generation by 2020, and possibly to 25% by 2030.
actual actual projected Growth %Growth
RUSSIA 2000 2010 2020 2000-20 2000-20
Population (million) 146.3 142.4 149.7 3 2.3%
Urban population 102.4 102.7 110.8 8 8.2%
% Urban 70.0% 72.1% 74.0% +4.0 pts of total
GDP per capita ($PPP) $7,700 $15,900 $19,400 151.9%
Electricity Consumption (million MWhs) 751 861 900 149 19.8%
Electricity Consumption per capita (MWhs) 5.1 6.0 6.0 0.9 17.1%
Electricity - nuclear generation (million MWhs) 140 170 238 98 70.0%
18.6% 19.7% 26.4% 7.8 pts
Total Electric capacity (GWs) 206.0 229.0 240.0 34 16.5%
Total Nuclear capacity (GWs) 23.0 24.0 32.0 9 39.1%
Policy and Market Factors for Nuclear Energy in France Currently, Rosatom is building 9 or 10 reactors (8.7 GWe net), and at least 20 reactors are planned by 2030 – financing remains an issue -- with the aim of doubling the contribution of nuclear power to the electric portfolio. Hence, Russia has set a top-down policy and is funding a Nuclear Renaissance, second only to China in reactor plans. National Strategy points for Russia – Renaissance Heavy strategy: Favorable:
Despite, its lack of urban load drivers, a cold climate throughout Russia and severe demands for heat and electricity make nuclear reactors top priorities.
In addition to its 1200 MWe reactor offering, Russia is pursuing a 35-50 MWe barge-mounted reactor (SMR) based on its nuclear ice-breaker marine engine. Sold as a “rental unit” this might pose a significant marketing angle, depending on licensing and safety features, as well as host country attributes for coastal cities or desalination.
Challenges:
‒ Other than Moscow and St. Petersburg, Russia lacks drivers for rising urban loads. ‒ Like the other winter wonderland, Canada, Russia has withdrawn from the Kyoto
Protocol extension despite signing on in 2005. Russia is a fossil exporter with no commitment to curbing GHG emissions. Global warming is viewed positively in Siberia.
‒ International sanctions from Russia’s incursions in the Ukraine could blunt some of Russia’s opportunities for exports, but this is an evolving situation, and China is neutral.

Policy and Market Factors Shaping National Nuclear Energy Strategies FINAL – 4 May 2014
EBI: ADPaterson, WSHowes 34
Moscow (12 million) and St. Petersburg (5 million) are the only cities with more than 2 million people in Russia. No other cities will grow larger than 2 million for decades. Unlike in Asia, the key drivers for new construction in Russia are: (a) replacing old units; and (b) “Gazprom has cut back on high level of natural gas supplies for electricity generation because it can make about five times as much money by exporting the gas to Europe.”6 Supply-side and Demand-side Factors for Russia
SUPPLY SIDE FACTORS RUSSIA
S1 R&D Reactors, Univ. programs, Nat'l Labs; Tech innovation 4 S2 Military industrial base for nuclear navy 4 S3 High quality nuclear regulatory practices 3 S4 Nuclear fuel infrastructure and ore supply 5 S5 Nuclear engineering talent (univ. programs, firms) 4 S6 Access to low cost debt financing, capital (public or private) 4 Credit rating: BBB
S7 Current reactor operating base 4 S8 Engineering firms with recent construction experience 4
32
DEMAND SIDE FACTORS RUSSIA
D1 Growing population overall 1 D2 Current dense, urban electric loads 3 D3 Advanced industrial and manufacturing base 3 D4 Rising per capita energy use (vs. OECD average) 2 D5 Higher natural gas prices (nuclear competitiveness) 1 D6 Significant air pollution (need for clean energy options) 2 D7 Future growth in urban load 2 D8 Policies and regulations favoring reduced emissions 1
15
Supply-side factors and the value of exporting gas (rather than burning it to generate power) remain the main drivers in Russia’s nuclear strategy. Still, the severe accident at Chernobyl [Ukraine] in 1986 remains a scar on the Russian technical legacy – unlike the tsunami at Fukushima, Chernobyl was a design and operations failure without a natural disaster. Russia’s strategy is built up much more by its top-down Supply-side factors, and its mercantile commitment to exports of energy and minerals, including take-back of used nuclear fuel. With a recent successful bid for two reactors in Turkey, and others in China and India, Rosatom is also aggressively pursuing exports. In 2013, the “Mega-tons to MegaWatts” warhead spin down program with USA expired, ending a major nuclear fuel alliance. Russia will use the uranium for its own fuel. Russia is also active in emerging markets, and in considering SMRs.
6 WNA: http://www.world-nuclear.org/info/Country-Profiles/Countries-O-S/Russia--Nuclear-Power/
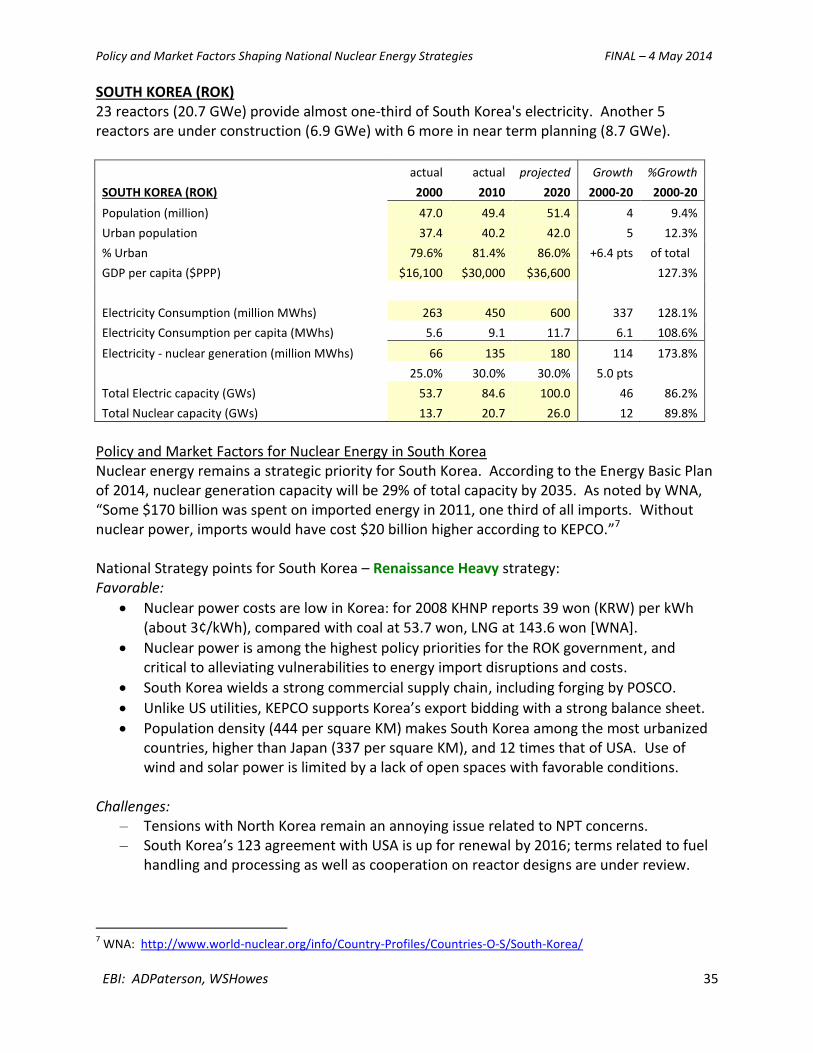
Policy and Market Factors Shaping National Nuclear Energy Strategies FINAL – 4 May 2014
EBI: ADPaterson, WSHowes 35
SOUTH KOREA (ROK) 23 reactors (20.7 GWe) provide almost one-third of South Korea's electricity. Another 5 reactors are under construction (6.9 GWe) with 6 more in near term planning (8.7 GWe).
actual actual projected Growth %Growth
SOUTH KOREA (ROK) 2000 2010 2020 2000-20 2000-20
Population (million) 47.0 49.4 51.4 4 9.4%
Urban population 37.4 40.2 42.0 5 12.3%
% Urban 79.6% 81.4% 86.0% +6.4 pts of total
GDP per capita ($PPP) $16,100 $30,000 $36,600 127.3%
Electricity Consumption (million MWhs) 263 450 600 337 128.1%
Electricity Consumption per capita (MWhs) 5.6 9.1 11.7 6.1 108.6%
Electricity - nuclear generation (million MWhs) 66 135 180 114 173.8%
25.0% 30.0% 30.0% 5.0 pts
Total Electric capacity (GWs) 53.7 84.6 100.0 46 86.2%
Total Nuclear capacity (GWs) 13.7 20.7 26.0 12 89.8%
Policy and Market Factors for Nuclear Energy in South Korea Nuclear energy remains a strategic priority for South Korea. According to the Energy Basic Plan of 2014, nuclear generation capacity will be 29% of total capacity by 2035. As noted by WNA, “Some $170 billion was spent on imported energy in 2011, one third of all imports. Without nuclear power, imports would have cost $20 billion higher according to KEPCO.”7 National Strategy points for South Korea – Renaissance Heavy strategy: Favorable:
Nuclear power costs are low in Korea: for 2008 KHNP reports 39 won (KRW) per kWh (about 3¢/kWh), compared with coal at 53.7 won, LNG at 143.6 won [WNA].
Nuclear power is among the highest policy priorities for the ROK government, and critical to alleviating vulnerabilities to energy import disruptions and costs.
South Korea wields a strong commercial supply chain, including forging by POSCO.
Unlike US utilities, KEPCO supports Korea’s export bidding with a strong balance sheet.
Population density (444 per square KM) makes South Korea among the most urbanized countries, higher than Japan (337 per square KM), and 12 times that of USA. Use of wind and solar power is limited by a lack of open spaces with favorable conditions.
Challenges:
‒ Tensions with North Korea remain an annoying issue related to NPT concerns. ‒ South Korea’s 123 agreement with USA is up for renewal by 2016; terms related to fuel
handling and processing as well as cooperation on reactor designs are under review.
7 WNA: http://www.world-nuclear.org/info/Country-Profiles/Countries-O-S/South-Korea/

Policy and Market Factors Shaping National Nuclear Energy Strategies FINAL – 4 May 2014
EBI: ADPaterson, WSHowes 36
Unlike the USA that is skewed to strength in Supply-side factors (a 37 versus 23 in Demand-side factors), South Korea is balanced in its factors (28 and 28, shown below). Population growth runs a little higher than Japan, and will peak before 2025. Dense, urban electric loads in high-rise apartment buildings and office towers, plus electrified mass transit are huge drivers. Supply-side and Demand-side Factors for South Korea
SUPPLY SIDE FACTORS S.KOREA
S1 R&D Reactors, Univ. programs, Nat'l Labs; Tech innovation 4 S2 Military industrial base for nuclear navy 1 S3 High quality nuclear regulatory practices 3 S4 Nuclear fuel infrastructure and ore supply 3 S5 Nuclear engineering talent (univ. programs, firms) 4 S6 Access to low cost debt financing, capital (public or private) 4 Credit rating: A+
S7 Current reactor operating base 4 S8 Engineering firms with recent construction experience 5
28
DEMAND SIDE FACTORS S.KOREA
D1 Growing population overall 2 D2 Current dense, urban electric loads 5 D3 Advanced industrial and manufacturing base 5 D4 Rising per capita energy use (vs. OECD average) 2 D5 Higher natural gas prices (nuclear competitiveness) 5 D6 Significant air pollution (need for clean energy options) 2 D7 Future growth in urban load 4 D8 Policies and regulations favoring reduced emissions 3
28
South Korea has demonstrated a strong commitment to a “Renaissance Heavy” strategy since the 1980s: “Shortly following its sale of four modern nuclear power reactors to the United Arab Emirates (UAE), the South Korean Ministry of Trade, Industry and Energy (MOTIE; formerly MKE) declared in January 2010 that it aimed to achieve exports of more than 40 nuclear power reactors worth $200 billion by 2030, in the course of becoming the world's third largest supplier of such technology, with a 20% share of the world market, behind the USA and France or Russia. ‘Nuclear power-related business will be the most profitable market after automobiles, semiconductors and shipbuilding,’ as MOTIE views it. Following the UAE sale, it is marketing to Jordan, Romania and Saudi Arabia, as well as South East Asian countries. South Africa could also be a market (>6 GWe), if financing can be arranged. In addition to exporting reactors, it plans to enter the $78 billion market for operation, maintenance and repair of reactors.” [WNA]
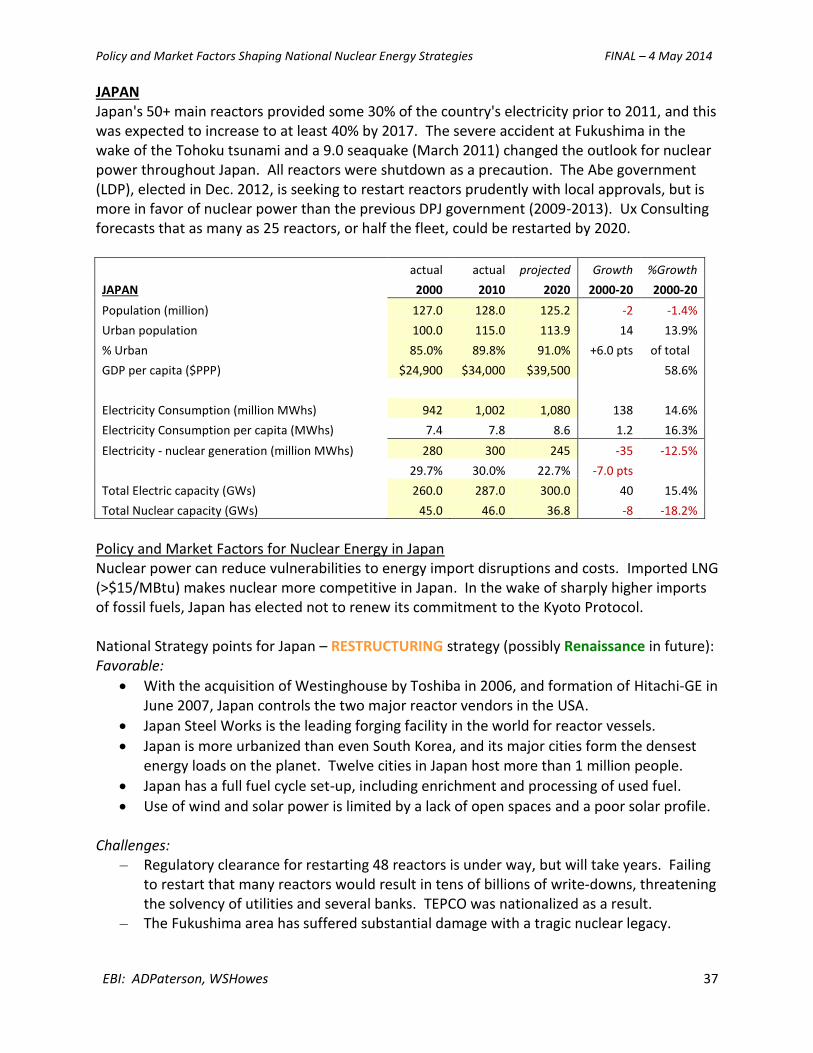
Policy and Market Factors Shaping National Nuclear Energy Strategies FINAL – 4 May 2014
EBI: ADPaterson, WSHowes 37
JAPAN Japan's 50+ main reactors provided some 30% of the country's electricity prior to 2011, and this was expected to increase to at least 40% by 2017. The severe accident at Fukushima in the wake of the Tohoku tsunami and a 9.0 seaquake (March 2011) changed the outlook for nuclear power throughout Japan. All reactors were shutdown as a precaution. The Abe government (LDP), elected in Dec. 2012, is seeking to restart reactors prudently with local approvals, but is more in favor of nuclear power than the previous DPJ government (2009-2013). Ux Consulting forecasts that as many as 25 reactors, or half the fleet, could be restarted by 2020.
actual actual projected Growth %Growth
JAPAN 2000 2010 2020 2000-20 2000-20
Population (million) 127.0 128.0 125.2 -2 -1.4%
Urban population 100.0 115.0 113.9 14 13.9%
% Urban 85.0% 89.8% 91.0% +6.0 pts of total
GDP per capita ($PPP) $24,900 $34,000 $39,500 58.6%
Electricity Consumption (million MWhs) 942 1,002 1,080 138 14.6%
Electricity Consumption per capita (MWhs) 7.4 7.8 8.6 1.2 16.3%
Electricity - nuclear generation (million MWhs) 280 300 245 -35 -12.5%
29.7% 30.0% 22.7% -7.0 pts
Total Electric capacity (GWs) 260.0 287.0 300.0 40 15.4%
Total Nuclear capacity (GWs) 45.0 46.0 36.8 -8 -18.2%
Policy and Market Factors for Nuclear Energy in Japan Nuclear power can reduce vulnerabilities to energy import disruptions and costs. Imported LNG (>$15/MBtu) makes nuclear more competitive in Japan. In the wake of sharply higher imports of fossil fuels, Japan has elected not to renew its commitment to the Kyoto Protocol. National Strategy points for Japan – RESTRUCTURING strategy (possibly Renaissance in future): Favorable:
With the acquisition of Westinghouse by Toshiba in 2006, and formation of Hitachi-GE in June 2007, Japan controls the two major reactor vendors in the USA.
Japan Steel Works is the leading forging facility in the world for reactor vessels.
Japan is more urbanized than even South Korea, and its major cities form the densest energy loads on the planet. Twelve cities in Japan host more than 1 million people.
Japan has a full fuel cycle set-up, including enrichment and processing of used fuel.
Use of wind and solar power is limited by a lack of open spaces and a poor solar profile. Challenges:
‒ Regulatory clearance for restarting 48 reactors is under way, but will take years. Failing to restart that many reactors would result in tens of billions of write-downs, threatening the solvency of utilities and several banks. TEPCO was nationalized as a result.
‒ The Fukushima area has suffered substantial damage with a tragic nuclear legacy.

Policy and Market Factors Shaping National Nuclear Energy Strategies FINAL – 4 May 2014
EBI: ADPaterson, WSHowes 38
Supply-side and Demand-side Factors for Japan
SUPPLY SIDE FACTORS JAPAN
S1 R&D Reactors, Univ. programs, Nat'l Labs; Tech innovation 4 S2 Military industrial base for nuclear navy 2 S3 High quality nuclear regulatory practices 3 S4 Nuclear fuel infrastructure and ore supply 3 S5 Nuclear engineering talent (univ. programs, firms) 5 S6 Access to low cost debt financing, capital (public or private) 5 Credit rating: AA-
S7 Current reactor operating base 3 S8 Engineering firms with recent construction experience 5
30
DEMAND SIDE FACTORS JAPAN
D1 Growing population overall 1 D2 Current dense, urban electric loads 5 D3 Advanced industrial and manufacturing base 5 D4 Rising per capita energy use (vs. OECD average) 1 D5 Higher natural gas prices (nuclear competitiveness) 5 D6 Significant air pollution (need for clean energy options) 2 D7 Future growth in urban load 3 D8 Policies and regulations favoring reduced emissions 3
25
The results of the general election in Japan in Dec. 2012 further demonstrated that nuclear energy operates in a political economy, where both policy and market factors play large roles in the direction and pace of nuclear energy’s role in the electric sector:
“In December 2012, after a decisive victory in national elections for the Diet's lower house, with 294 out of 480 seats, the Liberal Democratic Party took a more positive view of restarting idled nuclear power plants than its predecessor, which had seemed indifferent to electricity shortages and massive LNG and other fossil fuel import costs. (The DPJ won only 57 seats, down from 267) The new government said it would take responsibility for allowing reactor restarts after the Nuclear Regulation Authority issued new safety standards and confirmed the safety of individual units. The LDP also said that abandoning reprocessing of used fuel was ruled out. Construction of reactors at Shimane 3 and Ohma 1 was to continue, and construction of up to 12 further units could be approved. In July 2013, elections for the Diet’s upper house gave the LDP 115 seats out of 242. Its coalition partner and another pro-nuclear party won 29 seats. The DPJ with its policy of abandoning nuclear power by 2040 won only 59 seats.” [WNA]
The massive electoral loss by DPJ resulted in a sharp cancellation of the “Rollback” strategy announced just three months before the 2012 election. Unlike China or Russia or South Korea, Japan must undergo some “restructuring” of its utility sector before it can consider a full Renaissance strategy again, as it advocated in 2010 before Fukushima.

Policy and Market Factors Shaping National Nuclear Energy Strategies FINAL – 4 May 2014
EBI: ADPaterson, WSHowes 39
CHINA Mainland China has 20 nuclear power reactors in operation, 28 under construction, and more about to start construction. Additional reactors are planned for more than a three-fold increase in nuclear capacity to at least 58 GWe by 2020, then more than 100 GWe by 2030. “China’s policy is to ‘go global’ with exporting nuclear technology including heavy components in the supply chain.” [WNA] China’s policy favors a closed fuel cycle for more self-sufficiency.
actual actual projected Growth %Growth
CHINA 2000 2010 2020 2000-20 2000-20
Population (million) 1,270.0 1,340.0 1,440.0 170 13.4%
Urban population 533.4 635.0 775.0 242 45.3%
% Urban 42.0% 47.4% 53.8% 11.8 pts of total
GDP per capita ($PPP) $3,600 $7,600 $14,300 297.2%
Electricity Consumption (million MWhs) 1,180 4,100 8,200 7,020 594.9%
Electricity Consumption per capita (MWhs) 0.9 3.1 5.7 4.8 512.9%
Electricity - nuclear generation (million MWhs) 16 70 492 476 2975.0%
1.4% 1.7% 6.0% 4.6 pts
Total Electric capacity (GWs) 325.0 950.0 1,800.0 1,475 453.8%
Total Nuclear capacity (GWs) 2.0 12.0 50.0 48 2400.0%
Policy and Market Factors for Nuclear Energy in China The impetus for increasing nuclear power in China is in part due to severe air pollution from coal-fired plants. Coal provides more than 80% of electricity in China, and in 2012 China consumed more than 4 billion tons of coal, more than the rest of the world combined. China and the fossil-oriented developing countries now dominate carbon emissions worldwide because CO2 emissions for North American and Europe peaked in 2005. “China has become largely self-sufficient in reactor design and construction, as well as other aspects of the fuel cycle, but is making full use of western technology while adapting and improving it.” [WNA] National Strategy points for China – Renaissance Heavy strategy Favorable:
The massive scale of urbanization in China dwarfs all other societies, with nearly one million people per month moving to cities.
Urban pollution from coal burning plants has reached levels that is shutting down Beijing and could lead to more civil protests. China fears internal unrest most, and more than international competition. Over time, building 200 GWe of nuclear power by 2040 can gradually replace some high emission coal units.
Imported LNG (>$15/MBtu) makes nuclear competitive in China, and China would rather make higher value-added chemicals and fuels with LNG than burn it.
China has strategically ramped up nuclear engineering training and education programs at its elite universities, and uses this capability in its bids overseas.
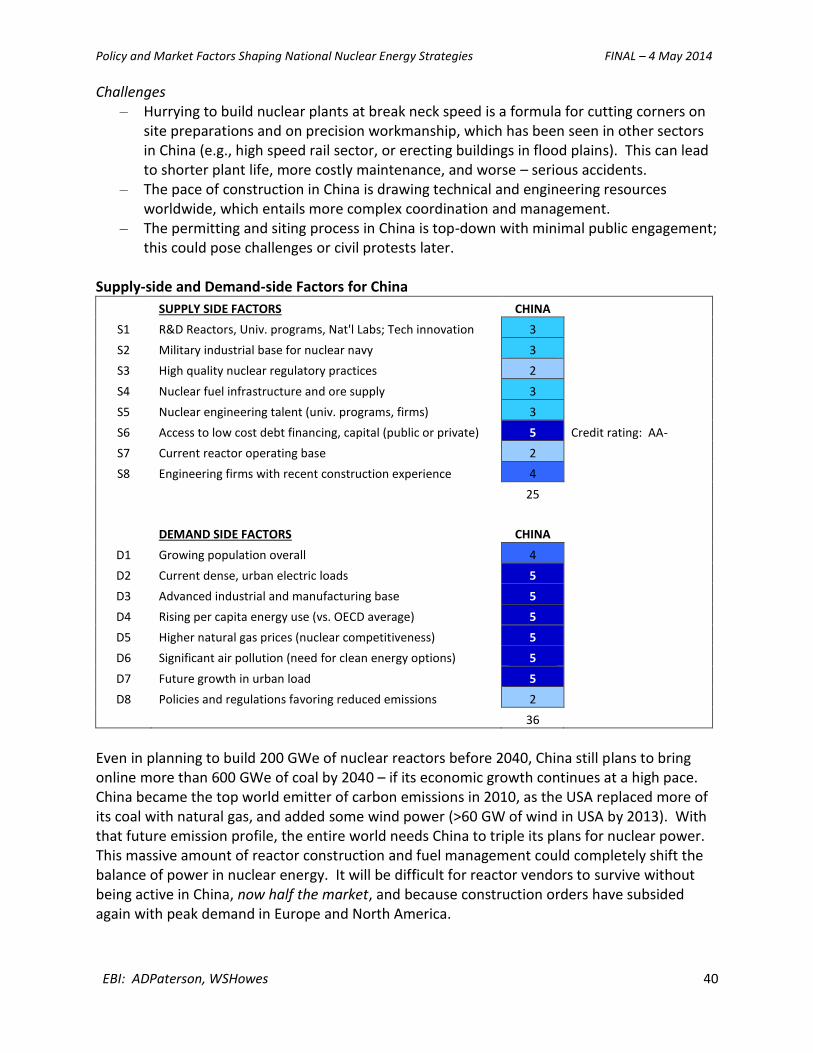
Policy and Market Factors Shaping National Nuclear Energy Strategies FINAL – 4 May 2014
EBI: ADPaterson, WSHowes 40
Challenges ‒ Hurrying to build nuclear plants at break neck speed is a formula for cutting corners on
site preparations and on precision workmanship, which has been seen in other sectors in China (e.g., high speed rail sector, or erecting buildings in flood plains). This can lead to shorter plant life, more costly maintenance, and worse – serious accidents.
‒ The pace of construction in China is drawing technical and engineering resources worldwide, which entails more complex coordination and management.
‒ The permitting and siting process in China is top-down with minimal public engagement; this could pose challenges or civil protests later.
Supply-side and Demand-side Factors for China
SUPPLY SIDE FACTORS CHINA
S1 R&D Reactors, Univ. programs, Nat'l Labs; Tech innovation 3 S2 Military industrial base for nuclear navy 3 S3 High quality nuclear regulatory practices 2 S4 Nuclear fuel infrastructure and ore supply 3 S5 Nuclear engineering talent (univ. programs, firms) 3 S6 Access to low cost debt financing, capital (public or private) 5 Credit rating: AA-
S7 Current reactor operating base 2 S8 Engineering firms with recent construction experience 4
25
DEMAND SIDE FACTORS CHINA
D1 Growing population overall 4 D2 Current dense, urban electric loads 5 D3 Advanced industrial and manufacturing base 5 D4 Rising per capita energy use (vs. OECD average) 5 D5 Higher natural gas prices (nuclear competitiveness) 5 D6 Significant air pollution (need for clean energy options) 5 D7 Future growth in urban load 5 D8 Policies and regulations favoring reduced emissions 2
36
Even in planning to build 200 GWe of nuclear reactors before 2040, China still plans to bring online more than 600 GWe of coal by 2040 – if its economic growth continues at a high pace. China became the top world emitter of carbon emissions in 2010, as the USA replaced more of its coal with natural gas, and added some wind power (>60 GW of wind in USA by 2013). With that future emission profile, the entire world needs China to triple its plans for nuclear power. This massive amount of reactor construction and fuel management could completely shift the balance of power in nuclear energy. It will be difficult for reactor vendors to survive without being active in China, now half the market, and because construction orders have subsided again with peak demand in Europe and North America.

Policy and Market Factors Shaping National Nuclear Energy Strategies FINAL – 4 May 2014
EBI: ADPaterson, WSHowes 41
INDIA India has a flourishing and largely indigenous nuclear power program and expects to have 14.6 GWe in nuclear capacity on line by 2020. It aims to supply 25% of electricity from nuclear power by 2050. Due to a lack of indigenous uranium, India has uniquely been developing a nuclear fuel cycle to exploit its reserves of thorium. Foreign technology and fuel are expected to boost India's nuclear power plans considerably. All plants are owned by NPCIL and will have high indigenous engineering and construction content. India has a vision of becoming a world leader in nuclear technology due to its expertise in fast reactors and thorium fuel cycle.
actual actual projected Growth %Growth
INDIA 2000 2010 2020 2000-20 2000-20
Population (million) 1,042.0 1,206.0 1,380.0 338 32.4%
Urban population 286.6 361.8 448.5 162 56.5%
% Urban 27.5% 30.0% 32.5% +5.0 pts of total
GDP per capita ($PPP) $2,200 $3,500 $6,300 186.4%
Electricity Consumption (million MWhs) 376 700 1,400 1,024 272.3%
Electricity Consumption per capita (MWhs) 0.4 0.6 1.0 0.7 181.1%
Electricity - nuclear generation (million MWhs) 10 20 60 50 500.0%
2.7% 2.9% 4.3% 1.6 pts
Total Electric capacity (GWs) 110.0 200.0 400.0 290 263.6%
Total Nuclear capacity (GWs) 2.5 4.4 14.6 12 484.0%
Policy and Market Factors for Nuclear Energy in India A major impetus for increasing nuclear power share in India lies in pollution from coal-fired power plants, similar to China. India now consumes nearly 800 million tons of coal annually, twice the volume it used in 2000, and nearing the volume used by USA. In addition, India’s population will surpass that of China’s at 1.45 billion near 2030. Like China, India must meet rising demand from heavier urbanization going forward, so reactors fit the bill. National Strategy points for India – Renaissance Heavy strategy Favorable:
The huge scale of urbanization and threat of pollution combined with energy poverty in India makes nuclear a top national priority.
India is a nuclear power also with dozens of warheads; a position it will not “rollback”; Nuclear power is a fused element in national identity and global status.
India’s engineering and educational base in nuclear engineering makes it a global player. “I know the environmentalists will not be very happy with my decision, but it is foolish romance to think that India can attain high-growth rate and sustain the energy needs of a 1.2 billion population with the help of solar, wind, biogas and such other forms of energy. It is paradoxical that environmentalists are against nuclear energy. “ Jairam Ramesh, Environment Minister [The Hindu, 29 Nov. 2010]

Policy and Market Factors Shaping National Nuclear Energy Strategies FINAL – 4 May 2014
EBI: ADPaterson, WSHowes 42
Challenges ‒ The level of poverty remains high placing downward pressure on the prices sought for
electricity. In the last decade several of the local electricity entities entered bankruptcy and have encountered social challenges in collections of tariffs.
‒ India has experienced some local opposition, such as to the huge plant (6 EPRs by Areva) proposed at Jaitapur, northeast of Mumbai. France and India recently agreed to a price of around $6.5 billion per reactor. This plant could double India’s capacity.
‒ Local economics could place strains on the pace of new reactor construction. Supply-side and Demand-side Factors for India
SUPPLY SIDE FACTORS INDIA
S1 R&D Reactors, Univ. programs, Nat'l Labs; Tech innovation 2
S2 Military industrial base for nuclear navy 3
S3 High quality nuclear regulatory practices 3
S4 Nuclear fuel infrastructure and ore supply 4
S5 Nuclear engineering talent (univ. programs, firms) 3
S6 Access to low cost debt financing, capital (public or private) 3 Credit rating: BBB-
S7 Current reactor operating base 4
S8 Engineering firms with recent construction experience 3
25
DEMAND SIDE FACTORS INDIA
D1 Growing population overall 5
D2 Current dense, urban electric loads 5
D3 Advanced industrial and manufacturing base 3
D4 Rising per capita energy use (vs. OECD average) 5
D5 Higher natural gas prices (nuclear competitiveness) 5
D6 Significant air pollution (need for clean energy options) 4
D7 Future growth in urban load 5
D8 Policies and regulations favoring reduced emissions 1
33
Its native supply of thorium enables India to lead the world in researching a thorium fuel cycle (rather than uranium), which if made more economic would offer some proliferation advantages by diminishing plutonium volumes as a by-product from the uranium fission cycle. In a recent speech (Jan. 2014), current Prime Minister Manmohan Singh summarized the national policy: "Nuclear energy is a dependable and clean option to produce power. India is among the very few nations which have developed technology to install nuclear power plants and have achieved the capability to make nuclear fuel. Our aim is that in the coming ten years, we should achieve the capability to generate more than 27,000 MWe nuclear power."8
A victory in the May 2014 national election by the challenging party led by development-minded, Hindu-nationalist BJP party head Narendra Modi would likely be even more bullish for nuclear power, since BJP has endorsed nuclear energy as a high national priority.
8 Hindustan Times, 3 Jan 2014
Policy and Market Factors Shaping National Nuclear Energy Strategies FINAL – 4 May 2014
EBI: ADPaterson, WSHowes 43
SUMMARY – Part I: Redefining Leadership in the Global Nuclear Energy Market
CONTENTS Rising Global Electricity Demand
The Market Pivot to Urban Asia The Benefits of Nuclear Power The New Global Commercial Nuclear Power Landscape US Commercial Nuclear Industry Challenges
International Partnerships as a Strategic Path Forward A Focused Partnership Strategy to Reinvigorate US Role in Global Nuclear Energy Other Examples of Multinational Partnerships Success Factors for Nuclear Energy: Supply-Side and Demand-Side Drivers
Conclusions Possible Outcomes for International Nuclear Cooperation
Global Outlook to 2030 The most recent projections from the World Nuclear Association (WNA) for nuclear capacity predict that “world nuclear generating capacity will increase from the current level of 370 GWe (including all Japanese reactors except Fukushima Daiichi 1-4) to 433 GWe by 2020 and to 574 GWe by 2030.” The WNA projection falls within the International Atomic Energy Agency’s (IAEA) low (501GWe) and high (746 GWe) projections of global capacity by 2030. The majority of growth in the nuclear industry is currently occurring in China, India, and South Korea. Several emerging countries are making plans. Challenges for the US Commercial Nuclear Industry The US nuclear industry, with the two major vendors owned now by Japanese entities, must address the following challenges before it can secure future partnerships and maintain global leadership:
1. Low growth in domestic demand for energy and electricity 2. Fragmented ownership of nuclear assets (in regional investor-owned utilities) 3. Competition from currently low natural gas prices in North America (<$6/Mbtu to 2020) 4. Little value for emissions savings (with dim prospects for policy enactment) 5. Uncertain regulatory and policy landscape related to spent fuel 6. Development of next-generation technologies, such as Small Modular Reactors (SMRs)
The new reality is that while US utilities remain a leader in operating nuclear plants, this status may be short-lived, as US companies will not lead the construction of new nuclear power plants. New domestic orders for plants will be few and far between until electric demand rebounds in the United States, and low prices of natural gas will make it difficult for other fuel sources to compete. It appears that the best strategic opportunities for US industry may reside in countries with:
‒ A robust track record of current operations of nuclear reactors (S7) ‒ High quality nuclear regulatory capacity with strong ties to IAEA and US NRC (S3) ‒ Superior engineering, skilled labor, and manufacturing in nuclear supply chain (S4, S5, S8) ‒ Access to low cost capital for financing for capital intensive nuclear plants (S6) ‒ Clear regimes of asset control for nuclear facilities (e.g., military bases, secured sites) ‒ Strong presence in Asia (Japan and Korea are the most obvious allies based on current ties.)
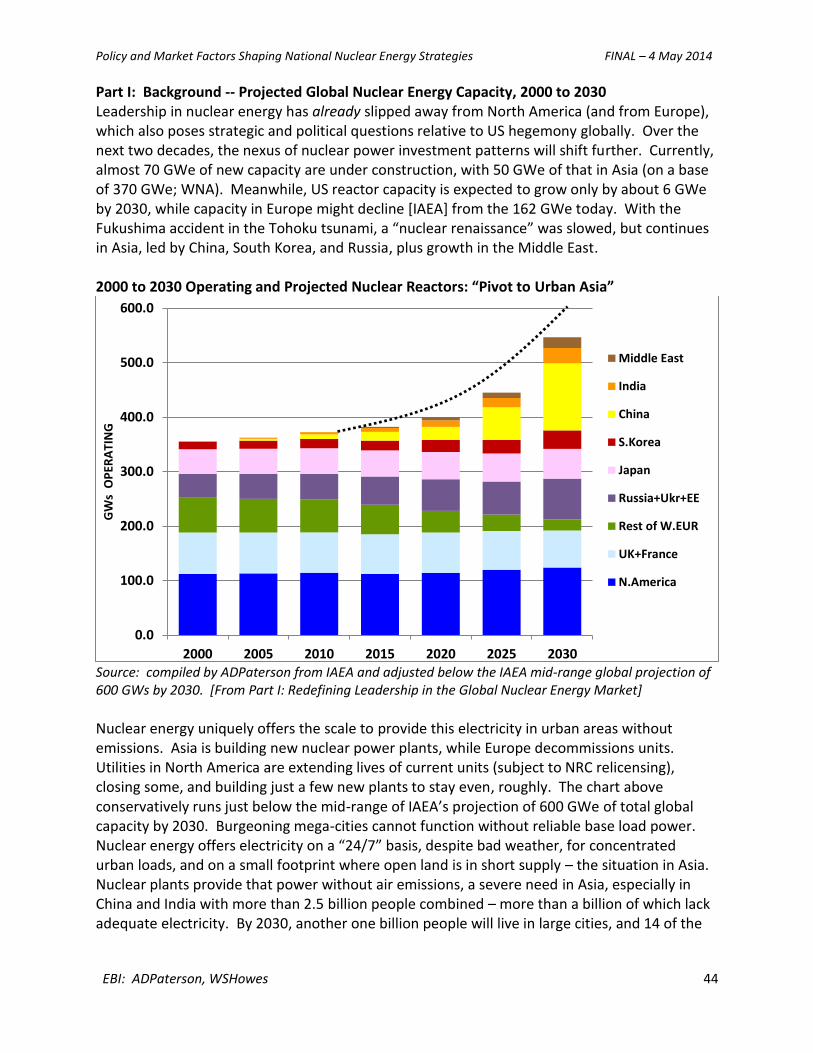
Policy and Market Factors Shaping National Nuclear Energy Strategies FINAL – 4 May 2014
EBI: ADPaterson, WSHowes 44
Part I: Background -- Projected Global Nuclear Energy Capacity, 2000 to 2030 Leadership in nuclear energy has already slipped away from North America (and from Europe), which also poses strategic and political questions relative to US hegemony globally. Over the next two decades, the nexus of nuclear power investment patterns will shift further. Currently, almost 70 GWe of new capacity are under construction, with 50 GWe of that in Asia (on a base of 370 GWe; WNA). Meanwhile, US reactor capacity is expected to grow only by about 6 GWe by 2030, while capacity in Europe might decline [IAEA] from the 162 GWe today. With the Fukushima accident in the Tohoku tsunami, a “nuclear renaissance” was slowed, but continues in Asia, led by China, South Korea, and Russia, plus growth in the Middle East. 2000 to 2030 Operating and Projected Nuclear Reactors: “Pivot to Urban Asia”
Source: compiled by ADPaterson from IAEA and adjusted below the IAEA mid-range global projection of 600 GWs by 2030. [From Part I: Redefining Leadership in the Global Nuclear Energy Market]
Nuclear energy uniquely offers the scale to provide this electricity in urban areas without emissions. Asia is building new nuclear power plants, while Europe decommissions units. Utilities in North America are extending lives of current units (subject to NRC relicensing), closing some, and building just a few new plants to stay even, roughly. The chart above conservatively runs just below the mid-range of IAEA’s projection of 600 GWe of total global capacity by 2030. Burgeoning mega-cities cannot function without reliable base load power. Nuclear energy offers electricity on a “24/7” basis, despite bad weather, for concentrated urban loads, and on a small footprint where open land is in short supply – the situation in Asia. Nuclear plants provide that power without air emissions, a severe need in Asia, especially in China and India with more than 2.5 billion people combined – more than a billion of which lack adequate electricity. By 2030, another one billion people will live in large cities, and 14 of the
0.0
100.0
200.0
300.0
400.0
500.0
600.0
2000 2005 2010 2015 2020 2025 2030
GW
s O
PER
ATI
NG
Middle East
India
China
S.Korea
Japan
Russia+Ukr+EE
Rest of W.EUR
UK+France
N.America

Policy and Market Factors Shaping National Nuclear Energy Strategies FINAL – 4 May 2014
EBI: ADPaterson, WSHowes 45
world’s 20 largest urban areas will be located in Asia. 60 percent of people will live in cities and the world will have 1,000 cities with over 1 million people. In fact, the majority of global gross domestic product is now produced in the top 600 urban areas.9 The summary of the World Energy Congress 2010 offered this observation:
“Trend #19: Mega-cities have major needs: The WEC 2010 has reported that the equivalent of seven cities with ten million people will be added every year in the next 20 years. As urban populations increase worldwide, so does the importance of providing a clean, efficient energy supply and improving standards of living. More than half of the world’s population now lives in cities; by 2030, that will increase to 60 percent.”10
Global electricity demand will be driven by many factors, including urbanization, the rise of the middle class, policies to reduce air pollution, developing a balanced electricity generation portfolio for security, and the need to clean and pump more potable water for drinking and agriculture. The “resource nexus” of energy, water, and agriculture is intensifying. EIA: Projected World Electricity Generation by Fuel Source to 2040
Source: US Energy Information Administration (EIA), International Energy Outlook 2013, July 2013
After 2020, the appetite for appliances and electricity with an expanding middle class, more use of electric vehicles and urban mass transit, along with desalination, will drive more electricity demand in the global energy and water sectors. And, as shown in the chart above, China and Asia are driving this growth, as demand curves in OECD countries have crested. With pressures for development, the world cannot conserve its way to less resource use; technology must be deployed, including nuclear energy – more electricity with much lower emissions.
9 McKinsey Global Institute, Urban world: Mapping the economic power of cities, March 2011
10 World Energy Council, www.worldenergy.org/documents/wec_addendum_lores.pdf

Policy and Market Factors Shaping National Nuclear Energy Strategies FINAL – 4 May 2014
EBI: ADPaterson, WSHowes 46
REFERENCES: Emissions savings Nuclear and Natural Gas Account for Most Carbon Displacement Since 1950 US Saved About 54 Billion Tonnes of Carbon Dioxide Emissions Switching to Cleaner Energy September 3, 2013 | Max Luke, Breakthrough Institute
http://thebreakthrough.org/index.php/programs/energy-and-climate/nuclear-and-gas-account-for-most-carbon-displacement-since-1950/ Small footprint of Nuclear Reactors, Breakthrough Institute A chief advantage of nuclear power is the extreme compactness of nuclear energy systems. For example, the same thought experiment that produced the 83,000-mile long coal train would yield a 1-mile long nuclear train – the train bearing all the nuclear fuel assemblies needed to power the nation’s 100 nuclear power reactors for a year. (A train carrying all the spent fuel away from the 100 reactors would be about 2 miles long, because of the additional shielding and physical protection required.) http://thebreakthrough.org/index.php/programs/energy-and-climate/the-nuclear-power-imperative
Policy and Market Factors Shaping National Nuclear Energy Strategies FINAL – 4 May 2014
EBI: ADPaterson, WSHowes 47
REFERENCES
ACUS: “Redefining Leadership in Nuclear Energy Markets” by Andrew Paterson, Walter Howes www.atlanticcouncil.org/publications/reports/redefining-leadership-in-the-global-nuclear-energy-market
CSIS: Restoring US Leadership in Nuclear Energy http://csis.org/publication/restoring-us-leadership-nuclear-energy
WNA: “National Sovereignty and Nuclear Strategy –Renaissance, Rollback, or Restructuring?” By Andrew Paterson, World Nuclear Symposium 2012 (London, UK). BPC: Challenges and Opportunities for Nuclear Power in the United States (2012) http://bipartisanpolicy.org/content/about-nuclear-initiative
Nuclear Firsts: Milestones on the Road to Nuclear Power Development, Dr. Gail H. Marcus, American Nuclear Society, 2010 “Atoms for Prosperity”: ITA Leads Largest Ever U.S. Industry Delegation to 6th Annual U.S. Industry Program at IAEA (October 2013) http://blog.trade.gov/2013/10/30/atoms-for-prosperity-ita-leads-largest-ever-u-s-industry-delegation-to-6th-annual-u-s-industry-program-at-the-international-atomic-energy-agency-general-conference/ EEI: Credit Rating Analysis for Regulated and Diversified Utilities (Sept 2013) http://www.eei.org/resourcesandmedia/industrydataanalysis/industryfinancialanalysis/QtrlyFinancialUpdates/Documents/QFU_Credit/2013_Q3_Credit_Ratings.pdf MIT: The Future of Nuclear Power, Dr. John Deutch, Dr. Ernest Moniz, July 2003 http://web.mit.edu/nuclearpower/pdf/nuclearpower-update2009.pdf IAEA / OECD: Red Book 2011: Global Uranium Supply Ensured for Long Term “Uranium resources and production are on the rise with the security of uranium supply ensured for the long term. It shows that total identified uranium resources have grown 12.5% since 2008… Global uranium mine production increased by over 25% between 2008 and 2010 because of significantly increased production in Kazakhstan, currently the world's leading producer.” http://www.iaea.org/OurWork/ST/NE/NEFW/Technical_Areas/NFC/uranium-production-cycle-redbook.html IAEA: Country Nuclear Fuel Cycle Profiles, Vienna 2005 http://www-pub.iaea.org/MTCD/publications/PDF/TRS425_web.pdf B&W Funding for mPower reduced (April 14, 2014) http://www.world-nuclear-news.org/C-Funding-for-mPower-reduced-1404141.html Opposing View: Small Isn't Always Beautiful: Safety, Security, and Cost Concerns about SMRs http://www.ucsusa.org/nuclear_power/nuclear_power_technology/small-modular-reactors.html

Policy and Market Factors Shaping National Nuclear Energy Strategies FINAL – 4 May 2014
EBI: ADPaterson, WSHowes 48
DOE: Benefits of SMRs http://energy.gov/ne/nuclear-reactor-technologies/small-modular-nuclear-reactors Small Modular Reactors offer the advantage of lower initial capital investment, scalability, and siting flexibility at locations unable to accommodate more traditional larger reactors. They also have the potential for enhanced safety and security, and enhanced non-proliferation features.
U.S. Dept. of Energy Strategic Framework for SMR Deployment (February 2012), p. 5 http://energy.gov/sites/prod/files/SMR%20Strategic%20Framework.pdf
Small Modular Reactors: Costs, Waste and Safety Benefits Geoffrey Rothwell, Ph.D. Department of Economics, Stanford University, December 17, 2012 http://nepinstitute.org/wp-content/uploads/2013/04/Rothwell-Small-Modular-Reactors-Dec-20121.pdf CAES: Economic and Employment Impacts of SMRs, June 2010 David Sloan – Boise State Center for Advanced Energy Studies (CAES) http://epi.boisestate.edu/media/3494/economic%20and%20employment%20impacts%20of%20smrs.pdf Reactors of SMR size (<300 MW to 50 MW) are already made for the US and Russian navies. “The U.S. Navy has accumulated over 5,400 "reactor years" of accident-free experience, and operates more than 80 nuclear-powered ships” Statement of Admiral F. L. "Skip" Bowman, former U.S. Navy Director, Naval Nuclear Propulsion Program before the House Committee on Science, 29 October 2003. NEI listing: SMR vendors by technology (45 MWs to 180 MWs in size) http://www.nei.org/Master-Document-Folder/Backgrounders/Fact-Sheets/Small-Reactors-Provide-Clean,-Safe-Power-and-Indus Wall Street Journal, June 04, 2013: Worldwide Capacity of Small Modular Reactors Could Reach 18 Gigawatts by 2030, Forecasts Navigant Research "The move toward smaller, more flexible reactors is returning the nuclear power industry to its roots, in the U.S. Navy's nuclear submarine program," says Richard Martin, editorial director at Navigant Research. "It's clear that for the so-called renaissance of nuclear power to achieve its potential, SMRs must become a significant part of the world's nuclear fleet."

Policy and Market Factors Shaping National Nuclear Energy Strategies FINAL – 4 May 2014
EBI: ADPaterson, WSHowes 49
ENDNOTES
i Business Associations Urge Assertive Approach to Nuclear Trade (NEI, NAM, Chamber of
Commerce)
http://www.nei.org/News-Media/News/News-Archives/Business-Associations-Urge-Assertive-
Approach-to-N
ii WNA: “International Nuclear Waste Disposal Concepts” (April 2012), including fuel
management http://www.world-nuclear.org/info/Nuclear-Fuel-Cycle/Nuclear-Wastes/International-Nuclear-Waste-Disposal-Concepts/
iii
“Section 123 Agreements for Peaceful Cooperation in Nuclear Energy” [State Dept., NNSA]
http://export.gov/civilnuclear/eg_main_022093.asp
iv
“Try again on US-South Korea cooperation deal”, April 25, 2013, World Nuclear News
http://www.world-nuclear-
news.org/np_try_again_on_us_south_korea_cooperation_deal_2504131.html
“U.S.-ROK Civil Nuclear Cooperation Agreement: Overcoming the Impasse”, October 11, 2013
http://www.brookings.edu/research/speeches/2013/10/us-south-korea-civil-nuclear-cooperation-
agreement-einhorn
vi “The turnaround in enrollments was due to a prescient decision by the DOE in the very early 2000s to restore some funding for university nuclear engineering programs and facilities, and to continue funding from both DOE and NRC since then. This funding has not only increased enrollments, but has also spurred the start-up of several new nuclear engineering departments around the country. Continued support is needed to assure that the US maintains the expertise to support the kinds of programs envisioned in this paper.” Interview with Dr. Gail H. Marcus for this paper, April 2014.