Factors Shaping Global Food Markets
13
Consumers today are upgrading their diets to include more higher valued products than in the past (Regmi, 2001; Rosegrant et al., 2001). Initially, this trend was accompanied by rapid growth in trade for high-value foods, fueling speculation of continued trade growth in the sector. However, contrary to conventional wisdom, global food trade patterns have shifted again and the trade share of high-value food, particularly processed products, has started to decline. Competing in the global food industry is a complex undertaking, as firms must continually react to the demands of wealthier and more selective consumers for higher quality and more varied products. Markets for individual food products, however, are not becoming global. Rather, consumer demand for food products varies based on income and regional cultural preferences. Successful local, regional, and global firms supplying foods to these diverse markets employ increasingly sophisticated technologies and business practices to customize food products to meet local tastes and preferences. Size and Changing Shape of the Global Food Market Food is sold either through retail stores or through foodservice establish- ments, mainly hotels and restaurants. Global sales of food, including food sold through foodservice establishments, are estimated at $4 trillion in 2002 (table 1-1). Over 40 percent of the total value of global food sales is currently accounted for by the foodservice sector. With consumers increas- ingly demanding convenience, it is likely that the value of global foodser- vice sales will overtake global retail food sales in the future. The demand for convenience is not limited to consumers in developed countries. In the developing countries, rising demand for convenience is reflected by the rapidly expanding fast food sector. 2 As the food sector is not consistently defined across countries and regions, nor is food sold in the same manner, it is difficult to measure precisely the actual size of the world food market. For example, in developed countries, the foodservice sector accounts for a large and growing share of total food sold. However, food service covers a wide variety of outlets, and reliable data are generally hard to obtain across different countries. In developing countries, a large share of food is traditionally sold through streetside 1 Mark Gehlhar and Anita Regmi are economists, Market and Trade Economics Division, ERS/USDA. 5 New Directions in Global Food Markets / AIB-794 Economic Research Service/USDA Chapter 1 Factors Shaping Global Food Markets Mark Gehlhar & Anita Regmi 1 Modern food markets are responding to consumer preferences at a local level, as the food industry becomes more global. 2 The World Bank defines high-income countries as those with year 2000 per capita Gross National Income (GNI) above $9,266; upper-middle-income countries as those between $2,996 and $9,266; low-middle-income countries as those between $756 and $2,995; and low-income countries as those below $756. Countries in the low- and middle-income groups are generally considered to be developing countries.
-
Upload
independent -
Category
Documents
-
view
0 -
download
0
Transcript of Factors Shaping Global Food Markets

Consumers today are upgrading their diets to include more higher valuedproducts than in the past (Regmi, 2001; Rosegrant et al., 2001). Initially,this trend was accompanied by rapid growth in trade for high-valuefoods, fueling speculation of continued trade growth in the sector.However, contrary to conventional wisdom, global food trade patternshave shifted again and the trade share of high-value food, particularlyprocessed products, has started to decline.
Competing in the global food industry is a complex undertaking, as firmsmust continually react to the demands of wealthier and more selectiveconsumers for higher quality and more varied products. Markets for individualfood products, however, are not becoming global. Rather, consumer demandfor food products varies based on income and regional cultural preferences.Successful local, regional, and global firms supplying foods to these diversemarkets employ increasingly sophisticated technologies and business practicesto customize food products to meet local tastes and preferences.
Size and Changing Shape of the GlobalFood Market
Food is sold either through retail stores or through foodservice establish-ments, mainly hotels and restaurants. Global sales of food, including foodsold through foodservice establishments, are estimated at $4 trillion in 2002(table 1-1). Over 40 percent of the total value of global food sales iscurrently accounted for by the foodservice sector. With consumers increas-ingly demanding convenience, it is likely that the value of global foodser-vice sales will overtake global retail food sales in the future. The demandfor convenience is not limited to consumers in developed countries. In thedeveloping countries, rising demand for convenience is reflected by therapidly expanding fast food sector.2
As the food sector is not consistently defined across countries and regions,nor is food sold in the same manner, it is difficult to measure precisely theactual size of the world food market. For example, in developed countries,the foodservice sector accounts for a large and growing share of total foodsold. However, food service covers a wide variety of outlets, and reliabledata are generally hard to obtain across different countries. In developingcountries, a large share of food is traditionally sold through streetside
1 Mark Gehlhar and Anita Regmi areeconomists, Market and TradeEconomics Division, ERS/USDA.
5New Directions in Global Food Markets / AIB-794
Economic Research Service/USDA
Chapter 1
Factors Shaping Global Food Markets
Mark Gehlhar & Anita Regmi1
Modern food markets are responding to consumer preferencesat a local level, as the food industry becomes more global.
2 The World Bank defines high-incomecountries as those with year 2000 percapita Gross National Income (GNI)above $9,266; upper-middle-incomecountries as those between $2,996 and$9,266; low-middle-income countriesas those between $756 and $2,995;and low-income countries as thosebelow $756. Countries in the low- andmiddle-income groups are generallyconsidered to be developing countries.

stalls. Products sold in such markets include food prepared at vendors’homes and sold to consumers in a ready-to-eat form.
At the retail level (which excludes food service), a relatively consistentcomparison across regions is possible through the use of food sales datafrom grocery stores. However, these data fail to completely capture all foodsales, especially in the developing countries. Although supermarkets areincreasingly prevalent in developing countries, the available food sales datafrom these outlets may understate the actual size of individual developingcountry markets. Nevertheless, lacking alternative sources, this study usesretail sales data collected by a commercial vendor, Euromonitor, whichconsists of globally consistent food categories (see box on Euromonitor).
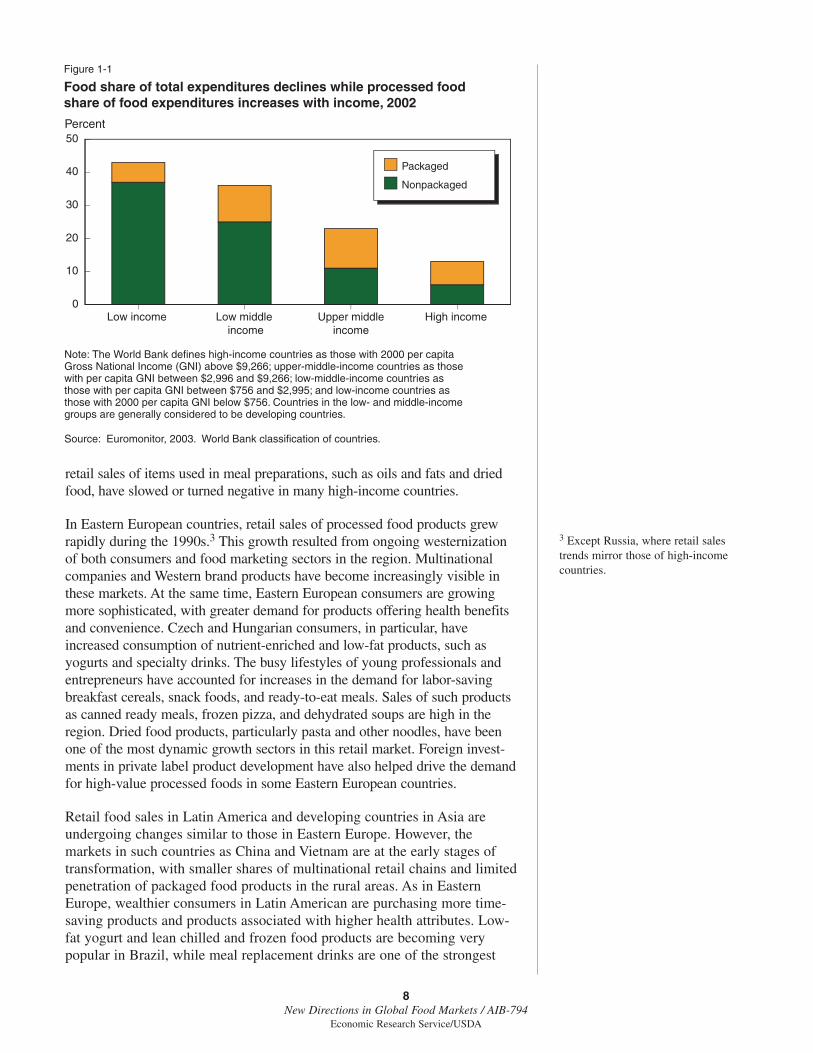
At the retail level, food can be broken down to fresh ($531 billion) andprocessed ($1.7 trillion). Processed product sales are the combined sales ofpackaged food ($1.1 trillion) and beverages ($641 billion). High-incomeregions, including European Union (EU) countries, the United States, andJapan, accounted for over 60 percent of packaged food sales in the world in2002. Packaged food accounts for about half of total food expenditures indeveloped countries but only a third or less in most developing countries(fig. 1-1). In most countries, packaged food accounts for about two-thirds ofall processed products sales, with alcoholic beverages, soft drinks and hotdrinks constituting the remaining one-third. The value of packaged foodsales varies among countries based on per capita incomes (table 1-2).
Market sizes, as indicated by the value of retail sales, are much larger inhigh-income countries, but market growth has generally been faster amongdeveloping countries (table 1-3). Among developing countries, oils and fats,dried food, and dairy products have sizable retail markets with stronggrowth trends. While smaller in terms of retail value, the breakfast cerealsmarket has skyrocketed, registering double- and triple-digit sales growth insome developing countries.
In the mature markets of high-income countries, processed food retail sales aregrowing at a slower pace than in the developing countries. Ready-to-eat mealsare one of the fastest growing sectors in developed countries, while breakfastcereals are making inroads in the nontraditional French and Singaporeanmarkets. As growth rates of ready-to-eat products have risen, growth rates in
6New Directions in Global Food Markets / AIB-794
Economic Research Service/USDA
Table 1-1—Global food sales, 2002
Retail stores Food service Total
Billion dollars
Fresh food 531 382 913Processed products 1,762 1,420 3,182
Packaged food 1,148 828 1,976Beverages 614 592 1,206
Alcoholic drinks 316 422 729Hot drinks 53 12 65Soft drinks 245 167 412
Total food 2,293 1,803 4,096
Source: Euromonitor, 2003.
7New Directions in Global Food Markets / AIB-794
Economic Research Service/USDA
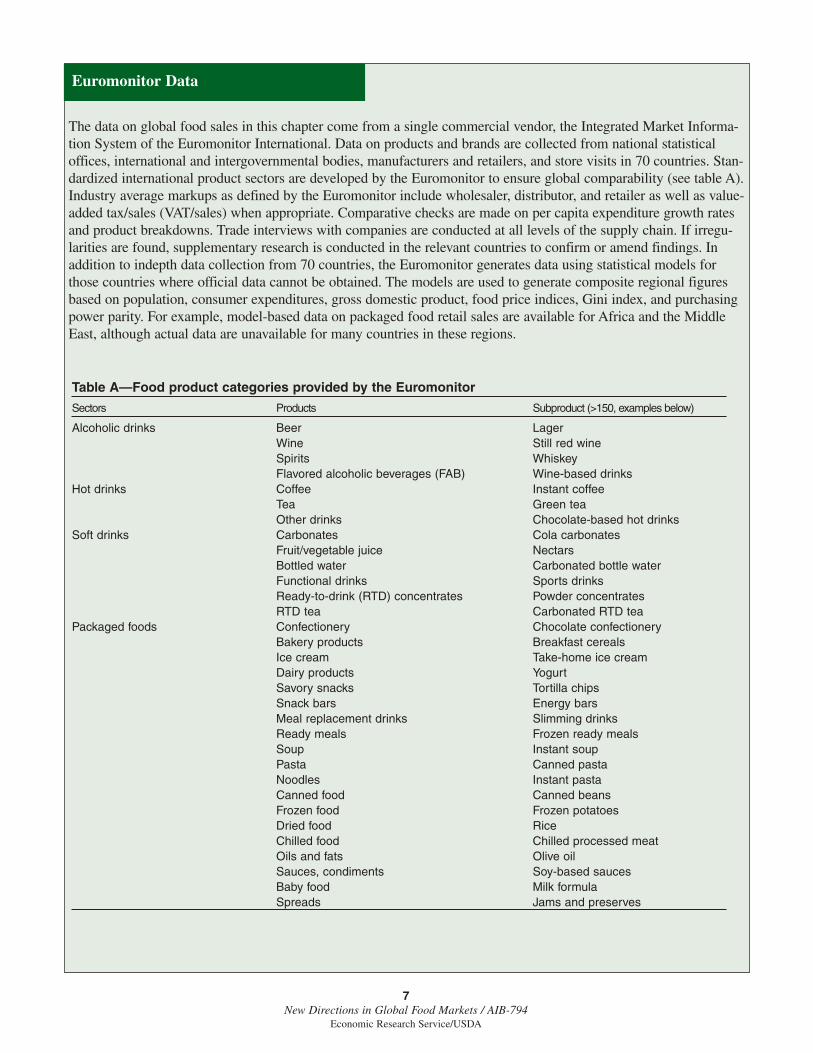
The data on global food sales in this chapter come from a single commercial vendor, the Integrated Market Informa-tion System of the Euromonitor International. Data on products and brands are collected from national statisticaloffices, international and intergovernmental bodies, manufacturers and retailers, and store visits in 70 countries. Stan-dardized international product sectors are developed by the Euromonitor to ensure global comparability (see table A).Industry average markups as defined by the Euromonitor include wholesaler, distributor, and retailer as well as value-added tax/sales (VAT/sales) when appropriate. Comparative checks are made on per capita expenditure growth ratesand product breakdowns. Trade interviews with companies are conducted at all levels of the supply chain. If irregu-larities are found, supplementary research is conducted in the relevant countries to confirm or amend findings. Inaddition to indepth data collection from 70 countries, the Euromonitor generates data using statistical models forthose countries where official data cannot be obtained. The models are used to generate composite regional figuresbased on population, consumer expenditures, gross domestic product, food price indices, Gini index, and purchasingpower parity. For example, model-based data on packaged food retail sales are available for Africa and the MiddleEast, although actual data are unavailable for many countries in these regions.
Euromonitor Data
Table A—Food product categories provided by the Euromonitor
Sectors Products Subproduct (>150, examples below)
Alcoholic drinks Beer LagerWine Still red wineSpirits WhiskeyFlavored alcoholic beverages (FAB) Wine-based drinks
Hot drinks Coffee Instant coffeeTea Green teaOther drinks Chocolate-based hot drinks
Soft drinks Carbonates Cola carbonatesFruit/vegetable juice NectarsBottled water Carbonated bottle waterFunctional drinks Sports drinksReady-to-drink (RTD) concentrates Powder concentratesRTD tea Carbonated RTD tea
Packaged foods Confectionery Chocolate confectioneryBakery products Breakfast cerealsIce cream Take-home ice creamDairy products YogurtSavory snacks Tortilla chipsSnack bars Energy barsMeal replacement drinks Slimming drinksReady meals Frozen ready mealsSoup Instant soupPasta Canned pastaNoodles Instant pastaCanned food Canned beansFrozen food Frozen potatoesDried food RiceChilled food Chilled processed meatOils and fats Olive oilSauces, condiments Soy-based saucesBaby food Milk formulaSpreads Jams and preserves
retail sales of items used in meal preparations, such as oils and fats and driedfood, have slowed or turned negative in many high-income countries.
In Eastern European countries, retail sales of processed food products grewrapidly during the 1990s.3 This growth resulted from ongoing westernizationof both consumers and food marketing sectors in the region. Multinationalcompanies and Western brand products have become increasingly visible inthese markets. At the same time, Eastern European consumers are growingmore sophisticated, with greater demand for products offering health benefitsand convenience. Czech and Hungarian consumers, in particular, haveincreased consumption of nutrient-enriched and low-fat products, such asyogurts and specialty drinks. The busy lifestyles of young professionals andentrepreneurs have accounted for increases in the demand for labor-savingbreakfast cereals, snack foods, and ready-to-eat meals. Sales of such productsas canned ready meals, frozen pizza, and dehydrated soups are high in theregion. Dried food products, particularly pasta and other noodles, have beenone of the most dynamic growth sectors in this retail market. Foreign invest-ments in private label product development have also helped drive the demandfor high-value processed foods in some Eastern European countries.
Retail food sales in Latin America and developing countries in Asia areundergoing changes similar to those in Eastern Europe. However, themarkets in such countries as China and Vietnam are at the early stages oftransformation, with smaller shares of multinational retail chains and limitedpenetration of packaged food products in the rural areas. As in EasternEurope, wealthier consumers in Latin American are purchasing more time-saving products and products associated with higher health attributes. Low-fat yogurt and lean chilled and frozen food products are becoming verypopular in Brazil, while meal replacement drinks are one of the strongest
3 Except Russia, where retail salestrends mirror those of high-incomecountries.
8New Directions in Global Food Markets / AIB-794
Economic Research Service/USDA
Figure 1-1
Food share of total expenditures declines while processed foodshare of food expenditures increases with income, 2002
Source: Euromonitor, 2003. World Bank classification of countries.
Low income Low middle income
Upper middleincome
High income0
10
20
30
40
50Percent
Note: The World Bank defines high-income countries as those with 2000 per capita Gross National Income (GNI) above $9,266; upper-middle-income countries as those with per capita GNI between $2,996 and $9,266; low-middle-income countries as those with per capita GNI between $756 and $2,995; and low-income countries as those with 2000 per capita GNI below $756. Countries in the low- and middle-income groups are generally considered to be developing countries.
Packaged
Nonpackaged

9New Directions in Global Food Markets / AIB-794
Economic Research Service/USDA
Table 1-2—Annual average growth in retail sales of packaged foods
Per capita Per capita Total retail growth Per capita growthCountry group gross national 2002 retail sales
income (2000) 1996-2002 2002-081 1996-2002 2002-081
Dollars Percent Percent
High-income >=9,266 979 3.2 1.7 2.5 1.1Upper-middle-income 2,996-9,265 298 8.1 4.0 6.7 2.8Lower-middle-income 756-2,995 143 28.8 4.4 28.1 3.8Low-income <755 63 12.9 6.1 11.9 5.3
Note: Country classifications as per the World Bank. Retail sales are sales of packaged foods.1 Retail growth projections made by Euromonitor.
Source: Euromonitor, 2003.
Table 1-3—Retail sales size and growth of selected food items
Retail sales, 2002 Average annual growth rate (1998-2003)
Market Oils & Breakfast Ready Dried Dairy Oils & Breakfast Ready Dried Dairyfats cereals meals food products fats cereals meals food products
Million dollars Percent
High-income countries:France 2,294 646 2,924 1,085 14,733 1.3 5.0 4.8 1.5 3.8Germany 2,413 711 1,986 1,969 13,798 -1.7 0.4 3.4 2.2 2.4Japan 2,731 300 11,573 22,510 18,801 -1.8 2.2 4.9 -1.5 0.9Singapore 35 17 22 139 134 2.2 10.0 3.6 3.6 4.7United Kingdom 1,997 1,999 6,172 1,215 10,239 1.1 1.0 5.9 3.5 1.8United States 4,673 9,476 17,278 9,965 46,969 -0.1 1.3 5.8 1.4 3.8
High-middle-income countries:Brazil 2,559 117 203 3,369 7,106 24.0 8.9 17.3 16.1 13.4Chile 250 48 10 217 747 1.0 10.3 4.0 -0.2 3.7Czech Republic 443 19 201 221 1,427 0.8 12.4 10.8 11.3 4.4Hungary 319 40 124 378 1,206 6.9 16.2 10.2 7.9 8.6Mexico 1,105 1,008 36 1,757 7,393 9.6 14.6 13.8 20.8 9.8South Africa 964 144 196 637 1,404 10.4 4.0 3.3 7.9 6.2South Korea 782 141 24 3,936 2,608 4.9 9.2 5.0 4.6 4.1Turkey 2,097 27 33 447 4,692 1.5 2.2 -1.1 -1.8 3.0
Low-middle-income countries:Bulgaria 142 6 4 60 348 2.9 14.5 5.0 4.4 5.1China 1,576 – 665 4,615 4,479 11.2 – 2.9 10.4 15.4Colombia 909 58 20 754 3,266 5.6 11.0 8.9 11.0 13.3Morocco 697 1 1 98 705 3.5 16.1 5.1 5.1 5.9Philippines 492 23 30 305 571 8.0 12.0 4.8 12.0 11.0Romania 270 6 3 169 652 29.4 27.8 34.6 37.3 27.3Russia 3,095 207 618 1,543 3,790 -3.6 2.5 9.3 -3.8 1.8
Low-income countries:India 1,466 16 – 437 1,245 5.5 11.7 – 10.6 9.8Indonesia 404 20 12 1,944 895 6.7 10.8 9.5 3.8 14.8Ukraine 1,177 9 33 457 651 19.6 20.7 12.5 12.6 10.4Vietnam 208 0.2 – 96 156 14.7 182.0 – 30.6 10.6
Note: – = unavailable sales data.Source: Euromonitor, 2003.
growth sectors in Colombia. Latin American consumers are also developinga taste for different ethnic foods, with pasta being the fastest growing driedpackaged product sold in the region.
Reflecting the increased demand for variety as incomes increase, thenumber of products purchased at retail outlets is greater for wealthier coun-tries. For example, the top five product categories account for 71 percent ofprocessed food retail sales for Mexico and 74 percent for India, but only 48percent for the United States and 47 percent for the United Kingdom. Inmost countries, the top five product categories are bakery, dairy, confec-tionery, carbonated drinks, and chilled foods.
As the demand for processed foods is also driven by the demand for higherquality and labor-saving products, the items consumed by countries atdifferent income levels reflect different levels of demand for servicesembodied in the products. For example, ready-to-eat meals account forabout 4 percent of total retail sales in the United States and the UnitedKingdom, but only 0.06 percent in Mexico, 0.55 percent in China, and 0percent in India. On the other hand, intermediate products, such as fats andoils, while accounting for over 7 percent of total processed food retail salesin India, 13 percent in Indonesia, and 5 or more percent in many developingcountries, account for less than 2 percent of retail sales in high-incomecountries (0.79 percent in the United States).
Trends in the soft drink and beverage sector are often an indicator of theability of consumers to purchase higher value foods. For example, growingaffluence in the developing countries is associated with greater expenditureson soft drinks, which, in turn, indicates increased consumer ability topurchase processed foods. In fact, foreign direct investments (FDI) in thebeverage sector often function as a bellwether in the local food industry(Bolling, 2002). The global market for soft drinks is rapidly expanding, withlarge growth in sales in Eastern Europe and Asia (table 1-4). Growth in softdrink sales is particularly high in East Asia, with markets expanding at ratesranging from almost 12 percent (Philippines) to 22 percent (Indonesia) annu-ally. The soft drink markets in developed countries, however, are sluggish,with average annual growth rates for all soft drinks ranging from 3 percent inGermany to about 5 percent in Singapore. The growth in sales of carbonateddrinks is considerably lower in all developed country markets, where manyconsumers seek more healthful alternatives to carbonated drinks, with annualgrowth rates at or below 3 percent, and negative for Singapore. Sales growthdata for soft drinks offer a picture of future growth for processed food sales.
Although high-income countries account for over 60 percent of totalprocessed food retail sales, they are essentially mature markets with limitedfuture growth potential in this sector. In developed countries, growth in foodconsumption is expected to arise mainly from slow rates of population growthrather than from increases in per capita consumption. Developing countries,on the other hand, are expected to account for most future increases in fooddemand, resulting from both increases in population as well as increases inper capita food consumption. Diet upgrades made possible by income growthare expected to double the quantity of meat demanded by consumers in devel-oping countries by the year 2020, as well as increase the demand for otherhigh-value food products (Rosegrant et al., 2001).
10New Directions in Global Food Markets / AIB-794
Economic Research Service/USDA

While retail sales of packaged foods have grown at about 2-3 percent annu-ally in high-income countries, they have grown much faster among devel-oping countries, ranging from 7 percent in upper-middle-income countriesto 28 percent in lower-middle-income countries. The dramatic growthamong middle-income countries is partly due to tremendous growth in salesamong Eastern European countries, such as Romania, Poland, and Hungary.With sales in these countries nearing their peak potential, future growth inpackaged food retail sales among developing countries is expected to bemuch slower, but will continue to exceed the rates for high-income coun-tries. As with retail sales in the soft drink and beverage sectors, a slowdownin sales of packaged foods in Eastern Europe is expected to be offset bygrowth in sales in East Asia. China, Thailand, the Philippines, Indonesia,Vietnam, and India are expected to be some of the fastest growing marketsfor packaged food retail sales in the next 5 years.
Based on per capita income levels, retail sales of different food productsvary across countries, with greater sales in higher value-added productsoccurring in wealthier countries. In fact, high-income countries currently
11New Directions in Global Food Markets / AIB-794
Economic Research Service/USDA
Table 1-4—Retail sales of soft drinks
1997-2002 an. avg. growth
Market 2002 Share of All Carbonatedsales carbonated drinks soft drinks drinks
Million liters —————— Percent ——————
High-income countries:France 12,755 17.4 4.4 2.4Germany 18,920 31.2 2.4 2.9Japan 16,885 16.3 4.5 1.0Singapore 448 41.2 4.9 -0.9United Kingdom 10,031 57.3 3.6 1.9United States 91,286 66.0 3.1 1.4
High-middle-income countries:Brazil 16,630 71.8 5.9 2.5Chile 1,762 85.2 2.4 1.9Czech Republic 2,524 33.3 10.7 8.0Hungary 1,561 44.1 7.0 1.6Mexico 34,874 46.0 8.6 4.1South Africa 2,938 80.1 6.8 6.2South Korea 3,737 33.4 5.7 3.8Turkey 7,508 32.2 6.7 5.2
Low-middle-income countries:Bulgaria 774 52.3 14.3 10.4China 22,952 27.4 15.9 8.8Colombia 3,484 76.0 -0.1 3.3Morocco 961 38.6 3.5 2.8Philippines 4,998 64.2 12.0 8.4Romania 1,561 41.8 13.5 9.9Russia 5,010 47.6 7.9 2.7
Low-income countries:India 3,272 60.3 13.9 7.9Indonesia 9,017 8.9 21.7 7.8Ukraine 1,378 47.7 7.9 6.0Vietnam 539 58.4 4.8 -1.8
Source: Euromonitor, 2003.

account for most global retail sales of processed foods. However, these largemarkets offer little potential for future growth in this sector. On the otherhand, markets for processed foods and beverages are rapidly expanding indeveloping countries.
The Changing Consumer
A primary driving force in the global food market is the consumer. Incomegrowth, lifestyle changes brought about by urbanization, and changingfamily structures have resulted in diet changes among consumers world-wide. Because of either increases in purchasing power or the increasedopportunity cost of time required for preparing food, the demand for highervalue and processed food products has expanded globally. Consumers indeveloping countries, whose diets have traditionally been high in low-value,carbohydrate-rich cereals, have increased their consumption of higher valuemeats, fruits, and vegetables. Similarly, consumers in wealthier countries areincreasingly moving their diets toward relatively higher value foods,although the higher value reflects not increases in quantity and nutrientvalue of the food basket but the value-added service embodied in the prod-ucts, which reduces time required to prepare the foods for consumption.
Although consumers with higher income levels spend more money on food,the food share of total household expenditures is low for wealthierconsumers, who typically spend a larger share of their incomes on moreexpensive items, such as health care, energy, and recreation (Seale, Regmi,and Bernstein, 2003). During the last decade, consumers in high-incomecountries spent an average of 13 percent of their total household expendi-tures on food while consumers in low-income countries spent an average of43 percent (fig. 1-1).4 In 2002, these shares ranged from a high of 55percent of total household expenditures in Indonesia, to 7 percent in theUnited States. Over half of total food expenditures in high-income countriesare attributable to packaged food products. In developing countries, pack-aged foods account for a smaller share of the total food budget. The averageshare in low-income countries is 14 percent.
The increased share of high-value food expenditures in total food expendituresreflects not only consumers’ increased purchasing power but also lifestylechanges brought about by the increased prevalence of household amenities. Forexample, increases in acquisitions of refrigerators may lead to greater house-hold purchases of perishable food products, while increases in ownership ofmicrowave ovens may lead to increased purchases of ready-to-eat foods thatrequire minimal preparation. Ownership of refrigerators has risen significantlyin most developing countries over the last decade (table 1-5).
Microwave oven ownership in high-income and high-middle-income coun-tries increased significantly during the last decade. Over 90 percent ofhouseholds in Japan now possess microwave ovens, compared with about 76percent a decade ago, while over 85 percent of U.S. households possessmicrowave ovens, compared with less than 80 percent in 1990. In lowerincome countries, such as Bulgaria, Brazil, Indonesia, and Mexico, thenumber of households possessing microwave ovens is small but growing(table 1-6). Increased ownership of microwave ovens is likely to increase
4 Food expenditure data excludeexpenses on food consumed awayfrom home.
12New Directions in Global Food Markets / AIB-794
Economic Research Service/USDA

purchases and consumption of prepared foods. Retail sales of ready mealshave increased among some developing countries, with dramatic rates ofgrowth in many middle-income countries in Eastern Europe and LatinAmerica. In developing Asia, total value of retail sales of prepared meals isrelatively small, and annual growth in sales suffered in the late 1990s due tothe Asian financial crisis. Given the region’s financial recovery, ready mealsales are picking up and have registered healthy growth rates between 1998and 2002.
The eating habits among countries at different income levels illustrate thetrend to upgrade diets as incomes grow. As incomes rise, consumers increas-ingly substitute products embodying higher levels of value-added service intotheir diet. For example, in 2000, total per capita consumption in Vietnam was
13New Directions in Global Food Markets / AIB-794
Economic Research Service/USDA
Table 1-5—Refrigerator possession per 100 households
1990 1995 2000 2002
Number
China 1 4 6 6India 5 9 12 13Vietnam 9 14 17 18Indonesia 13 20 24 26Philippines 22 31 38 41Morocco 27 34 41 44Egypt 47 56 69 70Romania 59 66 74 76Brazil 62 75 82 83
Source: Euromonitor, 2003.
Table 1-6—Ownership of microwave ovens and retail sales of ready meals
Ownership of microwave ovens Ready meal sales
An. av. growth An. av. growth 2002 1998-2002 1998-2002
No. per 100 households ————— Percent —————
Brazil 5 7 17Bulgaria 9 23 5Chile 9 6 4Colombia 8 4 9Czech Republic 36 8 11Hungary 47 9 10Indonesia 1 6 10Japan 91 0 5Malaysia 65 1 2Mexico 22 7 14Morocco 0 3 5Russia 4 9 9Singapore 53 6 4South Africa 6 5 3Thailand 3 3 4United Kingdom 87 3 6United States 85 0 6
Source: Euromonitor, 2003.
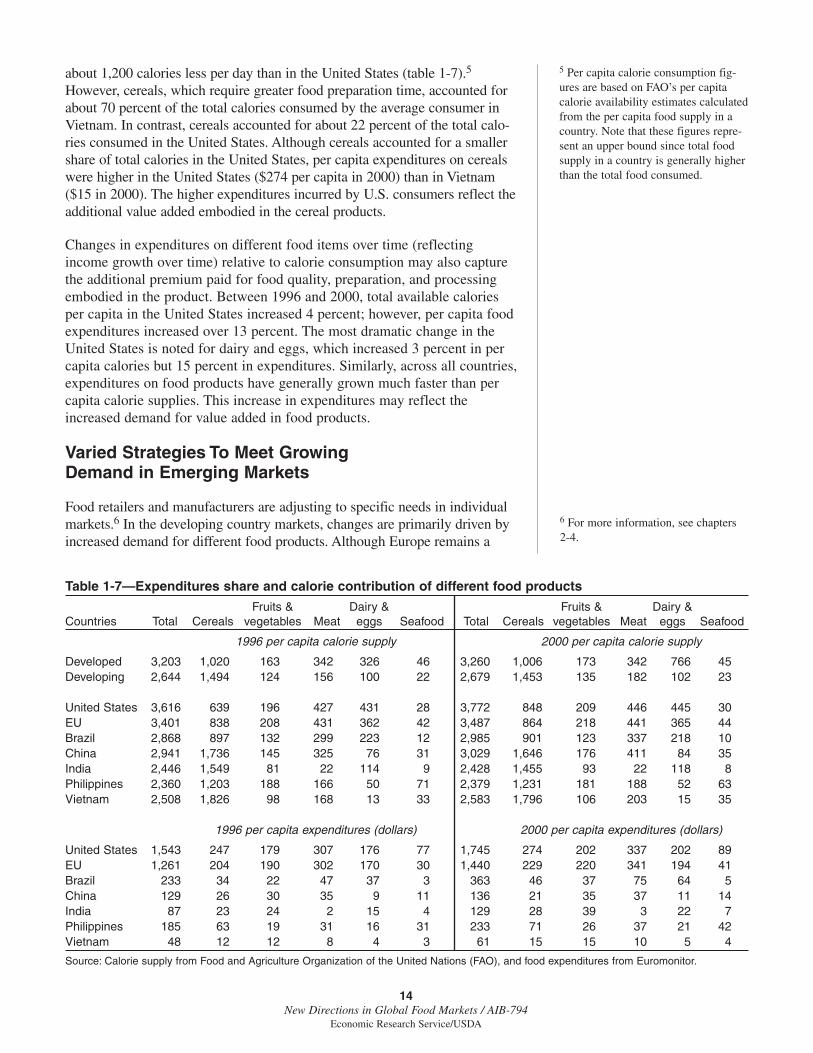
about 1,200 calories less per day than in the United States (table 1-7).5
However, cereals, which require greater food preparation time, accounted forabout 70 percent of the total calories consumed by the average consumer inVietnam. In contrast, cereals accounted for about 22 percent of the total calo-ries consumed in the United States. Although cereals accounted for a smallershare of total calories in the United States, per capita expenditures on cerealswere higher in the United States ($274 per capita in 2000) than in Vietnam($15 in 2000). The higher expenditures incurred by U.S. consumers reflect theadditional value added embodied in the cereal products.
Changes in expenditures on different food items over time (reflectingincome growth over time) relative to calorie consumption may also capturethe additional premium paid for food quality, preparation, and processingembodied in the product. Between 1996 and 2000, total available caloriesper capita in the United States increased 4 percent; however, per capita foodexpenditures increased over 13 percent. The most dramatic change in theUnited States is noted for dairy and eggs, which increased 3 percent in percapita calories but 15 percent in expenditures. Similarly, across all countries,expenditures on food products have generally grown much faster than percapita calorie supplies. This increase in expenditures may reflect theincreased demand for value added in food products.
Varied Strategies To Meet GrowingDemand in Emerging Markets
Food retailers and manufacturers are adjusting to specific needs in individualmarkets.6 In the developing country markets, changes are primarily driven byincreased demand for different food products. Although Europe remains a
5 Per capita calorie consumption fig-ures are based on FAO’s per capitacalorie availability estimates calculatedfrom the per capita food supply in acountry. Note that these figures repre-sent an upper bound since total foodsupply in a country is generally higherthan the total food consumed.
6 For more information, see chapters2-4.
14New Directions in Global Food Markets / AIB-794
Economic Research Service/USDA
Table 1-7—Expenditures share and calorie contribution of different food products
Fruits & Dairy & Fruits & Dairy &Countries Total Cereals vegetables Meat eggs Seafood Total Cereals vegetables Meat eggs Seafood
1996 per capita calorie supply 2000 per capita calorie supply
Developed 3,203 1,020 163 342 326 46 3,260 1,006 173 342 766 45Developing 2,644 1,494 124 156 100 22 2,679 1,453 135 182 102 23
United States 3,616 639 196 427 431 28 3,772 848 209 446 445 30EU 3,401 838 208 431 362 42 3,487 864 218 441 365 44Brazil 2,868 897 132 299 223 12 2,985 901 123 337 218 10China 2,941 1,736 145 325 76 31 3,029 1,646 176 411 84 35India 2,446 1,549 81 22 114 9 2,428 1,455 93 22 118 8Philippines 2,360 1,203 188 166 50 71 2,379 1,231 181 188 52 63Vietnam 2,508 1,826 98 168 13 33 2,583 1,796 106 203 15 35
1996 per capita expenditures (dollars) 2000 per capita expenditures (dollars)
United States 1,543 247 179 307 176 77 1,745 274 202 337 202 89EU 1,261 204 190 302 170 30 1,440 229 220 341 194 41Brazil 233 34 22 47 37 3 363 46 37 75 64 5China 129 26 30 35 9 11 136 21 35 37 11 14India 87 23 24 2 15 4 129 28 39 3 22 7Philippines 185 63 19 31 16 31 233 71 26 37 21 42Vietnam 48 12 12 8 4 3 61 15 15 10 5 4
Source: Calorie supply from Food and Agriculture Organization of the United Nations (FAO), and food expenditures from Euromonitor.
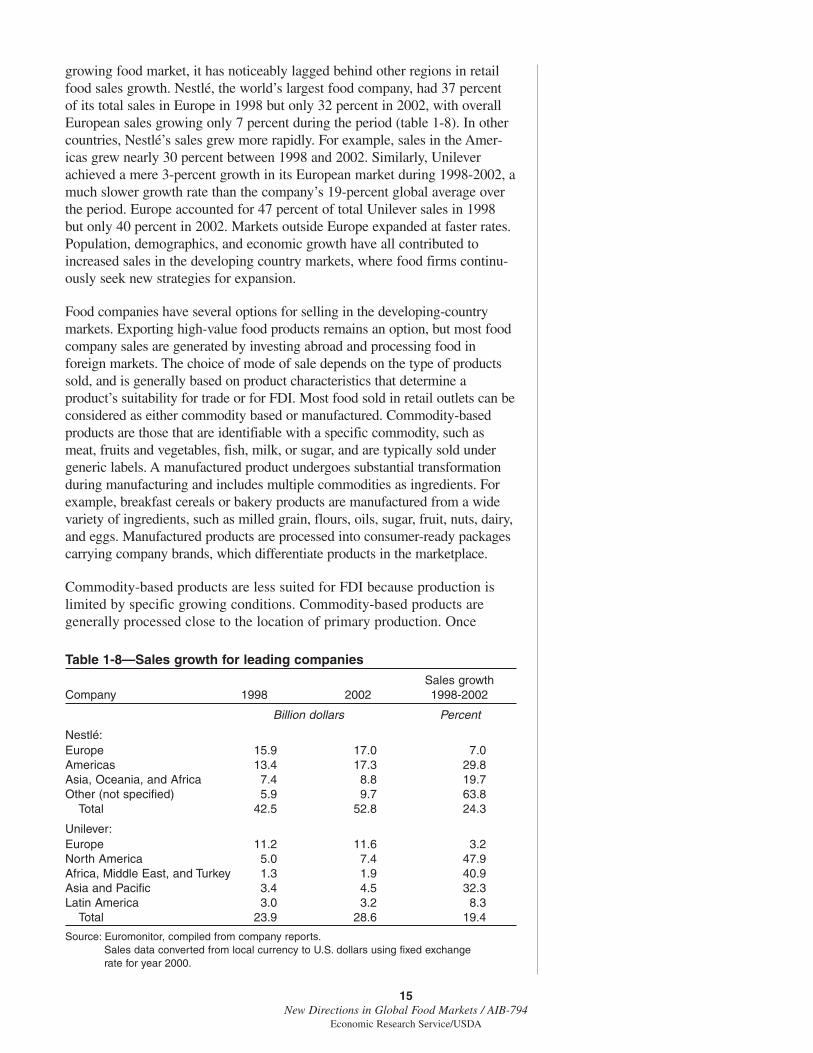
growing food market, it has noticeably lagged behind other regions in retailfood sales growth. Nestlé, the world’s largest food company, had 37 percentof its total sales in Europe in 1998 but only 32 percent in 2002, with overallEuropean sales growing only 7 percent during the period (table 1-8). In othercountries, Nestlé’s sales grew more rapidly. For example, sales in the Amer-icas grew nearly 30 percent between 1998 and 2002. Similarly, Unileverachieved a mere 3-percent growth in its European market during 1998-2002, amuch slower growth rate than the company’s 19-percent global average overthe period. Europe accounted for 47 percent of total Unilever sales in 1998but only 40 percent in 2002. Markets outside Europe expanded at faster rates.Population, demographics, and economic growth have all contributed toincreased sales in the developing country markets, where food firms continu-ously seek new strategies for expansion.
Food companies have several options for selling in the developing-countrymarkets. Exporting high-value food products remains an option, but most foodcompany sales are generated by investing abroad and processing food inforeign markets. The choice of mode of sale depends on the type of productssold, and is generally based on product characteristics that determine aproduct’s suitability for trade or for FDI. Most food sold in retail outlets can beconsidered as either commodity based or manufactured. Commodity-basedproducts are those that are identifiable with a specific commodity, such asmeat, fruits and vegetables, fish, milk, or sugar, and are typically sold undergeneric labels. A manufactured product undergoes substantial transformationduring manufacturing and includes multiple commodities as ingredients. Forexample, breakfast cereals or bakery products are manufactured from a widevariety of ingredients, such as milled grain, flours, oils, sugar, fruit, nuts, dairy,and eggs. Manufactured products are processed into consumer-ready packagescarrying company brands, which differentiate products in the marketplace.
Commodity-based products are less suited for FDI because production islimited by specific growing conditions. Commodity-based products aregenerally processed close to the location of primary production. Once
15New Directions in Global Food Markets / AIB-794
Economic Research Service/USDA
Table 1-8—Sales growth for leading companies
Sales growthCompany 1998 2002 1998-2002
Billion dollars Percent
Nestlé:Europe 15.9 17.0 7.0Americas 13.4 17.3 29.8Asia, Oceania, and Africa 7.4 8.8 19.7Other (not specified) 5.9 9.7 63.8
Total 42.5 52.8 24.3
Unilever:Europe 11.2 11.6 3.2North America 5.0 7.4 47.9Africa, Middle East, and Turkey 1.3 1.9 40.9Asia and Pacific 3.4 4.5 32.3Latin America 3.0 3.2 8.3
Total 23.9 28.6 19.4
Source: Euromonitor, compiled from company reports.Sales data converted from local currency to U.S. dollars using fixed exchange rate for year 2000.
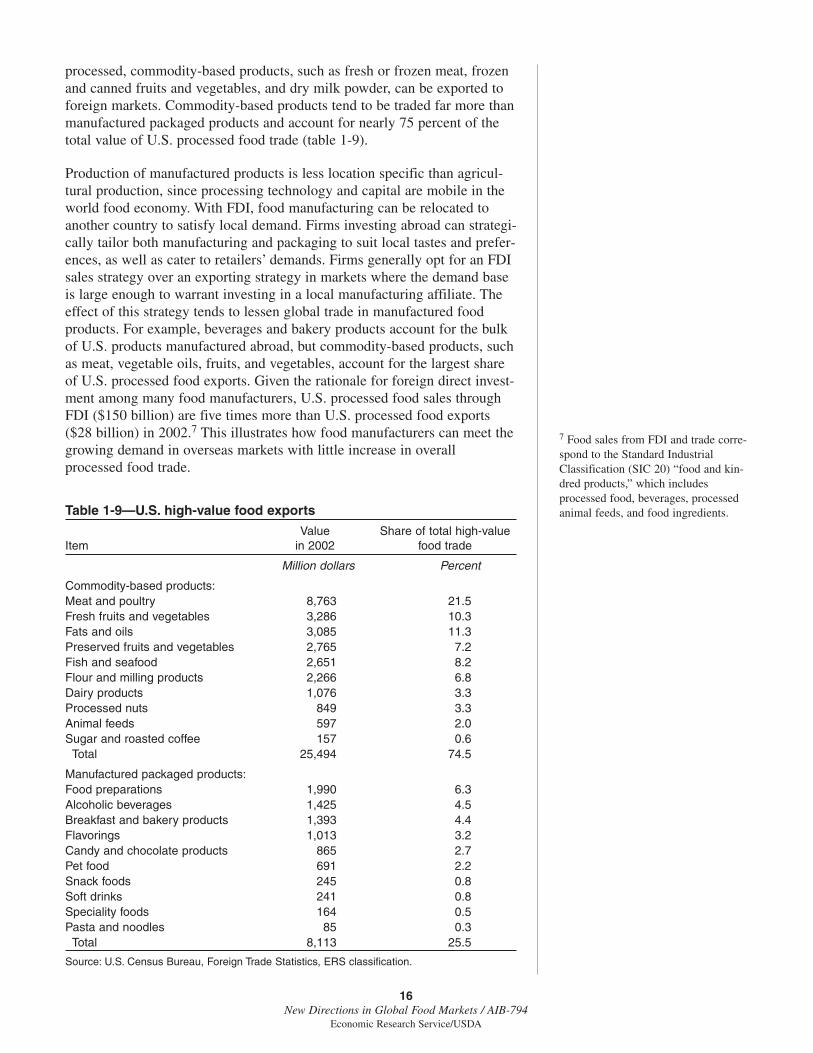
processed, commodity-based products, such as fresh or frozen meat, frozenand canned fruits and vegetables, and dry milk powder, can be exported toforeign markets. Commodity-based products tend to be traded far more thanmanufactured packaged products and account for nearly 75 percent of thetotal value of U.S. processed food trade (table 1-9).
Production of manufactured products is less location specific than agricul-tural production, since processing technology and capital are mobile in theworld food economy. With FDI, food manufacturing can be relocated toanother country to satisfy local demand. Firms investing abroad can strategi-cally tailor both manufacturing and packaging to suit local tastes and prefer-ences, as well as cater to retailers’ demands. Firms generally opt for an FDIsales strategy over an exporting strategy in markets where the demand baseis large enough to warrant investing in a local manufacturing affiliate. Theeffect of this strategy tends to lessen global trade in manufactured foodproducts. For example, beverages and bakery products account for the bulkof U.S. products manufactured abroad, but commodity-based products, suchas meat, vegetable oils, fruits, and vegetables, account for the largest shareof U.S. processed food exports. Given the rationale for foreign direct invest-ment among many food manufacturers, U.S. processed food sales throughFDI ($150 billion) are five times more than U.S. processed food exports($28 billion) in 2002.7 This illustrates how food manufacturers can meet thegrowing demand in overseas markets with little increase in overallprocessed food trade.
7 Food sales from FDI and trade corre-spond to the Standard IndustrialClassification (SIC 20) “food and kin-dred products,” which includesprocessed food, beverages, processedanimal feeds, and food ingredients.
16New Directions in Global Food Markets / AIB-794
Economic Research Service/USDA
Table 1-9—U.S. high-value food exports
Value Share of total high-value Item in 2002 food trade
Million dollars Percent
Commodity-based products:Meat and poultry 8,763 21.5Fresh fruits and vegetables 3,286 10.3Fats and oils 3,085 11.3Preserved fruits and vegetables 2,765 7.2Fish and seafood 2,651 8.2Flour and milling products 2,266 6.8Dairy products 1,076 3.3Processed nuts 849 3.3Animal feeds 597 2.0Sugar and roasted coffee 157 0.6
Total 25,494 74.5
Manufactured packaged products:Food preparations 1,990 6.3Alcoholic beverages 1,425 4.5Breakfast and bakery products 1,393 4.4Flavorings 1,013 3.2Candy and chocolate products 865 2.7Pet food 691 2.2Snack foods 245 0.8Soft drinks 241 0.8Speciality foods 164 0.5Pasta and noodles 85 0.3
Total 8,113 25.5
Source: U.S. Census Bureau, Foreign Trade Statistics, ERS classification.

Looking Ahead
While the United States, the European Union, and Japan currently accountfor about two-thirds of global processed food sales, developing countriesaccount for over three-fourths of total global food consumers. Given thegrowth in demand and projected food sales in developing countries, multi-national food retailers and manufacturers are expected to increasingly focuson those markets. Data on retail sales across regions and FDI in theprocessed food sector tend to support the hypothesis that a global marketmay exist only for limited food products. Food preferences vary based onincome and geographic location. Moreover, processed food products tend tobe manufactured locally, which allows manufacturers to prepare andpackage products to suit local preferences and values. Therefore, while thefood industry becomes more global, with retail chains and multinationalmanufacturers operating across many countries, growth in food trade maynot keep pace with growth in global food demand.
References
Bolling, Chris. “Globalization of the Soft Drink Industry,” AgriculturalOutlook, No. 297, December 2002, pp. 25-27.
Euromonitor International. 2003, http://www.euromonitor.com.
Food and Agriculture Organization of the United Nations (FAO). Statisticaldatabase, www.fao.org
Hentzepeter, V. “Corporate Responsibility: Reporting Beyond Financials,”Elsevier Food International, No. 4, November 2003, pp. 34-38.
Regmi, Anita (ed.). Changing Structure of Global Food Demand and Trade,Agriculture and Trade Report WRS-01-1, U.S. Department ofAgriculture, Economic Research Service, May 2001.
Reardon, T., and J.A. Berdegue. “The Rapid Rise of Supermarkets in LatinAmerica: Challenges and Opportunities for Development” DevelopmentPolicy Review, 2002, 20(4):317-334.
Rosegrant, M., M. Paiser, S. Meijer, and J. Witcover. Global FoodProjections to 2020, 2020 Vision Series, International Food PolicyResearch Institute, 2001.
SAI, www.saiplatform.org, accessed April 2003.
Seale, James, Jr., A. Regmi, and J. Bernstein. International Evidence onFood Consumption Patterns, Technical Bulletin 1904, U.S. Department ofAgriculture, Economic Research Service, October 2003.
U.S. Census Bureau. Foreign Trade Statistics, http://www.census.gov/for-eign-trade/statistics/index.html
U.S. Department of Agriculture. USDA Agricultural Baseline Projections to2011, February 2002.
17New Directions in Global Food Markets / AIB-794
Economic Research Service/USDA