Appendix A, FARMING, FOOD, AND MARKETS IN ADAMS ...
164
A-1 Public Draft - February, 2016 Appendix A, FARMING, FOOD, AND MARKETS IN ADAMS COUNTY
-
Upload
khangminh22 -
Category
Documents
-
view
0 -
download
0
Transcript of Appendix A, FARMING, FOOD, AND MARKETS IN ADAMS ...

A-1Public Draft - February, 2016
Appendix A,FARMING, FOOD, AND MARKETS IN ADAMS COUNTY

Farming, Food, & Markets in Adams County
Ken Meter, Crossroads Resource Center Compiled for
Adams County District Plan process Adams County, & City of Brighton, Colorado
Logan Simpson Design
November 30, 2015
Crossroads Resource Center
7415 Humboldt Ave. S. / Minneapolis, Minnesota 55423 / 612.869.8664 [email protected] www.crcworks.org
Tools for Community Self-determination

For Logan Simpson — Farming, Food, & Markets in Adams County — Ken Meter, November 30, 2015
— — 2
Guiding Values of This Study (Adopted by consultants)
Advance Adams County’s agricultural heritage. Adams County’s history is closely connected to food and farming, and its future is tied to healthy food. Protect private property & landowners. Landowners should be free to use their land for productive purposes, and their rights of ownership will be respected. Ensure transparency. Residents should be involved in shaping decisions for the future of the County, and should know how these decisions were made. Protect the rural landscape. Adams County’s rural landscape sets it apart as unique from other metro suburbs. The Special District contains some of the best farmland left in Colorado.
For Logan Simpson — Farming, Food, & Markets in Adams County — Ken Meter, November 30, 2015
— — 3
Table of Contents
EXECUTIVE SUMMARY ......................................................................................................................... 4
MARKET CONDITIONS IN ADAMS COUNTY ........................................................................................... 9
FARMS IN ADAMS COUNTY ................................................................................................................ 17
SPECIFIC FARMING SECTORS IN ADAMS COUNTY ............................................................................... 25
LOCAL FOODS OPPORTUNITIES .......................................................................................................... 53
FARMS OR VALUE-‐ADDED BUSINESSES SELLING LOCAL FOOD ............................................................ 57
FOOD CONSUMPTION ........................................................................................................................ 66
FARMING & FOOD IN THE SPECIAL DISTRICT ...................................................................................... 73 THE PREDOMINANT LAND USE IS RAISING PRODUCE ON RENTED LAND ................................................................. 73 VEGETABLE FARMING MAY BE MORE PROFITABLE THAN OTHER TYPES IN DISTRICT ................................................. 74 FARMING PRACTICES MAY NOT BE COMPATIBLE WITH RESIDENTIAL DEVELOPMENT ................................................ 74 LAND & WATER PRICES ARE HIGHER THAN FARMING CAN SUPPORT ..................................................................... 75 THE PRIMARY BUYER FOR FARMLAND FOR AGRICULTURAL USE IS THE CITY ............................................................ 76 INVESTMENT IS CRITICAL FOR BOTH ECONOMIC AND NONECONOMIC REASONS ..................................................... 76 LOCAL MARKETS FOR FOOD ARE ROBUST ........................................................................................................ 77 BERRY PATCH FARM FOCUSES ON BRIGHTON MARKETS .................................................................................... 77 OTHER LAND PARCELS IN THE DISTRICT .......................................................................................................... 78 LABOR IS A CRITICAL ISSUE ........................................................................................................................... 79 THE DISTRICT HOLDS STRONG POTENTIAL FOR AGRI-‐TOURISM ............................................................................ 80 OVERALL SUMMARY ................................................................................................................................... 81 FARMLAND PROTECTION STRATEGY: DEVELOP NODES OF ACTIVITY THAT SUPPORT LOCAL FOODS ............................. 82 SPECIFIC INVESTMENTS ............................................................................................................................... 83
APPENDIX: QUANTITATIVE DATA ....................................................................................................... 86
For Logan Simpson — Farming, Food, & Markets in Adams County — Ken Meter, November 30, 2015
— — 4
Executive Summary If Brighton and Adams County wish to protect farmland in the Special District, it will be necessary to design and build a local food system as well — since without strong support from Brighton area consumers, there will be no constituency to protect this farmland in the future. There are strong economic reasons for doing so. Residents of the City of Brighton spend about $83 million each year buying food. The vast majority of this food is sourced from outside of the City, so a conservative estimate is that $75 million of these payments for food leave the City each year. Stakes are even higher when it comes to Adams County, where County residents spend about $1.3 billion each year buying food. Once again, most all of this food is sourced outside the County, so $1.2 billion leaks out of the County annually. Reclaiming these dollars would help the Brighton region pay for many refinements to the region’s strong quality of life — including future development, city and county services, and further efforts to protect open space. Moreover, if public agencies do nothing to protect farmland in the Special District, this farmland will go away. Much of it will be lost to development over time. This would be a severe loss, since Brighton’s very identity is centered on being a rural community that is located close to a major urban center. Many residents say they moved to Brighton because of the open landscape, the relative quiet, and the rural qualities of life. Without farms and open space, Brighton — at least in the form it has been known to generations of residents — will cease to exist. The situation is urgent. Interviews with local residents show that current land uses are very vulnerable. One major produce company farms land in the Special District — Petrocco Farms, which leases from several different landowners. Celebrating its 100th year of farming in Brighton in 2016, Petrocco Farms is critical to the local economy. The firm supports a family with deep roots in Brighton, but also pays a considerable share of the $22 million Adams County farmers pay for farm laborers every year. The region can hardly afford to lose this employment, nor this dedication to community. Yet the head of the Petrocco family also expressed considerable concern about whether their way of farming will continue to be compatible with suburban development on surrounding land. David Petrocco said that the firm does not want to shoulder the costs of buying land in the Special District, since land values have been inflated by development pressure to levels that cannot be covered by farming. Purchasing water rights is even more expensive, with some estimating this to be 1.5 times the sale price of the land alone. Moreover, the farm relies upon chemical sprays — fertilizers, herbicides, fungicides, and pesticides — to ensure crop quality, but this may pose conflicts when people live nearby. A third concern raised by the Petroccos is that they increasingly have difficulty moving tractors and other field equipment from farm to farm, as more and more suburban drivers occupy the roadway, oblivious to the flow of farm traffic, or traveling at such speed they cannot adjust to the slow pace of farm equipment.

For Logan Simpson — Farming, Food, & Markets in Adams County — Ken Meter, November 30, 2015
— — 5
For these and other reasons, as the Petrocco family has seen strip malls and storage facilities encroach on farmland, they have planned for a future that would allow them to move north if need be. The farm leases thousands of acres in Weld County, not only because land is cheaper there, but also as a hedge against localized weather calamities, and also to position themselves favorably if development requires them to leave the Brighton area. They have stated that they could consider moving their entire operation to Weld County if they could sell their established packing houses off Brighton Road for enough money to build new facilities further north. Similarly, Sakata Farms, which took root after World War II, maintains its packing shed and wholesale operations in Brighton, but no longer farms land in the Special District. Owner Bob Sakata also sees traffic conflicts, and has ordered his farm crews to move their equipment only on larger trucks that can keep pace with faster traffic. He also states that farm chemical use may not be compatible with residential development. Sakata’s son, who currently manages the company, has considered moving operations further north, the elder Sakata said. Both farms say they would prefer to remain where they are, if conditions were right. Retaining both farms appears to be a priority for Brighton, since if either were to leave, the City would lose substantial connection to its heritage, and would lose a significant claim to being an agricultural community. The County would also lose the income earned by farmers and farmworkers. Losing direct contact with this heritage would, in turn, threaten Brighton’s ability to position itself as destination for agritourism. Indeed, if the City wishes to welcome visitors who are interested in experiencing rural culture, Brighton must not only protect its farmland, it must also embrace a culture of food that expresses a sense of place. The reason for this is straightforward. If Brighton residents do not themselves celebrate (and savor eating) food that is produced and processed locally, it is difficult to imagine why any visitor would be attracted to visit Brighton to see farms and food destinations, especially with competing options such as Boulder so close by. Even a quick glance at the economics of farming in Adams County shows the dangers that are posed to the sustainability of farms and farmland. County farmers earned $95 million less by farming in 2013 than they had earned in 1969, after adjusting for inflation, even though both the number of farms in Adams County and acres farmed have remained relatively constant [See Charts 6 and 7 on pages 17-18]. Since 1994, there has not been a single year when Adams County farms (as a group) covered their production costs by selling crops and livestock — often one or more family members had to work off the farm to offset farm production losses. In the most recent Census of Agriculture, 2012, 61% of Adams County farms reported a net loss. Further, this data shows how disconnected farming in Adams County has become from local consumers. Over the past 45 years, county population has increased 150%, while personal income has risen at twice that rate (300%) after adjusting for inflation. Yet farm income has plummeted steadily. The two most important farm commodities, cattle and wheat, have lost ground nationally due to global economic trends. The industries that have survived the best, ornamentals and produce, have been those most connected to Denver markets — but these are also subject to national and international market forces.

For Logan Simpson — Farming, Food, & Markets in Adams County — Ken Meter, November 30, 2015
— — 6
This strongly suggests that if agriculture is to have a future in Adams County, farmers must once again connect to local markets, and grow for consumers who are more loyal to spending money for locally produced foods. Market forces, if left to themselves, will only deepen the patterns noted above. City and county action will be required to create a thriving local food system, as well as to protect farmland. Only if Brighton consumers eat food raised on nearby fields will they feel any determination to protect those lands for farming. Creating a culture that celebrates local eating will require public action and investment. One implication of the conclusions drawn above is that the only real buyers for premium farmland in the Special District who might want to use this land for agricultural purposes would be public bodies — the City and the County — unless some very wealthy individual were to take a strong interest in developing a farm in the District. This places a special responsibility upon the City and County to act deliberately. Furthermore, no outside party or developer can create a local food culture for the region; it must be built by local residents, businesses, and public bodies. It also seems clear that despite reluctance on the part of some growers, future farms in and near Brighton must pursue sustainable and organic practices if farming is to be compatible with residential housing and other development.
Strengths of the Special District • Contains some of the best land in the state • Water is available in significant portions of farmland • Holds a rich heritage of produce farming • Vegetable farming has been more rewarding financially than raising other products • Farmworkers in Adams County earn $20 million per year • Farms are near to robust consumer markets
Limitations of the Special District • Suburban development has encroached • Prevalent farming practices appear to be incompatible with residential development • Major produce growers may move north • Land is too expensive to be paid for through farm production alone • Water rights are even more expensive • Few local residents have farming skills • Farm labor is in short supply
Opportunities for the Special District • To serve as a symbol for protecting farmland and rural quality of life • To raise food for Brighton, Adams County, and Metro Denver markets • To maintain farming practices that are compatible with residential development • To serve as the core of a vibrant local food culture in Brighton • To provide agri-‐tourism experiences for visitors
For Logan Simpson — Farming, Food, & Markets in Adams County — Ken Meter, November 30, 2015
— — 7
Potential obstacles for protecting farmland • Residents may perceive that it is too late to protect the tradition of rural living • Landowners want to sell land (or water rights) at development prices to fund retirement • Few landowning families have heirs who want to farm • The City may be the only buyer of land for agricultural use
We suggest the following specific investments in local food systems for the Special District south of Brighton:
1. The City of Brighton must announce a clear priority, and take definitive action steps, to show its commitment to protecting farmland if efforts to protect land are to be credible. This outreach should make the City’s long-term strategy clear and show how the City is targeting its resources to achieve its vision.
2. The City of Brighton should build (or cause to be built) a washing, packing,
aggregation, & distribution facility scaled to small farm production, located near growers who raise produce for local markets. This could be built on a working farm raising food for local markets, or in close proximity to several such farms. The old school site may be a prime location for this. Such an investment would hopefully help attract additional farms to locate nearby over time.
3. The City should explore investing in (or facilitating investment by private parties in) flash-freezing equipment, most likely at the same site, for local farms to use to extend shelf life of fresh produce items.
4. The City already owns enough land to launch an incubator farm for training new
farmers, with leasable land (roughly in 5 to 50 acre plots) nearby, so that graduates may remain in the community of farmers, and make use of some of the infrastructure listed above. This might be an excellent use of the Anderson farm, should it be purchased by the City. Local sources state that there are young people in Boulder County who are looking for land; CSU runs a farmer training program in Boulder County, and urban farmer training programs also operate in Denver.
5. The City must resell or lease this land to new small-scale growers at price levels that
can be paid through farm production (the use-value of the land) rather than at the development value.
6. To raise the visibility of local foods, it will be critical to create a prominent connection point that brings together town and rural residents to celebrate local foods and buy from local farms (e.g., at Bromley Farm or Palizzi’s farm stand).
7. The City and County must actively market local foods, including publicizing the
seasonal availability of the foods raised on Brighton area farms, the farmers who raise these foods, where local foods may be purchased, and the chefs and households who use them.
8. The City and County should jointly launch (perhaps in collaboration with local
health care providers) an “Eat 5, Buy 5” campaign similar to the one devised in

For Logan Simpson — Farming, Food, & Markets in Adams County — Ken Meter, November 30, 2015
— — 8
Montezuma County, Colorado. This would call for each county resident to eat five fruits and vegetables each day for health reasons, and buy five dollars of food from an Adams County farm each week. If each county household purchased this much food from county farms per person each week, this would amount to $122 million of revenue for the County’s farms — almost as much as the $145 million of crops and livestock county farms currently sell each year.
9. In the future, the City and County may wish to raise funds from external sources to purchase additional farmland as it becomes available for sale by current landowners. Private individuals, conservation funds, state, or federal sources could be used to leverage City and County investments.

For Logan Simpson — Farming, Food, & Markets in Adams County — Ken Meter, November 30, 2015
— — 9
Market Conditions in Adams County
Population & personal income • As Charts 1 and 2 show, Adams County population increased 150% from 1969 to 2013,
while personal income rose 300%, so income gains far overtake population change.
Chart 1: Population of Adams County, 1969 - 2013
Source: Bureau of Economic Analysis Chart 2: Personal income earned in Adams County, 1969 – 2013 (adjusted to 2013)
Source: Bureau of Economic Analysis (in 2013 dollars)
300% increase in personal income
150% increase in population
For Logan Simpson — Farming, Food, & Markets in Adams County — Ken Meter, November 30, 2015
— — 10
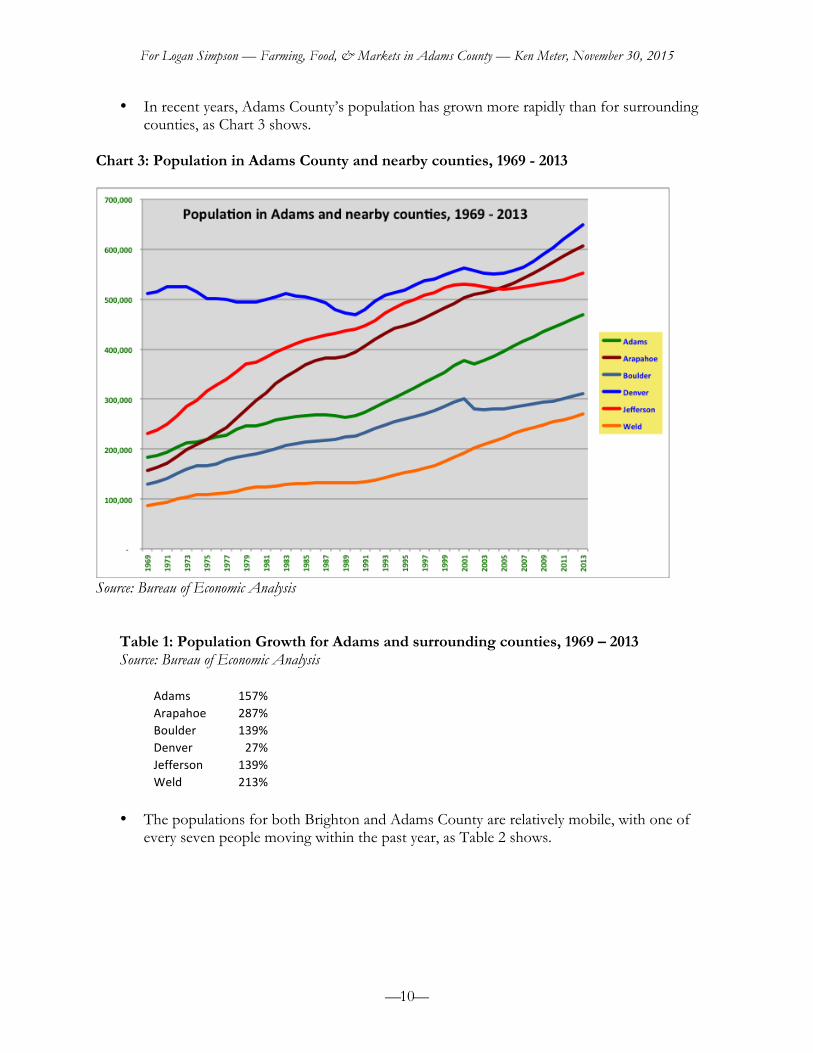
• In recent years, Adams County’s population has grown more rapidly than for surrounding counties, as Chart 3 shows.
Chart 3: Population in Adams County and nearby counties, 1969 - 2013
Source: Bureau of Economic Analysis
Table 1: Population Growth for Adams and surrounding counties, 1969 – 2013 Source: Bureau of Economic Analysis
Adams 157% Arapahoe 287% Boulder 139% Denver 27% Jefferson 139% Weld 213%
• The populations for both Brighton and Adams County are relatively mobile, with one of
every seven people moving within the past year, as Table 2 shows.
For Logan Simpson — Farming, Food, & Markets in Adams County — Ken Meter, November 30, 2015
— — 11
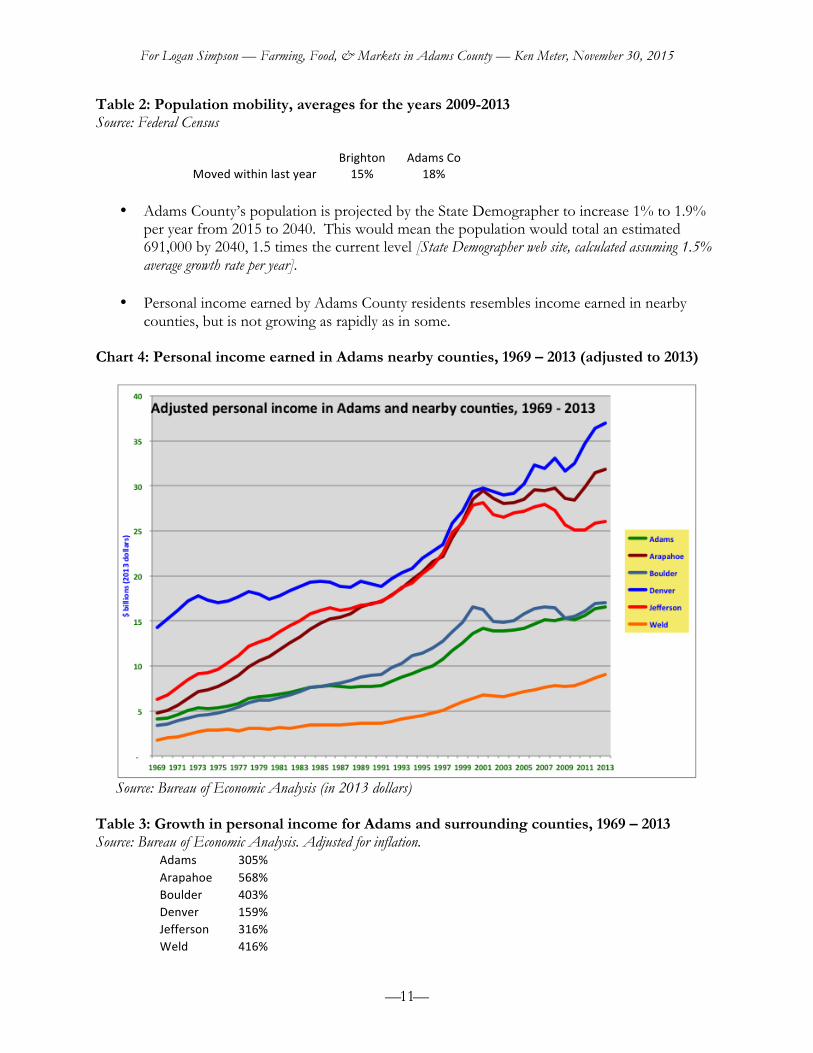
Table 2: Population mobility, averages for the years 2009-2013 Source: Federal Census
Brighton Adams Co
Moved within last year 15% 18%
• Adams County’s population is projected by the State Demographer to increase 1% to 1.9% per year from 2015 to 2040. This would mean the population would total an estimated 691,000 by 2040, 1.5 times the current level [State Demographer web site, calculated assuming 1.5% average growth rate per year].
• Personal income earned by Adams County residents resembles income earned in nearby
counties, but is not growing as rapidly as in some. Chart 4: Personal income earned in Adams nearby counties, 1969 – 2013 (adjusted to 2013)
Source: Bureau of Economic Analysis (in 2013 dollars) Table 3: Growth in personal income for Adams and surrounding counties, 1969 – 2013 Source: Bureau of Economic Analysis. Adjusted for inflation.
Adams 305% Arapahoe 568% Boulder 403% Denver 159% Jefferson 316% Weld 416%
For Logan Simpson — Farming, Food, & Markets in Adams County — Ken Meter, November 30, 2015
— — 12
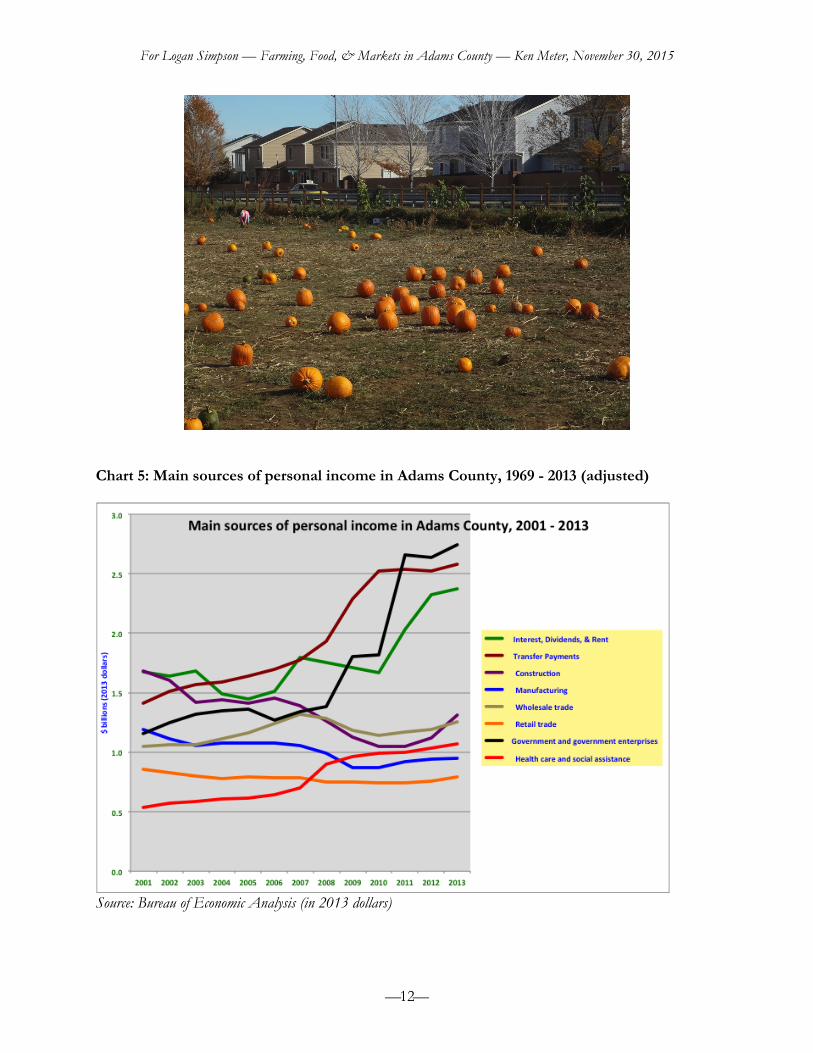
Chart 5: Main sources of personal income in Adams County, 1969 - 2013 (adjusted)
Source: Bureau of Economic Analysis (in 2013 dollars)
For Logan Simpson — Farming, Food, & Markets in Adams County — Ken Meter, November 30, 2015
— — 13
• County residents receive $16.6 billion of income per year [Bureau of Economic Analysis]. Sources include:
o The largest source of personal income is government jobs (mostly state and local government), accounting for $2.7 billion of income.
o Transfer payments (from government programs such as pensions) rank second, at $2.6 billion.
o Capital income (from interest, rent, or dividends) totals $2.4 billion. o Construction workers earned $1.3 billion in 2013. o Wholesale workers earned $1.2 billion. o Health care professions bring in $1 billion of personal income. o Manufacturing jobs produce $951 million of personal income. o Transportation workers earn $871 million. o Retail workers earned $790 million of personal income.
• The County’s 469,193 residents receive $10 billion of income from sources other than
employment [Bureau of Economic Analysis] and [Federal Census, County Business Patterns, 2013].
• Income from public sources makes up 33% of all income received. This includes government jobs, primarily for state and local government, and public programs such as retirement pensions [Bureau of Economic Analysis].
• Manufacturing income has been declining steadily, when inflation is taken into account [Bureau of Economic Analysis].
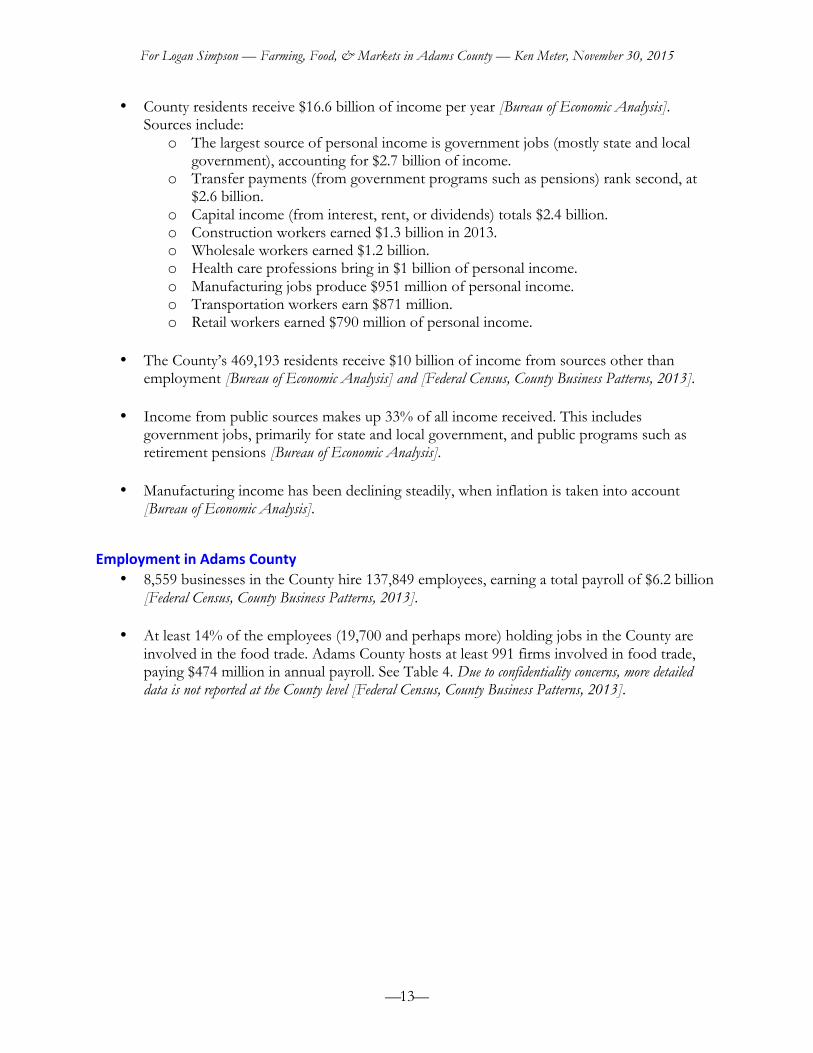
Employment in Adams County • 8,559 businesses in the County hire 137,849 employees, earning a total payroll of $6.2 billion
[Federal Census, County Business Patterns, 2013].
• At least 14% of the employees (19,700 and perhaps more) holding jobs in the County are involved in the food trade. Adams County hosts at least 991 firms involved in food trade, paying $474 million in annual payroll. See Table 4. Due to confidentiality concerns, more detailed data is not reported at the County level [Federal Census, County Business Patterns, 2013].

For Logan Simpson — Farming, Food, & Markets in Adams County — Ken Meter, November 30, 2015
— — 14
Table 4: Employment and payroll for food-related businesses in Adams County, 2013
NAICS
No. Employees
($) Payroll
No. Establish-‐ments
code Adams County totals 137,849 6,204,748,000 8,559
115 Support of Agriculture 9 214,000 4 311 Food manufacturing 2,288 82,041,000 44
4244 Grocery & Related Wholesale 2,085 105,523,000 53
4245 Farm Product Raw Material (D) 759,000 4 4248 Beer, Wine, & Alcohol (D) (D) 9
42491 Farm Supplies, Wholesale (D) (D) 5 445 Food & Beverage Stores 3,339 86,802,000 208
49312 Refrigerated Warehousing (D) (D) 1 722 Food Services & Drinking 12,013 198,890,000 663
Food-‐related employment 19,734 474,229,000 991
Percent of county total 14% 8% 12%
Source: Federal Census, County Business Patterns. (D) indicates data that is suppressed to protect confidentiality. Note: this data does not include farms or farm owners.
Market data from Leland Consulting • ESRI (Environmental Systems Research Institute, Inc.) projects that household growth rates
in the Brighton market region (a larger region than the City of Brighton) will average 4% per year from 2015 to 2025, from 38,234 to an estimated 55,800 households. This would require 17,600 new housing units over 10 years [p. 24-25 of Leland’s Market Assessment].
• Leland Consulting estimates that the City of Brighton can capture about 20-30% of this demand, roughly 2,700 single-family units, 760 townhomes and condos, and 1,900 rental units, for a total of 5,455 residential units (projections range from 4,230 to 6,640). This would require between 573 and 859 acres of land [p. 27 of Leland’s Market Assessment; note that totals in the final row of Leland’s Table 10 are incorrect] and about $1.2 billion of investment over ten years, assuming an average cost of $240,000 for single-family homes (the current median sale price, so this is a high estimate) and $200,000 for each multiple-occupancy unit. This investment would produce an (roughly) estimated $43 million in mortgage payments and $38 million in rental income per year, as well as additional property taxes and consumer spending. These housing units would also demand additional costs to service new homes and residents, as the Agricultural Preservation Subcommittee has pointed out using data from American Farmland Trust.
For Logan Simpson — Farming, Food, & Markets in Adams County — Ken Meter, November 30, 2015
— — 15
• Most of the growth in housing need is projected to involve buyers aged 20 to 49, earning incomes of $50,000 to $150,000, with houses valued at $250,000 to $500,000 and perhaps higher [Table 9; p. 26 of Leland’s Market Assessment].
• The City of Brighton is also likely to attract a separate demographic, an increasing number of
seniors for both ownership and rental housing [Figure 11; p. 14 of Leland’s Market Assessment].
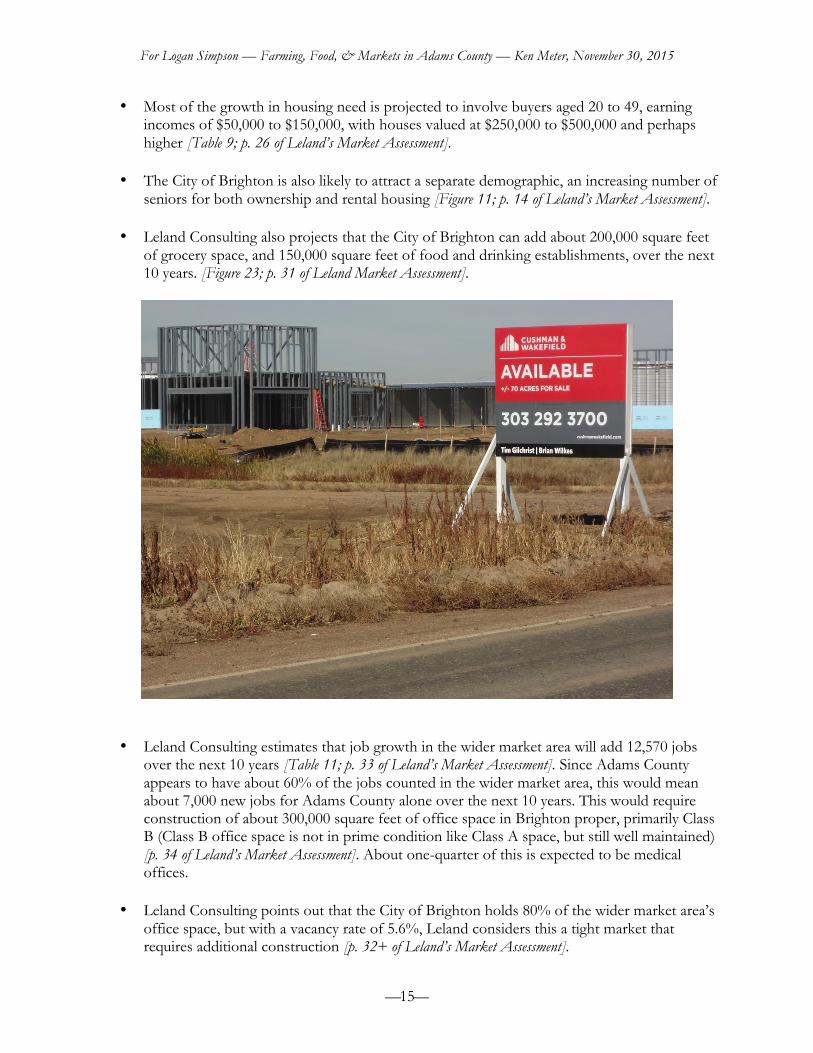
• Leland Consulting also projects that the City of Brighton can add about 200,000 square feet of grocery space, and 150,000 square feet of food and drinking establishments, over the next 10 years. [Figure 23; p. 31 of Leland Market Assessment].
• Leland Consulting estimates that job growth in the wider market area will add 12,570 jobs
over the next 10 years [Table 11; p. 33 of Leland’s Market Assessment]. Since Adams County appears to have about 60% of the jobs counted in the wider market area, this would mean about 7,000 new jobs for Adams County alone over the next 10 years. This would require construction of about 300,000 square feet of office space in Brighton proper, primarily Class B (Class B office space is not in prime condition like Class A space, but still well maintained) [p. 34 of Leland’s Market Assessment]. About one-quarter of this is expected to be medical offices.
• Leland Consulting points out that the City of Brighton holds 80% of the wider market area’s office space, but with a vacancy rate of 5.6%, Leland considers this a tight market that requires additional construction [p. 32+ of Leland’s Market Assessment].

For Logan Simpson — Farming, Food, & Markets in Adams County — Ken Meter, November 30, 2015
— — 16
• Leland Consulting estimates that another 1.6 million square feet of industrial/flex space may be needed in Brighton proper over the next ten years, as well. This future is clouded by the fact that a 1.4-million square foot distribution center for K-Mart now stands empty [p. 34+ of Leland’s Market Assessment].
• Leland further estimates that Brighton will require from 285 to 356 acres of land to meet
demand for commercial property. With 2,500 acres already set aside in the City’s comprehensive plan for commercial development, this means the City already holds an oversupply of commercial acreage that should be adequate for as much as 65 years [p. 36 of Leland’s Market Assessment].
Table 5. Ranges of cash rent values for irrigated land in three Colorado regions, 2013 (dollars/acre)
Northern region
Southern region
Western region
Corn & sorghum 150 – 200 185 – 325 200 – 350 Small grains 190 – 250 185 – 325 200 – 350 Alfalfa 190 – 255 200 – 300 225 – 250 Sugar beets 255 – 350 250 – 350 250 – 350
Source: Colorado State University Extension Agriculture and Business Management Notes (ABM). “Custom Rates for Colorado Farms & Ranches in 2013.” (www.coopext.colostate.edu/ABM/)
For Logan Simpson — Farming, Food, & Markets in Adams County — Ken Meter, November 30, 2015
— — 17
Farms in Adams County
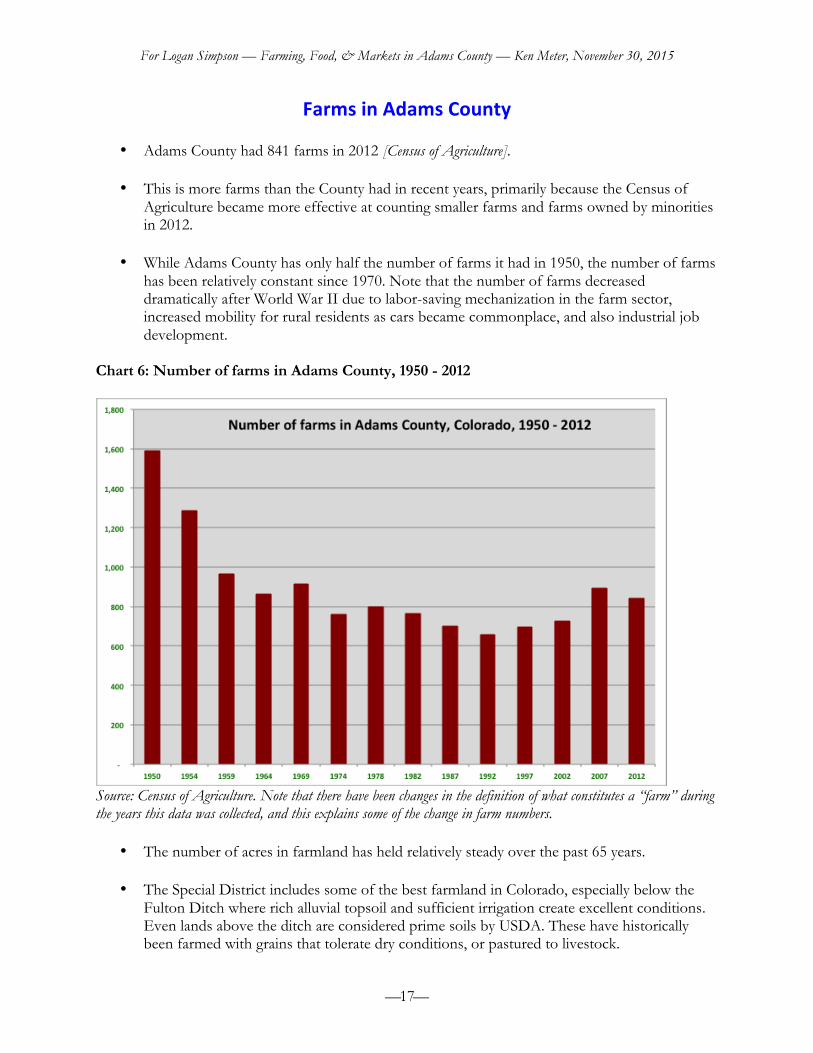
• Adams County had 841 farms in 2012 [Census of Agriculture].
• This is more farms than the County had in recent years, primarily because the Census of Agriculture became more effective at counting smaller farms and farms owned by minorities in 2012.
• While Adams County has only half the number of farms it had in 1950, the number of farms
has been relatively constant since 1970. Note that the number of farms decreased dramatically after World War II due to labor-saving mechanization in the farm sector, increased mobility for rural residents as cars became commonplace, and also industrial job development.
Chart 6: Number of farms in Adams County, 1950 - 2012
Source: Census of Agriculture. Note that there have been changes in the definition of what constitutes a “farm” during the years this data was collected, and this explains some of the change in farm numbers.
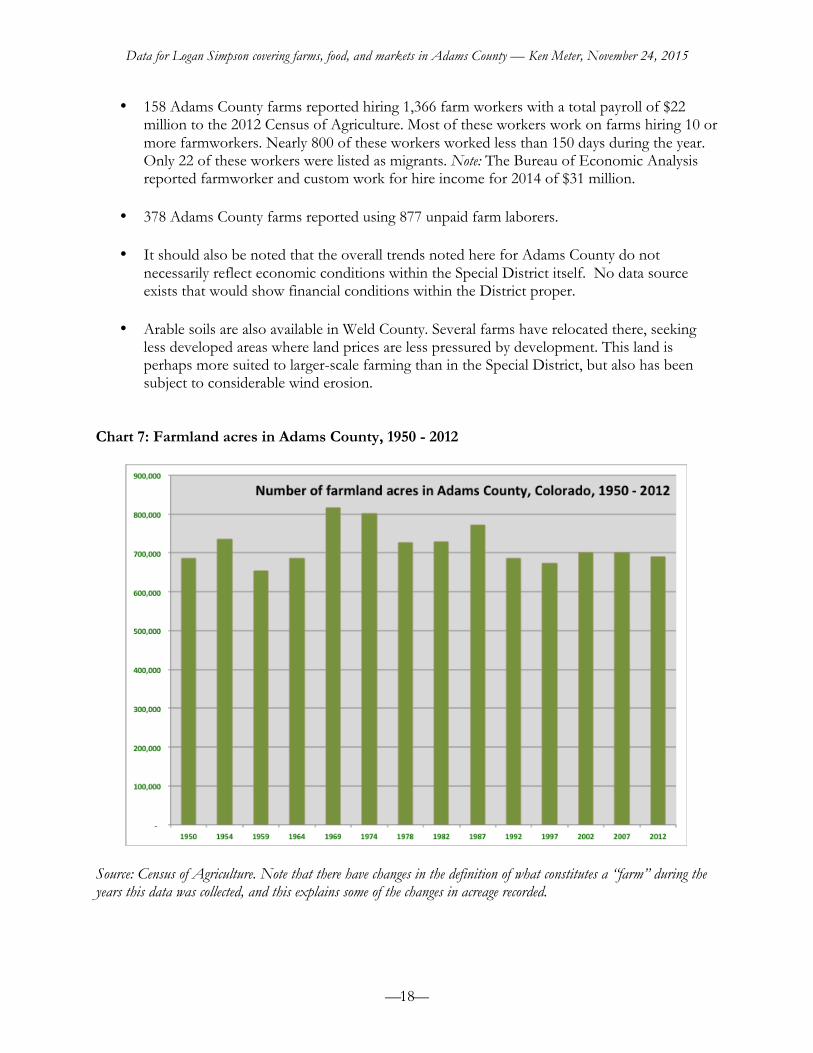
• The number of acres in farmland has held relatively steady over the past 65 years.
• The Special District includes some of the best farmland in Colorado, especially below the Fulton Ditch where rich alluvial topsoil and sufficient irrigation create excellent conditions. Even lands above the ditch are considered prime soils by USDA. These have historically been farmed with grains that tolerate dry conditions, or pastured to livestock.
Data for Logan Simpson covering farms, food, and markets in Adams County — Ken Meter, November 24, 2015
— — 18
• 158 Adams County farms reported hiring 1,366 farm workers with a total payroll of $22 million to the 2012 Census of Agriculture. Most of these workers work on farms hiring 10 or more farmworkers. Nearly 800 of these workers worked less than 150 days during the year. Only 22 of these workers were listed as migrants. Note: The Bureau of Economic Analysis reported farmworker and custom work for hire income for 2014 of $31 million.
• 378 Adams County farms reported using 877 unpaid farm laborers.
• It should also be noted that the overall trends noted here for Adams County do not
necessarily reflect economic conditions within the Special District itself. No data source exists that would show financial conditions within the District proper.
• Arable soils are also available in Weld County. Several farms have relocated there, seeking
less developed areas where land prices are less pressured by development. This land is perhaps more suited to larger-scale farming than in the Special District, but also has been subject to considerable wind erosion.
Chart 7: Farmland acres in Adams County, 1950 - 2012
Source: Census of Agriculture. Note that there have changes in the definition of what constitutes a “farm” during the years this data was collected, and this explains some of the changes in acreage recorded.
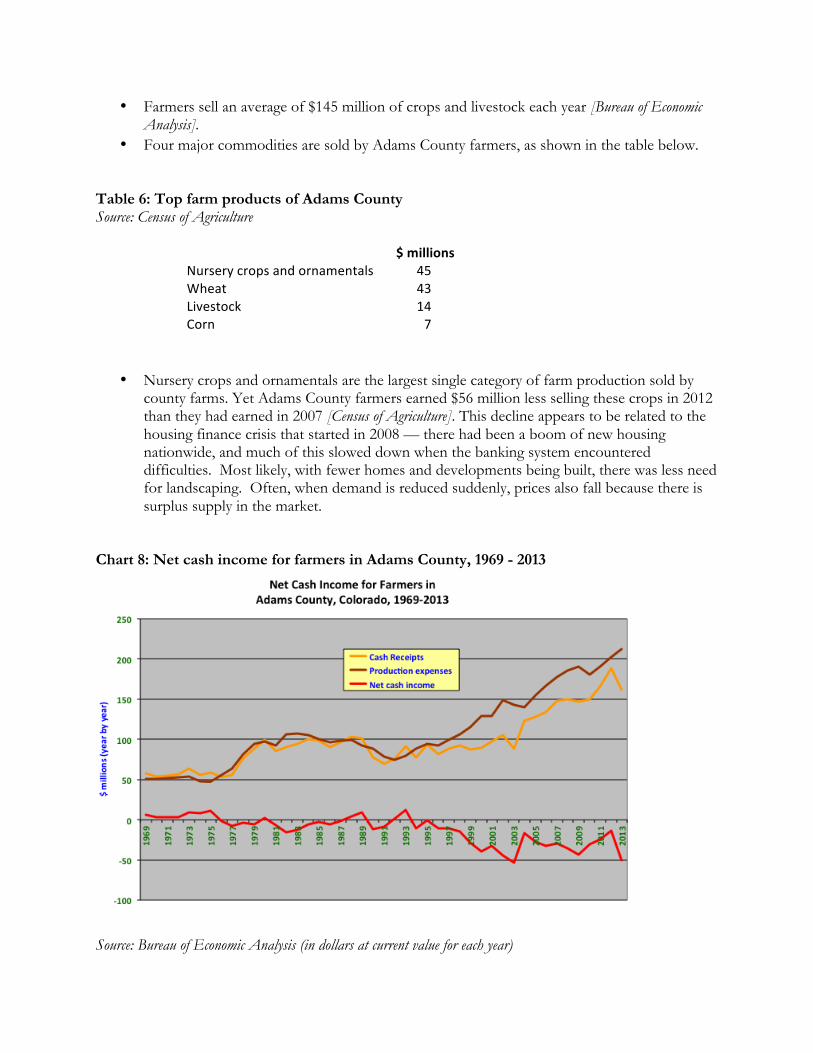
• Farmers sell an average of $145 million of crops and livestock each year [Bureau of Economic Analysis].
• Four major commodities are sold by Adams County farmers, as shown in the table below.
Table 6: Top farm products of Adams County Source: Census of Agriculture
$ millions
Nursery crops and ornamentals 45 Wheat 43 Livestock 14 Corn 7
• Nursery crops and ornamentals are the largest single category of farm production sold by county farms. Yet Adams County farmers earned $56 million less selling these crops in 2012 than they had earned in 2007 [Census of Agriculture]. This decline appears to be related to the housing finance crisis that started in 2008 — there had been a boom of new housing nationwide, and much of this slowed down when the banking system encountered difficulties. Most likely, with fewer homes and developments being built, there was less need for landscaping. Often, when demand is reduced suddenly, prices also fall because there is surplus supply in the market.
Chart 8: Net cash income for farmers in Adams County, 1969 - 2013
Source: Bureau of Economic Analysis (in dollars at current value for each year)

Data for Logan Simpson covering farms, food, and business in Adams County — Ken Meter, November 13, 2015
— — 20
• This suggests that a combination of reduced demand and falling prices for those who did make sales accounts for the large decline. There is also the possibility that one or more major farms stopped selling ornamentals, or that there was some very local disruption in the ornamentals market.
• Historically, Adams County farms have excelled in producing both cattle and wheat. Yet as we will see later [see sections starting on page 26 and page 42], both industries have declined markedly since World War II. In both cases, farmers became exceptionally efficient at producing these commodities, only to find that global financial trends (a) transformed cattle production from farmsteads to feed lots (many of which are in Weld County), making it uneconomic for smaller farms in the County to produce livestock, and (b) eroded the wheat price so that it became difficult to make money raising one crop that is well-suited to dry land farming.
• Chart 8 above shows that, although cash receipts have steadily increased for Adams County farmers, production expenses have risen even faster.
Chart 9: Net cash income for farmers in Adams County, 1969 – 2013 (adjusted)
Source: Bureau of Economic Analysis (in 2013 dollars) • Moreover, as Chart 9 shows, once dollars are adjusted for inflation, it is clear that both cash
receipts and production expenses are far lower today than they were in 1969. Adams County farmers sold $95 million less of crops and livestock in 2013 than they had sold in 1969. Production costs were far lower than 1969 levels, but still overran cash receipts. The number of farms remained more or less the same, as did the acreage of land farmed, during this period.
Data for Logan Simpson covering farms, food, and business in Adams County — Ken Meter, November 13, 2015
— — 21
• Although several important farms in the Brighton region are profitable, Bureau of Economic
Analysis data show that all county farmers combined spend on average $26 million more in production expenses than they earn by selling their products. This is an average loss of $31,200 per farm, and a total loss to the farm sector of $656 million over the years 1989 – 2013. [Bureau of Economic Analysis].
• Over the past 25 years, farmers have spent more producing crops in livestock than they
earned by selling them for all but three years, and have spent more in production expenses than they earned in cash receipts each year since 1994 [Bureau of Economic Analysis]. 61% of the County’s farms reported a net loss in 2012, slightly higher than the Colorado average of 59% [Census of Agriculture].
• Farmers often sell crops, livestock or milk at prices lower than the cost of production, but need to sell at these prices to earn money they can use to pay off production expenses.
• How is it that farmers can sustain such losses? There are several reasons, listed below.
o When farm families account for their production costs, they would typically list money paid to workers (who may be family members) as costs of production, which would tend to make the finances of the farm less favorable than they actually are. This should not apply to payments made to the owner of each farm, which should be accounted as operator income.
o Many farmers hold on to their farms even if farming at a loss because they hope to sell the land for development someday. They would prefer to stay on the land rather than leave, because they enjoy rural living and hold a sense of connection to the land. Selling for development becomes in a very real sense the family retirement plan, and the family does what it needs to do to make ends meet until that time.
o Most farm families have one or more members of the family working off the farm in order to have a steadier source of income than farming, and to obtain health benefits.
o Adams County is also very dependent on wheat production, and the price of wheat has been low and declining for years, except for 2012-2013 when grain prices were artificially high. The trends here also mirror those from other wheat growing areas. 2015 is projected to be a difficult year for grain farmers now that prices have returned to lower levels.
o When times are good, farmers may take on debt to purchase land, or to buy new equipment, and this may make their farm more effective at producing, but also holding greater debt. Some may purchase land in the hopes of selling it to a developer later, or because they see land as a long-term investment, or because they want to increase their land base for growing cash grains at larger volume. This, however, is unlikely inside the Special District because land prices are so high that most produce farms are renting or leasing land, and few can afford to buy land.
o To reduce tax liabilities, farmers may shoulder additional expenses in years when income is high enough to allow this.
o As farmland prices are shaped more by the costs of development (i.e., a developer or urban investor may pay far more for the land than the farmer paid for it) any new farm owner — either an investor who declares their farm an agricultural operation
Data for Logan Simpson covering farms, food, and business in Adams County — Ken Meter, November 13, 2015
— — 22
by raising a few cattle, say, or a young farmer starting out, have more interest costs to carry, and this increases farm expenditures.
o Many landowners rent out their land, because the return is often higher than for farming, which means they gain income from rents, not from farming itself. This shows up as a different income stream. This is especially true in the Special District area, where development pressures have raised land purchase prices.
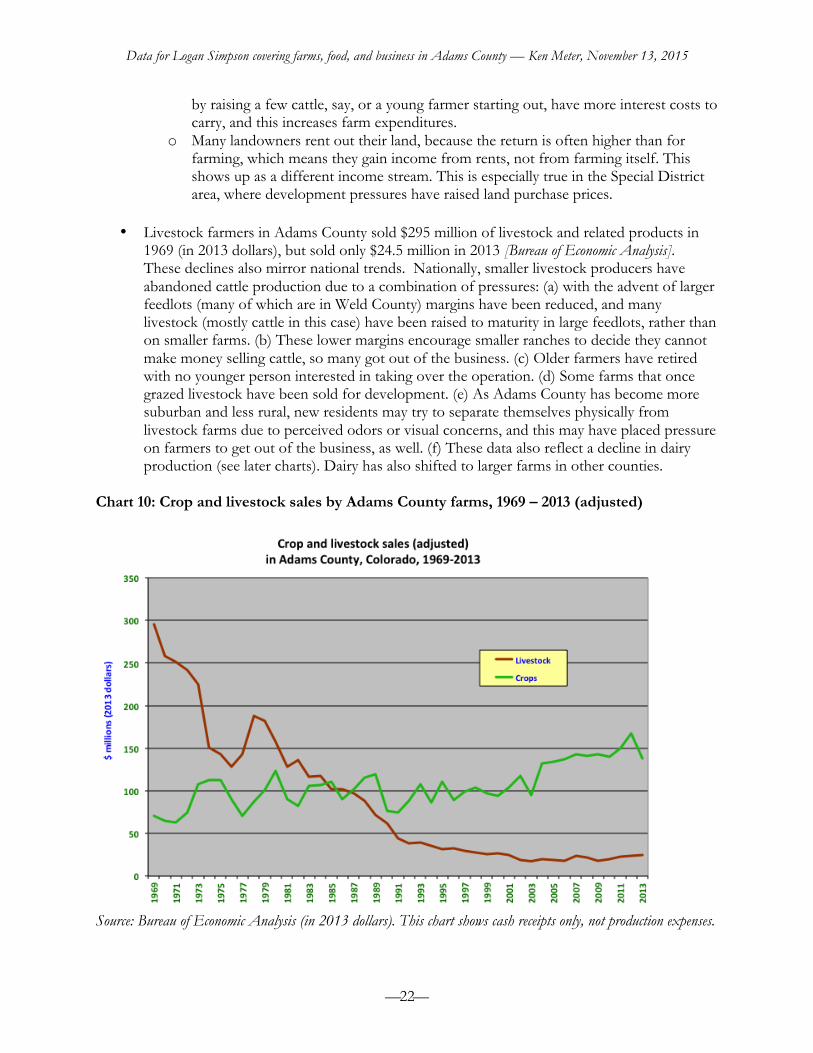
• Livestock farmers in Adams County sold $295 million of livestock and related products in
1969 (in 2013 dollars), but sold only $24.5 million in 2013 [Bureau of Economic Analysis]. These declines also mirror national trends. Nationally, smaller livestock producers have abandoned cattle production due to a combination of pressures: (a) with the advent of larger feedlots (many of which are in Weld County) margins have been reduced, and many livestock (mostly cattle in this case) have been raised to maturity in large feedlots, rather than on smaller farms. (b) These lower margins encourage smaller ranches to decide they cannot make money selling cattle, so many got out of the business. (c) Older farmers have retired with no younger person interested in taking over the operation. (d) Some farms that once grazed livestock have been sold for development. (e) As Adams County has become more suburban and less rural, new residents may try to separate themselves physically from livestock farms due to perceived odors or visual concerns, and this may have placed pressure on farmers to get out of the business, as well. (f) These data also reflect a decline in dairy production (see later charts). Dairy has also shifted to larger farms in other counties.
Chart 10: Crop and livestock sales by Adams County farms, 1969 – 2013 (adjusted)
Source: Bureau of Economic Analysis (in 2013 dollars). This chart shows cash receipts only, not production expenses.

Data for Logan Simpson covering farms, food, and business in Adams County — Ken Meter, November 13, 2015
— — 23
• Note that income from crops has increased steadily since 1969, even after inflation is taken into account, despite the fact there are now fewer farms.
Chart 11: Production expenses for Adams County farms, 1969 – 2012 (adjusted)
Source: Bureau of Economic Analysis (in 2013 dollars). This chart reflects cash receipts only, not production expenses. Note that detailed data were not made available for 2013 due to budget shortfalls.
• Labor costs are the highest single production expense for Adams County farmers. These have diminished since 2009, presumably as land was taken out of production.
• Note that the decline in livestock purchases and feed purchases also reflect the fact that fewer farmers are raising livestock (primarily cattle and dairy).

Data for Logan Simpson covering farms, food, and business in Adams County — Ken Meter, November 13, 2015
— — 24
Chart 12: Net farm income by type for Adams County farms, 1969 – 2013 (adjusted)
Source: Bureau of Economic Analysis (in 2013 dollars).
• The steadiest source of net income for Adams County farmers has been renting out land.
• The second most important source of net income has been federal payments, although these only accrue to farmers that raise corn, wheat, or soybeans that are covered under crop programs.
• Actual production has been one of the least reliable ways of gaining net income for farmers
in Adams County.

Data for Logan Simpson covering farms, food, and business in Adams County — Ken Meter, November 13, 2015
— — 25
Specific Farming Sectors in Adams County
Overall trends in farm product sales Chart 13: Key farm products sold by Adams County farms, 1950 – 2012 (adjusted)
Source: Census of Agriculture, various years
• Note that a once-thriving cattle market for farms in Adams County has dwindled to very
small sales figures.
• The main product sold by Adams County farms since 1992 has been nursery crops, ornamentals, and other landscaping products, which are strongly related to suburban development. The global housing finance crisis of 2008 took a severe toll on ornamental sales, since housing starts declined precipitously.
• Note that wheat sales data are missing for several years, but overall sales of wheat have
remained fairly steady over the past 65 years.
• Sales of milk and dairy products by Adams County farms have fallen to about half of their 1950 levels.

Data for Logan Simpson covering farms, food, and business in Adams County — Ken Meter, November 13, 2015
— — 26
Cattle Chart 14: Number of Adams County farms raising cattle, 1945 – 2012
Source: Census of Agriculture
• More than 900 farms in the County raised cattle in 1945.
• Cattle production on Adams County farms remained high during World War II when demand for beef was high to feed troops. County farmers enjoyed considerable prosperity after the war as well, but many farm youth, or returning soldiers, opted to move away from farms.
• Farms also consolidated into larger units as increased mechanization allowed farmers to
work more land and tend more animals.
• The number of Adams County farms raising cattle has held relatively steady since 1987. Yet as Chart 15 (next page) shows, the number of cattle fell steadily. This likely reflects the growth of feed lots such as those near Greeley, general decline of margins in the cattle industry as a result of greater concentration of production, and an aging farm population.
Data for Logan Simpson covering farms, food, and business in Adams County — Ken Meter, November 13, 2015
— — 27
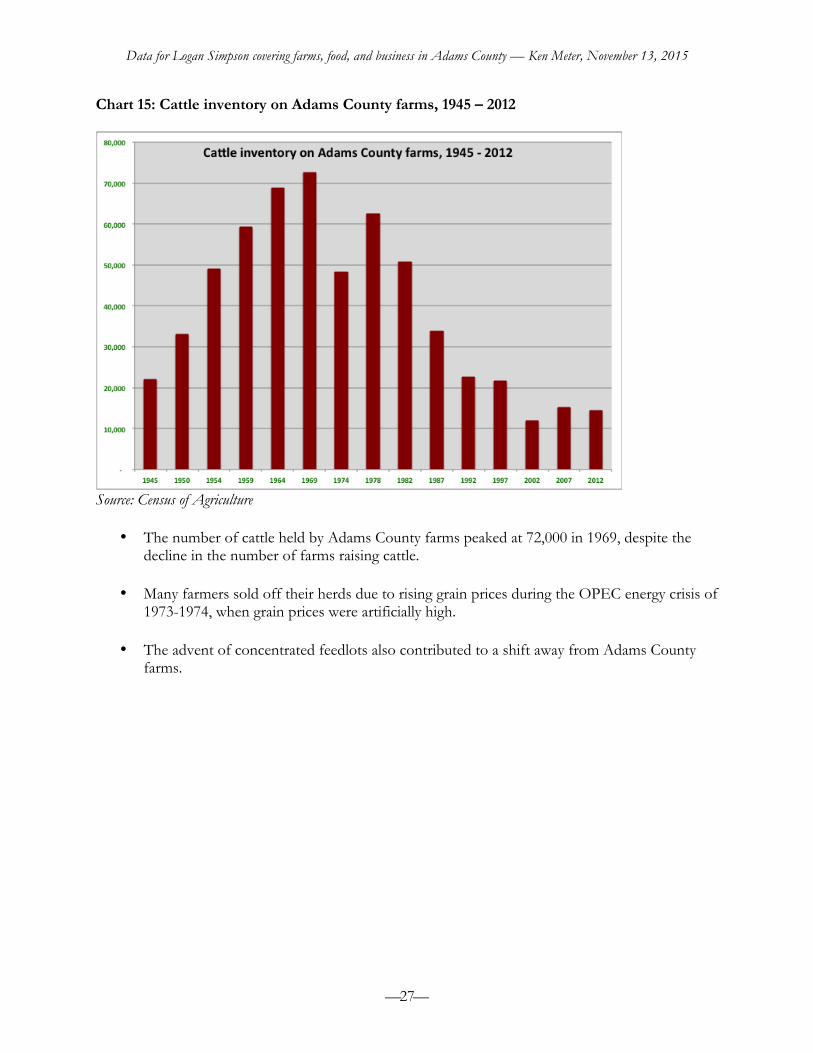
Chart 15: Cattle inventory on Adams County farms, 1945 – 2012
Source: Census of Agriculture
• The number of cattle held by Adams County farms peaked at 72,000 in 1969, despite the decline in the number of farms raising cattle.
• Many farmers sold off their herds due to rising grain prices during the OPEC energy crisis of 1973-1974, when grain prices were artificially high.
• The advent of concentrated feedlots also contributed to a shift away from Adams County
farms.

Data for Logan Simpson covering farms, food, and business in Adams County — Ken Meter, November 13, 2015
— — 28
Chart 16: Cattle sold by Adams County farms, 1964 – 2012
Source: Census of Agriculture
• The number of cattle sold by Adams County farms also peaked in 1969 at 110,000.
• There was a dramatic decline in the number of cattle after 1987. Sales in 1992 were less than one-third the level recorded five years earlier.
Data for LS fact sheet on farms, food, and business in Adams County — Ken Meter, October 13, 2015
— — 29
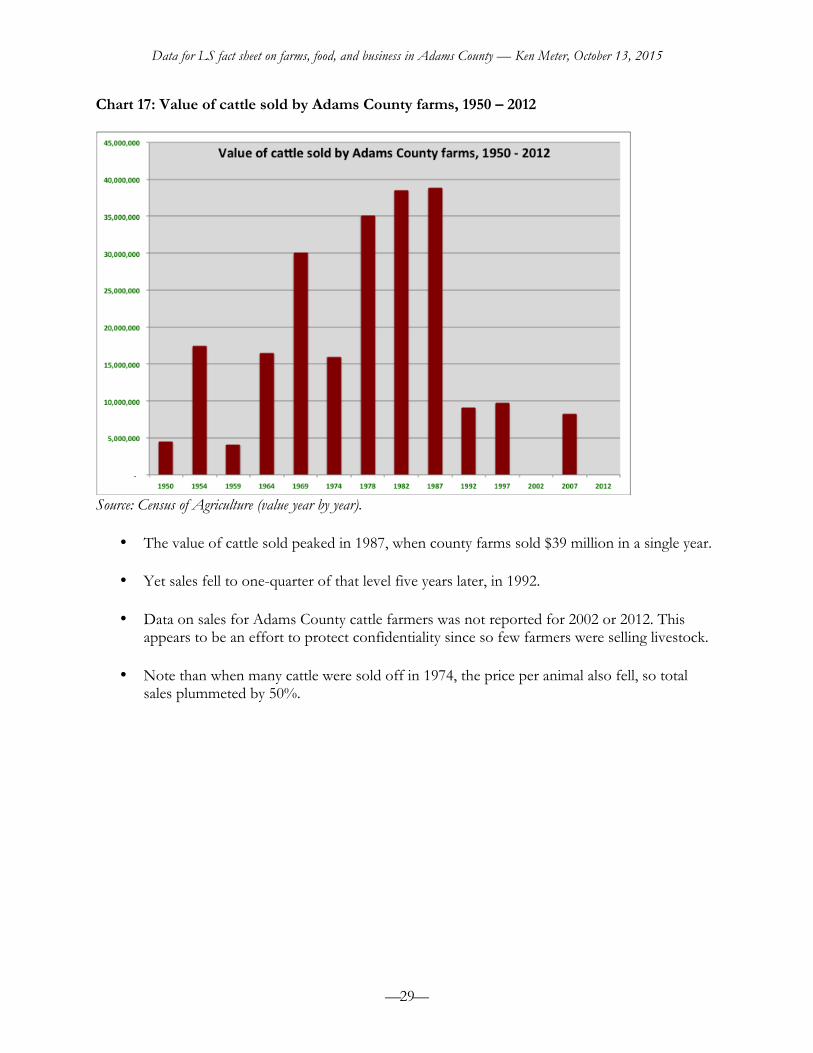
Chart 17: Value of cattle sold by Adams County farms, 1950 – 2012
Source: Census of Agriculture (value year by year).
• The value of cattle sold peaked in 1987, when county farms sold $39 million in a single year.
• Yet sales fell to one-quarter of that level five years later, in 1992.
• Data on sales for Adams County cattle farmers was not reported for 2002 or 2012. This appears to be an effort to protect confidentiality since so few farmers were selling livestock.
• Note than when many cattle were sold off in 1974, the price per animal also fell, so total
sales plummeted by 50%.
Data for Logan Simpson covering farms, food, and business in Adams County — Ken Meter, November 13, 2015
— — 30
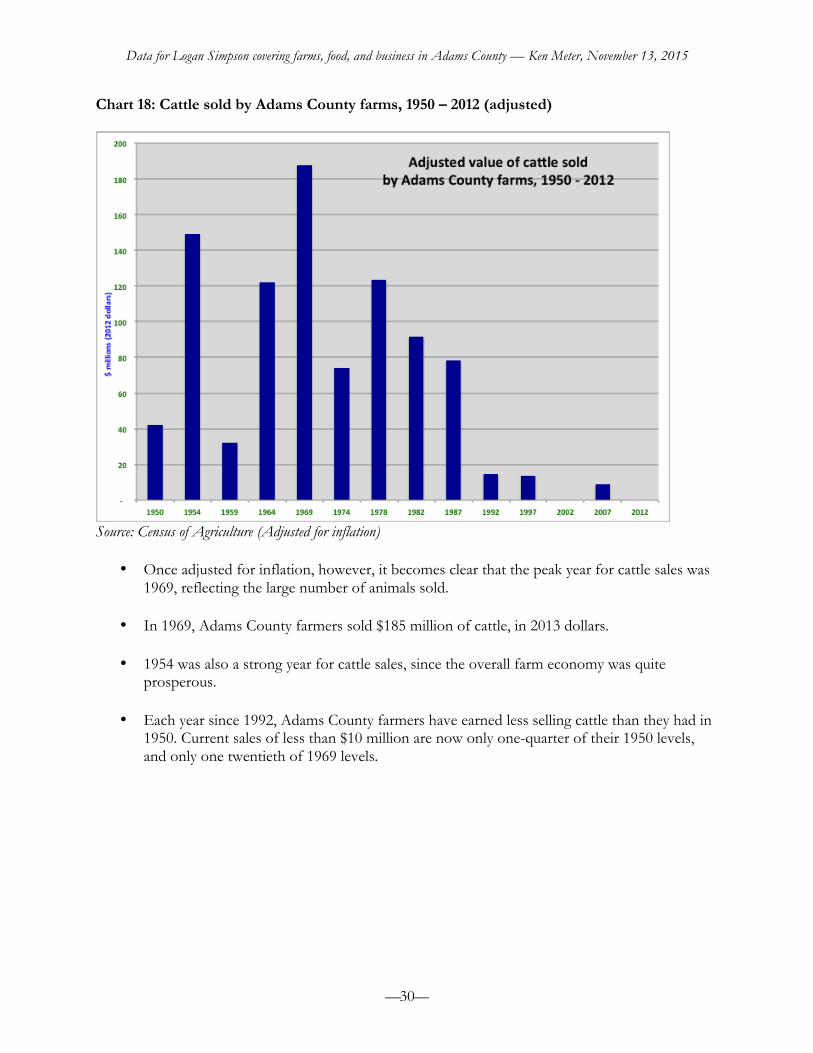
Chart 18: Cattle sold by Adams County farms, 1950 – 2012 (adjusted)
Source: Census of Agriculture (Adjusted for inflation)
• Once adjusted for inflation, however, it becomes clear that the peak year for cattle sales was 1969, reflecting the large number of animals sold.
• In 1969, Adams County farmers sold $185 million of cattle, in 2013 dollars.
• 1954 was also a strong year for cattle sales, since the overall farm economy was quite prosperous.
• Each year since 1992, Adams County farmers have earned less selling cattle than they had in
1950. Current sales of less than $10 million are now only one-quarter of their 1950 levels, and only one twentieth of 1969 levels.
Data for Logan Simpson covering farms, food, and business in Adams County — Ken Meter, November 13, 2015
— — 31
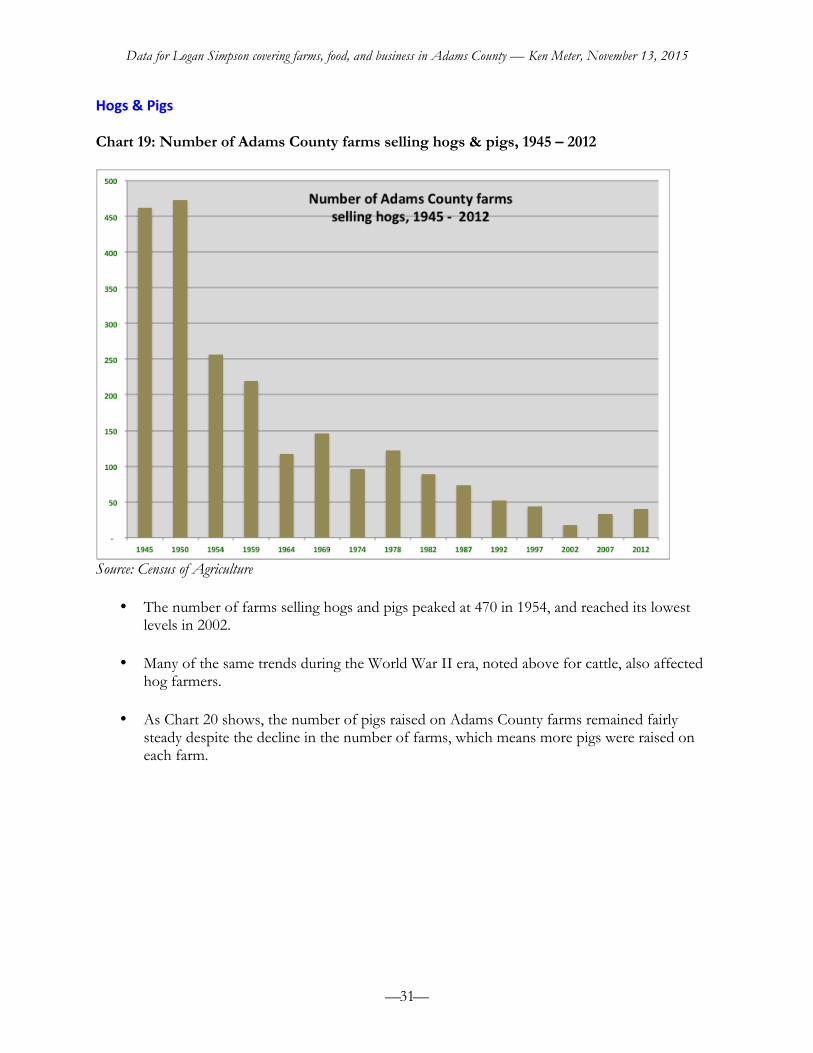
Hogs & Pigs Chart 19: Number of Adams County farms selling hogs & pigs, 1945 – 2012
Source: Census of Agriculture
• The number of farms selling hogs and pigs peaked at 470 in 1954, and reached its lowest levels in 2002.
• Many of the same trends during the World War II era, noted above for cattle, also affected hog farmers.
• As Chart 20 shows, the number of pigs raised on Adams County farms remained fairly
steady despite the decline in the number of farms, which means more pigs were raised on each farm.
Data for LS fact sheet on farms, food, and business in Adams County — Ken Meter, October 13, 2015
— — 32
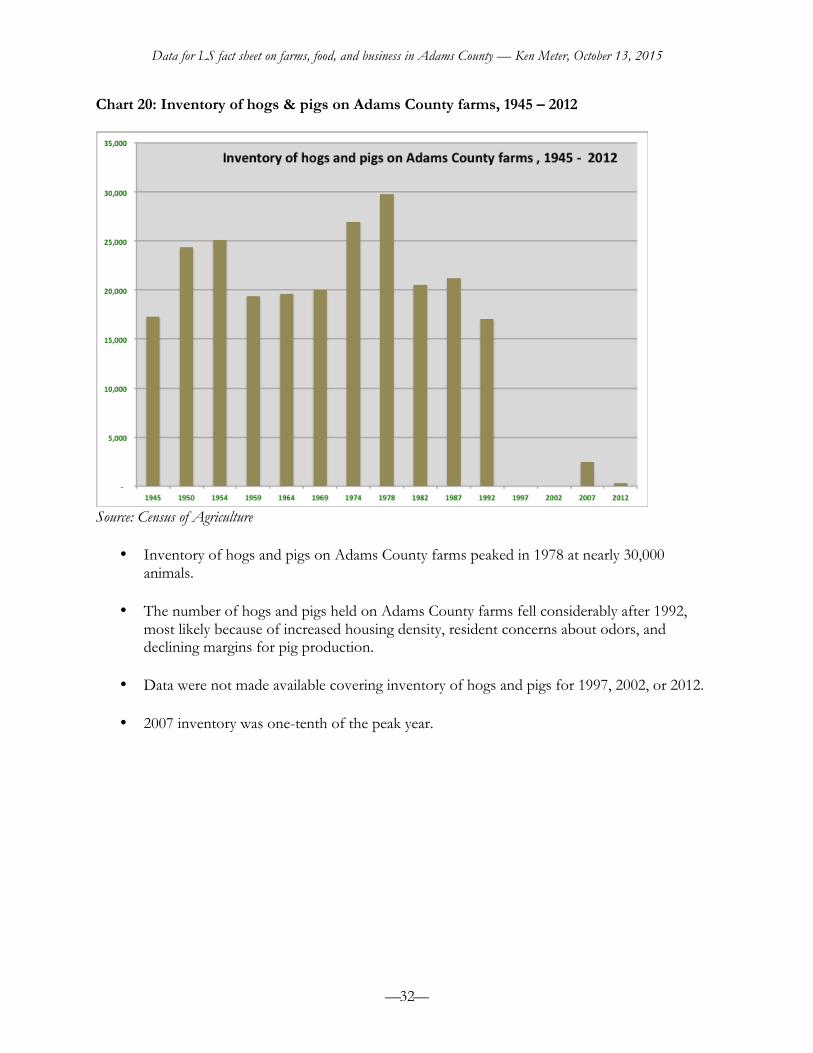
Chart 20: Inventory of hogs & pigs on Adams County farms, 1945 – 2012
Source: Census of Agriculture
• Inventory of hogs and pigs on Adams County farms peaked in 1978 at nearly 30,000 animals.
• The number of hogs and pigs held on Adams County farms fell considerably after 1992, most likely because of increased housing density, resident concerns about odors, and declining margins for pig production.
• Data were not made available covering inventory of hogs and pigs for 1997, 2002, or 2012.
• 2007 inventory was one-tenth of the peak year.

Data for LS fact sheet on farms, food, and business in Adams County — Ken Meter, October 13, 2015
— — 33
Chart 21: Number of hogs & pigs sold by Adams County farms, 1945 – 2012
Source: Census of Agriculture
• Hog and pig sales peaked in 1978, when more than 47,000 were sold by Adams County farmers.
• Data on hog and pig sales have seldom been recorded since 1997, but the sales recorded in 2012, of several hundred animals, were exceptionally low compared to previous years.

Data for LS fact sheet on farms, food, and business in Adams County — Ken Meter, October 13, 2015
— — 34
Chart 22: Value of hogs & pigs sold by Adams County farms, 1959 – 2012 (adjusted)
Source: Census of Agriculture
• Value of hogs sold by Adams County farms peaked in 1969 at $33 million.
• Sales plummeted to far less than half these figures only five years later, despite rising inventories and sales.
• Data covering hog and pig sales have seldom been reported since 1997, but total sales of
$71,000 recorded in 2012 were exceptionally low compared to previous years.

Data for LS fact sheet on farms, food, and business in Adams County — Ken Meter, October 13, 2015
— — 35
Dairy Chart 23: Number of Adams County farms raising dairy cows, 1945 – 2012
Source: Census of Agriculture
• The number of dairy farms peaked at 780 in 1950.
• At this point, almost half of the County’s farms raised dairy cows.
• Farms with dairy herds diminished rapidly until 1969, then trailed off more slowly until reaching their lowest level in 2007.
• Currently, the Census of Agriculture reports 14 farms in the County raising dairy cows.

Data for LS fact sheet on farms, food, and business in Adams County — Ken Meter, October 13, 2015
— — 36
Chart 24: Inventory of dairy cows on Adams County farms, 1945 – 2012
Source: Census of Agriculture
• The inventory of dairy cows peaked in 1959, when more than 7,000 cows were raised in Adams County. The population fell dramatically in 1964, and decreased steadily.
• By 2012, the Census of Agriculture suppressed data on the number of dairy cows to protect confidentiality of the remaining farms.
• The population appears to be less than 2,000, apportioned on 14 farms.

Data for LS fact sheet on farms, food, and business in Adams County — Ken Meter, October 13, 2015
— — 37
Chart 25: Sales of milk and dairy products by Adams County farms, 1950 – 2012
Source: Census of Agriculture
• Sales of milk, cheese, and other dairy products peaked at $22 million in 1969.
• From then on, sales declined steadily.
• By 2012, the Census of Agriculture suppressed data dairy sales to protect confidentiality of the remaining farms.

Data for LS fact sheet on farms, food, and business in Adams County — Ken Meter, October 13, 2015
— — 38
Corn for grain Chart 26: Number of Adams County farms selling corn for grain, 1945 – 2012
Source: Census of Agriculture
• Reflecting similar trends noted above in the livestock industry, the number of farms raising field corn was at its highest level in 1945, when more than 430 farms raised corn for grain.
• The number of farms raising corn fell precipitously from 1950 to 1954, when only 70 farms raised corn.
• Corn farming experienced a small peak in 1969, when nearly 200 farms raised field corn.
• From 1974 to 2012, however, the number of farms raising field corn held fairly steady, only
declining a small amount to less than 50 farms.

Data for LS fact sheet on farms, food, and business in Adams County — Ken Meter, October 13, 2015
— — 39
Chart 27: Number of acres of corn raised by Adams County farms, 1945 – 2012
Source: Census of Agriculture
• After reaching a low point in 1954, field corn acreage has risen steadily, despite the decline in the number of farms.
• In 2012, Adams County farmers reported 25,000 acres of corn production – an all time high for the post-war period.
• However, acreage planted in corn fell to low levels of less than 5,000 acres in 2002.
Data for LS fact sheet on farms, food, and business in Adams County — Ken Meter, October 13, 2015
— — 40
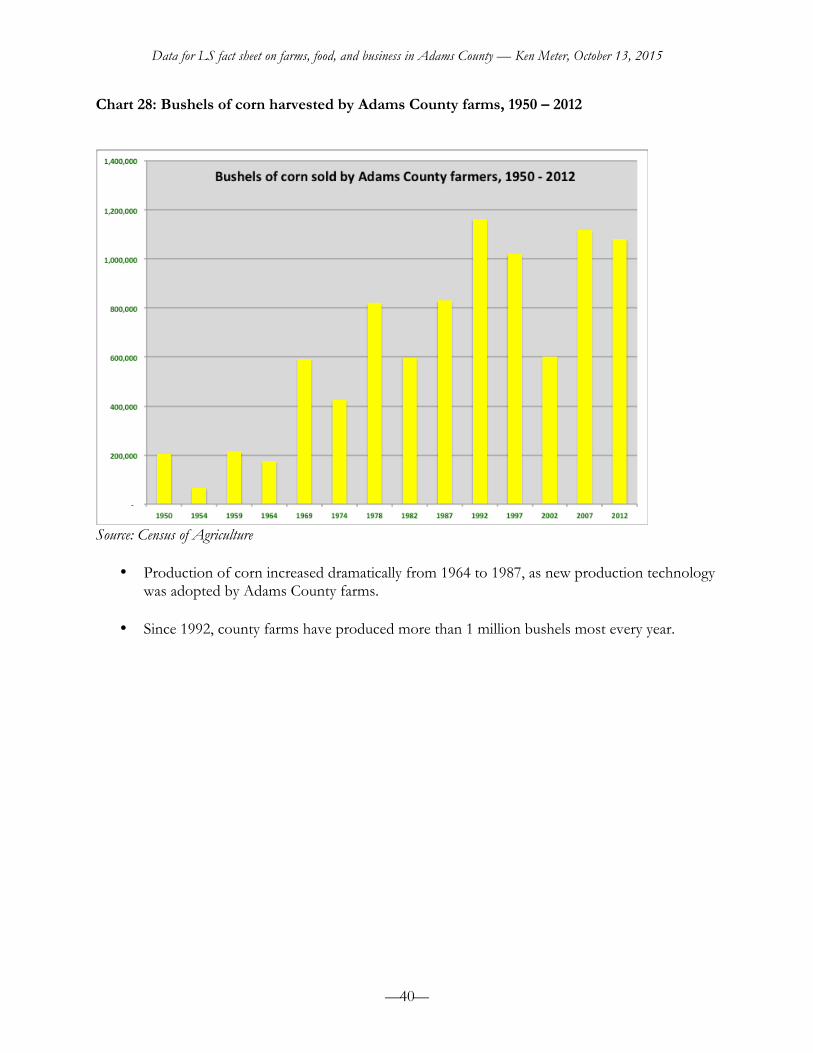
Chart 28: Bushels of corn harvested by Adams County farms, 1950 – 2012
Source: Census of Agriculture
• Production of corn increased dramatically from 1964 to 1987, as new production technology was adopted by Adams County farms.
• Since 1992, county farms have produced more than 1 million bushels most every year.
Data for LS fact sheet on farms, food, and business in Adams County — Ken Meter, October 13, 2015
— — 41
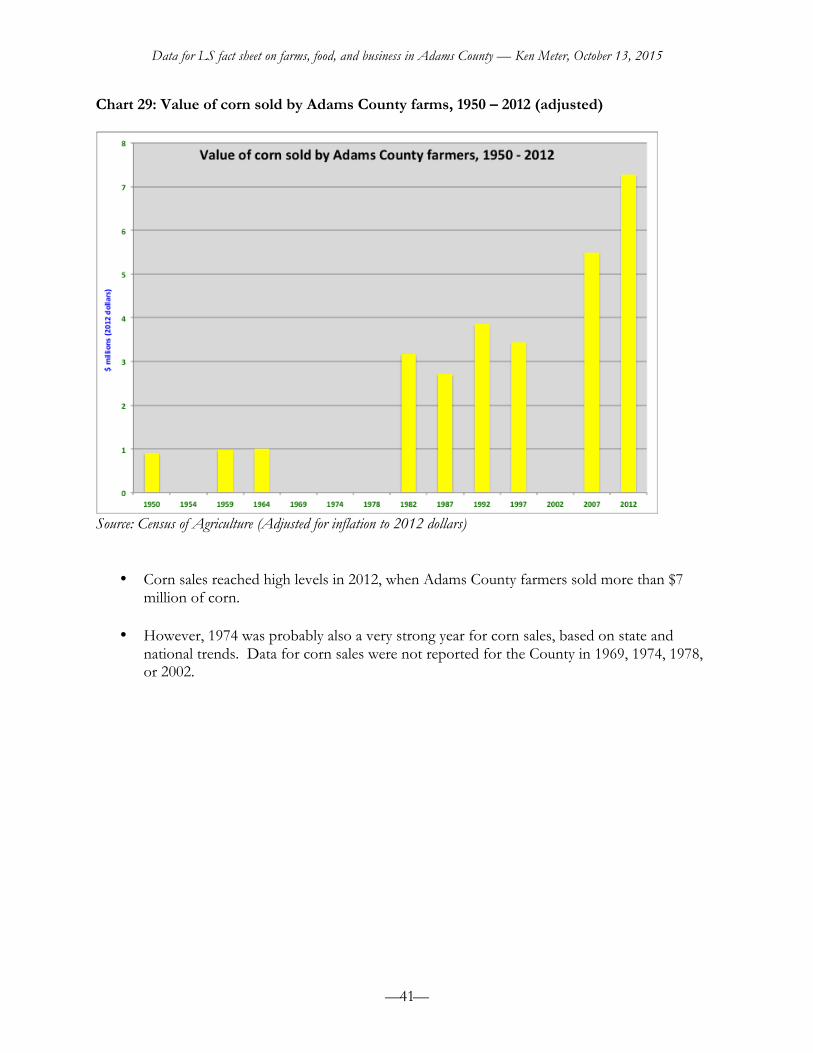
Chart 29: Value of corn sold by Adams County farms, 1950 – 2012 (adjusted)
Source: Census of Agriculture (Adjusted for inflation to 2012 dollars)
• Corn sales reached high levels in 2012, when Adams County farmers sold more than $7 million of corn.
• However, 1974 was probably also a very strong year for corn sales, based on state and national trends. Data for corn sales were not reported for the County in 1969, 1974, 1978, or 2002.

Data for LS fact sheet on farms, food, and business in Adams County — Ken Meter, October 13, 2015
— — 42
Wheat Chart 30: Number of Adams County farms raising wheat, 1950 – 2012
Source: Census of Agriculture
• The number of Adams County farms raising wheat has generally fallen steadily since 1950, when more than 650 farms grew wheat.
• Now, however, fewer than 200 farms raise wheat.
Data for LS fact sheet on farms, food, and business in Adams County — Ken Meter, October 13, 2015
— — 43
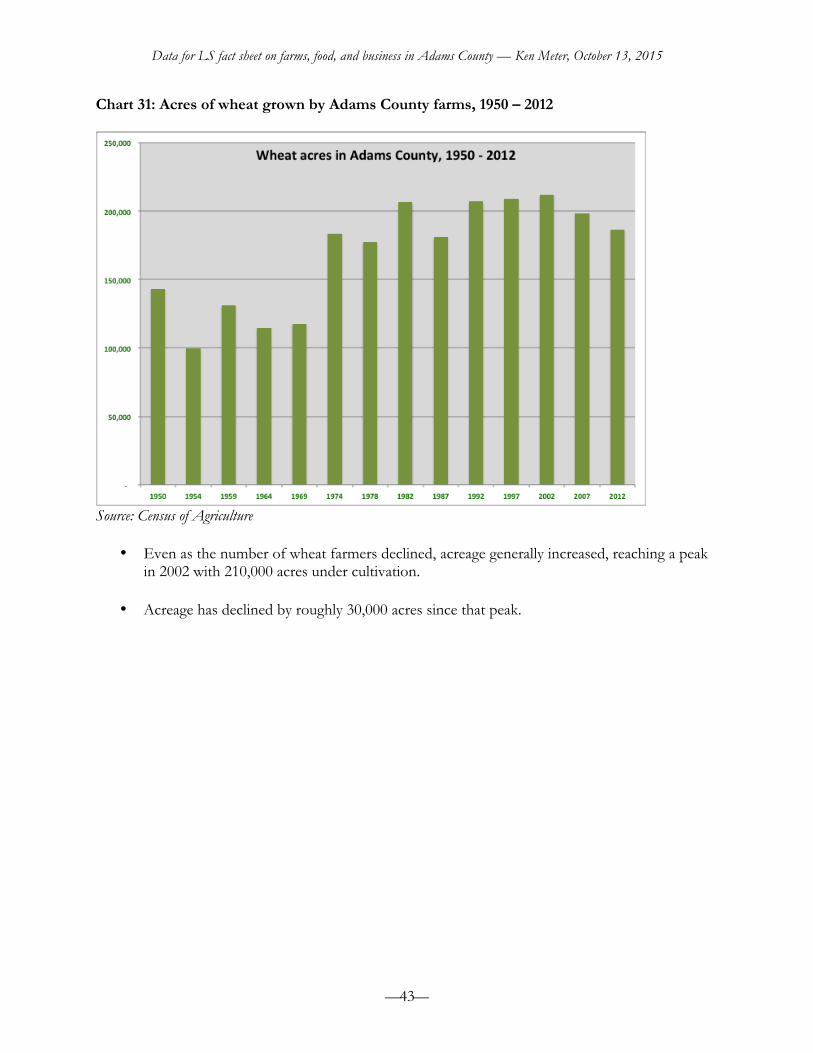
Chart 31: Acres of wheat grown by Adams County farms, 1950 – 2012
Source: Census of Agriculture
• Even as the number of wheat farmers declined, acreage generally increased, reaching a peak in 2002 with 210,000 acres under cultivation.
• Acreage has declined by roughly 30,000 acres since that peak.

Data for LS fact sheet on farms, food, and business in Adams County — Ken Meter, October 13, 2015
— — 44
Chart 32: Bushels of wheat produced by Adams County farms, 1950 – 2012
Source: Census of Agriculture
• Even though acreage of wheat rose fairly steadily, production began to fall in 1997 after reaching a peak of over 7 million bushels.

Data for LS fact sheet on farms, food, and business in Adams County — Ken Meter, October 13, 2015
— — 45
Chart 33: Value of wheat produced by Adams County farms, 1950 – 2012
Source: Census of Agriculture
• Considerable data regarding value of the wheat crop is missing from Census of Agriculture reports covering Adams County.
• One period in which considerable wheat was probably sold was 1973-1974, when U.S. farmers shipped large amounts of wheat and corn to the Soviet Union during the OPEC energy crisis.
• Lacking data from the period 1954 to 1978, it is notable that sales of wheat (in inflation-
adjusted dollars) are about the same today as they were in 1950. Loss of wheat acreage and declining prices have contributed to an erosion of the wheat industry in Adams County that has offset gains in productivity per acre.

Data for LS fact sheet on farms, food, and business in Adams County — Ken Meter, October 13, 2015
— — 46
Vegetables Chart 34: Number of Adams County farms raising vegetables, 1950 – 2012
Source: Census of Agriculture
• In 1950, one of every four farms in Adams County raised vegetables.
• However, vegetable production fell steadily until 1974, when farm families began to depend on grocery stores for their food.
• Today only 24 farms raise vegetables, but some of these farms are quite large, and many of
these larger farms lease acreage from nearby landowners, as in the Special District.

Data for LS fact sheet on farms, food, and business in Adams County — Ken Meter, October 13, 2015
— — 47

Data for LS fact sheet on farms, food, and business in Adams County — Ken Meter, October 13, 2015
— — 48
Chart 35: Acres of vegetables raised by Adams County farms, 1950 – 2012
Source: Census of Agriculture
• Acreage of vegetables have not fallen as fast as the number of farms, showing that some farms became larger.
• From 1992 to 2002, between 4,000 and 5,000 acres of vegetables were raised in Adams County each year, after reaching a low point in 1987 following the farm credit crisis.
• Currently, the Census of Agriculture shows only 108 acres planted to vegetables in Adams
County. Some of this may also be an undercount due to leased land not being reported in Adams County.
• Vegetable production in Weld County is far more prevalent, with 9,955 acres — yet even in
Weld County, acres of vegetables decreased, from 13,085 acres in 2007.
• For the state of Colorado, vegetable acreage also decreased, from 97,251 acres in 2007 to 83,266 acres in 2012. Only 39,526 acres of vegetables were reported for Colorado farms in 2002, so there have been dramatic shifts in recent years.
Data for LS fact sheet on farms, food, and business in Adams County — Ken Meter, October 13, 2015
— — 49
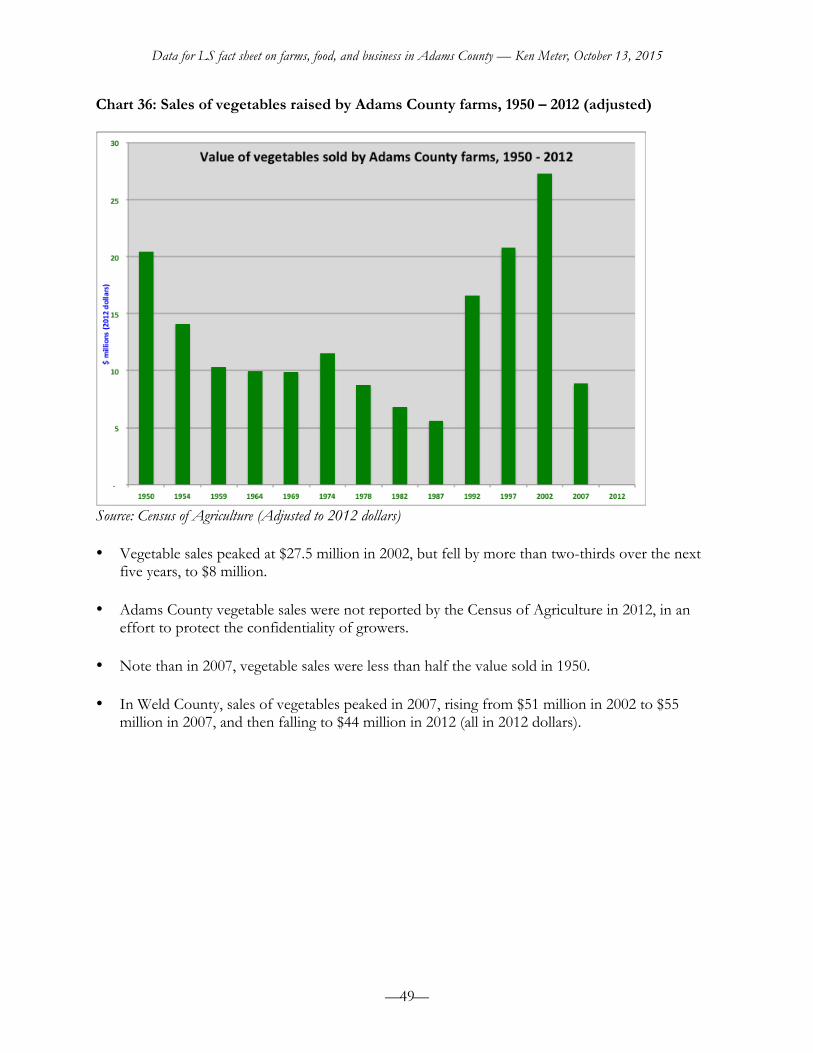
Chart 36: Sales of vegetables raised by Adams County farms, 1950 – 2012 (adjusted)
Source: Census of Agriculture (Adjusted to 2012 dollars) • Vegetable sales peaked at $27.5 million in 2002, but fell by more than two-thirds over the next
five years, to $8 million.
• Adams County vegetable sales were not reported by the Census of Agriculture in 2012, in an effort to protect the confidentiality of growers.
• Note than in 2007, vegetable sales were less than half the value sold in 1950. • In Weld County, sales of vegetables peaked in 2007, rising from $51 million in 2002 to $55
million in 2007, and then falling to $44 million in 2012 (all in 2012 dollars).


Data for Logan Simpson covering farms, food, and business in Adams County — Ken Meter, November 13, 2015
— — 51
Ornamentals & Nursery Crops Chart 37: Number of Adams County farms selling ornamentals, 1959 – 2012
Source: Census of Agriculture
• The number of farms selling ornamental, nursery, and greenhouse crops peaked in 1974 with 60 farms.
• Current levels are half this at just over 30 farms in Adams County.

Data for LS fact sheet on farms, food, and business in Adams County — Ken Meter, October 13, 2015
— — 52
Chart 38: Value of ornamental sales by Adams County farms, 1954 – 2012 (adjusted)
Source: Census of Agriculture
• Despite declining numbers of farms selling ornamentals, sales increased fairly steadily until 2007, when more than $106 million were sold.
• This number was high due to intense construction of new homes in the Denver Metro area.
• After the global housing finance crisis was over, and housing starts stalled, sales
plummeted to $45 million.
• This is nevertheless still the largest single farm product sold in Adams County today.

Data for Logan Simpson covering farms, food, and business in Adams County — Ken Meter, November 13, 2015
— — 53
Local Foods Opportunities
This section by Megan Phillips Goldenberg & Ken Meter Consumers Build the Communities They Want With Purchasing Decisions Shifting consumer preferences for purchasing consumer goods from local purveyors and manufacturers has created a sea change in most marketplaces, from US-based automotive manufacturers to hand crafted gifts to foods grown on a nearby farm to craft microbrews. Spending money locally isn’t just about a preference for certain inherit product qualities, its also a preference for community, fair pay, good jobs, resilient businesses, connection, environmental stewardship, etc. Food is the most widely available local good and increasingly people are choosing to build the communities they want by purchasing local foods. What is Local Food Really About? But local food isn’t just about the approximate distance between producer and consumer (Meter & Goldenberg, 2014). It is much more than that. Research reveals that food purchasing decisions do not depend primarily on the distances foods travel. A preference for “local” food is often overlaid with several deeply held values, and “local” is only the catch phrase used to capture these values (Meter, 2011; Born & Purcell, 2006). Not all of these values can be expressed in the selection of any one “local” product. For example, a given consumer who seeks to buy a locally raised chicken may choose not to purchase from a nearby farm if they are persuaded that management or labor practices are more sustainable on a farm 200 miles down the road. “Local” is largely in the eye of the consumer, contingent on individual values. A basic industry trends report examined various motives for purchasing local, and yielded the following survey results (DaSilva, 2014):
• 64% of surveyed consumers state a desire to support local businesses • 39% believes the taste and quality of a local product is better • 31% has more trust in the standards for locally produced foods than those of other regions
or countries • 28% believes that local products are healthier • 26% thinks it is better for the environment when food doesn’t travel as far
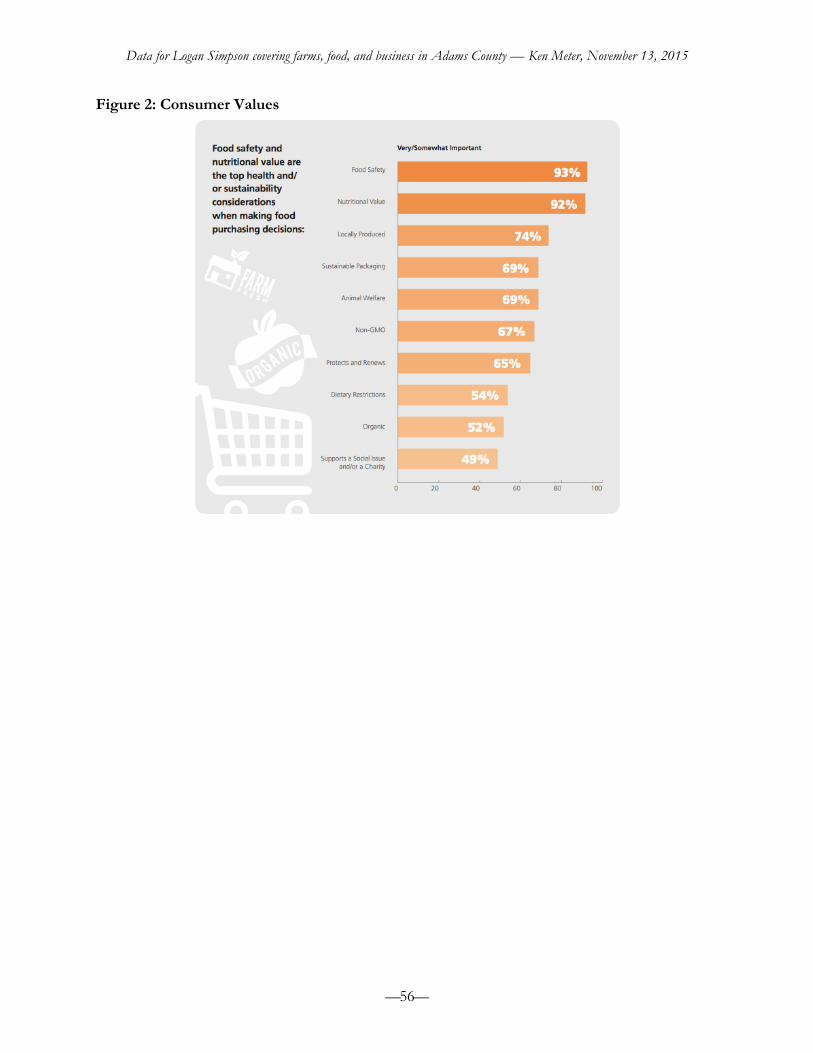
So What Do Consumers Actually Want? Above all, consumers are concerned about quality, freshness, nutrition, and food safety. A food trends survey shows 97% of consumers are primarily concerned with family satisfaction, 93% of survey respondents are concerned about nutritional quality and 92% are concerned about food safety, followed by 77% being concerned about sustainability. When forced to choose just one concern, family satisfaction (54%) and nutritional quality (41%) split the vote, with sustainability receiving only 5% (DaSilva, 2014). An interesting survey comparing producer and consumer perspectives found that consumers were far more likely to describe local food with words such as a “freshness,” “taste” and “quality” than producers, who defaulted to “miles traveled” or other geographic descriptors (Selfa & Qazi, 2005).

Data for Logan Simpson covering farms, food, and business in Adams County — Ken Meter, November 13, 2015
— — 54
Local Versus Organic Although local food does not directly correlate to any one set of production practices, consumers often consider local products to be more natural or humanely raised, especially when they are grown on a smaller farm. One study found that 20% of survey respondents thought local produce carried less pesticide residue; 22% thought local produce was non-GMO; and 23% perceived local produce to also be organic (Campbell, Khachatryan, Behe, Dennis, & Hall, 2014). Despite such assumptions, studies reveal that “local” and “organic” are not jointly demanded. Some consumers will chose an imported organic product over a local conventional product, and vice versa. Willingness-to-pay studies find that consumers will pay more for a local product than an organic product (Thilmany, Bond, & Bond, 2008) and are more likely to purchase local products over organic products (Campbell, Khachatryan, Behe, Dennis, & Hall, 2014). Strict locavores and a strict organic consumers may share similar primary and secondary values and motivations, but prioritize such values differently. Building Community Through Local Production and Purchasing Community interaction is the essential and defining element of local food, and indeed to building consumer loyalty to a farm, a label, or a brand. The greatest indicator of the magnitude of consumers’ preference for community interaction may be the widespread growth of farmers markets and CSAs. Research suggests that at least in the eyes of some, direct interaction between producer and consumer is just as important as geographic distinctions and public good factors (Eriksen, 2013; Meter, 2003, 2011). A regression analysis of consumer traits, market atmosphere, and consumer spending found that consumer interaction with the farmer was a greater predictor of spending than product attributes (freshness, quality) or household income (Hunt, 2007). This is supported by a general belief among farmers that they make more money at market when they go themselves instead of sending staff. References for local branding section Born, B., & Purcell, M. (2006). Avoiding the Local Trap: Scale and Food Systems in Planning Research . Journal of Planning Education and Research , 26, 195-207. Campbell, B., Khachatryan, H., Behe, B. K., Dennis, J., & Hall, C. (2014). U.S. and Canadian Consumer Perception of Local and Organic Terminology. International Food and Agribusiness Management Review , 17 (2). Dasilva, A. (2014). Three-Quarters of Americans Say Sustainability is a Priority When Making Food Purchasing Decisions, According to New Cone Communications Research. Boston, MA: Cone Communications. Eriksen, S. N. (2013). Defining local food: constructing a new taxonomy- three domains of proximity. Acta Agriculturea Scandinavica, Section B- Soil & Plant Science , 63, 47-55. Glassman, M. (2015). Hungry for Information: Polling Amercians on Their Trust in the Food System. Chicago, IL: The Chicago Council on Global Affairs. Hunt, A. (2007). Consumers interactions and influences on farmers' market vendors. Renewable Agriculture and Food Systems , 21 (1), 54-66.

Data for Logan Simpson covering farms, food, and business in Adams County — Ken Meter, November 13, 2015
— — 55
Meter, K. & Goldenberg, M.P. (2014) The Real Deal: How do we define “local” in a meaningful and measureable way? Pennsylvania Association for Sustainable Agriculture, with the Farmers Market Coalition, Crossroads Resource Center, and FoodRoutes Network, LL. June 30. Available at http://1local.org/resources/ Meter, K. (2012). "Local" foods are key to economic recovery. In S. Amin, E. Holt-Gimenez, R. Patel, O. De Schutter, & J. P. Stedile, Food Movements Unite!: Strategies to Transform Our Food System (pp. 201-220). Food First Books. Meter, K. (2011). Breaking Our Chains. Journal of Agriculture, Food Systems, and Community Development , 1 (4), 23-25. Selfa, T., & Qazi, J. (2005). Place, taste, or face-to-face? Understanding producer–consumer networks in ‘‘local’’ food systems in Washington State. Agriculture and Human Values , 22, 451–64. Thilmany, D., Bond, C., & Bond, J. (2008). Going Local: Exploring Consumer Behavior and Motivations for Direct Food Purchases. American Journal of Agricultural Economics , 90 (5), 1303-09. Figure 1: Consumer Values (Glassman, 2015)
Data for Logan Simpson covering farms, food, and business in Adams County — Ken Meter, November 13, 2015
— — 56
Figure 2: Consumer Values

Data for Logan Simpson covering farms, food, and business in Adams County — Ken Meter, November 13, 2015
— — 57
Farms or value-‐added businesses selling local food in the Denver Metro and Northeast Colorado regions
Wholesale distribution to local accounts LoCo Distribution Fort Collins, Colorado Picks up produce at Petrocco Farms, Brighton, and many other farms in the Front Range. Delivers to:
• Boulder • Colorado Springs • Denver • Estes Park • Fort Collins
Grocery Delivery Services Door-to-Door Organics Lafayette, Colorado

Data for Logan Simpson covering farms, food, and business in Adams County — Ken Meter, November 13, 2015
— — 58
Farms selling to local consumers
(not necessarily a complete list)
Ambrosia Farms Bennett, Colorado Free-‐range turkeys Bartels Land and Livestock Fort Collins, Colorado Organic vegetables; U-‐pick Becker's Produce 6888 CR 18 Merino, Colorado Vegetables & apples Berry Patch Farms Brighton, Colorado Organic vegetables & berries Big Willy's Farm Longmont, Colorado Organic vegetables (year-‐round) Boulder Organic Foods LLC Niwot, Colorado Prepared soups Boulder Lamb LLC Longmont, Colorado Pastured lamb Colorful Ranch Matheson, Colorado Grass-‐fed beef Cure Organic Farm Boulder, Colorado Organic vegetables, fruits, & pastured meats Ela Family Farms Hotchkiss, Colorado Organic tree fruits & berries Fossil Creek Farms Fort Collins, Colorado Organic vegetables
Fresh Start Family Farms Aurora, Colorado Eggs Fritzler Farms Lasalle, Colorado Vegetables & fruits Full Circle Organic Farms Longmont, Colorado Organic vegetables & small grains Garden Sweet Farm Fort Collins, Colorado Sustainably grown vegetables, berries, herbs, & flowers; U-‐pick strawberries Golden Prairie Nunn, Colorado Organic wheat & millet Harvest Farm 4240 East County Road 66 Wellington, Colorado Beef, honey Hazel Dell Mushrooms Loveland, Colorado Mushrooms Hoot 'n' Howl Farm Boulder, Colorado Sustainably raised berries, veggies, honey bees, beef, & chickens; U-‐pick berries Inglorious Monk Bakery Longmont, Colorado Gluten-‐free baked goods Isabelle Farms Lafayette, Colorado Organic produce
Data for Logan Simpson covering farms, food, and business in Adams County — Ken Meter, November 13, 2015
— — 59
Johnson’s Acres Brighton, Colorado Unpasteurized cow’s milk, cream, yogurt, whey, eggs, & honey Just What Grows Gardens Brush, Colorado Salad greens, herbs, flowers, lavender, & native plants Kiowa Valley Organics Roggen, Colorado Organic produce, grass-‐fed beef, naturally raised beef & free-‐range chickens Kovach Family Farms Fort Lupton, Colorado Vegetables & berries; U-‐pick Leffler Family Farms Eaton, Colorado Transitional potatoes & sugar beets Lukens Farms Fort Collins, Colorado Apples, pumpkins, flowers, & turkeys Miller Farms Platteville, Colorado Vegetables, U-‐pick; agri-‐tourism MMLocal Boulder, Colorado Canned Colorado vegetables & fruits Monroe Organic Farm Kersey, Colorado Organic vegetables & meats Nelms Farm Golden, Colorado Organic apples; U-‐pick On The Vine at Richmond Farm Fort Collins, Colorado Sustainably raised/transitional vegetables, fruits, & herbs
Ozuké Lafayette, Colorado Organic fermented foods Quixotic Farming Cañon City, Colorado Tilapia Petrocco Farms Brighton, Colorado Conventionally grown vegetables Plowshares Community Farm Longmont, Colorado Organic vegetables & heritage pork Ray Domenico Farms Platteville, Colorado Organic beets, jalapenos, chard, green beans, kale, & other vegetables Red Wagon Farm Niwot, Colorado Organic vegetables Scarecrow Gardens Greeley, Colorado Sustainably grown vegetables & fruits Schnorr Organics Fort Collins, Colorado Organic vegetables Simply Natural at Desiderata Ranch Berthoud, Colorado Grass-‐fed beef, free-‐range poultry, eggs, unpasteurized cow’s milk, & yogurt Skål Farm Golden, Colorado Permaculture farm raising goats and chickens; also sell raw milk, yogurt, kombucha starters, & kefir grains Strohauer Farms La Salle, Colorado Organic and conventional vegetables, corn, & wheat

Vert Kitchen Denver, Colorado Prepared soups & salads Winking Girl Salsa Louisville, Colorado Salsas Ya Ya Farm & Orchard Longmont, Colorado Apples, U-‐pick, & agri-‐tourism

Data for Logan Simpson covering farms, food, and business in Adams County — Ken Meter, November 13, 2015
— — 61
Farmers Markets (not necessarily a complete list – check local listings for days and hours of operation)
Arvada 57th & Olde Wadsworth Aurora 6626 S. Parker Rd. (Arapahoe Crossing in Big Lots parking lot) Aurora Southlands Shopping Center Bennett 401 S. 1st St. Boulder 13th & Canyon Broomfield 1700 W. 10th Ave. Centennial 6400 S. University Centennial 13050 E. Peakview Ave. Denver 200 Santa Fe Dr. Denver 1st & University (Cherry Creek Shopping Center) Denver 1500 block of Boulder St. (between 15th and 16th Streets) Denver 44th Ave. & Vallejo Street Denver 1420 Larimer St. (Larimer Square, Bistro Vendome Courtyard) Denver E. 29th Ave. & Roslyn St. (Stapleton Founder’s Green)
Denver E. Colfax Ave. & Columbine St. (Sullivan Fountain, across from the Tattered Cover) Denver 32nd & Lowell Denver 970 S. Pearl St. (1500 block of S. Pearl St. between Florida and Iowa) Edgewater 2401 Sheridan Blvd. Erie Wells St. between Piece and Biggs Estes Park Bond Park (Main St., next to the public library) Fort Collins 200 West Oak St. Fort Collins Harmony & Lemay Fort Collins 810 Harmony Rd. (in front of Ace Hardware parking lot) Fort Collins 802 West Drake Road Frederick 105 5th St. (5th St. between Main St. and Elm St.) Greeley 902 Seventh Ave.
Data for Logan Simpson covering farms, food, and business in Adams County — Ken Meter, November 13, 2015
— — 62
Greenwood Village 7600 Landmark Way Highlands Ranch 9288 Dorchester St. (Highlands Ranch Town Center Square) Lafayette 400 W. South Boulder Rd. (Behind the Laayette Marketplace) Lakewood Denver Federal Center (6th Ave. & Kipling St.) Lakewood 6501 W. Colfax (Lamar Station Plaza) Lakewood 9077 W Alameda Ave Alameda & Garrison (Mile Hi Church) Littleton 7301 S. Santa Fe Littleton 8501 W. Bowles (W. Bowles & S. Wadsworth)
Longmont 9595 Nelson Road Louisville 824 Front Street Loveland 700 S. Railroad (Fairgrounds Park) Loveland 3133 N. Garfield (Garfield St. & Orchards Rd., in parking lot in front of Hobby Lobby) Lowry 7581 E. Academy Blvd. Parker East Main Street Wellington 3815 Harrison Ave. Westminster Sheridan & 72nd Wheat Ridge 4252 Wadsworth Blvd.
Farm Stands & Roadside Stands
(not necessarily a complete list)
Becker's Produce 6888 CR 18 Merino, Colorado Vegetables & apples; peaches from other farms Berry Patch Farms 13785 Potomac St. Brighton, Colorado Organic vegetables & berries
Boulder Family Farms 1005 Cherryvale Rd. Boulder, Colorado Produce (some organic), eggs, artisanal products, & crafts Cure Organic Farm 7416 Valmont Rd. Boulder, Colorado Organic vegetables & fruits, honey, & eggs
Data for Logan Simpson covering farms, food, and business in Adams County — Ken Meter, November 13, 2015
— — 63
Everitt Farms 9300 W Alameda Ave. Lakewood, Colorado Vegetables & fruits, artisanal foods Fritzler Farms 20861 County Road 33 Lasalle, Colorado Vegetables & fruits Garden Sweet 719 W. Willox Lane Fort Collins, Colorado Vegetables, U-‐pick strawberries Just What Grows Gardens County Road T.9 Brush, Colorado Salad greens, herbs, flowers, lavender, & native plants Heinie’s Market 11801 W 44th Ave. Wheat Ridge, Colorado (not located at farm) Vegetables, fruits, eggs, fresh-‐pressed cider, honey, & baked goods Hoot ‘n’ Howl Farm 6033 Jay Road Boulder, Colorado Vegetables, fruits, beef, & fresh eggs Kovach Family Farms 754 South Denver Avenue Fort Lupton, Colorado Vegetables & berries; U-‐pick Lukens Farms 9320 East State Highway 14 Fort Collins, Colorado Apples, pumpkins, flowers, & turkeys
Lulu’s Farm 13201 E. 144th Ave. Brighton, Colorado Vegetables, fruits, & specialty foods Palombo Farms Market 11500 Havana St. Henderson, Colorado Vegetables, fruits, & honey Palizzi’s Farm 15380 E Bromley Lane Brighton, Colorado Vegetables & fruits Plowshares Community Farm 8040 Oxford Rd Longmont, Colorado Vegetables, fruits, & eggs Rocky Mountain Green Market Rainbow Plaza — 4229 West Eisenhower Loveland, Colorado Vegetables & fruits, other Colorado food items Scarecrow Gardens 2235 North 47th Avenue Greeley, Colorado Sustainably grown vegetables & fruits Veggiescapes 7777 Oxford Road — Yarmouth & North 26th Ave. Boulder, Colorado Vegetables & fruits; U-‐pick Zweck’s Fresh 10901 Airport Road Longmont, Colorado Vegetables & fruits

Data for Logan Simpson covering farms, food, and business in Adams County — Ken Meter, November 13, 2015
— — 64
Other Agri-tourism farms (not necessarily a complete list)
Aspen Lodge at Estes Park 6120 State Highway 7 Estes Park, Colorado Horse rentals, lessons, bed & breakfast Harvest Farm 4240 East County Road 66 Wellington, Colorado Petting zoo; beef, honey
Kiowa Creek Coaches 14200 W. County Road 7 Mead, Colorado Horse ranch, boarding stables, rising, hosts events Tigges Farm Produce and Pumpkin Patch 12404 Weld County Road 64 ½ Greeley, Colorado Vegetables & fruits; U-‐pick

Data for Logan Simpson covering farms, food, and business in Adams County — Ken Meter, November 13, 2015
— — 65
All of the following crops have been grown commercially in Adams County Source: Census of Agriculture, various years Beans, Snap Beets Broccoli Brussels Sprouts Cabbage, Head Cantaloupes & Muskmelons Carrots Cucumbers Eggplant Herbs, Fresh Cut Kale Lettuce, leaf Lettuce, romaine Okra Onions, dry
Onions, green Peas, green Peppers, bell Peppers, Chili Potatoes Pumpkins Radishes Rhubarb Spinach Squash, summer Squash, winter Sweet corn Sweet potatoes Tomatoes Watermelons
Data for Logan Simpson covering farms, food, and business in Adams County — Ken Meter, November 30, 2015
— — 66
Food Consumption
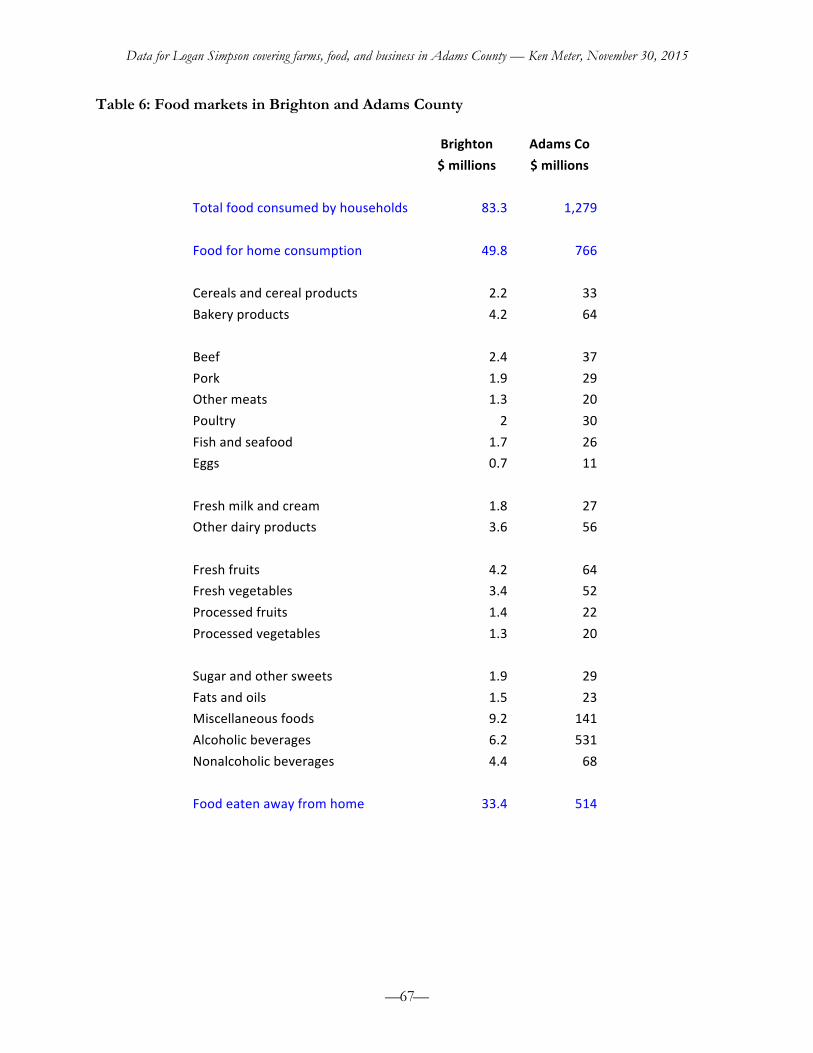
• Brighton residents purchase $83 million of food each year [Calculated using Bureau of Labor Statistics using regional averages for Western states].
• County residents purchase $1.3 billion of food each year [Calculated using Bureau of Labor Statistics using regional averages for Western states].
• Metro Denver residents purchase more than $7 billion of food each year [Calculated using
Bureau of Labor Statistics using regional averages for Western states].
• If every Adams County residents purchased $5 of food each week from some farm in the County, farmers would earn $122 million over a year – almost as much as they earn now selling all crops and livestock [Calculation: population x $5 x 52 weeks].
Data for Logan Simpson covering farms, food, and business in Adams County — Ken Meter, November 30, 2015
— — 67
Table 6: Food markets in Brighton and Adams County
Brighton Adams Co
$ millions $ millions
Total food consumed by households 83.3 1,279
Food for home consumption 49.8 766
Cereals and cereal products 2.2 33 Bakery products 4.2 64
Beef 2.4 37 Pork 1.9 29 Other meats 1.3 20 Poultry 2 30 Fish and seafood 1.7 26 Eggs 0.7 11
Fresh milk and cream 1.8 27 Other dairy products 3.6 56
Fresh fruits 4.2 64 Fresh vegetables 3.4 52 Processed fruits 1.4 22 Processed vegetables 1.3 20
Sugar and other sweets 1.9 29 Fats and oils 1.5 23 Miscellaneous foods 9.2 141 Alcoholic beverages 6.2 531 Nonalcoholic beverages 4.4 68
Food eaten away from home 33.4 514

Data for Logan Simpson covering farms, food, and business in Adams County — Ken Meter, November 30, 2015
— — 68
Consumer Markets for Food in Brighton and Adams County (Assuming consumption is typical of rest of U.S.) Source: Economic Research Service Table 7: Estimated food consumption in pounds by local consumers If Brighton or Adams County wanted to feed itself all the foods it currently consumes, these are the approximate amounts local farms would have to produce.
Vegetables
Brighton Adams Co.
pounds pounds
Artichokes 47,146 601,675 Asparagus 59,975 765,397 Dry Beans 212,304 2,709,407 Dry Peas 40,713 519,580 Beans, Lima 13,055 166,612 Beans, Snap 242,031 3,088,786 Beets 21,023 268,300 Broccoli 345,856 4,413,798 Brussels Sprouts 15,843 202,184 Cabbages 291,085 3,714,814 Carrots 384,545 4,907,547 Cauliflower 61,247 781,625 Celery 201,343 2,569,534 Greens, Collard 46,727 596,324 Corn, Sweet 795,938 10,157,720 Cucumbers 387,337 4,943,180 Eggplant 31,175 397,859 Escarole 7,159 91,364 Garlic 73,759 941,305 Kale 20,502 261,639 Lettuce, Head 517,941 6,609,935 Lettuce, Romaine 419,801 5,357,479 Mushrooms 139,499 1,780,283 Greens, Mustard 8,152 104,030 Okra 11,318 144,438 Onions 718,969 9,175,445 Peas, Green 87,631 1,118,341 Pepper, Bell 368,550 4,703,411 Peppers, Chili 256,401 3,272,182 Potatoes 4,251,795 54,261,186 Pumpkins 172,034 2,195,490 Radishes 17,032 217,357 Spinach 90,239 1,151,630 Squash 163,019 2,080,437 Sweet Potatoes 245,772 3,136,530 Tomatoes 3,167,079 40,418,097 Greens, Turnip 8,495 108,414
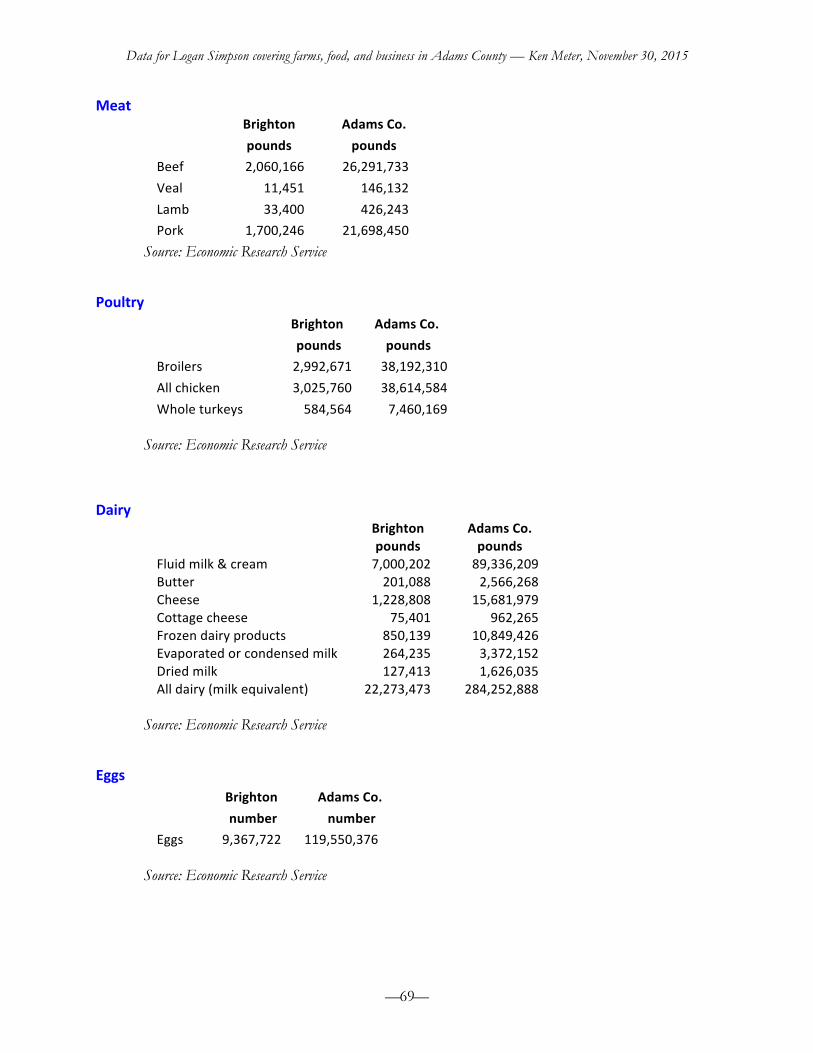
Data for Logan Simpson covering farms, food, and business in Adams County — Ken Meter, November 30, 2015
— — 69
Meat Brighton Adams Co. pounds pounds Beef 2,060,166 26,291,733 Veal 11,451 146,132 Lamb 33,400 426,243 Pork 1,700,246 21,698,450
Source: Economic Research Service
Poultry
Brighton Adams Co.
pounds pounds
Broilers 2,992,671 38,192,310 All chicken 3,025,760 38,614,584 Whole turkeys 584,564 7,460,169
Source: Economic Research Service
Dairy Brighton Adams Co. pounds pounds Fluid milk & cream 7,000,202 89,336,209 Butter 201,088 2,566,268 Cheese 1,228,808 15,681,979 Cottage cheese 75,401 962,265 Frozen dairy products 850,139 10,849,426 Evaporated or condensed milk 264,235 3,372,152 Dried milk 127,413 1,626,035 All dairy (milk equivalent) 22,273,473 284,252,888
Source: Economic Research Service
Eggs
Brighton Adams Co.
number number
Eggs 9,367,722 119,550,376 Source: Economic Research Service
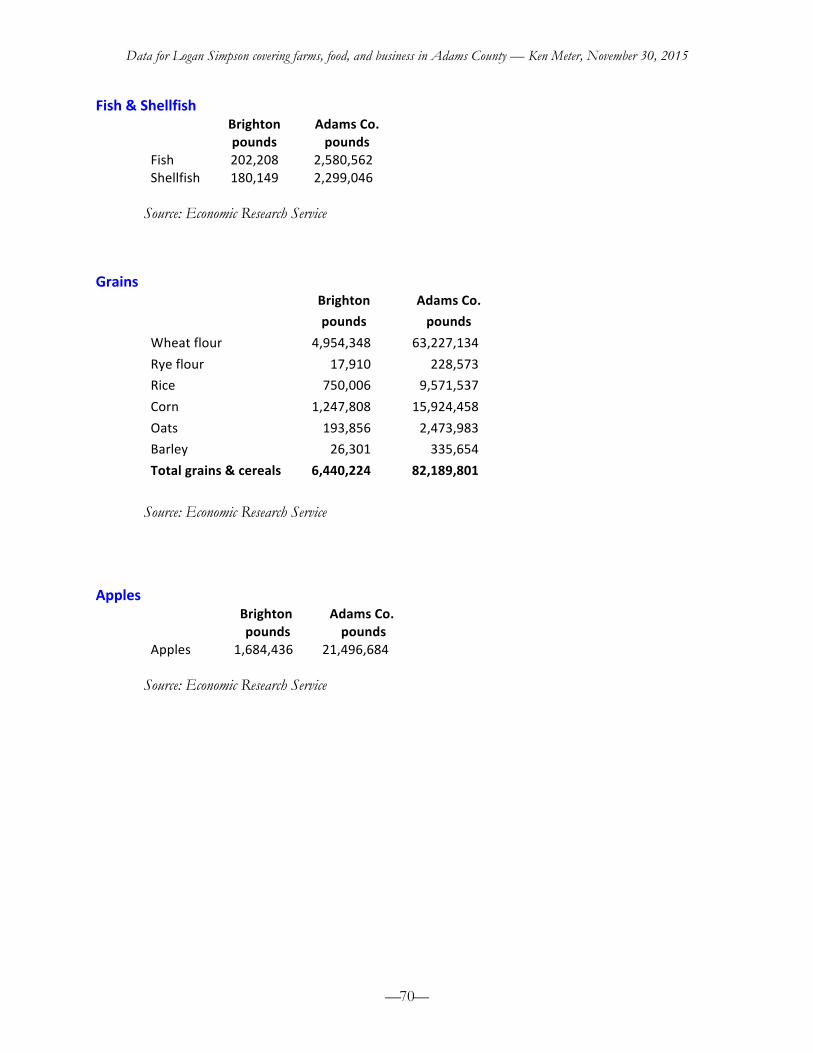
Data for Logan Simpson covering farms, food, and business in Adams County — Ken Meter, November 30, 2015
— — 70
Fish & Shellfish Brighton Adams Co. pounds pounds Fish 202,208 2,580,562 Shellfish 180,149 2,299,046
Source: Economic Research Service
Grains Brighton Adams Co. pounds pounds Wheat flour 4,954,348 63,227,134 Rye flour 17,910 228,573 Rice 750,006 9,571,537 Corn 1,247,808 15,924,458 Oats 193,856 2,473,983 Barley 26,301 335,654 Total grains & cereals 6,440,224 82,189,801
Source: Economic Research Service
Apples
Brighton Adams Co.
pounds pounds
Apples 1,684,436 21,496,684 Source: Economic Research Service

Data for Logan Simpson covering farms, food, and business in Adams County — Ken Meter, November 30, 2015
— — 71
Issues affecting low-income residents in Adams County
• 5% percent of the County’s households (over 23,000 residents) earn less than $10,000 per year. [Source: Federal Census of 2009-2013].
• Over 144,000 county residents (32%) earn less than 185% of federal poverty guidelines. At this level of income, children qualify for free or reduced-price lunch at school.
• These lower-income residents spend an estimated $300 million each year buying food,
including an average of $30 million of SNAP benefits (formerly known as food stamps) for the years 1989 to 2013, as well as additional WIC coupons.
• However, since 2008 there has been a dramatic increase in SNAP collections, from $36
million in 2008 to $90 million for each year 2011 to 2013.
• The County’s 841 farmers receive an annual combined total of $8 million in subsidies (25-year average, 1989-2013), mostly to raise crops such as wheat or corn that are sold as commodities, not to feed local residents [Sources: Federal Census of 2009-2013, Bureau of Labor Statistics, & Bureau of Economic Analysis].
• More than $80 million of SNAP coupons were received by Adams County residents each
year since 2011, while farmers receive on average less than $10 million in federal payments per year.

Data for Logan Simpson covering farms, food, and business in Adams County — Ken Meter, November 30, 2015
— — 72
Chart 39: SNAP coupons (formerly known as food stamps) compared to federal payments to Adams County farms, 1969 – 2013 (adjusted)
Source: Bureau of Economic Analysis (in 2013 dollars).

Data for Logan Simpson covering farms, food, and business in Adams County — Ken Meter, November 30, 2015
— — 73
Farming & Food in the Special District
The predominant land use is raising produce on rented land • Most of the farmland in the District is rented or leased to larger produce farms. • Petrocco Farms is leasing a large portion of the land in the District.
• Sakata Farms is not currently leasing land within the District for growing vegetables.
• Both Petrocco and Sakata sell produce nationally or internationally, but also sell to stores in
Brighton and Denver. Among their customers are WalMart, Safeway, and King Soopers.
• Even when produce raised by Petrocco crews is sold in Brighton stores (for example, King Soopers has a display featuring local farms and Safeway features local produce) it is primarily channeled through warehouses in Denver.
• Sakata reports that some vendors purchase produce from their farm to re-sell at roadside
stands or farmers markets.
Data for Logan Simpson covering farms, food, and business in Adams County — Ken Meter, November 30, 2015
— — 74
Vegetable farming may be more profitable than other types in District • While financial information is not readily available for individual farms in the District, some
conclusions may be drawn from data covering both Adams County and the state of Colorado. First, despite lower overall sales for vegetables by Adams County farms compared to other products ($9 million sales in 2002; no data reported for 2012), on smaller plots of land (a total of 1,100 acres planted in vegetables in Adams County in 2007; only 100 acres reported for the entire county in 2012), several prominent produce farms have attained considerable financial presence in the region, while cattle ($39 million in sales in 1987; $8 million in 2012) and wheat production ($43 million in sales from 200,000 acres in 2012) have declined. Data from the 2012 Census of Agriculture show that Colorado had 763 farms that raised vegetables on 83,266 acres, selling a total of $280 million of vegetables. This means the average vegetable farm was 109 acres in size, selling $3,370 of vegetables per acre for an average total of $367,747 per farm. On the other hand, the 3,653 Colorado farmers who raised wheat planted an average of 597 acres of wheat, which sold for $477 million, or $219 per acre and an average total of $130,685 per farm. This means that even though the average wheat acreage per farm was almost six times the average vegetable acreage, sales per farm were nearly three times higher, and sales per acre were more than fifteen times higher for the vegetable farms. While this data does not include the costs of production, so cannot address profitability, the fact remains that produce farms have expanded while cattle and wheat production have declined.
• Augmenting these broader statistics are two dynamics that clearly apply in the Special District: (a) farmers have recognized the special nature of the alluvial soil and irrigation available in the Platte Valley, and its high quality for raising produce; and (b) vegetable growers have a somewhat closer connection to local buyers and wholesalers than if they sold to a global commodity industry.
• Both Sakata and Petrocco are important to the local economy and for keeping District land in farm production. Both remain committed to Brighton, but nonetheless appear to be positioning themselves to withdraw from farming within the District if conditions change. Both firms have packing sheds in the District, yet both lease land in locations further north in Weld County or Platte County, where there is more open land, less development pressure, lower lease and rental rates, and fewer land use and transportation conflicts.
• Petrocco Farms maintains an office in Weld County already; Sakata says it has considered moving its distribution center and offices further north as well.
Farming practices may not be compatible with residential development • Both Sakata and Petrocco note that they increasingly see conflicts between farm equipment
and suburban traffic on local roads. Sakata has adopted a policy that none of its tractors should be driven on highways from field to field, but rather should be transported on trailers, which can fit better into the flow of traffic because they can drive at higher speed.
• Both Petrocco and Sakata Farms say they see conflicts between suburban development and
farms because of their need to spray fungicides, pesticides, and farm chemicals on their fields. People are not likely to want to live near these chemical applications.
Data for Logan Simpson covering farms, food, and business in Adams County — Ken Meter, November 30, 2015
— — 75
• Organic farming is a rising force in food markets nationally, growing faster than overall grocery sales. Organic Trade Association (OTA) data released earlier this year show that organic food sales nationally rose 11 percent in 2014 to reach $35.9 billion.1
• OTA further concluded that organic fruits and vegetables led organic sales, growing 12%
from 2013 to $13 billion in 2014. Fruits and vegetables accounted for more than 36 percent of all organic food sales. Organic dairy product sales rose 11% to $5.5 billion.
• OTA has tracked organic food sales since 1997, when total sales across the U.S. were $3.4
billion, making up less than 1 percent of total food sales. “In 2014, organic food claimed almost 5 percent of the total food sales in the United States, and has consistently far exceeded the 3-percent growth pace for the total food industry,” Food Product Design concluded in reporting on the OTA data.
• According to the newly released 2014 Organic Survey of farmers conducted by USDA,
Colorado is the eighth-largest state in the U.S. for organic sales by farmers, with 157 certified organic farmers selling $147 million of organic products in 2014 — nearly $1 million in average sales per farm.2
• Looking at vegetable production only, 46 Colorado farms raised 4,233 acres of organic
vegetables in 2014, selling these for $18.8 million. These farms, then, averaged 92 acres per farm, and sold $409,000 of products per farm, or $4,441 per acre — considerably higher than the Colorado average sales of $3,370 per acre for all vegetable farms in 2012.
• Nationally, sales of organic farm products increased 72% from 2008 to 2014.
Land & water prices are higher than farming can support • Dave Petrocco, Sr. says that the cost of land is prohibitive today; due to pressures from
development, it is impossible to purchase land at a price that farming can cover, so the firm relies upon leasing land for vegetable production.
• Purchasing water rights is even more expensive, with some estimating this to be 1.5 times
the sale price of the land alone.
• Sakata Farms says it has successfully produced higher quantities per acre to help offset these rising land costs.
1 Bizzozero, J. (2015). “U.S. Organic Food Sales Grow to $36 Billion.” Food Product Design (blog) http://www.foodproductdesign.com/blogs/trending-foods/2015/04/u-s-organic-food-sales-grow-to-36-billion.aspx. See also https://www.ota.com/resources/market-analysis 2 USDA NASS 2014 Organic Survey http://www.agcensus.usda.gov/Publications/2012/Online_Resources/Organics/

Data for Logan Simpson covering farms, food, and business in Adams County — Ken Meter, November 30, 2015
— — 76
• Critical to the presence of both Sakata and Petrocco in the District is the fact that both farms were started long ago when land was cheaper, and were able to build strong businesses free from development pressure. It is unlikely that either firm could be launched with the same success today given higher overall costs of production, greater competition for land, and less supportive infrastructure. This also means that should they leave, new farm businesses are unlikely to replace them.
• As one farmer put it, “Farm production will never repay the investment in the land.” This
means that if family farming is to continue in the District, public agencies (or some wealthy private entity) will have to make land available for lease or repurchase at rates commensurate with what can be earned by farming the land.
The primary buyer for farmland for agricultural use is the City • This suggests that the primary buyer for farmland in the District (for agricultural uses) would
be the City of Brighton. The City’s choice of parcels to buy, their locations, and which supportive infrastructure are created, is likely to determine whether there is farming in the District, and what types of farming it might be. If the City and County do not develop a proactive policy for protecting this prime farmland, it is likely to be lost forever.
• Further, it seems that developers, very wealthy individuals, conservation-minded funds, or public entities are some of the few parties able to consider purchasing land in the District, but few would have economic reasons to retain farmland uses.
• Therefore, if farming is to survive in the District, its survival will depend on public
investment. Smaller farms, in particular, would require supportive infrastructure that helps create local efficiencies in food trade.
Investment is critical for both economic and noneconomic reasons • Although it would be easy to consider public investments in farming and food to be
questionable economically, the costs of a proactive land protection strategy should also be balanced against the costs of doing nothing. For example, the state of Colorado pays more than $2 billion per year to cover the medical costs of diabetes and related health conditions — all connected to the food Coloradans currently eat, and perhaps preventable with a healthier diet and more consistent exercise.
• There are less tangible, but nonetheless critical reasons to protect working farms: farms are
training grounds for youth learning work skills, offer starting job opportunities for Brighton youth, and knowing food production processes appears to be central to making healthier eating choices as a consumer. Farm involvement cultivates a sense of connection to nature and open space. If farmed properly, property values for nearby homes may rise. Engagement in growing food through gardens and farms is often a strong inspiration for learning about science and technology. The community of Brighton appears to depend on farming as a central core of its unique identity, and there would be economic consequences if this were lost.
Data for Logan Simpson covering farms, food, and business in Adams County — Ken Meter, November 30, 2015
— — 77
Local markets for food are robust • Since residents of the City of Brighton spend an estimated $83 million per year buying food,
there is considerable economic opportunity to be tapped by focusing local farm production on feeding local residents. Since Adams County residents purchase $1.3 billion of food each year, and the Denver Metro area residents purchase $7.3 billion of food each year, there are considerable markets in nearby communities as well.
Berry Patch Farm focuses on Brighton markets Note: Berry Patch owner Tim Ferrell is a leader in the Agricultural Land Preservation Subcommittee.
• Claudia Ferrell considers the 40-acre farm she works with her husband Tim to be the “best
soil in the state.” She adds that it is the “best soil for organic agriculture anywhere.” Sited largely in the Platte River floodplain, it draws benefit from centuries of alluvial deposits.
• Like other farms in the District, the farm relies upon irrigation water from the Fulton ditch and its system of waterways.
• The owners of Berry Patch have farmed since 1991. The couple hired nine part-time
workers this year; some of these want to go into farming for themselves. The Ferrells have arranged for a conservation easement on the land, hoping to protect it for agricultural purposes. They say they have no descendants who would wish to take over their farm.
• The farm grows a wide variety of vegetables, for sale at their on-farm store, which is open
year-round. Hardy crops such as kale are grown indoors in high tunnels. The Ferrells view season extension as critical if Brighton is to be viewed as a food destination.
• One crop the Ferrells have found to be too difficult to grow is sweet peas, since the cool-
weather season is so short.
• Berry Patch also offers pick-your-own from May through September, including strawberries, raspberries, currants, pie cherries, plums, apples, basil, flowers, and pickling cucumbers.
• The couple also has tapped a variety of other markets; for example working with one local
baker to use their farm’s zucchini for baking bread. By offering recipes to their customers, they have generated new interest in less-known vegetables such as leeks, rutabagas, and celeriac. These lesser-known crops that are easy to grow in the District would likely assume more importance in our diet as consumers become more attuned to healthy eating, eating within season, and purchasing locally raised produce.
• Hosting farm-to-table events at the Berry Patch maintain the farm’s visibility with local
consumers; hosting parties or other special events brings in additional income.
• The Ferrells would like to offer value-added products such as frozen and dehydrated vegetables, but lack the equipment to produce these. Additional storage would also help, they said.
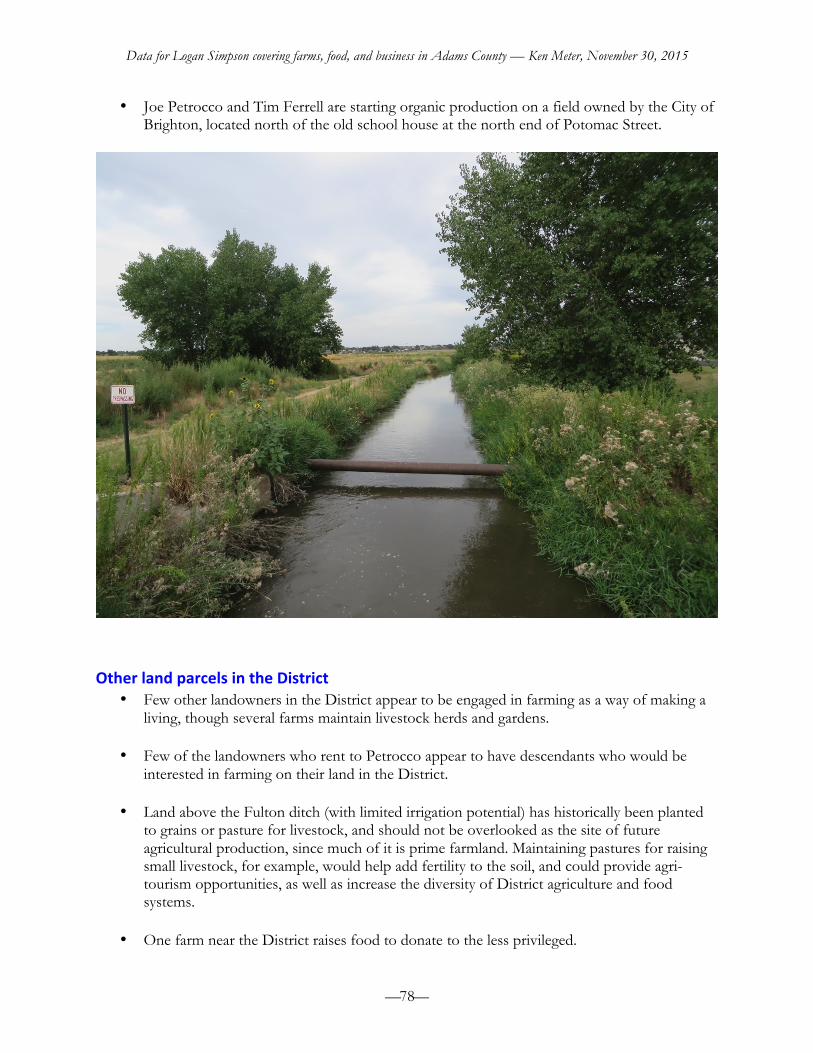
Data for Logan Simpson covering farms, food, and business in Adams County — Ken Meter, November 30, 2015
— — 78
• Joe Petrocco and Tim Ferrell are starting organic production on a field owned by the City of Brighton, located north of the old school house at the north end of Potomac Street.
Other land parcels in the District • Few other landowners in the District appear to be engaged in farming as a way of making a
living, though several farms maintain livestock herds and gardens.
• Few of the landowners who rent to Petrocco appear to have descendants who would be interested in farming on their land in the District.
• Land above the Fulton ditch (with limited irrigation potential) has historically been planted
to grains or pasture for livestock, and should not be overlooked as the site of future agricultural production, since much of it is prime farmland. Maintaining pastures for raising small livestock, for example, would help add fertility to the soil, and could provide agri-tourism opportunities, as well as increase the diversity of District agriculture and food systems.
• One farm near the District raises food to donate to the less privileged.

Data for Logan Simpson covering farms, food, and business in Adams County — Ken Meter, November 30, 2015
— — 79
• The County has already negotiated conservation easements for about 3,000 acres of land,
primarily west of the Platte or east of Brighton.
Labor is a critical issue • Several farmers (both large and small) said that one of the largest obstacles to sustaining
their farm is the lack of youth with the skills or interest in doing farm work.
• Lack of labor is one more reason that the current forms of agriculture do not regenerate themselves over time. If Brighton wishes to save farm land and fashion itself into a tourist destination, it would be important for local schools to teach skills in gardening and farming as part of generating a new identity as a contemporary agricultural community.
• Laboring on farms is currently an important income source for Adams County residents,
who earn $22 million per year through farm labor.

Data for Logan Simpson covering farms, food, and business in Adams County — Ken Meter, November 30, 2015
— — 80
The District holds strong potential for agri-‐tourism • Brighton has strong potential for creating a regional destination around the District’s
heritage of food and farming. With its proximity to Denver, excellent highway access, and future bike and light rail access, Adams County could serve as a destination for those who want to enjoy visiting a productive rural landscape, and savor its unique foods and culture.
• However, it will be difficult to attract tourists to visit farms in Brighton unless Brighton itself embraces local farms and local foods in a wholehearted manner. This would mean: having more working farms that produce food for local residents; creating closer connections among local farms and local consumers; running consistent and frequent marketing campaigns to encourage Brighton residents to buy food from local farms; encouraging restaurants to feature local food items on their menus; featuring local foods in local school nutrition programs; and other steps.
• A distribution firm focused on local markets, LoCo Distribution (based in Fort Collins),
already picks up food from Brighton area farms for distribution to Front Range outlets, so increasing local distribution points should be relatively straightforward if local consumers ask for local food deliveries.
• The Sakata and Petrocco distribution facilities are tangible expressions of Brighton’s rich
agricultural heritage, and their heritage could potentially be a strong part of a tourist draw for the District, for example through a Brighton food heritage center. Yet these facilities would not seem to be significant attractions as working farm operations, nor are they likely to welcome visitors, for either food safety or liability reasons, during production seasons.
• Expansive vegetable fields are excellent stretches of open space, and worth protecting for
that reason. These would be attractive fields to bike past, for example. They are critical as income sources for farmworkers and owners, and as a source of produce. Yet these also do not create agri-tourism destinations by themselves, without accompanying activities and locations: for example, signboards showing the history of produce production or displays at a Brighton food heritage center.
• Culinary destinations such as food processors, gourmet restaurants, breweries, wineries, beds
and breakfasts, and the like, could be developed without having agricultural land nearby, but will have greater tourist appeal if they express a unique sense of place for, and a commitment to protecting farmland, by Brighton. Fostering these qualities would likely center around locally produced foods.
• These commercial destinations are likely to prove more profitable than the farms
themselves, because they face fewer difficulties than farmers, who have to farm in uncertain weather conditions, and sell products that have lower value to begin with. They might therefore be asked to help support local farm and food activity financially.
• The predominant cuisine in Brighton today is Latino; this might become central to the
town’s sense of place and appeal to tourists.

Data for Logan Simpson covering farms, food, and business in Adams County — Ken Meter, November 30, 2015
— — 81
Overall summary
Strengths of the Special District • Contains some of the best land in the state • Water is available in significant portions of farmland • Holds a rich heritage of produce farming • Vegetable farming has been more rewarding financially than raising other products • Farmworkers in Adams County earn $20 million per year • Farms are near to robust consumer markets
Limitations of the Special District • Suburban development has encroached • Prevalent farming practices appear to be incompatible with residential development • Major produce growers may move north • Land is too expensive to be paid for through farm production alone • Water rights are even more expensive • Few local residents have farming skills • Farm labor is in short supply
Opportunities for the Special District • To serve as a symbol for protecting farmland and rural quality of life • To raise food for Brighton, Adams County, and Metro Denver markets • To maintain farming practices that are compatible with residential development • To serve as the core of a vibrant local food culture in Brighton • To provide agri-‐tourism experiences for visitors
Potential obstacles for protecting farmland • Residents may perceive that it is too late to protect the tradition of rural living • Landowners want to sell land (or water rights) at development prices to fund retirement • Few landowning families have heirs who want to farm • The City may be the only buyer of land for agricultural use

Data for Logan Simpson covering farms, food, and business in Adams County — Ken Meter, November 30, 2015
— — 82
Farmland protection strategy: Develop nodes of activity that support local foods If Brighton and Adams County wish to support a vibrant agriculture and cluster of food businesses as part of its future identity, here are some suggestions for how that might be accomplished:
• To preserve farms as open space over the long term, they must be productive and sustainable businesses. It will be difficult to protect farmland, or to protect agriculture, by themselves; these must be part of a local food system that sustains working family farms and engages consumers in supporting these local farms. City and County policy should focus on food and farming, not simply on protecting agricultural lands — although of course protecting farmlands is critical if Brighton wishes to preserve open space and farms.
• No external developer will construct a local food system for the District; if the City and
County wish this to happen it will take concerted proactive effort on the part of both public bodies. These must be grown from the inside, starting with what is already in place and emerging, rather than by importing businesses from elsewhere.
• Local foods planning should embrace what is already emerging in local foods trade, and make strategic investments that strengthen and leverage this activity to help create a coordinated and sustainable local food system.
• Just as the City and County have considerable control over the location of housing
development by decisions they make with regard to zoning, and where water and sewer infrastructure are installed, these public bodies can play an active role in creating more

Data for Logan Simpson covering farms, food, and business in Adams County — Ken Meter, November 30, 2015
— — 83
profitable small farms by investing in supportive infrastructure (see specific suggestions below) that creates new efficiencies in local food trade.
• It seems clear that despite reluctance on the part of some growers, future farms in and near
Brighton must pursue sustainable and organic practices, if farming is to be compatible with residential housing and other development.
• For organic farming to flourish, livestock must be raised on farms in and near the District in
such a way that is compatible with housing. Crops should be rotated with pastures, to balance nutrients, increase diversity, build healthier soil, and maintain high productivity.
Specific investments We suggest the following specific investments in local food systems for the Special District south of Brighton:
1. The City of Brighton must announce a clear priority, and take definitive action steps, to show its commitment to protecting farmland if efforts to protect land are to be credible. This outreach should make the City’s long-term strategy clear and show how the City is targeting its resources to achieve its vision. Timeline: Assuming the City and County decide to preserve farmland in the Special District, this action should be taken immediately. Since some parcels of farmland in Brighton have already been sold for development, several residents seem persuaded that nothing can be done to curtail development; others wish to be free to sell their land to developers and hope further development will make this possible. The City and County should publish detailed information showing how much land has already been dedicated to development, and how much farmland could be purchased with available resources, along with longer-term projections showing how much farmland could be protected in the future.
2. The City of Brighton should build (or cause to be built) a washing, packing, aggregation, & distribution facility scaled to small farm production, located near growers who raise produce for local markets. This could be built on a working farm raising food for local markets, or in close proximity to several such farms. The old school site may be a prime location for this. Such an investment would hopefully help attract additional farms to locate nearby over time.
Timeline: This action should be taken at whatever point a grower or group of growers who grow for local markets, or a firm or organization working closely with growers, presents a detailed business plan for building and operating such a facility for at least five years. If this plan were to show that several growers will share use of the facility, that would likely have more positive impact in building a local food system over time.
3. The City should explore investing in (or facilitating investment by private parties in) flash-freezing equipment, most likely at the same site, for local farms to use to extend shelf life of fresh produce items.

Data for Logan Simpson covering farms, food, and business in Adams County — Ken Meter, November 30, 2015
— — 84
Timeline: As above, this step should be taken when a grower or group of growers offers a credible plan for building and operating such a facility.
4. The City already owns enough land to launch an incubator farm for training new farmers, with leasable land (roughly in 5 to 50 acre plots) nearby, so that graduates may remain in the community of farmers, and make use of some of the infrastructure listed above. This might be an excellent use of the Anderson farm, should it be purchased by the City. Local sources state that there are young people in Boulder County who are looking for land; CSU runs a farmer training program in Boulder County, and urban farmer training programs also operate in Denver.
Timeline: Planning for this training farm should be initiated immediately under the City’s initiative; it is unlikely that an outside vendor would conform to the City’s vision unless such a vision is spelled out and held by the City itself. For more information on incubator farms, see Meter & Goldenberg (2013), “Making Small Farms into Big Business,” http://www.crcworks.org/scfood.pdf). The most difficult element of this is likely to be locating an expert farmer who is also an expert instructor. Actual creation of an incubator farm should be undertaken when a firm or organization has been identified (perhaps in response to an RFP from the City) that can develop and implement an effective farmer training program with sufficient resources to ensure the project’s sustainability. A softer start might be launched once emerging farmers (perhaps graduates of other programs) apply to the City for access to land with water rights so they can grow food for local markets. Investments in infrastructure noted above could encourage such farmers to relocate to these farms.
5. The City must resell or lease this land to new small-scale growers at price levels that
can be paid through farm production (the use-value of the land) rather than at the development value.
Timeline: Considerable preparation work may be required to establish clear policies, procedures, and pragmatic regulations that would allow the City to formally lease or re-sell land to small-scale farmers growing for local markets at the use-rate of the land (and water) for farming. Creation of these legal frameworks could begin immediately.
6. To raise the visibility of local foods, it will be critical to create a prominent connection point that brings together town and rural residents to celebrate local foods and buy from local farms (e.g., at Bromley Farm or Palizzi’s farm stand).
Timeline: This is a longer-term priority that should be considered early in planning for agritourism, and local foods marketing, but could be developed at a later date. Such a connection point will also serve as a focal point for agritourism and other visitors.
7. The City and County must actively market local foods, including publicizing the
seasonal availability of the foods raised on Brighton area farms, the farmers who raise these foods, where local foods may be purchased, and the chefs and households who use them.

Data for Logan Simpson covering farms, food, and business in Adams County — Ken Meter, November 30, 2015
— — 85
Timeline: This should commence immediately, since it will be important to increase consumer awareness of the availability of locally grown food, if farmers are to be profitable in selling food to local consumers.
8. The City and County should jointly launch (perhaps in collaboration with local
health care providers) an “Eat 5, Buy 5” campaign similar to the one devised in Montezuma County, Colorado. This would call for each county resident to eat five fruits and vegetables each day for health reasons, and buy five dollars of food from an Adams County farm each week. If each county household purchased this much food from county farms per person each week, this would amount to $122 million of revenue for the County’s farms — almost as much as the $145 million of crops and livestock county farms currently sell each year.
Timeline: This should commence immediately. Such a campaign could be launched with minimal cost, and expanded over time. The initial campaign in Southwest Colorado was launched with $500.
9. In the future, the City and County may wish to raise funds from external sources to purchase
additional farmland as it becomes available for sale by current landowners. Private individuals, conservation funds, state, or federal sources could be used to leverage City and County investments.
Timeline: This is a long-term strategy.

Data for Logan Simpson covering farms, food, and business in Adams County — Ken Meter, November 30, 2015
— — 86
Appendix: Quantitative Data Adams County (Bureau of Economic Analysis, 2013) 469,193 Adams County residents receive $16.6 billion of income annually. Aggregate personal income for county residents increased 300% from 1969 to 2013, after dollars were adjusted for inflation. Adams County population has increased more than 150% since 1969. The largest source of personal income is government jobs, accounting for $2.7 billion of income. Transfer payments (from government programs such as pensions) rank second, at $2.6 billion [see below]. Capital income (from interest, rent, or dividends) totals $2.4 billion. Construction workers earned $1.3 billion in 2013, while wholesale workers earned $1.2 billion. Health care professions bring in $1 billion of personal income. Manufacturing jobs produce $951 million of personal income, and transportation workers earn $871 million. Retail workers accounted for $790 million of personal income. Note that income from public sources makes up 33% of all personal income in the County. During the years 2003 and 2004, construction workers in Adams County earned an aggregate total of $8 billion of personal income each year. These income levels returned to about $1 billion per year from 2005 to 2013. Income earned from transfer payments includes $834 million of retirement and disability insurance benefits; $1.1 billion of medical benefits; $307 million of income maintenance benefits; $88 million of unemployment insurance; and $97 million of veterans’ benefits. Government income includes $137 million of income earned by federal workers and $2.5 billion earned by state and local government workers. Military personnel earn $71 million of personal income. Issues affecting low-income residents of Adams County: Over 144,000 residents (32%) earn less than 185% of federal poverty guidelines. At this level of income, children qualify for free or reduced-price lunch at school. These lower-income residents spend an estimated $300 million each year buying food, including an average of $30 million of SNAP benefits (formerly known as food stamps) for the years 1989 to 2013, as well as additional WIC coupons. However, since 2008 there has been a dramatic increase in SNAP collections, from $36 million in 2008 to $90 million for each year 2011 to 2013. The County’s 841 farmers receive an annual combined total of $8 million in subsidies (25-year average, 1989-2013), mostly to raise crops such as wheat or corn that are sold as commodities, not to feed local residents. Data from Federal Census of 2009-2013, Bureau of Labor Statistics, & Bureau of Economic Analysis. 5% percent of the County’s households (over 23,000 residents) earn less than $10,000 per year. Source: Federal Census of 2009-2013. 15% of all adults aged 18-64 in Colorado carried no health care coverage in 2014. Source: Centers for Disease Control.

Data for Logan Simpson covering farms, food, and business in Adams County — Ken Meter, November 30, 2015
— — 87
Food-related health conditions in Colorado: 36% of the state’s residents reported in 2013 that they eat less than one serving of fruit per day. 19% eat less than one serving of vegetables. This is a key indicator of health, since proper fruit and vegetable consumption has been connected to better health outcomes. Many providers recommend consumption of at least five servings of fruit and vegetables each day, while others suggest even higher rates. Source: Centers for Disease Control. 84% of Colorado adults report they get sufficient exercise each week to meet recommended guidelines. Source: Centers for Disease Control. 7% of Colorado residents have been diagnosed with diabetes as of 2014. Source: Centers for Disease Control. Medical costs for treating diabetes and related conditions in the state are estimated at $2.5 billion. Source: American Diabetes Association. 56% of residents in Colorado were overweight (35%) or obese (21%) in 2014. Source: Centers for Disease Control. Adams County's farms (Census of Agriculture, 2012) Agriculture Census data for 2012 were released May 2, 2014 The Census of Agriculture defines a “farm” as “an operation that produces, or would normally produce and sell, $1,000 or more of agricultural products per year.” Land:
• 841 farms in 2012. This is a 6% decrease in farms since 2007. • Adams County has 2.3% of Colorado’s farms. • 122 (15%) of these are 1,000 acres or more. • 424 (50%) farms are less than 50 acres. • The most prevalent farm size is 10-49 acres, with a total of 331 farms (39% of farms). • Average farm size is 821 acres, slightly less than Colorado’s average of 881. • The County has 690,528 acres of land in farms, a decrease of 2% since 2007. • This amounts to 2.2% of the state's farmland. • 80% of farmland is cropland, and 2% is pasture. • Adams County farms have 249,000 acres of harvested cropland. • 178 (21%) farms have a total of 17,649 acres of irrigated land. • Average value of land and buildings per farm is $1.2 million. This is just above the state
average of $1.1 million. Sales: With the exception of foods sold directly to consumers (see below), farmers typically sell commodities to wholesalers, brokers or manufacturers that require further processing or handling to become consumer items. The word “commodities” is used in this report to mean the crops and livestock sold by farmers through these wholesale channels. The term “products” encompasses commodity sales, direct sales, and any other sales.
• $116 million of crops and livestock were sold in 2012, 1.5% of state ag sales.

Data for Logan Simpson covering farms, food, and business in Adams County — Ken Meter, November 30, 2015
— — 88
• $102 million of these sales were crops. • $14 million of these sales were livestock and products. • This was a decline of 24% from 2007 sales of $153 million. • 575 (68%) of the County’s farms sold less than $10,000 of products in 2012. Their aggregate
sales of $1 million amounted to 1% of the County’s farm product sales. • 128 farms (15%) sold more than $100,000 of products, an aggregate total of $111 million,
95% of county farm product sales. • 342 (41%) farms received $5.5 million of federal payments in 2012. Federal crop subsidies
accrue only to farmers who raise specific crops such as wheat or corn. [Note that Agriculture Census data differ from Bureau of Economic Analysis data; see below.]
• 61% (511) of the County’s farms reported net losses in 2012 even after subsidies are taken into account. This just above the Colorado rate of 59%.
Top farm products in Adams County, 2012
$ millions Ornamentals & nursery crops 44.7 Wheat 42.9 Livestock & milk 13.9 Corn 7.3
Production Expenses:
• Total farm production expenses were $99 million, down from $130 million in 2007. • Hired farm labor expenses were $22 million (22%). • Supplies, repairs, and maintenance cost farmers $8.2 million (8%). • Costs for seeds, plants, and vines ranked third at $8.2 million (8%). • Farmers charged $7.9 million to depreciation (8%). • Chemical purchases totaled $7.7 million (8%). • Gasoline, oil, and fuels cost $7.6 million (85). • Fertilizer, lime, and soil conditioners ranked seventh, at $7 million (7%). • Feed purchases totaled $6 million (6% of production expenses).
Grains, Dry Edible Beans, Oil Crops, and others:
• Adams County farms sold $53 million of grains, oil crops, and edible beans, more than the $40 million sold in 2007 .
• 181 county farms sold 6.3 million bushels of winter wheat from 186,439 acres. • The County’s wheat crop brought a total of $43 million, an increase from 2007 sales of $31
million. • 42 Adams County farms raised $7.2 million (1 million bushels) of corn on 24,638 acres in
2012.

Data for Logan Simpson covering farms, food, and business in Adams County — Ken Meter, November 30, 2015
— — 89
• This was an average price of $7.20 per bushel. Note that this price is an approximation, and does not necessarily represent an actual price at which corn was sold.
Cattle & Dairy:
• Livestock and livestock products worth $14 million were sold from 354 Adams County in 2012, but sales figures for specific livestock items were suppressed by USDA in an effort to protect confidentiality.
• 259 farms hold an inventory of 14,433 cattle and calves. • 6,770 cattle were sold from 198 farms in 2012. • 14 farms were reported as selling milk or dairy products, but neither the number of dairy animals
nor sales were disclosed by USDA in an effort to protect confidentiality. • 165 farms produced 19,481 dry tons of forage crops (hay, etc.) on 13,361 acres of cropland.
Forage sales figures were suppressed by USDA in an effort to protect confidentiality. Other livestock & animal products:
• 48 farms sold hogs and pigs worth a total of $71,000. • 45 farms hold an inventory of 345 hogs and pigs. • 67 farms sold a total of $704,000 of horses. • 69 farms raise sheep or goats, selling $294,000 worth. • 42 county farms hold an inventory of 863 sheep and lambs. • 138 farms hold an inventory of 3,600 laying hens. • 79 farms sold $61,000 of poultry and eggs in 2012. • Adams County has 11 broiler chicken producers, with a total inventory of 623 birds.
Nursery, Landscape and Ornamental Crops:
• 32 farms sold $45 million of ornamental and nursery crops. This was a substantial decline from the $83 million that was sold by county farms in 2007.
• 2 county farms sold Christmas trees.
Vegetables & Melons (some farmers state that Ag Census data does not fully represent vegetable production):
• Vegetable and potato sales figures for farms in Adams County were withheld by the Census of Agriculture in 2012. In 2007, county vegetable sales totaled $8 million.
• 24 farms produced these vegetables on 108 acres of land. • 3 farms raise potatoes.
Fruits (some farmers state that Census of Agriculture data does not fully represent fruit production):
• The County has 11 farms with a total of 15 acres of orchards.
Data for Logan Simpson covering farms, food, and business in Adams County — Ken Meter, November 30, 2015
— — 90
Direct & organic sales and related practices: • 96 (11%) farms sold $502,000 of food directly to household consumers. This is a four-farm
decrease in the number of farms selling direct (100 in 2007), and a 78% decrease in direct sales from $2.2 million in 2007. Direct sales account for 0.4% of county farm sales, higher than the national average of 0.3%.
• 3 county farms reported selling $500,000 of organic foods. • 4 county farms reported to the Census of Agriculture that they market through community-
supported agriculture (CSA). • 17 farms sell directly to retail customers. • 3 farms reported having on-farm packing facilities. • 11 county farms reported earning $422,000 from agri-tourism. • 48 farms produce added-value products on the farm.
Conservation practices:
• 134 farms use rotational management or intensive grazing. Sources of farm-related income for Adams County farmers in 2012 (Census of Agriculture) (other than sales of crops or livestock)
dollars
Insurance payments 3,790,000 Custom work 3,640,000 Other 2,750,000 Cash rents 2,110,000 Agri-tourism 420,000 Patronage dividends 180,000 State & local governments 90,000

Data for Logan Simpson covering farms, food, and business in Adams County — Ken Meter, November 30, 2015
— — 91
Adams County highlights (Census of Agriculture, 2012): • Ranks 1st of 18 counties in Colorado for inventory of pheasants. • The County ranks 2nd in state for sales of nursery, greenhouse, and floriculture crops. • Ranks 4th in Colorado for acreage devoted to wheat. • Adams County ranks 6th in state for inventory of goats, with 1,441. • Ranks 7th in Colorado for value of crops sold, with $102 million. • Ranks 8th in state for dairy sales. • Ranks 10th in state for sales of grains, oilseeds, and dry peas, with $53 million. • Ranks 11th in Colorado for sales of fruit and nuts.
Colorado highlights (Census of Agriculture, 2012):
• Colorado has 36,180 farms, down 2% from 37,054 farms in 2007. • The state has 31.6 million acres in farms, up one percent from 2007. • Colorado farmers sold $7.8 billion of farm products in 2012, 28% higher than five years
earlier. • Crop sales totaled $2.4 billion, 31% higher than in 2007. • Livestock sales totaled $5.3 billion, up 69% from 2007. • Federal payments to Colorado farmers totaled $165 million, up 6% from 2007. • Average payment per farm receiving federal payments was $14,897. • The most prevalent farm size was 10-49 acres, with 10,008 farms at this scale. • Colorado is the 10th-most important state for livestock sales, with $5.4 billion. • The state ranks 20th in overall farm product sales. • Colorado is the third-most important state in the U.S. for both inventory of sheep and
lambs, with 401,376, and in sales of sheep, lambs, and goats at $87 million. • The state ranks 5th in the U.S. for sales of cattle, with $4.3 billion. • Colorado is the 5th-most important winter wheat producing state, with 2.2 million acres. • 2,896 Colorado farms sold $19 million of food products directly to household consumers in
2012. • This was a 4% increase in the number of farms selling direct, from 2,777, but overall direct
sales fell 15% from 2007 level of $22.6 million. • The value of direct sales from Colorado farms was just less than the value of the 12th-ranked
product, oil crops. • 234 farms reported to the Census of Agriculture that they operated community-supported
agriculture (CSA) farms. • 407 farms have on-farm packing facilities. • 848 farms marketed directly to retail outlets such as grocery stores. • 1,798 farms produced value-added products on the farm. • 176 farms sold $68 million of organic products in 2012. • 6,712 farms practiced rotational or management-intensive grazing. • 3,897 farms received water from the Bureau of Land Reclamation. • 22 farms practiced alley cropping or silvopasture. • 247 farms harvested biomass for renewable energy use.

Data for Logan Simpson covering farms, food, and business in Adams County — Ken Meter, November 30, 2015
— — 92
Table 8: Colorado’s top farm products in 2014 (Economic Research Service) The data in the table below and Chart 40 on the following page cover Colorado as a whole.
$ millions
Cattle & calves 3,832 Dairy products & milk 857 Corn 546 Feed crops (except corn) 496 Other crops 452 Wheat 412 Vegetables & melons 259 Hogs 256 Poultry & eggs 161 Other animals & products 136 Fruits & nuts 38 Oil crops 17
Note also that at $19 million, direct sales from farmers to household consumers are valued at just less than the 12th-ranking product, oil crops.

Data for Logan Simpson covering farms, food, and business in Adams County — Ken Meter, November 30, 2015
— — 93
Chart 40: Colorado’s top farm products in 2014 (Economic Research Service) See Table 8 on previous page
Source: USDA Economic Research Service
Data for Logan Simpson covering farms, food, and business in Adams County — Ken Meter, November 30, 2015
— — 94
Balance of Cash Receipts and Production Costs (BEA): Adams County farmers sell $145 million of food commodities per year (1989-2013 average), spending $171 million to raise them, for an average loss of $26 million each year. This is an average net cash income of $30,916 per farm. Note that these sales figures compiled by the BEA may differ from cash receipts recorded by the USDA Census of Agriculture (above). Overall, farmers spent $656 million more to produce crops and livestock over the years 1989 to 2013 than they earned by selling these products. Farm production costs exceeded cash receipts for all but three years of that 25-year period. Moreover, 61% of the County's farms reported that they lost money in 2012 (Census of Agriculture), and Adams County farmers and ranchers earned $91 million less by selling commodities in 2013 than they earned in 1969 (in 2013 dollars). Farmers and ranchers earn another $11 million per year of farm-related income — primarily custom work, and rental income (25-year average for 1989-2013). Federal farm support payments are a more important source of net income than commodity production, averaging $8 million per year for the County for the same years. These do not fully compensate for production losses, meaning Adams County farmers rely upon off-farm sources of income to make ends meet. These are aggregate figures for all farmers in the County, and do not reflect the financial situation of any individual farm. Many farms in the study area report they have lucrative markets. Some farmers who inherited land or who purchased land at lower prices years ago have more favorable financial returns. The County's consumers: See also information covering low-income food consumption and food-related health conditions, page 1-2 above. Adams County consumers spend $1.3 billion buying food each year, including $766 million for home use. Most of this food is sourced outside the County, so the Adams County consumers spend about $1.1 billion per year buying food sourced outside. Only $502,000 of food products (0.4% of farm cash receipts and 0.04% of the County’s consumer market) are sold by farmers directly to household consumers. Farm and food economy summary: Farmers lose $26 million each year producing food commodities, which is only partially compensated by $8 million of federal payments (and these payments only go to farmers producing certain crops). Moreover, farmers spend an estimated $60 million buying inputs sourced outside of the County. Meanwhile, consumers spend $1.1 billion buying food from outside. Thus, total loss to the County is $1.1 billion of potential wealth each year. This loss amounts to more than seven times the value of all food commodities raised in the County.
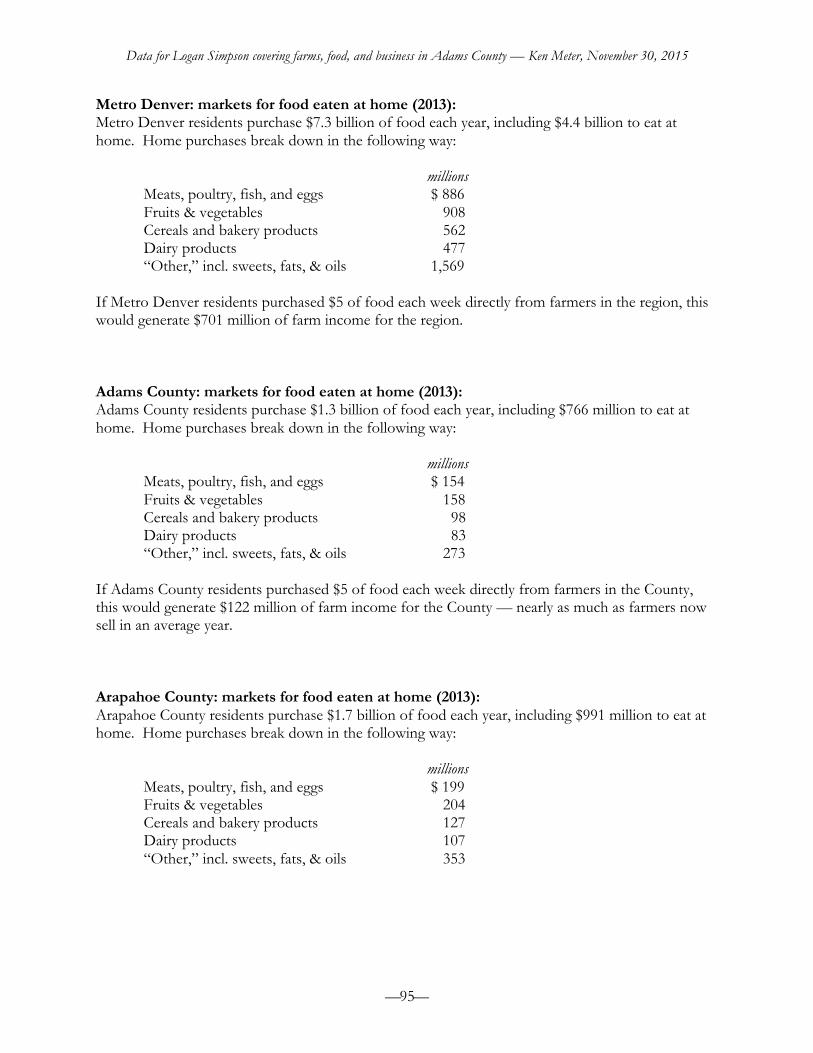
Data for Logan Simpson covering farms, food, and business in Adams County — Ken Meter, November 30, 2015
— — 95
Metro Denver: markets for food eaten at home (2013): Metro Denver residents purchase $7.3 billion of food each year, including $4.4 billion to eat at home. Home purchases break down in the following way:
millions Meats, poultry, fish, and eggs $ 886 Fruits & vegetables 908 Cereals and bakery products 562 Dairy products 477 “Other,” incl. sweets, fats, & oils 1,569
If Metro Denver residents purchased $5 of food each week directly from farmers in the region, this would generate $701 million of farm income for the region. Adams County: markets for food eaten at home (2013): Adams County residents purchase $1.3 billion of food each year, including $766 million to eat at home. Home purchases break down in the following way:
millions Meats, poultry, fish, and eggs $ 154 Fruits & vegetables 158 Cereals and bakery products 98 Dairy products 83 “Other,” incl. sweets, fats, & oils 273
If Adams County residents purchased $5 of food each week directly from farmers in the County, this would generate $122 million of farm income for the County — nearly as much as farmers now sell in an average year. Arapahoe County: markets for food eaten at home (2013): Arapahoe County residents purchase $1.7 billion of food each year, including $991 million to eat at home. Home purchases break down in the following way:
millions Meats, poultry, fish, and eggs $ 199 Fruits & vegetables 204 Cereals and bakery products 127 Dairy products 107 “Other,” incl. sweets, fats, & oils 353
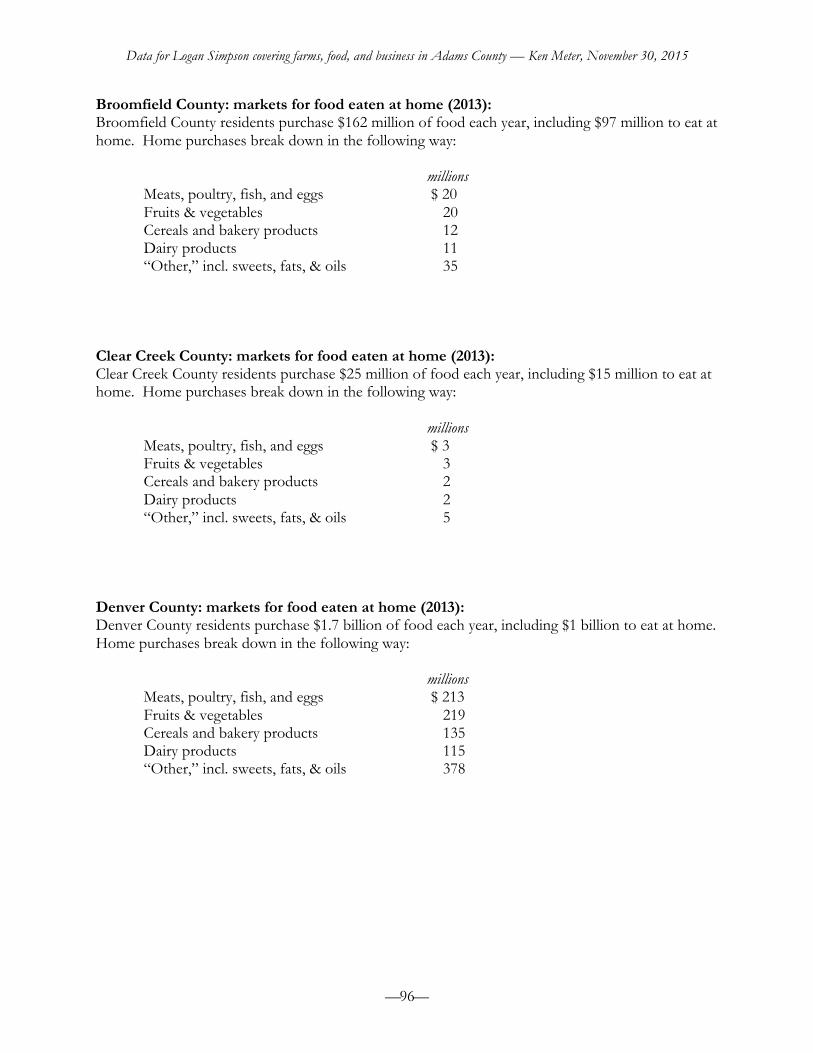
Data for Logan Simpson covering farms, food, and business in Adams County — Ken Meter, November 30, 2015
— — 96
Broomfield County: markets for food eaten at home (2013): Broomfield County residents purchase $162 million of food each year, including $97 million to eat at home. Home purchases break down in the following way:
millions Meats, poultry, fish, and eggs $ 20 Fruits & vegetables 20 Cereals and bakery products 12 Dairy products 11 “Other,” incl. sweets, fats, & oils 35
Clear Creek County: markets for food eaten at home (2013): Clear Creek County residents purchase $25 million of food each year, including $15 million to eat at home. Home purchases break down in the following way:
millions Meats, poultry, fish, and eggs $ 3 Fruits & vegetables 3 Cereals and bakery products 2 Dairy products 2 “Other,” incl. sweets, fats, & oils 5
Denver County: markets for food eaten at home (2013): Denver County residents purchase $1.7 billion of food each year, including $1 billion to eat at home. Home purchases break down in the following way:
millions Meats, poultry, fish, and eggs $ 213 Fruits & vegetables 219 Cereals and bakery products 135 Dairy products 115 “Other,” incl. sweets, fats, & oils 378

Data for Logan Simpson covering farms, food, and business in Adams County — Ken Meter, November 30, 2015
— — 97
Douglas County: markets for food eaten at home (2013): Douglas County residents purchase $834 million of food each year, including $500 million to eat at home. Home purchases break down in the following way:
millions Meats, poultry, fish, and eggs $ 100 Fruits & vegetables 103 Cereals and bakery products 64 Dairy products 54 “Other,” incl. sweets, fats, & oils 178
Elbert County: markets for food eaten at home (2013): Elbert County residents purchase $65 million of food each year, including $39 million to eat at home. Home purchases break down in the following way:
millions Meats, poultry, fish, and eggs $ 8 Fruits & vegetables 8 Cereals and bakery products 5 Dairy products 4 “Other,” incl. sweets, fats, & oils 14
Gilpin County: markets for food eaten at home (2013): Gilpin County residents purchase $15 million of food each year, including $9 million to eat at home. Home purchases break down in the following way:
millions Meats, poultry, fish, and eggs $ 2 Fruits & vegetables 2 Cereals and bakery products 1 Dairy products 1 “Other,” incl. sweets, fats, & oils 3
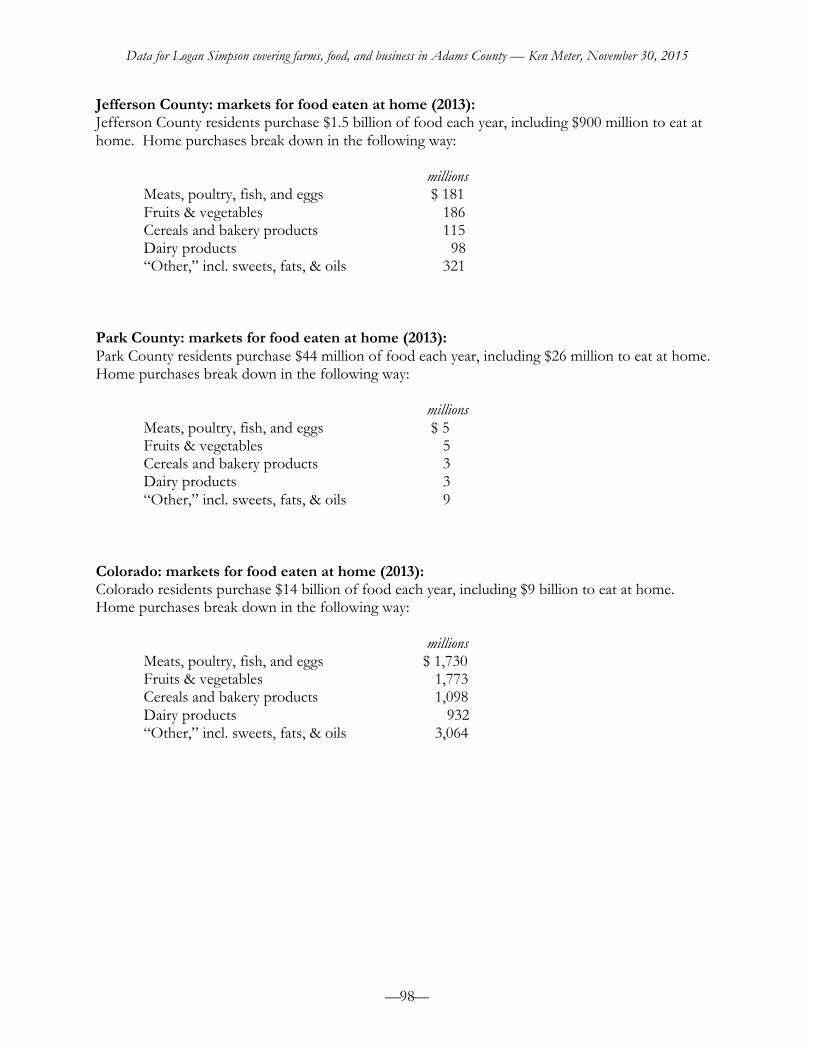
Data for Logan Simpson covering farms, food, and business in Adams County — Ken Meter, November 30, 2015
— — 98
Jefferson County: markets for food eaten at home (2013): Jefferson County residents purchase $1.5 billion of food each year, including $900 million to eat at home. Home purchases break down in the following way:
millions Meats, poultry, fish, and eggs $ 181 Fruits & vegetables 186 Cereals and bakery products 115 Dairy products 98 “Other,” incl. sweets, fats, & oils 321
Park County: markets for food eaten at home (2013): Park County residents purchase $44 million of food each year, including $26 million to eat at home. Home purchases break down in the following way:
millions Meats, poultry, fish, and eggs $ 5 Fruits & vegetables 5 Cereals and bakery products 3 Dairy products 3 “Other,” incl. sweets, fats, & oils 9
Colorado: markets for food eaten at home (2013): Colorado residents purchase $14 billion of food each year, including $9 billion to eat at home. Home purchases break down in the following way:
millions Meats, poultry, fish, and eggs $ 1,730 Fruits & vegetables 1,773 Cereals and bakery products 1,098 Dairy products 932 “Other,” incl. sweets, fats, & oils 3,064

Data for Logan Simpson covering farms, food, and business in Adams County — Ken Meter, November 30, 2015
— — 99
Key public data sources: Bureau of Economic Analysis data http://www.bea.doc.gov/bea/regional/reis/ Food consumption estimates from Bureau of Labor Statistics Consumer Expenditure Survey http://www.bls.gov/cex/home.htm U.S. Census of Agriculture http://www.nass.usda.gov/census/ USDA/Economic Research Service food consumption data: http://www.ers.usda.gov/data/foodconsumption/ USDA/ Economic Research Service farm income data: http://ers.usda.gov/Data/FarmIncome/finfidmu.htm For more information: To see results from Finding Food in Farm Country studies in other regions of the U.S.: http://www.crcworks.org/?submit=fffc To read the original Finding Food in Farm Country study from Southeast Minnesota (written for the Experiment in Rural Cooperation): http://www.crcworks.org/ff.pdf For further information: http://www.crcworks.org/ Contact Ken Meter at Crossroads Resource Center <[email protected]> (612) 869-8664

B-1Public Draft - February, 2016
Appendix B,BE BRIGHTON OPPORTUNITIES SURVEY RESULTS
APPENDIX B
PUBLIC SURVEY COMMENTS
BE BRIGHTON COMPREHENSIVE PLAN
JANUARY 2016

THIS PAGE INTENTIONALLY LEFT BLANK

PUBLIC SURVEY RESULTS | I
CONTENTS
CONTENTS
Introduction
Online Survey Results
The Regional Leader for the Northeast Metro Area
Inclusive Community Where We Collaborate and Share
A Sustainable and Complete Community
A Future Rooted in a Small Town Identity and Farming Heritage
I 2 3
3 6 8
11
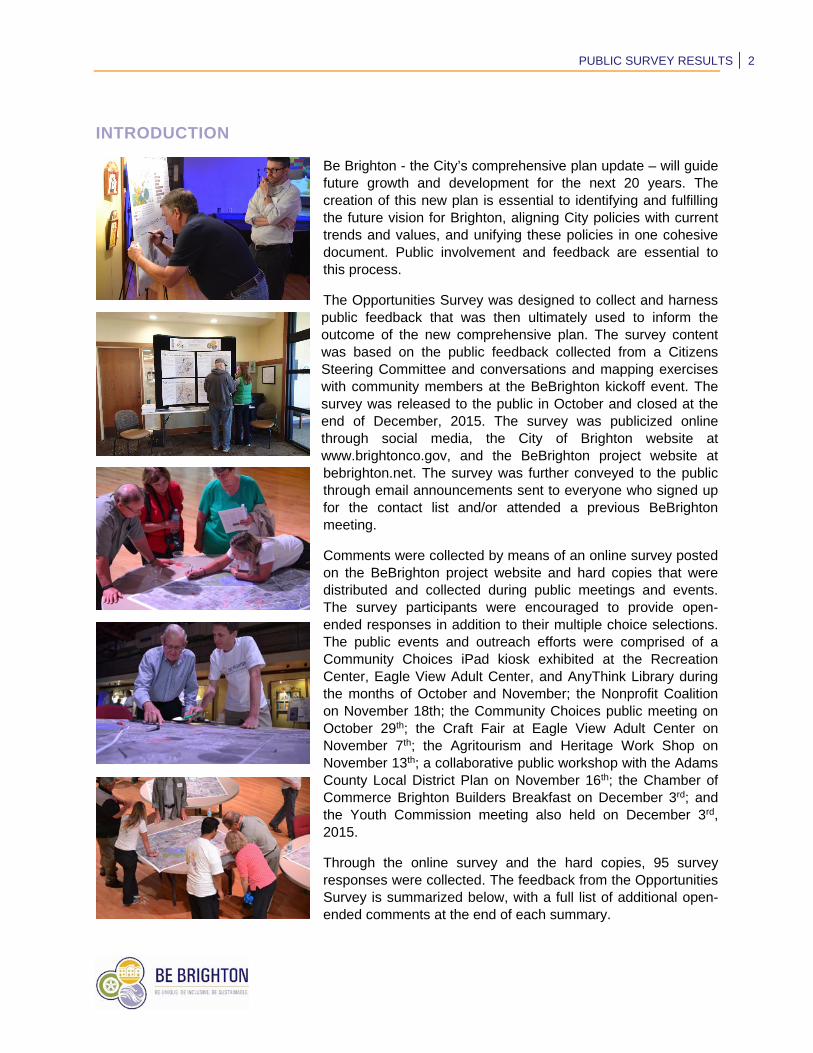
PUBLIC SURVEY RESULTS | 2
INTRODUCTION
Be Brighton - the City’s comprehensive plan update – will guide future growth and development for the next 20 years. The creation of this new plan is essential to identifying and fulfilling the future vision for Brighton, aligning City policies with current trends and values, and unifying these policies in one cohesive document. Public involvement and feedback are essential to this process.
The Opportunities Survey was designed to collect and harness public feedback that was then ultimately used to inform the outcome of the new comprehensive plan. The survey content was based on the public feedback collected from a Citizens Steering Committee and conversations and mapping exercises with community members at the BeBrighton kickoff event. The survey was released to the public in October and closed at the end of December, 2015. The survey was publicized online through social media, the City of Brighton website at www.brightonco.gov, and the BeBrighton project website at bebrighton.net. The survey was further conveyed to the public through email announcements sent to everyone who signed up for the contact list and/or attended a previous BeBrighton meeting.
Comments were collected by means of an online survey posted on the BeBrighton project website and hard copies that were distributed and collected during public meetings and events. The survey participants were encouraged to provide open-ended responses in addition to their multiple choice selections. The public events and outreach efforts were comprised of a Community Choices iPad kiosk exhibited at the Recreation Center, Eagle View Adult Center, and AnyThink Library during the months of October and November; the Nonprofit Coalition on November 18th; the Community Choices public meeting on October 29th; the Craft Fair at Eagle View Adult Center on November 7th; the Agritourism and Heritage Work Shop on November 13th; a collaborative public workshop with the Adams County Local District Plan on November 16th; the Chamber of Commerce Brighton Builders Breakfast on December 3rd; and the Youth Commission meeting also held on December 3rd, 2015.
Through the online survey and the hard copies, 95 survey responses were collected. The feedback from the Opportunities Survey is summarized below, with a full list of additional open-ended comments at the end of each summary.

PUBLIC SURVEY RESULTS | 3
ONLINE SURVEY RESULTS
THE REGIONAL LEADER FOR THE NORTHEAST METRO AREA
0%10%20%30%40%50%60%70%80%90%
Agree Disagree

PUBLIC SURVEY RESULTS | 4
Additional Comments
One of the major problems in Brighton is the lack of Quality Eating Establishments. I would like to see a more active role in getting Restaurants, such as Bonefish, Panera's Bread, Out Back and Olive Garden to name a few. Today, we must leave Brighton to go to quality eating establishments.
Less big business, more community
We need more restaurants. Shopping, and family friendly activity. Parks and recreation is fast growing but I'd love to see a specific recreation area (similar to Thornton, Northglenn recreation center. I have a Brighton address but am largely left out of being a Brighton "resident" by way if I pay water or not (per your rec center front desk hosts). A larger emphasis on small business growth is just as important to commercial growth. Start building a 21st century community! Seek advice of Adams 12 school district for future potential growth, expansion and needs!
Have developers pay for new schools instead of dunning established taxpayers to raise taxes for more new schools.
Re-pave older streets and manage weeds alongside walks better
"Denver Art District" in Brighton
Shopping Center?
More youth-related stuff
Bring in new business & family friendly restaurants (not bars) to Main Street
More walking/outdoor ideas
Make Main Street a big attraction
More art.
Underground shopping
Art/Murals
Homeless youth shelter
We need Sprouts and Trader Joes in Brighton
WE NEED A SOCCER COMPLEX!
I would love if Brighton had more safe, connecting paths. It is hard to be active in a community when you are running in the street because there is no sidewalk or the side walk just ends. Especially connecting the east side neighborhoods of Brighton. I would like to see a nice sports complex here which includes a place for soccer, the fields we use are bad. It would be nice to get more businesses out here.
Sit down family restaurants

PUBLIC SURVEY RESULTS | 5
I envision a "higher end" look to the city along the US85 corridor between Bromley and WCR2 with replacement of the ugly pedestrian bridge, better landscape and easy access to new shopping and quality restaurants on the east side of the highway. Thanks!
Railroad traffic is a problem! I propose 1 crossing (Highway 2) be made into an underpass. Highway 2 would make a great route to use for this traffic. The train noise also needs to be toned down- the loud horns can be replaced with high intensity strobe lights. Deaf and hearing impaired persons would benefit.
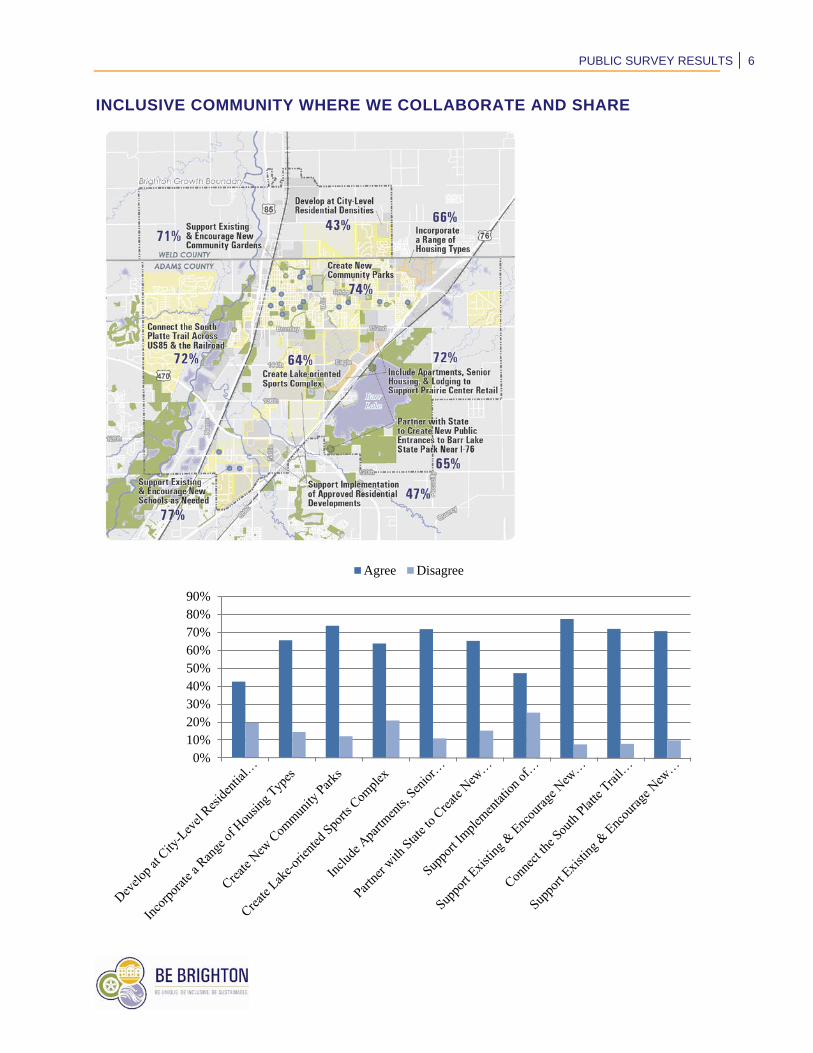
PUBLIC SURVEY RESULTS | 6
INCLUSIVE COMMUNITY WHERE WE COLLABORATE AND SHARE
0%10%20%30%40%50%60%70%80%90%
Agree Disagree

PUBLIC SURVEY RESULTS | 7
Additional Comments:
I would like to see the developers become more involved in providing new schools as needed. Today we tax the older population who have already given for the schools in our area and the newer developments should be contributing more for our growth in new schools.
More family-driven and outdoor opportunities
We need more restaurants. shopping, and family friendly activity. Parks and recreation is fast growing but I'd love to see a specific recreation area (similar to Thornton, Northglenn recreation center. I have a Brighton address but am largely left out of being a Brighton "resident" by way if I pay water or not (per your rec center front desk hosts). A larger emphasis on small business growth is just as important to commercial growth. Start building a 21st century community! Seek advice of Adams 12 school district for future potential growth, expansion and needs!
Develop and sustain a Downtown environment - North Main Street to help it grow and expand an existing area.
Campground at Barr Lake
Multi-use communities where health and economic development is considered into planning.
We desperately need to attract more restaurants to the Brighton area!
Ice skating
Shopping center
Recreational Activities
Red Mango!
Ice skating
Winter activities
Additional affordable housing
Retail shopping
Youth homeless shelter
Ice skating
Restore downtown Brighton
I really like the idea of community gardens.
HOMELESS SHELTER!
Minneapolis has an art garden, with lots of sculptures and murals.

PUBLIC SURVEY RESULTS | 8
New community park at water tower fields
It's great to support outdoor related sports.
Better biking accessibility throughout the city
Focus on fixing run down Brighton areas and fix school crowding before even thinking of adding any income housing
Get more affordable housing and apartments here and more businesses and restaurants
Add shade structures to open space.
Need more senior space.
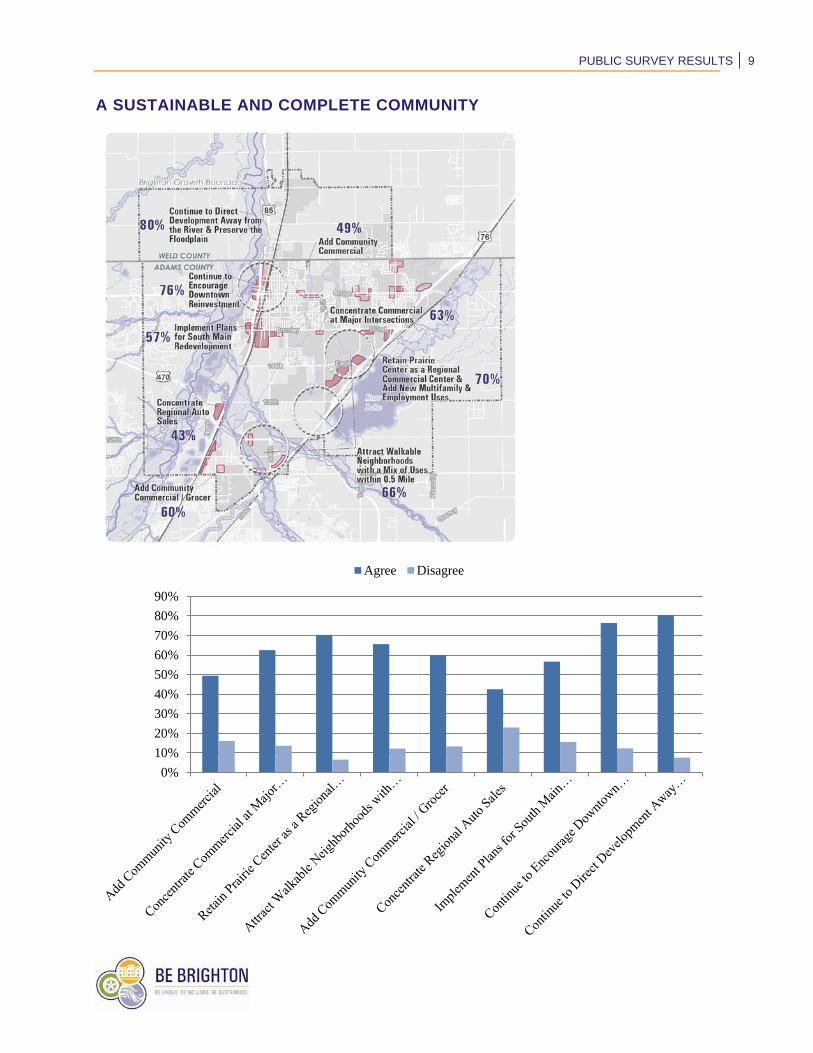
PUBLIC SURVEY RESULTS | 9
A SUSTAINABLE AND COMPLETE COMMUNITY
0%
10%
20%
30%
40%
50%
60%
70%
80%
90%
Agree Disagree
PUBLIC SURVEY RESULTS | 10
Additional Comments:
We need more restaurants. Shopping, and family friendly activity. Parks and recreation is fast growing but I'd love to see a specific recreation area (similar to Thornton, Northglenn recreation center. I have a Brighton address but am largely left out of being a Brighton "resident" by way if I pay water or not (per your rec center front desk hosts). A larger emphasis on small business growth is just as important to commercial growth. Start building a 21st century community! Seek advice of Adams 12 school district for future potential growth, expansion and needs!
Brighton's main street has always had a problem expanding because of the railroad and Highway 85. It will never be a main shopping area again without major anchor stores.
Stop traffic on Main and make better walking mall with adequate parking
Add Sprouts Grocery Store
Recycling
Recycling in all schools
More efficient energy
WIND POWER!
Concentrating regional auto sales looks trashy.
Empty retail already exists
Need more community meeting space

PUBLIC SURVEY RESULTS | 11
A FUTURE ROOTED IN A SMALL TOWN IDENTITY AND FARMING HERITAGE
0%10%20%30%40%50%60%70%80%90%
100%
Agree Disagree

PUBLIC SURVEY RESULTS | 12
Additional Comments:
Give farmers better benefits to stay and grow here
More Farmer's Markets & more incentives for farmers & those markets.
bebrighton.net
Incorporate school to community gardens
Art studio!
Thrift Store!
Local Variety of restaurants by the new King Soopers and Prairie Center
Soccer complex would be great!!!!
More solar projects, green initiatives, movements towards highly sustainable community. Discounts to developers, attract tech companies like Google and Amazon (specifically cloud services). Colorado is ripe for tech... tech jobs are coming to DTC and Boulder... why not Brighton?
Provide shade structures in outdoor recreation areas, outdoor events
More/another dog park with shade
Cultural Center
Please upgrade the recycling program to the equivalent of the Broomfield program. It is sorely lacking + would be beneficial to upgrade it!!
More bus service + a way to get over tracks in town for 911
Let Brighton grow, already. Everybody wants the economy to boom, but it seems like the "old timers" want Brighton to remain in a stagnant state of growth. As a contractor, it's hard for me to watch other cities keep reeling in tax dollars, while improving roads, schools and other things Brighton so sorely needs. No more initiatives, bonds or other creative ways to band-aid, please. Just grow, already.

This page is intentionally blank.
C-1Public Draft - February, 2016
Appendix C,WATER RIGHTS FINDINGS
Memorandum HRS Water Consultants, Inc. 303.462.1111 Fax 303.462.3030 [email protected]
Project: 15-17
To: Mr. Jeremy Call, Logan Simpson
From: Steven Barrett and Eric Harmon, P.E. – HRS Water Consultants, Inc.
Date: December 4, 2015
Subject: Water Rights Evaluation of Parcels within Adams County and the City of Brighton’s Local District Plan Study Area
On behalf of Logan Simpson, HRS Water Consultants, Inc. (“HRS”) has prepared this memorandum to summarize our findings regarding water rights within the Local District Plan Study Area (“study area”). The study area is located within the boundaries of Adams County and the City of Brighton as shown in Figure 1. HRS has been tasked with the examination of water rights associated with select parcels within this study area in order to support Adam County’s and the City of Brighton’s preservation planning project being conducted by Logan Simpson, Crossroads Resource Center, Two Forks Collective, and Urban Interactive Studios.
Parcel Selection Process
HRS initiated the water rights evaluation task by collecting relevant data from State, County, and other government sources, and then importing these data into a GIS for analysis of parcels within the study area. Parcels of interest were narrowed down using GIS queries along with input from the other consultants and the City and County. The majority of these selected parcels were parcels zoned as agriculture that were historically irrigated or are currently irrigated. All of the parcels are served by one of two ditch companies: the Burlington Ditch, Reservoir and Land Company (“Burlington”) and the Fulton Irrigating Ditch Company (“Fulton”). The Burlington generally serves farms within the east portion of the study area, while the Fulton Ditch serves farms in the west portion (see Figure 1). Based on feedback from City and County representatives, the focus of HRS’ effort was primarily limited to parcels under the Fulton Ditch system on the southwest side and parcels irrigated by the Burlington system on the southeast side. Parcels in the northern and eastern sections of the study area were not considered relevant to this project.
After identifying parcels of interest, HRS contacted the superintendents of the Burlington and Fulton ditch companies to obtain general information on each ditch, along with share ownership
1
information for the selected parcels. Steve Barrett from HRS, met with Mr. Bernie Widhalm, Ditch Superintendent for the Burlington Ditch Company and Mr. George McDonald, Ditch Superintendent for the Fulton Ditch Company. Both ditch company representatives have been with their respective companies for over 20 years and each was generally familiar with the selected parcels and their water use. HRS was able to collect specific share information for most properties as shown in Figure 2. This share information is summarized in Table 1 at the end of this memo. Figure 2 shows the number of shares owned by each of these farms. Many of these property owners no longer have shares in the ditch company or may practice dryland farming (so no ditch water is necessary). The number of shares has been consolidated in Table 1 and on Figure 2 for larger family farms such as the Petrocco and Palizzi farms.
General Background on the Burlington & Fulton Ditches
The Fulton and Burlington Ditches have fairly senior water rights in the South Platte River Basin. Both ditches divert water from the South Platte River and both have large lateral branches that enable water to be distributed to a large number of users. The Burlington system delivers water through the main Burlington (aka O’Brian Canal), the Little Burlington and the Brighton Lateral. Selected Burlington parcels within the study area are all served by the Little Burlington Ditch. The Fulton Ditch delivers water through the main Fulton and the Fulton Lateral. Selected Fulton parcels in the study area are served by both the Fulton Lateral and the main Fulton Ditch. The Fulton Ditch has more senior water rights priorities than the Burlington system, and therefore, is capable of delivering a more reliable supply in priority in dry years.
It should be noted that, unlike Fulton Ditch shares, shares in the Burlington system are often paired together with Wellington shares. In simple terms, a Burlington share provides a certain amount of water delivered to the farmers via its direct-flow ditch conveyance system, and a Wellington share provides water storage1 that can be released and delivered downstream at critical times to allow the Burlington system to divert water in priority for its shareholders. Therefore, two “paired” shares would equal two individual shares of Burlington Company and two individual shares of Wellington Company. The Fulton Ditch has approximately 7,185 shares and the Burlington has approximately 4,000 individual shares. Each year these shares will yield different amounts of water under each ditch system. Historically, on average, the Fulton Ditch has diverted 26,992 acre-feet annually at the headgate. This equates to approximately 3.76 acre-feet per share on an annual basis, compared to the Burlington’s approximate 4.00 acre-feet per share diverted at the ditch headgate. Both ditches experience ditch loss due to seepage, direct evaporation from the water surface in the ditch, and evapotranspiration from ditch bank vegetation. The Fulton’s total ditch loss is typically around 20% while the Burlington’s ranges from approximately 20% to 35% depending on time of year and flow rates. Per George McDonald, the Fulton Ditch normally provides sufficient water supply to farms under the system, and any irrigation well use is generally a supplemental backup supply to the primary
1 In Wellington Lake, in NE Park County south of the town of Bailey.
2

supply provided by the ditch. The same is generally true of farms irrigated by the Little Burlington Ditch.
Water Rights Valuation
The last item in our water rights evaluation task was to research market values for the Fulton and Burlington ditch shares and to assign a water rights value to each selected parcel based on share ownership. Where relevant data are available, water rights values are typically estimated based upon comparable sales of shares in the subject ditches, or nearby ditches. Because the Fulton and Burlington have been the subject of numerous share sales and changes of uses, there were recent comparable sales transactions available for estimation of value.
HRS contacted several entities that have recently bought shares in these ditches or had knowledge of recent sales. This included contacting representatives from the Fulton Ditch Company, Burlington Ditch, Reservoir and Land Company, City of Brighton, South Adams County Water & Sanitation District, and other sources. Based on our research, we determined an approximate value for Fulton Ditch shares in the range of $15,000 - $20,000 per share and a value for individual Burlington shares to be in the low $20,000’s, or in the low $40,000’s for paired Burlington/Wellington shares. Based upon these ranges, which in our professional opinion are reflective of current market conditions, water rights values have been estimated for each selected shareholder within the study area and are summarized in Table 2 below. For these estimates, we used an average value of $17,500 for shares in the Fulton Ditch and a value of $20,000 for individual Burlington shares.
The water rights share value can also be translated into a price per volume of water diverted. The Burlington value per acre-foot of water diverted at the headgate is approximately $5,000, while the Fulton is approximately $4,670 per acre-foot. However, due to higher ditch loss, the amount of water delivered at the farm headgate, and the associated farm delivery value, may be less under the Burlington system.
Additional Tasks Performed
Question of South Adams County Water & Sanitation District Expansion
South Adams County Water and Sanitation District (“SACWSD”) is the water and sewer service provider in the area adjoining the Local District Study Area on the south. A question arose within the Study Team as to whether any expansion of the boundaries or service area of SACWSD is anticipated in the future, such that current agricultural water rights within the Local District area may change due to acquisition and transfer by or for SACWSD for municipal or augmentation use. The northern boundary of SACWSD is shown on Figure 1, relative to the Local District Study Area.
3
Research and inquiries by HRS show that expansion of boundaries or service area by SACWSD is not anticipated in the foreseeable future for the following reasons.
1. The majority of the Local District Study Area is presently included in the corporate boundaries of the City of Brighton (Ward 3), and could only be served by a special contractual arrangement with the City. Such a contractual arrangement does not exist, and is not contemplated by SACWSD.
2. Current SACWSD Rules and Regulations2 state as follows:
Service Outside the District’s Service Area: No future service is available outside the District’s service area except as specifically authorized by the Board, at its sole discretion. Any service outside the District’s service area would be dependent on, among other issues, discussions with other service providers, inclusion into the District boundaries or payment of extraterritorial fees, extension of District water and wastewater facilities, consideration of urban growth boundaries, and any other factors deemed relevant by the District.3
Policy: The District’s boundaries may be expanded by inclusion of property pursuant to § 32-1-401, et seq., C.R.S., in compliance with these Rules, provided that the property lies within the service area of the District. 4 (emphasis added).
3. HRS has communicated with the SACWSD Water System Manager, Mr. Kipp Scott. Mr. Scott confirmed that SACWSD cannot expand its boundaries or service area without special contractual arrangements, and SACWSD has no plans to expand services or its boundaries.5
2 South Adams County Water and Sanitation District, Rules and Regulations for Receiving Public Water and Wastewater Service. Effective August 6, 2013. 3 Ibid, Article I, Rule 3.12, p. 21. 4 Ibid, Article I, Rule 4.1, p. 22. 5 Kipp Scott, email communication, 11-18-2015.
4
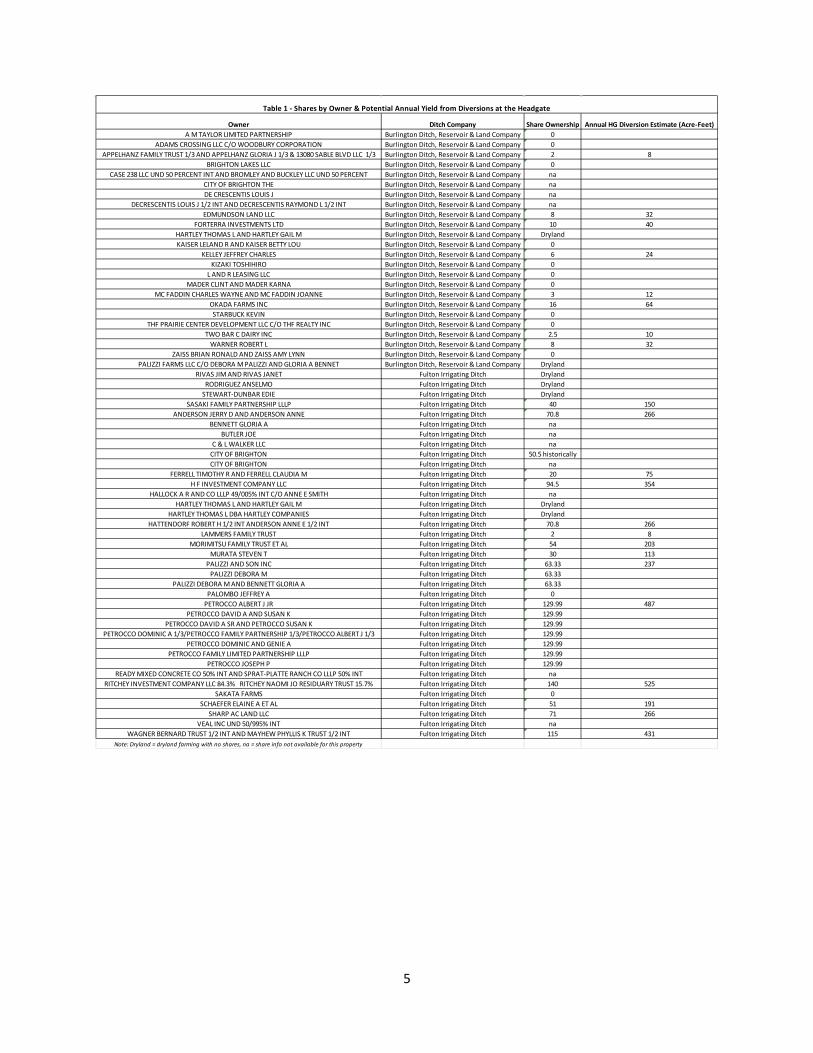
Owner Ditch Company Share Ownership Annual HG Diversion Estimate (Acre-Feet)A M TAYLOR LIMITED PARTNERSHIP Burlington Ditch, Reservoir & Land Company 0
ADAMS CROSSING LLC C/O WOODBURY CORPORATION Burlington Ditch, Reservoir & Land Company 0APPELHANZ FAMILY TRUST 1/3 AND APPELHANZ GLORIA J 1/3 & 13080 SABLE BLVD LLC 1/3 Burlington Ditch, Reservoir & Land Company 2 8
BRIGHTON LAKES LLC Burlington Ditch, Reservoir & Land Company 0CASE 238 LLC UND 50 PERCENT INT AND BROMLEY AND BUCKLEY LLC UND 50 PERCENT Burlington Ditch, Reservoir & Land Company na
CITY OF BRIGHTON THE Burlington Ditch, Reservoir & Land Company naDE CRESCENTIS LOUIS J Burlington Ditch, Reservoir & Land Company na
DECRESCENTIS LOUIS J 1/2 INT AND DECRESCENTIS RAYMOND L 1/2 INT Burlington Ditch, Reservoir & Land Company naEDMUNDSON LAND LLC Burlington Ditch, Reservoir & Land Company 8 32
FORTERRA INVESTMENTS LTD Burlington Ditch, Reservoir & Land Company 10 40HARTLEY THOMAS L AND HARTLEY GAIL M Burlington Ditch, Reservoir & Land Company DrylandKAISER LELAND R AND KAISER BETTY LOU Burlington Ditch, Reservoir & Land Company 0
KELLEY JEFFREY CHARLES Burlington Ditch, Reservoir & Land Company 6 24KIZAKI TOSHIHIRO Burlington Ditch, Reservoir & Land Company 0
L AND R LEASING LLC Burlington Ditch, Reservoir & Land Company 0MADER CLINT AND MADER KARNA Burlington Ditch, Reservoir & Land Company 0
MC FADDIN CHARLES WAYNE AND MC FADDIN JOANNE Burlington Ditch, Reservoir & Land Company 3 12OKADA FARMS INC Burlington Ditch, Reservoir & Land Company 16 64STARBUCK KEVIN Burlington Ditch, Reservoir & Land Company 0
THF PRAIRIE CENTER DEVELOPMENT LLC C/O THF REALTY INC Burlington Ditch, Reservoir & Land Company 0TWO BAR C DAIRY INC Burlington Ditch, Reservoir & Land Company 2.5 10
WARNER ROBERT L Burlington Ditch, Reservoir & Land Company 8 32ZAISS BRIAN RONALD AND ZAISS AMY LYNN Burlington Ditch, Reservoir & Land Company 0
PALIZZI FARMS LLC C/O DEBORA M PALIZZI AND GLORIA A BENNET Burlington Ditch, Reservoir & Land Company DrylandRIVAS JIM AND RIVAS JANET Fulton Irrigating Ditch Dryland
RODRIGUEZ ANSELMO Fulton Irrigating Ditch DrylandSTEWART-DUNBAR EDIE Fulton Irrigating Ditch Dryland
SASAKI FAMILY PARTNERSHIP LLLP Fulton Irrigating Ditch 40 150ANDERSON JERRY D AND ANDERSON ANNE Fulton Irrigating Ditch 70.8 266
BENNETT GLORIA A Fulton Irrigating Ditch naBUTLER JOE Fulton Irrigating Ditch na
C & L WALKER LLC Fulton Irrigating Ditch naCITY OF BRIGHTON Fulton Irrigating Ditch 50.5 historicallyCITY OF BRIGHTON Fulton Irrigating Ditch na
FERRELL TIMOTHY R AND FERRELL CLAUDIA M Fulton Irrigating Ditch 20 75H F INVESTMENT COMPANY LLC Fulton Irrigating Ditch 94.5 354
HALLOCK A R AND CO LLLP 49/005% INT C/O ANNE E SMITH Fulton Irrigating Ditch naHARTLEY THOMAS L AND HARTLEY GAIL M Fulton Irrigating Ditch Dryland
HARTLEY THOMAS L DBA HARTLEY COMPANIES Fulton Irrigating Ditch DrylandHATTENDORF ROBERT H 1/2 INT ANDERSON ANNE E 1/2 INT Fulton Irrigating Ditch 70.8 266
LAMMERS FAMILY TRUST Fulton Irrigating Ditch 2 8MORIMITSU FAMILY TRUST ET AL Fulton Irrigating Ditch 54 203
MURATA STEVEN T Fulton Irrigating Ditch 30 113PALIZZI AND SON INC Fulton Irrigating Ditch 63.33 237
PALIZZI DEBORA M Fulton Irrigating Ditch 63.33PALIZZI DEBORA M AND BENNETT GLORIA A Fulton Irrigating Ditch 63.33
PALOMBO JEFFREY A Fulton Irrigating Ditch 0PETROCCO ALBERT J JR Fulton Irrigating Ditch 129.99 487
PETROCCO DAVID A AND SUSAN K Fulton Irrigating Ditch 129.99PETROCCO DAVID A SR AND PETROCCO SUSAN K Fulton Irrigating Ditch 129.99
PETROCCO DOMINIC A 1/3/PETROCCO FAMILY PARTNERSHIP 1/3/PETROCCO ALBERT J 1/3 Fulton Irrigating Ditch 129.99PETROCCO DOMINIC AND GENIE A Fulton Irrigating Ditch 129.99
PETROCCO FAMILY LIMITED PARTNERSHIP LLLP Fulton Irrigating Ditch 129.99PETROCCO JOSEPH P Fulton Irrigating Ditch 129.99
READY MIXED CONCRETE CO 50% INT AND SPRAT-PLATTE RANCH CO LLLP 50% INT Fulton Irrigating Ditch naRITCHEY INVESTMENT COMPANY LLC 84.3% RITCHEY NAOMI JO RESIDUARY TRUST 15.7% Fulton Irrigating Ditch 140 525
SAKATA FARMS Fulton Irrigating Ditch 0SCHAEFER ELAINE A ET AL Fulton Irrigating Ditch 51 191
SHARP AC LAND LLC Fulton Irrigating Ditch 71 266VEAL INC UND 50/995% INT Fulton Irrigating Ditch na
WAGNER BERNARD TRUST 1/2 INT AND MAYHEW PHYLLIS K TRUST 1/2 INT Fulton Irrigating Ditch 115 431Note: Dryland = dryland farming with no shares, na = share info not available for this property
Table 1 - Shares by Owner & Potential Annual Yield from Diversions at the Headgate
5

Owner Ditch Company Share Ownership Estimated Value of SharesA M TAYLOR LIMITED PARTNERSHIP Burlington Ditch, Reservoir & Land Company 0
ADAMS CROSSING LLC C/O WOODBURY CORPORATION Burlington Ditch, Reservoir & Land Company 0APPELHANZ FAMILY TRUST 1/3 AND APPELHANZ GLORIA J 1/3 & 13080 SABLE BLVD LLC 1/3 Burlington Ditch, Reservoir & Land Company 2 40,000.00$
BRIGHTON LAKES LLC Burlington Ditch, Reservoir & Land Company 0CASE 238 LLC UND 50 PERCENT INT AND BROMLEY AND BUCKLEY LLC UND 50 PERCENT Burlington Ditch, Reservoir & Land Company na
CITY OF BRIGHTON THE Burlington Ditch, Reservoir & Land Company naDE CRESCENTIS LOUIS J Burlington Ditch, Reservoir & Land Company na
DECRESCENTIS LOUIS J 1/2 INT AND DECRESCENTIS RAYMOND L 1/2 INT Burlington Ditch, Reservoir & Land Company naEDMUNDSON LAND LLC Burlington Ditch, Reservoir & Land Company 8 160,000.00$
FORTERRA INVESTMENTS LTD Burlington Ditch, Reservoir & Land Company 10 200,000.00$ HARTLEY THOMAS L AND HARTLEY GAIL M Burlington Ditch, Reservoir & Land Company DrylandKAISER LELAND R AND KAISER BETTY LOU Burlington Ditch, Reservoir & Land Company 0
KELLEY JEFFREY CHARLES Burlington Ditch, Reservoir & Land Company 6 120,000.00$ KIZAKI TOSHIHIRO Burlington Ditch, Reservoir & Land Company 0
L AND R LEASING LLC Burlington Ditch, Reservoir & Land Company 0MADER CLINT AND MADER KARNA Burlington Ditch, Reservoir & Land Company 0
MC FADDIN CHARLES WAYNE AND MC FADDIN JOANNE Burlington Ditch, Reservoir & Land Company 3 60,000.00$ OKADA FARMS INC Burlington Ditch, Reservoir & Land Company 16 320,000.00$ STARBUCK KEVIN Burlington Ditch, Reservoir & Land Company 0
THF PRAIRIE CENTER DEVELOPMENT LLC C/O THF REALTY INC Burlington Ditch, Reservoir & Land Company 0TWO BAR C DAIRY INC Burlington Ditch, Reservoir & Land Company 2.5 50,000.00$
WARNER ROBERT L Burlington Ditch, Reservoir & Land Company 8 160,000.00$ ZAISS BRIAN RONALD AND ZAISS AMY LYNN Burlington Ditch, Reservoir & Land Company 0
PALIZZI FARMS LLC C/O DEBORA M PALIZZI AND GLORIA A BENNET Burlington Ditch, Reservoir & Land Company DrylandRIVAS JIM AND RIVAS JANET Fulton Irrigating Ditch Dryland
RODRIGUEZ ANSELMO Fulton Irrigating Ditch DrylandSTEWART-DUNBAR EDIE Fulton Irrigating Ditch Dryland
SASAKI FAMILY PARTNERSHIP LLLP Fulton Irrigating Ditch 40 700,000.00$ ANDERSON JERRY D AND ANDERSON ANNE Fulton Irrigating Ditch 70.8 1,239,000.00$
BENNETT GLORIA A Fulton Irrigating Ditch naBUTLER JOE Fulton Irrigating Ditch na
C & L WALKER LLC Fulton Irrigating Ditch naCITY OF BRIGHTON Fulton Irrigating Ditch 50.5 historicallyCITY OF BRIGHTON Fulton Irrigating Ditch na
FERRELL TIMOTHY R AND FERRELL CLAUDIA M Fulton Irrigating Ditch 20 350,000.00$ H F INVESTMENT COMPANY LLC Fulton Irrigating Ditch 94.5 1,653,750.00$
HALLOCK A R AND CO LLLP 49/005% INT C/O ANNE E SMITH Fulton Irrigating Ditch naHARTLEY THOMAS L AND HARTLEY GAIL M Fulton Irrigating Ditch Dryland
HARTLEY THOMAS L DBA HARTLEY COMPANIES Fulton Irrigating Ditch DrylandHATTENDORF ROBERT H 1/2 INT ANDERSON ANNE E 1/2 INT Fulton Irrigating Ditch 70.8 1,239,000.00$
LAMMERS FAMILY TRUST Fulton Irrigating Ditch 2MORIMITSU FAMILY TRUST ET AL Fulton Irrigating Ditch 54
MURATA STEVEN T Fulton Irrigating Ditch 30PALIZZI AND SON INC Fulton Irrigating Ditch 63.33 1,108,275.00$
PALIZZI DEBORA M Fulton Irrigating Ditch 63.33PALIZZI DEBORA M AND BENNETT GLORIA A Fulton Irrigating Ditch 63.33
PALOMBO JEFFREY A Fulton Irrigating Ditch 0PETROCCO ALBERT J JR Fulton Irrigating Ditch 129.99 2,274,825.00$
PETROCCO DAVID A AND SUSAN K Fulton Irrigating Ditch 129.99PETROCCO DAVID A SR AND PETROCCO SUSAN K Fulton Irrigating Ditch 129.99
PETROCCO DOMINIC A 1/3/PETROCCO FAMILY PARTNERSHIP 1/3/PETROCCO ALBERT J 1/3 Fulton Irrigating Ditch 129.99PETROCCO DOMINIC AND GENIE A Fulton Irrigating Ditch 129.99
PETROCCO FAMILY LIMITED PARTNERSHIP LLLP Fulton Irrigating Ditch 129.99PETROCCO JOSEPH P Fulton Irrigating Ditch 129.99
READY MIXED CONCRETE CO 50% INT AND SPRAT-PLATTE RANCH CO LLLP 50% INT Fulton Irrigating Ditch naRITCHEY INVESTMENT COMPANY LLC 84.3% RITCHEY NAOMI JO RESIDUARY TRUST 15.7% Fulton Irrigating Ditch 140 2,450,000.00$
SAKATA FARMS Fulton Irrigating Ditch 0SCHAEFER ELAINE A ET AL Fulton Irrigating Ditch 51 892,500.00$
SHARP AC LAND LLC Fulton Irrigating Ditch 71 1,242,500.00$ VEAL INC UND 50/995% INT Fulton Irrigating Ditch na
WAGNER BERNARD TRUST 1/2 INT AND MAYHEW PHYLLIS K TRUST 1/2 INT Fulton Irrigating Ditch 115 2,012,500.00$
Table 2 - Estimated Share Value by Owner & Ditch
6

This page is intentionally blank.
D-1Public Draft - February, 2016
Appendix D,EXAMPLE OF A MIXED USE AGRICULTURAL DISTRICT ZONING ORDINANCE
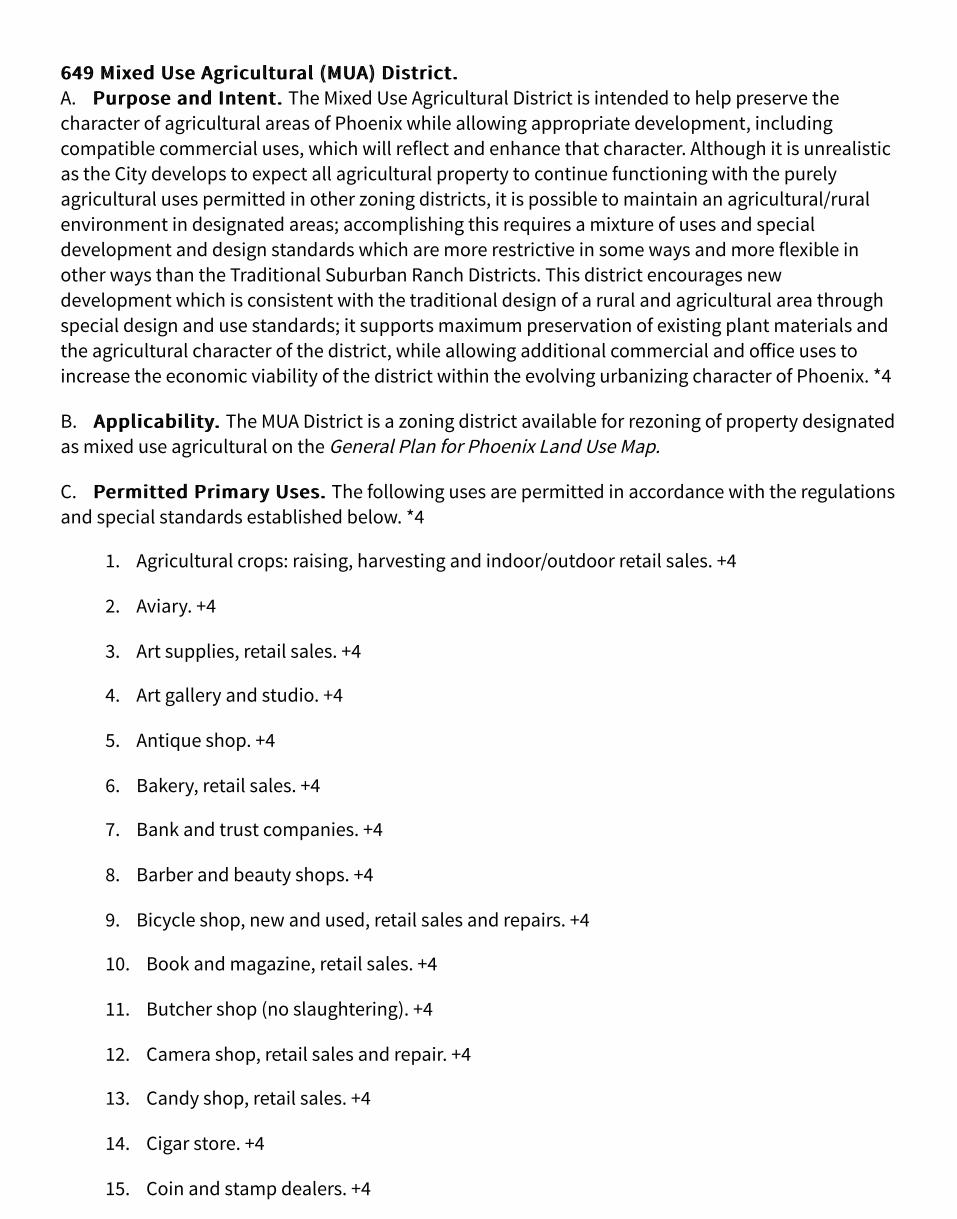
649 Mixed Use Agricultural (MUA) District.649 Mixed Use Agricultural (MUA) District.A. Purpose and Intent.Purpose and Intent. The Mixed Use Agricultural District is intended to help preserve thecharacter of agricultural areas of Phoenix while allowing appropriate development, includingcompatible commercial uses, which will reflect and enhance that character. Although it is unrealisticas the City develops to expect all agricultural property to continue functioning with the purelyagricultural uses permitted in other zoning districts, it is possible to maintain an agricultural/ruralenvironment in designated areas; accomplishing this requires a mixture of uses and specialdevelopment and design standards which are more restrictive in some ways and more flexible inother ways than the Traditional Suburban Ranch Districts. This district encourages newdevelopment which is consistent with the traditional design of a rural and agricultural area throughspecial design and use standards; it supports maximum preservation of existing plant materials andthe agricultural character of the district, while allowing additional commercial and office uses toincrease the economic viability of the district within the evolving urbanizing character of Phoenix. *4
B. Applicability.Applicability. The MUA District is a zoning district available for rezoning of property designatedas mixed use agricultural on the General Plan for Phoenix Land Use Map.
C. Permitted Primary Uses.Permitted Primary Uses. The following uses are permitted in accordance with the regulationsand special standards established below. *4
1. Agricultural crops: raising, harvesting and indoor/outdoor retail sales. +4
2. Aviary. +4
3. Art supplies, retail sales. +4
4. Art gallery and studio. +4
5. Antique shop. +4
6. Bakery, retail sales. +4
7. Bank and trust companies. +4
8. Barber and beauty shops. +4
9. Bicycle shop, new and used, retail sales and repairs. +4
10. Book and magazine, retail sales. +4
11. Butcher shop (no slaughtering). +4
12. Camera shop, retail sales and repair. +4
13. Candy shop, retail sales. +4
14. Cigar store. +4
15. Coin and stamp dealers. +4

16. Clothing, retail sales. +4
17. Equestrian stable, commercial including boarding and instruction, subject to the followingconditions: +4
a. Minimum lot size of ten acres; and
b. Minimum perimeter set back of one hundred feet for all animal sheltering buildings.
18. Farmer’s market. +4
19. Farms, including dairies, devoted (as applicable) to hatching, raising, breeding, andmarketing of fowls, horses, dogs, sheep, goats, cows, llamas, rabbits, fur-bearing animals andfish subject to the following conditions: +4
a. This use shall not include commercial feeder lots.
b. Areas devoted to the raising of fowl shall be located at least one hundred feet from anyproperty line which is contiguous with a residentially zoned lot or parcel.
c. The total site area shall not exceed 10 acres.
20. Feed, retail sales. +4
21. Fine art, instruction. +4
22. Fish, retail sales. +4
23. Florist, retail sales and wholesale. +4
24. Grocery, retail sales. +4
25. Furniture, retail sales. +4
26. Group home for the handicapped, provided that: +4
a. No such home is located on a lot with a property line within one thousand threehundred twenty feet, measured in a straight line in any direction, of the lot line of anothersuch group home;
b. Such home contains more than five but not more than ten residents, not includingstaff; and
c. Such home is registered with, and administratively approved by, the ZoningAdministrator as to compliance with the standards of this section as provided in Section701
27. Craft studio, retail sales and handcrafting of; textiles, pottery, glass blowing, jewelry,wood, leather and photography. +4
28. Health club. +4
29. Hobby and craft products, retail sales. +4
30. Home furnishing, retail sales. +4
31. Household appliance, retail sales and repair. +4
32. Ice cream shop. +4
33. Jeweler, retail sales and repair. +4
34. Music instruction, musical instrument repair and retail sales. +4
35. Office, administrative or professional. +4
36. Pet store, retail sales. +4
37. Pharmacy. +4
38. Photographic developing and printing. +4
39. Photographic equipment and supplies, retail sales. +4
40. Picture framing. +4
41. Places of worship. +4
42. Plant nursery, wholesale or retail sales, provided that: +4
a. Any bulk or hardscape materials shall be stored in contained areas or bins and not bevisible from the public right-of-way.
b. Boxing of plants and other similar processing shall not be visible from the public right-of-way.
c. Sales may include garden-related items including, fertilizers, pest and weed controlitems, gardening implements, and garden furniture.
43. Residential. +4
44. Restaurant, provided that: +4
a. Music and entertainment is limited to recorded music or one entertainer
b. Entrances to the restaurant shall be from the side of the restaurant which does not facea contiguous residentially zoned property, including undeveloped or residentiallydeveloped R-5 parcels, on the same block, and side of the street as the restaurant. For thepurpose of applying this provision, property separated by a right-of-way of twenty (20) feetor less in width shall be considered contiguous.
45. Saddlery and tack shops, custom crafting and retail sales. +4
46. School, public, parochial and institutions of higher education. +4
47. School, commercial. +4
48. Veterinary office and hospital. +4
49. Veterinary supplies, wholesale and retail sales. +4
50. Vineyard, production and retail sales. +4
51. Window treatment and upholstery; custom fabrication and retail sales. +4
D. Use Permit Uses.Use Permit Uses. Land in the MUA District may be used for the following purposes, subject toobtaining a use permit in accordance with the standards and procedures of Section 307. *4
1. Animal boarding. +4
2. Bed and breakfast provided that: +4
a. The establishment must be owner-occupied as a principal residence;
b. Not more than eight guestrooms with sleeping accommodations for sixteen guestsmay be provided;
c. Separate cooking facilities for guestrooms are prohibited;
d. Guest stays shall be a minimum of one night and shall not exceed thirty-oneconsecutive nights in any ninety-day period. The owner of the bed and breakfastestablishment shall maintain a reservation book or registration log. The book or log shallshow the arrival and departure dates of all guests and shall be open to inspection by aZoning Enforcement Officer.
e. One off-street parking space shall be provided for each guestroom in addition to theparking required for the principal residence.
3. Dependent care facility, as an accessory use, for seven to twelve dependents, subject to thefollowing conditions: +4
a. Resident dependents under the age of twelve years shall not be counted when they arepresent on the premises.
b. Outdoor play areas shall be screened from adjacent properties by a six-foot-highlandscape hedge, solid fence or solid wall.
c. Hours of operation shall only be between 6:00 a.m. and 10:00 p.m. These hours may berestricted as part of the use permit approval.
d. Nonresident employees may be permitted with the use permit if necessary to meetState requirements.
e. One parking space shall be provided for each employee who does not reside at thefacility.
f. If a swimming pool is on the site, it shall be screened in accordance with Section 1109of the Building Construction Code.
g. Smoke detectors shall be installed in the house in accordance with Section 1210(A) ofthe Building Construction Code.
h. No signage shall be permitted.
i. The facility shall be subject to Arizona licensing requirements.
4. Environmental remediation facility, subject to the following conditions: +4
a. The aboveground area of land occupied by the environmental remediation facilityshall not exceed the minimum number of square feet necessary to implement the remedialor corrective action.
b. All structures and devices constructed above ground level shall be shielded from theview of persons outside the property boundary by an opaque fence or solid landscapescreen, as approved by the Planning and Development Department.
c. Outdoor equipment installed as part of the final environmental remediation facilityshall not exceed a height of ten feet and shall be set back from the screen wall orlandscape material a minimum of three feet for every one foot of height over six feet.
d. After installation, no equipment or materials beyond that necessary to operate thefacility shall be stored on the lot.
e. Any lighting shall be placed so as to reflect the light away from adjacent residentialdistricts. The facility shall not emit noise, odor or vibration at any time so that it exceedsthe general level of noise, odor or vibration uses emit outside the site. Such comparisonshall be made at the boundary of the lot on which the treatment facility is located.
f. The facility shall comply with all applicable provisions of the Fire Code.
g. A permit issued under Section 307 shall include reasonable restrictions on theoperation of the facility to mitigate any adverse impacts on nearby land, including but notlimited to restrictions on vehicular traffic and hours of operation of the facility.
h. This section allows authorization of activities to undertake all on-site investigative,construction, and maintenance activities ancillary to the operation of the facility. All off-site discharges of any substance shall be separately authorized pursuant to applicablelaws.
i. The structures used for the facility shall not exceed a total area of five thousand squarefeet.
j. Neither the Zoning Administrator nor the Board of Adjustment shall have thejurisdiction to vary these provisions.
5. Game court, lighted, as an accessory use. *4
6. Massage therapy, performed by a licensed massage therapist, as an accessory use. +4
7. Processing of off site grown agricultural products, including, pressing cider, oil, or wine. +4

8. Outdoor public assembly uses/special events, including seasonal festivals. +4
9. Restaurant with: +4
a. Sales of alcoholic beverages permitted upon approval by the Zoning Administrator orthe Board of Adjustment of a specific floor plan for the restaurant facility.
b. Live music or entertainment of more than one entertainer
c. Patron dancing
d. Outdoor dining, outdoor recreation uses, and associated lighting
e. Drive-through facility as an accessory use, access to the site is to be from an arterial orcollector street as defined on the street classification map
10. Reserved. -5
E. Permitted Accessory Uses.Permitted Accessory Uses. Land in the MUA District may be used as permitted accessory usesand structures, incidental to and on the same zoning lot as the primary use, for the following uses:
1. Amateur communication tower.
2. Dependent care facility for six dependents, subject to the following conditions:
a. Resident dependents under the age of twelve years shall not be counted when they arepresent on the premises.
b. Outdoor play areas shall be screened from adjacent properties by a six-foot-highlandscape hedge, solid fence or solid wall.
c. There shall be no employees who do not reside at the site unless required by theArizona Department of Health Services.
d. If a swimming pool is on the site, it shall be screened in accordance with the BuildingConstruction Code.
e. Smoke detectors shall be installed in the house in accordance with the BuildingConstruction Code.
3. Guesthouse, provided that it does not exceed six hundred square feet or twenty-fivepercent of the floor area of the principal structure, whichever is larger.
4. Instruction/classes pertaining to the primary use of the site, including, culinary classes at arestaurant or horticulture classes at a plant nursery. *4
5. Reserved. -5
F. Special Permit Uses.Special Permit Uses. Land in the MUA District may be used for the following purposes, subjectto obtaining a special permit in accordance with the standards and procedures of Section 504.1
1. Environmental remediation facility which cannot satisfy the standards of section 649.D.,

above. *4
2. Farms and dairies on sites larger than ten acres. +4
G. Commercial UsesCommercial Uses on a site shall be limited to a maximum of 15,000 (fifteen thousand) grosssquare feet per each establishment. +4
H. Height, Building Setbacks, Density and Area Requirements.Height, Building Setbacks, Density and Area Requirements. All property in the MUADistrict shall be developed in accordance with the following standards. *4
1. For any non-residential uses permitted in the district, the following requirements shallapply: +4
a. A maximum building height of one story (1) not to exceed twenty (20) feet shall bepermitted.
b. Request to exceed the above height limit may be granted by the City Council fordevelopment up to two (2) stories not to exceed thirty (30) feet upon recommendation bythe Planning Commission or the Zoning Hearing Officer finding that such additional heightis not detrimental to adjacent property or the public welfare in general.
2. Except as provided in Section 649.H.1., the following development standards shall apply: +4
DEVELOPMENT STANDARDSDEVELOPMENT STANDARDS
MAXIMUM BUILDING OR STRUCTURE HEIGHTMAXIMUM BUILDING OR STRUCTURE HEIGHT
Residential Thirty (30) feet
Non-residential Twenty (20) feet
BUILDING SETBACKS (EXCLUDING CANAL RIGHT-OF-WAY SETBACKS)BUILDING SETBACKS (EXCLUDING CANAL RIGHT-OF-WAY SETBACKS)
Baseline Road
Maximum fifteen (15) foot high building Fifty (50) feet
Maximum thirty (30) foot high building Sixty (60) feet
Front Yard
Arterial/collector streets Forty (40) feet
Local streets Thirty (30) feet
Side Yard
Interior Fifteen (15) feet
Street Twenty (20) feet
Rear Yard
Rear yard Twenty (20) feet
LOT COVERAGELOT COVERAGE
Maximum lot coverage 35%Shade structures accessory to agricultural orplant nursery uses which are fabric or plastic

film covered and which do not exceed twelvefeet in height shall not be included in lotcoverage calculations.
DENSITYDENSITY
Maximum density 2 units per acre
3. Landscape setbacks (excluding canal right-of-way setbacks).Landscape setbacks (excluding canal right-of-way setbacks). +4
STREETSCAPESTREETSCAPE
Landscaped setback Average 35' along arterial/collector streets,minimum 30' permitted for up to 50% of thefrontage. Average 25' along local streets, minimum20' for up to 50% of the frontage.
PLANT TYPEPLANT TYPE MINIMUM PLANTING SIZEMINIMUM PLANTING SIZE
Trees Min. 2-inch caliper (50% of required trees)Min. 3-inch caliper or multi-trunk tree (25% ofrequired trees)Min. 4-inch caliper or multi-trunk tree (25% ofrequired trees)
Shrubs Min. five (5) 5-gallon shrubs per tree
PARKING LOT AREAPARKING LOT AREA
Interior surface area (exclusive ofperimeter landscaping and all requiredsetbacks)
Min. 10%
Landscaped planters At ends of each row of parking & approximatelyevery 110'
Landscaped planters, single row ofparking
Min. 120 sq. ft.
Landscaped planters, double row ofparking
Min. 240 sq. ft.
Additional parking lot landscaping As needed to meet 10% minimum requirement,evenly distributed throughout the entire parkinglot.Min. interior dimension 5' (length and width).
PLANT TYPEPLANT TYPE MINIMUM PLANTING SIZEMINIMUM PLANTING SIZE
Trees Min. 2-inch caliper (60% of required trees)Min. 1-inch caliper (40% of required trees)
Shrubs Min. five (5) 5-gallon shrubs per tree
PERIMETER PROPERTY LINES (NOT ADJACENT TO A STREET)PERIMETER PROPERTY LINES (NOT ADJACENT TO A STREET)
Property lines not adjacent to a street Min. 10-foot landscaped setback
PLANT TYPEPLANT TYPE MINIMUM PLANTING SIZEMINIMUM PLANTING SIZE
Trees* Min. 2-inch caliper (60% of required trees)Min. 1-inch caliper (40% of required trees)
Shrubs Min. five (5) 5-gallon shrubs per tree
ADJACENT TO A BUILDINGADJACENT TO A BUILDING
Building facades within 100' of the publicright-of-way or adjacent to public entriesto the building (excluding alleys)
Min. 25% of the exterior wall length shall betreated with either a landscaped planter a min.five (5) feet in width or an arcade or equivalentfeature.
PLANT TYPEPLANT TYPE MINIMUM PLANTING SIZEMINIMUM PLANTING SIZE
Trees Min. 2-inch caliper (60% of required trees)Min. 1-inch caliper (40% of required trees)
Shrubs Min. five (5) 5-gallon shrubs per tree
I. Signs. Signs. The following standards are intended to permit only signs which are attractive, low inprofile, and consistent with the agricultural and rural character of the MUA District. Signs fornonresidential development in the MUA District shall be governed by the regulations of Section 705applicable to nonresidential uses of residential property except as modified below. Signs forresidential development in the MUA District shall be governed by the regulations of Section 705applicable to residential uses of residential property except as modified below. Sign which are notvisible beyond the boundaries or the lot or parcel upon which they are situated shall not beregulated as signs. *4
1. Prohibited signs.Prohibited signs.
a. Outdoor advertising/off-premises signs.
b. Backlit awnings with or without sign copy.
c. Balloons and banners adjacent to multiple-use trails.
d. Roof-mounted signs.
e. Multiple tenant identification ground signs identifying more than one tenant. *4
f. Signs which move, rotate, flash, automatically or manually change copy, or simulatemovement.
2. Permitted signs for nonresidential development.Permitted signs for nonresidential development.
a. Ground-mounted monument signs identifying a commercial/agricultural center: not toexceed six feet in height, sixteen square feet in sign area, and thirty-two square feet in totalarea for the monument structure.
b. Signs painted on the building surface or letters mounted directly to the buildingsurface:
(1) Maximum of one square foot of signage for each lineal foot of building elevation
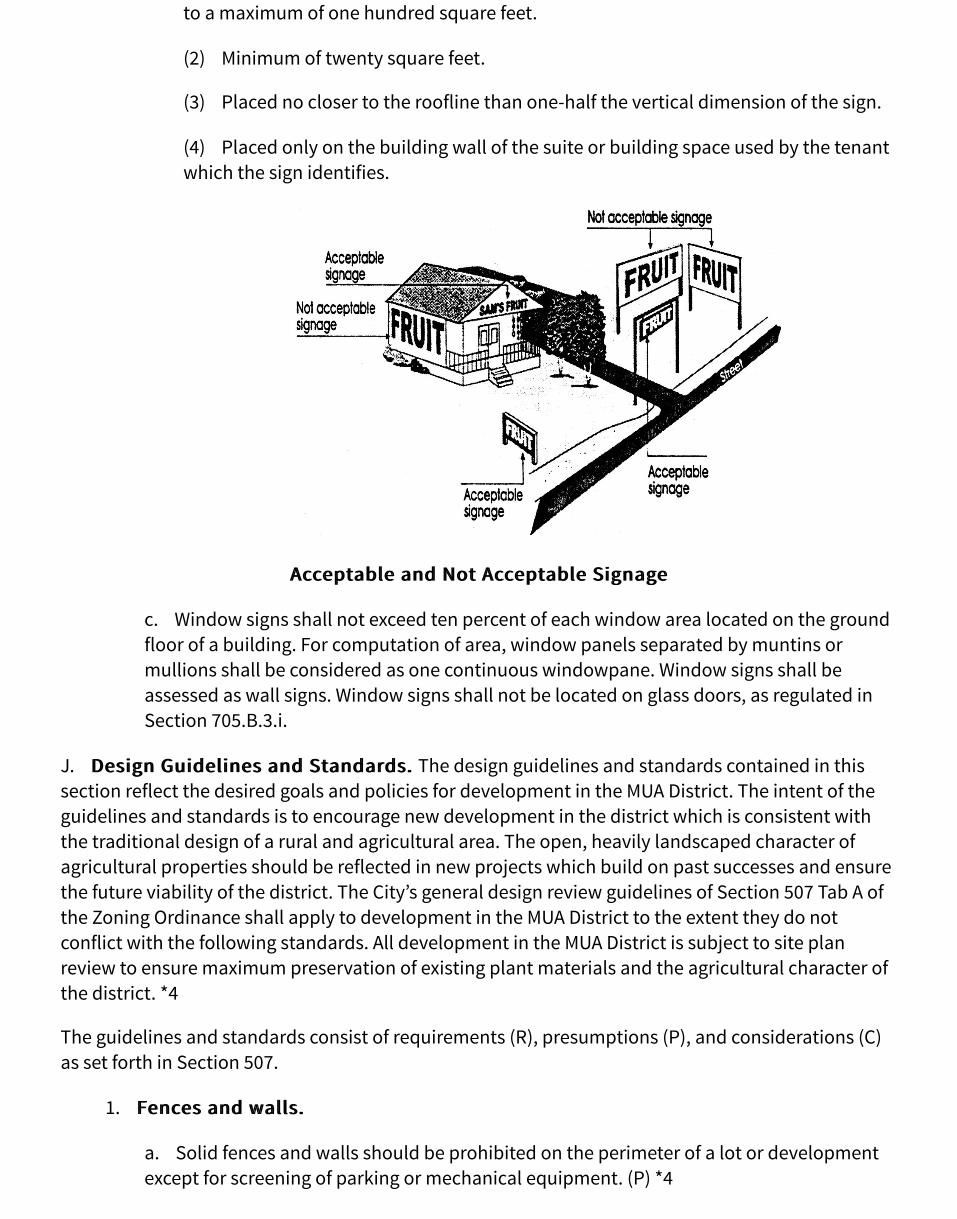
to a maximum of one hundred square feet.
(2) Minimum of twenty square feet.
(3) Placed no closer to the roofline than one-half the vertical dimension of the sign.
(4) Placed only on the building wall of the suite or building space used by the tenantwhich the sign identifies.
Acceptable and Not Acceptable SignageAcceptable and Not Acceptable Signage
c. Window signs shall not exceed ten percent of each window area located on the groundfloor of a building. For computation of area, window panels separated by muntins ormullions shall be considered as one continuous windowpane. Window signs shall beassessed as wall signs. Window signs shall not be located on glass doors, as regulated inSection 705.B.3.i.
J. Design Guidelines and Standards.Design Guidelines and Standards. The design guidelines and standards contained in thissection reflect the desired goals and policies for development in the MUA District. The intent of theguidelines and standards is to encourage new development in the district which is consistent withthe traditional design of a rural and agricultural area. The open, heavily landscaped character ofagricultural properties should be reflected in new projects which build on past successes and ensurethe future viability of the district. The City’s general design review guidelines of Section 507 Tab A ofthe Zoning Ordinance shall apply to development in the MUA District to the extent they do notconflict with the following standards. All development in the MUA District is subject to site planreview to ensure maximum preservation of existing plant materials and the agricultural character ofthe district. *4
The guidelines and standards consist of requirements (R), presumptions (P), and considerations (C)as set forth in Section 507.
1. Fences and walls.Fences and walls.
a. Solid fences and walls should be prohibited on the perimeter of a lot or developmentexcept for screening of parking or mechanical equipment. (P) *4
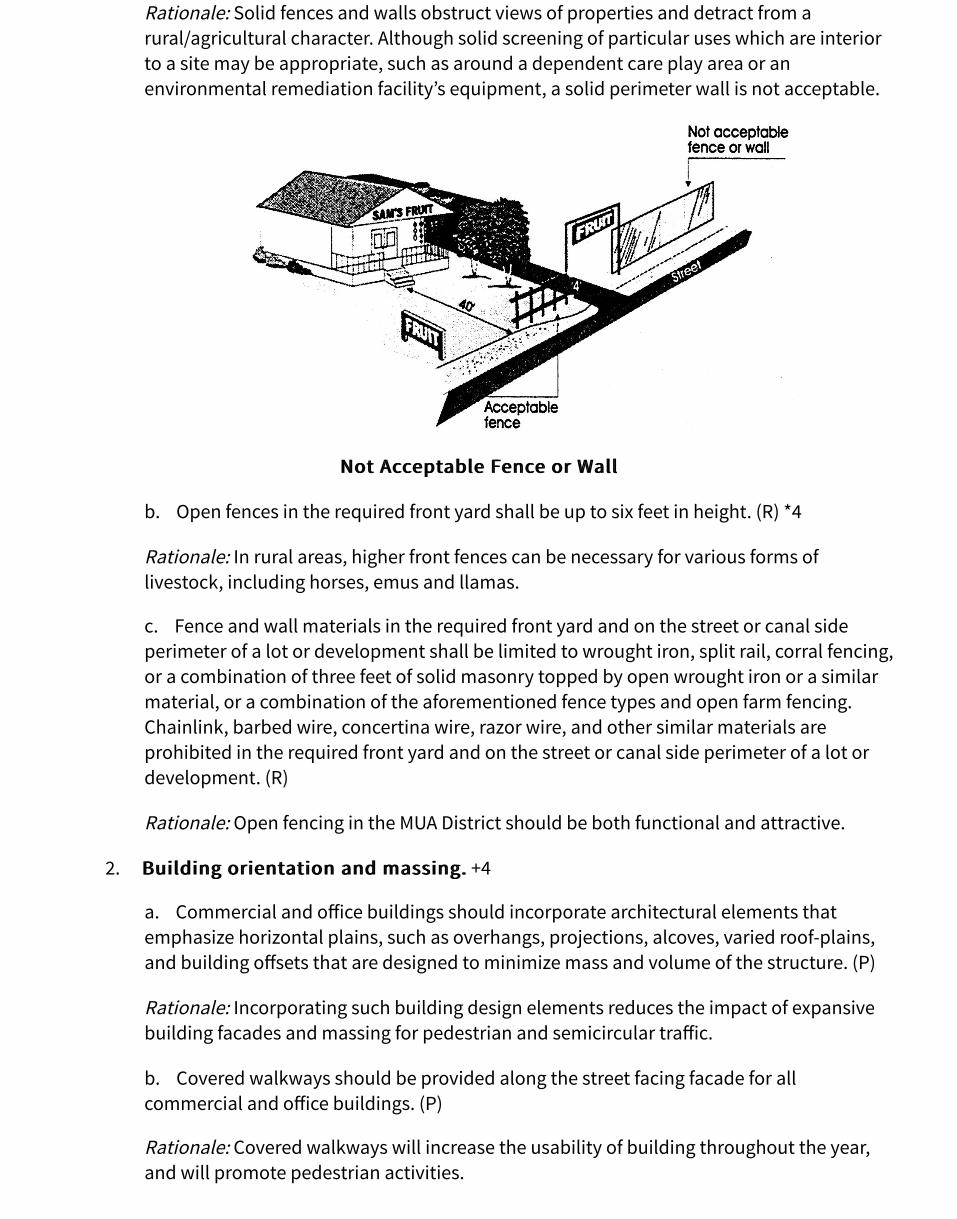
Rationale: Solid fences and walls obstruct views of properties and detract from arural/agricultural character. Although solid screening of particular uses which are interiorto a site may be appropriate, such as around a dependent care play area or anenvironmental remediation facility’s equipment, a solid perimeter wall is not acceptable.
Not Acceptable Fence or WallNot Acceptable Fence or Wall
b. Open fences in the required front yard shall be up to six feet in height. (R) *4
Rationale: In rural areas, higher front fences can be necessary for various forms oflivestock, including horses, emus and llamas.
c. Fence and wall materials in the required front yard and on the street or canal sideperimeter of a lot or development shall be limited to wrought iron, split rail, corral fencing,or a combination of three feet of solid masonry topped by open wrought iron or a similarmaterial, or a combination of the aforementioned fence types and open farm fencing.Chainlink, barbed wire, concertina wire, razor wire, and other similar materials areprohibited in the required front yard and on the street or canal side perimeter of a lot ordevelopment. (R)
Rationale: Open fencing in the MUA District should be both functional and attractive.
2. Building orientation and massing.Building orientation and massing. +4
a. Commercial and office buildings should incorporate architectural elements thatemphasize horizontal plains, such as overhangs, projections, alcoves, varied roof-plains,and building offsets that are designed to minimize mass and volume of the structure. (P)
Rationale: Incorporating such building design elements reduces the impact of expansivebuilding facades and massing for pedestrian and semicircular traffic.
b. Covered walkways should be provided along the street facing facade for allcommercial and office buildings. (P)
Rationale: Covered walkways will increase the usability of building throughout the year,and will promote pedestrian activities.

c. Changes in facade, such as, material, window design, facade height or decorativedetails should be expressed so that the composition appears to be a collection of smallerbuildings. (P)
Rationale: Varied building facades promote a traditional and rural building design thatminimizes the visual impact of the building.
d. The amount of cut and fill should be the minimum amount necessary to accommodatesite infrastructure. (P)
Rationale: Building layouts that follow and blend into the natural landscape arecompatible with traditional agrarian design.
e. Buildings should be oriented towards the street by placing the primary entrance on thestreet frontage. (P)
Rationale: Building orientation towards street will reinforce community orientation in theMUA District.
3. Parking and maneuvering areas. Parking and maneuvering areas. *4
a. No parking or maneuvering areas, other than required driveways, shall be permitted inthe perimeter setbacks of a lot or development. (R)
Rationale: Parking areas are intrusive and have a more urban character than is appropriatein this district. At a minimum, parking and maneuvering areas must be placed outside ofthe site’s perimeter setbacks. An exception is needed for driveways to bring vehicles ontothe site.
b. Parking areas should be placed behind or along the nonstreet side of a building. (P) *4
Rationale: A building can provide an effective screen for a parking area and help preventthe parking area from dominating the appearance of the site.

Parking and Maneuvering AreasParking and Maneuvering Areas
c. The surface of parking stalls should be composed of an alternative to asphalt orconcrete, as approved by the Zoning Administrator. (P) *4
Rationale: Although it is critical that parking and maneuvering areas be dustproofed dueto problems with air pollution from particulates, rural and agricultural developments havetraditionally used a form of decomposed granite rather than asphalt. With currentdustproofing technology, an acceptable level of protection is possible with an alternativesurface material. These alternatives are consistent with the desired character for the MUADistrict.
d. A maximum of one row of parking should be permitted between the building and right-of-way for commercial, office or mixed use buildings, except when the parking is locatedalong an arterial street. (P) +4
Rationale: A single row of parking facing the street reinforces the rural/agrarian characterof the development. +4
e. No single surface parking area should exceed 50 spaces unless divided into two ormore sub-areas by a building, roadway or landscaping equal to 25% of the width of theparking area. (P) +4
Rationale: Expansive parking lots should be avoided to preserve a rural agricultureidentity. +4
4. Lighting.Lighting. +4
a. On site lighting should be accomplished with low level, uniform lighting fixturesdispersed throughout the site with a lumen rating of 3,000 or less. (P) +4
Rationale: Uniform lighting avoids abrupt changes from lit to dark areas, providing aneven low intensity lighting pattern. +4
5. Building materials.Building materials. +4
a. The following building materials should be incorporated into commercial buildings: (P)+4
1) Board and batten;
2) Clapboard siding;
3) Wood/heavy timbers;
4) Adobe;
5) Stone or stone veneer;
6) Stucco, not to exceed 70% of the exterior wall surface area.
Rationale: These types of building materials ensure the agrarian character of the MUA

District. +4
6. Roofs.Roofs. +4
a. Barrel tile roofs shall be prohibited. (P) +4
b. Pitched roof elements should be encouraged for commercial buildings. (P) +4
c. If flat roofs are proposed for commercial buildings a false front parapet should beincluded. (P) +4
d. Overhanging wooden eaves and exposed rafters should be encouraged. (P) +4
Rationale: Barrel tile roofs are not consistent with the desired character of the MUA ZoningDistrict. Pitched or flat roofs with false front parapets and exposed rafters are morereminiscent of a rural or farm building style. +4
7. Signs.Signs. +4
a. Neon tubed exterior accent light, external neon tubed signs and internally illuminatedsigns are not permitted. (R) +4
Rationale: Such lighting is symbolic of an urban setting and is not compatible with therural character of the MUA District. +4
b. Ground, shingle or wall mounted signs made of wood, or similar appearing materialshould be encouraged. (P) +4
Rationale: Signs mounted to the building reinforce the agrarian character of the MUADistrict. +4
8. Windows.Windows. +4
a. All windows in commercial buildings shall be either divided lite or double hung. (R) +4
Rationale: Divide lite or double hung windows prevent the introduction of large singlepane windows that will create a building facade out of character with the MUA District. +4
b. Ground floor building elevations which face the public right-of-way or pedestrianplazas shall provide a minimum of 40% and maximum of 70% by means of windows anddoors between three (3) feet and seven (7) feet above the finished floor elevation. (R) +4
Rationale: Window and door openings create an interactive and appealing pedestrian andright-of-way building facade. +4
c. All windows must achieving a visible transmittance rating (VTR) of 0.85 or higher. (R) +4
Rationale: Transparency along the street encourages pedestrian activities and enhancessecurity. +4
9. Open space.Open space. +4
a. A minimum of twenty-five percent of the net site area of a commercial, office or mixeduse development, not including landscaping setbacks, shall be set aside as open spaceaccessible to the public. For sites less than two acres a minimum of ten percent shall be setaside. (R) +4
Rationale: Open space will enhance the agricultural character of the developmentsupporting the MUA District. +4
b. Open space accessible to the public should be centrally located. (P) +4
Rationale: In addition to providing an open character for the surrounding area, it is equallyimportant for the development’s occupants to be able visually and physically to enjoy theopen space. +4
c. Required open space accessible to the public may be used for storm water retention.(C) +4
Rationale: The open space can serve as a retention area. +4
d. Required open space accessible to the public may be active (pasture/riding ring, foodor flower garden, citrus grove) or passive (landscaped area). (C) +4
Rationale: The open space should respect the traditional agricultural uses. +4
10. Landscape standards.Landscape standards.
a. Plant materials in required landscape areas shall be limited to those listed on theMixed Use Agricultural plant list, a copy of which is available at the Phoenix Planning andDevelopment Department, or their equivalent as approved by the Zoning Administrator.(R)
Rationale: A key method to preserve and foster the agricultural character of this district islandscaping with plant materials which have historic significance for ornamental or cropuse in agricultural areas of Phoenix or provide the visual equivalent to those plants. Themixed use agricultural plant list combines plants (trees, shrubs, ground covers, accentplants, and vines) which Phoenicians have historically used in farming areas and droughttolerant plants which have the potential for crop use or have a lush appearance whichcomplements the color, texture, and density of the traditional plants. The landscapepalette enhances the district’s character through its contrast to the plant materials whichare used in and appropriate for Sonoran desert areas without an agricultural heritage.
b. Any plants listed in the invasive species list in Appendix B of the Sonoran PreserveEdge Treatment Guidelines, Section 507 TAB A3.7 shall be prohibited in the MUA District.(R) +4
Rationale: Invasive species shall be prohibited to protect the plant materials in the vicinityand to preserve the environment. +4
c. Where prominent existing plant materials are native species then the landscapingshould be limited to the Sonoran Plant List. (P) +4
Rationale: Native Sonoran Desert landscaping should be encouraged where appropriate topromote uniform landscaping themes in areas with native vegetation. +4
d. A minimum of five percent of the landscaped area should be planted in flowers. (P) *4
Rationale: Flowers will contribute to the beauty of the project. *4
Date of Addition/Revision/Deletion - Section 649+1 Addition on 6-9-1999 by Ordinance No. G-4189*2 Revision on 5-22-2002 by Ordinance No. G-4435, eff. 6-21-2002*3 Revision on 6-26-2002 by Ordinance No. G-4447, eff. 7-26-2002+4 Addition on 7-2-2008 by Ordinance No. G-5217, eff. 8-1-2008*4 Addition on 7-2-2008 by Ordinance No. G-5217, eff. 8-1-2008-5 Deletion on 3-4-2009 by Ordinance No. G-5329, eff. 4-3-2009

This page is intentionally blank.
E-1Public Draft - February, 2016
Appendix E,SELECTED EXAMPLES OF INNOVATIVE FARM ORGANIZATIONS AND OPERATIONS
ADAMS COUNTY CITY OF BRIGHTON
Study Draft, February 2016 1
APPENDIX E: SELECTED EXAMPLES OF INNOVATIVE FARM ORGANIZATIONS AND OPERATIONS
FULL CIRCLE CERTIFIED ORGANIC FARM (Longmont, Colorado) www.fullcircleorganicfarms.com/
1,100-acre farm located in Longmont, Colorado. Actually ten separate farms under one umbrella. Combined, these ten farms grow more than 70 varieties of vegetables as well as small grains, grass hay and alfalfa.
Applicability to District:
Similar growing season Adequate water available Close to Boulder and Fort Collins markets Reach wholesale as well as direct markets (farm stand on property) Served by produce distributors (LoCo; Door to Door)
AGRITOPIA (Gilbert, AZ) http://agritopia.com/ and http://joesfarmgrill.com/
Agritopia is a 166-acre mixed use community in Gilbert, AZ. This site was originally a family farm, establishing the future community to embrace its agrarian roots. The community was established in 2000. There are currently 450 single family homes. The initial farm size was a 22-acre USDA certified organic farm. The long term goal is to have up to 8 acres of full production.
Applicability to District:
Farmer operates farm under lease structure Staff ( owners: head farmer and spouse, farm manager; 3 month interns) Infrastructure (tractors, small walk-in cooler, packing shed, well, irrigation, hut, farm stand and delivery
truck.) Vegetable output includes CSA (50 shares, shifting to 100 in 2015); Farmers Market ( three markets
including farm stand on premise); Wholesale (25 restaurant accounts); and U-pick Farm to Table Restaurant (Joe’s Farm Grill)
ADAMS COUNTY CITY OF BRIGHTON
Study Draft, February 2016 2
WOODLAND GARDENS (Athens, Georgia) woodlandgardensorganic.com/
This four-acre farm is owned by a couple that hires younger staff to manage the farm. Selling organic produce through a variety of channels: direct sales through delivered boxes, farmers’ market sales, sales to restaurants, etc., the farm reportedly sold $80,000 per acre several years ago, and had a goal of selling $100,000 per acre. The previous farm manager said that the difference between where they were and where they wanted to be was all in marketing – it was easy to produce that much food on the land. The farm hires four full-time staff who earn salaries of about $30,000 per year.
Applicability to District:
Longer growing season in Georgia Adequate water available Consumers are close to farm Experienced farm manager, trained at UC Santa Cruz with exceptional motivation Like Brighton, in a smaller town with a large metro area nearby Unlike Brighton, in a university town
GREENSGROW GARDENS (Center City of Philadelphia, Pennsylvania) www.greensgrow.org/
This one-acre farm took over a brownfield site in a severely depressed area of town. The land is owned by the City, which offered a 99-year lease for $1. Owners Mary Seton Corboy and Tom Sereduk began the farm in 1998 hoping to sell wholesale to nearby restaurants; over time a retail model surfaced that combines selling 20 vegetables in smaller quantities to nearby restaurants (see list below); brokering food from rural farms to these same restaurants; selling 2,000 pounds of food to immediate neighbors through CSA shares; selling landscape plants to nearby residents who are fixing up their homes; and sales from a farm stand. The farm won a three-year grant from the USDA Community Food Projects Competitive Grant Program that allowed this vision to flourish. By 2012, the farm realized $1 million in sales (the largest share of this is landscape plants).
Greensgrow has now opened a farm in a suburban location, and is becoming a solar demonstration site as well as a working farm. In addition to sales noted above, the farm receives considerable support through philanthropic donations that help focus service to inner-city residents who are low-income, and to build innovative new sustainable technologies. This includes installing a closed-loop water system for hydroponic lettuce production. Rain water is saved in barrels. The entire farm sits on a slab of concrete.
Restaurant Partners serve a variety of dining styles:
Bufad Pizza: bufadpizza.com Cafe Lift: cafelift.com Capogiro: capogirogelato.com Cedar Point Bar & Kitchen: cedarpointbarandkitchen.com Franklin Fountain: franklinfountain.com Johnny Brenda’s: johnnybrendas.com Little Baby’s Ice Cream: littlebabysicecream.com
ADAMS COUNTY CITY OF BRIGHTON
Study Draft, February 2016 3
London Grill: londongrill.com The Standard Tap: standardtap.com Pizza Brain: pizzabrain.org Prohibition Taproom: theprohibitiontaproom.com Vedge Restaurant: vedgerestaurant.com
Applicability to District:
Growing season is similar to Brighton Brighton Special District has better land and water Water is managed very carefully; may be able to rely on city water supply This farm’s access to urban consumers is the most significant factor in its viability Earns main income from sales; receives grants for special projects Multiple market channels make the farm more sustainable Demonstration site that attracts visitors
THE CROP STOP (Charleston, South Carolina) www.postandcourier.com/article/.../150329997
Clemson Extension agent Harry Crissy has worked with small growers in South Carolina’s Lowcountry to design a small, and potentially mobile, produce processing plant that will make it easier for small farms to gain access to light processing capability, such as washing, chopping, blanching, and freezing, right on the farm. The first Crop Stop has been installed on a farm on the outskirts of Charleston, and has been certified by the state of South Carolina for food processing. A second is planned for the Greenville-Spartanburg area. Initial cost runs about $100,000.
Applicability to District:
This facility could be located anywhere Locating close to several farms that raise produce would offer them more choice in deciding where and
how to sell A small facility such as this can prepare foods for school or hospital use Since the Crop Stop is mobile and modular, it can be expanded or moved as farms grow new capacity
LAS MILPITAS DE COTTONWOOD FARM (Tucson, Arizona) https://www.communityfoodbank.org/las-milpitas
Las Milpitas is a farm wholly within the city limits of Tucson, founded by the Community Food Bank of Southern Arizona, as a training and demonstration farm where organic practices are pursued in near-desert soils. It is run in partnership with the nearby Pima County, City High School, and many other community organizations. Food that is raised here is sold at lower cost to low-income residents of the city through a subsidized farmers’ market. While not a model of a farm that is commercially independent, the farm is an excellent example of capacity building among low-income residents, and of producing food in a scarce-water environment.
Applicability to District:

ADAMS COUNTY CITY OF BRIGHTON
Study Draft, February 2016 4
Grows organic produce in near-desert conditions Owned and operated by a food bank to serve low-income population Trains low-income residents in food production Located inside an urban area Uses drip irrigation to conserve water Formed around community partnerships
TRELLIS SYSTEMS (Fort Wayne, Indiana) trellisgrowingsystems.com/
Richard Barnes, a manufacturing engineer, began to farm in 2000 with a small, 9,000-row-ft. operation in Wells County, Indiana, growing seven varieties of raspberries and blackberries. As markets expanded, and with the help of several research grants, he was able in 2007 to design and build a modular system for growing berries on trellises that significantly increases the yield by forcing production to one side of the plant. He moved the operation from a rural site to a demonstration farm that covers about 40 acres inside the city of Fort Wayne. Barnes partners with more than 50 growers with 300 acres in Indiana, Ohio, and Pennsylvania (many of them Amish), projecting a 2016 harvest of 1,000,000 pounds. The firm represents each of these growers as a marketing agent and works through a national produce distributor.
Applicability to District:
Successful and profitable berry production on irrigated land inside a city Vertical integration allows scattered small farmers to market collaboratively Technology offers a competitive advantage and should be applicable to Brighton Sales are more to national markets than to local consumers Engages producers who are marginalized from the mainstream economy
SEVEN SONS FARM (Roanoke, Indiana) https://sevensons.net/
The Hitchfield family has developed a vertically integrated farm operation that is actually several different businesses under one family umbrella. They raise grass-fed beef, pastured pork, and eggs, selling through an extensive network of buying clubs with 46 drop sites in Chicago, Detroit, and Indianapolis, and also sell $250,000 of products from a self-serve farm stand. They also sell a limited amount to mid-sized grocery stores. Each separate product is organized under its own business entity, both to reduce liability and for tax advantages.
By nesting production (rotating different livestock through the same plots of land), they can increase profits dramatically. The Hitchfields calculate that the farm earns a profit of $400-$500 per acre by direct marketing beef. Chickens are pastured on the same land (typically after the cattle have grazed, in order to clean up insects that have settled on the manure, and also to clip the grass one more time). So the cost of producing the chickens can be justified both as a sanitation strategy and as a production strategy (largely for laying eggs). The brothers estimate that grazing chickens adds value of about $3,000 per acre above what is earned by raising beef – on the same land. The presence of the chickens also lower veterinary costs for the cattle. Raising 200 hogs per year on the same land

ADAMS COUNTY CITY OF BRIGHTON
Study Draft, February 2016 5
adds about $800 profit per acre. Feed costs for these hogs (Duroc, Large Black, Hampshire) are reduced by 20% if they rotate the animals through pasture, rather than feeding them grain continuously. All in all, the brothers claim profits of $4,300 per acre of livestock. Total acreage of their farm (not all pastured) is 550 acres The farm also earns money by selling internet services, having developed their own ordering platform that is unique in that it allows farmer to set prices that vary with the price of inputs and the weight of the animal. Their files show 5,200 total members, but not all of these are actively purchasing food from Seven Sons at any one time.
Applicability to District:
Rainfall is more plentiful in Indiana than in Colorado Soil is richer in Indiana Brighton is closer to more lucrative urban markets Nested business structures and vertical integration can be implemented in any location Intensive use of livestock builds soil fertility as well as profitability Direct marketing is performed at considerable scale Relies upon prior family wealth
CULTIVATE KANSAS CITY http://www.cultivatekc.org/
Nonprofit organization in Kansas City whose tagline is “Growing food, farms, and community for a healthy food system.” This is one of the more successful urban agriculture ventures we know, running three separate farms within city limits, and growing new farms in the future. They work in collaboration with the City of Kansas City which has just launched a grant program to help farmers and community gardens get access to water and improve their water management practices. The program, KC Grow, will provide funding to growers in Kansas City, MO for:
Municipal water line tap and hydrant installation Rainwater and storm water catchment systems Supply lines from existing water supplies Farm design/ development to maximize rain water catchment and soil management practices that improve
the water holding capacity of the soil.
Applicability to District:
Close enough to serve as a technical resource to Brighton Fosters use of municipal water Commercially viable farming in urban settings Greater rainfall in Kansas City than in Brighton Brighton has more effective irrigation system in place
ADAMS COUNTY CITY OF BRIGHTON
Study Draft, February 2016 6
PRAIRIE HERITAGE FARM (Power, Montana) http://www.prairieheritagefarm.com/p/grain-and-seed-csa.html
This diversified, certified organic farm near Great Falls is a family farm owned and operated by Jacob and Courtney Cowgill. The couple offers CSA shares in the Great Falls, Montana area, offering organic vegetables, ancient and heritage wheat, and lentils in what they call the “Grainy Day CSA Box.” They have installed a small grain mill so they can mill flour to custom order. The couple once sold heritage turkeys, but is taking a break from this. They also sell at local farmers markets.
Applicability to District:
Dryland grain farming on a small scale Differentiated grains marketed directly to residential customers Custom milling offers added value and agritourism opportunities Suited to those limiting gluten intake
MEADOWLARK FARM (Nampa, Idaho) http://www.meadowlarkfarmidaho.com/description
Meadowlark Farm raises grass-fed lamb and pastured poultry from a suburban Boise farm, selling primarily direct to local residents in eastern Oregon and southwest Idaho. They have been in operation 24 years, and have become leaders in fostering the Boise local food movement, helping to start the new Boise Farmers Market, and creating a food destination zone in downtown Boise where food businesses are locating close to each other to create synergy and to raise visibility among consumers.
Applicability to District:
Could serve as a technical resource to Brighton on constructing a local food system Experienced in clustering local food businesses Small scale livestock production should be very compatible with housing development on dry land in
Brighton; this also builds soil fertility Idaho is also a relatively dry region with large scale vegetable production (onions and potatoes)

This page is intentionally blank.

F-1Public Draft - February, 2016
Appendix F,OIL AND GAS INFORMATION


Wel
l Sum
mar
y Ad
ams/
Brig
hton
Pla
nnin
g Di
stric
t
IDW
ell N
ame
Wel
l #O
pera
tor N
ame
Ope
rato
r #St
atus
Dat
eLo
catio
nN
otes
05-0
01-0
9847
And
erso
n19
-1-1
0HC
W
AR
D P
ET
RO
LEU
M C
OR
PO
RA
TIO
N10
359
DG
5/29
/201
5
SW
SW
18
1S 6
6W 6
Pa
d ap
prov
ed fo
r 12
wel
ls, o
nly
1 Fo
rm 2
subm
itted
05-0
01-0
9801
SH
AR
P24
-3-1
1HC
W
AR
D P
ET
RO
LEU
M C
OR
PO
RA
TIO
N10
359
WO
3/13
/201
5
SW
SW
24
1S 6
7W 6
Pa
d ap
prov
ed fo
r 2 w
ells
05-0
01-0
9802
Sha
rp24
-3-9
HC
W
AR
D P
ET
RO
LEU
M C
OR
PO
RA
TIO
N10
359
XX
2/8/
2014
S
WS
W 2
4 1S
67W
6
05-0
01-0
9842
Sch
aefe
r25
-1-4
HC
W
AR
D P
ET
RO
LEU
M C
OR
PO
RA
TIO
N10
359
XX
1/28
/201
5
SW
SE
24
1S 6
7W 6
Fo
rm 2
A fo
r 16
wel
ls, 1
4 Fo
rm 2
s,
0 dr
illed
, exp
. 1/2
017
05-0
01-0
9849
Sch
aefe
r25
-1-2
HC
W
AR
D P
ET
RO
LEU
M C
OR
PO
RA
TIO
N10
359
XX
7/13
/201
5
SW
SE
24
1S 6
7W 6
05-0
01-0
9858
Sch
aefe
r25
-1-5
HN
W
AR
D P
ET
RO
LEU
M C
OR
PO
RA
TIO
N10
359
XX
9/29
/201
5
SW
SE
24
1S 6
7W 6
05-0
01-0
9859
Sch
aefe
r24
-3-3
HC
W
AR
D P
ET
RO
LEU
M C
OR
PO
RA
TIO
N10
359
XX
9/29
/201
5
SW
SE
24
1S 6
7W 6
05-0
01-0
9860
Sch
aefe
r24
-3-8
HN
W
AR
D P
ET
RO
LEU
M C
OR
PO
RA
TIO
N10
359
XX
9/29
/201
5
SW
SE
24
1S 6
7W 6
05-0
01-0
9861
Sch
aefe
r25
-1-6
HC
W
AR
D P
ET
RO
LEU
M C
OR
PO
RA
TIO
N10
359
XX
9/29
/201
5
SW
SE
24
1S 6
7W 6
05-0
01-0
9862
Sch
aefe
r24
-3-4
HN
W
AR
D P
ET
RO
LEU
M C
OR
PO
RA
TIO
N10
359
XX
9/29
/201
5
SW
SE
24
1S 6
7W 6
05-0
01-0
9863
Sch
aefe
r24
-3-7
HC
W
AR
D P
ET
RO
LEU
M C
OR
PO
RA
TIO
N10
359
XX
9/29
/201
5
SW
SE
24
1S 6
7W 6
05-0
01-0
9864
Sch
aefe
r24
-3-2
HN
W
AR
D P
ET
RO
LEU
M C
OR
PO
RA
TIO
N10
359
XX
9/29
/201
5
SW
SE
24
1S 6
7W 6
05-0
01-0
9865
Sch
aefe
r25
-1-3
HN
W
AR
D P
ET
RO
LEU
M C
OR
PO
RA
TIO
N10
359
XX
9/29
/201
5
SW
SE
24
1S 6
7W 6
05-0
01-0
9866
Sch
aefe
r25
-1-8
HC
W
AR
D P
ET
RO
LEU
M C
OR
PO
RA
TIO
N10
359
XX
9/29
/201
5
SW
SE
24
1S 6
7W 6
05-0
01-0
9867
Sch
aefe
r24
-3-6
HN
W
AR
D P
ET
RO
LEU
M C
OR
PO
RA
TIO
N10
359
XX
9/29
/201
5
SW
SE
24
1S 6
7W 6
05-0
01-0
9868
Sch
aefe
r24
-3-5
HC
W
AR
D P
ET
RO
LEU
M C
OR
PO
RA
TIO
N10
359
XX
9/29
/201
5
SW
SE
24
1S 6
7W 6
05-0
01-0
9869
Sch
aefe
r25
-1-7
HN
W
AR
D P
ET
RO
LEU
M C
OR
PO
RA
TIO
N10
359
XX
9/29
/201
5
SW
SE
24
1S 6
7W 6
05-0
01-0
6790
CA
SE
1N
OB
LE E
NE
RG
Y IN
C10
0322
PA
6/20
/201
3
NE
NE
17
1S 6
6W 6
05-0
01-0
6841
TA
SH
IRO
-UP
RR
1N
OB
LE E
NE
RG
Y IN
C10
0322
PA
9/17
/201
3
SW
SW
17
1S 6
6W 6
05-0
01-0
8670
WA
GN
ER
1B
RA
ND
LY O
ILM
AN
CO
NS
ULT
AN
TS
INC
9800
PA
6/7/
1985
S
WS
E 1
8 1S
66W
6
05-0
01-0
6809
DA
VIS
1E
XT
RA
CT
ION
OIL
& G
AS
LLC
1045
9P
A4/
21/2
014
NE
SW
20
1S 6
6W 6
05-0
01-0
9002
HU
EB
NE
R25
-44
PE
TR
O-C
AN
AD
A R
ES
OU
RC
ES
(U
SA
) IN
C72
085
PA
7/1/
1999
S
ES
E 2
5 1S
67W
6
05-0
01-0
6679
LET
TE
RLY
-SC
OT
T1
PD
C E
NE
RG
Y IN
C69
175
PR
7/1/
2013
N
EN
E 2
4 1S
67W
6
PA in
201
4, st
atus
in e
rror
on
scou
t car
d05
-001
-069
99C
AS
E1
CO
N P
ET
RO
INC
1917
5D
A6/
10/1
975
NE
NE
17
1S 6
6W 6
05-0
01-0
8515
RIT
CH
EY
19-J
anP
ET
RO
DY
NE
PR
OD
CO
INC
6908
5D
A9/
19/1
984
SE
SW
19
1S 6
6W 6
05-0
01-0
7215
AM
EN
D1
CH
AP
AR
RA
L R
ES
OU
RC
ES
INC
1625
0D
A3/
4/19
77
SW
SW
30
1S 6
6W 6
05-0
01-0
6700
KN
OW
LTO
N1
XO
EX
PLO
RA
TIO
N IN
C98
000
AL
1/11
/197
4
NE
SE
30
1S 6
6W 6