Impact of Reforms in Agricultural Input Markets on Crop Sector Profitability in Bangladesh
Upload
khangminh22Category
view
6download
0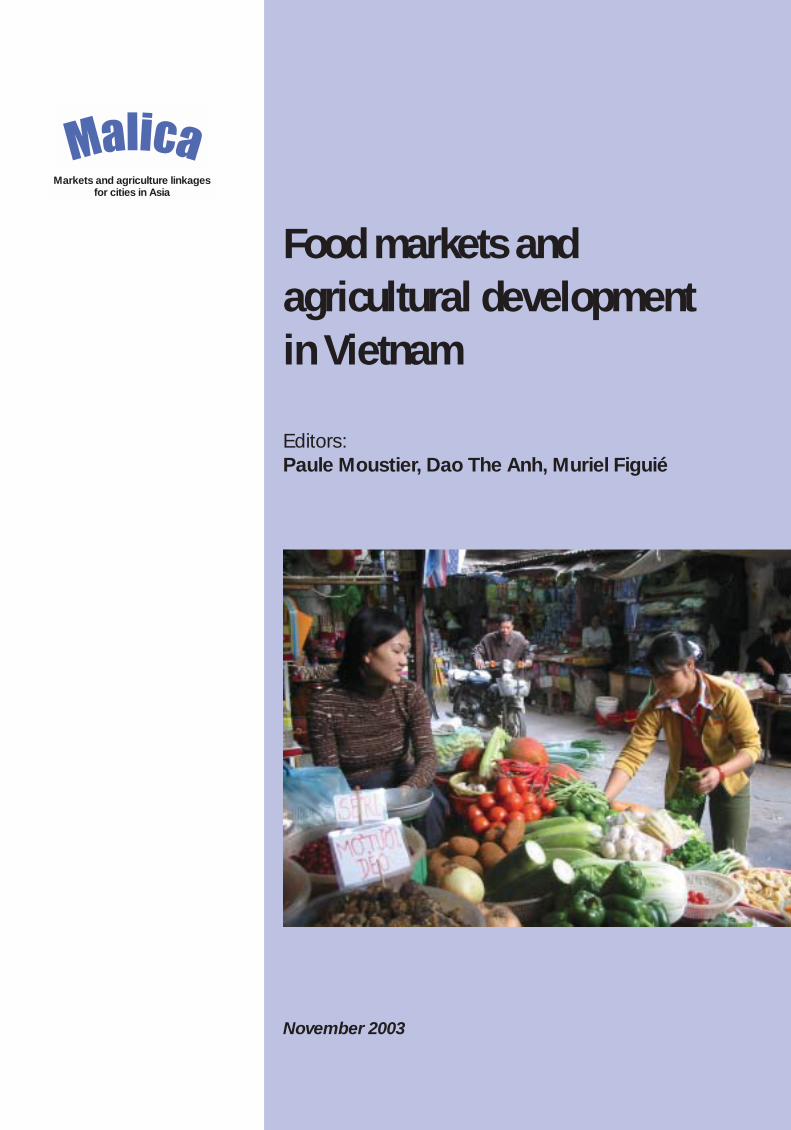
Food markets and agricultural developmentin Vietnam
Editors: Paule Moustier, Dao The Anh, Muriel Figuié
November 2003
Markets and agriculture linkagesfor cities in Asia
Markets and Agricultural Linkages for Cities in Asia (MALICA)
The MALICA consortium brings French and Vietnamese research institutes together. Theseinclude the CIRAD, the IOS – the Institute of Sociology of the National Centre of Social Sciencesand Humanities, the RIFAV – the Research Institute on Fruits and Vegetables, the VASI – theVietnam Agricultural Science Institute, as well as the Hanoi Agricultural and Forestry Universityand the Agricultural and Forestry University of Ho Chi Minh City. Its main objective is to rein-force the capacity of researchers, students, administrators as well as private groups in analysingfood markets and city/country relations. These methods are applied to projects which aim at acorrelation between local food production and local market demand, in terms of both quantityand quality, such as the regional periurban agricultural project, SUSPER, or the project aboutfood behaviour and risk perception. Stakeholders’ information and cooperation mechanisms aretaken into consideration as a complement to classical technical and economic efficiency analy-sis of different stages in the commodity chains. Methods of consumption and commodity chainanalysis are applied to two priority research fields: increasing quality in the food sector; and thecomparative advantages of periurban and rural flows. The main activities over the past yearhave focused on the application of these methods to the vegetable, pork and wheat commo-dity chains and the analysis of the wholesale markets.
Contact: [email protected]
© 2003Design and printing
Reference for quotation: Moustier P., Dao The Anh, Figuié M., 2003.Food markets and agricultural development in Vietnam.Hanoi, MALICA (CIRAD - IOS - RIFAV - VASI), 108 p.

Food marketsand agricultural developmentin Vietnam
Editors: Paule Moustier, Dao The Anh, Muriel Figuié
November 2003
Food markets and agricultural development in Vietnam
2
Foreword This document is the fruit of a collective work
carried out at the request of the Department ofCultural Cooperation and Action (SCAC) of theFrench Embassy in Vietnam. The main aim is todemonstrate the new stakes resulting from thegrowth of the domestic market and to establishdevelopment strategies for the agricultural sector.Aware of these stakes, French and Vietnameseresearchers from different disciplines andinstitutes came together to form a researchconsortium (MALICA). The SCAC wished toencourage this initiative and help us tocommunicate our initial results to decision-makers, both in Vietnam and for international aid,by means of this publication and its presentationduring the seminar taking place on 11th December2003 in Hanoi. We present our sincere thanks toSerge Snrech, Deputy Advisor for Cooperation,for his support and shrewd advice.
This document is the product of more than ayear’s collaboration within the MALICAconsortium. Although not all of the researchpartners participated directly in this document withtheir own writings, they contributed by means oftheir work and their participation in the ideasdebated within the group. We give special thanksto Dr Jean-François Lecoq, Dr Isabelle Vagneron(CIRAD) and Ms Bui Thi Thai (VASI). We hopethat this debate will be pursued even moreintensively after the appraisal of the initial stage ofcooperation represented by this document.
We would particularly like to thank the directorsof the partner institutes and the MALICAadvisorycommittee headed by Dr Nguyen Van Bo,Director of the Department of Science andTechnology at the Ministry of Agriculture andRural Development; Dr Tran Van Lai and Dr VuManh Hai, Director and Deputy Directorrespectively of the RIFAV; Dr Trinh Duy Luan,Director of the Institute of Sociology at theNational Centre for Social Sciences andHumanities; Dr Le Quoc Doanh, Vice-President ofthe VASI; Dr Dang Kim Son, Director ofthe Information Centre on Agriculture andRural Development; Dr Gilles Mandret, repre-
sentative of the CIRAD in Vietnam. We would alsolike to thank the university partners of the MALICAconsortium: the Faculty of Economics and RuralDevelopment at the Hanoi Agricultural University,its Dean, Dr Pham Van Dinh, and Vice-Dean,Dr Ngo Thi Thuan; the Faculty of Economics atthe University of Nong Lam in Ho Chi Minh City,its Dean, Dr Pham Thanh Binh, and Vice-Dean,Dr Phan Thi Giac Tam.
The document is also the result of theparticipation of the referees who shared with ustheir comments regarding our work and who,most helpfully and with great indulgence,highlighted its shortcomings: François Geay,technical assistant at the Ministry of ForeignAffairs; Jean-Marie Cour, consultant with “UrbanForum” in Vietnam; Dr Nigel Poole, economist atImperial College at Wye in the United Kingdom.Although not all of their comments could be takeninto account in this document and certain gapsremain, it is more often than not because many ofthe necessary improvements require additionalresearch. These comments are most important tous in orienting future work.
The results of our research have been mademore attractive and accessible by the patientediting of Corinne Cohen and the translation fromFrench to English by John Baker and MairHyman. We believe that, at least in part thanks toimproved circulation of information between thoseinvolved, the Vietnamese food sector will rise tothe challenge and seize the opportunities offeredby the domestic market.
As editors, we therefore hope that, as a resultof these different contributions, and despitecertain dark areas and some rather broad views,we have succeeded in painting a picture whichwill help to orient both research works and thechoices of decision-makers alike.
The editors:Dr Paule Moustier, Dr Dao The Anh, Dr Muriel Figuié
3
Contents
Foreword ..........................................................................................................................2
Contents ........................................................................................................................... 3
Summary ........................................................................................................................ 10
Paule Moustier (CIRAD), Dao The Anh (VASI), Muriel Figuié (CIRAD)
Introduction .................................................................................................................... 14
Paule Moustier (CIRAD)
Objectives ..................................................................................................................... 14
Plan of the document ...................................................................................................... 15
Chapter 1: Domestic market and foreign market ............................................................... 18
Paule Moustier (CIRAD)
1. The importance of the domestic market ......................................................................... 18
2 Specific and common features of outlets ......................................................................... 20
2.1. In terms of products ........................................................................................ 20
2.2. In terms of regions .......................................................................................... 21
2.3. In terms of companies ..................................................................................... 21
2.4. In terms of demand for quality ........................................................................... 21
3. Dynamism and fragility of exports ..................................................................................22
3.1. Four products dominating exports ..................................................................... 223.2. Declining trend after rapid growth ...................................................................... 22
3.3. Instability of international markets ...................................................................... 22
The case of rice, Nguyen Ngoc Que (ICARD) ...............................................23
The case of pork, Tran Cong Thang (ICARD) ............................................... 24
4. The threat of imports ................................................................................................... 24
Conclusion: differences and synergies .............................................................................. 27
Chapter 2: Demographic and socio-economic changes .......................................................28
Sylvie Fanchette (IRD)
1. An unequally distributed population ...............................................................................28
2. A country in demographic transition ............................................................................... 29
3. Towards an urbanised population .................................................................................. 29
4. Political strategies in the face of urbanisation .................................................................. 31
5. Attempts at demographic rebalancing ............................................................................ 33
5.1. Strong demographic disparities .........................................................................335.2. Emigration from the overpopulated areas to the pioneer fronts ............................... 33
5.3. Industrialisation, diversification and urbanisation of the rural milieu ......................... 34Conclusion: less poor, but more unequal ........................................................................... 35
Food markets and agricultural development in Vietnam
4
Chapter 3: The evolution of food consumption ................................................................... 36
Muriel Figuié et Nicolas Bricas (CIRAD)
1. Strong growth of food consumption .............................................................................. 371.1. Growth linked to multiple factors ....................................................................... 371.2. The development of food consumption outside the home ......................................371.3. Marked regional differences ............................................................................. 38
2. A quantitative evolution varying according to the products ................................................. 38
2.1. On a national scale ......................................................................................... 38
2.2. On an individual scale .....................................................................................38
3. Differences in household consumption ...........................................................................40
3.1. Between urban and rural households ................................................................. 40
3.2. According to income ........................................................................................ 40
3.3. According to regions ........................................................................................41
4. A low, but increasing, level of imports ............................................................................. 42
5. A challenge: the quality of food ......................................................................................42
5.1. Health problems ............................................................................................. 42
5.2. Concerned consumers .................................................................................... 44
6. New consumer behaviours .......................................................................................... 46
Conclusion: answer to the changes in food consumption ......................................................46
Chapter 4: Changes in food production .............................................................................. 48
Dao The Anh, Vu Trong Binh, Le Duc Thinh (VASI)
1. Globally dynamic products ........................................................................................... 50
1.1. Rice .............................................................................................................. 50
1.2. Sweet potatoes .............................................................................................. 51
1.3. Corn ............................................................................................................. 51
1.4. Vegetables .................................................................................................... 52
1.5. Fruits ............................................................................................................ 53
1.6. Meat ............................................................................................................. 54
1.7. Dairy production ............................................................................................. 54
1.8. Aquatic production .......................................................................................... 55
1.9. Differences in production according to the regions ............................................... 55
2. Limiting structures and environment .............................................................................. 58
2.1. Unequal land availability .................................................................................. 58
2.2. An abundant and educated labour-force ............................................................. 58
2.3. Access to credit still insufficient ..........................................................................59
2.4. Highly uncoordinated agricultural extension ........................................................ 60
2.5. Commercial services to be improved ................................................................. 60
3. Increasing differentiation .............................................................................................. 61
3.1. Land, a key factor of differentiation .................................................................... 61
3.2. Widening inequalities in agricultural income ........................................................ 63
3.3. Differentiated access to extra-agricultural activities ............................................... 63
Contents
5
4. Fluctuating relationships with the other sectors ................................................................64
4.1. Varying contribution of agriculture to the GDP ......................................................64
4.2. The change in the share of agricultural GDP per region ........................................ 64
4.3. Improved terms of exchange? .......................................................................... 66
Conclusion: overcoming the weaknesses to satisfy domestic demand ................................... 67
Chapter 5: The response of the market .............................................................................. 68
Paule Moustier (CIRAD), Nguyen Thi Tan Loc (RIFAV), Jean-Joseph Cadilhon (Imperial College at Wye - CIRAD), Vu Trong Binh (VASI)
1. Increasing recourse to the market ................................................................................. 69
2. Efficient yet too segmented commodity systems ..............................................................69
2.1. The vegetables commodity systems for the domestic market .................................70
Spatial organisation ...................................................................................70
Organisation of the stakeholders ................................................................. 72
Low marketing margins ..............................................................................73
An irregular supply .................................................................................... 73
Problems of quality 73
Strengths and weaknesses of coordination mechanisms ................................ 74
2.2. The rice channels of the Red River delta ............................................................ 75
Dao The Anh (VASI), Franck Jésus (CIRAD)Spatial organisation ...................................................................................75
Organisation of the stakeholders ................................................................. 75
Low marketing margins ..............................................................................75
Instability of prices, payments and quality ..................................................... 76
Strengths and weaknesses of coordination mechanisms ................................ 76
Conclusion .............................................................................................. 76
2. 3. The pork channel in northern Vietnam ............................................................... 76
Vu Trong Binh (VASI)2.4. Conclusions for the three channels .................................................................... 77
3. The planning of new markets ........................................................................................78
Jean-Joseph Cadilhon, (Imperial College at Wye - CIRAD) 3.1. The objectives of the urban development plans ................................................... 78
3.2. Two models of wholesale markets ..................................................................... 79
3.3. Problems of tomorrow ..................................................................................... 79
3.4. The necessity for dialogue ................................................................................80
4. The development of large volume distribution ................................................................. 80
Nguyen Thi Tan Loc (RIFAV)4.1. The development of supermarkets throughout the world ....................................... 80
4.2. The development of supermarkets in Vietnam ..................................................... 81
4.3. The place of food products ............................................................................... 82
4.4. Relations with the producers and consumers ...................................................... 82
4.5. Positive and negative effects ............................................................................ 82
Conclusion: the need for new contractual arrangements ...................................................... 83
Food markets and agricultural development in Vietnam
6
Chapter 6: Peri-urban agriculture: challenges and threats on corner food supply .................. 86
Hubert de Bon (CIRAD)
1. A multi-functional agriculture ......................................................................................... 86
1.1. A feeding, economic and social role ................................................................... 86
1.2. Preserving the environment and cultural identity .................................................. 88
2. Threats to peri-urban agriculture ................................................................................... 89
2.1. Extension of construction ................................................................................. 89
2.2. Low ecological sustainability of the production systems ........................................ 89
Conclusion: preserving multifunctionality ........................................................................... 89
Conclusion: Motors of change and lines of action ...............................................................92
Paule Moustier (CIRAD), Dao The Anh (VASI), Muriel Figuié (CIRAD)
1. The key variables of change .........................................................................................92
1.1. Demographic growth ....................................................................................... 92
1.2. Population imbalances .................................................................................... 92
1.3. The standard of living of the households .............................................................92
1.4. Quality demands and health crises .................................................................... 92
1.5. Competition from the international market ...........................................................92
1.6. Access to land ................................................................................................ 93
1.7. The instability of the food sector ........................................................................ 93
1.8. The necessity for organisation of the profession and the consumers ....................... 93
2. The necessary regulatory intervention of the state ........................................................... 94
3. What role for research? ............................................................................................... 94
3.1. Information system on the food sector changes ................................................... 94
3.2. Research concerning property .......................................................................... 95
3.3. Research concerning coordination within the commodity systems .......................... 95
3.4. Research concerning the structured intensification of production systems ..................96
3.5. Solutions for fighting against poverty .................................................................. 96
Appendix: some figures ................................................................................................... 98
References ................................................................................................................... 100
List of acronyms ............................................................................................................ 108
Contents
7
Tables
Table 1. Value added in the different sectors ............................................................. 19
Table 2. Domestic and foreign outlets by type of food product ...................................... 20
Table 3. Total value of Vietnamese exports, 1990-2000 .............................................. 23
Table 4. Rural and urban food market ...................................................................... 37
Table 5. The food market in the regions of Vietnam .................................................... 38
Table 6. The change in quantities of foodstuffs consumed per inhabitant,according to sources, 1987-2000 ................................................................ 39
Table 7. Distribution of the food consumption value per product group .......................... 40
Table 8. Distribution of the food consumption value per product groupin the different regions ............................................................................... 41
Table 9. Change in the quality of meals and commercialised food productsaccording to consumers in Hanoi ................................................................ 44
Table 10. Growth in animal production, between 1990-2000 ..........................................55
Table 11. Production and importation of milk ............................................................... 55
Table 12. Rate of growth of agricultural, forestry and aquacultural productionbetween 1996 and 2000 ............................................................................ 56
Table 13. Agricultural diversification in the different regions, 1996-2000 ...........................57
Table 14. Change in farming areas in the different regions ............................................ 58
Table 15. Share of agricultural labour according to the regions, 1996-2000 ......................58
Table 16. Level of education of Vietnamese labour ...................................................... 59
Table 17. Agricultural area per household according to regions ......................................62
Table 18. Agricultural area per household according to the living standardof the households ..................................................................................... 62
Table 19. Number of peasants without land in the Mekong Delta ....................................62
Table 20. The different sources of income of rural households in Vietnam 1993-1998 ....... 63
Table 21. Distribution of employment, poverty and rice yields for workers agedbetween 15 and 65 ................................................................................... 64
Table 22. Changes in economic structures,1996-2000 ................................................. 65
Table 23. Trends for rice, vegetable and pork commodity channels ................................ 78
Table 24. Statistical data for the cities of Hanoi and Ho Chi Minh City ............................. 86
Table 25. Deficit in Hanoi for the main food categories ..................................................88
In box 4Table A. Imports and exports of fruit and vegetables by China ......................................26
Table B. Exports of fruit and vegetables from Vietnam to Chinavia the Tan Thanh border ........................................................................... 26
Table C. Vietnamese imports of fruit and vegetables from Chinavia the Tan Thanh border............................................................................ 27
Table D. Trade between China and Vietnam via the Tan Thanh border post ................... 27
In box 14Table A. Major characteristics of agricultural production near Hanoi .............................. 87
Tables, maps, figures and boxes

Food markets and agricultural development in Vietnam
8
Maps
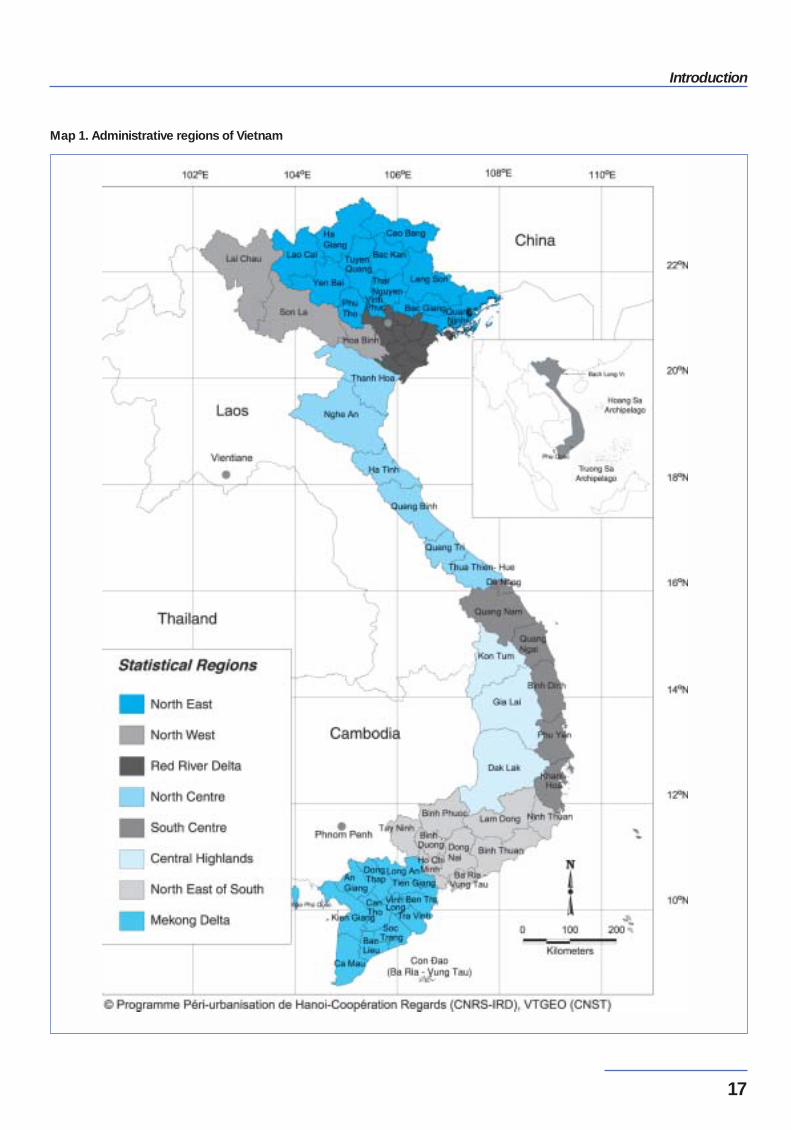
Map 1. Administrative regions of Vietnam .......................................................................... 17
Map 2. Main vegetables flows in Vietnam ... ....................................................................... 71
Figures
Figure 1. Domestic food market and agricultural exports .............................................. 19
Figure 2. Proportion of domestic and foreign outlets for major products .......................... 21
Figure 3. Agricultural exports, excluding maritime products ........................................... 22
Figure 4. Agricultural exports, including maritime products ............................................22
Figure 5. Evolution of agricultural exports, excluding maritime products .......................... 22
Figure 6. Evolution of agricultural exports, including maritime products ........................... 22
Figure 7. Change in the quantities of foodstuffs consumed, 1987-2001 .......................... 39
Figure 8. Food consumption and total households expenditure ..................................... 41
Figure 9. Consumption of rice and total household expenditure .................................... 41
Figures 10. Consumption and importation of the main food products per inhabitant ............. 43
Figure 11. Food products deemed a health risk by consumersand the perceived origins of these risks ........................................................ 45
Figure 12. The food products which present problems of nutritional qualityin the eyes of the consumers of Hanoi ..........................................................45
Figure 13. Change in average foodstuff production per inhabitant, 1990-2001 ................... 50
Figure 14. Change in rice-farming areas in the different regions ...................................... 50
Figure 15. Change in rice production in the different regions ........................................... 50
Figure 16. Change in rice yields in the different regions ..................................................50
Figure 17. Change in sweet potato areas in the different regions ..................................... 51
Figure 18. Change in sweet potato production in the different regions .............................. 51
Figure 19. Change in sweet potato yields in the different regions ..................................... 51
Figure 20. Change in corn areas in the different areas ................................................... 52
Figure 21. Change in corn production in the different regions .......................................... 52
Figure 22. Change in corn yields in the different regions ................................................ 52
Figure 23. Change in vegetable areas in the different regions ......................................... 53
Figure 24. Change in vegetable production in the different regions .................................. 53
Figure 25. Change in vegetable yield in the different regions ...........................................53
Figure 26. Change in fruit areas in the different regions ..................................................54
Figure 27. Change in value of fruit production in the different regions ............................... 54
Contents
9
Figure 28. Change in value of animal production in the different regions ........................... 54
Figure 29. Change in value of poultry production in the different regions ........................... 55
Figure 30. Change in number of pigs in the different regions ...........................................55
Figure 31. Change in the value of aquatic production in the different regions ..................... 57
Figure 32. Change in the value of pisciculture production in the different regions ............... 57
Figure 33. Change in employment sectors ...................................................................58
Figure 34. Proportion of farmers with access to credit in the different regions .................... 60
Figure 35. Growth rate of general GDP and agricultural GDP ......................................... 64
Figure 36. The structure of national GDP per sector ...................................................... 64
Figure 37. The structure of rural GDP in Vietnam per sector ........................................... 65
Figure 38. Growth of agricultural GDP and agricultural exports ....................................... 65
Figure 39. Evolution in average monthly price of paddy and ureain Nam Sach, Hai Duon ............................................................................. 66
In box 2 Figure A. Evolution of farm gate price in the Red River delta
and world price, 1994-1999 ....................................................................... 19
Boxes
Box 1. Sources used and reliability of data ..............................................................16
Box 2. Are exports more remunerative for farmers? ................................................. 19
Box 3. The food sector and the international market ................................................. 23
Box 4. Trade between Vietnam and China: the case of fruit and vegetables .................26
Box 5. The city, centre of attraction for job searching ................................................ 30
Box 6. The policy of development corridors .............................................................31
Box 7. What role for medium-sized towns? ............................................................. 32
Box 8. The various demographic situations of the provinces ...................................... 33
Box 9. Self-consumption in rural areas ................................................................... 40
Box 10. The pho crisis ...........................................................................................44
Box 11. The agricultural policies from 1998 to 2001 ................................................... 49
Box 12. Market information and consultation systems ................................................ 84
Box 13. Setting up quality commodity chains ............................................................ 84
Box 14. The peri-urban production systems around Hanoi .......................................... 87
Box 15. The specific place of peri-urban agriculture in supplies to the cities ................... 88
Box 16. Peri-urban agriculture under discussion ........................................................90
Food markets and agricultural development in Vietnam
10
SummaryPaule Moustier (CIRAD), Dao The Anh (VASI), Muriel Figuié (CIRAD)
The main objective of this document is topresent the evolution of trends of the domesticmarket for agricultural products in Vietnam and todetermine the opportunities and constraints thatthese changes represent for local agriculture.Indeed, the integration of Vietnam into theregional and international economy is generallyseen as the main motor for transforming theeconomy, which explains that state policies takehigher account of agricultural exports than of thedomestic market. However, this difference intreatment is not based on an evaluation of thecomparative significance of these sectors tomeeting the economic and social objectives of theVietnamese government.
This document highlights the changes over thelast ten years (1991 to 2000) in food consumption(strongly influenced by demographic andeconomic parameters), crop production and foodsupply channels. The coordination betweensupply and demand is considered in the followingdimensions: quantity, regularity, quality, prices andcosts, distribution of incomes. Finally, particularemphasis is placed on the information flows andcoordination mechanisms between private playersin the food sector, who are at the very heart ofadjustments between supply and demand.
The weight of the domestic market
Despite the exports boom between 1990 and1997, Vietnamese agriculture is still mainlyoriented towards the domestic market, whichabsorbs 90% of production. In value, the domes-tic food market represents twice that of agricul-tural exports, i.e. 5 billion dollars in 1998 (andmore than 7 billion dollars in 2002 by extrapola-tion).
In terms of products, regions, production struc-tures, quality and price characteristics, there aredifferences between the domestic market and
exports, but there also exist overlaps: some chan-nels are oriented towards both the domesticmarket and exports (rice, aquatic products), whileothers are mainly aimed at exports (coffee,rubber), and others still are marginally exported(fruit and vegetables, meat). Whereas for aquaticproducts the nature of the companies and thequality demands differ for the two types of outlet,they are similar for rice and pork.
Finally, the domestic market can be led to weighon the trade balance if food imports – limited toless than 10% of food consumption in 2001 –develop with new trade agreements. Moreover,fertiliser imports, which presently weigh more invalue than the imports of agricultural products,develop rapidly.
The growth of the domestic market
The domestic food market has experiencedconsiderable growth: it increased in value by 46%between 1993 and 1998. From 1991 to 2000, theincrease was particularly strong for meat (7% peryear), vegetables (6% per year) and importedfood products such as wheat (8% per year) andoils (6% per year).
The growth of the Vietnamese market is linkedto the following three main factors: demographicgrowth, urbanisation and the increase in incomes(with a link between these last two phenomena).
With a population of 76.3 million inhabitantsaccording to the 1999 census and almost 80million in 2002, Vietnam is the most densely popu-lated country in the region after Singapore. Annualdemographic growth is estimated at 1.7% peryear. The rate of urbanisation - 25% in 2002 - isrelatively low compared to the average for South-East Asia (36%), but it will rise, with a demo-graphic growth rate in the cities estimated at 3.8%per year for the period 1998-2020 compared to0.1% in rural areas (Cour, 2001).
Summary
11
Although they only concentrate 23% of thepopulation in 1998 (and 25% in 2002), the citiesrepresent 40% of the domestic market in value(1998), due to the differences in incomes betweenrural and urban areas (the cities account for 70%of the GDP) and the lower share of self-consump-tion (5% in urban areas compared to 35% in ruralareas). The rise in incomes has been a conti-nuous phenomenon since the 1990s, with agrowth rate of the economy of 7% per year inrecent years, much higher than neighbouringcountries (4% for Thailand, for example).
Diversification of consumptionand quality demands
The range of food products is diversifying infavour of meat, fruit and vegetables and streetrestaurants. The demand for products of specificquality, like flavoured rice or lean pork, is increa-sing. However, urban consumers expressincreasing concerns with regard to the healthquality of food products (especially for vegetablesand pork).
The few quality signals provided to reassureconsumers, for example for clean vegetables,have encountered little success due to their lowcredibility and the absence of reliable controls.
A satisfactory response of production inquantity…
Local crop production has shown its capacity tomeet increasing local demand. This responsehas, for the most part, been supported by the poli-tical context (allocation of land to peasants, with-drawal from commercialisation by the state).During the past ten years, pork production hasincreased by 5.8% per year, corn by 11.2% andvegetables by 7% per year. Rice production hasincreased by an average of 5.6% per year, 80%of which is attributed to the increase in crop inten-
sity and yields, and 20% to the increase in area;this trend may continue as there is still a potentialfor growth of these two parameters in manyregions. However, rice production provides poorincomes for producers who, for about a decade,have combined the process of intensification ofrice-farming with diversification, although theprocess of diversification is slow: rice still occupiesmore than 60% of farmed lands (this figure was70% in 1991).
…yet unsatisfactory in regularity andquality
However, this quantitative appraisal masksproblems of coordination between supply anddemand. On the one hand, production does notalways succeed in supplying the market in regularfashion all throughout the year. Thus, the supplyof temperate vegetables and corn experiencesshortages for five months in the year, leading tocostly imports from China. On the other hand,production does not totally satisfy demand interms of quality.
Low and unequal creation of wealth
Agriculture accounts for more than 60% ofworkers over the age of 15, but this percentage istending to fall. The contribution of agriculture tothe GDP(23% in 2001) is lower than that of indus-try and services. In rural area, it is nevertheless atthe 70% level.
Finally, agricultural growth is reflected in theincreasing gaps in incomes, explained for themost part by differential access to factors ofproduction and commercial services, and trans-port. The size ratio between the smallest andlargest farms is 2 in the Centre and 10 in theSouth. On average, the farms are characterisedby their small size (9,000 m2, i.e. less than onehectare, per household).
Food markets and agricultural development in Vietnam
12
Low level of interaction of agriculturewith the other economic sectors
At present in Vietnam, it is in the agricultural andfood processing sectors that the rural populationfinds employment, rather than in non-agriculturaljobs whose contribution to rural incomes hasstagnated at less than 20% since 1990. This isdue in particular to certain areas being physicallycut off thus damaging the profitability of ruralcompanies, as well as to problems of economicaccess to outlets. In the Red River delta, labour isunder-employed in rural areas at a level of morethan 20% of working time, but it cannot be re-deployed in the industrial sector which is capital-intensive and labour non-intensive.
Agriculture is less and less productivecompared with the other sectors. The ratiobetween non-agricultural and agricultural produc-tivity increased from 4.4 in 1986 to 7.3 in 1998(Cour, 2001). The food processing sector is stilllittle developed: it represented 6% of the GDP in1996, much less than primary production.However, research conducted in other countriesshows that industrialisation, highlighted as a prio-rity by the Vietnamese government, relies on theincrease in agricultural productivity, notablythrough the development of agri-business, like inTaiwan.
It is very important to increase agriculturalproductivity, by linking it to the development ofnon-agricultural activities in rural areas, in order toabsorb the labour force, notably in food proces-sing.
Imperfect market mechanisms
The process of economic reform has improvedaccess to the market for both producers andconsumers, in rural and urban areas alike,causing a reduction in the rate of self-consump-tion. The ratio of the non-agricultural population tothe agricultural population rose from 0.39 in 1986to 0.47 in 1998 and should reach 0.96 in 2020 (ie,a farmer must feed him/herself plus one non-farmer).
Market system organisation depends greatly onthe type of product and the location of the produc-tion zones in relation to the destination market. In
the case of perishable goods, such as leafyvegetables, they mainly come from peri-urbanzones (less than 50 km from the cities) and themarkets or shop retailers are supplied directly byproducers or collectors (who are also often pro-ducers) bringing small quantities (a few hundredkilos per day) using two-wheeled transport.
In the case of other products (onions, fruit,meat, etc.), there is an additional link in the personof the wholesaler who buys from the collectors.Food marketing in Vietnam is characterised asdisorganised by many authors, but it neverthelesssatisfies the supply function at very low costs(15% commercial margin for rice, 20% for pork,45-50% for vegetables). These levels can belinked to the low opportunity cost of labour, whichis unskilled and highly available, the short marketchains, competitive trade and the minimal cha-racter of services added to the products.
Moreover, the organisation of the marketingchannels into networks satisfies the dispersedcharacteristics of production and the transportconstraints (limited access to motor-driven vehi-cles and refrigeration). However, the marketingchannels are still not capable of translatingdemands for quality into income-generatingopportunities for produ-cers, even when the latterhave the technical capacity to do so: this wouldrequire multiplying the producer associationscapable of indicating and communicatingimproved quality procedures, establishing internaland external quality controls together with thepublic authorities and defining, together with thetraders, differentiated price strategies accordingto quality.
Agricultural production must adapt to the evolu-tion of distribution structures, which is tendingtowards higher levels of concentration. In bothHanoi and Ho Chi Minh City, the municipalitieshave planned a network of wholesale markets,with a view to eliminating informal markets andtravelling vendors. Furthermore, large volumedistribution is developing. At present, there areonly 3 hypermarkets in Vietnam, located in Ho ChiMinh City. This is compared to 78 hypermarketsin Thailand. However, the number of supermar-kets in Hanoi and Ho Chi Minh City has nowreached 70, whereas ten years ago there werenone. The impact of the changes in distribution in
Summary
13
terms of employment and end costs needs to bebetter quantified. At present, the large volumedistribution system targets only a well-off clienteledue to the higher sale prices and the requirementfor more complex means of transport than forlocal distribution. In European or Latin Americancountries, the evolution of more concentrateddistribution systems has caused an increase inthe margin between production and consumptionand a reduction in employment in the food tradesector, partially compensated for by the develop-ment of the transformation sector. The indirectcosts of food in terms of energy for transport andtransformation have also increased considerablyin developed countries. These phenomena haveimportant implications for developing countriessuch as Vietnam.
Peri-urban agriculture under threat
Due to their proximity to the market, peri-urbanzones (less than 50 kilometres from the urbancentre) play a very important role in supplyingnumerous perishable goods (vegetables, meat,eggs, milk). Moreover, these zones fulfil manynon-economic functions: social insertion of low-skilled populations without employment in thecities (30% of the population of the province ofHanoi is employed in agriculture); increasedgreen areas in the cities; protection against floods.However, peri-urban production is under seriousthreat from the expansion of construction areas.
(This is expected to lead to a 25% reduction inagricultural area in the coming ten years for theprovince of Hanoi). Furthermore, agriculture mustdemonstrate its non-polluting character and thesafety of its products in order to be allowed toremain close to the cities; as over-consumption ofchemical inputs and the use of polluted waterhave been attested, various national and interna-tional programmes are currently combating theseproblems.
The levers of change
This appraisal has allowed us to highlight thekey variables which will determine the futureevolution of the domestic markets: (i) demo-graphic growth; (ii) demographic imbalancesbetween regions (deltas/uplands, town/country);(iii) the standard of living of households; (iv) healthcrises; (v) competition from the internationalmarket; (vi) access to land; (v) the capacity oforganisation of the trade and the consumers ; (vi)the involvement of the state in supporting theprivate sector (quality controls, credit, transport,training, concerted planning of the markets). Onthe basis of hypotheses regarding these vari-ables, the future trends of the domestic marketscould be simulated, as well as their impact onemployment and incomes in the different sectors.New policies could then be defined and imple-mented, with the support of research.
Food markets and agricultural development in Vietnam
14
Objectives
Since the beginning of the Doi Moi policies in1986, the Vietnamese government has wanted tomaintain a steady rate of economic growth whileat the same time controlling the development ofinequalities and poverty (Socialist Republic ofVietnam, 2000). To achieve this objective,Vietnam should strengthen the competitivenessof the different economic sectors in the regionaland international markets and accelerate indus-trialisation.
When these strategies integrate the agriculturalsector, the latter is above all considered asan exporter (coffee, rubber, fruit and vegetables,tea, etc.), with a concern for competitiveness onthe regional and international markets. As forstrategies for fighting against poverty, they arecentred on support for target populations inrural and urban zones and for programmes toimprove infrastructures and services (education,credit, etc.). They are designed as “corrections”of the problems posed by economic growth andare rarely linked to policies of market develop-ment 1.
Despite undeniable past success, policiesoriented towards exports and industrialisation are,at present, limited. The coffee sector illustrates thefragility of export strategies due to the price insta-bility on the international markets. Between 1999and 2003, the price of coffee fell from 1,400 to 340dollars per tonne, causing losses of more than400,000 dollars per year to the planters of the DacLac province (Thuy Phuong, 2003). The fragilityof exports also results from the socio-politicaltroubles which the countries of destination might
experience at any time. Thus, until the outbreakof war, the major customer for tea exports wasIraq (Vietnam Investment Review, 2003).
While the entire attention of policies, the mediaand social science analysts is turned towardsagriculture for exportation, the domestic marketsare undergoing profound changes, due to threeparallel trends: urbanisation; the rise and diffe-rentiation in living standards; cultural changes asregards food habits. These evolutions providetremendous opportunities for the agriculturalsectors which are capable of satisfying localdemand. The experience of other developingcountries demonstrates that taking into accountboth domestic and export markets, avoiding theextremes of only inward- or outward-orientedstrategies, has proved efficient 2. The volatility ofinternational markets, like new demands withregard to the reduction of environmental and foodrisks, should encourage the best-possibleexploitation of local potentialities, be it in terms ofproduction or markets.
Although domestic markets have not beensufficiently taken into account to date, it is partlydue to the difficulty in collecting data as thecommodity channels of the domestic market aremore diffuse and varied than the export channels,and sometimes qualified as informal and insuffi-ciently structured. There is also the difficulty ininterpreting the very quickly changing tendencies,such as those of food consumption. One of theobjectives of this document is to begin to fill in thegaps, taking account of the specificities of the foodmarkets, which mean that the approach must becentred on the dynamics and interactionsbetween players.
IntroductionPaule Moustier (CIRAD)
1 There nevertheless exist certain macro-economic works demonstrating the link between the development of the market (forexports) and the reduction of poverty (Winters, 2002). 2 Regarding the dangers of strategies oriented towards foreign markets, see: Witton, Browett, Gertzel, Leaver, 1988, for thecase of Indonesia; for Brazil: Hollist, Tullis, 1987; for Central America: Conroy, Murray, 1996; for the beneficial interactionsbetween the domestic market and the export market in Taiwan, Tin-Yin Liu, 1999.
Introduction
15
The main objective is to evaluate the opportu-nities and constraints presented by the domesticfood product markets in order to fulfil the objec-tives of creation of wealth and improvement ofhealth in the different regions and sectors of thecountry:- What is the economic weight of domestic food
markets? What place do they occupy in relationto the export markets?
- What is the demand of the domestic foodmarkets in terms of quantity, quality and diver-sity of products? Are agricultural production,marketing channels and processing sectorscapable of satisfying the evolutions of fooddemand in terms of quantity, quality, cost andcreation of stable incomes?
- How can the policies influence the changes inprogress to achieve the different economic andsocial objectives? What is the place of researchand development in orienting the actions of poli-cies and private operators?
Plan of the document
What do the domestic and export marketscover in terms of products, regions, type ofcompany? What is the weight of these two typesof market for the different products? This is theobject of the first part.
The second part is devoted to demographictrends: population growth, urbanisation, popula-tion distribution between the regions, the impactof policies. Indeed, these trends have directrepercussions on food demand, the division oflabour between producers and non-producersand thus on the possibilities of incomes for theagricultural sector. The socio-economic charac-teristics of the Vietnamese population will also bepresented.
What are the consequences of these demo-graphic and economic evolutions on food
consumption and thus the outlets for agriculturalcommodities? The third part presents the evolu-tion of demand in quantity and value, the varioustrends according to the type of product and thesocio-economic profile of the households, as wellas the share of local and imported products inconsumption. The qualitative changes in urbandemand are then analysed, in particular require-ments with regard to health quality.
How can production (fourth section) andmarketing (fifth section) respond to these evolu-tions? Afavourable political context has facilitatedthe growth of food crop production. The quantitiesare specified by product and by region of thecountry, as well as the structural characteristics ofVietnamese agriculture which will be decisive forthe future evolution of food supply: access to land,labour, services. The changes in production interms of quality are described. Finally, the trans-lation of these changes in terms of incomes for thefarmers and the ratchet effects on the othersectors of the economy are presented.
The commodity channels – all of the economicplayers between the producer and theconsumer – are the subject of the fifth section. Arethey capable of transmitting and adjusting thechange in supply and demand? Their organisa-tion and efficiency in terms of quantity, quality andprice are illustrated through the examples of thevegetable, pork and rice sectors. Two evolutionsessential to the development of the sectors arethen presented: wholesale and retail market plan-ning and the rise of large volume distribution.
The sixth part is devoted to the evolution of localfood supply, using the case of peri-urban agricul-ture, and the consequences of these changes onthe different roles of this multi-functional agricul-ture.
Finally, the key-variables for trends arepresented. We conclude by showing how policiesand research can accompany these trends.
Food markets and agricultural development in Vietnam
16
As data do not exist for all the years in the reference period of thisstudy (1991-2000), it is occasionally necessary to extrapolate. Thesources used are as follows:● for demography, the censuses of 1979, 1989 and 1999;● for consumption, the GSO survey of household living standards
GSO (1993 and 1998); the NIN survey (2002); the FAO foodappraisals (2001);
● for production and prices, GSO data for the different years;● for production, imports and exports in value, the FAO data, which
stop in 1999;● for production, imports and exports in quantity, we used the data
from the Ministry of Agriculture and Rural Development, FoodBalance Sheets, 2001. These are different from the data publishedon Internet by the FAO (FAOSTAT), as they incorporate varied datasources, both official and unofficial.
● for consumption, the research works carried out by the CIRAD andthe IOS in 2002, on the vegetable sectors, the CIRAD-RIFAV-VASIprogramme; on the pork and rice sectors, the works of the VASI incollaboration with the CIRAD (1997–2002). The IFPRI also con-ducted works on the supply and demand of these three products in1999-2000.
The document is limited to a presentation of past and present trends.It could act as a basis for a future workshop which would test the dif-ferent trends of evolution based on a series of hypotheses concerningthe key parameters which influence consumption, the commodity chan-nels and production.
The statistical data should be used with caution. Indeed trade,notably with China, is underestimated. Comparison of data from diffe-rent sources highlights the considerable disparities, for examplebetween the GSO, the NIN and the FAO with regard to consumption;or between the GSO and our own surveys on the price of vegetables.As far as possible, it is thus indispensable to cross-check different datasources and to specify the data collection method. It is also necessaryto establish trusting relations with the agents of statistical institutionsand the operators in the commodity channels. Certain data are notavailable, for example regarding food processing companies, withoutit being easy to establish whether the data have not been collected orwhether they exist – for example at the Ministry of Industry – but areyet to be located. We indicate the data which is unavailable, for whichit would be necessary to set up relevant observation systems.
Box 1. Sources used and reliability of data
Exchange rate
1 American dollar = 15,000 dongs (2000)11,500 dongs (1992)
Introduction
17
Map 1. Administrative regions of Vietnam
Food markets and agricultural development in Vietnam
18
Which food products are destined for exporta-tion? Or for the domestic market? In what quan-tity and for what value? How are these twomarkets inter-related? What proportion doimports, exports and local production represent?This is the object of this chapter.
1. The importance of the domesticmarket
Be it in tonnage or value, the agriculturaldomestic market is much more important thanexports. In tonnage, exports only represent 10%
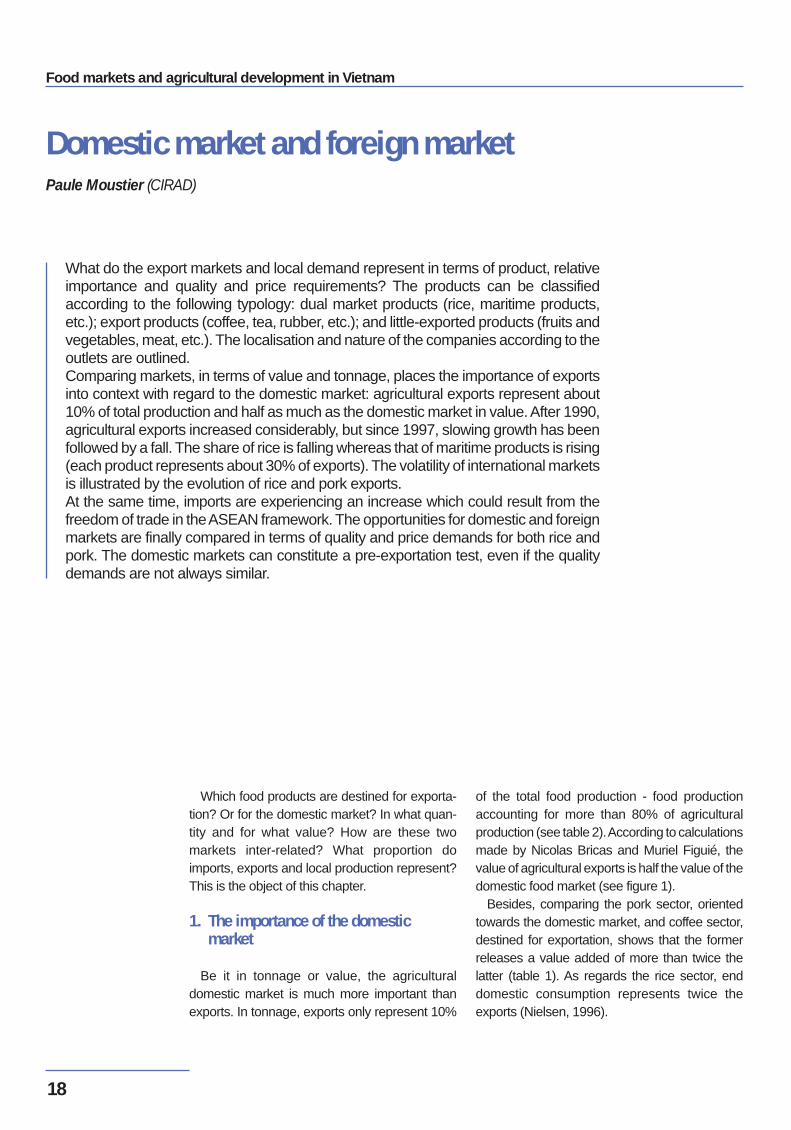
of the total food production - food productionaccounting for more than 80% of agriculturalproduction (see table 2). According to calculationsmade by Nicolas Bricas and Muriel Figuié, thevalue of agricultural exports is half the value of thedomestic food market (see figure 1).
Besides, comparing the pork sector, orientedtowards the domestic market, and coffee sector,destined for exportation, shows that the formerreleases a value added of more than twice thelatter (table 1). As regards the rice sector, enddomestic consumption represents twice theexports (Nielsen, 1996).
Domestic market and foreign marketPaule Moustier (CIRAD)
What do the export markets and local demand represent in terms of product, relativeimportance and quality and price requirements? The products can be classifiedaccording to the following typology: dual market products (rice, maritime products,etc.); export products (coffee, tea, rubber, etc.); and little-exported products (fruits andvegetables, meat, etc.). The localisation and nature of the companies according to theoutlets are outlined.Comparing markets, in terms of value and tonnage, places the importance of exportsinto context with regard to the domestic market: agricultural exports represent about10% of total production and half as much as the domestic market in value. After 1990,agricultural exports increased considerably, but since 1997, slowing growth has beenfollowed by a fall. The share of rice is falling whereas that of maritime products is rising(each product represents about 30% of exports). The volatility of international marketsis illustrated by the evolution of rice and pork exports.At the same time, imports are experiencing an increase which could result from thefreedom of trade in the ASEAN framework. The opportunities for domestic and foreignmarkets are finally compared in terms of quality and price demands for both rice andpork. The domestic markets can constitute a pre-exportation test, even if the qualitydemands are not always similar.
Domestic market and foreign market
19
Source: estimation by Nicolas Bricas and Muriel Figuié,from GSO data (VLSS) and FAO data (FAOSTAT,category “agricultural products, total export value”),in current prices.
Source: Nielsen (1996).
Table 1. Value added in the different sectors (in billion of dongs)
Figure 1. Domestic food market (not including out-door consumption)and agricultural exports
Local end consumption
Intermediate consumption
Exports
Value added
Rice
36,567
5,315
12,693
32,692
Pork
11,612
679
1,028
7,023
Coffee
529
483
5,848
3,077
Fresh maritime
products
8,438
7,999
3,656
12,014
Transformed
maritime products
1,079
2,608
9,518
3,150
Fruits, vegetables,
nuts, tea, jute
17,014
10,580
119,620
9,856
Box 2. Are exports more remunerative for farmers?
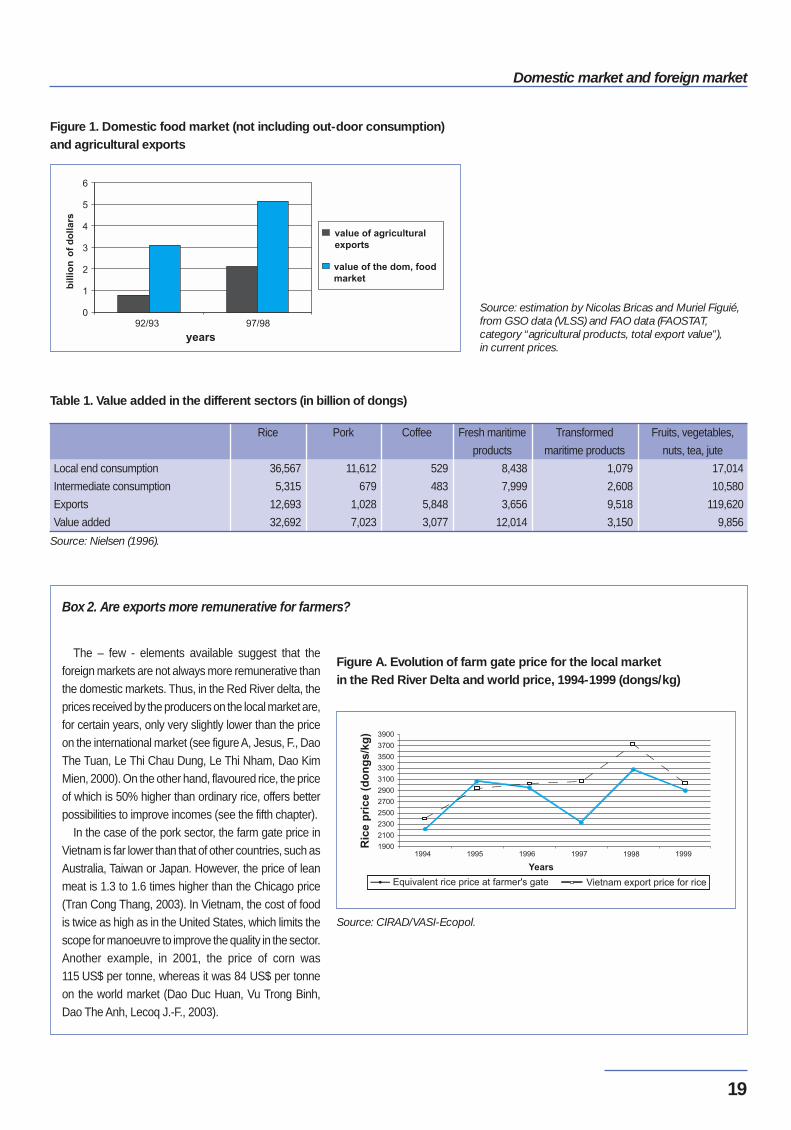
The – few - elements available suggest that theforeign markets are not always more remunerative thanthe domestic markets. Thus, in the Red River delta, theprices received by the producers on the local market are,for certain years, only very slightly lower than the priceon the international market (see figure A, Jesus, F., DaoThe Tuan, Le Thi Chau Dung, Le Thi Nham, Dao KimMien, 2000). On the other hand, flavoured rice, the priceof which is 50% higher than ordinary rice, offers betterpossibilities to improve incomes (see the fifth chapter).
In the case of the pork sector, the farm gate price inVietnam is far lower than that of other countries, such asAustralia, Taiwan or Japan. However, the price of leanmeat is 1.3 to 1.6 times higher than the Chicago price(Tran Cong Thang, 2003). In Vietnam, the cost of foodis twice as high as in the United States, which limits thescope for manoeuvre to improve the quality in the sector.Another example, in 2001, the price of corn was115 US$ per tonne, whereas it was 84 US$ per tonneon the world market (Dao Duc Huan, Vu Trong Binh,Dao The Anh, Lecoq J.-F., 2003).
Source: CIRAD/VASI-Ecopol.
Figure A. Evolution of farm gate price for the local market in the Red River Delta and world price, 1994-1999 (dongs/kg)
Food markets and agricultural development in Vietnam
20
2. Specific and common features ofoutlets
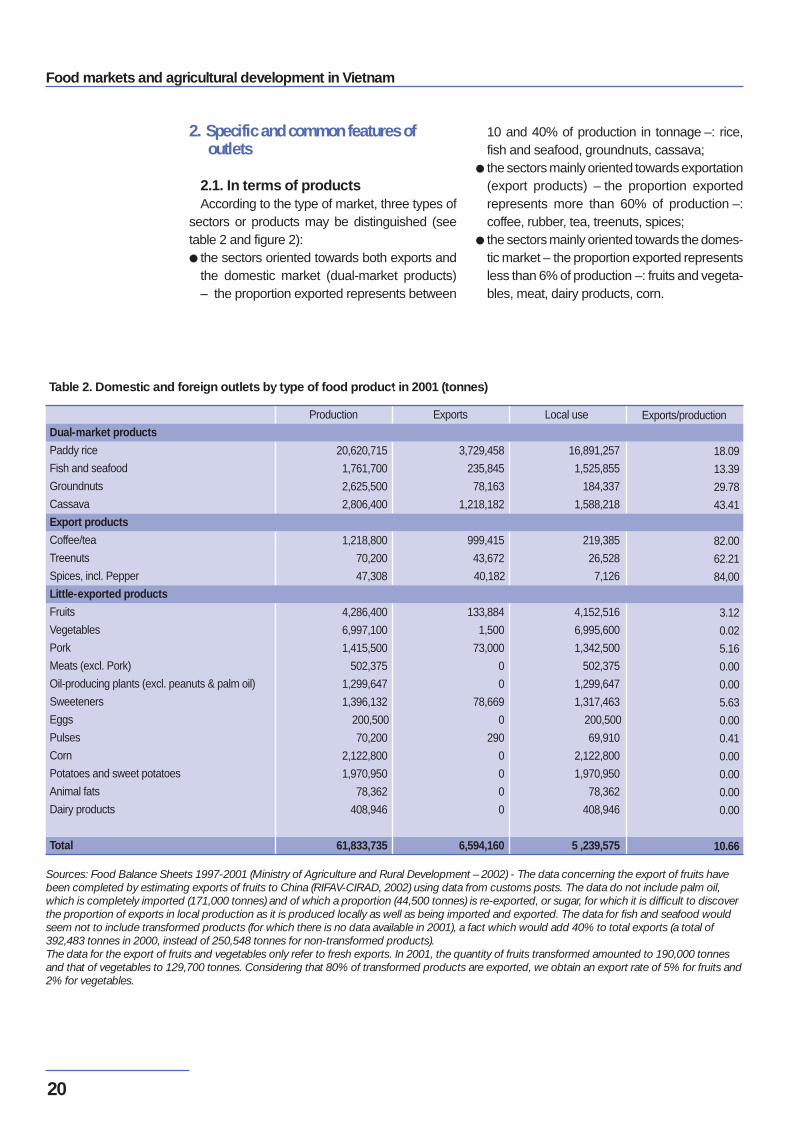
2.1. In terms of productsAccording to the type of market, three types of
sectors or products may be distinguished (seetable 2 and figure 2):● the sectors oriented towards both exports and
the domestic market (dual-market products)– the proportion exported represents between
10 and 40% of production in tonnage –: rice,fish and seafood, groundnuts, cassava;
● the sectors mainly oriented towards exportation(export products) – the proportion exportedrepresents more than 60% of production –:coffee, rubber, tea, treenuts, spices;
● the sectors mainly oriented towards the domes-tic market – the proportion exported representsless than 6% of production –: fruits and vegeta-bles, meat, dairy products, corn.
Sources: Food Balance Sheets 1997-2001 (Ministry of Agriculture and Rural Development – 2002) - The data concerning the export of fruits havebeen completed by estimating exports of fruits to China (RIFAV-CIRAD, 2002) using data from customs posts. The data do not include palm oil,which is completely imported (171,000 tonnes) and of which a proportion (44,500 tonnes) is re-exported, or sugar, for which it is difficult to discoverthe proportion of exports in local production as it is produced locally as well as being imported and exported. The data for fish and seafood wouldseem not to include transformed products (for which there is no data available in 2001), a fact which would add 40% to total exports (a total of392,483 tonnes in 2000, instead of 250,548 tonnes for non-transformed products).The data for the export of fruits and vegetables only refer to fresh exports. In 2001, the quantity of fruits transformed amounted to 190,000 tonnesand that of vegetables to 129,700 tonnes. Considering that 80% of transformed products are exported, we obtain an export rate of 5% for fruits and2% for vegetables.
Table 2. Domestic and foreign outlets by type of food product in 2001 (tonnes)
Dual-market products
Paddy rice
Fish and seafood
Groundnuts
Cassava
Export products
Coffee/tea
Treenuts
Spices, incl. Pepper
Little-exported products
Fruits
Vegetables
Pork
Meats (excl. Pork)
Oil-producing plants (excl. peanuts & palm oil)
Sweeteners
Eggs
Pulses
Corn
Potatoes and sweet potatoes
Animal fats
Dairy products
Total
Production
20,620,715
1,761,700
2,625,500
2,806,400
1,218,800
70,200
47,308
4,286,400
6,997,100
1,415,500
502,375
1,299,647
1,396,132
200,500
70,200
2,122,800
1,970,950
78,362
408,946
61,833,735
Exports
3,729,458
235,845
78,163
1,218,182
999,415
43,672
40,182
133,884
1,500
73,000
0
0
78,669
0
290
0
0
0
0
6,594,160
Local use
16,891,257
1,525,855
184,337
1,588,218
219,385
26,528
7,126
4,152,516
6,995,600
1,342,500
502,375
1,299,647
1,317,463
200,500
69,910
2,122,800
1,970,950
78,362
408,946
5 ,239,575
Exports/production
18.09
13.39
29.78
43.41
82.00
62.21
84,00
3.12
0.02
5.16
0.00
0.00
5.63
0.00
0.41
0.00
0.00
0.00
0.00
10.66
Domestic market and foreign market
21
2.2. In terms of regionsMost products for exportation are localised in
the south of the country (rubber, coffee, tea, rice,fish), whereas products for the domestic marketare cultivated in all regions. In the Red River delta,the horticultural and pig sectors are orientedtowards both the domestic market and exports.
2.3. In terms of companiesThe companies oriented towards exportation
are generally more specialised and larger. Thereis a marked difference for the fish sector: we findlarge-scale private companies which dominatethe export market whereas, for the local market,the production and commercialisation companiesare numerous and small-scale. The difference ismuch less striking in the case of the fruit,vegetable and flower sectors: here we often findthe same producers who sell in the regional anddomestic markets (China, Japan, Russia), withnetworks of different collectors.
2.4. In terms of demand for qualityFor certain authors, foreign markets exercise
pressure to improve the quality of products on thedomestic markets; and the domestic markets canrepresent a good test before exportation.
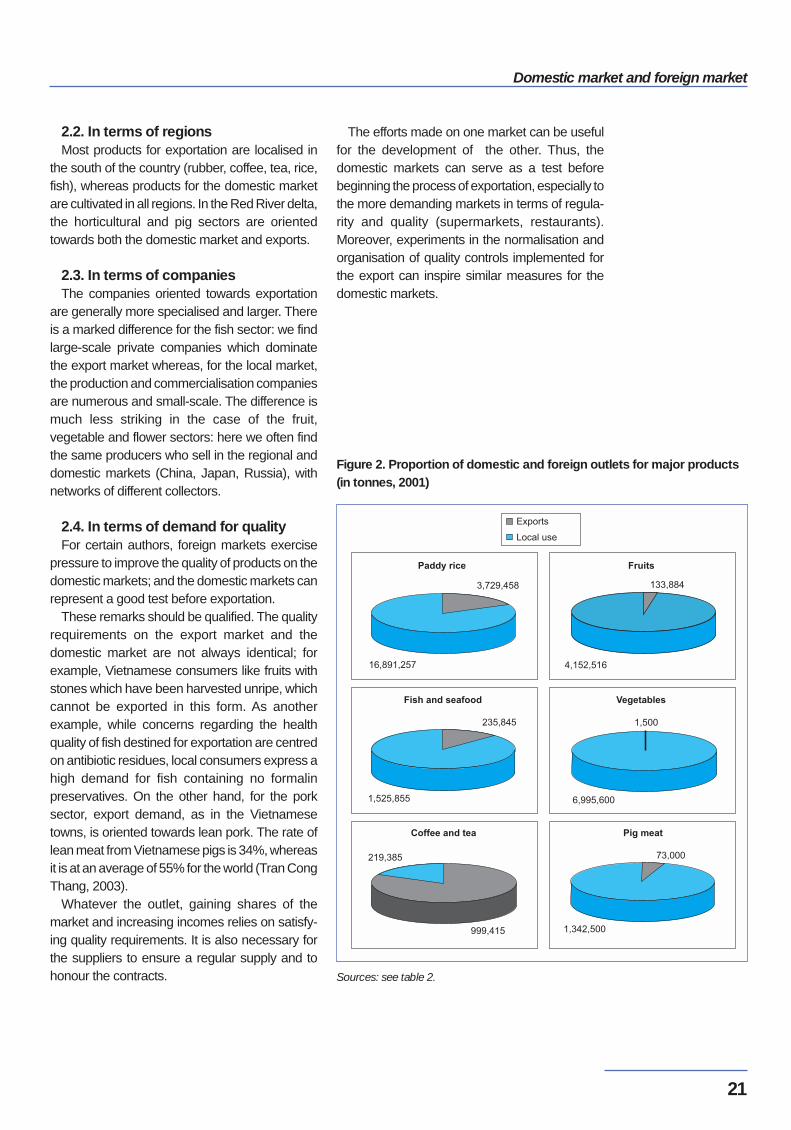
These remarks should be qualified. The qualityrequirements on the export market and thedomestic market are not always identical; forexample, Vietnamese consumers like fruits withstones which have been harvested unripe, whichcannot be exported in this form. As anotherexample, while concerns regarding the healthquality of fish destined for exportation are centredon antibiotic residues, local consumers express ahigh demand for fish containing no formalinpreservatives. On the other hand, for the porksector, export demand, as in the Vietnamesetowns, is oriented towards lean pork. The rate oflean meat from Vietnamese pigs is 34%, whereasit is at an average of 55% for the world (Tran CongThang, 2003).
Whatever the outlet, gaining shares of themarket and increasing incomes relies on satisfy-ing quality requirements. It is also necessary forthe suppliers to ensure a regular supply and tohonour the contracts.
The efforts made on one market can be usefulfor the development of the other. Thus, thedomestic markets can serve as a test beforebeginning the process of exportation, especially tothe more demanding markets in terms of regula-rity and quality (supermarkets, restaurants).Moreover, experiments in the normalisation andorganisation of quality controls implemented forthe export can inspire similar measures for thedomestic markets.
Figure 2. Proportion of domestic and foreign outlets for major products(in tonnes, 2001)
Sources: see table 2.
Food markets and agricultural development in Vietnam
22
3. Dynamism and fragility of exports
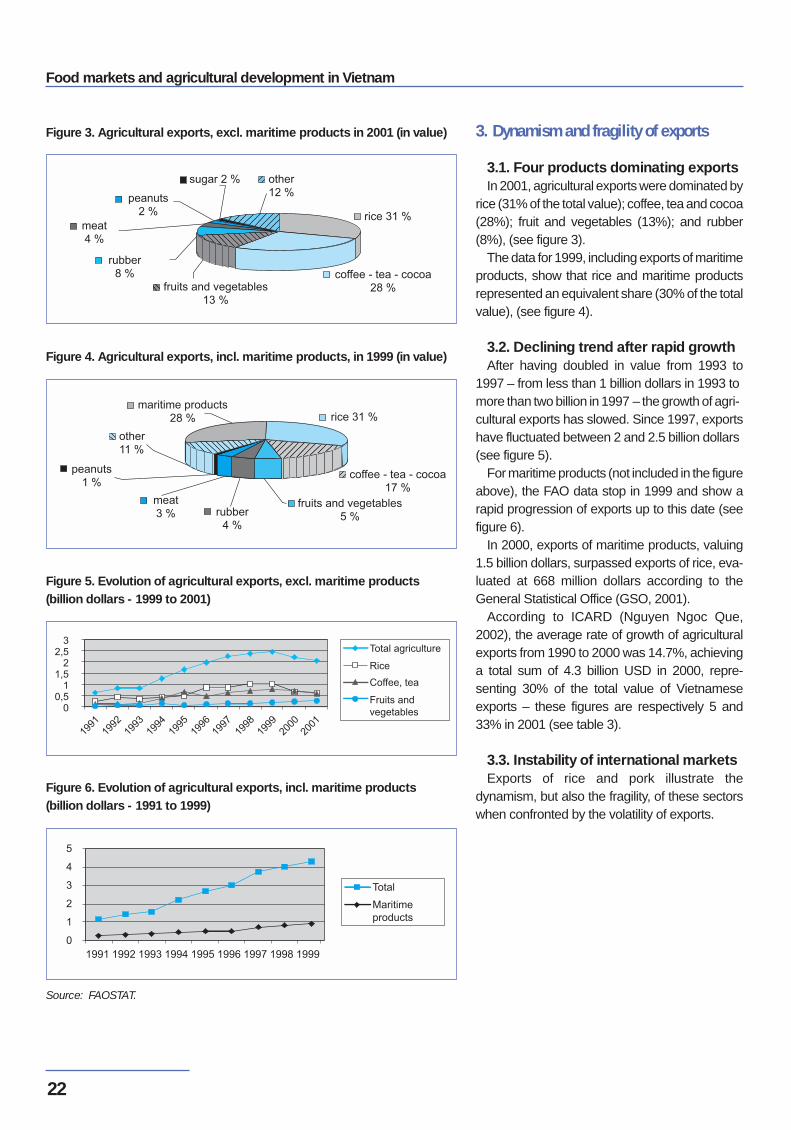
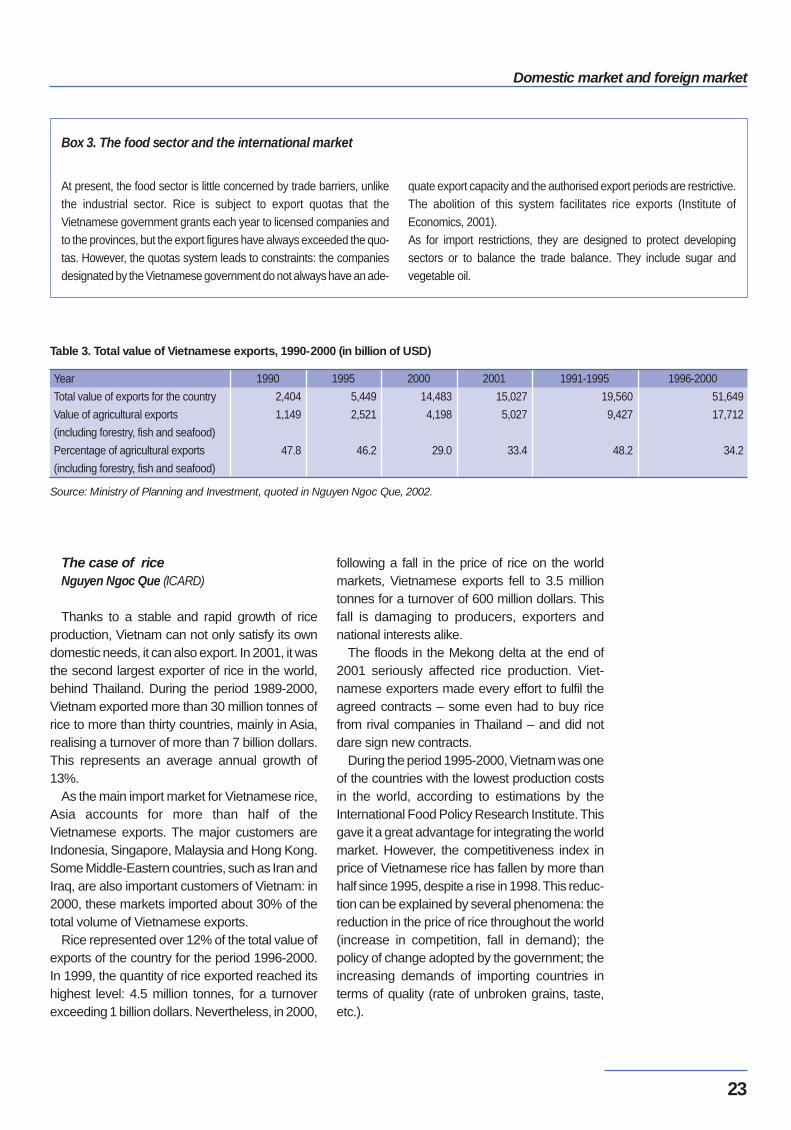
3.1. Four products dominating exportsIn 2001, agricultural exports were dominated by
rice (31% of the total value); coffee, tea and cocoa(28%); fruit and vegetables (13%); and rubber(8%), (see figure 3).
The data for 1999, including exports of maritimeproducts, show that rice and maritime productsrepresented an equivalent share (30% of the totalvalue), (see figure 4).
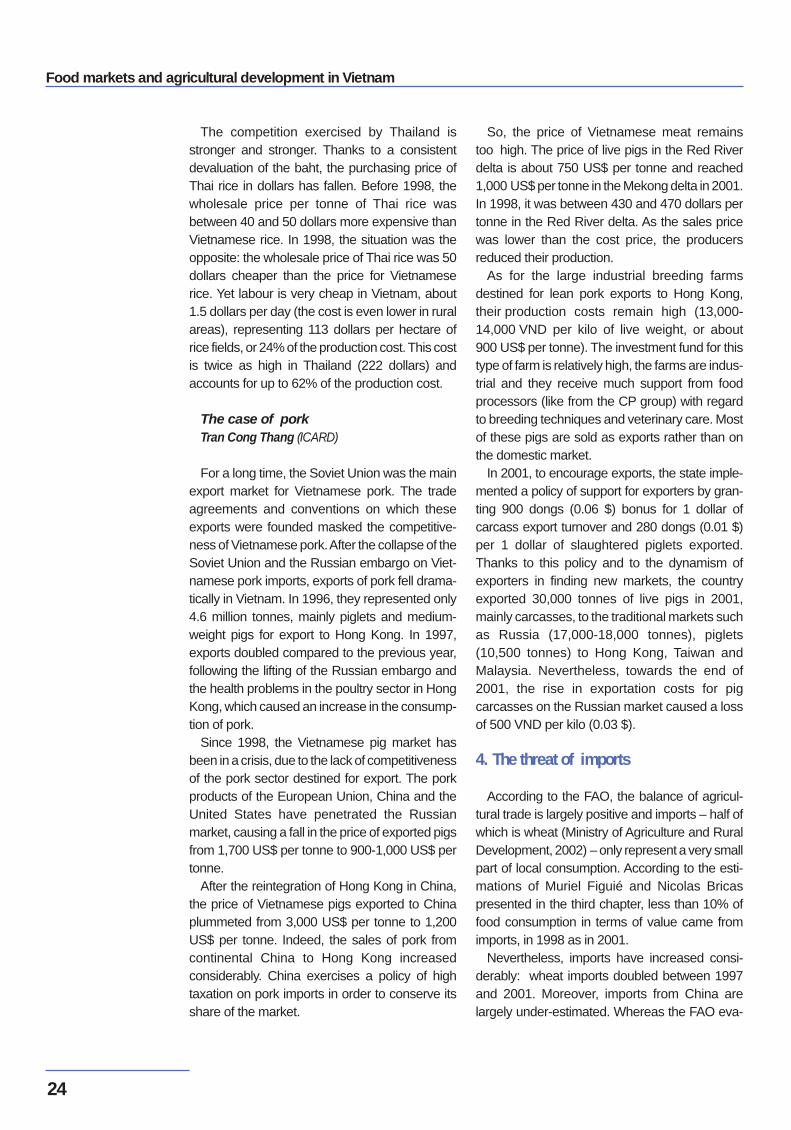
3.2. Declining trend after rapid growthAfter having doubled in value from 1993 to
1997 – from less than 1 billion dollars in 1993 tomore than two billion in 1997 – the growth of agri-cultural exports has slowed. Since 1997, exportshave fluctuated between 2 and 2.5 billion dollars(see figure 5).
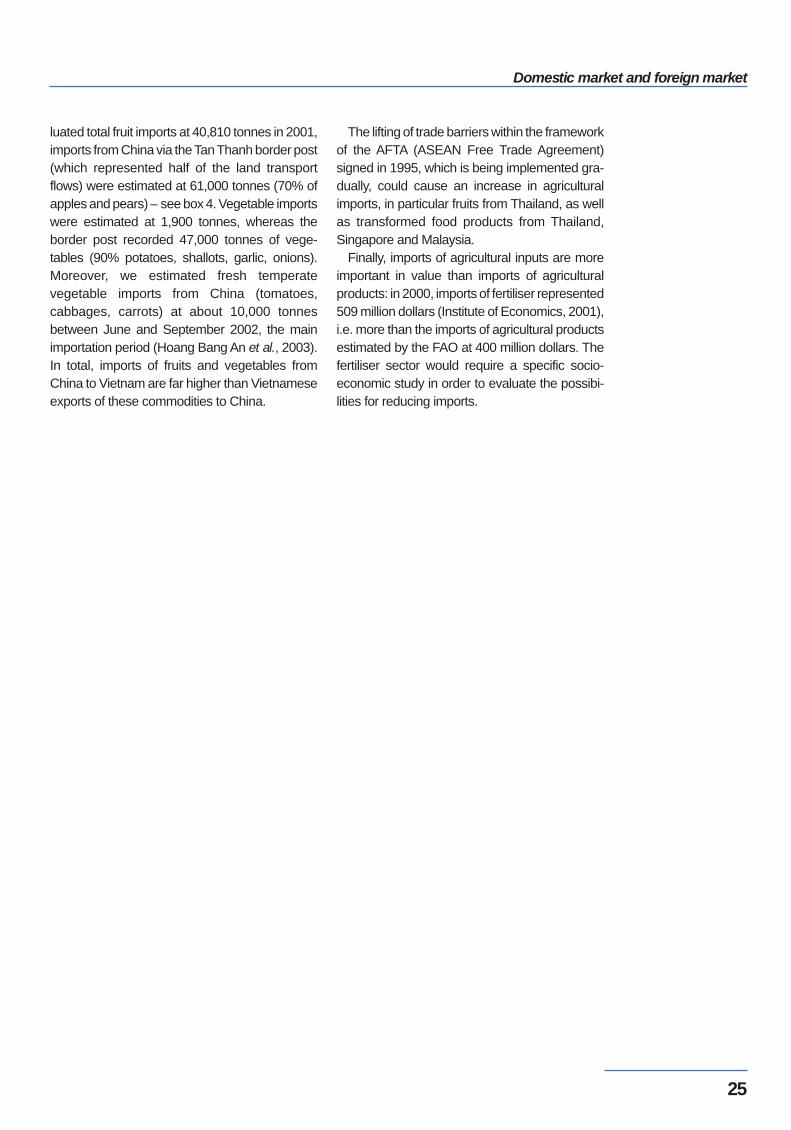
For maritime products (not included in the figureabove), the FAO data stop in 1999 and show arapid progression of exports up to this date (seefigure 6).
In 2000, exports of maritime products, valuing1.5 billion dollars, surpassed exports of rice, eva-luated at 668 million dollars according to theGeneral Statistical Office (GSO, 2001).
According to ICARD (Nguyen Ngoc Que,2002), the average rate of growth of agriculturalexports from 1990 to 2000 was 14.7%, achievinga total sum of 4.3 billion USD in 2000, repre-senting 30% of the total value of Vietnameseexports – these figures are respectively 5 and33% in 2001 (see table 3).
3.3. Instability of international marketsExports of rice and pork illustrate the
dynamism, but also the fragility, of these sectorswhen confronted by the volatility of exports.
Source: FAOSTAT.
Figure 3. Agricultural exports, excl. maritime products in 2001 (in value)
Figure 4. Agricultural exports, incl. maritime products, in 1999 (in value)
Figure 5. Evolution of agricultural exports, excl. maritime products(billion dollars - 1999 to 2001)
Figure 6. Evolution of agricultural exports, incl. maritime products(billion dollars - 1991 to 1999)
Domestic market and foreign market
23
The case of rice Nguyen Ngoc Que (ICARD)
Thanks to a stable and rapid growth of riceproduction, Vietnam can not only satisfy its owndomestic needs, it can also export. In 2001, it wasthe second largest exporter of rice in the world,behind Thailand. During the period 1989-2000,Vietnam exported more than 30 million tonnes ofrice to more than thirty countries, mainly in Asia,realising a turnover of more than 7 billion dollars.This represents an average annual growth of13%.
As the main import market for Vietnamese rice,Asia accounts for more than half of theVietnamese exports. The major customers areIndonesia, Singapore, Malaysia and Hong Kong.Some Middle-Eastern countries, such as Iran andIraq, are also important customers of Vietnam: in2000, these markets imported about 30% of thetotal volume of Vietnamese exports.
Rice represented over 12% of the total value ofexports of the country for the period 1996-2000.In 1999, the quantity of rice exported reached itshighest level: 4.5 million tonnes, for a turnoverexceeding 1 billion dollars. Nevertheless, in 2000,
following a fall in the price of rice on the worldmarkets, Vietnamese exports fell to 3.5 milliontonnes for a turnover of 600 million dollars. Thisfall is damaging to producers, exporters andnational interests alike.
The floods in the Mekong delta at the end of2001 seriously affected rice production. Viet-namese exporters made every effort to fulfil theagreed contracts – some even had to buy ricefrom rival companies in Thailand – and did notdare sign new contracts.
During the period 1995-2000, Vietnam was oneof the countries with the lowest production costsin the world, according to estimations by theInternational Food Policy Research Institute. Thisgave it a great advantage for integrating the worldmarket. However, the competitiveness index inprice of Vietnamese rice has fallen by more thanhalf since 1995, despite a rise in 1998. This reduc-tion can be explained by several phenomena: thereduction in the price of rice throughout the world(increase in competition, fall in demand); thepolicy of change adopted by the government; theincreasing demands of importing countries interms of quality (rate of unbroken grains, taste,etc.).
At present, the food sector is little concerned by trade barriers, unlikethe industrial sector. Rice is subject to export quotas that theVietnamese government grants each year to licensed companies andto the provinces, but the export figures have always exceeded the quo-tas. However, the quotas system leads to constraints: the companiesdesignated by the Vietnamese government do not always have an ade-
quate export capacity and the authorised export periods are restrictive.The abolition of this system facilitates rice exports (Institute ofEconomics, 2001).As for import restrictions, they are designed to protect developingsectors or to balance the trade balance. They include sugar andvegetable oil.
Source: Ministry of Planning and Investment, quoted in Nguyen Ngoc Que, 2002.
Table 3. Total value of Vietnamese exports, 1990-2000 (in billion of USD)
Year
Total value of exports for the country
Value of agricultural exports
(including forestry, fish and seafood)
Percentage of agricultural exports
(including forestry, fish and seafood)
1990
2,404
1,149
47.8
1995
5,449
2,521
46.2
2000
14,483
4,198
29.0
2001
15,027
5,027
33.4
1991-1995
19,560
9,427
48.2
1996-2000
51,649
17,712
34.2
Box 3. The food sector and the international market
Food markets and agricultural development in Vietnam
24
The competition exercised by Thailand isstronger and stronger. Thanks to a consistentdevaluation of the baht, the purchasing price ofThai rice in dollars has fallen. Before 1998, thewholesale price per tonne of Thai rice wasbetween 40 and 50 dollars more expensive thanVietnamese rice. In 1998, the situation was theopposite: the wholesale price of Thai rice was 50dollars cheaper than the price for Vietnameserice. Yet labour is very cheap in Vietnam, about1.5 dollars per day (the cost is even lower in ruralareas), representing 113 dollars per hectare ofrice fields, or 24% of the production cost. This costis twice as high in Thailand (222 dollars) andaccounts for up to 62% of the production cost.
The case of pork Tran Cong Thang (ICARD)
For a long time, the Soviet Union was the mainexport market for Vietnamese pork. The tradeagreements and conventions on which theseexports were founded masked the competitive-ness of Vietnamese pork. After the collapse of theSoviet Union and the Russian embargo on Viet-namese pork imports, exports of pork fell drama-tically in Vietnam. In 1996, they represented only4.6 million tonnes, mainly piglets and medium-weight pigs for export to Hong Kong. In 1997,exports doubled compared to the previous year,following the lifting of the Russian embargo andthe health problems in the poultry sector in HongKong, which caused an increase in the consump-tion of pork.
Since 1998, the Vietnamese pig market hasbeen in a crisis, due to the lack of competitivenessof the pork sector destined for export. The porkproducts of the European Union, China and theUnited States have penetrated the Russianmarket, causing a fall in the price of exported pigsfrom 1,700 US$ per tonne to 900-1,000 US$ pertonne.
After the reintegration of Hong Kong in China,the price of Vietnamese pigs exported to Chinaplummeted from 3,000 US$ per tonne to 1,200US$ per tonne. Indeed, the sales of pork fromcontinental China to Hong Kong increasedconsiderably. China exercises a policy of hightaxation on pork imports in order to conserve itsshare of the market.
So, the price of Vietnamese meat remainstoo high. The price of live pigs in the Red Riverdelta is about 750 US$ per tonne and reached1,000 US$ per tonne in the Mekong delta in 2001.In 1998, it was between 430 and 470 dollars pertonne in the Red River delta. As the sales pricewas lower than the cost price, the producersreduced their production.
As for the large industrial breeding farmsdestined for lean pork exports to Hong Kong,their production costs remain high (13,000-14,000 VND per kilo of live weight, or about900 US$ per tonne). The investment fund for thistype of farm is relatively high, the farms are indus-trial and they receive much support from foodprocessors (like from the CP group) with regardto breeding techniques and veterinary care. Mostof these pigs are sold as exports rather than onthe domestic market.
In 2001, to encourage exports, the state imple-mented a policy of support for exporters by gran-ting 900 dongs (0.06 $) bonus for 1 dollar ofcarcass export turnover and 280 dongs (0.01 $)per 1 dollar of slaughtered piglets exported.Thanks to this policy and to the dynamism ofexporters in finding new markets, the countryexported 30,000 tonnes of live pigs in 2001,mainly carcasses, to the traditional markets suchas Russia (17,000-18,000 tonnes), piglets(10,500 tonnes) to Hong Kong, Taiwan andMalaysia. Nevertheless, towards the end of2001, the rise in exportation costs for pigcarcasses on the Russian market caused a lossof 500 VND per kilo (0.03 $).
4. The threat of imports
According to the FAO, the balance of agricul-tural trade is largely positive and imports – half ofwhich is wheat (Ministry of Agriculture and RuralDevelopment, 2002) – only represent a very smallpart of local consumption. According to the esti-mations of Muriel Figuié and Nicolas Bricaspresented in the third chapter, less than 10% offood consumption in terms of value came fromimports, in 1998 as in 2001.
Nevertheless, imports have increased consi-derably: wheat imports doubled between 1997and 2001. Moreover, imports from China arelargely under-estimated. Whereas the FAO eva-
Domestic market and foreign market
25
luated total fruit imports at 40,810 tonnes in 2001,imports from China via the Tan Thanh border post(which represented half of the land transportflows) were estimated at 61,000 tonnes (70% ofapples and pears) – see box 4. Vegetable importswere estimated at 1,900 tonnes, whereas theborder post recorded 47,000 tonnes of vege-tables (90% potatoes, shallots, garlic, onions).Moreover, we estimated fresh temperatevegetable imports from China (tomatoes,cabbages, carrots) at about 10,000 tonnesbetween June and September 2002, the mainimportation period (Hoang Bang An et al., 2003).In total, imports of fruits and vegetables fromChina to Vietnam are far higher than Vietnameseexports of these commodities to China.
The lifting of trade barriers within the frameworkof the AFTA (ASEAN Free Trade Agreement)signed in 1995, which is being implemented gra-dually, could cause an increase in agriculturalimports, in particular fruits from Thailand, as wellas transformed food products from Thailand,Singapore and Malaysia.
Finally, imports of agricultural inputs are moreimportant in value than imports of agriculturalproducts: in 2000, imports of fertiliser represented509 million dollars (Institute of Economics, 2001),i.e. more than the imports of agricultural productsestimated by the FAO at 400 million dollars. Thefertiliser sector would require a specific socio-economic study in order to evaluate the possibi-lities for reducing imports.
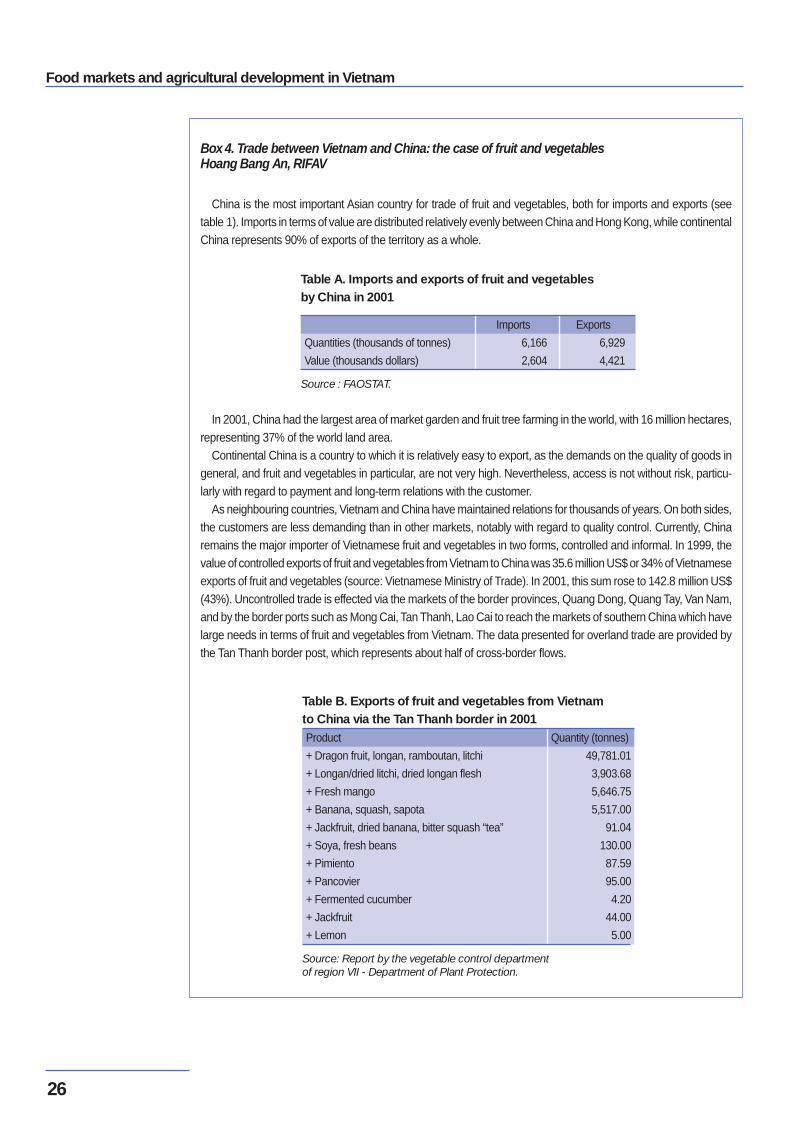
Food markets and agricultural development in Vietnam
26
Source : FAOSTAT.
Table A. Imports and exports of fruit and vegetablesby China in 2001
Quantities (thousands of tonnes)
Value (thousands dollars)
Imports
6,166
2,604
Exports
6,929
4,421
In 2001, China had the largest area of market garden and fruit tree farming in the world, with 16 million hectares,representing 37% of the world land area.
Continental China is a country to which it is relatively easy to export, as the demands on the quality of goods ingeneral, and fruit and vegetables in particular, are not very high. Nevertheless, access is not without risk, particu-larly with regard to payment and long-term relations with the customer.
As neighbouring countries, Vietnam and China have maintained relations for thousands of years. On both sides,the customers are less demanding than in other markets, notably with regard to quality control. Currently, Chinaremains the major importer of Vietnamese fruit and vegetables in two forms, controlled and informal. In 1999, thevalue of controlled exports of fruit and vegetables from Vietnam to China was 35.6 million US$ or 34% of Vietnameseexports of fruit and vegetables (source: Vietnamese Ministry of Trade). In 2001, this sum rose to 142.8 million US$(43%). Uncontrolled trade is effected via the markets of the border provinces, Quang Dong, Quang Tay, Van Nam,and by the border ports such as Mong Cai, Tan Thanh, Lao Cai to reach the markets of southern China which havelarge needs in terms of fruit and vegetables from Vietnam. The data presented for overland trade are provided bythe Tan Thanh border post, which represents about half of cross-border flows.
Source: Report by the vegetable control departmentof region VII - Department of Plant Protection.
Table B. Exports of fruit and vegetables from Vietnamto China via the Tan Thanh border in 2001Product
+ Dragon fruit, longan, ramboutan, litchi
+ Longan/dried litchi, dried longan flesh
+ Fresh mango
+ Banana, squash, sapota
+ Jackfruit, dried banana, bitter squash “tea”
+ Soya, fresh beans
+ Pimiento
+ Pancovier
+ Fermented cucumber
+ Jackfruit
+ Lemon
Quantity (tonnes)
49,781.01
3,903.68
5,646.75
5,517.00
91.04
130.00
87.59
95.00
4.20
44.00
5.00
Box 4. Trade between Vietnam and China: the case of fruit and vegetablesHoang Bang An, RIFAV
China is the most important Asian country for trade of fruit and vegetables, both for imports and exports (seetable 1). Imports in terms of value are distributed relatively evenly between China and Hong Kong, while continentalChina represents 90% of exports of the territory as a whole.
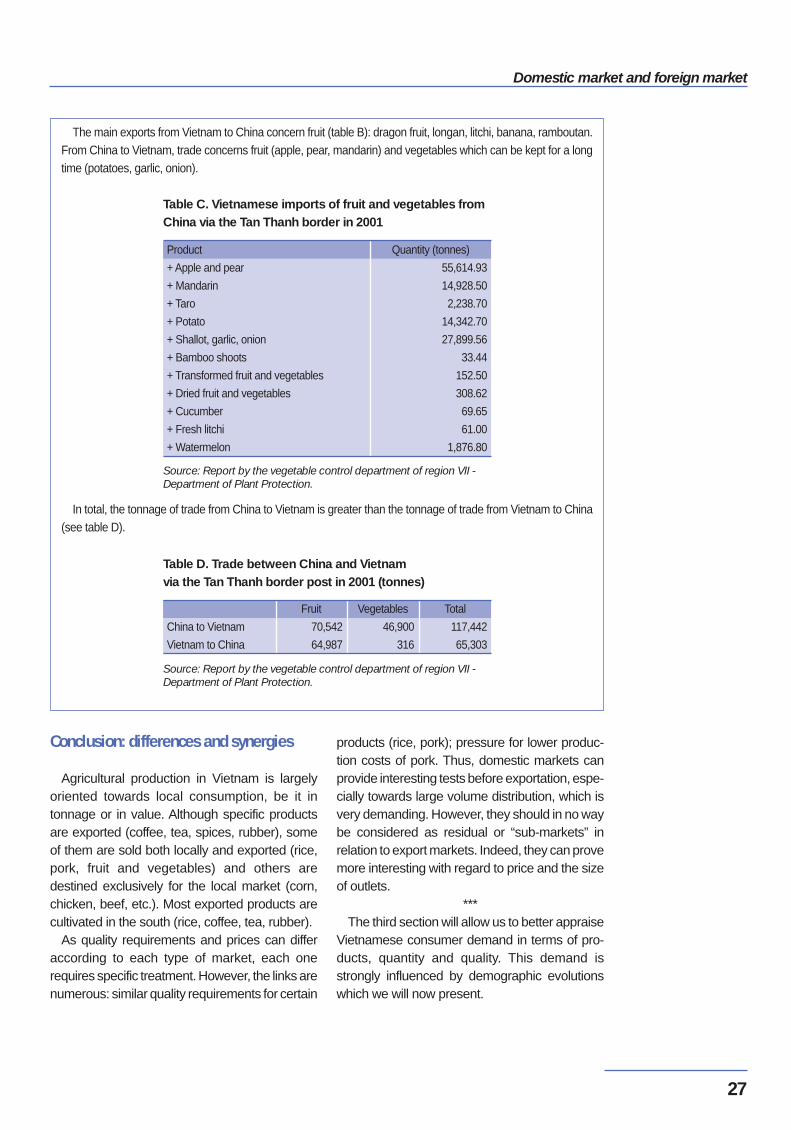
Domestic market and foreign market
27
Source: Report by the vegetable control department of region VII -Department of Plant Protection.
Table D. Trade between China and Vietnam via the Tan Thanh border post in 2001 (tonnes)
China to Vietnam
Vietnam to China
Fruit
70,542
64,987
Vegetables
46,900
316
Total
117,442
65,303
The main exports from Vietnam to China concern fruit (table B): dragon fruit, longan, litchi, banana, ramboutan.From China to Vietnam, trade concerns fruit (apple, pear, mandarin) and vegetables which can be kept for a longtime (potatoes, garlic, onion).
In total, the tonnage of trade from China to Vietnam is greater than the tonnage of trade from Vietnam to China(see table D).
Conclusion: differences and synergies
Agricultural production in Vietnam is largelyoriented towards local consumption, be it intonnage or in value. Although specific productsare exported (coffee, tea, spices, rubber), someof them are sold both locally and exported (rice,pork, fruit and vegetables) and others aredestined exclusively for the local market (corn,chicken, beef, etc.). Most exported products arecultivated in the south (rice, coffee, tea, rubber).
As quality requirements and prices can differaccording to each type of market, each onerequires specific treatment. However, the links arenumerous: similar quality requirements for certain
products (rice, pork); pressure for lower produc-tion costs of pork. Thus, domestic markets canprovide interesting tests before exportation, espe-cially towards large volume distribution, which isvery demanding. However, they should in no waybe considered as residual or “sub-markets” inrelation to export markets. Indeed, they can provemore interesting with regard to price and the sizeof outlets.
***The third section will allow us to better appraise
Vietnamese consumer demand in terms of pro-ducts, quantity and quality. This demand isstrongly influenced by demographic evolutionswhich we will now present.
Source: Report by the vegetable control department of region VII -Department of Plant Protection.
Table C. Vietnamese imports of fruit and vegetables fromChina via the Tan Thanh border in 2001
Product
+ Apple and pear
+ Mandarin
+ Taro
+ Potato
+ Shallot, garlic, onion
+ Bamboo shoots
+ Transformed fruit and vegetables
+ Dried fruit and vegetables
+ Cucumber
+ Fresh litchi
+ Watermelon
Quantity (tonnes)
55,614.93
14,928.50
2,238.70
14,342.70
27,899.56
33.44
152.50
308.62
69.65
61.00
1,876.80
Food markets and agricultural development in Vietnam
28
Demographic and socio-economic changesSylvie Fanchette (IRD)
1. An unequally distributed population
With a population of 76.3 million inhabitants in1999 – estimated at 79.7 million in 2002 –Vietnam is one of the most populated countriesof the region, except Singapore. The populationis very unequally distributed over an area of330,900 km2. Within the two deltas of the RedRiver and the Mekong, the two rice granaries ofthe country, 57% of the population occupies 18%of the total area. Thus, in the highland areas thereare very low population densities – falling toabout 50 inhabitants/km2 in the case of theCentral Highlands –, whereas the populationdensity can reach 400 inhabitants/km2 in thesouthern plains (Mekong delta) and more than
1,000 inhabitants/km2 in the northern plains (RedRiver delta).
In the North, these marked differences can beexplained by past human occupation and by thegrouping of the population in the dense habita-tions with structured socio-political organisations.The systems of production and of supervision ofthe populations to carry out the large-scalehydraulic works required for the development ofthe deltas was borrowed from China. In the agri-cultural sector, this is characterised by a predo-minance of vegetable production over animalproduction. Dyking, a characteristic of the deve-lopment of rural areas by the Chinese the upkeepof which conditions the maintenance of a systemthreatened by flooding, required a minimum level
Vietnam is a very densely populated country. The concentrations are particularly high inthe deltas (as many as 1,000 inhabitants per km2 in the Red River delta), in contrast tothe mountainous regions (where population density can fall as low as 50 inhabitants perkm2). After a period of birth control implemented by the authorities, the country hasentered a phase of demographic transition with a population growth rate of 1.7% per year. The relatively low rate of urbanisation (23.5%) is growing significantly (the urbanpopulation is increasing by 3.5% per year). The rural exodus, initially curbed byauthoritarian measures, is now tackled by various policies: colonisation (oftenauthoritarian) of the pioneer fronts, in the South and on the Central Highlands;economic diversification, notably through industrial development; urbanisation of therural areas, with the development of secondary urban centres in the countryside.Although the socio-economic condition of the population as a whole would seem tohave improved – increased revenues, reduction of malnutrition –, inequalities havenevertheless opened up. The Vietnamese government is currently confronted by two challenges: balancing thegeographic occupation of the territory and distributing the fruits of economic growthequitably.
Demographic and socio-economic changes
29
of collective discipline. The main technical charac-teristic is the control of water, essentially by usinggravity and submersion. The monoculture of riceand high-performance and labour-intensive agri-cultural techniques has allowed the developmentof high rural densities (Lacoste Y., 1988).
The Mekong delta is far less inhabited, due to itsrecent history and its specific configuration.Progressively occupied by the Kinhs since the 17th
century, the pioneer front has advanced over timewith the arrival of migrants from the north of thecountry in the regions least threatened by flooding.This delta has been a land reserve for the over-inhabited plains of the north and centre. Thereduced risk of flooding has favoured a moredispersed habitat and villages which are betterspaced and more open than those of the northernplains (Langlet-Quach Thanh Tam, 2000, p. 187).These deltas have been progressively occupiedby people living in ever more structured politicalsystems, a fact reflected by the homogenisationof the population. In Vietnam, the Kinhs form themajority of the population, that of the plains, andthe very foundations of the State. This homogeni-sation is reflected by a marked demographic andsocial contrast between the plains and the moun-tains surrounding them (Lacoste Y., 1988). Forexample, the populations of the plains haveresponded to the voluntarist policies of thegovernment concerning birth limitation, whereasthe minority populations in the mountainousregions continue to maintain a high level of ferti-lity (see box 8).
The contrast between the plains and the high-lands remains the dominant characteristic of terri-torial occupation in Vietnam, and this despite theefforts of the government to redistribute the popu-lation and the spontaneous migrations from theplains to the mountains, from the north to thesouth and from the east to the west.
2. A country in demographic transition
Since the end of the 80s, the annual rate ofdemographic growth has slowed considerably:between the censuses of 1979 and 1989, it wasat 2.1%, but fell to 1.7% between the lastcensuses (1989 and 1999).
This situation illustrates the end of the demo-graphic transition, which began at the start of the
50s and is characterised today by a slow naturalincrease in the population resulting from both alow fecundity rate and a low mortality rate. As aresult of the high birth rate in the past, theVietnamese population is young, but beginning toage (Hoang Xuyen, 2000).
Thus, in 2000, 54% of the Vietnamese wereunder 25. This results in significant culturalchanges. Indeed, as Gubry notes, in 2000, 62%of the population had either not experienced waror had no specific memories of it (they were under5 in 1975); and 40% had not experienced a totallyplanned economy or had no specific memory ofit (they were under 5 in 1986, the adoption datefor the Renovation policy, or Doi moi), (Gubry P.,2000).
There are also economic consequences: theactive population increases by 3% each year.There are thus 1.4 million young people whoenter the labour market each year. It is also aneducated labour force (in 2001, 93% of the adultpopulation was literate whereas, in 1945, 90% ofthe population was illiterate) (CNSSH, 2002).
3. Towards an urbanised population
The recent evolution of the Vietnamese popu-lation is marked by the increase in the proportionof the urban population. From 1960 to 1989, theurban population remained at 20% of the totalpopulation, due to the strict political control ofinternal migrations (through residents’ permit).From 1989 to 1999, the annual increase in theurban population was 3.6%, whereas that of therural population only reached 1.2%. In 1999, theurban population represented 23.5% of the totalpopulation.
This movement should, according to estima-tions, accelerate in the future. For the period 1998-2020, the population should increase by 3.8% peryear and the rural population by 0.1%. In 2020, theurban population should represent 39.5% of thetotal population (Cour J.-M., 2001). These rates,however, remain modest compared to those forother countries in the region: an average of 36.4%in South-East Asia, approx. 58% for the Philippinesand Malaysia (2000). In 1980, both China andVietnam had the same rate of urbanisation of 20%;nearly 20 years later, it had risen to 31.6% in China(in 2000) but to only 23.5% in Vietnam (in 1999).
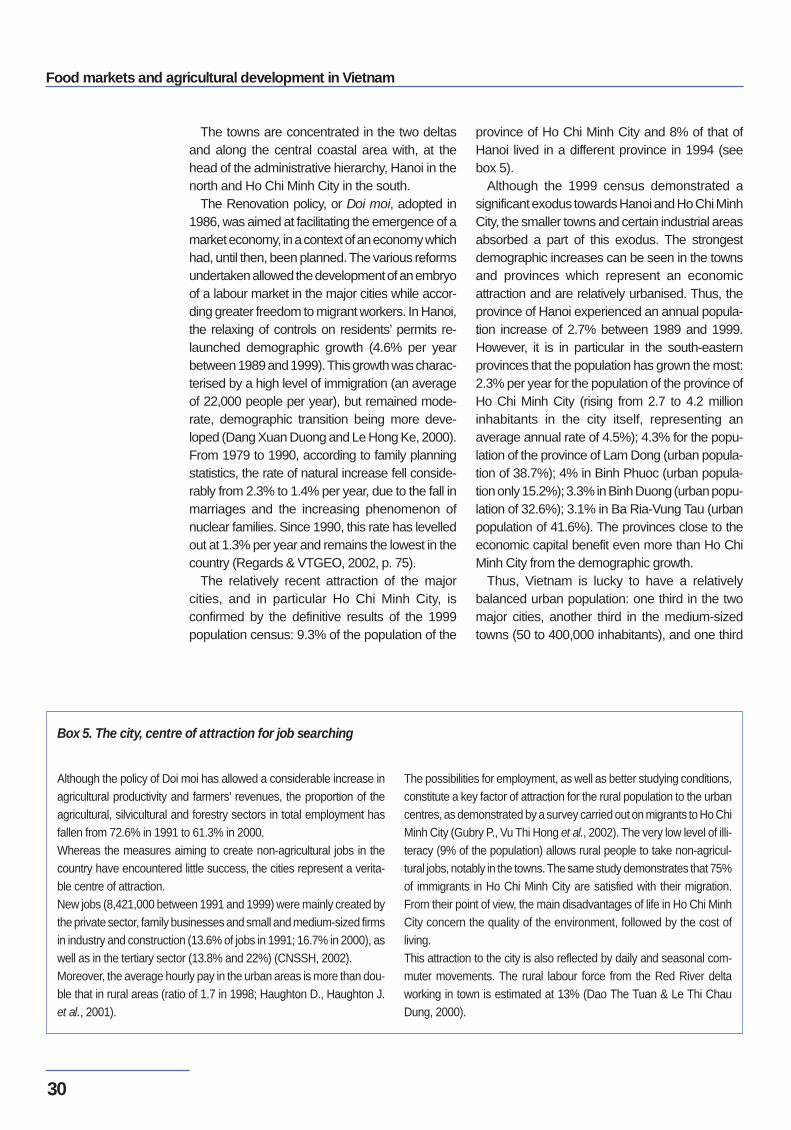
Food markets and agricultural development in Vietnam
30
The towns are concentrated in the two deltasand along the central coastal area with, at thehead of the administrative hierarchy, Hanoi in thenorth and Ho Chi Minh City in the south.
The Renovation policy, or Doi moi, adopted in1986, was aimed at facilitating the emergence of amarket economy, in a context of an economy whichhad, until then, been planned. The various reformsundertaken allowed the development of an embryoof a labour market in the major cities while accor-ding greater freedom to migrant workers. In Hanoi,the relaxing of controls on residents’ permits re-launched demographic growth (4.6% per yearbetween 1989 and 1999). This growth was charac-terised by a high level of immigration (an averageof 22,000 people per year), but remained mode-rate, demographic transition being more deve-loped (Dang Xuan Duong and Le Hong Ke, 2000).From 1979 to 1990, according to family planningstatistics, the rate of natural increase fell conside-rably from 2.3% to 1.4% per year, due to the fall inmarriages and the increasing phenomenon ofnuclear families. Since 1990, this rate has levelledout at 1.3% per year and remains the lowest in thecountry (Regards & VTGEO, 2002, p. 75).
The relatively recent attraction of the majorcities, and in particular Ho Chi Minh City, isconfirmed by the definitive results of the 1999population census: 9.3% of the population of the
province of Ho Chi Minh City and 8% of that ofHanoi lived in a different province in 1994 (seebox 5).
Although the 1999 census demonstrated asignificant exodus towards Hanoi and Ho Chi MinhCity, the smaller towns and certain industrial areasabsorbed a part of this exodus. The strongestdemographic increases can be seen in the townsand provinces which represent an economicattraction and are relatively urbanised. Thus, theprovince of Hanoi experienced an annual popula-tion increase of 2.7% between 1989 and 1999.However, it is in particular in the south-easternprovinces that the population has grown the most:2.3% per year for the population of the province ofHo Chi Minh City (rising from 2.7 to 4.2 millioninhabitants in the city itself, representing anaverage annual rate of 4.5%); 4.3% for the popu-lation of the province of Lam Dong (urban popula-tion of 38.7%); 4% in Binh Phuoc (urban popula-tion only 15.2%); 3.3% in Binh Duong (urban popu-lation of 32.6%); 3.1% in Ba Ria-Vung Tau (urbanpopulation of 41.6%). The provinces close to theeconomic capital benefit even more than Ho ChiMinh City from the demographic growth.
Thus, Vietnam is lucky to have a relativelybalanced urban population: one third in the twomajor cities, another third in the medium-sizedtowns (50 to 400,000 inhabitants), and one third
Although the policy of Doi moi has allowed a considerable increase inagricultural productivity and farmers’ revenues, the proportion of theagricultural, silvicultural and forestry sectors in total employment hasfallen from 72.6% in 1991 to 61.3% in 2000. Whereas the measures aiming to create non-agricultural jobs in thecountry have encountered little success, the cities represent a verita-ble centre of attraction. New jobs (8,421,000 between 1991 and 1999) were mainly created bythe private sector, family businesses and small and medium-sized firmsin industry and construction (13.6% of jobs in 1991; 16.7% in 2000), aswell as in the tertiary sector (13.8% and 22%) (CNSSH, 2002).Moreover, the average hourly pay in the urban areas is more than dou-ble that in rural areas (ratio of 1.7 in 1998; Haughton D., Haughton J.et al., 2001).
The possibilities for employment, as well as better studying conditions,constitute a key factor of attraction for the rural population to the urbancentres, as demonstrated by a survey carried out on migrants to Ho ChiMinh City (Gubry P., Vu Thi Hong et al., 2002). The very low level of illi-teracy (9% of the population) allows rural people to take non-agricul-tural jobs, notably in the towns. The same study demonstrates that 75%of immigrants in Ho Chi Minh City are satisfied with their migration.From their point of view, the main disadvantages of life in Ho Chi MinhCity concern the quality of the environment, followed by the cost ofliving. This attraction to the city is also reflected by daily and seasonal com-muter movements. The rural labour force from the Red River deltaworking in town is estimated at 13% (Dao The Tuan & Le Thi ChauDung, 2000).
Box 5. The city, centre of attraction for job searching
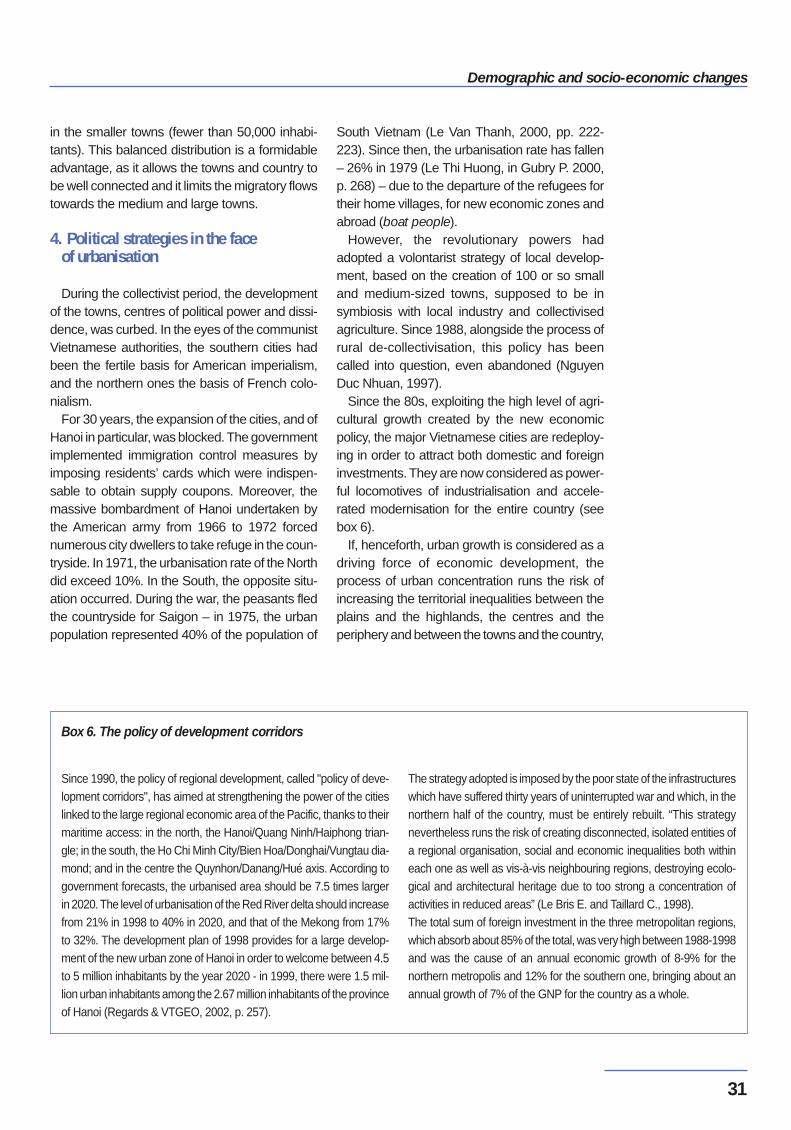
Demographic and socio-economic changes
31
in the smaller towns (fewer than 50,000 inhabi-tants). This balanced distribution is a formidableadvantage, as it allows the towns and country tobe well connected and it limits the migratory flowstowards the medium and large towns.
4. Political strategies in the faceof urbanisation
During the collectivist period, the developmentof the towns, centres of political power and dissi-dence, was curbed. In the eyes of the communistVietnamese authorities, the southern cities hadbeen the fertile basis for American imperialism,and the northern ones the basis of French colo-nialism.
For 30 years, the expansion of the cities, and ofHanoi in particular, was blocked. The governmentimplemented immigration control measures byimposing residents’ cards which were indispen-sable to obtain supply coupons. Moreover, themassive bombardment of Hanoi undertaken bythe American army from 1966 to 1972 forcednumerous city dwellers to take refuge in the coun-tryside. In 1971, the urbanisation rate of the Northdid exceed 10%. In the South, the opposite situ-ation occurred. During the war, the peasants fledthe countryside for Saigon – in 1975, the urbanpopulation represented 40% of the population of
South Vietnam (Le Van Thanh, 2000, pp. 222-223). Since then, the urbanisation rate has fallen– 26% in 1979 (Le Thi Huong, in Gubry P. 2000,p. 268) – due to the departure of the refugees fortheir home villages, for new economic zones andabroad (boat people).
However, the revolutionary powers hadadopted a volontarist strategy of local develop-ment, based on the creation of 100 or so smalland medium-sized towns, supposed to be insymbiosis with local industry and collectivisedagriculture. Since 1988, alongside the process ofrural de-collectivisation, this policy has beencalled into question, even abandoned (NguyenDuc Nhuan, 1997).
Since the 80s, exploiting the high level of agri-cultural growth created by the new economicpolicy, the major Vietnamese cities are redeploy-ing in order to attract both domestic and foreigninvestments. They are now considered as power-ful locomotives of industrialisation and accele-rated modernisation for the entire country (seebox 6).
If, henceforth, urban growth is considered as adriving force of economic development, theprocess of urban concentration runs the risk ofincreasing the territorial inequalities between theplains and the highlands, the centres and theperiphery and between the towns and the country,
Since 1990, the policy of regional development, called "policy of deve-lopment corridors", has aimed at strengthening the power of the citieslinked to the large regional economic area of the Pacific, thanks to theirmaritime access: in the north, the Hanoi/Quang Ninh/Haiphong trian-gle; in the south, the Ho Chi Minh City/Bien Hoa/Donghai/Vungtau dia-mond; and in the centre the Quynhon/Danang/Hué axis. According togovernment forecasts, the urbanised area should be 7.5 times largerin 2020. The level of urbanisation of the Red River delta should increasefrom 21% in 1998 to 40% in 2020, and that of the Mekong from 17%to 32%. The development plan of 1998 provides for a large develop-ment of the new urban zone of Hanoi in order to welcome between 4.5to 5 million inhabitants by the year 2020 - in 1999, there were 1.5 mil-lion urban inhabitants among the 2.67 million inhabitants of the provinceof Hanoi (Regards & VTGEO, 2002, p. 257).
The strategy adopted is imposed by the poor state of the infrastructureswhich have suffered thirty years of uninterrupted war and which, in thenorthern half of the country, must be entirely rebuilt. “This strategynevertheless runs the risk of creating disconnected, isolated entities ofa regional organisation, social and economic inequalities both withineach one as well as vis-à-vis neighbouring regions, destroying ecolo-gical and architectural heritage due to too strong a concentration ofactivities in reduced areas” (Le Bris E. and Taillard C., 1998). The total sum of foreign investment in the three metropolitan regions,which absorb about 85% of the total, was very high between 1988-1998and was the cause of an annual economic growth of 8-9% for thenorthern metropolis and 12% for the southern one, bringing about anannual growth of 7% of the GNP for the country as a whole.
Box 6. The policy of development corridors
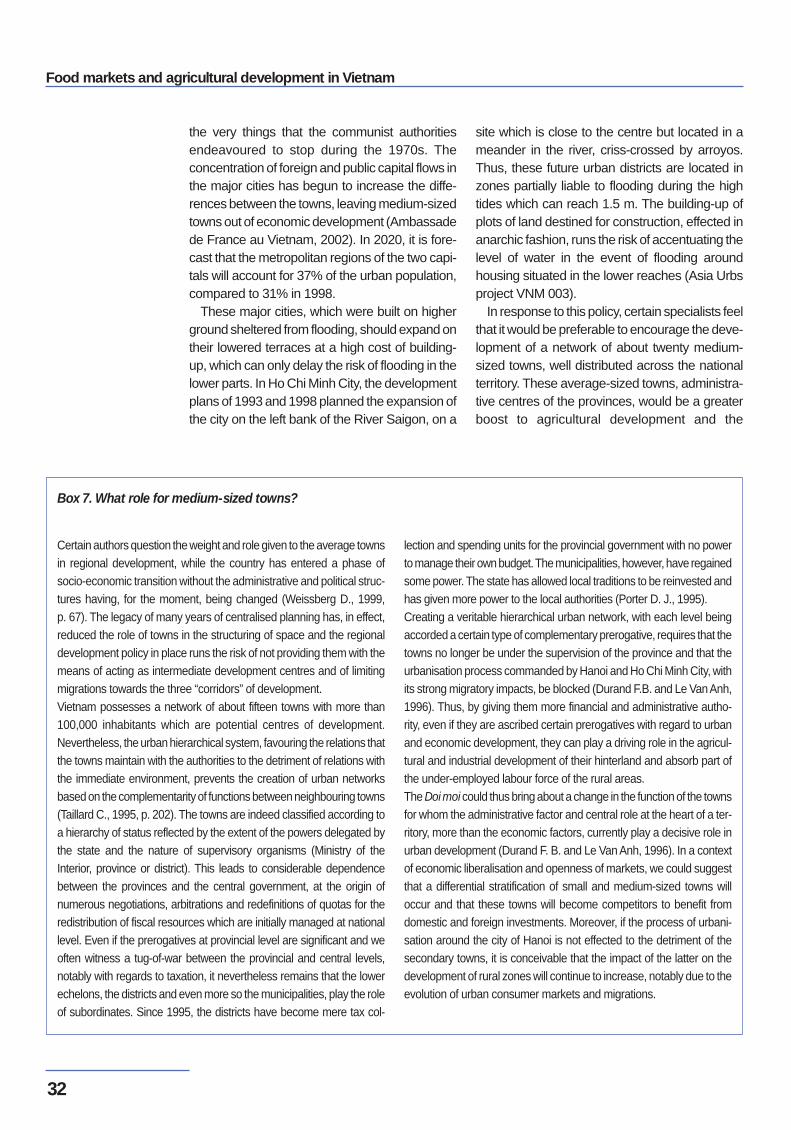
Food markets and agricultural development in Vietnam
32
the very things that the communist authoritiesendeavoured to stop during the 1970s. Theconcentration of foreign and public capital flows inthe major cities has begun to increase the diffe-rences between the towns, leaving medium-sizedtowns out of economic development (Ambassadede France au Vietnam, 2002). In 2020, it is fore-cast that the metropolitan regions of the two capi-tals will account for 37% of the urban population,compared to 31% in 1998.
These major cities, which were built on higherground sheltered from flooding, should expand ontheir lowered terraces at a high cost of building-up, which can only delay the risk of flooding in thelower parts. In Ho Chi Minh City, the developmentplans of 1993 and 1998 planned the expansion ofthe city on the left bank of the River Saigon, on a
site which is close to the centre but located in ameander in the river, criss-crossed by arroyos.Thus, these future urban districts are located inzones partially liable to flooding during the hightides which can reach 1.5 m. The building-up ofplots of land destined for construction, effected inanarchic fashion, runs the risk of accentuating thelevel of water in the event of flooding aroundhousing situated in the lower reaches (Asia Urbsproject VNM 003).
In response to this policy, certain specialists feelthat it would be preferable to encourage the deve-lopment of a network of about twenty medium-sized towns, well distributed across the nationalterritory. These average-sized towns, administra-tive centres of the provinces, would be a greaterboost to agricultural development and the
Certain authors question the weight and role given to the average townsin regional development, while the country has entered a phase ofsocio-economic transition without the administrative and political struc-tures having, for the moment, being changed (Weissberg D., 1999,p. 67). The legacy of many years of centralised planning has, in effect,reduced the role of towns in the structuring of space and the regionaldevelopment policy in place runs the risk of not providing them with themeans of acting as intermediate development centres and of limitingmigrations towards the three “corridors” of development.Vietnam possesses a network of about fifteen towns with more than100,000 inhabitants which are potential centres of development.Nevertheless, the urban hierarchical system, favouring the relations thatthe towns maintain with the authorities to the detriment of relations withthe immediate environment, prevents the creation of urban networksbased on the complementarity of functions between neighbouring towns(Taillard C., 1995, p. 202). The towns are indeed classified according toa hierarchy of status reflected by the extent of the powers delegated bythe state and the nature of supervisory organisms (Ministry of theInterior, province or district). This leads to considerable dependencebetween the provinces and the central government, at the origin ofnumerous negotiations, arbitrations and redefinitions of quotas for theredistribution of fiscal resources which are initially managed at nationallevel. Even if the prerogatives at provincial level are significant and weoften witness a tug-of-war between the provincial and central levels,notably with regards to taxation, it nevertheless remains that the lowerechelons, the districts and even more so the municipalities, play the roleof subordinates. Since 1995, the districts have become mere tax col-
lection and spending units for the provincial government with no powerto manage their own budget. The municipalities, however, have regainedsome power. The state has allowed local traditions to be reinvested andhas given more power to the local authorities (Porter D. J., 1995).Creating a veritable hierarchical urban network, with each level beingaccorded a certain type of complementary prerogative, requires that thetowns no longer be under the supervision of the province and that theurbanisation process commanded by Hanoi and Ho Chi Minh City, withits strong migratory impacts, be blocked (Durand F.B. and Le Van Anh,1996). Thus, by giving them more financial and administrative autho-rity, even if they are ascribed certain prerogatives with regard to urbanand economic development, they can play a driving role in the agricul-tural and industrial development of their hinterland and absorb part ofthe under-employed labour force of the rural areas.The Doi moi could thus bring about a change in the function of the townsfor whom the administrative factor and central role at the heart of a ter-ritory, more than the economic factors, currently play a decisive role inurban development (Durand F. B. and Le Van Anh, 1996). In a contextof economic liberalisation and openness of markets, we could suggestthat a differential stratification of small and medium-sized towns willoccur and that these towns will become competitors to benefit fromdomestic and foreign investments. Moreover, if the process of urbani-sation around the city of Hanoi is not effected to the detriment of thesecondary towns, it is conceivable that the impact of the latter on thedevelopment of rural zones will continue to increase, notably due to theevolution of urban consumer markets and migrations.
Box 7. What role for medium-sized towns?
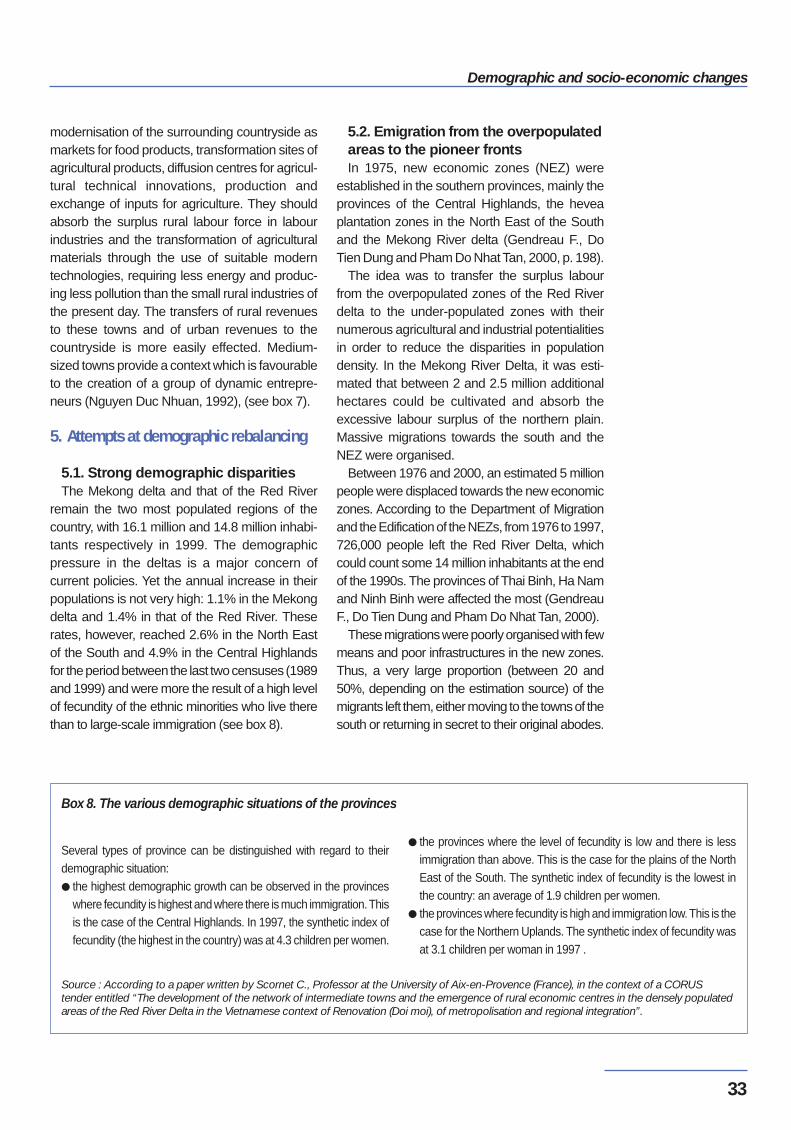
Demographic and socio-economic changes
33
5.2. Emigration from the overpopulatedareas to the pioneer fronts In 1975, new economic zones (NEZ) were
established in the southern provinces, mainly theprovinces of the Central Highlands, the heveaplantation zones in the North East of the Southand the Mekong River delta (Gendreau F., DoTien Dung and Pham Do Nhat Tan, 2000, p. 198).
The idea was to transfer the surplus labourfrom the overpopulated zones of the Red Riverdelta to the under-populated zones with theirnumerous agricultural and industrial potentialitiesin order to reduce the disparities in populationdensity. In the Mekong River Delta, it was esti-mated that between 2 and 2.5 million additionalhectares could be cultivated and absorb theexcessive labour surplus of the northern plain.Massive migrations towards the south and theNEZ were organised.
Between 1976 and 2000, an estimated 5 millionpeople were displaced towards the new economiczones. According to the Department of Migrationand the Edification of the NEZs, from 1976 to 1997,726,000 people left the Red River Delta, whichcould count some 14 million inhabitants at the endof the 1990s. The provinces of Thai Binh, Ha Namand Ninh Binh were affected the most (GendreauF., Do Tien Dung and Pham Do Nhat Tan, 2000).
These migrations were poorly organised with fewmeans and poor infrastructures in the new zones.Thus, a very large proportion (between 20 and50%, depending on the estimation source) of themigrants left them, either moving to the towns of thesouth or returning in secret to their original abodes.
modernisation of the surrounding countryside asmarkets for food products, transformation sites ofagricultural products, diffusion centres for agricul-tural technical innovations, production andexchange of inputs for agriculture. They shouldabsorb the surplus rural labour force in labourindustries and the transformation of agriculturalmaterials through the use of suitable moderntechnologies, requiring less energy and produc-ing less pollution than the small rural industries ofthe present day. The transfers of rural revenuesto these towns and of urban revenues to thecountryside is more easily effected. Medium-sized towns provide a context which is favourableto the creation of a group of dynamic entrepre-neurs (Nguyen Duc Nhuan, 1992), (see box 7).
5. Attempts at demographic rebalancing
5.1. Strong demographic disparities The Mekong delta and that of the Red River
remain the two most populated regions of thecountry, with 16.1 million and 14.8 million inhabi-tants respectively in 1999. The demographicpressure in the deltas is a major concern ofcurrent policies. Yet the annual increase in theirpopulations is not very high: 1.1% in the Mekongdelta and 1.4% in that of the Red River. Theserates, however, reached 2.6% in the North Eastof the South and 4.9% in the Central Highlandsfor the period between the last two censuses (1989and 1999) and were more the result of a high levelof fecundity of the ethnic minorities who live therethan to large-scale immigration (see box 8).
Several types of province can be distinguished with regard to theirdemographic situation:● the highest demographic growth can be observed in the provinces
where fecundity is highest and where there is much immigration. Thisis the case of the Central Highlands. In 1997, the synthetic index offecundity (the highest in the country) was at 4.3 children per women.
● the provinces where the level of fecundity is low and there is lessimmigration than above. This is the case for the plains of the NorthEast of the South. The synthetic index of fecundity is the lowest inthe country: an average of 1.9 children per women.
● the provinces where fecundity is high and immigration low. This is thecase for the Northern Uplands. The synthetic index of fecundity wasat 3.1 children per woman in 1997 .
Box 8. The various demographic situations of the provinces
Source : According to a paper written by Scornet C., Professor at the University of Aix-en-Provence (France), in the context of a CORUStender entitled “The development of the network of intermediate towns and the emergence of rural economic centres in the densely populatedareas of the Red River Delta in the Vietnamese context of Renovation (Doi moi), of metropolisation and regional integration”.
Food markets and agricultural development in Vietnam
34
Moreover, such movements contributed todeforestation and increased the threats to theecological balance of the immigration zones -more than one million hectares were used forcultivation (Gubry P., 2000, p. 445).
5.3. Industrialisation, diversificationand urbanisation of the rural milieu Since the Doi moi, the mobility of people, the
liberalisation of trade and the re-launch of privatelocal crafts have reactivated relations between thetowns and the rural area. This is demonstrated bythe high level of monetary revenues acquiredoutside the municipality of residence, significant ofthe widening sphere of action of rural householdsin a densely populated region. Town-country rela-tions have, thus, been intensified.
However, although two-thirds of the investmentin rural companies have an urban origin, sales ofthe products of these companies is mostly localdue to the lack of means of transport. Indeed, theconsumer basins are localised and fragmentedand the urban markets will not be able to developif the majority of the surrounding settlements arenot connected by road networks which areaccessible during the rainy season (Porter D. J.,1995). Thus, the ability to procure incomesoutside the villages is not available to all. Incertain cases, the proximity of towns andcommunication lines affects the economic andagricultural diversification of the village farms inthe context of economic liberalisation and theemergence of consumer markets for fresh anddiversified products.
Private commerce has mainly developed closeto the most used roads: this is reflected by a delo-calisation from households close to the centre ofthe village towards the roads. There is a more andmore marked process of linear urbanisation alongthe roads leading to the large towns.
We could hypothesise that the relatively densenetwork of villages will become even more denseas these spatial entities are the most active sitesof socio-economic transformations occurring as aresult of the openness of the markets (social stra-tification, division of labour, development ofsecondary and tertiary sectors, etc.). It is to thesevillages that the surrounding countryside comesfor its supplies and that the local inhabitants cometo sell their products.
The proximity of transport networks and labourand consumer markets is not the only determi-nant of the importance of the exchanges.According to Gironde C., (2001, p. 372) analysisof the networks can be a framework to under-stand the complexity of the evolution of systemsof activity and their spatial distribution sinceRenovation. From opportunities for trade culturesto the proletarianisation of the towns, the specia-lities and trades of each person are linked to theirnetworks or reflect, where applicable, theabsence of networks. This author demonstratesto what extent belonging to a migration networktowards the Northern Uplands in the north ofVietnam can favour cross-border trade withChina, or belonging to political or professionalnetworks for former members of cooperative canfavour agricultural and economic diversificationleading to outlets. “The activity of the networkshas intensified with the dismantling of the coope-rative and state-controlled structures whoseformer customers now deal directly with theformer villages” (Gironde C., 2001, p. 371).
The most common extra-agricultural activities inthe Red River Delta are craftwork, food transfor-mation and trade, notably with China or the borderprovinces. Traditional crafts, formerly repressed,are reappearing and spreading according to thenetworks of villages and intermarriage in the 500craft villages in the Red River delta. The “craft tradevillages” make better use of local workers, whosometimes has many generations’ of expertise inthe domain. However, many craftsmen have tolimit their production due to the narrow scope of themarket (Dao The Tuan, Molle F., 2000).
In the absence of political and economic power,the local communities encounter numerous obsta-cles to the development of their industry, or at leastof their crafts. Thus local executives, agents of thecentral state, are more preoccupied by their reco-gnition at the next administrative level than by thepromotion of local development. Only by grantingnew prerogatives to the basic administrative levelsin a context of decentralisation can this tendencybe reversed. Tax reform, according the municipa-lities and districts the power to administrate themajority of the taxes they collect, would representa direct incentive for local economic developmentand thus for widening the base on which thesetaxes rest (Bergeret P., 2002).
Demographic and socio-economic changes
35
Conclusion: less poor, but more unequal
The policy of Doi moi has allowed the socio-economic situation of the Vietnamese to improveconsiderably. Annual incomes are twice as highnow as in the mid 1980s, rising to between 265and 400 $ per inhabitant per year, depending onthe sources (GSO, 2002; CNSSH, 2000). Povertyhas diminished, the rate 2 falling from 75% in themid 1980s to 58% in 1993 and to 37% in 1998(CNSSH, op. cit). The malnutrition rate for chil-dren under five (calculated using the size/ageratio) fell from 56.5% in 1990 to 36.5% in 2000(NIN, 2003).
These improvements should not, however,mask some weaknesses. Vietnam remains a verypoor country (114th position in terms ofGDP/inhabitant and 104th position in terms of theHDI out of 162 pays in 1999 compared to 150th
and 116th position out of 173 pays in 1992,CNSSH, op.cit, p. 45). Not only do inequalitiesremain, notably between the rural and urbanzones, with 45% poor in rural areas compared to9% in urban areas in 1998 (GSO, 2000), theyeven increase. Although, according to the reporton human development in Vietnam (CNSSH,2002), the population as a whole would seem tohave benefited from the fruits of growth, distribu-tion remains unequal and an increase in inequal-ities is in fact to be noted: in 1994, the averageincome per inhabitant of the wealthiest 20% of thepopulation of the richest province was 25 timeshigher than that of the poorest 20% of the poorestprovince. The ratio in 1999 was 50/1 (CNSSH, op.
cit.). Finally, recent improvements seem to beslowing down: after falling between 1991 and1996, urban unemployment rose again to nearly7% of the active population in 1999 (CNSSH,op.cit, p. 35). Similarly, the rise in the standard ofliving has slowed: an increase in the standard ofliving of 8.8% from 1996 to 1999 and only 6%from 2000 to the first semester of 2002.
Some figures show that the situation of certainhouseholds has fallen recently: this is the case forinhabitants of the Central Highlands, who sawtheir purchasing power fall by 22% between 1999and the first semester of 2002 after the fall in theprice of coffee. Similarly, for the same period in thedeprived provinces of Ninh Thuan and BinhThuan, the purchasing power of the inhabitantsfell by 7.2% (Courrier du Vietnam, 14/01/03).These evolutions may be due to the economicsituation, but they invite caution with regard to thesustainability of the global changes recorded.
The improvement in production conditions inthe country is a major concern for the durability ofagricultural holdings, notably in the areas of highdemographic pressure, and for the reduction oftown-country inequalities. It occurs through thediversification of agricultural activities, the struc-tured intensification of farming systems and theextension of the farmed areas in these zones. Thecurrent growth of the domestic consumer marketis a potential motor which requires the intensifi-cation of the integration in the market by adaptingto the changes in the demands in terms of quan-tity and quality. This point will be developed laterin this document.
2 Households considered as “poor” are those households under a poverty line defined as the minimum level of consumerexpenditure (food and non-food) sufficient to cover both spending on the purchase of food satisfying minimum caloric needsand basic spending on non-food purchases (health, education, etc.). This poverty line was estimated at a little less than1,700,000 dongs/person/year in 1998, i.e. about 110 dollars (GSO, 2000).
Food markets and agricultural development in Vietnam
36
The evolution of food consumptionMuriel Figuié and Nicolas Bricas (CIRAD)
Over the past ten years, the value of the Vietnamese food market has doubled. Thisgrowth is the result of three factors: the increase in the population; the increase in thequantities consumed per person; and the reduction in self-consumption of households,especially rural households. The Vietnamese food market, evaluated at 7.2 billiondollars in 2002.National consumption for all food products has grown, except for root vegetables andtubers (cassava, sweet potato, etc.). Consumption of rice per person is falling.Differences are appearing depending on the region or zone, urban or rural. The incomelevel also leads to differences. The richest do not only eat more, they eat differently.As their incomes increase, households consume more rice to the detriment of tubers;they then reduce their rice consumption in favour of other cereals such as wheat.This increase in consumption is in part satisfied by recourse to imports (the case ofwheat, milk and, to a lesser extent, oils and fats). The transformations of theVietnamese agricultural and food processing sectors in order to satisfy this demandare eyed with suspicion by the consumers, shaken by regular revelations in the pressof cases of food poisoning.The evolutions in consumption have contributed to reducing malnutrition. However, so-called “diseases of excess” are appearing (obesity, cardiovascular diseases, etc.) andurban consumers associate certain products, such as animal fats or meat, to anegative dietetic image. Finally, new food behaviours are appearing in urban areas: the development ofsupermarkets and, in particular, of street food and restaurants, which represents animportant factor from both an economic and nutritional point of view.
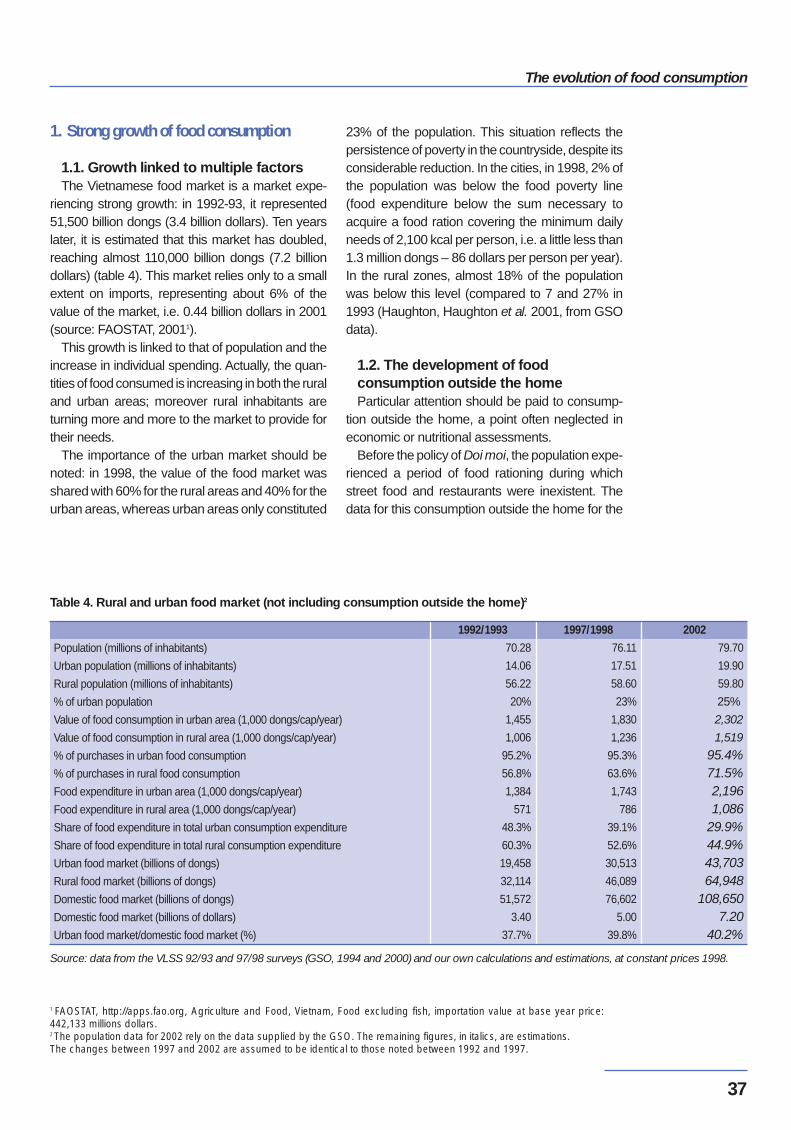
The evolution of food consumption
37
1. Strong growth of food consumption
1.1. Growth linked to multiple factors The Vietnamese food market is a market expe-
riencing strong growth: in 1992-93, it represented51,500 billion dongs (3.4 billion dollars). Ten yearslater, it is estimated that this market has doubled,reaching almost 110,000 billion dongs (7.2 billiondollars) (table 4). This market relies only to a smallextent on imports, representing about 6% of thevalue of the market, i.e. 0.44 billion dollars in 2001(source: FAOSTAT, 20011).
This growth is linked to that of population and theincrease in individual spending. Actually, the quan-tities of food consumed is increasing in both the ruraland urban areas; moreover rural inhabitants areturning more and more to the market to provide fortheir needs.
The importance of the urban market should benoted: in 1998, the value of the food market wasshared with 60% for the rural areas and 40% for theurban areas, whereas urban areas only constituted
23% of the population. This situation reflects thepersistence of poverty in the countryside, despite itsconsiderable reduction. In the cities, in 1998, 2% ofthe population was below the food poverty line(food expenditure below the sum necessary toacquire a food ration covering the minimum dailyneeds of 2,100 kcal per person, i.e. a little less than1.3 million dongs – 86 dollars per person per year).In the rural zones, almost 18% of the populationwas below this level (compared to 7 and 27% in1993 (Haughton, Haughton et al. 2001, from GSOdata).
1.2. The development of foodconsumption outside the homeParticular attention should be paid to consump-
tion outside the home, a point often neglected ineconomic or nutritional assessments.
Before the policy of Doi moi, the population expe-rienced a period of food rationing during whichstreet food and restaurants were inexistent. Thedata for this consumption outside the home for the
Source: data from the VLSS 92/93 and 97/98 surveys (GSO, 1994 and 2000) and our own calculations and estimations, at constant prices 1998.
Table 4. Rural and urban food market (not including consumption outside the home)2
Population (millions of inhabitants)
Urban population (millions of inhabitants)
Rural population (millions of inhabitants)
% of urban population
Value of food consumption in urban area (1,000 dongs/cap/year)
Value of food consumption in rural area (1,000 dongs/cap/year)
% of purchases in urban food consumption
% of purchases in rural food consumption
Food expenditure in urban area (1,000 dongs/cap/year)
Food expenditure in rural area (1,000 dongs/cap/year)
Share of food expenditure in total urban consumption expenditure
Share of food expenditure in total rural consumption expenditure
Urban food market (billions of dongs)
Rural food market (billions of dongs)
Domestic food market (billions of dongs)
Domestic food market (billions of dollars)
Urban food market/domestic food market (%)
1992/1993
70.28
14.06
56.22
20%
1,455
1,006
95.2%
56.8%
1,384
571
48.3%
60.3%
19,458
32,114
51,572
3.40
37.7%
1997/1998
76.11
17.51
58.60
23%
1,830
1,236
95.3%
63.6%
1,743
786
39.1%
52.6%
30,513
46,089
76,602
5.00
39.8%
2002
79.70
19.90
59.80
25%
2,302
1,519
95.4%71.5%2,1961,086
29.9%44.9%43,70364,948
108,6507.20
40.2%
1 FAOSTAT, http://apps.fao.org, Agriculture and Food, Vietnam, Food excluding fish, importation value at base year price:442,133 millions dollars.2 The population data for 2002 rely on the data supplied by the GSO. The remaining figures, in italics, are estimations.The changes between 1997 and 2002 are assumed to be identical to those noted between 1992 and 1997.
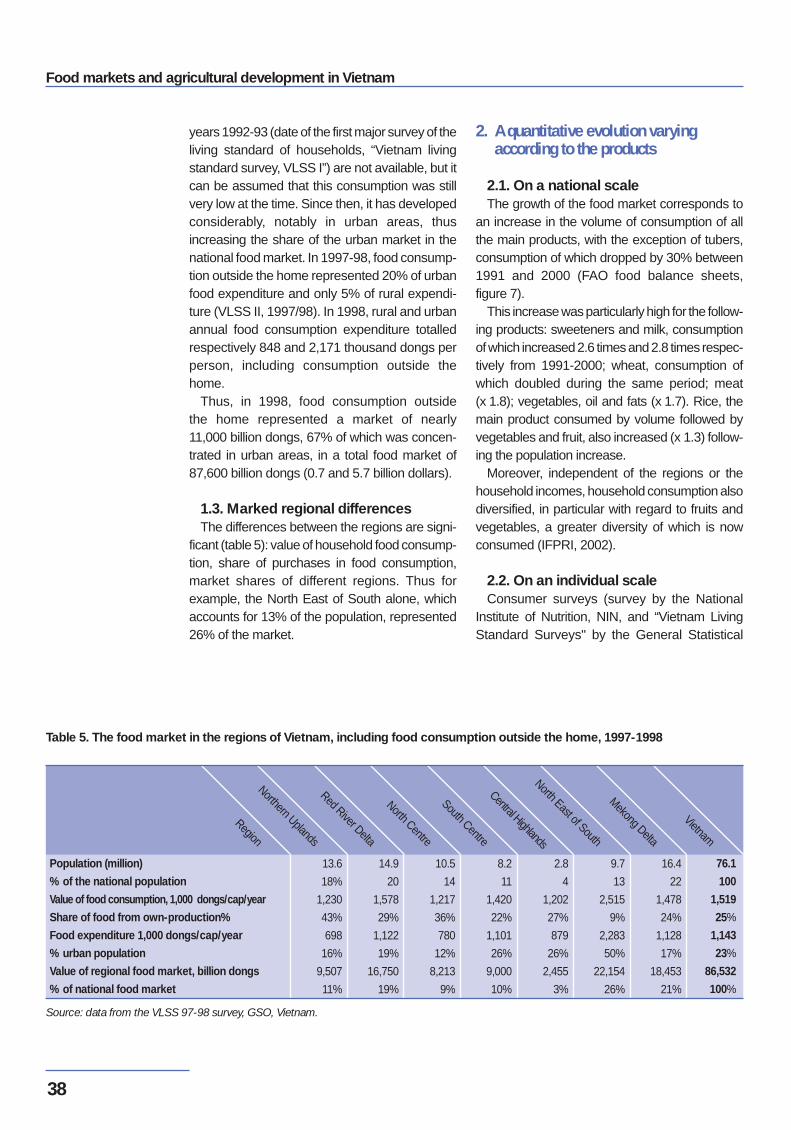
Food markets and agricultural development in Vietnam
38
years 1992-93 (date of the first major survey of theliving standard of households, “Vietnam livingstandard survey, VLSS I”) are not available, but itcan be assumed that this consumption was stillvery low at the time. Since then, it has developedconsiderably, notably in urban areas, thusincreasing the share of the urban market in thenational food market. In 1997-98, food consump-tion outside the home represented 20% of urbanfood expenditure and only 5% of rural expendi-ture (VLSS II, 1997/98). In 1998, rural and urbanannual food consumption expenditure totalledrespectively 848 and 2,171 thousand dongs perperson, including consumption outside thehome.
Thus, in 1998, food consumption outsidethe home represented a market of nearly11,000 billion dongs, 67% of which was concen-trated in urban areas, in a total food market of87,600 billion dongs (0.7 and 5.7 billion dollars).
1.3. Marked regional differencesThe differences between the regions are signi-
ficant (table 5): value of household food consump-tion, share of purchases in food consumption,market shares of different regions. Thus forexample, the North East of South alone, whichaccounts for 13% of the population, represented26% of the market.
2. A quantitative evolution varyingaccording to the products
2.1. On a national scaleThe growth of the food market corresponds to
an increase in the volume of consumption of allthe main products, with the exception of tubers,consumption of which dropped by 30% between1991 and 2000 (FAO food balance sheets,figure 7).
This increase was particularly high for the follow-ing products: sweeteners and milk, consumptionof which increased 2.6 times and 2.8 times respec-tively from 1991-2000; wheat, consumption ofwhich doubled during the same period; meat(x 1.8); vegetables, oil and fats (x 1.7). Rice, themain product consumed by volume followed byvegetables and fruit, also increased (x 1.3) follow-ing the population increase.
Moreover, independent of the regions or thehousehold incomes, household consumption alsodiversified, in particular with regard to fruits andvegetables, a greater diversity of which is nowconsumed (IFPRI, 2002).
2.2. On an individual scaleConsumer surveys (survey by the National
Institute of Nutrition, NIN, and “Vietnam LivingStandard Surveys" by the General Statistical
Source: data from the VLSS 97-98 survey, GSO, Vietnam.
Table 5. The food market in the regions of Vietnam, including food consumption outside the home, 1997-1998
Population (million)
% of the national population
Value of food consumption, 1,000 dongs/cap/year
Share of food from own-production%
Food expenditure 1,000 dongs/cap/year
% urban population
Value of regional food market, billion dongs
% of national food market
13.6
18%
1,230
43%
698
16%
9,507
11%
14.9
20
1,578
29%
1,122
19%
16,750
19%
10.5
14
1,217
36%
780
12%
8,213
9%
8.2
11
1,420
22%
1,101
26%
9,000
10%
2.8
4
1,202
27%
879
26%
2,455
3%
9.7
13
2,515
9%
2,283
50%
22,154
26%
16.4
22
1,478
24%
1,128
17%
18,453
21%
76.1
100
1,519
25%
1,143
23%
86,532
100%
Region
Northern Uplands
North Centre
South Centre
Central Highlands
North East of South
Mekong Delta
Vietnam
Red River Delta
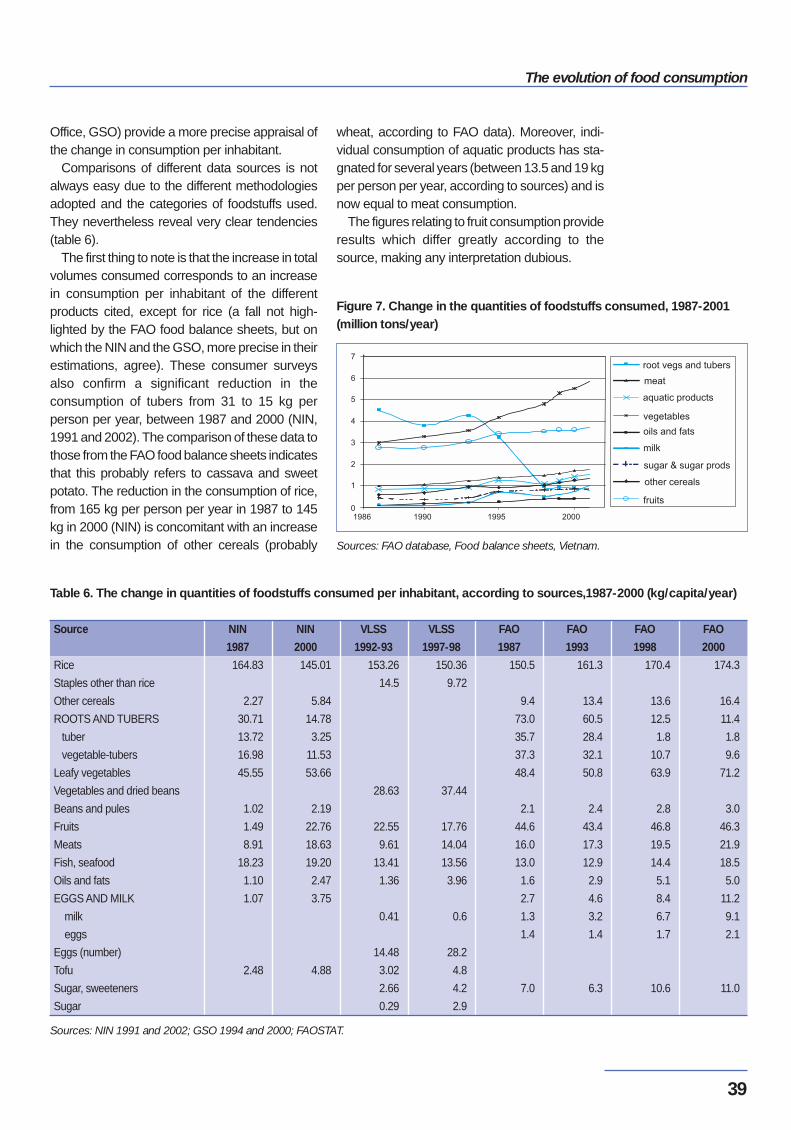
The evolution of food consumption
39
Office, GSO) provide a more precise appraisal ofthe change in consumption per inhabitant.
Comparisons of different data sources is notalways easy due to the different methodologiesadopted and the categories of foodstuffs used.They nevertheless reveal very clear tendencies(table 6).
The first thing to note is that the increase in totalvolumes consumed corresponds to an increasein consumption per inhabitant of the differentproducts cited, except for rice (a fall not high-lighted by the FAO food balance sheets, but onwhich the NIN and the GSO, more precise in theirestimations, agree). These consumer surveysalso confirm a significant reduction in theconsumption of tubers from 31 to 15 kg perperson per year, between 1987 and 2000 (NIN,1991 and 2002). The comparison of these data tothose from the FAO food balance sheets indicatesthat this probably refers to cassava and sweetpotato. The reduction in the consumption of rice,from 165 kg per person per year in 1987 to 145kg in 2000 (NIN) is concomitant with an increasein the consumption of other cereals (probably
wheat, according to FAO data). Moreover, indi-vidual consumption of aquatic products has sta-gnated for several years (between 13.5 and 19 kgper person per year, according to sources) and isnow equal to meat consumption.
The figures relating to fruit consumption provideresults which differ greatly according to thesource, making any interpretation dubious.
Sources: FAO database, Food balance sheets, Vietnam.
Figure 7. Change in the quantities of foodstuffs consumed, 1987-2001(million tons/year)
Table 6. The change in quantities of foodstuffs consumed per inhabitant, according to sources,1987-2000 (kg/capita/year)
Source
Rice
Staples other than rice
Other cereals
ROOTS AND TUBERS
tuber
vegetable-tubers
Leafy vegetables
Vegetables and dried beans
Beans and pules
Fruits
Meats
Fish, seafood
Oils and fats
EGGS AND MILK
milk
eggs
Eggs (number)
Tofu
Sugar, sweeteners
Sugar
NIN
1987
164.83
2.27
30.71
13.72
16.98
45.55
1.02
1.49
8.91
18.23
1.10
1.07
2.48
NIN
2000
145.01
5.84
14.78
3.25
11.53
53.66
2.19
22.76
18.63
19.20
2.47
3.75
4.88
VLSS
1992-93
153.26
14.5
28.63
22.55
9.61
13.41
1.36
0.41
14.48
3.02
2.66
0.29
VLSS
1997-98
150.36
9.72
37.44
17.76
14.04
13.56
3.96
0.6
28.2
4.8
4.2
2.9
FAO
1987
150.5
9.4
73.0
35.7
37.3
48.4
2.1
44.6
16.0
13.0
1.6
2.7
1.3
1.4
7.0
FAO
1993
161.3
13.4
60.5
28.4
32.1
50.8
2.4
43.4
17.3
12.9
2.9
4.6
3.2
1.4
6.3
FAO
1998
170.4
13.6
12.5
1.8
10.7
63.9
2.8
46.8
19.5
14.4
5.1
8.4
6.7
1.7
10.6
FAO
2000
174.3
16.4
11.4
1.8
9.6
71.2
3.0
46.3
21.9
18.5
5.0
11.2
9.1
2.1
11.0
Sources: NIN 1991 and 2002; GSO 1994 and 2000; FAOSTAT.
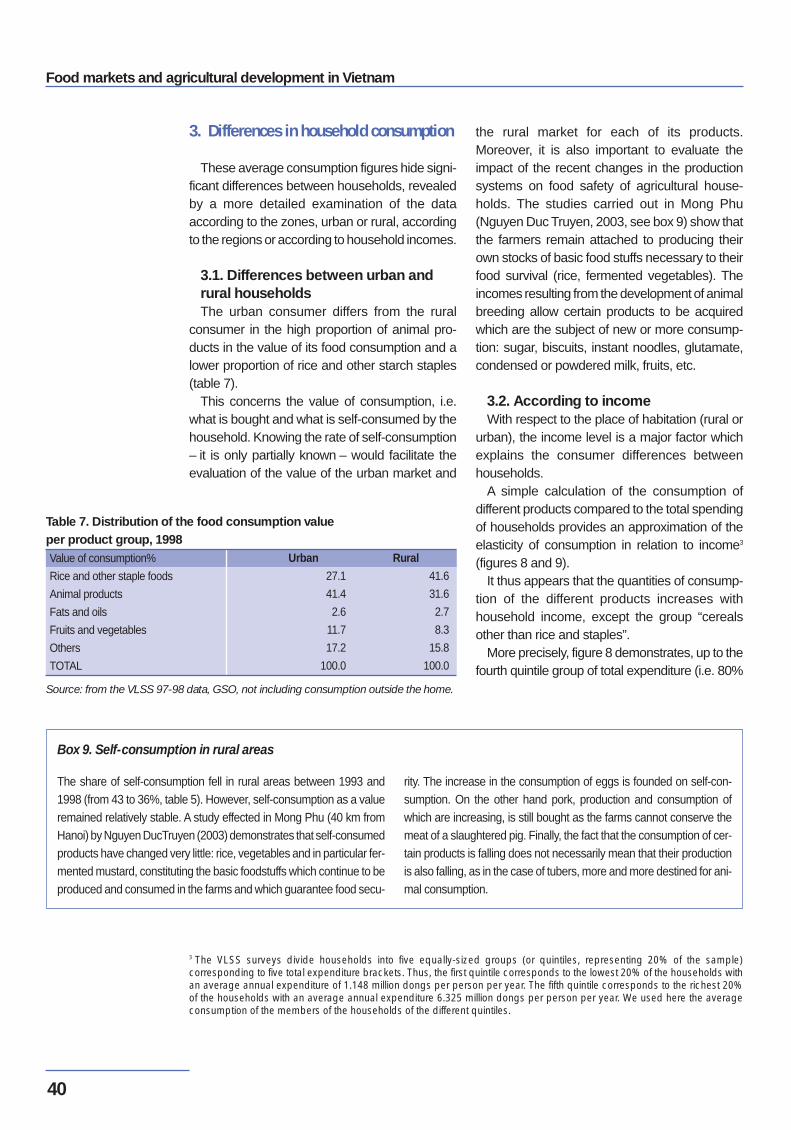
Food markets and agricultural development in Vietnam
40
3. Differences in household consumption
These average consumption figures hide signi-ficant differences between households, revealedby a more detailed examination of the dataaccording to the zones, urban or rural, accordingto the regions or according to household incomes.
3.1. Differences between urban andrural households The urban consumer differs from the rural
consumer in the high proportion of animal pro-ducts in the value of its food consumption and alower proportion of rice and other starch staples(table 7).
This concerns the value of consumption, i.e.what is bought and what is self-consumed by thehousehold. Knowing the rate of self-consumption– it is only partially known – would facilitate theevaluation of the value of the urban market and
the rural market for each of its products.Moreover, it is also important to evaluate theimpact of the recent changes in the productionsystems on food safety of agricultural house-holds. The studies carried out in Mong Phu(Nguyen Duc Truyen, 2003, see box 9) show thatthe farmers remain attached to producing theirown stocks of basic food stuffs necessary to theirfood survival (rice, fermented vegetables). Theincomes resulting from the development of animalbreeding allow certain products to be acquiredwhich are the subject of new or more consump-tion: sugar, biscuits, instant noodles, glutamate,condensed or powdered milk, fruits, etc.
3.2. According to incomeWith respect to the place of habitation (rural or
urban), the income level is a major factor whichexplains the consumer differences betweenhouseholds.
A simple calculation of the consumption ofdifferent products compared to the total spendingof households provides an approximation of theelasticity of consumption in relation to income3
(figures 8 and 9).It thus appears that the quantities of consump-
tion of the different products increases withhousehold income, except the group “cerealsother than rice and staples”.
More precisely, figure 8 demonstrates, up to thefourth quintile group of total expenditure (i.e. 80%
3 The VLSS surveys divide households into five equally-sized groups (or quintiles, representing 20% of the sample)corresponding to five total expenditure brackets. Thus, the first quintile corresponds to the lowest 20% of the households withan average annual expenditure of 1.148 million dongs per person per year. The fifth quintile corresponds to the richest 20%of the households with an average annual expenditure 6.325 million dongs per person per year. We used here the averageconsumption of the members of the households of the different quintiles.
Source: from the VLSS 97-98 data, GSO, not including consumption outside the home.
Table 7. Distribution of the food consumption valueper product group, 1998Value of consumption%
Rice and other staple foods
Animal products
Fats and oils
Fruits and vegetables
Others
TOTAL
Urban
27.1
41.4
2.6
11.7
17.2
100.0
Rural
41.6
31.6
2.7
8.3
15.8
100.0
The share of self-consumption fell in rural areas between 1993 and1998 (from 43 to 36%, table 5). However, self-consumption as a valueremained relatively stable. A study effected in Mong Phu (40 km fromHanoi) by Nguyen DucTruyen (2003) demonstrates that self-consumedproducts have changed very little: rice, vegetables and in particular fer-mented mustard, constituting the basic foodstuffs which continue to beproduced and consumed in the farms and which guarantee food secu-
rity. The increase in the consumption of eggs is founded on self-con-sumption. On the other hand pork, production and consumption ofwhich are increasing, is still bought as the farms cannot conserve themeat of a slaughtered pig. Finally, the fact that the consumption of cer-tain products is falling does not necessarily mean that their productionis also falling, as in the case of tubers, more and more destined for ani-mal consumption.
Box 9. Self-consumption in rural areas
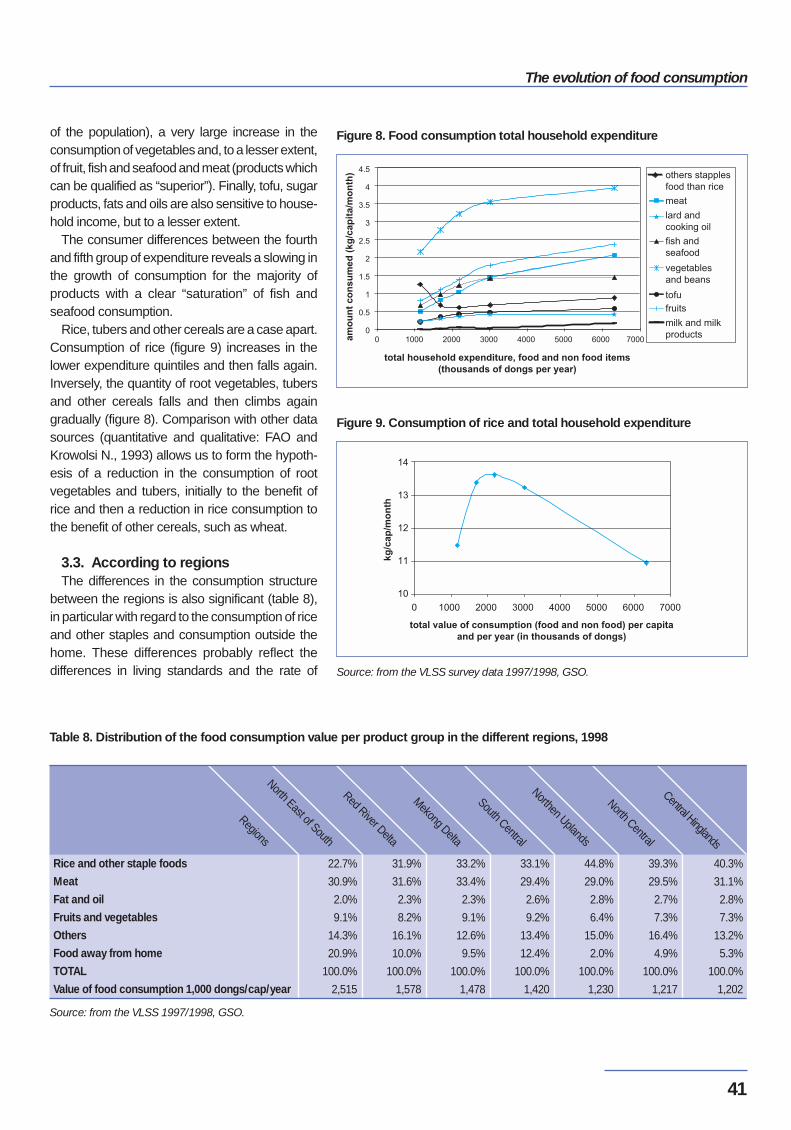
The evolution of food consumption
41
of the population), a very large increase in theconsumption of vegetables and, to a lesser extent,of fruit, fish and seafood and meat (products whichcan be qualified as “superior”). Finally, tofu, sugarproducts, fats and oils are also sensitive to house-hold income, but to a lesser extent.
The consumer differences between the fourthand fifth group of expenditure reveals a slowing inthe growth of consumption for the majority ofproducts with a clear “saturation” of fish andseafood consumption.
Rice, tubers and other cereals are a case apart.Consumption of rice (figure 9) increases in thelower expenditure quintiles and then falls again.Inversely, the quantity of root vegetables, tubersand other cereals falls and then climbs againgradually (figure 8). Comparison with other datasources (quantitative and qualitative: FAO andKrowolsi N., 1993) allows us to form the hypoth-esis of a reduction in the consumption of rootvegetables and tubers, initially to the benefit ofrice and then a reduction in rice consumption tothe benefit of other cereals, such as wheat.
3.3. According to regionsThe differences in the consumption structure
between the regions is also significant (table 8),in particular with regard to the consumption of riceand other staples and consumption outside thehome. These differences probably reflect thedifferences in living standards and the rate of Source: from the VLSS survey data 1997/1998, GSO.
Figure 8. Food consumption total household expenditure
Figure 9. Consumption of rice and total household expenditure
Source: from the VLSS 1997/1998, GSO.
Table 8. Distribution of the food consumption value per product group in the different regions, 1998
Rice and other staple foods
Meat
Fat and oil
Fruits and vegetables
Others
Food away from home
TOTAL
Value of food consumption 1,000 dongs/cap/year
22.7%
30.9%
2.0%
9.1%
14.3%
20.9%
100.0%
2,515
31.9%
31.6%
2.3%
8.2%
16.1%
10.0%
100.0%
1,578
33.2%
33.4%
2.3%
9.1%
12.6%
9.5%
100.0%
1,478
33.1%
29.4%
2.6%
9.2%
13.4%
12.4%
100.0%
1,420
44.8%
29.0%
2.8%
6.4%
15.0%
2.0%
100.0%
1,230
39.3%
29.5%
2.7%
7.3%
16.4%
4.9%
100.0%
1,217
40.3%
31.1%
2.8%
7.3%
13.2%
5.3%
100.0%
1,202
Regions
North East of South
Mekong Delta
South Central
Northen Uplands
North Central
Central Hinglands
Red River Delta
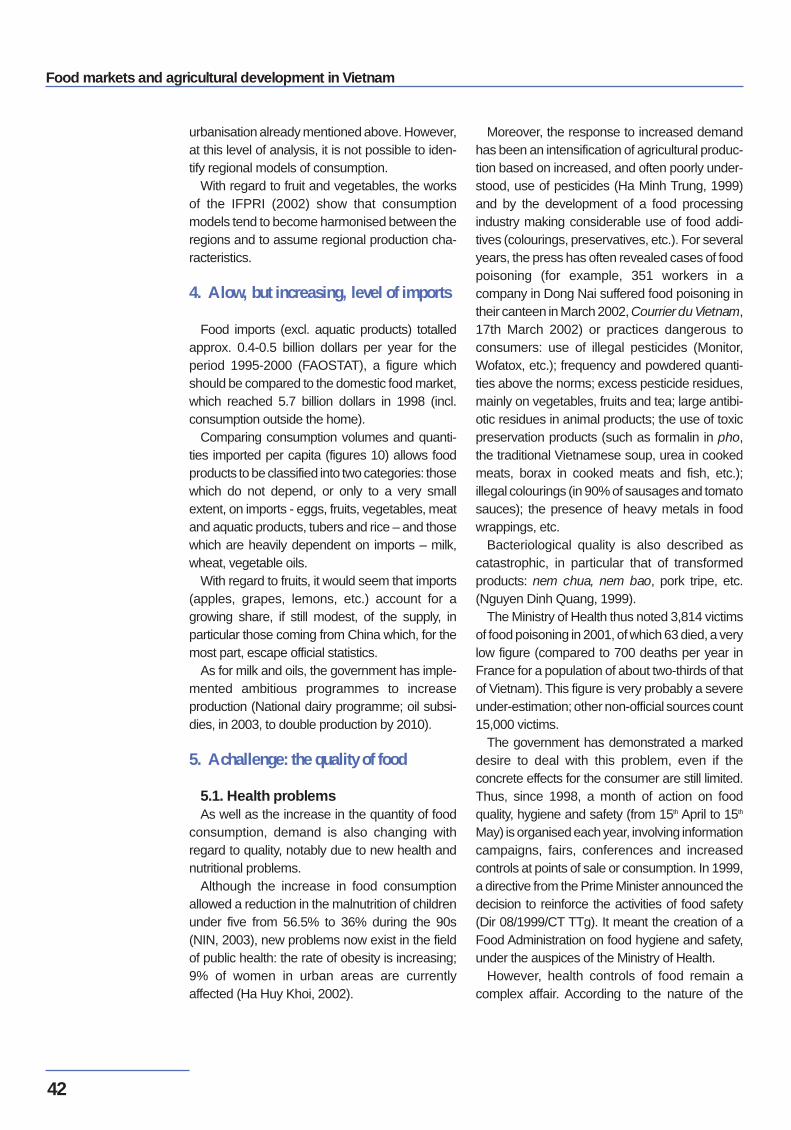
Food markets and agricultural development in Vietnam
42
urbanisation already mentioned above. However,at this level of analysis, it is not possible to iden-tify regional models of consumption.
With regard to fruit and vegetables, the worksof the IFPRI (2002) show that consumptionmodels tend to become harmonised between theregions and to assume regional production cha-racteristics.
4. A low, but increasing, level of imports
Food imports (excl. aquatic products) totalledapprox. 0.4-0.5 billion dollars per year for theperiod 1995-2000 (FAOSTAT), a figure whichshould be compared to the domestic food market,which reached 5.7 billion dollars in 1998 (incl.consumption outside the home).
Comparing consumption volumes and quanti-ties imported per capita (figures 10) allows foodproducts to be classified into two categories: thosewhich do not depend, or only to a very smallextent, on imports - eggs, fruits, vegetables, meatand aquatic products, tubers and rice – and thosewhich are heavily dependent on imports – milk,wheat, vegetable oils.
With regard to fruits, it would seem that imports(apples, grapes, lemons, etc.) account for agrowing share, if still modest, of the supply, inparticular those coming from China which, for themost part, escape official statistics.
As for milk and oils, the government has imple-mented ambitious programmes to increaseproduction (National dairy programme; oil subsi-dies, in 2003, to double production by 2010).
5. A challenge: the quality of food
5.1. Health problems As well as the increase in the quantity of food
consumption, demand is also changing withregard to quality, notably due to new health andnutritional problems.
Although the increase in food consumptionallowed a reduction in the malnutrition of childrenunder five from 56.5% to 36% during the 90s(NIN, 2003), new problems now exist in the fieldof public health: the rate of obesity is increasing;9% of women in urban areas are currentlyaffected (Ha Huy Khoi, 2002).
Moreover, the response to increased demandhas been an intensification of agricultural produc-tion based on increased, and often poorly under-stood, use of pesticides (Ha Minh Trung, 1999)and by the development of a food processingindustry making considerable use of food addi-tives (colourings, preservatives, etc.). For severalyears, the press has often revealed cases of foodpoisoning (for example, 351 workers in acompany in Dong Nai suffered food poisoning intheir canteen in March 2002, Courrier du Vietnam,17th March 2002) or practices dangerous toconsumers: use of illegal pesticides (Monitor,Wofatox, etc.); frequency and powdered quanti-ties above the norms; excess pesticide residues,mainly on vegetables, fruits and tea; large antibi-otic residues in animal products; the use of toxicpreservation products (such as formalin in pho,the traditional Vietnamese soup, urea in cookedmeats, borax in cooked meats and fish, etc.);illegal colourings (in 90% of sausages and tomatosauces); the presence of heavy metals in foodwrappings, etc.
Bacteriological quality is also described ascatastrophic, in particular that of transformedproducts: nem chua, nem bao, pork tripe, etc.(Nguyen Dinh Quang, 1999).
The Ministry of Health thus noted 3,814 victimsof food poisoning in 2001, of which 63 died, a verylow figure (compared to 700 deaths per year inFrance for a population of about two-thirds of thatof Vietnam). This figure is very probably a severeunder-estimation; other non-official sources count15,000 victims.
The government has demonstrated a markeddesire to deal with this problem, even if theconcrete effects for the consumer are still limited.Thus, since 1998, a month of action on foodquality, hygiene and safety (from 15th April to 15th
May) is organised each year, involving informationcampaigns, fairs, conferences and increasedcontrols at points of sale or consumption. In 1999,a directive from the Prime Minister announced thedecision to reinforce the activities of food safety(Dir 08/1999/CT TTg). It meant the creation of aFood Administration on food hygiene and safety,under the auspices of the Ministry of Health.
However, health controls of food remain acomplex affair. According to the nature of the
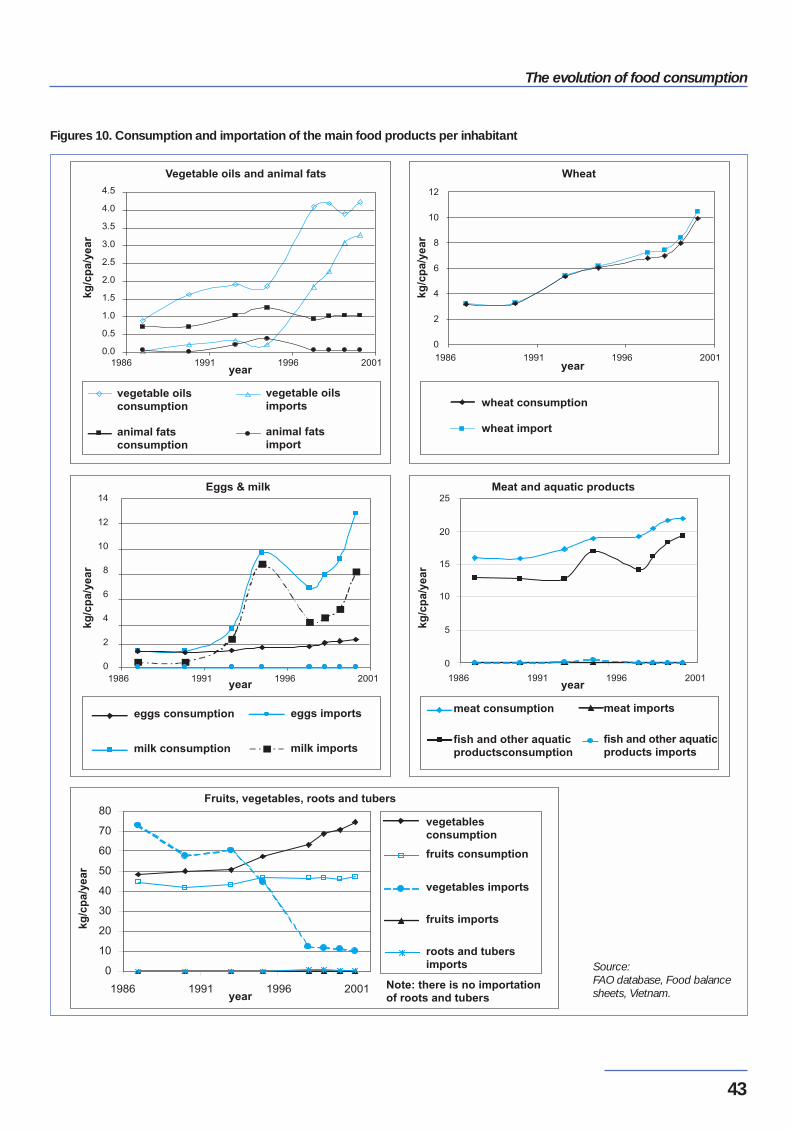
The evolution of food consumption
43
Source:FAO database, Food balancesheets, Vietnam.
Figures 10. Consumption and importation of the main food products per inhabitant

Food markets and agricultural development in Vietnam
44
products (fresh, transformed, imported, etc.) andthe place of the controls (places of production,transformation, sales, consumption, transport),the controls involve a wide range of institutions(linked to the Ministries of Health, Trade,Agriculture and Rural Development, Fisheries,Science and Technology, etc.). The means arelimited and the controls are concentrated on twoperiods: the Tet (festival celebrating the new lunaryear, during which household consumptionincreases considerably) and the month of actionmentioned above.
5.2. Concerned consumersConfronted by these problems and following
sensitisation campaigns, certain studies revealnew concerns of urban consumers with regard tothe quality of products (Bridier B., 2000; GinhouxV., 2001; Figuié M., 2003).
According to the survey, carried out in Hanoi(CIRAD-IOS, 2002, table 9), urban consumersbelieve that the quality of their meals hasincreased over the last ten years (foodstuffs areseen to be more plentiful and more varied, provi-ding the consumer with choice). However, morethan half of them feel that the quality of food pro-ducts has fallen. To such an extent that, for 65%of consumers, food products today represent ahealth risk.
With regard to health quality, it is in particularvegetables, then meat and finally fruit and aquaticproducts which present the greatest danger in theeyes of the consumers (figure 11). In the case ofvegetables, it is the probable presence of pesti-cide residues which is called into question. Withfruits, there is the added problem of the use ofpreservative products in which the fruit are appa-rently soaked after harvesting (a practice essen-tially associated with fruits imported from China).As for meat, the criticisms are more varied, butmainly concern the use of “stimulants” (a relativelyvague term in the dialogue of the consumers butwhich would seem to correspond to the growthactivators used in animal food). With regard to fishand other seafood (prawns, crabs, etc.), it is theuse of preservative products (urea, formalin,borax, etc.) which is criticised.
Suspicion, then, can be seen on a massivescale with regard to the increasing use of chemi-cal products in the food processing sector: pesti-cides – the use of pesticides increased by 75%from 1991 to 1997 (Ha Minh Trung, 1999) –,growth activators, preservatives. The nature ofthe products (products which are sometimesillegal) are called into question, as well as thetreatment dates (too close to the harvest) and thequantities used.
Source: CIRAD-IOS survey, 2002.
Questions posed to 200 interviewees:
(1) Do you think that the quality of your meals has improved, remained the same or
fallen over the last ten years?
(2) Do you think that the quality of the commercialised food products has improved,
remained the same or fallen over the last ten years?
Table 9. Change in the quality of meals and commercialised food products according to consumers in Hanoi, 2002 (%)
Change in quality
Has improved
Remained the same
Has fallen
Do not know, no answer
Total
Quality of meals
93.5
5.0
1.0
0.5
100.0
Quality of food products
35.5
6.0
56.0
2.5
100.0
Pho is a culinary speciality from Hanoi. It is a soup, eaten at all hoursby the inhabitants of Hanoi, containing rice noodles. In 1999, after expo-sure by an employee in a production unit of pho noodles, controls werecarried out in various street restaurants, revealing the presence of for-malin in 7 samples out of 10 (Nhan Dan, 6th January 2000). Formalinis used to improve the consistency of the noodles and to prolong theconservation of the soup. The publication of these results brought about
what is called the “pho crisis”. The consumers were shaken by what thepress called a serious crime against the national gastronomic culture.In the days that followed, the consumption of pho plummeted by almost80%. Then the consumers fell back into their old habits without any realmeasures having been taken. Recently, 172 school children at a primaryschool in Ho Chi Minh City had to be hospitalised after eating pho intheir school canteen (Courrier du Vietnam, 17th March 2003).
Box 10. The pho crisis
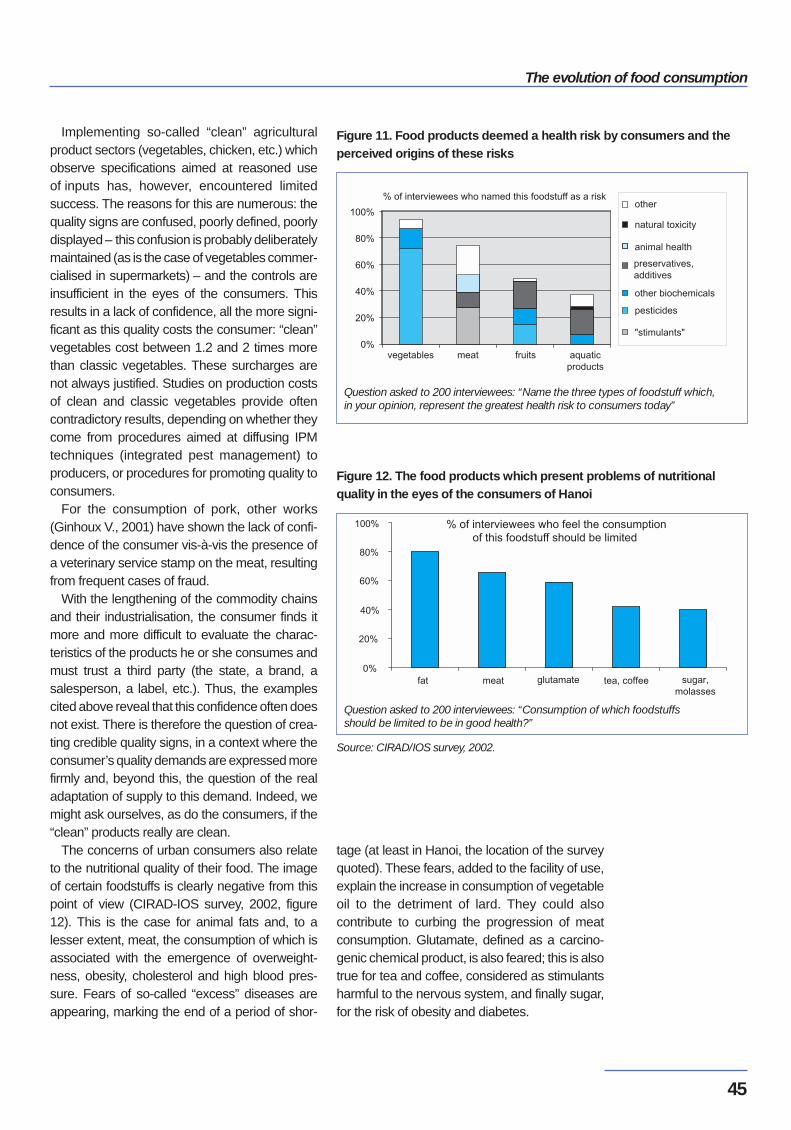
The evolution of food consumption
45
Implementing so-called “clean” agriculturalproduct sectors (vegetables, chicken, etc.) whichobserve specifications aimed at reasoned useof inputs has, however, encountered limitedsuccess. The reasons for this are numerous: thequality signs are confused, poorly defined, poorlydisplayed – this confusion is probably deliberatelymaintained (as is the case of vegetables commer-cialised in supermarkets) – and the controls areinsufficient in the eyes of the consumers. Thisresults in a lack of confidence, all the more signi-ficant as this quality costs the consumer: “clean”vegetables cost between 1.2 and 2 times morethan classic vegetables. These surcharges arenot always justified. Studies on production costsof clean and classic vegetables provide oftencontradictory results, depending on whether theycome from procedures aimed at diffusing IPMtechniques (integrated pest management) toproducers, or procedures for promoting quality toconsumers.
For the consumption of pork, other works(Ginhoux V., 2001) have shown the lack of confi-dence of the consumer vis-à-vis the presence ofa veterinary service stamp on the meat, resultingfrom frequent cases of fraud.
With the lengthening of the commodity chainsand their industrialisation, the consumer finds itmore and more difficult to evaluate the charac-teristics of the products he or she consumes andmust trust a third party (the state, a brand, asalesperson, a label, etc.). Thus, the examplescited above reveal that this confidence often doesnot exist. There is therefore the question of crea-ting credible quality signs, in a context where theconsumer’s quality demands are expressed morefirmly and, beyond this, the question of the realadaptation of supply to this demand. Indeed, wemight ask ourselves, as do the consumers, if the“clean” products really are clean.
The concerns of urban consumers also relateto the nutritional quality of their food. The imageof certain foodstuffs is clearly negative from thispoint of view (CIRAD-IOS survey, 2002, figure12). This is the case for animal fats and, to alesser extent, meat, the consumption of which isassociated with the emergence of overweight-ness, obesity, cholesterol and high blood pres-sure. Fears of so-called “excess” diseases areappearing, marking the end of a period of shor-
tage (at least in Hanoi, the location of the surveyquoted). These fears, added to the facility of use,explain the increase in consumption of vegetableoil to the detriment of lard. They could alsocontribute to curbing the progression of meatconsumption. Glutamate, defined as a carcino-genic chemical product, is also feared; this is alsotrue for tea and coffee, considered as stimulantsharmful to the nervous system, and finally sugar,for the risk of obesity and diabetes.
Question asked to 200 interviewees: “Name the three types of foodstuff which, in your opinion, represent the greatest health risk to consumers today”
Figure 11. Food products deemed a health risk by consumers and theperceived origins of these risks
Figure 12. The food products which present problems of nutritionalquality in the eyes of the consumers of Hanoi
Source: CIRAD/IOS survey, 2002.
Question asked to 200 interviewees: “Consumption of which foodstuffsshould be limited to be in good health?”
Food markets and agricultural development in Vietnam
46
6. New consumer behaviours
These transformations are also accompaniedby changes in consumer practices. The moststriking are without doubt those relating to supplymethods and meal-taking.
The quality demands are expressed in acontext of plenty marked by the abolition of rationtickets since 1989, whereas points of sale, and inparticular small supermarkets in urban zones, areproliferating. These supermarkets are essentiallyfrequented at the weekend by customers livingnearby.
With regard to meal-taking, the most strikingfact is the development of food consumptionoutside the home. The economic importance ofthis type of consumption was mentioned earlier.From a nutritional point of view, it represented, in1997, 30% of the caloric consumption of urbanconsumers in Hanoi (Le Danh Tuyen, Bricas N.et al., 2000).
According to Pham Kim Anh (1997), the mealstaken outside the home are essentially breakfast,to a lesser extent lunch and, more rare, dinners.They are mainly meals taken during the week, insmall street restaurants (57%) or purchased fromitinerant vendors (37%). Customers can eatdishes which generally take a long time to cook orare costly to prepare in small quantities. Thus wewitness the development (Krowolski N., 1993) of“one-dish meals” (the meal is composed of asingle dish), such as pho or bun cha, and "snac-king" (consumption between fixed meals).
Another change, probably important from aneconomic and social point of view, concerns theincreasing consumption of transformed products(canned foods, take-away food, etc.). Thisremains to be quantified.
Conclusions: answers to the changes in food production
This brief look at recent food changes inVietnam demonstrates the opportunity repre-sented by this market for the agricultural and food-processing sector. An opportunity but a challenge
as well as it means being capable of measuringthese changes - in both their quantitative andqualitative dimensions. It also means following thetempo which, as we have seen, is very quick. Atpresent, this dynamic is still only partially known.What is the share of self-consumption of thesedifferent products? How are the behaviours ofyoung people changing compared to their elders?What differences exist between the differentregions? These are so many questions theanswers to which will allow a better evaluation ofthe locomotive potential of food consumption foreconomic growth in Vietnam.
The importance is also to satisfy this demand ina responsible manner, including not onlyeconomic objectives but also objectives of publichealth or social and cultural concerns.Consumption models are evolving, especially inurban areas, causing new problems of publichealth. With the industrialisation of agriculturalproduction and food transformation, new qualityproblems are arising. This requires that we gobeyond the sector-based approach to includeother stakeholders, in particular those in thehealth sector, and to encourage communicationwith the public.
These food changes also have social andcultural consequences. The spectacular deve-lopment of food consumption outside the home inthe towns leads to fears of the destructuring ofmeals and, at a higher level, family relations andcohesion. Increasing disparities are alreadyemerging in the access to food and in the foodmodels between rural and urban areas, betweenrich and poor and between regions. Finally, therapid opening to international trade and the resul-ting increase in food imports raise the question ofthe capacity of the Vietnamese food system tomaintain its food culture while remaining compe-titive.
An operational and responsible approach tofood thus requires that this theme be tackled in allits complexities, i.e. as a nutritional, social,economic and cultural act. And this in order tosatisfy the economic stakes for the producers, aswell as those of food security and safety.
The evolution of food consumption
47
Food markets and agricultural development in Vietnam
48
Changes in food productionDao The Anh, Vu Trong Binh, Le Duc Thinh (VASI)
Since the reform of 1988 and the allocation of land to the rural households, theagricultural production of Vietnam has experienced remarkable success, with a growthrate of 4.2% per year. Between 1991 and 2000, production of rice increased by 5.6%per year, of corn by 10.2%, of vegetables by 7% and of pigs by 5%. This growthsatisfied the needs for both food consumption and exportation. However, the structural transformations of the rural economy are slow, especially inthe larger deltas of the North and South. In each region, the diversification of agricultureis real, although rice still covers 60% of the areas and production is continuing toprogress rapidly. After aiming at self-sufficiency (before 1993), agricultural farms havebecome more and more oriented towards the market, even in the mountain areas.Nevertheless, due to a lack of sufficient infrastructures and of a suitable legalframework, the market economy has only developed gradually. Rural households today operate in an unfavourable economic and social context. Inmany places, public services are limited or non-existent (credit, extension, commercialinformation). The new collective private services are having difficulty in becomingestablished. These constraints curb the diversification of agriculture. Already practiced by rural households, non-agricultural activities can be a motor ofstructural change to diversify the economic activities of the rural households in acontext of limited agricultural land. By transforming agricultural products and byproviding the services to sell them, they allow agricultural activities to be diversified.They provide financial resources which can be invested in agriculture. The State hasan important role to play, acting as a catalyst for local initiatives by according suitablesupport. Agricultural development oriented towards the domestic market has adiversified request, which can bring about structural transformations with theagricultural and non-agricultural diversification.
At first we see how the agricultural productionhas evolved during the last ten years, thanks to afavourable political context (see box 11). Wepresent the problems of access to factors ofproduction factors and to the different agriculturalservices (credit, extension, trade), which may limit
the agricultural growth. We insist on the growingeconomic differentiation between the differentregions and inside the regions. The relationshipbetween agriculture and the other sectors of theeconomy, in terms of reciprocal ratchet effects,are exposed in a last part.
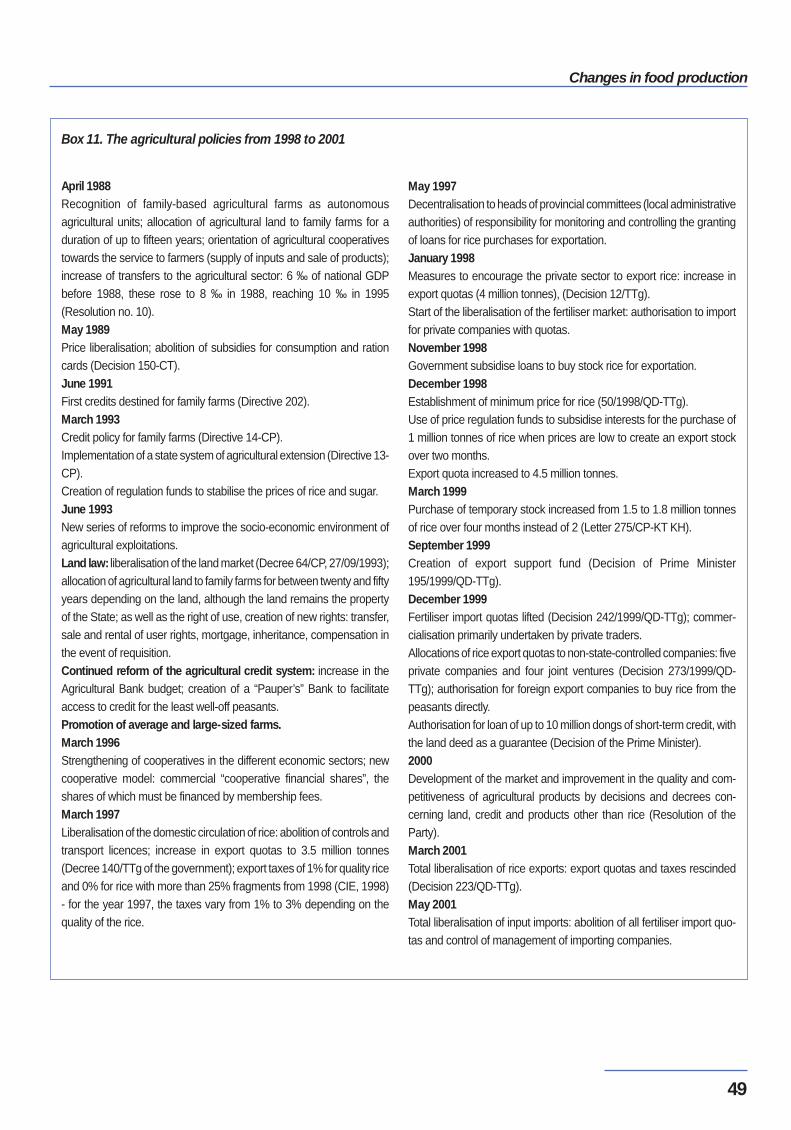
49
Changes in food production
April 1988Recognition of family-based agricultural farms as autonomousagricultural units; allocation of agricultural land to family farms for aduration of up to fifteen years; orientation of agricultural cooperativestowards the service to farmers (supply of inputs and sale of products);increase of transfers to the agricultural sector: 6 ‰ of national GDPbefore 1988, these rose to 8 ‰ in 1988, reaching 10 ‰ in 1995(Resolution no. 10).May 1989Price liberalisation; abolition of subsidies for consumption and rationcards (Decision 150-CT).June 1991First credits destined for family farms (Directive 202).March 1993Credit policy for family farms (Directive 14-CP).Implementation of a state system of agricultural extension (Directive 13-CP).Creation of regulation funds to stabilise the prices of rice and sugar.June 1993New series of reforms to improve the socio-economic environment ofagricultural exploitations.Land law: liberalisation of the land market (Decree 64/CP, 27/09/1993);allocation of agricultural land to family farms for between twenty and fiftyyears depending on the land, although the land remains the propertyof the State; as well as the right of use, creation of new rights: transfer,sale and rental of user rights, mortgage, inheritance, compensation inthe event of requisition.Continued reform of the agricultural credit system: increase in theAgricultural Bank budget; creation of a “Pauper’s” Bank to facilitateaccess to credit for the least well-off peasants.Promotion of average and large-sized farms.March 1996Strengthening of cooperatives in the different economic sectors; newcooperative model: commercial “cooperative financial shares”, theshares of which must be financed by membership fees.March 1997Liberalisation of the domestic circulation of rice: abolition of controls andtransport licences; increase in export quotas to 3.5 million tonnes(Decree 140/TTg of the government); export taxes of 1% for quality riceand 0% for rice with more than 25% fragments from 1998 (CIE, 1998)- for the year 1997, the taxes vary from 1% to 3% depending on thequality of the rice.
May 1997Decentralisation to heads of provincial committees (local administrativeauthorities) of responsibility for monitoring and controlling the grantingof loans for rice purchases for exportation.January 1998Measures to encourage the private sector to export rice: increase inexport quotas (4 million tonnes), (Decision 12/TTg).Start of the liberalisation of the fertiliser market: authorisation to importfor private companies with quotas. November 1998Government subsidise loans to buy stock rice for exportation.December 1998Establishment of minimum price for rice (50/1998/QD-TTg).Use of price regulation funds to subsidise interests for the purchase of1 million tonnes of rice when prices are low to create an export stockover two months.Export quota increased to 4.5 million tonnes.March 1999Purchase of temporary stock increased from 1.5 to 1.8 million tonnesof rice over four months instead of 2 (Letter 275/CP-KT KH).September 1999Creation of export support fund (Decision of Prime Minister195/1999/QD-TTg).December 1999Fertiliser import quotas lifted (Decision 242/1999/QD-TTg); commer-cialisation primarily undertaken by private traders.Allocations of rice export quotas to non-state-controlled companies: fiveprivate companies and four joint ventures (Decision 273/1999/QD-TTg); authorisation for foreign export companies to buy rice from thepeasants directly.Authorisation for loan of up to 10 million dongs of short-term credit, withthe land deed as a guarantee (Decision of the Prime Minister).2000Development of the market and improvement in the quality and com-petitiveness of agricultural products by decisions and decrees con-cerning land, credit and products other than rice (Resolution of theParty).March 2001Total liberalisation of rice exports: export quotas and taxes rescinded(Decision 223/QD-TTg).May 2001Total liberalisation of input imports: abolition of all fertiliser import quo-tas and control of management of importing companies.
Box 11. The agricultural policies from 1998 to 2001
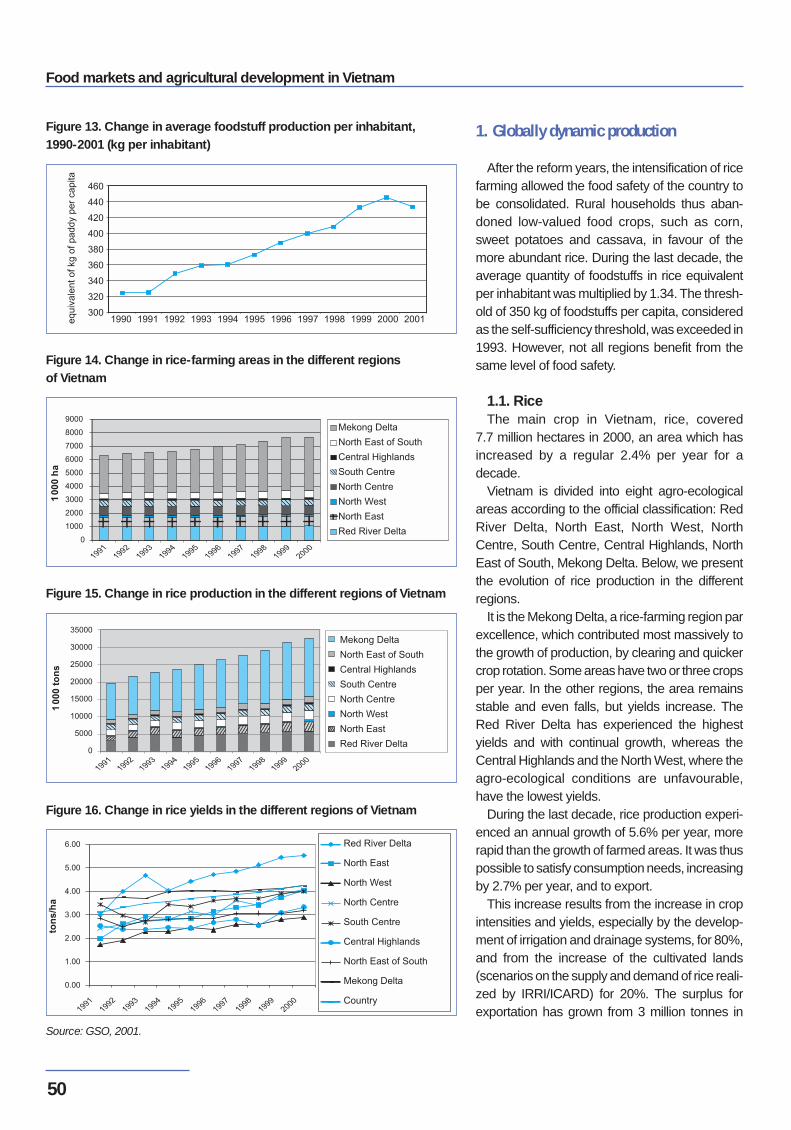
Food markets and agricultural development in Vietnam
50
1. Globally dynamic production
After the reform years, the intensification of ricefarming allowed the food safety of the country tobe consolidated. Rural households thus aban-doned low-valued food crops, such as corn,sweet potatoes and cassava, in favour of themore abundant rice. During the last decade, theaverage quantity of foodstuffs in rice equivalentper inhabitant was multiplied by 1.34. The thresh-old of 350 kg of foodstuffs per capita, consideredas the self-sufficiency threshold, was exceeded in1993. However, not all regions benefit from thesame level of food safety.
1.1. RiceThe main crop in Vietnam, rice, covered
7.7 million hectares in 2000, an area which hasincreased by a regular 2.4% per year for adecade.
Vietnam is divided into eight agro-ecologicalareas according to the official classification: RedRiver Delta, North East, North West, NorthCentre, South Centre, Central Highlands, NorthEast of South, Mekong Delta. Below, we presentthe evolution of rice production in the differentregions.
It is the Mekong Delta, a rice-farming region parexcellence, which contributed most massively tothe growth of production, by clearing and quickercrop rotation. Some areas have two or three cropsper year. In the other regions, the area remainsstable and even falls, but yields increase. TheRed River Delta has experienced the highestyields and with continual growth, whereas theCentral Highlands and the North West, where theagro-ecological conditions are unfavourable,have the lowest yields.
During the last decade, rice production experi-enced an annual growth of 5.6% per year, morerapid than the growth of farmed areas. It was thuspossible to satisfy consumption needs, increasingby 2.7% per year, and to export.
This increase results from the increase in cropintensities and yields, especially by the develop-ment of irrigation and drainage systems, for 80%,and from the increase of the cultivated lands(scenarios on the supply and demand of rice reali-zed by IRRI/ICARD) for 20%. The surplus forexportation has grown from 3 million tonnes in
Source: GSO, 2001.
Figure 13. Change in average foodstuff production per inhabitant,1990-2001 (kg per inhabitant)
Figure 14. Change in rice-farming areas in the different regionsof Vietnam
Figure 15. Change in rice production in the different regions of Vietnam
Figure 16. Change in rice yields in the different regions of Vietnam
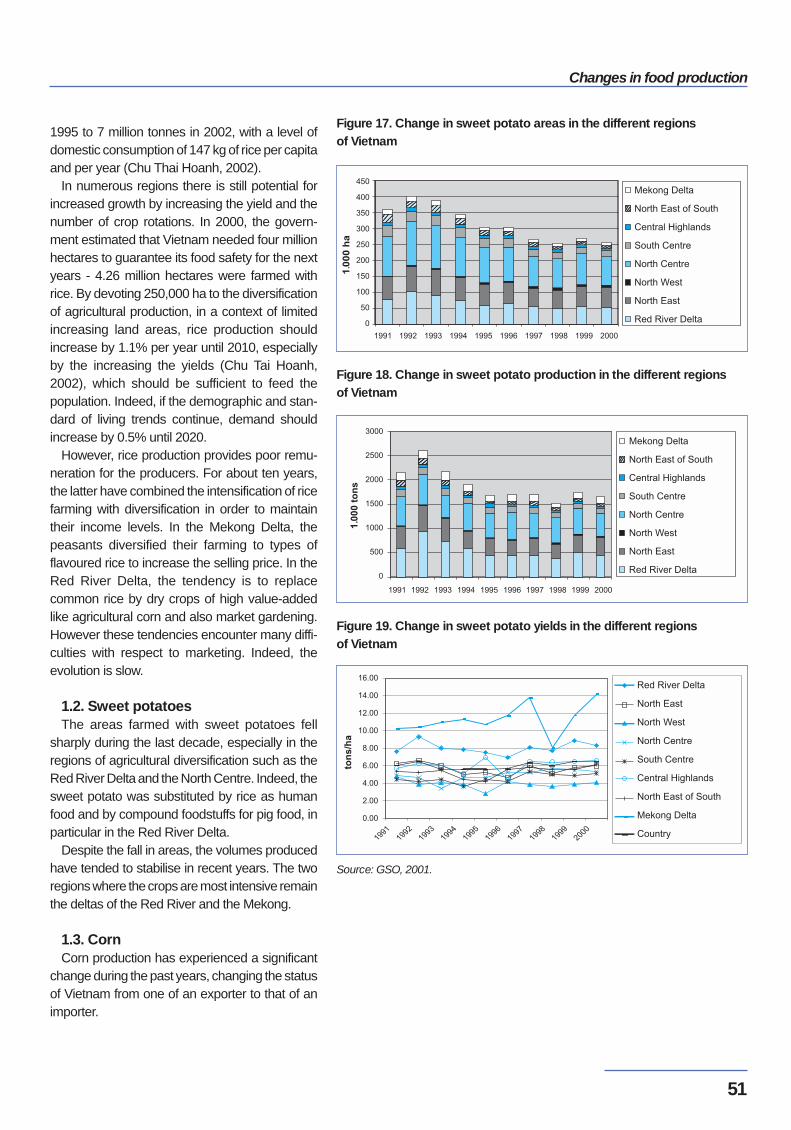
51
Changes in food production
1995 to 7 million tonnes in 2002, with a level ofdomestic consumption of 147 kg of rice per capitaand per year (Chu Thai Hoanh, 2002).
In numerous regions there is still potential forincreased growth by increasing the yield and thenumber of crop rotations. In 2000, the govern-ment estimated that Vietnam needed four millionhectares to guarantee its food safety for the nextyears - 4.26 million hectares were farmed withrice. By devoting 250,000 ha to the diversificationof agricultural production, in a context of limitedincreasing land areas, rice production shouldincrease by 1.1% per year until 2010, especiallyby the increasing the yields (Chu Tai Hoanh,2002), which should be sufficient to feed thepopulation. Indeed, if the demographic and stan-dard of living trends continue, demand shouldincrease by 0.5% until 2020.
However, rice production provides poor remu-neration for the producers. For about ten years,the latter have combined the intensification of ricefarming with diversification in order to maintaintheir income levels. In the Mekong Delta, thepeasants diversified their farming to types offlavoured rice to increase the selling price. In theRed River Delta, the tendency is to replacecommon rice by dry crops of high value-addedlike agricultural corn and also market gardening.However these tendencies encounter many diffi-culties with respect to marketing. Indeed, theevolution is slow.
1.2. Sweet potatoesThe areas farmed with sweet potatoes fell
sharply during the last decade, especially in theregions of agricultural diversification such as theRed River Delta and the North Centre. Indeed, thesweet potato was substituted by rice as humanfood and by compound foodstuffs for pig food, inparticular in the Red River Delta.
Despite the fall in areas, the volumes producedhave tended to stabilise in recent years. The tworegions where the crops are most intensive remainthe deltas of the Red River and the Mekong.
1.3. CornCorn production has experienced a significant
change during the past years, changing the statusof Vietnam from one of an exporter to that of animporter.
Source: GSO, 2001.
Figure 17. Change in sweet potato areas in the different regionsof Vietnam
Figure 18. Change in sweet potato production in the different regionsof Vietnam
Figure 19. Change in sweet potato yields in the different regionsof Vietnam
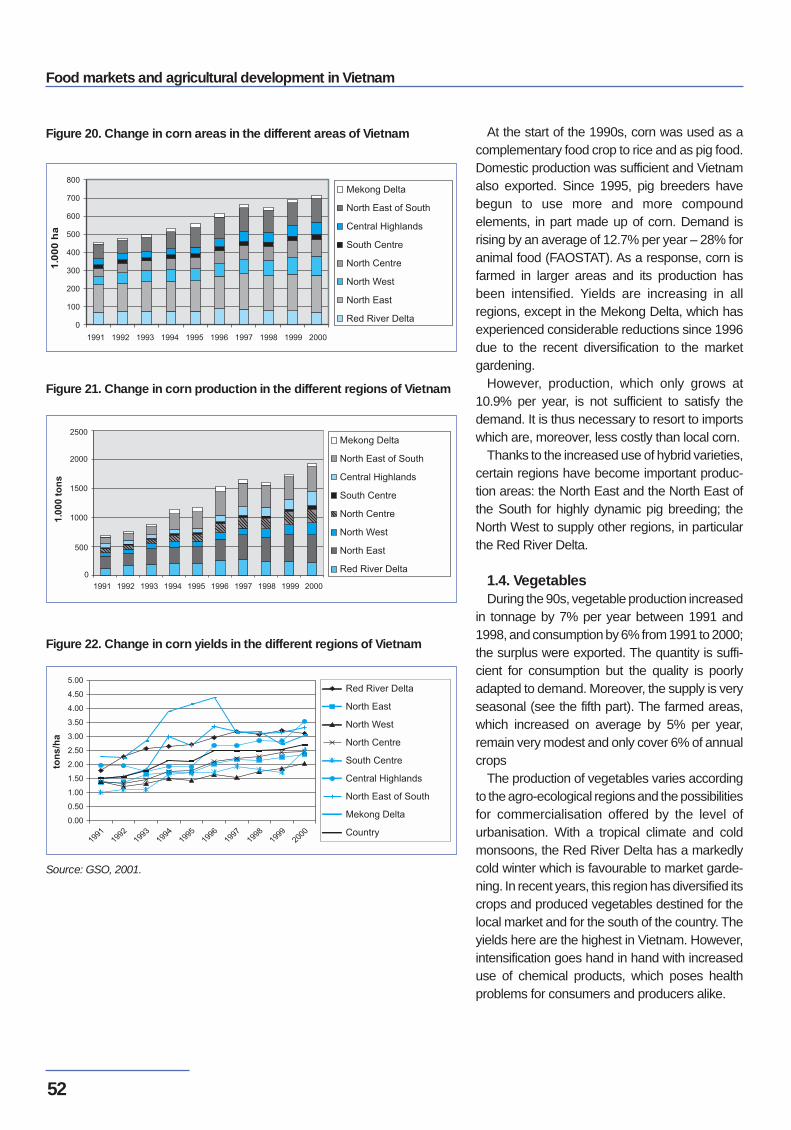
Food markets and agricultural development in Vietnam
52
At the start of the 1990s, corn was used as acomplementary food crop to rice and as pig food.Domestic production was sufficient and Vietnamalso exported. Since 1995, pig breeders havebegun to use more and more compoundelements, in part made up of corn. Demand isrising by an average of 12.7% per year – 28% foranimal food (FAOSTAT). As a response, corn isfarmed in larger areas and its production hasbeen intensified. Yields are increasing in allregions, except in the Mekong Delta, which hasexperienced considerable reductions since 1996due to the recent diversification to the marketgardening.
However, production, which only grows at10.9% per year, is not sufficient to satisfy thedemand. It is thus necessary to resort to importswhich are, moreover, less costly than local corn.
Thanks to the increased use of hybrid varieties,certain regions have become important produc-tion areas: the North East and the North East ofthe South for highly dynamic pig breeding; theNorth West to supply other regions, in particularthe Red River Delta.
1.4. VegetablesDuring the 90s, vegetable production increased
in tonnage by 7% per year between 1991 and1998, and consumption by 6% from 1991 to 2000;the surplus were exported. The quantity is suffi-cient for consumption but the quality is poorlyadapted to demand. Moreover, the supply is veryseasonal (see the fifth part). The farmed areas,which increased on average by 5% per year,remain very modest and only cover 6% of annualcrops
The production of vegetables varies accordingto the agro-ecological regions and the possibilitiesfor commercialisation offered by the level ofurbanisation. With a tropical climate and coldmonsoons, the Red River Delta has a markedlycold winter which is favourable to market garde-ning. In recent years, this region has diversified itscrops and produced vegetables destined for thelocal market and for the south of the country. Theyields here are the highest in Vietnam. However,intensification goes hand in hand with increaseduse of chemical products, which poses healthproblems for consumers and producers alike.
Source: GSO, 2001.
Figure 20. Change in corn areas in the different areas of Vietnam
Figure 21. Change in corn production in the different regions of Vietnam
Figure 22. Change in corn yields in the different regions of Vietnam
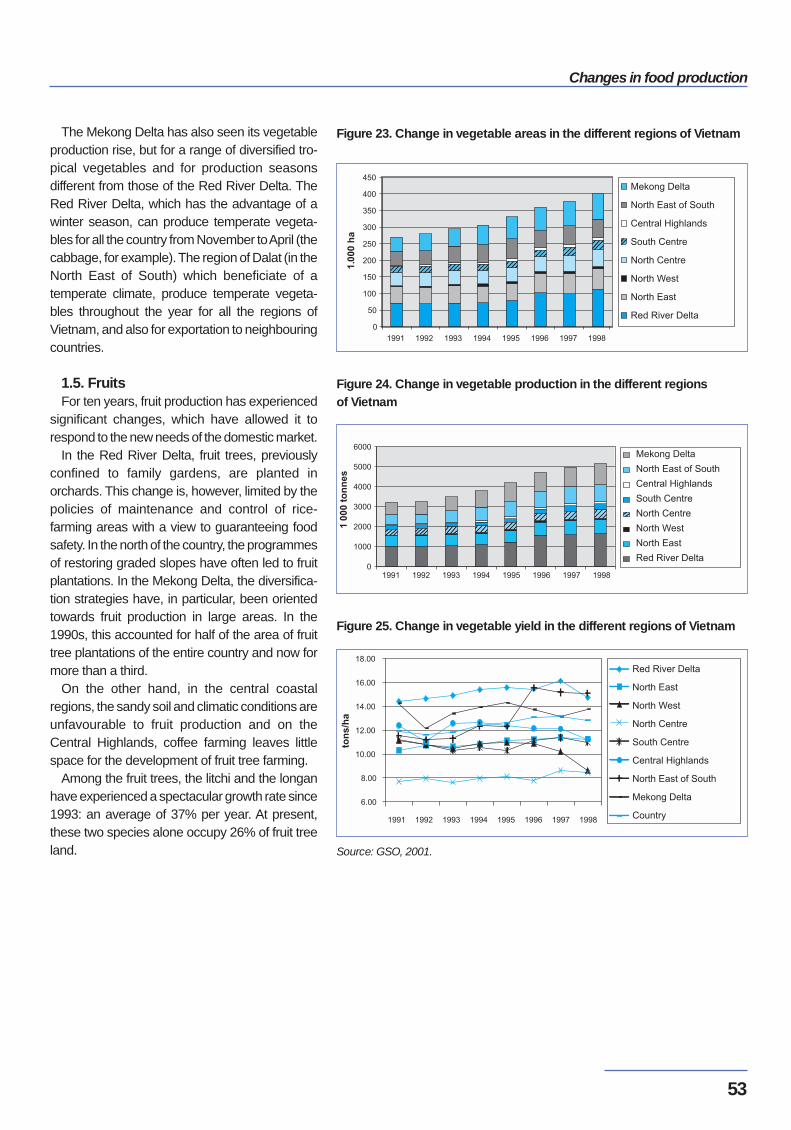
53
Changes in food production
The Mekong Delta has also seen its vegetableproduction rise, but for a range of diversified tro-pical vegetables and for production seasonsdifferent from those of the Red River Delta. TheRed River Delta, which has the advantage of awinter season, can produce temperate vegeta-bles for all the country from November to April (thecabbage, for example). The region of Dalat (in theNorth East of South) which beneficiate of atemperate climate, produce temperate vegeta-bles throughout the year for all the regions ofVietnam, and also for exportation to neighbouringcountries.
1.5. FruitsFor ten years, fruit production has experienced
significant changes, which have allowed it torespond to the new needs of the domestic market.
In the Red River Delta, fruit trees, previouslyconfined to family gardens, are planted inorchards. This change is, however, limited by thepolicies of maintenance and control of rice-farming areas with a view to guaranteeing foodsafety. In the north of the country, the programmesof restoring graded slopes have often led to fruitplantations. In the Mekong Delta, the diversifica-tion strategies have, in particular, been orientedtowards fruit production in large areas. In the1990s, this accounted for half of the area of fruittree plantations of the entire country and now formore than a third.
On the other hand, in the central coastalregions, the sandy soil and climatic conditions areunfavourable to fruit production and on theCentral Highlands, coffee farming leaves littlespace for the development of fruit tree farming.
Among the fruit trees, the litchi and the longanhave experienced a spectacular growth rate since1993: an average of 37% per year. At present,these two species alone occupy 26% of fruit treeland. Source: GSO, 2001.
Figure 23. Change in vegetable areas in the different regions of Vietnam
Figure 24. Change in vegetable production in the different regionsof Vietnam
Figure 25. Change in vegetable yield in the different regions of Vietnam
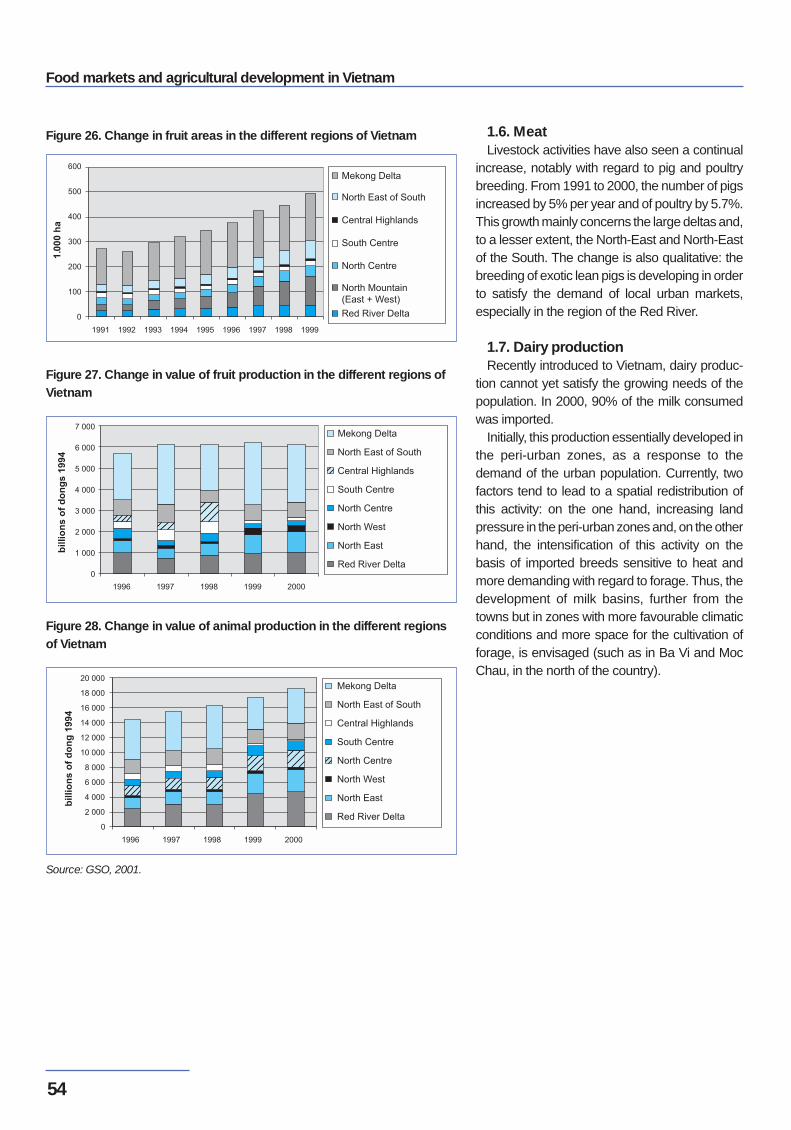
Food markets and agricultural development in Vietnam
54
1.6. MeatLivestock activities have also seen a continual
increase, notably with regard to pig and poultrybreeding. From 1991 to 2000, the number of pigsincreased by 5% per year and of poultry by 5.7%.This growth mainly concerns the large deltas and,to a lesser extent, the North-East and North-Eastof the South. The change is also qualitative: thebreeding of exotic lean pigs is developing in orderto satisfy the demand of local urban markets,especially in the region of the Red River.
1.7. Dairy productionRecently introduced to Vietnam, dairy produc-
tion cannot yet satisfy the growing needs of thepopulation. In 2000, 90% of the milk consumedwas imported.
Initially, this production essentially developed inthe peri-urban zones, as a response to thedemand of the urban population. Currently, twofactors tend to lead to a spatial redistribution ofthis activity: on the one hand, increasing landpressure in the peri-urban zones and, on the otherhand, the intensification of this activity on thebasis of imported breeds sensitive to heat andmore demanding with regard to forage. Thus, thedevelopment of milk basins, further from thetowns but in zones with more favourable climaticconditions and more space for the cultivation offorage, is envisaged (such as in Ba Vi and MocChau, in the north of the country).
Source: GSO, 2001.
Figure 26. Change in fruit areas in the different regions of Vietnam
Figure 27. Change in value of fruit production in the different regions ofVietnam
Figure 28. Change in value of animal production in the different regionsof Vietnam
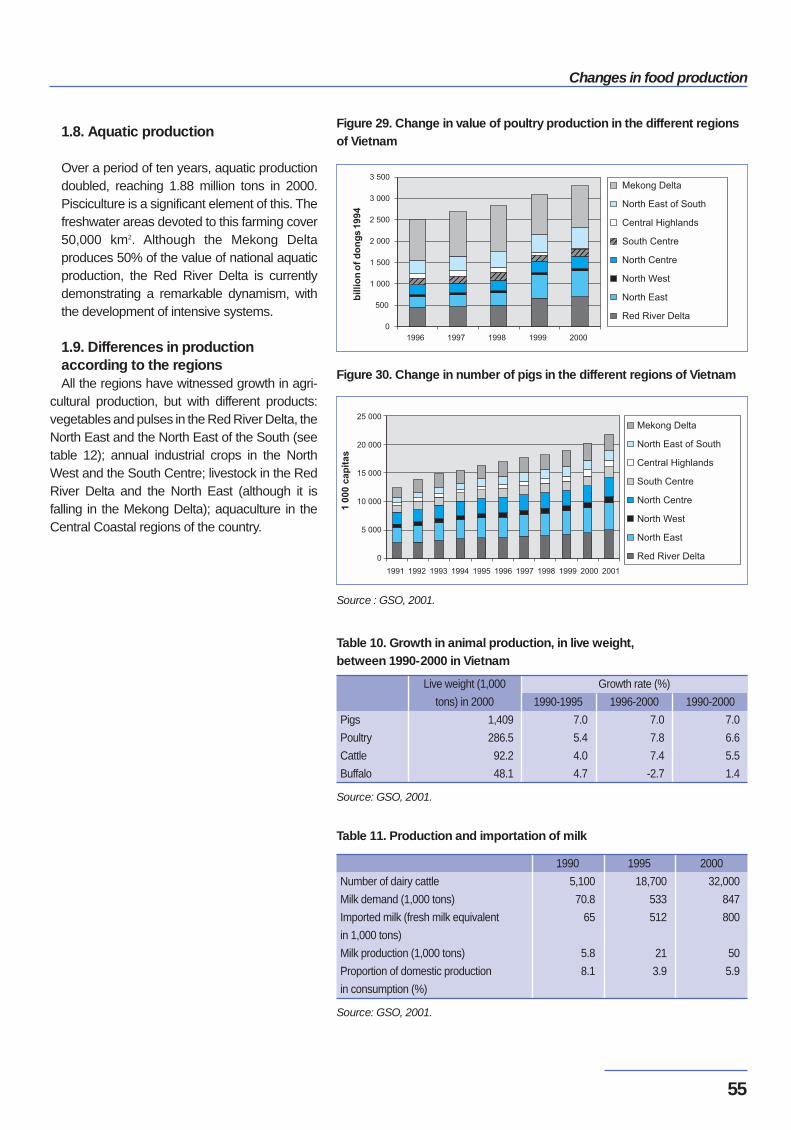
55
Changes in food production
1.8. Aquatic production
Over a period of ten years, aquatic productiondoubled, reaching 1.88 million tons in 2000.Pisciculture is a significant element of this. Thefreshwater areas devoted to this farming cover50,000 km2. Although the Mekong Deltaproduces 50% of the value of national aquaticproduction, the Red River Delta is currentlydemonstrating a remarkable dynamism, withthe development of intensive systems.
1.9. Differences in productionaccording to the regions All the regions have witnessed growth in agri-
cultural production, but with different products:vegetables and pulses in the Red River Delta, theNorth East and the North East of the South (seetable 12); annual industrial crops in the NorthWest and the South Centre; livestock in the RedRiver Delta and the North East (although it isfalling in the Mekong Delta); aquaculture in theCentral Coastal regions of the country.
Source : GSO, 2001.
Source: GSO, 2001.
Table 10. Growth in animal production, in live weight,between 1990-2000 in Vietnam
Pigs
Poultry
Cattle
Buffalo
Live weight (1,000
tons) in 2000
1,409
286.5
92.2
48.1
1990-1995
7.0
5.4
4.0
4.7
Growth rate (%)
1990-2000
7.0
6.6
5.5
1.4
1996-2000
7.0
7.8
7.4
-2.7
Source: GSO, 2001.
Table 11. Production and importation of milk
Number of dairy cattle
Milk demand (1,000 tons)
Imported milk (fresh milk equivalent
in 1,000 tons)
Milk production (1,000 tons)
Proportion of domestic production
in consumption (%)
1990
5,100
70.8
65
5.8
8.1
1995
18,700
533
512
21
3.9
2000
32,000
847
800
50
5.9
Figure 29. Change in value of poultry production in the different regionsof Vietnam
Figure 30. Change in number of pigs in the different regions of Vietnam
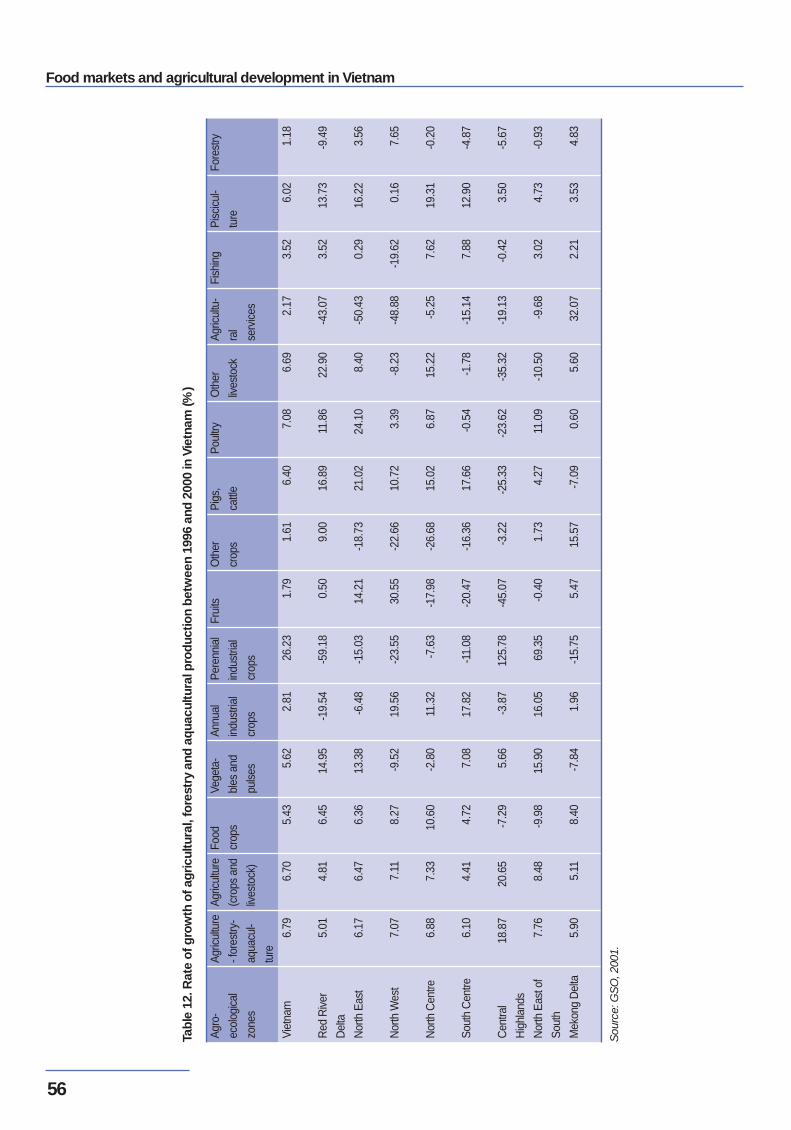
Food markets and agricultural development in Vietnam
56
Sou
rce:
GS
O, 2
001.
Tabl
e 12
. Rat
e of
gro
wth
of a
gric
ultu
ral,
fore
stry
and
aqu
acul
tura
l pro
duct
ion
betw
een
1996
and
200
0 in
Vie
tnam
(%)
Agro
-
ecol
ogic
al
zone
s
Viet
nam
Red
Riv
er
Del
ta
Nor
th E
ast
Nor
th W
est
Nor
th C
entre
Sout
h C
entre
Cen
tral
Hig
hlan
ds
Nor
th E
ast o
f
Sout
h
Mek
ong
Del
ta
Agric
ultu
re
- for
estry
-
aqua
cul-
ture
6.79
5.01
6.17
7.07
6.88
6.10
18.8
7
7.76
5.90
Food
crop
s 5.43
6.45
6.36
8.27
10.6
0
4.72
-7.2
9
-9.9
8
8.40
Agric
ultu
re
(cro
ps a
nd
lives
tock
)
6.70
4.81
6.47
7.11
7.33
4.41
20.6
5
8.48
5.11
Frui
ts
1.79
0.50
14.2
1
30.5
5
-17.
98
-20.
47
-45.
07
-0.4
0
5.47
Oth
er
crop
s 1.61
9.00
-18.
73
-22.
66
-26.
68
-16.
36
-3.2
2
1.73
15.5
7
Pigs
,
cattl
e
6.40
16.8
9
21.0
2
10.7
2
15.0
2
17.6
6
-25.
33
4.27
-7.0
9
Poul
try 7.08
11.8
6
24.1
0
3.39
6.87
-0.5
4
-23.
62
11.0
9
0.60
Oth
er
lives
tock 6.69
22.9
0
8.40
-8.2
3
15.2
2
-1.7
8
-35.
32
-10.
50
5.60
Agric
ultu
-
ral
serv
ices
2.17
-43.
07
-50.
43
-48.
88
-5.2
5
-15.
14
-19.
13
-9.6
8
32.0
7
Fish
ing 3.
52
3.52
0.29
-19.
62
7.62
7.88
-0.4
2
3.02
2.21
Pisc
icul
-
ture
6.02
13.7
3
16.2
2
0.16
19.3
1
12.9
0
3.50
4.73
3.53
Fore
stry 1.18
-9.4
9
3.56
7.65
-0.2
0
-4.8
7
-5.6
7
-0.9
3
4.83
Vege
ta-
bles
and
puls
es 5.62
14.9
5
13.3
8
-9.5
2
-2.8
0
7.08
5.66
15.9
0
-7.8
4
Annu
al
indu
stria
l
crop
s 2.81
-19.
54
-6.4
8
19.5
6
11.3
2
17.8
2
-3.8
7
16.0
5
1.96
Pere
nnia
l
indu
stria
l
crop
s 26.2
3
-59.
18
-15.
03
-23.
55
-7.6
3
-11.
08
125.
78
69.3
5
-15.
75
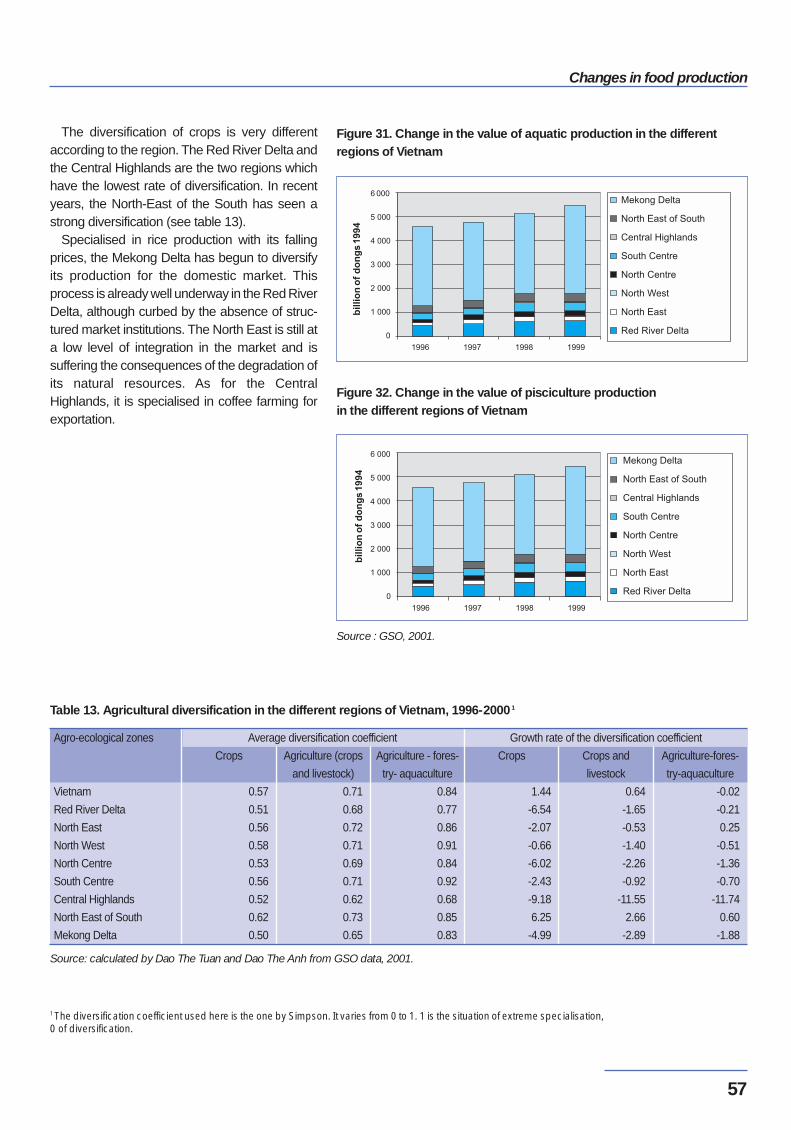
57
Changes in food production
The diversification of crops is very differentaccording to the region. The Red River Delta andthe Central Highlands are the two regions whichhave the lowest rate of diversification. In recentyears, the North-East of the South has seen astrong diversification (see table 13).
Specialised in rice production with its fallingprices, the Mekong Delta has begun to diversifyits production for the domestic market. Thisprocess is already well underway in the Red RiverDelta, although curbed by the absence of struc-tured market institutions. The North East is still ata low level of integration in the market and issuffering the consequences of the degradation ofits natural resources. As for the CentralHighlands, it is specialised in coffee farming forexportation.
Source : GSO, 2001.
Source: calculated by Dao The Tuan and Dao The Anh from GSO data, 2001.
Table 13. Agricultural diversification in the different regions of Vietnam, 1996-20001
Agro-ecological zones
Vietnam
Red River Delta
North East
North West
North Centre
South Centre
Central Highlands
North East of South
Mekong Delta
Crops
0.57
0.51
0.56
0.58
0.53
0.56
0.52
0.62
0.50
Agriculture (crops
and livestock)
0.71
0.68
0.72
0.71
0.69
0.71
0.62
0.73
0.65
Agriculture - fores-
try- aquaculture
0.84
0.77
0.86
0.91
0.84
0.92
0.68
0.85
0.83
Crops
1.44
-6.54
-2.07
-0.66
-6.02
-2.43
-9.18
6.25
-4.99
Crops and
livestock
0.64
-1.65
-0.53
-1.40
-2.26
-0.92
-11.55
2.66
-2.89
Agriculture-fores-
try-aquaculture
-0.02
-0.21
0.25
-0.51
-1.36
-0.70
-11.74
0.60
-1.88
Average diversification coefficient Growth rate of the diversification coefficient
Figure 31. Change in the value of aquatic production in the differentregions of Vietnam
Figure 32. Change in the value of pisciculture productionin the different regions of Vietnam
1 The diversification coefficient used here is the one by Simpson. It varies from 0 to 1. 1 is the situation of extreme specialisation,0 of diversification.
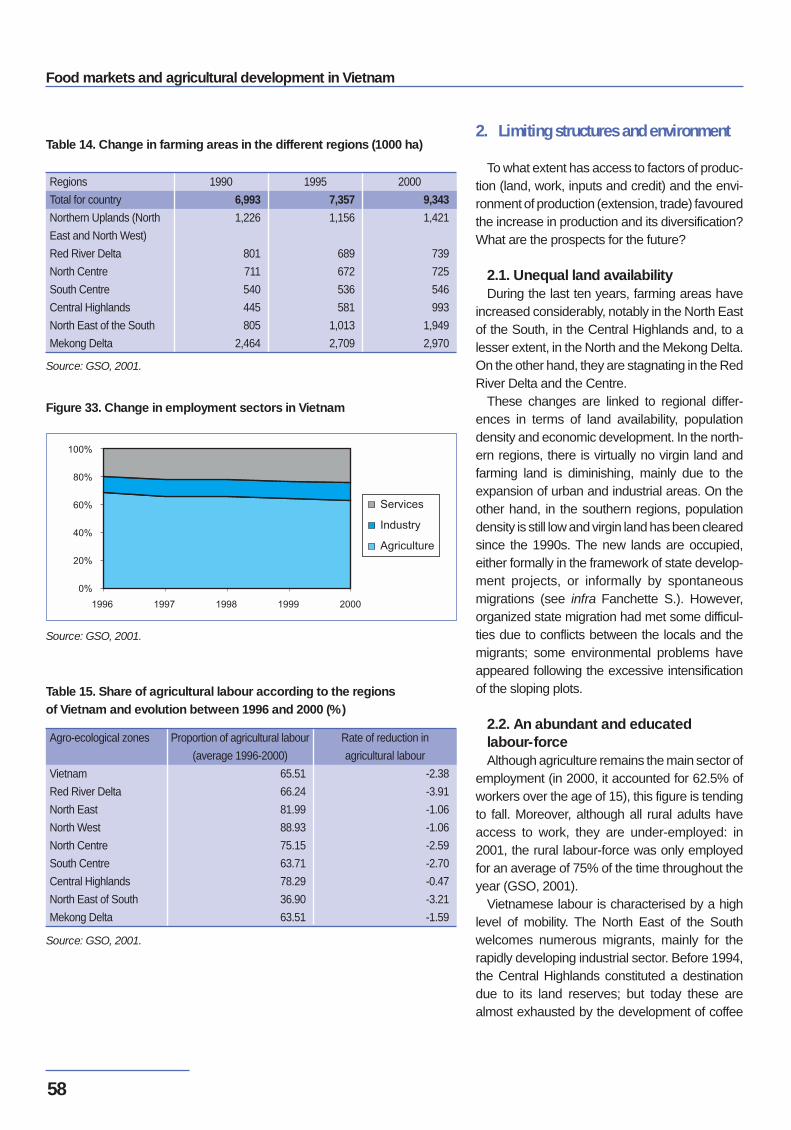
Food markets and agricultural development in Vietnam
58
2. Limiting structures and environment
To what extent has access to factors of produc-tion (land, work, inputs and credit) and the envi-ronment of production (extension, trade) favouredthe increase in production and its diversification?What are the prospects for the future?
2.1. Unequal land availability During the last ten years, farming areas have
increased considerably, notably in the North Eastof the South, in the Central Highlands and, to alesser extent, in the North and the Mekong Delta.On the other hand, they are stagnating in the RedRiver Delta and the Centre.
These changes are linked to regional differ-ences in terms of land availability, populationdensity and economic development. In the north-ern regions, there is virtually no virgin land andfarming land is diminishing, mainly due to theexpansion of urban and industrial areas. On theother hand, in the southern regions, populationdensity is still low and virgin land has been clearedsince the 1990s. The new lands are occupied,either formally in the framework of state develop-ment projects, or informally by spontaneousmigrations (see infra Fanchette S.). However,organized state migration had met some difficul-ties due to conflicts between the locals and themigrants; some environmental problems haveappeared following the excessive intensificationof the sloping plots.
2.2. An abundant and educatedlabour-force Although agriculture remains the main sector of
employment (in 2000, it accounted for 62.5% ofworkers over the age of 15), this figure is tendingto fall. Moreover, although all rural adults haveaccess to work, they are under-employed: in2001, the rural labour-force was only employedfor an average of 75% of the time throughout theyear (GSO, 2001).
Vietnamese labour is characterised by a highlevel of mobility. The North East of the Southwelcomes numerous migrants, mainly for therapidly developing industrial sector. Before 1994,the Central Highlands constituted a destinationdue to its land reserves; but today these arealmost exhausted by the development of coffee
Source: GSO, 2001.
Table 14. Change in farming areas in the different regions (1000 ha)
Regions
Total for country
Northern Uplands (North
East and North West)
Red River Delta
North Centre
South Centre
Central Highlands
North East of the South
Mekong Delta
1990
6,993
1,226
801
711
540
445
805
2,464
1995
7,357
1,156
689
672
536
581
1,013
2,709
2000
9,343
1,421
739
725
546
993
1,949
2,970
Source: GSO, 2001.
Table 15. Share of agricultural labour according to the regions of Vietnam and evolution between 1996 and 2000 (%)
Agro-ecological zones
Vietnam
Red River Delta
North East
North West
North Centre
South Centre
Central Highlands
North East of South
Mekong Delta
Proportion of agricultural labour
(average 1996-2000)
65.51
66.24
81.99
88.93
75.15
63.71
78.29
36.90
63.51
Rate of reduction in
agricultural labour
-2.38
-3.91
-1.06
-1.06
-2.59
-2.70
-0.47
-3.21
-1.59
Source: GSO, 2001.
Figure 33. Change in employment sectors in Vietnam
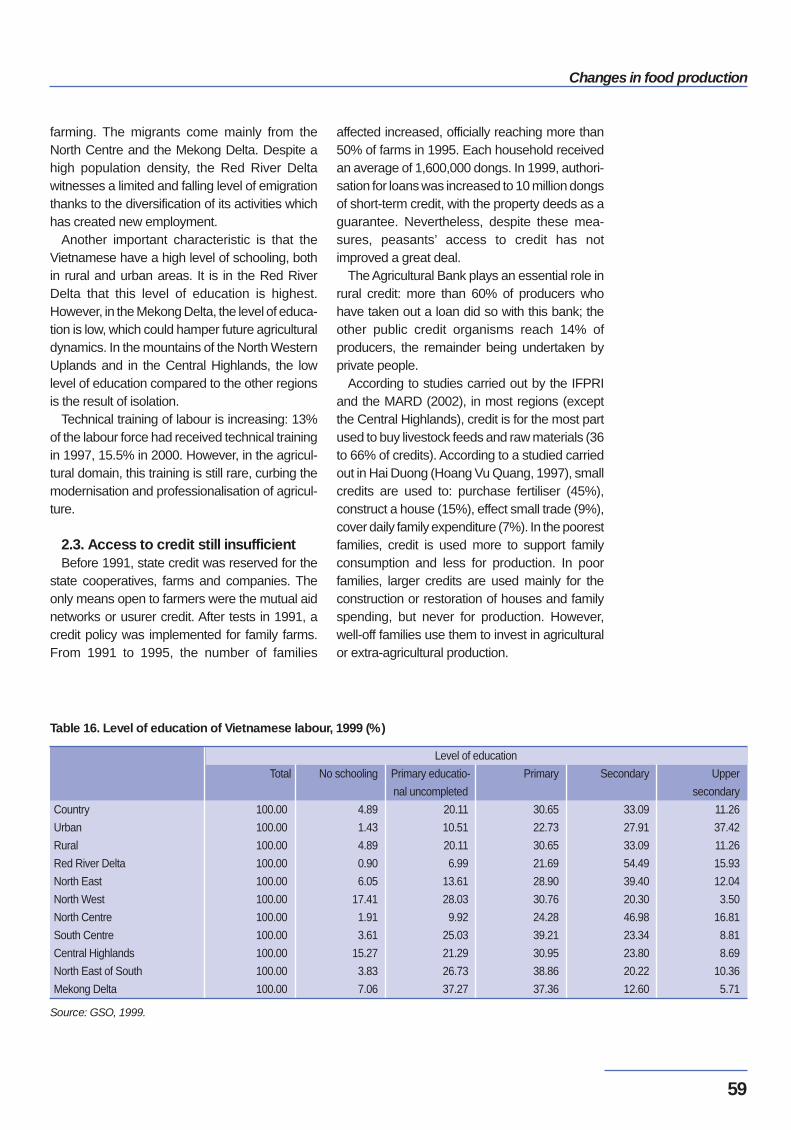
59
Changes in food production
farming. The migrants come mainly from theNorth Centre and the Mekong Delta. Despite ahigh population density, the Red River Deltawitnesses a limited and falling level of emigrationthanks to the diversification of its activities whichhas created new employment.
Another important characteristic is that theVietnamese have a high level of schooling, bothin rural and urban areas. It is in the Red RiverDelta that this level of education is highest.However, in the Mekong Delta, the level of educa-tion is low, which could hamper future agriculturaldynamics. In the mountains of the North WesternUplands and in the Central Highlands, the lowlevel of education compared to the other regionsis the result of isolation.
Technical training of labour is increasing: 13%of the labour force had received technical trainingin 1997, 15.5% in 2000. However, in the agricul-tural domain, this training is still rare, curbing themodernisation and professionalisation of agricul-ture.
2.3. Access to credit still insufficientBefore 1991, state credit was reserved for the
state cooperatives, farms and companies. Theonly means open to farmers were the mutual aidnetworks or usurer credit. After tests in 1991, acredit policy was implemented for family farms.From 1991 to 1995, the number of families
affected increased, officially reaching more than50% of farms in 1995. Each household receivedan average of 1,600,000 dongs. In 1999, authori-sation for loans was increased to 10 million dongsof short-term credit, with the property deeds as aguarantee. Nevertheless, despite these mea-sures, peasants’ access to credit has notimproved a great deal.
The Agricultural Bank plays an essential role inrural credit: more than 60% of producers whohave taken out a loan did so with this bank; theother public credit organisms reach 14% ofproducers, the remainder being undertaken byprivate people.
According to studies carried out by the IFPRIand the MARD (2002), in most regions (exceptthe Central Highlands), credit is for the most partused to buy livestock feeds and raw materials (36to 66% of credits). According to a studied carriedout in Hai Duong (Hoang Vu Quang, 1997), smallcredits are used to: purchase fertiliser (45%),construct a house (15%), effect small trade (9%),cover daily family expenditure (7%). In the poorestfamilies, credit is used more to support familyconsumption and less for production. In poorfamilies, larger credits are used mainly for theconstruction or restoration of houses and familyspending, but never for production. However,well-off families use them to invest in agriculturalor extra-agricultural production.
Source: GSO, 1999.
Table 16. Level of education of Vietnamese labour, 1999 (%)
Country
Urban
Rural
Red River Delta
North East
North West
North Centre
South Centre
Central Highlands
North East of South
Mekong Delta
Total
100.00
100.00
100.00
100.00
100.00
100.00
100.00
100.00
100.00
100.00
100.00
No schooling
4.89
1.43
4.89
0.90
6.05
17.41
1.91
3.61
15.27
3.83
7.06
Primary educatio-
nal uncompleted
20.11
10.51
20.11
6.99
13.61
28.03
9.92
25.03
21.29
26.73
37.27
Primary
30.65
22.73
30.65
21.69
28.90
30.76
24.28
39.21
30.95
38.86
37.36
Secondary
33.09
27.91
33.09
54.49
39.40
20.30
46.98
23.34
23.80
20.22
12.60
Upper
secondary
11.26
37.42
11.26
15.93
12.04
3.50
16.81
8.81
8.69
10.36
5.71
Level of education
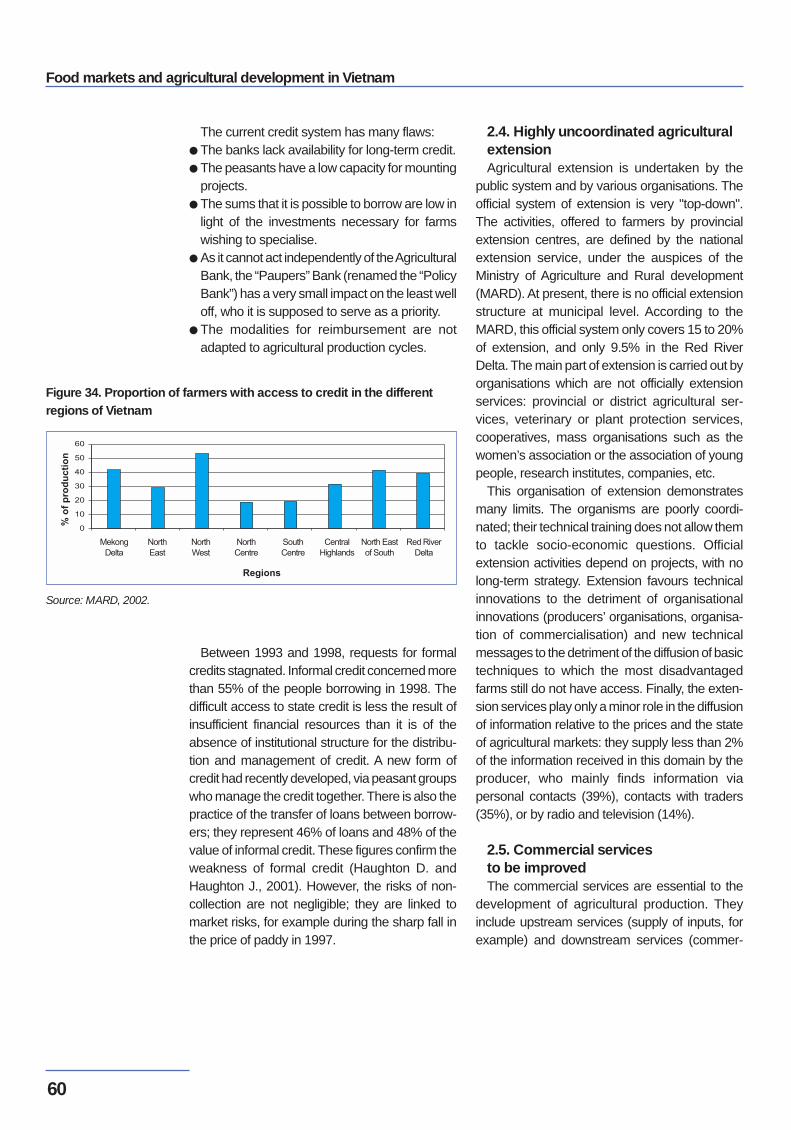
Food markets and agricultural development in Vietnam
60
The current credit system has many flaws: ● The banks lack availability for long-term credit.● The peasants have a low capacity for mounting
projects.● The sums that it is possible to borrow are low in
light of the investments necessary for farmswishing to specialise.
● As it cannot act independently of the AgriculturalBank, the “Paupers” Bank (renamed the “PolicyBank”) has a very small impact on the least welloff, who it is supposed to serve as a priority.
● The modalities for reimbursement are notadapted to agricultural production cycles.
Between 1993 and 1998, requests for formalcredits stagnated. Informal credit concerned morethan 55% of the people borrowing in 1998. Thedifficult access to state credit is less the result ofinsufficient financial resources than it is of theabsence of institutional structure for the distribu-tion and management of credit. A new form ofcredit had recently developed, via peasant groupswho manage the credit together. There is also thepractice of the transfer of loans between borrow-ers; they represent 46% of loans and 48% of thevalue of informal credit. These figures confirm theweakness of formal credit (Haughton D. andHaughton J., 2001). However, the risks of non-collection are not negligible; they are linked tomarket risks, for example during the sharp fall inthe price of paddy in 1997.
2.4. Highly uncoordinated agriculturalextensionAgricultural extension is undertaken by the
public system and by various organisations. Theofficial system of extension is very "top-down".The activities, offered to farmers by provincialextension centres, are defined by the nationalextension service, under the auspices of theMinistry of Agriculture and Rural development(MARD). At present, there is no official extensionstructure at municipal level. According to theMARD, this official system only covers 15 to 20%of extension, and only 9.5% in the Red RiverDelta. The main part of extension is carried out byorganisations which are not officially extensionservices: provincial or district agricultural ser-vices, veterinary or plant protection services,cooperatives, mass organisations such as thewomen’s association or the association of youngpeople, research institutes, companies, etc.
This organisation of extension demonstratesmany limits. The organisms are poorly coordi-nated; their technical training does not allow themto tackle socio-economic questions. Officialextension activities depend on projects, with nolong-term strategy. Extension favours technicalinnovations to the detriment of organisationalinnovations (producers’ organisations, organisa-tion of commercialisation) and new technicalmessages to the detriment of the diffusion of basictechniques to which the most disadvantagedfarms still do not have access. Finally, the exten-sion services play only a minor role in the diffusionof information relative to the prices and the stateof agricultural markets: they supply less than 2%of the information received in this domain by theproducer, who mainly finds information viapersonal contacts (39%), contacts with traders(35%), or by radio and television (14%).
2.5. Commercial servicesto be improvedThe commercial services are essential to the
development of agricultural production. Theyinclude upstream services (supply of inputs, forexample) and downstream services (commer-
Source: MARD, 2002.
Figure 34. Proportion of farmers with access to credit in the differentregions of Vietnam
61
Changes in food production
cialisation support). The analysis of the down-stream services will be developed in the sectiondealing with the commodity channels.
The upstream commercial services are under-taken by state-controlled and non-state-controlledactors such as cooperatives and private compa-nies, sometimes of foreign origin, etc. They mainlysupply fertiliser, livestock feed, plant material,fattening or breeding animals, production mate-rials, etc.
According to the MARD, in 1999 there were 105animal feed production factories, with a capacityof 2.8 million tonnes per year: 62% of these werenational, non-state-controlled factories, 22% werestate-controlled, 12% were developed withforeign capital and 5% were mixed companieswith funds from share up.
There are few national poultry or pork industrialselection farms (10 and 12 respectively), andthese are small (a few hundred sows or a fewthousand hens per farm). At the provincial levelthe farms, which remain modest, only concernpigs. There are no foreign companies involved inthis sector of activity.
With regard to the supply of artificial fertiliser,production and importation (509 million dollars ofimported fertiliser in 2000, Institute of Economics,2001) are primarily managed by state-controlledcompanies. Retail distribution is essentially in thehands of the private sector.
As for the downstream services, the privatesector is responsible for most of the collection anddistribution on the domestic market, with state-controlled companies representing only a smallproportion. However, the state controls the exportmarkets through many companies.
The major limits of the current support measurefor the supply of inputs and the sale of productionare linked to many elements. The quality controlof inputs supplied to the producers is insufficient.The imports of inputs are the monopoly of state-controlled companies whose practices (system ofquotas) contribute to increasing the costs for theproducers. The collection network for agriculturalproducts, either for export or for the domesticmarkets, is entirely in the hands of the private
sector, with no state control.In the districts and provinces, there is no admi-
nistrative unit responsible for the commercialservice vis-à-vis the producers. State interven-tions are mostly administrative and orientedtowards the export channel.
3. Increasing differentiation
3.1. Land, a key factor of differentiationDespite the agrarian reform of 1993, which
aimed at an egalitarian distribution of farmingland, land differentiation between the regions, andwithin the regions, is increasing. Although, in1998, the average size of farms was 0.9 ha at thenational level, it was much larger in the North Eastof the South (1.4 ha) and in the Central Highlands(1.5 ha) and much smaller in the South Centralregion (0.55 ha).
The differences are also significant betweenrural and peri-urban zones. Vietnam can countalmost six hundred towns, of varying size, whosepopulation is increasing by 4-8% per year. Thisprocess of urbanisation is leading to heavy landspeculation on the edges of these towns.
Land differentiation is also significant within theregions. In the Centre, the area of the largestfarms is twice that of the smallest. In the South,the ratio is 1 to 10.
These questions are all the more important asland concentration is increasing. In the MekongDelta and in particular in provinces such as TraVinh and Bac Lieu, the proportion of peasantswithout land is increasing rapidly.
Although the promotion of average and large-sized farms is political will, its implementationremains ambiguous. In official documents, thestate encourages the development of averageand large-sized farms in order to promote marketproduction and to facilitate land concentration inrural areas, in particular in marginal zones.However, these measures are not very opera-tional for several reasons: land capacity is limited;the commodity channels poorly organised; andthe support for sectors downstream of productionare still insufficient.
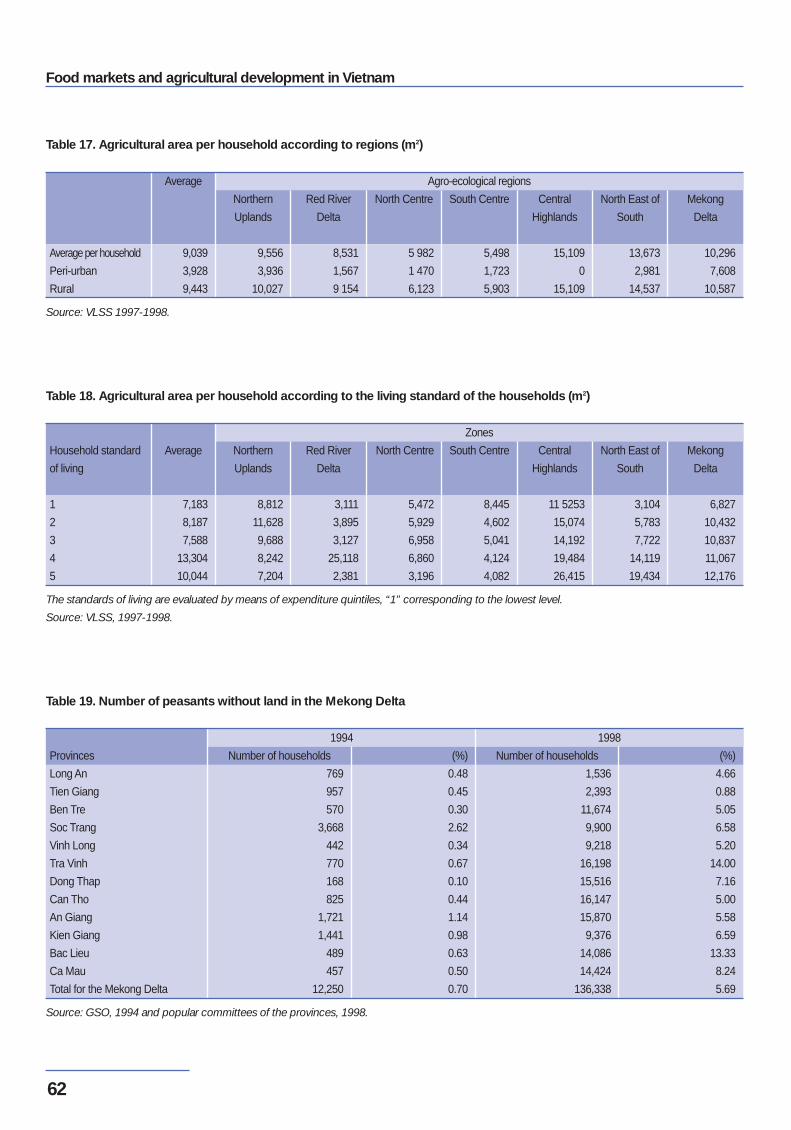
Food markets and agricultural development in Vietnam
62
Source: VLSS 1997-1998.
Table 17. Agricultural area per household according to regions (m2)
Average per household
Peri-urban
Rural
Average
9,039
3,928
9,443
Northern
Uplands
9,556
3,936
10,027
Red River
Delta
8,531
1,567
9 154
North Centre
5 982
1 470
6,123
South Centre
5,498
1,723
5,903
Central
Highlands
15,109
0
15,109
North East of
South
13,673
2,981
14,537
Mekong
Delta
10,296
7,608
10,587
Agro-ecological regions
The standards of living are evaluated by means of expenditure quintiles, “1” corresponding to the lowest level.
Source: VLSS, 1997-1998.
Table 18. Agricultural area per household according to the living standard of the households (m2)
Household standard
of living
1
2
3
4
5
Average
7,183
8,187
7,588
13,304
10,044
Northern
Uplands
8,812
11,628
9,688
8,242
7,204
Red River
Delta
3,111
3,895
3,127
25,118
2,381
North Centre
5,472
5,929
6,958
6,860
3,196
South Centre
8,445
4,602
5,041
4,124
4,082
Central
Highlands
11 5253
15,074
14,192
19,484
26,415
North East of
South
3,104
5,783
7,722
14,119
19,434
Mekong
Delta
6,827
10,432
10,837
11,067
12,176
Zones
Source: GSO, 1994 and popular committees of the provinces, 1998.
Table 19. Number of peasants without land in the Mekong Delta
Provinces
Long An
Tien Giang
Ben Tre
Soc Trang
Vinh Long
Tra Vinh
Dong Thap
Can Tho
An Giang
Kien Giang
Bac Lieu
Ca Mau
Total for the Mekong Delta
Number of households
769
957
570
3,668
442
770
168
825
1,721
1,441
489
457
12,250
(%)
0.48
0.45
0.30
2.62
0.34
0.67
0.10
0.44
1.14
0.98
0.63
0.50
0.70
Number of households
1,536
2,393
11,674
9,900
9,218
16,198
15,516
16,147
15,870
9,376
14,086
14,424
136,338
(%)
4.66
0.88
5.05
6.58
5.20
14.00
7.16
5.00
5.58
6.59
13.33
8.24
5.69
1994 1998
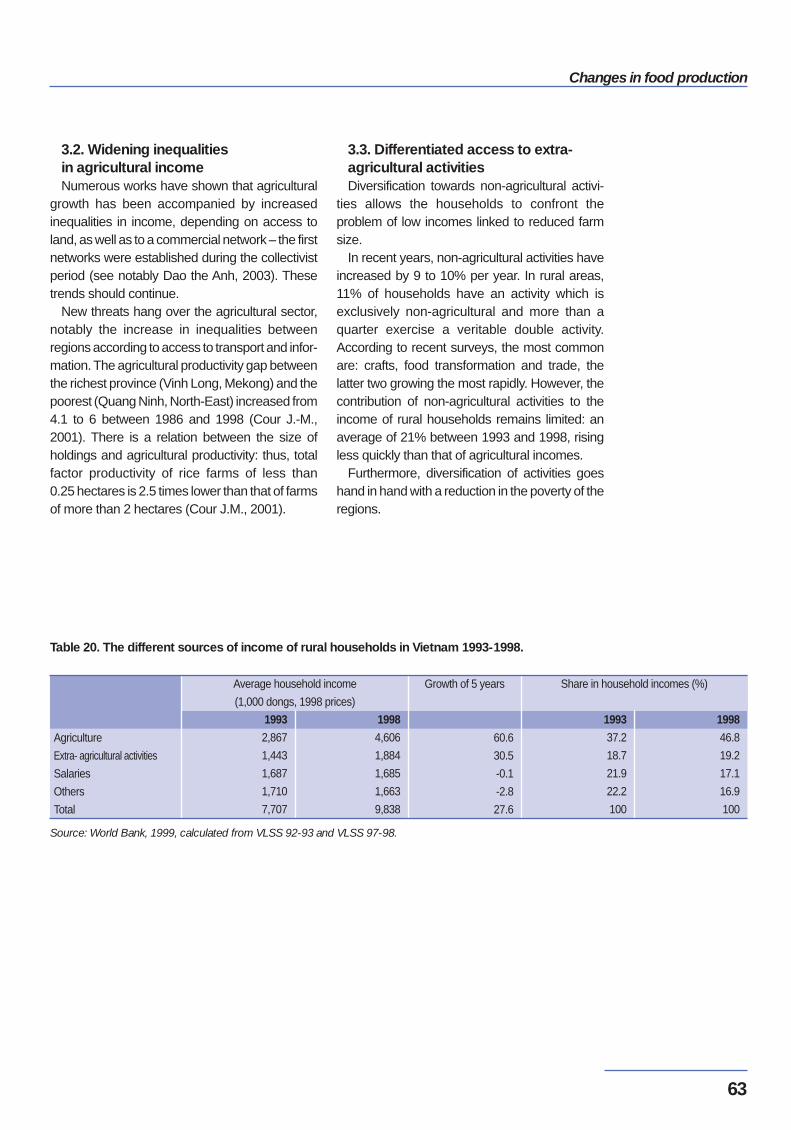
63
Changes in food production
3.2. Widening inequalitiesin agricultural incomeNumerous works have shown that agricultural
growth has been accompanied by increasedinequalities in income, depending on access toland, as well as to a commercial network – the firstnetworks were established during the collectivistperiod (see notably Dao the Anh, 2003). Thesetrends should continue.
New threats hang over the agricultural sector,notably the increase in inequalities betweenregions according to access to transport and infor-mation. The agricultural productivity gap betweenthe richest province (Vinh Long, Mekong) and thepoorest (Quang Ninh, North-East) increased from4.1 to 6 between 1986 and 1998 (Cour J.-M.,2001). There is a relation between the size ofholdings and agricultural productivity: thus, totalfactor productivity of rice farms of less than0.25 hectares is 2.5 times lower than that of farmsof more than 2 hectares (Cour J.M., 2001).
3.3. Differentiated access to extra-agricultural activitiesDiversification towards non-agricultural activi-
ties allows the households to confront theproblem of low incomes linked to reduced farmsize.
In recent years, non-agricultural activities haveincreased by 9 to 10% per year. In rural areas,11% of households have an activity which isexclusively non-agricultural and more than aquarter exercise a veritable double activity.According to recent surveys, the most commonare: crafts, food transformation and trade, thelatter two growing the most rapidly. However, thecontribution of non-agricultural activities to theincome of rural households remains limited: anaverage of 21% between 1993 and 1998, risingless quickly than that of agricultural incomes.
Furthermore, diversification of activities goeshand in hand with a reduction in the poverty of theregions.
Source: World Bank, 1999, calculated from VLSS 92-93 and VLSS 97-98.
Table 20. The different sources of income of rural households in Vietnam 1993-1998.
Agriculture
Extra- agricultural activities
Salaries
Others
Total
1993
2,867
1,443
1,687
1,710
7,707
1998
4,606
1,884
1,685
1,663
9,838
60.6
30.5
-0.1
-2.8
27.6
1993
37.2
18.7
21.9
22.2
100
1998
46.8
19.2
17.1
16.9
100
Average household income
(1,000 dongs, 1998 prices)
Growth of 5 years Share in household incomes (%)
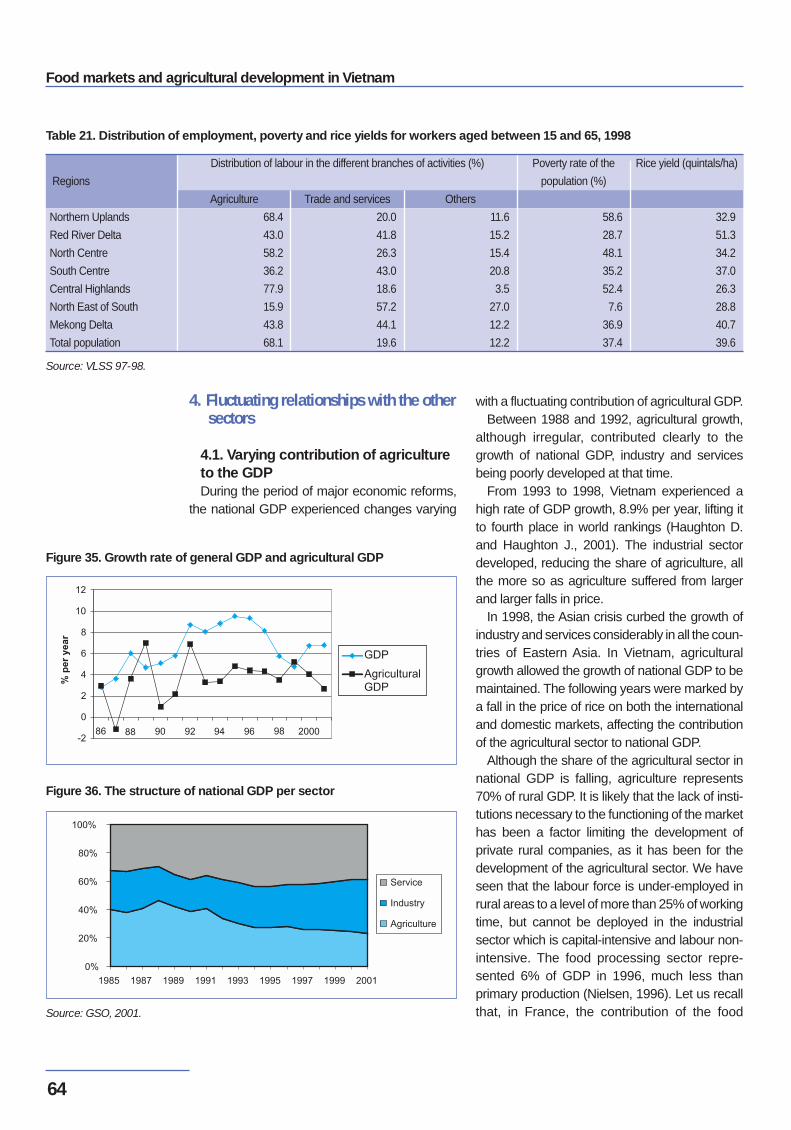
Food markets and agricultural development in Vietnam
64
4. Fluctuating relationships with the othersectors
4.1. Varying contribution of agricultureto the GDPDuring the period of major economic reforms,
the national GDP experienced changes varying
with a fluctuating contribution of agricultural GDP. Between 1988 and 1992, agricultural growth,
although irregular, contributed clearly to thegrowth of national GDP, industry and servicesbeing poorly developed at that time.
From 1993 to 1998, Vietnam experienced ahigh rate of GDP growth, 8.9% per year, lifting itto fourth place in world rankings (Haughton D.and Haughton J., 2001). The industrial sectordeveloped, reducing the share of agriculture, allthe more so as agriculture suffered from largerand larger falls in price.
In 1998, the Asian crisis curbed the growth ofindustry and services considerably in all the coun-tries of Eastern Asia. In Vietnam, agriculturalgrowth allowed the growth of national GDP to bemaintained. The following years were marked bya fall in the price of rice on both the internationaland domestic markets, affecting the contributionof the agricultural sector to national GDP.
Although the share of the agricultural sector innational GDP is falling, agriculture represents70% of rural GDP. It is likely that the lack of insti-tutions necessary to the functioning of the markethas been a factor limiting the development ofprivate rural companies, as it has been for thedevelopment of the agricultural sector. We haveseen that the labour force is under-employed inrural areas to a level of more than 25% of workingtime, but cannot be deployed in the industrialsector which is capital-intensive and labour non-intensive. The food processing sector repre-sented 6% of GDP in 1996, much less thanprimary production (Nielsen, 1996). Let us recallthat, in France, the contribution of the foodSource: GSO, 2001.
Figure 35. Growth rate of general GDP and agricultural GDP
Figure 36. The structure of national GDP per sector
Source: VLSS 97-98.
Table 21. Distribution of employment, poverty and rice yields for workers aged between 15 and 65, 1998
Regions
Northern Uplands
Red River Delta
North Centre
South Centre
Central Highlands
North East of South
Mekong Delta
Total population
Agriculture
68.4
43.0
58.2
36.2
77.9
15.9
43.8
68.1
Trade and services
20.0
41.8
26.3
43.0
18.6
57.2
44.1
19.6
Others
11.6
15.2
15.4
20.8
3.5
27.0
12.2
12.2
58.6
28.7
48.1
35.2
52.4
7.6
36.9
37.4
32.9
51.3
34.2
37.0
26.3
28.8
40.7
39.6
Distribution of labour in the different branches of activities (%) Poverty rate of the
population (%)
Rice yield (quintals/ha)
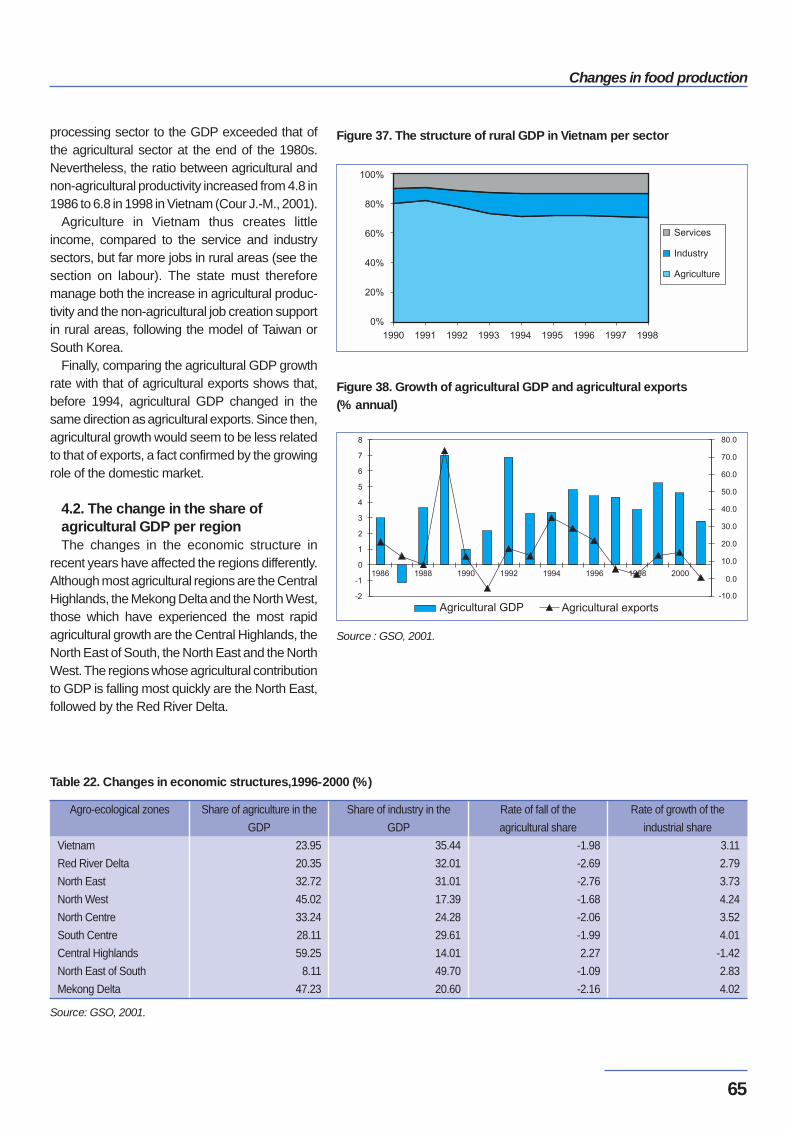
65
Changes in food production
Source : GSO, 2001.
Source: GSO, 2001.
Table 22. Changes in economic structures,1996-2000 (%)
Agro-ecological zones
Vietnam
Red River Delta
North East
North West
North Centre
South Centre
Central Highlands
North East of South
Mekong Delta
Share of agriculture in the
GDP
23.95
20.35
32.72
45.02
33.24
28.11
59.25
8.11
47.23
Share of industry in the
GDP
35.44
32.01
31.01
17.39
24.28
29.61
14.01
49.70
20.60
Rate of fall of the
agricultural share
-1.98
-2.69
-2.76
-1.68
-2.06
-1.99
2.27
-1.09
-2.16
Rate of growth of the
industrial share
3.11
2.79
3.73
4.24
3.52
4.01
-1.42
2.83
4.02
Figure 37. The structure of rural GDP in Vietnam per sector
Figure 38. Growth of agricultural GDP and agricultural exports(% annual)
processing sector to the GDP exceeded that ofthe agricultural sector at the end of the 1980s.Nevertheless, the ratio between agricultural andnon-agricultural productivity increased from 4.8 in1986 to 6.8 in 1998 in Vietnam (Cour J.-M., 2001).
Agriculture in Vietnam thus creates littleincome, compared to the service and industrysectors, but far more jobs in rural areas (see thesection on labour). The state must thereforemanage both the increase in agricultural produc-tivity and the non-agricultural job creation supportin rural areas, following the model of Taiwan orSouth Korea.
Finally, comparing the agricultural GDP growthrate with that of agricultural exports shows that,before 1994, agricultural GDP changed in thesame direction as agricultural exports. Since then,agricultural growth would seem to be less relatedto that of exports, a fact confirmed by the growingrole of the domestic market.
4.2. The change in the share ofagricultural GDP per regionThe changes in the economic structure in
recent years have affected the regions differently.Although most agricultural regions are the CentralHighlands, the Mekong Delta and the North West,those which have experienced the most rapidagricultural growth are the Central Highlands, theNorth East of South, the North East and the NorthWest. The regions whose agricultural contributionto GDP is falling most quickly are the North East,followed by the Red River Delta.
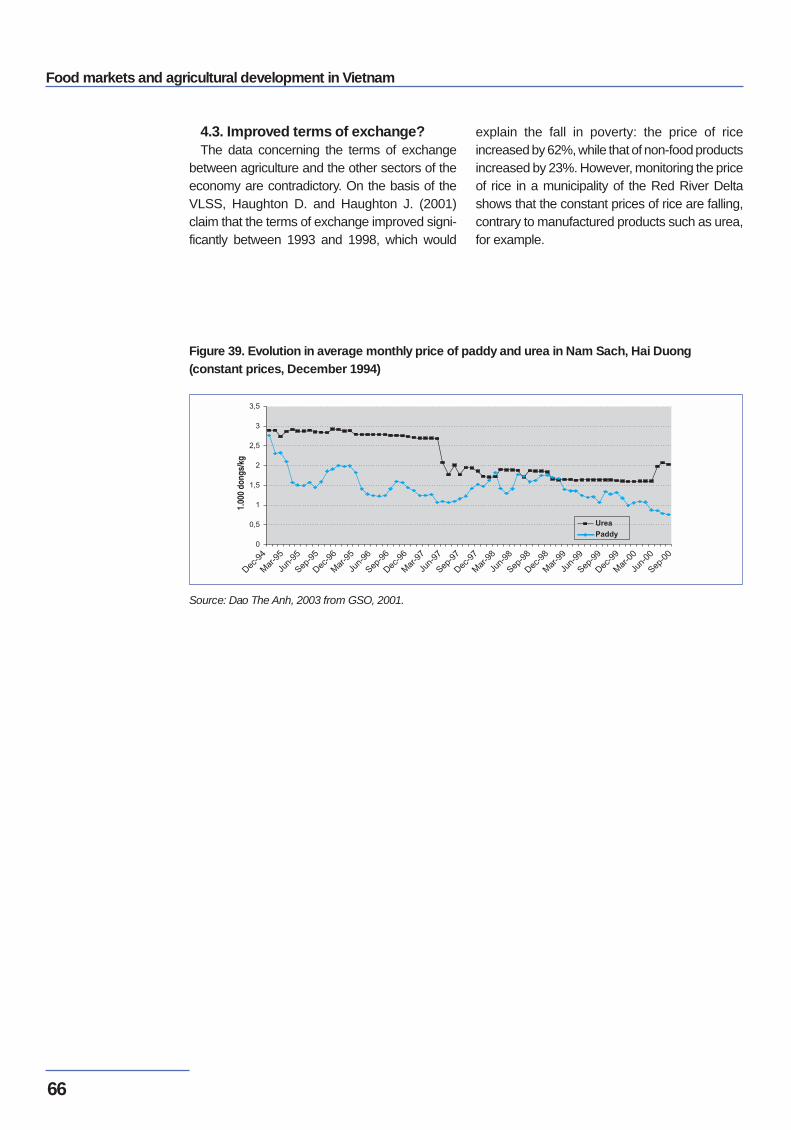
Food markets and agricultural development in Vietnam
66
Source: Dao The Anh, 2003 from GSO, 2001.
Figure 39. Evolution in average monthly price of paddy and urea in Nam Sach, Hai Duong(constant prices, December 1994)
4.3. Improved terms of exchange? The data concerning the terms of exchange
between agriculture and the other sectors of theeconomy are contradictory. On the basis of theVLSS, Haughton D. and Haughton J. (2001)claim that the terms of exchange improved signi-ficantly between 1993 and 1998, which would
explain the fall in poverty: the price of riceincreased by 62%, while that of non-food productsincreased by 23%. However, monitoring the priceof rice in a municipality of the Red River Deltashows that the constant prices of rice are falling,contrary to manufactured products such as urea,for example.
67
Changes in food production
Conclusion: overcoming the weaknessesto satisfy domestic demand
Agricultural production has thus been able tosatisfy the growth in demand in quantity for themain food products (except for corn, imports ofwhich are increasing).
However, the quantitative appraisal masksproblems of adjustment between supply anddemand. On the one hand, production does notalways succeed in supplying the market regularlythroughout the entire year. On the other hand,production does not satisfy market demand wellin terms of quality (see following section). Finally,the diversification process is still very slow: ricestill occupies more than 60% of farmed land (thisfigure was 70% in 1991).
The evaluations of agricultural growth in termsof creation of wealth are also divided. The growthof agriculture is reflected by a large contribution toemployment and to incomes in rural areas.However, the impact on the economy of the wholecountry is less significant than that of industry and
services. In rural areas, it is important to favourextra-agricultural activities, such as trade andtransformation of food products, or crafts whichpeasant households already exercise and whichprovide them with liquid assets which can be rein-vested in the agricultural sector.
Finally, agricultural growth is reflected in thegrowing gaps in incomes due, for the most part,to differentiated access to factors of productionand commercial services, extension and trans-port. This situation seems all the more marked inthe Red River Delta than in the Mekong Deltawhere private services are better organised. TheState has a key role to play in re-establishing thebalance of access to the conditions of productionand market outlets.
The structural change in agriculture must beachieved by a differentiated approach for eachagro-ecological region because each region is ata different stage of development and has specificadvantages in the production of the differentcommodities.
Food markets and agricultural development in Vietnam
68
The response of the marketPaule Moustier (CIRAD), Nguyen Thi Tan Loc (RIFAV),Jean-Joseph Cadilhon (Imperial College at Wye - CIRAD), Vu Trong Binh (VASI)
The economic reforms have facilitated access to the market for both producers andconsumers, leading to a reduction in self-consumption. The proportion of purchasesin supplies currently exceeds 65% in rural areas and 95% in urban areas. Thecommercial commodity systems play an essential role in transmitting the consumptionneeds to the production units. How are these commodity systems organised – flowsin space, stakeholders, types of transport? Their efficiency is evaluated in terms ofcompetition, scale of transactions, price and income formation and quality, using theexamples of three commodity systems destined for the domestic market: rice,vegetables, pigs. The market is characterised by a small-scale and competitive structure as well as byrelatively short marketing chains, except in the case of the vegetables commoditysystem between the north and the south where wholesalers control the information onsupply and demand. Contractualisation is rare. Traders have low commercial margins(15% for rice, 20% for pork, 45-50% for vegetables), which is a sign of efficiency,although they do not succeed in controlling the numerous risks which weigh on themarket: cheating with regard to quality; production deficits or surpluses; non-paymentin the event of sale on credit. Moreover, economies of scale can be achieved byregrouping production and improving transport.Vietnam is currently experiencing a certain degree of centralisation of its transactions,with the planning of wholesale and retail markets – which will reduce or even eliminatenumerous points of sale – and the development of large volume distribution (thenumber of supermarkets doubled between 1997 and 2001). These evolutions will havenegative consequences on employment for unskilled populations and will beunfavourable to producers, traders and consumers who do not have motorised meansof transport; compensatory measures could accompany these developments. Finally,these changes reinforce the necessity for producers to draw together; in this way, theycould indicate and control the quality of their products and increase their pricebargaining power vis-à-vis the buyers.
The response of the market
69
Although production has been able to satisfythe increase in domestic demand in terms ofquantity (see fourth chapter), the response is stilllimited with regards to quality and regularity ofsupply, as well as the creation and distribution ofincomes. The connection between productionand consumption is determined by the organisa-tion of the market, i.e. the organisation of tran-sactions between the stakeholders of production,of the market and of consumption.
Producers and consumers are turning moreand more to the market. How does the markettransmit the evolutions in demand and supply interms of quantity and quality? Do the size andorganisation of the commercial commoditysystem (transactions) allow the information to betransmitted between the producers and theconsumers to the benefit of all the stakeholders?How is this reflected in terms of income distribu-tion within the commodity systems? What is theimpact on the food commodity system of tworecent evolutions in food distribution: the deve-lopment of large volume distribution and the plan-ning of new markets?
1. Increasing recourse to the market
The economic reform has facilitated access tothe market for both producers and consumers,and both in rural and urban areas alike, causinga reduction in self-consumption. In rural areas, theproportion of purchases rose from 57% of foodconsumption in 1992-1993 to 64% in 1997-1998;it was estimated at 71% in 2002. In urban areas,the figure has been at 95% since 1992 1 . The ratioof the non-agricultural to the agricultural popula-tion rose from 0.39 in 1986 to 0.47 in 1998 andshould reach 0.96 in 2020 (Cour, 2001). At thattime, a farmer should thus feed a farmer plus anon-farmer 2 .
As Gironde (2001) says, “although talking of amarket economy is debatable, the role of themarket is undeniable, in that a solvent demandand a price system influence the choices of theeconomic systems”. The growth of commer-cialised productions is the result of the increase inpotential customers and the monetarisation ofrural areas. Indeed, the rural populations areconfronted by increasing monetary spending – forland, with the system of auctions, to pay taxes andpublic services in the municipalities. “The marketthus designates an economic and social environ-ment which is favourable to transition from aneconomy driven by supply, where it was difficultto buy, to an economy driven by demand, wherepeople struggle to sell.”
Recourse to the market differs according toregions and products. It is the upland regions, withthe most difficult access, which commercialisetheir productions the least. Thus, in the CentralHighlands, the proportion of fruit and vegetablescommercialised represents less than 50%,whereas it exceeds 90% in the Mekong Delta.There are strong disparities between pro-ducts ata national level: production of potatoes is onlycommercialised at a level of 15%, whereas thispercentage reaches 80% for tomatoes and 95%for litchis and longans (IFPRI, 2002).
2. Efficient yet too segmented commoditysystems
How is the distribution of food products orga-nised between producers and consumers: inter-mediaries, types of transaction, trading places?How do intermediaries’ strategies and their orga-nisation influence the response of local productionto demand in terms of quantity, quality and cost?The answer to these questions is based on thecase of three commodity systems: vegetables,rice and pork.
1 Muriel Figuié, Nicolas Bricas, infra (The evolution of food consumption in Vietnam; from GSO data, Vietnam Living StandardSurvey 1992-93 and 1997-98).2 Jean-Marie Cour’s calculations result from a demo-economic model which uses population, imports and exports asexogenous variables. Figures on the agricultural and non-agricultural population result from hypotheses on the distribution ofthe population of agglomerations with varying size in the different sectors. During the writing of the present document, Jean-Marie Cour was involved in the revision of the different model parameters.
Food markets and agricultural development in Vietnam
70
2.1. The vegetables commoditysystems for the domestic marketNumerous researchers and decision-makers
have a rather negative assessment of the func-tioning of the vegetable markets in Vietnam. “Thesales chains used by the producers are disor-ganised: the wholesale and retail marketsemerged spontaneously and are not organised”(Ngo Van Nam, 2002). “The markets are under-developed and spontaneous”. “The commercia-lisation system for vegetables in Hanoi has spon-taneous characteristics, the intermediaries arenew and play a minor role in the circulation ofproducts” (Bui Thi Gia, 2002). Nevertheless,these affirmations are not based on a rigorousassessment of the coordination of transactions,notably the circulation of information and deci-sion-making.
What are the characteristics of the vegetablecommodity systems destined for the cities:geographic flows (spatial organisation), relationsbetween the stakeholders (functional and institu-tional organisation)? How does this organisationallow the adjustment between consumptionneeds and production potentials? What are itsadvantages in terms of cost and its limits in termsof scale and circulation of information?
Spatial organisationThe production response to the growth of the
market logically comes from the closest areas,especially for the most perishable vegetables.Indeed, these areas benefit from the lowest trans-port and information access costs. The market isalso supplied by distant production basins, whichbenefit from favourable climatic conditions (seemap 2). This is the case for the Dalat region withregard to the supply of Hanoi and Ho Chi MinhCity or for the Son La region and the Chineseproduction areas for the supply of Hanoi. The rela-tive importance of these production zones - close(peri-urban, less than 30 kilometres from thecentre), more distant (rural) and foreign - variesaccording to the nature of the product (level ofperishability, adaptation to tropical conditions) and
the periods of the year (production of temperatevegetables is more difficult in the north of Vietnambetween July and September). The vegetable-producing areas are, in decreasing order, the RedRiver delta, the Mekong delta, the province ofLam Dong (Dalat).
Thus, in Hanoi, more than three quarters ofleafy vegetables, such as water morning glory(rau muong) and lettuce, are produced fewer than20 kilometres from the urban centre and areavailable all year round 3. Temperate vegetables(tomato, cabbage, carrot) come from peri-urbanareas when climatic conditions are favourable(November to March) and elsewhere outside ofthis winter period, for example in August, fromChina (80% of tomatoes), from Dalat (15% oftomatoes) and from Son La (5% of tomatoes).
Surveys in the markets show that a productiondistrict in the peri-urban areas can be linked toeach product: this is the case for the districts ofThuong Tin and Hoai Duc in the province of HaTay for winter tomatoes (representing a quarter ofthe flows between them) and of Me Linh in theprovince of Vinh Phuc for June tomatoes; GiaLam in the province of Ha Noi for winter cabbages(45% of flows); Gia Lam and Tu Liem for leafyvegetables.
For temperate vegetables, the vegetableproduction districts in the Red River delta supplythe city of Hanoi and other cities, such as Vinh inthe central region, and even Ho Chi Minh City. Inthe region of the Bac Hung Hai, more than 70%of the production of temperate vegetables aredestined for the distant markets in the centre andsouth of the country which do not benefit fromfavourable production conditions in winter, theremainder being commercialised in Hanoi (BuiThi Thai, 2000).
Since 1994 and the first market reforms,villages have refined their commercial positioning,linking their advantages – type of vegetable andquality, according to the soil and climatic charac-teristics and the experience of the region – to thetargeted destination market.
In Ho Chi Minh City, vegetables are provided for
3 Information on the flows of vegetables destined for Hanoi are provided by the AVRDC-CIRAD project on peri-urbanagriculture, Hoang Bang An, Isabelle Vagneron et al., 2003, and for Ho Chi Minh City, surveys from CIRAD/Imperial College atWye/Agriculture and Forestry University of Ho Chi Minh City.
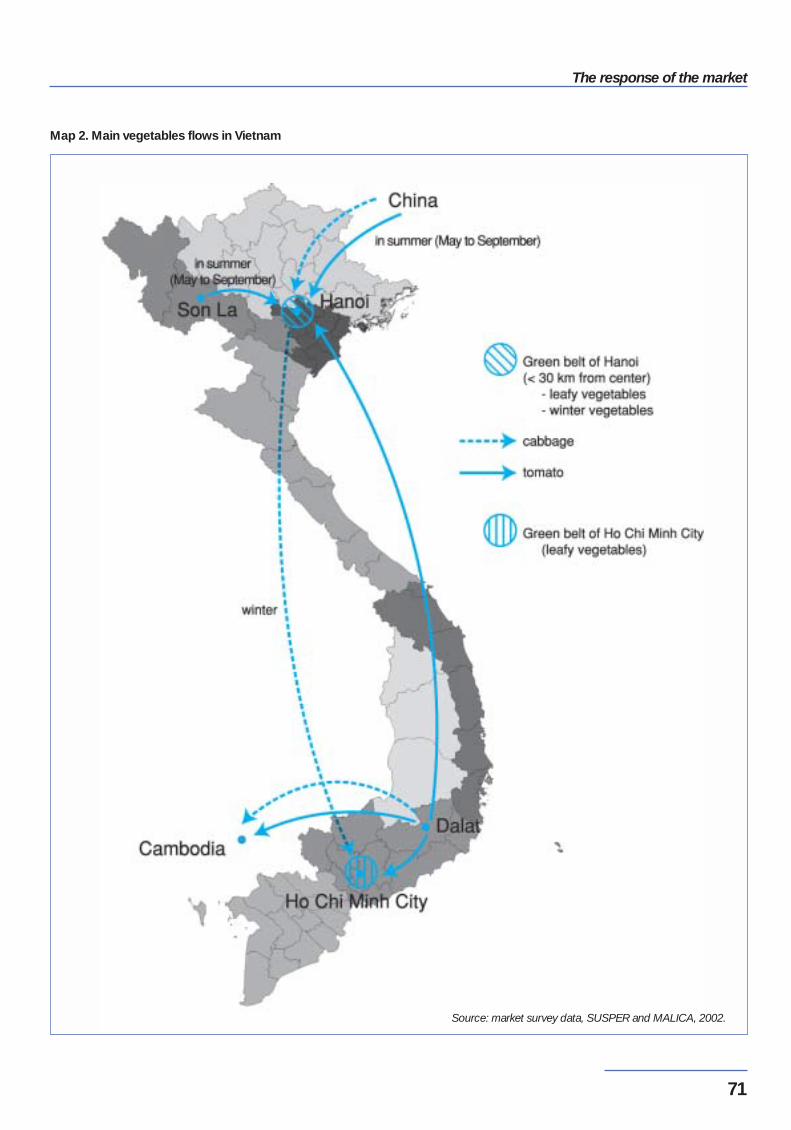
The response of the market
71
Map 2. Main vegetables flows in Vietnam
Source: market survey data, SUSPER and MALICA, 2002.
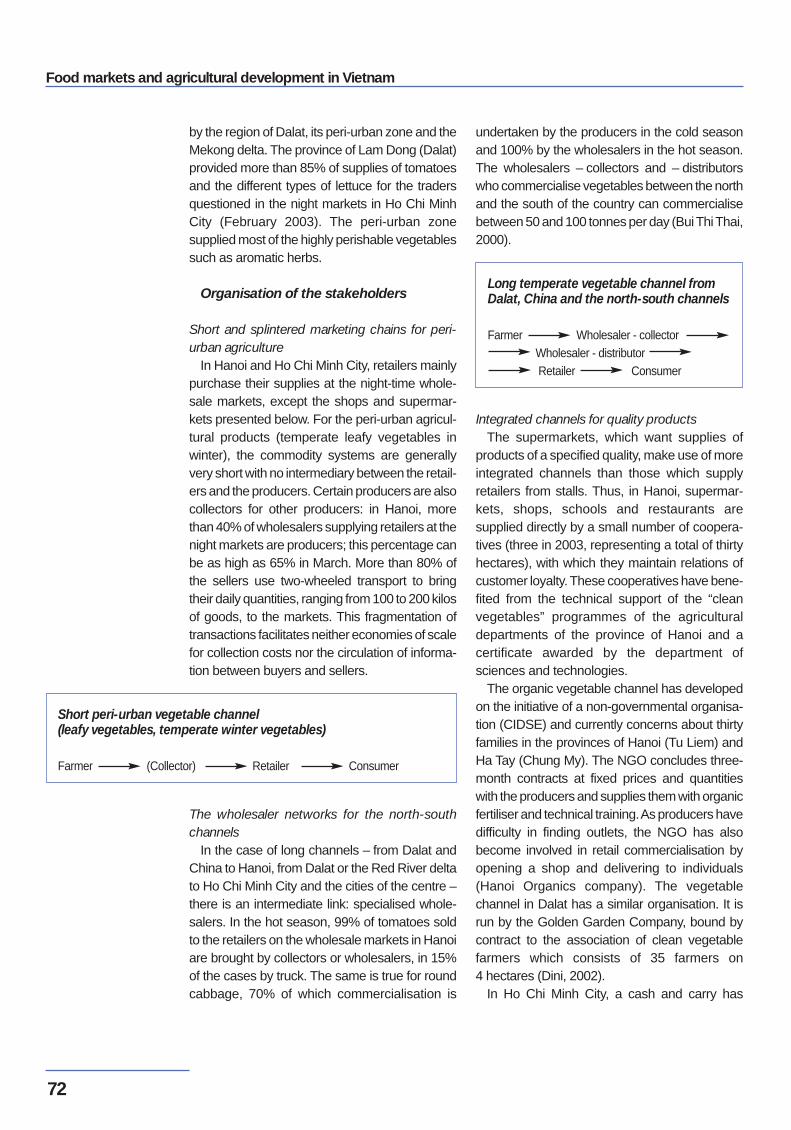
Food markets and agricultural development in Vietnam
72
by the region of Dalat, its peri-urban zone and theMekong delta. The province of Lam Dong (Dalat)provided more than 85% of supplies of tomatoesand the different types of lettuce for the tradersquestioned in the night markets in Ho Chi MinhCity (February 2003). The peri-urban zonesupplied most of the highly perishable vegetablessuch as aromatic herbs.
Organisation of the stakeholders
Short and splintered marketing chains for peri-urban agriculture
In Hanoi and Ho Chi Minh City, retailers mainlypurchase their supplies at the night-time whole-sale markets, except the shops and supermar-kets presented below. For the peri-urban agricul-tural products (temperate leafy vegetables inwinter), the commodity systems are generallyvery short with no intermediary between the retail-ers and the producers. Certain producers are alsocollectors for other producers: in Hanoi, morethan 40% of wholesalers supplying retailers at thenight markets are producers; this percentage canbe as high as 65% in March. More than 80% ofthe sellers use two-wheeled transport to bringtheir daily quantities, ranging from 100 to 200 kilosof goods, to the markets. This fragmentation oftransactions facilitates neither economies of scalefor collection costs nor the circulation of informa-tion between buyers and sellers.
The wholesaler networks for the north-southchannels
In the case of long channels – from Dalat andChina to Hanoi, from Dalat or the Red River deltato Ho Chi Minh City and the cities of the centre –there is an intermediate link: specialised whole-salers. In the hot season, 99% of tomatoes soldto the retailers on the wholesale markets in Hanoiare brought by collectors or wholesalers, in 15%of the cases by truck. The same is true for roundcabbage, 70% of which commercialisation is
undertaken by the producers in the cold seasonand 100% by the wholesalers in the hot season.The wholesalers – collectors and – distributorswho commercialise vegetables between the northand the south of the country can commercialisebetween 50 and 100 tonnes per day (Bui Thi Thai,2000).
Integrated channels for quality productsThe supermarkets, which want supplies of
products of a specified quality, make use of moreintegrated channels than those which supplyretailers from stalls. Thus, in Hanoi, supermar-kets, shops, schools and restaurants aresupplied directly by a small number of coopera-tives (three in 2003, representing a total of thirtyhectares), with which they maintain relations ofcustomer loyalty. These cooperatives have bene-fited from the technical support of the “cleanvegetables” programmes of the agriculturaldepartments of the province of Hanoi and acertificate awarded by the department ofsciences and technologies.
The organic vegetable channel has developedon the initiative of a non-governmental organisa-tion (CIDSE) and currently concerns about thirtyfamilies in the provinces of Hanoi (Tu Liem) andHa Tay (Chung My). The NGO concludes three-month contracts at fixed prices and quantitieswith the producers and supplies them with organicfertiliser and technical training. As producers havedifficulty in finding outlets, the NGO has alsobecome involved in retail commercialisation byopening a shop and delivering to individuals(Hanoi Organics company). The vegetablechannel in Dalat has a similar organisation. It isrun by the Golden Garden Company, bound bycontract to the association of clean vegetablefarmers which consists of 35 farmers on4 hectares (Dini, 2002).
In Ho Chi Minh City, a cash and carry has
Short peri-urban vegetable channel(leafy vegetables, temperate winter vegetables)
Farmer (Collector) Retailer Consumer
Long temperate vegetable channel fromDalat, China and the north-south channels
Farmer Wholesaler - collector Wholesaler - distributor Retailer Consumer
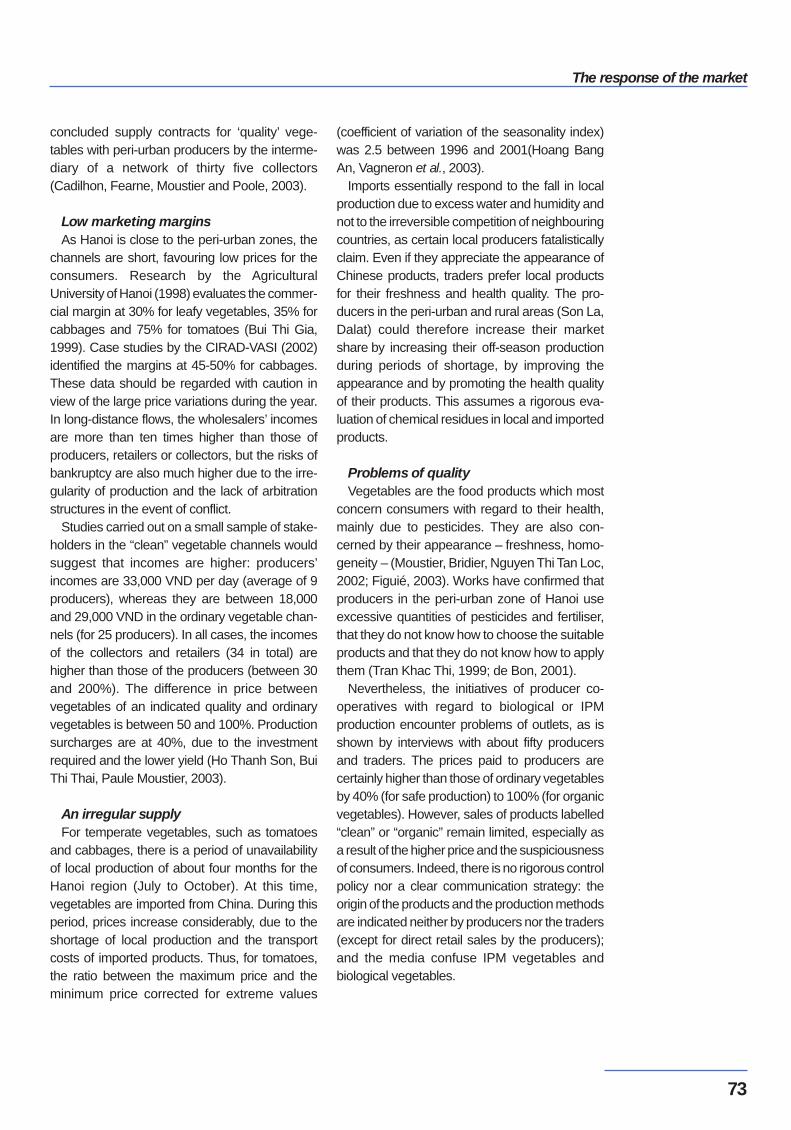
The response of the market
73
concluded supply contracts for ‘quality’ vege-tables with peri-urban producers by the interme-diary of a network of thirty five collectors(Cadilhon, Fearne, Moustier and Poole, 2003).
Low marketing marginsAs Hanoi is close to the peri-urban zones, the
channels are short, favouring low prices for theconsumers. Research by the AgriculturalUniversity of Hanoi (1998) evaluates the commer-cial margin at 30% for leafy vegetables, 35% forcabbages and 75% for tomatoes (Bui Thi Gia,1999). Case studies by the CIRAD-VASI (2002)identified the margins at 45-50% for cabbages.These data should be regarded with caution inview of the large price variations during the year.In long-distance flows, the wholesalers’ incomesare more than ten times higher than those ofproducers, retailers or collectors, but the risks ofbankruptcy are also much higher due to the irre-gularity of production and the lack of arbitrationstructures in the event of conflict.
Studies carried out on a small sample of stake-holders in the “clean” vegetable channels wouldsuggest that incomes are higher: producers’incomes are 33,000 VND per day (average of 9producers), whereas they are between 18,000and 29,000 VND in the ordinary vegetable chan-nels (for 25 producers). In all cases, the incomesof the collectors and retailers (34 in total) arehigher than those of the producers (between 30and 200%). The difference in price betweenvegetables of an indicated quality and ordinaryvegetables is between 50 and 100%. Productionsurcharges are at 40%, due to the investmentrequired and the lower yield (Ho Thanh Son, BuiThi Thai, Paule Moustier, 2003).
An irregular supplyFor temperate vegetables, such as tomatoes
and cabbages, there is a period of unavailabilityof local production of about four months for theHanoi region (July to October). At this time,vegetables are imported from China. During thisperiod, prices increase considerably, due to theshortage of local production and the transportcosts of imported products. Thus, for tomatoes,the ratio between the maximum price and theminimum price corrected for extreme values
(coefficient of variation of the seasonality index)was 2.5 between 1996 and 2001(Hoang BangAn, Vagneron et al., 2003).
Imports essentially respond to the fall in localproduction due to excess water and humidity andnot to the irreversible competition of neighbouringcountries, as certain local producers fatalisticallyclaim. Even if they appreciate the appearance ofChinese products, traders prefer local productsfor their freshness and health quality. The pro-ducers in the peri-urban and rural areas (Son La,Dalat) could therefore increase their marketshare by increasing their off-season productionduring periods of shortage, by improving theappearance and by promoting the health qualityof their products. This assumes a rigorous eva-luation of chemical residues in local and importedproducts.
Problems of qualityVegetables are the food products which most
concern consumers with regard to their health,mainly due to pesticides. They are also con-cerned by their appearance – freshness, homo-geneity – (Moustier, Bridier, Nguyen Thi Tan Loc,2002; Figuié, 2003). Works have confirmed thatproducers in the peri-urban zone of Hanoi useexcessive quantities of pesticides and fertiliser,that they do not know how to choose the suitableproducts and that they do not know how to applythem (Tran Khac Thi, 1999; de Bon, 2001).
Nevertheless, the initiatives of producer co-operatives with regard to biological or IPMproduction encounter problems of outlets, as isshown by interviews with about fifty producersand traders. The prices paid to producers arecertainly higher than those of ordinary vegetablesby 40% (for safe production) to 100% (for organicvegetables). However, sales of products labelled“clean” or “organic” remain limited, especially asa result of the higher price and the suspiciousnessof consumers. Indeed, there is no rigorous controlpolicy nor a clear communication strategy: theorigin of the products and the production methodsare indicated neither by producers nor the traders(except for direct retail sales by the producers);and the media confuse IPM vegetables andbiological vegetables.
Food markets and agricultural development in Vietnam
74
Strengths and weaknesses of coordi-nation mechanisms
Short and long marketing chainsThe characteristics of the short channels
described – low quantities, two-wheeled trans-port and frequent integration of production, collec-tion and even retail sales – favour neither thelarge-scale collection of products, nor the circula-tion of information concerning the needs of themarket and the production potential.
On the other hand, in the long channels,networks have for a long time linked wholesaler-receivers, based in the destination cities, towholesaler-distributors, with information beingexchanged regularly, sometimes by telephone(Bui Thi Thai, 2000).
Institutional economics allows the forms of verti-cal integration and the personalised relationsbetween operators to be identified and interpretedas responses to high transaction costs (Moustier,Vagneron, Bui Thi Thai, 2003).
In the short channels, vertical integration limitsthe size of transactions and implies that theproducer sells at night on the market instead ofdevoting himself to his farming (but finishes withlow prices). In the wholesaler networks, in a situ-ation of oligopoly, market organisation is dama-ging to the distribution of incomes in the channelsas the wholesalers have much higher incomesthan those of the producers as a result of theircontrolling information concerning the finaloutlets; however, this organisation facilitates morelarge-scale transactions.
Strengths and weaknesses of contractual formsThe relations between stakeholders are more
integrated in the quality goods channels than in theordinary vegetable channels, integration respon-ding to a strategy to minimise uncertainty concer-ning health quality. The producers maintain rela-tions of loyalty with distributors: regular orders,delivery to the shops and, in the case of two coo-peratives, direct retail sales by the producers onmarket stands. Moreover, two companies, HanoiOrganics and Golden Garden Company in Dalat,
specify in the signed contracts the quantities, theprice and the production and control protocols. Wecould also quote the example of “Metro” cash andcarry in Ho Chi Minh City, which has signedcontracts with peri-urban producers (see above).
The contracts between producers and tradersare still very few. Indeed, the instability of thequantities and prices leads the producers to adoptopportunist behaviours: when prices increase,they prefer to change buyers and, in periods ofoverproduction, they are reticent to sell fixedquantities. Evidence of this can be seen in thecompany Hanoi Organics, which has difficulty indrawing up contracts with the producers 4.Furthermore, only 10% of the traders interviewedin the framework of the IFPRI survey claimed tohave contracts with producers (IFPRI, 2002);85% said that they did not enter into contracts dueto price instability. Finally, 70% spoke of disagree-ments with their suppliers regarding the quality ofthe products.
Traceability and quality controlTraceability and quality control have become a
major concern of consumers. In response, theproducers have to organise themselves. Theycould thus improve the labelling of products(wrapping, labels, information about productionand control practices) and implement a crediblequality control at their level.
Currently, controls are undertaken by severaladministrations (Department of Sciences andTechnology, Ministry of Agriculture and RuralDevelopment, Ministry of Health) and are notwidespread: only 20% of vegetable sellers inter-viewed in the IFPRI survey (IFPRI, 2002) hadbeen visited by a quality controller. It is henceforthnecessary that the system of controls be validatedby public bodies.
Lack of trade associationsProducer organisations are also a solution to
group the products, with sales delegated totraders who are members of the group of produ-cers, as demonstrated by the success of someclean vegetable cooperatives in Hanoi. In the
4 Interviews with two producers from Tu Liem, contracting parties of Hanoi Organics and with the officials of the company.
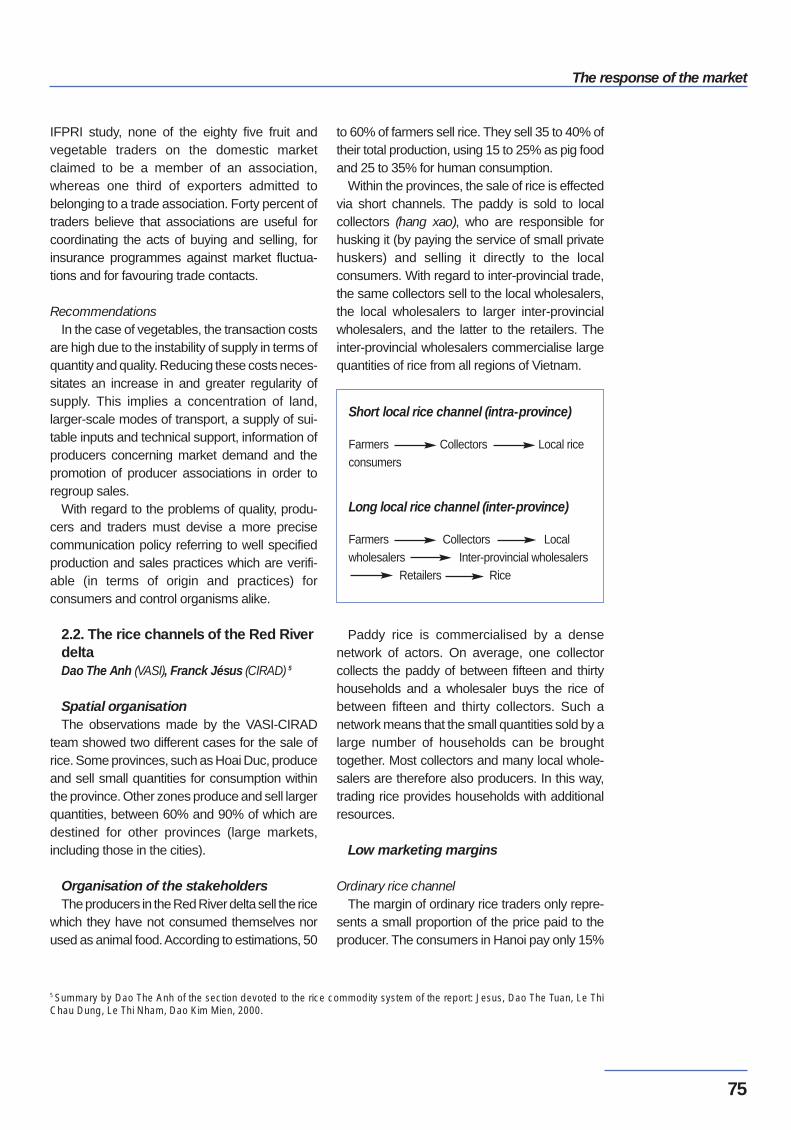
The response of the market
75
IFPRI study, none of the eighty five fruit andvegetable traders on the domestic marketclaimed to be a member of an association,whereas one third of exporters admitted tobelonging to a trade association. Forty percent oftraders believe that associations are useful forcoordinating the acts of buying and selling, forinsurance programmes against market fluctua-tions and for favouring trade contacts.
RecommendationsIn the case of vegetables, the transaction costs
are high due to the instability of supply in terms ofquantity and quality. Reducing these costs neces-sitates an increase in and greater regularity ofsupply. This implies a concentration of land,larger-scale modes of transport, a supply of sui-table inputs and technical support, information ofproducers concerning market demand and thepromotion of producer associations in order toregroup sales.
With regard to the problems of quality, produ-cers and traders must devise a more precisecommunication policy referring to well specifiedproduction and sales practices which are verifi-able (in terms of origin and practices) forconsumers and control organisms alike.
2.2. The rice channels of the Red RiverdeltaDao The Anh (VASI), Franck Jésus (CIRAD) 5
Spatial organisation The observations made by the VASI-CIRAD
team showed two different cases for the sale ofrice. Some provinces, such as Hoai Duc, produceand sell small quantities for consumption withinthe province. Other zones produce and sell largerquantities, between 60% and 90% of which aredestined for other provinces (large markets,including those in the cities).
Organisation of the stakeholdersThe producers in the Red River delta sell the rice
which they have not consumed themselves norused as animal food. According to estimations, 50
to 60% of farmers sell rice. They sell 35 to 40% oftheir total production, using 15 to 25% as pig foodand 25 to 35% for human consumption.
Within the provinces, the sale of rice is effectedvia short channels. The paddy is sold to localcollectors (hang xao), who are responsible forhusking it (by paying the service of small privatehuskers) and selling it directly to the localconsumers. With regard to inter-provincial trade,the same collectors sell to the local wholesalers,the local wholesalers to larger inter-provincialwholesalers, and the latter to the retailers. Theinter-provincial wholesalers commercialise largequantities of rice from all regions of Vietnam.
Paddy rice is commercialised by a densenetwork of actors. On average, one collectorcollects the paddy of between fifteen and thirtyhouseholds and a wholesaler buys the rice ofbetween fifteen and thirty collectors. Such anetwork means that the small quantities sold by alarge number of households can be broughttogether. Most collectors and many local whole-salers are therefore also producers. In this way,trading rice provides households with additionalresources.
Low marketing margins
Ordinary rice channelThe margin of ordinary rice traders only repre-
sents a small proportion of the price paid to theproducer. The consumers in Hanoi pay only 15%
5 Summary by Dao The Anh of the section devoted to the rice commodity system of the report: Jesus, Dao The Tuan, Le ThiChau Dung, Le Thi Nham, Dao Kim Mien, 2000.
Short local rice channel (intra-province)
Farmers Collectors Local riceconsumers
Long local rice channel (inter-province)
Farmers Collectors Localwholesalers Inter-provincial wholesalers
Retailers Rice
Food markets and agricultural development in Vietnam
76
more than the price paid to the producer. Thefarmers obtain 87% of the urban retails price - inIndonesia, the wholesale prices are 40% higherthan the price paid to the producers (Erwidodo,Prajogo U. Hadi, 1999) and in the United States,farmers obtain only 8% of the retail cereal price(U.S. Department of Agriculture, 1998). This smallmargin is possible because the local collectorsalso sell bran and competition is fierce due to thelarge number of traders.
Flavoured rice channelFlavoured rice is a high-quality variety (Tam
Xoan) that most consumers prefer to ordinary rice.The price paid to the producer is 50% higher thanthat of ordinary rice. For all that, however, thefarmer is not interested in cultivating flavoured rice,as the yields are lower and costs higher. Profits arethe same as those obtained for ordinary rice (twothirds of the sale price). On the other hand, collec-tors, wholesalers and retailers make more profitthan with ordinary rice. Urban consumers pay40 % more for flavoured rice than is paid to theproducer. Although this is low compared to othercountries, this margin is much higher than that ofordinary rice. This can be explained by the lowlevel of competition between buyers of flavouredrice, as supply is still insufficient.
Moreover, profiting from the imbalancebetween supply and demand, traders have devel-oped a “false flavoured rice” channel with varietiesof Chinese rice which have an identical grain tothat of Tam Xoan rice and the price of which is onlyslightly higher than that of ordinary rice. At themoment of purchase, the consumers are unableto differentiate the real flavoured rice from thefalse. These illegal practices discourage produ-cers from cultivating flavoured rice.
Instability of prices, payments and qualityThe main problem mentioned by rice traders, all
the more detrimental as the average margins perkilo are low, is the instability of prices and thequantities available. Suitable storage could solvethis problem. Another problem mentioned is thedelay in payments in the chain: from retailers to
wholesalers; from certain consumers who buy oncredit to the retailers.
As for the physical quality of the rice – cleanli-ness, colour, percentage of humidity and propor-tion of broken rice –, it is very heterogeneous andrequires sorting which the retailers and whole-salers find difficult to effect due to the differentorigins.
Strengths and weaknesses of coordi-nation mechanisms
Producers and consumers benefit from thesmall commercial margins in the ordinary ricechannel. Producers would profit from the diffe-rences in physical quality being visible andvalorised in terms of price. In the flavoured ricechannel, the producers from the Tam Xoan regionhave created an organisation making their labelrecognised and thus better valorising theirproduction in terms of price. This type of organi-sation could be extended to other zones.
ConclusionThe ordinary rice channel is globally efficient
with regard to commercialisation. For the riceproducers, the problems lie at the production levelrather than the marketing level: water surplusesor deficits linked to problems of collectivemanagement of irrigation infrastructures; pesti-cides and seeds which are often unsuitable. Thedesired improvements in commercialisationmostly concern the flavoured rice channel.
2.3. The pork channel in northernVietnamVu Trong Binh (VASI) 6
This section will highlight the similarities anddifferences between the pork channel and thevegetable and rice channels.
The sale of pigs occupies a varying place infarmers’ strategies. For two thirds of producers,who have an average of three pigs, selling is aresidual activity, the main part being the supply ofmanure and savings. For the remaining third,the sale of pigs can represent more than half of
6 This part was written using: Jesus, Dao The Tuan, Le Thi Chau Dung, Le Thi Nham, Dao Kim Mien, 2000, and Vu Trong Binh,2002.
The response of the market
77
their incomes. Whereas rice farmers highlightproduction problems (access to water, qualityof pesticides and seeds), pig farmers, likevegetable farmers, face problems of commercia-lisation.
The supply to consumers is effected directly bythe slaughterers or by the retailers who buy fromthem. Based in rural or peri-urban zones, theslaughterers are supplied directly by producers orby the intermediary of collectors. The commercialmargins, which are small, fall between those ofthe rice and vegetable channels: the retail price isonly 20% higher than the price paid to theproducer and the producer receives 80% of theend price – in the United States, this figure isbetween 25 and 40%.
Consumption of pork differs in the country andin the cities, urban consumers preferring leanpork. There are numerous difficulties in producinglean pork, both technical and structural. Thebreed of exotic pig introduced recently requiresnew practices in piglet supply, feeding and care,which producers and extension workers do notknow. Moreover, the small size of breeding (7 pigsin Nam Thanh) reduces bargaining power with thecollectors and thus the valorisation of effortstowards quality.
In Nam Thanh (Hai Duong province), breedershave successfully tested collective actions inorder to control piglet supplies, draw up agree-ments with veterinary services and developregular relations with collectors.
As for the other channels, the increase inproducers’ incomes could occur via a clear diffe-rentiation of qualities (lean pork, fat pork). Atpresent, the purchasing prices from the producerare not significantly different whereas for leanpork, animal food and care are more costly. Thepork channel also suffers from price instability andthe risks of buyer credit.
The food ration, consisting of half corn, repre-sents about 65% of the production costs of pork.The efficiency of the pork channel thus dependson efficiency of the corn channel; indeed the retailprice of corn is high (115 US$ per tonne, whereasthe international market price is only 84 US$ pertonne) and unstable (Dao Duc Huan, Vu Trong
Binh, Dao The Anh, Lecoq, 2003). In order toknow how the price of Vietnamese corn could bereduced whilst retaining the socio-economic rolethat this product plays in the upland areas, it isnecessary to know the limits to the increase inproduction in the different regions of production(notably Son La) and the transport problemsexperienced. Furthermore, the extensive produc-tion of corn in mountain areas is not sustainable(erosion, loss of ferti-lity of the soil). One solutionlies in agro-ecological practices for productionsystems based on corn in these upland areas.
2.4. Conclusions for the three channelsThe table below summarises the trends of the
three channels. In all three cases, demand isgreater for products of a specified quality (fla-voured rice, clean vegetables, lean pork); for stan-dard products, demand remains high for the lowliving standard population.
Currently, vegetables remain cheap productswhereas pork is a costly foodstuff. The consump-tion of pork will only increase if the price for theconsumer falls, which would require a fall in thecost of feeding and care.
Vegetable producers will see their incomesincrease if they group together. They could thusbenefit from economies of scale for production,marketing and transport.
To rebalance their position in relation to thewholesalers, the producers in the rural areasspecialised in vegetable production (Dalat, SonLa) will have to improve the transport (at presentnon-refrigerated trucks) and organise the circula-tion of information between producers and traders.
For the three channels, although the dispersedorganisation with no long-term contractual rela-tions allows low end prices and a certain flexibi-lity, it does not favour risk-taking to conquermarket shares for quality products providinghigher incomes. The sale of specified qualityproducts necessitates an organisation of commu-nication and controls at three levels: producergroups; producer-trader groups (with the deve-lopment of contractualisation between producersand traders); and public authorities to certifycontrol structures in relation to the profession.
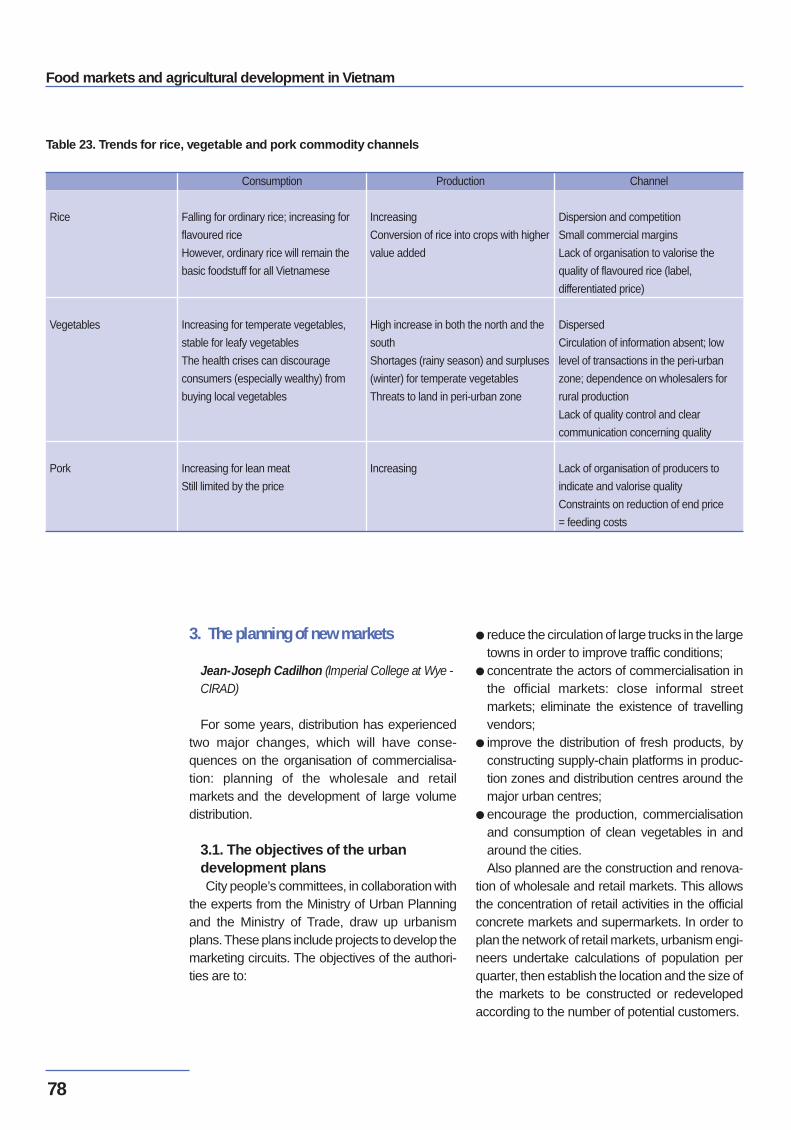
Food markets and agricultural development in Vietnam
78
3. The planning of new markets
Jean-Joseph Cadilhon (Imperial College at Wye -CIRAD)
For some years, distribution has experiencedtwo major changes, which will have conse-quences on the organisation of commercialisa-tion: planning of the wholesale and retailmarkets and the development of large volumedistribution.
3.1. The objectives of the urbandevelopment plansCity people’s committees, in collaboration with
the experts from the Ministry of Urban Planningand the Ministry of Trade, draw up urbanismplans. These plans include projects to develop themarketing circuits. The objectives of the authori-ties are to:
● reduce the circulation of large trucks in the largetowns in order to improve traffic conditions;
● concentrate the actors of commercialisation inthe official markets: close informal streetmarkets; eliminate the existence of travellingvendors;
● improve the distribution of fresh products, byconstructing supply-chain platforms in produc-tion zones and distribution centres around themajor urban centres;
● encourage the production, commercialisationand consumption of clean vegetables in andaround the cities.Also planned are the construction and renova-
tion of wholesale and retail markets. This allowsthe concentration of retail activities in the officialconcrete markets and supermarkets. In order toplan the network of retail markets, urbanism engi-neers undertake calculations of population perquarter, then establish the location and the size ofthe markets to be constructed or redevelopedaccording to the number of potential customers.
Table 23. Trends for rice, vegetable and pork commodity channels
Rice
Vegetables
Pork
Consumption
Falling for ordinary rice; increasing for
flavoured rice
However, ordinary rice will remain the
basic foodstuff for all Vietnamese
Increasing for temperate vegetables,
stable for leafy vegetables
The health crises can discourage
consumers (especially wealthy) from
buying local vegetables
Increasing for lean meat
Still limited by the price
Production
Increasing
Conversion of rice into crops with higher
value added
High increase in both the north and the
south
Shortages (rainy season) and surpluses
(winter) for temperate vegetables
Threats to land in peri-urban zone
Increasing
Channel
Dispersion and competition
Small commercial margins
Lack of organisation to valorise the
quality of flavoured rice (label,
differentiated price)
Dispersed
Circulation of information absent; low
level of transactions in the peri-urban
zone; dependence on wholesalers for
rural production
Lack of quality control and clear
communication concerning quality
Lack of organisation of producers to
indicate and valorise quality
Constraints on reduction of end price
= feeding costs
The response of the market
79
3.2. Two models of wholesale markets The construction plans of new wholesale
markets on the periphery of Hanoi and Ho ChiMinh City differ in their design, but seem adaptedto the local context.
In Hanoi, more than half of the vegetablesconsumed are produced in the peri-urban zoneand transported by bicycle or motorbike by collec-tors or farmers. On the other hand, fruit mainlycomes from the south of the country or fromChina. The major roads which serve theseproduction zones end south of Hanoi in the firstcase and on the left bank of the Red River in theother. It is thus necessary to cross the river toreach the centre of town. The plans of thePeople’s Committee of the city favour theconstruction of a network of seven small peri-pheral markets, closer to the production zones,which will be linked by a ring road for the circula-tion of trucks. Two of these markets have alreadybeen developed (Denlu to the south of the city,Dich Vong to the west). Moreover, a new markethas been constructed in the south of the city tohouse the fruit wholesalers and their largecargoes. A bridge to cross the Red River shouldbe built nearby. These peripheral markets wouldact as warehousing and redistribution centres.The large trucks will remain outside the city andsmaller trucks will transport the products to retai-lers who cannot travel to the secondary wholesalemarkets within the city.
In Ho Chi Minh City, the fruit and vegetablesdistribution networks are much more concen-trated: each night, collectors transport large quan-tities by truck to the wholesale markets. The mainsupply areas for fruit and vegetables are the southcentral region (notably the region of Dalat), theMekong delta and the peri-urban zone of Cu Chito the north of the city. The roads coming fromthese zones arrive in the east, west and north ofthe city respectively. The People’s committee ofHo Chi Minh City is planning the construction ofthree large peripheral distribution centres: one inthe east for the products from the north, one in thewest for the products from the Mekong delta andone in the north for products from the peri-urbanzone. These markets, the largest of which, in thewest, will cover an area of 150 hectares, arelocated to permit a break in the load betweenlarge and small trucks. Aperipheral boulevard will
link these three markets. At first generalist innature, they will later specialise according toproduction.
Compared with spontaneous wholesale mar-kets (Long Bien and Nga Tu So in Hanoi, CauMuoi, Mai Xuan Thuong and Tan Xuan in Ho ChiMinh City), planned wholesale markets havesome specific features (concrete soil, parkingarea, lighting).
3.3. Problems of tomorrowThe possible consequences of the develop-
ment of new markets are numerous; they may befavourable or unfavourable to the functioning ofmarketing chains and to the stakeholders. Itnevertheless seems that the authorities are notaware of all of these effects.
Greater transparency in the food chainsThe construction of wholesale markets should
solve certain problems currently observed in thecommercialisation channels for fruit and vege-tables. The concentration in time and space ofnumerous traders – in a limited and regulatedmarket – should improve the transparency ofprice setting and promote competition betweenwholesalers, something which will benefit thecustomers of the latter and the end consumers.New infrastructures should also improve thehandling of fresh products with storage, sortingand packaging areas, as well as cold rooms. Thisshould contribute to reducing losses in thecommodity channels. Finally, moving the centralwholesale markets to the periphery of the citiesand the ban on the circulation of large transportvehicles in the town centres will certainly resolvethe congestion problems in town.
More shared effects on the insertion ofproducers in the markets
In Hanoi, the construction of peripheral marketsshould reduce the travelling time of producerswho market their production or that of otherfarmers. In the markets already built, lighting andsecurity against theft are much appreciated by thesellers.
In Ho Chi Minh City, thanks to the high degreeof transparency and the improved circulation ofinformation between the urban and rural markets,more producers can sell their production at prices
Food markets and agricultural development in Vietnam
80
more representative of the conditions of supplyand demand.
However, the elimination of travelling vendors offood products will be a severe blow to poorerhouseholds around the edge of the city. Indeed,when their labour is not required on the farm,farmers’wives go to the city as travelling vendors.Their prices, higher than those offered by sales-women on the official fixed markets of Ho ChiMinh City, take into account the delivery at homeservice. Moreover, as travelling sales and theinformal markets can represent more than 80% ofthe sale of fruit and vegetables in Hanoi (NguyenDinh Quang, 1999), it is important to provide foran alternative which allows a wide distribution ofproducts.
Long-term effects on job and incomecreation
The governmental policies regulating commer-cialisation and the construction of new marketscan have ambivalent consequences on jobcreation and the increase of revenues.
In the short term, we might fear a clear loss injobs due to the elimination of the informal mar-keting chains such as travelling vendors and infor-mal markets. In Ho Chi Minh City, moving thewholesale markets will cause a reduction in thenumber of wholesalers: only the biggest, whohave a means of transport to travel from theirhome in the town centre to the new peripheralwholesale markets, could continue their activity.According to author’s surveys of wholesalers,numerous small wholesalers have decided tochange their activity when the markets changelocation, a fact which promises to be difficult in amilieu where urban unemployment is already aproblem.
In the long term, these planning policies shouldbe accompanied by an increase in the number ofjobs and in the incomes of the stakeholders in thecommodity channels. At a more general level, theurban population of Vietnam will increase withindustrial development. If changing the locationsof the markets is a success and the new whole-sale markets become attractive sites for thehandling and exchange of food products, theincreasing number of mouths to feed in the citesand the development of a food processing indus-
try will bring about more activity for the whole-salers and, upstream, for the collectors andfarmers. This in turn should result in a clearincrease in terms of the creation of jobs andincomes.
3.4. The necessity for dialogueIn the wholesale market planning process, no
dialogue has been provided for with the marketusers, the traders and the producers. However,this would be desirable to adapt the markets tothe constraints and needs of the operators: loca-lisation, location costs, times, services rendered.Moreover, for the traders who will not be able touse the wholesale and retail markets due toinsufficient liquid assets or to localisation, it isimportant to imagine solutions, for example acredit programme to open shops or to acquire avehicle.
4. The development of large volumedistribution
Nguyen Thi Tan Loc (RIFAV)
Is the food commodity system in Vietnam, likein many Asian, European and Latin-Americancountries, heading towards a concentration ofretail distribution and a growing proportion occu-pied by large volume distribution? What effectswill these changes have on production, trade,transformation and the consumers?
4.1. The development of supermarketsthroughout the worldSupermarkets are playing a larger and larger
role in the trade of common consumer goods, inparticular food products.
Supermarkets were born in the 1930s in theUnited States then in developed countries ofEurope, such as England, France and Germany.They later spread outside of Europe.
In Latin America, where poverty affects 40% ofthe population, supermarkets experienced rapidgrowth, initially in the major cities (1980s),followed by the medium-sized towns and othertowns (end of the 90s). Supermarkets wereinitially established in wealthier quarters, then theareas inhabited by the middle class, finally reach-
The response of the market
81
ing the working class areas. Their share in supply-ing increased from 10-20% in 1990 to 50-60% in2000 – an evolution which required fifty years inthe United States (Reardon and Berdegué,2002). For example, in Guatemala, the poorestcountry in Latin America, supermarkets, whichincreased in number from 66 in 1994 to 128 in2002, sell 35% of the total quantity of food sold inretail outlets (15% in 1994).
Since the 1990s, the Asian countries, such asSingapore, China, Thailand, possess super-markets, the diversity of which reflects the livingstandards of the clientele. However, the share oflarge volume distribution in food trade remainssmall: in Taiwan, large volume distribution stillonly represents 20% of fresh product purchasesand in Thailand, 35% (Cadilhon, Fearne et al.,2003).
Three main factors can explain the growth oflarge volume distribution: urbanisation; the growthin incomes with its direct and indirect effects(purchase of refrigerators and means of tran-sport); and the increasing proportion of workingwomen.
The rise of large volume distribution transformsthe food sector, due to the strong competitionwhich exists in the sector and thus the necessityto reduce the selling price. Supply chain platformsare created as well as contracts between whole-salers and producers, private standards of quality,food safety, volumes, packaging. The directmarketing chains between producers and sellersare strengthened, directly by the points of sale orindirectly by the intermediary of purchasingcentres; the proportion of supplying from thewholesale markets falls.
Demands with regard to quality, regularity ofsupply and modes of payment can lead to theexclusion of small farmers. However, producers’organisations have succeeded in taking advan-tage of these changes by implementing, oftenwith the support of the state, a certification andsignalisation adapted to the supermarkets(Reardon and Berdegué, 2002; Lautent, 2001).Generally, the development of large volume distri-bution places the power of decision and negotia-tion more than ever at the retail level, in thecontact with the end customers and in a situationof oligopoly (Moati, 2001).
Nevertheless, some commodity systems resistthe growth of large volume distribution. Whateverits share in the food trade may be, local sales inshops retain certain comparative advantages:freshness of products, care in the presentation,support for local production. Moreover, theproportion of fruit and vegetables commercialisedis always lower than that of other food products:50 to 75% less in Latin America, especially forreasons of conservation. In France, in 1995,hypermarkets, supermarkets and mini-marketscommercialised 60% of fruit and vegetables(Vernin, 1998), whereas these productsaccounted for 80% of food trade (Malassis andGhersi, 1997). Finally, as large volume distributionis controlled by oligopolies, the products availabletend to become uniform, a tendency which hasdifficulty in being compatible with the differentia-tion of consumer purchasing practices. Thus,large volume distribution is experiencing a crisis– even if it adapts by diversifying the range ofproducts available by concluding partnershipswith suppliers (Moati, 2001).
The effect of large volume distribution on theend price of food products is difficult to establish;although it reduces the price of stabilised or trans-formed products, it varies much more for freshproduce; moreover, transport costs to super-markets do not necessarily make buying in asupermarket more economical than buying inlocal markets (Saada, Valentin, 1997).
4.2. The development of supermarketsin VietnamBefore 1990, there were no supermarkets in
Vietnam (that is no shop of an area of more than400 m2). In the context of a subsidised economy,the Ministry of Trade managed the shops directly.Customers bought goods according to a fixedquantity without being able to choose either theproducts or the desired quantity. The first super-markets appeared at the start of the 1990s. Theywere initially concentrated in the major cities likeHo Chi Minh City and Hanoi, then in the surround-ing towns. Initially, the supermarkets, which wereeither small (less than 500 m2) or medium-sized(500-1,000 m2), were constructed in the citycentre, like the Citimart or Minimax outlets. Theythen multiplied in the peri-urban districts and their
Food markets and agricultural development in Vietnam
82
size increased: for example, on the outskirts of HoChi Minh City, the Coop Mart and Fivimart super-markets (between 1,000 and 15,000 m2), thenCora Mien Dong, Cora An Lac and Cora DongNai, which exceeded 15,000 m2 (and are there-fore hypermarkets, a term used for shops cove-ring more than 2,000 m2). In September 2001,Vietnam could count 70 supermarkets, 32 inHanoi et 38 in Ho Chi Minh City 7.
The diversity and quantity of the goods sold inthe supermarkets is rapidly increasing, due to theincrease in purchasing power. This is demon-strated by the record turnover recorded by thesupermarkets during the Tet festival of 2003. Dailysales in the Intimex, Fivimart, etc. supermarketsexceeded one billion dongs. the Intimex super-market, which marketed 10,000 types of goods in2001, sold 15,000 in March 2003 and it is aimingat 20,000 before the end of 2003.
The turnover of supermarkets is increasing. Forexample, the Seiyu supermarket in Hanoi saw itsdaily turnover triple from 1996 (700,000 VND) tothe end of 2002 (2,000,000 VND). Yet theeconomic efficiency of the supermarkets is still nota general phenomenon, a fact which poses aproblem for investors. As they represent a newmethod of commerce, certain supermarkets arestill not profitable. Thus, of the 70 supermarketsin Hanoi and Ho Chi Minh City, 14 were in deficitin 2001, 14 were breaking even and 15 were inprofit, profit of more than 500 million dongs for tenof them 8. Traders are forecasting the appearanceof new supermarkets in 2003, not only in thetowns, but also in the provinces and major indus-trial zones such as Da Nang, Binh Thuan, CanTho, Tien Giang, An Giang, Vinh Long, HaiPhong, Thai Binh and Bac Giang. At the sametime, the supermarkets are increasing their area.
4.3. The place of food productsMost supermarkets participate in the marketing
of foodstuffs (48 from a total of 70, or 70%), 23 outof 32 in Hanoi, 25 out of 38 in Ho Chi Minh City.Food products represent 30% of all goods in morethan 80% of supermarkets.
As fresh fruit and vegetables are bulky andperishable, not all supermarkets sell them. Only
14 of the 32 supermarkets in Hanoi sell freshvegetables and 21 out of 38 in Ho Chi Minh City.As for other food products, the sale of fruit andvegetables in supermarkets is increasing anddiversifying. For example, it is possible to findunusual local products such as baby corn,cucumber and asparagus, sweet peppers,carrots, green beans and Nam roi grapefruits, aswell as imported products such as apples fromNew-Zealand, grapes from the United States andtropical fruits from Thailand. Prepared vegetablesare also sold.
4.4. Relations with the producersand consumers In order to have regular supplies, supermarket
managers attempt to develop contracts, verbal orwritten, with producers (cooperative managers orindividuals) and, more rarely, with wholesalers.The contracts specify the quantity, species, price,quality, delivery and mode of payment. Contractsare thus concluded with farmers who producelean pork, dairy products and clean chicken(Proconco), as well as with cooperatives produ-cing clean vegetables. Thus, producers commitmore responsibility to the end quality of the pro-ducts and are forced to take the market orienta-tion more into account.
With regard to the consumers, surveys shouldbe carried out on a large sample to be moreaware of which points of sale they prefer whenmaking their purchases. The thirty supermarketcustomers interviewed in Hanoi and Ho Chi MinhCity mention the following reasons for makingtheir purchases in a supermarket: more confi-dence in the health quality of the products andpossible recourse to the responsibility of thesupermarket in the event of a problem; healthservice controls; the attraction of specific productswhich cannot be found on the market; and theattractive presentation of the products.
4.5. Positive and negative effectsIn summary, the number of supermarkets and
their turnover is increasing more and more rapidly.Supermarkets contribute to reducing the role ofthe open and travelling markets. For the moment,
7 Source: Communication from an official of the Department of Commerce, General Statistical Office in 2001.8 Source: Communication from an official of the Department of Commerce of the GSO in 2003.

The response of the market
83
the development of large volume distribution hasnot been accompanied by a reduction in distribu-tion costs. It is necessary to analyse whetherthese high prices are due to the initial phase ofdevelopment of the supermarkets and the costswill fall as the extent widens; or whether they arethe result of consumer mistrust of the quality of theproducts sold in supermarkets due to the lessthan rigorous nature of the controls; or even theresult of consumer preference for purchasing inlocal markets and from regular vendors.
As the prices in supermarkets are high, nume-rous consumers do not have the means to maketheir purchases there. There is, therefore, a dualdistribution system: the supermarket for well-offconsumers, the market for the others.
Conclusions: the need for new contractualarrangements
At present, the food commodity channels arefragmented. Wholesale transactions are limited tonorth-south and border trade; the wholesalersplay a major role in controlling information andsteering flows, a role which is nonetheless limitedby an inadequate transport infrastructure (norefrigeration).
The incentives provided by the market todevelop quality products are limited, despite thehigh consumer demand. This state of affairs is theresult of at least four problems: the lack of precisecommunication with regard to production andcontrol practices on the part of producer andtrader organisations; the lack of rigorous qualitycontrol linking public and private structures;unclear strategies in terms of purchasing price forquality products; the difficulty in implementingcontracts between producers and traders in orderto secure supply and outlets in terms of qualityand quantity.
In developed countries, contractualisation ismore and more common; it permits the flows andstakeholders’ incomes to be stabilised. However,in Vietnam, this development is confronted by
several obstacles: the high level of price varia-bility; the weakness of the legal framework in theevent of conflict; the diversity of the activities ofproducers and traders. It would be necessary tosensitise the latter to the advantages of contractu-alisation and to the responsibilities that they imply.
The short marketing chains, a limited cost ofwork and the unelaborated products favour lowend costs if we compare them to other countries.Prices nevertheless increase rapidly, especiallyfor fresh products, which corresponds to thegrowth of demand. The market should be able toadapt to a differentiated demand in terms ofpurchasing power and supply products with priceranges and variable additional services.
Finally, the current trends towards centralisationof distribution (reduction in the number of whole-sale and retail markets, development of largevolume distribution) will doubtless have negativeeffects in terms of employment which should beevaluated and partially compensated (credit andtraining programmes).
The opportunities provided by the domesticmarket to producers are still imperfectly transmit-ted by market mechanisms. Improving access totechnical and market information and coordina-tion within commodity systems would have a posi-tive impact on food supply in terms of quantity andquality.
Hence, the response of agriculture to marketopportunities is presently constrained by pro-blems of production structures as well as defi-ciencies in market organisation. We will considerthe case of peri-urban agriculture to illustratethese constraints. Peri-urban agriculture is veryreceptive to product market opportunities, but it isthreatened by constraints on the factor markets,including land and chemical products. It also illus-trates the non-economic functions of agriculture(social integration, buffer against urban density,waste recycling), that are presently endangeredby expansion of built-up areas without publicregulation of land use.
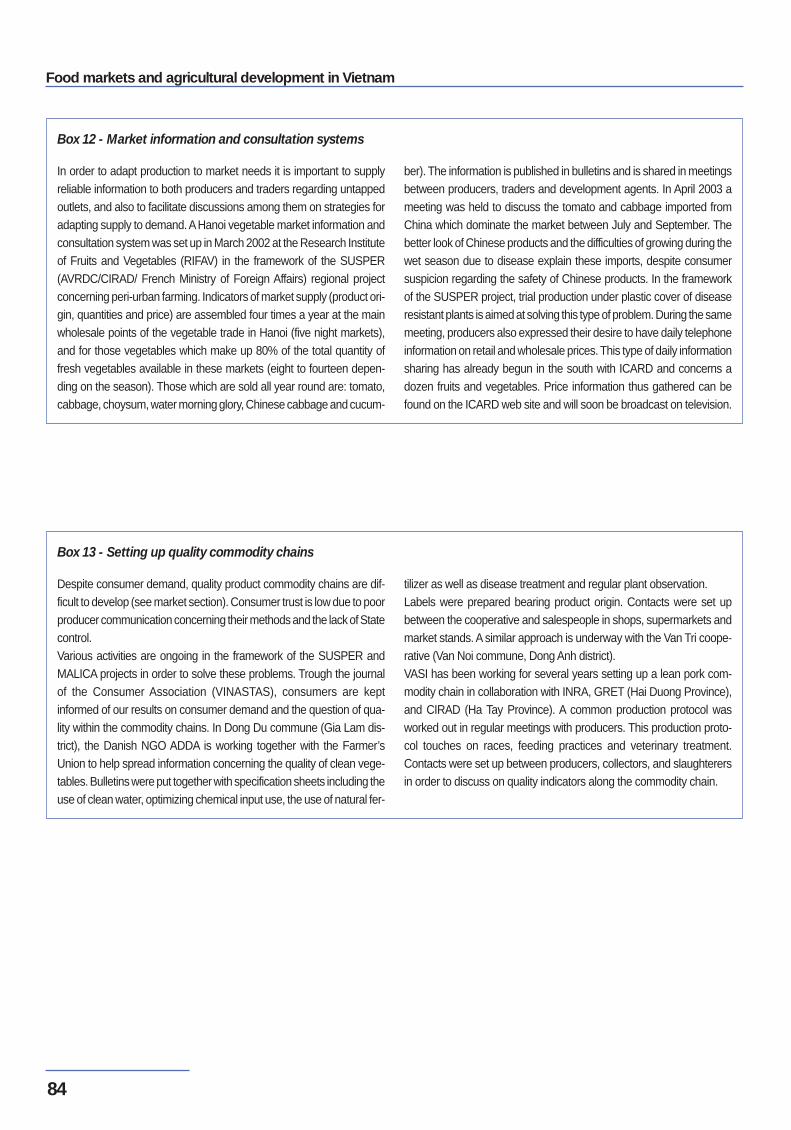
Food markets and agricultural development in Vietnam
84
In order to adapt production to market needs it is important to supplyreliable information to both producers and traders regarding untappedoutlets, and also to facilitate discussions among them on strategies foradapting supply to demand. AHanoi vegetable market information andconsultation system was set up in March 2002 at the Research Instituteof Fruits and Vegetables (RIFAV) in the framework of the SUSPER(AVRDC/CIRAD/ French Ministry of Foreign Affairs) regional projectconcerning peri-urban farming. Indicators of market supply (product ori-gin, quantities and price) are assembled four times a year at the mainwholesale points of the vegetable trade in Hanoi (five night markets),and for those vegetables which make up 80% of the total quantity offresh vegetables available in these markets (eight to fourteen depen-ding on the season). Those which are sold all year round are: tomato,cabbage, choysum, water morning glory, Chinese cabbage and cucum-
ber). The information is published in bulletins and is shared in meetingsbetween producers, traders and development agents. In April 2003 ameeting was held to discuss the tomato and cabbage imported fromChina which dominate the market between July and September. Thebetter look of Chinese products and the difficulties of growing during thewet season due to disease explain these imports, despite consumersuspicion regarding the safety of Chinese products. In the frameworkof the SUSPER project, trial production under plastic cover of diseaseresistant plants is aimed at solving this type of problem. During the samemeeting, producers also expressed their desire to have daily telephoneinformation on retail and wholesale prices. This type of daily informationsharing has already begun in the south with ICARD and concerns adozen fruits and vegetables. Price information thus gathered can befound on the ICARD web site and will soon be broadcast on television.
Box 12 - Market information and consultation systems
Despite consumer demand, quality product commodity chains are dif-ficult to develop (see market section). Consumer trust is low due to poorproducer communication concerning their methods and the lack of Statecontrol.Various activities are ongoing in the framework of the SUSPER andMALICA projects in order to solve these problems. Trough the journalof the Consumer Association (VINASTAS), consumers are keptinformed of our results on consumer demand and the question of qua-lity within the commodity chains. In Dong Du commune (Gia Lam dis-trict), the Danish NGO ADDA is working together with the Farmer’sUnion to help spread information concerning the quality of clean vege-tables. Bulletins were put together with specification sheets including theuse of clean water, optimizing chemical input use, the use of natural fer-
tilizer as well as disease treatment and regular plant observation. Labels were prepared bearing product origin. Contacts were set upbetween the cooperative and salespeople in shops, supermarkets andmarket stands. A similar approach is underway with the Van Tri coope-rative (Van Noi commune, Dong Anh district).VASI has been working for several years setting up a lean pork com-modity chain in collaboration with INRA, GRET (Hai Duong Province),and CIRAD (Ha Tay Province). A common production protocol wasworked out in regular meetings with producers. This production proto-col touches on races, feeding practices and veterinary treatment.Contacts were set up between producers, collectors, and slaughterersin order to discuss on quality indicators along the commodity chain.
Box 13 - Setting up quality commodity chains

The response of the market
85
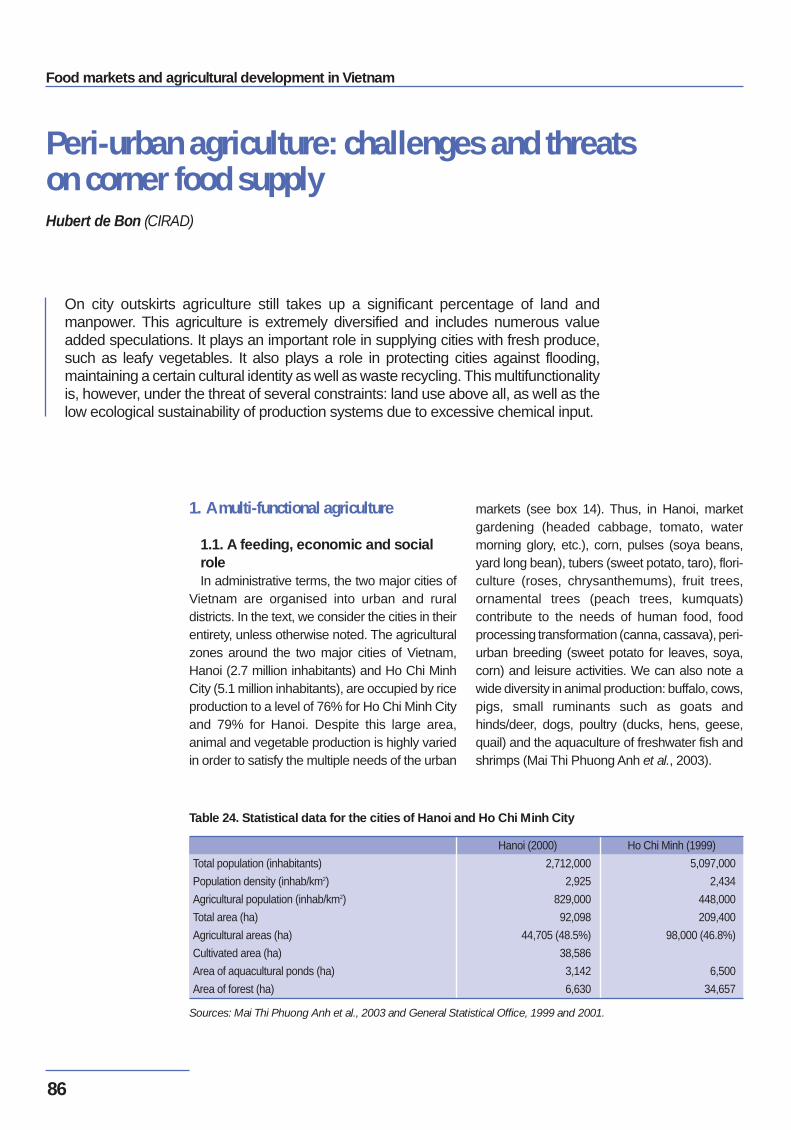
Food markets and agricultural development in Vietnam
86
Peri-urban agriculture: challenges and threats on corner food supplyHubert de Bon (CIRAD)
On city outskirts agriculture still takes up a significant percentage of land andmanpower. This agriculture is extremely diversified and includes numerous valueadded speculations. It plays an important role in supplying cities with fresh produce,such as leafy vegetables. It also plays a role in protecting cities against flooding,maintaining a certain cultural identity as well as waste recycling. This multifunctionalityis, however, under the threat of several constraints: land use above all, as well as thelow ecological sustainability of production systems due to excessive chemical input.
1. A multi-functional agriculture
1.1. A feeding, economic and socialroleIn administrative terms, the two major cities of
Vietnam are organised into urban and ruraldistricts. In the text, we consider the cities in theirentirety, unless otherwise noted. The agriculturalzones around the two major cities of Vietnam,Hanoi (2.7 million inhabitants) and Ho Chi MinhCity (5.1 million inhabitants), are occupied by riceproduction to a level of 76% for Ho Chi Minh Cityand 79% for Hanoi. Despite this large area,animal and vegetable production is highly variedin order to satisfy the multiple needs of the urban
markets (see box 14). Thus, in Hanoi, marketgardening (headed cabbage, tomato, watermorning glory, etc.), corn, pulses (soya beans,yard long bean), tubers (sweet potato, taro), flori-culture (roses, chrysanthemums), fruit trees,ornamental trees (peach trees, kumquats)contribute to the needs of human food, foodprocessing transformation (canna, cassava), peri-urban breeding (sweet potato for leaves, soya,corn) and leisure activities. We can also note awide diversity in animal production: buffalo, cows,pigs, small ruminants such as goats andhinds/deer, dogs, poultry (ducks, hens, geese,quail) and the aquaculture of freshwater fish andshrimps (Mai Thi Phuong Anh et al., 2003).
Sources: Mai Thi Phuong Anh et al., 2003 and General Statistical Office, 1999 and 2001.
Total population (inhabitants)
Population density (inhab/km2)
Agricultural population (inhab/km2)
Total area (ha)
Agricultural areas (ha)
Cultivated area (ha)
Area of aquacultural ponds (ha)
Area of forest (ha)
Hanoi (2000)
2,712,000
2,925
829,000
92,098
44,705 (48.5%)
38,586
3,142
6,630
Ho Chi Minh (1999)
5,097,000
2,434
448,000
209,400
98,000 (46.8%)
6,500
34,657
Table 24. Statistical data for the cities of Hanoi and Ho Chi Minh City
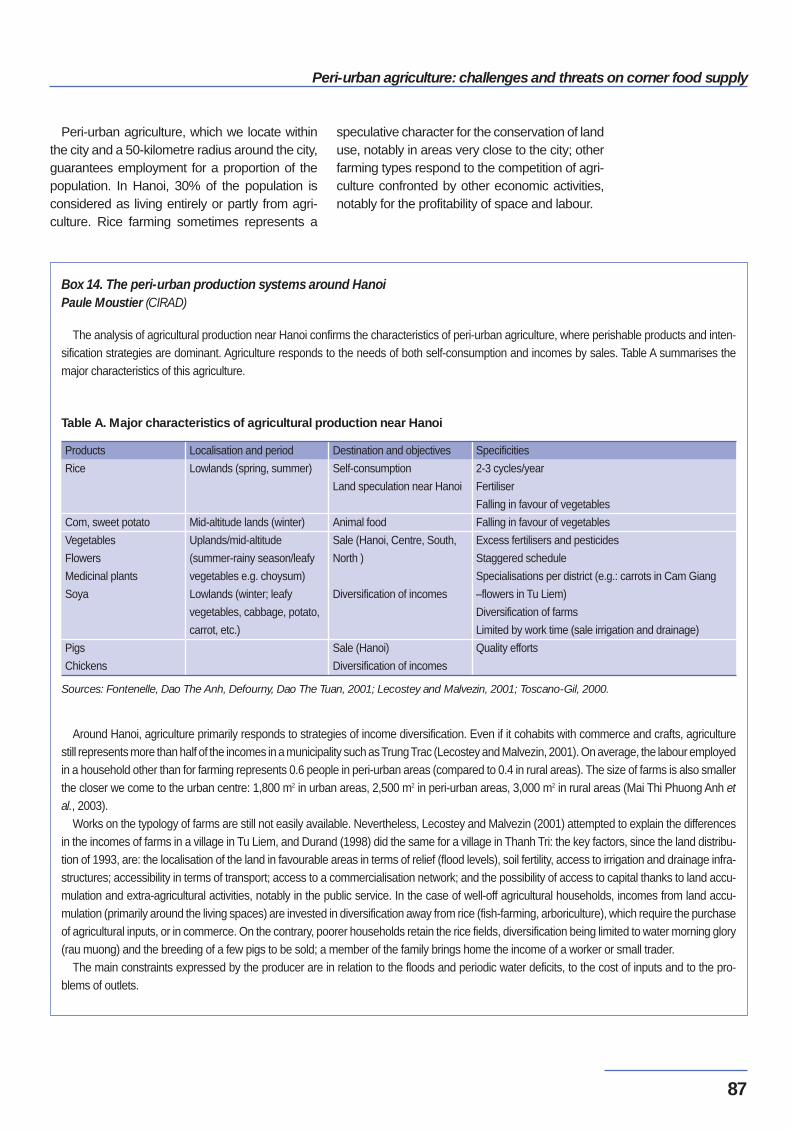
Peri-urban agriculture: challenges and threats on corner food supply
87
Peri-urban agriculture, which we locate withinthe city and a 50-kilometre radius around the city,guarantees employment for a proportion of thepopulation. In Hanoi, 30% of the population isconsidered as living entirely or partly from agri-culture. Rice farming sometimes represents a
speculative character for the conservation of landuse, notably in areas very close to the city; otherfarming types respond to the competition of agri-culture confronted by other economic activities,notably for the profitability of space and labour.
Box 14. The peri-urban production systems around Hanoi Paule Moustier (CIRAD)
The analysis of agricultural production near Hanoi confirms the characteristics of peri-urban agriculture, where perishable products and inten-sification strategies are dominant. Agriculture responds to the needs of both self-consumption and incomes by sales. Table A summarises themajor characteristics of this agriculture.
Around Hanoi, agriculture primarily responds to strategies of income diversification. Even if it cohabits with commerce and crafts, agriculturestill represents more than half of the incomes in a municipality such as Trung Trac (Lecostey and Malvezin, 2001). On average, the labour employedin a household other than for farming represents 0.6 people in peri-urban areas (compared to 0.4 in rural areas). The size of farms is also smallerthe closer we come to the urban centre: 1,800 m2 in urban areas, 2,500 m2 in peri-urban areas, 3,000 m2 in rural areas (Mai Thi Phuong Anh etal., 2003).
Works on the typology of farms are still not easily available. Nevertheless, Lecostey and Malvezin (2001) attempted to explain the differencesin the incomes of farms in a village in Tu Liem, and Durand (1998) did the same for a village in Thanh Tri: the key factors, since the land distribu-tion of 1993, are: the localisation of the land in favourable areas in terms of relief (flood levels), soil fertility, access to irrigation and drainage infra-structures; accessibility in terms of transport; access to a commercialisation network; and the possibility of access to capital thanks to land accu-mulation and extra-agricultural activities, notably in the public service. In the case of well-off agricultural households, incomes from land accu-mulation (primarily around the living spaces) are invested in diversification away from rice (fish-farming, arboriculture), which require the purchaseof agricultural inputs, or in commerce. On the contrary, poorer households retain the rice fields, diversification being limited to water morning glory(rau muong) and the breeding of a few pigs to be sold; a member of the family brings home the income of a worker or small trader.
The main constraints expressed by the producer are in relation to the floods and periodic water deficits, to the cost of inputs and to the pro-blems of outlets.
Sources: Fontenelle, Dao The Anh, Defourny, Dao The Tuan, 2001; Lecostey and Malvezin, 2001; Toscano-Gil, 2000.
Table A. Major characteristics of agricultural production near Hanoi
Products
Rice
Com, sweet potato
Vegetables
Flowers
Medicinal plants
Soya
Pigs
Chickens
Localisation and period
Lowlands (spring, summer)
Mid-altitude lands (winter)
Uplands/mid-altitude
(summer-rainy season/leafy
vegetables e.g. choysum)
Lowlands (winter; leafy
vegetables, cabbage, potato,
carrot, etc.)
Destination and objectives
Self-consumption
Land speculation near Hanoi
Animal food
Sale (Hanoi, Centre, South,
North )
Diversification of incomes
Sale (Hanoi)
Diversification of incomes
Specificities
2-3 cycles/year
Fertiliser
Falling in favour of vegetables
Falling in favour of vegetables
Excess fertilisers and pesticides
Staggered schedule
Specialisations per district (e.g.: carrots in Cam Giang
–flowers in Tu Liem)
Diversification of farms
Limited by work time (sale irrigation and drainage)
Quality efforts
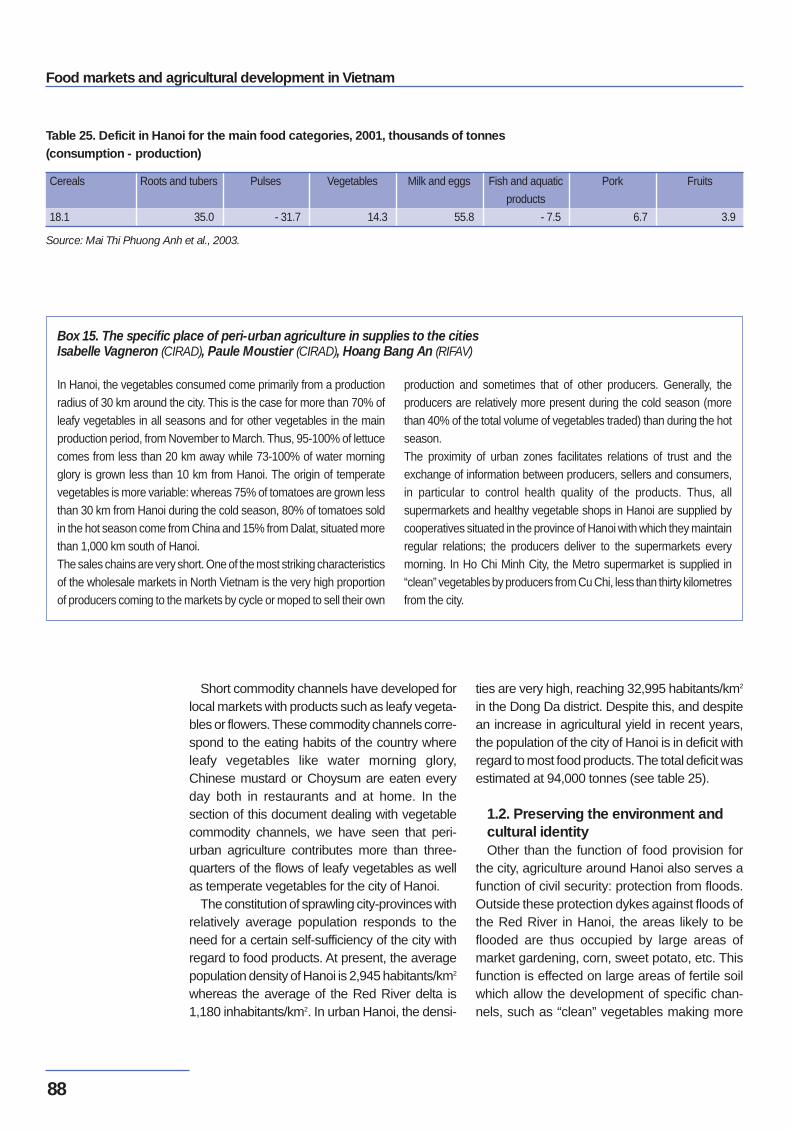
Food markets and agricultural development in Vietnam
88
Short commodity channels have developed forlocal markets with products such as leafy vegeta-bles or flowers. These commodity channels corre-spond to the eating habits of the country whereleafy vegetables like water morning glory,Chinese mustard or Choysum are eaten everyday both in restaurants and at home. In thesection of this document dealing with vegetablecommodity channels, we have seen that peri-urban agriculture contributes more than three-quarters of the flows of leafy vegetables as wellas temperate vegetables for the city of Hanoi.
The constitution of sprawling city-provinces withrelatively average population responds to theneed for a certain self-sufficiency of the city withregard to food products. At present, the averagepopulation density of Hanoi is 2,945 habitants/km2
whereas the average of the Red River delta is1,180 inhabitants/km2. In urban Hanoi, the densi-
ties are very high, reaching 32,995 habitants/km2
in the Dong Da district. Despite this, and despitean increase in agricultural yield in recent years,the population of the city of Hanoi is in deficit withregard to most food products. The total deficit wasestimated at 94,000 tonnes (see table 25).
1.2. Preserving the environment andcultural identityOther than the function of food provision for
the city, agriculture around Hanoi also serves afunction of civil security: protection from floods.Outside these protection dykes against floods ofthe Red River in Hanoi, the areas likely to beflooded are thus occupied by large areas ofmarket gardening, corn, sweet potato, etc. Thisfunction is effected on large areas of fertile soilwhich allow the development of specific chan-nels, such as “clean” vegetables making more
Source: Mai Thi Phuong Anh et al., 2003.
Table 25. Deficit in Hanoi for the main food categories, 2001, thousands of tonnes(consumption - production)
Cereals
18.1
Roots and tubers
35.0
Pulses
- 31.7
Vegetables
14.3
Milk and eggs
55.8
Fish and aquatic
products
- 7.5
Pork
6.7
Fruits
3.9
Box 15. The specific place of peri-urban agriculture in supplies to the citiesIsabelle Vagneron (CIRAD), Paule Moustier (CIRAD), Hoang Bang An (RIFAV)
In Hanoi, the vegetables consumed come primarily from a productionradius of 30 km around the city. This is the case for more than 70% ofleafy vegetables in all seasons and for other vegetables in the mainproduction period, from November to March. Thus, 95-100% of lettucecomes from less than 20 km away while 73-100% of water morningglory is grown less than 10 km from Hanoi. The origin of temperatevegetables is more variable: whereas 75% of tomatoes are grown lessthan 30 km from Hanoi during the cold season, 80% of tomatoes soldin the hot season come from China and 15% from Dalat, situated morethan 1,000 km south of Hanoi. The sales chains are very short. One of the most striking characteristicsof the wholesale markets in North Vietnam is the very high proportionof producers coming to the markets by cycle or moped to sell their own
production and sometimes that of other producers. Generally, theproducers are relatively more present during the cold season (morethan 40% of the total volume of vegetables traded) than during the hotseason. The proximity of urban zones facilitates relations of trust and theexchange of information between producers, sellers and consumers,in particular to control health quality of the products. Thus, allsupermarkets and healthy vegetable shops in Hanoi are supplied bycooperatives situated in the province of Hanoi with which they maintainregular relations; the producers deliver to the supermarkets everymorning. In Ho Chi Minh City, the Metro supermarket is supplied in“clean” vegetables by producers from Cu Chi, less than thirty kilometresfrom the city.
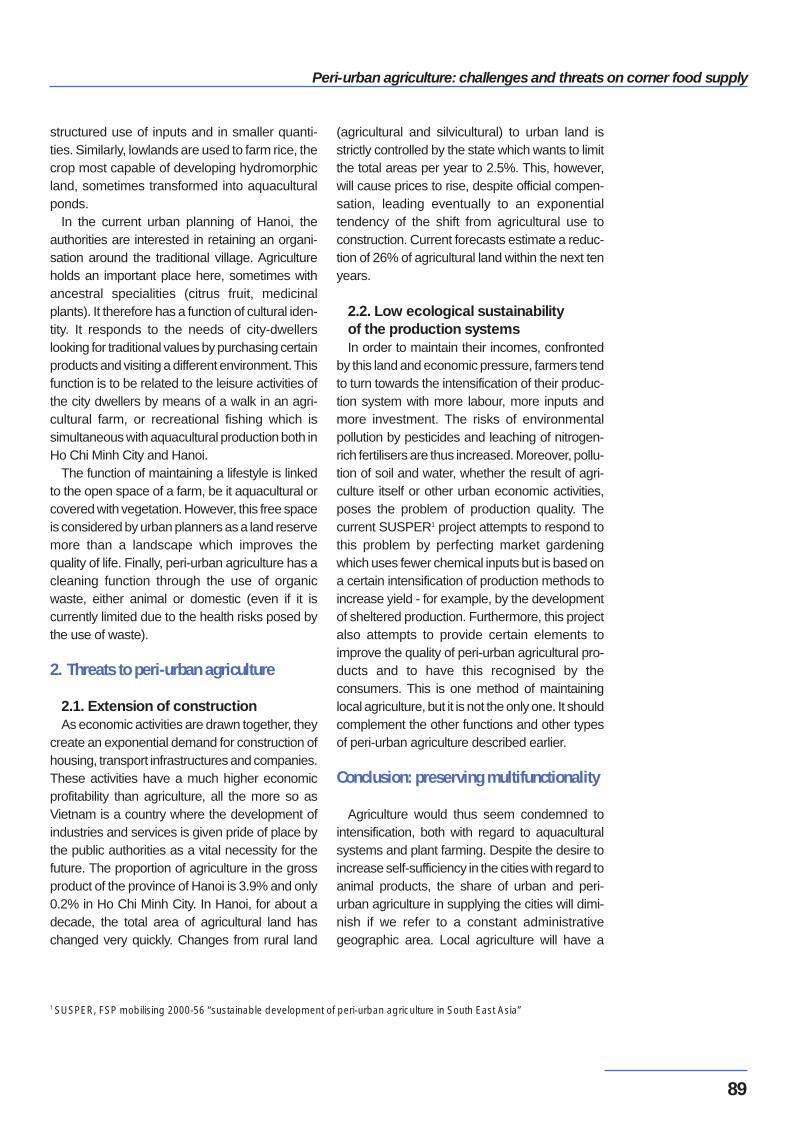
Peri-urban agriculture: challenges and threats on corner food supply
89
structured use of inputs and in smaller quanti-ties. Similarly, lowlands are used to farm rice, thecrop most capable of developing hydromorphicland, sometimes transformed into aquaculturalponds.
In the current urban planning of Hanoi, theauthorities are interested in retaining an organi-sation around the traditional village. Agricultureholds an important place here, sometimes withancestral specialities (citrus fruit, medicinalplants). It therefore has a function of cultural iden-tity. It responds to the needs of city-dwellerslooking for traditional values by purchasing certainproducts and visiting a different environment. Thisfunction is to be related to the leisure activities ofthe city dwellers by means of a walk in an agri-cultural farm, or recreational fishing which issimultaneous with aquacultural production both inHo Chi Minh City and Hanoi.
The function of maintaining a lifestyle is linkedto the open space of a farm, be it aquacultural orcovered with vegetation. However, this free spaceis considered by urban planners as a land reservemore than a landscape which improves thequality of life. Finally, peri-urban agriculture has acleaning function through the use of organicwaste, either animal or domestic (even if it iscurrently limited due to the health risks posed bythe use of waste).
2. Threats to peri-urban agriculture
2.1. Extension of constructionAs economic activities are drawn together, they
create an exponential demand for construction ofhousing, transport infrastructures and companies.These activities have a much higher economicprofitability than agriculture, all the more so asVietnam is a country where the development ofindustries and services is given pride of place bythe public authorities as a vital necessity for thefuture. The proportion of agriculture in the grossproduct of the province of Hanoi is 3.9% and only0.2% in Ho Chi Minh City. In Hanoi, for about adecade, the total area of agricultural land haschanged very quickly. Changes from rural land
(agricultural and silvicultural) to urban land isstrictly controlled by the state which wants to limitthe total areas per year to 2.5%. This, however,will cause prices to rise, despite official compen-sation, leading eventually to an exponentialtendency of the shift from agricultural use toconstruction. Current forecasts estimate a reduc-tion of 26% of agricultural land within the next tenyears.
2.2. Low ecological sustainability of the production systemsIn order to maintain their incomes, confronted
by this land and economic pressure, farmers tendto turn towards the intensification of their produc-tion system with more labour, more inputs andmore investment. The risks of environmentalpollution by pesticides and leaching of nitrogen-rich fertilisers are thus increased. Moreover, pollu-tion of soil and water, whether the result of agri-culture itself or other urban economic activities,poses the problem of production quality. Thecurrent SUSPER1 project attempts to respond tothis problem by perfecting market gardeningwhich uses fewer chemical inputs but is based ona certain intensification of production methods toincrease yield - for example, by the developmentof sheltered production. Furthermore, this projectalso attempts to provide certain elements toimprove the quality of peri-urban agricultural pro-ducts and to have this recognised by theconsumers. This is one method of maintaininglocal agriculture, but it is not the only one. It shouldcomplement the other functions and other typesof peri-urban agriculture described earlier.
Conclusion: preserving multifunctionality
Agriculture would thus seem condemned tointensification, both with regard to aquaculturalsystems and plant farming. Despite the desire toincrease self-sufficiency in the cities with regard toanimal products, the share of urban and peri-urban agriculture in supplying the cities will dimi-nish if we refer to a constant administrativegeographic area. Local agriculture will have a
1 SUSPER, FSP mobilising 2000-56 “sustainable development of peri-urban agriculture in South East Asia”
Food markets and agricultural development in Vietnam
90
Box 16. Peri-urban agriculture under discussion Paule Moustier (CIRAD)
For about ten years, peri-urban agriculture has been the subject of anincreasingly large body of literature. This interest is the result of thecurrent context of increasing urbanisation and the dynamism of differentprogrammes at international level (for example, Cities Feeding Peopleof the IDRC, the UNDP-Habitat, the ETC-GTZ NGO which runs theRUAF network, the SIUPA initiative of the CGIAR). The first debate concerns the definition of urban agriculture and itsspecificity in relation to rural agriculture. A certain number ofinternational institutions (FAO, CGIAR), differentiate urban agriculturesituated in towns and peri-urban agriculture located around the towns.Other institutions use a single term to designate both types ofagriculture, referring to “urban agriculture” (CRDI, UNPD) or “peri-urbanagriculture (CIRAD, WECARD). For our part, we will use the term peri-urban agriculture in the broader sense of the word (including intra-urbanagriculture). Beyond these semantic differences, the main question ofgeographical contours defined by peri-urban agriculture is a delicateone. Certain authors adopt a broad definition of peri-urban agriculture,with an unclear notion of proximity to the city and the emphasis on thefunction of food supply to the cities, an approach which does not clearlydistinguish it from rural agriculture, itself more and more orientedtowards the market. For other authors, the specificity of peri-urbanagriculture is in its relations with the cities concerning the exchange ofresources and products, providing a certain number of opportunitiesand constraints (Mougeot, 2000). Thus, peri-urban agriculture concernsthe area where we can witness the effects of competition betweenagricultural and non-agricultural urban uses of resources: land, water,labour, waste (Moustier, 2000). Although these definitions allow a betterunderstanding of the factors which differentiate urban and rural
agriculture, they remain difficult to apply in order to define a precisegeographical zone and must be adapted to each particular context.Thus, for Hanoi, we considered a distance of 50 kilometres from thecity centre, in the province of Hanoi and in the peripheral provinces ofHa Tay, Vinh Phuc, Hung Yen and Bac Ninh. Asecond debate concerns the viability of peri-urban agriculture and thenecessity for political support. In light of the land costs in urban areasand the still not catered for housing and infrastructure needs, it wouldseem legitimate to let agriculture move towards rural areas whilst at thesame time improving the transport infrastructures, as occurred inEurope. Moreover, urban agriculture is subjected to many types ofpollution and is itself a pollutant (Ellis and Sumberg, 1998). However,other authors emphasise the numerous positive externalities of urbanagriculture, which justify public support: waste recycling (Midmore andJansen, 2002); creation of open spaces (Fleury and Donadieu, 2001);social insertion of disadvantaged populations (Mougeot, 2000). In fact,it can be claimed that the multi-functionality of urban agriculture rendersit more economical for society than other types of green areas, such asparks for example (Moustier, 2003).Thus, most authors recognise that moving agriculture far from the urbancentres is inevitable if only market forces are left at work. However,deciding whether this shift is desirable or not depends on the evaluationof the impact of peri-urban agriculture on all of its functions, botheconomic and non-economic. The authorities can strengthen thepositive impacts of agriculture and reducing the negative impacts. Thisis the aim of many peri-urban agriculture development projects, whichwork along technical paths which are both more profitable and lesspollutant.
place in urban development, not only via tradi-tional channels of foodstuff provision, but also bythe various rural amenities which it brings aboutfor economic activities which want to benefit fromthe peri-urban country structure and the habit-
ability of the city. However, to maintain this place,it should prove its capacity not to pollute the envi-ronment and not to place the consumers’ healthat risk.

Peri-urban agriculture: challenges and threats on corner food supply
91
Food markets and agricultural development in Vietnam
92
ConclusionMotors of change and lines of action
1. The key variables of change
What are the key variables which determine theevolution of the domestic market? How can theychange?
1.1. Demographic growthThe annual growth of 1.7% per year will
continue and may even increase : in 2003, thegovernment has lifted the sanctions which previ-ously prevailed in case of more than two childrenby couple. We will witness, then, minimum growthwhich will cause the increase in food consumptionand employment needs.
1.2. Population imbalancesThe population imbalances between, on the
one hand, upland and delta zones and, on theother hand, rural and urban zones are likely toworsen if the state does not implement volun-taristic policies, notably concerning credit andtraining, in order to develop agricultural and extra-agricultural employment in rural zones – followingthe successful example of Taiwan.
Whatever the changes, the proportion ofconsumers who are non-producers of foodcommodities in relation to agricultural producerswill increase.
1.3. The standard of living of thehouseholdsThe standard of living of the households deter-
mines the value of food outlets and the type ofproducts consumed. The increase in the standardof living leads to less consumption of rice and anincreasing consumption of fruit and vegetables,meat, dairy products and processed products. Itis also accompanied by a demand for products ofa specific quality (for example flavoured rice orlean pork). Finally, it favours purchases from largevolume distribution.
The standard of living is linked to the growth ofthe Vietnamese economy. In recent years, therate of growth has reached 7%.
1.4. Quality demands and health crisesAs quality controls are not, at present, nume-
rous and as the media are sensitised concerninghealth crises, it is to be feared that, as in the past,(formalin soup scandal, water morning glorypoisoning, etc.) health crises will become morenumerous. The products most likely to be thesubject of health crises are vegetables, due to thequantity consumed and the conditions of produc-tion; however, these crises can also affect meatand fish.
Health crises increase the mistrust of theconsumers vis-à-vis local products and can affectconsumption of the products involved for severalyears. They encourage trade enterprises, inparticular large volume distribution, to resort toimports from Australia, New Zealand, etc. Thismay be also favoured by Vietnam joining theWorld Trade Organisation, following the govern-ment will. However, if it is reactive and organised,the profession can profit from the situation byimplementing credible quality measures.
1.5. Competition from the internationalmarketThe consequences of the gradual implementa-
tion of the AFTAagreements (ASEAN Free TradeAgreement) are still little known, as there are veryfew clear documents which relate to the traderegulations of agricultural products.
The opening of the ASEAN markets can offernew outlets for products where Vietnam iscompetitive. However, for many of them (rice,coffee, rubber), the markets are saturated.Moreover, with the increased living standards,Vietnamese production costs will be forcedupwards. Thus, according to studies cited by the
Conclusion - Motors of change and lines of action
93
report on human development (CNSSH, 2002,p. 84), Vietnam is less competitive than the othercountries in the region and than the economies intransition (fifty-second position in the worldwhereas Thailand is in twenty-seventh positionand China forty-sixth). Nevertheless, as agricul-ture has been less protected than the othersectors of the economy (in particular theconsumer goods industry), it should suffer fewernegative effects of trade liberalisation.
At the same time, Vietnam will be confronted bymore aggressive export strategies by its neigh-bours (China, Taiwan) and countries further away(Australia, the United States). Among the pro-ducts threatened are, in the short term, corn – andas a consequence animal feeds and pork - and,in the medium term, temperate fruits and vegeta-bles. Indeed, if they succeed in guaranteeing amore regular supply than local producers,Australia and the United States could tap theclientele with a high standard of living and whopurchase from supermarkets.
However, the international market may gene-rate opportunities for the development of qualityproducts with geographical indications.
1.6. Access to landAccess to land is particularly complex in
Vietnam. Properties are much divided and verysmall, especially in the north of the country. Thesize of the farms can only increase by informalmethods. The information on the urban develop-ment plans is very hard to find. An undergroundproperty market is developing. This absence oftransparency does not allow farmers to expandtheir land and is not favourable to the protectionof agricultural land in the peri-urban zones.
Although an official property market is beingdeveloped, there is a risk that absentee landowners will monopolise the land and the peasantswill not have the means to have access to pro-perty.
Recently, the government has encouraged theexchange of plots between farmers. This repre-sents a first step towards regrouping of lands andincrease in the farm scale. The development of aland market regulated by the state, combinedwith marketing outlets becoming more stable, canresult in the increase in the scale of transactions,and in the development of a more specialised and
skilled agriculture. In the Red River Delta the farmsize may yet still be limited by demographic pres-sure and labour being little absorbed by the indus-trial sector.
1.7. The instability of the food sectorLocal food crop production has demonstrated
its capacity to respond to the increased demandfor quantity thanks to favourable policies.However, food supply remains unstable in termsof quantity, price and quality. This instability is acharacteristic of the Vietnamese food sector.
The farmers are confronted by the risks ofclimatic variations and of access to irrigationwater, which are of considerable significance forproduction. The resulting price instability iscompounded by the lack of information andorganisation of the producers on the markets, aswell as deficient infrastructures and means oftransport (isolated upland zones, transport domi-nated by two-wheeled vehicles, non-refrigeratedengine-powered vehicles). In order to minimisethe risks, the producers diversify their production.These strategies, however, contribute to com-pounding market instability: the producers are notparticularly inclined to invest time, competenciesand capital in one of their productions and thetraders have difficulty in finding regular suppliers.Forms of contractualisation, or vertical integrationnevertheless appear between producers andtraders. This is the case in the quality vegetablesand pork commodity channels. These attemptsare, however, limited as there are no mecha-nisms allowing recourse to public authorities inthe event of disputes, for example between theparties.
1.8. The necessity for organisation ofthe profession and the consumersIn order to conquer markets in terms of both
quantity and quality, it is essential that the produc-ers organise themselves to better communicatewith regard to quality efforts, negotiate prices withthe traders and organise internal and externalquality control.
To anticipate, and possibly manage, healthcrises, the players in the commodity channelsshould institute inter-professions capable ofcommunicating with the consumers and thepublic authorities.
Food markets and agricultural development in Vietnam
94
Consumer associations could also be a drivingforce in orienting production towards theirdemands in terms of quality and product diversity.
Without this organisation, domestic productionruns the risk of being partially substituted byimports.
2. The necessary regulatory interventionof the state
Although the state has intervened to encourageexports, the same cannot be said for the deve-lopment of the domestic market, apart from plan-ning the wholesale markets. Furthermore, agri-culture has benefited from far less public – andprivate – investment than the other sectors of theeconomy (CNSSH, 2002). This situation, which istypical of developing countries, is highly ineffi-cient: indeed, the modernisation of the agriculturalsector has a more marked ratchet effect on therest of the economy than does the industrialsector and should therefore take priority in thesequence of public interventions (Lipton, 1977).This was practised in Taiwan with a certain degreeof success (Kay, 2001).
The intervention of the state is necessary toorient the changes, compensate for the deficien-cies of the private sector, reduce the risks, investin public goods. Indeed, in the food commoditychannels, the risks are of differing types: nutri-tional and health-related for the consumers; quan-titative losses for the producers; dishonesty withregard to quality for the traders; economic riskslinked to transport problems for both the produ-cers and traders. In light of these risks, thoseinvolved develop strategies, both individual andcollective, which are, however, limited in their effi-ciency. The state can intervene in severaldomains:● infrastructures - irrigation, drainage, storage;● transport, by opening up the upland production
zones and identifying the transport systemsadapted to the transport of food products andthe configuration of the production zones;
● credit, by implementing credit programmes forproducers, traders and transformers of foodproducts according to their needs (acquisition ofland, notably for the peasants, of points of sale,of packaging and transformation units, of vehi-
cles); by creating complementary savings andcredit institutions (mutuelles) for producer ortrader groups;
● technical training, notably in practices of struc-tured intensification of production systems (fruitand vegetables, pork, corn); as well as trainingon management and marketing;
● technical support for off-season crop and horti-cultural production;
● organisational support – for dialogue betweenthe operators, especially for the development ofnew markets; to reinforce the procedures ofcontractualisation and recourse in the event ofdisputes between the parties of the contract;
● quality control, by organising impromptu inspec-tions and accrediting private control bodies;
● provision of information to the consumers,concerning the sources of health risks, and tothe producers, concerning prices;
● support for populations at risk through targetedcomplementary nutrition programmes
3. What role for research?
As we have just seen, voluntaristic policies arenecessary for local production to be able torespond efficiently to changes in domesticdemand. However, the data are lacking for thesepolicies to be based on solid elements. Researchhas an important role to play in collecting andanalysing these data.
3.1. Information system on the foodsector changesThis document provides the elements to under-
stand the evolution of outlets for food products. Itis based on an integrated approach to the dimen-sions of the adjustment of supply and demand,i.e. quantity, costs and incomes, quality, coordi-nation between players at the different levels ofconsumption and the supply channels.
This appraisal is, nevertheless, incomplete. Itlacks studies on consumption and to marketing inthe centre and south of the country.
The quantitative information on price andincome setting in the channels, collected from asmall sample, should be confirmed for a largersample. The evolution of commercial regulationsand its impact on imports and exports require
Conclusion - Motors of change and lines of action
95
macro-economic work. The niches in the marketfor products of agricultural diversification (forexample dairy products, goats, flowers, etc.)should be identified more precisely.
It is also necessary to regularly update the typeof appraisal presented in this document. In orderto do this, we recommend the implementation ofa consumption and market information system.
An information system on food changes wouldallow the other economic actors in the commo-dity system to be informed, regularly and in goodtime, of changes in the quantities consumed andquality expectations, as well as in supply (place ofpurchase, frequency, etc.) and consumer beha-viours (method of preparation, place of consump-tion, etc.). It would also be a tool for the publichealth services, which work towards the reductionof food shortages and are at the same timeconfronted by the new, so-called “transitional”diseases (obesity, cardio-vascular diseases, etc.).By monitoring the behaviours (anti-risk, etc.) andbeliefs of the consumers (dietetic image of pro-ducts, etc.), the information system will be able toorient health and nutritional communicationactions efficiently.
A market information system should provideregular information concerning the quantities andprice of the main food products in collection,wholesale and retail zones. It should monitor thevariations in the sources of the products through-out the year in order to map the supply flows. Itwill also include the monitoring of farms, in orderto analyse constraints for marketing at the level ofproduction. It will regularly update the informationon the organisation and the efficiency of thecommodity systems, in terms of competitivenesscompared to the foreign markets, of income distri-bution, of quality.
Apanel of operators in consumption, trade andproduction could be created to monitor the evolu-tion of the qualitative parameters – consumerpreferences with regard to the product and theplace of purchase, perception of risks, reaction toprice changes – and to evaluate the organisation,information and negotiating power within thechannels. Surveys on a representative samplewould facilitate the estimation of quantitiesconsumed and exchanged and the identificationof how prices, incomes and quantities are set.
3.2. Research concerning propertyProperty differentiation calls for a closer study
of the methods of transfer of land, mostly informal(land law has still not been completed), the rulesand practices with regard to temporary (rental,sharecropping, etc.) or definitive (sale, inheri-tance) transfer. For example, are the plots frag-mented or does one son benefit from the inheri-tance in order to maintain a viable farm? Domodalities differ from one region to the next(urban proximity, dynamics of the productionsystems, etc.)? Are there problems of land inse-curity? How are the transfers of rights adminis-trated or officialised at local level? Is a propertymarket beginning to emerge? What are the linksbetween land differentiation and land concentra-tion, diversification/specialisation and economicdifferentiation?
3.3. Research concerning coordinationwithin the commodity systemsResearch in social sciences has an important
role to play in identifying the information and coor-dination mechanisms in the channels which willbe most efficient in regulating quality and quanti-ties. These organisations should:● realise economies of scale, by regrouping sales
within producer groups and wholesale markets;● provide incentives to improve quality, by imple-
menting systems of contractualisation or inte-gration, payments differentiated by quality,sanctions and bonuses;
● communicate quality practices – productlabelling, organisation of traceability;
● increase negotiating power vis-à-vis buyers bycoming to prior agreements regarding prices,quantities and the time of sale;
● manage crises within the inter-professions(mutualisation of risks, communication to theconsumer). For each of these functions, several measures,
both public and private can be suggested, testedand evaluated. If the measure is private in origin,it must be accompanied by a public interventionin order to lend credibility to the commitmentsundertaken and provide for arbitration in the caseof dispute.
Research in social sciences concerning qualityshould be combined with more technical work
Food markets and agricultural development in Vietnam
96
dealing with the sources of health risks and reper-cussions in terms of health: the measurement ofcontaminating elements (chemical products,microbes, heavy metals, etc) at the differentstages of the channels, epidemiological monitor-ing of consequences in terms of health for theconsumers.
3.4. Research concerning thestructured intensification ofproduction systemsIn order to be competitive on the domestic
market, certain commodity channels - corn, pork,off-season vegetables – should reduce theirproduction costs and make optimum use ofchemical products to guarantee the health qualityof the products and the protection of the envi-ronment. Research should suggest technicalmethods, using fewer harmful products, andevaluate their economic profitability. It shouldalso play a role in compiling and preserving thelocal savoir-faire as regards products of specificquality.
3.5. Solutions for fighting againstpovertyThe fight against poverty is a priority for both the
Vietnamese government and the donors alike.This document suggests outlines for increasingthe distribution of wealth to the poor populationsin a context of strong economic growth.
The poor populations are mainly located in therural zones, but also, and increasingly so, in urbanzones, where the opportunities for employmentare few for the unskilled population.
At present, there are 60 million people in ruralareas and 20 million in urban areas. In 2020, therural population will have remained unchanged(60 million) whereas the urban population willhave doubled, reaching 40 million people. In orderto increase the opportunities for the creation ofwealth in rural areas, farmers will have to reckonwith all the available options, both agricultural andnon-agricultural, for both the domestic market andfor exports. The city market is a reservoir for thecreation of wealth for farming populationsbecause there are still untapped outlets. The largevariations in the quantities and prices throughoutthe year bear witness to this (especially for freshproducts), as well as the demand for quality pro-
ducts (clean fruits and vegetables, lean pork,flavoured rice), which is only imperfectly reflectedby purchases as a result of insufficient supply.
In more concrete terms, the opportunitiesprovided by the domestic markets should bespecified for each geographic zone. Thus, eachrural zone can be considered as a supply reser-voir, current or potential, for a town (rural orurban). The originality of the suggested procedurelies in the diagnosis of the demand for consumergoods in these towns in order to identify newoutlets, in terms of products, period of the year,quality (the approach adopted for food goods canbe applied to non-food goods). The diagnosis ofdemand is followed by the analysis of the currentsupply flows of the towns. This spatial analysisallows the particular positioning of the rural andperi-urban zones to be demonstrated in terms ofcomparative advantages for the products ofspecific periods and the means of strengtheningthese advantages to be understood: for example,the zone of Son La has an advantage in theproduction of tomatoes during the rainy season tosupply the Hanoi market, which always experi-ences deficits during this period. Increasing theproduction of this reservoir at this time can provideadditional income for the inhabitants; the meansof doing this should result from a diagnosis of theconstraints to increased supply, which may lie inthe state of the transport and conservation infra-structures.
Reduction of agricultural inequalities requiresthe rebalancing of indispensable resources inorder to benefit from the market opportunities,including the transport infrastructures, marketinformation, credit and technical training.
In urban areas, the domestic market createsjobs for a whole chain of commercialisation andrestaurant services. However, many of these jobsare threatened by both public and private initia-tives for the “modernisation” or centralisation offood distribution. Preserving these jobs requiresthe social utility of local distribution to be recog-nised, as well as the correction of their negativeeffects, in particular the relative lack of hygiene,which could be resolved by suitable trainingprogrammes. Training and credit programmesadapted to the personal projects of these smallentrepreneurs would also allow retraining formore remunerative jobs.
Conclusion - Motors of change and lines of action
97
Finally, as consumers, the poorest populationsare penalised by the problems of health qualityand periodically high prices. The actions aimedat improving the quality and availability of food-stuffs will, therefore, have a positive effect onthese populations if they are not reflected byoverly high surcharges. Thus, with regard toimproving quality, the state should at the veryleast ensure that the food supplied is not toxic byorganising impromptu controls followed by sanc-tions. At the same time, private commodity chan-nels may develop for goods of specified qualitywith higher prices which correspond to an addi-tional service in terms of technical, control andcommunication strategies.
Opportunities for employment in the food trans-formation sector, still at an embryonic stage,should be intensified by market research as wellas by support for the organisation of supplies ofraw materials.
Thus, the development of the market, bothdomestic and foreign, will be a driving force in thefight for the creation of more equally distributedwealth, if the public authorities, with the support ofresearchers, encourage physical and institutionallinks between the producers, the consumers andall of the intermediate companies.
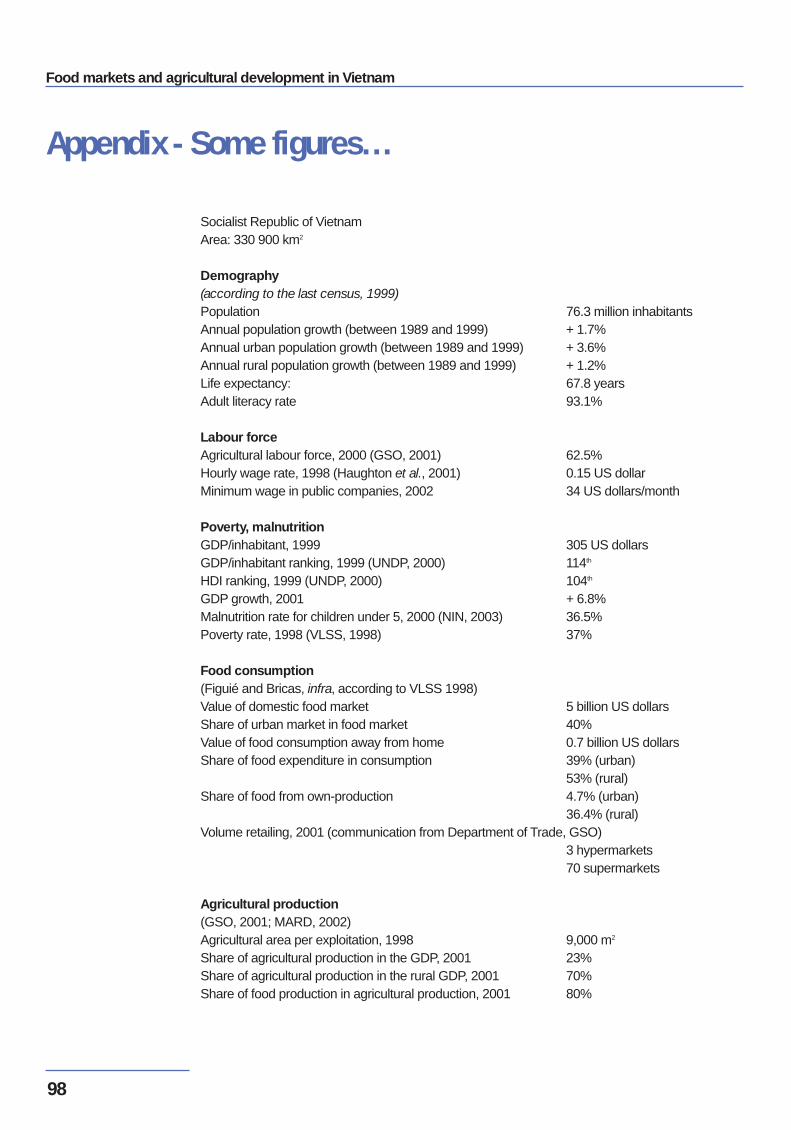
Food markets and agricultural development in Vietnam
98
Appendix - Some figures…
Socialist Republic of VietnamArea: 330 900 km2
Demography(according to the last census, 1999)Population 76.3 million inhabitantsAnnual population growth (between 1989 and 1999) + 1.7% Annual urban population growth (between 1989 and 1999) + 3.6%Annual rural population growth (between 1989 and 1999) + 1.2%Life expectancy: 67.8 years Adult literacy rate 93.1%
Labour forceAgricultural labour force, 2000 (GSO, 2001) 62.5% Hourly wage rate, 1998 (Haughton et al., 2001) 0.15 US dollarMinimum wage in public companies, 2002 34 US dollars/month
Poverty, malnutritionGDP/inhabitant, 1999 305 US dollars GDP/inhabitant ranking, 1999 (UNDP, 2000) 114th
HDI ranking, 1999 (UNDP, 2000) 104th
GDP growth, 2001 + 6.8% Malnutrition rate for children under 5, 2000 (NIN, 2003) 36.5%Poverty rate, 1998 (VLSS, 1998) 37%
Food consumption(Figuié and Bricas, infra, according to VLSS 1998)Value of domestic food market 5 billion US dollars Share of urban market in food market 40%Value of food consumption away from home 0.7 billion US dollarsShare of food expenditure in consumption 39% (urban)
53% (rural)Share of food from own-production 4.7% (urban)
36.4% (rural)Volume retailing, 2001 (communication from Department of Trade, GSO)
3 hypermarkets70 supermarkets
Agricultural production(GSO, 2001; MARD, 2002)Agricultural area per exploitation, 1998 9,000 m2
Share of agricultural production in the GDP, 2001 23%Share of agricultural production in the rural GDP, 2001 70% Share of food production in agricultural production, 2001 80%
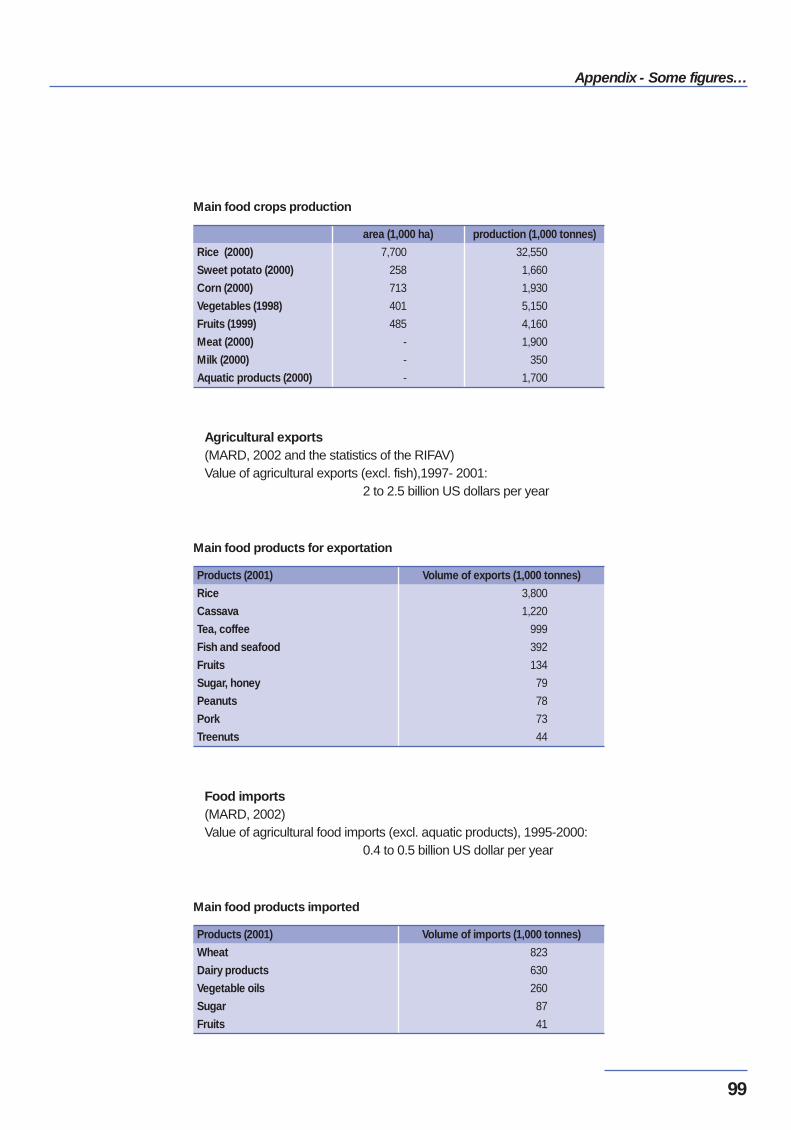
Appendix - Some figures…
99
Main food crops production
Rice (2000)
Sweet potato (2000)
Corn (2000)
Vegetables (1998)
Fruits (1999)
Meat (2000)
Milk (2000)
Aquatic products (2000)
area (1,000 ha)
7,700
258
713
401
485
-
-
-
production (1,000 tonnes)
32,550
1,660
1,930
5,150
4,160
1,900
350
1,700
Main food products for exportation
Products (2001)
Rice
Cassava
Tea, coffee
Fish and seafood
Fruits
Sugar, honey
Peanuts
Pork
Treenuts
Volume of exports (1,000 tonnes)
3,800
1,220
999
392
134
79
78
73
44
Main food products imported
Products (2001)
Wheat
Dairy products
Vegetable oils
Sugar
Fruits
Volume of imports (1,000 tonnes)
823
630
260
87
41
Agricultural exports(MARD, 2002 and the statistics of the RIFAV)Value of agricultural exports (excl. fish),1997- 2001:
2 to 2.5 billion US dollars per year
Food imports(MARD, 2002)Value of agricultural food imports (excl. aquatic products), 1995-2000:
0.4 to 0.5 billion US dollar per year
Food markets and agricultural development in Vietnam
100
References
Ambassade de France au Vietnam, 2002. Action de la France pour le développement urbain auVietnam. Les cahiers de la coopération française au Vietnam, 34 p.
Auriac F., Vu Chi Dong, 1997. Villes et organisation de l’espace au Vietnam. Montpellier, Maison de lagéographie, GIP RECLUS.
Barbieri M., Allman J., Pham Bich San, Nguyen Minh Thang, 1995. La situation démographique duVietnam. In Revue Population, N°3, pp. 651-652.
Bergeret P., 2002. Paysans, Etat et marchés au Vietnam. Paris, Karthala-Gret, 291 p.
Bergeret P., Pham Hoang Ha, 1997. Dynamiques comparées de trois filières dans le delta du fleuveRouge : riz, porc, ail. In Cahiers Agricultures - Agriculture et Développement, Numéro commun :Spécial Vietnam, (sept-oct 1997), pp. 19-25.
Bridier E., 2000. Etude de la perception de la qualité des légumes par les consommateurs de Hanoi(Vietnam). Cas particulier de la qualité sanitaire. ESAT Développement agricole tropical. Option:Valorisation des productions. Montpellier, CNEARC, 149 p. + ann.
Bui Quang Toan, 2000. Mot so ket qua nghien cuu thuc nghiem tao mo hinh hop tac xa kieu moi thoigian qua o mot so vung nong thon nuoc ta. Ha noi, CECI.
Bui Thi Gia, 1999. Vegetable production and marketing in Hanoi. Hanoi Agricultural University andHAU-JICA ERCB project, Agricultural products marketing in Japan and Vietnam. In Proceedings ofthe first joint workshop at Faculty of Economics and Rural Development, pp. 37-47.
Bui Thi Gia, 2002. Vegetable marketing in Hanoi. Presentation to the methodological workshop: “Marketappraisal of peri-urban food commodities”, CIRAD/RIFAV, Hanoi, 26/02-05/03, 5 p.
Bui Thi Thai, 2000. Commercialisation des légumes d’hiver dans la zone de Bac Hung Hai. Programmefleuve Rouge, Projet INCO, INSA/ GRET, 42 p.
Bui Thi Thai, 2001. Tinh hinh hop tac xa o Dong bang song Hong. Hanoi, DSA-VASI, 55 p.
Cadilhon J., Fearne A.P., Moustier P., Poole N.D., 2003. Modelling vegetable systems in South-EastAsia: phenomenological insights from Vietnam. In Supply Chain Management: an internationaljournal, (8), pp. 427-411.
Chu Thai Hoanh, 2002. Modelling of rice production in Vietnam. Working paper, Los Banos, IRRI.
CNSSH, 2002. Rapport sur le développement humain au Vietnam 2001 : Le Doi moi et ledéveloppement humain au Vietnam. Hanoi, Editions politiques nationales, 149 p.
Conroy M.E., Murray D.L., 1996. Central America’s lost decade and non traditional agricultural exportstrategy. In Conroy M.E., Murray D.L., Rosset P.M. (eds.): A cautionary tale: failed US developmentpolicy in Central America. Boulder, Colorado, USA, pp. 1-25.
References
101
Cour J.-M., 2001. Migrations, urbanisation et transformation du monde rural au Vietnam. Paris,Ministère des affaires étrangères, ISTED, 43 p.
Dang Xuan Duong, Le Hong Ke, 2000. La population de Hanoi. In Gubry P. (ed.), Population etdéveloppement au Vietnam. Paris, Karthala-Ceped, pp. 243-162.
Dao Duc Huan, Vu Trong Binh, Dao The Anh, Lecoq J.-F., 2003. Maize commodity chain in the Northof Vietnam. Presentation to the seminar “2010 trends for animal production in Vietnam”, Hanoi 24-25th of October 2002. Hanoi, CIRAD-Prise.
Dao The Anh, 1997. Approche micro-économique de la différenciation des exploitations agricoles dansle delta du fleuve Rouge au Nord Vietnam. In Cahiers Agricultures - Agriculture et Développement,Numéro commun : Spécial Vietnam, (sept-oct 1997), pp. 27-34.
Dao The Anh, 2003. Réformes socio-économiques et adaptation des choix d'activité des ménagesruraux dans le delta du fleuve Rouge au Vietnam. Thèse de doctorat au ESR Montpellier. Montpellier,ENSAM, 300 p.
Dao The Anh, Jésus F., 1995. Différenciation des exploitations agricoles du delta du fleuve Rouge dansle contexte de transition économique actuel. Développement et transition vers l'économie demarché. Hanoi, AUPELF-UREF.
Dao The Anh, Jésus F., 1998. Les réformes au Vietnam depuis 1979 et leurs effets sur les ménagesagricoles. Paris, URPA-CIRAD, 82 p.
Dao The Anh, Le Thi Chau Dung, Jésus F., 1997. Challenges and opportunities for the Red River Delta,Vietnam. A tool for measuring policy impact in rural area: the multilevel analysis tool for agriculture(MATA). Bangkok, CGPRT.
Dao The Tuan, 1997. Les transformations rurales récentes au Vietnam. In Cahiers Agricultures -Agriculture et Développement, Numéro commun : Spécial Vietnam, (sept-oct 1997), pp.13-18.
Dao The Tuan, 1999. Problèmes agricoles actuels. In Etudes vietnamiennes, Numéro spécial : Où enest l'économie du Vietnam ? (N2), pp. 44-80.
Dao The Tuan, Dao The Anh, 1997. The diversification of agriculture in the Red River Delta. Hanoi,VASI, 14 p.
Dao The Tuan, Le Thi Chau Dung, 2000. La diversification de l’agriculture dans le delta du fleuveRouge. In VASI/GRET/PFR, Appui à l’organisation de la production agricole dans le Nord du Vietnam,t.XXXIX, n°153, janv-mars, pp. 161-174.
Dao The Tuan, Molle F., 2000. The Chao Phraya delta in perspective: a comparison with the Red Riverand Mekong deltas, Vietnam. In The Chao Phraya delta: historical development, dynamics andchallenges of Thailand’s rice bowl, symposium Kasetsart Univ, IRD, Chulalongkorn Univ. And KyotoUniv, Bangkok, dec. 2000.
Food markets and agricultural development in Vietnam
102
De Bon H., 2001. Safe vegetable production. Hanoi-CLV peri-urban agriculture project. In AVRDCreport 2001, pp. 114-115.
Dini L., 2002. La gestion de la qualité sanitaire dans la filière des légumes à Hanoi. Mémoire de master.Montpellier, CNEARC , 121 p.
Donadieu P., Fleury A., 1997. L’agriculture, une nature pour la ville ? InAnnales de la recherche urbaine,74, pp. 31-39.
Durand F.B., Le Van Anh, 1996. The case of study of Can Tho city, Vietnam. In The management ofsecondary cities in Southeast Asia. United Nation Centre for Human Settlement, Nairobi, pp. 60-86.
Durand P., 1998. Kim Giang: mutations foncières et stratégies socio-économiques dans un village dela périphérie de Hanoi. T.E.R. en géographie tropicale. Bordeaux, 183 p.
Ellis F., Sumberg J., 1998. Food production, urban areas and policy responses. Word Development,26, pp. 213-225.
Erwidodo Prajogo U. Hadi, 1999. Effects of trade liberalisation on agriculture in Indonesia: commodityaspects. Working paper n°48. CGPRT Centre, Bogor, 126 p.
Fanchette S., 2002. Le delta du fleuve Rouge (Vietnam) : étude des densités de population et del’urbanisation des campagnes. In Espace, Populations, Sociétés, pp. 189-202.
Figuié M., 2003. Vegetable consumption behavior in Hanoi. FSP project 2000-56, SUSPER:Sustainable development of peri-urban agriculture in South-East Asia (Kingdom of Cambodia, LaoPDR, Vietnam RS). Hanoi, RIFAV, 23 p.
Fleury A., 2002. Le rôle de l'agriculture périurbaine dans d'autres régions : cas de la France et del'Europe. In Quertamp F., de Bon H., Baudoin N. (eds.), Le développement périurbain à Hanoi.Nouveaux enjeux. Les cahiers de la coopération française au Vietnam. Hanoi, Ambassade de Franceen République Socialiste du Vietnam, pp. 59-62.
Fontenelle J.P., Dao The Anh, Defourny P., Dao The Tuan (eds.), 2001. Atlas of the Bac Hung HaiPolder (Vietnam). Hanoi, Agricultural Publishing House.
Gendreau F., Dô Tiên Dung, Pham Dô Nhât Tân, 2000. Les migrations internes. In Gubry P. (ed.),Population et développement au Vietnam. Paris, Karthala-Ceped, pp. 194-217.
Ginhoux V., 2001. Etude de la sensibilité des consommateurs urbains de viande porcine (Hanoi et HaiPhong, Vietnam). Hanoi, GRET, VASI, VSF, CIRAD, Programme fleuve Rouge.
Gironde C., 2001. Réhabilitation et transformation de l’économie familiale au Nord-Vietnam : systèmesd’activités villageois et réseaux de relations dans le delta du Fleuve Rouge. Thèse de doctorat.Genève, IUED, 437 p.
Goletti F., Rich K., 1998. Policy Simulation for Agricultural Diversification. Washington DC, IFPRI, 232 p.
GSO, 1994. Vietnam Living Standards Survey 1992-1993. Hanoi, Statistical Publishing house.
References
103
GSO, 2000. Vietnam Living Standards Survey 1997-1998. Hanoi, Statistical Publishing house.
GSO, 2001. Statistical Yearbook. Hanoi, Statistical Publishing House.
GSO, 2001. Thong ke nong lam thuy san 1975-2000. Ha Noi, Nha xuat ban thong ke.
GSO, 2002. Thong ke hang, nam 2001. Ha Noi, Nha xuat ban thong ke.
GSO, 2002. Tinh Hinh Kinh Tê- Xa Hôi, Nam 2002. Ha Noi, Nha xuat ban thong ke, 57 p.
Gubry P. (ed.), 2000. Population et développement au Vietnam. Paris, Karthala-Ceped, 607 p.
Gubry P., Vu Thi Hông, Le Van Thanh (eds.), 2002. Les chemins vers la ville. Paris, Karthala-Ceped,343 p.
Ha Huy Khoi, 2002. Thua can va beo phi, mot van de suc khoe cong doi moi o nuoc ta. Thua can vabeo phi voi suc khoe cong dong. Hanoi, NIN.
Ha Minh Trung, 1999. Etude de l'influence des produits chimiques toxiques utilisés en agriculture surla santé humaine. Recommandations (traduction française). Hanoi, Institut national des Plantes,49 p.
Haughton D., Haughton J., Bales S. et al., 1999. Ho gia dinh Viet nam nhin qua phan tich dinh luong.Hanoi, Nha XB Chinh tri quoc gia.
Haughton D., Haughton J., Nguyen Phong (eds.), 2001. Living Standards during an Economic Boom.The Case of Vietnam. Hanoi, Statistical publishing House.
Ho Thanh Son, Bui Thi Thai, Moustier P., 2003. Strategies of stakeholders Participating in thecommodity chain of vegetables supplied to Hanoi markets. AVRDC/SUSPER regional project. Hanoi,RIFAV, 44 p.
Hoang Bang An, Vagneron I., Le Nhu Thinh, Moustier P., Dang Dinh Dam, Ngo Van Nam, Le ThuyHang, Trinh Quang Thoai, 2003. Spatial and institutional organization of vegetable markets in Hanoi.AVRDC/SUSPER regional project. Hanoi, RIFAV, 43 p.
Hoang Vu Quang, 1997. Evaluation des formes de microcrédit en milieu rural. Document de travail.Hanoi, VASI/Programme Fleuve Rouge.
Hoang Xuyen, 2000. La transition démographique. In Gubry P. (ed.), Population et développement auVietnam. Paris, Karthala-Ceped, pp. 61- 82.
Hollist W.L., Tullis F.L., 1987. The politics of hunger in Brazil. In Hollist W.L., Tullis F.L. (eds.). Pursuingfood security. Strategies and obstacles in Africa, Asia, Latin America and the Middle East. InternationalPolicy Economy Yearbook, Lynne Rienner Publishers, Inc., Boulder, Colorado, USA, vol.3, pp. 230-246.
Institute of Economics (IE), 2001. IDRC/CIDAproject. An overview of Vietnam trade policy in the 1990s:the changes and impacts. Hanoi, Institute of Economics, 36 p.
Food markets and agricultural development in Vietnam
104
International Food Policy Research Institute (IFPRI), 2002. Vietnam's fruit and vegetable sector: raisingrural incomes by improving post-harvest activities. Washington DC, IFPRI, 18 p.
Jésus F., Dao The Anh, 1997. L'agriculture du delta du fleuve Rouge face aux réformes économiques.In Cahiers Agricultures - Agriculture et Développement Numéro commun : Spécial Vietnam, (sept-oct 1997), pp. 67-73.
Jésus F., Dao The Tuan, Le Thi Chau Dung, Le Thi Nham, Dao Kim Mien, 2000. CIRAD-Ecopol/VASI,Reports of Phase I. Hanoi, VASI, 50 p.
Kay C., 2001. Asia’s and Latin America’s development in comparative perspective : landlords, peasantsand industrialization. The Netherlands, the Hague, Institute of Social Studies, Working paper series,n°336.
Krowolski N., 1993. Entre pénurie et "abondance": pratiques alimentaires en milieu urbain (Da Nang,Vietnam). In Krowolski N. (ed.), Autour du riz. Le repas chez quelques populations d'Asie du Sud-Est. Paris, L'Harmattan, pp. 121-164.
Lacoste Y., 1988. A l’angle de l’Asie, le problème Vietnam-Cambodge. In Hérodote n°49, Géopolitiqueen Asie des moussons, pp. 3-20.
Langlet-Quach Thanh Tâm, 2000. La répartition spatiale de la population. In In Gubry P. (ed.),Population et développement au Vietnam. Paris, Karthala-Ceped, pp. 167-194.
Lautent C., 2001. Cours sur les activités commerciales dans les supermarchés. Montpellier, CNEARC,France, Option VALOR (valorisation des productions agroalimentaires).
Le Bris E., Taillard C., 1998. Régionalisation et urbanisation au Centre-Vietnam : les dimensionsscientifiques du débat sur l’aménagement du territoire. In Espace géographique, n°2, pp. 97-110.
Le Goulven K., 2000. Dispositifs institutionnels et intégration des marchés. La commercialisation duporc au Vietnam. INRA-ESR Montpellier. Montpellier, ENSAM , 400 p.
Le Thi Huong, 2000. La population de Ho Chi Minh-ville. In Gubry P. (ed.), Population et développementau Vietnam. Paris, Karthala-Ceped, pp. 263-284.
Le Van Thanh, 2000. L'urbanisation. In Gubry P. (ed.), Population et développement au Vietnam. Paris,Karthala-Ceped, pp. 219-242.
Lecostey N., Malvezin C., 2001. Analyse diagnostic de la commune de Trung Trac en zone péri-urbainede Hanoi, Vietnam. Mémoire de diplôme d’agronomie approfondie. Paris, INAPG/ENGREF, 32 p.
Lipton, M., 1977. Why poor people stay poor: urban bias and world development. London, TempleSmith, 467 p.
Mai Thi Phuong Anh, 2002. Développement de l'agriculture péri-urbaine de Hanoi: résultats, difficultéset orientations pour 2010. In Quertamp F., de Bon H., Baudoin N. (eds.), Le développement péri-urbain à Hanoi. Nouveaux enjeux. Les cahiers de la coopération française au Vietnam. Hanoi,Ambassade de France en République Socialiste du Vietnam, pp. 49-58.
References
105
Mai Thi Phuong Anh, Hoang Lan Anh, Hoang Bang An, To Thi Thu Ha, Ali M., 2003. Urban and peri-urban agriculture in Hanoi: resources and opportunities for food production. SUSPER projectdocument. Hanoi, RIFAV, 35 p.
Malassis L., Ghersi G., 1997. Economie de la production et de la consommation. Paris, Editions Cujas,393 p.
MARD, 2001. The state of food security in Vietnam progress since the 1996 world food summit. Keyindicators. Hanoi, Ministry of Agriculture and Rural Development, Department of Planning andProjection, 16 p.
MARD, 2002. Food balance Sheets Vietnam, 1997-2001. Hanoi, Department of Planning andProjection, Ministry of Agriculture and Rural Development.
Midmore D.J., Jansen H.G.P., 2003. Supplying vegetables to Asian cities: is there a case for peri-urbanproduction? In Food Policy, 28, pp. 13-27.
Minot N., Goletti F., 1997. Impact of rice export policy on domestic prices and food security: furtheranalysis using the Vietnam agricultural spatial equilibrium model (VASEM) a report for the WorldBank, July 9. Hanoi, World Bank.
Minot N., Goletti F., 1998. Export liberalization and household welfare: the case of rice in Vietnam. InAmerican Journal of Agricultural economics 80 (4), pp. 738-749.
Minot N., Goletti F., 2000. Rice market liberalization and poverty in Vietnam. Washington DC, IFPRI.
Moati P., 2001. L’avenir de la grande distribution. Paris, Editions Odile Jacob, 392 p.
Mougeot L., 2000. Urban agriculture: definition, presence, potentials and risks. In Bakker N. et al. (eds.),Growing Cities Growing Food: Urban Agriculture on the Policy Agenda. Germany, Feldafong, DSE,pp.1-43.
Moustier P., 2003. L’agriculture dans le projet urbain et la gouvernance territoriale. Points de conclusionde l’atelier INRA/CEMAGREF/CIRAD, 27- 28/08/2003. Montpellier, CIRAD, 2 p.
Moustier P., Bridier E., Nguyen Thi Tan Loc, 2002. Food safety in Hanoi vegetable supply. Some insightsfrom a consumer survey. In Hanak E., Boutrif E., Fabre P., Pineiro M. (eds.). Food safety managementin developing countries. Proceedings of CIRAD/FAO international workshop CDRom.
Moustier P., Mbaye A., 1999. Introduction générale. In Moustier P. et al. (eds.), Agriculture périurbaineen Afrique subsaharienne: Actes de l’atelier international, 20-24 avril 1998, Montpellier, France,CIRAD, CORAF, Montpellier, France, CIRAD, Colloques. pp. 7-13.
Moustier P., Ngo Van Nam, Bui Thi Thai, 2002. Apports de l’économie institutionnelle et spatiale à larégulation des marchés alimentaires au Vietnam. Communication au séminaire Sciences Socialesorganisé par l’Ambassade de France à Hanoi, 23-24/05/2002.
Moustier P., Nguyen Thi Tan Loc, Figuié M., 2003. Organisation and management of vegetable safetyin Hanoi supplying chains. Paper presented to “Stakeholder meeting on vegetable safety”, Hanoi,RIFAV, SUSPER and MALICA projects, 17/06/2003, 8 p.
Food markets and agricultural development in Vietnam
106
Moustier P., Vagneron I., Bui Thi Thai, 2003. Some insights on the organization and efficiency ofvegetable market supplying Hanoi. Montpellier, INRA, UMR MOISA, working paper, 14 p.
Ngo Van Nam, 2002. Vegetable supply in Haiphong Province. Presentation to the methodologicalworkshop "Market appraisal of peri-urban food commodities", CIRAD-RIFAV, Hanoi, 26/02-05/03,3 p.
Nguyen Dinh Quang, Argenti O. 1999. Pre-case study of food supply and distribution to Hanoi.Presentation to the workshop "Food Supply and Distribution in Hanoi". Hanoi, 17-18 sept 1999. FAO,Feeding the cities. AC/22-99 E. http://www.fao.org/org/sada.htm.
Nguyen Duc Nhuan, 1992. Le district rural vietnamien ou l’Etat en campagne. In Matras-Guin J., TaillardCh. (eds.), Habitations et habitat d’Asie du Sud-Est continental. Paris, Harmattan, pp. 343-378.
Nguyen Duc Nhuan, 1997. Vietnam : un demi-siècle de chassé croisé urbain (1946-1996), ConférenceEuroviet, Amsterdam.
Nguyen Duc Truyen, 2003. Alimentations et productions paysannes. Le cas du village de Mong Phudans la région péri-urbaine de Hanoi. Document de projet, MALICA : CIRAD/IOS. Hanoi, CNSSH,77 p.
Nguyen Ngoc Que, 2002. La production rizicole au Vietnam. Document interne MALICA. Hanoi,MALICA/ICARD.
Nguyen Van Cat, 2000, Rapport d’enquête sur les tendances de développement de l’élevage. Hanoi,VASI.
Nielsen C.P.,1996. Social accounting matrixes for Vietnam 1996. IFPRI. TND discussion paper n°86.
Pham Kim Anh, 1997. Changements des modes alimentaires au Vietnam, en milieu urbain (Hanoi)sur une période de dix ans (1988-1997). Montpellier, Université de Montpellier II, 41 p.
Porter D. J., 1995. Economic liberalization, marginality, and the local state. In Kerkvilet B. J. T., PorterD. J. (eds.), Vietnam's Rural transformation. Singapore, Westview Press, Institute of Southeast AsianStudies, pp. 215-246.
Reardon T., Berdegué J.A., 2002. The rapid rise of supermarkets in Latin America: challenges andopportunities for development. In Development Policy Review, 20 (4), pp. 371-388.
Saada E., Valentin J., 1997. Petit commerce et grande surface : structure de marché et bien-être social.Communication au colloque SFER « Grande distribution alimentaire », 22-23/05/1997.
Sikor T.,1996. Vietnam's agricultural miracle: A Preliminary analysis of its causes. In Vietnam's Socio-economic Development (6).
Socialist Republic of Vietnam, 2000. Interim Poverty Reduction Strategy Paper. Hanoi, World Bank,30 p. Draft.
Socialist Republic of Vietnam, 2002. The comprehensive poverty reduction and growth strategy(CPRGS). Hanoi, Government of Vietnam, 141 p.
References
107
Taillard C., 1995. Le Vietnam, émergence d’un nouveau dragon. In Géographie Universelle. Paris,Belin-Reclus, pp. 188-211.
Thuy Phuong, 2003. Les producteurs de café face à de grands défis. In Courrier du Vietnam,12/03/2003.
Tin-Yin Liu, 1999. Development and constraints of food industries in Taiwan. In Proceedings of the5th JIRCAS international symposium on postharvest technology in Asia, pp. 179-189.
Toscano-Gil, 2000. Vegetable production during hot wet season in peri-urban area. Hanoi, CIRAD-RIFAV, 41 p.
Tran Cong Thang, 2003. Aperçu sur la filière porc au Vietnam. Document interne MALICA. Hanoi,MALICA/ICARD.
Tran Khac Thi, 1999. Study on some environmental factors and solutions on safe vegetabledevelopment. Paper presented at National workshop on safe and year round vegetable productionin peri-urban areas, CIRAD/RIFAV, Hanoi, 15-16 December, pp. 33-47.
Tuyen Le Danh, Bricas N., et al., 2000. Trend in food consumption and the nutritional status inurban Vietnam. Paper prepared for the FAO seminar, Feeding Asian Cities, 23-27/11/2000, Bangkok(Thaïland), http://www.fao.org/ag/ags/AGSM/SADA/Asia/pages/papers.htm.
UMR “Regards”, VTGEO, 2002. Péri-urbanisation dans la province de Hanoi. Atlas infographique dela province de Hanoi. Hanoi, 379 p.
U.S. Department of Agriculture, 1998. Agriculture Fact Book 1998. USDA, 11/1998.
Vernin X., 1998. La distribution des fruits et légumes frais. Paris, CTIFL, 255 p.
Vietnam Central Census Steering Commitee, 2000. 1999 population and housing census: sampleresults. Hanoi, The Gioi Publishers, 238 p.
Vietnam Investment Review, 2003. Tea exports take a tumble as Iraq conflict brews. N° 3.
Vu Trong Binh, 2002. La qualité des porcs, facteur d'organisation des producteurs dans le delta dufleuve Rouge. Mémoire de thèse de doctorat, INA Paris-grignon. Programme fleuve Rouge. Paris,INA-PG, 300 p.
Weissberg D., 1999. Réformes économiques, investissement étranger et mutations du territoire auViêt-nam. In Annales de Géographie, n° 605, pp. 65-85.
Winters A., 2002. Trade liberalisation and poverty dynamics in Vietnam. University of Sussex.
Witton R., Browett J, Gertzel C., Leaver L. (eds.), 1988. The constraints of export-oriented growth andthe possibilities of agriculture led industrialisation with special reference to Indonesia. ConferencePaper Series. Centre for Development Studies, Flinders, University of South Australia.
World Bank, 2002. Implementing reforms for faster growth and poverty reduction. Vietnamdevelopment report 2002. Hanoi, World Bank.
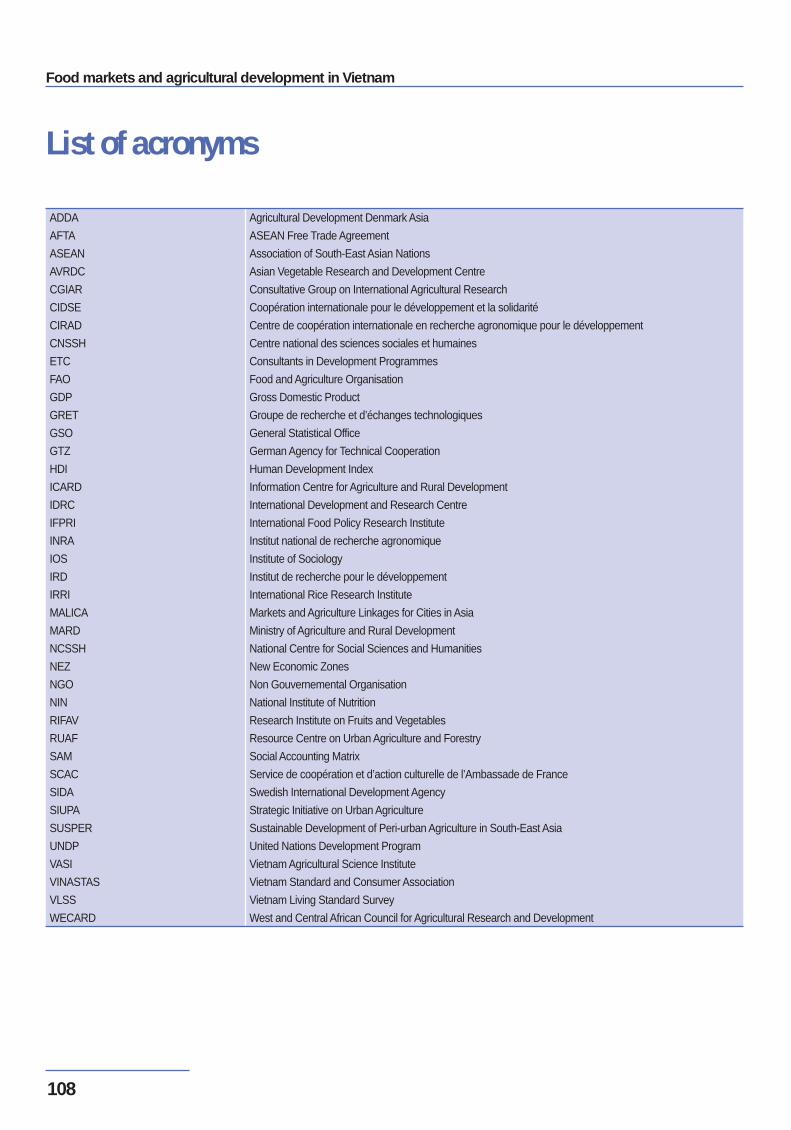
Food markets and agricultural development in Vietnam
108
List of acronyms
ADDA
AFTA
ASEAN
AVRDC
CGIAR
CIDSE
CIRAD
CNSSH
ETC
FAO
GDP
GRET
GSO
GTZ
HDI
ICARD
IDRC
IFPRI
INRA
IOS
IRD
IRRI
MALICA
MARD
NCSSH
NEZ
NGO
NIN
RIFAV
RUAF
SAM
SCAC
SIDA
SIUPA
SUSPER
UNDP
VASI
VINASTAS
VLSS
WECARD
Agricultural Development Denmark Asia
ASEAN Free Trade Agreement
Association of South-East Asian Nations
Asian Vegetable Research and Development Centre
Consultative Group on International Agricultural Research
Coopération internationale pour le développement et la solidarité
Centre de coopération internationale en recherche agronomique pour le développement
Centre national des sciences sociales et humaines
Consultants in Development Programmes
Food and Agriculture Organisation
Gross Domestic Product
Groupe de recherche et d’échanges technologiques
General Statistical Office
German Agency for Technical Cooperation
Human Development Index
Information Centre for Agriculture and Rural Development
International Development and Research Centre
International Food Policy Research Institute
Institut national de recherche agronomique
Institute of Sociology
Institut de recherche pour le développement
International Rice Research Institute
Markets and Agriculture Linkages for Cities in Asia
Ministry of Agriculture and Rural Development
National Centre for Social Sciences and Humanities
New Economic Zones
Non Gouvernemental Organisation
National Institute of Nutrition
Research Institute on Fruits and Vegetables
Resource Centre on Urban Agriculture and Forestry
Social Accounting Matrix
Service de coopération et d’action culturelle de l’Ambassade de France
Swedish International Development Agency
Strategic Initiative on Urban Agriculture
Sustainable Development of Peri-urban Agriculture in South-East Asia
United Nations Development Program
Vietnam Agricultural Science Institute
Vietnam Standard and Consumer Association
Vietnam Living Standard Survey
West and Central African Council for Agricultural Research and Development

Document prepared for the French Embassy in Vietnam
What are the wealth generating opportunities in Vietnam, other than exports,for the urban and rural poor? The domestic market represents twice the valueof agricultural exports, yet the latter are the priority focus of policies. The domes-tic market is currently experiencing considerable growth due to the increasingpopulation, urbanisation and higher incomes. Food is diversifying towards meat,fruits and vegetables. Street food is expanding. Quality of appearance, taste andsafety are becoming a major concern for consumers.
Local food production has demonstrated its capacity to respond to the growthof consumer demand, thanks to appropriate agricultural policies. However, thefood supply is often irregular in quantity (seasonal surplus and deficits) andquality. Moreover, inequalities in agricultural incomes are becoming more andmore marked from one region to another and the workforce, in excess in the ruralareas, cannot easily shift from agriculture to other activities, e.g. the foodprocessing sector is still to a large extent undeveloped. In perurban areas, agri-culture is very receptive to market opportunities and its roles are varied (supplyof fresh food, employment, greening), but its sustainability is threatened by pres-sure on land, as well as agricultural and non-agricultural pollution.
The present organisation of commodity chains, both small-scale and compe-titive, is favourable to a low end price of food products. Yet due to a lack offarmers’ trade associations, contracts between farmers and traders, and infor-mation and control devices, quality and regularity of food supply cannot be gua-ranteed. Hence the economic opportunities in the domestic food sector could beimproved by public support of the provision of information (both technical andcommercial) and the organisation of the stakeholders in the agricultural sector.
Contact: MALICA19, Han Thuyen, Hanoi, VietnamTel: (84) 4 972 06 31Fax: (84) 4 972 06 24Email: [email protected]
Copyright © 2022 FDOKUMEN