Institutional adjustment and agricultural markets: Following the transaction costs in the Tanzanian...
38
INSTITUTIONAL ADJUSTMENT AND AGRICULTURAL MARKETS: FOLLOWING THE TRANSACTION COSTS IN THE TANZANIAN COFFEE SYSTEM Anna Temu Sokoine Agricultural University Morogoro, Tanzania [email protected] and Alex Winter-Nelson* Agricultural and Consumer Economics University of Illinois, Urbana-Champaign 1301 West Gregory Drive, Urbana, IL, 61801 (217) 244-1381 [email protected] DRAFT.
Transcript of Institutional adjustment and agricultural markets: Following the transaction costs in the Tanzanian...

INSTITUTIONAL ADJUSTMENT AND AGRICULTURAL MARKETS: FOLLOWING THE TRANSACTION COSTS IN THE
TANZANIAN COFFEE SYSTEM
Anna Temu
Sokoine Agricultural University
Morogoro, Tanzania
and
Alex Winter-Nelson*
Agricultural and Consumer Economics
University of Illinois, Urbana-Champaign
1301 West Gregory Drive,
Urbana, IL, 61801
(217) 244-1381
DRAFT.

2
March 21, 2001
* Corresponding author.
3
INSTITUTIONAL ADJUSTMENT AND AGRICULTURAL MARKETS: FOLLOWING THE TRANSACTION COSTS IN THE
TANZANIAN COFFEE SYSTEM
Abstract:
If commodity market liberalization is to improve incentives for production it must reduce the
total costs of transforming products through space, form and time, and the costs of arranging
transactions in complete agricultural systems. While liberalization often leads to reduced costs in
output exchange, it can remove opportunities for linked input-output transactions that served to
lower the costs of providing finance in state-controlled markets. Assessments of liberalization
that focus on output exchange alone obscure or ignore the impact of rising transaction costs in
finance. This study of liberalization in the Tanzanian coffee market documents declining costs in
output marketing, rising transactions costs for finance, and differential, but generally positive, net
impacts on growers.
Keywords: Africa, Tanzania, Agricultural Markets, Liberalization, Transaction Costs.

4
INSTITUTIONAL ADJUSTMENT AND AGRICULTURAL MARKETS: FOLLOWING
THE TRANSACTION COSTS IN THE TANZANIAN COFFEE SYSTEM
1.0 Introduction
By the late 1980s, most observers agreed that agricultural development in Africa was
suffering due to policy interventions that had failed to �get the prices right�. While the diagnosis
was based on neoclassical analysis, the prescriptions were institutional. Starting in the early
1990s, countries adopted structural adjustment programs aimed at correcting price distortions by
changing the institutional framework in which transactions were completed (Meerman, 1997).
Liberalization programs to replace state-controlled trading systems with competitive commodity
markets were expected to result in lower marketing margins, higher producer prices, and
increased productivity.
Marketing margins may be high because poor physical infrastructure or mismanagement
result in high costs to transforming products through space, form and time, or because poor
institutional infrastructure implies high costs to gathering information, and negotiating,
monitoring or enforcing contracts. These latter costs are often referred to as transaction costs
(Bardhan, 1989; Williamson, 1985; Sadoulet and de Janvrey, 1995) while the former can be
termed transformation costs (Wallis and North, 1986).1 Liberalization can bring a decline in the
transformation costs of marketing if a competitive environment stimulates improved
management or increased investment. For transaction costs to fall, organizations must establish
contracts that reduce the costs of making exchanges in the new institutional setting. The costs of

5
storage, transportation and processing are more readily quantified than the transaction costs, but
Minten and Kyle (2000) demonstrate that search and negotiating costs can dominate the
transformation expenses in agricultural markets.
Market liberalization and the emergence of competitive trade could simultaneously
reduce transformation costs and increase transaction costs if, for example, competition led to
lower assembly and transportation costs, but higher costs of negotiating and enforcing contracts.
Moreover, because there are often many transactions in a commodity system, institutional
changes that reduce the margins in one exchange may lead to higher transaction costs in related
contracts and have an ambiguous impact on the system as a whole. For example, replacing a
controlled system of interlinked credit, inputs and output exchange with distinct, competitive
transactions could result in greater efficiency in output marketing, but higher transaction costs to
financing the production. The need for policy reforms to generate lower transactions and
transformation costs throughout the marketing chain is now recognized,2 but empirical
assessment of liberalization tends to focus on its impact on output marketing margins, output
prices, or the structure of output markets (Badiene and Shively, 1998; Jayne and Jones, 1997;
Meerman, 1997; World Bank, 1994, 2000; Barrett, 1997; Masters, 1993). Less attention is given
to costs in the inputs and financial markets, if they are assessed at all (World Bank 2000a,
Kherallah et al, 2000). This paper provides a more complete view of the impact of liberalization
on incomes by considering the costs of each exchange that farmers make when they engage in
commercial production.

6
New Institutional Economics defines institutions as the rules that govern social
interaction. The theory posits that organizations develop contracts to minimize transaction costs
given their institutional setting (Bardhan, 1989; North, 1990; Hubbard, 1997). Changes in
institutions brought on by structural adjustment should therefore imply changes in contracts to
minimize costs. The more flexible organizations can be in response to the structural adjustment
program, the more likely reforms are to be successful. A second key proposition of New
Institutional Economics is that institutions themselves are altered as changes in relative prices
impel social action for reform. Whereas the institutional changes brought on by structural
adjustment are often exogenously imposed by donors or creditors, the economies that are most
likely to develop are those in which institutions evolve endogenously with changes in local
conditions. In a complex economic system, externally imposed institutional innovations are
unlikely to account for all contingencies. Hence the capacity of a system to develop additional
institutional changes will influence an economy�s pace of development after adjustment policies
are imposed.
Focusing on transaction costs, this paper examines developments in the Tanzanian coffee
system since the market was liberalized in 1994. After liberalization, organizations rapidly
developed new contracts to lower transaction costs. The analysis reveals the extent to which
transaction costs in the commodity system have shifted, resulting in different impacts at various
stages in the commodity chain and differential impacts across producers. For most coffee
growers, liberalization appears to have brought a net improvement in incentives to produce. The

7
degree to which liberalization has been successful reflects the ability of the system to provide
new contractual arrangements and secondary institutional modifications after the initial
institutional shock.
2.0 Coffee Marketing in Tanzania
This study is based on a survey of 159 farmers, eight traders and eight exporters in
Arusha District of Tanzania in 1998. Arusha and neighboring Kilimanjaro District account for
more than half of Tanzania�s Arabica coffee, which constitutes about a third of the country�s
foreign exchange earnings. Smallholder farmers produce over ninety percent of Tanzania�s
coffee. Before marketing their crop, farmers pulp away the fleshy exterior of the coffee �cherry�
and dry it into �parchment� coffee. The parchment must then be milled in a curing factory to
reveal the �clean� coffee beans, which are graded based on international standards and auctioned
for export. In this system, farmers face multiple transactions, which may or may not be linked
into bundled exchanges. First, they may require finance to purchase inputs for production. In
this market the farmer will pay some discount rate plus the transaction costs associated with the
exchange (eg. screening, monitoring, and enforcement). Second, farmers will make some
transactions to purchase inputs, paying the import price of inputs plus the costs of internal
marketing, including transportation and various transaction costs. Labor might be hired or
household labor allocated to production. Finally, the producers sell parchment coffee, receiving
the export price, minus the transformation and transaction costs in the market. Marketing the
output may involve multiple exchanges as coffee is assembled at the village, transported to a

8
factory, processed, and transported to auction or port. To effectively enhance the returns to
production, an institutional innovation must reduce the net transformation and transaction costs
throughout this system, not at a single point of exchange.
Prior to 1994, the market for coffee was completely controlled by state organizations.3
Farmers delivered parchment coffee to primary cooperative societies and received an initial
payment based on a state-mandated price. Farmers also secured inputs at their primary
cooperative society. Parchment coffee was taken from cooperative societies to a coffee-curing
factory by the state-supported cooperative union, which controlled the factory. Once it had been
milled and graded, the �clean� coffee was then delivered to the Tanzania Coffee Marketing
Board (TCMB), where private exporters were allowed to purchase the coffee through an open
auction. The TCMB was the only organization that could legally sell coffee or coffee inputs.
The TCMB distributed inputs through the cooperative unions, which extended them on credit to
the cooperative societies at a negligible real rate of interest. Auction realizations were remitted
to the cooperative unions, which deducted processing costs and charges for input credit and
transferred remaining funds to cooperative societies. The cooperative societies then made final
payments to farmers to cover the difference between their initial payments and the auction
realization minus costs.
In this system, the credit, input, and output transactions were linked. Because farmers
had only one outlet for coffee, the cooperative unions could extend crop-secured loans through
the primary cooperative societies. Given the low degree of financial market development in rural

9
Tanzania, this system allowed scarce credit to be extended at low transaction costs. Similarly,
because all growers worked with a single marketing intermediary, it was possible to delay
payment until the actual value of the coffee delivered was determined. The quality of coffee
cannot be ascertained until it is cured and graded and its value is not known until it is sold in a
competitive market. The multi-part payment system therefore allowed farmers to receive the full
(average) value of coffee delivered at their primary cooperative society. However, it also meant
that payments were delayed well after delivery. In the 1980s, there was typically a second
payment after nine months and a final payment a year to 15 months after delivery.
While the multi-part payment system removed uncertainty regarding the quality of the
coffee exchanged between the grower and the marketer, it also exposed the cooperative union to
considerable international market risk. If the initial price offered to farmers at delivery exceeded
the auction realizations minus the union�s costs, the union operated at a loss. In fact, cooperative
unions suffered consistent losses between 1989 and 1993, which resulted in delayed or denied
payments to farmers and heavy borrowing from the state-controlled financial system. Over this
period, the cooperative system had no funds for payments beyond the initial payment made at
delivery. From 1989 to 1992, the multi-part payment system operated as a spot market, with a
government mandated price. After 1992, cooperative unions set the initial price and only rarely
made additional payments (Ministry of Agriculture and Cooperatives, 1997).
By 1994, the cooperative unions lacked liquidity to make initial payments to farmers,
were indebted to farmers for past deliveries, and could not access credit through the recently

10
liberalized financial market. To avoid complete collapse of domestic marketing, the government
allowed private traders to engage in trade starting in the 1994/95 marketing season. The TCMB
was replaced with the Tanzania Coffee Board (TCB), which continued to operate the export
auction, to issue export permits and licenses for domestic trade, and to monitor the industry.
Private traders, most of whom had been either coffee exporters or producers prior to
liberalization, quickly entered the domestic market, accounting for 13% of auction deliveries in
1994, 41% in 1995, and 69% in 1996. By 1996/97, private buyers of parchment coffee were
responsible for 45% of coffee curing and 84% of coffee exporting (Tanzania Coffee Board).
3.0 Contracts and Transaction Costs in the Liberalized Market
Given the new institutional arrangements, organizations would be expected to develop
new contracts to minimize transaction costs. If the transformation and transaction costs in
marketing fall below the level that existed prior to liberalization, marketing margins would fall,
and producer incomes rise. In fact, new contracts quickly emerged to reduce the marketing costs
of moving output from the farm gate onward. However, the innovations that lowered the costs of
output marketing, raised the transaction costs in the credit market. This shift in costs from one
part of the crop system to another suggests an ambiguous impact on farmers.
3.1 Contracts and costs in output markets
At liberalization, exporters who purchased clean coffee at the auction had to develop

11
contracts to ensure that coffee continued to move from the farm gate to the export market. The
contract they arrived at was to vertically integrate, directly assembling parchment, curing it, and
transporting and storing the clean coffee. Vertical integration tends to reduce transaction costs in
the presence of uncertainty, concentration, or asset specificity (Williamson, 1985; Klein,
Crawford and Alchian, 1978; Frank and Henderson, 1992). Since each of these factors exists in
the coffee marketing system, vertical integration was a natural response by coffee exporters.
Through the early 1990s, exporters faced increasing uncertainty about the ability of
existing domestic traders (cooperative unions) to supply coffee to the auction. Although coffee is
not highly perishable, there is a premium for freshness and exporters� contacts typically stipulate
a delivery date. Consequently, timely supply has a value and uncertainty in supply is costly. The
incentive to integrate was reinforced by concerns over concentration. The presence of few
parchment traders exposed the exporters to risk that they would face exploitive or unreliable
suppliers if they did not enter to ensure competition. Finally, upon entry into any aspect of
domestic marketing, private agents had to make substantial investments that were highly industry
specific. These investments included, licenses, parchment buying stations in villages,
warehouses (idiosyncratically located), and curing factories.4 Having incurred the expense of
investing in any element of domestic trade, exporters had an incentive to control the flow of
coffee by engaging in other aspects of the marketing system.
By 1998, there were 54 licensed exporters and 27 private parchment coffee buyers
operating in Arusha and Kilimanjaro Districts. Five of the private buyers also owned coffee

12
curing and grading factories and held export licenses. According to the TCB auction catalogues,
these five vertically integrated firms accounted for 45% of deliveries to the auction and 62% of
exports in 1998. The expansion of the private, vertically integrated traders is shown in table 1.
Within two years of liberalization, private vertically integrated firms assembled, processed, and
exported over half of Tanzania�s coffee. An additional 25% of production was channeled
through the vertically integrated public cooperative system. The remainder was handled either by
private assemblers and estates that did not export or by exporters, who assembled parchment and
contracted with the cooperative or private curing factories for processing prior to exporting the
clean coffee.
Liberalization and vertical integration came with a significant drop in costs of marketing
coffee. Vertically integrated exporters established factories that proved to be far more efficient
than the cooperative union�s outmoded plant. The new factories produced higher-grade coffee on
average, raising the value of the output by Tsh 26 per kilogram at 1997 prices. These factories
yielded four percent more processed coffee per unit input, implying a gain of Tsh 53 per
kilogram of parchment, and they operated at a lower unit cost, leading to a savings of Tsh 21 per
kilogram of parchment. Combined, these improvements implied a reduction of Tsh 100 per
kilogram, about 10% of the 1996 producer price. In addition, control over processing allowed
vertically integrated exporters to accelerate the movement of coffee through the system. Prior to
liberalization only 15% of coffee was exported in the first three months of the season. After
liberalization, 35% of the deliveries were completed in this time (Tanzania Coffee Board).

13
Faster delivery allowed exporters to save capital expenses and to access premiums for early
delivery on the international market.
Whereas private traders could reduce processing costs relative to the cooperative union,
they faced higher assembly costs than the primary cooperative societies. Cooperatives had staff
and facilities in place in villages, while the private buyers required new staff and physical
structures. In many cases, private coffee buyers contracted with primary cooperative societies,
hiring them as assembly agents. Interviews with private traders indicate that where primary
cooperative societies acted as agents for a private coffee buyer, assembly costs decreased from
Tsh11.0 per kilogram parchment to Tsh 3.5. When a primary cooperative society contracts with
a private trader, individual members may still sell to alternative traders. Nonetheless, traders
benefit from such contracts because they are cost efficient, compared to maintaining a buying
post, and because they give private traders access to farmers who have strong loyalties to their
cooperative.
As table 2 shows, the average marketing margins for coffee dropped substantially after
liberalization, with a large impact on producer prices. The average real margin to marketers
dropped from Tsh 450/kg over the 1985-1993 period to Tsh 100/kg after liberalization (1994-
1997). Thus, declining transformation costs in output marketing led to a reduction in marketing
margins of Tsh 350/kg, compared to an average export price of Tsh 1020/kg, in constant 1995
prices. The commensurate increase in producer prices therefore amounted to over a third of the
average export price.

14
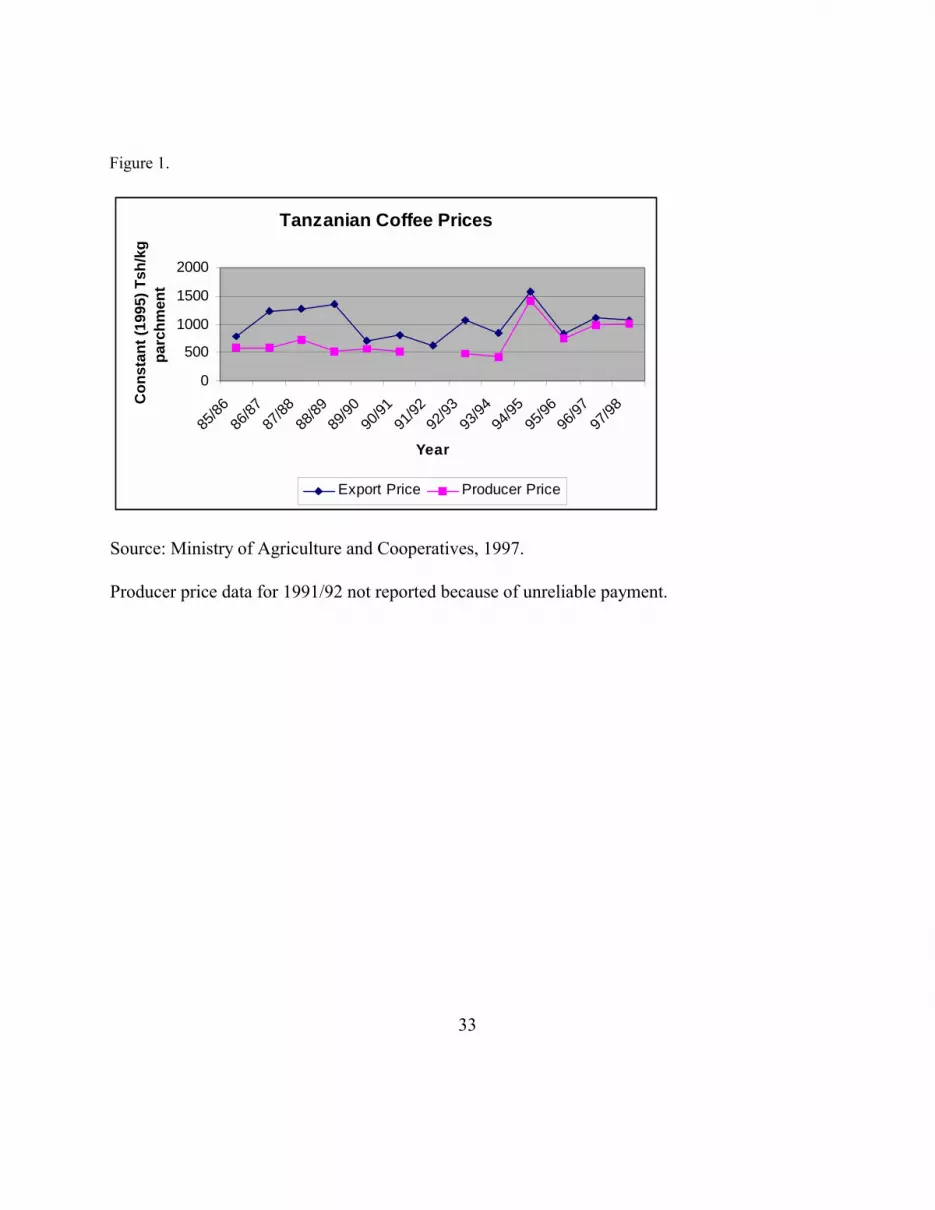
Figure 1 presents annual export and producer prices, revealing the decline in average
margins after 1994. The prices shown here and in table 2 represent an average of the prices
offered by the cooperative and private buyers, based on data collected by the Ministry of
Agriculture and Cooperatives (1996). However, the 1998 survey of 159 coffee growers found
that producer prices varied significantly depending on whether growers sold to private traders or
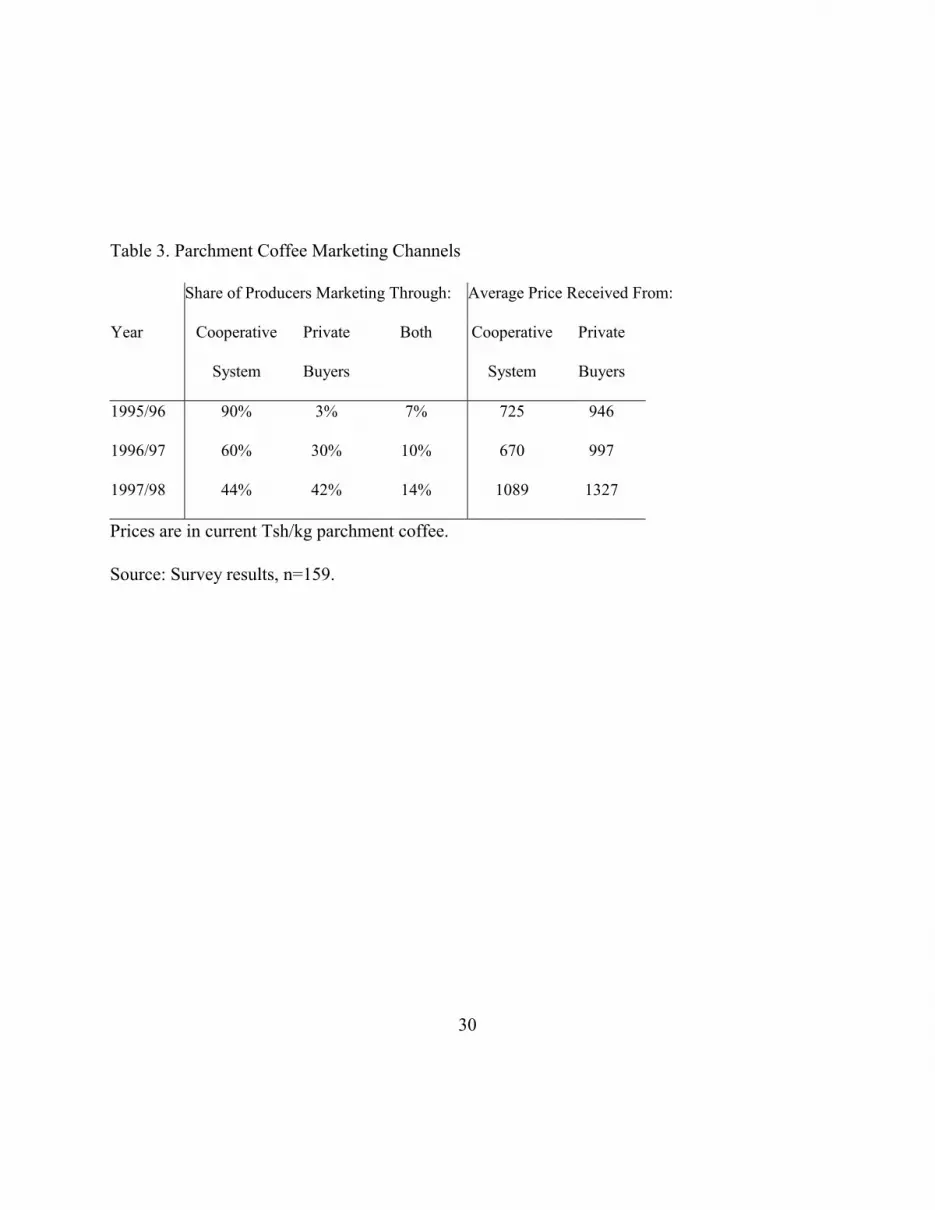
through the cooperative union. As table 3 indicates, 44% of the respondents marketed through
the cooperative system in 1997/98 and received an average of Tsh1100/kg. Another 41% of the
growers marketed through private coffee buyers and received on average Tsh1325/kg. The
remaining farmers split deliveries between the two outlets.
Surveyed farmers reported that in 1995/96, 1996/97, and 1997/98 they received Tsh 212,
Tsh 339, and Tsh 225 more per kilogram parchment from the private buyers than from the
cooperative. All the growers interviewed had access to both types of buyers at similar distances
from their farms. Some farmers still sold coffee to the union with expectations that the union
would make further payments based coffee quality realizations. Farmers also expressed a desire
to support cooperatives based on some perceived long-term benefits of marketing through
cooperative unions. Still other farmers chose to sell to the unions in hopes that deliveries would
enable the union to pay them arrears from previous coffee deliveries. Whatever the reasons for
continuing to support the cooperative unions, it would appear that the reduction in margins
shown in table 2, was not experienced equally by all growers, but probably ranged from about
Tsh 250 to Tsh 450 per kilogram, in 1995 Tanzanian Shillings.

15
3.2 Contracts and costs in input markets
Because farmers selling to private coffee buyers could not access inputs from the
cooperative union, private coffee buyers had to develop a new system of distributing inputs to
ensure that supplies of parchment would be available. The initial strategies for private coffee
buyers included providing input delivery services as a way of attracting farmers. By 1996, the
four largest coffee exporters had become both parchment buyers and input importers and
distributors. Other private coffee buyers contracted with input suppliers to distribute inputs from
their coffee buying posts. Consequently, inputs remained available to farmers at the points of
output sale, as had been the case prior to liberalization. This suggests that transaction costs in
purchasing inputs remained roughly constant after liberalization. When questioned about the
availability of coffee inputs, 31% of respondents indicated that there had been no changes since
liberalization. Thirty-nine percent indicated that inputs availability had improved and 30% felt
that availability had declined. Dissatisfaction with inputs distribution related to problems of
quality control in the inputs themselves, suggesting rising costs in transactions through
asymmetric information. These issues of quality control seem to have been resolved as
distributors developed reputations (World Bank, 2000a). Therefore, it is reasonable to treat the
transactions and marketing costs for inputs as unchanged with liberalization. This conclusion is
consistent with farmers� attitudes revealed in the survey and the continued use of output
assembly stations for input distribution.
3.3 Contracts and costs in seasonal finance

16
Liberalization of the coffee marketing system generated reduced marketing costs in the
output market, but also severed the links between the inputs, finance, and output exchange.
Under the monopsony system, the cooperative unions could provide finance for inputs purchases
at low screening and monitoring costs. Inputs could be provided to producers and the costs could
be deducted from the value of the crop. Since most inputs were useful only on coffee and all
coffee was sold through the cooperative system, there was little possibility for strategic default.
Moreover, since input costs are usually less than a third of the value of the product, they could be
recovered even in the event of a poor yield. Once private traders created new outlets for coffee,
the cooperative unions could no longer cheaply enforce repayment of loans. The system of crop-
secured lending ended after the first season of liberalized trade, with heavy losses for the
cooperative unions, the Tanzania Coffee Marketing Board and ultimately the central government,
which paid off Tsh 3.4 billion in outstanding debt in 1998.
Since liberalization, no large-scale system for financing inputs has emerged. In the
presence of multiple outlets for coffee, the screening, monitoring and enforcement costs for
finance have grown too large to allow the transactions to occur. While all coffee growers
received inputs finance prior to liberalization, 80% of the growers interviewed indicated that they
had had no access to inputs credit since liberalization.5 The competitive forces that served to
reduce marketing costs for coffee output, drove the transaction costs for financing coffee
production so high that the market has largely disappeared.
A simple cost-benefit calculation can be used to assess the net impact on coffee growers

17
of the losses they suffer through reduced access to finance and the gains they experience through
reduced marketing margins for their output. In the state-controlled system, coffee growers
received revenue (Rs) with input costs (I) deducted upon delivery of their coffee. The growers�
cash income was simply Rs-I. After liberalization, growers using similar levels of inputs received
revenue (Rl) at delivery, but incurred the cost (I) earlier in the year. In the absence low-interest,
crop-secured lending, farmers must forego consumption or other investments to purchase inputs.
Hence, the cost (I) must be inflated by the subjective discount rate (δ) to capture the cost of
delayed consumption. Net cash returns for the farmer in the liberalized setting are therefore Rl-
I(1+δ). Assuming conditions obtaining prior to 1994 could have been sustained in the absence of
liberalization, Rl-I-Iδ must exceed Rs-I for the reduced output marketing margins attributable to
the policy change to compensate for the loss of inputs finance. Rearranging, the benefits of
reduced marketing costs exceed the value of the lost finance if: (Rl-Rs)/I>δ.6
According to Ministry of Agriculture (1996), inputs required for one hectare of coffee in
Arusha yielding 450 kilograms of parchment were valued at Tsh126,000.7 To estimate what
revenues would have been without liberalization (Rs), we assume that the margins existing in the
decade prior to liberalization would have been maintained in the absence of the institutional
reform. This suggests attributing the Tsh 350 per kilogram decline in margins (shown in Table
2) to the liberalization. At a yield of 450 kg per hectare, this reduction in margins implies an
increase in revenues (Rl-Rs) of Tsh157,500. Based on these values, the reduced output costs
outweigh the value of lost finance as long as farmers� subjective discount rate is less than 125%

18
(157,500/126,000=1.25). It is unlikely that many individuals would exhibit a rate of time
preference of this magnitude, implying that the benefits of reduced output marketing costs exceed
the losses through increased transaction costs in farm finance.
The counterfactual employed above assumes that yields were not affected by
liberalization, that marketing margins would have remained at their pre-1994 level in the absence
of liberalization, that farmers would continue to pay a real interest rate of zero on inputs finance
if liberalization had not occurred, and that the multipart payment system would not have
reemerged in the absence of liberalization. The implications of the first two assumptions will be
explored in sensitivity analysis. If a positive real interest rate were charged in a controlled
system, it is the difference between the farmers� subjective rate of discount and the real interest
rate that must exceed (Rl-Rs)/I for the policy change to be beneficial. Hence, rates of time
preference would have to be even higher than 125% for the policy reform to be detrimental.
Similarly, if the multi-part payment system were reinstated, the present value of revenues under
the controlled system would fall and the threshold rate of discount would rise. Relaxation of
these assumptions would therefore reinforce the conclusion above.
The gains from liberalization are overstated if yields or the impact on marketing margins
were overestimated. Using the average 1985-1993 margin as the counterfactual to compare with
the actual margins after liberalization probably underestimates the reduction in costs attributable
to liberalization. Since the cooperative unions were operating at deficits in the early 1990s, one
could reasonably project the margins increasing to cover costs, had liberalization not been

19
adopted. On the other hand, since farmers who continue to market through the cooperative
unions face a higher marketing margin than others, the average margin since liberalization
exaggerates the reduction some farmers experienced. Sensitivity analysis shown in table 4
reveals that even if the reduction in margins has been grossly exaggerated, the minimum value of
the discount rate required to imply that growers have lost through liberalization is beyond what
would normally be observed, unless yields are exceptionally low. If producers experienced
reductions in output marketing margins of only Tsh 200, rather than the average of Tsh 350, and
yields of only 250 kilograms per hectare, an exceedingly unlikely event given the inputs level
suggested by I, they would still benefit from liberalization as long as their discount rate did not
exceed 40%.8 This calculation suggests that most growers benefited on balance from
liberalization, but that the benefits have been greater for those farmers who have lower subjective
rates of discount and higher yields. Those would probably be growers with more financial
resources and greater liquidity than the more resource poor households.
For smallholder coffee growers who produce near subsistence, deferred consumption may
be physically impossible, suggesting that the discount rate is not relevant to their investment
decision. In these households, a minimum consumption requirement places a fixed constraint on
spending that prohibits purchase of farm inputs prior to the sale of the output. The demise of
crop-secured lending implies reduced input use and reduced yields for such households. In this
case the cost-benefit calculation differs from that given above. Prior to liberalization, these
households would have earned cash income from coffee equal to a high yield (Qh) times the price

20
in the state-controlled system (Ps) minus the cost of inputs (I). The price these farmers received
was the export price (Pe) minus the rather high margins charged in the state system (Ms). Thus,
their cash income prior to reform was Πs: Πs = Qh(Pe-Ms)-I.
Under liberalization, these households can be assumed to have lower yields (Ql) because
of reduced input use, but to receive a larger share of the export price because of the lower
marketing margins (Ml). Their cash revenues after liberalization (Πl) can be modeled as: Πl =
(Ql)(Pe-Ml).
Again, margins without liberalization are taken as the average over the 1985-1993 period
(Tsh 450 per kilogram) and margins under liberalization are set at the average level from 1994 to
1997 (Tsh 100 per kilogram). Ministry of Agriculture (1996) data suggest that reducing input
use lowers yields in Arusha from 450 kilograms per hectare to 250 kilograms per hectare, while
saving farmers Tsh 126,000. In 1995 Tanzanian shillings, Πs = 450(Pe-450)-126,000, and Πl =
(250)(Pe-100). Simple algebra reveals that as long as the export price (Pe) is less than Tsh
1,517.5 per kilogram of parchment equivalent, cash income under the controlled system (Πs) will
be less than cash income under liberalization (Πl). As figure 1 shows, export prices only reached
this threshold once between 1985 and 1999. Sensitivity analysis in table 5 indicates that if
producers experienced a significantly larger decline in yield (which may be possible in some
environmental settings) and if they simultaneously enjoyed a smaller decline in marketing
margins (which would occur if they continued to market through the cooperative system) the
critical value for the export price falls below Tsh 1,200 per kilogram parchment. Coffee prices
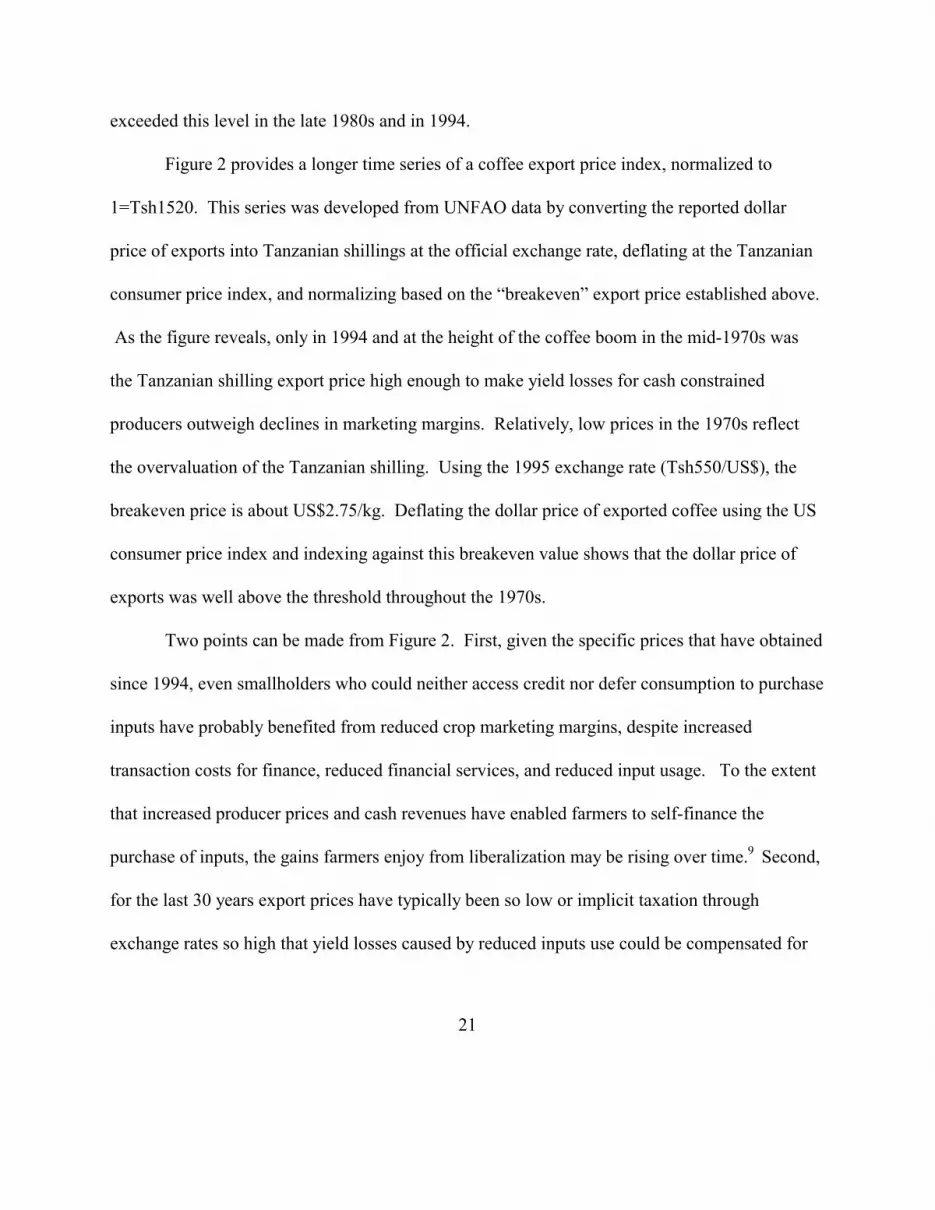
21
exceeded this level in the late 1980s and in 1994.
Figure 2 provides a longer time series of a coffee export price index, normalized to
1=Tsh1520. This series was developed from UNFAO data by converting the reported dollar
price of exports into Tanzanian shillings at the official exchange rate, deflating at the Tanzanian
consumer price index, and normalizing based on the �breakeven� export price established above.
As the figure reveals, only in 1994 and at the height of the coffee boom in the mid-1970s was
the Tanzanian shilling export price high enough to make yield losses for cash constrained
producers outweigh declines in marketing margins. Relatively, low prices in the 1970s reflect
the overvaluation of the Tanzanian shilling. Using the 1995 exchange rate (Tsh550/US$), the
breakeven price is about US$2.75/kg. Deflating the dollar price of exported coffee using the US
consumer price index and indexing against this breakeven value shows that the dollar price of
exports was well above the threshold throughout the 1970s.
Two points can be made from Figure 2. First, given the specific prices that have obtained
since 1994, even smallholders who could neither access credit nor defer consumption to purchase
inputs have probably benefited from reduced crop marketing margins, despite increased
transaction costs for finance, reduced financial services, and reduced input usage. To the extent
that increased producer prices and cash revenues have enabled farmers to self-finance the
purchase of inputs, the gains farmers enjoy from liberalization may be rising over time.9 Second,
for the last 30 years export prices have typically been so low or implicit taxation through
exchange rates so high that yield losses caused by reduced inputs use could be compensated for

22
with the reduction in marketing margins experienced at liberalization. However, the historical
distribution of prices suggests that it is conceivable that prices could rise to range that
smallholders who could not self-finance inputs purchases would have been net losers from
reforms.
4.0 Secondary Institutional Innovations: Flexibility and Rigidity
Since the costs of arranging exchange can deter otherwise profitable transactions from
occurring, economic development requires that institutions and contracts emerge to diminish
transaction costs. The apparent success in reducing marketing costs in the Tanzanian coffee
system is partly attributable to the effectiveness of organizations in developing new contracts to
work in the new institutional environment. These contracts were often only available because the
government of Tanzania supported the development of mechanisms to allow continued
institutional and contractual development after the initial liberalization in 1994.
4.1 Disputes, enforcement and communication
One mechanism for reducing marketing margins has been the contracting of primary
cooperative societies as assembly agents for private traders. These agreements can reduce the
costs of assembling parchment, but have led to conflicts between and among cooperative
societies, cooperative unions, and private coffee buyers. In many instances cooperative unions
challenged the rights of primary cooperative societies to market coffee outside of the cooperative
system. Such sales both reduce the union�s revenues and divert coffee from the union�s

23
processing plant, raising its unit costs. The contracts between the cooperative societies and the
private coffee buyers have also generated disputes among private buyers, as societies have
entered multiple, sometimes contradictory, agreements involving different traders. To facilitate
resolution of these conflicts, the government has allowed the development of the Tanzanian
Coffee Association (TCA) as a forum for dispute resolution. The Tanzania Coffee Association
consists of licensed parchment traders, parchment processors, cooperative unions and exporters.
It represents an institutional innovation in legal support for transactions in the liberalized market
because it is used for arbitration of conflicts between members of the association. The
government�s recognition of the TCA�s right to rule on these matters has lowered costs that
would arise if traders resolved such conflicts through the civil courts. If the TCA lacked the
authority to resolve conflicts, transaction costs in the new system would rise.
The Government of Tanzania has also supported the emergence of the annual coffee
conference in which the cooperative unions, private traders, growers, exporters, and various
government ministries with interests in coffee discuss and attempt to resolve problems in the
evolving market. Indicators of the importance of the coffee conference and the public-private
partnerships that it facilitates include the emergence of research and extension programs funded
by its members and the development of the National Inputs Voucher Scheme.
4.2 National Inputs Voucher Scheme
Lower use of inputs due to the rising costs or the absence of finance may be responsible
for reducing the quality and quantity of coffee produced by many growers. This outcome is
24
undesirable for traders, farmers, and the state of Tanzania. Mutual interest in a functional
production and marketing system generated dialogue among the government, the Tanzania
Coffee Board, the Tanzania Coffee Association, and other stakeholders, which resulted in
establishment of National Input Voucher Scheme (NIVS) in 1996.
The NIVS operates a special input fund whereby licensed parchment buyers issue a
specified portion of farmers� coffee payments in the form of input vouchers. Vouchers channel
part of each farmer�s income from coffee into the purchase of coffee inputs in the following
season. Traders purchase input vouchers proportional to the amount of parchment coffee they
expect to buy from farmers. These vouchers are then distributed to farmers at coffee buying
posts. In the 1996/97 season, vouchers accounted for 20% of the value of inputs required by
farmers (considering variable costs of fertilizers, pesticides, bags, and tools). For monitoring
purposes, NIVS registers input distributors who apply to participate in the scheme. By 1997,
there were 18 registered input distributors nationwide; out of the 18, four were also licensed
parchment buyers and exporters. The vouchers collected by registered input distributors are then
submitted to NIVS office for cash payment. While the NIVS does not provide credit, but it does
encourage self-finance, appears to be sustainable, and represents the importance of government
support for continued institutional innovation after the initial liberalization.
4.3 The Export Auction
Institutions governing the export of coffee have been more rigid than those relating to the
exchange of inputs and parchment coffee. By law, all coffee bound for export must pass through

25
the Tanzanian Coffee Board auction, as was the case prior to liberalization. Before 1994, the
cooperative unions transferred clean coffee to competitive private exporters at this auction.
Since liberalization, these exporters have expanded operations to include the purchase of
parchment coffee and processing. According to auction catalogues (Tanzania Coffee Board), the
exporter-processor-traders accounted for about 50% of deliveries to the auction and 65% of the
purchases from the auction between 1996 and 1998. The integrated exporters bid on and buy
essentially all the lots of coffee they supply, plus additional lots supplied by parchment traders
who do not export. Hence, over half of Tanzania�s coffee is now transferred to exporters at the
village level, processed and then delivered to the auction. The vertically integrated exporters
usually sell in futures contracts against the expected collection of parchment from farmers.
Typically, the coffee they deliver to the �export� auction has already been committed to an
importer abroad about 8 weeks before the auction.
For the coffee supplied to the auction by the vertically integrated exporters, the auction is
not a locus of exchange. While the auction provides no exchange services for this coffee, it does
increase the exporters� marketing costs through storage and handling and causes delays in access
to the international market that may deprive the exporter of premiums for early delivery. The
Tanzania Coffee Board collects sales taxes and levies based on transactions at the auction
market; it also uses the sales data to determine traders� contribution to the coffee industry
research and extension funds. It seems likely that an alternative mechanism for assessing these
fees could be developed at lower costs than the use of a redundant auction. The development of

26
such a contract would require yet another institutional change by the government to reduce the
role of the auction.
5.0 Conclusions
Market liberalization enhances agriculture if it reduces the costs associated with
producing output and moving it from farm to final market. Whereas most attention has been
focused on reducing margins associated with output exchange, marketing costs must be reduced
through the entire commodity system if liberalization is to yield benefits. When credit, input and
output markets have been linked under a controlled system, market liberalization is likely to
lower costs of output exchange while raising transaction costs in the financial market. Increases
in the share of world prices accruing to African farmers readily confirm reduced costs in output
markets (Kheralla et al, World bank, 1994), but changes in transaction costs in the exchanges for
inputs and finance remain difficult to quantify.
After the liberalization of the Tanzanian coffee market, organizations formed new
contracts to reduce costs in the new institutional setting. These contracts ranged from the vertical
integration of exporters into assembly and processing, to collaborative support for the NIVS
among private traders, cooperative unions, and the government. This range of contracting
response, as well as secondary institutional changes that allowed them, generated reductions in
the marketing costs for output, but increases in the transaction costs for financing production.
The particular combination of prices, costs, and yields that obtained in Tanzania since
1994 implied that most farmers gained from the mix of lower output marketing margins and

27
reduced access to finance. Because farm households are heterogeneous, their experiences will
have varied, but available budget data suggests that a large core of growers has experienced
higher net revenues due to reforms. Only those growers who simultaneously experienced
exceptionally low yields, remained in relatively high cost marketing channels, and had no access
to finance or had finance only at a very high opportunity cost could have been net losers from the
change.
Price policy reform is institutional reform. Its success depends on the capacity for
organizations to reduce their transformation and transaction costs given the new institutional
setting. Competitive pressures in a liberalized system are likely to reduce the costs of output
marketing. However, when liberalization severs the linked inputs, finance and output exchanges
it may increase transaction costs at other points in the commodity chain. To assess the impact of
liberalization, the transaction costs through the entire system must be measured. Conclusions
based on reduced costs at any one exchange can misrepresent the actual impact of reforms and
obscure the need for further institutional change or policy intervention.

28
Table 1. Market Shares in Coffee Trade in Northern Tanzania
Share of coffee delivered to export auction
1993/94 1994/95 1995/96 1996/97 1997/98
Vertically Integrated Exporters with
processing capacity a 0% 12% 33% 57% 45%
Other Private Coffee Buyers b 0% 1% 8% 12% 22%
Cooperative System 75% 58% 44% 22% 26%
Estates 6% 8% 4% 6% 7%
Other Governmental Organizations 19% 21% 11% 2% 1%
Total c 100% 100% 100% 100% 100%
a) This represents the 5 firms that are licensed for domestic marketing and export, and own processing facilities.
b) Includes vertically integrated exporters who outsource processing and traders who do not export.
c) Shares do not add up to 100% due to rounding error.
Source: Tanzania Coffee Board.

29
Table 2. Producer Prices and Marketing Margins for Tanzanian Coffee. (Constant, 1995, Tanzanian Shillings, except where noted.)
1985-90 1992/93 1993/94 1994/95a 1995/96 1996/97 1997/98
Export Price
(US$/kg clean coffeeb) 2.40 1.38 1.25 2.80 1.90 2.80 3.00
Export Price
(Tsh/kg parchment coffeec) 1025 1064 848 1578 836 1111 1063
Producer Price
(Tsh/kg parchment coffee) 589 495 424 1410 750 992 1000
Marketing Margin
(Tsh/kg parchment coffee) 436 569 424 168 86 119d 63
a) Year markets were liberalized.
b) Current dollars
c) Conversion factor of 0.80 was used to convert clean coffee into parchment. Tanzanian
Shilling values were converted at official exchange rates and deflated using the consumer price
index to constant (1995) values.
d) High marketing costs in this season are attributable to widespread flooding and mudslides
caused by El Niño rains.
Note: Producer price data for 1991/92 not reported due to unreliability of actual payment.
Source: Based on Ministry of Agriculture and Cooperatives (1997), Tanzania Coffee
Board.
30
Table 3. Parchment Coffee Marketing Channels
Share of Producers Marketing Through: Average Price Received From:
Year Cooperative Private Both Cooperative Private
System Buyers System Buyers
1995/96 90% 3% 7% 725 946
1996/97 60% 30% 10% 670 997
1997/98 44% 42% 14% 1089 1327
Prices are in current Tsh/kg parchment coffee.
Source: Survey results, n=159.

31
Table 4. Sensitivity Analysis: Breakeven values of subjective discount rate (δ).
Decline in Marketing Margin
Yield 350 325 300 275 250 225 200
450 1.25 1.16 1.07 0.98 0.89 0.80 0.71
425 1.18 1.10 1.01 0.93 0.84 0.76 0.67
400 1.11 1.03 0.95 0.87 0.79 0.71 0.63
375 1.04 0.97 0.89 0.82 0.74 0.67 0.60
350 0.97 0.90 0.83 0.76 0.69 0.63 0.56
325 0.90 0.84 0.77 0.71 0.64 0.58 0.52
300 0.83 0.77 0.71 0.65 0.60 0.54 0.48
275 0.76 0.71 0.65 0.60 0.55 0.49 0.44
250 0.69 0.64 0.60 0.55 0.50 0.45 0.40
Subjective rate of discount below, which benefits from reduced marketing margin exceed costs
of reduced input finance, assuming input costs of Tsh 126,000 (1995 prices).

32
Table 5. Sensitivity Analysis: Breakeven values for export prices
(1995 Tsh/kg parchment equivalent)
Decline in Decline in Marketing Margins
Yield 350 325 300 275 250 225 200
150 1990 1940 1890 1840 1790 1740 1690
175 1720 1681 1641 1602 1563 1524 1484
200 1518 1486 1455 1424 1393 1361 1330
225 1360 1335 1310 1285 1260 1235 1210
250 1234 1214 1194 1174 1154 1134 1114
Values represent the export price below which the losses through reduced
yield with liberalization are less than the gains through reduced marketing
margins, assuming input cost of Tsh 126,000 and yield of 450 kg/HA without
liberalization and no input use with liberalization.
33
Figure 1.
Tanzanian Coffee Prices
0
500
1000
1500
2000
85/86
86/87
87/88
88/89
89/90
90/91
91/92
92/93
93/94
94/95
95/96
96/97
97/98
Year
Con
stan
t (19
95) T
sh/k
gpa
rchm
ent
Export Price Producer Price
Source: Ministry of Agriculture and Cooperatives, 1997.
Producer price data for 1991/92 not reported because of unreliable payment.

34
Figure 2.
Tanzanian Coffee Export Price Index
0.00
1.00
2.00
3.00
4.00
1970 72 74 76 78 80 82 84 86 88 90 92 94 96 98
Year
Pric
e
Tsh Index US $ Index
Source: UNFAO, 2001.

35
References:
Badiene, O. and G. Shively (1998), �Spatial Integration, Transport Costs, and the Response of Local Prices to Policy Changes in Ghana,� Journal of Development Economics 56, 414-431. Bardhan, P. (ed) (1989), The Economic Theory of Agrarian Institutions. Oxford University Press, Oxford. Barrett, C. (1997), �Food Marketing Liberalization and Trader Entry: Evidence for Madagascar,� World Development 25(5), 763-777. Frank, S. and D. Henderson (1992), �Transactions Costs as Determinants of Vertical Integration in the US Food Industries,� American Journal of Agricultural Economics, 74(4), 941-950. Holden, S., B. Shiferaw, and M. Wik (1998) �Poverty, market Imperfections, and Time Preferences: Of Relevance for Environmental Policy?� Environment and Development Economics 3(1), 105-130. Hubbard, M. (1997), �The �New Institutional Economics� In Agricultural Development: Insights and Challenges,� Journal of Agricultural Economics 48(2), 239-249. Jayne, T.S., and S. Jones (1997), �Food Marketing and Pricing Policy in Eastern and Southern Africa: A Survey,� World Development 25(9), 1505-1527. Kherallah, M., C. Delgado, E. Gabre-Madhin, N. Minot, M. Johnson (2000) The Road Half Traveled: Agricultural Market Reform in Sub-Saharan Africa, International Food Policy Research Institute, Food Policy Report, Washington, DC. Klein, B, R. Crawford, and A. Alchian (1978), �Vertical Integration, Appropriable Rents and the Competitive Contracting Process,� Journal of Law and Economics, 21(2), 297-326. Masters, W. (1993), The Scope and Sequence of Maize Market Reform in Zimbabwe, Food Research Institute Studies 22(3), 227-252. Meerman, J. (1997), Reforming Agriculture: The World Bank Goes to Market, The World Bank, Washington, DC. Ministry of Agriculture, Coffee Management Unit (1996), Coffee Production, Processing and Marketing 1976-1995: An Overview, United Republic of Tanzania, Dar es Salaam. Ministry of Agriculture and Cooperatives (1996), Report of the Annual Coffee Industry Meeting,

36
United Republic of Tanzania, Dar es Salaam. Ministry of Agriculture and Cooperatives, Marketing Development Bureau (1997), 1995/96 Marketing Review of Coffee, United Republic of Tanzania, Dar es Salaam. Minten, B., and S. Kyle (2000), �Retail Margins, Price Transmission and Price Asymmetry in Urban Food markets: The Case of Kinshasa (Zaire),� Journal of African Economies 9(1), 1-23. North, D.C. (1990), Institutions, Institutional Change and Economic Performance, Cambridge University Press, Cambridge. Pender, J. (1996), �Discount Rates and Credit Markets: Theory and Evidence from Rural India,� Journal of Development Economics 50(2), 257-296. Sadoulet, E. and A. de Janvry (1995), Quantitative Development Policy Analysis, Johns Hopkins University Press, Baltimore. Staal, S., C. Delgado, C. Nicholson (1997), �Smallholder Dairying Under Transactions Costs in East Africa,� World Development 25(5), 779-794. Tanzania Coffee Board (various issues), Auction Catalogue, Moshi, Tanzania. UNFAO, FAOSTAT webpage, http://apps.fao.org/cgi-bin/nph-db.pl?subset=agriculture, Accessed Feb 14, 2001. Wallis, J., and D.C. North (1986) �Measuring the Transactions Sector in the American Economy, 1870-1970,� in Long Term Factors in American Economic Growth, S. Engerman and R. Gallman (eds.), University of Chicago Press, Chicago (pp.95-161). Williamson, O.E. (1985), The Economic Institutions of capitalism: Firms, Markets, Relational Contracting. The Free Press, Collier Macmillan Publishers, New York. World Bank (1994), Adjustment in Africa: Reforms, Results and the Road Ahead, Oxford University Press, New York. World Bank (2000), World Development Report 2000/2001: Attacking Poverty, Oxford University Press, New York. World Bank (2000a), Agriculture in Tanzania: Follower or Leader of Growth, A World Bank Country Study, World Bank, Washington, DC.

37
1 Some authors have termed all these expenses transactions costs (Staal, Delgado, and Nicholson, 1997) while others equate the transformation costs with marketing costs. As in North and Wallis (1985) and Minten and Kyle (2000) this paper uses the term transaction costs for the costs of arranging an exchange that do not relate to physical treatment of the commodity. Marketing costs will refer to the combined transaction and transformation costs of marketing.
2 Jayne and Jones (1997) note �The challenge now is to design coordinated and sustainable
systems of input delivery, farm finance, and reliable output markets to reduce the costs and risks of input intensification in smallholder agriculture� (p. 1520). Similarly, The World Bank (2000) acknowledges, �when reforms leave an institutional vacuum, performance suffers� (p.69).
3 The exact mechanisms through which the state controlled the domestic marketing of coffee
have varied since independence, but state control has been constant. The system described here operated over the periods 1962-1976 and 1984-1992.
4. In 1996, license regulations required parchment buyers to be registered companies that have a
paid-up capital of not less than Tsh 30 million (US$ 46,000). Applicants needed regional trading licenses costing some Tsh 6.2 million (US$10,000) per region. Machinery for the curing factory costs US$500,000.
5 Of the remaining 20%, 8% claimed they had access to finance through shopkeepers, 8%
through their cooperative society, and 4% through special projects. 6 This calculation takes the perspective of a producer paying a real interest rate of zero under the
controlled system. From a national perspective it would be appropriate to charge the social rate of return to capital (r) to the loan of I in the controlled system. In this case, liberalization would be beneficial as long as (R l�R s)/I> δ-r.
7 Average yields for the country are about 400kg/HA. 8 Experimental estimates of small-scale farmers� rates of time preference suggest discount rates
of over 50%, and imply that rates are higher for poorer farmers than for wealthier ones (Pender, 1996; Holden, Shiferaw and Wik, 1998). Pender notes that the experimental design used to estimate rates of time preference was susceptible to an upward bias, but it remains plausible that some growers would have discount rates of over 40%.

38
9 The recent enthusiasm for planting coffee confirms this assessment of liberalization�s impact. Annual demand for coffee seedlings from the National Coffee Seeding Scheme rose from 500,000 plants in 1996 to 13,000,000 in 1999.