Ares Landmark Transaction Overview
21
Ares Landmark Transaction Overview March 2021
-
Upload
khangminh22 -
Category
Documents
-
view
3 -
download
0
Transcript of Ares Landmark Transaction Overview
Ares Landmark Transaction OverviewMarch 2021
2
DisclaimerThe information contained in this presentation is summary information that is intended to be considered in the context of Ares Management Corporation (NYSE: ARES) Securities and Exchange Commission filings and other public announcements that Ares may make, by press release or otherwise, from time to time. For purposes of this presentation “Ares” refers to Ares Management Corporation and its subsidiaries, including Ares Holdings L.P., which has entered into an agreement to acquire Landmark Partners LLC (together with its operating subsidiaries, “Landmark”) (the “Transaction”). The Transaction is subject to customary closing conditions, including regulatory approvals.
Statements included herein may constitute "forward-looking statements" within the meaning of the Private Securities Litigation Reform Act of 1995, which relate to future events or future performance or financial condition of Ares or Landmark following the Transaction. You can identify these statements by the use of the words “assumes,” “believes,” “estimates,”“expects,” “guidance,” “intends,” “plans,” “projects,” and similar expressions that do not relate to historical matters. These statements are based on certain assumptions about future events or conditions and involve a number of known and unknown risks and uncertainties. These statements are not guarantees of future performance, condition or results and involve a number of risks and uncertainties, including the ability of Ares to consummate the Transaction and to effectively integrate the acquired business into our operations and to achieve the expected benefits therefrom. Actual results may differ materially from those in the forward-looking statements as a result of a number of factors, including those beyond Ares’ and Landmark’s control, including but not limited to the impact of the COVID-19 pandemic and the pandemic’s impact on the U.S. and global economy, as well as those described in the “Risk Factors” section of our filings with the Securities and Exchange Commission (“SEC”). You should not view information related to the past performance of Ares or Landmark or information about the market, as indicative of future results, the achievement of which cannot be assured. Any such forward-looking statements are made pursuant to the safe harbor provisions available under applicable securities laws and speak only as of the date of this presentation. Neither Ares nor Landmark undertakes any duty or obligation to update or revise the forward-looking statements or other information contained in this presentation, whether as a result of new information, future events, or otherwise.
In addition to factors previously disclosed in Ares’ filings with the SEC, including those discussed under the heading “Risk Factors” in its most recently filed reports on Form 10-K and 10-Q, the following factors, among others, could cause actual results to differ materially from forward-looking statements or historical performance: the possibility that regulatory and other approvals and conditions to the Transaction are not received or satisfied on a timely basis or at all, or contain unanticipated terms or conditions; the possibility that modifications to the terms of the Transaction may be required in order to obtain or satisfy such approvals or conditions; delays in closing the Transaction; difficulties, delays or unanticipated costs in integrating Landmark’s operations; purchase price adjustments; unexpected costs resulting from the Transaction, delays or other disruptions associated with the Transaction or integration of personnel or operations in international jurisdictions; changes in economic conditions; and regulatory conditions.
Nothing in these materials should be construed as a recommendation to invest in any securities that may be issued by Ares or Landmark or as legal, accounting or tax advice. None of Ares, Landmark, their affiliated funds or any affiliate of Ares or Landmark or their affiliated funds makes any representation or warranty, express or implied, as to the accuracy or completeness of the information contained herein and nothing contained herein shall be relied upon as a promise or representation whether as to past or future performance. Certain information set forth herein includes estimates, projections or targets and involves significant elements of subjective judgment and analysis. Further, such information, unless otherwise stated, is before giving effect to management and incentive fees and deductions for taxes. No representations are made as to the accuracy of such estimates, projections or targets or that all assumptions relating to such estimates, projections or targets have been considered or stated or that such estimates, projections or targets will be realized.
Management uses certain non-GAAP financial measures, including Assets Under Management, Fee Paying Assets Under Management, Fee Related Earnings (or “FRE”), FRE Margin, Realized Income and After Tax Realized Income Per Common Share to evaluate Ares’ and Landmark’s performance. Management believes that these measures provide investors with a greater understanding of the business and that investors should review the same supplemental non-GAAP financial measures that management uses to analyze performance. The measures described herein represent those non-GAAP measures used by management, in each case, before giving effect to the consolidation of certain funds within its results in accordance with GAAP. These measures should be considered in addition to, and not in lieu of, Ares’ or Landmark’s financial statements prepared in accordance with GAAP. Ares’ definition of certain non-GAAP measures may differ from those of Landmark. Please refer to slide 10 and Ares’ filings with the SEC for definitions and explanations of these non-GAAP measures, as well as reconciliations to the most directly comparable GAAP measures, and the Appendix for a reconciliation of Landmark’s FRE to the most directly comparable GAAP measure. Amounts and percentages may reflect rounding adjustments and consequently totals may not appear to sum.
These materials are not intended as an offer to sell, or the solicitation of an offer to purchase, any security, the offer and/or sale of which can only be made by definitive offering documentation. Any offer or solicitation with respect to any securities that may be issued by Ares or Landmark will be made only by means of definitive offering memoranda or prospectus, which will be provided to prospective investors and will contain material information that is not set forth herein, including risk factors relating to any such investment.
This presentation also contains estimates and information concerning Ares' industry that are based on industry publications, reports and peer company public filings. This information involves a number of assumptions and limitations, and you are cautioned not to rely on or give undue weight to this information. Ares has not independently verified the accuracy or completeness of the data contained in these industry publications, reports or filings. The industry in which Ares operates is subject to a high degree of uncertainty and risk due to variety of factors, including those described in the "Risk Factors" section of the Ares' public filings with the SEC.
An investment in Ares may be volatile and can suffer from adverse or unexpected market moves or other adverse events. Investors may suffer the loss of their entire investment. The information set forth herein is as of the date of this presentation unless otherwise indicated.
REF: AM-00929
3
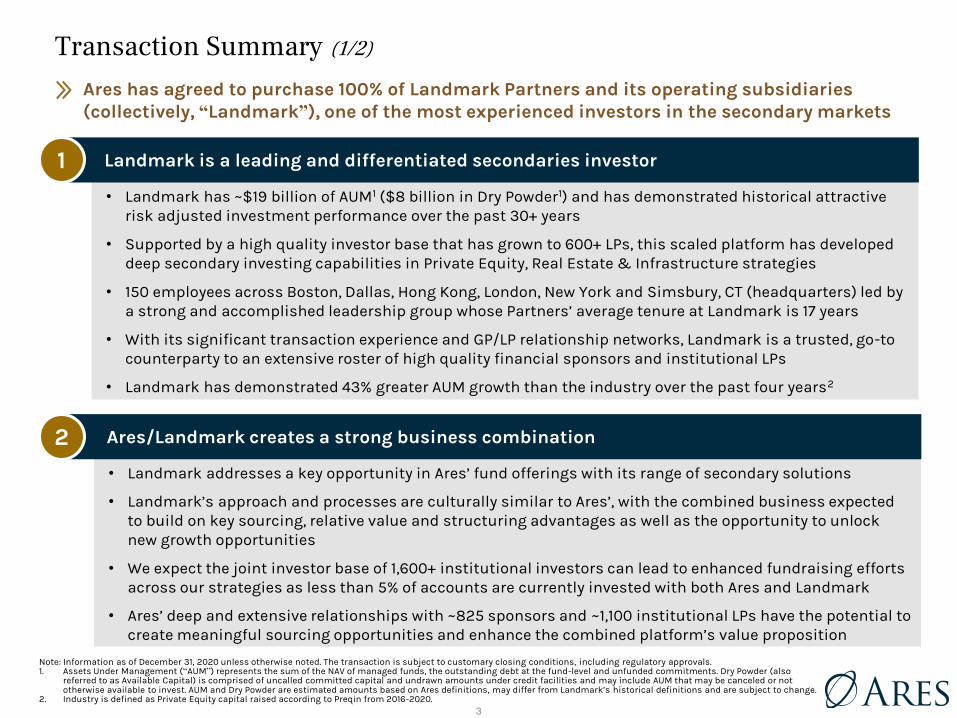
• Landmark addresses a key opportunity in Ares’ fund offerings with its range of secondary solutions
• Landmark’s approach and processes are culturally similar to Ares’, with the combined business expected to build on key sourcing, relative value and structuring advantages as well as the opportunity to unlock new growth opportunities
• We expect the joint investor base of 1,600+ institutional investors can lead to enhanced fundraising efforts across our strategies as less than 5% of accounts are currently invested with both Ares and Landmark
• Ares’ deep and extensive relationships with ~825 sponsors and ~1,100 institutional LPs have the potential to create meaningful sourcing opportunities and enhance the combined platform’s value proposition
• Landmark has ~$19 billion of AUM1 ($8 billion in Dry Powder1) and has demonstrated historical attractive risk adjusted investment performance over the past 30+ years
• Supported by a high quality investor base that has grown to 600+ LPs, this scaled platform has developed deep secondary investing capabilities in Private Equity, Real Estate & Infrastructure strategies
• 150 employees across Boston, Dallas, Hong Kong, London, New York and Simsbury, CT (headquarters) led by a strong and accomplished leadership group whose Partners’ average tenure at Landmark is 17 years
• With its significant transaction experience and GP/LP relationship networks, Landmark is a trusted, go-to counterparty to an extensive roster of high quality financial sponsors and institutional LPs
• Landmark has demonstrated 43% greater AUM growth than the industry over the past four years2
Transaction Summary (1/2)
Note: Information as of December 31, 2020 unless otherwise noted. The transaction is subject to customary closing conditions, including regulatory approvals.1. Assets Under Management (“AUM”) represents the sum of the NAV of managed funds, the outstanding debt at the fund-level and unfunded commitments. Dry Powder (also
referred to as Available Capital) is comprised of uncalled committed capital and undrawn amounts under credit facilities and may include AUM that may be canceled or not otherwise available to invest. AUM and Dry Powder are estimated amounts based on Ares definitions, may differ from Landmark’s historical definitions and are subject to change.
2. Industry is defined as Private Equity capital raised according to Preqin from 2016-2020.
Ares has agreed to purchase 100% of Landmark Partners and its operating subsidiaries (collectively, “Landmark”), one of the most experienced investors in the secondary markets
Landmark is a leading and differentiated secondaries investor
Ares/Landmark creates a strong business combination
1
2
4
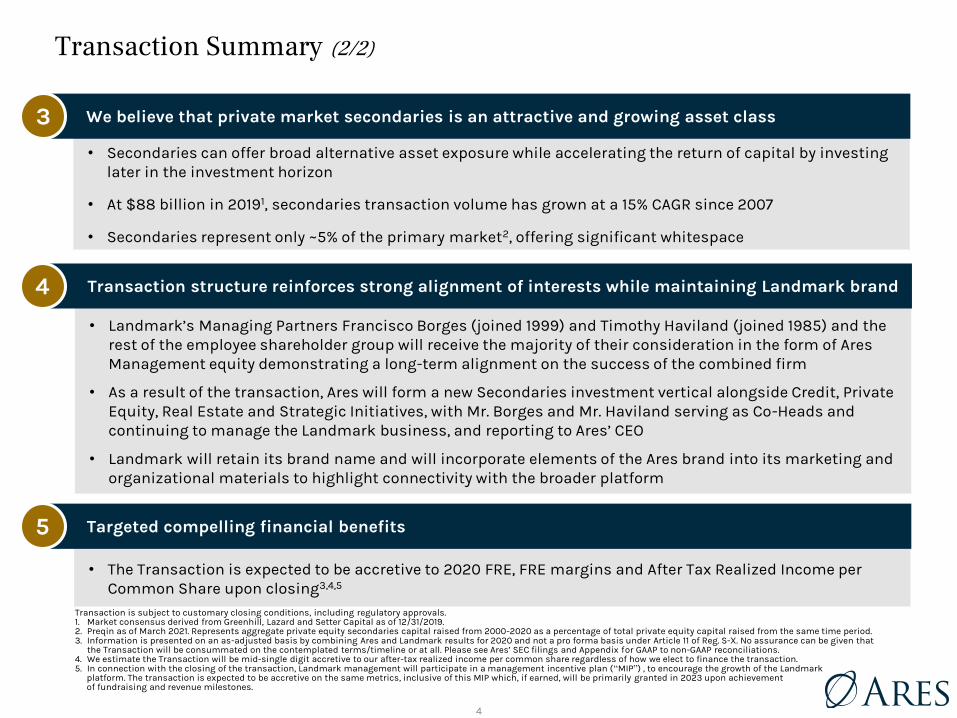
• Landmark’s Managing Partners Francisco Borges (joined 1999) and Timothy Haviland (joined 1985) and the rest of the employee shareholder group will receive the majority of their consideration in the form of Ares Management equity demonstrating a long-term alignment on the success of the combined firm
• As a result of the transaction, Ares will form a new Secondaries investment vertical alongside Credit, Private Equity, Real Estate and Strategic Initiatives, with Mr. Borges and Mr. Haviland serving as Co-Heads and continuing to manage the Landmark business, and reporting to Ares’ CEO
• Landmark will retain its brand name and will incorporate elements of the Ares brand into its marketing and organizational materials to highlight connectivity with the broader platform
• Secondaries can offer broad alternative asset exposure while accelerating the return of capital by investing later in the investment horizon
• At $88 billion in 20191, secondaries transaction volume has grown at a 15% CAGR since 2007
• Secondaries represent only ~5% of the primary market2, offering significant whitespace
• The Transaction is expected to be accretive to 2020 FRE, FRE margins and After Tax Realized Income per Common Share upon closing3,4,5
Transaction Summary (2/2)
Transaction is subject to customary closing conditions, including regulatory approvals.1. Market consensus derived from Greenhill, Lazard and Setter Capital as of 12/31/2019.2. Preqin as of March 2021. Represents aggregate private equity secondaries capital raised from 2000-2020 as a percentage of total private equity capital raised from the same time period.3. Information is presented on an as-adjusted basis by combining Ares and Landmark results for 2020 and not a pro forma basis under Article 11 of Reg. S-X. No assurance can be given that
the Transaction will be consummated on the contemplated terms/timeline or at all. Please see Ares’ SEC filings and Appendix for GAAP to non-GAAP reconciliations.4. We estimate the Transaction will be mid-single digit accretive to our after-tax realized income per common share regardless of how we elect to finance the transaction.5. In connection with the closing of the transaction, Landmark management will participate in a management incentive plan (“MIP”) , to encourage the growth of the Landmark
platform. The transaction is expected to be accretive on the same metrics, inclusive of this MIP which, if earned, will be primarily granted in 2023 upon achievement of fundraising and revenue milestones.
We believe that private market secondaries is an attractive and growing asset class
Transaction structure reinforces strong alignment of interests while maintaining Landmark brand
Targeted compelling financial benefits
3
4
5
5
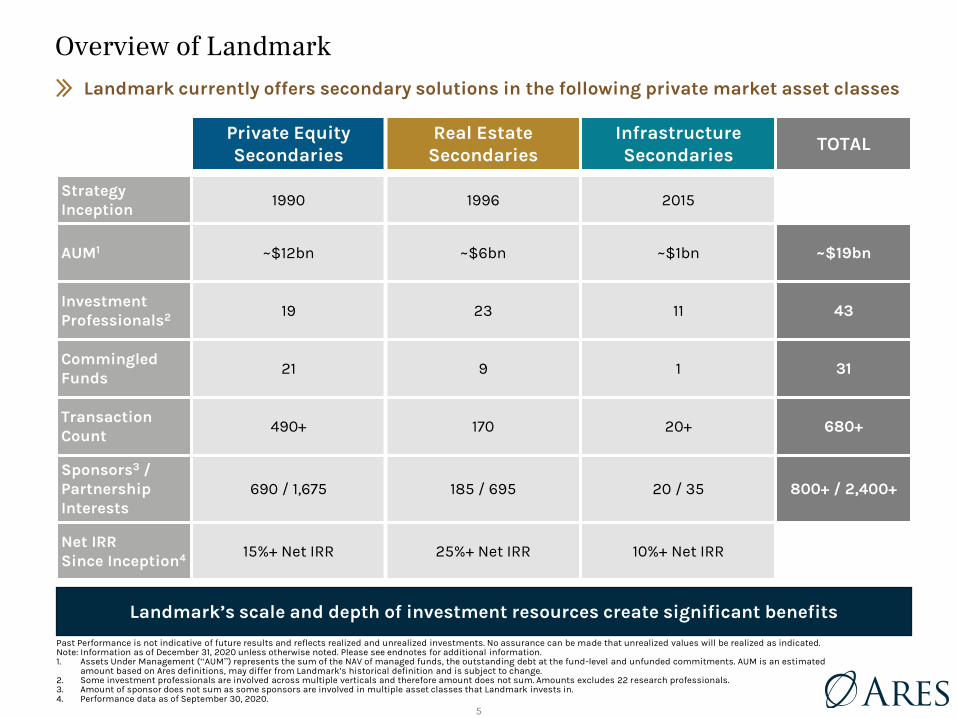
Overview of LandmarkLandmark currently offers secondary solutions in the following private market asset classes
Past Performance is not indicative of future results and reflects realized and unrealized investments. No assurance can be made that unrealized values will be realized as indicated. Note: Information as of December 31, 2020 unless otherwise noted. Please see endnotes for additional information.1. Assets Under Management (“AUM”) represents the sum of the NAV of managed funds, the outstanding debt at the fund-level and unfunded commitments. AUM is an estimated
amount based on Ares definitions, may differ from Landmark’s historical definition and is subject to change.2. Some investment professionals are involved across multiple verticals and therefore amount does not sum. Amounts excludes 22 research professionals.3. Amount of sponsor does not sum as some sponsors are involved in multiple asset classes that Landmark invests in.4. Performance data as of September 30, 2020.
Private Equity Secondaries
Real Estate Secondaries
Infrastructure Secondaries
TOTAL
Strategy Inception
1990 1996 2015
AUM1 ~$12bn ~$6bn ~$1bn ~$19bn
Investment Professionals2 19 23 11 43
Commingled Funds
21 9 1 31
Transaction Count
490+ 170 20+ 680+
Sponsors3 / Partnership Interests
690 / 1,675 185 / 695 20 / 35 800+ / 2,400+
Net IRR Since Inception4 15%+ Net IRR 25%+ Net IRR 10%+ Net IRR
Landmark’s scale and depth of investment resources create significant benefits
6
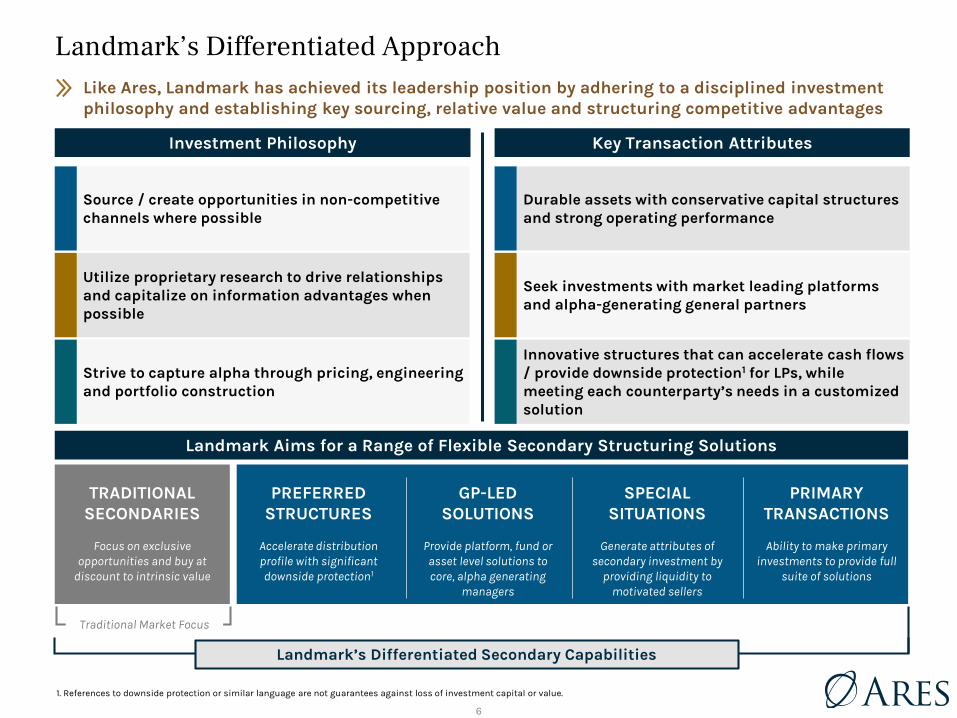
Landmark’s Differentiated ApproachLike Ares, Landmark has achieved its leadership position by adhering to a disciplined investment philosophy and establishing key sourcing, relative value and structuring competitive advantages
Source / create opportunities in non-competitive channels where possible
Investment Philosophy Key Transaction Attributes
Landmark Aims for a Range of Flexible Secondary Structuring Solutions
PREFERRED STRUCTURES
Accelerate distribution profile with significant downside protection1
GP-LED SOLUTIONS
Provide platform, fund or asset level solutions to core, alpha generating
managers
PRIMARY TRANSACTIONS
Ability to make primary investments to provide full
suite of solutions
TRADITIONAL SECONDARIES
Focus on exclusive opportunities and buy at
discount to intrinsic value
SPECIAL SITUATIONS
Generate attributes of secondary investment by
providing liquidity to motivated sellers
Utilize proprietary research to drive relationships and capitalize on information advantages when possible
Strive to capture alpha through pricing, engineering and portfolio construction
Durable assets with conservative capital structures and strong operating performance
Seek investments with market leading platforms and alpha-generating general partners
Innovative structures that can accelerate cash flows / provide downside protection1 for LPs, while meeting each counterparty’s needs in a customized solution
Traditional Market Focus
Landmark’s Differentiated Secondary Capabilities
1. References to downside protection or similar language are not guarantees against loss of investment capital or value.

7
Secondary AcquisitionsTypically Occur Here
Investment Rationale for Private Market SecondariesSecondaries can offer broad alternative asset exposure while accelerating the return of capital by investing later in the investment horizon
Secondaries Overview
Investment PeriodCapital contributions for acquisitions, management fees and operating costs
FAVORABLE PRICING
Stable, mature assets at a discount to intrinsic value
Potential Portfolio Benefits
ATTRACTIVE RETURNS
Identified, seasoned and underwritable assets
BROAD DIVERSIFICATION1
Across vintage year, strategy, geography and manager
ACCELLERATED INFLOWS
J-Curve mitigation with attractive yield
Harvesting and LiquidationDistributions from investment sales and
company operating cash flows
Illustrative Secondary Transaction Timeline2
0 1 2 3 4 5 6 7 8 9 10 11 12Years
Cu
mu
lati
ve
Cas
h F
low
s
1. Diversification does not assure profit or protect against market loss.2. The above is for illustrative purposes only. There is no guarantee whether expressed or implied, that actual cash flows will follow this pattern. A secondary
transaction can occur anytime between ‘0’ and ’12’ in this illustration. Source: Landmark.
• Investors acquire interests in existing funds, partnerships and other structured entities invested in underlying alternative asset classes
• Acquisitions typically occur well into a fund’s investment period at which point underlying investments are identified and the harvesting period has begun
• Broad exposure to alternative asset classes across fund type, company and industry
8
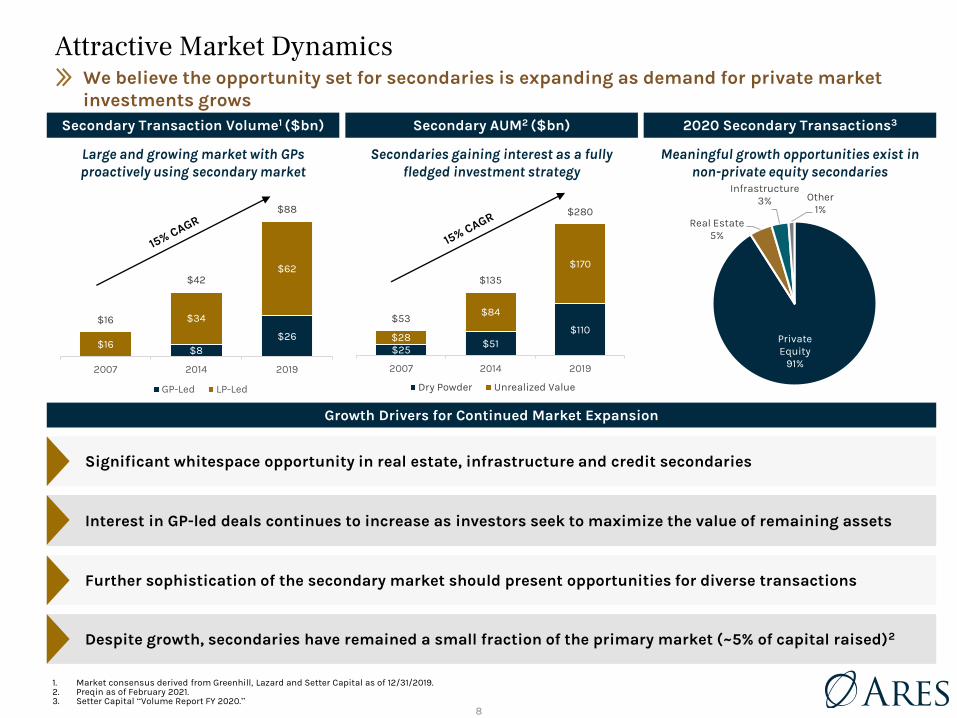
Attractive Market Dynamics
Secondary Transaction Volume1 ($bn) Secondary AUM2 ($bn) 2020 Secondary Transactions3
We believe the opportunity set for secondaries is expanding as demand for private market investments grows
Large and growing market with GPs proactively using secondary market
Secondaries gaining interest as a fully fledged investment strategy
Meaningful growth opportunities exist in non-private equity secondaries
Private Equity
91%
Real Estate5%
Infrastructure3% Other
1%
Further sophistication of the secondary market should present opportunities for diverse transactions
Interest in GP-led deals continues to increase as investors seek to maximize the value of remaining assets
Significant whitespace opportunity in real estate, infrastructure and credit secondaries
Despite growth, secondaries have remained a small fraction of the primary market (~5% of capital raised)2
1. Market consensus derived from Greenhill, Lazard and Setter Capital as of 12/31/2019.2. Preqin as of February 2021.3. Setter Capital “Volume Report FY 2020.”
$8 $26
$16
$34
$62
$16
$42
$88
2007 2014 2019
GP-Led LP-Led
$25 $51$110
$28
$84
$170
$53
$135
$280
2007 2014 2019
Dry Powder Unrealized Value
Growth Drivers for Continued Market Expansion
9
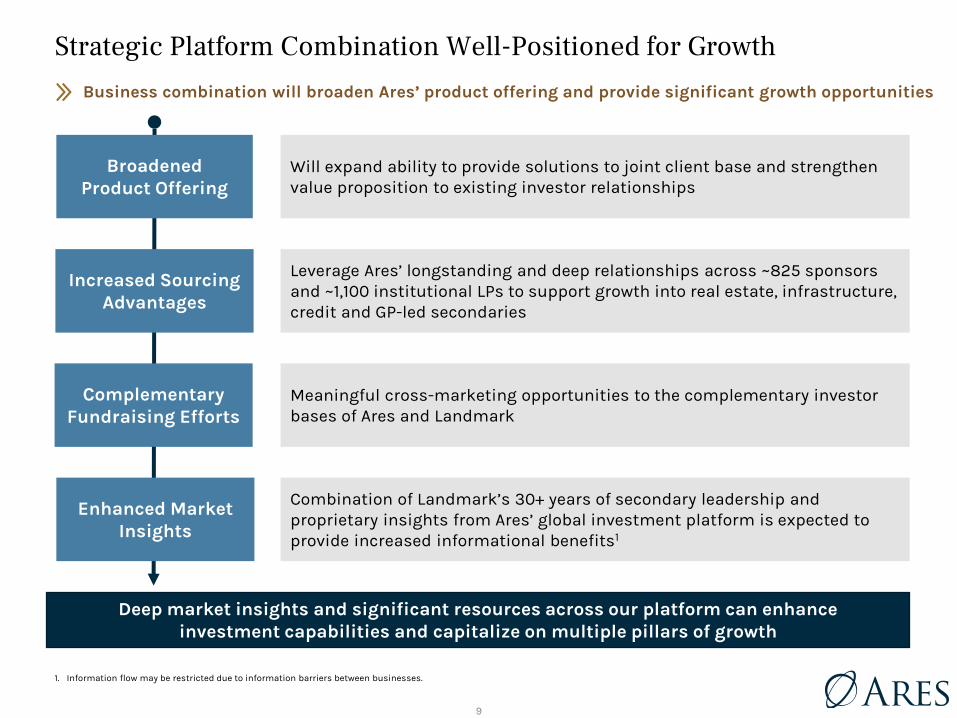
Strategic Platform Combination Well-Positioned for GrowthBusiness combination will broaden Ares’ product offering and provide significant growth opportunities
BroadenedProduct Offering
Enhanced Market Insights
Increased Sourcing Advantages
Will expand ability to provide solutions to joint client base and strengthen value proposition to existing investor relationships
Leverage Ares’ longstanding and deep relationships across ~825 sponsors and ~1,100 institutional LPs to support growth into real estate, infrastructure, credit and GP-led secondaries
Combination of Landmark’s 30+ years of secondary leadership and proprietary insights from Ares’ global investment platform is expected to provide increased informational benefits1
Deep market insights and significant resources across our platform can enhance investment capabilities and capitalize on multiple pillars of growth
Complementary Fundraising Efforts
Meaningful cross-marketing opportunities to the complementary investor bases of Ares and Landmark
1. Information flow may be restricted due to information barriers between businesses.
10
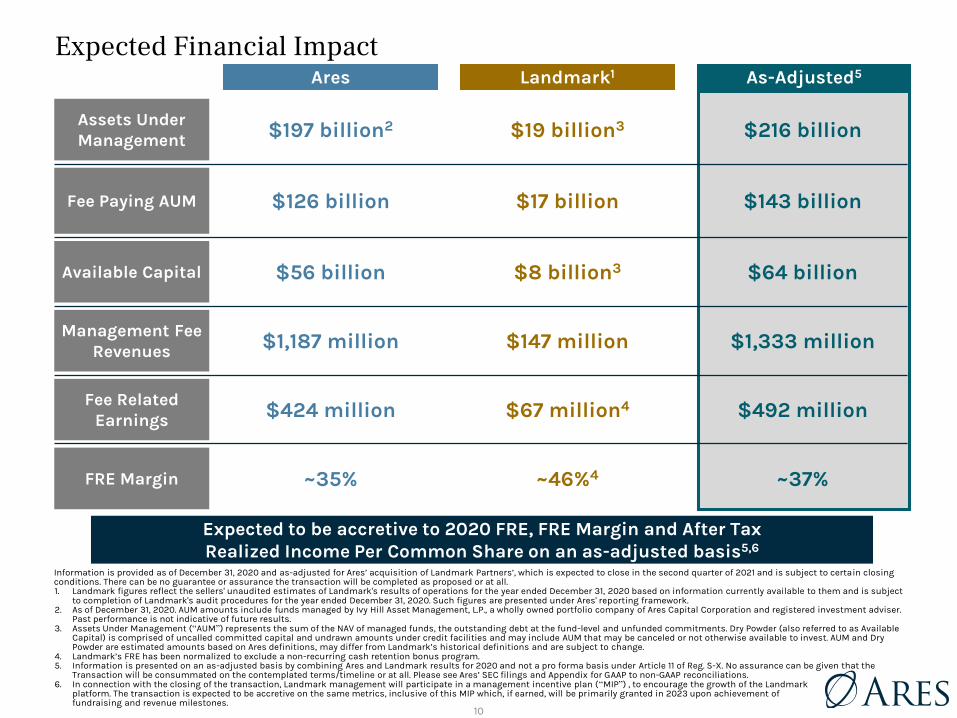
Expected Financial Impact
Assets Under Management
Ares Landmark1 As-Adjusted5
Fee Paying AUM
Available Capital
Information is provided as of December 31, 2020 and as-adjusted for Ares’ acquisition of Landmark Partners’, which is expected to close in the second quarter of 2021 and is subject to certain closing conditions. There can be no guarantee or assurance the transaction will be completed as proposed or at all.1. Landmark figures reflect the sellers' unaudited estimates of Landmark's results of operations for the year ended December 31, 2020 based on information currently available to them and is subject
to completion of Landmark's audit procedures for the year ended December 31, 2020. Such figures are presented under Ares' reporting framework.2. As of December 31, 2020. AUM amounts include funds managed by Ivy Hill Asset Management, L.P., a wholly owned portfolio company of Ares Capital Corporation and registered investment adviser.
Past performance is not indicative of future results.3. Assets Under Management (“AUM”) represents the sum of the NAV of managed funds, the outstanding debt at the fund-level and unfunded commitments. Dry Powder (also referred to as Available
Capital) is comprised of uncalled committed capital and undrawn amounts under credit facilities and may include AUM that may be canceled or not otherwise available to invest. AUM and Dry Powder are estimated amounts based on Ares definitions, may differ from Landmark’s historical definitions and are subject to change.
4. Landmark’s FRE has been normalized to exclude a non-recurring cash retention bonus program. 5. Information is presented on an as-adjusted basis by combining Ares and Landmark results for 2020 and not a pro forma basis under Article 11 of Reg. S-X. No assurance can be given that the
Transaction will be consummated on the contemplated terms/timeline or at all. Please see Ares’ SEC filings and Appendix for GAAP to non-GAAP reconciliations.6. In connection with the closing of the transaction, Landmark management will participate in a management incentive plan (“MIP”) , to encourage the growth of the Landmark
platform. The transaction is expected to be accretive on the same metrics, inclusive of this MIP which, if earned, will be primarily granted in 2023 upon achievement of fundraising and revenue milestones.
$197 billion2 $19 billion3 $216 billion
$126 billion $17 billion $143 billion
$56 billion $8 billion3 $64 billion
Expected to be accretive to 2020 FRE, FRE Margin and After Tax Realized Income Per Common Share on an as-adjusted basis5,6
Management Fee Revenues $1,187 million $147 million $1,333 million
Fee Related Earnings $424 million $67 million4 $492 million
FRE Margin ~35% ~46%4 ~37%

Appendix
12
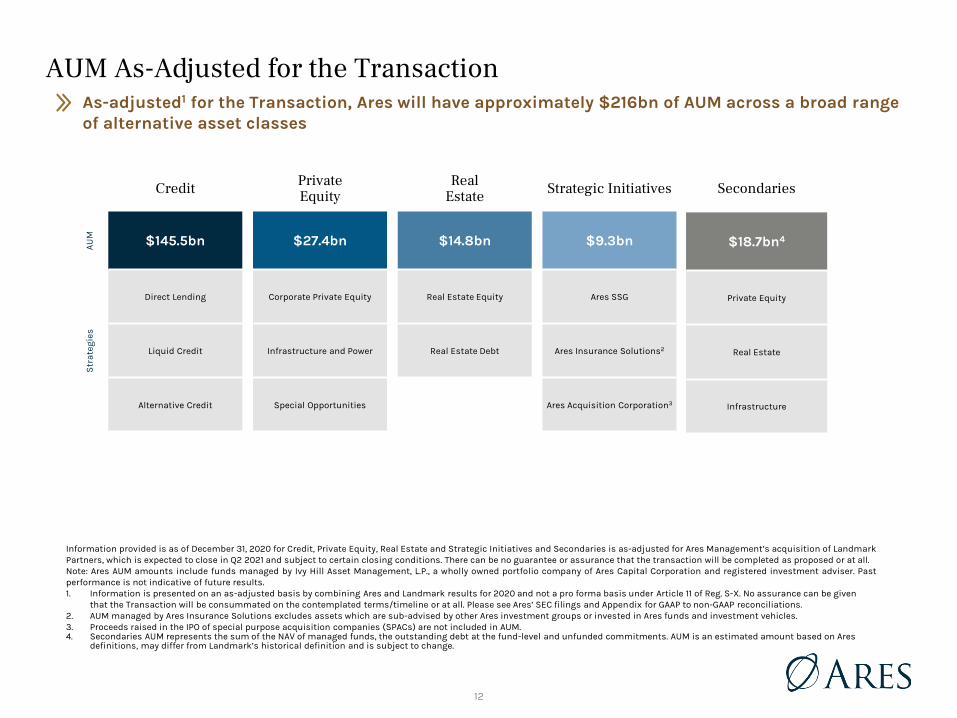
AUM As-Adjusted for the Transaction
Credit PrivateEquity
RealEstate Strategic Initiatives
AUM
$145.5bn $27.4bn $14.8bn $9.3bn
Str
ateg
ies
Direct Lending Corporate Private Equity Real Estate Equity Ares SSG
Liquid Credit Infrastructure and Power Real Estate Debt Ares Insurance Solutions2
Alternative Credit Special Opportunities Ares Acquisition Corporation3
Secondaries
$18.7bn4
Private Equity
Real Estate
Infrastructure
Information provided is as of December 31, 2020 for Credit, Private Equity, Real Estate and Strategic Initiatives and Secondaries is as-adjusted for Ares Management’s acquisition of LandmarkPartners, which is expected to close in Q2 2021 and subject to certain closing conditions. There can be no guarantee or assurance that the transaction will be completed as proposed or at all.Note: Ares AUM amounts include funds managed by Ivy Hill Asset Management, L.P., a wholly owned portfolio company of Ares Capital Corporation and registered investment adviser. Pastperformance is not indicative of future results.1. Information is presented on an as-adjusted basis by combining Ares and Landmark results for 2020 and not a pro forma basis under Article 11 of Reg. S-X. No assurance can be given
that the Transaction will be consummated on the contemplated terms/timeline or at all. Please see Ares’ SEC filings and Appendix for GAAP to non-GAAP reconciliations.2. AUM managed by Ares Insurance Solutions excludes assets which are sub-advised by other Ares investment groups or invested in Ares funds and investment vehicles.3. Proceeds raised in the IPO of special purpose acquisition companies (SPACs) are not included in AUM.4. Secondaries AUM represents the sum of the NAV of managed funds, the outstanding debt at the fund-level and unfunded commitments. AUM is an estimated amount based on Ares
definitions, may differ from Landmark’s historical definition and is subject to change.
As-adjusted1 for the Transaction, Ares will have approximately $216bn of AUM across a broad range of alternative asset classes

13
RI and Other Measures Financial Summary
Note: All historical filings can be found on the SEC’s website.1. Includes ARCC Part I Fees of $184.1 million and $164.4 million for 2020 and 2019, respectively.2. For 2020 and 2019, after-tax Realized Income includes current income tax related to: (i) realized performance and investment income of $20.3 million and $21.0 million, respectively and (ii) FRE
of $20.9 million and $24.2 million, respectively. Of the current tax related to FRE, this includes (a) entity level taxes of $10.7 million and $10.4 million, respectively, and (b) corporate level taxexpense of $10.2 million and $13.8 million, respectively.
3. Calculation of after-tax Realized Income per share of Class A common stock uses total average shares of Class A common stock outstanding and proportional dilutive effects of the Ares' equity-based awards.
4. Total fee revenue is calculated as the total of management fees, other fees and realized net performance income.5. Effective management fee rate represents the quotient of management fees and the aggregate fee bases for the periods presented. The effective rate shown excludes the effect of one-time
catch-up fees.
Year Ended December 31,
$ in thousands, except share data (and as otherwise noted) 2020 2019 2018 2017 2016
Management fees(1) $1,186,565 $1,012,530 $836,744 $744,825 $659,451
Other fees 19,948 18,078 24,288 22,431 12,351
Compensation and benefits expenses (609,966) (528,207) (456,255) (413,735) (384,715)
General, administrative and other expenses (172,097) (178,742) (149,465) (136,531) (114,737)
Fee Related Earnings 424,450 323,659 255,312 216,990 172,350
Realized net performance income 131,548 112,136 105,610 75,457 94,734
Realized net investment income (loss) 25,958 67,691 34,474 32,993 33,244
Realized Income 581,956 503,486 395,396 325,440 300,328
After-tax Realized Income, net of Series A Preferred Stock dividends(2) $519,028 $436,666 $345,926 $273,624 $248,686
After-tax Realized Income per share of Class A common stock, net of Series A Preferred Stock dividends(3) $1.86 $1.67 $1.42 $1.08 $0.98
Other Data
Total Fee Revenue(4) $1,338,061 $1,142,744 $966,642 $842,713 $766,536
Effective management fee rate(5) 1.09% 1.10% 1.07% 1.06% 1.09%
14
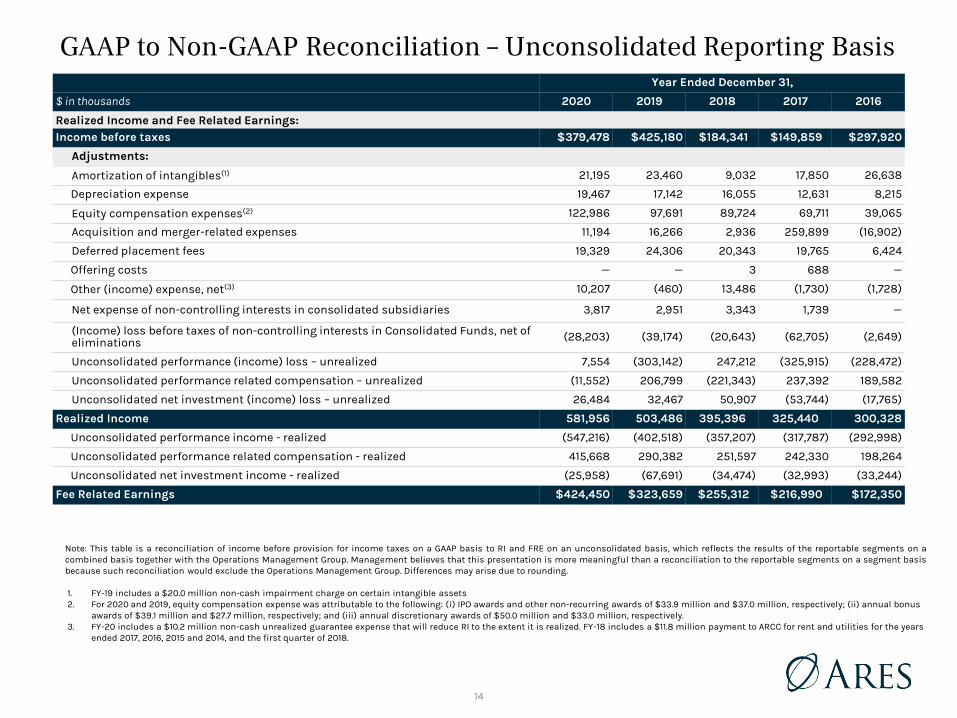
GAAP to Non-GAAP Reconciliation – Unconsolidated Reporting BasisYear Ended December 31,
$ in thousands 2020 2019 2018 2017 2016
Realized Income and Fee Related Earnings:Income before taxes $379,478 $425,180 $184,341 $149,859 $297,920
Adjustments:
Amortization of intangibles(1) 21,195 23,460 9,032 17,850 26,638
Depreciation expense 19,467 17,142 16,055 12,631 8,215
Equity compensation expenses(2) 122,986 97,691 89,724 69,711 39,065
Acquisition and merger-related expenses 11,194 16,266 2,936 259,899 (16,902)
Deferred placement fees 19,329 24,306 20,343 19,765 6,424
Offering costs — — 3 688 —
Other (income) expense, net(3) 10,207 (460) 13,486 (1,730) (1,728)
Net expense of non-controlling interests in consolidated subsidiaries 3,817 2,951 3,343 1,739 —
(Income) loss before taxes of non-controlling interests in Consolidated Funds, net of eliminations (28,203) (39,174) (20,643) (62,705) (2,649)
Unconsolidated performance (income) loss – unrealized 7,554 (303,142) 247,212 (325,915) (228,472)
Unconsolidated performance related compensation – unrealized (11,552) 206,799 (221,343) 237,392 189,582
Unconsolidated net investment (income) loss – unrealized 26,484 32,467 50,907 (53,744) (17,765)
Realized Income 581,956 503,486 395,396 325,440 300,328
Unconsolidated performance income - realized (547,216) (402,518) (357,207) (317,787) (292,998)
Unconsolidated performance related compensation - realized 415,668 290,382 251,597 242,330 198,264
Unconsolidated net investment income - realized (25,958) (67,691) (34,474) (32,993) (33,244)
Fee Related Earnings $424,450 $323,659 $255,312 $216,990 $172,350
Note: This table is a reconciliation of income before provision for income taxes on a GAAP basis to RI and FRE on an unconsolidated basis, which reflects the results of the reportable segments on acombined basis together with the Operations Management Group. Management believes that this presentation is more meaningful than a reconciliation to the reportable segments on a segment basisbecause such reconciliation would exclude the Operations Management Group. Differences may arise due to rounding.
1. FY-19 includes a $20.0 million non-cash impairment charge on certain intangible assets2. For 2020 and 2019, equity compensation expense was attributable to the following: (i) IPO awards and other non-recurring awards of $33.9 million and $37.0 million, respectively; (ii) annual bonus
awards of $39.1 million and $27.7 million, respectively; and (iii) annual discretionary awards of $50.0 million and $33.0 million, respectively.3. FY-20 includes a $10.2 million non-cash unrealized guarantee expense that will reduce RI to the extent it is realized. FY-18 includes a $11.8 million payment to ARCC for rent and utilities for the years
ended 2017, 2016, 2015 and 2014, and the first quarter of 2018.
15
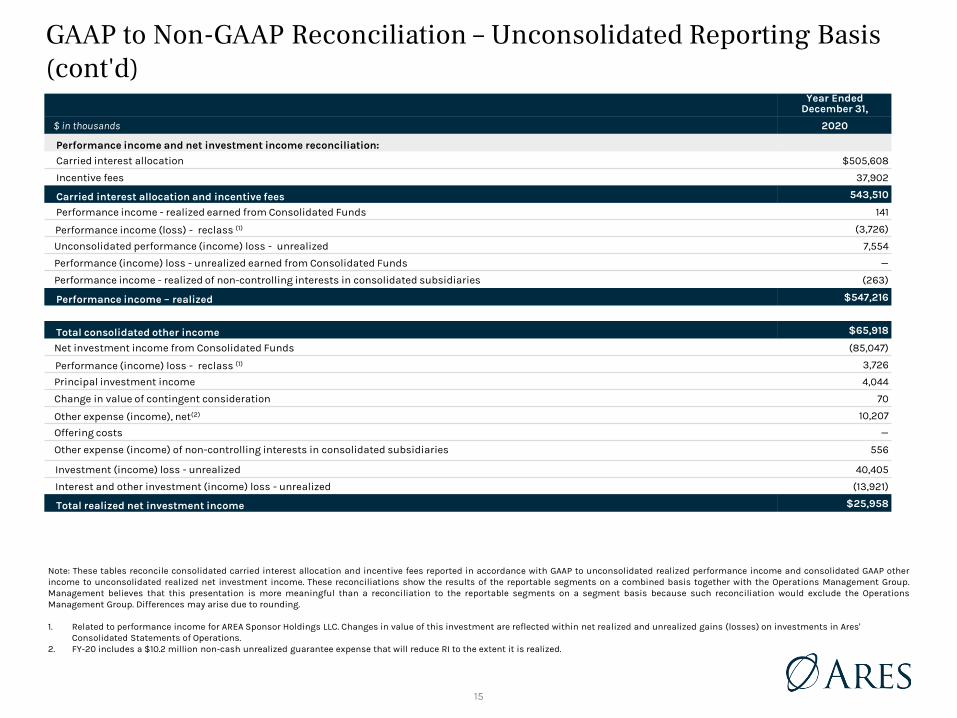
GAAP to Non-GAAP Reconciliation – Unconsolidated Reporting Basis (cont'd)
Year Ended December 31,
$ in thousands 2020
Performance income and net investment income reconciliation:Carried interest allocation $505,608
Incentive fees 37,902
Carried interest allocation and incentive fees 543,510
Performance income - realized earned from Consolidated Funds 141
Performance income (loss) - reclass (1) (3,726)
Unconsolidated performance (income) loss - unrealized 7,554
Performance (income) loss - unrealized earned from Consolidated Funds —
Performance income - realized of non-controlling interests in consolidated subsidiaries (263)
Performance income – realized $547,216
Total consolidated other income $65,918
Net investment income from Consolidated Funds (85,047)
Performance (income) loss - reclass (1) 3,726
Principal investment income 4,044
Change in value of contingent consideration 70
Other expense (income), net(2) 10,207
Offering costs —
Other expense (income) of non-controlling interests in consolidated subsidiaries 556
Investment (income) loss - unrealized 40,405
Interest and other investment (income) loss - unrealized (13,921)
Total realized net investment income $25,958
Note: These tables reconcile consolidated carried interest allocation and incentive fees reported in accordance with GAAP to unconsolidated realized performance income and consolidated GAAP otherincome to unconsolidated realized net investment income. These reconciliations show the results of the reportable segments on a combined basis together with the Operations Management Group.Management believes that this presentation is more meaningful than a reconciliation to the reportable segments on a segment basis because such reconciliation would exclude the OperationsManagement Group. Differences may arise due to rounding.
1. Related to performance income for AREA Sponsor Holdings LLC. Changes in value of this investment are reflected within net realized and unrealized gains (losses) on investments in Ares' Consolidated Statements of Operations.
2. FY-20 includes a $10.2 million non-cash unrealized guarantee expense that will reduce RI to the extent it is realized.
16
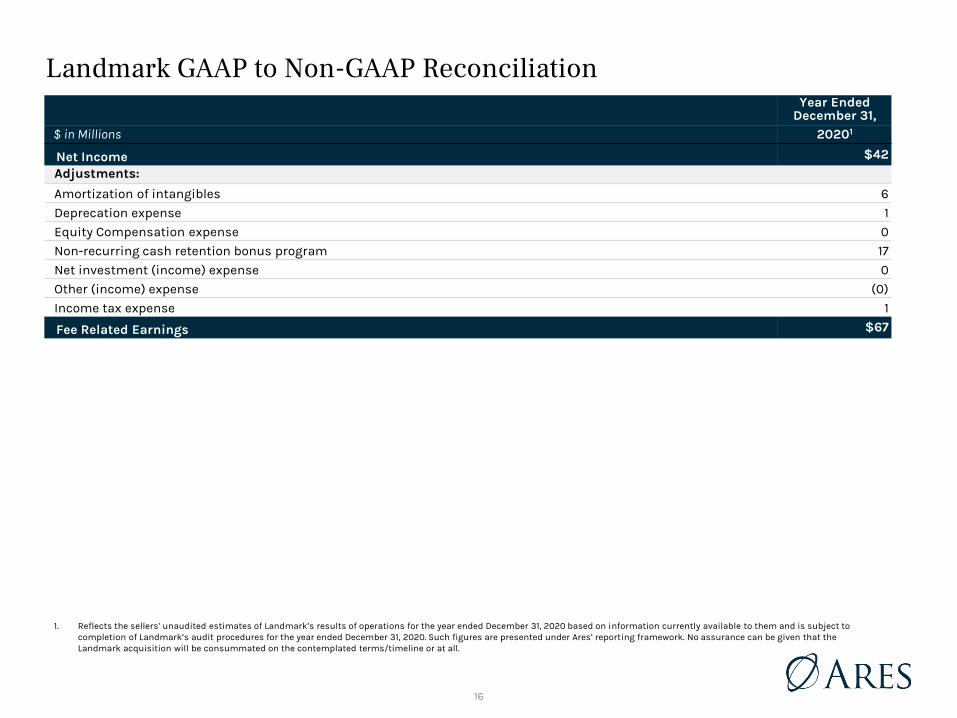
Landmark GAAP to Non-GAAP ReconciliationYear Ended
December 31,$ in Millions 20201
Net Income $42Adjustments:
Amortization of intangibles 6Deprecation expense 1Equity Compensation expense 0Non-recurring cash retention bonus program 17Net investment (income) expense 0Other (income) expense (0)Income tax expense 1
Fee Related Earnings $67
1. Reflects the sellers’ unaudited estimates of Landmark’s results of operations for the year ended December 31, 2020 based on information currently available to them and is subject to completion of Landmark’s audit procedures for the year ended December 31, 2020. Such figures are presented under Ares’ reporting framework. No assurance can be given that the Landmark acquisition will be consummated on the contemplated terms/timeline or at all.

17
Overview of Landmark Endnotes
Past performance is not necessarily indicative of future results and reflects realized and unrealized investments. No assurance can be made that unrealized values will be realized as indicated. Any investment involves significant risk, including the loss of principal. Actual outcomes and results may differ materially from the returns presented herein. Returns are unaudited. As with all unaudited returns, they are subject to uncertainties and variations and may not be predictive of final results. Performance of individual capital accounts may vary from the composite results.
Performance returns for the Private Equity Secondary, Real Estate Secondary, and Infrastructure Secondary strategies are represented by the combined performance of the underlying funds in each strategy. Returns include the reinvestment of income and other earnings from securities or other investments and reflect the deduction of all trading expenses. Gross returns takes into account the cumulative invested capital, cumulative cash distributions, other realized proceeds and unrealized gains or losses of the portfolio companies, excluding any bridge financings, before giving effect to deductions for management fees, carried interest and other expenses, the application of which would reduce such gross rates of return.
The net return is an annualized since inception net internal rate of return that is calculated by combining the cash flows to and from the underlying funds in each strategy and the applicable residual fund values at the end of the measurement period. Net IRRs reflect returns to the fee-paying limited partners and are calculated after giving effect to management fees, administrative expenses, carried interest, and credit facility interest expenses, as applicable. There may be funds in each strategy that utilize a credit facility during the investment period and for general cash management purposes. Net returns would likely have been lower had capital been called from its limited partners instead of utilizing the credit facility.
Net IRR do not exclude limited partners that pay reduced management fees and, therefore, the management fee rate used in calculating Net IRR is a blended rate of full fee and reduced fee limited partners; the Net IRR of a limited partner that does not benefit from a fee discount would be lower. Net IRRs are fund-level IRRs and take into consideration the timing of contributions and distributions to and from the funds. The funds may utilize a credit facility for general cash management purposes. The Net IRRs would generally be lower had the applicable fund called capital from limited partners instead of utilizing the credit facility. The net returns reflect reinvestment of certain gains and other proceeds to the full extent permitted under the applicable governing documents.
All of the information included in this presentation regarding Landmark is based on information provided by the sellers in connection with Ares due diligence related to the pending acquisition.

18
GlossaryARCC Part I Fees ARCC Part I Fees refers to a quarterly performance income on the net investment income of Ares Capital
Corporation (NASDAQ: ARCC) (“ARCC”). Such fees from ARCC are classified as management fees as they arepredictable and recurring in nature, not subject to contingent repayment and generally cash-settled eachquarter, unless subject to a payment deferral.
ARCC Part II Fees ARCC Part II Fees refers to fees that are paid in arrears as of the end of each calendar year when the cumulativeaggregate realized capital gains exceed the cumulative aggregate realized capital losses and aggregateunrealized capital depreciation, less the aggregate amount of ARCC Part II Fees paid in all prior years sinceinception.
Ares Operating Group Entities
Ares Operating Group Entities refers to, collectively, Ares Holdings L.P., Ares Offshore Holdings L.P. and AresInvestments L.P.
Ares Operating Group Unit
Ares Operating Group Unit or an “AOG Unit” refers to, collectively, a partnership unit in each of the Ares OperatingGroup entities.
Assets Under Management
Assets Under Management or “AUM” refers to the assets we manage. For our funds other than CLOs, our AUMrepresents the sum of the net asset value ("NAV") of such funds, the drawn and undrawn debt (at the fund-levelincluding amounts subject to restrictions) and uncalled committed capital (including commitments to fundsthat have yet to commence their investment periods). NAV refers to the fair value of the assets of a fund less thefair value of the liabilities of the fund. For our funds that are CLOs, our AUM is equal to initial principal amountsadjusted for paydowns.
AUM Not Yet Paying Fees
AUM Not Yet Paying Fees (also referred to as "shadow AUM") refers to AUM that is not currently paying fees and iseligible to earn management fees upon deployment.
Available Capital Available Capital (also referred to as “dry powder”) is comprised of uncalled committed capital and undrawnamounts under credit facilities and may include AUM that may be canceled or not otherwise available to invest.
Class B Membership Interests
Class B Membership Interests refers to the interests that were retained by the former owners of Crestline DenaliCapital LLC and represent the financial interests in the subordinated notes of the related CLOs.
Consolidated Funds Consolidated Funds refers collectively to certain Ares-affiliated funds, related co-investment entities and certainCLOs that are required under GAAP to be consolidated in our consolidated financial statements.
Fee Paying AUM Fee Paying AUM or “FPAUM” refers to the AUM from which we directly earn management fees. FPAUM is equal tothe sum of all the individual fee bases of our funds that directly contribute to our management fees. For ourfunds other than CLOs, our FPAUM represents the amount of limited partner capital commitments for certainclosed-end funds within the reinvestment period, the amount of limited partner invested capital for theaforementioned closed-end funds beyond the reinvestment period and the portfolio value, gross asset value orNAV. For our funds that are CLOs, our FPAUM is equal to the gross amount of aggregate collateral balance, at par,adjusted for defaulted or discounted collateral.

19
Glossary (cont’d)Fee Related Earnings Fee Related Earnings or “FRE”, a non-GAAP measure, is used to assess core operating performance by
determining whether recurring revenue, primarily consisting of management fees, is sufficient to cover operatingexpenses and to generate profits. FRE differs from income before taxes computed in accordance with GAAP as itexcludes performance income, performance related compensation, investment income from our ConsolidatedFunds and non-consolidated funds and certain other items that we believe are not indicative of our coreoperating performance.
Gross Invested Capital Gross Invested Capital refers to the aggregate amount of capital invested by our funds during a given period, andincludes investments made by our draw-down funds and permanent capital vehicles (and affiliated funds) andnew capital raised and invested by our open-ended managed accounts, sub-advised accounts and CLOs, butexcludes capital that is reinvested (after receiving repayments of capital) by our open-ended managed accounts,sub-advised accounts and CLOs.
Incentive Eligible AUM Incentive Eligible AUM or “IEAUM” refers to the AUM of our funds from which performance income may begenerated, regardless of whether or not they are currently generating performance income. It generally representsthe NAV plus uncalled equity or total assets plus uncalled debt, as applicable, of our funds for which we areentitled to receive performance income, excluding capital committed by us and our professionals (from which wegenerally do not earn performance income). With respect to ARCC's AUM, only ARCC Part II Fees may be generatedfrom IEAUM.
Incentive Generating AUM
Incentive Generating AUM or “IGAUM” refers to the AUM of our funds that are currently generating performanceincome on a realized or unrealized basis. It generally represents the NAV or total assets of our funds, asapplicable, for which we are entitled to receive performance income, excluding capital committed by us and ourprofessionals (from which we generally do not earn performance income). ARCC is only included in IGAUM whenARCC Part II Fees are being generated.
Net Inflows of Capital Net Inflows of Capital refers to net new commitments during the period, including equity and debt commitmentsand gross inflows into our open-ended managed accounts and sub-advised accounts, as well as new debt andequity issuances by our publicly traded vehicles minus redemptions from our open-ended funds, managedaccounts and sub-advised accounts.
Operations ManagementGroup
In addition to our operating segments, we have an Operations Management Group (the “OMG”) that consists ofshared resource groups to support our reportable segments by providing infrastructure and administrativesupport in the areas of accounting/finance, operations, information technology, strategy and relationshipmanagement, legal, compliance and human resources. The OMG’s expenses are not allocated to our reportablesegments but we consider the cost structure of the OMG when evaluating our financial performance. Ourmanagement uses this information to assess the performance of our reportable segments and OMG, and webelieve that this information enhances the ability of shareholders to analyze our performance.
Our Funds Our Funds refers to the funds, alternative asset companies, co-investment vehicles and other entities andaccounts that are managed or co-managed by the Ares Operating Group, and which are structured to pay fees. Italso includes funds managed by Ivy Hill Asset Management, L.P., a wholly owned portfolio company of ARCC andan SEC-registered investment adviser.

20
Glossary (cont’d)Performance Income Performance Income refers to income we earn based on the performance of a fund that is generally based on
certain specific hurdle rates as defined in the fund’s investment management or partnership agreements andmay be either an incentive fee or carried interest.
Permanent Capital Permanent Capital refers to capital of our funds that do not have redemption provisions or a requirement toreturn capital to investors upon exiting the investments made with such capital, except as required byapplicable law. Such funds currently consist of ARCC, Ares Commercial Real Estate Corporation (“ACRE”) and AresDynamic Credit Allocation Fund, Inc. (“ARDC”). Such funds may be required, or elect, to return all or a portion ofcapital gains and investment income. In addition, permanent capital includes certain insurance related assetsthat are owned or related to Aspida Life Re Ltd (“Aspida”).
Realized Income Realized Income or “RI”, a non-GAAP measure, is an operating metric used by management to evaluateperformance of the business based on operating performance and the contribution of each of the businesssegments to that performance, while removing the fluctuations of unrealized income and losses, which may ormay not be eventually realized at the levels presented and whose realizations depend more on future outcomesthan current business operations. RI differs from income before taxes by excluding (a) operating results of ourConsolidated Funds, (b) depreciation and amortization expense, (c) the effects of changes arising from corporateactions, (d) unrealized gains and losses related to performance income and investment performance and (e)certain other items that we believe are not indicative of our operating performance. Changes arising fromcorporate actions include equity-based compensation expenses, the amortization of intangible assets,transaction costs associated with mergers, acquisitions and capital transactions, underwriting costs andexpenses incurred in connection with corporate reorganization.
Total Fee Revenue Total Fee Revenue refers to the total of segment management fees, other fees and realized net performanceincome.