world-economic-and-social-survey-2003.pdf - the United ...
318
In 2002, the world economy did not recover from its slowdown of the previous year, and exhibited another weak performance. Unemployment increased in many countries. International trade lacked dynamism. Capital flows to developing countries declined owing to the difficult economic and political environment that characterized much of the year and that persisted into early 2003. As part one of the World Economic and Social Survey 2003 shows, the world economy remains some distance away from achieving the fast and sustained economic growth needed to confront poverty and other challenges. Part two of the Survey examines the effects on poverty of growth-enhancing economic policies. When Governments draw up fis- cal and monetary policies, or seek to enhance trade and agricultural productivity, or, in the case of a number of countries, make the transi- tion from a planned economy to the market, they should carefully assess the effects of these policies on the poor—especially in light of the com- mitment they have made to reduce, by the year 2015, the proportion of people living on less than a dollar a day and the proportion of those who suffer from hunger. The Survey argues that while long-term eco- nomic growth is a powerful force behind poverty reduction, it is neces- sary and possible to tailor policies in order to achieve even greater reductions. The global target of the Millennium Development Goal for the eradication of poverty is bold but achievable. At the global level, many millions of people have been rescued from poverty, in particular because of progress in the world’s most populous countries, China and India. However, the results there tend to obscure setbacks or stagnation PREFACE W O R L D E C O N O M I C A N D S O C I A L S U R V E Y 2 0 0 3 III
-
Upload
khangminh22 -
Category
Documents
-
view
1 -
download
0
Transcript of world-economic-and-social-survey-2003.pdf - the United ...
In 2002, the world economy did not recover from its slowdown
of the previous year, and exhibited another weak performance.
Unemployment increased in many countries. International trade lacked
dynamism. Capital flows to developing countries declined owing to the
difficult economic and political environment that characterized much of
the year and that persisted into early 2003. As part one of the World
Economic and Social Survey 2003 shows, the world economy remains
some distance away from achieving the fast and sustained economic
growth needed to confront poverty and other challenges.
Part two of the Survey examines the effects on poverty of
growth-enhancing economic policies. When Governments draw up fis-
cal and monetary policies, or seek to enhance trade and agricultural
productivity, or, in the case of a number of countries, make the transi-
tion from a planned economy to the market, they should carefully assess
the effects of these policies on the poor—especially in light of the com-
mitment they have made to reduce, by the year 2015, the proportion of
people living on less than a dollar a day and the proportion of those
who suffer from hunger. The Survey argues that while long-term eco-
nomic growth is a powerful force behind poverty reduction, it is neces-
sary and possible to tailor policies in order to achieve even greater
reductions.
The global target of the Millennium Development Goal for the
eradication of poverty is bold but achievable. At the global level, many
millions of people have been rescued from poverty, in particular
because of progress in the world’s most populous countries, China and
India. However, the results there tend to obscure setbacks or stagnation
PREFACE
W O R L D E C O N O M I C A N D S O C I A L S U R V E Y 2 0 0 3 III
elsewhere—for example, in many of the least developed countries, par-
ticularly in Africa, where the number of poor people is expected to rise.
Governments therefore need to pursue the reforms that will ensure sus-
tainable growth, and the international community must provide the
assistance that can enable these policies to succeed.
Indeed, in a world where economies are increasingly more inte-
grated, the importance of international cooperation cannot be overem-
phasized. The international community has forged consensus on devel-
opment priorities and actions, as defined in the outcomes of the meet-
ings in Doha, Monterrey, Mexico, and Johannesburg, South Africa, and
has pledged to move forward on the basis of shared responsibilities and
mutual commitments. This Survey is intended not just as a source of
information and analysis, but also as a spur to action. I commend it to
the widest possible audience.
W O R L D E C O N O M I C A N D S O C I A L S U R V E Y 2 0 0 3IV
KOFI A. ANNANSecretary-General
After being delayed through increasing geopolitical tensions andother economic uncertainties, faster economic growth is expected toreturn to the world economy in the second half of 2003. Some signshave been already evident in the United States of America, a countrythat once again will be instrumental in launching the global recovery.Nonetheless, the sustainability of the recovery will depend upon howfast the positive impulses that originated in the United States are spreadvia trade and investment throughout the world and are picked up andmaintained by the other economies. Part one of the World Economicand Social Survey 2003 examines the factors that have shaped therecent economic performance of the global economy and analyses theforces that will likely determine its course in the near term.
The negative effects of the past boom in equity markets and capitalspending continued to constrain economic activity in 2002 and early2003, as overcapacity in several sectors discouraged new investmentwhile growing unemployment constrained consumption. Increasinguncertainty brought about by geopolitical tensions and corporate gover-nance failures compounded the problem. Sluggish global economicgrowth, with its accompanying weak trade and reduced capital flows,resulted in depressed commodity prices and fewer resources for devel-oping countries. Growth suffered as a result, particularly in those devel-oping countries that were also facing constraints on adopting counter-cyclical policies.
The invasion of Iraq took a heavy toll on human life and economicactivity in the region. Another non-economic shock, a severe and high-ly contagious respiratory disease (severe acute respiratory syndrome(SARS)), clouded economic prospects in several countries in early 2003but appears now to have been contained. Additionally, several positivefactors remain in place to facilitate a recovery. Macroeconomic policyis supportive in several countries and interest rates continue to be lowin many developed countries while cyclical inventory adjustment willalso contribute to recovery.
It is likely, however, that the recovery’s strength will not be as pro-nounced as in past cyclical upturns. The increase in longer-term unem-ployment, for instance, will continue to contain demand for some time.Furthermore, the depreciation of the United States dollar will moderateimport demand by the United States, thus weakening a powerful stimu-lus to the world economy. Finally, this short-term economic outlook issurrounded by a number of uncertainties and risks, which are discussedfurther in part one of the Survey.
FOREWORD
W O R L D E C O N O M I C A N D S O C I A L S U R V E Y 2 0 0 3 V
Part two of the Survey examines the relationships between recenteconomic policies and poverty reduction. The commitment by MemberStates to the achievement of the Millennium Development Goals has putpoverty reduction at the top of the global agenda. MillenniumDevelopment Goal 1 is for a reduction in absolute poverty, but there isstill widespread poverty throughout the developing countries and insome of the transition economies and still considerable pockets ofpoverty even in the richest of the developed countries. Thus, all groupsof countries are trying to devise policies to eradicate poverty.
Sustained economic growth is an effective means to reduce poverty.Historical experience has shown that growth has always lifted a numberof people out of poverty. Often the income distribution within a countryhas worsened while growth has accelerated, but it is unknown for thepoor to lose ground in absolute (as compared with relative) terms dur-ing a period of long-term growth. As their incomes expand, the rich willalways demand better goods and services from the poor and will havethe ability to pay for them. The lifting of millions of human beings outof absolute poverty in China and India since their pro-growth and mar-ket-friendly reforms raised their growth rates has been one of the mostsignificant and encouraging developments in the global economy at thebeginning of the new millennium. It is to be hoped that their successwill be emulated in other regions of the world where rapid growth hasnot yet been achieved.
The Survey looks at policies that countries adopt to promotegrowth—fiscal and monetary policies, trade and agricultural policiesand the replacement of central planning by a market-based economy. Itasks whether and how they can be attuned and, where necessary, com-plemented in order to achieve even greater reductions in poverty. Therenewed national and international concern regarding poverty has led tothe collection of much better data and to greater efforts to listen to thevoices of the poor which will help policy makers in their task. PovertyReduction Strategy Papers are now required for all World Bank andInternational Monetary Fund lending to low-income countries.
Chapter IV sets the stage for the subsequent discussion by examiningin depth the growth-poverty nexus. While growth benefits the poor inincome terms, periods of growth have not always seen improvements inother indicators of poverty, such as health and educational achieve-ments. Moreover, in the short term, economic growth might affect somegroups adversely. The analysis of a policy’s effects on poverty cannot
W O R L D E C O N O M I C A N D S O C I A L S U R V E Y 2 0 0 3VI
be unidimensional and confined to a simple headcount. It must addresssuch matters as the time dimension and also the many different groupsthat can be affected, including women and vulnerable minorities,regions within a country, and urban and rural dwellers.
Chapter V looks at how monetary and fiscal policy, by achievingmacroeconomic stability, assist in ensuring growth and poverty reduc-tion. However, stability is particularly important, as periods of stop-gocan be harmful to the poor who do not have the cushions to protectthemselves during a downturn. For this reason, during economic expan-sion and prosperity, it would be wise for Governments to put in placethose social protection schemes that will be needed if and when theeconomy falters. Many programmes, though, are designed to reachthose in the formal sector, which leaves the informal sector unprotectedand unattended after being hit by recession. Governments should, then,explore other forms of social assistance, based on grass-roots involve-ment, that reach the poor in the informal sector.
The effects of trade liberalization on the poor are examined in chapterVI. Trade reform is normally not undertaken with any specific intentionof benefiting the poor. Rather, by expanding the choice of goods avail-able to all consumers and increasing the competition between domesticand foreign suppliers, trade liberalization should benefit the poor bymaking their limited budgets stretch further. Trade liberalization can alsospur economic dynamism and growth and, as growth reduces poverty,lead to a reduction in poverty. It is on the demand for labour that muchconcern is concentrated—concern that trade liberalization would dis-place the poor employed in domestic industries that cannot compete withimports, or that the need to attract foreign direct investment wouldinduce countries to lower their labour standards. The Survey examinesthese possible negative effects of liberalization, and argues that, wherenecessary, these concerns can be addressed by specific policy interven-tions. They do not detract from the overall efficacy of trade and invest-ment liberalization in helping everyone, including the poor.
Another area where liberalization has been pursued has been in agri-culture, which is analysed in chapter VII. As with trade, the basic ratio-nale of market liberalization is to make available to consumers a widervariety of goods at cheaper prices. This should benefit the poor as con-sumers of food. However, the rural poor are also producers of foodstuffsand this aspect must be taken into account in any programme of reform.In many cases, corrective measures will have to be taken as reforms are
W O R L D E C O N O M I C A N D S O C I A L S U R V E Y 2 0 0 3 VII
implemented. Market-based land reform, where a willing seller sells toa willing buyer, is another policy now being increasingly pursued. Thechapter argues that this can lead to greater economic efficiency andmore equitable patterns in rural growth.
The last chapter reviews the impact on poverty of the change from acentrally planned system to a market system. In the economies in tran-sition, this could be brought about only through an initial recession—whose length and depth varied widely across countries—as industriesthat had been overmanned or otherwise not viable in a market economywere forced to shed labour or to close down. As social benefits wereoften provided by the place of work, those who lost their jobs were hitespecially hard, through losing both their income and their social pro-tection. What is now increasingly apparent in the transition economiesis that, although the return to economic growth will lift out of povertythose whose situation was caused by their losing their jobs, there is stilla large class of the chronically poor who will not benefit so easily fromrenewed growth. Carefully targeted interventions are necessary toaddress the causes of their poverty.
Part two of the Survey, then, presents a nuanced picture of the possi-bilities of reducing poverty. It balances the optimistic assessment thatthe Millennium Development Goal is achievable at the global level,with the realization that, unless strong measures are taken nationallyand internationally, many countries will fail to reduce the number of theabsolute poor and many regions and groups of people will not escapeavoidable poverty. These strong measures do not imply an abandonmentof those macroeconomic policies that have been seen to result in sus-tainable economic growth, but rather their refinement and the enactmentof complementary policies to ensure that the resulting economic growthwill bring about an even greater reduction in poverty.
W O R L D E C O N O M I C A N D S O C I A L S U R V E Y 2 0 0 3VIII
Nitin DesaiUnder-Secretary-Generalfor Economic and Social Affairs
CONTENTS
Preface . . . . . . . . . . . . . . . . . . . . . . . . . . . . . . . . . . . . . . . . . . . . . . . . . . . . . . . . . . . . . . . . . . . . . . . . . . . . . . . . . . . . . . . . . .IIIForeword . . . . . . . . . . . . . . . . . . . . . . . . . . . . . . . . . . . . . . . . . . . . . . . . . . . . . . . . . . . . . . . . . . . . . . . . . . . . . . . . . . . . . . . . .VExplanatory notes . . . . . . . . . . . . . . . . . . . . . . . . . . . . . . . . . . . . . . . . . . . . . . . . . . . . . . . . . . . . . . . . . . . . . . . . . . . . . . . . .XV
PART ONE. STATE OF THE WORLD ECONOMY
Chapter Page
I. THE WORLD ECONOMY IN 2003 . . . . . . . . . . . . . . . . . . . . . . . . . . . . . . . . . . . . . . . . . . . . . . . . . . . . . . . . . . . . . . . . . . . .3Delayed recovery . . . . . . . . . . . . . . . . . . . . . . . . . . . . . . . . . . . . . . . . . . . . . . . . . . . . . . . . . . . . . . . . . . . . . . . . . . . . . . . . . .4A lacklustre international economic environment . . . . . . . . . . . . . . . . . . . . . . . . . . . . . . . . . . . . . . . . . . . . . . . . . . . . . . . . .7Policy responses to slow growth . . . . . . . . . . . . . . . . . . . . . . . . . . . . . . . . . . . . . . . . . . . . . . . . . . . . . . . . . . . . . . . . . . . . . .9Regional performance and prospects . . . . . . . . . . . . . . . . . . . . . . . . . . . . . . . . . . . . . . . . . . . . . . . . . . . . . . . . . . . . . . . . .10
Developed countries: recovery derailed . . . . . . . . . . . . . . . . . . . . . . . . . . . . . . . . . . . . . . . . . . . . . . . . . . . . .10Economies in transition: limited deceleration . . . . . . . . . . . . . . . . . . . . . . . . . . . . . . . . . . . . . . . . . . . . . . . . . . . . . . . .12Developing countries: continuing underachievement . . . . . . . . . . . . . . . . . . . . . . . . . . . . . . . . . . . . . . . . . . .12
Short-term uncertainties and risks . . . . . . . . . . . . . . . . . . . . . . . . . . . . . . . . . . . . . . . . . . . . . . . . . . . . . . . . . . .14Delivering on the new development commitment . . . . . . . . . . . . . . . . . . . . . . . . . . . . . . . . . . . . . . . . . . . . . . . . . . . . . . . .17
Securing progress on the trade agenda . . . . . . . . . . . . . . . . . . . . . . . . . . . . . . . . . . . . . . . . . . . . . . . . . . . . .18Addressing external debt . . . . . . . . . . . . . . . . . . . . . . . . . . . . . . . . . . . . . . . . . . . . . . . . . . . . . . . . . . . . . . . . . . . . . . . .19Reviving concessional financial flows . . . . . . . . . . . . . . . . . . . . . . . . . . . . . . . . . . . . . . . . . . . . . . . . . . . . . . . . . . . . . .20
II. INTERNATIONAL TRADE AND FINANCE . . . . . . . . . . . . . . . . . . . . . . . . . . . . . . . . . . . . . . . . . . . . . . . . . . . . . . . . . . .23International trade . . . . . . . . . . . . . . . . . . . . . . . . . . . . . . . . . . . . . . . . . . . . . . . . . . . . . . . . . . . . . . . . . . . . . . . . . . . . . . . .24Commodity prices and markets . . . . . . . . . . . . . . . . . . . . . . . . . . . . . . . . . . . . . . . . . . . . . . . . . . . . . . . . . . . . . . . . . . . . . .29
World oil market: recent developments and prospects . . . . . . . . . . . . . . . . . . . . . . . . . . . . . . . . . . . . . . . . . . . . . . . . .29Non-fuel commodities: excess supplies and weak demand . . . . . . . . . . . . . . . . . . . . . . . . . . . . . . . . . . . . . . . . . . . . .32
Trade policy developments . . . . . . . . . . . . . . . . . . . . . . . . . . . . . . . . . . . . . . . . . . . . . . . . . . . . . . . . . . . . . . . . . . . . . . . . . .37Financial flows to developing countries and economies in transition . . . . . . . . . . . . . . . . . . . . . . . . . . . . . . . . . . . . . . . .41
Private capital flows . . . . . . . . . . . . . . . . . . . . . . . . . . . . . . . . . . . . . . . . . . . . . . . . . . . . . . . . . . . . . . . . . . . . . . . . . . . .42Official flows . . . . . . . . . . . . . . . . . . . . . . . . . . . . . . . . . . . . . . . . . . . . . . . . . . . . . . . . . . . . . . . . . . . . . . . . . . . . . . . . .45
Continuing reform of the international financial architecture . . . . . . . . . . . . . . . . . . . . . . . . . . . . . . . . . . . . . . . . . . . . . . .50Crisis prevention activities . . . . . . . . . . . . . . . . . . . . . . . . . . . . . . . . . . . . . . . . . . . . . . . . . . . . . . . . . . . . . . . . . . . . . . .50Approaches to crisis resolution . . . . . . . . . . . . . . . . . . . . . . . . . . . . . . . . . . . . . . . . . . . . . . . . . . . . . . . . . . . . . . . . . . .57
III. THE CURRENT SITUATION IN THE WORLD’S ECONOMIES . . . . . . . . . . . . . . . . . . . . . . . . . . . . . . . . . . . . .63Developed economies . . . . . . . . . . . . . . . . . . . . . . . . . . . . . . . . . . . . . . . . . . . . . . . . . . . . . . . . . . . . . . . . . . . . . . . . . . . . .64
North America: recovery under way . . . . . . . . . . . . . . . . . . . . . . . . . . . . . . . . . . . . . . . . . . . . . . . . . . . . . . . . . . . . . . .64Developed Asia and the Pacific: subdued growth in Japan and vigour elsewhere . . . . . . . . . . . . . . . . . . . . . . . . . . .70Western Europe: upturn faces negative headwinds . . . . . . . . . . . . . . . . . . . . . . . . . . . . . . . . . . . . . . . . . . . . . . . . . . .72
W O R L D E C O N O M I C A N D S O C I A L S U R V E Y 2 0 0 3 IX
Chapter Page
Economies in transition . . . . . . . . . . . . . . . . . . . . . . . . . . . . . . . . . . . . . . . . . . . . . . . . . . . . . . . . . . . . . . . . . . . . . . . . . . . .76Central and Eastern Europe: withstanding the global slowdown . . . . . . . . . . . . . . . . . . . . . . . . . . . . . . . . . . . . . . . . .76The Baltic countries: the world’s fastest growing region . . . . . . . . . . . . . . . . . . . . . . . . . . . . . . . . . . . . . . . . . . . . . . .81Commonwealth of Independent States (CIS): sustaining robust growth . . . . . . . . . . . . . . . . . . . . . . . . . . . . . . . . . . .82
Developing economies . . . . . . . . . . . . . . . . . . . . . . . . . . . . . . . . . . . . . . . . . . . . . . . . . . . . . . . . . . . . . . . . . . . . . . . . . . . . .87Africa: the challenge of poverty reduction . . . . . . . . . . . . . . . . . . . . . . . . . . . . . . . . . . . . . . . . . . . . . . . . . . . . . . . . . .87East Asia: dealing with shocks . . . . . . . . . . . . . . . . . . . . . . . . . . . . . . . . . . . . . . . . . . . . . . . . . . . . . . . . . . . . . . . . . . .93South Asia: moving towards a more balanced growth . . . . . . . . . . . . . . . . . . . . . . . . . . . . . . . . . . . . . . . . . . . . . . . . .97Western Asia: caught between war and volatile oil prices . . . . . . . . . . . . . . . . . . . . . . . . . . . . . . . . . . . . . . . . . . . . .98Latin America and the Caribbean: slowly emerging from recession . . . . . . . . . . . . . . . . . . . . . . . . . . . . . . . . . . . . .101
PART TWO. ECONOMIC POLICY AND POVERTY
OVERVIEW . . . . . . . . . . . . . . . . . . . . . . . . . . . . . . . . . . . . . . . . . . . . . . . . . . . . . . . . . . . . . . . . . . . . . . . . . . . . . . . . . . . .111
IV. GROWTH AND POVERTY: A FRAMEWORK FOR EVALUATING POLICY . . . . . . . . . . . . . . . . . . . . . . . . . . . . . . . . .117Relationships between development, policy and poverty . . . . . . . . . . . . . . . . . . . . . . . . . . . . . . . . . . . . . . . . . . . . . . . . .120Average relationships between growth and poverty . . . . . . . . . . . . . . . . . . . . . . . . . . . . . . . . . . . . . . . . . . . . . . . . . . . . .123
General relationship between growth and poverty in the long run . . . . . . . . . . . . . . . . . . . . . . . . . . . . . . . .124Looking behind the regional average . . . . . . . . . . . . . . . . . . . . . . . . . . . . . . . . . . . . . . . . . . . . . . . . . . . . . . . . . . . . . . . . .135
Deviation from averages . . . . . . . . . . . . . . . . . . . . . . . . . . . . . . . . . . . . . . . . . . . . . . . . . . . . . . . . . . . . . . . .135Mobility in and out of poverty . . . . . . . . . . . . . . . . . . . . . . . . . . . . . . . . . . . . . . . . . . . . . . . . . . . . . . . . . . .136Evolution of poverty in the short run . . . . . . . . . . . . . . . . . . . . . . . . . . . . . . . . . . . . . . . . . . . . . . . . . . . . . . .138
Concluding remarks . . . . . . . . . . . . . . . . . . . . . . . . . . . . . . . . . . . . . . . . . . . . . . . . . . . . . . . . . . . . . . . . . . . . . . . . . . . . . .141
V. MACROECONOMIC POLICY AND POVERTY . . . . . . . . . . . . . . . . . . . . . . . . . . . . . . . . . . . . . . . . . . . . . . . . . . . . . . . .143Monetary policy and poverty . . . . . . . . . . . . . . . . . . . . . . . . . . . . . . . . . . . . . . . . . . . . . . . . . . . . . . . . . . . . . . . . . . . . . . .144Fiscal policy and poverty . . . . . . . . . . . . . . . . . . . . . . . . . . . . . . . . . . . . . . . . . . . . . . . . . . . . . . . . . . . . . . . . . . . . . . . . . .145Macroeconomic policy in times of crisis . . . . . . . . . . . . . . . . . . . . . . . . . . . . . . . . . . . . . . . . . . . . . . . . . . . . . . . . . . . . . .148
Macroeconomic policy responses to crises in East Asia and Latin America . . . . . . . . . . . . . . . . . . . . . . . . .149Comparing policy responses . . . . . . . . . . . . . . . . . . . . . . . . . . . . . . . . . . . . . . . . . . . . . . . . . . . . . . . . . . . . .151
Poverty after the crises . . . . . . . . . . . . . . . . . . . . . . . . . . . . . . . . . . . . . . . . . . . . . . . . . . . . . . . . . . . . . . . . . . . . . . . . . . .152Direct measures to address urban poverty . . . . . . . . . . . . . . . . . . . . . . . . . . . . . . . . . . . . . . . . . . . . . . . . . . . . . . . . . . . .154Policy implications and recommendations . . . . . . . . . . . . . . . . . . . . . . . . . . . . . . . . . . . . . . . . . . . . . . . . . . . . . . . . . . . . .159
VI. TRADE POLICIES, GROWTH AND POVERTY . . . . . . . . . . . . . . . . . . . . . . . . . . . . . . . . . . . . . . . . . . . . . . . . . . . . . . . .163Trade and the economy . . . . . . . . . . . . . . . . . . . . . . . . . . . . . . . . . . . . . . . . . . . . . . . . . . . . . . . . . . . . . . . . . . . . . . . . . . .164Trade and growth . . . . . . . . . . . . . . . . . . . . . . . . . . . . . . . . . . . . . . . . . . . . . . . . . . . . . . . . . . . . . . . . . . . . . . . . . . . . . . . .167
Liberalization and growth in theory and practice . . . . . . . . . . . . . . . . . . . . . . . . . . . . . . . . . . . . . . . . . . . . .167Caveats concerning the trade-poverty link . . . . . . . . . . . . . . . . . . . . . . . . . . . . . . . . . . . . . . . . . . . . . . . . . .169
Assessing the evidence . . . . . . . . . . . . . . . . . . . . . . . . . . . . . . . . . . . . . . . . . . . . . . . . . . . . . . . . . . . . . . . . . . . . . . . . . . .170
X T A B L E O F C O N T E N T S
Chapter Page
Adjustment . . . . . . . . . . . . . . . . . . . . . . . . . . . . . . . . . . . . . . . . . . . . . . . . . . . . . . . . . . . . . . . . . . . . . . . . . . . . . . . . . . . . .171The channels for assuring the welfare of the poor . . . . . . . . . . . . . . . . . . . . . . . . . . . . . . . . . . . . . . . . . . . . . . . . . . . . . .172
Prices and availability of goods and services . . . . . . . . . . . . . . . . . . . . . . . . . . . . . . . . . . . . . . . . . . . . . . . .172Labour markets . . . . . . . . . . . . . . . . . . . . . . . . . . . . . . . . . . . . . . . . . . . . . . . . . . . . . . . . . . . . . . . . . . . . . . .174Investment and innovation: capital inflows and direct foreign investment . . . . . . . . . . . . . . . . . . . . . . . . . .176Government revenue . . . . . . . . . . . . . . . . . . . . . . . . . . . . . . . . . . . . . . . . . . . . . . . . . . . . . . . . . . . . . . . . . . .177The distribution of income . . . . . . . . . . . . . . . . . . . . . . . . . . . . . . . . . . . . . . . . . . . . . . . . . . . . . . . . . . . . . .179
The role of the international community . . . . . . . . . . . . . . . . . . . . . . . . . . . . . . . . . . . . . . . . . . . . . . . . . . . . . . . . . . . . . .180Conclusions . . . . . . . . . . . . . . . . . . . . . . . . . . . . . . . . . . . . . . . . . . . . . . . . . . . . . . . . . . . . . . . . . . . . . . . . . . . . . . . . . . . . .185
VII. MARKET-BASED APPROACHES TO RURAL DEVELOPMENT IN SUB-SAHARAN AFRICA . . . . . . . . . . . . . . . .187Rural development and poverty reduction in sub-Saharan Africa . . . . . . . . . . . . . . . . . . . . . . . . . . . . . . . . . . . . . . . . . . .188
The need for greater emphasis on rural poverty reduction . . . . . . . . . . . . . . . . . . . . . . . . . . . . . . . . . . . . . . . . . . . . .188Focusing on sub-Saharan Africa . . . . . . . . . . . . . . . . . . . . . . . . . . . . . . . . . . . . . . . . . . . . . . . . . . . . . . . . . . . . . . . . .189
Food marketing reform in sub-Saharan Africa . . . . . . . . . . . . . . . . . . . . . . . . . . . . . . . . . . . . . . . . . . . . . . . . . . . . . . . . . .192The role of food markets in rural poverty alleviation . . . . . . . . . . . . . . . . . . . . . . . . . . . . . . . . . . . . . . . . . . . . . . . . .192Food marketing reform in selected African countries . . . . . . . . . . . . . . . . . . . . . . . . . . . . . . . . . . . . . . . . . . . . . . . . .194An assessment of food marketing reform in Africa . . . . . . . . . . . . . . . . . . . . . . . . . . . . . . . . . . . . . . . . . . . . . . . . . .201
A market-based approach to land reform . . . . . . . . . . . . . . . . . . . . . . . . . . . . . . . . . . . . . . . . . . . . . . . . . . . . . . . . . . . . .205The central role of land reform in rural poverty alleviation . . . . . . . . . . . . . . . . . . . . . . . . . . . . . . . . . . . . . . . . . . . .205The case for market-based land reform . . . . . . . . . . . . . . . . . . . . . . . . . . . . . . . . . . . . . . . . . . . . . . . . . . . . . . . . . . . .207Market-based land reform in South Africa . . . . . . . . . . . . . . . . . . . . . . . . . . . . . . . . . . . . . . . . . . . . . . . . . . . . . . . . .210An assessment of market-based land reform . . . . . . . . . . . . . . . . . . . . . . . . . . . . . . . . . . . . . . . . . . . . . . . . . . . . . . .215
Concluding remarks . . . . . . . . . . . . . . . . . . . . . . . . . . . . . . . . . . . . . . . . . . . . . . . . . . . . . . . . . . . . . . . . . . . . . . . . . . . . . .216
VIII. TRANSITION ECONOMIES AND POVERTY . . . . . . . . . . . . . . . . . . . . . . . . . . . . . . . . . . . . . . . . . . . . . . . . . . . . . . . . .219The macroeconomic background . . . . . . . . . . . . . . . . . . . . . . . . . . . . . . . . . . . . . . . . . . . . . . . . . . . . . . . . . . . . . . . . . . . .223
The transformational recession . . . . . . . . . . . . . . . . . . . . . . . . . . . . . . . . . . . . . . . . . . . . . . . . . . . . . . . . . . . . . . . . . .223Inflation . . . . . . . . . . . . . . . . . . . . . . . . . . . . . . . . . . . . . . . . . . . . . . . . . . . . . . . . . . . . . . . . . . . . . . . . . . . . . . . . . . . . .224Private sector investment . . . . . . . . . . . . . . . . . . . . . . . . . . . . . . . . . . . . . . . . . . . . . . . . . . . . . . . . . . . . . . . . . . . . . . .225Income distribution . . . . . . . . . . . . . . . . . . . . . . . . . . . . . . . . . . . . . . . . . . . . . . . . . . . . . . . . . . . . . . . . . . . . . . . . . . . .225Fiscal policy . . . . . . . . . . . . . . . . . . . . . . . . . . . . . . . . . . . . . . . . . . . . . . . . . . . . . . . . . . . . . . . . . . . . . . . . . . . . . . . . .226Trade and foreign exchange policy . . . . . . . . . . . . . . . . . . . . . . . . . . . . . . . . . . . . . . . . . . . . . . . . . . . . . . . . . . . . . . .227
Transient versus chronic poverty . . . . . . . . . . . . . . . . . . . . . . . . . . . . . . . . . . . . . . . . . . . . . . . . . . . . . . . . . . . . . . . . . . . .229The emergence of chronic poverty . . . . . . . . . . . . . . . . . . . . . . . . . . . . . . . . . . . . . . . . . . . . . . . . . . . . . . . . . . . . . . . .229Sectoral and geographical differentiation of incomes . . . . . . . . . . . . . . . . . . . . . . . . . . . . . . . . . . . . . . . . . . . . . . . .231Conflicts and poverty . . . . . . . . . . . . . . . . . . . . . . . . . . . . . . . . . . . . . . . . . . . . . . . . . . . . . . . . . . . . . . . . . . . . . . . . . .234Ethnic-specific poverty . . . . . . . . . . . . . . . . . . . . . . . . . . . . . . . . . . . . . . . . . . . . . . . . . . . . . . . . . . . . . . . . . . . . . . . . .234Household characteristics and poverty . . . . . . . . . . . . . . . . . . . . . . . . . . . . . . . . . . . . . . . . . . . . . . . . . . . . . . . . . . . .235
W O R L D E C O N O M I C A N D S O C I A L S U R V E Y 2 0 0 3 XI
Chapter Page
Employment, unemployment and poverty . . . . . . . . . . . . . . . . . . . . . . . . . . . . . . . . . . . . . . . . . . . . . . . . . . . . . . . . . . . . .236Unemployment benefits and the minimum wage . . . . . . . . . . . . . . . . . . . . . . . . . . . . . . . . . . . . . . . . . . . . . . . . . . . .238
Coping with poverty: the government’s response . . . . . . . . . . . . . . . . . . . . . . . . . . . . . . . . . . . . . . . . . . . . . . . . . . . . . . .240Pensions reform . . . . . . . . . . . . . . . . . . . . . . . . . . . . . . . . . . . . . . . . . . . . . . . . . . . . . . . . . . . . . . . . . . . . . . . . . . . . . .240Targeted social protection . . . . . . . . . . . . . . . . . . . . . . . . . . . . . . . . . . . . . . . . . . . . . . . . . . . . . . . . . . . . . . . . . . . . . .242Untargeted subsidies . . . . . . . . . . . . . . . . . . . . . . . . . . . . . . . . . . . . . . . . . . . . . . . . . . . . . . . . . . . . . . . . . . . . . . . . . .243Public spending on education and health . . . . . . . . . . . . . . . . . . . . . . . . . . . . . . . . . . . . . . . . . . . . . . . . . . . . . . . . . .244
Coping with poverty: the private response . . . . . . . . . . . . . . . . . . . . . . . . . . . . . . . . . . . . . . . . . . . . . . . . . . . . . . . . . . . .247Self-employment and the growth of the informal economy . . . . . . . . . . . . . . . . . . . . . . . . . . . . . . . . . . . . . . . . . . . .247Cultivation of family plots and de-urbanization . . . . . . . . . . . . . . . . . . . . . . . . . . . . . . . . . . . . . . . . . . . . . . . . . . . . . .248Migration and emigration . . . . . . . . . . . . . . . . . . . . . . . . . . . . . . . . . . . . . . . . . . . . . . . . . . . . . . . . . . . . . . . . . . . . . .249The role of intra-framily transfers . . . . . . . . . . . . . . . . . . . . . . . . . . . . . . . . . . . . . . . . . . . . . . . . . . . . . . . . . . . . . . . .249
Conclusions . . . . . . . . . . . . . . . . . . . . . . . . . . . . . . . . . . . . . . . . . . . . . . . . . . . . . . . . . . . . . . . . . . . . . . . . . . . . . . . . . . . . .250
ANNEX
STATISTICAL TABLES . . . . . . . . . . . . . . . . . . . . . . . . . . . . . . . . . . . . . . . . . . . . . . . . . . . . . . . . . . . . . . . . . . . . . . . . . . . . . . . .253
BOXES
I.1. Economic implications of the depreciation of the United States dollar . . . . . . . . . . . . . . . . . . . . . . . . . . . . . . . . . . . . . . .15III.1. CIS-7 Initiative to Promote Poverty Reduction, Growth and Debt Sustainability
in the Low-income Countries of the Commonwealth of Independent States . . . . . . . . . . . . . . . . . . . . . . . . . . . . . . . . . . .84III.2. Elections and economic stability in Africa . . . . . . . . . . . . . . . . . . . . . . . . . . . . . . . . . . . . . . . . . . . . . . . . . . . . . . . . . . . . . .89III.3. Ecuador and El Salvador: a tale of two dollarizations . . . . . . . . . . . . . . . . . . . . . . . . . . . . . . . . . . . . . . . . . . . . . . . . . . . .103IV.1. Equality, growth and poverty: are there trade-offs? . . . . . . . . . . . . . . . . . . . . . . . . . . . . . . . . . . . . . . . . . . . . . . . . . . . . .126IV.2. Drawing the poverty line . . . . . . . . . . . . . . . . . . . . . . . . . . . . . . . . . . . . . . . . . . . . . . . . . . . . . . . . . . . . . . . . . . . . . . . . . .130IV.3. Growth and relative poverty . . . . . . . . . . . . . . . . . . . . . . . . . . . . . . . . . . . . . . . . . . . . . . . . . . . . . . . . . . . . . . . . . . . . . . . .132V.1. Participation of civil society in strengthening poverty reduction strategies . . . . . . . . . . . . . . . . . . . . . . . . . . . . . . . . . . .147
VI.1. Beyond agriculture: furniture manufacturing in Ghana . . . . . . . . . . . . . . . . . . . . . . . . . . . . . . . . . . . . . . . . . . . . . . . . . . .182VI.2. Beyond agriculture: clothing and textile manufacturing in Lesotho . . . . . . . . . . . . . . . . . . . . . . . . . . . . . . . . . . . . . . . . .183VIII.1. Poverty in Armenia . . . . . . . . . . . . . . . . . . . . . . . . . . . . . . . . . . . . . . . . . . . . . . . . . . . . . . . . . . . . . . . . . . . . . . . . . . . . . . .222VIII.2. The Russian Federation: land of billionaires? . . . . . . . . . . . . . . . . . . . . . . . . . . . . . . . . . . . . . . . . . . . . . . . . . . . . . . . . . .227VIII.3. Measurement of poverty in transition economies . . . . . . . . . . . . . . . . . . . . . . . . . . . . . . . . . . . . . . . . . . . . . . . . . . . . . . .230VIII.4. The Russian defence industry: the case of a shrinking giant . . . . . . . . . . . . . . . . . . . . . . . . . . . . . . . . . . . . . . . . . . . . . .232
XII T A B L E O F C O N T E N T S
Page
FIGURES
II.1. World trade: value of monthly exports, January 2001-February 2003 . . . . . . . . . . . . . . . . . . . . . . . . . . . . . . . . . . . . . . . .24II.2. Selected developed economies: growth of imports of goods and services,
seasonally adjusted, first quarter 2001-first quarter 2003 . . . . . . . . . . . . . . . . . . . . . . . . . . . . . . . . . . . . . . . . . . . . . . . . .25II.3. Oil prices, January 2000-April 2003 . . . . . . . . . . . . . . . . . . . . . . . . . . . . . . . . . . . . . . . . . . . . . . . . . . . . . . . . . . . . . . . . . . .30II.4. World oil supply and demand and OPEC production, first quarter 2000-fourth quarter 2003 . . . . . . . . . . . . . . . . . . . . . .31II.5. Non-fuel commodity prices, 1994-2003 . . . . . . . . . . . . . . . . . . . . . . . . . . . . . . . . . . . . . . . . . . . . . . . . . . . . . . . . . . . . . . . .33II.6. Yield spreads on emerging market bonds, 2 January 2002-30 April 2003 . . . . . . . . . . . . . . . . . . . . . . . . . . . . . . . . . . . . .43III.1. Consumer confidence in the major economies, 1998-2003 . . . . . . . . . . . . . . . . . . . . . . . . . . . . . . . . . . . . . . . . . . . . . . . .65III.2. Industrial production, excluding construction, 1999-2003 . . . . . . . . . . . . . . . . . . . . . . . . . . . . . . . . . . . . . . . . . . . . . . . . . .66III.3. Unemployment rates in the EU-15, Japan and the United States, 1999-2003 . . . . . . . . . . . . . . . . . . . . . . . . . . . . . . . . . .68III.4. Euro zone: selected price indices, January 1999-April 2003 . . . . . . . . . . . . . . . . . . . . . . . . . . . . . . . . . . . . . . . . . . . . . . . .73III.5. Latin America, selected countries: industrial production index, seasonally adjusted, January 2001-February 2003 . . .102IV.1. Number of people living in extreme poverty in developing countries, by region, 1990 and 1999 . . . . . . . . . . . . . . . . . .118IV.2. Per capita income and extreme poverty in the 1990s . . . . . . . . . . . . . . . . . . . . . . . . . . . . . . . . . . . . . . . . . . . . . . . . . . . .125IV.3. Growth and the evolution of extreme poverty, 1990-1999 . . . . . . . . . . . . . . . . . . . . . . . . . . . . . . . . . . . . . . . . . . . . . . . .134IV.4. Growth and the evolution of nationally defined poverty during the 1980s and 1990s . . . . . . . . . . . . . . . . . . . . . . . . . .135IV.5. Short-term evolution of poverty, first quarter 1996-third quarter 1999, Indonesia . . . . . . . . . . . . . . . . . . . . . . . . . . . . .140VI.1. Relationship between the average annual rates of growth of GDP and trade, 1990-2000 . . . . . . . . . . . . . . . . . . . . . . .168VII.1. Share of developing-country regions in world extreme poverty, 1999 and 2015 . . . . . . . . . . . . . . . . . . . . . . . . . . . . . . .190VII.2. Coarse grain output per capita in selected African countries, 1980-1994 . . . . . . . . . . . . . . . . . . . . . . . . . . . . . . . . . . . .203VII.3. Distribution of land transferred under the South African redistribution programme,
by type of use (in projects approved by 1999) . . . . . . . . . . . . . . . . . . . . . . . . . . . . . . . . . . . . . . . . . . . . . . . . . . . . . . . . . .212
TABLES
I.1. Growth of world output and trade, 1994-2004 . . . . . . . . . . . . . . . . . . . . . . . . . . . . . . . . . . . . . . . . . . . . . . . . . . . . . . . . . . .5I.2. Indicators of the international economic environment, 1998-2002 . . . . . . . . . . . . . . . . . . . . . . . . . . . . . . . . . . . . . . . . . . .7I.3. Frequency of high and low growth of per capita output, 2000-2002 . . . . . . . . . . . . . . . . . . . . . . . . . . . . . . . . . . . . . . . . .11II.1. Net transfer of financial resources to developing economies and economies in transition, 1994-2002 . . . . . . . . . . . . . .42II.2. Net financial flows to developing economies and economies in transition, 1992-2002 . . . . . . . . . . . . . . . . . . . . . . . . . .43II.3. Official development assistance of member countries of the Development Assistance Committee, 2002 . . . . . . . . . . .47III.1. Major industrialized countries: quarterly indicators, 2001-2002 . . . . . . . . . . . . . . . . . . . . . . . . . . . . . . . . . . . . . . . . . . . . .67III.2. Economies in transition: quarterly indicators, 2001-2002 . . . . . . . . . . . . . . . . . . . . . . . . . . . . . . . . . . . . . . . . . . . . . . . . . .79III.3. Major developing countries: quarterly indicators, 2001-2002 . . . . . . . . . . . . . . . . . . . . . . . . . . . . . . . . . . . . . . . . . . . . . . .94IV.1. Evolution of standard poverty measures in selected sub-Saharan countries . . . . . . . . . . . . . . . . . . . . . . . . . . . . . . . . . .121IV.2. Proportion of households in chronic and transitory poverty, various countries . . . . . . . . . . . . . . . . . . . . . . . . . . . . . . . . . .138V.1. Macroeconomic policy responses to crises in selected countries in Asia and Latin America . . . . . . . . . . . . . . . . . . . . . .149V.2. Effects of economic crises in selected countries in Asia and Latin America . . . . . . . . . . . . . . . . . . . . . . . . . . . . . . . . . .153
W O R L D E C O N O M I C A N D S O C I A L S U R V E Y 2 0 0 3 XIII
Page
V.3. Social policy responses to economic crises . . . . . . . . . . . . . . . . . . . . . . . . . . . . . . . . . . . . . . . . . . . . . . . . . . . . . . . . . . . .155VI.1. Ratio of trade to gross domestic product in different country groups, 1990 and 2000 . . . . . . . . . . . . . . . . . . . . . . . . . .165VII.1. Poverty in South Africa, 1995 . . . . . . . . . . . . . . . . . . . . . . . . . . . . . . . . . . . . . . . . . . . . . . . . . . . . . . . . . . . . . . . . . . . . . . .210VII.2. Land distribution in South Africa: sliding scale of grants and personal contributions . . . . . . . . . . . . . . . . . . . . . . . . . . .214VIII.1. Absolute poverty rates in transition economies, 1992-1999 . . . . . . . . . . . . . . . . . . . . . . . . . . . . . . . . . . . . . . . . . . . . . . .221VIII.2. Gini coefficients in transition economies, 1987-1998 . . . . . . . . . . . . . . . . . . . . . . . . . . . . . . . . . . . . . . . . . . . . . . . . . . . .226VIII.3. Transient and chronic poverty: Hungary, Poland and the Russian Federation, 1994-1996 . . . . . . . . . . . . . . . . . . . . . . . .231VIII.4. Poverty by ethnicity in Bulgaria . . . . . . . . . . . . . . . . . . . . . . . . . . . . . . . . . . . . . . . . . . . . . . . . . . . . . . . . . . . . . . . . . . . . .235VIII.5. Output, unemployment, and real wages in selected transition economies, 1991-2001 . . . . . . . . . . . . . . . . . . . . . . . . .237VIII.6. Public expenditures on pensions, 1994-2000 . . . . . . . . . . . . . . . . . . . . . . . . . . . . . . . . . . . . . . . . . . . . . . . . . . . . . . . . . .241VIII.7. Targeting of cash benefits in transition economies, 1996-1997 . . . . . . . . . . . . . . . . . . . . . . . . . . . . . . . . . . . . . . . . . . . .243VIII.8. Public expenditures on education and health as a proportion of GDP, 1990, 1998 and 2000 . . . . . . . . . . . . . . . . . . . . .245VIII.9. Estimates of the share of GDP produced in the unofficial economy
in selected transition countries, 1990 and 1995 . . . . . . . . . . . . . . . . . . . . . . . . . . . . . . . . . . . . . . . . . . . . . . . . . . . . . . . .248
XIV T A B L E O F C O N T E N T S
EXPLANATORY NOTES
The following symbols have been used in the tablesthroughout the report:
.. Two dots indicate that data are not available or are notseparately reported.
– A dash indicates that the amount is nil or negligible.
- A hyphen (-) indicates that the item is not applicable.
- A minus sign (-) indicates deficit or decrease, except as indicated.
. A full stop (.) is used to indicate decimals.
/ A slash (/) between years indicates a crop year or financial year, for example, 1990/91.
- Use of a hyphen (-) between years, for example, 1990-1991,signifies the full period involved, including the beginning and end years.
Reference to “tons” indicates metric tons and to “dollars” ($) United States dollars, unless otherwise stated.
Annual rates of growth or change, unless otherwise stated, refer to annual compound rates.
In most cases, the growth rate forecasts for 2003 and 2004 arerounded to the nearest quarter of a percentage point.
Details and percentages in tables do not necessarily add tototals, because of rounding.
The following abbreviations have been used:
AGOA African Growth and Opportunity Act (United States)
AIDS acquired immunodeficiency syndromeAPEC Asia-Pacific Economic CooperationASEAN Association of Southeast Asian Nationsbpd barrels per daybps basis pointsCAC collective action clauseCACM Central American Common MarketCAP Common Agricultural Policy (EU)
CCFF Compensatory and Contingency Financing Facility (IMF)
CDI Commitment to Development IndexCEFTA Central European Free Trade AgreementCFA Communauté financière africaineCFF Compensatory Financing Facility (IMF)CIS Commonwealth of Independent StatesCOMTRADE United Nations External Trade Statistics DatabaseDAC Development Assistance Committee (of OECD)EAP Enhanced Access Policy (IMF)EBRD European Bank for Reconstruction
and DevelopmentECA Economic Commission for AfricaECB European Central BankECE Economic Commission for EuropeECLAC Economic Commission for Latin America and
the CaribbeanEFF Extended Fund Facility (IMF)EMBI+ Emerging Markets Bond Index PlusEMU European Economic and Monetary UnionEPZ export processing zoneESAF Enhanced Structural Adjustment Facility (IMF)ESCAP Economic and Social Commission for Asia
and the PacificEU European UnionEURIBOR Euro Interbank Offered RateFDI foreign direct investmentf.o.b. free on boardFTAA Free Trade Area of the AmericasGATT General Agreement on Tariffs and TradeGDP gross domestic productGNI gross national incomeGNP gross national productGSP Generalized System of PreferencesGSTP Global System of Trade Preferences among
Developing CountriesGWP gross world productHICP Harmonized Index of Consumer PricesHIPC heavily indebted poor countriesHIV human immunodeficiency virusIADB Inter-American Development BankIBRD International Bank for Reconstruction and
DevelopmentICO International Coffee Organization
W O R L D E C O N O M I C A N D S O C I A L S U R V E Y 2 0 0 3 XV
XVI E X P L A N A T O R Y N O T E S
ICP International Comparison ProgrammeICT information and communication technologiesICTSD International Centre for Trade and Sustainable
DevelopmentIDA International Development AssociationIEA International Energy AgencyIFAD International Fund for Agricultural DevelopmentIFC International Finance CorporationIFI international financial institutionIMF International Monetary FundINTRASTAT system of data collection for intra-EU tradeITRO International Tripartite Rubber OrganisationLIBOR London Interbank Offered Ratembd millions of barrels per dayMERCOSUR Mercado Común del Sur (Southern
Common Market)NAFTA North American Free Trade AgreementNATO North Atlantic Treaty OrganizationNBER National Bureau of Economic Research
(Cambridge, Massachusetts)NEPAD New Partnership for Africa's DevelopmentNIPA National Income and Product AccountsNPL non-performing loanNPV net present valueODA official development assistanceOECD Organisation for Economic Cooperation
and DevelopmentOPEC Organization of the Petroleum Exporting Countriespb per barrelppp purchasing power parityPRGF Poverty Reduction and Growth Facility (IMF)
Project LINK international collaborative research group for econometric modelling, coordinated jointly by the Economic Monitoring and Assessment Unitof the United Nations Secretariat, and the
University of TorontoPRSP Poverty Reduction Strategy Paper
(IMF and World Bank)R&D research and developmentRTA regional trade agreementSADC Southern African Development CommunitySAF Structural Adjustment Facility (IMF)SARS severe acute respiratory syndromeSDRs special drawing rights (IMF)SDT special and differential treatmentSFF Supplementary Financing Facility (IMF)SITC Standard International Trade ClassificationSMEs small and medium-sized enterprisesSRF Supplemental Reserve Facility (IMF)STF Systemic Transformation Facility (IMF)TRIPs trade-related intellectual property rightsUNAIDS Joint United Nations Programme on Human
Immunodeficiency Virus/Acquired Immunodeficiency Syndrome (HIV/AIDS)
UNCTAD United Nations Conference on Trade and Development
UN/DESA Department of Economic and Social Affairs of the United Nations Secretariat
UNU United Nations UniversityVAT value-added taxWIDER World Institute for Development Economics
Research
The designations employed and the presentation of the material in this publication do not imply the expression of any opinion whatsoeveron the part of the United Nations Secretariat concerning the legal status of any country, territory, city or area or of its authorities, or con-cerning the delimitation of its frontiers or boundaries.
The term "country" as used in the text of this report also refers, as appropriate, to territories or areas.
a Names and composition of geographical areas follow those of "Standard country orarea codes for statistical use" (ST/ESA/STAT/SER.M/49/Rev.3), with one exception,namely, Western Asia, which in the Survey includes the Islamic Republic of Iran(owing to the large role of the petroleum sector in its economy) and excludes thetransition economies of the region. Also, "Eastern Europe", as used in this Survey,is a contraction of "Central and Eastern Europe"; thus the composition of the regiondesignated by the term differs from that of the strictly geographical grouping.
b As of 4 February 2003, the official name of “Federal Republic of Yugoslavia” hasbeen changed to “Serbia and Montenegro”.
For analytical purposes, the following country groupingsand subgroupings have been used:a
Developed economies (developed market economies):Europe, excluding the European transition economiesCanada and the United States of AmericaJapan, Australia and New Zealand.
Major developed economies (the Group of Seven):Canada, France, Germany, Italy, Japan, United Kingdom of Great Britain and Northern Ireland, United States of America.
European Union:Austria, Belgium, Denmark, Finland, France, Germany, Greece, Ireland, Italy, Luxembourg, Netherlands, Portugal, Spain, Sweden, United Kingdom of Great Britain and Northern Ireland.
Economies in transition:Central and Eastern European transition economies (CEETEs, sometimes contracted to “Eastern Europe”):
Albania, Bulgaria, Czech Republic, Hungary, Poland, Romania, Slovakia and successor States of the Socialist Federal Republic of Yugoslavia, namely, Bosnia and Herzegovina, Croatia, Slovenia, the former Yugoslav Republic of Macedonia, Yugoslavia.b
Baltic StatesEstonia, Latvia and Lithuania.
Commonwealth of Independent States (CIS)Armenia, Azerbaijan, Belarus, Georgia, Kazakhstan, Kyrgyzstan, Republic of Moldova, Russian Federation, Tajikistan, Turkmenistan, Ukraine, Uzbekistan.
Developing economies:AfricaAsia and the Pacific (excluding Japan, Australia, New Zealand and the member States of CIS in Asia) Latin America and the Caribbean.
Subgroupings of Asia and the Pacific:Western Asia plus Islamic Republic of Iran (commonly contracted to “Western Asia”):
Bahrain, Cyprus, Iran (Islamic Republic of), Iraq, Israel, Jordan, Kuwait, Lebanon, Oman, Qatar, Saudi Arabia, Syrian Arab Republic, Turkey, United Arab Emirates, Yemen.
Eastern and Southern Asia:All other developing economies in Asia and the Pacific (including China, unless listed separately). This group has in some cases been subdivided into:
ChinaSouth Asia: Bangladesh, India, Nepal, Pakistan, Sri LankaEast Asia: all other developing economies in Asia and the Pacific.
Subgrouping of Africa:Sub-Saharan Africa, excluding Nigeria and South Africa (commonly contracted to "sub-Saharan Africa"):
All of Africa except Algeria, Egypt, Libyan Arab Jamahiriya, Morocco, Nigeria, South Africa, Tunisia.
For particular analyses, developing countries have beensubdivided into the following groups:
Net-creditor countries:Brunei Darussalam, Kuwait, Libyan Arab Jamahiriya, Oman, Qatar, Saudi Arabia, Singapore, Taiwan Province of China, United Arab Emirates.
Net-debtor countries:All other developing countries.
Fuel-exporting countries:Algeria, Angola, Bahrain, Bolivia, Brunei Darussalam, Cameroon, Colombia, Congo, Ecuador, Egypt, Gabon, Indonesia, Iran (Islamic Republic of), Iraq, Kuwait, Libyan Arab Jamahiriya, Mexico, Nigeria, Oman, Qatar, Saudi Arabia, Syrian Arab Republic, Trinidad and Tobago, United Arab Emirates, Venezuela, Viet Nam.
Fuel-importing countries:All other developing countries.
Least developed countries:Afghanistan, Angola, Bangladesh, Benin, Bhutan, Burkina Faso, Burundi, Cambodia, Cape Verde, Central African Republic, Chad, Comoros, Democratic Republic of the Congo (formerly Zaire), Djibouti, Equatorial Guinea, Eritrea, Ethiopia, Gambia, Guinea, Guinea-Bissau, Haiti, Kiribati, Lao People’s Democratic Republic, Lesotho, Liberia, Madagascar, Malawi, Maldives, Mali, Mauritania, Mozambique, Myanmar, Nepal, Niger, Rwanda, Samoa, Sao Tome and Principe, Senegal, Sierra Leone, Solomon Islands, Somalia, Sudan, Togo, Tuvalu, Uganda, United Republic of Tanzania, Vanuatu, Yemen, Zambia.
The designation of country groups in the text and the tables isintended solely for statistical or analytical convenience and doesnot necessarily express a judgement about the stage reached by aparticular country or area in the development process.
W O R L D E C O N O M I C A N D S O C I A L S U R V E Y 2 0 0 3 XVII

PART ONE STATEOF THEWORLDECONOMY

The world economy has not yet recovered from its slowdown in 2001.Gross world product (GWP) increased by less than 2 per cent in 2002,marking a second consecutive year of growth substantially below potential.China and India, together with a number of economies in transition, werenotable exceptions to the sub-par performance that characterized themajority of the world’s economies. More generally, as in 2001, a substan-tial number of developing countries, as well as a few developed countriesand economies in transition, experienced a decline in output per capita.Overall, the first few years of the new millennium have been a develop-ment disappointment for the majority of developing countries and anabsolute setback for a number of them.
A global recovery is now forecast for the second half of 2003, with GWPexpected to increase by 2 per cent for the year as a whole, accelerating toslightly above 3 per cent for 2004. The developed countries, most notablythe United States of America, are expected to lead the recovery and to pro-vide a stimulus to the rest of the world. However, world trade and inter-national financial flows will continue to be sluggish by the standards of the1990s, with exports growing by less than 4 per cent in 2003. Moreover, thestimulus provided by the United States will be reduced for many countriesif the recent depreciation of the dollar against their currencies persists.Under these circumstances, few developing countries are expected toreturn to their desirable longer-term rates of growth before the end of2004. The economies in transition, in contrast, have been relativelyresilient in the face of this slowdown and are expected to remain so.
The world economy was beset by heightened geopolitical uncertaintiesin late 2002 and early 2003. Such factors continue to pose a downside riskto global economic growth, but this risk diminished substantially in thesecond quarter of 2003. A new non-economic shock—severe acute respira-tory syndrome (SARS)—jolted economic activity in some countries inearly 2003 but appears to have been largely contained. On the other hand,there remain some well-identified economic risks that could pose a threatto short-term global growth. The most important is linked to the nature ofthe inevitable adjustment of the United States external deficit, a processthat appears to have started with the depreciation of the dollar. A second,related challenge is the possibility of deflation in a growing number ofcountries. In addressing these immediate threats, policy makers should notneglect the agenda that they have established to address longer-term glob-al development issues.
ITHE WORLDECONOMYIN 2003
3T H E W O R L D E C O N O M Y I N 2 0 0 3
DELAYED RECOVERY
It was expected that a recovery from the global economic slowdown of 2001would begin in the United States in the second half of 2002 and graduallyaccelerate and spread throughout the world economy. There was a tentativerecovery in 2002, but it quickly faded, largely because of the geopoliticaluncertainties associated with the looming confrontation with Iraq.
The heightened geopolitical uncertainties and perceived risks that arosebefore the invasion of Iraq permeated the world economy through a number ofchannels. The fear that conflict might disrupt oil supplies raised the prices ofoil far higher than warranted by economic fundamentals; higher oil prices werethemselves a global economic shock that dampened aggregate demand andimposed additional price pressures in oil-importing countries. Global politicaltensions caused most equity markets to plummet, aggravating the global assetprice deflation that had been in effect since 2000. In several countries, con-sumer and business confidence fell to their lowest levels in a decade. Businesscapital spending declined in many developed economies. Economically, theoverall effect of the stand-off with Iraq was reduced activity in late 2002 andearly 2003, with the setback being most pronounced in the developed countries(see table I.1). Instead of recovering as anticipated, growth in these countriesin the first quarter of 2003 was generally lower than a year earlier.
With the exception of Western Asia, the developing countries andeconomies in transition were less directly affected by the geopolitical uncer-tainties surrounding the issue of Iraq. Nevertheless, indirectly, the delayedrecovery in the developed countries itself had negative consequences. In somecases, most notably in Latin America, these were aggravated by domestic dif-ficulties. To a greater extent, however, domestic economic circumstances indeveloping countries and particularly in the economies in transition served asa buffer against the weak external environment. China and India offered themost pronounced examples of this but most of the economies in transition alsodemonstrated an important degree of domestically led growth. To a lesserextent, sub-Saharan Africa displayed similar signs of resilience, althoughgrowth remained modest.
The invasion of Iraq took a heavy toll on human life and economic activi-ty in the region. Nevertheless, the military action was briefer, less costly inhuman life, less extensive and less disruptive of global economic activity thanhad been feared, with the result that several of the earlier negative manifesta-tions of the previous geopolitical uncertainty were quickly and measurablyreduced. Oil prices retreated and are expected to fall further as global oil pro-duction recovers, with beneficial effects on global growth and on inflationarypressure in oil-importing countries. Equity prices rebounded in the post-inva-sion period, reflecting and contributing to increased optimism regarding eco-nomic prospects. There was also a post-conflict recovery in the indices of bothconsumer and business confidence. Most of the negative consequences of theearlier geopolitical uncertainties are expected to dissipate by the third quarterof 2003.
In addition, a number of the positive factors that were expected to prompt arecovery in 2002 remain in effect. The most important are the continuing stim-ulative effects of macroeconomic policy. Policy interest rates in the developed
W O R L D E C O N O M I C A N D S O C I A L S U R V E Y 2 0 0 34
countries continue to be low, with some limited room for further loosening insome cases. Most developed countries are also benefiting from fiscal stimuli,with further fiscal relaxation already promised in some countries. Coupled withthe wealth effects of a surge in house prices in some developed countries, thesetwo policy stimuli should reinvigorate consumer demand during 2003. Cyclicalinventory replenishment will also provide a boost, possibly more substantialthan previously anticipated because it has been delayed. Excess capacity in theinformation and communication technologies (ICT) sector, which was previ-ously a major disincentive to investment, is also being reduced with the pas-sage of time, particularly with the more rapid rate of obsolescence that nowcharacterizes the sector. These underlying cyclical factors, reinforced by thepositive developments since the end of the conflict in Iraq, augur well for arecovery in the second half of 2003.
At the same time, a number of factors will dampen the speed of the recov-ery. In particular, the extension of the period of below-average growth has
5T H E W O R L D E C O N O M Y I N 2 0 0 3
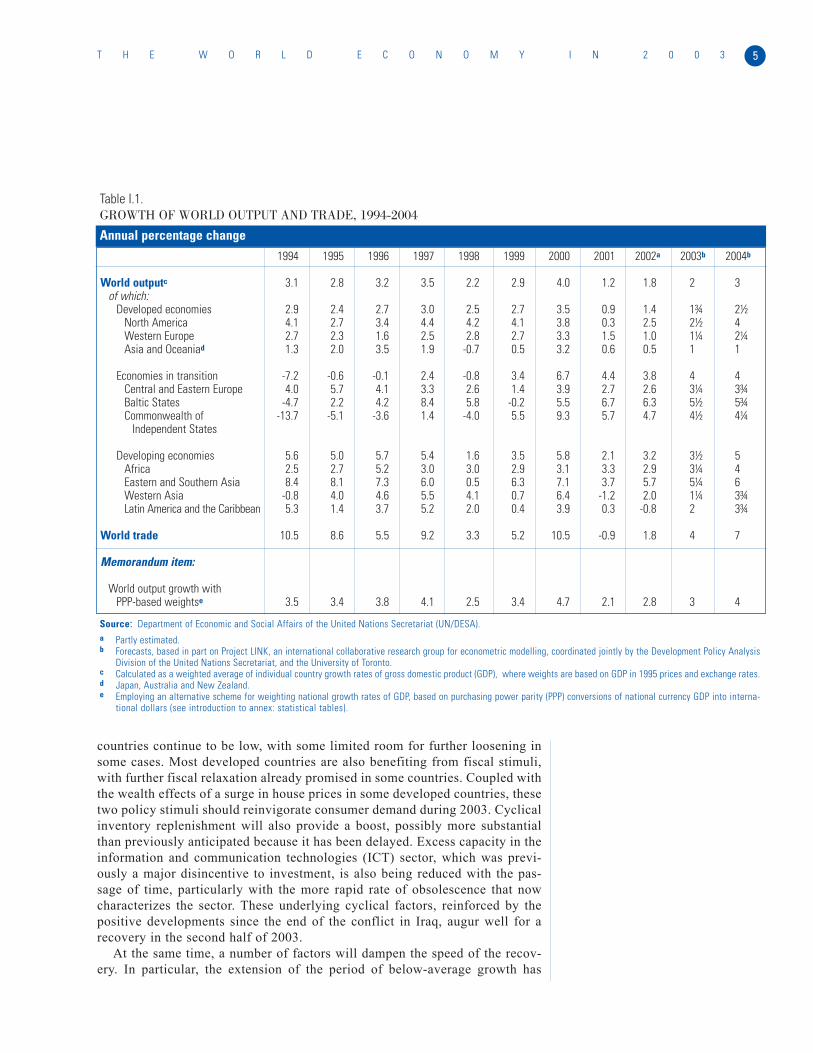
Table I.1.GROWTH OF WORLD OUTPUT AND TRADE, 1994-2004
1994 1995 1996 1997 1998 1999 2000 2001 2002a 2003b 2004b
World outputc 3.1 2.8 3.2 3.5 2.2 2.9 4.0 1.2 1.8 2 3of which:
Developed economies 2.9 2.4 2.7 3.0 2.5 2.7 3.5 0.9 1.4 1¾ 2½North America 4.1 2.7 3.4 4.4 4.2 4.1 3.8 0.3 2.5 2½ 4Western Europe 2.7 2.3 1.6 2.5 2.8 2.7 3.3 1.5 1.0 1¼ 2¼Asia and Oceaniad 1.3 2.0 3.5 1.9 -0.7 0.5 3.2 0.6 0.5 1 1
Economies in transition -7.2 -0.6 -0.1 2.4 -0.8 3.4 6.7 4.4 3.8 4 4Central and Eastern Europe 4.0 5.7 4.1 3.3 2.6 1.4 3.9 2.7 2.6 3¼ 3¾Baltic States -4.7 2.2 4.2 8.4 5.8 -0.2 5.5 6.7 6.3 5½ 5¾Commonwealth of -13.7 -5.1 -3.6 1.4 -4.0 5.5 9.3 5.7 4.7 4½ 4¼
Independent States
Developing economies 5.6 5.0 5.7 5.4 1.6 3.5 5.8 2.1 3.2 3½ 5Africa 2.5 2.7 5.2 3.0 3.0 2.9 3.1 3.3 2.9 3¼ 4Eastern and Southern Asia 8.4 8.1 7.3 6.0 0.5 6.3 7.1 3.7 5.7 5¼ 6Western Asia -0.8 4.0 4.6 5.5 4.1 0.7 6.4 -1.2 2.0 1¼ 3¾Latin America and the Caribbean 5.3 1.4 3.7 5.2 2.0 0.4 3.9 0.3 -0.8 2 3¾
World trade 10.5 8.6 5.5 9.2 3.3 5.2 10.5 -0.9 1.8 4 7
Memorandum item:
World output growth withPPP-based weightse 3.5 3.4 3.8 4.1 2.5 3.4 4.7 2.1 2.8 3 4
Source:: Department of Economic and Social Affairs of the United Nations Secretariat (UN/DESA).a Partly estimated.b Forecasts, based in part on Project LINK, an international collaborative research group for econometric modelling, coordinated jointly by the Development Policy Analysis
Division of the United Nations Secretariat, and the University of Toronto.c Calculated as a weighted average of individual country growth rates of gross domestic product (GDP), where weights are based on GDP in 1995 prices and exchange rates. d Japan, Australia and New Zealand.e Employing an alternative scheme for weighting national growth rates of GDP, based on purchasing power parity (PPP) conversions of national currency GDP into interna-
tional dollars (see introduction to annex: statistical tables).
Annual percentage change

aggravated some earlier weaknesses. For example, the further increase inunemployment, particularly, the increase in longer-term unemployment, is like-ly to constrain the growth of consumer demand. Similarly, the hostile interna-tional political environment had a particularly adverse effect on some specificsectors, notably international tourism and airlines, which had not recoveredfrom the fallout of the terrorist attacks of 11 September 2001. Some of thesesectors are not expected to recover fully for some time; meanwhile, their weak-ened positions, including bankruptcies, are likely to have negative effects ongrowth more generally. These negative factors are likely to reduce the acceler-ation in growth to levels below those usually seen in cyclical upturns.
Among the developed countries, the United States was the most adverselyaffected by the heightened geopolitical uncertainties and, correspondingly, isbenefiting the most from the return to normalcy. As in 2002, therefore, theUnited States is expected to lead the global economic recovery. No other majoreconomy appears to be in a position to assume this role in the near future.Japan, for example, continues to face difficulties in extricating itself from itsslow growth path while Germany appears to have entered a recession in early2003. Most countries are explicitly looking for improved growth in the UnitedStates to act as a catalyst in revitalizing their own economies.
Recovery in the United States is expected to materialize in the second halfof 2003 and to provide a stimulus to growth elsewhere. The depreciation of thedollar in early 2003, if sustained, will reinforce this recovery in the UnitedStates but will reduce the extent of the stimulus that United States growth pro-vides to the rest of the world. Nevertheless, there will be an acceleration in thegrowth of world trade, to the benefit of all countries. Many developing coun-tries are also benefiting from improved, albeit still historically low, commodi-ty prices and some have the advantage of lower interest rates in internationalcapital markets.
A widespread recovery is necessary because, while they may launch arecovery, the present positive forces in the developed countries, particularlythe United States, are unlikely to be sufficient on their own to sustain a recov-ery throughout 2004. Business investment has been particularly sluggish overthe past two years and will need to revive in order to sustain the momentum.The decline in excess capacity should increase the demand for new capital,while improved equity prices and higher profits as a result of the revival ofconsumer demand should ease its financing. Although low interest rates havenot stimulated business investment to date, they should facilitate increasedinvestment if other conditions improve. However, there is also a need for amore positive international environment, comprising improved internationaltrade and a revival of international capital flows, in order to induce increasedbusiness spending.
A better external environment will enable the economies in transition tobuild upon their recent domestic strength. In the developing countries, improv-ing external demand in the second half of 2003 and 2004 is expected to buttressrecovery in Latin America and to provide additional support to steady but lim-ited growth in Africa. Partially because of the effect of SARS in the early partof the year, growth will moderate in Southern and Eastern Asia in 2003 but willrebound in 2004. Similarly, the situation in Iraq will cause a slowdown inWestern Asia before the recovery forecast for 2004.
W O R L D E C O N O M I C A N D S O C I A L S U R V E Y 2 0 0 36
A LACKLUSTRE INTERNATIONAL ECONOMIC ENVIRONMENT
Particularly when contrasted with the 1990s, both world trade and capitalflows currently lack dynamism, reflecting and contributing to the overallweakness in the world economy. Having declined in 2001, world tradeincreased by only 1.8 per cent in 2002 and is expected to grow by less than 4per cent in 2003, with expansion of some 7 per cent forecast for 2004 (seetable I.1). The non-economic shocks to the world economy were detrimentalto world merchandise trade, but above all to trade in such services as traveland tourism. In addition to there being a lower rate of growth of trade than inthe 1990s, the ratio of the growth of merchandise trade to the growth of out-put, having tended to increase from about 2 towards 3 as a result of globaliza-tion, has reverted to the lower figure.
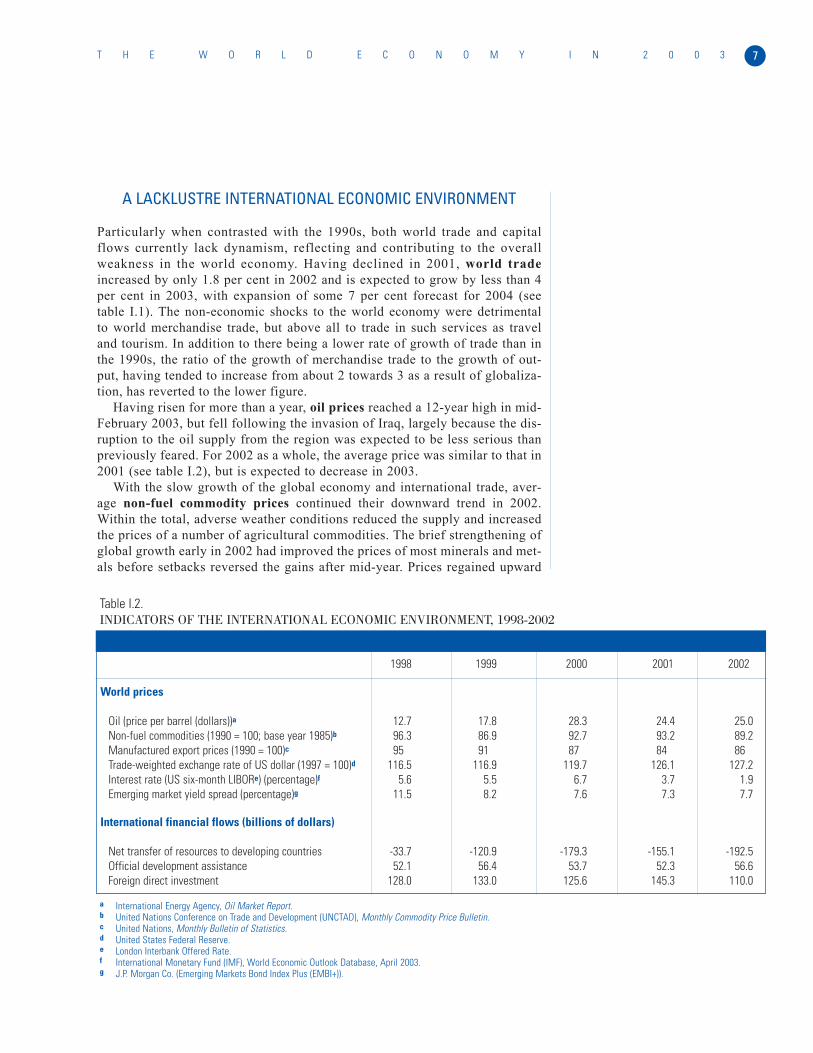
Having risen for more than a year, oil prices reached a 12-year high in mid-February 2003, but fell following the invasion of Iraq, largely because the dis-ruption to the oil supply from the region was expected to be less serious thanpreviously feared. For 2002 as a whole, the average price was similar to that in2001 (see table I.2), but is expected to decrease in 2003.
With the slow growth of the global economy and international trade, aver-age non-fuel commodity prices continued their downward trend in 2002.Within the total, adverse weather conditions reduced the supply and increasedthe prices of a number of agricultural commodities. The brief strengthening ofglobal growth early in 2002 had improved the prices of most minerals and met-als before setbacks reversed the gains after mid-year. Prices regained upward
7T H E W O R L D E C O N O M Y I N 2 0 0 3
Table I.2.INDICATORS OF THE INTERNATIONAL ECONOMIC ENVIRONMENT, 1998-2002
1998 1999 2000 2001 2002
World prices
Oil (price per barrel (dollars))a 12.7 17.8 28.3 24.4 25.0Non-fuel commodities (1990 = 100; base year 1985)b 96.3 86.9 92.7 93.2 89.2Manufactured export prices (1990 = 100)c 95 91 87 84 86Trade-weighted exchange rate of US dollar (1997 = 100)d 116.5 116.9 119.7 126.1 127.2Interest rate (US six-month LIBORe) (percentage)f 5.6 5.5 6.7 3.7 1.9Emerging market yield spread (percentage)g 11.5 8.2 7.6 7.3 7.7
International financial flows (billions of dollars)
Net transfer of resources to developing countries -33.7 -120.9 -179.3 -155.1 -192.5Official development assistance 52.1 56.4 53.7 52.3 56.6Foreign direct investment 128.0 133.0 125.6 145.3 110.0
a International Energy Agency, Oil Market Report.b United Nations Conference on Trade and Development (UNCTAD), Monthly Commodity Price Bulletin.c United Nations, Monthly Bulletin of Statistics.d United States Federal Reserve.e London Interbank Offered Rate.f International Monetary Fund (IMF), World Economic Outlook Database, April 2003.g J.P. Morgan Co. (Emerging Markets Bond Index Plus (EMBI+)).
momentum towards the end of 2002. With the global economic recovery gain-ing momentum and with the weakening of the dollar, most non-fuel commodi-ty prices are expected to strengthen during 2003 as a whole and in 2004.
There was a substantial movement in the exchange rates among the majorcurrencies in mid-2002 and in the first few months of 2003, most notably adecline in the value of the United States dollar against the euro and, to a less-er extent, other major currencies. If this depreciation of the dollar is sustained,it will have major implications for global economic prospects (see below).
Net official financial flows to developing countries remained substantial in2002 but this was mostly because of large International Monetary Fund (IMF)loans to a few countries facing financial pressures. More encouragingly, offi-cial development assistance (ODA) increased in 2002, not only in absoluteterms but also, marginally, as a proportion of the gross national income (GNI)of donor countries. There were also pledges during the year of future increas-es in ODA, hopefully marking a turnaround in the downward trend that hascharacterized recent years.
Private international financial flows continued to be lacklustre in 2002and no major improvement is expected in the short term. Among the developedcountries, the global economic slowdown and the bursting of the bubble inequity markets have created a lull in international financial transactions,notably large cross-border mergers and acquisitions between companies.
For developing countries, official and private capital outflows and paymentsabroad associated with earlier inflows not only exceeded the correspondingreceipts for the sixth consecutive year in 2002 but did so by a record amount.This net financial transfer has exacerbated the negative effects for develop-ing countries of the slow growth in the real sectors of the developed countries.
Foreign direct investment (FDI) flows to developing countries initiallywithstood the global economic slowdown of 2001, possibly because of the lagbetween investment decisions and implementation. In 2002, however, globaleconomic conditions and the slowdown in privatizations resulted in a fall inFDI flows to developing countries, with the notable exception of China. Amajor resurgence in these flows seems unlikely in the short term. FDI flows toEastern European economies, on the other hand, continue to be robust, prompt-ed not only by cost considerations but also by the prospect of their entry intothe European Union (EU); these flows are expected to be sustained.
Reflecting their largely pro-cyclical nature as well as the poor geopoliticalclimate, other private capital flows to developing countries continued to beweak in 2002 and were exceeded by outflows. For those developing countriesthat are able to participate in international capital markets, the cost of interna-tional borrowing has tended to fall as lower interest rates in the developedcountries have been coupled with lower “spreads” for borrowing developingcountries, particularly since the invasion of Iraq. Private financial flows todeveloping countries may increase as the global geopolitical environmentimproves and the world economy gains momentum. However, these samedevelopments are likely to prompt a recovery in financial markets in developedcountries, which may reduce the present incentive to channel funds to devel-oping countries.
W O R L D E C O N O M I C A N D S O C I A L S U R V E Y 2 0 0 38

POLICY RESPONSES TO SLOW GROWTH
The extent of the initial economic slowdown, while severe, was reduced bythe counter-cyclical policy measures, including those of an automatic nature,adopted by many countries. There were, however, variations in the extent towhich countries were able or willing to adopt expansionary measures, par-ticularly as the period of slow growth lengthened. The continued sluggish-ness suggests the need for more stimuli, but the policy framework in a largenumber of economies is constraining many authorities from adopting suchmeasures.
The immediate reaction to the economic slowdown in 2000-2001 was sub-stantial reductions in policy interest rates in developed countries. Althoughenergy and, in some countries, housing prices rose in 2002, inflation was notseen as a major threat in the majority of developed countries and low interestrates were maintained in most countries throughout the year and into early2003. Some central banks, notably the Federal Reserve of the United States(Fed), reduced interest rates further in this period, bringing them to unusuallylow levels in many cases. The inflation-targeting rule followed by theEuropean Central Bank (ECB) until early 2003 gave it less room for manoeu-vre and delayed its cuts in policy interest rates until March 2003. At the sametime, it changed its inflation objective of 2 per cent from a ceiling to a target,allowing greater flexibility in its monetary policy. The possibility of deflationhas encouraged a number of central banks to indicate that they would considerthe possibility of further monetary easing if necessary. In several countries inEastern Europe, interest rates were reduced in 2002, primarily to dampen anyappreciation of the exchange rate so as to maintain competitiveness.
Most countries have had less scope for expansionary fiscal policies becausethe size of their fiscal deficits has made them subject to either a self-imposedbudgetary rule or a possible adverse reaction from global financial markets orthe international financial institutions. A major exception has been the UnitedStates where increased central government expenditures and reduced taxationin 2002 combined to produce a sizeable fiscal stimulus and a growing fiscaldeficit. In Western Europe, fiscal policy was slightly expansionary in 2002, butFrance, Germany and Italy are under pressure to consolidate their budgetarypositions in order to meet the 3 per cent deficit ceiling embodied in theStability and Growth Pact. Although it has no such policy rule, the Governmentof Japan is already in a difficult financial position and any further sizeable fis-cal stimulus would aggravate the risk of a further downgrade in its sovereigndebt by international rating agencies, further damaging economic confidence.
Many developing countries and some economies in transition improvedtheir fiscal positions in the 1990s but deficits remain a problem, aggravatedsince 2001 by reduced government receipts and, in some cases, increasedexpenditures to offset the economic slowdown. However, there is a broaddichotomy between developing countries with relatively sustainable macro-economic positions and those with macroeconomic disequilibria and/or other,often external, constraints. China and most economies in East Asia have beenable to use monetary and fiscal instruments in the appropriate counter-cycli-cal manner during the present period of slow growth. In contrast, mosteconomies in Latin America and Africa have had to give priority to address-
9T H E W O R L D E C O N O M Y I N 2 0 0 3
ing their macroeconomic imbalances; this has usually required using theirmacroeconomic policy instruments in a restrictive, currently pro-cyclicalmanner, rather than as a means of offsetting the present sluggish conditions.This dichotomy is likely to continue in 2003 and will contribute to a continu-ation of the divergent growth outcomes, and hence widening income dispari-ties, across regions and countries.
REGIONAL PERFORMANCE AND PROSPECTS
Because they have faster rates of population growth, developing countriesneed to grow faster than developed countries if they are to achieve a year-to-year improvement in the well-being of their average citizen. If they are tomake meaningful progress towards reducing the number of people living inpoverty, developing countries have to maintain a high growth rate continuous-ly for an extended period of time. The current period of sub-par growth hascompromised both these objectives.
Although growth in the developed countries has been generally deemedunsatisfactory, only four of these countries experienced a decrease in per capi-ta income in 2002 (see table I.3). The economies in transition fared even bet-ter, with only two suffering such a setback. In the case of the developing coun-tries, per capita output fell in 33 of the 95 countries monitored (compared with37 in 2001). These 33 countries accounted for 8 per cent of the world popula-tion (compared with 10 per cent in 2001). In 2002, 16 developing countries,accounting for 46 per cent of the world population, achieved an increase in percapita output exceeding 3 per cent. However, most of the people in this groupwere accounted for by China and India. If these two countries are excluded,only about one fifth of the 2.5 billion people in the rest of the developing worldwere living in countries where the increase in GDP per capita exceeded 3 percent. Of the 41 least developed countries for which data are available, 15recorded a fall in per capita GDP in 2002. Only seven least developed coun-tries, five less than in 2001, achieved growth in their per capita GDP exceed-ing 3 per cent more in 2002. These data suggest that, for most countries andpeople in the developing world, 2002 was another year in which there was lit-tle progress in reducing poverty
Developed countries: recovery derailed
The uncertainties associated with the possibility of conflict in Iraq constituteda major factor causing GDP growth in the United States to plummet from 5per cent at the beginning of 2002 to 1.4 per cent in the fourth quarter. With the“war overhang” largely eliminated, the economic outlook has improved andgrowth is expected to accelerate as 2003 progresses. The household sector wasweak during the pre-war period, but should strengthen: consumer confidencehas recovered, interest rates are still at historic lows and the housing and resi-dential construction markets remain strong. The depreciation of the dollar willprovide a boost to exports and import-substituting activities in the mediumterm, when the recovery will depend more heavily on an upturn in businessspending. Growth in Canada slowed as 2002 progressed, largely because of
W O R L D E C O N O M I C A N D S O C I A L S U R V E Y 2 0 0 310
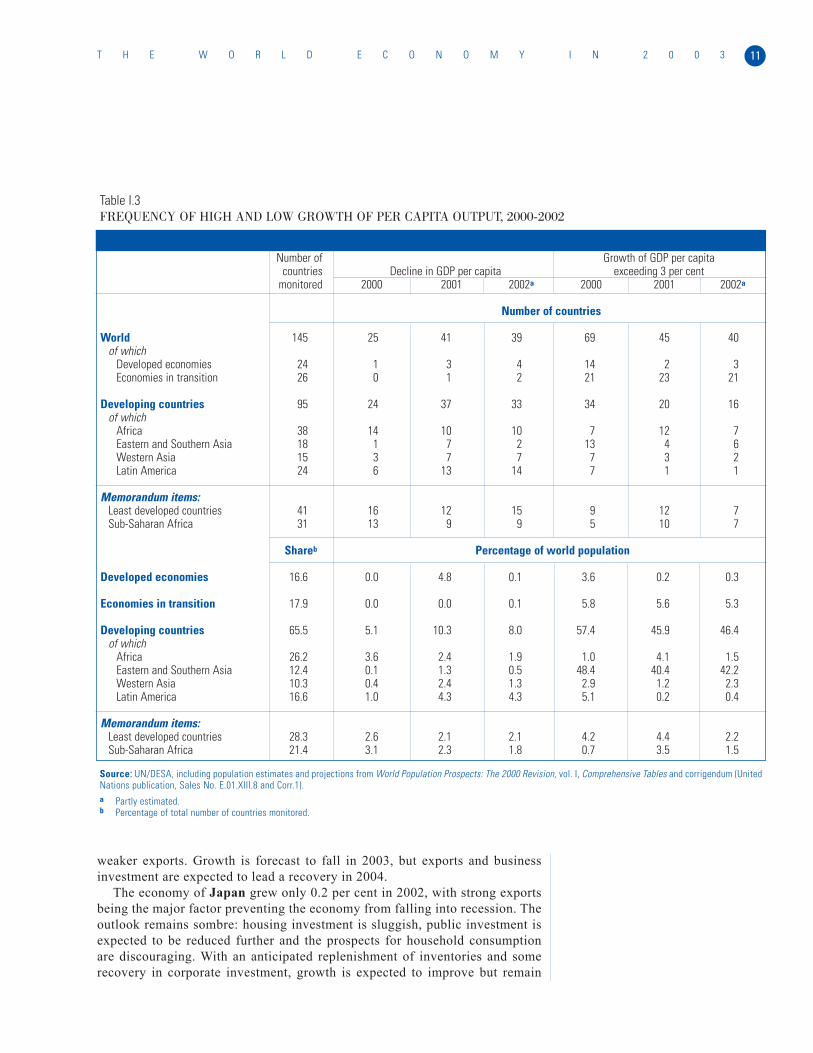
weaker exports. Growth is forecast to fall in 2003, but exports and businessinvestment are expected to lead a recovery in 2004.
The economy of Japan grew only 0.2 per cent in 2002, with strong exportsbeing the major factor preventing the economy from falling into recession. Theoutlook remains sombre: housing investment is sluggish, public investment isexpected to be reduced further and the prospects for household consumptionare discouraging. With an anticipated replenishment of inventories and somerecovery in corporate investment, growth is expected to improve but remain
11T H E W O R L D E C O N O M Y I N 2 0 0 3
Table I.3FREQUENCY OF HIGH AND LOW GROWTH OF PER CAPITA OUTPUT, 2000-2002
Number of Growth of GDP per capitacountries Decline in GDP per capita exceeding 3 per cent
monitored 2000 2001 2002a 2000 2001 2002a
Number of countries
World 145 25 41 39 69 45 40of which
Developed economies 24 1 3 4 14 2 3Economies in transition 26 0 1 2 21 23 21
Developing countries 95 24 37 33 34 20 16of which
Africa 38 14 10 10 7 12 7Eastern and Southern Asia 18 1 7 2 13 4 6Western Asia 15 3 7 7 7 3 2Latin America 24 6 13 14 7 1 1
Memorandum items:Least developed countries 41 16 12 15 9 12 7Sub-Saharan Africa 31 13 9 9 5 10 7
Shareb Percentage of world population
Developed economies 16.6 0.0 4.8 0.1 3.6 0.2 0.3
Economies in transition 17.9 0.0 0.0 0.1 5.8 5.6 5.3
Developing countries 65.5 5.1 10.3 8.0 57.4 45.9 46.4of which
Africa 26.2 3.6 2.4 1.9 1.0 4.1 1.5Eastern and Southern Asia 12.4 0.1 1.3 0.5 48.4 40.4 42.2Western Asia 10.3 0.4 2.4 1.3 2.9 1.2 2.3Latin America 16.6 1.0 4.3 4.3 5.1 0.2 0.4
Memorandum items:Least developed countries 28.3 2.6 2.1 2.1 4.2 4.4 2.2Sub-Saharan Africa 21.4 3.1 2.3 1.8 0.7 3.5 1.5
Source:: UN/DESA, including population estimates and projections from World Population Prospects: The 2000 Revision, vol. I, Comprehensive Tables and corrigendum (UnitedNations publication, Sales No. E.01.XIII.8 and Corr.1).a Partly estimated.b Percentage of total number of countries monitored.
low in 2003 and 2004. However, growth remains highly dependent on exportsand is therefore vulnerable with respect to the appreciation of the yen.
Following growth of only 1.0 per cent in 2002, Western Europe is expect-ed to recover somewhat in 2003, with a further improvement in 2004. Theextended period of below-trend growth has led to higher region-wide unem-ployment and to a number of States’ approaching or exceeding the fiscal deficitceiling of 3 per cent of GDP called for by the EU Stability and Growth Pact.Together with the appreciation of the euro, these factors will dampen the recov-ery, but consumption is expected to strengthen slowly and business investmentis forecast to rebound.
In both Australia and New Zealand, strong domestic demand offset theweak external sector in 2002, with both economies growing by over 3½ percent. High business profitability and low debt levels contributed to higher cap-ital spending, while growth in employment and increases in real wages led tostrong household spending. Growth in both economies is expected to deceler-ate, but will remain between 2½ and 3 per cent in 2003 and 2004.
Economies in transition: limited deceleration
Growth in Central and Eastern Europe was almost unchanged in 2002, butis expected to strengthen in 2003 and 2004. By the end of 2002, there werealready some indications of strengthening industrial production in CentralEurope. More generally, growth is expected to be supported by growingdomestic demand, continuing FDI inflows and associated investment and bysome further relocation of production from EU to the region.
The economies of the Commonwealth of Independent States (CIS) con-tinue to be largely sheltered from global economic uncertainties, havingrecorded strong growth each year since 2000. Robust domestic demand in boththe Russian Federation and Ukraine, and rising oil prices and correspondinghydrocarbon investment in the Caspian region, have been the primary causes ofthis expansion. In Central Asia, many economies continue to surge owing tolarge oil and gas investments, while smaller economies are benefiting fromexpansion in their mining and metals sectors. Growth for the region as a wholeis projected to be 4½ per cent in 2003, moderating to 4¼ per cent in 2004.
The Baltic countries grew by 6.3 per cent in 2002 on the basis of strongdomestic demand and their flexibility in responding to robust demand from CISto offset decreased demand from EU. Growth is expected to moderate in 2003and 2004, with domestic demand remaining the driving force.
Developing countries: continuing underachievement
Africa’s GDP growth is forecast to improve modestly in 2003 and to continueaccelerating in 2004. Exports are expected to increase as global economicgrowth picks up in the second half of 2003. Projected price increases foralmost all categories of export commodities will additionally strengthenexport revenues and support GDP growth in many countries.
Reduced Organization of the Petroleum Exporting Countries (OPEC) quo-tas and sluggish international demand dampened North Africa’s performancein 2002, but these economies are expected to grow more vigorously in 2003.
W O R L D E C O N O M I C A N D S O C I A L S U R V E Y 2 0 0 312
Sub-Saharan Africa’s growth in 2002 was driven largely by domestic factors:most countries benefited from increased agricultural output, lower inflationand significant growth in non-agricultural sectors. The impact of these posi-tive forces is expected to continue in 2003 and 2004. At the same time, theoutlook for some subregions remains clouded by the persistence of instabilityin a few countries.
East Asia’s rebound from its sharp slowdown in 2001 started to ease in thesecond half of 2002. Sluggish external demand persisted in the first quarter of2003 and expected growth for the year as a whole has been further reduced bythe outbreak of SARS. If the epidemic is contained, growth is expected toimprove in the second half of the year and into 2004. Import demand from theUnited States and continuing robust demand from China will support exportgrowth, while broadly accommodative policies, lower oil prices and improvingconfidence will strengthen domestic demand and boost industrial production,particularly in export-oriented industries.
Growth in China accelerated in early 2003. Both domestic demand and theexternal sector expanded rapidly. Fixed investment in all sectors and regionshas been leading domestic demand, although housing continues to expandrapidly. Both exports and imports grew by more than 15 per cent in 2002 andare forecast to increase by nearly 20 per cent in 2003. Despite some perennialchallenges, such as large-scale unemployment, widening income gaps, and thefragility of the financial system, GDP growth is expected to remain high in2003 and 2004.
South Asia’s growth increased modestly in 2002 and the region’s near-termprospects are positive. Growth is being supported by both domestic demandand exports. Exports in most countries were increasing in the first half of 2003and are expected to increase further as external demand picks up in the secondhalf of the year. Domestic demand is also expected to strengthen, supported bylower interest rates, rising exports and a better harvest as weather conditionsnormalize. Stronger growth will emerge by mid-2003 and the outlook for 2004is for a further increase, with more balance across the region.
Following a decline in 2001, Western Asia’s economy grew modestly in2002 as oil production declined in most oil-exporting countries and the uncer-tainties associated with the conflict between Israel and Palestine and the situa-tion in Iraq resulted in declines in FDI, tourism revenues and consumer andinvestment confidence. The invasion of Iraq had negative economic effects onthe country and the region. While the damage to oil infrastructure was limited,a return to former levels of oil production and exports may take severalmonths. Regional prospects are expected to improve in 2004 as oilfield devel-opment and several petrochemicals projects come on-stream. The reconstruc-tion of Iraq will provide additional stimuli to the region, although growth in theother oil-exporting countries will be modest. Oil-importing economies of theregion are not expected to exhibit much dynamism.
After contracting in 2002, Latin America is making a limited recovery,although the weak international environment and domestic economic or politi-cal problems in a number of countries are a constraint. Growth in the regionremains heavily dependent on the volume of foreign capital flows. AlthoughFDI continues to be the major source of external finance, inflows are general-ly weak while portfolio flows have been volatile.
13T H E W O R L D E C O N O M Y I N 2 0 0 3
W O R L D E C O N O M I C A N D S O C I A L S U R V E Y 2 0 0 314
SHORT-TERM UNCERTAINTIES AND RISKS
The overriding task for policy makers in the short term must be to restoreglobal economic growth to its long-term potential. Although the immediateeconomic outlook has become more positive than earlier in 2003 and a grad-ual global recovery is expected to take off in the second half of the year, theshort-term outlook is fraught with a number of uncertainties and risks, the bal-ance of which are on the downside.
First and foremost, although some geopolitical uncertainties have abated,they have not all evaporated. The invasion of Iraq removed the pre-war uncer-tainties but future political developments pertaining to Western Asia, as well asto some other regions, remain uncertain. There were further international ter-rorist acts perpetrated in the second quarter of 2003, suggesting that such activ-ities are likely to continue in future. Experience shows that such acts can havelarge effects on confidence and hence on short-term growth.
Although oil prices have declined since the invasion of Iraq, they remainhighly volatile and therefore present both upside and downside risks. In thiscase, the balance is likely to be on the upside since potential oversupply couldcause prices in late 2003 and 2004 to fall further than expected, with beneficialeffects on global growth.
SARS reduced growth in a number of Asian developing countries in the firsthalf of 2003. While the outbreak appears to have been largely controlled, awidespread occurrence of this or a similarly devastating disease could adverse-ly affect some regional economies or even the world economy as a whole.
The global recovery continues to depend heavily on having the United Statesact as a catalyst and driving force and it is therefore vulnerable to the uncertain-ties and risks faced by the United States economy. The major uncertainties thatare unique to the United States economy are the nature and timing of theinevitable adjustment of its external deficits. This correction may have startedwith the fall in the value of the dollar in the first months of 2003, but the depre-ciation itself poses a number of risks for the global recovery (see box I.1).
A separate but related risk is that posed by the burgeoning United States fis-cal deficit. While this does not pose any immediate threat (to the contrary, afurther increase in government expenditures in 2003 is an appropriate counter-cyclical measure), difficulties are likely to arise in the medium term throughcrowding-out effects. These will include higher interest rates with adverseeffects on consumption as well as investment expenditure.
Furthermore, other risks that apply in varying measure to the economies ofmany developed countries are—again because of its key role—particularly per-tinent to the economy of the United States. There continues to be overcapaci-ty in some industrial sectors, either globally or within particular countries. Thistendency initially applied most notably to the ICT sector, where overcapacityhas since been reduced. However, there is now overcapacity in a number ofsectors that have been most acutely affected by the geopolitical developmentsof the past two years (such as airlines and travel) and a number of other indus-tries (such as automobiles). Such excess capacity will have a dampening effecton the business investment that is necessary to sustain the recovery.
Equity markets are recovering from the negative effects of the Iraq situa-tion and a further substantial or prolonged fall in prices, which was feared ear-
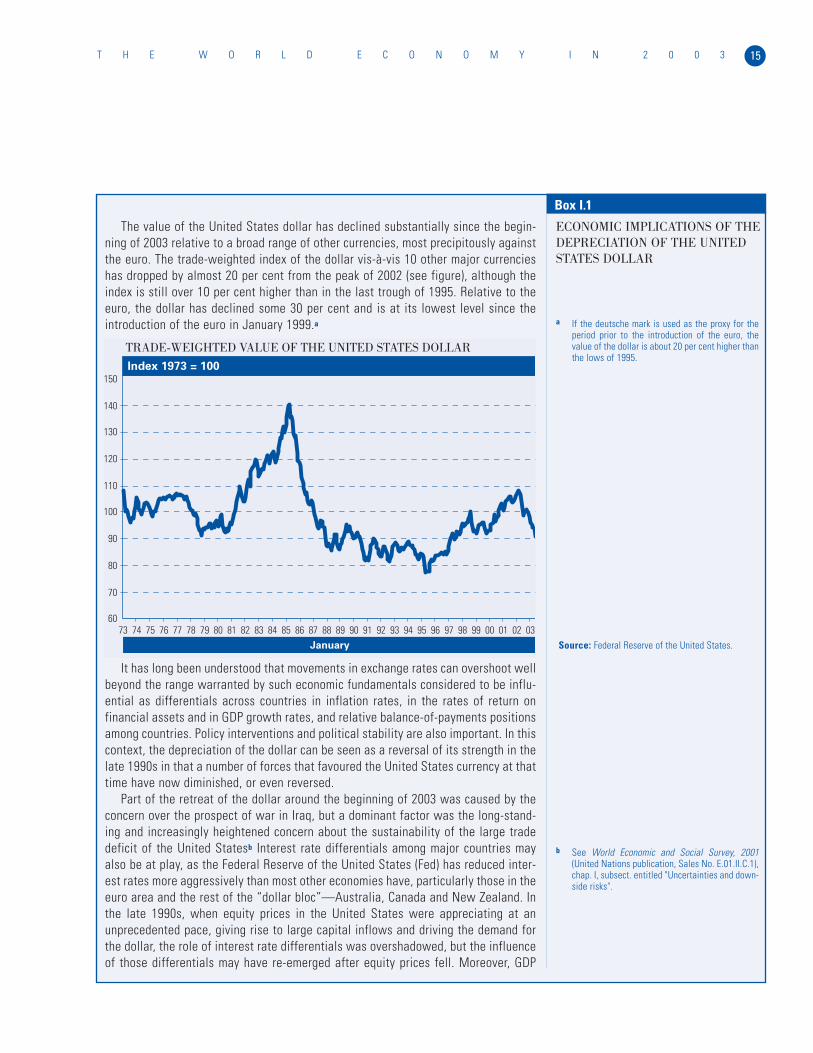
15T H E W O R L D E C O N O M Y I N 2 0 0 3
The value of the United States dollar has declined substantially since the begin-ning of 2003 relative to a broad range of other currencies, most precipitously againstthe euro. The trade-weighted index of the dollar vis-à-vis 10 other major currencieshas dropped by almost 20 per cent from the peak of 2002 (see figure), although theindex is still over 10 per cent higher than in the last trough of 1995. Relative to theeuro, the dollar has declined some 30 per cent and is at its lowest level since theintroduction of the euro in January 1999.a
It has long been understood that movements in exchange rates can overshoot wellbeyond the range warranted by such economic fundamentals considered to be influ-ential as differentials across countries in inflation rates, in the rates of return onfinancial assets and in GDP growth rates, and relative balance-of-payments positionsamong countries. Policy interventions and political stability are also important. In thiscontext, the depreciation of the dollar can be seen as a reversal of its strength in thelate 1990s in that a number of forces that favoured the United States currency at thattime have now diminished, or even reversed.
Part of the retreat of the dollar around the beginning of 2003 was caused by theconcern over the prospect of war in Iraq, but a dominant factor was the long-stand-ing and increasingly heightened concern about the sustainability of the large tradedeficit of the United Statesb Interest rate differentials among major countries mayalso be at play, as the Federal Reserve of the United States (Fed) has reduced inter-est rates more aggressively than most other economies have, particularly those in theeuro area and the rest of the “dollar bloc”—Australia, Canada and New Zealand. Inthe late 1990s, when equity prices in the United States were appreciating at anunprecedented pace, giving rise to large capital inflows and driving the demand forthe dollar, the role of interest rate differentials was overshadowed, but the influenceof those differentials may have re-emerged after equity prices fell. Moreover, GDP
Box I.1
ECONOMIC IMPLICATIONS OF THEDEPRECIATION OF THE UNITEDSTATES DOLLAR
Source: Federal Reserve of the United States.
a If the deutsche mark is used as the proxy for theperiod prior to the introduction of the euro, thevalue of the dollar is about 20 per cent higher thanthe lows of 1995.
TRADE-WEIGHTED VALUE OF THE UNITED STATES DOLLAR
Index 1973 = 100
60
70
80
90
100
110
120
130
140
150
73 74 75 76 77 78 79 80 81 82 83 84 85 86 87 88 89 90 91 92 93 94 95 96 97 98 99 00 01 02 03January
b See World Economic and Social Survey, 2001(United Nations publication, Sales No. E.01.II.C.1),chap. I, subsect. entitled "Uncertainties and down-side risks".
W O R L D E C O N O M I C A N D S O C I A L S U R V E Y 2 0 0 316
growth of the United States has slowed significantly, at least in the short run, reduc-ing the growth differential relative to other economies. Furthermore, the “strong dol-lar” policy of the United States for the past decade seems to have been jettisoned,at least tacitly. In face of all these developments, the long-anticipated depreciationof the United States dollar is not surprising; nonetheless, the prospects for the dol-lar remain uncertain, as overshooting can occur in both directions.c
The weaker dollar has implications not only for the economy of the United Statesbut for the economic growth of the rest of the world. In principle, the depreciation ofthe dollar is expected to benefit the United States economy, particularly the manu-facturing and exporting sectors, which have been weak for the past two years. Mostof the impact on the real economy is likely to be felt only gradually as the pass-through of the depreciation into the changes of relative prices will take time, and theresponse of real demand and supply to the price changes will take even longer.d Theweaker dollar is reinforcing the monetary stimulus engendered by the low interestrates policy of the Fed, which is especially auspicious for exports and corporate prof-its—for the large United States transnational corporations in particular. The impacton the trade deficit will also not be tangible immediately—to the contrary, the deficitmay continue to widen in the short run.e
On the other hand, the depreciation of the dollar is likely to have a negativeimpact on financial markets in the United States because it will result in losses forforeign investors who are holding dollar-denominated financial assets. This may leadto a further decline in capital inflows to the United States, and reduced demand forthe dollar, begetting a further depreciation of the dollar. If such a vicious circle wasformed, financial markets worldwide would be in jeopardy, and so would be adverse-ly affected, to the detriment of economic growth.
The impact on economic growth in the rest of the world will be mixed. The depre-ciation has weakened import demand and thus the role of the United States as theglobal locomotive for the economic recovery in many other economies. Major devel-oped economies, particularly those in the euro area, will face more downward pres-sure on their manufacturing and external sectors. Developing countries whose cur-rencies are pegged to the dollar or have not appreciated much against the dollar,such as China and a few others, will benefit from the dollar depreciation, and theirimport demand from the United States will not be affected. The prices of many com-modities are likely to rise because of the weaker dollar, boosting export revenues formany developing economies, but the real purchasing power of the revenue, or theterms of trade, for these economies may not improve. The weaker dollar will also pro-vide some relief for developing countries with dollar-denominated debts, particularlythose that are highly indebted.
The impact of the dollar depreciation on the rest of the world will also depend onthe policy response of the economies. For example, with a stronger euro and henceless inflationary pressure, the European Central Bank (ECB) may become more flexi-ble in reducing interest rates in the euro area, and this will stimulate domesticdemand. At the same time, a number of developing countries, particularly thosewhere interest rates have been maintained at high levels, now have more room toreduce rates, thereby making them more supportive of growth.
Box I.1 (continued)
d Various econometric studies, including ProjectLINK, indicate that it will take about one year topass about half of the depreciation of the dollarthrough to relative prices, and depreciation of thedollar by 10 per cent would lead to an increase ofabout 1 percentage point in the GDP of the UnitedStates in the second year.
e This is due to the so-called "J-curve" effects.When the price elasticity of import demand is low,as is the case in the United States, the adjustmentin the real demand for imports will be smaller thanthe increase in the relative price of imports, lead-ing initially to an even higher bill for imports.
c As indicated by the baseline outlook, GDP growthfor the United States is expected to recover at arate much stronger than that of other majoreconomies, in favour of the dollar.

lier, now seems unlikely to materialize. However, a housing bubble is widelyperceived to exist in a number of developed countries. Rising house priceshave been an important element in sustaining strong consumer expenditure, aswell as the housing and construction industry itself, in such countries. Theserising prices, together with the experience of Japan, suggest that a bursting ofthe bubble could have sizeable negative effects on these economies.
Deflation has already had profound negative consequences for the Japaneseeconomy; it has also touched a number of other Asian economies and is nowviewed by some observers as a possibility in some of the major industrializedeconomies. The depreciation of the United States dollar reduces the possibilityof deflation in the United States but makes it more likely in economies withappreciating currencies, notably the EU countries (particularly Germany).Some Asian economies have experienced brief periods of deflation withoutwidespread detrimental effects but Japan’s experience highlights the dangers ofallowing deflation to become entrenched. Measures against deflation need—toan even greater extent than an anti-inflationary policy—to be pre-emptive andbased on prospects rather than on current developments. Inevitably, such anapproach embodies its own set of risks.
DELIVERING ON THE NEW DEVELOPMENT COMMITMENT
For any improvement in growth to be sustained over the medium term, it willbe necessary to revitalize international cooperation for development in orderto address some underlying challenges to growth in developing countries.Cooperative international development efforts can contribute to repairing thedamage inflicted on multilateral cooperation during the past year, as well asconstitute an important means of addressing the global inequality that con-tributes to the underlying geopolitical tensions.
Prior to the emergence of the geopolitical uncertainties that hampered glob-al economic growth in late 2002 and early 2003, the international communityhad forged, through a sequence of global meetings, an international consensuson development priorities and actions. The Fourth Ministerial Conference ofthe World Trade Organization, held at Doha in November 2001, theInternational Conference on Financing for Development, held in Monterrey,Mexico, in March 2002, and the World Summit on Sustainable Development,held in Johannesburg, South Africa, in August-September 2002, collectivelydefined a new global partnership for development between developed anddeveloping countries. The overriding objective of this partnership is to accel-erate development through shared responsibilities and mutual commitment. Ineach case, the programmes for the implementation of this partnership giveattention to both resources and policies.
During the past year, work has continued on the refinement and implemen-tation of these programmes. An important dimension of this work has been anincreasing need for coherence among policies and programmes. This is partic-ularly apparent where policies are in direct contradiction, but more generally itrequires ensuring not only that all policies and actions are development-friend-ly but that they are so to the fullest extent possible.
17T H E W O R L D E C O N O M Y I N 2 0 0 3
Securing progress on the trade agenda
Inevitably, progress in the implementation of the programmes drawn up atDoha, Monterrey and Johannesburg has been mixed, but it is discouraging thatprogress on the work programme with the shortest time frame and, in someways, the largest short-term potential, namely, the “Doha DevelopmentAgenda”, has been the most limited. Many of its deadlines for agreement onspecific issues have already passed without having been met. Most such issuesare of particular concern to developing countries, not only from the point ofview of trade but because they relate to a priority developmental concern.Given the slow start, the successful completion of the Doha programme willrequire a high degree of political determination, including a willingness on thepart of the developed countries to undertake the types of adjustment measuresthat developing countries have long been called upon to make in liberalizingtheir trade regimes.
The Doha work programme is ambitious both in its scope and in its time-horizon and yet it has been agreed that it should be a “single undertaking” where“nothing is agreed until everything is agreed”. The Doha negotiations are tooimportant to fail so the fact that progress to date has been limited makes theoriginally ambitious goal even more so. It is essential that meaningful progressbe registered at the Fifth Ministerial Conference of the World TradeOrganization, to be held in Cancún, Mexico, in September 2003, whose maintask will be to undertake a mid-term review of progress in negotiations andother work under the Doha Development Agenda. This will require allGovernments to take a more flexible approach to these negotiations and, aboveall, to see them not as trade negotiations but as part of the new partnership tofoster development. They should also be seen in the context of the current needto accelerate global economic growth in the short term. To this end,Governments may wish to focus for the immediate future on a few issues ofoverriding development concern and, in so doing, to adopt a more openapproach.
A priority issue is to enhance the World Trade Organization Declaration onthe TRIPS agreement and public health (WT/MIN(01)/DEC/2) adopted at theFourth Ministerial Conference on 14 November 2001.1 The declaration hasbeen an important development breakthrough because it authorizes a develop-ing country to issue a licence to a domestic entity to produce a patent-protect-ed pharmaceutical “predominantly for the supply of the domestic market” (arti-cle 31 (f) of the TRIPS agreement). However, countries without the necessarypharmaceutical manufacturing capacity are unable not only to take advantageof this provision but also to import from countries that have been granted sucha licence. Such excluded countries are frequently the poorest, the most disease-afflicted and the most in need of low-cost drugs. Governments agreed toresolve this problem in the World Trade Organization but have failed to meettwo self-imposed deadlines for doing so (although several developed countrieshave declared a moratorium on applying the existing restrictions until a solu-tion is found). This problem relates directly to human well-being and so is atthe very core of development. A prompt compromise solution, possibly involv-ing a sequenced approach, would provide a much-needed boost to the Dohanegotiations, as well as testify to the validity of the new partnership for devel-
W O R L D E C O N O M I C A N D S O C I A L S U R V E Y 2 0 0 318
1 For the Agreement on Trade-related Aspects ofIntellectual Property Rights (TRIPS agreement), seeLegal Instruments Embodying the Results of theUruguay Round of Multilateral Trade Negotiations,done at Marrakesh on 15 April 1994 (GATT secre-tariat publication, Sales No. GATT/1994-7), annex 1C.
opment not only between the developed and the developing countries but alsobetween the public and the private sectors.
A second major concern is agricultural trade, in particular the subsidies andother support that developed countries provide to their agricultural sector.Developing countries have long been encouraged to eliminate subsidies inorder to remove distortions in their economies and to improve their fiscal bal-ances but the developed countries continue to maintain massive agriculturalsubsidies for, as well as high tariffs on, many agricultural products. Because ofthe central role of the agricultural sector in many developing countries, thesemeasures are directly to the detriment of developing countries, offsetting oreven undoing the benefits of other forms of cooperation with those same coun-tries. They are therefore in direct contradiction to the principles of partnershipand coherence that form the backbone of the new development compact.Developed countries should therefore begin to reduce agricultural subsidieswithout delay and make time-bound commitments to eliminating them withouta quid pro quo in other Doha negotiations. A starting point would be the elim-ination of all export subsidies and the discontinuance of the “dumping” of agri-cultural products in developing countries; this would have an immediate salu-tary effect on the agriculture sector in developing countries—and hence on thelivelihoods of millions, including many of the poorest.
The question of “special and differential treatment” for developing coun-tries assumes particular significance in a round of negotiations that aims atmaking the global trading system more development-friendly. It is generallyagreed that countries at lower levels of development should be subject to lessstringent trading rules than more developed countries, but there is little agree-ment on how this principle should be made operational. As a result, the nego-tiations on special and differential treatment have also failed to meet a suc-cession of deadlines.
The least developed countries constitute one group that is particularlydeserving of special treatment. This is recognized in World Trade Organizationnegotiations, as well as in some bilateral and regional concessions. In particu-lar, the EU “Everything but Arms” initiative allows duty-free access to all non-arms imports from least developed countries except so-called sensitive prod-ucts—bananas, sugar and rice; duties on these products are to be eliminated by2009. As a first step towards enhanced differential treatment for developingcountries, all developed countries should adopt the “Everything but Arms”principle and such commitments should be bound within the World TradeOrganization. In addition, some of the more advanced developing countriesshould apply the same principles to the less advantaged members of the group.Finally, every effort should be made to advance the date for the elimination ofduties on sensitive products, even if this is done on a case-by-case basis.
Addressing external debt
The past few years have highlighted the fact that, more than 20 years after thedebt crisis erupted in Latin America, many developing countries continue toface difficulties servicing their external debt. A long-term solution to this prob-lem would be for developing countries to rely as far as possible on non-debt-creating flows. This already appears to be taking place with the reduced willing-
19T H E W O R L D E C O N O M Y I N 2 0 0 3
ness of capital markets to lend to many developing countries. In the meantime,the magnitude of the Argentine crisis underscores the need for more effectiveinternational arrangements to deal with private sector debt crises associatedwith existing obligations. The ongoing discussions on means to avoid andresolve financial crises in middle-income countries should be continued.
It is also necessary to resolve the immediate difficulties of the heavilyindebted poor countries (HIPCs). There are 15 HIPCs, such as those emergingfrom conflict situations, whose cases have not yet been considered and whoseeligibility needs to be assessed as soon as conditions permit. Of those alreadyreviewed, only 3 more of the 26 countries that had reached the “decision point”in the enhanced HIPC Initiative moved on to the “completion point” betweenApril 2002 and April 2003, bringing the total to 8. Further measures need to betaken to ensure that all eligible countries reach the completion point as expe-ditiously as possible. For those that have already done so, the amount of reliefthat is required to achieve debt sustainability as originally envisaged has turnedout to be higher than anticipated in several cases; this is often because growthand/or export earnings have been lower than expected, owing frequently to afall in commodity prices. It is necessary to ensure that the HIPC programmereduces a country’s debt to a level that remains sustainable even when it isadversely affected by events beyond its control. Most importantly, the quanti-ty of debt relief provided is already being threatened by the insufficient fund-ing for the HIPC Trust Fund and by the fact that not all creditors are providingrelief. Renewed efforts are required to mobilize the resources necessary toimplement the Initiative fully.
Reviving concessional financial flows
There was an encouraging increase in ODA in 2002 and there are commit-ments to further increases by a number of donors in the next few years.Reflecting the recognition that even these improvements would fall short ofwhat is widely perceived to be required, a proposal was launched in 2003 bythe United Kingdom of Great Britain and Northern Ireland for an internationalfinance facility which would aim at doubling the flow of ODA in the next fewyears. Although a number of donors have had questions about the proposal, itreflects official donor recognition of the need for a substantial increase inODA flows. There was also progress towards improving the effectiveness ofaid flows by the members of the Development Assistance Committee (DAC)of the Organisation for Economic Cooperation and Development (OECD)through the simplification and harmonization of procedures.
These favourable developments were counteracted by an increased politi-cization of aid flows. There is a growing tendency in the donor community toconcentrate assistance on recipient countries that comply with donors’ currentperceptions of “sound policies”, including “good governance”. It is a truismthat sound policies and good governance foster development, but definingthese terms is less straightforward. Conceptually, it is difficult to reconcile thisapproach with the widespread recognition that conditionality is ineffective,that “one size doesn’t fit all” and that “ownership” is central to successfuldevelopment. A modicum of modesty might be more appropriate in the light ofthe donor community’s limited successes to date.
W O R L D E C O N O M I C A N D S O C I A L S U R V E Y 2 0 0 320
The global geopolitical situation is also having a bearing on aid flows. TheUnited States, the largest donor, recorded a sudden and substantial increase inODA flows in 2002, but this was largely a response to the terrorist attacks of11 September 2001. It is anticipated that the reconstruction of Iraq will alsoresult in a substantial increase in ODA flows over the next few years. Thedonor community has made several efforts over recent years to ensure thatODA is appropriately defined and measured, for example, by excluding high-income recipients. Inasmuch as ODA inevitably serves geopolitical purposes tosome extent funds used for purely geopolitical or commercial objectives shouldbe separately identified so as to ensure that they are not disbursed at the costof providing development assistance to the many countries that need it to con-front long-term development challenges.
21T H E W O R L D E C O N O M Y I N 2 0 0 3

International trade and capital flows were in the doldrums for much of2002 and the early part of 2003. International trade lacked dynamism inthe face of sluggish global growth and was beset by geopolitical uncertain-ties, staging only a mild recovery from the reversal it had suffered in 2002.Some acceleration is expected in the second half of 2003 and into 2004,when the growth of world trade in goods is expected to be about 7 per cent.One of the notable features of the past few years, however, has been thedisruption to trade in services, particularly travel and tourism, caused bya sequence of non-economic shocks, from the terrorist attacks of 2001 tothe outbreak of severe acute respiratory syndrome (SARS) in early 2003.Apart from the sectors themselves, small economies heavily dependent onthese sectors were severely affected.
International capital flows were also slowed by the difficult economicand political environment. Banks continued to reduce their lending todeveloping countries, although a number of emerging markets made suc-cessful bond issuances in this period and some saw improvements in theirinternational credit ratings. With the notable exception of China, flows offoreign direct investment (FDI) to developing countries also declined in2002. A reflection of the financial difficulties facing a small number ofdeveloping countries was another year of substantial non-concessional netlending by the international financial institutions. More encouragingly,there was an increase in official concessional flows to developing countriesin 2002. Seemingly reversing the downward trend of the past few years,official development assistance (ODA) increased, with pledges of furtheradditions in the future. This, however, was the only bright spot because, inaggregate, there was a record net financial transfer out of developingcountries in 2002.
On the policy front, progress was muted. Negligible progress was madein the trade negotiations launched in Doha in 2001, and early prospects inthe run-up to the Fifth Ministerial Conference of the World TradeOrganization, to be held in Cancún, Mexico, in September 2003, were dis-couraging. In addition to the increase in ODA flows and commitments,other follow-ups to the International Conference on Financing forDevelopment held in Monterrey, Mexico, in March 2002 included continu-ing efforts to formulate means of preventing and resolving internationalfinancial crises. One major initiative in this area failed to find approvalbut the use (and market acceptance) of collective action clauses (CACs) ina number of bond issuances by developing countries in early 2003 was amore encouraging development.
IIINTERNATIONAL TRADE AND FINANCE
23I N T E R N A T I O N A L T R A D E A N D F I N A N C E
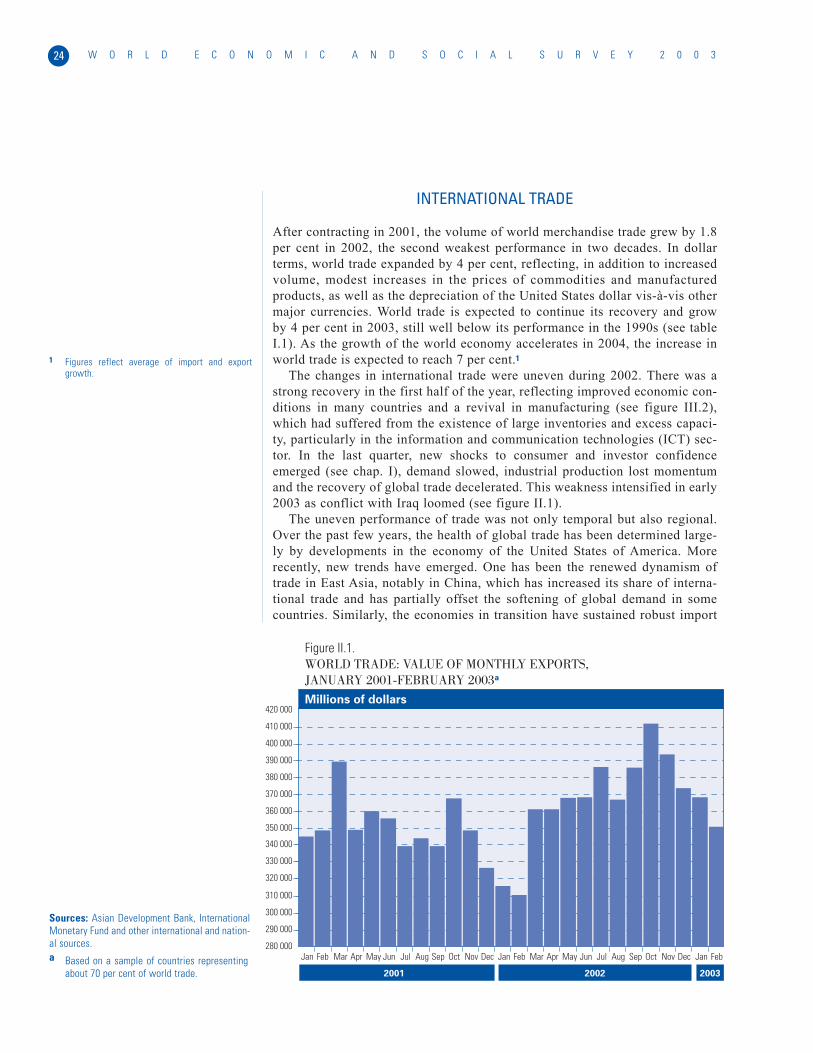
INTERNATIONAL TRADE
After contracting in 2001, the volume of world merchandise trade grew by 1.8per cent in 2002, the second weakest performance in two decades. In dollarterms, world trade expanded by 4 per cent, reflecting, in addition to increasedvolume, modest increases in the prices of commodities and manufacturedproducts, as well as the depreciation of the United States dollar vis-à-vis othermajor currencies. World trade is expected to continue its recovery and growby 4 per cent in 2003, still well below its performance in the 1990s (see tableI.1). As the growth of the world economy accelerates in 2004, the increase inworld trade is expected to reach 7 per cent.1
The changes in international trade were uneven during 2002. There was astrong recovery in the first half of the year, reflecting improved economic con-ditions in many countries and a revival in manufacturing (see figure III.2),which had suffered from the existence of large inventories and excess capaci-ty, particularly in the information and communication technologies (ICT) sec-tor. In the last quarter, new shocks to consumer and investor confidenceemerged (see chap. I), demand slowed, industrial production lost momentumand the recovery of global trade decelerated. This weakness intensified in early2003 as conflict with Iraq loomed (see figure II.1).
The uneven performance of trade was not only temporal but also regional.Over the past few years, the health of global trade has been determined large-ly by developments in the economy of the United States of America. Morerecently, new trends have emerged. One has been the renewed dynamism oftrade in East Asia, notably in China, which has increased its share of interna-tional trade and has partially offset the softening of global demand in somecountries. Similarly, the economies in transition have sustained robust import
W O R L D E C O N O M I C A N D S O C I A L S U R V E Y 2 0 0 324
Sources: Asian Development Bank, InternationalMonetary Fund and other international and nation-al sources.a Based on a sample of countries representing
about 70 per cent of world trade.
Figure II.1.WORLD TRADE: VALUE OF MONTHLY EXPORTS, JANUARY 2001-FEBRUARY 2003a
2001 2002 2003
Millions of dollars
280 000
290 000
300 000
310 000
320 000
330 000
340 000
350 000
360 000
370 000
380 000
390 000
400 000
410 000
420 000
Jan Feb Mar Apr May Jun Jul Aug Sep Oct Nov Dec Jan Feb Mar Apr May Jun Jul Aug Sep Oct Nov Dec Jan Feb
1 Figures reflect average of import and exportgrowth.
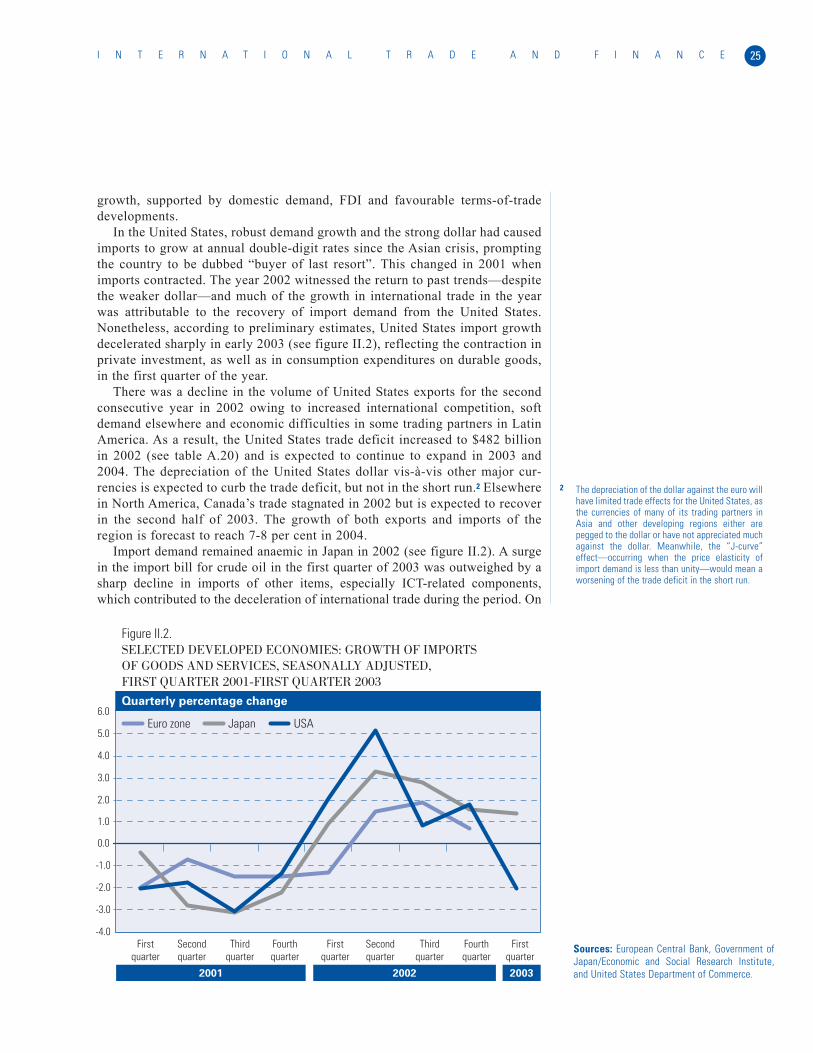
growth, supported by domestic demand, FDI and favourable terms-of-tradedevelopments.
In the United States, robust demand growth and the strong dollar had causedimports to grow at annual double-digit rates since the Asian crisis, promptingthe country to be dubbed “buyer of last resort”. This changed in 2001 whenimports contracted. The year 2002 witnessed the return to past trends—despitethe weaker dollar—and much of the growth in international trade in the yearwas attributable to the recovery of import demand from the United States.Nonetheless, according to preliminary estimates, United States import growthdecelerated sharply in early 2003 (see figure II.2), reflecting the contraction inprivate investment, as well as in consumption expenditures on durable goods,in the first quarter of the year.
There was a decline in the volume of United States exports for the secondconsecutive year in 2002 owing to increased international competition, softdemand elsewhere and economic difficulties in some trading partners in LatinAmerica. As a result, the United States trade deficit increased to $482 billionin 2002 (see table A.20) and is expected to continue to expand in 2003 and2004. The depreciation of the United States dollar vis-à-vis other major cur-rencies is expected to curb the trade deficit, but not in the short run.2 Elsewherein North America, Canada’s trade stagnated in 2002 but is expected to recoverin the second half of 2003. The growth of both exports and imports of theregion is forecast to reach 7-8 per cent in 2004.
Import demand remained anaemic in Japan in 2002 (see figure II.2). A surgein the import bill for crude oil in the first quarter of 2003 was outweighed by asharp decline in imports of other items, especially ICT-related components,which contributed to the deceleration of international trade during the period. On
25I N T E R N A T I O N A L T R A D E A N D F I N A N C E
Sources: European Central Bank, Government ofJapan/Economic and Social Research Institute,and United States Department of Commerce.
Figure II.2.SELECTED DEVELOPED ECONOMIES: GROWTH OF IMPORTS OF GOODS AND SERVICES, SEASONALLY ADJUSTED, FIRST QUARTER 2001-FIRST QUARTER 2003
2001 2002 2003
First quarter
Second quarter
Third quarter
Fourth quarter
First quarter
Second quarter
Third quarter
Fourth quarter
First quarter
Quarterly percentage change
-4.0
-3.0
-2.0
-1.0
0.0
1.0
2.0
3.0
4.0
5.0
6.0Euro zone Japan USA
2 The depreciation of the dollar against the euro willhave limited trade effects for the United States, asthe currencies of many of its trading partners inAsia and other developing regions either arepegged to the dollar or have not appreciated muchagainst the dollar. Meanwhile, the “J-curve”effect—occurring when the price elasticity ofimport demand is less than unity—would mean aworsening of the trade deficit in the short run.
the other hand, strong Japanese export performance, due particularly to buoyanttrade in Asia in 2002 and the integration of Japanese manufacturing with that inEast Asia, was the major impetus preventing the economy from falling into arecession.3 Shipments to other parts of Asia continued to boom in early 2003,while exports to the United States declined sharply and exports to the EuropeanUnion (EU) remained weak. The growth of Japanese exports is expected to beabout 3 per cent for 2003-2004 and the growth of imports is expected to be sim-ilar, with the annual trade surplus remaining at about $100 billion.
After a modest performance in 2001, imports by EU showed almost no realgrowth in 2002, as continued weak domestic demand countered any boost fromcurrency appreciation. Almost no change in the volume of imports is expectedin 2003 as domestic demand remains lacklustre, but growth of some 3½ percent is forecast for 2004 as the effects of currency appreciation on prices feedthrough and domestic demand strengthens. Meanwhile, export volume growthdecelerated further in the region in 2002 owing to slow world demand and theappreciating currency, which hurt competitiveness.4 Continued dollar depreci-ation is expected and will place further pressure on European exporters whoare expected to lose market share. Nevertheless, exports are expected to pickup over the course of 2003 and gain further momentum in 2004, as worlddemand revives.
Among the economies in transition, imports continued to grow in theCentral and Eastern European region, owing to the growth of private con-sumption. In some countries, Bulgaria and Croatia in particular, strong importgrowth was associated with high rates of investment; in the Czech Republic,increased imports were due to recovery from the floods. Import growth isexpected to remain strong in 2003, driven both by private and public con-sumption and by investment, FDI in particular.
Most economies in Central Europe exhibited modest rates of export growthin real terms owing to lower EU import demand and stronger currencies. Insome cases, stronger exports to the Commonwealth of Independent States(CIS) and Central European Free Trade Agreement (CEFTA) countries com-pensated for stagnant exports to EU. The export performance of a number ofcountries in Southern and Eastern Europe (notably Bulgaria, Romania andYugoslavia) improved because of increased intraregional trade and improvedcompetitiveness brought about by FDI. Exports from other States of this sub-region remained weak owing to remaining constraints on industrial capacity.The prospects for the region’s exports in 2003 are largely dependent on EU: anupturn in EU will encourage exports of intermediate products from Central andEastern Europe. In addition, an impetus to the region’s trade may be providedby growing import demand from the CIS economies, as well as a number ofdeveloping countries. Some bilateral trade agreements that took effect in theregion in 2002 and 2003 will also have a favourable effect.
Imports by the Baltic and CIS countries, with the exception ofTurkmenistan, also increased in 2002. Higher imports reflected strong con-sumer demand and investment in several countries as well as, in the case of theRussian Federation, the real appreciation of the ruble against the dollar and theeuro, and, in the case of Estonia and Lithuania, the appreciation of their euro-pegged currencies against the dollar. Continued strong domestic demand inthese countries will provide an impetus for import growth in 2003.
W O R L D E C O N O M I C A N D S O C I A L S U R V E Y 2 0 0 326
3 The value of Japan’s exports measured in UnitedStates dollars grew by 6.4 per cent in 2002, butits exports to the United States grew by only 1 percent while those to EU dropped by 2 per cent.
4 The euro appreciated by about 20 per cent againstthe United States dollar in 2002 and by 11 percent in trade-weighted terms.

CIS countries also had a strong export performance in 2002. In most cases,merchandise export revenues increased substantially, by almost 50 per cent indollar terms in the case of Armenia. Azerbaijan was the only country thatreported a drop (6 per cent) in nominal exports. In the Russian Federation, thevolume of exports increased by over 10 per cent in 2002, largely on account ofincreased oil exports. Oil exports cannot, however, increase much further, ascapacity limits have been reached. The State-owned company that controlsexports neither has plans for expansion nor is willing to relinquish control andallow private companies to build their own pipelines. The growth of Russianexports is therefore likely to decelerate in 2003. Geographically, Russian tradecontinues to shift away from the CIS countries: non-CIS countries accountedfor 83 per cent of Russian foreign trade in 2002.
Among the developing regions, Africa’s merchandise trade showed weak butresilient growth in both imports and exports in 2002. Imports grew moderately,reflecting a return to more normal patterns after sharp declines in 2001. Foodimports accounted for large increases in import expenditures in drought-afflict-ed countries while higher oil prices increased the import bills of most net fuelimporting countries. Imports are expected to grow moderately in 2003, reflect-ing similarly moderate growth of gross domestic product (GDP), increaseddemand for imported consumer goods and increased imports of capital goodsfor large-scale investment in infrastructure development and industrial projectsin several countries. The spike in food imports in southern Africa should recedewith the easing of the drought in most of the affected countries.
Meanwhile, in oil-exporting countries, export revenues in 2002 were drivenby higher prices and increased demand for oil, supported by increased produc-tion in Angola, Equatorial Guinea and the Sudan. Non-fuel commodity exportingcountries benefited from the modest improvement in prices and demand in 2002.Sharp increases in the prices of precious metals, such as gold and platinum, andan increase in the demand for diamonds, all as a result of the geopolitical uncer-tainties in the months leading up to the United States invasion of Iraq, benefitedSouth Africa and other producers of minerals and metals in southern Africa.Export volumes are expected to increase only marginally in 2003.
East Asia was one of the few bright spots for trade in 2002. Importsincreased in most economies in line with strong consumption and risingdemand for intermediate inputs to export industries. Import growth in Chinareached 20 per cent in real terms in 2002 (see table A.13) and was over 50 percent in nominal terms in the first quarter of 2003. This latter pace, however,was due partially to seasonal factors, such as the rush of importers to useremaining 2002 quotas and a significant increase in imports of petroleum, andwill not be sustained throughout the year. For the region as a whole, importgrowth is expected to pick up in the second half of 2003 (in response to astrengthening of both domestic demand and exports) and to accelerate in 2004.In most economies, the reversal of the deterioration in their terms of trade (asoil prices weaken and the prices of manufacturing exports bottom out) willfavour their trade balance, countering the increase in import volume.
Exports by Eastern and Southern Asia grew robustly in 2002, after thedecline in 2001 (see table A.13). Export growth is likely to be moderate untilmid-2003, dampened by the uncertainties associated with SARS and the con-tinuing subdued recovery in major developed countries. Export growth is
27I N T E R N A T I O N A L T R A D E A N D F I N A N C E
expected to pick up from the second half of 2003, boosted by strengtheningdemand in major developed countries and continuing robust imports by China.China, Hong Kong Special Administrative Region (SAR) of China andMalaysia, with their currencies pegged to the depreciated United States dollar,will begin to benefit from stronger competitiveness. In 2004, export growthwill accelerate further in response to strengthening world trade but may not beas strong as in 2000 because demand in the developed countries will be weak-er. A marked contribution from ICT exports is likely because, through theregional processing network, the demand for components quickens rapidly inresponse to rising global demand. However, given excess capacities, a fullrecovery in the world ICT cycle, particularly in the United States, is unlikelyuntil late 2004.
Imports increased in most South Asian countries in 2002 and are expectedto strengthen from mid-2003 in response to rising domestic demand and ongo-ing import liberalization, resulting in widening trade deficits. Exports recov-ered in most countries in 2002 but individual performances reflected differ-ences in export structure, market access and security. Export growth is expect-ed to strengthen in the second half of 2003, but competition and socio-politicaluncertainties are expected to continue to restrain export growth in Bangladesh,Nepal and Sri Lanka. These countries’ narrow export base, notably their heavydependence on garments, makes them vulnerable to intensifying competition intheir major export markets, the United States5 and EU. The diversification andupgrading of their export base are a major policy challenge for these countries.
Imports in most Western Asian oil-exporting countries virtually stagnated in2002, reflecting weak domestic demand, while export volumes contractedowing to reduced oil output. Despite the rise in oil prices, export revenues wereslightly lower than in 2001, although most countries recorded trade surpluses.Among the region’s oil-importing countries, the value of Turkey’s exportsincreased by over 13 per cent in 2002, while import costs soared almost 23 percent, reflecting partly economic recovery and partly higher oil prices. As aresult, the trade deficit widened. The region’s external balance is expected toimprove, but with divergent trends between oil-importing and oil-exportingcountries. Growth in the region’s export receipts is expected to be about 6 percent in 2003, mainly reflecting increased oil production and higher oil prices.However, export earnings will decline in most oil-importing countries in 2003,as the Iraq war and the subsequent suspension of the oil-for-food programmereduced trade flows between Iraq and its trading partners in the first half of theyear. At the same time, the region’s import bill is expected to contract by about2½ per cent, owing mostly to weak domestic demand but also to the adverseeffects of the Iraq war on regional trade flows. Jordan, for example, used toimport all its oil from Iraq on generous terms, half in grants and the remainderat a discount. Overall export prospects for 2004 are more favourable.
The most salient feature of Latin America’s external sector in 2002 was thesharp adjustment in its current-account deficit, which was slashed by 70 percent to about $15 billion (see table A.22), largely reflecting the reduced avail-ability of external financing. The region’s aggregate trade balance recorded asurplus in 2002. Imports were drastically curtailed in such countries asArgentina, Brazil and Venezuela, reflecting weak internal demand and adjust-ments in real exchange rates, whereas exports remained stagnant in both nom-
W O R L D E C O N O M I C A N D S O C I A L S U R V E Y 2 0 0 328
5 In addition, the United States allowed low-income Caribbean and sub-Saharan African coun-tries free access to its market for their garmentexports in 2000.
inal and real terms. The region is also facing increased competition in its majorexport markets. China, for instance, has recently overtaken Mexico as the sec-ond largest external supplier of the United States. Export volumes are expect-ed to advance by about 2 per cent in 2003, reflecting the moderate recovery ofinternational trade. Imports are expected to recover from 2002, supported by alimited improvement of domestic demand throughout the region. Importgrowth, however, is expected to remain below 1 per cent in real terms.
COMMODITY PRICES AND MARKETS
The prices of non-fuel commodities in 2002 continued the downward trendthat had begun in 1995 and was interrupted only in 2000 (see table A.17). Oilprices, in contrast, recovered in 2002 but were highly volatile during the year.Some price increases are expected for non-fuel commodities in 2003.Nonetheless, such increases reflect largely the weakening of the United Statesdollar because excess supply, including large inventories in many commoditymarkets, continues to exert pressure on prices. With the end of the war in Iraqand the recovery of production, not only in Iraq but also in other countriesthat recently experienced disruptions, oil prices are expected to remain withinthe target price range of the Organization of the Petroleum ExportingCountries (OPEC) in 2003.
World oil market: recent developments and prospects
Oil prices recovered in 2002 owing to increased demand, low inventories andrelatively low quotas for OPEC countries (totalling 21.7 million barrels perday (mbd)).6 In contrast, oil output in the Russian Federation increased byover 9 per cent in 2002, reaching a record post-Soviet level of 7.62 mbd. Priorto the invasion of Iraq, oil prices rose to a 12-year high in mid-February 2003(see figure II.3), reflecting mostly increased geopolitical tensions but alsounderlying market fundamentals. There was fear that conflict in Iraq couldcreate severe oil shortages due to disruptions in supply and in transportation:prices were bid up accordingly. In addition to the war premium, there wastightness in world oil markets because of reduced production, rising globaldemand and resulting lower inventories. The strike in Venezuela, the thirdlargest producer of OPEC, reduced the country’s oil supply by some 2.7 mbd.In response to these developments, OPEC decided to increase its productionquotas initially to 23.0 mbd with effect from 1 January 2003 and then, in anemergency meeting on 12 January 2003, to 24.5 mbd from 1 February 2003.
Nevertheless, pressure on prices continued to build as the inevitability of awar in Iraq became increasingly apparent, and oil prices reached $35 per bar-rel (pb) in early March 2003. World inventories continued to decline, as theVenezuelan strike had removed a total of some 100 million barrels from theglobal oil market. At the end of February 2003, total oil stocks of theOrganisation for Economic Cooperation and Development (OECD) countrieswere at their lowest level since March 2000. In the United States—the world’slargest oil consumer—stocks were at their lowest level since 1975, as coldweather boosted demand. Higher oil prices also contributed to the decline in
29I N T E R N A T I O N A L T R A D E A N D F I N A N C E
6 OPEC quotas refer to crude oil only and excludeIraqi production.

United States oil stocks, as many United States refiners withdrew oil from theirown inventories. Other countries were affected as well. For instance, China’soil stockpile fell to only 14 days of oil imports—much lower than the interna-tional standard of 90 days.
At a meeting on 11 March 2003, OPEC decided to keep production quotasunchanged but expressed its commitment to compensating for any shortfallemanating from disruptions in the Iraqi supply. The Organization also called onother oil producers to help in containing the rise in prices and in supplyingmarkets adequately. In the meantime, the strike in Venezuela ended and outputwas slowly recovering. As a result, world oil supply increased during the firstquarter of 2003 (see figure II.4).
With the invasion of Iraq, some 3 mbd of oil were removed from the worldmarket. Iraq’s supply of about 2.3 mbd was lost owing to the war and the con-sequent suspension of the United Nations oil-for-food programme; Kuwaiti oilfields near the border with Iraq were also closed, removing a further 700,000barrels per day from the market. World supply conditions deteriorated furtherwhen political unrest disrupted oil production in Nigeria. Surprisingly, oilprices fell to $26 pb during the first days of the war (see figure II.3).
Several factors were at play. First, the previous uncertainty about possibledevelopments regarding Iraq was replaced by a perception in oil markets thatthe conflict would be short-lived and would involve minimal interruptions tooil supplies. In particular, more than 80 per cent of Iraqi oil production is locat-ed in the country’s southern region and this was quickly controlled byAmerican and British troops with minimal damage to the oil infrastructure.Second, some of Saudi Arabia’s stockpile of 28 million barrels had alreadybeen drawn upon and was in transit and expected to reach developed countries
W O R L D E C O N O M I C A N D S O C I A L S U R V E Y 2 0 0 330
Figure II.3.OIL PRICES, JANUARY 2000-APRIL 2003a
Dollars per barrel
2000 2001 2002 2003
15
17
19
21
23
25
27
29
31
33
35
J F M A M J J A S O N D J F M A M J J A S O N D J F M A M J J A S O N D J F M ASource: International Energy Agency, Oil MarketReport.a Prices of Brent oil.
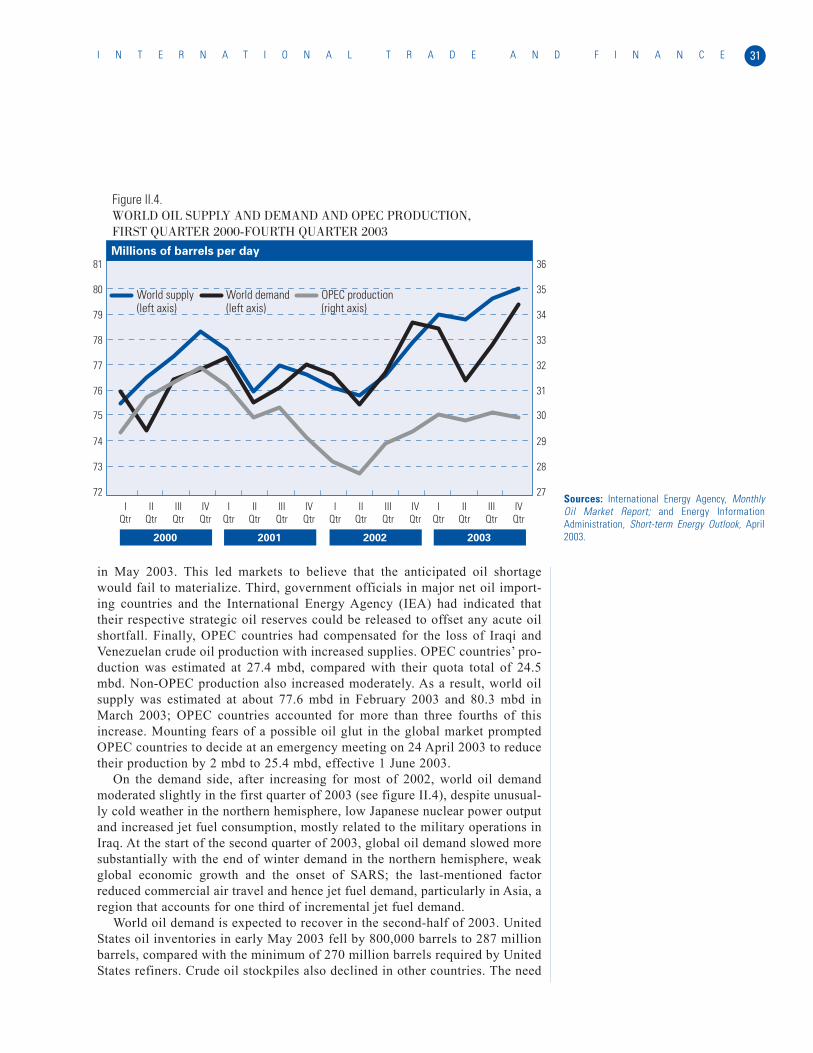
in May 2003. This led markets to believe that the anticipated oil shortagewould fail to materialize. Third, government officials in major net oil import-ing countries and the International Energy Agency (IEA) had indicated thattheir respective strategic oil reserves could be released to offset any acute oilshortfall. Finally, OPEC countries had compensated for the loss of Iraqi andVenezuelan crude oil production with increased supplies. OPEC countries’ pro-duction was estimated at 27.4 mbd, compared with their quota total of 24.5mbd. Non-OPEC production also increased moderately. As a result, world oilsupply was estimated at about 77.6 mbd in February 2003 and 80.3 mbd inMarch 2003; OPEC countries accounted for more than three fourths of thisincrease. Mounting fears of a possible oil glut in the global market promptedOPEC countries to decide at an emergency meeting on 24 April 2003 to reducetheir production by 2 mbd to 25.4 mbd, effective 1 June 2003.
On the demand side, after increasing for most of 2002, world oil demandmoderated slightly in the first quarter of 2003 (see figure II.4), despite unusual-ly cold weather in the northern hemisphere, low Japanese nuclear power outputand increased jet fuel consumption, mostly related to the military operations inIraq. At the start of the second quarter of 2003, global oil demand slowed moresubstantially with the end of winter demand in the northern hemisphere, weakglobal economic growth and the onset of SARS; the last-mentioned factorreduced commercial air travel and hence jet fuel demand, particularly in Asia, aregion that accounts for one third of incremental jet fuel demand.
World oil demand is expected to recover in the second-half of 2003. UnitedStates oil inventories in early May 2003 fell by 800,000 barrels to 287 millionbarrels, compared with the minimum of 270 million barrels required by UnitedStates refiners. Crude oil stockpiles also declined in other countries. The need
31I N T E R N A T I O N A L T R A D E A N D F I N A N C E
Figure II.4.WORLD OIL SUPPLY AND DEMAND AND OPEC PRODUCTION, FIRST QUARTER 2000-FOURTH QUARTER 2003
Millions of barrels per day
2000 2001 2002 2003
IVQtr
IIIQtr
IIQtr
IQtr
IVQtr
IIIQtr
IIQtr
IQtr
IVQtr
IIIQtr
IIQtr
IQtr
IVQtr
IIIQtr
IIQtr
IQtr
World supply (left axis)
World demand (left axis)
OPEC production (right axis)
72
73
74
75
76
77
78
79
80
81
27
28
29
30
31
32
33
34
35
36
Sources: International Energy Agency, MonthlyOil Market Report; and Energy InformationAdministration, Short-term Energy Outlook, April2003.

to replenish world oil inventories will therefore support global demand. Jet fueldemand (accounting for 10 per cent of world oil demand) is likely to recoverduring the second half of 2003 as the adverse impact of SARS eases, but sup-ply is also expected to increase with production in both Iraq and Venezuelareturning to earlier levels. A modest excess supply is expected to keep oilprices at the lower band of the OPEC target price range of $22-$28 pb duringthe last quarter of 2003. For the year as a whole, oil prices are expected to aver-age $28 pb, an increase of 12 per cent over 2002.
Non-fuel commodities: excess supplies and weak demand
Non-fuel commodity prices continued their downward trend in 2002, with theUnited Nations Conference on Trade and Development (UNCTAD) combinedcommodity price index falling by an additional 2 per cent (see table A.17).Over the past five years, the drop in the prices of the main tropical commodi-ties (namely, coffee, cotton and sugar) has been severe, leading to increasedpoverty and vulnerability in a large number of countries. The fall in priceswas due to various factors, such as the slowdown in global economic growth,7
structural oversupplies (for example, in coffee) and market distortions (forexample, in cotton and sugar).8 Nonetheless, from October 2002 to March2003, the prices of some commodities increased, mainly owing to increasedgeopolitical uncertainties and associated risks, but also to the weakening ofthe United States dollar. However, this price increase is likely to prove tempo-rary and should not be taken as an indication of a general strengthening ofmarket fundamentals.
For some commodities, the deterioration in consumer confidence, percep-tions of a worsening economy and geopolitical factors affected decisions by alarge number of economic actors from late 2002 to early 2003. For instance,there were instances of flight into “safe havens”, such as gold, while turmoil inWest Africa temporarily boosted prices in the cocoa sector. However, after theinitial shocks, the situation in these markets is returning to normal, while theprices of a large number of other commodities remain depressed. Coffee prices,for example, continue to be subject to the pressures of the large surplus accu-mulated over the past four years. Similar observations apply to cocoa—whereearlier supply problems could lead to the complete reshaping of an alreadyfragile sector—and to sugar and cotton. In the two last-mentioned sectors, bothAustralia and Brazil are challenging the support regimes maintained in EU andthe United States (see below).
Agricultural commoditiesAfter two years of increase, prices of food products fell by 4 per cent in 2002(see table A.17). However, the various items of this group showed divergingmovements between 2001 and 2002, with a moderate deterioration for bananasand beef, but a fall of over 20 per cent in the case of sugar. In contrast, pricesof such commodities as fishmeal and wheat rose by more than 20 and 15 percent, respectively.
Several factors explain the decline in the price of sugar in the first part of2002, including record production in Brazil and trade arrangements betweenEU and the African, Caribbean and Pacific (ACP) countries and between the
W O R L D E C O N O M I C A N D S O C I A L S U R V E Y 2 0 0 332
7 The downturn, in particular in the automobile andtelecommunication sectors, had a severe impacton the minerals and metals sectors.
8 For more information on commodity market struc-tures and characteristics, see United NationsConference on Trade and Develoment (UNCTAD)and Cyclope, World Commodity Survey 2003-2004(Geneva, UNCTAD, June 2003).
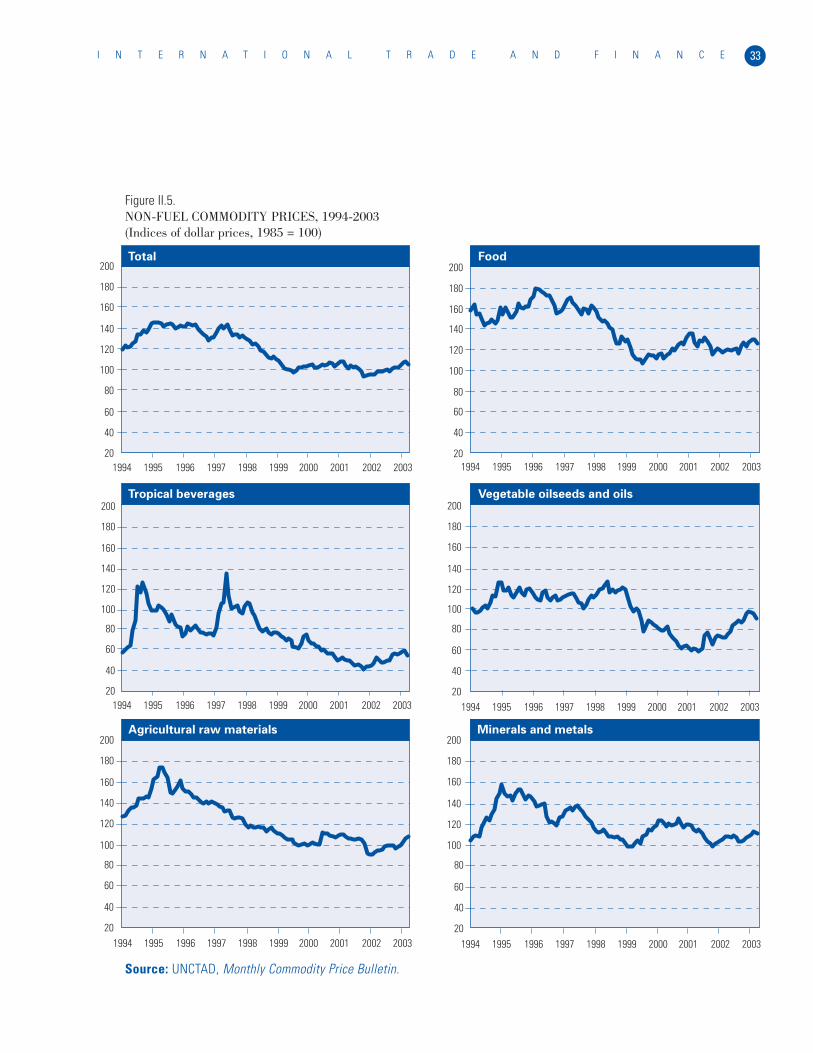
33I N T E R N A T I O N A L T R A D E A N D F I N A N C E
Figure II.5.NON-FUEL COMMODITY PRICES, 1994-2003(Indices of dollar prices, 1985 = 100)
Source: UNCTAD, Monthly Commodity Price Bulletin.
Food
Tropical beverages
Total
Vegetable oilseeds and oils
Minerals and metalsAgricultural raw materials
20
40
60
80
100
120
140
160
180
200
1994 1995 1996 1997 1998 1999 2000 2001 2002 2003 20
40
60
80
100
120
140
160
180
200
1994 1995 1996 1997 1998 1999 2000 2001 2002 2003
20
40
60
80
100
120
140
160
180
200
1994 1995 1996 1997 1998 1999 2000 2001 2002 2003 20
40
60
80
100
120
140
160
180
200
1994 1995 1996 1997 1998 1999 2000 2001 2002 2003
20
40
60
80
100
120
140
160
180
200
1994 1995 1996 1997 1998 1999 2000 2001 2002 2003 20
40
60
80
100
120
140
160
180
200
1994 1995 1996 1997 1998 1999 2000 2001 2002 2003
United States and some other producing countries. The EU import quota forACP countries was cut by 115,000 tons and the system of stock financing,which had been used under the Protocol 3 on ACP Sugar to the PartnershipAgreement Between the Members of the African, Caribbean and Pacific Groupof States, and the European Community and its Member States (CotonouAgreement), was abolished, potentially increasing the supply of sugar in worldmarkets. In addition, market distortions may be boosting production by insu-lating domestic producers from international market signals.
From October 2002 to March 2003, the price of sugar increased by 3.3 percent, probably pointing to some increase in demand.9 The growth of consump-tion in such markets as the Russian Federation and the other CIS countries willbe a major factor influencing price developments in the medium term.
The prices of grains in general improved in 2002, mainly as a consequenceof drought and other unfavourable weather conditions which reduced supplyfrom major producing areas. According to the International Grains Council, theimprovement in the crop outlook for all grains in developed countries for 2003(particularly countries in North America, Australia and EU countries) “reintro-duced a more bearish tone in the major markets”10 and the price of wheatdeclined in the first half of the year.
After a strong decline in 1994, followed by continued slower erosion from1996 to 2001, the price of rice increased 11 per cent in 2002. The major factorsbehind this upturn, which was sustained into the first quarter of 2003, includ-ed a decline in production and, in Thailand, domestic market interventions andhigher taxes on transportation. Since Thai rice prices serve as an internationalbenchmark, these decisions influence the market directly.
The price index for tropical beverages dropped by over 50 per cent from1997 to 2001, but there was an 8.7 per cent increase in 2002 (see figure II.5).This was due mainly to higher cocoa prices, which were strongly influenced bythe security problems in Côte d’Ivoire11 during the last quarter of 2002, androse by 63 per cent for the year as a whole. The increase in cocoa prices, how-ever, subsequently lost momentum, mainly because there were no major supplydisruptions in Côte d’Ivoire: high prices provided an incentive for producers toharvest the crop, despite security concerns.12 The volume of cocoa reachingIvoirian ports was close to normal, leading to an accumulation of stocks ofmore than 1.1 million tons. Combined with good crops in Ghana and Indonesia,the result was a sizeable production surplus. Looking ahead, countries such asIndonesia are increasing production, while others, such as Brazil, have found anew variety of cocoa plant resistant to witches’ broom disease and have reha-bilitated their plantations.
Although the world coffee price increased 4.7 per cent in 2002, pricesremained depressed following the drop of two thirds between 1997 and 2001.This downward trend was due mainly to three factors: the rapid increase in pro-duction in the late 1990s from such emerging producing countries as Viet Nam;record Brazilian production; and the stagnation of consumption. In the last twoquarters of 2002, there was a break in the downward price trend, chiefly result-ing from speculation about a possible decline in Brazilian output, the efforts ofsome coffee-producing countries (for example, Brazil, Côte d’Ivoire and VietNam) to rationalize their production in order to adjust to the depressed market,International Coffee Organization (ICO) awareness-raising efforts and a new
W O R L D E C O N O M I C A N D S O C I A L S U R V E Y 2 0 0 334
9 There has been a slight decrease in production indeveloped countries (with the exception ofAustralia), but sugar production in developingcountries (for example, Thailand and Brazil) is stillgrowing.
10 See International Grains Council, Grain MarketReport Summary (http://www.igc.org.uk/gmr/gmrsummary.htm).
11 Côte d’Ivoire accounts for about 45 per cent ofworld production.
12 Some cocoa was smuggled into Liberia andGuinea and also into Côte d’Ivoire from Ghana inJanuary and February 2003 (source: ED&F Man,Cocoa Market Report, April 2003).
“Coffee Quality-Improvement Programme” which took off in October 2002. 13
Nonetheless, the market turned soft again in March 2003. Supply factors havecontinued to maintain pressure on the market; global availability (productionplus stocks) is estimated to have been some 151 million bags in the crop year2001/02, slightly higher than in 2000/01, and forecasts for 2002/03 are 157.5million bags.
Tea prices did not experience any change in their trend, with an 8 per centdecrease from 1998 to 2002, due mainly to regular growth in supply and stag-nating consumption, leading to the accumulation of a high level of stocks.
The prices of vegetable oilseeds and oils improved by over a quarter in2002, after a 19 per cent fall from 1997 to 2001 (see figure II.5). This turn-around was confirmed in early 2003 with increases in prices for most vegetableoilseed and oil products, in particular cottonseed oil (13.6 per cent) andgroundnut oil (8.9 per cent). Although each item in the group has its owndynamics, one of the factors influencing the market is the growing pace ofimports in some countries, particularly China, where the growth of imports ofsoybean and palm oil exceeded expectations.
The price of agricultural raw materials fell by 6.7 per cent in 2002, owingmainly to slow world economic growth, leading to weak demand and highstocks. There had been a decline in both cotton price indices (A and B, corre-sponding to different qualities of cotton) of 10 per cent per year from 1995 to2002, to which strong competition from synthetic fibres contributed. During theperiod October 2002-March 2003, cotton prices rose by nearly 4 per cent, main-ly owing to the role of China, a major player in the raw cotton market and onethat has just become a net importer.14 Nonetheless, the price of cotton in inter-national markets has been severely affected by subsidies to domestic produc-tion, for instance, in China and the United States. The case of the United Statessubsidies to upland cotton is currently under consideration in the World TradeOrganization following a claim by Brazil that United States producers receiveddomestic subsidies in excess of 100 per cent of crop value in 2001.15
In 2002, natural rubber prices rose by almost one third and were slightlyhigher in early 2003 as a consequence of strong demand growth, appreciatingexchange rates in the main producing countries and supply/demand imbalances.Global rubber consumption is forecast to increase by 7 per cent in 2003.16
Weather conditions and the creation of the International Tripartite RubberOrganisation (ITRO), which has the objectives of rationalizing and coordinatingproduction, have also had some influence on rubber price developments.
Minerals and metalsThe uncertainty about the outlook for the world economy affected mineralsand metals prices in 2002 and early 2003. The situation was further aggravat-ed by the volatility of financial and oil markets and declining confidence inthe corporate sector in the wake of the accounting scandals in the UnitedStates. Moreover, developments in the minerals and metals sector are now dri-ven mostly by supply-side factors, owing to excess capacity for most metalssince the investment boom of the late 1990s. The most important factor on thedemand side is the emergence of China as a key consumer and importer. Thiscountry is now seen as an important price-maker for such commodities as ironore, aluminium and alumina17 and copper.
35I N T E R N A T I O N A L T R A D E A N D F I N A N C E
13 This is a voluntary programme aimed at removinglow-quality coffee beans from the market.
14 China’s recent membership in the World TradeOrganization is of great importance to the worldcotton sector, since China has agreed to open animport quota of over 800,000 tons at a tariff rateof 1 per cent and plans to reduce cotton produc-tion and export subsidies.
15 Brazil has listed a large number of laws and reg-ulations that provide support to United Statescotton producers and exporters, claiming thatthese violate at least six provisions in the WorldTrade Organization Agreement on Agriculture (seeLegal Instruments Embodying the Results of theUruguay Round of Multilateral TradeNegotiations, done at Marrakesh on 15 April 1994(GATT secretariat publication, Sales No.GATT/1994-7)) and five in the Agreement onSubsidies and Countervailing Measures (ibid. 1),as well as three rules of the General Agreementon Tariffs and Trade (GATT). (See InternationalCentre for Trade and Sustainable Development(ICTSD), Bridges Monthly Digest, Year 7, No. 25,March 2003).
16 See International Rubber Study Group, StatisticalData (http://www.rubberstudy.com/report.aspx).
17 According to Metal Bulletin, No. 8767, 24 April2003, “the strong alumina market shows littlesign of waning as healthy buying interest fromChina holds the spot price firmly above $300 pertonne f.o.b. Australia”.
Apart from a one-time recovery in 2000, the overall trend in the prices ofminerals and metals has been negative since 1995 (see figure II.5). Pricesdecreased a further 1.8 per cent in 2002, although the declining trend wasreversed for some mineral and metal products between October 2002 and March2003. There were increases in prices in this period for nickel (4.6 per cent), tin(2.4 per cent), copper (1.8 per cent) and aluminium (1.3 per cent), even thoughthe SARS outbreak in China put downward pressure on metal and mineralprices.18 However, the increase in prices in United States dollars is largely off-set by the depreciation of the dollar against other major currencies. Moreover,despite some cuts in production, high stock levels and gloomy demandprospects in several cases militate against a sustainable revival.
Iron ore production is estimated to have increased by about 10 per cent in2002, following a fall in 2001. Strong demand from the steel industry in almostall countries caused the increase in production. Demand from China, where ironore imports expanded by over 20 per cent, was a major factor and Chinese importdemand is expected to grow at roughly the same rate in 2003. Iron ore supplycontract negotiations set price increases at about 9 per cent for 2003.
The recent surge in nickel prices can be explained by continued demandgrowth of between 3 and 4 per cent per year and limited supply additions. Thestrong growth of Chinese demand (both directly and indirectly, in the nickelcontent of stainless steel imports) accounted for roughly half the total globalgrowth in nickel demand in 2002. Underinvestment in new nickel capacitymight limit production capacity and the market, which is at present finely bal-anced, might move into deficit over the next two years, giving a further boostto prices.
Despite robust demand, aluminium stocks reached a 15-year high inDecember 2002 and are still exercising a depressing influence on prices. Chinais a major factor in world aluminium supply and has shifted from being a netimporter (120,000 tons in 2001) to being a net exporter (205,000 tons in 2002),a trend likely to continue in 2003-2005 with the entry into production of newsmelting capacity in the country. These projects may add to the already highstocks and delay the recovery of the market further. Since the balance betweensupply and demand is considerably tighter in the case of alumina, the rapidexpansion of Chinese aluminium production and consequent rapid growth inalumina imports (almost 37 per cent in 2002) has caused alumina spot prices torise by 50 per cent.
The copper market moved from extensive surplus in 2001 to close to balancebetween supply and demand at the end of 2002.19 This was due to the supplydiscipline introduced at the end of 2001, when producers accepted the necessi-ty of reducing deliveries. Accordingly, despite sluggish demand growth, stocksheld in the warehouses of the London Metal Exchange (LME) have stabilized,although at a high level. However, one of the leading world producers,CODELCO (Corporación Nacional del Cobre, Chile), is building a stock of17,000-20,000 tons of copper per month, with the total stock planned to reach200,000 tons at the beginning of 2004.
Both production and consumption of lead have been relatively stagnant overthe past few years. Owing to the increasing use of secondary lead, comingmainly from used batteries and accounting for 62.2 per cent of total refinedlead production in 2002, primary producers have been squeezed and close-
W O R L D E C O N O M I C A N D S O C I A L S U R V E Y 2 0 0 336
18 Platinum prices, for instance, were hit by the out-break of SARS as demand by China plummeted(Metal Bulletin, No. 8769 of 1 May 2003).
19 According to the International Copper StudyGroup (ICSG), “the apparent refined copper sur-plus for the year 2002 has declined fromDecember’s estimate to 207,000 tonnes.Preliminary results for January 2003 show a sur-plus of 53,000 tonnes of refined copper comparedwith a surplus of 99,000 tonnes in January 2002”(ICSG press release of 9 April 2003).
downs have occurred at both the mine and smelter stages. Stocks grew steadi-ly until mid-2002 and prices remained depressed. A slight upturn in prices inearly 2003 was reversed in April. However, since stocks appear to be on adownward trend, prices may strengthen later in 2003.
Tin prices were low in 2002, owing to slow demand growth and high stocks.However, in mid-2002, stocks at LME began to fall as a result of reductions inChinese production; and exports and prices began to recover. The downwardtrend in stocks continued in the first four months of 2003 and led to a recoveryin prices. Future developments depend mainly on whether the limits onChinese production remain in place, since consumption growth is relativelyweak. Moreover, tin is particularly dependent on the electronics sector andcould still suffer from the weakness in the ICT sector.
Mine production of zinc declined by 2 per cent in 2002, while refined metalproduction increased by 1 per cent. Consumption increased by 1.6 per cent,owing mainly to strong Asian, particularly Chinese, demand. Nevertheless,prices continued their downward trend as LME stocks increased. During thefirst months of 2003, however, both prices and stocks levelled out. Zinc mineoutput is expected to increase with the reopening of Outokumpu’s Tara mine inIreland (with an annual capacity of 165,000 tons) and with the potential open-ing of Anglo American’s Skopion operations in Namibia (as well as potentialincreases in Australia, India, Peru and Sweden). It is therefore unlikely that anyimprovement in prices will be sustainable, particularly in the absence of mea-sures to reduce capacity.
TRADE POLICY DEVELOPMENTS
Launched in November 2001, the Doha round of trade negotiations has beenfacing increasing challenges to its scheduled conclusion by 1 January 2005 asa single undertaking. Several negotiation deadlines were missed during 2002and early 2003 and the lack of progress in certain key areas—particularlythose of special interest to developing countries—has raised concerns whetherthe Fifth Ministerial Conference of the WTO in Cancún, Mexico, 10-14September 2003, will be able to recover lost ground by resolving the widerange of outstanding and sensitive issues. A few areas of negotiations haveadvanced but, even in these, many pending issues remain.
In the case of services, there has been agreement on the modalities to give“credit” to countries that unilaterally liberalized this sector, often developingcountries in the context of a structural adjustment programme with the WorldBank or the International Monetary Fund (IMF). On the other hand, there hasbeen resistance to the idea of emergency safeguards which many developingcountries feel are necessary in view of their limited knowledge of the possibleconsequences for their economies of further liberalization of the service sector.As a result, only a few countries met the deadline of 31 March 2003 for spe-cific offers of liberalization in services.
Developing countries have a particular interest in increasing market accessin services through Mode 4 of services supply, that is to say, through the pres-ence of natural persons in the importing market.20 Total labour remittances arewell above ODA flows21 and represent a considerable source of foreignexchange for many developing countries. Greater international labour mobility
37I N T E R N A T I O N A L T R A D E A N D F I N A N C E
20 The other three modes of service supply, as rec-ognized by the General Agreement on Trade inServices (GATS), are cross-border trade, con-sumption abroad and commercial presence.
21 Data include transition economies of Europe andCentral Asia. See World Bank, Global DevelopmentFinance, 2003 (Washington, D.C., World Bank, 2003).
could expand such flows and their contribution to development and povertyreduction. Currently, Mode 4 is limited to a narrow range of professionals,highly skilled individuals, high-level managers and business visitors and cov-ers only temporary arrangements. It thus does not apply to the vast majority ofimmigrants from developing countries engaged in low-skilled activities orseeking permanent migration.
Negotiations on market access for non-agricultural goods have been pro-gressing although negotiators did not meet the deadline of 31 May 2003 for anagreement on modalities. The United States proposed the elimination of all tar-iffs on industrial goods in two phases over a period of 10 years. This proposalwould require substantial tariff cuts by developing countries, exposing theirdomestic manufacturing sector to external competition in a relatively shortperiod of time. Additionally, the loss of revenue from trade taxes—though lesssignificant than previously in many developing countries—would need to beaddressed, since many low-income developing countries and small islandeconomies continue to rely heavily on trade taxes as a source of governmentrevenue.22 EU also tabled a proposal: it included tariff compression with a flat-ter range of tariffs; elimination of peaks and high rates; deeper cuts for prod-ucts that are of interest to developing countries (clothing, footwear and tex-tiles); elimination of tariffs at and below 2 per cent; and unilateral tariff elim-ination for imports from least developed countries (in the spirit of the EU“Everything but Arms” initiative for these countries).
There has been limited progress in negotiations on implementation-relatedissues and concerns. Implementation issues are the incomplete, unrealized orpost-dated elements from the Uruguay Round of multilateral trade negotiationsand range from textiles to dispute settlement proceedings. Out of the 93 suchpoints raised by the developing countries, 39 were the subject of immediatedelivery by adoption of the Doha implementation decision,23 but few of theremaining issues witnessed advances after Doha. Meanwhile, work on WorldTrade Organization rules (anti-dumping, subsidies and countervailing duties,and regional trade agreements (RTAs)) is nearing the end of its first phase,namely, the identification of issues to be addressed; and a significant numberof proposals and comments have already been submitted. This negotiatinggroup does not have any specific deadline before the Cancún meeting.
The deadline of 31 December 2002 (and its two subsequent extensions)established by the Declaration on the TRIPS Agreement and public health(WT/MIN (01)/DEC/2) by which to remove constraints faced by developingcountries in making effective use of compulsory licensing was not met. Thegovernments of some developing countries have dealt with domestic public-health crises, such as the acquired immunodeficiency syndrome (AIDS) pan-demic, by granting licences to the domestic pharmaceutical industry, as pro-vided for under the Declaration, to manufacture patented drugs, enabling themto supply the necessary treatment at zero or minimal cost. However, mostdeveloping countries, particularly least developed countries, lack such manu-facturing capacity. This could be dealt with by importing the needed medicinesat low cost from those developing countries that possess the manufacturingcapacity but that are not allowed by World Trade Organization rules to exportdrugs produced under compulsory licensing arrangements. Disagreementemerged, as some developed countries wished to limit the right of compulsory
W O R L D E C O N O M I C A N D S O C I A L S U R V E Y 2 0 0 338
22 The share of trade taxes in total government rev-enues was about 25 per cent in Africa in 1996-1999 but averaged 40 per cent in the Caribbeanislands during the 1990s (IMF, “Developments inthe Doha round and selected activities of interestto the Fund”, 8 April 2003) http://www.imf.org/external/np/pdr/doha/2003/040803.htm.
23 See Implementation related issues and concerns:decision of 14 November 2001 (http://www.wto.org/english/tratop_e/dda_e/implem_explained_e.htm).
licensing in third countries to a specific list of diseases, while developing coun-tries argued for an open-ended list of diseases. Canada, Switzerland and theUnited States, however, have agreed not to challenge any developing-countrymembers of the World Trade Organization (except those with a high income)that export drugs produced under compulsory licensing to a country in needuntil a permanent solution to the issue is found. The moratorium applies, how-ever, only to human immunodeficiency virus (HIV)/AIDS, malaria, tuberculo-sis and other infectious diseases. EU has also declared a moratorium but withfewer restrictions on eligible diseases.
Negotiations on the strengthening of special and differential treatment(SDT) also failed to meet their extended deadline. SDT provisions give devel-oping countries a series of privileges in implementing World TradeOrganization rules and include measures to increase trade opportunities.Developing countries felt that such provisions needed revision, not only toenhance their efficiency but also to widen their scope. Such improvementscould be achieved by making them mandatory, thus changing the language ofcertain best-endeavour provisions. Developed countries, however, do not wantto amend existing texts or alter the existing balance of rights and duties.24
Negotiators could not agree on a final report on a package of agreement-spe-cific proposals and on the framework for continuing the negotiations, whichwas to be submitted to the General Council of the World Trade Organization.Members even failed to have a common understanding of their mandate andsought a clarification from the General Council.
Another major setback for developing countries, and for the progress ofnegotiations, was the failure of the Committee on Agriculture to agree onmodalities for future commitments on trade in agriculture. Special provisionsand subsidies by developed countries have created distortions in the trade ofagricultural products and have prevented developing countries from exploitingtheir natural comparative advantages, constraining them in their pursuit of fastereconomic growth and development. The chairman of the Committee presenteda first draft on modalities but the document—even after being revised—failedto gather support, as members remained deeply entrenched in their divergentpositions. The United States and the Cairns Group of agricultural exporters arepushing for increased market access through significant reductions of tariffs andexpansion of tariff rate quotas, while including the right of developing countriesto safeguards under certain conditions.25 Additionally, this group of countries, aswell as many developing countries, supports a fast dismantling of trade-distort-ing domestic and export subsidies. EU members and other developed countrieshave supported a less aggressive schedule for the reduction of tariffs, domesticsupport and subsidies, with comparable burden-sharing among World TradeOrganization members. EU is also proposing a special safeguard instrument fordeveloping countries to ensure food security. A complicating factor in the nego-tiations is the erosion of preferences for ACP countries and least developedcountries in the EU market. Other complicating factors include domestic policydevelopments in major countries. The United States adopted a major expansionof its farm support programme in 2002 (an additional $70 billion over a 10-yearperiod), including increases in direct support payments to farmers and increasedsubsidies for grains and cotton producers; while some steps have been taken toreform the EU Common Agricultural Policy (CAP), the implications for theDoha negotiations are unclear.
39I N T E R N A T I O N A L T R A D E A N D F I N A N C E
24 World Trade Organization, Special Session of theCommittee on Trade and Development, report bythe Chairman, Ambassador Ransford Smith(Jamaica), to the Trade Negotiations Committee(TN/CTD/8), 4 March 2003.
25 Under the present system, only products thathave been “tariffied”, that is to say, only productsthat have lost protection through the reduction ofquotas and/or other trade barriers, are subject tospecial agricultural safeguards. As most develop-ing countries have few non-tariff barriers on agri-cultural products, the special agricultural safe-guards are of limited use to them (InternationalCentre for Trade and Sustainable Development,“Agriculture” (Doha Round Briefing Series, vol. 1,No. 2 (February 2003)).
Lack of progress in areas that are of special interest for developing countriesmay compromise the pace of negotiations in other areas. Several countries haveargued that progress in negotiations on agriculture, in particular, is necessary tosupport negotiations elsewhere. Negotiations on “Singapore issues” (investment,competition policy, transparency in government procurement and trade facilita-tion), for instance, are to be launched in Cancún if there is an explicit consensusat the ministerial meetings on the modalities. There has been very little progresson these issues and agreement seems unlikely. Investment and competition poli-cy remain the most controversial issues. Developing countries have resistedexpanding the scope of trade negotiations into these areas and are concernedabout agreeing on issues and standards that may be difficult and costly for themto implement and incompatible with their level of development.26
These major setbacks, as well as the slow progress in other areas, may leavean overwhelming number of issues to be agreed upon at Cancún. If that hap-pens, there will be very little time for analysis and assessment during the nego-tiations themselves, particularly for developing countries, which have lesstechnical capacity than developed countries. Besides the overcrowding of theagenda, a lack of political will could hamper negotiations. In their reports, sev-eral chairmen referred to the wide gaps among members as the main reason forthe slow or non-existent progress in their respective negotiating groups. TheDoha trade negotiations need to be given the political attention thatGovernments committed themselves to.
Bilateral and regional developmentsOther developments indicate conflicting trends in multilateralism and globaltrade liberalization. Several free trade agreement (FTA) initiatives have beenlaunched or concluded since early 2002. While further trade liberalization canentail benefits for the countries concerned, the proliferation of regional tradeagreements (RTAs) may also create a complex web of competing and conflict-ing jurisdictions that could restrain, not promote, trade. The examples in thefollowing paragraphs are illustrative. Additionally, it is not clear whetherdeveloping countries have enough resources to engage in simultaneous negoti-ations at the bilateral, regional and multilateral levels. Negotiations at themultilateral level, and thus developing-country gains, may suffer as a result.
Most of the new regional initiatives include a major developed country. Forinstance, the United States trade agenda for 2003 includes the negotiation ofFTAs with the Southern African Customs Union (Botswana, Lesotho, Namibia,South Africa and Swaziland), the Central American Common Market (CostaRica, El Salvador, Guatemala, Honduras and Nicaragua), Australia andMorocco. Moreover, the United States is a major force behind negotiationstowards the establishment of a Free Trade Area of the Americas (FTAA) andhas signalled future trade liberalization initiatives with the Association ofSoutheast Asian Nations (ASEAN) countries. EU is conducting FTA negotia-tions with the Southern Common Market (MERCOSUR) and moving forwardwith the implementation of the Euro-Mediterranean Free Trade Area by 2010.As of early 2003, EU had signed Association Agreements with 11Mediterranean countries; Egypt, Jordan, Morocco and Tunisia concluded nego-tiations for a regional FTA in January 2003. In April 2003, EU held consulta-tions to facilitate trade with ASEAN countries. Meanwhile developing coun-
W O R L D E C O N O M I C A N D S O C I A L S U R V E Y 2 0 0 340
26 Razeen Sally, “Whither the WTO? a progressreport on the Doha round”, Cato Institute TradePolicy Analysis, No. 23, 3 March 2003.
tries have also been active in forging free trade alliances. India and Chinaannounced trade negotiations with the ASEAN nations, whereas MERCOSURstarted negotiations with India.
Bilateral and regional negotiations may move faster than their multilateralcounterparts because fewer actors are involved, but RTAs have not necessarilypromoted the interests of developing countries. While trade liberalization onindustrial goods has advanced further in RTAs, concessions in agriculture, forinstance, have been limited. Most RTAs have failed to promote deeper liberal-ization in agriculture, as tariffs remain high despite preferential treatment.27
Additionally, issues such as agricultural subsidies are often referred to WorldTrade Organization negotiations and not advanced in regional agreements.
A broad point is that developing countries’ bargaining power may be weak-ened outside multilateral forums, where they can use their numbers to strength-en their positions, particularly in their negotiations with developed countries.In their quest for increased access to developed countries’ markets, developingcountries may agree to concessions in RTAs that they would not necessarilyaccept in a multilateral context when dealing as a group.28 Issues that have notyet been fully discussed and agreed in a multilateral forum, such as competi-tion policy, are frequently included in RTAs and often based on legal provi-sions in the United States. A similar approach exists in the EU AssociationAgreements with the Mediterranean developing countries, which include aseries of provisions beyond trade liberalization that aim at making the partner’seconomic legislation similar to that of EU. Developed countries’ economicpolicies were designed to respond to those countries’ specific needs and goalsand are compatible with their level of development. This does not imply, how-ever, that they are suitable for developing countries facing different conditionsand different constraints.
FINANCIAL FLOWS TO DEVELOPING COUNTRIESAND ECONOMIES IN TRANSITION
Developing countries made a net transfer of financial resources to other coun-tries for a sixth consecutive year in 2002, as payments of foreign investmentincome and net financial outflows, including increases in holdings of foreignreserves, exceeded receipts of foreign investment income and net financialinflows from abroad (see table II.1). In dollars, this was the largest negativeresource transfer ever by these countries. There was also a net outward trans-fer of financial resources from economies in transition in 2002.
A net inward transfer of financial resources can be an important supplementto gross domestic saving in financing domestic investment. Conversely, a netoutward transfer of resources reduces the resources available for consumptionor investment in the country. The large net outward transfer of financialresources from Latin America in 2002 was brought about by a sharp contrac-tion of imports as crisis countries compressed consumption and investment inresponse to the withdrawal of capital flows by international investors. On theother hand, in Eastern and Southern Asia, the large net outward resource trans-fer grew further, but in an environment of strong growth of exports and importsunderpinned by economic growth. Financial resource outflows from this regiontook the form of a net repayment of debt and the purchase of foreign assets,
41I N T E R N A T I O N A L T R A D E A N D F I N A N C E
27 WTO secretariat, “Regional trade integrationunder transformation” (preliminary draft preparedfor Seminar on Regionalism and the World TradeOrganization), Geneva, 26 April 2002.
28 For instance, the recent FTAs that the UnitedStates negotiated with Chile and Singapore placeconsiderable restrictions on the use of capitalcontrols (“US backs curbs on capital controls”,Financial Times, 2 April 2003).

especially official reserves. The net inward transfer of resources to sub-Saharan Africa consisted of net private and official financial flows whichhelped to finance the trade deficit.
Focusing on the net capital flow component of the net transfer, developingcountries received an estimated $75 billion in net capital inflows in 2002 (seetable II.2). The only sources of net capital inflows in 2002 were FDI and offi-cial loans and grants, as financial markets and international banks continued toreduce their exposure to developing countries as a whole. Net capital flows totransition economies were almost unchanged in 2002, consisting of net inflowsof FDI, portfolio credit and equity investment and official flows.
Private capital flows
International investors’ confidence in developing and transition economieswas unusually low in 2002 owing to the crisis in Argentina, uncertainty overthe direction of policy in Brazil and other factors in Latin America and else-where. In early 2003, along with the weak global economic situation,investors were concerned about rising oil prices, war in Iraq and the threat ofinternational terrorism. Nevertheless, the beginning of economic recovery inArgentina, the direction of the economic policies of the newly electedGovernment in Brazil and positive developments in economic policies andperformance in Colombia and Peru strengthened investor sentiment. The con-sequent reduction in the yields on these countries’ bonds reduced the averagespread between the yield on bonds of Latin American countries and that of therisk-free benchmark, United States Treasury bonds (see figure II.6).Investment risk in Turkey was also perceived to have diminished after theelection of a new Government in November 2002, although concerns soonemerged about the economic and political fallout of possible conflict in Iraq.
W O R L D E C O N O M I C A N D S O C I A L S U R V E Y 2 0 0 342
Table II.1.NET TRANSFER OF FINANCIAL RESOURCES TO DEVELOPING ECONOMIES AND ECONOMIES IN TRANSITION, 1994-2002
1994 1995 1996 1997 1998 1999 2000 2001 2002a
Developing economies 44.2 49.7 30.3 -2.7 -33.7 -120.9 -179.3 -155.1 -192.5
Africa 4.6 6.6 -4.4 -3.7 15.6 5.1 -18.8 -11.2 -9.0Sub-Saharan (excluding
Nigeria and South Africa) 6.7 8.2 10.5 7.9 13.2 9.7 5.0 9.0 9.5Eastern and Southern Asia 5.1 25.6 22.4 -34.6 -130.1 -134.8 -110.4 -111.0 -141.5Western Asia 15.2 18.8 11.2 11.4 36.1 -0.3 -48.3 -34.9 -13.2Latin America 19.3 -1.3 1.1 24.2 44.7 9.1 -1.8 2.0 -28.8
Economies in transition -2.2 10.0 20.0 30.2 33.7 4.5 -23.4 -9.7 -9.5
Memorandum item:Heavily indebted poor
countries (HIPCs) 9.6 10.9 10.7 11.2 13.7 10.7 5.7 8.2 10.3
Source: UN/DESA, based on International Monetary Fund (IMF), World Economic Outlook, April 2003, and IMF, Balance of Payments Statistics.a Preliminary estimate.
Billions of dollars
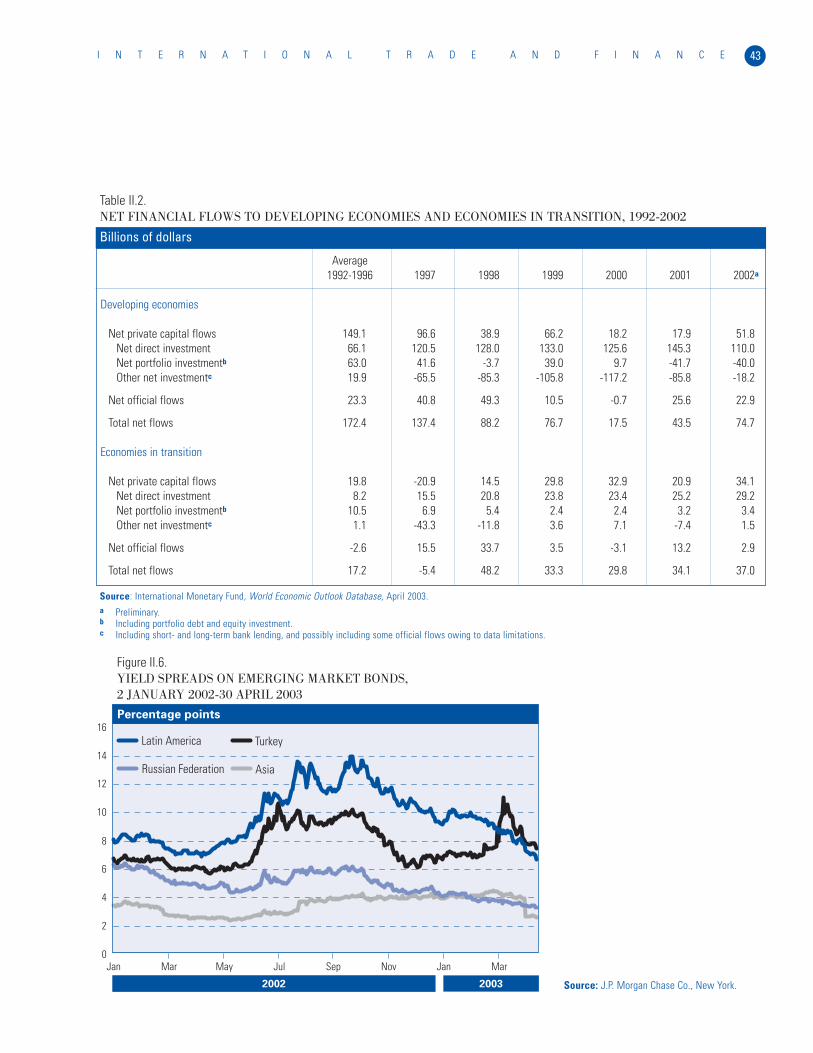
43I N T E R N A T I O N A L T R A D E A N D F I N A N C E
Table II.2.NET FINANCIAL FLOWS TO DEVELOPING ECONOMIES AND ECONOMIES IN TRANSITION, 1992-2002
Average1992-1996 1997 1998 1999 2000 2001 2002a
Developing economies
Net private capital flows 149.1 96.6 38.9 66.2 18.2 17.9 51.8Net direct investment 66.1 120.5 128.0 133.0 125.6 145.3 110.0Net portfolio investmentb 63.0 41.6 -3.7 39.0 9.7 -41.7 -40.0Other net investmentc 19.9 -65.5 -85.3 -105.8 -117.2 -85.8 -18.2
Net official flows 23.3 40.8 49.3 10.5 -0.7 25.6 22.9
Total net flows 172.4 137.4 88.2 76.7 17.5 43.5 74.7
Economies in transition
Net private capital flows 19.8 -20.9 14.5 29.8 32.9 20.9 34.1Net direct investment 8.2 15.5 20.8 23.8 23.4 25.2 29.2Net portfolio investmentb 10.5 6.9 5.4 2.4 2.4 3.2 3.4Other net investmentc 1.1 -43.3 -11.8 3.6 7.1 -7.4 1.5
Net official flows -2.6 15.5 33.7 3.5 -3.1 13.2 2.9
Total net flows 17.2 -5.4 48.2 33.3 29.8 34.1 37.0
Source: International Monetary Fund, World Economic Outlook Database, April 2003.a Preliminary.b Including portfolio debt and equity investment.c Including short- and long-term bank lending, and possibly including some official flows owing to data limitations.
Billions of dollars
Figure II.6.YIELD SPREADS ON EMERGING MARKET BONDS, 2 JANUARY 2002-30 APRIL 2003
Percentage points
2002 2003
0
2
4
6
8
10
12
14
16
Jan Mar May Jul Sep Nov Jan Mar
Latin America Turkey
Russian Federation Asia
Source: J.P. Morgan Chase Co., New York.
Investors continued to discriminate among markets with different levels ofrisk in late 2002 and early 2003, as reflected in the differences in the bondspreads among emerging markets. Sovereign credit ratings were upgraded in2002 for a number of countries, including Mexico, the Republic of Korea andthe Russian Federation. Notably, the sovereign debt ratings of the Republic ofKorea and Mexico were increased to “investment grade”, making their bondseligible for purchase by pension funds and other regulated institutionalinvestors in developed countries. In Asia, prospects for continued robust exportand economic growth underpinned a perception of relatively low risk, althoughconcerns about the prospect of war in Iraq and a slower-than-expected globalrecovery, as well as elevated geopolitical tensions in the Korean peninsula andthe feared spread of SARS in the region, contributed to increased uncertaintiesin early 2003. Continued strong economic growth and the external surplus ofthe Russian Federation resulted in a fall in the yield on Russian bonds to a lowlevel in early 2003.
A number of “high-grade” emerging market bonds were issued in late 2002,followed by a strong rebound in the issuance of what the market characterizesas lower credit quality bonds. Such countries as Colombia, Peru and Turkeyregained access to international financial markets. Brazilian corporate borrow-ers were able to access international credit, mainly to refinance maturing debt,but there was no issuance of Brazilian sovereign bonds until the end of April2003. Other countries in Latin America and Asia were able to issue bonds atlower yield spreads, reflecting their high credit ratings.
All in all, however, private capital flows into emerging market bonds weredepressed in 2002. Bond issuance by Latin American countries was less thanhalf the volume in 2001. In contrast, bond issuance by countries of Asia wasunchanged as robust economic growth and continued strengthening of financialsystems made the region attractive to investors, especially against the backdropof financial difficulties in Latin America. At the same time, the RussianFederation and a number of other economies in transition increased bondissuance. At the end of 2002 and beginning of 2003, declining risk and the rel-atively high yields of emerging market bonds in an environment of low inter-est rates in developed countries and depressed prices in global stock marketsattracted increased investment flows. In addition, anticipation of the invasionof Iraq led some planned bond issuances to be advanced.
Developing and transition economies made net repayments to foreign banksin 2002, albeit in substantially lower amounts than in 2001. This resulted fromdecreased amortizations and a low level of new lending, continuing a trend thathad begun a few years previously as international banks reduced their emerg-ing market loan operations in favour of fee-based transactions. Also, local cur-rency loans and bond markets have grown in some of these countries, in suchregions as Western Asia and Eastern and Southern Asia, reducing demand forforeign currency borrowing. Most of the international private lending was tocorporations considered low credit risks, for example, in Asian countries,Central and Eastern European countries (the Czech Republic, Hungary andPoland) and the Russian Federation. There was a large net repayment by LatinAmerica of bank loans in 2002 and Turkey continued to make net repayments.
Although net FDI inflows to developing economies were less in 2002 thanin 2001, they did total over $100 billion and were the only source of net pri-
W O R L D E C O N O M I C A N D S O C I A L S U R V E Y 2 0 0 344
vate capital flow to these countries (see table II.2). Adverse global economicand political conditions and dampened investment activity of corporations,especially in mergers and acquisitions, slowed FDI, as did financial difficultiesin some Latin American countries and reduced levels of privatization in a num-ber of countries in Latin America and North Africa. The exception was anincrease in FDI in China, with its desirability as a location for low-cost manu-facturing reinforced by its accession to the World Trade Organization. FDI intransition economies also increased modestly in 2002.29
Prices in emerging stock markets declined by 8 per cent in dollar terms for2002 as a whole, even after a recovery from lows in September.30 LatinAmerican markets suffered the largest decline; only the markets of theEuropean transition economies made gains. The issuance of shares was sub-dued for a second year and remained concentrated in a few countries. Asia con-tinued to dominate equity issuance, with China accounting for about one thirdof the total. Latin American issuance was very low, with little activity in thesecond half of the year. Russian energy and financial corporations dominatedissuance by the economies in transition. In the first quarter of 2003, prices ofemerging market equities as a whole continued to fall in tandem with the pricesof equities in developed markets.
Official flows
Official financial flows to developing countries in 2002 were high for the sec-ond consecutive year (see table II.2), reflecting substantial multilateral lend-ing. IMF was a net provider of $15 billion to the developing countries (downfrom $17.6 billion in 2001), as it continued to make large disbursements insupport of economic programmes to countries in financial distress (see tableA.23). The major disbursements were under standby facilities: $13 billion toTurkey, $6 billion to Brazil and $1.4 billion to Uruguay. The net repayment offunds to IMF by countries with economies in transition fell to $1.8 billion in2002 from $4.1 billion in 2001, owing mainly to lower repurchases by theRussian Federation (see table A.24).
Argentina’s difficulties in late 2002 in meeting scheduled debt-service pay-ments on some loans to multilateral creditors were resolved in early 2003.31 InJanuary 2003, Argentina reached agreement with the IMF for a “rollover” loan,that is to say, funds to be used to service IMF debt maturing through August2003. The agreement with IMF, together with Argentina’s payment of arrearsto the World Bank, paved the way for the release, also in January, of a sizeableWorld Bank sectoral loan. In the same month, Argentina also settled its arrearswith the Inter-American Development Bank (IADB).
Resource commitments to developing and transition economies by the mul-tilateral development institutions and programmes decreased from $46.5 bil-lion in 2001 to almost $43.1 billion in 2002 (see table A.27), about the sameamount in real terms as in most years since 1997. Non-concessional commit-ments in 2002 fell by 14 per cent in dollar terms, marked by the sharp decreasein commitments by the IADB owing to decreased lending to Argentina, feweremergency loans, the slowdown in loan approvals for Brazil as its electionresults were awaited and a drop in overall investment activity in Latin Americadue to the recessionary conditions. Non-concessional resource commitments
45I N T E R N A T I O N A L T R A D E A N D F I N A N C E
29 For a detailed discussion of FDI developments indeveloping and transition economies in 2002, seeWorld Economic Situation and Prospects, 2003(United Nations publication, Sales No.E.03.II.C.2), chap. II, sects. entitled “Reduced FDIflows” and “International financial cooperation”.
30 Morgan Stanley Capital International, EmergingMarkets Free Index (EMFI).
31 See World Economic Situation and Prospects,2003 (United Nations publication, Sales No.E.03.II.C.2), p. 24.
from the International Bank for Reconstruction and Development (IBRD),which had provided, on average, more than 25 per cent of total non-conces-sional finance through the years, fell by 10 per cent as loans to several majorborrowing countries, including Argentina and Turkey, were smaller in 2002than in 2001. In contrast, commitments from the European Bank forReconstruction and Development (EBRD) rose sharply on the strength ofrobust lending and investment in the Russian Federation and in countries inSouth-eastern Europe. About 60 per cent of EBRD commitments went to thefinancial sector and infrastructure. Concessional commitments rose by 6 percent as a result of the strong increase in International Development Association(IDA) credit commitments following its refunding agreement. Commitmentsfrom the Development Fund for Africa fell 30 per cent in 2002 owing largelyto the disruptions in its activities and delayed loan agreements caused by dis-turbances in Côte d’Ivoire.
Official development assistanceOfficial development assistance (ODA) may finally have begun to recover in2002, rising 8.8 per cent to $57.0 billion from $52.3 billion in 2001 (see tableII.3). When the effects of inflation and exchange-rate movements are takeninto account, “real” ODA rose by 4.8 per cent. The ODA “effort” ofOrganisation for Economic Cooperation and Development/DevelopmentAssistance Committee (OECD/DAC) member countries as a group, measuredas the ratio of ODA to donor gross national income (GNI), rose to 0.23 percent from the record low of 0.22 per cent in each of the previous three years.Twelve of the 22 OECD/DAC member countries reported an increase in ODAin real terms. Nine countries reported an increase of more than 10 per cent.ODA from the United States, the largest donor, increased by 11.6 per cent inreal terms in 2002, while that from Japan, the second largest donor, declinedby 1.8 per cent. The increases by a number of donors, including Canada, EU,Norway, Switzerland and the United States, reflected commitments made inthe context of the International Conference on Financing for Development inMonterrey, Mexico.32 According to DAC estimates, fulfilling the Monterreypledges to increase ODA will raise the volume by 31 per cent (about $16 bil-lion) and the ODA/GNP ratio to 0.26 per cent by 2006.33 However, the ratiowould still fall far short of the 0.33 per cent consistently reached until 1992.
Denmark, Luxembourg, the Netherlands, Norway and Sweden are still theonly countries to meet the United Nations ODA target of 0.7 per cent of GNP.Three countries, however, have declared dates to reach that target: Ireland by2007, Belgium by 2010 and France by 2012. EU, as a group, is committed toraising its ODA-to-GNP average to 0.39 per cent by 2006; in 2002, EU mem-ber countries collectively increased their ODA by 2.8 per cent, in real terms,with an average ODA-to-GNP ratio of 0.34 per cent.
ODA would rise more dramatically if a proposal by the United Kingdom ofGreat Britain and Northern Ireland to establish an international finance facility(IFF) was enacted.34 The IFF would bring forward ODA contributions by bor-rowing funds from the private market through bond issuance and servicing theborrowing with annual ODA outlays (15 years per bond issue). Other majordonors did not immediately commit to the proposal and it is unclear whether theUnited Kingdom would use the approach unilaterally if other donors did not join.
W O R L D E C O N O M I C A N D S O C I A L S U R V E Y 2 0 0 346
32 See report of the Secretary-General entitled“Follow-up efforts to the InternationalConference on Financing for Development”(A/57/319-E/2002/85), paras. 4-14.
33 See OECD news release, “OECD DAC countriesbegin recovery in development aid: 5 % increasein 2002”, Paris, 22 April 2003 (www.oecd.org/dac).
34 See United Kingdom Treasury and Department forInternational Development, “InternationalFinance Facility”, January 2003.
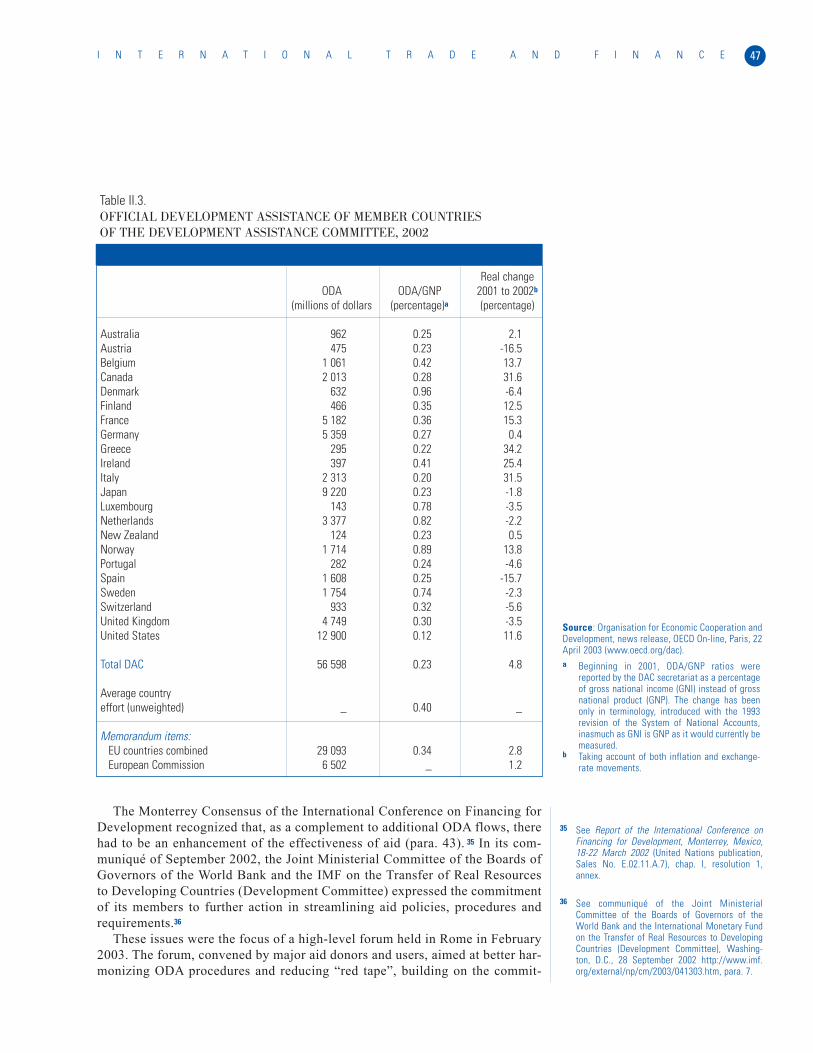
The Monterrey Consensus of the International Conference on Financing forDevelopment recognized that, as a complement to additional ODA flows, therehad to be an enhancement of the effectiveness of aid (para. 43). 35 In its com-muniqué of September 2002, the Joint Ministerial Committee of the Boards ofGovernors of the World Bank and the IMF on the Transfer of Real Resourcesto Developing Countries (Development Committee) expressed the commitmentof its members to further action in streamlining aid policies, procedures andrequirements.36
These issues were the focus of a high-level forum held in Rome in February2003. The forum, convened by major aid donors and users, aimed at better har-monizing ODA procedures and reducing “red tape”, building on the commit-
47I N T E R N A T I O N A L T R A D E A N D F I N A N C E
Real changeODA ODA/GNP 2001 to 2002b
(millions of dollars (percentage)a (percentage)
Australia 962 0.25 2.1Austria 475 0.23 -16.5Belgium 1 061 0.42 13.7Canada 2 013 0.28 31.6Denmark 632 0.96 -6.4Finland 466 0.35 12.5France 5 182 0.36 15.3Germany 5 359 0.27 0.4Greece 295 0.22 34.2Ireland 397 0.41 25.4Italy 2 313 0.20 31.5Japan 9 220 0.23 -1.8Luxembourg 143 0.78 -3.5Netherlands 3 377 0.82 -2.2New Zealand 124 0.23 0.5Norway 1 714 0.89 13.8Portugal 282 0.24 -4.6Spain 1 608 0.25 -15.7Sweden 1 754 0.74 -2.3Switzerland 933 0.32 -5.6United Kingdom 4 749 0.30 -3.5United States 12 900 0.12 11.6
Total DAC 56 598 0.23 4.8
Average country effort (unweighted) _ 0.40 _
Memorandum items:EU countries combined 29 093 0.34 2.8European Commission 6 502 _ 1.2
Table II.3.OFFICIAL DEVELOPMENT ASSISTANCE OF MEMBER COUNTRIES OF THE DEVELOPMENT ASSISTANCE COMMITTEE, 2002
Source: Organisation for Economic Cooperation andDevelopment, news release, OECD On-line, Paris, 22April 2003 (www.oecd.org/dac).a Beginning in 2001, ODA/GNP ratios were
reported by the DAC secretariat as a percentageof gross national income (GNI) instead of grossnational product (GNP). The change has beenonly in terminology, introduced with the 1993revision of the System of National Accounts,inasmuch as GNI is GNP as it would currently bemeasured.
b Taking account of both inflation and exchange-rate movements.
35 See Report of the International Conference onFinancing for Development, Monterrey, Mexico,18-22 March 2002 (United Nations publication,Sales No. E.02.11.A.7), chap. I, resolution 1,annex.
36 See communiqué of the Joint MinisterialCommittee of the Boards of Governors of theWorld Bank and the International Monetary Fundon the Transfer of Real Resources to DevelopingCountries (Development Committee), Washing-ton, D.C., 28 September 2002 http://www.imf.org/external/np/cm/2003/041303.htm, para. 7.
ments of the Monterrey Consensus.37 The experiences reviewed in the forumhighlighted the fact that although some countries had acquired sufficientcapacity to evaluate their development needs, many had not yet reached thislevel of expertise. In addition to taking stock of the “good practice” work ofDAC and the multilateral development banks and the work in progress in theUnited Nations Development Group, forum participants committed themselvesto enhancing harmonization in a number of ways and to setting out a voluntarywork programme to improve harmonization of development assistance at thecountry level. After roughly half a century of development cooperation andmany attempts to reduce the administrative burden of ODA, this initiativecould be a breakthrough.
The view that developing-country efforts, when combined with enhancedpolicy coherence among donor countries and higher levels of aid, lead to greateraid effectiveness was voiced also by Development Cooperation Ministers andHeads of Aid Agencies at the Annual High Level Meeting of DAC, held in Parisin April 2003. At that meeting, the participants discussed ways to furtherimprove policies and strategies in order to achieve the Millennium DevelopmentGoals. They expressed support for better monitoring and reviewing of develop-ment outcomes. Aid agencies pledged to strengthen results-based managementof aid and promised to support country-led development strategies. In a furtherboost to promoting policy coherence in development cooperation, it was notedthat DAC had begun to work with the Economic Commission for Africa (ECA)on mutual reviews of development effectiveness.
Even the most effective and efficient delivery of the current volume of ODAwill fall far short of what is needed to meet the Millennium DevelopmentGoals. The High-level Panel on Financing for Development estimated thatODA on the order of two times the current level, or roughly an additional $50billion a year, was required to meet these Goals, and that a further increase onthe order of $50 billion a year would be needed to reach the aid target of 0.7per cent of GNI.38 The challenges remain both to translate the increases in ODAassociated with the International Conference on Financing for Developmentinto outlays as quickly as possible and to raise commitments substantially.
Initiative for the Heavily Indebted Poor Countries (HIPCs)The Monterrey Consensus stresses that the speedy, effective and full imple-mentation of the Initiative to lighten the external debt burden of the HeavilyIndebted Poor Countries (HIPCs) is critical if it is to strengthen the economicprospects and poverty reduction efforts of beneficiary countries. As of end-April 2003, only 8 of the 26 HIPCs that had reached the intermediate bench-mark, the “decision point”,39 had proceeded to their “completion point”.Moreover, some of the eight countries appear to have experienced worseningdebt indicators, owing to lower world commodity prices and export receiptsthan had been assumed. “Topping up” debt relief at the completion point ispossible if commodity prices have fallen since the projected need for reliefwas calculated, and such arrangements were made for Burkina Faso in early2003. However, the length and complexity of the HIPC process and therepeated need to enhance it remain concerns.
IMF and the World Bank attribute the delay in bringing more countries totheir completion point to the complications that a number of countries have
W O R L D E C O N O M I C A N D S O C I A L S U R V E Y 2 0 0 348
37 See letter dated 18 March 2003 from thePermanent Representative of Italy to the UnitedNations addressed to the Secretary-Generaltransmitting the Rome Declaration onHarmonization (A/57/763).
38 See report of the High-level Panel on Financingfor Development, transmitted in a letter dated 25June 2001 from the Secretary-General to thePresident of the General Assembly (A/55/1000),recommendations of the Panel, sects. entitled“Estimates of need”, “Further debt relief for high-ly endebted poor countries” and “More develop-ment aid needed”.
39 Mali and Benin became the seventh and eighthcountries to reach the completion point, on 7March and 25 March 2003, respectively.
faced in implementing programmes to meet their fiscal targets and the diffi-culty that some countries have had in preparing Poverty Reduction StrategyPapers (PRSPs), which are prerequisites for receipt of irrevocable debt relief atthe completion point under the HIPC Initiative.40 In part, the domestic policydisappointments reflect the weak international economy of the past few yearsor, in some cases, domestic insecurity. However, they also raise questionswhether expectations were too high about the benefits that would be derived inthe near term from the policy reforms that the international community hadsought from the HIPCs. Long-term debt sustainability in these countriesrequires not only some reduction in their debt stocks under the HIPC Initiative,but also domestic policies in support of more rapid and broad-based growthand a supportive international economic environment. In addition, the conceptof debt sustainability may not have been sufficiently robust in the light of theperformance of the international economy. This matter is being given furtherconsideration by the Bretton Woods institutions.
Other factors have slowed the implementation of the HIPC programme. TheJoint Ministerial Committee of the Boards of Governors of the World Bank andthe International Monetary Fund on the Transfer of Real Resources toDeveloping Countries (Development Committee) and the InternationalMonetary and Financial Committee of the Board of Governors have urged fur-ther Bank and Fund efforts to address such factors as HIPC-to-HIPC debt reliefand creditor litigation issues.41 Although the total costs of HIPC-to-HIPC debtrelief are small (about 1 per cent of total costs of debt relief provided by allcreditors to these countries), the amount may be significant to a creditor HIPCthat is itself heavily in debt. This may explain, in part, why not all HIPC cred-itors have made commitments to deliver debt relief. In other cases, disputesover technical matters have resulted in delays in reaching full agreement onsettlements between creditors and debtors. In cases where the creditor’s finan-cial constraints make the provision of debt relief more difficult, it has been rec-ommended that a donor trust fund be established to improve creditor participa-tion in debt-relief efforts.
Compounding these problems is the difficulty being faced by the interna-tional community in raising resources to fully fund the current framework ofthe HIPC Initiative. As at end-April 2003, paid-in contributions were $2.4 bil-lion out of total pledges of $2.6 billion. Full funding of the HIPC Trust Fund isabout to occur at a time when the adequacy of the total pledges can be ques-tioned. Even when pledges are fully paid, the HIPC Trust Fund would lack theresources required to attain its objectives, especially in light of the fact that theeconomies of many HIPCs remain more fragile than expected and the interna-tional situation is not very supportive. The latter pertains, above all, to disap-pointing trade trends, but it also reflects the need of HIPCs to receive more oftheir capital inflows in the form of grants. A review of the HIPC Initiative bythe World Bank’s Operations Evaluation Department in providing an explana-tion for the slow progress of the programme, concluded that the objective ofthe HIPC Initiative had been to reduce debt to sustainable levels as part of abroader strategy to achieve debt sustainability. This is a less ambitious goalthan assuring a permanent exit from debt rescheduling, which would be a moreappropriate goal for these impoverished countries.42
49I N T E R N A T I O N A L T R A D E A N D F I N A N C E
40 International Monetary Fund and InternationalDevelopment Association, “Heavily Indebted PoorCountries (HIPC) Initiative: status of implementa-tion”, 23 September 2002 (IMFC/Doc/6/02/4).
41 HIPC relief for outstanding official bilateralclaims of HIPC creditors on the 26 HIPC countriesthat have reached the decision point amounted to$143.3 million in 2001 in net present value (NPV)terms. The total is concentrated heavily on a fewHIPC countries: Honduras to Nicaragua ($102.2million NPV); Angola to several HIPC countries($25.8 million); Côte d’Ivoire to Burkina Faso ($9.7million); and the United Republic of Tanzania toUganda ($3.4 million).
42 See World Bank, Operations EvaluationDepartment, “The Heavily Indebted Poor Country(HIPC) Debt Initiative: an OED review”, 20February 2003.
CONTINUING REFORM OF THE INTERNATIONALFINANCIAL ARCHITECTURE
Especially since the Asian financial crisis, the international community hasmade considerable efforts to help countries prevent financial crises and with-stand potential shocks. It has also considered ways to speed up workouts fromfinancial crises when they do occur. There have been considerable reforms ofthe international financial architecture, but much still needs to be done toachieve a more stable and development-friendly international financial sys-tem. This need was recognized in the Monterrey Consensus which noted theneed for international efforts to reform the international financial architecture“to be sustained with greater transparency and the effective participation ofdeveloping countries and countries with economies in transition”.43
Crisis prevention activities
Much attention was focused in the year under review on two major compo-nents of the global crisis-prevention strategy: multinational surveillance andthe implementation and design of financial standards and codes.
Multilateral surveillanceMultilateral surveillance of national economic and financial policies, primarilyby IMF, is a critical instrument of the international community for crisis preven-tion. The key objective is early identification of risks and vulnerabilities.Beyond the traditional macroeconomic policy areas, surveillance is now alsofocusing on improvement in the transparency of countries’ policies, implemen-tation of various standards and codes, and the provision of more specializedfinancial sector assessments. Increased attention is also being paid to improvingthe assessment of debt sustainability and vulnerability to financial crisis.
Most of the recent efforts have targeted developing and transitioneconomies. In this regard, concerns have been raised about the increased bur-den of the various surveillance exercises on national authorities. It has alsobeen argued that the growth of initiatives may dilute policy advice, undermin-ing the main purpose of surveillance. With so many instruments being intro-duced, there may be less focus on those areas that can really enhance a coun-try’s crisis prevention capacities.
Accordingly, there is a growing view that further expansion of the scope ofIMF surveillance should be avoided and that the existing surveillance frame-work needs to be consolidated. The surveillance framework for any particularcountry should demonstrate the relationships between the different policy areasand thereby facilitate a deeper analysis and discussion to inform policy formu-lation. Consolidating the framework also requires tailoring priorities withinsurveillance so that they accord with country needs and capacities; this requiresselectivity among the wide range of issues that could potentially require atten-tion. Sometimes, to ensure that advice has impact, it may be preferable to doless but to do it better.
One reason for the focus on developing and transition economies is that, inthe age of liberalized financial markets and high international capital mobility,
W O R L D E C O N O M I C A N D S O C I A L S U R V E Y 2 0 0 350
43 See Report of the International Conference onFinancing for Development, ..., para. 53.
weakness in the financial infrastructure of a single developing or transitioneconomy could set off a financial crisis, as in the case of Thailand in 1997.However, country-specific factors do not drive crises from country to country.Indeed, globalization has heightened the significance of factors that can spreadfinancial distress, including the behaviour of international short-term investors.
In addition, there is a broadly held view that, because their macroeconomicpolicies can have a global impact, multilateral surveillance of major developedcountries should be intensified. The economic policies of these countries sig-nificantly affect other economies and may be the source of systemic shocks andvulnerabilities. These countries have thus been repeatedly called upon to payparticular attention to the coherence of their policies with respect to globalobjectives and priorities.
It has been suggested that recent financial crises could be, at least in part,the by-products of the rapid credit expansion, asset price increases and overin-vestment in the industrialized countries in the 1990s.44 Institutional shortcom-ings in many emerging market countries contributed to the crises, but theseexcesses played an important role. Accordingly, improving governance, devel-oping and implementing standards and codes and strengthening financial archi-tecture in developing and transition economies are important, but their effec-tiveness depends on the global macroeconomic policy-setting. This, in turn,depends almost solely on the actions of the major industrialized countries.
It has therefore been suggested that IMF should give greater weight in itsassessments of the major economies to the systemic impact of their macroeco-nomic development and policies. However, according to many observers,including IMF itself, industrialized countries have been much less receptive toFund advice than other members, as they are unlikely to seek financing fromthe Fund, and therefore find it less necessary to take account of the views ofthe international community in the formulation of their policies.45 As a result,this important segment of surveillance is weak.
International standards and codes and their implementationA fundamental part of crisis prevention strategy is for countries to strengthentheir financial and macroeconomic systems by following international stan-dards and codes of best practice. As part of this process, the internationalcommunity has sought to develop a single set of international rules and princi-ples for crucial areas of domestic policy in the financial and monetaryspheres. These rules and principles have been developed in a variety offorums, with different degrees of participation by developing countries andcountries with economies in transition.
Because the financial sector is characterized by considerable interdepen-dence and complementarity, the standards cover many issues, but they can begrouped in three main areas: transparency (official data and fiscal, monetaryand financial policy decisions); regulation and supervision of the main types offinancial intermediaries (banks, securities issuers and insurance companies);and market integrity of the corporate sector (corporate governance, accounting,auditing, insolvency, creditor rights and payment systems). To make theprocess of implementation manageable, the Bretton Woods institutions and theFinancial Stability Forum (FSF), which brings together the ministries of
51I N T E R N A T I O N A L T R A D E A N D F I N A N C E
44 William White, “International financial crisis: pre-vention, management and resolution”, speech at aconference on “Economic governance: the role ofmarkets and the State”, Bern, 20 March 2003(www.bis.org).
45 International Monetary Fund, Policy Developmentand Review Department, “Enhancing the effec-tiveness of surveillance: operational responses,the agenda ahead, and next steps”, 14 March2003 http://www.imf.org/external/np/pdr/surv/2003/031403.htm, p. 9.
finance, central banks and main financial regulators of the major global mar-kets, have selected 12 core standards out of more than 70 different standardsthat have been issued by various bodies.
While most of the standards have largely been developed, they are regular-ly reviewed and revised in the various standard-setting bodies. Over the pastyear, much of this activity has focused on the “market integrity” cluster of stan-dards and codes, reflecting the need for enhanced corporate governance,accounting and auditing which was highlighted by the spate of large corporatefailures associated with improper management behaviour in developed coun-tries. The major development in the area of accounting has been the globalmove towards the adoption of principles-based internationally convergentaccounting standards, as developed by the International Accounting StandardsBoard (IASB). On 11 September 2002, the EU regulation on internationalaccounting standards (IAS) entered into force. It requires that, by 2007, all EUlisted companies prepare their consolidated financial statements using theinternational accounting standards.46 Meanwhile, in the United States, amidcorporate scandals, the attitude to IAS is becoming more positive. In October2002, the United States Financial Accounting Standards Board (FASB) andIASB issued a Memorandum of Understanding formalizing their commitmentto the convergence of United States and international accounting standards andagreed on a project to achieve this convergence. The Boards expect to issue ajoint draft to address those differences in the latter part of 2003.47
Along with the adoption of international accounting standards, the growinginstances of accounting irregularities at major corporations have promptedinternational efforts to further improve accounting standards and close theexisting gaps in the guidelines. Those include treatment of stock options, pen-sion fund deficits and financial derivatives.
As for other parts of the market integrity segment, there is an ongoing effortto finalize the principles and guidelines on insolvency regimes and creditorrights by converging to a single standard set of principles based on the modelsdeveloped by the World Bank and the United Nations Commission onInternational Trade Law (UNCITRAL). Also, in March 2003, the IMFExecutive Board agreed to include the Recommendations for SecuritiesSettlement Systems developed by the International Organization of SecuritiesCommissions (IOSCO) and the Committee on Payment and SettlementSystems (CPSS) as another standard for member countries with substantialsecurities trading.
FSF has also taken up these issues. At its ninth meeting in March 2003, itendorsed the ongoing revision of the Principles of Corporate Governance ofOECD.48 It also affirmed the importance of ensuring strong auditor indepen-dence, called for development of sound international audit practice standardsand welcomed work by the Securities and Exchange Commission of the UnitedStates and by international bodies to address possible conflicts of interest andissues relating to credit rating agencies. In addition, the Forum reviewedprogress in addressing earlier concerns, including assessment of offshorefinancial centres.
Meanwhile, efforts to foster implementation of international standards,especially in developing and transition economies, face complications. In anideal world, standards would represent global best practices and be equally
W O R L D E C O N O M I C A N D S O C I A L S U R V E Y 2 0 0 352
46 Regulation No. 1606/2002 of the EuropeanParliament and the Council of 19 July 2002 on theapplication of international accounting standards(http://europa.eu.int).
47 FASB News Release, 29 October 2002(www.fasb.org).
48 See Financial Stability Forum (FSF), ninth meetingof FSF (Berlin, 24 and 25 March 2003) (www.fsfo-rum.org).
applicable to all countries. However, countries differ in their historical and cul-tural characteristics. In practice, this calls for some degree of differentiation inthe application of standards, even in countries that seem to have similar levelsof financial development. For countries at an early stage of development, thelow level of sophistication of the domestic financial system conditions theextent to which particular standards or best practices can be adopted. Requiringsuch countries to apply standards in their full complexity might unnecessarilydelay the implementation process and even deter countries from starting it.
Moreover, the notion that “standards must always be standard” (in otherwords, best practices rather than minimum requirements or principles) essen-tially confines country-specific flexibility to decisions about sequencing andprioritization in implementation. It has been argued that international accep-tance of the importance of sequencing and prioritization is not sufficient toresolve the “one size fits all” dilemma.49 Indeed, it is not clear how sequencingand prioritization per se could make most standards and codes designed main-ly for industrialized countries applicable in economies with different legal andinstitutional situations and at different stages of development.
There have thus been suggestions that standards and codes should not bebased on single models, but rather should have some flexibility with which toreflect local cultures and economic policy frameworks. In particular, standardsand codes in developing countries should not only safeguard financial stabili-ty but also contribute to the creation of a financial sector supportive of devel-opment. Consequently, there are doubts whether global standards are appropri-ate at all.50 The development of models reflecting the realities of developingcountries requires, first of all, increasing these countries’ participation in theirdesign, through either regional or subregional standard-setting bodies or repre-sentation in global standard-setting bodies, and including areas of interest tothese countries in the work of such bodies.
In addition, recent experience suggests that the implementation of standardsand codes has limits as a crisis prevention mechanism. Before its crisis,Argentina had received high marks for compliance. With hindsight, it can beseen that reports on standards and codes failed to capture the factors that madethe country vulnerable to crisis. Reliance on standards and codes could betaken to excess, lead to complacency and divert attention from more pressingsources of vulnerability to crisis.
IMF and the World Bank play an important role in the implementation of thewide range of standards. They are using their consultation missions with mem-ber countries to carry out, on a voluntary basis, Financial Sector AssessmentPrograms (FSAPs) and Reports on the observance of Standards and Codes(ROSCs). As of end-2002, over 340 ROSCs had been prepared for 89 coun-tries.51 The coverage of ROSCs remained very uneven across regions. Forinstance, only 24 per cent of Asian countries had completed at least one ROSC,compared with 80 per cent of Central and Eastern European countries and 58per cent of the member countries of the Commonwealth of Independent States(CIS).52 In addition, no corporate governance, accounting, auditing or insol-vency ROSC had been undertaken with any industrialized country, despite therecent problems in these areas.
Technical assistance to facilitate implementation of standards and codes hasbeen inadequate. Only one quarter of developing countries and countries with
53I N T E R N A T I O N A L T R A D E A N D F I N A N C E
49 Benu Schneider, “Issues in implementing stan-dards and codes”, paper presented at the ODIConference on International Standards andCodes: The Developing Country Perspective,Overseas Development Institute (ODI), London, 21June 2002, p. 9.
50 For a discussion of this issue, see, for instance,Stephany Griffith-Jones and Ricardo Gottschalk,“Enhancing private capital flows to developingcountries in the new international context”,report on a Major Commonwealth Secretariat,World Bank and Commonwealth Business CouncilConference, London, August 2002.
51 Report of the Managing Director to theInternational Monetary and Financial Committeeon the IMF’s policy agenda (IMFC/Doc/7/03/9),International Monetary Fund, 11 April 2003http://www.imf.org/external/np/omd/surv/2003/041103.htm, p. 10.
52 “International standards: background paper onstrengthening surveillance, domestic institutionsand international markets”, InternationalMonetary Fund, 5 March 2003 http://www.imf.org/external/np/pdr/sac/2003/030503sl.pdf, p. 4.
economies in transition that had completed ROSCs or FSAPs received follow-uptechnical assistance. In addition to the lack of country-specific flexibility, theresource constraint could be a problem in implementing standards and codes.
Resources are also needed for the assessment exercises themselves. The expe-rience with FSAPs and ROSCs has demonstrated the costs of these programmes.In response, the Fund and the Bank are trying to make those programmes moreefficient and effective through streamlining and prioritization.53 This meansbringing greater selectivity to the scope and pace of assessments, as well as bet-ter tailoring the assessments to individual country circumstances. Account willbe taken in this regard of relative costs and benefits, as well as the authorities’priorities and capacity constraints, in scheduling future ROSCs.
From the beginning, it was thought that the implementation of internation-al standards and codes would increase confidence of potential investors inemerging economies. This has been slow in coming, but there seems to besome evidence of progress in market response to the standards initiative. Forinstance, a survey of large, internationally active financial institutions foundthat 58 per cent of respondents used ROSCs in their financial decision-mak-ing, while another 25 per cent were aware of ROSCs, but did not use them fre-quently. The use of ROSCs is mostly concentrated in New York, and fairlylimited in institutions based in Japan and Europe.54 The rating agencies alsofind ROSCs useful. For instance, Standard and Poor’s explicitly considersstandards in assigning ratings.55
There are some indications that the observance of standards and codes maybe associated with higher credit ratings. One study found that, following pub-lication of a ROSC, a country was more likely to receive an upgrade in its sov-ereign credit rating (or to retain its rating) than to receive a downgrade.56
However, it is understood that the implementation of standards and codes is along-term strategy for confidence-building and it is too early to draw conclu-sions concerning investors’ response to the standards initiative. The “pay-off”,in terms of increased capital inflows as a consequence of complying with alarge number of standards and codes, may also require a long-term perspective.
The New Basel Capital AccordOne of the most important regulatory developments since the 1997-1998 finan-cial crisis has been the proposal by the Basel Committee on BankingSupervision (BCBS) regarding a new capital adequacy framework to replacethe 1988 Basel Capital Accord (Basel I). Basel I was the first internationalstandard for regulation by national authorities of the commercial banks thatwere active in international finance. It has since grown into a standard for bankregulation globally, but regulators in the major financial centres have found itincreasingly unsatisfactory for their needs. The first draft of the proposed newaccord (Basel II) was circulated in June 1999.57 After almost five years of dis-cussion and revision, BCBS is expected to finalize the New Capital Accord inthe fourth quarter of 2003, with implementation to begin in late 2006.
Basel I is considered insufficiently sophisticated to address the expandedactivities of complex banking institutions because of the lack of differentiationamong the degrees of risk they face and thus the capital they should holdagainst unforeseen emergencies. Risk management and the determination ofappropriate capital requirements have evolved since Basel I was designed.
W O R L D E C O N O M I C A N D S O C I A L S U R V E Y 2 0 0 354
53 “IMF Executive Board reviews international stan-dards: strengthening surveillance, domestic insti-tutions and international markets”, PublicInformation Notice, No. 03/43, 3 April 2003.
54 “International standards: background paper…”,p. 27.
55 See http://www.standardandpoors.com/Forum/RatingsAnalysis/
56 Fitch Ratings, “Standards and codes: their impacton sovereign ratings”, 10 July 2002 (www.fitchib-ca.com).
57 For an overview of the Basel II proposal, see sec-retariat of BCBS, “The New Basel Capital Accord:an explanatory note”, Bank for InternationalSettlements, January 2001.
Banks themselves have developed and adopted new techniques to improvetheir risk management and internal control measures. Basel II is supposed tocreate incentives to accelerate adoption of these new techniques by large banksand promote the future evolution of risk management by establishing a frame-work that is more risk-sensitive.
Unlike the 1988 Accord, the new framework begins by acknowledging that“one size does not fit all” and thus provides a spectrum of approaches, fromsimple to advanced, for the measurement of risk in determining capital levels.For the measurement of credit risk, two principal options have been proposed.The first is the standardized approach, generally for smaller and simpler banks,and the second is the internal ratings-based (IRB) approach, for larger andmore complex banks, with two variants, “foundation” and “advanced”.
The standardized approach is conceptually the same as the present accord,but is more risk-sensitive. Banks are required to differentiate their exposuresthrough broad categories, such as loans to corporations, loans to sovereign bor-rowers and loans to banks. The loans in each category are multiplied by a cat-egory-specific “risk weighting” and the results aggregated. The required capi-tal is then a specified fraction of this sum. However, under the new Accord,these broad categories will be divided into several subcategories with riskweights being assigned by reference to a rating provided by an external creditinstitution (such as a rating agency). For example, the existing Accord providesonly one risk weight (100 per cent) for corporate lending, but the new Accordwill provide four categories (20, 50, 100 and 150 per cent). Also, under the cur-rent system, claims on Governments denominated in foreign currency andclaims on banks with maturity over one year are treated differently, dependingon whether the borrowers are located within or outside the member countriesof OECD. The latter group are subject to much higher capital charges. In theproposed modification, loans to similarly rated banks or sovereigns, whetherlocated in OECD countries or not, would receive the same risk weight.
Under the IRB approach, banks will be allowed to use their internal esti-mates of borrower creditworthiness to assess credit risk, subject to strictmethodological and disclosure standards. These estimates of a potential futureloss amount will form the basis of minimum capital requirements. In otherwords, the banks’ internal ratings systems are expected to accurately and con-sistently differentiate between degrees of risk. Under the IRB approach, therange of risk weights will be more diverse than in the standardized approach,resulting in greater risk-sensitivity.
To ensure that each bank has sound internal processes in place, a “second pil-lar”, supervisory review, has been included in the draft framework. Supervisorswill be expected to review banks’ own assessments and their methodologies forarriving at the amount of capital they should hold relative to their risk. That pil-lar had not been deemed necessary when the original Accord was prepared.Another innovation is the “the third pillar”, market discipline, which calls formore extensive public disclosure of risk management procedures and financialconditions of regulated entities. The expectation is that banks with superior riskmanagement systems would be rewarded with higher stock market valuationsand lower spreads on their borrowings than other banks.
Despite the effort and progress made by BCBS over the past five years,questions remain in both the developed and developing countries about aspects
55I N T E R N A T I O N A L T R A D E A N D F I N A N C E
of the Basel II framework. The fact that the rules are enormous in number andcomplexity is one source of concern. Complex rules have been developed pri-marily for a relatively small number of large, complex internationally activebanking organizations that are supposed to implement the IRB approach. Forthe majority of banks that are likely to implement the standardized approach,the new Accord adds little. Also, to accommodate concerns expressed by devel-oping countries, BCBS has developed a simple version of the standardizedapproach of about 12 pages (compared with about 500 pages for the advancedIRB approach).
There are also doubts whether the transition to any form of Basel II makessense for most banks. For instance, United States supervisory authorities intendto apply only the advanced IRB version of Basel II and will likely require onlylarge United States banks to adopt it. All other banks will remain on the BaselI capital standard. United States supervisors believe that, for most banks, BaselI is adequate for the foreseeable future and that the costs of requiring mostbanks to shift to Basel II may far exceed the benefits.58
For the largest banks and their regulators, the complexity of the new Accordmay become a problem. There is widespread concern that Basel II regulatoryrequirements for banks applying the IRB approach are not clear enough to bewell understood by institutions that are expected to implement them, by theirregulators, or by third parties.59
The prospect of different regulatory treatment for different types of bankshas also raised concerns about the potential effect of Basel II on the competi-tive balance between large and small banks, as well as between banks and non-banks. It is expected that banks implementing the IRB approach will experi-ence lower capital requirements in some lines of business. This may put small-er banks at a competitive disadvantage when competing against the large banksin these same product lines. For many large banks, the principal source of com-petition is non-banks. There is concern that the implementation of Basel II mayexacerbate differences in regulatory requirements to the disadvantage of depos-itory institutions.
Another concern is that a more risk-sensitive framework may increase thecost and reduce the supply of bank lending to certain categories of borrowers,notably small and medium-sized enterprises (SMEs). In response to these con-cerns, BCBS has set capital requirements for lending to SMEs below those forlarge corporations. The justification for this change was that the probability ofdefault was less correlated among SMEs than among large firms. It has beensuggested that a similar case can be made for developing countries because ofthe lower correlation of their risk with that of developed countries (as com-pared with the correlation among developed countries).60
Many observers find the most controversial aspect of the standardizedapproach to be the suggestion that assessments by credit rating agencies ofdeveloping countries be used to categorize borrowers. There has been very lim-ited penetration of ratings in developing economies, especially at the firmlevel, and rating agencies have had a mixed record in these countries. Theirsovereign risk assessments, it is argued, have tended to lag changes in marketconditions, first encouraging excessive investment through overly optimisticratings and then aggravating abrupt and huge capital outflows with negativeassessments.
W O R L D E C O N O M I C A N D S O C I A L S U R V E Y 2 0 0 356
58 Testimony by Mr. Roger W. Ferguson, Vice-Chairman of the Board of Governors of the UnitedStates Federal Reserve System, before theSubcommittee on Domestic and InternationalMonetary Policy, Trade and Technology of theCommittee on Financial Services of the UnitedStates House of Representatives, Washington,D.C., 27 February 2003.
59 See, for instance, statement of John D. Hawke,Comptroller of the Currency, before theSubcommittee on Domestic and InternationalMonetary Policy, Trade and Technology of theCommittee on Financial Services of the UnitedStates House of Representatives, Washington,D.C., 27 February 2003.
60 See, for instance, S. Griffith-Jones, M. Segovianoand S. Spratt, “Basel II and developing countries:diversification and portfolio effects”, Institute ofDevelopment Studies, Sussex, United Kingdom,2003 (www.ids.ac.uk/intfinance/).
There is also a view that increased risk-sensitivity due to the New CapitalAccord may increase the “pro-cyclicality” of bank lending. The proponents ofthis view argue that, if capital requirements were more sensitive to risk, bankswould cut lending even more in economic downturns (when measured risk tendsto increase), thus aggravating the decline, and the opposite during a boom.
The financial sphere is inherently pro-cyclical and financial liberalizationand innovation, including the proliferation of internal risk management systemsin the chief transnational financial institutions, may have already reinforcedpro-cyclicality in financial behaviour. Most risk measures are of short-termnature, and existing techniques of risk assessment are said not to pay sufficientattention to the movement of risk through the business cycle. Besides, manyleading financial institutions use similar models to guide their behaviour. In thissituation, what is sensible and rational for an individual market participant, act-ing in isolation may produce a devastating outcome for the market as a whole.61
The architects of Basel II are trying to moderate the gravity of the problem.They note that supervisory oversight and market discipline (pillars II and III)should reinforce the incentive for banks to maintain a cushion of capital abovethe minimum so as to have a margin of protection in downturns. They are alsourging financial institutions to adopt risk management practices that take bet-ter account of the evolution of risk over time and that are not excessively vul-nerable to short-term revisions.62 The regulators’ success in dealing with thisproblem within the context of Basel II remains a concern.
Approaches to crisis resolution
Notwithstanding the best efforts to strengthen crisis prevention, it is widelybelieved that financial crises will still occur. Those crises may range fromshort-term liquidity problems to problems of solvency, but they all entail sig-nificant economic shocks. The international community acknowledges that itneeds a strong and comprehensive set of instruments to help countries resolvesuch financial difficulties.
The role of official financingIt is recognized that if a crisis is clearly identified as a problem of externalliquidity rather than solvency, official financial support, possibly in largeamounts, may help the country resolve its problem and that a clear frame-work is needed to guide official actions in such cases. Clearly stated princi-ples of official intervention would help debtors and their creditors to formu-late expectations and set the stage for greater accountability on the part ofpolicy makers.
To heighten the degree of clarity and predictability about the officialresponse to crises, IMF has developed a new framework for exceptional accessto its resources in capital-account crisis.63 IMF is prepared to provide largerloans than normally allowed if a country meets the following criteria: excep-tionally large need; a debt burden that will be sustainable under reasonablyconservative assumptions; good prospects of regaining access to private capi-tal markets during the period of the IMF loan; and indications that the coun-try’s policies have a strong chance of succeeding.
57I N T E R N A T I O N A L T R A D E A N D F I N A N C E
61 For a discussion of why and how market-sensitiverisk management systems may raise volatility,see, for instance, Avinash Persaud, “Liquidityblack holes: what are they and how are they gen-erated”, paper presented at a seminar on “BaselII: The Challenges for the G-24”, IMF headquar-ters, Washington, D.C., 11 April 2003.
62 See, for instance, Andrew Crockett, “Centralbanking, financial stability and Basel II”, speechat the 38th South East Asian Central Banks (SEA-CEN) Governors Conference, Manila, 13 February2003 (www.bis.org).
63 See “IMF concludes discussion on access policyin the context of capital-account crisis; andreview of access policies in the credit tranchesand the Extended Fund Facility”, PublicInformation Notice, No. 03/37, 21 March 2003.
Among those criteria, the central, and most controversial, is the judgementabout debt sustainability. Knowledge of whether a country is facing a liquidi-ty, as opposed to a solvency, crisis is crucial for deciding whether internation-al liquidity support is desirable or not (in other words, there is no point in lend-ing to an insolvent country since the debt outstanding already exceeds the max-imum serviceable).
To better distinguish cases of illiquidity from cases of unsustainability, IMFdeveloped a new standardized analytical framework for debt sustainabilityassessments, which was published in June 2002.64 The framework covers bothfiscal and external debt sustainability and centres on the medium-term projec-tions for a country’s economy. In addition to baseline projections for public andexternal debt, the framework incorporates a set of sensitivity tests to simulatethe debt dynamics under alternative assumptions about key variables (includ-ing economic growth, interest rates and the exchange rate).
The framework may be useful not only for making decisions on exceptionalaccess to official financing, but also in debt workouts for insolvent countries.An indicator of debt sustainability is needed in restructuring the debt of suchcountries so as to guide debtors and creditors in their discussions on how muchdebt reduction is required in order to reach a manageable pattern of repaymentsover time. Such a framework may also be useful for crisis prevention, as itcould better identify when debt levels had moved towards dangerous levels soas to enable action to be taken to avoid a crisis.
Nevertheless, past experience has shown that, in many external financialcrises, it is not known initially whether solvency is at issue or not. It is noteasy, even theoretically, much less operationally, to distinguish clearly betweensolvency and liquidity difficulties. For instance, with a loss of confidence in acountry’s situation, the international financial market may demand very highinterest rates, which could make the debt unsustainable; but with lower inter-est rates that were believed to be consistent with the underlying economic fun-damentals, there would be no solvency crisis. In this case, the internationalcommunity might seek to calm the market and reduce interest rates by provid-ing substantial financing. Alternatively, the market could be forced to face theimplications of its own judgement that the country’s debt is unsustainable and,in the absence of up-front official financing, begin negotiations on debtrestructuring as soon as possible. In addition to difficulties in identifying pure-ly “technical” aspects of the crisis, there will always be political considerationsand associated pressures.
Given the difficulty in identifying ex ante the origins of almost any crisis,as well as the myriad political and social factors, it is doubtful whether simpleand mechanical calculations, formulas, thresholds or ratios alone would bevery helpful. Ultimately, the key test will be the judgements that are made inindividual cases. In order to be credible, those judgements should be as con-sistent as possible in providing signals to markets concerning when the inter-national community’s support will be forthcoming and when it will not.
Along with developing a clearer framework in respect of when to use offi-cial resources, IMF has sought to improve the design of its loan facilities tobetter support countries in capital-account crisis. Most of the Fund’s facilitieswere designed in a period of low capital mobility to deal with slowly evolvingcurrent-account crises. However, the traditional strategy of enforcing policy
W O R L D E C O N O M I C A N D S O C I A L S U R V E Y 2 0 0 358
64 For a discussion of the IMF analytical framework,see Christina Daseking, “Debt: how much is toomuch?”, Finance and Development, December2002, pp. 12-14.
conditionality by disbursing money in tranches over time may not be fullyappropriate for dealing with modern capital-account crises which move muchfaster and may generate large swings in capital flows.
In response to these new realities, IMF in 1997 established the SupplementalReserve Facility (SRF). SRF can provide larger and more front-loaded financingto countries hit by a capital-account crisis. In March 2003, the IMF ExecutiveBoard decided to lengthen the maturity of drawings from the SRF by one year,as experience had shown that the duration of countries’ balance-of-paymentsneeds might be longer than originally expected. At the same time, it decided toretain quota-based limits on access to the SRF (300 per cent of quota). It has beenargued, however, that exceptional access norms should not be linked to countryquotas and that it is necessary to examine other approaches.65
According to many observers, SRF has not gone far enough and there is aneed to supplement this strategy with the possibility of the provision of a largeamount of funding quickly, based on ex ante judgements and preconditions.66
This was the intention of the Contingent Credit Line (CCL), introduced by theFund in 1999. Besides providing external liquidity with a high degree of auto-maticity to pre-qualified countries during an emergency, it was expected tohave a preventive function, that is to say, by providing an agreed credit line inadvance, it could help discourage a sudden withdrawal of external credit.However, as of May 2003, no member country had availed itself of the facili-ty. The key problem is that potential users are concerned that application forthe facility, not to mention drawing from it, would be viewed as a sign of weak-ness by the international financial market, thereby reducing, rather thanstrengthening, confidence in the country. The scheduled expiration of the facil-ity is November 2003 and there appears to be insufficient support to extend it.
In May 2002, the World Bank introduced a structural adjustment counterpartto the CCL, the Deferred Drawdown Option (DDO), to protect core structuralprogrammes if a country faces reduced access to international financial mar-kets. A DDO gives borrowers a credit line on which they can draw for up tothree years, provided that overall programme implementation and the macro-economic framework remain adequate. Several countries have already estab-lished DDO facilities, as they consider that this instrument, unlike the CCL,does not have the negative signalling effect.
Sovereign debt restructuringIn addition to clear policy on handling liquidity crises, it is necessary tohave an agreed international strategy for resolving solvency crises. In suchcrises, the level of debt has to be reduced. Intense work in the past year hasfocused on cases in which the primary insolvent debtor is the government.One aim of this work has been to provide incentives to sovereign debtorsand their private sector creditors to quickly begin constructive negotiationson restructuring unsustainable debt. However, along with incentives, thereshould be a process that is a clear and known in advance. Debtors and credi-tors should also have confidence that it can produce an orderly and effectiveresolution of unsustainable debt situations without undue delay. The lack ofsuch a process is considered to be one of the major gaps in the internationalfinancial architecture.
59I N T E R N A T I O N A L T R A D E A N D F I N A N C E
65 See, for instance, International Monetary andFinancial Committee, statement by Aleksei L.Kudrin, Deputy Prime Minister and Minister ofFinance of the Russian Federation, Washington,D.C., 12 April 2003 http://www.imf.org/exter-nal/spring/2003/imfc/state/eng/rus.htm, p. 6.
66 See, for instance, Thomas D. Willet, “Why isthere so much disagreement about the IMF andreform of the international financial architec-ture?”, paper prepared for the IMF seminar oncurrent developments in monetary and financiallaw, August 2002 http://www.imf.org/external/np/leg/sem/2002/cdmfl/eng/willet.pdf, pp.19-20.
One of the approaches explored recently, the “contractual” approach, whichfocuses on one instrument for sovereign lending, namely, bonds, would addnew clauses to each sovereign bond contract specifying how to carry outrestructuring of the bond issue in a crisis situation. The Group of 7, the Groupof 10 and the International Monetary and Financial Committee have endorsedthis approach. Also, the Group of 24 has indicated its preference for approach-es to restructuring that are voluntary, country-specific and market-friendly, andthe contractual approach is deemed to be so.67
Central to this approach are collective action clauses (CACs), which wouldprevent a small minority of bondholders from sabotaging the bond’s restruc-turing. These clauses would specify what majority would be needed to approvea change in the financial terms of the bond. In addition, representation clauses(specifying how debtors and creditors would come together in the event ofrestructuring), initiation clauses (describing how the sovereign debtor wouldinitiate the process) and commitments to keep bondholders informed on theproposed treatment of other creditors would be included.68 Furthermore, theborrowing Government and the bondholders would pledge to follow a code ofconduct for both crisis prevention and crisis resolution, which broadly stipu-lated the respective roles that key parties would be expected to play duringtimes of crisis. There are various proposals for the content of the code, includ-ing one from private sector organizations.69
The concept of CACs is not new: they are incorporated in sovereign bondsgoverned by the laws of the United Kingdom and Japan. About 30 per cent ofthe total outstanding volume of emerging market sovereign bonds alreadyinclude CACs. There is no evidence that these bonds trade at a discount tobonds without this feature and thus it may be said that they have market accep-tance. Nevertheless, most bonds are subject to New York State law, underwhich all bondholders must agree to any amendment of payment terms. Theproposal is thus to extend CACs to bonds issued under New York law, as wellas to modify the CACs in other bond issuances.
The contractual approach, however, has several shortcomings. One is that,even if bond contracts were written so as to bring the holders of all outstand-ing bonds together to vote on a bond restructuring (referred to as aggregationacross debt contracts of the same class), it would remain to coordinate reliefgiven by bondholders with that of other classes of creditors (“comparable treat-ment”) so as to reach an adequate overall relief package. Proponents of CACsresponded to this criticism by advocating the inclusion of the same clauses inall private loan contracts (bonds, bank loans, trade credits etc.)70 and the for-mation of a voluntary forum to organize the negotiations and resolve disputesin individual cases, entailing the introduction of a major aspect of the statuto-ry approach described below, but as a voluntary device.71 Another weakness isthat, if the clauses were included only in new issues, it would take many yearsbefore all outstanding sovereign bonds of any country had these clauses.
To make the use of such clauses more common, EU member States havepledged to include them in their own government bonds issued under foreignjurisdictions. Before that decision, among the developed countries, only Canadaand the United Kingdom had CACs in their foreign currency bond and note con-tracts. Meanwhile, both the Governments in the working group of the Group of10 and private creditor associations have been drafting sets of model clauses.
W O R L D E C O N O M I C A N D S O C I A L S U R V E Y 2 0 0 360
67 Communiqué of the Group of 24, Washington,D.C., 11 April 2003, pp. 3-4.
68 See John B. Taylor, Under Secretary of theTreasury for International Affairs, “Using clausesto reform the process for sovereign debt work-outs: progress and next steps”, remarks at theEmerging Markets Traders Association (EMTA)Annual Meeting, New York, 5 December 2002.
69 See “Sovereign debt restructuring”, discussiondraft of a joint statement by EMTA, the Instituteof International Finance, the International PrimaryMarket Association, the International SecuritiesMarket Association, the Securities IndustryAssociation and the Bond Market Association, 6December 2002 (available at www.emta.org).
70 R. Glen Hubbard, Chair, United States Council ofEconomic Advisors, “Enhancing sovereign debtrestructuring”, remarks at the Conference on theIMF Sovereign Debt Proposal, AmericanEnterprise Institute, Washington, D.C., 7 October2002.
71 See “Sovereign debt restructuring”, loc. cit., p. 8.
These efforts are already bringing results. The first countries to include aCAC in a New York law-governed bond were Lebanon (2000), Qatar (2000)and Egypt (2001). However, Mexico was the first large emerging market issuerthat publicly announced the inclusion of such clauses in the bond issuance. Inlate February 2003, Mexico included a version of a CAC in a new $1 billionissue of bonds governed by New York law. The Mexican issue will allow cred-itors holding 75 per cent of the bonds to modify the payments terms. There wasno evidence of a premium priced into the new bond because of the CAC.72 Thismay help emerging market issuers to embrace this practice more broadly.Following Mexico’s lead, Brazil, South Africa and Uruguay decided to includeCACs in bond issues governed by New York law.
To address criticisms of the contractual approach, IMF proposed inNovember 2001 establishing a new international statutory framework for debtworkouts, to be called the sovereign debt restructuring mechanism (SDRM).While the framework was revised several times in response to public reaction,its core objective remained, namely, to enable a debtor in crisis and a qualifiedmajority of its creditors to make a restructuring agreement binding on all cred-itors in all the covered classes of debt through a formal international process.73
Although a number of countries expressed interest in developing the proposal,it did not find broad enough support to move from proposal to implementation.
Under the proposal, after the activation of the SDRM by the debtor, all cov-ered creditors would be formed into separate classes for the purpose of votingon a proposed debt restructuring. The sovereign would then formally proposethe component draft agreements to each class, which would vote on them. Theoverall debt agreement would be considered adopted when approved by thestipulated supermajority (for example, 75 per cent) of the outstanding principalof registered claims in each class. New lending during the restructuring processwould have repayment priority over defaulted claims, so as to facilitate essen-tial credit flows to the debtor Government during the crisis period from someprivate as well as official sources.
A new international legal mechanism, the sovereign debt dispute resolutionforum (SDDRF), was proposed to oversee the formation of the classes, validatethe claims of individual creditors, and resolve disputes on the allocation ofindividual creditors to the classes and voting process. The SDRM would beestablished through amendment of the IMF Articles of Agreement, whichwould bind all IMF member States, even those that had not endorsed theamendment per se.
Many issues in the design of SDRM have been controversial, for example,that concerning the scope of the debt that would be covered. There were alsoconcerns that the adoption of the SDRM through an amendment of the IMFArticles of Agreement would put the mechanism too close to IMF, which isitself a creditor, as well as the body responsible for negotiating an adjustmentprogramme with the Government. For this reason, there have been proposals tocreate the SDRM or something similar under a standalone treaty, since therewas nothing in the operation of the mechanism itself that needed to directlyinvolve IMF.
Many emerging market countries fear that the SDRM might not only raisetheir borrowing costs and impede market access, but also entail a loss of sov-ereignty, especially if bound by an IMF amendment for which they did not
61I N T E R N A T I O N A L T R A D E A N D F I N A N C E
72 International Monetary Fund, Global FinancialStability Report: Market Developments andIssues (Washington, D.C., March 2003), p. 58.
73 For the latest version of the IMF proposal, see“Report of the Managing Director to theInternational Monetary and Financial Committeeon a statutory sovereign debt restructuring mech-anism”, IMF, 8 April 2003 http://www.imf.org/external/np/omd/surv/2003/040803.htm.
vote. In their turn, many private sector creditors worry that, by overridingexisting bond contracts, the SDRM would curtail the legal rights of bondhold-ers. In early 2003, the United States, which had previously been open to devel-oping the SDRM proposal, signalled that it was neither necessary nor feasibleto continue working on the SDRM.74 It appears that further work on the SDRMwill not go forward at this time.
There remains a concern whether the contractual approach, which by designis not comprehensive, will suffice. Mechanisms that incorporate or build on thecontractual approach should continue to be investigated, as should issues ofhow to ensure the overall adequacy of negotiated debt relief from the point ofview of the debtor country and its people, how to bring about comparability oftreatment of creditors, how to ensure full participation of all creditors in eachcreditor class, and how to resolve debt crises more expeditiously. Non-treatyapproaches, which could include other potential international legal instru-ments, as well as voluntary mechanisms, should also continue to be explored,especially as interim measures that could help foster adequate and fair debt res-olution and demonstrate the value of the comprehensive approach.
W O R L D E C O N O M I C A N D S O C I A L S U R V E Y 2 0 0 362
74 See Meeting of the International Monetary andFinancial Committee, “Statement by SecretaryJohn W. Snow, United States Treasury”,International Monetary Fund, Washington, D.C.,12 April 2003 http://www.imf.org/external/spring/2003/imfc/state/eng/usa.htm, p. 2.
There was some recovery in growth in most countries during 2002, butthe momentum weakened towards the end of the year and into early 2003.Growth is expected to accelerate as 2003 progresses but, in most countries,the average for the year will be only a modest improvement over 2002.With the recovery continuing, growth is expected to move closer to itslong-term potential in most countries in 2004.
The anticipated recovery in the developed market economies in 2002was delayed, in large measure by various fears associated with the situa-tion in Iraq. A recovery is now forecast for the second half of 2003, with theUnited States of America expected to lead and be the driving force. Therecovery in Western Europe and Japan is projected to be less robust andwill be dampened further by the additional appreciation of their curren-cies vis-à-vis the dollar which took place in the first half of 2003.
The economies in transition continue to be the fastest growing of thethree major country groupings, although they have gradually deceleratedfrom their high point of 2000. Most members of the Commonwealth ofIndependent States (CIS) and the Baltic countries now appear to be on along-term path towards recovery from the setbacks endured in the 1990s.Growth in the countries of Central and Eastern Europe slowed in 2001 and2002, but exceeds that of their Western neighbours. Their forthcomingaccession to the European Union (EU) should accelerate convergence.
The developing countries as a group are making a sluggish recoveryfrom their slowdown in 2001, the more so if the strong performances ofChina and India are excluded. In Latin America, there was a fall in outputin 2002 after a very weak performance in 2001. The opposite applied inWest Asia, but the rise in the output of the group was mainly due to therecovery of Turkey from the crisis of 2001, while many other economies inthe group suffered from the heightened geopolitical conflicts in the region.Each of these two regions has achieved an increase in per capita output inonly one of the past four years and the prospects for 2003 suggest only amodest gain. Growth in Africa fell below 3 per cent in 2002 and only a min-imal improvement is expected in 2003. The reappearance of conflict inparts of sub-Saharan Africa has already adversely affected growth in theconcerned areas and, unless very quickly contained, will damage medium-and longer-term development prospects more widely. In contrast with allother regions, Eastern and Southern Asia rebounded strongly in 2002.Some deceleration in early 2003 is forecast to be reversed as the year pro-gresses so that the region is likely to maintain, with some margin, its posi-tion as the most economically dynamic in the world.
III THE CURRENT SITUATION INTHE WORLD’S ECONOMIES
63T H E C U R R E N T S I T U A T I O N I N T H E W O R L D ’ S E C O N O M I E S
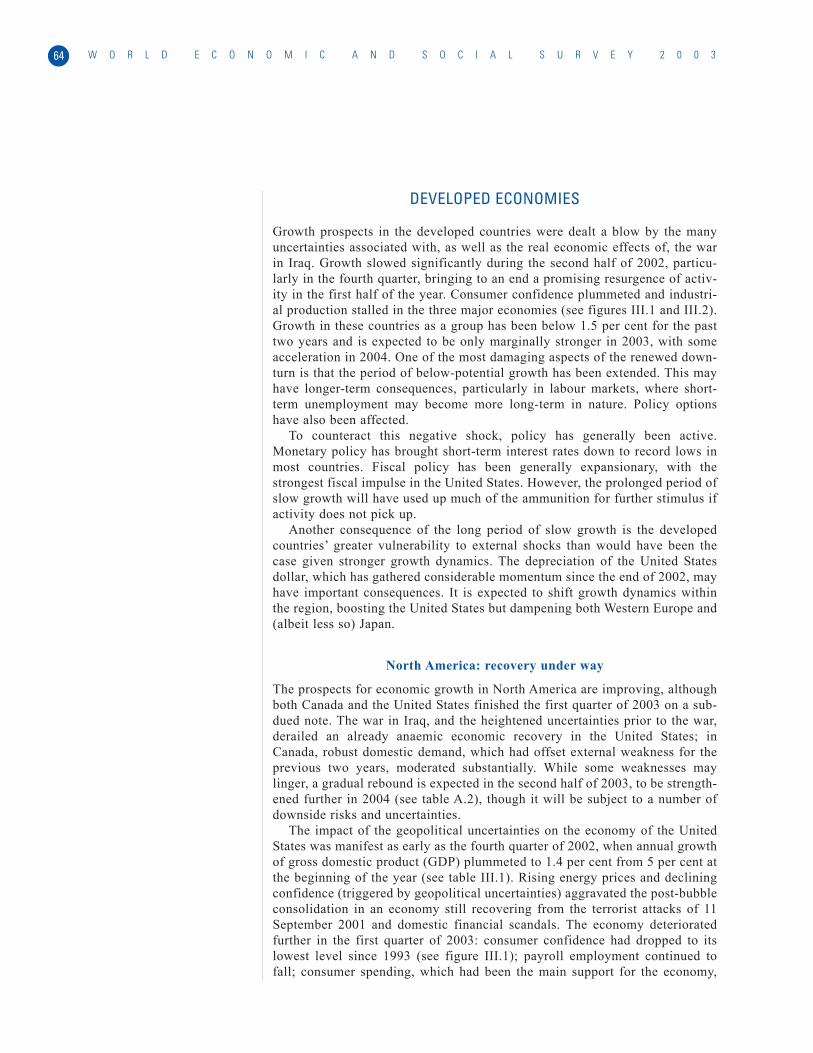
DEVELOPED ECONOMIES
Growth prospects in the developed countries were dealt a blow by the manyuncertainties associated with, as well as the real economic effects of, the warin Iraq. Growth slowed significantly during the second half of 2002, particu-larly in the fourth quarter, bringing to an end a promising resurgence of activ-ity in the first half of the year. Consumer confidence plummeted and industri-al production stalled in the three major economies (see figures III.1 and III.2).Growth in these countries as a group has been below 1.5 per cent for the pasttwo years and is expected to be only marginally stronger in 2003, with someacceleration in 2004. One of the most damaging aspects of the renewed down-turn is that the period of below-potential growth has been extended. This mayhave longer-term consequences, particularly in labour markets, where short-term unemployment may become more long-term in nature. Policy optionshave also been affected.
To counteract this negative shock, policy has generally been active.Monetary policy has brought short-term interest rates down to record lows inmost countries. Fiscal policy has been generally expansionary, with thestrongest fiscal impulse in the United States. However, the prolonged period ofslow growth will have used up much of the ammunition for further stimulus ifactivity does not pick up.
Another consequence of the long period of slow growth is the developedcountries’ greater vulnerability to external shocks than would have been thecase given stronger growth dynamics. The depreciation of the United Statesdollar, which has gathered considerable momentum since the end of 2002, mayhave important consequences. It is expected to shift growth dynamics withinthe region, boosting the United States but dampening both Western Europe and(albeit less so) Japan.
North America: recovery under way
The prospects for economic growth in North America are improving, althoughboth Canada and the United States finished the first quarter of 2003 on a sub-dued note. The war in Iraq, and the heightened uncertainties prior to the war,derailed an already anaemic economic recovery in the United States; inCanada, robust domestic demand, which had offset external weakness for theprevious two years, moderated substantially. While some weaknesses maylinger, a gradual rebound is expected in the second half of 2003, to be strength-ened further in 2004 (see table A.2), though it will be subject to a number ofdownside risks and uncertainties.
The impact of the geopolitical uncertainties on the economy of the UnitedStates was manifest as early as the fourth quarter of 2002, when annual growthof gross domestic product (GDP) plummeted to 1.4 per cent from 5 per cent atthe beginning of the year (see table III.1). Rising energy prices and decliningconfidence (triggered by geopolitical uncertainties) aggravated the post-bubbleconsolidation in an economy still recovering from the terrorist attacks of 11September 2001 and domestic financial scandals. The economy deterioratedfurther in the first quarter of 2003: consumer confidence had dropped to itslowest level since 1993 (see figure III.1); payroll employment continued tofall; consumer spending, which had been the main support for the economy,
W O R L D E C O N O M I C A N D S O C I A L S U R V E Y 2 0 0 364

European Union
Japan
United States
Germany
United KingdomFrance
J A J O J A J O J A J O J A J O J A J O J A1998 1999 2000 2001 2002 2003
J A J O J A J O J A J O J A J O J A J O J A1998 1999 2000 2001 2002 2003
J A J O J A J O J A J O J A J O J A J O J A1998 1999 2000 2001 2002 2003
J A J O J A J O J A J O J A J O J A J O J A1998 1999 2000 2001 2002 2003
J A J O J A J O J A J O J A J O J A J O J A1998 1999 2000 2001 2002 2003
Q1 Q3 Q1 Q3 Q1 Q3 Q1 Q3 Q1 Q3 Q11998 1999 2000 2001 2002 2003
30.0
32.0
34.0
36.0
38.0
40.0
42.0
44.0
46.0
60.0
70.0
80.0
90.0
100.0
110.0
120.0
130.0
140.0
150.0
-20.0
-15.0
-10.0
-5.0
0.0
-25.0
-20.0
-15.0
-10.0
-5.0
0.0
5.0
10.0
-35.0
-30.0
-25.0
-20.0
-15.0
-10.0
-5.0
0.0
5.0
10.0
-15.0
-10.0
-5.0
0.0
5.0
10.0
65T H E C U R R E N T S I T U A T I O N I N T H E W O R L D ’ S E C O N O M I E S
Sources: United States: The Conference Board; Japan: Economic and Social Research Institute; all European Union countries: European Economy, Businessand Consumer Surveys.a For United States, measure is an index (1985 = 100); for Japan, measure is a composite index (percentage); for European Union, measure shows percent-
age of respondents to survey who expect an improvement minus percentage of those who expect a deterioration.
Figure III.1.CONSUMER CONFIDENCE IN THE MAJOR ECONOMIES, 1998-2003a
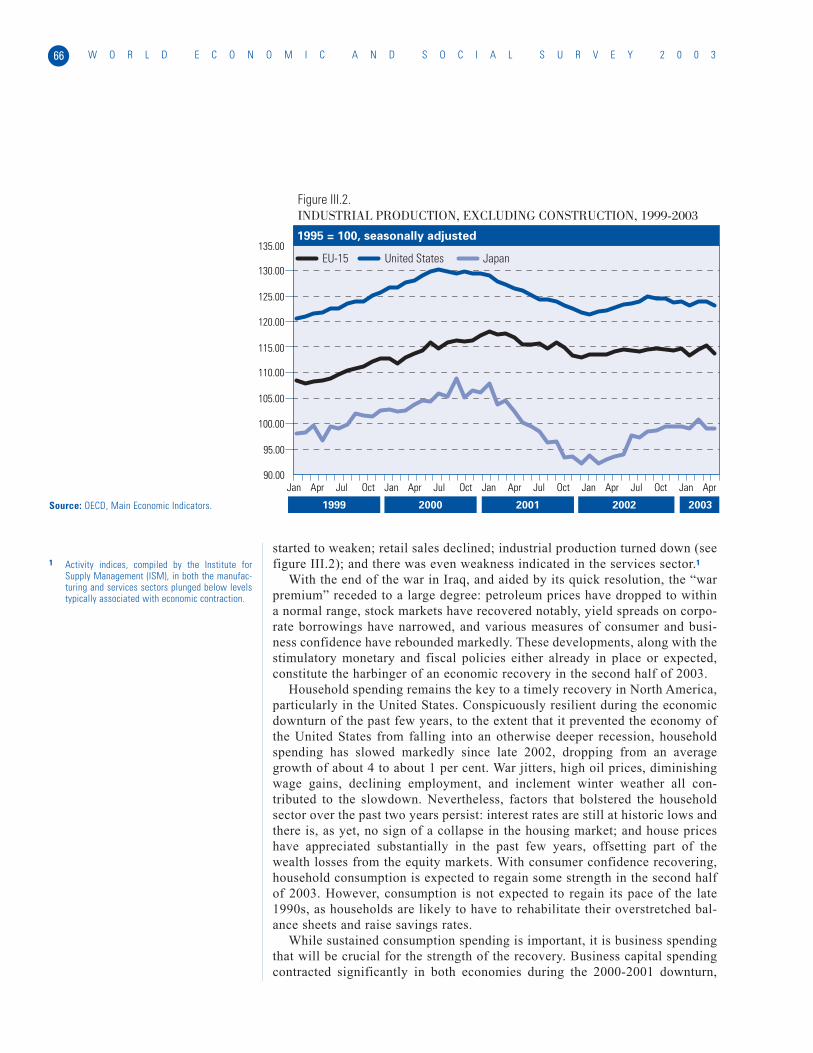
started to weaken; retail sales declined; industrial production turned down (seefigure III.2); and there was even weakness indicated in the services sector.1
With the end of the war in Iraq, and aided by its quick resolution, the “warpremium” receded to a large degree: petroleum prices have dropped to withina normal range, stock markets have recovered notably, yield spreads on corpo-rate borrowings have narrowed, and various measures of consumer and busi-ness confidence have rebounded markedly. These developments, along with thestimulatory monetary and fiscal policies either already in place or expected,constitute the harbinger of an economic recovery in the second half of 2003.
Household spending remains the key to a timely recovery in North America,particularly in the United States. Conspicuously resilient during the economicdownturn of the past few years, to the extent that it prevented the economy ofthe United States from falling into an otherwise deeper recession, householdspending has slowed markedly since late 2002, dropping from an averagegrowth of about 4 to about 1 per cent. War jitters, high oil prices, diminishingwage gains, declining employment, and inclement winter weather all con-tributed to the slowdown. Nevertheless, factors that bolstered the householdsector over the past two years persist: interest rates are still at historic lows andthere is, as yet, no sign of a collapse in the housing market; and house priceshave appreciated substantially in the past few years, offsetting part of thewealth losses from the equity markets. With consumer confidence recovering,household consumption is expected to regain some strength in the second halfof 2003. However, consumption is not expected to regain its pace of the late1990s, as households are likely to have to rehabilitate their overstretched bal-ance sheets and raise savings rates.
While sustained consumption spending is important, it is business spendingthat will be crucial for the strength of the recovery. Business capital spendingcontracted significantly in both economies during the 2000-2001 downturn,
W O R L D E C O N O M I C A N D S O C I A L S U R V E Y 2 0 0 366
Figure III.2.INDUSTRIAL PRODUCTION, EXCLUDING CONSTRUCTION, 1999-2003
1999 2000 2001 2002 2003
Jan Apr Jul Oct Jan Apr Jul Oct Jan Apr Jul Oct Jan Apr Jul Oct Jan Apr
EU-15 United States Japan
1995 = 100, seasonally adjusted
90.00
95.00
100.00
105.00
110.00
115.00
120.00
125.00
130.00
135.00
Source: OECD, Main Economic Indicators.
1 Activity indices, compiled by the Institute forSupply Management (ISM), in both the manufac-turing and services sectors plunged below levelstypically associated with economic contraction.
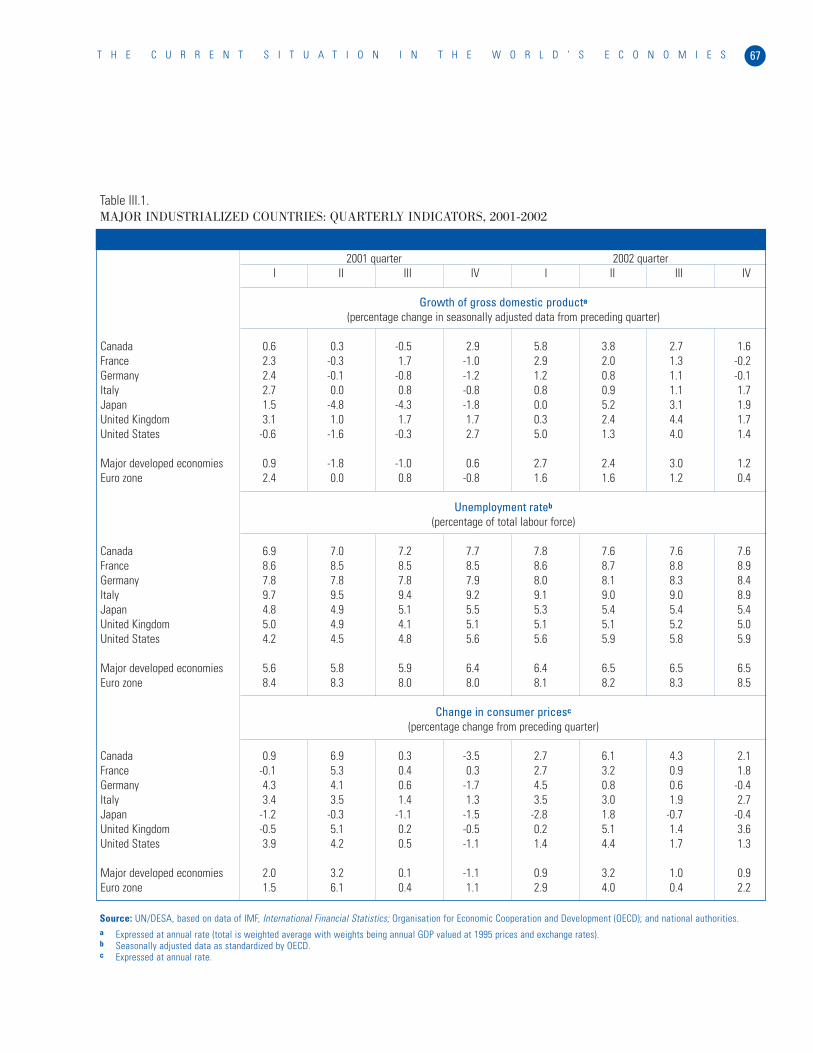
67T H E C U R R E N T S I T U A T I O N I N T H E W O R L D ’ S E C O N O M I E S
2001 quarter 2002 quarterI II III IV I II III IV
Growth of gross domestic producta
(percentage change in seasonally adjusted data from preceding quarter)
Canada 0.6 0.3 -0.5 2.9 5.8 3.8 2.7 1.6France 2.3 -0.3 1.7 -1.0 2.9 2.0 1.3 -0.2Germany 2.4 -0.1 -0.8 -1.2 1.2 0.8 1.1 -0.1Italy 2.7 0.0 0.8 -0.8 0.8 0.9 1.1 1.7Japan 1.5 -4.8 -4.3 -1.8 0.0 5.2 3.1 1.9United Kingdom 3.1 1.0 1.7 1.7 0.3 2.4 4.4 1.7United States -0.6 -1.6 -0.3 2.7 5.0 1.3 4.0 1.4
Major developed economies 0.9 -1.8 -1.0 0.6 2.7 2.4 3.0 1.2Euro zone 2.4 0.0 0.8 -0.8 1.6 1.6 1.2 0.4
Unemployment rateb
(percentage of total labour force)
Canada 6.9 7.0 7.2 7.7 7.8 7.6 7.6 7.6France 8.6 8.5 8.5 8.5 8.6 8.7 8.8 8.9Germany 7.8 7.8 7.8 7.9 8.0 8.1 8.3 8.4Italy 9.7 9.5 9.4 9.2 9.1 9.0 9.0 8.9Japan 4.8 4.9 5.1 5.5 5.3 5.4 5.4 5.4United Kingdom 5.0 4.9 4.1 5.1 5.1 5.1 5.2 5.0United States 4.2 4.5 4.8 5.6 5.6 5.9 5.8 5.9
Major developed economies 5.6 5.8 5.9 6.4 6.4 6.5 6.5 6.5Euro zone 8.4 8.3 8.0 8.0 8.1 8.2 8.3 8.5
Change in consumer pricesc
(percentage change from preceding quarter)
Canada 0.9 6.9 0.3 -3.5 2.7 6.1 4.3 2.1France -0.1 5.3 0.4 0.3 2.7 3.2 0.9 1.8Germany 4.3 4.1 0.6 -1.7 4.5 0.8 0.6 -0.4Italy 3.4 3.5 1.4 1.3 3.5 3.0 1.9 2.7Japan -1.2 -0.3 -1.1 -1.5 -2.8 1.8 -0.7 -0.4United Kingdom -0.5 5.1 0.2 -0.5 0.2 5.1 1.4 3.6United States 3.9 4.2 0.5 -1.1 1.4 4.4 1.7 1.3
Major developed economies 2.0 3.2 0.1 -1.1 0.9 3.2 1.0 0.9Euro zone 1.5 6.1 0.4 1.1 2.9 4.0 0.4 2.2
Table III.1.MAJOR INDUSTRIALIZED COUNTRIES: QUARTERLY INDICATORS, 2001-2002
Source: UN/DESA, based on data of IMF, International Financial Statistics; Organisation for Economic Cooperation and Development (OECD); and national authorities.a Expressed at annual rate (total is weighted average with weights being annual GDP valued at 1995 prices and exchange rates).b Seasonally adjusted data as standardized by OECD.c Expressed at annual rate.
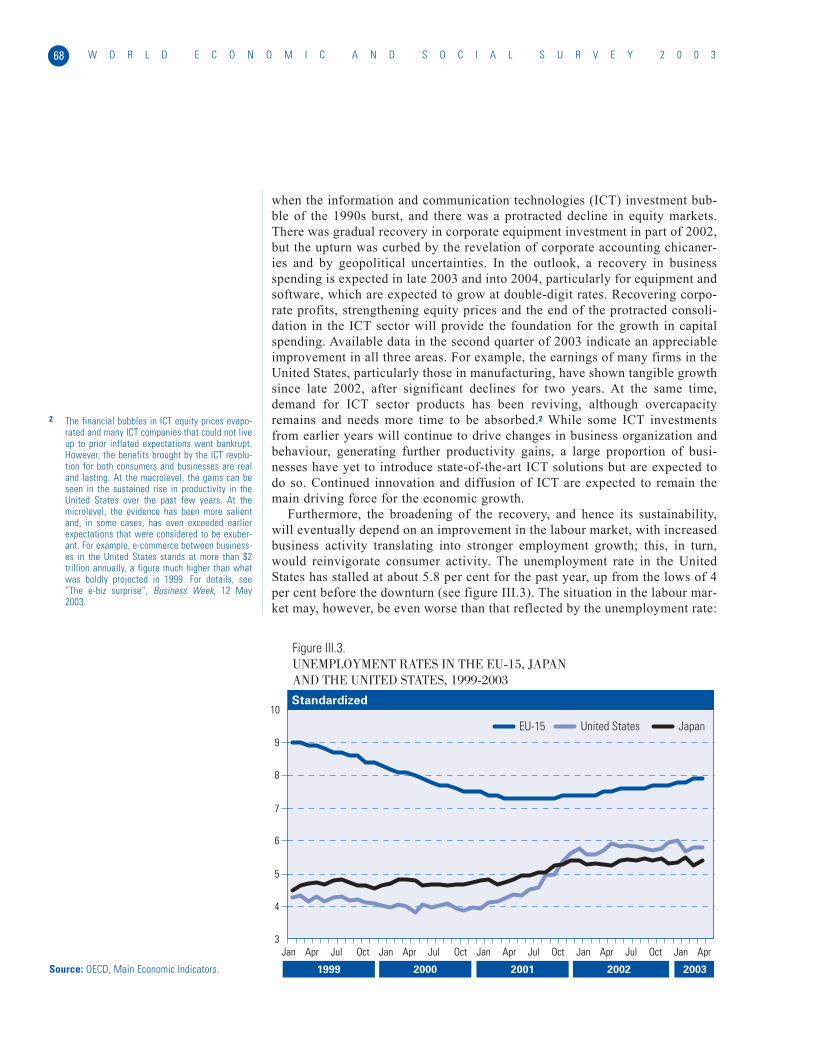
when the information and communication technologies (ICT) investment bub-ble of the 1990s burst, and there was a protracted decline in equity markets.There was gradual recovery in corporate equipment investment in part of 2002,but the upturn was curbed by the revelation of corporate accounting chicaner-ies and by geopolitical uncertainties. In the outlook, a recovery in businessspending is expected in late 2003 and into 2004, particularly for equipment andsoftware, which are expected to grow at double-digit rates. Recovering corpo-rate profits, strengthening equity prices and the end of the protracted consoli-dation in the ICT sector will provide the foundation for the growth in capitalspending. Available data in the second quarter of 2003 indicate an appreciableimprovement in all three areas. For example, the earnings of many firms in theUnited States, particularly those in manufacturing, have shown tangible growthsince late 2002, after significant declines for two years. At the same time,demand for ICT sector products has been reviving, although overcapacityremains and needs more time to be absorbed.2 While some ICT investmentsfrom earlier years will continue to drive changes in business organization andbehaviour, generating further productivity gains, a large proportion of busi-nesses have yet to introduce state-of-the-art ICT solutions but are expected todo so. Continued innovation and diffusion of ICT are expected to remain themain driving force for the economic growth.
Furthermore, the broadening of the recovery, and hence its sustainability,will eventually depend on an improvement in the labour market, with increasedbusiness activity translating into stronger employment growth; this, in turn,would reinvigorate consumer activity. The unemployment rate in the UnitedStates has stalled at about 5.8 per cent for the past year, up from the lows of 4per cent before the downturn (see figure III.3). The situation in the labour mar-ket may, however, be even worse than that reflected by the unemployment rate:
W O R L D E C O N O M I C A N D S O C I A L S U R V E Y 2 0 0 368
Figure III.3.UNEMPLOYMENT RATES IN THE EU-15, JAPAN AND THE UNITED STATES, 1999-2003
1999 2000 2001 2002 2003
Jan Apr Jul Oct Jan Apr Jul Oct Jan Apr Jul Oct Jan Apr Jul Oct Jan Apr
EU-15 United States Japan
Standardized
3
4
5
6
7
8
9
10
Source: OECD, Main Economic Indicators.
2 The financial bubbles in ICT equity prices evapo-rated and many ICT companies that could not liveup to prior inflated expectations went bankrupt.However, the benefits brought by the ICT revolu-tion for both consumers and businesses are realand lasting. At the macrolevel, the gains can beseen in the sustained rise in productivity in theUnited States over the past few years. At themicrolevel, the evidence has been more salientand, in some cases, has even exceeded earlierexpectations that were considered to be exuber-ant. For example, e-commerce between business-es in the United States stands at more than $2trillion annually, a figure much higher than whatwas boldly projected in 1999. For details, see“The e-biz surprise”, Business Week, 12 May2003.
there was a net loss of a half-million jobs between the fourth quarter of 2002and the first quarter of 2003, and some unemployed may have dropped out ofthe waiting queue. An increase in hiring always lags the recovery in output dur-ing a cyclical upturn; given low capacity utilization and rising productivity, ameasurable improvement in the labour market is not expected in the UnitedStates until 2004. By contrast, employment in Canada registered robust growthduring 2002, softening only at the beginning of 2003.
The net contribution of the external sector to growth in the United States hasbeen negative for many years, and it was also insignificant for Canada in 2002.This situation will likely continue in the near term. International trade in botheconomies dwindled over the past two years. Exports of the United States, involume terms, declined for two consecutive years, while imports recovered byonly 3.7 per cent in 2002 from a drop in the previous year. Canada’s trade stag-nated in 2002. Trade is expected to recover in the second half of 2003, as worlddemand strengthens, and the growth of both exports and imports of the regionis forecast to reach about 7-8 per cent in 2004 (see table A.13). The deprecia-tion of the United State dollar is expected to provide some boost to net exportsin the United States over the medium term. At the same time, the appreciationof the Canadian dollar against the United States dollar has already had someadverse impact on Canada’s exports, and hence its growth.
The inflation outlook for the region remains benign. Inflation in the UnitedStates rose to an annual rate of about 3 per cent in the first quarter of 2003,mainly because of the surge in oil prices. Inflation in Canada in 2002 and early2003 has been just above the target of 2 per cent of the Central Bank of Canada(CBC). With the prices of oil having retreated, and with the large slack in theeconomy, particularly in the United States, inflation rates are expected todecline. Deflation is a possibility, but an unlikely one.
Monetary policy is expected to remain accommodative in the United States.The Federal Reserve of the United States (Fed) is expected to keep interestrates at their current level, the lowest in four decades, until the fourth quarterof 2003, tightening gradually thereafter. The Central Bank of Canada is expect-ed to tighten further during 2003.
Fiscal policy in the United States will continue to be stimulatory, with fed-eral spending growing by 10 per cent in 2003, offsetting the drag of restrictivebudget stances by many State and local governments. The most recent packageconsists of $359 billion in tax cuts. The budget deficit for the United States isexpected to reach $330 billion in 2003 and $400 billion in 2004. In contrast,the fiscal stance in Canada is expected to be neutral to slightly stimulatory, andthe government budget will remain in small surplus, or at least balanced, dur-ing 2003-2004.
The foregoing baseline outlook is subject to a number of uncertainties anddownside risks. The major military operation in Iraq has ended, but not all ofthe geopolitical uncertainties have dissipated. On the economic front, the largeand growing trade and fiscal deficits in the United States, along with theirimplications for exchange rates, portend risks, not only for the stability of thedomestic economy but also for the world economy and global financial mar-kets. In the medium term, the crowding-out effects of increased military spend-ing may dampen potential growth.
69T H E C U R R E N T S I T U A T I O N I N T H E W O R L D ’ S E C O N O M I E S

Developed Asia and the Pacific: subduedgrowth in Japan and vigour elsewhere
After another year of stagnation in 2002, when GDP grew by 0.3 per cent, theeconomy of Japan remains fragile; GDP is expected to grow by under 1 percent in both 2003 and 2004. Despite an improvement in some economic indi-cators at the beginning of 2003, economic fundamentals continue to be weak.The lingering danger of a deflationary spiral persists as asset prices continue todecline, aggravating severe problems in the banking sector and in the realeconomy.
Strong support from net exports in the past year kept the economy fromfalling into a recession. The growth of exports is expected to be about 3 percent for 2003-2004, while the growth of imports is expected to occur at a sim-ilar pace (see table A.13).
A noticeable improvement by the end of the first quarter of 2003 was the sta-bilization of business sentiment, and, correspondingly, a rise in business pro-jections for capital spending, supported by a recovery in corporate profits andan anticipated replenishment of inventories. Business investment is expected togrow by about 2 per cent in 2003, recovering from a decline of 3 per cent in2002. Housing investment, however, remains sluggish, and public investmentis expected to decline further.
The prospects for household consumption remain lacklustre, as there are nosigns of improvement in the labour market or household income. While thenumber of new job offers is increasing gradually, most recent business surveysindicate that firms of all sizes continue to reduce personnel expenses: wagescontinue to decrease and the number of long-term employees is declining. Theunemployment rate, particularly the number of involuntarily unemployed,remains at a historically high level (see figure III.3).
Despite a rise in the prices of imports at the beginning of 2003—mainlybecause of the surge in the price of oil—broad price indices continue to fall,though at a slower pace. Meanwhile, equity prices dropped to their lowest levelin 20 years and real estate prices, both commercial and residential, continued adecade-long slide. Deflation is expected to continue in 2003 and 2004.
The government fiscal position continues to deteriorate. Official budget pro-jections suggest that a revenue gap of about 40 trillion yen would have to bemet by new bond issuances in fiscal year 2004 and annual new issuances couldreach 45 trillion yen in the next few years. With current debt levels and theissuance of new government bonds, a sizeable fiscal stimulus is unlikely, as itwould imperil the Government’s financial position and increase the risk of afurther downgrading in sovereign debt by international rating agencies.
During the war in Iraq, the Bank of Japan (BoJ) injected more liquidity intothe economy with the aim of stabilizing financial markets. The outstanding cur-rent-account balance of the Bank, the official target of monetary policy, retreat-ed after the war, but has remained at a high level. The overnight call rate con-tinues to be virtually zero; nevertheless, a large gap between the growth of themonetary base and that of the broad measure of money supply persists, reflect-ing the dysfunction of the commercial banking system and the inefficacy ofmonetary easing in boosting real economic activity. Constrained by mountingnon-performing loans (NPLs), lending from commercial banks continues todecrease, insensitive to the low interest rates and the high growth in the mon-
W O R L D E C O N O M I C A N D S O C I A L S U R V E Y 2 0 0 370
etary base. Despite the adoption of various institutional measures, efforts todispose of NPLs have shown only marginal progress, with growth of new NPLsoccurring faster than disposal of old ones.
The prospects for the growth of the Japanese economy remain highly depen-dent on exports and thus highly vulnerable to external shocks: the outbreak ofsevere acute respiratory syndrome (SARS) in a number of developing Asianeconomies, for example, is threatening the growth of exports, and the depreci-ation of the United States dollar against other major currencies, including theyen, is also inauspicious for Japanese exports.
A sharp contrast can be found in the economies of Australia and NewZealand, in which strong, even overheated, domestic demand has overcome theweakness in the external sector. GDP growth in these two economies is, how-ever, expected to moderate in 2003 and 2004, although it will still be above 3per cent.
The business sector has been in better shape in Australia than in most otherdeveloped economies. High profitability and low debt levels in the corporatesector have contributed to robust capital spending and growth in employment.The unemployment rate declined significantly in 2002, reaching a record lowof about 6 per cent, although the momentum has softened since late 2002.Strong employment growth and increases in real wages have in turn boostedhousehold income, leading to strong household spending.
In New Zealand, a surge in immigration, with the population growing by 2per cent in 2002, together with a conspicuous rise in incomes of farmers in thepast couple of years, has added significant stimulus to consumer demand.
The housing sector has been particularly buoyant in both of theseeconomies, contributing to their strength through both strong constructionactivity and the rising prices of houses, the wealth effects of which helped sus-tain consumer spending. Developments in the housing cycle, in terms of bothconstruction and pricing, will be a crucial factor for the outlook in the nearterm. There have been signs of a moderation in the housing sector in Australia,with approvals for the construction of private houses declining for a fewmonths while, in New Zealand, the driving force for housing, namely, netimmigration flows, may also have peaked. Policy makers have been increas-ingly concerned about the rapid rise in house prices over the past few years andthe possibility of a large downward adjustment.
While Australia offset, through enhanced linkages to developing countries inAsia, some of the adverse impulses from major developed economies, NewZealand benefited over the past couple of years from a rise in the prices of itsexport products. Some positive factors, however, have turned less favourable, orwaned gradually: the currencies of both economies have appreciated against theUnited States dollar, with the New Zealand dollar rising by more than 20 percent, and the central banks in both economies raised interest rates during 2002,reversing part of the earlier easing. The combination of currency appreciationand the rise in policy interest rates implies a substantial tightening in monetaryconditions in these economies. In April 2003, the Reserve Bank of New Zealand,noting the slowing economy, reduced interest rates by 25 basis points.
Economic strength has moderated more noticeably in Australia than in NewZealand. Drought has been the main cause, estimated to have reduced the pro-duction of a number of crops by about 60 per cent, but there are also imbal-ances facing Australia: the unsustainable boom in the housing sector, the large
71T H E C U R R E N T S I T U A T I O N I N T H E W O R L D ’ S E C O N O M I E S
current-account deficit, and the low, recently negative household saving rates.In New Zealand, a rise in the inflation rate in the non-tradable sector to about4 per cent indicates an overstretched utilization of capacity and resources.
Western Europe: upturn faces negative headwinds
The outlook for growth in Western Europe has deteriorated substantially. In theeuro zone, growth in the final quarter of 2002 was only 0.4 per cent, well belowthe average for the major developed economies (see table III.1), with five coun-tries in the region, including France and Germany, having contracted. Preliminaryestimates for the first quarter of 2003 suggest that there was no growth in the eurozone as a whole, that Germany may have been and the Netherlands was in reces-sion, and that other countries in the region faired little better.
Much of the current weakness can be traced to the effects of the run-up tothe war in Iraq, with higher oil prices and depressed confidence. Consumerconfidence declined dramatically in the months prior to and including the war,and the rebound in confidence in the post war period has been more muted thanin the United States (see figure III.1). This led to further delays in spendingdecisions and should be seen against the backdrop of a long period of slowgrowth, starting in 2001, that had stemmed from previous negative worldshocks and continuing structural problems plaguing some of the majoreconomies in the region. The delay is evident in industrial production, whichhas displayed little upward movement since mid-2002 (see figure III.2). Thisprotracted period of growth below potential has led to an increase in unem-ployment across the region and further slippage in government budget posi-tions. The former has negatively impacted consumer confidence, raising sav-ings rates, while the latter has put pressure on Governments to consolidate bud-gets. This delay has also raised the risks of renewed downturn. An accelerationof activity in the second half of 2003 is envisaged, but the effects of the delayare expected to weaken the upturn, with growth in the EU-15 expected to reg-ister only 1.3 per cent in 2003 (compared with 0.9 per cent in 2002) and theforecast for growth in 2004 to be 2.4 per cent (see table A.2).
The weaker outlook is exhibited in both domestic and foreign demand com-ponents, but the weakness in domestic demand is the most troubling. In theeuro zone, for example, final domestic demand, in 2002, contributed only 0.4percentage points to growth, while net exports contributed 0.5 percentagepoints. However, the strength of the latter was due more to import weakness,reflecting the weak domestic demand, than to export strength.3 Export growthregistered only 1 per cent in 2002, stalling completely in the final quarter of theyear. The weak recovery profile for external demand, together with the appre-ciation of the euro since the end of 2002 and its effect on competitiveness, isexpected to dampen the rebound in exports, with growth of only 3 per cent in2003, and 6.5 per cent in 2004 (see table A.13).
Consumption expenditure held up over the course of 2002 and was the mainimpetus to growth, but was still running at its slowest pace since the early 1990s.Real disposable income was constrained by persistently high inflation andincreasing unemployment. The latter had the added effect of increasing uncer-tainty over future employment prospects which, when combined with the height-ened uncertainty arising from the war in Iraq, led consumers to increase theirsavings rates. Wealth was depressed by lower equity prices, offset in some coun-
W O R L D E C O N O M I C A N D S O C I A L S U R V E Y 2 0 0 372
3 In Austria, Germany, Portugal, and Switzerland,final domestic demand detracted from growth in2002 (see OECD Economic Outlook, spring 2003,pp. 55-56).
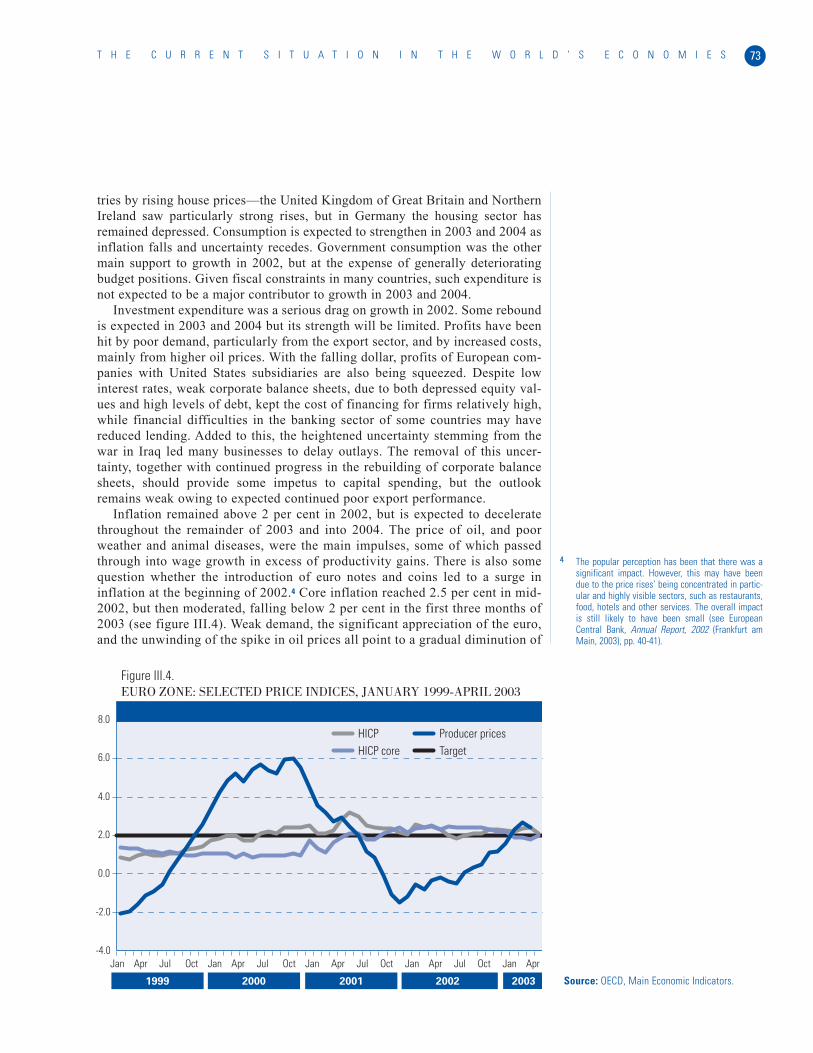
tries by rising house prices—the United Kingdom of Great Britain and NorthernIreland saw particularly strong rises, but in Germany the housing sector hasremained depressed. Consumption is expected to strengthen in 2003 and 2004 asinflation falls and uncertainty recedes. Government consumption was the othermain support to growth in 2002, but at the expense of generally deterioratingbudget positions. Given fiscal constraints in many countries, such expenditure isnot expected to be a major contributor to growth in 2003 and 2004.
Investment expenditure was a serious drag on growth in 2002. Some reboundis expected in 2003 and 2004 but its strength will be limited. Profits have beenhit by poor demand, particularly from the export sector, and by increased costs,mainly from higher oil prices. With the falling dollar, profits of European com-panies with United States subsidiaries are also being squeezed. Despite lowinterest rates, weak corporate balance sheets, due to both depressed equity val-ues and high levels of debt, kept the cost of financing for firms relatively high,while financial difficulties in the banking sector of some countries may havereduced lending. Added to this, the heightened uncertainty stemming from thewar in Iraq led many businesses to delay outlays. The removal of this uncer-tainty, together with continued progress in the rebuilding of corporate balancesheets, should provide some impetus to capital spending, but the outlookremains weak owing to expected continued poor export performance.
Inflation remained above 2 per cent in 2002, but is expected to deceleratethroughout the remainder of 2003 and into 2004. The price of oil, and poorweather and animal diseases, were the main impulses, some of which passedthrough into wage growth in excess of productivity gains. There is also somequestion whether the introduction of euro notes and coins led to a surge ininflation at the beginning of 2002.4 Core inflation reached 2.5 per cent in mid-2002, but then moderated, falling below 2 per cent in the first three months of2003 (see figure III.4). Weak demand, the significant appreciation of the euro,and the unwinding of the spike in oil prices all point to a gradual diminution of
73T H E C U R R E N T S I T U A T I O N I N T H E W O R L D ’ S E C O N O M I E S
Figure III.4.EURO ZONE: SELECTED PRICE INDICES, JANUARY 1999-APRIL 2003
1999 2000 2001 2002 2003
-4.0
-2.0
0.0
2.0
4.0
6.0
8.0
Jan Apr Jul Oct Jan Apr Jul Oct Jan Apr Jul Oct Jan Apr Jul Oct Jan Apr
HICP Producer pricesHICP core Target
Source: OECD, Main Economic Indicators.
44 The popular perception has been that there was asignificant impact. However, this may have beendue to the price rises’ being concentrated in partic-ular and highly visible sectors, such as restaurants,food, hotels and other services. The overall impactis still likely to have been small (see EuropeanCentral Bank, Annual Report, 2002 (Frankfurt amMain, 2003), pp. 40-41).
inflationary pressures (see table A.8). However, the dispersion of rates of infla-tion across the region remains wide, even among the largest economies of theregion. The inflation differential of Germany vis-à-vis Italy and Spain was 2percentage points in April 2003, and it was nearly 1 percentage point vis-à-visFrance.
Unemployment has increased significantly since the beginning of 2002,climbing in the EU-15 from a low of 7.4 per cent in December 2001 to 7.9 percent in March 2003 (see figure III.3), with a yearly average of 7.6 per cent in2002. Continued below-trend growth in the first half of 2003 is expected tolead to a further increase to 8.0 per cent in 2003, before levelling off in 2004(see table A.7). This pattern of rising unemployment was spread widely acrossthe region. Since the end of 2001, the largest absolute increases have occurredin Belgium, Germany, the Netherlands, Portugal and Spain, all of which expe-rienced a rise of 1 percentage point or more in the unemployment rate. Sizeableincreases were also registered in Austria, France, Ireland, Luxembourg,Denmark and Norway. Only in Finland, Italy and the United Kingdom hasunemployment remained stable. Compared with previous slowdowns, howev-er, labour-market performance has so far been encouraging, reflecting in partthe effects of structural change in some countries.5 However, it is too soon toknow whether this is a sign of greater labour-market flexibility or of firms’having chosen to hoard labour, owing to the high costs of hiring and firing, asthey wait for more evidence of future prospects.
Macroeconomic policies in the second quarter of 2003 were stimulative, butnot tremendously so. The European Central Bank (ECB) lowered its policy rate,the minimum bid rate, to 2.5 per cent in early March 2003 and then to 2.0 percent in June, a cumulative 75 basis points (bps) since the beginning of 2003.These moves were prompted by continued evidence of economic weakness, thedownside risks that mounted over the situation in Iraq, the appreciation of theeuro against the United States dollar (which serves to tighten monetary condi-tions) and the behaviour of core inflation, which fell below the 2 per cent upperbound of the Bank’s inflation target in the first three months of 2003. The move-ment in oil prices represented a strong positive impulse for inflation earlier inthe year, muted by the appreciation of the currency, but subsequently became anelement of downward pressure on inflation. Towards the end of the second quar-ter, short-term interest rates, both nominal and real, were at their lowest levelsince the beginning of the European Economic and Monetary Union (EMU).However, the degree of stimulus is lessened to some extent by the appreciationof the euro. In addition, as mentioned, inflation differentials vary widely acrossthe region, so that real interest rates are still high in countries with low inflation.Germany, with the lowest rate of inflation in the euro zone, has the highest realinterest rate. Given the long time lag for monetary policy to achieve its maxi-mum impact, there should be a substantial boost to activity between mid-2003and mid-2004. In making the forecasts of growth, it was assumed there wouldbe no further easing and that policy would gradually return to a more neutralstance as growth strengthened and downside risks diminished.
Fiscal policy was moderately supportive of growth in 2002 owing both tothe workings of automatic stabilizers and to some additional expansionarymeasures. However, this led to an increase in fiscal deficits across the region,which in some cases came into conflict with the 3 per cent maximum deficitallowed under the terms of the Stability and Growth Pact. Consequently, poli-
W O R L D E C O N O M I C A N D S O C I A L S U R V E Y 2 0 0 374
5 During the recession of the early 1990s, unemploy-ment rose by 2.5 percentage points.
cy in 2003 and 2004 is expected to be, at best, broadly neutral, with some coun-tries involved in fiscal consolidation programmes.
The fiscal deficit for the EU-15 deteriorated in 2002, for the second consec-utive year, increasing by a full percentage point to 1.9 per cent of GDP. Furtherdeterioration is expected in 2003, before some improvement in 2004. Most ofthe deterioration was due to the economic downturn, with higher expenditureon unemployment benefits and lower tax receipts. There were also some expen-diture overruns, particularly in health-care spending, while receipts were lowerthan expected owing in part to tax cuts implemented in previous years and tothe sharp fall in asset prices. However, discretionary policy also played a role.6
The free play of automatic stabilizers led to difficulties in countries that hadnot already attained medium-term balance in their fiscal positions or that con-tinued to maintain large debt positions. At the end of 2002 and the beginningof 2003, excessive deficit procedures were initiated by the EuropeanCommission against Portugal and Germany, and an early warning recommen-dation was issued to France. In Italy, there are dangers that the deficit willbreach the bound in 2004. So far, only Germany and Portugal have put intoplace programmes for consolidation, but there is pressure on France and Italyto consolidate. Debt is also a constraining factor. Belgium, Greece and Italyhave debt-to-GDP ratios greater than 100 per cent, while Austria, France,Germany and Portugal either are close to or have exceeded the 60 per cent ref-erence value. On the other hand, countries that have achieved budget balanceand sustainable debt positions in the recent past have had room to allow the fullplay of their fiscal stabilizers. For example, the United Kingdom has embarkedon a public investment programme that will lead to higher deficits in 2003 and2004, but it currently enjoys a low debt-to-GDP ratio.
The euro continued its appreciation against the United States dollar in thefirst two quarters of 2003, the exchange rate increasing to $1.19 per euro inMay, from $1.05 per euro in January. The appreciation against the yen was lessdramatic, owing in part to currency market interventions by Japanese authori-ties to reduce the yen’s appreciation against the dollar. In trade-weighted terms,the euro appreciated by nearly 14 per cent between its low in February 2002and April 2003. This, however, has been more a matter of dollar weaknessrather than euro strength, and can be attributed to a combination of long-stand-ing structural issues and the uncertainties surrounding the war. The UnitedStates dollar has long been considered overvalued, from both purchasing powerparity (PPP) and current-account deficit perspectives, but superior perceivedreturns in the United States relative to the rest of the world outweighed theseconsiderations. However, with both the euro zone and the United States expe-riencing weak growth and their respective equity markets performing poorly,concern over the United States current account and its financing requirementshas gained more attention. Interest rate differentials have also become animportant factor favouring the euro, as monetary policy has been far moreactive in the United States than in the euro zone. Added to this, the currencymovements experienced during the Iraqi conflict suggest that the United Statesdollar has lost much of its allure as a safe haven currency.
The forecast assumes, however, that not all of these gains are permanent, butrather that the euro will retrench somewhat against the dollar in the second halfof the year. Some of the appreciation in the first half of 2003 can be ascribedto the overshooting that currency markets are often prone to—a phenomenon
75T H E C U R R E N T S I T U A T I O N I N T H E W O R L D ’ S E C O N O M I E S
6 The European Commission estimates that, in theeuro zone, 0.3 per cent of the deterioration in theoverall deficit could be attributed to more relaxedbudgetary stances, as measured by the change inthe cyclically adjusted primary balance. By thismeasure, the majority of countries pursued looserpolicy in 2002 (see European Economy, No. 2/2003(Luxembourg, European Commission, 2003), p. 37).
which has been exacerbated by foreign exchange markets’ singular focus on thedollar’s fall. In addition, interest rate differentials are expected to narrow in thesecond half of the year. Finally, relative growth rates are expected to regaintheir significance inasmuch as expansion in the United States in the second halfof the year is forecast to be more robust than in the euro zone. Overall, it isexpected that the euro will appreciate significantly in 2003 compared with2002, with further, but more moderate, appreciation assumed in 2004 as cur-rent-account financing problems continue to play a prominent role.
The largest risk surrounding the current outlook is a further and rapid appre-ciation of the euro. This risk is compounded by the fact that, so far, most of thecorrection of the United States dollar has been against the euro, despite the factthat the United States current-account imbalances vis-à-vis other regions in theworld are more pronounced. Further appreciation would add to the loss of com-petitivity for European exports and represent a major deflationary shock to theEuropean region, particularly to those countries most dependent on exports. Asecond and related risk is that the upturn could be further delayed or even turninto a downturn. In early 2003, Germany was in recession and some othercountries in the region were experiencing extremely slow growth. The unem-ployment situation is another area of concern. If the relatively mild deteriora-tion in unemployment results from labour-hoarding by firms rather than struc-tural improvements in the labour market, there is a risk that the unemploymentsituation could deteriorate further. Finally, the implementation continues to bein doubt of the many different reforms in labour-market regulations, pensionsystems and health care that have long been under consideration and that havemade the region vulnerable to external shocks. These reforms need to be initi-ated as soon as possible as part of the effort both to revive growth in the shortterm and to enhance growth over the medium term.
ECONOMIES IN TRANSITION
There was a further slowdown in growth in the economies in transition in 2002.All three subgroups of countries played a contributing role but the decelerationwas greatest in the rapidly growing CIS and least in Central and EasternEurope. Growth in the latter region is forecast to improve with a recovery inWestern Europe in 2003 and 2004, whereas a further modest consolidation ofgrowth towards a more sustainable long-term rate is expected for othereconomies in transition during this period. For the Baltic countries and thoseof Central and Eastern Europe, the present overriding challenge is that of join-ing EU, including meeting all its economic benchmarks. For the CIS countries,there is a continuing need for wide-ranging reforms; moreover, a number ofthem also face long-term development challenges and need international sup-port akin to that provided to developing countries.
Central and Eastern Europe: withstanding the global slowdown
Economic growth in Central and Eastern Europe decelerated from 2.7 per centin 2001 to about 2.5 per cent in 2002, but is expected to strengthen to about 3per cent in 2003. While a larger decline in response to the slowdown in EUcould have been expected, higher rates of growth, and especially investment,
W O R L D E C O N O M I C A N D S O C I A L S U R V E Y 2 0 0 376
are needed for these economies to converge to the average EU per capita GDPlevels in a short period of time. Foreign direct investment (FDI) flows into theregion and modernization of the economies continued in 2002, but investmentrates in Central Europe remained modest.
The deceleration in 2002 was largely a consequence of weak export perfor-mance. From almost double-digit rates in 2001, growth of external tradedropped to about 3 per cent as a result of weak business confidence, weakimport demand in EU and, to a large extent, currency appreciation. Strong cur-rencies undermined exports to EU and, in the case of Hungary, encouragedsome foreign investors to consider relocating their production facilities to Asia.In response, monetary policy in the region was focused on weakening the cur-rencies so as to restore export competitiveness. While the small, export-orient-ed economies of Central Europe tried to cope with the lacklustre demand inEU, the largest, Poland, suffered a second year of economic stagnation.
By the end of 2002, there was a strengthening in industrial production inexport-oriented sectors in Central Europe, although high inventories raisedconcern. In early 2003, stronger exports to EU were registered in CentralEurope, with the exception of Hungary, reflecting the success of actions aimedat weakening the exchange rate.
With exports subdued, growth in the economies of Central and EasternEurope (with the exception of Poland) was supported by strong domesticdemand; both private and public consumption in the region grew by about 4 percent. Expansionary fiscal policies, triggered by parliamentary electionsthroughout the region in 2002, played a role, as did rising household incomes,stronger currencies and lower interest rates. A repetition of such a scenario in2003 is unlikely, however, since monetary and fiscal authorities in the regionhave become more concerned about meeting the criteria for entry into the eurozone. While neither changes in the fiscal system nor austerity measures areanticipated at this stage, a strong fiscal expansion is not expected in 2003. Thiswill undermine the recent dependence of these strongly export-orientedeconomies on domestic demand as a primary source of growth. Growth, how-ever, will continue to be supported by continuing FDI flows and associatedinvestment and possibly by some further relocation of production from EU tothe region.
The economic situation in Central Europe remains mixed. The CzechRepublic is recovering from the floods in 2002, which caused damage to a num-ber of industrial areas and affected the tourism industry. The economy of Polandis improving and, following two consecutive years of growth at about 1 per cent,is expected to expand at 2½ per cent in 2003. The financial condition of the pri-vate sector is improving and investment is expected to recover, following twoyears of decline. Export performance was good towards the end of 2002, in partbecause the currency was not as strong as those of other Central and EasternEuropean countries. In Hungary, exports declined at the beginning of 2003, butprivate consumption and public consumption are expected to be buoyant and toact as the main engine of growth. In contrast, Slovakia registered record sales inthe automotive industry at the beginning of 2003. Private consumption in thecountry is also strong and will support growth.
The economies of both Bulgaria and Romania grew at above 4 per cent in2002 and South-eastern Europe will become the fastest growing subregion in2003. Growth in Bulgaria was supported mostly by strong government con-
77T H E C U R R E N T S I T U A T I O N I N T H E W O R L D ’ S E C O N O M I E S
sumption and good export performance. In Romania, although public con-sumption remained weak, an increase in FDI resulted in a high rate of invest-ment. In both countries, economic policy is focused on fiscal consolidationand privatization, as called for in standby agreements with the InternationalMonetary Fund (IMF). Growth was also strong in Croatia, supported by pub-lic spending on infrastructure projects and by growing consumer credit. Thecurrent standby agreement with IMF, however, limits the budget deficit andpublic debt and, following policy tightening, growth is expected to deceleratein 2003.
The economic situation in other countries of the subregion has been more dif-ficult. Industrial output in Albania was disrupted by energy shortages in the firsthalf of 2002. The economy of Serbia and Montenegro expanded by 3 per cent in2002, mostly owing to the services sector. Growth of 4 per cent is expected in2003, although political uncertainty may impede macroeconomic stabilizationand discourage much-needed foreign investment. The country needs to upgradeits economy and infrastructure, as well as harmonize the monetary, taxation andtariff systems of Serbia with those of Montenegro. Cooperation with IMF con-tinues, with emphasis on fiscal stability and privatization. The economy of theformer Yugoslav Republic of Macedonia, which became a member of the WorldTrade Organization in April 2003, is still feeling the effects of the 2001 crisis;its growth of 0.3 per cent in 2002 was achieved owing to the increase in ser-vices, since both industrial and agricultural output declined. The prospects offuture growth are contingent on political stability and improved business confi-dence, as well as foreign investment flows.
Inflation in the region decelerated in 2002 (see table III.2) and hit recordlows for the entire transition period in the Czech Republic, Poland andSlovakia; there was even deflation in the Czech Republic at the beginning of2003. That this occurred despite high real wage growth (which outpaced pro-ductivity growth in the Czech Republic, Hungary and Slovakia), strong privateconsumption, a series of interest rates cuts (followed by domestic creditgrowth), and higher oil prices was owing to the fact that these pressures wereoutweighed by the strong currencies and low inflation in EU, low food prices,frozen administered prices in Slovakia and economic stagnation in Poland.
Inflation targets for 2002 were undershot in a number of countries, even inPoland despite a mid-year downward revision of the target in that country.Stronger inflation was registered late in 2002 in Hungary, where the CentralBank abandoned its inflation-targeting policy in favour of targeting theexchange rate. Similar action is also possible in the Czech Republic. Inflationwas above the regional average in Romania, owing to lax monetary policy andan increase in energy prices, and in Serbia and Montenegro, owing to priceliberalization.
Inflation in the region is expected to decelerate further in 2003, with theexception of Slovakia, where administered prices, including prices of energy,are to be liberalized in 2003. Strong portfolio capital inflows and price liberal-ization are the main inflationary forces in the region.
Benefiting from low inflation and low interest rates in the developed coun-tries, the Central Banks of the Czech Republic, Hungary and Poland relaxedmonetary policy at the beginning of 2003. This continued the trend started in2002 and was aimed at weakening the exchange rates and also, in the case ofthe Czech Republic, at fighting deflation. Interest rates in the Czech Republic
W O R L D E C O N O M I C A N D S O C I A L S U R V E Y 2 0 0 378
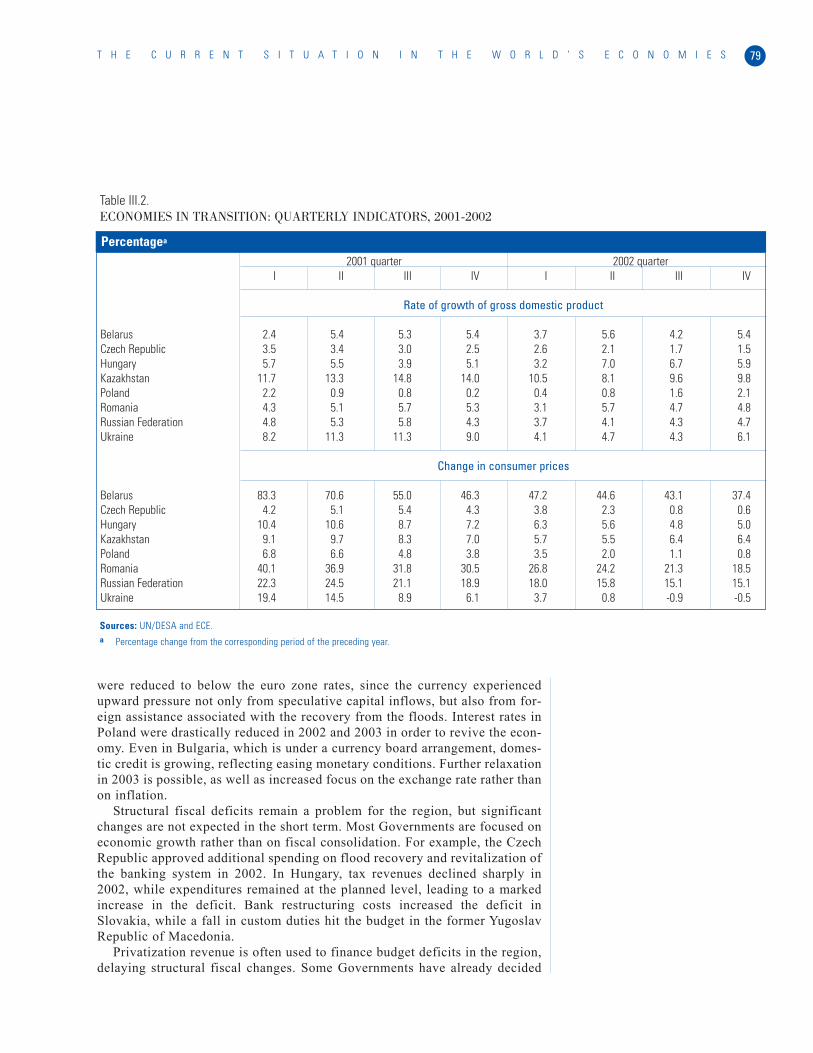
were reduced to below the euro zone rates, since the currency experiencedupward pressure not only from speculative capital inflows, but also from for-eign assistance associated with the recovery from the floods. Interest rates inPoland were drastically reduced in 2002 and 2003 in order to revive the econ-omy. Even in Bulgaria, which is under a currency board arrangement, domes-tic credit is growing, reflecting easing monetary conditions. Further relaxationin 2003 is possible, as well as increased focus on the exchange rate rather thanon inflation.
Structural fiscal deficits remain a problem for the region, but significantchanges are not expected in the short term. Most Governments are focused oneconomic growth rather than on fiscal consolidation. For example, the CzechRepublic approved additional spending on flood recovery and revitalization ofthe banking system in 2002. In Hungary, tax revenues declined sharply in2002, while expenditures remained at the planned level, leading to a markedincrease in the deficit. Bank restructuring costs increased the deficit inSlovakia, while a fall in custom duties hit the budget in the former YugoslavRepublic of Macedonia.
Privatization revenue is often used to finance budget deficits in the region,delaying structural fiscal changes. Some Governments have already decided
79T H E C U R R E N T S I T U A T I O N I N T H E W O R L D ’ S E C O N O M I E S
2001 quarter 2002 quarterI II III IV I II III IV
Rate of growth of gross domestic product
Belarus 2.4 5.4 5.3 5.4 3.7 5.6 4.2 5.4Czech Republic 3.5 3.4 3.0 2.5 2.6 2.1 1.7 1.5Hungary 5.7 5.5 3.9 5.1 3.2 7.0 6.7 5.9Kazakhstan 11.7 13.3 14.8 14.0 10.5 8.1 9.6 9.8Poland 2.2 0.9 0.8 0.2 0.4 0.8 1.6 2.1Romania 4.3 5.1 5.7 5.3 3.1 5.7 4.7 4.8Russian Federation 4.8 5.3 5.8 4.3 3.7 4.1 4.3 4.7Ukraine 8.2 11.3 11.3 9.0 4.1 4.7 4.3 6.1
Change in consumer prices
Belarus 83.3 70.6 55.0 46.3 47.2 44.6 43.1 37.4Czech Republic 4.2 5.1 5.4 4.3 3.8 2.3 0.8 0.6Hungary 10.4 10.6 8.7 7.2 6.3 5.6 4.8 5.0Kazakhstan 9.1 9.7 8.3 7.0 5.7 5.5 6.4 6.4Poland 6.8 6.6 4.8 3.8 3.5 2.0 1.1 0.8Romania 40.1 36.9 31.8 30.5 26.8 24.2 21.3 18.5Russian Federation 22.3 24.5 21.1 18.9 18.0 15.8 15.1 15.1Ukraine 19.4 14.5 8.9 6.1 3.7 0.8 -0.9 -0.5
Table III.2.ECONOMIES IN TRANSITION: QUARTERLY INDICATORS, 2001-2002
Sources: UN/DESA and ECE.a Percentage change from the corresponding period of the preceding year.
Percentagea
not to implement any fiscal changes before 2004, and the decision to call earlyelections in Poland in 2004 will make any structural changes unlikely. Theaccession to EU will impose additional fiscal costs, associated with improve-ments in infrastructure and environmental policy, on all prospective members.Payments to the EU budget will be substantial, and many EU-assisted pro-grammes are funded only on condition of co-financing from the recipientcountry’s budget. EU has promised to compensate any “net loss” to new mem-bers for the first three years following the accession, but it is not clear howquickly this will materialize.
Lower interest rates alone were not sufficient to generate an upturn ininvestment in Central Europe in 2002. Investment even fell in Poland, owingto the poor financial condition of the corporate sector and weak business con-fidence. There was also a decline in investment in Slovakia. On the other hand,in Bulgaria investment grew at about 9 per cent, as bank lending to the privatesector increased and many newly privatized firms upgraded their facilities.Strong investment was also registered in Romania, following privatization andincreased FDI flows.
The employment situation in the region remains difficult owing to the ongo-ing privatization and restructuring of enterprises. The low mobility of the pop-ulation and the underdeveloped housing market are additional impediments toraising employment. The situation in rural areas is especially difficult. As inprevious years, unemployment is highest in Bulgaria, Poland, Slovakia andmost of the former Yugoslav States. Government programmes to deal with theissue have produced limited results so far.
With the exception of Slovenia, the current accounts of the economies ofCentral and Eastern Europe remain in deficit owing to the strong domesticdemand in the region and falling exports, as well as low tourism receipts in2002, when floods affected most of the region. The strong currency adverselyaffected the services balance and stimulated retail sales of foreign brands.Profit repatriation was another source of deficit, although low interest rates inthe developed countries reduced debt-servicing costs. Since imports of tech-nology, including for greenfield investment, will continue throughout theregion and spending on flood recovery needs will continue to require importsin the Czech Republic, no significant improvement in current-account balancesis expected in the near future. Most deficits have been covered by FDI in thepast, although the recent drop in foreign investment in Hungary may raise con-cern. In Serbia and Montenegro, inflows of FDI are insufficient to cover thecurrent-account gap and foreign assistance is therefore crucial.
The process of EU enlargement continues as planned, after most of theobstacles, largely associated with the Common Agricultural Policy and EUregional aid, were removed at the EU Copenhagen summit at the end of 2002.Prospective members were offered more generous assistance following theiradmission to EU than originally planned. Most of the proposed assistance,however, is to be co-financed by the new member States themselves and thismay complicate the implementation of some projects. New members areexpected to join the Union on 1 May 2004.
W O R L D E C O N O M I C A N D S O C I A L S U R V E Y 2 0 0 380

The Baltic countries: the world’s fastest growing region
The Baltic countries were the world’s fastest growing region in 2002, with anincrease of 6.3 per cent in GDP. Buoyant domestic demand and strong importdemand in CIS offset weakened import demand from EU. The revival in domes-tic demand was broad-based with investment expanding at a double-digit rateand private consumption boosted by higher real wages, credit expansion anddeclining unemployment. Three years of sustained strong economic growthfinally resulted in an improvement in the employment situation in the region. Theunemployment rate fell in Estonia and Lithuania, the latter recording a drop ofover 1 percentage point in 2002 to 11.3 per cent of the workforce.
Growth in industrial output slowed somewhat in 2002. The strongest deceler-ation was in Lithuania, reflecting a continuing decline in oil refining, owing todisruptions in deliveries of oil to the Mazeikiai refinery. This problem eased,however, in the fourth quarter, when supplies of oil from the Russian Federationincreased as the change of ownership7 started bearing fruit. This should enhancethe stability of Lithuania’s industrial output and export revenue.
In 2003, growth in the region will continue to be driven by domestic demandand is expected to stabilize at about 5¼ per cent. The largest deceleration isexpected in Latvia owing to a sharp drop in transit trade through the port ofVentspils, which has been the most affected by the Russian Federation’s open-ing of a new oil terminal in the Gulf of Finland. The Russian companyTransneft has announced that it will not resume shipments through Ventspilsuntil the end of the second quarter of 2003. It is likely that a 50 per cent stakein Ventspils Nafta will be sold to Transneft in order to secure steady shipments.
Exports from Latvia and Lithuania increased by 12 and 10 per cent respec-tively in 2002 as import demand from EU recovered slightly and the countriescontinued to redirect some of their exports to CIS. Estonia, on the other hand,experienced a 2 per cent fall in exports, as a result of a sharp contraction in for-eign sales of mobile telephones and related components in the first half of2002. Prospects for Estonian exports in 2003 are more encouraging, as thegrowth in import demand in Sweden and Finland, Estonia’s main trading part-ners, is expected to outperform that in the rest of EU.
Reflecting export performance, the current-account deficit increased sub-stantially in Estonia in 2002, reaching 12.5 per cent of GDP, but decreased inLatvia and remained about the same in Lithuania. A reduction in the region’scurrent-account deficit is contingent on EU economic recovery’s generatingincreased demand for Baltic exports. High deficits in these countries are man-ageable, however, because of substantial FDI inflows. FDI inflows more thandoubled in Latvia and increased by almost 60 per cent in Lithuania in 2002, butfell by 45 per cent in Estonia (which had previously attracted the largestamount of FDI per capita).
The Baltic economies have transformed themselves into fully functioningsmall open economies and maintain a strong record of reform and sound poli-cies. All three countries signed the accession treaty at the EU summit in Athenson 16 April 2003 and are due to join EU on 1 May 2004 subject to their refer-endums on membership. Lithuania has already held its referendum and 90 percent voted in favour of joining EU. Referendums in Estonia and Latvia arescheduled to be held in September 2003.
81T H E C U R R E N T S I T U A T I O N I N T H E W O R L D ’ S E C O N O M I E S
7 The Russian company Yukos acquired a majoritystake in the Mazeikiai refinery.
Fiscal and monetary policies in all three countries are influenced by theMaastricht criteria. Maintaining a currency board or close equivalent reducesthe scope of monetary policy and makes prudent fiscal policy particularlyimportant. All three countries maintained a tight fiscal stance in 2002. Estoniareported a fiscal surplus while Latvia and Lithuania had deficits of 2.6 and 1.2per cent of GDP respectively. Fiscal deficits will widen in 2003. The 2003 bud-gets reflect a loosening of fiscal policy to accommodate increased expendituresrelated to the costs of membership in the North Atlantic Treaty Organization(NATO) and preparations for EU membership. Even Estonia, whose lawrequires its budgets to be balanced, except in extraordinary circumstances,approved a 2003 draft budget that was the first with a deficit since 1991.However, all three Governments have indicated that they will ensure that bud-get deficits are kept below the Maastricht criterion of 3 per cent of GDP.
Average inflation in the region declined to about 1.6 per cent in 2002. Themain reason for the fall was a drop in food prices and lower import prices dueto the appreciation against the dollar of the euro-pegged currencies in Estoniaand Lithuania. Inflation is expected to inch up in 2003, reaching an averagerate of about 2.5 per cent. The moderate upward pressure will result from theslight loosening of fiscal policies and continued strong domestic demand.
Commonwealth of Independent States (CIS): sustaining robust growth
Following two years of strong performance, the CIS economy expanded at alower pace of 4.7 per cent in 2002. The region had little exposure to the glob-al slowdown and benefited from higher oil prices. All countries in the group,with the exception of Kyrgyzstan, recorded rates of growth of over 4 per cent.Robust domestic demand in the Russian Federation and Ukraine and, to a less-er extent, in other CIS countries, backed by rising real incomes,8 lower interestrates and a continuing oil-related investment boom in the Caspian region, willsustain growth at a similar rate in 2003.
The recent deceleration mostly reflected a slowdown in the RussianFederation and Ukraine. The Russian economy grew by 4.3 per cent in 2002,mostly on the basis of recovering private consumption and strong energy exports.The volume of crude oil exports rose by 14 per cent and oil products by almost20 per cent in 2002. Growth in 2003 will continue to be driven by these two fac-tors. Investment, which had a poor performance in 2002, is also likely to pick upin 2003 if oil prices continue to be high. Investment reportedly grew by close to10 per cent in the first two months of 2003, partly owing to an investment ofalmost $7 billion in the oil sector by a foreign corporation. Oil output in theRussian Federation increased by 9.1 per cent in 2002, reaching a record post-Soviet level of 7.62 million barrels per day (bpd). Exports of oil cannot, howev-er, be increased without building additional pipelines, as the export capacity limithas been reached. The system is controlled by a State-owned company, but theState does not have plans for sufficient expansion, nor is it willing to give upcontrol and allow private companies to build their own pipelines.
In Ukraine, growing private consumption did not fully offset the impact oflower external demand, mostly from the Russian Federation. Lower prices ofsteel and the proliferation of trade barriers also resulted in a slump in metallur-gy production in the first half of 2002. However, steel production started recov-ering towards the end of 2002, reflecting mostly the reorientation of exports to
W O R L D E C O N O M I C A N D S O C I A L S U R V E Y 2 0 0 382
8 Real wages and real incomes in the RussianFederation rose 17 per cent and 9 per cent respec-tively in 2002.
markets in West Asia and other CIS countries. In Ukraine, as in the RussianFederation, a return to the high rates of growth recorded in 2000 and 2001 isunlikely without further restructuring and a substantial increase in investment toaddress supply bottlenecks, which continue to constrain output growth.
The boom in Azerbaijan and Kazakhstan will continue in 2003, thanks tocontinuing FDI flows related to large-scale oil and gas projects and rising oilexports. The construction of the Baku-Tbilisi-Ceyhan (BTC) pipeline, whichofficially started in September 2002, will benefit Georgia as well. Growth inTurkmenistan, another hydrocarbon exporter, will slow from its high ratesbecause the country has reached its export capacity limits. However, the coun-try’s export capacity will increase substantially, reducing its dependence onsuch traditional markets as the Russian Federation and Ukraine, if an alterna-tive pipeline from Turkmenistan through Afghanistan to Pakistan is built. Thismassive project has been revived with the end of the war in Afghanistan andnow seems feasible.
Many other smaller economies of the region enjoyed continued stronggrowth. Armenia grew by almost 13 per cent in 2002, reflecting continuingrecovery in the industrial sector, mostly in precious metals and stone process-ing, as well as booming construction. The country’s exports increased byalmost 50 per cent, while investment rose 43 per cent. In line with ongoingrestructuring and improving efficiency in the industrial sector, strong growth islikely to continue in 2003, albeit at a lower rate. Reflecting continued indus-trial expansion,9 Tajikistan recorded 9.1 per cent growth in 2002. In the case ofthe Republic of Moldova, strengthening domestic demand raised growth to 7.2per cent. Growth in these economies is likely to decelerate somewhat in 2003.
Kyrgyzstan was the only CIS country whose economy did not grow in 2002.Its GDP contracted by 0.5 per cent owing to a sharp drop in production of goldin the Kumtor gold mine,10 caused by a switch to mining lower-grade ore andan accident in July. Growth will recover in 2003, provided gold production isrestored to full capacity.
The Russian Federation remains the regional engine of growth, but the linksare weakening as Russian trade continues to shift away from the CIS countries.Also, mutual investment is increasing very slowly. For example, the RussianFederation is only the fifth largest source of foreign investment in Ukraine.These economic factors, together with some political considerations, led thefour largest CIS countries—the Russian Federation, Ukraine, Kazakhstan andBelarus—to sign a joint statement in February 2003, on forming a single eco-nomic space. It remains to be seen what is envisaged.
Despite robust growth in these countries, employment-generation is stilllagging owing to productivity improvements. In most CIS countries, unem-ployment remains high and any changes are difficult to follow owing to theunreliability of official data. Unemployment in the Russian Federationdeclined in 2002 but began to rise in September and had reached about 9 percent of the workforce by January 2003.
The external position remained uneven across the CIS region in 2002. TheRussian Federation and Ukraine reported current-account surpluses of 9.1 percent and 6.4 per cent of GDP respectively. For the Russian Federation, this nev-ertheless represented a deterioration compared with 2001, reflecting a decline inexports in the first half of 2002 and an almost 10 per cent growth in imports dueto strong domestic demand and continued real appreciation of the rouble against
83T H E C U R R E N T S I T U A T I O N I N T H E W O R L D ’ S E C O N O M I E S
9 The aluminium sector accounts for up to 60 per centof industrial output.
10 Gold production accounts for 40 per cent of thecountry’s industrial production, 90 per cent of whichis provided by the Kumtor mine.
W O R L D E C O N O M I C A N D S O C I A L S U R V E Y 2 0 0 384
Box III.1CIS-7 INITIATIVE TO PROMOTEPOVERTY REDUCTION, GROWTHAND DEBT SUSTAINABILITY INTHE LOW-INCOME COUNTRIES OFTHE COMMONWEALTH OFINDEPENDENT STATES
a It varies from US$ 158 in Tajikistan to US$ 652 inAzerbaijan, compared with $1,720 in the RussianFederation (see International Monetary Fund andWorld Bank, "Poverty reduction, growth and debtsustainability in low-income CIS countries", 4February 2002 (http://www.imf.org/external/np/eu2/2002/edebt/eng).
The CIS-7 Initiative to Promote Poverty Reduction, Growth and Debt Sustainability in theLow-income Countries of the Commonwealth of Independent States was launched in April2002 by the Asian Development Bank, the European Bank for Reconstruction andDevelopment (EBRD), the International Monetary Fund (IMF) and the World Bank. The CIS-7Initiative aims to accelerate economic growth and poverty reduction in seven low-income CIScountries—Armenia, Azerbaijan, Georgia, Kyrgyzstan, the Republic of Moldova, Tajikistanand Uzbekistan—while maintaining fiscal and external debt sustainability.
Transition from a centrally planned to a market economy in these poorer former Sovietrepublics has been more difficult than in other transition countries. Real GDP for the group asa whole fell by 55 per cent between 1990 and 2000 (compared with an average of 23 per centfor all transition countries) and poverty increased to high levels (see chap. VIII below). GDPper capita fell by more than half during that period in every country.a In the Republic ofMoldova and Tajikistan, more than 80 per cent of the population were below the nationalpoverty line in 1999, compared with 13 per cent and 59 per cent respectively in 1988. Manyof the CIS-7 countries are labouring under a large external debt, all of which has been accu-mulated since the beginning of the transition. In Kyrgyzstan, the Republic of Moldova andTajikistan, the ratios of external debt to GDP exceed 100 per cent.
The countries included in the CIS-7 Initiative have committed themselves to strengthenedreform programmes, fiscal consolidation and macroeconomic stability. The international com-munity, in turn, has pledged to provide these countries with greater market access and finan-cial assistance. Actions under the CIS-7 Initiative are intertwined with other activities of theinternational community and therefore difficult to identify separately. Nevertheless, the CIS-7 Initiative has provided a useful umbrella for enhanced cooperation by the participating inter-national financial institutions and has provided the CIS-7 countries with increased visibility inthe eyes of the donor community.
One of the key objectives of the CIS-7 Initiative is to enhance donor assistance and coor-dination, including debt relief where needed. Georgia and Kyrgyzstan have already resched-uled their debts with Paris Club creditors and Armenia has concluded a debt-equity swapagreement with the Russian Federation. A high-level conference held in Lucerne, Switzerland,in January 2003, recommended that more grant financing should be provided by both theInternational Development Association (IDA) and bilateral donors.
The CIS-7 Initiative stresses the importance of the CIS-7 countries’ taking greater own-ership of their reform programmes, particularly through nationally developed PovertyReduction Strategy Papers (PRSPs). A third Forum on Poverty Reduction Strategies for theCIS-7 countries, held in Almaty in December 2002, provided the CIS-7 countries with adviceon how to address policy issues related to the PRSP process, emphasizing that PRSPs need-ed to become fully integrated into the Governments’ normal operations, including nationalbudgets.
An important objective of the CIS-7 Initiative is to build capacity in the CIS-7 countries todesign and implement reforms in such areas as poverty reduction, rural development, publicfinancial management, private sector development, labour-market development, infrastruc-ture and social policies. Discussions on these subjects were initiated during the conferencein Lucerne and will be followed up with in-depth technical seminars and workshops in theCIS-7 countries, as well as with targeted partnerships that will help to raise donor support forthe financing of specific programmes.
Strengthening public expenditure management has been another focus of the CIS-7Initiative. The thrust of the technical and financial assistance from the World Bank is tohelp ensure that public resource use reflects scarcity and PRSP priorities. Public expendi-ture reforms to improve governance and reduce corruption are a key focus in adjustmentloans under preparation by the World Bank in Armenia and Kyrgyzstan. An added challengein the resource-rich countries is prudent management of natural resource wealth. The

85T H E C U R R E N T S I T U A T I O N I N T H E W O R L D ’ S E C O N O M I E S
establishment of a legal and administrative framework for an oil fund in Azerbaijan is anexample of work in this area.
Policy and expenditure reforms in education, health and social protection are supported bytechnical assistance, analytical and advisory services and lending from the World Bank andthe Asian Development Bank. Tax policy and administration, including customs reforms ineach of the CIS-7 countries, have received technical assistance from IMF and the World Bank.
Energy sector reforms remain an urgent task in all CIS-7 countries which, following thebreak-up of the former Soviet Union, suffered massive terms-of-trade shocks because of theincrease in their energy import prices to world levels. The Asian Development Bank, EBRD andthe International Finance Corporation (IFC) are involved in power sector projects in many ofthese countries, frequently focusing on improving regional cooperation in power transmission.
Improving the investment climate for small and medium-sized enterprises (SMEs) is anoth-er priority. The IFC Private Enterprise Partnership was set up to provide SMEs with technicalassistance and to work with the Governments on improving the legislative framework forSMEs. Initially, the Partnership focused on Armenia, Kyrgyzstan and Uzbekistan, but recentlythe programme was expanded to include Georgia and Tajikistan.
Each of the international financial institutions has been involved in extensive assistance tothe financial sector. The Asian Development Bank, IMF and the World Bank provided support insuch areas as bank restructuring, accounting, and payments system reform, as well as corpo-rate governance reforms. The Asian Development Bank, EBRD and IFC have also supported pri-vate financial institutions through loans and technical assistance to commercial banks.
The CIS-7 Initiative also aims to promote greater regional cooperation in trade, transport,water, energy, and the environment, as well as in such key social areas, as the fight againsthuman immunodeficiency virus/acquired immunodeficiency syndrome (HIV/AIDS) and tuber-culosis. In particular, resolving the regional trade disputes created by the political tensionsover Nagorny Karabakh, and in Georgian-Russian relations, as well as addressing the gener-al lack of commitment to trade liberalization in Uzbekistan, remains a high priority for ensur-ing economic growth in the region.
Achieving prosperity in these small and relatively isolated economies also depends criti-cally on improved trade access and transport links to the rest of the world. A number of ini-tiatives are under way to facilitate trade in the region. The Asian Development Bank and theWorld Bank are conducting regional transportation facilitation projects in the Caucasus andCentral Asia, focusing on regional road and rail transportation networks.
Despite fiscal consolidation, the challenge remains for oil-exporting countries to minimizethe dependence of national income on the prices of oil. Following the example of Azerbaijanand Kazakhstan, the Russian Federation has decided to introduce a fiscal stabilization fundand the Government is planning to pass the necessary legislation by the end of 2003.
In line with the current disinflationary trend, most of the central banks in the region low-ered their interest rates in 2002. Average inflation in the region declined to 14.4 per cent in2002 compared with 18.5 in 2002, mostly owing to the fall in food prices, lower oil prices inthe first quarter of the year, and relatively tight monetary policies in most countries. In sev-eral countries, inflation dropped to very low levels. Ukraine, for example, recorded less than1 per cent inflation in 2002. However, inflation is still stubbornly high in Belarus, the RussianFederation and Uzbekistan. Inflation in the Russian Federation in 2002 was 15.1 per cent,despite the Russian Central Bank’s target of 10–12 per cent inflation. If the Bank had contin-ued to target the real exchange rate in order to protect domestic producers, inflation wouldlikely have continued to exceed the official target. In early 2003, however, the Bankannounced that it would allow 4-6 per cent real exchange-rate appreciation in order to curbinflation: this would lead to a decrease of 1–1.5 percentage points in the average inflation inthe region in 2003. As a first step in this direction, the rouble strengthened 5 per cent againstthe dollar in real terms in the first quarter of 2003.
Box III.1 (continued)
the United States dollar. However, exports started growing towards the end of theyear and increased by about 6 per cent for the year as a whole. With the higherprices of oil, no substantial narrowing of the current-account surplus is expectedin 2003. Ukraine is also likely to maintain a current-account surplus in 2003although it will be reduced owing to gradual real appreciation of the currencyand rising import demand. All the other CIS countries recorded current-accountdeficits or only marginal surpluses in 2002. According to the available data, thehighest current-account deficit was recorded in Azerbaijan (8.4 per cent of GDPin the first 9 months of 2002), reflecting a sharp rise in investment in the oil sec-tor. This deficit, however, was entirely covered by FDI inflows.
A continuation of reforms will be key to sustained economic growth in theCIS countries. The pace of Russian reforms slowed in 2002 after the successesof 2001. A noteworthy development in 2002 was the passage by the Duma oflegislation to break up the State electricity monopoly, Unified Energy Systems.There has also been some progress in the reform of the banking system and theDuma has been discussing the Law on Deposit Insurance. The ongoing taxreform will, according to the government programme, concentrate on shiftingthe tax burden from the manufacturing sector to energy and other primary pro-ducers. Reforms are not likely to accelerate in 2003 because there are parlia-mentary and presidential elections in 2003 and 2004 respectively and the pend-ing reforms include such socially sensitive issues as the deregulation of natur-al monopoly tariffs, as well as social security and the pension system.
Progress with reform in Ukraine will remain slow, particularly in the lightof continuing political instability, which could intensify in the run-up to the2004 presidential election. In February 2003, the National Bank of Ukraineannounced a series of measures to liberalize the currency market and toincrease safeguards against capital flight. A priority is to adopt a new tax code;if achieved by mid-2003, this would allow the next budget to be formulated onthe basis of the new tax system.
A great deal of structural reform is still needed in other CIS countries. In oil-rich countries such as Azerbaijan and Kazakhstan, the lack of restructuring ishampering the expansion of the non-oil sector.
The CIS countries have achieved substantial fiscal consolidation over thepast several years, to a large extent because of fiscal reforms and, in the caseof the oil-producing countries, helped by higher prices of oil. In 2002, howev-er, there was some deterioration of fiscal positions. In the Russian Federation,for example, the fiscal surplus decreased from 2.4 per cent of GDP in 2001 to1.4 per cent of GDP in 2002. Fiscal loosening is expected in 2003 because ofpre-election spending and a continued decline in revenues from custom dutiesand profit taxes, in the latter case because the tax rate was cut from 35 to 24per cent at the beginning of 2002. The decline is reflected in the 2003 budget,which has been drafted with a 0.6 per cent surplus (compared with the 1.6 percent surplus planned for 2002). In Ukraine, despite moderate fiscal looseningexpected in 2003, the fiscal position will remain sound. It is expected to bene-fit from the passage of a new tax code which, as indicated above, it is hopedthat parliament will approve by mid-2003.
Persistent fiscal deficits continue to be a problem for some of the highlyindebted CIS countries, like Kyrgyzstan, the Republic of Moldova, Tajikistan,Armenia and Georgia, and debt servicing remains a major strain on theirfinances. These countries need more debt relief in order to achieve sustainabil-
W O R L D E C O N O M I C A N D S O C I A L S U R V E Y 2 0 0 386
ity. Recognizing this, IMF, the World Bank, the Asian Development Bank andthe European Bank for Reconstruction and Development (EBRD) havelaunched the so-called CIS-7 Initiative to Promote Poverty Reduction, Growthand Debt Sustainability in the Low-income Countries of the Commonwealth ofIndependent States11 (see box III.1).
DEVELOPING ECONOMIES
Developing countries grew by 3.2 per cent in 2002. Faced with depressedexternal demand, limited and costly financial inflows, uncertainties that affect-ed investor and consumer confidence worldwide and, in many instances, poli-cy constraints that precluded the use of counter-cyclical domestic policies, thisperformance was below potential but an improvement over 2001, when growthhad been only 2.1 per cent. Not all regions were able to participate in this mildrecovery: GDP contracted in Latin America and growth decelerated in Africa.The enhanced performance was largely in Eastern and Southern Asia and, tosome extent, Western Asia. In the latter, however, faster growth was mostlyattributable to the recovery in Turkey.
With the further delay until the second half of 2003 of the economic recov-ery in major developed economies, weak trade flows and the persistence offinancial and policy constraints, growth in developing countries will accelerateonly slightly to 3½ per cent in 2003. This improved performance, however,masks shortcomings at the regional level: Latin America will record only mod-est growth, due mostly to the recovery in Argentina; Western Asia will decel-erate owing to the impact of the war in Iraq, the continuation of the conflictbetween Israel and the Palestinian people and a slowdown in Turkey; andAfrica will continue to grow at only about 3 per cent, while East Asia, con-fronted with the negative impact of SARS and the tentative recovery in worldtrade, will decelerate. The only bright spots in the outlook are South Asia,where growth is expected to reach 5¾ per cent in 2003, and China, which willcontinue its strong performance (see table A.4). Reflecting improved externalconditions and a recovery in domestic demand in many economies, growth in2004 is expected to accelerate in all regions, reaching 5 per cent.
Africa: the challenge of poverty reduction
Africa’s overall GDP growth in 2003 is expected to reach 3¼ per cent, a slightincrease from the 2.9 per cent recorded in 2002. Growth is projected to contin-ue accelerating to 4 per cent in 2004.
For the first time in many years, in 2002 sub-Saharan Africa grew faster—albeit only slightly faster—than North Africa, as the large economies of the lat-ter subregion were constrained by low Organization of the Petroleum ExportingCountries (OPEC) quotas and/or decreased external demand. Despite reducedgrowth in Nigeria, and only a marginal increase in growth in South Africa, morethan 20 countries—almost all sub-Saharan—grew in excess of 3 per cent (seetable I.3). However, this relatively faster subregional growth did not embody anincrease in per capita GDP in all cases. Healthy performance generally reflecteda variety of favourable domestic elements: most States benefited from increasedagricultural output, which, given the dominance of this sector in many of them,
87T H E C U R R E N T S I T U A T I O N I N T H E W O R L D ’ S E C O N O M I E S
11 CIS-7 comprises Armenia, Azerbaijan, Georgia,Kyrgyzstan, the Republic of Moldova, Tajikistan andUzbekistan.
led to higher rural incomes, lower inflation and significant growth in non-agri-cultural sectors, such as agro-based industries and distributive trades.
Only four countries—Côte d’Ivoire, Madagascar, Malawi and Zimbabwe—suffered contraction. Other than in Malawi, which endured a severe drought,contraction was a result of conflict, protracted in Côte d’Ivoire and Zimbabwe,and the continued consequences of earlier instability in Madagascar.
Increased mining output of both base metals (mainly copper) and preciousmetals (gold and platinum) and diamonds, together with slightly improvedprices in international markets, contributed to growth in Botswana, theDemocratic Republic of the Congo, Namibia, South Africa, the UnitedRepublic of Tanzania, Zambia and Zimbabwe. In Namibia, Zambia, Zimbabwe,and some of the other countries affected by drought, growth in minerals andmetals output prevented steep declines in GDP growth.
Increased manufacturing output for exports to the United States under thepreferential treatment provided by the African Growth and Opportunity Act(AGOA) contributed to an improvement in overall growth performance inKenya, Lesotho, Mauritius, Madagascar and South Africa. Uganda’s highrates of economic growth have been partly attributed to private capital inflowsinto a range of economic activities that support that country’s export diversi-fication strategy.
Towards the end of 2002, the external environment became less supportiveof growth in the region as the EU economies decelerated and uncertaintiesmounted. The difficulty was exacerbated by decreased prices for almost all ofAfrica’s food commodity exports—with the exception of cocoa—and thedepreciation of the United States dollar against the euro. African commoditiesare sold in dollars, but the majority of imports are priced in euros, which meansthat the continent was increasingly hurt as the dollar declined. These difficul-ties persisted in the first half of 2003.
The impending combat in Iraq further hampered tourism in North Africa andincreased political instability in many States in which citizens expressed vio-lent disapproval of the war. States such as Egypt were severely impacted, fac-ing losses in tourism earnings and currency value, which, combined with theconsequences of its designation as being in a war zone, constrained growthduring the final months of the year. The other major test for the continent aroseout of the increasingly intractable crisis in Côte d’Ivoire, which began to havea region-wide impact. With the mass repatriation of its foreign workers, Côted’Ivoire lost the backbone of its cocoa economy, and the region lost remittanceflows, the locus of substantial FDI, and a prime engine of growth. The conta-gion effects of this crisis have been considerable; especially affected have beenthe landlocked countries of Burkina Faso, Mali and the Niger, whoseeconomies have had to absorb not just reduced remittances and increasedunemployment, but also substantially higher trans-shipment costs. Continuedtensions in the Democratic Republic of the Congo, and between Ethiopia andEritrea, as well as in Zimbabwe, also depressed end-of-year growth in otherparts of the continent.
Nigeria, the largest economy in West Africa, was impacted both by globaland by internal tensions. The key internal uncertainty related to the April 2003presidential and legislative elections, campaigning for which began in early2002. As is common in elections, there was a marked increase in fiscal spend-ing by the incumbent Government (see box III.2), a strategy allowed by the
W O R L D E C O N O M I C A N D S O C I A L S U R V E Y 2 0 0 388

89T H E C U R R E N T S I T U A T I O N I N T H E W O R L D ’ S E C O N O M I E S
A key dimension of the broad process of political and economic reform in Africa sincethe beginning of the 1990s has been the trend towards the use of elections as the prima-ry means of selecting Governments. Though a small number of elections had been held onthe continent prior to the 1990s, it was only in that decade that elections became almostuniversal throughout Africa (see figure). Elections are not isolated events, but are part ofa holistic process of democratic transition and governance. Regardless of national historyor economic standing, elections—and broader aspects of democracy—began to be pro-moted in every corner of the continent. The unprecedented speed and pervasiveness ofthis change were brought about by a confluence of external and internal influences.External pressures, catalysed in part by the demise of the Soviet Union, included the grow-ing international focus on individual rights, the communications revolution, and the resolveof donors and trading partners that their economic engagement should increasingly belinked with political reforms in partner countries.a These pressures, buttressed by domes-tic forces for democratization, with activists being ennobled by the "democratic contagion"from other States, were aided both by the new ideological climate and by the growingworldwide acceptance of the ballot as the most legitimate means to support or changeleadership. The result of these myriad forces has been the continent-wide promotion ofelections and wider political liberties, with most African States explicitly embracinggreater democracy at the national level, as well as in such regional undertakings as theAfrican Union and the New Partnership for Africa's Development (document A/57/304,annex).
The increasing use of elections in Africa augurs well for the future of the people onthe continent. The human rights benefits of elections and democratization are evident.Free and fair elections, when accompanied by supporting institutions to ensure that theproper checks and balances are in place to prevent misuse of economic and politicalpower by incumbents (such as an independent election commission, an independent judi-ciary and independent media), provide citizens with voice, redress and power to shapetheir surroundings and their futures. Additionally, by bringing a diversity of issues to thefore, elections can be a powerful tool for furthering and solidifying economic change and
Box III.2
ELECTIONS AND ECONOMIC STA-BILITY IN AFRICA
FIVE DECADES OF AFRICAN ELECTIONS
African electoral contests, 1950s-1990s
0 0 1 3
74
2
11
18
26
86
0
10
20
30
40
50
60
70
80
90
100
1950s 1960s 1970s 1980s 1990s
Presidential Parliamentary
a In regard to aid, donors announced and imple-mented new political and economic conditionsthat would be attached to the allocation of assis-tance and continued support. For instance, donorssuspended aid to Equatorial Guinea, Kenya,Malawi and Zaire in the early 1990s to fosterpolitical and economic reform and resumed aid toKenya and Malawi at the end of 1993 after multi-party elections were organized and economicreforms implemented. Concerning trade, theUnited States African Growth and Opportunity Act(AGOA) and the Partnership Agreement betweenthe Members of the African, Caribbean and PacificGroup of States and the European Community andits Member States (Cotonou Agreement) areexamples of the political/economic linkagesrequired by partners. Eligibility for AGOA is predi-cated not only on applicant States' making posi-tive market reforms, but also on their establishingreforms oriented towards enhanced human rights,as well as "rule of law and political pluralism".The Cotonou Agreement has a similar clauseaimed at ensuring that beneficiaries of the tradeagreement "encourag[e] the promotion of partici-patory methods…".
Source: International Institute for Democracy andElectoral Assistance (International IDEA).
W O R L D E C O N O M I C A N D S O C I A L S U R V E Y 2 0 0 390
helping to ensure that reforms enjoy wide support. Even though democratization canmake imposing such reforms more difficult—by opening up the space for dissent—theevidence in Africa suggests that successful economic reforms and political liberalizationare not mutually exclusive.
However, in some instances, the introduction of elections in African countries has beenthe source of political and economic instability. Election-related economic instability takesa number of forms. In some countries, the formation of political parties along ethnic or reli-gious lines has exacerbated existing cleavages, while in other cases, disputes over thelegitimacy of candidates have led to hostility, actions against certain groups in the popu-lation, and economic disarray. Further, in a number of countries, balloting has involvedintimidation and, in several cases, the outcome has been controversial often owing to dis-putes regarding vote-counting. Such friction has often reduced national unity, and inter-rupted domestic and regional commerce, and has sometimes sparked violence, all withnegative effects on economic activity.
Election-related economic instability has also occurred in the absence of political vio-lence. In the era of globalization, any tensions surrounding elections, particularly if theyinvolve the potential for economic dislocation, can raise uncertainty in the internationalcommunity about a country's economic prospects. Though private investors appreciate thepredictability and the respect for the rule of law that is usually associated with electionsand other democratic practices, in a number of countries uncertainties leading up to anelection—due to the possibility of violence or of abrupt policy changes prior to, or in thewake of, the contest—have had negative impacts on both exchange rates and portfolioand FDI flows. Secondly, as in many countries, including developed countries, electioncampaigns in African countries have often been associated with fiscal indiscipline. Suchindiscipline has involved not only an overexpansion in the public sector prior to a vote, butalso a shift in fiscal expenditures from long-term investment to the provision of short-termgoods and services intended to bolster the popularity of the incumbent. Though such elec-tion-induced spending is common in many States, in countries where the mobilization ofpublic resources is challenging, as is the case for most African States, the long-term costof such a reallocation of resources can be high and may delay, or even derail, hard-wonprogrammes of economic reform.
Finally, even if elections are held without such instability, campaigns held amid socialdiscord, and seen to involve intimidation or other non-democratic features, may bedeemed by the international community as not "free and fair". Such a designation entailsa further economic risk, as it may result in the isolation of the State from bilateral donorsand international financial institutions.
Almost 30 national-level elections (presidential and parliamentary elections, as well as1 national referendum) are scheduled to take place in Africa during 2002-2003, continuingthe rapid pace of democratization on the continent. Though there are increasing numbersof countries in Africa that have held free and fair electoral contests with only minor eco-nomic disturbances, on the basis of experience to date it must be expected that some ofthe impending contests will involve a degree of economic disruption. It thus remains achallenge for domestic policy makers and the international community to identify thenational risks associated with electoral contests and to adopt countermeasures to miti-gate the sources of conflict and instability. One clear requirement is to establish robustand flexible economic and political institutions designed to withstand the stresses of elec-tions, without sacrificing continued democratization and economic development. Suchinstitutions would strengthen and render more sustainable the social, economic and polit-ical reforms under way in many of Africa's emerging democracies.
Box III.2 (continued)
repudiation of its IMF agreement in early 2002. As a result, Nigeria weatheredmacroeconomic instability throughout the year, with double-digit inflation andan unstable exchange rate, which depreciated by as much as 11 per cent duringthe year. The oil sector, which accounts for almost all of the country’s foreignexchange earnings, was also the catalyst for two crises that impaired the econ-omy. Continued, and often violent, disagreements between the littoral oil Statesand the federal Government as to the equitable distribution of oil earningsinterrupted production from some fields.
South Africa, the largest economy in sub-Saharan Africa, witnessed a returnto growth in private sector employment for the first time in over six years, in thethird quarter of 2002. Reduction of high levels of unemployment neverthelessremains one of the key policy challenges of the South African authorities. Theeconomy showed remarkable resiliency by growing 3 per cent in 2002. Growthwas underscored by increased agricultural output and increased output in goldand platinum mining in a year when international prices for those two commodi-ties had strengthened from recent lows, while export growth also improved.
Average inflation rates in Africa increased slightly in 2002 (see table A.10)and reached 9 per cent on average during the year, an outcome that masks con-tinuing difficulties in maintaining low price growth in Ghana, Madagascar,Malawi, Mozambique, Namibia, Nigeria, South Africa and Zambia, all ofwhich recorded double-digit inflation during the year. In South Africa, policymakers expressed renewed commitment to an inflation-targeting policy despitean inflation outcome that had exceeded the upper limits of the target set for2002, even after revisions in the calculation of the consumer price index. Byearly 2003, inflationary pressures began to ease with the strengthening of therand (due, in part to the depreciation of the dollar) and lower food and import-ed oil prices. In Zimbabwe, inflation increased sharply to triple-digit levelsowing to severe shortages of food and other essential commodities and thesteep depreciation of the currency. Other economies, notably Botswana, theUnited Republic of Tanzania and many Communauté financière africaine(CFA) countries, managed to reduce inflation, in many cases as a result of tightmonetary and fiscal policies and increased domestic food supplies. Inflation inthe Democratic Republic of the Congo, most notably, fell from 360 per cent inthe previous year to 16 per cent in 2002.
North African States are expected to grow more vigorously in 2003. The oilStates of Algeria and the Libyan Arab Jamahiriya, in response to higher OPECquotas and momentary price spikes, should achieve higher growth, whileMorocco and Tunisia are expected to continue their recovery from terroristattacks. Though continent-wide growth will improve slightly, and Africaninflation will decline, the outlook for many African States remains clouded byevents in the Middle East and continued instability in many subregions. TheIraq crisis, and the continuation of tensions between Israel and the Palestinianpeople, will also reduce Egypt’s growth, while increasing its inflation rate.
Meanwhile, the predicament of Côte d’Ivoire will depress growth potentialthroughout West Africa, aggravating the economic fallout of election-relatedviolence—and the disruption of oil production—in Nigeria. Additional insta-bility visited this subregion during the first quarter of 2003, with a coup in theCentral African Republic, increased fighting and political volatility in theMano River region. Growing regional enmity in West and Central Africa meansthat, even if stability returns, the post-conflict scenario is troubling, with the
91T H E C U R R E N T S I T U A T I O N I N T H E W O R L D ’ S E C O N O M I E S
frayed relations between many States in the subregion suggesting that tradeflows could be reduced even after the conflict subsides, setting back efforts atfurther regional integration.
Some private investments into Africa will be impacted by the insecurity pre-vailing in certain areas; however, substantial financial flows into the hydrocar-bon sector are projected to continue unabated in 2003. Additionally, large-scalemanufacturing and infrastructure development projects by South African firmswill provide an additional stimulus to economic activity in several countries.12
Other exogenous factors, such as the tentative recovery of major developedcountries and the risks associated with it, make the immediate economic futureof Africa uncertain. However, exports should increase if global economicgrowth picks up in the second half of 2003. Projected price increases for almostall categories of export commodities will additionally strengthen export rev-enues and GDP growth in many countries.
Global and subregional uncertainty may also affect official financial flows tothe continent. Though African States continue to benefit from the HeavilyIndebted Poor Countries (HIPC) Initiative (see chap. II), the aftermath of thewar in Iraq and the continued rebuilding of Afghanistan may create competingdemands for attention by the international community. That Africa’s needs maybe eclipsed by seemingly more pressing issues elsewhere could prevent fasterprogress by the region towards the achievement of the Millennium DevelopmentGoals (see document A/56/326, annex). Owing to a slow start in the early 1990s,many countries are now faced with the challenge of generating higher rates ofsustainable annual GDP growth to satisfy the regional and global objectives ofsignificant poverty reduction and other indicators of development.
Several countries face the risk of falling short of these poverty reduction tar-gets because economic activities that account for high rates of growth are con-centrated in some parts of those countries while other areas remain impoverished.This is most evident in Uganda where, despite its overall fast rates of growth,some areas remain immersed in continuing instability and armed conflict, therebypreventing the reconstruction and rehabilitation of infrastructure vital for eco-nomic development. In Angola, Nigeria, the Sudan and other oil States, econom-ic growth is largely driven by oil production while the other sectors of the econo-my stay undeveloped. Similarly, most areas in Mozambique derive little benefitfrom recent large-scale industrial projects that have underpinned that country’srapid economic growth in recent years because the vast majority of these projectsare located in the Maputo Corridor—in the country’s far south—reflecting thepreferences of foreign investors. Thus, high GDP growth rates mask the unevenpatterns of development in each of those countries.
Even with improved macroeconomic management in most countries, there iswidespread acknowledgement of a need for further economic reforms. As iden-tified by stakeholders in the countries themselves, international financial insti-tutions and donor countries, necessary reforms encompass a wide range ofrequirements related to addressing the need for good governance, the rootingout of corruption and mismanagement in the public sector and the implemen-tation of required legal and regulatory frameworks in order to gain the confi-dence of domestic and foreign investors. These are considered vital precondi-tions for accelerating growth so as to achieve the required poverty reductionand social development targets.
W O R L D E C O N O M I C A N D S O C I A L S U R V E Y 2 0 0 392
12 These projects include the expansion of the Mozalaluminium smelter in Mozambique; the constructionof a gas export pipeline from Mozambique to SouthAfrica; the Bujagali Dam project for electricity-gen-eration in Uganda; and the Inga Dam project to sup-ply electricity from the Democratic Republic of theCongo to South Africa through transmission facili-ties in Angola and Namibia.

93T H E C U R R E N T S I T U A T I O N I N T H E W O R L D ’ S E C O N O M I E S
East Asia: dealing with shocks
Economic growth in East Asia accelerated to 5.8 per cent in 2002, a markedimprovement over the region’s performance in 2001. As the year progressed,adverse external conditions, including increased uncertainties due to a possiblewar in Iraq and the terrorist attacks in the region, imposed a toll on growth. Theregion’s economies started to decelerate, with the exception of China, whichcontinued to grow strongly (see table III.3). The persistence of weak externalconditions in the first half of 2003, the outbreak of SARS and tensions relatedto the nuclear issue in the Democratic People’s Republic of Korea, impliesslower growth for the region—forecast to be 5 per cent for 2003 as a whole butstrengthening to 6¼ per cent in 2004 (see table A.4).
An upturn in both exports and domestic demand supported the region’srecovery in the first half of 2002. Export recovery started in the ICT sector inresponse to restocking in the United States and spread into the other sectors ofthe economy. In the latter part of 2002, surging imports from China offset neg-ative global trends in the other economies in the region. Domestic demand, inturn, was supported by accommodative policies and rising exports. The mainthrust of the region’s recovery came from buoyant private consumption andincreased public spending. In a number of economies, such as the Republic ofKorea and Thailand, increased credit to households further boosted privateconsumption. Meanwhile, Indonesia, Malaysia and Thailand benefited fromimproved commodity prices while increased labour remittances contributed tohigher incomes and consumption in the Philippines. The recovery, however,was modest in Hong Kong SAR, Singapore and Taiwan Province of Chinawhere high unemployment, weak asset prices and low confidence depressedprivate consumption. Private investment, with the exception of China, theRepublic of Korea and Thailand, remained weak in most economies owing toexcess capacity and the continuing relocation of facilities to China and otherlow-cost economies.
As the rest of East Asia decelerated owing to sluggish external demand,higher oil prices and other factors that dampened market sentiment and domes-tic demand, growth surged in China and the economy recorded a balanced andstrong performance, which had not been seen since the Asian crisis. Privateinvestment led domestic demand owing to policy stimuli and increased foreigncapital inflows. Fixed investment growth remained robust in the first quarter of2003, when it surged by nearly 23 per cent. In comparison, household spend-ing has been growing more slowly, particularly in the rural areas, although anupturn was observed at the beginning of 2003. GDP growth accelerated to 9.9per cent in the first quarter of 2003. Nonetheless, this fast pace of growth isunlikely to be sustained in the short run as the economy deals with the impactof SARS.
Reflecting improved economic performance in 2002, the unemployment ratefell somewhat in a number of economies, including the Republic of Korea andThailand, but it remains above the pre-1997 level in most of them.Unemployment rose in Hong Kong SAR, Singapore and Taiwan Province ofChina owing not only to their cyclical weaknesses but also to the ongoingrebalancing in trade and industrial structures within the region. Urban unem-ployment also increased in China, where the official rate reached 4 per cent in2002 owing to fast labour-force growth, restructuring of State enterprises and
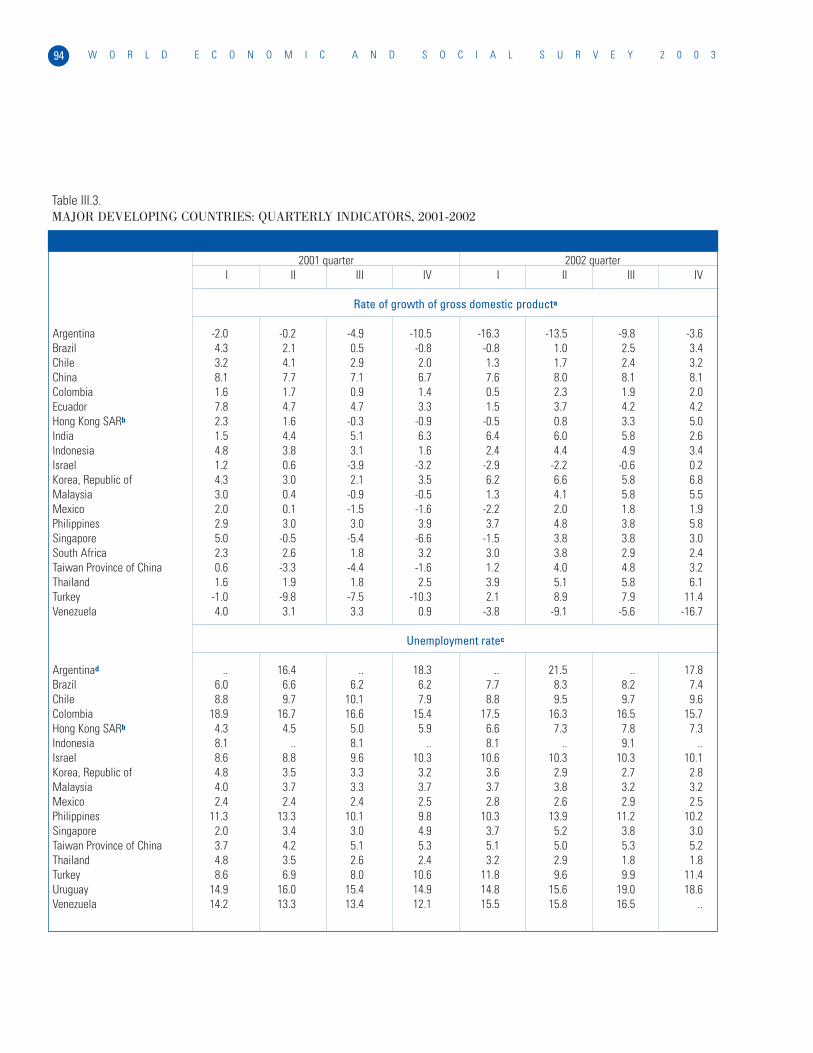
W O R L D E C O N O M I C A N D S O C I A L S U R V E Y 2 0 0 394
2001 quarter 2002 quarterI II III IV I II III IV
Rate of growth of gross domestic producta
Argentina -2.0 -0.2 -4.9 -10.5 -16.3 -13.5 -9.8 -3.6Brazil 4.3 2.1 0.5 -0.8 -0.8 1.0 2.5 3.4Chile 3.2 4.1 2.9 2.0 1.3 1.7 2.4 3.2China 8.1 7.7 7.1 6.7 7.6 8.0 8.1 8.1Colombia 1.6 1.7 0.9 1.4 0.5 2.3 1.9 2.0Ecuador 7.8 4.7 4.7 3.3 1.5 3.7 4.2 4.2Hong Kong SARb 2.3 1.6 -0.3 -0.9 -0.5 0.8 3.3 5.0India 1.5 4.4 5.1 6.3 6.4 6.0 5.8 2.6Indonesia 4.8 3.8 3.1 1.6 2.4 4.4 4.9 3.4Israel 1.2 0.6 -3.9 -3.2 -2.9 -2.2 -0.6 0.2Korea, Republic of 4.3 3.0 2.1 3.5 6.2 6.6 5.8 6.8Malaysia 3.0 0.4 -0.9 -0.5 1.3 4.1 5.8 5.5Mexico 2.0 0.1 -1.5 -1.6 -2.2 2.0 1.8 1.9Philippines 2.9 3.0 3.0 3.9 3.7 4.8 3.8 5.8Singapore 5.0 -0.5 -5.4 -6.6 -1.5 3.8 3.8 3.0South Africa 2.3 2.6 1.8 3.2 3.0 3.8 2.9 2.4Taiwan Province of China 0.6 -3.3 -4.4 -1.6 1.2 4.0 4.8 3.2Thailand 1.6 1.9 1.8 2.5 3.9 5.1 5.8 6.1Turkey -1.0 -9.8 -7.5 -10.3 2.1 8.9 7.9 11.4Venezuela 4.0 3.1 3.3 0.9 -3.8 -9.1 -5.6 -16.7
Unemployment ratec
Argentinad .. 16.4 .. 18.3 .. 21.5 .. 17.8Brazil 6.0 6.6 6.2 6.2 7.7 8.3 8.2 7.4Chile 8.8 9.7 10.1 7.9 8.8 9.5 9.7 9.6Colombia 18.9 16.7 16.6 15.4 17.5 16.3 16.5 15.7Hong Kong SARb 4.3 4.5 5.0 5.9 6.6 7.3 7.8 7.3Indonesia 8.1 .. 8.1 .. 8.1 .. 9.1 ..Israel 8.6 8.8 9.6 10.3 10.6 10.3 10.3 10.1Korea, Republic of 4.8 3.5 3.3 3.2 3.6 2.9 2.7 2.8Malaysia 4.0 3.7 3.3 3.7 3.7 3.8 3.2 3.2Mexico 2.4 2.4 2.4 2.5 2.8 2.6 2.9 2.5Philippines 11.3 13.3 10.1 9.8 10.3 13.9 11.2 10.2Singapore 2.0 3.4 3.0 4.9 3.7 5.2 3.8 3.0Taiwan Province of China 3.7 4.2 5.1 5.3 5.1 5.0 5.3 5.2Thailand 4.8 3.5 2.6 2.4 3.2 2.9 1.8 1.8Turkey 8.6 6.9 8.0 10.6 11.8 9.6 9.9 11.4Uruguay 14.9 16.0 15.4 14.9 14.8 15.6 19.0 18.6Venezuela 14.2 13.3 13.4 12.1 15.5 15.8 16.5 ..
Table III.3.MAJOR DEVELOPING COUNTRIES: QUARTERLY INDICATORS, 2001-2002
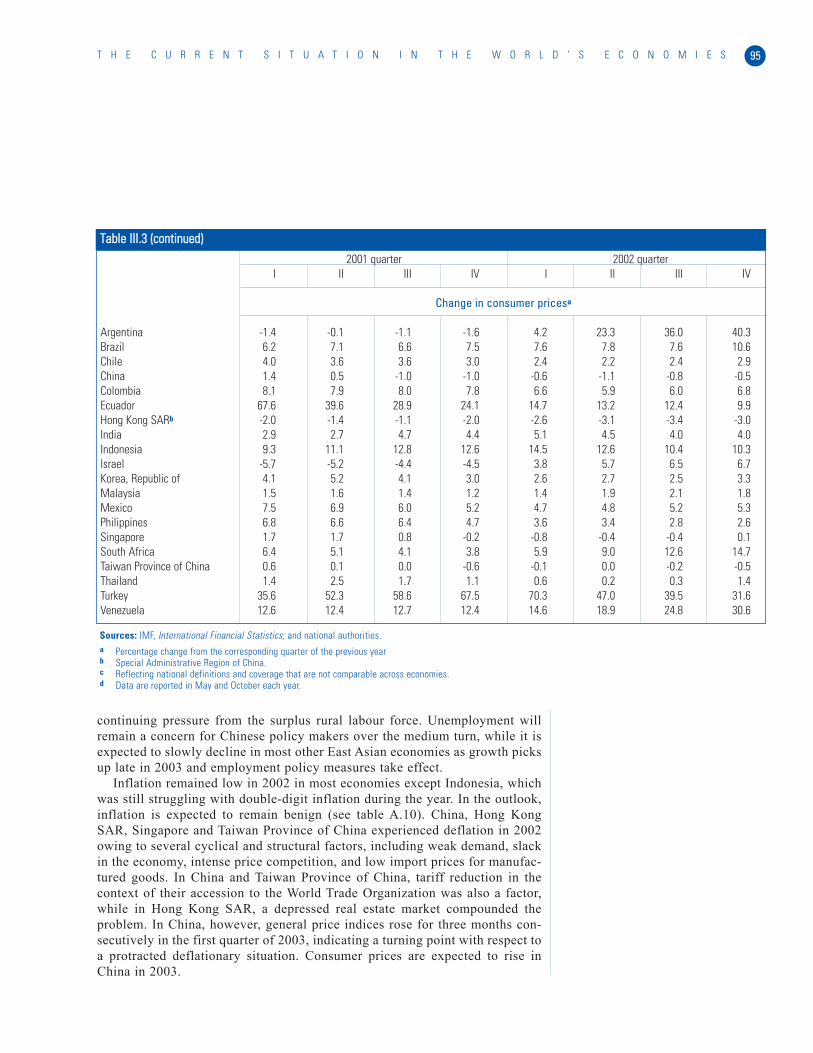
continuing pressure from the surplus rural labour force. Unemployment willremain a concern for Chinese policy makers over the medium turn, while it isexpected to slowly decline in most other East Asian economies as growth picksup late in 2003 and employment policy measures take effect.
Inflation remained low in 2002 in most economies except Indonesia, whichwas still struggling with double-digit inflation during the year. In the outlook,inflation is expected to remain benign (see table A.10). China, Hong KongSAR, Singapore and Taiwan Province of China experienced deflation in 2002owing to several cyclical and structural factors, including weak demand, slackin the economy, intense price competition, and low import prices for manufac-tured goods. In China and Taiwan Province of China, tariff reduction in thecontext of their accession to the World Trade Organization was also a factor,while in Hong Kong SAR, a depressed real estate market compounded theproblem. In China, however, general price indices rose for three months con-secutively in the first quarter of 2003, indicating a turning point with respect toa protracted deflationary situation. Consumer prices are expected to rise inChina in 2003.
95T H E C U R R E N T S I T U A T I O N I N T H E W O R L D ’ S E C O N O M I E S
2001 quarter 2002 quarterI II III IV I II III IV
Change in consumer pricesa
Argentina -1.4 -0.1 -1.1 -1.6 4.2 23.3 36.0 40.3Brazil 6.2 7.1 6.6 7.5 7.6 7.8 7.6 10.6Chile 4.0 3.6 3.6 3.0 2.4 2.2 2.4 2.9China 1.4 0.5 -1.0 -1.0 -0.6 -1.1 -0.8 -0.5Colombia 8.1 7.9 8.0 7.8 6.6 5.9 6.0 6.8Ecuador 67.6 39.6 28.9 24.1 14.7 13.2 12.4 9.9Hong Kong SARb -2.0 -1.4 -1.1 -2.0 -2.6 -3.1 -3.4 -3.0India 2.9 2.7 4.7 4.4 5.1 4.5 4.0 4.0Indonesia 9.3 11.1 12.8 12.6 14.5 12.6 10.4 10.3Israel -5.7 -5.2 -4.4 -4.5 3.8 5.7 6.5 6.7Korea, Republic of 4.1 5.2 4.1 3.0 2.6 2.7 2.5 3.3Malaysia 1.5 1.6 1.4 1.2 1.4 1.9 2.1 1.8Mexico 7.5 6.9 6.0 5.2 4.7 4.8 5.2 5.3Philippines 6.8 6.6 6.4 4.7 3.6 3.4 2.8 2.6Singapore 1.7 1.7 0.8 -0.2 -0.8 -0.4 -0.4 0.1South Africa 6.4 5.1 4.1 3.8 5.9 9.0 12.6 14.7Taiwan Province of China 0.6 0.1 0.0 -0.6 -0.1 0.0 -0.2 -0.5Thailand 1.4 2.5 1.7 1.1 0.6 0.2 0.3 1.4Turkey 35.6 52.3 58.6 67.5 70.3 47.0 39.5 31.6Venezuela 12.6 12.4 12.7 12.4 14.6 18.9 24.8 30.6
TTaabbllee IIIIII..33 ((ccoonnttiinnuueedd))
Sources: IMF, International Financial Statistics; and national authorities.a Percentage change from the corresponding quarter of the previous yearb Special Administrative Region of China.c Reflecting national definitions and coverage that are not comparable across economies.d Data are reported in May and October each year.
Monetary policy remained accommodative in 2002 to support growth. Benigninflation, interest rate cuts in the United States and adequate foreign reservesfacilitated the easing monetary policy, which is unlikely to be changed until late2003. In most economies, interest rates are at historically low levels. Givenuncertainties related to SARS and the subdued recovery, countries are expectedto keep their policies flexible for a while. Most economies still have some roomfor further monetary easing. If external uncertainties fade and growth picks up inlate 2003, however, countries are likely to begin to shift their policy to a lessexpansionary stance and to raise interest rates gradually. From then on, theirinterest rates will also be under upward pressure from rising international inter-est rates. In China, monetary policy will likely focus on liberalizing the controlson interest rates so as to increase the efficiency of the financial system and toimprove the effect of monetary policy on the real economy.
Fiscal policy in most economies also remained broadly accommodative in2002. Only Indonesia, the largest public debtor in the region, made significantprogress in reducing its public deficit and debt under the IMF programme. Inthe near term, given its heavy public debt burden, Indonesia, as well as thePhilippines, will continue to be under pressure to tighten fiscal policy. HongKong SAR and Taiwan Province of China will also be pressed to restore fiscalbalance. Fiscal policy in most other economies is expected to focus on growthand remain flexible. In China, the budget for 2003 suggests a smaller stimula-tory policy stance, and the amount of additional bond issuance for publicinvestment in 2003 is slightly lower than in previous years. Nonetheless, thepublic deficit, which rose to 3 per cent of GDP in 2002, is expected to contin-ue to widen. In the Republic of Korea, the budget for 2003 aimed at fiscal bal-ance, with a modest spending increase to be financed by increased tax receiptsbut, in view of slowing growth, an additional fiscal stimulus is possible.Malaysia, given its high government deficit, armed as well for fiscal consoli-dation in 2003, but it also may inject an additional fiscal stimulus if growth fal-ters. Despite the urge for fiscal consolidation, countries may have to takeproactive measures to offset the negative impacts from exogenous shocks, suchas SARS. If, however, growth strengthens in late 2003, policy will be tight-ened, reflecting these countries’ concern about medium-term fiscal viabilityand longer-run potential growth.
The region’s growth in the balance of 2003 will hinge crucially on the con-tainment of SARS. If the disease is quickly controlled, growth will pick upfrom the second half of 2003. Reduced uncertainty and improved market sen-timent, combined with lower oil prices, will lead to stronger domestic demandand exports. The strengthening demand in developed countries and continuingrobust imports from China, in line with its strong domestic demand and tradeliberalization, will boost exports. Domestic demand in the region will bestrengthened in line with the reversal of adverse factors, broadly accommoda-tive policies, stronger exports and improving market sentiment. ICT exports,which are important for a durable industrial recovery, remain fragile, but arelikely to gain strength as world trade picks up, especially in view of the lowerlevel of inventories and rising demand for inputs through the expanding pro-cessing network in the ICT sector. Nonetheless, owing to excess capacity andmoderate expansion in global demand, a full recovery in the ICT sector isunlikely until late 2004.
W O R L D E C O N O M I C A N D S O C I A L S U R V E Y 2 0 0 396
In 2004, growth is expected to quicken but to be below that in 2000, asmomentum will be tempered by the expected policy tightening and moderatingexternal demand. Political tensions in the run-up to the elections in a numberof countries in 2004 and, in the Republic of Korea, those tensions associatedwith the nuclear issue in the Democratic People’s Republic of Korea, will alsohamper the acceleration. In Hong Kong SAR, Singapore and Taiwan Provinceof China, outsourcing and retrenchment will continue to weigh on theiremployment and domestic demand.
South Asia: moving towards a more balanced growth
The growth performance of South Asian economies has been uneven, mainlyreflecting different climatic and security conditions. The region’s GDP growthreached 4.8 per cent in 2002, slightly higher than in 2001 (see table A.4). Themodest increase in the region’s growth in 2002 was largely due to the econom-ic rebound in Pakistan and Sri Lanka. Bangladesh and India maintained aboutthe same moderate pace as in 2001. The sharp downturn that had begun inNepal in 2001 continued into 2002, as the country suffered its worst setback intwo decades.
The region’s near-term prospects are positive. Real GDP growth is expectedto pick up in mid-2003, supported by both domestic demand and exports, andreach 5¾ per cent for the year as a whole. The outlook for 2004 is alsofavourable, as economic growth, forecast at 6 per cent, will be more balancedacross the region, although its strength will be subject to structural factors,including fiscal constraints.
Rising exports and an improving economic environment supported domes-tic demand in Pakistan and Sri Lanka in 2002, while in Nepal, the securityproblem continued to depress domestic demand and tourism revenues. InIndia, after an improvement in the first half, private consumption eased in late2002 owing to the autumn crop failure, slowing overall growth (see tableIII.3). In Bangladesh, weak agricultural production and socio-political uncer-tainties restrained domestic demand. In some countries, fiscal considerationsconstrained public spending on development projects. Sectorally, the recoveryin Pakistan was largely led by services, the textile industry and livestock pro-duction. In Sri Lanka, the agricultural and trading sectors benefited fromimproved weather and the ceasefire in the country’s long civil war, while theindustrial sector grew marginally from a low base. Moderation of growth inIndia was due to a significant fall in the aforementioned autumn harvest as aresult of the worst summer drought in more than a decade. On the other hand,the Indian industrial and service sectors exhibited a robust performance.Similarly, a healthy performance by the industrial and service sectors offset aweak agricultural outcome in Bangladesh. In contrast, the Nepalese economyremained severely weak owing to the heightened Maoist insurgency and anirregular monsoon.
Monetary policy in the region remained accommodative in 2002. Owing tothe region’s relatively stable inflation (see table A.10) and the need to supportgrowth, most countries cut key interest rates gradually and tried to promotebusiness lending. The soft monetary policy is expected to continue for a while,but the scope for monetary easing will remain constrained by the need tofinance the large fiscal deficits most countries have. Despite these difficulties,
97T H E C U R R E N T S I T U A T I O N I N T H E W O R L D ’ S E C O N O M I E S
fiscal policy has remained expansionary in the region, except in Bangladeshand Sri Lanka. Public deficits in 2002 were larger than anticipated in mostcountries (except Pakistan), owing to revenue shortfalls caused by the cyclicalslowdown and structural factors, such as inefficient tax collection and the nar-rowness of the tax base. Although the budgets for fiscal year 2002/03 contin-ued to stress fiscal consolidation, political resistance, increased spending onsecurity and on the farm sector, and the need to support growth will continueto hamper strict implementation. In India, the budget for 2003/04 includedstimulative measures, such as tax cuts and other incentives, and increasedspending on infrastructure. Nevertheless, concerns about their fiscal positionswill continue to limit the scope for fiscal stimuli in most countries.
During early 2003, growth in the region was moderate and mixed but isexpected to strengthen in the near term. Pakistan and Sri Lanka continued torecover. However, in Bangladesh and India, growth decelerated owing to thelagged effects of unfavourable agricultural production. In Sri Lanka, the sus-pension of peace talks in April increased uncertainties about the country’s out-look. Meanwhile, there have been some signs of a turnaround in Nepal sincethe formal ceasefire in late February 2003, though security issues continued torestrain the recovery. In contrast with East Asia, the impact of SARS on theregion has been negligible. Several countries have intensified their domesticeconomic reforms and external liberalization to create a more conducive envi-ronment for growth. Success in fiscal consolidation and other reforms will alsobe crucial for medium-term fiscal viability and for securing a sustainable high-growth path.
From mid-2003, growth is expected to pick up in most countries as bothexports and domestic demand strengthen. Exports should increase in line withrising external demand. Domestic demand will be supported by low interestrates, rising exports and, in a number of countries, a better harvest andimproved security conditions. Sectoral performance is expected to be morebalanced, particularly in Bangladesh and India, once normal weather returns.Industrial output is forecast to continue its upward trend, boosted by more sta-ble oil prices and rising exports and domestic demand. Stronger primary activ-ities will support the service sector in most countries. In Nepal, on the otherhand, the upward momentum in most sectors will be modest for a while.
In 2004, growth is expected to accelerate further, supported by improve-ments in both the external and domestic sectors. Nonetheless, structural imped-iments, including fiscal imbalances, inadequate infrastructure, governanceproblems and, in a number of countries, a narrow export base and politicaluncertainties, will continue to constrain growth in the region.
Western Asia: caught between war and volatile oil prices
Largely owing to Turkey’s strong recovery, GDP grew by 2.0 per cent inWestern Asia in 2002, after a contraction of about 1.2 per cent in 2001.13
Except for Turkey, the largest economy in the region and itself recoveringfrom the severe recession of 2001, and a few other economies, economic per-formance in the region in 2002 was poor as the conflict between Israel and thePalestinian people caused growth in Israel to contract and the Palestinianeconomy to collapse, while oil production declined in most oil-exportingcountries in response to reduced OPEC quotas. FDI declined, tourism rev-
W O R L D E C O N O M I C A N D S O C I A L S U R V E Y 2 0 0 398
13 Excluding Turkey, the rate of GDP growth in theregion actually decelerated further to 0.5 per cent in2002 from 0.8 per cent in 2001.
enues plummeted and consumer and investor confidence declined owing tosoaring uncertainties associated with the geopolitical climate that prevailed inthe region throughout 2002.
Economic difficulties persisted in early 2003 as the invasion of Iraqimposed a severe toll on the Iraqi economy and on its main trading partners inthe region, notably Jordan and the Syrian Arab Republic, as well as on otherneighbouring economies where uncertainties and increased regional risksaffected market sentiment and disturbed trade and capital flows, as well astourism. Despite increased oil production in the major fuel-exporting countries,GDP growth is expected to decelerate to 1¼ per cent in 2003, as Turkey isunlikely to be able to sustain its fast pace of growth and Iraq is coping with theaftermath of the war. The outlook for 2004 is more favourable. GDP growth isforecast at 3¾ per cent as reconstruction in Iraq advances, oilfield developmentand several petrochemicals projects come on-stream, and market sentimenttowards the region improves.
Most countries performed poorly in 2002. Oil production declined in mostoil-exporting countries in the region, responding to a lower OPEC ceiling thatwas kept unchanged throughout 2002. The non-oil sector suffered from weakdomestic and external demand; and the economies of both Iraq and Kuwaitcontracted in 2002.
In March-May 2003, Iraq was confronted with war which compounded thedifficulties facing a country that had already been crippled by the 1991 Gulfwar and international sanctions.14 While damage to oil infrastructure was neg-ligible and most oil wells and oil production facilities were preserved, much ofthe Iraqi physical infrastructure was damaged or destroyed. Vandalism andlooting have occurred, while law and security have not been restored. Iraqi oilproduction and exports were suspended and their recovery to pre-war levelsmay take some time.
Financing the reconstruction is yet another challenge facing the country.Excluding humanitarian needs and industrial rehabilitation, the cost of repair-ing part of Iraq’s physical infrastructure—oil export facilities and powerplants—has been estimated at about $25 billion. Oil revenues amount to some$12 billion annually which is insufficient to finance all of Iraq’s reconstructionneeds. In addition, Iraq’s total external debt has been estimated at $383 billion,of which $199 billion is compensation from the first Gulf war, $127 billion isforeign bilateral debt (including $47 billion of accrued interest) and $57 billionis owed on pending contracts, inter alia, for energy and communication deals.Heavy debt-service payments remain a major obstacle for the country’s eco-nomic rehabilitation.
Increased tension and the pre-war climate took their toll on the economicperformance of the oil-importing countries of the region. The economic reces-sion in Israel deepened in 2002 (see table III.3). Most economic sectors con-tracted in 2002: manufacturing output and exports plummeted, tourism activi-ty declined and agricultural production decreased. Only construction outputincreased, responding to lower mortgage interest rates and the rising uncer-tainty in financial markets which encouraged investments in the real estatemarket. Imports also declined, and real wages slumped, leading to a sharpreduction in private consumption. Private investment deteriorated, but publicconsumption rose mainly owing to defence spending.
99T H E C U R R E N T S I T U A T I O N I N T H E W O R L D ’ S E C O N O M I E S
14 Iraqi GDP in 2002 was about 85 per cent of its 1990level and the share of the economy in the region fellfrom 19 per cent in 1990 to 12 per cent in 2002.
W O R L D E C O N O M I C A N D S O C I A L S U R V E Y 2 0 0 3100
Conversely, the Turkish economy recovered strongly in 2002. The robustgrowth was mainly due to a sharp rise in stock-building following substantialdepletion in 2001. Public consumption and investment expanded moderately.External demand also contributed to the 2002 economic recovery. Meanwhile, pri-vate consumption, accounting for nearly two thirds of GDP, remained weak,reflecting deteriorating consumer sentiment, high unemployment and reducedcredit. On the supply front, the recovery was broad-based across sectors.Agricultural output expanded in 2002. Despite weak domestic demand, industrialproduction rebounded, mostly driven by export-led manufacturing industries.
The employment situation continued to deteriorate in the region.Unemployment increased in both Turkey and Israel (see table III.3), while youthunemployment remains a serious problem in most fuel-exporting countries.
All oil-exporting countries framed their 2002 budgets under conservativeassumptions with regard to both oil production and prices. With limited alter-natives to increasing non-oil revenue, most countries opted for the continuationof fiscal consolidation in 2002. As in the past, reducing current spending(mostly wages and salaries, but also subsidies) remains politically sensitive.Capital expenditures on development projects were reduced. Fiscal deficitswere projected to rise in most countries but, with higher oil prices during theyear, fiscal deficits were much smaller than anticipated. In the outlook, mostoil-exporting countries will adopt a more relaxed fiscal stance thanks to high-er oil revenues and also owing to the need to lift their economies out of stag-nation and, in some cases, recession.
Fiscal imbalances deteriorated in the larger oil-importing countries in 2002. InIsrael, the fiscal deficit target was changed from 1.8 per cent of GDP to 3.9 percent of GDP in 2002. The new budget target, however, was not attained, as taxreceipts plummeted owing to continued economic recession and increased gov-ernment spending. The 2003 budget calls for a drastic reduction in governmentexpenditure and a rise in tax revenue of about 3.6 per cent in real terms.However, the first four months of the year have indicated that tax revenue con-tinues to fall and defence-related spending to increase. With economic growthexpected to remain weak this year, a sharper deviation from fiscal targeting islikely.
Turkey’s fiscal policy was expansionary in 2002. Government spendingrose, mainly owing to increased non-personnel outlays (mainly for the securi-ty forces), transfers payments to State enterprises, and social security.Moreover, debt-service payments soared, responding to rising interest rates,while fiscal revenues declined, reflecting weaker tax collection and tax rebates.As a result, the consolidated public sector primary surplus declined to about 4per cent of GDP in 2002, below the official target of about 6.5 per cent—theminimum requirement for debt sustainability. The consolidated fiscal deficithas been estimated at about 13 per cent of GDP in 2002, higher than the offi-cial target of about 9.6 per cent.
Although relatively high, inflation remained stable in the region (see tableA.10). Turkey made further advances in inflation control while Israel overshotits inflation target owing to the depreciation of its currency and higher oilprices. The Bank of Israel reversed its monetary easing in June 2002 by rais-ing the interest rates by 4.5 percentage points to 9.1 per cent. As a result, thecurrency stabilized and inflationary expectations were slightly reduced. In anumber of oil exporters, however, inflation—albeit still low—has been
increasing recently in response to increased costs of imported goods, mainlybecause of the depreciation of the United States dollar against major tradingcurrencies. Continued subsidies on basic goods and services will contain therise in consumer prices.
Monetary policy in most oil-exporting countries remained unchanged in 2002with the currency pegs against the United States dollar comfortably supported byabundant foreign reserves and assets. This implies that interest rates in thesecountries followed those in the United States and will continue to do so.Monetary authorities are expected to keep a positive interest rate differential vis-à-vis United States interest rates to avoid pressures on their domestic currencies.
Latin America and the Caribbean: slowly emerging from recession
The economy of Latin America and the Caribbean is in a serious predicament,with GDP having grown at very modest rates since 2000 (see table A.4). GDPcontracted by 0.7 per cent in 2002, marking the worst overall performance inmore than a decade and a new decline in the region’s income per capita. Twentyyears after the emergence of the debt crisis, over 10 years after the “lostdecade”, and after several years of reform effort, Latin American found itselfonce again immersed in external payments difficulties, with renewed debtcrises either taking place or being barely avoided. A moderate recovery isexpected for 2003, but it largely reflects Argentina’s improved performanceafter a prolonged and painful recession. Other countries in the region will con-tinue to exhibit modest growth but should benefit from the anticipated recov-ery of industrial activity during the second half of the year in the major devel-oped countries—notably the United States—and more stable financial and cur-rency markets. GDP growth is expected to reach 2 per cent in 2003, furtherstrengthening to 3¾ per cent in 2004.15
Economic conditions in 2002 in Latin America were marked by a lacklustreexternal environment, which affected countries to varying degrees. Comparedwith such cases as Argentina and Venezuela, greater flexibility and consisten-cy of the macroeconomic policy framework proved a key factor in absorbingexternal shocks in such countries as Brazil, Chile and Mexico, despite theirdiverse external vulnerabilities. Several trends were notable in 2002: muchweaker external demand than expected; a significant contraction of capitalinflows and tightening of financing conditions which were reflected in volatileand widening sovereign debt spreads and depreciating currencies; and lowworld prices for the region’s major commodity exports. A sharp adjustmenttook place in the region’s current-account deficit, which was slashed by 70 percent to $14.5 billion. Efforts at stabilizing the current-account will likely per-sist in 2003. In Brazil, for instance, the current-account deficit fell to 1.7 percent of GDP in 2002 from 4.6 per cent the year before and is expected to reach1.1 per cent of GDP in 2003.
Notwithstanding the above, signs of a mild recovery of the economic activ-ity became apparent in 2002. A turnaround in industrial production was evidentas early as the second quarter of 2002 in Argentina and Brazil, a pattern ofrecovery that held up throughout 2002, with particular strength in the case ofArgentina (see figure III.5). This evolution reflected the substantial adjustmentof real exchange rates that has taken place in both countries and the resultingimport-substitution processes, along with strong export growth in the case of
101T H E C U R R E N T S I T U A T I O N I N T H E W O R L D ’ S E C O N O M I E S
15 Excluding Argentina, Latin America’s GDP growthreached 1.2 per cent in 2001 and 1 per cent in 2002and is forecast at 1.5 per cent in 2003.
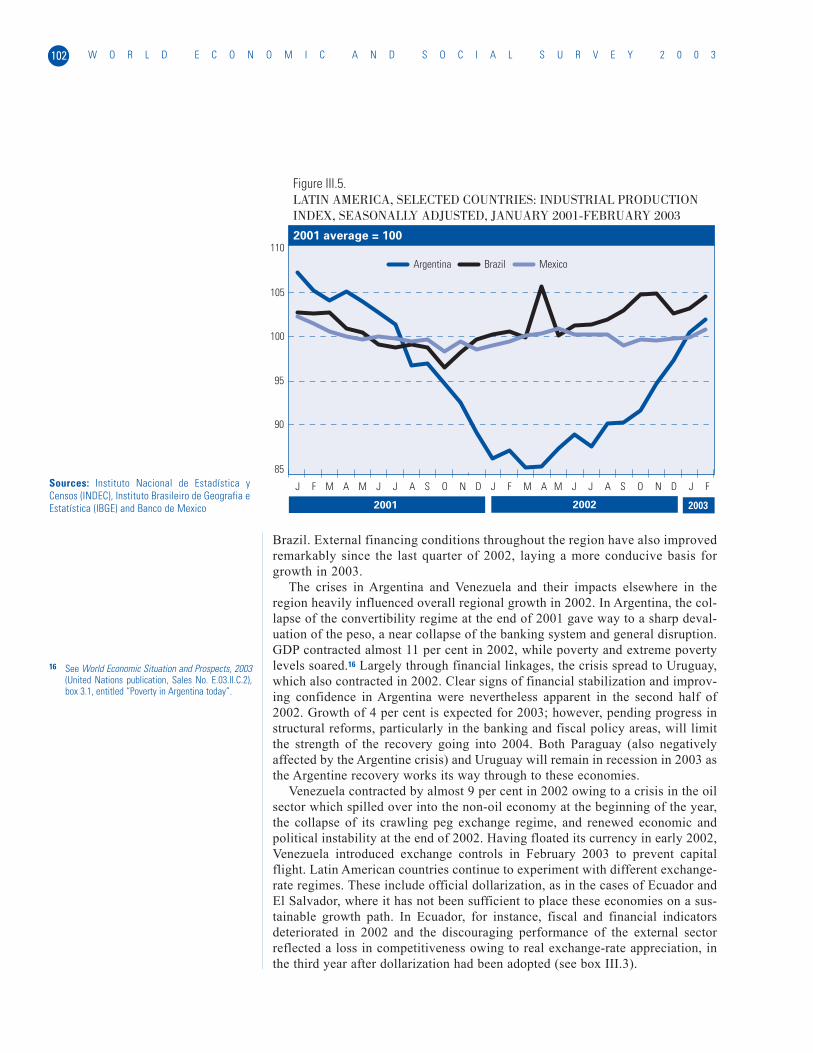
Brazil. External financing conditions throughout the region have also improvedremarkably since the last quarter of 2002, laying a more conducive basis forgrowth in 2003.
The crises in Argentina and Venezuela and their impacts elsewhere in theregion heavily influenced overall regional growth in 2002. In Argentina, the col-lapse of the convertibility regime at the end of 2001 gave way to a sharp deval-uation of the peso, a near collapse of the banking system and general disruption.GDP contracted almost 11 per cent in 2002, while poverty and extreme povertylevels soared.16 Largely through financial linkages, the crisis spread to Uruguay,which also contracted in 2002. Clear signs of financial stabilization and improv-ing confidence in Argentina were nevertheless apparent in the second half of2002. Growth of 4 per cent is expected for 2003; however, pending progress instructural reforms, particularly in the banking and fiscal policy areas, will limitthe strength of the recovery going into 2004. Both Paraguay (also negativelyaffected by the Argentine crisis) and Uruguay will remain in recession in 2003 asthe Argentine recovery works its way through to these economies.
Venezuela contracted by almost 9 per cent in 2002 owing to a crisis in the oilsector which spilled over into the non-oil economy at the beginning of the year,the collapse of its crawling peg exchange regime, and renewed economic andpolitical instability at the end of 2002. Having floated its currency in early 2002,Venezuela introduced exchange controls in February 2003 to prevent capitalflight. Latin American countries continue to experiment with different exchange-rate regimes. These include official dollarization, as in the cases of Ecuador andEl Salvador, where it has not been sufficient to place these economies on a sus-tainable growth path. In Ecuador, for instance, fiscal and financial indicatorsdeteriorated in 2002 and the discouraging performance of the external sectorreflected a loss in competitiveness owing to real exchange-rate appreciation, inthe third year after dollarization had been adopted (see box III.3).
W O R L D E C O N O M I C A N D S O C I A L S U R V E Y 2 0 0 3102
Sources: Instituto Nacional de Estadística yCensos (INDEC), Instituto Brasileiro de Geografia eEstatística (IBGE) and Banco de Mexico
Figure III.5.LATIN AMERICA, SELECTED COUNTRIES: INDUSTRIAL PRODUCTION INDEX, SEASONALLY ADJUSTED, JANUARY 2001-FEBRUARY 2003
2001 average = 100
2001 2003
85
90
95
100
105
110
J F M A M J J A S O N D J F M A M J J A S O N D J F
2002
Argentina Brazil Mexico
16 See World Economic Situation and Prospects, 2003(United Nations publication, Sales No. E.03.II.C.2),box 3.1, entitled “Poverty in Argentina today”.

103T H E C U R R E N T S I T U A T I O N I N T H E W O R L D ’ S E C O N O M I E S
Both Ecuador and El Salvador have formally "dollarized" their economies.The two economies had presented different "initial conditions" and perceiveddollarization as a means to accomplish different objectives. El Salvadoradopted it as a growth-inducing mechanism, whereas Ecuador perceived it asa stabilization tool.
Ecuador experienced a severe crisis in the late 1990s with widening macro-economic imbalances (see table), increasing unemployment, the collapse ofthe exchange rate, a partial default on its external debt, a freeze on domesticbank deposits, and widespread bank failures.a In order to arrest the downturnspiral, official dollarization was announced in January 2000 and, after a briefperiod of intense political instability, the corresponding legislation wasapproved by the Congress in March 2000.
El Salvador, on the other hand, adopted dollarization under less dramaticcircumstances. The exchange rate had functioned as the anchor of the coun-try's stabilization programme and had been fixed to the dollar since 1994.While inflation declined (a freeze in official minimum wages since 1998 hav-ing contributed to this decline), real interest rates remained high and eco-nomic growth stalled after the initial spur brought about by the end of thecivil war. The Government perceived dollarization as a means to reduce inter-est rates and to facilitate El Salvador's integration into the global economy byreducing transaction costs and eliminating the currency risk. Dollarizationbecame official in November 2000.
Dollarization in Ecuador helped restore confidence and stopped the eco-nomic deterioration, at least initially. The banking system retained depositsonce the freeze ended. The fact that interest rates fell drastically, evenbecoming negative in real terms, helped borrowers to honour their debt oblig-ations, thus improving banks' portfolios. Nonetheless, banks remained fragileas the restructuring of larger loans suffered delays, and the country's largestbank failed in 2001. Credit has remained constrained. Interest rates alsodeclined in El Salvador, in part owing to the elimination of currency risk andin part owing to the lower interest rates in the United States. However, cred-it has not increased in support of additional private investment and consump-tion as expected. Growth has thus remained subdued and largely sustained byreconstruction efforts after a severe earthquake in early 2001. Dollarizationappears to have addressed one symptom (high interest rates), but has notdealt with the problems themselves (depressed domestic conditions, underde-veloped financial markets, a fragile portfolio etc.).
Unemployment stabilized and started to decline in Ecuador (see table),owing not only to the recovery of the economy but also to the increased migra-tion of the labour force, particularly to the United States. At $1.4 billion in2001, annual labour remittances are a major source of dollar earnings andattest to labour mobility—although largely informal and illegal—betweenEcuador and the United States. This is also the case for El Salvador, which hadthe equivalent of 28 per cent of its population living in the United States in2001.b
Inflation accelerated in Ecuador owing to the severe devaluation that hadbeen suffered by the sucre immediately before dollarization. Moreover, cer-tain key administered prices required adjustments. This implied some correc-tion in wages as well. Annual inflation declined to 9.2 per cent in March 2003,
Box III.3
ECUADOR AND EL SALVADOR: ATALE OF TWO DOLLARIZATIONS
a On events leading to dollarization, see PaulBeckerman and Andrés Solimano, eds., Crisis andDollarization in Ecuador: Stability, Growth, andSocial Equity (Washington, D.C., World Bank,2002); and Alfredo Calcagno and others,"Dollarization in Ecuador: a parallel with theArgentine 'convertibility' system" (paper present-ed at the Seminar on Monetary and FinancialIntegration, Kalamazoo College, Kalamazoo,Michigan, May 2001). For a discussion on thecosts and benefits of dollarization vis-à-vis hardpeg regimes, see World Economic and SocialSurvey, 2000 (United Nations publication, SalesNo. E.00.II.C.1), box III.4, entitled "Rethinkingexchange-rate regimes in Latin America". See alsofootnote f.
b El Salvador's population was estimated at 6.3 mil-lion in 2001 and about 1.8 million Salvadoranslived in the United States in early 2001 (see TheNew York Times, 3 March 2001, p. A7; and BancoCentral de Reserva de El Salvador, "Indicadoreseconomicos anuales" (http://www.bcr.gob.sv/boletin.htm)).
W O R L D E C O N O M I C A N D S O C I A L S U R V E Y 2 0 0 3104
still above world levels. The inflation differential implied an appreciation ofthe real effective exchange rate (see table A.12), which, in absence ofrequired reforms, compromised the competitiveness of the economy, particu-larly in non-traditional sectors, and constrained diversification efforts. In ElSalvador, annual inflation remained relatively low (see table) but since dol-larization did not correct for the appreciation of the currency that had takenplace under the fixed exchange-rate regime, there was some loss in competi-tiveness.c While Ecuador has lost the initial competitive advantage given bythe sharp depreciation of its currency, El Salvador adopted dollarization at anappreciated exchange rate. As a result, both economies will need to bringinflation below world levels in order to regain competitiveness. This couldrequire a fall in domestic prices, including wages or, in the absence of priceflexibility, more rapid productivity growth than in the economies of tradingpartners.
Both economies continue to have external imbalances. In Ecuador, a tradedeficit re-emerged in 2001 and 2002 as exports decelerated, whereas importssurged, in part owing to the recovery in private consumption and the strongappreciation of the currency. Imports of consumer goods increased, in dollarterms, by 73 per cent in 2001 and by 28 per cent in 2002. Imports also grewbecause of the capital goods required for a new oil pipeline. While thepipeline will double Ecuador's oil export capacity, it will also increase thecountry's dependency on oil and keep it vulnerable to the instability of oilmarkets. The latter may imply increased volatility of GDP growth and compli-cate the management of an economy with a reduced set of policy instrumentsand binding constraints.d
In El Salvador, terms-of-trade shocks and depressed external demand con-tributed to the persistence of large trade deficits. Traditional exports (such ascoffee) have been affected by global excess capacity and lower prices whilethe in-bond industry—the country's major net exporter—is largely dependenton the United States economic cycle. It is also dependent on maintaining itsinternational competitiveness, both to attract new investors to the processingzones and to retain those that are already operating in the country, particu-larly in view of the growing competition from lower-cost producers elsewhere.It is not clear how the new currency regime can contribute to increasing FDIor boosting exports.
External support helped Ecuador's stabilization. The country secured loansfrom the international financial institutions and was able to reduce its exter-nal debt through a restructuring with private creditors, which resulted in alower debt burden. Oil prices recovered in 2000 and, together with expendi-ture compression and enhanced tax collection, contributed to the improvementof the fiscal position, despite the loss of seigniorage.e Later on, fiscal disci-pline eroded as public sector wages rose. Spreads on external debt soaredowing to increased default risk and uncertainties due to the forthcoming pres-idential election. By the end of 2002, Ecuador was again facing the possibili-ty of incurring payments arrears. The new Administration negotiated a stand-by agreement with IMF—the country's second since dollarization started. It
Box III.3 (continued)
c See ECLAC, Estudio Económico de América Latinay el Caribe, 2000-2001 (United Nations publica-tion, Sales No. S.01.II.G.2), p. 184.
d Owing to the need to isolate public revenues fromthe vagaries of oil markets so that fiscal policycould be used counter-cyclically, an oil stabiliza-tion fund was created, where tax revenues gener-ated by the new oil pipeline will be deposited.Nonetheless, the fact that Ecuador has pledged tofully compensate any shortfall in programmed oilrevenues with expenditure cuts indicates thatthere will be some transition problems until thefund is fully operational. Moreover, only 20 percent of such revenues can be used for contingen-cies. With most of the eventual oil windfallalready earmarked to retire external debt, the sta-bilization fund's revenue smoothing function isseverely curtailed.
e Seigniorage is the net revenue accruing to theGovernment from issuing currency. In the case ofEcuador, annual average revenue from seignioragehas been estimated at 1.5 per cent of GDP duringthe period 1990-1998 (Ecuador: Selected Issuesand Statistical Annex, IMF Staff Country Report,No. 00/125 (Washington, D.C., IMF, October2000)). It is a significant source of revenue for acountry constantly struggling to maintain fiscalsustainability.
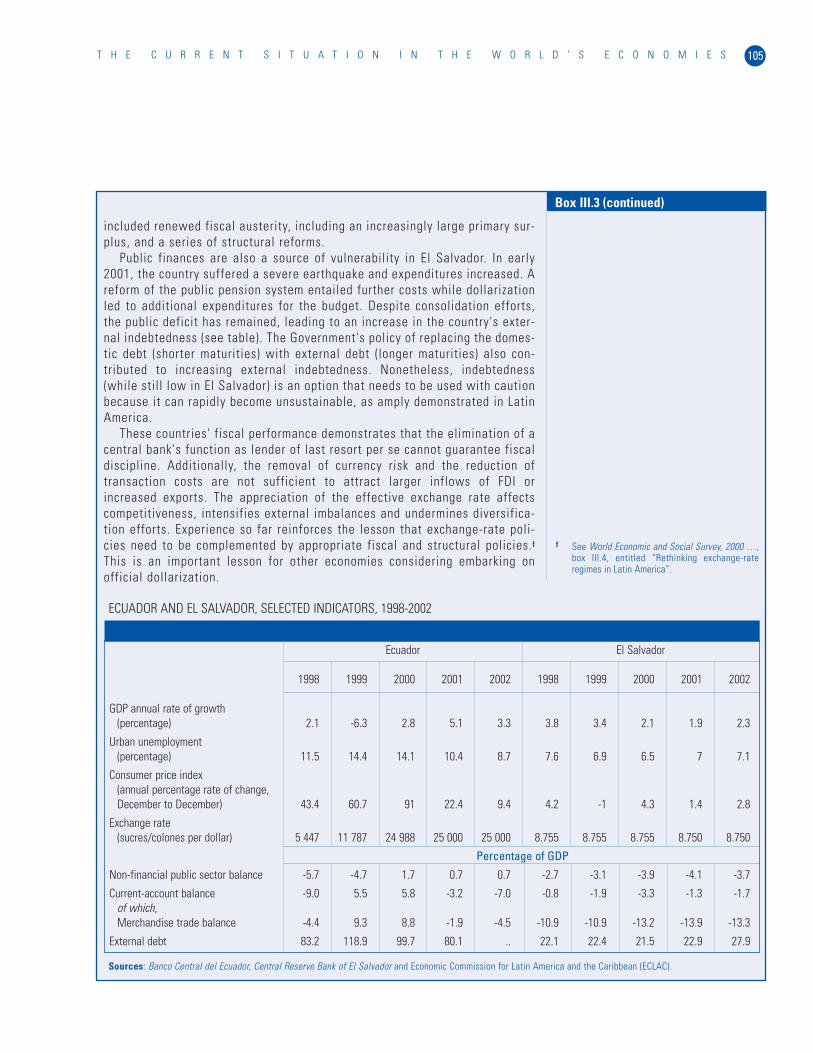
105T H E C U R R E N T S I T U A T I O N I N T H E W O R L D ’ S E C O N O M I E S
included renewed fiscal austerity, including an increasingly large primary sur-plus, and a series of structural reforms.
Public finances are also a source of vulnerability in El Salvador. In early2001, the country suffered a severe earthquake and expenditures increased. Areform of the public pension system entailed further costs while dollarizationled to additional expenditures for the budget. Despite consolidation efforts,the public deficit has remained, leading to an increase in the country's exter-nal indebtedness (see table). The Government's policy of replacing the domes-tic debt (shorter maturities) with external debt (longer maturities) also con-tributed to increasing external indebtedness. Nonetheless, indebtedness(while still low in El Salvador) is an option that needs to be used with cautionbecause it can rapidly become unsustainable, as amply demonstrated in LatinAmerica.
These countries' fiscal performance demonstrates that the elimination of acentral bank's function as lender of last resort per se cannot guarantee fiscaldiscipline. Additionally, the removal of currency risk and the reduction oftransaction costs are not sufficient to attract larger inflows of FDI orincreased exports. The appreciation of the effective exchange rate affectscompetitiveness, intensifies external imbalances and undermines diversifica-tion efforts. Experience so far reinforces the lesson that exchange-rate poli-cies need to be complemented by appropriate fiscal and structural policies. f
This is an important lesson for other economies considering embarking onofficial dollarization.
Box III.3 (continued)
Ecuador El Salvador
1998 1999 2000 2001 2002 1998 1999 2000 2001 2002
GDP annual rate of growth(percentage) 2.1 -6.3 2.8 5.1 3.3 3.8 3.4 2.1 1.9 2.3
Urban unemployment(percentage) 11.5 14.4 14.1 10.4 8.7 7.6 6.9 6.5 7 7.1
Consumer price index(annual percentage rate of change, December to December) 43.4 60.7 91 22.4 9.4 4.2 -1 4.3 1.4 2.8
Exchange rate(sucres/colones per dollar) 5 447 11 787 24 988 25 000 25 000 8.755 8.755 8.755 8.750 8.750
Percentage of GDP
Non-financial public sector balance -5.7 -4.7 1.7 0.7 0.7 -2.7 -3.1 -3.9 -4.1 -3.7
Current-account balance -9.0 5.5 5.8 -3.2 -7.0 -0.8 -1.9 -3.3 -1.3 -1.7of which, Merchandise trade balance -4.4 9.3 8.8 -1.9 -4.5 -10.9 -10.9 -13.2 -13.9 -13.3
External debt 83.2 118.9 99.7 80.1 .. 22.1 22.4 21.5 22.9 27.9
ECUADOR AND EL SALVADOR, SELECTED INDICATORS, 1998-2002
Sources: Banco Central del Ecuador, Central Reserve Bank of El Salvador and Economic Commission for Latin America and the Caribbean (ECLAC).
f See World Economic and Social Survey, 2000 …,box III.4, entitled “Rethinking exchange-rateregimes in Latin America”.
Colombia, a large supplier of manufactures to Venezuela, felt the impact ofits dwindling activity, as well as the disruption of external payments, all ofwhich added to the volatility on its external front. Growth remained weak inBolivia as well, making Peru the only Andean country that had an acceptablegrowth performance in 2002 (see table A.4).
In Brazil, concerns over macroeconomic management by the Governmentthat took office in October 2002 resulted in volatility in the value of the cur-rency, mirroring the increases in spreads over sovereign bonds.17 The newGovernment provided early assurances on its commitment to achieving soundmacroeconomic management, not least by tightening its monetary and fiscalstances. Sluggish internal demand constrained growth in 2002 in spite of thedynamic external sector. The stabilization of the currency and other financialindicators since the last quarter of 2002, along with signs of moderating infla-tion, point to a possible monetary easing during the second half of 2003 whichwould lay the basis for gradually improving economic conditions.
Mexico, Central America and the Caribbean, which are heavily dependenton import demand from the United States, especially for manufacturingexports, were particularly affected by sluggish external demand in 2002.Mexico’s performance reflected both the weakness of the external sector andits negative impact on private investment. However, this was offset by a mildrecovery in domestic consumption from the contraction registered in 2001.Meanwhile, the Caribbean island States suffered from limited tourist inflows.
Economic conditions in 2002 and in early 2003 have been reflected in pooradvances in job creation throughout the region. In Argentina, the unemploy-ment rate remains high, at about 18 per cent according to the latest official fig-ures. High unemployment and underemployment continue to represent a dragon the recovery of domestic demand in many countries in the region, a case inpoint being Colombia. In Mexico, employment losses in the manufacturingexport sector, linked to stagnant external demand during 2001 and 2002, are yetto be reversed. On the other hand, significant advances in job creation havebeen apparent in Chile since the last quarter of 2002, a development that isexpected to provide greater momentum for growth in 2003.
Inflation rates deteriorated in a number of countries (see table A.10), par-ticularly during the second half of 2002 and the beginning of 2003, over-shooting targets in such countries as Brazil, Colombia and Mexico. Spikes ininflation rates have been largely a supply-side phenomenon, reflecting inmany cases a pass-through effect from depreciated currencies into the pricesof tradable goods, particularly food, as well as upward revisions of energyprices due to higher oil prices. A case in point is Argentina, where a sharprealignment of the relative prices of tradable goods took place in 2002 fol-lowing the devaluation. In Ecuador, inflation was still above 9 per cent at theend of 2002, reflecting continued price inertia from the 1999 crisis that hadpreceded dollarization, as well as strong public sector wage increases in 2002(see box III.3). Hikes in Government-controlled prices have also contributedto higher inflation in Brazil and Mexico. Inflation is expected to graduallymoderate in 2003, as currency markets stabilize. Disinflation will be key topreserving the real exchange-rate adjustment that took place in 2002 in coun-tries like Brazil and Argentina.
Fiscal policies in Latin America in 2002 and early 2003 were framed byweak tax revenue growth and tightening financing conditions. Constrained by
W O R L D E C O N O M I C A N D S O C I A L S U R V E Y 2 0 0 3106
17 Between December 2001 and October 2002, the reallost 38 per cent of its value against the UnitedStates dollar, while the spread on sovereign bondsjumped from 843 basis points (bps) in January 2002to 2,039 bps in October 2002.
large public debts and a difficult external environment, Governments general-ly maintained restrictive fiscal stances, even in a context of sluggish activity,with the exception of Chile. In Brazil, the primary surplus reached 3.9 per centof GDP in 2002 and, at the beginning of 2003, the Government announced anincreased target of 4.25 per cent for the year as a whole, whereas Argentina waswell on course to meet primary surplus targets at the beginning of 2003.Compromised fiscal situations met the new Governments of Colombia andEcuador, and extraordinary measures were implemented in both cases.Throughout the region, fiscal reforms remain high in the policy agenda, andmany countries are currently implementing IMF-monitored economic pro-grammes. Demonstrations against fiscal austerity measures in Bolivia inFebruary 2003 resulted in several deaths and were a clear reminder of the chal-lenges confronting fiscal reform and consolidation in times of crisis.
Rising inflationary expectations have prompted policy makers to tightenmonetary stances in the region’s two largest economies, Brazil and Mexico,since the third quarter of 2002: the SELIC rate rose by 850 bps in Brazilbetween September 2002 and May 2003.18 Conversely, monetary conditionsremained relatively lax and interest rates low in such countries as Chile, Peruand Colombia. In Colombia, however, the Central Bank moved in the firstquarter of 2003 to prevent the peso’s depreciation from feeding into inflation-ary expectations. Countries that maintained a relatively relaxed policy stance,however, have not witnessed a significant growth of bank credit, largely as aresult of both lacklustre demand and cautious bank lending policies.
107T H E C U R R E N T S I T U A T I O N I N T H E W O R L D ’ S E C O N O M I E S
18 SELIC is the acronym for Sistema Especial deLiquidação e Custódia (Special System forSettlement and Custody).

ECONOMICPOLICY ANDPOVERTY
PART TWO


The United Nations Millennium Declaration,1 adopted by all 189 StatesMembers of the United Nations on 8 September 2000, presents a set ofcommitments aimed at improving the well-being of humanity in thetwenty-first century. The development goals set out in the MillenniumDeclaration focus on poverty eradication through broad-based sustainabledevelopment. The Millennium Development Goals include the objective ofhalving, between 1990 and 2015, the proportion of the world’s populationthat lives on one dollar per day or less (a measure of extreme poverty) andthe proportion that suffers from hunger.
Poverty is intrinsically a difficult problem to analyse because it touches onmany aspects of the human condition, ranging from the economic and social tothe environmental, political and cultural. Reflecting its multifaceted aspects,poverty is variously defined and manifested in terms of income, consumption,deprivation of access to health and educational resources, vulnerability, voice-lessness and powerlessness.2 Even those who live in poverty have no easy wayto describe the deprivation and hardship they experience. However, their voice-lessness is being addressed. Part of the World Bank’s efforts to understand andreduce poverty has involved gathering and publishing the views, experiencesand aspirations of the poor.3
Understanding the causes of poverty, the interactions among those causesand the consequences of poverty for human lives is essential for formulatingand implementing policies to achieve the poverty reduction goals establishedin the Millennium Declaration. Measuring the extent of poverty at the nationaland global levels in turn enables Governments and the international communi-ty to assess the impacts of policy actions. It is within this context that theMillennium Development Goals were formulated to include various povertyindicators to monitor progress towards the targets and to evaluate national andinternational actions.
The goal of reducing poverty by half by the year 2015 has prompted policymakers to increase the attention given to policies and measures that are target-ed directly at achieving this goal. At the same time, it is necessary to alsoexamine earlier policies aimed at achieving this same goal, possibly throughdifferent channels, as well as policies and measures with other, possibly relat-ed, goals, that are expected to have a bearing on poverty, even if they are notspecifically directed at poverty reduction per se. Part two of the present Surveyexamines a number of areas in which policies are expected to have a beneficialeffect on poverty over the medium or longer term, even if poverty reduction isnot those policies’ primary short-term goal.
OVERVIEW
111O V E R V I E W
1 See General Assembly resolution 55/2 of 8September 2000. See also the report of theSecretary General entitled “Implementationof the United Nations MillenniumDeclaration” (A/57/270 and Corr.1), particu-larly the annex, entitled “Millennium devel-opment goals”.
2 Report on the World Social Situation, 2003(United Nations publication, forthcoming)discusses the aspects of social vulnerability,voicelessness and powerlessness and exam-ines several policies aimed at removing eco-nomic, social and cultural barriers that con-tribute to the vulnerability of the poor.
3 Part of the work undertaken for the WorldBank World Development Report,2000/2001: Attacking Poverty (New York,Oxford University Press, 2001) consisted insystematically seeking the views of morethan 60,000 men and women living in pover-ty in 60 countries. These were published inthree volumes: Voices of the Poor: CanAnyone Hear Us? (New York, OxfordUniversity Press, 2000), Voices of the Poor:Crying Out for Change (New York, OxfordUniversity Press, 2000) and Voices of thePoor: From Many Lands (New York, OxfordUniversity Press, 2002).
In particular, Part two of this Survey examines the impact of economic poli-cy in a number of areas on the material dimensions of poverty, such as income,consumption, employment and productivity, in the developing countries andeconomies in transition. The policies examined are monetary and fiscal policies(chap. V), trade policies (chap. VI), agricultural reforms (chap. VII) and thepolicies arising in the move from a planned to a market economy (chap. VIII).These policies are not specifically designed to combat poverty; their aim israther to enhance the overall productivity of the economy and thus to reducepoverty in the long term. For example, macroeconomic and trade policies areconsidered to have a beneficial impact on poverty largely through economicgrowth: appropriate policies in these areas are expected to stimulate economicgrowth and growth, in turn, is expected to reduce poverty.4 Agricultural reformsaffect the incidence of poverty through increased efficiencies in agriculturalproduction and distribution and more equitable patterns of rural development.Through various channels, these different policies affect the incidence of pover-ty, not just in the long term but also in the short and medium terms.
The primary importance given to poverty reduction by the internationalcommunity is reflected in the fact that all World Bank and InternationalMonetary Fund (IMF) lending to low-income countries requires the preparationof national Poverty Reduction Strategy Papers (PRSPs). These Papers not onlyfocus on the consequences of macroeconomic policies for poverty reduction,but also include poverty-targeted microeconomic policies aimed at bringingemployment and education to the poor in order to help them escape longer-termpoverty, and such measures as income subsidies and food aid to help themovercome their present difficulties. This reflects the consideration that helpshould be provided to those who are poor but likely to find employment in thenear future, as well as additional help to those who will remain poor without animprovement in their chances of obtaining employment. This distinctionbetween transitory and chronic poverty is crucial, but is often disguised by theoverall headcount figures for the poor, which do not distinguish between thosewho remained poor for longer than, say, a year, and those who had been poorat the time of the headcount but escaped poverty soon thereafter. This is of rel-evance to both the developing countries and the economies in transition. In thelatter, Governments have combined macrolevel policies designed to ensurelong-term employment-generating growth—and therefore the emergence frompoverty of those who were plunged into it by the loss of employment during thetransitional recession—with policies targeted at tackling chronic poverty (seechap. VIII).
There remains the question what is the impact on poverty of the economicpolicies available to Governments and the whole movement to liberalize eco-nomic activity. An examination of these different economic policies showsthat, while they are effective instruments in reducing the incidence of povertyin the long term, they need to be complemented by micropolicies so as toachieve the greatest impact in reducing poverty in the short-to-medium term. Asecond consideration is that economic policies affect different groups of a soci-ety to varying degrees and, at least in the short and medium terms, some groupsmay be harmed if appropriate action is not taken. In particular, although tradeliberalization nurtures the development of activities in which a country has acomparative advantage, it could lead to the longer-term decline—and even to
W O R L D E C O N O M I C A N D S O C I A L S U R V E Y 2 0 0 3112
4 For a criticism of the assumed connectionamong good policies, growth and povertyreduction, see the Special Contribution(Poverty, globalization and growth: perspec-tives on some of the statistical links) byJoseph E. Stiglitz in United Nations Deve-lopment Programme, Human DevelopmentReport, 2003 (New York, Oxford UniversityPress, 2003), p. 80.
the disappearance—of other activities without such an advantage. Similarly,while market-based agricultural reforms encourage the more efficient use ofavailable resources in the public and private domains, a State-sponsoredfinancing scheme would need to be put in place to ensure that the poorest ofthe poor who have no access to credit do not lose but actually benefit. Animmediate implication of these two considerations is that several complemen-tary policies must be pursued, simultaneously or sequentially.
It is difficult, however, to demonstrate the linkages among these policies andtheir combined impact on poverty. Part two aims to address these questions.One of the lessons that emerges is that increased discussion is required at thedomestic and international levels on prioritizing policies, on the trade-offsamong complementary policies, and on the correct sequencing. For example,the experience of some countries with economies in transition during the 1990sshows that economic policies need to be implemented with an awareness of thelikely effects on poverty, that is to say, there needs to be a combination of com-plementary policies that provide a buffer against their possible adverse impactsand that target those most likely to fall into chronic poverty.
To clarify the links among economic policies and poverty and with a viewto setting the framework for evaluating the policies examined in Part two,chapter IV argues that the impact of policies on poverty should be assessedfrom different aspects. Assessing the impacts of a policy on the evolution ofpoverty critically depends on (a) which aspect(s) of poverty—includingincome and/or non-income dimensions—the policy maker chooses to focus on;(b) the level of aggregation used—for example, national or subnational, urbanor rural, tradable or non-tradable sectors, female or male; and (c) the time-hori-zon—short- or long-run—over which the impact of the policy is to be assessed.
Chapter IV examines growth-poverty relationships and demonstrates, basedon cross-country evidence and case studies, the importance of using all threeaspects in establishing a framework for evaluating policy. Economic growthand the reduction of income poverty usually go hand in hand, but increases inaverage income levels are not necessarily associated with improvements inhealth status and educational attainment, which constitute an important dimen-sion of chronic poverty. When only the income dimension of poverty is con-sidered, economic growth is generally found to be beneficial for the poor. Thisfinding, however, is based upon an average of many countries’ experiences;and the same degree of improvement in economic growth may affect the inci-dence of poverty in different countries differently, depending on the initial eco-nomic and social conditions and the sources of growth (for example, export-driven growth as opposed to increases in agricultural production for domesticconsumption). Economic growth may thus affect some groups of peopleadversely, particularly in relative terms. Moreover, because even long-termgrowth is rarely steady but often consists of short-run fluctuations, during aneconomic downturn, poor people—who have few assets to smooth out con-sumption over such fluctuations—are more likely to be impoverished even fur-ther, compared with the non-poor.
Chapter V analyses the impacts of monetary and fiscal policies on poverty,in both the short and the long run. Special attention is given to these relation-ships during times of economic crisis, when the poor constitute the group thatis most adversely affected. The experiences of East Asia and Latin America
113O V E R V I E W
during the past 10 years are examined in order to elucidate some of the possi-ble effects, especially on poverty, of periods of stop-and-go in macroeconomicpolicy. The importance of maintaining macroeconomic stability during times ofgrowth, in order to have a greater degree of freedom to manoeuvre duringcrises and to be able to protect the poor, is emphasized. The focus is on theurban poor since they have been identified as more vulnerable in times of eco-nomic crises than the rural poor. The analysis concludes that macroeconomicpolicies alone are not sufficient to address the problems of the poor: comple-mentary measures are necessary.
The analysis emphasizes that preventing or reducing economic shocks isessential, particularly in the context of poverty, since the protection of the pooris rarely a priority in the macroeconomic responses to crises when they dooccur. Therefore, preventive measures should be put in place within a socialprotection scheme even before a crisis erupts, and curative measures must beundertaken when a crisis occurs, with the degree of intensiveness depending onneed. Access to health, education and nutrition is usually better in urban areasthan in rural areas, but since many of the poor are in the informal sector, suchprogrammes are more likely to reach the middle- and higher-income familiesin the formal sector. Thus, in addition to formal social programmes, otherforms of social assistance based on grass-roots involvement are necessary inorder to reach all of the poor, especially those in the informal sector.
Chapter VI demonstrates how trade liberalization is conducive to povertyreduction because of its long-run effects on growth and focuses on the effect ofshort- and medium-term adjustment on the incidence of poverty. The chapteranalyses various channels through which trade liberalization affects poverty.These include changes in prices and in the availability of goods and services,impacts on labour markets, changes in the incentives for investment and thetransfer of technology, effects on government tax revenues, and changes inincome distribution. Overall, trade liberalization is beneficial to the poor,although it should often be complemented by other policies. There is little evi-dence of a “race to the bottom” as countries lower standards to attract foreigninvestment. However, there do remain major impediments to the poorest coun-tries’ taking full advantage of trade’s income-generating potential, particularlythe protectionist and subsidizing policies of the developed countries.
Chapter VII addresses selected market-based policies intended to increaseagricultural productivity. It identifies the impact of such policies on theachievement of more equitable patterns of rural development, particularly insub-Saharan Africa. The chapter demonstrates that liberalization of staple foodmarkets is especially important for the rural poor, who often generate the bulkof their income from producing staple foods. Particular attention should thus bepaid to the role of food marketing reform in rural economic growth. The chap-ter also analyses how land redistribution policies can promote greater econom-ic efficiency and more equitable patterns in rural growth.
The chapter shows that market-based policies, although not primarily aimedat reducing rural poverty, can still have an indirect positive impact on povertyalleviation. Greater emphasis on market-based approaches, aimed at improvingthe efficiency and cost-effectiveness of agricultural production and marketing,has produced mixed results in terms of rural poverty alleviation. The majorchallenge for the future is thus to implement corrective measures to deal with
W O R L D E C O N O M I C A N D S O C I A L S U R V E Y 2 0 0 3114
problems that occur as reforms are being implemented while maintaining theimprovements in efficiency, reductions in marketing costs and fiscal savingsthat have resulted from market-based approaches to reform.
Chapter VIII deals with the effects on poverty of the economic dimensionsof a unique shock: the end of the centrally planned system first in EasternEurope and then over the Soviet Union, which broke up into independentStates. It was widely believed that, after the collapse, the market system wouldbe created within a short time and would lead to much higher standards of liv-ing than had been enjoyed before.
For the countries that will enter the European Union in 2004, this predictionhas proved broadly correct, although after a longer time than many had expect-ed. Poverty rose in the first years of transition, but has now fallen. However,especially among the members of the Commonwealth of Independent States,the collapse of central planning has given rise to a dramatic rise in poverty, towidening income inequalities and to chronic poverty. Various groups of thepopulation—the unemployed, ethnic minorities, single mothers, those living inpreviously closed military towns—were hit particularly badly by the transition.Moreover, no longer can mass poverty be viewed as a transitory phenomenon,as was the case in much of Eastern Europe—it must now be regarded as chron-ic. These States had to confront, at a time of diminished government resources,the challenge of constructing social safety nets that target the most needy. Thistask should be easier now that their economic revival is under way, but it stillrequires action on many fronts, as the form of chronic poverty from which theysuffer is not likely to be removed by economic revival alone.
The experience of the transition economies highlights dramatically the mainconclusion of Part two of the Survey, namely, that there is no inherent contra-diction between poverty reduction and the pursuit of optimum economic poli-cies, including those in the macroeconomic sphere, and liberalization in tradeand agriculture, for these policies should result in faster economic growthwhich will serve to reduce poverty. Growth will make possible the enactmentof those microlevel policies that can address the needs of the poor. However,the enactment of macroeconomic policies should also be infused with anawareness of the likely effects on poverty, and, where necessary, complemen-tary policies should be pursued to ensure that they result in even greater gainsin terms of poverty reduction.5
115O V E R V I E W
5 For a discussion on how to achieve an equi-ty-enhancing growth strategy and an analysisof the priorities of social policies in an inte-grated approach to growth, see the Report ofthe Executive Committee on Economic andSocial Affairs of the United Nations entitled“Social dimensions of macroeconomic poli-cy”, New York, 22 June 2001 (ECESA/4).

It deserves to be remarked, perhaps, that it is in the progres-sive state, while the society is advancing to the furtheracquisition, rather than when it has acquired its full com-plement of riches, that the condition of the labouring poor,of the great body of the people, seems to be the happiest andthe most comfortable. It is hard in the stationary, and miser-able in the declining state. The progressive state is in realitythe cheerful and the hearty state to all the different orders ofthe society. The stationary is dull: the declining melancholy.
Adam Smith, An Inquiry into the Nature and the Causes of the Wealth of Nations
Edwin Cannon, ed. (New YorkModern Library, 1937), p. 81.
Concerns for poverty have been expressed for many years at the nationaland international levels, even if its priority in the political agenda has notalways been high. The World Summit for Social Development, held inCopenhagen in 1995, produced new initiatives for the eradication of povertyand, subsequently, all countries in the United Nations endorsed, for the firsttime, in the United Nations Millennium Declaration (see General Assemblyresolution 55/2 of 8 September 2000) the commitment to halve the proportionof people living in extreme poverty by 2015. Combating poverty has become apriority in the agenda for the international community and every organizationof the United Nations system.
The number of people in the world whose income is less than one dollar perday, measured at purchasing power parity (PPP), was estimated in 1999 to beabout 1.2 billion, the most recent available figure (see figure IV.1).1 This num-ber constitutes about 23 per cent of the total population of developing and tran-sition economies, an improvement from 30 per cent in 1990. During the period1990-1999, only Eastern and Southern Asia had reduced the proportion of thepopulation living on one dollar or less per day. The rest of the developing worldincreased the proportions of that population, though the increments were mar-ginal in Latin America and the Caribbean and the Middle East and North Africa.The proportion of people living in extreme poverty in sub-Saharan Africaincreased from 47.4 per cent in 1990 to 49.0 per cent in 1999 and, owing to highpopulation growth, the number of people below the poverty line increased from241 million to 315 million during the same period. The proportion of people liv-ing in extreme poverty in the economies in transition also increased because of
IVGROWTH AND POVERTY:A FRAMEWORK FOREVALUATING POLICY
117G R O W T H A N D P O V E R T Y
1 Strictly speaking, this estimate is based on con-sumption/expenditure, not on income. Because itis now common to refer to this PPP per day figureas income, the present chapter follows the com-mon usage. For details of the estimation method,see Shaohua Chen and Martin Ravallion, How didthe World’s Poorest Fare in the 1990s?, WorldBank Policy Research Working Paper, No. 2409(Washington, D.C., World Bank, August 2000).
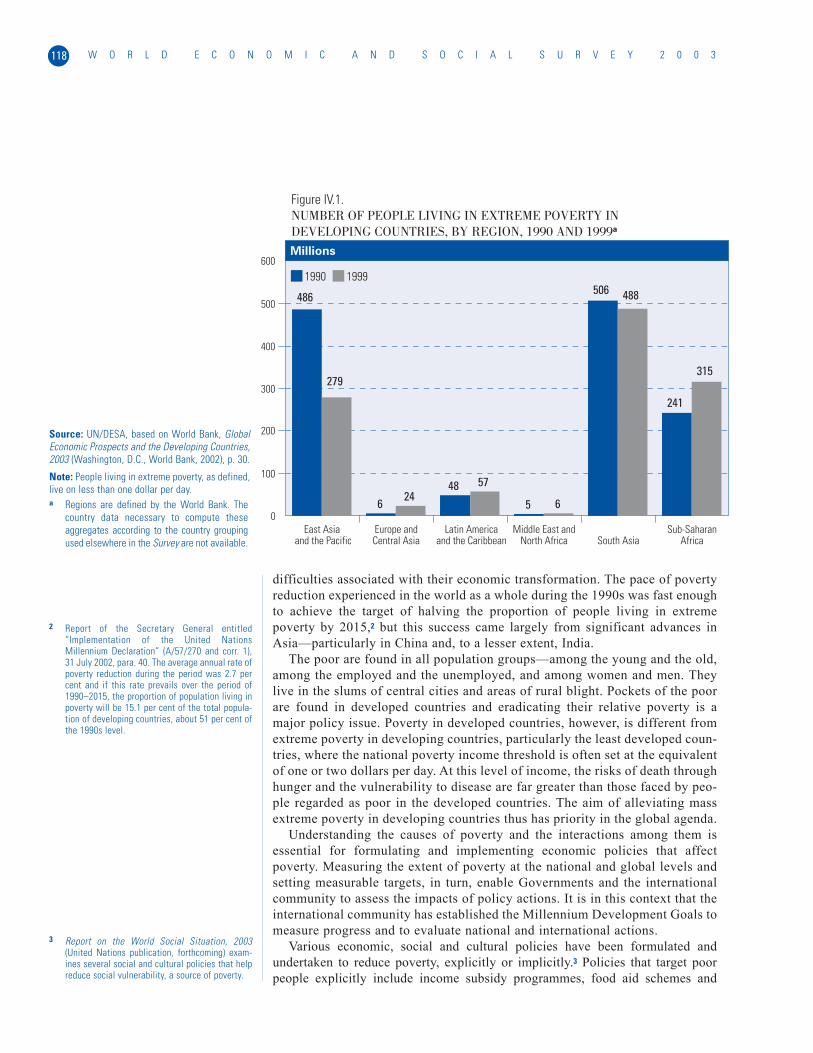
difficulties associated with their economic transformation. The pace of povertyreduction experienced in the world as a whole during the 1990s was fast enoughto achieve the target of halving the proportion of people living in extremepoverty by 2015,2 but this success came largely from significant advances inAsia—particularly in China and, to a lesser extent, India.
The poor are found in all population groups—among the young and the old,among the employed and the unemployed, and among women and men. Theylive in the slums of central cities and areas of rural blight. Pockets of the poorare found in developed countries and eradicating their relative poverty is amajor policy issue. Poverty in developed countries, however, is different fromextreme poverty in developing countries, particularly the least developed coun-tries, where the national poverty income threshold is often set at the equivalentof one or two dollars per day. At this level of income, the risks of death throughhunger and the vulnerability to disease are far greater than those faced by peo-ple regarded as poor in the developed countries. The aim of alleviating massextreme poverty in developing countries thus has priority in the global agenda.
Understanding the causes of poverty and the interactions among them isessential for formulating and implementing economic policies that affectpoverty. Measuring the extent of poverty at the national and global levels andsetting measurable targets, in turn, enable Governments and the internationalcommunity to assess the impacts of policy actions. It is in this context that theinternational community has established the Millennium Development Goals tomeasure progress and to evaluate national and international actions.
Various economic, social and cultural policies have been formulated andundertaken to reduce poverty, explicitly or implicitly.3 Policies that target poorpeople explicitly include income subsidy programmes, food aid schemes and
W O R L D E C O N O M I C A N D S O C I A L S U R V E Y 2 0 0 3118
Figure IV.1.NUMBER OF PEOPLE LIVING IN EXTREME POVERTY INDEVELOPING COUNTRIES, BY REGION, 1990 AND 1999a
Millions
486
648
5
506
241
279
2457
6
488
315
0
100
200
300
400
500
600
East Asia and the Pacific
Europe andCentral Asia
Latin Americaand the Caribbean
Middle East andNorth Africa South Asia
Sub-SaharanAfrica
1990 1999
Source: UN/DESA, based on World Bank, GlobalEconomic Prospects and the Developing Countries,2003 (Washington, D.C., World Bank, 2002), p. 30.
Note: People living in extreme poverty, as defined,live on less than one dollar per day.a Regions are defined by the World Bank. The
country data necessary to compute theseaggregates according to the country groupingused elsewhere in the Survey are not available.
2 Report of the Secretary General entitled“Implementation of the United NationsMillennium Declaration” (A/57/270 and corr. 1),31 July 2002, para. 40. The average annual rate ofpoverty reduction during the period was 2.7 percent and if this rate prevails over the period of1990–2015, the proportion of population living inpoverty will be 15.1 per cent of the total popula-tion of developing countries, about 51 per cent ofthe 1990s level.
3 Report on the World Social Situation, 2003(United Nations publication, forthcoming) exam-ines several social and cultural policies that helpreduce social vulnerability, a source of poverty.
actions to provide employment and education. Because of the directedness ofthese policies, measuring their impacts on the people targeted and their effective-ness in relation to their intended goals is straightforward, at least in theory.However, many other policies do not place poverty reduction as their direct goal,even though their implementation may help eliminate poverty as part of the effortto improve the well-being of all. Macroeconomic policies, including structuraladjustment programmes and trade policies, agricultural reforms, industrial poli-cies, and national development plans are examples of such policies. They aim atstrengthening or stabilizing activities within an economy, a sector or an industryin order to achieve sustained growth of the economy and, by doing so, improvingthe welfare of the population, including that of the poor. Their overall impacts onpoverty are significant, and may sometimes surpass those of the direct policiesbecause of the economy-wide effects that some of them have.
One distinction between the recent trends in policy-making and those formu-lated up until the mid-1980s (such as national development plans) lies in thecurrent recognition of the roles that markets can play in economic development.Policy makers now formulate economic policies that nurture the development ofmarkets and incorporate the working of existing markets in policy design. Forexample, instead of fixing the market interest rate at a predetermined level withlittle consideration of market conditions, more countries now adopt so-calledinflation-targeting to stabilize the economy, with the monetary authorities com-municating with the public through the money market so as to achieve the tar-get.4 Many countries have liberalized the external sector of their economies,instead of protecting certain industries with import tariffs and distorted foreignexchange rates. Prices of staple foods, water and electricity often used to bedirectly set by the Governments in many developing and transition economies,but these prices are now increasingly determined by market conditions,although in many cases some safeguard arrangements are still in place.
The linkages between each of these “market-friendly” policies and the inci-dence of poverty are complex because their effects on poverty are not direct:there are many channels through which each policy can affect poverty. In orderto clarify the nature of the web of indirect links between policy and povertyand to set a framework for evaluating the policies examined in the followingchapters of the present Survey, the present chapter argues that policies shouldbe assessed from three different perspectives: that of the definition of poverty,that of the social and geographical level of aggregation of poverty, and that ofthe time-horizon.
As recognized in the Millennium Development Goals, poverty touches manyaspects of the human condition, including the economic, social, environmental,political and cultural. As a reflection of its multifaceted aspects, poverty isdefined in various ways. Which definition of poverty to adopt is not an issue ofright or wrong: it depends on the objective of the policy, or the priority thatpolicy makers set. For example, if the objective of a macroeconomic policy isto stabilize economic conditions, its effects on poverty should be judged interms of income, consumption, employment or wages, but not in terms ofhealth status or access to water. If, on the other hand, the goal of a health pol-icy is to improve the general health status of women, that policy should beevaluated in terms of the health indicators of the women targeted, not in termsof the incomes that they earn.
119G R O W T H A N D P O V E R T Y
4 See World Economic and Social Survey, 2000(United Nations publication, Sales No.E.00.II.C.1), box I.1.
The level of aggregation matters particularly when discussing the effective-ness of policy on individuals or on a certain group of people categorized bysocio-economic or geographical attributes. A nationwide unemployment com-pensation scheme is an important tool with which to supplement incomedeclines associated with job losses in the formal sector, but it is of little use toworkers in the informal sector or those who are chronically impoverishedbecause of the lack of productive employment. The effectiveness of such ascheme should not be judged on the basis of the number of poor people remain-ing in the informal sector.
Assessment of the impacts of a policy on poverty also critically depends onthe time-horizon that policy assessors—policy makers, experts or civil soci-ety—choose to apply. While policies aimed at increasing the average level ofeducational attainment are conducive to reducing poverty over a long period oftime, no one should expect to observe a measurable impact of such policies onpoverty within a year or two.
The two extremes of a wide policy spectrum—anti-globalization groups andnaive market liberalization groups—often oversimplify, in their own ways, thelinkages between policy and poverty in order to justify their respective claims.This chapter argues that such oversimplifications do not capture the essence ofthe linkages and, in many instances, mislead policy debates; and that assessinggrowth-poverty relationships depends, instead, on the choice of the definitionof poverty, the level of poverty aggregation and the time-horizon. Analysingthe relationship between growth and poverty highlights several importantissues that become critical when assessing the impacts on poverty incidence ofthe policies mentioned above.
RELATIONSHIPS BETWEEN DEVELOPMENT,POLICY AND POVERTY
Over the centuries, the world has witnessed many events and changes thathave harmed people’s lives and livelihoods. Man-made disasters, such aswars, civil strife and political instabilities associated with regime changes,have had adverse impacts on innumerable lives. Natural disasters, such asfloods, droughts, earthquakes and volcanic eruptions, have affected them aswell. Even in politically stable times, economic and political reforms, changesin the external environment, such as the oil shocks of the 1970s and 1980s andthe currency and financial crises in the 1980s and 1990s, and serious epi-demics, such as bubonic plague (the Black Death) which killed one quarter ofEurope’s population in the fourteenth century and human immunodeficiencyvirus/acquired immunodeficiency syndrome (HIV/AIDS), have all devastatednot only human lives but many nations’ economic vitality. In many cases, thepoor have been affected most severely by these events and changes, owing toa lack of resources with which to address the situation.
At the World Summit for Social Development, held in Copenhagen in March1995, the States Members of the United Nations recognized that poverty occursin all countries—mass poverty in many developing countries, pockets of pover-ty amid wealth in developed countries, loss of livelihoods as a result of eco-nomic recession, and sudden poverty as a result of disaster or conflict. Member
W O R L D E C O N O M I C A N D S O C I A L S U R V E Y 2 0 0 3120
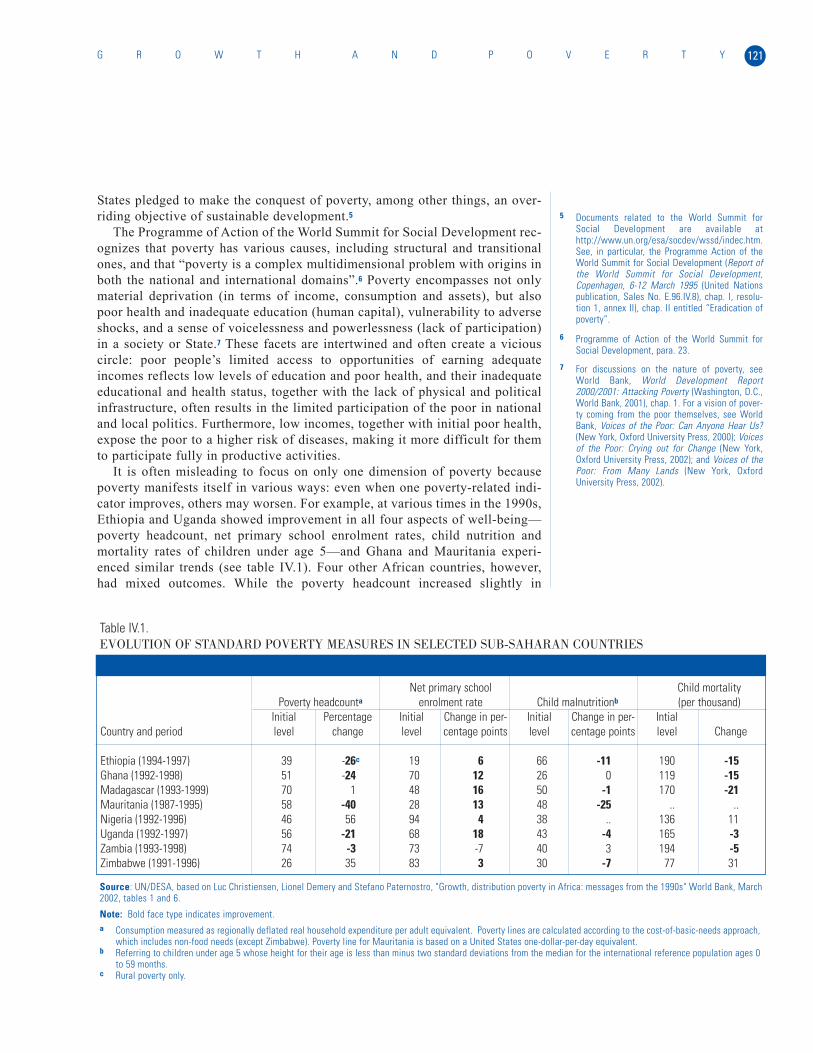
States pledged to make the conquest of poverty, among other things, an over-riding objective of sustainable development.5
The Programme of Action of the World Summit for Social Development rec-ognizes that poverty has various causes, including structural and transitionalones, and that “poverty is a complex multidimensional problem with origins inboth the national and international domains”.6 Poverty encompasses not onlymaterial deprivation (in terms of income, consumption and assets), but alsopoor health and inadequate education (human capital), vulnerability to adverseshocks, and a sense of voicelessness and powerlessness (lack of participation)in a society or State.7 These facets are intertwined and often create a viciouscircle: poor people’s limited access to opportunities of earning adequateincomes reflects low levels of education and poor health, and their inadequateeducational and health status, together with the lack of physical and politicalinfrastructure, often results in the limited participation of the poor in nationaland local politics. Furthermore, low incomes, together with initial poor health,expose the poor to a higher risk of diseases, making it more difficult for themto participate fully in productive activities.
It is often misleading to focus on only one dimension of poverty becausepoverty manifests itself in various ways: even when one poverty-related indi-cator improves, others may worsen. For example, at various times in the 1990s,Ethiopia and Uganda showed improvement in all four aspects of well-being—poverty headcount, net primary school enrolment rates, child nutrition andmortality rates of children under age 5—and Ghana and Mauritania experi-enced similar trends (see table IV.1). Four other African countries, however,had mixed outcomes. While the poverty headcount increased slightly in
121G R O W T H A N D P O V E R T Y
Table IV.1.EVOLUTION OF STANDARD POVERTY MEASURES IN SELECTED SUB-SAHARAN COUNTRIES
Net primary school Child mortalityPoverty headcounta enrolment rate Child malnutritionb (per thousand)
Initial Percentage Initial Change in per- Initial Change in per- IntialCountry and period level change level centage points level centage points level Change
Ethiopia (1994-1997) 39 -26c 19 6 66 -11 190 -15Ghana (1992-1998) 51 -24 70 12 26 0 119 -15Madagascar (1993-1999) 70 1 48 16 50 -1 170 -21Mauritania (1987-1995) 58 -40 28 13 48 -25 .. ..Nigeria (1992-1996) 46 56 94 4 38 .. 136 11Uganda (1992-1997) 56 -21 68 18 43 -4 165 -3Zambia (1993-1998) 74 -3 73 -7 40 3 194 -5Zimbabwe (1991-1996) 26 35 83 3 30 -7 77 31
Source: UN/DESA, based on Luc Christiensen, Lionel Demery and Stefano Paternostro, "Growth, distribution poverty in Africa: messages from the 1990s" World Bank, March2002, tables 1 and 6.
Note: Bold face type indicates improvement.a Consumption measured as regionally deflated real household expenditure per adult equivalent. Poverty lines are calculated according to the cost-of-basic-needs approach,
which includes non-food needs (except Zimbabwe). Poverty line for Mauritania is based on a United States one-dollar-per-day equivalent.b Referring to children under age 5 whose height for their age is less than minus two standard deviations from the median for the international reference population ages 0
to 59 months.c Rural poverty only.
5 Documents related to the World Summit forSocial Development are available athttp://www.un.org/esa/socdev/wssd/indec.htm.See, in particular, the Programme Action of theWorld Summit for Social Development (Report ofthe World Summit for Social Development,Copenhagen, 6-12 March 1995 (United Nationspublication, Sales No. E.96.IV.8), chap. I, resolu-tion 1, annex II), chap. II entitled “Eradication ofpoverty”.
6 Programme of Action of the World Summit forSocial Development, para. 23.
7 For discussions on the nature of poverty, seeWorld Bank, World Development Report2000/2001: Attacking Poverty (Washington, D.C.,World Bank, 2001), chap. 1. For a vision of pover-ty coming from the poor themselves, see WorldBank, Voices of the Poor: Can Anyone Hear Us?(New York, Oxford University Press, 2000); Voicesof the Poor: Crying out for Change (New York,Oxford University Press, 2002); and Voices of thePoor: From Many Lands (New York, OxfordUniversity Press, 2002).
Madagascar, the other variables showed improvement. Nigeria and Zimbabweexperienced significant increases in the number of poor people and child mor-tality rates, but larger proportions of children attended school. In Zambia, onthe other hand, the share of the population living below the poverty line andchild mortality rates declined slightly, but a lower proportion of childrenattended school and the incidence of child malnutrition increased.
While the well-being of the poor in Ethiopia, Ghana, Mauritania andUganda clearly improved on average during the periods specified—albeit froma very low level—it is not obvious how the changes in the poverty situation inthe other countries can be summarized. Such complexity tends to make forextensive debate about the relationship among economic, social, political andother human development-related factors as causes and consequences of pover-ty.8 Moreover, hard evidence is difficult to come by to support or refute argu-ments, because of the costs and technical difficulties associated with data col-lection. In the end, the complexity of the poverty issues and the lack of hardevidence “can overwhelm adequate understanding”.9 This situation poses aproblem for policy makers, particularly when they design a policy that aims toimprove the living standards of the poor and when they evaluate the outcomeof this policy. A policy inevitably induces changes in economic, social andother variables in complicated ways; without adequate understanding, it is dif-ficult, if not impossible, for policy makers to design and implement an appro-priate policy with feasible targets.
Selecting a few poverty variables—depending on the policy goal establishedand on data availability—helps improve analytical capability and allows poli-cy makers to examine more closely the relationship between poverty and poli-cy actions. Given the current stock of knowledge about the relationships amongpoverty, development and policy, policy makers and experts in the field willgain practical insight, however incomplete, by focusing on a narrower range ofmanifestations of poverty, at the expense of a more in-depth description of themultifaceted experiences of the poor.10
Focusing on one or a few indicators that gauge material aspects of poverty(income, consumption and productivity) has additional advantages. One reasonfor this focus is the limited availability of internationally comparable data foranalysing the impact of policy changes on consumption or income over time.Such data are indispensable because tracing the impacts of policy on poverty isinevitably required to track changes in poverty indicators over time (the so-called poverty dynamics). Second, there are well-established statistical defini-tions of the indicators related to the material dimensions of poverty, which isnot the case for the sense of being powerless and voiceless, for example. Third,some indicators related to the material dimension of poverty are generally moreresponsive to economic policy changes than are such social variables as health,education and literacy rates. These indicators, particularly income and con-sumption, involve fewer measurement problems and are observed frequentlyenough to allow for the detection of the relationships between them and thechanging socio-political environment, including policy changes. Fourth, andperhaps most importantly, the multidimensional definition of poverty tends tolead to a complex but static view of poverty—that is to say, a snapshot at onepoint in time—in which the focus of the anti-poverty strategy is on what peo-ple lack.11 The narrower material definition of poverty, in contrast, makes more
W O R L D E C O N O M I C A N D S O C I A L S U R V E Y 2 0 0 3122
11 See the Least Developed Countries Report, 2002…, part two, chap. 1.
8 One way to evaluate the status of the poor is toconstruct a “poverty index”, which assignsweights to various poverty-related variables andsums them up to create a single number.However, the question remains what variablesshould be included and what weight should beattached to each variable.
9 United Nations Conference on Trade andDevelopment (UNCTAD), The Least DevelopedCountries Report, 2002: Escaping the Poverty Trap(United Nations publication, Sales No.E.02.II.D.13), p. 40.
10 The theoretical links between growth, povertyreduction and social indicators are discussed inLance Taylor, Santosh Mehrotra and EnriqueDelamonica, “The links between economicgrowth, poverty reduction, and social develop-ment: theory and policy”, in Development with aHuman Face: Experiences in Social Achievementand Economic Growth, Santosh Mehrotra andRichard Jolly, eds. (New York, Oxford UniversityPress, 1998).

tractable the relationship between policy changes and poverty dynamics andallows policy makers to focus on why people lack certain things.12 Furthermore,this approach allows policy makers to distinguish chronic poverty from tran-sient poverty (that is to say, those stuck in poverty over a long period in con-trast with those who can be expected to escape from poverty after a short peri-od), each requiring for its reduction, in many cases, its own unique set of pol-icy prescriptions.
The following sections in this chapter focus on the relationship betweeneconomic variables, especially growth, and poverty indicators, and examinethe impact of economic policies on those variables and indicators, with a viewto drawing implications and proposing guidelines for poverty reduction in thecontext of a macroeconomic framework.
AVERAGE RELATIONSHIPS BETWEENGROWTH AND POVERTY
History suggests that sustained economic growth over “the very long run” isthe critical factor for reducing or even to eliminating extreme poverty.13
Without sustained growth over the centuries, Western Europe, where until themid-eighteenth century most social scientists were resigned to accepting thephenomenon of poverty as an inescapable fact of life,14 could not haveachieved the high living standards that the region enjoys at present. This istrue for developed countries in other regions as well. While the developedcountries experienced wars, economic depressions, social unrest and other set-backs during the course of their development, they undertook countermea-sures to rectify these situations and maintained long-term sustained growththat has led to their current developed status.
In the current debate on policy and poverty, however, the issue is hownational authorities in developing and transition economies, assisted by theinternational community, can enable the poor to escape from poverty as quick-ly and effectively as possible, in order to reach the Millennium DevelopmentGoals by 2015. The importance of sustained economic growth over the verylong term in eliminating poverty is recognized, but policy makers need to iden-tify, beyond the economic and social policies adopted by the now-developedcountries over the course of their development, a new set of policies that alloweconomic growth to reduce the incidence of poverty more positively.
One of the major policy debates on poverty has centred on the relationshipbetween poverty and macroeconomic policies—policies that aim at stabilizing,sustaining or enhancing economic growth. The main questions raised havebeen the following: Do macroeconomic reforms based on free-market disci-pline have positive impacts on the poor? Is liberalization of trade and financebeneficial for poor people and poor countries, or does it only further enrichalready rich people and wealthy countries? Is economic growth in general pro-poor and, if not, what types of growth are pro-poor?15 More generally, has glob-alization of the world economy in recent years had a positive impact on peoplein developing countries, particularly the poor?
These questions seem to assume that various linkages—direct or indirect—between poverty and globalization, poverty and economic growth, and poverty
123G R O W T H A N D P O V E R T Y
12 Furthermore, as discussed later in this chapter,focusing on the dynamics of poverty narrowlydefined sheds light on the issue of short- versuslong-term impacts of a policy change, which hascreated disagreement on economic policy amongpolicy makers, experts and non-governmentalorganizations. See Ravi Kanbur, “Economic policy,distribution and poverty: the nature of disagree-ments”, World Development, vol. 29, No. 6 (June2001), pp. 1083–1094.
13 While no clear definition of it has emerged, thevery long run refers generally to periods longerthan a century. For an example of such an analy-sis, see Charles I. Jones, Was an IndustrialRevolution Inevitable?: Economic Growth over theVery Long Run, National Bureau of EconomicResearch Working Paper Series, No. 7375(Cambridge, Massachusetts, October 1999).
14 World Development Report, 2000/2001…, chap. 3.
15 The term “pro-poor growth” is now frequentlyused in policy debates, but there is no consensusas to its meaning. See Howard White and EdwardAnderson, “Growth versus distribution: does thepattern of growth matter?”, Development PolicyReview, vol. 19, No. 3 (September 2001), pp.267–289.

and economic reforms exist over reasonably short periods of time. As arguedpreviously, however, poverty has various causes and manifestations and thusdoes not display any straightforward relationship with global or macroeconom-ic phenomena. It is argued below that, while some relationship showing statis-tical regularity exists between growth and income or consumption poverty overthe medium-to-long term across many developing and transition countries, theimpacts of growth on poverty depend on the different socio-economic condi-tions in different countries, including the degree of initial income inequality.The assessment of impacts of growth on poverty also depends critically on thelevel of aggregation (national, regional, sectoral or individual) and the time-horizon chosen (short- versus long-run), which give rise to different pictures ofpoverty dynamics, often leading to different policy implications.
General relationship between growth and poverty in the long run
The World Bank estimates that 19 per cent of the world population lived onless than $1 per day and 46 per cent on less than $2 dollar per day in 1999.16
The incidence of such poverty, however, exhibited a large variation amongcountries. The relationship between per capita income and poverty incidence,suggests some general tendencies related to income and poverty levels (seefigure IV.2). First, on average, the higher the per capita income, the lower theincidence of poverty—which is not a surprising. Second, while poorer coun-tries tend to have a higher incidence of poverty, the incidence varies widelyamong countries with similar annual per capita incomes. For example, amongcountries with per capita income less than $1,000 a year, the share of the pop-ulation living on less than $1 per day varies between less than 20 and morethan 70 per cent.17 This variation reflects the degree of income inequality ofthe countries: for two countries with similar average income levels, the onewith a higher income inequality tends to have a higher poverty rate.
The relationships between poverty and average income and the differencesin the incidence of poverty among countries with similar per capita incomelevel are subjects of much research. However, the large differences in the inci-dence of poverty between richer and poorer countries point to the importanceof achieving sustained growth, and the wide variation in poverty incidence(and income inequality) among countries with similar income levels suggeststhe need to improve income equality as a means to reduce poverty.
The consensus, however, stops at this point, and debates arise on the issueof the evolution of poverty and economic growth, defined as a rise in the aver-age living standard of a country, that is to say, in income per capita. While aredistribution of income at any point of time could reduce poverty in the shortrun, the long-run relationship between income distribution within a countryand growth is the subject of considerable interest and debate (see box IV.1).Over long period of time, growth, an increase in inequality and a reduction ofpoverty have occurred in tandem. More recently, the debate has extended to therelationship between poverty reduction and the globalization of the worldeconomy, which is presumed to affect, in one way or another, growth and liv-ing standards in the country. The issues in their simplest form are whether ornot sustained economic growth is good for the poor, and whether globalizationof the world economy has a positive or negative impact on the poor, possiblyvia its effects on the growth of the national economy.
W O R L D E C O N O M I C A N D S O C I A L S U R V E Y 2 0 0 3124
16 World Bank, Global Economic Prospects and theDeveloping Countries: Making Trade Work for theWorld’s Poor (Washington, D.C., World Bank,2002), table1.8.
17 UNCTAD defines “generalized poverty” as a con-dition in which a major part of the populationlives at or below income levels sufficient to meettheir basic needs, and in which the availableresources in the economy are barely sufficient tocater for the basic needs of the population on asustainable basis. See the Least DevelopedCountries, 2002 ...
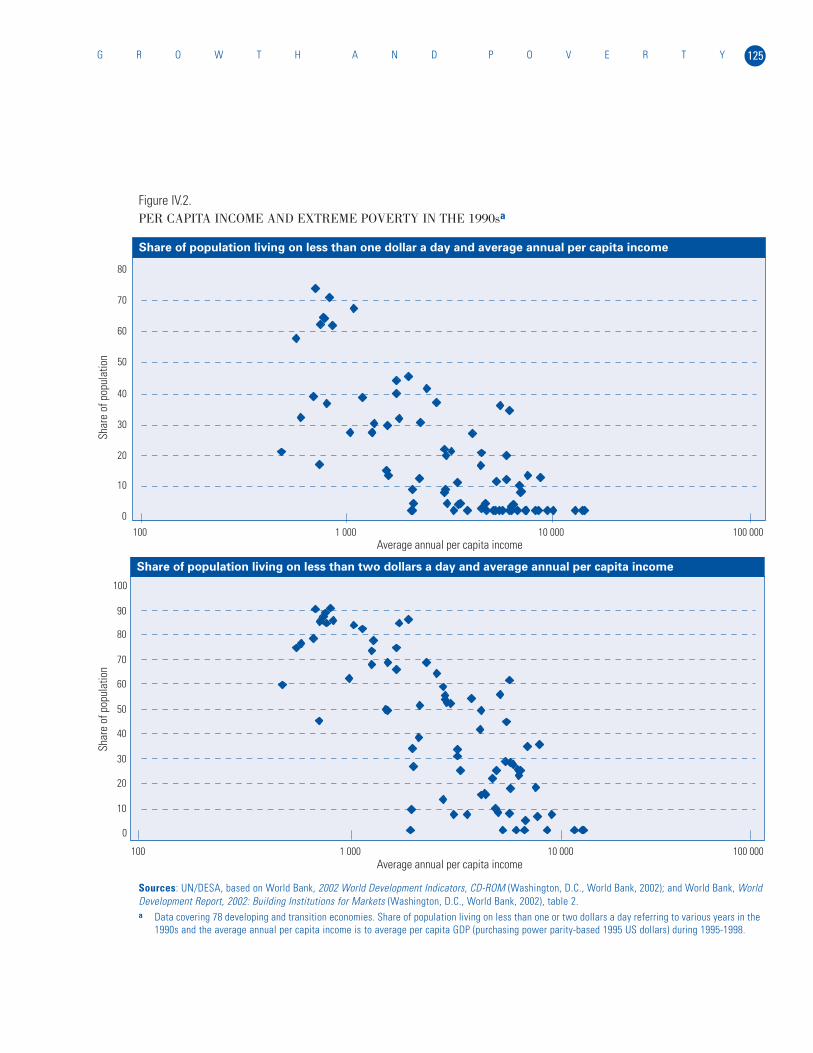
125G R O W T H A N D P O V E R T Y
Figure IV.2.PER CAPITA INCOME AND EXTREME POVERTY IN THE 1990sa
Sources: UN/DESA, based on World Bank, 2002 World Development Indicators, CD-ROM (Washington, D.C., World Bank, 2002); and World Bank, WorldDevelopment Report, 2002: Building Institutions for Markets (Washington, D.C., World Bank, 2002), table 2.a Data covering 78 developing and transition economies. Share of population living on less than one or two dollars a day referring to various years in the
1990s and the average annual per capita income is to average per capita GDP (purchasing power parity-based 1995 US dollars) during 1995-1998.
Share of population living on less than one dollar a day and average annual per capita income
0
10
20
30
40
50
60
70
80
100 1 000 10 000 100 000
Share of population living on less than two dollars a day and average annual per capita income
0
10
20
30
40
50
60
70
80
90
100
100 1 000 10 000 100 000
Average annual per capita income
Average annual per capita income
Shar
e of
pop
ulat
ion
Shar
e of
pop
ulat
ion
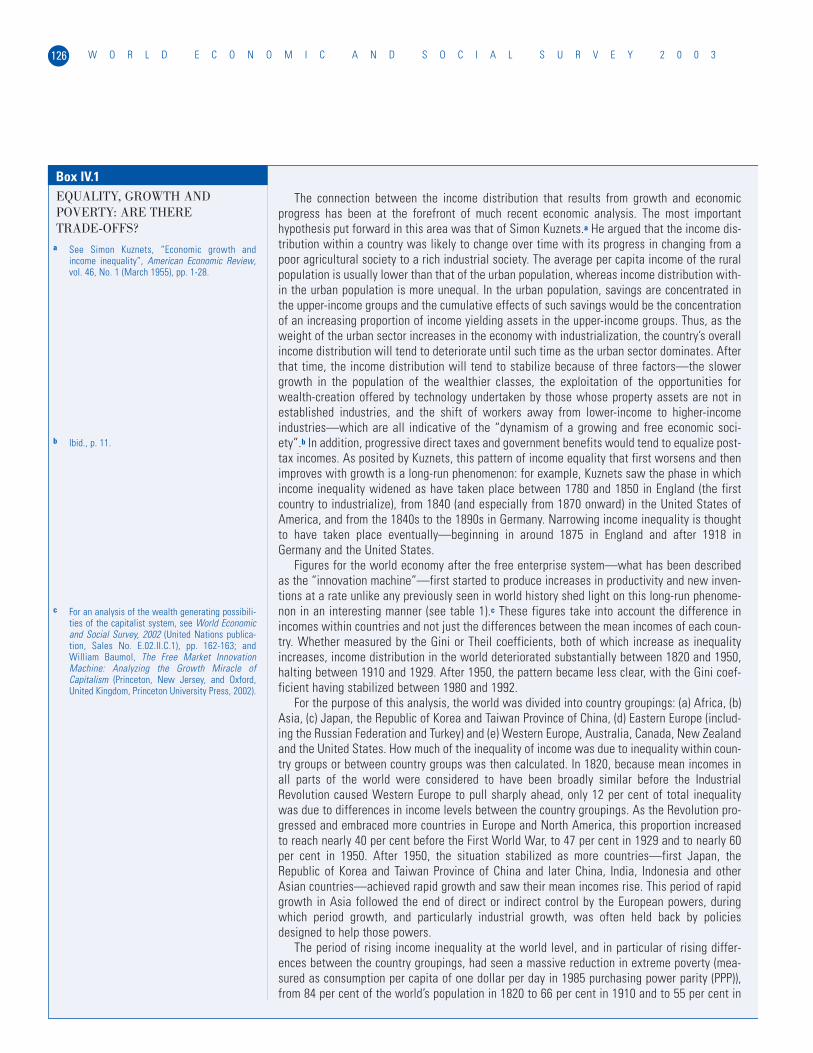
W O R L D E C O N O M I C A N D S O C I A L S U R V E Y 2 0 0 3126
Box IV.1EQUALITY, GROWTH ANDPOVERTY: ARE THERETRADE-OFFS?
a See Simon Kuznets, “Economic growth andincome inequality”, American Economic Review,vol. 46, No. 1 (March 1955), pp. 1-28.
b Ibid., p. 11.
c For an analysis of the wealth generating possibili-ties of the capitalist system, see World Economicand Social Survey, 2002 (United Nations publica-tion, Sales No. E.02.II.C.1), pp. 162-163; andWilliam Baumol, The Free Market InnovationMachine: Analyzing the Growth Miracle ofCapitalism (Princeton, New Jersey, and Oxford,United Kingdom, Princeton University Press, 2002).
The connection between the income distribution that results from growth and economicprogress has been at the forefront of much recent economic analysis. The most importanthypothesis put forward in this area was that of Simon Kuznets.a He argued that the income dis-tribution within a country was likely to change over time with its progress in changing from apoor agricultural society to a rich industrial society. The average per capita income of the ruralpopulation is usually lower than that of the urban population, whereas income distribution with-in the urban population is more unequal. In the urban population, savings are concentrated inthe upper-income groups and the cumulative effects of such savings would be the concentrationof an increasing proportion of income yielding assets in the upper-income groups. Thus, as theweight of the urban sector increases in the economy with industrialization, the country’s overallincome distribution will tend to deteriorate until such time as the urban sector dominates. Afterthat time, the income distribution will tend to stabilize because of three factors—the slowergrowth in the population of the wealthier classes, the exploitation of the opportunities forwealth-creation offered by technology undertaken by those whose property assets are not inestablished industries, and the shift of workers away from lower-income to higher-incomeindustries—which are all indicative of the “dynamism of a growing and free economic soci-ety”.b In addition, progressive direct taxes and government benefits would tend to equalize post-tax incomes. As posited by Kuznets, this pattern of income equality that first worsens and thenimproves with growth is a long-run phenomenon: for example, Kuznets saw the phase in whichincome inequality widened as have taken place between 1780 and 1850 in England (the firstcountry to industrialize), from 1840 (and especially from 1870 onward) in the United States ofAmerica, and from the 1840s to the 1890s in Germany. Narrowing income inequality is thoughtto have taken place eventually—beginning in around 1875 in England and after 1918 inGermany and the United States.
Figures for the world economy after the free enterprise system—what has been describedas the “innovation machine”—first started to produce increases in productivity and new inven-tions at a rate unlike any previously seen in world history shed light on this long-run phenome-non in an interesting manner (see table 1).c These figures take into account the difference inincomes within countries and not just the differences between the mean incomes of each coun-try. Whether measured by the Gini or Theil coefficients, both of which increase as inequalityincreases, income distribution in the world deteriorated substantially between 1820 and 1950,halting between 1910 and 1929. After 1950, the pattern became less clear, with the Gini coef-ficient having stabilized between 1980 and 1992.
For the purpose of this analysis, the world was divided into country groupings: (a) Africa, (b)Asia, (c) Japan, the Republic of Korea and Taiwan Province of China, (d) Eastern Europe (includ-ing the Russian Federation and Turkey) and (e) Western Europe, Australia, Canada, New Zealandand the United States. How much of the inequality of income was due to inequality within coun-try groups or between country groups was then calculated. In 1820, because mean incomes inall parts of the world were considered to have been broadly similar before the IndustrialRevolution caused Western Europe to pull sharply ahead, only 12 per cent of total inequalitywas due to differences in income levels between the country groupings. As the Revolution pro-gressed and embraced more countries in Europe and North America, this proportion increasedto reach nearly 40 per cent before the First World War, to 47 per cent in 1929 and to nearly 60per cent in 1950. After 1950, the situation stabilized as more countries—first Japan, theRepublic of Korea and Taiwan Province of China and later China, India, Indonesia and otherAsian countries—achieved rapid growth and saw their mean incomes rise. This period of rapidgrowth in Asia followed the end of direct or indirect control by the European powers, duringwhich period growth, and particularly industrial growth, was often held back by policiesdesigned to help those powers.
The period of rising income inequality at the world level, and in particular of rising differ-ences between the country groupings, had seen a massive reduction in extreme poverty (mea-sured as consumption per capita of one dollar per day in 1985 purchasing power parity (PPP)),from 84 per cent of the world’s population in 1820 to 66 per cent in 1910 and to 55 per cent in
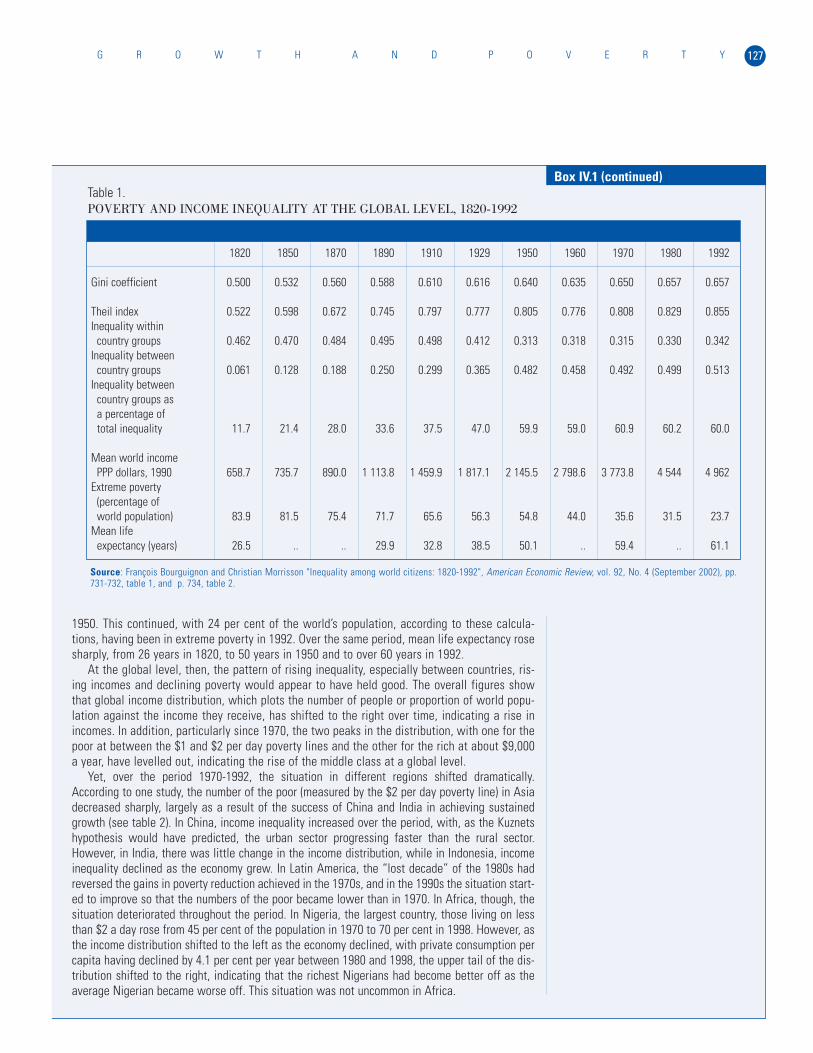
127G R O W T H A N D P O V E R T Y
1950. This continued, with 24 per cent of the world’s population, according to these calcula-tions, having been in extreme poverty in 1992. Over the same period, mean life expectancy rosesharply, from 26 years in 1820, to 50 years in 1950 and to over 60 years in 1992.
At the global level, then, the pattern of rising inequality, especially between countries, ris-ing incomes and declining poverty would appear to have held good. The overall figures showthat global income distribution, which plots the number of people or proportion of world popu-lation against the income they receive, has shifted to the right over time, indicating a rise inincomes. In addition, particularly since 1970, the two peaks in the distribution, with one for thepoor at between the $1 and $2 per day poverty lines and the other for the rich at about $9,000a year, have levelled out, indicating the rise of the middle class at a global level.
Yet, over the period 1970-1992, the situation in different regions shifted dramatically.According to one study, the number of the poor (measured by the $2 per day poverty line) in Asiadecreased sharply, largely as a result of the success of China and India in achieving sustainedgrowth (see table 2). In China, income inequality increased over the period, with, as the Kuznetshypothesis would have predicted, the urban sector progressing faster than the rural sector.However, in India, there was little change in the income distribution, while in Indonesia, incomeinequality declined as the economy grew. In Latin America, the “lost decade” of the 1980s hadreversed the gains in poverty reduction achieved in the 1970s, and in the 1990s the situation start-ed to improve so that the numbers of the poor became lower than in 1970. In Africa, though, thesituation deteriorated throughout the period. In Nigeria, the largest country, those living on lessthan $2 a day rose from 45 per cent of the population in 1970 to 70 per cent in 1998. However, asthe income distribution shifted to the left as the economy declined, with private consumption percapita having declined by 4.1 per cent per year between 1980 and 1998, the upper tail of the dis-tribution shifted to the right, indicating that the richest Nigerians had become better off as theaverage Nigerian became worse off. This situation was not uncommon in Africa.
Box IV.1 (continued)
1820 1850 1870 1890 1910 1929 1950 1960 1970 1980 1992
Gini coefficient 0.500 0.532 0.560 0.588 0.610 0.616 0.640 0.635 0.650 0.657 0.657
Theil index 0.522 0.598 0.672 0.745 0.797 0.777 0.805 0.776 0.808 0.829 0.855Inequality within
country groups 0.462 0.470 0.484 0.495 0.498 0.412 0.313 0.318 0.315 0.330 0.342Inequality between
country groups 0.061 0.128 0.188 0.250 0.299 0.365 0.482 0.458 0.492 0.499 0.513Inequality between
country groups asa percentage of total inequality 11.7 21.4 28.0 33.6 37.5 47.0 59.9 59.0 60.9 60.2 60.0
Mean world income PPP dollars, 1990 658.7 735.7 890.0 1 113.8 1 459.9 1 817.1 2 145.5 2 798.6 3 773.8 4 544 4 962
Extreme poverty (percentage of world population) 83.9 81.5 75.4 71.7 65.6 56.3 54.8 44.0 35.6 31.5 23.7
Mean life expectancy (years) 26.5 .. .. 29.9 32.8 38.5 50.1 .. 59.4 .. 61.1
Table 1.POVERTY AND INCOME INEQUALITY AT THE GLOBAL LEVEL, 1820-1992
Source: François Bourguignon and Christian Morrisson "Inequality among world citizens: 1820-1992", American Economic Review, vol. 92, No. 4 (September 2002), pp.731-732, table 1, and p. 734, table 2.
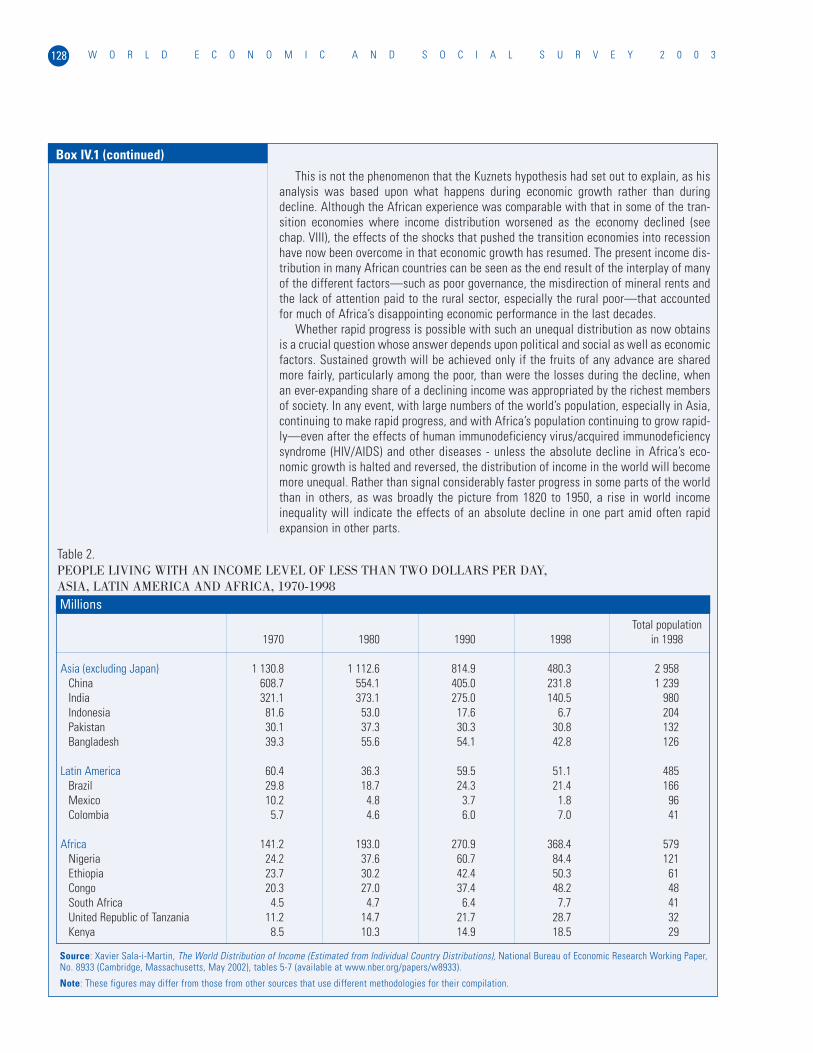
W O R L D E C O N O M I C A N D S O C I A L S U R V E Y 2 0 0 3128
Box IV.1 (continued)
This is not the phenomenon that the Kuznets hypothesis had set out to explain, as hisanalysis was based upon what happens during economic growth rather than duringdecline. Although the African experience was comparable with that in some of the tran-sition economies where income distribution worsened as the economy declined (seechap. VIII), the effects of the shocks that pushed the transition economies into recessionhave now been overcome in that economic growth has resumed. The present income dis-tribution in many African countries can be seen as the end result of the interplay of manyof the different factors—such as poor governance, the misdirection of mineral rents andthe lack of attention paid to the rural sector, especially the rural poor—that accountedfor much of Africa’s disappointing economic performance in the last decades.
Whether rapid progress is possible with such an unequal distribution as now obtainsis a crucial question whose answer depends upon political and social as well as economicfactors. Sustained growth will be achieved only if the fruits of any advance are sharedmore fairly, particularly among the poor, than were the losses during the decline, whenan ever-expanding share of a declining income was appropriated by the richest membersof society. In any event, with large numbers of the world’s population, especially in Asia,continuing to make rapid progress, and with Africa’s population continuing to grow rapid-ly—even after the effects of human immunodeficiency virus/acquired immunodeficiencysyndrome (HIV/AIDS) and other diseases - unless the absolute decline in Africa’s eco-nomic growth is halted and reversed, the distribution of income in the world will becomemore unequal. Rather than signal considerably faster progress in some parts of the worldthan in others, as was broadly the picture from 1820 to 1950, a rise in world incomeinequality will indicate the effects of an absolute decline in one part amid often rapidexpansion in other parts.
Total population1970 1980 1990 1998 in 1998
Asia (excluding Japan) 1 130.8 1 112.6 814.9 480.3 2 958China 608.7 554.1 405.0 231.8 1 239India 321.1 373.1 275.0 140.5 980Indonesia 81.6 53.0 17.6 6.7 204Pakistan 30.1 37.3 30.3 30.8 132Bangladesh 39.3 55.6 54.1 42.8 126
Latin America 60.4 36.3 59.5 51.1 485Brazil 29.8 18.7 24.3 21.4 166Mexico 10.2 4.8 3.7 1.8 96Colombia 5.7 4.6 6.0 7.0 41
Africa 141.2 193.0 270.9 368.4 579Nigeria 24.2 37.6 60.7 84.4 121Ethiopia 23.7 30.2 42.4 50.3 61Congo 20.3 27.0 37.4 48.2 48South Africa 4.5 4.7 6.4 7.7 41United Republic of Tanzania 11.2 14.7 21.7 28.7 32Kenya 8.5 10.3 14.9 18.5 29
Table 2.PEOPLE LIVING WITH AN INCOME LEVEL OF LESS THAN TWO DOLLARS PER DAY, ASIA, LATIN AMERICA AND AFRICA, 1970-1998Millions
Source: Xavier Sala-i-Martin, The World Distribution of Income (Estimated from Individual Country Distributions), National Bureau of Economic Research Working Paper,No. 8933 (Cambridge, Massachusetts, May 2002), tables 5-7 (available at www.nber.org/papers/w8933).
Note: These figures may differ from those from other sources that use different methodologies for their compilation.
It is important to distinguish logical considerations from empirical findings.The logical answer to the question concerning the growth-poverty relationship israther straightforward if no consideration is paid to the differences in socio-eco-nomic conditions of countries that are observed in the real world. The economicgrowth of a nation—an increase in its production or per capita income—is nei-ther a necessary, nor a sufficient condition for poverty reduction: there is no log-ical linkage running from sustained growth to poverty reduction. Growth is notnecessary for poverty reduction because poverty can be reduced by redistribut-ing incomes among all members of the country in the absence of economicgrowth. Growth is not sufficient for poverty reduction because economic growthdoes not necessarily have any distributional aspects: sustained growth may makethe rich richer with no trickle-down effects to the poor at all. While logically pos-sible, however, this is unlikely, as the rich will increasingly demand more andbetter goods and services, and will be in a position to pay more for them. In short,there is bound to be some trickle down, although this could be very limited. Theimpacts of growth or globalization of the world economy on the poor thus can-not be judged a priori because of this lack of a firm and consistent logical link-age between growth or globalization and poverty.
Actual observations of market-based economies seem to suggest, however,a correlation between growth and poverty, contrary to the preceding logicalconjecture. The observed relation is a result of the political and socio-econom-ic environment in these economies—a factor that the logical considerationscompletely ignore—which limits the range of observable combinations. Forexample, while an income-redistribution policy that eliminates extreme pover-ty may be politically feasible for high-income countries, where the fiscal trans-fers (such as taxes and subsidies) required to eliminate extreme poverty aresmall relative to national income, it is not feasible for low-income developingcountries. In the latter group of countries, eliminating poverty would requiremassive fiscal transfers relative to their national incomes. There are likely tobe severe political difficulties to implementing such a policy and the measuresmight themselves undermine growth prospects. On the other hand, economicgrowth that benefits the rich disproportionally for a long time cannot be pur-sued, because of the increasing dissatisfaction of the majority of the populationwith the unfair distribution of incomes and consequent likelihood of politicalinstability or social unrest. A continued high degree of income inequality mayalso adversely affect the work incentives of the non-rich.
Studies of the growth-poverty relationship have given rise to disagreementswith regard to the measurement of income poverty, the compatibility of cross-country and inter-temporal data and the methods of analysis employed (see boxIV.2). Even where consensus is reached, the data often give no clear conclu-sions, or are not very informative. The rest of this section therefore focusesprimarily on the points of common understanding among experts about therelationship between growth and poverty, in order to create a framework for thesubsequent review of policy issues.
One point of consensus is that growth is generally beneficial for the poor,albeit not without exceptions. Growth has been found beneficial for the poorwhen growth-poverty experiences in various countries are “averaged out” andeach growth period is sustained over a reasonably long period, typically fiveyears or more. Countries’ experiences differ widely around the average, howev-
129G R O W T H A N D P O V E R T Y
The Millennium Development Goals for poverty reduction use an internation-al absolute poverty line of one-dollar-per day in purchasing power parity.a Thesimplicity of the one dollar per day standard has been successful in promotingthe concept of extreme poverty and has provided a useful reference mark for pol-icy discussions. However, this line arouses controversy among experts with dif-ferent professional points of view and experience.b
The one dollar-per-day line has been criticized on at least three grounds,namely, (a) the use of a single indicator as an international benchmark, (b) thecalculation of purchasing power parity (PPP) conversion rates and, (c) the designof the household surveys used, and the sole reliance on them.c
With respect to (a), according to some researchers, the conception of povertyshould refer to minimum rights to resources, and constitute a measure of theopportunities open to people to participate in the community’s style of living witha salient set of elementary capabilities. The minimum resources (and thusincome) required to participate in the community’s lifestyle would depend on thecommunity in which the individual/family resides, because lifestyles vary amongcountries. National poverty lines in many countries are constructed in a way thatis consistent with this concept. “The notion of a fixed absolute poverty standard,applicable to all societies and at all times is therefore a chimera.”d The interna-tional poverty line of one dollar-per-day is, on the other hand, based on the stan-dard-of-living approach and is assumed to correspond to a specified level of con-sumption. It is designed to measure the number of very poor, most of whom livein the poorest countries, but not the community-dependent poverty in the rest ofthe world. It corresponds approximately to the national poverty lines of manylow-income developing countries.e
With regard to (b) the purchasing power parity (PPP) conversion rate is a priceindex that is applied to convert the cost, measured in local currency, of a typicalbasket of goods that the average person consumes in a country to the cost inUnited States dollars. Besides the general problems associated with any indexnumbers,f there is a question about the relevance of the baskets of consumptionused to calculate PPP rates. It is conceivable, and even likely, that the typicalbasket of goods consumed by the poor and the prices they pay are different fromthose relevant to the average person in the same country.g Furthermore, sincesome agricultural goods are available only in a particular local area and take alarge share of local people’s expenditure, it is difficult to find a relevant compar-ative price at the global level. In those cases, the cost of the basket relevant forpoor people will not be accurately converted into dollars.h While these are impor-tant considerations, the current capacities of statistical offices in many countriesdo not allow for such detailed analysis.
As for (c), national household surveys are, in many cases, the source for con-structing consumption or income distributions and estimating extreme poverty,but their designs are not standardized across countries and over time. Someexperts use average consumption or personal income based on National Income
W O R L D E C O N O M I C A N D S O C I A L S U R V E Y 2 0 0 3130
Box IV.2DRAWING THE POVERTY LINEa Strictly speaking, the line is drawn at $1.08 per
day in 1993 international purchasing power parityprices. See Shaohua Chen and Martin Ravallion,How did the World’s Poorest Fare in the 1990s?,World Bank Policy Research Working Paper, No.2409 (Washington, D.C., World Bank, August2000).
b For more technical aspects of the following argu-ments, see Angus Deaton, “Data for monitoringthe poverty MDG”, mimeo, Research Program inDevelopment Studies, Princeton University,January 2003.
c Another concern is connected with the unit ofanalysis (individual versus family), and is moretechnical in nature. See Deaton, loc. cit.
d A. B. Atkinson, “Poverty”, in The New Palgrave: ADictionary of Economics, John Eatwell, MurrayMilgate and Peter Newman, eds. (London,MacMillan, 1987), p. 931. See also Food andAgriculture Organization of the United Nations(FAO), World Agriculture: Towards 2015/2030: AnFAO Perspective (London, Earthscan Publications,2003), p. 214, box 8.1.
e Deaton, loc. cit.
f Ibid.
g Some evidence is found in Christophe Muller,“Prices and living standards: evidence forRwanda”, Journal of Development Economics, vol.68, No. 1 (June 2002), pp. 187-203.
h See Jeffrey G. Williamson, Winners and Losersover two Centuries of Globalization, NationalBureau of Economic Research Working PaperSeries, No. 9161 (Cambridge, Massachusetts,September 2002).
and Product Accounts (NIPA) to calculate poverty estimates because the concep-tual framework of the NIPA is more standardized across countries and over time.i
However, the NIPA framework does not necessarily produce more accurate infor-mation on consumption or income. Inasmuch as the NIPA framework demandsmuch wider coverage of economic activities and more detailed estimation proce-dures, the chances are greater that the “residuals”, that is to say, items that areunaccounted for by direct estimates, will become large and biased.
Another concern is how well a survey represents the population of a nation. Itis often costly to travel to remote rural areas where the proportion of theextremely poor tends to be high, and in urban areas it is difficult to count andsample the homeless, or “street people”. Moreover, rich people often refuse toparticipate in surveys or answer questionnaires dishonestly, because they fearthat, based on answers they give, the tax authorities may discover their untaxed“informal” activities. While NIPA-based estimates are free from such problems,at least in concept, their estimates of consumption or income include items thatdo not represent actual expenditure of private persons, such as consumption byfor- and non-profit organizations, imputed charges for financial intermediation(so as to remove double-counting) and imputed income from owner-occupiedhousing.j
Owing to the differences in design and methodology between household sur-veys and the NIPA framework, estimates of average consumption or personalincome sometimes differ significantly. With NIPA-based numbers, estimatedaverage consumption tends to be higher when economic growth is high, makingpoverty estimates lower than otherwise. When growth is stagnant, estimatedconsumption is lower and poverty higher. For example, using the NIPA method,the United Nations Conference on Trade and Development (UNCTAD) reports thatthe number of people in poverty in the least developed countries in Asia is foundto be less than the number estimated by the World Bank, which is based onhousehold surveys;k but UNCTAD also estimates that extreme poverty is muchmore widespread in sub-Saharan Africa than estimates by the Bank would indi-cate, owing to low growth in the region. Some researchers even claim, based onNIPA methods, that the Millennium Development Goals on poverty reduction hasalready been met, largely because of high growth in some developing regionsoutside sub-Saharan Africa.l These authors note, however, that, irrespective oftheir estimation procedures, mass poverty in sub-Saharan Africa should continueto be a major concern.
The construction and use of the one dollar-per-day poverty line entail severalissues that are difficult to resolve. Resolving them would require actions byGovernments, international organizations and experts to standardize householdsurveys across countries and over time and to improve the capabilities of nation-al statistical authorities in developing countries.m Meanwhile, survey- and NIPA-based estimates should be considered complementary, rather than competing,sources of information.
131G R O W T H A N D P O V E R T Y
Box IV.2 (continued)
i Examples include: UNCTAD, The Least DevelopedCountries Report, 2002: Escaping the Poverty Trap(United Nations publication, Sales No.E.02.II.D.13), part two; and Xavier Sala-i-Martin, TheDisturbing Rise of Global Income Inequality,National Bureau of Economic Research WorkingPaper Series, No. 8904 (Cambridge,Massachusetts, April 2002).
j Average income or consumption and the distribu-tion of either are also sensitive to the timing ofvisits of survey teams, particularly in agrariancommunities, and the recall period.
k See the Least Developed Countries Report, 2002,….
l See Sala-i-Martin, op. cit.; and Robert J. Barro,“The UN is dead wrong on poverty and inequali-ty”, Business Week, 6 May 2002, p. 24. Theirpoverty estimates are based on GDP. Their methodtakes into account government expenditure, suchas health and education expenditure, that con-tributes to the living standard of the poor.
m The United Nations has initiated a project on theefficient design and implementation of householdsurveys in developing and transition countries.See United Nations Statistics Division, “An analy-sis of operating characteristics of household sur-veys in developing and transition countries: surveycosts, design effects and non-sampling errors”(ESA/STAT/AC.85), 3 September 2002, draft sub-mitted to an Expert Group Meeting, New York, 2-11 October 2002.
W O R L D E C O N O M I C A N D S O C I A L S U R V E Y 2 0 0 3132
Box IV.3
Poverty is defined in absolute terms in the Millennium Development Goals. Oncepoverty is defined in relative terms (as encompassing, first example, the lowest quin-tile of the income distribution), however, a different growth-poverty relationshipemerges, creating multiple but sometimes conflicting visions of the nature of growth’simpact on poverty.
The conceptual difference between the absolute and relative definitions of pover-ty is closely related to the difference between the standard-of-living and minimumresources approaches to defining poverty (see box IV.2). According to the formerapproach, an individual needs to attain a specific level of consumption and (thus tospend a certain amount of money), no matter where that person resides. This is onereason that levels of absolute poverty are often based on the consumption basket. Thelatter approach, on the other hand, emphasizes the importance, when identifyingpoverty, of the community to which the individual belongs. For example, the needs ofan individual who lives in a least developed country with respect to participating inthe local lifestyle are recognized to be different from the needs of an individual wholives in a developed country. In many instances, relatively poor people are definedeither as individuals or households whose incomes (which are taken to represent theopportunities for participation in the community) are at or below a certain percentageof the national average income,a or as those who belong to the lowest bracket ofincome distribution. In order to enjoy a certain level of the local lifestyle, an individ-ual living in a developed country needs to consume more varieties of goods and ser-vices in, possibly, larger quantities than an individual in a least developed country.
If the poor are defined as the people in the lowest bracket of a country’s incomedistribution—typically the lowest income quintile (20 per cent) of the size distributionof income— and if the growth periods are at least five years long, cross-countryregression analysis suggests that the poor benefit from economic growth and sufferfrom economic decline as much as the average income-earners do;b that is to say,when the national average per capita income rises (or falls), the average income of thepoorest quintile rises (or falls) by the same proportion.c
While the cross-country-regression approach to analysing the growth-poverty rela-tionship has been criticized on technical grounds,d similar results have been obtainedby a different approach, based on observations of fluctuations in economic growth andincome inequality and the correlation between the two. Because countries’ incomedistributions over time have been observed to be more stable than economic fluctua-
GROWTH AND RELATIVEPOVERTY
er, and shorter-run fluctuations in the growth and poverty relationship do not fitneatly within the long-run relationship. Furthermore, the extent to which growthis good for the poor depends on the definition of income poverty chosen, evenwhen the same data set is used (see box IV.3). Overall, while economic growthtends to benefit the poor, this assertion must be understood relative to the ana-lytical framework (including the time-horizon) and definitions used. These sub-jects are among the sources of disagreements among policy makers, researchersand civil society about economic policy aimed at poverty reduction.
At the regional level for the period 1990-1999, there was negative correla-tion between growth and extreme poverty—higher growth was associated witha lower poverty rate—but the responses of extreme poverty to growth variedamong the regions (see figure IV.3). For example, each 1 percentage point
a Nationally defined poverty used in figure IV.3is such an example.
b The elasticity of average incomes in the bot-tom quintile with respect to overall averageincome is found to be unity, or very close tounity (see David Dollar and Aart Kraay,“Growth is good for the poor”, DevelopmentResearch Group, World Bank (March 2000)).It should be noted that this is equivalent tosaying that the share of the lowest quintile isuncorrelated with GDP per capita. See MartinRavallion, “Growth, inequality and poverty:looking beyond averages”, WorldDevelopment, vol. 29, No. 11 (November2001), pp. 1803- 1815.
c This does not mean that growth raises theincome of the poor by the same absoluteamount as that by which it raises the incomeof the average income-earner. The continuedinequality of income distribution makes theaverage gains to the poor smaller than theaverage gains to the non-poor.
d See, for example, T.N. Srinivasan and JagdishBhagwati, “Outward-orientation and develop-ment: are revisionists right?”, September1999, mimeo; and Steven N. Durlauf,“Manifesto for a growth econometrics”,Journal of Econometrics, vol. 100, No. 3(January 2001), pp. 65-69.

133G R O W T H A N D P O V E R T Y
tions over the business cycle, it is empirically impossible to claim that the non-pooralone benefited disproportionally and that the poor did not benefit. If this were thecase, the income distribution would have worsened to an extent are not compatiblewith any historical records.e
Through its impressive growth between 1990 and 1999, China reduced absolutepoverty significantly, both in the number and in the proportion of the poor. However, thepercentage share in the country’s total income of the lowest quintile declined from 7only to 5.9 per cent.f Burkina Faso, on the other hand, saw the poverty rate rise from 44.5per cent in 1994 to 45.3 per cent in 1998 despite strong growth during that period, butthe share in total income of the lowest quintile was almost unchanged, increasing from4.4 to 4.5 per cent.g These cases demonstrate that the income shares of the poor changevery little, even when the economy shows strong growth, and that different poverty def-initions give rise to different perspectives on the impacts of growth on poverty.
Overall, both approaches have shown that growth is distribution-neutral when thepoor are defined as the group at the bottom of a country’s income distribution. Basedon both types of analysis, the share of the lowest quintile in a country’s total income isnot affected much by economic growth, thus making gains from growth proportional tothe existing incomes of the poor and non-poor. For example, if the average income ofthe richest quintile is 10 times higher than that of the poorest quintile, the absoluteincome gain to the richest is 10 times higher than the gain to poorest, thus leaving theincome distribution unaltered. Thus, a political question is whether or not policy mak-ers and the general public, including non-governmental organizations, should acceptsuch growth as “pro-poor”, on the grounds that it benefits everyone, including the poor,inasmuch as the same growth can be labelled “anti-poor”, on the basis that it widensthe absolute income gap between the poor and the rest of the population. An advan-tage of defining poverty based on an absolute level is that distributional considerationsbetween the poor and the non-poor are not at issue; as long as the poor escape fromone dollar-per-day poverty, or some other agreed poverty level in absolute terms,growth can be called pro-poor.
The choice of the definition of poverty depends on the purpose of the analysis orthe policy objective. There is no universally accepted concept of poverty that can beapplied to every conceivable situation in every country. Nevertheless, the one dollar-per-day poverty benchmark is useful for evaluating how economic and social develop-ment affects extreme poverty in the poorer countries (see box IV.2).
Box IV.3 (continued)
increase in per capita income was associated with a 1.2 percentage pointdecline in extreme poverty in East Asia, including China, but with only a 0.7percentage point growth, but in a negative direction in South Asia. Europe andCentral Asia saw the largest response in poverty to economic growth, but in anegative direction: each 1 percentage point decline in GDP led to a 5.9 per-centage point increase in poverty incidence. Such a sharp increase in the pover-ty rate in response to economic contraction suggests that the collapse of thecentrally planned economic system has affected the welfare of the populationnot only through economic decline, but also through the deterioration of socialconditions, because of reductions in social expenditures by Governments.18
Latin America and the Caribbean and the Middle East and North Africa expe-rienced positive, albeit meagre, growth in per-capita GDP during the 1990s, but
e This is the argument employed and calibratedin Danny Quah, “Some simple arithmetic onhow income inequality and economic growthmatter”, London School of Economics,Economics Department (July 2001), and“One third of the world’s growth and inequal-ity”, London School of Economics,Economics Department (April 2002).
f Based on World Bank, 2002 WorldDevelopment Indicators, CD-ROM (Washing-ton, D.C., 2002), table 2.8; and “Deininger andSquire data set: a new data set measuringincome inequality”, available athttp://www.worldbank.org/research/growth/dddeisqu.htm.
g Based on Hippolyte Fofack, Célestin Mongaand Hasan Tuluy, “Household welfare andpoverty dynamics in Burkina Faso: empiricalevidence from household surveys”, mimeo,World Bank, 2001, table 2 and annex 1.
18 United Nations, World Economic and SocialSurvey, 2001 (United Nations publication, SalesNo. E.01.II.C.1), chap. VI.
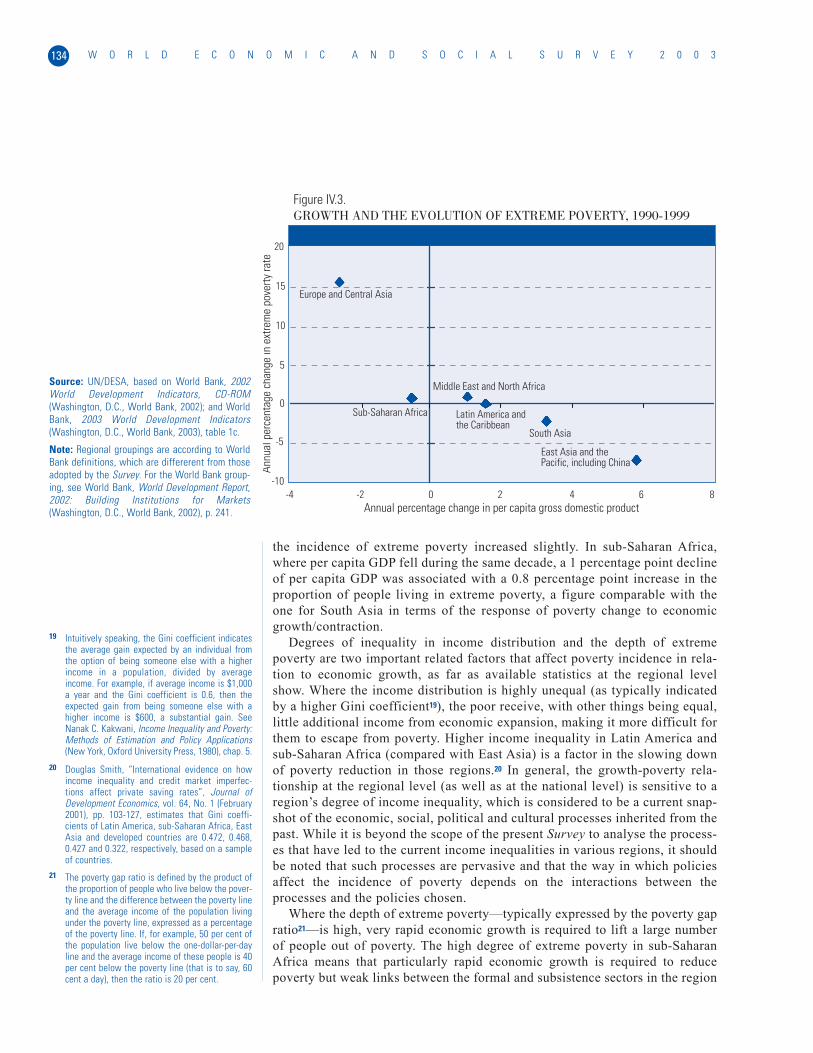
the incidence of extreme poverty increased slightly. In sub-Saharan Africa,where per capita GDP fell during the same decade, a 1 percentage point declineof per capita GDP was associated with a 0.8 percentage point increase in theproportion of people living in extreme poverty, a figure comparable with theone for South Asia in terms of the response of poverty change to economicgrowth/contraction.
Degrees of inequality in income distribution and the depth of extremepoverty are two important related factors that affect poverty incidence in rela-tion to economic growth, as far as available statistics at the regional levelshow. Where the income distribution is highly unequal (as typically indicatedby a higher Gini coefficient19), the poor receive, with other things being equal,little additional income from economic expansion, making it more difficult forthem to escape from poverty. Higher income inequality in Latin America andsub-Saharan Africa (compared with East Asia) is a factor in the slowing downof poverty reduction in those regions.20 In general, the growth-poverty rela-tionship at the regional level (as well as at the national level) is sensitive to aregion’s degree of income inequality, which is considered to be a current snap-shot of the economic, social, political and cultural processes inherited from thepast. While it is beyond the scope of the present Survey to analyse the process-es that have led to the current income inequalities in various regions, it shouldbe noted that such processes are pervasive and that the way in which policiesaffect the incidence of poverty depends on the interactions between theprocesses and the policies chosen.
Where the depth of extreme poverty—typically expressed by the poverty gapratio21—is high, very rapid economic growth is required to lift a large numberof people out of poverty. The high degree of extreme poverty in sub-SaharanAfrica means that particularly rapid economic growth is required to reducepoverty but weak links between the formal and subsistence sectors in the region
W O R L D E C O N O M I C A N D S O C I A L S U R V E Y 2 0 0 3134
Source: UN/DESA, based on World Bank, 2002World Development Indicators, CD-ROM(Washington, D.C., World Bank, 2002); and WorldBank, 2003 World Development Indicators(Washington, D.C., World Bank, 2003), table 1c.
Note: Regional groupings are according to WorldBank definitions, which are differerent from thoseadopted by the Survey. For the World Bank group-ing, see World Bank, World Development Report,2002: Building Institutions for Markets(Washington, D.C., World Bank, 2002), p. 241.
Figure IV.3.GROWTH AND THE EVOLUTION OF EXTREME POVERTY, 1990-1999
Annual percentage change in per capita gross domestic product
Annu
al p
erce
ntag
e ch
ange
in e
xtre
me
pove
rty ra
te
Europe and Central Asia
Sub-Saharan Africa
Middle East and North Africa
Latin America andthe Caribbean
East Asia and thePacific, including China
South Asia
-10
-5
0
5
10
15
20
-4 -2 0 2 4 6 8
19 Intuitively speaking, the Gini coefficient indicatesthe average gain expected by an individual fromthe option of being someone else with a higherincome in a population, divided by averageincome. For example, if average income is $1,000a year and the Gini coefficient is 0.6, then theexpected gain from being someone else with ahigher income is $600, a substantial gain. SeeNanak C. Kakwani, Income Inequality and Poverty:Methods of Estimation and Policy Applications(New York, Oxford University Press, 1980), chap. 5.
20 Douglas Smith, “International evidence on howincome inequality and credit market imperfec-tions affect private saving rates”, Journal ofDevelopment Economics, vol. 64, No. 1 (February2001), pp. 103-127, estimates that Gini coeffi-cients of Latin America, sub-Saharan Africa, EastAsia and developed countries are 0.472, 0.468,0.427 and 0.322, respectively, based on a sampleof countries.
21 The poverty gap ratio is defined by the product ofthe proportion of people who live below the pover-ty line and the difference between the poverty lineand the average income of the population livingunder the poverty line, expressed as a percentageof the poverty line. If, for example, 50 per cent ofthe population live below the one-dollar-per-dayline and the average income of these people is 40per cent below the poverty line (that is to say, 60cent a day), then the ratio is 20 per cent.
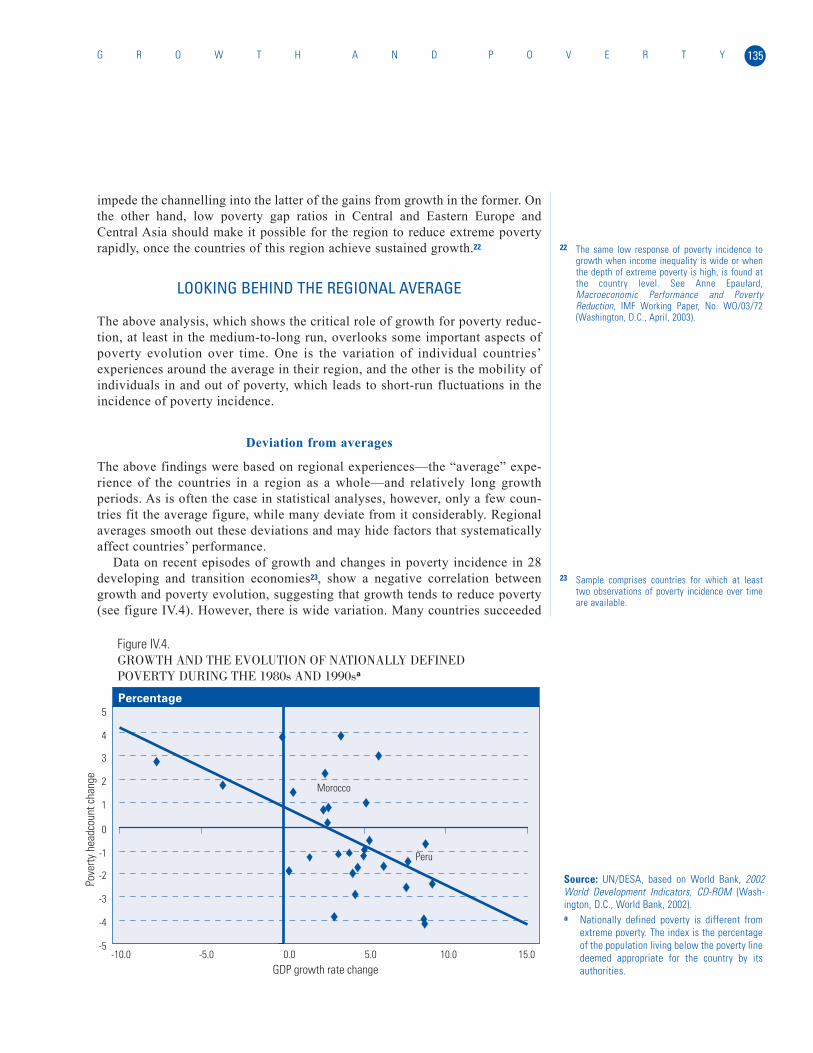
impede the channelling into the latter of the gains from growth in the former. Onthe other hand, low poverty gap ratios in Central and Eastern Europe andCentral Asia should make it possible for the region to reduce extreme povertyrapidly, once the countries of this region achieve sustained growth.22
LOOKING BEHIND THE REGIONAL AVERAGE
The above analysis, which shows the critical role of growth for poverty reduc-tion, at least in the medium-to-long run, overlooks some important aspects ofpoverty evolution over time. One is the variation of individual countries’experiences around the average in their region, and the other is the mobility ofindividuals in and out of poverty, which leads to short-run fluctuations in theincidence of poverty incidence.
Deviation from averages
The above findings were based on regional experiences—the “average” expe-rience of the countries in a region as a whole—and relatively long growthperiods. As is often the case in statistical analyses, however, only a few coun-tries fit the average figure, while many deviate from it considerably. Regionalaverages smooth out these deviations and may hide factors that systematicallyaffect countries’ performance.
Data on recent episodes of growth and changes in poverty incidence in 28developing and transition economies23, show a negative correlation betweengrowth and poverty evolution, suggesting that growth tends to reduce poverty(see figure IV.4). However, there is wide variation. Many countries succeeded
135G R O W T H A N D P O V E R T Y
Source: UN/DESA, based on World Bank, 2002World Development Indicators, CD-ROM (Wash-ington, D.C., World Bank, 2002).a Nationally defined poverty is different from
extreme poverty. The index is the percentageof the population living below the poverty linedeemed appropriate for the country by itsauthorities.
Figure IV.4.GROWTH AND THE EVOLUTION OF NATIONALLY DEFINEDPOVERTY DURING THE 1980s AND 1990sa
GDP growth rate change
Pove
rty h
eadc
ount
cha
nge
-5
-4
-3
-2
-1
0
1
2
3
4
5
-10.0 -5.0 0.0 5.0 10.0 15.0
Morocco
Peru
Percentage
22 The same low response of poverty incidence togrowth when income inequality is wide or whenthe depth of extreme poverty is high, is found atthe country level. See Anne Epaulard,Macroeconomic Performance and PovertyReduction, IMF Working Paper, No. WO/03/72(Washington, D.C., April, 2003).
23 Sample comprises countries for which at leasttwo observations of poverty incidence over timeare available.

in reducing nationally defined poverty headcounts with economic growth (indi-cated by the data points in lower right quadrant); but in eight countries, pover-ty, as measured by their poverty lines, did not fall even though their economieshad grown (upper right quadrant), in some cases considerably. Three countriesexperienced negative growth with increased poverty (upper left quadrant).
At the country level, the evolution of poverty is further influenced by thesituation where poverty incidence is being measured for the first time and bythe policies that a Government adopts or abandons after that first measurement.This is particularly the case when the Government initiates a major economicreform, such as structural adjustment, liberalization or deregulation. For exam-ple, in cases where a country kept poverty (and income inequality) low in apre-reform period by guaranteeing jobs for everyone, the introduction of mar-ket liberalization and greater openness to external trade would eliminate somejobs, at least temporarily, thus increasing poverty if no safety nets were inplace. Countries with economies in transition fall into this category (see chap.VIII). On the other hand, in cases where a Government favoured the interestsof the rich, where poverty was widespread and where inequality was high in apre-reform era, market and trade reforms might have income-equalizingeffects, benefiting the poor. For example, Peru cut its poverty rate and reducedincome inequality during the mid-1990s while implementing reform policiesthat had been initiated in the mid-1980s.24 Regional averages may cancel outsuch differing experiences, hiding the interactions between the initial condi-tions and the policies undertaken subsequently. While the reform policieshelped alleviate poverty in Peru during the mid-1990s, some countries in LatinAmerica and the Caribbean, which were slow to adopt such policies, experi-enced a rising incidence of poverty, even with positive growth.
The extent of differentials between urban and rural development, or eco-nomic dualism (which is often approximated by the relative productivity of thenon-agricultural sector as compared with the agricultural sector), also influ-ences the growth-poverty relationship at the country level.25 Growth of the ruralsector—farm yields plus non-farm incomes—matters for poverty reduction:26
macroeconomic growth without development of the rural sector does not nec-essarily translate into poverty reduction as effectively as otherwise. Morocco,for example, experienced positive growth with rising poverty during the 1990s,mainly because of the deterioration in rural areas. Droughts in the second halfof the decade were a major contributor, but widespread planting of crops thatcommanded higher prices in markets but were less resistant to drought aggra-vated the situation.27 On the other hand, growth in many Asian countries, suchas Japan, the Republic of Korea and Taiwan Province of China in the past andChina and India at present, has led to significant poverty reduction. Strong pro-ductivity increases in agriculture and the transformation of the rural non-farmsector have come about as a result of reforms in land ownership or usage, theintroduction of highly productive seeds combined with new technologies, andimprovements in physical infrastructure.28
Mobility in and out of poverty
At a more fundamental level, averages hide not only countries’ different initialconditions and sectoral characteristics, but also the movement of individual
W O R L D E C O N O M I C A N D S O C I A L S U R V E Y 2 0 0 3136
24 For the income distributions of Peru and othercountries in Latin American and the Caribbean,see Barbara Stallings and Wilson Peres, Growth,Employment, and Equity: The Impact of theEconomic Reforms in Latin America and theCaribbean (Washington, D.C., BrookingsInstitution/ECLAC, 2000), chap. 5.
25 François Bourguignon and Christian Morrisson,“Inequality and development: the role of dual-ism”, Journal of Development Economics, vol. 57,No. 2 (December 1998), pp. 233-257.
26 Ibid. and Martin Ravallion and Gaurav Datt, “Whyhas economic growth been more pro-poor in somestates of India than others?”, Journal ofDevelopment Economics, vol. 68, No. 2 (August2002), pp. 381– 400.
27 IMF, “Morocco; 2001 Article IV consultation: staffreport; public information notice; and statementby the Executive Director for Morocco”, CountryReport, No. 01/205, 13 November 2001.
28 World Economic and Social Survey, 2000 ..., chap. V.
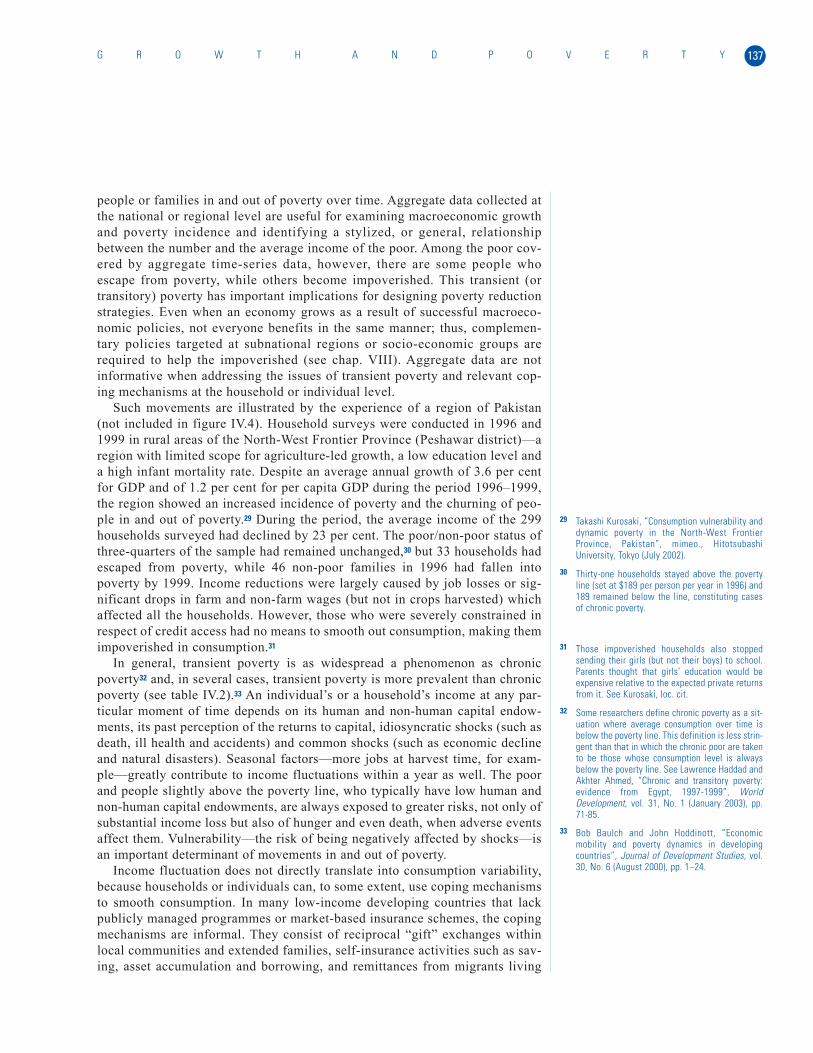
people or families in and out of poverty over time. Aggregate data collected atthe national or regional level are useful for examining macroeconomic growthand poverty incidence and identifying a stylized, or general, relationshipbetween the number and the average income of the poor. Among the poor cov-ered by aggregate time-series data, however, there are some people whoescape from poverty, while others become impoverished. This transient (ortransitory) poverty has important implications for designing poverty reductionstrategies. Even when an economy grows as a result of successful macroeco-nomic policies, not everyone benefits in the same manner; thus, complemen-tary policies targeted at subnational regions or socio-economic groups arerequired to help the impoverished (see chap. VIII). Aggregate data are notinformative when addressing the issues of transient poverty and relevant cop-ing mechanisms at the household or individual level.
Such movements are illustrated by the experience of a region of Pakistan(not included in figure IV.4). Household surveys were conducted in 1996 and1999 in rural areas of the North-West Frontier Province (Peshawar district)—aregion with limited scope for agriculture-led growth, a low education level anda high infant mortality rate. Despite an average annual growth of 3.6 per centfor GDP and of 1.2 per cent for per capita GDP during the period 1996–1999,the region showed an increased incidence of poverty and the churning of peo-ple in and out of poverty.29 During the period, the average income of the 299households surveyed had declined by 23 per cent. The poor/non-poor status ofthree-quarters of the sample had remained unchanged,30 but 33 households hadescaped from poverty, while 46 non-poor families in 1996 had fallen intopoverty by 1999. Income reductions were largely caused by job losses or sig-nificant drops in farm and non-farm wages (but not in crops harvested) whichaffected all the households. However, those who were severely constrained inrespect of credit access had no means to smooth out consumption, making themimpoverished in consumption.31
In general, transient poverty is as widespread a phenomenon as chronicpoverty32 and, in several cases, transient poverty is more prevalent than chronicpoverty (see table IV.2).33 An individual’s or a household’s income at any par-ticular moment of time depends on its human and non-human capital endow-ments, its past perception of the returns to capital, idiosyncratic shocks (such asdeath, ill health and accidents) and common shocks (such as economic declineand natural disasters). Seasonal factors—more jobs at harvest time, for exam-ple—greatly contribute to income fluctuations within a year as well. The poorand people slightly above the poverty line, who typically have low human andnon-human capital endowments, are always exposed to greater risks, not only ofsubstantial income loss but also of hunger and even death, when adverse eventsaffect them. Vulnerability—the risk of being negatively affected by shocks—isan important determinant of movements in and out of poverty.
Income fluctuation does not directly translate into consumption variability,because households or individuals can, to some extent, use coping mechanismsto smooth consumption. In many low-income developing countries that lackpublicly managed programmes or market-based insurance schemes, the copingmechanisms are informal. They consist of reciprocal “gift” exchanges withinlocal communities and extended families, self-insurance activities such as sav-ing, asset accumulation and borrowing, and remittances from migrants living
137G R O W T H A N D P O V E R T Y
29 Takashi Kurosaki, “Consumption vulnerability anddynamic poverty in the North-West FrontierProvince, Pakistan”, mimeo., HitotsubashiUniversity, Tokyo (July 2002).
30 Thirty-one households stayed above the povertyline (set at $189 per person per year in 1996) and189 remained below the line, constituting casesof chronic poverty.
31 Those impoverished households also stoppedsending their girls (but not their boys) to school.Parents thought that girls’ education would beexpensive relative to the expected private returnsfrom it. See Kurosaki, loc. cit.
32 Some researchers define chronic poverty as a sit-uation where average consumption over time isbelow the poverty line. This definition is less strin-gent than that in which the chronic poor are takento be those whose consumption level is alwaysbelow the poverty line. See Lawrence Haddad andAkhter Ahmed, “Chronic and transitory poverty:evidence from Egypt, 1997-1999”, WorldDevelopment, vol. 31, No. 1 (January 2003), pp.71-85.
33 Bob Baulch and John Hoddinott, “Economicmobility and poverty dynamics in developingcountries”, Journal of Development Studies, vol.30, No. 6 (August 2000), pp. 1–24.
abroad or in another part of the country.34 Such private mechanisms can help tobuffer both common shocks to incomes and shocks that are specific to an indi-vidual. These mechanisms do not, however, completely protect people fromfalling into poverty. If a whole community was hit by a natural disaster, therewould be no one who could provide an immediate “gift” exchange, as mostassets in the community, such as land, crops, livestock and houses, would havebeen destroyed. In cases of long illness or the death of a main income-earnerwithin the family, support from the community is lost eventually. Householdsor individuals who are detached from these mechanisms, and thus constrainedin their access to credit, are at higher risk of becoming consumption-poor.
Evolution of poverty in the short run
Movements of people into and out of poverty cause short-run fluctuations inthe incidence of poverty at the national or subnational level. Such short-runmovements, however, are not captured by macroeconomic variables andhousehold surveys in many developing countries because the former are esti-mated only once a year and the latter are conducted only once every fewyears. The lack of data for tracking poverty over short periods makes it diffi-cult to analyse separately the shorter- and longer-run impacts on poverty ofeconomy-wide policies, such as trade liberalization and macroeconomicadjustment.
Yet differences between the short-run and long-run effects of a particularpolicy are often at the core of controversies about the impact on poverty ofmacroeconomic policies, for example, between economists and policy makersin international financial institutions on the one hand and local authorities and
W O R L D E C O N O M I C A N D S O C I A L S U R V E Y 2 0 0 3138
Percentage of householdsAlways Sometimes Never
Country Study period Welfare measure poor poor poor
South Africa 1993-1998 Expenditures per capita 22.7 31.5 45.8Ethiopia 1994-1995 Expenditures per capita 24.8 30.1 45.1India 1968/1969-1970/1971 Income per capita 33.3 36.7 30.0India 1975/1976-1983/1984 Income per capita 21.8 65.8 12.4Côte d'Ivoire 1985-1986 Expenditures per capita 14.5 20.2 65.3Côte d'Ivoire 1986-1987 Expenditures per capita 13.0 22.9 64.1Côte d'Ivoire 1987-1988 Expenditures per capita 25.0 22.0 53.0Zimbabwe 1992/1993-1995/1996 Income per capita 10.6 59.6 29.8China 1985-1990 Expenditures per capita 6.2 47.8 46.0Pakistan 1986-1991 Income per adult equivalent 3.0 55.3 41.7Russian Federation 1992-1993 Income per capita 12.6 30.2 57.2Chile 1967/1968-1985/1986 Income per capita 54.1 31.5 14.4Indonesia 1997-1998 Expenditures per capita 8.6 19.8 71.6
Table IV.2.PROPORTION OF HOUSEHOLDS IN CHRONIC AND TRANSITORY POVERTY, VARIOUS COUNTRIES
Source: Bob Baulch and John Hoddinott, "Economic mobility and poverty dynamics in developing countries", Journal of Development Studies, vol. 30, No. 6 (August 2000),table 1.
34 See chapter VIII of the present Survey; andJonathan Morduch, “Between the state and themarket: can informal insurance patch the safetynet?”, World Bank Research Observer, vol. 14,No. 2 (August 1999), pp. 187–207. According tothe latter, these mechanisms are more prevalentin rural than in urban areas.
fieldworkers in developing countries on the other.35 Analyses by the formergroup are largely based on macroeconomic indicators and survey data and,because of the frequency of data collection, their time-horizon is usually a yearor longer. They assert that growth and the policies that support it are beneficialfor the poor in the longer term. The latter group of local authorities and field-workers (including non-governmental organizations) have day-to-day, hands-on experiences with poverty, and their time-horizon can be as short as a day.36
The impact of growth or policy changes on the poor within the short time-frame may not be captured by long-term macroeconomic and survey data. Forexample, consider a monetary contraction that aims at restraining high infla-tion, but also slows economic activity. Stable and low inflation is key forgrowth and thus for poverty reduction in the long run (see chap. V).37 However,economic slowdowns may adversely affect the poor disproportionally througha rise in unemployment in the short run. Those who focus on a short time-hori-zon are concerned that the poor are on the edge of survival; to them, the possi-bility that the welfare of the poor will improve in a year or more is of littleimportance or relevance.
As discussed previously, there is strong evidence that growth is beneficialfor the poor on average in the long run, but there is little systematic evidenceregarding changes in the welfare status of the poor during short-run fluctua-tions, especially in developing countries. Most of the available evidence is con-fined to anecdotes. To make short-run analyses of poverty evolution that arecomparable with longer-run analyses requires quarterly or semi-annual data onmacroeconomic variables and poverty surveys conducted at least twice a year.Such data are generally unavailable in many developing countries because ofthe scarce human and fiscal resources of Governments.
One exception is Indonesia where the Asian financial crisis that erupted inAugust 1997 and affected the lives of many people in the country invited inten-sified research on economic crises, policy changes and poverty. The country,with the collaboration of the World Bank, tracked short-run changes in pover-ty over the course of the crisis (see figure IV.5). Its Government conducted anumber of large-scale (but not necessarily nationally representative) householdsurveys covering between 10,000 and 65,000 households, starting in 1996.38
While these different surveys used different sampling methods and povertylines, researchers estimated a fairly consistent series of poverty rates for theperiod before and throughout the crisis.
Four findings emerge from a consideration of figure IV.5. First, changes in thelevel of economic activities have significant impacts on the evolution of povertyeven in the short run: the poverty rate had declined steadily while the economywas growing, but the rate almost doubled in the six months after the third quar-ter in 1997, when the crisis hit the country.39 Second, the response of the pover-ty rate to growth was asymmetric with respect to the boom and recession peri-ods; during 1996 and the first three quarters of 1997, the economy is estimatedto have grown by 6 per cent and the poverty rate to have declined from 9.8 to alow of 6.6 per cent, implying that each percentage point of growth had led to a0.5 percentage point reduction in the poverty rate. After the crisis, however, theeconomy shrank by 13 per cent in 1998 and the poverty rate increased from a lowof 6.6 per cent in the third quarter of 1997 to 17.4 per cent in the fourth quarterof 1998, implying that 1 percentage point of output decline had led to an almost
139G R O W T H A N D P O V E R T Y
35 Such a sharp division oversimplifies a complexand wide spectrum of analytical and policy posi-tions held by those who are concerned withpoverty issues. The purpose of such a simple clas-sification is to highlight disagreements in regardto the status of poor people and policy prescrip-tions. See Kanbur, loc. cit., sect. 2.
36 Ibid., sect. 5.
37 See, for example, William Easterly and StanleyFischer, “Inflation and the poor”, Journal ofMoney, Credit and Banking, vol. 33, No. 2 (May2001, part 1), pp. 160-178.
39 A survey conducted during August-October in1997 suggests that the impacts of the crisis werenot yet felt at that time.
38 For details, see Asep Suryahadi and others, “Theevolution of poverty during the crisis in Indonesia,1996 to 1999”, Social Monitoring and EarlyResponse Unit, Jakarta (September 2000). Seealso Menno Pradhan and others, “Measurementsof poverty in Indonesia: 1996, 1999 and beyond”,Social Monitoring and Early Response Unit,Jakarta (n.d.).
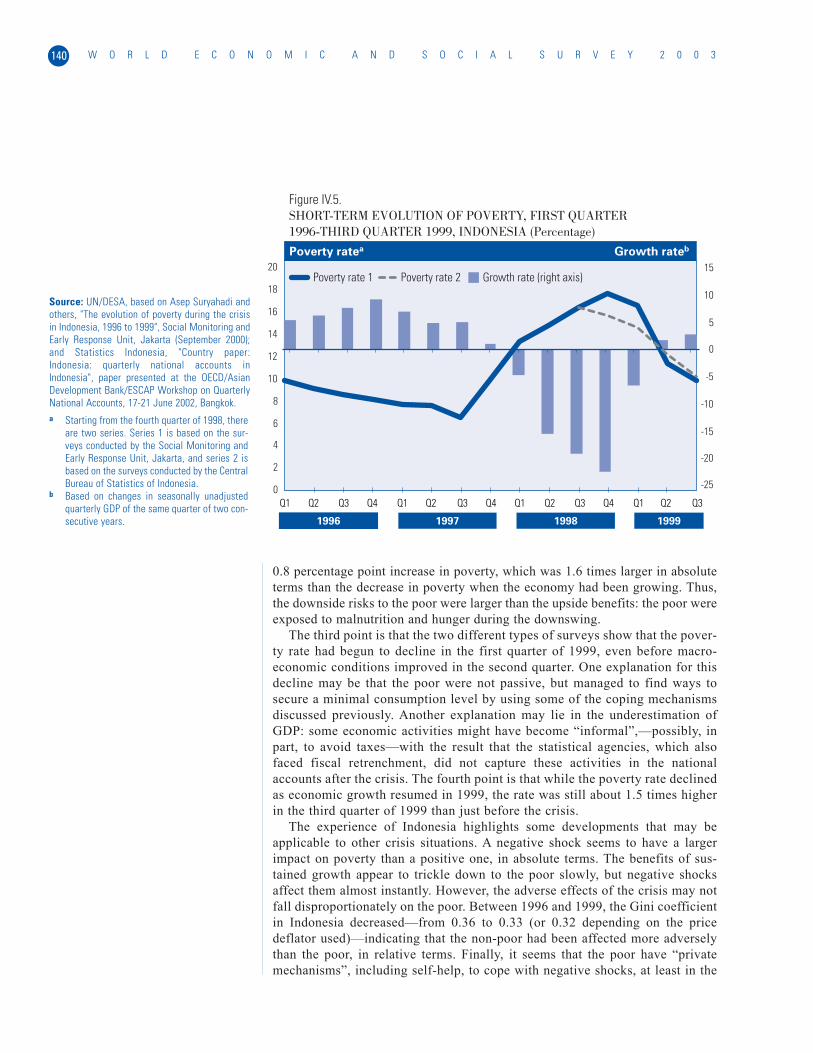
0.8 percentage point increase in poverty, which was 1.6 times larger in absoluteterms than the decrease in poverty when the economy had been growing. Thus,the downside risks to the poor were larger than the upside benefits: the poor wereexposed to malnutrition and hunger during the downswing.
The third point is that the two different types of surveys show that the pover-ty rate had begun to decline in the first quarter of 1999, even before macro-economic conditions improved in the second quarter. One explanation for thisdecline may be that the poor were not passive, but managed to find ways tosecure a minimal consumption level by using some of the coping mechanismsdiscussed previously. Another explanation may lie in the underestimation ofGDP: some economic activities might have become “informal”,—possibly, inpart, to avoid taxes—with the result that the statistical agencies, which alsofaced fiscal retrenchment, did not capture these activities in the nationalaccounts after the crisis. The fourth point is that while the poverty rate declinedas economic growth resumed in 1999, the rate was still about 1.5 times higherin the third quarter of 1999 than just before the crisis.
The experience of Indonesia highlights some developments that may beapplicable to other crisis situations. A negative shock seems to have a largerimpact on poverty than a positive one, in absolute terms. The benefits of sus-tained growth appear to trickle down to the poor slowly, but negative shocksaffect them almost instantly. However, the adverse effects of the crisis may notfall disproportionately on the poor. Between 1996 and 1999, the Gini coefficientin Indonesia decreased—from 0.36 to 0.33 (or 0.32 depending on the pricedeflator used)—indicating that the non-poor had been affected more adverselythan the poor, in relative terms. Finally, it seems that the poor have “privatemechanisms”, including self-help, to cope with negative shocks, at least in the
W O R L D E C O N O M I C A N D S O C I A L S U R V E Y 2 0 0 3140
Figure IV.5.SHORT-TERM EVOLUTION OF POVERTY, FIRST QUARTER 1996-THIRD QUARTER 1999, INDONESIA (Percentage)
Poverty ratea Growth rateb
0
2
4
6
8
10
12
14
16
18
20
1996 1997 1998 1999
Q1 Q2 Q3 Q4 Q1 Q2 Q3 Q4 Q1 Q2 Q3 Q4 Q1 Q2 Q3
-25
-20
-15
-10
-5
0
5
10
15Poverty rate 1 Poverty rate 2 Growth rate (right axis)
Source: UN/DESA, based on Asep Suryahadi andothers, "The evolution of poverty during the crisisin Indonesia, 1996 to 1999", Social Monitoring andEarly Response Unit, Jakarta (September 2000);and Statistics Indonesia, "Country paper:Indonesia: quarterly national accounts inIndonesia", paper presented at the OECD/AsianDevelopment Bank/ESCAP Workshop on QuarterlyNational Accounts, 17-21 June 2002, Bangkok.a Starting from the fourth quarter of 1998, there
are two series. Series 1 is based on the sur-veys conducted by the Social Monitoring andEarly Response Unit, Jakarta, and series 2 isbased on the surveys conducted by the CentralBureau of Statistics of Indonesia.
b Based on changes in seasonally unadjustedquarterly GDP of the same quarter of two con-secutive years.
short run. No evidence is available about the extent to which such coping mech-anisms protect the poor, but the faster turnaround of the poverty rate than ofGDP growth in Indonesia hints at the effectiveness of such mechanisms.
Although there exists a large volume of empirical studies on growth and theevolution of poverty in the long run, short-run analyses of how economic fluc-tuations affect poverty and to what extent coping mechanisms—public and pri-vate—influence the welfare of the poor are still scarce. More such analysescould help fill the void in respect of knowledge about the connections betweenshort-run movements into and out of poverty and the long-run evolution ofpoverty. They also could help in assessing the immediate versus the long-last-ing effects of policies on poverty.
CONCLUDING REMARKS
This chapter has argued that assessing the extent to which growth—which isgenerally desirable for poverty reduction—affects the incidence of poverty isinfluenced by the definition of poverty, the social and geographical level ofaggregation of poverty, and the time-horizon employed for the assessment. Asargued above, improvements in the material dimensions of poverty do notnecessarily go hand in hand with improvements in the non-material dimen-sions of poverty. Even when poverty is defined solely in terms of its materialdimensions, economic growth has been found not to affect all social or geo-graphical groups uniformly and, in some cases, the same growth has affectedtwo groups of people contrarily. Unsustainably high growth tends to reducepoverty incidence in the short run, but it eventually ignites high inflation,eroding the welfare of the population, particularly the poor with little stock ofwealth. Furthermore, as noted in box IV.3, the choice of poverty line influ-ences the general characterization of growth-poverty linkages: if the poor aredefined as the people in the lowest bracket of a country’s income distribution,then they benefit from growth as much as the average income-earner does butif, instead, the poor are defined in absolute terms (as in the MillenniumDevelopment Goals), such distributional neutrality disappears. In short, a sim-ple statement such as “growth is beneficial for the poor” conveys a powerfulmessage, but it can be misleading if not understood in the specific context ofan assessment framework.
The extent to which growth affects the incidence of absolute poverty criti-cally depends on various socio-economic conditions, such as initial distribu-tions of income and physical and human capital, and the economic and politi-cal regimes that prevailed at the time of economic growth. In contrast withgrowth in East Asia, which led to a large decline in the poverty rate, economicgrowth in Latin America and the Caribbean during the 1990s did not reduce thepoverty rate at all. While it is not easy to single out the most important deter-minants, an income distribution highly skewed against the poor and the largepool of chronic poverty, both rooted in the economic, social, political and cul-tural history of Latin America and the Caribbean, are factors that explain theweak linkages between growth and poverty reduction. In sub-Saharan Africa,income inequality aside, the presence of a large number of extremely poor peo-ple, who do not possess human and non-human capital, and the isolation of thesubsistence sector from the formal sector of the economy, make it difficult for
141G R O W T H A N D P O V E R T Y
the benefits of growth to trickle down to the extreme poor, even when the econ-omy grows.
The following chapters of the Survey examine the effects of policies on theincidence of poverty via their effects on the growth of a particular sector or thegrowth of an economy as a whole. They will argue that the complexity of thelinkage between growth and poverty carries over to the relationship betweenpolicies and poverty. The policies to be examined are fiscal and monetary poli-cies, trade policy and two key agricultural reforms, all conducted within theframework of a market-based economy. These policies are not necessarilydesigned to combat poverty directly, but they can have significant impacts onthe incidence of poverty. The complexity of the linkage between policies andpoverty stems from the complex reactions of the market to the policies imple-mented and from the economic, social, political and cultural conditions thatunderlie the state of poverty and income inequalities. Like the assessment ofthe relationship between growth and poverty, the determination by policy mak-ers and researchers of the extent to which a policy is good for the poor needsto be undertaken in terms of three dimensions: the definition of poverty, thelevel of aggregation and the time-horizon employed.
W O R L D E C O N O M I C A N D S O C I A L S U R V E Y 2 0 0 3142
Links between macroeconomic policies and poverty are complex. In the-ory, “good” macroeconomic policies are growth-enhancing,1 and sustainedgrowth reduces poverty in the long run; in practice, however, the extent towhich growth affects poverty varies considerably among countries andover time, as was seen in chapter IV. In addition to the effects of growth,macroeconomic policies have their own direct effects on poverty. For thisreason, it becomes a challenge to evaluate the overall effects of a particu-lar macroeconomic policy on poverty.
Macroeconomic policy is used to manage aggregate demand in the shortrun and to bring the economy to a higher-growth trajectory in the longrun. By these means, policy makers attempt to enhance the well-being ofsociety as a whole, including the poor. In the short run, fiscal and mone-tary policies are used to balance aggregate demand and supply (see partone of the present Survey for a discussion of current practice). In the longrun, structural changes are implemented to influence one or more of thethree sources of growth:2 growth in the factors of production, increasedefficiency in the allocation of these factors across economic activities, andinnovation that increases efficiency in the use of these factors or leads tonew products or new uses for existing products. Trade liberalization, forexample, can increase efficiency in the use of a country’s resources, byexploiting comparative advantage, and introduces new products and tech-nologies from abroad.3 Deregulation of the economy and privatization ofState-owned enterprises aim at improving allocation and production effi-ciency based on market mechanisms. However, the effects of macroeco-nomic policies, especially in the short run, do not always favour the condi-tion of the poor. Therefore, other measures are necessary to protect thepoor until favourable macroeconomic conditions are restored.
The present chapter will first analyse the theoretical relationshipsbetween macroeconomic policy and poverty in the short and long run. Itwill then focus on these relationships when changes in macroeconomic pol-icy occur, especially during times of economic crises, when the poor aremost vulnerable. The experiences of East Asia and Latin America duringthe past 10 years will help illustrate some of the possible effects on pover-ty of sudden changes in macroeconomic policies and conditions. Theimportance of maintaining stability during times of growth in order tohave greater freedom to manoeuvre during times of crises and to be ableto protect the socially and economically vulnerable will be examined. Thefocus will then be placed on the urban poor, since they have been identifiedas more vulnerable in times of economic crises (especially financial) thanthe rural poor. It will then be argued that, since macroeconomic policies
VMACROECONOMIC POLICYAND POVERTY
143M A C R O E C O N O M I C P O L I C Y A N D P O V E R T Y
1 Stanley Fischer, “The role of macroeconomic fac-tors in growth”, Journal of Monetary Economics,vol. 32, No. 3 (December 1993), pp. 485-512.
2 T. N. Srinivasan, “Growth and poverty alleviation:lessons from development experience”, mimeo,February 2001.
3 Trade and poverty are examined in chap. VI.
alone are not sufficient to address the problems of the poor, direct comple-mentary measures are necessary. Examples from the two regions will bestudied. Finally, based on the observations made, policy recommendationsat different levels of actions will be presented.
MONETARY POLICY AND POVERTY
Monetary policy is utilized to affect aggregate demand, and price and employ-ment levels, through a management of the monetary system that uses any orall of its main tools, namely, open-market operations, the setting of an officialdiscount (or other) rate, and transactions in the foreign exchange market. Thedegree to which the monetary authorities depend on individual tools and thecombination chosen will vary depending on the economic situation, the set ofobjectives and the exchange-rate regime. Each tool and combination of toolshas an effect on prices (including interest rates and exchange rates), wagesand employment. Each of these variables, in turn, has a different effect onpoverty. Therefore, one cannot define one general relationship between mone-tary policy and poverty. However, one could simplify the analysis by examin-ing the effects of monetary policy on poverty through observing two basicmacroeconomic variables, namely, output and inflation.
Expansionary monetary policy tends to raise both output and inflation in theshort run. This affects the poor in two main ways. First, high and unanticipat-ed inflation induces an unintended redistribution of income. It can harm thepoor by reducing the real value of wages and transfers (such as pensionincomes and other government-sponsored schemes), but it can benefit the nom-inal debtor—a typical role assumed by the poor—at the expense of creditors.Second, and most importantly, the rise in total output can reduce povertydirectly, as the experience of East Asian countries prior to the 1997 crisisshows (see below). A cyclical expansion creates jobs, the majority of which arelikely to be low-skilled or to have low education requirements.
However, an expansionary monetary policy cannot continue indefinitely. Itdecreases unemployment and increases output above the trend capacity in theshort run. On the other hand, low unemployment and high output, relative tothe trend capacity, cause inflation to rise, in response to which the monetaryauthorities eventually have to contain inflation by shifting to a contractionarypolicy, which will harm the poor, along with other groups, in the short run. Ifnot contained, inflation would accelerate further, leading to hyperinflation and,eventually, economic decline. Therefore, although expansionary policies, ingeneral, may seem more beneficial towards the poor, restraining inflation andpreventing abrupt output fluctuations would be of greater benefit to them in thelong run.4
Prolonged high inflation has several effects on poverty. First, as in the shortrun, it causes a redistribution of income, whose net effects can be either posi-tive or negative for the poor, depending on the combined effect on their wages,transfer payments and debt. Second, uncertainty associated with high inflationdiscourages physical investment in general, thus raising the marginal and aver-age returns on capital and consequently lowering market-based wages; howev-er, if the average return on capital rises and if the tax authorities capture this,the tax burden may shift away from labour and towards capital, partially off-
W O R L D E C O N O M I C A N D S O C I A L S U R V E Y 2 0 0 3144
4 Christina D. Romer and David H. Romer, Monetarypolicy and the well-being of the poor, NationalBureau of Economic Research Working PaperSeries, No. 6793 (Cambridge, Massachusetts,November 1998).
setting the loss in wages. Third, economic uncertainty also discourages thepoor from investing in their own human capital (for example, health and edu-cation), which is an important means for them to escape from poverty. Finally,high inflation may harm some industrial sectors more than others. For exam-ple, it is likely that inflation has adverse impacts on export-oriented sectors inmany developing countries, such as agriculture and light manufacturing whichare labour-intensive and employ the labour-abundant poor. On the other hand,these export sectors may become more competitive depending on the degree ofdepreciation of the currency.
Because these factors affect the poor in different directions and with differ-ent intensities, the net impact of prolonged high inflation on the poor cannot bedetermined a priori. To observe the actual effects, researchers have often usedthe so-called cross-country regression analysis, in which the statistical rela-tionship between prolonged inflation and the incidence of poverty is estimatedbased on many countries’ experiences. In those studies, higher inflation rateshave been associated with lower average incomes of the poor.5 While averageinflation and the variability of nominal growth of gross domestic product(GDP) are highly correlated, making it difficult to isolate the effects of infla-tion on the income of the poor from those exerted by GDP growth, it is appar-ent that monetary policy—through lower inflation, less volatile growth orboth—has contributed to the well-being of the poor. 6
The strong inflation-aversion of the poor that has been revealed in interna-tional polling data substantiates this macrolevel observation:7 the likelihood ofmentioning inflation as a top concern increases as level of income and level ofeducation decrease. Thus, while the rich or highly educated are more informedabout the damage that inflation can cause, their physical, financial and humancapital work as a hedge against inflation, making it less of a concern for themthan for the poor or less well educated. With the least amount of human capi-tal (education) and/or a negligible supply of non-human assets, the poor clear-ly do not have the means to buffer the shocks associated with inflation, andconsequently make it a top concern.
The dilemma of policy makers, who are prone to choose expansionary poli-cies to favour the poor, cannot be resolved within the framework of monetarypolicy alone. The poor prefer low inflation in the long run, but may accept highinflation in the short run if it is associated with expansionary policy and greateremployment opportunities, provided that they have some source of income andhave expectations of taking advantage of these new opportunities. However,expansionary policy must be abandoned sooner or later, to prevent inflationfrom accelerating.
FISCAL POLICY AND POVERTY
The macroeconomic policy that is most closely related to more direct povertyreduction strategies is fiscal policy, since it affects the amount to be spent onsocial needs. Social expenditures usually comprise expenditures for education,health and nutrition, housing, social security and welfare. Social security hasrelatively less relevance to poverty reduction since a larger percentage of thebeneficiaries are typically at income levels above the poverty line.
145M A C R O E C O N O M I C P O L I C Y A N D P O V E R T Y
5 Ibid.
6 William Easterly and Stanley Fischer, “Inflationand the poor”, Journal of Money, Credit andBanking, vol. 33, No. 2 (May 2001, part 1), pp. 160-178.
7 Ibid.

The pursuit of the main objectives of fiscal policy, namely, allocation ofresources, general stabilization and distribution, has an effect on poverty lev-els. Two types of analysis can be performed: at the aggregate level and by com-position. The impact of changes in fiscal policy could be assessed by examin-ing the impact on economic growth of changes in total expenditure or in thedeficit, if these were the only variables that mattered in poverty reduction.8 Anincrease of fiscal expenditure or reductions of taxes will tend to increasenational income in the short run, when the supply constraint is slack. Such arise in national income tends to reduce poverty, as discussed above. In the longrun, however, continuing fiscal expansion without accompanying increases intax revenue will lead to structural fiscal deficits—crowding out private invest-ment, accelerating inflation and slowing growth—particularly if the deficitsare financed by the monetary authorities. Furthermore, when domestic savingsare not large enough to cover domestic investment plus the fiscal deficit (as isoften the case in many developing countries), the current-account balance dete-riorates, creating the so-called twin deficits—fiscal and external. Tax reduc-tions, without reductions in fiscal expenditure, will lead to the same situation.Thus, persistent fiscal imbalances over the long run may have adverse impactson the economy as a whole and on poverty, if these deficits accumulate andreach unsustainable debt levels. It should also be noted that, even if the bal-ances are maintained, unproductive fiscal expenditures that do not facilitate theaccumulation of capital and consequent productivity growth could lowerpotential economic growth over the long run.
However, the total impact of fiscal policy on poverty cannot be predictedaccurately solely on the basis of total expenditure and revenue or the size of thefiscal deficit. The composition of the entire fiscal package—current and capi-tal spending, the functional distribution of expenditure (for example, on edu-cation, health and nutrition, social security and welfare, defence, interest pay-ments etc.) and the types and distribution of financing (taxes, fees and externalassistance)—greatly influences the nature and outcome of the policy. Wheninterest payments take a large share of total expenditure, the Government hasless money to channel towards other objectives, including poverty reduction.On the revenue side, fees of health or educational services limit the opportuni-ties of the poor to receive these services.9 The burden of value-added (or con-sumption) taxes can be disproportionately high for poorer people. On the otherhand, social expenditures may have a positive impact on the poor, if they areeffectively targeted. In order for there to be funds available for the expansionof social programmes when required, the fiscal situation must be stable duringtimes of growth. In the following sections, issues concerning social expendi-tures in different countries will be analysed.
In sum, because of the sensitivity of poverty outcomes to the composition offiscal expenditure and taxes, it is not possible to establish a single general link-age between fiscal policy and poverty. In recognition of the complex relationshipbetween policy and poverty reduction, Governments are agreeing to approach thechallenge by means of the greater participation of civil society, partially basingtheir decision on positive experiences with the participation of, for example, non-governmental organizations during the process of decision-making on fiscal bud-gets in developing countries. This is reflected in the formulation and adoption ofPoverty Reduction Strategy Papers (PRSPs) (See box V.1).
W O R L D E C O N O M I C A N D S O C I A L S U R V E Y 2 0 0 3146
8 For relationships between economic growth andthe size of fiscal expenditures or the size of fiscaldeficits, see Fischer, loc. cit.; and Robert J. Barro,Determinants of Economic Growth: A Cross-Country Empirical Study (Cambridge,Massachusetts, MIT Press, 1997), chap. 1.
9 See World Economic and Social Survey, 2002(United Nations publication, Sales No. E.02.II.C.1),chaps. VII and VIII.

The international community’s increasing awareness that the linkage between eco-nomic growth and poverty incidence is not clear-cut, together with the current domesticand international recognition of the need for national ownership of development pro-grammes, has led to efforts to revise the roles of the State and civil society in formulat-ing poverty reduction policies. In respect of the Poverty Reduction Strategy Papers(PRSPs)—the statements of recipient-government objectives, whose preparation isrequired for all International Monetary Fund (IMF) and World Bank lending to low-incomecountries—the new consensus is to invite wide, active participation by civil society andthe private sector in formulating national public policy—including both macroeconomicand sectoral policies—for the reduction of poverty. The international financial institu-tions, in turn, have introduced new lending instruments designed to support the imple-mentation of poverty reduction strategies.a Bilateral donors have increasingly reorga-nized their own aid programmes with reference to the national policies and goals set outin the PRSPs.b This signifies a fundamental shift, at the domestic and international lev-els, in the way in which Governments and international organizations formulate interna-tional development strategies.
In the PRSPs, it is recognized that macroeconomic stability could help the poor benefitfrom growth, if accompanied by structural adjustment, adequate social policies (on health,education, employment and social inclusion) and effective governance (including budgetaryprocesses and monitoring systems). The PRSPs have strengthened the reform efforts ofdeveloping countries. The use of PRSPs has also expanded reform efforts beyond the socialsector, which was the main area targeted by previous adjustment programmes. Ministriesof finance are now central figures in coordinating countries’ principal policy instruments,linking poverty reduction strategies to medium-term national budget processes for domes-tic and external resources. In these processes, poverty reduction is considered a goal of allsectors, cutting across most if not all macroeconomic and other policy areas.
The participation of civil society in the formulation of all policies that affect the inci-dence of poverty, including macroeconomic policy, is an underlying principle of the PRSPs,drawing on previous positive experiences at the national and local levels in some devel-oping countries.
For example, Uganda’s effort to devise a participatory national strategy for povertyreduction was a model both for the use of PRSPs by the World Bank and IMF, and for theenhanced Heavily Indebted Poor Countries (HIPC) Initiative. In formulating its PovertyEradication Action Plan in 1996-1997, the Government sought participation from “centraland local governments, the donor community, non-governmental organizations and civilsociety, and academia”, and quickly used the results to reallocate public expendituretowards basic services in 1997.c Opportunities for local citizens and non-governmentalorganizations to participate in policy-making have increased since 1998, when responsi-bility for providing many services was devolved to local authorities and relevant budgetdata were presented to the public through the press.d Along these lines, when consultedby the Government in 1998, poor urban and rural communities pleaded for greater accessto clean water, leading to greater priority for this in Uganda’s central budget.e
If the PRSP initiative is not to be “ephemeral, a passing fashion in the ever-changingworld of international development”,f Governments, the international community and civilsociety have to strengthen their capabilities in various areas. These include gatheringmore accurate information on the poor, examining the conditions and causes of poverty,understanding better the links between poverty incidence and the policies considered inthe PRSPs (including fiscal policy in general and allocation of budget funds) and estab-lishing systems for tracking poverty-reducing public spending.g Such actions could great-ly strengthen the participation of the civil society groups that represent the poor, and thusthe ability of the entire development community to reduce poverty.
147M A C R O E C O N O M I C P O L I C Y A N D P O V E R T Y
Box V.1PARTICIPATION OF CIVIL SOCIETY IN STRENGTHENINGPOVERTY REDUCTION STRATEGIES
a Notably, the Poverty Reduction and GrowthFacility of IMF and the Poverty Reduction SupportCredit of the World Bank/InternationalDevelopment Association (IDA).
b David Booth, “Introduction and overview”,Development Policy Review, vol. 21, No. 2 (Specialissue on “Are PRSPs making a difference? TheAfrican experience”) (March 2003), pp. 131-159.
c John Mackinnon and Ritva Reinikka, Lessons fromUganda on Strategies to Fight Poverty, PolicyResearch Working Paper, WPS 2440 (Washington,D.C., World Bank, 30 September 2000).
d Derick W. Brinkerhoff and Arthur A. Goldsmith,“How citizens participate in macroeconomic poli-cy: international experience and implications forpoverty reduction”, World Development, vol. 31,No. 4 (April 2003), p. 696.
f David Booth, loc. cit., p. 135.
e Ibid., p. 690.
g IMF and International Development Association(IDA), “Tracking of poverty-reducing public spend-ing in heavily indebted poor countries”, 27 March2001 (http://www.imf.org/External/np/hipc/2001/track/track.pdf); and IMF and IDA, “Actions tostrengthen the tracking of poverty-reducing publicspending in heavily indebted poor countries”, 22March 2002 (http://www.imf.org/External/np/hipc/2002/track/032202.htm).

MACROECONOMIC POLICY IN TIMES OF CRISIS
Shocks to the domestic economy can come in different shapes and sizes. Theycan be caused either by non-economic factors such as natural disasters, inter-nal political turmoil and wars, or by economic factors like sudden changes inthe prices of commodities, domestic banking crises or fiscal crises, whichcould create an outflow of capital leading to balance-of-payments crises.Additionally, a crisis in one country may be triggered by events in another: aflight of capital may assume regional dimensions, affecting other neighbour-ing countries and their currencies. Although both non-economic and economicshocks can have important effects on the economy and poverty, focus will bedirected towards shocks caused by economic factors, since they are moreclosely related to economic policy.
Such economic shocks have become more commonplace as economies havebecome more open and thus more sensitive to changes in the internationaleconomy. On the one hand, without liberalization, capital flows would havebeen smaller and would have provided less support to the development process;on the other hand, liberalization also meant an increase in vulnerability,demanding greater care in both the macroeconomic and sectoral managementof the economy in order for it to be able to reap the benefits of liberalization.10
Economic crises, which are often associated with sharp increases in pover-ty, induce Governments and international financial institutions to introducevarious measures to reduce economic volatility. Given the importance andseverity of the crises in the 1990s, more analysis is required on the extent towhich increases in poverty have differed among crisis-affected countries andon why there have been such differences. An important policy question con-cerns the priority attached to reducing poverty, since measures to protect thepoor (increasing social expenditure, for example) may worsen the fiscal bal-ance in the short run. Policy makers have to consider the trade-offs betweendifferent policies and measures, for example, social and macroeconomic poli-cies, when prioritizing objectives. Another important issue is whether anyincrease in poverty during a crisis will turn out to be just transitory or (in partor in its entirety) chronic.
While a review of recent country experiences can give policy makers somehints on the relationship between policy and poverty, more systematic andmore comprehensive understanding is required to make the tolls of macroeco-nomic policy a more effective part of poverty reduction strategies.
Economic crises magnify the effects of changes in growth and short-termmacroeconomic policy on poverty. The crises during the 1990s serve as recentcase studies of this relationship and confirm the limitations of macroeconomicpolicy in reducing poverty in times of crises. Experiences on two continents,Asia and Latin America, in countries with different economic structures showboth similarities and differences, but at the same time provide some insight intothe prevention of future crises and their consequences. The following sectionswill briefly describe the macroeconomic responses to these crises, analyse thepossible effects on poverty, and discuss the supplementary measures that had tobe taken in light of the limitations of macroeconomic policies in times of shock.
W O R L D E C O N O M I C A N D S O C I A L S U R V E Y 2 0 0 3148
10 For a further discussion on vulnerability, refer tothe World Economic and Social Survey, 2001(United Nations publication, Sales No. E.01.II.C.1),part two.
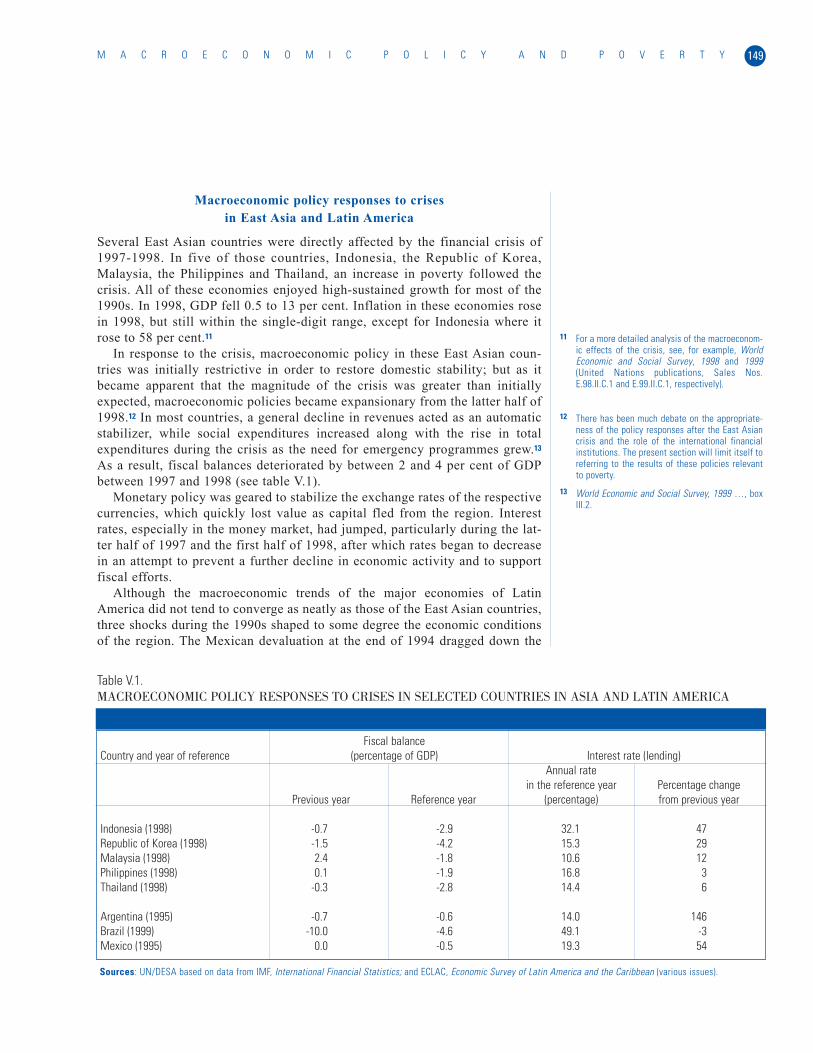
Macroeconomic policy responses to crisesin East Asia and Latin America
Several East Asian countries were directly affected by the financial crisis of1997-1998. In five of those countries, Indonesia, the Republic of Korea,Malaysia, the Philippines and Thailand, an increase in poverty followed thecrisis. All of these economies enjoyed high-sustained growth for most of the1990s. In 1998, GDP fell 0.5 to 13 per cent. Inflation in these economies rosein 1998, but still within the single-digit range, except for Indonesia where itrose to 58 per cent.11
In response to the crisis, macroeconomic policy in these East Asian coun-tries was initially restrictive in order to restore domestic stability; but as itbecame apparent that the magnitude of the crisis was greater than initiallyexpected, macroeconomic policies became expansionary from the latter half of1998.12 In most countries, a general decline in revenues acted as an automaticstabilizer, while social expenditures increased along with the rise in totalexpenditures during the crisis as the need for emergency programmes grew.13
As a result, fiscal balances deteriorated by between 2 and 4 per cent of GDPbetween 1997 and 1998 (see table V.1).
Monetary policy was geared to stabilize the exchange rates of the respectivecurrencies, which quickly lost value as capital fled from the region. Interestrates, especially in the money market, had jumped, particularly during the lat-ter half of 1997 and the first half of 1998, after which rates began to decreasein an attempt to prevent a further decline in economic activity and to supportfiscal efforts.
Although the macroeconomic trends of the major economies of LatinAmerica did not tend to converge as neatly as those of the East Asian countries,three shocks during the 1990s shaped to some degree the economic conditionsof the region. The Mexican devaluation at the end of 1994 dragged down the
149M A C R O E C O N O M I C P O L I C Y A N D P O V E R T Y
Fiscal balanceCountry and year of reference (percentage of GDP) Interest rate (lending)
Annual ratein the reference year Percentage change
Previous year Reference year (percentage) from previous year
Indonesia (1998) -0.7 -2.9 32.1 47Republic of Korea (1998) -1.5 -4.2 15.3 29Malaysia (1998) 2.4 -1.8 10.6 12Philippines (1998) 0.1 -1.9 16.8 3Thailand (1998) -0.3 -2.8 14.4 6
Argentina (1995) -0.7 -0.6 14.0 146Brazil (1999) -10.0 -4.6 49.1 -3Mexico (1995) 0.0 -0.5 19.3 54
Table V.1.MACROECONOMIC POLICY RESPONSES TO CRISES IN SELECTED COUNTRIES IN ASIA AND LATIN AMERICA
Sources: UN/DESA based on data from IMF, International Financial Statistics; and ECLAC, Economic Survey of Latin America and the Caribbean (various issues).
11 For a more detailed analysis of the macroeconom-ic effects of the crisis, see, for example, WorldEconomic and Social Survey, 1998 and 1999(United Nations publications, Sales Nos.E.98.II.C.1 and E.99.II.C.1, respectively).
12 There has been much debate on the appropriate-ness of the policy responses after the East Asiancrisis and the role of the international financialinstitutions. The present section will limit itself toreferring to the results of these policies relevantto poverty.
13 World Economic and Social Survey, 1999 …, boxIII.2.
Argentine economy in 1995. Brazil had not been directly affected at that time,but the East Asian crisis followed by the Russian crisis of August 1998 put pres-sure on the Brazilian real, which had remained within a band since the begin-ning of the Real Plan in 1994 but had to be devalued in 1999. At the turn of thecentury, Argentina underwent its own crisis, while economic activity in Mexicoand Brazil remained anaemic owing to the general global slowdown.
Inflation was rampant in the region during the first part of the 1990s; itsurged in 1995 in Mexico, while Argentina managed to control its hyperinfla-tion with the introduction of the Convertibility Plan, pegging the peso to thedollar one to one. The inflation situations in the three economies in the begin-ning of the new century had seemed to converge, although Brazil’s inflationwas slowly rising again in 2002. The Mexican peso had fallen in 1995, whilethe Argentine peso remained pegged until Argentina’s abandonment of itsConvertibility Plan in 2002, after which it plummeted. The real experiencedmore fluctuations during this period. Despite different exchange-rate paths, thecurrent-account balances of the three largest economies in the region con-verged into deficits ranging between 1 and 5 per cent of GDP during the latterhalf of the 1990s. This meant a reduction in the current-account deficits ofArgentina and Mexico compared with those of their pre-crisis period that wasbrought about by an increase in exports. Brazil’s current-account deficitexpanded between 1994 and 1999 and stabilized at about 4 per cent of GDPduring the post-crisis years.
In general, macroeconomic policy in Latin America during the 1990s waslargely conditioned by the swings in the economy. For example, on the fiscalside, since government revenues closely followed the trends in growth, andexpenditures tended to follow revenues, Governments tended to spend morein times of growth and to cut down in times of trouble. Given the potential offiscal policy to positively affect growth, this pro-cyclical tendency becamecounterproductive.14
Similarly, monetary policy in Latin America in general has not been able tosmooth the volatile tendencies of the economies of the region. Usually, after asharp fall in GDP accompanied by a significant outflow of capital, domesticcurrencies quickly began to lose their value. In an attempt to adjust and to pre-vent the inflationary effects of the depreciation, monetary authorities wereforced to raise interest rates. This, in turn, dampened investment and madeindebtedness more expensive in the medium term, with particularly adverseeffects on domestic financing. In consequence, this type of monetary policycould only exacerbate the contractionary effect of fiscal policy, at a time whenthe entire economy was shrinking from the effect of the shock.
In the absence of domestic and external finance, this policy combinationmay be the only means to return to price stability and eventually regain thepath of growth. However, the impact on the economy and society may havelong-lasting repercussions.
Of the three Latin American countries discussed here, Mexico had a rela-tively stable fiscal situation throughout the decade of the 1990s, even duringthe crisis of 1994-1995. In general, primary expenditures remained fairly sta-ble and fiscal deficits did not experience visible increases during the crisis. Atthe beginning of the 1990s, Argentina’s fiscal situation had been stable but,afflicted by problems in the real domestic economy, the external sector and
W O R L D E C O N O M I C A N D S O C I A L S U R V E Y 2 0 0 3150
14 Ricardo Martner, “Los estabilizadores fiscalesautomáticos”, Revista de la CEPAL (Santiago), No.70 (April 2000).

provincial finances, it deteriorated during the latter part of the decade until2002. This accumulation of problems ended up with the abandonment of theConvertibility Plan, and the cutting of expenditures during declines in eco-nomic activity. Brazil’s public sector had suffered a large fiscal deficit fuelledby the increasing costs of servicing its debt in 1998. This was followed by aquick contraction in 1999, following recommendations of the internationalfinancial community to put limits on primary expenditures.15
Monetary policy in these three countries was attempting to ease the fall ofthe value of their currencies, to attract short-term capital and/or to attenuate theimminent sharp rise in prices. Interest rates had been raised to a much higherlevel in Argentina and Mexico during the crisis of 1995 and in Brazil in 1998and 1999. The first two lowered their rates the following year, while Brazil wasmore hesitant in easing its monetary policy, given that the real value of its cur-rency had dropped 36 per cent in 1999.
Comparing policy responses
While only one major economic shock, that of 1997-1998,16 affected the EastAsian region, Latin America and the Caribbean experienced the Tequila crisisat the end of 1994, the repercussions of the Asian and Russian crises in the1990s, the devaluation of the Brazilian real in 1999 and the series of Argentinecrises. This greater vulnerability of Latin America and the Caribbean alsotranslated into the greater volatility of its economies during this period, notallowing much time or space for recovery. In addition to this constant short-term volatility, domestic savings in Latin America during the 1990s remainedpractically stagnant, partly owing to the lower savings of the public sector.17
Furthermore, all five East Asian countries discussed here ended up with cur-rent-account surpluses, while each of the major Latin American countries stillhad to finance a deficit in its current account after the crises.18
Given these differences in the need for capital flows and degree of volatili-ty, the macroeconomic policy responses varied among regions. As seen above,the Asian countries were able to pursue a fiscal policy that would help preventa further fall in growth. Similarly, on the monetary side, interest rates werelowered to help reactivate the economy, except in Indonesia where inflationarypressure was much greater. In the case of Latin America, lack of financingobliged Governments to tighten their belts, putting off reactivation policies.Monetary authorities in Latin America were required to adopt contractionarypolicies and fiscal expansion was limited (see table V.1).
This delay in regaining the growth path had repercussions on poverty.Moreover, since the specific crises mentioned affected primarily urban activi-ties, the urban poor were the most afflicted.
The channels of transmission to the poor will vary, depending on the policyresponses taken and the effects on the economic sectors. Two of the most rele-vant variables for the poor are changes in wages and unemployment. The rela-tive degree of adjustment of these variables will depend on inflation, which inturn is affected by the macroeconomic policies. For example, in Argentina,while the Convertibility Plan was still in effect, fiscal deficits had been keptunder 2 per cent of GDP while interest rates were higher than in pre-crisisyears. Thus, inflation was under control and real average wages (although fluc-
151M A C R O E C O N O M I C P O L I C Y A N D P O V E R T Y
16 All five East Asian countries were growing at highsustained rates before the crisis. The Philippineswas growing at a lower rate, but also experiencedthe smallest fall in growth. Although the shock interms of the magnitude of the fall in growth inEast Asia was larger than in the major LatinAmerica countries, recovery came relatively quick-ly to the region.
15 Total expenditures without including debt-servicing.
17 Economic Commission for Latin America and theCaribbean (ECLAC), Una Década de Luces ySombras: América Latina y el Caribe en los AñosNoventa, Alfaomega and ECLAC (Bogotá andSantiago, 2001), p. 89.
18 Except for the 2002 Argentine crisis, which endedup with a current-account surplus owing to a con-traction of its imports.
tuating) were maintained, but they plunged when Argentina abandoned the Planand let the peso float freely (in January 2002). Hence, during the period of theConvertibility Plan, the adjustment was made mostly via unemployment, whichremained consistently high after the initial shock in 1995. In 2002, unemploy-ment also increased greatly but at a slower rate than after the crisis of the mid-1990s. During the Tequila crisis and at the end of the Brazilian Real Plan, thedevaluation and consequent inflation also saw wages in Mexico and Brazil fallbehind the rapid growth of prices. However, wages in Mexico recovered andunemployment was decreased under an expansionary macroeconomic policy,whereas wages in Brazil kept falling and unemployment remained high understrict contractionary measures.
In the aftermath of the Asian crisis, all five countries had experienced high-er unemployment for a few years before it returned to pre-crisis levels, exceptfor Indonesia and the Philippines where unemployment continued to rise. Inthese two countries, monetary policy during the post-crisis years was morerestrictive than in the other countries (that is to say, official and lending inter-est rates remained at higher levels). However, all five countries pursued expan-sionary fiscal policies during the years immediately after the crisis. Of themain sectors with employment data, manufacturing had the biggest fall inemployment in absolute terms in these countries during the crisis years. In con-trast, employment in agriculture rose, despite the fall in output in the sector in1998, except in Thailand where employment in all sectors fell.19 Real averagewages took a dive especially in Indonesia and the Republic of Korea, whichalso experienced large depreciation of their currencies and inflation.
POVERTY AFTER THE CRISES
It has been argued that the single most important cause of short-term increasesin urban poverty (with possible medium- and long-term repercussions) is eco-nomic shocks that are typically produced by external or domestic imbalancesand the policy responses to those imbalances.20 Cities, given the nature of theactivities, investments and industries that are usually concentrated in them areconsequently more susceptible to certain types of shocks than other areas.Falls in investments are a first reaction to crises and as a result, unemploy-ment, especially in the construction and manufacturing sectors, rises. Terms-of-trade shocks could affect rural or urban areas, depending on the location ofthe good’s production. Whatever the shock, the first victims are usually low-skilled workers, who are also at the bottom of the income ladder and the mostneedy.
Although evidence is neither complete nor conclusive, in general, the ruralsectors in East Asia seem to have been more resistant to the effects of the cri-sis in 1997 owing to their reliance on the agricultural sector which was largelyunaffected by the crisis. In Latin America (see below), the majority of the pop-ulation and the poor are concentrated in the urban areas. In addition, the agri-cultural sector in Latin America, similar to that of most of the East Asian coun-tries, was much more resistant to the shocks than the urban-based sectors, andcontinued to grow throughout the crisis periods.21 Therefore, the scope of thepresent discussion is limited to the effect of changes in the macroeconomicenvironment on the urban areas.22
W O R L D E C O N O M I C A N D S O C I A L S U R V E Y 2 0 0 3152
19 Since mining does not employ large amounts oflabour, its decrease was not significant in terms ofthe economically active population or the increaseof poverty. See Asian Development Bank, “Keyindicators of developing Asian and Pacific coun-tries” (http://www.adb.org).
20 For further discussion of this argument, see, forexample, Camilo Arriagada, Pobreza en AméricaLatina: Nuevos Escenarios y Desafíos de PolíticasPara El Hábitat Urbano, Serie Medio Ambiente yDesarrollo, No. 27 (Santiago, ECLAC, October2000); and Nora Lustig, “Crises and the poor:socially responsible macroeconomics”, presiden-tial address given at the Fourth Annual Meeting ofthe Latin American and Caribbean EconomicAssociation, Santiago, 22 October 1999.
21 Based on data from ECLAC, Estudio Económico deAmérica Latina y el Caribe (Santiago, variousissues).
22 Another factor, rapid demographic growth, affectsthe situation of urban poverty in the medium andlong term in an important way. At the presentgrowth rate, the urban population will soon sur-pass the rural population (World UrbanizationProspects: The 2001 Revision (United Nations pub-lication, Sales No. E.02.XIII.16). Studies have alsoshown that if urban poverty continues its presentrate of growth, it will surpass its rural counterpart.(Martin Ravallion, “On the urbanization of pover-ty,” Journal of Development Economics, vol. 68(2002), pp. 435-442; see also chap. VII of the pre-sent Survey for a discussion on rural poverty).Thus, urban poverty may become a problem if theappropriate policies are not implemented.
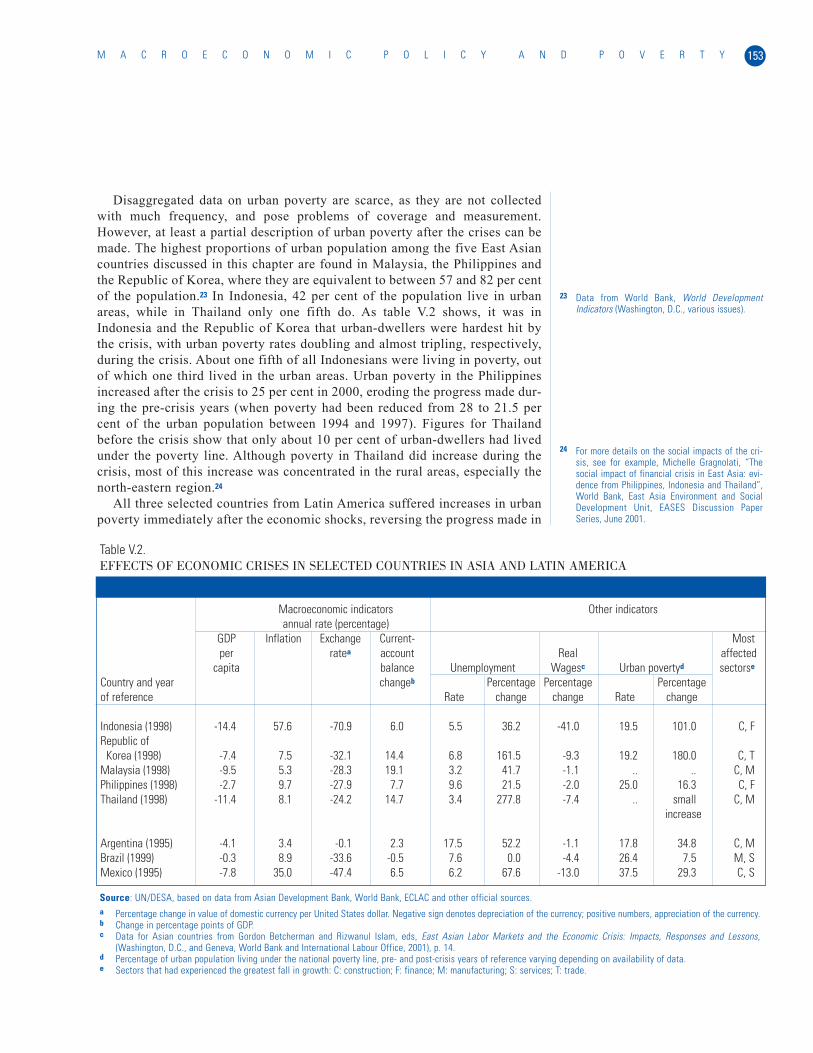
Disaggregated data on urban poverty are scarce, as they are not collectedwith much frequency, and pose problems of coverage and measurement.However, at least a partial description of urban poverty after the crises can bemade. The highest proportions of urban population among the five East Asiancountries discussed in this chapter are found in Malaysia, the Philippines andthe Republic of Korea, where they are equivalent to between 57 and 82 per centof the population.23 In Indonesia, 42 per cent of the population live in urbanareas, while in Thailand only one fifth do. As table V.2 shows, it was inIndonesia and the Republic of Korea that urban-dwellers were hardest hit bythe crisis, with urban poverty rates doubling and almost tripling, respectively,during the crisis. About one fifth of all Indonesians were living in poverty, outof which one third lived in the urban areas. Urban poverty in the Philippinesincreased after the crisis to 25 per cent in 2000, eroding the progress made dur-ing the pre-crisis years (when poverty had been reduced from 28 to 21.5 percent of the urban population between 1994 and 1997). Figures for Thailandbefore the crisis show that only about 10 per cent of urban-dwellers had livedunder the poverty line. Although poverty in Thailand did increase during thecrisis, most of this increase was concentrated in the rural areas, especially thenorth-eastern region.24
All three selected countries from Latin America suffered increases in urbanpoverty immediately after the economic shocks, reversing the progress made in
153M A C R O E C O N O M I C P O L I C Y A N D P O V E R T Y
Table V.2.EFFECTS OF ECONOMIC CRISES IN SELECTED COUNTRIES IN ASIA AND LATIN AMERICA
Macroeconomic indicators Other indicatorsannual rate (percentage)
GDP Inflation Exchange Current- Mostper ratea account Real affected
capita balance Unemployment Wagesc Urban povertyd sectorse
Country and year changeb Percentage Percentage Percentageof reference Rate change change Rate change
Indonesia (1998) -14.4 57.6 -70.9 6.0 5.5 36.2 -41.0 19.5 101.0 C, FRepublic of
Korea (1998) -7.4 7.5 -32.1 14.4 6.8 161.5 -9.3 19.2 180.0 C, TMalaysia (1998) -9.5 5.3 -28.3 19.1 3.2 41.7 -1.1 .. .. C, MPhilippines (1998) -2.7 9.7 -27.9 7.7 9.6 21.5 -2.0 25.0 16.3 C, FThailand (1998) -11.4 8.1 -24.2 14.7 3.4 277.8 -7.4 .. small C, M
increase
Argentina (1995) -4.1 3.4 -0.1 2.3 17.5 52.2 -1.1 17.8 34.8 C, MBrazil (1999) -0.3 8.9 -33.6 -0.5 7.6 0.0 -4.4 26.4 7.5 M, SMexico (1995) -7.8 35.0 -47.4 6.5 6.2 67.6 -13.0 37.5 29.3 C, S
Source: UN/DESA, based on data from Asian Development Bank, World Bank, ECLAC and other official sources.a Percentage change in value of domestic currency per United States dollar. Negative sign denotes depreciation of the currency; positive numbers, appreciation of the currency. b Change in percentage points of GDP.c Data for Asian countries from Gordon Betcherman and Rizwanul Islam, eds, East Asian Labor Markets and the Economic Crisis: Impacts, Responses and Lessons,
(Washington, D.C., and Geneva, World Bank and International Labour Office, 2001), p. 14.d Percentage of urban population living under the national poverty line, pre- and post-crisis years of reference varying depending on availability of data.e Sectors that had experienced the greatest fall in growth: C: construction; F: finance; M: manufacturing; S: services; T: trade.
23 Data from World Bank, World DevelopmentIndicators (Washington, D.C., various issues).
24 For more details on the social impacts of the cri-sis, see for example, Michelle Gragnolati, “Thesocial impact of financial crisis in East Asia: evi-dence from Philippines, Indonesia and Thailand”,World Bank, East Asia Environment and SocialDevelopment Unit, EASES Discussion PaperSeries, June 2001.
terms of poverty reduction before the crises occurred, as was the case in EastAsia. The majority of the population in these countries (75-88 per cent), as inmost Latin American countries, live in urban areas, as do about 60-75 per centof the total poor population.25 Argentina and Mexico had managed to reduceurban poverty before 1994, especially the former, from almost 19 per cent ofthe total population in 1990 to a little over 11 per cent by 1994. After a sharpincrease in urban poverty in Mexico in 1996, the level fell close to the pre-cri-sis level. However, the urban poverty level (29 per cent of the total population)remains high in Mexico. Argentina’s urban poverty problem continued to wors-en during the second half of the 1990s and into the new decade, along with themacroeconomic downturn. In the Greater Buenos Aires area alone, the popula-tion below the nationally established poverty line increased from about 30 to50 per cent between October 2000 and May 2002.26 The rate of poverty in urbanareas of Brazil decreased from 36 to 24 per cent between 1990 and 199627, butthis reduction was reversed during the crisis of 1999 when the poverty rate roseto over 26 per cent.
DIRECT MEASURES TO ADDRESS URBAN POVERTY
The degrees of freedom in the macroeconomic policy arena that authorities mayearn during times of growth affect the availability of resources when they aremost required to attend to social needs during times of crisis. The pre-crisisaccumulation of surpluses in the East Asian countries allowed them to under-take fiscal expansion in times of crisis and create measures to protect the needy,since such measures had not existed before the crisis.28 The Latin Americanexamples illustrate how greater fiscal constraints even before the crisis and theunmet needs of the large number of the chronic poor limited the extension ofexisting social protection programmes when the crisis occurred.
In general, Governments in Latin America increase the amount directedtowards social expenditures in times of growth. During the times of contractionand slower growth during the 1990s, many countries in the region found it dif-ficult to protect the budgeted social expenditures. The degree of the adjustmentdiffered among countries but, in general, its pro-cyclical pattern correspondedto the pattern of the Governments’ total expenditures. Although attempts weremade to protect funds budgeted towards social objectives, this could notalways be achieved in the presence of financial constraints. Total expendituresare sensitive to the changes in revenues which, at the same time, are condi-tioned by the growth of the economy. As markets have become more open toforeign capital, fluctuations in the economy occur more often and more abrupt-ly, making fiscal expenditures also volatile and thus hard to manage.29
Thus, the fiscal situation may affect the number and size of social protectionschemes. There are two broad types of schemes which can be categorized bytheir objectives: those focused on assisting the affected people in generatingincome or compensating for its loss and those aimed at preserving human orphysical capital and/or recuperating any such capital that was lost. The formerinclude programmes such as workfare, unemployment insurance systems, sev-erance payments and microcredit assistance. The latter includes programmes ineducation, health, nutrition and housing, sometimes referred to as livelihoodprotection.30 Although the social service in the areas in the latter category could
W O R L D E C O N O M I C A N D S O C I A L S U R V E Y 2 0 0 3154
25 World Bank, World Development Indicators, …
26 World Economic Situation and Prospects 2003(United Nations publication, Sales No. E.03.II.C.2),box III.1, entitled “Poverty in Argentina today”.
27 ECLAC, Social Panorama of Latin America, 2000-2001 (United Nations publication, Sales No.E.01.II.G.141).
28 Economic and Social Commission for Asia and thePacific (ESCAP), Protecting Marginalized Groupsduring Economic Downturns: Lessons from theAsian Experience (United Nations publication,Sales No. E.03.II.F.2).
29 For a more detailed elaboration of this argument,refer to ECLAC, Social Panorama of Latin America,2000-2001 …; and ECLAC, The Fiscal Covenant:Strengths, Weaknesses, Challenges (UnitedNations publication, Sales No. E.98.II.G.5),pp.125-129
30 In public financing terms, both types of pro-grammes are budgeted under social expendituresof the government. The income-related pro-grammes are usually part of the social securityexpenditures, while livelihood protection pertainsto the rest of the budget.

also be regarded as constituting monetary assistance, similar to that in the firstgroup of programmes, the focus is nevertheless on investing in human capitaland preventing permanent damage to it. Housing is physical capital, but at thesame time it helps preserve the quality of human capital and the livelihood ofpeople. Governments now see housing not merely as a spatial or physical issue,but as an integral part of efforts to reduce poverty and social isolation, as willbe explained below. Since urban poverty presents multidimensional (incomeand non-income) challenges and each country faces specific problems and con-straints, Governments have applied different measures according to their cir-cumstances. These two types of programmes should complement each other,especially when the income generated by the poor alone is not sufficient to com-pensate for the human capital lost during a crisis or to provide access to services(see table V.3, which categories policies applied after crises).
Indonesia and the Republic of Korea experienced a much higher increase inthe incidence of urban poverty than the Latin America countries (see table V.2).However, on average, poverty rates in Latin America have been higher than inEast Asia. Much progress has been made in poverty reduction in East Asia dur-ing the sustained high-growth period before the crisis. This means that therewas a greater surge in the number of people who became poor after the EastAsian crisis. In addition, most of these “new poor” had been employed in theformal sector before they lost their jobs. Therefore, income-generating pro-grammes were executed in the region to help these new poor return to their pre-vious situations. In contrast, the proportion of the poor had been higher in LatinAmerica before the crisis years, although progress was also made in povertyreduction in those years.31 However, much of the poverty in Latin America isstructural or chronic in nature, and existed even in times of growth. Hence, avariety of programmes have been in place in the region to attend to bothincome and non-income types of needs.
Several “income-type” programmes were implemented in South-East Asiato assist the population affected by the crisis of 1997.32 The programmesincluded proactive measures, that is to say, measures aimed at generating
155M A C R O E C O N O M I C P O L I C Y A N D P O V E R T Y
Types of policiesIncome generation/compensation Livelihood protection
Active Human capital
Workfare programmes Health provisionTraining programmes Nutrition programmesMicro credit programmes Educational programmes
Passive Physical capital
Unemployment insurance Housing programmesSeverance paymentSubsidies
Table V.3.SOCIAL POLICY RESPONSES TO ECONOMIC CRISES
Source: UN/DESA.
31 ECLAC, Social Panorama of Latin America, 2000-2001 ...
32 ESCAP, Protecting Marginalized Groups duringEconomic Downturns ...
income and creating employment, such as public works programmes, micro-credit and small and medium-sized enterprise (SME) credit, and “passive” pro-grammes such as unemployment insurance schemes. In general, these measurespartially achieved their goal of alleviating the loss of income of the needydirectly affected by the regional financial crisis. However, they all encounteredproblems of coverage and efficiency. Many of these programmes had to be cre-ated and implemented after the crisis began, since many of them had not exist-ed or had been discontinued while the region was growing rapidly and did nothave an urgent need for them. In addition, reliance on existing close-knit andstrong family relations and support, that is to say, “social capital”, often tookthe place of government protection, especially during good times, in the fiveEast Asian countries discussed in this chapter. Thus, many of these pro-grammes were ad hoc in nature and lacked the institutionalization and planningnecessary to confront this sudden surge in poverty.
Public works programmes implemented in Indonesia and Thailand generat-ed jobs and expanded necessary infrastructure at the same time. However,given the nature of the jobs offered, namely, heavy construction work, womenand the elderly were not always able to participate in such activities. In addi-tion, most of these programmes were located in the rural areas, and did notattract those who had lost their jobs in the formal sector in the urban areas.Indonesians found that the duration of such programmes was too short and leftmany people still jobless and in need. The arguments in favour of these pro-grammes emphasized their easy execution, the good response from workerswith low levels of education and the rise in income while the work lasted. Inthe Republic of Korea, the Government combined public works and job train-ing with cash and in-kind transfers of food, clothing, housing, education andhealth care, for those eligible for its Livelihood Protection Programme.33 In thisway, the Programme served the dual purpose of providing income-generatingcapacity, and offering assistance in protecting human capital as needed.
Microcredit programmes executed in Indonesia and Thailand benefited, inparticular, women with low education levels.34 Through this credit, beneficia-ries were able to finance income-generating activities with short gestationperiods. However, like the public works programme, the microcredit failed toreach those most directly affected by the financial crisis—the unemployed inthe formal urban sector. One of the reasons for this was the requirement ofcreating groups in order to receive credit. The urban unemployed were notable to form these groups in a short period of time. Another shortcoming ofthe programme was that credit was used by the recipients to finance con-sumption rather than productive investment, reflecting their difficulties inmeeting basic requirements.
The unemployment insurance schemes in the Republic of Korea managed togive just enough relief to the beneficiaries in the formal sector to cover theirbasic needs35 but, as with most insurance schemes, they failed to cover theinformal sector. In the other countries, unemployment insurance was not devel-oped at the time of the crisis.
An important problem with the SME credit programme applied in theRepublic of Korea was that the SMEs most afflicted by the crisis received theleast amount of assistance, while those in better financial standing wereapproved for larger loans. Because standard credit criteria were used to selectthe beneficiaries,36 the most vulnerable had the least access.
W O R L D E C O N O M I C A N D S O C I A L S U R V E Y 2 0 0 3156
33 World Bank, International Monetary Fund (IMF),Asian Development Bank and Inter-AmericanDevelopment Bank (IDB), “Social safety nets inresponse to crisis: lessons and guidelines fromAsia and Latin America,” submitted to the Asia-Pacific Economic Cooperation (APEC) FinanceMinisters, February 2001, pp. 13-14.
34 ESCAP, Protecting Marginalized Groups duringEconomic Downturns …, pp. 44-45.
35 Ibid., p. 52.
36 Ibid., p. 59.
Social protection schemes of the income-generating type have also beenexecuted in Latin America. As in East Asia, targeting is a major challenge inthe region, but for a different reason. Unlike the South-East Asian new poor,many of the poor in Latin America were not part of the formal sector evenbefore the crises. Therefore, these programmes, which are closely related to theformal sector, often failed to reach them. Indonesia and the Philippines haverelatively small informal sectors, accounting for about a fifth of total employ-ment.37 Data for Thailand vary but indicate that the informal sector in the citiesis small, accounting for less than one tenth of total employment. In contrast,the informal sector in cities of Argentina, Brazil and Mexico accounts for from45 per cent to over half of total urban employment.
Some Governments in Latin America and the Caribbean have thus under-taken various programmes that target workers in the informal sector andaddress long-term structural problems.38 Examples of long-term solutions forunskilled poor workers are training programmes such as the RetrainingProgramme on Employment and Wages (Programa de Becas de Capacitaciónpara los Desempleados (Probecat)) in Mexico, which has trained nearly half amillion urban workers per year since the late 1980s. However, each trainingprogramme, owing to its brevity, does not seem to have provided the requiredlong-term skills. In Brazil, the Government is implementing an innovative pro-fessional training programme called the National Worker Qualification Plan(Programa Nacional de Qualificação do Trabalhador (PLANFOR), which is notlinked to the formal sector. With the participation of local government and non-governmental organizations, the programme aims to target the poor who aremostly engaged in the informal sector.39
Unemployment insurance programmes are rarer in Latin America, althoughseverance payments are implemented. However, the high level of informalityof the labour market limits the coverage of such programmes, especially amongthe poor. A case in point is Brazil’s unemployment insurance programme, fund-ed by earmarked contributions from the employers, which benefits mostly theunemployed at higher-income levels.40
The credit programmes in Brazil try to combine two objectives: to supportsmall enterprises, and also to generate employment for the poor through theseenterprises, which are administered and staffed by the poor. The same fund thathas been reserved for the unemployment insurance schemes, the Workers’Assistance Fund (Fundo de Amparo ao Trabalhador (FAT)), established in1990, supports these employment-generation programmes.41
Standards of living are also affected during times of crisis, and their declinemay have long-term effects. A decrease in funding for livelihood protection canmake access to basic services more difficult. Livelihood protection pro-grammes in education, health, nutrition and housing, like income-related socialprotection schemes, have experienced coverage problems. Many of these aretargeted at the entire population and miss the really needy. Thus, often the bet-ter-off benefit more from these programmes since they have more direct accessto them. This can be a problem in times of crisis, when deterioration in humancapital may cause permanent damage to the livelihood of the poor. For exam-ple, a decision to drop out of school in order to start working early because ofloss of income in the household may have lasting repercussions in the futurefor the individual and his/her future household. Newly poor tenants may be
157M A C R O E C O N O M I C P O L I C Y A N D P O V E R T Y
37 International Labour Organization (ILO), KeyIndicators of the Labour Market, 2001-2002(Geneva, 2002).
39 For a review of poverty reduction policies in Brazil,see World Bank, Attacking Brazil’s Poverty: APoverty Report with a Focus on Urban PovertyReduction Policies, vols. 1 and 2, Report No.20475-BR (Washington, D.C., World Bank, 31March 2001).
40 Ibid., pp. 78-79.
41 Ibid., p. 39.
38 There are also work programmes that target work-ers in the formal sector. For example, “workfare”programmes, such as Trabajar in Argentina,offered construction jobs for public infrastructureat wages set not higher than 90 per cent of themarket rate in order to attract only the needy andto encourage a return to the market when thedemand recovered. The advantage of this type ofprogramme is the ability to expand quickly intimes of crisis, target poor areas and attract thepoor. However, the cost assumed by theGovernment could be high. See Norman Hicks andQuentin Wodon, “Social protection for the poor inLatin America”, Revista de la CEPAL, No. 73 (April2001); and Jyotsna Jalan and Martin Ravallion,Income Gains to the Poor from Workfare:Estimates for Argentina’s Trabajar program, WorldBank Policy Research Working Paper, No. 2149(Washington, D.C., July 1999).
forced to leave their dwellings and live in more precarious conditions. In themedium to long term, social expenditures can create positive externalities thatmay permeate other sectors of society. However, a regressive or poorly target-ed programme would not be able to address the post-crisis needs of the lowerdeciles of the population.
The recent experience of Mexico in education and health programmes isillustrative of some of these problems of appropriately reaching the poor.Studies have shown that public education expenditures in Mexico havefavoured the better-off and are highly concentrated in the urban areas, althoughthis distribution became less skewed during the period 1994-2000.Expenditures per student at higher levels of education were disproportionatelyhigher than expenditures at the primary level. In addition, the higher the levelsof education, the more regressive the expenditures. Only at the primary levelwas it found that the poorest 40 per cent of the households were receiving morethan 40 per cent of total public expenditures. Similarly, lower-income decileshave little access to health services, since they do not have medical insurance.Under reform programmes, the Government is attempting to increase access byoffering medical insurance to workers outside the formal sector.42
Strategies with multiple objectives, that is to say, incentives to encouragethe poor to try to protect or build various aspects of their “human capital”simultaneously, have also faced targeting problems. For example, food subsi-dies have been implemented to encourage school attendance and health treat-ment. However, lack of access to education and health facilities still impedesthe poor’s participation despite the incentives. Conditional cash transfers areinstruments with similar problems in respect of targeting and reaching theappropriate groups.
Housing problems are probably the most visible result of urban poverty.Insufficient income and lack of access to credit force the poor to illegally claimland and build their living quarters with whatever means they have available.These large slums, well known in cities of Brazil (favelas) and Mexico (colo-nias populares), not only pose urban policy problems to the authorities, but canalso perpetuate the precarious conditions of the poor living in them. Since landis claimed haphazardly, appropriate infrastructure is not in place, creatingunhealthy, unsanitary, crowded and even dangerous conditions (such as steephillsides vulnerable to landslides) for the inhabitants. In addition, such livingquarters create physical and social isolation from the rest of the urban area andcommunity. The mere provision of housing does not reduce urban povertyalthough it does improve living conditions.
In Brazil, several different approaches have been taken to address the hous-ing problem of the urban poor.43 One approach is offering credit to eitherhouseholds or communities. The credit programmmes for households targetgroups with different income levels under different conditions. Programmescovering communities include many non-poor households, but some munici-palities are not eligible for credit at all owing to their low creditworthiness.Thus, the truly needy communities still remain without access to credit, whilesome non-poor households in eligible communities receive benefits.
A second type of programme is geared to the general improvement of theconditions of slums. These programmes provide the infrastructure necessaryfor basic services to be received and also provide support and advice in order
W O R L D E C O N O M I C A N D S O C I A L S U R V E Y 2 0 0 3158
42 Ana Corbacho and Gerd Schwartz, Mexico:Experiences with Pro-Poor Expenditure Policies,IMF Working Paper WP/02/12 (Washington, D.C.,January 2002).
43 Further analysis of these programmes can befound in World Bank, Attacking Brazil’s Poverty…, vol. 2.

to enhance the livelihoods of the dwellers in the favelas. One multisector favelaimprovement project in Rio de Janeiro has the objective of enabling thedwellers to integrate socially and physically with the rest of the neighbour-hoods of the city covering all medium-sized settlements. The Favela Bairro isan ambitious project, which includes the construction of infrastructure,schools, training centres, commercial establishments, sports facilities, provi-sion of basic services etc. Although this project reflects a new type of approachto the housing problem of the poor by attempting to improve not only their liv-ing conditions but also their social integration, the complexity in respect ofachieving these objectives has caused the project to fall short of its objectives.44
A third means of addressing the housing problem of the poor in Braziliancities is to reform land regulations by either legalizing illegally claimed land oreasing up on land-use regulation.45 According to the World Bank, strict land-use regulations in Brazil’s urban areas promote the growth of informal neigh-bourhoods, since the poor cannot meet the requirements and conditions forusing legal land.46
In sum, programmes for both income-generation and the protection of poorpeople’s livelihoods have encountered problems in reaching their target popu-lation, particularly in cases where the informal section is large. Many of theproblems arise from the lack of access to formal institutions. While many ofthe newly poor can be aided through programmes related to the formal sector,the chronic poor remain neglected and are more difficult to mobilize.Programmes that target workers in the informal sector or long-term structuralproblems are required to address chronic poverty. Such programmes provide a“safety net” for the poor in times of crisis.
POLICY IMPLICATIONS AND RECOMMENDATIONS
As can be seen, economic shocks can be very detrimental to the urban poorand recovery can be slow and costly. Therefore, the best macroeconomic poli-cy is one that can soften or prevent these shocks. In times of crisis, the imme-diate and primary goal of economic policy is macroeconomic stabilization,and the direct results may or may not coincide with a reduction in poverty.Furthermore, financial constraints can also limit the space for manoeuvre forfiscal policy and determine the course of the subset of policies at the sociallevel. Hence, measures to prevent crises at the macrolevel can and should betaken during times of growth, when constraints are fewer and space formanoeuvre is more ample.
The principle motivation behind taking preventive measures is to avoidexcesses during both good and bad times by “saving for a rainy day”. There hasbeen greater consensus in this respect, especially after the experiences duringthe crises of the 1990s. However, it is also recognized that one set of measuresis not sufficient to prevent crises and that policies must adjust to the specificeconomic situation. Applying sound macroeconomic policies is a necessary butnot a sufficient condition for preventing crises. For example, regulation andsupervision of the domestic banking system and appropriate capital controlscan complement the macroeconomic policies in their efforts directed towards,crisis prevention.47
159M A C R O E C O N O M I C P O L I C Y A N D P O V E R T Y
44 Elizabeth Riley and others, “Favela Bairro and anew generation of housing programmes for theurban poor”, Geoforum, No. 32 (2001), pp. 521-531.
45 Hernando de Soto would also argue, as he has inThe Mystery of Capital: Why Capitalism Triumphsin the West and Fails Everywhere Else (New York,Basic Books, 2000), that the poor not only needproperty rights but also the access to the marketmechanisms that would allow them to increasethe value of their acquired assets.
46 World Bank, Attacking Brazil’s Poverty ...
47 For a discussion on financial vulnerability in aglobalizing world, see chap. IV, entitled “Financialvulnerability in a globalizing world”, WorldEconomic and Social Survey, 2001 (United Nationspublication, Sales No. E.01.II.C.I).
Ideally, such preventive measures would allow Governments to continuous-ly pursue policies that resulted in relatively smooth and uninterrupted growth.In other words, counter-cyclical policies in periods of growth should allow forexpansionary policies when they are required unexpectedly.48 This is essentialfor an effective process of poverty reduction, since this process requires long-term stability and an interruption would mean losing ground in respect of theprogress already made. 49
Such policies would help attenuate the volatility of the economy, whichmakes policy response more difficult in times of crisis. Fiscal constraints dur-ing recessions usually directly reduce the budget assigned for social purposes,thereby impeding assistance to the needy. Hence macroeconomic policy canalso directly affect the efficacy of social protection schemes, and the socialimpact of changes in macroeconomic policy in times of crisis should also be animportant consideration for policy makers.
Social protection schemes are necessary to assist the vulnerable sectors ofthe population in case preventive measures, that is to say, macroeconomic poli-cies, fail to protect the overall economy from either an internal or an externalshock, and to help the chronically poor eventually escape their situation.Ideally, curative measures should not be necessary. Moreover, if structuralproblems (such as the pro-cyclical tendencies of fiscal policies) were reduced,especially during periods of growth, there would be more resources availableduring times of slow or negative growth for social protection schemes.Although such schemes do not guarantee complete shelter from economic fall-out, they may help soften the shock.
Governments have faced many challenges in their pursuit of the reduction ofurban poverty. The gap between the efforts made through policies and theresults demonstrate the complexity of the problem. Problems exist at all stagesof the process: from the design, planning, funding and targeting to the execu-tion and monitoring.
One general difference between the Asian and Latin American economiesconcerns those who became poor as a result of the crises. In Asia, the newlypoor were predominantly those in the formal sector who suddenly faced pover-ty as a result of losing their employment, but who could expect to escapepoverty as a result of re-employment when the crisis subsided. In LatinAmerica, the newly poor were often in the informal sector and joined the ranksof the chronically poor. This structural difference can determine the effective-ness of policies. For example, some policies directed at the poor who are orwho were working in the formal sector may not reach the rest of the urban poor,who may not have access to formal sector institutions. To reach the chronical-ly poor, other types of programmes may be needed.
East Asian countries had to resort to new ad hoc measures, since manysocial protection programmes were either discontinued or non-existent in theregion. These were deemed unnecessary since the region had enjoyed morethan a decade of high growth and relied more on family relationships in timesof trouble—so-called social capital. In contrast, Latin American countriesrelied on extending existing programmes, since the countries had always hadpoverty problems, even during periods of high growth.50
Social expenditures in Latin American countries have followed the cycles ofeconomic activity, which have been very volatile in nature, causing social
W O R L D E C O N O M I C A N D S O C I A L S U R V E Y 2 0 0 3160
48 For a discussion on such policies, see J. A.Ocampo, Developing Countries’ Anti-cyclicalPolicies in a Globalized World, Serie Informes yEstudios Especiales, No. 4 (United Nations publi-cation, Sales No. E.00.II.G.115).
49 Some studies have calculated the cost of crises interms of an increase in urban poverty. For somerecent examples and further discussion on thesocial impact of economic crises, see Nora Lustig,loc. cit.
50 World Bank, IMF, Asian Development Bank andIDB, “Social safety nets in response to crisis ...

expenditures to decrease in times of recession.51 Hence, as is the case for pre-ventive measures at the macrolevel, social protection programmes should beset up during times of growth when resources are available.
Besides all of the above-mentioned problems of implementation, the majorchallenge is to reach the most needy through programmes funded by socialexpenditures. Even though access to health, education and nutrition facilitiesis usually greater in urban areas than in rural areas owing to the populationdispersion and the difficulties of reaching distant locations in rural areas,these urban-based programmes often reach only the middle—and higher-income individuals in the cities. Most programmes can reach only those whoare already in the formal sector, while the extreme poor are often in the infor-mal sector with little access to educational and health facilities.52 In addition,the social structure of many cities in developing countries, especially thosewith a more uneven distribution of income, creates segregation of differenttypes. Large slums are an example of spatial or residential segregation (orconcentration, depending on the viewpoint). The schools near these areas tendto be of a lower standard than the average. The informal sector creates its owndynamic away from the formal labour market, perpetuating a system of isola-tion.53 Thus, conventional programmes are not sufficient for reaching theentire targeted population.
Grass-roots activities have been organized to try to fill this gap and bringneeded services to the urban poor. Given the isolation of the urban poor fromthe formal sector, including institutions and local government, non-govern-mental organizations serve as a natural bridge. Non-governmental organiza-tions have shown that they can build social capital among low-income neigh-bourhoods and obtain financial capital to invest locally.54
The reduction of urban poverty requires the participation of many actors atall levels of society and is as complex a process as economic developmentitself, as well as an essential part of that process. At the highest macrolevel,prevention of shocks is essential, but macroeconomic responses to crises do notalways favour the protection of the poor, particularly since financial con-straints can limit the degrees of freedom of macroeconomic policy. Therefore,at a second level, preventive and curative measures within a social protectionscheme should be in place at all times with varying degrees of intensitydepending on the need. In theory, social programmes would be able to coverthe needs of the poor if they were integrated in the formal sector. However,since the informal sector is very large in most developing countries, grass-roots-level involvement is also necessary to facilitate the access to services ofthe whole community.
161M A C R O E C O N O M I C P O L I C Y A N D P O V E R T Y
51 ECLAC, Social Panorama of Latin America, 2000-2001 ...
52 For a study on the case of Mexico, see for exam-ple, Ana Corbacho, and Gerd Schwartz, op. cit.
53 For a sociological discussion of this phenomenonof isolation of the poor in Latin America, see forexample, Rubén Kaztman, “Seducidos y abandon-ados: el aislamiento social de los pobresurbanos”, Revista de la CEPAL (Santiago), No. 75(December 2001).
54 For a review of grass-roots activities for the urbanpoor, see for example, Diana Mitlin, “Addressingurban poverty through strengthening assets”,Habitat International (forthcoming).

John Stuart Mill, writing in the middle of the nineteenth century, noted
the crucial role that trade can play in the process of development, main-
taining that “the opening of foreign trade … sometimes works as a sort of
industrial revolution in a country whose resources were previously under-
developed”.1 At the beginning of the twenty-first century, this link has
taken on a slightly different emphasis. The current focus is heavily on the
impact of trade policy on an economy and, specifically, on the potential
role of trade policy in poverty reduction. A variety of factors have con-
spired to bring this connection to the forefront in recent decades. First,
there has been the strong export performance of a number of East Asian
economies, commencing in the 1970s, and the vigorous economic growth
that came in the wake of their export drives.2 Moreover, beginning in the
1990s, concern with the process of globalization began to capture the
attention of policy makers and the public. In particular, a great deal of
attention has been directed at the question whether income gaps are
widening between those countries that are successfully integrating them-
selves into the world economy via their trading patterns and those that are
falling by the wayside. Increasing concern is being expressed at the lack of
progress of these poorest economies and their possible marginalization.
The need to include the poorest has been articulated in the United Nations
Millennium Declaration.3 The Millennium Declaration emphasizes the
need for poverty eradication and underscores the need for an open trading
system that is “rule-based, predictable and non-discriminatory” (para. 13)
as one means to this end. Finally, the Monterrey Consensus of the
International Conference on Financing for Development,4 noting that
international trade is “an engine of growth”, stated that a “universal, rule-
based, open, non-discriminatory and equitable multilateral trading sys-
tem, as well as meaningful trade liberalization, can substantially stimulate
development worldwide, benefiting countries at all stages of develop-
ment”(para. 26).
The present chapter will examine the role of trade and trade policies in
stimulating growth and thereby contributing to poverty reduction. Trade
policies are government policies that directly influence the quantity of
goods and services that a country imports or exports. Such policies can
take various forms. For example, liberal trade policies are geared towards
allowing a nation’s residents to trade internationally with a minimum of
government interference, whereas strategic trade policy is intended to
T R A D E P O L I C I E S, G R O W T H A N D P O V E R T Y
VITRADE POLICIES,GROWTH ANDPOVERTY
163
1 John Stuart Mill, Principles of Political Economy(London, Taylor and Francis Books, Ltd., 1996),book III, chap. VII. Originally published in 1848.
2 For example, between 1969 and 1999, the share ofworld exports of goods and services of Hong KongSAR of China, China, Malaysia, the Republic ofKorea and Thailand increased from under 2 to over8 per cent.
3 See General Assembly resolution 55/2 of 8September 2000.
4 Report of the International Conference onFinancing for Development, Monterrey, Mexico,18-22 March 2002 (United Nations publication,Sales No. E. 02.II.A.7), chap. I, resolution 1, annex.

influence the trade policies of partner countries. Such policies are benefi-
cial only if other countries respond by changing their trade policies, as
anticipated. Trade policy liberalization entails such measures as tariff
reductions, relaxing or removing import quotas (quantitative restrictions),
reducing import taxes and dropping export subsidies. All such policies can
be carried out to a greater or lesser degree so that trade liberalization does
not imply a shift to complete laissez-faire.
The basic contention of this chapter is that trade liberalization is a nec-
essary, but not sufficient, condition for economic growth and that it is via
such growth that poverty can be reduced. The chapter will argue that
trade effects—and the policies that instigate them—operate in the short,
medium and long run. Moreover, trade can impact on poverty via a vari-
ety of channels—for example, changing the prices and availability of goods
and services or influencing the distribution of income within a country.
Many of the changes brought about by trade and trade policies incur
adjustment costs. In the longer run, however, the benefits of expanded
trade tend to outweigh the costs. Moreover, avoiding trade expansion
because of a concern with potential adjustment costs would be a recipe for
stagnation. Yet, trade policies have to be thought out, since trade is but
one—sometimes a small—variable in the growth equation, and policies
suited to one country cannot be easily translated for use by other countries
because conditions are as individualistic as are individual economies.
Thus, the trade policy experiences of one country cannot be used to pro-
duce a generally valid “policy prescription”.
TRADE AND THE ECONOMY
The potential of trade to serve as a catalyst for development can be put into
sharp relief by looking at the ratio of trade to gross domestic product (GDP)
in a variety of country groups (see table VI.1). Exports—which are conven-
tionally viewed as contributing to, rather than subtracting from, GDP—had
grown over the course of the 1990s by 29 per cent. By 2000, the ratio of
exports to world GDP was almost 26 per cent. The importance of exports is
further documented by noting that the ratio of exports to GDP was almost 30
per cent in both low-income and low- and middle-income countries, and over
20 per cent in least developed countries. Moreover, in each case, exports had
risen substantially during the decade, at least at double the rate for the devel-
oped countries. With figures such as these, the focus has to be not on whether
trade can serve the interests of growth and poverty reduction, but rather on
putting the policies in place to ensure that it does so.
There are a variety of difficulties inherent in trying to pinpoint the econom-
ic consequences of specific trade policies, as well as in ascertaining the effects
of changes in such policies. The greatest problem lies in the fact that trade
policies are variable, shifting as circumstances demand. In part, this is because
such policies are a useful tool and often easier to implement than changes in
either monetary or fiscal policies. For example, raising government revenue by
levying an import duty may be politically more palatable than raising revenue
by increasing taxes, since the former may hurt a much smaller subset of the
population. Similarly, non-tariff barriers to trade, while economically ineffi-
W O R L D E C O N O M I C A N D S O C I A L S U R V E Y 2 0 0 3164
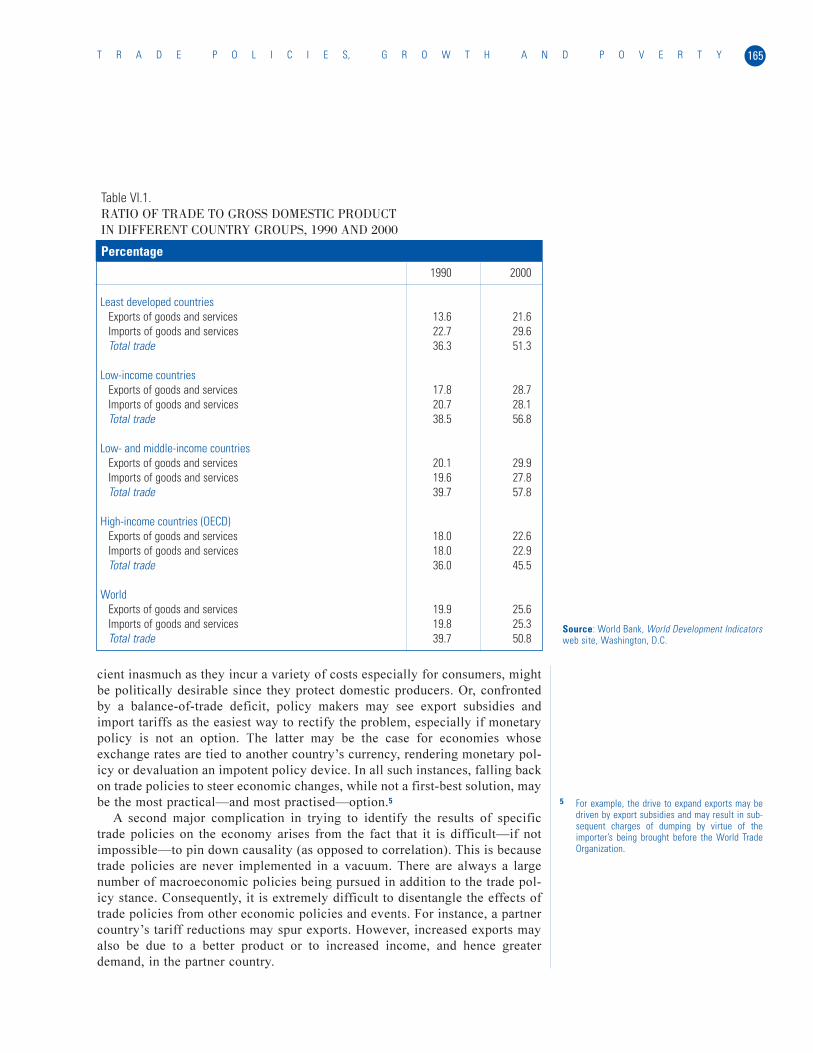
cient inasmuch as they incur a variety of costs especially for consumers, might
be politically desirable since they protect domestic producers. Or, confronted
by a balance-of-trade deficit, policy makers may see export subsidies and
import tariffs as the easiest way to rectify the problem, especially if monetary
policy is not an option. The latter may be the case for economies whose
exchange rates are tied to another country’s currency, rendering monetary pol-
icy or devaluation an impotent policy device. In all such instances, falling back
on trade policies to steer economic changes, while not a first-best solution, may
be the most practical—and most practised—option.5
A second major complication in trying to identify the results of specific
trade policies on the economy arises from the fact that it is difficult—if not
impossible—to pin down causality (as opposed to correlation). This is because
trade policies are never implemented in a vacuum. There are always a large
number of macroeconomic policies being pursued in addition to the trade pol-
icy stance. Consequently, it is extremely difficult to disentangle the effects of
trade policies from other economic policies and events. For instance, a partner
country’s tariff reductions may spur exports. However, increased exports may
also be due to a better product or to increased income, and hence greater
demand, in the partner country.
165T R A D E P O L I C I E S, G R O W T H A N D P O V E R T Y
1990 2000
Least developed countriesExports of goods and services 13.6 21.6Imports of goods and services 22.7 29.6Total trade 36.3 51.3
Low-income countriesExports of goods and services 17.8 28.7Imports of goods and services 20.7 28.1Total trade 38.5 56.8
Low- and middle-income countriesExports of goods and services 20.1 29.9Imports of goods and services 19.6 27.8Total trade 39.7 57.8
High-income countries (OECD)Exports of goods and services 18.0 22.6Imports of goods and services 18.0 22.9Total trade 36.0 45.5
WorldExports of goods and services 19.9 25.6Imports of goods and services 19.8 25.3Total trade 39.7 50.8
Table VI.1.RATIO OF TRADE TO GROSS DOMESTIC PRODUCT IN DIFFERENT COUNTRY GROUPS, 1990 AND 2000
Source: World Bank, World Development Indicatorsweb site, Washington, D.C.
Percentage
5 For example, the drive to expand exports may bedriven by export subsidies and may result in sub-sequent charges of dumping by virtue of theimporter’s being brought before the World TradeOrganization.
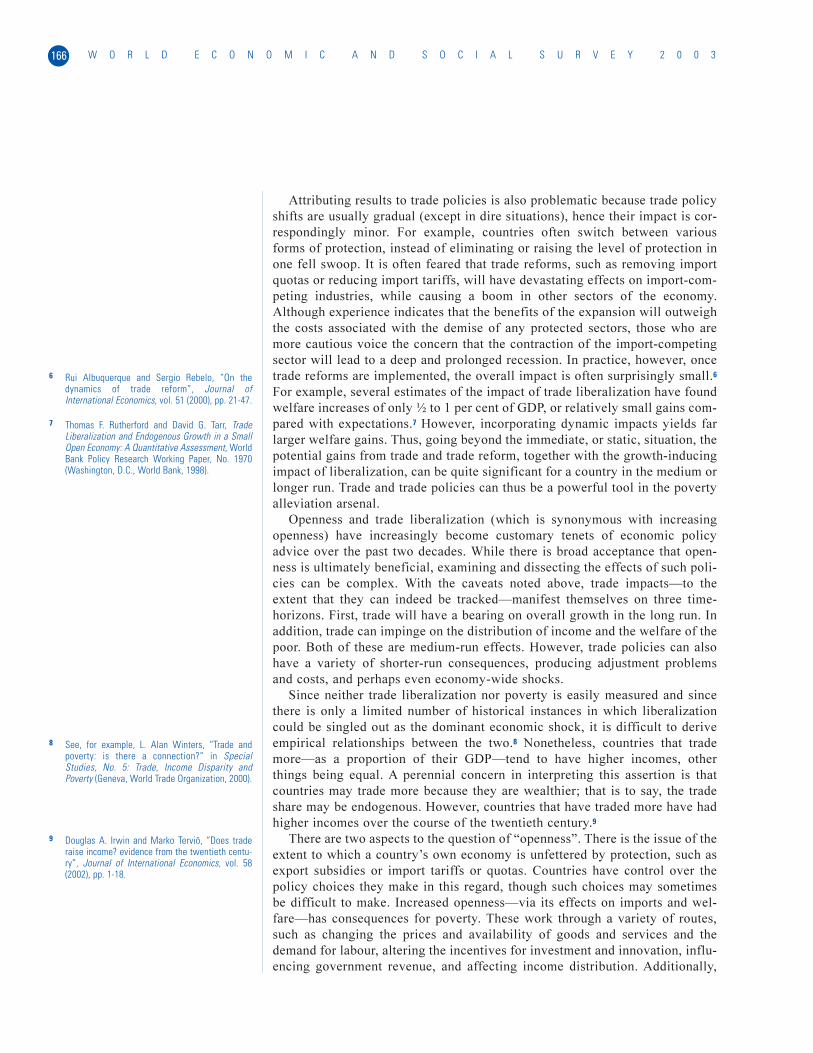
Attributing results to trade policies is also problematic because trade policy
shifts are usually gradual (except in dire situations), hence their impact is cor-
respondingly minor. For example, countries often switch between various
forms of protection, instead of eliminating or raising the level of protection in
one fell swoop. It is often feared that trade reforms, such as removing import
quotas or reducing import tariffs, will have devastating effects on import-com-
peting industries, while causing a boom in other sectors of the economy.
Although experience indicates that the benefits of the expansion will outweigh
the costs associated with the demise of any protected sectors, those who are
more cautious voice the concern that the contraction of the import-competing
sector will lead to a deep and prolonged recession. In practice, however, once
trade reforms are implemented, the overall impact is often surprisingly small.6
For example, several estimates of the impact of trade liberalization have found
welfare increases of only ½ to 1 per cent of GDP, or relatively small gains com-
pared with expectations.7 However, incorporating dynamic impacts yields far
larger welfare gains. Thus, going beyond the immediate, or static, situation, the
potential gains from trade and trade reform, together with the growth-inducing
impact of liberalization, can be quite significant for a country in the medium or
longer run. Trade and trade policies can thus be a powerful tool in the poverty
alleviation arsenal.
Openness and trade liberalization (which is synonymous with increasing
openness) have increasingly become customary tenets of economic policy
advice over the past two decades. While there is broad acceptance that open-
ness is ultimately beneficial, examining and dissecting the effects of such poli-
cies can be complex. With the caveats noted above, trade impacts—to the
extent that they can indeed be tracked—manifest themselves on three time-
horizons. First, trade will have a bearing on overall growth in the long run. In
addition, trade can impinge on the distribution of income and the welfare of the
poor. Both of these are medium-run effects. However, trade policies can also
have a variety of shorter-run consequences, producing adjustment problems
and costs, and perhaps even economy-wide shocks.
Since neither trade liberalization nor poverty is easily measured and since
there is only a limited number of historical instances in which liberalization
could be singled out as the dominant economic shock, it is difficult to derive
empirical relationships between the two.8 Nonetheless, countries that trade
more—as a proportion of their GDP—tend to have higher incomes, other
things being equal. A perennial concern in interpreting this assertion is that
countries may trade more because they are wealthier; that is to say, the trade
share may be endogenous. However, countries that have traded more have had
higher incomes over the course of the twentieth century.9
There are two aspects to the question of “openness”. There is the issue of the
extent to which a country’s own economy is unfettered by protection, such as
export subsidies or import tariffs or quotas. Countries have control over the
policy choices they make in this regard, though such choices may sometimes
be difficult to make. Increased openness—via its effects on imports and wel-
fare—has consequences for poverty. These work through a variety of routes,
such as changing the prices and availability of goods and services and the
demand for labour, altering the incentives for investment and innovation, influ-
encing government revenue, and affecting income distribution. Additionally,
W O R L D E C O N O M I C A N D S O C I A L S U R V E Y 2 0 0 3166
6 Rui Albuquerque and Sergio Rebelo, “On thedynamics of trade reform”, Journal ofInternational Economics, vol. 51 (2000), pp. 21-47.
7 Thomas F. Rutherford and David G. Tarr, TradeLiberalization and Endogenous Growth in a SmallOpen Economy: A Quantitative Assessment, WorldBank Policy Research Working Paper, No. 1970(Washington, D.C., World Bank, 1998).
8 See, for example, L. Alan Winters, “Trade andpoverty: is there a connection?” in SpecialStudies, No. 5: Trade, Income Disparity andPoverty (Geneva, World Trade Organization, 2000).
9 Douglas A. Irwin and Marko Terviö, “Does traderaise income? evidence from the twentieth centu-ry”, Journal of International Economics, vol. 58(2002), pp. 1-18.

there is the issue of access to markets and the degree to which potential part-
ner economies resort to protectionist measures of various sorts, such as quotas,
tariffs and non-tariff barriers to trade. Here the role of exports in generating
GDP growth becomes relevant. To recoup gains from trade, foreign markets
have to be open. Nevertheless, this is something concerning which individual
countries have very little leverage. It falls, rather, upon the partners them-
selves, the World Trade Organization and the international community to
ensure that the multilateral trading system is open and equitable.
TRADE AND GROWTH
Economic growth is acknowledged as a key to permanent poverty alleviation.
The first fundamental question, therefore, is whether opening an economy to
trade is an important determinant of growth.10 This trade opening-growth rela-
tionship must be examined before exploring whether the growth that is associ-
ated with trade liberalization is particularly pro- or anti-poor.
Liberalization and growth in theory and practice
The theoretical links between liberalization and growth are ambiguous. Robert
Solow’s 1956 neoclassical growth model is the standard-bearer in this regard.
The implication of this model is that openness, by allowing for a more effi-
cient allocation of resources, can—under specified conditions—raise the
steady-state level of income and the growth rate. Over the past two decades,
endogenous growth theory has built on this foundation, suggesting that open-
ness may promote long-run growth in a variety of ways, such as through the
diffusion of technology or learning-by-doing.
To assess the empirical evidence of the liberalization-growth link, it is first
of all necessary to recognize the difference between the active opening up—or
liberalization—of an economy and the existing state of openness. It is logical
to seek a relationship between two dynamic variables, such as liberalization
and growth. It is equally logical to look for a relationship between two static
variables, namely, the degree of openness and the level of incomes. However,
it would generally be a mistake to seek an association between the level of
trade openness and growth.11 The benefit of free trade—or openness—is a sta-
tic efficiency benefit. Dynamic benefits, which emanate from liberalization,
impact on growth.12
Casual empiricism attests to an association between export growth and GDP
growth (see figure VI.1). Nevertheless, there are at least two problems that
arise when examining the relationship from a policy perspective. It can be dif-
ficult to assess accurately the trade stance of a country, particularly when it is
relatively closed. This is a definitional issue. In addition, the difficulty of
establishing an empirical link is complicated by the fact that trade policies are
usually part of a policy package.13
While the domestic impacts of liberalization or, conversely, the costs of pro-
tection, can be difficult to gauge, there is a great deal of cross-country and
sometimes controversial evidence that documents a positive relationship
between a liberal trade regime and GDP growth. This finding has been con-
167T R A D E P O L I C I E S, G R O W T H A N D P O V E R T Y
10 For a cogent exposition of these relationships, seeJagdish Bhagwati and T.N. Srinivasan, “Trade andpoverty in the poor countries”, American EconomicReview: Papers and Proceedings, vol. 92 (2002),pp. 180-183.
11 Andrew Berg and Anne Krueger, “Lifting all boats:why openness helps curb poverty”, Finance andDevelopment, vol. 39, No. 3 (September 2002).
12 T. N. Srinivasan and Jagdish Bhagwati, “Outward-orientation and development: are revisionsright?”, Economic Growth Center, Yale University,New Haven, Connecticut, 1999.
13 Neil McCulloch, L. Alan Winters and Xavier Ciera,Trade Liberalization and Poverty: A Handbook(London, United Kingdom Department forInternational Development and Centre forEconomic Policy Research, 2001).
firmed for a diverse set of countries, including a number of sub-Saharan
African economies.14 Looked at from the reverse perspective, findings suggest
that trade barriers for agricultural and industrial goods impose major costs,
both in developed and in developing economies.15 High protection and large
consumer costs are usually concentrated in a handful of industries in each
country. Some sectors appear with regularity on inventories of highly protect-
ed activities. Agriculture, apparel and textiles are on practically every devel-
oped country’s list, while automobiles and parts feature prominently on the
protection schedules of developing countries. Transport, communications and
finance are severely protected by many developed and developing countries.
A positive empirical association between openness and economic growth has
been established, with evidence accumulating that outward-oriented countries
grow faster. Some of these investigations have focused exclusively on develop-
ing countries.16 Others have cast their net wider. A survey of 57 developed and
developing countries over the period 1970-1989 concluded that openness sup-
ports growth.17 Some analyses take the next logical step, looking at openness in
more dynamic terms—that is to say, as synonymous with opening up or liberal-
ization. One examination of the effects of liberalization focused on over 100
developed and developing economies from the post-Second World War period
to the mid-1990s.18 A strong relationship between liberalization and growth was
evident. Within the group of developing countries, the more open economies
grew at a rate of 4.5 per cent per year, whereas the relatively closed economies
grew at a rate of 0.7 per cent per year. Within the group of developed countries,
the results were a growth rate of 2.3 per cent per year for the “open” economies
and a rate of 0.7 per cent per year for the “closed” ones. These findings also
extend to the economies of Central and Eastern Europe that have been under-
taking market reforms, including trade liberalization, since 1990: the strong
trade reformers achieved positive economic growth by 1994.
W O R L D E C O N O M I C A N D S O C I A L S U R V E Y 2 0 0 3168
Figure VI.1.RELATIONSHIP BETWEEN THE AVERAGE ANNUAL RATES OF GROWTH OF GDP AND TRADE, 1990-2000
-5.0
0.0
5.0
10.0
15.0
-20.0 -10.0 0.0 10.0 20.0 30.0
Trade
GDP
Percentage
Source: World Bank, World DevelopmentIndicators, 2002 (Washington, D.C., World Bank,2002).
14 Kazi Matin, Openness and Economic Performancein Sub-Saharan Africa: Evidence from Time-SeriesCross-Country Analysis, World Bank WorkingPaper, No. 1025; and Ann Harrison, Openness andGrowth: A Time Series, Cross-Country Analysis forDeveloping Countries, NBER Working Paper No.5221 (Cambridge, Massachusetts, NationalBureau of Economic Research, 1995).
15 Gary Clyde Hufbauer, “Surveying the costs of pro-tection: a partial equilibrium approach” in TheWorld Trading System: Challenges Ahead, JeffreyJ. Schott, ed. (Washington, D.C., Institute forInternational Economics, 1996).
16 See, for example, Michael Michaely, “Exports andgrowth: an empirical investigation”, Journal ofDevelopment Economics, vol. 4, No. 1, 1977, pp.49-53.
17 Romain Wacziarg, “Measuring the dynamic gainsfrom trade”, Graduate School of Business,Stanford University, Palo Alto, California, 1998;and The World Bank Economic Review, vol. 15,No. 3 (2001), pp. 393-429.
18 Jeffrey D. Sachs and Andrew Warner, “Economicreform and the process of global integration”,Brookings Papers on Economic Activity, No. 1(Washington, D.C., Brookings Institution, 1995).The authors classify the developing economiesinto one of three sets: those that have alwaysbeen open; those that had opened by 1994 afterinitial closure; and those that were closed as ofthe end of 1994.

These studies rarely differentiate between degrees of openness. Further
results for a cross section of over 100 developed and developing countries over
the last three decades, using two groups of trade openness measures, demon-
strated that “trade liberalization does not have a simple and straightforward
relationship with growth…”.19 Nevertheless, trade volume measures are found
to be significantly and positively correlated with growth, while a second set of
proxies for openness support the view that trade promotes growth through a
variety of channels, such as technology transfers, scale economies and com-
parative advantage. An analysis of 93 developed and developing countries dur-
ing 1980-1990, using nine different estimates of “openness”, yielded similar
results. Regardless of how openness is defined, “more open countries have
indeed experienced faster … growth”.20 Moreover, while openness alone seems
to be no guarantee of faster growth, the conclusions of most researchers
involved in these studies is that lower trade barriers, in combination with a sta-
ble and non-discriminatory exchange-rate system, and prudent monetary and
fiscal policies, as well as other elements of good governance, promote eco-
nomic growth.21
Caveats concerning the trade-poverty link
A link exists between trade reform and the efficiency gains necessary for
growth. Reduced average tariff levels, as well as lower quantitative restric-
tions on imports, are associated with increased output growth—even for given
levels of investment and capacity use. However, the extent to which trade
reform benefits a country reflects the initial conditions prevailing in that
country. Countries with well-functioning markets and a better human capital
base benefit more from trade reforms. For example, Ghana, Indonesia and
Turkey had begun their respective trade reform programmes in the 1980s
under different conditions. While all three carried out extensive reforms,
Indonesia and Turkey benefited more because, at that time, they had more
diversified production structures and better-functioning markets than had
Ghana.22 Initial conditions are thus extremely important.
Moreover, a concomitant of “initial conditions” is the considerable variation
that can exist between countries depending on what is and can be exported. The
impact of manufacturing exports on economic growth is likely to be greater
than the impact of primary commodity exports because the former typically
generate greater externalities and learning effects. Such external effects in
commodity-exporting economies tend to be small. Furthermore, the export
growth-economic growth relationship has often been fragile for mineral-
exporting economies. Several explanations have been proffered for this,
including the “Dutch disease” phenomenon, where surges in mineral export
revenues lead to an appreciation of the real exchange rate and consequently to
reduced competitiveness in other tradables.23
Another qualification is that the correlations between trade openness and a
variety of other variables are frequently high. For example, the quality of a
country’s institutions, sustained long-run growth and high levels of trade often
go together. There are findings that suggest “an important joint role for both
trade and institutions in the very long run…”.24 Thus, liberalization is but one
element in an array of variables important for growth, and its relative impor-
tance may vary depending on the time-horizon.
169T R A D E P O L I C I E S, G R O W T H A N D P O V E R T Y
19 Halit Yanikkaya, “Trade openness and economicgrowth: a cross-country empirical investigation”,Journal of Development Economics, vol. X (2003).
20 Sebastian Edwards, Openness, Productivity andGrowth: What Do We Really Know?, NationalBureau of Economic Research Working Paper, No.5978 (Cambridge, Massachusetts, NBER, 1997);and The Economist, 21 March 1998.
21 Robert E. Baldwin, Openness and Growth: What’sthe Empirical Relationship?, National Bureau ofEconomic Research Working Paper, No. 9578,(Cambridge, Massachusetts, NBER, 2003).
22 Ejaz Ghani and Carl Jayarajah, Trade Reform,Efficiency and Growth, World Bank Policy WorkingPaper, No. 1438 (Washington, D.C., World Bank,1995).
23 United Nations Conference on Trade andDevelopment, The Least Developed CountriesReport, 2002: Escaping the Poverty Trap (UnitedNations publication, Sales No. E.02.II.D.13), box 11.
24 David Dollar and Aart Kray, “Institutions, tradeand growth”, Journal of Monetary Economics, vol.50X, No. 1 (2003), pp. 133-162.
Finally, trade policies are but a single element in the policy makers’ arsenal
of macroeconomic policy tools. More significantly, there are objectives that
trade policy cannot—and should not be expected—to achieve. For example, an
examination of the relationship between trade policies and macroeconomic
adjustment in Argentina, Brazil, Chile, Colombia, Costa Rica and Mexico over
the period 1965-95 confirmed the inability of trade policies to solve those
countries’ current-account difficulties. Other means had to be found to deal
with this problem.25
ASSESSING THE EVIDENCE
One of the major problems in determining the trade growth-poverty reduction
relationship is the fragility of the various statistical techniques that can be
applied to an examination of this issue.26 Although trade liberalization is gen-
erally viewed as a positive contributor to poverty alleviation, the evidence as
regards the trade-poverty linkage is usually both fragmentary and often
incomplete. Liberalization allows productive potential to be exploited, assists
with economic growth and curtails arbitrary policy interventions. However,
most reforms will create some losers—even in the longer run—and some
reforms may temporarily exacerbate poverty.27
Moreover, while poverty reduction typically comes hand in hand with econom-
ic growth (see chap. IV), there is considerable variation in the impact of a given
rate of growth on poverty.28 One explanation is that differences in the impact of
growth on poverty are a function of the initial level of inequality. Higher inequal-
ity results in the poor’s receiving a lower share of the gains from growth.
Numerous investigations have found that the poor gain as trade expands. For
a set of “post-1980 globalizers”, which includes China and India, no systemat-
ic relationship was found between large increases in trade volumes and small
changes in household income inequality. The conclusion was that the increase
in growth rates that had accompanied expanded trade on average translated into
more or less proportionate increases in the incomes of the poor.29
Comparable results have also been established for individual countries. For
example, simulations for Cameroon, the Gambia, Madagascar and the Niger
suggested that trade (and exchange-rate) liberalization tended to benefit poor
households in both rural and urban areas, as rents on foreign exchange were
eliminated, demand for labour increased and returns to the production of agri-
cultural tradables rose.30
A further example is provided by a study of India in the 1990s. This sug-
gested that economic growth in India had typically reduced poverty prior to the
1990s and that the 1980s rate of poverty reduction was most likely maintained
through the last decade. At the same time, however, achieving higher aggregate
economic growth was only one element of an effective poverty reduction strat-
egy for India. Had the sectoral and geographical composition of growth been
more balanced, and had existing inequalities in human resource development
and between urban and rural areas been better redressed, the rate of poverty
reduction would have been considerably higher.31
Overall, therefore, while trade liberalization alone cannot be linked incon-
trovertibly to poverty reduction, the general tendency of the evidence, com-
prising both cross-sectional and case studies, is strongly in the direction of
such a linkage.32
W O R L D E C O N O M I C A N D S O C I A L S U R V E Y 2 0 0 3170
25 Sarath Rajapatirana, Trade Policies, Macroeco-nomic Adjustment, and Manufactured Exports:The Latin American Experience, World Bank PolicyResearch Working Paper, No. 1492 (Washington,D.C., World Bank, 1995).
26 Methods in current use fall into four broad cate-gories, namely, cross-country regression analysis,partial equilibrium/cost-of-living analysis, generalequilibrium simulation, and micro-macro synthe-sis. These four groups encompass both the “bot-tom-up” and the “top-down” approaches that areemployed by poverty and trade specialists, respec-tively. The first approach is based on detailed sur-vey information and emphasizes the heterogeneityof individual households and commodity marketlinks between trade and poverty. The secondmethodology begins with microeconomic theory’s“representative household” assumption and usu-ally incorporates additional links between tradeand poverty, such as factor earnings and terms-of-trade effects. One general conclusion of thoseworking in this field is that any thorough analysisneeds to incorporate both approaches. See JeffreyJ. Reimer, “Estimating poverty impacts of tradeliberalization”, Center for Global Trade Analysisand Department of Agricultural Economics, PurdueUniversity, West Lafayette, Indiana, 2002.
27 L. Alan Winters, “Trade and poverty: is there aconnection?”, background paper (2000) for WorldBank, World Development Report 2000/2001:Attacking Poverty (New York, Oxford UniversityPress, 2001).
28 With 95 per cent confidence, a 1 per cent rate ofgrowth of consumption per person can yield any-where from a 0.5 to a 3.5 per cent decline in theshare of population living on less than one dollarper day. See Martin Ravillion, “Have we alreadymet the millennium development goal for pover-ty?”, Economic and Political Weekly, 16 November2002.
29 David Dollar and Aart Kraay, “Trade, growth andpoverty”, Development Research Group, WorldBank, 2001. See also Dani Rodrik, “Comments ontrade, growth and poverty” (2000) for a critique ofthis paper.
30 Paul A. Dorosh and David E. Sahn, “A general equi-librium analysis of the effect of macroeconomicadjustment on poverty in Africa”, Journal of PolicyModelling, vol. 22, No. 6 (2000), pp. 753-776.
31 Gaurav Datt and Martin Ravallion, “Is India’s eco-nomic growth leaving the poor behind?”, Journalof Economic Perspectives, Vol. 16, No. 3 (2002),pp. 89-108.
32 L. Allan Winters, “Trade liberalisation and pover-ty: what are the links?”, The World Economy, vol.25, No. 9 (2002), pp. 1339-1367.
ADJUSTMENT
Trade liberalization may involve adjustment problems and costs. Examples
include the loss of jobs that existed only by virtue of a subsidy or distortion,
lower wages in contracting activities or higher prices for certain imports when
their importation is no longer subsidized. For example, estimates of the effects
of the Uruguay Round of multilateral trade negotiations found large potential
gains in East Asian World Trade Organization members—such as Indonesia,
Malaysia, the Republic of Korea and Thailand—as well as in the South Asia
region. However, the Middle East and North Africa had relatively small gains,
while a loss was projected for sub-Saharan Africa, reflecting the lack of liber-
alization in the area, and likely increases in prices for some foodstuffs, as well
as higher prices of imported textile and apparel products.33 Similarly, all the
evidence shows that abolishing the Multifibre Arrangement would generate
enormous benefits for importers, but that two groups of exporters would suffer,
namely, those whose quotas are large relative to their comparative advantage
and those that may have been induced by the Arrangement to enter the produc-
tion of textiles and clothing without possessing a true comparative advantage
in those goods.34
In each liberalizing country, there are always winners and losers if trade pol-
icy shifts to a significant extent, because of the need for the changes to work
themselves through. Two problems can emerge during the adjustment process.
The first occurs when adjustment is constrained and prolongs the dependence
on products with poor export prospects for them.35 Similarly, trade adjustment
assistance—designed to overcome political opposition to trade liberalization—
reduces policy makers’ incentives to press for such liberalization and may thus
slow down the pace of needed reform.36 This problem arises when there is a
lack of social safety nets to ease and mitigate the adjustment process. This is
especially critical because those who are harmed the most in the short term typ-
ically lack political power.37
It has been suggested that international trade policies have a “gender-differ-
entiated” impact: strong export performance in manufactures in developing
countries is secured via reliance on female labour in such areas as textiles,
apparel, electronics, leather products and food processing. By contrast, in most
industrialized economies, increased trade with developing countries has led to
a loss of employment in such industries as textiles, apparel and leather goods,
in which women are heavily represented.38
Adjustment costs in a diversified economy are small relative to the benefits
for several reasons. Adjustment costs related to unemployment are typically
short-term and terminate when workers find new employment. The benefits of
trade reform, meanwhile, grow with the economy. Second, in most industries,
estimates indicate that the duration of unemployment of their workers is not
long, especially, in cases where workers were not earning substantial wages in
their original jobs. Third, in many industries, normal labour turnover exceeds
the dislocation from trade liberalization, so that downsizing—where neces-
sary—is accomplished without much forced unemployment. Moreover, in many
instances in which a dynamic role is played by micro- and small-scale enter-
prises, which are quick to respond to new opportunities, a significant portion of
the resource reallocation after trade liberalization has been observed to occur
through inter-industry shifts, thereby minimizing the dislocation of labour.
171T R A D E P O L I C I E S, G R O W T H A N D P O V E R T Y
33 G.W. Harrison, T.F. Rutherford and D.G. Tarr,“Quantifying the Uruguay Round”, EconomicJournal, vol. 107, No. 444 (1997), pp. 1405-1430.
34 Will Martin and L. Alan Winters, The UruguayRound: Widening and Deepening the WorldTrading System (Washington, D.C., World Bank,1995).
35 Mark S. Leclair, “Fighting the tide: alternativetrade organizations in the era of global freetrade”, World Development, vol. 30, No. 6 (2002),pp. 949-958.
36 Christopher Magee, “Endogenous tariffs and tradeadjustment assistance”, Journal of InternationalEconomics, vol. 60 (2003), pp. 203-222.
37 Bernard Hoekman and others, “Trade policy reformand poverty alleviation”, Development ResearchGroup, International Trade Team, World Bank,Washington, D.C., 2002.
38 Nilüfer Cagatay, “Gender, poverty and trade”,background paper (2001) for the UNDP Report onTrade and Sustainable Human Development, 2001,UNDP, New York.
Finally, developing countries typically have a comparative advantage in labour-
intensive industries, hence trade liberalization, resulting in greater trade, tends
to favour labour. This may partially explain why manufacturing employment
has typically increased in developing countries after trade liberalization.39
Because the adjustment process may entail difficulties, which can be rela-
tively more pronounced at lower income levels, many developing countries,
including (but not only) the least developed countries, have been provided with
longer transition periods in which to implement a variety of World Trade
Organization liberalization agreements. These fall into such categories as safe-
guards, subsidies and countervailing measures, anti-dumping, sanitary and
phytosanitary measures and trade related intellectual property rights (TRIPs).
However, developing countries, especially those confronted by fiscal con-
straints, often have limited resources to direct towards the areas of public
administration responsible for overseeing the implementation of these agree-
ments, which can be both time-consuming and costly. A number of these tran-
sition periods expired before the developing countries in question could over-
come their difficulties in establishing the institutions necessary for the imple-
mentation of the agreements.40 Institutional weaknesses of this sort thus add
greatly to the costs of adjustment, despite the fact that longer transition periods
are set up precisely to reduce such adjustment costs. Therefore, special and dif-
ferential treatment for developing countries should encompass more than just
longer periods of implementation.
Finally, adjustment costs depend on individual circumstances and the exter-
nal environment. The estimated adjustment costs in Mexico for the period
1987-1995 were found to be small—a result consistent with an earlier finding.41
That adjustment costs vary between countries has been documented in analy-
ses of developed economies, though few studies exist for developing countries.
THE CHANNELS FOR ASSURING THE WELFARE OF THE POOR
Prices and availability of goods and services
David Ricardo, in the early 1800s, demonstrated several important “gains from
trade”. Foremost among these was the ability of consumers to buy goods and ser-
vices at prices lower than original home prices. However, a secondary advantage
of a country’s being open to trade is consumer access to goods and services that
would otherwise not even be available for purchase and certainly not at prices
that would prevail were these products to be produced domestically.
The removal of import tariffs, as well as any non-tariff barriers to trade,
affects the prices and availability of goods and services. The prices of imports
are thereby lowered. Additionally, the prices of substitutes for such imports are
also kept down, effectively increasing the real incomes of the poor. Imported
goods that might be of particular importance to the poor include basic foods,
pharmaceuticals and other basic health products.42 However, high import tariffs
on agricultural products are a continuing reality in both developed and devel-
oping economies.43 To counter the problem of high import tariffs on pharma-
ceuticals and other basic health products, at the African Summit on Roll Back
Malaria held in Abuja in April 2000, Governments pledged to reduce or waive
taxes and tariffs for the mosquito nets, insecticides and anti-malarial drugs
necessary for malaria control.
W O R L D E C O N O M I C A N D S O C I A L S U R V E Y 2 0 0 3172
39 Steven J. Matusz and David Tarr, “Adjusting totrade policy reform”, Trade, DevelopmentResearch Group, World Bank, Washington, D.C.,1999.
40 Constantine Michalopoulos, “Trade and develop-ment in the GATT and WTO: the role of special anddifferential treatment for developing countries”,paper presented to the World Trade OrganizationSeminar on Special and Differential Treatment forDeveloping Countries, Geneva, March 2000.
41 Raymond Robertson and Donald Dutkowsky,“Labor adjustment costs in a destination country:the case of Mexico”, Journal of DevelopmentEconomics, vol. 67 (2002), pp. 29-54. See alsoDani Rodrik, Has Globalization Gone Too Far?(Washington, D.C., Institute for InternationalEconomics, 1997).
42 For more on this point, see Geoffrey J. Bannisterand Kamau Thugge, International Trade andPoverty Alleviation, IMF Working Paper WP/01/54(Washington, D.C., 2001).
43 World Trade Organization, “Market access: post-Uruguay Round inventory and issues”, SpecialStudies, No. 6 (Geneva, 2001), p. 48 and table III.3.
Another strategy that results in changed prices and availability of goods and
services—and one that has burgeoned in recent years—consists in joining a
regional trading arrangement. Such schemes are frequently trade-creating and
can therefore be favourable from a welfare-enhancing perspective. In addition,
there may be dynamic gains to be realized. For example, production will be
possible on a larger scale and greater exposure to other markets may mean
greater efficiency, which in turn, may lead to greater output at lower prices.
Joining a trading arrangement is a policy choice and, from that perspective,
it is important to gauge whether it is the best choice that could be made. There
are indications that the new wave of regionalism that had occurred during the
1990s—during which decade a number of preferential trading arrangements
were either created (the Southern Common Market (MERCOSUR) and the
North American Free Trade Agreement (NAFTA)) or revamped (the
Association of the Southeast Asian Nations (ASEAN), the Central American
Common Market (CACM) and the Andean Community (ANDEAN))—did lit-
tle to boost intra-bloc trade significantly, above and beyond what historical
trade trends would have predicted.44 Moreover, evidence for a data set for about
40 developed and developing economies for the period 1950-1992 compares
the growth performance of countries that liberalized broadly with those that
joined a regional trading arrangement. Economies grew faster when they
undertook broad-based liberalization than when they limited their liberaliza-
tion efforts to participation in a regional trading arrangement.45 Nevertheless,
numerous countries have joined, or have expressed an interest in joining, a
variety of regional trading arrangements. In Eastern Europe, a number of coun-
tries are waiting to join an enlarged European Union (EU).
Regional arrangements may have negative welfare implications for nearby
countries that are excluded. For example, Argentina’s beef and cattle exports to
Peru fell when Peru established a pact whose members included Colombia, an
exporter of the same products.46 Another example was the reduction of prices
on exports from Brazil—a non-member State of MERCOSUR—to member
States of MERCOSUR, following the formation of this regional trading bloc.
Because of high tariffs levied on exports from outside the trading bloc, Brazil’s
exporters had to reduce the prices of their products significantly, compared
with prices of exports to countries outside the trading bloc, in order to main-
tain price competitiveness in markets of the member States.47
Sub-Saharan African countries have pursued regional integration schemes
for over three decades in order to accelerate industrialization and growth.
However, the problems associated with African regional trade arrangements as
a means to this end are daunting, since Africa’s exports are highly concentrat-
ed in a few products, so that the economies in question appear to have very lit-
tle to trade with one another.48
Several Asian economies have used accession to a regional arrangement as
part of their respective reform strategies in pursuit of the export and income
growth necessary for poverty reduction. For Cambodia, the Lao People’s
Democratic Republic, Myanmar and Viet Nam, forging regional linkages has
been an important part of their export growth dynamic. Meeting the require-
ments of accession to the ASEAN Free Trade Area49 has helped these countries
to modernize their trade regulations and, at the same time, has required wide-
ranging preferential trade liberalization.50
173T R A D E P O L I C I E S, G R O W T H A N D P O V E R T Y
44 Isidro Soloaga and L. Alan Winters, Regionalismin the Nineties: What Effect on Trade?, WorldBank Working Paper, No. 2156 (Washington, D.C.,1999).
45 Athanasios Vamvakidis, Regional TradeAgreements Versus Broad Liberalization: WhichPath Leads to Faster Growth? Time SeriesEvidence, International Monetary Fund WorkingPaper, No. WP/98/40 (Washington, D.C., IMF,1998).
46 The Andean Pact was created in 1969 betweenBolivia, Chile, Colombia, Ecuador and Peru.Venezuela joined in 1973 and Chile withdrew in1976. See Ana Gupta and Maurice Schiff,Outsiders and Regional Trade Agreements amongSmall Countries, World Bank Policy ResearchWorking Paper, No. 1847 (Washington, D.C.,World Bank, 1997).
47 Won Chang and L. Alan Winters, “Preferentialtrading arrangements and excluded countries: ex-post estimates of the effects on prices”, TheWorld Economy, vol. 24, No. 6 (2001), pp. 797-807.
48 Alexander Yeats, What Can Be Expected FromAfrican Regional Trade Arrangements?: SomeEmpirical Evidence, World Bank Policy ResearchWorking Paper, No. 2004 (Washington, D.C.,World Bank, 1998).
49 ASEAN members are Indonesia, Malaysia, thePhilippines, Singapore, Thailand and Viet Nam.
50 The Least Developed Countries Report, 2002…,box 11; and Will Martin , Trade Policy Reform inthe East Asian Transition Economies, World BankPolicy Research Working Paper, No. 2535(Washington, D.C., World Bank, 2001).
There is a dilemma that arises, however, centering around the fact that cost-
ly trade diversion has been introduced alongside healthy trade creation.51 Such
a problem is particularly serious if the external trade barriers in the bloc are
high. However, even in ASEAN—where external trade barriers are relatively
low—welfare gains from trade creation have been substantially undermined for
the new members of the group by their losses from trade diversion.52
While regional trade agreements (RTAs) have garnered a great deal of atten-
tion in recent years, there are other stratagems that affect liberalization and the
level of trade and hence can affect growth and reduce poverty. One such strat-
agem entails the creation of an export processing zone (EPZ). Malaysia, the
Republic of Korea and Thailand initiated their EPZs as part of a shift in policy
from an inward to an outward orientation. China initiated its open-door policy
and economic reforms by introducing special economic zones. In addition to
fostering job creation, such zones have an indirect impact on poverty by pro-
moting linkages with the domestic economy and encouraging technology trans-
fers. The spillovers can affect the entire economy. The export-generating effect
of the Malaysian EPZs has been significant, and foreign affiliates attracted to
these EPZs stimulated local firms to begin to export by assisting them in pro-
ducing, marketing and distributing manufactures internationally.53 Zones in
China, Indonesia, Malaysia, the Philippines, the Republic of Korea and Sri
Lanka have been an important source of employment and have encouraged
local entrepreneurship in some cases.54
Labour markets
Trade liberalization impinges on the labour market in a variety of ways. First
and foremost, such reforms can lead to changes in the demand for labour, that
is to say, to employment creation or contraction. Reforms may also have an
effect on wages, including changing the relative wages of skilled versus
unskilled labour. Trade liberalization can change conditions of work in the
labour market. For example, when transnational corporations are allowed into
a country, they may have more or less stringent health and safety standards
than do local companies.
Trade liberalization is consistent with continued growth of employment.
Following such liberalization in a sample of 19 countries, 12 of them develop-
ing, all but 1 experienced higher manufacturing employment during, as well as
a year after, the liberalization. Moreover, the strongest liberalizers—Brazil and
Chile—experienced the strongest employment gain.55 Similar results have been
observed in five African economies—Ghana, Malawi, Mali, Senegal and the
United Republic of Tanzania,56, as well as in Costa Rica, Peru and Uruguay. In
Malawi, the welfare advantages were due to the increase in the number of
traders and vendors throughout the country.57
Trade liberalization also exerts an influence on employment via wages.
Under certain restrictive conditions, the opening of trade can be expected to
increase the relative price of labour in the labour-abundant country as it
decreases the relative price of labour in the capital-abundant country.58
Empirical evidence from East Asia—especially from Hong Kong Special
Administrative Region (SAR) of China, the Republic of Korea, Singapore and
Taiwan Province of China—has lent credence to the view that greater openness
W O R L D E C O N O M I C A N D S O C I A L S U R V E Y 2 0 0 3174
51 Trade creation results when domestic productionis replaced by imports from a lower-cost and moreefficient producer within the trading arrangement.Trade diversion results when higher-cost suppliersfrom within replace imports from lower-cost, moreefficient producers outside a trading arrangement.
52 Emiko Fukase and Will Martin “Economic effectsof joining ASEAN Free Trade Area (AFTA): the caseof the Lao People’s Democratic Republic”, WorldBank, Development Research Group (Washington,D.C., 1999); and Emiko Fukase and Will Martin,Free Trade Membership as a Stepping Stone toDevelopment: The Case of ASEAN (Washington,D.C., World Bank, 2001).
53 Helena Johansson and Lars Nilsson, “Export pro-cessing zones as catalysts”, World Development,vol. 25, No. 12 (1997), pp. 2115-2128. The 10economies in the study were: the DominicanRepublic, Egypt, Hong Kong SAR of China,Malaysia, Mauritius, the Philippines, the Republicof Korea, Singapore, Sri Lanka and Tunisia.
54 Kankesu Jayanthakumaran, “Benefit-costappraisals of export processing zones: a survey ofthe literature”, Development Policy Review(Overseas Development Institute, London), vol. 21,No. 1 (2003), pp. 51-65.
55 See Demetrios Papageorgiou, Armeane Choksiand Michael Michaely, Liberalizing Foreign Tradein Developing Countries: The Lessons ofExperience (Washington, D.C., World Bank, 1990).The period examined was from the Second WorldWar to 1984.
56 See Ronald Parker, Randall Riopelle, and WiliamSteel, “Small enterprises adjusting to liberaliza-tion in five African countries”, World BankDiscussion Paper, No. 271, Washington, D.C.,1995.
57 Sanjukta Mukherjee and Todd Benson, “The deter-minants of poverty in Malawi, 1998”, WorldDevelopment, vol. 31, No. 2 (2003), pp. 339-358.
58 The Stolper-Samuelson Theorem, so named afterthe two economists who proved it algebraically.
in countries with large reserves of unskilled labour has benefited this type of
labour. However, in a number of Latin American economies—including
Argentina, Chile, Colombia, Costa Rica, Mexico and Uruguay—increased
openness has done little to elevate the wages of unskilled labour. Mexico actu-
ally experienced a substantial rise in the premium paid to skilled labour—and
therefore an increase in overall wage inequality—following the trade reform of
the mid-1980s. This reflected improved productivity in reformed industries and
a shift towards the use of more skilled labour.59 The consequence of trade lib-
eralization of Mexico in the mid-1980s, prior to its joining the General
Agreement on Tariffs and Trade (GATT), differed from the consequences of
Mexico’s entry into NAFTA in 1994. In the former episode, the wages of
skilled Mexican workers had risen, while in the latter case, the wages of
unskilled labour increased. This was because Mexico is a skill-abundant coun-
try vis-à-vis the rest of the world (comprising the relevant partner countries
when Mexico joined GATT), but a labour-abundant country vis-à-vis its
NAFTA partners.60
Brazil’s trade liberalization between 1988 and 1994 contributed to the grow-
ing skill premium through technological change, instigated by increased for-
eign competition. Moreover, industry-specific returns to skill increased by a
larger amount in industries that had undergone larger tariff reductions. Overall,
however, the effects of trade liberalization on wage inequality were relatively
modest.61
Wages in the Chilean cosmetics industry since it began to be liberalized in
1974 have also shown higher returns to skilled labour. One explanation hinges
on the fact that the region as a whole had reduced trade barriers in the 1990s,
leading to far greater competition and a surge in imports. Seeking to be more
competitive, multinationals often closed local factories, forcing the dismissal
of the mostly low-skill workforce, employed in simple, labour-intensive tasks.
Many multinationals also outsourced non-core personnel, such as maintenance
staff, who were then rehired through subcontractors at a lower salary.
Meanwhile, the workers that had kept their jobs in multinational firms were
employed in management, marketing and sales—all well-paid positions for
educated workers. The net result was a large upward shift in the relative
demand for skilled compared with unskilled workers in multinationals.
Domestic firms, meanwhile, made every effort to keep costs down, resulting in
employment gains for low-skill workers in these companies which were not,
however, matched by wage gains, in large part because of union weakness.62
Increased openness also impacts on labour conditions. Among the outcomes
ascribed to trade openness is the expansion of the categories of part-time, tem-
porary and subcontracted labour, whose members do not receive the benefits
enjoyed by those employed full-time and regularly. Also observed is an
increase in the female labour force and an expansion of middle-salaried work-
ers, especially in the service sectors. Several of these trends were observed in
Brazil in the late 1990s. One startling statistic derived from data published in
2000 indicates that the economically active population in Brazil totalled 71
million workers, only one third of whom were found in the formal job market.
The remaining two thirds worked in the informal sector, with few of the bene-
fits that formal employment confers.63 In Indonesia, wages are low by world
standards and a sizeable portion of the workforce consists of young females,
175T R A D E P O L I C I E S, G R O W T H A N D P O V E R T Y
59 Ana Revenga, Employment and Wage Effects ofTrade Liberalization: The Case of MexicanManufacturing, World Bank Policy ResearchWorking Paper, No. 1524 (Washington, D.C.,World Bank, 1995).
60 Raymond Robertson, “Relative prices and wageinequality: evidence from Mexico”, MacalesterCollege, Department of Economics, St. Paul,Minnesota.
61 Nina Pavcnik and others, Trade Liberalization andLabor Market Adjustment in Brazil, World BankWorking Paper, No. 2982 (Washington, D.C.,World Bank, 2003).
62 Janine Berg, “Technology versus trade versussocial institutions: rising wage inequality in theChilean cosmetics industry”, Center for EconomicPolicy Analysis, The New School (2002), NewYork.
63 Ricardo Antunes,“Global economic restructuringand the world of labor in Brazil: the challenges totrade unions and social movements”, Geoforum,vol. 32 (2001), pp. 449-458.
who are frequently less activist than their male counterparts. However, while
there may be a correlation between openness and sub-standard working condi-
tions in Indonesia, this does not imply causality. In fact, working conditions in
foreign-owned plants are frequently considerably better than in locally owned
enterprises. Standard procedures in the former—for shift times, and medical
leave, as well as health and safety precautions—often conform to global rather
than local standards.64
While increased openness is conducive to increasing employment (both
male and female), it is not clear how it benefits women differently from men.
In some cases, for example, greater female secondary schooling has been found
to have had a negative impact on levels of female employment. This may be
because enterprises introduce technologies that require a small number of high-
ly specialized employees and a large workforce with little training.65
Empirical estimates for the Philippines using data for the period from 1980
to 2000 indicate that, at both the aggregate and manufacturing sub-industry
levels, increases in the propensity to export shift the demand for labour
upward. In terms of the employment structure, the impact of openness on
women workers, in particular, was not significant in the aggregate. However,
at the manufacturing industry sub-level, the increase in the propensity to export
has been a boom, especially for women workers. Finally, increases in export
propensity increased the proportion of low-skilled production workers, at both
the aggregate and manufacturing sub-industries levels.66
The effects of trade on women vary by socio-economic characteristics, sec-
tor and country. In Bangladesh, for instance, women’s participation in market
activities had traditionally been low and confined to a narrow range of casual
jobs on the margins of the labour market.67 With the establishment of a large
number of garment factories in the 1980s (ready-made garments provide some
60 per cent of total foreign earnings), there were significant increases in female
labour-force participation rates.
Investment and innovation: capital inflows
and direct foreign investment
Increased openness might impact positively on growth through its effect on the
rate of investment.68 An increase in foreign investment impacts on growth and
poverty reduction via improved efficiency and the adoption of new technolo-
gies. For example, in India, where liberalization began in July 1991, following
a long-standing policy of fostering self-reliance, “liberalization has driven
competition and competition has driven technical change”.69 Firms have there-
fore responded to post-1991 liberalization by improving their efficiency, by
importing technology and by increasing in-house research and development.
An analysis using data from Hong Kong SAR of China-based garment manu-
facturers, which had invested in mainland China in the 1990s, showed that such
firms were endowed with valuable managerial technology and had acted as
effective channels for the transfer of such technology to mainland China.70
After the Second World War, Mexico, like India, pursued an import substi-
tution policy in order to reduce its dependence on both exports of raw materi-
al and imports of manufactured goods. The nascent manufacturing sector was
protected from competition by heavy tariffs and quantitative restrictions on
W O R L D E C O N O M I C A N D S O C I A L S U R V E Y 2 0 0 3176
64 Debora Spar, “Trade, investment and labor: thecase of Indonesia”, The Columbia Journal ofWorld Business (Winter 1996)
65 Karin A. Siegmann, “Effects of foreign directinvestment in manufacturing: gender-specificemployment in Indonesia”, Centre forDevelopment Research (ZEF), University of Bonn,Germany, 2002.
66 Aniceto C. Orbeta, “Globalization and employ-ment: the impact of trade on employment leveland structure in the Philippines”, PhilippineInstitute for Development Studies, DiscussionPaper Series, No. 2002-04, Manila.
67 Marzia Fontana, “ Modelling the effects of tradeon women, at work and at home: a comparativeperspective”, International Food Policy ResearchInstitute, Washington, D.C., 2002.
68 Romain Wacziarg, “Measuring the dynamic gainsfrom trade”, background paper for World Bank,Global Economic Prospects and the DevelopingCountries, 1997 (Washington, D.C., 1997).
69 Naushad Forbes, “Technology and Indian industry:what is liberalization changing?”, Technovation,vol. 19 (1999), pp. 403-412. See also: T.N.Srinivasan, “Economic liberalization and economicdevelopment: India”, Journal of Asian Economies,vol. 7, No. 2 (1996), pp. 203-216.
70 Edmund R. Thompson, “Technology transfer toChina by Hong Kong’s cross-border garmentfirms”, The Developing Economies, vol. 41, No. 1(2003), pp. 88-111.
imports. Managers viewed this environment as “a means of avoiding techno-
logical change and pressures for greater competitiveness”.71 Much of this has
changed since 1985, when reforms were initiated in anticipation of Mexico’s
1986 admission to GATT. Most firms polled have reported significant revisions
in their competitive strategies. Moreover, in addition to focusing on competi-
tiveness, many firms saw the need to retool technologically—for example, by
modernizing plant and equipment.72 An examination of the development of
technological capabilities by Vitro, a Mexican firm in the glass industry, con-
firms this finding. Under an import substitution regime, innovation efforts had
been slow. As the Mexican market opened up, however, major innovative
efforts were instigated. Not only were these efforts more specialized, but there
was also an attempt to master production engineering faster and to adapt when
this was required to increase Vitro’s exports.73
Trade liberalization also has a role to play in increasing productivity.
Studies on manufacturing productivity and costs in Japan found that the rapid
increases in volume, due to freer trade, led to dramatic improvements in output
per hour, especially in large plants, as well as reductions in average cost per
unit.74 Evidence from India, based on the sizeable 1991 trade liberalization,
supports this link. Firm-level data from a variety of industries over the period
1986-1993 show large increases in the growth rate of productivity in three of
the four industries investigated: electronics, non-electrical machinery and elec-
trical machinery (transport equipment was the fourth). One explanation for
these increases invokes a traditional efficiency argument.75 Additional substan-
tiation comes from an investigation of 30 Indian industries over the period
1973-1988 which found that trade liberalization had raised total factor produc-
tivity growth.76
The potential for greater openness to increase investment flows to a country is
of particular importance because of the likelihood that foreign investment will
bring with it new technologies and greater innovation. The causality runs both
ways. Increased investment can bring in new technology, enhance productivity
and increase innovation, as in the case of the Mexican firm Vitro. At the same
time, these domestic developments can induce greater foreign investment. Hence,
the process becomes a “virtuous circle”, spurring poverty reduction via growth.
However, for investment to be encouraged, the trade liberalization and reforms
being undertaken have to be credible. Investor confidence in the viability of lib-
eralization and reform is thus decisive for the success of these measures.77
Government revenue
Although trade liberalization generates greater efficiency and potentially high-
er levels of output and welfare, some real trade-offs, involving, for example,
the impact on government revenues, have to be considered.78 For countries with
fiscal imbalances, any loss of revenue is an important consideration, especial-
ly since this may translate into reduced spending on the poor.
Frequently, a first step in trade liberalization is to replace quantitative
restrictions with tariffs. The process then continues with the gradual reduction
of tariffs. However, such tariff reductions can lower government revenue. The
impact can be considerable. In 1997, trade taxes accounted for 24 per cent of
central government revenue in developing countries overall and for 33 per cent
177T R A D E P O L I C I E S, G R O W T H A N D P O V E R T Y
71 Len J. Trevino, “Strategic responses of Mexicanmanagers to economic reform”, BusinessHorizons, May-June 1998.
72 Ibid.
73 Cristina Casanueva, “The acquisition of firm tech-nological capabilities in Mexico’s open economy:the case of Vitro”, Technological Forecasting andSocial Change, vol. 66 (2001), pp. 75-85.
74 Donald J. Daly, “Canadian research on the produc-tion effects of free trade: a summary and implica-tions for Mexico”, North American Journal ofEconomics and Finance, vol. 9 (1998), pp. 147-167.
75 Pravin Krishna and Devashish Mitra, “Trade liber-alization, market discipline and productivitygrowth: new evidence from India”, Journal ofDevelopment Economics, vol. 56 (1998), pp. 447-462. The contention of X-efficiency is that firmsseek to produce the maximum output technicallypossible from any given inputs.
76 Satish Chand and Kunal Sen, “Trade liberalizationand productivity growth: evidence from Indianmanufacturing”, Review of DevelopmentEconomics, vol. 6, No. 1 (2002), pp. 120-132.
77 Halvor Mehlum, “Zimbabwe: investments, credi-bility, and the dynamics following trade liberaliza-tion”, Economic Modelling, vol. 19 (2002), pp.565-584.
78 Andrea Cattaneo and others, “Costa Rica tradeliberalization, fiscal imbalances and macroeco-nomic policy: a computable general equilibriummodel”, North American Journal of Economics andFinance, vol. 10 (1999), pp. 39-67.
in Africa.79 The problem can be great in those economies for which tariff rev-
enue makes the largest contribution to government revenue: in 1997, tariff rev-
enues amounted to over 12 per cent of GDP in the Gambia and over 26 per cent
of GDP in Lesotho. The specific impact of a tariff reduction varies by country,
depending on a country’s initial conditions and its reform strategy. An exami-
nation of the relationship between trade liberalization and the budget position
in Kenya concluded that liberalization may be strongly budget-enhancing
because of increased trade flows.80 An analysis of the case of China suggests
the use of various tax instruments to compensate budget losses arising from
trade liberalization.81
If import values are unchanged, the short-term effect of tariff reductions is
to lower government revenue. However, increased demand for now-cheaper
products could compensate for this loss—eventually even outweighing it,
depending on the elasticity of demand for the goods in question. In the case of
differentiated tariffs, by reducing higher tariffs and increasing lower ones to
create a more uniform average rate, Governments may increase revenues
(depending upon which goods are affected). In addition, such a uniform tariff
rate alleviates administrative difficulties and discourages tariff evasion, thus
allowing for increased—rather than decreased—revenue, since the lower the
tariff rate, the smaller the motivation to seek exemptions. Mexico’s 1985 liber-
alization plan serves as one example. Tariffs gradually replaced quantity
restrictions. Tariff rates were, in turn, reduced and their range and coverage
were made more uniform, with positive results in terms of the productivity of
the export sector. Moreover, total revenues from import duties remained
approximately constant in real terms, while overall budgetary revenues rose.82
Reducing tariffs has important implications for the fiscal position of many
countries, especially smaller economies, which are traditionally more depen-
dent on this type of revenue. For this reason, a reduction in tariffs should be a
part of the package through which the overall tax structure is changed.83 Since
domestic taxes and the expanded tax base provided by economic growth even-
tually compensate for the role of tariff revenues in GDP, strengthening domes-
tic taxes is very important, especially during the initial stages of liberalization.
In this regard, taxes on international trade should play a minimal role since
using trade taxes/subsidies to raise government revenue is not a first-best pol-
icy from a welfare perspective.84 From a welfare standpoint, trade tariffs and/or
subsidies should be levied only to affect trade-related variables. To raise gov-
ernment revenue, personal and corporate and excise taxes are the more appro-
priate tools. However, personal and corporate income taxes need to be simpli-
fied, modernized and reformed. Finally, a simplified and streamlined tax
process is often a necessity.85
Several case studies highlight specific examples of the impact of tariff reduc-
tion on government revenue. In Malawi, the initial focus on reducing quantita-
tive restrictions and tariff dispersion, together with the favourable impact of for-
eign exchange market liberalization and enhanced tax administration, resulted
in both strengthened revenue mobilization and a more liberal trade regime.
Following reform in the Philippines, imports increased significantly as a per-
centage of GDP. The increase in imports, coupled with a reform strategy, result-
ed in an increase in trade taxes as a percentage of GDP and of total tax revenue,
even as the tax rate declined. Argentina and Morocco, like the Philippines and
W O R L D E C O N O M I C A N D S O C I A L S U R V E Y 2 0 0 3178
79 World Public Sector Report: Globalization and theState 2001 (United Nations publication, Sales No.E.01.II.H.2). See also Liam Ebrill, Janet Stotshyand Reint Gropp, Revenue Implications of TradeLiberalization, IMF Occasional Paper, No. 180(Washington, D.C., IMF, 1999).
80 David Bevan, Fiscal Implications of TradeLiberalization, IMF Working Paper No. 95/50(Washington, D.C., IMF, 1995).
81 Zhi Wang and Fan Zhai, “Tariff reductions, taxreplacement, and implications for income distribu-tion in China”, Journal of Comparative Economics,vol. 26, issue 2 (1998), pp. 358-387.
82 Andrew Feldenstein, Tax Policy and TradeLiberalization: An Application, IMF Working Paper,No. 92/108 (Washington, D.C., IMF, 1992).
83 See Hubert Escaith and Keiji Inoue, “Smalleconomies’ tariff and subsidy policies in the faceof trade liberalization in the Americas”,Integration & Trade (Inter-American DevelopmentBank, Buenos Aires), vol. 5. No. 14 (2001).
84 See Jagdish Bhagwati and T.N. Srinivasan,Lectures in International Trade (Cambridge,Massachusetts, The MIT Press, 1983).
85 See, for example, Ebrill, Stotshy and Gropp, op.cit.; and George T. Abed, Trade Liberalization andTax Reform in the Southern MediterraneanRegion, IMF Working Paper, No. 98/49(Washington, D.C., IMF, 1998).
Malawi, consolidated tariffs and reduced the range that they covered.86 In
Argentina, following post-1991 reforms, overall revenue rose. Morocco, com-
mencing with its initial reforms in the 1980s, coupled an overhaul of the domes-
tic tax system with trade liberalization. It had reduced its maximum tariff rate
from 400 to 35 per cent between 1982 and 1993 and the number of tariff bands
was reduced from 47 to 6 in 1996. The combination of tax charges and tariff
reductions resulted in relatively stable government revenues.87 Numerous exam-
ples suggest that it is possible to undertake domestic fiscal reform so as, over
time, to offset any revenue losses from reductions in trade taxes.
The distribution of income
There is a debate on whether trade liberalization is associated with a narrow-
ing or widening of the intra-country distribution of income. Evidence garnered
from over 40 developed and developing economies between 1978 and 1994
suggests that reduced protection worsened the distribution of income in the
developing countries examined, but did not contribute significantly to
increased income inequality in the developed economies.88 On the other hand,
observations covering 137 countries over the past four decades led to the con-
clusion that several determinants of growth, including openness to internation-
al trade, had had little systematic effect on the share of income accruing to the
bottom quintile.
A focus on individual countries indicates that China, for example, dramati-
cally increased its openness over the 1980s and 1990s. Income inequality rose
as well. According to one estimate, China’s Gini coefficient rose from 28.8 in
1981 to 38.8 in 1995.89 However, disaggregating the data further shows that
regions that had experienced an increase in openness between 1988 and 1993
also experienced a faster decrease in inequality. Embracing trade openness cre-
ated opportunities for rural areas not only to grow, but to grow faster, than their
urban neighbours. However, evidence for the Republic of Korea, using annual
data for the period 1975-1995, showed that changes in the openness ratio had
not been significant in influencing the distribution of income.90 Meanwhile,
there is evidence, using the 1996 Mexican National Household Income and
Expenditure Survey, that, in Mexico, the impact of tariff reform on welfare was
positive in general for all income deciles, with poor individuals having bene-
fited relatively more than rich ones.91
Cross-country evidence suggests that, on balance, trade liberalization bene-
fits the poor via its beneficial impact on economic growth, particularly when
accompanied by other policies that are generally considered to foster growth;92
but trade openness may not have systematic effects on the poor beyond its
effect on overall growth and thus on overall poverty reduction. Micro-evidence
from a large number of individual liberalization episodes shows that there is no
clear-cut relationship between trade liberalization and income distribution.
Even if trade liberalization results in aggregate welfare gains over all house-
holds, it is possible that the poorest households might not benefit as much in
relative terms. Such a scenario has been of concern in Turkey as it deepens its
relationship with EU.93
The policy implication—and the explanation for the diverse findings—lie in
the distinction between “necessary” and “sufficient” conditions. Thus, trade
179T R A D E P O L I C I E S, G R O W T H A N D P O V E R T Y
86 This is referred to as reduced “dispersion” and istypically consistent with a reduction in averageeffective protection.
87 Ebrill, Stotshy and Gropp, op. cit.
88 Andras Savvides, “Trade policy and incomeinequality: new evidence”, Economics Letters, vol.61 (1998), pp. 365-372.
89 Shang-Jin Wei, “Is Globalization good for the poorin China?”, Finance and Development, vol. 39, No.3 (September 2002).
90 Jai S. Mah, “A note on globalization and incomedistribution: the case of Korea, 1975-1995”,Journal of Asian Economics, vol. 14 (2003), pp.157-164.
91 Elena Ianchovichina, Alessandro Nicita and IsidroSoloaga, “Trade reform and poverty: the case ofMexico”, World Economy, vol. 25, No. 8 (2002),pp. 945-972.
92 Andrew MaKay, L. Alan Winters and Abbi MamoKedir, “A review of empirical evidence on trade,trade policy and poverty”, report to theDepartment for International Development (DFID),prepared as a background document for theSecond Development White Paper, London, 2000.
93 Glenn W. Harrison, Thomas F. Rutherford andDavid G. Tarr, “Trade liberalization, poverty andefficient equity”, Journal of DevelopmentEconomics, vol. 71 (2003), pp. 97-128.
liberalization can be expected to help the poor overall. However, trade liberal-
ization, while necessary, may not by itself be sufficient to achieve this end.94
The outcome may differ depending on the route that is taken. For example,
prior to 1990, the distributional impacts of the liberalization measures under-
taken by Chile had been relatively unfavourable for the poor. However, post-
1990, Chile managed to combine high growth with decreasing inequality.95
Similarly, it has been suggested that trade liberalization enhanced both eco-
nomic efficiency and income equality in China: the extent of the efficiency
gains appear to have depended on which instrument the Government chose to
balance its budget. Imposing a progressive household income tax reduced the
Gini coefficient while retaining most of the efficiency gains.96
Concomitant policies are then critical to whether liberalization will actually
result in poverty reduction. It is especially the case that these policies need to
be appropriate and balanced. In particular, the success of trade liberalization
and its impact on the poor depend critically on the extent to which product and
labour-market reforms are synchronized.
The focus on domestic reforms and policies in areas other than trade raises
another issue. Increasingly, the two goals of promoting development and max-
imizing trade are viewed as identical by policy makers. However, an alterna-
tive account of economic development questions the centrality of trade and
trade policy and emphasizes instead the critical role of domestic institutional
innovations. This train of thought argues that imported blueprints rarely spark
economic growth and that opening up the economy is hardly ever critical at the
outset. Rather, policy reforms must be “targeted to domestic investors and tai-
lored to domestic institutional realities”.97 However, liberalization and institu-
tional reform do not constitute the terms of an either-or proposition. Both are
necessary for a successful development strategy.
THE ROLE OF THE INTERNATIONAL COMMUNITY
Thus far, the discussion has reviewed the various internal mechanisms whereby
trade expansion and trade liberalization can have an impact on poverty in a
developing country. However, intrinsic to this process is the ability of the econ-
omy in question to integrate with the global economy. This, in turn, raises the
question of the role of developed countries—to which 55 per cent of developing
economies’ exports were directed in 2001—in facilitating such integration.
Trade policy of developed countries is key, since shutting out the exports of
developing countries condemns the poor to remaining poor. It has been esti-
mated that developed countries’ trade barriers cost developing countries more
than 100 billion dollars per year, roughly twice what is provided in aid. Among
the most protected sectors in industrialized countries are agriculture, textiles
and apparel—exactly those where developing economies are most competitive
and where they could create the most jobs, including jobs for low-skilled and
poor people, were such protection absent. Producers in industrialized countries
often benefit from a combination of government subsidies and import tariffs
and quotas.
The issue of the need for specific market access advantages for developing
countries was first raised at the Second Session of the United Nations
Conference on Trade and Development (UNCTAD) in 1968. Special treatment
W O R L D E C O N O M I C A N D S O C I A L S U R V E Y 2 0 0 3180
94 Ramkishen S. Rajan and Graham Bird, “Trade lib-eralization and poverty: where do we stand?”,University of Adelaide, Australia, 2002.
95 Lance Taylor, “External liberalization, economicperformance, and distribution in Latin Americaand elsewhere”, United Nations University, WorldInstitute for Development Economics Research,Helsinki, 2000.
96 Zhi Wang and Fan Zhai, “Tariff reduction, taxreplacement, and implications for income distribu-tion in China”, Journal of Comparative Economics,vol. 26 (1998), issue 2, pp. 358-387.
97 Dani Rodrik, “The global governance of trade: as ifdevelopment really mattered”, background paperfor the Project on Trade and Sustainable HumanDevelopment, UNDP, New York, 2001.
specifically geared to the least developed countries has been provided by devel-
oped countries through the Generalized System of Preferences (GSP) schemes,
and by developing countries through the Global System of Trade Preferences
among Developing Countries (GSTP).98 While these schemes are designed to
assist developing countries in promoting faster export growth, the fact that pref-
erences are granted does not guarantee that they will be effectively utilized.
Nevertheless, various attempts to ascertain levels of market access have
been made, most recently in mid-2003. A Commitment to Development Index
(CDI) has been compiled whose trade component measures developed coun-
tries’ barriers to developing country exports, as well as the income that poor
countries forgo owing to internal production subsidies in richer economies.
Protection against developing countries is lowest in Australia, New Zealand
and the United States, intermediate in EU and highest in Japan and Norway.99
A number of developing countries have successfully seized the export
opportunities presented to them as a consequence of trade preferences from
developed countries. Two prominent measures in this regard are the United
States African Growth and Opportunity Act (AGOA) and the EU’s Everything
But Arms Initiative. The former had been signed into law in May 2000 and as
of January 2003, 38 sub-Saharan African countries were eligible for tariff pref-
erences.100 The Everything But Arms Initiative was approved in February 2001
and will eventually eliminate quotas and duties on all products, except arms,
from the world’s poorest countries. In September 2000, the Canadian
Government enlarged the product coverage of its GSP scheme to allow 570
products originating in the least developed countries to enter its market duty-
free. Some countries are already benefiting from these measures. For example,
Ghana, whose main trading partner is EU, has been developing a furniture-
manufacturing export sector (see box VI.1). Lesotho benefits from at least two
agreements—the Southern African Development Community Protocol and
AGOA (see box VI. 2). These agreements have enabled Lesotho to expand
clothing and textile exports to its two main export markets, South Africa and
the United States.
A wider window of opportunity currently exists to assist all developing
economies in the trade arena in the wake of the Fourth Ministerial Conference
of the World Trade Organization which took place in Doha in November 2001.
The outcome of the Conference was a Ministerial Declaration (see document
A/C.2/56/7, annex) and ministerial decisions which set out the elements of a
work programme with important development components, referred to as the
Doha Development Agenda—The low-income countries, in particular, have
much to gain from these negotiations, especially in the areas of agriculture and
textiles. One of the more important deadlines in the Doha trade round slipped
by, however, on 31 March 2003 when the 145 members of the World Trade
Organization were unable to agree on a framework for cuts to farm subsidies
and import duties on agricultural goods.101 It has been estimated that abolishing
Organisation for Economic Cooperation and Development (OECD) agricultur-
al subsidies would provide developing countries with three times their current
official development assistance (ODA) receipts. The elimination of all tariff
and non-tariff barriers could result in static gains for developing countries of
about $182 billion in the area of services, $162 billion in manufactures and $32
billion in agriculture.102
181T R A D E P O L I C I E S, G R O W T H A N D P O V E R T Y
98 The Least Developed Countries Report, 2002 ...,pp. 223-228.
99 For most countries, the results are driven by esti-mates of agricultural protection, which is so highthat it dominates the results despite the fact thatthe share of agriculture in total developed countryimports is modest. See William R. Cline, “An indexof industrial country trade policy toward develop-ing countries”, Working Paper, No. 14 (Washing-ton, D.C., Center for Global Development, 2002).
100 Paul Brenton, “Integrating the least developedcountries into the world trading system: the cur-rent impact of EU preferences under everythingbut arms”, World Bank, International TradeDepartment, Washington, D.C., 2003; andwww.whitehouse.gov/news/releases/2003. Seealso, World Economic and Social Survey, 2001(United Nations publication, Sales No. E.01.II.C.1),chap. V.
101 See IMF, “Developments in the Doha round andselected activities of interest to the Fund”, 8 April2003 (available at http://www.imf.org/external/np/pdr/doha/2003/040803.htm).
102 Economic Commission for Africa, Economic Reporton Africa, 2003: Accelerating the Pace ofDevelopment (United Nations publication, SalesNo. E.03.II.K.1).
For much of the world’s population, the growing integration of the global econo-my has provided an opportunity for substantial income growth. Manufactured exportsare seen as a key factor in a small number of African economic “lions” that have pur-sued sound macroeconomic policies—Ethiopia, Ghana, Mozambique, Uganda and theUnited Republic of Tanzania—enabling them to achieve higher and sustainable lev-els of economic growth.a
Like many African countries, Ghana is still predominantly an agrarian economyheavily dependent upon primary production, especially if subsistence agriculture istaken into account. Trade is relatively concentrated, both in commodities and in mar-kets. Primary production (especially agriculture), and services each account for over40 per cent of gross domestic product (GDP), while manufacturing represents about10 per cent. Government policy has been aimed at diversifying the economy’s exportbase away from the traditional commodities of cocoa, logs, gold and electricity.b Tothis end, the focus has shifted from the production of mainly agricultural products tomanufactured products with a higher value added.
Ghana’s main trading partner is the European Union (EU), accounting for almosthalf of total exports—partly owing to trade preferences—and imports. Within EU,Italy, the United Kingdom of Great Britain and Northern Ireland and France are themain European sources of imports.c
Firms in the wood and furniture sector have a higher export intensity than thosein other sectors.d The high probability of exporting in the wood sector was due tocomparative advantage. Ghana has a relative abundance of natural resources, includ-ing wood, and labour. Ghana’s furniture exports increased almost 250 per cent overthe last decade.e This was despite the global furniture industry’s being characterizedby increased competition, with unit prices converging across countries and fallingoverall.f
Some of the characteristics to which this export success can be attributed are:size of firms, their age and their technical efficiency. For example, there is a strongpositive relationship between size and export success, as firms face large fixed costsin entering the export market.g Such costs include establishing an overseas supplynetwork, market research in foreign markets, and specific product design for over-seas markets.
Larger firms tend to be older and are more likely to invest and export. However, inthe case of Ghana, firm age has been found to have a significant—but negative—impact on the probability of exporting. This may be attributed to the fact that recent-ly established firms are more outward-oriented than are older firms. Alternatively, itmay be because the newer firms have more advanced capital equipment and are thusbetter able to produce goods for export. This suggests that these factors may over-shadow the benefits of “learning-through-exporting”, if there are any.
The lesson to be learned from Ghana’s furniture industry is that both macroeco-nomic policy and firm-level efficiency are key ingredients in enabling firms to enterthe export market. Policies that improve the performance of firms can greatlyenhance the growth prospects of developing economies, including those facing prob-lems in respect of taking the first step into the export market in labour-intensive sec-tors, such as furniture manufacturingh.
W O R L D E C O N O M I C A N D S O C I A L S U R V E Y 2 0 0 3182
Box VI.1
BEYOND AGRICULTURE: FURNITURE MANUFACTURING IN GHANA
a N. Rankin, M. Söderbom and F. Teal, “The GhanaianManufacturing Enterprise Survey 2000”, Centre forthe Study of African Economies (CSAE), Universityof Oxford, Oxford, November 2002, p. 31.
b World Trade Organization secretariat, “TradePolicy: Ghana”, Trade Policy Review Body(WT/TPR/S/81), p. 1.
c Ibid., p. 8
d N. Rankin, M. Söderbom and F. Teal, loc. cit., p. vi.
e United Nations Statistical aggregated countrydata, 1991-2001.
f R. Kaplinsky, M. Morris and J. Readman, “Theglobalization of product markets and immiserizinggrowth: lessons from the South African furnitureindustry”, World Development, vol. 30, 7:1159–1177, p. 1173.
g M. Söderbom and F. Teal, “Can African manufac-turing firms become successful exporters?”,Centre for the Study of African Economies (CSAE)in cooperation with United Nations IndustrialDevelopment Organization, CSAE-Unido WorkingPaper No. 4, Vienna and Oxford, United Kingdom,2001.
h N. Rankin, M. Söderbom and F. Teal, loc. cit., p. 9.
Landlocked and completely surrounded by South Africa, Lesotho’s main economicactivity has been subsistence farming. However, the manufacturing industry inLesotho constituted 44 per cent of gross domestic product (GDP) in 2000, comparedwith just over 25 per cent in 1985 and 33 per cent in 1990. It now employs a quarterof the workforce. Future development of the manufacturing sector is therefore seenas vital for improving the living standards of the population of 2.2 million. Clothingand textile companies have led the way in growth terms. In 1999, the sectoremployed about 18,000 people and contributed 30 per cent of total value added inmanufacturing. Companies export to the United States of America, the EuropeanUnion (EU) and South Africa.a With the nationwide unemployment rate estimated at45 per cent, job creation is central to government policy, which places the futureexpansion of the clothing and textile sector—with its high labour-intensiveness—insharp focus.
The growth of Lesotho’s textile sector can be attributed mainly to external factors:Lesotho is too small to sustain a manufacturing sector on its own. Gaining a footholdin the overseas market is therefore all-important for boosting the economy. Althoughtrade linkages exist among the members of the States of the Southern AfricanDevelopment Community (SADC), most are more integrated with EU and the UnitedStates than they are within SADC, though Lesotho is an exception in this respectowing to its strong reliance on South Africa.
The textiles and clothing industry is mainly influenced, or regulated, by a pletho-ra of different bilateral and multilateral trade arrangements that have been largelygeared towards greater market access and an expansion of market boundaries. Thesector mainly benefits from two agreements—the Southern African DevelopmentCommunity Trade Protocol and the African Growth and Opportunity Act (AGOA) of theUnited States. It further continues to benefit from preferential access to markets inEU under the Lomé Convention, though quotas limit access to this market.
Promotion of a SADC free trade area will yield benefits to all participants, but thesmall size of SADC relative to the global economy and trade imbalances among itsmembers are likely to limit the medium-term scope for trade expansion.b However,AGOA offers sub-Saharan African countries duty-free and quota-free status into theUnited States for those products meeting the eligibility requirements. Since April2001, Lesotho has been eligible for duty-free access to United States markets for tex-tiles and apparel under AGOA.
For the firms in this sector, the benefits have been significant and have provideda huge boost. Lesotho has established a growing presence in the United Statesclothing and textile market. About one third of Lesotho’s exports are sold there, and90 per cent of those sales are of jeans and T-shirts. Since April 2001, apparel andtextile exports to the United States from Lesotho have risen by nearly 40 per cent.c
The jump in Lesotho’s exports of apparel to the United States from $140.3 million in2000 to $215.3 million in 2001, has led to the soaring of investment to $122 million.For example, the Taiwan Province of China textile firm Nien Hsign is building aclothing factory outside Maseru, scheduled for completion in 2004. Some 20,000extra jobs in the textile industry have been created as a result of AGOA—jobs thatpay 5 to 10 times the average wage.d
Although the clothing and textile industry in Southern Africa is large, directlyemploying up to 260,000 workers and contributing 6 per cent towards the region’s
183T R A D E P O L I C I E S, G R O W T H A N D P O V E R T Y
BEYOND AGRICULTURE:CLOTHING AND TEXTILEMANUFACTURING INLESOTHO
Box VI.2
a South African Ministry of Finance, “Lesotho”,1999, p. 3.
b Samson Muradzikwa, “Textiles and clothing inSADC: key issues and policy perspectives”, PolicyBrief, No. 01/P20, Development Policy ResearchUnit (DPRU), University of Cape Town, Cape Town,2001, p.10.
c http://www.finance.gov.za/documents/fiscu/sum-mits/1999/lesotho.pdf.
d Samson Muradzikwa, “The Southern Africanregional clothing and textile industry: case studiesof Malawi, Mauritius and Zimbabwe”, WorkingPaper, No. 01/58, Development Policy ResearchUnit (DPRU), University of Cape Town, Cape Town,2001, p.9.
In Doha, ministers had also agreed to negotiate on improved market access
for non-agricultural goods. The aim was to reduce or eliminate tariff peaks and
tariff escalation (said to exist when tariff rates rise as the level of the process-
ing of a product increases) as well as to abolish non-tariff measures. These
measures would be particularly important to poor African countries because the
region as a whole is highly dependent on external trade. Tariff escalation makes
it difficult for African countries to diversify their economies towards high-
value-added processed goods. Tariff peaks are often concentrated in products
of export interest to developing countries. In respect of the two sectors of par-
ticular importance to these exporters, textiles and agriculture, tariff barriers in
textiles remain high, while high tariffs for agricultural commodities and the
continued subsidization of agriculture repel agricultural exports.
For many developing countries, a successful outcome to the Doha round
will necessitate obtaining significant concessions on special and differential
treatment (SDT). While there are a wide assortment of SDT and implementa-
tion proposals, most seek either to exempt eligible countries from World
Trade Organization disciplines (or soften them) or to deal with capacity
shortfalls in meeting such regulations. One key concern is the criteria for eli-
gibility—at present, developing-country status in the World Trade
Organization is conferred through self-declaration. The group of least devel-
oped countries, however, is an exception, their identification being carried
out by the United Nations.
national output, in a global context the industry is still very small; and even thoughthe benefits of bilateral trade agreements like AGOA have started to materialize,African clothing manufacturers exported only 3 per cent of the apparel they had beenentitled to ship into the United States tariff-free—suggesting that there is still ahuge potential for SADC producers to seize the opportunities presented by this mar-ket. At present, the United States imports 85 per cent of its clothing. Of the totalclothing imports amounting to $60 billion, approximately $600 million are fromAfrica.e
The presence of spinners and weavers, garment manufacturers, and cross-borderformal and informal trade means that this sector has both vertical and horizontalgrowth possibilities. By creating an attractive investment climate, Lesotho continuesto encourage foreign investors with the financial, managerial and technical skills toexpand the country’s industry.
There are, however, concerns related to the success of the sector. Weak taxadministration continues to give scope to smuggling and undervaluation of imports,thereby causing market instability within Lesotho. Customs authorities andborder/port controls need to be strengthened so as to combat smuggling, especiallyof illegal second-hand clothing.f Although legal and illegal imports of second-handclothing imports provide cheap clothing for scores of relatively poor people inSouthern Africa, these imports have devastating effects on clothing and textile pro-ducers in the region.g Finally, there is growing unease regarding the chemical efflu-ent from textiles production, which is fed virtually untreated into the Caledon River,an important source of drinking water, downstream, for both Lesotho and SouthAfricah.
W O R L D E C O N O M I C A N D S O C I A L S U R V E Y 2 0 0 3184
Box VI.2 (continued)
e Business Day, 16 February 2001.
f Muradzikwa, “The Southern African regionalclothing and textile industry” …, p. 23.
g Muradzikwa, “Textiles and Clothing in SADC” ...,p. 13. Used clothing accounted for 51 per cent oftotal United States exports of textiles and apparelto sub-Saharan Africa (United States, Departmentof Trade, “US trade and investment with sub-Saharan Africa”, 2002, p. xv.
h EU Courier, Country report 194 (2002), p. 91.
Since almost 40 per cent of developing-country exports in 2001 were directed
to other developing countries, a discussion of the role of the international com-
munity in assisting developing countries on the trade front no longer can—nor
should—focus exclusively on the developed economies. The average unweighted
tariff rates in developing economies in Africa, East Asia, Latin America, the
Middle East and North Africa, and South Asia were 17.8, 10.4, 11.1, 19.3 and 30.7
per cent, respectively, in 1996-1999 (in contrast with a rate of 6.1 per cent in the
developed countries). While these tariff rates came down in the 1990s, non-tariff
barriers persist. For example, not only have developing countries become frequent
users of anti-dumping measures, a predominant non-tariff barrier to trade, but on
a per-dollar-of-import basis, they are the most intensive users.103
CONCLUSIONS
While increased openness is conducive to economic growth, and growth, in
turn, is conducive to poverty reduction, openness and liberalization are not a
panacea for poverty reduction. The prime explanation for this lies in the fact
that the impact of trade on an economy is generally rather small, particularly in
the short run. Trade policy is but one element in the relationship between
growth and poverty reduction.
The effects of liberalization can manifest themselves in the short, medium
and long run. In the short-to-medium term, adjustment costs are of major con-
cern to policy makers. Stabilization schemes and other safety nets capable of
being quickly implemented—such as temporary income support, and relocation
assistance—are called for. All reforms—and there is no reason that trade liber-
alization should be an exception—create winners and losers. Indeed, this
notion is built into conventional trade theory, the argument being that the
“gains from trade” will be so great that the winners will be able to compensate
the losers so that the welfare of both groups will rise. Reality is, unfortunate-
ly, not so neat, and appropriate policy responses are therefore required to mit-
igate hardships and facilitate adjustment. Potential safety net measures include
targeted subsidies, cash transfers (such as fee waivers for basic services or
child allowances), retraining for workers laid off from non-competitive firms,
and public works employment.
In the longer run, however, due to their dynamics, trade liberalization and
increased trade contribute to growth, which is necessary for poverty reduction.
One lesson, therefore, is that the appropriate reaction to any of the short- and
medium-run problems engendered by trade liberalization is to devise suitable
policy responses, such as the introduction of retraining programmes for dis-
placed workers, rather than to abort the trade reform process. Identification of
hardships arising from generally desirable policy reforms should spur the
search for complementary policies to minimize adverse consequences, such as
providing training and disseminating best business practices so that new mar-
ket opportunities can be exploited, and gradually phasing in trade reforms in
sectors that are likely to have a particularly large impact on the poor. Rejecting
all reforms that could adversely affect any poor person would be a recipe for
long-run stagnation, which would ultimately increase—rather than reduce—
poverty. Such a policy is not only undesirable but unnecessary, since it is pos-
sible to design approaches to trade liberalization that preclude losses by the
185T R A D E P O L I C I E S, G R O W T H A N D P O V E R T Y
103 J. Michael Finger, Francis Ng and SonamWangchuk, Antidumping as safeguard policy,World Bank Policy Research Working Paper, No.2730 (Washington, D.C., World Bank, 2001).
poorest households. One such method is selective, rather than across-the-
board, tariff reform; but while tariff exemptions can redress the adverse distri-
butional impacts of tariff reform, they incur the danger of inducing rent-seek-
ing practices.
Finally, the results of trade policies tend to be country-specific because
effects are contingent on individual conditions. This makes it extremely diffi-
cult to gauge and predict the outcome of trade liberalization on poverty by
applying the results derived from a given country at a given time to other coun-
tries and periods. Nevertheless, there are two compelling arguments for trade
liberalization and the importance of trade to economic growth and, via growth,
to poverty reduction. The first is that trade liberalization is generally not under-
taken in isolation; rather, it is part of a “package” of complementary reforms—
all of which may be necessary for, and conducive to, growth. The second argu-
ment attesting to the importance of trade reform is based on the fact that there
are virtually no “counter-examples”—that is to say, cases of closed economies
that have thrived in the long term. Countries that have performed well as
regards economic growth over the past 20 years or so have made opening up
part of the reform process. Given today’s ever more globalized world economy,
it is difficult to imagine that any country hoping to prosper and reduce pover-
ty in the future could do otherwise.
W O R L D E C O N O M I C A N D S O C I A L S U R V E Y 2 0 0 3186
Policies to improve the economic efficiency of agriculture can play acritical role in the implementation of rural development strategies, includ-ing efforts to combat rural poverty. The present chapter focuses on select-ed market-based policies, namely food marketing reform and land redis-tribution, intended to increase agricultural efficiency and identifies theindirect impacts of such policies on the achievement of more equitable pat-terns of rural development, particularly in sub-Saharan Africa, a region inwhich the total number of people living in extreme poverty is expected torise between 1990 and 2015. Although market-based policies are not usu-ally adopted primarily to reduce rural poverty, they can have overall pos-itive impacts on poverty alleviation.
Better access to staple food markets is especially important for the ruralpoor, who often generate the bulk of their income from producing staplefoods. Particular attention should thus be paid to the role of food market-ing in rural economic growth. Until the mid-1980s, the marketing of majorfood crops in many African countries was carried out by ad hoc State agen-cies, notably marketing boards. State intervention in food marketing, how-ever, created economic inefficiencies and unsustainable fiscal costs, besidesproving generally ineffective in ensuring sustained rural economic growth.This led to greater emphasis on market-based approaches aimed at improv-ing the efficiency and cost-effectiveness of agricultural marketing. The casestudies of marketing reform presented in this chapter suggest that provid-ing the enabling environment for improved marketing efficiency—througha better transport network, food storage capacity and credit provision forpoor farmers—can be a more effective form of government involvement infood marketing than direct intervention through marketing boards.
The chapter also argues that market-based land redistribution policiescan promote greater economic efficiency and more equitable rural growth.When small-scale farmers have secure access to arable land—in the formof land titles or long-term rental—they are likely to increase investment intheir land, produce more food and raise their incomes. Expanded land-useor ownership rights also increase their chances of securing cheaper andmore extensive credit by using land as collateral. At the same time, successwith redistributive land reform depends, to a large extent, on the imple-mentation of complementary measures to foster rural development.
Market-based schemes can be considered one of the most innovativeapproaches to land reform that have emerged over the last decade, andprovide a useful alternative to more conventional, State-controlled land
VII MARKET-BASED APPROACHESTO RURAL DEVELOPMENT INSUB-SAHARAN AFRICA
187M A R K E T - B A S E D A P P R O A C H E S T O R U R A L D E V E L O P M E N T I N S U B - S A H A R A N A F R I C A

redistribution programmes. The chapter concludes, however, that whencountries opt for market-based approaches to land redistribution, theState still has an important role to play, without necessarily deciding whichland parcels change hands.
RURAL DEVELOPMENT AND POVERTY REDUCTIONIN SUB-SAHARAN AFRICA
The need for greater emphasis on rural poverty reduction
Approximately 75 per cent of the world’s extreme poor live and work in ruralareas and two thirds of them depend for their livelihoods mainly on farming orfarm labour.1 Although rural poverty rates fell sharply in many developingcountries during the 1970s and 1980s, the decline has slowed down around theworld since then. It is estimated that 60 per cent of the world’s poor will stilllive in rural areas by 2020, even though the world urban population is likelyto have overtaken the rural share.2 Substantial progress on rural poverty reduc-tion in developing countries will thus be crucial for the attainment of theMillennium Development Goal for poverty.
Rural poverty is a multidimensional phenomenon that is reflected by lowincome, inequality in access to resources, low education standards, poor nutri-tion, inadequate health services and vulnerability to shocks, among other fac-tors. Sustainable development strategies to combat rural poverty must reflectits multidimensional nature and thus be targeted at different economic, socialand environmental objectives. This implies that social policies to improve poorpeople’s access to health, nutrition, education and training should become anintegral part of rural development strategies, even though a discussion of theseissues lies beyond the scope of this chapter.3 The chapter examines selectedmarket-based policies to improve the economic efficiency of agriculture—andlooks at their indirect impact on the promotion of more equitable patterns ofrural development—as opposed to broad socio-economic policies to combatrural (and urban) poverty.
The relationship between rural and urban poverty is a critical underlyingfactor in the analysis of poverty issues, given that persistently high levels ofrural poverty in developing countries have stimulated migration of the ruralpoor to urban areas. A significant share of urban poverty can be seen as a resultof the personal poverty alleviation strategies of poor rural people who have fewoptions other than migrating to urban areas.4 In many developing countries,economic policies primarily based on urban development seem unlikely to alle-viate poverty as effectively as policies that also incorporate rural developmentstrategies. Furthermore, government policies that penalize the agricultural sec-tor and neglect the social and physical infrastructure in rural areas have beenmajor contributors to both rural and, through migration, urban poverty.5
Examples of policies that negatively affect the rural poor include urban bias inthe public provision of social services and infrastructure; and bias in favour oflarge landowners and agribusinesses with respect to land ownership rights,publicly provided extension services and subsidized access to credit and irri-gation water. Unequal land distribution is one of the greatest obstacles to ruralpoverty reduction in developing countries.
W O R L D E C O N O M I C A N D S O C I A L S U R V E Y 2 0 0 3188
1 International Fund for Agricultural Development(IFAD), Rural Poverty Report 2001: The Challengeof Ending Rural Poverty (New York, OxfordUniversity Press, 2001). The United NationsMillennium Declaration (See General Assemblyresolution 55/2 of 8 September 2000) defines peo-ple in extreme poverty as those whose income isless than one dollar a day.
2 M. Ravallion, “On the urbanization of poverty”,Journal of Development Economics, vol. 68 (2002),pp. 435-442.
3 See, for example, Report of the World Summit forSocial Development, Copenhagen, 6-12 March1995 (United Nations publication, Sales No.E.96.IV.8); and Report on the World SocialSituation, 2001 (United Nations publication, SalesNo. E.01.IV.5).
4 M.H. Khan, Rural Poverty in Developing Countries:Issues and Policies, IMF Working Paper, No.WP/00/78 (Washington, D.C., InternationalMonetary Fund, April 2000).
5 See R. Sobhan, “Eradicating rural poverty: movingfrom a micro to a macro agenda”, mimeo, Centrefor Policy Dialogue, Dhaka, June 2001.
It can be argued that the success of efforts to combat rural poverty dependson at least two economic factors: granting the rural poor legally secure entitle-ment to assets—notably land—and improving their access to agricultural mar-kets.6 Inadequate access to arable land is probably the most important cause ofrural poverty, and redistributive land reform is increasingly seen as crucial inmany developing countries. There is an urgent need, therefore, to focus atten-tion on the implementation of land redistribution policies as a means to promotemore equitable rural growth patterns. Similarly, better access to staple food mar-kets is especially important because staples farming often accounts for a largeproportion of the income of the rural poor. Particular attention should thus alsobe paid to the role of food marketing reform in rural economic growth, even ifthis type of policy reform is not designed to reduce poverty directly.
Focusing on sub-Saharan Africa
The latest poverty projections suggest that the Millennium Development Goalof halving extreme poverty between 1990 and 2015 (see document A/56/326,annex, goal 1, target 1) is likely to be achieved on a global level, althoughthere will be considerable regional disparities. While the largest share of theworld’s extremely poor people live in South Asia (41.7 per cent in 1999), thehighest proportion of poor people within a region is found in sub-SaharanAfrica, where over 315 million people (approximately 40 per cent of the pop-ulation) lived on less than one dollar a day in 1999. Moreover, sub-SaharanAfrica is the only developing-country region in which the total number ofpeople living in extreme poverty is expected to rise considerably between1990 and 2015.7 With more than 400 million people projected to be in extremepoverty in Africa in 2015, this region will have a total number of extremelypoor people equal to that of all other developing-country regions put together(see figure VII.1).
Non-income poverty indicators have also deteriorated in sub-SaharanAfrica. For example, while East Asia has made significant progress in reducingthe proportion of people who suffer from hunger, the estimated number ofundernourished Africans rose by 27 million during the 1990s.8 Similarly, sub-Saharan Africa has the highest share of its population below the minimum levelof dietary energy consumption; the lowest net enrolment ratio in primary edu-cation; the highest under-five mortality rate; the highest prevalence and deathrates associated with human immunodeficiency virus/acquired immunodefi-ciency syndrome (HIV/AIDS), malaria and other diseases; and the highest pro-portion of its population without access to safe drinking water.
This significant deterioration of poverty indicators calls for systematic actionto deal with the dire situation in sub-Saharan Africa. The international commu-nity and sub-Saharan African Governments must pull together to promote sus-tained economic growth and combat poverty. In other words, just as there is anurgent need to give greater emphasis to rural poverty reduction around theworld, international efforts to achieve the Millennium Development Goal forpoverty reduction should also give greater priority to sub-Saharan Africa.
A greater international focus on rural poverty alleviation would strengthenpoverty reduction efforts in sub-Saharan Africa, where the vast majority of the
189M A R K E T - B A S E D A P P R O A C H E S T O R U R A L D E V E L O P M E N T I N S U B - S A H A R A N A F R I C A
6 In addition to social factors based on improvedaccess to human assets, such as health, nutrition,education and skills. See Rural Poverty Report,2001 ... .
7 See World Bank, Global Economic Prospects andthe Developing Countries, 2003 (Washington,D.C., World Bank, 2002), p. 30.
8 Report of the Secretary-General entitled“Implementation of the United NationsMillennium Declaration” (document A/57/270 andCorr.1).
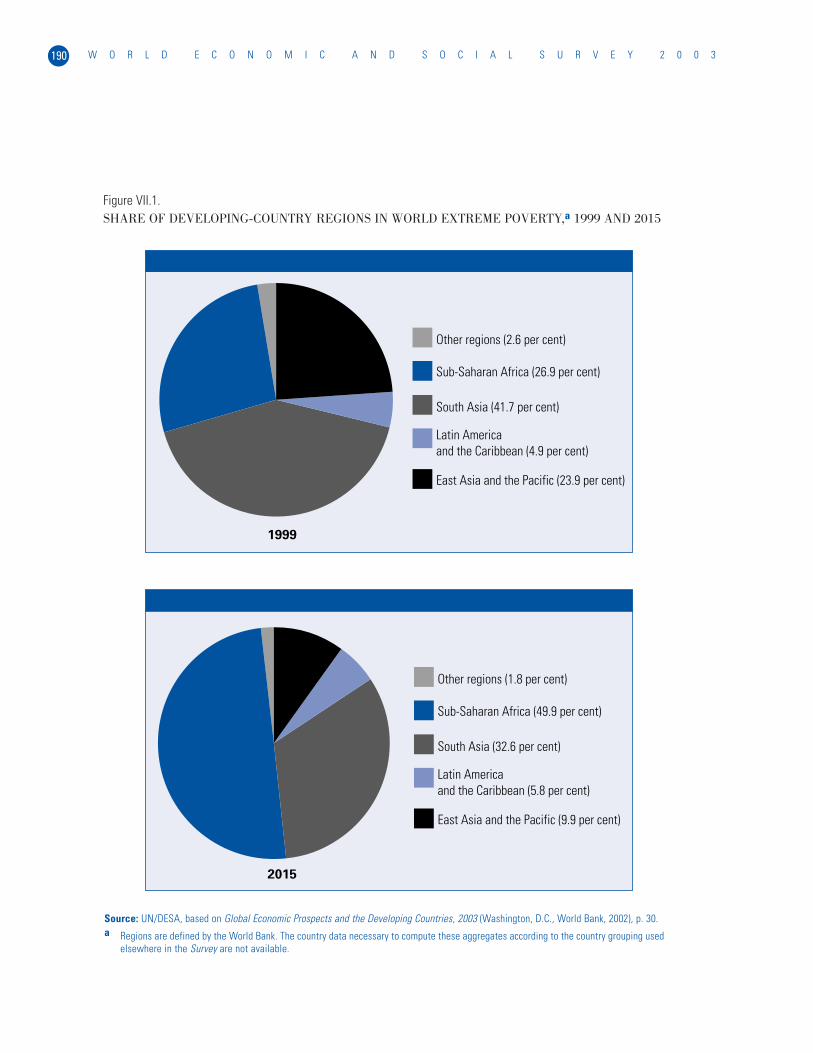
W O R L D E C O N O M I C A N D S O C I A L S U R V E Y 2 0 0 3190
Source: UN/DESA, based on Global Economic Prospects and the Developing Countries, 2003 (Washington, D.C., World Bank, 2002), p. 30.a Regions are defined by the World Bank. The country data necessary to compute these aggregates according to the country grouping used
elsewhere in the Survey are not available.
Other regions (2.6 per cent)
Sub-Saharan Africa (26.9 per cent)
South Asia (41.7 per cent)
Latin America and the Caribbean (4.9 per cent)
East Asia and the Pacific (23.9 per cent)
1999
Other regions (1.8 per cent)
Sub-Saharan Africa (49.9 per cent)
South Asia (32.6 per cent)
Latin America and the Caribbean (5.8 per cent)
East Asia and the Pacific (9.9 per cent)
2015
Figure VII.1.SHARE OF DEVELOPING-COUNTRY REGIONS IN WORLD EXTREME POVERTY,a 1999 AND 2015
poor live and work in rural areas. In Eastern and Southern Africa, at least fourfifths of the extreme poor live in rural areas and 85 per cent of the poor dependon agriculture for their livelihood.9 In the United Republic of Tanzania, forexample, income from agriculture—including crops, livestock and wagelabour—is the main income source for 96 per cent of the households in the bot-tom income quintile.10 Even in Central and Western Africa—where urban pover-ty has been rising rapidly—the incidence of poverty is still much higher in rural(as opposed to urban) areas in most countries.11 In Ghana, for instance, 83 percent of the poor lived in rural areas in 1998-1999 and most of them were foodcrop farmers.12 The most recent projections indicate that in only two Africancountries—Ghana and Madagascar—are rural poverty rates likely to decline at apace adequate to achieve the Millennium Development Goal for poverty.13
Sustained growth of the farm sector could offer an opportunity for manyAfricans to escape from poverty. One of the most important means for reduc-ing rural poverty in Africa would be to raise the incomes of poor farmers byincreasing their agricultural productivity and output. For example, the signifi-cant reduction of rural poverty in the developing countries between 1970 and1990 was closely associated with increased agricultural productivity, arisingprimarily from the expansion of irrigated croplands and the introduction ofother forms of enhanced agricultural technology during the so-called green rev-olution, between the mid-1960s and the mid-1980s.
At the regional level, however, the implementation and success of both thesepolicies were highly unbalanced. For example, East Asia’s and South Asia’sconsiderable agricultural growth and poverty reduction during that period arepartly explained by their expansion of irrigation agriculture. Conversely, thepersistence of rural poverty and agricultural stagnation in most of sub-SaharanAfrica has been partly caused by its meagre 5 per cent of irrigated croplandarea.14 Similarly, although the green revolution did reach sub-Saharan Africa,the region failed to benefit from it as much as Asia, which experienced a sig-nificant agricultural “technology shift” that increased the productivity of staplefoods, notably rice, wheat and maize.15 Higher crop yields arising from techno-logical progress achieved during the green revolution contributed to the rapiddecline of rural poverty in many Asian developing countries.
For the rural economy to be Africa’s growth engine, appropriate economicpolicies to promote agricultural growth are thus crucial. Over the past twodecades, many sub-Saharan African Governments have introduced significantmacro- and microeconomic policy changes that have had a direct impact onagricultural productivity and rural development. While agricultural policyreform throughout the continent has been closely associated with aid condi-tionality in general, and structural adjustment programmes in particular, thereare also key endogenous dimensions of economic policy change. The heavy fis-cal burden of State intervention and the need to improve efficiency were par-ticularly instrumental in encouraging African Governments to introduce differ-ent approaches to agricultural development in their countries.
Among the economic policies that can promote agricultural development inAfrica are agricultural market reform; policies to provide better access to phys-ical assets (mainly land) and financial assets, and to improve extension services,transport and irrigation infrastructure; pricing, tax and exchange-rate policies
191M A R K E T - B A S E D A P P R O A C H E S T O R U R A L D E V E L O P M E N T I N S U B - S A H A R A N A F R I C A
9 IFAD, Assessment of Rural Poverty: Eastern andSouthern Africa (Rome, IFAD, 2002).
10 Ibid.
11 IFAD, Assessment of Rural Poverty: Western andCentral Africa (Rome, IFAD, December 2001), p.24. One country (Cameroon) currently has a higherpoverty incidence rate in urban than in rural areas.
12 C.K. Dordunoo and G.Y. Dogbey, “Globalization andeconomic reforms in Ghana”, in Globalization andthe Developing Countries: Emerging Strategies forRural Development and Poverty Alleviation, D.Bigman, ed. (Wallingford, United Kingdom, Centrefor Agriculture and Biosciences International/International Service for National AgriculturalResearch (CABI/ISNAR) 2002), chap. 4.
13 D.E. Sahn and D. C. Stifel, “Progress toward theMillennium Development Goals in Africa”, WorldDevelopment, vol. 31, No. 1 (2003), pp. 23-52.
14 Rural Poverty Report, 2001… .
15 See World Economic and Social Survey, 2002(United Nations publication, Sales No. E.02.II.C.1),chap. V.
W O R L D E C O N O M I C A N D S O C I A L S U R V E Y 2 0 0 3192
that do not penalize agriculture; agricultural trade liberalization; and the expan-sion and dissemination of agricultural technology research. This chapter arguesthat innovative market-based approaches aimed at increasing agricultural effi-ciency in Africa have emerged under the first two of these sets of policies,namely, marketing reform and a market-based approach to land reform.
FOOD MARKETING REFORM IN SUB-SAHARAN AFRICA
The role of food markets in rural poverty alleviation
Agriculture is vital to most of Africa’s rural population as their major sourceof both food and income. Furthermore, while the urban poor derive their mainsource of income from the urban informal sector, smallholder agriculture is byfar the main source of income of the rural poor in sub-Saharan Africa.16
Farming of basic food crops (staples), in particular, account for a considerableshare of the income of Africa’s rural poor, although an increasing proportionof them also generate income from other sources, notably cash crops, live-stock and some non-farm activity. In addition, the rural poor usually obtain 70to 80 per cent of their calorie intake from staple foods.17
Domestic production of basic food crops also has considerable impacts ondomestic inflation in poor African countries in view of their significant effecton (national) retail price index baskets of goods and the well-being of the poor.In sum, properly functioning food markets are crucial for poverty alleviation inAfrica, for three major reasons: food purchases tend to dominate the expendi-ture of the poor; the sale of staples is one of the major sources of income of therural poor; and poorly organized food markets and food distribution systemsoften result in heavy socio-economic costs, including famine, in both rural andurban areas.
There is plenty of evidence to show that food marketing uncertainty in sub-Saharan Africa contributes to stagnation in agricultural output and productivity.18
Grain markets in the region are prone to instability owing to a series of uniquephysical and economic characteristics that set them apart from other agriculturalmarkets. First, staple grains are subject to large differences between import andexport prices because their value tends to be low relative to transportation costs,notably in areas with poor transport infrastructure. Second, since grains can bestored at relatively low cost, price expectations have considerable influence oncurrent price movements in grain markets. Third, low short-run price elasticity ofaggregate demand and supply of grains means that even moderate changes inoutput are likely to lead to large price fluctuations.
In addition, international grain markets tend to be dominated by the activi-ties of a relatively small number of countries whose surplus disposal policiesare a further source of price instability.19 International price fluctuations forsome staple food commodities, such as rice, for example, tend to be muchgreater than domestic fluctuations. Greater alignment between domestic andinternational grain prices arising from agricultural trade liberalization can thusincrease domestic price volatility. Nonetheless, as chapter VI illustrates, therehave been several “success stories” that can be at least partly associated withagricultural trade liberalization in Africa.20 The present section, however, will
17 Rural Poverty Report, 2001… .
18 J. Coulter and G. Onumah, “The role of warehousereceipt systems in enhanced commodity marketingand rural livelihoods in Africa”, Food Policy, vol.27 (2002), pp. 319-337.
16 The term “smallholder” is often used to refer topoor small farmers without formal land titles,sometimes tilling poor-quality soils—inter alia, onplots owned by large landlords—and who dependdirectly on this activity for their subsistence. Thisbroad definition thus includes tenants and share-croppers but not landless farm labourers, many ofwhom subsist on very low wages and the payderived from insecure jobs, and are thus also partof the rural poor. See, for example, E. R. Wolf,Peasant Wars of the Twentieth Century (New York,Harper and Row, 1969).
19 There has been, however, a long-term downwardtrend in international grain prices in general,sometimes interrupted by sharp price rises, as in1995. See also S. Jones, Liberalized FoodMarketing in Developing Countries: Key PolicyProblems (Oxford, United Kingdom, Oxford PolicyManagement (OPM), May 1998), p. 2.
20 For a criticism of the assumed connectionbetween agricultural trade liberalization andpoverty reduction, see the Special Contribution byJ. Stiglitz in United Nations DevelopmentProgramme, Human Development Report, 2003(New York, Oxford University Press, 2003), p. 80.
focus on food production for domestic markets, in view of its close links torural poverty through smallholder production and the dominant share of foodstaples in the consumption of the rural poor.
Although State intervention in food markets is generally aimed at stabilizingdomestic prices, it is often justified on three main grounds: (a) to avoid interrup-tion of food supply and to ensure food access for the poor; (b) to protect con-sumers (both urban and rural) from sharp price rises; and (c) to protect produc-ers from sharp price falls associated with imbalances in demand and supply. Stateintervention has thus often involved granting price-reducing subsidies to con-sumers and price-raising subsidies to producers. However, restraining retail foodprices has not always been compatible with guaranteeing minimum producerprices, especially in poor countries with limited budgets. Despite the fiscal costsarising from State intervention in food markets, marketing and storage of majorfood crops in most African (and many other developing) countries tended to bein the hands of State agencies until the 1980s. Furthermore, State institutions inmany countries also controlled both international purchases and domestic distri-bution of critical inputs, such as fertilizers and pesticides.
This intervention in food production and marketing was often carried outthrough State marketing boards that had a statutory monopoly over key domes-tic marketing functions, as well as (external) agricultural trade. Marketingboards in Africa have usually been associated with export cash crops—such ascocoa, coffee, cotton, groundnuts and tea—and with their price stabilizationfunctions. However, at least one of these (cash crop) marketing boards—aswell as several ad hoc food marketing boards—also intervened in the purchas-ing, processing and distribution of staple food crops, such as maize, millet,rice, sorghum and yam. Regardless of their intervention in food staple or cashcrop markets, most marketing boards in sub-Saharan Africa either have failedto achieve their price stabilization objectives—mainly because of financial ormanagerial constraints—or have achieved them only temporarily, at the cost offiscal destabilization.21 As a result of these domestic constraints, the 1980s and1990s witnessed a redefinition of the State’s role in food marketing and amarked trend towards food (and agricultural) marketing reform throughoutAfrica. There were therefore critical endogenous reasons for this reform,notably the unsustainable fiscal cost of pricing intervention by State agencies.
At the same time, policy reform has been closely associated with the imple-mentation of the structural adjustment programmes promoted by the BrettonWoods institutions and bilateral aid programmes from the early 1980s onward.For example, a World Bank report published in 1981 advocated a series ofactions for African economies caught in a downward spiral, including a rec-ommendation that African Governments reduce control over food markets andincrease the role of market forces.22 Aid conditionality thus also contributed toshaping policies on food (and agricultural) marketing reform in Africa over thepast two decades.23 The main features of this reform have been (a) the partialor complete withdrawal of State agencies from staple food marketing; (b) thereduction or removal of consumer and producer pricing subsidies, includinginput subsidies; (c) a gradual movement away from State-controlled pricestowards market-determined pricing; and (d) relaxation of regulatory controlsover private marketing activities.
193M A R K E T - B A S E D A P P R O A C H E S T O R U R A L D E V E L O P M E N T I N S U B - S A H A R A N A F R I C A
21 See S. Jones and S. Wickrema, “Price stabiliza-tion policies in the context of market liberaliza-tion”, OPM Policy Briefing Note 2 (Oxford, UnitedKingdom, OPM, n.d.).
22 World Bank, Accelerated Development in Sub-Saharan Africa: An Agenda for Action(Washington, D.C., World Bank, 1981). This docu-ment is widely referred to as “The Berg report”after its senior author, E. Berg.
23 Many African countries have also liberalized mar-kets of non-staple commodities, such as cottonand coffee, but their analysis lies outside thescope of this chapter. See, for example, T.Akiyama and others, “Commodity market reform inAfrica: some recent experience”, EconomicSystems (forthcoming, 2003); and A. W. Shepherdand S. Farolfi, “Export crop liberalization in Africa:a review”, FAO Agricultural Services Bulletin 135(Rome, FAO, 1999).
W O R L D E C O N O M I C A N D S O C I A L S U R V E Y 2 0 0 3194
Food marketing reform in selected African countries
The implementation of food marketing reform in sub-Saharan Africa has var-ied considerably across countries and the achievement of reform objectiveshas often been closely associated with the degree of political commitment.Reform measures have focused mainly on reducing State involvement in mar-keting and price-fixing, or on increasing the efficiency of the remaining mar-keting boards. By the end of the 1990s, these boards were either “generallylosing out in competition with the private sector” throughout sub-SaharanAfrica or had “been converted into non-trading industry boards for the pur-pose of promotion and regulation”.24
Some countries, such as Ghana and Mali, had already had significant privatesector involvement in food marketing (often in contravention of marketingboards’ monopoly status) before reforms were introduced. In many WesternAfrican countries, State marketing boards nominally had statutory monop-sonies and monopolies over food marketing but rarely handled more than afifth of total marketed staples output. Well-established private grain tradingnetworks operated extensive parallel markets, both within countries and acrossborders. In these cases, reform eventually focused on providing the enablingenvironment for the expansion of private trading, inter alia, by improvingphysical infrastructure, extension services and access to credit.
Countries that had more effective State intervention in food marketing beforereform, notably in Eastern and Southern Africa, embarked on market liberaliza-tion as a result of fiscal constraints and aid conditionality, but several of themdid so without full political commitment to reform. Frequent policy reversals insome of these countries have undermined the attainment of major reform objec-tives and also have created a good deal of uncertainty for the emerging privatesector. For example, a comprehensive review of marketing reform in Kenya,Malawi and the United Republic of Tanzania found out that private agriculturaltraders repeatedly complained about the unpredictability of Government poli-cies.25 However, South Africa—and, to a lesser extent, the United Republic ofTanzania—have succeeded in making a transition from a State-controlled foodmarketing system to an increasingly market-based one. In addition, as will beshown below, the transition in South Africa has led to greater reliance on exist-ing private commodity markets to correct price fluctuations arising from thewithdrawal of marketing boards from price stabilization.
The following seven case studies illustrate the varied extent of marketingreform in sub-Saharan Africa, and their different degrees of success in improv-ing food marketing efficiency and reducing the real prices of staple foods, aswell as the indirect impacts of the reforms on household food security andpoverty alleviation.
GhanaEven prior to reform, small private traders were already responsible for thebulk of food marketing in Ghana, including staple foods such as maize. Partlyin response to the food shortages associated with the drought of 1982-1983,the Government sought to expand the role of the Ghana Food DistributionCorporation (GFDC) in maize marketing activities, notably through pricingstabilization;26 but the inability of GFDC to maintain this pricing policy—
24 Food and Agriculture Organization of the UnitedNations, “A guide to maize marketing for exten-sion officers”, Marketing Extension Guide 2(Rome, FAO, 1999).
25 P. Seppälä, ed., Liberalized and Neglected? FoodMarketing Policies in Eastern Africa, WorldDevelopment Studies, No. 12 (Helsinki, UnitedNations University (UNU) World Institute forDevelopment Economics Research (WIDER),March 1998).
26 See M. Kherallah and others, Agricultural MarketReforms in Sub-Saharan Africa: A Synthesis ofResearch Findings (Washington, D.C.,International Food Policy Research Institute(IFPRI), August 2000), chap. 4.
mainly because of its deteriorating finances—contributed to a rapid reversalof State intervention and greater marketing liberalization.
The Economic Recovery Programme (ERP), initiated in 1983 with the sup-port of the Bretton Woods institutions, introduced several market-based macro-and microeconomic reforms. These included the elimination of guaranteed min-imum maize prices and the creation of an enabling environment for the expan-sion of private sector grain trading, including small-scale traders. In the early1990s, the Government introduced a medium-term agricultural developmentprogramme (MTP), covering the period 1991-2000, whose aim was “to estab-lish and support market-led growth in agriculture”.27 MTP reforms included theGovernment’s withdrawal from price fixing and price support operations in theagricultural sector—with the notable exception of cocoa—and a significantreduction in Government subsidies for State agencies, such as GFDC.
Marketing reform has changed the Government’s role from that of interven-ing in food pricing and marketing to one of implementing measures in supportof private sector expansion, such as the provision of better storage services toboth maize farmers and traders and the construction of rural feeder roads andother infrastructure essential for agricultural and marketing expansion.Improvements in local storage capacity and transport systems have helped toreduce both long-term food prices and their variability.28 GFDC is now focusedon the provision of marketing support services—notably grain drying, cleaningand storage—to private sector clients. Support for small-scale marketing hasalso had positive gender effects, given that women traders are particularlyactive in small-scale food marketing in Ghana.29
Marketing reform, however, has had mixed results for agricultural develop-ment. For example, real grain prices have fallen since 1984 and agriculturaloutput per capita also declined between the mid-1980s and mid-1990s.30 Inaddition, the expansion of small-scale agricultural marketing activities hasoften been hampered by the inability of commercial financial institutions toserve rural areas and the rural poor adequately. In order to deal with this prob-lem, the Government, in cooperation with bilateral donors and multilateralagencies, is currently implementing a programme aimed at strengtheningmicrofinance institutions and improving rural access to financial services, par-ticularly for the poorest segments of the rural population.31
Political resistance to further restructuring of GFDC has limited the poten-tial benefits of food marketing reform in the country. Particular problems havearisen from the Government’s unwillingness to deal with overstaffing in GFDCand the latter’s resistance to making its warehouses fully available to the pri-vate sector.32 It has been recommended that “serious consideration should begiven to … selling off or leasing (GFDC) stores and grain handling equipmentto the private sector”.33 However, the privatization of grain storage facilitiesmay raise problems of monopoly power in cases where other storage opportu-nities are limited. As a result, efforts to increase the efficiency of food distrib-ution should address such problems by leasing storage facilities to the privatesector and by obliging private operators to facilitate competition by makinggrain storage services available to third parties on commercial and non-dis-criminatory terms.34
195M A R K E T - B A S E D A P P R O A C H E S T O R U R A L D E V E L O P M E N T I N S U B - S A H A R A N A F R I C A
27 See Dordunoo and Dogbey, loc. cit.
28 O. Badiane and G. E. Shively, “Spatial integration,transport costs and the response of local prices topolicy changes in Ghana”, Journal of DevelopmentEconomics, vol. 56 (1998), pp. 411-431.
29 F. Lyon, “Trust, networks and norms: the creationof social capital in agricultural economies inGhana”, World Development, vol. 28, No. 4 (2000),pp. 663-681.
30 T.S. Jayne and others, Trends in real food prices insix Sub-Saharan African countries, MSUInternational Development Working Paper, No. 55(East Lansing, Michigan, Michigan StateUniversity, n.d.).
31 See Assessment of Rural Poverty: Western andCentral Africa…, p. 61.
32 See J. Coulter and A. W. Shepherd, “Inventorycredit: An approach to developing agriculturalmarkets”, FAO Agricultural Services Bulletin 120(Rome, FAO, 1995), case study 4.
33 Ibid., sect. 7.
34 See, for example, S. Jones and S. Wickrema,“Defining the role of the State in staple food mar-kets”, OPM Policy Briefing Note 3 (Oxford, UnitedKingdom, OPM, n.d.).

KenyaKenya has had a slow and uneven process of marketing reform, for severaleconomic, social and political reasons. Until the 1980s, State intervention infood marketing was exercised through a monopoly, granted to the NationalCereals and Produce Board (NCPB), over grain movements between differentdistricts of the country, sales to large grain mills and international agriculturaltrade. The Government also set a fixed national price for producers. Despitethe monopoly status of NCPB, private sector trading (both legal and illegal)accounted for a significant share of marketed maize output. Because of thisprivate involvement in food marketing, as well as restrictions on internal grainmovements, NCPB was unable to eliminate disparities between official andparallel market prices, and there were large price differentials among differentareas of the country.
In 1980, the country’s first structural adjustment programme included limit-ed reform of producer prices, but pressure to reform NCPB met with stiff polit-ical resistance. Increased producer prices and a threefold increase in NCPBpersonnel associated with the establishment of local buying centres in the mid-1980s made that marketing board a considerable fiscal burden to the country.By 1987, NCPB accumulated debt was equivalent to 5 per cent of Kenya’sgross domestic product (GDP).35 Radical reform of NCPB was repeatedlyemphasized in structural adjustment and bilateral aid programmes throughoutthe 1980s and early 1990s, but never fully implemented owing to a lack ofpolitical commitment.
Grain marketing reform has, however, made significant progress in otherareas. The partial implementation between 1986 and 1991 of a Cereal SectorReform Programme (CSRP)—with the financial support of the EuropeanUnion (EU)—allowed grain millers to purchase an increasing proportion oftheir supplies from the private sector. By 1992, about 50 per cent of (national)millers’ requirements were purchased from non-NCPB sources. In addition,small-scale (hammer) mills gained a significant market share from large-scale(subsidized) millers. By the mid-1990s, urban hammer meal consumption hadincreased to as much as 40 per cent of total maize meal consumption. Giventhat a large proportion of low-income families own or work in those smallurban mills, this is likely to have had a positive impact on poverty alleviation.
Another important outcome of reform has been the partial lifting of controlson grain movements within the country. As a result, consumer prices have fall-en in most parts of Kenya as trade flows between surplus and deficit areas rose,and increased private sector efficiency has been encouraged by a “spatial con-figuration of agricultural production more in line with regional comparativeadvantage”.36 In addition, the parallel liberalization of the country’s fertilizermarket has produced broad efficiency gains in the farming sector. There is alsoevidence that the liberalized maize milling has improved the sector’s competi-tiveness—notably through the expansion of small-scale hammer mills—andcontributed to lower maize flour (real) prices.37
Nonetheless, in key reform areas, such as NCPB restructuring, price liberal-ization and allowing licensed buying agents to operate legally in the food mar-ket, Kenya’s marketing reform programme has suffered from erratic implemen-tation. Opposition to reform by past Kenyan Governments meant that privatemarketing was liberalized only during the 1990s and only after concerted donor
W O R L D E C O N O M I C A N D S O C I A L S U R V E Y 2 0 0 3196
35 S. Jones and S. Wickrema, “The use of condition-ality in reform: food markets in Africa”, OPMPolicy Briefing Note 1 (Oxford, United Kingdom,OPM, n.d.).
36 S. Were Omamo and L. O. Mose, “Fertilizer tradeunder market liberalization: preliminary evidencefrom Kenya”, Food Policy, vol. 26 (2001), pp. 1-10.See also J. K. Nyoro and others, “Evolution ofKenya’s marketing system in the post-liberaliza-tion era”, paper presented at the Workshop onAgricultural Transformation in Africa, Nairobi, 27-30 June 1999.
37 Seppälä, op. cit.

pressure. Lack of political commitment, and major weaknesses in the formula-tion and implementation of the reform programme, have been the two main rea-sons for the relatively slow pace of reform so far. Although real grain pricesgradually fell during the 1990s, further success in marketing reform will requirepolicies to intensify marketing liberalization, including the creation offavourable economic conditions for private sector expansion in food marketing.
MalawiMalawi’s agricultural sector includes a smallholder subsector—whichaccounts for 70 per cent of agricultural output, including the bulk of food sta-ples—and the private commercial subsector, which mainly produces cashcrops.38 In 1971, the Government set up the State-owned AgriculturalDevelopment and Marketing Corporation (ADMARC) to intervene in the pur-chasing and marketing of agricultural produce. ADMARC had monopsonistpowers only in the purchase of non-food crops, such as cotton and tobacco.However, it became increasingly involved in the purchasing and marketing offood products that were supposed to be freely traded, which led to somecrowding-out of private traders.39
The marketing activities of ADMARC aimed at providing a reliable marketfor smallholder output; setting uniform national prices that cross-subsidizedless competitive farmers living in areas lacking adequate transport networks;and providing subsidized agricultural inputs. It also provided large subsidiesfor the consumption of maize and rice.40 The activities of ADMARC during itsfirst decade played an important role in sustaining the smallholder sector andcontributing to household food security. However, from the early 1980sonward, ADMARC had increasing difficulty in sustaining its pricing policy,with increasing losses in its food marketing activities, owing to several micro-and macroeconomic problems, including exogenous shocks. These problemsincluded the escalating fiscal cost of producer and consumer subsidies; theinflated number of ADMARC employees and their decreasing productivity;Malawi’s falling or negative economic growth rates and deteriorating terms oftrade; increasing transport costs arising from the civil war in Mozambique; andfalling world prices for tobacco, whose export tax revenues were used to sub-sidize the marketing board’s maize support operations.
As a result of these economic difficulties, as well as aid conditionality,Malawi launched a series of structural adjustment programmes during the1980s and 1990s, which led to the gradual liberalization of grain pricing andmarketing. In fiscal year 1981/82, the producer price of maize was increasedby two thirds and the ADMARC statutory monopsony in smallholder agricul-ture purchases was officially eliminated in 1987, although the State marketingboard still remained active in food markets. Despite the considerable pressureexerted by international financial institutions to promote extensive price andmarketing liberalization, Malawi has been one of the African countries thatmost resisted the dismantling of a State marketing agency.
Although price and marketing liberalization led to a considerable increase inmaize production, it did not guarantee household food security. While small-holders who are net food sellers have gained from liberalization, small farmerswho are net food buyers or who live in remote areas appear to have becomeworse off. 41 Small-scale traders as a whole—a significant proportion of whom
197M A R K E T - B A S E D A P P R O A C H E S T O R U R A L D E V E L O P M E N T I N S U B - S A H A R A N A F R I C A
38 See W. Chilowa, “The impact of agricultural liber-alization on food security in Malawi”, Food Policy,vol. 23, No. 6 (1998), pp. 553-569.
39 The increasing involvement of ADMARC in foodmarketing was facilitated by its establishment of1,400 marketing points by the early 1980s. See T.S. Jayne and S. Jones, “Food marketing and pric-ing policy in Eastern and Southern Africa: a sur-vey”, World Development, vol. 25, No. 9 (1997),pp. 1505-1527.
40 Chilowa, loc. cit., p. 557.
41 Chilowa, loc. cit.

W O R L D E C O N O M I C A N D S O C I A L S U R V E Y 2 0 0 3198
have relatively low incomes—have benefited from marketing reform, eventhough they have also faced serious constraints that have hindered their abilityto improve marketing efficiency. These constraints include poor and costlytransport infrastructure, inadequate storage facilities and lack of credit, train-ing and extension services, including insufficient technical advice. GreaterGovernment (and donor) efforts are thus needed in order to accelerate foodmarketing reform and ensure that the benefits of improved private marketingefficiency are passed on to consumers, especially the poor.
MaliThe establishment of Mali’s agricultural marketing board—L’Office maliendes produits agricoles (OMPA)—dates back to the mid-1960s. Before market-ing reforms, it had a statutory monopoly over grain trade and the authority toset uniform prices for both producers and consumers throughout the country.Food pricing policy was primarily aimed at providing “cheap food to thearmy, State employees, and the urban population”.42 During the 1960s and1970s, OMPA was also the main State agency responsible for the distributionof food aid.
Partly as a result of its ineffective monopoly status, questionable food pric-ing policy and inefficient marketing operations, private traders developed anextensive parallel grain market. By the early 1980s, the OMPA “monopoly”accounted for as little as 15 per cent of total marketed production, although itsoperational deficit had increased significantly, mainly as a result of its foodimport operations and (consumer) price subsidies. The increasing fiscal drainof OMPA on the Malian Government’s financial resources drove theGovernment to adopt marketing reforms—with the support of donors—in1981.43 Reform has taken place over the past two decades through the gradualimplementation of different phases of the Cereal Market RestructuringProgramme (Programme de restructuration du marché céréalier), known by itsFrench acronym, PRMC.
Phase I of PRMC (1981-1986) aimed at increasing the role of the privatesector in official grain trading and reducing subsidies to both producers andconsumers. During this phase, physical grain losses were sharply reduced andthe operational deficit of OMPA was cut by two thirds. However, the market-ing board was unable to maintain the official price at the end of this phase,eventually leading to its withdrawal from price stabilization in order to complywith the fiscal terms of an International Monetary Fund (IMF) structuraladjustment programme. The major objectives of OMPA for phase II (1988-1990) included managing a national food security buffer stock and food aiddistribution. In addition, donor aid support was channelled into a credit pro-gramme for private grain traders. Phase III (1991-1994) focused on extendingcredit to farmers associations (administered by a State-owned developmentbank) and promoting the expansion of private sector storage, including the pri-vatization of State-owned storage facilities.
PRMC succeeded in removing OMPA from price stabilization activities andreducing its role in (non-aid) food distribution, together with ensuring greatercompetition and private sector involvement in food marketing. The increasingfiscal costs of the State marketing system were reversed and average grain out-put over the period 1985-1991 was 40 per cent larger than the averages for the
42 Jones and Wickrema, “The use of conditionality inreform”… .
43 See, in particular, N.N. Dembele and J.M. Staatz,“The impact of market reform on agriculturaltransformation in Mali”, paper presented at theWorkshop on Agricultural Transformation, EgertonUniversity, Nairobi, 27-30 June 1999.
periods 1975-1979 and 1980-1984.44 There is also evidence that marketingreform contributed to an increase in competition, lower grain distribution costsand improved physical access to grains by consumers.45 In addition, reducedmarketing costs and improved market integration associated with the reformhave benefited both urban and rural consumers by improving food access forthe poor and by ensuring lower grain prices.
Nonetheless, the continuing responsibility of OMPA for food aid distribu-tion and the national food security stock has continued to be a fiscal burden andhas contributed to a distorting of prices. For example, the national food secu-rity stock has suffered from “political pressure to provide price support (subsi-dies) to some producers and to favour certain suppliers in the awards of con-tracts”.46 In addition, there are still substantial problems in ensuring reliableaccess to cereals by low-income consumers owing to structural problems thatmarketing reform alone is unlikely to resolve, including, in particular, poortransport infrastructure in many parts of the country.47 While some progress hasbeen achieved to date, the future success of the marketing reforms is likely tobe compromised unless those problems are dealt with by the Government, withthe cooperation of its international partners.
South AfricaSouth Africa’s food marketing system has undergone a decisive transition frombeing State-controlled to being predominantly market-based, notably in maizemarketing. For over five decades up to the mid-1990s, the South African MaizeBoard (SAMB) operated a price stabilization scheme that provided significantsubsidies to maize farmers.48 The Government began to curtail the activities ofthis maize marketing board in 1995, although it continued to collect a stabiliza-tion levy and to support maize exports. In 1996, new legislation still allowedcertain types of market intervention, including the collection of stabilizationlevies and export controls, although there are important checks and balances.In particular, the Minister of Agriculture must be satisfied that any proposedintervention advances the improvement of market access and the optimizationof export earnings, without being significantly detrimental to specific socio-economic objectives, including household food security.
Statutory intervention in the South African maize market ceased in 1997,when SAMB was closed down. Controls over who buys or sells maize, or onthe prices at which maize is traded, were abolished, together with all restric-tions on maize exports. In addition, the South African Futures Exchange(SAFEX) has been trading future maize contracts on a regular basis for sever-al years. One of the reasons for the growth of SAFEX is that maize market lib-eralization created a great deal of spot market price volatility and this caused“farmers, traders, and millers to use forward contracts and futures contracts tomanage their price risk”.49 However, small-scale, black farmers still contributea very small part of the marketed grain production of South Africa which, inthis respect, is unlike most other countries in Southern Africa.
The effectiveness of SAFEX as a food commodity market was first testedduring the 1997 El Niño/Southern Oscillation (ENSO) event.50 The expecteddrought in the region caused a sharp rise in futures prices of white maize asmillers tried to secure supplies for the following season. The price of yellowmaize (not used for human consumption)—which had always been pegged to
199M A R K E T - B A S E D A P P R O A C H E S T O R U R A L D E V E L O P M E N T I N S U B - S A H A R A N A F R I C A
44 Jones and Wickrema, “The use of conditionality inreform”… .
45 Coulter and Shepherd, loc. cit., case study 3.
46 Jones and Wickrema, “The use of conditionality inreform”… .
47 See Dembele and Staatz, loc. cit.
48 See, in particular, B. Bayley, A Revolution in theMarket: The Deregulation of South AfricanAgriculture (Oxford, United Kingdom, OPM,January 2000).
49 S. Jones, op. cit., p. 33.
50 See Jones and Wickrema, “Price stabilization poli-cies in the context of market liberalization”… .

white maize prices under the State marketing regime—increased very little bycomparison. This led to a considerable shift to white maize planting by manyfarmers. As fears of drought receded, futures contract prices fell, showing thatmarkets are often better prepared than State-controlled systems to respond toshocks. The range of risk-hedging opportunities allowed by SAFEX futurescontracts thus provides a solution to increased price instability arising fromfood market liberalization. Other countries in the region—including those witha significant proportion of smallholders—are also considering the use of simi-lar futures markets.
United Republic of TanzaniaDespite initial resistance to marketing reform, the United Republic of Tanzaniaeventually liberalized maize trading decisively, particularly during the 1990s.Marketing reform in the country can be traced to the “collapse after 1981 of theofficial marketing system as a result of the unsustainable pricing policies imple-mented by the National Milling Corporation (NMC)”.51 Even prior to liberaliza-tion, parallel markets were handling a significant share of grain trading owing tothe inability of NMC to enforce its statutory monopoly status. Illegal tradeamong different regions was also encouraged owing to differences among localprices arising from Government restrictions on interregional trade.
Although the Tanzanian Government had tried to suppress illegal privatetrading until 1983, restriction of private marketing was afterwards graduallyreduced, as it had become clear that the inefficient and costly State marketingsystem could neither compete with the (legal or illegal) private sector normaintain official prices. Marketing liberalization thus merely legalized rapidlyexpanding parallel grain markets. In 1984, liberalization policies werelaunched and, as part of structural adjustment programmes, the Governmenteliminated subsidies for maize. Between 1987 and 1990, restrictions on inter-regional trade were also removed. Private trading was fully liberalized in 1990,and NMC activities were basically limited to milling maize.
The private marketing system has expanded throughout the country but,partly because of a lack of investment in both greater storage capacity and bet-ter transport infrastructure, price fluctuations are still large. The private mar-keting system has faced other obstacles to its further expansion, notably thelack of credit for purchases and investment. Most of the operators are smalltraders with a limited amount of capital. The lack of both capital and transportfacilities means that many small farmers also have difficulties selling theircrops at reasonable prices. Nonetheless, it can be argued that the liberalizationof the maize market “has been one of the success stories of agricultural liber-alization in Tanzania”.52 Furthermore, while the withdrawal of subsidies hassometimes caused urban riots in other African countries, the availability ofmaize generally kept pace with demand during and after marketing reform.53
ZambiaThe main priority of State intervention in food marketing in Zambia has beento benefit urban consumers. The Government established the NationalAgricultural Marketing Board (Namboard) shortly after independence in themid-1960s. Namboard monopolized maize marketing and fixed producer andconsumer prices until the late 1970s.
W O R L D E C O N O M I C A N D S O C I A L S U R V E Y 2 0 0 3200
51 Jones and Wickrema, “The use of conditionality inreform”… .
52 B. Cooksey, “Marketing reform? the rise and fall ofagricultural liberalization in Tanzania”,Development Policy Review, vol. 21, No. 1 (2003),pp. 67-91.
53 Ibid.
Marketing reform was initiated in 1981, when the Government partiallytransferred maize marketing to cooperatives and allowed maize meal and fer-tilizer prices to rise in order to comply with an IMF structural adjustment pro-gramme. The Government attempted to reduce maize subsidies in the mid-1980s but the design and implementation of the subsidy reduction programmewere badly mishandled and resulted in a reduced supply of maize meal prod-ucts and sharp consumer price increases.54 Serious food riots at the end of 1986prompted the Government to increase subsidies and nationalize large-scale pri-vate maize mills. Further attempts to reduce subsidies were made through theintroduction of food coupons in the late 1980s but another policy U-turn elim-inated the food coupon system in the early 1990s. In addition, Namboard wasabolished, the national milling industry was privatized and many productionand consumption subsidies were eliminated at around the same time.
Although the State’s involvement in marketing was significantly reducedduring the first half of the 1990s—following the abolition of Namboard—theState-owned Food Reserve Agency, established in 1995, has continued to usepublic funds to sell maize to industrial millers below market prices. While thisagency’s grain sales have been relatively small—given the lack of funding tosupport its expanded operation—they have contributed to the disruption of pri-vate marketing and trading in some local markets. At the same time, the expan-sion of smallholder production and private marketing has been hindered bypoor road infrastructure, and lack of credit and adequate provision of inputsand extension services. This has been particularly detrimental to the rural poor,as it has contributed to a rise in grain (consumer) prices in rural areas.Furthermore, the party winning the 2001 election had run on the premise ofreintroducing a food marketing board to provide subsidized maize prices tofarmers and consumers and the legislation for the new Crop MarketingAuthority was set for parliamentary consideration in 2002.55
The rural poor in Zambia will be able to derive significant benefits from lib-eralized maize marketing only if such policy reversals are avoided, theGovernment’s pro-urban bias is reduced and further reform measures areimplemented decisively, including policies to increase agricultural output andproductivity, and the provision of the necessary infrastructure and extensionservices for efficient marketing, as well as adequate technical and financialsupport by donors. However, the implementation of these policies is likely tofail unless there is full political commitment to reform.
An assessment of food marketing reform in Africa
An examination of reform experiences in selected African countries showsthat food marketing liberalization has produced several positive (as well asnegative) socio-economic results. One general point is that in most, if not allcases, there was private sector food marketing, whether legal or not. Thisitself suggests that food marketing boards were not performing their statutoryfunctions effectively.
The withdrawal of marketing boards from food pricing and trading activitieshas generally contributed to increasing the efficiency and thus reducing the costof grain distribution. It has also reduced the fiscal burden of State-controlledfood marketing systems, which is a particularly important issue in poor countries
201M A R K E T - B A S E D A P P R O A C H E S T O R U R A L D E V E L O P M E N T I N S U B - S A H A R A N A F R I C A
54 S. Jones, op. cit., p. 8.
55 T.S. Jayne and others, “False promise or falsepremise? the experience of food and input marketreform in Eastern and Southern Africa”, WorldDevelopment, vol. 30, No. 11 (2002), pp. 1967-1985.

with scarce financial resources. Greater spatial market integration arising fromthe removal of State restrictions on private grain trading between contiguousregions (both subnationally and internationally) has also contributed to lowerprices and an increase in the range of food products available. Both rural and(especially) urban consumers in many African countries now have a greateravailability of food products as a result of the increased entry of private tradersinto the food and agricultural marketing sector. While consumer vulnerability toprice fluctuations arising from marketing liberalization has sometimes increasedin the short run, this negative impact has often been eventually mitigated bygreater private investments in grain processing and distribution, as well as inter-regional or cross-border trade, which contributed to the expansion of consumerchoice and the ability to stabilize expenditures on maize meal.56
Consumers in many countries have generally benefited from efficiencygains of private marketing through lower prices, notably by small-scale ham-mer mills.57 A survey of grain and grain meal prices in six African countries thathave liberalized food marketing (to different degrees) shows that real pricesdeclined in five of them during the 1980s and 1990s: Mali, since 1982; Ghana,since 1984; Zambia, since 1987; Kenya, since 1988; and Ethiopia, since 1990.58
There were, however, different reasons for the decline in real consumer foodprices in these countries, including increased competition and lower costs infood marketing and processing in Kenya, Mali and Zambia; and better trans-mission of falling real world prices into the domestic economies by removal oftrade barriers in Ghana and Mali. Nonetheless, in all five countries, increasedefficiency arising from greater private sector involvement in grain distributioncontributed to lower real prices.
At the same time, food market liberalization has given rise to some criticalproblems that require corrective policy action. First of all, withdrawal of theState marketing boards from food marketing has sometimes made net pur-chasers of food more vulnerable to short-run price fluctuations, given that Stateintervention had some success in ensuring price stabilization, even if the ben-efits of such policies had often been limited by fiscal constraints on marketingboards’ ability to defend official prices. Since price fluctuations sometimeshave a negative impact on rural (and urban) poverty, corrective measures arerequired to maintain household food security, including the distribution of(means-tested) food coupons.
Second, some small farmers have been negatively affected by the withdraw-al of guaranteed official purchasing at fixed prices, particularly when market-ing boards are abolished before an adequate private food marketing system isin place. In addition, the abolition or streamlining of State marketing boardshas sometimes disrupted the provision of essential support services to small-holders. The above-mentioned case studies underline that the adequate provi-sion of both credit59 and extension services is vital for agricultural developmentin Africa. Similarly, improving infrastructure—notably roads and storage facil-ities—is critical for raising the efficiency of food marketing activities (carriedout by either the public or private sectors). There is particular evidence thatlack of rural feeder roads is a major cause of high transportation costs and poormarket integration in most African countries.60
Third, it is also argued that the removal of fertilizer subsidies arising fromfood marketing reform has reduced their use by smallholders. This, in turn, has
W O R L D E C O N O M I C A N D S O C I A L S U R V E Y 2 0 0 3202
57 Ibid.
56 See T.S. Jayne and others, Successes andChallenges of Food Market Reform: Experiencesfrom Kenya, Mozambique, Zambia and Zimbabwe(East Lansing, Michigan, Michigan StateUniversity, 1999). Those negative short-termimpacts, however, suggests a need for targetedaction, such as the provision of food stamps forthe poor.
58 T.S. Jayne and others, Trends in real foodprices… .
59 It is worth noting, however, that credit provisionby marketing boards (and agricultural banks) in thepast was not only officially subsidized but some-times constituted unofficial subsidies through thefailure of farmers, many of them politically wellconnected, to repay loans.
60 See S. Jones (op. cit., pp. 21-22), who also propos-es a “road funds” tax earmarked to finance roadimprovements and maintenance in poor countries.
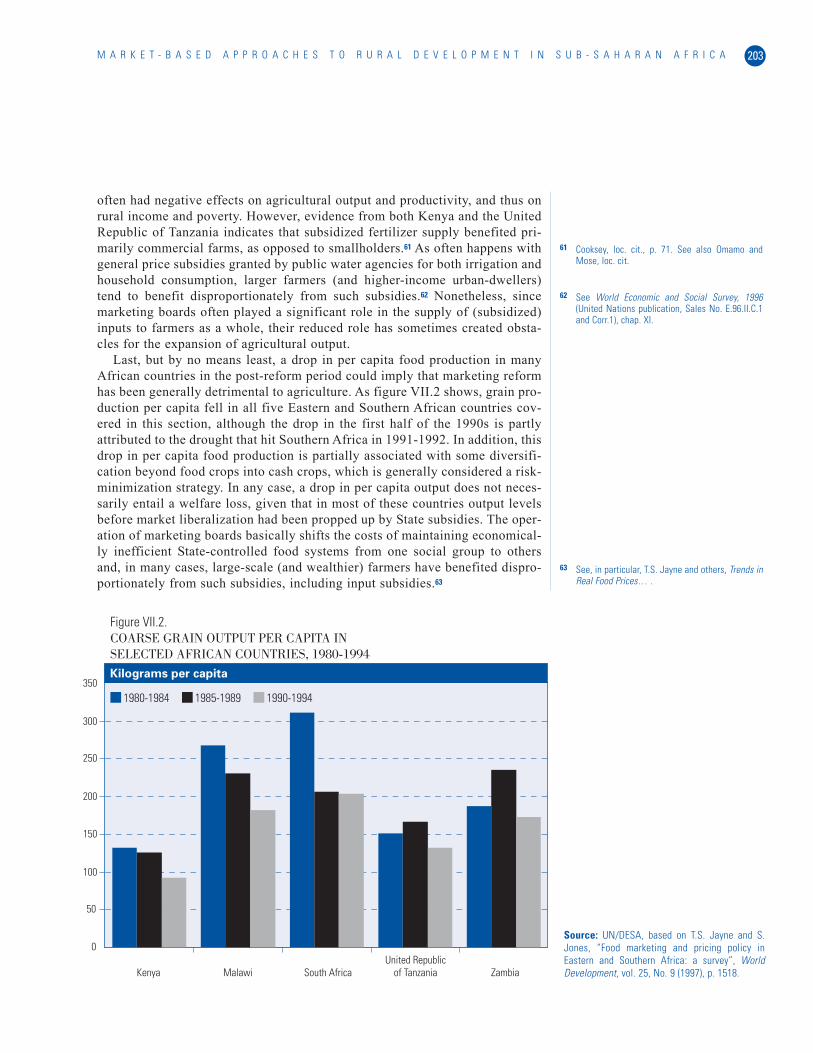
203M A R K E T - B A S E D A P P R O A C H E S T O R U R A L D E V E L O P M E N T I N S U B - S A H A R A N A F R I C A
often had negative effects on agricultural output and productivity, and thus onrural income and poverty. However, evidence from both Kenya and the UnitedRepublic of Tanzania indicates that subsidized fertilizer supply benefited pri-marily commercial farms, as opposed to smallholders.61 As often happens withgeneral price subsidies granted by public water agencies for both irrigation andhousehold consumption, larger farmers (and higher-income urban-dwellers)tend to benefit disproportionately from such subsidies.62 Nonetheless, sincemarketing boards often played a significant role in the supply of (subsidized)inputs to farmers as a whole, their reduced role has sometimes created obsta-cles for the expansion of agricultural output.
Last, but by no means least, a drop in per capita food production in manyAfrican countries in the post-reform period could imply that marketing reformhas been generally detrimental to agriculture. As figure VII.2 shows, grain pro-duction per capita fell in all five Eastern and Southern African countries cov-ered in this section, although the drop in the first half of the 1990s is partlyattributed to the drought that hit Southern Africa in 1991-1992. In addition, thisdrop in per capita food production is partially associated with some diversifi-cation beyond food crops into cash crops, which is generally considered a risk-minimization strategy. In any case, a drop in per capita output does not neces-sarily entail a welfare loss, given that in most of these countries output levelsbefore market liberalization had been propped up by State subsidies. The oper-ation of marketing boards basically shifts the costs of maintaining economical-ly inefficient State-controlled food systems from one social group to othersand, in many cases, large-scale (and wealthier) farmers have benefited dispro-portionately from such subsidies, including input subsidies.63
Figure VII.2.COARSE GRAIN OUTPUT PER CAPITA IN SELECTED AFRICAN COUNTRIES, 1980-1994
0
50
100
150
200
250
300
350
Kenya Malawi South AfricaUnited Republic
of Tanzania Zambia
Kilograms per capita
1980-1984 1985-1989 1990-1994
Source: UN/DESA, based on T.S. Jayne and S.Jones, “Food marketing and pricing policy inEastern and Southern Africa: a survey”, WorldDevelopment, vol. 25, No. 9 (1997), p. 1518.
61 Cooksey, loc. cit., p. 71. See also Omamo andMose, loc. cit.
62 See World Economic and Social Survey, 1996(United Nations publication, Sales No. E.96.II.C.1and Corr.1), chap. XI.
63 See, in particular, T.S. Jayne and others, Trends inReal Food Prices… .
W O R L D E C O N O M I C A N D S O C I A L S U R V E Y 2 0 0 3204
Similarly, negative impacts of reforms on smallholders in isolated areasraise the question whether cross-subsidies are preferable to providing anenabling environment for increasing their economic efficiency vis-à-vis morecompetitive farmers, inter alia, through the State provision of better transportand grain storage infrastructure. Following marketing reform and the with-drawal or reduction of producer subsidies, the production of staple crops inexcess of subsistence requirements is not economically viable to many small-holders in remote areas, given that transport costs may exceed the value of thecrops themselves. While improved road networks can help to reduce costs,marketing liberalization also has encouraged remote farmers “to change theircropping patterns and identify new crops which have higher value-for-weightratios and can thus absorb higher transport costs”.64 Marketing boards’ with-drawal from—or reduced involvement in—food pricing, purchasing, transportand distribution has thus encouraged food production to be more responsive todemand and consumer preferences.
While food marketing liberalization may have adverse impacts on less effi-cient farmers, the reversion to State marketing systems with their associatedoperational inefficiencies, pricing distortions and heavy fiscal cost would be aworse alternative. The move towards greater liberalization in Africa was aresult of not only aid conditionality, but also the unsustainable fiscal burdenand inefficient operation of State marketing boards. There is, however, concernthat, since many sub-Saharan African countries had little experience with mar-ket-oriented food systems before the 1980s or 1990s, pricing and marketingliberalization should be implemented gradually.
The case studies show that corrective Government policies to reduce marketinstability and increase efficiency in both food production and marketinginclude: (a) improving the transport infrastructure and food storage capacity inrural areas; (b) adequate provision of extension services and credit to bothsmall farmers and private traders; (c) dissemination of reliable market infor-mation to smallholders;65 (d) market-based measures to reduce the effects ofprice fluctuations, as reflected, for example, in South Africa’s innovative expe-rience with future commodity exchanges; and (e) regional trade integrationmeasures, such as those supported by the New Partnership for Africa’sDevelopment (NEPAD) (see document A/57/304, annex).66 Some of these func-tions were, in theory, supposed to be carried out by marketing boards but, inpractice, they were poorly provided by such boards, partly because of theircentral focus on (and problems with) pricing intervention and direct food mar-keting. It is now also recognized that food security objectives can be achievedmore effectively (and more economically) through targeted socio-economicpolicies rather than through State marketing boards that have other primaryobjectives and are often inefficiently operated.
Finally, the development of a competitive (and more efficient) private foodmarketing calls for effective regulation to deal with potential market failures,detrimental activities by powerful traders and food quality control. Since thesefunctions—notably quality control for food and non-food export crops—werepartly carried out by marketing boards, it is critical that other Governmentagencies enforce food quality regulation after the abolition or streamlining ofmarketing boards. Effective regulation is important not only to secure exportmarkets but also to ensure adequate standards of human health for domestic
64 Food and Agriculture Organization of the UnitedNations, “Understanding and using marketinginformation”, Marketing Extension Guide 2 (Rome,FAO, 2000), p. 3.
65 FAO has produced several useful guides to assistextension workers in sub-Saharan Africa in advisingsmall farmers and traders how best to use marketinformation for marketing maize and other foodcrops. See, for example, “Understanding and usingmarketing”…; and “A guide to maize marketing”… .
66 See Declaration on Democracy, Political, Economicand Corporate Governance of 18 June 2002(NEPAD, n.p.), paras. 3 and 24. See also WorldEconomic and Social Survey, 2002, pp. 111-112.
food consumers. The development of a legal framework should also include theclear definition of property rights and a legitimate authority to enforce theserights.67 In this context, as will be argued in the next section, there is a partic-ularly strong case to be made for strengthening the land-use and ownershiprights of small farmers as a means of increasing agricultural productivity andpromoting more equitable rural growth patterns.
A MARKET-BASED APPROACH TO LAND REFORM
The central role of land reform in rural poverty alleviation
In most developing countries, agriculture makes a significant contribution toemployment, income and economic growth. Policies to promote more effi-cient and equitable agricultural growth should thus play a central role in ruralpoverty reduction strategies. Increasing agricultural productivity and outputis particularly critical for improving living standards and reducing ruralpoverty in sub-Saharan Africa, where most of the poor depend on farming fortheir livelihood.
While much economic research on agricultural productivity focuses onincreased mechanization, revolutionary technology shifts and increased soilfertility, higher yields can also be derived from redistributive land reform.Small farms in developing countries tend to be more productive than largerfarms per unit of land, notably because hired labour on large farms is usuallyless productive than family labour, unless there is effective supervision orappropriate incentives—both of which can be very costly.68 In north-eastBrazil, for example, farm yields rose by between 10 and 40 per cent on non-irrigated land and between 30 and 70 per cent on irrigated land that was redis-tributed to small farmers.69
In the 1960s, some economists argued that redistributing land to small farm-ers would lead to lower crop yields, but subsequent empirical research showedthat land redistribution to the poor increased agricultural output per hectare inmany developing countries, at least in the medium to long run, for three mainreasons.70 First, small farms often use more labour per hectare—extra labourthat might not have otherwise been used—and thus tend to be more productive.Second, as noted above, the costs of supervising farm labour increase with thesize of the farm. Third, when small farmers have secure land titles, they aremore likely to obtain cheaper and more extensive credit—by using land as col-lateral—and undertake farm improvements and increase output. More equalpatterns of land ownership thus often contribute to faster, as well as more equi-table, aggregate economic growth.71
Redistributive land reform has traditionally been carried out by (a) distrib-uting unused State lands to the rural poor; (b) expropriating large private land-holdings—with or without compensation—for division and distribution tolandless peasants and small farmers without land titles; and (c) strengtheningthe land rights of smallholders. Strengthening the land-use or property rights ofsmall farmers, in particular, has made a significant contribution to the produc-tion of greater food output per hectare and thus to poverty alleviation in sever-al Asian developing countries, including the world’s two most populous ones.
In India, greater increases in food output and faster poverty reduction wereachieved in States that had implemented redistributive land reform.72 While
205M A R K E T - B A S E D A P P R O A C H E S T O R U R A L D E V E L O P M E N T I N S U B - S A H A R A N A F R I C A
67 Jones and Wickrema, “Defining the role of theState”… .
68 See R. A. Berry and W. R. Cline, Agrarian Structureand Productivity in Developing Countries(Baltimore, Maryland, Johns Hopkins UniversityPress, 1979); and A. V. Banerjee, “Land reforms:prospects and strategies”, mimeo (Cambridge,Massachusetts, Massachusetts Institute ofTechnology, n.d.).
69 UNDP, Human Development Report, 2003…, p. 89.
70 For a detailed discussion of these factors, seeWorld Economic and Social Survey, 2000 (UnitedNations publication, Sales No. E.00.II.C.1), chap.V; and E. Wayne Nafziger, The Economics ofDeveloping Countries (Upper Saddle River, NewJersey, Prentice Hall, 1997), chap. 7.
71 A recent analysis of incentives conducive to eco-nomic growth across countries stresses that moreunequal land distribution patterns are often asso-ciated with lower growth. See W. Easterly, TheElusive Quest for Growth: Economists’ Adventuresand Misadventures in the Tropics (Cambridge,Massachusetts, MIT Press, 2001), chap. 13.
72 Rural Poverty Report, 2001… .

W O R L D E C O N O M I C A N D S O C I A L S U R V E Y 2 0 0 3206
increased agricultural productivity in the country is often associated with thegreen revolution in the late 1960s and 1970s, empirical research covering theperiod between 1955 and 1988 also shows a clear link between poverty reduc-tion and land reform, notably tenancy reform.73 The Indian experience indi-cates, in particular, that a more adequate legal title to ownership or tenancy ofland provides an incentive for small farmers to invest in the land and enablesthem to use land as collateral in accessing the credit market.
China provides one of the most remarkable examples of the positive impactsof land reform on agricultural growth and rural poverty reduction. The house-hold responsibility system (HRS), introduced during the 1978-1984 landreform, was based upon the distribution of collectively owned land to house-holds, mainly according to family size.74 While collective land ownership wasofficially maintained, the granting of land-use rights to peasant householdslinked their remuneration to output. This contributed to reducing costs andboosting agricultural production and rural incomes. Between 1978 and 1984,output of the three main types of crops—grain, cotton and oil-bearing seeds—increased at annual rates of 4.8 per cent, 7.7 per cent and 13.8 per cent, respec-tively, compared with the average annual growth rates of 2.4 per cent, 1.0 percent and 0.8 per cent between 1952 and 1978.75 Similarly, while the per capitaincome of farmers had risen at an average annual rate of 3.9 per cent between1949 and 1978, the rate increased to 13.1 per cent between 1978 and 1986.76
Although there were other reasons for this significant rise of productivity andincomes during the 1980s, such as the expansion of irrigated croplands, landreform played a crucial role in agricultural expansion and socio-economicdevelopment. The resulting fall in rural poverty is ultimately attributed to the“combined impact of egalitarian distribution of communal lands, better seeds,more irrigation and less repression of farm prices”.77
In Viet Nam, rapid growth of agricultural output, achieved through landredistribution and market liberalization, is considered the main reason for thecountry’s success in reducing poverty during the 1990s.78 The liberalization ofthe agricultural sector began in the late 1980s with the granting of long-termland leases, the lifting of price controls and the gradual removal of restrictionson agricultural trade. A 1993 law allowed landholders to sell, lease and inheritland, and use it as collateral. Private ownership of agricultural machinery andfarm animals, as well as the right to buy and sell them, was also permitted.These reforms allowed the development of a private land market and the even-tual privatization of agriculture. Greater security of tenure, particularly from thedistribution of collective farmlands to small-scale farmers, has been responsiblefor increased productivity and agricultural diversification, notably into cashcrops with large export potential, such as rice and coffee. Recent research alsoindicates that land reform led to a considerable increase in the total area devot-ed to (more productive) multi-year crops between 1993 and 1998.79
The strengthening of land property rights achieved under Viet Nam’s decol-lectivization programme can be considered a type of market-oriented landreform in that it has led to the development of private land markets. Tenurereform is based on the recognition that rural economic development requires asecure system of property rights for small farmers that encourages investmentand facilitates access to credit. In cases where land markets do not function sat-isfactorily, and where it is impossible to enforce land repossession, formal land
73 See Human Development in South Asia 2002:Agriculture and Rural Development (Karachi,Oxford University Press, 2003).
74 See World Economic and Social Survey, 2000…,p. 144.
75 Fu Chen, L. Wang and J. Davis, “Land reform inrural China since the mid-1980s”, Land Reform, No.2 (1998), pp. 122-137. While HRS has succeeded inraising agricultural productivity and output, theauthors identify several institutional weaknessesand propose measures to strengthen land use orproperty rights. See also J. M. Zhou, “Principalforms of land consolidation and expansion inChina”, Land Reform, No. 1 (2000), pp. 89-107.
76 See United Nations University (UNU), The Impactof Economic Development on Rural Women inChina (United Nations publication, Sales No.E.92.III.A.2).
77 Rural Poverty Report, 2001…, chap. II, p. 28, seealso chap. III. According to this report, the ruralPoverty Head Count Index in China fell from 33.0in 1978 to 11.5 in 1990 and to 4.6 in 1998 (seetable 2.1).
78 See, for example, World Economic and SocialSurvey, 2000… , box VIII.3; and World Bank, “VietNam: Delivering on Its Promise”, DevelopmentReport 2003, No. 25050-VN (Washington, D.C.,World Bank, November 2002), pp. 45-50.
79 See Q.T. Do and L. Iyer, “Land rights and econom-ic development: evidence from Viet Nam, mimeo(Cambridge, Massachusetts, MIT, July 2002).

titles tend to be useless as collateral.80 Secure access to land—in the form ofownership or long-term rental—also tends to reduce landless peasants’ depen-dence on poorly paid and volatile rural labour markets.
Land tenure reform is particularly suitable to countries with large numbersof labourers working on State farms or small farmers working on State-ownedlands. Market-oriented land reform can also be used to settle landless peasantsand smallholders without land titles in countries with large tracts of unusedState land that are suitable for agriculture. By contrast, countries with largenumbers of landless peasants—or small farmers without land titles—andwhose most arable land is formally owned by private landlords, have oftenredistributed such land through coercive measures. While coercive land reformis normally associated with expropriation without compensation, land redistri-bution can also be based on compulsory purchase below market prices.
Japan, for example, was one of the first countries to successfully implementthis type of land redistribution in the modern world, during the late 1940s andearly 1950s. The State played a central role in that programme by redistributingland owned by large landholders in equal lots to landless peasants and small-holders for individual ownership. The Government also implemented a range ofcomplementary policies, including the adequate provision of credit and exten-sion services for small farmers. More controversial measures—such asGovernment subsidies, tax preferences and import barriers—also contributed tothe success of land reform in the country. Since many of the new (small-scale)landowners had been tenants working the land prior to reform, the implementa-tion of the programme was further facilitated by the fact that the beneficiarieshad a proved capacity to work (and even manage) the farms they received.
Japan’s pioneering programme was different from other coercive types ofland reform—notably those associated with widespread political upheaval81—in that former landowners were at least partially compensated for the expropri-ated land by the Government, “which reconveyed the fields at nominal pricesto the small sharecroppers already working on them”.82 Japan’s land redistrib-ution programme contributed to increasing productivity and raising the smallfarmer’s income substantially.83 Successful land reform programmes—some-times even State-controlled programmes, as in Japan—can thus lead to bothgreater aggregate economic growth and a more equitable income distributionamong farmers as well as between farmers and non-farmers.84
Although land reform programmes similar to the one implemented by Japanwere subsequently introduced successfully in the Republic of Korea andTaiwan Province of China, other forms of land reform have been used moreextensively in developing countries, ranging from more radical coerciveapproaches to market-based land reform. The rest of this section focuses on thelatter approach.
The case for market-based land reform
Interest in market-based land reform has increased because of the problemswith coercive forms of land reform—notably land expropriation without com-pensation—in many developing countries. First of all, because land expropria-tion is fundamentally inconsistent with the protection of private propertyrights, it tends to undermine private investment and even “international confi-
207M A R K E T - B A S E D A P P R O A C H E S T O R U R A L D E V E L O P M E N T I N S U B - S A H A R A N A F R I C A
80 See H. de Soto, The Mystery of Capital: WhyCapitalism Triumphs in the West and FailsEverywhere Else (New York, Basic Books, 2000),who argues that the formal recognition of proper-ty rights would enable property currently heldinformally to be used as collateral and thus unlockthe “hidden” capital assets of the poor.
81 In the past, most (coercive) large-scale land redis-tribution was associated with socio-politicalrevolts or the demise of colonial rule. See H.Binswanger, K. Deininger and G. Feder, “Power,distortions, revolt and reform in agricultural landrelations”, in Handbook of DevelopmentEconomics, vol. III, J. Behrman and T. Srinivasan,eds. (New York, Elsevier, 1995), pp. 2659-2772.
82 M.G. McDonald, “Agricultural landholding inJapan: fifty years after land reform”, Geoforum,vol. 28, No. 1 (1997), p. 58.
83 World Economic and Social Survey, 2000…,p. 139.
84 Recent research, however, point to long-termproblems with Japan’s pioneering land reform pro-gramme, including lower efficiency arising fromland fragmentation and political obstacles to theexpansion of the non-farm economy. See, forexample, M. G. McDonald, loc. cit. and J. M. Zhou,loc. cit.

dence in the economy”.85 In addition, landowners and other local elites oftenuse political power to weaken the implementation of coercive land redistribu-tion programmes. Reaction to the confiscatory nature of these programmes hasled powerful landowners to slow down their implementation through variouslegal or other means, including subdividing their land to evade expropriationor submitting the plots unsuitable for agriculture for compulsory purchase.86
Resistance to expropriation, in turn, has often led to political instability andmore radical, undemocratic responses by Governments.
Second, Governments sometimes attempt to introduce coercive land reformas a response to immediate socio-political pressure rather than as part of a long-term rural development strategy. For example, Government efforts to redistrib-ute land are often made in regions where well-organized and politically activeland reform movements exist.87 As a result, such efforts tend to ignore the needsof the poorest peasants, who are often disorganized. In addition, efforts to pla-cate the most vigorous peasant organizations may open the way for politicalmanipulation, the inappropriate selection of both the beneficiaries and the tractsof land expropriated, and even the exacerbation of social conflict.88
A third problem is that many land reform programmes became inefficientbecause they were often accompanied by a considerable expansion of agrarianreform bureaucracies at the central Government level. Political interferencecan also contribute to the undermining of land redistribution and lower land-use efficiency when land is allocated for speculative rather than productivepurposes. It is argued, for example, that this was a major problem in Kenya’sattempt to replace the colonial land tenure system with a new system in whichAfricans purchased land from Europeans between 1954 and 1974. Althoughhuge tracts of land were transferred to Africans in the central and western high-lands, “the political leadership redistributed most of the land to itself, allies,and clients, many of whom had no experience in farming”.89
Similarly, it can be argued that coercive land reform tends to be supply-dri-ven and thus to lead to greater economic inefficiency.90 This aspect is signifi-cant because coercive forms of land reform usually begin by identifying farm-land for expropriation and then looking for potential landless beneficiaries toreceive and settle on this land. Lower land-use efficiency results when produc-tive farms (as opposed to underutilized land) are expropriated and given to set-tlers who lack the knowledge and means to become efficient producers or whenenvironmentally fragile land is distributed by the State. Even in countries witha long history of smallholder agriculture, State institutions have been ineffec-tive at targeting underutilized land and in achieving the intended gains in eco-nomic efficiency.91
The final—and arguably most significant—problem is that coercive formsof land reform often distort the operation of land markets. Two of the most use-ful functions of (arable) land markets are to allow more efficient producers topurchase or increase their landholdings and, conversely, to allow inefficientfarmers to exit from agriculture. While there are structural obstacles that hin-der the rural poor from obtaining land through the market, evidence also showsthat State institutions in many developing countries use regulatory tools torestrict (rather than facilitate) land use, sales and rental, as part of coerciveland reform programmes.92 In the absence of these restrictions, “land rentalmarkets tend to be friendlier to the rural poor … in allowing them access to
W O R L D E C O N O M I C A N D S O C I A L S U R V E Y 2 0 0 3208
85 K. Deininger and J. May, “Is there scope forgrowth with equity: the case of land reform inSouth Africa”, mimeo (Washington, D.C., WorldBank, 2000).
86 See, for example, A. de Janvry and E. Sadoulet, “Astudy in resistance to institutional change: the lostgame of Latin American land reform”, WorldDevelopment, vol. 17, No. 9 (1989), pp. 1397-1407.
87 K. Deininger, “Making negotiated land reformwork: initiatives from Colombia, Brazil and SouthAfrica”, World Development, vol. 27, No. 4 (1999),pp. 651-672.
88 See United Kingdom Department for InternationalDevelopment (DFID), “Better livelihoods for poorpeople: the role of land policy”, consultation doc-ument (London, DFID, November 2002).
89 E. Wayne Nafziger, op. cit., p. 194.
90 See S. M. Borras, “Towards a better understand-ing of market-led agrarian reform in theory andpractice: focusing on the Brazilian case”, LandReform, vol. 33, No. 1 (2002), pp. 32-50.
91 Deininger and May, loc. cit., p. 20.
92 See A. de Janvry and others, “Access to land andland policy reforms”, in Access to Land, RuralPoverty and Public Action, A. de Janvry and oth-ers, eds. (Oxford, United Kingdom, OxfordUniversity Press, 2001), pp. 1-26; and K. Deiningerand H. P. Binswanger, “The evolution of the WorldBank’s land policy: principles, experiences andfuture challenges”, World Bank ResearchObserver, vol. 14, No. 2 (1999), pp. 247-276.
209M A R K E T - B A S E D A P P R O A C H E S T O R U R A L D E V E L O P M E N T I N S U B - S A H A R A N A F R I C A
land”, owing to lower transaction costs and greater opportunities for mitigatingthe market failures to which the rural poor are exposed.93
When coercive land reform programmes create or exacerbate socio-econom-ic tensions among central or local Governments, large landowners and small-holders or landless peasants, they tend to escalate social conflict and undermineagricultural development, as was the case in parts of Brazil, the Philippines andZimbabwe. There are, however, several non-coercive alternatives for improvingland distribution—without resorting to expropriation of private landholdings—that may also increase agricultural productivity and reduce rural poverty. Theseinclude (a) the distribution of unused State lands that are neither environmen-tally fragile nor unsuitable for agriculture, (b) the introduction of progressiveland taxes to discourage ownership of large tracts of land for non-productivepurposes over the long run and (c) market-based land reform.
Market-based land reform could be particularly suitable for countries withlittle unused State lands and with large numbers of landless peasants and smallfarmers without satisfactory claims to (arable) land rights. Its main innovationis to enable beneficiary farmers to receive grants from State institutions inorder to purchase land from voluntary sellers at market prices. This “willingseller-willing buyer” approach differs markedly from land expropriation, as itcan encourage landowners to sell idle land, and provide an alternative to ille-gal occupation by landless peasants.
A market-based approach to land redistribution is thus, to a large extent,demand-driven in that it involves voluntary exchanges between willing buy-ers—initially assisted by a Government grant—and land sellers in the market.Rather than depend on Governments’ deciding who will benefit from expropri-ated land—sometimes on political grounds—the potential beneficiaries them-selves “compete” for available land in the market. The potential beneficiarieswho want land the most, and who are best prepared to farm it, are likely to nav-igate the screening process for obtaining the Government grants better thanother segments of the peasantry. This would lead not only to more effective tar-geting but also to higher productivity, given that the most skilled potentialfarmers are likely to be more successful in obtaining land than those with littleinterest in or knowledge of farming.
This approach is intended to stimulate the operation of rural land marketsfrom both the supply and the demand sides. On the supply side, it encourageslandowners to undertake the reduction of their holdings of (underutilized)farmland, which could be reinforced by the introduction of progressive landtaxes and other fiscal mechanisms. On the demand side, it providesGovernment grants to poor small farmers or rural labourers with farming expe-rience to purchase land through the market. In order to strengthen the bargain-ing position of potential beneficiaries and to reduce transaction costs, benefi-ciaries are encouraged to join community organizations designed for those pur-poses. These organizations, sometimes in cooperation with local Governmentsor rural financial institutions willing to provide loans to beneficiaries, can helpto screen applicants, negotiate purchases on their behalf and provide follow-uptechnical assistance.
Several developing countries, such as Brazil, Colombia, Ecuador and SouthAfrica, have experimented with market-based land reform. Since implementa-tion is most advanced in South Africa, the following section will examine its
93 A. de Janvry and others, op. cit., p. 15.
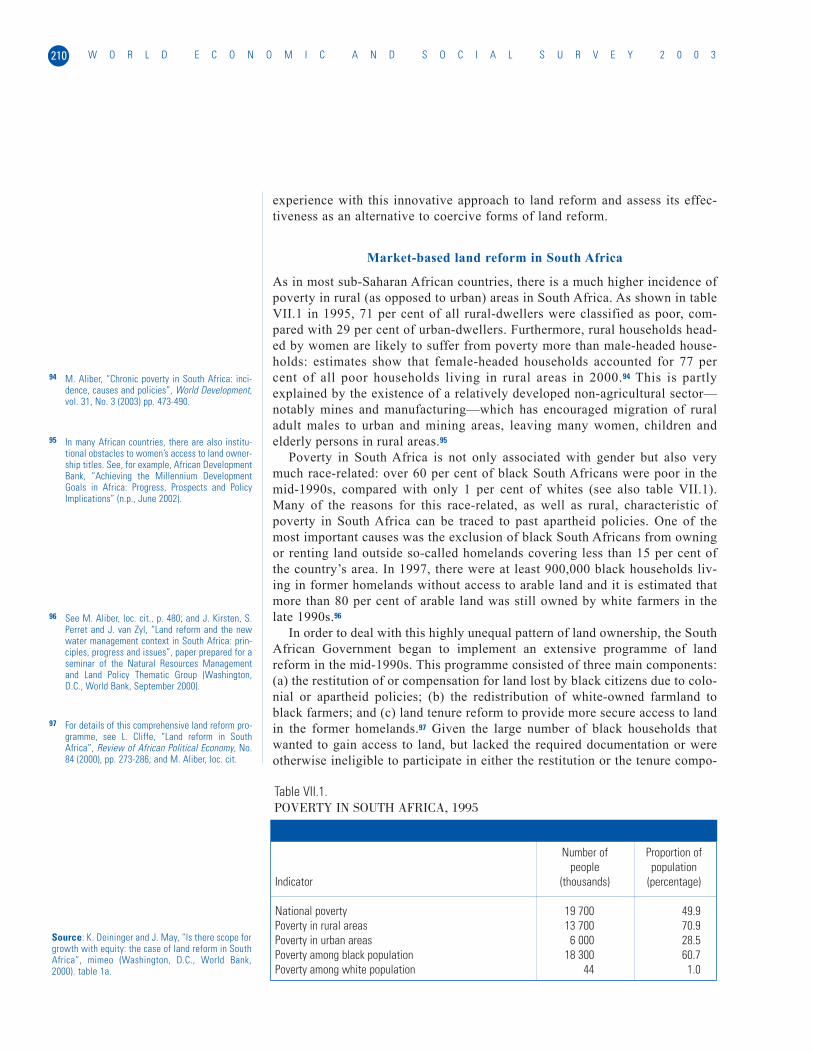
W O R L D E C O N O M I C A N D S O C I A L S U R V E Y 2 0 0 3210
experience with this innovative approach to land reform and assess its effec-tiveness as an alternative to coercive forms of land reform.
Market-based land reform in South Africa
As in most sub-Saharan African countries, there is a much higher incidence ofpoverty in rural (as opposed to urban) areas in South Africa. As shown in tableVII.1 in 1995, 71 per cent of all rural-dwellers were classified as poor, com-pared with 29 per cent of urban-dwellers. Furthermore, rural households head-ed by women are likely to suffer from poverty more than male-headed house-holds: estimates show that female-headed households accounted for 77 percent of all poor households living in rural areas in 2000.94 This is partlyexplained by the existence of a relatively developed non-agricultural sector—notably mines and manufacturing—which has encouraged migration of ruraladult males to urban and mining areas, leaving many women, children andelderly persons in rural areas.95
Poverty in South Africa is not only associated with gender but also verymuch race-related: over 60 per cent of black South Africans were poor in themid-1990s, compared with only 1 per cent of whites (see also table VII.1).Many of the reasons for this race-related, as well as rural, characteristic ofpoverty in South Africa can be traced to past apartheid policies. One of themost important causes was the exclusion of black South Africans from owningor renting land outside so-called homelands covering less than 15 per cent ofthe country’s area. In 1997, there were at least 900,000 black households liv-ing in former homelands without access to arable land and it is estimated thatmore than 80 per cent of arable land was still owned by white farmers in thelate 1990s.96
In order to deal with this highly unequal pattern of land ownership, the SouthAfrican Government began to implement an extensive programme of landreform in the mid-1990s. This programme consisted of three main components:(a) the restitution of or compensation for land lost by black citizens due to colo-nial or apartheid policies; (b) the redistribution of white-owned farmland toblack farmers; and (c) land tenure reform to provide more secure access to landin the former homelands.97 Given the large number of black households thatwanted to gain access to land, but lacked the required documentation or wereotherwise ineligible to participate in either the restitution or the tenure compo-
Number of Proportion ofpeople population
Indicator (thousands) (percentage)
National poverty 19 700 49.9Poverty in rural areas 13 700 70.9Poverty in urban areas 6 000 28.5Poverty among black population 18 300 60.7Poverty among white population 44 1.0
Table VII.1.POVERTY IN SOUTH AFRICA, 1995
Source: K. Deininger and J. May, “Is there scope forgrowth with equity: the case of land reform in SouthAfrica”, mimeo (Washington, D.C., World Bank,2000). table 1a.
94 M. Aliber, “Chronic poverty in South Africa: inci-dence, causes and policies”, World Development,vol. 31, No. 3 (2003) pp. 473-490.
95 In many African countries, there are also institu-tional obstacles to women’s access to land owner-ship titles. See, for example, African DevelopmentBank, “Achieving the Millennium DevelopmentGoals in Africa: Progress, Prospects and PolicyImplications” (n.p., June 2002).
96 See M. Aliber, loc. cit., p. 480; and J. Kirsten, S.Perret and J. van Zyl, “Land reform and the newwater management context in South Africa: prin-ciples, progress and issues”, paper prepared for aseminar of the Natural Resources Managementand Land Policy Thematic Group (Washington,D.C., World Bank, September 2000).
97 For details of this comprehensive land reform pro-gramme, see L. Cliffe, “Land reform in SouthAfrica”, Review of African Political Economy, No.84 (2000), pp. 273-286; and M. Aliber, loc. cit.
nents, redistribution became the major pillar of land reform in the country. TheGovernment set ambitious targets for land redistribution: the (voluntary) trans-fer of almost 30 million hectares of farmland—that is to say, 30 per cent of thecountry’s total arable land area—between 1995 and 1999.
Particular efforts were made to formulate a land redistribution programmethat avoided the above-mentioned problems connected with coercive forms ofland reform—notably expropriation, compulsory acquisition below marketprices and the expansion of agrarian reform bureaucracies. Greater emphasiswas thus placed on assisting potential beneficiaries, including landless peas-ants who had been dispossessed during apartheid, to purchase land through thedevelopment of land markets. This innovative approach to land redistributionwas based upon the provision of a Government grant—known as the Settlementand Land Acquisition Grant (SLAG)—to enable rural households to purchasearable land in the market. The SLAG was originally equal to the maximum sub-sidy under the national housing programme, that is to say, 16,000 rand (R)(equivalent to approximately US$ 2,000 at present). The grant was availableonly to potential beneficiaries with a monthly income below R 1,500.
Potential beneficiaries could use the grant to purchase land on offer fromprivate owners so long as the purchased land was intended for an agriculturaluse, such as cultivation of cash crops, grazing or even subsistence farmingintended to improve household food consumption. Large landowners could ini-tiate transactions, for example, by dividing a portion of a commercial farm intosmall parcels for sale under the programme. In addition, property developerscould purchase arable land (with private funds, rather than Governmentgrants), build basic infrastructure, divide it into parcels and then sell it to ben-eficiaries under the programme. Potential beneficiaries were otherwise respon-sible for designing their own projects, although they could use grant money tohire consultants for that purpose.
In practice, beneficiaries have often grouped together in order to obtain thegrant, design projects and acquire land collectively. This type of collectiveaction was particularly encouraged after the Government enacted theCommunal Property Associations Act in 1996. This Act established mecha-nisms to finance and facilitate community initiatives to purchase land on behalfof groups of landless citizens. However, an unexpected degree of State inter-ference in providing assistance to these community initiatives had an adverseimpact on the implementation of the market-based land redistribution pro-gramme. The Department of Land Affairs (DLA), established by theGovernment to implement the land reform programme, played a central role inmobilizing community associations, on behalf of potential beneficiaries, toaccess different types of grants available for land purchases. The paternalisticway in which proposed projects were dealt with by DLA slowed down the pro-gramme’s implementation: it is estimated that it took an average of two yearsto approve a project.98
As a result, the land redistribution programme failed to avoid one of themajor problems faced by coercive programmes as “it has become an over-cen-tralized and bureaucratic process where the public sector tries to do every-thing”.99 Bureaucratic delay in the implementation of the programme was part-ly responsible for its failure to meet the land redistribution targets. Between1995 and 2000, less than 1 per cent of the country’s commercial farmland was
211M A R K E T - B A S E D A P P R O A C H E S T O R U R A L D E V E L O P M E N T I N S U B - S A H A R A N A F R I C A
98 Deininger and May, loc. cit., p. 24.
99 See Kirsten, Perret and van Zyl, loc. cit.
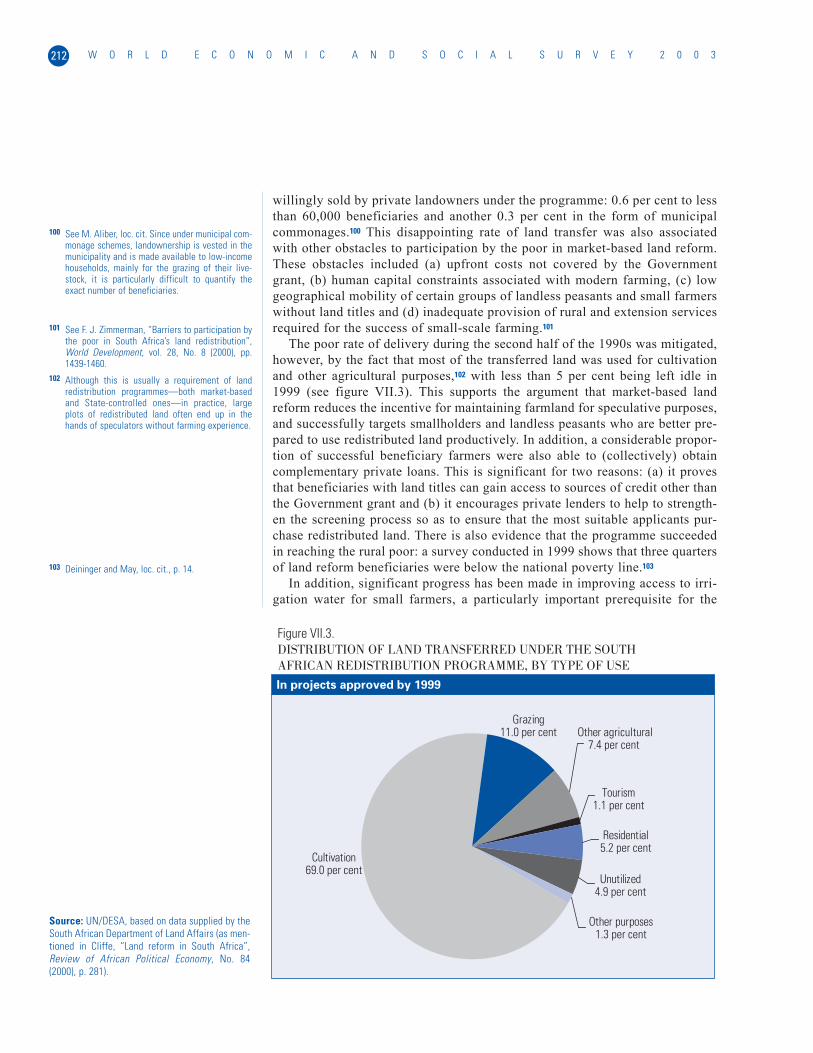
willingly sold by private landowners under the programme: 0.6 per cent to lessthan 60,000 beneficiaries and another 0.3 per cent in the form of municipalcommonages.100 This disappointing rate of land transfer was also associatedwith other obstacles to participation by the poor in market-based land reform.These obstacles included (a) upfront costs not covered by the Governmentgrant, (b) human capital constraints associated with modern farming, (c) lowgeographical mobility of certain groups of landless peasants and small farmerswithout land titles and (d) inadequate provision of rural and extension servicesrequired for the success of small-scale farming.101
The poor rate of delivery during the second half of the 1990s was mitigated,however, by the fact that most of the transferred land was used for cultivationand other agricultural purposes,102 with less than 5 per cent being left idle in1999 (see figure VII.3). This supports the argument that market-based landreform reduces the incentive for maintaining farmland for speculative purposes,and successfully targets smallholders and landless peasants who are better pre-pared to use redistributed land productively. In addition, a considerable propor-tion of successful beneficiary farmers were also able to (collectively) obtaincomplementary private loans. This is significant for two reasons: (a) it provesthat beneficiaries with land titles can gain access to sources of credit other thanthe Government grant and (b) it encourages private lenders to help to strength-en the screening process so as to ensure that the most suitable applicants pur-chase redistributed land. There is also evidence that the programme succeededin reaching the rural poor: a survey conducted in 1999 shows that three quartersof land reform beneficiaries were below the national poverty line.103
In addition, significant progress has been made in improving access to irri-gation water for small farmers, a particularly important prerequisite for the
W O R L D E C O N O M I C A N D S O C I A L S U R V E Y 2 0 0 3212
Figure VII.3.DISTRIBUTION OF LAND TRANSFERRED UNDER THE SOUTH AFRICAN REDISTRIBUTION PROGRAMME, BY TYPE OF USE
In projects approved by 1999
Cultivation 69.0 per cent
Grazing 11.0 per cent Other agricultural
7.4 per cent
Tourism 1.1 per cent
Residential 5.2 per cent
Unutilized 4.9 per cent
Other purposes 1.3 per cent
Source: UN/DESA, based on data supplied by theSouth African Department of Land Affairs (as men-tioned in Cliffe, “Land reform in South Africa”,Review of African Political Economy, No. 84(2000), p. 281).
100 See M. Aliber, loc. cit. Since under municipal com-monage schemes, landownership is vested in themunicipality and is made available to low-incomehouseholds, mainly for the grazing of their live-stock, it is particularly difficult to quantify theexact number of beneficiaries.
101 See F. J. Zimmerman, “Barriers to participation bythe poor in South Africa’s land redistribution”,World Development, vol. 28, No. 8 (2000), pp.1439-1460.
102 Although this is usually a requirement of landredistribution programmes—both market-basedand State-controlled ones—in practice, largeplots of redistributed land often end up in thehands of speculators without farming experience.
103 Deininger and May, loc. cit., p. 14.
success of land reform. The South African National Water Act of 1998 recog-nized that water must be used to promote socio-economic development andintroduced a series of innovative measures to tackle the highly unequal patternsof access to water resources in the country, including the strengthening ofwater user associations and smallholding irrigation schemes.104 Although thereare difficult transition issues arising from past apartheid water resource poli-cies, the new water policy formulated in the Act can be “a powerful tool toachieve equity, poverty alleviation and development in rural areas”.105
Furthermore, market-based land reform took place in the context of broadereconomic liberalization in the country. Relevant liberalization policies includedthe withdrawal of State agencies from agricultural marketing activities and amovement from State-controlled prices towards market-determined pricing, asthe experience of the above-mentioned SAFEX market illustrates. It also includ-ed the reduction or removal of input subsidies to commercial (white-owned)farms that created distortions in the agricultural sector. These subsidies con-tributed to South Africa’s focus on the production of low-value crops (such aswheat), rather than “specialization in labour-intensive production of high valuecrops and agro-exportables that one would expect given the country’s naturalendowment”.106 In addition, there was a major restructuring of financial institu-tions, including rural financial agencies, and greater public investment in phys-ical and social infrastructure, notably rural roads, schools and hospitals. Thesecomplementary economic policies to promote macroeconomic and sectoral lib-eralization were essential for the introduction of market-based land reform inthe country. This broad process of economic liberalization was closely associat-ed with an increase in the number of land transactions: while an annual averageof 4.5 per cent of arable land had changed hands during apartheid, this figureincreased to more than 6 per cent in both 1997 and 1998.107
Nonetheless, by the late 1990s, it became clear that the major challengeswere how to accelerate the redistribution of land and to provide more effectiveextension services to farmers already resettled under the programme. It becameincreasingly recognized that the long-term economic viability of the landreform programme required new measures to create greater opportunities insmall-scale commercial agriculture and to streamline programme implementa-tion. The revised market-based programme, entitled “Land Reform forAgricultural Development”, was launched in 2001 with a number of key adjust-ments, summarized below.108
In order to increase the pace of land redistribution and reduce bureaucraticdelay, implementation has been decentralized. While district-level officialsnow provide assistance to applicants in the preparation of project proposals, acommittee at the provincial (as opposed to national) level has become respon-sible for approval of those project proposals. As a result, beneficiaries can nowjoin the programme, purchase land from willing sellers and obtain land titlesmore swiftly than in the original programme. By speeding up the effectivetransfer of underutilized land to small farmers, the revised programme isexpected to accelerate the growth of agricultural output and income, and thuscontribute to alleviating rural poverty.
The most significant adjustment is that all beneficiaries must now make acontribution—in cash, labour and/or kind—in order to obtain the grant. Theminimum grant amount requires a minimum personal contribution of R 5,000
213M A R K E T - B A S E D A P P R O A C H E S T O R U R A L D E V E L O P M E N T I N S U B - S A H A R A N A F R I C A
104 See S. R. Perret, “Water policies and smallholdingirrigation schemes in South Africa: a history andnew institutional challenges”, Water Policy, No. 4(2002), pp. 283-300; and Kirsten, Perret and vanZyl, loc. cit.
105 See, in particular, Perret, loc. cit., p. 298.
106 Deininger and May, loc. cit., p. 6.
107 Ibid., p. 7.
108 See Kirsten, Perret and van Zyl (loc. cit.) for detailsof the revised programme.
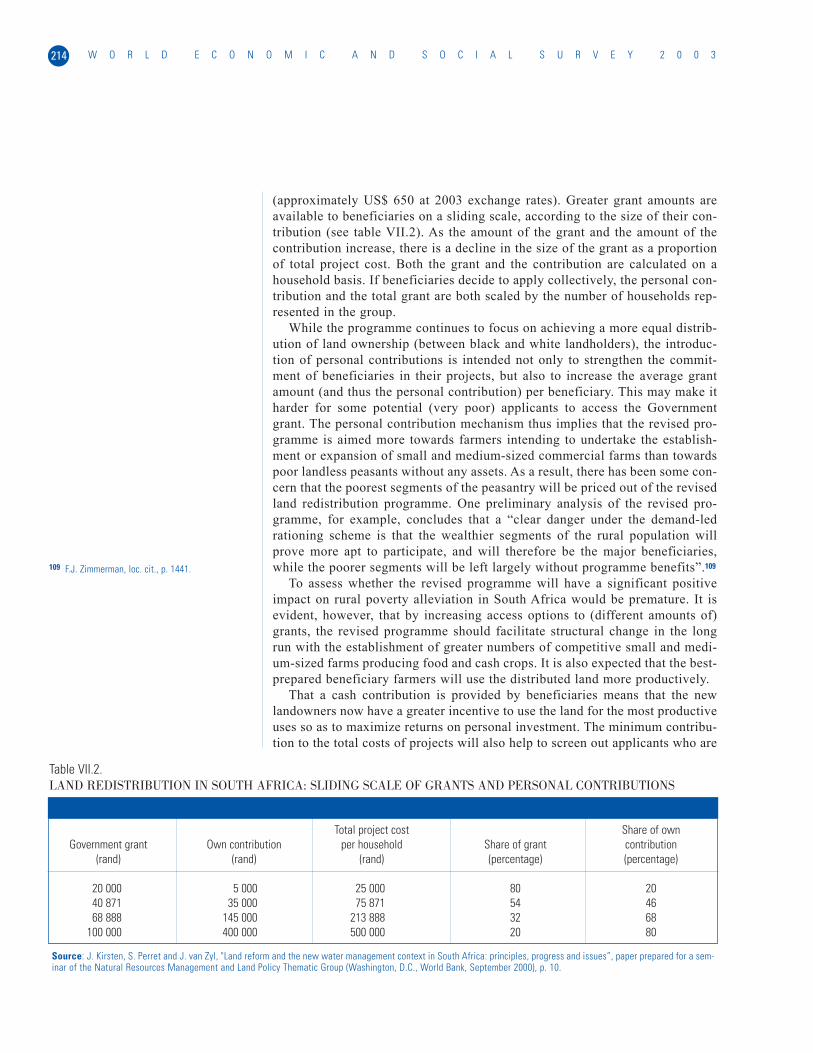
(approximately US$ 650 at 2003 exchange rates). Greater grant amounts areavailable to beneficiaries on a sliding scale, according to the size of their con-tribution (see table VII.2). As the amount of the grant and the amount of thecontribution increase, there is a decline in the size of the grant as a proportionof total project cost. Both the grant and the contribution are calculated on ahousehold basis. If beneficiaries decide to apply collectively, the personal con-tribution and the total grant are both scaled by the number of households rep-resented in the group.
While the programme continues to focus on achieving a more equal distrib-ution of land ownership (between black and white landholders), the introduc-tion of personal contributions is intended not only to strengthen the commit-ment of beneficiaries in their projects, but also to increase the average grantamount (and thus the personal contribution) per beneficiary. This may make itharder for some potential (very poor) applicants to access the Governmentgrant. The personal contribution mechanism thus implies that the revised pro-gramme is aimed more towards farmers intending to undertake the establish-ment or expansion of small and medium-sized commercial farms than towardspoor landless peasants without any assets. As a result, there has been some con-cern that the poorest segments of the peasantry will be priced out of the revisedland redistribution programme. One preliminary analysis of the revised pro-gramme, for example, concludes that a “clear danger under the demand-ledrationing scheme is that the wealthier segments of the rural population willprove more apt to participate, and will therefore be the major beneficiaries,while the poorer segments will be left largely without programme benefits”.109
To assess whether the revised programme will have a significant positiveimpact on rural poverty alleviation in South Africa would be premature. It isevident, however, that by increasing access options to (different amounts of)grants, the revised programme should facilitate structural change in the longrun with the establishment of greater numbers of competitive small and medi-um-sized farms producing food and cash crops. It is also expected that the best-prepared beneficiary farmers will use the distributed land more productively.
That a cash contribution is provided by beneficiaries means that the newlandowners now have a greater incentive to use the land for the most productiveuses so as to maximize returns on personal investment. The minimum contribu-tion to the total costs of projects will also help to screen out applicants who are
W O R L D E C O N O M I C A N D S O C I A L S U R V E Y 2 0 0 3214
Total project cost Share of ownGovernment grant Own contribution per household Share of grant contribution
(rand) (rand) (rand) (percentage) (percentage)
20 000 5 000 25 000 80 2040 871 35 000 75 871 54 4668 888 145 000 213 888 32 68
100 000 400 000 500 000 20 80
Table VII.2.LAND REDISTRIBUTION IN SOUTH AFRICA: SLIDING SCALE OF GRANTS AND PERSONAL CONTRIBUTIONS
Source: J. Kirsten, S. Perret and J. van Zyl, "Land reform and the new water management context in South Africa: principles, progress and issues”, paper prepared for a sem-inar of the Natural Resources Management and Land Policy Thematic Group (Washington, D.C., World Bank, September 2000), p. 10.
109 F.J. Zimmerman, loc. cit., p. 1441.
interested in an easy transfer of wealth but do not have the intention of farmingthe redistributed land. As a result, the share of unutilized land in approved pro-jects is likely to drop even below the 5 per cent figure recorded in the originalland redistribution programme. In addition, by promoting the growth of smalland medium-sized commercial farms, the programme is also expected toencourage increased involvement of private financial institutions in projectimplementation through the provision of complementary (private) loans. Thiswill not only reinforce beneficiaries’ commitment to the success of their farms,but also encourage private lenders to strengthen the screening process and toprovide independent monitoring of projects after they come on-stream.
The revised programme is intended to increase agricultural output, stimulaterural income growth—notably the income of beneficiaries—and improve land-use efficiency, given that small-scale beneficiaries often convert underutilizedfarmland to productive purposes. By ensuring greater agricultural output andproductivity by small farmers, market-based land reform can indirectly con-tribute to growth in rural areas and more equitable rural development patterns(notably with respect to white and black farmers). It cannot, however, eradicaterural poverty on its own. In order to maximize its effectiveness, the revisedprogramme, like all forms of land reform, also needs to be complemented bybetter infrastructure, such as rural roads, the provision of agricultural supportservices and adequate financial resources for its implementation.
While it has sometimes been argued that the implementation of market-based land reform would be hindered by its cost, the annual capital expenditureon the original South African land redistribution programme at the peak fiscalyear (1998/99) was equivalent to only 0.2 per cent of the total annual govern-ment budget.110 Although this relatively insignificant share of Governmentexpenditure can also be associated with the poor rate of delivery of the origi-nal land redistribution programme, the annual expenditure on the provision ofthe physical and social infrastructure required to support, for example, 40,000small-scale beneficiaries under the revised programme would be less than 1 percent of general Government expenditure in 2001.111 The provision of infra-structure and agricultural support services—in addition to the provision ofGovernment grants—is thus within the budget of many developing countries.What is required is the political will to give greater priority to redistributiveland reform within broader rural development strategies and to invest in theinfrastructure and services required to support the activities of land redistribu-tion beneficiaries, with the aim of turning many rural people into landowners.
An assessment of market-based land reform
It is increasingly recognized that market-based land redistribution pro-grammes can be a useful alternative to coercive forms of land reform in manydeveloping countries. While the implementation of market-based land pro-grammes can be slowed down by teething problems, the South African experi-ence shows that this type of land reform can be adjusted to respond to suchproblems without compromising the shift towards greater economic efficiencyin the operation of land and agricultural markets. Market-based schemes alsotend to be far less politicized than coercive approaches.112
215M A R K E T - B A S E D A P P R O A C H E S T O R U R A L D E V E L O P M E N T I N S U B - S A H A R A N A F R I C A
110 See A.V. Banerjee, loc. cit., p. 31; and M. Aliber,loc. cit., p. 486.
111 See Kirsten, Perret and van Zyl, loc. cit. This esti-mate includes water supply and sanitation, elec-tricity, and rural roads, as well as health and edu-cation. At this rate, it would take 11 years to suc-cessfully settle as many as half of the 900,000landless households living in the former home-lands in 1997. The term “general governmentexpenditure” is used as defined in WorldDevelopment Report, 2003 (Washington, D.C.,World Bank, Oxford University Press, 2003).
112 It is worth noting, however, that similar initiativeshave been fiercely opposed by landless or revolu-tionary movements in other developing countries,such as Brazil, Colombia and the Philippines.
At the same time, market-based approaches to land redistribution are likelyto be implemented more effectively when targeted towards beneficiaries withagricultural skills and at least a little financial capital reserve. By encouragingthe most dynamic segments of the peasantry to obtain arable land, market-based programmes can thus increase agricultural efficiency (a particularlyimportant objective in countries with relative scarcity of arable land), outputand rural incomes. In addition, market-based schemes often contribute to thedevelopment of land markets and make them more accessible to peasants withlower incomes, even when the poorest landless peasants experience difficultyin participating in those schemes.
As a result of this focus on increased productivity, the poorest (and leastcompetitive) segments of the peasantry may have difficulty participating inschemes such as the South African one. Market-based programmes, on theirown, are thus unlikely to transfer enough land to meet the needs of all poorrural people with the desire and the ability to farm it. When countries opt formarket-based approaches to land redistribution, the State still has an importantrole to play, without necessarily deciding which land parcels change hands. Inthis regard, Governments need: (a) to draw up the criteria for selecting benefi-ciaries; (b) to reserve areas that are environmentally inappropriate for farming;(c) to provide grants and loans for land purchases; (d) to provide extension ser-vices and better transport infrastructure; and (e) to consider complementarypolicies to reach landless peasants unable to benefit from existing programmes.Market-based land reform can be a more effective policy tool when it becomesan integral part of a larger rural development and poverty alleviation strategy.
Market-based reform could be particularly useful in countries such as SouthAfrica with little unused arable land and many landless peasants and small-holders without clear-cut claims to land rights. South Africa’s experience withland reform could thus be relevant to other developing countries—not only insub-Saharan Africa, but also in Latin America and parts of Asia—with highlyunequal patterns of land distribution. In Southern Africa, for example, market-based land schemes could be implemented, at least to a limited extent, in coun-tries such as Malawi and Namibia—where land reform is urgently needed—andcould have offered a less conflictual option for land reform in Zimbabwe.113 Inother countries—such as Angola, Mozambique and the United Republic ofTanzania—where there are large tracts of unused State-owned land suitable foragriculture—smallholder expansion does not require land reform measures, asmuch as credit, extension services and improved rural infrastructure.
CONCLUDING REMARKS
Over the past two decades, the Governments of many poor countries haverealized that certain types of State intervention in the agricultural sector havecreated economic inefficiencies and unsustainable fiscal cost, besides provinggenerally ineffective in ensuring sustained rural economic growth. In addition,bilateral and international donor or lender institutions have become increas-ingly unwilling or unable to fund the rising cost of direct State intervention inagricultural production and marketing, as well as the maintenance of ineffi-cient land-use policies. This has led to greater emphasis on market-basedapproaches aimed at improving both the efficiency and the cost recovery of
W O R L D E C O N O M I C A N D S O C I A L S U R V E Y 2 0 0 3216
113 There are, in fact, proposals for a market-basedscheme intended to benefit 15,000-20,000 ruralhouseholds in Malawi.
agricultural production and marketing. These approaches, however, have pro-duced mixed results in respect of rural poverty alleviation. The major chal-lenge for the future is therefore to implement corrective measures to deal withreform problems while maintaining the efficiency improvements, marketingcost reductions and fiscal savings that have resulted from market-basedapproaches to reform.
Future efforts to consolidate or intensify food marketing reform in African(and other developing) countries must thus be better integrated into broaderrural development strategies focusing on household food security and povertyalleviation. It is crucial, however, to design and use alternative instruments toachieve the food security objectives that many developing countries have longpursued through food marketing boards. Reform should have increasing theefficiency of food marketing systems as its primary objective, as opposed toquestionable objectives, such as propping up inefficient farmers, which havecontributed to the disappointing performance (and eventual demise) of foodmarketing boards over the long run.
At the same time, the case studies show that poor transport infrastructureand high transport costs of marketing agricultural produce pose serious obsta-cles to the successful implementation of both marketing and land reform. It canbe concluded, therefore, that Government intervention in food marketingshould move away from monopsonistic approaches and price-fixing, towardsefforts to provide the enabling environment conducive to improved marketingefficiency, which would include better transport infrastructure, improved foodstorage capacity and the development of rural markets. Improved access torural markets can make a significant contribution to raising the incomes of therural poor and thus combating rural poverty.
The rural poor will be able to increase their income significantly only iftheir access to available productive resources—the most important of which, inpoor countries, remains land—is substantially expanded. Although land redis-tribution is only one of several options for raising agricultural productivity, itis increasingly seen as crucial in many developing countries with highlyunequal patterns of land ownership, particularly in Southern Africa, LatinAmerica and parts of Asia. While it is now broadly recognized that land redis-tribution can play a critical role in efforts to reduce poverty in rural areas andto promote more equitable growth patterns, there has been an increasing inter-est in market-based approaches to land reform, as a result of the problems asso-ciated with coercive forms of land reform in many developing countries. Thepath-breaking South African experience with market-based land reform showsthat this approach is flexible enough to respond to country-specific problemswithout compromising efforts towards the development of land markets,greater economic efficiency in agriculture, improved rural incomes and ruralpoverty alleviation.
Inasmuch as land redistribution can make a significant contribution topoverty alleviation, market-based land reform cannot be considered the singlesolution to rural poverty, in isolation from other policies designed to increaseagricultural productivity, and to promote integrated rural development. Successwith market-based land reform depends, in particular, on the implementation ofcomplementary measures to foster rural development and smallholder agricul-ture. Such measures must address the availability of credit, the provision of
217M A R K E T - B A S E D A P P R O A C H E S T O R U R A L D E V E L O P M E N T I N S U B - S A H A R A N A F R I C A
extension services, the dissemination of appropriate agricultural technology,the access to irrigation water and better transport infrastructure, among otherfactors. Governments therefore still have an important role to play in promot-ing more equitable patterns of rural development, not only in terms of ensuringeffective regulation but also with respect to the creation of a favourable envi-ronment for increased private investment, in the context of a broader econom-ic liberalization strategy.
As in other sectors, the move towards greater overall economic efficiencymay produce adverse socio-economic impacts and may even mean the contrac-tion of some economic sectors. The fundamental goal, however, must be toraise employment and production in the economy as a whole and thereby raiseoverall living standards and reduce poverty. How to reduce rural poverty is acomplex issue, which requires a comprehensive set of economic (and social)policies; the promotion of market-based approaches to food marketing and landredistribution are two such policies that could be potentially helpful.
W O R L D E C O N O M I C A N D S O C I A L S U R V E Y 2 0 0 3218
After more than a decade of reforms, most of the former centrally
planned countries of Eastern Europe and the former Soviet Union have
largely completed their transition from central planning to a market
economy. 1 However, only a few of these countries were able to restore
and surpass the pre-reform level of output and employment. The transi-
tion was achieved at a very high human cost, leading to unprecedented
increases in poverty and inequality. In the course of the 1990s, the
region of the transition economies was the only region in the world that
experienced an overall decline in living standards. The present chapter
focuses on some of the key policy-related problems of poverty in the
transition economies. The main questions the chapter tries to answer
are: What caused the dramatic increase in poverty in the transition
economies? What is the nature of poverty in the transition economies?
What explains the major differences in poverty levels in different tran-
sition economies? How do Governments and individuals in transition
economies cope with poverty? In what ways can these coping strategies
be made more successful?
The transition to a market economy that started in the Eastern European
countries in 1989 and in countries of the former Soviet Union in 1992 led to a
dramatic increase in poverty. Prior to the start of reforms, in 1989, the number
of the poor in the region, as measured by those living on less than $4 a day at
international prices, had been 13.6 million, about 4 per cent of the population,
with 6.5 million in the Central Asian republics of the then Soviet Union, 3.6
million in Belarus, the Russian Federation and Ukraine, 3.6 million in the
Balkans, and 0.1 million each in the Central European centrally planned
economies and the Baltic States. By 1993-1994, the total number of poor in
the region was 119.2 million, of whom 83.2 million were in Belarus, the
Russian Federation and Ukraine, 19.9 million in the Central Asian Republics,
12.9 million in the Balkan countries, 3.0 million in the Baltic States and 0.4
million in Central Europe.2
These figures show that the countries and areas that were under central plan-
ning the longest, namely, the Russian Federation and the other parts of tsarist
Russia, had a much higher rate of poverty both before and after the transition
than the countries of Central Europe, namely, the Czech Republic, Hungary,
Poland and Slovakia. The Central European countries had been forced to adopt
VIIITRANSITIONECONOMIES ANDPOVERTY
219T R A N S I T I O N E C O N O M I E S A N D P O V E R T Y
1 In the present chapter, the region of the transitioneconomies is understood to comprise 30 coun-tries, including 15 Eastern European countries(Albania, Bosnia and Herzegovina, Bulgaria,Croatia, the Czech Republic, Estonia, Hungary,Latvia, Lithuania, Poland, Romania, Slovakia,Slovenia, the former Yugoslav Republic ofMacedonia and the Federal Republic ofYugoslavia), the three Baltic States (Estonia,Latvia and Lithuania) and 12 countries membersof the Commonwealth of Independent States (CIS)(Armenia, Azerbaijan, Belarus, Georgia,Kazakhstan, Kyrgyzstan, the Republic of Moldova,the Russian Federation, Tajikistan, Turkmenistan,Ukraine, and Uzbekistan). As of 4 February 2003,the official name of “Federal Republic ofYugoslavia” was changed to “Serbia andMontenegro”. It will be noted that “EasternEurope” refers to all the transition economiesexcept the CIS member States and thus includesthe Baltic States.
2 United Nations Development Programme,Regional Bureau for Europe and CIS, Poverty inTransition (United Nations publication, Sales No.E.98.III.B.27), p. 15, figure 1.8. These figures werebased upon a $4 purchasing power parity (PPP)per day poverty line.
the centrally planned system only after the Second World War. They were
wealthier than the republics of the Soviet Union and still retained some of the
institutions that were to make it easier to operate a market economy. If it had
not been for the imposition of central planning, they would have been devel-
oped economies like their neighbours to the West and would almost certainly
have become members of the European Union (EU) many years earlier. The
Balkan countries were less advanced economically than the Central European
countries and the Baltic States were among the wealthiest republics of the for-
mer Soviet Union. Thus, the relative states of impoverishment of the different
transition economies could not be considered altogether surprising. However,
what was unexpected to some observers—and to many of the inhabitants of the
region—was that the transition, instead of lasting for a few years and resulting
in faster growth and rising living standards once the inefficiencies of central
planning had been removed and a futile and costly arms race with the devel-
oped countries abandoned, had actually led to mass pauperization in many
countries. This was especially the case in those parts of the Soviet Union that,
unlike the Baltic States, had no experience of independence in the modern era
and had not been prepared for the shock that would be caused by attaining
independence and being set free to operate in a world economy that was
increasingly subject to market forces.
Table VIII.1 shows how, in the late 1990s, absolute poverty, defined as those
living on less than $1 a day at international prices, was still less than 2 per cent
in the countries of Eastern Europe, with the exception of Romania, which,
apart from Albania, had the lowest gross domestic product (GDP) per capita in
the region in 2001. Measured at $2 per day, the poverty rates in Bulgaria and
Romania stand out as much higher than those of the other Eastern European
countries. Not only were these countries poorer, in terms of average income per
capita, than those set to enter EU in 2004, but they had still not recovered fully
from the transition recession. Thus, while Poland’s GDP per capita in 2002 was
nearly 30 per cent above its level of 1989, Bulgaria’s and Romania’s was over
10 per cent lower.
None of the members of the Commonwealth of Independent States (CIS),
with the exception of Uzbekistan, had surpassed its 1989 level of GDP per
capita by 2002. Poverty rates, when measured by the percentage of the popu-
lation living on less than $2 per day, were considerably higher in CIS coun-
tries than in Eastern Europe. The problems confronting the CIS countries in
tackling poverty are of a different order of magnitude from those confronting
the Eastern European countries: they must recover their output levels of
before the transition and ensure that the fruits of economic growth are enjoyed
by the poorer members of society. Much of the analysis in this chapter, then,
will be concerned with the CIS countries rather than with the Eastern
European countries.
The shock that was followed by a rise in poverty in the transition economies
was primarily a result of political factors—the breakdown of Soviet control
first over the nominally independent countries of Central and Southern Europe
and then, later, over the individual republics within the Soviet Union. These
political factors had economic roots—the poor performance of the centrally
planned system as compared with the market economy system in terms of
delivering the goods and services that the citizens of these countries actually
W O R L D E C O N O M I C A N D S O C I A L S U R V E Y 2 0 0 3220
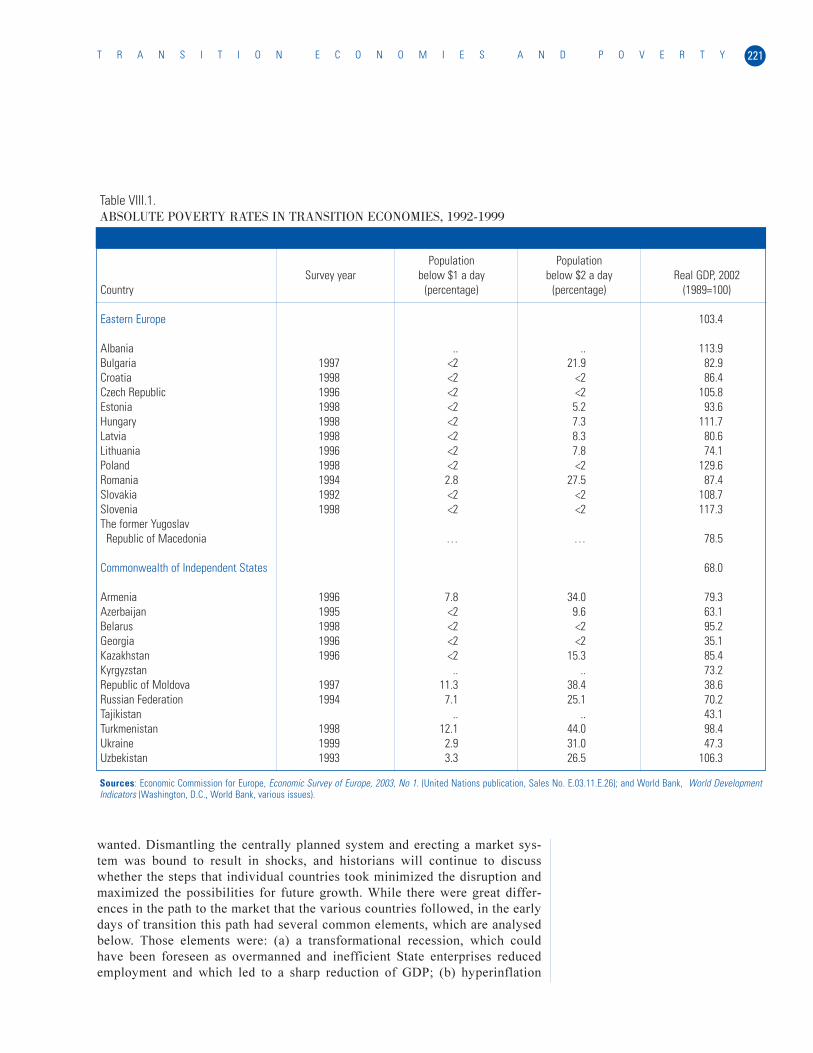
wanted. Dismantling the centrally planned system and erecting a market sys-
tem was bound to result in shocks, and historians will continue to discuss
whether the steps that individual countries took minimized the disruption and
maximized the possibilities for future growth. While there were great differ-
ences in the path to the market that the various countries followed, in the early
days of transition this path had several common elements, which are analysed
below. Those elements were: (a) a transformational recession, which could
have been foreseen as overmanned and inefficient State enterprises reduced
employment and which led to a sharp reduction of GDP; (b) hyperinflation
221T R A N S I T I O N E C O N O M I E S A N D P O V E R T Y
Table VIII.1.ABSOLUTE POVERTY RATES IN TRANSITION ECONOMIES, 1992-1999
Population Population Survey year below $1 a day below $2 a day Real GDP, 2002
Country (percentage) (percentage) (1989=100)
Eastern Europe 103.4
Albania .. .. 113.9Bulgaria 1997 <2 21.9 82.9Croatia 1998 <2 <2 86.4Czech Republic 1996 <2 <2 105.8Estonia 1998 <2 5.2 93.6Hungary 1998 <2 7.3 111.7Latvia 1998 <2 8.3 80.6Lithuania 1996 <2 7.8 74.1Poland 1998 <2 <2 129.6Romania 1994 2.8 27.5 87.4Slovakia 1992 <2 <2 108.7Slovenia 1998 <2 <2 117.3The former Yugoslav
Republic of Macedonia … … 78.5
Commonwealth of Independent States 68.0
Armenia 1996 7.8 34.0 79.3Azerbaijan 1995 <2 9.6 63.1Belarus 1998 <2 <2 95.2Georgia 1996 <2 <2 35.1Kazakhstan 1996 <2 15.3 85.4Kyrgyzstan .. .. 73.2Republic of Moldova 1997 11.3 38.4 38.6Russian Federation 1994 7.1 25.1 70.2Tajikistan .. .. 43.1Turkmenistan 1998 12.1 44.0 98.4Ukraine 1999 2.9 31.0 47.3Uzbekistan 1993 3.3 26.5 106.3
Sources: Economic Commission for Europe, Economic Survey of Europe, 2003, No 1. (United Nations publication, Sales No. E.03.11.E.26); and World Bank, World DevelopmentIndicators (Washington, D.C., World Bank, various issues).

The Republic of Armenia, with a population of 3.8 million, was one of the 15 con-stituent republics of the former Soviet Union and is a current member of theCommonwealth of Independent States (CIS). Relatively poor in natural resources andlandlocked, it nevertheless was one of the more prosperous republics in the SovietUnion, where Armenians enjoyed the reputation of being a well educated, industriousand entrepreneurial people.
The break-up of the Soviet Union at the end of 1991 dealt a severe blow to the well-being of Armenia. The transfers from the federal Government, mostly in the form oflow-priced energy, which in 1989-1991 had constituted 31 per cent of fiscal revenuesand 12 per cent of the gross domestic product (GDP) of Armenia, were abruptly ended.The timing was most unfortunate, as at the time Armenia still had to deal with the con-sequences of the devastating earthquake of 1989. The simultaneous collapse of inter-republic trade virtually cut off Armenian exports to the rest of the Soviet Union. Toaggravate the situation, hostilities with Azerbaijan over the disputed enclave ofNagorny Karabakh escalated into a full-scale war, further draining the budgetaryresources, and causing refugees to flow in both directions. Close to 300,000 refugeesentered Armenia.
In the first four years of transition, Armenia’s GDP dropped by 63 per cent.During the worst years of the crisis, in the mid-1990s, with almost no electricity orheating, many Armenian cities looked like ghost towns. In the capital city ofYerevan, with a population of over 1 million, people cut down trees in city parks foruse as fuel.
The shrinking economy and the war meant that government spending on social pro-tection had to be drastically reduced. At the end of the 1990s, pension spending wasjust 3.1 per cent of GDP, with the average pension dropping to less than one fifth of theaverage per capita income. Public spending on education fell to 2 per cent of GDP, andthat on health care to 3.5 per cent of GDP. Faced with the economic crisis and inability
which destroyed the savings of the population and helped to depress real wages
in many transition economies; (c) an increase in income inequality across
social groups, regions and sectors of the economy; and (d) the disintegration of
the Soviet-era social protection system. In addition, in almost half of the coun-
tries in the region, people suffered severe losses of income from civil and eth-
nic conflicts. Given that, before the transition, incomes of a large part of the
population in transition economies had been relatively low, any one of the
above factors could have pushed them under the poverty line. This was even
more likely when these factors worked in concert.
The negative factors were particularly evident in the poorest countries of
CIS, which suffered greatly from the loss of federal subsidies that had been
terminated with the dissolution of the Soviet Union.3 In addition, during the
1990s, five of these countries were affected by wars and civil conflicts and had
to accommodate sometimes hundreds of thousands of refugees and internally
displaced persons (IDPs). Moreover, some countries suffered from extensive
natural disasters and from recurring political crises (see box VIII.1, for the
example of Armenia).
W O R L D E C O N O M I C A N D S O C I A L S U R V E Y 2 0 0 3222
Box VIII.1
POVERTY IN ARMENIA
3 For example, for Kyrgyzstan in the last years ofthe Soviet Union, these subsidies were equiva-lent to 30 per cent of the government budget and10-12 per cent of the GDP, while in Uzbekistansubsidies constituted 18.5 per cent of GDP. SeeWorld Economic and Social Survey, 2001.(UnitedNations publication, Sales No. E.01.11.C.1), chap.VI, subsect. entitled “Increased vulnerability:poverty and deteriorating social conditions”; andMartin C. Spechler, “Hunting for the Central Asiantiger”, Comparative Economic Studies, vol. 42,issue 3 (fall 2002), p. 17.

223T R A N S I T I O N E C O N O M I E S A N D P O V E R T Y
of the State to protect them from poverty, hundreds of thousands Armenians left therepublic for the Russian Federation and countries further away. Many of those whostayed turned to the informal economy.
The recovery started in Armenia earlier than in most other members of CIS and inthe last seven years GDP has been growing at 6 per cent annually, helped by foreignassistance and remittances from Armenians abroad which constitute an estimated oneeighth of GDP. Still, the per capita GDP of Armenia is just over $2,000 at purchasingpower parity (PPP) valuation. In 1999, the poverty headcount, measured at the interna-tional poverty line of $4.30, was 86.2 per cent of the population, while acute poverty,measured at half that line, was 43.5 per cent of the population. This high incidence ofpoverty was also to a large degree the result of an extremely sharp disparity ofincomes. Between 1987-1990 and 1996-1998, the Gini coefficient of inequality inArmenia had gone up from 0.27 to 0.61, with 50.6 per cent of incomes going to the rich-est, and only 5.5 per cent to the poorest quintile of the population.
In the last several years, thanks to economic recovery, large remittances frommigrants and substantial international assistance, massive transitory poverty inArmenia has diminished. Government efforts to rebuild the social protection system arealso bringing results. Armenia has become one of the leaders in CIS in the volume andefficiency of the distribution of targeted subsidies to the poorest families. Targetedmeans-tested subsidies constitute 2 per cent of GDP, a figure much higher than that inother CIS countries, where such subsidies constitute between 0.1 and 1.5 per cent ofGDP. The poor in Armenia should also benefit from the new international “CIS-7”Initiative, launched in 2002 by the World Bank, the International Monetary Fund (IMF),the European Bank for Reconstruction and Development (EBRD), the AsianDevelopment Bank and the Governments of the Netherlands and Switzerland to provideassistance to the seven poorest countries of CIS (Armenia, Azerbaijan, Georgia,Kyrgyzstan, the Republic of Moldova, Tajikistan and Uzbekistan).
Box VIII.1 (continued)
Sources: World Economic and Social Survey, 2001(United Nations publication, Sales No. E.01.II.C.1),chap. VI entitled “The challenge to small, landlockedtransition economies”; Transition: The First Ten Years.Analysis and Lessons for Eastern Europe and theFormer Soviet Union (Washington, D.C., World Bank,2002); Making Transition Work for Everyone: Povertyand Inequality in Europe and Central Asia(Washington, D.C., World Bank, 2000); and SamVaknin, United Press International, 23 January 2003.
THE MACROECONOMIC BACKGROUND
The transformational recession
During the 1990s, the main cause of mass poverty in transition economies was
the deep recession that had followed the collapse of the centrally planned
economies. The length of the transformational recession across the 27 coun-
tries of the region ranged between three years (Poland) and nine years
(Ukraine). The fall in GDP ranged from 15 to 70 per cent, although the fall
cannot be attributed entirely to the transformation. In the CIS countries, the
recession led to a fall in incomes surpassing that of the Great Depression and
comparable only with the situation during periods following the Russian
(Bolshevik) Revolution of 1917 and the Second World War.
In view of the widespread suffering of the poor in the transition economies,
in particular the successor States of the former Soviet Union, the following
question is often asked: Was it possible to escape the massive increase in
poverty in the course of market reforms?

W O R L D E C O N O M I C A N D S O C I A L S U R V E Y 2 0 0 3224
Most specialists agree that the initial sharp drop in output in the transition
economies was caused by the combination of the demand shock brought
about by the change in relative prices, the reduction of Government orders
and the disruption of foreign trade, and the supply shock resulting from the
inability of producers to quickly reallocate resources to the new uses. The
poor quality of market institutions and a high degree of corruption in many
transition economies contributed to the depth of the recession.4
There is still disagreement about the speed and sequencing of reforms. Some
argue that the more rapid reforms would have been more beneficial to growth,
while others think that the more rapid reforms, while more painful in the short
run, were more conducive to higher longer-term growth.5 With the benefit of
hindsight, it would appear that the course that the reforms took in a particular
country was largely predetermined by the distribution of political power.6 Thus,
in the republics of the former Soviet Union, practically all power on the eve of
reforms was concentrated in the hands of the former Communist Party bureau-
cracy and managers of large State-owned enterprises. The majority of the pop-
ulation had little role in determining the reform agenda. In many Eastern
European countries, in contrast, civil society was quite vocal and grass-roots
organizations, such as the “Solidarity” trade union in Poland, were important
players in their own right. As a result, in Eastern Europe the working popula-
tion could count on poverty alleviation measures, being incorporated in the
reform programme from the very start.
Inflation
Political differences were significant in the case of inflation. The poor suffer
from inflation more than the well-to-do, as they usually lack the information
and skills to protect their incomes and assets from rapidly rising prices. As a
result, hyperinflation generally leads to an increase in poverty and income
inequality.7 However, in the transition economies, the success of stabilization
policies generally depended on political factors. Governments of the leading
Eastern European countries, operating under national consensus, were able to
contain inflation relatively quickly. In the CIS countries, the struggle with
inflation was frequently complicated by the presence of powerful political
interests. In the Russian Federation, in the first years of reform, the lobbying
by enterprise directors secured a massive flow of Government credits to their
firms which helped fuel the hyperinflation. By some estimates, in 1992-1993,
these credits had resulted in a net transfer of wealth to enterprises of about 15
per cent of GDP.8 The net losers from hyperinflation were private savers,
mostly pensioners. Overall, the destruction of private savings in the Russian
Federation eliminated up to one fourth of household wealth.9
Inflation damaged or destroyed private savings in many other transition
economies, in most of which deposits were not indexed or otherwise compen-
sated for inflation. However, in Eastern European countries such as in Hungary
and the Czech Republic, where levels of inflation were lower, and in countries
such as Poland where most savings were kept in foreign currencies, losses of
depositors were relatively small.10
4 Janos Kornai, Highways and Byways: Studies onReform and Postcommunist Transition(Cambridge, Massachusetts, and London,England, The MIT Press, 1995); World Bank,Making Transition Work for Everyone: Poverty andInequality in Europe and Central Asia(Washington, D.C., World Bank, 2000); VladimirPopov, “Shock therapy versus gradualism: the endof the debate”, Comparative Economic Studies,vol. XLII, No. 1 (spring 2000), pp. 1-58; and JanSvejnar, “Transition economies: performance andchallenges”, Journal of Economic Perspectives,vol. 16, No. 1 (winter 2002), pp. 3-28.
5 Joseph Stiglitz, Globalization and Its Discontents(New York, W.W. Norton, 2002); World Bank,From Plan to Market (Washington, D.C., WorldBank, 1996); Marek Dabrowski, StanislawGomulka and Jacek Rostowski, Whence Reform?A Critique of the Stiglitz Perspective (London,Centre for Economic Performance, London Schoolof Economics and Political Science, 2000); andStanley Fischer and Ratna Sahay, “Taking stock”,Finance and Development, vol. 37, No. 3(September 2000), pp. 2-6.
6 “Much of the reform policy has been driven by theweakness of the Government and by the desire topreserve freedom through preventing a return ofthe communists”, admits one of the leadingWestern consultants on the market transition.See Richard Layard, “Why so much pain?”, inEmerging From Communism: Lessons from Russia,China and Eastern Europe, Peter Boone,Stanislaw Gomulka, and Richard Layard, eds.(Cambridge, Massachusetts and London, The MITPress, 1998), p. 5. See also: Joseph Stiglitz,Whither Socialism (Cambridge, Massachusetts,The MIT Press, 1994); Marek Dabrowski,Stanislaw Gomulka, and Jacek Rostowski, op.cit.; Stanley Fischer and Ratna Sahay, loc. cit.;Leszek Balcerovicz, “Poland’s transformation”,Finance and Development, vol. 37, No. 3(September 2000), pp. 14-16; and Gerald Roland,“The political economy of transition”, Journal ofEconomic Perspectives, vol. 16, No. 1 (winter2002), pp. 29-50.
7 “Inflation is a regressive and arbitrary tax, theburden of which is typically borne disproportion-ately by those in lower income brackets”, ASourcebook for Poverty Reduction Strategies, Vol.2, p.5. See also Poverty in Transition …, p. 23.
8 Richard Layard, loc. cit., p. 8.9 Simon Commander, Andrei Tolstopiatenko and
Ruslan Yemtsov, “Channels of redistribution”,Economics of Transition, vol. 7, issue 2 (July1999), p. 24.
10 In the last several years, depositors in theRussian Federation, Ukraine and some other CIScountries have started to receive limited compen-sation on deposits for the losses in the hyperin-flation of the early 1990s. However compensationis partial and is limited only to the oldest of sur-viving depositors.
225T R A N S I T I O N E C O N O M I E S A N D P O V E R T Y
Private sector investment
With privatization and the sharp reduction of the role of the State in the econ-
omy, much of the responsibility for generating growth has naturally shifted to
private, including foreign, investment. In this matter, however, the situation in
the transition economies is far from satisfactory. The level of investment in
most of these countries is less than 20 per cent of GDP. For the CIS countries,
the problem is often not a lack of savings, but rather the relatively poor busi-
ness climate and the low quality of institutional support. Thus, in 1999-2001,
domestic savings in the Russian Federation surpassed 30 per cent, while
domestic investments were less than 20 per cent, with a good part of the dif-
ference explained by capital flight. The business climate in CIS affects the
inflow of foreign direct investment (FDI). During the period 1999-2001, in the
EU accession countries of Eastern Europe, FDI constituted almost 5 per cent
of GDP, or about $200 per capita, while in the CIS countries, the comparable
figures were less than 1 per cent of GDP, or less than $40 per capita.11
In recent years, investment and the general business climate in many transi-
tion economies have improved. According to the extensive survey of enterpris-
es conducted in the transition economies jointly by the World Bank and the
European Bank for Reconstruction and Development (EBRD) since 1996, in
almost all countries of the region, between 1999 and 2002, economic gover-
nance and the general business environment have improved. Progress was par-
ticularly significant in the countries of South-Eastern Europe and CIS, partly
from the impact of the change in the Government of the former Federal
Republic of Yugoslavia and the accession to power of the new leadership in the
Russian Federation. However, the overall scores for the quality of the business
environment in the countries of South-Eastern Europe and in CIS remain lower
than those for the countries of Central and Eastern Europe. On average, the
scores for the two former groups of countries in 2002 were equal to those of
the latter group of countries for 1999.12
Income distribution
Over the course of transition, income inequality, measured at the household
level, increased rapidly and significantly in almost all of the transition
economies. In the Russian Federation and Ukraine, the Gini coefficient of
inequality rose to over 45 per cent (see table VIII.2). The rise in income
inequality, in its turn, was directly linked to a major increase in wealth
inequality, resulting from the way in which the privatization of government
assets had been carried out. This was particularly true in resource-rich coun-
tries such as Azerbaijan, Kazakhstan and the Russian Federation. Here a
whole class of instant millionaires and even billionaires was created, as a
result of the highly questionable method by which the privatization of oil and
other natural resources had been achieved (see box VIII.2). Measured by the
Gini inequality coefficients, the level of inequality in the Eastern European
countries was much lower than in the CIS countries: in 1999-2000, the coeffi-
cients were in the range of 0.30-0.34, or close to that in the Organisation for
Economic Cooperation and Development (OECD) member countries.
11 European Bank for Reconstruction andDevelopment (EBRD), Transition Report, 2002:Agriculture and Rural Transition (London, EBRD,2002), pp. 54-55.
12 Ibid., pp. 22-31.
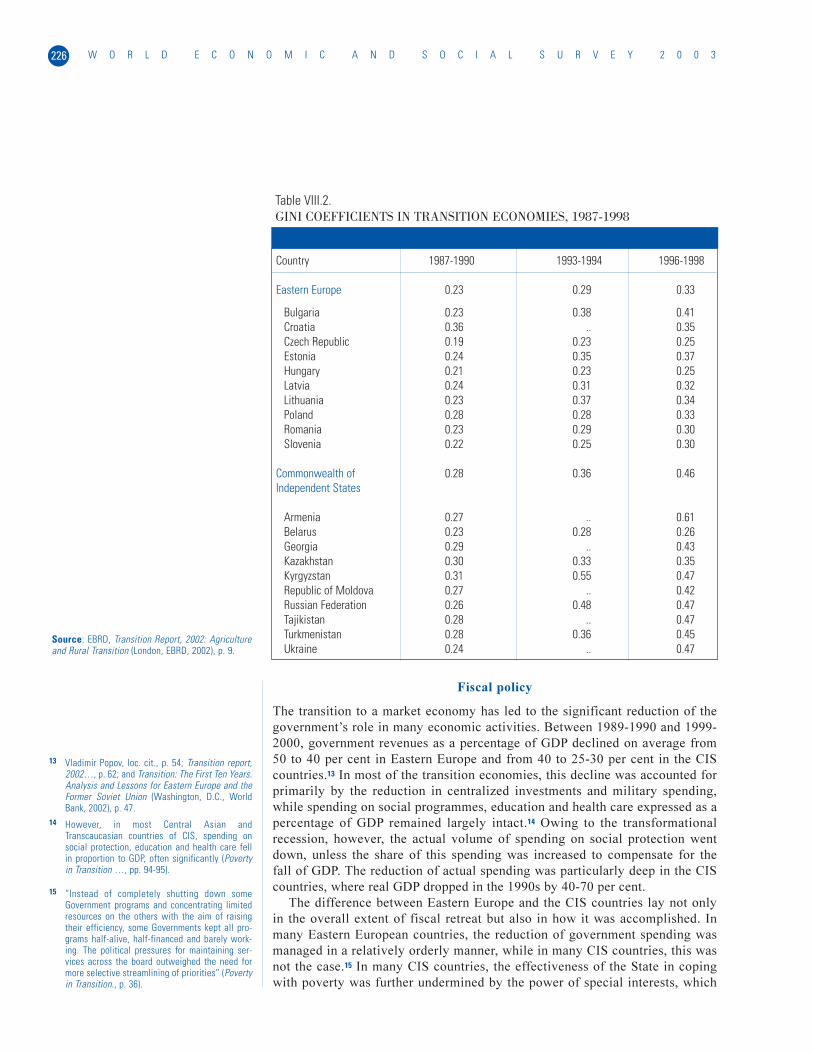
W O R L D E C O N O M I C A N D S O C I A L S U R V E Y 2 0 0 3226
Fiscal policy
The transition to a market economy has led to the significant reduction of the
government’s role in many economic activities. Between 1989-1990 and 1999-
2000, government revenues as a percentage of GDP declined on average from
50 to 40 per cent in Eastern Europe and from 40 to 25-30 per cent in the CIS
countries.13 In most of the transition economies, this decline was accounted for
primarily by the reduction in centralized investments and military spending,
while spending on social programmes, education and health care expressed as a
percentage of GDP remained largely intact.14 Owing to the transformational
recession, however, the actual volume of spending on social protection went
down, unless the share of this spending was increased to compensate for the
fall of GDP. The reduction of actual spending was particularly deep in the CIS
countries, where real GDP dropped in the 1990s by 40-70 per cent.
The difference between Eastern Europe and the CIS countries lay not only
in the overall extent of fiscal retreat but also in how it was accomplished. In
many Eastern European countries, the reduction of government spending was
managed in a relatively orderly manner, while in many CIS countries, this was
not the case.15 In many CIS countries, the effectiveness of the State in coping
with poverty was further undermined by the power of special interests, which
Table VIII.2.GINI COEFFICIENTS IN TRANSITION ECONOMIES, 1987-1998
Country 1987-1990 1993-1994 1996-1998
Eastern Europe 0.23 0.29 0.33
Bulgaria 0.23 0.38 0.41Croatia 0.36 .. 0.35Czech Republic 0.19 0.23 0.25Estonia 0.24 0.35 0.37Hungary 0.21 0.23 0.25Latvia 0.24 0.31 0.32Lithuania 0.23 0.37 0.34Poland 0.28 0.28 0.33Romania 0.23 0.29 0.30Slovenia 0.22 0.25 0.30
Commonwealth of 0.28 0.36 0.46Independent States
Armenia 0.27 .. 0.61Belarus 0.23 0.28 0.26Georgia 0.29 .. 0.43Kazakhstan 0.30 0.33 0.35Kyrgyzstan 0.31 0.55 0.47Republic of Moldova 0.27 .. 0.42Russian Federation 0.26 0.48 0.47Tajikistan 0.28 .. 0.47Turkmenistan 0.28 0.36 0.45Ukraine 0.24 .. 0.47
Source: EBRD, Transition Report, 2002: Agricultureand Rural Transition (London, EBRD, 2002), p. 9.
13 Vladimir Popov, loc. cit., p. 54; Transition report,2002…, p. 62; and Transition: The First Ten Years.Analysis and Lessons for Eastern Europe and theFormer Soviet Union (Washington, D.C., WorldBank, 2002), p. 47.
14 However, in most Central Asian andTranscaucasian countries of CIS, spending onsocial protection, education and health care fellin proportion to GDP, often significantly (Povertyin Transition …, pp. 94-95).
15 “Instead of completely shutting down someGovernment programs and concentrating limitedresources on the others with the aim of raisingtheir efficiency, some Governments kept all pro-grams half-alive, half-financed and barely work-ing. The political pressures for maintaining ser-vices across the board outweighed the need formore selective streamlining of priorities” (Povertyin Transition., p. 36).
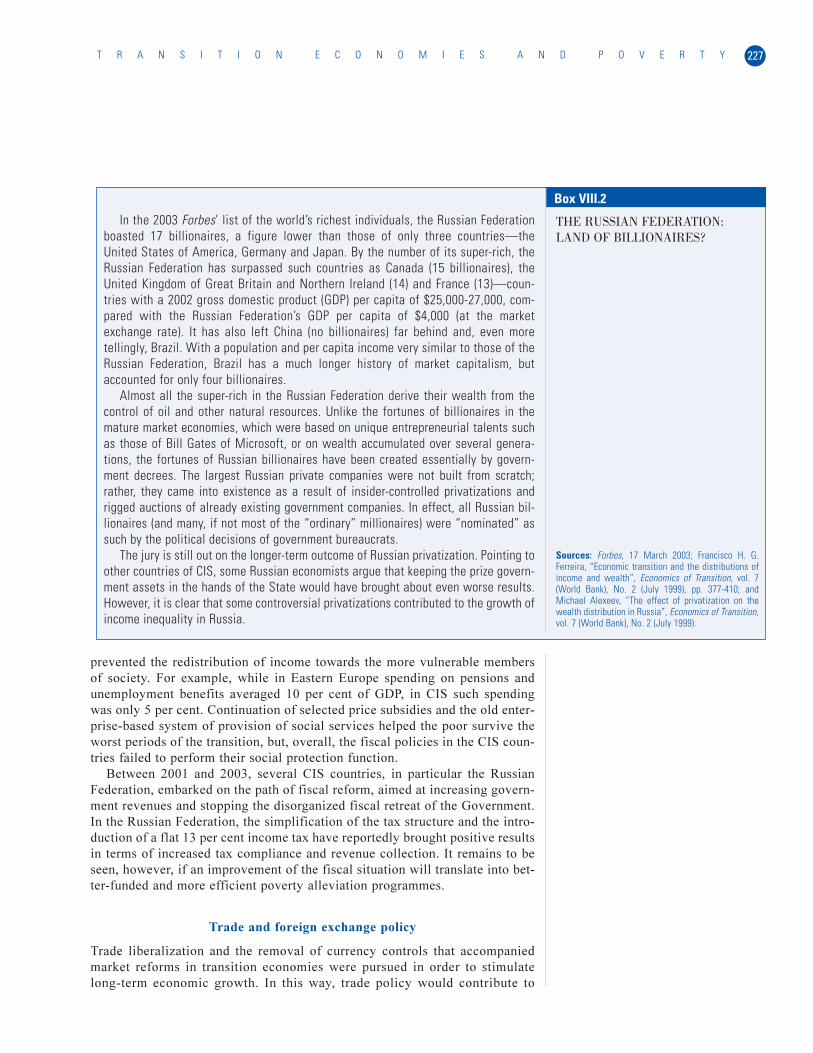
In the 2003 Forbes’ list of the world’s richest individuals, the Russian Federationboasted 17 billionaires, a figure lower than those of only three countries—theUnited States of America, Germany and Japan. By the number of its super-rich, theRussian Federation has surpassed such countries as Canada (15 billionaires), theUnited Kingdom of Great Britain and Northern Ireland (14) and France (13)—coun-tries with a 2002 gross domestic product (GDP) per capita of $25,000-27,000, com-pared with the Russian Federation’s GDP per capita of $4,000 (at the marketexchange rate). It has also left China (no billionaires) far behind and, even moretellingly, Brazil. With a population and per capita income very similar to those of theRussian Federation, Brazil has a much longer history of market capitalism, butaccounted for only four billionaires.
Almost all the super-rich in the Russian Federation derive their wealth from thecontrol of oil and other natural resources. Unlike the fortunes of billionaires in themature market economies, which were based on unique entrepreneurial talents suchas those of Bill Gates of Microsoft, or on wealth accumulated over several genera-tions, the fortunes of Russian billionaires have been created essentially by govern-ment decrees. The largest Russian private companies were not built from scratch;rather, they came into existence as a result of insider-controlled privatizations andrigged auctions of already existing government companies. In effect, all Russian bil-lionaires (and many, if not most of the “ordinary” millionaires) were “nominated” assuch by the political decisions of government bureaucrats.
The jury is still out on the longer-term outcome of Russian privatization. Pointing toother countries of CIS, some Russian economists argue that keeping the prize govern-ment assets in the hands of the State would have brought about even worse results.However, it is clear that some controversial privatizations contributed to the growth ofincome inequality in Russia.
227T R A N S I T I O N E C O N O M I E S A N D P O V E R T Y
Sources: Forbes, 17 March 2003; Francisco H. G.Ferreira, “Economic transition and the distributions ofincome and wealth”, Economics of Transition, vol. 7(World Bank), No. 2 (July 1999), pp. 377-410; andMichael Alexeev, “The effect of privatization on thewealth distribution in Russia”, Economics of Transition,vol. 7 (World Bank), No. 2 (July 1999).
THE RUSSIAN FEDERATION:LAND OF BILLIONAIRES?
Box VIII.2
prevented the redistribution of income towards the more vulnerable members
of society. For example, while in Eastern Europe spending on pensions and
unemployment benefits averaged 10 per cent of GDP, in CIS such spending
was only 5 per cent. Continuation of selected price subsidies and the old enter-
prise-based system of provision of social services helped the poor survive the
worst periods of the transition, but, overall, the fiscal policies in the CIS coun-
tries failed to perform their social protection function.
Between 2001 and 2003, several CIS countries, in particular the Russian
Federation, embarked on the path of fiscal reform, aimed at increasing govern-
ment revenues and stopping the disorganized fiscal retreat of the Government.
In the Russian Federation, the simplification of the tax structure and the intro-
duction of a flat 13 per cent income tax have reportedly brought positive results
in terms of increased tax compliance and revenue collection. It remains to be
seen, however, if an improvement of the fiscal situation will translate into bet-
ter-funded and more efficient poverty alleviation programmes.
Trade and foreign exchange policy
Trade liberalization and the removal of currency controls that accompanied
market reforms in transition economies were pursued in order to stimulate
long-term economic growth. In this way, trade policy would contribute to

W O R L D E C O N O M I C A N D S O C I A L S U R V E Y 2 0 0 3228
combating poverty. However in the short-run perspective, an open-trade
regime creates not only winners but also losers. The poor depend upon foreign
trade as consumers and their welfare increases when the opening up of trade
gives them access to foreign goods, services and food supplies that were pre-
viously unavailable or too expensive. As producers, the poor who are
employed in export or export-related industries also gain from freer trade. At
the same time, the poor may lose as producers when the industries in which
they have been employed are affected by competition from foreign imports.16
In the first years of market reforms, the opening of domestic markets in tran-
sition economies to foreign competition inflicted serious damage on domestic
industries. Unable to compete with foreign producers, they had to reduce out-
put, employment and/or wages. At the same time, exporters from some transi-
tion economies were making hefty profits by taking advantage of sharp differ-
ences between the domestic and world prices of raw materials, such as oil, tim-
ber and metals. Very soon, protectionist pressures in the transition economies
forced the Governments to retreat from the path of full liberalization and to
start increasing tariffs and imposing quotas and other forms of import contain-
ment and export control. To protect their domestic markets, some countries,
such as Uzbekistan, also preserved multiple exchange rates.
The benefits of trade liberalization depend on many factors in the country
itself (whether it has a diversified economy, its geographic position and the
state of its institutions) and in its trading partners. Costs might also be incurred
when liberalizing trade; jobs could be lost in industries competing with imports
before new jobs are created.17. However, the introduction of low uniform tariffs
has proved to be quite effective for some countries. The leader here is proba-
bly Estonia, with its uniform zero-level tariffs, similar to those in Hong Kong
Special Administrative Region (SAR) of China and Singapore. Kyrgyzstan has
also introduced a progressive tariff system with a small dispersion of rates,
comparable with those in Chile.18
In the field of exchange-rate regulation, a pro-growth, and therefore pro-
poor, policy calls for maintaining an undervalued rather than an overvalued
real exchange rate vis-à-vis a country’s main trade partners. An undervalued
exchange rate helps promote exports. Historically, the policy of having an
undervalued national currency had helped to spur export growth in South-East
Asia and Japan, China and other countries that were successful in overcoming
or reducing poverty. At the same time, however, the benefits of an overvalued
exchange rate in terms of cheaper imports are enjoyed less by the poor than by
the rich, since imported goods constitute a smaller share of the consumption of
the poor.19
The situation in resource-based economies, such as the Russian Federation,
is more complex. Here, the massive inflow of foreign currency from the export
of raw materials creates a constant risk of the overvaluation of the national cur-
rency—the so-called Dutch disease. In the Russian Federation, the large appre-
ciation of the ruble prior to the 1998 crisis had served as a major drag on
growth. As a result, the 1998 devaluation, while disrupting the country’s finan-
cial system, was nevertheless quite beneficial for economic growth and, over-
all, was arguably a positive development for the poor. The fact that, in the last
few years, the currency has appreciated again in real terms is becoming a major
policy concern.
16 “Trade liberalization can be expected to help thepoor overall, given the positive associationbetween openness and growth. However, in theshort run, liberalization may have a negativeimpact on some of the poor, depending on theirsources of income and the impact of liberalizationon the prices of goods and services the poor con-sume.” See Bernard Hoekman and others, “Tradepolicy”. In A Sourcebook for Poverty ReductionStrategies, vol. 2…, p. 30.
18 See Bernard Hoekman and others, loc. cit., pp.33-34.
17 See Joseph E. Stiglitz, “Globalization andGrowth in Emerging Markets and the NewEconomy”, Journal of Policy Modeling, vol. 25(2003), p. 513.
19 See Brian Ames and others, “MacroeconomicIssues”, in A Sourcebook for Poverty ReductionStrategies, vol. 2, p. 9.
229T R A N S I T I O N E C O N O M I E S A N D P O V E R T Y
TRANSIENT VERSUS CHRONIC POVERTY
The emergence of chronic poverty
Government shortcomings in coping with poverty in the early days of the tran-
sition forced people in the poorer transition economies to resort heavily to
self-help methods of economic survival. The private response to coping with
poverty included increased employment in the informal economy, cultivation
of family plots, and heavy reliance on intra-family transfers. Lack of opportu-
nity at home led to massive labour migration to better-off economies of the
region and to other countries. As a last resort, large numbers of people
engaged in crime and prostitution.
Since the mid-1990s, the poverty situation in the transition economies
region has improved, led by an economic recovery in Eastern Europe.
Economies of CIS have been growing rather vigorously since the 1998 deval-
uation of the ruble. However, this general improvement has been accompanied
by a concentration of poverty in particular regions and sectors of the economy,
and among specific groups of the population. Thus, while the recession-
induced “transient” poverty has subsided, the smaller-scale but entrenched
pockets of chronic poverty have not disappeared. The emergence of concen-
trated and acute long-term poverty is a relatively new phenomenon.20
Owing to the various levels of poverty, the problems experienced by the
leading reformers of Eastern Europe in coping with it are significantly differ-
ent from those confronting the CIS countries. In the Eastern European coun-
tries, in particular the EU accession countries,21 transient poverty is subsiding
now that income levels are surpassing their pre-transition levels and market-
based economic growth is being achieved. The goal of the Governments con-
sists largely of improving the existing social protection mechanisms and root-
ing out the pockets of concentrated poverty. In the poorest CIS countries, the
main challenge is to alleviate their acute poverty and to prevent the collapse of
the existing health-care and education systems. For other CIS countries, the
task consists of reducing the still massive transient poverty via stimulative eco-
nomic policies while at the same time containing the dangerous increase in
concentrated long-term poverty.
At the present time, poverty in transition economies has many unique fea-
tures (see box VIII.3). Prior to the transition, poverty was largely prevented
by Government-guaranteed employment, free health care and education, and
heavily subsidized food, housing and utilities. In line with its collectivist ide-
ology, the Government ensured a fairly egalitarian distribution of wages and
severely restricted other sources of incomes. At the same time, Governments
provided fairly generous social protection systems for children and families.
Extensive health and education services were also provided to all households,
ensuring a high level of human capital. In addition, most households in transi-
tion economies inherited from the centrally planned period valuable physical
capital in the form of formerly State-owned apartments complete with a full
set of amenities. This made them relatively assets-rich in contrast with compa-
rable households in developing countries. Another feature of the centrally
planned economies was the main provision of some of the key services and
social protection, such as housing, childcare and social security, by enterprises
rather than by the government.
20 Attesting to the recent emergence of this phe-nomenon is the fact that it was not mentioned asa major problem neither in the comprehensive1996 World Bank report on the transitioneconomies nor in the 1998 UNDP report on pover-ty in transition, which stated that there was “lit-tle indication as yet” of the emergence of anunderclass in the region (see From Plan toMarket…; and Poverty in Transition …, p. 18).
21 The EU accession countries are: Bulgaria, theCzech Republic, Estonia, Hungary, Latvia,Lithuania, Poland, Romania, Slovakia andSlovenia. Eight of them are scheduled to join EUin May 2004. Bulgaria, and Romania are sched-uled to be admitted in 2007.
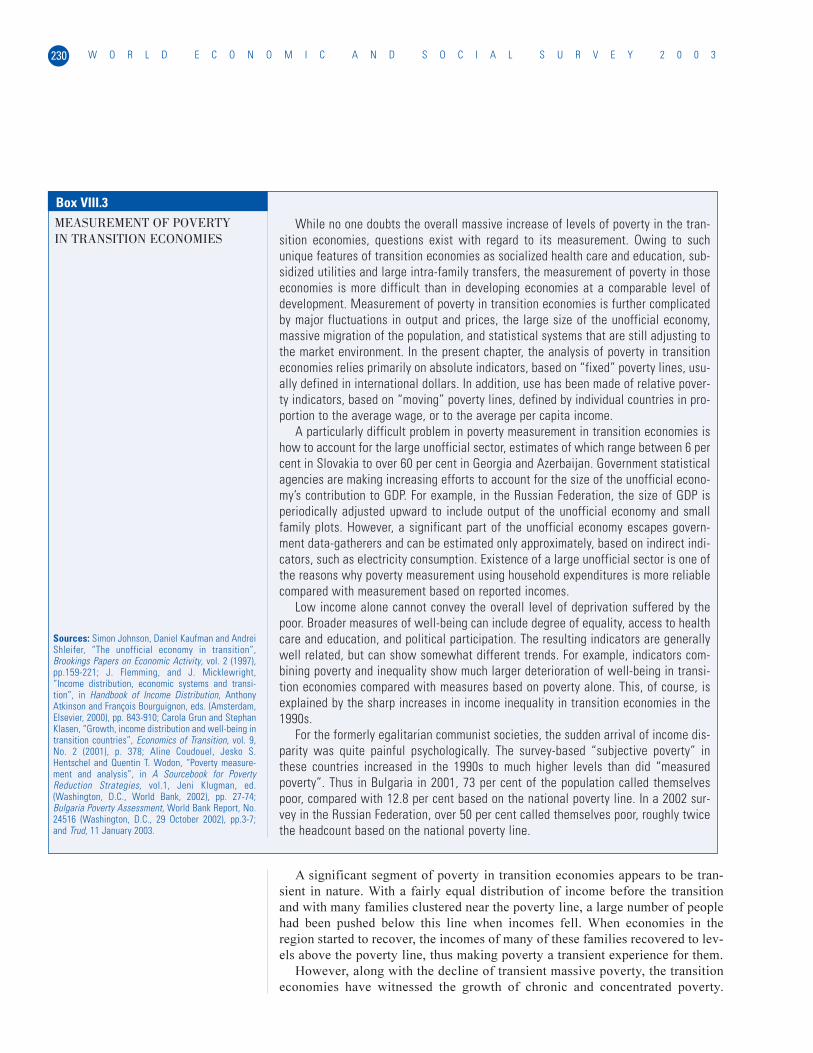
While no one doubts the overall massive increase of levels of poverty in the tran-sition economies, questions exist with regard to its measurement. Owing to suchunique features of transition economies as socialized health care and education, sub-sidized utilities and large intra-family transfers, the measurement of poverty in thoseeconomies is more difficult than in developing economies at a comparable level ofdevelopment. Measurement of poverty in transition economies is further complicatedby major fluctuations in output and prices, the large size of the unofficial economy,massive migration of the population, and statistical systems that are still adjusting tothe market environment. In the present chapter, the analysis of poverty in transitioneconomies relies primarily on absolute indicators, based on “fixed” poverty lines, usu-ally defined in international dollars. In addition, use has been made of relative pover-ty indicators, based on “moving” poverty lines, defined by individual countries in pro-portion to the average wage, or to the average per capita income.
A particularly difficult problem in poverty measurement in transition economies ishow to account for the large unofficial sector, estimates of which range between 6 percent in Slovakia to over 60 per cent in Georgia and Azerbaijan. Government statisticalagencies are making increasing efforts to account for the size of the unofficial econo-my’s contribution to GDP. For example, in the Russian Federation, the size of GDP isperiodically adjusted upward to include output of the unofficial economy and smallfamily plots. However, a significant part of the unofficial economy escapes govern-ment data-gatherers and can be estimated only approximately, based on indirect indi-cators, such as electricity consumption. Existence of a large unofficial sector is one ofthe reasons why poverty measurement using household expenditures is more reliablecompared with measurement based on reported incomes.
Low income alone cannot convey the overall level of deprivation suffered by thepoor. Broader measures of well-being can include degree of equality, access to healthcare and education, and political participation. The resulting indicators are generallywell related, but can show somewhat different trends. For example, indicators com-bining poverty and inequality show much larger deterioration of well-being in transi-tion economies compared with measures based on poverty alone. This, of course, isexplained by the sharp increases in income inequality in transition economies in the1990s.
For the formerly egalitarian communist societies, the sudden arrival of income dis-parity was quite painful psychologically. The survey-based “subjective poverty” inthese countries increased in the 1990s to much higher levels than did “measuredpoverty”. Thus in Bulgaria in 2001, 73 per cent of the population called themselvespoor, compared with 12.8 per cent based on the national poverty line. In a 2002 sur-vey in the Russian Federation, over 50 per cent called themselves poor, roughly twicethe headcount based on the national poverty line.
W O R L D E C O N O M I C A N D S O C I A L S U R V E Y 2 0 0 3230
Sources: Simon Johnson, Daniel Kaufman and AndreiShleifer, “The unofficial economy in transition”,Brookings Papers on Economic Activity, vol. 2 (1997),pp.159-221; J. Flemming, and J. Micklewright,“Income distribution, economic systems and transi-tion”, in Handbook of Income Distribution, AnthonyAtkinson and François Bourguignon, eds. (Amsterdam,Elsevier, 2000), pp. 843-910; Carola Grun and StephanKlasen, “Growth, income distribution and well-being intransition countries”, Economics of Transition, vol. 9,No. 2 (2001), p. 378; Aline Coudouel, Jesko S.Hentschel and Quentin T. Wodon, “Poverty measure-ment and analysis”, in A Sourcebook for PovertyReduction Strategies, vol.1, Jeni Klugman, ed.(Washington, D.C., World Bank, 2002), pp. 27-74;Bulgaria Poverty Assessment, World Bank Report, No.24516 (Washington, D.C., 29 October 2002), pp.3-7;and Trud, 11 January 2003.
Box VIII.3MEASUREMENT OF POVERTYIN TRANSITION ECONOMIES
A significant segment of poverty in transition economies appears to be tran-
sient in nature. With a fairly equal distribution of income before the transition
and with many families clustered near the poverty line, a large number of people
had been pushed below this line when incomes fell. When economies in the
region started to recover, the incomes of many of these families recovered to lev-
els above the poverty line, thus making poverty a transient experience for them.
However, along with the decline of transient massive poverty, the transition
economies have witnessed the growth of chronic and concentrated poverty.
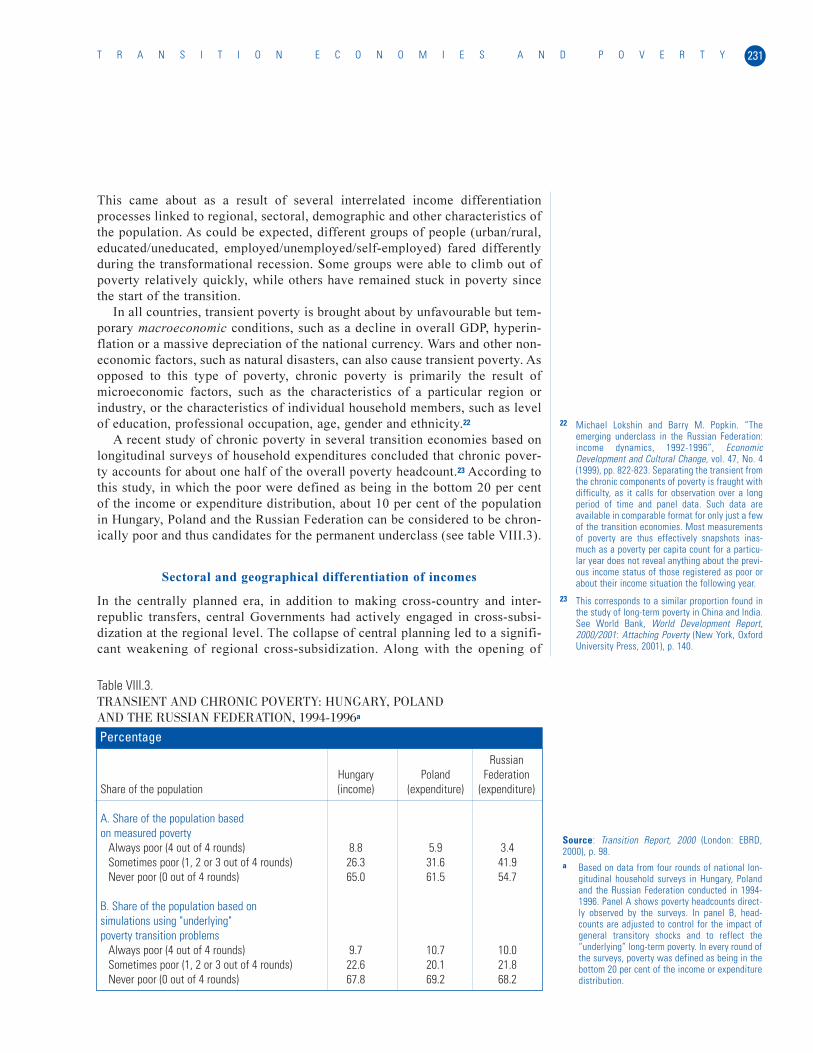
231T R A N S I T I O N E C O N O M I E S A N D P O V E R T Y
This came about as a result of several interrelated income differentiation
processes linked to regional, sectoral, demographic and other characteristics of
the population. As could be expected, different groups of people (urban/rural,
educated/uneducated, employed/unemployed/self-employed) fared differently
during the transformational recession. Some groups were able to climb out of
poverty relatively quickly, while others have remained stuck in poverty since
the start of the transition.
In all countries, transient poverty is brought about by unfavourable but tem-
porary macroeconomic conditions, such as a decline in overall GDP, hyperin-
flation or a massive depreciation of the national currency. Wars and other non-
economic factors, such as natural disasters, can also cause transient poverty. As
opposed to this type of poverty, chronic poverty is primarily the result of
microeconomic factors, such as the characteristics of a particular region or
industry, or the characteristics of individual household members, such as level
of education, professional occupation, age, gender and ethnicity.22
A recent study of chronic poverty in several transition economies based on
longitudinal surveys of household expenditures concluded that chronic pover-
ty accounts for about one half of the overall poverty headcount.23 According to
this study, in which the poor were defined as being in the bottom 20 per cent
of the income or expenditure distribution, about 10 per cent of the population
in Hungary, Poland and the Russian Federation can be considered to be chron-
ically poor and thus candidates for the permanent underclass (see table VIII.3).
Sectoral and geographical differentiation of incomes
In the centrally planned era, in addition to making cross-country and inter-
republic transfers, central Governments had actively engaged in cross-subsi-
dization at the regional level. The collapse of central planning led to a signifi-
cant weakening of regional cross-subsidization. Along with the opening of
RussianHungary Poland Federation
Share of the population (income) (expenditure) (expenditure)
A. Share of the population based on measured poverty
Always poor (4 out of 4 rounds) 8.8 5.9 3.4Sometimes poor (1, 2 or 3 out of 4 rounds) 26.3 31.6 41.9Never poor (0 out of 4 rounds) 65.0 61.5 54.7
B. Share of the population based on simulations using "underlying" poverty transition problems
Always poor (4 out of 4 rounds) 9.7 10.7 10.0Sometimes poor (1, 2 or 3 out of 4 rounds) 22.6 20.1 21.8Never poor (0 out of 4 rounds) 67.8 69.2 68.2
Table VIII.3.TRANSIENT AND CHRONIC POVERTY: HUNGARY, POLAND AND THE RUSSIAN FEDERATION, 1994-1996a
Percentage
Source: Transition Report, 2000 (London: EBRD,2000), p. 98.a Based on data from four rounds of national lon-
gitudinal household surveys in Hungary, Polandand the Russian Federation conducted in 1994-1996. Panel A shows poverty headcounts direct-ly observed by the surveys. In panel B, head-counts are adjusted to control for the impact ofgeneral transitory shocks and to reflect the“underlying” long-term poverty. In every round ofthe surveys, poverty was defined as being in thebottom 20 per cent of the income or expendituredistribution.
22 Michael Lokshin and Barry M. Popkin. “Theemerging underclass in the Russian Federation:income dynamics, 1992-1996”, EconomicDevelopment and Cultural Change, vol. 47, No. 4(1999), pp. 822-823. Separating the transient fromthe chronic components of poverty is fraught withdifficulty, as it calls for observation over a longperiod of time and panel data. Such data areavailable in comparable format for only just a fewof the transition economies. Most measurementsof poverty are thus effectively snapshots inas-much as a poverty per capita count for a particu-lar year does not reveal anything about the previ-ous income status of those registered as poor orabout their income situation the following year.
23 This corresponds to a similar proportion found inthe study of long-term poverty in China and India.See World Bank, World Development Report,2000/2001: Attaching Poverty (New York, OxfordUniversity Press, 2001), p. 140.

Box VIII.4
THE RUSSIAN DEFENCE INDUSTRY: THE CASE OFA SHRINKING GIANT
In the course of the 1990s, the Russian defence industry was hit by the triple shockof severe budget cuts, radical market reforms and the breakdown of traditional eco-nomic ties with partners in the other former Soviet republics. Between the peak of theSoviet military build-up of the late 1980s and the lowest point reached in 1996, theshare of defence spending in Russian GDP dropped from 15-17 to 3-4 per cent, the mil-itary industry’s output fell by 80 per cent, and employment in the defence industry fellby two thirds.
Defence industry enterprises are found in the majority of the Russian provinces.However, most of them are concentrated in just a few regions, in particular in Moscowand Saint Petersburg, the Urals and western Siberia.
In the Soviet era, defence enterprises had many advantages in comparison with therest of the economy: they possessed the highest-skilled personnel, both workers andengineers, and developed the best research and development (R&D) and innovations.Higher wages were the main factor in attracting and retaining better workers. In addi-tion, defence enterprises owned extensive facilities that provided social services—retail outlets, hospitals, kindergartens and summer camps for children, sport stadi-ums, seaside resorts and libraries.
As a result of the severe reduction of military orders, defence enterprises found them-selves in a more disadvantageous position than the rest of the economy. This was reflect-ed in particularly deep cuts in wages, wage arrears, losses of personnel and tension inlabour-management relations. During the transition period, some of the social service facil-ities were closed down or sold off as enterprises were no longer able to fund them.
Throughout the decade of reforms, average wages in the defence industry constitut-ed only 40-60 per cent of average wages and 50-80 per cent of average wages in man-ufacturing. Among other branches of the economy, only education, agriculture andhealth care had lower average wages than the defence industry. In recent years, wagesin the defence industry have started to catch up with those in other sectors of the econ-omy. However, the gap remains. In 2002, based on a survey of defence enterprises, aver-age wages therein amounted to 3,135 rubles (just over US$ 100 at the market exchangerate) per month, which was equivalent to 60 per cent of the level of average wages in
W O R L D E C O N O M I C A N D S O C I A L S U R V E Y 2 0 0 3232
national economies to the outside world, this produced major changes in the
fortunes of individual regions, cities and districts. This was particularly true
for the regions of the former Soviet Union, many of which lost valuable ener-
gy subsidies and other federal aid; but in the course of their transition to the
market, even the wealthier transition economies witnessed the emergence of
numerous depressed regions within their borders. These were regions that
were hit particularly severely by market reforms, such as changes in relative
prices, the elimination of subsidies, drops in State orders and increases in
transportation costs. Examples include the northern territories and defence-
producing regions in the Russian Federation (see box VIII. 4).
On the other hand, the transition to a market economy led to the relative
increase in the well-being of most capital cities and the emergence of newly
prosperous regions, such as oil-rich western Siberia. Generally, the winners are
regions rich in natural resources, with a large population and close proximity
to the main economic centres.24
The resulting differences in poverty levels can be substantial. For example,
a resident of Warsaw is six times less likely to be poor than residents of the rest
24 See: V. Popov, “ Reform strategies and economicperformance of Russia’s regions”, WorldDevelopment, vol. 29, No. 5 (2000), pp. 865-886;N. Mikheeva, “Differentiation of social-economicsituation of Russian regions and problems ofregional policy” (Moscow, Economics Educationand Research Consortium (EERC), 1998); IrinaDolinskaya, Transition and Regional Inequality inRussia: Reorganization or Procrastination?, IMFWorking Paper, No. 02/169, (Washington, D.C.,October 2002, Leonid Fedorov, “Regional inequal-ity and regional polarization in the RussianFederation, 1990-99”, World Development, vol.30, No.3 (2002), pp. 443-456; and SimonCommander, Andrei Tolstopiatenko and RuslanYemtsov, loc. cit.
Box VIII.4 (continued)
industry, and 80 per cent of the level of average wages in manufacturing.A low level of wages, however, is only one aspect of the wage problem in the
Russian defence industry. Another aspect is persistent wage arrears. Even the mostcompetitive enterprises suffer from this problem. For example, in 2002, wages onaverage in the Izhmash plant in the republic of Udmurtia producing the Kalashnikovguns were two months in arrears.
As a means of retaining workers while not paying them competitive wages, manydefence enterprises continue to rely on enterprise-based social services. By presiden-tial decree, control of all “social infrastructure objects” of defence enterprises was tohave been transferred to the municipal authorities by 1997. In reality, the process oftransfer has not been completed. By 2003, only part of the social infrastructure hadbeen transferred to municipal budgets, sold or rented out.
Having begun the transformation of their social infrastructure, enterprises realizedthe importance of some of these properties for retaining personnel and decided to slowor halt the transition altogether. As of 2001, 60-70 per cent of the defence enterprisescontinued to own medical clinics, cafeterias and libraries; 35-55 per cent of enterpris-es owned stores, camps for children, recreation facilities, sports stadiums and housing;and about 20 per cent of the defence enterprises owned kindergartens.
Considerable differentiation exists among defence enterprises located in differentregions of the Russian Federation. Enterprises located in, or in the vicinity of, the cen-tral cities generally enjoy better economic and social conditions than those located inthe remote regions of the country, especially the far east, eastern Siberia and north-ern Caucasus. In the defence enterprises of Moscow and the Moscow region, averagemonthly wages in 2002 were more than 1.4 times higher than in other regions. Thisreflects the fact that, in central cities, the labour market is much more vibrant than inthe provinces, hence defence industry workers unhappy with their pay or working con-ditions can simply leave for a better job. In provincial defence enterprises, in particu-lar those based in the so-called closed cities, fewer workers have such an option. Yet,the fact that Moscow has a considerably higher cost of living largely offsets the dif-ferences in wage levels measured in real terms.
233T R A N S I T I O N E C O N O M I E S A N D P O V E R T Y
Sources: Clifford Gaddy, The Price of the Past:Russia’s Struggle with the Legacy of a MilitarizedEconomy (Washington, D.C., Brookings InstitutionPress, 1996); Ksenia Gonchar, “Russia’s defence idus-try at the turn of the century”, Bonn InternationalCentre for Conversion, Bonn, 2000; Alexei Izyumov andothers, “Market reforms and regional differentiation ofRussian defence enterprises”, Europe-Asia Studies,vol. 54, No. 6 (2002), pp. 959-974; State Committee forStatistics of the Russian Federation, Living Standardsof Population (available at: http://www.gks.ru/); andUdmurtia, “Weapons producers still suffer from wagearrears”, 21 September 2002 (available at http://www.regions.ru/article/any/id/854061.html).
of Poland; the poverty level in Saint Petersburg in the Russian Federation is
eight times lower than that in the Russian republic of Tuva.25 As a result, per
capita income disparities among the 89 administrative regions of the Russian
Federation are much larger than, for example, disparities among the 50 States
in the United States of America, with a coefficient of variation of 51.9 per cent
as compared with one of 14.8 per cent for the United States.26
In transition economies, rural areas remain poorer compared with urban
areas. However, the patterns are different in Eastern European and CIS coun-
tries. In most Eastern European countries, the levels of rural poverty are sig-
nificantly (about 50 per cent) higher than the levels in the cities. In the CIS
countries, the gap between urban and rural regions is not as pronounced. In
some of these countries (for example, Georgia) poverty is actually lower in
rural than in the urban areas. The reason for the relatively better situation of
rural areas in the CIS countries is a much deeper fall in industrial production
in these countries compared with that in the Eastern European countries. In
some of the CIS regions, the dire economic crisis in manufacturing made even
depressed farming areas appear attractive. In extreme cases, it led to de-urban-
25 Making Transition Work for Everyone…, p. 74;and Simon Clarke, “Poverty in Russia”, Problemsof Economic Transition, vol. 42, No. 5 (September1999), p. 21.
26 Simon Commander, Andrei Tolstopiatenko andRuslan Yemtsov, loc. cit., p. 34; and Jeni Klugmanand Jenine Braithwaite, “Poverty in the RussianFederation during the transition: an overview”,The World Bank Research Observer, vol. 13, No. 1(February 1998), p. 39.

W O R L D E C O N O M I C A N D S O C I A L S U R V E Y 2 0 0 3234
ization, or a reverse flow of urban citizens back to rural areas, which occurred
in the Central Asian countries of CIS.27
Conflicts and poverty
The breakdown of the centrally planned system had led to the creation of
almost 20 newly independent States, but this was accompanied by numerous
national and ethnic conflicts, several of which escalated to fully fledged mili-
tary conflicts.
Wars and political crises resulted in major dislocations. In the course of the
1990s, close to 50 million people in transition economies were directly affect-
ed by wars and disturbances. Of these, 8 million had to flee their homes and
became refugees or internally displaced persons (IDPs).28 Half of these
refugees came from within the former Yugoslavia because of the wars fought
there, another 1.5 million from wars in Transcaucasus and the rest from con-
flicts in other CIS countries. Many of these countries have witnessed the for-
mation of an urban underclass of beggars, including migrant children, and the
creation of camps of refugees from ethnic conflicts, in, for example, the suc-
cessor States of the former Soviet Union and the former Yugoslavia.
By the end of the 1990s, practically all the military conflicts in transition
economies had ended or had entered a low-intensity stage. However, the num-
ber of IDPs and refugees remains very high. As late as 1999, based on the
United Nations estimates, the population of IDPs was 570,000 in Azerbaijan,
279,000 in Georgia and 498,000 in the Russian Federation.29 The consequences
of wars and forced migration will be felt for many years to come. For example,
in Azerbaijan in 1999, 75 per cent of IDPs lived in temporary accommodations.
In Georgia, one third of displaced families had no regular income several years
after resettlement.30 In Bosnia, families of former soldiers and refugees were
found to have a significantly higher risk of being poor.31
Ethnic-specific poverty
Not all ethnic-specific poverty in transition economies is related to civil con-
flicts. Groups experiencing peacetime poverty of this type include Roma and
ethnic Turks in Eastern European countries and migrant workers from Central
Asia in the Russian Federation and other successor countries of the former
Soviet Union. Roma, numbering between 7 million and 9 million, are consid-
ered the largest ethnic minority in Europe.
In Bulgaria, ethnic minorities constitute less than 20 per cent of the popula-
tion, but 60 per cent of the poor. The risk of poverty among ethnic Turks is 3.5
times greater, and among Roma more than 10 times greater, than among ethnic
Bulgarians (see table VIII.4). Poverty among ethnic minorities is not only wider
but also deeper. The poverty gap (the percentage increase in income necessary to
bring income up to the poverty line) for the poor among the Roma is 25.9 per
cent compared with just 1.1 per cent for the poor among ethnic Bulgarians. The
high level of poverty among Roma in Bulgaria and other Eastern European coun-
tries has led to a recent initiative spear-headed by the European Commission, the
George Soros Open Society Institute and the World Bank. A high-level confer-
ence on the subject was held in Budapest in June 2003.
In the Russian Federation, the poorest ethnic minorities are refugees from
other CIS countries, IDPs created by ethnic conflicts, such as the Chechen con-
27 Kathryn H. Anderson and Richard Pomfret,“Relative living standards in new marketeconomies: evidence from Central Asian house-hold surveys”, Journal of Comparative Economics,vol. 30 (2002), p.702.
28 Branko Milanovic, Income, Inequality and Povertyduring the Transition from Planned to MarketEconomy (Washington, D.C., World Bank, 1998),pp. 4-5.
29 United Nations Development Programme, HumanDevelopment Report, 2001: Making NewTechnologies Work for Human Development andaddendum, United Nations DevelopmentProgramme and addendum (New York, OxfordUniversity Press, 2001), pp. 205 and 207.
30 Making Transition Work for Everyone…,p. 52; and“Monitoring in Central and Eastern Europe, theCommonwealth of Independent States and theBaltics”, (MONEE Project), Women in Transition,Regional Monitoring Report, 6 (Florence, Italy,United Nations Children’s Fund/InternationalChild Development Centre, 1999), p.11.
31 Marcelo Bisogno and Alberto Chong, “On thedeterminants of inequality in Bosnia andHerzegovina”, Economics of Transition, vol. 10,No. 2 (2002), p. 335.
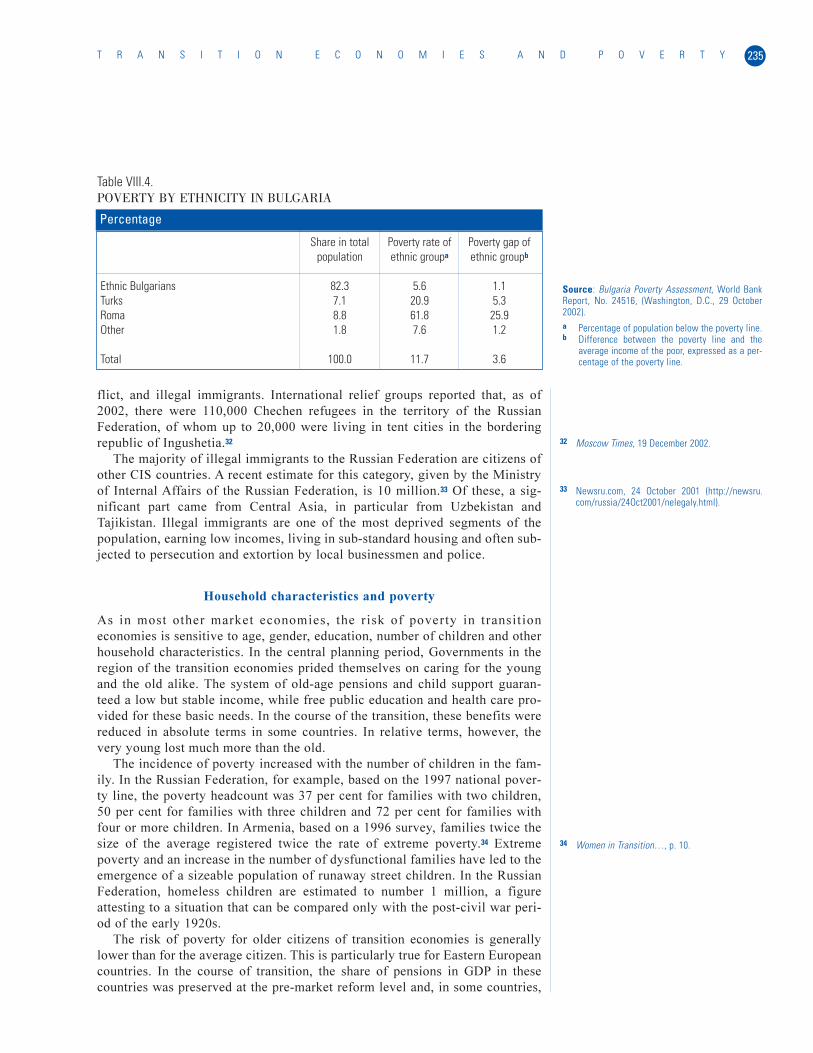
235T R A N S I T I O N E C O N O M I E S A N D P O V E R T Y
flict, and illegal immigrants. International relief groups reported that, as of
2002, there were 110,000 Chechen refugees in the territory of the Russian
Federation, of whom up to 20,000 were living in tent cities in the bordering
republic of Ingushetia.32
The majority of illegal immigrants to the Russian Federation are citizens of
other CIS countries. A recent estimate for this category, given by the Ministry
of Internal Affairs of the Russian Federation, is 10 million.33 Of these, a sig-
nificant part came from Central Asia, in particular from Uzbekistan and
Tajikistan. Illegal immigrants are one of the most deprived segments of the
population, earning low incomes, living in sub-standard housing and often sub-
jected to persecution and extortion by local businessmen and police.
Household characteristics and poverty
As in most other market economies, the risk of poverty in transition
economies is sensitive to age, gender, education, number of children and other
household characteristics. In the central planning period, Governments in the
region of the transition economies prided themselves on caring for the young
and the old alike. The system of old-age pensions and child support guaran-
teed a low but stable income, while free public education and health care pro-
vided for these basic needs. In the course of the transition, these benefits were
reduced in absolute terms in some countries. In relative terms, however, the
very young lost much more than the old.
The incidence of poverty increased with the number of children in the fam-
ily. In the Russian Federation, for example, based on the 1997 national pover-
ty line, the poverty headcount was 37 per cent for families with two children,
50 per cent for families with three children and 72 per cent for families with
four or more children. In Armenia, based on a 1996 survey, families twice the
size of the average registered twice the rate of extreme poverty.34 Extreme
poverty and an increase in the number of dysfunctional families have led to the
emergence of a sizeable population of runaway street children. In the Russian
Federation, homeless children are estimated to number 1 million, a figure
attesting to a situation that can be compared only with the post-civil war peri-
od of the early 1920s.
The risk of poverty for older citizens of transition economies is generally
lower than for the average citizen. This is particularly true for Eastern European
countries. In the course of transition, the share of pensions in GDP in these
countries was preserved at the pre-market reform level and, in some countries,
Share in total Poverty rate of Poverty gap ofpopulation ethnic groupa ethnic groupb
Ethnic Bulgarians 82.3 5.6 1.1Turks 7.1 20.9 5.3Roma 8.8 61.8 25.9Other 1.8 7.6 1.2
Total 100.0 11.7 3.6
Table VIII.4.POVERTY BY ETHNICITY IN BULGARIA
Percentage
Source: Bulgaria Poverty Assessment, World BankReport, No. 24516, (Washington, D.C., 29 October2002).a Percentage of population below the poverty line.b Difference between the poverty line and the
average income of the poor, expressed as a per-centage of the poverty line.
32 Moscow Times, 19 December 2002.
33 Newsru.com, 24 October 2001 (http://newsru.com/russia/24Oct2001/nelegaly.html).
34 Women in Transition…, p. 10.
W O R L D E C O N O M I C A N D S O C I A L S U R V E Y 2 0 0 3236
actually increased. In most CIS countries, spending on pensions in proportion to
GDP was largely maintained. In view of the sharp drop of GDP, this meant a fall
in real incomes. However, compared with other groups of the population, pen-
sioners fared relatively well. A recent World Bank study found the poverty risk
for pensioners lower than for the population at large in all of the Eastern
European countries with the exception of Bulgaria and Croatia. In the CIS coun-
tries, the risk of poverty for the elderly was generally higher than the average,
but not by a large amount, and in two countries, Turkmenistan and Tajikistan,
the risk of poverty was lower.35 Unlike young people, most retirees in transition
economies could rely on accumulated assets, such as apartments and garden
plots. In many of the poor families in CIS, pensioners actually share their mon-
etary and in-kind resources with the younger members of their families.
Lack of education is a significant predictor of poverty risk. According to a
recent study, people with only elementary education have a risk of being poor
that is 20-60 per cent higher compared with the national averages. In contrast,
people with a higher education have a lower-than-average probability of being
drawn into poverty. This relationship is stronger in the more wealthy Eastern
European economies, where returns to education are higher, but it also holds
for the poorest economies such as those of Central Asia.
Overall, the links between individual and household characteristics and
chronic poverty are stronger in Eastern European countries than in the CIS
countries. This indicates the decline in indiscriminate mass transient poverty in
the former and the dominance of such poverty in the latter.
EMPLOYMENT, UNEMPLOYMENT AND POVERTY
Because of their inefficiency and disregard for the true costs of production,
the pre-transition economies operated under conditions of an apparent labour
shortage and claimed an official unemployment rate of zero. In the early peri-
od of market reforms, the reduction of output in the transition countries that
came about as much of the inefficient, wasteful and unwanted production was
eliminated, was more pronounced than the increase in recorded unemploy-
ment. The reasons for this included the inertia of the full employment para-
digm, the political fear of mass unemployment, the preservation of soft budget
constraints in many of the State-owned and newly privatized enterprises,
labour hoarding by firms accustomed to labour shortages, and the low geo-
graphical mobility of labour.36
By the mid-1990s, however, the legacy of the centrally planned economy
had been largely destroyed, thereby weakening the strength of many of the
above factors, especially in the countries most advanced in their transition. As
a result, several years into market reforms, unemployment in the transition
economies rose from less than 5 per cent to 10-15 per cent or more (for select-
ed countries, see table VIII.5). The overall losses of employment were even
larger than indicated by the unemployment figures alone, as millions of people
withdrew from the labour force altogether. Between 1989 and 1998, an esti-
mated 26 million jobs were lost in the transition economies—13 per cent of the
pre-transition total. However, in contrast with the experience of the developed
countries, where a drop in employment is generally not accompanied by a drop
35 Making Transition Work for Everyone…, pp. 82-83.
36 See World Economic and Social Survey, 2002(United Nations publication, Sales No.E.02.II.C.1), box IV.2, for the adverse effects ofsoft budget constraints. See also Janos Kornai,Highways and Byways…; Olivier Blanchard, TheEconomics of Post-communist transition (Oxford,United Kingdom, Clarendon Press (1998); Mark E.Shaffer, “Do firms in transition economies havesoft budget constraints? a reconsideration of con-cepts and evidence”, Journal of ComparativeEconomics, vol. 26, pp. 80-103; and VahalyIzyumov, “The unemployment-output trade-off intransition economies: does Okun’s law apply”,Economics of Planning (forthcoming).
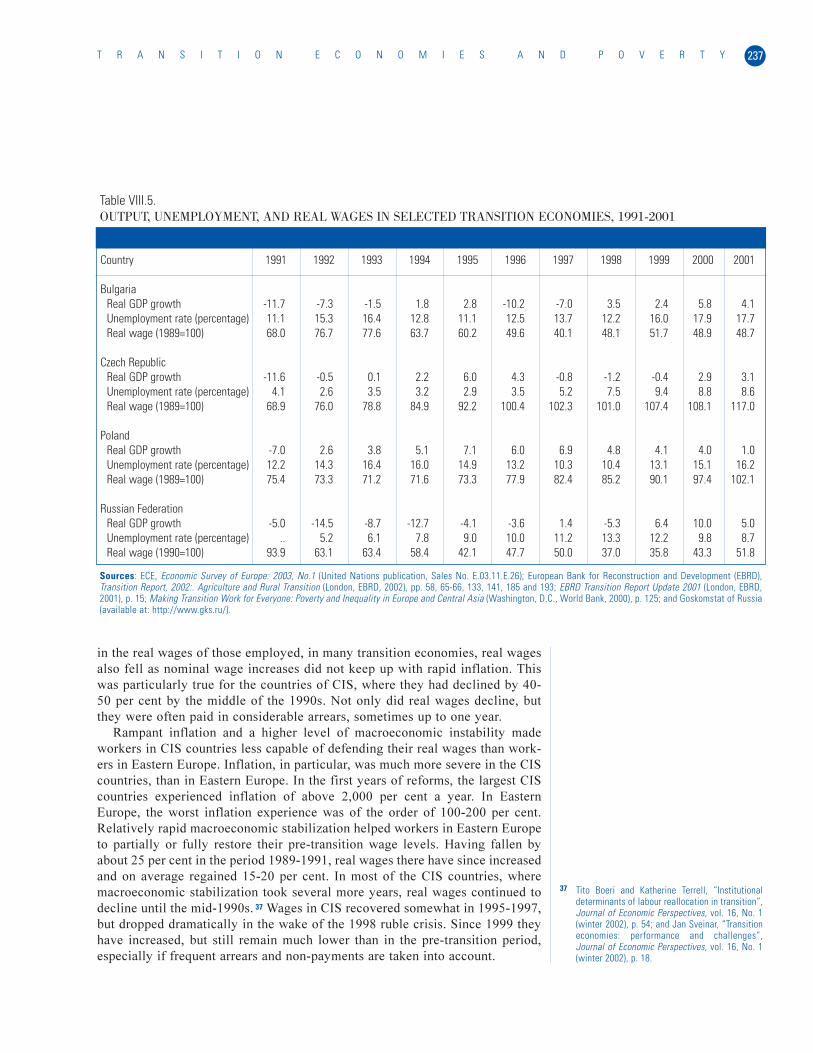
237T R A N S I T I O N E C O N O M I E S A N D P O V E R T Y
in the real wages of those employed, in many transition economies, real wages
also fell as nominal wage increases did not keep up with rapid inflation. This
was particularly true for the countries of CIS, where they had declined by 40-
50 per cent by the middle of the 1990s. Not only did real wages decline, but
they were often paid in considerable arrears, sometimes up to one year.
Rampant inflation and a higher level of macroeconomic instability made
workers in CIS countries less capable of defending their real wages than work-
ers in Eastern Europe. Inflation, in particular, was much more severe in the CIS
countries, than in Eastern Europe. In the first years of reforms, the largest CIS
countries experienced inflation of above 2,000 per cent a year. In Eastern
Europe, the worst inflation experience was of the order of 100-200 per cent.
Relatively rapid macroeconomic stabilization helped workers in Eastern Europe
to partially or fully restore their pre-transition wage levels. Having fallen by
about 25 per cent in the period 1989-1991, real wages there have since increased
and on average regained 15-20 per cent. In most of the CIS countries, where
macroeconomic stabilization took several more years, real wages continued to
decline until the mid-1990s. 37 Wages in CIS recovered somewhat in 1995-1997,
but dropped dramatically in the wake of the 1998 ruble crisis. Since 1999 they
have increased, but still remain much lower than in the pre-transition period,
especially if frequent arrears and non-payments are taken into account.
Table VIII.5.OUTPUT, UNEMPLOYMENT, AND REAL WAGES IN SELECTED TRANSITION ECONOMIES, 1991-2001
Country 1991 1992 1993 1994 1995 1996 1997 1998 1999 2000 2001
BulgariaReal GDP growth -11.7 -7.3 -1.5 1.8 2.8 -10.2 -7.0 3.5 2.4 5.8 4.1Unemployment rate (percentage) 11.1 15.3 16.4 12.8 11.1 12.5 13.7 12.2 16.0 17.9 17.7Real wage (1989=100) 68.0 76.7 77.6 63.7 60.2 49.6 40.1 48.1 51.7 48.9 48.7
Czech RepublicReal GDP growth -11.6 -0.5 0.1 2.2 6.0 4.3 -0.8 -1.2 -0.4 2.9 3.1Unemployment rate (percentage) 4.1 2.6 3.5 3.2 2.9 3.5 5.2 7.5 9.4 8.8 8.6Real wage (1989=100) 68.9 76.0 78.8 84.9 92.2 100.4 102.3 101.0 107.4 108.1 117.0
PolandReal GDP growth -7.0 2.6 3.8 5.1 7.1 6.0 6.9 4.8 4.1 4.0 1.0Unemployment rate (percentage) 12.2 14.3 16.4 16.0 14.9 13.2 10.3 10.4 13.1 15.1 16.2Real wage (1989=100) 75.4 73.3 71.2 71.6 73.3 77.9 82.4 85.2 90.1 97.4 102.1
Russian FederationReal GDP growth -5.0 -14.5 -8.7 -12.7 -4.1 -3.6 1.4 -5.3 6.4 10.0 5.0Unemployment rate (percentage) .. 5.2 6.1 7.8 9.0 10.0 11.2 13.3 12.2 9.8 8.7Real wage (1990=100) 93.9 63.1 63.4 58.4 42.1 47.7 50.0 37.0 35.8 43.3 51.8
Sources: ECE, Economic Survey of Europe: 2003, No.1 (United Nations publication, Sales No. E.03.11.E.26); European Bank for Reconstruction and Development (EBRD),Transition Report, 2002:. Agriculture and Rural Transition (London, EBRD, 2002), pp. 58, 65-66, 133, 141, 185 and 193; EBRD Transition Report Update 2001 (London, EBRD,2001), p. 15; Making Transition Work for Everyone: Poverty and Inequality in Europe and Central Asia (Washington, D.C., World Bank, 2000), p. 125; and Goskomstat of Russia(available at: http://www.gks.ru/).
37 Tito Boeri and Katherine Terrell, “Institutionaldeterminants of labour reallocation in transition”,Journal of Economic Perspectives, vol. 16, No. 1(winter 2002), p. 54; and Jan Sveinar, “Transitioneconomies: performance and challenges”,Journal of Economic Perspectives, vol. 16, No. 1(winter 2002), p. 18.
W O R L D E C O N O M I C A N D S O C I A L S U R V E Y 2 0 0 3238
Weaker trade unions, the inadequacy of unemployment protection and
reliance on enterprise-specific non-wage benefits, such as subsidized housing,
health care and childcare, force workers in CIS countries to hold on to low-paid
jobs. Low geographical mobility of labour reinforces this tendency. Owing to
such obstacles as undeveloped housing markets, high costs of transportation
and legal restrictions, millions of workers cannot take advantage of job oppor-
tunities in other districts and are stuck with poorly paid jobs or no jobs at all.
CIS countries suffer from another major bottleneck in their labour mar-
kets—an inadequate number of small and medium-sized enterprises (SMEs), a
situation rooted mainly in the poor legal and tax environments facing such
enterprises and the preservation of soft budget constraints and other privileges
for larger enterprises.38 In contrast, in Eastern Europe, where SMEs are treated
favourably, these enterprises serve as a major source of new jobs and thus as
an important antidote to poverty. As a result, in Eastern Europe, employment
and output in SMEs have grown quickly, making this sector the main engine of
economic growth. By 1998, enterprises employing 50 workers or less produced
55-65 per cent of GDP in the Czech Republic, Hungary and Lithuania, in con-
trast with just 10-20 per cent of GDP in Belarus, Kazakhstan, the Russian
Federation and Ukraine. The share of SMEs in CIS countries was still low
despite the fact that their productivity had been higher than the average in the
economy. This is significant as, according to a recent World Bank study, the
positive impact of SMEs on overall employment and growth can be felt only
after a threshold of 40 per cent in employment and value added is reached.39
Unemployment benefits and the minimum wage
The different ways in which the labour market adjusted to the transition—
mostly through the reduction of employment in Eastern Europe and through
reductions both in employment and in real wages in CIS—resulted from the
different labour policies in these two groups of countries and had significantly
different implications for poverty.
In Eastern Europe, in particular in those countries more advanced in their tran-
sition, from the start, Governments maintained relatively high unemployment
benefits. In the CIS countries, on the contrary, unemployment benefits were mea-
gre. For example, in Slovakia, in 2000, unemployment benefits generally ranged
between 40 and 50 per cent of the average wage. The duration and coverage of
unemployment benefits were also set longer and broader in Eastern Europe com-
pared with CIS countries. For example, benefits had been limited to 24 months
in the former Yugoslav Republic of Macedonia, as against a limit of 6 months in
the Russian Federation. In Romania, even new entrants to the labour force are
eligible for unemployment benefits if they cannot find work.
In the Russian Federation, the minimum wage is less than 10 per cent of the
average wage, while unemployment compensation, instead of being based on
the average wage before redundancy, is often paid at the minimum wage
level.40 With unemployment benefits being set so low, most unemployed do not
even care to register. As a result, registered unemployment in the Russian
Federation is about three or four times less than survey-based unemployment.
The low level of benefits is only partially explained by limited funding: in the
Russian Federation, the Federal Employment Service has recorded a budget
surplus for a number of years.41
38 In the first three years of reforms (1992-1994), thenumber of small businesses increased in theRussian Federation from 268,000 to 897,000. Yet,macroeconomic instability, unfair competitionfrom larger companies and highly unfavourablegovernment policies stopped the growth of thesmall private businesses, effectively freezingthem at the level of 1 million.
39 Transition: The First Ten Years…, pp. 39-42.
40 Poorly protected from inflation, the minimumwage in the Russian Federation and many otherCIS countries had essentially lost its primarymeaning and was turned by various Governmentagencies into a unique accounting unit.
41 Making Transition Work for Everyone …, p. 345;and Tito Boeri and Katherine Terrell, loc. cit., p. 72.
239T R A N S I T I O N E C O N O M I E S A N D P O V E R T Y
Unemployment status is a fairly accurate predictor of poverty in the coun-
tries most advanced in their transition. In Poland and Hungary, households
headed by an unemployed person are four times more likely to be poor than
those headed by an employed person. In Hungary in the mid-1990s, 60 per cent
of heads of poor households were unemployed; in Bulgaria, and Poland, 30 per
cent; and in Estonia, 24 per cent. However, in CIS, the link between poverty
and unemployment is weak. Only 11 per cent of the poor in the Russian
Federation and only 5 per cent of the poor in Belarus came from the ranks of
the unemployed.42 The main reason for this seeming anomaly is the extremely
low level of wages in CIS, making the difference between the employed and
the unemployed less distinguishable there than in Eastern Europe.
Minimum wage legislation in Eastern Europe is different from that in CIS.
In Eastern Europe, the minimum wage is set at between 30 and 40 per cent of
the average wage, while in the CIS countries, it was allowed to shrink from
close to 30 per cent of the average wage in 1990 to less than 10 per cent in 1996
and to less than 7 per cent in 2002.43
In principle, the minimum wage should be set at a level that provides the
household with an income at least sufficient for its members to reach the
national poverty line. For example, in the United States, the minimum wage is
set at approximately four times the national poverty line. Thus, one working
member in a family of four earning the minimum wage should generate just
enough income to keep the family from falling below the poverty line. Even in
the countries most advanced in their transition, this condition is met only by
those earning the average, rather than the minimum, wage. Thus, in Poland in
the mid-1990s, the ratio of the average wage to the official poverty line was
almost 3:1. In the Russian Federation and Ukraine, this ratio was just 2:1.44
Higher minimum wage and unemployment benefits in Eastern Europe pro-
vided a wage floor, which allowed the working population to escape poverty.
The costs of this policy were a reduction in the effective demand for labour,
and higher taxation. In CIS, in contrast, the absence of the effective wage floor
led to real wages dropping well below the poverty line and creating millions of
“working poor”.
In recent years, policy makers in CIS countries have increasingly recognized
that low real wages are a major obstacle to both the struggle against poverty
and the broader goal of economic restructuring: low minimum wages have dis-
couraged the shedding of redundant labour and have thereby slowed down the
badly needed restructuring of obsolete enterprises. In the Russian Federation,
some of the participants in the “minimum wage debate” have called for a
national tri-party agreement among labour unions, business and the
Government, aiming at a substantial increase in the level of wages in the econ-
omy. In exchange for such a commitment, the Government would agree to an
across-the-board reduction in taxes, while trade unions would guarantee high-
er productivity and labour discipline.45 In 2000-2001, the Government of
Slovenia, and employees and employers of both public and private sectors,
entered into a “social partnership” agreement over wages. A similar partnership
is being negotiated in Croatia.46 In all such attempts to raise the minimum
wage, the disincentive effects on investment and, particularly, FDI must be
carefully assessed.
42 Branko Milanovic, op. cit., pp. 98 and 117.
43 Tito Boeri and Katherine Terrell, loc. cit., p. 65;and Russian State Statistical Agency (availableat: http://www.gks.ru).
44 Branko Milanovic, op. cit., pp. 97-99.
45 Interview with Dr. Viktor Ivanter, Director of theInstitute of Economic Forecasting of the RussianAcademy of Sciences in Moscow (available atwww.echo.msk.ru).
46 EBRD, Transition Report, 2001: Energy inTransition (London, EBRD, 2001), p. 195; andTransition Report 2002: Agriculture and RuralTransition…, p. 135.
W O R L D E C O N O M I C A N D S O C I A L S U R V E Y 2 0 0 3240
COPING WITH POVERTY: THE GOVERNMENT’S RESPONSE
The transition from a political, social and economic system based upon cen-
trally planning to one based upon market forces necessitates changes in all
aspects of the economy, including the provision of social services and social
security. Under the previous system, poverty had been claimed to be largely a
non-problem, as employment, basic housing, education and health care were
guaranteed and provided by the State. Not only income but also a large pro-
portion of social services were provided by the place of employment.47
The recession attending the transformation subjected the old social protec-
tion system to a test for which it was totally unprepared. In addition to the
shrinking of GDP in all transition economies, there was also a shrinking of the
share of the government in the economy. The dual shock of recession and fis-
cal retreat meant that Governments had to construct an alternative system for
delivering social services and for reducing poverty—but with fewer resources.
Between 1989 and 2000, in Eastern Europe, the share of aggregate Government
expenditures in GDP fell on average from 53 to 42 per cent, while in the CIS
countries, it fell from 50 to 26 per cent. In several of the poorest CIS countries,
this share fell to a much lower level, for example, to 18 per cent in Georgia.48
Much of this decline, however, was due to cuts in Government investment
expenditures.
The response to the challenge of protecting the population during the transi-
tion differed markedly across the transition economies. In the countries most
advanced in their transition, Governments played a proactive role in alleviating
the shock of transition. In spite of recessionary pressures, the level of social pro-
tection was left largely intact, while the system itself was reoriented towards the
needs of the market economy. The level of social protection was also largely
maintained in some CIS countries, such as Belarus and Uzbekistan. Here,
though, little restructuring of the system took place. In the rest of the transition
economies, the social protection system was downsized while being reformed on
an ad hoc basis. The situation is particularly difficult in several war-torn coun-
tries, such as Georgia, where social protection almost disintegrated.
The main components of the Government social protection system are: (a)
social security (including pensions and unemployment benefits); (b) targeted
welfare (family allowances); (c) untargeted subsidies; and (d) and the provi-
sion of health care and education. In addition to social protection, Government
can undertake proactive measures to cope with poverty, such as job training
and public works.
Pensions reform
Of all social protection programmes, pension programmes have probably sur-
vived the transition best. This is particularly true for Eastern Europe, where,
in some countries, the share of GDP spent on pensions has surpassed its pre-
transition level; but even in the poorest transition economies, pensions have
played a very important income-stabilizing role for pensioners and their fami-
lies. As previously discussed, the risk of poverty for pensioners is generally
less than or close to that of the population at large and significantly less than
for the unemployed or for residents of rural areas.49
47 For a description of the pre-reform social protec-tion systems, see, for example, Branko Milanovic,op. cit., pp. 12-19; and Poverty in Transition…,pp. 90-93.
48 Making Transition Work for Everyone…, p. 132;Transition: The First Ten Years..., pp. 81-82.
49 Branko Milanovic, op. cit.; and Transition: TheFirst Ten Years…, pp. 39-42.
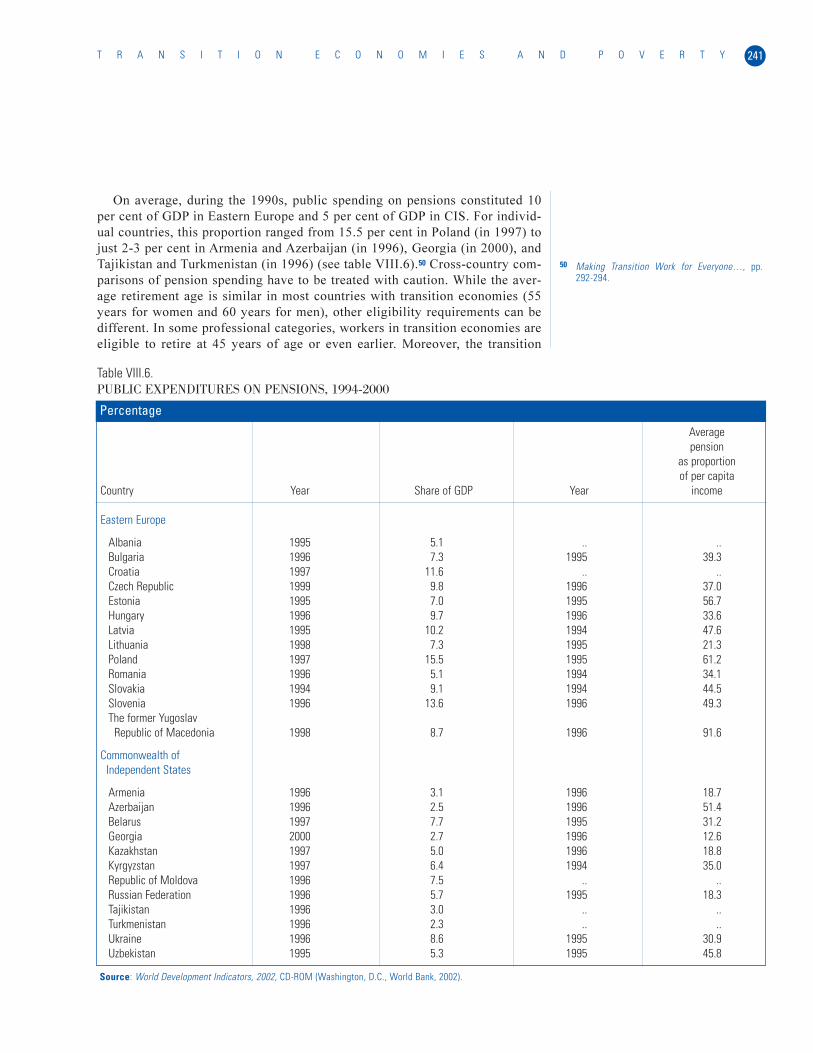
241T R A N S I T I O N E C O N O M I E S A N D P O V E R T Y
On average, during the 1990s, public spending on pensions constituted 10
per cent of GDP in Eastern Europe and 5 per cent of GDP in CIS. For individ-
ual countries, this proportion ranged from 15.5 per cent in Poland (in 1997) to
just 2-3 per cent in Armenia and Azerbaijan (in 1996), Georgia (in 2000), and
Tajikistan and Turkmenistan (in 1996) (see table VIII.6).50 Cross-country com-
parisons of pension spending have to be treated with caution. While the aver-
age retirement age is similar in most countries with transition economies (55
years for women and 60 years for men), other eligibility requirements can be
different. In some professional categories, workers in transition economies are
eligible to retire at 45 years of age or even earlier. Moreover, the transition
Averagepension
as proportionof per capita
Country Year Share of GDP Year income
Eastern Europe
Albania 1995 5.1 .. ..Bulgaria 1996 7.3 1995 39.3Croatia 1997 11.6 .. ..Czech Republic 1999 9.8 1996 37.0Estonia 1995 7.0 1995 56.7Hungary 1996 9.7 1996 33.6Latvia 1995 10.2 1994 47.6Lithuania 1998 7.3 1995 21.3Poland 1997 15.5 1995 61.2Romania 1996 5.1 1994 34.1Slovakia 1994 9.1 1994 44.5Slovenia 1996 13.6 1996 49.3The former Yugoslav
Republic of Macedonia 1998 8.7 1996 91.6
Commonwealth of Independent States
Armenia 1996 3.1 1996 18.7Azerbaijan 1996 2.5 1996 51.4Belarus 1997 7.7 1995 31.2Georgia 2000 2.7 1996 12.6Kazakhstan 1997 5.0 1996 18.8Kyrgyzstan 1997 6.4 1994 35.0Republic of Moldova 1996 7.5 .. ..Russian Federation 1996 5.7 1995 18.3Tajikistan 1996 3.0 .. ..Turkmenistan 1996 2.3 .. ..Ukraine 1996 8.6 1995 30.9Uzbekistan 1995 5.3 1995 45.8
Table VIII.6.PUBLIC EXPENDITURES ON PENSIONS, 1994-2000
Percentage
Source: World Development Indicators, 2002, CD-ROM (Washington, D.C., World Bank, 2002).
50 Making Transition Work for Everyone…, pp.292-294.
W O R L D E C O N O M I C A N D S O C I A L S U R V E Y 2 0 0 3242
economies were often generous in their requirements for disability pensions
and so the number of disabled persons among pre-retirement-age pensioners
increased. In Poland and Croatia, 60 per cent and 90 per cent, respectively, of
those in their first year on a pension are under age 60.51
To complement their pension incomes, many retired people in transition
economies continue to work. Of the total number of pensioners, between 10
and 12 per cent continue to work in the Czech Republic, Poland and the
Russian Federation, but only between 4 and 6 per cent in Bulgaria, Hungary,
Slovakia and Slovenia. The average rate of employment of pensioners for
European OECD member countries is less than 4 per cent.52
While the level of pensions is inadequate in the poorest CIS countries, it is
probably unsustainable over the longer run for the richest transition economies.
This is all the more true given the demographics in most transition economies.
The share of the elderly in the population is increasing more rapidly than that
of the employed, making the dependency ratio grow quickly. In the late 1990s,
in some Eastern European countries, the number of pensioners approached that
of wage earners.
In recent years, most transition economies have started reforming their pen-
sion systems. The goal is to emulate the pension systems of some of the devel-
oped and developing countries, such as Chile, that have reformed the pension
schemes by gradually reducing the pay-as-you-go component of pensions while
adding to existing pensions employment-based defined contribution plans and
individual private plans. In addition, most of these reforms propose the exten-
sion of the retirement age and stricter eligibility requirements. In 2001-2002,
the retirement age was increased in Albania from 55 to 60 years for women and
from 60 to 65 years for men. Estonia has started its move towards a universal
retirement age of 63 years. Extension of the retirement age is a reasonable pro-
posal for the richer Eastern European countries. However, in some CIS coun-
tries, such as the Russian Federation and Kazakhstan, by some estimates aver-
age life expectancy for men is already below the retirement age.53 The problems
caused by an ageing population are thus fading in significance when set against
those caused by high morbidity among the working-age population.
Targeted social protection
Targeted welfare programmes (direct payment to poor families with children,
individual housing, utilities and other subsidies) constitute a much smaller
part of the social protection system than pensions. In Eastern Europe, spend-
ing on targeted assistance ranges between 0.5 and 2 per cent of GDP, while in
the CIS countries, it is generally less than 0.5 per cent of GDP (with the
exception of Armenia, where this spending is 2 per cent of GDP).54
Owing to the rapidly changing economic situation, the large size of the infor-
mal sector and little experience in means-testing, the effective administration of
such programmes is difficult. As a result, a significant part of nominally targeted
subsidies goes to well-to-do rather than poor households. The waste of resources
is particularly large in countries where means-testing is not used at all.
There are, however, several successful examples of targeted welfare pro-
grammes in transition economies. One economy with such programmes is
Romania, where targeted assistance to families with children is linked to
51 Poverty in Transition …, p. 98; and TransitionReport, 2002…, p. 183.
52 Alexandre Kolev and Anne Pascal, “What keepspensioners at work in Russia?”, Economics ofTransition, vol. 10, No. 1 (2002), p.33
53 Michael Ellman, “The social costs and conse-quences of the transformation process”, inEconomic Survey of Europe, 2000, No. 2/3 (UnitedNations publication, Sales No. E.00.II.E.28), p. 133.
54 World Development Report, 2000/2001…, p. 293.
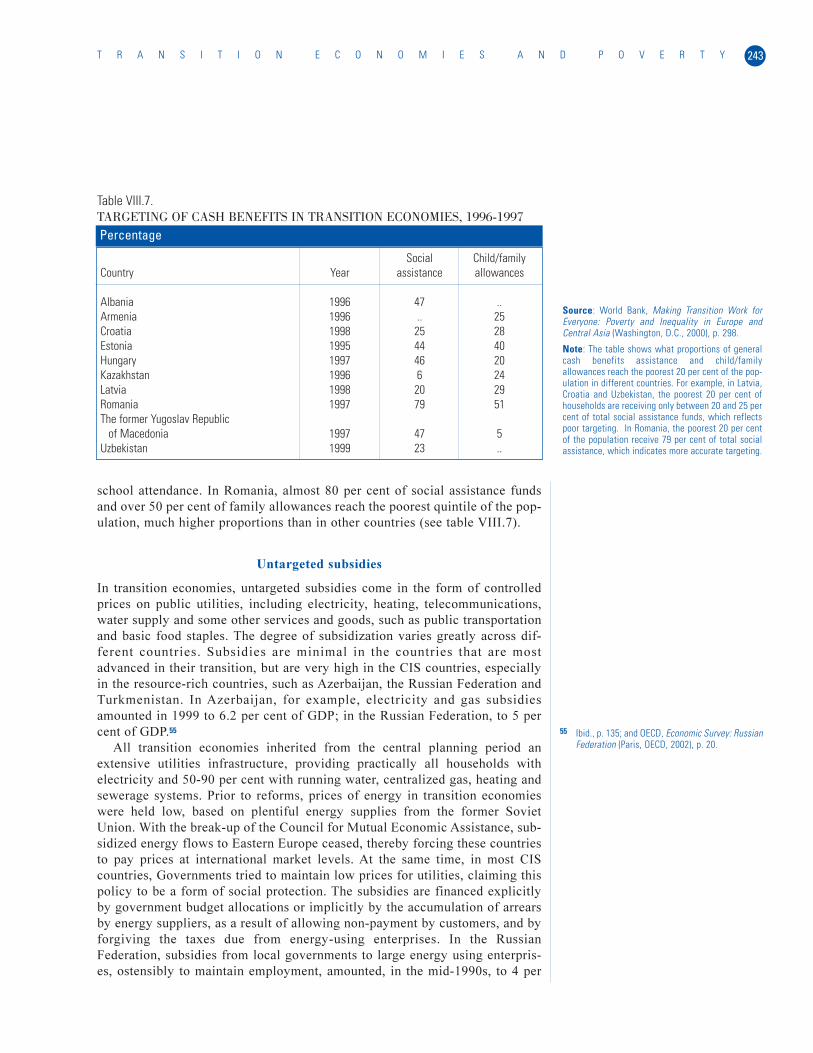
243T R A N S I T I O N E C O N O M I E S A N D P O V E R T Y
school attendance. In Romania, almost 80 per cent of social assistance funds
and over 50 per cent of family allowances reach the poorest quintile of the pop-
ulation, much higher proportions than in other countries (see table VIII.7).
Untargeted subsidies
In transition economies, untargeted subsidies come in the form of controlled
prices on public utilities, including electricity, heating, telecommunications,
water supply and some other services and goods, such as public transportation
and basic food staples. The degree of subsidization varies greatly across dif-
ferent countries. Subsidies are minimal in the countries that are most
advanced in their transition, but are very high in the CIS countries, especially
in the resource-rich countries, such as Azerbaijan, the Russian Federation and
Turkmenistan. In Azerbaijan, for example, electricity and gas subsidies
amounted in 1999 to 6.2 per cent of GDP; in the Russian Federation, to 5 per
cent of GDP.55
All transition economies inherited from the central planning period an
extensive utilities infrastructure, providing practically all households with
electricity and 50-90 per cent with running water, centralized gas, heating and
sewerage systems. Prior to reforms, prices of energy in transition economies
were held low, based on plentiful energy supplies from the former Soviet
Union. With the break-up of the Council for Mutual Economic Assistance, sub-
sidized energy flows to Eastern Europe ceased, thereby forcing these countries
to pay prices at international market levels. At the same time, in most CIS
countries, Governments tried to maintain low prices for utilities, claiming this
policy to be a form of social protection. The subsidies are financed explicitly
by government budget allocations or implicitly by the accumulation of arrears
by energy suppliers, as a result of allowing non-payment by customers, and by
forgiving the taxes due from energy-using enterprises. In the Russian
Federation, subsidies from local governments to large energy using enterpris-
es, ostensibly to maintain employment, amounted, in the mid-1990s, to 4 per
Social Child/familyCountry Year assistance allowances
Albania 1996 47 ..Armenia 1996 .. 25Croatia 1998 25 28Estonia 1995 44 40Hungary 1997 46 20Kazakhstan 1996 6 24Latvia 1998 20 29Romania 1997 79 51The former Yugoslav Republic
of Macedonia 1997 47 5Uzbekistan 1999 23 ..
Table VIII.7.TARGETING OF CASH BENEFITS IN TRANSITION ECONOMIES, 1996-1997
Percentage
Source: World Bank, Making Transition Work forEveryone: Poverty and Inequality in Europe andCentral Asia (Washington, D.C., 2000), p. 298.
Note: The table shows what proportions of generalcash benefits assistance and child/familyallowances reach the poorest 20 per cent of the pop-ulation in different countries. For example, in Latvia,Croatia and Uzbekistan, the poorest 20 per cent ofhouseholds are receiving only between 20 and 25 percent of total social assistance funds, which reflectspoor targeting. In Romania, the poorest 20 per centof the population receive 79 per cent of total socialassistance, which indicates more accurate targeting.
55 Ibid., p. 135; and OECD, Economic Survey: RussianFederation (Paris, OECD, 2002), p. 20.
W O R L D E C O N O M I C A N D S O C I A L S U R V E Y 2 0 0 3244
cent of GDP. Cross-subsidization is widespread. For example, in the Russian
Federation, electricity tariffs for industrial users are approximately double
those for households.56
Energy subsidies are extremely costly to the transition economies, in terms
both of their fiscal impact and of the losses of macroeconomic efficiency.
Moreover, the role of these subsidies in helping the poor is highly questionable.
Even with prices based upon the true costs of production, expenditures on elec-
tricity and heat in most transition economies would constitute a fairly small
proportion of the family budget—usually under 5 per cent.57 In view of the fact
that the poor are receiving only a fraction of the resources used to maintain
energy subsidies, it can be seen that other, more selective programmes of social
assistance are needed.
Among the alternative methods currently used in transition economies to
help the poor pay for their utilities are: (a) lifeline tariffs, where an initial block
of energy is supplied free or at a low price; (b) targeted energy subsidies; and
(c) general income support. The efficiency of these programmes varies, as it
depends upon accurate measurement of income and energy use; but in many
transition economies, this measurement is highly imprecise. However, it is
clear that the existing system of wasteful across-the-board subsidization preva-
lent in the CIS countries needs to be reformed.
Public spending on education and health
The role of good education and health in overcoming poverty is hard to over-
estimate. Universal education and health-care systems were the pride of the
centrally planned countries. However, by the time that the centrally planned
system had collapsed, the health and education systems were already failing,
as shown by the lower life expectancy in those countries compared with the
developed countries.
In the course of market reforms, even as GDP fell, most transition
economies strove to maintain the level of public spending on education and
health care measured as a proportion of their GDP. In some countries, such as
Belarus, Latvia, Lithuania and the Republic of Moldova, the share even
increased. However, in countries of Caucasus and Central Asia, the share fell
(see table VIII.8). However, the transformational recession produced heavy
declines in the amounts spent.58
In addition to lower spending on health and education, transition economies suf-
fered from problems of low efficiency and a waste of resources. In education, those
problems included overstaffing, low capacity utilization, a shift of resources in
favour of tertiary education, falling quality of education and growing corruption.
The decline in spending and efficiency has already influenced the quality
outcomes and disproportionately affected the poor. Enrolment rates in compul-
sory basic education and, in particular, in secondary education fell in the 1990s
in many CIS countries. In Kazakhstan in 1998, 19 per cent of children aged 6-
12 years were not attending school.59 Between 1989 and 1997, enrolment in
general secondary education fell by 15 per cent in Armenia, by 40 per cent in
Georgia and by 45 per cent in Tajikistan.
Inequality in access to education has increased. In Armenia and Kazakhstan,
the lowest income quintile of the population received less than 10 per cent of
56 Transition Report, 2001..., p. 98.
57 Ibid., p. 99.
58 Women in Transition…, p. 16.
59 Poverty in Transition…, p. 72; and MakingTransition Work for Everyone…, p. 230.
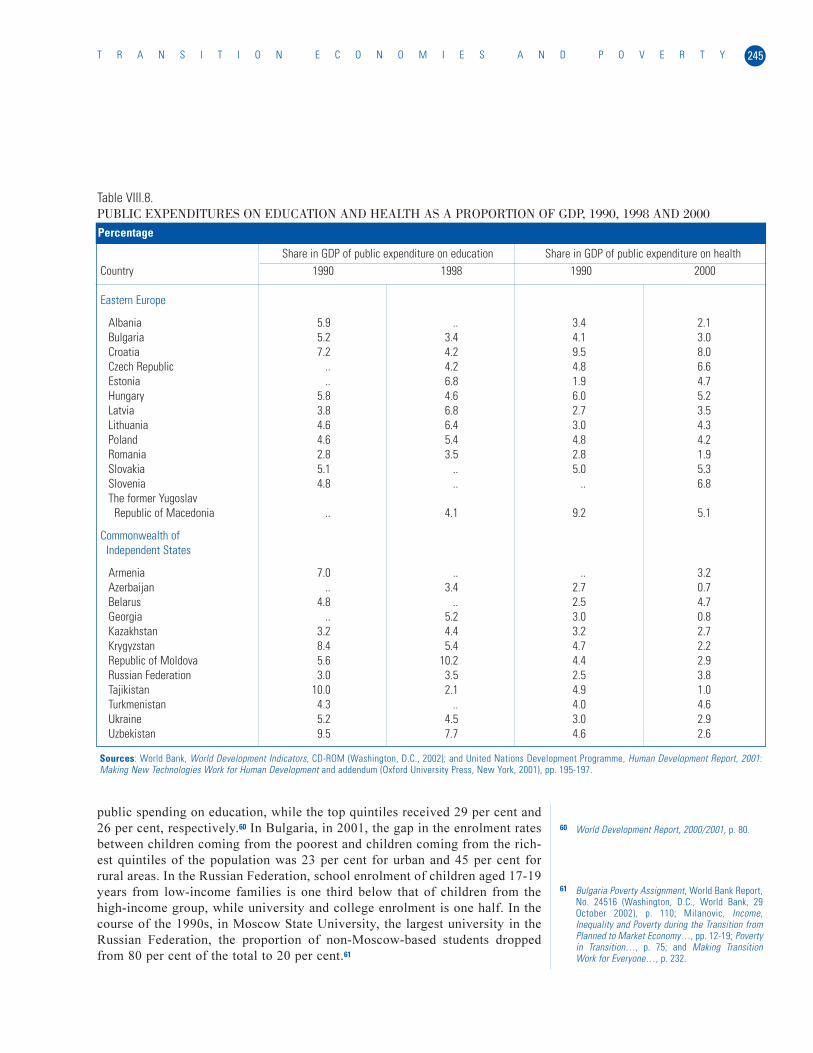
245T R A N S I T I O N E C O N O M I E S A N D P O V E R T Y
public spending on education, while the top quintiles received 29 per cent and
26 per cent, respectively.60 In Bulgaria, in 2001, the gap in the enrolment rates
between children coming from the poorest and children coming from the rich-
est quintiles of the population was 23 per cent for urban and 45 per cent for
rural areas. In the Russian Federation, school enrolment of children aged 17-19
years from low-income families is one third below that of children from the
high-income group, while university and college enrolment is one half. In the
course of the 1990s, in Moscow State University, the largest university in the
Russian Federation, the proportion of non-Moscow-based students dropped
from 80 per cent of the total to 20 per cent.61
Share in GDP of public expenditure on education Share in GDP of public expenditure on healthCountry 1990 1998 1990 2000
Eastern Europe
Albania 5.9 .. 3.4 2.1Bulgaria 5.2 3.4 4.1 3.0Croatia 7.2 4.2 9.5 8.0Czech Republic .. 4.2 4.8 6.6Estonia .. 6.8 1.9 4.7Hungary 5.8 4.6 6.0 5.2Latvia 3.8 6.8 2.7 3.5Lithuania 4.6 6.4 3.0 4.3Poland 4.6 5.4 4.8 4.2Romania 2.8 3.5 2.8 1.9Slovakia 5.1 .. 5.0 5.3Slovenia 4.8 .. .. 6.8The former Yugoslav
Republic of Macedonia .. 4.1 9.2 5.1
Commonwealth of Independent States
Armenia 7.0 .. .. 3.2Azerbaijan .. 3.4 2.7 0.7Belarus 4.8 .. 2.5 4.7Georgia .. 5.2 3.0 0.8Kazakhstan 3.2 4.4 3.2 2.7Krygyzstan 8.4 5.4 4.7 2.2Republic of Moldova 5.6 10.2 4.4 2.9Russian Federation 3.0 3.5 2.5 3.8Tajikistan 10.0 2.1 4.9 1.0Turkmenistan 4.3 .. 4.0 4.6Ukraine 5.2 4.5 3.0 2.9Uzbekistan 9.5 7.7 4.6 2.6
Table VIII.8.PUBLIC EXPENDITURES ON EDUCATION AND HEALTH AS A PROPORTION OF GDP, 1990, 1998 AND 2000
Percentage
Sources: World Bank, World Development Indicators, CD-ROM (Washington, D.C., 2002); and United Nations Development Programme, Human Development Report, 2001:Making New Technologies Work for Human Development and addendum (Oxford University Press, New York, 2001), pp. 195-197.
60 World Development Report, 2000/2001, p. 80.
61 Bulgaria Poverty Assignment, World Bank Report,No. 24516 (Washington, D.C., World Bank, 29October 2002), p. 110; Milanovic, Income,Inequality and Poverty during the Transition fromPlanned to Market Economy…, pp. 12-19; Povertyin Transition…, p. 75; and Making TransitionWork for Everyone…, p. 232.
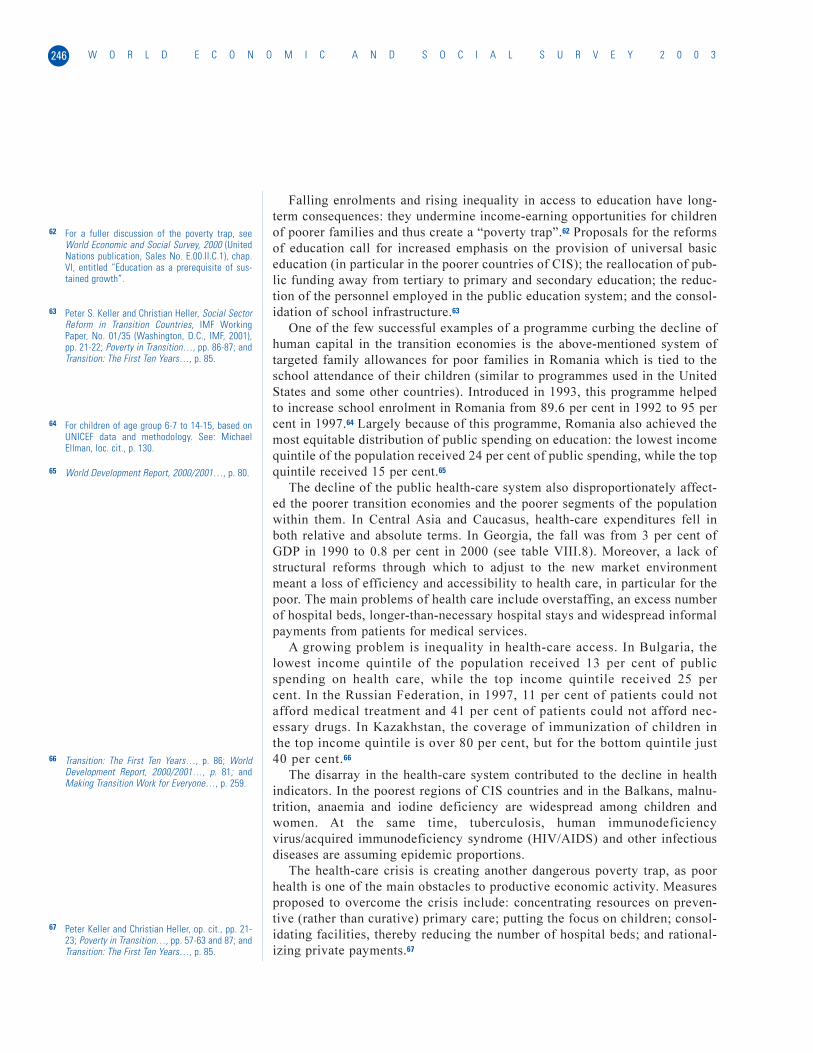
Falling enrolments and rising inequality in access to education have long-
term consequences: they undermine income-earning opportunities for children
of poorer families and thus create a “poverty trap”.62 Proposals for the reforms
of education call for increased emphasis on the provision of universal basic
education (in particular in the poorer countries of CIS); the reallocation of pub-
lic funding away from tertiary to primary and secondary education; the reduc-
tion of the personnel employed in the public education system; and the consol-
idation of school infrastructure.63
One of the few successful examples of a programme curbing the decline of
human capital in the transition economies is the above-mentioned system of
targeted family allowances for poor families in Romania which is tied to the
school attendance of their children (similar to programmes used in the United
States and some other countries). Introduced in 1993, this programme helped
to increase school enrolment in Romania from 89.6 per cent in 1992 to 95 per
cent in 1997.64 Largely because of this programme, Romania also achieved the
most equitable distribution of public spending on education: the lowest income
quintile of the population received 24 per cent of public spending, while the top
quintile received 15 per cent.65
The decline of the public health-care system also disproportionately affect-
ed the poorer transition economies and the poorer segments of the population
within them. In Central Asia and Caucasus, health-care expenditures fell in
both relative and absolute terms. In Georgia, the fall was from 3 per cent of
GDP in 1990 to 0.8 per cent in 2000 (see table VIII.8). Moreover, a lack of
structural reforms through which to adjust to the new market environment
meant a loss of efficiency and accessibility to health care, in particular for the
poor. The main problems of health care include overstaffing, an excess number
of hospital beds, longer-than-necessary hospital stays and widespread informal
payments from patients for medical services.
A growing problem is inequality in health-care access. In Bulgaria, the
lowest income quintile of the population received 13 per cent of public
spending on health care, while the top income quintile received 25 per
cent. In the Russian Federation, in 1997, 11 per cent of patients could not
afford medical treatment and 41 per cent of patients could not afford nec-
essary drugs. In Kazakhstan, the coverage of immunization of children in
the top income quintile is over 80 per cent, but for the bottom quintile just
40 per cent.66
The disarray in the health-care system contributed to the decline in health
indicators. In the poorest regions of CIS countries and in the Balkans, malnu-
trition, anaemia and iodine deficiency are widespread among children and
women. At the same time, tuberculosis, human immunodeficiency
virus/acquired immunodeficiency syndrome (HIV/AIDS) and other infectious
diseases are assuming epidemic proportions.
The health-care crisis is creating another dangerous poverty trap, as poor
health is one of the main obstacles to productive economic activity. Measures
proposed to overcome the crisis include: concentrating resources on preven-
tive (rather than curative) primary care; putting the focus on children; consol-
idating facilities, thereby reducing the number of hospital beds; and rational-
izing private payments.67
W O R L D E C O N O M I C A N D S O C I A L S U R V E Y 2 0 0 3246
62 For a fuller discussion of the poverty trap, seeWorld Economic and Social Survey, 2000 (UnitedNations publication, Sales No. E.00.II.C.1), chap.VI, entitled “Education as a prerequisite of sus-tained growth”.
63 Peter S. Keller and Christian Heller, Social SectorReform in Transition Countries, IMF WorkingPaper, No. 01/35 (Washington, D.C., IMF, 2001),pp. 21-22; Poverty in Transition…, pp. 86-87; andTransition: The First Ten Years…, p. 85.
64 For children of age group 6-7 to 14-15, based onUNICEF data and methodology. See: MichaelEllman, loc. cit., p. 130.
65 World Development Report, 2000/2001…, p. 80.
66 Transition: The First Ten Years…, p. 86; WorldDevelopment Report, 2000/2001…, p. 81; andMaking Transition Work for Everyone…, p. 259.
67 Peter Keller and Christian Heller, op. cit., pp. 21-23; Poverty in Transition…, pp. 57-63 and 87; andTransition: The First Ten Years…, p. 85.

COPING WITH POVERTY: THE PRIVATE RESPONSE
As a result of the inadequacy of Government-provided poverty abatement pro-
grammes in most of the transition economies, poor families and individuals
have borne the brunt of the struggle with poverty. At the start of the transition,
people in transition economies were not very well positioned to handle this
task, as their knowledge of the rules of the market economy was minimal.
Moreover, as mentioned previously, the savings of many people had been
wiped out by the hyperinflation of the early 1990s.
Various coping strategies have come into play: the growth of self-employ-
ment and of the informal economy; the cultivation of family plots to satisfy
food needs; intra-family transfers; internal migration; and emigration to other
countries. Each of these strategies has its benefits, and some proved to be more
efficient than government transfers in alleviating poverty. For example, it is
established that intra-family transfers to the poor are better targeted than simi-
lar Government subsidies and thus, for a given transfer of resources, larger
gains in welfare are generated.68 At the same time, many of the private coping
strategies lead to socially and economically questionable outcomes such as de-
urbanization (migration of urban-dwellers back to farming areas), the growth
of the informal economy and the spread of crime.
Self-employment and the growth of the informal economy
Faced with unemployment and/or falling wages, millions of people in the tran-
sition economies turned to self-employment. Many of them formed unregis-
tered one-person businesses in activities such as the resale of consumer goods,
“shuttle trade” and in-home-based businesses, such as sewing, repairing,
cleaning, providing day care and tutoring.69
Between 1990 and 1995, the share of GDP produced in the unofficial sector
is estimated to have grown from 25 to 36 per cent in Bulgaria; from 12 to 35
per cent in Latvia; from 14 to 19 per cent in Romania; from 22 to 61 per cent
in Azerbaijan; from 15 to 42 per cent in the Russian Federation; and from 16
to 49 per cent in Ukraine (see table VIII.9). However, the sector’s growth was
not universal. In the Czech Republic, Estonia, Hungary and Poland, as well as
in the CIS countries of Belarus and Uzbekistan, the informal sector’s share in
the economy decreased or barely increased.70
The different growth patterns of the informal economy underscore differ-
ences in the openness and dynamism of labour markets in transition economies.
While in those countries that had been more advanced in their transition, the
official economy provided increasing opportunities for employment and entre-
preneurship, in other transition economies, the lack of these opportunities
forced millions of people into the unofficial sector. For example, in the Russian
Federation, over 12 million people are self-employed, most in one-person oper-
ations. At the same time, the number of officially registered small businesses
in the Russian Federation is less than 1 million, compared with 4 million in
Poland and over 15 million in the United States. In fact, the total number of
small private businesses in the Russian Federation is less than the number of
new businesses opening up in the United States every year.
247T R A N S I T I O N E C O N O M I E S A N D P O V E R T Y
68 Bulgaria Poverty Assessment…, p. 100; andStanislav Kolesnikov and Ksenia Yudaeva,“Inequality and poverty in post-crisis Russia”,Economic Trends, vol. 8, issue 3 (August 1999),p. 14.
69 Shuttle trade is a term generally applied todescribe the massive unregulated and unregis-tered commerce conducted by hundreds of thou-sands of individuals in transition economies. Itinvolves buying goods abroad and selling them inthe Russian Federation in street markets. In theRussian Federation in the mid-1990s, the turnoverof the unregistered shuttle trade had reached anestimated $10 billion, comparable with the totalannual revenue from Russian oil exports.
70 Estimates of the size of the informal economy can,by definition, be only approximate. Every suchestimate strongly depends upon the assumptionsand methodology used. For a discussion see, forexample: Simon Johnson, Daniel Kaufman andAndrei Shleifer, “The unofficial economy in transi-tion”, Brookings Papers on Economic Activity, vol.2 (1997), pp. 159-221; and Maria Lacko, “Hiddeneconomy—an unknown quantity?”, Economics ofTransition, vol. 8, No. 1 (2000), pp. 117-149.
In addition to self-employment opportunities, the informal economy pro-
vides the bulk of second jobs for hire. For example, in the Russian Federation
about 70 per cent of such jobs are estimated to be in the informal economy.71
Cultivation of family plots and de-urbanization
Widespread ownership of small family plots was one of the features of the
centrally planned economies. Rooted in part in ideology (the Marxist dream of
abolishing the distinction between the city and the village in the communist
society of the future) and in part in practicality, this feature proved to be high-
ly important in helping people to survive the transition back to capitalism. By
some estimates, over two thirds of urban residents and practically all rural res-
idents of the successor countries of the former Soviet Union own such family
plots. The proportion is probably somewhat lower in Central and Eastern
Europe but similar in the Balkans. In the Russian Federation, for a population
of approximately 145 million people, the number of such plots in the mid-
1990s was estimated at 55 million.72 The role of family plots as poverty allevi-
ation tools is hard to overestimate. Production from these plots generates 22
per cent of all food consumption in Bulgaria and 20-24 per cent in the Russian
Federation.73
In some countries, escape to rural labour became a longer-term solution to
poverty, leading to resettlement of urban-dwellers in villages. This trend is
most visible in the Central Asian republics of Uzbekistan and Tajikistan, in the
W O R L D E C O N O M I C A N D S O C I A L S U R V E Y 2 0 0 3248
Country 1990 1995
Eastern EuropeBulgaria 25.1 36.2Czech Republic 6.7 11.3Estonia 19.9 11.8Hungary 28.0 29.0Latvia 12.8 35.3Lithuania 11.3 21.6Poland 19.6 12.6Romania 13.7 19.1Slovakia 7.7 5.8
Commonwealth of Independent StatesAzerbaijan 21.9 60.6Belarus 15.4 19.3Georgia 24.9 62.6Kazakhstan 17.0 34.3Republic of Moldova 18.1 35.7Russian Federation 14.7 41.6Ukraine 16.3 48.9Uzbekistan 11.4 6.5
Table VIII.9.ESTIMATES OF THE SHARE OF GDP PRODUCED IN THE UNOFFICIALECONOMY IN SELECTED TRANSITION COUNTRIES, 1990 AND 1995
Percentage
Source: Simon Johnson, Daniel Kaufman andAndrei Shleifer, "The unofficial economy in transi-tion", Brookings Papers on Economic Activity, vol. 2(1997), p. 183.
71 Byung-Yeon Kim, “The participation of Russianhouseholds in the informal economy”, Economicsof Transition, vol. 10, No. 3 (2002), p. 703.
72 Harm Tho Seeth and others, “Russian poverty:muddling through economic transition with gar-den plots”, World Development, vol. 26, No. 9(1998), p. 1612.
73 Bulgaria Poverty Assessment…, p. 100; andSimon Clarke, loc. cit., p. 15.
Russian Federation, in Ukraine and in the Balkans. In the first five years of
reform, employment in agriculture actually increased in the Russian Federation
and Ukraine, as well as in Romania and Bulgaria. Agriculture thus played a
buffer role, softening the blow of the transformational recession for the poor-
est segment of the population.74
Migration and emigration
In spite of the relative immobility of labour markets, millions of people in
transition economies tried to escape the threat of poverty by moving to other
localities or other countries. Migration of people in response to economic and
political disturbances was particularly heavy in CIS. During the 1990s, the
Russian Federation alone admitted almost 11 million immigrants, almost all of
them from CIS.75 At the same time, in the period 1992-2002, close to 5.4 mil-
lion Russian citizens emigrated to other countries. The actual number of emi-
grants and immigrants was probably much larger, as Government agencies
have difficulty tracking illegal labour migration.
Illegal migration is widespread in other countries of CIS, as evidenced, for
example, by the migration of Belarusians and Ukrainians seeking work in the
Russian Federation and Poland, and the migration of Moldovans to Romania
and countries of Western Europe as well as other countries. Migration from the
countries of Eastern Europe has been less heavy, but still substantial. During
the 1990s, between 50,000 and 90,000 people emigrated annually from
Bulgaria, and between 10,000 and 20,000 from Poland (on a net migration
basis). Characteristically, in this period, two of the richest transition countries,
the Czech Republic and Hungary, registered positive net immigration.76
The role of intra-family transfers
Intra-family transfers, including remittances from emigrants, have been particu-
larly important in the CIS countries, where government social protection sys-
tems proved to be especially weak. Thus in the Russian Federation, based on
household surveys, intra-family transfers were received in 1997 by 25.2 per
cent of all households and by 31.5 per cent of the poorest quintile of house-
holds; in Kazakhstan, similar ratios were 27.5 per cent and 33.8 per cent,
respectively; and in Kyrgyzstan 35.5 per cent and 31.7 per cent.77 In the Russian
Federation, intra-family transfers constituted 4.7 per cent of overall household
money income in 1993, 7.1 per cent in 1996 and 12 per cent in 1998. These
transfers constituted 20 per cent of the income of net recipients of such trans-
fers and from one third to one half of the income of the poorest quartile of all
recipients.78 Characteristically, while in the Russian Federation, in the course of
the transition to the market, the role of intra-family transfers increased, in
Poland, which had resumed economic growth much earlier, that role
decreased.79 In Bulgaria in 2001, 14 per cent of families received private trans-
fers which amounted to 34 per cent of their average household consumption.
Intra-family transfers are generally better targeted than government assis-
tance. A recent study found that in the Russian Federation, intra-family trans-
fers reduced the overall poverty count per capita by 4 per cent compared with
the 1.5 per cent reduction achieved by government transfers.80 In Bulgaria,
249T R A N S I T I O N E C O N O M I E S A N D P O V E R T Y
74 Liesbeth Dries and Johan F. M. Swinnen,“Institutional reform and labour reallocation dur-ing transition: theory evidence from Polish agri-culture”, World Development, vol. 30, No. 3(2002), p. 458.
75 Russian Statistical Annual (Moscow, Goskomstat,1991), p. 128; and http://www.gks.ru.
76 Bulgaria Poverty Assessment…, p. 102.
77 World Development Report, 2000/2001..., p. 144
78 Simon Clarke, loc. cit., p. 30.
79 Jeni Klugman and Jenine Braithwaite, loc. cit.,p. 54.
80 Stanislav Kolesnikov and Ksenia Yudaeva, loc.cit., p. 14.
such transfers reduced the poverty rate among receiving households by 16 per-
centage points and the overall poverty rate in Bulgaria by 2 percentage points.81
CONCLUSIONS
Contrary to most expectations, the transition to the market proved to be longer
and much more costly in social terms than had been envisaged in many coun-
tries at the outset. The transformational recession of the 1990s and a sharp
decline in income for many households resulted in massive poverty and depri-
vation in the region. By the mid-1990s, almost 30 per cent of the 414 million
people in the transition economies lived below the $4 a day poverty line in
PPP terms.
The increase of poverty was contained in the Eastern European countries
that moved most rapidly to a market economy. In these countries, the recession
was shorter, income differentiation was not as drastic, and Governments made
a concerted effort to provide social protection to the most vulnerable groups
among the population, such as pensioners, the unemployed, single mothers and
children. In most of the CIS countries, the situation was much more serious and
in some countries, such as Armenia, Georgia, the Republic of Moldova and
Tajikistan, the overwhelming majority of the population was poor.
While Governments of those Eastern European countries that were most
advanced in their transition to a market economy generally achieved an ade-
quate response to the challenge of mass poverty, the policy response of
Governments of the CIS countries and other countries of Eastern Europe (such
as those in the Balkans) was at best inadequate. To some degree, this govern-
ment failure was predetermined by the lower level of development, the obsolete
structure of the economy and other objective factors. However, policy choices
also played an important role. In many of the CIS countries, particularly the
resource-rich countries, special interests succeeded in channeling a large part of
the already shrinking government funds away from social spending.
Faced with the inability of Governments to protect them from suffering, mil-
lions of people in transition economies resorted to private strategies of fighting
off poverty. Those included unregistered employment and self-employment,
migration to other countries and regions and, in extreme cases, engaging in
crime. Thus, while in Eastern Europe, the struggle with poverty was dominated
by government action, in CIS, it was dominated by the private response.
More than 10 years after the start of market reforms, all transition
economies have returned to the path of economic growth, which has curbed
further increases in poverty. However, many challenges remain.
One of these challenges is the emergence of chronic long-term poverty. This
form of poverty exists in both the relatively well-to-do and the poorer transi-
tion countries and brings with it the risk of the development of a permanent
new underclass. Chronic poverty is concentrated in depressed industries, and
among specific regions and demographic and ethnic groups, as well as among
rural families with many children. For the richer countries of Eastern Europe,
the emergence of chronic poverty, some of it acute, is probably the single most
important poverty challenge facing Governments and societies.
The use of targeted social protection, relying on successful experiences
within developed countries and some early examples of such experiences in
W O R L D E C O N O M I C A N D S O C I A L S U R V E Y 2 0 0 3250
81 Bulgaria Poverty Assessment…, p. 100.

transition economies might prove to be beneficial to transition economies in
their efforts to combat chronic poverty. Measures would include the develop-
ment of regional poverty maps, investment in transportation facilities to help
depressed regions access new markets and overcome labour-market restrictions
and ethnic-specific social programmes. In some cases, more drastic actions
may be in order, such as resettling the population of localities, like some of the
northern territories and closed military cities in the Russian Federation, where
no prospects of sustainable employment exist.
The broad challenge in the labour-market area is to provide people in tran-
sition economies with increasing opportunities for gainful and legitimate
employment. Here, the policy tasks are different for Eastern Europe and CIS
countries. In the former, where labour markets are relatively flexible, this task
can be described as one of fine-tuning existing legislation, for example,
through the introduction of stricter eligibility requirements for unemployment
benefits. In CIS countries, on the contrary, the meagre unemployment benefits
and minimum wages have to be increased and tied to a subsistence minimum.
Labour markets in CIS would benefit from the removal of administrative and
fiscal restrictions on SMEs and the curtailment of implicit subsidies to ineffi-
cient large enterprises. Government unemployment agencies might be encour-
aged to provide more proactive employment services such as job matching and
job retraining.
The second generation of reforms in transition economies should include
measures aimed at coordinating Government and private responses to poverty.
These would include, for example, extending social security to the informal
sector and the adoption of migration legislation that would deal with the prob-
lem of massive illegal migration.
In the area of social protection, the Governments in Eastern Europe face the
task of adjusting existing levels of benefits, such as those of pensions, to the
fiscal capacity of the State. This would mean, for example, a switch to multi-
pillar pension systems and possible curtailment of unsustainable social securi-
ty expenditures in countries like Poland and Slovenia, where they constitute a
larger share of GDP than in the developed countries. In the CIS countries, the
goal is to reduce or eliminate the wasteful across-the board energy subsidies,
to lift the share of social security payments in GDP, and to bring the level of
individual basic social protection closer to the subsistence minimum.
Some of the Governments of transition economies might find it beneficial to
increase the share in GDP of public spending on education and health. A rea-
sonable share is essential for the preservation of human capital, which is the
key determinant of the income-generating prospects of the population.82 The
decline in the education and health levels of the population, which is particu-
larly noticeable in the largest CIS countries (Kazakhstan, the Russian
Federation and Ukraine,) should be arrested and reversed. Otherwise, poor
health and low education will keep millions of young people in these countries
in a vicious poverty trap.
The outlook for the eradication of mass poverty is quite encouraging for many
of the Eastern European countries. Eight of these countries will join the EU in
May 2004 and two others (Bulgaria and Romania) are scheduled to follow in
2007. By the end of the decade, the problem of poverty in these countries will be
considerably reduced, with their own efforts being supported by EU.
251T R A N S I T I O N E C O N O M I E S A N D P O V E R T Y
82 Poverty in Transition …, pp. 36-37.
The prospects for reducing poverty in CIS are much less clear. In the small-
er and poorer countries of Central Asia and Caucasus, acute mass poverty will
probably subside as their economies continue to recover. However, without the
reversal of the extreme inequality of incomes and active policies of job cre-
ation, progress in poverty reduction will be slow. The role of international
strategies, such as the multilateral “CIS-7” Initiative, can be very important in
achieving poverty containment here.
In the largest of the CIS countries—the Russian Federation and Ukraine—
much will depend upon the direction of the second stage of reform. To realize
their growth potential, the Governments of these countries might consider lib-
eralizing labour and capital markets, encouraging the growth of the SME sector,
and eliminating wasteful subsidies to large enterprises. The achievement of
these measures, in turn, will depend upon reducing the power of special inter-
ests and upon the maintenance of overall political stability.
The promise of a better life and the manifest failings of the centrally
planned system led peoples of Eastern Europe and the Soviet Union away from
that system, despite all of its security and social guarantees. Now, over 10
years into the transition to the market system, this promise is being fulfilled,
but not for all. While some countries of the region are getting ready to join—
or rejoin—the developed world, in others a third or more of the population live
in poverty. At the present time, the worst is probably over but much remains to
be done. Given the right tools and with appropriate government support and
policies, millions of well-educated, hard-working people in the transition
economies would be fully capable of pulling themselves out of their misery.
W O R L D E C O N O M I C A N D S O C I A L S U R V E Y 2 0 0 3252
STATISTICALTABLES
ANNEX

The present annex contains the main sets of data on which the analysisprovided in the World Economic and Social Survey, 2003 is based. The dataand the information are those available as of 15 May 2003.
The annex was prepared by the Economic Monitoring and AssessmentUnit of the Department of Economic and Social Affairs of the UnitedNations Secretariat. It is based on information obtained from the UnitedNations Statistics Division and the Population Division of the Departmentof Economic and Social Affairs of the United Nations Secretariat, as wellas from the United Nations regional commissions, the InternationalMonetary Fund (IMF), the World Bank, the Organisation for EconomicCooperation and Development (OECD), the United Nations Conference onTrade and Development (UNCTAD) and national and private sources.Estimates for the most recent years were made by the EconomicMonitoring and Assessment Unit in consultation with the regional com-missions and participants in Project LINK (see directly below). Data pre-sented in this Survey may differ, however, from those published by theseother organizations and sources for a variety of reasons, including differ-ences in timing, sample composition, and aggregation methods (see sectionon “Data quality” below for additional reason for data discrepancies).Historical data may differ from those in previous editions of the Surveybecause of updating and changes in the availability of data for individualcountries.
Forecasts are based on the results of the April 2003 forecasting exerciseof Project LINK, an international collaborative research group for econo-metric modelling, which is coordinated jointly by the EconomicMonitoring and Assessment Unit and the University of Toronto. LINKitself is a global model that links the trade and financial variables of 79country and regional economic models, which are managed by over 60national institutions and by the Unit.a The primary linkages are merchan-dise trade and prices, as well as the interest and currency exchange ratesof major countries. The LINK system uses an iterative process to generatea consistent forecast for the world economy in which international tradeflows and prices, among other variables, are determined endogenously andsimultaneously. The one exception is the international price of crude oil.The average price of the basket of seven crude oils of the Organization ofthe Petroleum Exporting Countries (OPEC) is estimated to increase by 12per cent in 2003 and to decline by some 10 per cent in 2004.
ANNEXSTATISTICAL TABLES
255S T A T I S T I C A L T A B L E S
a Additional information on Project LINK is availableat: http://www.un.org/analysis/link/ index.htm.
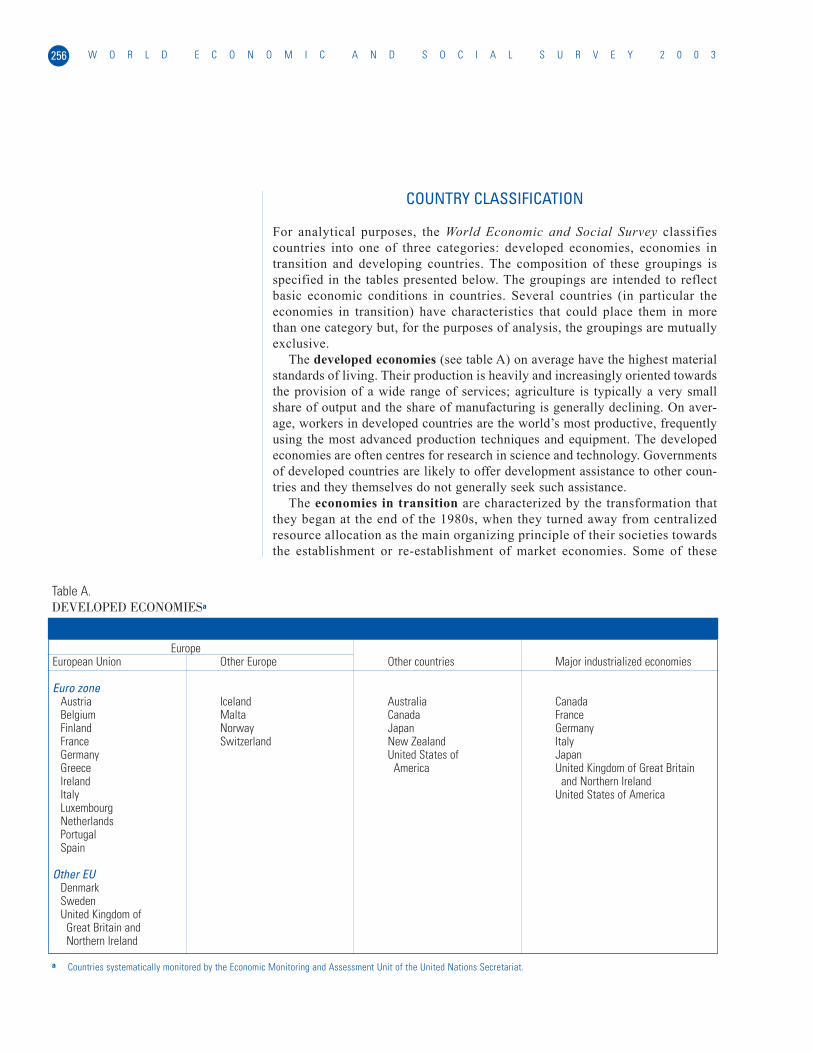
COUNTRY CLASSIFICATION
For analytical purposes, the World Economic and Social Survey classifiescountries into one of three categories: developed economies, economies intransition and developing countries. The composition of these groupings isspecified in the tables presented below. The groupings are intended to reflectbasic economic conditions in countries. Several countries (in particular theeconomies in transition) have characteristics that could place them in morethan one category but, for the purposes of analysis, the groupings are mutuallyexclusive.
The developed economies (see table A) on average have the highest materialstandards of living. Their production is heavily and increasingly oriented towardsthe provision of a wide range of services; agriculture is typically a very smallshare of output and the share of manufacturing is generally declining. On aver-age, workers in developed countries are the world’s most productive, frequentlyusing the most advanced production techniques and equipment. The developedeconomies are often centres for research in science and technology. Governmentsof developed countries are likely to offer development assistance to other coun-tries and they themselves do not generally seek such assistance.
The economies in transition are characterized by the transformation thatthey began at the end of the 1980s, when they turned away from centralizedresource allocation as the main organizing principle of their societies towardsthe establishment or re-establishment of market economies. Some of these
W O R L D E C O N O M I C A N D S O C I A L S U R V E Y 2 0 0 3256
Table A.DEVELOPED ECONOMIESa
EuropeEuropean Union Other Europe Other countries Major industrialized economies
Euro zoneAustria Iceland Australia CanadaBelgium Malta Canada FranceFinland Norway Japan GermanyFrance Switzerland New Zealand ItalyGermany United States of JapanGreece America United Kingdom of Great BritainIreland and Northern IrelandItaly United States of AmericaLuxembourgNetherlandsPortugalSpain
Other EUDenmarkSwedenUnited Kingdom of
Great Britain andNorthern Ireland
a Countries systematically monitored by the Economic Monitoring and Assessment Unit of the United Nations Secretariat.
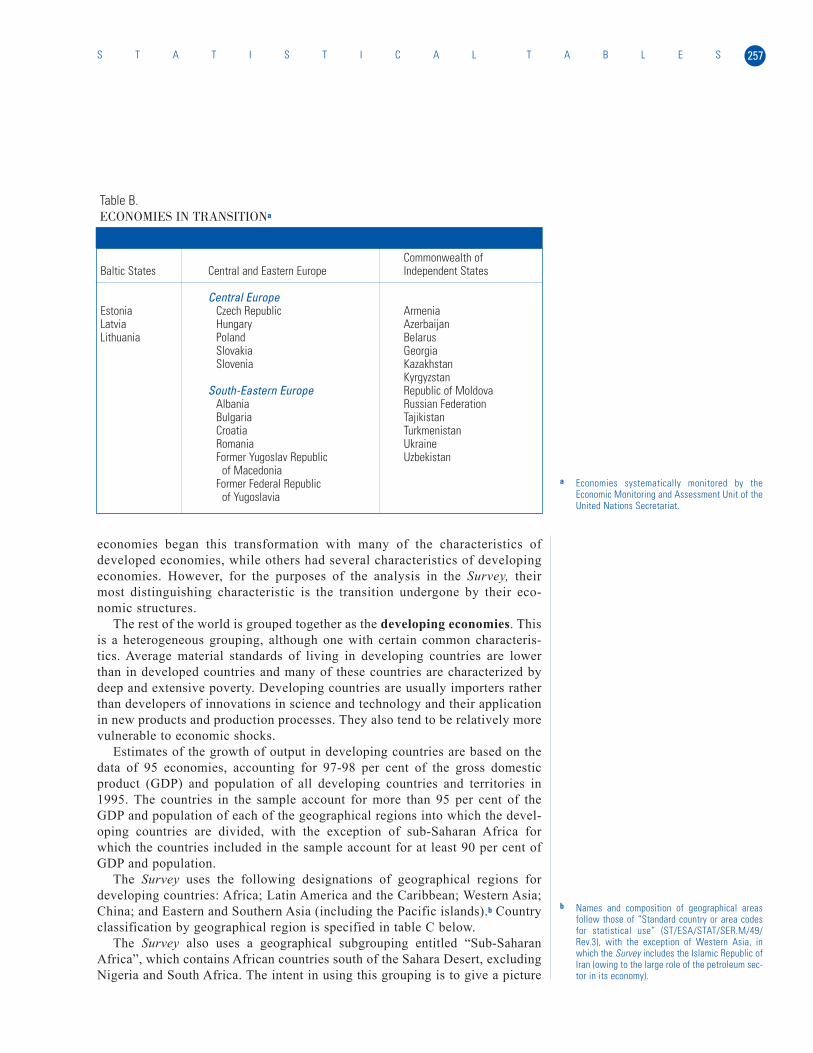
economies began this transformation with many of the characteristics ofdeveloped economies, while others had several characteristics of developingeconomies. However, for the purposes of the analysis in the Survey, theirmost distinguishing characteristic is the transition undergone by their eco-nomic structures.
The rest of the world is grouped together as the developing economies. Thisis a heterogeneous grouping, although one with certain common characteris-tics. Average material standards of living in developing countries are lowerthan in developed countries and many of these countries are characterized bydeep and extensive poverty. Developing countries are usually importers ratherthan developers of innovations in science and technology and their applicationin new products and production processes. They also tend to be relatively morevulnerable to economic shocks.
Estimates of the growth of output in developing countries are based on thedata of 95 economies, accounting for 97-98 per cent of the gross domesticproduct (GDP) and population of all developing countries and territories in1995. The countries in the sample account for more than 95 per cent of theGDP and population of each of the geographical regions into which the devel-oping countries are divided, with the exception of sub-Saharan Africa forwhich the countries included in the sample account for at least 90 per cent ofGDP and population.
The Survey uses the following designations of geographical regions fordeveloping countries: Africa; Latin America and the Caribbean; Western Asia;China; and Eastern and Southern Asia (including the Pacific islands).b Countryclassification by geographical region is specified in table C below.
The Survey also uses a geographical subgrouping entitled “Sub-SaharanAfrica”, which contains African countries south of the Sahara Desert, excludingNigeria and South Africa. The intent in using this grouping is to give a picture
257S T A T I S T I C A L T A B L E S
Table B.ECONOMIES IN TRANSITIONa
Commonwealth ofBaltic States Central and Eastern Europe Independent States
Central EuropeEstonia Czech Republic ArmeniaLatvia Hungary AzerbaijanLithuania Poland Belarus
Slovakia GeorgiaSlovenia Kazakhstan
KyrgyzstanSouth-Eastern Europe Republic of Moldova
Albania Russian FederationBulgaria TajikistanCroatia TurkmenistanRomania UkraineFormer Yugoslav Republic Uzbekistan
of MacedoniaFormer Federal Republic
of Yugoslaviaa Economies systematically monitored by the
Economic Monitoring and Assessment Unit of theUnited Nations Secretariat.
b Names and composition of geographical areasfollow those of “Standard country or area codesfor statistical use” (ST/ESA/STAT/SER.M/49/Rev.3), with the exception of Western Asia, inwhich the Survey includes the Islamic Republic ofIran (owing to the large role of the petroleum sec-tor in its economy).
W O R L D E C O N O M I C A N D S O C I A L S U R V E Y 2 0 0 3258
of the situation in the large number of smaller sub-Saharan economies by avoid-ing any distortion that may be introduced by including the two countries thatdominate the region in terms of GDP, population and international trade.
For analytical purposes, developing countries are classified as fuel exportersor fuel importers inasmuch as the ability to export fuel or the need to importfuel has a large effect on a country’s capacity to import other goods and ser-vices—and therefore on the growth of output, as growth in developing countriesis often constrained by the availability of foreign exchange. Fuels, rather thanenergy sources more broadly, are considered because fuel prices are moredirectly linked to oil prices, and oil prices are particularly volatile and oftenhave a considerable impact on countries’ incomes and capacity to import.
A country is defined as a fuel exporter if, simultaneously: (a) its domesticproduction of primary commercial fuel (including oil, natural gas, coal andlignite, but excluding hydro- and nuclear electricity) exceeds domestic con-sumption by at least 20 per cent; (b) the value of its fuel exports amounts toat least 20 per cent of its total exports; and (c) it is not classified as a leastdeveloped country.
The least developed countries are a subgroup of the fuel-importing devel-oping countries. The list of least developed countries is decided by theGeneral Assembly, on the basis of recommendations by the Economic andSocial Council emanating from proposals by the Committee for DevelopmentPolicy. The Committee proposes criteria for identifying the least developedcountries and assesses the eligibility of individual countries. The basic crite-ria for inclusion require being below specified thresholds with regard to percapita GDP, an economic vulnerability index and an augmented physical qual-ity of life index.c As of May 2003, the following 49 countries were classifiedas least developed countries:
Afghanistan, Angola, Bangladesh, Benin, Bhutan, Burkina Faso, Burundi,Cambodia, Cape Verde, Central African Republic, Chad, Comoros, DemocraticRepublic of the Congo, Djibouti, Equatorial Guinea, Eritrea, Ethiopia, Gambia,Guinea, Guinea-Bissau, Haiti, Kiribati, Lao People’s Democratic Republic,Lesotho, Liberia, Madagascar, Malawi, Maldives, Mali, Mauritania,Mozambique, Myanmar, Nepal, Niger, Rwanda, Samoa, Sao Tome andPrincipe, Senegal, Sierra Leone, Solomon Islands, Somalia, Sudan, Togo,Tuvalu, Uganda, United Republic of Tanzania, Vanuatu, Yemen, Zambia.
A classification of net-creditor and net-debtor countries is used in sometables. This is based on the net foreign asset position of each country at the endof 1995, as assessed by IMF in its World Economic Outlook, October 1996.d
The net-creditor countries are indicated by footnote indicator b in table C.The heavily indebted poor countries (HIPCs), are those considered by the
World Bank and IMF for their debt-relief initiative (the enhanced HIPCInitiative). As of April 2003, the heavily indebted poor countries were: Angola,Benin, Bolivia, Burkina Faso, Burundi, Cameroon, Central African Republic,Chad, Comoros, Congo, Côte d’Ivoire, Democratic Republic of the Congo (for-merly Zaire), Ethiopia, Gambia, Ghana, Guinea, Guinea-Bissau, Guyana,Honduras, Kenya, Lao People’s Democratic Republic, Liberia, Madagascar,Malawi, Mali, Mauritania, Mozambique, Myanmar, Nicaragua, Niger, Rwanda,Sao Tome and Principe, Senegal, Sierra Leone, Somalia, Sudan, Togo, Uganda,United Republic of Tanzania, Viet Nam, Zambia.e
c See report of the Committee for DevelopmentPolicy on its second session (3-7 April 2000)(Official Records of the Economic and SocialCouncil, 2000, Supplement No. 13 (E/2000/33)),chap. IV.
d Washington, D.C., IMF, 1996.
e See IMF, “Debt relief under the Heavily IndebtedPoor Countries (HIPC) Initiative: a factsheet”,April 2003 (http: //www.imf.org/external/np/exr/facts/hipc.htm).
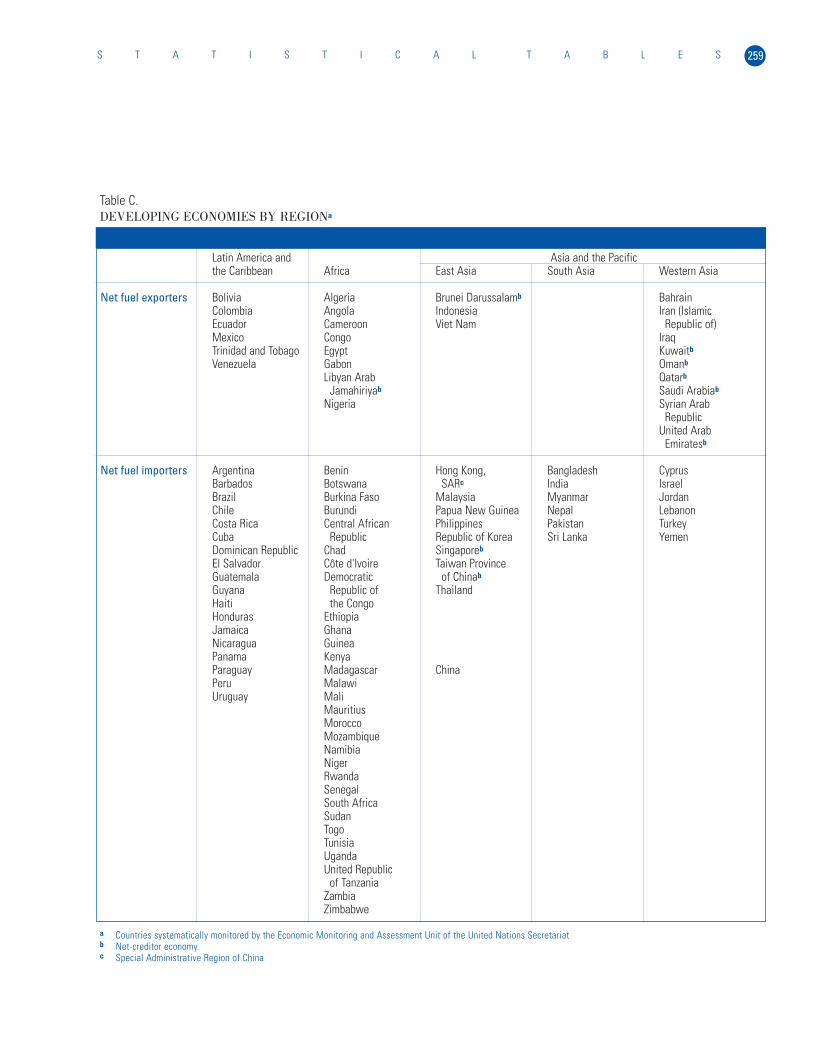
259S T A T I S T I C A L T A B L E S
Table C.DEVELOPING ECONOMIES BY REGIONa
Latin America and Asia and the Pacificthe Caribbean Africa East Asia South Asia Western Asia
Net fuel exporters Bolivia Algeria Brunei Darussalamb BahrainColombia Angola Indonesia Iran (IslamicEcuador Cameroon Viet Nam Republic of)Mexico Congo IraqTrinidad and Tobago Egypt Kuwaitb
Venezuela Gabon Omanb
Libyan Arab Qatarb
Jamahiriyab Saudi Arabiab
Nigeria Syrian ArabRepublic
United ArabEmiratesb
Net fuel importers Argentina Benin Hong Kong, Bangladesh CyprusBarbados Botswana SARc India IsraelBrazil Burkina Faso Malaysia Myanmar JordanChile Burundi Papua New Guinea Nepal LebanonCosta Rica Central African Philippines Pakistan TurkeyCuba Republic Republic of Korea Sri Lanka YemenDominican Republic Chad Singaporeb
El Salvador Côte d'Ivoire Taiwan ProvinceGuatemala Democratic of Chinab
Guyana Republic of ThailandHaiti the CongoHonduras EthiopiaJamaica GhanaNicaragua GuineaPanama KenyaParaguay Madagascar ChinaPeru MalawiUruguay Mali
MauritiusMoroccoMozambiqueNamibiaNigerRwandaSenegalSouth AfricaSudanTogoTunisiaUganda United Republic
of TanzaniaZambiaZimbabwe
a Countries systematically monitored by the Economic Monitoring and Assessment Unit of the United Nations Secretariatb Net-creditor economy.c Special Administrative Region of China
DATA QUALITY
Statistical information that is consistent and comparable over time and acrosscountries is of vital importance for monitoring economic developments, dis-cussing social issues and poverty, and assessing environmental change. Themultifaceted nature of these and other related issues calls for an integratedapproach to national and international economic, social and environmentaldata.
The 1993 revision of the System of National Accounts (SNA)f and the 1993Balance of Payments Manual(the IMF Manual)g provide a basis for an inte-grated and harmonized system of statistics that reflect economic and socialchange. The SNA embodies concepts, definitions and classifications that areinterrelated at both the macro- and microlevels. Concepts in the IMF Manualhave been harmonized, as closely as possible, with those of the SNA and withIMF methodologies pertaining to banking, government finance and money sta-tistics. In addition, a system of satellite accounts, which are semi-integratedwith the central framework of the SNA, provides linkages between nationalaccounts data and other statistical data, such as social statistics, health statis-tics, social protection statistics and tourism statistics.
Governments are increasingly reporting their data on the basis of these stan-dards and, where available, such data are used in the statistics in this annex.However, inconsistency of coverage, definitions and data-collection methodsamong reporting countries mars some of the national and international statis-tics that are perforce used in this Survey and other international publications.In the case of late, incomplete or unreported data, adjustments and estimationsare made in selected cases.
One widespread source of inaccuracy is the use of out-of-date benchmarksurveys and censuses or obsolete models and assumptions about behaviour andconditions. On the other hand, when statistical administrations seek to improvetheir estimates by using new sources of data and updated surveys, there can bediscontinuities in the series. National income estimates are especially affected,sometimes being subject to revisions on the order of 10-30 per cent.
National accounts and related indicators record mainly market transactionsconducted through monetary exchange. Barter, production by households, sub-sistence output and informal sector activities are not always recorded; yet suchitems can constitute a large share of total activity in some countries and theiromission can lead to a considerable underestimation of national output. As thedegree of underestimation varies across countries, comparisons may give faultyresults. In addition, as the non-market sector is absorbed over time into themainstream of production through increasing monetization, output growth willbe overstated.
The extent of the economic activity not captured by national statistics and theevolution of such activity over time have become a concern in some countries,particularly economies in transition. In addition, new modes of production,transactions and organization have made parts of the previous institutional andmethodological framework for statistics inadequate. A comprehensive reform ofnational statistical systems has thus been under way in many economies in tran-sition. As a result, there have been revisions to several data series for thesecountries and further revisions of measures of past and current performance areexpected.h
W O R L D E C O N O M I C A N D S O C I A L S U R V E Y 2 0 0 3260
f Commission of the European Communities, IMF,OECD, United Nations and World Bank, System ofNational Accounts, 1993 (United Nations publica-tion, Sales No. E.94.XVII.4).
g IMF, Balance of Payments Manual, 5th ed.(Washington, D.C., IMF, 1993).
h See World Economic and Social Survey, 1995(United Nations publication, Sales No.E.95.II.C.1), statistical annex, sect. entitled “Datacaveats and conventions”.

Weaknesses at the national level handicap comparisons between countries orgroupings of countries at a given time or over time. Missing, unreliable orincompatible country data necessitate estimation and substitution in order toretain a consistent country composition of aggregated data over time. In par-ticular, the absence of reliable GDP estimates for many developing countriesand economies in transition requires the use of estimates in preparing countryaggregations for many data series, as GDP weights are often used for suchaggregations.
The veracity of estimates of output and of other statistical data of developingcountries is related to the stage of development of their statistical systems. InAfrica in particular, there are wide divergences in the values of the economicaggregates provided by different national and international sources for manycountries. In addition, data for countries in which there is civil strife or war oftenprovide only rough orders of magnitude. Finally, in countries experiencing highrates of inflation and disequilibrium exchange rates, there can be substantial dis-tortions in national accounts data.
There are also problems with other economic statistics, such as those onunemployment, consumer price inflation, and the volume of exports andimports. For example, cross-country comparisons of unemployment must bemade with caution, owing to differences in definition among countries, hencetable A.7 employs the standardized definitions of unemployment rates for thosedeveloped countries where data are available. In a number of cases, such datadiffer substantially from national definitions.
Consumer price indices are among the oldest of the economic data series col-lected by Governments, but they are still surrounded by controversy, even incountries with the most advanced statistical systems. This is attributable particu-larly to the introduction of new goods and to changes in the quality of goods andconsumer behaviour that are often not captured because of, inter alia, infrequentconsumer surveys and revisions to the sample baskets of commodities.
There are no clear-cut solutions to many of the problems noted above, andeven when there are, inadequate resources allocated to the improvement of sta-tistical systems and reporting can perpetuate statistical shortcomings. In thislight, some of the economic and social indicators presented in this Surveyshould be recognized as approximations and estimations.
DATA DEFINITIONS AND CONVENTIONS
Aggregate data are either sums or weighted averages of individual countrydata. Unless otherwise indicated, multi-year averages of growth rates areexpressed as compound annual percentage rates of change. The conventionfollowed is to omit the base year in a multi-year growth rate; for example, the10-year average growth rate of a variable in the 1980s would be identified asthe average annual growth rate from 1981 to 1990.
Output
National practices are followed in defining real GDP for each country andthese national data are aggregated to create regional and global output figures.The growth of output in each group of countries is calculated from the sum of
261S T A T I S T I C A L T A B L E S
GDP of individual countries measured at 1995 prices and exchange rates. Datafor GDP in 1995 in national currencies were converted into dollars (withadjustments in selected casesi) and extended forward and backward in timeusing changes in real GDP for each country. This method supplies a reasonableset of aggregate growth rates for a period of about 15 years, centred on 1995.
Alternative aggregation methodologies for calculating world outputThe World Economic and Social Survey utilizes a weighting scheme derivedfrom exchange-rate conversions of national data in order to aggregate rates ofgrowth of output of individual countries into regional and global totals, asnoted above. This is similar to the approach followed in some other interna-tional reports, such as those of the World Bank. However, the aggregationsused by IMF in its World Economic Outlook and by OECD in its EconomicOutlook rely on country weights derived from national GDP in “internationaldollars”, as converted from local currency using purchasing power parities(PPPs). The different weights arising from these two approaches are given intable D. The question which approach to use is controversial.
The reason advanced for using PPP weights is that, when aggregating pro-duction in two countries, a common set of prices should be used to value thesame activities in both countries. This is frequently not the case when marketexchange rates are used to convert local currency values of GDP. The PPPapproach revalues gross expenditure in different countries using a single set ofprices, in most cases some average of the prices in the countries being com-pared. By construction, these revalued GDP magnitudes are then related to anumeraire country, usually the United States of America, by assuming that GDPat PPP values for that country is identical with its GDP at the market exchangerate. The PPP conversion factor is then, in principle, the number of units ofnational currency needed to buy the goods and services that can be bought withone unit of the currency of the numeraire country.
In principle as well as in practice, however, PPPs are difficult to calculatebecause goods and services are not always directly comparable across coun-tries, making direct comparisons of their prices correspondingly difficult. It isparticularly difficult to measure the output and prices of many services, suchas health care and education.
One problem in employing PPP estimates for calculating the relative sizes ofeconomies is that even the most recently completed set of PPP prices coversonly a comparatively small group of countries. Initially, in 1985, there were PPPdata for only 64 countries. Subsequent work under the auspices of theInternational Comparison Programme (ICP) has increased this number, but itremains far lower than the number of countries for which this Survey needs data.
However, certain regularities have been observed, on the one hand, betweenGDP and its major expenditure components when measured in market pricesand, on the other, between GDP and its components measured in “internation-al” prices as derived through ICP. On that basis (and using other partial data onconsumer prices), a technique was devised to approximate PPP levels of GDPand its major expenditure components for countries that had not participated inICP. The results are known as the Penn World Tables.j
Neither the PPP approach nor the exchange-rate approach to weightingcountry GDP data can be applied in a theoretically pure or fully consistent way.
W O R L D E C O N O M I C A N D S O C I A L S U R V E Y 2 0 0 3262
i When individual exchange rates seemed unrealis-tic, alternative exchange rates were substituted,using averages of the exchange rates in relevantyears or the exchange rate of a more normal year,adjusted using relative inflation rates since thattime.
j See Robert Summers and Alan Heston, The PennWorld Table (Mark 5): An Expanded Set ofInternational Comparisons, 1950-1988, NationalBureau of Economic Research (NBER) WorkingPaper, No. R1562 (Cambridge, Massachusetts,May 1991).
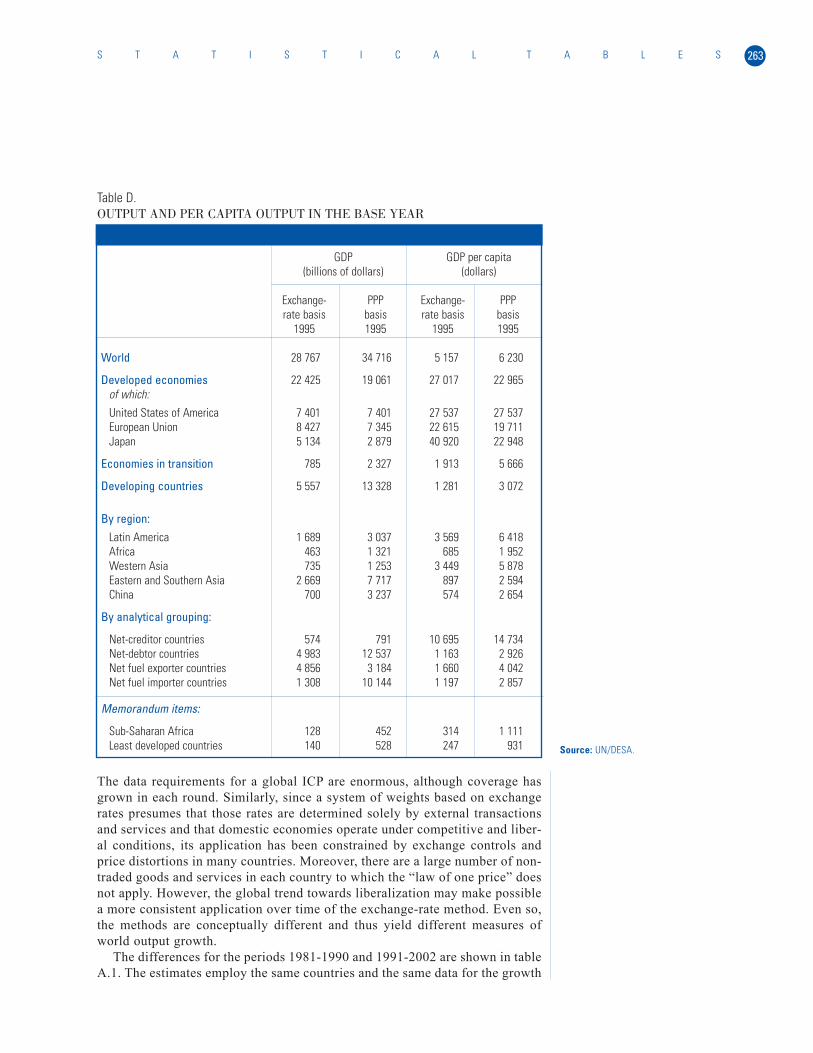
263S T A T I S T I C A L T A B L E S
The data requirements for a global ICP are enormous, although coverage hasgrown in each round. Similarly, since a system of weights based on exchangerates presumes that those rates are determined solely by external transactionsand services and that domestic economies operate under competitive and liber-al conditions, its application has been constrained by exchange controls andprice distortions in many countries. Moreover, there are a large number of non-traded goods and services in each country to which the “law of one price” doesnot apply. However, the global trend towards liberalization may make possiblea more consistent application over time of the exchange-rate method. Even so,the methods are conceptually different and thus yield different measures ofworld output growth.
The differences for the periods 1981-1990 and 1991-2002 are shown in tableA.1. The estimates employ the same countries and the same data for the growth
GDP GDP per capita(billions of dollars) (dollars)
Exchange- PPP Exchange- PPPrate basis basis rate basis basis
1995 1995 1995 1995
World 28 767 34 716 5 157 6 230
Developed economies 22 425 19 061 27 017 22 965of which:United States of America 7 401 7 401 27 537 27 537European Union 8 427 7 345 22 615 19 711Japan 5 134 2 879 40 920 22 948
Economies in transition 785 2 327 1 913 5 666
Developing countries 5 557 13 328 1 281 3 072
By region:Latin America 1 689 3 037 3 569 6 418Africa 463 1 321 685 1 952Western Asia 735 1 253 3 449 5 878Eastern and Southern Asia 2 669 7 717 897 2 594China 700 3 237 574 2 654
By analytical grouping:
Net-creditor countries 574 791 10 695 14 734Net-debtor countries 4 983 12 537 1 163 2 926Net fuel exporter countries 4 856 3 184 1 660 4 042Net fuel importer countries 1 308 10 144 1 197 2 857
Memorandum items:
Sub-Saharan Africa 128 452 314 1 111Least developed countries 140 528 247 931
Table D.OUTPUT AND PER CAPITA OUTPUT IN THE BASE YEAR
Source: UN/DESA.
W O R L D E C O N O M I C A N D S O C I A L S U R V E Y 2 0 0 3264
rates of GDP of the individual countries in the two computations. The differ-ences in the aggregate growth rates are purely the result of using the two dif-ferent sets of weights shown in table D.
Even though the growth rates for the regions do not differ much when dataare converted at PPP rather than at exchange rates, the measure of the growthof world GDP is larger when country GDPs are valued at PPP conversion fac-tors rather than at exchange rates (see table A.1). This is because the develop-ing countries, in the aggregate, grew more rapidly than the rest of the world inthe 1990s and the share of GDP of these countries is larger under PPP mea-surements than under market exchange rates. The influence of China is partic-ularly important, given its high growth rate for nearly two decades.
International trade and finance
Trade values in table A.13 are based largely on customs data for merchandisetrade converted into dollars using average annual exchange rates and aremainly drawn from IMF, International Financial Statistics. These data aresupplemented by balance-of-payments data in certain cases. Estimates of thedollar values of trade include estimates by the regional commissions and theEconomic Monitoring and Assessment Unit, while forecasts for both the vol-ume and value of imports and exports rely largely on Project LINK.
The unit values that are used to determine measures of the volume of exportsand imports for groupings of developing countries are estimated in part fromweighted averages of export prices of commodity groupings at a combinationof three- and four-digit Standard International Trade Classification (SITC) lev-els, based on the United Nations External Trade Statistics Database (COM-TRADE); the weights reflect the share of each commodity or commodity groupin the value of the region’s total exports or imports.
For developed economies and economies in transition, the growth of tradevolumes are aggregated from national data, as collected by the EconomicCommission for Europe (ECE), IMF and the Economic Monitoring andAssessment Unit. As of 1 January 1993, customs offices at the borders betweenStates members of the European Union (EU), which used to collect and checkcustoms declarations on national exports and imports, were abolished as thesingle European market went into effect and a new system of data collectionfor intra-EU trade, called INTRASTAT, was put in place. INTRASTAT relieson information collected directly from enterprises and is linked with the sys-tem of declarations of value-added tax (VAT) relating to intra-EU trade so as toallow for quality control of the data. There is therefore a discontinuity between1992 and 1993 for these countries owing to the change in methodology.
Total primary commodities refer to SITC sections 0 to 4:• Foods comprise SITC sections 0 and 1, namely, food and live animals
chiefly for food; and beverages and tobacco.• Agricultural raw materials include SITC section 2 (crude materials, ined-
ible, except fuels), except for divisions 27 and 28 (crude fertilizers andcrude minerals, and metalliferous ores and metal scrap, respectively) andsection 4 (animal and vegetable oils, fats and waxes).
• Fuels refer to SITC section 3 (mineral fuels, lubricants and related materials).

265S T A T I S T I C A L T A B L E S
Total manufactures comprise sections 5 to 8:• Textiles include divisions 65 (textile yarn, fabrics, made-up articles, not
elsewhere specified or included, and related products) and 84 (articles ofapparel and clothing accessories).
• Chemicals are SITC section 5.• Machinery and transport equipment refer to SITC division 7.• Metals include divisions 67 (iron and steel) and 68 (non-ferrous metals).
Tables A.19 to A.22 are based on the IMF Balance of Payments Statisticsand on the definitions and methodologies set out in the IMF Balance ofPayments Manual. Data from the regional commissions, and official and pri-vate sources, as well as estimates by the Economic Monitoring and AssessmentUnit, were used to complement the IMF data. Whenever necessary, data report-ed in national currency were converted into United States dollars at the aver-age market exchange rate in the period. Regional and subregional aggregatesare sums of individual country data so that the current-account balance for theeuro zone countries reflects the aggregation of individual country positions anddoes not exclude intra euro-zone transactions.
Table A.18 is, with the exception of data for OPEC in 2003, based on theInternational Energy Agency (IEA) Monthly Oil Market Report. The estimateof supply from OPEC in 2003 is based on production data for the first quarterof 2003 and information about OPEC production quotas. The country groupsand regions used in this Survey differ from those used by IEA, and adjustmentswere made to take account of these differences.

LIST OF TABLES
I. GLOBAL OUTPUT AND MACROECONOMIC INDICATORS Page
A. 1. World population, output and per capita GDP, 1980-2002 . . . . . . . . . . . . . . . . . . . . . . . . . . . . . . . . . . . . . . . . . . . . . . . . . . . . . . . . . .269A. 2. Developed economies: rates of growth of real GDP, 1994-2004 . . . . . . . . . . . . . . . . . . . . . . . . . . . . . . . . . . . . . . . . . . . . . . . . . . . . .270A. 3. Economies in transition: rates of growth of real GDP, 1994-2004 . . . . . . . . . . . . . . . . . . . . . . . . . . . . . . . . . . . . . . . . . . . . . . . . . . . .271A. 4. Developing economies: rates of growth of real GDP, 1994-2004 . . . . . . . . . . . . . . . . . . . . . . . . . . . . . . . . . . . . . . . . . . . . . . . . . . . . .272A. 5. Developed economies: investment, saving and net transfer, 1985-2001 . . . . . . . . . . . . . . . . . . . . . . . . . . . . . . . . . . . . . . . . . . . . . . .273A. 6. Developed economies: unemployment rates, 1994-2004 . . . . . . . . . . . . . . . . . . . . . . . . . . . . . . . . . . . . . . . . . . . . . . . . . . . . . . . . . . .274A. 7. Central and Eastern Europe and the Baltic States: unemployment rates, 1994-2004 . . . . . . . . . . . . . . . . . . . . . . . . . . . . . . . . . . . . .275A. 8. Developed economies: consumer price inflation, 1994-2004 . . . . . . . . . . . . . . . . . . . . . . . . . . . . . . . . . . . . . . . . . . . . . . . . . . . . . . . .276A. 9. Economies in transition: consumer price inflation, 1994-2004 . . . . . . . . . . . . . . . . . . . . . . . . . . . . . . . . . . . . . . . . . . . . . . . . . . . . . . .277A.10. Developing countries: consumer price inflation, 1994-2004 . . . . . . . . . . . . . . . . . . . . . . . . . . . . . . . . . . . . . . . . . . . . . . . . . . . . . . . . .278A.11. Major developed economies: financial indicators, 1994-2002 . . . . . . . . . . . . . . . . . . . . . . . . . . . . . . . . . . . . . . . . . . . . . . . . . . . . . . .279A.12. Selected countries: real effective exchange rates, broad measurement, 1994-2002 . . . . . . . . . . . . . . . . . . . . . . . . . . . . . . . . . . . . .280
II. INTERNATIONAL TRADE
A.13. World trade: changes in value and volume of exports and imports, by major country group, 1994-2003 . . . . . . . . . . . . . . . . . . . . .281A.14. Direction of trade: exports (f.o.b.), 1990-2002 . . . . . . . . . . . . . . . . . . . . . . . . . . . . . . . . . . . . . . . . . . . . . . . . . . . . . . . . . . . . . . . . . . .283A.15. Composition of world merchandise trade: exports, 1990-2001 . . . . . . . . . . . . . . . . . . . . . . . . . . . . . . . . . . . . . . . . . . . . . . . . . . . . . .285A.16. Composition of world merchandise trade: imports, 1990-2001 . . . . . . . . . . . . . . . . . . . . . . . . . . . . . . . . . . . . . . . . . . . . . . . . . . . . . .287A.17. Indices of prices of primary commodities, 1994-2003 . . . . . . . . . . . . . . . . . . . . . . . . . . . . . . . . . . . . . . . . . . . . . . . . . . . . . . . . . . . . .289A.18. World oil supply, demand and prices, 1994-2003 . . . . . . . . . . . . . . . . . . . . . . . . . . . . . . . . . . . . . . . . . . . . . . . . . . . . . . . . . . . . . . . . .290
III. INTERNATIONAL FINANCE AND FINANCIAL MARKETS
A.19. World balance of payments on current account, by country group, 1994-2002 . . . . . . . . . . . . . . . . . . . . . . . . . . . . . . . . . . . . . . . . . .291A.20. Current-account transactions: developed economies, 1994-2002 . . . . . . . . . . . . . . . . . . . . . . . . . . . . . . . . . . . . . . . . . . . . . . . . . . . .292A.21. Current-account transactions: economies in transition, 1994-2002 . . . . . . . . . . . . . . . . . . . . . . . . . . . . . . . . . . . . . . . . . . . . . . . . . . .293A.22. Current-account transactions: developing economies, 1994-2002 . . . . . . . . . . . . . . . . . . . . . . . . . . . . . . . . . . . . . . . . . . . . . . . . . . . .295A.23. Net IMF lending to developing countries, by facility, 1993-2002 . . . . . . . . . . . . . . . . . . . . . . . . . . . . . . . . . . . . . . . . . . . . . . . . . . . . .297A.24. Net IMF lending to economies in transition, by facility, 1993-2002 . . . . . . . . . . . . . . . . . . . . . . . . . . . . . . . . . . . . . . . . . . . . . . . . . . .298A.25. Net ODA from major sources, by type, 1982-2001 . . . . . . . . . . . . . . . . . . . . . . . . . . . . . . . . . . . . . . . . . . . . . . . . . . . . . . . . . . . . . . . .299A.26. Regional distribution of ODA from major sources, 1990-2001 . . . . . . . . . . . . . . . . . . . . . . . . . . . . . . . . . . . . . . . . . . . . . . . . . . . . . . .300A.27. Resource commitments of multilateral development institutions, 1994-2002 . . . . . . . . . . . . . . . . . . . . . . . . . . . . . . . . . . . . . . . . . . .301
267S T A T I S T I C A L T A B L E S

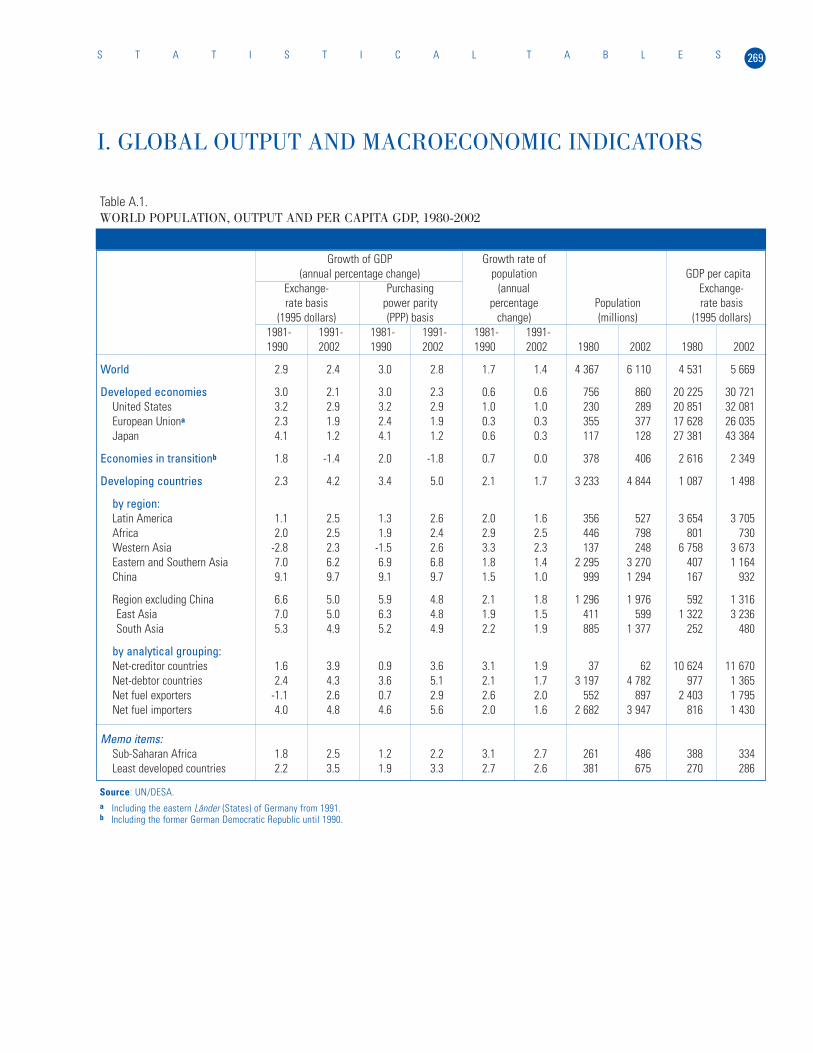
Table A.1.WORLD POPULATION, OUTPUT AND PER CAPITA GDP, 1980-2002
Growth of GDP Growth rate of(annual percentage change) population GDP per capita
Exchange- Purchasing (annual Exchange-rate basis power parity percentage Population rate basis
(1995 dollars) (PPP) basis change) (millions) (1995 dollars)1981- 1991- 1981- 1991- 1981- 1991-1990 2002 1990 2002 1990 2002 1980 2002 1980 2002
World 2.9 2.4 3.0 2.8 1.7 1.4 4 367 6 110 4 531 5 669
Developed economies 3.0 2.1 3.0 2.3 0.6 0.6 756 860 20 225 30 721United States 3.2 2.9 3.2 2.9 1.0 1.0 230 289 20 851 32 081European Uniona 2.3 1.9 2.4 1.9 0.3 0.3 355 377 17 628 26 035Japan 4.1 1.2 4.1 1.2 0.6 0.3 117 128 27 381 43 384
Economies in transitionb 1.8 -1.4 2.0 -1.8 0.7 0.0 378 406 2 616 2 349
Developing countries 2.3 4.2 3.4 5.0 2.1 1.7 3 233 4 844 1 087 1 498
by region:Latin America 1.1 2.5 1.3 2.6 2.0 1.6 356 527 3 654 3 705Africa 2.0 2.5 1.9 2.4 2.9 2.5 446 798 801 730Western Asia -2.8 2.3 -1.5 2.6 3.3 2.3 137 248 6 758 3 673Eastern and Southern Asia 7.0 6.2 6.9 6.8 1.8 1.4 2 295 3 270 407 1 164China 9.1 9.7 9.1 9.7 1.5 1.0 999 1 294 167 932
Region excluding China 6.6 5.0 5.9 4.8 2.1 1.8 1 296 1 976 592 1 316East Asia 7.0 5.0 6.3 4.8 1.9 1.5 411 599 1 322 3 236South Asia 5.3 4.9 5.2 4.9 2.2 1.9 885 1 377 252 480
by analytical grouping:Net-creditor countries 1.6 3.9 0.9 3.6 3.1 1.9 37 62 10 624 11 670Net-debtor countries 2.4 4.3 3.6 5.1 2.1 1.7 3 197 4 782 977 1 365Net fuel exporters -1.1 2.6 0.7 2.9 2.6 2.0 552 897 2 403 1 795Net fuel importers 4.0 4.8 4.6 5.6 2.0 1.6 2 682 3 947 816 1 430
Memo items:Sub-Saharan Africa 1.8 2.5 1.2 2.2 3.1 2.7 261 486 388 334Least developed countries 2.2 3.5 1.9 3.3 2.7 2.6 381 675 270 286
Source: UN/DESA.a Including the eastern Länder (States) of Germany from 1991.b Including the former German Democratic Republic until 1990.
I. GLOBAL OUTPUT AND MACROECONOMIC INDICATORS
S T A T I S T I C A L T A B L E S 269
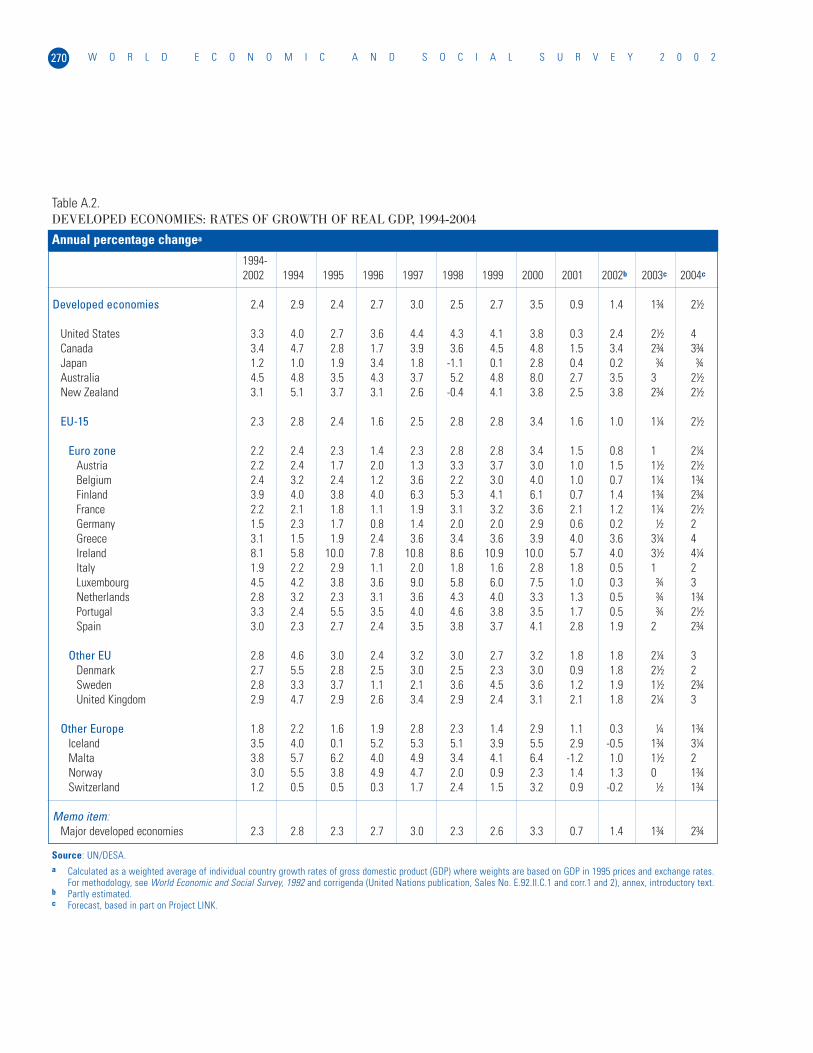
Table A.2.DEVELOPED ECONOMIES: RATES OF GROWTH OF REAL GDP, 1994-2004
Annual percentage changea
1994-2002 1994 1995 1996 1997 1998 1999 2000 2001 2002b 2003c 2004c
Developed economies 2.4 2.9 2.4 2.7 3.0 2.5 2.7 3.5 0.9 1.4 1¾ 2½
United States 3.3 4.0 2.7 3.6 4.4 4.3 4.1 3.8 0.3 2.4 2½ 4Canada 3.4 4.7 2.8 1.7 3.9 3.6 4.5 4.8 1.5 3.4 2¾ 3¾Japan 1.2 1.0 1.9 3.4 1.8 -1.1 0.1 2.8 0.4 0.2 ¾ ¾Australia 4.5 4.8 3.5 4.3 3.7 5.2 4.8 8.0 2.7 3.5 3 2½New Zealand 3.1 5.1 3.7 3.1 2.6 -0.4 4.1 3.8 2.5 3.8 2¾ 2½
EU-15 2.3 2.8 2.4 1.6 2.5 2.8 2.8 3.4 1.6 1.0 1¼ 2½
Euro zone 2.2 2.4 2.3 1.4 2.3 2.8 2.8 3.4 1.5 0.8 1 2¼Austria 2.2 2.4 1.7 2.0 1.3 3.3 3.7 3.0 1.0 1.5 1½ 2½Belgium 2.4 3.2 2.4 1.2 3.6 2.2 3.0 4.0 1.0 0.7 1¼ 1¾Finland 3.9 4.0 3.8 4.0 6.3 5.3 4.1 6.1 0.7 1.4 1¾ 2¾France 2.2 2.1 1.8 1.1 1.9 3.1 3.2 3.6 2.1 1.2 1¼ 2½Germany 1.5 2.3 1.7 0.8 1.4 2.0 2.0 2.9 0.6 0.2 ½ 2Greece 3.1 1.5 1.9 2.4 3.6 3.4 3.6 3.9 4.0 3.6 3¼ 4Ireland 8.1 5.8 10.0 7.8 10.8 8.6 10.9 10.0 5.7 4.0 3½ 4¼Italy 1.9 2.2 2.9 1.1 2.0 1.8 1.6 2.8 1.8 0.5 1 2Luxembourg 4.5 4.2 3.8 3.6 9.0 5.8 6.0 7.5 1.0 0.3 ¾ 3Netherlands 2.8 3.2 2.3 3.1 3.6 4.3 4.0 3.3 1.3 0.5 ¾ 1¾Portugal 3.3 2.4 5.5 3.5 4.0 4.6 3.8 3.5 1.7 0.5 ¾ 2½Spain 3.0 2.3 2.7 2.4 3.5 3.8 3.7 4.1 2.8 1.9 2 2¾
Other EU 2.8 4.6 3.0 2.4 3.2 3.0 2.7 3.2 1.8 1.8 2¼ 3Denmark 2.7 5.5 2.8 2.5 3.0 2.5 2.3 3.0 0.9 1.8 2½ 2Sweden 2.8 3.3 3.7 1.1 2.1 3.6 4.5 3.6 1.2 1.9 1½ 2¾United Kingdom 2.9 4.7 2.9 2.6 3.4 2.9 2.4 3.1 2.1 1.8 2¼ 3
Other Europe 1.8 2.2 1.6 1.9 2.8 2.3 1.4 2.9 1.1 0.3 ¼ 1¾Iceland 3.5 4.0 0.1 5.2 5.3 5.1 3.9 5.5 2.9 -0.5 1¾ 3¼Malta 3.8 5.7 6.2 4.0 4.9 3.4 4.1 6.4 -1.2 1.0 1½ 2Norway 3.0 5.5 3.8 4.9 4.7 2.0 0.9 2.3 1.4 1.3 0 1¾Switzerland 1.2 0.5 0.5 0.3 1.7 2.4 1.5 3.2 0.9 -0.2 ½ 1¾
Memo item:Major developed economies 2.3 2.8 2.3 2.7 3.0 2.3 2.6 3.3 0.7 1.4 1¾ 2¾
Source: UN/DESA.a Calculated as a weighted average of individual country growth rates of gross domestic product (GDP) where weights are based on GDP in 1995 prices and exchange rates.
For methodology, see World Economic and Social Survey, 1992 and corrigenda (United Nations publication, Sales No. E.92.II.C.1 and corr.1 and 2), annex, introductory text.b Partly estimated.c Forecast, based in part on Project LINK.
W O R L D E C O N O M I C A N D S O C I A L S U R V E Y 2 0 0 2270
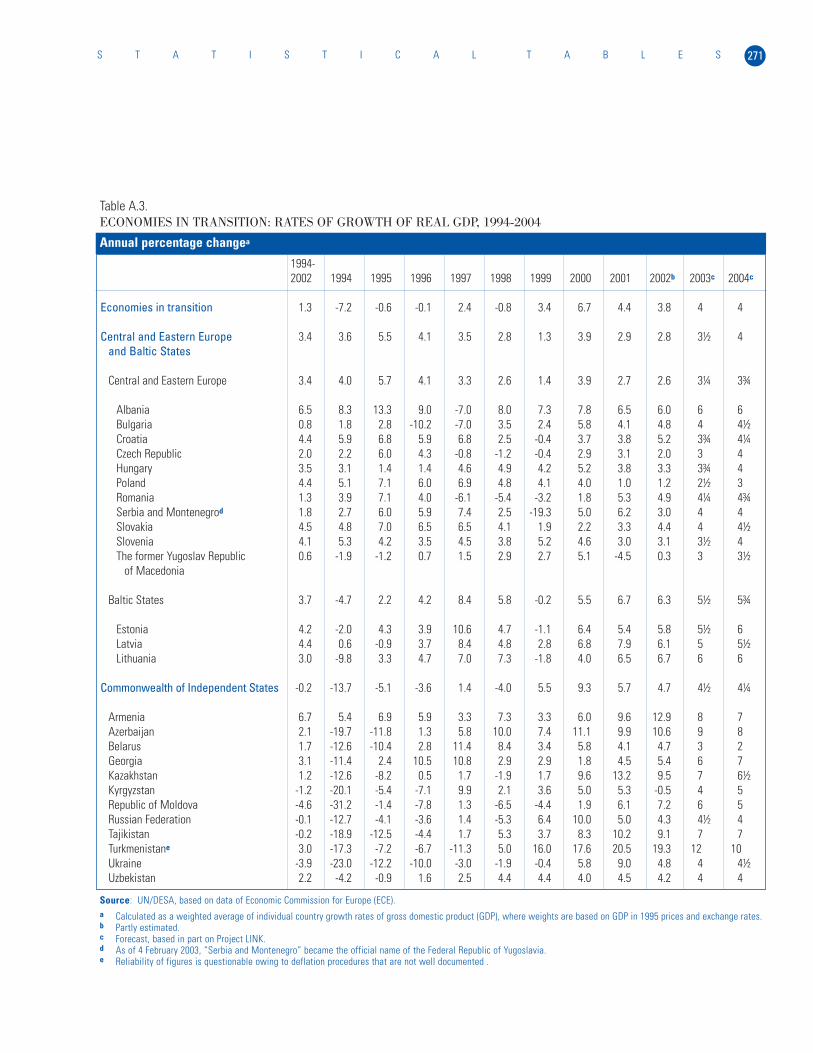
271S T A T I S T I C A L T A B L E S
Table A.3.ECONOMIES IN TRANSITION: RATES OF GROWTH OF REAL GDP, 1994-2004
Annual percentage changea
1994-2002 1994 1995 1996 1997 1998 1999 2000 2001 2002b 2003c 2004c
Economies in transition 1.3 -7.2 -0.6 -0.1 2.4 -0.8 3.4 6.7 4.4 3.8 4 4
Central and Eastern Europe 3.4 3.6 5.5 4.1 3.5 2.8 1.3 3.9 2.9 2.8 3½ 4and Baltic States
Central and Eastern Europe 3.4 4.0 5.7 4.1 3.3 2.6 1.4 3.9 2.7 2.6 3¼ 3¾
Albania 6.5 8.3 13.3 9.0 -7.0 8.0 7.3 7.8 6.5 6.0 6 6Bulgaria 0.8 1.8 2.8 -10.2 -7.0 3.5 2.4 5.8 4.1 4.8 4 4½Croatia 4.4 5.9 6.8 5.9 6.8 2.5 -0.4 3.7 3.8 5.2 3¾ 4¼Czech Republic 2.0 2.2 6.0 4.3 -0.8 -1.2 -0.4 2.9 3.1 2.0 3 4Hungary 3.5 3.1 1.4 1.4 4.6 4.9 4.2 5.2 3.8 3.3 3¾ 4Poland 4.4 5.1 7.1 6.0 6.9 4.8 4.1 4.0 1.0 1.2 2½ 3Romania 1.3 3.9 7.1 4.0 -6.1 -5.4 -3.2 1.8 5.3 4.9 4¼ 4¾Serbia and Montenegrod 1.8 2.7 6.0 5.9 7.4 2.5 -19.3 5.0 6.2 3.0 4 4Slovakia 4.5 4.8 7.0 6.5 6.5 4.1 1.9 2.2 3.3 4.4 4 4½Slovenia 4.1 5.3 4.2 3.5 4.5 3.8 5.2 4.6 3.0 3.1 3½ 4The former Yugoslav Republic 0.6 -1.9 -1.2 0.7 1.5 2.9 2.7 5.1 -4.5 0.3 3 3½
of Macedonia
Baltic States 3.7 -4.7 2.2 4.2 8.4 5.8 -0.2 5.5 6.7 6.3 5½ 5¾
Estonia 4.2 -2.0 4.3 3.9 10.6 4.7 -1.1 6.4 5.4 5.8 5½ 6Latvia 4.4 0.6 -0.9 3.7 8.4 4.8 2.8 6.8 7.9 6.1 5 5½Lithuania 3.0 -9.8 3.3 4.7 7.0 7.3 -1.8 4.0 6.5 6.7 6 6
Commonwealth of Independent States -0.2 -13.7 -5.1 -3.6 1.4 -4.0 5.5 9.3 5.7 4.7 4½ 4¼
Armenia 6.7 5.4 6.9 5.9 3.3 7.3 3.3 6.0 9.6 12.9 8 7Azerbaijan 2.1 -19.7 -11.8 1.3 5.8 10.0 7.4 11.1 9.9 10.6 9 8Belarus 1.7 -12.6 -10.4 2.8 11.4 8.4 3.4 5.8 4.1 4.7 3 2Georgia 3.1 -11.4 2.4 10.5 10.8 2.9 2.9 1.8 4.5 5.4 6 7Kazakhstan 1.2 -12.6 -8.2 0.5 1.7 -1.9 1.7 9.6 13.2 9.5 7 6½Kyrgyzstan -1.2 -20.1 -5.4 -7.1 9.9 2.1 3.6 5.0 5.3 -0.5 4 5Republic of Moldova -4.6 -31.2 -1.4 -7.8 1.3 -6.5 -4.4 1.9 6.1 7.2 6 5Russian Federation -0.1 -12.7 -4.1 -3.6 1.4 -5.3 6.4 10.0 5.0 4.3 4½ 4Tajikistan -0.2 -18.9 -12.5 -4.4 1.7 5.3 3.7 8.3 10.2 9.1 7 7Turkmenistane 3.0 -17.3 -7.2 -6.7 -11.3 5.0 16.0 17.6 20.5 19.3 12 10Ukraine -3.9 -23.0 -12.2 -10.0 -3.0 -1.9 -0.4 5.8 9.0 4.8 4 4½Uzbekistan 2.2 -4.2 -0.9 1.6 2.5 4.4 4.4 4.0 4.5 4.2 4 4
Source: UN/DESA, based on data of Economic Commission for Europe (ECE).a Calculated as a weighted average of individual country growth rates of gross domestic product (GDP), where weights are based on GDP in 1995 prices and exchange rates.b Partly estimated.c Forecast, based in part on Project LINK.d As of 4 February 2003, “Serbia and Montenegro” became the official name of the Federal Republic of Yugoslavia.e Reliability of figures is questionable owing to deflation procedures that are not well documented .
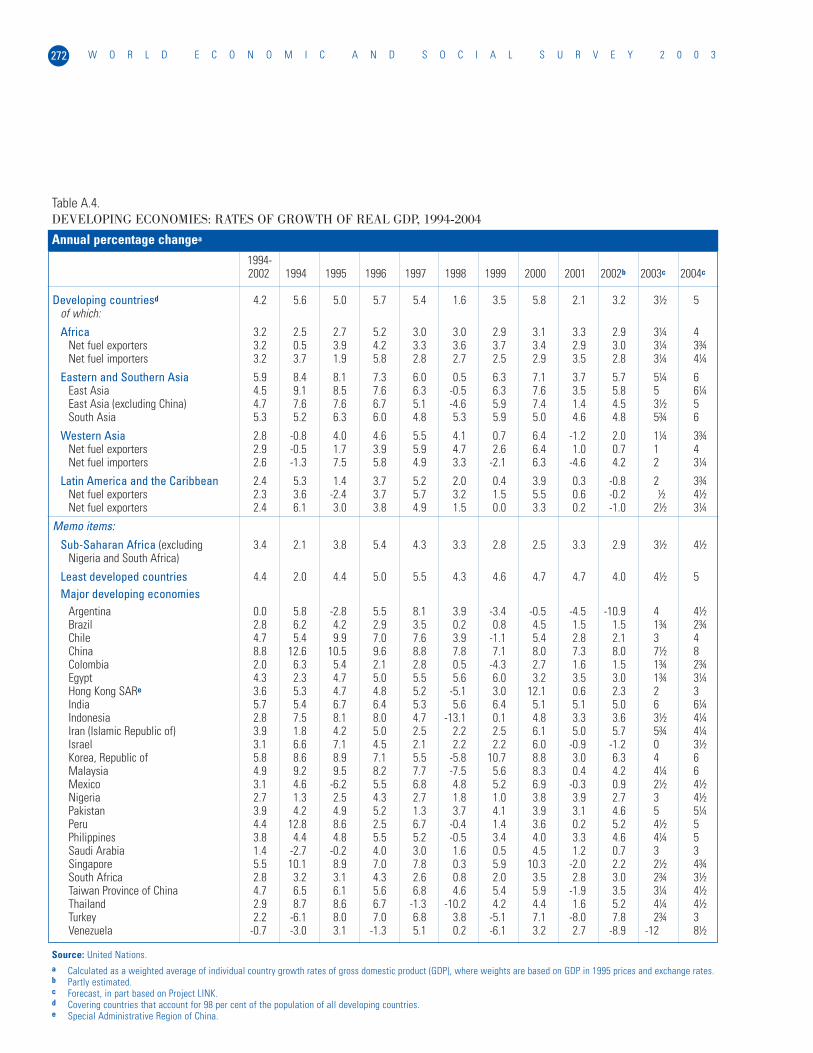
W O R L D E C O N O M I C A N D S O C I A L S U R V E Y 2 0 0 3272
Table A.4.DEVELOPING ECONOMIES: RATES OF GROWTH OF REAL GDP, 1994-2004
Annual percentage changea
Source: United Nations.a Calculated as a weighted average of individual country growth rates of gross domestic product (GDP), where weights are based on GDP in 1995 prices and exchange rates.b Partly estimated.c Forecast, in part based on Project LINK.d Covering countries that account for 98 per cent of the population of all developing countries.e Special Administrative Region of China.
1994-2002 1994 1995 1996 1997 1998 1999 2000 2001 2002b 2003c 2004c
Developing countriesd 4.2 5.6 5.0 5.7 5.4 1.6 3.5 5.8 2.1 3.2 3½ 5of which:
Africa 3.2 2.5 2.7 5.2 3.0 3.0 2.9 3.1 3.3 2.9 3¼ 4Net fuel exporters 3.2 0.5 3.9 4.2 3.3 3.6 3.7 3.4 2.9 3.0 3¼ 3¾Net fuel importers 3.2 3.7 1.9 5.8 2.8 2.7 2.5 2.9 3.5 2.8 3¼ 4¼
Eastern and Southern Asia 5.9 8.4 8.1 7.3 6.0 0.5 6.3 7.1 3.7 5.7 5¼ 6East Asia 4.5 9.1 8.5 7.6 6.3 -0.5 6.3 7.6 3.5 5.8 5 6¼East Asia (excluding China) 4.7 7.6 7.6 6.7 5.1 -4.6 5.9 7.4 1.4 4.5 3½ 5South Asia 5.3 5.2 6.3 6.0 4.8 5.3 5.9 5.0 4.6 4.8 5¾ 6
Western Asia 2.8 -0.8 4.0 4.6 5.5 4.1 0.7 6.4 -1.2 2.0 1¼ 3¾Net fuel exporters 2.9 -0.5 1.7 3.9 5.9 4.7 2.6 6.4 1.0 0.7 1 4Net fuel importers 2.6 -1.3 7.5 5.8 4.9 3.3 -2.1 6.3 -4.6 4.2 2 3¼
Latin America and the Caribbean 2.4 5.3 1.4 3.7 5.2 2.0 0.4 3.9 0.3 -0.8 2 3¾Net fuel exporters 2.3 3.6 -2.4 3.7 5.7 3.2 1.5 5.5 0.6 -0.2 ½ 4½Net fuel exporters 2.4 6.1 3.0 3.8 4.9 1.5 0.0 3.3 0.2 -1.0 2½ 3¼
Memo items:Sub-Saharan Africa (excluding 3.4 2.1 3.8 5.4 4.3 3.3 2.8 2.5 3.3 2.9 3½ 4½
Nigeria and South Africa)
Least developed countries 4.4 2.0 4.4 5.0 5.5 4.3 4.6 4.7 4.7 4.0 4½ 5Major developing economies
Argentina 0.0 5.8 -2.8 5.5 8.1 3.9 -3.4 -0.5 -4.5 -10.9 4 4½Brazil 2.8 6.2 4.2 2.9 3.5 0.2 0.8 4.5 1.5 1.5 1¾ 2¾Chile 4.7 5.4 9.9 7.0 7.6 3.9 -1.1 5.4 2.8 2.1 3 4China 8.8 12.6 10.5 9.6 8.8 7.8 7.1 8.0 7.3 8.0 7½ 8Colombia 2.0 6.3 5.4 2.1 2.8 0.5 -4.3 2.7 1.6 1.5 1¾ 2¾Egypt 4.3 2.3 4.7 5.0 5.5 5.6 6.0 3.2 3.5 3.0 1¾ 3¼Hong Kong SARe 3.6 5.3 4.7 4.8 5.2 -5.1 3.0 12.1 0.6 2.3 2 3India 5.7 5.4 6.7 6.4 5.3 5.6 6.4 5.1 5.1 5.0 6 6¼Indonesia 2.8 7.5 8.1 8.0 4.7 -13.1 0.1 4.8 3.3 3.6 3½ 4¼Iran (Islamic Republic of) 3.9 1.8 4.2 5.0 2.5 2.2 2.5 6.1 5.0 5.7 5¾ 4¼Israel 3.1 6.6 7.1 4.5 2.1 2.2 2.2 6.0 -0.9 -1.2 0 3½Korea, Republic of 5.8 8.6 8.9 7.1 5.5 -5.8 10.7 8.8 3.0 6.3 4 6Malaysia 4.9 9.2 9.5 8.2 7.7 -7.5 5.6 8.3 0.4 4.2 4¼ 6Mexico 3.1 4.6 -6.2 5.5 6.8 4.8 5.2 6.9 -0.3 0.9 2½ 4½Nigeria 2.7 1.3 2.5 4.3 2.7 1.8 1.0 3.8 3.9 2.7 3 4½Pakistan 3.9 4.2 4.9 5.2 1.3 3.7 4.1 3.9 3.1 4.6 5 5¼Peru 4.4 12.8 8.6 2.5 6.7 -0.4 1.4 3.6 0.2 5.2 4½ 5Philippines 3.8 4.4 4.8 5.5 5.2 -0.5 3.4 4.0 3.3 4.6 4¼ 5Saudi Arabia 1.4 -2.7 -0.2 4.0 3.0 1.6 0.5 4.5 1.2 0.7 3 3Singapore 5.5 10.1 8.9 7.0 7.8 0.3 5.9 10.3 -2.0 2.2 2½ 4¾South Africa 2.8 3.2 3.1 4.3 2.6 0.8 2.0 3.5 2.8 3.0 2¾ 3½Taiwan Province of China 4.7 6.5 6.1 5.6 6.8 4.6 5.4 5.9 -1.9 3.5 3¼ 4½Thailand 2.9 8.7 8.6 6.7 -1.3 -10.2 4.2 4.4 1.6 5.2 4¼ 4½Turkey 2.2 -6.1 8.0 7.0 6.8 3.8 -5.1 7.1 -8.0 7.8 2¾ 3Venezuela -0.7 -3.0 3.1 -1.3 5.1 0.2 -6.1 3.2 2.7 -8.9 -12 8½

273S T A T I S T I C A L T A B L E S
Gross domestic Gross domestic Net financialinvestment saving transfer
Totala 1985 21.8 21.4 0.41990 22.9 22.7 0.11995 21.5 22.2 -0.72000 21.9 21.1 0.72001 20.4 19.8 0.7
Major developed economiesa 1985 21.7 21.1 0.51990 22.6 22.4 0.21995 21.5 22.0 -0.42000 21.8 20.5 1.22001 20.1 18.9 1.2
European Union (EU-15) 1985 14.9 15.5 -0.71990 16.6 16.7 -0.11995 14.7 15.9 -1.22000 15.1 15.5 -0.52001 14.4 15.2 -0.8
Germanyb 1985 20.0 23.0 -3.01990 22.7 26.0 -3.31995 22.6 23.3 -0.62000 21.9 22.3 -0.42001 19.6 21.5 -1.9
Japan 1985 28.3 31.7 -3.41990 32.8 33.7 -0.91995 28.2 29.6 -1.42000 25.9 27.4 -1.42001 25.5 26.1 -0.6
United States of America 1985 20.2 17.4 2.71990 17.6 16.4 1.21995 18.1 17.0 1.12000 20.7 17.0 3.72001 18.7 15.2 3.5
Percentage of GDP
Table A.5.DEVELOPED ECONOMIES: INVESTMENT, SAVING AND NET TRANSFER, 1985-2001
Source: OECD, National Accounts.a National data converted to dollars for aggregation at annual average exchange rates.b Prior to 1991, data referring to Western Germany only.
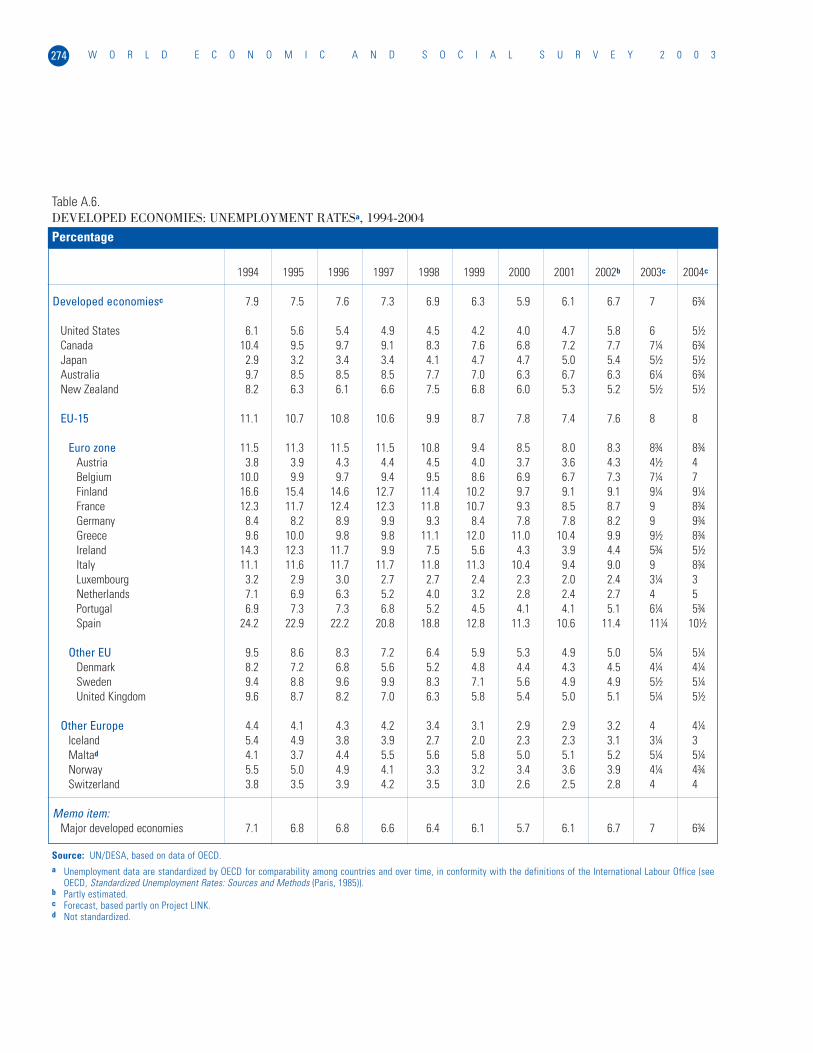
W O R L D E C O N O M I C A N D S O C I A L S U R V E Y 2 0 0 3274
Table A.6.DEVELOPED ECONOMIES: UNEMPLOYMENT RATESa, 1994-2004
Percentage
1994 1995 1996 1997 1998 1999 2000 2001 2002b 2003c 2004c
Developed economiesc 7.9 7.5 7.6 7.3 6.9 6.3 5.9 6.1 6.7 7 6¾
United States 6.1 5.6 5.4 4.9 4.5 4.2 4.0 4.7 5.8 6 5½Canada 10.4 9.5 9.7 9.1 8.3 7.6 6.8 7.2 7.7 7¼ 6¾Japan 2.9 3.2 3.4 3.4 4.1 4.7 4.7 5.0 5.4 5½ 5½Australia 9.7 8.5 8.5 8.5 7.7 7.0 6.3 6.7 6.3 6¼ 6¾New Zealand 8.2 6.3 6.1 6.6 7.5 6.8 6.0 5.3 5.2 5½ 5½
EU-15 11.1 10.7 10.8 10.6 9.9 8.7 7.8 7.4 7.6 8 8
Euro zone 11.5 11.3 11.5 11.5 10.8 9.4 8.5 8.0 8.3 8¾ 8¾Austria 3.8 3.9 4.3 4.4 4.5 4.0 3.7 3.6 4.3 4½ 4Belgium 10.0 9.9 9.7 9.4 9.5 8.6 6.9 6.7 7.3 7¼ 7Finland 16.6 15.4 14.6 12.7 11.4 10.2 9.7 9.1 9.1 9¼ 9¼France 12.3 11.7 12.4 12.3 11.8 10.7 9.3 8.5 8.7 9 8¾Germany 8.4 8.2 8.9 9.9 9.3 8.4 7.8 7.8 8.2 9 9¾Greece 9.6 10.0 9.8 9.8 11.1 12.0 11.0 10.4 9.9 9½ 8¾Ireland 14.3 12.3 11.7 9.9 7.5 5.6 4.3 3.9 4.4 5¾ 5½Italy 11.1 11.6 11.7 11.7 11.8 11.3 10.4 9.4 9.0 9 8¾Luxembourg 3.2 2.9 3.0 2.7 2.7 2.4 2.3 2.0 2.4 3¼ 3Netherlands 7.1 6.9 6.3 5.2 4.0 3.2 2.8 2.4 2.7 4 5Portugal 6.9 7.3 7.3 6.8 5.2 4.5 4.1 4.1 5.1 6¼ 5¾Spain 24.2 22.9 22.2 20.8 18.8 12.8 11.3 10.6 11.4 11¼ 10½
Other EU 9.5 8.6 8.3 7.2 6.4 5.9 5.3 4.9 5.0 5¼ 5¼Denmark 8.2 7.2 6.8 5.6 5.2 4.8 4.4 4.3 4.5 4¼ 4¼Sweden 9.4 8.8 9.6 9.9 8.3 7.1 5.6 4.9 4.9 5½ 5¼United Kingdom 9.6 8.7 8.2 7.0 6.3 5.8 5.4 5.0 5.1 5¼ 5½
Other Europe 4.4 4.1 4.3 4.2 3.4 3.1 2.9 2.9 3.2 4 4¼Iceland 5.4 4.9 3.8 3.9 2.7 2.0 2.3 2.3 3.1 3¼ 3Maltad 4.1 3.7 4.4 5.5 5.6 5.8 5.0 5.1 5.2 5¼ 5¼Norway 5.5 5.0 4.9 4.1 3.3 3.2 3.4 3.6 3.9 4¼ 4¾Switzerland 3.8 3.5 3.9 4.2 3.5 3.0 2.6 2.5 2.8 4 4
Memo item:Major developed economies 7.1 6.8 6.8 6.6 6.4 6.1 5.7 6.1 6.7 7 6¾
Source: UN/DESA, based on data of OECD.a Unemployment data are standardized by OECD for comparability among countries and over time, in conformity with the definitions of the International Labour Office (see
OECD, Standardized Unemployment Rates: Sources and Methods (Paris, 1985)).b Partly estimated.c Forecast, based partly on Project LINK.d Not standardized.
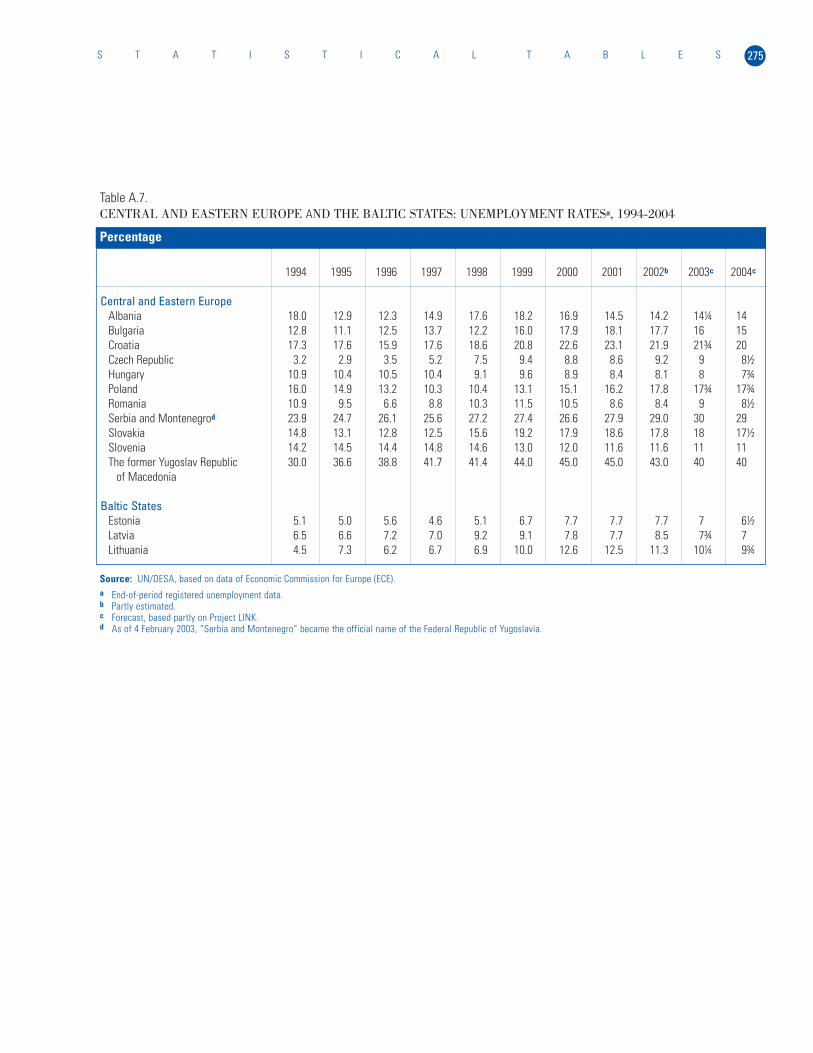
275S T A T I S T I C A L T A B L E S
Percentage
1994 1995 1996 1997 1998 1999 2000 2001 2002b 2003c 2004c
Central and Eastern EuropeAlbania 18.0 12.9 12.3 14.9 17.6 18.2 16.9 14.5 14.2 14¼ 14Bulgaria 12.8 11.1 12.5 13.7 12.2 16.0 17.9 18.1 17.7 16 15Croatia 17.3 17.6 15.9 17.6 18.6 20.8 22.6 23.1 21.9 21¾ 20Czech Republic 3.2 2.9 3.5 5.2 7.5 9.4 8.8 8.6 9.2 9 8½Hungary 10.9 10.4 10.5 10.4 9.1 9.6 8.9 8.4 8.1 8 7¾Poland 16.0 14.9 13.2 10.3 10.4 13.1 15.1 16.2 17.8 17¾ 17¾Romania 10.9 9.5 6.6 8.8 10.3 11.5 10.5 8.6 8.4 9 8½Serbia and Montenegrod 23.9 24.7 26.1 25.6 27.2 27.4 26.6 27.9 29.0 30 29Slovakia 14.8 13.1 12.8 12.5 15.6 19.2 17.9 18.6 17.8 18 17½Slovenia 14.2 14.5 14.4 14.8 14.6 13.0 12.0 11.6 11.6 11 11The former Yugoslav Republic 30.0 36.6 38.8 41.7 41.4 44.0 45.0 45.0 43.0 40 40
of Macedonia
Baltic StatesEstonia 5.1 5.0 5.6 4.6 5.1 6.7 7.7 7.7 7.7 7 6½Latvia 6.5 6.6 7.2 7.0 9.2 9.1 7.8 7.7 8.5 7¾ 7Lithuania 4.5 7.3 6.2 6.7 6.9 10.0 12.6 12.5 11.3 10¼ 9¾
Source: UN/DESA, based on data of Economic Commission for Europe (ECE).a End-of-period registered unemployment data.b Partly estimated.c Forecast, based partly on Project LINK.d As of 4 February 2003, “Serbia and Montenegro” became the official name of the Federal Republic of Yugoslavia.
Table A.7.CENTRAL AND EASTERN EUROPE AND THE BALTIC STATES: UNEMPLOYMENT RATESa, 1994-2004
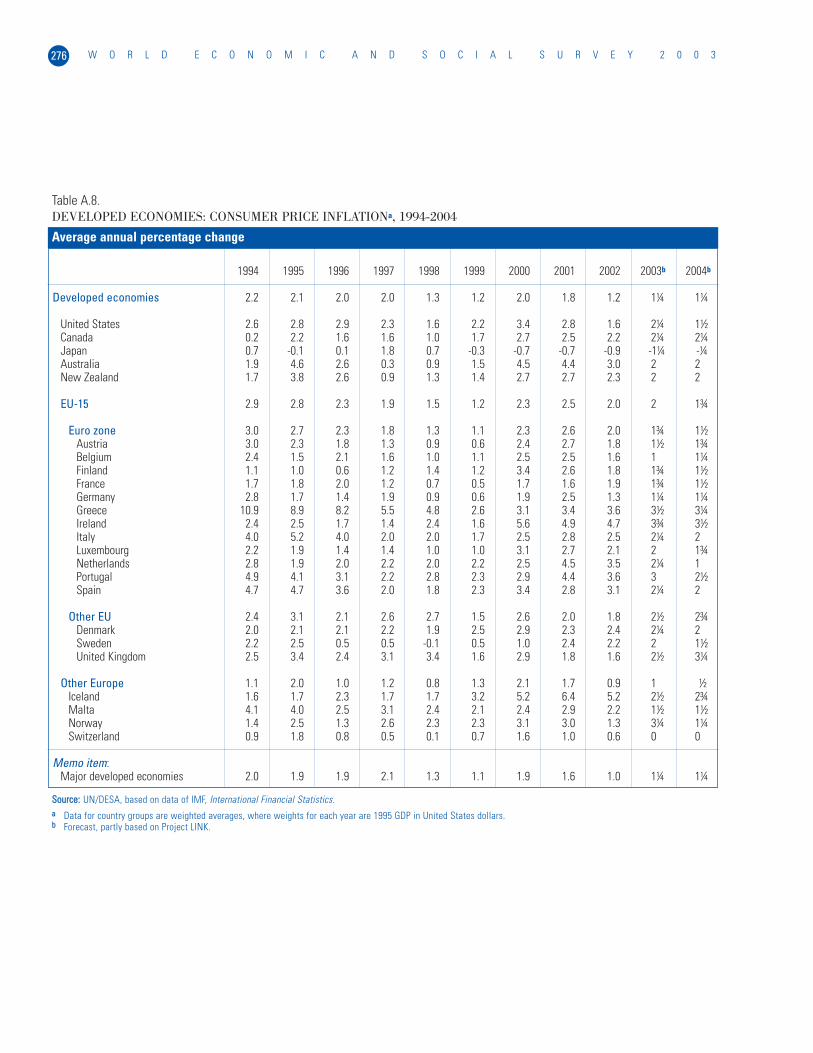
W O R L D E C O N O M I C A N D S O C I A L S U R V E Y 2 0 0 3276
Table A.8.DEVELOPED ECONOMIES: CONSUMER PRICE INFLATIONa, 1994-2004
Average annual percentage change
SSoouurrccee:: UN/DESA, based on data of IMF, International Financial Statistics.aa Data for country groups are weighted averages, where weights for each year are 1995 GDP in United States dollars.bb Forecast, partly based on Project LINK.
1994 1995 1996 1997 1998 1999 2000 2001 2002 2003b 2004b
Developed economies 2.2 2.1 2.0 2.0 1.3 1.2 2.0 1.8 1.2 1¼ 1¼
United States 2.6 2.8 2.9 2.3 1.6 2.2 3.4 2.8 1.6 2¼ 1½Canada 0.2 2.2 1.6 1.6 1.0 1.7 2.7 2.5 2.2 2¼ 2¼Japan 0.7 -0.1 0.1 1.8 0.7 -0.3 -0.7 -0.7 -0.9 -1¼ -¼Australia 1.9 4.6 2.6 0.3 0.9 1.5 4.5 4.4 3.0 2 2New Zealand 1.7 3.8 2.6 0.9 1.3 1.4 2.7 2.7 2.3 2 2
EU-15 2.9 2.8 2.3 1.9 1.5 1.2 2.3 2.5 2.0 2 1¾
Euro zone 3.0 2.7 2.3 1.8 1.3 1.1 2.3 2.6 2.0 1¾ 1½Austria 3.0 2.3 1.8 1.3 0.9 0.6 2.4 2.7 1.8 1½ 1¾Belgium 2.4 1.5 2.1 1.6 1.0 1.1 2.5 2.5 1.6 1 1¼Finland 1.1 1.0 0.6 1.2 1.4 1.2 3.4 2.6 1.8 1¾ 1½France 1.7 1.8 2.0 1.2 0.7 0.5 1.7 1.6 1.9 1¾ 1½Germany 2.8 1.7 1.4 1.9 0.9 0.6 1.9 2.5 1.3 1¼ 1¼Greece 10.9 8.9 8.2 5.5 4.8 2.6 3.1 3.4 3.6 3½ 3¼Ireland 2.4 2.5 1.7 1.4 2.4 1.6 5.6 4.9 4.7 3¾ 3½Italy 4.0 5.2 4.0 2.0 2.0 1.7 2.5 2.8 2.5 2¼ 2Luxembourg 2.2 1.9 1.4 1.4 1.0 1.0 3.1 2.7 2.1 2 1¾Netherlands 2.8 1.9 2.0 2.2 2.0 2.2 2.5 4.5 3.5 2¼ 1Portugal 4.9 4.1 3.1 2.2 2.8 2.3 2.9 4.4 3.6 3 2½Spain 4.7 4.7 3.6 2.0 1.8 2.3 3.4 2.8 3.1 2¼ 2
Other EU 2.4 3.1 2.1 2.6 2.7 1.5 2.6 2.0 1.8 2½ 2¾Denmark 2.0 2.1 2.1 2.2 1.9 2.5 2.9 2.3 2.4 2¼ 2Sweden 2.2 2.5 0.5 0.5 -0.1 0.5 1.0 2.4 2.2 2 1½United Kingdom 2.5 3.4 2.4 3.1 3.4 1.6 2.9 1.8 1.6 2½ 3¼
Other Europe 1.1 2.0 1.0 1.2 0.8 1.3 2.1 1.7 0.9 1 ½Iceland 1.6 1.7 2.3 1.7 1.7 3.2 5.2 6.4 5.2 2½ 2¾Malta 4.1 4.0 2.5 3.1 2.4 2.1 2.4 2.9 2.2 1½ 1½Norway 1.4 2.5 1.3 2.6 2.3 2.3 3.1 3.0 1.3 3¼ 1¼Switzerland 0.9 1.8 0.8 0.5 0.1 0.7 1.6 1.0 0.6 0 0
Memo item:Major developed economies 2.0 1.9 1.9 2.1 1.3 1.1 1.9 1.6 1.0 1¼ 1¼
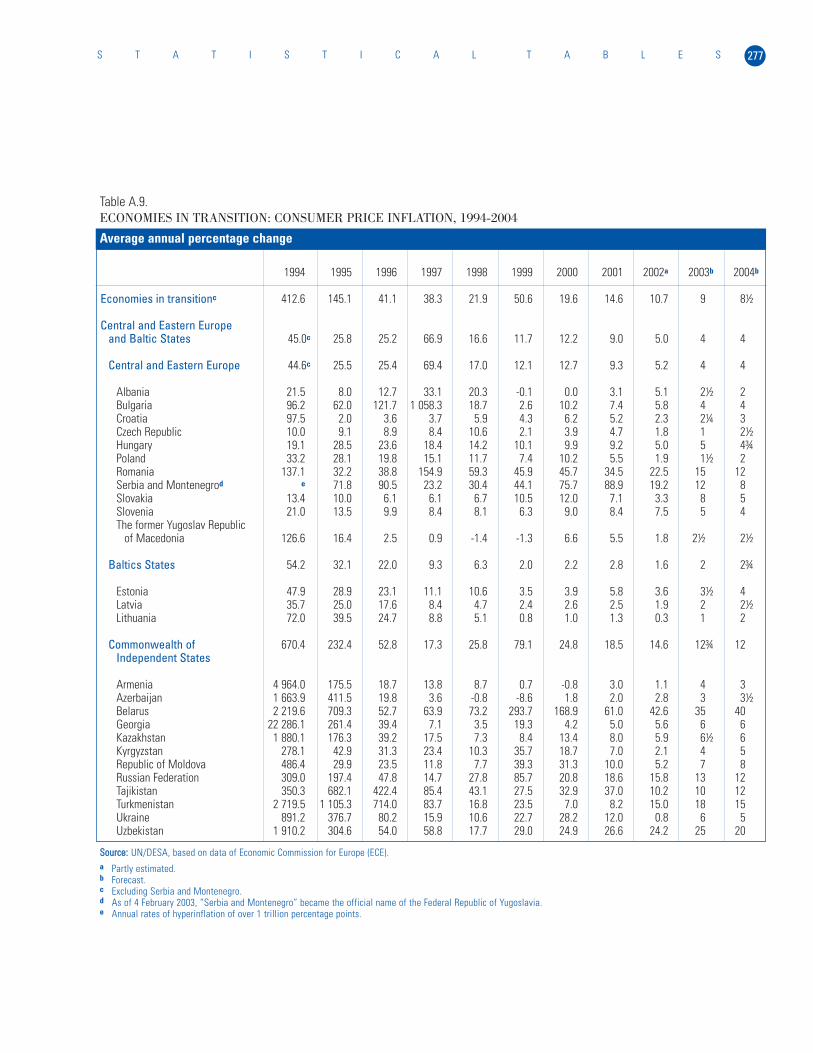
277S T A T I S T I C A L T A B L E S
Table A.9.ECONOMIES IN TRANSITION: CONSUMER PRICE INFLATION, 1994-2004
Average annual percentage change
SSoouurrccee:: UN/DESA, based on data of Economic Commission for Europe (ECE). a Partly estimated.b Forecast.c Excluding Serbia and Montenegro.d As of 4 February 2003, “Serbia and Montenegro” became the official name of the Federal Republic of Yugoslavia.e Annual rates of hyperinflation of over 1 trillion percentage points.
1994 1995 1996 1997 1998 1999 2000 2001 2002a 2003b 2004b
Economies in transitionc 412.6 145.1 41.1 38.3 21.9 50.6 19.6 14.6 10.7 9 8½
Central and Eastern Europeand Baltic States 45.0c 25.8 25.2 66.9 16.6 11.7 12.2 9.0 5.0 4 4
Central and Eastern Europe 44.6c 25.5 25.4 69.4 17.0 12.1 12.7 9.3 5.2 4 4
Albania 21.5 8.0 12.7 33.1 20.3 -0.1 0.0 3.1 5.1 2½ 2Bulgaria 96.2 62.0 121.7 1 058.3 18.7 2.6 10.2 7.4 5.8 4 4Croatia 97.5 2.0 3.6 3.7 5.9 4.3 6.2 5.2 2.3 2¼ 3Czech Republic 10.0 9.1 8.9 8.4 10.6 2.1 3.9 4.7 1.8 1 2½Hungary 19.1 28.5 23.6 18.4 14.2 10.1 9.9 9.2 5.0 5 4¾Poland 33.2 28.1 19.8 15.1 11.7 7.4 10.2 5.5 1.9 1½ 2Romania 137.1 32.2 38.8 154.9 59.3 45.9 45.7 34.5 22.5 15 12Serbia and Montenegrod e 71.8 90.5 23.2 30.4 44.1 75.7 88.9 19.2 12 8Slovakia 13.4 10.0 6.1 6.1 6.7 10.5 12.0 7.1 3.3 8 5Slovenia 21.0 13.5 9.9 8.4 8.1 6.3 9.0 8.4 7.5 5 4The former Yugoslav Republic
of Macedonia 126.6 16.4 2.5 0.9 -1.4 -1.3 6.6 5.5 1.8 2½ 2½
Baltics States 54.2 32.1 22.0 9.3 6.3 2.0 2.2 2.8 1.6 2 2¾
Estonia 47.9 28.9 23.1 11.1 10.6 3.5 3.9 5.8 3.6 3½ 4Latvia 35.7 25.0 17.6 8.4 4.7 2.4 2.6 2.5 1.9 2 2½Lithuania 72.0 39.5 24.7 8.8 5.1 0.8 1.0 1.3 0.3 1 2
Commonwealth of 670.4 232.4 52.8 17.3 25.8 79.1 24.8 18.5 14.6 12¾ 12Independent States
Armenia 4 964.0 175.5 18.7 13.8 8.7 0.7 -0.8 3.0 1.1 4 3Azerbaijan 1 663.9 411.5 19.8 3.6 -0.8 -8.6 1.8 2.0 2.8 3 3½Belarus 2 219.6 709.3 52.7 63.9 73.2 293.7 168.9 61.0 42.6 35 40Georgia 22 286.1 261.4 39.4 7.1 3.5 19.3 4.2 5.0 5.6 6 6Kazakhstan 1 880.1 176.3 39.2 17.5 7.3 8.4 13.4 8.0 5.9 6½ 6 Kyrgyzstan 278.1 42.9 31.3 23.4 10.3 35.7 18.7 7.0 2.1 4 5Republic of Moldova 486.4 29.9 23.5 11.8 7.7 39.3 31.3 10.0 5.2 7 8Russian Federation 309.0 197.4 47.8 14.7 27.8 85.7 20.8 18.6 15.8 13 12Tajikistan 350.3 682.1 422.4 85.4 43.1 27.5 32.9 37.0 10.2 10 12Turkmenistan 2 719.5 1 105.3 714.0 83.7 16.8 23.5 7.0 8.2 15.0 18 15Ukraine 891.2 376.7 80.2 15.9 10.6 22.7 28.2 12.0 0.8 6 5Uzbekistan 1 910.2 304.6 54.0 58.8 17.7 29.0 24.9 26.6 24.2 25 20
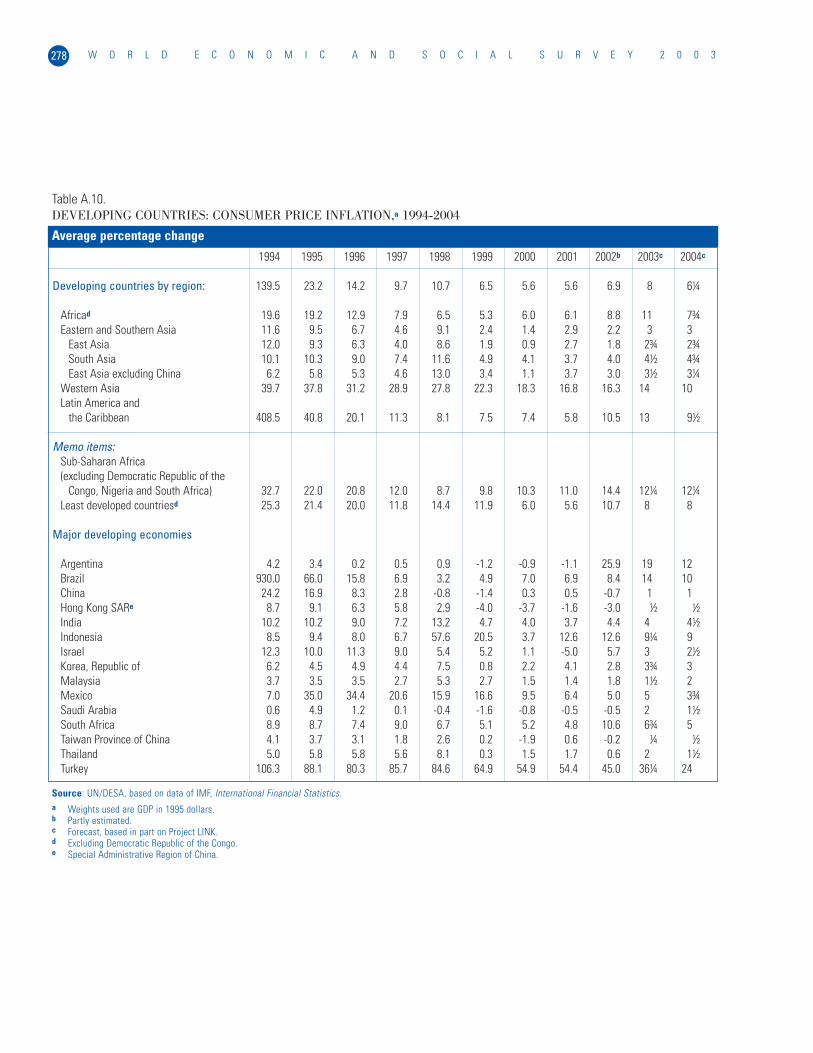
W O R L D E C O N O M I C A N D S O C I A L S U R V E Y 2 0 0 3278
Table A.10.DEVELOPING COUNTRIES: CONSUMER PRICE INFLATION,a 1994-2004
Average percentage change
1994 1995 1996 1997 1998 1999 2000 2001 2002b 2003c 2004c
Developing countries by region: 139.5 23.2 14.2 9.7 10.7 6.5 5.6 5.6 6.9 8 6¼
Africad 19.6 19.2 12.9 7.9 6.5 5.3 6.0 6.1 8.8 11 7¾Eastern and Southern Asia 11.6 9.5 6.7 4.6 9.1 2.4 1.4 2.9 2.2 3 3
East Asia 12.0 9.3 6.3 4.0 8.6 1.9 0.9 2.7 1.8 2¾ 2¾South Asia 10.1 10.3 9.0 7.4 11.6 4.9 4.1 3.7 4.0 4½ 4¾East Asia excluding China 6.2 5.8 5.3 4.6 13.0 3.4 1.1 3.7 3.0 3½ 3¼
Western Asia 39.7 37.8 31.2 28.9 27.8 22.3 18.3 16.8 16.3 14 10Latin America and
the Caribbean 408.5 40.8 20.1 11.3 8.1 7.5 7.4 5.8 10.5 13 9½
Memo items:Sub-Saharan Africa(excluding Democratic Republic of the
Congo, Nigeria and South Africa) 32.7 22.0 20.8 12.0 8.7 9.8 10.3 11.0 14.4 12¼ 12¼Least developed countriesd 25.3 21.4 20.0 11.8 14.4 11.9 6.0 5.6 10.7 8 8
Major developing economies
Argentina 4.2 3.4 0.2 0.5 0.9 -1.2 -0.9 -1.1 25.9 19 12Brazil 930.0 66.0 15.8 6.9 3.2 4.9 7.0 6.9 8.4 14 10China 24.2 16.9 8.3 2.8 -0.8 -1.4 0.3 0.5 -0.7 1 1Hong Kong SARe 8.7 9.1 6.3 5.8 2.9 -4.0 -3.7 -1.6 -3.0 ½ ½India 10.2 10.2 9.0 7.2 13.2 4.7 4.0 3.7 4.4 4 4½Indonesia 8.5 9.4 8.0 6.7 57.6 20.5 3.7 12.6 12.6 9¼ 9Israel 12.3 10.0 11.3 9.0 5.4 5.2 1.1 -5.0 5.7 3 2½Korea, Republic of 6.2 4.5 4.9 4.4 7.5 0.8 2.2 4.1 2.8 3¾ 3Malaysia 3.7 3.5 3.5 2.7 5.3 2.7 1.5 1.4 1.8 1½ 2Mexico 7.0 35.0 34.4 20.6 15.9 16.6 9.5 6.4 5.0 5 3¾Saudi Arabia 0.6 4.9 1.2 0.1 -0.4 -1.6 -0.8 -0.5 -0.5 2 1½South Africa 8.9 8.7 7.4 9.0 6.7 5.1 5.2 4.8 10.6 6¾ 5Taiwan Province of China 4.1 3.7 3.1 1.8 2.6 0.2 -1.9 0.6 -0.2 ¼ ½Thailand 5.0 5.8 5.8 5.6 8.1 0.3 1.5 1.7 0.6 2 1½Turkey 106.3 88.1 80.3 85.7 84.6 64.9 54.9 54.4 45.0 36¼ 24
Source: UN/DESA, based on data of IMF, International Financial Statistics.a Weights used are GDP in 1995 dollars.b Partly estimated.c Forecast, based in part on Project LINK.d Excluding Democratic Republic of the Congo.e Special Administrative Region of China.
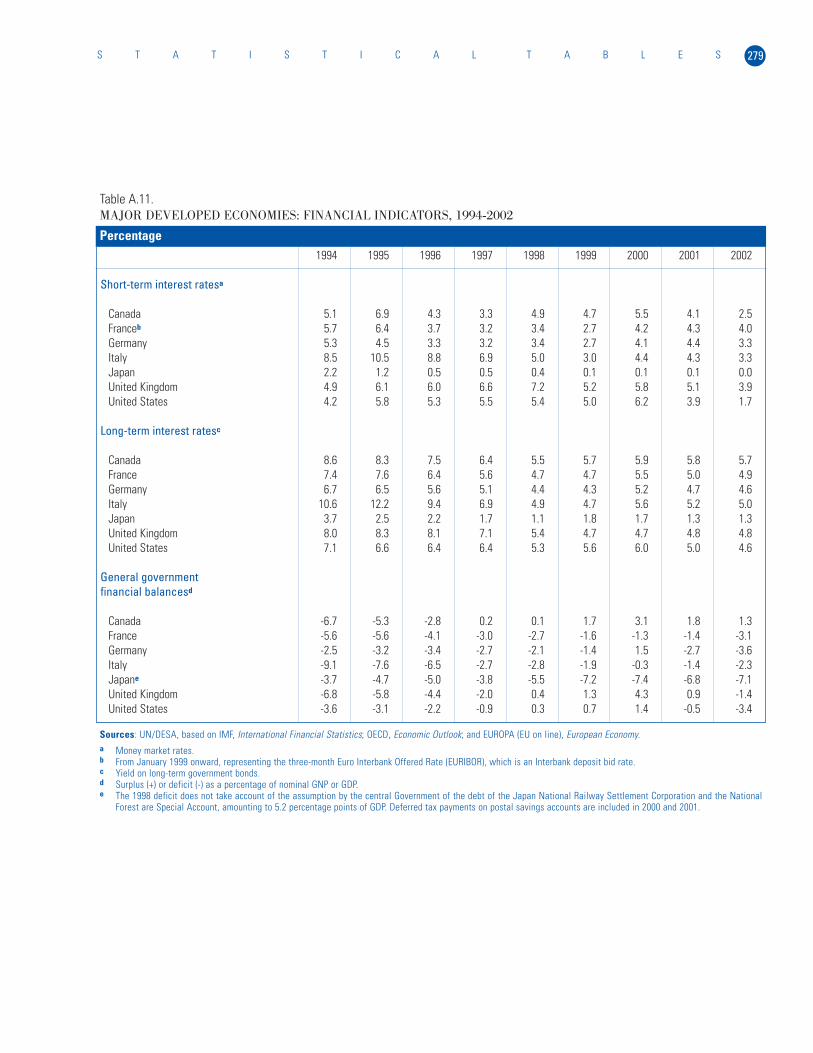
279S T A T I S T I C A L T A B L E S
Table A.11.MAJOR DEVELOPED ECONOMIES: FINANCIAL INDICATORS, 1994-2002
Percentage1994 1995 1996 1997 1998 1999 2000 2001 2002
Short-term interest ratesa
Canada 5.1 6.9 4.3 3.3 4.9 4.7 5.5 4.1 2.5Franceb 5.7 6.4 3.7 3.2 3.4 2.7 4.2 4.3 4.0Germany 5.3 4.5 3.3 3.2 3.4 2.7 4.1 4.4 3.3Italy 8.5 10.5 8.8 6.9 5.0 3.0 4.4 4.3 3.3Japan 2.2 1.2 0.5 0.5 0.4 0.1 0.1 0.1 0.0United Kingdom 4.9 6.1 6.0 6.6 7.2 5.2 5.8 5.1 3.9United States 4.2 5.8 5.3 5.5 5.4 5.0 6.2 3.9 1.7
Long-term interest ratesc
Canada 8.6 8.3 7.5 6.4 5.5 5.7 5.9 5.8 5.7France 7.4 7.6 6.4 5.6 4.7 4.7 5.5 5.0 4.9Germany 6.7 6.5 5.6 5.1 4.4 4.3 5.2 4.7 4.6Italy 10.6 12.2 9.4 6.9 4.9 4.7 5.6 5.2 5.0Japan 3.7 2.5 2.2 1.7 1.1 1.8 1.7 1.3 1.3United Kingdom 8.0 8.3 8.1 7.1 5.4 4.7 4.7 4.8 4.8United States 7.1 6.6 6.4 6.4 5.3 5.6 6.0 5.0 4.6
General government financial balancesd
Canada -6.7 -5.3 -2.8 0.2 0.1 1.7 3.1 1.8 1.3France -5.6 -5.6 -4.1 -3.0 -2.7 -1.6 -1.3 -1.4 -3.1Germany -2.5 -3.2 -3.4 -2.7 -2.1 -1.4 1.5 -2.7 -3.6Italy -9.1 -7.6 -6.5 -2.7 -2.8 -1.9 -0.3 -1.4 -2.3Japane -3.7 -4.7 -5.0 -3.8 -5.5 -7.2 -7.4 -6.8 -7.1United Kingdom -6.8 -5.8 -4.4 -2.0 0.4 1.3 4.3 0.9 -1.4United States -3.6 -3.1 -2.2 -0.9 0.3 0.7 1.4 -0.5 -3.4
Sources: UN/DESA, based on IMF, International Financial Statistics; OECD, Economic Outlook; and EUROPA (EU on line), European Economy.a Money market rates.b From January 1999 onward, representing the three-month Euro Interbank Offered Rate (EURIBOR), which is an Interbank deposit bid rate.c Yield on long-term government bonds.d Surplus (+) or deficit (-) as a percentage of nominal GNP or GDP.e The 1998 deficit does not take account of the assumption by the central Government of the debt of the Japan National Railway Settlement Corporation and the National
Forest are Special Account, amounting to 5.2 percentage points of GDP. Deferred tax payments on postal savings accounts are included in 2000 and 2001.
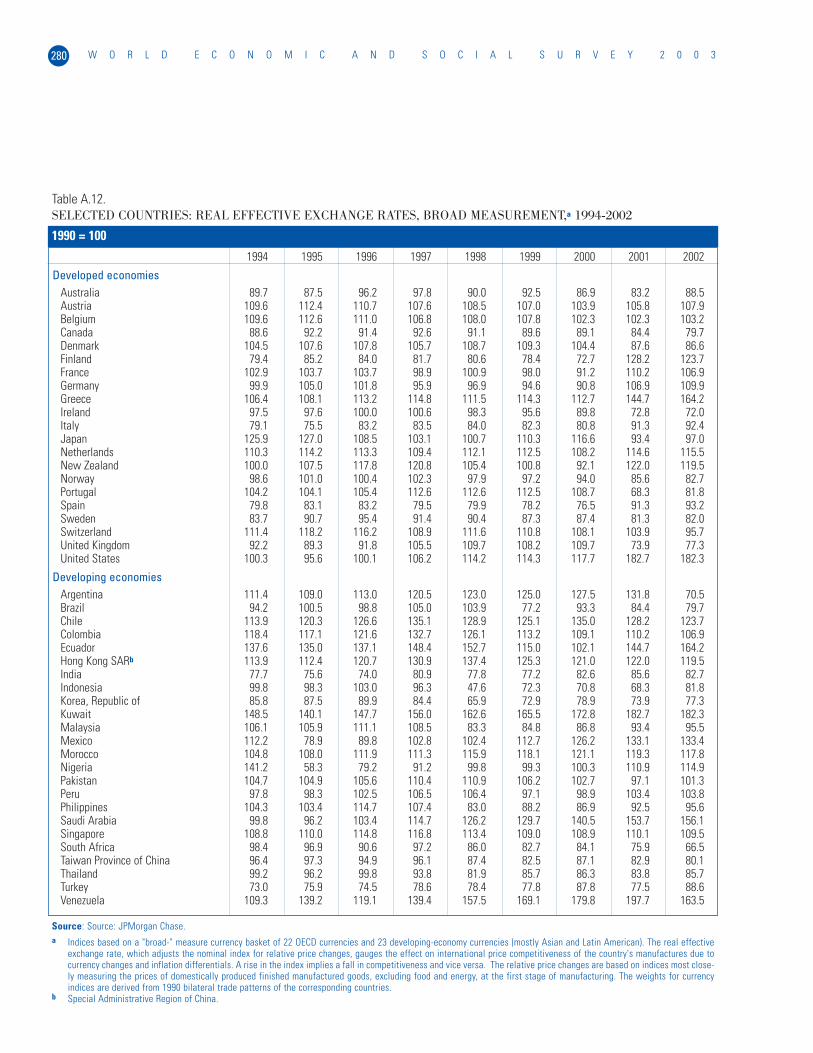
W O R L D E C O N O M I C A N D S O C I A L S U R V E Y 2 0 0 3280
Table A.12.SELECTED COUNTRIES: REAL EFFECTIVE EXCHANGE RATES, BROAD MEASUREMENT,a 1994-2002
1994 1995 1996 1997 1998 1999 2000 2001 2002
Developed economiesAustralia 89.7 87.5 96.2 97.8 90.0 92.5 86.9 83.2 88.5Austria 109.6 112.4 110.7 107.6 108.5 107.0 103.9 105.8 107.9Belgium 109.6 112.6 111.0 106.8 108.0 107.8 102.3 102.3 103.2Canada 88.6 92.2 91.4 92.6 91.1 89.6 89.1 84.4 79.7Denmark 104.5 107.6 107.8 105.7 108.7 109.3 104.4 87.6 86.6Finland 79.4 85.2 84.0 81.7 80.6 78.4 72.7 128.2 123.7France 102.9 103.7 103.7 98.9 100.9 98.0 91.2 110.2 106.9Germany 99.9 105.0 101.8 95.9 96.9 94.6 90.8 106.9 109.9Greece 106.4 108.1 113.2 114.8 111.5 114.3 112.7 144.7 164.2Ireland 97.5 97.6 100.0 100.6 98.3 95.6 89.8 72.8 72.0Italy 79.1 75.5 83.2 83.5 84.0 82.3 80.8 91.3 92.4Japan 125.9 127.0 108.5 103.1 100.7 110.3 116.6 93.4 97.0Netherlands 110.3 114.2 113.3 109.4 112.1 112.5 108.2 114.6 115.5New Zealand 100.0 107.5 117.8 120.8 105.4 100.8 92.1 122.0 119.5Norway 98.6 101.0 100.4 102.3 97.9 97.2 94.0 85.6 82.7Portugal 104.2 104.1 105.4 112.6 112.6 112.5 108.7 68.3 81.8Spain 79.8 83.1 83.2 79.5 79.9 78.2 76.5 91.3 93.2Sweden 83.7 90.7 95.4 91.4 90.4 87.3 87.4 81.3 82.0Switzerland 111.4 118.2 116.2 108.9 111.6 110.8 108.1 103.9 95.7United Kingdom 92.2 89.3 91.8 105.5 109.7 108.2 109.7 73.9 77.3United States 100.3 95.6 100.1 106.2 114.2 114.3 117.7 182.7 182.3
Developing economiesArgentina 111.4 109.0 113.0 120.5 123.0 125.0 127.5 131.8 70.5Brazil 94.2 100.5 98.8 105.0 103.9 77.2 93.3 84.4 79.7Chile 113.9 120.3 126.6 135.1 128.9 125.1 135.0 128.2 123.7Colombia 118.4 117.1 121.6 132.7 126.1 113.2 109.1 110.2 106.9Ecuador 137.6 135.0 137.1 148.4 152.7 115.0 102.1 144.7 164.2Hong Kong SARb 113.9 112.4 120.7 130.9 137.4 125.3 121.0 122.0 119.5India 77.7 75.6 74.0 80.9 77.8 77.2 82.6 85.6 82.7Indonesia 99.8 98.3 103.0 96.3 47.6 72.3 70.8 68.3 81.8Korea, Republic of 85.8 87.5 89.9 84.4 65.9 72.9 78.9 73.9 77.3Kuwait 148.5 140.1 147.7 156.0 162.6 165.5 172.8 182.7 182.3Malaysia 106.1 105.9 111.1 108.5 83.3 84.8 86.8 93.4 95.5Mexico 112.2 78.9 89.8 102.8 102.4 112.7 126.2 133.1 133.4Morocco 104.8 108.0 111.9 111.3 115.9 118.1 121.1 119.3 117.8Nigeria 141.2 58.3 79.2 91.2 99.8 99.3 100.3 110.9 114.9Pakistan 104.7 104.9 105.6 110.4 110.9 106.2 102.7 97.1 101.3Peru 97.8 98.3 102.5 106.5 106.4 97.1 98.9 103.4 103.8Philippines 104.3 103.4 114.7 107.4 83.0 88.2 86.9 92.5 95.6Saudi Arabia 99.8 96.2 103.4 114.7 126.2 129.7 140.5 153.7 156.1Singapore 108.8 110.0 114.8 116.8 113.4 109.0 108.9 110.1 109.5South Africa 98.4 96.9 90.6 97.2 86.0 82.7 84.1 75.9 66.5Taiwan Province of China 96.4 97.3 94.9 96.1 87.4 82.5 87.1 82.9 80.1Thailand 99.2 96.2 99.8 93.8 81.9 85.7 86.3 83.8 85.7Turkey 73.0 75.9 74.5 78.6 78.4 77.8 87.8 77.5 88.6Venezuela 109.3 139.2 119.1 139.4 157.5 169.1 179.8 197.7 163.5
1990 = 100
Source: Source: JPMorgan Chase.a Indices based on a "broad-" measure currency basket of 22 OECD currencies and 23 developing-economy currencies (mostly Asian and Latin American). The real effective
exchange rate, which adjusts the nominal index for relative price changes, gauges the effect on international price competitiveness of the country's manufactures due tocurrency changes and inflation differentials. A rise in the index implies a fall in competitiveness and vice versa. The relative price changes are based on indices most close-ly measuring the prices of domestically produced finished manufactured goods, excluding food and energy, at the first stage of manufacturing. The weights for currencyindices are derived from 1990 bilateral trade patterns of the corresponding countries.
b Special Administrative Region of China.
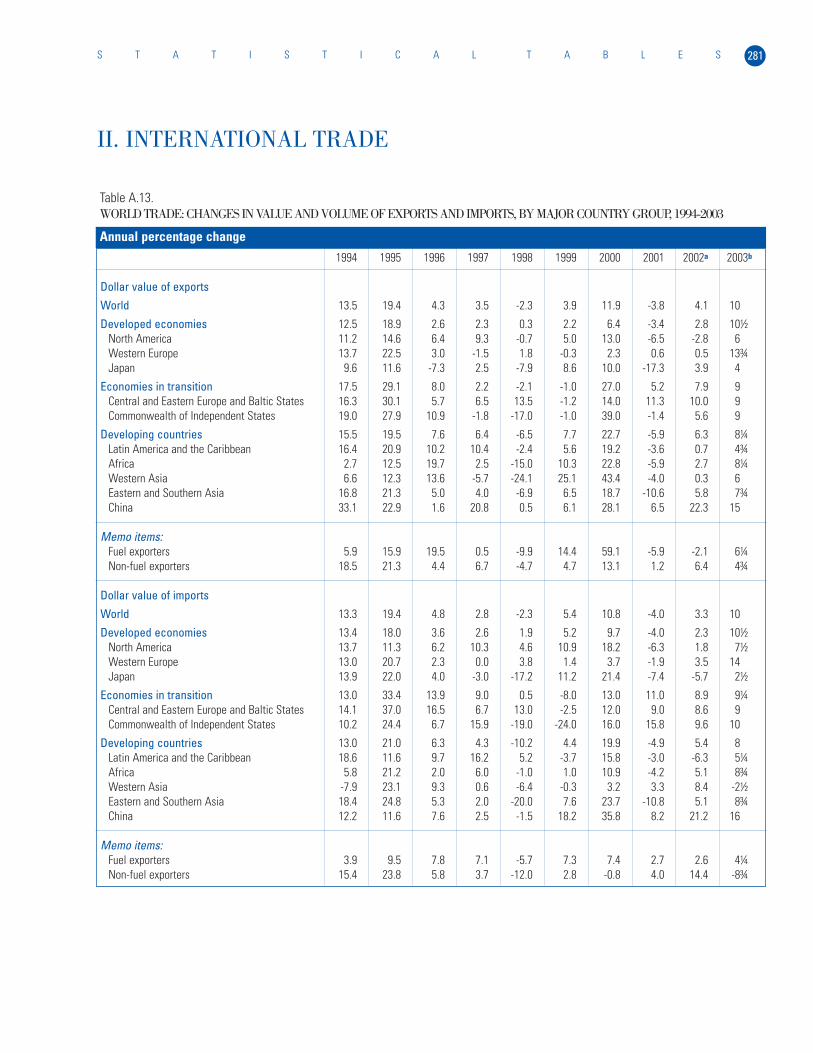
281S T A T I S T I C A L T A B L E S
II. INTERNATIONAL TRADE
Table A.13.WORLD TRADE: CHANGES IN VALUE AND VOLUME OF EXPORTS AND IMPORTS, BY MAJOR COUNTRY GROUP, 1994-2003
Annual percentage change
1994 1995 1996 1997 1998 1999 2000 2001 2002a 2003b
Dollar value of exports
World 13.5 19.4 4.3 3.5 -2.3 3.9 11.9 -3.8 4.1 10
Developed economies 12.5 18.9 2.6 2.3 0.3 2.2 6.4 -3.4 2.8 10½North America 11.2 14.6 6.4 9.3 -0.7 5.0 13.0 -6.5 -2.8 6Western Europe 13.7 22.5 3.0 -1.5 1.8 -0.3 2.3 0.6 0.5 13¾Japan 9.6 11.6 -7.3 2.5 -7.9 8.6 10.0 -17.3 3.9 4
Economies in transition 17.5 29.1 8.0 2.2 -2.1 -1.0 27.0 5.2 7.9 9Central and Eastern Europe and Baltic States 16.3 30.1 5.7 6.5 13.5 -1.2 14.0 11.3 10.0 9Commonwealth of Independent States 19.0 27.9 10.9 -1.8 -17.0 -1.0 39.0 -1.4 5.6 9
Developing countries 15.5 19.5 7.6 6.4 -6.5 7.7 22.7 -5.9 6.3 8¼Latin America and the Caribbean 16.4 20.9 10.2 10.4 -2.4 5.6 19.2 -3.6 0.7 4¾Africa 2.7 12.5 19.7 2.5 -15.0 10.3 22.8 -5.9 2.7 8¼Western Asia 6.6 12.3 13.6 -5.7 -24.1 25.1 43.4 -4.0 0.3 6Eastern and Southern Asia 16.8 21.3 5.0 4.0 -6.9 6.5 18.7 -10.6 5.8 7¾China 33.1 22.9 1.6 20.8 0.5 6.1 28.1 6.5 22.3 15
Memo items:Fuel exporters 5.9 15.9 19.5 0.5 -9.9 14.4 59.1 -5.9 -2.1 6¼Non-fuel exporters 18.5 21.3 4.4 6.7 -4.7 4.7 13.1 1.2 6.4 4¾
Dollar value of imports
World 13.3 19.4 4.8 2.8 -2.3 5.4 10.8 -4.0 3.3 10
Developed economies 13.4 18.0 3.6 2.6 1.9 5.2 9.7 -4.0 2.3 10½North America 13.7 11.3 6.2 10.3 4.6 10.9 18.2 -6.3 1.8 7½Western Europe 13.0 20.7 2.3 0.0 3.8 1.4 3.7 -1.9 3.5 14Japan 13.9 22.0 4.0 -3.0 -17.2 11.2 21.4 -7.4 -5.7 2½
Economies in transition 13.0 33.4 13.9 9.0 0.5 -8.0 13.0 11.0 8.9 9¼Central and Eastern Europe and Baltic States 14.1 37.0 16.5 6.7 13.0 -2.5 12.0 9.0 8.6 9Commonwealth of Independent States 10.2 24.4 6.7 15.9 -19.0 -24.0 16.0 15.8 9.6 10
Developing countries 13.0 21.0 6.3 4.3 -10.2 4.4 19.9 -4.9 5.4 8Latin America and the Caribbean 18.6 11.6 9.7 16.2 5.2 -3.7 15.8 -3.0 -6.3 5¼Africa 5.8 21.2 2.0 6.0 -1.0 1.0 10.9 -4.2 5.1 8¾Western Asia -7.9 23.1 9.3 0.6 -6.4 -0.3 3.2 3.3 8.4 -2½Eastern and Southern Asia 18.4 24.8 5.3 2.0 -20.0 7.6 23.7 -10.8 5.1 8¾China 12.2 11.6 7.6 2.5 -1.5 18.2 35.8 8.2 21.2 16
Memo items:Fuel exporters 3.9 9.5 7.8 7.1 -5.7 7.3 7.4 2.7 2.6 4¼Non-fuel exporters 15.4 23.8 5.8 3.7 -12.0 2.8 -0.8 4.0 14.4 -8¾
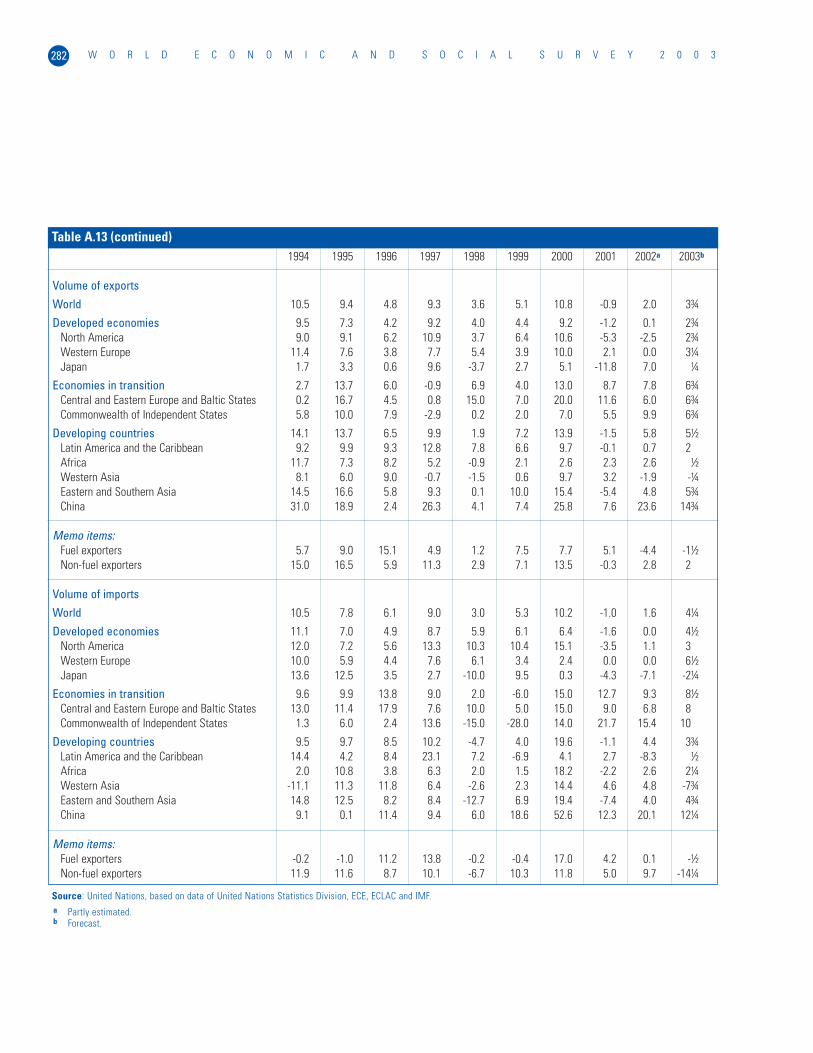
W O R L D E C O N O M I C A N D S O C I A L S U R V E Y 2 0 0 3282
1994 1995 1996 1997 1998 1999 2000 2001 2002a 2003b
Volume of exports
World 10.5 9.4 4.8 9.3 3.6 5.1 10.8 -0.9 2.0 3¾
Developed economies 9.5 7.3 4.2 9.2 4.0 4.4 9.2 -1.2 0.1 2¾North America 9.0 9.1 6.2 10.9 3.7 6.4 10.6 -5.3 -2.5 2¾Western Europe 11.4 7.6 3.8 7.7 5.4 3.9 10.0 2.1 0.0 3¼Japan 1.7 3.3 0.6 9.6 -3.7 2.7 5.1 -11.8 7.0 ¼
Economies in transition 2.7 13.7 6.0 -0.9 6.9 4.0 13.0 8.7 7.8 6¾Central and Eastern Europe and Baltic States 0.2 16.7 4.5 0.8 15.0 7.0 20.0 11.6 6.0 6¾Commonwealth of Independent States 5.8 10.0 7.9 -2.9 0.2 2.0 7.0 5.5 9.9 6¾
Developing countries 14.1 13.7 6.5 9.9 1.9 7.2 13.9 -1.5 5.8 5½Latin America and the Caribbean 9.2 9.9 9.3 12.8 7.8 6.6 9.7 -0.1 0.7 2Africa 11.7 7.3 8.2 5.2 -0.9 2.1 2.6 2.3 2.6 ½Western Asia 8.1 6.0 9.0 -0.7 -1.5 0.6 9.7 3.2 -1.9 -¼Eastern and Southern Asia 14.5 16.6 5.8 9.3 0.1 10.0 15.4 -5.4 4.8 5¾China 31.0 18.9 2.4 26.3 4.1 7.4 25.8 7.6 23.6 14¾
Memo items:Fuel exporters 5.7 9.0 15.1 4.9 1.2 7.5 7.7 5.1 -4.4 -1½Non-fuel exporters 15.0 16.5 5.9 11.3 2.9 7.1 13.5 -0.3 2.8 2
Volume of imports
World 10.5 7.8 6.1 9.0 3.0 5.3 10.2 -1.0 1.6 4¼
Developed economies 11.1 7.0 4.9 8.7 5.9 6.1 6.4 -1.6 0.0 4½North America 12.0 7.2 5.6 13.3 10.3 10.4 15.1 -3.5 1.1 3Western Europe 10.0 5.9 4.4 7.6 6.1 3.4 2.4 0.0 0.0 6½Japan 13.6 12.5 3.5 2.7 -10.0 9.5 0.3 -4.3 -7.1 -2¼
Economies in transition 9.6 9.9 13.8 9.0 2.0 -6.0 15.0 12.7 9.3 8½Central and Eastern Europe and Baltic States 13.0 11.4 17.9 7.6 10.0 5.0 15.0 9.0 6.8 8Commonwealth of Independent States 1.3 6.0 2.4 13.6 -15.0 -28.0 14.0 21.7 15.4 10
Developing countries 9.5 9.7 8.5 10.2 -4.7 4.0 19.6 -1.1 4.4 3¾Latin America and the Caribbean 14.4 4.2 8.4 23.1 7.2 -6.9 4.1 2.7 -8.3 ½Africa 2.0 10.8 3.8 6.3 2.0 1.5 18.2 -2.2 2.6 2¼Western Asia -11.1 11.3 11.8 6.4 -2.6 2.3 14.4 4.6 4.8 -7¾Eastern and Southern Asia 14.8 12.5 8.2 8.4 -12.7 6.9 19.4 -7.4 4.0 4¾China 9.1 0.1 11.4 9.4 6.0 18.6 52.6 12.3 20.1 12¼
Memo items:Fuel exporters -0.2 -1.0 11.2 13.8 -0.2 -0.4 17.0 4.2 0.1 -½Non-fuel exporters 11.9 11.6 8.7 10.1 -6.7 10.3 11.8 5.0 9.7 -14¼
Table A.13 (continued)
Source: United Nations, based on data of United Nations Statistics Division, ECE, ECLAC and IMF.a Partly estimated.b Forecast.
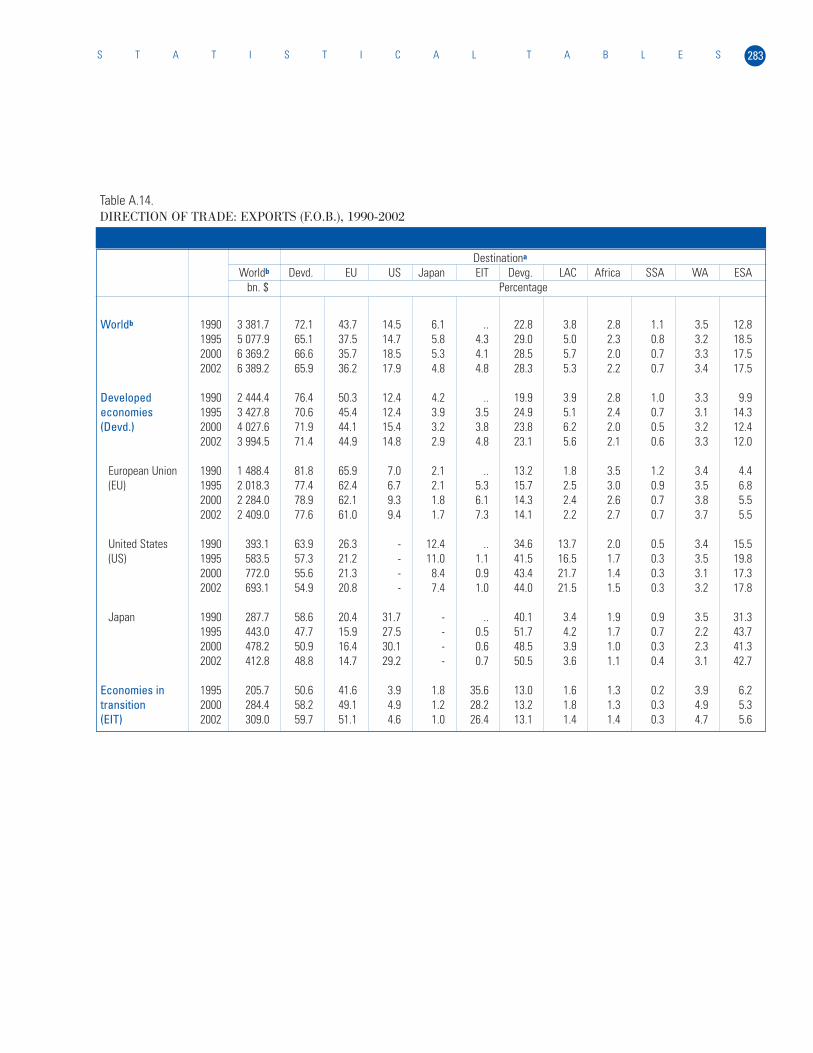
283S T A T I S T I C A L T A B L E S
Table A.14.DIRECTION OF TRADE: EXPORTS (F.O.B.), 1990-2002
Destinationa
Worldb Devd. EU US Japan EIT Devg. LAC Africa SSA WA ESAbn. $ Percentage
Worldb 1990 3 381.7 72.1 43.7 14.5 6.1 .. 22.8 3.8 2.8 1.1 3.5 12.81995 5 077.9 65.1 37.5 14.7 5.8 4.3 29.0 5.0 2.3 0.8 3.2 18.52000 6 369.2 66.6 35.7 18.5 5.3 4.1 28.5 5.7 2.0 0.7 3.3 17.52002 6 389.2 65.9 36.2 17.9 4.8 4.8 28.3 5.3 2.2 0.7 3.4 17.5
Developed 1990 2 444.4 76.4 50.3 12.4 4.2 .. 19.9 3.9 2.8 1.0 3.3 9.9economies 1995 3 427.8 70.6 45.4 12.4 3.9 3.5 24.9 5.1 2.4 0.7 3.1 14.3(Devd.) 2000 4 027.6 71.9 44.1 15.4 3.2 3.8 23.8 6.2 2.0 0.5 3.2 12.4
2002 3 994.5 71.4 44.9 14.8 2.9 4.8 23.1 5.6 2.1 0.6 3.3 12.0
European Union 1990 1 488.4 81.8 65.9 7.0 2.1 .. 13.2 1.8 3.5 1.2 3.4 4.4(EU) 1995 2 018.3 77.4 62.4 6.7 2.1 5.3 15.7 2.5 3.0 0.9 3.5 6.8
2000 2 284.0 78.9 62.1 9.3 1.8 6.1 14.3 2.4 2.6 0.7 3.8 5.52002 2 409.0 77.6 61.0 9.4 1.7 7.3 14.1 2.2 2.7 0.7 3.7 5.5
United States 1990 393.1 63.9 26.3 - 12.4 .. 34.6 13.7 2.0 0.5 3.4 15.5(US) 1995 583.5 57.3 21.2 - 11.0 1.1 41.5 16.5 1.7 0.3 3.5 19.8
2000 772.0 55.6 21.3 - 8.4 0.9 43.4 21.7 1.4 0.3 3.1 17.32002 693.1 54.9 20.8 - 7.4 1.0 44.0 21.5 1.5 0.3 3.2 17.8
Japan 1990 287.7 58.6 20.4 31.7 - .. 40.1 3.4 1.9 0.9 3.5 31.31995 443.0 47.7 15.9 27.5 - 0.5 51.7 4.2 1.7 0.7 2.2 43.72000 478.2 50.9 16.4 30.1 - 0.6 48.5 3.9 1.0 0.3 2.3 41.32002 412.8 48.8 14.7 29.2 - 0.7 50.5 3.6 1.1 0.4 3.1 42.7
Economies in 1995 205.7 50.6 41.6 3.9 1.8 35.6 13.0 1.6 1.3 0.2 3.9 6.2transition 2000 284.4 58.2 49.1 4.9 1.2 28.2 13.2 1.8 1.3 0.3 4.9 5.3(EIT) 2002 309.0 59.7 51.1 4.6 1.0 26.4 13.1 1.4 1.4 0.3 4.7 5.6
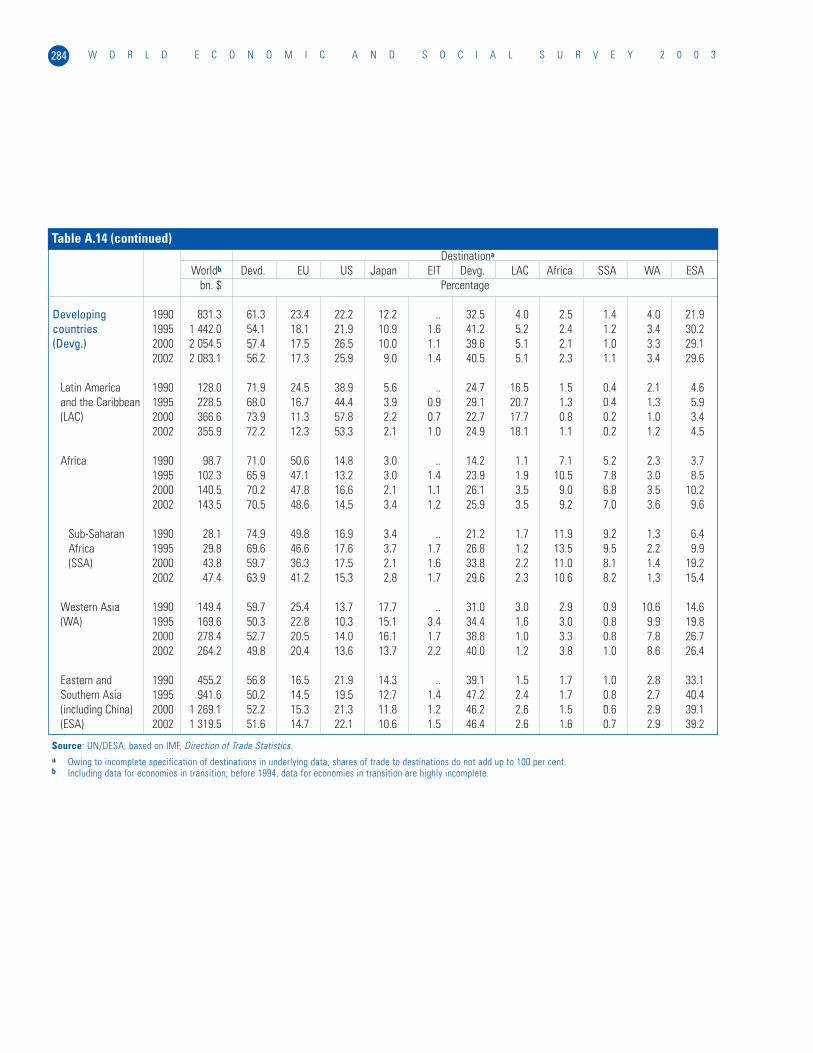
W O R L D E C O N O M I C A N D S O C I A L S U R V E Y 2 0 0 3284
Destinationa
Worldb Devd. EU US Japan EIT Devg. LAC Africa SSA WA ESAbn. $ Percentage
Developing 1990 831.3 61.3 23.4 22.2 12.2 .. 32.5 4.0 2.5 1.4 4.0 21.9countries 1995 1 442.0 54.1 18.1 21.9 10.9 1.6 41.2 5.2 2.4 1.2 3.4 30.2(Devg.) 2000 2 054.5 57.4 17.5 26.5 10.0 1.1 39.6 5.1 2.1 1.0 3.3 29.1
2002 2 083.1 56.2 17.3 25.9 9.0 1.4 40.5 5.1 2.3 1.1 3.4 29.6
Latin America 1990 128.0 71.9 24.5 38.9 5.6 .. 24.7 16.5 1.5 0.4 2.1 4.6and the Caribbean 1995 228.5 68.0 16.7 44.4 3.9 0.9 29.1 20.7 1.3 0.4 1.3 5.9(LAC) 2000 366.6 73.9 11.3 57.8 2.2 0.7 22.7 17.7 0.8 0.2 1.0 3.4
2002 355.9 72.2 12.3 53.3 2.1 1.0 24.9 18.1 1.1 0.2 1.2 4.5
Africa 1990 98.7 71.0 50.6 14.8 3.0 .. 14.2 1.1 7.1 5.2 2.3 3.71995 102.3 65.9 47.1 13.2 3.0 1.4 23.9 1.9 10.5 7.8 3.0 8.52000 140.5 70.2 47.8 16.6 2.1 1.1 26.1 3.5 9.0 6.8 3.5 10.22002 143.5 70.5 48.6 14.5 3.4 1.2 25.9 3.5 9.2 7.0 3.6 9.6
Sub-Saharan 1990 28.1 74.9 49.8 16.9 3.4 .. 21.2 1.7 11.9 9.2 1.3 6.4Africa 1995 29.8 69.6 46.6 17.6 3.7 1.7 26.8 1.2 13.5 9.5 2.2 9.9(SSA) 2000 43.8 59.7 36.3 17.5 2.1 1.6 33.8 2.2 11.0 8.1 1.4 19.2
2002 47.4 63.9 41.2 15.3 2.8 1.7 29.6 2.3 10.6 8.2 1.3 15.4
Western Asia 1990 149.4 59.7 25.4 13.7 17.7 .. 31.0 3.0 2.9 0.9 10.6 14.6(WA) 1995 169.6 50.3 22.8 10.3 15.1 3.4 34.4 1.6 3.0 0.8 9.9 19.8
2000 278.4 52.7 20.5 14.0 16.1 1.7 38.8 1.0 3.3 0.8 7.8 26.72002 264.2 49.8 20.4 13.6 13.7 2.2 40.0 1.2 3.8 1.0 8.6 26.4
Eastern and 1990 455.2 56.8 16.5 21.9 14.3 .. 39.1 1.5 1.7 1.0 2.8 33.1Southern Asia 1995 941.6 50.2 14.5 19.5 12.7 1.4 47.2 2.4 1.7 0.8 2.7 40.4(including China) 2000 1 269.1 52.2 15.3 21.3 11.8 1.2 46.2 2.6 1.5 0.6 2.9 39.1(ESA) 2002 1 319.5 51.6 14.7 22.1 10.6 1.5 46.4 2.6 1.6 0.7 2.9 39.2
Table A.14 (continued)
Source: UN/DESA, based on IMF, Direction of Trade Statistics.a Owing to incomplete specification of destinations in underlying data, shares of trade to destinations do not add up to 100 per cent.b Including data for economies in transition; before 1994, data for economies in transition are highly incomplete.
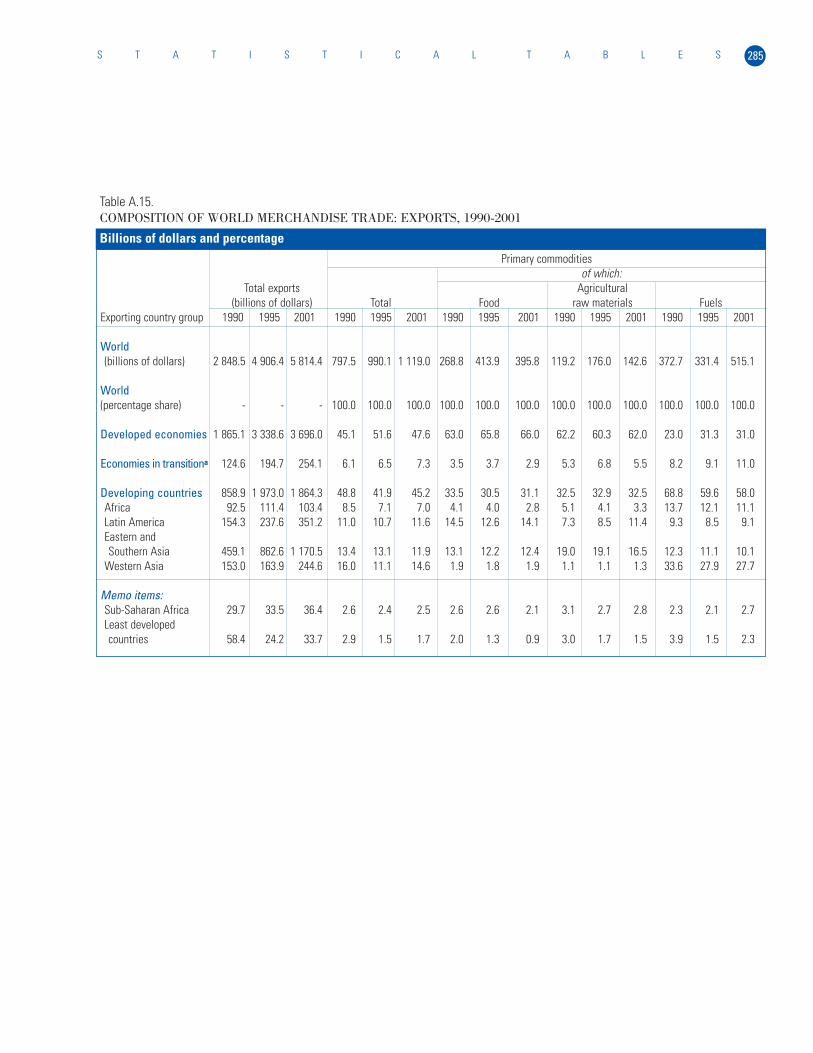
285S T A T I S T I C A L T A B L E S
Table A.15.COMPOSITION OF WORLD MERCHANDISE TRADE: EXPORTS, 1990-2001
Primary commoditiesof which:
Total exports Agricultural(billions of dollars) Total Food raw materials Fuels
Exporting country group 1990 1995 2001 1990 1995 2001 1990 1995 2001 1990 1995 2001 1990 1995 2001
World(billions of dollars) 2 848.5 4 906.4 5 814.4 797.5 990.1 1 119.0 268.8 413.9 395.8 119.2 176.0 142.6 372.7 331.4 515.1
World(percentage share) - - - 100.0 100.0 100.0 100.0 100.0 100.0 100.0 100.0 100.0 100.0 100.0 100.0
Developed economies 1 865.1 3 338.6 3 696.0 45.1 51.6 47.6 63.0 65.8 66.0 62.2 60.3 62.0 23.0 31.3 31.0
Economies in transitiona 124.6 194.7 254.1 6.1 6.5 7.3 3.5 3.7 2.9 5.3 6.8 5.5 8.2 9.1 11.0
Developing countries 858.9 1 973.0 1 864.3 48.8 41.9 45.2 33.5 30.5 31.1 32.5 32.9 32.5 68.8 59.6 58.0Africa 92.5 111.4 103.4 8.5 7.1 7.0 4.1 4.0 2.8 5.1 4.1 3.3 13.7 12.1 11.1Latin America 154.3 237.6 351.2 11.0 10.7 11.6 14.5 12.6 14.1 7.3 8.5 11.4 9.3 8.5 9.1Eastern andSouthern Asia 459.1 862.6 1 170.5 13.4 13.1 11.9 13.1 12.2 12.4 19.0 19.1 16.5 12.3 11.1 10.1
Western Asia 153.0 163.9 244.6 16.0 11.1 14.6 1.9 1.8 1.9 1.1 1.1 1.3 33.6 27.9 27.7
Memo items:Sub-Saharan Africa 29.7 33.5 36.4 2.6 2.4 2.5 2.6 2.6 2.1 3.1 2.7 2.8 2.3 2.1 2.7Least developedcountries 58.4 24.2 33.7 2.9 1.5 1.7 2.0 1.3 0.9 3.0 1.7 1.5 3.9 1.5 2.3
Billions of dollars and percentage
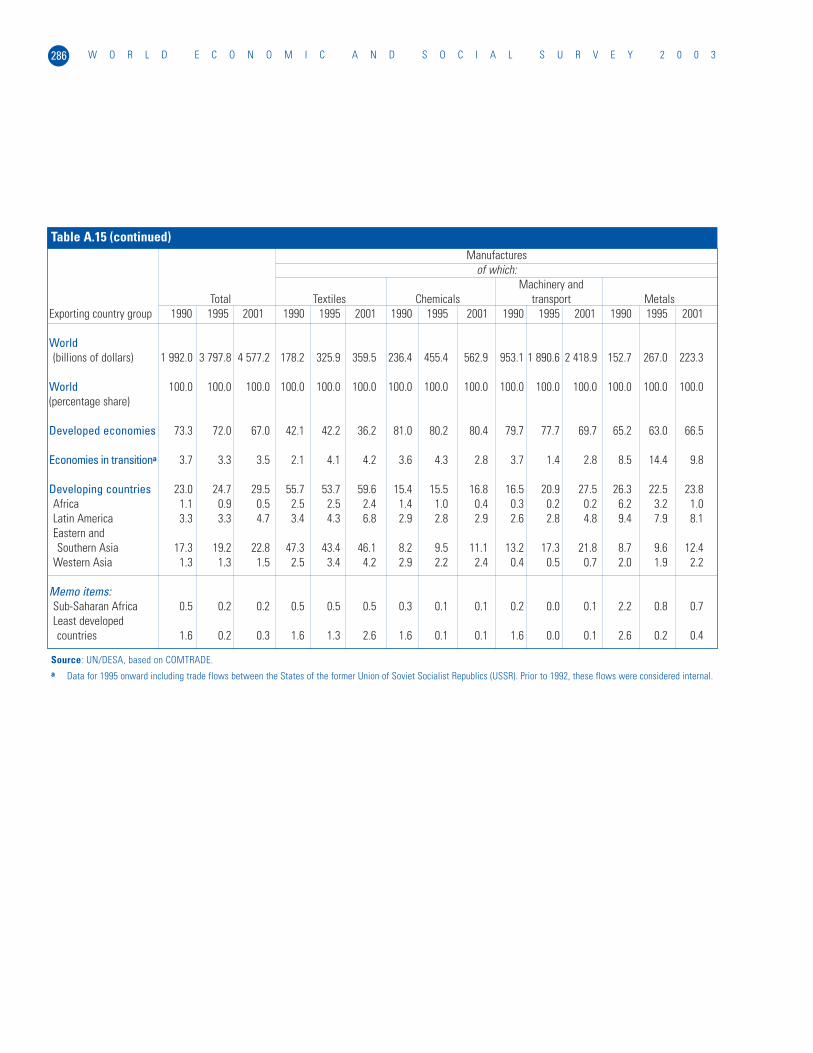
W O R L D E C O N O M I C A N D S O C I A L S U R V E Y 2 0 0 3286
Manufacturesof which:
Machinery andTotal Textiles Chemicals transport Metals
Exporting country group 1990 1995 2001 1990 1995 2001 1990 1995 2001 1990 1995 2001 1990 1995 2001
World(billions of dollars) 1 992.0 3 797.8 4 577.2 178.2 325.9 359.5 236.4 455.4 562.9 953.1 1 890.6 2 418.9 152.7 267.0 223.3
World 100.0 100.0 100.0 100.0 100.0 100.0 100.0 100.0 100.0 100.0 100.0 100.0 100.0 100.0 100.0(percentage share)
Developed economies 73.3 72.0 67.0 42.1 42.2 36.2 81.0 80.2 80.4 79.7 77.7 69.7 65.2 63.0 66.5
Economies in transitiona 3.7 3.3 3.5 2.1 4.1 4.2 3.6 4.3 2.8 3.7 1.4 2.8 8.5 14.4 9.8
Developing countries 23.0 24.7 29.5 55.7 53.7 59.6 15.4 15.5 16.8 16.5 20.9 27.5 26.3 22.5 23.8Africa 1.1 0.9 0.5 2.5 2.5 2.4 1.4 1.0 0.4 0.3 0.2 0.2 6.2 3.2 1.0Latin America 3.3 3.3 4.7 3.4 4.3 6.8 2.9 2.8 2.9 2.6 2.8 4.8 9.4 7.9 8.1Eastern andSouthern Asia 17.3 19.2 22.8 47.3 43.4 46.1 8.2 9.5 11.1 13.2 17.3 21.8 8.7 9.6 12.4
Western Asia 1.3 1.3 1.5 2.5 3.4 4.2 2.9 2.2 2.4 0.4 0.5 0.7 2.0 1.9 2.2
Memo items:Sub-Saharan Africa 0.5 0.2 0.2 0.5 0.5 0.5 0.3 0.1 0.1 0.2 0.0 0.1 2.2 0.8 0.7Least developedcountries 1.6 0.2 0.3 1.6 1.3 2.6 1.6 0.1 0.1 1.6 0.0 0.1 2.6 0.2 0.4
Table A.15 (continued)
Source: UN/DESA, based on COMTRADE.a Data for 1995 onward including trade flows between the States of the former Union of Soviet Socialist Republics (USSR). Prior to 1992, these flows were considered internal.
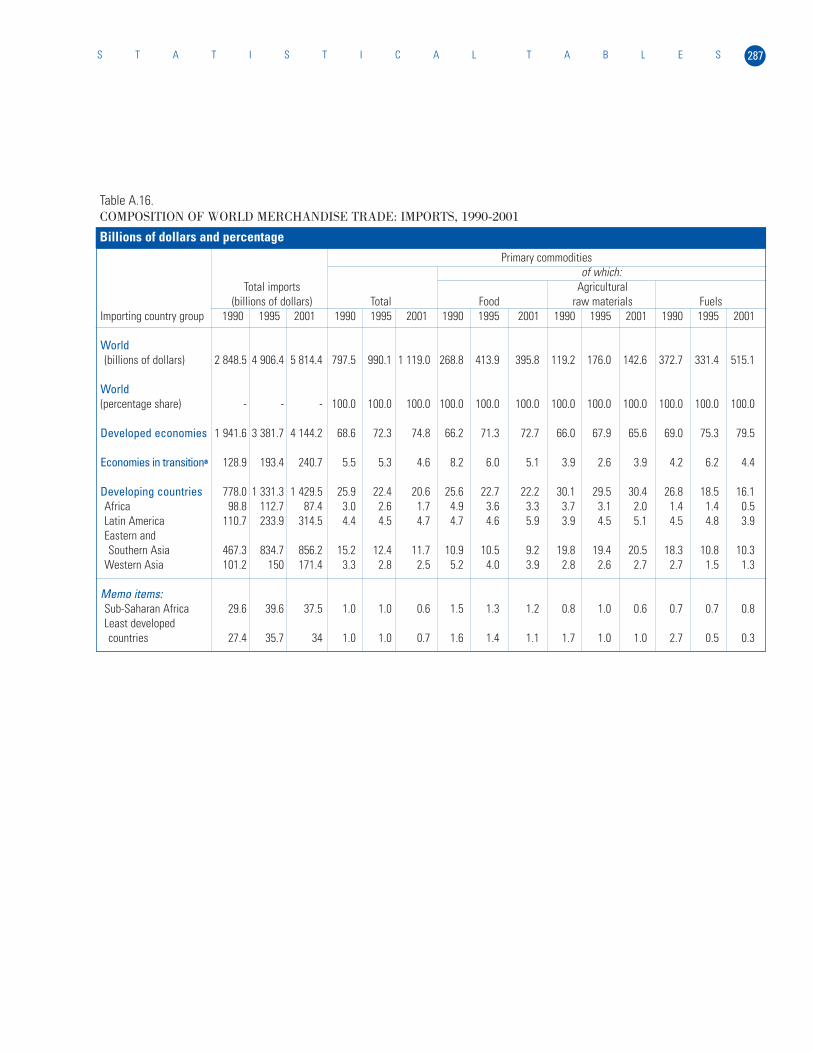
287S T A T I S T I C A L T A B L E S
Table A.16.COMPOSITION OF WORLD MERCHANDISE TRADE: IMPORTS, 1990-2001
Primary commoditiesof which:
Total imports Agricultural(billions of dollars) Total Food raw materials Fuels
Importing country group 1990 1995 2001 1990 1995 2001 1990 1995 2001 1990 1995 2001 1990 1995 2001
World(billions of dollars) 2 848.5 4 906.4 5 814.4 797.5 990.1 1 119.0 268.8 413.9 395.8 119.2 176.0 142.6 372.7 331.4 515.1
World(percentage share) - - - 100.0 100.0 100.0 100.0 100.0 100.0 100.0 100.0 100.0 100.0 100.0 100.0
Developed economies 1 941.6 3 381.7 4 144.2 68.6 72.3 74.8 66.2 71.3 72.7 66.0 67.9 65.6 69.0 75.3 79.5
Economies in transitiona 128.9 193.4 240.7 5.5 5.3 4.6 8.2 6.0 5.1 3.9 2.6 3.9 4.2 6.2 4.4
Developing countries 778.0 1 331.3 1 429.5 25.9 22.4 20.6 25.6 22.7 22.2 30.1 29.5 30.4 26.8 18.5 16.1Africa 98.8 112.7 87.4 3.0 2.6 1.7 4.9 3.6 3.3 3.7 3.1 2.0 1.4 1.4 0.5Latin America 110.7 233.9 314.5 4.4 4.5 4.7 4.7 4.6 5.9 3.9 4.5 5.1 4.5 4.8 3.9Eastern and Southern Asia 467.3 834.7 856.2 15.2 12.4 11.7 10.9 10.5 9.2 19.8 19.4 20.5 18.3 10.8 10.3
Western Asia 101.2 150 171.4 3.3 2.8 2.5 5.2 4.0 3.9 2.8 2.6 2.7 2.7 1.5 1.3
Memo items:Sub-Saharan Africa 29.6 39.6 37.5 1.0 1.0 0.6 1.5 1.3 1.2 0.8 1.0 0.6 0.7 0.7 0.8Least developedcountries 27.4 35.7 34 1.0 1.0 0.7 1.6 1.4 1.1 1.7 1.0 1.0 2.7 0.5 0.3
Billions of dollars and percentage
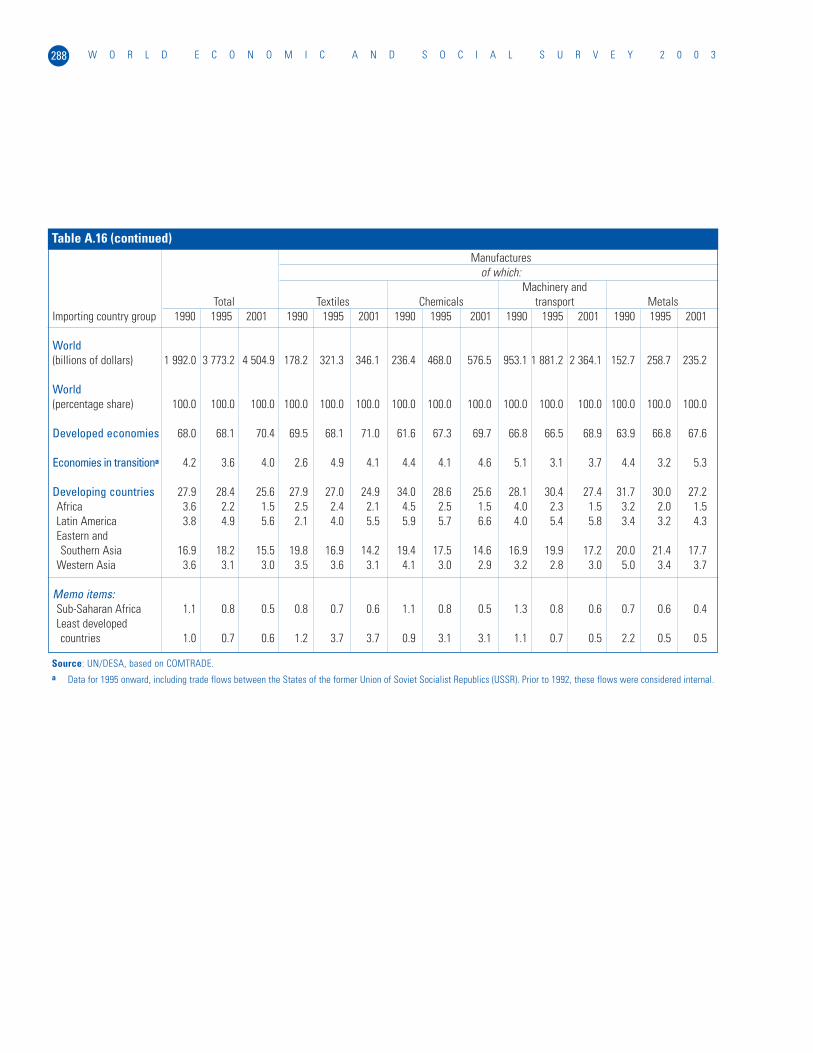
W O R L D E C O N O M I C A N D S O C I A L S U R V E Y 2 0 0 3288
Manufacturesof which:
Machinery andTotal Textiles Chemicals transport Metals
Importing country group 1990 1995 2001 1990 1995 2001 1990 1995 2001 1990 1995 2001 1990 1995 2001
World(billions of dollars) 1 992.0 3 773.2 4 504.9 178.2 321.3 346.1 236.4 468.0 576.5 953.1 1 881.2 2 364.1 152.7 258.7 235.2
World(percentage share) 100.0 100.0 100.0 100.0 100.0 100.0 100.0 100.0 100.0 100.0 100.0 100.0 100.0 100.0 100.0
Developed economies 68.0 68.1 70.4 69.5 68.1 71.0 61.6 67.3 69.7 66.8 66.5 68.9 63.9 66.8 67.6
Economies in transitiona 4.2 3.6 4.0 2.6 4.9 4.1 4.4 4.1 4.6 5.1 3.1 3.7 4.4 3.2 5.3
Developing countries 27.9 28.4 25.6 27.9 27.0 24.9 34.0 28.6 25.6 28.1 30.4 27.4 31.7 30.0 27.2Africa 3.6 2.2 1.5 2.5 2.4 2.1 4.5 2.5 1.5 4.0 2.3 1.5 3.2 2.0 1.5Latin America 3.8 4.9 5.6 2.1 4.0 5.5 5.9 5.7 6.6 4.0 5.4 5.8 3.4 3.2 4.3Eastern and Southern Asia 16.9 18.2 15.5 19.8 16.9 14.2 19.4 17.5 14.6 16.9 19.9 17.2 20.0 21.4 17.7
Western Asia 3.6 3.1 3.0 3.5 3.6 3.1 4.1 3.0 2.9 3.2 2.8 3.0 5.0 3.4 3.7
Memo items:Sub-Saharan Africa 1.1 0.8 0.5 0.8 0.7 0.6 1.1 0.8 0.5 1.3 0.8 0.6 0.7 0.6 0.4Least developedcountries 1.0 0.7 0.6 1.2 3.7 3.7 0.9 3.1 3.1 1.1 0.7 0.5 2.2 0.5 0.5
Table A.16 (continued)
Source: UN/DESA, based on COMTRADE.a Data for 1995 onward, including trade flows between the States of the former Union of Soviet Socialist Republics (USSR). Prior to 1992, these flows were considered internal.
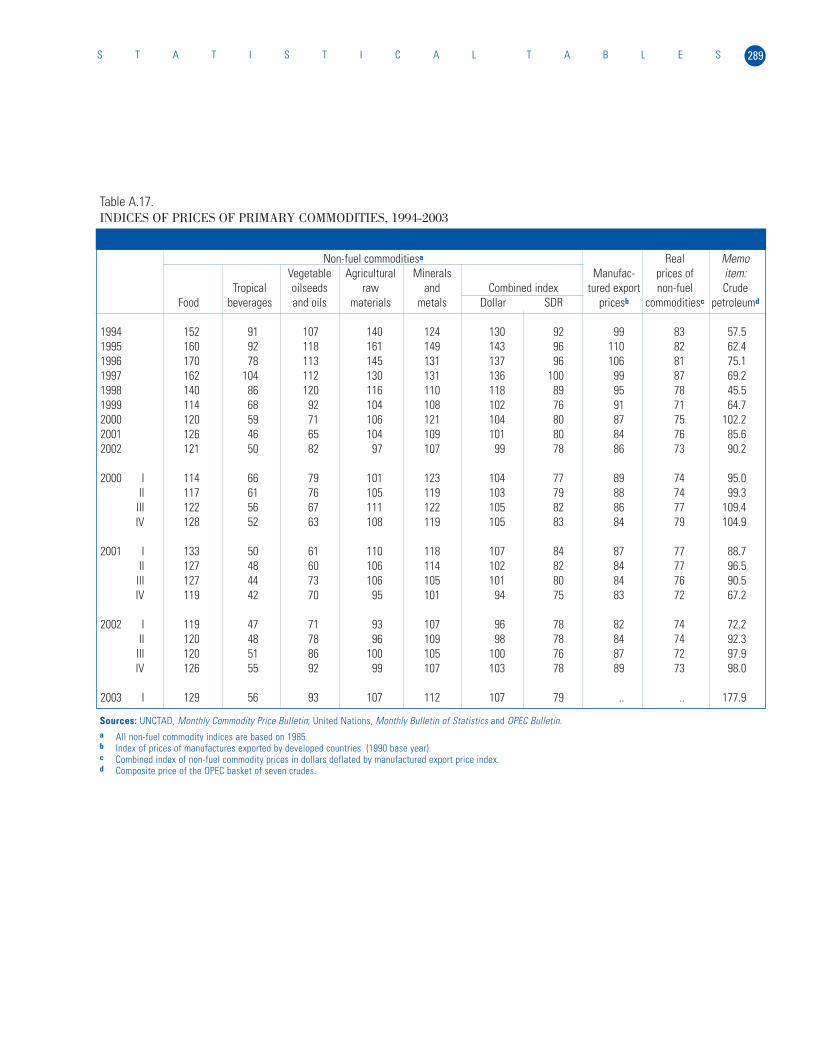
289S T A T I S T I C A L T A B L E S
Table A.17.INDICES OF PRICES OF PRIMARY COMMODITIES, 1994-2003
Non-fuel commoditiesa Real MemoVegetable Agricultural Minerals Manufac- prices of item:
Tropical oilseeds raw and Combined index tured export non-fuel CrudeFood beverages and oils materials metals Dollar SDR pricesb commoditiesc petroleumd
1994 152 91 107 140 124 130 92 99 83 57.51995 160 92 118 161 149 143 96 110 82 62.41996 170 78 113 145 131 137 96 106 81 75.11997 162 104 112 130 131 136 100 99 87 69.21998 140 86 120 116 110 118 89 95 78 45.51999 114 68 92 104 108 102 76 91 71 64.72000 120 59 71 106 121 104 80 87 75 102.22001 126 46 65 104 109 101 80 84 76 85.62002 121 50 82 97 107 99 78 86 73 90.2
2000 I 114 66 79 101 123 104 77 89 74 95.0II 117 61 76 105 119 103 79 88 74 99.3III 122 56 67 111 122 105 82 86 77 109.4IV 128 52 63 108 119 105 83 84 79 104.9
2001 I 133 50 61 110 118 107 84 87 77 88.7II 127 48 60 106 114 102 82 84 77 96.5III 127 44 73 106 105 101 80 84 76 90.5IV 119 42 70 95 101 94 75 83 72 67.2
2002 I 119 47 71 93 107 96 78 82 74 72.2II 120 48 78 96 109 98 78 84 74 92.3III 120 51 86 100 105 100 76 87 72 97.9IV 126 55 92 99 107 103 78 89 73 98.0
2003 I 129 56 93 107 112 107 79 .. .. 177.9
Sources: UNCTAD, Monthly Commodity Price Bulletin; United Nations, Monthly Bulletin of Statistics and OPEC Bulletin.a All non-fuel commodity indices are based on 1985.b Index of prices of manufactures exported by developed countries (1990 base year).c Combined index of non-fuel commodity prices in dollars deflated by manufactured export price index.d Composite price of the OPEC basket of seven crudes.
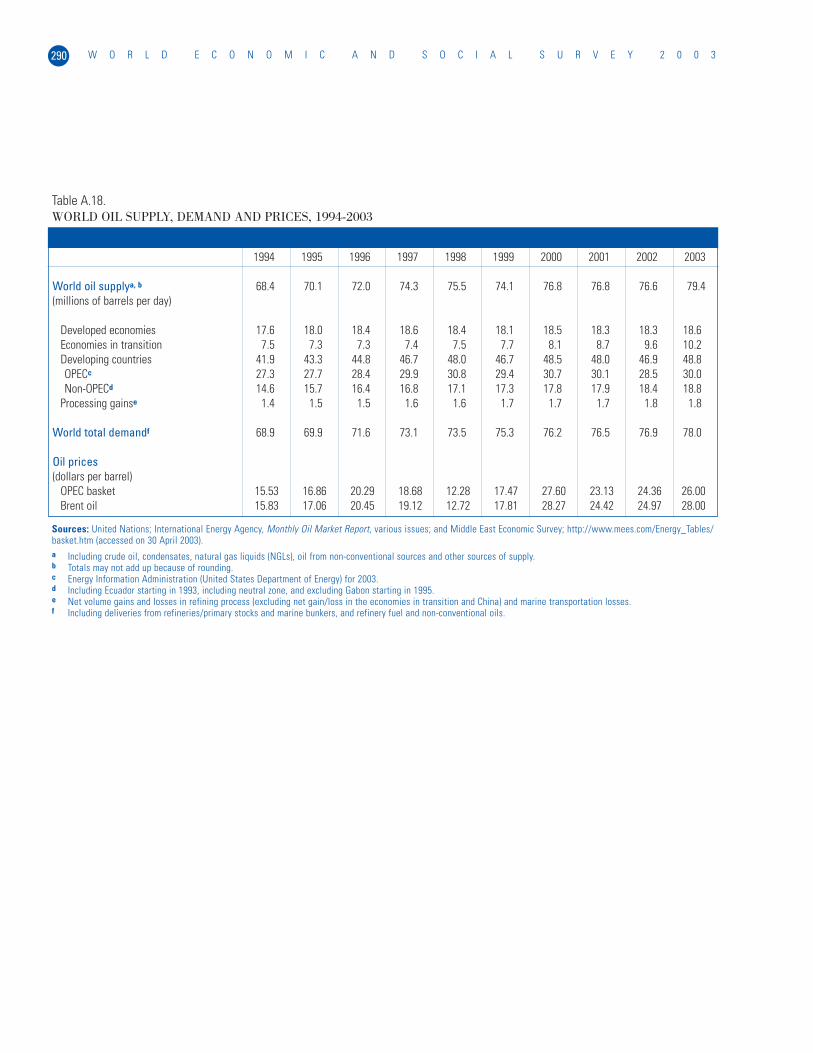
W O R L D E C O N O M I C A N D S O C I A L S U R V E Y 2 0 0 3290
Table A.18.WORLD OIL SUPPLY, DEMAND AND PRICES, 1994-2003
1994 1995 1996 1997 1998 1999 2000 2001 2002 2003
World oil supplya, b 68.4 70.1 72.0 74.3 75.5 74.1 76.8 76.8 76.6 79.4(millions of barrels per day)
Developed economies 17.6 18.0 18.4 18.6 18.4 18.1 18.5 18.3 18.3 18.6Economies in transition 7.5 7.3 7.3 7.4 7.5 7.7 8.1 8.7 9.6 10.2Developing countries 41.9 43.3 44.8 46.7 48.0 46.7 48.5 48.0 46.9 48.8OPECc 27.3 27.7 28.4 29.9 30.8 29.4 30.7 30.1 28.5 30.0Non-OPECd 14.6 15.7 16.4 16.8 17.1 17.3 17.8 17.9 18.4 18.8
Processing gainse 1.4 1.5 1.5 1.6 1.6 1.7 1.7 1.7 1.8 1.8
World total demandf 68.9 69.9 71.6 73.1 73.5 75.3 76.2 76.5 76.9 78.0
Oil prices(dollars per barrel)
OPEC basket 15.53 16.86 20.29 18.68 12.28 17.47 27.60 23.13 24.36 26.00Brent oil 15.83 17.06 20.45 19.12 12.72 17.81 28.27 24.42 24.97 28.00
Sources: United Nations; International Energy Agency, Monthly Oil Market Report, various issues; and Middle East Economic Survey; http://www.mees.com/Energy_Tables/basket.htm (accessed on 30 April 2003).a Including crude oil, condensates, natural gas liquids (NGLs), oil from non-conventional sources and other sources of supply.b Totals may not add up because of rounding.c Energy Information Administration (United States Department of Energy) for 2003.d Including Ecuador starting in 1993, including neutral zone, and excluding Gabon starting in 1995.e Net volume gains and losses in refining process (excluding net gain/loss in the economies in transition and China) and marine transportation losses.f Including deliveries from refineries/primary stocks and marine bunkers, and refinery fuel and non-conventional oils.
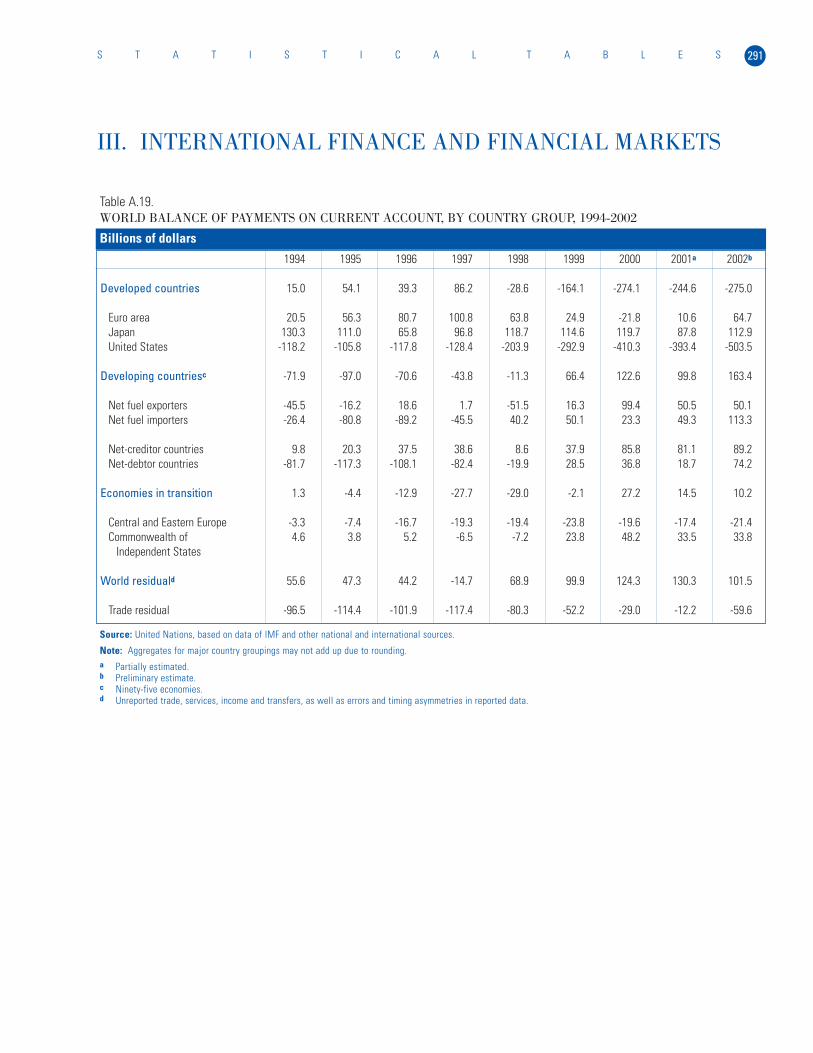
291S T A T I S T I C A L T A B L E S
Table A.19.WORLD BALANCE OF PAYMENTS ON CURRENT ACCOUNT, BY COUNTRY GROUP, 1994-2002
1994 1995 1996 1997 1998 1999 2000 2001a 2002b
Developed countries 15.0 54.1 39.3 86.2 -28.6 -164.1 -274.1 -244.6 -275.0
Euro area 20.5 56.3 80.7 100.8 63.8 24.9 -21.8 10.6 64.7Japan 130.3 111.0 65.8 96.8 118.7 114.6 119.7 87.8 112.9United States -118.2 -105.8 -117.8 -128.4 -203.9 -292.9 -410.3 -393.4 -503.5
Developing countriesc -71.9 -97.0 -70.6 -43.8 -11.3 66.4 122.6 99.8 163.4
Net fuel exporters -45.5 -16.2 18.6 1.7 -51.5 16.3 99.4 50.5 50.1Net fuel importers -26.4 -80.8 -89.2 -45.5 40.2 50.1 23.3 49.3 113.3
Net-creditor countries 9.8 20.3 37.5 38.6 8.6 37.9 85.8 81.1 89.2Net-debtor countries -81.7 -117.3 -108.1 -82.4 -19.9 28.5 36.8 18.7 74.2
Economies in transition 1.3 -4.4 -12.9 -27.7 -29.0 -2.1 27.2 14.5 10.2
Central and Eastern Europe -3.3 -7.4 -16.7 -19.3 -19.4 -23.8 -19.6 -17.4 -21.4Commonwealth of 4.6 3.8 5.2 -6.5 -7.2 23.8 48.2 33.5 33.8
Independent States
World residuald 55.6 47.3 44.2 -14.7 68.9 99.9 124.3 130.3 101.5
Trade residual -96.5 -114.4 -101.9 -117.4 -80.3 -52.2 -29.0 -12.2 -59.6
Billions of dollars
Source: United Nations, based on data of IMF and other national and international sources.
Note: Aggregates for major country groupings may not add up due to rounding.a Partially estimated.b Preliminary estimate.c Ninety-five economies.d Unreported trade, services, income and transfers, as well as errors and timing asymmetries in reported data.
III. INTERNATIONAL FINANCE AND FINANCIAL MARKETS
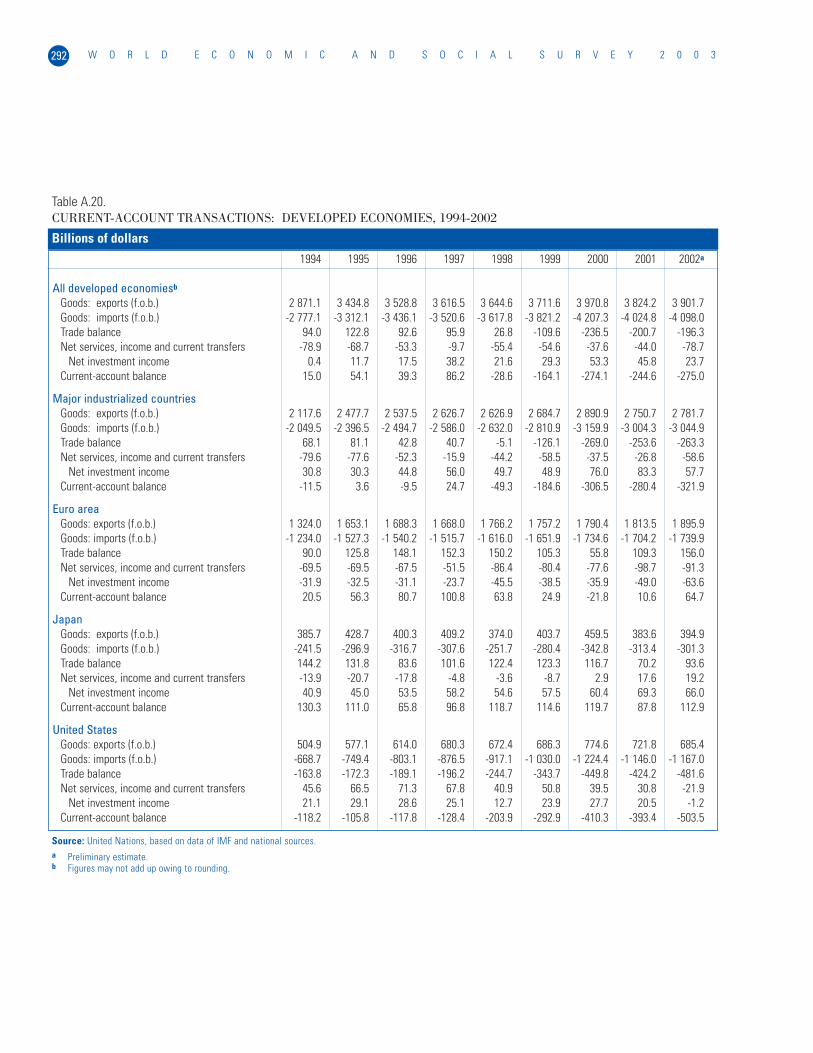
W O R L D E C O N O M I C A N D S O C I A L S U R V E Y 2 0 0 3292
Table A.20.CURRENT-ACCOUNT TRANSACTIONS: DEVELOPED ECONOMIES, 1994-2002
1994 1995 1996 1997 1998 1999 2000 2001 2002a
All developed economiesb
Goods: exports (f.o.b.) 2 871.1 3 434.8 3 528.8 3 616.5 3 644.6 3 711.6 3 970.8 3 824.2 3 901.7Goods: imports (f.o.b.) -2 777.1 -3 312.1 -3 436.1 -3 520.6 -3 617.8 -3 821.2 -4 207.3 -4 024.8 -4 098.0Trade balance 94.0 122.8 92.6 95.9 26.8 -109.6 -236.5 -200.7 -196.3Net services, income and current transfers -78.9 -68.7 -53.3 -9.7 -55.4 -54.6 -37.6 -44.0 -78.7
Net investment income 0.4 11.7 17.5 38.2 21.6 29.3 53.3 45.8 23.7Current-account balance 15.0 54.1 39.3 86.2 -28.6 -164.1 -274.1 -244.6 -275.0
Major industrialized countriesGoods: exports (f.o.b.) 2 117.6 2 477.7 2 537.5 2 626.7 2 626.9 2 684.7 2 890.9 2 750.7 2 781.7Goods: imports (f.o.b.) -2 049.5 -2 396.5 -2 494.7 -2 586.0 -2 632.0 -2 810.9 -3 159.9 -3 004.3 -3 044.9Trade balance 68.1 81.1 42.8 40.7 -5.1 -126.1 -269.0 -253.6 -263.3Net services, income and current transfers -79.6 -77.6 -52.3 -15.9 -44.2 -58.5 -37.5 -26.8 -58.6
Net investment income 30.8 30.3 44.8 56.0 49.7 48.9 76.0 83.3 57.7Current-account balance -11.5 3.6 -9.5 24.7 -49.3 -184.6 -306.5 -280.4 -321.9
Euro areaGoods: exports (f.o.b.) 1 324.0 1 653.1 1 688.3 1 668.0 1 766.2 1 757.2 1 790.4 1 813.5 1 895.9Goods: imports (f.o.b.) -1 234.0 -1 527.3 -1 540.2 -1 515.7 -1 616.0 -1 651.9 -1 734.6 -1 704.2 -1 739.9Trade balance 90.0 125.8 148.1 152.3 150.2 105.3 55.8 109.3 156.0Net services, income and current transfers -69.5 -69.5 -67.5 -51.5 -86.4 -80.4 -77.6 -98.7 -91.3
Net investment income -31.9 -32.5 -31.1 -23.7 -45.5 -38.5 -35.9 -49.0 -63.6Current-account balance 20.5 56.3 80.7 100.8 63.8 24.9 -21.8 10.6 64.7
JapanGoods: exports (f.o.b.) 385.7 428.7 400.3 409.2 374.0 403.7 459.5 383.6 394.9Goods: imports (f.o.b.) -241.5 -296.9 -316.7 -307.6 -251.7 -280.4 -342.8 -313.4 -301.3Trade balance 144.2 131.8 83.6 101.6 122.4 123.3 116.7 70.2 93.6Net services, income and current transfers -13.9 -20.7 -17.8 -4.8 -3.6 -8.7 2.9 17.6 19.2
Net investment income 40.9 45.0 53.5 58.2 54.6 57.5 60.4 69.3 66.0Current-account balance 130.3 111.0 65.8 96.8 118.7 114.6 119.7 87.8 112.9
United StatesGoods: exports (f.o.b.) 504.9 577.1 614.0 680.3 672.4 686.3 774.6 721.8 685.4Goods: imports (f.o.b.) -668.7 -749.4 -803.1 -876.5 -917.1 -1 030.0 -1 224.4 -1 146.0 -1 167.0Trade balance -163.8 -172.3 -189.1 -196.2 -244.7 -343.7 -449.8 -424.2 -481.6Net services, income and current transfers 45.6 66.5 71.3 67.8 40.9 50.8 39.5 30.8 -21.9
Net investment income 21.1 29.1 28.6 25.1 12.7 23.9 27.7 20.5 -1.2Current-account balance -118.2 -105.8 -117.8 -128.4 -203.9 -292.9 -410.3 -393.4 -503.5
Billions of dollars
Source: United Nations, based on data of IMF and national sources.a Preliminary estimate.b Figures may not add up owing to rounding.
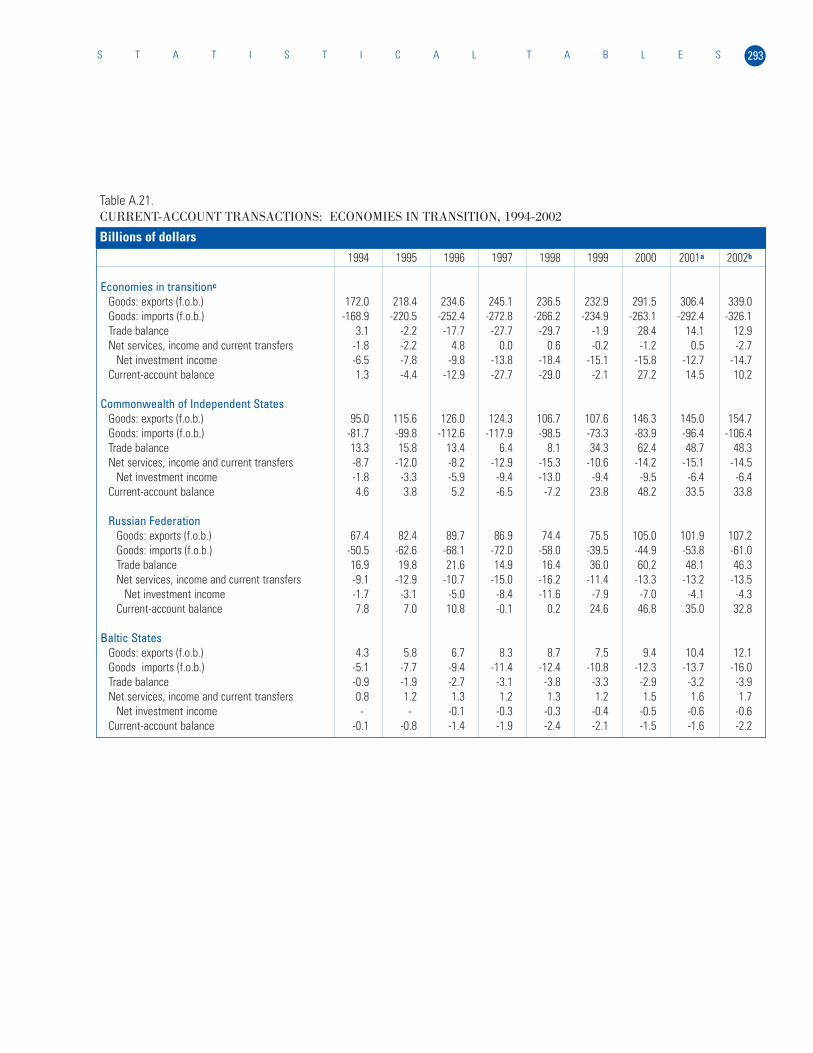
293S T A T I S T I C A L T A B L E S
Table A.21.CURRENT-ACCOUNT TRANSACTIONS: ECONOMIES IN TRANSITION, 1994-2002
1994 1995 1996 1997 1998 1999 2000 2001a 2002b
Economies in transitionc
Goods: exports (f.o.b.) 172.0 218.4 234.6 245.1 236.5 232.9 291.5 306.4 339.0Goods: imports (f.o.b.) -168.9 -220.5 -252.4 -272.8 -266.2 -234.9 -263.1 -292.4 -326.1Trade balance 3.1 -2.2 -17.7 -27.7 -29.7 -1.9 28.4 14.1 12.9Net services, income and current transfers -1.8 -2.2 4.8 0.0 0.6 -0.2 -1.2 0.5 -2.7
Net investment income -6.5 -7.8 -9.8 -13.8 -18.4 -15.1 -15.8 -12.7 -14.7Current-account balance 1.3 -4.4 -12.9 -27.7 -29.0 -2.1 27.2 14.5 10.2
Commonwealth of Independent StatesGoods: exports (f.o.b.) 95.0 115.6 126.0 124.3 106.7 107.6 146.3 145.0 154.7Goods: imports (f.o.b.) -81.7 -99.8 -112.6 -117.9 -98.5 -73.3 -83.9 -96.4 -106.4Trade balance 13.3 15.8 13.4 6.4 8.1 34.3 62.4 48.7 48.3Net services, income and current transfers -8.7 -12.0 -8.2 -12.9 -15.3 -10.6 -14.2 -15.1 -14.5
Net investment income -1.8 -3.3 -5.9 -9.4 -13.0 -9.4 -9.5 -6.4 -6.4Current-account balance 4.6 3.8 5.2 -6.5 -7.2 23.8 48.2 33.5 33.8
Russian FederationGoods: exports (f.o.b.) 67.4 82.4 89.7 86.9 74.4 75.5 105.0 101.9 107.2Goods: imports (f.o.b.) -50.5 -62.6 -68.1 -72.0 -58.0 -39.5 -44.9 -53.8 -61.0Trade balance 16.9 19.8 21.6 14.9 16.4 36.0 60.2 48.1 46.3Net services, income and current transfers -9.1 -12.9 -10.7 -15.0 -16.2 -11.4 -13.3 -13.2 -13.5
Net investment income -1.7 -3.1 -5.0 -8.4 -11.6 -7.9 -7.0 -4.1 -4.3Current-account balance 7.8 7.0 10.8 -0.1 0.2 24.6 46.8 35.0 32.8
Baltic StatesGoods: exports (f.o.b.) 4.3 5.8 6.7 8.3 8.7 7.5 9.4 10.4 12.1Goods imports (f.o.b.) -5.1 -7.7 -9.4 -11.4 -12.4 -10.8 -12.3 -13.7 -16.0Trade balance -0.9 -1.9 -2.7 -3.1 -3.8 -3.3 -2.9 -3.2 -3.9Net services, income and current transfers 0.8 1.2 1.3 1.2 1.3 1.2 1.5 1.6 1.7
Net investment income - - -0.1 -0.3 -0.3 -0.4 -0.5 -0.6 -0.6Current-account balance -0.1 -0.8 -1.4 -1.9 -2.4 -2.1 -1.5 -1.6 -2.2
Billions of dollars
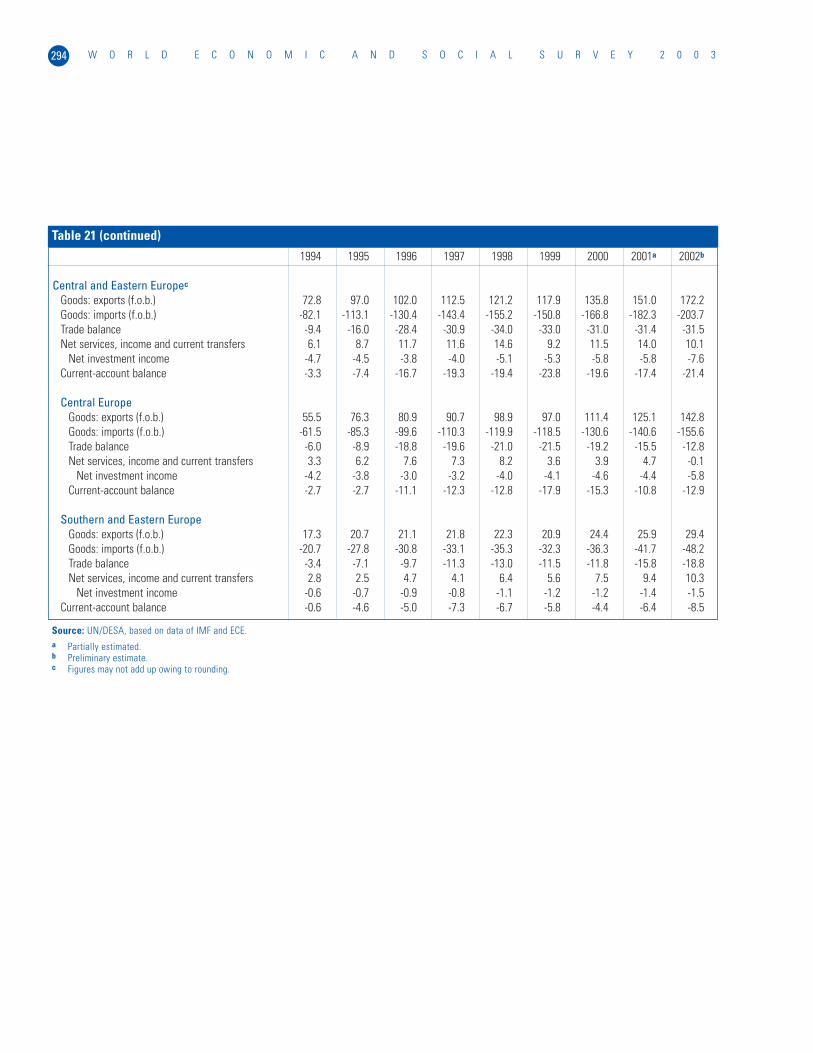
W O R L D E C O N O M I C A N D S O C I A L S U R V E Y 2 0 0 3294
1994 1995 1996 1997 1998 1999 2000 2001a 2002b
Central and Eastern Europec
Goods: exports (f.o.b.) 72.8 97.0 102.0 112.5 121.2 117.9 135.8 151.0 172.2Goods: imports (f.o.b.) -82.1 -113.1 -130.4 -143.4 -155.2 -150.8 -166.8 -182.3 -203.7Trade balance -9.4 -16.0 -28.4 -30.9 -34.0 -33.0 -31.0 -31.4 -31.5Net services, income and current transfers 6.1 8.7 11.7 11.6 14.6 9.2 11.5 14.0 10.1
Net investment income -4.7 -4.5 -3.8 -4.0 -5.1 -5.3 -5.8 -5.8 -7.6Current-account balance -3.3 -7.4 -16.7 -19.3 -19.4 -23.8 -19.6 -17.4 -21.4
Central EuropeGoods: exports (f.o.b.) 55.5 76.3 80.9 90.7 98.9 97.0 111.4 125.1 142.8Goods: imports (f.o.b.) -61.5 -85.3 -99.6 -110.3 -119.9 -118.5 -130.6 -140.6 -155.6Trade balance -6.0 -8.9 -18.8 -19.6 -21.0 -21.5 -19.2 -15.5 -12.8Net services, income and current transfers 3.3 6.2 7.6 7.3 8.2 3.6 3.9 4.7 -0.1
Net investment income -4.2 -3.8 -3.0 -3.2 -4.0 -4.1 -4.6 -4.4 -5.8Current-account balance -2.7 -2.7 -11.1 -12.3 -12.8 -17.9 -15.3 -10.8 -12.9
Southern and Eastern EuropeGoods: exports (f.o.b.) 17.3 20.7 21.1 21.8 22.3 20.9 24.4 25.9 29.4Goods: imports (f.o.b.) -20.7 -27.8 -30.8 -33.1 -35.3 -32.3 -36.3 -41.7 -48.2Trade balance -3.4 -7.1 -9.7 -11.3 -13.0 -11.5 -11.8 -15.8 -18.8Net services, income and current transfers 2.8 2.5 4.7 4.1 6.4 5.6 7.5 9.4 10.3
Net investment income -0.6 -0.7 -0.9 -0.8 -1.1 -1.2 -1.2 -1.4 -1.5Current-account balance -0.6 -4.6 -5.0 -7.3 -6.7 -5.8 -4.4 -6.4 -8.5
Table 21 (continued)
Source: UN/DESA, based on data of IMF and ECE.a Partially estimated.b Preliminary estimate.c Figures may not add up owing to rounding.
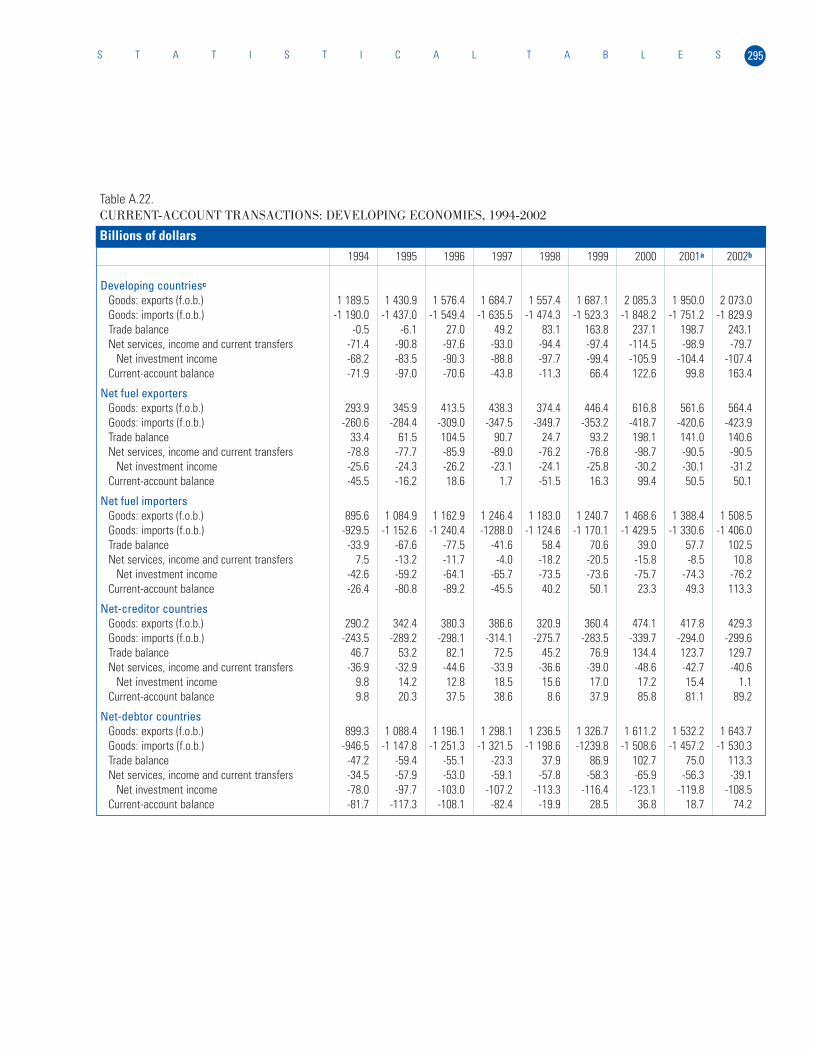
295S T A T I S T I C A L T A B L E S
Table A.22.CURRENT-ACCOUNT TRANSACTIONS: DEVELOPING ECONOMIES, 1994-2002
1994 1995 1996 1997 1998 1999 2000 2001a 2002b
Developing countriesc
Goods: exports (f.o.b.) 1 189.5 1 430.9 1 576.4 1 684.7 1 557.4 1 687.1 2 085.3 1 950.0 2 073.0Goods: imports (f.o.b.) -1 190.0 -1 437.0 -1 549.4 -1 635.5 -1 474.3 -1 523.3 -1 848.2 -1 751.2 -1 829.9Trade balance -0.5 -6.1 27.0 49.2 83.1 163.8 237.1 198.7 243.1Net services, income and current transfers -71.4 -90.8 -97.6 -93.0 -94.4 -97.4 -114.5 -98.9 -79.7
Net investment income -68.2 -83.5 -90.3 -88.8 -97.7 -99.4 -105.9 -104.4 -107.4Current-account balance -71.9 -97.0 -70.6 -43.8 -11.3 66.4 122.6 99.8 163.4
Net fuel exportersGoods: exports (f.o.b.) 293.9 345.9 413.5 438.3 374.4 446.4 616.8 561.6 564.4Goods: imports (f.o.b.) -260.6 -284.4 -309.0 -347.5 -349.7 -353.2 -418.7 -420.6 -423.9Trade balance 33.4 61.5 104.5 90.7 24.7 93.2 198.1 141.0 140.6Net services, income and current transfers -78.8 -77.7 -85.9 -89.0 -76.2 -76.8 -98.7 -90.5 -90.5
Net investment income -25.6 -24.3 -26.2 -23.1 -24.1 -25.8 -30.2 -30.1 -31.2Current-account balance -45.5 -16.2 18.6 1.7 -51.5 16.3 99.4 50.5 50.1
Net fuel importersGoods: exports (f.o.b.) 895.6 1 084.9 1 162.9 1 246.4 1 183.0 1 240.7 1 468.6 1 388.4 1 508.5Goods: imports (f.o.b.) -929.5 -1 152.6 -1 240.4 -1288.0 -1 124.6 -1 170.1 -1 429.5 -1 330.6 -1 406.0Trade balance -33.9 -67.6 -77.5 -41.6 58.4 70.6 39.0 57.7 102.5Net services, income and current transfers 7.5 -13.2 -11.7 -4.0 -18.2 -20.5 -15.8 -8.5 10.8
Net investment income -42.6 -59.2 -64.1 -65.7 -73.5 -73.6 -75.7 -74.3 -76.2Current-account balance -26.4 -80.8 -89.2 -45.5 40.2 50.1 23.3 49.3 113.3
Net-creditor countriesGoods: exports (f.o.b.) 290.2 342.4 380.3 386.6 320.9 360.4 474.1 417.8 429.3Goods: imports (f.o.b.) -243.5 -289.2 -298.1 -314.1 -275.7 -283.5 -339.7 -294.0 -299.6Trade balance 46.7 53.2 82.1 72.5 45.2 76.9 134.4 123.7 129.7Net services, income and current transfers -36.9 -32.9 -44.6 -33.9 -36.6 -39.0 -48.6 -42.7 -40.6
Net investment income 9.8 14.2 12.8 18.5 15.6 17.0 17.2 15.4 1.1Current-account balance 9.8 20.3 37.5 38.6 8.6 37.9 85.8 81.1 89.2
Net-debtor countriesGoods: exports (f.o.b.) 899.3 1 088.4 1 196.1 1 298.1 1 236.5 1 326.7 1 611.2 1 532.2 1 643.7Goods: imports (f.o.b.) -946.5 -1 147.8 -1 251.3 -1 321.5 -1 198.6 -1239.8 -1 508.6 -1 457.2 -1 530.3Trade balance -47.2 -59.4 -55.1 -23.3 37.9 86.9 102.7 75.0 113.3Net services, income and current transfers -34.5 -57.9 -53.0 -59.1 -57.8 -58.3 -65.9 -56.3 -39.1
Net investment income -78.0 -97.7 -103.0 -107.2 -113.3 -116.4 -123.1 -119.8 -108.5Current-account balance -81.7 -117.3 -108.1 -82.4 -19.9 28.5 36.8 18.7 74.2
Billions of dollars
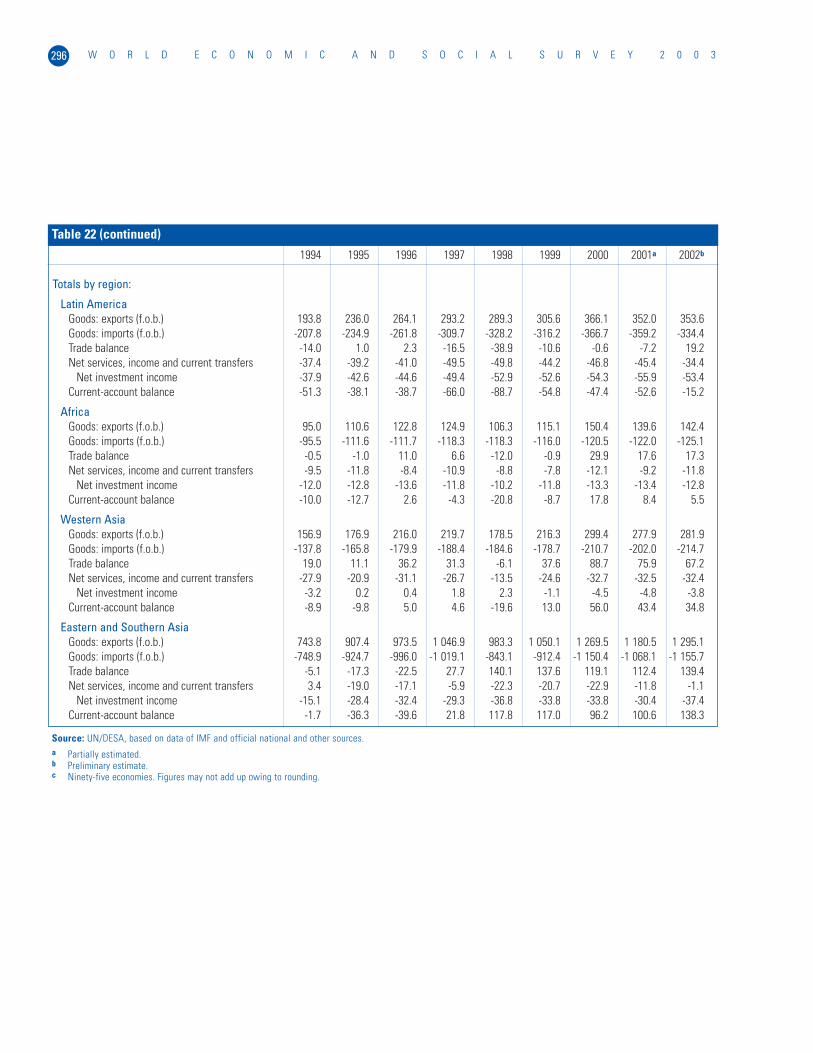
W O R L D E C O N O M I C A N D S O C I A L S U R V E Y 2 0 0 3296
1994 1995 1996 1997 1998 1999 2000 2001a 2002b
Totals by region:
Latin AmericaGoods: exports (f.o.b.) 193.8 236.0 264.1 293.2 289.3 305.6 366.1 352.0 353.6Goods: imports (f.o.b.) -207.8 -234.9 -261.8 -309.7 -328.2 -316.2 -366.7 -359.2 -334.4Trade balance -14.0 1.0 2.3 -16.5 -38.9 -10.6 -0.6 -7.2 19.2Net services, income and current transfers -37.4 -39.2 -41.0 -49.5 -49.8 -44.2 -46.8 -45.4 -34.4
Net investment income -37.9 -42.6 -44.6 -49.4 -52.9 -52.6 -54.3 -55.9 -53.4Current-account balance -51.3 -38.1 -38.7 -66.0 -88.7 -54.8 -47.4 -52.6 -15.2
AfricaGoods: exports (f.o.b.) 95.0 110.6 122.8 124.9 106.3 115.1 150.4 139.6 142.4Goods: imports (f.o.b.) -95.5 -111.6 -111.7 -118.3 -118.3 -116.0 -120.5 -122.0 -125.1Trade balance -0.5 -1.0 11.0 6.6 -12.0 -0.9 29.9 17.6 17.3Net services, income and current transfers -9.5 -11.8 -8.4 -10.9 -8.8 -7.8 -12.1 -9.2 -11.8
Net investment income -12.0 -12.8 -13.6 -11.8 -10.2 -11.8 -13.3 -13.4 -12.8Current-account balance -10.0 -12.7 2.6 -4.3 -20.8 -8.7 17.8 8.4 5.5
Western AsiaGoods: exports (f.o.b.) 156.9 176.9 216.0 219.7 178.5 216.3 299.4 277.9 281.9Goods: imports (f.o.b.) -137.8 -165.8 -179.9 -188.4 -184.6 -178.7 -210.7 -202.0 -214.7Trade balance 19.0 11.1 36.2 31.3 -6.1 37.6 88.7 75.9 67.2Net services, income and current transfers -27.9 -20.9 -31.1 -26.7 -13.5 -24.6 -32.7 -32.5 -32.4
Net investment income -3.2 0.2 0.4 1.8 2.3 -1.1 -4.5 -4.8 -3.8Current-account balance -8.9 -9.8 5.0 4.6 -19.6 13.0 56.0 43.4 34.8
Eastern and Southern AsiaGoods: exports (f.o.b.) 743.8 907.4 973.5 1 046.9 983.3 1 050.1 1 269.5 1 180.5 1 295.1Goods: imports (f.o.b.) -748.9 -924.7 -996.0 -1 019.1 -843.1 -912.4 -1 150.4 -1 068.1 -1 155.7Trade balance -5.1 -17.3 -22.5 27.7 140.1 137.6 119.1 112.4 139.4Net services, income and current transfers 3.4 -19.0 -17.1 -5.9 -22.3 -20.7 -22.9 -11.8 -1.1
Net investment income -15.1 -28.4 -32.4 -29.3 -36.8 -33.8 -33.8 -30.4 -37.4Current-account balance -1.7 -36.3 -39.6 21.8 117.8 117.0 96.2 100.6 138.3
Table 22 (continued)
Source: UN/DESA, based on data of IMF and official national and other sources.a Partially estimated.b Preliminary estimate.c Ninety-five economies. Figures may not add up owing to rounding.
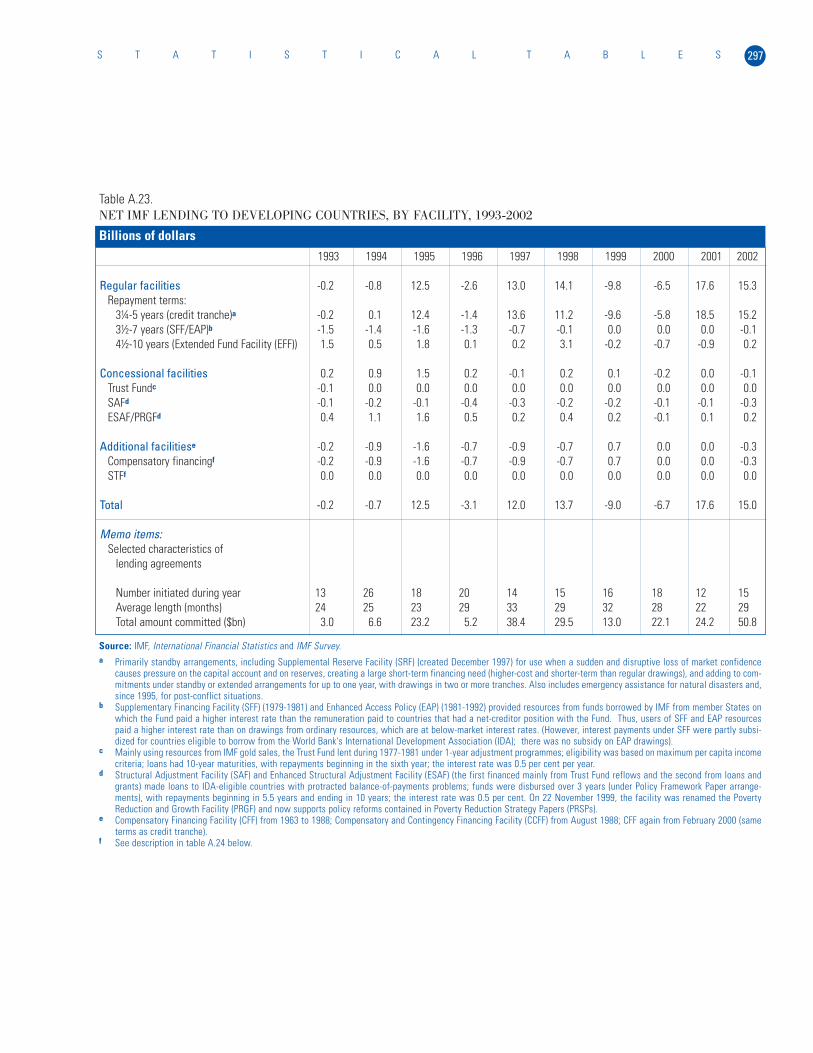
297S T A T I S T I C A L T A B L E S
Table A.23.NET IMF LENDING TO DEVELOPING COUNTRIES, BY FACILITY, 1993-2002
1993 1994 1995 1996 1997 1998 1999 2000 2001 2002
Regular facilities -0.2 -0.8 12.5 -2.6 13.0 14.1 -9.8 -6.5 17.6 15.3Repayment terms:
3¼-5 years (credit tranche)a -0.2 0.1 12.4 -1.4 13.6 11.2 -9.6 -5.8 18.5 15.23½-7 years (SFF/EAP)b -1.5 -1.4 -1.6 -1.3 -0.7 -0.1 0.0 0.0 0.0 -0.14½-10 years (Extended Fund Facility (EFF)) 1.5 0.5 1.8 0.1 0.2 3.1 -0.2 -0.7 -0.9 0.2
Concessional facilities 0.2 0.9 1.5 0.2 -0.1 0.2 0.1 -0.2 0.0 -0.1Trust Fundc -0.1 0.0 0.0 0.0 0.0 0.0 0.0 0.0 0.0 0.0SAFd -0.1 -0.2 -0.1 -0.4 -0.3 -0.2 -0.2 -0.1 -0.1 -0.3ESAF/PRGFd 0.4 1.1 1.6 0.5 0.2 0.4 0.2 -0.1 0.1 0.2
Additional facilitiese -0.2 -0.9 -1.6 -0.7 -0.9 -0.7 0.7 0.0 0.0 -0.3Compensatory financingf -0.2 -0.9 -1.6 -0.7 -0.9 -0.7 0.7 0.0 0.0 -0.3STFf 0.0 0.0 0.0 0.0 0.0 0.0 0.0 0.0 0.0 0.0
Total -0.2 -0.7 12.5 -3.1 12.0 13.7 -9.0 -6.7 17.6 15.0
Memo items:Selected characteristics of
lending agreements
Number initiated during year 13 26 18 20 14 15 16 18 12 15Average length (months) 24 25 23 29 33 29 32 28 22 29Total amount committed ($bn) 3.0 6.6 23.2 5.2 38.4 29.5 13.0 22.1 24.2 50.8
Billions of dollars
Source: IMF, International Financial Statistics and IMF Survey.a Primarily standby arrangements, including Supplemental Reserve Facility (SRF) (created December 1997) for use when a sudden and disruptive loss of market confidence
causes pressure on the capital account and on reserves, creating a large short-term financing need (higher-cost and shorter-term than regular drawings), and adding to com-mitments under standby or extended arrangements for up to one year, with drawings in two or more tranches. Also includes emergency assistance for natural disasters and,since 1995, for post-conflict situations.
b Supplementary Financing Facility (SFF) (1979-1981) and Enhanced Access Policy (EAP) (1981-1992) provided resources from funds borrowed by IMF from member States onwhich the Fund paid a higher interest rate than the remuneration paid to countries that had a net-creditor position with the Fund. Thus, users of SFF and EAP resourcespaid a higher interest rate than on drawings from ordinary resources, which are at below-market interest rates. (However, interest payments under SFF were partly subsi-dized for countries eligible to borrow from the World Bank's International Development Association (IDA); there was no subsidy on EAP drawings).
c Mainly using resources from IMF gold sales, the Trust Fund lent during 1977-1981 under 1-year adjustment programmes; eligibility was based on maximum per capita incomecriteria; loans had 10-year maturities, with repayments beginning in the sixth year; the interest rate was 0.5 per cent per year.
d Structural Adjustment Facility (SAF) and Enhanced Structural Adjustment Facility (ESAF) (the first financed mainly from Trust Fund reflows and the second from loans andgrants) made loans to IDA-eligible countries with protracted balance-of-payments problems; funds were disbursed over 3 years (under Policy Framework Paper arrange-ments), with repayments beginning in 5.5 years and ending in 10 years; the interest rate was 0.5 per cent. On 22 November 1999, the facility was renamed the PovertyReduction and Growth Facility (PRGF) and now supports policy reforms contained in Poverty Reduction Strategy Papers (PRSPs).
e Compensatory Financing Facility (CFF) from 1963 to 1988; Compensatory and Contingency Financing Facility (CCFF) from August 1988; CFF again from February 2000 (sameterms as credit tranche).
f See description in table A.24 below.
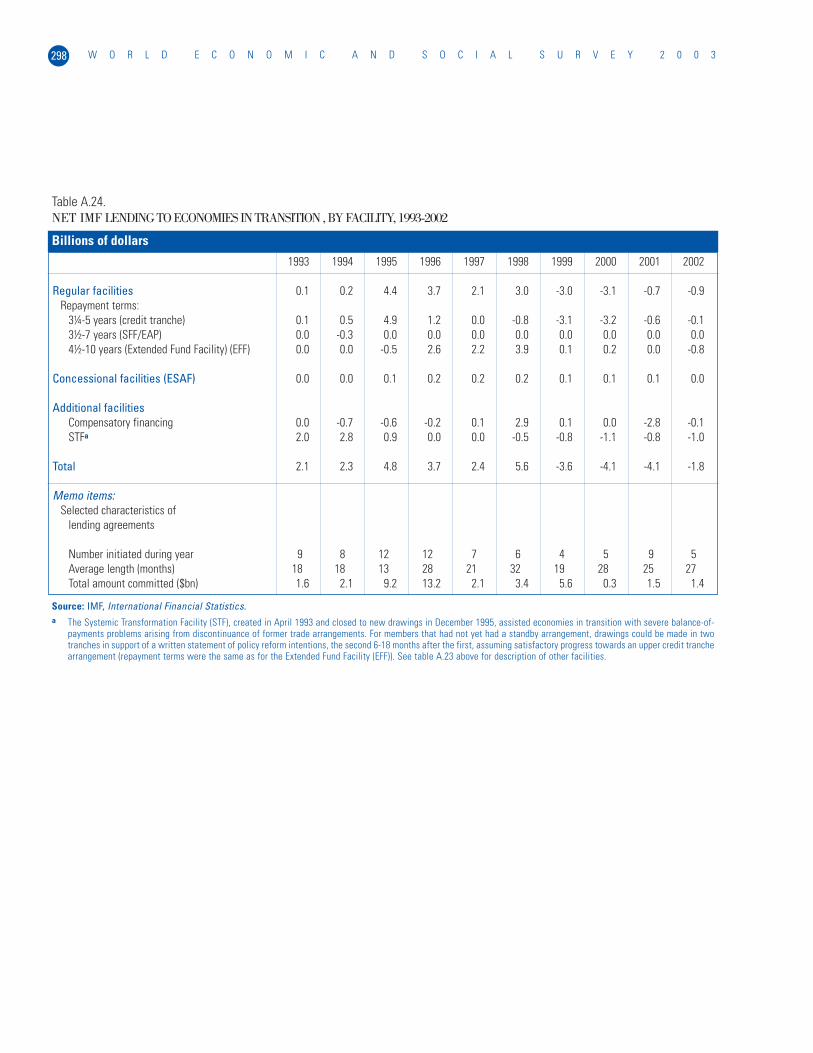
W O R L D E C O N O M I C A N D S O C I A L S U R V E Y 2 0 0 3298
Table A.24.NET IMF LENDING TO ECONOMIES IN TRANSITION , BY FACILITY, 1993-2002
Billions of dollars
1993 1994 1995 1996 1997 1998 1999 2000 2001 2002
Regular facilities 0.1 0.2 4.4 3.7 2.1 3.0 -3.0 -3.1 -0.7 -0.9Repayment terms:
3¼-5 years (credit tranche) 0.1 0.5 4.9 1.2 0.0 -0.8 -3.1 -3.2 -0.6 -0.13½-7 years (SFF/EAP) 0.0 -0.3 0.0 0.0 0.0 0.0 0.0 0.0 0.0 0.04½-10 years (Extended Fund Facility) (EFF) 0.0 0.0 -0.5 2.6 2.2 3.9 0.1 0.2 0.0 -0.8
Concessional facilities (ESAF) 0.0 0.0 0.1 0.2 0.2 0.2 0.1 0.1 0.1 0.0
Additional facilitiesCompensatory financing 0.0 -0.7 -0.6 -0.2 0.1 2.9 0.1 0.0 -2.8 -0.1STFa 2.0 2.8 0.9 0.0 0.0 -0.5 -0.8 -1.1 -0.8 -1.0
Total 2.1 2.3 4.8 3.7 2.4 5.6 -3.6 -4.1 -4.1 -1.8
Memo items:Selected characteristics of
lending agreements
Number initiated during year 9 8 12 12 7 6 4 5 9 5Average length (months) 18 18 13 28 21 32 19 28 25 27Total amount committed ($bn) 1.6 2.1 9.2 13.2 2.1 3.4 5.6 0.3 1.5 1.4
Source: IMF, International Financial Statistics.a The Systemic Transformation Facility (STF), created in April 1993 and closed to new drawings in December 1995, assisted economies in transition with severe balance-of-
payments problems arising from discontinuance of former trade arrangements. For members that had not yet had a standby arrangement, drawings could be made in twotranches in support of a written statement of policy reform intentions, the second 6-18 months after the first, assuming satisfactory progress towards an upper credit tranchearrangement (repayment terms were the same as for the Extended Fund Facility (EFF)). See table A.23 above for description of other facilities.

299S T A T I S T I C A L T A B L E S
Table A.25.NET ODA FROM MAJOR SOURCES, BY TYPE, 1982-2001
Growth rate of ODAa ODA as Total ODA(2000 prices and percentage (millions of Percentage distribution of ODA by type, 2001exchange rates) of GNP dollars) Bilateral Multilateral
1982- 1992- Technical UnitedDonor group or country 1991 2001 2001 2001 Grantsb cooperation Loans Nations IDA Other
Total DAC countries 2.84 -0.50 0.22 52 336 63.8 26.0 3.1 10.0 6.8 16.3
Total EU 3.34 -0.33 0.33 26 290 61.7 19.9 -1.8 8.8 6.4 24.9 Austria 3.03 1.03 0.29 533 62.7 16.7 1.3 3.4 4.7 27.8 Belgium 0.04 0.56 0.37 867 58.5 24.7 .. 4.2 5.7 32.3 Denmark 4.49 3.81 1.03 1 634 64.1 8.4 -0.9 16.6 3.1 17.1 Finland 14.17 -5.16 0.32 389 58.9 18.3 -1.0 17.2 8.0 17.2 Francec 5.04 -4.34 0.32 4 198 69.6 31.8 -7.7 2.6 5.5 30.0 Germany 1.85 -1.85 0.27 4 990 57.3 31.8 -0.1 9.2 7.0 26.6 Greece .. .. 0.17 202 40.1 7.9 0.5 3.0 2.5 53.5 Ireland 3.08 14.83 0.33 287 64.1 .. .. 8.7 2.8 24.0 Italy 8.99 -5.88 0.15 1 627 33.6 5.7 -6.4 11.2 14.8 46.9 Luxembourg 16.41 15.31 0.82 141 75.2 3.5 .. 5.7 2.8 16.3 Netherlands 1.03 2.77 0.82 3 172 75.4 20.0 -5.3 14.3 3.6 12.0 Portugal .. 3.63 0.25 268 118.1 33.2 -52.0 3.0 0.0 28.7 Spain .. 4.73 0.30 1 737 50.5 9.0 9.8 2.9 5.6 25.3 Sweden 3.21 1.16 0.81 1 666 67.9 3.9 1.1 16.4 0.0 11.3 United Kingdom -0.34 3.51 0.32 4 579 56.9 15.2 3.2 7.6 10.2 25.0
Australia 1.02 1.08 0.25 873 75.6 45.9 .. 5.8 7.6 10.9 Canada 3.29 -3.17 0.22 1 533 79.7 22.6 -1.4 8.1 0.0 13.6 Japan 4.66 -0.37 0.23 9 847 48.2 19.7 27.6 8.6 8.8 6.9 New Zealand -0.77 2.74 0.25 112 75.9 36.6 .. 8.9 3.6 11.6 Norway 5.60 0.86 0.83 1 346 73.2 8.6 0.7 18.2 5.9 6.0 Switzerland 5.92 1.52 0.34 908 68.3 11.2 2.2 9.0 9.1 10.8 United States 1.68 -2.61 0.11 11 429 81.3 43.4 -6.9 13.7 6.8 7.1
Arab countriesd
Saudi Arabia .. .. .. 490 80.6 19.4Kuwait .. .. .. 73 100.0 0.0
Other developing economiesd
Korea, Republic of .. .. .. 265 64.9 35.1Taiwan Province
of China .. .. .. 100.0
Source: UN/DESA, based on OECD, Development Co-operation: 2002 Report (Paris, 2003).a Average annual rates of growth, calculated from average levels in 1980-1981, 1990-1991 and 2000-2001.b Including technical cooperation.c Excluding flows from France to the Overseas Departments, namely, Guadeloupe, French Guiana, Martinique and Réunion.d Bilateral ODA includes all grants and loans; multilateral ODA includes United Nations, IDA and "other", including technical cooperation.
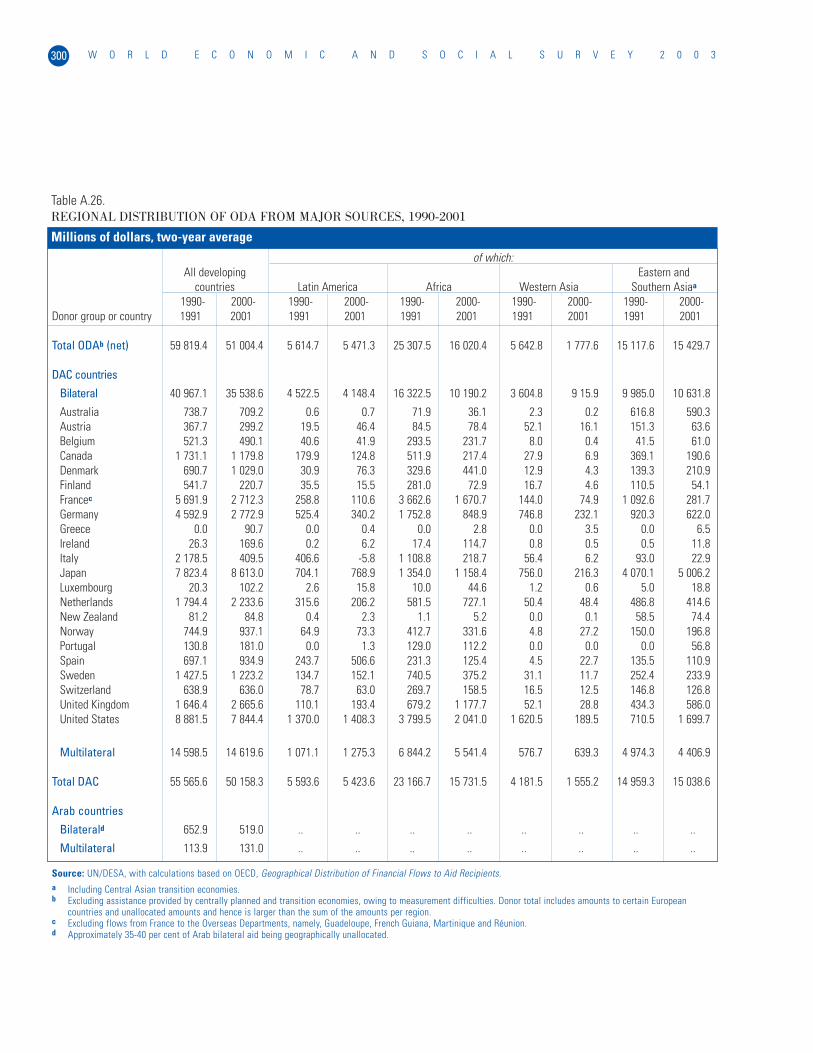
W O R L D E C O N O M I C A N D S O C I A L S U R V E Y 2 0 0 3300
Table A.26.REGIONAL DISTRIBUTION OF ODA FROM MAJOR SOURCES, 1990-2001
of which:All developing Eastern and
countries Latin America Africa Western Asia Southern Asiaa
1990- 2000- 1990- 2000- 1990- 2000- 1990- 2000- 1990- 2000-Donor group or country 1991 2001 1991 2001 1991 2001 1991 2001 1991 2001
Total ODAb (net) 59 819.4 51 004.4 5 614.7 5 471.3 25 307.5 16 020.4 5 642.8 1 777.6 15 117.6 15 429.7
DAC countries
Bilateral 40 967.1 35 538.6 4 522.5 4 148.4 16 322.5 10 190.2 3 604.8 9 15.9 9 985.0 10 631.8
Australia 738.7 709.2 0.6 0.7 71.9 36.1 2.3 0.2 616.8 590.3 Austria 367.7 299.2 19.5 46.4 84.5 78.4 52.1 16.1 151.3 63.6 Belgium 521.3 490.1 40.6 41.9 293.5 231.7 8.0 0.4 41.5 61.0 Canada 1 731.1 1 179.8 179.9 124.8 511.9 217.4 27.9 6.9 369.1 190.6 Denmark 690.7 1 029.0 30.9 76.3 329.6 441.0 12.9 4.3 139.3 210.9 Finland 541.7 220.7 35.5 15.5 281.0 72.9 16.7 4.6 110.5 54.1 Francec 5 691.9 2 712.3 258.8 110.6 3 662.6 1 670.7 144.0 74.9 1 092.6 281.7 Germany 4 592.9 2 772.9 525.4 340.2 1 752.8 848.9 746.8 232.1 920.3 622.0 Greece 0.0 90.7 0.0 0.4 0.0 2.8 0.0 3.5 0.0 6.5 Ireland 26.3 169.6 0.2 6.2 17.4 114.7 0.8 0.5 0.5 11.8 Italy 2 178.5 409.5 406.6 -5.8 1 108.8 218.7 56.4 6.2 93.0 22.9 Japan 7 823.4 8 613.0 704.1 768.9 1 354.0 1 158.4 756.0 216.3 4 070.1 5 006.2 Luxembourg 20.3 102.2 2.6 15.8 10.0 44.6 1.2 0.6 5.0 18.8 Netherlands 1 794.4 2 233.6 315.6 206.2 581.5 727.1 50.4 48.4 486.8 414.6 New Zealand 81.2 84.8 0.4 2.3 1.1 5.2 0.0 0.1 58.5 74.4 Norway 744.9 937.1 64.9 73.3 412.7 331.6 4.8 27.2 150.0 196.8 Portugal 130.8 181.0 0.0 1.3 129.0 112.2 0.0 0.0 0.0 56.8 Spain 697.1 934.9 243.7 506.6 231.3 125.4 4.5 22.7 135.5 110.9 Sweden 1 427.5 1 223.2 134.7 152.1 740.5 375.2 31.1 11.7 252.4 233.9 Switzerland 638.9 636.0 78.7 63.0 269.7 158.5 16.5 12.5 146.8 126.8 United Kingdom 1 646.4 2 665.6 110.1 193.4 679.2 1 177.7 52.1 28.8 434.3 586.0 United States 8 881.5 7 844.4 1 370.0 1 408.3 3 799.5 2 041.0 1 620.5 189.5 710.5 1 699.7
Multilateral 14 598.5 14 619.6 1 071.1 1 275.3 6 844.2 5 541.4 576.7 639.3 4 974.3 4 406.9
Total DAC 55 565.6 50 158.3 5 593.6 5 423.6 23 166.7 15 731.5 4 181.5 1 555.2 14 959.3 15 038.6
Arab countries
Bilaterald 652.9 519.0 .. .. .. .. .. .. .. ..
Multilateral 113.9 131.0 .. .. .. .. .. .. .. ..
Millions of dollars, two-year average
Source: UN/DESA, with calculations based on OECD, Geographical Distribution of Financial Flows to Aid Recipients.a Including Central Asian transition economies.b Excluding assistance provided by centrally planned and transition economies, owing to measurement difficulties. Donor total includes amounts to certain European
countries and unallocated amounts and hence is larger than the sum of the amounts per region.c Excluding flows from France to the Overseas Departments, namely, Guadeloupe, French Guiana, Martinique and Réunion.d Approximately 35-40 per cent of Arab bilateral aid being geographically unallocated.
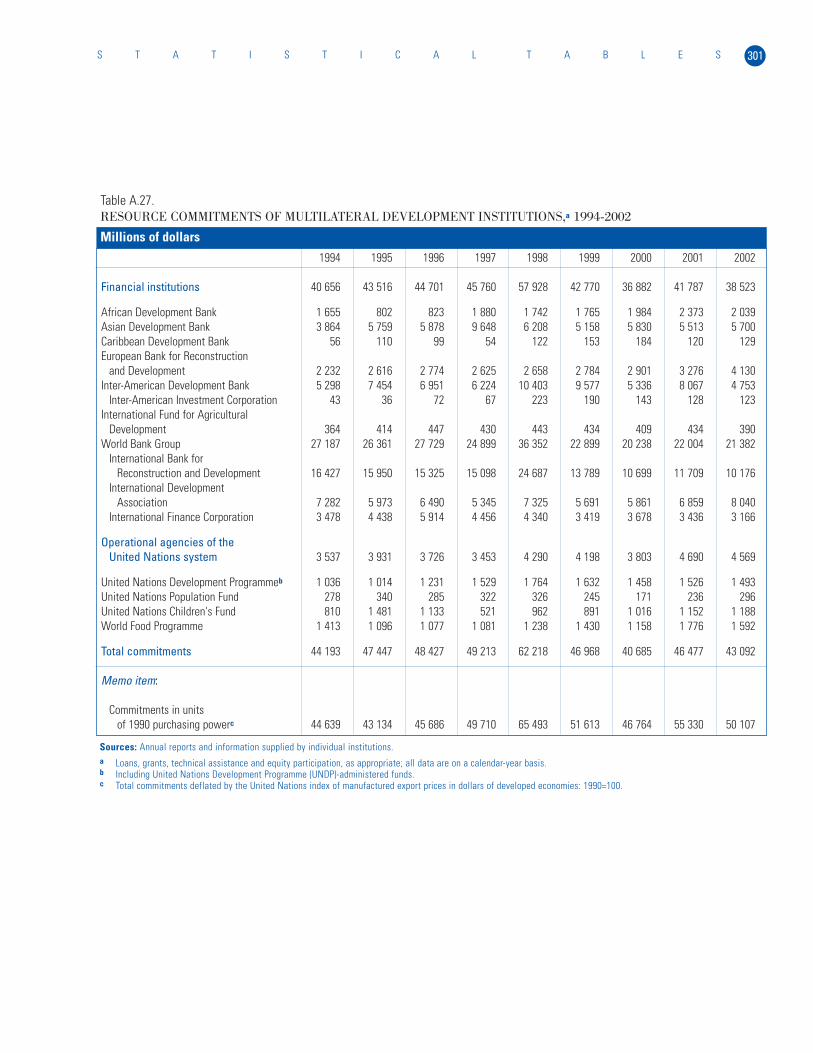
301S T A T I S T I C A L T A B L E S
Table A.27.RESOURCE COMMITMENTS OF MULTILATERAL DEVELOPMENT INSTITUTIONS,a 1994-2002
1994 1995 1996 1997 1998 1999 2000 2001 2002
Financial institutions 40 656 43 516 44 701 45 760 57 928 42 770 36 882 41 787 38 523
African Development Bank 1 655 802 823 1 880 1 742 1 765 1 984 2 373 2 039Asian Development Bank 3 864 5 759 5 878 9 648 6 208 5 158 5 830 5 513 5 700Caribbean Development Bank 56 110 99 54 122 153 184 120 129European Bank for Reconstruction
and Development 2 232 2 616 2 774 2 625 2 658 2 784 2 901 3 276 4 130Inter-American Development Bank 5 298 7 454 6 951 6 224 10 403 9 577 5 336 8 067 4 753
Inter-American Investment Corporation 43 36 72 67 223 190 143 128 123International Fund for Agricultural
Development 364 414 447 430 443 434 409 434 390World Bank Group 27 187 26 361 27 729 24 899 36 352 22 899 20 238 22 004 21 382
International Bank forReconstruction and Development 16 427 15 950 15 325 15 098 24 687 13 789 10 699 11 709 10 176
International DevelopmentAssociation 7 282 5 973 6 490 5 345 7 325 5 691 5 861 6 859 8 040
International Finance Corporation 3 478 4 438 5 914 4 456 4 340 3 419 3 678 3 436 3 166
Operational agencies of theUnited Nations system 3 537 3 931 3 726 3 453 4 290 4 198 3 803 4 690 4 569
United Nations Development Programmeb 1 036 1 014 1 231 1 529 1 764 1 632 1 458 1 526 1 493United Nations Population Fund 278 340 285 322 326 245 171 236 296United Nations Children's Fund 810 1 481 1 133 521 962 891 1 016 1 152 1 188World Food Programme 1 413 1 096 1 077 1 081 1 238 1 430 1 158 1 776 1 592
Total commitments 44 193 47 447 48 427 49 213 62 218 46 968 40 685 46 477 43 092
Memo item:
Commitments in unitsof 1990 purchasing powerc 44 639 43 134 45 686 49 710 65 493 51 613 46 764 55 330 50 107
Millions of dollars
Sources: Annual reports and information supplied by individual institutions.a Loans, grants, technical assistance and equity participation, as appropriate; all data are on a calendar-year basis.b Including United Nations Development Programme (UNDP)-administered funds.c Total commitments deflated by the United Nations index of manufactured export prices in dollars of developed economies: 1990=100.